UNITED STATES
SECURITIES AND EXCHANGE COMMISSION
Washington, D.C. 20549
FORM N-CSR
CERTIFIED SHAREHOLDER REPORT
OF
REGISTERED MANAGEMENT INVESTMENT COMPANIES
Investment Company Act file number: 811-07803
| Name of Registrant: | Vanguard Scottsdale Funds |
| Address of Registrant: | P.O. Box 2600 |
Valley Forge, PA 19482
| Name and address of agent for service: | Anne E. Robinson, Esquire |
P.O. Box 876
Valley Forge, PA 19482
Registrant’s telephone number, including area code: (610) 669-1000
Date of fiscal year end: August 31
Date of reporting period: September 1, 2019—August 31, 2020
Item 1: Reports to Shareholders

| Annual Report | August 31, 2020 Vanguard Explorer Value™ Fund |
| See the inside front cover for important information about access to your fund’s annual and semiannual shareholder reports. |
Important information about access to shareholder reports
Beginning on January 1, 2021, as permitted by regulations adopted by the Securities and Exchange Commission, paper copies of your fund’s annual and semiannual shareholder reports will no longer be sent to you by mail, unless you specifically request them. Instead, you will be notified by mail each time a report is posted on the website and will be provided with a link to access the report.
If you have already elected to receive shareholder reports electronically, you will not be affected by this change and do not need to take any action. You may elect to receive shareholder reports and other communications from the fund electronically by contacting your financial intermediary (such as a broker-dealer or bank) or, if you invest directly with the fund, by calling Vanguard at one of the phone numbers on the back cover of this report or by logging on to vanguard.com.
You may elect to receive paper copies of all future shareholder reports free of charge. If you invest through a financial intermediary, you can contact the intermediary to request that you continue to receive paper copies. If you invest directly with the fund, you can call Vanguard at one of the phone numbers on the back cover of this report or log on to vanguard.com. Your election to receive paper copies will apply to all the funds you hold through an intermediary or directly with Vanguard.
| Contents | |
| | |
| Your Fund’s Performance at a Glance | 1 |
| Advisors’ Report | 2 |
| About Your Fund’s Expenses | 6 |
| Performance Summary | 8 |
| Financial Statements | 10 |
| Liquidity Risk Management | 24 |
Please note: The opinions expressed in this report are just that—informed opinions. They should not be considered promises or advice. Also, please keep in mind that the information and opinions cover the period through the date on the front of this report. Of course, the risks of investing in your fund are spelled out in the prospectus.
Your Fund’s Performance at a Glance
● Vanguard Explorer Value Fund returned –8.12% for the 12 months ended August 31, 2020. The fund’s result lagged the –4.96% return of its benchmark, the Russell 2500 Value Index.
● A number of stock market indexes around the world climbed to record highs in February and then plummeted as the spread of the coronavirus beyond China led to lockdowns, the shuttering of nonessential businesses, and travel restrictions in many countries. However, the unprecedented scale of the response from policymakers, the start of trials for vaccines and treatments, and the easing of some pandemic-related restrictions helped lift investor sentiment.
● While the U.S. stock market as a whole posted a strong result, small-capitalization stocks underperformed their mid- and large-cap counterparts for the 12 months, and value stocks lagged growth stocks.
● The fund lagged its benchmark in a majority of industry sectors, including financials, consumer discretionary, and consumer staples. Its holdings in information technology and real estate, however, helped the fund’s relative performance.
Market Barometer
| | Average Annual Total Returns Periods Ended August 31, 2020 |
| | One Year | Three Years | Five Years |
| Stocks | | | |
| Russell 1000 Index (Large-caps) | 22.50% | 14.58% | 14.31% |
| Russell 2000 Index (Small-caps) | 6.02 | 5.03 | 7.65 |
| Russell 3000 Index (Broad U.S. market) | 21.44 | 13.95 | 13.86 |
| FTSE All-World ex US Index (International) | 8.78 | 2.92 | 6.00 |
| | | | |
| Bonds | | | |
| Bloomberg Barclays U.S. Aggregate Bond Index (Broad taxable market) | 6.47% | 5.09% | 4.33% |
| Bloomberg Barclays Municipal Bond Index (Broad tax-exempt market) | 3.24 | 4.09 | 3.99 |
| FTSE Three-Month U.S. Treasury Bill Index | 1.18 | 1.67 | 1.15 |
| | | | |
| CPI | | | |
| Consumer Price Index | 1.31% | 1.92% | 1.75% |
Advisors’ Report
For the fiscal year ended August 31, 2020, Vanguard Explorer Value Fund returned –8.12%, underperforming the –4.96% return of its benchmark, the Russell 2500 Value Index. Your fund is managed by two independent advisors, a strategy that enhances the fund’s diversification by providing exposure to distinct yet complementary investment approaches. It is not uncommon for different advisors to have different views about individual securities or the broader investment environment.
The advisors, the amount and percentage of fund assets each manages, and brief descriptions of their investment strategies are presented in the table below. The advisors have also prepared a discussion of the investment environment that existed during the 12 months and of how their portfolio positioning reflects this assessment. (Please note that the Frontier discussion refers to industry sectors as defined by Russell classifications rather than by the Global Industry Classification Standard used elsewhere in this report.) These comments were prepared on September 18, 2020.
Vanguard Explorer Value Fund Investment Advisors
| | Fund Assets Managed | |
| | | | | |
| Investment Advisor | % | $ Million | | Investment Strategy |
| | | | |
| Frontier Capital Management Co., LLC | 49 | 274 | | The advisor selects stocks by identifying companies it believes are underpriced relative to their long-term value. These companies are generally inexpensive and have low price-to-book and price-to-earnings ratios. |
| | | | |
| Cardinal Capital Management, L.L.C. | 48 | 270 | | The advisor seeks stocks that are able to generate excess cash flow and reinvest the cash to increase shareholder value. |
| | | | | |
| Cash Investments | 3 | 19 | | These short-term reserves are invested by Vanguard in equity index products to simulate investment in stocks. Each advisor may also maintain a modest cash position. |
| | | | | |
Frontier Capital Management Co., LLC
Portfolio Managers:
William A. Teichner, CFA,
Managing Partner
Rushan Jiang, CFA,
Vice President
Stock selection was a drag on the Frontier portion of the fund during the fiscal year, while sector allocation was modestly positive. Relative returns were weighed down primarily by holdings in financial services, materials and processing, and consumer discretionary.
The portfolio’s ten best-contributing stocks added, on average, approximately 100 basis points each to absolute performance (a basis point is one-hundredth of a percentage point). These stocks were spread over five sectors and encompassed five technology companies, two health care firms, and one position each from materials and processing, producer durables, and consumer discretionary. The technology holdings comprised three companies in the semiconductor industry, a distributor of information technology products, and a contract manufacturer. The health care holdings were a manufacturer of disposable medical devices and a maker of pain management products.
The top contributor was BMC Stock Holdings, a distributor of lumber and complementary products to home builders. The stock added approximately 110 basis points to performance as BMC exceeded revenue and earnings expectations. The company executed well on its strategy of growing high-value-added products such as millwork and windows, increasing repair and remodel sales, generating cash flows, and acquiring smaller companies. In late August, the company entered into a definitive agreement to merge with another distributor, Builders FirstSource, in an all-stock transaction. The merger should accelerate growth and deliver $140 million in cost synergies by the third year postmerger. We continue to find the stock attractive.
The portfolio’s ten largest detractors trimmed, on average, approximately 130 basis points each from performance. These stocks were spread over three sectors and encompassed seven financial services firms, two utilities, and one producer durables company. The financial services firms were four banks, two real estate investment trusts (REITs) that own outdoor shopping centers, and one property and casualty insurer. Banks’ earnings were hurt by lower interest rates as their loans typically reprice faster than deposits, and by higher credit costs as a result of the pandemic. The banks we currently own
are well-capitalized and many have company-specific drivers of earnings, such as non-interest-rate-related fee income. The REITs underperformed because of a slowdown in retail establishments following the lockdowns in many parts of the country. Our REITs have strong liquidity positions and reported improving rent collections recently as stores reopened.
The largest detractor was Texas Capital Bancshares, a Dallas-based commercial bank. The stock deducted approximately 160 basis points from performance as banks in general declined. We sold the stock when the company announced its CEO’s resignation and the termination of a merger with Independent Bank Group. The merger would have helped diversify Texas Capital’s loan portfolio and reduce an elevated percentage of energy loans. Although regulators consider the bank well-capitalized, its capital ratios are below average, reducing the company’s financial flexibility and increasing the possibility it would need to raise capital in a prolonged downturn.
During the fiscal year, we bought 22 new stocks and exited 16 holdings. Both the purchases and the sales were spread across seven sectors: financial services, producer durables, consumer discretionary, materials and processing, technology, health care, and energy. As is usual for the portfolio, the changes were made for company-specific reasons rather than sector positioning.
Cardinal Capital Management, L.L.C.
Portfolio Managers:
Eugene Fox III, Managing Partner
Robert B. Kirkpatrick, CFA,
Managing Partner
Rachel D. Matthews, Partner
Robert Fields, Partner
During the 12 months ended August 31, 2020, investors reduced their exposure to risk assets because the U.S. economy fell into a severe recession when businesses deemed nonessential were closed to reduce the impact of the COVID-19 pandemic on public health. The pandemic, unprecedented in modern times, has led to nearly 1 million deaths globally as of this writing. In response to the economic downturn, investors rotated into large-capitalization stocks, particularly technology, and shunned value stocks, particularly small-caps. Our portfolio benefited from being higher growth and quality than its benchmark, but its lower beta and greater exposure to companies using financial leverage detracted.
Investments in the industrial, consumer discretionary, and consumer staples sectors were the primary relative detractors. In industrials, the share price of KAR Auction Services declined after the wholesale car auction company lowered its earnings outlook on investments behind its dealer-to-
dealer business. The stock price fell further when physical auctions were closed temporarily because of the pandemic. However, the business has snapped back with strong used-car sales, and management accelerated its move to an entirely internet-based business model.
In consumer discretionary, the share price of theme-park operator Six Flags declined amid disappointing financial guidance and subsequent worries that, because of COVID-19, the company’s parks would see far fewer guests after reopening. In consumer staples, the share price of baked-goods provider Hostess Brands declined because of the lack of a near-term sale of the company and the withdrawal of guidance despite solid operating results. The primary contributors to relative performance were investments in materials and real estate.
Our outlook for the U.S. economy and equity market is cautious considering the pandemic and its impact on the economy. Although the equity market has tried to discount the impact, uncertainty persists. The U.S. has not experienced such a deadly virus, nor such a rapid and forced temporary shutdown of the economy. Nonetheless, as businesses have reopened, optimism has replaced fear and investors’ risk appetites have increased, even as unemployment reached levels not seen since the Great Depression. Normal economic activity is still unlikely until there is a safe and effective vaccine. Although the government and the Federal Reserve are committed to cushioning the economic impact, there are limits and consequences to their actions.
Thoughtful policies and medical advances against COVID-19 will help restore confidence and improve economic activity. The longer the virus persists, however, the more likely an economic recovery will be extended. For long-term investors, short-term economic disruptions have created attractive buying opportunities. Yet with heightened uncertainty, our managers continue to prefer investments whose success depends primarily on company-specific drivers rather than economic growth.
Despite the market’s post-March recovery, dispersion of stock returns was enormous as investors analyzed changing corporate fundamentals and possible postpandemic environments. Our managers reduced several positions that had erased most or all of their COVID-19-related declines and positions where they felt that the market consensus was overly optimistic. They added to investments where expectations were low but long-term fundamentals were sound. Overall, only modest changes were made to holdings, as the team believes the market is overly concerned with short-term fundamentals. The team continues to search for high-quality companies with good visibility whose shares have fallen because of short-term issues such as COVID-19.
About Your Fund’s Expenses
As a shareholder of the fund, you incur ongoing costs, which include costs for portfolio management, administrative services, and shareholder reports (like this one), among others. Operating expenses, which are deducted from a fund’s gross income, directly reduce the investment return of the fund.
A fund’s expenses are expressed as a percentage of its average net assets. This figure is known as the expense ratio. The following examples are intended to help you understand the ongoing costs (in dollars) of investing in your fund and to compare these costs with those of other mutual funds. The examples are based on an investment of $1,000 made at the beginning of the period shown and held for the entire period.
The accompanying table illustrates your fund’s costs in two ways:
• Based on actual fund return. This section helps you to estimate the actual expenses that you paid over the period. The ”Ending Account Value“ shown is derived from the fund‘s actual return, and the third column shows the dollar amount that would have been paid by an investor who started with $1,000 in the fund. You may use the information here, together with the amount you invested, to estimate the expenses that you paid over the period.
To do so, simply divide your account value by $1,000 (for example, an $8,600 account value divided by $1,000 = 8.6), then multiply the result by the number given for your fund under the heading ”Expenses Paid During Period.“
• Based on hypothetical 5% yearly return. This section is intended to help you compare your fund‘s costs with those of other mutual funds. It assumes that the fund had a yearly return of 5% before expenses, but that the expense ratio is unchanged. In this case—because the return used is not the fund’s actual return—the results do not apply to your investment. The example is useful in making comparisons because the Securities and Exchange Commission requires all mutual funds to calculate expenses based on a 5% return. You can assess your fund’s costs by comparing this hypothetical example with the hypothetical examples that appear in shareholder reports of other funds.
Note that the expenses shown in the table are meant to highlight and help you compare ongoing costs only and do not reflect transaction costs incurred by the fund for buying and selling securities. Further, the expenses do not include any purchase, redemption, or account service fees described in the fund prospectus. If such fees were applied to your account, your costs would be higher. Your fund does not carry a “sales load.”
The calculations assume no shares were bought or sold during the period. Your actual costs may have been higher or lower, depending on the amount of your investment and the timing of any purchases or redemptions.
You can find more information about the fund’s expenses, including annual expense ratios, in the Financial Statements section of this report. For additional information on operating expenses and other shareholder costs, please refer to your fund’s current prospectus.
Six Months Ended August 31, 2020
| | Beginning | Ending | Expenses |
| | Account Value | Account Value | Paid During |
| Explorer Value Fund | 2/29/2020 | 8/31/2020 | Period |
| Based on Actual Fund Return | $1,000.00 | $959.19 | $3.20 |
| Based on Hypothetical 5% Yearly Return | 1,000.00 | 1,021.87 | 3.30 |
The calculations are based on expenses incurred in the most recent six-month period. The fund’s annualized six-month expense ratio for that period is 0.65%. The dollar amounts shown as “Expenses Paid” are equal to the annualized expense ratio multiplied by the average account value over the period, multiplied by the number of days in the most recent six-month period, then divided by the number of days in the most recent 12-month period (184/366).
Explorer Value Fund
Performance Summary
All of the returns in this report represent past performance, which is not a guarantee of future results that may be achieved by the fund. (Current performance may be lower or higher than the performance data cited. For performance data current to the most recent month-end, visit our website at vanguard.com/performance.) Note, too, that both investment returns and principal value can fluctuate widely, so an investor’s shares, when sold, could be worth more or less than their original cost. The returns shown do not reflect taxes that a shareholder would pay on fund distributions or on the sale of fund shares.
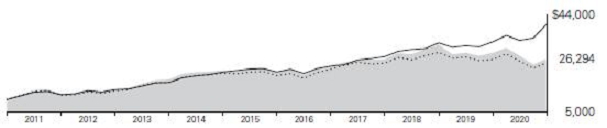
Cumulative Performance: August 31, 2010, Through August 31, 2020
Initial Investment of $10,000
| | | Average Annual Total Returns | | |
| | | Periods Ended August 31, 2020 | | |
| | | | | | Final Value |
| | | One | Five | Ten | of a $10,000 | |
| | | Year | Years | Years | Investment | |
 | Explorer Value Fund | -8.12% | 4.64% | 10.15% | $26,294 | |
 | Russell 2500 Value Index | -4.96 | 4.72 | 9.46 | 24,699 | |
 | Dow Jones U.S. Total Stock Market Float Adjusted Index | 21.20 | 13.77 | 14.88 | 40,053 | |
See Financial Highlights for dividend and capital gains information.
Explorer Value Fund
Fund Allocation
As of August 31, 2020
| Communication Services | 1.9% |
| Consumer Discretionary | 8.0 |
| Consumer Staples | 1.6 |
| Energy | 2.7 |
| Financials | 18.5 |
| Health Care | 7.6 |
| Industrials | 18.9 |
| Information Technology | 16.8 |
| Materials | 10.0 |
| Real Estate | 11.0 |
| Utilities | 3.0 |
The table reflects the fund’s investments, except for short-term investments and derivatives. Sector categories are based on the Global Industry Classification Standard ("GICS"), except for the "Other" category (if applicable), which includes securities that have not been provided a GICS classification as of the effective report-ing period.
The Global Industry Classification Standard (“GICS”) was developed by and is the exclusive property and a service mark of MSCI Inc. (“MSCI”) and Standard and Poor’s, a division of McGraw-Hill Companies, Inc. (“S&P”), and is licensed for use by Vanguard. Neither MSCI, S&P nor any third party involved in making or compiling the GICS or any GICS classification makes any express or implied warranties or representations with respect to such standard or classification (or the results to be obtained by the use thereof), and all such parties hereby expressly disclaim all warranties of originality, accuracy, completeness, merchantability or fitness for a particular purpose with respect to any such standard or classification. Without limiting any of the foregoing, in no event shall MSCI, S&P, any of its affiliates or any third party involved in making or compiling the GICS or any GICS classification have any liability for any direct, indirect, special, punitive, consequential or any other damages (including lost profits) even if notified of the possibility of such damages.
Explorer Value Fund
Financial Statements
Schedule of Investments
As of August 31, 2020
The fund files its complete schedule of portfolio holdings with the Securities and Exchange Commission (SEC) for the first and third quarters of each fiscal year as an exhibit to its reports on Form N-PORT. The fund’s Form N-PORT reports are available on the SEC’s website at www.sec.gov.
| | | | | Market | |
| | | | | Value• | |
| | | Shares | | ($000) | |
| Common Stocks (93.5%) | | | | |
| Communication Services (1.7%) | | | |
| | Nexstar Media Group Inc. Class A | 101,557 | | 9,750 | |
| | | | | | |
| Consumer Discretionary (7.5%) | | | |
| | Lithia Motors Inc. Class A | 36,435 | | 9,071 | |
| | Cooper Tire & Rubber Co. | 151,682 | | 5,244 | |
| * | Adtalem Global Education Inc. | 128,663 | | 4,272 | |
| | LCI Industries | 37,219 | | 4,229 | |
| * | LGI Homes Inc. | 34,431 | | 3,851 | |
| * | Perdoceo Education Corp. | 246,270 | | 3,539 | |
| * | Boot Barn Holdings Inc. | 114,936 | | 3,245 | |
| | Kontoor Brands Inc. | 125,489 | | 2,773 | |
| * | Modine Manufacturing Co. | 358,255 | | 2,425 | |
| * | Stoneridge Inc. | 95,142 | | 1,922 | |
| * | Lands’ End Inc. | 122,952 | | 1,645 | |
| | | | | 42,216 | |
| Consumer Staples (1.5%) | | | | |
| * | Hostess Brands Inc. Class A | 653,484 | | 8,391 | |
| | | | | | |
| Energy (2.5%) | | | | |
| | Parsley Energy Inc. Class A | 270,298 | | 2,906 | |
| * | PDC Energy Inc. | 174,624 | | 2,644 | |
| | International Seaways Inc. | 147,609 | | 2,503 | |
| | Rattler Midstream LP | 272,685 | | 2,282 | |
| * | WPX Energy Inc. | 373,191 | | 2,075 | |
| | Viper Energy Partners LP | 175,782 | | 1,790 | |
| | | | | 14,200 | |
| Financials (17.3%) | | | | |
| | PacWest Bancorp | 409,376 | | 7,811 | |
| | Starwood Property Trust Inc. | 486,213 | | 7,585 | |
| | Columbia Banking System Inc. | 254,520 | | 7,104 | |
| | James River Group Holdings Ltd. | 128,018 | | 6,236 | |
| | Popular Inc. | 166,905 | | 6,182 | |
| * | Bancorp Inc. | 546,571 | | 5,192 | |
| | Washington Federal Inc. | 220,588 | | 5,173 | |
| | First BanCorp (XNYS) | 855,831 | | 4,904 | |
| | Argo Group International Holdings Ltd. | 121,705 | | 4,520 | |
| | Evercore Inc. Class A | 68,724 | | 4,253 | |
| | Webster Financial Corp. | 145,458 | | 4,000 | |
| | Wintrust Financial Corp. | 91,789 | | 3,995 | |
| | Pinnacle Financial Partners Inc. | 99,316 | | 3,968 | |
| | BGC Partners Inc. Class A | 1,483,399 | | 3,738 | |
| | Renasant Corp. | 142,277 | | 3,609 | |
| | Flushing Financial Corp. | 289,601 | | 3,513 | |
| | WSFS Financial Corp. | 117,522 | | 3,443 | |
| | PJT Partners Inc. | 56,186 | | 3,325 | |
| | BankUnited Inc. | 140,583 | | 3,287 | |
| | Pacific Premier Bancorp Inc. | 140,060 | | 3,164 | |
| | First Merchants Corp. | 100,012 | | 2,558 | |
| | | | | 97,560 | |
| Health Care (7.1%) | | | | |
| *,^ | Ligand Pharmaceuticals Inc. | 98,454 | | 10,042 | |
| * | Syneos Health Inc. | 141,157 | | 8,907 | |
| * | Change Healthcare Inc. | 539,152 | | 7,629 | |
| * | Pacira BioSciences Inc. | 77,133 | | 4,822 | |
| * | Envista Holdings Corp. | 190,735 | | 4,576 | |
| * | Merit Medical Systems Inc. | 82,022 | | 4,027 | |
| | | | | 40,003 | |
Explorer Value Fund
| | | | | Market | |
| | | | | Value• | |
| | | Shares | | ($000) | |
| Industrials (17.7%) | | | | |
| * | Colfax Corp. | 281,995 | | 9,385 | |
| | BWX Technologies Inc. | 154,206 | | 8,576 | |
| | KAR Auction Services Inc. | 474,915 | | 8,235 | |
| * | BMC Stock Holdings Inc. | 157,897 | | 6,303 | |
| | Kaman Corp. | 111,099 | | 5,138 | |
| * | Teledyne Technologies Inc. | 16,160 | | 5,068 | |
| | Trinity Industries Inc. | 236,921 | | 4,850 | |
| | Encore Wire Corp. | 92,777 | | 4,788 | |
| | Quanta Services Inc. | 91,512 | | 4,690 | |
| * | Beacon Roofing Supply Inc. | 138,182 | | 4,683 | |
| | Altra Industrial Motion Corp. | 111,764 | | 4,365 | |
| | EnerSys | 57,724 | | 4,155 | |
| * | Saia Inc. | 23,974 | | 3,217 | |
| * | XPO Logistics Inc. | 36,002 | | 3,178 | |
| * | Stericycle Inc. | 49,071 | | 3,146 | |
| | Greenbrier Cos. Inc. | 114,390 | | 3,110 | |
| | HNI Corp. | 93,031 | | 2,963 | |
| | Applied Industrial Technologies Inc. | 45,358 | | 2,731 | |
| * | IAA Inc. | 47,674 | | 2,494 | |
| | Interface Inc. Class A | 314,052 | | 2,374 | |
| * | WESCO International Inc. | 39,813 | | 1,865 | |
| | AZZ Inc. | 42,172 | | 1,465 | |
| | Steelcase Inc. Class A | 131,608 | | 1,375 | |
| * | MRC Global Inc. | 203,308 | | 1,157 | |
| | | | | 99,311 | |
| Information Technology (15.7%) | | | |
| * | ACI Worldwide Inc. | 495,619 | | 14,561 | |
| * | J2 Global Inc. | 143,937 | | 10,074 | |
| | Silicon Motion Technology Corp. ADR | 206,416 | | 7,825 | |
| * | Verint Systems Inc. | 149,867 | | 7,128 | |
| * | Insight Enterprises Inc. | 91,594 | | 5,478 | |
| | Jabil Inc. | 152,664 | | 5,214 | |
| | SYNNEX Corp. | 37,805 | | 4,807 | |
| * | Itron Inc. | 79,408 | | 4,730 | |
| * | Fabrinet | 61,165 | | 4,268 | |
| | MKS Instruments Inc. | 34,349 | | 4,106 | |
| | Belden Inc. | 118,926 | | 4,006 | |
| | KBR Inc. | 134,857 | | 3,370 | |
| * | Virtusa Corp. | 71,375 | | 2,822 | |
| * | Perficient Inc. | 62,439 | | 2,679 | |
| * | Semtech Corp. | 45,502 | | 2,669 | |
| * | MACOM Technology Solutions Holdings Inc. | 70,451 | | 2,510 | |
| | Dolby Laboratories Inc. Class A | 30,843 | | 2,154 | |
| | | | | 88,401 | |
| Materials (9.4%) | | | | |
| | FMC Corp. | 142,868 | | 15,267 | |
| | Silgan Holdings Inc. | 369,103 | | 14,048 | |
| | Ashland Global Holdings Inc. | 93,358 | | 6,879 | |
| * | Axalta Coating Systems Ltd. | 278,546 | | 6,643 | |
| | Eagle Materials Inc. | 71,624 | | 5,857 | |
| | Carpenter Technology Corp. | 108,929 | | 2,291 | |
| | Compass Minerals International Inc. | 31,455 | | 1,791 | |
| | | | | 52,776 | |
| Real Estate (10.3%) | | | | |
| | Medical Properties Trust Inc. | 654,266 | | 12,156 | |
| | Gaming and Leisure Properties Inc. | 251,968 | | 9,159 | |
| | STAG Industrial Inc. | 204,009 | | 6,589 | |
| | Corporate Office Properties Trust | 246,580 | | 6,076 | |
| * | Howard Hughes Corp. | 89,200 | | 5,273 | |
| | Spirit Realty Capital Inc. | 120,014 | | 4,262 | |
| | Sunstone Hotel Investors Inc. | 361,174 | | 3,009 | |
| | Cousins Properties Inc. | 95,859 | | 2,861 | |
| | SITE Centers Corp. | 373,065 | | 2,802 | |
| | Invitation Homes Inc. | 91,019 | | 2,606 | |
| | Newmark Group Inc. Class A | 429,008 | | 1,900 | |
| | RPT Realty | 216,358 | | 1,268 | |
| | | | | 57,961 | |
| Utilities (2.8%) | | | | |
| | MDU Resources Group Inc. | 250,761 | | 5,923 | |
| | Portland General Electric Co. | 135,558 | | 5,172 | |
| | Unitil Corp. | 108,609 | | 4,583 | |
| | | | | 15,678 | |
| | | | | |
| Total Common Stocks | | | | |
| (Cost $495,065) | | | 526,247 | |
| Temporary Cash Investments (8.3%) | | | |
| Money Market Fund (8.0%) | | | | |
| 1,2 | Vanguard Market | | | | |
| | Liquidity Fund, 0.147% | 452,519 | | 45,252 | |
Explorer Value Fund
| | | Face | | Market | |
| | | Amount | | Value• | |
| | | ($000) | | ($000) | |
| U.S. Government and Agency Obligations (0.3%) | | | | |
| 3 | United States Cash Management Bill, 0.210%, 9/15/20 | 180 | | 180 | |
| 3 | United States Cash Management Bill, 0.145%, 12/15/20 | 300 | | 300 | |
| 3 | United States Treasury Bill, 0.087%, 9/24/20 | 1,000 | | 1,000 | |
| | | | | 1,480 | |
| | | | |
| Total Temporary Cash Investments | | | |
| (Cost $46,723) | | | 46,732 | |
| Total Investments (101.8%) | | | | |
| (Cost $541,788) | | | 572,979 | |
| Other Assets and Liabilities— | | | | |
| Net (-1.8%) | | | (10,355) | |
| Net Assets (100%) | | | 562,624 | |
Cost is in $000.
• See Note A in Notes to Financial Statements.
* Non-income-producing security.
^ Includes partial security positions on loan to broker-dealers. The total value of securities on loan is $7,344,000.
1 Affiliated money market fund available only to Vanguard funds and certain trusts and accounts managed by Vanguard. Rate shown is the 7-day yield.
2 Collateral of $7,632,000 was received for securities on loan.
3 Securities with a value of $1,480,000 have been segregated as initial margin for open futures contracts.
ADR—American Depositary Receipt.
| Derivative Financial Instruments Outstanding as of Period End | | | | | | | |
| | | | | | | | |
| Futures Contracts | | | | | | | | |
| | | | | | | | ($000) | |
| | | | | | | | Value and | |
| | | | Number of | | | | Unrealized | |
| | | | Long (Short) | | Notional | | Appreciation | |
| | Expiration | | Contracts | | Amount | | (Depreciation) | |
| Long Futures Contracts | | | | | | | | |
| E-mini Russell 2000 Index | September 2020 | | 242 | | 18,892 | | 1,409 | |
See accompanying Notes, which are an integral part of the Financial Statements.
Explorer Value Fund
Statement of Assets and Liabilities
As of August 31, 2020
| ($000s, except shares and per-share amounts) | Amount |
| Assets | |
| Investments in Securities, at Value | |
| Unaffiliated Issuers (Cost $496,545) | 527,727 |
| Affiliated Issuers (Cost $45,243) | 45,252 |
| Total Investments in Securities | 572,979 |
| Investment in Vanguard | 23 |
| Cash Collateral Pledged—Futures Contracts | 131 |
| Receivables for Investment Securities Sold | 360 |
| Receivables for Accrued Income | 628 |
| Receivables for Capital Shares Issued | 253 |
| Total Assets | 574,374 |
| Liabilities | |
| Due to Custodian | 99 |
| Payables for Investment Securities Purchased | 572 |
| Collateral for Securities on Loan | 7,632 |
| Payables to Investment Advisor | 608 |
| Payables for Capital Shares Redeemed | 2,581 |
| Payables to Vanguard | 62 |
| Variation Margin Payable—Futures Contracts | 196 |
| Total Liabilities | 11,750 |
| Net Assets | 562,624 |
| | |
| At August 31, 2020, net assets consisted of: | |
| | |
| Paid-in Capital | 555,086 |
| Total Distributable Earnings (Loss) | 7,538 |
| Net Assets | 562,624 |
| | |
| Net Assets | |
| Applicable to 18,553,431 outstanding $.001 par value shares of beneficial interest (unlimited authorization) | 562,624 |
| Net Asset Value Per Share | $30.32 |
See accompanying Notes, which are an integral part of the Financial Statements.
Explorer Value Fund
Statement of Operations
| | Year Ended |
| | August 31, 2020 |
| | ($000) |
| Investment Income | |
| Income | |
| Dividends | 11,305 |
| Interest1 | 542 |
| Securities Lending—Net | 82 |
| Total Income | 11,929 |
| Expenses | |
| Investment Advisory Fees—Note B | |
| Basic Fee | 1,998 |
| Performance Adjustment | 582 |
| The Vanguard Group—Note C | |
| Management and Administrative | 1,221 |
| Marketing and Distribution | 77 |
| Custodian Fees | 10 |
| Auditing Fees | 42 |
| Shareholders’ Reports | 17 |
| Trustees’ Fees and Expenses | 1 |
| Total Expenses | 3,948 |
| Net Investment Income | 7,981 |
| Realized Net Gain (Loss) | |
| Investment Securities Sold1 | (19,930) |
| Futures Contracts | 1,470 |
| Realized Net Gain (Loss) | (18,460) |
| Change in Unrealized Appreciation (Depreciation) | |
| Investment Securities1 | (52,221) |
| Futures Contracts | 1,968 |
| Change in Unrealized Appreciation (Depreciation) | (50,253) |
| Net Increase (Decrease) in Net Assets Resulting from Operations | (60,732) |
1 Interest income, realized net gain (loss), and change in unrealized appreciation (depreciation) from an affiliated company of the fund were $530,000, $8,000, and $2,000, respectively. Purchases and sales are for temporary cash investment purposes.
See accompanying Notes, which are an integral part of the Financial Statements.
Explorer Value Fund
Statement of Changes in Net Assets
| | Year Ended August 31, |
| | 2020 | 2019 |
| | ($000) | ($000) |
| Increase (Decrease) in Net Assets | | |
| Operations | | |
| Net Investment Income | 7,981 | 9,791 |
| Realized Net Gain (Loss) | (18,460) | (4,010) |
| Change in Unrealized Appreciation (Depreciation) | (50,253) | (84,055) |
| Net Increase (Decrease) in Net Assets Resulting from Operations | (60,732) | (78,274) |
| Distributions1 | | |
| Total Distributions | (10,473) | (49,375) |
| Capital Share Transactions | | |
| Issued | 179,685 | 104,548 |
| Issued in Lieu of Cash Distributions | 9,910 | 46,711 |
| Redeemed | (210,832) | (136,426) |
| Net Increase (Decrease) from Capital Share Transactions | (21,237) | 14,833 |
| Total Increase (Decrease) | (92,442) | (112,816) |
| Net Assets | | |
| Beginning of Period | 655,066 | 767,882 |
| End of Period | 562,624 | 655,066 |
1 Certain prior period numbers have been reclassified to conform with current period presentation.
See accompanying Notes, which are an integral part of the Financial Statements.
Explorer Value Fund
Financial Highlights
| For a Share Outstanding | | | | | | Year Ended August 31, | |
| Throughout Each Period | | 2020 | | 2019 | | 2018 | | 2017 | | 2016 | |
| Net Asset Value, Beginning of Period | | $33.49 | | $40.53 | | $34.45 | | $31.55 | | $30.09 | |
| Investment Operations | | | | | | | | | | | |
| Net Investment Income | | .400 | 1 | .494 | 1 | .355 | 1 | .329 | 1 | .293 | |
| Net Realized and Unrealized Gain (Loss) on Investments | | (3.032 | ) | (4.921 | ) | 7.112 | | 3.331 | | 2.964 | |
| Total from Investment Operations | | (2.632 | ) | (4.427 | ) | 7.467 | | 3.660 | | 3.257 | |
| Distributions | | | | | | | | | | | |
| Dividends from Net Investment Income | | (.538 | ) | (.366 | ) | (.288 | ) | (.308 | ) | (.237 | ) |
| Distributions from Realized Capital Gains | | — | | (2.247 | ) | (1.099 | ) | (.452 | ) | (1.560 | ) |
| Total Distributions | | (.538 | ) | (2.613 | ) | (1.387 | ) | (.760 | ) | (1.797 | ) |
| Net Asset Value, End of Period | | $30.32 | | $33.49 | | $40.53 | | $34.45 | | $31.55 | |
| | | | | | | | | | | | |
| Total Return2 | | -8.12% | | -10.10% | | 22.10% | | 11.64% | | 11.41% | |
| | | | | | | | | | | | |
| Ratios/Supplemental Data | | | | | | | | | | | |
| Net Assets, End of Period (Millions) | | $563 | | $655 | | $768 | | $607 | | $377 | |
| Ratio of Total Expenses to Average Net Assets3 | | 0.64% | | 0.55% | | 0.56% | | 0.55% | | 0.57% | |
| Ratio of Net Investment Income to Average Net Assets | | 1.28% | | 1.45% | | 0.95% | | 0.98% | | 1.03% | |
| Portfolio Turnover Rate | | 42% | | 27% | | 31% | | 33% | | 61% | |
| 1 | Calculated based on average shares outstanding. |
| 2 | Total returns do not include account service fees that may have applied in the periods shown. Fund prospectuses provide information about any applicable account service fees. |
| 3 | Includes performance-based investment advisory fee increases (decreases) of 0.09%, 0.01%, 0.03%, (0.01%), and (0.01%). |
See accompanying Notes, which are an integral part of the Financial Statements.
Explorer Value Fund
Notes to Financial Statements
Vanguard Explorer Value Fund is registered under the Investment Company Act of 1940 as an open-end investment company, or mutual fund. Market disruptions associated with the COVID-19 pandemic have had a global impact, and uncertainty exists as to the long-term implications. Such disruptions can adversely affect assets of the fund and thus fund performance.
A. The following significant accounting policies conform to generally accepted accounting principles for U.S. investment companies. The fund consistently follows such policies in preparing its financial statements.
1. Security Valuation: Securities are valued as of the close of trading on the New York Stock Exchange (generally 4 p.m., Eastern time) on the valuation date. Equity securities are valued at the latest quoted sales prices or official closing prices taken from the primary market in which each security trades; such securities not traded on the valuation date are valued at the mean of the latest quoted bid and asked prices. Securities for which market quotations are not readily available, or whose values have been materially affected by events occurring before the fund’s pricing time but after the close of the securities’ primary markets, are valued by methods deemed by the board of trustees to represent fair value. Investments in Vanguard Market Liquidity Fund are valued at that fund’s net asset value. Temporary cash investments are valued using the latest bid prices or using valuations based on a matrix system (which considers such factors as security prices, yields, maturities, and ratings), both as furnished by independent pricing services.
2. Futures Contracts: The fund uses index futures contracts to a limited extent, with the objective of maintaining full exposure to the stock market while maintaining liquidity. The fund may purchase or sell futures contracts to achieve a desired level of investment, whether to accommodate portfolio turnover or cash flows from capital share transactions. The primary risks associated with the use of futures contracts are imperfect correlation between changes in market values of stocks held by the fund and the prices of futures contracts, and the possibility of an illiquid market. Counterparty risk involving futures is mitigated because a regulated clearinghouse is the counterparty instead of the clearing broker. To further mitigate counterparty risk, the fund trades futures contracts on an exchange, monitors the financial strength of its clearing brokers and clearinghouse, and has entered into clearing agreements with its clearing brokers. The clearinghouse imposes initial margin requirements to secure the fund’s performance and requires daily settlement of variation margin representing changes in the market value of each contract. Any securities pledged as initial margin for open contracts are noted in the Schedule of Investments.
Futures contracts are valued at their quoted daily settlement prices. The notional amounts of the contracts are not recorded in the Statement of Assets and Liabilities. Fluctuations in the value of the contracts are recorded in the Statement of Assets and Liabilities as an asset (liability) and in the Statement of Operations as unrealized appreciation (depreciation) until the contracts are closed, when they are recorded as realized gains (losses) on futures contracts.
During the year ended August 31, 2020, the fund’s average investments in long and short futures contracts represented 3% and 0% of net assets, respectively, based on the average of the notional amounts at each quarter-end during the period.
Explorer Value Fund
3. Federal Income Taxes: The fund intends to continue to qualify as a regulated investment company and distribute all of its taxable income. The fund’s tax returns are open to examination by the relevant tax authorities until expiration of the applicable statute of limitations, which is generally three years after the filing of the tax return. Management has analyzed the fund’s tax positions taken for all open federal and state income tax years, and has concluded that no provision for income tax is required in the fund’s financial statements.
4. Distributions: Distributions to shareholders are recorded on the ex-dividend date. Distributions are determined on a tax basis at the fiscal year-end and may differ from net investment income and realized capital gains for financial reporting purposes.
5. Securities Lending: To earn additional income, the fund lends its securities to qualified institutional borrowers. Security loans are subject to termination by the fund at any time, and are required to be secured at all times by collateral in an amount at least equal to the market value of securities loaned. Daily market fluctuations could cause the value of loaned securities to be more or less than the value of the collateral received. When this occurs, the collateral is adjusted and settled before the opening of the market on the next business day. The fund further mitigates its counterparty risk by entering into securities lending transactions only with a diverse group of prequalified counterparties, monitoring their financial strength, and entering into master securities lending agreements with its counterparties. The master securities lending agreements provide that, in the event of a counterparty’s default (including bankruptcy), the fund may terminate any loans with that borrower, determine the net amount owed, and sell or retain the collateral up to the net amount owed to the fund; however, such actions may be subject to legal proceedings. While collateral mitigates counterparty risk, in the event of a default, the fund may experience delays and costs in recovering the securities loaned. The fund invests cash collateral received in Vanguard Market Liquidity Fund, and records a liability in the Statement of Assets and Liabilities for the return of the collateral, during the period the securities are on loan. Collateral investments in Vanguard Market Liquidity Fund are subject to market appreciation or depreciation. Securities lending income represents fees charged to borrowers plus income earned on invested cash collateral, less expenses associated with the loan. During the term of the loan, the fund is entitled to all distributions made on or in respect of the loaned securities.
6. Credit Facilities and Interfund Lending Program: The fund and certain other funds managed by The Vanguard Group (“Vanguard”) participate in a $4.3 billion committed credit facility provided by a syndicate of lenders pursuant to a credit agreement and an uncommitted credit facility provided by Vanguard. Both facilities may be renewed annually. Each fund is individually liable for its borrowings, if any, under the credit facilities. Borrowings may be utilized for temporary or emergency purposes, subject to the fund’s regulatory and contractual borrowing restrictions. With respect to the committed credit facility, the participating funds are charged administrative fees and an annual commitment fee of 0.10% of the undrawn committed amount of the facility; these fees are allocated to the funds based on a method approved by the fund’s board of trustees and included in Management and Administrative expenses on the fund’s Statement of Operations. Any borrowings under either facility bear interest at a rate based upon the higher of the one-month London Interbank Offered Rate (or an acceptable alternate rate, if necessary), federal funds effective rate, or overnight bank funding rate plus an agreed-upon spread, except that borrowings under the uncommitted credit facility may bear interest based upon an alternative rate agreed to by the fund and Vanguard.
Explorer Value Fund
In accordance with an exemptive order (the “Order”) from the SEC, the fund may participate in a joint lending and borrowing program that allows registered open-end Vanguard funds to borrow money from and lend money to each other for temporary or emergency purposes (the “Interfund Lending Program”), subject to compliance with the terms and conditions of the Order, and to the extent permitted by the fund’s investment objective and investment policies. Interfund loans and borrowings normally extend overnight, but can have a maximum duration of seven days. Loans may be called on one business day’s notice. The interest rate to be charged is governed by the conditions of the Order and internal procedures adopted by the board of trustees. The board of trustees is responsible for overseeing the Interfund Lending Program.
For the year ended August 31, 2020, the fund did not utilize the credit facilities or the Interfund Lending Program.
7. Other: Dividend income is recorded on the ex-dividend date. Interest income includes income distributions received from Vanguard Market Liquidity Fund and is accrued daily. Premiums and discounts on debt securities are amortized and accreted, respectively, to interest income over the lives of the respective securities, except for premiums on certain callable debt securities that are amortized to the earliest call date. Security transactions are accounted for on the date securities are bought or sold. Costs used to determine realized gains (losses) on the sale of investment securities are those of the specific securities sold.
B. The investment advisory firms Frontier Capital Management Co., LLC, and Cardinal Capital Management, L.L.C., each provide investment advisory services to a portion of the fund for a fee calculated at an annual percentage rate of average net assets managed by the advisor. The basic fee of Frontier Capital Management Co., LLC, is subject to quarterly adjustments based on performance relative to the Russell 2000 Value Index for the preceding three years. The basic fee of Cardinal Capital Management, L.L.C., is subject to quarterly adjustments based on performance relative to the Russell 3000 Value Custom Index for the preceding three years.
Vanguard manages the cash reserves of the fund as described below.
For the year ended August 31, 2020, the aggregate investment advisory fee represented an effective annual basic rate of 0.32% of the fund’s average net assets, before an increase of $582,000 (0.09%) based on performance.
C. In accordance with the terms of a Funds’ Service Agreement (the “FSA”) between Vanguard and the fund, Vanguard furnishes to the fund corporate management, administrative, marketing, distribution, and cash management services at Vanguard’s cost of operations (as defined by the FSA). These costs of operations are allocated to the fund based on methods and guidelines approved by the board of trustees and are generally settled twice a month.
Upon the request of Vanguard, the fund may invest up to 0.40% of its net assets as capital in Vanguard. At August 31, 2020, the fund had contributed to Vanguard capital in the amount of $23,000, representing less than 0.01% of the fund’s net assets and 0.01% of Vanguard’s capital received pursuant to the FSA. The fund’s trustees and officers are also directors and employees, respectively, of Vanguard.
Explorer Value Fund
D. Various inputs may be used to determine the value of the fund’s investments and derivatives. These inputs are summarized in three broad levels for financial statement purposes. The inputs or methodologies used to value securities are not necessarily an indication of the risk associated with investing in those securities.
Level 1—Quoted prices in active markets for identical securities.
Level 2—Other significant observable inputs (including quoted prices for similar securities, interest rates, prepayment speeds, credit risk, etc.).
Level 3—Significant unobservable inputs (including the fund’s own assumptions used to determine the fair value of investments). Any investments and derivatives valued with significant unobservable inputs are noted on the Schedule of Investments.
The following table summarizes the market value of the fund’s investments and derivatives as of August 31, 2020, based on the inputs used to value them:
| | Level 1 | | Level 2 | | Level 3 | | Total | |
| | ($000 | ) | ($000 | ) | ($000 | ) | ($000 | ) |
| Investments | | | | | | | | |
| Assets | | | | | | | | |
| Common Stocks | 526,247 | | — | | — | | 526,247 | |
| Temporary Cash Investments | 45,252 | | 1,480 | | — | | 46,732 | |
| Total | 571,499 | | 1,480 | | — | | 572,979 | |
| Derivative Financial Instruments | | | | | | | | |
| Liabilities | | | | | | | | |
| Futures Contracts1 | 196 | | — | | — | | 196 | |
1 Represents variation margin on the last day of the reporting period.
E. Permanent differences between book-basis and tax-basis components of net assets, if any, are reclassified among capital accounts in the financial statements to reflect their tax character. These reclassifications have no effect on net assets or net asset value per share.
Temporary differences between book-basis and tax-basis components of total distributable earnings (loss) arise when certain items of income, gain, or loss are recognized in different periods for financial statement and tax purposes; these differences will reverse at some time in the future. The differences are primarily related to the deferral of losses from wash sales; and the recognition of unrealized gains or losses from certain derivative contracts. As of period end, the tax-basis components of total distributable earnings (loss) are detailed in the table as follows:
| | Amount | |
| | ($000 | ) |
| Undistributed Ordinary Income | 3,215 | |
| Undistributed Long-Term Gains | — | |
| Capital Loss Carryforwards | (26,868 | ) |
| Qualified Late-Year Losses | — | |
| Net Unrealized Gains (Losses) | 31,191 | |
Explorer Value Fund
The tax character of distributions paid was as follows:
| | Year Ended August 31, | |
| | 2020 | | 2019 | |
| | Amount | | Amount | |
| | ($000 | ) | ($000 | ) |
| Ordinary Income * | 10,473 | | 16,392 | |
| Long-Term Capital Gains | — | | 32,983 | |
| Total | 10,473 | | 49,375 | |
*Includes short-term capital gains, if any.
As of August 31, 2020, gross unrealized appreciation and depreciation for investments and derivatives based on cost for U.S. federal income tax purposes were as follows:
| | Amount | |
| | ($000 | ) |
| Tax Cost | 541,788 | |
| Gross Unrealized Appreciation | 109,769 | |
| Gross Unrealized Depreciation | (78,578 | ) |
| Net Unrealized Appreciation (Depreciation) | 31,191 | |
F. During the year ended August 31, 2020, the fund purchased $239,321,000 of investment securities and sold $254,874,000 of investment securities, other than temporary cash investments.
G. Capital shares issued and redeemed were:
| | Year Ended August 31, | |
| | 2020 | | 2019 | |
| | Shares | | Shares | |
| | (000 | ) | (000 | ) |
| Issued | 5,985 | | 3,084 | |
| Issued in Lieu of Cash Distributions | 274 | | 1,573 | |
| Redeemed | (7,268 | ) | (4,042 | ) |
| Net Increase (Decrease) in Shares Outstanding | (1,009 | ) | 615 | |
H. Management has determined that no events or transactions occurred subsequent to August 31, 2020, that would require recognition or disclosure in these financial statements.
Report of Independent Registered Public Accounting Firm
To the Board of Trustees of Vanguard Scottsdale Funds and Shareholders of Vanguard Explorer Value Fund
Opinion on the Financial Statements
We have audited the accompanying statement of assets and liabilities, including the schedule of investments, of Vanguard Explorer Value Fund (one of the funds constituting Vanguard Scottsdale Funds, referred to hereafter as the “Fund”) as of August 31, 2020, the related statement of operations for the year ended August 31, 2020, the statement of changes in net assets for each of the two years in the period ended August 31, 2020, including the related notes, and the financial highlights for each of the five years in the period ended August 31, 2020 (collectively referred to as the “financial statements”). In our opinion, the financial statements present fairly, in all material respects, the financial position of the Fund as of August 31, 2020, the results of its operations for the year then ended, the changes in its net assets for each of the two years in the period ended August 31, 2020 and the financial highlights for each of the five years in the period ended August 31, 2020 in conformity with accounting principles generally accepted in the United States of America.
Basis for Opinion
These financial statements are the responsibility of the Fund’s management. Our responsibility is to express an opinion on the Fund’s financial statements based on our audits. We are a public accounting firm registered with the Public Company Accounting Oversight Board (United States) (“PCAOB”) and are required to be independent with respect to the Fund in accordance with the U.S. federal securities laws and the applicable rules and regulations of the Securities and Exchange Commission and the PCAOB.
We conducted our audits of these financial statements in accordance with the standards of the PCAOB. Those standards require that we plan and perform the audit to obtain reasonable assurance about whether the financial statements are free of material misstatement, whether due to error or fraud.
Our audits included performing procedures to assess the risks of material misstatement of the financial statements, whether due to error or fraud, and performing procedures that respond to those risks. Such procedures included examining, on a test basis, evidence regarding the amounts and disclosures in the financial statements. Our audits also included evaluating the accounting principles used and significant estimates made by management, as well as evaluating the overall presentation of the financial statements. Our procedures included confirmation of securities owned as of August 31, 2020 by correspondence with the custodian and brokers and by agreement to the underlying ownership records of the transfer agent; when replies were not received from brokers, we performed other auditing procedures. We believe that our audits provide a reasonable basis for our opinion.
/s/PricewaterhouseCoopers LLP
Philadelphia, Pennsylvania
October 15, 2020
We have served as the auditor of one or more investment companies in The Vanguard Group of Funds since 1975.
Special 2020 tax information (unaudited) for Vanguard Explorer Value Fund
This information for the fiscal year ended August 31, 2020, is included pursuant to provisions of the Internal Revenue Code.
The fund distributed $0 as capital gain dividends (20% rate gain distributions) to shareholders during the fiscal year.
For nonresident alien shareholders, 100% of short-term capital gain dividends distributed by the fund are qualified short-term capital gains.
The fund distributed $9,051,000 of qualified dividend income to shareholders during the fiscal year.
The fund distributed $1,422,000 of qualified business income to shareholders during the fiscal year.
For corporate shareholders, 96.3% of investment income (dividend income plus short-term gains, if any) qualifies for the dividends-received deduction.
Liquidity Risk Management
Vanguard funds (except for the money market funds) have adopted and implemented a written liquidity risk management program (the “Program”) as required by Rule 22e-4 under the Investment Company Act of 1940. Rule 22e-4 requires that each fund adopt a program that is reasonably designed to assess and manage the fund’s liquidity risk, which is the risk that the fund could not meet redemption requests without significant dilution of remaining investors’ interests in the fund.
Assessment and management of a fund’s liquidity risk under the Program take into consideration certain factors, such as the fund’s investment strategy and the liquidity of its portfolio investments during normal and reasonably foreseeable stressed conditions, its short- and long-term cash-flow projections during both normal and reasonably foreseeable stressed conditions, and its cash and cash-equivalent holdings and access to other funding sources. As required by the rule, the Program includes policies and procedures for classification of fund portfolio holdings in four liquidity categories, maintaining certain levels of highly liquid investments, and limiting holdings of illiquid investments.
The board of trustees of Vanguard Scottsdale Funds approved the appointment of liquidity risk management program administrators responsible for administering Vanguard Explorer Value Fund’s Program and for carrying out the specific responsibilities set forth in the Program, including reporting to the board on at least an annual basis regarding the Program’s operation, its adequacy, and the effectiveness of its implementation for the past year (the “Program Administrator Report”). The board has reviewed the Program Administrator Report covering the period from December 1, 2018, through December 31, 2019 (the “Review Period”). The Program Administrator Report stated that during the Review Period the Program operated and was implemented effectively to manage the fund’s liquidity risk.
This page intentionally left blank.
This page intentionally left blank.
The People Who Govern Your Fund
The trustees of your mutual fund are there to see that the fund is operated and managed in your best interests since, as a shareholder, you are a part owner of the fund. Your fund’s trustees also serve on the board of directors of The Vanguard Group, Inc., which is owned by the Vanguard funds and provides services to them.
A majority of Vanguard’s board members are independent, meaning that they have no affiliation with Vanguard or the funds they oversee, apart from the sizable personal investments they have made as private individuals. The independent board members have distinguished backgrounds in business, academia, and public service. Each of the trustees and executive officers oversees 212 Vanguard funds.
Information for each trustee and executive officer of the fund appears below. That information, as well as the Vanguard fund count, is as of the date on the cover of this fund report. The mailing address of the trustees and officers is P.O. Box 876, Valley Forge, PA 19482. More information about the trustees is in the Statement of Additional Information, which can be obtained, without charge, by contacting Vanguard at 800-662-7447, or online at vanguard.com.
Interested Trustee1
Mortimer J. Buckley
Born in 1969. Trustee since January 2018. Principal occupation(s) during the past five years and other experience: chairman of the board (2019–present) of Vanguard and of each of the investment companies served by Vanguard; chief executive officer (2018– present) of Vanguard; chief executive officer, president, and trustee (2018–present) of each of the investment companies served by Vanguard; president and director (2017–present) of Vanguard; and president (2018–present) of Vanguard Marketing Corporation. Chief investment officer (2013–2017), managing director (2002–2017), head of the Retail Investor Group (2006–2012), and chief information officer (2001–2006) of Vanguard. Chairman of the board (2011–2017) and trustee (2009–2017) of the Children’s Hospital of Philadelphia; and trustee (2018–present) and vice chair (2019–present) of The Shipley School.
Independent Trustees
Emerson U. Fullwood
Born in 1948. Trustee since January 2008. Principal occupation(s) during the past five years and other experience: executive chief staff and marketing officer for North America and corporate vice president (retired 2008) of Xerox Corporation (document management products and services). Former president of the Worldwide Channels Group, Latin America, and Worldwide Customer Service and executive chief staff officer of Developing Markets of Xerox. Executive in residence and 2009–2010 Distinguished Minett Professor at the Rochester Institute of Technology. Director of SPX FLOW, Inc. (multi-industry manufac-turing). Director of the University of Rochester Medical Center, the Monroe Community College Foundation, the United Way of Rochester, North Carolina A&T University, and Roberts Wesleyan College. Trustee of the University of Rochester.
Amy Gutmann
Born in 1949. Trustee since June 2006. Principal occupation(s) during the past five years and other experience: president (2004–present) of the University of Pennsylvania. Christopher H. Browne Distinguished Professor of Political Science, School of Arts and Sciences, and professor of communication, Annenberg School for Communication, with secondary faculty appointments in the Department of Philosophy, School of Arts and Sciences, and at the Graduate School of Education, University of Pennsylvania.
F. Joseph Loughrey
Born in 1949. Trustee since October 2009. Principal occupation(s) during the past five years and other experience: president and chief operating officer (retired 2009) and vice chairman of the board (2008–2009) of Cummins Inc. (industrial machinery). Chairman of the board of Hillenbrand, Inc. (specialized consumer services) and the Lumina Foundation. Director of the V Foundation. Member of the advisory
| 1 | Mr. Buckley is considered an “interested person,” as defined in the Investment Company Act of 1940, because he is an officer of the Vanguard funds. |
council for the College of Arts and Letters and chair of the advisory board to the Kellogg Institute for International Studies, both at the University of Notre Dame.
Mark Loughridge
Born in 1953. Trustee since March 2012. Principal occupation(s) during the past five years and other experience: senior vice president and chief financial officer (retired 2013) of IBM (information technology services). Fiduciary member of IBM’s Retirement Plan Committee (2004–2013), senior vice president and general manager (2002–2004) of IBM Global Financing, vice president and controller (1998–2002) of IBM, and a variety of other prior management roles at IBM. Member of the Council on Chicago Booth.
Scott C. Malpass
Born in 1962. Trustee since March 2012. Principal occupation(s) during the past five years and other experience: chief investment officer (retired June 2020) and vice president (retired June 2020) of the University of Notre Dame. Assistant professor of finance at the Mendoza College of Business, University of Notre Dame, and member of the Notre Dame 403(b) Investment Committee (retired June 2020). Member of the board of Catholic Investment Services, Inc. (investment advisors) and the board of superintendence of the Institute for the Works of Religion.
Deanna Mulligan
Born in 1963. Trustee since January 2018. Principal occupation(s) during the past five years and other experience: chief executive officer (2011–present) of The Guardian Life Insurance Company of America. President (2010–2019), chief operating officer (2010–2011), and executive vice president (2008–2010) of Individual Life and Disability of The Guardian Life Insurance Company of America. Member of the board of The Guardian Life Insurance Company of America, the American Council of Life Insurers, and the Economic Club of New York. Trustee of the Partnership for New York City (business leadership), Chief Executives for Corporate Purpose, NewYork-Presbyterian Hospital, Catalyst, and the Bruce Museum (arts and science). Member of the Advisory Council for the Stanford Graduate School of Business.
André F. Perold
Born in 1952. Trustee since December 2004. Principal occupation(s) during the past five years and other experience: George Gund Professor of Finance and Banking, Emeritus at the Harvard Business School (retired 2011). Chief investment officer and co-managing partner of HighVista Strategies (private investment firm). Member of the board of advisors and member of the investment committee of the Museum of Fine Arts Boston. Member of the board (2018–present) of RIT Capital Partners (investment firm). Member of the investment committee of Partners Health Care System.
Sarah Bloom Raskin
Born in 1961. Trustee since January 2018. Principal occupation(s) during the past five years and other experience: deputy secretary (2014–2017) of the United States Department of the Treasury. Governor (2010–2014) of the Federal Reserve Board. Commissioner (2007–2010) of financial regulation for the State of Maryland. Member of the board of directors (2012–2014) of Neighborhood Reinvestment Corporation. Director (2017–present) of i(x) Investments, LLC; director (2017–present) of Reserve Trust. Rubenstein Fellow (2017–present) of Duke University; trustee (2017–present) of Amherst College, and trustee (2019–present) of the Folger Shakespeare Library.
Peter F. Volanakis
Born in 1955. Trustee since July 2009. Principal occupation(s) during the past five years and other experience: president and chief operating officer (retired 2010) of Corning Incorporated (communications equipment) and director of Corning Incorporated (2000–2010) and Dow Corning (2001–2010). Director (2012) of SPX Corporation (multi-industry manufacturing). Overseer of the Amos Tuck School of Business Administration, Dartmouth College (2001–2013). Chairman of the board of trustees of Colby-Sawyer College. Member of the board of Hypertherm Inc. (industrial cutting systems, software, and consumables).
Executive Officers
John Bendl
Born in 1970. Principal occupation(s) during the past five years and other experience: principal of Vanguard. Chief financial officer (2019–present) of each of the investment companies served by Vanguard. Chief accounting officer, treasurer, and controller of Vanguard (2017–present). Partner (2003–2016) at KPMG (audit, tax, and advisory services).
Glenn Booraem
Born in 1967. Principal occupation(s) during the past five years and other experience: principal of Vanguard. Investment stewardship officer (2017–present), treasurer (2015–2017), controller (2010–2015), and assistant controller (2001–2010) of each of the investment companies served by Vanguard.
Christine M. Buchanan
Born in 1970. Principal occupation(s) during the past five years and other experience: principal of Vanguard. Treasurer (2017–present) of each of the investment companies served by Vanguard. Partner (2005–2017) at KPMG (audit, tax, and advisory services).
David Cermak
Born in 1960. Principal occupation(s) during the past five years and other experience: principal of Vanguard. Finance director (2019–present) of each of the investment companies served by Vanguard. Managing director and head (2017–present) of Vanguard Investments Singapore. Managing director and head (2017–2019) of Vanguard Investments Hong Kong. Representative director and head (2014–2017) of Vanguard Investments Japan.
Thomas J. Higgins
Born in 1957. Principal occupation(s) during the past five years and other experience: principal of Vanguard. Finance director (2019–present), chief financial officer (2008–2019), and treasurer (1998–2008) of each of the investment companies served by Vanguard.
Peter Mahoney
Born in 1974. Principal occupation(s) during the past five years and other experience: principal of Vanguard. Controller (2015–present) of each of the investment companies served by Vanguard. Head of International Fund Services (2008–2014) at Vanguard.
Anne E. Robinson
Born in 1970. Principal occupation(s) during the past five years and other experience: general counsel (2016–present) of Vanguard. Secretary (2016–present) of Vanguard and of each of the investment companies served by Vanguard. Managing director (2016–present) of Vanguard. Managing director and general counsel of Global Cards and Consumer Services (2014–2016) at Citigroup. Counsel (2003–2014) at American Express.
Michael Rollings
Born in 1963. Principal occupation(s) during the past five years and other experience: finance director (2017–present) and treasurer (2017) of each of the investment companies served by Vanguard. Managing director (2016–present) of Vanguard. Chief financial officer (2016–present) of Vanguard. Director (2016–present) of Vanguard Marketing Corporation. Executive vice president and chief financial officer (2006–2016) of MassMutual Financial Group.
John E. Schadl
Born in 1972. Principal occupation(s) during the past five years and other experience: principal of Vanguard. Chief compliance officer (2019–present) of Vanguard and of each of the investment companies served by Vanguard. Assistant vice president (2019–present) of Vanguard Marketing Corporation.
Vanguard Senior Management Team
| Joseph Brennan | | Chris D. McIsaac |
| Mortimer J. Buckley | | James M. Norris |
| Gregory Davis | | Thomas M. Rampulla |
| John James | | Karin A. Risi |
| Martha G. King | | Anne E. Robinson |
| John T. Marcante | | Michael Rollings |
Connect with Vanguard® > vanguard.com
Fund Information > 800-662-7447
Direct Investor Account Services > 800-662-2739
Institutional Investor Services > 800-523-1036
Text Telephone for People
Who Are Deaf or Hard of Hearing > 800-749-7273
This material may be used in conjunction with the offering of shares of any Vanguard fund only if preceded or accompanied by the fund’s current prospectus.
All comparative mutual fund data are from Morningstar, Inc., unless otherwise noted.
You can obtain a free copy of Vanguard’s proxy voting guidelines by visiting vanguard.com/proxyreporting or by calling Vanguard at 800-662-2739. The guidelines are also available from the SEC’s website, www.sec.gov. In addition, you may obtain a free report on how your fund voted the proxies for securities it owned during the 12 months ended June 30. To get the report, visit either vanguard.com/proxyreporting or www.sec.gov.
You can review information about your fund on the SEC’s website, and you can receive copies of this information, for a fee, by sending a request via email addressed to publicinfo@sec.gov.
Source for Bloomberg Barclays indexes: Bloomberg Index Services Limited. Copyright 2020, Bloomberg. All rights reserved.
CFA® is a registered trademark owned by CFA Institute.
| | © 2020 The Vanguard Group, Inc. | |
| | All rights reserved. | |
| | Vanguard Marketing Corporation, Distributor. | |
| | | |
| | Q16900 102020 | |

| | |
| | |
| | |
| | |
| Annual Report | August 31, 2020 | |
| | |
| | |
| Vanguard Russell 1000 Index Funds |
| | |
| | |
| | |
| | |
| | |
| | |
| | |
| | |
| | |
| | |
| | |
| Vanguard Russell 1000 Index Fund | |
| | |
| Vanguard Russell 1000 Value Index Fund | |
| | |
| Vanguard Russell 1000 Growth Index Fund | |
| | |
| | |
| | |
| | |
| | |
| | |
| | |
| | |
| | |
| | |
| | |
| | |
| | |
| | |
| | |
| | |
| | |
| | |
| | |
| | |
| | |
| | |
| See the inside front cover for important information about access to your fund’s annual and semiannual shareholder reports. |
| | |
Important information about access to shareholder reports
Beginning on January 1, 2021, as permitted by regulations adopted by the Securities and Exchange Commission, paper copies of your fund’s annual and semiannual shareholder reports will no longer be sent to you by mail, unless you specifically request them. Instead, you will be notified by mail each time a report is posted on the website and will be provided with a link to access the report.
If you have already elected to receive shareholder reports electronically, you will not be affected by this change and do not need to take any action. You may elect to receive shareholder reports and other communications from the fund electronically by contacting your financial intermediary (such as a broker-dealer or bank) or, if you invest directly with the fund, by calling Vanguard at one of the phone numbers on the back cover of this report or by logging on to vanguard.com.
You may elect to receive paper copies of all future shareholder reports free of charge. If you invest through a financial intermediary, you can contact the intermediary to request that you continue to receive paper copies. If you invest directly with the fund, you can call Vanguard at one of the phone numbers on the back cover of this report or log on to vanguard.com. Your election to receive paper copies will apply to all the funds you hold through an intermediary or directly with Vanguard.
| Contents | |
| | |
| Your Fund’s Performance at a Glance | 1 |
| | |
| About Your Fund’s Expenses | 2 |
| | |
| Russell 1000 Index Fund | 4 |
| | |
| Russell 1000 Value Index Fund | 20 |
| | |
| Russell 1000 Growth Index Fund | 39 |
| | |
| Trustees Approve Advisory Arrangements | 58 |
| | |
| Liquidity Risk Management | 60 |
Please note: The opinions expressed in this report are just that—informed opinions. They should not be considered promises or advice. Also, please keep in mind that the information and opinions cover the period through the date on the front of this report. Of course, the risks of investing in your fund are spelled out in the prospectus.
Your Fund’s Performance at a Glance
· Returns for the three Vanguard Russell 1000 Index Funds for the 12 months ended August 31, 2020, ranged from less than 1% for Vanguard Russell 1000 Value Index Fund to more than 44% for Vanguard Russell 1000 Growth Index Fund. Vanguard Russell 1000 Index Fund returned about 22%. Each fund closely tracked its target index.
· After declining nearly 35% in parts of February and March, the broad U.S. stock market reached a record high in August as the response of some major banks and governments to the spread of the coronavirus and vaccine hopes lifted investor sentiment. U.S. stock markets rebounded more strongly than either developed markets outside the United States or emerging markets.
· Large-capitalization stocks outperformed their mid-and small-cap counterparts for the period, and growth stocks surpassed value.
· Technology stocks, a top contributor to returns for all three funds, benefited from the pandemic-induced online environment and the continued rise of digital services.
· Energy stocks were among the weakest performers for all three funds as the pandemic severely reduced global demand for oil.
| Market Barometer | | | |
| | | Average Annual Total Returns |
| | | Periods Ended August 31, 2020 |
| | One Year | Three Years | Five Years |
| Stocks | | | |
| Russell 1000 Index (Large-caps) | 22.50% | 14.58% | 14.31% |
| Russell 2000 Index (Small-caps) | 6.02 | 5.03 | 7.65 |
| Russell 3000 Index (Broad U.S. market) | 21.44 | 13.95 | 13.86 |
| FTSE All-World ex US Index (International) | 8.78 | 2.92 | 6.00 |
| | | | |
| Bonds | | | |
| Bloomberg Barclays U.S. Aggregate Bond Index (Broad taxable market) | 6.47% | 5.09% | 4.33% |
| Bloomberg Barclays Municipal Bond Index (Broad tax-exempt market) | 3.24 | 4.09 | 3.99 |
| FTSE Three-Month U.S. Treasury Bill Index | 1.18 | 1.67 | 1.15 |
| | | | |
| CPI | | | |
| Consumer Price Index | 1.31% | 1.92% | 1.75% |
About Your Fund’s Expenses
As a shareholder of the fund, you incur ongoing costs, which include costs for portfolio management, administrative services, and shareholder reports (like this one), among others. Operating expenses, which are deducted from a fund’s gross income, directly reduce the investment return of the fund.
A fund’s expenses are expressed as a percentage of its average net assets. This figure is known as the expense ratio. The following examples are intended to help you understand the ongoing costs (in dollars) of investing in your fund and to compare these costs with those of other mutual funds. The examples are based on an investment of $1,000 made at the beginning of the period shown and held for the entire period.
The accompanying table illustrates your fund’s costs in two ways:
· Based on actual fund return. This section helps you to estimate the actual expenses that you paid over the period. The “Ending Account Value” shown is derived from the fund’s actual return, and the third column shows the dollar amount that would have been paid by an investor who started with $1,000 in the fund. You may use the information here, together with the amount you invested, to estimate the expenses that you paid over the period.
To do so, simply divide your account value by $1,000 (for example, an $8,600 account value divided by $1,000 = 8.6), then multiply the result by the number given for your fund under the heading “Expenses Paid During Period.”
· Based on hypothetical 5% yearly return. This section is intended to help you compare your fund’s costs with those of other mutual funds. It assumes that the fund had a yearly return of 5% before expenses, but that the expense ratio is unchanged. In this case—because the return used is not the fund’s actual return—the results do not apply to your investment. The example is useful in making comparisons because the Securities and Exchange Commission requires all mutual funds to calculate expenses based on a 5% return. You can assess your fund’s costs by comparing this hypothetical example with the hypothetical examples that appear in shareholder reports of other funds.
Note that the expenses shown in the table are meant to highlight and help you compare ongoing costs only and do not reflect transaction costs incurred by the fund for buying and selling securities. Further, the expenses do not include any purchase, redemption, or account service fees described in the fund prospectus. If such fees were applied to your account, your costs would be higher. Your fund does not carry a “sales load.”
The calculations assume no shares were bought or sold during the period. Your actual costs may have been higher or lower, depending on the amount of your investment and the timing of any purchases or redemptions.
You can find more information about the fund’s expenses, including annual expense ratios, in the Financial Statements section of this report. For additional information on operating expenses and other shareholder costs, please refer to your fund’s current prospectus.
| Six Months Ended August 31, 2020 | | | |
| | Beginning | Ending | Expenses |
| | Account Value | Account Value | Paid During |
| | 2/29/2020 | 8/31/2020 | Period |
| Based on Actual Fund Return | | | |
| Russell 1000 Index Fund | | | |
| ETF Shares | $1,000.00 | $1,200.65 | $0.44 |
| Institutional Shares | 1,000.00 | 1,201.16 | 0.39 |
| Russell 1000 Value Index Fund | | | |
| ETF Shares | $1,000.00 | $1,025.15 | $0.41 |
| Institutional Shares | 1,000.00 | 1,025.73 | 0.36 |
| Russell 1000 Growth Index Fund | | | |
| ETF Shares | $1,000.00 | $1,368.59 | $0.48 |
| Institutional Shares | 1,000.00 | 1,368.97 | 0.42 |
| Based on Hypothetical 5% Yearly Return | | | |
| Russell 1000 Index Fund | | | |
| ETF Shares | $1,000.00 | $1,024.73 | $0.41 |
| Institutional Shares | 1,000.00 | 1,024.78 | 0.36 |
| Russell 1000 Value Index Fund | | | |
| ETF Shares | $1,000.00 | $1,024.73 | $0.41 |
| Institutional Shares | 1,000.00 | 1,024.78 | 0.36 |
| Russell 1000 Growth Index Fund | | | |
| ETF Shares | $1,000.00 | $1,024.73 | $0.41 |
| Institutional Shares | 1,000.00 | 1,024.78 | 0.36 |
The calculations are based on expenses incurred in the most recent six-month period. The funds’ annualized six-month expense ratios for that period are: for the Russell 1000 Index Fund, 0.08% for ETF Shares and 0.07% for Institutional Shares; for the Russell 1000 Value Index Fund, 0.08% for ETF Shares and 0.07% for Institutional Shares; and for the Russell 1000 Growth Index Fund, 0.08% for ETF Shares and 0.07% for Institutional Shares. The dollar amounts shown as “Expenses Paid” are equal to the annualized expense ratio multiplied by the average account value over the period, multiplied by the number of days in the most recent six-month period, then divided by the number of days in the most recent 12-month period (184/366).
Russell 1000 Index Fund
Performance Summary
All of the returns in this report represent past performance, which is not a guarantee of future results that may be achieved by the fund. (Current performance may be lower or higher than the performance data cited. For performance data current to the most recent month-end, visit our website at vanguard.com/performance.) Note, too, that both investment returns and principal value can fluctuate widely, so an investor’s shares, when sold, could be worth more or less than their original cost. The returns shown do not reflect taxes that a shareholder would pay on fund distributions or on the sale of fund shares.
Cumulative Performance: September 20, 2010, Through August 31, 2020
Initial Investment of $10,000
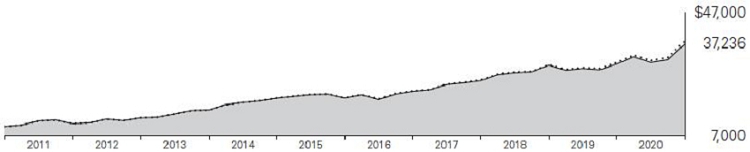
| | | | Average Annual Total Returns | |
| | | | Periods Ended August 31, 2020 | |
| | | | | Since | Final Value |
| | | One | Five | Inception | of a $10,000 |
| | | Year | Years | (9/20/2010) | Investment |
 | Russell 1000 Index Fund ETF Shares Net Asset Value | 22.39% | 14.17% | 14.13% | $37,236 |
| | Russell 1000 Index Fund ETF Shares Market Price | 22.53 | 14.17 | 14.14 | 37,257 |
 | Russell 1000 Index | 22.50 | 14.31 | 14.27 | 37,693 |
 | Dow Jones U.S. Total Stock Market Float Adjusted Index | 21.20 | 13.77 | 13.96 | 36,668 |
| | | | | | |
| “Since Inception” performance is calculated from the ETF Shares’ inception date for both the fund and its comparative standards. |
| |
| | | | | Since | Final Value |
| | | One | Five | Inception | of a $5,000,000 |
| | | Year | Years | (10/15/2010) | Investment |
| Russell 1000 Index Fund Institutional Shares | 22.45% | 14.21% | 13.92% | $18,108,775 |
| Russell 1000 Index | 22.50 | 14.31 | 14.01 | 18,260,510 |
| Dow Jones U.S. Total Stock Market Float Adjusted Index | 21.20 | 13.77 | 13.68 | 17,737,176 |
| | | | | | | |
“Since Inception” performance is calculated from the Institutional Shares’ inception date for both the fund and its comparative standards.
See Financial Highlights for dividend and capital gains information.
Russell 1000 Index Fund
| Cumulative Returns of ETF Shares: September 20, 2010, Through August 31, 2020 |
| | | | Since |
| | One | Five | Inception |
| | Year | Years | (9/20/2010) |
| Russell 1000 Index Fund ETF Shares Market Price | 22.53% | 94.00% | 272.57% |
| Russell 1000 Index Fund ETF Shares Net Asset Value | 22.39 | 93.96 | 272.36 |
| Russell 1000 Index | 22.50 | 95.18 | 276.93 |
“Since Inception” performance is calculated from the ETF Shares’ inception date for both the fund and its comparative standards.
For the ETF Shares, the market price is determined by the midpoint of the bid-offer spread as of the closing time of the New York Stock Exchange (generally 4 p.m., Eastern time). The net asset value is also determined as of the NYSE closing time. For more information about how the ETF Shares’ market prices have compared with their net asset value, visit vanguard.com, select your ETF, and then select the Price and Performance tab. The ETF premium/discount analysis there shows the percentages of days on which the ETF Shares’ market price was above or below the NAV.
Russell 1000 Index Fund
Fund Allocation
As of August 31, 2020
| Consumer Discretionary | 16.9% |
| Consumer Staples | 5.5 |
| Energy | 2.3 |
| Financial Services | 16.7 |
| Health Care | 13.4 |
| Materials & Processing | 3.0 |
| Producer Durables | 8.4 |
| Technology | 29.5 |
| Utilities | 4.3 |
The table reflects the fund’s investments, except for short-term investments and derivatives. Sector categories are based on the Russell Global Sectors (“RGS”), except for the “Other” category (if applicable), which includes securities that have not been provided a RGS classification as of the effective reporting period.
The fund may invest in derivatives (such as futures and swap contracts) for various reasons, including, but not limited to, at-tempting to remain fully invested and tracking its target index as closely as possible.
Russell 1000 Index Fund
Financial Statements
Schedule of Investments—Investments Summary
As of August 31, 2020
This Statement summarizes the fund’s holdings by asset type. Details are reported for each of the fund’s 50 largest individual holdings and for investments that, in total for any issuer, represent more than 1% of the fund’s net assets. The total value of smaller holdings is reported as a single amount within each category.
The fund files its complete schedule of portfolio holdings with the Securities and Exchange Commission (SEC) four times in each fiscal year. For the second and fourth quarters the complete list of the fund’s holdings is available on vanguard.com and on Form N-CSR, or you can have it mailed to you without charge by calling 800-662-7447. For the first and third quarters of each fiscal year, the complete list of the fund’s holdings is available as an exhibit to its reports on Form N-PORT. The fund’s Form N-CSR and Form N-PORT reports are available on the SEC’s website at www.sec.gov.
| | | | Market | Percentage |
| | | | Value● | of Net |
| | | Shares | ($000) | Assets |
| Common Stocks | | | |
| Consumer Discretionary | | | |
| * | Amazon.com Inc. | 54,550 | 188,250 | 4.5% |
| * | Tesla Inc. | 95,155 | 47,418 | 1.1% |
| | Home Depot Inc. | 138,093 | 39,362 | 0.9% |
| | Walt Disney Co. | 232,591 | 30,672 | 0.7% |
| * | Netflix Inc. | 54,718 | 28,976 | 0.7% |
| | Comcast Corp. Class A | 582,743 | 26,113 | 0.6% |
| | Walmart Inc. | 179,235 | 24,887 | 0.6% |
| | McDonald’s Corp. | 95,809 | 20,457 | 0.5% |
| | Costco Wholesale Corp. | 56,789 | 19,743 | 0.5% |
| | NIKE Inc. Class B | 155,793 | 17,432 | 0.4% |
| | Consumer Discretionary—Other † | | 264,766 | 6.3% |
| | | | 708,076 | 16.8% |
| Consumer Staples | | | |
| | Procter & Gamble Co. | 313,415 | 43,355 | 1.0% |
| | PepsiCo Inc. | 178,498 | 25,000 | 0.6% |
| | Coca-Cola Co. | 497,526 | 24,642 | 0.6% |
| | Consumer Staples—Other † | | 138,094 | 3.3% |
| | | | 231,091 | 5.5% |
| Energy | | | |
| | Exxon Mobil Corp. | 544,860 | 21,762 | 0.5% |
| | Chevron Corp. | 240,493 | 20,185 | 0.5% |
| | Energy—Other † | | 52,705 | 1.3% |
| | | | 94,652 | 2.3% |
| Financial Services | | | |
| * | Berkshire Hathaway Inc. Class B | 250,884 | 54,703 | 1.3% |
| | Visa Inc. Class A | 217,170 | 46,038 | 1.1% |
| | Mastercard Inc. Class A | 113,428 | 40,629 | 1.0% |
| | JPMorgan Chase & Co. | 389,186 | 38,993 | 0.9% |
| * | PayPal Holdings Inc. | 151,133 | 30,852 | 0.7% |
Russell 1000 Index Fund
| | | | Market | Percentage |
| | | | Value· | of Net |
| | | Shares | ($000) | Assets |
| | Bank of America Corp. | 995,542 | 25,625 | 0.6% |
| | Financial Services—Other † | | 463,123 | 11.1% |
| | | | 699,963 | 16.7% |
| Health Care | | | |
| | Johnson & Johnson | 339,193 | 52,036 | 1.2% |
| | UnitedHealth Group Inc. | 121,424 | 37,951 | 0.9% |
| | Merck & Co. Inc. | 325,094 | 27,721 | 0.7% |
| | Pfizer Inc. | 715,604 | 27,043 | 0.7% |
| | Abbott Laboratories | 222,262 | 24,331 | 0.6% |
| | Thermo Fisher Scientific Inc. | 50,798 | 21,791 | 0.5% |
| | AbbVie Inc. | 226,749 | 21,716 | 0.5% |
| | Amgen Inc. | 75,759 | 19,191 | 0.5% |
| | Medtronic plc | 172,428 | 18,531 | 0.4% |
| | Bristol-Myers Squibb Co. | 291,395 | 18,125 | 0.4% |
| § | Health Care—Other † | | 292,793 | 7.0% |
| | | | 561,229 | 13.4% |
| Materials & Processing | | | |
| | Linde plc | 67,577 | 16,877 | 0.4% |
| | Materials & Processing—Other † | | 109,189 | 2.6% |
| | | | 126,066 | 3.0% |
| Producer Durables | | | |
| | Accenture plc Class A | 81,945 | 19,661 | 0.5% |
| | Union Pacific Corp. | 87,339 | 16,808 | 0.4% |
| | Producer Durables—Other † | | 315,875 | 7.5% |
| | | | 352,344 | 8.4% |
| Technology | | | |
| | Apple Inc. | 2,104,852 | 271,610 | 6.5% |
| | Microsoft Corp. | 963,462 | 217,290 | 5.2% |
| * | Facebook Inc. Class A | 308,845 | 90,553 | 2.2% |
| * | Alphabet Inc. Class A | 38,792 | 63,213 | 1.5% |
| * | Alphabet Inc. Class C | 37,943 | 62,006 | 1.5% |
| | NVIDIA Corp. | 75,925 | 40,618 | 1.0% |
| * | Adobe Inc. | 61,889 | 31,773 | 0.7% |
| * | salesforce.com Inc. | 111,422 | 30,379 | 0.7% |
| | Intel Corp. | 545,041 | 27,770 | 0.7% |
| | Cisco Systems Inc. | 546,267 | 23,063 | 0.5% |
| | Broadcom Inc. | 50,231 | 17,438 | 0.4% |
| | QUALCOMM Inc. | 144,832 | 17,250 | 0.4% |
| | Texas Instruments Inc. | 118,110 | 16,789 | 0.4% |
| | Technology—Other † | | 325,282 | 7.7% |
| | | | 1,235,034 | 29.4% |
| Utilities | | | |
| | Verizon Communications Inc. | 532,802 | 31,579 | 0.8% |
| | AT&T Inc. | 917,276 | 27,344 | 0.6% |
| | NextEra Energy Inc. | 62,909 | 17,562 | 0.4% |
| | Utilities—Other † | | 105,968 | 2.5% |
| | | | 182,453 | 4.3% |
| Total Common Stocks (Cost $2,727,749) | | 4,190,908 | 99.8% |
Russell 1000 Index Fund
| | | | Market | Percentage |
| | | | Value· | of Net |
| | Coupon | Shares | ($000) | Assets |
| Temporary Cash Investments | | | | |
| Money Market Fund | | | | |
| 1,2 | Vanguard Market Liquidity Fund | 0.147% | 44,930 | 4,493 | 0.1% |
| 3U.S. Government and Agency Obligations † | | | 870 | 0.0% |
| Total Temporary Cash Investments (Cost $5,363) | | | 5,363 | 0.1% |
| 4Total Investments (Cost $2,733,112) | | | 4,196,271 | 99.9% |
| Other Assets and Liabilities—Net | | | 5,279 | 0.1% |
| Net Assets | | | 4,201,550 | 100.0% |
Cost is in $000.
| · | See Note A in Notes to Financial Statements. |
| * | Non-income-producing security. |
| † | Represents the aggregate value, by category, of securities that are not among the 50 largest holdings and, in total for any issuer, represent 1% or less of net assets. |
| § | Certain securities are valued using significant unobservable inputs. |
| 1 | Affiliated money market fund available only to Vanguard funds and certain trusts and accounts managed by Vanguard. Rate shown is the 7-day yield. |
| 2 | Collateral of $590,000 was received for securities on loan. |
| 3 | Securities with a value of $707,000 have been segregated as initial margin for open futures contracts. |
| 4 | The total value of securities on loan is $562,000. |
| Derivative Financial Instruments Outstanding as of Period End | | |
| | | |
| Futures Contracts | | | | |
| | | | | ($000) |
| | | | | Value and |
| | | Number of | | Unrealized |
| | | Long (Short) | Notional | Appreciation |
| | Expiration | Contracts | Amount | (Depreciation) |
| Long Futures Contracts | | | | |
| E-mini S&P 500 Index | September 2020 | 66 | 11,546 | 707 |
See accompanying Notes, which are an integral part of the Financial Statements.
Russell 1000 Index Fund
Statement of Assets and Liabilities
As of August 31, 2020
| ($000s, except shares and per-share amounts) | Amount |
| Assets | |
| Investments in Securities, at Value | |
| Unaffiliated Issuers (Cost $2,728,619) | 4,191,778 |
| Affiliated Issuers (Cost $4,493) | 4,493 |
| Total Investments in Securities | 4,196,271 |
| Investment in Vanguard | 168 |
| Receivables for Accrued Income | 5,969 |
| Receivables for Capital Shares Issued | 867 |
| Total Assets | 4,203,275 |
| Liabilities | |
| Due to Custodian | 535 |
| Collateral for Securities on Loan | 590 |
| Payables for Capital Shares Redeemed | 435 |
| Payables to Vanguard | 149 |
| Variation Margin Payable—Futures Contracts | 16 |
| Total Liabilities | 1,725 |
| Net Assets | 4,201,550 |
| | |
| | |
| At August 31, 2020, net assets consisted of: | |
| | |
| Paid-in Capital | 2,815,074 |
| Total Distributable Earnings (Loss) | 1,386,476 |
| Net Assets | 4,201,550 |
| | |
| ETF Shares—Net Assets | |
| Applicable to 10,400,000 outstanding $.001 par value shares of beneficial interest (unlimited authorization) | 1,678,194 |
| Net Asset Value Per Share—ETF Shares | $161.36 |
| | |
| Institutional Shares—Net Assets | |
| Applicable to 8,072,451 outstanding $.001 par value shares of beneficial interest (unlimited authorization) | 2,523,356 |
| Net Asset Value Per Share—Institutional Shares | $312.59 |
See accompanying Notes, which are an integral part of the Financial Statements.
Russell 1000 Index Fund
Statement of Operations
| | Year Ended |
| | August 31, 2020 |
| | ($000) |
| Investment Income | |
| Income | |
| Dividends | 69,512 |
| Interest1 | 154 |
| Securities Lending—Net | 166 |
| Total Income | 69,832 |
| Expenses | |
| The Vanguard Group—Note B | |
| Investment Advisory Services | 556 |
| Management and Administrative—ETF Shares | 676 |
| Management and Administrative—Institutional Shares | 1,103 |
| Marketing and Distribution—ETF Shares | 81 |
| Marketing and Distribution—Institutional Shares | 66 |
| Custodian Fees | 196 |
| Auditing Fees | 31 |
| Shareholders’ Reports—ETF Shares | 22 |
| Shareholders’ Reports—Institutional Shares | 2 |
| Trustees’ Fees and Expenses | 2 |
| Total Expenses | 2,735 |
| Net Investment Income | 67,097 |
| Realized Net Gain (Loss) | |
| Investment Securities Sold1,2 | 83,737 |
| Futures Contracts | 423 |
| Realized Net Gain (Loss) | 84,160 |
| Change in Unrealized Appreciation (Depreciation) | |
| Investment Securities1 | 624,397 |
| Futures Contracts | 705 |
| Change in Unrealized Appreciation (Depreciation) | 625,102 |
| Net Increase (Decrease) in Net Assets Resulting from Operations | 776,359 |
| 1 | Interest income, realized net gain (loss), and change in unrealized appreciation (depreciation) from an affiliated company of the fund were $145,000, ($4,000), and ($1,000), respectively. Purchases and sales are for temporary cash investment purposes. |
| 2 | Includes $134,790,000 of net gain (loss) resulting from in-kind redemptions. |
See accompanying Notes, which are an integral part of the Financial Statements.
Russell 1000 Index Fund
Statement of Changes in Net Assets
| | Year Ended August 31, |
| | 2020 | 2019 |
| | ($000) | ($000) |
| Increase (Decrease) in Net Assets | | |
| Operations | | |
| Net Investment Income | 67,097 | 58,249 |
| Realized Net Gain (Loss) | 84,160 | 148,119 |
| Change in Unrealized Appreciation (Depreciation) | 625,102 | (95,786) |
| Net Increase (Decrease) in Net Assets Resulting from Operations | 776,359 | 110,582 |
| Distributions1 | | |
| ETF Shares | (23,937) | (18,678) |
| Institutional Shares | (43,999) | (38,353) |
| Total Distributions | (67,936) | (57,031) |
| Capital Share Transactions | | |
| ETF Shares | 210,407 | 157,814 |
| Institutional Shares | (236,257) | 165,134 |
| Net Increase (Decrease) from Capital Share Transactions | (25,850) | 322,948 |
| Total Increase (Decrease) | 682,573 | 376,499 |
| Net Assets | | |
| Beginning of Period | 3,518,977 | 3,142,478 |
| End of Period | 4,201,550 | 3,518,977 |
| 1 | Certain prior period numbers have been reclassified to conform with current period presentation. |
See accompanying Notes, which are an integral part of the Financial Statements.
Russell 1000 Index Fund
Financial Highlights
| ETF Shares | | | | | |
| | | | | | |
| For a Share Outstanding | Year Ended August 31, |
| Throughout Each Period | 2020 | 2019 | 2018 | 2017 | 2016 |
| Net Asset Value, Beginning of Period | $134.37 | $133.57 | $113.60 | $99.81 | $91.37 |
| Investment Operations | | | | | |
| Net Investment Income | 2.5251 | 2.3951 | 2.2091 | 2.0541 | 1.892 |
| Net Realized and Unrealized Gain (Loss) on Investments | 27.028 | .759 | 19.896 | 13.753 | 8.383 |
| Total from Investment Operations | 29.553 | 3.154 | 22.105 | 15.807 | 10.275 |
| Distributions | | | | | |
| Dividends from Net Investment Income | (2.563) | (2.354) | (2.135) | (2.017) | (1.835) |
| Distributions from Realized Capital Gains | — | — | — | — | — |
| Total Distributions | (2.563) | (2.354) | (2.135) | (2.017) | (1.835) |
| Net Asset Value, End of Period | $161.36 | $134.37 | $133.57 | $113.60 | $99.81 |
| | | | | | |
| Total Return | 22.39% | 2.45% | 19.68% | 16.02% | 11.41% |
| | | | | | |
| Ratios/Supplemental Data | | | | | |
| Net Assets, End of Period (Millions) | $1,678 | $1,196 | $1,008 | $724 | $679 |
| Ratio of Total Expenses to Average Net Assets | 0.08% | 0.08% | 0.12% | 0.12% | 0.12% |
| Ratio of Net Investment Income to Average Net Assets | 1.79% | 1.85% | 1.78% | 1.94% | 2.05% |
| Portfolio Turnover Rate2 | 9% | 6% | 9% | 11% | 9% |
| 1 | Calculated based on average shares outstanding. |
| 2 | Excludes the value of portfolio securities received or delivered as a result of in-kind purchases or redemptions of the fund’s capital shares, including ETF Creation Units. |
See accompanying Notes, which are an integral part of the Financial Statements.
Russell 1000 Index Fund
Financial Highlights
| Institutional Shares | | | | | |
| | | | | | |
| For a Share Outstanding | Year Ended August 31, |
| Throughout Each Period | 2020 | 2019 | 2018 | 2017 | 2016 |
| Net Asset Value, Beginning of Period | $260.26 | $258.75 | $220.06 | $193.36 | $176.99 |
| Investment Operations | | | | | |
| Net Investment Income | 4.9271 | 4.6451 | 4.3451 | 4.0801 | 3.732 |
| Net Realized and Unrealized Gain (Loss) on Investments | 52.362 | 1.483 | 38.573 | 26.609 | 16.259 |
| Total from Investment Operations | 57.289 | 6.128 | 42.918 | 30.689 | 19.991 |
| Distributions | | | | | |
| Dividends from Net Investment Income | (4.959) | (4.618) | (4.228) | (3.989) | (3.621) |
| Distributions from Realized Capital Gains | — | — | — | — | — |
| Total Distributions | (4.959) | (4.618) | (4.228) | (3.989) | (3.621) |
| Net Asset Value, End of Period | $312.59 | $260.26 | $258.75 | $220.06 | $193.36 |
| | | | | | |
| Total Return | 22.45% | 2.45% | 19.72% | 16.06% | 11.47% |
| | | | | | |
| Ratios/Supplemental Data | | | | | |
| Net Assets, End of Period (Millions) | $2,523 | $2,323 | $2,134 | $2,014 | $1,549 |
| Ratio of Total Expenses to Average Net Assets | 0.07% | 0.07% | 0.08% | 0.08% | 0.08% |
| Ratio of Net Investment Income to Average Net Assets | 1.81% | 1.86% | 1.82% | 1.98% | 2.09% |
| Portfolio Turnover Rate2 | 9% | 6% | 9% | 11% | 9% |
| 1 | Calculated based on average shares outstanding. |
| 2 | Excludes the value of portfolio securities received or delivered as a result of in-kind purchases or redemptions of the fund’s capital shares, including ETF Creation Units. |
See accompanying Notes, which are an integral part of the Financial Statements.
Russell 1000 Index Fund
Notes to Financial Statements
Vanguard Russell 1000 Index Fund is registered under the Investment Company Act of 1940 as an open-end investment company, or mutual fund. The fund offers two classes of shares: ETF Shares and Institutional Shares. Each of the share classes has different eligibility and minimum purchase requirements, and is designed for different types of investors. ETF Shares are listed for trading on Nasdaq; they can be purchased and sold through a broker.
Market disruptions associated with the COVID-19 pandemic have had a global impact, and uncertainty exists as to the long-term implications. Such disruptions can adversely affect assets of the fund and thus fund performance.
A. The following significant accounting policies conform to generally accepted accounting principles for U.S. investment companies. The fund consistently follows such policies in preparing its financial statements.
1. Security Valuation: Securities are valued as of the close of trading on the New York Stock Exchange (generally 4 p.m., Eastern time) on the valuation date. Equity securities are valued at the latest quoted sales prices or official closing prices taken from the primary market in which each security trades; such securities not traded on the valuation date are valued at the mean of the latest quoted bid and asked prices. Securities for which market quotations are not readily available, or whose values have been materially affected by events occurring before the fund’s pricing time but after the close of the securities’ primary markets, are valued by methods deemed by the board of trustees to represent fair value. Investments in Vanguard Market Liquidity Fund are valued at that fund’s net asset value. Temporary cash investments are valued using the latest bid prices or using valuations based on a matrix system (which considers such factors as security prices, yields, maturities, and ratings), both as furnished by independent pricing services.
2. Futures Contracts: The fund uses index futures contracts to a limited extent, with the objectives of maintaining full exposure to the stock market, maintaining liquidity, and minimizing transaction costs. The fund may purchase futures contracts to immediately invest incoming cash in the market, or sell futures in response to cash outflows, thereby simulating a fully invested position in the underlying index while maintaining a cash balance for liquidity. The primary risks associated with the use of futures contracts are imperfect correlation between changes in market values of stocks held by the fund and the prices of futures contracts, and the possibility of an illiquid market. Counterparty risk involving futures is mitigated because a regulated clearinghouse is the counterparty instead of the clearing broker. To further mitigate counterparty risk, the fund trades futures contracts on an exchange, monitors the financial strength of its clearing brokers and clearinghouse, and has entered into clearing agreements with its clearing brokers. The clearinghouse imposes initial margin requirements to secure the fund’s performance and requires daily settlement of variation margin representing changes in the market value of each contract. Any securities pledged as initial margin for open contracts are noted in the Schedule of Investments.
Futures contracts are valued at their quoted daily settlement prices. The notional amounts of the contracts are not recorded in the Statement of Assets and Liabilities. Fluctuations in the value of the contracts are recorded in the Statement of Assets and Liabilities as an asset (liability) and in the Statement of Operations as unrealized appreciation (depreciation) until the contracts are closed, when they are recorded as realized gains (losses) on futures contracts.
During the year ended August 31, 2020, the fund’s average investments in long and short futures contracts represented less than 1% and 0% of net assets, respectively, based on the average of the notional amounts at each quarter-end during the period.
Russell 1000 Index Fund
3. Federal Income Taxes: The fund intends to continue to qualify as a regulated investment company and distribute all of its taxable income. The fund’s tax returns are open to examination by the relevant tax authorities until expiration of the applicable statute of limitations, which is generally three years after the filing of the tax return. Management has analyzed the fund’s tax positions taken for all open federal and state income tax years, and has concluded that no provision for income tax is required in the fund’s financial statements.
4. Distributions: Distributions to shareholders are recorded on the ex-dividend date. Distributions are determined on a tax basis at the fiscal year-end and may differ from net investment income and realized capital gains for financial reporting purposes.
5. Securities Lending: To earn additional income, the fund lends its securities to qualified institutional borrowers. Security loans are subject to termination by the fund at any time, and are required to be secured at all times by collateral in an amount at least equal to the market value of securities loaned. Daily market fluctuations could cause the value of loaned securities to be more or less than the value of the collateral received. When this occurs, the collateral is adjusted and settled before the opening of the market on the next business day. The fund further mitigates its counterparty risk by entering into securities lending transactions only with a diverse group of prequalified counterparties, monitoring their financial strength, and entering into master securities lending agreements with its counterparties. The master securities lending agreements provide that, in the event of a counterparty’s default (including bankruptcy), the fund may terminate any loans with that borrower, determine the net amount owed, and sell or retain the collateral up to the net amount owed to the fund; however, such actions may be subject to legal proceedings. While collateral mitigates counterparty risk, in the event of a default, the fund may experience delays and costs in recovering the securities loaned. The fund invests cash collateral received in Vanguard Market Liquidity Fund, and records a liability in the Statement of Assets and Liabilities for the return of the collateral, during the period the securities are on loan. Collateral investments in Vanguard Market Liquidity Fund are subject to market appreciation or depreciation. Securities lending income represents fees charged to borrowers plus income earned on invested cash collateral, less expenses associated with the loan. During the term of the loan, the fund is entitled to all distributions made on or in respect of the loaned securities.
6. Credit Facilities and Interfund Lending Program: The fund and certain other funds managed by The Vanguard Group (“Vanguard”) participate in a $4.3 billion committed credit facility provided by a syndicate of lenders pursuant to a credit agreement and an uncommitted credit facility provided by Vanguard. Both facilities may be renewed annually. Each fund is individually liable for its borrowings, if any, under the credit facilities. Borrowings may be utilized for temporary or emergency purposes, subject to the fund’s regulatory and contractual borrowing restrictions. With respect to the committed credit facility, the participating funds are charged administrative fees and an annual commitment fee of 0.10% of the undrawn committed amount of the facility; these fees are allocated to the funds based on a method approved by the fund’s board of trustees and included in Management and Administrative expenses on the fund’s Statement of Operations. Any borrowings under either facility bear interest at a rate based upon the higher of the one-month London Interbank Offered Rate (or an acceptable alternate rate, if necessary), federal funds effective rate, or overnight bank funding rate plus an agreed-upon spread, except that borrowings under the uncommitted credit facility may bear interest based upon an alternative rate agreed to by the fund and Vanguard.
Russell 1000 Index Fund
In accordance with an exemptive order (the “Order”) from the SEC, the fund may participate in a joint lending and borrowing program that allows registered open-end Vanguard funds to borrow money from and lend money to each other for temporary or emergency purposes (the “Interfund Lending Program”), subject to compliance with the terms and conditions of the Order, and to the extent permitted by the fund’s investment objective and investment policies. Interfund loans and borrowings normally extend overnight, but can have a maximum duration of seven days. Loans may be called on one business day’s notice. The interest rate to be charged is governed by the conditions of the Order and internal procedures adopted by the board of trustees. The board of trustees is responsible for overseeing the Interfund Lending Program.
For the year ended August 31, 2020, the fund did not utilize the credit facilities or the Interfund Lending Program.
7. Other: Dividend income is recorded on the ex-dividend date. Interest income includes income distributions received from Vanguard Market Liquidity Fund and is accrued daily. Premiums and discounts on debt securities are amortized and accreted, respectively, to interest income over the lives of the respective securities, except for premiums on certain callable debt securities that are amortized to the earliest call date. Security transactions are accounted for on the date securities are bought or sold. Costs used to determine realized gains (losses) on the sale of investment securities are those of the specific securities sold.
Each class of shares has equal rights as to assets and earnings, except that each class separately bears certain class-specific expenses related to maintenance of shareholder accounts (included in Management and Administrative expenses) and shareholder reporting. Marketing and distribution expenses are allocated to each class of shares based on a method approved by the board of trustees. Income, other non-class-specific expenses, and gains and losses on investments are allocated to each class of shares based on its relative net assets.
B. In accordance with the terms of a Funds’ Service Agreement (the “FSA”) between Vanguard and the fund, Vanguard furnishes to the fund investment advisory, corporate management, administrative, marketing, and distribution services at Vanguard’s cost of operations (as defined by the FSA). These costs of operations are allocated to the fund based on methods and guidelines approved by the board of trustees and are generally settled twice a month.
Upon the request of Vanguard, the fund may invest up to 0.40% of its net assets as capital in Vanguard. At August 31, 2020, the fund had contributed to Vanguard capital in the amount of $168,000, representing less than 0.01% of the fund’s net assets and 0.07% of Vanguard’s capital received pursuant to the FSA. The fund’s trustees and officers are also directors and employees, respectively, of Vanguard.
C. Various inputs may be used to determine the value of the fund’s investments and derivatives. These inputs are summarized in three broad levels for financial statement purposes. The inputs or methodologies used to value securities are not necessarily an indication of the risk associated with investing in those securities.
Level 1—Quoted prices in active markets for identical securities.
Level 2—Other significant observable inputs (including quoted prices for similar securities, interest rates, prepayment speeds, credit risk, etc.).
Level 3—Significant unobservable inputs (including the fund’s own assumptions used to determine the fair value of investments). Any investments and derivatives valued with significant unobservable inputs are noted on the Schedule of Investments.
Russell 1000 Index Fund
The following table summarizes the market value of the fund’s investments and derivatives as of August 31, 2020, based on the inputs used to value them:
| | Level 1 | Level 2 | Level 3 | Total |
| | ($000) | ($000) | ($000) | ($000) |
| Investments | | | | |
| Assets | | | | |
| Common Stocks | 4,190,908 | — | — | 4,190,908 |
| Temporary Cash Investments | 4,493 | 870 | — | 5,363 |
| Total | 4,195,401 | 870 | — | 4,196,271 |
| Derivative Financial Instruments | | | | |
| Liabilities | | | | |
| Futures Contracts1 | 16 | — | — | 16 |
1 Represents variation margin on the last day of the reporting period.
D. Permanent differences between book-basis and tax-basis components of net assets are reclassified among capital accounts in the financial statements to reflect their tax character. These reclassifications have no effect on net assets or net asset value per share. As of period end, permanent differences primarily attributable to the accounting for in-kind redemptions were reclassified between the following accounts:
| | Amount |
| | ($000) |
| Paid-in Capital | 134,815 |
| Total Distributable Earnings (Loss) | (134,815) |
Temporary differences between book-basis and tax-basis components of total distributable earnings (loss) arise when certain items of income, gain, or loss are recognized in different periods for financial statement and tax purposes; these differences will reverse at some time in the future. The differences are primarily related to the deferral of losses from wash sales; the recognition of unrealized gains or losses from certain derivative contracts; and the classification of securities for tax purposes. As of period end, the tax-basis components of total distributable earnings (loss) are detailed in the table as follows:
| | Amount |
| | ($000) |
| Undistributed Ordinary Income | 12,260 |
| Undistributed Long-term Gains | — |
| Capital Loss Carryforwards | (88,954) |
| Qualified Late-Year Losses | — |
| Net Unrealized Gains (Losses) | 1,463,170 |
Russell 1000 Index Fund
The tax character of distributions paid was as follows:
| | Year Ended August 31, |
| | 2020 | 2019 |
| | Amount | Amount |
| | ($000) | ($000) |
| Ordinary Income* | 67,936 | 57,031 |
| Long-Term Capital Gains | — | — |
| Total | 67,936 | 57,031 |
* Includes short-term capital gains, if any.
As of August 31, 2020, gross unrealized appreciation and depreciation for investments and derivatives based on cost for U.S. federal income tax purposes were as follows:
| | Amount |
| | ($000) |
| Tax Cost | 2,733,102 |
| Gross Unrealized Appreciation | 1,711,816 |
| Gross Unrealized Depreciation | (248,646) |
| Net Unrealized Appreciation (Depreciation) | 1,463,170 |
E. During the year ended August 31, 2020, the fund purchased $613,408,000 of investment securities and sold $636,508,000 of investment securities, other than temporary cash investments. Purchases and sales include $288,742,000 and $272,047,000, respectively, in connection with in-kind purchases and redemptions of the fund’s capital shares.
F. Capital share transactions for each class of shares were:
| | Year Ended August 31, |
| | 2020 | | 2019 |
| | Amount | Shares | | Amount | Shares |
| | ($000) | (000) | | ($000) | (000) |
| ETF Shares | | | | | |
| Issued | 484,207 | 3,500 | | 478,030 | 3,800 |
| Issued in Lieu of Cash Distributions | — | — | | — | — |
| Redeemed | (273,800) | (2,000) | | (320,216) | (2,450) |
| Net Increase (Decrease)—ETF Shares | 210,407 | 1,500 | | 157,814 | 1,350 |
| Institutional Shares | | | | | |
| Issued | 264,170 | 1,009 | | 501,900 | 2,013 |
| Issued in Lieu of Cash Distributions | 42,228 | 165 | | 35,811 | 143 |
| Redeemed | (542,655) | (2,028) | | (372,577) | (1,478) |
| Net Increase (Decrease)—Institutional Shares | (236,257) | (854) | | 165,134 | 678 |
G. Management has determined that no events or transactions occurred subsequent to August 31, 2020, that would require recognition or disclosure in these financial statements.
Russell 1000 Value Index Fund
Performance Summary
All of the returns in this report represent past performance, which is not a guarantee of future results that may be achieved by the fund. (Current performance may be lower or higher than the performance data cited. For performance data current to the most recent month-end, visit our website at vanguard.com/performance.) Note, too, that both investment returns and principal value can fluctuate widely, so an investor’s shares, when sold, could be worth more or less than their original cost. The returns shown do not reflect taxes that a shareholder would pay on fund distributions or on the sale of fund shares.
Cumulative Performance: September 20, 2010, Through August 31, 2020
Initial Investment of $10,000
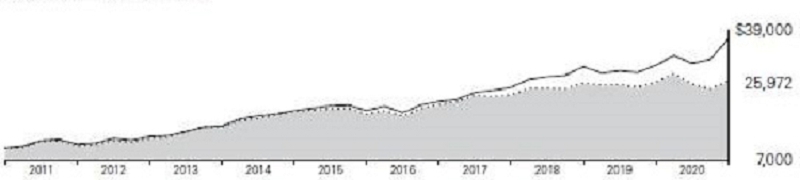
| | | Average Annual Total Returns | |
| | | Periods Ended August 31, 2020 | |
| | | | | Since | Final Value |
| | | One | Five | Inception | of a $10,000 |
| | | Year | Years | (9/20/2010) | Investment |
 | Russell 1000 Value Index Fund ETF Shares Net Asset Value | 0.75% | 7.41% | 10.07% | $25,972 |
| | Russell 1000 Value Index Fund ETF Shares Market Price | 0.82 | 7.42 | 10.08 | 25,987 |
 | Russell 1000 Value Index | 0.84 | 7.53 | 10.21 | 26,297 |
 | Dow Jones U.S. Total Stock Market Float Adjusted Index | 21.20 | 13.77 | 13.96 | 36,668 |
“Since Inception” performance is calculated from the ETF Shares’ inception date for both the fund and its comparative standards.
| | | | Since | Final Value |
| | One | Five | Inception | of a $5,000,000 |
| | Year | Years | (12/10/2010) | Investment |
| Russell 1000 Value Index Fund Institutional Shares | 0.81% | 7.45% | 9.54% | $12,130,157 |
| Russell 1000 Value Index | 0.84 | 7.53 | 9.63 | 12,220,171 |
| Dow Jones U.S. Total Stock Market Float Adjusted Index | 21.20 | 13.77 | 13.16 | 16,641,749 |
“Since Inception” performance is calculated from the Institutional Shares’ inception date for both the fund and its comparative standards.
See Financial Highlights for dividend and capital gains information.
Russell 1000 Value Index Fund
Cumulative Returns of ETF Shares: September 20, 2010, Through August 31, 2020
| | | | Since |
| | One | Five | Inception |
| | Year | Years | (9/20/2010) |
| Russell 1000 Value Index Fund ETF Shares Market Price | 0.82% | 43.03% | 159.87% |
| Russell 1000 Value Index Fund ETF Shares Net Asset Value | 0.75 | 42.99 | 159.72 |
| Russell 1000 Value Index | 0.84 | 43.78 | 162.97 |
“Since Inception” performance is calculated from the ETF Shares’ inception date for both the fund and its comparative standards.
For the ETF Shares, the market price is determined by the midpoint of the bid-offer spread as of the closing time of the New York Stock Exchange (generally 4 p.m., Eastern time). The net asset value is also determined as of the NYSE closing time. For more information about how the ETF Shares’ market prices have compared with their net asset value, visit vanguard.com, select your ETF, and then select the Price and Performance tab. The ETF premium/discount analysis there shows the percentages of days on which the ETF Shares’ market price was above or below the NAV.
Russell 1000 Value Index Fund
Fund Allocation
As of August 31, 2020
| Consumer Discretionary | 12.7% |
| Consumer Staples | 7.7 |
| Energy | 4.6 |
| Financial Services | 24.6 |
| Health Care | 13.6 |
| Materials & Processing | 5.3 |
| Producer Durables | 11.9 |
| Technology | 10.3 |
| Utilities | 9.3 |
The table reflects the fund’s investments, except for short-term investments and derivatives. Sector categories are based on the Russell Global Sectors (“RGS”), except for the “Other” category (if applicable), which includes securities that have not been provided a RGS classification as of the effective reporting period.
The fund may invest in derivatives (such as futures and swap contracts) for various reasons, including, but not limited to, at-tempting to remain fully invested and tracking its target index as closely as possible.
Russell 1000 Value Index Fund
Financial Statements
Schedule of Investments—Investments Summary
As of August 31, 2020
This Statement summarizes the fund’s holdings by asset type. Details are reported for each of the fund’s 50 largest individual holdings and for investments that, in total for any issuer, represent more than 1% of the fund’s net assets. The total value of smaller holdings is reported as a single amount within each category.
The fund files its complete schedule of portfolio holdings with the Securities and Exchange Commission (SEC) four times in each fiscal year. For the second and fourth quarters the complete list of the fund’s holdings is available on vanguard.com and on Form N-CSR, or you can have it mailed to you without charge by calling 800-662-7447. For the first and third quarters of each fiscal year, the complete list of the fund’s holdings is available as an exhibit to its reports on Form N-PORT. The fund’s Form N-CSR and Form N-PORT reports are available on the SEC’s website at www.sec.gov.
| | | | | Market | | Percentage | |
| | | | | Value· | | of Net | |
| | | Shares | | ($000 | ) | Assets | |
| Common Stocks | | | | | | |
| Consumer Discretionary | | | | | | |
| | Walt Disney Co. | 457,406 | | 60,318 | | 1.6% | |
| | Comcast Corp. Class A | 1,146,804 | | 51,388 | | 1.3% | |
| | Walmart Inc. | 307,535 | | 42,701 | | 1.1% | |
| | Home Depot Inc. | 135,966 | | 38,756 | | 1.0% | |
| | McDonald’s Corp. | 161,439 | | 34,470 | | 0.9% | |
| | Target Corp. | 126,520 | | 19,131 | | 0.5% | |
| | Consumer Discretionary—Other † | | | 243,966 | | 6.3% | |
| | | | | 490,730 | | 12.7% | |
| Consumer Staples | | | | | | |
| | Procter & Gamble Co. | 340,843 | | 47,149 | | 1.2% | |
| | Philip Morris International Inc. | 393,767 | | 31,419 | | 0.8% | |
| | Mondelez International Inc. Class A | 357,074 | | 20,860 | | 0.6% | |
| | CVS Health Corp. | 330,839 | | 20,552 | | 0.5% | |
| | Coca-Cola Co. | 403,938 | | 20,007 | | 0.5% | |
| | Colgate-Palmolive Co. | 213,210 | | 16,899 | | 0.4% | |
| | Consumer Staples—Other † | | | 137,703 | | 3.6% | |
| | | | | 294,589 | | 7.6% | |
| Energy | | | | | | |
| | Exxon Mobil Corp. | 1,071,128 | | 42,781 | | 1.1% | |
| | Chevron Corp. | 473,120 | | 39,709 | | 1.0% | |
| | Energy—Other † | | | 95,761 | | 2.5% | |
| | | | 178,251 | | 4.6% | |
| Financial Services | | | | | | |
| * | Berkshire Hathaway Inc. Class B | 493,294 | | 107,558 | | 2.8% | |
| | JPMorgan Chase & Co. | 766,471 | | 76,793 | | 2.0% | |
| | Bank of America Corp. | 1,957,343 | | 50,382 | | 1.3% | |
| | Citigroup Inc. | 527,131 | | 26,947 | | 0.7% | |
| | Fidelity National Information Services Inc. | 156,196 | | 23,562 | | 0.6% | |
| | Wells Fargo & Co. | 950,460 | | 22,954 | | 0.6% | |
Russell 1000 Value Index Fund
| | | | | Market | | Percentage | |
| | | | | Value· | | of Net | |
| | | Shares | | ($000 | ) | Assets | |
| | BlackRock Inc. | 37,236 | | 22,125 | | 0.6% | |
| | Prologis Inc. | 186,201 | | 18,966 | | 0.5% | |
| | Goldman Sachs Group Inc. | 83,863 | | 17,181 | | 0.5% | |
| | American Express Co. | 165,468 | | 16,810 | | 0.4% | |
| | Financial Services—Other † | | | 562,044 | | 14.6% | |
| | | | | 945,322 | | 24.6% | |
| Health Care | | | | | | |
| | Johnson & Johnson | 577,816 | | 88,643 | | 2.3% | |
| | Pfizer Inc. | 1,407,314 | | 53,182 | | 1.4% | |
| | Medtronic plc | 339,398 | | 36,475 | | 0.9% | |
| | Danaher Corp. | 158,364 | | 32,697 | | 0.8% | |
| | Abbott Laboratories | 269,365 | | 29,487 | | 0.8% | |
| | Bristol-Myers Squibb Co. | 364,994 | | 22,703 | | 0.6% | |
| | Gilead Sciences Inc. | 317,793 | | 21,213 | | 0.6% | |
| | Thermo Fisher Scientific Inc. | 41,261 | | 17,700 | | 0.5% | |
| | Becton Dickinson and Co. | 68,262 | | 16,572 | | 0.4% | |
| | Health Care—Other † | | | 204,245 | | 5.3% | |
| | | | | 522,917 | | 13.6% | |
| Materials & Processing | | | | | | |
| | Linde plc | 132,889 | | 33,188 | | 0.9% | |
| | Materials & Processing—Other † | | | 169,996 | | 4.4% | |
| | | | | 203,184 | | 5.3% | |
| Producer Durables | | | | | | |
| | Honeywell International Inc. | 177,688 | | 29,416 | | 0.8% | |
| | Boeing Co. | 135,140 | | 23,220 | | 0.6% | |
| | Raytheon Technologies Corp. | 360,774 | | 22,007 | | 0.6% | |
| | Caterpillar Inc. | 137,028 | | 19,500 | | 0.5% | |
| | Union Pacific Corp. | 84,114 | | 16,187 | | 0.4% | |
| | Producer Durables—Other † | | | 346,712 | | 9.0% | |
| | | | | 457,042 | | 11.9% | |
| Technology | | | | | | |
| | Intel Corp. | 1,072,699 | | 54,654 | | 1.4% | |
| | Cisco Systems Inc. | 1,074,408 | | 45,361 | | 1.2% | |
| | International Business Machines Corp. | 224,803 | | 27,720 | | 0.7% | |
| * | Alphabet Inc. Class A | 16,971 | | 27,655 | | 0.7% | |
| * | Alphabet Inc. Class C | 16,840 | | 27,520 | | 0.7% | |
| | Texas Instruments Inc. | 116,580 | | 16,572 | | 0.5% | |
| | Technology—Other † | | | 197,207 | | 5.1% | |
| | | | | 396,689 | | 10.3% | |
| Utilities | | | | | | |
| | Verizon Communications Inc. | 1,048,186 | | 62,126 | | 1.6% | |
| | AT&T Inc. | 1,804,559 | | 53,794 | | 1.4% | |
| | NextEra Energy Inc. | 123,786 | | 34,557 | | 0.9% | |
| | Dominion Energy Inc. | 212,073 | | 16,635 | | 0.4% | |
| * | T-Mobile US Inc. | 139,151 | | 16,236 | | 0.4% | |
| | Utilities—Other † | | | 174,867 | | 4.6% | |
| | | | | 358,215 | | 9.3% | |
| Total Common Stocks (Cost $3,635,834) | | | 3,846,939 | | 99.9% | |
Russell 1000 Value Index Fund
| | | | | | Market | | Percentage | |
| | | | | | Value· | | of Net | |
| | | Coupon | Shares | | ($000 | ) | Assets | |
| Temporary Cash Investments | | | | | | | |
| Money Market Fund | | | | | | | |
| 1,2 | Vanguard Market Liquidity Fund | 0.147% | 17,768 | | 1,777 | | 0.0% | |
| | | | | | | | | |
| 3U.S. Government and Agency Obligations † | | | | 450 | | 0.0% | |
| Total Temporary Cash Investments (Cost $2,226) | | | | 2,227 | | 0.0% | |
| 4Total Investments (Cost $3,638,060) | | | | 3,849,166 | | 99.9% | |
| Other Assets and Liabilities—Net | | | | 3,662 | | 0.01% | |
| Net Assets | | | | 3,852,828 | | 100.0% | |
Cost is in $000.
| · | See Note A in Notes to Financial Statements. |
| * | Non-income-producing security. |
| † | Represents the aggregate value, by category, of securities that are not among the 50 largest holdings and, in total for any issuer, represent 1% or less of net assets. |
| 1 | Affiliated money market fund available only to Vanguard funds and certain trusts and accounts managed by Vanguard. Rate shown is the 7-day yield. |
| 2 | Collateral of $1,777,000 was received for securities on loan. |
| 3 | Securities with a value of $22,000 have been segregated as initial margin for open futures contracts. |
| 4 | The total value of securities on loan is $1,574,000. |
Russell 1000 Value Index Fund
Derivative Financial Instruments Outstanding as of Period End
| Futures Contracts | | | | | | |
| | | | | | ($000 | ) |
| | | | | | Value and | |
| | | Number of | | | Unrealized | |
| | | Long (Short | ) | Notional | Appreciation | |
| | Expiration | Contracts | | Amount | (Depreciation | ) |
| Long Futures Contracts | | | | | | |
| E-mini S&P 500 Index | September 2020 | 3 | | 525 | 4 | |
| Over-the-Counter Total Return Swaps | | | | | | | | | |
| | | | | | Floating | | | | | |
| | | | | | Interest | | | | | |
| | | | | | Rate | | Value and | | Value and | |
| | | | Notional | | Received | | Unrealized | | Unrealized | |
| | Termination | | Amount | | (Paid | )1 | Appreciation | | (Depreciation | ) |
| Reference Entity | Date | Counterparty | ($000 | ) | (% | ) | ($000 | ) | ($000 | ) |
| Walmart Inc. | 9/2/20 | BOANA | 5,823 | | (0.155 | ) | 449 | | — | |
| Walmart Inc. | 9/2/21 | BOANA | 6,248 | | (0.157 | ) | — | | — | |
| 1 | Based on 1-month USD London Interbank Offered Rate (LIBOR) as of the most recent payment date. Floating interest payment received/paid monthly. |
BOANA—Bank of America, N.A.
At August 31, 2020, a counterparty had deposited in a segregated account securities with a value of $532,000 in connection with open over-the-counter swap contracts.
See accompanying Notes, which are an integral part of the Financial Statements.
Russell 1000 Value Index Fund
Statement of Assets and Liabilities
As of August 31, 2020
| ($000s, except shares and per-share amounts) | Amount |
| Assets | |
| Investments in Securities, at Value | |
| Unaffiliated Issuers (Cost $3,636,284) | 3,847,389 |
| Affiliated Issuers (Cost $1,776) | 1,777 |
| Total Investments in Securities | 3,849,166 |
| Investment in Vanguard | 162 |
| Receivables for Accrued Income | 8,777 |
| Receivables for Capital Shares Issued | 547 |
| Unrealized Appreciation—Over-the-Counter Swap Contracts | 449 |
| Total Assets | 3,859,101 |
| Liabilities | |
| Due to Custodian | 3,765 |
| Collateral for Securities on Loan | 1,777 |
| Payables for Capital Shares Redeemed | 586 |
| Payables to Vanguard | 145 |
| Variation Margin Payable—Futures Contracts | — |
| Total Liabilities | 6,273 |
| Net Assets | 3,852,828 |
| | |
| | |
| At August 31, 2020, net assets consisted of: | |
| | |
| Paid-in Capital | 4,024,185 |
| Total Distributable Earnings (Loss) | (171,357) |
| Net Assets | 3,852,828 |
| | |
| ETF Shares—Net Assets | |
| Applicable to 24,725,000 outstanding $.001 par value shares of beneficial interest (unlimited authorization) | 2,646,241 |
| Net Asset Value Per Share—ETF Shares | $107.03 |
| | |
| Institutional Shares—Net Assets | |
| Applicable to 5,773,070 outstanding $.001 par value shares of beneficial interest (unlimited authorization) | 1,206,587 |
| Net Asset Value Per Share—Institutional Shares | $209.00 |
See accompanying Notes, which are an integral part of the Financial Statements.
Russell 1000 Value Index Fund
Statement of Operations
| | Year Ended |
| | August 31, 2020 |
| | ($000) |
| Investment Income | |
| Income | |
| Dividends | 103,304 |
| Interest1 | 34 |
| Securities Lending—Net | 293 |
| Total Income | 103,631 |
| Expenses | |
| The Vanguard Group—Note B | |
| Investment Advisory Services | 572 |
| Management and Administrative—ETF Shares | 1,052 |
| Management and Administrative—Institutional Shares | 669 |
| Marketing and Distribution—ETF Shares | 137 |
| Marketing and Distribution—Institutional Shares | 60 |
| Custodian Fees | 325 |
| Auditing Fees | 31 |
| Shareholders’ Reports—ETF Shares | 40 |
| Shareholders’ Reports—Institutional Shares | 4 |
| Trustees’ Fees and Expenses | 2 |
| Total Expenses | 2,892 |
| Net Investment Income | 100,739 |
| Realized Net Gain (Loss) | |
| Investment Securities Sold1,2 | (100,926) |
| Futures Contracts | 865 |
| Swap Contracts | 19 |
| Realized Net Gain (Loss) | (100,042) |
| Change in Unrealized Appreciation (Depreciation) | |
| Investment Securities1 | 59,087 |
| Futures Contracts | (7) |
| Swap Contracts | 449 |
| Change in Unrealized Appreciation (Depreciation) | 59,529 |
| Net Increase (Decrease) in Net Assets Resulting from Operations | 60,226 |
| 1 | Interest income, realized net gain (loss), and change in unrealized appreciation (depreciation) from an affiliated company of the fund were $29,000, ($11,000), and $1,000, respectively. Purchases and sales are for temporary cash investment purposes. |
| 2 | Includes $219,756,000 of net gain (loss) resulting from in-kind redemptions. |
See accompanying Notes, which are an integral part of the Financial Statements.
Russell 1000 Value Index Fund
Statement of Changes in Net Assets
| | Year Ended August 31, |
| | 2020 | 2019 |
| | ($000) | ($000) |
| Increase (Decrease) in Net Assets | | |
| Operations | | |
| Net Investment Income | 100,739 | 86,224 |
| Realized Net Gain (Loss) | (100,042) | 224,418 |
| Change in Unrealized Appreciation (Depreciation) | 59,529 | (270,040) |
| Net Increase (Decrease) in Net Assets Resulting from Operations | 60,226 | 40,602 |
| Distributions1 | | |
| ETF Shares | (60,505) | (41,769) |
| Institutional Shares | (42,607) | (39,827) |
| Total Distributions | (103,112) | (81,596) |
| Capital Share Transactions | | |
| ETF Shares | 674,867 | 447,077 |
| Institutional Shares | (582,146) | 306,866 |
| Net Increase (Decrease) from Capital Share Transactions | 92,721 | 753,943 |
| Total Increase (Decrease) | 49,835 | 712,949 |
| Net Assets | | |
| Beginning of Period | 3,802,993 | 3,090,044 |
| End of Period | 3,852,828 | 3,802,993 |
| 1 | Certain prior period numbers have been reclassified to conform with current period presentation. |
See accompanying Notes, which are an integral part of the Financial Statements.
Russell 1000 Value Index Fund
Financial Highlights
| ETF Shares | | | | | |
| | | | | | |
| For a Share Outstanding | | | Year Ended August 31, |
| Throughout Each Period | 2020 | 2019 | 2018 | 2017 | 2016 |
| Net Asset Value, Beginning of Period | $109.22 | $111.20 | $101.32 | $93.14 | $84.77 |
| Investment Operations | | | | | |
| Net Investment Income | 2.8151 | 2.7131 | 2.5221 | 2.4371 | 2.205 |
| Net Realized and Unrealized Gain (Loss) on Investments | (2.121) | (2.107) | 9.836 | 8.109 | 8.312 |
| Total from Investment Operations | .694 | .606 | 12.358 | 10.546 | 10.517 |
| Distributions | | | | | |
| Dividends from Net Investment Income | (2.884) | (2.586) | (2.478) | (2.366) | (2.147) |
| Distributions from Realized Capital Gains | — | — | — | — | — |
| Total Distributions | (2.884) | (2.586) | (2.478) | (2.366) | (2.147) |
| Net Asset Value, End of Period | $107.03 | $109.22 | $111.20 | $101.32 | $93.14 |
| | | | | | |
| Total Return | 0.75% | 0.60% | 12.36% | 11.45% | 12.65% |
| | | | | | |
| Ratios/Supplemental Data | | | | | |
| Net Assets, End of Period (Millions) | $2,646 | $1,914 | $1,487 | $1,153 | $668 |
| Ratio of Total Expenses to Average Net Assets | 0.08% | 0.08% | 0.12% | 0.12% | 0.12% |
| Ratio of Net Investment Income to Average Net Assets | 2.65% | 2.51% | 2.35% | 2.48% | 2.58% |
| Portfolio Turnover Rate2 | 24% | 17% | 16% | 22% | 18% |
| 1 | Calculated based on average shares outstanding. |
| 2 | Excludes the value of portfolio securities received or delivered as a result of in-kind purchases or redemptions of the fund’s capital shares, including ETF Creation Units. |
See accompanying Notes, which are an integral part of the Financial Statements.
Russell 1000 Value Index Fund
Financial Highlights
| Institutional Shares | | | | | |
| | | | | | |
| For a Share Outstanding | | | Year Ended August 31, |
| Throughout Each Period | 2020 | 2019 | 2018 | 2017 | 2016 |
| Net Asset Value, Beginning of Period | $213.25 | $217.14 | $197.85 | $181.86 | $165.50 |
| Investment Operations | | | | | |
| Net Investment Income | 5.5941 | 5.2941 | 4.9781 | 4.8501 | 4.359 |
| Net Realized and Unrealized Gain (Loss) on Investments | (4.226) | (4.087) | 19.227 | 15.821 | 16.249 |
| Total from Investment Operations | 1.368 | 1.207 | 24.205 | 20.671 | 20.608 |
| Distributions | | | | | |
| Dividends from Net Investment Income | (5.618) | (5.097) | (4.915) | (4.681) | (4.248) |
| Distributions from Realized Capital Gains | — | — | — | — | — |
| Total Distributions | (5.618) | (5.097) | (4.915) | (4.681) | (4.248) |
| Net Asset Value, End of Period | $209.00 | $213.25 | $217.14 | $197.85 | $181.86 |
| | | | | | |
| Total Return | 0.81% | 0.61% | 12.39% | 11.49% | 12.72% |
| | | | | | |
| Ratios/Supplemental Data | | | | | |
| Net Assets, End of Period (Millions) | $1,207 | $1,889 | $1,603 | $1,541 | $1,485 |
| Ratio of Total Expenses to Average Net Assets | 0.07% | 0.07% | 0.08% | 0.08% | 0.08% |
| Ratio of Net Investment Income to Average Net Assets | 2.64% | 2.52% | 2.39% | 2.52% | 2.62% |
| Portfolio Turnover Rate2 | 24% | 17% | 16% | 22% | 18% |
| 1 | Calculated based on average shares outstanding. |
| 2 | Excludes the value of portfolio securities received or delivered as a result of in-kind purchases or redemptions of the fund’s capital shares, including ETF Creation Units. |
See accompanying Notes, which are an integral part of the Financial Statements.
Russell 1000 Value Index Fund
Notes to Financial Statements
Vanguard Russell 1000 Value Index Fund is registered under the Investment Company Act of 1940 as an open-end investment company, or mutual fund. The fund offers two classes of shares: ETF Shares and Institutional Shares. Each of the share classes has different eligibility and minimum purchase requirements, and is designed for different types of investors. ETF Shares are listed for trading on Nasdaq; they can be purchased and sold through a broker.
Market disruptions associated with the COVID-19 pandemic have had a global impact, and uncertainty exists as to the long-term implications. Such disruptions can adversely affect assets of the fund and thus fund performance.
A. The following significant accounting policies conform to generally accepted accounting principles for U.S. investment companies. The fund consistently follows such policies in preparing its financial statements.
1. Security Valuation: Securities are valued as of the close of trading on the New York Stock Exchange (generally 4 p.m., Eastern time) on the valuation date. Equity securities are valued at the latest quoted sales prices or official closing prices taken from the primary market in which each security trades; such securities not traded on the valuation date are valued at the mean of the latest quoted bid and asked prices. Securities for which market quotations are not readily available, or whose values have been materially affected by events occurring before the fund’s pricing time but after the close of the securities’ primary markets, are valued by methods deemed by the board of trustees to represent fair value. Investments in Vanguard Market Liquidity Fund are valued at that fund’s net asset value. Temporary cash investments are valued using the latest bid prices or using valuations based on a matrix system (which considers such factors as security prices, yields, maturities, and ratings), both as furnished by independent pricing services.
2. Futures Contracts: The fund uses index futures contracts to a limited extent, with the objectives of maintaining full exposure to the stock market, maintaining liquidity, and minimizing transaction costs. The fund may purchase futures contracts to immediately invest incoming cash in the market, or sell futures in response to cash outflows, thereby simulating a fully invested position in the underlying index while maintaining a cash balance for liquidity. The primary risks associated with the use of futures contracts are imperfect correlation between changes in market values of stocks held by the fund and the prices of futures contracts, and the possibility of an illiquid market. Counterparty risk involving futures is mitigated because a regulated clearinghouse is the counterparty instead of the clearing broker. To further mitigate counterparty risk, the fund trades futures contracts on an exchange, monitors the financial strength of its clearing brokers and clearinghouse, and has entered into clearing agreements with its clearing brokers. The clearinghouse imposes initial margin requirements to secure the fund’s performance and requires daily settlement of variation margin representing changes in the market value of each contract. Any securities pledged as initial margin for open contracts are noted in the Schedule of Investments.
Futures contracts are valued at their quoted daily settlement prices. The notional amounts of the contracts are not recorded in the Statement of Assets and Liabilities. Fluctuations in the value of the contracts are recorded in the Statement of Assets and Liabilities as an asset (liability) and in the Statement of Operations as unrealized appreciation (depreciation) until the contracts are closed, when they are recorded as realized gains (losses) on futures contracts.
During the year ended August 31, 2020, the fund’s average investments in long and short futures contracts represented less than 1% and 0% of net assets, respectively, based on the average of the notional amounts at each quarter-end during the period.
Russell 1000 Value Index Fund
3. Swap Contracts: The fund has entered into equity swap contracts to earn the total return on selected reference stocks in the fund’s target index. Under the terms of the swaps, the fund receives the total return on the referenced stock (i.e., receiving the increase or paying the decrease in value of the selected reference stock and receiving the equivalent of any dividends in respect of the selected referenced stock) over a specified period of time, applied to a notional amount that represents the value of a designated number of shares of the selected reference stock at the beginning of the equity swap contract. The fund also pays a floating rate that is based on short-term interest rates, applied to the notional amount. At the same time, the fund generally invests an amount approximating the notional amount of the swap in high-quality temporary cash investments.
A risk associated with all types of swaps is the possibility that a counterparty may default on its obligation to pay net amounts due to the fund. The fund’s maximum amount subject to counterparty risk is the unrealized appreciation on the swap contract. The fund mitigates its counterparty risk by entering into swaps only with a diverse group of prequalified counterparties, monitoring their financial strength, entering into master netting arrangements with its counterparties, and requiring its counterparties to transfer collateral as security for their performance. In the absence of a default, the collateral pledged or received by the fund cannot be repledged, resold, or rehypothecated. In the event of a counterparty’s default (including bankruptcy), the fund may terminate any swap contracts with that counterparty, determine the net amount owed by either party in accordance with its master netting arrangements, and sell or retain any collateral held up to the net amount owed to the fund under the master netting arrangements. The swap contracts contain provisions whereby a counterparty may terminate open contracts if the fund’s net assets decline below a certain level, triggering a payment by the fund if the fund is in a net liability position at the time of the termination. The payment amount would be reduced by any collateral the fund has pledged. Any securities pledged as collateral for open contracts are noted in the Schedule of Investments. The value of collateral received or pledged is compared daily to the value of the swap contracts exposure with each counterparty, and any difference, if in excess of a specified minimum transfer amount, is adjusted and settled within two business days.
The notional amounts of swap contracts are not recorded in the Statement of Assets and Liabilities. Swaps are valued daily based on market quotations received from independent pricing services or recognized dealers and the change in value is recorded in the Statement of Assets and Liabilities as an asset (liability) and in the Statement of Operations as unrealized appreciation (depreciation) until periodic payments are made or the termination of the swap, at which time realized gain (loss) is recorded.
During the year ended August 31, 2020, the fund’s average amounts of investments in total return swaps represented less than 1% of net assets, based on the average of notional amounts at each quarter-end during the period.
4. Federal Income Taxes: The fund intends to continue to qualify as a regulated investment company and distribute all of its taxable income. The fund’s tax returns are open to examination by the relevant tax authorities until expiration of the applicable statute of limitations, which is generally three years after the filing of the tax return. Management has analyzed the fund’s tax positions taken for all open federal and state income tax years, and has concluded that no provision for income tax is required in the fund’s financial statements.
Russell 1000 Value Index Fund
5. Distributions: Distributions to shareholders are recorded on the ex-dividend date. Distributions are determined on a tax basis at the fiscal year-end and may differ from net investment income and realized capital gains for financial reporting purposes.
6. Securities Lending: To earn additional income, the fund lends its securities to qualified institutional borrowers. Security loans are subject to termination by the fund at any time, and are required to be secured at all times by collateral in an amount at least equal to the market value of securities loaned. Daily market fluctuations could cause the value of loaned securities to be more or less than the value of the collateral received. When this occurs, the collateral is adjusted and settled before the opening of the market on the next business day. The fund further mitigates its counterparty risk by entering into securities lending transactions only with a diverse group of prequalified counterparties, monitoring their financial strength, and entering into master securities lending agreements with its counterparties. The master securities lending agreements provide that, in the event of a counterparty’s default (including bankruptcy), the fund may terminate any loans with that borrower, determine the net amount owed, and sell or retain the collateral up to the net amount owed to the fund; however, such actions may be subject to legal proceedings. While collateral mitigates counterparty risk, in the event of a default, the fund may experience delays and costs in recovering the securities loaned. The fund invests cash collateral received in Vanguard Market Liquidity Fund, and records a liability in the Statement of Assets and Liabilities for the return of the collateral, during the period the securities are on loan. Collateral investments in Vanguard Market Liquidity Fund are subject to market appreciation or depreciation. Securities lending income represents fees charged to borrowers plus income earned on invested cash collateral, less expenses associated with the loan. During the term of the loan, the fund is entitled to all distributions made on or in respect of the loaned securities.
7. Credit Facilities and Interfund Lending Program: The fund and certain other funds managed by The Vanguard Group (“Vanguard”) participate in a $4.3 billion committed credit facility provided by a syndicate of lenders pursuant to a credit agreement and an uncommitted credit facility provided by Vanguard. Both facilities may be renewed annually. Each fund is individually liable for its borrowings, if any, under the credit facilities. Borrowings may be utilized for temporary or emergency purposes, subject to the fund’s regulatory and contractual borrowing restrictions. With respect to the committed credit facility, the participating funds are charged administrative fees and an annual commitment fee of 0.10% of the undrawn committed amount of the facility; these fees are allocated to the funds based on a method approved by the fund’s board of trustees and included in Management and Administrative expenses on the fund’s Statement of Operations. Any borrowings under either facility bear interest at a rate based upon the higher of the one-month London Interbank Offered Rate (or an acceptable alternate rate, if necessary), federal funds effective rate, or overnight bank funding rate plus an agreed-upon spread, except that borrowings under the uncommitted credit facility may bear interest based upon an alternative rate agreed to by the fund and Vanguard.
In accordance with an exemptive order (the “Order”) from the SEC, the fund may participate in a joint lending and borrowing program that allows registered open-end Vanguard funds to borrow money from and lend money to each other for temporary or emergency purposes (the “Interfund Lending Program”), subject to compliance with the terms and conditions of the Order, and to the extent permitted by the fund’s investment objective and investment policies. Interfund loans and borrowings normally extend overnight, but can have a maximum duration of seven days. Loans
Russell 1000 Value Index Fund
may be called on one business day’s notice. The interest rate to be charged is governed by the conditions of the Order and internal procedures adopted by the board of trustees. The board of trustees is responsible for overseeing the Interfund Lending Program.
For the year ended August 31, 2020, the fund did not utilize the credit facilities or the Interfund Lending Program.
8. Other: Dividend income is recorded on the ex-dividend date. Interest income includes income distributions received from Vanguard Market Liquidity Fund and is accrued daily. Premiums and discounts on debt securities are amortized and accreted, respectively, to interest income over the lives of the respective securities, except for premiums on certain callable debt securities that are amortized to the earliest call date. Security transactions are accounted for on the date securities are bought or sold. Costs used to determine realized gains (losses) on the sale of investment securities are those of the specific securities sold.
Each class of shares has equal rights as to assets and earnings, except that each class separately bears certain class-specific expenses related to maintenance of shareholder accounts (included in Management and Administrative expenses) and shareholder reporting. Marketing and distribution expenses are allocated to each class of shares based on a method approved by the board of trustees. Income, other non-class-specific expenses, and gains and losses on investments are allocated to each class of shares based on its relative net assets.
B. In accordance with the terms of a Funds’ Service Agreement (the “FSA”) between Vanguard and the fund, Vanguard furnishes to the fund investment advisory, corporate management, administrative, marketing, and distribution services at Vanguard’s cost of operations (as defined by the FSA). These costs of operations are allocated to the fund based on methods and guidelines approved by the board of trustees and are generally settled twice a month.
Upon the request of Vanguard, the fund may invest up to 0.40% of its net assets as capital in Vanguard. At August 31, 2020, the fund had contributed to Vanguard capital in the amount of $162,000, representing less than 0.01% of the fund’s net assets and 0.06% of Vanguard’s capital received pursuant to the FSA. The fund’s trustees and officers are also directors and employees, respectively, of Vanguard.
C. Various inputs may be used to determine the value of the fund’s investments and derivatives. These inputs are summarized in three broad levels for financial statement purposes. The inputs or methodologies used to value securities are not necessarily an indication of the risk associated with investing in those securities.
Level 1—Quoted prices in active markets for identical securities.
Level 2—Other significant observable inputs (including quoted prices for similar securities, interest rates, prepayment speeds, credit risk, etc.).
Level 3—Significant unobservable inputs (including the fund’s own assumptions used to determine the fair value of investments). Any investments and derivatives valued with significant unobservable inputs are noted on the Schedule of Investments.
Russell 1000 Value Index Fund
The following table summarizes the market value of the fund’s investments and derivatives as of August 31, 2020, based on the inputs used to value them:
| | Level 1 | | Level 2 | | Level 3 | | Total | |
| | ($000 | ) | ($000 | ) | ($000 | ) | ($000 | ) |
| Investments | | | | | | | | |
| Assets | | | | | | | | |
| Common Stocks | 3,846,939 | | — | | — | | 3,846,939 | |
| Temporary Cash Investments | 1,777 | | 450 | | — | | 2,227 | |
| Total | 3,848,716 | | 450 | | — | | 3,849,166 | |
| Derivative Financial Instruments | | | | | | | | |
| Assets | | | | | | | | |
| Swap Contracts | — | | 449 | | — | | 449 | |
| Liabilities | | | | | | | | |
| Futures Contracts1 | — | | — | | — | | — | |
| 1 | Represents variation margin on the last day of the reporting period. |
D. Permanent differences between book-basis and tax-basis components of net assets are reclassified among capital accounts in the financial statements to reflect their tax character. These reclassifications have no effect on net assets or net asset value per share. As of period end, permanent differences primarily attributable to the accounting for in-kind redemptions and swap agreements were reclassified between the following accounts:
| | Amount | |
| | ($000 | ) |
| Paid-in Capital | 219,839 | |
| Total Distributable Earnings (Loss) | (219,839 | ) |
Temporary differences between book-basis and tax-basis components of total distributable earnings (loss) arise when certain items of income, gain, or loss are recognized in different periods for financial statement and tax purposes; these differences will reverse at some time in the future. The differences are primarily related to the deferral of losses from wash sales; the recognition of unrealized gains or losses from certain derivative contracts; and the classification of securities for tax purposes. As of period end, the tax-basis components of total distributable earnings (loss) are detailed in the table as follows:
| | Amount | |
| | ($000 | ) |
| Undistributed Ordinary Income | 18,717 | |
| Undistributed Long-term Gains | — | |
| Capital Loss Carryforwards | (401,214 | ) |
| Qualified Late-Year Losses | — | |
| Net Unrealized Gains (Losses) | 211,140 | |
Russell 1000 Value Index Fund
The tax character of distributions paid was as follows:
| | | Year Ended August 31, | |
| | | 2020 | | 2019 | |
| | | Amount | | Amount | |
| | | ($000 | ) | ($000 | ) |
| Ordinary Income * | | 103,112 | | 81,596 | |
| Long-Term Capital Gains | | — | | — | |
| Total | | 103,112 | | 81,596 | |
* Includes short-term capital gains, if any.
As of August 31, 2020, gross unrealized appreciation and depreciation for investments and derivatives based on cost for U.S. federal income tax purposes were as follows:
| | Amount | |
| | ($000 | ) |
| Tax Cost | 3,638,026 | |
| Gross Unrealized Appreciation | 567,668 | |
| Gross Unrealized Depreciation | (356,528 | ) |
| Net Unrealized Appreciation (Depreciation) | 211,140 | |
E. During the year ended August 31, 2020, the fund purchased $1,966,015,000 of investment securities and sold $1,876,668,000 of investment securities, other than temporary cash investments. Purchases and sales include $1,052,802,000 and $788,933,000, respectively, in connection with in-kind purchases and redemptions of the fund’s capital shares.
The fund purchased securities from and sold securities to other Vanguard funds or accounts managed by Vanguard or its affiliates, in accordance with procedures adopted by the board of trustees in compliance with Rule 17a-7 of the Investment Company Act of 1940. For the year ended August 31, 2020, such purchases and sales were $416,847,000 and $113,291,000, respectively; these amounts are included in the purchases and sales of investment securities noted above.
Russell 1000 Value Index Fund
F. Capital share transactions for each class of shares were:
| | | | | | | Year Ended August 31, | |
| | | | 2020 | | | | | 2019 | |
| | Amount | | Shares | | | Amount | | Shares | |
| | ($000 | ) | (000 | ) | | ($000 | ) | (000 | ) |
| ETF Shares | | | | | | | | | |
| Issued | 1,468,858 | | 14,775 | | | 1,270,748 | | 11,700 | |
| Issued in Lieu of Cash Distributions | — | | — | | | — | | — | |
| Redeemed | (793,991 | ) | (7,575 | ) | | (823,671 | ) | (7,550 | ) |
| Net Increase (Decrease)—ETF Shares | 674,867 | | 7,200 | | | 447,077 | | 4,150 | |
| Institutional Shares | | | | | | | | | |
| Issued | 342,811 | | 1,698 | | | 634,913 | | 3,030 | |
| Issued in Lieu of Cash Distributions | 38,347 | | 191 | | | 36,445 | | 173 | |
| Redeemed | (963,304 | ) | (4,974 | ) | | (364,492 | ) | (1,727 | ) |
| Net Increase (Decrease)—Institutional Shares | (582,146 | ) | (3,085 | ) | | 306,866 | | 1,476 | |
G. Management has determined that no events or transactions occurred subsequent to August 31, 2020, that would require recognition or disclosure in these financial statements.
Russell 1000 Growth Index Fund
Performance Summary
All of the returns in this report represent past performance, which is not a guarantee of future results that may be achieved by the fund. (Current performance may be lower or higher than the performance data cited. For performance data current to the most recent month-end, visit our website at vanguard.com/performance.) Note, too, that both investment returns and principal value can fluctuate widely, so an investor’s shares, when sold, could be worth more or less than their original cost. The returns shown do not reflect taxes that a shareholder would pay on fund distributions or on the sale of fund shares.
Cumulative Performance: September 20, 2010, Through August 31, 2020
Initial Investment of $10,000
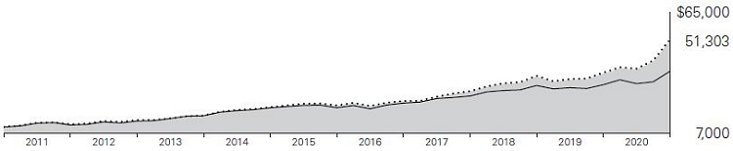
| | | Average Annual Total Returns | |
| | | Periods Ended August 31, 2020 | |
| | | | | Since | Final Value |
| | | One | Five | Inception | of a $10,000 |
| | | Year | Years | (9/20/2010) | Investment |
| Russell 1000 Growth Index Fund ETF | | | | |
| Shares Net Asset Value | 44.18% | 20.54% | 17.87% | $51,303 |
| | Russell 1000 Growth Index Fund ETF | | | | |
| Shares Market Price | 44.38 | 20.54 | 17.88 | 51,334 |
 | Russell 1000 Growth Index | 44.34 | 20.66 | 18.02 | 51,960 |
 | Dow Jones U.S. Total Stock Market | | | | |
| Float Adjusted Index | 21.20 | 13.77 | 13.96 | 36,668 |
| “Since Inception” performance is calculated from the ETF Shares’ inception date for both the fund and its comparative standards. |
| |
| |
| |
| | | | | Since | Final Value |
| | | One | Five | Inception | of a $5,000,000 |
| | | Year | Years | (12/6/2010) | Investment |
| Russell 1000 Growth Index Fund Institutional Shares | 44.24% | 20.58% | 17.12% | $23,292,992 |
| Russell 1000 Growth Index | 44.34 | 20.66 | 17.22 | 23,476,337 |
| Dow Jones U.S. Total Stock Market Float Adjusted Index | 21.20 | 13.77 | 13.31 | 16,877,403 |
“Since Inception” performance is calculated from the Institutional Shares’ inception date for both the fund and its comparative standards.
See Financial Highlights for dividend and capital gains information.
Russell 1000 Growth Index Fund
Cumulative Returns of ETF Shares: September 20, 2010, Through August 31, 2020
| | | | Since |
| | One | Five | Inception |
| | Year | Years | (9/20/2010) |
| Russell 1000 Growth Index Fund ETF Shares Market Price | 44.38% | 154.52% | 413.34% |
| Russell 1000 Growth Index Fund ETF Shares Net Asset Value | 44.18 | 154.45 | 413.03 |
| Russell 1000 Growth Index | 44.34 | 155.74 | 419.60 |
“Since Inception” performance is calculated from the ETF Shares’ inception date for both the fund and its comparative standards.
For the ETF Shares, the market price is determined by the midpoint of the bid-offer spread as of the closing time of the New York Stock Exchange (generally 4 p.m., Eastern time). The net asset value is also determined as of the NYSE closing time. For more information about how the ETF Shares’ market prices have compared with their net asset value, visit vanguard.com, select your ETF, and then select the Price and Performance tab. The ETF premium/discount analysis there shows the percentages of days on which the ETF Shares’ market price was above or below the NAV.
Russell 1000 Growth Index Fund
Fund Allocation
As of August 31, 2020
| Consumer Discretionary | 20.4% |
| Consumer Staples | 3.7 |
| Energy | 0.2 |
| Financial Services | 9.8 |
| Health Care | 13.2 |
| Materials & Processing | 1.0 |
| Producer Durables | 5.4 |
| Technology | 46.3 |
| Utilities | 0.0 |
The table reflects the fund’s investments, except for short-term investments and derivatives. Sector categories are based on the Russell Global Sectors (“RGS”), except for the “Other” category (if applicable), which includes securities that have not been provided a RGS classification as of the effective reporting period.
The fund may invest in derivatives (such as futures and swap contracts) for various reasons, including, but not limited to, attempting to remain fully invested and tracking its target index as closely as possible.
Russell 1000 Growth Index Fund
Financial Statements
Schedule of Investments—Investments Summary
As of August 31, 2020
This Statement summarizes the fund’s holdings by asset type. Details are reported for each of the fund’s 50 largest individual holdings and for investments that, in total for any issuer, represent more than 1% of the fund’s net assets. The total value of smaller holdings is reported as a single amount within each category.
The fund files its complete schedule of portfolio holdings with the Securities and Exchange Commission (SEC) four times in each fiscal year. For the second and fourth quarters the complete list of the fund’s holdings is available on vanguard.com and on Form N-CSR, or you can have it mailed to you without charge by calling 800-662-7447. For the first and third quarters of each fiscal year, the complete list of the fund’s holdings is available as an exhibit to its reports on Form N-PORT. The fund’s Form N-CSR and Form N-PORT reports are available on the SEC’s website at www.sec.gov.
| | | | | Market | Percentage |
| | | | | Value· | of Net |
| | | Shares | | ($000) | Assets |
| Common Stocks | | | | |
| Consumer Discretionary | | | | |
| * | Amazon.com Inc. | 207,375 | | 715,643 | 8.4% |
| * | Tesla Inc. | 361,604 | | 180,194 | 2.1% |
| * | Netflix Inc. | 207,989 | | 110,143 | 1.3% |
| | Home Depot Inc. | 262,632 | | 74,861 | 0.9% |
| | NIKE Inc. Class B | 592,407 | | 66,284 | 0.8% |
| | Costco Wholesale Corp. | 190,529 | | 66,239 | 0.8% |
| | Lowe’s Cos. Inc. | 369,566 | | 60,864 | 0.7% |
| * | Charter Communications Inc. Class A | 66,038 | | 40,654 | 0.5% |
| * | Booking Holdings Inc. | 19,983 | | 38,177 | 0.4% |
| | Consumer Discretionary—Other † | | | 377,997 | 4.5% |
| | | | | 1,731,056 | 20.4% |
| Consumer Staples | | | | |
| | Procter & Gamble Co. | 532,587 | | 73,673 | 0.9% |
| | PepsiCo Inc. | 498,113 | | 69,766 | 0.8% |
| | Coca-Cola Co. | 1,109,633 | | 54,960 | 0.6% |
| | Consumer Staples—Other † | | | 111,091 | 1.3% |
| | | | | 309,490 | 3.6% |
| | | | | | |
| Energy † | | | 15,345 | 0.2% |
| | | | | |
| Financial Services | | | | |
| | Visa Inc. Class A | 825,702 | | 175,041 | 2.1% |
| | Mastercard Inc. Class A | 431,429 | | 154,534 | 1.8% |
| * | PayPal Holdings Inc. | 574,331 | | 117,244 | 1.4% |
| | American Tower Corp. | 215,698 | | 53,741 | 0.6% |
| | Equinix Inc. | 42,964 | | 33,932 | 0.4% |
| | Crown Castle International Corp. | 189,532 | | 30,941 | 0.4% |
| * | Square Inc. | 176,561 | | 28,172 | 0.3% |
| | Financial Services—Other † | | | 240,455 | 2.8% |
| | | | | 834,060 | 9.8% |
Russell 1000 Growth Index Fund
| | | | Market | Percentage |
| | | | Value· | of Net |
| | | Shares | ($000) | Assets |
| Health Care | | | |
| | UnitedHealth Group Inc. | 384,064 | 120,039 | 1.4% |
| | Merck & Co. Inc. | 1,079,819 | 92,076 | 1.1% |
| | AbbVie Inc. | 809,951 | 77,569 | 0.9% |
| | Amgen Inc. | 287,901 | 72,931 | 0.9% |
| | Eli Lilly and Co. | 411,923 | 61,125 | 0.7% |
| | Thermo Fisher Scientific Inc. | 113,367 | 48,632 | 0.6% |
| * | Intuitive Surgical Inc. | 56,588 | 41,357 | 0.5% |
| | Abbott Laboratories | 324,524 | 35,526 | 0.4% |
| * | Vertex Pharmaceuticals Inc. | 126,971 | 35,440 | 0.4% |
| | Zoetis Inc. | 210,345 | 33,676 | 0.4% |
| * | Regeneron Pharmaceuticals Inc. | 47,287 | 29,315 | 0.3% |
| | Health Care—Other † | | 475,205 | 5.6% |
| | | | 1,122,891 | 13.2% |
| | | | | |
| Materials & Processing † | | 86,783 | 1.0% |
| | | | |
| Producer Durables | | | |
| | Accenture plc Class A | 311,682 | 74,782 | 0.9% |
| | Lockheed Martin Corp. | 121,002 | 47,222 | 0.6% |
| | United Parcel Service Inc. Class B | 227,580 | 37,237 | 0.4% |
| | Union Pacific Corp. | 169,311 | 32,582 | 0.4% |
| | 3M Co. | 181,359 | 29,565 | 0.3% |
| | Producer Durables—Other † | | 234,936 | 2.8% |
| | | | 456,324 | 5.4% |
| | | | | |
| Technology | | | |
| | Apple Inc. | 8,001,002 | 1,032,449 | 12.2% |
| | Microsoft Corp. | 3,662,330 | 825,965 | 9.7% |
| * | Facebook Inc. Class A | 1,174,370 | 344,325 | 4.0% |
| * | Alphabet Inc. Class A | 113,916 | 185,630 | 2.2% |
| * | Alphabet Inc. Class C | 112,461 | 183,781 | 2.2% |
| | NVIDIA Corp. | 288,700 | 154,449 | 1.8% |
| * | Adobe Inc. | 235,264 | 120,782 | 1.4% |
| * | salesforce.com Inc. | 392,643 | 107,054 | 1.3% |
| | QUALCOMM Inc. | 550,379 | 65,550 | 0.8% |
| | Broadcom Inc. | 180,968 | 62,823 | 0.7% |
| | Oracle Corp. | 849,426 | 48,604 | 0.6% |
| * | Advanced Micro Devices Inc. | 530,263 | 48,158 | 0.6% |
| * | ServiceNow Inc. | 92,929 | 44,794 | 0.5% |
| | Intuit Inc. | 123,168 | 42,541 | 0.5% |
| | Texas Instruments Inc. | 223,617 | 31,787 | 0.4% |
| | Technology—Other † | | 629,626 | 7.4% |
| | | | 3,928,318 | 46.3% |
| | | | | |
| Utilities † | | 1,413 | 0.0% |
| Total Common Stocks (Cost $4,876,602) | | 8,485,680 | 99.9% |
Russell 1000 Growth Index Fund
| | | | Market | Percentage |
| | | | Value· | of Net |
| | Coupon | Shares | ($000) | Assets |
| Temporary Cash Investments | | | | |
| Money Market Fund | | | | |
| 1,2 Vanguard Market Liquidity Fund | 0.147% | 15,804 | 1,580 | 0.0% |
| | | | | |
| 3U.S. Government and Agency Obligations † | | | 371 | 0.0% |
| Total Temporary Cash Investments (Cost $1,951) | | | 1,951 | 0.0% |
| 4Total Investments (Cost $4,878,553) | | | 8,487,631 | 99.9% |
| Other Assets and Liabilities—Net | | | 5,128 | 0.1% |
| Net Assets | | | 8,492,759 | 100.0% |
Cost is in $000.
| · | See Note A in Notes to Financial Statements. |
| * | Non-income-producing security. |
| † | Represents the aggregate value, by category, of securities that are not among the 50 largest holdings and, in total for any issuer, represent 1% or less of net assets. |
| 1 | Affiliated money market fund available only to Vanguard funds and certain trusts and accounts managed by Vanguard. Rate shown is the 7-day yield. |
| 2 | Collateral of $752,000 was received for securities on loan. |
| 3 | Securities with a value of $371,000 have been segregated as initial margin for open futures contracts. |
| 4 | The total value of securities on loan is $709,000. |
| Derivative Financial Instruments Outstanding as of Period End |
| |
| Futures Contracts | | | | |
| | | | | ($000) |
| | | | | Value and |
| | | Number of | | Unrealized |
| | | Long (Short) | Notional | Appreciation |
| | Expiration | Contracts | Amount | (Depreciation) |
| Long Futures Contracts | | | | |
| E-mini S&P 500 Index | September 2020 | 42 | 7,348 | 112 |
See accompanying Notes, which are an integral part of the Financial Statements.
Russell 1000 Growth Index Fund
Statement of Assets and Liabilities
As of August 31, 2020
| ($000s, except shares and per-share amounts) | Amount |
| Assets | |
| Investments in Securities, at Value | |
| Unaffiliated Issuers (Cost $4,876,973) | 8,486,051 |
| Affiliated Issuers (Cost $1,580) | 1,580 |
| Total Investments in Securities | 8,487,631 |
| Investment in Vanguard | 336 |
| Cash Collateral Pledged—Futures Contracts | 145 |
| Receivables for Accrued Income | 5,588 |
| Receivables for Capital Shares Issued | 16,682 |
| Total Assets | 8,510,382 |
| Liabilities | |
| Due to Custodian | 164 |
| Payables for Investment Securities Purchased | 15,798 |
| Collateral for Securities on Loan | 752 |
| Payables for Capital Shares Redeemed | 594 |
| Payables to Vanguard | 303 |
| Variation Margin Payable—Futures Contracts | 12 |
| Total Liabilities | 17,623 |
| Net Assets | 8,492,759 |
| | |
| At August 31, 2020, net assets consisted of: | |
| | |
| Paid-in Capital | 5,158,274 |
| Total Distributable Earnings (Loss) | 3,334,485 |
| Net Assets | 8,492,759 |
| | |
| ETF Shares—Net Assets | |
| Applicable to 21,101,711 outstanding $.001 par value shares of beneficial interest (unlimited authorization) | 4,950,947 |
| Net Asset Value Per Share—ETF Shares | $234.62 |
| | |
| Institutional Shares—Net Assets | |
| Applicable to 7,850,580 outstanding $.001 par value shares of beneficial interest (unlimited authorization) | 3,541,812 |
| Net Asset Value Per Share—Institutional Shares | $451.15 |
See accompanying Notes, which are an integral part of the Financial Statements.
Russell 1000 Growth Index Fund
Statement of Operations
| | Year Ended |
| | August 31, 2020 |
| | ($000) |
| Investment Income | |
| Income | |
| Dividends | 74,860 |
| Interest1 | 104 |
| Securities Lending—Net | 162 |
| Total Income | 75,126 |
| Expenses | |
| The Vanguard Group—Note B | |
| Investment Advisory Services | 999 |
| Management and Administrative—ETF Shares | 1,904 |
| Management and Administrative—Institutional Shares | 1,521 |
| Marketing and Distribution—ETF Shares | 216 |
| Marketing and Distribution—Institutional Shares | 101 |
| Custodian Fees | 173 |
| Auditing Fees | 31 |
| Shareholders’ Reports—ETF Shares | 79 |
| Shareholders’ Reports—Institutional Shares | 7 |
| Trustees’ Fees and Expenses | 4 |
| Total Expenses | 5,035 |
| Net Investment Income | 70,091 |
| Realized Net Gain (Loss) | |
| Investment Securities Sold1,2 | 567,617 |
| Futures Contracts | (1,796) |
| Realized Net Gain (Loss) | 565,821 |
| Change in Unrealized Appreciation (Depreciation) | |
| Investment Securities1 | 2,018,301 |
| Futures Contracts | 118 |
| Change in Unrealized Appreciation (Depreciation) | 2,018,419 |
| Net Increase (Decrease) in Net Assets Resulting from Operations | 2,654,331 |
| 1 | Interest income, realized net gain (loss), and change in unrealized appreciation (depreciation) from an affiliated company of the fund were $94,000, $7,000, and $1,000, respectively. Purchases and sales are for temporary cash investment purposes. |
| 2 | Includes $706,581,000 of net gain (loss) resulting from in-kind redemptions. |
See accompanying Notes, which are an integral part of the Financial Statements.
Russell 1000 Growth Index Fund
Statement of Changes in Net Assets
| | Year Ended August 31, |
| | 2020 | 2019 |
| | ($000) | ($000) |
| Increase (Decrease) in Net Assets | | |
| Operations | | |
| Net Investment Income | 70,091 | 66,842 |
| Realized Net Gain (Loss) | 565,821 | 266,693 |
| Change in Unrealized Appreciation (Depreciation) | 2,018,419 | (81,179) |
| Net Increase (Decrease) in Net Assets Resulting from Operations | 2,654,331 | 252,356 |
| Distributions1 | | |
| ETF Shares | (38,092) | (24,807) |
| Institutional Shares | (34,009) | (32,305) |
| Total Distributions | (72,101) | (57,112) |
| Capital Share Transactions | | |
| ETF Shares | 645,864 | 683,781 |
| Institutional Shares | (683,204) | (195,359) |
| Net Increase (Decrease) from Capital Share Transactions | (37,340) | 488,422 |
| Total Increase (Decrease) | 2,544,890 | 683,666 |
| Net Assets | | |
| Beginning of Period | 5,947,869 | 5,264,203 |
| End of Period | 8,492,759 | 5,947,869 |
| 1 | Certain prior period numbers have been reclassified to conform with current period presentation. |
See accompanying Notes, which are an integral part of the Financial Statements.
Russell 1000 Growth Index Fund
Financial Highlights
| ETF Shares | | | �� | | | |
| | | | | | | |
| For a Share Outstanding | | | Year Ended August 31, | |
| Throughout Each Period | 2020 | 2019 | 2018 | 2017 | 2016 | |
| Net Asset Value, Beginning of Period | $164.56 | $159.56 | $127.08 | $106.90 | $98.24 | |
| Investment Operations | | | | | | |
| Net Investment Income | 1.9001 | 1.9221 | 1.7621 | 1.6841 | 1.602 | |
| Net Realized and Unrealized Gain (Loss) on Investments | 70.098 | 4.711 | 32.386 | 20.177 | 8.556 | |
| Total from Investment Operations | 71.998 | 6.633 | 34.148 | 21.861 | 10.158 | |
| Distributions | | | | | | |
| Dividends from Net Investment Income | (1.938) | (1.633) | (1.668) | (1.681) | (1.498) | |
| Distributions from Realized Capital Gains | — | — | — | — | — | |
| Total Distributions | (1.938) | (1.633) | (1.668) | (1.681) | (1.498) | |
| Net Asset Value, End of Period | $234.62 | $164.56 | $159.56 | $127.08 | $106.90 | |
| | | | | | | |
| Total Return | 44.18% | 4.20% | 27.09% | 20.66% | 10.44% | |
| | | | | | | |
| Ratios/Supplemental Data | | | | | | |
| Net Assets, End of Period (Millions) | $4,951 | $2,872 | $2,083 | $1,319 | $738 | |
| Ratio of Total Expenses to Average Net Assets | 0.08% | 0.08% | 0.12% | 0.12% | 0.12% | |
| Ratio of Net Investment Income to Average Net Assets | 1.04% | 1.25% | 1.24% | 1.45% | 1.60% | |
| Portfolio Turnover Rate2 | 14% | 17% | 15% | 21% | 15% | |
| 1 | Calculated based on average shares outstanding. |
| 2 | Excludes the value of portfolio securities received or delivered as a result of in-kind purchases or redemptions of the fund’s capital shares, including ETF Creation Units. |
See accompanying Notes, which are an integral part of the Financial Statements.
Russell 1000 Growth Index Fund
Financial Highlights
| Institutional Shares | | | | | | |
| | | | | | | |
| For a Share Outstanding | | | Year Ended August 31, | |
| Throughout Each Period | 2020 | 2019 | 2018 | 2017 | 2016 | |
| Net Asset Value, Beginning of Period | $316.39 | $306.82 | $244.34 | $205.53 | $188.88 | |
| Investment Operations | | | | | | |
| Net Investment Income | 3.6951 | 3.7111 | 3.4851 | 3.2911 | 3.147 | |
| Net Realized and Unrealized Gain (Loss) on Investments | 134.792 | 9.061 | 62.293 | 38.832 | 16.449 | |
| Total from Investment Operations | 138.487 | 12.772 | 65.778 | 42.123 | 19.596 | |
| Distributions | | | | | | |
| Dividends from Net Investment Income | (3.727) | (3.202) | (3.298) | (3.313) | (2.946) | |
| Distributions from Realized Capital Gains | — | — | — | — | — | |
| Total Distributions | (3.727) | (3.202) | (3.298) | (3.313) | (2.946) | |
| Net Asset Value, End of Period | $451.15 | $316.39 | $306.82 | $244.34 | $205.53 | |
| | | | | | | |
| Total Return | 44.24% | 4.21% | 27.14% | 20.72% | 10.48% | |
| | | | | | | |
| Ratios/Supplemental Data | | | | | | |
| Net Assets, End of Period (Millions) | $3,542 | $3,076 | $3,182 | $2,476 | $1,989 | |
| Ratio of Total Expenses to Average Net Assets | 0.07% | 0.07% | 0.08% | 0.08% | 0.08% | |
| Ratio of Net Investment Income to | 1.06% | 1.26% | 1.28% | 1.49% | 1.64% | |
| Average Net Assets | | | | | | |
| Portfolio Turnover Rate2 | 14% | 17% | 15% | 21% | 15% | |
| 1 | Calculated based on average shares outstanding. |
| 2 | Excludes the value of portfolio securities received or delivered as a result of in-kind purchases or redemptions of the fund’s capital shares, including ETF Creation Units. |
See accompanying Notes, which are an integral part of the Financial Statements.
Russell 1000 Growth Index Fund
Notes to Financial Statements
Vanguard Russell 1000 Growth Index Fund is registered under the Investment Company Act of 1940 as an open-end investment company, or mutual fund. The fund offers two classes of shares: ETF Shares and Institutional Shares. Each of the share classes has different eligibility and minimum purchase requirements, and is designed for different types of investors. ETF Shares are listed for trading on Nasdaq; they can be purchased and sold through a broker.
Market disruptions associated with the COVID-19 pandemic have had a global impact, and uncertainty exists as to the long-term implications. Such disruptions can adversely affect assets of the fund and thus fund performance.
A. The following significant accounting policies conform to generally accepted accounting principles for U.S. investment companies. The fund consistently follows such policies in preparing its financial statements.
1. Security Valuation: Securities are valued as of the close of trading on the New York Stock Exchange (generally 4 p.m., Eastern time) on the valuation date. Equity securities are valued at the latest quoted sales prices or official closing prices taken from the primary market in which each security trades; such securities not traded on the valuation date are valued at the mean of the latest quoted bid and asked prices. Securities for which market quotations are not readily available, or whose values have been materially affected by events occurring before the fund’s pricing time but after the close of the securities’ primary markets, are valued by methods deemed by the board of trustees to represent fair value. Investments in Vanguard Market Liquidity Fund are valued at that fund’s net asset value. Temporary cash investments are valued using the latest bid prices or using valuations based on a matrix system (which considers such factors as security prices, yields, maturities, and ratings), both as furnished by independent pricing services.
2. Futures Contracts: The fund uses index futures contracts to a limited extent, with the objectives of maintaining full exposure to the stock market, maintaining liquidity, and minimizing transaction costs. The fund may purchase futures contracts to immediately invest incoming cash in the market, or sell futures in response to cash outflows, thereby simulating a fully invested position in the underlying index while maintaining a cash balance for liquidity. The primary risks associated with the use of futures contracts are imperfect correlation between changes in market values of stocks held by the fund and the prices of futures contracts, and the possibility of an illiquid market. Counterparty risk involving futures is mitigated because a regulated clearinghouse is the counterparty instead of the clearing broker. To further mitigate counterparty risk, the fund trades futures contracts on an exchange, monitors the financial strength of its clearing brokers and clearinghouse, and has entered into clearing agreements with its clearing brokers. The clearinghouse imposes initial margin requirements to secure the fund’s performance and requires daily settlement of variation margin representing changes in the market value of each contract. Any securities pledged as initial margin for open contracts are noted in the Schedule of Investments.
Futures contracts are valued at their quoted daily settlement prices. The notional amounts of the contracts are not recorded in the Statement of Assets and Liabilities. Fluctuations in the value of the contracts are recorded in the Statement of Assets and Liabilities as an asset (liability) and in the Statement of Operations as unrealized appreciation (depreciation) until the contracts are closed, when they are recorded as realized gains (losses) on futures contracts.
During the year ended August 31, 2020, the fund’s average investments in long and short futures contracts represented less than 1% and 0% of net assets, respectively, based on the average of the notional amounts at each quarter-end during the period.
Russell 1000 Growth Index Fund
3. Federal Income Taxes: The fund intends to continue to qualify as a regulated investment company and distribute all of its taxable income. The fund’s tax returns are open to examination by the relevant tax authorities until expiration of the applicable statute of limitations, which is generally three years after the filing of the tax return. Management has analyzed the fund’s tax positions taken for all open federal and state income tax years, and has concluded that no provision for income tax is required in the fund’s financial statements.
4. Distributions: Distributions to shareholders are recorded on the ex-dividend date. Distributions are determined on a tax basis at the fiscal year-end and may differ from net investment income and realized capital gains for financial reporting purposes.
5. Securities Lending: To earn additional income, the fund lends its securities to qualified institutional borrowers. Security loans are subject to termination by the fund at any time, and are required to be secured at all times by collateral in an amount at least equal to the market value of securities loaned. Daily market fluctuations could cause the value of loaned securities to be more or less than the value of the collateral received. When this occurs, the collateral is adjusted and settled before the opening of the market on the next business day. The fund further mitigates its counterparty risk by entering into securities lending transactions only with a diverse group of prequalified counterparties, monitoring their financial strength, and entering into master securities lending agreements with its counterparties. The master securities lending agreements provide that, in the event of a counterparty’s default (including bankruptcy), the fund may terminate any loans with that borrower, determine the net amount owed, and sell or retain the collateral up to the net amount owed to the fund; however, such actions may be subject to legal proceedings. While collateral mitigates counterparty risk, in the event of a default, the fund may experience delays and costs in recovering the securities loaned. The fund invests cash collateral received in Vanguard Market Liquidity Fund, and records a liability in the Statement of Assets and Liabilities for the return of the collateral, during the period the securities are on loan. Collateral investments in Vanguard Market Liquidity Fund are subject to market appreciation or depreciation. Securities lending income represents fees charged to borrowers plus income earned on invested cash collateral, less expenses associated with the loan. During the term of the loan, the fund is entitled to all distributions made on or in respect of the loaned securities.
6. Credit Facilities and Interfund Lending Program: The fund and certain other funds managed by The Vanguard Group (“Vanguard”) participate in a $4.3 billion committed credit facility provided by a syndicate of lenders pursuant to a credit agreement and an uncommitted credit facility provided by Vanguard. Both facilities may be renewed annually. Each fund is individually liable for its borrowings, if any, under the credit facilities. Borrowings may be utilized for temporary or emergency purposes, subject to the fund’s regulatory and contractual borrowing restrictions. With respect to the committed credit facility, the participating funds are charged administrative fees and an annual commitment fee of 0.10% of the undrawn committed amount of the facility; these fees are allocated to the funds based on a method approved by the fund’s board of trustees and included in Management and Administrative expenses on the fund’s Statement of Operations. Any borrowings under either facility bear interest at a rate based upon the higher of the one-month London Interbank Offered Rate (or an acceptable alternate rate, if necessary), federal funds effective rate, or overnight bank funding rate plus an agreed-upon spread, except that borrowings under the uncommitted credit facility may bear interest based upon an alternative rate agreed to by the fund and Vanguard.
Russell 1000 Growth Index Fund
In accordance with an exemptive order (the “Order”) from the SEC, the fund may participate in a joint lending and borrowing program that allows registered open-end Vanguard funds to borrow money from and lend money to each other for temporary or emergency purposes (the “Interfund Lending Program”), subject to compliance with the terms and conditions of the Order, and to the extent permitted by the fund’s investment objective and investment policies. Interfund loans and borrowings normally extend overnight, but can have a maximum duration of seven days. Loans may be called on one business day’s notice. The interest rate to be charged is governed by the conditions of the Order and internal procedures adopted by the board of trustees. The board of trustees is responsible for overseeing the Interfund Lending Program.
For the year ended August 31, 2020, the fund did not utilize the credit facilities or the Interfund Lending Program.
7. Other: Dividend income is recorded on the ex-dividend date. Interest income includes income distributions received from Vanguard Market Liquidity Fund and is accrued daily. Premiums and discounts on debt securities are amortized and accreted, respectively, to interest income over the lives of the respective securities, except for premiums on certain callable debt securities that are amortized to the earliest call date. Security transactions are accounted for on the date securities are bought or sold. Costs used to determine realized gains (losses) on the sale of investment securities are those of the specific securities sold.
Each class of shares has equal rights as to assets and earnings, except that each class separately bears certain class-specific expenses related to maintenance of shareholder accounts (included in Management and Administrative expenses) and shareholder reporting. Marketing and distribution expenses are allocated to each class of shares based on a method approved by the board of trustees. Income, other non-class-specific expenses, and gains and losses on investments are allocated to each class of shares based on its relative net assets.
B. In accordance with the terms of a Funds’ Service Agreement (the “FSA”) between Vanguard and the fund, Vanguard furnishes to the fund investment advisory, corporate management, administrative, marketing, and distribution services at Vanguard’s cost of operations (as defined by the FSA). These costs of operations are allocated to the fund based on methods and guidelines approved by the board of trustees and are generally settled twice a month.
Upon the request of Vanguard, the fund may invest up to 0.40% of its net assets as capital in Vanguard. At August 31, 2020, the fund had contributed to Vanguard capital in the amount of $336,000, representing less than 0.01% of the fund’s net assets and 0.13% of Vanguard’s capital received pursuant to the FSA. The fund’s trustees and officers are also directors and employees, respectively, of Vanguard.
C. Various inputs may be used to determine the value of the fund’s investments and derivatives. These inputs are summarized in three broad levels for financial statement purposes. The inputs or methodologies used to value securities are not necessarily an indication of the risk associated with investing in those securities.
Level 1—Quoted prices in active markets for identical securities.
Level 2—Other significant observable inputs (including quoted prices for similar securities, interest rates, prepayment speeds, credit risk, etc.).
Level 3—Significant unobservable inputs (including the fund’s own assumptions used to determine the fair value of investments). Any investments and derivatives valued with significant unobservable inputs are noted on the Schedule of Investments.
Russell 1000 Growth Index Fund
The following table summarizes the market value of the fund’s investments and derivatives as of August 31, 2020, based on the inputs used to value them:
| | Level 1 | Level 2 | Level 3 | Total |
| | ($000) | ($000) | ($000) | ($000) |
| Investments | | | | |
| Assets | | | | |
| Common Stocks | 8,485,680 | — | — | 8,485,680 |
| Temporary Cash Investments | 1,580 | 371 | — | 1,951 |
| Total | 8,487,260 | 371 | — | 8,487,631 |
| Derivative Financial Instruments | | | | |
| Assets | | | | |
| Futures Contracts1 | 12 | — | — | 12 |
| 1 | Represents variation margin on the last day of the reporting period. |
D. Permanent differences between book-basis and tax-basis components of net assets are reclassified among capital accounts in the financial statements to reflect their tax character. These reclassifications have no effect on net assets or net asset value per share. As of period end, permanent differences primarily attributable to the accounting for in-kind redemptions were reclassified between the following accounts:
| | Amount |
| | ($000) |
| Paid-in Capital | 706,536 |
| Total Distributable Earnings (Loss) | (706,536) |
Temporary differences between book-basis and tax-basis components of total distributable earnings (loss) arise when certain items of income, gain, or loss are recognized in different periods for financial statement and tax purposes; these differences will reverse at some time in the future. The differences are primarily related to the deferral of losses from wash sales; and the recognition of unrealized gains or losses from certain derivative contracts. As of period end, the tax-basis components of total distributable earnings (loss) are detailed in the table as follows:
| | Amount |
| | ($000) |
| Undistributed Ordinary Income | 11,306 |
| Undistributed Long-term Gains | — |
| Capital Loss Carryforwards | (285,899) |
| Qualified Late-Year Losses | — |
| Net Unrealized Gains (Losses) | 3,609,078 |
Russell 1000 Growth Index Fund
The tax character of distributions paid was as follows:
| | Year Ended August 31, |
| | 2020 | 2019 |
| | Amount | Amount |
| | ($000) | ($000) |
| Ordinary Income* | 72,101 | 57,112 |
| Long-Term Capital Gains | — | — |
| Total | 72,101 | 57,112 |
* Includes short-term capital gains, if any.
As of August 31, 2020, gross unrealized appreciation and depreciation for investments and derivatives based on cost for U.S. federal income tax purposes were as follows:
| | Amount |
| | ($000) |
| Tax Cost | 4,878,553 |
| Gross Unrealized Appreciation | 3,643,686 |
| Gross Unrealized Depreciation | (34,608) |
| Net Unrealized Appreciation (Depreciation) | 3,609,078 |
E. During the year ended August 31, 2020, the fund purchased $2,292,677,000 of investment securities and sold $2,340,816,000 of investment securities, other than temporary cash investments. Purchases and sales include $1,324,066,000 and $1,383,646,000, respectively, in connection with in-kind purchases and redemptions of the fund’s capital shares.
The fund purchased securities from and sold securities to other Vanguard funds or accounts managed by Vanguard or its affiliates, in accordance with procedures adopted by the board of trustees in compliance with Rule 17a-7 of the Investment Company Act of 1940. For the year ended August 31, 2020, such purchases and sales were $180,489,000 and $394,227,000, respectively; these amounts are included in the purchases and sales of investment securities noted above.
Russell 1000 Growth Index Fund
F. Capital share transactions for each class of shares were:
| | | | | Year Ended August 31, |
| | | 2020 | | | 2019 |
| | Amount | Shares | | Amount | Shares |
| | ($000) | (000) | | ($000) | (000) |
| ETF Shares | | | | | |
| Issued | 2,042,520 | 11,050 | | 1,469,861 | 9,450 |
| Issued in Lieu of Cash Distributions | — | — | | — | — |
| Redeemed | (1,396,656) | (7,400) | | (786,080) | (5,050) |
| Net Increase (Decrease)—ETF Shares | 645,864 | 3,650 | | 683,781 | 4,400 |
| Institutional Shares | | | | | |
| Issued | 490,711 | 1,343 | | 493,524 | 1,733 |
| Issued in Lieu of Cash Distributions | 30,560 | 94 | | 28,976 | 95 |
| Redeemed | (1,204,475) | (3,309) | | (717,859) | (2,475) |
| Net Increase (Decrease)—Institutional Shares | (683,204) | (1,872) | | (195,359) | (647) |
G. Management has determined that no events or transactions occurred subsequent to August 31, 2020, that would require recognition or disclosure in these financial statements.
Report of Independent Registered Public Accounting Firm
To the Board of Trustees of Vanguard Scottsdale Funds and Shareholders of Vanguard Russell 1000 Index Fund, Vanguard Russell 1000 Value Index Fund and Vanguard Russell 1000 Growth Index Fund
Opinions on the Financial Statements
We have audited the accompanying statements of assets and liabilities, including the schedules of investments—investments summary, of Vanguard Russell 1000 Index Fund, Vanguard Russell 1000 Value Index Fund and Vanguard Russell 1000 Growth Index Fund (three of the funds constituting Vanguard Scottsdale Funds, hereafter collectively referred to as the “Funds”) as of August 31, 2020, the related statements of operations for the year ended August 31, 2020, the statements of changes in net assets for each of the two years in the period ended August 31, 2020, including the related notes, and the financial highlights for each of the five years in the period ended August 31, 2020 (collectively referred to as the “financial statements”). In our opinion, the financial statements present fairly, in all material respects, the financial position of each of the Funds as of August 31, 2020, the results of each of their operations for the year then ended, the changes in each of their net assets for each of the two years in the period ended August 31, 2020 and each of the financial highlights for each of the five years in the period ended August 31, 2020 in conformity with accounting principles generally accepted in the United States of America.
Basis for Opinions
These financial statements are the responsibility of the Funds’ management. Our responsibility is to express an opinion on the Funds’ financial statements based on our audits. We are a public accounting firm registered with the Public Company Accounting Oversight Board (United States) (“PCAOB”) and are required to be independent with respect to the Funds in accordance with the U.S. federal securities laws and the applicable rules and regulations of the Securities and Exchange Commission and the PCAOB.
We conducted our audits of these financial statements in accordance with the standards of the PCAOB. Those standards require that we plan and perform the audit to obtain reasonable assurance about whether the financial statements are free of material misstatement, whether due to error or fraud.
Our audits included performing procedures to assess the risks of material misstatement of the financial statements, whether due to error or fraud, and performing procedures that respond to those risks. Such procedures included examining, on a test basis, evidence regarding the amounts and disclosures in the financial statements. Our audits also included evaluating the accounting principles used and significant estimates made by management, as well as evaluating the overall presentation of the financial statements. Our procedures included confirmation of securities owned as of August 31, 2020 by correspondence with the custodian and brokers and by agreement to the underlying ownership records of the transfer agent; when replies were not received from brokers, we performed other auditing procedures. We believe that our audits provide a reasonable basis for our opinions.
/s/PricewaterhouseCoopers LLP
Philadelphia, Pennsylvania
October 19, 2020
We have served as the auditor of one or more investment companies in The Vanguard Group of Funds since 1975.
Special 2020 tax information (unaudited) for Vanguard Russell 1000 Index Funds
This information for the fiscal year ended August 31, 2020, is included pursuant to provisions of the Internal Revenue Code.
The funds distributed qualified dividend income to shareholders during the fiscal year as follows:
| Fund | ($000) |
| Russell 1000 Index Fund | 67,786 |
| Russell 1000 Value Index Fund | 99,087 |
| Russell 1000 Growth Index Fund | 72,101 |
The funds distributed qualified business income to shareholders during the fiscal year as follows:
| Fund | ($000) |
| Russell 1000 Index Fund | — |
| Russell 1000 Value Index Fund | 4,019 |
| Russell 1000 Growth Index Fund | — |
For corporate shareholders, the percentage of investment income (dividend income plus short-term gains, if any) that qualifies for the dividends-received deduction is as follows:
| Fund | Percentage |
| Russell 1000 Index Fund | 94.6% |
| Russell 1000 Value Index Fund | 91.7 |
| Russell 1000 Growth Index Fund | 100.0 |
Trustees Approve Advisory Arrangements
The board of trustees of Vanguard Russell 1000 Index Fund, Vanguard Russell 1000 Value Index Fund, and Vanguard Russell 1000 Growth Index Fund has renewed each fund’s investment advisory arrangement with The Vanguard Group, Inc. (Vanguard), through its Equity Index Group. The board determined that continuing each fund’s internalized management structure was in the best interests of the fund and its shareholders.
The board based its decision upon an evaluation of the advisor’s investment staff, portfolio management process, and performance. This evaluation included information provided to the board by Vanguard’s Portfolio Review Department, which is responsible for fund and advisor oversight and product management. The Portfolio Review Department met regularly with the advisor and made monthly presentations to the board during the fiscal year that directed the board’s focus to relevant information and topics.
The board, or an investment committee made up of board members, also received information throughout the year through advisor presentations. For each advisor presentation, the board was provided with letters and reports that included information about, among other things, the advisory firm and the advisor’s assessment of the investment environment, portfolio performance, and portfolio characteristics.
In addition, the board received monthly reports, which included a Market and Economic Report, a Fund Dashboard Monthly Summary, and a Fund Performance Report.
Prior to their meeting, the trustees were provided with a memo and materials that summarized the information they received over the course of the year. They also considered the factors discussed below, among others. However, no single factor determined whether the board approved the arrangements. Rather, it was the totality of the circumstances that drove the board’s decision.
Nature, extent, and quality of services
The board reviewed the quality of the investment management services provided to the funds since their inception in 2010, and took into account the organizational depth and stability of the advisor. The board considered that Vanguard has been managing investments for more than four decades. The Equity Index Group adheres to a sound, disciplined investment management process; the team has considerable experience, stability, and depth.
The board concluded that Vanguard’s experience, stability, depth, and performance, among other factors, warranted continuation of each advisory arrangement.
Investment performance
The board considered each fund’s performance since its inception, including any periods of outperformance or underperformance compared with its target index and peer group. The board concluded that the performance was such that each advisory arrangement should continue.
Cost
The board concluded that each fund’s expense ratio was well below the average expense ratio charged by funds in its peer group and that each fund’s advisory expenses were also well below the peer-group average.
The board does not conduct a profitability analysis of Vanguard because of Vanguard’s unique structure. Unlike most other mutual fund management companies, Vanguard is owned by the funds it oversees.
The benefit of economies of scale
The board concluded that each fund’s arrangement with Vanguard ensures that the funds will realize economies of scale as they grow, with the cost to shareholders declining as fund assets increase.
The board will consider whether to renew the advisory arrangements again after a one-year period.
Liquidity Risk Management
Vanguard funds (except for the money market funds) have adopted and implemented a written liquidity risk management program (the “Program”) as required by Rule 22e-4 under the Investment Company Act of 1940. Rule 22e-4 requires that each fund adopt a program that is reasonably designed to assess and manage the fund’s liquidity risk, which is the risk that the fund could not meet redemption requests without significant dilution of remaining investors’ interests in the fund.
Assessment and management of a fund’s liquidity risk under the Program take into consideration certain factors, such as the fund’s investment strategy and the liquidity of its portfolio investments during normal and reasonably foreseeable stressed conditions, its short- and long-term cash-flow projections during both normal and reasonably foreseeable stressed conditions, and its cash and cash-equivalent holdings and access to other funding sources. As required by the rule, the Program includes policies and procedures for classification of fund portfolio holdings in four liquidity categories, maintaining certain levels of highly liquid investments, and limiting holdings of illiquid investments.
The board of trustees of Vanguard Scottsdale Funds approved the appointment of liquidity risk management program administrators responsible for administering the Program for Russell 1000 Index Fund, Russell 1000 Value Index Fund, and Russell 1000 Growth Index Fund, and for carrying out the specific responsibilities set forth in the Program, including reporting to the board on at least an annual basis regarding the Program’s operation, its adequacy, and the effectiveness of its implementation for the past year (the “Program Administrator Report”). The board has reviewed the Program Administrator Report covering the period from December 1, 2018, through December 31, 2019 (the “Review Period”). The Program Administrator Report stated that during the Review Period the Program operated and was implemented effectively to manage the funds’ liquidity risk.
The Products are not sponsored, endorsed, sold or promoted by Frank Russell Company (“Russell”). Russell makes no representation or warranty, express or implied, to the owners of the Products or any member of the public regarding the advisability of investing in securities generally or in the Products particularly or the ability of the Russell 1000, Russell 1000 Value, and Russell 1000 Growth Indexes to track general stock market performance or a segment of the same. Russell’s publication of the Russell 1000, Russell 1000 Value, and Russell 1000 Growth Indexes in no way suggests or implies an opinion by Russell as to the advisability of investment in any or all of the securities upon which the Russell 1000, Russell 1000 Value, and Russell 1000 Growth Indexes are based. Russell’s only relationship to The Vanguard Group, Inc. is the licensing of certain trademarks and trade names of Russell and of the Russell 1000, Russell 1000 Value, and Russell 1000 Growth Indexes which are determined, composed and calculated by Russell without regard to The Vanguard Group, Inc. or the Products. Russell is not responsible for and has not reviewed the Products nor any associated literature or publications and Russell makes no representation or warranty express or implied as to their accuracy or completeness, or otherwise. Russell has no obligation or liability in connection with the administration, marketing or trading of the Products.
Russell makes no representation, warranty or guarantee as to the accuracy, completeness, reliability or otherwise of the Russell Indexes or any data included in the Russell Indexes. Russell does not guarantee the accuracy and/or the completeness of the Russell 1000, Russell 1000 Value, and Russell 1000 Growth Indexes or any data included therein and Russell shall have no liability for any errors, omissions, or interruptions therein. Russell makes no warranty, express or implied, as to the use of or results to be obtained by The Vanguard Group, Inc., investors, owners of the Products, or any other person or entity from the use of the Russell 1000, Russell 1000 Value, and Russell 1000 Growth Indexes or any data included therein. Russell makes no express or implied warranties, and expressly disclaims all warranties of merchantability or fitness for a particular purpose or use with respect to the Russell 1000, Russell 1000 Value, and Russell 1000 Growth Indexes or any data included therein. Without limiting any of the foregoing, in no event shall Russell have any liability for any special, punitive, indirect, or consequential damages (including lost profits), even if notified of the possibility of such damages.
Russell reserves the right, at any time and without notice, to alter, amend, terminate or in any way change the Russell Indexes. Russell has no obligation to take the needs of any particular fund or its participants or any other product or person into consideration in determining, composing or calculating any of the Russell Indexes.
This page intentionally left blank.
The People Who Govern Your Fund
The trustees of your mutual fund are there to see that the fund is operated and managed in your best interests since, as a shareholder, you are a part owner of the fund. Your fund’s trustees also serve on the board of directors of The Vanguard Group, Inc., which is owned by the Vanguard funds and provides services to them.
A majority of Vanguard’s board members are independent, meaning that they have no affiliation with Vanguard or the funds they oversee, apart from the sizable personal investments they have made as private individuals. The independent board members have distinguished backgrounds in business, academia, and public service. Each of the trustees and executive officers oversees 212 Vanguard funds.
Information for each trustee and executive officer of the fund appears below. That information, as well as the Vanguard fund count, is as of the date on the cover of this fund report. The mailing address of the trustees and officers is P.O. Box 876, Valley Forge, PA 19482. More information about the trustees is in the Statement of Additional Information, which can be obtained, without charge, by contacting Vanguard at 800-662-7447, or online at vanguard.com.
Interested Trustee1
Mortimer J. Buckley
Born in 1969. Trustee since January 2018. Principal occupation(s) during the past five years and other experience: chairman of the board (2019–present) of Vanguard and of each of the investment companies served by Vanguard; chief executive officer (2018–present) of Vanguard; chief executive officer, president, and trustee (2018–present) of each of the investment companies served by Vanguard; president and director (2017–present) of Vanguard; and president (2018–present) of Vanguard Marketing Corporation. Chief investment officer (2013–2017), managing director (2002–2017), head of the Retail Investor Group (2006–2012), and chief information officer (2001–2006) of Vanguard. Chairman of the board (2011–2017) and trustee (2009–2017) of the Children’s Hospital of Philadelphia; and trustee (2018–present) and vice chair (2019–present) of The Shipley School.
Independent Trustees
Emerson U. Fullwood
Born in 1948. Trustee since January 2008. Principal occupation(s) during the past five years and other experience: executive chief staff and marketing officer for North America and corporate vice president (retired 2008) of Xerox Corporation (document management products and services). Former president of the Worldwide Channels Group, Latin America, and Worldwide Customer Service and executive chief staff officer of Developing Markets of Xerox. Executive in residence and 2009–2010 Distinguished Minett Professor at the Rochester Institute of Technology. Director of SPX FLOW, Inc. (multi-industry manufacturing). Director of the University of Rochester Medical Center, the Monroe Community College Foundation, the United Way of Rochester, North Carolina A&T University, and Roberts Wesleyan College. Trustee of the University of Rochester.
Amy Gutmann
Born in 1949. Trustee since June 2006. Principal occupation(s) during the past five years and other experience: president (2004–present) of the University of Pennsylvania. Christopher H. Browne Distinguished Professor of Political Science, School of Arts and Sciences, and professor of communication, Annenberg School for Communication, with secondary faculty appointments in the Department of Philosophy, School of Arts and Sciences, and at the Graduate School of Education, University of Pennsylvania.
F. Joseph Loughrey
Born in 1949. Trustee since October 2009. Principal occupation(s) during the past five years and other experience: president and chief operating officer (retired 2009) and vice chairman of the board (2008–2009) of Cummins Inc. (industrial machinery). Chairman of the board of Hillenbrand, Inc. (specialized consumer services) and the Lumina Foundation. Director of the V Foundation. Member of the advisory
1 Mr. Buckley is considered an “interested person,” as defined in the Investment Company Act of 1940, because he is an officer of the Vanguard funds.
council for the College of Arts and Letters and chair of the advisory board to the Kellogg Institute for International Studies, both at the University of Notre Dame.
Mark Loughridge
Born in 1953. Trustee since March 2012. Principal occupation(s) during the past five years and other experience: senior vice president and chief financial officer (retired 2013) of IBM (information technology services). Fiduciary member of IBM’s Retirement Plan Committee (2004–2013), senior vice president and general manager (2002–2004) of IBM Global Financing, vice president and controller (1998–2002) of IBM, and a variety of other prior management roles at IBM. Member of the Council on Chicago Booth.
Scott C. Malpass
Born in 1962. Trustee since March 2012. Principal occupation(s) during the past five years and other experience: chief investment officer (retired June 2020) and vice president (retired June 2020) of the University of Notre Dame. Assistant professor of finance at the Mendoza College of Business, University of Notre Dame, and member of the Notre Dame 403(b) Investment Committee (retired June 2020). Member of the board of Catholic Investment Services, Inc. (investment advisors) and the board of superintendence of the Institute for the Works of Religion.
Deanna Mulligan
Born in 1963. Trustee since January 2018. Principal occupation(s) during the past five years and other experience: chief executive officer (2011–present) of The Guardian Life Insurance Company of America. President (2010–2019), chief operating officer (2010–2011), and executive vice president (2008–2010) of Individual Life and Disability of The Guardian Life Insurance Company of America. Member of the board of The Guardian Life Insurance Company of America, the American Council of Life Insurers, and the Economic Club of New York. Trustee of the Partnership for New York City (business leadership), Chief Executives for Corporate Purpose, NewYork- Presbyterian Hospital, Catalyst, and the Bruce Museum (arts and science). Member of the Advisory Council for the Stanford Graduate School of Business.
André F. Perold
Born in 1952. Trustee since December 2004. Principal occupation(s) during the past five years and other experience: George Gund Professor of Finance and Banking, Emeritus at the Harvard Business School (retired 2011). Chief investment officer and co-managing partner of HighVista Strategies (private investment firm). Member of the board of advisors and member of the investment committee of the Museum of Fine Arts Boston. Member of the board (2018–present) of RIT Capital Partners (investment firm). Member of the investment committee of Partners Health Care System.
Sarah Bloom Raskin
Born in 1961. Trustee since January 2018. Principal occupation(s) during the past five years and other experience: deputy secretary (2014–2017) of the United States Department of the Treasury. Governor (2010–2014) of the Federal Reserve Board. Commissioner (2007–2010) of financial regulation for the State of Maryland. Member of the board of directors (2012–2014) of Neighborhood Reinvestment Corporation. Director (2017–present) of i(x) Investments, LLC; director (2017–present) of Reserve Trust. Rubenstein Fellow (2017–present) of Duke University; trustee (2017–present) of Amherst College, and trustee (2019–present) of the Folger Shakespeare Library.
Peter F. Volanakis
Born in 1955. Trustee since July 2009. Principal occupation(s) during the past five years and other experience: president and chief operating officer (retired 2010) of Corning Incorporated (communications equipment) and director of Corning Incorporated (2000–2010) and Dow Corning (2001–2010). Director (2012) of SPX Corporation (multi-industry manufacturing). Overseer of the Amos Tuck School of Business Administration, Dartmouth College (2001–2013). Chairman of the board of trustees of Colby-Sawyer College. Member of the board of Hypertherm Inc. (industrial cutting systems, software, and consumables).
Executive Officers
John Bendl
Born in 1970. Principal occupation(s) during the past five years and other experience: principal of Vanguard. Chief financial officer (2019–present) of each of the investment companies served by Vanguard. Chief accounting officer, treasurer, and controller of Vanguard (2017–present). Partner (2003–2016) at KPMG (audit, tax, and advisory services).
Glenn Booraem
Born in 1967. Principal occupation(s) during the past five years and other experience: principal of Vanguard. Investment stewardship officer (2017–present), treasurer (2015–2017), controller (2010–2015), and assistant controller (2001–2010) of each of the investment companies served by Vanguard.
Christine M. Buchanan
Born in 1970. Principal occupation(s) during the past five years and other experience: principal of Vanguard. Treasurer (2017–present) of each of the investment companies served by Vanguard. Partner (2005–2017) at KPMG (audit, tax, and advisory services).
David Cermak
Born in 1960. Principal occupation(s) during the past five years and other experience: principal of Vanguard. Finance director (2019–present) of each of the investment companies served by Vanguard. Managing director and head (2017–present) of Vanguard Investments Singapore. Managing director and head (2017–2019) of Vanguard Investments Hong Kong. Representative director and head (2014–2017) of Vanguard Investments Japan.
Thomas J. Higgins
Born in 1957. Principal occupation(s) during the past five years and other experience: principal of Vanguard. Finance director (2019–present), chief financial officer (2008–2019), and treasurer (1998–2008) of each of the investment companies served by Vanguard.
Peter Mahoney
Born in 1974. Principal occupation(s) during the past five years and other experience: principal of Vanguard. Controller (2015–present) of each of the investment companies served by Vanguard. Head of International Fund Services (2008–2014) at Vanguard.
Anne E. Robinson
Born in 1970. Principal occupation(s) during the past five years and other experience: general counsel (2016–present) of Vanguard. Secretary (2016–present) of Vanguard and of each of the investment companies served by Vanguard. Managing director (2016–present) of Vanguard. Managing director and general counsel of Global Cards and Consumer Services (2014–2016) at Citigroup. Counsel (2003–2014) at American Express.
Michael Rollings
Born in 1963. Principal occupation(s) during the past five years and other experience: finance director (2017–present) and treasurer (2017) of each of the investment companies served by Vanguard. Managing director (2016–present) of Vanguard. Chief financial officer (2016–present) of Vanguard. Director (2016–present) of Vanguard Marketing Corporation. Executive vice president and chief financial officer (2006–2016) of MassMutual Financial Group.
John E. Schadl
Born in 1972. Principal occupation(s) during the past five years and other experience: principal of Vanguard. Chief compliance officer (2019–present) of Vanguard and of each of the investment companies served by Vanguard. Assistant vice president (2019–present) of Vanguard Marketing Corporation.
Vanguard Senior Management Team
| Joseph Brennan | Chris D. McIsaac |
| Mortimer J. Buckley | James M. Norris |
| Gregory Davis | Thomas M. Rampulla |
| John James | Karin A. Risi |
| Martha G. King | Anne E. Robinson |
| John T. Marcante | Michael Rollings |
Connect with Vanguard® > vanguard.com
Fund Information > 800-662-7447
Direct Investor Account Services > 800-662-2739
Institutional Investor Services > 800-523-1036
Text Telephone for People
Who Are Deaf or Hard of Hearing > 800-749-7273
This material may be used in conjunction with the offering of shares of any Vanguard fund only if preceded or accompanied by the fund’s current prospectus.
All comparative mutual fund data are from Morningstar, Inc., unless otherwise noted.
You can obtain a free copy of Vanguard’s proxy voting guidelines by visiting vanguard.com/proxyreporting or by calling Vanguard at 800-662-2739. The guidelines are also available from the SEC’s website, www.sec.gov. In addition, you may obtain a free report on how your fund voted the proxies for securities it owned during the 12 months ended June 30. To get the report, visit either vanguard.com/proxyreporting or www.sec.gov.
You can review information about your fund on the SEC’s website, and you can receive copies of this information, for a fee, by sending a request via email addressed to publicinfo@sec.gov.
Source for Bloomberg Barclays indexes: Bloomberg Index Services Limited. Copyright 2020, Bloomberg. All rights reserved.
| | © 2020 The Vanguard Group, Inc. All rights reserved. U.S. Patent Nos. 6,879,964; 7,337,138; 7,720,749; 7,925,573; 8,090,646; 8,417,623; and 8,626,636. Vanguard Marketing Corporation, Distributor. |
| | |
| | Q18480 102020 |

| | Annual Report | August 31, 2020 Vanguard Russell 2000 Index Funds | |
| | Vanguard Russell 2000 Index Fund Vanguard Russell 2000 Value Index Fund Vanguard Russell 2000 Growth Index Fund See the inside front cover for important information about access to your fund’s annual and semiannual shareholder reports. | |
Important information about access to shareholder reports
Beginning on January 1, 2021, as permitted by regulations adopted by the Securities and Exchange Commission, paper copies of your fund’s annual and semiannual shareholder reports will no longer be sent to you by mail, unless you specifically request them. Instead, you will be notified by mail each time a report is posted on the website and will be provided with a link to access the report.
If you have already elected to receive shareholder reports electronically, you will not be affected by this change and do not need to take any action. You may elect to receive shareholder reports and other communications from the fund electronically by contacting your financial intermediary (such as a broker-dealer or bank) or, if you invest directly with the fund, by calling Vanguard at one of the phone numbers on the back cover of this report or by logging on to vanguard.com.
You may elect to receive paper copies of all future shareholder reports free of charge. If you invest through a financial intermediary, you can contact the intermediary to request that you continue to receive paper copies. If you invest directly with the fund, you can call Vanguard at one of the phone numbers on the back cover of this report or log on to vanguard.com. Your election to receive paper copies will apply to all the funds you hold through an intermediary or directly with Vanguard.
| Contents | |
| | |
| Your Fund’s Performance at a Glance | 1 |
| About Your Fund’s Expenses | 2 |
| Russell 2000 Index Fund | 4 |
| Russell 2000 Value Index Fund | 21 |
| Russell 2000 Growth Index Fund | 38 |
| Trustees Approve Advisory Arrangements | 57 |
| Liquidity Risk Management | 59 |
Please note: The opinions expressed in this report are just that—informed opinions. They should not be considered promises or advice. Also, please keep in mind that the information and opinions cover the period through the date on the front of this report. Of course, the risks of investing in your fund are spelled out in the prospectus.
Your Fund’s Performance at a Glance
· For the 12 months ended August 31, 2020, returns for the three Vanguard Russell 2000 Index Funds ranged from about –6% to more than 17%. Each fund closely tracked its target index.
· The period was marked by historic levels of volatility. After falling from highs in the early part of 2020, the broad U.S. stock market began a rebound. In August, it climbed to a record high as the response of some major central banks and governments to the spread of the coronavirus and vaccine hopes lifted investor sentiment. U.S. stocks rebounded more strongly than developed markets outside the United States and emerging markets.
· Small- and mid-capitalization stocks trailed their large-cap counterparts, and growth stocks surpassed value.
· Technology and health care stocks were top contributors to returns for all three funds; consumer discretionary and materials and processing also helped results. Financial services, a drag on all three funds, caused the most pain for Vanguard Russell 2000 Index and Vanguard Russell 2000 Value Index Funds.
| Market Barometer | | | |
| | | Average Annual Total Returns |
| | | Periods Ended August 31, 2020 |
| | One Year | Three Years | Five Years |
| Stocks | | | |
| Russell 1000 Index (Large-caps) | 22.50% | 14.58% | 14.31% |
| Russell 2000 Index (Small-caps) | 6.02 | 5.03 | 7.65 |
| Russell 3000 Index (Broad U.S. market) | 21.44 | 13.95 | 13.86 |
| FTSE All-World ex US Index (International) | 8.78 | 2.92 | 6.00 |
| | | | |
| Bonds | | | |
| Bloomberg Barclays U.S. Aggregate Bond Index (Broad taxable market) | 6.47% | 5.09% | 4.33% |
| Bloomberg Barclays Municipal Bond Index (Broad tax-exempt market) | 3.24 | 4.09 | 3.99 |
| FTSE Three-Month U.S. Treasury Bill Index | 1.18 | 1.67 | 1.15 |
| | | | |
| CPI | | | |
| Consumer Price Index | 1.31% | 1.92% | 1.75% |
About Your Fund’s Expenses
As a shareholder of the fund, you incur ongoing costs, which include costs for portfolio management, administrative services, and shareholder reports (like this one), among others. Operating expenses, which are deducted from a fund’s gross income, directly reduce the investment return of the fund.
A fund’s expenses are expressed as a percentage of its average net assets. This figure is known as the expense ratio. The following examples are intended to help you understand the ongoing costs (in dollars) of investing in your fund and to compare these costs with those of other mutual funds. The examples are based on an investment of $1,000 made at the beginning of the period shown and held for the entire period.
The accompanying table illustrates your fund’s costs in two ways:
· Based on actual fund return. This section helps you to estimate the actual expenses that you paid over the period. The “Ending Account Value” shown is derived from the fund’s actual return, and the third column shows the dollar amount that would have been paid by an investor who started with $1,000 in the fund. You may use the information here, together with the amount you invested, to estimate the expenses that you paid over the period.
To do so, simply divide your account value by $1,000 (for example, an $8,600 account value divided by $1,000 = 8.6), then multiply the result by the number given for your fund under the heading “Expenses Paid During Period.”
· Based on hypothetical 5% yearly return. This section is intended to help you compare your fund’s costs with those of other mutual funds. It assumes that the fund had a yearly return of 5% before expenses, but that the expense ratio is unchanged. In this case—because the return used is not the fund’s actual return—the results do not apply to your investment. The example is useful in making comparisons because the Securities and Exchange Commission requires all mutual funds to calculate expenses based on a 5% return. You can assess your fund’s costs by comparing this hypothetical example with the hypothetical examples that appear in shareholder reports of other funds.
Note that the expenses shown in the table are meant to highlight and help you compare ongoing costs only and do not reflect transaction costs incurred by the fund for buying and selling securities. Further, the expenses do not include any purchase, redemption, or account service fees described in the fund prospectus. If such fees were applied to your account, your costs would be higher. Your fund does not carry a “sales load.”
The calculations assume no shares were bought or sold during the period. Your actual costs may have been higher or lower, depending on the amount of your investment and the timing of any purchases or redemptions.
You can find more information about the fund’s expenses, including annual expense ratios, in the Financial Statements section of this report. For additional information on operating expenses and other shareholder costs, please refer to your fund’s current prospectus.
| Six Months Ended August 31, 2020 | | | |
| | Beginning | Ending | Expenses |
| | Account Value | Account Value | Paid During |
| | 2/29/2020 | 8/31/2020 | Period |
| Based on Actual Fund Return | | | |
| Russell 2000 Index Fund | | | |
| ETF Shares | $1,000.00 | $1,066.16 | $0.52 |
| Institutional Shares | 1,000.00 | 1,066.40 | 0.42 |
| Russell 2000 Value Index Fund | | | |
| ETF Shares | $1,000.00 | $964.47 | $0.74 |
| Institutional Shares | 1,000.00 | 965.07 | 0.40 |
| Russell 2000 Growth Index Fund | | | |
| ETF Shares | $1,000.00 | $1,156.88 | $0.81 |
| Institutional Shares | 1,000.00 | 1,157.52 | 0.43 |
| Based on Hypothetical 5% Yearly Return | | | |
| Russell 2000 Index Fund | | | |
| ETF Shares | $1,000.00 | $1,024.63 | $0.51 |
| Institutional Shares | 1,000.00 | 1,024.73 | 0.41 |
| Russell 2000 Value Index Fund | | | |
| ETF Shares | $1,000.00 | $1,024.38 | $0.76 |
| Institutional Shares | 1,000.00 | 1,024.73 | 0.41 |
| Russell 2000 Growth Index Fund | | | |
| ETF Shares | $1,000.00 | $1,024.38 | $0.76 |
| Institutional Shares | 1,000.00 | 1,024.73 | 0.41 |
The calculations are based on expenses incurred in the most recent six-month period. The funds’ annualized six-month expense ratios for that period are: for the Russell 2000 Index Fund, 0.10% for ETF Shares and 0.08% for Institutional Shares; for the Russell 2000 Value Index Fund, 0.15% for ETF Shares and 0.08% for Institutional Shares; and for the Russell 2000 Growth Index Fund, 0.15% for ETF Shares and 0.08% for Institutional Shares. The dollar amounts shown as “Expenses Paid” are equal to the annualized expense ratio multiplied by the average account value over the period, multiplied by the number of days in the most recent six-month period, then divided by the number of days in the most recent 12-month period (184/366).
Russell 2000 Index Fund
Performance Summary
All of the returns in this report represent past performance, which is not a guarantee of future results that may be achieved by the fund. (Current performance may be lower or higher than the performance data cited. For performance data current to the most recent month-end, visit our website at vanguard.com/performance.) Note, too, that both investment returns and principal value can fluctuate widely, so an investor’s shares, when sold, could be worth more or less than their original cost. The returns shown do not reflect taxes that a shareholder would pay on fund distributions or on the sale of fund shares.
Cumulative Performance: September 20, 2010, Through August 31, 2020
Initial Investment of $10,000
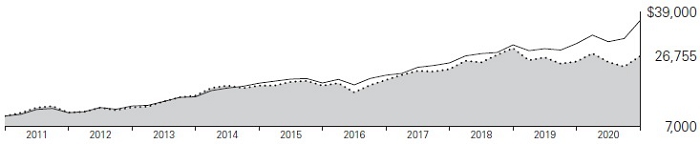
| | Average Annual Total Returns | |
| | Periods Ended August 31, 2020 | |
| | | | Since | Final Value |
| | One | Five | Inception | of a $10,000 |
| | Year | Years | (9/20/2010) | Investment |
 | Russell 2000 Index Fund ETF Shares Net Asset Value | 6.12% | 7.70% | 10.40% | $26,755 |
| | Russell 2000 Index Fund ETF Shares Market Price | 6.25 | 7.72 | 10.41 | 26,772 |
 | Russell 2000 Index | 6.02 | 7.65 | 10.39 | 26,737 |
 | Dow Jones U.S. Total Stock Market Float Adjusted Index | 21.20 | 13.77 | 13.96 | 36,668 |
“Since Inception” performance is calculated from the ETF Shares’ inception date for both the fund and its comparative standards.
| | | | Since | Final Value |
| | One | Five | Inception | of a $5,000,000 |
| | Year | Years | (12/22/2010) | Investment |
| Russell 2000 Index Fund Institutional Shares | 6.15% | 7.76% | 8.85% | $11,370,863 |
| Russell 2000 Index | 6.02 | 7.65 | 8.77 | 11,293,522 |
| Dow Jones U.S. Total Stock Market Float Adjusted Index | 21.20 | 13.77 | 13.02 | 16,375,456 |
“Since Inception” performance is calculated from the Institutional Shares’ inception date for both the fund and its comparative standards.
See Financial Highlights for dividend and capital gains information.
Russell 2000 Index Fund
| Cumulative Returns of ETF Shares: September 20, 2010, Through August 31, 2020 |
| | | | |
| | | | Since |
| | One | Five | Inception |
| | Year | Years | (9/20/2010) |
| Russell 2000 Index Fund ETF Shares Market Price | 6.25% | 45.02% | 167.72% |
| Russell 2000 Index Fund ETF Shares Net Asset Value | 6.12 | 44.92 | 167.55 |
| Russell 2000 Index | 6.02 | 44.57 | 167.37 |
“Since Inception” performance is calculated from the ETF Shares’ inception date for both the fund and its comparative standards.
For the ETF Shares, the market price is determined by the midpoint of the bid-offer spread as of the closing time of the New York Stock Exchange (generally 4 p.m., Eastern time). The net asset value is also determined as of the NYSE closing time. For more information about how the ETF Shares’ market prices have compared with their net asset value, visit vanguard.com, select your ETF, and then select the Price and Performance tab. The ETF premium/discount analysis there shows the percentages of days on which the ETF Shares’ market price was above or below the NAV.
Russell 2000 Index Fund
Fund Allocation
As of August 31, 2020
| Consumer Discretionary | 14.8% |
| Consumer Staples | 3.2 |
| Energy | 2.7 |
| Financial Services | 22.4 |
| Health Care | 19.6 |
| Materials & Processing | 6.9 |
| Other | 0.1 |
| Producer Durables | 12.8 |
| Technology | 13.3 |
| Utilities | 4.2 |
The table reflects the fund’s investments, except for short-term investments and derivatives. Sector categories are based on the Russell Global Sectors (“RGS”), except for the “Other” category (if applicable), which includes securities that have not been provided a RGS classification as of the effective reporting period.
The fund may invest in derivatives (such as futures and swap contracts) for various reasons, including, but not limited to, attempting to remain fully invested and tracking its target index as closely as possible.
Russell 2000 Index Fund
Financial Statements
Schedule of Investments—Investments Summary
As of August 31, 2020
This Statement summarizes the fund’s holdings by asset type. Details are reported for each of the fund’s 50 largest individual holdings and for investments that, in total for any issuer, represent more than 1 % of the fund’s net assets. The total value of smaller holdings is reported as a single amount within each category.
The fund files its complete schedule of portfolio holdings with the Securities and Exchange Commission (SEC) four times in each fiscal year. For the second and fourth quarters the complete list of the fund’s holdings is available on vanguard.com and on Form N-CSR, or you can have it mailed to you without charge by calling 800-662-7447. For the first and third quarters of each fiscal year, the complete list of the fund’s holdings is available as an exhibit to its reports on Form N-PORT. The fund’s Form N-CSR and Form N-PORT reports are available on the SEC’s website at www.sec.gov.
| | | | | | Market | | Percentage | |
| | | | | | Value• | | of Net | |
| | | | Shares | | ($000 | ) | Assets | |
| Common Stocks | | | | | | | |
| Consumer Discretionary | | | | | | | |
| * | Penn National Gaming Inc. | | 169,574 | | 8,665 | | 0.4% | |
| | Churchill Downs Inc. | | 48,149 | | 8,415 | | 0.3% | |
| | Caesars Entertainment Inc. | | 172,101 | | 7,882 | | 0.3% | |
| * | BJ’s Wholesale Club Holdings Inc. | | 173,474 | | 7,704 | | 0.3% | |
| * | Deckers Outdoor Corp. | | 35,435 | | 7,224 | | 0.3% | |
| * | Rh | | 21,176 | | 7,000 | | 0.3% | |
| * | SiteOne Landscape Supply Inc. | | 55,652 | | 6,959 | | 0.3% | |
| | Lithia Motors Inc. Class A | | 27,944 | | 6,957 | | 0.3% | |
| | Wingstop Inc. | | 37,534 | | 6,133 | | 0.2% | |
| | Texas Roadhouse Inc. Class A | | 83,173 | | 5,239 | | 0.2% | |
| * | Stamps.com Inc. | | 20,931 | | 5,219 | | 0.2% | |
| | Consumer Discretionary—Other † | | | | 281,120 | | 11.6% | |
| | | | | | 358,517 | | 14.7% | |
| Consumer Staples | | | | | | | |
| * | Helen of Troy Ltd. | | 32,018 | | 6,622 | | 0.3% | |
| * | Darling Ingredients Inc. | | 203,713 | | 6,513 | | 0.3% | |
| * | Performance Food Group Co. | | 165,954 | | 6,059 | | 0.2% | |
| * | Freshpet Inc. | | 49,047 | | 5,572 | | 0.2% | |
| | Consumer Staples—Other † | | | | 53,184 | | 2.2% | |
| | | | | | 77,950 | | 3.2% | |
| Energy | | | | | | | |
| * | Sunrun Inc. | | 147,108 | | 8,320 | | 0.3% | |
| | Energy—Other † | | | | 57,273 | | 2.4% | |
| | | | | | 65,593 | | 2.7% | |
| Financial Services | | | | | | | |
| | EastGroup Properties Inc. | | 48,902 | | 6,512 | | 0.3% | |
| | STAG Industrial Inc. | | 189,666 | | 6,126 | | 0.3% | |
| * | Redfin Corp. | | 121,534 | | 5,781 | | 0.2% | |
| | Kinsale Capital Group Inc. | | 26,363 | | 5,463 | | 0.2% | |
Russell 2000 Index Fund
| | | | | | Market | | Percentage | |
| | | | | | Value• | | of Net | |
| | | | Shares | | ($000 | ) | Assets | |
| | QTS Realty Trust Inc. Class A | | 76,036 | | 5,157 | | 0.2% | |
| | Financial Services—Other † | | | | 515,147 | | 21.2% | |
| | | | | | 544,186 | | 22.4% | |
| Health Care | | | | | | | |
| * | Novavax Inc. | | 73,804 | | 8,144 | | 0.3% | |
| * | LHC Group Inc. | | 38,440 | | 8,012 | | 0.3% | |
| * | Momenta Pharmaceuticals Inc. | | 149,348 | | 7,791 | | 0.3% | |
| * | iRhythm Technologies Inc. | | 34,267 | | 7,545 | | 0.3% | |
| * | Mirati Therapeutics Inc. | | 46,577 | | 6,957 | | 0.3% | |
| * | MyoKardia Inc. | | 62,953 | | 6,890 | | 0.3% | |
| * | Emergent BioSolutions Inc. | | 56,543 | | 6,449 | | 0.3% | |
| * | Ultragenyx Pharmaceutical Inc. | | 71,863 | | 6,113 | | 0.3% | |
| * | Nevro Corp. | | 42,514 | | 5,847 | | 0.3% | |
| * | Natera Inc. | | 88,365 | | 5,630 | | 0.2% | |
| * | HealthEquity Inc. | | 94,177 | | 5,413 | | 0.2% | |
| * | Arrowhead Pharmaceuticals Inc. | | 127,121 | | 5,370 | | 0.2% | |
| * | Blueprint Medicines Corp. | | 68,729 | | 5,322 | | 0.2% | |
| * | Invitae Corp. | | 146,216 | | 5,112 | | 0.2% | |
| * | NeoGenomics Inc. | | 131,177 | | 5,109 | | 0.2% | |
| * | Neogen Corp. | | 66,790 | | 5,089 | | 0.2% | |
| § | Health Care—Other † | | | | 373,689 | | 15.4% | |
| | | | | | 474,482 | | 19.5% | |
| Materials & Processing | | | | | | | |
| * | TopBuild Corp. | | 41,903 | | 6,445 | | 0.3% | |
| | Simpson Manufacturing Co. Inc. | | 55,144 | | 5,423 | | 0.2% | |
| | Materials & Processing—Other † | | | | 156,071 | | 6.4% | |
| | | | | | 167,939 | | 6.9% | |
| | | | | | | | | |
| §,1Other † | | | | 1,668 | | 0.1% | |
| | | | | | | | |
| Producer Durables | | | | | | | |
| | Tetra Tech Inc. | | 68,253 | | 6,300 | | 0.3% | |
| | MAXIMUS Inc. | | 77,354 | | 5,999 | | 0.2% | |
| * | Plug Power Inc. | | 449,505 | | 5,835 | | 0.2% | |
| | Exponent Inc. | | 64,984 | | 5,228 | | 0.2% | |
| | EMCOR Group Inc. | | 68,789 | | 5,160 | | 0.2% | |
| 2 | Producer Durables—Other † | | | | 281,101 | | 11.6% | |
| | | | | | 309,623 | | 12.7% | |
| Technology | | | | | | | |
| * | Q2 Holdings Inc. | | 62,811 | | 6,111 | | 0.3% | |
| * | Silicon Laboratories Inc. | | 54,888 | | 5,621 | | 0.3% | |
| | Cabot Microelectronics Corp. | | 36,759 | | 5,598 | | 0.2% | |
| * | II-VI Inc. | | 125,773 | | 5,597 | | 0.2% | |
| * | Envestnet Inc. | | 67,229 | | 5,579 | | 0.2% | |
| * | Blackline Inc. | | 63,530 | | 5,551 | | 0.2% | |
| | Technology—Other † | | | | 288,956 | | 11.9% | |
| | | | | | 323,013 | | 13.3% | |
| | | | | | | | | |
| Utilities † | | | | 101,253 | | 4.2% | |
| Total Common Stocks (Cost $2,418,947) | | | | 2,424,224 | | 99.7% | |
Russell 2000 Index Fund
| | | | | | Market | | Percentage | |
| | | | | | Value• | | of Net | |
| | | | Coupon | | Shares | | ($000 | ) | Assets | |
| Temporary Cash Investments | | | | | | | | | |
| Money Market Fund | | | | | | | | | |
| 3,4 | Vanguard Market Liquidity Fund | | 0.147% | | 412,345 | | 41,235 | | 1.7% | |
| | | | | | | | | | | |
| 5U.S. Government and Agency Obligations † | | | | | | 640 | | 0.0% | |
| Total Temporary Cash Investments (Cost $41,862) | | | | | | 41,875 | | 1.7% | |
| 6Total Investments (Cost $2,460,809) | | | | | | 2,466,099 | | 101.4% | |
| Other Assets and Liabilities—Net | | | | | | (33,500 | ) | (1.4% | ) |
| Net Assets | | | | | | 2,432,599 | | 100.0% | |
Cost is in $000.
| • | See Note A in Notes to Financial Statements. |
| * | Non-income-producing security. |
| † | Represents the aggregate value, by category, of securities that are not among the 50 largest holdings and, in total for any issuer, represent 1% or less of net assets. |
| § | Certain securities are valued using significant unobservable inputs. |
| 1 | “Other” represents securities that are not classified by the fund’s benchmark index. |
| 2 | Certain securities are exempt from registration under Rule 144A of the Securities Act of 1933. Such securities may be sold in transactions exempt from registration, normally to qualified institutional buyers. At August 31, 2020, the aggregate value of these securities was $2,512,000, representing 0.1% of net assets. |
| 3 | Affiliated money market fund available only to Vanguard funds and certain trusts and accounts managed by Vanguard. Rate shown is the 7-day yield. |
| 4 | Collateral of $38,189,000 was received for securities on loan, of which $35,553,000 is held in Vanguard Market Liquidity Fund and $2,636,000 is held in cash. |
| 5 | Securities with a value of $629,000 have been segregated as initial margin for open futures contracts. |
| 6 | The total value of securities on loan is $34,746,000. |
| Derivative Financial Instruments Outstanding as of Period End |
Futures Contracts
| | | | | | | | | ($000 | ) |
| | | | | | | | | Value and | |
| | | | | Number of | | | | Unrealized | |
| | | | | Long (Short | ) | Notional | | Appreciation | |
| | | Expiration | | Contracts | | Amount | | (Depreciation | ) |
| Long Futures Contracts | | | | | | | | | |
| E-mini Russell 2000 Index | | September 2020 | | 106 | | 8,275 | | 195 | |
See accompanying Notes, which are an integral part of the Financial Statements.
Russell 2000 Index Fund
Statement of Assets and Liabilities
As of August 31, 2020
| ($000s, except shares and per-share amounts) | | Amount | |
| Assets | | | |
| Investments in Securities, at Value | | | |
| Unaffiliated Issuers (Cost $2,419,587) | | 2,424,864 | |
| Affiliated Issuers (Cost $41,222) | | 41,235 | |
| Total Investments in Securities | | 2,466,099 | |
| Investment in Vanguard | | 97 | |
| Cash | | 2,828 | |
| Receivables for Accrued Income | | 1,782 | |
| Receivables for Capital Shares Issued | | 209 | |
| Total Assets | | 2,471,015 | |
| Liabilities | | | |
| Payables for Investment Securities Purchased | | 1 | |
| Collateral for Securities on Loan | | 38,189 | |
| Payables for Capital Shares Redeemed | | 36 | |
| Payables to Vanguard | | 114 | |
| Variation Margin Payable—Futures Contracts | | 76 | |
| Total Liabilities | | 38,416 | |
| Net Assets | | 2,432,599 | |
| At August 31, 2020, net assets consisted of: | | | |
| | | | |
| Paid-in Capital | | 2,736,378 | |
| Total Distributable Earnings (Loss) | | (303,779 | ) |
| Net Assets | | 2,432,599 | |
| | | | |
| ETF Shares—Net Assets | | | |
| Applicable to 14,375,000 outstanding $.001 par value shares of beneficial interest (unlimited authorization) | | 1,802,388 | |
| Net Asset Value Per Share—ETF Shares | | $125.38 | |
| | | | |
| Institutional Shares—Net Assets | | | |
| Applicable to 2,627,580 outstanding $.001 par value shares of beneficial interest (unlimited authorization) | | 630,211 | |
| Net Asset Value Per Share—Institutional Shares | | $239.84 | |
See accompanying Notes, which are an integral part of the Financial Statements.
Russell 2000 Index Fund
Statement of Operations
| | | Year Ended | |
| | | August 31, 2020 | |
| | | ($000 | ) |
| Investment Income | | | |
| Income | | | |
| Dividends | | 28,407 | |
| Interest1 | | 113 | |
| Securities Lending—Net | | 3,940 | |
| Total Income | | 32,460 | |
| Expenses | | | |
| The Vanguard Group—Note B | | | |
| Investment Advisory Services | | 330 | |
| Management and Administrative—ETF Shares | | 630 | |
| Management and Administrative—Institutional Shares | | 195 | |
| Marketing and Distribution—ETF Shares | | 92 | |
| Marketing and Distribution—Institutional Shares | | 27 | |
| Custodian Fees | | 686 | |
| Auditing Fees | | 31 | |
| Shareholders’ Reports—ETF Shares | | 69 | |
| Shareholders’ Reports—Institutional Shares | | 7 | |
| Trustees’ Fees and Expenses | | 1 | |
| Total Expenses | | 2,068 | |
| Net Investment Income | | 30,392 | |
| Realized Net Gain (Loss) | | | |
| Investment Securities Sold1,2 | | 114,467 | |
| Futures Contracts | | 166 | |
| Realized Net Gain (Loss) | | 114,633 | |
| Change in Unrealized Appreciation (Depreciation) | | | |
| Investment Securities1 | | 40,693 | |
| Futures Contracts | | 676 | |
| Change in Unrealized Appreciation (Depreciation) | | 41,369 | |
| Net Increase (Decrease) in Net Assets Resulting from Operations | | 186,394 | |
| 1 | Interest income, realized net gain (loss), and change in unrealized appreciation (depreciation) from an affiliated company of the fund were $104,000, $7,000, and $5,000, respectively. Purchases and sales are for temporary cash investment purposes. |
| 2 | Includes $319,082,000 of net gain (loss) resulting from In-kind redemptions. |
See accompanying Notes, which are an integral part of the Financial Statements.
Russell 2000 Index Fund
Statement of Changes in Net Assets
| | | Year Ended August 31, | |
| | | 2020 | | 2019 | |
| | | ($000 | ) | ($000 | ) |
| Increase (Decrease) in Net Assets | | | | | |
| Operations | | | | | |
| Net Investment Income | | 30,392 | | 31,315 | |
| Realized Net Gain (Loss) | | 114,633 | | 99,386 | |
| Change in Unrealized Appreciation (Depreciation) | | 41,369 | | (458,714 | ) |
| Net Increase (Decrease) in Net Assets Resulting from Operations | | 186,394 | | (328,013 | ) |
| Distributions1 | | | | | |
| ETF Shares | | (21,019 | ) | (19,016 | ) |
| Institutional Shares | | (9,718 | ) | (11,454 | ) |
| Total Distributions | | (30,737 | ) | (30,470 | ) |
| Capital Share Transactions | | | | | |
| ETF Shares | | 232,606 | | (27,258 | ) |
| Institutional Shares | | (278,614 | ) | 12,275 | |
| Net Increase (Decrease) from Capital Share Transactions | | (46,008 | ) | (14,983 | ) |
| Total Increase (Decrease) | | 109,649 | | (373,466 | ) |
| Net Assets | | | | | |
| Beginning of Period | | 2,322,950 | | 2,696,416 | |
| End of Period | | 2,432,599 | | 2,322,950 | |
| 1 | Certain prior period numbers have been reclassified to conform with current period presentation. |
See accompanying Notes, which are an integral part of the Financial Statements.
Russell 2000 Index Fund
Financial Highlights
ETF Shares
| For a Share Outstanding | | Year Ended August 31, | |
| Throughout Each Period | | 2020 | | 2019 | | 2018 | | 2017 | | 2016 | |
| Net Asset Value, Beginning of Period | | $119.75 | | $139.11 | | $112.21 | | $98.98 | | $92.71 | |
| Investment Operations | | | | | | | | | | | |
| Net Investment Income | | 1.619 | 1 | 1.593 | 1 | 1.554 | 1 | 1.443 | 1 | 1.302 | |
| Net Realized and Unrealized Gain (Loss) on Investments | | 5.640 | | (19.408 | ) | 26.846 | | 13.255 | | 6.537 | |
| Total from Investment Operations | | 7.259 | | (17.815 | ) | 28.400 | | 14.698 | | 7.839 | |
| Distributions | | | | | | | | | | | |
| Dividends from Net Investment Income | | (1.629 | ) | (1.545 | ) | (1.500 | ) | (1.468 | ) | (1.569 | ) |
| Distributions from Realized Capital Gains | | — | | — | | — | | — | | — | |
| Total Distributions | | (1.629 | ) | (1.545 | ) | (1.500 | ) | (1.468 | ) | (1.569 | ) |
| Net Asset Value, End of Period | | $125.38 | | $119.75 | | $139.11 | | $112.21 | | $98.98 | |
| | | | | | | | | | | | |
| Total Return | | 6.12% | | -12.83% | | 25.49% | | 14.94% | | 8.62% | |
| | | | | | | | | | | | |
| Ratios/Supplemental Data | | | | | | | | | | | |
| Net Assets, End of Period (Millions) | | $1,802 | | $1,464 | | $1,715 | | $1,083 | | $698 | |
| Ratio of Total Expenses to Average Net Assets | | 0.10% | | 0.10% | | 0.15% | | 0.15% | | 0.15% | |
| Ratio of Net Investment Income to Average Net Assets | | 1.37% | | 1.30% | | 1.23% | | 1.34% | | 1.52% | |
| Portfolio Turnover Rate2 | | 19% | | 16% | | 19% | | 23% | | 19% | |
| 1 | Calculated based on average shares outstanding. |
| 2 | Excludes the value of portfolio securities received or delivered as a result of in-kind purchases or redemptions of the fund’s capital shares, including ETF Creation Units. |
See accompanying Notes, which are an integral part of the Financial Statements.
Russell 2000 Index Fund
Financial Highlights
Institutional Shares
| For a Share Outstanding | | Year Ended August 31, | |
| Throughout Each Period | | 2020 | | 2019 | | 2018 | | 2017 | | 2016 | |
| Net Asset Value, Beginning of Period | | $229.03 | | $266.12 | | $214.65 | | $189.31 | | $177.40 | |
| Investment Operations | | | | | | | | | | | |
| Net Investment Income | | 3.208 | 1 | 3.078 | 1 | 3.129 | 1 | 2.956 | 1 | 2.606 | |
| Net Realized and Unrealized Gain (Loss) on Investments | | 10.710 | | (37.106 | ) | 51.369 | | 25.315 | | 12.503 | |
| Total from Investment Operations | | 13.918 | | (34.028 | ) | 54.498 | | 28.271 | | 15.109 | |
| Distributions | | | | | | | | | | | |
| Dividends from Net Investment Income | | (3.108 | ) | (3.062 | ) | (3.028 | ) | (2.931 | ) | (3.199 | ) |
| Distributions from Realized Capital Gains | | — | | — | | — | | — | | — | |
| Total Distributions | | (3.108 | ) | (3.062 | ) | (3.028 | ) | (2.931 | ) | (3.199 | ) |
| Net Asset Value, End of Period | | $239.84 | | $229.03 | | $266.12 | | $214.65 | | $189.31 | |
| | | | | | | | | | | | |
| Total Return | | 6.15% | | -12.83% | | 25.58% | | 15.03% | | 8.69% | |
| | | | | | | | | | | | |
| Ratios/Supplemental Data | | | | | | | | | | | |
| Net Assets, End of Period (Millions) | | $630 | | $859 | | $982 | | $576 | | $479 | |
| Ratio of Total Expenses to Average Net Assets | | 0.08% | | 0.08% | | 0.08% | | 0.08% | | 0.08% | |
| Ratio of Net Investment Income to Average Net Assets | | 1.41% | | 1.32% | | 1.30% | | 1.41% | | 1.59% | |
| Portfolio Turnover Rate2 | | 19% | | 16% | | 19% | | 23% | | 19% | |
| 1 | Calculated based on average shares outstanding. |
| 2 | Excludes the value of portfolio securities received or delivered as a result of in-kind purchases or redemptions of the fund’s capital shares, including ETF Creation Units. |
See accompanying Notes, which are an integral part of the Financial Statements.
Russell 2000 Index Fund
Notes to Financial Statements
Vanguard Russell 2000 Index Fund is registered under the Investment Company Act of 1940 as an open-end investment company, or mutual fund. The fund offers two classes of shares: ETF Shares and Institutional Shares. Each of the share classes has different eligibility and minimum purchase requirements, and is designed for different types of investors. ETF Shares are listed for trading on Nasdaq; they can be purchased and sold through a broker.
Market disruptions associated with the COVID-19 pandemic have had a global impact, and uncertainty exists as to the long-term implications. Such disruptions can adversely affect assets of the fund and thus fund performance.
A. The following significant accounting policies conform to generally accepted accounting principles for U.S. investment companies. The fund consistently follows such policies in preparing its financial statements.
1. Security Valuation: Securities are valued as of the close of trading on the New York Stock Exchange (generally 4 p.m., Eastern time) on the valuation date. Equity securities are valued at the latest quoted sales prices or official closing prices taken from the primary market in which each security trades; such securities not traded on the valuation date are valued at the mean of the latest quoted bid and asked prices. Securities for which market quotations are not readily available, or whose values have been materially affected by events occurring before the fund’s pricing time but after the close of the securities’ primary markets, are valued by methods deemed by the board of trustees to represent fair value. Investments in Vanguard Market Liquidity Fund are valued at that fund’s net asset value. Temporary cash investments are valued using the latest bid prices or using valuations based on a matrix system (which considers such factors as security prices, yields, maturities, and ratings), both as furnished by independent pricing services.
2. Futures Contracts: The fund uses index futures contracts to a limited extent, with the objectives of maintaining full exposure to the stock market, maintaining liquidity, and minimizing transaction costs. The fund may purchase futures contracts to immediately invest incoming cash in the market, or sell futures in response to cash outflows, thereby simulating a fully invested position in the underlying index while maintaining a cash balance for liquidity. The primary risks associated with the use of futures contracts are imperfect correlation between changes in market values of stocks held by the fund and the prices of futures contracts, and the possibility of an illiquid market. Counterparty risk involving futures is mitigated because a regulated clearinghouse is the counterparty instead of the clearing broker. To further mitigate counterparty risk, the fund trades futures contracts on an exchange, monitors the financial strength of its clearing brokers and clearinghouse, and has entered into clearing agreements with its clearing brokers. The clearinghouse imposes initial margin requirements to secure the fund’s performance and requires daily settlement of variation margin representing changes in the market value of each contract. Any securities pledged as initial margin for open contracts are noted in the Schedule of Investments.
Futures contracts are valued at their quoted daily settlement prices. The notional amounts of the contracts are not recorded in the Statement of Assets and Liabilities. Fluctuations in the value of the contracts are recorded in the Statement of Assets and Liabilities as an asset (liability) and in the Statement of Operations as unrealized appreciation (depreciation) until the contracts are closed, when they are recorded as realized gains (losses) on futures contracts.
Russell 2000 Index Fund
During the year ended August 31, 2020, the fund’s average investments in long and short futures contracts represented less than 1% and 0% of net assets, respectively, based on the average of the notional amounts at each quarter-end during the period.
3. Federal Income Taxes: The fund intends to continue to qualify as a regulated investment company and distribute all of its taxable income. The fund’s tax returns are open to examination by the relevant tax authorities until expiration of the applicable statute of limitations, which is generally three years after the filing of the tax return. Management has analyzed the fund’s tax positions taken for all open federal and state income tax years, and has concluded that no provision for income tax is required in the fund’s financial statements.
4. Distributions: Distributions to shareholders are recorded on the ex-dividend date. Distributions are determined on a tax basis at the fiscal year-end and may differ from net investment income and realized capital gains for financial reporting purposes.
5. Securities Lending: To earn additional income, the fund lends its securities to qualified institutional borrowers. Security loans are subject to termination by the fund at any time, and are required to be secured at all times by collateral in an amount at least equal to the market value of securities loaned. Daily market fluctuations could cause the value of loaned securities to be more or less than the value of the collateral received. When this occurs, the collateral is adjusted and settled before the opening of the market on the next business day. The fund further mitigates its counterparty risk by entering into securities lending transactions only with a diverse group of prequalified counterparties, monitoring their financial strength, and entering into master securities lending agreements with its counterparties. The master securities lending agreements provide that, in the event of a counterparty’s default (including bankruptcy), the fund may terminate any loans with that borrower, determine the net amount owed, and sell or retain the collateral up to the net amount owed to the fund; however, such actions may be subject to legal proceedings. While collateral mitigates counterparty risk, in the event of a default, the fund may experience delays and costs in recovering the securities loaned. The fund invests cash collateral received in Vanguard Market Liquidity Fund, and records a liability in the Statement of Assets and Liabilities for the return of the collateral, during the period the securities are on loan. Collateral investments in Vanguard Market Liquidity Fund are subject to market appreciation or depreciation. Securities lending income represents fees charged to borrowers plus income earned on invested cash collateral, less expenses associated with the loan. During the term of the loan, the fund is entitled to all distributions made on or in respect of the loaned securities.
6. Credit Facilities and Interfund Lending Program: The fund and certain other funds managed by The Vanguard Group (“Vanguard”) participate in a $4.3 billion committed credit facility provided by a syndicate of lenders pursuant to a credit agreement and an uncommitted credit facility provided by Vanguard. Both facilities may be renewed annually. Each fund is individually liable for its borrowings, if any, under the credit facilities. Borrowings may be utilized for temporary or emergency purposes, subject to the fund’s regulatory and contractual borrowing restrictions. With respect to the committed credit facility, the participating funds are charged administrative fees and an annual commitment fee of 0.10% of the undrawn committed amount of the facility; these fees are allocated to the funds based on a method approved by the fund’s board of trustees
Russell 2000 Index Fund
and included in Management and Administrative expenses on the fund’s Statement of Operations. Any borrowings under either facility bear interest at a rate based upon the higher of the one-month London Interbank Offered Rate (or an acceptable alternate rate, if necessary), federal funds effective rate, or overnight bank funding rate plus an agreed-upon spread, except that borrowings under the uncommitted credit facility may bear interest based upon an alternative rate agreed to by the fund and Vanguard.
In accordance with an exemptive order (the “Order”) from the SEC, the fund may participate in a joint lending and borrowing program that allows registered open-end Vanguard funds to borrow money from and lend money to each other for temporary or emergency purposes (the “Interfund Lending Program”), subject to compliance with the terms and conditions of the Order, and to the extent permitted by the fund’s investment objective and investment policies. Interfund loans and borrowings normally extend overnight, but can have a maximum duration of seven days. Loans may be called on one business day’s notice. The interest rate to be charged is governed by the conditions of the Order and internal procedures adopted by the board of trustees. The board of trustees is responsible for overseeing the Interfund Lending Program.
For the year ended August 31, 2020, the fund did not utilize the credit facilities or the Interfund Lending Program.
7. Other: Dividend income is recorded on the ex-dividend date. Interest income includes income distributions received from Vanguard Market Liquidity Fund and is accrued daily. Premiums and discounts on debt securities are amortized and accreted, respectively, to interest income over the lives of the respective securities, except for premiums on certain callable debt securities that are amortized to the earliest call date. Security transactions are accounted for on the date securities are bought or sold. Costs used to determine realized gains (losses) on the sale of investment securities are those of the specific securities sold.
Each class of shares has equal rights as to assets and earnings, except that each class separately bears certain class-specific expenses related to maintenance of shareholder accounts (included in Management and Administrative expenses) and shareholder reporting. Marketing and distribution expenses are allocated to each class of shares based on a method approved by the board of trustees. Income, other non-class-specific expenses, and gains and losses on investments are allocated to each class of shares based on its relative net assets.
B. In accordance with the terms of a Funds’ Service Agreement (the “FSA”) between Vanguard and the fund, Vanguard furnishes to the fund investment advisory, corporate management, administrative, marketing, and distribution services at Vanguard’s cost of operations (as defined by the FSA). These costs of operations are allocated to the fund based on methods and guidelines approved by the board of trustees and are generally settled twice a month.
Upon the request of Vanguard, the fund may invest up to 0.40% of its net assets as capital in Vanguard. At August 31, 2020, the fund had contributed to Vanguard capital in the amount of $97,000, representing less than 0.01% of the fund’s net assets and 0.04% of Vanguard’s capital received pursuant to the FSA. The fund’s trustees and officers are also directors and employees, respectively, of Vanguard.
Russell 2000 Index Fund
C. Various inputs may be used to determine the value of the fund’s investments and derivatives. These inputs are summarized in three broad levels for financial statement purposes. The inputs or methodologies used to value securities are not necessarily an indication of the risk associated with investing in those securities.
Level 1—Quoted prices in active markets for identical securities.
Level 2—Other significant observable inputs (including quoted prices for similar securities, interest rates, prepayment speeds, credit risk, etc.).
Level 3—Significant unobservable inputs (including the fund’s own assumptions used to determine the fair value of investments). Any investments and derivatives valued with significant unobservable inputs are noted on the Schedule of Investments.
The following table summarizes the market value of the fund’s investments and derivatives as of August 31, 2020, based on the inputs used to value them:
| | | Level 1 | | Level 2 | | Level 3 | | Total | |
| | | ($000 | ) | ($000 | ) | ($000 | ) | ($000 | ) |
| Investments | | | | | | | | | |
| Assets | | | | | | | | | |
| Common Stocks | | 2,424,159 | | 1 | | 64 | | 2,424,224 | |
| Temporary Cash Investments | | 41,235 | | 640 | | — | | 41,875 | |
| Total | | 2,465,394 | | 641 | | 64 | | 2,466,099 | |
| Derivative Financial Instruments | | | | | | | | | |
| Liabilities | | | | | | | | | |
| Futures Contracts1 | | 76 | | — | | — | | 76 | |
1 Represents variation margin on the last day of the reporting period.
D. Permanent differences between book-basis and tax-basis components of net assets are reclassified among capital accounts in the financial statements to reflect their tax character. These reclassifications have no effect on net assets or net asset value per share. As of period end, permanent differences primarily attributable to the accounting for in-kind redemptions and passive foreign investment companies were reclassified between the following accounts:
| | | Amount | |
| | | ($000 | ) |
| Paid-in Capital | | 319,284 | |
| Total Distributable Earnings (Loss) | | (319,284 | ) |
Russell 2000 Index Fund
Temporary differences between book-basis and tax-basis components of total distributable earnings (loss) arise when certain items of income, gain, or loss are recognized in different periods for financial statement and tax purposes; these differences will reverse at some time in the future. The differences are primarily related to the deferral of losses from wash sales; the recognition of unrealized gains or losses from certain derivative contracts; and the recognition of unrealized gains from passive foreign investment companies. As of period end, the tax-basis components of total distributable earnings (loss) are detailed in the table as follows:
| | | Amount | |
| | | ($000 | ) |
| Undistributed Ordinary Income | | 7,272 | |
| Undistributed Long-Term Gains | | — | |
| Capital Loss Carryforwards | | (316,133 | ) |
| Qualified Late-Year Losses | | — | |
| Net Unrealized Gains (Losses) | | 5,082 | |
The tax character of distributions paid was as follows:
| | | Year Ended August 31, | |
| | | 2020 | | 2019 | |
| | | Amount | | Amount | |
| | | ($000 | ) | ($000 | ) |
| Ordinary Income* | | 30,737 | | 30,470 | |
| Long-Term Capital Gains | | — | | — | |
| Total | | 30,737 | | 30,470 | |
* Includes short-term capital gains, if any.
As of August 31, 2020, gross unrealized appreciation and depreciation for investments and derivatives based on cost for U.S. federal income tax purposes were as follows:
| | | Amount | |
| | | ($000 | ) |
| Tax Cost | | 2,461,016 | |
| Gross Unrealized Appreciation | | 417,853 | |
| Gross Unrealized Depreciation | | (412,771 | ) |
| Net Unrealized Appreciation (Depreciation) | | 5,082 | |
Russell 2000 Index Fund
E. During the year ended August 31, 2020, the fund purchased $1,596,271,000 of investment securities and sold $1,637,047,000 of investment securities, other than temporary cash investments. Purchases and sales include $1,181,183,000 and $988,757,000, respectively, in connection with in-kind purchases and redemptions of the fund’s capital shares.
F. Capital share transactions for each class of shares were:
| | | Year Ended August 31, | |
| | | 2020 | | 2019 | |
| | | Amount | | Shares | | Amount | | Shares | |
| | | ($000 | ) | (000 | ) | ($000 | ) | (000 | ) |
| ETF Shares | | | | | | | | | |
| Issued | | 1,228,574 | | 11,050 | | 384,122 | | 3,200 | |
| Issued in Lieu of Cash Distributions | | — | | — | | — | | — | |
| Redeemed | | (995,968 | ) | (8,900 | ) | (411,380 | ) | (3,300 | ) |
| Net Increase (Decrease)—ETF Shares | | 232,606 | | 2,150 | | (27,258 | ) | (100 | ) |
| Institutional Shares | | | | | | | | | |
| Issued | | 133,855 | | 621 | | 127,299 | | 549 | |
| Issued in Lieu of Cash Distributions | | 9,407 | | 41 | | 11,202 | | 47 | |
| Redeemed | | (421,876 | ) | (1,785 | ) | (126,226 | ) | (535 | ) |
| Net Increase (Decrease)—Institutional Shares | | (278,614 | ) | (1,123 | ) | 12,275 | | 61 | |
G. Management has determined that no events or transactions occurred subsequent to August 31, 2020, that would require recognition or disclosure in these financial statements.
Russell 2000 Value Index Fund
Performance Summary
All of the returns in this report represent past performance, which is not a guarantee of future results that may be achieved by the fund. (Current performance may be lower or higher than the performance data cited. For performance data current to the most recent month-end, visit our website at vanguard.com/performance.) Note, too, that both investment returns and principal value can fluctuate widely, so an investor’s shares, when sold, could be worth more or less than their original cost. The returns shown do not reflect taxes that a shareholder would pay on fund distributions or on the sale of fund shares.
Cumulative Performance: September 20, 2010, Through August 31, 2020
Initial Investment of $10,000
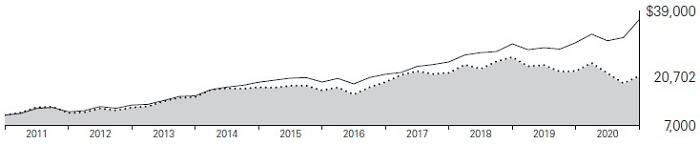
| | | Average Annual Total Returns | |
| | | Periods Ended August 31, 2020 | |
| | | | | Since | Final Value |
| | | One | Five | Inception | of a $10,000 |
| | | Year | Years | (9/20/2010) | Investment |
| Russell 2000 Value Index Fund ETF Shares Net Asset Value | -6.05% | 4.32% | 7.59% | $20,702 |
| | Russell 2000 Value Index Fund ETF Shares Market Price | -5.91 | 4.35 | 7.60 | 20,725 |
| Russell 2000 Value Index | -6.14 | 4.37 | 7.70 | 20,921 |
| Dow Jones U.S. Total Stock Market Float Adjusted Index | 21.20 | 13.77 | 13.96 | 36,668 |
“Since Inception” performance is calculated from the ETF Shares’ inception date for both the fund and its comparative standards.
| | | | | Since | Final Value |
| | | One | Five | Inception | of a $5,000,000 |
| | | Year | Years | (7/13/2012) | Investment |
| Russell 2000 Value Index Fund Institutional Shares | -5.97% | 4.43% | 7.17% | $8,781,864 |
| Russell 2000 Value Index | -6.14 | 4.37 | 7.15 | 8,768,849 |
| Dow Jones U.S. Total Stock Market Float Adjusted Index | 21.20 | 13.77 | 14.33 | 14,861,456 |
“Since Inception” performance is calculated from the Institutional Shares’ inception date for both the fund and its comparative standards.
See Financial Highlights for dividend and capital gains information.
Russell 2000 Value Index Fund
Cumulative Returns of ETF Shares: September 20, 2010, Through August 31, 2020
| | | | Since |
| | One | Five | Inception |
| | Year | Years | (9/20/2010) |
| Russell 2000 Value Index Fund ETF Shares Market Price | -5.91% | 23.74% | 107.25% |
| Russell 2000 Value Index Fund ETF Shares Net Asset Value | -6.05 | 23.55 | 107.02 |
| Russell 2000 Value Index | -6.14 | 23.82 | 109.21 |
“Since Inception” performance is calculated from the ETF Shares’ inception date for both the fund and its comparative standards.
For the ETF Shares, the market price is determined by the midpoint of the bid-offer spread as of the closing time of the New York Stock Exchange (generally 4 p.m., Eastern time). The net asset value is also determined as of the NYSE closing time. For more information about how the ETF Shares’ market prices have compared with their net asset value, visit vanguard.com, select your ETF, and then select the Price and Performance tab. The ETF premium/discount analysis there shows the percentages of days on which the ETF Shares’ market price was above or below the NAV.
Russell 2000 Value Index Fund
Fund Allocation
As of August 31, 2020
| Consumer Discretionary | 15.2% |
| Consumer Staples | 3.3 |
| Energy | 4.3 |
| Financial Services | 37.2 |
| Health Care | 6.1 |
| Materials & Processing | 8.0 |
| Other | 0.0 |
| Producer Durables | 14.7 |
| Technology | 5.9 |
| Utilities | 5.3 |
The table reflects the fund’s investments, except for short-term investments and derivatives. Sector categories are based on the Russell Global Sectors (“RGS”), except for the “Other” category (if applicable), which includes securities that have not been provided a RGS classification as of the effective reporting period.
The fund may invest in derivatives (such as futures and swap contracts) for various reasons, including, but not limited to, at-tempting to remain fully invested and tracking its target index as closely as possible.
Russell 2000 Value Index Fund
Financial Statements
Schedule of Investments—Investments Summary
As of August 31, 2020
This Statement summarizes the fund’s holdings by asset type. Details are reported for each of the fund’s 50 largest individual holdings and for investments that, in total for any issuer, represent more than 1% of the fund’s net assets. The total value of smaller holdings is reported as a single amount within each category.
The fund files its complete schedule of portfolio holdings with the Securities and Exchange Commission (SEC) four times in each fiscal year. For the second and fourth quarters the complete list of the fund’s holdings is available on vanguard.com and on Form N-CSR, or you can have it mailed to you without charge by calling 800-662-7447. For the first and third quarters of each fiscal year, the complete list of the fund’s holdings is available as an exhibit to its reports on Form N-PORT. The fund’s Form N-CSR and Form N-PORT reports are available on the SEC’s website at www.sec.gov.
| | | | Market | Percentage |
| | | | Value• | of Net |
| | | Shares | ($000) | Assets |
| Common Stocks | | | |
| Consumer Discretionary | | | |
| * | Penn National Gaming Inc. | 28,122 | 1,437 | 0.4% |
| * | Meritage Homes Corp. | 14,750 | 1,416 | 0.4% |
| | Marriott Vacations Worldwide Corp. | 14,855 | 1,406 | 0.4% |
| | Aaron’s Inc. | 24,727 | 1,382 | 0.3% |
| | Lithia Motors Inc. Class A | 4,757 | 1,184 | 0.3% |
| | TEGNA Inc. | 92,238 | 1,155 | 0.3% |
| | KB Home | 31,797 | 1,137 | 0.3% |
| * | Taylor Morrison Home Corp. Class A | 47,944 | 1,128 | 0.3% |
| | Consumer Discretionary—Other † | | 49,026 | 12.5% |
| | | | 59,271 | 15.2% |
| Consumer Staples | | | |
| * | Darling Ingredients Inc. | 67,866 | 2,170 | 0.6% |
| * | Performance Food Group Co. | 55,239 | 2,017 | 0.5% |
| | Consumer Staples—Other † | | 8,588 | 2.2% |
| | | | 12,775 | 3.3% |
| Energy | | | |
| | Ovintiv Inc. | 109,986 | 1,219 | 0.3% |
| | Energy—Other † | | 15,453 | 3.9% |
| | | | 16,672 | 4.2% |
| Financial Services | | | |
| | STAG Industrial Inc. | 58,132 | 1,878 | 0.5% |
| | Healthcare Realty Trust Inc. | 56,988 | 1,644 | 0.4% |
| | South State Corp. | 29,473 | 1,641 | 0.4% |
| | Essent Group Ltd. | 45,766 | 1,634 | 0.4% |
| | Physicians Realty Trust | 85,632 | 1,554 | 0.4% |
| | Agree Realty Corp. | 22,435 | 1,501 | 0.4% |
| | Selective Insurance Group Inc. | 24,915 | 1,490 | 0.4% |
| | Stifel Financial Corp. | 28,041 | 1,422 | 0.4% |
| | Blackstone Mortgage Trust Inc. Class A | 58,034 | 1,379 | 0.4% |
| | United Bankshares Inc. | 52,170 | 1,364 | 0.4% |
Russell 2000 Value Index Fund
| | | | Market | Percentage |
| | | | Value• | of Net |
| | | Shares | ($000) | Assets |
| * | Cannae Holdings Inc. | 35,683 | 1,346 | 0.4% |
| | Community Bank System Inc. | 21,623 | 1,301 | 0.3% |
| | Sabra Health Care REIT Inc. | 86,485 | 1,283 | 0.3% |
| | PotlatchDeltic Corp. | 27,581 | 1,270 | 0.3% |
| | Glacier Bancorp Inc. | 36,107 | 1,267 | 0.3% |
| | Valley National Bancorp | 167,801 | 1,260 | 0.3% |
| | Radian Group Inc. | 80,603 | 1,245 | 0.3% |
| | Lexington Realty Trust | 107,794 | 1,226 | 0.3% |
| | Hannon Armstrong Sustainable Infrastructure Capital Inc. | 28,175 | 1,196 | 0.3% |
| | Financial Services—Other † | | 117,986 | 30.2% |
| | | | 144,887 | 37.1% |
| Health Care | | | |
| * | Novavax Inc. | 17,916 | 1,977 | 0.5% |
| * | Arena Pharmaceuticals Inc. | 21,746 | 1,518 | 0.4% |
| * | Tenet Healthcare Corp. | 39,639 | 1,117 | 0.3% |
| | Health Care—Other † | | 19,203 | 4.9% |
| | | | 23,815 | 6.1% |
| Materials & Processing | | | |
| | Hecla Mining Co. | 219,995 | 1,324 | 0.3% |
| | Rexnord Corp. | 41,387 | 1,199 | 0.3% |
| * | Alcoa Corp. | 79,003 | 1,155 | 0.3% |
| * | BMC Stock Holdings Inc. | 28,354 | 1,132 | 0.3% |
| § | Materials & Processing—Other † | | 26,324 | 6.8% |
| | | | 31,134 | 8.0% |
| | | | |
| §,1Other † | | 121 | 0.0% |
| | | | | |
| Producer Durables | | | |
| | EMCOR Group Inc. | 20,946 | 1,571 | 0.4% |
| | KBR Inc. | 52,444 | 1,311 | 0.3% |
| | EnerSys | 16,304 | 1,174 | 0.3% |
| | UniFirst Corp. | 5,993 | 1,154 | 0.3% |
| 2 | Producer Durables—Other † | | 52,279 | 13.4% |
| | | | 57,489 | 14.7% |
| | | | | |
| | | | |
| Technology † | | 23,077 | 5.9% |
| | | | | |
| Utilities | | | |
| | Black Hills Corp. | 26,519 | 1,487 | 0.4% |
| | PNM Resources Inc. | 33,487 | 1,463 | 0.4% |
| | ONE Gas Inc. | 19,580 | 1,451 | 0.4% |
| | Portland General Electric Co. | 37,942 | 1,448 | 0.4% |
| | Southwest Gas Holdings Inc. | 21,400 | 1,345 | 0.3% |
| | Brookfield Renewable Corp. Class A | 26,417 | 1,345 | 0.3% |
| | Spire Inc. | 21,146 | 1,231 | 0.3% |
| | New Jersey Resources Corp. | 40,139 | 1,210 | 0.3% |
| | ALLETE Inc. | 21,941 | 1,184 | 0.3% |
| | Utilities—Other † | | 8,433 | 2.2% |
| | | | 20,597 | 5.3% |
| Total Common Stocks (Cost $376,331) | | 389,838 | 99.8% |
Russell 2000 Value Index Fund
| |
| | | | Market | Percentage |
| | | | Value• | of Net |
| | Coupon | Shares | ($000) | Assets |
| Temporary Cash Investments | | | | |
| Money Market Fund | | | | |
| 3,4 | Vanguard Market Liquidity Fund | 0.147% | 30,380 | 3,038 | 0.8% |
| | | | | |
| 5U.S. Government and Agency Obligations † | | | 85 | 0.0% |
| Total Temporary Cash Investments (Cost $3,122) | | | 3,123 | 0.8% |
| 6Total Investments (Cost $379,453) | | | 392,961 | 100.6% |
| Other Assets and Liabilities—Net | | | (2,513) | (0.6) |
| Net Assets | | | 390,448 | 100.0% |
Cost is in $000.
| | • | See Note A in Notes to Financial Statements. |
| | * | Non-income-producing security. |
| | † | Represents the aggregate value, by category, of securities that are not among the 50 largest holdings and, in total for any issuer, represent 1% or less of net assets. |
| | § | Certain securities are valued using significant unobservable inputs. |
| | 1 | “Other” represents securities that are not classified by the fund’s benchmark index. |
| | 2 | Certain securities are exempt from registration under Rule 144A of the Securities Act of 1933. Such securities may be sold in transactions exempt from registration, normally to qualified institutional buyers. At August 31, 2020, the aggregate value of these securities was $835,000, representing 0.2% of net assets. |
| | 3 | Affiliated money market fund available only to Vanguard funds and certain trusts and accounts managed by Vanguard. Rate shown is the 7-day yield. |
| | 4 | Collateral of $3,036,000 was received for securities on loan. |
| | 5 | Securities with a value of $43,000 have been segregated as initial margin for open futures contracts. |
| | 6 | The total value of securities on loan is $2,763,000. |
| | | REIT—Real Estate Investment Trust. |
| Derivative Financial Instruments Outstanding as of Period End | | |
| | | |
| Futures Contracts | | | | |
| | | | | | ($000) |
| | | | | Value and |
| | | Number of | | Unrealized |
| | | Long (Short) | Notional | Appreciation |
| | Expiration | Contracts | Amount | (Depreciation) |
| Long Futures Contracts | | | | |
| E-mini Russell 2000 Index | September 2020 | 7 | 546 | 20 |
See accompanying Notes, which are an integral part of the Financial Statements.
Russell 2000 Value Index Fund
Statement of Assets and Liabilities
As of August 31, 2020
| ($000s, except shares and per-share amounts) | Amount |
| Assets | |
| Investments in Securities, at Value | |
| Unaffiliated Issuers (Cost $376,417) | 389,923 |
| Affiliated Issuers (Cost $3,036) | 3,038 |
| Total Investments in Securities | 392,961 |
| Investment in Vanguard | 16 |
| Receivables for Investment Securities Sold | 577 |
| Receivables for Accrued Income | 451 |
| Total Assets | 394,005 |
| Liabilities | |
| Due to Custodian | 466 |
| Collateral for Securities on Loan | 3,036 |
| Payables for Capital Shares Redeemed | 24 |
| Payables to Vanguard | 26 |
| Variation Margin Payable—Futures Contracts | 5 |
| Total Liabilities | 3,557 |
| Net Assets | 390,448 |
| | |
| | |
| At August 31, 2020, net assets consisted of: | |
| | |
| Paid-in Capital | 465,248 |
| Total Distributable Earnings (Loss) | (74,800) |
| Net Assets | 390,448 |
| | |
| ETF Shares—Net Assets | |
| Applicable to 3,300,000 outstanding $.001 par value shares of beneficial interest (unlimited authorization) | 302,822 |
| Net Asset Value Per Share—ETF Shares | $91.76 |
| | |
| Institutional Shares—Net Assets | |
| Applicable to 484,185 outstanding $.001 par value shares of beneficial interest (unlimited authorization) | 87,626 |
| Net Asset Value Per Share—Institutional Shares | $180.98 |
See accompanying Notes, which are an integral part of the Financial Statements.
Russell 2000 Value Index Fund
Statement of Operations
| | Year Ended |
| | August 31, 2020 |
| | ($000) |
| Investment Income | |
| Income | |
| Dividends | 8,039 |
| Interest1 | 20 |
| Securities Lending—Net | 559 |
| Total Income | 8,618 |
| Expenses | |
| The Vanguard Group—Note B | |
| Investment Advisory Services | 60 |
| Management and Administrative—ETF Shares | 275 |
| Management and Administrative—Institutional Shares | 53 |
| Marketing and Distribution—ETF Shares | 16 |
| Marketing and Distribution—Institutional Shares | 5 |
| Custodian Fees | 58 |
| Auditing Fees | 31 |
| Shareholders’ Reports—ETF Shares | 14 |
| Shareholders’ Reports—Institutional Shares | — |
| Total Expenses | 512 |
| Net Investment Income | 8,106 |
| Realized Net Gain (Loss) | |
| Investment Securities Sold1,2 | (52,322) |
| Futures Contracts | (359) |
| Realized Net Gain (Loss) | (52,681) |
| Change in Unrealized Appreciation (Depreciation) | |
| Investment Securities1 | 29,372 |
| Futures Contracts | 55 |
| Change in Unrealized Appreciation (Depreciation) | 29,427 |
| Net Increase (Decrease) in Net Assets Resulting from Operations | (15,148) |
| | 1 | Interest income, realized net gain (loss), and change in unrealized appreciation (depreciation) from an affiliated company of the fund were $19,000, ($1,000), and $1,000, respectively. Purchases and sales are for temporary cash investment purposes. |
| | 2 | Includes $9,430,000 of net gain (loss) resulting from in-kind redemptions. |
See accompanying Notes, which are an integral part of the Financial Statements.
Russell 2000 Value Index Fund
Statement of Changes in Net Assets
| | Year Ended August 31, |
| | 2020 | 2019 |
| | ($000) | ($000) |
| Increase (Decrease) in Net Assets | | |
| Operations | | |
| Net Investment Income | 8,106 | 6,850 |
| Realized Net Gain (Loss) | (52,681) | 15,080 |
| Change in Unrealized Appreciation (Depreciation) | 29,427 | (75,606) |
| Net Increase (Decrease) in Net Assets Resulting from Operations | (15,148) | (53,676) |
| Distributions1 | | |
| ETF Shares | (5,262) | (3,946) |
| Institutional Shares | (2,732) | (2,495) |
| Total Distributions | (7,994) | (6,441) |
| Capital Share Transactions | | |
| ETF Shares | 63,025 | 62,708 |
| Institutional Shares | (40,708) | 14,009 |
| Net Increase (Decrease) from Capital Share Transactions | 22,317 | 76,717 |
| Total Increase (Decrease) | (825) | 16,600 |
| Net Assets | | |
| Beginning of Period | 391,273 | 374,673 |
| End of Period | 390,448 | 391,273 |
1 Certain prior period numbers have been reclassified to conform with current period presentation.
See accompanying Notes, which are an integral part of the Financial Statements.
Russell 2000 Value Index Fund
Financial Highlights
ETF Shares
| For a Share Outstanding | | | Year Ended August 31, |
| Throughout Each Period | 2020 | 2019 | 2018 | 2017 | 2016 |
| Net Asset Value, Beginning of Period | $99.51 | $119.05 | $100.96 | $90.64 | $81.88 |
| Investment Operations | | | | | |
| Net Investment Income | 1.8681 | 1.9121 | 1.9051 | 1.7361 | 1.561 |
| Net Realized and Unrealized Gain (Loss) on Investments | (7.771) | (19.589) | 18.070 | 10.358 | 9.305 |
| Total from Investment Operations | (5.903) | (17.677) | 19.975 | 12.094 | 10.866 |
| Distributions | | | | | |
| Dividends from Net Investment Income | (1.847) | (1.863) | (1.885) | (1.774) | (2.106) |
| Distributions from Realized Capital Gains | — | — | — | — | — |
| Total Distributions | (1.847) | (1.863) | (1.885) | (1.774) | (2.106) |
| Net Asset Value, End of Period | $91.76 | $99.51 | $119.05 | $100.96 | $90.64 |
| | | | | | |
| Total Return | -6.05% | -14.93% | 19.96% | 13.42% | 13.62% |
| | | | | | |
| Ratios/Supplemental Data | | | | | |
| Net Assets, End of Period (Millions) | $303 | $251 | $223 | $172 | $120 |
| Ratio of Total Expenses to Average Net Assets | 0.15% | 0.15% | 0.20% | 0.20% | 0.20% |
| Ratio of Net Investment Income to Average Net Assets | 1.99% | 1.83% | 1.73% | 1.76% | 2.02% |
| Portfolio Turnover Rate2 | 38% | 27% | 30% | 36% | 31% |
| 1 | Calculated based on average shares outstanding. |
| 2 | Excludes the value of portfolio securities received or delivered as a result of in-kind purchases or redemptions of the fund’s capital shares, including ETF Creation Units. |
See accompanying Notes, which are an integral part of the Financial Statements.
Russell 2000 Value Index Fund
Financial Highlights
Institutional Shares
| For a Share Outstanding | | | Year Ended August 31, |
| Throughout Each Period | 2020 | 2019 | 2018 | 2017 | 2016 |
| Net Asset Value, Beginning of Period | $196.24 | $234.81 | $199.13 | $178.76 | $161.59 |
| Investment Operations | | | | | |
| Net Investment Income | 3.7831 | 3.9661 | 4.0291 | 3.7371 | 3.265 |
| Net Realized and Unrealized Gain (Loss) on Investments | (15.303) | (38.670) | 35.618 | 20.356 | 18.355 |
| Total from Investment Operations | (11.520) | (34.704) | 39.647 | 24.093 | 21.620 |
| Distributions | | | | | |
| Dividends from Net Investment Income | (3.740) | (3.866) | (3.967) | (3.723) | (4.450) |
| Distributions from Realized Capital Gains | — | — | — | — | — |
| Total Distributions | (3.740) | (3.866) | (3.967) | (3.723) | (4.450) |
| Net Asset Value, End of Period | $180.98 | $196.24 | $234.81 | $199.13 | $178.76 |
| | | | | | |
| Total Return | -5.97% | -14.88% | 20.10% | 13.55% | 13.76% |
| | | | | | |
| Ratios/Supplemental Data | | | | | |
| Net Assets, End of Period (Millions) | $88 | $140 | $151 | $146 | $129 |
| Ratio of Total Expenses to Average Net Assets | 0.08% | 0.08% | 0.08% | 0.08% | 0.08% |
| Ratio of Net Investment Income to Average Net Assets | 2.04% | 1.90% | 1.85% | 1.88% | 2.14% |
| Portfolio Turnover Rate2 | 38% | 27% | 30% | 36% | 31% |
| 1 | Calculated based on average shares outstanding. |
| 2 | Excludes the value of portfolio securities received or delivered as a result of in-kind purchases or redemptions of the fund’s capital shares, including ETF Creation Units. |
See accompanying Notes, which are an integral part of the Financial Statements.
Russell 2000 Value Index Fund
Notes to Financial Statements
Vanguard Russell 2000 Value Index Fund is registered under the Investment Company Act of 1940 as an open-end investment company, or mutual fund. The fund offers two classes of shares: ETF Shares and Institutional Shares. Each of the share classes has different eligibility and minimum purchase requirements, and is designed for different types of investors. ETF Shares are listed for trading on Nasdaq; they can be purchased and sold through a broker.
Market disruptions associated with the COVID-19 pandemic have had a global impact, and uncertainty exists as to the long-term implications. Such disruptions can adversely affect assets of the fund and thus fund performance.
A. The following significant accounting policies conform to generally accepted accounting principles for U.S. investment companies. The fund consistently follows such policies in preparing its financial statements.
1. Security Valuation: Securities are valued as of the close of trading on the New York Stock Exchange (generally 4 p.m., Eastern time) on the valuation date. Equity securities are valued at the latest quoted sales prices or official closing prices taken from the primary market in which each security trades; such securities not traded on the valuation date are valued at the mean of the latest quoted bid and asked prices. Securities for which market quotations are not readily available, or whose values have been materially affected by events occurring before the fund’s pricing time but after the close of the securities’ primary markets, are valued by methods deemed by the board of trustees to represent fair value. Investments in Vanguard Market Liquidity Fund are valued at that fund’s net asset value. Temporary cash investments are valued using the latest bid prices or using valuations based on a matrix system (which considers such factors as security prices, yields, maturities, and ratings), both as furnished by independent pricing services.
2. Futures Contracts: The fund uses index futures contracts to a limited extent, with the objectives of maintaining full exposure to the stock market, maintaining liquidity, and minimizing transaction costs. The fund may purchase futures contracts to immediately invest incoming cash in the market, or sell futures in response to cash outflows, thereby simulating a fully invested position in the underlying index while maintaining a cash balance for liquidity. The primary risks associated with the use of futures contracts are imperfect correlation between changes in market values of stocks held by the fund and the prices of futures contracts, and the possibility of an illiquid market. Counterparty risk involving futures is mitigated because a regulated clearinghouse is the counterparty instead of the clearing broker. To further mitigate counterparty risk, the fund trades futures contracts on an exchange, monitors the financial strength of its clearing brokers and clearinghouse, and has entered into clearing agreements with its clearing brokers. The clearinghouse imposes initial margin requirements to secure the fund’s performance and requires daily settlement of variation margin representing changes in the market value of each contract. Any securities pledged as initial margin for open contracts are noted in the Schedule of Investments.
Futures contracts are valued at their quoted daily settlement prices. The notional amounts of the contracts are not recorded in the Statement of Assets and Liabilities. Fluctuations in the value of the contracts are recorded in the Statement of Assets and Liabilities as an asset (liability) and in the Statement of Operations as unrealized appreciation (depreciation) until the contracts are closed, when they are recorded as realized gains (losses) on futures contracts.
Russell 2000 Value Index Fund
During the year ended August 31, 2020, the fund’s average investments in long and short futures contracts represented less than 1% and 0% of net assets, respectively, based on the average of the notional amounts at each quarter-end during the period.
3. Federal Income Taxes: The fund intends to continue to qualify as a regulated investment company and distribute all of its taxable income. The fund’s tax returns are open to examination by the relevant tax authorities until expiration of the applicable statute of limitations, which is generally three years after the filing of the tax return. Management has analyzed the fund’s tax positions taken for all open federal and state income tax years, and has concluded that no provision for income tax is required in the fund’s financial statements.
4. Distributions: Distributions to shareholders are recorded on the ex-dividend date. Distributions are determined on a tax basis at the fiscal year-end and may differ from net investment income and realized capital gains for financial reporting purposes.
5. Securities Lending: To earn additional income, the fund lends its securities to qualified institutional borrowers. Security loans are subject to termination by the fund at any time, and are required to be secured at all times by collateral in an amount at least equal to the market value of securities loaned. Daily market fluctuations could cause the value of loaned securities to be more or less than the value of the collateral received. When this occurs, the collateral is adjusted and settled before the opening of the market on the next business day. The fund further mitigates its counterparty risk by entering into securities lending transactions only with a diverse group of prequalified counterparties, monitoring their financial strength, and entering into master securities lending agreements with its counterparties. The master securities lending agreements provide that, in the event of a counterparty’s default (including bankruptcy), the fund may terminate any loans with that borrower, determine the net amount owed, and sell or retain the collateral up to the net amount owed to the fund; however, such actions may be subject to legal proceedings. While collateral mitigates counterparty risk, in the event of a default, the fund may experience delays and costs in recovering the securities loaned. The fund invests cash collateral received in Vanguard Market Liquidity Fund, and records a liability in the Statement of Assets and Liabilities for the return of the collateral, during the period the securities are on loan. Collateral investments in Vanguard Market Liquidity Fund are subject to market appreciation or depreciation. Securities lending income represents fees charged to borrowers plus income earned on invested cash collateral, less expenses associated with the loan. During the term of the loan, the fund is entitled to all distributions made on or in respect of the loaned securities.
6. Credit Facilities and Interfund Lending Program: The fund and certain other funds managed by The Vanguard Group (“Vanguard”) participate in a $4.3 billion committed credit facility provided by a syndicate of lenders pursuant to a credit agreement and an uncommitted credit facility provided by Vanguard. Both facilities may be renewed annually. Each fund is individually liable for its borrowings, if any, under the credit facilities. Borrowings may be utilized for temporary or emergency purposes, subject to the fund’s regulatory and contractual borrowing restrictions. With respect to the committed credit facility, the participating funds are charged administrative fees and an annual commitment fee of 0.10% of the undrawn committed amount of the facility; these fees are allocated to the funds based on a method approved by the fund’s board of trustees
Russell 2000 Value Index Fund
and included in Management and Administrative expenses on the fund’s Statement of Operations. Any borrowings under either facility bear interest at a rate based upon the higher of the one-month London Interbank Offered Rate (or an acceptable alternate rate, if necessary), federal funds effective rate, or overnight bank funding rate plus an agreed-upon spread, except that borrowings under the uncommitted credit facility may bear interest based upon an alternative rate agreed to by the fund and Vanguard.
In accordance with an exemptive order (the “Order”) from the SEC, the fund may participate in a joint lending and borrowing program that allows registered open-end Vanguard funds to borrow money from and lend money to each other for temporary or emergency purposes (the “Interfund Lending Program”), subject to compliance with the terms and conditions of the Order, and to the extent permitted by the fund’s investment objective and investment policies. Interfund loans and borrowings normally extend overnight, but can have a maximum duration of seven days. Loans may be called on one business day’s notice. The interest rate to be charged is governed by the conditions of the Order and internal procedures adopted by the board of trustees. The board of trustees is responsible for overseeing the Interfund Lending Program.
For the year ended August 31, 2020, the fund did not utilize the credit facilities or the Interfund Lending Program.
7. Other: Dividend income is recorded on the ex-dividend date. Interest income includes income distributions received from Vanguard Market Liquidity Fund and is accrued daily. Premiums and discounts on debt securities are amortized and accreted, respectively, to interest income over the lives of the respective securities, except for premiums on certain callable debt securities that are amortized to the earliest call date. Security transactions are accounted for on the date securities are bought or sold. Costs used to determine realized gains (losses) on the sale of investment securities are those of the specific securities sold.
Each class of shares has equal rights as to assets and earnings, except that each class separately bears certain class-specific expenses related to maintenance of shareholder accounts (included in Management and Administrative expenses) and shareholder reporting. Marketing and distribution expenses are allocated to each class of shares based on a method approved by the board of trustees. Income, other non-class-specific expenses, and gains and losses on investments are allocated to each class of shares based on its relative net assets.
B. In accordance with the terms of a Funds’ Service Agreement (the “FSA”) between Vanguard and the fund, Vanguard furnishes to the fund investment advisory, corporate management, administrative, marketing, and distribution services at Vanguard’s cost of operations (as defined by the FSA). These costs of operations are allocated to the fund based on methods and guidelines approved by the board of trustees and are generally settled twice a month.
Upon the request of Vanguard, the fund may invest up to 0.40% of its net assets as capital in Vanguard. At August 31, 2020, the fund had contributed to Vanguard capital in the amount of $16,000, representing less than 0.01% of the fund’s net assets and 0.01% of Vanguard’s capital received pursuant to the FSA. The fund’s trustees and officers are also directors and employees, respectively, of Vanguard.
Russell 2000 Value Index Fund
C. Various inputs may be used to determine the value of the fund’s investments and derivatives. These inputs are summarized in three broad levels for financial statement purposes. The inputs or methodologies used to value securities are not necessarily an indication of the risk associated with investing in those securities.
Level 1—Quoted prices in active markets for identical securities.
Level 2—Other significant observable inputs (including quoted prices for similar securities, interest rates, prepayment speeds, credit risk, etc.).
Level 3—Significant unobservable inputs (including the fund’s own assumptions used to determine the fair value of investments). Any investments and derivatives valued with significant unobservable inputs are noted on the Schedule of Investments.
The following table summarizes the market value of the fund’s investments and derivatives as of August 31, 2020, based on the inputs used to value them:
| | Level 1 | Level 2 | Level 3 | Total |
| | ($000) | ($000) | ($000) | ($000) |
| Investments | | | | |
| Assets | | | | |
| Common Stocks | 389,836 | — | 2 | 389,838 |
| Temporary Cash Investments | 3,038 | 85 | — | 3,123 |
| Total | 392,874 | 85 | 2 | 392,961 |
| Derivative Financial Instruments | | | | |
| Liabilities | | | | |
| Futures Contracts1 | 5 | — | — | 5 |
1 Represents variation margin on the last day of the reporting period.
D. Permanent differences between book-basis and tax-basis components of net assets are reclassified among capital accounts in the financial statements to reflect their tax character. These reclassifications have no effect on net assets or net asset value per share. As of period end, permanent differences primarily attributable to the accounting for in-kind redemptions and passive foreign investment companies were reclassified between the following accounts:
| | Amount |
| | ($000) |
| Paid-in Capital | 9,437 |
| Total Distributable Earnings (Loss) | (9,437) |
Russell 2000 Value Index Fund
Temporary differences between book-basis and tax-basis components of total distributable earnings (loss) arise when certain items of income, gain, or loss are recognized in different periods for financial statement and tax purposes; these differences will reverse at some time in the future. The differences are primarily related to the deferral of losses from wash sales; the recognition of unrealized gains or losses from certain derivative contracts; and the recognition of unrealized gains from passive foreign investment companies. As of period end, the tax-basis components of total distributable earnings (loss) are detailed in the table as follows:
| | Amount |
| | ($000) |
| Undistributed Ordinary Income | 2,013 |
| Undistributed Long-Term Gains | — |
| Capital Loss Carryforwards | (90,291) |
| Qualified Late-Year Losses | — |
| Net Unrealized Gains (Losses) | 13,478 |
The tax character of distributions paid was as follows:
| | Year Ended August 31, |
| | 2020 | 2019 |
| | Amount | Amount |
| | ($000) | ($000) |
| Ordinary Income* | 7,994 | 6,441 |
| Long-Term Capital Gains | — | — |
| Total | 7,994 | 6,441 |
* Includes short-term capital gains, if any.
As of August 31, 2020, gross unrealized appreciation and depreciation for investments and derivatives based on cost for U.S. federal income tax purposes were as follows:
| | Amount |
| | ($000) |
| Tax Cost | 379,482 |
| Gross Unrealized Appreciation | 61,395 |
| Gross Unrealized Depreciation | (47,917) |
| Net Unrealized Appreciation (Depreciation) | 13,478 |
Russell 2000 Value Index Fund
E. During the year ended August 31, 2020, the fund purchased $250,722,000 of investment securities and sold $226,468,000 of investment securities, other than temporary cash investments. Purchases and sales include $98,824,000 and $27,317,000, respectively, in connection with in-kind purchases and redemptions of the fund’s capital shares.
The fund purchased securities from and sold securities to other Vanguard funds or accounts managed by Vanguard or its affiliates, in accordance with procedures adopted by the board of trustees in compliance with Rule 17a-7 of the Investment Company Act of 1940. For the year ended August 31, 2020, such purchases and sales were $63,164,000 and $40,056,000, respectively; these amounts, other than temporary cash investments, are included in the purchases and sales of investment securities noted above.
F. Capital share transactions for each class of shares were:
| | | | Year Ended August 31, |
| | | 2020 | | | 2019 |
| | Amount | Shares | Amount | Shares |
| | ($000) | (000) | ($000) | (000) |
| ETF Shares | | | | |
| Issued | 101,511 | 1,250 | 131,976 | 1,300 |
| Issued in Lieu of Cash Distributions | — | — | — | — |
| Redeemed | (38,486) | (475) | (69,268) | (650) |
| Net Increase (Decrease)—ETF Shares | 63,025 | 775 | 62,708 | 650 |
| Institutional Shares | | | | |
| Issued | 41,919 | 240 | 36,227 | 176 |
| Issued in Lieu of Cash Distributions | 2,732 | 14 | 2,464 | 12 |
| Redeemed | (85,359) | (483) | (24,682) | (120) |
| Net Increase (Decrease)—Institutional Shares | (40,708) | (229) | 14,009 | 68 |
G. Management has determined that no events or transactions occurred subsequent to August 31, 2020, that would require recognition or disclosure in these financial statements.
Russell 2000 Growth Index Fund
Performance Summary
All of the returns in this report represent past performance, which is not a guarantee of future results that may be achieved by the fund. (Current performance may be lower or higher than the performance data cited. For performance data current to the most recent month-end, visit our website at vanguard.com/performance.) Note, too, that both investment returns and principal value can fluctuate widely, so an investor’s shares, when sold, could be worth more or less than their original cost. The returns shown do not reflect taxes that a shareholder would pay on fund distributions or on the sale of fund shares.
Cumulative Performance: September 20, 2010, Through August 31, 2020
Initial Investment of $10,000

| | | Average Annual Total Returns | |
| | | Periods Ended August 31, 2020 | |
| | | | | Since | Final Value |
| | | One | Five | Inception | of a $10,000 |
| | | Year | Years | (9/20/2010) | Investment |
| Russell 2000 Growth Index Fund ETF Shares Net Asset Value | 17.32% | 10.49% | 12.80% | $33,146 |
| | Russell 2000 Growth Index Fund ETF Shares Market Price | 17.52 | 10.51 | 12.81 | 33,173 |
| Russell 2000 Growth Index | 17.28 | 10.45 | 12.82 | 33,180 |
| Dow Jones U.S. Total Stock Market Float Adjusted Index | 21.20 | 13.77 | 13.96 | 36,668 |
“Since Inception” performance is calculated from the ETF Shares’ inception date for both the fund and its comparative standards.
| | | | Since | Final Value |
| | One | Five | Inception | of a $5,000,000 |
| | Year | Years | (5/25/2011) | Investment |
| Russell 2000 Growth Index Fund Institutional Shares | 17.42% | 10.60% | 10.99% | $13,139,400 |
| Russell 2000 Growth Index | 17.28 | 10.45 | 10.87 | 13,012,547 |
| Dow Jones U.S. Total Stock Market Float Adjusted Index | 21.20 | 13.77 | 12.95 | 15,455,343 |
“Since Inception” performance is calculated from the Institutional Shares’ inception date for both the fund and its comparative standards.
See Financial Highlights for dividend and capital gains information.
Russell 2000 Growth Index Fund
| Cumulative Returns of ETF Shares: September 20, 2010, Through August 31, 2020 | |
| | | | Since |
| | One | Five | Inception |
| | Year | Years | (9/20/2010) |
| Russell 2000 Growth Index Fund ETF Shares Market Price | 17.52% | 64.81% | 231.73% |
| Russell 2000 Growth Index Fund ETF Shares Net Asset Value | 17.32 | 64.64 | 231.46 |
| Russell 2000 Growth Index | 17.28 | 64.40 | 231.80 |
“Since Inception” performance is calculated from the ETF Shares’ inception date for both the fund and its comparative standards.
For the ETF Shares, the market price is determined by the midpoint of the bid-offer spread as of the closing time of the New York Stock Exchange (generally 4 p.m., Eastern time). The net asset value is also determined as of the NYSE closing time. For more information about how the ETF Shares’ market prices have compared with their net asset value, visit vanguard.com, select your ETF, and then select the Price and Performance tab. The ETF premium/discount analysis there shows the percentages of days on which the ETF Shares’ market price was above or below the NAV.
Russell 2000 Growth Index Fund
Fund Allocation
As of August 31, 2020
| Consumer Discretionary | 14.4% |
| Consumer Staples | 3.2 |
| Energy | 1.2 |
| Financial Services | 8.7 |
| Health Care | 32.2 |
| Materials & Processing | 5.9 |
| Other | 0.1 |
| Producer Durables | 10.9 |
| Technology | 20.3 |
| Utilities | 3.1 |
The table reflects the fund’s investments, except for short-term investments and derivatives. Sector categories are based on the Russell Global Sectors (“RGS”), except for the “Other” category (if applicable), which includes securities that have not been provided a RGS classification as of the effective reporting period.
The fund may invest in derivatives (such as futures and swap contracts) for various reasons, including, but not limited to, at-tempting to remain fully invested and tracking its target index as closely as possible.
Russell 2000 Growth Index Fund
Financial Statements
Schedule of Investments—Investments Summary
As of August 31, 2020
This Statement summarizes the fund’s holdings by asset type. Details are reported for each of the fund’s 50 largest individual holdings and for investments that, in total for any issuer, represent more than 1% of the fund’s net assets. The total value of smaller holdings is reported as a single amount within each category.
The fund files its complete schedule of portfolio holdings with the Securities and Exchange Commission (SEC) four times in each fiscal year. For the second and fourth quarters the complete list of the fund’s holdings is available on vanguard.com and on Form N-CSR, or you can have it mailed to you without charge by calling 800-662-7447. For the first and third quarters of each fiscal year, the complete list of the fund’s holdings is available as an exhibit to its reports on Form N-PORT. The fund’s Form N-CSR and Form N-PORT reports are available on the SEC’s website at www.sec.gov.
| | | | | Market | Percentage |
| | | | | Value· | of Net |
| | | Shares | | ($000) | Assets |
| Common Stocks | | | | |
| Consumer Discretionary | | | | |
| | Churchill Downs Inc. | 33,408 | | 5,838 | 0.7% |
| * | BJ’s Wholesale Club Holdings Inc. | 120,408 | | 5,347 | 0.6% |
| * | Deckers Outdoor Corp. | 24,618 | | 5,019 | 0.6% |
| * | Rh | 14,697 | | 4,858 | 0.6% |
| * | SiteOne Landscape Supply Inc. | 38,623 | | 4,830 | 0.5% |
| | Wingstop Inc. | 26,055 | | 4,257 | 0.5% |
| | Texas Roadhouse Inc. Class A | 57,700 | | 3,635 | 0.4% |
| * | Stamps.com Inc. | 14,527 | | 3,622 | 0.4% |
| * | Fox Factory Holding Corp. | 33,880 | | 3,415 | 0.4% |
| * | YETI Holdings Inc. | 65,167 | | 3,348 | 0.4% |
| | Consumer Discretionary—Other † | | | 81,133 | 9.3% |
| | | | | 125,302 | 14.4% |
| Consumer Staples | | | | |
| * | Helen of Troy Ltd. | 22,256 | | 4,603 | 0.5% |
| * | Freshpet Inc. | 34,050 | | 3,868 | 0.5% |
| | Consumer Staples—Other † | | | 19,029 | 2.2% |
| | | | | 27,500 | 3.2% |
| Energy | | | | |
| * | Sunrun Inc. | 102,177 | | 5,779 | 0.6% |
| | Energy—Other † | | | 4,998 | 0.6% |
| | | | | 10,777 | 1.2% |
| Financial Services | | | | |
| | EastGroup Properties Inc. | 32,300 | | 4,301 | 0.5% |
| * | Redfin Corp. | 84,364 | | 4,013 | 0.5% |
| | Kinsale Capital Group Inc. | 18,296 | | 3,791 | 0.4% |
| | First Financial Bankshares Inc. | 113,533 | | 3,437 | 0.4% |
| | QTS Realty Trust Inc. Class A | 49,854 | | 3,381 | 0.4% |
| | Financial Services—Other † | | | 56,656 | 6.5% |
| | | | | 75,579 | 8.7% |
Russell 2000 Growth Index Fund
| | | | | Market | Percentage |
| | | | | Value· | of Net |
| | | Shares | | ($000) | Assets |
| Health Care | | | | |
| * | LHC Group Inc. | 26,694 | | 5,564 | 0.7% |
| * | iRhythm Technologies Inc. | 23,792 | | 5,239 | 0.6% |
| * | Momenta Pharmaceuticals Inc. | 97,223 | | 5,072 | 0.6% |
| * | Mirati Therapeutics Inc. | 32,322 | | 4,828 | 0.6% |
| * | Emergent BioSolutions Inc. | 39,251 | | 4,477 | 0.5% |
| * | Ultragenyx Pharmaceutical Inc. | 49,853 | | 4,240 | 0.5% |
| * | MyoKardia Inc. | 38,277 | | 4,189 | 0.5% |
| * | Nevro Corp. | 29,509 | | 4,059 | 0.5% |
| * | HealthEquity Inc. | 65,457 | | 3,762 | 0.4% |
| * | Arrowhead Pharmaceuticals Inc. | 88,246 | | 3,728 | 0.4% |
| * | Blueprint Medicines Corp. | 47,695 | | 3,693 | 0.4% |
| * | Natera Inc. | 57,588 | | 3,669 | 0.4% |
| * | NeoGenomics Inc. | 91,220 | | 3,553 | 0.4% |
| * | Invitae Corp. | 101,559 | | 3,550 | 0.4% |
| * | Neogen Corp. | 46,353 | | 3,532 | 0.4% |
| * | Halozyme Therapeutics Inc. | 119,576 | | 3,467 | 0.4% |
| * | Wright Medical Group NV | 113,225 | | 3,423 | 0.4% |
| § | Health Care—Other † | | | 209,785 | 24.1% |
| | | | | 279,830 | 32.2% |
| Materials & Processing | | | | |
| * | TopBuild Corp. | 29,082 | | 4,473 | 0.5% |
| | Simpson Manufacturing Co. Inc. | 38,291 | | 3,766 | 0.4% |
| | Materials & Processing—Other † | | | 43,417 | 5.0% |
| | | | | 51,656 | 5.9% |
| | | | | | |
| §,1Other † | | | 534 | 0.1% |
| | | | | | |
| Producer Durables | | | | |
| | Tetra Tech Inc. | 47,370 | | 4,373 | 0.5% |
| | MAXIMUS Inc. | 53,813 | | 4,173 | 0.5% |
| * | Plug Power Inc. | 311,870 | | 4,048 | 0.5% |
| | Exponent Inc. | 45,164 | | 3,634 | 0.4% |
| * | Proto Labs Inc. | 23,549 | | 3,462 | 0.4% |
| | Producer Durables—Other † | | | 75,333 | 8.6% |
| | | | | 95,023 | 10.9% |
| Technology | | | | |
| * | Q2 Holdings Inc. | 43,595 | | 4,241 | 0.5% |
| * | Silicon Laboratories Inc. | 38,116 | | 3,903 | 0.5% |
| | Cabot Microelectronics Corp. | 25,524 | | 3,887 | 0.4% |
| * | Envestnet Inc. | 46,660 | | 3,872 | 0.4% |
| * | Blackline Inc. | 44,062 | | 3,850 | 0.4% |
| * | II-VI Inc. | 77,038 | | 3,428 | 0.4% |
| * | Varonis Systems Inc. | 27,416 | | 3,387 | 0.4% |
| * | Lattice Semiconductor Corp. | 118,213 | | 3,381 | 0.4% |
| | Technology—Other † | | | 146,182 | 16.8% |
| | | | | 176,131 | 20.2% |
| | | | | | |
| Utilities † | | | 27,363 | 3.1% |
| Total Common Stocks (Cost $672,008) | | | 869,695 | 99.9% |
Russell 2000 Growth Index Fund
| | | | Market | Percentage |
| | | | Value· | of Net |
| | Coupon | Shares | ($000) | Assets |
| Temporary Cash Investments | | | | |
| Money Market Fund | | | | |
| 2,3 Vanguard Market Liquidity Fund | 0.147% | 126,519 | 12,652 | 1.5% |
| | | | | |
| 4U.S. Government and Agency Obligations † | | | 93 | 0.0% |
| Total Temporary Cash Investments (Cost $12,742) | | | 12,745 | 1.5% |
| 5Total Investments (Cost $684,750) | | | 882,440 | 101.4% |
| Other Assets and Liabilities—Net | | | (11,934) | (1.4%) |
| Net Assets | | | 870,506 | 100.0% |
Cost is in $000.
| · | See Note A in Notes to Financial Statements. |
| * | Non-income-producing security. |
| § | Certain securities are valued using significant unobservable inputs. |
| † | Represents the aggregate value, by category, of securities that are not among the 50 largest holdings and, in total for any issuer, represent 1% or less of net assets. |
| 1 | “Other” represents securities that are not classified by the fund’s benchmark index. |
| 2 | Affiliated money market fund available only to Vanguard funds and certain trusts and accounts managed by Vanguard. Rate shown is the 7-day yield. |
| 3 | Collateral of $11,746,000 was received for securities on loan. |
| 4 | Securities with a value of $75,000 have been segregated as initial margin for open futures contracts. |
| 5 | The total value of securities on loan is $10,826,000. |
| Derivative Financial Instruments Outstanding as of Period End | | | |
| | | | | | |
| Futures Contracts | | | | | |
| | | | | | ($000) |
| | | | | | Value and |
| | | Number of | | | Unrealized |
| | | Long (Short) | | Notional | Appreciation |
| | Expiration | Contracts | | Amount | (Depreciation) |
| Long Futures Contracts | | | | | |
| E-mini Russell 2000 Index | September 2020 | 12 | | 937 | (2) |
See accompanying Notes, which are an integral part of the Financial Statements.
Russell 2000 Growth Index Fund
Statement of Assets and Liabilities
As of August 31, 2020
| ($000s, except shares and per-share amounts) | Amount |
| Assets | |
| Investments in Securities, at Value | |
| Unaffiliated Issuers (Cost $672,101) | 869,788 |
| Affiliated Issuers (Cost $12,649) | 12,652 |
| Total Investments in Securities | 882,440 |
| Investment in Vanguard | 35 |
| Receivables for Accrued Income | 305 |
| Receivables for Capital Shares Issued | 5 |
| Total Assets | 882,785 |
| Liabilities | |
| Due to Custodian | 340 |
| Collateral for Securities on Loan | 11,746 |
| Payables for Capital Shares Redeemed | 137 |
| Payables to Vanguard | 47 |
| Variation Margin Payable—Futures Contracts | 9 |
| Total Liabilities | 12,279 |
| Net Assets | 870,506 |
| | |
| | |
| At August 31, 2020, net assets consisted of: | |
| | |
| Paid-in Capital | 848,938 |
| Total Distributable Earnings (Loss) | 21,568 |
| Net Assets | 870,506 |
| | |
| ETF Shares—Net Assets | |
| Applicable to 2,250,000 outstanding $.001 par value shares of beneficial interest (unlimited authorization) | 370,876 |
| Net Asset Value Per Share—ETF Shares | $164.83 |
| | |
| Institutional Shares—Net Assets | |
| Applicable to 1,591,148 outstanding $.001 par value shares of beneficial interest (unlimited authorization) | 499,630 |
| Net Asset Value Per Share—Institutional Shares | $314.01 |
See accompanying Notes, which are an integral part of the Financial Statements.
Russell 2000 Growth Index Fund
Statement of Operations
| | Year Ended |
| | August 31, 2020 |
| | ($000) |
| Investment Income | |
| Income | |
| Dividends | 5,628 |
| Interest1 | 20 |
| Securities Lending—Net | 1,638 |
| Total Income | 7,286 |
| Expenses | |
| The Vanguard Group—Note B | |
| Investment Advisory Services | 120 |
| Management and Administrative—ETF Shares | 370 |
| Management and Administrative—Institutional Shares | 246 |
| Marketing and Distribution—ETF Shares | 14 |
| Marketing and Distribution—Institutional Shares | 17 |
| Custodian Fees | 45 |
| Auditing Fees | 31 |
| Shareholders’ Reports—ETF Shares | 20 |
| Shareholders’ Reports—Institutional Shares | 8 |
| Total Expenses | 871 |
| Net Investment Income | 6,415 |
| Realized Net Gain (Loss) | |
| Investment Securities Sold1,2 | (615) |
| Futures Contracts | 27 |
| Realized Net Gain (Loss) | (588) |
| Change in Unrealized Appreciation (Depreciation) | |
| Investment Securities1 | 128,504 |
| Futures Contracts | 15 |
| Change in Unrealized Appreciation (Depreciation) | 128,519 |
| Net Increase (Decrease) in Net Assets Resulting from Operations | 134,346 |
| 1 | Interest income, realized net gain (loss), and change in unrealized appreciation (depreciation) from an affiliated company of the fund were $20,000, $4,000, and $1,000, respectively. Purchases and sales are for temporary cash investment purposes. |
| 2 | Includes $80,753,000 of net gain (loss) resulting from in-kind redemptions. |
See accompanying Notes, which are an integral part of the Financial Statements.
Russell 2000 Growth Index Fund
Statement of Changes in Net Assets
| | Year Ended August 31, |
| | 2020 | 2019 |
| | ($000) | ($000) |
| Increase (Decrease) in Net Assets | | |
| Operations | | |
| Net Investment Income | 6,415 | 5,609 |
| Realized Net Gain (Loss) | (588) | 19,075 |
| Change in Unrealized Appreciation (Depreciation) | 128,519 | (119,272) |
| Net Increase (Decrease) in Net Assets Resulting from Operations | 134,346 | (94,588) |
| Distributions1 | | |
| ETF Shares | (2,623) | (1,913) |
| Institutional Shares | (4,011) | (3,646) |
| Total Distributions | (6,634) | (5,559) |
| Capital Share Transactions | | |
| ETF Shares | 19,622 | 9,770 |
| Institutional Shares | (50,074) | (9,899) |
| Net Increase (Decrease) from Capital Share Transactions | (30,452) | (129) |
| Total Increase (Decrease) | 97,260 | (100,276) |
| Net Assets | | |
| Beginning of Period | 773,246 | 873,522 |
| End of Period | 870,506 | 773,246 |
1 Certain prior period numbers have been reclassified to conform with current period presentation.
See accompanying Notes, which are an integral part of the Financial Statements.
Russell 2000 Growth Index Fund
Financial Highlights
| ETF Shares | | | | | |
| | | | | | |
| For a Share Outstanding | | | Year Ended August 31, |
| Throughout Each Period | 2020 | 2019 | 2018 | 2017 | 2016 |
| Net Asset Value, Beginning of Period | $141.63 | $160.12 | $123.26 | $106.98 | $104.34 |
| Investment Operations | | | | | |
| Net Investment Income | 1.0971 | .9711 | .8951 | .9611 | .989 |
| Net Realized and Unrealized Gain (Loss) on Investments | 23.237 | (18.527) | 36.791 | 16.455 | 2.721 |
| Total from Investment Operations | 24.334 | (17.556) | 37.686 | 17.416 | 3.710 |
| Distributions | | | | | |
| Dividends from Net Investment Income | (1.134) | (.934) | (.826) | (1.136) | (1.070) |
| Distributions from Realized Capital Gains | — | — | — | — | — |
| Total Distributions | (1.134) | (.934) | (.826) | (1.136) | (1.070) |
| Net Asset Value, End of Period | $164.83 | $141.63 | $160.12 | $123.26 | $106.98 |
| | | | | | |
| Total Return | 17.32% | -10.97% | 30.69% | 16.39% | 3.62% |
| | | | | | |
| Ratios/Supplemental Data | | | | | |
| Net Assets, End of Period (Millions) | $371 | $301 | $328 | $194 | $144 |
| Ratio of Total Expenses to Average Net Assets | 0.15% | 0.15% | 0.20% | 0.20% | 0.20% |
| Ratio of Net Investment Income to Average Net Assets | 0.75% | 0.68% | 0.64% | 0.83% | 0.99% |
| Portfolio Turnover Rate2 | 38% | 28% | 35% | 34% | 33% |
| 1 | Calculated based on average shares outstanding. |
| 2 | Excludes the value of portfolio securities received or delivered as a result of in-kind purchases or redemptions of the fund’s capital shares, including ETF Creation Units. |
See accompanying Notes, which are an integral part of the Financial Statements.
Russell 2000 Growth Index Fund
Financial Highlights
| Institutional Shares | | | | | |
| | | | | | |
| For a Share Outstanding | | | Year Ended August 31, |
| Throughout Each Period | 2020 | 2019 | 2018 | 2017 | 2016 |
| Net Asset Value, Beginning of Period | $269.76 | $305.04 | $234.80 | $203.79 | $198.85 |
| Investment Operations | | | | | |
| Net Investment Income | 2.2751 | 2.0211 | 2.0261 | 2.1021 | 2.121 |
| Net Realized and Unrealized Gain (Loss) on Investments | 44.269 | (35.267) | 70.080 | 31.338 | 5.185 |
| Total from Investment Operations | 46.544 | (33.246) | 72.106 | 33.440 | 7.306 |
| Distributions | | | | | |
| Dividends from Net Investment Income | (2.294) | (2.034) | (1.866) | (2.430) | (2.366) |
| Distributions from Realized Capital Gains | — | — | — | — | — |
| Total Distributions | (2.294) | (2.034) | (1.866) | (2.430) | (2.366) |
| Net Asset Value, End of Period | $314.01 | $269.76 | $305.04 | $234.80 | $203.79 |
| | | | | | |
| Total Return | 17.42% | -10.91% | 30.85% | 16.53% | 3.74% |
| | | | | | |
| Ratios/Supplemental Data | | | | | |
| Net Assets, End of Period (Millions) | $500 | $472 | $545 | $370 | $219 |
| Ratio of Total Expenses to Average Net Assets | 0.08% | 0.08% | 0.08% | 0.08% | 0.08% |
| Ratio of Net Investment Income to Average Net Assets | 0.82% | 0.75% | 0.76% | 0.95% | 1.11% |
| Portfolio Turnover Rate2 | 38% | 28% | 35% | 34% | 33% |
| 1 | Calculated based on average shares outstanding. |
| 2 | Excludes the value of portfolio securities received or delivered as a result of in-kind purchases or redemptions of the fund’s capital shares, including ETF Creation Units. |
See accompanying Notes, which are an integral part of the Financial Statements.
Russell 2000 Growth Index Fund
Notes to Financial Statements
Vanguard Russell 2000 Growth Index Fund is registered under the Investment Company Act of 1940 as an open-end investment company, or mutual fund. The fund offers two classes of shares: ETF Shares and Institutional Shares Each of the share classes has different eligibility and minimum purchase requirements, and is designed for different types of investors. ETF Shares are listed for trading on Nasdaq; they can be purchased and sold through a broker.
Market disruptions associated with the COVID-19 pandemic have had a global impact, and uncertainty exists as to the long-term implications. Such disruptions can adversely affect assets of the fund and thus fund performance.
A. The following significant accounting policies conform to generally accepted accounting principles for U.S. investment companies. The fund consistently follows such policies in preparing its financial statements.
1. Security Valuation: Securities are valued as of the close of trading on the New York Stock Exchange (generally 4 p.m., Eastern time) on the valuation date. Equity securities are valued at the latest quoted sales prices or official closing prices taken from the primary market in which each security trades; such securities not traded on the valuation date are valued at the mean of the latest quoted bid and asked prices. Securities for which market quotations are not readily available, or whose values have been materially affected by events occurring before the fund’s pricing time but after the close of the securities’ primary markets, are valued by methods deemed by the board of trustees to represent fair value. Investments in Vanguard Market Liquidity Fund are valued at that fund’s net asset value. Temporary cash investments are valued using the latest bid prices or using valuations based on a matrix system (which considers such factors as security prices, yields, maturities, and ratings), both as furnished by independent pricing services.
2. Futures Contracts: The fund uses index futures contracts to a limited extent, with the objectives of maintaining full exposure to the stock market, maintaining liquidity, and minimizing transaction costs. The fund may purchase futures contracts to immediately invest incoming cash in the market, or sell futures in response to cash outflows, thereby simulating a fully invested position in the underlying index while maintaining a cash balance for liquidity. The primary risks associated with the use of futures contracts are imperfect correlation between changes in market values of stocks held by the fund and the prices of futures contracts, and the possibility of an illiquid market. Counterparty risk involving futures is mitigated because a regulated clearinghouse is the counterparty instead of the clearing broker. To further mitigate counterparty risk, the fund trades futures contracts on an exchange, monitors the financial strength of its clearing brokers and clearinghouse, and has entered into clearing agreements with its clearing brokers. The clearinghouse imposes initial margin requirements to secure the fund’s performance and requires daily settlement of variation margin representing changes in the market value of each contract. Any securities pledged as initial margin for open contracts are noted in the Schedule of Investments.
Futures contracts are valued at their quoted daily settlement prices. The notional amounts of the contracts are not recorded in the Statement of Assets and Liabilities. Fluctuations in the value of the contracts are recorded in the Statement of Assets and Liabilities as an asset (liability) and in the Statement of Operations as unrealized appreciation (depreciation) until the contracts are closed, when they are recorded as realized gains (losses) on futures contracts.
Russell 2000 Growth Index Fund
During the year ended August 31, 2020, the fund’s average investments in long and short futures contracts represented less than 1% and 0% of net assets, respectively, based on the average of the notional amounts at each quarter-end during the period.
3. Federal Income Taxes: The fund intends to continue to qualify as a regulated investment company and distribute all of its taxable income. The fund’s tax returns are open to examination by the relevant tax authorities until expiration of the applicable statute of limitations, which is generally three years after the filing of the tax return. Management has analyzed the fund’s tax positions taken for all open federal and state income tax years, and has concluded that no provision for income tax is required in the fund’s financial statements.
4. Distributions: Distributions to shareholders are recorded on the ex-dividend date. Distributions are determined on a tax basis at the fiscal year-end and may differ from net investment income and realized capital gains for financial reporting purposes.
5. Securities Lending: To earn additional income, the fund lends its securities to qualified institutional borrowers. Security loans are subject to termination by the fund at any time, and are required to be secured at all times by collateral in an amount at least equal to the market value of securities loaned. Daily market fluctuations could cause the value of loaned securities to be more or less than the value of the collateral received. When this occurs, the collateral is adjusted and settled before the opening of the market on the next business day. The fund further mitigates its counterparty risk by entering into securities lending transactions only with a diverse group of prequalified counterparties, monitoring their financial strength, and entering into master securities lending agreements with its counterparties. The master securities lending agreements provide that, in the event of a counterparty’s default (including bankruptcy), the fund may terminate any loans with that borrower, determine the net amount owed, and sell or retain the collateral up to the net amount owed to the fund; however, such actions may be subject to legal proceedings. While collateral mitigates counterparty risk, in the event of a default, the fund may experience delays and costs in recovering the securities loaned. The fund invests cash collateral received in Vanguard Market Liquidity Fund, and records a liability in the Statement of Assets and Liabilities for the return of the collateral, during the period the securities are on loan. Collateral investments in Vanguard Market Liquidity Fund are subject to market appreciation or depreciation. Securities lending income represents fees charged to borrowers plus income earned on invested cash collateral, less expenses associated with the loan. During the term of the loan, the fund is entitled to all distributions made on or in respect of the loaned securities.
6. Credit Facilities and Interfund Lending Program: The fund and certain other funds managed by The Vanguard Group (“Vanguard”) participate in a $4.3 billion committed credit facility provided by a syndicate of lenders pursuant to a credit agreement and an uncommitted credit facility provided by Vanguard. Both facilities may be renewed annually. Each fund is individually liable for its borrowings, if any, under the credit facilities. Borrowings may be utilized for temporary or emergency purposes, subject to the fund’s regulatory and contractual borrowing restrictions. With respect to the committed credit facility, the participating funds are charged administrative fees and an annual commitment fee of 0.10% of the undrawn committed amount of the facility; these fees are allocated to the funds based on a method approved by the fund’s board of trustees
Russell 2000 Growth Index Fund
and included in Management and Administrative expenses on the fund’s Statement of Operations. Any borrowings under either facility bear interest at a rate based upon the higher of the one-month London Interbank Offered Rate (or an acceptable alternate rate, if necessary), federal funds effective rate, or overnight bank funding rate plus an agreed-upon spread, except that borrowings under the uncommitted credit facility may bear interest based upon an alternative rate agreed to by the fund and Vanguard.
In accordance with an exemptive order (the “Order”) from the SEC, the fund may participate in a joint lending and borrowing program that allows registered open-end Vanguard funds to borrow money from and lend money to each other for temporary or emergency purposes (the “Interfund Lending Program”), subject to compliance with the terms and conditions of the Order, and to the extent permitted by the fund’s investment objective and investment policies. Interfund loans and borrowings normally extend overnight, but can have a maximum duration of seven days. Loans may be called on one business day’s notice. The interest rate to be charged is governed by the conditions of the Order and internal procedures adopted by the board of trustees. The board of trustees is responsible for overseeing the Interfund Lending Program.
For the year ended August 31, 2020, the fund did not utilize the credit facilities or the Interfund Lending Program.
7. Other: Dividend income is recorded on the ex-dividend date. Interest income includes income distributions received from Vanguard Market Liquidity Fund and is accrued daily. Premiums and discounts on debt securities are amortized and accreted, respectively, to interest income over the lives of the respective securities, except for premiums on certain callable debt securities that are amortized to the earliest call date. Security transactions are accounted for on the date securities are bought or sold. Costs used to determine realized gains (losses) on the sale of investment securities are those of the specific securities sold.
Each class of shares has equal rights as to assets and earnings, except that each class separately bears certain class-specific expenses related to maintenance of shareholder accounts (included in Management and Administrative expenses) and shareholder reporting. Marketing and distribution expenses are allocated to each class of shares based on a method approved by the board of trustees. Income, other non-class-specific expenses, and gains and losses on investments are allocated to each class of shares based on its relative net assets.
B. In accordance with the terms of a Funds’ Service Agreement (the “FSA”) between Vanguard and the fund, Vanguard furnishes to the fund investment advisory, corporate management, administrative, marketing, and distribution services at Vanguard’s cost of operations (as defined by the FSA). These costs of operations are allocated to the fund based on methods and guidelines approved by the board of trustees and are generally settled twice a month.
Upon the request of Vanguard, the fund may invest up to 0.40% of its net assets as capital in Vanguard. At August 31, 2020, the fund had contributed to Vanguard capital in the amount of $35,000, representing less than 0.01% of the fund’s net assets and 0.01% of Vanguard’s capital received pursuant to the FSA. The fund’s trustees and officers are also directors and employees, respectively, of Vanguard.
Russell 2000 Growth Index Fund
C. Various inputs may be used to determine the value of the fund’s investments and derivatives. These inputs are summarized in three broad levels for financial statement purposes. The inputs or methodologies used to value securities are not necessarily an indication of the risk associated with investing in those securities.
Level 1—Quoted prices in active markets for identical securities.
Level 2—Other significant observable inputs (including quoted prices for similar securities, interest rates, prepayment speeds, credit risk, etc.).
Level 3—Significant unobservable inputs (including the fund’s own assumptions used to determine the fair value of investments). Any investments and derivatives valued with significant unobservable inputs are noted on the Schedule of Investments.
The following table summarizes the market value of the fund’s investments and derivatives as of August 31, 2020, based on the inputs used to value them:
| | Level 1 | Level 2 | Level 3 | Total |
| | ($000) | ($000) | ($000) | ($000) |
| Investments | | | | |
| Assets | | | | |
| Common Stocks | 869,656 | 1 | 38 | 869,695 |
| Temporary Cash Investments | 12,652 | 93 | — | 12,745 |
| Total | 882,308 | 94 | 38 | 882,440 |
| Derivative Financial Instruments | | | | |
| Liabilities | | | | |
| Futures Contracts1 | 9 | — | — | 9 |
1 Represents variation margin on the last day of the reporting period.
D. Permanent differences between book-basis and tax-basis components of net assets are reclassified among capital accounts in the financial statements to reflect their tax character. These reclassifications have no effect on net assets or net asset value per share. As of period end, permanent differences primarily attributable to the accounting for in-kind redemptions and passive foreign investment companies were reclassified between the following accounts:
| | Amount |
| | ($000) |
| Paid-in Capital | 80,757 |
| Total Distributable Earnings (Loss) | (80,757) |
Russell 2000 Growth Index Fund
Temporary differences between book-basis and tax-basis components of total distributable earnings (loss) arise when certain items of income, gain, or loss are recognized in different periods for financial statement and tax purposes; these differences will reverse at some time in the future. The differences are primarily related to the deferral of losses from wash sales; the recognition of unrealized gains or losses from certain derivative contracts; and the recognition of unrealized gains from passive foreign investment companies. As of period end, the tax-basis components of total distributable earnings (loss) are detailed in the table as follows:
| | Amount |
| | ($000) |
| Undistributed Ordinary Income | 1,226 |
| Undistributed Long-Term Gains | — |
| Capital Loss Carryforwards | (177,332) |
| Qualified Late-Year Losses | — |
| Net Unrealized Gains (Losses) | 197,674 |
The tax character of distributions paid was as follows:
| | Year Ended August 31, |
| | 2020 | 2019 |
| | Amount | Amount |
| | ($000) | ($000) |
| Ordinary Income* | 6,634 | 5,559 |
| Long-Term Capital Gains | — | — |
| Total | 6,634 | 5,559 |
* Includes short-term capital gains, if any.
As of August 31, 2020, gross unrealized appreciation and depreciation for investments and derivatives based on cost for U.S. federal income tax purposes were as follows:
| | Amount |
| | ($000) |
| Tax Cost | 684,766 |
| Gross Unrealized Appreciation | 245,262 |
| Gross Unrealized Depreciation | (47,588) |
| Net Unrealized Appreciation (Depreciation) | 197,674 |
Russell 2000 Growth Index Fund
E. During the year ended August 31, 2020, the fund purchased $444,237,000 of investment securities and sold $474,248,000 of investment securities, other than temporary cash investments. Purchases and sales include $142,056,000 and $152,095,000, respectively, in connection with in-kind purchases and redemptions of the fund’s capital shares.
The fund purchased securities from and sold securities to other Vanguard funds or accounts managed by Vanguard or its affiliates, in accordance with procedures adopted by the board of trustees in compliance with Rule 17a-7 of the Investment Company Act of 1940. For the year ended August 31, 2020, such purchases and sales were $54,352,000 and $75,991,000, respectively; these amounts, other than temporary cash investments, are included in the purchases and sales of investment securities noted above.
F. Capital share transactions for each class of shares were:
| | | | Year Ended August 31, |
| | | 2020 | | | 2019 |
| | Amount | Shares | Amount | Shares |
| | ($000) | (000) | ($000) | (000) |
| ETF Shares | | | | |
| Issued | 172,356 | 1,175 | 150,524 | 1,050 |
| Issued in Lieu of Cash Distributions | — | — | — | — |
| Redeemed | (152,734) | (1,050) | (140,754) | (975) |
| Net Increase (Decrease)—ETF Shares | 19,622 | 125 | 9,770 | 75 |
| Institutional Shares | | | | |
| Issued | 152,291 | 545 | 46,667 | 176 |
| Issued in Lieu of Cash Distributions | 4,001 | 15 | 3,646 | 13 |
| Redeemed | (206,366) | (720) | (60,212) | (226) |
| Net Increase (Decrease)—Institutional Shares | (50,074) | (160) | (9,899) | (37) |
G. Management has determined that no events or transactions occurred subsequent to August 31, 2020, that would require recognition or disclosure in these financial statements.
Report of Independent Registered Public Accounting Firm
To the Board of Trustees of Vanguard Scottsdale Funds and Shareholders of Vanguard Russell 2000 Index Fund, Vanguard Russell 2000 Value Index Fund and Vanguard Russell 2000 Growth Index Fund
Opinions on the Financial Statements
We have audited the accompanying statements of assets and liabilities, including the schedules of investments - investments summary, of Vanguard Russell 2000 Index Fund, Vanguard Russell 2000 Value Index Fund and Vanguard Russell 2000 Growth Index Fund (three of the funds constituting Vanguard Scottsdale Funds, hereafter collectively referred to as the “Funds”) as of August 31, 2020, the related statements of operations for the year ended August 31, 2020, the statements of changes in net assets for each of the two years in the period ended August 31, 2020, including the related notes, and the financial highlights for each of the five years in the period ended August 31, 2020 (collectively referred to as the “financial statements”). In our opinion, the financial statements present fairly, in all material respects, the financial position of each of the Funds as of August 31, 2020, the results of each of their operations for the year then ended, the changes in each of their net assets for each of the two years in the period ended August 31, 2020 and each of the financial highlights for each of the five years in the period ended August 31, 2020 in conformity with accounting principles generally accepted in the United States of America.
Basis for Opinions
These financial statements are the responsibility of the Funds’ management. Our responsibility is to express an opinion on the Funds’ financial statements based on our audits. We are a public accounting firm registered with the Public Company Accounting Oversight Board (United States) (“PCAOB”) and are required to be independent with respect to the Funds in accordance with the U.S. federal securities laws and the applicable rules and regulations of the Securities and Exchange Commission and the PCAOB.
We conducted our audits of these financial statements in accordance with the standards of the PCAOB. Those standards require that we plan and perform the audit to obtain reasonable assurance about whether the financial statements are free of material misstatement, whether due to error or fraud.
Our audits included performing procedures to assess the risks of material misstatement of the financial statements, whether due to error or fraud, and performing procedures that respond to those risks. Such procedures included examining, on a test basis, evidence regarding the amounts and disclosures in the financial statements. Our audits also included evaluating the accounting principles used and significant estimates made by management, as well as evaluating the overall presentation of the financial statements. Our procedures included confirmation of securities owned as of August 31, 2020 by correspondence with the custodian and brokers and by agreement to the underlying ownership records of the transfer agent; when replies were not received from brokers, we performed other auditing procedures. We believe that our audits provide a reasonable basis for our opinions.
/s/PricewaterhouseCoopers LLP
Philadelphia, Pennsylvania
October 19, 2020
We have served as the auditor of one or more investment companies in The Vanguard Group of Funds since 1975.
Special 2020 tax information (unaudited) for Vanguard Russell 2000 Index Funds
This information for the fiscal year ended August 31, 2020, is included pursuant to provisions of the Internal Revenue Code.
The funds distributed qualified dividend income to shareholders during the fiscal year as follows:
| Fund | ($000) |
| Russell 2000 Index Fund | 22,780 |
| Russell 2000 Value Index Fund | 6,002 |
| Russell 2000 Growth Index Fund | 4,915 |
For corporate shareholders, the percentage of investment income (dividend income plus short-term gains, if any) that qualifies for the dividends-received deduction is as follows:
| Fund | Percentage |
| Russell 2000 Index Fund | 67.0% |
| Russell 2000 Value Index Fund | 68.1 |
| Russell 2000 Growth Index Fund | 67.4 |
The funds distributed qualified business income to shareholders during the fiscal year as follows:
| Fund | ($000) |
| Russell 2000 Index Fund | 5,746 |
| Russell 2000 Value Index Fund | 1,571 |
| Russell 2000 Growth Index Fund | 586 |
Trustees Approve Advisory Arrangements
The board of trustees of Vanguard Russell 2000 Index Fund, Vanguard Russell 2000 Value Index Fund, and Vanguard Russell 2000 Growth Index Fund has renewed each fund’s investment advisory arrangement with The Vanguard Group, Inc. (Vanguard), through its Equity Index Group. The board determined that continuing each fund’s internalized management structure was in the best interests of the fund and its shareholders.
The board based its decision upon an evaluation of the advisor’s investment staff, portfolio management process, and performance. This evaluation included information provided to the board by Vanguard’s Portfolio Review Department, which is responsible for fund and advisor oversight and product management. The Portfolio Review Department met regularly with the advisor and made monthly presentations to the board during the fiscal year that directed the board’s focus to relevant information and topics.
The board, or an investment committee made up of board members, also received information throughout the year through advisor presentations. For each advisor presentation, the board was provided with letters and reports that included information about, among other things, the advisory firm and the advisor’s assessment of the investment environment, portfolio performance, and portfolio characteristics.
In addition, the board received monthly reports, which included a Market and Economic Report, a Fund Dashboard Monthly Summary, and a Fund Performance Report.
Prior to their meeting, the trustees were provided with a memo and materials that summarized the information they received over the course of the year. They also considered the factors discussed below, among others. However, no single factor determined whether the board approved the arrangements. Rather, it was the totality of the circumstances that drove the board’s decision.
Nature, extent, and quality of services
The board reviewed the quality of the investment management services provided to the funds since their inception in 2010, and took into account the organizational depth and stability of the advisor. The board considered that Vanguard has been managing investments for more than four decades. The Equity Index Group adheres to a sound, disciplined investment management process; the team has considerable experience, stability, and depth.
The board concluded that Vanguard’s experience, stability, depth, and performance, among other factors, warranted continuation of each advisory arrangement.
Investment performance
The board considered each fund’s performance since its inception, including any periods of outperformance or underperformance compared with its target index and peer group. The board concluded that the performance was such that each advisory arrangement should continue.
Cost
The board concluded that each fund’s expense ratio was well below the average expense ratio charged by funds in its peer group and that each fund’s advisory expenses were also well below the peer-group average.
The board does not conduct a profitability analysis of Vanguard because of Vanguard’s unique structure. Unlike most other mutual fund management companies, Vanguard is owned by the funds it oversees.
The benefit of economies of scale
The board concluded that each fund’s arrangement with Vanguard ensures that the funds will realize economies of scale as they grow, with the cost to shareholders declining as fund assets increase.
The board will consider whether to renew the advisory arrangements again after a one-year period.
Liquidity Risk Management
Vanguard funds (except for the money market funds) have adopted and implemented a written liquidity risk management program (the “Program”) as required by Rule 22e-4 under the Investment Company Act of 1940. Rule 22e-4 requires that each fund adopt a program that is reasonably designed to assess and manage the fund’s liquidity risk, which is the risk that the fund could not meet redemption requests without significant dilution of remaining investors’ interests in the fund.
Assessment and management of a fund’s liquidity risk under the Program take into consideration certain factors, such as the fund’s investment strategy and the liquidity of its portfolio investments during normal and reasonably foreseeable stressed conditions, its short- and long-term cash-flow projections during both normal and reasonably foreseeable stressed conditions, and its cash and cash-equivalent holdings and access to other funding sources. As required by the rule, the Program includes policies and procedures for classification of fund portfolio holdings in four liquidity categories, maintaining certain levels of highly liquid investments, and limiting holdings of illiquid investments.
The board of trustees of Vanguard Scottsdale Funds approved the appointment of liquidity risk management program administrators responsible for administering the Program for Russell 2000 Index Fund, Russell 2000 Value Index Fund, and Russell 2000 Growth Index Fund, and for carrying out the specific responsibilities set forth in the Program, including reporting to the board on at least an annual basis regarding the Program’s operation, its adequacy, and the effectiveness of its implementation for the past year (the “Program Administrator Report”). The board has reviewed the Program Administrator Report covering the period from December 1, 2018, through December 31, 2019 (the “Review Period”). The Program Administrator Report stated that during the Review Period the Program operated and was implemented effectively to manage the funds’ liquidity risk.
The Products are not sponsored, endorsed, sold or promoted by Frank Russell Company (“Russell”). Russell makes no representation or warranty, express or implied, to the owners of the Products or any member of the public regarding the advisability of investing in securities generally or in the Products particularly or the ability of the Russell 2000, Russell 2000 Value, and Russell 2000 Growth Indexes to track general stock market performance or a segment of the same. Russell’s publication of the Russell 2000, Russell 2000 Value, and Russell 2000 Growth Indexes in no way suggests or implies an opinion by Russell as to the advisability of investment in any or all of the securities upon which the Russell 2000, Russell 2000 Value, and Russell 2000 Growth Indexes are based. Russell’s only relationship to The Vanguard Group, Inc. is the licensing of certain trademarks and trade names of Russell and of the Russell 2000, Russell 2000 Value, and Russell 2000 Growth Indexes which are determined, composed and calculated by Russell without regard to The Vanguard Group, Inc. or the Products. Russell is not responsible for and has not reviewed the Products nor any associated literature or publications and Russell makes no representation or warranty express or implied as to their accuracy or completeness, or otherwise. Russell has no obligation or liability in connection with the administration, marketing or trading of the Products.
Russell makes no representation, warranty or guarantee as to the accuracy, completeness, reliability or otherwise of the Russell Indexes or any data included in the Russell Indexes. Russell does not guarantee the accuracy and/or the completeness of the Russell 2000, Russell 2000 Value, and Russell 2000 Growth Indexes or any data included therein and Russell shall have no liability for any errors, omissions, or interruptions therein. Russell makes no warranty, express or implied, as to the use of or results to be obtained by The Vanguard Group, Inc., investors, owners of the Products, or any other person or entity from the use of the Russell 2000, Russell 2000 Value, and Russell 2000 Growth Indexes or any data included therein. Russell makes no express or implied warranties, and expressly disclaims all warranties of merchantability or fitness for a particular purpose or use with respect to the Russell 2000, Russell 2000 Value, and Russell 2000 Growth Indexes or any data included therein. Without limiting any of the foregoing, in no event shall Russell have any liability for any special, punitive, indirect, or consequential damages (including lost profits), even if notified of the possibility of such damages.
Russell reserves the right, at any time and without notice, to alter, amend, terminate or in any way change the Russell Indexes. Russell has no obligation to take the needs of any particular fund or its participants or any other product or person into consideration in determining, composing or calculating any of the Russell Indexes.
This page intentionally left blank.
This page intentionally left blank.
The People Who Govern Your Fund
The trustees of your mutual fund are there to see that the fund is operated and managed in your best interests since, as a shareholder, you are a part owner of the fund. Your fund’s trustees also serve on the board of directors of The Vanguard Group, Inc., which is owned by the Vanguard funds and provides services to them.
A majority of Vanguard’s board members are independent, meaning that they have no affiliation with Vanguard or the funds they oversee, apart from the sizable personal investments they have made as private individuals. The independent board members have distinguished backgrounds in business, academia, and public service. Each of the trustees and executive officers oversees 212 Vanguard funds.
Information for each trustee and executive officer of the fund appears below. That information, as well as the Vanguard fund count, is as of the date on the cover of this fund report. The mailing address of the trustees and officers is P.O. Box 876, Valley Forge, PA 19482. More information about the trustees is in the Statement of Additional Information, which can be obtained, without charge, by contacting Vanguard at 800-662-7447, or online at vanguard.com.
Interested Trustee1
Mortimer J. Buckley
Born in 1969. Trustee since January 2018. Principal occupation(s) during the past five years and other experience: chairman of the board (2019–present) of Vanguard and of each of the investment companies served by Vanguard; chief executive officer (2018–present) of Vanguard; chief executive officer, president, and trustee (2018–present) of each of the investment companies served by Vanguard; president and director (2017–present) of Vanguard; and president (2018–present) of Vanguard Marketing Corporation. Chief investment officer (2013–2017), managing director (2002–2017), head of the Retail Investor Group (2006–2012), and chief information officer (2001–2006) of Vanguard. Chairman of the board (2011–2017) and trustee (2009–2017) of the Children’s Hospital of Philadelphia; and trustee (2018–present) and vice chair (2019–present) of The Shipley School.
Independent Trustees
Emerson U. Fullwood
Born in 1948. Trustee since January 2008. Principal occupation(s) during the past five years and other experience: executive chief staff and marketing officer for North America and corporate vice president (retired 2008) of Xerox Corporation (document management products and services). Former president of the Worldwide Channels Group, Latin America, and Worldwide Customer Service and executive chief staff officer of Developing Markets of Xerox. Executive in residence and 2009–2010 Distinguished Minett Professor at the Rochester Institute of Technology. Director of SPX FLOW, Inc. (multi-industry manufacturing). Director of the University of Rochester Medical Center, the Monroe Community College Foundation, the United Way of Rochester, North Carolina A&T University, and Roberts Wesleyan College. Trustee of the University of Rochester.
Amy Gutmann
Born in 1949. Trustee since June 2006. Principal occupation(s) during the past five years and other experience: president (2004–present) of the University of Pennsylvania. Christopher H. Browne Distinguished Professor of Political Science, School of Arts and Sciences, and professor of communication, Annenberg School for Communication, with secondary faculty appointments in the Department of Philosophy, School of Arts and Sciences, and at the Graduate School of Education, University of Pennsylvania.
F. Joseph Loughrey
Born in 1949. Trustee since October 2009. Principal occupation(s) during the past five years and other experience: president and chief operating officer (retired 2009) and vice chairman of the board (2008–2009) of Cummins Inc. (industrial machinery). Chairman of the board of Hillenbrand, Inc. (specialized consumer services) and the Lumina Foundation. Director of the V Foundation. Member of the advisory
| 1 | Mr. Buckley is considered an “interested person,” as defined in the Investment Company Act of 1940, because he is an officer of the Vanguard funds. |
council for the College of Arts and Letters and chair of the advisory board to the Kellogg Institute for International Studies, both at the University of Notre Dame.
Mark Loughridge
Born in 1953. Trustee since March 2012. Principal occupation(s) during the past five years and other experience: senior vice president and chief financial officer (retired 2013) of IBM (information technology services). Fiduciary member of IBM’s Retirement Plan Committee (2004–2013), senior vice president and general manager (2002–2004) of IBM Global Financing, vice president and controller (1998–2002) of IBM, and a variety of other prior management roles at IBM. Member of the Council on Chicago Booth.
Scott C. Malpass
Born in 1962. Trustee since March 2012. Principal occupation(s) during the past five years and other experience: chief investment officer (retired June 2020) and vice president (retired June 2020) of the University of Notre Dame. Assistant professor of finance at the Mendoza College of Business, University of Notre Dame, and member of the Notre Dame 403(b) Investment Committee (retired June 2020). Member of the board of Catholic Investment Services, Inc. (investment advisors) and the board of superintendence of the Institute for the Works of Religion.
Deanna Mulligan
Born in 1963. Trustee since January 2018. Principal occupation(s) during the past five years and other experience: chief executive officer (2011–present) of The Guardian Life Insurance Company of America. President (2010–2019), chief operating officer (2010–2011), and executive vice president (2008–2010) of Individual Life and Disability of The Guardian Life Insurance Company of America. Member of the board of The Guardian Life Insurance Company of America, the American Council of Life Insurers, and the Economic Club of New York. Trustee of the Partnership for New York City (business leadership), Chief Executives for Corporate Purpose, NewYork-Presbyterian Hospital, Catalyst, and the Bruce Museum (arts and science). Member of the Advisory Council for the Stanford Graduate School of Business.
André F. Perold
Born in 1952. Trustee since December 2004. Principal occupation(s) during the past five years and other experience: George Gund Professor of Finance and Banking, Emeritus at the Harvard Business School (retired 2011). Chief investment officer and co-managing partner of HighVista Strategies (private investment firm). Member of the board of advisors and member of the investment committee of the Museum of Fine Arts Boston. Member of the board (2018–present) of RIT Capital Partners (investment firm). Member of the investment committee of Partners Health Care System.
Sarah Bloom Raskin
Born in 1961. Trustee since January 2018. Principal occupation(s) during the past five years and other experience: deputy secretary (2014–2017) of the United States Department of the Treasury. Governor (2010–2014) of the Federal Reserve Board. Commissioner (2007–2010) of financial regulation for the State of Maryland. Member of the board of directors (2012–2014) of Neighborhood Reinvestment Corporation. Director (2017–present) of i(x) Investments, LLC; director (2017–present) of Reserve Trust. Rubenstein Fellow (2017–present) of Duke University; trustee (2017–present) of Amherst College, and trustee (2019–present) of the Folger Shakespeare Library.
Peter F. Volanakis
Born in 1955. Trustee since July 2009. Principal occupation(s) during the past five years and other experience: president and chief operating officer (retired 2010) of Corning Incorporated (communications equipment) and director of Corning Incorporated (2000–2010) and Dow Corning (2001–2010). Director (2012) of SPX Corporation (multi-industry manufacturing). Overseer of the Amos Tuck School of Business Administration, Dartmouth College (2001–2013). Chairman of the board of trustees of Colby-Sawyer College. Member of the board of Hypertherm Inc. (industrial cutting systems, software, and consumables).
Executive Officers
John Bendl
Born in 1970. Principal occupation(s) during the past five years and other experience: principal of Vanguard. Chief financial officer (2019–present) of each of the investment companies served by Vanguard. Chief accounting officer, treasurer, and controller of Vanguard (2017–present). Partner (2003–2016) at KPMG (audit, tax, and advisory services).
Glenn Booraem
Born in 1967. Principal occupation(s) during the past five years and other experience: principal of Vanguard. Investment stewardship officer (2017–present), treasurer (2015–2017), controller (2010–2015), and assistant controller (2001–2010) of each of the investment companies served by Vanguard.
Christine M. Buchanan
Born in 1970. Principal occupation(s) during the past five years and other experience: principal of Vanguard. Treasurer (2017–present) of each of the investment companies served by Vanguard. Partner (2005–2017) at KPMG (audit, tax, and advisory services).
David Cermak
Born in 1960. Principal occupation(s) during the past five years and other experience: principal of Vanguard. Finance director (2019–present) of each of the investment companies served by Vanguard. Managing director and head (2017–present) of Vanguard Investments Singapore. Managing director and head (2017–2019) of Vanguard Investments Hong Kong. Representative director and head (2014–2017) of Vanguard Investments Japan.
Thomas J. Higgins
Born in 1957. Principal occupation(s) during the past five years and other experience: principal of Vanguard. Finance director (2019–present), chief financial officer (2008–2019), and treasurer (1998–2008) of each of the investment companies served by Vanguard.
Peter Mahoney
Born in 1974. Principal occupation(s) during the past five years and other experience: principal of Vanguard. Controller (2015–present) of each of the investment companies served by Vanguard. Head of International Fund Services (2008–2014) at Vanguard.
Anne E. Robinson
Born in 1970. Principal occupation(s) during the past five years and other experience: general counsel (2016–present) of Vanguard. Secretary (2016–present) of Vanguard and of each of the investment companies served by Vanguard. Managing director (2016–present) of Vanguard. Managing director and general counsel of Global Cards and Consumer Services (2014–2016) at Citigroup. Counsel (2003–2014) at American Express.
Michael Rollings
Born in 1963. Principal occupation(s) during the past five years and other experience: finance director (2017–present) and treasurer (2017) of each of the investment companies served by Vanguard. Managing director (2016–present) of Vanguard. Chief financial officer (2016–present) of Vanguard. Director (2016–present) of Vanguard Marketing Corporation. Executive vice president and chief financial officer (2006–2016) of MassMutual Financial Group.
John E. Schadl
Born in 1972. Principal occupation(s) during the past five years and other experience: principal of Vanguard. Chief compliance officer (2019–present) of Vanguard and of each of the investment companies served by Vanguard. Assistant vice president (2019–present) of Vanguard Marketing Corporation.
| Vanguard Senior Management Team |
| | |
| Joseph Brennan | Chris D. McIsaac |
| Mortimer J. Buckley | James M. Norris |
| Gregory Davis | Thomas M. Rampulla |
| John James | Karin A. Risi |
| Martha G. King | Anne E. Robinson |
| John T. Marcante | Michael Rollings |
Connect with Vanguard® > vanguard.com
Fund Information > 800-662-7447
Direct Investor Account Services > 800-662-2739
Institutional Investor Services > 800-523-1036
Text Telephone for People
Who Are Deaf or Hard of Hearing > 800-749-7273
This material may be used in conjunction with the offering of shares of any Vanguard fund only if preceded or accompanied by the fund’s current prospectus.
All comparative mutual fund data are from Morningstar, Inc., unless otherwise noted.
You can obtain a free copy of Vanguard’s proxy voting guidelines by visiting vanguard.com/proxyreporting or by calling Vanguard at 800-662-2739. The guidelines are also available from the SEC’s website, www.sec.gov. In addition, you may obtain a free report on how your fund voted the proxies for securities it owned during the 12 months ended June 30. To get the report, visit either vanguard.com/proxyreporting or www.sec.gov.
You can review information about your fund on the SEC’s website, and you can receive copies of this information, for a fee, by sending a request via email addressed to publicinfo@sec.gov.
Source for Bloomberg Barclays indexes: Bloomberg Index Services Limited. Copyright 2020, Bloomberg. All rights reserved.
| © 2020 The Vanguard Group, Inc. |
| All rights reserved. |
| U.S. Patent Nos. 6,879,964; 7,337,138; |
| | 7,720,749; 7,925,573; 8,090,646; 8,417,623; and 8,626,636. |
| | Vanguard Marketing Corporation, Distributor. |
| | |
| Q18510 102020 |

| | Annual Report | August 31, 2020 Vanguard Russell 3000 Index Fund | |
| | See the inside front cover for important information about access to your fund’s annual and semiannual shareholder reports. | |
Important information about access to shareholder reports
Beginning on January 1, 2021, as permitted by regulations adopted by the Securities and Exchange Commission, paper copies of your fund’s annual and semiannual shareholder reports will no longer be sent to you by mail, unless you specifically request them. Instead, you will be notified by mail each time a report is posted on the website and will be provided with a link to access the report.
If you have already elected to receive shareholder reports electronically, you will not be affected by this change and do not need to take any action. You may elect to receive shareholder reports and other communications from the fund electronically by contacting your financial intermediary (such as a broker-dealer or bank) or, if you invest directly with the fund, by calling Vanguard at one of the phone numbers on the back cover of this report or by logging on to vanguard.com.
You may elect to receive paper copies of all future shareholder reports free of charge. If you invest through a financial intermediary, you can contact the intermediary to request that you continue to receive paper copies. If you invest directly with the fund, you can call Vanguard at one of the phone numbers on the back cover of this report or log on to vanguard.com. Your election to receive paper copies will apply to all the funds you hold through an intermediary or directly with Vanguard.
| Contents | |
| | |
| Your Fund’s Performance at a Glance | 1 |
| About Your Fund’s Expenses | 2 |
| Performance Summary | 4 |
| Financial Statements | 7 |
| Trustees Approve Advisory Arrangement | 22 |
| Liquidity Risk Management | 24 |
Please note: The opinions expressed in this report are just that—informed opinions. They should not be considered promises or advice. Also, please keep in mind that the information and opinions cover the period through the date on the front of this report. Of course, the risks of investing in your fund are spelled out in the prospectus.
Your Fund’s Performance at a Glance
· Vanguard Russell 3000 Index Fund, which represents the broad U.S. stock market, returned 21.31% for ETF Shares (based on net asset value) and 21.38% for Institutional Shares for the 12 months ended August 31, 2020. The fund’s return was in line with that of its target index.
· After declining nearly 35% in parts of February and March, U.S. stocks climbed to record highs in August as the response of some major central banks and governments to the spread of the coronavirus, along with progress toward vaccines and treatments, helped lift investor sentiment. U.S. stocks rebounded more strongly than stocks in developed markets outside the United States or in emerging markets.
· Large-capitalization stocks outperformed their mid- and small-cap counterparts, and growth stocks surpassed value stocks.
· Industry sector performance varied greatly for the fiscal year. Technology, the fund’s largest sector, climbed nearly 60%. Consumer discretionary and health care stocks also performed well.
· Energy, one of the fund’s smaller sectors, returned about –32%. Utilities and financial services also declined.
| Market Barometer | | | |
| | | Average Annual Total Returns |
| | | Periods Ended August 31, 2020 |
| | One Year | Three Years | Five Years |
| Stocks | | | |
| Russell 1000 Index (Large-caps) | 22.50% | 14.58% | 14.31% |
| Russell 2000 Index (Small-caps) | 6.02 | 5.03 | 7.65 |
| Russell 3000 Index (Broad U.S. market) | 21.44 | 13.95 | 13.86 |
| FTSE All-World ex US Index (International) | 8.78 | 2.92 | 6.00 |
| | | | |
| Bonds | | | |
| Bloomberg Barclays U.S. Aggregate Bond Index (Broad taxable market) | 6.47% | 5.09% | 4.33% |
| Bloomberg Barclays Municipal Bond Index (Broad tax-exempt market) | 3.24 | 4.09 | 3.99 |
| FTSE Three-Month U.S. Treasury Bill Index | 1.18 | 1.67 | 1.15 |
| | | | |
| CPI | | | |
| Consumer Price Index | 1.31% | 1.92% | 1.75% |
About Your Fund’s Expenses
As a shareholder of the fund, you incur ongoing costs, which include costs for portfolio management, administrative services, and shareholder reports (like this one), among others. Operating expenses, which are deducted from a fund’s gross income, directly reduce the investment return of the fund.
A fund’s expenses are expressed as a percentage of its average net assets. This figure is known as the expense ratio. The following examples are intended to help you understand the ongoing costs (in dollars) of investing in your fund and to compare these costs with those of other mutual funds. The examples are based on an investment of $1,000 made at the beginning of the period shown and held for the entire period.
The accompanying table illustrates your fund’s costs in two ways:
· Based on actual fund return. This section helps you to estimate the actual expenses that you paid over the period. The “Ending Account Value” shown is derived from the fund’s actual return, and the third column shows the dollar amount that would have been paid by an investor who started with $1,000 in the fund. You may use the information here, together with the amount you invested, to estimate the expenses that you paid over the period.
To do so, simply divide your account value by $1,000 (for example, an $8,600 account value divided by $1,000 = 8.6), then multiply the result by the number given for your fund under the heading “Expenses Paid During Period.”
· Based on hypothetical 5% yearly return. This section is intended to help you compare your fund’s costs with those of other mutual funds. It assumes that the fund had a yearly return of 5% before expenses, but that the expense ratio is unchanged. In this case—because the return used is not the fund’s actual return—the results do not apply to your investment. The example is useful in making comparisons because the Securities and Exchange Commission requires all mutual funds to calculate expenses based on a 5% return. You can assess your fund’s costs by comparing this hypothetical example with the hypothetical examples that appear in shareholder reports of other funds.
Note that the expenses shown in the table are meant to highlight and help you compare ongoing costs only and do not reflect transaction costs incurred by the fund for buying and selling securities. Further, the expenses do not include any purchase, redemption, or account service fees described in the fund prospectus. If such fees were applied to your account, your costs would be higher. Your fund does not carry a “sales load.”
The calculations assume no shares were bought or sold during the period. Your actual costs may have been higher or lower, depending on the amount of your investment and the timing of any purchases or redemptions.
You can find more information about the fund’s expenses, including annual expense ratios, in the Financial Statements section of this report. For additional information on operating expenses and other shareholder costs, please refer to your fund’s current prospectus.
| Six Months Ended August 31, 2020 | | | |
| | Beginning | Ending | Expenses |
| | Account Value | Account Value | Paid During |
| Russell 3000 Index Fund | 2/29/2020 | 8/31/2020 | Period |
| Based on Actual Fund Return | | | |
| ETF Shares | $1,000.00 | $1,192.05 | $0.55 |
| Institutional Shares | 1,000.00 | 1,192.57 | 0.44 |
| Based on Hypothetical 5% Yearly Return | | | |
| ETF Shares | $1,000.00 | $1,024.63 | $0.51 |
| Institutional Shares | 1,000.00 | 1,024.73 | 0.41 |
The calculations are based on expenses incurred in the most recent six-month period. The fund’s annualized six-month expense ratios for that period are 0.10% for ETF Shares and 0.08% for Institutional Shares. The dollar amounts shown as “Expenses Paid” are equal to the annualized expense ratio multiplied by the average account value over the period, multiplied by the number of days in the most recent six-month period, then divided by the number of days in the most recent 12-month period (184/366).
Russell 3000 Index Fund
Performance Summary
All of the returns in this report represent past performance, which is not a guarantee of future results that may be achieved by the fund. (Current performance may be lower or higher than the performance data cited. For performance data current to the most recent month-end, visit our website at vanguard.com/performance.) Note, too, that both investment returns and principal value can fluctuate widely, so an investor’s shares, when sold, could be worth more or less than their original cost. The returns shown do not reflect taxes that a shareholder would pay on fund distributions or on the sale of fund shares.
Cumulative Performance: September 20, 2010, Through August 31, 2020
Initial Investment of $10,000

| | | Average Annual Total Returns | |
| | | Periods Ended August 31, 2020 | |
| | | | | Since | Final Value |
| | | One | Five | Inception | of a $10,000 |
| | | Year | Years | (9/20/2010) | Investment |
 | Russell 3000 Index Fund ETF Shares Net Asset Value | 21.31% | 13.71% | 13.85% | $36,333 |
| | Russell 3000 Index Fund ETF Shares Market Price | 21.45 | 13.70 | 13.86 | 36,355 |
 | Russell 3000 Index | 21.44 | 13.86 | 14.00 | 36,822 |
 | Dow Jones U.S. Total Stock Market Float Adjusted Index | 21.20 | 13.77 | 13.96 | 36,668 |
“Since Inception” performance is calculated from the ETF Shares’ inception date for both the fund and its comparative standards.
| | | | Since | Final Value |
| | One | Five | Inception | of a $5,000,000 |
| | Year | Years | (11/1/2010) | Investment |
| Russell 3000 Index Fund Institutional Shares | 21.38% | 13.77% | 13.63% | $17,562,977 |
| Russell 3000 Index | 21.44 | 13.86 | 13.71 | 17,684,646 |
| Dow Jones U.S. Total Stock Market Float Adjusted Index | 21.20 | 13.77 | 13.66 | 17,607,707 |
“Since Inception” performance is calculated from the Institutional Shares’ inception date for both the fund and its comparative standards.
See Financial Highlights for dividend and capital gains information.
Russell 3000 Index Fund
| Cumulative Returns of ETF Shares: September 20, 2010, Through August 31, 2020 | |
| | |
| | | | Since |
| | One | Five | Inception |
| | Year | Years | (9/20/2010) |
| Russell 3000 Index Fund ETF Shares Market Price | 21.45% | 90.03% | 263.55% |
| Russell 3000 Index Fund ETF Shares Net Asset Value | 21.31 | 90.11 | 263.33 |
| Russell 3000 Index | 21.44 | 91.35 | 268.22 |
“Since Inception” performance is calculated from the ETF Shares’ inception date for both the fund and its comparative standards.
For the ETF Shares, the market price is determined by the midpoint of the bid-offer spread as of the closing time of the New York Stock Exchange (generally 4 p.m., Eastern time). The net asset value is also determined as of the NYSE closing time. For more information about how the ETF Shares’ market prices have compared with their net asset value, visit vanguard.com, select your ETF, and then select the Price and Performance tab. The ETF premium/discount analysis there shows the percentages of days on which the ETF Shares’ market price was above or below the NAV.
Russell 3000 Index Fund
Fund Allocation
As of August 31, 2020
| Consumer Discretionary | 16.8% |
| Consumer Staples | 5.4 |
| Energy | 2.3 |
| Financial Services | 17.0 |
| Health Care | 13.7 |
| Materials & Processing | 3.2 |
| Other | 0.0 |
| Producer Durables | 8.7 |
| Technology | 28.6 |
| Utilities | 4.3 |
The table reflects the fund’s investments, except for short-term investments and derivatives. Sector categories are based on the Russell Global Sectors (“RGS”), except for the “Other” category (if applicable), which includes securities that have not been provided a RGS classification as of the effective reporting period.
The fund may invest in derivatives (such as futures and swap contracts) for various reasons, including, but not limited to, attempting to remain fully invested and tracking its target index as closely as possible.
Russell 3000 Index Fund
Financial Statements
Schedule of Investments — Investments Summary
As of August 31, 2020
This Statement summarizes the fund’s holdings by asset type. Details are reported for each of the fund’s 50 largest individual holdings and for investments that, in total for any issuer, represent more than 1% of the fund’s net assets. The total value of smaller holdings is reported as a single amount within each category.
The fund files its complete schedule of portfolio holdings with the Securities and Exchange Commission (SEC) four times in each fiscal year. For the second and fourth quarters the complete list of the fund’s holdings is available on vanguard.com and on Form N-CSR, or you can have it mailed to you without charge by calling 800-662-7447. For the first and third quarters of each fiscal year, the complete list of the fund’s holdings is available as an exhibit to its reports on Form N-PORT. The fund’s Form N-CSR and Form N-PORT reports are available on the SEC’s website at www.sec.gov.
| | | | Market | Percentage |
| | | | Value· | of Net |
| | | Shares | ($000) | Assets |
| Common Stocks | | | |
| Consumer Discretionary | | | |
| * | Amazon.com Inc. | 21,207 | 73,185 | 4.2% |
| * | Tesla Inc. | 36,970 | 18,423 | 1.1% |
| | Home Depot Inc. | 53,722 | 15,313 | 0.9% |
| | Walt Disney Co. | 90,318 | 11,910 | 0.7% |
| * | Netflix Inc. | 21,257 | 11,257 | 0.6% |
| | Comcast Corp. Class A | 226,480 | 10,149 | 0.6% |
| | Walmart Inc. | 69,664 | 9,673 | 0.6% |
| | McDonald’s Corp. | 37,212 | 7,946 | 0.5% |
| | Costco Wholesale Corp. | 22,055 | 7,668 | 0.4% |
| | NIKE Inc. Class B | 60,546 | 6,775 | 0.4% |
| | Consumer Discretionary—Other † | | 116,980 | 6.8% |
| | | | 289,279 | 16.8% |
| Consumer Staples | | | |
| | Procter & Gamble Co. | 121,889 | 16,861 | 1.0% |
| | PepsiCo Inc. | 69,493 | 9,733 | 0.6% |
| | Coca-Cola Co. | 193,150 | 9,567 | 0.5% |
| | Consumer Staples—Other † | | 56,841 | 3.3% |
| | | | 93,002 | 5.4% |
| Energy | | | |
| | Exxon Mobil Corp. | 211,383 | 8,443 | 0.5% |
| | Chevron Corp. | 93,434 | 7,842 | 0.5% |
| | Energy—Other † | | 23,122 | 1.3% |
| | | | 39,407 | 2.3% |
| Financial Services | | | |
| * | Berkshire Hathaway Inc. Class B | 97,506 | 21,260 | 1.2% |
| | Visa Inc. Class A | 84,424 | 17,897 | 1.0% |
| | Mastercard Inc. Class A | 44,110 | 15,800 | 0.9% |
| | JPMorgan Chase & Co. | 151,320 | 15,161 | 0.9% |
| * | PayPal Holdings Inc. | 58,703 | 11,984 | 0.7% |
Russell 3000 Index Fund
| | | | Market | Percentage |
| | | | Value· | of Net |
| | | Shares | ($000) | Assets |
| | Bank of America Corp. | 385,746 | 9,929 | 0.6% |
| | Financial Services—Other † | | 201,396 | 11.7% |
| | | | 293,427 | 17.0% |
| Health Care | | | |
| | Johnson & Johnson | 131,941 | 20,241 | 1.2% |
| | UnitedHealth Group Inc. | 47,211 | 14,756 | 0.9% |
| | Merck & Co. Inc. | 126,417 | 10,780 | 0.6% |
| | Pfizer Inc. | 278,086 | 10,509 | 0.6% |
| | Abbott Laboratories | 86,477 | 9,467 | 0.5% |
| | Thermo Fisher Scientific Inc. | 19,763 | 8,478 | 0.5% |
| | AbbVie Inc. | 88,015 | 8,429 | 0.5% |
| | Amgen Inc. | 29,422 | 7,453 | 0.4% |
| | Medtronic plc | 67,062 | 7,207 | 0.4% |
| | Bristol-Myers Squibb Co. | 113,226 | 7,043 | 0.4% |
| § | Health Care—Other † | | 132,388 | 7.7% |
| | | | 236,751 | 13.7% |
| Materials & Processing | | | |
| | Linde plc | 26,250 | 6,556 | 0.4% |
| | Materials & Processing—Other † | | 49,052 | 2.8% |
| | | | 55,608 | 3.2% |
| | | | | |
| §,1Other † | | 36 | 0.0% |
| | | | | |
| Producer Durables | | | |
| | Accenture plc Class A | 31,878 | 7,648 | 0.4% |
| | Union Pacific Corp. | 33,951 | 6,534 | 0.4% |
| 2 | Producer Durables—Other † | | 134,995 | 7.8% |
| | | | 149,177 | 8.6% |
| Technology | | | |
| | Apple Inc. | 818,240 | 105,586 | 6.1% |
| | Microsoft Corp. | 374,523 | 84,466 | 4.9% |
| * | Facebook Inc. Class A | 120,090 | 35,210 | 2.0% |
| * | Alphabet Inc. Class C | 15,045 | 24,586 | 1.4% |
| * | Alphabet Inc. Class A | 14,788 | 24,098 | 1.4% |
| | NVIDIA Corp. | 29,512 | 15,788 | 0.9% |
| * | Adobe Inc. | 24,051 | 12,348 | 0.7% |
| * | salesforce.com Inc. | 43,298 | 11,805 | 0.7% |
| | Intel Corp. | 212,002 | 10,802 | 0.6% |
| | Cisco Systems Inc. | 212,198 | 8,959 | 0.5% |
| | Broadcom Inc. | 19,539 | 6,783 | 0.4% |
| | QUALCOMM Inc. | 56,276 | 6,702 | 0.4% |
| | Texas Instruments Inc. | 45,958 | 6,533 | 0.4% |
| | Technology—Other † | | 139,131 | 8.1% |
| | | | 492,797 | 28.5% |
| Utilities | | | |
| | Verizon Communications Inc. | 207,322 | 12,288 | 0.7% |
| | AT&T Inc. | 356,252 | 10,620 | 0.6% |
| | NextEra Energy Inc. | 24,507 | 6,842 | 0.4% |
| | Utilities—Other † | | 45,169 | 2.6% |
| | | | 74,919 | 4.3% |
| Total Common Stocks (Cost $1,226,073) | | 1,724,403 | 99.8% |
Russell 3000 Index Fund
| | | | Market | Percentage |
| | | | Value· | of Net |
| | Coupon | Shares | ($000) | Assets |
| Temporary Cash Investments | | | | |
| Money Market Fund | | | | |
| 3,4 Vanguard Market Liquidity Fund | 0.147% | 17,775 | 1,777 | 0.1% |
| | | | | |
| 5U.S. Government and Agency Obligations † | | | 400 | 0.0% |
| Total Temporary Cash Investments (Cost $2,177) | | | 2,177 | 0.1% |
| 6Total Investments (Cost $1,228,250) | | | 1,726,580 | 99.9% |
| Other Assets and Liabilities—Net | | | 1,668 | 0.1% |
| Net Assets | | | 1,728,248 | 100.0% |
Cost is in $000.
| · | See Note A in Notes to Financial Statements. |
| * | Non-income-producing security. |
| † | Represents the aggregate value, by category, of securities that are not among the 50 largest holdings and, in total for any issuer, represent 1% or less of net assets. |
| § | Certain of the fund’s securities are valued using significant unobservable inputs. |
| 1 | “Other” represents securities that are not classified by the fund’s benchmark index. |
| 2 | Certain securities are exempt from registration under Rule 144A of the Securities Act of 1933. Such securities may be sold in transactions exempt from registration, normally to qualified institutional buyers. At August 31, 2020, the aggregate value of these securities was $98,000. |
| 3 | Affiliated money market fund available only to Vanguard funds and certain trusts and accounts managed by Vanguard. Rate shown is the 7-day yield. |
| 4 | Collateral of $509,000 was received for securities on loan. |
| 5 | Securities with a value of $251,000 have been segregated as initial margin for open futures contracts. |
| 6 | The total value of securities on loan is $483,000. |
| Derivative Financial Instruments Outstanding as of Period End | | |
| | | | | |
| Futures Contracts | | | | |
| | | | | ($000) |
| | | | | Value and |
| | | Number of | | Unrealized |
| | | Long (Short) | Notional | Appreciation |
| | Expiration | Contracts | Amount | (Depreciation) |
| Long Futures Contracts | | | | |
| E-mini S&P 500 Index | September 2020 | 17 | 2,974 | 213 |
| E-mini Russell 2000 Index | September 2020 | 7 | 546 | 27 |
| | | | | 240 |
See accompanying Notes, which are an integral part of the Financial Statements.
Russell 3000 Index Fund
Statement of Assets and Liabilities
As of August 31, 2020
| ($000s, except shares and per-share amounts) | Amount |
| Assets | |
| Investments in Securities, at Value | |
| Unaffiliated Issuers (Cost $1,226,473) | 1,724,803 |
| Affiliated Issuers (Cost $1,777) | 1,777 |
| Total Investments in Securities | 1,726,580 |
| Investment in Vanguard | 67 |
| Receivables for Accrued Income | 2,382 |
| Receivables for Capital Shares Issued | 3 |
| Total Assets | 1,729,032 |
| Liabilities | |
| Due to Custodian | 123 |
| Collateral for Securities on Loan | 509 |
| Payables for Capital Shares Redeemed | 69 |
| Payables to Vanguard | 73 |
| Variation Margin Payable—Futures Contracts | 10 |
| Total Liabilities | 784 |
| Net Assets | 1,728,248 |
| At August 31, 2020, net assets consisted of: | |
| | |
| Paid-in Capital | 1,262,526 |
| Total Distributable Earnings (Loss) | 465,722 |
| Net Assets | 1,728,248 |
| | |
| ETF Shares—Net Assets | |
| Applicable to 4,475,000 outstanding $.001 par value shares of beneficial interest (unlimited authorization) | 710,235 |
| Net Asset Value Per Share—ETF Shares | $158.71 |
| | |
| Institutional Shares—Net Assets | |
| Applicable to 3,313,994 outstanding $.001 par value shares of beneficial interest (unlimited authorization) | 1,018,013 |
| Net Asset Value Per Share—Institutional Shares | $307.19 |
See accompanying Notes, which are an integral part of the Financial Statements.
Russell 3000 Index Fund
Statement of Operations
| | Year Ended |
| | August 31, 2020 |
| | ($000) |
| Investment Income | |
| Income | |
| Dividends | 26,499 |
| Interest1 | 58 |
| Securities Lending—Net | 135 |
| Total Income | 26,692 |
| Expenses | |
| The Vanguard Group—Note B | |
| Investment Advisory Services | 216 |
| Management and Administrative—ETF Shares | 367 |
| Management and Administrative—Institutional Shares | 515 |
| Marketing and Distribution—ETF Shares | 31 |
| Marketing and Distribution—Institutional Shares | 31 |
| Custodian Fees | 60 |
| Auditing Fees | 31 |
| Shareholders’ Reports—ETF Shares | 12 |
| Shareholders’ Reports—Institutional Shares | — |
| Trustees’ Fees and Expenses | 1 |
| Total Expenses | 1,264 |
| Net Investment Income | 25,428 |
| Realized Net Gain (Loss) | |
| Investment Securities Sold1,2 | 64,053 |
| Futures Contracts | 161 |
| Realized Net Gain (Loss) | 64,214 |
| Change in Unrealized Appreciation (Depreciation) | |
| Investment Securities1 | 227,416 |
| Futures Contracts | 236 |
| Change in Unrealized Appreciation (Depreciation) | 227,652 |
| Net Increase (Decrease) in Net Assets Resulting from Operations | 317,294 |
| 1 | Interest income, realized net gain (loss), and change in unrealized appreciation (depreciation) from an affiliated company of the fund were $53,000, ($2,000), and $1,000, respectively. Purchases and sales are for temporary cash investment purposes. |
| 2 | Includes $73,893,000 of net gains resulting from in-kind redemptions. |
See accompanying Notes, which are an integral part of the Financial Statements.
Russell 3000 Index Fund
Statement of Changes in Net Assets
| | Year Ended August 31, |
| | 2020 | 2019 |
| | ($000) | ($000) |
| Increase (Decrease) in Net Assets | | |
| Operations | | |
| Net Investment Income | 25,428 | 23,173 |
| Realized Net Gain (Loss) | 64,214 | 51,327 |
| Change in Unrealized Appreciation (Depreciation) | 227,652 | (58,570) |
| Net Increase (Decrease) in Net Assets Resulting from Operations | 317,294 | 15,930 |
| Distributions1 | | |
| ETF Shares | (9,023) | (7,478) |
| Institutional Shares | (16,339) | (15,510) |
| Total Distributions | (25,362) | (22,988) |
| Capital Share Transactions | | |
| ETF Shares | 134,055 | 48,811 |
| Institutional Shares | (31,309) | 1,031 |
| Net Increase (Decrease) from Capital Share Transactions | 102,746 | 49,842 |
| Total Increase (Decrease) | 394,678 | 42,784 |
| Net Assets | | |
| Beginning of Period | 1,333,570 | 1,290,786 |
| End of Period | 1,728,248 | 1,333,570 |
1 Certain prior period numbers have been reclassified to conform with current period presentation.
See accompanying Notes, which are an integral part of the Financial Statements.
Russell 3000 Index Fund
Financial Highlights
| ETF Shares | | | | | |
| | | | | | |
| For a Share Outstanding | | | Year Ended August 31, |
| Throughout Each Period | 2020 | 2019 | 2018 | 2017 | 2016 |
| Net Asset Value, Beginning of Period | $133.26 | $133.98 | $113.52 | $99.77 | $91.43 |
| Investment Operations | | | | | |
| Net Investment Income | 2.4161 | 2.3121 | 2.0991 | 1.9801 | 1.850 |
| Net Realized and Unrealized Gain (Loss) on Investments | 25.494 | (.730) | 20.442 | 13.722 | 8.248 |
| Total from Investment Operations | 27.910 | 1.582 | 22.541 | 15.702 | 10.098 |
| Distributions | | | | | |
| Dividends from Net Investment Income | (2.460) | (2.302) | (2.081) | (1.952) | (1.758) |
| Distributions from Realized Capital Gains | — | — | — | — | — |
| Total Distributions | (2.460) | (2.302) | (2.081) | (1.952) | (1.758) |
| Net Asset Value, End of Period | $158.71 | $133.26 | $133.98 | $113.52 | $99.77 |
| | | | | | |
| Total Return | 21.31% | 1.25% | 20.07% | 15.92% | 11.20% |
| | | | | | |
| Ratios/Supplemental Data | | | | | |
| Net Assets, End of Period (Millions) | $710 | $463 | $412 | $343 | $282 |
| Ratio of Total Expenses to Average Net Assets | 0.10% | 0.10% | 0.15% | 0.15% | 0.15% |
| Ratio of Net Investment Income to Average Net Assets | 1.74% | 1.79% | 1.70% | 1.85% | 1.98% |
| Portfolio Turnover Rate2 | 8% | 10% | 14% | 16% | 8% |
| 1 | Calculated based on average shares outstanding. |
| 2 | Excludes the value of portfolio securities received or delivered as a result of in-kind purchases or redemptions of the fund’s capital shares, including ETF Creation Units. |
See accompanying Notes, which are an integral part of the Financial Statements.
Russell 3000 Index Fund
Financial Highlights
| Institutional Shares | | | | | |
| | | | | | |
| For a Share Outstanding | | | Year Ended August 31, |
| Throughout Each Period | 2020 | 2019 | 2018 | 2017 | 2016 |
| Net Asset Value, Beginning of Period | $257.87 | $259.33 | $219.72 | $193.10 | $176.98 |
| Investment Operations | | | | | |
| Net Investment Income | 4.7391 | 4.4991 | 4.2201 | 3.9521 | 3.689 |
| Net Realized and Unrealized Gain (Loss) on Investments | 49.347 | (1.394) | 39.578 | 26.583 | 15.965 |
| Total from Investment Operations | 54.086 | 3.105 | 43.798 | 30.535 | 19.654 |
| Distributions | | | | | |
| Dividends from Net Investment Income | (4.766) | (4.565) | (4.188) | (3.915) | (3.534) |
| Distributions from Realized Capital Gains | — | — | — | — | — |
| Total Distributions | (4.766) | (4.565) | (4.188) | (3.915) | (3.534) |
| Net Asset Value, End of Period | $307.19 | $257.87 | $259.33 | $219.72 | $193.10 |
| | | | | | |
| Total Return | 21.38% | 1.27% | 20.15% | 16.00% | 11.28% |
| | | | | | |
| Ratios/Supplemental Data | | | | | |
| Net Assets, End of Period (Millions) | $1,018 | $871 | $879 | $755 | $847 |
| Ratio of Total Expenses to Average Net Assets | 0.08% | 0.08% | 0.08% | 0.08% | 0.08% |
| Ratio of Net Investment Income to Average Net Assets | 1.76% | 1.81% | 1.77% | 1.92% | 2.05% |
| Portfolio Turnover Rate2 | 8% | 10% | 14% | 16% | 8% |
| 1 | Calculated based on average shares outstanding. |
| 2 | Excludes the value of portfolio securities received or delivered as a result of in-kind purchases or redemptions of the fund’s capital shares, including ETF Creation Units. |
See accompanying Notes, which are an integral part of the Financial Statements.
Russell 3000 Index Fund
Notes to Financial Statements
Vanguard Russell 3000 Index Fund is registered under the Investment Company Act of 1940 as an open-end investment company, or mutual fund. The fund offers two classes of shares: ETF Shares and Institutional Shares. Each of the share classes has different eligibility and minimum purchase requirements, and is designed for different types of investors. ETF Shares are listed for trading on Nasdaq; they can be purchased and sold through a broker.
Market disruptions associated with the COVID-19 pandemic have had a global impact, and uncertainty exists as to the long-term implications. Such disruptions can adversely affect assets of the fund and thus fund performance.
A. The following significant accounting policies conform to generally accepted accounting principles for U.S. investment companies. The fund consistently follows such policies in preparing its financial statements.
1. Security Valuation: Securities are valued as of the close of trading on the New York Stock Exchange (generally 4 p.m., Eastern time) on the valuation date. Equity securities are valued at the latest quoted sales prices or official closing prices taken from the primary market in which each security trades; such securities not traded on the valuation date are valued at the mean of the latest quoted bid and asked prices. Securities for which market quotations are not readily available, or whose values have been materially affected by events occurring before the fund’s pricing time but after the close of the securities’ primary markets, are valued at their fair values calculated according to procedures adopted by the board of trustees. Investments in Vanguard Market Liquidity Fund are valued at that fund’s net asset value. Temporary cash investments are valued using the latest bid prices or using valuations based on a matrix system (which considers such factors as security prices, yields, maturities, and ratings), both as furnished by independent pricing services.
2. Futures Contracts: The fund uses index futures contracts to a limited extent, with the objectives of maintaining full exposure to the stock market, maintaining liquidity, and minimizing transaction costs. The fund may purchase futures contracts to immediately invest incoming cash in the market, or sell futures in response to cash outflows, thereby simulating a fully invested position in the underlying index while maintaining a cash balance for liquidity. The primary risks associated with the use of futures contracts are imperfect correlation between changes in market values of stocks held by the fund and the prices of futures contracts, and the possibility of an illiquid market. Counterparty risk involving futures is mitigated because a regulated clearinghouse is the counterparty instead of the clearing broker. To further mitigate counterparty risk, the fund trades futures contracts on an exchange, monitors the financial strength of its clearing brokers and clearinghouse, and has entered into clearing agreements with its clearing brokers. The clearinghouse imposes initial margin requirements to secure the fund’s performance and requires daily settlement of variation margin representing changes in the market value of each contract. Any securities pledged as initial margin for open contracts are noted in the Schedule of Investments.
Futures contracts are valued at their quoted daily settlement prices. The notional amounts of the contracts are not recorded in the Statement of Assets and Liabilities. Fluctuations in the value of the contracts are recorded in the Statement of Assets and Liabilities as an asset (liability) and in the Statement of Operations as unrealized appreciation (depreciation) until the contracts are closed, when they are recorded as realized gains (losses) on futures contracts.
During the year ended August 31, 2020, the fund’s average investments in long and short futures contracts represented less than 1% and 0% of net assets, respectively, based on the average of the notional amounts at each quarter-end during the period.
Russell 3000 Index Fund
3. Federal Income Taxes: The fund intends to continue to qualify as a regulated investment company and distribute all of its taxable income. The fund’s tax returns are open to examination by the relevant tax authorities until expiration of the applicable statute of limitations, which is generally three years after the filing of the tax return. Management has analyzed the fund’s tax positions taken for all open federal and state income tax years, and has concluded that no provision for income tax is required in the fund’s financial statements.
4. Distributions: Distributions to shareholders are recorded on the ex-dividend date. Distributions are determined on a tax basis at the fiscal year-end and may differ from net investment income and realized capital gains for financial reporting purposes.
5. Securities Lending: To earn additional income, the fund lends its securities to qualified institutional borrowers. Security loans are subject to termination by the fund at any time, and are required to be secured at all times by collateral in an amount at least equal to the market value of securities loaned. Daily market fluctuations could cause the value of loaned securities to be more or less than the value of the collateral received. When this occurs, the collateral is adjusted and settled before the opening of the market on the next business day. The fund further mitigates its counterparty risk by entering into securities lending transactions only with a diverse group of prequalified counterparties, monitoring their financial strength, and entering into master securities lending agreements with its counterparties. The master securities lending agreements provide that, in the event of a counterparty’s default (including bankruptcy), the fund may terminate any loans with that borrower, determine the net amount owed, and sell or retain the collateral up to the net amount owed to the fund; however, such actions may be subject to legal proceedings. While collateral mitigates counterparty risk, in the event of a default, the fund may experience delays and costs in recovering the securities loaned. The fund invests cash collateral received in Vanguard Market Liquidity Fund, and records a liability in the Statement of Assets and Liabilities for the return of the collateral, during the period the securities are on loan. Collateral investments in Vanguard Market Liquidity Fund are subject to market appreciation or depreciation. Securities lending income represents fees charged to borrowers plus income earned on invested cash collateral, less expenses associated with the loan. During the term of the loan, the fund is entitled to all distributions made on or in respect of the loaned securities.
6. Credit Facilities and Interfund Lending Program: The fund and certain other funds managed by The Vanguard Group (“Vanguard”) participate in a $4.3 billion committed credit facility provided by a syndicate of lenders pursuant to a credit agreement and an uncommitted credit facility provided by Vanguard. Both facilities may be renewed annually. Each fund is individually liable for its borrowings, if any, under the credit facilities. Borrowings may be utilized for temporary or emergency purposes, subject to the fund’s regulatory and contractual borrowing restrictions. With respect to the committed credit facility, the participating funds are charged administrative fees and an annual commitment fee of 0.10% of the undrawn committed amount of the facility; these fees are allocated to the funds based on a method approved by the fund’s board of trustees and included in Management and Administrative expenses on the fund’s Statement of Operations. Any borrowings under either facility bear interest at a rate based upon the higher of the one-month London Interbank Offered Rate (or an acceptable alternate rate, if necessary), federal funds effective rate, or overnight bank funding rate plus an agreed-upon spread, except that borrowings under the uncommitted credit facility may bear interest based upon an alternative rate agreed to by the fund and Vanguard.
Russell 3000 Index Fund
In accordance with an exemptive order (the “Order”) from the SEC, the fund may participate in a joint lending and borrowing program that allows registered open-end Vanguard funds to borrow money from and lend money to each other for temporary or emergency purposes (the “Interfund Lending Program”), subject to compliance with the terms and conditions of the Order, and to the extent permitted by the fund’s investment objective and investment policies. Interfund loans and borrowings normally extend overnight, but can have a maximum duration of seven days. Loans may be called on one business day’s notice. The interest rate to be charged is governed by the conditions of the Order and internal procedures adopted by the board of trustees. The board of trustees is responsible for overseeing the Interfund Lending Program.
For the year ended August 31, 2020, the fund did not utilize the credit facilities or the Interfund Lending Program.
7. Other: Dividend income is recorded on the ex-dividend date. Interest income includes income distributions received from Vanguard Market Liquidity Fund and is accrued daily. Premiums and discounts on debt securities are amortized and accreted, respectively, to interest income over the lives of the respective securities, except for premiums on certain callable debt securities that are amortized to the earliest call date. Security transactions are accounted for on the date securities are bought or sold. Costs used to determine realized gains (losses) on the sale of investment securities are those of the specific securities sold.
Each class of shares has equal rights as to assets and earnings, except that each class separately bears certain class-specific expenses related to maintenance of shareholder accounts (included in Management and Administrative expenses) and shareholder reporting. Marketing and distribution expenses are allocated to each class of shares based on a method approved by the board of trustees. Income, other non-class-specific expenses, and gains and losses on investments are allocated to each class of shares based on its relative net assets.
B. In accordance with the terms of a Funds’ Service Agreement (the “FSA”) between Vanguard and the fund, Vanguard furnishes to the fund investment advisory, corporate management, administrative, marketing, and distribution services at Vanguard’s cost of operations (as defined by the FSA). These costs of operations are allocated to the fund based on methods and guidelines approved by the board of trustees and are generally settled twice a month.
Upon the request of Vanguard, the fund may invest up to 0.40% of its net assets as capital in Vanguard. At August 31, 2020, the fund had contributed to Vanguard capital in the amount of $67,000, representing less than 0.01% of the fund’s net assets and 0.03% of Vanguard’s capital received pursuant to the FSA. The fund’s trustees and officers are also directors and employees, respectively, of Vanguard.
C. Various inputs may be used to determine the value of the fund’s investments and derivatives. These inputs are summarized in three broad levels for financial statement purposes. The inputs or methodologies used to value securities are not necessarily an indication of the risk associated with investing in those securities.
Level 1—Quoted prices in active markets for identical securities.
Level 2—Other significant observable inputs (including quoted prices for similar securities, interest rates, prepayment speeds, credit risk, etc.).
Level 3—Significant unobservable inputs (including the fund’s own assumptions used to determine the fair value of investments). Any investments and derivatives valued with significant unobservable inputs are noted on the Schedule of Investments.
Russell 3000 Index Fund
The following table summarizes the market value of the fund’s investments and derivatives as of August 31, 2020, based on the inputs used to value them:
| | Level 1 | Level 2 | Level 3 | Total |
| | ($000) | ($000) | ($000) | ($000) |
| Investments | | | | |
| Assets | | | | |
| Common Stocks | 1,724,398 | — | 5 | 1,724,403 |
| Temporary Cash Investments | 1,777 | 400 | — | 2,177 |
| Total | 1,726,175 | 400 | 5 | 1,726,580 |
| Derivative Financial Instruments | | | | |
| Liabilities | | | | |
| Futures Contracts1 | 10 | — | — | 10 |
1 Represents variation margin on the last day of the reporting period.
D. Permanent differences between book-basis and tax-basis components of net assets are reclassified among capital accounts in the financial statements to reflect their tax character. These reclassifications have no effect on net assets or net asset value per share. As of period end, permanent differences primarily attributable to the accounting for in-kind redemptions and passive foreign investment companies were reclassified between the following accounts:
| | Amount |
| | ($000) |
| Paid-in Capital | 73,894 |
| Total Distributable Earnings (Loss) | (73,894) |
Temporary differences between book-basis and tax-basis components of total distributable earnings (loss) arise when certain items of income, gain, or loss are recognized in different periods for financial statement and tax purposes; these differences will reverse at some time in the future. The differences are primarily related to the deferral of losses from wash sales; the recognition of unrealized gains or losses from certain derivative contracts; the recognition of unrealized gains from passive foreign investment companies; and the classification of securities for tax purposes. As of period end, the tax-basis components of total distributable earnings (loss) are detailed in the table as follows:
| | Amount |
| | ($000) |
| Undistributed Ordinary Income | 4,921 |
| Undistributed Long-Term Gains | — |
| Capital Loss Carryforwards | (37,529) |
| Qualified Late-Year Losses | — |
| Net Unrealized Gains (Losses) | 498,330 |
Russell 3000 Index Fund
The tax character of distributions paid was as follows:
| | Year Ended August 31, |
| | 2020 | 2019 |
| | Amount | Amount |
| | ($000) | ($000) |
| Ordinary Income* | 25,362 | 22,988 |
| Long-Term Capital Gains | — | — |
| Total | 25,362 | 22,988 |
* Includes short-term capital gains, if any.
As of August 31, 2020, gross unrealized appreciation and depreciation for investments and derivatives based on cost for U.S. federal income tax purposes were as follows:
| | Amount |
| | ($000) |
| Tax Cost | 1,228,250 |
| Gross Unrealized Appreciation | 632,727 |
| Gross Unrealized Depreciation | (134,397) |
| Net Unrealized Appreciation (Depreciation) | 498,330 |
E. During the year ended August 31, 2020, the fund purchased $382,571,000 of investment securities and sold $277,658,000 of investment securities, other than temporary cash investments. Purchases and sales include $194,184,000 and $167,078,000, respectively, in connection with in-kind purchases and redemptions of the fund’s capital shares.
F. Capital share transactions for each class of shares were:
| | Year Ended August 31, |
| | 2020 | | 2019 |
| | Amount | Shares | | Amount | Shares |
| | ($000) | (000) | | ($000) | (000) |
| ETF Shares | | | | | |
| Issued | 303,642 | 2,225 | | 109,413 | 875 |
| Issued in Lieu of Cash Distributions | — | — | | — | — |
| Redeemed | (169,587) | (1,225) | | (60,602) | (475) |
| Net Increase (Decrease)—ETF Shares | 134,055 | 1,000 | | 48,811 | 400 |
| Institutional Shares | | | | | |
| Issued | 166,350 | 666 | | 196,124 | 780 |
| Issued in Lieu of Cash Distributions | 15,624 | 62 | | 15,108 | 61 |
| Redeemed | (213,283) | (790) | | (210,201) | (854) |
| Net Increase (Decrease)—Institutional Shares | (31,309) | (62) | | 1,031 | (13) |
G. Management has determined that no events or transactions occurred subsequent to August 31, 2020, that would require recognition or disclosure in these financial statements.
Report of Independent Registered Public Accounting Firm
To the Board of Trustees of Vanguard Scottsdale Funds and Shareholders of Vanguard Russell 3000 Index Fund
Opinion on the Financial Statements
We have audited the accompanying statement of assets and liabilities, including the schedule of investments—investments summary, of Vanguard Russell 3000 Index Fund (one of the funds constituting Vanguard Scottsdale Funds, referred to hereafter as the “Fund”) as of August 31, 2020, the related statement of operations for the year ended August 31, 2020, the statement of changes in net assets for each of the two years in the period ended August 31, 2020, including the related notes, and the financial highlights for each of the five years in the period ended August 31, 2020 (collectively referred to as the “financial statements”). In our opinion, the financial statements present fairly, in all material respects, the financial position of the Fund as of August 31, 2020, the results of its operations for the year then ended, the changes in its net assets for each of the two years in the period ended August 31, 2020 and the financial highlights for each of the five years in the period ended August 31, 2020 in conformity with accounting principles generally accepted in the United States of America.
Basis for Opinion
These financial statements are the responsibility of the Fund’s management. Our responsibility is to express an opinion on the Fund’s financial statements based on our audits. We are a public accounting firm registered with the Public Company Accounting Oversight Board (United States) (“PCAOB”) and are required to be independent with respect to the Fund in accordance with the U.S. federal securities laws and the applicable rules and regulations of the Securities and Exchange Commission and the PCAOB.
We conducted our audits of these financial statements in accordance with the standards of the PCAOB. Those standards require that we plan and perform the audit to obtain reasonable assurance about whether the financial statements are free of material misstatement, whether due to error or fraud.
Our audits included performing procedures to assess the risks of material misstatement of the financial statements, whether due to error or fraud, and performing procedures that respond to those risks. Such procedures included examining, on a test basis, evidence regarding the amounts and disclosures in the financial statements. Our audits also included evaluating the accounting principles used and significant estimates made by management, as well as evaluating the overall presentation of the financial statements. Our procedures included confirmation of securities owned as of August 31, 2020 by correspondence with the custodian and brokers and by agreement to the underlying ownership records of the transfer agent; when replies were not received from brokers, we performed other auditing procedures. We believe that our audits provide a reasonable basis for our opinion.
/s/PricewaterhouseCoopers LLP
Philadelphia, Pennsylvania
October 19, 2020
We have served as the auditor of one or more investment companies in The Vanguard Group of Funds since 1975.
Special 2020 tax information (unaudited) for Vanguard Russell 3000 Index Fund
This information for the fiscal year ended August 31, 2020, is included pursuant to provisions of the Internal Revenue Code.
The fund distributed $25,350,000 of qualified dividend income to shareholders during the fiscal year.
For corporate shareholders, 94.7% of investment income (dividend income plus short-term gains, if any) qualifies for the dividends-received deduction.
Trustees Approve Advisory Arrangement
The board of trustees of Vanguard Russell 3000 Index Fund has renewed the fund’s investment advisory arrangement with The Vanguard Group, Inc. (Vanguard), through its Equity Index Group. The board determined that continuing the fund’s internalized management structure was in the best interests of the fund and its shareholders.
The board based its decision upon an evaluation of the advisor’s investment staff, portfolio management process, and performance. This evaluation included information provided to the board by Vanguard’s Portfolio Review Department, which is responsible for fund and advisor oversight and product management. The Portfolio Review Department met regularly with the advisor and made monthly presentations to the board during the fiscal year that directed the board’s focus to relevant information and topics.
The board, or an investment committee made up of board members, also received information throughout the year through advisor presentations. For each advisor presentation, the board was provided with letters and reports that included information about, among other things, the advisory firm and the advisor’s assessment of the investment environment, portfolio performance, and portfolio characteristics.
In addition, the board received monthly reports, which included a Market and Economic Report, a Fund Dashboard Monthly Summary, and a Fund Performance Report.
Prior to their meeting, the trustees were provided with a memo and materials that summarized the information they received over the course of the year. They also considered the factors discussed below, among others. However, no single factor determined whether the board approved the arrangement. Rather, it was the totality of the circumstances that drove the board’s decision.
Nature, extent, and quality of services
The board reviewed the quality of the investment management services provided to the fund since its inception in 2010, and took into account the organizational depth and stability of the advisor. The board considered that Vanguard has been managing investments for more than four decades. The Equity Index Group adheres to a sound, disciplined investment management process; the team has considerable experience, stability, and depth.
The board concluded that Vanguard’s experience, stability, depth, and performance, among other factors, warranted continuation of the advisory arrangement.
Investment performance
The board considered the fund’s performance since its inception, including any periods of outperformance or underperformance compared with its target index and peer group. The board concluded that the performance was such that the advisory arrangement should continue.
Cost
The board concluded that the fund’s expense ratio was well below the average expense ratio charged by funds in its peer group and that the fund’s advisory expenses were also well below the peer-group average.
The board does not conduct a profitability analysis of Vanguard because of Vanguard’s unique structure. Unlike most other mutual fund management companies, Vanguard is owned by the funds it oversees.
The benefit of economies of scale
The board concluded that the fund’s arrangement with Vanguard ensures that the fund will realize economies of scale as it grows, with the cost to shareholders declining as fund assets increase.
The board will consider whether to renew the advisory arrangement again after a one-year period.
Liquidity Risk Management
Vanguard funds (except for the money market funds) have adopted and implemented a written liquidity risk management program (the “Program”) as required by Rule 22e-4 under the Investment Company Act of 1940. Rule 22e-4 requires that each fund adopt a program that is reasonably designed to assess and manage the fund’s liquidity risk, which is the risk that the fund could not meet redemption requests without significant dilution of remaining investors’ interests in the fund.
Assessment and management of a fund’s liquidity risk under the Program take into consideration certain factors, such as the fund’s investment strategy and the liquidity of its portfolio investments during normal and reasonably foreseeable stressed conditions, its short- and long-term cash-flow projections during both normal and reasonably foreseeable stressed conditions, and its cash and cash-equivalent holdings and access to other funding sources. As required by the rule, the Program includes policies and procedures for classification of fund portfolio holdings in four liquidity categories, maintaining certain levels of highly liquid investments, and limiting holdings of illiquid investments.
The board of trustees of Vanguard Scottsdale Funds approved the appointment of liquidity risk management program administrators responsible for administering Vanguard Russell 3000 Index Fund’s Program and for carrying out the specific responsibilities set forth in the Program, including reporting to the board on at least an annual basis regarding the Program’s operation, its adequacy, and the effectiveness of its implementation for the past year (the “Program Administrator Report”). The board has reviewed the Program Administrator Report covering the period from December 1, 2018, through December 31, 2019 (the “Review Period”). The Program Administrator Report stated that during the Review Period the Program operated and was implemented effectively to manage the fund’s liquidity risk.
The Product is not sponsored, endorsed, sold or promoted by Frank Russell Company (“Russell”). Russell makes no representation or warranty, express or implied, to the owners of the Product or any member of the public regarding the advisability of investing in securities generally or in the Product particularly or the ability of the Russell 3000 Index to track general stock market performance or a segment of the same. Russell’s publication of the Russell 3000 Index in no way suggests or implies an opinion by Russell as to the advisability of investment in any or all of the securities upon which the Russell 3000 Index is based. Russell’s only relationship to The Vanguard Group, Inc. is the licensing of certain trademarks and trade names of Russell and of the Russell 3000 Index which is determined, composed and calculated by Russell without regard to The Vanguard Group, Inc. or the Product. Russell is not responsible for and has not reviewed the Product nor any associated literature or publications and Russell makes no representation or warranty express or implied as to their accuracy or completeness, or otherwise. Russell has no obligation or liability in connection with the administration, marketing or trading of the Product.
Russell makes no representation, warranty or guarantee as to the accuracy, completeness, reliability or otherwise of the Russell Indexes or any data included in the Russell Indexes. Russell does not guarantee the accuracy and/or the completeness of the Russell 3000 Index or any data included therein and Russell shall have no liability for any errors, omissions, or interruptions therein. Russell makes no warranty, express or implied, as to the use of or results to be obtained by The Vanguard Group, Inc., investors, owners of the Product, or any other person or entity from the use of the Russell 3000 Index or any data included therein. Russell makes no express or implied warranties, and expressly disclaims all warranties of merchantability or fitness for a particular purpose or use with respect to the Russell 3000 Index or any data included therein. Without limiting any of the foregoing, in no event shall Russell have any liability for any special, punitive, indirect, or consequential damages (including lost profits), even if notified of the possibility of such damages.
Russell reserves the right, at any time and without notice, to alter, amend, terminate or in any way change the Russell Indexes. Russell has no obligation to take the needs of any particular fund or its participants or any other product or person into consideration in determining, composing or calculating any of the Russell Indexes.
This page intentionally left blank.
The People Who Govern Your Fund
The trustees of your mutual fund are there to see that the fund is operated and managed in your best interests since, as a shareholder, you are a part owner of the fund. Your fund’s trustees also serve on the board of directors of The Vanguard Group, Inc., which is owned by the Vanguard funds and provides services to them.
A majority of Vanguard’s board members are independent, meaning that they have no affiliation with Vanguard or the funds they oversee, apart from the sizable personal investments they have made as private individuals. The independent board members have distinguished backgrounds in business, academia, and public service. Each of the trustees and executive officers oversees 212 Vanguard funds.
Information for each trustee and executive officer of the fund appears below. That information, as well as the Vanguard fund count, is as of the date on the cover of this fund report. The mailing address of the trustees and officers is P.O. Box 876, Valley Forge, PA 19482. More information about the trustees is in the Statement of Additional Information, which can be obtained, without charge, by contacting Vanguard at 800-662-7447, or online at vanguard.com.
Interested Trustee1
Mortimer J. Buckley
Born in 1969. Trustee since January 2018. Principal occupation(s) during the past five years and other experience: chairman of the board (2019–present) of Vanguard and of each of the investment companies served by Vanguard; chief executive officer (2018–present) of Vanguard; chief executive officer, president, and trustee (2018–present) of each of the investment companies served by Vanguard; president and director (2017–present) of Vanguard; and president (2018–present) of Vanguard Marketing Corporation. Chief investment officer (2013–2017), managing director (2002–2017), head of the Retail Investor Group (2006–2012), and chief information officer (2001–2006) of Vanguard. Chairman of the board (2011–2017) and trustee (2009–2017) of the Children’s Hospital of Philadelphia; and trustee (2018–present) and vice chair (2019–present) of The Shipley School.
Independent Trustees
Emerson U. Fullwood
Born in 1948. Trustee since January 2008. Principal occupation(s) during the past five years and other experience: executive chief staff and marketing officer for North America and corporate vice president (retired 2008) of Xerox Corporation (document management products and services). Former president of the Worldwide Channels Group, Latin America, and Worldwide Customer Service and executive chief staff officer of Developing Markets of Xerox. Executive in residence and 2009–2010 Distinguished Minett Professor at the Rochester Institute of Technology. Director of SPX FLOW, Inc. (multi-industry manufacturing). Director of the University of Rochester Medical Center, the Monroe Community College Foundation, the United Way of Rochester, North Carolina A&T University, and Roberts Wesleyan College. Trustee of the University of Rochester.
Amy Gutmann
Born in 1949. Trustee since June 2006. Principal occupation(s) during the past five years and other experience: president (2004–present) of the University of Pennsylvania. Christopher H. Browne Distinguished Professor of Political Science, School of Arts and Sciences, and professor of communication, Annenberg School for Communication, with secondary faculty appointments in the Department of Philosophy, School of Arts and Sciences, and at the Graduate School of Education, University of Pennsylvania.
F. Joseph Loughrey
Born in 1949. Trustee since October 2009. Principal occupation(s) during the past five years and other experience: president and chief operating officer (retired 2009) and vice chairman of the board (2008–2009) of Cummins Inc. (industrial machinery). Chairman of the board of Hillenbrand, Inc. (specialized consumer services) and the Lumina Foundation. Director of the V Foundation. Member of the advisory
| 1 | Mr. Buckley is considered an “interested person,” as defined in the Investment Company Act of 1940, because he is an officer of the Vanguard funds. |
council for the College of Arts and Letters and chair of the advisory board to the Kellogg Institute for International Studies, both at the University of Notre Dame.
Mark Loughridge
Born in 1953. Trustee since March 2012. Principal occupation(s) during the past five years and other experience: senior vice president and chief financial officer (retired 2013) of IBM (information technology services). Fiduciary member of IBM’s Retirement Plan Committee (2004–2013), senior vice president and general manager (2002–2004) of IBM Global Financing, vice president and controller (1998–2002) of IBM, and a variety of other prior management roles at IBM. Member of the Council on Chicago Booth.
Scott C. Malpass
Born in 1962. Trustee since March 2012. Principal occupation(s) during the past five years and other experience: chief investment officer (retired June 2020) and vice president (retired June 2020) of the University of Notre Dame. Assistant professor of finance at the Mendoza College of Business, University of Notre Dame, and member of the Notre Dame 403(b) Investment Committee (retired June 2020). Member of the board of Catholic Investment Services, Inc. (investment advisors) and the board of superintendence of the Institute for the Works of Religion.
Deanna Mulligan
Born in 1963. Trustee since January 2018. Principal occupation(s) during the past five years and other experience: chief executive officer (2011–present) of The Guardian Life Insurance Company of America. President (2010–2019), chief operating officer (2010–2011), and executive vice president (2008–2010) of Individual Life and Disability of The Guardian Life Insurance Company of America. Member of the board of The Guardian Life Insurance Company of America, the American Council of Life Insurers, and the Economic Club of New York. Trustee of the Partnership for New York City (business leadership), Chief Executives for Corporate Purpose, NewYork- Presbyterian Hospital, Catalyst, and the Bruce Museum (arts and science). Member of the Advisory Council for the Stanford Graduate School of Business.
André F. Perold
Born in 1952. Trustee since December 2004. Principal occupation(s) during the past five years and other experience: George Gund Professor of Finance and Banking, Emeritus at the Harvard Business School (retired 2011). Chief investment officer and co-managing partner of HighVista Strategies (private investment firm). Member of the board of advisors and member of the investment committee of the Museum of Fine Arts Boston. Member of the board (2018–present) of RIT Capital Partners (investment firm). Member of the investment committee of Partners Health Care System.
Sarah Bloom Raskin
Born in 1961. Trustee since January 2018. Principal occupation(s) during the past five years and other experience: deputy secretary (2014–2017) of the United States Department of the Treasury. Governor (2010–2014) of the Federal Reserve Board. Commissioner (2007–2010) of financial regulation for the State of Maryland. Member of the board of directors (2012–2014) of Neighborhood Reinvestment Corporation. Director (2017–present) of i(x) Investments, LLC; director (2017–present) of Reserve Trust. Rubenstein Fellow (2017–present) of Duke University; trustee (2017–present) of Amherst College, and trustee (2019–present) of the Folger Shakespeare Library.
Peter F. Volanakis
Born in 1955. Trustee since July 2009. Principal occupation(s) during the past five years and other experience: president and chief operating officer (retired 2010) of Corning Incorporated (communications equipment) and director of Corning Incorporated (2000–2010) and Dow Corning (2001–2010). Director (2012) of SPX Corporation (multi-industry manufacturing). Overseer of the Amos Tuck School of Business Administration, Dartmouth College (2001–2013). Chairman of the board of trustees of Colby-Sawyer College. Member of the board of Hypertherm Inc. (industrial cutting systems, software, and consumables).
Executive Officers
John Bendl
Born in 1970. Principal occupation(s) during the past five years and other experience: principal of Vanguard. Chief financial officer (2019–present) of each of the investment companies served by Vanguard. Chief accounting officer, treasurer, and controller of Vanguard (2017–present). Partner (2003–2016) at KPMG (audit, tax, and advisory services).
Glenn Booraem
Born in 1967. Principal occupation(s) during the past five years and other experience: principal of Vanguard. Investment stewardship officer (2017–present), treasurer (2015–2017), controller (2010–2015), and assistant controller (2001–2010) of each of the investment companies served by Vanguard.
Christine M. Buchanan
Born in 1970. Principal occupation(s) during the past five years and other experience: principal of Vanguard. Treasurer (2017–present) of each of the investment companies served by Vanguard. Partner (2005–2017) at KPMG (audit, tax, and advisory services).
David Cermak
Born in 1960. Principal occupation(s) during the past five years and other experience: principal of Vanguard. Finance director (2019–present) of each of the investment companies served by Vanguard. Managing director and head (2017–present) of Vanguard Investments Singapore. Managing director and head (2017–2019) of Vanguard Investments Hong Kong. Representative director and head (2014–2017) of Vanguard Investments Japan.
Thomas J. Higgins
Born in 1957. Principal occupation(s) during the past five years and other experience: principal of Vanguard. Finance director (2019–present), chief financial officer (2008–2019), and treasurer (1998–2008) of each of the investment companies served by Vanguard.
Peter Mahoney
Born in 1974. Principal occupation(s) during the past five years and other experience: principal of Vanguard. Controller (2015–present) of each of the investment companies served by Vanguard. Head of International Fund Services (2008–2014) at Vanguard.
Anne E. Robinson
Born in 1970. Principal occupation(s) during the past five years and other experience: general counsel (2016–present) of Vanguard. Secretary (2016–present) of Vanguard and of each of the investment companies served by Vanguard. Managing director (2016–present) of Vanguard. Managing director and general counsel of Global Cards and Consumer Services (2014–2016) at Citigroup. Counsel (2003–2014) at American Express.
Michael Rollings
Born in 1963. Principal occupation(s) during the past five years and other experience: finance director (2017–present) and treasurer (2017) of each of the investment companies served by Vanguard. Managing director (2016–present) of Vanguard. Chief financial officer (2016–present) of Vanguard. Director (2016–present) of Vanguard Marketing Corporation. Executive vice president and chief financial officer (2006–2016) of MassMutual Financial Group.
John E. Schadl
Born in 1972. Principal occupation(s) during the past five years and other experience: principal of Vanguard. Chief compliance officer (2019–present) of Vanguard and of each of the investment companies served by Vanguard. Assistant vice president (2019–present) of Vanguard Marketing Corporation.
| Vanguard Senior Management Team |
| | |
| Joseph Brennan | Chris D. McIsaac |
| Mortimer J. Buckley | James M. Norris |
| Gregory Davis | Thomas M. Rampulla |
| John James | Karin A. Risi |
| Martha G. King | Anne E. Robinson |
| John T. Marcante | Michael Rollings |
Connect with Vanguard® > vanguard.com
Fund Information > 800-662-7447
Direct Investor Account Services > 800-662-2739
Institutional Investor Services > 800-523-1036
Text Telephone for People
Who Are Deaf or Hard of Hearing > 800-749-7273
This material may be used in conjunction with the offering of shares of any Vanguard fund only if preceded or accompanied by the fund’s current prospectus.
All comparative mutual fund data are from Morningstar, Inc., unless otherwise noted.
You can obtain a free copy of Vanguard’s proxy voting guidelines by visiting vanguard.com/proxyreporting or by calling Vanguard at 800-662-2739. The guidelines are also available from the SEC’s website, www.sec.gov. In addition, you may obtain a free report on how your fund voted the proxies for securities it owned during the 12 months ended June 30. To get the report, visit either vanguard.com/proxyreporting or www.sec.gov.
You can review information about your fund on the SEC’s website, and you can receive copies of this information, for a fee, by sending a request via email addressed to publicinfo@sec.gov.
Source for Bloomberg Barclays indexes: Bloomberg Index Services Limited. Copyright 2020, Bloomberg. All rights reserved.
| © 2020 The Vanguard Group, Inc. |
| All rights reserved. |
| U.S. Patent Nos. 6,879,964; 7,337,138; |
| | 7,720,749; 7,925,573; 8,090,646; 8,417,623; and 8,626,636. |
| | Vanguard Marketing Corporation, Distributor. |
| | |
| Q18540 102020 |

| |
| |
| |
| Annual Report | August 31, 2020 |
| |
| |
| Vanguard Sector Bond Index Funds |
| |
| |
| |
| |
| |
| |
| |
| |
| |
| |
| Vanguard Short-Term Treasury Index Fund |
| |
| Vanguard Intermediate-Term Treasury Index Fund |
| |
| Vanguard Long-Term Treasury Index Fund |
| |
| Vanguard Short-Term Corporate Bond Index Fund |
| |
| Vanguard Intermediate-Term Corporate Bond Index Fund |
| |
| Vanguard Long-Term Corporate Bond Index Fund |
| |
| Vanguard Mortgage-Backed Securities Index Fund |
| |
| |
| |
| |
| |
| |
| |
| |
| |
| |
| |
| |
| |
| |
| |
| |
| |
| See the inside front cover for important information about access to your fund’s annual and semiannual shareholder reports. |
| |
| |
Important information about access to shareholder reports
Beginning on January 1, 2021, as permitted by regulations adopted by the Securities and Exchange Commission, paper copies of your fund’s annual and semiannual shareholder reports will no longer be sent to you by mail, unless you specifically request them. Instead, you will be notified by mail each time a report is posted on the website and will be provided with a link to access the report.
If you have already elected to receive shareholder reports electronically, you will not be affected by this change and do not need to take any action. You may elect to receive shareholder reports and other communications from the fund electronically by contacting your financial intermediary (such as a broker-dealer or bank) or, if you invest directly with the fund, by calling Vanguard at one of the phone numbers on the back cover of this report or by logging on to vanguard.com.
You may elect to receive paper copies of all future shareholder reports free of charge. If you invest through a financial intermediary, you can contact the intermediary to request that you continue to receive paper copies. If you invest directly with the fund, you can call Vanguard at one of the phone numbers on the back cover of this report or log on to vanguard.com. Your election to receive paper copies will apply to all the funds you hold through an intermediary or directly with Vanguard.
| Contents | |
| | |
| Your Fund’s Performance at a Glance | 1 |
| | |
| About Your Fund’s Expenses | 2 |
| | |
| Short-Term Treasury Index Fund | 5 |
| | |
| Intermediate-Term Treasury Index Fund | 22 |
| | |
| Long-Term Treasury Index Fund | 39 |
| | |
| Short-Term Corporate Bond Index Fund | 55 |
| | |
| Intermediate-Term Corporate Bond Index Fund | 73 |
| | |
| Long-Term Corporate Bond Index Fund | 92 |
| | |
| Mortgage-Backed Securities Index Fund | 111 |
| | |
| Trustees Approve Advisory Arrangements | 132 |
| | |
| Liquidity Risk Management | 134 |
Please note: The opinions expressed in this report are just that—informed opinions. They should not be considered promises or advice. Also, please keep in mind that the information and opinions cover the period through the date on the front of this report. Of course, the risks of investing in your fund are spelled out in the prospectus.
Your Fund’s Performance at a Glance
· For the 12 months ended August 31, 2020, bond yields fell significantly despite a spike in volatility and a March erosion in liquidity resulting from the pandemic, and bond prices rose amid unprecedented actions from policymakers.
· Returns of the funds in this report ranged from more than 3% for Vanguard Short-Term Treasury Index Fund to about 12% for Vanguard Long-Term Treasury Index Fund. The funds mostly performed in line with their benchmarks after taking expenses into account.
· The yield of the 30-year U.S. Treasury bond dropped over the 12 months from 1.96% to 1.47%. Inflation remained low. Long-term Treasuries outperformed not only short-term Treasuries but also long-term corporates.
· Despite record corporate bond issuance, spreads tightened, in part because of the Federal Reserve’s decision in March to buy corporate bonds. (Spreads are the additional yields that corporate bonds offer above Treasuries with comparable maturities.)
· By maturity, longer-term corporates outpaced their shorter-term counterparts. By credit quality, results were more nuanced.
| Market Barometer | | | |
| | | Average Annual Total Returns |
| | | Periods Ended August 31, 2020 |
| | One Year | Three Years | Five Years |
| Stocks | | | |
| Russell 1000 Index (Large-caps) | 22.50% | 14.58% | 14.31% |
| Russell 2000 Index (Small-caps) | 6.02 | 5.03 | 7.65 |
| Russell 3000 Index (Broad U.S. market) | 21.44 | 13.95 | 13.86 |
| FTSE All-World ex US Index (International) | 8.78 | 2.92 | 6.00 |
| | | | |
| Bonds | | | |
| Bloomberg Barclays U.S. Aggregate Bond Index (Broad taxable market) | 6.47% | 5.09% | 4.33% |
| Bloomberg Barclays Municipal Bond Index (Broad tax-exempt market) | 3.24 | 4.09 | 3.99 |
| FTSE Three-Month U.S. Treasury Bill Index | 1.18 | 1.67 | 1.15 |
| | | | |
| CPI | | | |
| Consumer Price Index | 1.31% | 1.92% | 1.75% |
Except for ETF Shares, any returns cited for Vanguard Intermediate-Term Corporate Bond Index Fund or Vanguard Long-Term Corporate Bond Index Fund reflect purchase fees.
About Your Fund’s Expenses
As a shareholder of the fund, you incur ongoing costs, which include costs for portfolio management, administrative services, and shareholder reports (like this one), among others. Operating expenses, which are deducted from a fund’s gross income, directly reduce the investment return of the fund.
A fund’s expenses are expressed as a percentage of its average net assets. This figure is known as the expense ratio. The following examples are intended to help you understand the ongoing costs (in dollars) of investing in your fund and to compare these costs with those of other mutual funds. The examples are based on an investment of $1,000 made at the beginning of the period shown and held for the entire period.
The accompanying table illustrates your fund’s costs in two ways:
· Based on actual fund return. This section helps you to estimate the actual expenses that you paid over the period. The “Ending Account Value” shown is derived from the fund’s actual return, and the third column shows the dollar amount that would have been paid by an investor who started with $1,000 in the fund. You may use the information here, together with the amount you invested, to estimate the expenses that you paid over the period.
To do so, simply divide your account value by $1,000 (for example, an $8,600 account value divided by $1,000 = 8.6), then multiply the result by the number given for your fund under the heading “Expenses Paid During Period.”
· Based on hypothetical 5% yearly return. This section is intended to help you compare your fund’s costs with those of other mutual funds. It assumes that the fund had a yearly return of 5% before expenses, but that the expense ratio is unchanged. In this case—because the return used is not the fund’s actual return—the results do not apply to your investment. The example is useful in making comparisons because the Securities and Exchange Commission requires all mutual funds to calculate expenses based on a 5% return. You can assess your fund’s costs by comparing this hypothetical example with the hypothetical examples that appear in shareholder reports of other funds.
Note that the expenses shown in the table are meant to highlight and help you compare ongoing costs only and do not reflect transaction costs incurred by the fund for buying and selling securities. Further, the expenses do not include any purchase, redemption, or account service fees described in the fund prospectus. If such fees were applied to your account, your costs would be higher. Your fund does not carry a “sales load.”
The calculations assume no shares were bought or sold during the period. Your actual costs may have been higher or lower, depending on the amount of your investment and the timing of any purchases or redemptions.
You can find more information about the fund’s expenses, including annual expense ratios, in the Financial Statements section of this report. For additional information on operating expenses and other shareholder costs, please refer to your fund’s current prospectus.
| Six Months Ended August 31, 2020 | | | |
| | | | |
| | Beginning | Ending | Expenses |
| | Account Value | Account Value | Paid During |
| | 2/29/2020 | 8/31/2020 | Period |
| Based on Actual Fund Return | | | |
| Short-Term Treasury Index Fund | | | |
| ETF Shares | $1,000.00 | $1,015.85 | $0.25 |
| Admiral™ Shares | 1,000.00 | 1,015.56 | 0.35 |
| Institutional Shares | 1,000.00 | 1,015.99 | 0.25 |
| Intermediate-Term Treasury Index Fund | | | |
| ETF Shares | $1,000.00 | $1,035.10 | $0.26 |
| Admiral Shares | 1,000.00 | 1,035.12 | 0.36 |
| Institutional Shares | 1,000.00 | 1,035.16 | 0.26 |
| Long-Term Treasury Index Fund | | | |
| ETF Shares | $1,000.00 | $1,051.10 | $0.26 |
| Admiral Shares | 1,000.00 | 1,051.13 | 0.36 |
| Institutional Shares | 1,000.00 | 1,051.28 | 0.26 |
| Short-Term Corporate Bond Index Fund | | | |
| ETF Shares | $1,000.00 | $1,023.58 | $0.25 |
| Admiral Shares | 1,000.00 | 1,023.60 | 0.36 |
| Institutional Shares | 1,000.00 | 1,023.85 | 0.25 |
| Intermediate-Term Corporate Bond Index Fund | | | |
| ETF Shares | $1,000.00 | $1,036.03 | $0.26 |
| Admiral Shares | 1,000.00 | 1,036.06 | 0.36 |
| Institutional Shares | 1,000.00 | 1,036.17 | 0.26 |
| Long-Term Corporate Bond Index Fund | | | |
| ETF Shares | $1,000.00 | $1,020.23 | $0.25 |
| Admiral Shares | 1,000.00 | 1,020.21 | 0.36 |
| Institutional Shares | 1,000.00 | 1,020.34 | 0.25 |
| Mortgage-Backed Securities Index Fund | | | |
| ETF Shares | $1,000.00 | $1,019.38 | $0.25 |
| Admiral Shares | 1,000.00 | 1,019.28 | 0.36 |
| Institutional Shares | 1,000.00 | 1,019.68 | 0.25 |
| Six Months Ended August 31, 2020 | | | |
| | | | |
| | Beginning | Ending | Expenses |
| | Account Value | Account Value | Paid During |
| | 2/29/2020 | 8/31/2020 | Period |
| Based on Hypothetical 5% Yearly Return | | | |
| Short-Term Treasury Index Fund | | | |
| ETF Shares | $1,000.00 | $1,024.89 | $0.25 |
| Admiral Shares | 1,000.00 | 1,024.78 | 0.36 |
| Institutional Shares | 1,000.00 | 1,024.89 | 0.25 |
| Intermediate-Term Treasury Index Fund | | | |
| ETF Shares | $1,000.00 | $1,024.89 | $0.25 |
| Admiral Shares | 1,000.00 | 1,024.78 | 0.36 |
| Institutional Shares | 1,000.00 | 1,024.89 | 0.25 |
| Long-Term Treasury Index Fund | | | |
| ETF Shares | $1,000.00 | $1,024.89 | $0.25 |
| Admiral Shares | 1,000.00 | 1,024.78 | 0.36 |
| Institutional Shares | 1,000.00 | 1,024.89 | 0.25 |
| Short-Term Corporate Bond Index Fund | | | |
| ETF Shares | $1,000.00 | $1,024.89 | $0.25 |
| Admiral Shares | 1,000.00 | 1,024.78 | 0.36 |
| Institutional Shares | 1,000.00 | 1,024.89 | 0.25 |
| Intermediate-Term Corporate Bond Index Fund | | | |
| ETF Shares | $1,000.00 | $1,024.89 | $0.25 |
| Admiral Shares | 1,000.00 | 1,024.78 | 0.36 |
| Institutional Shares | 1,000.00 | 1,024.89 | 0.25 |
| Long-Term Corporate Bond Index Fund | | | |
| ETF Shares | $1,000.00 | $1,024.89 | $0.25 |
| Admiral Shares | 1,000.00 | 1,024.78 | 0.36 |
| Institutional Shares | 1,000.00 | 1,024.89 | 0.25 |
| Mortgage-Backed Securities Index Fund | | | |
| ETF Shares | $1,000.00 | $1,024.89 | $0.25 |
| Admiral Shares | 1,000.00 | 1,024.78 | 0.36 |
| Institutional Shares | 1,000.00 | 1,024.89 | 0.25 |
The calculations are based on expenses incurred in the most recent six-month period. The funds’ annualized six-month expense ratios for that period are: for the Short-Term Treasury Index Fund, 0.05% for ETF Shares, 0.07% for Admiral Shares, and 0.05% for Institutional Shares; for the Intermediate-Term Treasury Index Fund, 0.05% for ETF Shares, 0.07% for Admiral Shares, and 0.05% for Institutional Shares; for the Long-Term Treasury Index Fund, 0.05% for ETF Shares, 0.07% for Admiral Shares, and 0.05% for Institutional Shares; for the Short-Term Corporate Bond Index Fund, 0.05% for ETF Shares, 0.07% for Admiral Shares, and 0.05% for Institutional Shares; for the Intermediate-Term Corporate Bond Index Fund, 0.05% for ETF Shares, 0.07% for Admiral Shares, and 0.05% for Institutional Shares; for the Long-Term Corporate Bond Index Fund, 0.05% for ETF Shares, 0.07% for Admiral Shares, and 0.05% for Institutional Shares; and for the Mortgage-Backed Securities Index Fund, 0.05% for ETF Shares, 0.07% for Admiral Shares, and 0.05% for Institutional Shares. The dollar amounts shown as “Expenses Paid” are equal to the annualized expense ratio multiplied by the average account value over the period, multiplied by the number of days in the most recent six-month period, then divided by the number of days in the most recent 12-month period (184/366).
Short-Term Treasury Index Fund
Performance Summary
All of the returns in this report represent past performance, which is not a guarantee of future results that may be achieved by the fund. (Current performance may be lower or higher than the performance data cited. For performance data current to the most recent month-end, visit our website at vanguard.com/performance.) Note, too, that both investment returns and principal value can fluctuate widely, so an investor’s shares, when sold, could be worth more or less than their original cost. The returns shown do not reflect taxes that a shareholder would pay on fund distributions or on the sale of fund shares.
Cumulative Performance: August 31, 2010, Through August 31, 2020
Initial Investment of $10,000
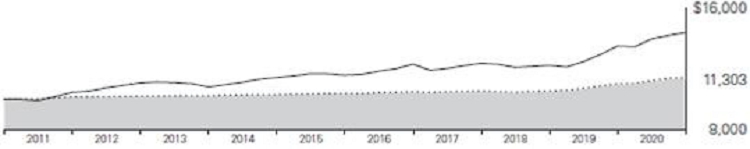
| | | Average Annual Total Returns | |
| | | Periods Ended August 31, 2020 | |
| | | | | | Final Value |
| | | One | Five | Ten | of a $10,000 |
| | | Year | Years | Years | Investment |
 | Short-Term Treasury Index Fund ETF Shares Net Asset Value | 3.43% | 1.81% | 1.23% | $11,303 |
| | Short-Term Treasury Index Fund ETF Shares Market Price | 3.40 | 1.81 | 1.22 | 11,292 |
 | Spliced Bloomberg Barclays U.S. Treasury 1–3 Year Index | 3.49 | 1.88 | 1.32 | 11,400 |
 | Bloomberg Barclays U.S. Aggregate Float Adjusted Index | 6.57 | 4.41 | 3.69 | 14,372 |
Spliced Bloomberg Barclays U.S. Treasury 1–3 Year Index: Bloomberg Barclays U.S. 1–3 Year Government Float Adjusted Index through December 11, 2017; Bloomberg Barclays U.S. Treasury 1–3 Year Bond Index thereafter.
See Financial Highlights for dividend and capital gains information.
Short-Term Treasury Index Fund
| | Average Annual Total Returns | |
| | Periods Ended August 31, 2020 | |
| | | | | Final Value |
| | One | Five | Ten | of a $10,000 |
| | Year | Years | Years | Investment |
| Short-Term Treasury Index Fund Admiral Shares | 3.41% | 1.80% | 1.23% | $11,295 |
| Spliced Bloomberg Barclays U.S. Treasury 1–3 Year Index | 3.49 | 1.88 | 1.32 | 11,400 |
| Bloomberg Barclays U.S. Aggregate Float Adjusted Index | 6.57 | 4.41 | 3.69 | 14,372 |
| | | | | |
| | | | | |
| | | | | Final Value |
| | One | Five | Ten | of a $5,000,000 |
| | Year | Years | Years | Investment |
| Short-Term Treasury Index Fund Institutional Shares | 3.42% | 1.82% | 1.25% | $5,663,836 |
| Spliced Bloomberg Barclays U.S. Treasury 1–3 Year Index | 3.49 | 1.88 | 1.32 | 5,700,215 |
| Bloomberg Barclays U.S. Aggregate Float Adjusted Index | 6.57 | 4.41 | 3.69 | 7,185,953 |
| Cumulative Returns of ETF Shares: August 31, 2010, Through August 31, 2020 | |
| | |
| | One | Five | Ten |
| | Year | Years | Years |
| Short-Term Treasury Index Fund ETF Shares Market Price | 3.40% | 9.37% | 12.92% |
| Short-Term Treasury Index Fund ETF Shares Net Asset Value | 3.43 | 9.41 | 13.03 |
| Spliced Bloomberg Barclays U.S. Treasury 1–3 Year Index | 3.49 | 9.74 | 14.00 |
For the ETF Shares, the market price is determined by the midpoint of the bid-offer spread as of the closing time of the New York Stock Exchange (generally 4 p.m., Eastern time). The net asset value is also determined as of the NYSE closing time. For more information about how the ETF Shares’ market prices have compared with their net asset value, visit vanguard.com, select your ETF, and then select the Price and Performance tab. The ETF premium/discount analysis there shows the percentages of days on which the ETF Shares’ market price was above or below the NAV.
Short-Term Treasury Index Fund
Distribution by Stated Maturity
As of August 31, 2020
| 0–1 Years | 1.0% |
| 1–2 Years | 56.4 |
| 2–3 Years | 41.4 |
| 3–4 Years | 1.2 |
The table reflects the fund’s investments, except for short-term investments.
The fund may invest in derivatives (such as futures and swap contracts) for various reasons, including, but not limited to, attempting to remain fully invested and tracking its target index as closely as possible.
Short-Term Treasury Index Fund
Financial Statements
Schedule of Investments
As of August 31, 2020
The fund files its complete schedule of portfolio holdings with the Securities and Exchange Commission (SEC) for the first and third quarters of each fiscal year as an exhibit to its reports on Form N-PORT. The fund’s Form N-PORT reports are available on the SEC’s website at www.sec.gov.
| | | | | Face | Market |
| | | | Maturity | Amount | Value· |
| | | Coupon | Date | ($000) | ($000) |
| U.S. Government and Agency Obligations (99.6%) | | | |
| U.S. Government Securities (99.6%) | | | | |
| | United States Treasury Note/Bond | 1.125% | 6/30/21 | 101,272 | 102,094 |
| | United States Treasury Note/Bond | 1.125% | 7/31/21 | 10,920 | 11,017 |
| | United States Treasury Note/Bond | 2.125% | 8/15/21 | 9,704 | 9,886 |
| | United States Treasury Note/Bond | 2.750% | 9/15/21 | 24,606 | 25,271 |
| | United States Treasury Note/Bond | 1.125% | 9/30/21 | 132,794 | 134,184 |
| | United States Treasury Note/Bond | 1.500% | 9/30/21 | 36,817 | 37,352 |
| | United States Treasury Note/Bond | 2.125% | 9/30/21 | 47,600 | 48,619 |
| | United States Treasury Note/Bond | 2.875% | 10/15/21 | 197,875 | 203,904 |
| | United States Treasury Note/Bond | 1.250% | 10/31/21 | 267,015 | 270,435 |
| | United States Treasury Note/Bond | 1.500% | 10/31/21 | 45,274 | 45,988 |
| | United States Treasury Note/Bond | 2.000% | 10/31/21 | 230,815 | 235,791 |
| | United States Treasury Note/Bond | 2.000% | 11/15/21 | 2,150 | 2,198 |
| | United States Treasury Note/Bond | 2.875% | 11/15/21 | 226,210 | 233,632 |
| | United States Treasury Note/Bond | 8.000% | 11/15/21 | 21,340 | 23,337 |
| | United States Treasury Note/Bond | 1.500% | 11/30/21 | 66,000 | 67,114 |
| | United States Treasury Note/Bond | 1.750% | 11/30/21 | 28,142 | 28,705 |
| | United States Treasury Note/Bond | 1.875% | 11/30/21 | 161,995 | 165,488 |
| | United States Treasury Note/Bond | 2.625% | 12/15/21 | 258,635 | 266,880 |
| | United States Treasury Note/Bond | 2.000% | 12/31/21 | 136,210 | 139,573 |
| | United States Treasury Note/Bond | 2.125% | 12/31/21 | 95,165 | 97,663 |
| | United States Treasury Note/Bond | 2.500% | 1/15/22 | 88,430 | 91,277 |
| | United States Treasury Note/Bond | 1.375% | 1/31/22 | 177,525 | 180,603 |
| | United States Treasury Note/Bond | 1.500% | 1/31/22 | 154,735 | 157,684 |
| | United States Treasury Note/Bond | 1.875% | 1/31/22 | 97,527 | 99,905 |
| | United States Treasury Note/Bond | 2.000% | 2/15/22 | 31,394 | 32,238 |
| | United States Treasury Note/Bond | 2.500% | 2/15/22 | 204,035 | 211,017 |
| | United States Treasury Note/Bond | 1.125% | 2/28/22 | 678,665 | 688,635 |
| | United States Treasury Note/Bond | 1.750% | 2/28/22 | 10,063 | 10,304 |
| | United States Treasury Note/Bond | 1.875% | 2/28/22 | 38,419 | 39,409 |
| | United States Treasury Note/Bond | 2.375% | 3/15/22 | 10,055 | 10,399 |
| | United States Treasury Note/Bond | 0.375% | 3/31/22 | 44,200 | 44,366 |
| | United States Treasury Note/Bond | 1.750% | 3/31/22 | 200,267 | 205,306 |
| | United States Treasury Note/Bond | 1.875% | 3/31/22 | 172,113 | 176,793 |
| | United States Treasury Note/Bond | 2.250% | 4/15/22 | 1,190 | 1,231 |
| | United States Treasury Note/Bond | 0.125% | 4/30/22 | 934,705 | 934,555 |
| | United States Treasury Note/Bond | 1.750% | 4/30/22 | 2 | 2 |
| | United States Treasury Note/Bond | 1.875% | 4/30/22 | 603 | 620 |
| | United States Treasury Note/Bond | 1.750% | 5/15/22 | 15 | 15 |
| | United States Treasury Note/Bond | 0.125% | 5/31/22 | 175,795 | 175,740 |
Short-Term Treasury Index Fund
| | | | | Face | Market |
| | | | Maturity | Amount | Value· |
| | | Coupon | Date | ($000) | ($000) |
| | United States Treasury Note/Bond | 1.750% | 5/31/22 | 243,986 | 250,810 |
| | United States Treasury Note/Bond | 1.875% | 5/31/22 | 27,695 | 28,530 |
| | United States Treasury Note/Bond | 1.750% | 6/15/22 | 197,405 | 203,049 |
| | United States Treasury Note/Bond | 0.125% | 6/30/22 | 124,470 | 124,431 |
| | United States Treasury Note/Bond | 1.750% | 6/30/22 | 124,744 | 128,389 |
| | United States Treasury Note/Bond | 2.125% | 6/30/22 | 38,359 | 39,743 |
| | United States Treasury Note/Bond | 1.750% | 7/15/22 | 133,730 | 137,742 |
| | United States Treasury Note/Bond | 0.125% | 7/31/22 | 162,685 | 162,635 |
| | United States Treasury Note/Bond | 1.875% | 7/31/22 | 190,280 | 196,554 |
| | United States Treasury Note/Bond | 2.000% | 7/31/22 | 159,880 | 165,525 |
| | United States Treasury Note/Bond | 1.500% | 8/15/22 | 233,220 | 239,414 |
| | United States Treasury Note/Bond | 1.625% | 8/15/22 | 124,107 | 127,695 |
| | United States Treasury Note/Bond | 7.250% | 8/15/22 | 2,525 | 2,873 |
| | United States Treasury Note/Bond | 0.125% | 8/31/22 | 159,540 | 159,514 |
| | United States Treasury Note/Bond | 1.625% | 8/31/22 | 191,225 | 196,872 |
| | United States Treasury Note/Bond | 1.875% | 8/31/22 | 54,582 | 56,459 |
| | United States Treasury Note/Bond | 1.500% | 9/15/22 | 97,989 | 100,699 |
| | United States Treasury Note/Bond | 1.750% | 9/30/22 | 61,750 | 63,805 |
| | United States Treasury Note/Bond | 1.875% | 9/30/22 | 87,452 | 90,595 |
| | United States Treasury Note/Bond | 1.375% | 10/15/22 | 192,083 | 197,066 |
| | United States Treasury Note/Bond | 1.875% | 10/31/22 | 95,824 | 99,402 |
| | United States Treasury Note/Bond | 2.000% | 10/31/22 | 57,966 | 60,285 |
| | United States Treasury Note/Bond | 1.625% | 11/15/22 | 283,990 | 293,220 |
| | United States Treasury Note/Bond | 2.000% | 11/30/22 | 235,245 | 245,022 |
| | United States Treasury Note/Bond | 1.625% | 12/15/22 | 259,115 | 267,940 |
| | United States Treasury Note/Bond | 2.125% | 12/31/22 | 75,640 | 79,115 |
| | United States Treasury Note/Bond | 1.500% | 1/15/23 | 166,770 | 172,138 |
| | United States Treasury Note/Bond | 1.750% | 1/31/23 | 77,905 | 80,924 |
| | United States Treasury Note/Bond | 2.375% | 1/31/23 | 34,680 | 36,544 |
| | United States Treasury Note/Bond | 1.375% | 2/15/23 | 256,985 | 264,736 |
| | United States Treasury Note/Bond | 2.000% | 2/15/23 | 225,635 | 235,859 |
| | United States Treasury Note/Bond | 1.500% | 2/28/23 | 130,902 | 135,320 |
| | United States Treasury Note/Bond | 2.625% | 2/28/23 | 148,900 | 158,114 |
| | United States Treasury Note/Bond | 0.500% | 3/15/23 | 171,060 | 172,610 |
| | United States Treasury Note/Bond | 1.500% | 3/31/23 | 105,660 | 109,358 |
| | United States Treasury Note/Bond | 2.500% | 3/31/23 | 131,300 | 139,259 |
| | United States Treasury Note/Bond | 0.250% | 4/15/23 | 344,820 | 345,789 |
| | United States Treasury Note/Bond | 1.625% | 4/30/23 | 45,230 | 47,004 |
| | United States Treasury Note/Bond | 2.750% | 4/30/23 | 25,400 | 27,154 |
| | United States Treasury Note/Bond | 0.125% | 5/15/23 | 347,655 | 347,439 |
| | United States Treasury Note/Bond | 1.750% | 5/15/23 | 104,395 | 108,913 |
| | United States Treasury Note/Bond | 1.625% | 5/31/23 | 36,775 | 38,263 |
| | United States Treasury Note/Bond | 2.750% | 5/31/23 | 79,015 | 84,645 |
| | United States Treasury Note/Bond | 0.250% | 6/15/23 | 213,000 | 213,599 |
| | United States Treasury Note/Bond | 1.375% | 6/30/23 | 170,020 | 175,891 |
| | United States Treasury Note/Bond | 2.625% | 6/30/23 | 56,910 | 60,885 |
| | United States Treasury Note/Bond | 0.125% | 7/15/23 | 247,490 | 247,297 |
| | United States Treasury Note/Bond | 1.250% | 7/31/23 | 44,747 | 46,174 |
| | United States Treasury Note/Bond | 2.750% | 7/31/23 | 66,037 | 71,021 |
| | United States Treasury Note/Bond | 0.125% | 8/15/23 | 316,460 | 316,213 |
| | United States Treasury Note/Bond | 2.500% | 8/15/23 | 81,420 | 87,056 |
| | United States Treasury Note/Bond | 6.250% | 8/15/23 | 10,525 | 12,410 |
| | United States Treasury Note/Bond | 1.375% | 8/31/23 | 56,515 | 58,564 |
| | United States Treasury Note/Bond | 2.750% | 8/31/23 | 66,499 | 71,653 |
Short-Term Treasury Index Fund
| | | | | Face | Market |
| | | | Maturity | Amount | Value· |
| | | Coupon | Date | ($000) | ($000) |
| | United States Treasury Note/Bond | 1.375% | 9/30/23 | 105,340 | 109,273 |
| | United States Treasury Note/Bond | 2.875% | 9/30/23 | 40,000 | 43,338 |
| Total U.S. Government and Agency Obligations (Cost $12,789,783) | | 12,944,057 |
| | | | | | |
| | | | | Shares | |
| Temporary Cash Investment (0.4%) | | | | |
| Money Market Fund (0.4%) | | | | |
| 1 | Vanguard Market Liquidity Fund
(Cost $49,728) | 0.147% | | 497,295 | 49,730 |
| Total Investments (100.0%) (Cost $12,839,511) | | | | 12,993,787 |
| Other Assets and Liabilities—Net (0.0%) | | | | (2,246) |
| Net Assets (100%) | | | | 12,991,541 |
Cost is in $000.
| • | See Note A in Notes to Financial Statements. |
| 1 | Affiliated money market fund available only to Vanguard funds and certain trusts and accounts managed by Vanguard. Rate shown is the 7-day yield. |
See accompanying Notes, which are an integral part of the Financial Statements.
Short-Term Treasury Index Fund
Statement of Assets and Liabilities
As of August 31, 2020
| ($000s, except shares and per-share amounts) | Amount |
| Assets | |
| Investments in Securities, at Value | |
| Unaffiliated Issuers (Cost $12,789,783) | 12,944,057 |
| Affiliated Issuers (Cost $49,728) | 49,730 |
| Total Investments in Securities | 12,993,787 |
| Investment in Vanguard | 549 |
| Cash | 1 |
| Receivables for Investment Securities Sold | 730,539 |
| Receivables for Accrued Income | 38,428 |
| Receivables for Capital Shares Issued | 4,896 |
| Total Assets | 13,768,200 |
| Liabilities | |
| Payables for Investment Securities Purchased | 766,836 |
| Payables for Capital Shares Redeemed | 8,971 |
| Payables for Distributions | 506 |
| Payables to Vanguard | 346 |
| Total Liabilities | 776,659 |
| Net Assets | 12,991,541 |
| | |
| | |
| At August 31, 2020, net assets consisted of: | |
| | |
| Paid-in Capital | 12,767,404 |
| Total Distributable Earnings (Loss) | 224,137 |
| Net Assets | 12,991,541 |
| | |
| ETF Shares—Net Assets | |
| Applicable to 147,113,339 outstanding $.001 par value shares of beneficial interest (unlimited authorization) | 9,139,523 |
| Net Asset Value Per Share—ETF Shares | $62.13 |
| | |
| Admiral Shares—Net Assets | |
| Applicable to 132,663,229 outstanding $.001 par value shares of beneficial interest (unlimited authorization) | 2,747,540 |
| Net Asset Value Per Share—Admiral Shares | $20.71 |
| | |
| Institutional Shares—Net Assets | |
| Applicable to 42,448,799 outstanding $.001 par value shares of beneficial interest (unlimited authorization) | 1,104,478 |
| Net Asset Value Per Share—Institutional Shares | $26.02 |
See accompanying Notes, which are an integral part of the Financial Statements.
Short-Term Treasury Index Fund
Statement of Operations
| | Year Ended |
| | August 31, 2020 |
| | ($000) |
| Investment Income | |
| Income | |
| Interest1 | 163,412 |
| Total Income | 163,412 |
| Expenses | |
| The Vanguard Group—Note B | |
| Investment Advisory Services | 294 |
| Management and Administrative—ETF Shares | 2,693 |
| Management and Administrative—Admiral Shares | 1,228 |
| Management and Administrative—Institutional Shares | 385 |
| Marketing and Distribution—ETF Shares | 431 |
| Marketing and Distribution—Admiral Shares | 148 |
| Marketing and Distribution—Institutional Shares | 42 |
| Custodian Fees | 14 |
| Auditing Fees | 47 |
| Shareholders’ Reports—ETF Shares | 148 |
| Shareholders’ Reports—Admiral Shares | 14 |
| Shareholders’ Reports—Institutional Shares | 56 |
| Trustees’ Fees and Expenses | 6 |
| Total Expenses | 5,506 |
| Net Investment Income | 157,906 |
| Realized Net Gain (Loss) on Investment Securities Sold1,2 | 116,819 |
| Change in Unrealized Appreciation (Depreciation) of Investment Securities1 | 45,925 |
| Net Increase (Decrease) in Net Assets Resulting from Operations | 320,650 |
| 1 | Interest income, realized net gain (loss), and change in unrealized appreciation (depreciation) from an affiliated company of the fund were $275,000, ($66,000), and $1,000, respectively. Purchases and sales are for temporary cash investment purposes. |
| 2 | Includes $26,257,000 of net gain (loss) resulting from in-kind redemptions. |
See accompanying Notes, which are an integral part of the Financial Statements.
Short-Term Treasury Index Fund
Statement of Changes in Net Assets
| | Year Ended August 31, |
| | 2020 | 2019 |
| | ($000) | ($000) |
| Increase (Decrease) in Net Assets | | |
| Operations | | |
| Net Investment Income | 157,906 | 163,089 |
| Realized Net Gain (Loss) | 116,819 | 6,115 |
| Change in Unrealized Appreciation (Depreciation) | 45,925 | 142,644 |
| Net Increase (Decrease) in Net Assets Resulting from Operations | 320,650 | 311,848 |
| Distributions1 | | |
| ETF Shares | (112,729) | (107,243) |
| Admiral Shares | (31,855) | (31,993) |
| Institutional Shares | (16,661) | (18,801) |
| Total Distributions | (161,245) | (158,037) |
| Capital Share Transactions | | |
| ETF Shares | 3,696,728 | 2,148,726 |
| Admiral Shares | 1,119,921 | 637,339 |
| Institutional Shares | 111,617 | 447,152 |
| Net Increase (Decrease) from Capital Share Transactions | 4,928,266 | 3,233,217 |
| Total Increase (Decrease) | 5,087,671 | 3,387,028 |
| Net Assets | | |
| Beginning of Period | 7,903,870 | 4,516,842 |
| End of Period | 12,991,541 | 7,903,870 |
1 Certain prior period numbers have been reclassified to conform with current period presentation.
See accompanying Notes, which are an integral part of the Financial Statements.
Short-Term Treasury Index Fund
Financial Highlights
| ETF Shares | | | | | |
| | | | | | |
| For a Share Outstanding | | | Year Ended August 31, |
| Throughout Each Period | 2020 | 2019 | 2018 | 2017 | 2016 |
| Net Asset Value, Beginning of Period | $61.12 | $59.89 | $60.86 | $61.14 | $61.03 |
| Investment Operations | | | | | |
| Net Investment Income | .9561 | 1.4301 | .9651 | .6141 | .478 |
| Net Realized and Unrealized Gain (Loss) on Investments | 1.115 | 1.165 | (1.062) | (.311) | .118 |
| Total from Investment Operations | 2.071 | 2.595 | (.097) | .303 | .596 |
| Distributions | | | | | |
| Dividends from Net Investment Income | (1.061) | (1.365) | (.873) | (.573) | (.462) |
| Distributions from Realized Capital Gains | — | — | — | (.010) | (.024) |
| Total Distributions | (1.061) | (1.365) | (.873) | (.583) | (.486) |
| Net Asset Value, End of Period | $62.13 | $61.12 | $59.89 | $60.86 | $61.14 |
| | | | | | |
| Total Return | 3.43% | 4.39% | -0.15% | 0.50% | 0.98% |
| | | | | | |
| Ratios/Supplemental Data | | | | | |
| Net Assets, End of Period (Millions) | $9,140 | $5,334 | $3,080 | $1,832 | $908 |
| Ratio of Total Expenses to Average Net Assets | 0.05% | 0.05% | 0.07% | 0.07% | 0.07% |
| Ratio of Net Investment Income to Average Net Assets | 1.55% | 2.37% | 1.61% | 1.01% | 0.80% |
| Portfolio Turnover Rate2 | 67% | 55% | 67% | 60% | 73% |
| 1 | Calculated based on average shares outstanding. |
| 2 | Excludes the value of portfolio securities received or delivered as a result of in-kind purchases or redemptions of the fund’s capital shares, including ETF Creation Units. |
See accompanying Notes, which are an integral part of the Financial Statements.
Short-Term Treasury Index Fund
Financial Highlights
Admiral Shares
| For a Share Outstanding | | | | | | Year Ended August 31, | |
| Throughout Each Period | | 2020 | | 2019 | | 2018 | | 2017 | | 2016 | |
| Net Asset Value, Beginning of Period | | $20.35 | | $19.95 | | $20.29 | | $20.38 | | $20.35 | |
| Investment Operations | | | | | | | | | | | |
| Net Investment Income | | .312 | 1 | .472 | 1 | .324 | 1 | .202 | 1 | .158 | |
| Net Realized and Unrealized Gain (Loss) on Investments | | .375 | | .384 | | (.358 | ) | (.096 | ) | .040 | |
| Total from Investment Operations | | .687 | | .856 | | (.034 | ) | .106 | | .198 | |
| Distributions | | | | | | | | | | | |
| Dividends from Net Investment Income | | (.327 | ) | (.456 | ) | (.306 | ) | (.193 | ) | (.160 | ) |
| Distributions from Realized Capital Gains | | — | | — | | — | | (.003 | ) | (.008 | ) |
| Total Distributions | | (.327 | ) | (.456 | ) | (.306 | ) | (.196 | ) | (.168 | ) |
| Net Asset Value, End of Period | | $20.71 | | $20.35 | | $19.95 | | $20.29 | | $20.38 | |
| | | | | | | | | | | | |
| Total Return2 | | 3.41% | | 4.34% | | -0.16% | | 0.53% | | 0.98% | |
| | | | | | | | | | | | |
| Ratios/Supplemental Data | | | | | | | | | | | |
| Net Assets, End of Period (Millions) | | $2,748 | | $1,596 | | $929 | | $507 | | $364 | |
| Ratio of Total Expenses to Average Net Assets | | 0.07% | | 0.07% | | 0.07% | | 0.07% | | 0.07% | |
| Ratio of Net Investment Income to Average Net Assets | | 1.52% | | 2.35% | | 1.61% | | 1.01% | | 0.80% | |
| Portfolio Turnover Rate3 | | 67% | | 55% | | 67% | | 60% | | 73% | |
| 1 | Calculated based on average shares outstanding. |
| | |
| 2 | Total returns do not include account service fees that may have applied in the periods shown. Fund prospectuses provide information about any applicable account service fees. |
| | |
| 3 | Excludes the value of portfolio securities received or delivered as a result of in-kind purchases or redemptions of the fund’s capital shares, including ETF Creation Units. |
See accompanying Notes, which are an integral part of the Financial Statements.
Short-Term Treasury Index Fund
Financial Highlights
Institutional Shares
| For a Share Outstanding | | | | | | Year Ended August 31, | |
| Throughout Each Period | | 2020 | | 2019 | | 2018 | | 2017 | | 2016 | |
| Net Asset Value, Beginning of Period | | $25.57 | | $25.06 | | $25.49 | | $25.60 | | $25.57 | |
| Investment Operations | | | | | | | | | | | |
| Net Investment Income | | .421 | 1 | .598 | 1 | .425 | 1 | .260 | 1 | .207 | |
| Net Realized and Unrealized Gain (Loss) on Investments | | .445 | | .490 | | (.467) | | (.117) | | .042 | |
| Total from Investment Operations | | .866 | | 1.088 | | (.042) | | .143 | | .249 | |
| Distributions | | | | | | | | | | | |
| Dividends from Net Investment Income | | (.416 | ) | (.578 | ) | (.388 | ) | (. 249 | ) | (. 209 | ) |
| Distributions from Realized Capital Gains | | — | | — | | — | | (.004 | ) | (.010 | ) |
| Total Distributions | | (.416 | ) | (.578 | ) | (.388 | ) | (.253 | ) | (.219 | ) |
| Net Asset Value, End of Period | | $26.02 | | $25.57 | | $25.06 | | $25.49 | | $25.60 | |
| | | | | | | | | | | | |
| Total Return | | 3.42% | | 4.40% | | -0.16% | | 0.56% | | 0.98% | |
| | | | | | | | | | | | |
| Ratios/Supplemental Data | | | | | | | | | | | |
| Net Assets, End of Period (Millions) | | $1,104 | | $974 | | $508 | | $208 | | $92 | |
| Ratio of Total Expenses to Average Net Assets | | 0.05% | | 0.05% | | 0.05% | | 0.05% | | 0.05% | |
| Ratio of Net Investment Income to Average Net Assets | | 1.63% | | 2.37% | | 1.63% | | 1.03% | | 0.82% | |
| Portfolio Turnover Rate2 | | 67% | | 55% | | 67% | | 60% | | 73% | |
| 1 | Calculated based on average shares outstanding. |
| | |
| 2 | Excludes the value of portfolio securities received or delivered as a result of in-kind purchases or redemptions of the fund’s capital shares, including ETF Creation Units. |
See accompanying Notes, which are an integral part of the Financial Statements.
Short-Term Treasury Index Fund
Notes to Financial Statements
Vanguard Short-Term Treasury Index Fund is registered under the Investment Company Act of 1940 as an open-end investment company, or mutual fund. The fund offers three classes of shares: ETF Shares, Admiral Shares and Institutional Shares. Each of the share classes has different eligibility and minimum purchase requirements, and is designed for different types of investors. ETF Shares are listed for trading on Nasdaq; they can be purchased and sold through a broker.
Market disruptions associated with the COVID-19 pandemic have had a global impact, and uncertainty exists as to the long-term implications. Such disruptions can adversely affect assets of the fund and thus fund performance.
A. The following significant accounting policies conform to generally accepted accounting principles for U.S. investment companies. The fund consistently follows such policies in preparing its financial statements.
1. Security Valuation: Securities are valued as of the close of trading on the New York Stock Exchange (generally 4 p.m., Eastern time) on the valuation date. Bonds and temporary cash investments are valued using the latest bid prices or using valuations based on a matrix system (which considers such factors as security prices, yields, maturities, and ratings), both as furnished by independent pricing services. Investments in Vanguard Market Liquidity Fund are valued at that fund’s net asset value. Securities for which market quotations are not readily available, or whose values have been affected by events occurring before the fund’s pricing time but after the close of the securities’ primary markets, are valued by methods deemed by the board of trustees to represent fair value.
2. Federal Income Taxes: The fund intends to continue to qualify as a regulated investment company and distribute all of its taxable income. The fund’s tax returns are open to examination by the relevant tax authorities until expiration of the applicable statute of limitations, which is generally three years after the filing of the tax return. Management has analyzed the fund’s tax positions taken for all open federal and state income tax years, and has concluded that no provision for income tax is required in the fund’s financial statements.
3. Distributions: Distributions to shareholders are recorded on the ex-dividend date. Distributions are determined on a tax basis at the fiscal year-end and may differ from net investment income and realized capital gains for financial reporting purposes.
4. Credit Facilities and Interfund Lending Program: The fund and certain other funds managed by The Vanguard Group (“Vanguard”) participate in a $4.3 billion committed credit facility provided by a syndicate of lenders pursuant to a credit agreement and an uncommitted credit facility provided by Vanguard. Both facilities may be renewed annually. Each fund is individually liable for its borrowings, if any, under the credit facilities. Borrowings may be utilized for temporary or emergency purposes, subject to the fund’s regulatory and contractual borrowing restrictions. With respect to the committed credit facility, the participating funds are charged administrative fees and an annual commitment fee of 0.10% of the undrawn committed amount of the facility; these fees are allocated to the funds based on a method approved by the fund’s board of trustees and included in Management and Administrative expenses on the fund’s Statement of Operations. Any borrowings under either facility bear interest at a rate based upon the higher of the one-month London Interbank Offered
Short-Term Treasury Index Fund
Rate (or an acceptable alternate rate, if necessary), federal funds effective rate, or overnight bank funding rate plus an agreed-upon spread, except that borrowings under the uncommitted credit facility may bear interest based upon an alternative rate agreed to by the fund and Vanguard.
In accordance with an exemptive order (the “Order”) from the SEC, the fund may participate in a joint lending and borrowing program that allows registered open-end Vanguard funds to borrow money from and lend money to each other for temporary or emergency purposes (the “Interfund Lending Program”), subject to compliance with the terms and conditions of the Order, and to the extent permitted by the fund’s investment objective and investment policies. Interfund loans and borrowings normally extend overnight, but can have a maximum duration of seven days. Loans may be called on one business day’s notice. The interest rate to be charged is governed by the conditions of the Order and internal procedures adopted by the board of trustees. The board of trustees is responsible for overseeing the Interfund Lending Program.
For the year ended August 31, 2020, the fund did not utilize the credit facilities or the Interfund Lending Program.
5. Other: Interest income includes income distributions received from Vanguard Market Liquidity Fund and is accrued daily. Premiums and discounts on debt securities are amortized and accreted, respectively, to interest income over the lives of the respective securities, except for premiums on certain callable debt securities that are amortized to the earliest call date. Security transactions are accounted for on the date securities are bought or sold. Costs used to determine realized gains (losses) on the sale of investment securities are those of the specific securities sold.
Each class of shares has equal rights as to assets and earnings, except that each class separately bears certain class-specific expenses related to maintenance of shareholder accounts (included in Management and Administrative expenses) and shareholder reporting. Marketing and distribution expenses are allocated to each class of shares based on a method approved by the board of trustees. Income, other non-class-specific expenses, and gains and losses on investments are allocated to each class of shares based on its relative net assets.
B. In accordance with the terms of a Funds’ Service Agreement (the “FSA”) between Vanguard and the fund, Vanguard furnishes to the fund investment advisory, corporate management, administrative, marketing, and distribution services at Vanguard’s cost of operations (as defined by the FSA). These costs of operations are allocated to the fund based on methods and guidelines approved by the board of trustees and are generally settled twice a month.
Upon the request of Vanguard, the fund may invest up to 0.40% of its net assets as capital in Vanguard. At August 31, 2020, the fund had contributed to Vanguard capital in the amount of $549,000, representing less than 0.01% of the fund’s net assets and 0.22% of Vanguard’s capital received pursuant to the FSA. The fund’s trustees and officers are also directors and employees, respectively, of Vanguard.
C. Various inputs may be used to determine the value of the fund’s investments. These inputs are summarized in three broad levels for financial statement purposes. The inputs or methodologies used to value securities are not necessarily an indication of the risk associated with investing in those securities.
Short-Term Treasury Index Fund
Level 1—Quoted prices in active markets for identical securities.
Level 2—Other significant observable inputs (including quoted prices for similar securities, interest rates, prepayment speeds, credit risk, etc.).
Level 3—Significant unobservable inputs (including the fund’s own assumptions used to determine the fair value of investments). Any investments valued with significant unobservable inputs are noted on the Schedule of Investments.
The following table summarizes the market value of the fund’s investments as of August 31, 2020, based on the inputs used to value them:
| | Level 1 | Level 2 | Level 3 | Total |
| | ($000) | ($000) | ($000) | ($000) |
| Investments | | | | |
| Assets | | | | |
| U.S. Government and Agency Obligations | — | 12,944,057 | — | 12,944,057 |
| Temporary Cash Investments | 49,730 | — | — | 49,730 |
| Total | 49,730 | 12,944,057 | — | 12,993,787 |
D. Permanent differences between book-basis and tax-basis components of net assets are reclassified among capital accounts in the financial statements to reflect their tax character. These reclassifications have no effect on net assets or net asset value per share. As of period end, permanent differences primarily attributable to the accounting for in-kind redemptions and distributions in connection with fund share redemptions were reclassified between the following accounts:
| | Amount |
| | ($000) |
| Paid-in Capital | 30,802 |
| Total Distributable Earnings (Loss) | (30,802) |
Temporary differences between book-basis and tax-basis components of total distributable earnings (loss) arise when certain items of income, gain, or loss are recognized in different periods for financial statement and tax purposes; these differences will reverse at some time in the future. The differences are primarily related to the deferral of losses from wash sales, and the inclusion of payables for distributions. As of period end, the tax-basis components of total distributable earnings (loss) are detailed in the table as follows:
| | Amount |
| | ($000) |
| Undistributed Ordinary Income | 50,609 |
| Undistributed Long-term Gains | 19,758 |
| Capital Loss Carryforwards | — |
| Qualified Late-Year Losses | — |
| Net Unrealized Gains (Losses) | 154,276 |
Short-Term Treasury Index Fund
The tax character of distributions paid was as follows:
| | Year Ended August 31, |
| | 2020 | 2019 |
| | Amount | Amount |
| | ($000) | ($000) |
| Ordinary Income * | 161,245 | 158,037 |
| Long-Term Capital Gains | — | — |
| Total | 161,245 | 158,037 |
* Includes short-term capital gains, if any.
As of August 31, 2020, gross unrealized appreciation and depreciation for investments based on cost for U.S. federal income tax purposes were as follows:
| | Amount |
| | ($000) |
| Tax Cost | 12,839,511 |
| Gross Unrealized Appreciation | 154,911 |
| Gross Unrealized Depreciation | (635) |
| Net Unrealized Appreciation (Depreciation) | 154,276 |
E. During the year ended August 31, 2020, the fund purchased $12,967,210,000 of investment securities and sold $8,037,295,000 of investment securities, other than temporary cash investments. Purchases and sales include $4,902,146,000 and $1,264,983,000, respectively, in connection with in-kind purchases and redemptions of the fund’s capital shares.
The fund purchased securities from and sold securities to other Vanguard funds or accounts managed by Vanguard or its affiliates, in accordance with procedures adopted by the board of trustees in compliance with Rule 17a-7 of the Investment Company Act of 1940. For the year ended August 31, 2020, such purchases and sales were $2,129,776,000 and $0, respectively; these amounts are included in the purchases and sales of investment securities noted above.
Short-Term Treasury Index Fund
F. Capital share transactions for each class of shares were:
| | Year Ended August 31, |
| | 2020 | | 2019 |
| | Amount | Shares | | Amount | Shares |
| | ($000) | (000) | | ($000) | (000) |
| ETF Shares | | | | | |
| Issued | 4,979,354 | 80,688 | | 4,617,915 | 76,876 |
| Issued in Lieu of Cash Distributions | — | — | | — | — |
| Redeemed | (1,282,626) | (20,850) | | (2,469,189) | (41,025) |
| Net Increase (Decrease)—ETF Shares | 3,696,728 | 59,838 | | 2,148,726 | 35,851 |
| Admiral Shares | | | | | |
| Issued | 2,327,381 | 112,804 | | 1,331,656 | 66,414 |
| Issued in Lieu of Cash Distributions | 24,666 | 1,202 | | 23,999 | 1,193 |
| Redeemed | (1,232,126) | (59,776) | | (718,316) | (35,725) |
| Net Increase (Decrease)—Admiral Shares | 1,119,921 | 54,230 | | 637,339 | 31,882 |
| Institutional Shares | | | | | |
| Issued | 587,617 | 22,789 | | 756,162 | 30,031 |
| Issued in Lieu of Cash Distributions | 14,867 | 578 | | 16,091 | 637 |
| Redeemed | (490,867) | (19,004) | | (325,101) | (12,864) |
| Net Increase (Decrease)—Institutional Shares | 111,617 | 4,363 | | 447,152 | 17,804 |
G. Management has determined that no events or transactions occurred subsequent to August 31, 2020, that would require recognition or disclosure in these financial statements.
Intermediate-Term Treasury Index Fund
Performance Summary
All of the returns in this report represent past performance, which is not a guarantee of future results that may be achieved by the fund. (Current performance may be lower or higher than the performance data cited. For performance data current to the most recent month-end, visit our website at vanguard.com/performance.) Note, too, that both investment returns and principal value can fluctuate widely, so an investor’s shares, when sold, could be worth more or less than their original cost. The returns shown do not reflect taxes that a shareholder would pay on fund distributions or on the sale of fund shares.
Cumulative Performance: August 31, 2010, Through August 31, 2020
Initial Investment of $10,000
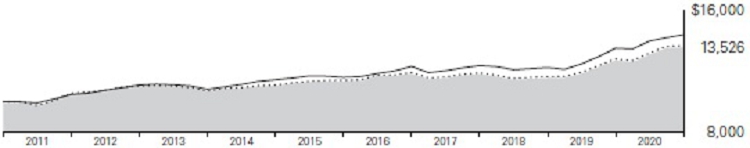
| | | | Average Annual Total Returns | | |
| | | | Periods Ended August 31, 2020 | �� | |
| | | | | | | | Final Value |
| | | | One | Five | Ten | | of a $10,000 |
| | | | Year | Years | Years | | Investment |
| Intermediate-Term Treasury Index Fund ETF Shares Net Asset Value | | 6.76% | 3.62% | 3.07% | | $13,526 |
| | Intermediate-Term Treasury Index Fund ETF Shares Market Price | | 6.74 | 3.60 | 3.06 | | 13,522 |
| Spliced Bloomberg Barclays U.S. Treasury 3–10 Year Index | | 6.90 | 3.68 | 3.16 | | 13,651 |
| Bloomberg Barclays U.S. Aggregate Float Adjusted Index | | 6.57 | 4.41 | 3.69 | | 14,372 |
Spliced Bloomberg Barclays U.S. Treasury 3–10 Year Index: Bloomberg Barclays U.S. 3–10 Year Government Float Adjusted Index through December 11, 2017; Bloomberg Barclays U.S. Treasury 3–10 Year Bond Index thereafter.
See Financial Highlights for dividend and capital gains information.
Intermediate-Term Treasury Index Fund
| | Average Annual Total Returns | |
| | Periods Ended August 31, 2020 | |
| | | | | Final Value |
| | One | Five | Ten | of a $10,000 |
| | Year | Years | Years | Investment |
| Intermediate-Term Treasury Index Fund Admiral Shares | 6.76% | 3.61% | 3.06% | $13,520 |
| Spliced Bloomberg Barclays U.S. Treasury 3–10 Year Index | 6.90 | 3.68 | 3.16 | 13,651 |
| Bloomberg Barclays U.S. Aggregate Float Adjusted Index | 6.57 | 4.41 | 3.69 | 14,372 |
| | | | | |
| | | | | |
| | | | | Final Value |
| | One | Five | Ten | of a $5,000,000 |
| | Year | Years | Years | Investment |
| Intermediate-Term Treasury Index Fund Institutional Shares | 6.76% | 3.63% | 3.09% | $6,779,498 |
| Spliced Bloomberg Barclays U.S. Treasury 3–10 Year Index | 6.90 | 3.68 | 3.16 | 6,825,729 |
| Bloomberg Barclays U.S. Aggregate Float Adjusted Index | 6.57 | 4.41 | 3.69 | 7,185,953 |
Cumulative Returns of ETF Shares: August 31, 2010, Through August 31, 2020
| | One | Five | Ten |
| | Year | Years | Years |
| Intermediate-Term Treasury Index Fund ETF Shares Market Price | 6.74% | 19.37% | 35.22% |
| Intermediate-Term Treasury Index Fund ETF Shares Net Asset Value | 6.76 | 19.43 | 35.26 |
| Spliced Bloomberg Barclays U.S. Treasury 3–10 Year Index | 6.90 | 19.82 | 36.51 |
For the ETF Shares, the market price is determined by the midpoint of the bid-offer spread as of the closing time of the New York Stock Exchange (generally 4 p.m., Eastern time). The net asset value is also determined as of the NYSE closing time. For more information about how the ETF Shares’ market prices have compared with their net asset value, visit vanguard.com, select your ETF, and then select the Price and Performance tab. The ETF premium/discount analysis there shows the percentages of days on which the ETF Shares’ market price was above or below the NAV.
Intermediate-Term Treasury Index Fund
Distribution by Stated Maturity
As of August 31, 2020
| 0–2 Years | 0.0% |
| 2–4 Years | 21.9 |
| 4–6 Years | 41.9 |
| 6–8 Years | 22.8 |
| 8–10 Years | 13.4 |
The table reflects the fund’s investments, except for short-term investments.
Intermediate-Term Treasury Index Fund
Financial Statements
Schedule of Investments
As of August 31, 2020
The fund files its complete schedule of portfolio holdings with the Securities and Exchange Commission (SEC) for the first and third quarters of each fiscal year as an exhibit to its reports on Form N-PORT. The fund’s Form N-PORT reports are available on the SEC’s website at www.sec.gov.
| | | | | Face | Market |
| | | | Maturity | Amount | Value• |
| | | Coupon | Date | ($000) | ($000) |
| U.S. Government and Agency Obligations (99.6%) | | | |
| U.S. Government Securities (99.6%) | | | | |
| | United States Treasury Note/Bond | 8.125% | 5/15/21 | 220 | 232 |
| | United States Treasury Note/Bond | 8.125% | 8/15/21 | 245 | 263 |
| | United States Treasury Note/Bond | 7.625% | 11/15/22 | 2,075 | 2,414 |
| | United States Treasury Note/Bond | 7.125% | 2/15/23 | 6,628 | 7,755 |
| | United States Treasury Note/Bond | 2.875% | 9/30/23 | 32,400 | 35,103 |
| | United States Treasury Note/Bond | 1.625% | 10/31/23 | 50,095 | 52,396 |
| | United States Treasury Note/Bond | 2.875% | 10/31/23 | 144,745 | 157,116 |
| | United States Treasury Note/Bond | 2.750% | 11/15/23 | 108,400 | 117,343 |
| | United States Treasury Note/Bond | 2.125% | 11/30/23 | 71,995 | 76,539 |
| | United States Treasury Note/Bond | 2.875% | 11/30/23 | 75,665 | 82,286 |
| | United States Treasury Note/Bond | 2.250% | 12/31/23 | 45,809 | 48,966 |
| | United States Treasury Note/Bond | 2.625% | 12/31/23 | 78,795 | 85,197 |
| | United States Treasury Note/Bond | 2.250% | 1/31/24 | 78,493 | 84,024 |
| | United States Treasury Note/Bond | 2.500% | 1/31/24 | 91,190 | 98,386 |
| | United States Treasury Note/Bond | 2.750% | 2/15/24 | 182,160 | 198,298 |
| | United States Treasury Note/Bond | 2.125% | 2/29/24 | 50,494 | 53,910 |
| | United States Treasury Note/Bond | 2.375% | 2/29/24 | 85,130 | 91,635 |
| | United States Treasury Note/Bond | 2.125% | 3/31/24 | 189,478 | 202,563 |
| | United States Treasury Note/Bond | 2.000% | 4/30/24 | 47,715 | 50,861 |
| | United States Treasury Note/Bond | 2.250% | 4/30/24 | 88,866 | 95,531 |
| | United States Treasury Note/Bond | 2.500% | 5/15/24 | 184,062 | 199,707 |
| | United States Treasury Note/Bond | 2.000% | 5/31/24 | 169,485 | 180,846 |
| | United States Treasury Note/Bond | 1.750% | 6/30/24 | 98,185 | 103,953 |
| | United States Treasury Note/Bond | 2.000% | 6/30/24 | 47,347 | 50,587 |
| | United States Treasury Note/Bond | 1.750% | 7/31/24 | 81,905 | 86,819 |
| | United States Treasury Note/Bond | 2.125% | 7/31/24 | 63,748 | 68,509 |
| | United States Treasury Note/Bond | 2.375% | 8/15/24 | 122,582 | 133,039 |
| | United States Treasury Note/Bond | 1.250% | 8/31/24 | 85,710 | 89,232 |
| | United States Treasury Note/Bond | 1.875% | 8/31/24 | 82,905 | 88,384 |
| | United States Treasury Note/Bond | 1.500% | 9/30/24 | 85,474 | 89,908 |
| | United States Treasury Note/Bond | 2.125% | 9/30/24 | 49,501 | 53,322 |
| | United States Treasury Note/Bond | 1.500% | 10/31/24 | 111,191 | 117,046 |
| | United States Treasury Note/Bond | 2.250% | 10/31/24 | 54,050 | 58,577 |
| | United States Treasury Note/Bond | 2.250% | 11/15/24 | 169,221 | 183,525 |
| | United States Treasury Note/Bond | 7.500% | 11/15/24 | 6,573 | 8,568 |
| | United States Treasury Note/Bond | 1.500% | 11/30/24 | 92,760 | 97,746 |
| | United States Treasury Note/Bond | 2.125% | 11/30/24 | 76,230 | 82,328 |
| | United States Treasury Note/Bond | 1.750% | 12/31/24 | 64,275 | 68,463 |
Intermediate-Term Treasury Index Fund
| | | | | Face | Market |
| | | | Maturity | Amount | Value• |
| | | Coupon | Date | ($000) | ($000) |
| | United States Treasury Note/Bond | 2.250% | 12/31/24 | 76,990 | 83,654 |
| | United States Treasury Note/Bond | 1.375% | 1/31/25 | 84,160 | 88,342 |
| | United States Treasury Note/Bond | 2.500% | 1/31/25 | 37,185 | 40,869 |
| | United States Treasury Note/Bond | 2.000% | 2/15/25 | 136,463 | 147,061 |
| | United States Treasury Note/Bond | 7.625% | 2/15/25 | 3,300 | 4,378 |
| | United States Treasury Note/Bond | 1.125% | 2/28/25 | 112,685 | 117,139 |
| | United States Treasury Note/Bond | 2.750% | 2/28/25 | 76,658 | 85,235 |
| | United States Treasury Note/Bond | 0.500% | 3/31/25 | 96,300 | 97,383 |
| | United States Treasury Note/Bond | 2.625% | 3/31/25 | 60,157 | 66,643 |
| | United States Treasury Note/Bond | 0.375% | 4/30/25 | 178,080 | 179,026 |
| | United States Treasury Note/Bond | 2.875% | 4/30/25 | 24,274 | 27,217 |
| | United States Treasury Note/Bond | 2.125% | 5/15/25 | 140,995 | 153,266 |
| | United States Treasury Note/Bond | 0.250% | 5/31/25 | 132,870 | 132,829 |
| | United States Treasury Note/Bond | 2.875% | 5/31/25 | 56,680 | 63,668 |
| | United States Treasury Note/Bond | 0.250% | 6/30/25 | 110,820 | 110,716 |
| | United States Treasury Note/Bond | 2.750% | 6/30/25 | 54,225 | 60,681 |
| | United States Treasury Note/Bond | 0.250% | 7/31/25 | 83,100 | 83,009 |
| | United States Treasury Note/Bond | 2.875% | 7/31/25 | 153,355 | 172,788 |
| | United States Treasury Note/Bond | 2.000% | 8/15/25 | 91,425 | 99,139 |
| | United States Treasury Note/Bond | 6.875% | 8/15/25 | 23,898 | 31,613 |
| | United States Treasury Note/Bond | 0.250% | 8/31/25 | 121,575 | 121,443 |
| | United States Treasury Note/Bond | 2.750% | 8/31/25 | 63,320 | 71,067 |
| | United States Treasury Note/Bond | 3.000% | 9/30/25 | 43,920 | 49,918 |
| | United States Treasury Note/Bond | 3.000% | 10/31/25 | 54,695 | 62,258 |
| | United States Treasury Note/Bond | 2.250% | 11/15/25 | 171,380 | 188,599 |
| | United States Treasury Note/Bond | 2.875% | 11/30/25 | 64,770 | 73,423 |
| | United States Treasury Note/Bond | 2.625% | 12/31/25 | 59,920 | 67,223 |
| | United States Treasury Note/Bond | 2.625% | 1/31/26 | 73,325 | 82,376 |
| | United States Treasury Note/Bond | 1.625% | 2/15/26 | 225,785 | 241,484 |
| | United States Treasury Note/Bond | 6.000% | 2/15/26 | 13,075 | 17,063 |
| | United States Treasury Note/Bond | 2.500% | 2/28/26 | 425 | 475 |
| | United States Treasury Note/Bond | 2.250% | 3/31/26 | 71,440 | 78,963 |
| | United States Treasury Note/Bond | 2.375% | 4/30/26 | 72,685 | 80,930 |
| | United States Treasury Note/Bond | 1.625% | 5/15/26 | 155,020 | 166,065 |
| | United States Treasury Note/Bond | 2.125% | 5/31/26 | 54,973 | 60,479 |
| | United States Treasury Note/Bond | 1.875% | 6/30/26 | 66,300 | 72,050 |
| | United States Treasury Note/Bond | 1.875% | 7/31/26 | 83,445 | 90,733 |
| | United States Treasury Note/Bond | 1.500% | 8/15/26 | 196,842 | 209,668 |
| | United States Treasury Note/Bond | 6.750% | 8/15/26 | 5,954 | 8,187 |
| | United States Treasury Note/Bond | 1.375% | 8/31/26 | 21,910 | 23,183 |
| | United States Treasury Note/Bond | 1.625% | 9/30/26 | 62,249 | 66,821 |
| | United States Treasury Note/Bond | 1.625% | 10/31/26 | 86,000 | 92,343 |
| | United States Treasury Note/Bond | 2.000% | 11/15/26 | 129,710 | 142,276 |
| | United States Treasury Note/Bond | 6.500% | 11/15/26 | 8,000 | 10,990 |
| | United States Treasury Note/Bond | 1.625% | 11/30/26 | 69,290 | 74,433 |
| | United States Treasury Note/Bond | 1.750% | 12/31/26 | 40,795 | 44,161 |
| | United States Treasury Note/Bond | 1.500% | 1/31/27 | 74,515 | 79,533 |
| | United States Treasury Note/Bond | 2.250% | 2/15/27 | 143,739 | 160,292 |
| | United States Treasury Note/Bond | 6.625% | 2/15/27 | 3,015 | 4,202 |
| | United States Treasury Note/Bond | 1.125% | 2/28/27 | 69,329 | 72,341 |
| | United States Treasury Note/Bond | 0.625% | 3/31/27 | 86,900 | 87,851 |
| | United States Treasury Note/Bond | 0.500% | 4/30/27 | 100,935 | 101,171 |
| | United States Treasury Note/Bond | 2.375% | 5/15/27 | 143,835 | 161,994 |
Intermediate-Term Treasury Index Fund
| | | | | Face | Market |
| | | | Maturity | Amount | Value• |
| | | Coupon | Date | ($000) | ($000) |
| | United States Treasury Note/Bond | 0.500% | 5/31/27 | 103,895 | 104,074 |
| | United States Treasury Note/Bond | 0.500% | 6/30/27 | 100,435 | 100,561 |
| | United States Treasury Note/Bond | 0.375% | 7/31/27 | 103,125 | 102,335 |
| | United States Treasury Note/Bond | 2.250% | 8/15/27 | 152,080 | 170,424 |
| | United States Treasury Note/Bond | 6.375% | 8/15/27 | 3,000 | 4,212 |
| | United States Treasury Note/Bond | 0.500% | 8/31/27 | 114,250 | 114,285 |
| | United States Treasury Note/Bond | 2.250% | 11/15/27 | 138,410 | 155,495 |
| | United States Treasury Note/Bond | 6.125% | 11/15/27 | 11,800 | 16,514 |
| | United States Treasury Note/Bond | 2.750% | 2/15/28 | 103,665 | 120,511 |
| | United States Treasury Note/Bond | 2.875% | 5/15/28 | 117,957 | 138,636 |
| | United States Treasury Note/Bond | 2.875% | 8/15/28 | 143,483 | 169,175 |
| | United States Treasury Note/Bond | 5.500% | 8/15/28 | 103,412 | 143,162 |
| | United States Treasury Note/Bond | 3.125% | 11/15/28 | 150,263 | 180,762 |
| | United States Treasury Note/Bond | 5.250% | 11/15/28 | 27,450 | 37,752 |
| | United States Treasury Note/Bond | 2.625% | 2/15/29 | 147,130 | 171,545 |
| | United States Treasury Note/Bond | 5.250% | 2/15/29 | 33,007 | 45,684 |
| | United States Treasury Note/Bond | 2.375% | 5/15/29 | 165,994 | 190,581 |
| | United States Treasury Note/Bond | 1.625% | 8/15/29 | 133,968 | 145,438 |
| | United States Treasury Note/Bond | 6.125% | 8/15/29 | 17,510 | 25,923 |
| | United States Treasury Note/Bond | 1.750% | 11/15/29 | 153,020 | 168,034 |
| | United States Treasury Note/Bond | 1.500% | 2/15/30 | 166,474 | 179,089 |
| | United States Treasury Note/Bond | 0.625% | 5/15/30 | 205,185 | 203,743 |
| | United States Treasury Note/Bond | 6.250% | 5/15/30 | 5,000 | 7,628 |
| | United States Treasury Note/Bond | 0.625% | 8/15/30 | 94,100 | 93,306 |
| Total U.S. Government and Agency Obligations (Cost $10,215,402) | | 10,798,897 |
| | | | | | |
| | | | | Shares | |
| Temporary Cash Investment (0.4%) | | | | |
| Money Market Fund (0.4%) | | | | |
| 1 | Vanguard Market Liquidity Fund (Cost $41,420) | 0.147% | | 414,206 | 41,421 |
| Total Investments (100.0%) (Cost $10,256,822) | | | 10,840,318 |
| Other Assets and Liabilities—Net (0.0%) | | | | 4,638 |
| Net Assets (100%) | | | | 10,844,956 |
Cost is in $000.
| • | See Note A in Notes to Financial Statements. |
| 1 | Affiliated money market fund available only to Vanguard funds and certain trusts and accounts managed by Vanguard. Rate shown is the 7-day yield. |
See accompanying Notes, which are an integral part of the Financial Statements.
Intermediate-Term Treasury Index Fund
Statement of Assets and Liabilities
As of August 31, 2020
| ($000s, except shares and per-share amounts) | Amount |
| Assets | |
| Investments in Securities, at Value | |
| Unaffiliated Issuers (Cost $10,215,402) | 10,798,897 |
| Affiliated Issuers (Cost $41,420) | 41,421 |
| Total Investments in Securities | 10,840,318 |
| Investment in Vanguard | 464 |
| Receivables for Investment Securities Sold | 289,928 |
| Receivables for Accrued Income | 38,364 |
| Receivables for Capital Shares Issued | 10,228 |
| Total Assets | 11,179,302 |
| Liabilities | |
| Due to Custodian | 5 |
| Payables for Investment Securities Purchased | 329,381 |
| Payables for Capital Shares Redeemed | 3,951 |
| Payables for Distributions | 717 |
| Payables to Vanguard | 292 |
| Total Liabilities | 334,346 |
| Net Assets | 10,844,956 |
| | |
| | |
| At August 31, 2020, net assets consisted of: | |
| | |
| Paid-in Capital | 10,196,585 |
| Total Distributable Earnings (Loss) | 648,371 |
| Net Assets | 10,844,956 |
| | |
| ETF Shares—Net Assets | |
| Applicable to 92,916,967 outstanding $.001 par value shares of beneficial interest (unlimited authorization) | 6,546,724 |
| Net Asset Value Per Share—ETF Shares | $70.46 |
| | |
| Admiral Shares—Net Assets | |
| Applicable to 115,237,104 outstanding $.001 par value shares of beneficial interest (unlimited authorization) | 2,739,843 |
| Net Asset Value Per Share—Admiral Shares | $23.78 |
| | |
| Institutional Shares—Net Assets | |
| Applicable to 52,816,910 outstanding $.001 par value shares of beneficial interest (unlimited authorization) | 1,558,389 |
| Net Asset Value Per Share—Institutional Shares | $29.51 |
See accompanying Notes, which are an integral part of the Financial Statements.
Intermediate-Term Treasury Index Fund
Statement of Operations
| | Year Ended |
| | August 31, 2020 |
| | ($000) |
| Investment Income | |
| Income | |
| Interest1 | 165,000 |
| Total Income | 165,000 |
| Expenses | |
| The Vanguard Group—Note B | |
| Investment Advisory Services | 258 |
| Management and Administrative—ETF Shares | 1,893 |
| Management and Administrative—Admiral Shares | 1,298 |
| Management and Administrative—Institutional Shares | 572 |
| Marketing and Distribution—ETF Shares | 325 |
| Marketing and Distribution—Admiral Shares | 158 |
| Marketing and Distribution—Institutional Shares | 55 |
| Custodian Fees | 17 |
| Auditing Fees | 47 |
| Shareholders’ Reports—ETF Shares | 229 |
| Shareholders’ Reports—Admiral Shares | 20 |
| Shareholders’ Reports—Institutional Shares | 3 |
| Trustees’ Fees and Expenses | 5 |
| Total Expenses | 4,880 |
| Net Investment Income | 160,120 |
| Realized Net Gain (Loss) on Investment Securities Sold1,2 | 166,294 |
| Change in Unrealized Appreciation (Depreciation) of Investment Securities1 | 244,806 |
| Net Increase (Decrease) in Net Assets Resulting from Operations | 571,220 |
| 1 | Interest income, realized net gain (loss), and change in unrealized appreciation (depreciation) from an affiliated company of the fund were $168,000, ($30,000), and $1,000, respectively. Purchases and sales are for temporary cash investment purposes. |
| 2 | Includes $83,070,000 of net gain (loss) resulting from in-kind redemptions. |
See accompanying Notes, which are an integral part of the Financial Statements.
Intermediate-Term Treasury Index Fund
Statement of Changes in Net Assets
| | Year Ended August 31, |
| | 2020 | 2019 |
| | ($000) | ($000) |
| Increase (Decrease) in Net Assets | | |
| Operations | | |
| Net Investment Income | 160,120 | 133,484 |
| Realized Net Gain (Loss) | 166,294 | 15,651 |
| Change in Unrealized Appreciation (Depreciation) | 244,806 | 432,052 |
| Net Increase (Decrease) in Net Assets Resulting from Operations | 571,220 | 581,187 |
| Distributions1 | | |
| ETF Shares | (96,073) | (80,241) |
| Admiral Shares | (39,783) | (34,323) |
| Institutional Shares | (24,641) | (15,996) |
| Total Distributions | (160,497) | (130,560) |
| Capital Share Transactions | | |
| ETF Shares | 1,955,597 | 1,395,386 |
| Admiral Shares | 750,787 | 667,745 |
| Institutional Shares | 305,818 | 735,266 |
| Net Increase (Decrease) from Capital Share Transactions | 3,012,202 | 2,798,397 |
| Total Increase (Decrease) | 3,422,925 | 3,249,024 |
| Net Assets | | |
| Beginning of Period | 7,422,031 | 4,173,007 |
| End of Period | 10,844,956 | 7,422,031 |
| 1 | Certain prior period numbers have been reclassified to conform with current period presentation. |
See accompanying Notes, which are an integral part of the Financial Statements.
Intermediate-Term Treasury Index Fund
Financial Highlights
| ETF Shares | | | | | |
| | | | | | |
| For a Share Outstanding | | | Year Ended August 31, |
| Throughout Each Period | 2020 | 2019 | 2018 | 2017 | 2016 |
| Net Asset Value, Beginning of Period | $67.26 | $62.67 | $65.29 | $66.54 | $64.80 |
| Investment Operations | | | | | |
| Net Investment Income | 1.2391 | 1.5151 | 1.2501 | 1.0431 | 1.035 |
| Net Realized and Unrealized Gain (Loss) on Investments | 3.248 | 4.552 | (2.691) | (1.201) | 1.770 |
| Total from Investment Operations | 4.487 | 6.067 | (1.441) | (.158) | 2.805 |
| Distributions | | | | | |
| Dividends from Net Investment Income | (1.287) | (1.477) | (1.179) | (1.011) | (1.038) |
| Distributions from Realized Capital Gains | — | — | — | (.081) | (.027) |
| Total Distributions | (1.287) | (1.477) | (1.179) | (1.092) | (1.065) |
| Net Asset Value, End of Period | $70.46 | $67.26 | $62.67 | $65.29 | $66.54 |
| | | | | | |
| Total Return | 6.76% | 9.84% | -2.21% | -0.21% | 4.37% |
| | | | | | |
| Ratios/Supplemental Data | | | | | |
| Net Assets, End of Period (Millions) | $6,547 | $4,353 | $2,680 | $1,329 | $908 |
| Ratio of Total Expenses to Average Net Assets | 0.05% | 0.05% | 0.07% | 0.07% | 0.07% |
| Ratio of Net Investment Income to Average Net Assets | 1.80% | 2.36% | 1.97% | 1.61% | 1.61% |
| Portfolio Turnover Rate2 | 28% | 29% | 31% | 32% | 37% |
| 1 | Calculated based on average shares outstanding. |
| | | |
| 2 | Excludes the value of portfolio securities received or delivered as a result of in-kind purchases or redemptions of the fund’s capital shares, including ETF Creation Units. |
See accompanying Notes, which are an integral part of the Financial Statements.
Intermediate-Term Treasury Index Fund
Financial Highlights
| Admiral Shares | | | | | |
| | | | | | |
| For a Share Outstanding | | | Year Ended August 31, |
| Throughout Each Period | 2020 | 2019 | 2018 | 2017 | 2016 |
| Net Asset Value, Beginning of Period | $22.68 | $21.13 | $22.03 | $22.45 | $21.86 |
| Investment Operations | | | | | |
| Net Investment Income | .4161 | .5071 | .4181 | .3511 | .349 |
| Net Realized and Unrealized Gain (Loss) on Investments | 1.101 | 1.540 | (.911) | (.400) | .601 |
| Total from Investment Operations | 1.517 | 2.047 | (.493) | (.049) | .950 |
| Distributions | | | | | |
| Dividends from Net Investment Income | (.417) | (.497) | (.407) | (.344) | (.351) |
| Distributions from Realized Capital Gains | — | — | — | (.027) | (.009) |
| Total Distributions | (.417) | (.497) | (.407) | (.371) | (.360) |
| Net Asset Value, End of Period | $23.78 | $22.68 | $21.13 | $22.03 | $22.45 |
| | | | | | |
| Total Return2 | 6.76% | 9.83% | -2.24% | -0.19% | 4.38% |
| | | | | | |
| Ratios/Supplemental Data | | | | | |
| Net Assets, End of Period (Millions) | $2,740 | $1,887 | $1,104 | $874 | $710 |
| Ratio of Total Expenses to Average Net Assets | 0.07% | 0.07% | 0.07% | 0.07% | 0.07% |
| Ratio of Net Investment Income to Average Net Assets | 1.79% | 2.34% | 1.97% | 1.61% | 1.61% |
| Portfolio Turnover Rate3 | 28% | 29% | 31% | 32% | 37% |
| 1 | Calculated based on average shares outstanding. |
| | | |
| 2 | Total returns do not include account service fees that may have applied in the periods shown. Fund prospectuses provide information about any applicable account service fees. |
| | | |
| 3 | Excludes the value of portfolio securities received or delivered as a result of in-kind purchases or redemptions of the fund’s capital shares, including ETF Creation Units. |
See accompanying Notes, which are an integral part of the Financial Statements.
Intermediate-Term Treasury Index Fund
Financial Highlights
| Institutional Shares | | | |
| | | | | | |
| For a Share Outstanding | | | Year Ended August 31, |
| Throughout Each Period | 2020 | 2019 | 2018 | 2017 | 2016 |
| Net Asset Value, Beginning of Period | $28.15 | $26.23 | $27.33 | $27.86 | $27.12 |
| Investment Operations | | | | | |
| Net Investment Income | .5271 | .6341 | .5241 | .4411 | .437 |
| Net Realized and Unrealized Gain (Loss) on Investments | 1.355 | 1.908 | (1.114) | (.507) | .752 |
| Total from Investment Operations | 1.882 | 2.542 | (.590) | (.066) | 1.189 |
| Distributions | | | | | |
| Dividends from Net Investment Income | (.522) | (.622) | (.510) | (.430) | (.438) |
| Distributions from Realized Capital Gains | — | — | — | (.034) | (.011) |
| Total Distributions | (.522) | (.622) | (.510) | (.464) | (.449) |
| Net Asset Value, End of Period | $29.51 | $28.15 | $26.23 | $27.33 | $27.86 |
| | | | | | |
| Total Return | 6.76% | 9.83% | -2.16% | -0.21% | 4.42% |
| | | | | | |
| Ratios/Supplemental Data | | | | | |
| Net Assets, End of Period (Millions) | $1,558 | $1,183 | $390 | $336 | $272 |
| Ratio of Total Expenses to Average Net Assets | 0.05% | 0.05% | 0.05% | 0.05% | 0.05% |
| Ratio of Net Investment Income to Average Net Assets | 1.83% | 2.36% | 1.99% | 1.63% | 1.63% |
| Portfolio Turnover Rate2 | 28% | 29% | 31% | 32% | 37% |
| 1 | Calculated based on average shares outstanding. |
| 2 | Excludes the value of portfolio securities received or delivered as a result of in-kind purchases or redemptions of the fund’s capital shares, including ETF Creation Units. |
See accompanying Notes, which are an integral part of the Financial Statements.
Intermediate-Term Treasury Index Fund
Notes to Financial Statements
Vanguard Intermediate-Term Treasury Index Fund is registered under the Investment Company Act of 1940 as an open-end investment company, or mutual fund. The fund offers three classes of shares: ETF Shares, Admiral Shares, and Institutional Shares. Each of the share classes has different eligibility and minimum purchase requirements, and is designed for different types of investors. ETF Shares are listed for trading on Nasdaq; they can be purchased and sold through a broker.
Market disruptions associated with the COVID-19 pandemic have had a global impact, and uncertainty exists as to the long-term implications. Such disruptions can adversely affect assets of the fund and thus fund performance.
A. The following significant accounting policies conform to generally accepted accounting principles for U.S. investment companies. The fund consistently follows such policies in preparing its financial statements.
1. Security Valuation: Securities are valued as of the close of trading on the New York Stock Exchange (generally 4 p.m., Eastern time) on the valuation date. Bonds and temporary cash investments are valued using the latest bid prices or using valuations based on a matrix system (which considers such factors as security prices, yields, maturities, and ratings), both as furnished by independent pricing services. Investments in Vanguard Market Liquidity Fund are valued at that fund’s net asset value. Securities for which market quotations are not readily available, or whose values have been affected by events occurring before the fund’s pricing time but after the close of the securities’ primary markets, are valued by methods deemed by the board of trustees to represent fair value.
2. Federal Income Taxes: The fund intends to continue to qualify as a regulated investment company and distribute all of its taxable income. The fund’s tax returns are open to examination by the relevant tax authorities until expiration of the applicable statute of limitations, which is generally three years after the filing of the tax return. Management has analyzed the fund’s tax positions taken for all open federal and state income tax years, and has concluded that no provision for income tax is required in the fund’s financial statements.
3. Distributions: Distributions to shareholders are recorded on the ex-dividend date. Distributions are determined on a tax basis at the fiscal year-end and may differ from net investment income and realized capital gains for financial reporting purposes.
4. Credit Facilities and Interfund Lending Program: The fund and certain other funds managed by The Vanguard Group (“Vanguard”) participate in a $4.3 billion committed credit facility provided by a syndicate of lenders pursuant to a credit agreement and an uncommitted credit facility provided by Vanguard. Both facilities may be renewed annually. Each fund is individually liable for its borrowings, if any, under the credit facilities. Borrowings may be utilized for temporary or emergency purposes, subject to the fund’s regulatory and contractual borrowing restrictions. With respect to the committed credit facility, the participating funds are charged administrative fees and an annual commitment fee of 0.10% of the undrawn committed amount of the facility; these fees are allocated to the funds based on a method approved by the fund’s board of trustees and included in Management and
Intermediate-Term Treasury Index Fund
Administrative expenses on the fund’s Statement of Operations. Any borrowings under either facility bear interest at a rate based upon the higher of the one-month London Interbank Offered Rate (or an acceptable alternate rate, if necessary), federal funds effective rate, or overnight bank funding rate plus an agreed-upon spread, except that borrowings under the uncommitted credit facility may bear interest based upon an alternative rate agreed to by the fund and Vanguard.
In accordance with an exemptive order (the “Order”) from the SEC, the fund may participate in a joint lending and borrowing program that allows registered open-end Vanguard funds to borrow money from and lend money to each other for temporary or emergency purposes (the “Interfund Lending Program”), subject to compliance with the terms and conditions of the Order, and to the extent permitted by the fund’s investment objective and investment policies. Interfund loans and borrowings normally extend overnight, but can have a maximum duration of seven days. Loans may be called on one business day’s notice. The interest rate to be charged is governed by the conditions of the Order and internal procedures adopted by the board of trustees. The board of trustees is responsible for overseeing the Interfund Lending Program.
For the year ended August 31, 2020, the fund did not utilize the credit facilities or the Interfund Lending Program.
5. Other: Interest income includes income distributions received from Vanguard Market Liquidity Fund and is accrued daily. Premiums and discounts on debt securities are amortized and accreted, respectively, to interest income over the lives of the respective securities, except for premiums on certain callable debt securities that are amortized to the earliest call date. Security transactions are accounted for on the date securities are bought or sold. Costs used to determine realized gains (losses) on the sale of investment securities are those of the specific securities sold.
Each class of shares has equal rights as to assets and earnings, except that each class separately bears certain class-specific expenses related to maintenance of shareholder accounts (included in Management and Administrative expenses) and shareholder reporting. Marketing and distribution expenses are allocated to each class of shares based on a method approved by the board of trustees. Income, other non-class-specific expenses, and gains and losses on investments are allocated to each class of shares based on its relative net assets.
B. In accordance with the terms of a Funds’ Service Agreement (the “FSA”) between Vanguard and the fund, Vanguard furnishes to the fund investment advisory, corporate management, administrative, marketing, and distribution services at Vanguard’s cost of operations (as defined by the FSA). These costs of operations are allocated to the fund based on methods and guidelines approved by the board of trustees and are generally settled twice a month.
Upon the request of Vanguard, the fund may invest up to 0.40% of its net assets as capital in Vanguard. At August 31, 2020, the fund had contributed to Vanguard capital in the amount of $464,000, representing less than 0.01%of the fund’s net assets and 0.19% of Vanguard’s capital received pursuant to the FSA. The fund’s trustees and officers are also directors and employees, respectively, of Vanguard.
Intermediate-Term Treasury Index Fund
C. Various inputs may be used to determine the value of the fund’s investments. These inputs are summarized in three broad levels for financial statement purposes. The inputs or methodologies used to value securities are not necessarily an indication of the risk associated with investing in those securities.
Level 1—Quoted prices in active markets for identical securities.
Level 2—Other significant observable inputs (including quoted prices for similar securities, interest rates, prepayment speeds, credit risk, etc.).
Level 3—Significant unobservable inputs (including the fund’s own assumptions used to determine the fair value of investments). Any investments valued with significant unobservable inputs are noted on the Schedule of Investments.
The following table summarizes the market value of the fund’s investments as of August 31, 2020, based on the inputs used to value them:
| | Level 1 | Level 2 | Level 3 | Total |
| | ($000) | ($000) | ($000) | ($000) |
| Investments | | | | |
| Assets | | | | |
| U.S. Government and Agency Obligations | — | 10,798,897 | — | 10,798,897 |
| Temporary Cash Investments | 41,421 | — | — | 41,421 |
| Total Assets | 41,421 | 10,798,897 | — | 10,840,318 |
D. Permanent differences between book-basis and tax-basis components of net assets are reclassified among capital accounts in the financial statements to reflect their tax character. These reclassifications have no effect on net assets or net asset value per share. As of period end, permanent differences primarily attributable to the accounting for in-kind redemptions and distributions in connection with fund share redemptions were reclassified between the following accounts:
| | Amount |
| | ($000) |
| Paid-in Capital | 87,045 |
| Total Distributable Earnings (Loss) | (87,045) |
Intermediate-Term Treasury Index Fund
Temporary differences between book-basis and tax-basis components of total distributable earnings (loss) arise when certain items of income, gain, or loss are recognized in different periods for financial statement and tax purposes; these differences will reverse at some time in the future. The differences are primarily related to the deferral of losses from wash sales; and the inclusion of payables for distributions. As of period end, the tax-basis components of total distributable earnings (loss) are detailed in the table as follows:
| | Amount |
| | ($000) |
| Undistributed Ordinary Income | 25,162 |
| Undistributed Long-Term Gains | 40,430 |
| Capital Loss Carryforwards | — |
| Qualified Late-Year Losses | — |
| Net Unrealized Gains (Losses) | 583,496 |
The tax character of distributions paid was as follows:
| | Year Ended August 31, |
| | 2020 | 2019 |
| | Amount | Amount |
| | ($000) | ($000) |
| Ordinary Income * | 160,497 | 130,560 |
| Long-Term Capital Gains | — | — |
| Total | 160,497 | 130,560 |
* Includes short-term capital gains, if any.
As of August 31, 2020, gross unrealized appreciation and depreciation for investments based on cost for U.S. federal income tax purposes were as follows:
| | Amount |
| | ($000) |
| Tax Cost | 10,256,822 |
| Gross Unrealized Appreciation | 586,815 |
| Gross Unrealized Depreciation | (3,319) |
| Net Unrealized Appreciation (Depreciation) | 583,496 |
Intermediate-Term Treasury Index Fund
E. During the year ended August 31, 2020, the fund purchased $6,530,201,000 of investment securities and sold $3,513,038,000 of investment securities, other than temporary cash investments. Purchases and sales include $2,967,765,000 and $1,034,435,000, respectively, in connection with in-kind purchases and redemptions of the fund’s capital shares.
The fund purchased securities from and sold securities to other Vanguard funds or accounts managed by Vanguard or its affiliates, in accordance with procedures adopted by the board of trustees in compliance with Rule 17a-7 of the Investment Company Act of 1940. For the year ended August 31, 2020, such purchases and sales were $7,720,000 and $1,991,035,000, respectively; these amounts, other than temporary cash investments, are included in the purchases and sales of investment securities noted above.
F. Capital share transactions for each class of shares were:
| | Year Ended August 31, |
| | | 2020 | | | 2019 |
| | Amount | Shares | | Amount | Shares |
| | ($000) | (000) | | ($000) | (000) |
| ETF Shares | | | | | |
| Issued | 3,000,182 | 43,309 | | 1,981,634 | 31,125 |
| Issued in Lieu of Cash Distributions | — | — | | — | — |
| Redeemed | (1,044,585) | (15,100) | | (586,248) | (9,175) |
| Net Increase (Decrease)—ETF Shares | 1,955,597 | 28,209 | | 1,395,386 | 21,950 |
| Admiral Shares | | | | | |
| Issued | 1,763,881 | 75,468 | | 1,148,062 | 53,224 |
| Issued in Lieu of Cash Distributions | 33,570 | 1,450 | | 28,925 | 1,333 |
| Redeemed | (1,046,664) | (44,861) | | (509,242) | (23,608) |
| Net Increase (Decrease)—Admiral Shares | 750,787 | 32,057 | | 667,745 | 30,949 |
| Institutional Shares | | | | | |
| Issued | 637,472 | 22,246 | | 849,876 | 31,471 |
| Issued in Lieu of Cash Distributions | 20,929 | 729 | | 14,002 | 519 |
| Redeemed | (352,583) | (12,178) | | (128,612) | (4,827) |
| Net Increase (Decrease)—Institutional Shares | 305,818 | 10,797 | | 735,266 | 27,163 |
G. Management has determined that no events or transactions occurred subsequent to August 31, 2020, that would require recognition or disclosure in these financial statements.
Long-Term Treasury Index Fund
Performance Summary
All of the returns in this report represent past performance, which is not a guarantee of future results that may be achieved by the fund. (Current performance may be lower or higher than the performance data cited. For performance data current to the most recent month-end, visit our website at vanguard.com/performance.) Note, too, that both investment returns and principal value can fluctuate widely, so an investor’s shares, when sold, could be worth more or less than their original cost. The returns shown do not reflect taxes that a shareholder would pay on fund distributions or on the sale of fund shares.
Cumulative Performance: August 31, 2010, Through August 31, 2020
Initial Investment of $10,000

| | | Average Annual Total Returns | |
| | | Periods Ended August 31, 2020 | |
| | | | | | Final Value |
| | | One | Five | Ten | of a $10,000 |
| | | Year | Years | Years | Investment |
 | Long-Term Treasury Index Fund ETF Shares Net Asset Value | 12.02% | 8.36% | 6.83% | $19,362 |
| | Long-Term Treasury Index Fund ETF Shares Market Price | 12.09 | 8.36 | 6.83 | 19,362 |
 | Spliced Bloomberg Barclays U.S. Long Treasury Index | 13.00 | 8.47 | 7.00 | 19,664 |
 | Bloomberg Barclays U.S. Aggregate Float Adjusted Index | 6.57 | 4.41 | 3.69 | 14,372 |
Spliced Bloomberg Barclays U.S. Long Treasury Index: Bloomberg Barclays U.S. Long Government Float Adjusted Index through December 11, 2017; Bloomberg Barclays U.S. Long Treasury Bond Index thereafter.
See Financial Highlights for dividend and capital gains information.
Long-Term Treasury Index Fund
| | Average Annual Total Returns | |
| | Periods Ended August 31, 2020 | |
| | | | | Final Value |
| | One | Five | Ten | of a $10,000 |
| | Year | Years | Years | Investment |
| Long-Term Treasury Index Fund Admiral Shares | 12.00% | 8.36% | 6.83% | $19,357 |
| Spliced Bloomberg Barclays U.S. Long Treasury Index | 13.00 | 8.47 | 7.00 | 19,664 |
| Bloomberg Barclays U.S. Aggregate Float Adjusted Index | 6.57 | 4.41 | 3.69 | 14,372 |
| | | | | Final Value |
| | One | Five | Ten | of a $5,000,000 |
| | Year | Years | Years | Investment |
| Long-Term Treasury Index Fund Institutional Shares | 12.03% | 8.39% | 6.86% | $9,706,828 |
| Spliced Bloomberg Barclays U.S. Long Treasury Index | 13.00 | 8.47 | 7.00 | 9,832,018 |
| Bloomberg Barclays U.S. Aggregate Float Adjusted Index | 6.57 | 4.41 | 3.69 | 7,185,953 |
Cumulative Returns of ETF Shares: August 31, 2010, Through August 31, 2020
| | One | Five | Ten |
| | Year | Years | Years |
| Long-Term Treasury Index Fund ETF Shares Market Price | 12.09% | 49.40% | 93.62% |
| Long-Term Treasury Index Fund ETF Shares Net Asset Value | 12.02 | 49.42 | 93.62 |
| Spliced Bloomberg Barclays U.S. Long Treasury Index | 13.00 | 50.18 | 96.64 |
For the ETF Shares, the market price is determined by the midpoint of the bid-offer spread as of the closing time of the New York Stock Exchange (generally 4 p.m., Eastern time). The net asset value is also determined as of the NYSE closing time. For more information about how the ETF Shares’ market prices have compared with their net asset value, visit vanguard.com, select your ETF, and then select the Price and Performance tab. The ETF premium/discount analysis there shows the percentages of days on which the ETF Shares’ market price was above or below the NAV.
Long-Term Treasury Index Fund
Distribution by Stated Maturity
As of August 31, 2020
| 0–10 Years | 0.5% |
| 10–15 Years | 0.2 |
| 15–20 Years | 14.1 |
| 20–25 Years | 33.6 |
| 25–30 Years | 51.6 |
The table reflects the fund’s investments, except for short-term investments.
The fund may invest in derivatives (such as futures and swap contracts) for various reasons, including, but not limited to, attempting to remain fully invested and tracking its target index as closely as possible.
Long-Term Treasury Index Fund
Financial Statements
Schedule of Investments
As of August 31, 2020
The fund files its complete schedule of portfolio holdings with the Securities and Exchange Commission (SEC) for the first and third quarters of each fiscal year as an exhibit to its reports on Form N-PORT. The fund’s Form N-PORT reports are available on the SEC’s website at www.sec.gov.
| | | | | Face | Market |
| | | | Maturity | Amount | Value• |
| | | Coupon | Date | ($000) | ($000) |
| U.S. Government and Agency Obligations (99.5%) | | | |
| U.S. Government Securities (99.5%) | | | | |
| | United States Treasury Note/Bond | 6.250% | 5/15/30 | 11,047 | 16,854 |
| | United States Treasury Note/Bond | 0.625% | 8/15/30 | 6,930 | 6,872 |
| | United States Treasury Note/Bond | 5.375% | 2/15/31 | 5,595 | 8,235 |
| | United States Treasury Note/Bond | 4.500% | 2/15/36 | 36,152 | 54,538 |
| | United States Treasury Note/Bond | 4.750% | 2/15/37 | 14,825 | 23,266 |
| | United States Treasury Note/Bond | 5.000% | 5/15/37 | 8,771 | 14,163 |
| | United States Treasury Note/Bond | 4.375% | 2/15/38 | 9,377 | 14,364 |
| | United States Treasury Note/Bond | 4.500% | 5/15/38 | 14,390 | 22,377 |
| | United States Treasury Note/Bond | 3.500% | 2/15/39 | 38,300 | 53,465 |
| | United States Treasury Note/Bond | 4.250% | 5/15/39 | 25,667 | 39,147 |
| | United States Treasury Note/Bond | 4.500% | 8/15/39 | 24,709 | 38,839 |
| | United States Treasury Note/Bond | 4.375% | 11/15/39 | 45,139 | 70,099 |
| | United States Treasury Note/Bond | 4.625% | 2/15/40 | 47,139 | 75,482 |
| | United States Treasury Note/Bond | 1.125% | 5/15/40 | 147,045 | 144,288 |
| | United States Treasury Note/Bond | 4.375% | 5/15/40 | 31,130 | 48,597 |
| | United States Treasury Note/Bond | 1.125% | 8/15/40 | 56,910 | 55,612 |
| | United States Treasury Note/Bond | 3.875% | 8/15/40 | 47,627 | 70,123 |
| | United States Treasury Note/Bond | 4.250% | 11/15/40 | 29,416 | 45,420 |
| | United States Treasury Note/Bond | 4.750% | 2/15/41 | 36,018 | 59,075 |
| | United States Treasury Note/Bond | 4.375% | 5/15/41 | 31,693 | 49,838 |
| | United States Treasury Note/Bond | 3.750% | 8/15/41 | 38,192 | 55,712 |
| | United States Treasury Note/Bond | 3.125% | 11/15/41 | 34,214 | 45,911 |
| | United States Treasury Note/Bond | 3.125% | 2/15/42 | 36,802 | 49,481 |
| | United States Treasury Note/Bond | 3.000% | 5/15/42 | 33,768 | 44,558 |
| | United States Treasury Note/Bond | 2.750% | 8/15/42 | 49,983 | 63,557 |
| | United States Treasury Note/Bond | 2.750% | 11/15/42 | 63,392 | 80,518 |
| | United States Treasury Note/Bond | 3.125% | 2/15/43 | 62,687 | 84,295 |
| | United States Treasury Note/Bond | 2.875% | 5/15/43 | 92,587 | 119,944 |
| | United States Treasury Note/Bond | 3.625% | 8/15/43 | 76,294 | 110,459 |
| | United States Treasury Note/Bond | 3.750% | 11/15/43 | 84,621 | 124,789 |
| | United States Treasury Note/Bond | 3.625% | 2/15/44 | 91,140 | 132,196 |
| | United States Treasury Note/Bond | 3.375% | 5/15/44 | 76,308 | 106,915 |
| | United States Treasury Note/Bond | 3.125% | 8/15/44 | 97,006 | 131,034 |
| | United States Treasury Note/Bond | 3.000% | 11/15/44 | 93,608 | 124,132 |
| | United States Treasury Note/Bond | 2.500% | 2/15/45 | 104,040 | 127,042 |
| | United States Treasury Note/Bond | 3.000% | 5/15/45 | 86,914 | 115,500 |
| | United States Treasury Note/Bond | 2.875% | 8/15/45 | 45,212 | 58,952 |
| | United States Treasury Note/Bond | 3.000% | 11/15/45 | 64,173 | 85,560 |
| | United States Treasury Note/Bond | 2.500% | 2/15/46 | 93,367 | 114,345 |
| | United States Treasury Note/Bond | 2.500% | 5/15/46 | 92,737 | 113,675 |
Long-Term Treasury Index Fund
| | | | | Face | Market |
| | | | Maturity | Amount | Value· |
| | | Coupon | Date | ($000) | ($000) |
| | United States Treasury Note/Bond | 2.250% | 8/15/46 | 104,286 | 122,210 |
| | United States Treasury Note/Bond | 2.875% | 11/15/46 | 85,539 | 112,269 |
| | United States Treasury Note/Bond | 3.000% | 2/15/47 | 88,151 | 118,384 |
| | United States Treasury Note/Bond | 3.000% | 5/15/47 | 103,669 | 139,353 |
| | United States Treasury Note/Bond | 2.750% | 8/15/47 | 90,470 | 116,650 |
| | United States Treasury Note/Bond | 2.750% | 11/15/47 | 105,355 | 136,023 |
| | United States Treasury Note/Bond | 3.000% | 2/15/48 | 94,967 | 128,235 |
| | United States Treasury Note/Bond | 3.125% | 5/15/48 | 105,217 | 145,397 |
| | United States Treasury Note/Bond | 3.000% | 8/15/48 | 100,782 | 136,528 |
| | United States Treasury Note/Bond | 3.375% | 11/15/48 | 102,282 | 147,957 |
| | United States Treasury Note/Bond | 3.000% | 2/15/49 | 116,854 | 158,866 |
| | United States Treasury Note/Bond | 2.875% | 5/15/49 | 75,415 | 100,432 |
| | United States Treasury Note/Bond | 2.250% | 8/15/49 | 133,370 | 157,731 |
| | United States Treasury Note/Bond | 2.375% | 11/15/49 | 156,026 | 189,498 |
| | United States Treasury Note/Bond | 2.000% | 2/15/50 | 218,932 | 246,264 |
| | United States Treasury Note/Bond | 1.250% | 5/15/50 | 155,169 | 146,222 |
| | United States Treasury Note/Bond | 1.375% | 8/15/50 | 48,970 | 47,669 |
| Total U.S. Government and Agency Obligations (Cost $4,574,294) | | 5,148,917 |
| | | | | Shares | |
| Temporary Cash Investment (0.7%) | | | | |
| Money Market Fund (0.7%) | | | | |
| 1 | Vanguard Market Liquidity Fund (Cost $34,963) | 0.147% | | 349,625 | 34,963 |
| Total Investments (100.2%) (Cost $4,609,257) | | | | 5,183,880 |
| Other Assets and Liabilities—Net (-0.2%) | | | | (11,893) |
| Net Assets (100%) | | | | 5,171,987 |
Cost is in $000.
| • | See Note A in Notes to Financial Statements. |
| 1 | Affiliated money market fund available only to Vanguard funds and certain trusts and accounts managed by Vanguard. Rate shown is the 7-day yield. |
See accompanying Notes, which are an integral part of the Financial Statements.
Long-Term Treasury Index Fund
Statement of Assets and Liabilities
As of August 31, 2020
| ($000s, except shares and per-share amounts) | Amount |
| Assets | |
| Investments in Securities, at Value | |
| Unaffiliated Issuers (Cost $4,574,294) | 5,148,917 |
| Affiliated Issuers (Cost $34,963) | 34,963 |
| Total Investments in Securities | 5,183,880 |
| Investment in Vanguard | 237 |
| Receivables for Investment Securities Sold | 68,363 |
| Receivables for Accrued Income | 19,231 |
| Receivables for Capital Shares Issued | 21,340 |
| Total Assets | 5,293,051 |
| Liabilities | |
| Payables for Investment Securities Purchased | 109,052 |
| Payables for Capital Shares Redeemed | 11,513 |
| Payables for Distributions | 353 |
| Payables to Vanguard | 146 |
| Total Liabilities | 121,064 |
| Net Assets | 5,171,987 |
| | |
| | |
| At August 31, 2020, net assets consisted of: | |
| | |
| Paid-in Capital | 4,586,127 |
| Total Distributable Earnings (Loss) | 585,860 |
| Net Assets | 5,171,987 |
| | |
| ETF Shares—Net Assets | |
| Applicable to 21,609,270 outstanding $.001 par value shares of beneficial interest (unlimited authorization) | 2,137,895 |
| Net Asset Value Per Share—ETF Shares | $98.93 |
| | |
| Admiral Shares—Net Assets | |
| Applicable to 54,159,380 outstanding $.001 par value shares of beneficial interest (unlimited authorization) | 1,800,022 |
| Net Asset Value Per Share—Admiral Shares | $33.24 |
| | |
| Institutional Shares—Net Assets | |
| Applicable to 29,252,931 outstanding $.001 par value shares of beneficial interest (unlimited authorization) | 1,234,070 |
| Net Asset Value Per Share—Institutional Shares | $42.19 |
See accompanying Notes, which are an integral part of the Financial Statements.
Long-Term Treasury Index Fund
Statement of Operations
| | Year Ended | |
| | August 31, 2020 | |
| | ($000 | ) |
| Investment Income | | |
| Income | | |
| Interest1 | 89,760 | |
| Total Income | 89,760 | |
| Expenses | | |
| The Vanguard Group—Note B | | |
| Investment Advisory Services | 126 | |
| Management and Administrative—ETF Shares | 596 | |
| Management and Administrative—Admiral Shares | 796 | |
| Management and Administrative—Institutional Shares | 468 | |
| Marketing and Distribution—ETF Shares | 113 | |
| Marketing and Distribution—Admiral Shares | 99 | |
| Marketing and Distribution—Institutional Shares | 38 | |
| Custodian Fees | 12 | |
| Auditing Fees | 47 | |
| Shareholders’ Reports—ETF Shares | 119 | |
| Shareholders’ Reports—Admiral Shares | 19 | |
| Shareholders’ Reports—Institutional Shares | — | |
| Trustees’ Fees and Expenses | 3 | |
| Total Expenses | 2,436 | |
| Expenses Paid Indirectly | (11 | ) |
| Net Expenses | 2,425 | |
| Net Investment Income | 87,335 | |
| Realized Net Gain (Loss) | | |
| Investment Securities Sold1,2 | 305,065 | |
| Futures Contracts | (123 | ) |
| Realized Net Gain (Loss) | 304,942 | |
| Change in Unrealized Appreciation (Depreciation) of Investment Securities1 | 134,898 | |
| Net Increase (Decrease) in Net Assets Resulting from Operations | 527,175 | |
| 1 | Interest income, realized net gain (loss), and change in unrealized appreciation (depreciation) from an affiliated company of the fund were $73,000, $1,000, and ($1,000), respectively. Purchases and sales are for temporary cash investment purposes. |
| 2 | Includes $258,041,000 of net gain (loss) resulting from in-kind redemptions. |
See accompanying Notes, which are an integral part of the Financial Statements.
Long-Term Treasury Index Fund
Statement of Changes in Net Assets
| | Year Ended August 31, |
| | 2020 | 2019 |
| | ($000) | ($000) |
| Increase (Decrease) in Net Assets | | |
| Operations | | |
| Net Investment Income | 87,335 | 60,623 |
| Realized Net Gain (Loss) | 304,942 | 34,967 |
| Change in Unrealized Appreciation (Depreciation) | 134,898 | 508,164 |
| Net Increase (Decrease) in Net Assets Resulting from Operations | 527,175 | 603,754 |
| Distributions1 | | |
| ETF Shares | (36,292) | (24,057) |
| Admiral Shares | (27,918) | (18,802) |
| Institutional Shares | (22,455) | (16,872) |
| Total Distributions | (86,665) | (59,731) |
| Capital Share Transactions | | |
| ETF Shares | 646,509 | 384,210 |
| Admiral Shares | 618,945 | 327,159 |
| Institutional Shares | 77,643 | 445,695 |
| Net Increase (Decrease) from Capital Share Transactions | 1,343,097 | 1,157,064 |
| Total Increase (Decrease) | 1,783,607 | 1,701,087 |
| Net Assets | | |
| Beginning of Period | 3,388,380 | 1,687,293 |
| End of Period | 5,171,987 | 3,388,380 |
1 Certain prior period numbers have been reclassified to conform with current period presentation.
See accompanying Notes, which are an integral part of the Financial Statements.
Long-Term Treasury Index Fund
Financial Highlights
| ETF Shares | | | | | | |
| | | | | | | |
| For a Share Outstanding | | | Year Ended August 31, | |
| Throughout Each Period | 2020 | 2019 | 2018 | 2017 | 2016 | |
| Net Asset Value, Beginning of Period | $90.17 | $74.33 | $78.76 | $85.64 | $75.13 | |
| Investment Operations | | | | | | |
| Net Investment Income | 1.9151 | 2.1151 | 2.0501 | 2.0061 | 2.021 | |
| Net Realized and Unrealized Gain (Loss) on Investments | 8.772 | 15.798 | (4.469) | (6.905) | 10.511 | |
| Total from Investment Operations | 10.687 | 17.913 | (2.419) | (4.899) | 12.532 | |
| Distributions | | | | | | |
| Dividends from Net Investment Income | (1.927) | (2.073) | (2.011) | (1.981) | (2.022) | |
| Distributions from Realized Capital Gains | — | — | — | — | — | |
| Total Distributions | (1.927) | (2.073) | (2.011) | (1.981) | (2.022) | |
| Net Asset Value, End of Period | $98.93 | $90.17 | $74.33 | $78.76 | $85.64 | |
| | | | | | | |
| Total Return | 12.02% | 24.69% | -3.07% | -5.63% | 16.96% | |
| | | | | | | |
| Ratios/Supplemental Data | | | | | | |
| Net Assets, End of Period (Millions) | $2,138 | $1,282 | $676 | $549 | $578 | |
| Ratio of Total Expenses to Average Net Assets | 0.05% | 0.05% | 0.07% | 0.07% | 0.07% | |
| Ratio of Net Investment Income to Average Net Assets | 2.03% | 2.75% | 2.73% | 2.62% | 2.58% | |
| Portfolio Turnover Rate2 | 29% | 16% | 19% | 19% | 18% | |
| 1 | Calculated based on average shares outstanding. |
| 2 | Excludes the value of portfolio securities received or delivered as a result of in-kind purchases or redemptions of the fund’s capital shares, including ETF Creation Units. |
See accompanying Notes, which are an integral part of the Financial Statements.
Long-Term Treasury Index Fund
Financial Highlights
| Admiral Shares | | | | | |
| | | | | | |
| For a Share Outstanding | | | Year Ended August 31, |
| Throughout Each Period | 2020 | 2019 | 2018 | 2017 | 2016 |
| Net Asset Value, Beginning of Period | $30.28 | $24.95 | $26.44 | $28.75 | $25.21 |
| Investment Operations | | | | | |
| Net Investment Income | .6371 | .7061 | .6901 | .6761 | .679 |
| Net Realized and Unrealized Gain (Loss) on Investments | 2.955 | 5.316 | (1.501) | (2.319) | 3.540 |
| Total from Investment Operations | 3.592 | 6.022 | (.811) | (1.643) | 4.219 |
| Distributions | | | | | |
| Dividends from Net Investment Income | (.632) | (.692) | (.679) | (.667) | (.679) |
| Distributions from Realized Capital Gains | — | — | — | — | — |
| Total Distributions | (.632) | (.692) | (.679) | (.667) | (.679) |
| Net Asset Value, End of Period | $33.24 | $30.28 | $24.95 | $26.44 | $28.75 |
| | | | | | |
| Total Return2 | 12.00% | 24.67% | -3.06% | -5.62% | 16.97% |
| | | | | | |
| Ratios/Supplemental Data | | | | | |
| Net Assets, End of Period (Millions) | $1,800 | $1,053 | $559 | $468 | $374 |
| Ratio of Total Expenses to Average Net Assets | 0.07% | 0.07% | 0.07% | 0.07% | 0.07% |
| Ratio of Net Investment Income to Average Net Assets | 2.01% | 2.73% | 2.73% | 2.62% | 2.58% |
| Portfolio Turnover Rate3 | 29% | 16% | 19% | 19% | 18% |
| 1 | Calculated based on average shares outstanding. |
| | |
| 2 | Total returns do not include account service fees that may have applied in the periods shown. Fund prospectuses provide information about any applicable account service fees. |
| | |
| 3 | Excludes the value of portfolio securities received or delivered as a result of in-kind purchases or redemptions of the fund’s capital shares, including ETF Creation Units. |
See accompanying Notes, which are an integral part of the Financial Statements.
Long-Term Treasury Index Fund
Financial Highlights
| Institutional Shares | | | | | |
| | | | | | |
| For a Share Outstanding | | | Year Ended August 31, |
| Throughout Each Period | 2020 | 2019 | 2018 | 2017 | 2016 |
| Net Asset Value, Beginning of Period | $38.43 | $31.66 | $33.56 | $36.49 | $32.00 |
| Investment Operations | | | | | |
| Net Investment Income | .8221 | .9021 | .8831 | .8651 | .868 |
| Net Realized and Unrealized Gain (Loss) on Investments | 3.748 | 6.753 | (1.915) | (2.942) | 4.492 |
| Total from Investment Operations | 4.570 | 7.655 | (1.032) | (2.077) | 5.360 |
| Distributions | | | | | |
| Dividends from Net Investment Income | (.810) | (.885) | (.868) | (.853) | (.870) |
| Distributions from Realized Capital Gains | — | — | — | — | — |
| Total Distributions | (.810) | (.885) | (.868) | (.853) | (.870) |
| Net Asset Value, End of Period | $42.19 | $38.43 | $31.66 | $33.56 | $36.49 |
| | | | | | |
| Total Return | 12.03% | 24.71% | -3.07% | -5.60% | 16.99% |
| | | | | | |
| Ratios/Supplemental Data | | | | | |
| Net Assets, End of Period (Millions) | $1,234 | $1,054 | $452 | $213 | $138 |
| Ratio of Total Expenses to Average Net Assets | 0.05% | 0.05% | 0.05% | 0.05% | 0.05% |
| Ratio of Net Investment Income to Average Net Assets | 2.06% | 2.75% | 2.75% | 2.64% | 2.60% |
| Portfolio Turnover Rate2 | 29% | 16% | 19% | 19% | 18% |
| 1 | Calculated based on average shares outstanding. |
| | | |
| 2 | Excludes the value of portfolio securities received or delivered as a result of in-kind purchases or redemptions of the fund’s capital shares, including ETF Creation Units. |
See accompanying Notes, which are an integral part of the Financial Statements.
Long-Term Treasury Index Fund
Notes to Financial Statements
Vanguard Long-Term Treasury Index Fund is registered under the Investment Company Act of 1940 as an open-end investment company, or mutual fund. The fund offers three classes of shares: ETF Shares, Admiral Shares, and Institutional Shares. Each of the share classes has different eligibility and minimum purchase requirements, and is designed for different types of investors. ETF Shares are listed for trading on Nasdaq; they can be purchased and sold through a broker.
Market disruptions associated with the COVID-19 pandemic have had a global impact, and uncertainty exists as to the long-term implications. Such disruptions can adversely affect assets of the fund and thus fund performance.
A. The following significant accounting policies conform to generally accepted accounting principles for U.S. investment companies. The fund consistently follows such policies in preparing its financial statements.
1. Security Valuation: Securities are valued as of the close of trading on the New York Stock Exchange (generally 4 p.m., Eastern time) on the valuation date. Bonds and temporary cash investments are valued using the latest bid prices or using valuations based on a matrix system (which considers such factors as security prices, yields, maturities, and ratings), both as furnished by independent pricing services. Investments in Vanguard Market Liquidity Fund are valued at that fund’s net asset value. Securities for which market quotations are not readily available, or whose values have been affected by events occurring before the fund’s pricing time but after the close of the securities’ primary markets, are valued by methods deemed by the board of trustees to represent fair value.
2. Futures Contracts: The fund uses futures contracts to invest in fixed income asset classes with greater efficiency and lower cost than is possible through direct investment, to add value when these instruments are attractively priced, or to adjust sensitivity to changes in interest rates. The primary risks associated with the use of futures contracts are imperfect correlation between changes in market values of bonds held by the fund and the prices of futures contracts, and the possibility of an illiquid market. Counterparty risk involving futures is mitigated because a regulated clearinghouse is the counterparty instead of the clearing broker. To further mitigate counterparty risk, the fund trades futures contracts on an exchange, monitors the financial strength of its clearing brokers and clearinghouse, and has entered into clearing agreements with its clearing brokers. The clearinghouse imposes initial margin requirements to secure the fund’s performance and requires daily settlement of variation margin representing changes in the market value of each contract. Any securities pledged as initial margin for open contracts are noted in the Schedule of Investments.
Futures contracts are valued at their quoted daily settlement prices. The notional amounts of the contracts are not recorded in the Statement of Assets and Liabilities. Fluctuations in the value of the contracts are recorded in the Statement of Assets and Liabilities as an asset (liability) and in the Statement of Operations as unrealized appreciation (depreciation) until the contracts are closed, when they are recorded as realized gains (losses) on futures contracts.
During the year ended August 31, 2020, the fund’s average investments in long and short futures contracts each represented 0% of net assets, based on the average of the notional amounts at each quarter-end during the period. The fund had no open futures contracts at August 31, 2020.
Long-Term Treasury Index Fund
3. Federal Income Taxes: The fund intends to continue to qualify as a regulated investment company and distribute all of its taxable income. The fund’s tax returns are open to examination by the relevant tax authorities until expiration of the applicable statute of limitations, which is generally three years after the filing of the tax return. Management has analyzed the fund’s tax positions taken for all open federal and state income tax years, and has concluded that no provision for income tax is required in the fund’s financial statements.
4. Distributions: Distributions to shareholders are recorded on the ex-dividend date. Distributions are determined on a tax basis at the fiscal year-end and may differ from net investment income and realized capital gains for financial reporting purposes.
5. Credit Facilities and Interfund Lending Program: The fund and certain other funds managed by The Vanguard Group (“Vanguard”) participate in a $4.3 billion committed credit facility provided by a syndicate of lenders pursuant to a credit agreement and an uncommitted credit facility provided by Vanguard. Both facilities may be renewed annually. Each fund is individually liable for its borrowings, if any, under the credit facilities. Borrowings may be utilized for temporary or emergency purposes, subject to the fund’s regulatory and contractual borrowing restrictions. With respect to the committed credit facility, the participating funds are charged administrative fees and an annual commitment fee of 0.10% of the undrawn committed amount of the facility; these fees are allocated to the funds based on a method approved by the fund’s board of trustees and included in Management and Administrative expenses on the fund’s Statement of Operations. Any borrowings under either facility bear interest at a rate based upon the higher of the one-month London Interbank Offered Rate (or an acceptable alternate rate, if necessary), federal funds effective rate, or overnight bank funding rate plus an agreed-upon spread, except that borrowings under the uncommitted credit facility may bear interest based upon an alternative rate agreed to by the fund and Vanguard.
In accordance with an exemptive order (the “Order”) from the SEC, the fund may participate in a joint lending and borrowing program that allows registered open-end Vanguard funds to borrow money from and lend money to each other for temporary or emergency purposes (the “Interfund Lending Program”), subject to compliance with the terms and conditions of the Order, and to the extent permitted by the fund’s investment objective and investment policies. Interfund loans and borrowings normally extend overnight, but can have a maximum duration of seven days. Loans may be called on one business day’s notice. The interest rate to be charged is governed by the conditions of the Order and internal procedures adopted by the board of trustees. The board of trustees is responsible for overseeing the Interfund Lending Program.
For the year ended August 31, 2020, the fund did not utilize the credit facilities or the Interfund Lending Program.
6. Other: Interest income includes income distributions received from Vanguard Market Liquidity Fund and is accrued daily. Premiums and discounts on debt securities are amortized and accreted, respectively, to interest income over the lives of the respective securities, except for premiums on certain callable debt securities that are amortized to the earliest call date. Security transactions are accounted for on the date securities are bought or sold. Costs used to determine realized gains (losses) on the sale of investment securities are those of the specific securities sold.
Long-Term Treasury Index Fund
Each class of shares has equal rights as to assets and earnings, except that each class separately bears certain class-specific expenses related to maintenance of shareholder accounts (included in Management and Administrative expenses) and shareholder reporting. Marketing and distribution expenses are allocated to each class of shares based on a method approved by the board of trustees. Income, other non-class-specific expenses, and gains and losses on investments are allocated to each class of shares based on its relative net assets.
B. In accordance with the terms of a Funds’ Service Agreement (the “FSA”) between Vanguard and the fund, Vanguard furnishes to the fund investment advisory, corporate management, administrative, marketing, and distribution services at Vanguard’s cost of operations (as defined by the FSA). These costs of operations are allocated to the fund based on methods and guidelines approved by the board of trustees and are generally settled twice a month.
Upon the request of Vanguard, the fund may invest up to 0.40% of its net assets as capital in Vanguard. At August 31, 2020, the fund had contributed to Vanguard capital in the amount of $237,000, representing less than 0.01% of the fund’s net assets and 0.09% of Vanguard’s capital received pursuant to the FSA. The fund’s trustees and officers are also directors and employees, respectively, of Vanguard.
C. The fund’s custodian bank has agreed to reduce its fees when the fund maintains cash on deposit in the non-interest-bearing custody account. For the year ended August 31, 2020, custodian fee offset arrangements reduced the fund’s expenses by $11,000 (an annual rate of less than 0.01% of average net assets).
D. Various inputs may be used to determine the value of the fund’s investments. These inputs are summarized in three broad levels for financial statement purposes. The inputs or methodologies used to value securities are not necessarily an indication of the risk associated with investing in those securities.
Level 1—Quoted prices in active markets for identical securities.
Level 2—Other significant observable inputs (including quoted prices for similar securities, interest rates, prepayment speeds, credit risk, etc.).
Level 3—Significant unobservable inputs (including the fund’s own assumptions used to determine the fair value of investments). Any investments valued with significant unobservable inputs are noted on the Schedule of Investments.
The following table summarizes the market value of the fund’s investments as of August 31, 2020, based on the inputs used to value them:
| | Level 1 | Level 2 | Level 3 | Total |
| | ($000) | ($000) | ($000) | ($000) |
| Investments | | | | |
| Assets | | | | |
| U.S. Government and Agency Obligations | — | 5,148,917 | — | 5,148,917 |
| Temporary Cash Investments | 34,963 | — | — | 34,963 |
| Total | 34,963 | 5,148,917 | — | 5,183,880 |
Long-Term Treasury Index Fund
E. Permanent differences between book-basis and tax-basis components of net assets are reclassified among capital accounts in the financial statements to reflect their tax character. These reclassifications have no effect on net assets or net asset value per share. As of period end, permanent differences primarily attributable to the accounting for in-kind redemptions and distributions in connection with fund share redemptions were reclassified between the following accounts:
| | Amount |
| | ($000) |
| Paid-in Capital | 258,686 |
| Total Distributable Earnings (Loss) | (258,686) |
Temporary differences between book-basis and tax-basis components of total distributable earnings (loss) arise when certain items of income, gain, or loss are recognized in different periods for financial statement and tax purposes; these differences will reverse at some time in the future. The differences are primarily related to the deferral of losses from wash sales; and the inclusion of payables for distributions. As of period end, the tax-basis components of total distributable earnings (loss) are detailed in the table as follows:
| | Amount |
| | ($000) |
| Undistributed Ordinary Income | 11,590 |
| Undistributed Long-term Gains | — |
| Capital Loss Carryforwards | — |
| Qualified Late-Year Losses | — |
| Net Unrealized Gains (Losses) | 574,623 |
The tax character of distributions paid was as follows:
| | Year Ended August 31, |
| | 2020 | 2019 |
| | Amount | Amount |
| | ($000) | ($000) |
| Ordinary Income * | 86,665 | 59,731 |
| Long-Term Capital Gains | — | — |
| Total | 86,665 | 59,731 |
* Includes short-term capital gains, if any.
Long-Term Treasury Index Fund
As of August 31, 2020, gross unrealized appreciation and depreciation for investments based on cost for U.S. federal income tax purposes were as follows:
| | Amount |
| | ($000) |
| Tax Cost | 4,609,257 |
| Gross Unrealized Appreciation | 607,113 |
| Gross Unrealized Depreciation | (32,490) |
| Net Unrealized Appreciation (Depreciation) | 574,623 |
F. During the year ended August 31, 2020, the fund purchased $3,842,362,000 of investment securities and sold $2,491,307,000 of investment securities, other than temporary cash investments. Purchases and sales include $1,919,241,000 and $1,255,293,000, respectively, in connection with in-kind purchases and redemptions of the fund’s capital shares.
G. Capital share transactions for each class of shares were:
| | | | | Year Ended August 31, |
| | | 2020 | | | 2019 |
| | Amount | Shares | | Amount | Shares |
| | ($000) | (000) | | ($000) | (000) |
| ETF Shares | | | | | |
| Issued | 1,915,555 | 20,470 | | 899,247 | 11,672 |
| Issued in Lieu of Cash Distributions | — | — | | — | — |
| Redeemed | (1,269,046) | (13,075) | | (515,037) | (6,550) |
| Net Increase (Decrease)—ETF Shares | 646,509 | 7,395 | | 384,210 | 5,122 |
| Admiral Shares | | | | | |
| Issued | 1,763,454 | 55,020 | | 587,551 | 22,376 |
| Issued in Lieu of Cash Distributions | 23,977 | 756 | | 15,716 | 605 |
| Redeemed | (1,168,486) | (36,399) | | (276,108) | (10,623) |
| Net Increase (Decrease)—Admiral Shares | 618,945 | 19,377 | | 327,159 | 12,358 |
| Institutional Shares | | | | | |
| Issued | 389,224 | 9,567 | | 576,383 | 17,077 |
| Issued in Lieu of Cash Distributions | 22,432 | 562 | | 16,872 | 510 |
| Redeemed | (334,013) | (8,292) | | (147,560) | (4,447) |
| Net Increase (Decrease)—Institutional Shares | 77,643 | 1,837 | | 445,695 | 13,140 |
H. Management has determined that no events or transactions occurred subsequent to August 31, 2020, that would require recognition or disclosure in these financial statements.
Short-Term Corporate Bond Index Fund
Performance Summary
All of the returns in this report represent past performance, which is not a guarantee of future results that may be achieved by the fund. (Current performance may be lower or higher than the performance data cited. For performance data current to the most recent month-end, visit our website at vanguard.com/performance.) Note, too, that both investment returns and principal value can fluctuate widely, so an investor’s shares, when sold, could be worth more or less than their original cost. The returns shown do not reflect taxes that a shareholder would pay on fund distributions or on the sale of fund shares.
Cumulative Performance: August 31, 2010, Through August 31, 2020
Initial Investment of $10,000
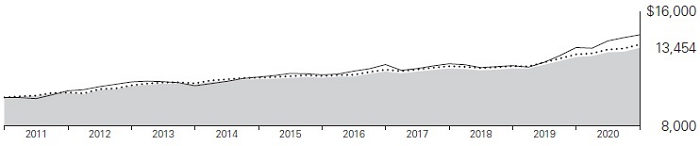
| | | Average Annual Total Returns | |
| | | Periods Ended August 31, 2020 | |
| | | | | | Final Value |
| | | One | Five | Ten | of a $10,000 |
| | | Year | Years | Years | Investment |
 | Short-Term Corporate Bond Index Fund ETF Shares Net Asset Value | 4.95% | 3.41% | 3.01% | $13,454 |
| | Short-Term Corporate Bond Index Fund ETF Shares Market Price | 5.00 | 3.44 | 3.01 | 13,446 |
 | Bloomberg Barclays U.S. 1–5 Year Corporate Bond Index | 5.36 | 3.56 | 3.20 | 13,701 |
 | Bloomberg Barclays U.S. Aggregate Float Adjusted Index | 6.57 | 4.41 | 3.69 | 14,372 |
Bloomberg Barclays U.S. 1–5 Year Corporate Bond Index: Includes U.S. dollar-denominated, investment-grade securities issued by industrial, utility, and financial companies, with maturities between 1 and 5 years.
See Financial Highlights for dividend and capital gains information.
Short-Term Corporate Bond Index Fund
| | Average Annual Total Returns | |
| | Periods Ended August 31, 2020 | |
| | | | Since | Final Value |
| | One | Five | Inception | of a $10,000 |
| | Year | Years | (11/18/2010) | Investment |
| Short-Term Corporate Bond Index Fund Admiral Shares | 4.90% | 3.40% | 3.01% | $13,362 |
| Bloomberg Barclays U.S. 1–5 Year Corporate Bond Index | 5.36 | 3.56 | 3.18 | 13,582 |
| Bloomberg Barclays U.S. Aggregate Float Adjusted Index | 6.57 | 4.41 | 3.82 | 14,431 |
“Since Inception” performance is calculated from the Admiral Shares’ inception date for both the fund and its comparative standards.
| | | | | Final Value |
| | One | Five | Ten | of a $5,000,000 |
| | Year | Years | Years | Investment |
| Short-Term Corporate Bond Index Fund Institutional Shares | 4.96% | 3.42% | 3.04% | $6,743,259 |
| Bloomberg Barclays U.S. 1–5 Year Corporate Bond Index | 5.36 | 3.56 | 3.20 | 6,850,698 |
| Bloomberg Barclays U.S. Aggregate Float Adjusted Index | 6.57 | 4.41 | 3.69 | 7,185,953 |
Cumulative Returns of ETF Shares: August 31, 2010, Through August 31, 2020
| | One | Five | Ten |
| | Year | Years | Years |
| Short-Term Corporate Bond Index Fund ETF Shares Market Price | 5.00% | 18.45% | 34.46% |
| Short-Term Corporate Bond Index Fund ETF Shares Net Asset Value | 4.95 | 18.27 | 34.54 |
| Bloomberg Barclays U.S. 1–5 Year Corporate Bond Index | 5.36 | 19.11 | 37.01 |
For the ETF Shares, the market price is determined by the midpoint of the bid-offer spread as of the closing time of the New York Stock Exchange (generally 4 p.m., Eastern time). The net asset value is also determined as of the NYSE closing time. For more information about how the ETF Shares’ market prices have compared with their net asset value, visit vanguard.com, select your ETF, and then select the Price and Performance tab. The ETF premium/discount analysis there shows the percentages of days on which the ETF Shares’ market price was above or below the NAV.
Short-Term Corporate Bond Index Fund
Fund Allocation
As of August 31, 2020
| Corporate Bonds–Finance | | | 41.4 | % |
| Corporate Bonds–Industrial | | | 53.7 | |
| Corporate Bonds–Utilities | | | 4.8 | |
| U.S. Government and Agency Obligations | | | 0.1 | |
The table reflects the fund’s investments, except for short-term reserves and derivatives.
The fund may invest in derivatives (such as futures and swap contracts) for various reasons, including, but not limited to, attempting to remain fully invested and tracking its target index as closely as possible.
Short-Term Corporate Bond Index Fund
Financial Statements
Schedule of Investments—Investments Summary
As of August 31, 2020
This Statement summarizes the fund’s holdings by asset type. Details are reported for each of the fund’s 50 largest individual holdings and for investments that, in total for any issuer, represent more than 1% of the fund’s net assets. The total value of smaller holdings is reported as a single amount within each category.
The fund files its complete schedule of portfolio holdings with the Securities and Exchange Commission (SEC) four times in each fiscal year. For the second and fourth quarters the complete list of the fund’s holdings is available on vanguard.com and on Form N-CSR, or you can have it mailed to you without charge by calling 800-662-7447. For the first and third quarters of each fiscal year, the complete list of the fund’s holdings is available as an exhibit to its reports on Form N-PORT. The fund’s Form N-CSR and Form N-PORT reports are available on the SEC’s website at www.sec.gov.
| | | | | Face | Market | Percentage |
| | | | Maturity | Amount | Value· | of Net |
| | | Coupon | Date | ($000) | ($000) | Assets |
| U.S. Government and Agency Obligations | | | | |
| U.S. Government Securities † (Cost $14,263) | | | 14,279 | 0.1% |
| Corporate Bonds | | | | | |
| Finance | | | | | |
| | Banking | | | | | |
| 1 | Bank of America Corp. | 3.004% | 12/20/23 | 114,451 | 120,325 | 0.3% |
| 1 | Bank of America Corp. | 3.550% | 3/5/24 | 67,885 | 72,588 | 0.2% |
| | Bank of America Corp. | 4.000% | 1/22/25 | 59,272 | 66,034 | 0.2% |
| | Bank of America Corp. | 3.950% | 4/21/25 | 57,694 | 64,890 | 0.2% |
| 1 | Bank of America Corp. | 3.864% | 7/23/24 | 59,136 | 64,180 | 0.2% |
| 1 | Bank of America Corp. | 3.458% | 3/15/25 | 55,529 | 60,657 | 0.2% |
| | Bank of America Corp. | 4.125% | 1/22/24 | 50,959 | 56,781 | 0.1% |
| 1 | Bank of America Corp. | 1.319%–5.700% | 5/13/21–6/19/26 | 493,542 | 526,168 | 1.4% |
| 1 | Bank of America NA | 3.335% | 1/25/23 | 6,278 | 6,529 | 0.0% |
| | Bank One Corp. | 7.750% | 7/15/25 | 1,336 | 1,735 | 0.0% |
| | Citibank NA | 3.650% | 1/23/24 | 36,846 | 40,518 | 0.1% |
| | Citigroup Inc. | 2.900% | 12/8/21 | 57,578 | 59,289 | 0.1% |
| 1 | Citigroup Inc. | 1.678%–4.500% | 8/2/21–4/8/26 | 572,417 | 610,113 | 1.6% |
| | Cooperatieve Rabobank UA | 3.875% | 2/8/22 | 68,502 | 71,991 | 0.2% |
| | Credit Suisse AG | 3.625% | 9/9/24 | 54,186 | 60,427 | 0.2% |
| | Goldman Sachs Group Inc. | 5.750% | 1/24/22 | 95,610 | 102,645 | 0.3% |
| | Goldman Sachs Group Inc. | 3.500% | 4/1/25 | 85,930 | 95,096 | 0.2% |
| 1 | Goldman Sachs Group Inc. | 2.876% | 10/31/22 | 66,686 | 68,365 | 0.2% |
| | Goldman Sachs Group Inc. | 3.500% | 1/23/25 | 58,054 | 63,822 | 0.2% |
Short-Term Corporate Bond Index Fund
| | | | | Face | Market | Percentage |
| | | | Maturity | Amount | Value· | of Net |
| | | Coupon | Date | ($000) | ($000) | Assets |
| 1 | Goldman Sachs Group Inc. | 2.350%–4.000% | 11/15/21–9/29/25 | 375,467 | 399,910 | 1.0% |
| 1 | HSBC Holdings plc | 3.262% | 3/13/23 | 62,030 | 64,455 | 0.2% |
| 1 | HSBC Holdings plc | 3.803% | 3/11/25 | 56,238 | 60,932 | 0.2% |
| 1 | HSBC Holdings plc | 2.099% | 6/4/26 | 55,438 | 56,616 | 0.1% |
| 1 | HSBC Holdings plc | 1.645%–4.250% | 1/5/22–4/18/26 | 203,492 | 217,585 | 0.6% |
| | HSBC USA Inc. | 3.500% | 6/23/24 | 20,657 | 22,614 | 0.1% |
| 1 | JPMorgan Chase & Co. | 2.083% | 4/22/26 | 88,045 | 92,350 | 0.2% |
| | JPMorgan Chase & Co. | 4.500% | 1/24/22 | 63,562 | 67,222 | 0.2% |
| 1 | JPMorgan Chase & Co. | 2.005% | 3/13/26 | 55,558 | 57,989 | 0.1% |
| 1 | JPMorgan Chase & Co. | 1.514%–4.125% | 9/23/22–12/15/26 | 671,480 | 721,609 | 1.9% |
| | Mitsubishi UFJ Financial Group Inc. | 1.412%–3.761% | 9/13/21–7/17/25 | 349,210 | 368,430 | 1.0% |
| 1 | Morgan Stanley | 3.737% | 4/24/24 | 59,413 | 64,082 | 0.2% |
| 1 | Morgan Stanley | 2.188% | 4/28/26 | 58,115 | 61,101 | 0.2% |
| | Morgan Stanley | 3.750% | 2/25/23 | 56,470 | 60,941 | 0.2% |
| | Morgan Stanley | 3.700% | 10/23/24 | 52,128 | 58,271 | 0.1% |
| | Morgan Stanley | 3.875% | 4/29/24 | 52,225 | 57,987 | 0.1% |
| 1 | Morgan Stanley | 2.625%–5.750% | 1/25/21–11/24/25 | 292,770 | 314,995 | 0.8% |
| | MUFG Americas Holdings Corp. | 3.000%–3.500% | 6/18/22–2/10/25 | 13,845 | 14,792 | 0.0% |
| | MUFG Union Bank NA | 2.100%–3.150% | 4/1/22–12/9/22 | 42,973 | 44,647 | 0.1% |
| | Natwest Group PLC | 3.875% | 9/12/23 | 54,394 | 59,023 | 0.1% |
| 1 | Truist Bank | 1.250%–3.689% | 10/26/21–9/17/29 | 217,010 | 228,527 | 0.6% |
| | Truist Financial Corp. | 1.200%–4.000% | 9/3/21–8/5/25 | 172,312 | 183,528 | 0.5% |
| 1 | Wells Fargo & Co. | 2.188% | 4/30/26 | 74,998 | 78,373 | 0.2% |
| | Wells Fargo & Co. | 3.069% | 1/24/23 | 73,801 | 76,377 | 0.2% |
| | Wells Fargo & Co. | 2.625% | 7/22/22 | 63,522 | 66,067 | 0.2% |
| | Wells Fargo & Co. | 3.000% | 2/19/25 | 59,031 | 63,849 | 0.2% |
| 1 | Wells Fargo & Co. | 2.406% | 10/30/25 | 54,354 | 57,256 | 0.1% |
| 1 | Wells Fargo & Co. | 1.654%–4.480% | 1/22/21–2/11/26 | 283,611 | 301,809 | 0.8% |
| 1 | Wells Fargo Bank NA | 2.082%–3.625% | 10/22/21–8/14/23 | 117,833 | 123,365 | 0.3% |
| 2 | Banking—Other † | | | | 6,207,396 | 16.3% |
| | Brokerage † | | | | 465,862 | 1.2% |
| 2 | Finance Companies † | | | | 547,890 | 1.4% |
| | Insurance † | | | | 1,253,095 | 3.3% |
| 2 | Other Finance † | | | | 34,290 | 0.1% |
| | Real Estate Investment Trusts † | | | | 900,061 | 2.4% |
| | | | | | 15,665,449 | 41.1% |
| Industrial | | | | | |
| 2 | Basic Industry † | | | | 851,058 | 2.2% |
| | Capital Goods | | | | | |
| | Boeing Co. | 4.875% | 5/1/25 | 61,353 | 67,072 | 0.2% |
| 2,3 | Capital Goods—Other † | | | | 2,065,618 | 5.4% |
| | Communication | | | | | |
| | AT&T Inc. | 3.400% | 5/15/25 | 77,371 | 85,750 | 0.2% |
| | Charter Communications Operating LLC / Charter Communications Operating Capital | 4.908% | 7/23/25 | 74,182 | 86,303 | 0.2% |
Short-Term Corporate Bond Index Fund
| | | | | Face | Market | Percentage |
| | | | Maturity | Amount | Value· | of Net |
| | | Coupon | Date | ($000) | ($000) | Assets |
| 2 | T-Mobile USA Inc. | 3.500% | 4/15/25 | 62,309 | 68,812 | 0.2% |
| | Verizon Communications Inc. | 5.150% | 9/15/23 | 69,427 | 79,083 | 0.2% |
| | Communication—Other † | | | | 1,606,114 | 4.2% |
| | Consumer Cyclical | | | | | |
| | General Motors Co. | 4.000%–6.125% | 10/2/23–10/1/25 | 51,212 | 56,785 | 0.2% |
| | General Motors Financial Co. Inc. | 1.700%–5.200% | 3/1/21–7/13/25 | 423,159 | 444,560 | 1.2% |
| | Toyota Motor Corp. | 2.157%–3.419% | 7/20/21–7/2/24 | 43,154 | 45,281 | 0.1% |
| | Toyota Motor Credit Corp. | 0.450%–3.450% | 9/15/21–4/14/25 | 324,002 | 338,954 | 0.9% |
| 2 | Consumer Cyclical—Other † | | | 2,191,745 | 5.7% |
| | Consumer Noncyclical | | | | | |
| 2 | AbbVie Inc. | 2.600% | 11/21/24 | 65,003 | 69,607 | 0.2% |
| | AbbVie Inc. | 2.900% | 11/6/22 | 65,251 | 68,513 | 0.2% |
| 2 | AbbVie Inc. | 3.800% | 3/15/25 | 58,930 | 65,783 | 0.2% |
| | AbbVie Inc. | 3.600% | 5/14/25 | 57,657 | 64,214 | 0.2% |
| 2 | AbbVie Inc. | 2.150%–3.850% | 11/14/21–6/15/24 | 268,088 | 280,346 | 0.7% |
| | Bristol-Myers Squibb Co. | 2.900% | 7/26/24 | 52,491 | 57,274 | 0.1% |
| | CVS Health Corp. | 3.700% | 3/9/23 | 75,178 | 80,783 | 0.2% |
| | CVS Health Corp. | 4.100% | 3/25/25 | 51,860 | 58,974 | 0.2% |
| 2 | Consumer Noncyclical—Other † | | | 4,558,547 | 11.9% |
| | Energy | | | | | |
| | Exxon Mobil Corp. | 2.992% | 3/19/25 | 68,771 | 75,504 | 0.2% |
| | Energy—Other † | | | | 2,841,867 | 7.4% |
| | Other Industrial † | | | | 28,679 | 0.1% |
| | Technology | | | | | |
| | Apple Inc. | 2.400% | 5/3/23 | 95,813 | 101,137 | 0.3% |
| | Apple Inc. | 0.550%–3.450% | 2/9/22–8/20/25 | 462,617 | 489,496 | 1.3% |
| 2 | Dell International LLC / EMC Corp. | 5.450% | 6/15/23 | 70,778 | 77,850 | 0.2% |
| | International Business Machines Corp. | 2.850% | 5/13/22 | 55,014 | 57,365 | 0.1% |
| | Oracle Corp. | 1.900% | 9/15/21 | 69,665 | 70,756 | 0.2% |
| | Oracle Corp. | 2.500% | 10/15/22 | 57,700 | 60,283 | 0.2% |
| | Oracle Corp. | 2.500% | 4/1/25 | 53,432 | 57,604 | 0.1% |
| | Oracle Corp. | 2.400%–3.625% | 5/15/22–5/15/25 | 242,864 | 260,150 | 0.7% |
| 2 | Technology—Other † | | | | 2,333,199 | 6.1% |
| | Transportation † | | | | 636,023 | 1.7% |
| | | | | | 20,381,089 | 53.4% |
| Utilities | | | | | |
| 2 | Electric † | | | | 1,694,259 | 4.4% |
| 2 | Natural Gas † | | | | 101,060 | 0.3% |
| | Other Utility † | | | | 17,541 | 0.0% |
| | | | | | 1,812,860 | 4.7% |
| Total Corporate Bonds (Cost $36,533,820) | | | 37,859,398 | 99.2% |
Short-Term Corporate Bond Index Fund
| | | | | Market | Percentage |
| | | | | Value· | of Net |
| | | Coupon | Shares | ($000) | Assets |
| Temporary Cash Investment | | | | |
| Money Market Fund | | | | |
| 4 | Vanguard Market Liquidity Fund (Cost $206,479) | 0.147% | 2,064,876 | 206,488 | 0.5% |
| Total Investments (Cost $36,754,562) | | | 38,080,165 | 99.8% |
| Other Assets and Liabilities — Net | | | 80,689 | 0.2% |
| Net Assets | | | 38,160,854 | 100.0% |
Cost is in $000s.
| · | See Note A in Notes to Financial Statements. |
| | |
| † | Represents the aggregate value, by category, of securities that are not among the 50 largest holdings and, in total for any issuer, represent 1% or less of net assets. |
| | |
| 1 | The average or expected maturity is shorter than the final maturity shown because of the possibility of interim principal payments and prepayments or the possibility of the issue being called. |
| | |
| 2 | Certain securities are exempt from registration under Rule 144A of the Securities Act of 1933. Such securities may be sold in transactions exempt from registration, normally to qualified institutional buyers. At August 31, 2020, the aggregate value of these securities was $921,401,000, representing 2.4% of net assets. |
| | |
| 3 | A security with a value of $1,558,000 has been segregated as initial margin for open futures contracts. |
| | |
| 4 | Affiliated money market fund available only to Vanguard funds and certain trusts and accounts managed by Vanguard. Rate shown is the 7-day yield. |
| Derivative Financial Instruments Outstanding as of Period End | | | |
| | | | | | |
| Futures Contracts | | | | | |
| | | | | | ($000) |
| | | | | | Value and |
| | | Number of | | | Unrealized |
| | | Long (Short) | | Notional | Appreciation |
| | Expiration | Contracts | | Amount | (Depreciation) |
| Long Futures Contracts | | | | | |
| 5-Year U.S. Treasury Note | December 2020 | 360 | | 45,371 | 2 |
| 2-Year U.S. Treasury Note | December 2020 | 86 | | 19,001 | 7 |
| | | | | | 9 |
See accompanying Notes, which are an integral part of the Financial Statements.
Short-Term Corporate Bond Index Fund
Statement of Assets and Liabilities
As of August 31, 2020
| ($000s, except shares and per-share amounts) | Amount |
| Assets | |
| Investments in Securities, at Value | |
| Unaffiliated Issuers (Cost $36,548,083) | 37,873,677 |
| Affiliated Issuers (Cost $206,479) | 206,488 |
| Total Investments in Securities | 38,080,165 |
| Investment in Vanguard | 1,550 |
| Receivables for Investment Securities Sold | 271,659 |
| Receivables for Accrued Income | 309,127 |
| Receivables for Capital Shares Issued | 24,562 |
| Variation Margin Receivable–Futures Contracts | 2 |
| Total Assets | 38,687,065 |
| Liabilities | |
| Due to Custodian | 16,985 |
| Payables for Investment Securities Purchased | 499,570 |
| Payables for Capital Shares Redeemed | 6,066 |
| Payables for Distributions | 2,211 |
| Payables to Vanguard | 968 |
| Variation Margin Payable–Futures Contracts | 411 |
| Total Liabilities | 526,211 |
| Net Assets | 38,160,854 |
| | |
| | |
| At August 31, 2020, net assets consisted of: | |
| | |
| Paid-in Capital | 36,912,770 |
| Total Distributable Earnings (Loss) | 1,248,084 |
| Net Assets | 38,160,854 |
| | |
| ETF Shares—Net Assets | |
| Applicable to 383,318,770 outstanding $.001 par value shares of beneficial interest (unlimited authorization) | 31,796,919 |
| Net Asset Value Per Share—ETF Shares | $82.95 |
| | |
| Admiral Shares—Net Assets | |
| Applicable to 208,542,013 outstanding $.001 par value shares of beneficial interest (unlimited authorization) | 4,703,166 |
| Net Asset Value Per Share—Admiral Shares | $22.55 |
| | |
| Institutional Shares—Net Assets | |
| Applicable to 60,154,425 outstanding $.001 par value shares of beneficial interest (unlimited authorization) | 1,660,769 |
| Net Asset Value Per Share—Institutional Shares | $27.61 |
See accompanying Notes, which are an integral part of the Financial Statements.
Short-Term Corporate Bond Index Fund
Statement of Operations
| | Year Ended |
| | August 31, 2020 |
| | ($000) |
| Investment Income | |
| Income | |
| Interest1 | 854,887 |
| Total Income | 854,887 |
| Expenses | |
| The Vanguard Group—Note B | |
| Investment Advisory Services | 941 |
| Management and Administrative—ETF Shares | 9,832 |
| Management and Administrative—Admiral Shares | 2,619 |
| Management and Administrative—Institutional Shares | 687 |
| Marketing and Distribution—ETF Shares | 1,527 |
| Marketing and Distribution—Admiral Shares | 314 |
| Marketing and Distribution—Institutional Shares | 58 |
| Custodian Fees | 87 |
| Auditing Fees | 55 |
| Shareholders’ Reports—ETF Shares | 768 |
| Shareholders’ Reports—Admiral Shares | 45 |
| Shareholders’ Reports—Institutional Shares | 1 |
| Trustees’ Fees and Expenses | 18 |
| Total Expenses | 16,952 |
| Expenses Paid Indirectly | (44) |
| Net Expenses | 16,908 |
| Net Investment Income | 837,979 |
| Realized Net Gain (Loss) | |
| Investment Securities Sold1,2 | 83,433 |
| Futures Contracts | (10,682) |
| Realized Net Gain (Loss) | 72,751 |
| Change in Unrealized Appreciation (Depreciation) | |
| Investment Securities1 | 649,096 |
| Futures Contracts | 9 |
| Change in Unrealized Appreciation (Depreciation) | 649,105 |
| Net Increase (Decrease) in Net Assets Resulting from Operations | 1,559,835 |
| 1 | Interest income, realized net gain (loss), and change in unrealized appreciation (depreciation) from an affiliated company of the fund were $1,567,000, $65,000, and $9,000, respectively. Purchases and sales are for temporary cash investment purposes. |
| | |
| 2 | Includes $105,566,000 of net gain (loss) resulting from in-kind redemptions. |
See accompanying Notes, which are an integral part of the Financial Statements.
Short-Term Corporate Bond Index Fund
Statement of Changes in Net Assets
| | Year Ended August 31, |
| | 2020 | 2019 |
| | ($000) | ($000) |
| Increase (Decrease) in Net Assets | | |
| Operations | | |
| Net Investment Income | 837,979 | 820,859 |
| Realized Net Gain (Loss) | 72,751 | (41,485) |
| Change in Unrealized Appreciation (Depreciation) | 649,105 | 1,081,348 |
| Net Increase (Decrease) in Net Assets Resulting from Operations | 1,559,835 | 1,860,722 |
| Distributions1 | | |
| ETF Shares | (684,396) | (652,259) |
| Admiral Shares | (115,588) | (110,299) |
| Institutional Shares | (41,601) | (46,783) |
| Total Distributions | (841,585) | (809,341) |
| Capital Share Transactions | | |
| ETF Shares | 6,667,731 | 2,170,231 |
| Admiral Shares | 303,962 | 640,603 |
| Institutional Shares | (11,125) | (130,462) |
| Net Increase (Decrease) from Capital Share Transactions | 6,960,568 | 2,680,372 |
| Total Increase (Decrease) | 7,678,818 | 3,731,753 |
| Net Assets | | |
| Beginning of Period | 30,482,036 | 26,750,283 |
| End of Period | 38,160,854 | 30,482,036 |
1 Certain prior period numbers have been reclassified to conform with current period presentation.
See accompanying Notes, which are an integral part of the Financial Statements.
Short-Term Corporate Bond Index Fund
Financial Highlights
| ETF Shares | | | | | |
| | | | | | |
| For a Share Outstanding | | | Year Ended August 31, |
| Throughout Each Period | 2020 | 2019 | 2018 | 2017 | 2016 |
| Net Asset Value, Beginning of Period | $81.18 | $78.32 | $80.25 | $80.52 | $79.33 |
| Investment Operations | | | | | |
| Net Investment Income | 2.1271 | 2.3111 | 1.9501 | 1.7681 | 1.661 |
| Net Realized and Unrealized Gain (Loss) on Investments | 1.815 | 2.826 | (1.953) | (.317) | 1.240 |
| Total from Investment Operations | 3.942 | 5.137 | (.003) | 1.451 | 2.901 |
| Distributions | | | | | |
| Dividends from Net Investment Income | (2.172) | (2.277) | (1.927) | (1.721) | (1.648) |
| Distributions from Realized Capital Gains | — | — | — | — | (.063) |
| Total Distributions | (2.172) | (2.277) | (1.927) | (1.721) | (1.711) |
| Net Asset Value, End of Period | $82.95 | $81.18 | $78.32 | $80.25 | $80.52 |
| | | | | | |
| Total Return | 4.95% | 6.68% | 0.01% | 1.84% | 3.71% |
| | | | | | |
| Ratios/Supplemental Data | | | | | |
| Net Assets, End of Period (Millions) | $31,797 | $24,537 | $21,511 | $20,862 | $14,121 |
| Ratio of Total Expenses to Average Net Assets | 0.05% | 0.05% | 0.07% | 0.07% | 0.07% |
| Ratio of Net Investment Income to Average Net Assets | 2.62% | 2.92% | 2.48% | 2.21% | 2.11% |
| Portfolio Turnover Rate2 | 56% | 51% | 56% | 66% | 57% |
| 1 | Calculated based on average shares outstanding. |
| 2 | Excludes the value of portfolio securities received or delivered as a result of in-kind purchases or redemptions of the fund’s capital shares, including ETF Creation Units. |
See accompanying Notes, which are an integral part of the Financial Statements.
Short-Term Corporate Bond Index Fund
Financial Highlights
| Admiral Shares | | | | | |
| | | | | | |
| For a Share Outstanding | | | Year Ended August 31, |
| Throughout Each Period | 2020 | 2019 | 2018 | 2017 | 2016 |
| Net Asset Value, Beginning of Period | $22.06 | $21.28 | $21.81 | $21.89 | $21.57 |
| Investment Operations | | | | | |
| Net Investment Income | .5781 | .6251 | .5321 | .4811 | .451 |
| Net Realized and Unrealized Gain (Loss) on Investments | .485 | .777 | (.531) | (.088) | .337 |
| Total from Investment Operations | 1.063 | 1.402 | .001 | .393 | .788 |
| Distributions | | | | | |
| Dividends from Net Investment Income | (.573) | (.622) | (.531) | (.473) | (.451) |
| Distributions from Realized Capital Gains | — | — | — | — | (.017) |
| Total Distributions | (.573) | (.622) | (.531) | (.473) | (.468) |
| Net Asset Value, End of Period | $22.55 | $22.06 | $21.28 | $21.81 | $21.89 |
| | | | | | |
| Total Return2 | 4.90% | 6.70% | 0.02% | 1.83% | 3.70% |
| | | | | | |
| Ratios/Supplemental Data | | | | | |
| Net Assets, End of Period (Millions) | $4,703 | $4,312 | $3,533 | $3,180 | $1,959 |
| Ratio of Total Expenses to Average Net Assets | 0.07% | 0.07% | 0.07% | 0.07% | 0.07% |
| Ratio of Net Investment Income to Average Net Assets | 2.61% | 2.90% | 2.48% | 2.21% | 2.11% |
| Portfolio Turnover Rate3 | 56% | 51% | 56% | 66% | 57% |
| 1 | Calculated based on average shares outstanding. |
| 2 | Total returns do not include account service fees that may have applied in the periods shown. Fund prospectuses provide information about any applicable account service fees. |
| 3 | Excludes the value of portfolio securities received or delivered as a result of in-kind purchases or redemptions of the fund’s capital shares, including ETF Creation Units. |
See accompanying Notes, which are an integral part of the Financial Statements.
Short-Term Corporate Bond Index Fund
Financial Highlights
| Institutional Shares | | | | | |
| | | | | | |
| For a Share Outstanding | | | Year Ended August 31, |
| Throughout Each Period | 2020 | 2019 | 2018 | 2017 | 2016 |
| Net Asset Value, Beginning of Period | $27.00 | $26.06 | $26.70 | $26.80 | $26.41 |
| Investment Operations | | | | | |
| Net Investment Income | .7131 | .7681 | .6561 | .5941 | .558 |
| Net Realized and Unrealized Gain (Loss) on Investments | .604 | .939 | (.641) | (.111) | .413 |
| Total from Investment Operations | 1.317 | 1.707 | .015 | .483 | .971 |
| Distributions | | | | | |
| Dividends from Net Investment Income | (.707) | (.767) | (.655) | (.583) | (.560) |
| Distributions from Realized Capital Gains | — | — | — | — | (.021) |
| Total Distributions | (.707) | (.767) | (.655) | (.583) | (.581) |
| Net Asset Value, End of Period | $27.61 | $27.00 | $26.06 | $26.70 | $26.80 |
| | | | | | |
| Total Return | 4.96% | 6.66% | 0.07% | 1.84% | 3.72% |
| | | | | | |
| Ratios/Supplemental Data | | | | | |
| Net Assets, End of Period (Millions) | $1,661 | $1,633 | $1,706 | $1,515 | $1,020 |
| Ratio of Total Expenses to Average Net Assets | 0.05% | 0.05% | 0.05% | 0.05% | 0.05% |
| Ratio of Net Investment Income to Average Net Assets | 2.63% | 2.92% | 2.50% | 2.23% | 2.13% |
| Portfolio Turnover Rate2 | 56% | 51% | 56% | 66% | 57% |
| 1 | Calculated based on average shares outstanding. |
| 2 | Excludes the value of portfolio securities received or delivered as a result of in-kind purchases or redemptions of the fund’s capital shares, including ETF Creation Units. |
See accompanying Notes, which are an integral part of the Financial Statements.
Short-Term Corporate Bond Index Fund
Notes to Financial Statements
Vanguard Short-Term Corporate Bond Index Fund is registered under the Investment Company Act of 1940 as an open-end investment company, or mutual fund. The fund offers three classes of shares: ETF Shares, Admiral Shares, and Institutional Shares. Each of the share classes has different eligibility and minimum purchase requirements, and is designed for different types of investors. ETF Shares are listed for trading on Nasdaq; they can be purchased and sold through a broker.
Certain of the fund’s investments are in corporate debt instruments; the issuers’ abilities to meet their obligations may be affected by economic developments in their respective industries. Market disruptions associated with the COVID-19 pandemic have had a global impact, and uncertainty exists as to the long-term implications. Such disruptions can adversely affect assets of the fund and thus fund performance.
A. The following significant accounting policies conform to generally accepted accounting principles for U.S. investment companies. The fund consistently follows such policies in preparing its financial statements.
1. Security Valuation: Securities are valued as of the close of trading on the New York Stock Exchange (generally 4 p.m., Eastern time) on the valuation date. Bonds and temporary cash investments are valued using the latest bid prices or using valuations based on a matrix system (which considers such factors as security prices, yields, maturities, and ratings), both as furnished by independent pricing services. Investments in Vanguard Market Liquidity Fund are valued at that fund’s net asset value. Securities for which market quotations are not readily available, or whose values have been affected by events occurring before the fund’s pricing time but after the close of the securities’ primary markets, are valued by methods deemed by the board of trustees to represent fair value.
2. Futures Contracts: The fund uses futures contracts to invest in fixed income asset classes with greater efficiency and lower cost than is possible through direct investment, to add value when these instruments are attractively priced, or to adjust sensitivity to changes in interest rates. The primary risks associated with the use of futures contracts are imperfect correlation between changes in market values of bonds held by the fund and the prices of futures contracts, and the possibility of an illiquid market. Counterparty risk involving futures is mitigated because a regulated clearinghouse is the counterparty instead of the clearing broker. To further mitigate counterparty risk, the fund trades futures contracts on an exchange, monitors the financial strength of its clearing brokers and clearinghouse, and has entered into clearing agreements with its clearing brokers. The clearinghouse imposes initial margin requirements to secure the fund’s performance and requires daily settlement of variation margin representing changes in the market value of each contract. Any securities pledged as initial margin for open contracts are noted in the Schedule of Investments.
Futures contracts are valued at their quoted daily settlement prices. The notional amounts of the contracts are not recorded in the Statement of Assets and Liabilities. Fluctuations in the value of the contracts are recorded in the Statement of Assets and Liabilities as an asset (liability) and in the Statement of Operations as unrealized appreciation (depreciation) until the contracts are closed, when they are recorded as realized gains (losses) on futures contracts.
During the year ended August 31, 2020, the fund’s average investments in long and short futures contracts represented less than 1% and 0% of net assets, respectively, based on the average of the notional amounts at each quarter-end during the period.
3. Federal Income Taxes: The fund intends to continue to qualify as a regulated investment company and distribute all of its taxable income. The fund’s tax returns are open to examination by the relevant tax authorities until expiration of the applicable statute of limitations, which is generally three years
Short-Term Corporate Bond Index Fund
after the filing of the tax return. Management has analyzed the fund’s tax positions taken for all open federal and state income tax years, and has concluded that no provision for income tax is required in the fund’s financial statements.
4. Distributions: Distributions to shareholders are recorded on the ex-dividend date. Distributions are determined on a tax basis at the fiscal year-end and may differ from net investment income and realized capital gains for financial reporting purposes.
5. Credit Facilities and Interfund Lending Program: The fund and certain other funds managed by The Vanguard Group (“Vanguard”) participate in a $4.3 billion committed credit facility provided by a syndicate of lenders pursuant to a credit agreement and an uncommitted credit facility provided by Vanguard. Both facilities may be renewed annually. Each fund is individually liable for its borrowings, if any, under the credit facilities. Borrowings may be utilized for temporary or emergency purposes, subject to the fund’s regulatory and contractual borrowing restrictions. With respect to the committed credit facility, the participating funds are charged administrative fees and an annual commitment fee of 0.10% of the undrawn committed amount of the facility; these fees are allocated to the funds based on a method approved by the fund’s board of trustees and included in Management and Administrative expenses on the fund’s Statement of Operations. Any borrowings under either facility bear interest at a rate based upon the higher of the one-month London Interbank Offered Rate (or an acceptable alternate rate, if necessary), federal funds effective rate, or overnight bank funding rate plus an agreed-upon spread, except that borrowings under the uncommitted credit facility may bear interest based upon an alternative rate agreed to by the fund and Vanguard.
In accordance with an exemptive order (the “Order”) from the SEC, the fund may participate in a joint lending and borrowing program that allows registered open-end Vanguard funds to borrow money from and lend money to each other for temporary or emergency purposes (the “Interfund Lending Program”), subject to compliance with the terms and conditions of the Order, and to the extent permitted by the fund’s investment objective and investment policies. Interfund loans and borrowings normally extend overnight, but can have a maximum duration of seven days. Loans may be called on one business day’s notice. The interest rate to be charged is governed by the conditions of the Order and internal procedures adopted by the board of trustees. The board of trustees is responsible for overseeing the Interfund Lending Program.
For the year ended August 31, 2020, the fund did not utilize the credit facilities or the Interfund Lending Program.
6. Other: Interest income includes income distributions received from Vanguard Market Liquidity Fund and is accrued daily. Premiums and discounts on debt securities are amortized and accreted, respectively, to interest income over the lives of the respective securities, except for premiums on certain callable debt securities that are amortized to the earliest call date. Security transactions are accounted for on the date securities are bought or sold. Costs used to determine realized gains (losses) on the sale of investment securities are those of the specific securities sold.
Each class of shares has equal rights as to assets and earnings, except that each class separately bears certain class-specific expenses related to maintenance of shareholder accounts (included in Management and Administrative expenses) and shareholder reporting. Marketing and distribution expenses are allocated to each class of shares based on a method approved by the board of trustees. Income, other non-class-specific expenses, and gains and losses on investments are allocated to each class of shares based on its relative net assets.
Short-Term Corporate Bond Index Fund
B. In accordance with the terms of a Funds’ Service Agreement (the “FSA”) between Vanguard and the fund, Vanguard furnishes to the fund investment advisory, corporate management, administrative, marketing, and distribution services at Vanguard’s cost of operations (as defined by the FSA). These costs of operations are allocated to the fund based on methods and guidelines approved by the board of trustees and are generally settled twice a month.
Upon the request of Vanguard, the fund may invest up to 0.40% of its net assets as capital in Vanguard. At August 31, 2020, the fund had contributed to Vanguard capital in the amount of $1,550,000, representing less than 0.01% of the fund’s net assets and 0.62% of Vanguard’s capital received pursuant to the FSA. The fund’s trustees and officers are also directors and employees, respectively, of Vanguard.
C. The fund’s custodian bank has agreed to reduce its fees when the fund maintains cash on deposit in the non-interest-bearing custody account. For the year ended August 31, 2020, custodian fee offset arrangements reduced the fund’s expenses by $44,000 (an annual rate of less than 0.01% of average net assets).
D. Various inputs may be used to determine the value of the fund’s investments. These inputs are summarized in three broad levels for financial statement purposes. The inputs or methodologies used to value securities are not necessarily an indication of the risk associated with investing in those securities.
Level 1—Quoted prices in active markets for identical securities.
Level 2—Other significant observable inputs (including quoted prices for similar securities, interest rates, prepayment speeds, credit risk, etc.).
Level 3—Significant unobservable inputs (including the fund’s own assumptions used to determine the fair value of investments). Any investments and derivatives valued with significant unobservable inputs are noted on the Schedule of Investments.
The following table summarizes the market value of the fund’s investments and derivatives as of August 31, 2020, based on the inputs used to value them:
| | Level 1 | Level 2 | Level 3 | Total |
| | ($000) | ($000) | ($000) | ($000) |
| Investments | | | | |
| Assets | | | | |
| U.S. Government and Agency Obligations | — | 14,279 | — | 14,279 |
| Corporate Bonds | — | 37,859,398 | — | 37,859,398 |
| Temporary Cash Investments | 206,488 | — | — | 206,488 |
| Total | 206,488 | 37,873,677 | — | 38,080,165 |
| Derivative Financial Instruments | | | | |
| Assets | | | | |
| Futures Contracts1 | 2 | — | — | 2 |
| Liabilities | | | | |
| Futures Contracts1 | 411 | — | — | 411 |
1 Represents variation margin on the last day of the reporting period.
Short-Term Corporate Bond Index Fund
E. Permanent differences between book-basis and tax-basis components of net assets are reclassified among capital accounts in the financial statements to reflect their tax character. These reclassifications have no effect on net assets or net asset value per share. As of period end, permanent differences primarily attributable to the accounting for in-kind redemptions were reclassified between the following accounts:
| | Amount |
| | ($000) |
| Paid-in Capital | 105,566 |
| Total Distributable Earnings (Loss) | (105,566) |
Temporary differences between book-basis and tax-basis components of total distributable earnings (loss) arise when certain items of income, gain, or loss are recognized in different periods for financial statement and tax purposes; these differences will reverse at some time in the future. The differences are primarily related to the deferral of losses from wash sales; the deferral of losses from straddles; the recognition of unrealized gains or losses from certain derivative contracts; and the inclusion of payables for distributions. As of period end, the tax-basis components of total distributable earnings (loss) are detailed in the table as follows:
| | Amount |
| | ($000) |
| Undistributed Ordinary Income | 55,919 |
| Undistributed Long-term Gains | — |
| Capital Loss Carryforwards | (125,350) |
| Qualified Late-Year Losses | — |
| Net Unrealized Gains (Losses) | 1,319,726 |
The tax character of distributions paid was as follows:
| | Year Ended August 31, |
| | 2020 | 2019 |
| | Amount | Amount |
| | ($000) | ($000) |
| Ordinary Income * | 841,585 | 809,341 |
| Long-Term Capital Gains | — | — |
| Total | 841,585 | 809,341 |
* Includes short-term capital gains, if any.
As of August 31, 2020, gross unrealized appreciation and depreciation for investments and derivatives based on cost for U.S. federal income tax purposes were as follows:
| | Amount |
| | ($000) |
| Tax Cost | 36,760,439 |
| Gross Unrealized Appreciation | 1,333,345 |
| Gross Unrealized Depreciation | (13,619) |
| Net Unrealized Appreciation (Depreciation) | 1,319,726 |
Short-Term Corporate Bond Index Fund
F. During the year ended August 31, 2020, the fund purchased $27,458,360,000 of investment securities and sold $20,181,754,000 of investment securities, other than U.S. government securities and temporary cash investments. Purchases and sales of U.S. government securities were $5,965,081,000 and $6,202,698,000, respectively. Total purchases and sales include $15,004,229,000 and $8,515,204,000, respectively, in connection with in-kind purchases and redemptions of the fund’s capital shares.
The fund purchased securities from and sold securities to other Vanguard funds or accounts managed by Vanguard or its affiliates, in accordance with procedures adopted by the board of trustees in compliance with Rule 17a-7 of the Investment Company Act of 1940. For the year ended August 31, 2020, such purchases and sales were $6,476,059,000 and $1,521,029,000, respectively.
G. Capital share transactions for each class of shares were:
| | Year Ended August 31, |
| | | 2020 | | | 2019 |
| | Amount | Shares | | Amount | Shares |
| | ($000) | (000) | | ($000) | (000) |
| ETF Shares | | | | | |
| Issued | 15,381,735 | 189,581 | | 7,080,904 | 89,891 |
| Issued in Lieu of Cash Distributions | — | — | | — | — |
| Redeemed | (8,714,004) | (108,500) | | (4,910,673) | (62,300) |
| Net Increase (Decrease)—ETF Shares | 6,667,731 | 81,081 | | 2,170,231 | 27,591 |
| Admiral Shares | | | | | |
| Issued | 2,392,625 | 108,113 | | 2,029,921 | 94,202 |
| Issued in Lieu of Cash Distributions | 91,744 | 4,151 | | 89,673 | 4,161 |
| Redeemed | (2,180,407) | (99,225) | | (1,478,991) | (68,831) |
| Net Increase (Decrease)—Admiral Shares | 303,962 | 13,039 | | 640,603 | 29,532 |
| Institutional Shares | | | | | |
| Issued | 491,624 | 18,281 | | 306,982 | 11,638 |
| Issued in Lieu of Cash Distributions | 34,136 | 1,261 | | 38,752 | 1,470 |
| Redeemed | (536,885) | (19,854) | | (476,196) | (18,126) |
| Net Increase (Decrease)—Institutional Shares | (11,125) | (312) | | (130,462) | (5,018) |
H. Management has determined that no events or transactions occurred subsequent to August 31, 2020, that would require recognition or disclosure in these financial statements.
Intermediate-Term Corporate Bond Index Fund
Performance Summary
All of the returns in this report represent past performance, which is not a guarantee of future results that may be achieved by the fund. (Current performance may be lower or higher than the performance data cited. For performance data current to the most recent month-end, visit our website at vanguard.com/performance.) Note, too, that both investment returns and principal value can fluctuate widely, so an investor’s shares, when sold, could be worth more or less than their original cost. The returns shown do not reflect taxes that a shareholder would pay on fund distributions or on the sale of fund shares.
Cumulative Performance: August 31, 2010, Through August 31, 2020
Initial Investment of $10,000
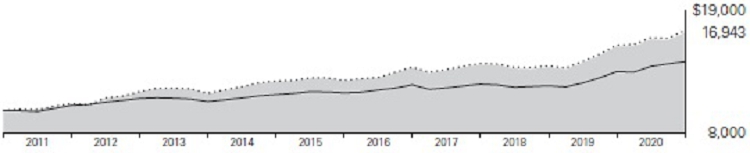
| | | Average Annual Total Returns | |
| | | Periods Ended August 31, 2020 | |
| | | | | | Final Value |
| | | One | Five | Ten | of a $10,000 |
| | | Year | Years | Years | Investment |
 | Intermediate-Term Corporate Bond Index Fund ETF Shares Net Asset Value | 7.78% | 6.07% | 5.41% | $16,943 |
| | Intermediate-Term Corporate Bond Index Fund ETF Shares Market Price | 8.03 | 6.19 | 5.39 | 16,908 |
 | Bloomberg Barclays U.S. 5–10 Year Corporate Bond Index | 8.22 | 6.22 | 5.54 | 17,154 |
 | Bloomberg Barclays U.S. Aggregate Float Adjusted Index | 6.57 | 4.41 | 3.69 | 14,372 |
Bloomberg Barclays U.S. 5–10 Year Corporate Bond Index: Includes U.S. dollar-denominated, investment-grade securities issued by industrial, utility, and financial companies, with maturities between 5 and 10 years.
Vanguard fund returns are adjusted to reflect the 0.25% fee on purchases of fund shares. The fee does not apply to the ETF Shares. See Financial Highlights for dividend and capital gains information.
Intermediate-Term Corporate Bond Index Fund
| | Average Annual Total Returns | |
| | Periods Ended August 31, 2020 | |
| | | | | Final Value |
| | One | Five | Ten | of a $10,000 |
| | Year | Years | Years | Investment |
| Intermediate-Term Corporate Bond Index Fund Admiral Shares | 7.52% | 6.02% | 5.39% | $16,909 |
| Bloomberg Barclays U.S. 5–10 Year Corporate Bond Index | 8.22 | 6.22 | 5.54 | 17,154 |
| Bloomberg Barclays U.S. Aggregate Float Adjusted Index | 6.57 | 4.41 | 3.69 | 14,372 |
| | | | | Final Value |
| | One | Five | Ten | of a $5,000,000 |
| | Year | Years | Years | Investment |
| Intermediate-Term Corporate Bond Index Fund Institutional Shares | 7.54% | 6.04% | 5.42% | $8,472,190 |
| Bloomberg Barclays U.S. 5–10 Year Corporate Bond Index | 8.22 | 6.22 | 5.54 | 8,576,859 |
| Bloomberg Barclays U.S. Aggregate Float Adjusted Index | 6.57 | 4.41 | 3.69 | 7,185,953 |
Cumulative Returns of ETF Shares: August 31, 2010, Through August 31, 2020
| | One | Five | Ten |
| | Year | Years | Years |
| Intermediate-Term Corporate Bond Index Fund ETF Shares Market Price | 8.03% | 35.03% | 69.08% |
| Intermediate-Term Corporate Bond Index Fund ETF Shares Net Asset Value | 7.78 | 34.29 | 69.43 |
| Bloomberg Barclays U.S. 5–10 Year Corporate Bond Index | 8.22 | 35.21 | 71.54 |
For the ETF Shares, the market price is determined by the midpoint of the bid-offer spread as of the closing time of the New York Stock Exchange (generally 4 p.m., Eastern time). The net asset value is also determined as of the NYSE closing time. For more information about how the ETF Shares’ market prices have compared with their net asset value, visit vanguard.com, select your ETF, and then select the Price and Performance tab. The ETF premium/discount analysis there shows the percentages of days on which the ETF Shares’ market price was above or below the NAV.
Vanguard fund returns are adjusted to reflect the 0.25% fee on purchases of fund shares. The fee does not apply to the ETF Shares.
Intermediate-Term Corporate Bond Index Fund
Fund Allocation
As of August 31, 2020
| Corporate Bonds–Finance | 34.8% |
| Corporate Bonds–Industrial | 58.7 |
| Corporate Bonds–Utilities | 6.4 |
| U.S. Government and Agency Obligations | 0.1 |
The table reflects the fund’s investments, except for short-term investments and derivatives.
The fund may invest in derivatives (such as futures and swap contracts) for various reasons, including, but not limited to, attempting to remain fully invested and tracking its target index as closely as possible.
Intermediate-Term Corporate Bond Index Fund
Financial Statements
Schedule of Investments—Investments Summary
As of August 31, 2020
This Statement summarizes the fund’s holdings by asset type. Details are reported for each of the fund’s 50 largest individual holdings and for investments that, in total for any issuer, represent more than 1% of the fund’s net assets. The total value of smaller holdings is reported as a single amount within each category.
The fund files its complete schedule of portfolio holdings with the Securities and Exchange Commission (SEC) four times in each fiscal year. For the second and fourth quarters the complete list of the fund’s holdings is available on vanguard.com and on Form N-CSR, or you can have it mailed to you without charge by calling 800-662-7447. For the first and third quarters of each fiscal year, the complete list of the fund’s holdings is available as an exhibit to its reports on Form N-PORT. The fund’s Form N-CSR and Form N-PORT reports are available on the SEC’s website at www.sec.gov.
| | | | | Face | Market | Percentage |
| | | | Maturity | Amount | Value● | of Net |
| | | Coupon | Date | ($000) | ($000) | Assets |
| U.S. Government and Agency Obligations | | | | |
| U.S. Government Securities † (Cost $22,405) | | 22,387 | 0.1% |
| Corporate Bonds | | | | | |
| Finance | | | | | |
| | Banking | | | | | |
| 1 | Bank of America Corp. | 3.419% | 12/20/28 | 121,462 | 135,480 | 0.3% |
| 1 | Bank of America Corp. | 3.974% | 2/7/30 | 70,903 | 82,672 | 0.2% |
| 1 | Bank of America Corp. | 2.496% | 2/13/31 | 72,231 | 75,814 | 0.2% |
| 1 | Bank of America Corp. | 1.898%–6.220% | 1/22/24–7/23/31 | 745,959 | 837,528 | 2.0% |
| | Bank One Corp. | 7.625%–8.000% | 10/15/26–4/29/27 | 27,504 | 37,610 | 0.1% |
| | Citigroup Inc. | 4.450% | 9/29/27 | 90,172 | 104,683 | 0.3% |
| 1 | Citigroup Inc. | 4.412% | 3/31/31 | 83,922 | 101,833 | 0.2% |
| 1 | Citigroup Inc. | 3.980% | 3/20/30 | 71,909 | 83,468 | 0.2% |
| 1 | Citigroup Inc. | 2.572%–6.625% | 9/13/25–6/3/31 | 574,052 | 646,441 | 1.6% |
| | Goldman Sachs Group Inc. | 3.850% | 1/26/27 | 78,157 | 88,974 | 0.2% |
| 1 | Goldman Sachs Group Inc. | 4.223% | 5/1/29 | 64,326 | 75,250 | 0.2% |
| 1 | Goldman Sachs Group Inc. | 2.600%–5.950% | 10/21/25–3/15/30 | 327,071 | 371,836 | 0.9% |
| 1 | HSBC Holdings plc | 4.583% | 6/19/29 | 67,786 | 78,879 | 0.2% |
| | HSBC Holdings plc | 4.950% | 3/31/30 | 62,819 | 77,401 | 0.2% |
| 1 | HSBC Holdings plc | 4.041% | 3/13/28 | 66,051 | 74,255 | 0.2% |
| 1 | HSBC Holdings plc | 2.357%–5.100% | 4/5/21–8/18/31 | 283,459 | 317,609 | 0.8% |
| 1 | JPMorgan Chase & Co. | 4.452% | 12/5/29 | 63,752 | 76,782 | 0.2% |
| 1 | JPMorgan Chase & Co. | 4.493% | 3/24/31 | 61,795 | 75,677 | 0.2% |
| | JPMorgan Chase & Co. | 2.950% | 10/1/26 | 67,806 | 75,001 | 0.2% |
| 1 | JPMorgan Chase & Co. | 2.182%–4.250% | 9/10/24–5/13/31 | 724,615 | 813,946 | 2.0% |
| | Morgan Stanley | 3.875% | 1/27/26 | 77,515 | 88,974 | 0.2% |
| 1 | Morgan Stanley | 2.699% | 1/22/31 | 72,807 | 78,399 | 0.2% |
Intermediate-Term Corporate Bond Index Fund
| | | | | Face | Market | Percentage |
| | | | Maturity | Amount | Value● | of Net |
| | | Coupon | Date | ($000) | ($000) | Assets |
| 1 | Morgan Stanley | 3.591% | 7/22/28 | 67,642 | 76,274 | 0.2% |
| | Morgan Stanley | 3.125% | 7/27/26 | 67,702 | 75,545 | 0.2% |
| 1 | Morgan Stanley | 3.622%–6.250% | 4/29/24–4/1/31 | 358,444 | 417,152 | 1.0% |
| | Wachovia Corp. | 7.574% | 8/1/26 | 4,939 | 6,344 | 0.0% |
| 1 | Wells Fargo & Co. | 2.879% | 10/30/30 | 88,700 | 95,288 | 0.2% |
| | Wells Fargo & Co. | 3.000% | 4/22/26 | 80,211 | 87,952 | 0.2% |
| | Wells Fargo & Co. | 3.000% | 10/23/26 | 77,567 | 85,497 | 0.2% |
| 1 | Wells Fargo & Co. | 3.584% | 5/22/28 | 73,303 | 82,047 | 0.2% |
| 1 | Wells Fargo & Co. | 2.164%–4.478% | 9/29/25–4/4/31 | 390,457 | 437,970 | 1.1% |
| 2 | Banking—Other † | | | | 3,838,597 | 9.4% |
| 2 | Brokerage † | | | | 591,978 | 1.5% |
| 2 | Finance Companies † | | | | 338,600 | 0.8% |
| 2 | Insurance † | | | | 1,705,715 | 4.2% |
| | Other Finance † | | | | 8,212 | 0.0% |
| | Real Estate Investment Trusts † | | | 1,849,570 | 4.5% |
| | | | | | 14,095,253 | 34.5% |
| Industrial | | | | | |
| 2 | Basic Industry † | | | | 1,111,579 | 2.7% |
| | Capital Goods | | | | | |
| | Boeing Co. | 5.150% | 5/1/30 | 85,271 | 95,408 | 0.3% |
| | Raytheon Technologies Corp. | 4.125% | 11/16/28 | 74,175 | 88,193 | 0.2% |
| 2 | Capital Goods—Other † | | | | 2,094,697 | 5.1% |
| | Communication | | | | | |
| | AT&T Inc. | 4.350% | 3/1/29 | 63,626 | 75,553 | 0.2% |
| | AT&T Inc. | 1.650%–4.300% | 1/15/26–2/15/30 | 351,317 | 396,471 | 1.0% |
| | Comcast Corp. | 4.150% | 10/15/28 | 78,316 | 94,509 | 0.2% |
| | Comcast Corp. | 2.350%–3.950% | 10/15/25–4/1/30 | 294,423 | 331,741 | 0.8% |
| | Deutsche Telekom International Finance BV | 8.750% | 6/15/30 | 70,233 | 110,103 | 0.3% |
| 2 | T-Mobile USA Inc. | 3.875% | 4/15/30 | 145,810 | 166,648 | 0.4% |
| 2 | T-Mobile USA Inc. | 3.750% | 4/15/27 | 84,975 | 96,217 | 0.2% |
| | TCI Communications Inc. | 7.125%–7.875% | 2/15/26–2/15/28 | 14,389 | 19,707 | 0.0% |
| | Verizon Communications Inc. | 4.329% | 9/21/28 | 88,636 | 107,342 | 0.3% |
| | Verizon Communications Inc. | 4.016% | 12/3/29 | 78,669 | 94,493 | 0.2% |
| | Vodafone Group plc | 4.375% | 5/30/28 | 69,410 | 82,881 | 0.2% |
| 2 | Communication—Other † | | | | 1,583,952 | 3.9% |
| | Consumer Cyclical | | | | | |
| | Amazon.com Inc. | 3.150% | 8/22/27 | 71,775 | 82,096 | 0.2% |
| | Visa Inc. | 3.150% | 12/14/25 | 79,148 | 88,830 | 0.2% |
| | Walmart Inc. | 3.700% | 6/26/28 | 65,847 | 78,036 | 0.2% |
| 2 | Consumer Cyclical—Other † | | | 2,902,704 | 7.1% |
| | Consumer Noncyclical | | | | | |
| 2 | AbbVie Inc. | 3.200% | 11/21/29 | 108,860 | 120,591 | 0.3% |
| 2 | AbbVie Inc. | 2.950% | 11/21/26 | 89,593 | 98,464 | 0.3% |
| | Anheuser-Busch InBev Worldwide Inc. | 4.750% | 1/23/29 | 82,903 | 101,120 | 0.3% |
| | Bristol-Myers Squibb Co. | 3.400% | 7/26/29 | 78,466 | 91,450 | 0.2% |
| | Cigna Corp. | 4.375% | 10/15/28 | 90,937 | 108,640 | 0.3% |
| | CVS Health Corp. | 4.300% | 3/25/28 | 183,253 | 214,276 | 0.5% |
| | CVS Health Corp. | 1.300%–6.250% | 6/1/26–8/21/30 | 195,718 | 212,314 | 0.5% |
| | Shire Acquisitions Investments Ireland DAC | 3.200% | 9/23/26 | 75,551 | 84,536 | 0.2% |
| 2 | Consumer Noncyclical— Other † | | | 5,241,389 | 12.8% |
Intermediate-Term Corporate Bond Index Fund
| | | | | Face | Market | Percentage |
| | | | Maturity | Amount | Value● | of Net |
| | | Coupon | Date | ($000) | ($000) | Assets |
| 2 | Energy † | | | | 2,873,672 | 7.0% |
| | Other Industrial † | | | | 48,751 | 0.1% |
| | Technology | | | | | |
| | Apple Inc. | 3.250% | 2/23/26 | 75,900 | 85,742 | 0.2% |
| 3 | Apple Inc. | 1.250%–3.450% | 5/6/24–8/20/30 | 350,119 | 383,021 | 0.9% |
| | Broadcom Corp. /Broadcom Cayman Finance Ltd. | 3.875% | 1/15/27 | 94,208 | 104,393 | 0.3% |
| | Broadcom Corp. /Broadcom Cayman Finance Ltd. | 3.500% | 1/15/28 | 32,000 | 34,583 | 0.1% |
| | Broadcom Inc. | 3.150%–5.000% | 11/15/25–4/15/30 | 267,373 | 301,971 | 0.7% |
| | CA Inc. | 4.700% | 3/15/27 | 6,619 | 7,281 | 0.0% |
| 2 | Diamond 1 Finance Corp. /Diamond 2 Finance Corp. | 6.020% | 6/15/26 | 77,351 | 90,748 | 0.2% |
| | Fiserv Inc. | 3.500% | 7/1/29 | 71,346 | 81,110 | 0.2% |
| | International Business Machines Corp. | 3.300% | 5/15/26 | 70,369 | 79,872 | 0.2% |
| | Microsoft Corp. | 2.400% | 8/8/26 | 88,249 | 96,475 | 0.2% |
| | Microsoft Corp. | 3.300% | 2/6/27 | 76,291 | 87,233 | 0.2% |
| | Oracle Corp. | 2.950% | 4/1/30 | 67,916 | 75,815 | 0.2% |
| 2 | Technology—Other † | | | | 2,632,025 | 6.5% |
| | Transportation † | | | | 811,923 | 2.0% |
| | | | | | 23,768,555 | 58.1% |
| Utilities | | | | | |
| 2 | Electric † | | | | 2,303,268 | 5.6% |
| 2 | Natural Gas † | | | | 207,440 | 0.5% |
| | Other Utility † | | | | 69,389 | 0.2% |
| | | | | | 2,580,097 | 6.3% |
| Total Corporate Bonds (Cost $38,085,587) | | | 40,443,905 | 98.9% |
| | | | | | | |
| | | | | Shares | | |
| Temporary Cash Investment | | | | |
| Money Market Fund | | | | | |
| 4 | Vanguard Market Liquidity Fund (Cost $27,428) | 0.147% | 274,280 | 27,428 | 0.1% |
| Total Investments (Cost $38,135,420) | | | 40,493,720 | 99.1% |
| Other Assets and Liabilities—Net | | | 356,508 | 0.9% |
| Net Assets | | | | 40,850,228 | 100.0% |
Cost is in $000.
| · | See Note A in Notes to Financial Statements. |
| | | |
| † | Represents the aggregate value, by category, of securities that are not among the 50 largest holdings and, in total for any issuer, represent 1% or less of net assets. |
| | | |
| 1 | The average or expected maturity is shorter than the final maturity shown because of the possibility of interim principal payments and prepayments or the possibility of the issue being called. |
| | | |
| 2 | Certain securities are exempt from registration under Rule 144A of the Securities Act of 1933. Such securities may be sold in transactions exempt from registration, normally to qualified institutional buyers. At August 31, 2020, the aggregate value of these securities was $1,543,820,000, representing 3.8% of net assets. |
| | | |
| 3 | Securities with a value of $5,141,000 have been segregated as initial margin for open futures contracts. |
| | | |
| 4 | Affiliated money market fund available only to Vanguard funds and certain trusts and accounts managed by Vanguard. Rate shown is the 7-day yield. |
Intermediate-Term Corporate Bond Index Fund
| Derivative Financial Instruments Outstanding as of Period End | | |
| | | |
| Futures Contracts | | | | |
| | | | | ($000) |
| | | | | Value and |
| | | Number of | | Unrealized |
| | | Long (Short) | Notional | Appreciation |
| | Expiration | Contracts | Amount | (Depreciation) |
| Short Futures Contracts | | | | |
| Ultra 10-Year U.S. Treasury Note | December 2020 | (105) | (16,741) | (18) |
| 5-Year U.S. Treasury Note | December 2020 | (44) | (5,545) | (1) |
| | | | | (19) |
See accompanying Notes, which are an integral part of the Financial Statements.
Intermediate-Term Corporate Bond Index Fund
Statement of Assets and Liabilities
As of August 31, 2020
| ($000s, except shares and per-share amounts) | Amount |
| Assets | |
| Investments in Securities, at Value | |
| Unaffiliated Issuers (Cost $38,107,992) | 40,466,292 |
| Affiliated Issuers (Cost $27,428) | 27,428 |
| Total Investments in Securities | 40,493,720 |
| Investment in Vanguard | 1,699 |
| Cash | 838 |
| Receivables for Investment Securities Sold | 436,840 |
| Receivables for Accrued Income | 363,058 |
| Receivables for Capital Shares Issued | 5,346 |
| Variation Margin Receivable—Futures Contracts | 322 |
| Total Assets | 41,301,823 |
| Liabilities | |
| Payables for Investment Securities Purchased | 447,793 |
| Payables for Capital Shares Redeemed | 1,102 |
| Payables for Distributions | 890 |
| Payables to Vanguard | 1,006 |
| Variation Margin Payable—Futures Contracts | 804 |
| Total Liabilities | 451,595 |
| Net Assets | 40,850,228 |
| | |
| | |
| At August 31, 2020, net assets consisted of: | |
| | |
| Paid-in Capital | 38,385,924 |
| Total Distributable Earnings (Loss) | 2,464,304 |
| Net Assets | 40,850,228 |
| | |
| ETF Shares—Net Assets | |
| Applicable to 405,738,074 outstanding $.001 par value shares of beneficial interest (unlimited authorization) | 38,944,402 |
| Net Asset Value Per Share—ETF Shares | $95.98 |
| | |
| Admiral Shares—Net Assets | |
| Applicable to 59,914,900 outstanding $.001 par value shares of beneficial interest (unlimited authorization) | 1,549,153 |
| Net Asset Value Per Share—Admiral Shares | $25.86 |
| | |
| Institutional Shares—Net Assets | |
| Applicable to 11,164,259 outstanding $.001 par value shares of beneficial interest (unlimited authorization) | 356,673 |
| Net Asset Value Per Share—Institutional Shares | $31.95 |
See accompanying Notes, which are an integral part of the Financial Statements.
Intermediate-Term Corporate Bond Index Fund
Statement of Operations
| | Year Ended | |
| | August 31, 2020 | |
| | ($000 | ) |
| Investment Income | | |
| Income | | |
| Interest1 | 938,464 | |
| Total Income | 938,464 | |
| Expenses | | |
| The Vanguard Group—Note B | | |
| Investment Advisory Services | 909 | |
| Management and Administrative—ETF Shares | 10,890 | |
| Management and Administrative—Admiral Shares | 849 | |
| Management and Administrative—Institutional Shares | 186 | |
| Marketing and Distribution—ETF Shares | 1,791 | |
| Marketing and Distribution—Admiral Shares | 101 | |
| Marketing and Distribution—Institutional Shares | 16 | |
| Custodian Fees | 98 | |
| Auditing Fees | 43 | |
| Shareholders’ Reports—ETF Shares | 881 | |
| Shareholders’ Reports—Admiral Shares | 12 | |
| Shareholders’ Reports—Institutional Shares | — | |
| Trustees’ Fees and Expenses | 17 | |
| Total Expenses | 15,793 | |
| Expenses Paid Indirectly | (97 | ) |
| Net Expenses | 15,696 | |
| Net Investment Income | 922,768 | |
| Realized Net Gain (Loss) | | |
| Investment Securities Sold1,2 | 648,728 | |
| Futures Contracts | (10,030 | ) |
| Realized Net Gain (Loss) | 638,698 | |
| Change in Unrealized Appreciation (Depreciation) | | |
| Investment Securities1 | 858,004 | |
| Futures Contracts | (319 | ) |
| Change in Unrealized Appreciation (Depreciation) | 857,685 | |
| Net Increase (Decrease) in Net Assets Resulting from Operations | 2,419,151 | |
| 1 | Interest income, realized net gain (loss), and change in unrealized appreciation (depreciation) from an affiliated company of the fund were $1,069,000, $212,000, and ($1,000), respectively. Purchases and sales are for temporary cash investment purposes. |
| 2 | Includes $479,701,000 of net gain (loss) resulting from in-kind redemptions. |
See accompanying Notes, which are an integral part of the Financial Statements.
Intermediate-Term Corporate Bond Index Fund
Statement of Changes in Net Assets
| | Year Ended August 31, | |
| | 2020 | | 2019 | |
| | ($000 | ) | ($000 | ) |
| Increase (Decrease) in Net Assets | | | | |
| Operations | | | | |
| Net Investment Income | 922,768 | | 839,679 | |
| Realized Net Gain (Loss) | 638,698 | | 177,920 | |
| Change in Unrealized Appreciation (Depreciation) | 857,685 | | 2,046,310 | |
| Net Increase (Decrease) in Net Assets Resulting from Operations | 2,419,151 | | 3,063,909 | |
| Distributions1 | | | | |
| ETF Shares | (856,258 | ) | (771,952 | ) |
| Admiral Shares | (42,509 | ) | (41,575 | ) |
| Institutional Shares | (12,870 | ) | (14,888 | ) |
| Total Distributions | (911,637 | ) | (828,415 | ) |
| Capital Share Transactions | | | | |
| ETF Shares | 13,435,330 | | 2,686,065 | |
| Admiral Shares | 105,631 | | 197,830 | |
| Institutional Shares | (64,920 | ) | (121,914 | ) |
| Net Increase (Decrease) from Capital Share Transactions | 13,476,041 | | 2,761,981 | |
| Total Increase (Decrease) | 14,983,555 | | 4,997,475 | |
| Net Assets | | | | |
| Beginning of Period | 25,866,673 | | 20,869,198 | |
| End of Period | 40,850,228 | | 25,866,673 | |
| 1 | Certain prior period numbers have been reclassified to conform with current period presentation. |
See accompanying Notes, which are an integral part of the Financial Statements.
Intermediate-Term Corporate Bond Index Fund
Financial Highlights
| For a Share Outstanding | | Year Ended August 31, | |
| Throughout Each Period | | 2020 | | 2019 | | 2018 | | 2017 | | 2016 | |
| Net Asset Value, Beginning of Period | | $91.82 | | $84.02 | | $88.35 | | $89.47 | | $84.39 | |
| Investment Operations | | | | | | | | | | | |
| Net Investment Income | | 2.761 | 1 | 3.132 | 1 | 2.935 | 1 | 2.869 | 1 | 2.831 | |
| Net Realized and Unrealized Gain (Loss) on Investments | | 4.205 | | 7.768 | | (4.362 | ) | (1.184 | ) | 5.083 | |
| Total from Investment Operations | | 6.966 | | 10.900 | | (1.427 | ) | 1.685 | | 7.914 | |
| Distributions | | | | | | | | | | | |
| Dividends from Net Investment Income | | (2.806 | ) | (3.100 | ) | (2.903 | ) | (2.805 | ) | (2.834 | ) |
| Distributions from Realized Capital Gains | | — | | — | | — | | — | | — | |
| Total Distributions | | (2.806 | ) | (3.100 | ) | (2.903 | ) | (2.805 | ) | (2.834 | ) |
| Net Asset Value, End of Period | | $95.98 | | $91.82 | | $84.02 | | $88.35 | | $89.47 | |
| | | | | | | | | | | | |
| Total Return | | 7.78% | | 13.33% | | -1.62% | | 1.98% | | 9.58% | |
| | | | | | | | | | | | |
| Ratios/Supplemental Data | | | | | | | | | | | |
| Net Assets, End of Period (Millions) | | $38,944 | | $24,080 | | $19,302 | | $16,699 | | $10,048 | |
| Ratio of Total Expenses to Average Net Assets | | 0.05% | | 0.05% | | 0.07% | | 0.07% | | 0.07% | |
| Ratio of Net Investment Income to Average Net Assets | | 2.99% | | 3.65% | | 3.44% | | 3.30% | | 3.34% | |
| Portfolio Turnover Rate2 | | 72% | | 59% | | 65% | | 65% | | 71% | |
| 1 | Calculated based on average shares outstanding. |
| 2 | Excludes the value of portfolio securities received or delivered as a result of in-kind purchases or redemptions of the fund’s capital shares, including ETF Creation Units. |
See accompanying Notes, which are an integral part of the Financial Statements.
Intermediate-Term Corporate Bond Index Fund
Financial Highlights
| For a Share Outstanding | | Year Ended August 31, | |
| Throughout Each Period | | 2020 | | 2019 | | 2018 | | 2017 | | 2016 | |
| Net Asset Value, Beginning of Period | | $24.71 | | $22.61 | | $23.78 | | $24.08 | | $22.71 | |
| Investment Operations | | | | | | | | | | | |
| Net Investment Income | | .747 | 1 | .839 | 1 | .792 | 1 | .774 | 1 | .764 | |
| Net Realized and Unrealized Gain (Loss) on Investments | | 1.138 | | 2.097 | | (1.175 | ) | (.318 | ) | 1.371 | |
| Total from Investment Operations | | 1.885 | | 2.936 | | (.383 | ) | .456 | | 2.135 | |
| Distributions | | | | | | | | | | | |
| Dividends from Net Investment Income | | (.735 | ) | (.836 | ) | (.787 | ) | (.756 | ) | (.765 | ) |
| Distributions from Realized Capital Gains | | — | | — | | — | | — | | — | |
| Total Distributions | | (.735 | ) | (.836 | ) | (.787 | ) | (.756 | ) | (.765 | ) |
| Net Asset Value, End of Period | | $25.86 | | $24.71 | | $22.61 | | $23.78 | | $24.08 | |
| | | | | | | | | | | | |
| Total Return2 | | 7.79% | | 13.30% | | -1.61% | | 1.99% | | 9.57% | |
| | | | | | | | | | | | |
| Ratios/Supplemental Data | | | | | | | | | | | |
| Net Assets, End of Period (Millions) | | $1,549 | | $1,381 | | $1,076 | | $1,014 | | $700 | |
| Ratio of Total Expenses to Average Net Assets | | 0.07% | | 0.07% | | 0.07% | | 0.07% | | 0.07% | |
| Ratio of Net Investment Income to Average Net Assets | | 3.01% | | 3.63% | | 3.44% | | 3.30% | | 3.34% | |
| Portfolio Turnover Rate3 | | 72% | | 59% | | 65% | | 65% | | 71% | |
| 1 | Calculated based on average shares outstanding. |
| 2 | Total returns do not include transaction or account service fees that may have applied in the periods shown. Fund prospectuses provide information about any applicable transaction and account service fees. |
| 3 | Excludes the value of portfolio securities received or delivered as a result of in-kind purchases or redemptions of the fund’s capital shares, including ETF Creation Units. |
See accompanying Notes, which are an integral part of the Financial Statements.
Intermediate-Term Corporate Bond Index Fund
Financial Highlights
| For a Share Outstanding | | Year Ended August 31, | |
| Throughout Each Period | | 2020 | | 2019 | | 2018 | | 2017 | | 2016 | |
| Net Asset Value, Beginning of Period | | $30.53 | | $27.94 | | $29.38 | | $29.75 | | $28.06 | |
| Investment Operations | | | | | | | | | | | |
| Net Investment Income | | .940 | 1 | 1.044 | 1 | .983 | 1 | .962 | 1 | .949 | |
| Net Realized and Unrealized Gain (Loss) on Investments | | 1.394 | | 2.584 | | (1.446 | ) | (.392 | ) | 1.690 | |
| Total from Investment Operations | | 2.334 | | 3.628 | | (.463 | ) | .570 | | 2.639 | |
| Distributions | | | | | | | | | | | |
| Dividends from Net Investment Income | | (.914 | ) | (1.038 | ) | (.977 | ) | (.940 | ) | (.949 | ) |
| Distributions from Realized Capital Gains | | — | | — | | — | | — | | — | |
| Total Distributions | | (.914 | ) | (1.038 | ) | (.977 | ) | (.940 | ) | (.949 | ) |
| Net Asset Value, End of Period | | $31.95 | | $30.53 | | $27.94 | | $29.38 | | $29.75 | |
| | | | | | | | | | | | |
| Total Return2 | | 7.81% | | 13.30% | | -1.57% | | 2.01% | | 9.58% | |
| | | | | | | | | | | | |
| Ratios/Supplemental Data | | | | | | | | | | | |
| Net Assets, End of Period (Millions) | | $357 | | $406 | | $492 | | $572 | | $387 | |
| Ratio of Total Expenses to Average Net Assets | | 0.05% | | 0.05% | | 0.05% | | 0.05% | | 0.05% | |
| Ratio of Net Investment Income to Average Net Assets | | 3.07% | | 3.65% | | 3.46% | | 3.32% | | 3.36% | |
| Portfolio Turnover Rate3 | | 72% | | 59% | | 65% | | 65% | | 71% | |
| 1 | Calculated based on average shares outstanding. |
| 2 | Total returns do not include transaction fees that may have applied in the periods shown. Fund prospectuses provide information about any applicable transaction fees. |
| 3 | Excludes the value of portfolio securities received or delivered as a result of in-kind purchases or redemptions of the fund’s capital shares, including ETF Creation Units. |
See accompanying Notes, which are an integral part of the Financial Statements.
Intermediate-Term Corporate Bond Index Fund
Notes to Financial Statements
Vanguard Intermediate-Term Corporate Bond Index Fund is registered under the Investment Company Act of 1940 as an open-end investment company, or mutual fund. The fund offers three classes of shares: ETF Shares, Admiral Shares, and Institutional Shares. Each of the share classes has different eligibility and minimum purchase requirements, and is designed for different types of investors. ETF Shares are listed for trading on Nasdaq; they can be purchased and sold through a broker.
Certain of the fund’s investments are in corporate debt instruments; the issuers’ abilities to meet their obligations may be affected by economic developments in their respective industries. Market disruptions associated with the COVID-19 pandemic have had a global impact, and uncertainty exists as to the long-term implications. Such disruptions can adversely affect assets of the fund and thus fund performance.
A. The following significant accounting policies conform to generally accepted accounting principles for U.S. investment companies. The fund consistently follows such policies in preparing its financial statements.
1. Security Valuation: Securities are valued as of the close of trading on the New York Stock Exchange (generally 4 p.m., Eastern time) on the valuation date. Bonds and temporary cash investments are valued using the latest bid prices or using valuations based on a matrix system (which considers such factors as security prices, yields, maturities, and ratings), both as furnished by independent pricing services. Investments in Vanguard Market Liquidity Fund are valued at that fund’s net asset value. Securities for which market quotations are not readily available, or whose values have been affected by events occurring before the fund’s pricing time but after the close of the securities’ primary markets, are valued by methods deemed by the board of trustees to represent fair value.
2. Futures Contracts: The fund uses futures contracts to invest in fixed income asset classes with greater efficiency and lower cost than is possible through direct investment, to add value when these instruments are attractively priced, or to adjust sensitivity to changes in interest rates. The primary risks associated with the use of futures contracts are imperfect correlation between changes in market values of bonds held by the fund and the prices of futures contracts, and the possibility of an illiquid market. Counterparty risk involving futures is mitigated because a regulated clearinghouse is the counterparty instead of the clearing broker. To further mitigate counterparty risk, the fund trades futures contracts on an exchange, monitors the financial strength of its clearing brokers and clearinghouse, and has entered into clearing agreements with its clearing brokers. The clearinghouse imposes initial margin requirements to secure the fund’s performance and requires daily settlement of variation margin representing changes in the market value of each contract. Any securities pledged as initial margin for open contracts are noted in the Schedule of Investments.
Intermediate-Term Corporate Bond Index Fund
Futures contracts are valued at their quoted daily settlement prices. The notional amounts of the contracts are not recorded in the Statement of Assets and Liabilities. Fluctuations in the value of the contracts are recorded in the Statement of Assets and Liabilities as an asset (liability) and in the Statement of Operations as unrealized appreciation (depreciation) until the contracts are closed, when they are recorded as realized gains (losses) on futures contracts.
During the year ended August 31, 2020, the fund’s average investments in long and short futures contracts each represented less than 1% of net assets, based on the average of the notional amounts at each quarter-end during the period.
3. Federal Income Taxes: The fund intends to continue to qualify as a regulated investment company and distribute all of its taxable income. The fund’s tax returns are open to examination by the relevant tax authorities until expiration of the applicable statute of limitations, which is generally three years after the filing of the tax return. Management has analyzed the fund’s tax positions taken for all open federal and state income tax years, and has concluded that no provision for income tax is required in the fund’s financial statements.
4. Distributions: Distributions to shareholders are recorded on the ex-dividend date. Distributions are determined on a tax basis at the fiscal year-end and may differ from net investment income and realized capital gains for financial reporting purposes.
5. Credit Facilities and Interfund Lending Program: The fund and certain other funds managed by The Vanguard Group (“Vanguard”) participate in a $4.3 billion committed credit facility provided by a syndicate of lenders pursuant to a credit agreement and an uncommitted credit facility provided by Vanguard. Both facilities may be renewed annually. Each fund is individually liable for its borrowings, if any, under the credit facilities. Borrowings may be utilized for temporary or emergency purposes, subject to the fund’s regulatory and contractual borrowing restrictions. With respect to the committed credit facility, the participating funds are charged administrative fees and an annual commitment fee of 0.10% of the undrawn committed amount of the facility; these fees are allocated to the funds based on a method approved by the fund’s board of trustees and included in Management and Administrative expenses on the fund’s Statement of Operations. Any borrowings under either facility bear interest at a rate based upon the higher of the one-month London Interbank Offered Rate (or an acceptable alternate rate, if necessary), federal funds effective rate, or overnight bank funding rate plus an agreed-upon spread, except that borrowings under the uncommitted credit facility may bear interest based upon an alternative rate agreed to by the fund and Vanguard.
In accordance with an exemptive order (the “Order”) from the SEC, the fund may participate in a joint lending and borrowing program that allows registered open-end Vanguard funds to borrow money from and lend money to each other for temporary or emergency purposes (the “Interfund Lending Program”), subject to compliance with the terms and conditions of the Order, and to the extent permitted by the fund’s investment objective and investment policies. Interfund loans and borrowings
Intermediate-Term Corporate Bond Index Fund
normally extend overnight, but can have a maximum duration of seven days. Loans may be called on one business day’s notice. The interest rate to be charged is governed by the conditions of the Order and internal procedures adopted by the board of trustees. The board of trustees is responsible for overseeing the Interfund Lending Program.
For the year ended August 31, 2020, the fund did not utilize the credit facilities or the Interfund Lending Program.
6. Other: Interest income includes income distributions received from Vanguard Market Liquidity Fund and is accrued daily. Premiums and discounts on debt securities are amortized and accreted, respectively, to interest income over the lives of the respective securities, except for premiums on certain callable debt securities that are amortized to the earliest call date. Security transactions are accounted for on the date securities are bought or sold. Costs used to determine realized gains (losses) on the sale of investment securities are those of the specific securities sold. Fees assessed on capital share transactions are credited to paid-in capital.
Each class of shares has equal rights as to assets and earnings, except that each class separately bears certain class-specific expenses related to maintenance of shareholder accounts (included in Management and Administrative expenses) and shareholder reporting. Marketing and distribution expenses are allocated to each class of shares based on a method approved by the board of trustees. Income, other non-class-specific expenses, and gains and losses on investments are allocated to each class of shares based on its relative net assets.
B. In accordance with the terms of a Funds’ Service Agreement (the “FSA”) between Vanguard and the fund, Vanguard furnishes to the fund investment advisory, corporate management, administrative, marketing, and distribution services at Vanguard’s cost of operations (as defined by the FSA). These costs of operations are allocated to the fund based on methods and guidelines approved by the board of trustees and are generally settled twice a month.
Upon the request of Vanguard, the fund may invest up to 0.40% of its net assets as capital in Vanguard. At August 31, 2020, the fund had contributed to Vanguard capital in the amount of $1,699,000, representing less than 0.01% of the fund’s net assets and 0.68% of Vanguard’s capital received pursuant to the FSA. The fund’s trustees and officers are also directors and employees, respectively, of Vanguard.
C. The fund’s custodian bank has agreed to reduce its fees when the fund maintains cash on deposit in the non-interest-bearing custody account. For the year ended August 31, 2020, custodian fee offset arrangements reduced the fund’s expenses by $97,000 (an annual rate of less than 0.01% of average net assets).
D. Various inputs may be used to determine the value of the fund’s investments and derivatives. These inputs are summarized in three broad levels for financial statement purposes. The inputs or methodologies used to value securities are not necessarily an indication of the risk associated with investing in those securities.
Intermediate-Term Corporate Bond Index Fund
Level 1—Quoted prices in active markets for identical securities.
Level 2—Other significant observable inputs (including quoted prices for similar securities, interest rates, prepayment speeds, credit risk, etc.).
Level 3—Significant unobservable inputs (including the fund’s own assumptions used to determine the fair value of investments). Any investments and derivatives valued with significant unobservable inputs are noted on the Schedule of Investments.
The following table summarizes the market value of the fund’s investments and derivatives as of August 31, 2020, based on the inputs used to value them:
| | Level 1 | Level 2 | Level 3 | Total |
| | ($000) | ($000) | ($000) | ($000) |
| Investments | | | | |
| Assets | | | | |
| U.S. Government and Agency Obligations | — | 22,387 | — | 22,387 |
| Corporate Bonds | — | 40,443,905 | — | 40,443,905 |
| Temporary Cash Investments | 27,428 | — | — | 27,428 |
| Total | 27,428 | 40,466,292 | — | 40,493,720 |
| Derivative Financial Instruments | | | | |
| Assets | | | | |
| Futures Contracts1 | 322 | — | — | 322 |
| Liabilities | | | | |
| Futures Contracts1 | 804 | — | — | 804 |
1 Represents variation margin on the last day of the reporting period.
E. Permanent differences between book-basis and tax-basis components of net assets are reclassified among capital accounts in the financial statements to reflect their tax character. These reclassifications have no effect on net assets or net asset value per share. As of period end, permanent differences primarily attributable to the accounting for in-kind redemptions and distributions in connection with fund share redemptions were reclassified between the following accounts:
| | Amount |
| | ($000) |
| Paid-in Capital | 487,212 |
| Total Distributable Earnings (Loss) | (487,212) |
Intermediate-Term Corporate Bond Index Fund
Temporary differences between book-basis and tax-basis components of total distributable earnings (loss) arise when certain items of income, gain, or loss are recognized in different periods for financial statement and tax purposes; these differences will reverse at some time in the future. The differences are primarily related to the deferral of losses from wash sales; the deferral of losses from straddles; the recognition of unrealized gains or losses from certain derivative contracts; and the inclusion of payables for distributions. As of period end, the tax-basis components of total distributable earnings (loss) are detailed in the table as follows:
| | Amount |
| | ($000) |
| Undistributed Ordinary Income | 78,611 |
| Undistributed Long-Term Gains | 31,682 |
| Capital Loss Carryforwards | — |
| Qualified Late-Year Losses | — |
| Net Unrealized Gains (Losses) | 2,354,902 |
The tax character of distributions paid was as follows:
| | Year Ended August 31, |
| | 2020 | 2019 |
| | Amount | Amount |
| | ($000) | ($000) |
| Ordinary Income * | 911,637 | 828,415 |
| Long-Term Capital Gains | — | — |
| Total | 911,637 | 828,415 |
* Includes short-term capital gains, if any.
As of August 31, 2020, gross unrealized appreciation and depreciation for investments and derivatives based on cost for U.S. federal income tax purposes were as follows:
| | Amount |
| | ($000) |
| Tax Cost | 38,138,818 |
| Gross Unrealized Appreciation | 2,421,705 |
| Gross Unrealized Depreciation | (66,803) |
| Net Unrealized Appreciation (Depreciation) | 2,354,902 |
Intermediate-Term Corporate Bond Index Fund
F. During the year ended August 31, 2020, the fund purchased $34,207,874,000 of investment securities and sold $20,866,986,000 of investment securities, other than U.S. government securities and temporary cash investments. Purchases and sales of U.S. government securities were $9,605,347,000 and $9,634,238,000, respectively. Total purchases and sales include $21,581,427,000 and $8,390,130,000, respectively, in connection with in-kind purchases and redemptions of the fund’s capital shares.
The fund purchased securities from and sold securities to other Vanguard funds or accounts managed by Vanguard or its affiliates, in accordance with procedures adopted by the board of trustees in compliance with Rule 17a-7 of the Investment Company Act of 1940. For the year ended August 31, 2020, such purchases and sales were $1,729,043,000 and $10,002,268,000, respectively; these amounts, other than temporary cash investments, are included in the purchases and sales of investment securities noted above.
G. Capital share transactions for each class of shares were:
| | Year Ended August 31, |
| | 2020 | | 2019 |
| | Amount | Shares | | Amount | Shares |
| | ($000) | (000) | | ($000) | (000) |
| ETF Shares | | | | | |
| Issued1 | 21,977,106 | 236,975 | | 8,279,726 | 96,725 |
| Issued in Lieu of Cash Distributions | — | — | | — | — |
| Redeemed | (8,541,776) | (93,500) | | (5,593,661) | (64,200) |
| Net Increase (Decrease)—ETF Shares | 13,435,330 | 143,475 | | 2,686,065 | 32,525 |
| Admiral Shares | | | | | |
| Issued1 | 526,493 | 21,282 | | 434,667 | 18,688 |
| Issued in Lieu of Cash Distributions | 34,053 | 1,371 | | 33,922 | 1,463 |
| Redeemed | (454,915) | (18,616) | | (270,759) | (11,844) |
| Net Increase (Decrease)—Admiral Shares | 105,631 | 4,037 | | 197,830 | 8,307 |
| Institutional Shares | | | | | |
| Issued1 | 139,541 | 4,570 | | 31,972 | 1,136 |
| Issued in Lieu of Cash Distributions | 8,451 | 276 | | 8,178 | 286 |
| Redeemed | (212,912) | (6,963) | | (162,064) | (5,745) |
| Net Increase (Decrease)—Institutional Shares | (64,920) | (2,117) | | (121,914) | (4,323) |
1 Includes purchase fees for fiscal 2020 and 2019 of $1,686,000 and $1,145,000, respectively (fund totals).
H. Management has determined that no events or transactions occurred subsequent to August 31, 2020, that would require recognition or disclosure in these financial statements.
Long-Term Corporate Bond Index Fund
Performance Summary
All of the returns in this report represent past performance, which is not a guarantee of future results that may be achieved by the fund. (Current performance may be lower or higher than the performance data cited. For performance data current to the most recent month-end, visit our website at vanguard.com/performance.) Note, too, that both investment returns and principal value can fluctuate widely, so an investor’s shares, when sold, could be worth more or less than their original cost. The returns shown do not reflect taxes that a shareholder would pay on fund distributions or on the sale of fund shares.
Cumulative Performance: August 31, 2010, Through August 31, 2020
Initial Investment of $10,000

| | | | Average Annual Total Returns | | |
| | | | Periods Ended August 31, 2020 | | |
| | | | | | | | Final Value |
| | | | One | Five | Ten | | of a $10,000 |
| | | | Year | Years | Years | | Investment |
| Long-Term Corporate Bond Index Fund ETF Shares Net Asset Value | | 7.90% | 9.12% | 7.36% | | $20,340 |
| | Long-Term Corporate Bond Index Fund ETF Shares Market Price | | 8.50 | 9.24 | 7.30 | | 20,227 |
| Bloomberg Barclays U.S. 10+ Year Corporate Bond Index | | 8.74 | 9.20 | 7.42 | | 20,460 |
| Bloomberg Barclays U.S. Aggregate Float Adjusted Index | | 6.57 | 4.41 | 3.69 | | 14,372 |
Bloomberg Barclays U.S. 10+ Year Corporate Bond Index: Includes U.S. dollar-denominated, investment-grade securities issued by industrial, utility, and financial companies, with maturities greater than 10 years.
Vanguard fund returns are adjusted to reflect the 1.00% fee on purchases of fund shares. The fee does not apply to the ETF Shares. See Financial Highlights for dividend and capital gains information.
Long-Term Corporate Bond Index Fund
| | Average Annual Total Returns | |
| | Periods Ended August 31, 2020 | |
| | | | | Final Value |
| | One | Five | Ten | of a $10,000 |
| | Year | Years | Years | Investment |
| Long-Term Corporate Bond Index Fund Admiral Shares | 6.79% | 8.91% | 7.26% | $20,150 |
| Bloomberg Barclays U.S. 10+ Year Corporate Bond Index | 8.74 | 9.20 | 7.42 | 20,460 |
| Bloomberg Barclays U.S. Aggregate Float Adjusted Index | 6.57 | 4.41 | 3.69 | 14,372 |
| | | | | |
| | | | | |
| | | | | Final Value |
| | One | Five | Ten | of a $5,000,000 |
| | Year | Years | Years | Investment |
| Long-Term Corporate Bond Index Fund Institutional Shares | 6.83% | 8.92% | 7.28% | $10,094,962 |
| Bloomberg Barclays U.S. 10+ Year Corporate Bond Index | 8.74 | 9.20 | 7.42 | 10,230,245 |
| Bloomberg Barclays U.S. Aggregate Float Adjusted Index | 6.57 | 4.41 | 3.69 | 7,185,953 |
| Cumulative Returns of ETF Shares: August 31, 2010, Through August 31, 2020 |
| |
| | One | Five | Ten |
| | Year | Years | Years |
| Long-Term Corporate Bond Index Fund ETF Shares Market Price | 8.50% | 55.56% | 102.27% |
| Long-Term Corporate Bond Index Fund ETF Shares Net Asset Value | 7.90 | 54.73 | 103.40 |
| Bloomberg Barclays U.S. 10+ Year Corporate Bond Index | 8.74 | 55.28 | 104.60 |
For the ETF Shares, the market price is determined by the midpoint of the bid-offer spread as of the closing time of the New York Stock Exchange (generally 4 p.m., Eastern time). The net asset value is also determined as of the NYSE closing time. For more information about how the ETF Shares’ market prices have compared with their net asset value, visit vanguard.com, select your ETF, and then select the Price and Performance tab. The ETF premium/discount analysis there shows the percentages of days on which the ETF Shares’ market price was above or below the NAV.
Vanguard fund returns are adjusted to reflect the 1.00% fee on purchases of fund shares. The fee does not apply to the ETF Shares.
Long-Term Corporate Bond Index Fund
Fund Allocation
As of August 31, 2020
| Corporate Bonds–Finance | 16.8% |
| Corporate Bonds–Industrial | 70.3 |
| Corporate Bonds–Utilities | 12.2 |
| Taxable Municipal Bonds | 0.2 |
| U.S. Government and Agency Obligations | 0.5 |
The table reflects the fund’s investments, except for short-term investments and derivatives.
The fund may invest in derivatives (such as futures and swap contracts) for various reasons, including, but not limited to, attempting to remain fully invested and tracking its target index as closely as possible.
Long-Term Corporate Bond Index Fund
Financial Statements
Schedule of Investments — Investments Summary
As of August 31, 2020
This Statement summarizes the fund’s holdings by asset type. Details are reported for each of the fund’s 50 largest individual holdings and for investments that, in total for any issuer, represent more than 1% of the fund’s net assets. The total value of smaller holdings is reported as a single amount within each category.
The fund files its complete schedule of portfolio holdings with the Securities and Exchange Commission (SEC) four times in each fiscal year. For the second and fourth quarters the complete list of the fund’s holdings is available on vanguard.com and on Form N-CSR, or you can have it mailed to you without charge by calling 800-662-7447. For the first and third quarters of each fiscal year, the complete list of the fund’s holdings is available as an exhibit to its reports on Form N-PORT. The fund’s Form N-CSR and Form N-PORT reports are available on the SEC’s website at www.sec.gov.
| | | | | Face | Market | Percentage | |
| | | | Maturity | Amount | Value● | of Net | |
| | | Coupon | Date | ($000) | ($000) | Assets | |
| U.S. Government and Agency Obligations | | | | | |
| U.S. Government Securities | | | | | | |
| | United States Treasury Note/Bond | 0.625% | 8/15/30 | 27,960 | 27,724 | 0.5% | |
| | U.S. Government Securities—Other † | | | | 438 | 0.0% | |
| Total U.S. Government and Agency Obligations (Cost $28,175) | | 28,162 | 0.5% | |
| Corporate Bonds | | | | | | |
| Finance | | | | | | |
| | Banking | | | | | | |
| 1 | Bank of America Corp. | 4.083% | 3/20/51 | 11,740 | 14,653 | 0.2% | |
| 1 | Bank of America Corp. | 2.676% | 6/19/41 | 12,902 | 13,176 | 0.2% | |
| 1 | Bank of America Corp. | 4.330% | 3/15/50 | 8,539 | 10,865 | 0.2% | |
| 1 | Bank of America Corp. | 3.946%–7.750% | 1/29/37–1/23/49 | 32,675 | 44,803 | 0.8% | |
| | Bank of America NA | 6.000% | 10/15/36 | 3,207 | 4,673 | 0.1% | |
| | Goldman Sachs Capital I | 6.345% | 2/15/34 | 1,431 | 2,011 | 0.0% | |
| | Goldman Sachs Group Inc. | 6.750% | 10/1/37 | 13,886 | 20,220 | 0.3% | |
| 1 | Goldman Sachs Group Inc. | 4.017%–6.450% | 2/15/33–10/21/45 | 31,057 | 40,888 | 0.7% | |
| | HSBC Holdings plc | 6.500% | 9/15/37 | 7,750 | 10,759 | 0.2% | |
| 1 | JPMorgan Chase & Co. | 3.882% | 7/24/38 | 9,461 | 11,329 | 0.2% | |
| | JPMorgan Chase & Co. | 6.400% | 5/15/38 | 6,250 | 9,669 | 0.2% | |
| 1 | JPMorgan Chase & Co. | 3.964% | 11/15/48 | 7,768 | 9,472 | 0.2% | |
| 1 | JPMorgan Chase & Co. | 3.109%–8.750% | 9/1/30–4/22/51 | 37,874 | 48,457 | 0.8% | |
| 1 | Morgan Stanley | 5.597% | 3/24/51 | 7,625 | 11,710 | 0.2% | |
| | Morgan Stanley | 4.300% | 1/27/45 | 7,560 | 9,844 | 0.2% | |
| | Wachovia Corp. | 5.500%–7.500% | 4/15/35–8/1/35 | 2,988 | 4,097 | 0.1% | |
| 1 | Wells Fargo & Co. | 5.013% | 4/4/51 | 10,560 | 14,475 | 0.2% | |
| 1 | Wells Fargo & Co. | 3.068% | 4/30/41 | 10,150 | 10,772 | 0.2% | |
| | Wells Fargo & Co. | 3.900%–5.950% | 2/7/35–12/1/86 | 36,786 | 46,301 | 0.8% | |
| | Wells Fargo Bank NA | 5.850%–6.600% | 8/26/36–1/15/38 | 6,981 | 9,961 | 0.2% | |
| | Banking—Other † | | | | 155,371 | 2.7% | |
Long-Term Corporate Bond Index Fund
| | | | | Face | Market | Percentage | |
| | | | Maturity | Amount | Value● | of Net | |
| | | Coupon | Date | ($000) | ($000) | Assets | |
| | Brokerage † | | | | 35,035 | 0.6% | |
| | Finance Companies | | | | | | |
| 2 | GE Capital Funding LLC | 4.550% | 5/15/32 | 1,705 | 1,796 | 0.0% | |
| | GE Capital International Funding Co. Unlimited Co. | 4.418% | 11/15/35 | 26,475 | 27,303 | 0.5% | |
| | Finance Companies—Other † | | | | 679 | 0.0% | |
| | Insurance | | | | | | |
| | Aetna Inc. | 3.875%–6.750% | 6/15/36–8/15/47 | 8,579 | 10,558 | 0.2% | |
| | Berkshire Hathaway Finance Corp. | 4.200%–5.750% | 1/15/40–1/15/49 | 15,458 | 19,974 | 0.3% | |
| | Berkshire Hathaway Inc. | 4.500% | 2/11/43 | 1,083 | 1,422 | 0.0% | |
| | UnitedHealth Group Inc. | 2.750%–6.875% | 7/15/35–5/15/60 | 49,197 | 62,234 | 1.1% | |
| | Insurance—Other † | | | | 225,702 | 3.9% | |
| | Real Estate Investment Trusts † | | | | 73,236 | 1.3% | |
| | | | | | 961,445 | 16.6% | |
| Industrial | |
| | Basic Industry | | | | | | |
| | Lubrizol Corp. | 6.500% | 10/1/34 | 658 | 1,016 | 0.0% | |
| | Basic Industry—Other † | | | | 207,019 | 3.6% | |
| | Capital Goods | | | | | | |
| | Boeing Co. | 5.805% | 5/1/50 | 9,410 | 11,232 | 0.2% | |
| | Boeing Co. | 5.930% | 5/1/60 | 8,629 | 10,516 | 0.2% | |
| | Boeing Co. | 5.705% | 5/1/40 | 9,005 | 10,442 | 0.2% | |
| | General Electric Co. | 4.125%–6.875% | 3/15/32–5/1/50 | 35,738 | 39,959 | 0.7% | |
| | Precision Castparts Corp. | 3.900%–4.375% | 1/15/43–6/15/45 | 2,026 | 2,439 | 0.0% | |
| | Raytheon Technologies Corp. | 4.500% | 6/1/42 | 7,840 | 9,883 | 0.2% | |
| 2,3 | Capital Goods—Other † | | | | 250,193 | 4.3% | |
| | Communication | | | | | | |
| | AT&T Inc. | 4.500% | 3/9/48 | 8,652 | 10,157 | 0.2% | |
| | AT&T Inc. | 2.250%–6.550% | 6/1/31–2/1/61 | 138,970 | 165,511 | 2.8% | |
| | Charter Communications Operating LLC / Charter Communications Operating Capital | 2.800%–6.834% | 4/1/31–10/23/55 | 41,762 | 50,497 | 0.9% | |
| | Comcast Corp. | 4.700% | 10/15/48 | 7,146 | 9,574 | 0.2% | |
| | Comcast Corp. | 4.600% | 10/15/38 | 7,321 | 9,354 | 0.2% | |
| | Comcast Corp. | 1.500%–7.050% | 10/15/30–8/15/62 | 93,044 | 113,984 | 2.0% | |
| | NBCUniversal Media LLC | 4.450%–6.400% | 4/30/40–1/15/43 | 7,056 | 9,980 | 0.2% | |
| | Orange SA | 9.000% | 3/1/31 | 7,139 | 11,664 | 0.2% | |
| | Time Warner Cable LLC | 4.500%–7.300% | 5/1/37–9/15/42 | 18,097 | 23,608 | 0.4% | |
| | Time Warner Entertainment Co. LP | 8.375% | 7/15/33 | 3,208 | 4,988 | 0.1% | |
| | Verizon Communications Inc. | 4.522% | 9/15/48 | 9,992 | 13,090 | 0.2% | |
| | Verizon Communications Inc. | 4.862% | 8/21/46 | 8,428 | 11,387 | 0.2% | |
| | Verizon Communications Inc. | 5.012% | 4/15/49 | 7,216 | 10,088 | 0.2% | |
| | Verizon Communications Inc. | 4.500% | 8/10/33 | 7,867 | 9,941 | 0.2% | |
| | Verizon Communications Inc. | 4.672% | 3/15/55 | 6,870 | 9,393 | 0.2% | |
| | Verizon Communications Inc. | 4.400% | 11/1/34 | 7,190 | 8,966 | 0.1% | |
| | Verizon Communications Inc. | 3.850%–6.400% | 9/15/33–8/21/54 | 28,603 | 36,333 | 0.6% | |
| | Vodafone Group plc | 5.250% | 5/30/48 | 7,209 | 9,263 | 0.1% | |
| | Walt Disney Co. | 2.650%–7.750% | 1/13/31-5/13/60 | 52,104 | 65,104 | 1.1% | |
Long-Term Corporate Bond Index Fund
| | | | | Face | Market | Percentage | |
| | | | Maturity | Amount | Value● | of Net | |
| | | Coupon | Date | ($000) | ($000) | Assets | |
| 2 | Communication—Other † | | | | 217,177 | 3.7% | |
| | Consumer Cyclical | | | | | | |
| | Amazon.com Inc. | 4.050% | 8/22/47 | 8,386 | 10,816 | 0.2% | |
| | Home Depot Inc. | 5.875% | 12/16/36 | 6,700 | 10,020 | 0.1% | |
| | Visa Inc. | 4.300% | 12/14/45 | 9,106 | 12,061 | 0.2% | |
| | Consumer Cyclical—Other † | | | | 317,942 | 5.5% | |
| | Consumer Noncyclical | | | | | | |
| 2 | AbbVie Inc. | 4.250% | 11/21/49 | 13,441 | 16,146 | 0.3% | |
| 2 | AbbVie Inc. | 4.050% | 11/21/39 | 7,456 | 8,743 | 0.1% | |
| 2 | AbbVie Inc. | 4.300%–4.875% | 3/15/35–11/14/48 | 40,572 | 49,570 | 0.9% | |
| | Amgen Inc. | 4.663% | 6/15/51 | 7,805 | 10,303 | 0.2% | |
| | Anheuser-Busch Cos.LLC / Anheuser-Busch InBev Worldwide Inc. | 4.900% | 2/1/46 | 19,769 | 24,354 | 0.4% | |
| | Anheuser-Busch Cos. LLC / Anheuser-Busch InBev Worldwide Inc. | 4.700% | 2/1/36 | 9,500 | 11,298 | 0.2% | |
| | Anheuser-Busch InBev Finance Inc. | 4.000%–4.900% | 2/1/36–2/1/46 | 16,043 | 18,836 | 0.3% | |
| | Anheuser-Busch InBev Worldwide Inc. | 5.550% | 1/23/49 | 7,430 | 9,913 | 0.2% | |
| | Anheuser-Busch InBev Worldwide Inc. | 3.750%–8.200% | 1/23/31–6/1/60 | 43,716 | 55,369 | 1.0% | |
| | AstraZeneca plc | 6.450% | 9/15/37 | 6,605 | 10,140 | 0.2% | |
| | Bristol-Myers Squibb Co. | 4.250% | 10/26/49 | 8,241 | 10,945 | 0.2% | |
| | CVS Health Corp. | 5.050% | 3/25/48 | 17,303 | 22,461 | 0.4% | |
| | CVS Health Corp. | 4.780% | 3/25/38 | 11,172 | 13,627 | 0.2% | |
| | CVS Health Corp. | 2.700%–6.125% | 7/20/35–4/1/50 | 19,971 | 24,460 | 0.4% | |
| | GlaxoSmithKline Capital Inc. | 6.375% | 5/15/38 | 6,242 | 9,677 | 0.2% | |
| | Pfizer Inc. | 2.550%–7.200% | 12/15/36–5/28/50 | 31,515 | 40,331 | 0.7% | |
| 2 | Upjohn Inc. | 3.850%–4.000% | 6/22/40–6/22/50 | 8,146 | 8,863 | 0.1% | |
| | Wyeth LLC | 5.950%–6.500% | 2/1/34–4/1/37 | 5,876 | 8,705 | 0.1% | |
| 2 | Consumer Noncyclical—Other † | | | | 772,354 | 13.3% | |
| | Energy | | | | | | |
| | Exxon Mobil Corp. | 4.327% | 3/19/50 | 7,945 | 10,082 | 0.2% | |
| 2 | Energy—Other † | | | | 498,448 | 8.6% | |
| | Other Industrial † | | | | 49,270 | 0.8% | |
| | Technology | | | | | | |
| | Apple Inc. | 4.650% | 2/23/46 | 9,850 | 13,482 | 0.2% | |
| | Apple Inc. | 2.400%–4.500% | 2/23/36–8/20/60 | 46,454 | 55,119 | 1.0% | |
| | Microsoft Corp. | 3.700% | 8/8/46 | 11,226 | 13,990 | 0.2% | |
| | Microsoft Corp. | 2.525% | 6/1/50 | 13,157 | 13,802 | 0.2% | |
| | Microsoft Corp. | 2.675% | 6/1/60 | 8,623 | 9,061 | 0.2% | |
| | Microsoft Corp. | 3.450%–4.750% | 2/12/35–2/6/57 | 38,480 | 49,469 | 0.9% | |
| | Oracle Corp. | 3.600% | 4/1/50 | 9,683 | 10,804 | 0.2% | |
| | Oracle Corp. | 3.850% | 4/1/60 | 8,724 | 10,032 | 0.2% | |
| | Oracle Corp. | 3.600%–6.500% | 7/8/34–5/15/55 | 52,852 | 64,183 | 1.1% | |
| 2 | Technology—Other † | | | | 211,758 | 3.6% | |
| | Transportation | | | | | | |
| | Burlington Northern Santa Fe LLC | 3.050%–6.200% | 8/15/36–2/15/51 | 31,418 | 41,053 | 0.7% | |
| 2 | Transportation—Other † | | | | 165,311 | 2.8% | |
| | | | | | 4,035,556 | 69.5% | |
Long-Term Corporate Bond Index Fund
| | | | | Face | Market | Percentage | |
| | | | Maturity | Amount | Value● | of Net | |
| | | Coupon | Date | ($000) | ($000) | Assets | |
| Utilities | | | | | | |
| | Electric | | | | | | |
| 2 | Berkshire Hathaway Energy Co. | 3.800%–6.125% | 4/1/36–10/15/50 | 13,209 | 17,501 | 0.3% | |
| | Duke Energy Carolinas LLC | 3.200%–6.450% | 10/15/32–8/15/49 | 12,975 | 17,189 | 0.3% | |
| | Duke Energy Corp. | 3.750%–4.800% | 12/15/45–6/15/49 | 8,218 | 10,076 | 0.2% | |
| | Duke Energy Florida LLC | 3.400%–6.400% | 9/15/37–7/15/48 | 8,538 | 11,482 | 0.2% | |
| | Duke Energy Indiana LLC | 2.750%–6.450% | 10/15/35–4/1/50 | 6,681 | 8,423 | 0.2% | |
| | Duke Energy Ohio Inc. | 3.700%–4.300% | 6/15/46–2/1/49 | 1,923 | 2,389 | 0.0% | |
| | Duke Energy Progress LLC | 3.600%–6.300% | 4/1/38–9/15/47 | 11,638 | 14,492 | 0.3% | |
| | MidAmerican Energy Co. | 3.150%–6.750% | 12/30/31–4/15/50 | 10,277 | 13,326 | 0.2% | |
| | Nevada Power Co. | 3.125%–6.750% | 4/1/36–8/1/50 | 4,820 | 6,287 | 0.1% | |
| | PacifiCorp | 2.700%–7.700% | 9/15/30–3/15/51 | 14,328 | 18,806 | 0.3% | |
| | Progress Energy Inc. | 6.000%–7.750% | 3/1/31–12/1/39 | 2,967 | 4,250 | 0.1% | |
| | Electric—Other † | | | | 506,867 | 8.7% | |
| | Natural Gas | | | | | | |
| | Piedmont Natural Gas Co. Inc. | 3.350%–4.650% | 8/1/43–6/1/50 | 2,616 | 2,939 | 0.1% | |
| | Natural Gas—Other † | | | | 49,757 | 0.8% | |
| | Other Utility † | | | | 15,593 | 0.3% | |
| | | | | | 699,377 | 12.1% | |
| Total Corporate Bonds (Cost $5,327,657) | | | 5,696,378 | 98.2% | |
| Taxable Municipal Bonds (Cost $8,058) † | | | 8,455 | 0.1% | |
| | | | | | | | |
| | | | | Shares | | | |
| Temporary Cash Investment | | | | | |
| Money Market Fund | | | | | | |
| 4 | Vanguard Market Liquidity Fund
(Cost $30,775) | 0.147% | | 307,753 | 30,775 | 0.5% | |
| Total Investments (Cost $5,394,665) | | | 5,763,770 | 99.3% | |
| Other Assets and Liabilities—Net | | | 37,815 | 0.7% | |
| Net Assets | | | | 5,801,585 | 100.0% | |
Cost is in $000.
| • | See Note A in Notes to Financial Statements. |
| † | Represents the aggregate value, by category, of securities that are not among the 50 largest holdings and, in total for any issuer, represent 1% or less of net assets. |
| 1 | The average or expected maturity is shorter than the final maturity shown because of the possibility of interim principal payments and prepayments or the possibility of the issue being called. |
| 2 | Certain securities are exempt from registration under Rule 144A of the Securities Act of 1933. Such securities may be sold in transactions exempt from registration, normally to qualified institutional buyers. At August 31, 2020, the aggregate value of these securities was $119,371,000, representing 2.1% of net assets. |
| 3 | Securities with a value of $2,268,000 have been segregated as initial margin for open futures contracts. |
| 4 | Affiliated money market fund available only to Vanguard funds and certain trusts and accounts managed by Vanguard. Rate shown is the 7-day yield. |
Long-Term Corporate Bond Index Fund
| Derivative Financial Instruments Outstanding as of Period End | | | |
| | | | | | |
| Futures Contracts | | | | | |
| | | | ($000) | |
| | | | | Value and | |
| | | Number of | | Unrealized | |
| | | Long (Short) | Notional | Appreciation | |
| | Expiration | Contracts | Amount | (Depreciation) | |
| Long Futures Contracts | | | | | |
| 30-Year U.S. Treasury Bond | December 2020 | 77 | 13,530 | 33 | |
| | | | | | |
| Short Futures Contracts | | | | | |
| Ultra Long U.S. Treasury Bond | December 2020 | (62) | (13,696) | (7) | |
| | | | | 26 | |
See accompanying Notes, which are an integral part of the Financial Statements.
Long-Term Corporate Bond Index Fund
Statement of Assets and Liabilities
As of August 31, 2020
| ($000s, except shares and per-share amounts) | Amount |
| Assets | |
| Investments in Securities, at Value | |
| Unaffiliated Issuers (Cost $5,363,890) | 5,732,995 |
| Affiliated Issuers (Cost $30,775) | 30,775 |
| Total Investments in Securities | 5,763,770 |
| Investment in Vanguard | 239 |
| Receivables for Investment Securities Sold | 40,570 |
| Receivables for Accrued Income | 59,561 |
| Receivables for Capital Shares Issued | 67,047 |
| Variation Margin Receivable—Futures Contracts | 201 |
| Total Assets | 5,931,388 |
| Liabilities | |
| Due to Custodian | 6,266 |
| Payables for Investment Securities Purchased | 122,435 |
| Payables for Capital Shares Redeemed | 630 |
| Payables for Distributions | 190 |
| Payables to Vanguard | 145 |
| Variation Margin Payable—Futures Contracts | 137 |
| Total Liabilities | 129,803 |
| Net Assets | 5,801,585 |
| | |
| | |
| At August 31, 2020, net assets consisted of: | |
| | |
| Paid-in Capital | 5,460,310 |
| Total Distributable Earnings (Loss) | 341,275 |
| Net Assets | 5,801,585 |
| | |
| ETF Shares—Net Assets | |
| Applicable to 48,721,706 outstanding $.001 par value shares of beneficial interest (unlimited authorization) | 5,213,530 |
| Net Asset Value Per Share—ETF Shares | $107.01 |
| | |
| Admiral Shares—Net Assets | |
| Applicable to 11,157,482 outstanding $.001 par value shares of beneficial interest (unlimited authorization) | 319,981 |
| Net Asset Value Per Share—Admiral Shares | $28.68 |
| | |
| Institutional Shares—Net Assets | |
| Applicable to 7,532,796 outstanding $.001 par value shares of beneficial interest (unlimited authorization) | 268,074 |
| Net Asset Value Per Share—Institutional Shares | $35.59 |
See accompanying Notes, which are an integral part of the Financial Statements.
Long-Term Corporate Bond Index Fund
Statement of Operations
| | Year Ended |
| | August 31, 2020 |
| | ($000) |
| Investment Income | |
| Income | |
| Interest1 | 180,476 |
| Total Income | 180,476 |
| Expenses | |
| The Vanguard Group—Note B | |
| Investment Advisory Services | 146 |
| Management and Administrative—ETF Shares | 1,541 |
| Management and Administrative—Admiral Shares | 161 |
| Management and Administrative—Institutional Shares | 188 |
| Marketing and Distribution—ETF Shares | 260 |
| Marketing and Distribution—Admiral Shares | 20 |
| Marketing and Distribution—Institutional Shares | 16 |
| Custodian Fees | 63 |
| Auditing Fees | 43 |
| Shareholders’ Reports—ETF Shares | 83 |
| Shareholders’ Reports—Admiral Shares | 3 |
| Shareholders’ Reports—Institutional Shares | — |
| Trustees’ Fees and Expenses | 3 |
| Total Expenses | 2,527 |
| Net Investment Income | 177,949 |
| Realized Net Gain (Loss) | |
| Investment Securities Sold1,2 | 311,134 |
| Futures Contracts | (1,738) |
| Realized Net Gain (Loss) | 309,396 |
| Change in Unrealized Appreciation (Depreciation) | |
| Investment Securities1 | (172,949) |
| Futures Contracts | 22 |
| Change in Unrealized Appreciation (Depreciation) | (172,927) |
| Net Increase (Decrease) in Net Assets Resulting from Operations | 314,418 |
| 1 | Interest income, realized net gain (loss), and change in unrealized appreciation (depreciation) from an affiliated company of the fund were $174,000, $34,000, and $1,000, respectively. Purchases and sales are for temporary cash investment purposes. |
| 2 | Includes $276,382,000 of net gain (loss) resulting from in-kind redemptions. |
See accompanying Notes, which are an integral part of the Financial Statements.
Long-Term Corporate Bond Index Fund
Statement of Changes in Net Assets
| | Year Ended August 31, |
| | 2020 | 2019 |
| | ($000) | ($000) |
| Increase (Decrease) in Net Assets | | |
| Operations | | |
| Net Investment Income | 177,949 | 169,997 |
| Realized Net Gain (Loss) | 309,396 | 48,730 |
| Change in Unrealized Appreciation (Depreciation) | (172,927) | 641,403 |
| Net Increase (Decrease) in Net Assets Resulting from Operations | 314,418 | 860,130 |
| Distributions1 | | |
| ETF Shares | (151,191) | (129,598) |
| Admiral Shares | (10,090) | (8,737) |
| Institutional Shares | (16,541) | (27,120) |
| Total Distributions | (177,822) | (165,455) |
| Capital Share Transactions | | |
| ETF Shares | 1,024,186 | 985,012 |
| Admiral Shares | 53,933 | 35,845 |
| Institutional Shares | (284,804) | (324,656) |
| Net Increase (Decrease) from Capital Share Transactions | 793,315 | 696,201 |
| Total Increase (Decrease) | 929,911 | 1,390,876 |
| Net Assets | | |
| Beginning of Period | 4,871,674 | 3,480,798 |
| End of Period | 5,801,585 | 4,871,674 |
1 Certain prior period numbers have been reclassified to conform with current period presentation.
See accompanying Notes, which are an integral part of the Financial Statements.
Long-Term Corporate Bond Index Fund
Financial Highlights
| ETF Shares | | | | | |
| | | | | | |
| For a Share Outstanding | | | Year Ended August 31, |
| Throughout Each Period | 2020 | 2019 | 2018 | 2017 | 2016 |
| Net Asset Value, Beginning of Period | $102.86 | $88.35 | $94.07 | $96.37 | $85.25 |
| Investment Operations | | | | | |
| Net Investment Income | 3.7011 | 3.9361 | 3.8801 | 3.8971 | 3.905 |
| Net Realized and Unrealized Gain (Loss) on Investments2 | 4.189 | 14.458 | (5.722) | (2.356) | 11.127 |
| Total from Investment Operations | 7.890 | 18.394 | (1.842) | 1.541 | 15.032 |
| Distributions | | | | | |
| Dividends from Net Investment Income | (3.740) | (3.884) | (3.878) | (3.841) | (3.912) |
| Distributions from Realized Capital Gains | — | — | — | — | — |
| Total Distributions | (3.740) | (3.884) | (3.878) | (3.841) | (3.912) |
| Net Asset Value, End of Period | $107.01 | $102.86 | $88.35 | $94.07 | $96.37 |
| | | | | | |
| Total Return | 7.90% | 21.60% | -2.01% | 1.81% | 18.21% |
| | | | | | |
| Ratios/Supplemental Data | | | | | |
| Net Assets, End of Period (Millions) | $5,214 | $4,074 | $2,509 | $2,098 | $1,494 |
| Ratio of Total Expenses to Average Net Assets | 0.05% | 0.05% | 0.07% | 0.07% | 0.07% |
| Ratio of Net Investment Income to Average Net Assets | 3.60% | 4.36% | 4.26% | 4.27% | 4.46% |
| Portfolio Turnover Rate3 | 62% | 47% | 48% | 56% | 59% |
| 1 | Calculated based on average shares outstanding. |
| 2 | Includes increases from purchase fees of $.00, $.00, $.09, $.09, and $.03. |
| 3 | Excludes the value of portfolio securities received or delivered as a result of in-kind purchases or redemptions of the fund’s capital shares, including ETF Creation Units. |
| See accompanying Notes, which are an integral part of the Financial Statements. |
Long-Term Corporate Bond Index Fund
Financial Highlights
| Admiral Shares | | | | | |
| | | | | | |
| For a Share Outstanding | | | Year Ended August 31, |
| Throughout Each Period | 2020 | 2019 | 2018 | 2017 | 2016 |
| Net Asset Value, Beginning of Period | $27.55 | $23.65 | $25.18 | $25.79 | $22.80 |
| Investment Operations | | | | | |
| Net Investment Income | .9881 | 1.0531 | 1.0431 | 1.0471 | 1.047 |
| Net Realized and Unrealized Gain (Loss) on Investments2 | 1.125 | 3.895 | (1.536) | (.625) | 2.991 |
| Total from Investment Operations | 2.113 | 4.948 | (.493) | .422 | 4.038 |
| Distributions | | | | | |
| Dividends from Net Investment Income | (.983) | (1.048) | (1.037) | (1.032) | (1.048) |
| Distributions from Realized Capital Gains | — | — | — | — | — |
| Total Distributions | (.983) | (1.048) | (1.037) | (1.032) | (1.048) |
| Net Asset Value, End of Period | $28.68 | $27.55 | $23.65 | $25.18 | $25.79 |
| | | | | | |
| Total Return3 | 7.87% | 21.64% | -2.00% | 1.84% | 18.21% |
| | | | | | |
| Ratios/Supplemental Data | | | | | |
| Net Assets, End of Period (Millions) | $320 | $256 | $186 | $161 | $90 |
| Ratio of Total Expenses to Average Net Assets | 0.07% | 0.07% | 0.07% | 0.07% | 0.07% |
| Ratio of Net Investment Income to Average Net Assets | 3.58% | 4.34% | 4.26% | 4.27% | 4.46% |
| Portfolio Turnover Rate4 | 62% | 47% | 48% | 56% | 59% |
| 1 | Calculated based on average shares outstanding. |
| 2 | Includes increases from purchase fees of $.00, $.00, $.03, $.02, and $.01. |
| 3 | Total returns do not include transaction or account service fees that may have applied in the periods shown. Fund prospectuses provide information about any applicable transaction and account service fees. |
| 4 | Excludes the value of portfolio securities received or delivered as a result of in-kind purchases or redemptions of the fund’s capital shares, including ETF Creation Units. |
| See accompanying Notes, which are an integral part of the Financial Statements. |
Long-Term Corporate Bond Index Fund
Financial Highlights
| Institutional Shares | | | | | |
| | | | | | |
| For a Share Outstanding | | | Year Ended August 31, |
| Throughout Each Period | 2020 | 2019 | 2018 | 2017 | 2016 |
| Net Asset Value, Beginning of Period | $34.18 | $29.36 | $31.25 | $32.02 | $28.31 |
| Investment Operations | | | | | |
| Net Investment Income | 1.2501 | 1.3141 | 1.2991 | 1.3061 | 1.306 |
| Net Realized and Unrealized Gain (Loss) on Investments2 | 1.387 | 4.812 | (1.895) | (.790) | 3.710 |
| Total from Investment Operations | 2.637 | 6.126 | (.596) | .516 | 5.016 |
| Distributions | | | | | |
| Dividends from Net Investment Income | (1.227) | (1.306) | (1.294) | (1.286) | (1.306) |
| Distributions from Realized Capital Gains | — | — | — | — | — |
| Total Distributions | (1.227) | (1.306) | (1.294) | (1.286) | (1.306) |
| Net Asset Value, End of Period | $35.59 | $34.18 | $29.36 | $31.25 | $32.02 |
| | | | | | |
| Total Return3 | 7.91% | 21.58% | -1.95% | 1.81% | 18.22% |
| | | | | | |
| Ratios/Supplemental Data | | | | | |
| Net Assets, End of Period (Millions) | $268 | $541 | $786 | $528 | $384 |
| Ratio of Total Expenses to Average Net Assets | 0.05% | 0.05% | 0.05% | 0.05% | 0.05% |
| Ratio of Net Investment Income to Average Net Assets | 3.68% | 4.36% | 4.28% | 4.29% | 4.48% |
| Portfolio Turnover Rate4 | 62% | 47% | 48% | 56% | 59% |
| 1 | Calculated based on average shares outstanding. |
| 2 | Includes increases from purchase fees of $.00, $.00, $.03, $.03, and $.01. |
| 3 | Total returns do not include transaction fees that may have applied in the periods shown. Fund prospectuses provide information about any applicable transaction fees. |
| 4 | Excludes the value of portfolio securities received or delivered as a result of in-kind purchases or redemptions of the fund’s capital shares, including ETF Creation Units. |
See accompanying Notes, which are an integral part of the Financial Statements.
Long-Term Corporate Bond Index Fund
Notes to Financial Statements
Vanguard Long-Term Corporate Bond Index Fund is registered under the Investment Company Act of 1940 as an open-end investment company, or mutual fund. The fund offers three classes of shares: ETF Shares, Admiral Shares, and Institutional Shares. Each of the share classes has different eligibility and minimum purchase requirements, and is designed for different types of investors. ETF Shares are listed for trading on Nasdaq; they can be purchased and sold through a broker.
Certain of the fund’s investments are in corporate debt instruments; the issuers’ abilities to meet their obligations may be affected by economic developments in their respective industries. Market disruptions associated with the COVID-19 pandemic have had a global impact, and uncertainty exists as to the long-term implications. Such disruptions can adversely affect assets of the fund and thus fund performance.
A. The following significant accounting policies conform to generally accepted accounting principles for U.S. investment companies. The fund consistently follows such policies in preparing its financial statements.
1. Security Valuation: Securities are valued as of the close of trading on the New York Stock Exchange (generally 4 p.m., Eastern time) on the valuation date. Bonds and temporary cash investments are valued using the latest bid prices or using valuations based on a matrix system (which considers such factors as security prices, yields, maturities, and ratings), both as furnished by independent pricing services. Investments in Vanguard Market Liquidity Fund are valued at that fund’s net asset value. Securities for which market quotations are not readily available, or whose values have been affected by events occurring before the fund’s pricing time but after the close of the securities’ primary markets, are valued by methods deemed by the board of trustees to represent fair value.
2. Futures Contracts: The fund uses futures contracts to invest in fixed income asset classes with greater efficiency and lower cost than is possible through direct investment, to add value when these instruments are attractively priced, or to adjust sensitivity to changes in interest rates. The primary risks associated with the use of futures contracts are imperfect correlation between changes in market values of bonds held by the fund and the prices of futures contracts, and the possibility of an illiquid market. Counterparty risk involving futures is mitigated because a regulated clearinghouse is the counterparty instead of the clearing broker. To further mitigate counterparty risk, the fund trades futures contracts on an exchange, monitors the financial strength of its clearing brokers and clearinghouse, and has entered into clearing agreements with its clearing brokers. The clearinghouse imposes initial margin requirements to secure the fund’s performance and requires daily settlement of variation margin representing changes in the market value of each contract. Any securities pledged as initial margin for open contracts are noted in the Schedule of Investments.
Futures contracts are valued at their quoted daily settlement prices. The notional amounts of the contracts are not recorded in the Statement of Assets and Liabilities. Fluctuations in the value of the contracts are recorded in the Statement of Assets and Liabilities as an asset (liability) and in the Statement of Operations as unrealized appreciation (depreciation) until the contracts are closed, when they are recorded as realized gains (losses) on futures contracts.
During the year ended August 31, 2020, the fund’s average investments in long and short futures contracts each represented less than 1% of net assets, based on the average of the notional amounts at each quarter-end during the period.
Long-Term Corporate Bond Index Fund
3. Federal Income Taxes: The fund intends to continue to qualify as a regulated investment company and distribute all of its taxable income. The fund’s tax returns are open to examination by the relevant tax authorities until expiration of the applicable statute of limitations, which is generally three years after the filing of the tax return. Management has analyzed the fund’s tax positions taken for all open federal and state income tax years, and has concluded that no provision for income tax is required in the fund’s financial statements.
4. Distributions: Distributions to shareholders are recorded on the ex-dividend date. Distributions are determined on a tax basis at the fiscal year-end and may differ from net investment income and realized capital gains for financial reporting purposes.
5. Credit Facilities and Interfund Lending Program: The fund and certain other funds managed by The Vanguard Group (“Vanguard”) participate in a $4.3 billion committed credit facility provided by a syndicate of lenders pursuant to a credit agreement and an uncommitted credit facility provided by Vanguard. Both facilities may be renewed annually. Each fund is individually liable for its borrowings, if any, under the credit facilities. Borrowings may be utilized for temporary or emergency purposes, subject to the fund’s regulatory and contractual borrowing restrictions. With respect to the committed credit facility, the participating funds are charged administrative fees and an annual commitment fee of 0.10% of the undrawn committed amount of the facility; these fees are allocated to the funds based on a method approved by the fund’s board of trustees and included in Management and Administrative expenses on the fund’s Statement of Operations. Any borrowings under either facility bear interest at a rate based upon the higher of the one-month London Interbank Offered Rate (or an acceptable alternate rate, if necessary), federal funds effective rate, or overnight bank funding rate plus an agreed-upon spread, except that borrowings under the uncommitted credit facility may bear interest based upon an alternative rate agreed to by the fund and Vanguard.
In accordance with an exemptive order (the “Order”) from the SEC, the fund may participate in a joint lending and borrowing program that allows registered open-end Vanguard funds to borrow money from and lend money to each other for temporary or emergency purposes (the “Interfund Lending Program”), subject to compliance with the terms and conditions of the Order, and to the extent permitted by the fund’s investment objective and investment policies. Interfund loans and borrowings normally extend overnight, but can have a maximum duration of seven days. Loans may be called on one business day’s notice. The interest rate to be charged is governed by the conditions of the Order and internal procedures adopted by the board of trustees. The board of trustees is responsible for overseeing the Interfund Lending Program.
For the year ended August 31, 2020, the fund did not utilize the credit facilities or the Interfund Lending Program.
6. Other: Interest income includes income distributions received from Vanguard Market Liquidity Fund and is accrued daily. Premiums and discounts on debt securities are amortized and accreted, respectively, to interest income over the lives of the respective securities, except for premiums on certain callable debt securities that are amortized to the earliest call date. Security transactions are accounted for on the date securities are bought or sold. Costs used to determine realized gains (losses) on the sale of investment securities are those of the specific securities sold. Fees assessed on capital share transactions are credited to paid-in capital.
Each class of shares has equal rights as to assets and earnings, except that each class separately bears certain class-specific expenses related to maintenance of shareholder accounts (included in Management and Administrative expenses) and shareholder reporting. Marketing and distribution
Long-Term Corporate Bond Index Fund
expenses are allocated to each class of shares based on a method approved by the board of trustees. Income, other non-class-specific expenses, and gains and losses on investments are allocated to each class of shares based on its relative net assets.
B. In accordance with the terms of a Funds’ Service Agreement (the “FSA”) between Vanguard and the fund, Vanguard furnishes to the fund investment advisory, corporate management, administrative, marketing, and distribution services at Vanguard’s cost of operations (as defined by the FSA). These costs of operations are allocated to the fund based on methods and guidelines approved by the board of trustees and are generally settled twice a month.
Upon the request of Vanguard, the fund may invest up to 0.40% of its net assets as capital in Vanguard. At August 31, 2020, the fund had contributed to Vanguard capital in the amount of $239,000, representing less than 0.01% of the fund’s net assets and 0.10% of Vanguard’s capital received pursuant to the FSA. The fund’s trustees and officers are also directors and employees, respectively, of Vanguard.
C. Various inputs may be used to determine the value of the fund’s investments and derivatives. These inputs are summarized in three broad levels for financial statement purposes. The inputs or methodologies used to value securities are not necessarily an indication of the risk associated with investing in those securities.
Level 1—Quoted prices in active markets for identical securities.
Level 2—Other significant observable inputs (including quoted prices for similar securities, interest rates, prepayment speeds, credit risk, etc.).
Level 3—Significant unobservable inputs (including the fund’s own assumptions used to determine the fair value of investments). Any investments and derivatives valued with significant unobservable inputs are noted on the Schedule of Investments.
The following table summarizes the market value of the fund’s investments and derivatives as of August 31, 2020, based on the inputs used to value them:
| | Level 1 | Level 2 | Level 3 | Total |
| | ($000) | ($000) | ($000) | ($000) |
| Investments | | | | |
| Assets | | | | |
| U.S. Government and Agency Obligations | — | 28,162 | — | 28,162 |
| Corporate Bonds | — | 5,696,378 | — | 5,696,378 |
| Taxable Municipal Bonds | — | 8,455 | — | 8,455 |
| Temporary Cash Investments | 30,775 | — | — | 30,775 |
| Total | 30,775 | 5,732,995 | — | 5,763,770 |
| Derivative Financial Instruments | | | | |
| Assets | | | | |
| Futures Contracts1 | 201 | — | — | 201 |
| Liabilities | | | | |
| Futures Contracts1 | 137 | — | — | 137 |
1 Represents variation margin on the last day of the reporting period.
Long-Term Corporate Bond Index Fund
D. Permanent differences between book-basis and tax-basis components of net assets are reclassified among capital accounts in the financial statements to reflect their tax character. These reclassifications have no effect on net assets or net asset value per share. As of period end, permanent differences primarily attributable to the accounting for in-kind redemptions were reclassified between the following accounts:
| | Amount |
| | ($000) |
| Paid-in Capital | 276,382 |
| Total Distributable Earnings (Loss) | (276,382) |
Temporary differences between book-basis and tax-basis components of total distributable earnings (loss) arise when certain items of income, gain, or loss are recognized in different periods for financial statement and tax purposes; these differences will reverse at some time in the future. The differences are primarily related to the deferral of losses from wash sales; the deferral of losses from straddles; the recognition of unrealized gains or losses from certain derivative contracts; and the inclusion of payables for distributions. As of period end, the tax-basis components of total distributable earnings (loss) are detailed in the table as follows:
| | Amount |
| | ($000) |
| Undistributed Ordinary Income | 13,218 |
| Undistributed Long-Term Gains | — |
| Capital Loss Carryforwards | (38,711) |
| Qualified Late-Year Losses | — |
| Net Unrealized Gains (Losses) | 366,958 |
The tax character of distributions paid was as follows:
| | Year Ended August 31, |
| | 2020 | 2019 |
| | Amount | Amount |
| | ($000) | ($000) |
| Ordinary Income * | 177,822 | 165,455 |
| Long-Term Capital Gains | — | — |
| Total | 177,822 | 165,455 |
* Includes short-term capital gains, if any.
As of August 31, 2020, gross unrealized appreciation and depreciation for investments and derivatives based on cost for U.S. federal income tax purposes were as follows:
| | Amount |
| | ($000) |
| Tax Cost | 5,396,812 |
| Gross Unrealized Appreciation | 416,102 |
| Gross Unrealized Depreciation | (49,144) |
| Net Unrealized Appreciation (Depreciation) | 366,958 |
Long-Term Corporate Bond Index Fund
E. During the year ended August 31, 2020, the fund purchased $5,512,529,000 of investment securities and sold $4,750,874,000 of investment securities, other than U.S. government securities and temporary cash investments. Purchases and sales of U.S. government securities were $1,225,816,000 and $1,217,277,000, respectively. Total purchases and sales include $3,697,653,000 and $2,787,892,000, respectively, in connection with in-kind purchases and redemptions of the fund’s capital shares.
The fund purchased securities from and sold securities to other Vanguard funds or accounts managed by Vanguard or its affiliates, in accordance with procedures adopted by the board of trustees in compliance with Rule 17a-7 of the Investment Company Act of 1940. For the year ended August 31, 2020, such purchases and sales were $176,679,000 and $1,410,246,000, respectively; these amounts, other than temporary cash investments, are included in the purchases and sales of investment securities noted above.
F. Capital share transactions for each class of shares were:
| | | | | Year Ended August 31, |
| | | 2020 | | | 2019 |
| | Amount | Shares | | Amount | Shares |
| | ($000) | (000) | | ($000) | (000) |
| ETF Shares | | | | | |
| Issued1 | 3,855,752 | 37,213 | | 1,984,864 | 21,804 |
| Issued in Lieu of Cash Distributions | — | — | | — | — |
| Redeemed | (2,831,566) | (28,100) | | (999,852) | (10,600) |
| Net Increase (Decrease)—ETF Shares | 1,024,186 | 9,113 | | 985,012 | 11,204 |
| Admiral Shares | | | | | |
| Issued1 | 140,978 | 5,094 | | 79,321 | 3,240 |
| Issued in Lieu of Cash Distributions | 7,676 | 277 | | 6,829 | 281 |
| Redeemed | (94,721) | (3,505) | | (50,305) | (2,083) |
| Net Increase (Decrease)—Admiral Shares | 53,933 | 1,866 | | 35,845 | 1,438 |
| Institutional Shares | | | | | |
| Issued1 | 13,691 | 364 | | 11,860 | 396 |
| Issued in Lieu of Cash Distributions | 14,985 | 440 | | 24,334 | 820 |
| Redeemed | (313,480) | (9,109) | | (360,850) | (12,138) |
| Net Increase (Decrease)—Institutional Shares | (284,804) | (8,305) | | (324,656) | (10,922) |
1 Includes purchase fees for fiscal 2020 and 2019 of $1,562,000 and $919,000, respectively (fund totals).
G. Management has determined that no events or transactions occurred subsequent to August 31, 2020, that would require recognition or disclosure in these financial statements.
Mortgage-Backed Securities Index Fund
Performance Summary
All of the returns in this report represent past performance, which is not a guarantee of future results that may be achieved by the fund. (Current performance may be lower or higher than the performance data cited. For performance data current to the most recent month-end, visit our website at vanguard.com/performance.) Note, too, that both investment returns and principal value can fluctuate widely, so an investor’s shares, when sold, could be worth more or less than their original cost. The returns shown do not reflect taxes that a shareholder would pay on fund distributions or on the sale of fund shares.
Cumulative Performance: August 31, 2010, Through August 31, 2020
Initial Investment of $10,000

| | | Average Annual Total Returns | |
| | | Periods Ended August 31, 2020 | |
| | | | | | Final Value |
| | | One | Five | Ten | of a $10,000 |
| | | Year | Years | Years | Investment |
 | Mortgage-Backed Securities Index Fund ETF Shares Net Asset Value | 4.45% | 2.97% | 2.87% | $13,275 |
| | Mortgage-Backed Securities Index Fund ETF Shares Market Price | 4.47 | 2.98 | 2.86 | 13,257 |
 | Bloomberg Barclays U.S. MBS Float Adjusted Index | 4.49 | 3.05 | 2.95 | 13,369 |
 | Bloomberg Barclays U.S. Aggregate Float Adjusted Index | 6.57 | 4.41 | 3.69 | 14,372 |
Bloomberg Barclays U.S. MBS Float Adjusted Index: Includes U.S. agency mortgage-backed pass-through securities.
See Financial Highlights for dividend and capital gains information.
Mortgage-Backed Securities Index Fund
| | Average Annual Total Returns | |
| | Periods Ended August 31, 2020 | |
| | | | | Final Value |
| | One | Five | Ten | of a $10,000 |
| | Year | Years | Years | Investment |
| Mortgage-Backed Securities Index Fund Admiral Shares | 4.43% | 2.96% | 2.87% | $13,273 |
| Bloomberg Barclays U.S. MBS Float Adjusted Index | 4.49 | 3.05 | 2.95 | 13,369 |
| Bloomberg Barclays U.S. Aggregate Float Adjusted Index | 6.57 | 4.41 | 3.69 | 14,372 |
| | | | | |
| | | | | |
| | | | Since | Final Value |
| | One | Five | Inception | of a $5,000,000 |
| | Year | Years | (10/31/2013) | Investment |
| Mortgage-Backed Securities Index Fund Institutional Shares | 4.48% | 2.98% | 3.02% | $6,127,381 |
| Bloomberg Barclays U.S. MBS Float Adjusted Index | 4.49 | 3.05 | 3.07 | 6,146,646 |
| Bloomberg Barclays U.S. Aggregate Float Adjusted Index | 6.57 | 4.41 | 3.99 | 6,534,425 |
“Since Inception” performance is calculated from the Institutional Shares’ inception date for both the fund and its comparative standards.
Cumulative Returns of ETF Shares: August 31, 2010, Through August 31, 2020
| | One | Five | Ten |
| | Year | Years | Years |
| Mortgage-Backed Securities Index Fund ETF Shares Market Price | 4.47% | 15.81% | 32.57% |
| Mortgage-Backed Securities Index Fund ETF Shares Net Asset Value | 4.45 | 15.75 | 32.75 |
| Bloomberg Barclays U.S. MBS Float Adjusted Index | 4.49 | 16.23 | 33.69 |
For the ETF Shares, the market price is determined by the midpoint of the bid-offer spread as of the closing time of the New York Stock Exchange (generally 4 p.m., Eastern time). The net asset value is also determined as of the NYSE closing time. For more information about how the ETF Shares’ market prices have compared with their net asset value, visit vanguard.com, select your ETF, and then select the Price and Performance tab. The ETF premium/discount analysis there shows the percentages of days on which the ETF Shares’ market price was above or below the NAV.
Mortgage-Backed Securities Index Fund
Distribution by Stated Maturity
As of August 31, 2020
| 0–10 Years | 2.5% |
| 10–20 Years | 15.1 |
| 20–30 Years | 67.5 |
| 30–40 Years | 14.9 |
The table reflects the fund’s investments, except for short-term investments. The agency and mortgage-backed securities may include issues from government-sponsored enterprises; such issues are generally not backed by the full faith and credit of the U.S. government.
The fund may invest in derivatives (such as futures and swap contracts) for various reasons, including, but not limited to, attempting to remain fully invested and tracking its target index as closely as possible.
Mortgage-Backed Securities Index Fund
Financial Statements
Schedule of Investments
As of August 31, 2020
The fund files its complete schedule of portfolio holdings with the Securities and Exchange Commission (SEC) for the first and third quarters of each fiscal year as an exhibit to its reports on Form N-PORT. The fund’s Form N-PORT reports are available on the SEC’s website at www.sec.gov.
| | | | | Face | Market |
| | | | Maturity | Amount | Value· |
| | | Coupon | Date | ($000) | ($000) |
| U.S. Government and Agency Obligations (99.6%) | | | |
| Conventional Mortgage-Backed Securities (99.6%) | | | |
| 1,2 | Fannie Mae Pool | 2.000% | 11/1/23–9/1/50 | 86,316 | 89,354 |
| 1,2 | Fannie Mae Pool | 2.500% | 11/1/26–9/1/50 | 617,552 | 649,901 |
| 1,2 | Fannie Mae Pool | 3.000% | 11/1/25–7/1/50 | 1,163,701 | 1,231,738 |
| ¤,1,2 | Fannie Mae Pool | 3.500% | 12/1/20–5/1/50 | 1,025,164 | 1,092,888 |
| 1,2 | Fannie Mae Pool | 4.000% | 5/1/21–2/1/50 | 797,700 | 861,735 |
| 1,2 | Fannie Mae Pool | 4.500% | 9/1/20–7/1/50 | 343,763 | 376,925 |
| 1,2 | Fannie Mae Pool | 5.000% | 10/1/20–2/1/50 | 118,778 | 133,178 |
| 1,2 | Fannie Mae Pool | 5.500% | 5/1/21–2/1/42 | 45,207 | 52,229 |
| 1,2 | Fannie Mae Pool | 6.000% | 12/1/20–5/1/41 | 28,854 | 33,872 |
| 1,2 | Fannie Mae Pool | 6.500% | 10/1/21–10/1/39 | 5,665 | 6,660 |
| 1,2 | Fannie Mae Pool | 7.000% | 12/1/22–10/1/37 | 413 | 484 |
| 1,2 | Fannie Mae Pool | 7.500% | 11/1/22 | 2 | 2 |
| 1,2 | Freddie Mac Gold Pool | 2.000% | 1/1/28–12/1/31 | 10,116 | 10,544 |
| 1,2 | Freddie Mac Gold Pool | 2.500% | 8/1/22–2/1/43 | 161,919 | 170,414 |
| 1,2,3 | Freddie Mac Gold Pool | 3.000% | 1/1/26–6/1/49 | 555,855 | 589,941 |
| 1,2 | Freddie Mac Gold Pool | 3.500% | 9/1/25–2/1/49 | 593,542 | 635,403 |
| 1,2 | Freddie Mac Gold Pool | 4.000% | 10/1/21–6/1/49 | 373,030 | 404,095 |
| 1,2 | Freddie Mac Gold Pool | 4.500% | 3/1/23–11/1/48 | 181,327 | 199,502 |
| 1,2 | Freddie Mac Gold Pool | 5.000% | 9/1/21–11/1/48 | 49,637 | 55,768 |
| 1,2 | Freddie Mac Gold Pool | 5.500% | 4/1/21–6/1/41 | 38,514 | 44,316 |
| 1,2 | Freddie Mac Gold Pool | 6.000% | 1/1/24–5/1/40 | 22,700 | 26,704 |
| 1,2 | Freddie Mac Gold Pool | 6.500% | 10/1/28–9/1/39 | 2,064 | 2,370 |
| 1,2 | Freddie Mac Gold Pool | 7.000% | 7/1/28–12/1/38 | 174 | 201 |
| 1 | Ginnie Mae I Pool | 3.000% | 1/15/26–3/15/45 | 23,458 | 24,591 |
| 1 | Ginnie Mae I Pool | 3.500% | 2/15/26–9/15/49 | 27,127 | 28,909 |
| 1 | Ginnie Mae I Pool | 4.000% | 7/15/24–6/15/49 | 31,002 | 33,208 |
| 1,4 | Ginnie Mae I Pool | 4.500% | 8/15/33–7/15/49 | 41,808 | 46,510 |
| 1 | Ginnie Mae I Pool | 5.000% | 5/15/33–4/15/41 | 19,346 | 21,952 |
| 1 | Ginnie Mae I Pool | 5.500% | 10/15/32–3/15/40 | 6,476 | 7,407 |
| 1 | Ginnie Mae I Pool | 6.000% | 4/15/28–5/15/41 | 1,618 | 1,866 |
| 1 | Ginnie Mae I Pool | 6.500% | 5/15/24–1/15/39 | 103 | 121 |
| 1 | Ginnie Mae I Pool | 7.000% | 10/15/27 | 3 | 3 |
| ¤,1 | Ginnie Mae II Pool | 2.000% | 9/1/50 | 7,525 | 7,797 |
| ¤,1 | Ginnie Mae II Pool | 2.500% | 6/20/27–9/1/50 | 322,451 | 340,311 |
| ¤,1,3 | Ginnie Mae II Pool | 3.000% | 10/20/26–9/1/50 | 963,864 | 1,016,929 |
| ¤,1 | Ginnie Mae II Pool | 3.500% | 12/20/25–9/1/50 | 926,106 | 986,679 |
| ¤,1,3 | Ginnie Mae II Pool | 4.000% | 9/20/25–9/1/50 | 486,839 | 525,615 |
| ¤,1 | Ginnie Mae II Pool | 4.500% | 2/20/39–9/1/50 | 231,589 | 252,467 |
Mortgage-Backed Securities Index Fund
| | | | | Face | Market |
| | | | Maturity | Amount | Value· |
| | | Coupon | Date | ($000) | ($000) |
| 1 | Ginnie Mae II Pool | 5.000% | 6/20/33–12/20/49 | 79,781 | 88,657 |
| 1 | Ginnie Mae II Pool | 5.500% | 11/20/33–7/20/49 | 10,153 | 11,517 |
| 1 | Ginnie Mae II Pool | 6.000% | 3/20/31–9/20/41 | 3,896 | 4,512 |
| 1 | Ginnie Mae II Pool | 6.500% | 10/20/28–9/20/40 | 594 | 716 |
| 1 | Ginnie Mae II Pool | 7.000% | 4/20/38–11/20/38 | 53 | 66 |
| ¤,1,2 | UMBS Pool | 1.500% | 9/1/35 | 11,450 | 11,718 |
| ¤,1,2 | UMBS Pool | 2.000% | 4/1/23–9/1/50 | 370,366 | 383,053 |
| ¤,1,2 | UMBS Pool | 2.500% | 8/1/34–9/1/50 | 689,585 | 725,861 |
| ¤,1,2 | UMBS Pool | 3.000% | 12/1/26–9/1/50 | 713,422 | 754,379 |
| ¤,1,2 | UMBS Pool | 3.500% | 7/1/26–9/1/50 | 412,197 | 437,735 |
| ¤,1,2 | UMBS Pool | 4.000% | 11/1/33–9/1/50 | 252,002 | 271,723 |
| ¤,1,2 | UMBS Pool | 4.500% | 10/1/48–9/1/50 | 198,324 | 215,825 |
| 1,2 | UMBS Pool | 5.000% | 3/1/49–3/1/50 | 37,613 | 41,673 |
| 1,2 | UMBS Pool | 5.500% | 10/1/38–6/1/49 | 4,409 | 4,897 |
| 1,2 | UMBS Pool | 6.000% | 7/1/40 | 2,575 | 3,021 |
| | | | | | 12,917,942 |
| Nonconventional Mortgage-Backed Securities (0.0%) | | | |
| 1,2 | Fannie Mae Pool | 2.277% | 7/1/43 | 573 | 596 |
| 1,2 | Fannie Mae Pool | 3.451% | 4/1/41 | 30 | 30 |
| 1,2,5 | Fannie Mae Pool, 12M USD LIBOR + 1.290% | 3.235% | 12/1/41 | 49 | 51 |
| 1,2,5 | Fannie Mae Pool, 12M USD LIBOR + 1.310% | 3.434% | 9/1/37 | 20 | 21 |
| 1,2,5 | Fannie Mae Pool, 12M USD LIBOR + 1.475% | 3.490% | 3/1/43 | 178 | 180 |
| 1,2,5 | Fannie Mae Pool, 12M USD LIBOR + 1.596% | 3.277% | 6/1/43 | 82 | 83 |
| 1,2,5 | Fannie Mae Pool, 12M USD LIBOR + 1.610% | 3.341% | 10/1/37 | 41 | 43 |
| 1,2,5 | Fannie Mae Pool, 12M USD LIBOR + 1.614% | 3.650% | 8/1/39 | 27 | 28 |
| 1,2,5 | Fannie Mae Pool, 12M USD LIBOR + 1.627% | 3.627% | 3/1/38 | 3 | 3 |
| 1,2,5 | Fannie Mae Pool, 12M USD LIBOR + 1.658% | 2.792% | 10/1/42 | 77 | 77 |
| 1,2,5 | Fannie Mae Pool, 12M USD LIBOR + 1.690% | 3.590% | 10/1/39 | 13 | 13 |
| 1,2,5 | Fannie Mae Pool, 12M USD LIBOR + 1.690% | 3.802% | 9/1/42 | 219 | 231 |
| 1,2,5 | Fannie Mae Pool, 12M USD LIBOR + 1.693% | 3.673% | 11/1/39 | 10 | 11 |
| 1,2,5 | Fannie Mae Pool, 12M USD LIBOR + 1.700% | 3.747% | 12/1/40 | 60 | 64 |
| 1,2,5 | Fannie Mae Pool, 12M USD LIBOR + 1.722% | 3.561% | 5/1/42 | 30 | 32 |
| 1,2,5 | Fannie Mae Pool, 12M USD LIBOR + 1.771% | 3.591% | 5/1/42 | 14 | 14 |
| 1,2,5 | Fannie Mae Pool, 12M USD LIBOR + 1.793% | 3.384% | 8/1/42 | 69 | 70 |
| 1,2,5 | Fannie Mae Pool, 12M USD LIBOR + 1.795% | 3.387% | 3/1/42 | 32 | 35 |
| 1,2,5 | Fannie Mae Pool, 12M USD LIBOR + 1.805% | 3.747% | 11/1/41 | 40 | 43 |
| 1,2,5 | Fannie Mae Pool, 12M USD LIBOR + 1.810% | 3.685% | 10/1/40 | 6 | 6 |
| 1,2,5 | Fannie Mae Pool, 12M USD LIBOR + 1.810% | 3.810% | 12/1/40 | 2 | 3 |
| 1,2,5 | Fannie Mae Pool, 12M USD LIBOR + 1.813% | 3.123% | 9/1/40 | 72 | 77 |
| 1,2,5 | Fannie Mae Pool, 12M USD LIBOR + 1.813% | 3.858% | 1/1/42 | 77 | 82 |
| 1,2,5 | Fannie Mae Pool, 12M USD LIBOR + 1.813% | 3.965% | 11/1/41 | 9 | 10 |
| 1,2,5 | Fannie Mae Pool, 12M USD LIBOR + 1.815% | 3.189% | 5/1/41 | 24 | 25 |
| 1,2,5 | Fannie Mae Pool, 12M USD LIBOR + 1.815% | 3.690% | 11/1/40 | 3 | 3 |
| 1,2,5 | Fannie Mae Pool, 12M USD LIBOR + 1.815% | 3.924% | 12/1/41 | 36 | 39 |
| 1,2,5 | Fannie Mae Pool, 12M USD LIBOR + 1.819% | 3.839% | 3/1/41 | 63 | 67 |
| 1,2,5 | Fannie Mae Pool, 12M USD LIBOR + 1.822% | 3.920% | 12/1/39 | 51 | 54 |
| 1,2,5 | Fannie Mae Pool, 12M USD LIBOR + 1.824% | 3.824% | 2/1/41 | 2 | 2 |
| 1,2,5 | Fannie Mae Pool, 12M USD LIBOR + 1.835% | 3.859% | 1/1/40 | 1 | 1 |
| 1,2,5 | Fannie Mae Pool, 12M USD LIBOR + 1.841% | 3.081% | 2/1/42 | 53 | 57 |
| 1,2,5 | Fannie Mae Pool, 12M USD LIBOR + 1.874% | 3.649% | 5/1/40 | 1 | 1 |
| 1,2,5 | Fannie Mae Pool, 12M USD LIBOR + 1.909% | 3.659% | 4/1/37 | 5 | 5 |
| 1,2 | Freddie Mac Non Gold Pool | 2.811% | 6/1/41 | 24 | 25 |
| 1,2 | Freddie Mac Non Gold Pool | 2.814% | 6/1/40 | 11 | 11 |
| 1,2 | Freddie Mac Non Gold Pool | 2.840% | 6/1/37 | 22 | 23 |
Mortgage-Backed Securities Index Fund
| | | | | Face | Market |
| | | | Maturity | Amount | Value· |
| | | Coupon | Date | ($000) | ($000) |
| 1,2 | Freddie Mac Non Gold Pool | 2.886% | 6/1/40 | 14 | 15 |
| 1,2 | Freddie Mac Non Gold Pool | 2.923% | 5/1/40 | 1 | 1 |
| 1,2 | Freddie Mac Non Gold Pool | 3.513% | 9/1/40 | 31 | 33 |
| 1,2 | Freddie Mac Non Gold Pool | 3.636% | 12/1/39 | 7 | 7 |
| 1,2 | Freddie Mac Non Gold Pool | 3.695% | 2/1/37 | 10 | 11 |
| 1,2 | Freddie Mac Non Gold Pool | 3.713% | 10/1/37 | 7 | 7 |
| 1,2 | Freddie Mac Non Gold Pool | 3.750% | 12/1/40 | 12 | 13 |
| 1,2 | Freddie Mac Non Gold Pool | 3.910% | 2/1/41 | 48 | 52 |
| 1,2 | Freddie Mac Non Gold Pool | 3.927% | 2/1/42 | 13 | 14 |
| 1,2 | Freddie Mac Non Gold Pool | 4.085% | 3/1/38 | 5 | 6 |
| 1,2,5 | Freddie Mac Non Gold Pool, 12M USD LIBOR + 1.640% | 3.809% | 11/1/43 | 123 | 128 |
| 1,5 | Ginnie Mae II Pool, 1YR CMT + 1.500% | 2.875% | 4/20/41 | 3 | 3 |
| 1,5 | Ginnie Mae II Pool, 1YR CMT + 1.500% | 3.000% | 1/20/41–2/20/41 | 205 | 215 |
| 1,5 | Ginnie Mae II Pool, 1YR CMT + 1.500% | 3.125% | 11/20/40–12/20/42 | 205 | 210 |
| 1,5 | Ginnie Mae II Pool, 1YR CMT + 1.500% | 3.250% | 7/20/41–8/20/41 | 60 | 62 |
| 1,5 | Ginnie Mae II Pool, 1YR CMT + 2.000% | 3.375% | 5/20/41 | 2 | 2 |
| 1,5 | Ginnie Mae II Pool, 1YR CMT + 2.000% | 3.625% | 11/20/40 | 3 | 3 |
| | | | | | 2,898 |
| Total U.S. Government and Agency Obligations (Cost $12,527,859) | | 12,920,840 |
| | | | | | |
| | | | | Shares | |
| Temporary Cash Investment (17.3%) | | | | |
| Money Market Fund (17.3%) | | | | |
| 6 | Vanguard Market Liquidity Fund (Cost $2,248,309) | 0.147% | | 22,487,127 | 2,248,713 |
| Total Investments (116.9%) (Cost $14,776,168) | | | | 15,169,553 |
| Other Assets and Liabilities—Net (-16.9%) | | | | (2,196,636) |
| Net Assets (100%) | | | | 12,972,917 |
Cost is in $000.
| · | See Note A in Notes to Financial Statements. |
| ¤ | Includes securities purchased on a when-issued or delayed-delivery basis for which the fund has not taken delivery as of August 31, 2020. |
| 1 | The average or expected maturity is shorter than the final maturity shown because of the possibility of interim principal payments and prepayments or the possibility of the issue being called. |
| 2 | The issuer was placed under federal conservatorship in September 2008; since that time, its daily operations have been managed by the Federal Housing Finance Agency and it receives capital from the U.S. Treasury, as needed to maintain a positive net worth, in exchange for senior preferred stock. |
| 3 | Securities with a value of $1,277,000 have been segregated as collateral for certain open To Be Announced (TBA) transactions. |
| 4 | Securities with a value of $18,000 has been segregated as initial margin for recently closed futures contracts. |
| 5 | Adjustable-rate security; rate shown is effective rate at period end. Certain adjustable-rate securities are not based on a published reference rate and spread but are determined by the issuer or agent based on current market conditions. |
| 6 | Affiliated money market fund available only to Vanguard funds and certain trusts and accounts managed by Vanguard. Rate shown is the 7-day yield. |
CMT—Constant Maturing Treasury Rate.
LIBOR—London Interbank Offered Rate.
UMBS—Uniform Mortgage-Backed Securities.
See accompanying Notes, which are an integral part of the Financial Statements.
Mortgage-Backed Securities Index Fund
Statement of Assets and Liabilities
As of August 31, 2020
| ($000s, except shares and per-share amounts) | Amount |
| Assets | |
| Investments in Securities, at Value | |
| Unaffiliated Issuers (Cost $12,527,859) | 12,920,840 |
| Affiliated Issuers (Cost $2,248,309) | 2,248,713 |
| Total Investments in Securities | 15,169,553 |
| Investment in Vanguard | 540 |
| Cash | 1,150 |
| Receivables for Investment Securities Sold | 98,339 |
| Receivables for Accrued Income | 31,872 |
| Receivables for Capital Shares Issued | 19,483 |
| Total Assets | 15,320,937 |
| Liabilities | |
| Payables for Investment Securities Purchased | 2,345,888 |
| Payables for Capital Shares Redeemed | 1,157 |
| Payables for Distributions | 648 |
| Payables to Vanguard | 327 |
| Total Liabilities | 2,348,020 |
| Net Assets | 12,972,917 |
| | |
| | |
| At August 31, 2020, net assets consisted of: | |
| | |
| Paid-in Capital | 12,537,804 |
| Total Distributable Earnings (Loss) | 435,113 |
| Net Assets | 12,972,917 |
| | |
| ETF Shares—Net Assets | |
| Applicable to 214,180,274 outstanding $.001 par value shares of beneficial interest (unlimited authorization) | 11,643,057 |
| Net Asset Value Per Share—ETF Shares | $54.36 |
| | |
| Admiral Shares—Net Assets | |
| Applicable to 53,365,035 outstanding $.001 par value shares of beneficial interest (unlimited authorization) | 1,159,219 |
| Net Asset Value Per Share—Admiral Shares | $21.72 |
| | |
| Institutional Shares—Net Assets | |
| Applicable to 5,797,182 outstanding $.001 par value shares of beneficial interest (unlimited authorization) | 170,641 |
| Net Asset Value Per Share—Institutional Shares | $29.44 |
See accompanying Notes, which are an integral part of the Financial Statements.
Mortgage-Backed Securities Index Fund
Statement of Operations
| | Year Ended |
| | August 31, 2020 |
| | ($000) |
| Investment Income | |
| Income | |
| Interest1 | 278,298 |
| Total Income | 278,298 |
| Expenses | |
| The Vanguard Group—Note B | |
| Investment Advisory Services | 357 |
| Management and Administrative—ETF Shares | 3,645 |
| Management and Administrative—Admiral Shares | 539 |
| Management and Administrative—Institutional Shares | 63 |
| Marketing and Distribution—ETF Shares | 669 |
| Marketing and Distribution—Admiral Shares | 69 |
| Marketing and Distribution—Institutional Shares | 6 |
| Custodian Fees | 103 |
| Auditing Fees | 39 |
| Shareholders’ Reports—ETF Shares | 790 |
| Shareholders’ Reports—Admiral Shares | 36 |
| Shareholders’ Reports—Institutional Shares | — |
| Trustees’ Fees and Expenses | 7 |
| Total Expenses | 6,323 |
| Net Investment Income | 271,975 |
| Realized Net Gain (Loss) | |
| Investment Securities Sold1 | 43,224 |
| Futures Contracts | (900) |
| Realized Net Gain (Loss) | 42,324 |
| Change in Unrealized Appreciation (Depreciation) | |
| Investment Securities1 | 218,272 |
| Sale Commitments | 69 |
| Futures Contracts | — |
| Change in Unrealized Appreciation (Depreciation) | 218,341 |
| Net Increase (Decrease) in Net Assets Resulting from Operations | 532,640 |
| 1 | Interest income, realized net gain (loss), and change in unrealized appreciation (depreciation) from an affiliated company of the fund were $12,584,000, $95,000, and $378,000, respectively. Purchases and sales are for temporary cash investment purposes. |
See accompanying Notes, which are an integral part of the Financial Statements.
Mortgage-Backed Securities Index Fund
Statement of Changes in Net Assets
| | Year Ended August 31, |
| | 2020 | 2019 |
| | ($000) | ($000) |
| Increase (Decrease) in Net Assets | | |
| Operations | | |
| Net Investment Income | 271,975 | 275,650 |
| Realized Net Gain (Loss) | 42,324 | 4,371 |
| Change in Unrealized Appreciation (Depreciation) | 218,341 | 341,466 |
| Net Increase (Decrease) in Net Assets Resulting from Operations | 532,640 | 621,487 |
| Distributions1 | | |
| ETF Shares | (255,578) | (243,723) |
| Admiral Shares | (21,433) | (23,071) |
| Institutional Shares | (3,282) | (2,741) |
| Total Distributions | (280,293) | (269,535) |
| Capital Share Transactions | | |
| ETF Shares | 1,098,083 | 2,803,060 |
| Admiral Shares | 298,089 | 87,297 |
| Institutional Shares | 48,576 | 45,330 |
| Net Increase (Decrease) from Capital Share Transactions | 1,444,748 | 2,935,687 |
| Total Increase (Decrease) | 1,697,095 | 3,287,639 |
| Net Assets | | |
| Beginning of Period | 11,275,822 | 7,988,183 |
| End of Period | 12,972,917 | 11,275,822 |
1 Certain prior period numbers have been reclassified to conform with current period presentation.
See accompanying Notes, which are an integral part of the Financial Statements.
Mortgage-Backed Securities Index Fund
Financial Highlights
| ETF Shares | | | | | |
| | | | | | |
| For a Share Outstanding | Year Ended August 31, |
| Throughout Each Period | 2020 | 2019 | 2018 | 2017 | 2016 |
| Net Asset Value, Beginning of Period | $53.26 | $51.38 | $53.00 | $53.79 | $53.05 |
| Investment Operations | | | | | |
| Net Investment Income | 1.1971 | 1.5641 | 1.3251 | 1.0591 | .967 |
| Net Realized and Unrealized Gain (Loss) on Investments | 1.146 | 1.859 | (1.683) | (.682) | .968 |
| Total from Investment Operations | 2.343 | 3.423 | (.358) | .377 | 1.935 |
| Distributions | | | | | |
| Dividends from Net Investment Income | (1.243) | (1.543) | (1.262) | (1.004) | (.955) |
| Distributions from Realized Capital Gains | — | — | — | (.163) | (.240) |
| Total Distributions | (1.243) | (1.543) | (1.262) | (1.167) | (1.195) |
| Net Asset Value, End of Period | $54.36 | $53.26 | $51.38 | $53.00 | $53.79 |
| | | | | | |
| Total Return | 4.45% | 6.80% | -0.67% | 0.74% | 3.70% |
| | | | | | |
| Ratios/Supplemental Data | | | | | |
| Net Assets, End of Period (Millions) | $11,643 | $10,316 | $7,193 | $4,252 | $2,837 |
| Ratio of Total Expenses to Average Net Assets | 0.05% | 0.05% | 0.07% | 0.07% | 0.07% |
| Ratio of Net Investment Income to Average Net Assets | 2.22% | 3.01% | 2.56% | 2.00% | 1.85% |
| Portfolio Turnover Rate2 | 218% | 190% | 279% | 339% | 380% |
1 Calculated based on average shares outstanding.
2 Includes 11%, 34%, 78%, 133%, and 175% attributable to mortgage-dollar-roll activity.
See accompanying Notes, which are an integral part of the Financial Statements.
Mortgage-Backed Securities Index Fund
Financial Highlights
| Admiral Shares | | | | | |
| | | | | | |
| For a Share Outstanding | Year Ended August 31, |
| Throughout Each Period | 2020 | 2019 | 2018 | 2017 | 2016 |
| Net Asset Value, Beginning of Period | $21.26 | $20.51 | $21.17 | $21.49 | $21.20 |
| Investment Operations | | | | | |
| Net Investment Income | .4701 | .6221 | .5281 | .4131 | .388 |
| Net Realized and Unrealized Gain (Loss) on Investments | .463 | .742 | (.674) | (.258) | .387 |
| Total from Investment Operations | .933 | 1.364 | (.146) | .155 | .775 |
| Distributions | | | | | |
| Dividends from Net Investment Income | (.473) | (.614) | (.514) | (.410) | (.389) |
| Distributions from Realized Capital Gains | — | — | — | (.065) | (.096) |
| Total Distributions | (.473) | (.614) | (.514) | (.475) | (.485) |
| Net Asset Value, End of Period | $21.72 | $21.26 | $20.51 | $21.17 | $21.49 |
| | | | | | |
| Total Return2 | 4.43% | 6.77% | -0.68% | 0.76% | 3.70% |
| | | | | | |
| Ratios/Supplemental Data | | | | | |
| Net Assets, End of Period (Millions) | $1,159 | $841 | $725 | $527 | $554 |
| Ratio of Total Expenses to Average Net Assets | 0.07% | 0.07% | 0.07% | 0.07% | 0.07% |
| Ratio of Net Investment Income to Average Net Assets | 2.18% | 2.99% | 2.56% | 2.00% | 1.85% |
| Portfolio Turnover Rate3 | 218% | 190% | 279% | 339% | 380% |
| 1 | Calculated based on average shares outstanding. |
| 2 | Total returns do not include account service fees that may have applied in the periods shown. Fund prospectuses provide information about any applicable account service fees. |
| 3 | Includes 11%, 34%, 78%, 133%, and 175% attributable to mortgage-dollar-roll activity. |
See accompanying Notes, which are an integral part of the Financial Statements.
Mortgage-Backed Securities Index Fund
Financial Highlights
| Institutional Shares | | | | | |
| | | | | | |
| For a Share Outstanding | Year Ended August 31, |
| Throughout Each Period | 2020 | 2019 | 2018 | 2017 | 2016 |
| Net Asset Value, Beginning of Period | $28.81 | $27.79 | $28.69 | $29.12 | $28.73 |
| Investment Operations | | | | | |
| Net Investment Income | .6411 | .8461 | .7211 | .5711 | .532 |
| Net Realized and Unrealized Gain (Loss) on Investments | .636 | 1.011 | (.920) | (.353) | .522 |
| Total from Investment Operations | 1.277 | 1.857 | (.199) | .218 | 1.054 |
| Distributions | | | | | |
| Dividends from Net Investment Income | (.647) | (.837) | (.701) | (.560) | (.534) |
| Distributions from Realized Capital Gains | — | — | — | (.088) | (.130) |
| Total Distributions | (.647) | (.837) | (.701) | (.648) | (.664) |
| Net Asset Value, End of Period | $29.44 | $28.81 | $27.79 | $28.69 | $29.12 |
| | | | | | |
| Total Return | 4.48% | 6.80% | -0.68% | 0.79% | 3.72% |
| | | | | | |
| Ratios/Supplemental Data | | | | | |
| Net Assets, End of Period (Millions) | $171 | $119 | $70 | $52 | $47 |
| Ratio of Total Expenses to Average Net Assets | 0.05% | 0.05% | 0.05% | 0.05% | 0.05% |
| Ratio of Net Investment Income to Average Net Assets | 2.20% | 3.01% | 2.58% | 2.02% | 1.87% |
| Portfolio Turnover Rate2 | 218% | 190% | 279% | 339% | 380% |
1 Calculated based on average shares outstanding.
2 Includes 11%, 34%, 78%, 133%, and 175% attributable to mortgage-dollar-roll activity.
See accompanying Notes, which are an integral part of the Financial Statements.
Mortgage-Backed Securities Index Fund
Notes to Financial Statements
Vanguard Mortgage-Backed Securities Index Fund is registered under the Investment Company Act of 1940 as an open-end investment company, or mutual fund. The fund offers three classes of shares: ETF Shares, Admiral Shares, and Institutional Shares. Each of the share classes has different eligibility and minimum purchase requirements, and is designed for different types of investors. ETF Shares are listed for trading on Nasdaq; they can be purchased and sold through a broker.
Market disruptions associated with the COVID-19 pandemic have had a global impact, and uncertainty exists as to the long-term implications. Such disruptions can adversely affect assets of the fund and thus fund performance.
A. The following significant accounting policies conform to generally accepted accounting principles for U.S. investment companies. The fund consistently follows such policies in preparing its financial statements.
1. Security Valuation: Securities are valued as of the close of trading on the New York Stock Exchange (generally 4 p.m., Eastern time) on the valuation date. Bonds and temporary cash investments are valued using the latest bid prices or using valuations based on a matrix system (which considers such factors as security prices, yields, maturities, and ratings), both as furnished by independent pricing services. Structured debt securities, including mortgages and asset-backed securities, are valued using the latest bid prices or using valuations based on a matrix system that considers such factors as issuer, tranche, nominal or option-adjusted spreads, weighted average coupon, weighted average maturity, credit enhancements, and collateral. Investments in Vanguard Market Liquidity Fund are valued at that fund’s net asset value. Securities for which market quotations are not readily available, or whose values have been affected by events occurring before the fund’s pricing time but after the close of the securities’ primary markets, are valued by methods deemed by the board of trustees to represent fair value.
2. Futures Contracts: The fund uses futures contracts to invest in fixed income asset classes with greater efficiency and lower cost than is possible through direct investment, to add value when these instruments are attractively priced, or to adjust sensitivity to changes in interest rates. The primary risks associated with the use of futures contracts are imperfect correlation between changes in market values of bonds held by the fund and the prices of futures contracts, and the possibility of an illiquid market. Counterparty risk involving futures is mitigated because a regulated clearinghouse is the counterparty instead of the clearing broker. To further mitigate counterparty risk, the fund trades futures contracts on an exchange, monitors the financial strength of its clearing brokers and clearinghouse, and has entered into clearing agreements with its clearing brokers. The clearinghouse imposes initial margin requirements to secure the fund’s performance and requires daily settlement of variation margin representing changes in the market value of each contract. Any securities pledged as initial margin for open contracts are noted in the Schedule of Investments.
Futures contracts are valued at their quoted daily settlement prices. The notional amounts of the contracts are not recorded in the Statement of Assets and Liabilities. Fluctuations in the value of the contracts are recorded in the Statement of Assets and Liabilities as an asset (liability) and in the Statement of Operations as unrealized appreciation (depreciation) until the contracts are closed, when they are recorded as realized gains (losses) on futures contracts.
Mortgage-Backed Securities Index Fund
During the year ended August 31, 2020, the fund’s average investments in long and short futures contracts represented 0% and less than 1% of net assets, respectively, based on the average of the notional amounts at each quarter-end during the period. The fund had no open futures contracts at August 31, 2020.
3. To Be Announced (TBA) Transactions: A TBA transaction is an agreement to buy or sell mortgage-backed securities with agreed-upon characteristics (face amount, coupon, maturity) for settlement at a future date. The fund may be a seller of TBA transactions to reduce its exposure to the mortgage-backed securities market or in order to sell mortgage-backed securities it owns under delayed-delivery arrangements. When the fund is a buyer of TBA transactions, it maintains cash or short-term investments in an amount sufficient to meet the purchase price at the settlement date of the TBA transaction. The primary risk associated with TBA transactions is that a counterparty may default on its obligations. The fund mitigates its counterparty risk by, among other things, performing a credit analysis of counterparties, allocating transactions among numerous counterparties, and monitoring its exposure to each counterparty. The fund may also enter into a Master Securities Forward Transaction Agreement (MSFTA) with certain counterparties and require them to transfer collateral as security for their performance. In the absence of a default, the collateral pledged or received by the fund cannot be repledged, resold, or rehypothecated. Under an MSFTA, upon a counterparty default (including bankruptcy), the fund may terminate any TBA transactions with that counterparty, determine the net amount owed by either party in accordance with its master netting arrangements, and sell or retain any collateral held up to the net amount owed to the fund under the master netting arrangements.
4. Mortgage Dollar Rolls: The fund enters into mortgage-dollar-roll transactions, in which the fund sells mortgage-backed securities to a dealer and simultaneously agrees to purchase similar securities in the future at a predetermined price. The proceeds of the securities sold in mortgage-dollar-roll transactions are typically invested in high-quality short-term fixed income securities. The fund forgoes principal and interest paid on the securities sold, and is compensated by interest earned on the proceeds of the sale and by a lower price on the securities to be repurchased. The fund has also entered into mortgage-dollar-roll transactions in which the fund buys mortgage-backed securities from a dealer pursuant to a TBA transaction and simultaneously agrees to sell similar securities in the future at a predetermined price. The securities bought in mortgage-dollar-roll transactions are used to cover an open TBA sell position. The fund continues to earn interest on mortgage-backed security pools already held and receives a lower price on the securities to be sold in the future. The fund accounts for mortgage-dollar-roll transactions as purchases and sales; as such, these transactions may increase the fund’s portfolio turnover rate. Amounts to be received or paid in connection with open mortgage dollar rolls are included in Receivables for Investment Securities Sold or Payables for Investment Securities Purchased in the Statement of Assets and Liabilities.
5. Federal Income Taxes: The fund intends to continue to qualify as a regulated investment company and distribute all of its taxable income. The fund’s tax returns are open to examination by the relevant tax authorities until expiration of the applicable statute of limitations, which is generally three years after the filing of the tax return. Management has analyzed the fund’s tax positions taken for all open federal and state income tax years, and has concluded that no provision for income tax is required in the fund’s financial statements.
Mortgage-Backed Securities Index Fund
6. Distributions: Distributions to shareholders are recorded on the ex-dividend date. Distributions are determined on a tax basis at the fiscal year-end and may differ from net investment income and realized capital gains for financial reporting purposes.
7. Credit Facilities and Interfund Lending Program: The fund and certain other funds managed by The Vanguard Group (“Vanguard”) participate in a $4.3 billion committed credit facility provided by a syndicate of lenders pursuant to a credit agreement and an uncommitted credit facility provided by Vanguard. Both facilities may be renewed annually. Each fund is individually liable for its borrowings, if any, under the credit facilities. Borrowings may be utilized for temporary or emergency purposes, subject to the fund’s regulatory and contractual borrowing restrictions. With respect to the committed credit facility, the participating funds are charged administrative fees and an annual commitment fee of 0.10% of the undrawn committed amount of the facility; these fees are allocated to the funds based on a method approved by the fund’s board of trustees and included in Management and Administrative expenses on the fund’s Statement of Operations. Any borrowings under either facility bear interest at a rate based upon the higher of the one-month London Interbank Offered Rate (or an acceptable alternate rate, if necessary), federal funds effective rate, or overnight bank funding rate plus an agreed-upon spread, except that borrowings under the uncommitted credit facility may bear interest based upon an alternative rate agreed to by the fund and Vanguard.
In accordance with an exemptive order (the “Order”) from the SEC, the fund may participate in a joint lending and borrowing program that allows registered open-end Vanguard funds to borrow money from and lend money to each other for temporary or emergency purposes (the “Interfund Lending Program”), subject to compliance with the terms and conditions of the Order, and to the extent permitted by the fund’s investment objective and investment policies. Interfund loans and borrowings normally extend overnight, but can have a maximum duration of seven days. Loans may be called on one business day’s notice. The interest rate to be charged is governed by the conditions of the Order and internal procedures adopted by the board of trustees. The board of trustees is responsible for overseeing the Interfund Lending Program.
For the year ended August 31, 2020, the fund did not utilize the credit facilities or the Interfund Lending Program.
8. Other: Interest income includes income distributions received from Vanguard Market Liquidity Fund and is accrued daily. Premiums and discounts on debt securities are amortized and accreted, respectively, to interest income over the lives of the respective securities, except for premiums on certain callable debt securities that are amortized to the earliest call date. Security transactions are accounted for on the date securities are bought or sold. Costs used to determine realized gains (losses) on the sale of investment securities are those of the specific securities sold.
Each class of shares has equal rights as to assets and earnings, except that each class separately bears certain class-specific expenses related to maintenance of shareholder accounts (included in Management and Administrative expenses) and shareholder reporting. Marketing and distribution expenses are allocated to each class of shares based on a method approved by the board of trustees. Income, other non-class-specific expenses, and gains and losses on investments are allocated to each class of shares based on its relative net assets.
Mortgage-Backed Securities Index Fund
B. In accordance with the terms of a Funds’ Service Agreement (the “FSA”) between Vanguard and the fund, Vanguard furnishes to the fund investment advisory, corporate management, administrative, marketing, and distribution services at Vanguard’s cost of operations (as defined by the FSA). These costs of operations are allocated to the fund based on methods and guidelines approved by the board of trustees and are generally settled twice a month.
Upon the request of Vanguard, the fund may invest up to 0.40% of its net assets as capital in Vanguard. At August 31, 2020, the fund had contributed to Vanguard capital in the amount of $540,000, representing less than 0.01% of the fund’s net assets and 0.22% of Vanguard’s capital received pursuant to the FSA. The fund’s trustees and officers are also directors and employees, respectively, of Vanguard.
C. Various inputs may be used to determine the value of the fund’s investments. These inputs are summarized in three broad levels for financial statement purposes. The inputs or methodologies used to value securities are not necessarily an indication of the risk associated with investing in those securities.
Level 1—Quoted prices in active markets for identical securities.
Level 2—Other significant observable inputs (including quoted prices for similar securities, interest rates, prepayment speeds, credit risk, etc.).
Level 3—Significant unobservable inputs (including the fund’s own assumptions used to determine the fair value of investments). Any investments valued with significant unobservable inputs are noted on the Schedule of Investments.
The following table summarizes the market value of the fund’s investments as of August 31, 2020, based on the inputs used to value them:
| | Level 1 | Level 2 | Level 3 | Total |
| | ($000) | ($000) | ($000) | ($000) |
| Investments | | | | |
| Assets | | | | |
| U.S. Government and Agency Obligations | — | 12,920,840 | — | 12,920,840 |
| Temporary Cash Investments | 2,248,713 | — | — | 2,248,713 |
| Total Assets | 2,248,713 | 12,920,840 | — | 15,169,553 |
D. Permanent differences between book-basis and tax-basis components of net assets are reclassified among capital accounts in the financial statements to reflect their tax character. These reclassifications have no effect on net assets or net asset value per share. As of period end, permanent differences primarily attributable to the accounting for distributions in connection with fund share redemptions were reclassified between the following accounts:
| | Amount |
| | ($000) |
| Paid-in Capital | 2,829 |
| Total Distributable Earnings (Loss) | (2,829) |
Mortgage-Backed Securities Index Fund
Temporary differences between book-basis and tax-basis components of total distributable earnings (loss) arise when certain items of income, gain, or loss are recognized in different periods for financial statement and tax purposes; these differences will reverse at some time in the future. The differences are primarily related to the deferral of losses from wash sales; the deferral of losses from straddles; and the inclusion of payables for distributions. As of period end, the tax-basis components of total distributable earnings (loss) are detailed in the table as follows:
| | Amount |
| | ($000) |
| Undistributed Ordinary Income | 40,431 |
| Undistributed Long-Term Gains | 2,667 |
| Capital Loss Carryforwards | — |
| Qualified Late-Year Losses | — |
| Net Unrealized Gains (Losses) | 392,663 |
The tax character of distributions paid was as follows:
| | Year Ended August 31, |
| | 2020 | 2019 |
| | Amount | Amount |
| | ($000) | ($000) |
| Ordinary Income * | 280,293 | 269,535 |
| Long-Term Capital Gains | — | — |
| Total | 280,293 | 269,535 |
* Includes short-term capital gains, if any.
As of August 31, 2020, gross unrealized appreciation and depreciation for investments based on cost for U.S. federal income tax purposes were as follows:
| | Amount |
| | ($000) |
| Tax Cost | 14,776,890 |
| Gross Unrealized Appreciation | 396,593 |
| Gross Unrealized Depreciation | (3,930) |
| Net Unrealized Appreciation (Depreciation) | 392,663 |
E. During the year ended August 31, 2020, the fund purchased $28,163,847,000 of investment securities and sold $26,648,989,000 of investment securities, other than temporary cash investments. Purchases and sales include $86,513,000 and $0, respectively, in connection with in-kind purchases and redemptions of the fund’s capital shares.
Mortgage-Backed Securities Index Fund
F. Capital share transactions for each class of shares were:
| | | | | Year Ended August 31, |
| | | 2020 | | | 2019 |
| | Amount | Shares | | Amount | Shares |
| | ($000) | (000) | | ($000) | (000) |
| ETF Shares | | | | | |
| Issued | 2,840,003 | 52,845 | | 3,225,170 | 61,834 |
| Issued in Lieu of Cash Distributions | — | — | | — | — |
| Redeemed | (1,741,920) | (32,350) | | (422,110) | (8,150) |
| Net Increase (Decrease)—ETF Shares | 1,098,083 | 20,495 | | 2,803,060 | 53,684 |
| Admiral Shares | | | | | |
| Issued | 684,698 | 31,678 | | 295,379 | 14,288 |
| Issued in Lieu of Cash Distributions | 13,116 | 609 | | 13,356 | 644 |
| Redeemed | (399,725) | (18,497) | | (221,438) | (10,709) |
| Net Increase (Decrease)—Admiral Shares | 298,089 | 13,790 | | 87,297 | 4,223 |
| Institutional Shares | | | | | |
| Issued | 74,790 | 2,567 | | 53,939 | 1,914 |
| Issued in Lieu of Cash Distributions | 2,297 | 79 | | 2,185 | 78 |
| Redeemed | (28,511) | (970) | | (10,794) | (384) |
| Net Increase (Decrease)—Institutional Shares | 48,576 | 1,676 | | 45,330 | 1,608 |
At August 31, 2020, one shareholder was the record or beneficial owner of 31% of the fund’s net assets. If this shareholder were to redeem its investment in the fund, the redemption might result in an increase in the fund’s expense ratio, cause the fund to incur higher transaction costs, or lead to the realization of taxable capital gains.
G. Management has determined that no events or transactions occurred subsequent to August 31, 2020, that would require recognition or disclosure in these financial statements.
Report of Independent Registered Public Accounting Firm
To the Board of Trustees of Vanguard Scottsdale Funds and Shareholders of Vanguard Short-Term Treasury Index Fund, Vanguard Intermediate-Term Treasury Index Fund, Vanguard Long-Term Treasury Index Fund, Vanguard Short-Term Corporate Bond Index Fund, Vanguard Intermediate-Term Corporate Bond Index Fund, Vanguard Long-Term Corporate Bond Index Fund and Vanguard Mortgage-Backed Securities Index Fund
Opinions on the Financial Statements
We have audited the accompanying statements of assets and liabilities, including the schedules of investments, of Vanguard Short-Term Treasury Index Fund, Vanguard Intermediate-Term Treasury Index Fund, Vanguard Long-Term Treasury Index Fund and Vanguard Mortgage-Backed Securities Index Fund, and the statements of assets and liabilities, including the schedules of investments—investments summary, of Vanguard Short-Term Corporate Bond Index Fund, Vanguard Intermediate-Term Corporate Bond Index Fund and Vanguard Long-Term Corporate Bond Index Fund (seven of the funds constituting Vanguard Scottsdale Funds, hereafter collectively referred to as the “Funds”) as of August 31, 2020, the related statements of operations for the year ended August 31, 2020, the statements of changes in net assets for each of the two years in the period ended August 31, 2020, including the related notes, and the financial highlights for each of the five years in the period ended August 31, 2020 (collectively referred to as the “financial statements”). In our opinion, the financial statements present fairly, in all material respects, the financial position of each of the Funds as of August 31, 2020, the results of each of their operations for the year then ended, the changes in each of their net assets for each of the two years in the period ended August 31, 2020 and each of the financial highlights for each of the five years in the period ended August 31, 2020 in conformity with accounting principles generally accepted in the United States of America.
Basis for Opinions
These financial statements are the responsibility of the Funds’ management. Our responsibility is to express an opinion on the Funds’ financial statements based on our audits. We are a public accounting firm registered with the Public Company Accounting Oversight Board (United States) (“PCAOB”) and are required to be independent with respect to the Funds in accordance with the U.S. federal securities laws and the applicable rules and regulations of the Securities and Exchange Commission and the PCAOB.
We conducted our audits of these financial statements in accordance with the standards of the PCAOB. Those standards require that we plan and perform the audit to obtain reasonable assurance about whether the financial statements are free of material misstatement, whether due to error or fraud.
Our audits included performing procedures to assess the risks of material misstatement of the financial statements, whether due to error or fraud, and performing procedures that respond to those risks. Such procedures included examining, on a test basis, evidence regarding the amounts and disclosures in the financial statements. Our audits also included evaluating the accounting principles used and significant estimates made by management, as well as evaluating the overall presentation of the financial statements. Our procedures included confirmation of securities owned as of August 31, 2020 by correspondence with the custodian, transfer agent and brokers; when replies were not received from brokers, we performed other auditing procedures. We believe that our audits provide a reasonable basis for our opinions.
/s/PricewaterhouseCoopers LLP
Philadelphia, Pennsylvania
October 19, 2020
We have served as the auditor of one or more investment companies in The Vanguard Group of Funds since 1975.
Special 2020 tax information (unaudited) for Vanguard Short-Term Treasury Index Fund
This information for the fiscal year ended August 31, 2020, is included pursuant to provisions of the Internal Revenue Code.
The fund distributed $1,425,000 as capital gain dividends (20% rate gain distributions) to shareholders during the fiscal year.
For nonresident alien shareholders, 100% of short-term capital gain dividends distributed by the fund are qualified short-term capital gains.
For nonresident alien shareholders, 100% of income dividends are interest-related dividends.
Special 2020 tax information (unaudited) for Vanguard Intermediate-Term Treasury Index Fund
This information for the fiscal year ended August 31, 2020, is included pursuant to provisions of the Internal Revenue Code.
The fund distributed $2,810,000 as capital gain dividends (20% rate gain distributions) to shareholders during the fiscal year.
For nonresident alien shareholders, 100% of income dividends are interest-related dividends.
Special 2020 tax information (unaudited) for Vanguard Long-Term Treasury Index Fund
This information for the fiscal year ended August 31, 2020, is included pursuant to provisions of the Internal Revenue Code.
For nonresident alien shareholders, 100% of short-term capital gain dividends distributed by the fund are qualified short-term capital gains.
Special 2020 tax information (unaudited) for Vanguard Short-Term Corporate Bond Index Fund
This information for the fiscal year ended August 31, 2020, is included pursuant to provisions of the Internal Revenue Code.
For nonresident alien shareholders, 79.5% of income dividends are interest-related dividends.
Special 2020 tax information (unaudited) for Vanguard Intermediate-Term Corporate Bond Index Fund
This information for the fiscal year ended August 31, 2020, is included pursuant to provisions of the Internal Revenue Code.
The fund distributed 7,510,000 as capital gain dividends (20% rate gain distributions) to shareholders during the fiscal year.
For nonresident alien shareholders, 84.3% of income dividends are interest-related dividends.
Special 2020 tax information (unaudited) for Vanguard Long-Term Corporate Bond Index Fund
This information for the fiscal year ended August 31, 2020, is included pursuant to provisions of the Internal Revenue Code.
For nonresident alien shareholders, 86.4% of income dividends are interest-related dividends.
Special 2020 tax information (unaudited) for Vanguard Mortgage-Backed Securities Index Fund
This information for the fiscal year ended August 31, 2020, is included pursuant to provisions of the Internal Revenue Code.
The fund distributed $265,000 as capital gain dividends (20% rate gain distributions) to shareholders during the fiscal year.
For nonresident alien shareholders, 100% of income dividends are interest-related dividends.
Trustees Approve Advisory Arrangements
The board of trustees of Vanguard Short-Term Treasury Index Fund, Vanguard Intermediate-Term Treasury Index Fund, Vanguard Long-Term Treasury Index Fund, Vanguard Short-Term Corporate Bond Index Fund, Vanguard Intermediate-Term Corporate Bond Index Fund, Vanguard Long-Term Corporate Bond Index Fund, and Vanguard Mortgage-Backed Securities Index Fund has renewed each fund’s investment advisory arrangement with The Vanguard Group, Inc. (Vanguard), through its Fixed Income Group. The board determined that continuing each fund’s internalized management structure was in the best interests of the fund and its shareholders.
The board based its decision upon an evaluation of the advisor’s investment staff, portfolio management process, and performance. This evaluation included information provided to the board by Vanguard’s Portfolio Review Department, which is responsible for fund and advisor oversight and product management. The Portfolio Review Department met regularly with the advisor and made monthly presentations to the board during the fiscal year that directed the board’s focus to relevant information and topics.
The board, or an investment committee made up of board members, also received information throughout the year through advisor presentations. For each advisor presentation, the board was provided with letters and reports that included information about, among other things, the advisory firm and the advisor’s assessment of the investment environment, portfolio performance, and portfolio characteristics.
In addition, the board received monthly reports, which included a Market and Economic Report, a Fund Dashboard Monthly Summary, and a Fund Performance Report.
Prior to their meeting, the trustees were provided with a memo and materials that summarized the information they received over the course of the year. They also considered the factors discussed below, among others. However, no single factor determined whether the board approved the arrangements. Rather, it was the totality of the circumstances that drove the board’s decision.
Nature, extent, and quality of services
The board reviewed the quality of each fund’s investment management services over both the short and long term, and took into account the organizational depth and stability of the advisor. The board considered that Vanguard has been managing investments for more than four decades. The Fixed Income Group adheres to a sound, disciplined investment management process; the team has considerable experience, stability, and depth.
The board concluded that Vanguard’s experience, stability, depth, and performance, among other factors, warranted continuation of each advisory arrangement.
Investment performance
The board considered the short- and long-term performance of each fund, including any periods of outperformance or underperformance compared with its target index and peer group. The board concluded that the performance was such that each advisory arrangement should continue.
Cost
The board concluded that each fund’s expense ratio was well below the average expense ratio charged by funds in its peer group and that each fund’s advisory expenses were also well below the peer-group average.
The board does not conduct a profitability analysis of Vanguard because of Vanguard’s unique structure. Unlike most other mutual fund management companies, Vanguard is owned by the funds it oversees.
The benefit of economies of scale
The board concluded that each fund’s arrangement with Vanguard ensures that the funds will realize economies of scale as they grow, with the cost to shareholders declining as fund assets increase.
The board will consider whether to renew the advisory arrangements again after a one-year period.
Liquidity Risk Management
Vanguard funds (except for the money market funds) have adopted and implemented a written liquidity risk management program (the “Program”) as required by Rule 22e-4 under the Investment Company Act of 1940. Rule 22e-4 requires that each fund adopt a program that is reasonably designed to assess and manage the fund’s liquidity risk, which is the risk that the fund could not meet redemption requests without significant dilution of remaining investors’ interests in the fund.
Assessment and management of a fund’s liquidity risk under the Program take into consideration certain factors, such as the fund’s investment strategy and the liquidity of its portfolio investments during normal and reasonably foreseeable stressed conditions, its short- and long-term cash-flow projections during both normal and reasonably foreseeable stressed conditions, and its cash and cash-equivalent holdings and access to other funding sources. As required by the rule, the Program includes policies and procedures for classification of fund portfolio holdings in four liquidity categories, maintaining certain levels of highly liquid investments, and limiting holdings of illiquid investments.
The board of trustees of Vanguard Scottsdale Funds approved the appointment of liquidity risk management program administrators responsible for administering the Program for Vanguard Short-Term Treasury Index Fund, Vanguard Intermediate-Term Treasury Index Fund, Vanguard Long-Term Treasury Index Fund, Vanguard Short-Term Corporate Bond Index Fund, Vanguard Intermediate-Term Corporate Bond Index Fund, Vanguard Long-Term Corporate Bond Index Fund, and Vanguard Mortgage-Backed Securities Index Fund, and for carrying out the specific responsibilities set forth in the Program, including reporting to the board on at least an annual basis regarding the Program’s operation, its adequacy, and the effectiveness of its implementation for the past year (the “Program Administrator Report”). The board has reviewed the Program Administrator Report covering the period from December 1, 2018, through December 31, 2019 (the “Review Period”). The Program Administrator Report stated that during the Review Period the Program operated and was implemented effectively to manage the funds’ liquidity risk.
BLOOMBERG is a trademark and service mark of Bloomberg Finance L.P. BARCLAYS is a trademark and service mark of Barclays Bank Plc, used under license. Bloomberg Finance L.P. and its affiliates, including Bloomberg Index Services Limited (BISL) (collectively, Bloomberg), or Bloomberg’s licensors, own all proprietary rights in the Bloomberg Barclays U.S. Treasury 1–3 Year Bond Index, Bloomberg Barclays U.S. Treasury 3–10 Year Bond Index, Bloomberg Barclays U.S. Long Treasury Bond Index, Bloomberg Barclays U.S. 1–5 Year Corporate Bond Index, Bloomberg Barclays U.S. 5–10 Year Corporate Bond Index, Bloomberg Barclays U.S. 10+ Year Corporate Bond Index, and Bloomberg Barclays U.S. MBS Float Adjusted Index (the Indices or Bloomberg Barclays Indices).
Neither Barclays Bank Plc, Barclays Capital Inc., or any affiliate (collectively Barclays) or Bloomberg is the issuer or producer of the Sector Bond Index Funds and neither Bloomberg nor Barclays has any responsibilities, obligations or duties to investors in the Sector Bond Index Funds. The Indices are licensed for use by The Vanguard Group, Inc. (Vanguard) as the sponsor of the Sector Bond Index Funds. Bloomberg and Barclays’ only relationship with Vanguard in respect to the Indices is the licensing of the Indices, which are determined, composed and calculated by BISL, or any successor thereto, without regard to the Issuer or the Sector Bond Index Funds or the owners of the Sector Bond Index Funds.
Additionally, Vanguard may for itself execute transaction(s) with Barclays in or relating to the Indices in connection with the Sector Bond Index Funds. Investors acquire the Sector Bond Index Funds from Vanguard and investors neither acquire any interest in the Indices nor enter into any relationship of any kind whatsoever with Bloomberg or Barclays upon making an investment in the Sector Bond Index Funds. The Sector Bond Index Funds are not sponsored, endorsed, sold or promoted by Bloomberg or Barclays. Neither Bloomberg nor Barclays makes any representation or warranty, express or implied regarding the advisability of investing in the Sector Bond Index Funds or the advisability of investing in securities generally or the ability of the Indices to track corresponding or relative market performance. Neither Bloomberg nor Barclays has passed on the legality or suitability of the Sector Bond Index Funds with respect to any person or entity. Neither Bloomberg nor Barclays is responsible for and has not participated in the determination of the timing of, prices at, or quantities of the Sector Bond Index Funds to be issued. Neither Bloomberg nor Barclays has any obligation to take the needs of the Issuer or the owners of the Sector Bond Index Funds or any other third party into consideration in determining, composing or calculating the Indices. Neither Bloomberg nor Barclays has any obligation or liability in connection with administration, marketing or trading of the Sector Bond Index Funds.
The licensing agreement between Bloomberg and Barclays is solely for the benefit of Bloomberg and Barclays and not for the benefit of the owners of the Sector Bond Index Funds, investors or other third parties. In addition, the licensing agreement between Vanguard and Bloomberg is solely for the benefit of Vanguard and Bloomberg and not for the benefit of the owners of the Sector Bond Index Funds, investors or other third parties.
NEITHER BLOOMBERG NOR BARCLAYS SHALL HAVE ANY LIABILITY TO THE ISSUER, INVESTORS OR TO OTHER THIRD PARTIES FOR THE QUALITY, ACCURACY AND/OR COMPLETENESS OF THE BLOOMBERG BARCLAYS INDICES OR ANY DATA INCLUDED THEREIN OR FOR INTERRUPTIONS IN THE DELIVERY OF THE BLOOMBERG BARCLAYS INDICES. NEITHER BLOOMBERG NOR BARCLAYS MAKES ANY WARRANTY, EXPRESS OR IMPLIED, AS TO RESULTS TO BE OBTAINED BY THE ISSUER, THE INVESTORS OR ANY OTHER PERSON OR ENTITY FROM THE USE OF THE BLOOMBERG BARCLAYS INDICES OR ANY DATA INCLUDED THEREIN. NEITHER BLOOMBERG NOR BARCLAYS MAKES ANY EXPRESS OR IMPLIED WARRANTIES, AND EACH HEREBY EXPRESSLY DISCLAIMS ALL WARRANTIES OF MERCHANTABILITY OR FITNESS FOR A PARTICULAR PURPOSE OR USE WITH RESPECT TO THE BLOOMBERG BARCLAYS INDICES OR ANY DATA INCLUDED THEREIN. BLOOMBERG RESERVES THE RIGHT TO CHANGE THE METHODS OF CALCULATION OR PUBLICATION, OR TO CEASE THE CALCULATION OR PUBLICATION OF THE BLOOMBERG BARCLAYS INDICES, AND NEITHER BLOOMBERG NOR BARCLAYS SHALL BE LIABLE FOR ANY MISCALCULATION OF OR ANY INCORRECT, DELAYED OR INTERRUPTED PUBLICATION WITH RESPECT TO ANY OF THE BLOOMBERG BARCLAYS INDICES. NEITHER BLOOMBERG NOR BARCLAYS SHALL BE LIABLE FOR ANY DAMAGES, INCLUDING, WITHOUT LIMITATION, ANY SPECIAL, INDIRECT OR CONSEQUENTIAL DAMAGES, OR ANY LOST PROFITS AND EVEN IF ADVISED OF THE POSSIBILITY OF SUCH, RESULTING FROM THE USE OF BLOOMBERG BARCLAYS INDICES OR ANY DATA INCLUDED THEREIN OR WITH RESPECT TO THE SECTOR BOND INDEX FUNDS.
None of the information supplied by Bloomberg or Barclays and used in this publication may be reproduced in any manner without the prior written permission of both Bloomberg and Barclays Capital, the investment banking division of Barclays Bank Plc. Barclays Bank Plc is registered in England No. 1026167. Registered office 1 Churchill Place London E14 5HP.
© 2020 Bloomberg. Used with Permission.
Source: Bloomberg Index Services Limited. Copyright 2020, Bloomberg. All rights reserved.
This page intentionally left blank.
This page intentionally left blank.
The People Who Govern Your Fund
The trustees of your mutual fund are there to see that the fund is operated and managed in your best interests since, as a shareholder, you are a part owner of the fund. Your fund’s trustees also serve on the board of directors of The Vanguard Group, Inc., which is owned by the Vanguard funds and provides services to them.
A majority of Vanguard’s board members are independent, meaning that they have no affiliation with Vanguard or the funds they oversee, apart from the sizable personal investments they have made as private individuals. The independent board members have distinguished backgrounds in business, academia, and public service. Each of the trustees and executive officers oversees 212 Vanguard funds.
Information for each trustee and executive officer of the fund appears below. That information, as well as the Vanguard fund count, is as of the date on the cover of this fund report. The mailing address of the trustees and officers is P.O. Box 876, Valley Forge, PA 19482. More information about the trustees is in the Statement of Additional Information, which can be obtained, without charge, by contacting Vanguard at 800-662-7447, or online at vanguard.com.
Interested Trustee1
Mortimer J. Buckley
Born in 1969. Trustee since January 2018. Principal occupation(s) during the past five years and other experience: chairman of the board (2019–present) of Vanguard and of each of the investment companies served by Vanguard; chief executive officer (2018–present) of Vanguard; chief executive officer, president, and trustee (2018–present) of each of the investment companies served by Vanguard; president and director (2017–present) of Vanguard; and president (2018–present) of Vanguard Marketing Corporation. Chief investment officer (2013–2017), managing director (2002–2017), head of the Retail Investor Group (2006–2012), and chief information officer (2001–2006) of Vanguard. Chairman of the board (2011–2017) and trustee (2009–2017) of the Children’s Hospital of Philadelphia; and trustee (2018–present) and vice chair (2019–present) of The Shipley School.
Independent Trustees
Emerson U. Fullwood
Born in 1948. Trustee since January 2008. Principal occupation(s) during the past five years and other experience: executive chief staff and marketing officer for North America and corporate vice president (retired 2008) of Xerox Corporation (document management products and services). Former president of the Worldwide Channels Group, Latin America, and Worldwide Customer Service and executive chief staff officer of Developing Markets of Xerox. Executive in residence and 2009–2010 Distinguished Minett Professor at the Rochester Institute of Technology. Director of SPX FLOW, Inc. (multi-industry manufacturing). Director of the University of Rochester Medical Center, the Monroe Community College Foundation, the United Way of Rochester, North Carolina A&T University, and Roberts Wesleyan College. Trustee of the University of Rochester.
Amy Gutmann
Born in 1949. Trustee since June 2006. Principal occupation(s) during the past five years and other experience: president (2004–present) of the University of Pennsylvania. Christopher H. Browne Distinguished Professor of Political Science, School of Arts and Sciences, and professor of communication, Annenberg School for Communication, with secondary faculty appointments in the Department of Philosophy, School of Arts and Sciences, and at the Graduate School of Education, University of Pennsylvania.
F. Joseph Loughrey
Born in 1949. Trustee since October 2009. Principal occupation(s) during the past five years and other experience: president and chief operating officer (retired 2009) and vice chairman of the board (2008–2009) of Cummins Inc. (industrial machinery). Chairman of the board of Hillenbrand, Inc. (specialized consumer services) and the Lumina Foundation. Director of the V Foundation. Member of the advisory
| 1 | Mr. Buckley is considered an “interested person,” as defined in the Investment Company Act of 1940, because he is an officer of the Vanguard funds. |
council for the College of Arts and Letters and chair of the advisory board to the Kellogg Institute for International Studies, both at the University of Notre Dame.
Mark Loughridge
Born in 1953. Trustee since March 2012. Principal occupation(s) during the past five years and other experience: senior vice president and chief financial officer (retired 2013) of IBM (information technology services). Fiduciary member of IBM’s Retirement Plan Committee (2004–2013), senior vice president and general manager (2002–2004) of IBM Global Financing, vice president and controller (1998–2002) of IBM, and a variety of other prior management roles at IBM. Member of the Council on Chicago Booth.
Scott C. Malpass
Born in 1962. Trustee since March 2012. Principal occupation(s) during the past five years and other experience: chief investment officer (retired June 2020) and vice president (retired June 2020) of the University of Notre Dame. Assistant professor of finance at the Mendoza College of Business, University of Notre Dame, and member of the Notre Dame 403(b) Investment Committee (retired June 2020). Member of the board of Catholic Investment Services, Inc. (investment advisors) and the board of superintendence of the Institute for the Works of Religion.
Deanna Mulligan
Born in 1963. Trustee since January 2018. Principal occupation(s) during the past five years and other experience: chief executive officer (2011–present) of The Guardian Life Insurance Company of America. President (2010–2019), chief operating officer (2010–2011), and executive vice president (2008–2010) of Individual Life and Disability of The Guardian Life Insurance Company of America. Member of the board of The Guardian Life Insurance Company of America, the American Council of Life Insurers, and the Economic Club of New York. Trustee of the Partnership for New York City (business leadership), Chief Executives for Corporate Purpose, NewYork-Presbyterian Hospital, Catalyst, and the Bruce Museum (arts and science). Member of the Advisory Council for the Stanford Graduate School of Business.
André F. Perold
Born in 1952. Trustee since December 2004. Principal occupation(s) during the past five years and other experience: George Gund Professor of Finance and Banking, Emeritus at the Harvard Business School (retired 2011). Chief investment officer and co-managing partner of HighVista Strategies (private investment firm). Member of the board of advisors and member of the investment committee of the Museum of Fine Arts Boston. Member of the board (2018–present) of RIT Capital Partners (investment firm). Member of the investment committee of Partners Health Care System.
Sarah Bloom Raskin
Born in 1961. Trustee since January 2018. Principal occupation(s) during the past five years and other experience: deputy secretary (2014–2017) of the United States Department of the Treasury. Governor (2010–2014) of the Federal Reserve Board. Commissioner (2007–2010) of financial regulation for the State of Maryland. Member of the board of directors (2012–2014) of Neighborhood Reinvestment Corporation. Director (2017–present) of i(x) Investments, LLC; director (2017–present) of Reserve Trust. Rubenstein Fellow (2017–present) of Duke University; trustee (2017–present) of Amherst College, and trustee (2019–present) of the Folger Shakespeare Library.
Peter F. Volanakis
Born in 1955. Trustee since July 2009. Principal occupation(s) during the past five years and other experience: president and chief operating officer (retired 2010) of Corning Incorporated (communications equipment) and director of Corning Incorporated (2000–2010) and Dow Corning (2001–2010). Director (2012) of SPX Corporation (multi-industry manufacturing). Overseer of the Amos Tuck School of Business Administration, Dartmouth College (2001–2013). Chairman of the board of trustees of Colby-Sawyer College. Member of the board of Hypertherm Inc. (industrial cutting systems, software, and consumables).
Executive Officers
John Bendl
Born in 1970. Principal occupation(s) during the past five years and other experience: principal of Vanguard. Chief financial officer (2019–present) of each of the investment companies served by Vanguard. Chief accounting officer, treasurer, and controller of Vanguard (2017–present). Partner (2003–2016) at KPMG (audit, tax, and advisory services).
Glenn Booraem
Born in 1967. Principal occupation(s) during the past five years and other experience: principal of Vanguard. Investment stewardship officer (2017–present), treasurer (2015–2017), controller (2010–2015), and assistant controller (2001–2010) of each of the investment companies served by Vanguard.
Christine M. Buchanan
Born in 1970. Principal occupation(s) during the past five years and other experience: principal of Vanguard. Treasurer (2017–present) of each of the investment companies served by Vanguard. Partner (2005–2017) at KPMG (audit, tax, and advisory services).
David Cermak
Born in 1960. Principal occupation(s) during the past five years and other experience: principal of Vanguard. Finance director (2019–present) of each of the investment companies served by Vanguard. Managing director and head (2017–present) of Vanguard Investments Singapore. Managing director and head (2017–2019) of Vanguard Investments Hong Kong. Representative director and head (2014–2017) of Vanguard Investments Japan.
Thomas J. Higgins
Born in 1957. Principal occupation(s) during the past five years and other experience: principal of Vanguard. Finance director (2019–present), chief financial officer (2008–2019), and treasurer (1998–2008) of each of the investment companies served by Vanguard.
Peter Mahoney
Born in 1974. Principal occupation(s) during the past five years and other experience: principal of Vanguard. Controller (2015–present) of each of the investment companies served by Vanguard. Head of International Fund Services (2008–2014) at Vanguard.
Anne E. Robinson
Born in 1970. Principal occupation(s) during the past five years and other experience: general counsel (2016–present) of Vanguard. Secretary (2016–present) of Vanguard and of each of the investment companies served by Vanguard. Managing director (2016–present) of Vanguard. Managing director and general counsel of Global Cards and Consumer Services (2014–2016) at Citigroup. Counsel (2003–2014) at American Express.
Michael Rollings
Born in 1963. Principal occupation(s) during the past five years and other experience: finance director (2017–present) and treasurer (2017) of each of the investment companies served by Vanguard. Managing director (2016–present) of Vanguard. Chief financial officer (2016–present) of Vanguard. Director (2016–present) of Vanguard Marketing Corporation. Executive vice president and chief financial officer (2006–2016) of MassMutual Financial Group.
John E. Schadl
Born in 1972. Principal occupation(s) during the past five years and other experience: principal of Vanguard. Chief compliance officer (2019–present) of Vanguard and of each of the investment companies served by Vanguard. Assistant vice president (2019–present) of Vanguard Marketing Corporation.
| Vanguard Senior Management Team |
| | |
| Joseph Brennan | Chris D. McIsaac |
| Mortimer J. Buckley | James M. Norris |
| Gregory Davis | Thomas M. Rampulla |
| John James | Karin A. Risi |
| Martha G. King | Anne E. Robinson |
| John T. Marcante | Michael Rollings |

Connect with Vanguard® > vanguard.com
Fund Information > 800-662-7447
Direct Investor Account Services > 800-662-2739
Institutional Investor Services > 800-523-1036
Text Telephone for People
Who Are Deaf or Hard of Hearing > 800-749-7273
This material may be used in conjunction with the offering of shares of any Vanguard fund only if preceded or accompanied by the fund’s current prospectus.
All comparative mutual fund data are from Morningstar, Inc., unless otherwise noted.
You can obtain a free copy of Vanguard’s proxy voting guidelines by visiting vanguard.com/proxyreporting or by calling Vanguard at 800-662-2739. The guidelines are also available from the SEC’s website, www.sec.gov. In addition, you may obtain a free report on how your fund voted the proxies for securities it owned during the 12 months ended June 30. To get the report, visit either vanguard.com/proxyreporting or www.sec.gov.
You can review information about your fund on the SEC’s website, and you can receive copies of this information, for a fee, by sending a request via email addressed to publicinfo@sec.gov.
| | © 2020 The Vanguard Group, Inc. All rights reserved. U.S. Patent Nos. 6,879,964; 7,337,138; 7,720,749; 7,925,573; 8,090,646; 8,417,623; and 8,626,636. Vanguard Marketing Corporation, Distributor. Q16420 102020 |

Annual Report | August 31, 2020 Vanguard Total Corporate Bond ETF |
See the inside front cover for important information about access to your fund’s annual and semiannual shareholder reports. |
Important information about access to shareholder reports
Beginning on January 1, 2021, as permitted by regulations adopted by the Securities and Exchange Commission, paper copies of your fund’s annual and semiannual shareholder reports will no longer be sent to you by mail, unless you specifically request them. Instead, you will be notified by mail each time a report is posted on the website and will be provided with a link to access the report.
If you have already elected to receive shareholder reports electronically, you will not be affected by this change and do not need to take any action. You may elect to receive shareholder reports and other communications from the fund electronically by contacting your financial intermediary (such as a broker-dealer or bank) or, if you invest directly with the fund, by calling Vanguard at one of the phone numbers on the back cover of this report or by logging on to vanguard.com.
You may elect to receive paper copies of all future shareholder reports free of charge. If you invest through a financial intermediary, you can contact the intermediary to request that you continue to receive paper copies. If you invest directly with the fund, you can call Vanguard at one of the phone numbers on the back cover of this report or log on to vanguard.com. Your election to receive paper copies will apply to all the funds you hold through an intermediary or directly with Vanguard.
| Contents | |
| | |
| Your Fund’s Performance at a Glance | 1 |
| | |
| About Your Fund’s Expenses | 2 |
| | |
| Performance Summary | 4 |
| | |
| Financial Statements | 7 |
| | |
| Trustees Approve Advisory Arrangement | 18 |
| | |
| Liquidity Risk Management | 20 |
Please note: The opinions expressed in this report are just that—informed opinions. They should not be considered promises or advice. Also, please keep in mind that the information and opinions cover the period through the date on the front of this report. Of course, the risks of investing in your fund are spelled out in the prospectus.
Your Fund’s Performance at a Glance
· Vanguard Total Corporate Bond ETF returned 7.18% for the 12 months ended August 31, 2020. Its benchmark returned 7.50%.
· The pandemic contributed to a spike in volatility and an erosion in liquidity in the bond markets in March. Bond yields nevertheless ended the period significantly lower—and bond prices ended higher—amid unprecedented actions from policymakers and the far dimmer outlook for economic activity.
· Despite economic uncertainty and corporate bond issuance approaching record levels, spreads tightened in part because of the Fed’s decision in March to buy corporate bonds. (Spreads are the additional yields that corporate bonds offer above Treasuries with comparable maturities.)
· By maturity, longer-term corporates outpaced their shorter-term counterparts. By quality, results were more nuanced. And by sector, bonds in the utilities sector outperformed those in financials and industrials.
| Market Barometer | | | | | | |
| | Average Annual Total Returns | |
| | Periods Ended August 31, 2020 | |
| | One Year | | Three Years | | Five Years | |
| Stocks | | | | | | |
| Russell 1000 Index (Large-caps) | 22.50% | | 14.58% | | 14.31% | |
| Russell 2000 Index (Small-caps) | 6.02 | | 5.03 | | 7.65 | |
| Russell 3000 Index (Broad U.S. market) | 21.44 | | 13.95 | | 13.86 | |
| FTSE All-World ex US Index (International) | 8.78 | | 2.92 | | 6.00 | |
| | | | | | | |
| Bonds | | | | | | |
| Bloomberg Barclays U.S. Aggregate Bond Index (Broad taxable market) | 6.47% | | 5.09% | | 4.33% | |
| Bloomberg Barclays Municipal Bond Index (Broad tax-exempt market) | 3.24 | | 4.09 | | 3.99 | |
| FTSE Three-Month U.S. Treasury Bill Index | 1.18 | | 1.67 | | 1.15 | |
| | | | | | | |
| CPI | | | | | | |
| Consumer Price Index | 1.31% | | 1.92% | | 1.75% | |
About Your Fund’s Expenses
As a shareholder of the fund, you incur ongoing costs, which include costs for portfolio management, administrative services, and shareholder reports (like this one), among others. Operating expenses, which are deducted from a fund’s gross income, directly reduce the investment return of the fund.
A typical fund’s expenses are expressed as a percentage of its average net assets. The Total Corporate Bond ETF has no direct expenses, but bears its proportionate share of the costs for the underlying funds in which it invests. These indirect expenses make up the acquired fund fees and expenses, also expressed as a percentage of average net assets.
The following examples are intended to help you understand the ongoing cost (in dollars) of investing in your fund and to compare these costs with those of other mutual funds. The examples are based on an investment of $1,000 made at the beginning of the period shown and held for the entire period. The costs were calculated using the acquired fund fees and expenses for the Total Corporate Bond ETF.
The accompanying table illustrates your fund’s costs in two ways:
· Based on actual fund return. This section helps you to estimate the actual expenses that you paid over the period. The “Ending Account Value” shown is derived from the fund’s actual return, and the third column shows the dollar amount that would have been paid by an investor who started with $1,000 in the fund. You may use the information here, together with the amount you invested, to estimate the expenses that you paid over the period.
To do so, simply divide your account value by $1,000 (for example, an $8,600 account value divided by $1,000 = 8.6), then multiply the result by the number given for your fund under the heading “Expenses Paid During Period.”
· Based on hypothetical 5% yearly return. This section is intended to help you compare your fund’s costs with those of other mutual funds. It assumes that the fund had a yearly return of 5% before expenses, but that the expense ratio is unchanged. In this case—because the return used is not the fund’s actual return—the results do not apply to your investment. The example is useful in making comparisons because the Securities and Exchange Commission requires all mutual funds to calculate expenses based on a 5% return. You can assess your fund’s costs by comparing this hypothetical example with the hypothetical examples that appear in shareholder reports of other funds.
Note that the expenses shown in the table are meant to highlight and help you compare ongoing costs only and do not reflect transaction costs incurred by the fund for buying and selling securities. Further, the expenses do not include any purchase, redemption, or account service fees described in the fund prospectus. If such fees were applied to your account, your costs would be higher. Your fund does not carry a “sales load.”
The calculations assume no shares were bought or sold during the period. Your actual costs may have been higher or lower, depending on the amount of your investment and the timing of any purchases or redemptions.
You can find more information about the fund’s expenses, including annual expense ratios, in the Financial Statements section of this report. For additional information on operating expenses and other shareholder costs, please refer to your fund’s current prospectus.
| Six Months Ended August 31, 2020 | | | |
| | Beginning | Ending | Expenses |
| | Account Value | Account Value | Paid During |
| Total Corporate Bond ETF | 2/29/2020 | 8/31/2020 | Period |
| Based on Actual Fund Return | $1,000.00 | $1,029.47 | $0.26 |
| Based on Hypothetical 5% Yearly Return | 1,000.00 | 1,024.89 | 0.25 |
The calculations are based on acquired fund fees and expenses charged by the underlying mutual funds in which the Total Corporate Bond ETF invests. The Total Corporate Bond ETF’s annualized expense figure for the period is 0.05%. The dollar amounts shown as “Expenses Paid” are equal to the annualized average weighted expense ratio for the underlying funds multiplied by the average account value over the period, multiplied by the number of days in the most recent six-month period, then divided by the number of days in the most recent 12-month period (184/366).
Total Corporate Bond ETF
Performance Summary
All of the returns in this report represent past performance, which is not a guarantee of future results that may be achieved by the fund. (Current performance may be lower or higher than the performance data cited. For performance data current to the most recent month-end, visit our website at vanguard.com/performance.) Note, too, that both investment returns and principal value can fluctuate widely, so an investor’s shares, when sold, could be worth more or less than their original cost. The returns shown do not reflect taxes that a shareholder would pay on fund distributions or on the sale of fund shares.
Cumulative Performance: November 7, 2017, Through August 31, 2020
Initial Investment of $10,000
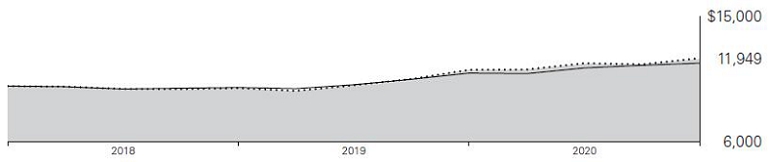
| | | Average Annual Total Returns | |
| | | Periods Ended August 31, 2020 | |
| | | | Since | Final Value |
| | | One | Inception | of a $10,000 |
| | | Year | (11/7/2017) | Investment |
 | Total Corporate Bond ETF Net Asset Value | 7.18% | 6.53% | $11,949 |
| | Total Corporate Bond ETF Market Price | 7.07 | 6.55 | 11,955 |
 | Bloomberg Barclays U.S. Corporate Bond Index | 7.50 | 6.70 | 12,003 |
 | Bloomberg Barclays U.S. Aggregate Float Adjusted Index | 6.57 | 5.56 | 11,646 |
“Since Inception” performance is calculated from the ETF Shares’ inception date for both the fund and its comparative standards.
See Financial Highlights for dividend and capital gains information.
Total Corporate Bond ETF
| Cumulative Returns of ETF Shares: November 7, 2017, Through August 31, 2020 | |
| | | Since |
| | One | Inception |
| | Year | (11/7/2017) |
| Total Corporate Bond ETF Market Price | 7.07% | 19.55% |
| Total Corporate Bond ETF Net Asset Value | 7.18 | 19.49 |
| Bloomberg Barclays U.S. Corporate Bond Index | 7.50 | 20.03 |
“Since Inception” performance is calculated from the ETF Shares’ inception date for both the fund and its comparative standards.
The market price is determined by the midpoint of the bid-offer spread as of the closing time of the New York Stock Exchange (generally 4 p.m., Eastern time). The net asset value is also determined as of the NYSE closing time. For more information about how the ETF Shares’ market prices have compared with their net asset value, visit vanguard.com, select your ETF, and then select the Price and Performance tab. The ETF premium/discount analysis there shows the percentages of days on which the ETF Shares’ market price was above or below the NAV.
Total Corporate Bond ETF
| Underlying Vanguard Funds | |
| As of August 31, 2020 | |
| | |
| Vanguard Long-Term Corporate Bond ETF | 38.0% |
| Vanguard Short-Term Corporate Bond ETF | 31.9 |
| Vanguard Intermediate-Term Corporate Bond ETF | 30.1 |
The table reflects the fund’s investments, except for short-term investments.
Total Corporate Bond ETF
Financial Statements
Schedule of Investments
As of August 31, 2020
The fund files its complete schedule of portfolio holdings with the Securities and Exchange Commission (SEC) for the first and third quarters of each fiscal year as an exhibit to its reports on Form N-PORT. The fund’s Form N-PORT reports are available on the SEC’s website at www.sec.gov.
| | | Market | |
| | | Value• | |
| | Shares | ($000 | ) |
| Investment Companies (100.0%) | | | |
| U.S. Bond Funds (100.0%) | | | |
| Vanguard Long-Term Corporate Bond ETF | 2,187,507 | 235,157 | |
| Vanguard Short-Term Corporate Bond ETF | 2,374,144 | 197,267 | |
| Vanguard Intermediate-Term Corporate Bond ETF | 1,932,284 | 186,253 | |
| Total Investment Companies (Cost $596,820) | | 618,677 | |
| Temporary Cash Investment (0.0%) | | | |
| Money Market Fund (0.0%) | | | |
| 1 Vanguard Market Liquidity Fund, 0.147% (Cost $14) | 138 | 14 | |
| Total Investments (100.0%) (Cost $596,834) | | 618,691 | |
| Other Assets and Liabilities—Net (0.0%) | | (7 | ) |
| Net Assets (100%) | | 618,684 | |
Cost is in $000.
| • | | See Note A in Notes to Financial Statements. |
| 1 | | Affiliated money market fund available only to Vanguard funds and certain trusts and accounts managed by Vanguard. Rate shown is the 7-day yield. |
See accompanying Notes, which are an integral part of the Financial Statements.
Total Corporate Bond ETF
| Statement of Assets and Liabilities | |
| As of August 31, 2020 | |
| | |
| ($000s, except shares and per-share amounts) | Amount |
| Assets | |
| Investments in Securities, at Value—Affiliated Funds (Cost $596,834) | 618,691 |
| Cash | 1 |
| Cash Collateral Received for ETF Capital Activity | 1,903 |
| Receivables for Investment Securities Sold | 3,442 |
| Total Assets | 624,037 |
| Liabilities | |
| Payables for Investment Securities Purchased | 3,450 |
| Collateral for ETF Capital Activity | 1,903 |
| Total Liabilities | 5,353 |
| Net Assets | 618,684 |
| | |
| | |
| At August 31, 2020, net assets consisted of: | |
| | |
| Paid-in Capital | 597,102 |
| Total Distributable Earnings (Loss) | 21,582 |
| Net Assets | 618,684 |
| | |
| Net Assets | |
| Applicable to 6,680,000 outstanding $.001 par value shares of beneficial interest (unlimited authorization) | 618,684 |
| Net Asset Value Per Share | $92.62 |
See accompanying Notes, which are an integral part of the Financial Statements.
Total Corporate Bond ETF
| Statement of Operations | |
| | Year Ended |
| | August 31, 2020 |
| | ($000) |
| Investment Income | |
| Income | |
| Income Distributions Received from Affiliated Funds | 11,005 |
| Net Investment Income—Note B | 11,005 |
| Realized Net Gain (Loss) on Affiliated Funds Sold1 | 1,932 |
| Change in Unrealized Appreciation (Depreciation) from Affiliated Funds | 12,234 |
| Net Increase (Decrease) in Net Assets Resulting from Operations | 25,171 |
1 Includes $2,157,000 of net gain (loss) resulting from in-kind redemptions.
See accompanying Notes, which are an integral part of the Financial Statements.
Total Corporate Bond ETF
| Statement of Changes in Net Assets | |
| | Year Ended August 31, |
| | 2020 | 2019 |
| | ($000) | ($000) |
| Increase (Decrease) in Net Assets | | |
| Operations | | |
| Net Investment Income | 11,005 | 3,876 |
| Realized Net Gain (Loss) | 1,932 | 3,437 |
| Change in Unrealized Appreciation (Depreciation) | 12,234 | 11,001 |
| Net Increase (Decrease) in Net Assets Resulting from Operations | 25,171 | 18,314 |
| Distributions1 | | |
| Total Distributions | (11,058) | (3,825) |
| Capital Share Transactions | | |
| Issued | 468,094 | 182,867 |
| Issued in Lieu of Cash Distributions | — | — |
| Redeemed | (66,422) | (49,530) |
| Net Increase (Decrease) from Capital Share Transactions | 401,672 | 133,337 |
| Total Increase (Decrease) | 415,785 | 147,826 |
| Net Assets | | |
| Beginning of Period | 202,899 | 55,073 |
| End of Period | 618,684 | 202,899 |
1 Certain prior period numbers have been reclassified to conform with current period presentation.
See accompanying Notes, which are an integral part of the Financial Statements.
Total Corporate Bond ETF
Financial Highlights
| | | | Nov. 7, |
| | Year Ended | 20171 to |
| | August 31, | Aug. 31, |
| For a Share Outstanding Throughout Each Period | 2020 | 2019 | 2018 |
| Net Asset Value, Beginning of Period | $89.19 | $81.59 | $85.00 |
| Investment Operations | | | |
| Net Investment Income2 | 2.638 | 2.825 | 2.081 |
| Capital Gain Distributions Received | — | — | — |
| Net Realized and Unrealized Gain (Loss) on Investments | 3.614 | 7.717 | (3.445) |
| Total from Investment Operations | 6.252 | 10.542 | (1.364) |
| Distributions | | | |
| Dividends from Net Investment Income | (2.822) | (2.942) | (2.046) |
| Distributions from Realized Capital Gains | — | — | — |
| Total Distributions | (2.822) | (2.942) | (2.046) |
| Net Asset Value, End of Period | $92.62 | $89.19 | $81.59 |
| | | | |
| Total Return | 7.18% | 13.29% | -1.60% |
| | | | |
| Ratios/Supplemental Data | | | |
| Net Assets, End of Period (Millions) | $619 | $203 | $55 |
| Ratio of Total Expenses to Average Net Assets | — | — | —* |
| Acquired Fund Fees and Expenses | 0.05% | 0.05% | 0.07%* |
| Ratio of Net Investment Income to Average Net Assets | 2.94% | 3.38% | 3.10%* |
| Portfolio Turnover Rate3 | 40% | 12% | 4% |
| * | Annualized. |
| 1 | Inception. |
| 2 | Calculated based on average shares outstanding. |
| 3 | Excludes the value of portfolio securities received or delivered as a result of in-kind purchases or redemptions of the fund’s capital shares, included ETF Creation Units. |
See accompanying Notes, which are an integral part of the Financial Statements.
Total Corporate Bond ETF
Notes to Financial Statements
Vanguard Total Corporate Bond ETF is registered under the Investment Company Act of 1940 as an open-end investment company, or mutual fund. The fund seeks to match the performance of its target index by investing in select bond index ETFs. ETF Shares are listed for trading on Nasdaq; they can be purchased and sold through a broker. Financial statements and other information about each underlying fund are available on vanguard.com.
Market disruptions associated with the COVID-19 pandemic have had a global impact, and uncertainty exists as to the long-term implications. Such disruptions can adversely affect assets of the fund and thus fund performance.
A. The following significant accounting policies conform to generally accepted accounting principles for U.S. investment companies. The fund consistently follows such policies in preparing its financial statements.
1. Security Valuation: Underlying ETFs are valued at the latest quoted sales prices or official closing prices taken from their primary market or, if not traded on the valuation date, at the mean of the latest quoted bid and asked prices. Investments in Vanguard Market Liquidity Fund are valued at that fund’s net asset value.
2. Federal Income Taxes: The fund intends to continue to qualify as a regulated investment company and distribute all of its taxable income. The fund’s tax returns are open to examination by the relevant tax authorities until expiration of the applicable statute of limitations, which is generally three years after the filing of the tax return. Management has analyzed the fund’s tax positions taken for all open federal and state income tax years, and has concluded that no provision for income tax is required in the fund’s financial statements.
3. Distributions: Distributions to shareholders are recorded on the ex-dividend date. Distributions are determined on a tax basis at the fiscal year-end and may differ from net investment income and realized capital gains for financial reporting purposes.
4. Collateral for ETF Capital Activity: When an authorized participant fails to deliver one or more of the securities within a designated basket (in the case of a subscription) or fails to deliver the fund ETF Shares (in the case of a redemption), the fund may require the authorized participant to deliver and maintain cash collateral in accordance with the authorized participant agreement. The fund may invest the collateral in short-term debt instruments or U.S. Treasury securities, or maintain the balance as cash. Daily market fluctuations could cause the value of the missing securities or fund ETF Shares to be more or less than the value of the collateral received; when this occurs the collateral is adjusted. The fund earns interest income from investments and/or custody fee offsets from the cash balance. The fund records an asset (cash or investment, as applicable) and a corresponding liability for the return of the collateral in the Statement of Assets and Liabilities. Interest income and custody fee offsets earned on the investment of collateral are included in the Statement of Operations.
5. Credit Facilities and Interfund Lending Program: The fund and certain other funds managed by The Vanguard Group (“Vanguard”) participate in a $4.3 billion committed credit facility provided by a syndicate of lenders pursuant to a credit agreement and an uncommitted credit facility provided by Vanguard. Both facilities may be renewed annually. Each fund is individually liable for its borrowings, if any, under the credit facilities. Borrowings may be utilized for temporary or emergency purposes, subject to the fund’s regulatory and contractual borrowing restrictions. With respect to the committed credit facility, the participating funds are charged administrative fees and an annual commitment fee
Total Corporate Bond ETF
of 0.10% of the undrawn committed amount of the facility; these fees are allocated to the funds based on a method approved by the fund’s board of trustees and borne by the funds in which the fund invests (see Note B). Any borrowings under either facility bear interest at a rate based upon the higher of the one-month London Interbank Offered Rate (or an acceptable alternate rate, if necessary), federal funds effective rate, or overnight bank funding rate plus an agreed-upon spread, except that borrowings under the uncommitted credit facility may bear interest based upon an alternative rate agreed to by the fund and Vanguard.
In accordance with an exemptive order (the “Order”) from the SEC, the fund may participate in a joint lending and borrowing program that allows registered open-end Vanguard funds to borrow money from and lend money to each other for temporary or emergency purposes (the “Interfund Lending Program”), subject to compliance with the terms and conditions of the Order, and to the extent permitted by the fund’s investment objective and investment policies. Interfund loans and borrowings normally extend overnight, but can have a maximum duration of seven days. Loans may be called on one business day’s notice. The interest rate to be charged is governed by the conditions of the Order and internal procedures adopted by the board of trustees. The board of trustees is responsible for overseeing the Interfund Lending Program.
For the year ended August 31, 2020, the fund did not utilize the credit facilities or the Interfund Lending Program.
6. Other: Income and capital gain distributions received are recorded on the ex-dividend date. Security transactions are accounted for on the date securities are bought or sold. Costs used to determine realized gains (losses) on the sale of investment securities are those of the specific securities sold.
B. In accordance with the terms of a Funds’ Service Agreement (the “FSA”) between Vanguard and the fund, Vanguard furnishes to the fund investment advisory, corporate management, administrative, marketing, and distribution services at Vanguard’s cost of operations (as defined by the FSA). These costs of operations are allocated to the fund based on methods and guidelines approved by the board of trustees. The FSA provides that expenses otherwise allocable to Vanguard funds-of-funds may be reduced or eliminated to the extent of savings realized by the underlying Vanguard funds by virtue of being part of a fund-of-funds. Accordingly, all expenses for services provided by Vanguard to the fund and all other expenses incurred by the fund during the period ended August 31, 2020, were borne by the underlying Vanguard funds in which the fund invests. The fund’s trustees and officers are also trustees and officers, respectively, of the underlying Vanguard funds, as well as directors and employees, respectively, of Vanguard.
C. Various inputs may be used to determine the value of the fund’s investments. These inputs are summarized in three broad levels for financial statement purposes. The inputs or methodologies used to value securities are not necessarily an indication of the risk associated with investing in those securities.
Level 1—Quoted prices in active markets for identical securities.
Level 2—Other significant observable inputs (including quoted prices for similar securities, interest rates, prepayment speeds, credit risk, etc.).
Level 3—Significant unobservable inputs (including the fund’s own assumptions used to determine the fair value of investments). Any investments valued with significant unobservable inputs are noted on the Schedule of Investments.
Total Corporate Bond ETF
At August 31, 2020, 100% of the market value of the fund’s investments was determined based on Level 1 inputs.
D. Permanent differences between book-basis and tax-basis components of net assets are reclassified among capital accounts in the financial statements to reflect their tax character. These reclassifications have no effect on net assets or net asset value per share. As of period end, permanent differences primarily attributable to the accounting for in-kind redemptions were reclassified between the following accounts:
| | Amount | |
| | ($000 | ) |
| Paid-in Capital | 2,157 | |
| Total Distributable Earnings (Loss) | (2,157 | ) |
Temporary differences between book-basis and tax-basis components of total distributable earnings (loss) arise when certain items of income, gain, or loss are recognized in different periods for financial statement and tax purposes; these differences will reverse at some time in the future. The differences are primarily related to the deferral of losses from wash sales. As of period end, the tax-basis components of total distributable earnings (loss) are detailed in the table as follows:
| | | Amount | |
| | | ($000 | ) |
| Undistributed Ordinary Income | | 14 | |
| Undistributed Long-Term Gains | | — | |
| Capital Loss Carryforwards | | (289 | ) |
| Qualified Late-Year Losses | | — | |
| Net Unrealized Gains (Losses) | | 21,857 | |
The tax character of distributions paid was as follows:
| | | Year Ended August 31, | |
| | | 2020 | | | 2019 | |
| | | Amount | | | Amount | |
| | | ($000 | ) | | ($000 | ) |
| Ordinary Income* | | 11,058 | | | 3,825 | |
| Long-Term Capital Gains | | — | | | — | |
| Total | | 11,058 | | | 3,825 | |
*Includes short-term capital gains, if any.
Total Corporate Bond ETF
As of August 31, 2020, gross unrealized appreciation and depreciation for investments based on cost for U.S. federal income tax purposes were as follows:
| | | Amount | |
| | | ($000 | ) |
| Tax Cost | | 596,834 | |
| Gross Unrealized Appreciation | | 23,790 | |
| Gross Unrealized Depreciation | | (1,933 | ) |
| Net Unrealized Appreciation (Depreciation) | | 21,857 | |
E. Capital shares issued and redeemed were:
| | | Year Ended August 31, | |
| | | 2020 | | | 2019 | |
| | | Shares | | | Shares | |
| | | (000 | ) | | (000 | ) |
| Issued | | 5,185 | | | 2,175 | |
| Issued in Lieu of Cash Distributions | | — | | | — | |
| Redeemed | | (780 | ) | | (575 | ) |
| Net Increase (Decrease) in Shares Outstanding | | 4,405 | | | 1,600 | |
F. Transactions during the period in affiliated underlying Vanguard funds were as follows:
| | | | | | Current Period Transactions | | | |
| | | Aug. 31, | | | | | | Proceeds | | | Realized | | | | | | | | | | | | Aug. 31, | |
| | | 2019 | | | | | | from | | | Net | | | Change in | | | | | | Capital Gain | | | 2020 | |
| | | Market | | | Purchases | | | Securities | | | Gain | | | Unrealized | | | | | | Distributions | | | Market | |
| | | Value | | | at Cost1 | | | Sold2 | | | (Loss | ) | | App. (Dep. | ) | | Income | | | Received | | | Value | |
| | | ($000 | ) | | ($000 | ) | | ($000 | ) | | ($000 | ) | | ($000 | ) | | ($000 | ) | | ($000 | ) | | ($000 | ) |
| Vanguard Intermediate-Term Corporate Bond ETF | | 59,530 | | | 164,254 | | | 43,754 | | | 754 | | | 5,469 | | | 3,164 | | | — | | | 186,253 | |
| Vanguard Long-Term Corporate Bond ETF | | 71,293 | | | 248,324 | | | 89,455 | | | 1,223 | | | 3,772 | | | 4,657 | | | — | | | 235,157 | |
| Vanguard Market Liquidity Fund | | 27 | | | NA3 | | | NA3 | | | — | | | — | | | 1 | | | — | | | 14 | |
| Vanguard Short-Term Corporate Bond ETF | | 72,064 | | | 206,299 | | | 84,044 | | | (45 | ) | | 2,993 | | | 3,183 | | | — | | | 197,267 | |
| Total | | 202,914 | | | 618,877 | | | 217,253 | | | 1,932 | | | 12,234 | | | 11,005 | | | — | | | 618,691 | |
1 Includes $468,035,000 of portfolio securities received as a result of in-kind purchases of the fund’s capital shares.
2 Includes $65,797,000 of portfolio securities delivered as a result of in-kind redemptions of the fund’s capital shares.
3 Not applicable—purchases and sales are for temporary cash investment purposes.
G. Management has determined that no events or transactions occurred subsequent to August 31, 2020, that would require recognition or disclosure in these financial statements.
Report of Independent Registered Public Accounting Firm
To the Board of Trustees of Vanguard Scottsdale Funds and Shareholders of Vanguard Total Corporate Bond ETF
Opinion on the Financial Statements
We have audited the accompanying statement of assets and liabilities, including the schedule of investments, of Vanguard Total Corporate Bond ETF (one of the funds constituting Vanguard Scottsdale Funds, referred to hereafter as the “Fund”) as of August 31, 2020, the related statement of operations for the year ended August 31, 2020, the statement of changes in net assets for each of the two years in the period ended August 31, 2020, including the related notes, and the financial highlights for each of the periods indicated therein (collectively referred to as the “financial statements”). In our opinion, the financial statements present fairly, in all material respects, the financial position of the Fund as of August 31, 2020, the results of its operations for the year then ended, the changes in its net assets for each of the two years in the period ended August 31, 2020 and the financial highlights for each of the periods indicated therein in conformity with accounting principles generally accepted in the United States of America.
Basis for Opinion
These financial statements are the responsibility of the Fund’s management. Our responsibility is to express an opinion on the Fund’s financial statements based on our audits. We are a public accounting firm registered with the Public Company Accounting Oversight Board (United States) (“PCAOB”) and are required to be independent with respect to the Fund in accordance with the U.S. federal securities laws and the applicable rules and regulations of the Securities and Exchange Commission and the PCAOB.
We conducted our audits of these financial statements in accordance with the standards of the PCAOB. Those standards require that we plan and perform the audit to obtain reasonable assurance about whether the financial statements are free of material misstatement, whether due to error or fraud.
Our audits included performing procedures to assess the risks of material misstatement of the financial statements, whether due to error or fraud, and performing procedures that respond to those risks. Such procedures included examining, on a test basis, evidence regarding the amounts and disclosures in the financial statements. Our audits also included evaluating the accounting principles used and significant estimates made by management, as well as evaluating the overall presentation of the financial statements. Our procedures included confirmation of securities owned as of August 31, 2020 by correspondence with the custodian, transfer agent and brokers; when replies were not received from brokers, we performed other auditing procedures. We believe that our audits provide a reasonable basis for our opinion.
/s/PricewaterhouseCoopers LLP
Philadelphia, Pennsylvania
October 15, 2020
We have served as the auditor of one or more investment companies in The Vanguard Group of Funds since 1975.
Special 2020 tax information (unaudited) for Vanguard Total Corporate Bond ETF
This information for the fiscal year ended August 31, 2020, is included pursuant to provisions of the Internal Revenue Code.
For nonresident alien shareholders, 83.8% of income dividends are interest-related dividends.
Trustees Approve Advisory Arrangement
The board of trustees of Vanguard Total Corporate Bond ETF has renewed the fund’s investment advisory arrangement with The Vanguard Group, Inc. (Vanguard), through its Fixed Income Group. The board determined that continuing the fund’s internalized management structure was in the best interests of the fund and its shareholders.
The board based its decision upon an evaluation of the advisor’s investment staff, portfolio management process, and performance. This evaluation included information provided to the board by Vanguard’s Portfolio Review Department, which is responsible for fund and advisor oversight and product management. The Portfolio Review Department met regularly with the advisor and made monthly presentations to the board during the fiscal year that directed the board’s focus to relevant information and topics.
The board, or an investment committee made up of board members, also received information throughout the year during advisor presentations. For each advisor presentation, the board was provided with letters and reports that included information about, among other things, the advisory firm and the advisor’s assessment of the investment environment, portfolio performance, and portfolio characteristics.
In addition, the board received monthly reports, which included a Market and Economic Report, a Fund Dashboard Monthly Summary, and a Fund Performance Report.
Prior to their meeting, the trustees were provided with a memo and materials that summarized the information they received over the course of the year. They also considered the factors discussed below, among others. However, no single factor determined whether the board approved the arrangement. Rather, it was the totality of the circumstances that drove the board’s decision.
Nature, extent, and quality of services
The board reviewed the quality of the investment management services provided to the fund since its inception in 2017 and took into account the organizational depth and stability of the advisor. The board considered that Vanguard has been managing investments for more than four decades. The Fixed Income Group adheres to a sound, disciplined investment management process; the team has considerable experience, stability, and depth.
The board concluded that Vanguard’s experience, stability, depth, and performance, among other factors, warranted continuation of the advisory arrangement.
Investment performance
The board considered the fund’s performance since its inception, including any periods of outperformance or underperformance compared with its target index and peer group. The board concluded that the performance was such that the advisory arrangement should continue.
Cost
The board concluded that the fund’s acquired fund fees and expenses were well below the average expense ratio charged by funds in its peer group. The fund does not incur advisory expenses directly; however, the board noted that each of the underlying funds in which the fund invests has advisory expenses well below the relevant peer-group average.
The board does not conduct a profitability analysis of Vanguard because of Vanguard’s unique structure. Unlike most other mutual fund management companies, Vanguard is owned by the funds it oversees.
The benefit of economies of scale
The board concluded that Vanguard’s arrangement with the fund ensures that the fund will realize economies of scale as it grows, with the cost to shareholders declining as fund assets increase.
The board will consider whether to renew the advisory arrangement again after a one-year period.
Liquidity Risk Management
Vanguard funds (except for the money market funds) have adopted and implemented a written liquidity risk management program (the “Program”) as required by Rule 22e-4 under the Investment Company Act of 1940. Rule 22e-4 requires that each fund adopt a program that is reasonably designed to assess and manage the fund’s liquidity risk, which is the risk that the fund could not meet redemption requests without significant dilution of remaining investors’ interests in the fund.
Assessment and management of a fund’s liquidity risk under the Program take into consideration certain factors, such as the fund’s investment strategy and the liquidity of its portfolio investments during normal and reasonably foreseeable stressed conditions, its short- and long-term cash-flow projections during both normal and reasonably foreseeable stressed conditions, and its cash and cash-equivalent holdings and access to other funding sources. As required by the rule, the Program includes policies and procedures for classification of fund portfolio holdings in four liquidity categories, maintaining certain levels of highly liquid investments, and limiting holdings of illiquid investments.
The board of trustees of Vanguard Scottsdale Funds approved the appointment of liquidity risk management program administrators responsible for administering Vanguard Total Corporate Bond ETF’s Program and for carrying out the specific responsibilities set forth in the Program, including reporting to the board on at least an annual basis regarding the Program’s operation, its adequacy, and the effectiveness of its implementation for the past year (the “Program Administrator Report”). The board has reviewed the Program Administrator Report covering the period from December 1, 2018, through December 31, 2019 (the “Review Period”). The Program Administrator Report stated that during the Review Period the Program operated and was implemented effectively to manage the fund’s liquidity risk.
BLOOMBERG is a trademark and service mark of Bloomberg Finance L.P. BARCLAYS is a trademark and service mark of Barclays Bank Plc, used under license. Bloomberg Finance L.P. and its affiliates, including Bloomberg Index Services Limited (BISL) (collectively, Bloomberg), or Bloomberg’s licensors, own all proprietary rights in the Bloomberg Barclays U.S. Corporate Bond Index, including its component Bloomberg Barclays U.S. 1–5 Year Corporate Bond Index, Bloomberg Barclays U.S. 5–10 Year Corporate Bond Index, and Bloomberg Barclays U.S. 10+ Year Corporate Bond Index (the Indices or Bloomberg Barclays Indices).
Neither Barclays Bank Plc, Barclays Capital Inc., or any affiliate (collectively Barclays) or Bloomberg is the issuer or producer of Vanguard Total Corporate Bond ETF, including Vanguard Short-Term Corporate Bond ETF, Vanguard Intermediate-Term Corporate Bond ETF, and Vanguard Long-Term Corporate Bond ETF (collectively, ETFs), and neither Bloomberg nor Barclays has any responsibilities, obligations or duties to investors in the ETFs. The Indices are licensed for use by The Vanguard Group, Inc. (Vanguard) as the sponsor of the ETFs. Bloomberg and Barclays only relationship with Vanguard in respect of the Indices is the licensing of the Indices, which are determined, composed and calculated by BISL, or any successor thereto, without regard to the Issuer or the ETFs or the owners of the ETFs.
Additionally, Vanguard may for itself execute transaction(s) with Barclays in or relating to the Indices in connection with the ETFs. Investors acquire the ETFs from Vanguard and investors neither acquire any interest in the Indices nor enter into any relationship of any kind whatsoever with Bloomberg or Barclays upon making an investment in the ETFs. The ETFs are not sponsored, endorsed, sold or promoted by Bloomberg or Barclays. Neither Bloomberg nor Barclays makes any representation or warranty, express or implied regarding the advisability of investing in the ETFs or the advisability of investing in securities generally or the ability of the Indices to track corresponding or relative market performance. Neither Bloomberg nor Barclays has passed on the legality or suitability of the ETFs with respect to any person or entity. Neither Bloomberg nor Barclays is responsible for and has not participated in the determination of the timing of, prices at, or quantities of the ETFs to be issued. Neither Bloomberg nor Barclays has any obligation to take the needs of the Issuer or the owners of the ETFs or any other third party into consideration in determining, composing or calculating the Indices. Neither Bloomberg nor Barclays has any obligation or liability in connection with administration, marketing or trading of the ETFs.
The licensing agreement between Bloomberg and Barclays is solely for the benefit of Bloomberg and Barclays and not for the benefit of the owners of the ETFs, investors or other third parties. In addition, the licensing agreement between Vanguard and Bloomberg is solely for the benefit of Vanguard and Bloomberg and not for the benefit of the owners of the ETFs, investors or other third parties.
NEITHER BLOOMBERG NOR BARCLAYS SHALL HAVE ANY LIABILITY TO THE ISSUER, INVESTORS OR TO OTHER THIRD PARTIES FOR THE QUALITY, ACCURACY AND/OR COMPLETENESS OF THE INDICES OR ANY DATA INCLUDED THEREIN OR FOR INTERRUPTIONS IN THE DELIVERY OF THE INDICES. NEITHER BLOOMBERG NOR BARCLAYS MAKES ANY WARRANTY, EXPRESS OR IMPLIED, AS TO RESULTS TO BE OBTAINED BY THE ISSUER, THE INVESTORS OR ANY OTHER PERSON OR ENTITY FROM THE USE OF THE INDICES OR ANY DATA INCLUDED THEREIN. NEITHER BLOOMBERG NOR BARCLAYS MAKES ANY EXPRESS OR IMPLIED WARRANTIES, AND EACH HEREBY EXPRESSLY DISCLAIMS ALL WARRANTIES OF MERCHANTABILITY OR FITNESS FOR A PARTICULAR PURPOSE OR USE WITH RESPECT TO THE INDICES OR ANY DATA INCLUDED THEREIN. BLOOMBERG RESERVES THE RIGHT TO CHANGE THE METHODS OF CALCULATION OR PUBLICATION, OR TO CEASE THE CALCULATION OR PUBLICATION OF THE INDICES, AND NEITHER BLOOMBERG NOR BARCLAYS SHALL BE LIABLE FOR ANY MISCALCULATION OF OR ANY INCORRECT, DELAYED OR INTERRUPTED PUBLICATION WITH RESPECT TO ANY OF THE INDICES. NEITHER BLOOMBERG NOR BARCLAYS SHALL BE LIABLE FOR ANY DAMAGES, INCLUDING, WITHOUT LIMITATION, ANY SPECIAL, INDIRECT OR CONSEQUENTIAL DAMAGES, OR ANY LOST PROFITS AND EVEN IF ADVISED OF THE POSSIBILITY OF SUCH, RESULTING FROM THE USE OF THE INDICES OR ANY DATA INCLUDED THEREIN OR WITH RESPECT TO THE ETFS.
None of the information supplied by Bloomberg or Barclays and used in this publication may be reproduced in any manner without the prior written permission of both Bloomberg and Barclays Capital, the investment banking division of Barclays Bank Plc. Barclays Bank Plc is registered in England No. 1026167. Registered office 1 Churchill Place London E14 5HP.
© 2020 Bloomberg. Used with Permission.
Source: Bloomberg Index Services Limited. Copyright 2020, Bloomberg. All rights reserved.
This page intentionally left blank.
The People Who Govern Your Fund
The trustees of your mutual fund are there to see that the fund is operated and managed in your best interests since, as a shareholder, you are a part owner of the fund. Your fund’s trustees also serve on the board of directors of The Vanguard Group, Inc., which is owned by the Vanguard funds and provides services to them.
A majority of Vanguard’s board members are independent, meaning that they have no affiliation with Vanguard or the funds they oversee, apart from the sizable personal investments they have made as private individuals. The independent board members have distinguished backgrounds in business, academia, and public service. Each of the trustees and executive officers oversees 212 Vanguard funds.
Information for each trustee and executive officer of the fund appears below. That information, as well as the Vanguard fund count, is as of the date on the cover of this fund report. The mailing address of the trustees and officers is P.O. Box 876, Valley Forge, PA 19482. More information about the trustees is in the Statement of Additional Information, which can be obtained, without charge, by contacting Vanguard at 800-662-7447, or online at vanguard.com.
Interested Trustee1
Mortimer J. Buckley
Born in 1969. Trustee since January 2018. Principal occupation(s) during the past five years and other experience: chairman of the board (2019–present) of Vanguard and of each of the investment companies served by Vanguard; chief executive officer (2018–present) of Vanguard; chief executive officer, president, and trustee (2018–present) of each of the investment companies served by Vanguard; president and director (2017–present) of Vanguard; and president (2018–present) of Vanguard Marketing Corporation. Chief investment officer (2013–2017), managing director (2002–2017), head of the Retail Investor Group (2006–2012), and chief information officer (2001–2006) of Vanguard. Chairman of the board (2011–2017) and trustee (2009–2017) of the Children’s Hospital of Philadelphia; and trustee (2018–present) and vice chair (2019–present) of The Shipley School.
Independent Trustees
Emerson U. Fullwood
Born in 1948. Trustee since January 2008. Principal occupation(s) during the past five years and other experience: executive chief staff and marketing officer for North America and corporate vice president (retired 2008) of Xerox Corporation (document management products and services). Former president of the Worldwide Channels Group, Latin America, and Worldwide Customer Service and executive chief staff officer of Developing Markets of Xerox. Executive in residence and 2009–2010 Distinguished Minett Professor at the Rochester Institute of Technology. Director of SPX FLOW, Inc. (multi-industry manufacturing). Director of the University of Rochester Medical Center, the Monroe Community College Foundation, the United Way of Rochester, North Carolina A&T University, and Roberts Wesleyan College. Trustee of the University of Rochester.
Amy Gutmann
Born in 1949. Trustee since June 2006. Principal occupation(s) during the past five years and other experience: president (2004–present) of the University of Pennsylvania. Christopher H. Browne Distinguished Professor of Political Science, School of Arts and Sciences, and professor of communication, Annenberg School for Communication, with secondary faculty appointments in the Department of Philosophy, School of Arts and Sciences, and at the Graduate School of Education, University of Pennsylvania.
F. Joseph Loughrey
Born in 1949. Trustee since October 2009. Principal occupation(s) during the past five years and other experience: president and chief operating officer (retired 2009) and vice chairman of the board (2008–2009) of Cummins Inc. (industrial machinery). Chairman of the board of Hillenbrand, Inc. (specialized consumer services) and the Lumina Foundation. Director of the V Foundation. Member of the advisory
| 1 | Mr. Buckley is considered an “interested person,” as defined in the Investment Company Act of 1940, because he is an officer of the Vanguard funds. |
council for the College of Arts and Letters and chair of the advisory board to the Kellogg Institute for International Studies, both at the University of Notre Dame.
Mark Loughridge
Born in 1953. Trustee since March 2012. Principal occupation(s) during the past five years and other experience: senior vice president and chief financial officer (retired 2013) of IBM (information technology services). Fiduciary member of IBM’s Retirement Plan Committee (2004–2013), senior vice president and general manager (2002–2004) of IBM Global Financing, vice president and controller (1998–2002) of IBM, and a variety of other prior management roles at IBM. Member of the Council on Chicago Booth.
Scott C. Malpass
Born in 1962. Trustee since March 2012. Principal occupation(s) during the past five years and other experience: chief investment officer (retired June 2020) and vice president (retired June 2020) of the University of Notre Dame. Assistant professor of finance at the Mendoza College of Business, University of Notre Dame, and member of the Notre Dame 403(b) Investment Committee (retired June 2020). Member of the board of Catholic Investment Services, Inc. (investment advisors) and the board of superintendence of the Institute for the Works of Religion.
Deanna Mulligan
Born in 1963. Trustee since January 2018. Principal occupation(s) during the past five years and other experience: chief executive officer (2011–present) of The Guardian Life Insurance Company of America. President (2010–2019), chief operating officer (2010–2011), and executive vice president (2008–2010) of Individual Life and Disability of The Guardian Life Insurance Company of America. Member of the board of The Guardian Life Insurance Company of America, the American Council of Life Insurers, and the Economic Club of New York. Trustee of the Partnership for New York City (business leadership), Chief Executives for Corporate Purpose, NewYork-Presbyterian Hospital, Catalyst, and the Bruce Museum (arts and science). Member of the Advisory Council for the Stanford Graduate School of Business.
André F. Perold
Born in 1952. Trustee since December 2004. Principal occupation(s) during the past five years and other experience: George Gund Professor of Finance and Banking, Emeritus at the Harvard Business School (retired 2011). Chief investment officer and co-managing partner of HighVista Strategies (private investment firm). Member of the board of advisors and member of the investment committee of the Museum of Fine Arts Boston. Member of the board (2018–present) of RIT Capital Partners (investment firm). Member of the investment committee of Partners Health Care System.
Sarah Bloom Raskin
Born in 1961. Trustee since January 2018. Principal occupation(s) during the past five years and other experience: deputy secretary (2014–2017) of the United States Department of the Treasury. Governor (2010–2014) of the Federal Reserve Board. Commissioner (2007–2010) of financial regulation for the State of Maryland. Member of the board of directors (2012–2014) of Neighborhood Reinvestment Corporation. Director (2017–present) of i(x) Investments, LLC; director (2017–present) of Reserve Trust. Rubenstein Fellow (2017–present) of Duke University; trustee (2017–present) of Amherst College, and trustee (2019–present) of the Folger Shakespeare Library.
Peter F. Volanakis
Born in 1955. Trustee since July 2009. Principal occupation(s) during the past five years and other experience: president and chief operating officer (retired 2010) of Corning Incorporated (communications equipment) and director of Corning Incorporated (2000–2010) and Dow Corning (2001–2010). Director (2012) of SPX Corporation (multi-industry manufacturing). Overseer of the Amos Tuck School of Business Administration, Dartmouth College (2001–2013). Chairman of the board of trustees of Colby-Sawyer College. Member of the board of Hypertherm Inc. (industrial cutting systems, software, and consumables).
Executive Officers
John Bendl
Born in 1970. Principal occupation(s) during the past five years and other experience: principal of Vanguard. Chief financial officer (2019–present) of each of the investment companies served by Vanguard. Chief accounting officer, treasurer, and controller of Vanguard (2017–present). Partner (2003–2016) at KPMG (audit, tax, and advisory services).
Glenn Booraem
Born in 1967. Principal occupation(s) during the past five years and other experience: principal of Vanguard. Investment stewardship officer (2017–present), treasurer (2015–2017), controller (2010–2015), and assistant controller (2001–2010) of each of the investment companies served by Vanguard.
Christine M. Buchanan
Born in 1970. Principal occupation(s) during the past five years and other experience: principal of Vanguard. Treasurer (2017–present) of each of the investment companies served by Vanguard. Partner (2005–2017) at KPMG (audit, tax, and advisory services).
David Cermak
Born in 1960. Principal occupation(s) during the past five years and other experience: principal of Vanguard. Finance director (2019–present) of each of the investment companies served by Vanguard. Managing director and head (2017–present) of Vanguard Investments Singapore. Managing director and head (2017–2019) of Vanguard Investments Hong Kong. Representative director and head (2014–2017) of Vanguard Investments Japan.
Thomas J. Higgins
Born in 1957. Principal occupation(s) during the past five years and other experience: principal of Vanguard. Finance director (2019–present), chief financial officer (2008–2019), and treasurer (1998–2008) of each of the investment companies served by Vanguard.
Peter Mahoney
Born in 1974. Principal occupation(s) during the past five years and other experience: principal of Vanguard. Controller (2015–present) of each of the investment companies served by Vanguard. Head of International Fund Services (2008–2014) at Vanguard.
Anne E. Robinson
Born in 1970. Principal occupation(s) during the past five years and other experience: general counsel (2016–present) of Vanguard. Secretary (2016–present) of Vanguard and of each of the investment companies served by Vanguard. Managing director (2016–present) of Vanguard. Managing director and general counsel of Global Cards and Consumer Services (2014–2016) at Citigroup. Counsel (2003–2014) at American Express.
Michael Rollings
Born in 1963. Principal occupation(s) during the past five years and other experience: finance director (2017–present) and treasurer (2017) of each of the investment companies served by Vanguard. Managing director (2016–present) of Vanguard. Chief financial officer (2016–present) of Vanguard. Director (2016–present) of Vanguard Marketing Corporation. Executive vice president and chief financial officer (2006–2016) of MassMutual Financial Group.
John E. Schadl
Born in 1972. Principal occupation(s) during the past five years and other experience: principal of Vanguard. Chief compliance officer (2019–present) of Vanguard and of each of the investment companies served by Vanguard. Assistant vice president (2019–present) of Vanguard Marketing Corporation.
| Vanguard Senior Management Team |
| | |
| Joseph Brennan | Chris D. McIsaac |
| Mortimer J. Buckley | James M. Norris |
| Gregory Davis | Thomas M. Rampulla |
| John James | Karin A. Risi |
| Martha G. King | Anne E. Robinson |
| John T. Marcante | Michael Rollings |
Connect with Vanguard® > vanguard.com
Fund Information > 800-662-7447
Direct Investor Account Services > 800-662-2739
Institutional Investor Services > 800-523-1036
Text Telephone for People
Who Are Deaf or Hard of Hearing > 800-749-7273
This material may be used in conjunction with the offering of shares of any Vanguard fund only if preceded or accompanied by the fund’s current prospectus.
All comparative mutual fund data are from Morningstar, Inc., unless otherwise noted.
You can obtain a free copy of Vanguard’s proxy voting guidelines by visiting vanguard.com/proxyreporting or by calling Vanguard at 800-662-2739. The guidelines are also available from the SEC’s website, www.sec.gov. In addition, you may obtain a free report on how your fund voted the proxies for securities it owned during the 12 months ended June 30. To get the report, visit either vanguard.com/proxyreporting or www.sec.gov.
You can review information about your fund on the SEC’s website, and you can receive copies of this information, for a fee, by sending a request via email addressed to publicinfo@sec.gov.
© 2020 The Vanguard Group, Inc.
All rights reserved.
Vanguard Marketing Corporation, Distributor.
Q9850 102020

| | Annual Report | August 31, 2020 Vanguard Total World Bond ETF | |
| | See the inside front cover for important information about access to your fund’s annual and semiannual shareholder reports. | |
Important information about access to shareholder reports
Beginning on January 1, 2021, as permitted by regulations adopted by the Securities and Exchange Commission, paper copies of your fund’s annual and semiannual shareholder reports will no longer be sent to you by mail, unless you specifically request them. Instead, you will be notified by mail each time a report is posted on the website and will be provided with a link to access the report.
If you have already elected to receive shareholder reports electronically, you will not be affected by this change and do not need to take any action. You may elect to receive shareholder reports and other communications from the fund electronically by contacting your financial intermediary (such as a broker-dealer or bank) or, if you invest directly with the fund, by calling Vanguard at one of the phone numbers on the back cover of this report or by logging on to vanguard.com.
You may elect to receive paper copies of all future shareholder reports free of charge. If you invest through a financial intermediary, you can contact the intermediary to request that you continue to receive paper copies. If you invest directly with the fund, you can call Vanguard at one of the phone numbers on the back cover of this report or log on to vanguard.com. Your election to receive paper copies will apply to all the funds you hold through an intermediary or directly with Vanguard.
| Contents | |
| | |
| Your Fund’s Performance at a Glance | 1 |
| About Your Fund’s Expenses | 2 |
| Performance Summary | 4 |
| Financial Statements | 7 |
| Trustees Approve Advisory Arrangements | 18 |
| Liquidity Risk Management | 20 |
Please note: The opinions expressed in this report are just that—informed opinions. They should not be considered promises or advice. Also, please keep in mind that the information and opinions cover the period through the date on the front of this report. Of course, the risks of investing in your fund are spelled out in the prospectus.
Your Fund’s Performance at a Glance
· Vanguard Total World Bond ETF returned 3.69% for the 12 months ended August 31, 2020, roughly in line with the 3.73% return of its expense-free benchmark.
· A number of stock market indexes around the world climbed to record highs in February and then plummeted as the coronavirus spread outside of China. This led to lockdowns, the shuttering of nonessential businesses, and travel restrictions in many countries. However, the unprecedented scale of the response from policymakers, the start of trials for vaccines and treatments, and the easing of some pandemic-related restrictions helped lift investor sentiment.
· The pandemic contributed to a spike in volatility and an erosion in liquidity in the bond markets in March. Bond yields nevertheless ended the period significantly lower—and bond prices ended higher.
· The United States, which accounted for more than 40% of the ETF’s assets at the end of the fiscal year, outperformed. European bonds produced a positive return, in contrast to another heavyweight in the index, Japan, which posted a slightly negative result.
· Corporate bonds tended to fare better than government bonds, with debt issued by utilities outpacing that of industrial companies and financial institutions.
Market Barometer
| | Average Annual Total Returns |
| | Periods Ended August 31, 2020 |
| | One Year | Three Years | Five Years |
| Stocks | | | |
| Russell 1000 Index (Large-caps) | 22.50% | 14.58% | 14.31% |
| Russell 2000 Index (Small-caps) | 6.02 | 5.03 | 7.65 |
| Russell 3000 Index (Broad U.S. market) | 21.44 | 13.95 | 13.86 |
| FTSE All-World ex US Index (International) | 8.78 | 2.92 | 6.00 |
| | | | |
| Bonds | | | |
Bloomberg Barclays U.S. Aggregate Bond Index
(Broad taxable market) | 6.47% | 5.09% | 4.33% |
Bloomberg Barclays Municipal Bond Index
(Broad tax-exempt market) | 3.24 | 4.09 | 3.99 |
| FTSE Three-Month U.S. Treasury Bill Index | 1.18 | 1.67 | 1.15 |
| | | | |
| CPI | | | |
| Consumer Price Index | 1.31% | 1.92% | 1.75% |
About Your Fund’s Expenses
As a shareholder of the fund, you incur ongoing costs, which include costs for portfolio management, administrative services, and shareholder reports (like this one), among others. Operating expenses, which are deducted from a fund’s gross income, directly reduce the investment return of the fund.
A typical fund’s expenses are expressed as a percentage of its average net assets. The Total World Bond ETF has no direct expenses, but bears its proportionate share of the costs for the underlying funds in which it invests. These indirect expenses make up the acquired fund fees and expenses, also expressed as a percentage of average net assets.
The following examples are intended to help you understand the ongoing cost (in dollars) of investing in your fund and to compare these costs with those of other mutual funds. The examples are based on an investment of $1,000 made at the beginning of the period shown and held for the entire period. The costs were calculated using the acquired fund fees and expenses for the Total World Bond ETF.
The accompanying table illustrates your fund’s costs in two ways:
· Based on actual fund return. This section helps you to estimate the actual expenses that you paid over the period. The ”Ending Account Value“ shown is derived from the fund‘s actual return, and the third column shows the dollar amount that would have been paid by an investor who started with $1,000 in the fund. You may use the information here, together with the amount you invested, to estimate the expenses that you paid over the period.
To do so, simply divide your account value by $1,000 (for example, an $8,600 account value divided by $1,000 = 8.6), then multiply the result by the number given for your fund under the heading ”Expenses Paid During Period.“
· Based on hypothetical 5% yearly return. This section is intended to help you compare your fund‘s costs with those of other mutual funds. It assumes that the fund had a yearly return of 5% before expenses, but that the expense ratio is unchanged. In this case—because the return used is not the fund’s actual return—the results do not apply to your investment. The example is useful in making comparisons because the Securities and Exchange Commission requires all mutual funds to calculate expenses based on a 5% return. You can assess your fund’s costs by comparing this hypothetical example with the hypothetical examples that appear in shareholder reports of other funds.
Note that the expenses shown in the table are meant to highlight and help you compare ongoing costs only and do not reflect transaction costs incurred by the fund for buying and selling securities. Further, the expenses do not include any purchase, redemption, or account service fees described in the fund prospectus. If such fees were applied to your account, your costs would be higher. Your fund does not carry a “sales load.”
The calculations assume no shares were bought or sold during the period. Your actual costs may have been higher or lower, depending on the amount of your investment and the timing of any purchases or redemptions.
You can find more information about the fund’s expenses, including annual expense ratios, in the Financial Statements section of this report. For additional information on operating expenses and other shareholder costs, please refer to your fund’s current prospectus.
Six Months Ended August 31, 2020
| | Beginning | Ending | Expenses |
| | Account Value | Account Value | Paid During |
| Total World Bond ETF | 2/29/2020 | 8/31/2020 | Period |
| Based on Actual Fund Return | $1,000.00 | $1,016.28 | $0.30 |
| Based on Hypothetical 5% Yearly Return | 1,000.00 | 1,024.83 | 0.31 |
The calculations are based on acquired fund fees and expenses charged by the underlying mutual funds in which the Total World Bond ETF invests. The Total World Bond ETF’s annualized expense figure for the period is 0.06%. The dollar amounts shown as ”Expenses Paid” are equal to the annualized average weighted expense ratio for the underlying funds multiplied by the average account value over the period, multiplied by the number of days in the most recent six-month period, then divided by the number of days in the most recent 12-month period (184/366).
Total World Bond ETF
Performance Summary
All of the returns in this report represent past performance, which is not a guarantee of future results that may be achieved by the fund. (Current performance may be lower or higher than the performance data cited. For performance data current to the most recent month-end, visit our website at vanguard.com/performance.) Note, too, that both investment returns and principal value can fluctuate widely, so an investor’s shares, when sold, could be worth more or less than their original cost. The returns shown do not reflect taxes that a shareholder would pay on fund distributions or on the sale of fund shares.
Cumulative Performance: September 4, 2018, Through August 31, 2020
Initial Investment of $10,000
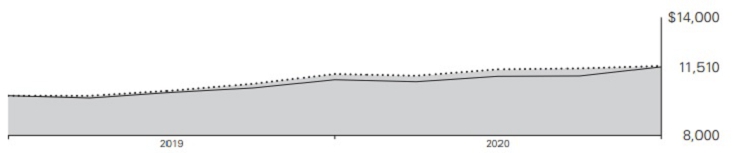
| | | Average Annual Total Returns | |
| | | Periods Ended August 31, 2020 | |
| | | | Since | Final Value |
| | | One | Inception | of a $10,000 |
| | | Year | (9/4/2018) | Investment |
 | Total World Bond ETF Net Asset Value | 3.69% | 15.10% | $11,510 |
| | Total World Bond ETF Market Price | 3.69 | 15.14 | 11,514 |
 | Bloomberg Barclays Global Aggregate Float Adjusted Composite Index | 3.73 | 15.36 | 11,536 |
"Since Inception" performance is calculated from the ETF Shares’ inception date for both the fund and its comparative standards.
Bloomberg Barclays Global Aggregate Float Adjusted Composite Index: Composed of the Bloomberg Barclays U.S. Aggregate Float Adjusted Index and the Bloomberg Barclays Global Aggregate ex-USD Float Adjusted RIC Capped Index.
See Financial Highlights for dividend and capital gains information.
Total World Bond ETF
Cumulative Returns of ETF Shares: September 4, 2018, Through August 31, 2020
| | | Since |
| | One | Inception |
| | Year | (9/4/2018) |
| Total World Bond ETF Market Price | 3.69% | 15.14% |
| Total World Bond ETF Net Asset Value | 3.69 | 15.10 |
| Bloomberg Barclays Global Aggregate Float Adjusted Composite Index | 3.73 | 15.36 |
"Since Inception" performance is calculated from the ETF Shares’ inception date for both the fund and its comparative standards.
The market price is determined by the midpoint of the bid-offer spread as of the closing time of the New York Stock Exchange (generally 4 p.m., Eastern time). The net asset value is also determined as of the NYSE closing time. For more information about how the ETF Shares' market prices have compared with their net asset value, visit vanguard.com, select your ETF, and then select the Price and Performance tab. The ETF premium/discount analysis there shows the percentages of days on which the ETF Shares' market price was above or below the NAV.
Total World Bond ETF
Underlying Vanguard Funds
As of August 31, 2020
| Vanguard Total International Bond ETF | | 53.0 | % |
| Vanguard Total Bond Market ETF | | 47.0 | |
The table reflects the fund’s investments, except for short-term investments.
Total World Bond ETF
Financial Statements
Schedule of Investments
As of August 31, 2020
The fund files its complete schedule of portfolio holdings with the Securities and Exchange Commission (SEC) for the first and third quarters of each fiscal year as an exhibit to its reports on Form N-PORT. The fund’s Form N-PORT reports are available on the SEC’s website at www.sec.gov.
| | | | Market | |
| | | | Value• | |
| | Shares | | ($000 | ) |
| Investment Companies (100.0%) | | | | | | |
| U.S. Bond Fund (47.0%) | | | | | | |
| Vanguard Total Bond Market ETF | | 2,380,317 | | | 210,563 | |
| | | | | | | |
| International Bond Fund (53.0%) | | | | | | |
| Vanguard Total International Bond ETF | | 4,107,559 | | | 237,170 | |
| Total Investment Companies (Cost $439,558) | | | | | 447,733 | |
| Temporary Cash Investment (0.0%) | | | | | | |
| Money Market Fund (0.0%) | | | | | | |
| 1 | Vanguard Market Liquidity Fund, 0.147% (Cost $14) | | 137 | | | 14 | |
| Total Investments (Cost $439,572) | | | | | 447,747 | |
| Other Assets and Liabilities—Net (0.0%) | | | | | 4 | |
| Net Assets (100%) | | | | | 447,751 | |
Cost is in $000.
| • | See Note A in Notes to Financial Statements. |
| 1 | Affiliated money market fund available only to Vanguard funds and certain trusts and accounts managed by Vanguard. Rate shown is the 7-day yield. |
See accompanying Notes, which are an integral part of the Financial Statements.
Total World Bond ETF
Statement of Assets and Liabilities
As of August 31, 2020
| ($000s, except shares and per-share amounts) | Amount | |
| Assets | | | |
| Investments in Securities, at Value—Affiliated Funds (Cost $439,572) | | 447,747 | |
| Cash | | 1 | |
| Receivables for Investment Securities Sold | | 1,735 | |
| Total Assets | | 449,483 | |
| Liabilities | | | |
| Payables for Investment Securities Purchased | | 1,732 | |
| Total Liabilities | | 1,732 | |
| Net Assets | | 447,751 | |
| | | | |
| | | | |
| At August 31, 2020, net assets consisted of: | | | |
| | | | |
| Paid-in Capital | | 439,671 | |
| Total Distributable Earnings (Loss) | | 8,080 | |
| Net Assets | | 447,751 | |
| | | | |
| Net Assets | | | |
| Applicable to 5,490,000 outstanding $.001 par value shares of beneficial interest (unlimited authorization) | | 447,751 | |
| Net Asset Value Per Share | | $81.56 | |
See accompanying Notes, which are an integral part of the Financial Statements.
Total World Bond ETF
Statement of Operations
| | Year Ended | |
| | August 31, 2020 | |
| | ($000 | ) |
| Investment Income | | | |
| Income | | | |
| Income Distributions Received from Affiliated Funds | | 7,958 | |
| Net Investment Income—Note B | | 7,958 | |
| Realized Net Gain (Loss) on Affiliated Funds Sold1 | | 6,818 | |
| Change in Unrealized Appreciation (Depreciation) from Affiliated Funds | | (1,953 | ) |
| Net Increase (Decrease) in Net Assets Resulting from Operations | | 12,823 | |
1 Includes $6,914,000 of net gain (loss) resulting from in-kind redemptions.
See accompanying Notes, which are an integral part of the Financial Statements.
Total World Bond ETF
Statement of Changes in Net Assets
| | | | September 4, | |
| | Year Ended | | 20181 to | |
| | August 31, | | August 31, | |
| | 2020 | | | 2019 | |
| | ($000 | ) | | ($000 | ) |
| Increase (Decrease) in Net Assets | | | | | | |
| Operations | | | | | | |
| Net Investment Income | | 7,958 | | | 2,431 | |
| Realized Net Gain (Loss) | | 6,818 | | | 95 | |
| Change in Unrealized Appreciation (Depreciation) | | (1,953 | ) | | 10,128 | |
| Net Increase (Decrease) in Net Assets Resulting from Operations | | 12,823 | | | 12,654 | |
| Distributions2 | | | | | | |
| Total Distributions | | (7,983 | ) | | (2,405 | ) |
| Capital Share Transactions | | | | | | |
| Issued | | 384,254 | | | 151,614 | |
| Issued in Lieu of Cash Distributions | | — | | | — | |
| Redeemed | | (101,259 | ) | | (1,947 | ) |
| Net Increase (Decrease) from Capital Share Transactions | | 282,995 | | | 149,667 | |
| Total Increase (Decrease) | | 287,835 | | | 159,916 | |
| Net Assets | | | | | | |
| Beginning of Period | | 159,916 | | | — | |
| End of Period | | 447,751 | | | 159,916 | |
| 1 | Inception. |
| 2 | Certain prior period numbers have been reclassified to conform with current period presentation. |
See accompanying Notes, which are an integral part of the Financial Statements.
Total World Bond ETF
Financial Highlights
| | Year | Sept. 4, |
| | Ended | 20181 to |
| | Aug. 31, | Aug. 31, |
| For a Share Outstanding Throughout Each Period | 2020 | 2019 |
| Net Asset Value, Beginning of Period | $80.97 | $75.00 |
| Investment Operations | | |
| Net Investment Income2 | 2.125 | 2.004 |
| Capital Gain Distributions Received2 | — | — |
| Net Realized and Unrealized Gain (Loss) on Investments | 0.782 | 6.071 |
| Total from Investment Operations | 2.907 | 8.075 |
| Distributions | | |
| Dividends from Net Investment Income | (2.317) | (2.105) |
| Distributions from Realized Capital Gains | — | — |
| Total Distributions | (2.317) | (2.105) |
| Net Asset Value, End of Period | $81.56 | $80.97 |
| | | |
| Total Return | 3.69% | 11.00% |
| | | |
| Ratios/Supplemental Data | | |
| Net Assets, End of Period (Millions) | $448 | $160 |
| Ratio of Total Expenses to Average Net Assets | — | —3 |
| Acquired Fund Fees and Expenses | 0.06% | 0.06%3 |
| Ratio of Net Investment Income to Average Net Assets | 2.64% | 2.62%3 |
| Portfolio Turnover Rate4 | 19% | 8% |
| 1 | Inception. |
| 2 | Calculated based on average shares outstanding. |
| 3 | Annualized. |
| 4 | Excludes the value of portfolio securities received or delivered as a result of in-kind purchases or redemptions of the fund’s capital shares, including ETF Creation Units. |
See accompanying Notes, which are an integral part of the Financial Statements.
Total World Bond ETF
Notes to Financial Statements
Vanguard Total World Bond ETF is registered under the Investment Company Act of 1940 as an open-end investment company, or mutual fund. The fund seeks to match the performance of its target index by investing in select Vanguard bond index ETFs. ETF Shares are listed for trading on Nasdaq; they can be purchased and sold through a broker. Financial statements and other information about each underlying fund are available on www.vanguard.com.
Market disruptions associated with the COVID-19 pandemic have had a global impact, and uncertainty exists as to the long-term implications. Such disruptions can adversely affect assets of the fund and thus fund performance.
A. The following significant accounting policies conform to generally accepted accounting principles for U.S. investment companies. The fund consistently follows such policies in preparing its financial statements.
1. Security Valuation: Underlying ETFs are valued at the latest quoted sales prices or official closing prices taken from their primary market or, if not traded on the valuation date, at the mean of the latest quoted bid and asked prices. Investments in Vanguard Market Liquidity Fund are valued at that fund’s net asset value.
2. Federal Income Taxes: The fund intends to continue to qualify as a regulated investment company and distribute all of its taxable income. The fund’s tax returns are open to examination by the relevant tax authorities until expiration of the applicable statute of limitations, which is generally three years after the filing of the tax return. Management has analyzed the fund’s tax positions taken for all open federal and state income tax years, and has concluded that no provision for income tax is required in the fund’s financial statements.
3. Distributions: Distributions to shareholders are recorded on the ex-dividend date. Distributions are determined on a tax basis at the fiscal year-end and may differ from net investment income and realized capital gains for financial reporting purposes.
4. Credit Facilities and Interfund Lending Program: The fund and certain other funds managed by The Vanguard Group (“Vanguard”) participate in a $4.3 billion committed credit facility provided by a syndicate of lenders pursuant to a credit agreement and an uncommitted credit facility provided by Vanguard. Both facilities may be renewed annually. Each fund is individually liable for its borrowings, if any, under the credit facilities. Borrowings may be utilized for temporary or emergency purposes, subject to the fund’s regulatory and contractual borrowing restrictions. With respect to the committed credit facility, the participating funds are charged administrative fees and an annual commitment fee of 0.10% of the undrawn committed amount of the facility; these fees are allocated to the funds based on a method approved by the fund’s board of trustees and borne by the funds in which the fund invests (see Note B). Any borrowings under either facility bear interest at a rate based upon the higher of the one-month London Interbank Offered Rate (or an acceptable alternate rate, if necessary), federal funds effective rate, or overnight bank funding rate plus an agreed-upon spread, except that borrowings under the uncommitted credit facility may bear interest based upon an alternative rate agreed to by the fund and Vanguard.
In accordance with an exemptive order (the “Order”) from the SEC, the fund may participate in a joint lending and borrowing program that allows registered open-end Vanguard funds to borrow money from and lend money to each other for temporary or emergency purposes (the “Interfund Lending Program”), subject to compliance with the terms and conditions of the Order, and to the extent permitted by the fund’s investment objective and investment policies. Interfund loans and borrowings normally extend overnight, but can have a maximum duration of seven days. Loans
Total World Bond ETF
may be called on one business day’s notice. The interest rate to be charged is governed by the conditions of the Order and internal procedures adopted by the board of trustees. The board of trustees is responsible for overseeing the Interfund Lending Program.
For the year ended August 31, 2020, the fund did not utilize the credit facilities or the Interfund Lending Program.
5. Other: Income and capital gain distributions received are recorded on the ex-dividend date. Security transactions are accounted for on the date securities are bought or sold. Costs used to determine realized gains (losses) on the sale of investment securities are those of the specific securities sold.
B. In accordance with the terms of a Funds’ Service Agreement (the “FSA”) between Vanguard and the fund, Vanguard furnishes to the fund investment advisory, corporate management, administrative, marketing, and distribution services at Vanguard’s cost of operations (as defined by the FSA). These costs of operations are allocated to the fund based on methods and guidelines approved by the board of trustees. The FSA provides that expenses otherwise allocable to Vanguard funds-of-funds may be reduced or eliminated to the extent of savings realized by the underlying Vanguard funds by virtue of being part of a fund-of-funds. Accordingly, all expenses for services provided by Vanguard to the fund and all other expenses incurred by the fund during the period ended August 31, 2020, were borne by the underlying Vanguard funds in which the fund invests. The fund’s trustees and officers are also trustees and officers, respectively, of the underlying Vanguard funds, as well as directors and employees, respectively, of Vanguard.
C. Various inputs may be used to determine the value of the fund’s investments. These inputs are summarized in three broad levels for financial statement purposes. The inputs or methodologies used to value securities are not necessarily an indication of the risk associated with investing in those securities.
Level 1—Quoted prices in active markets for identical securities.
Level 2—Other significant observable inputs (including quoted prices for similar securities, interest rates, prepayment speeds, credit risk, etc.).
Level 3—Significant unobservable inputs (including the fund’s own assumptions used to determine the fair value of investments). Any investments valued with significant unobservable inputs are noted on the Schedule of Investments.
At August 31, 2020, 100% of the market value of the fund’s investments was determined based on Level 1 inputs.
D. Permanent differences between book-basis and tax-basis components of net assets are reclassified among capital accounts in the financial statements to reflect their tax character. These reclassifications have no effect on net assets or net asset value per share. As of period end, permanent differences primarily attributable to the accounting for in-kind redemptions were reclassified between the following accounts:
| | Amount | |
| | ($000) | |
| Paid-in Capital | 6,914 | |
| Total Distributable Earnings (Loss) | (6,914) | |
Total World Bond ETF
Temporary differences between book-basis and tax-basis components of total distributable earnings (loss) arise when certain items of income, gain, or loss are recognized in different periods for financial statement and tax purposes; these differences will reverse at some time in the future. The differences are primarily related to the deferral of losses from wash sales. As of period end, the tax-basis components of total distributable earnings (loss) are detailed in the table as follows:
| | Amount | |
| | ($000) | |
| Undistributed Ordinary Income | 1 | |
| Undistributed Long-term Gains | — | |
| Capital Loss Carryforwards | (96) | |
| Qualified Late-Year Losses | — | |
| Net Unrealized Gains (Losses) | 8,175 | |
The tax character of distributions paid was as follows:
| | Year Ended August 31, | |
| | 2020 | 2019 | |
| | Amount | Amount | |
| | ($000) | ($000) | |
| Ordinary Income * | 7,983 | 2,405 | |
| Long-Term Capital Gains | — | — | |
| Total | 7,983 | 2,405 | |
* Includes short-term capital gains, if any.
As of August 31, 2020, gross unrealized appreciation and depreciation for investments based on cost for U.S. federal income tax purposes were as follows:
| | Amount | |
| | ($000) | |
| Tax Cost | 439,572 | |
| Gross Unrealized Appreciation | 9,011 | |
| Gross Unrealized Depreciation | (836) | |
| Net Unrealized Appreciation (Depreciation) | 8,175 | |
E. Capital shares issued and redeemed were:
| | Year Ended | | September 4, 20181 to | |
| | August 31, 2020 | | August 31, 2019 | |
| | Shares | | Shares | |
| | (000) | | (000) | |
| Issued | 4,775 | | 2,000 | |
| Issued in Lieu of Cash Distributions | — | | — | |
| Redeemed | (1,260) | | (25) | |
| Net Increase (Decrease) in Shares Outstanding | 3,515 | | 1,975 | |
| 1 Inception. | | | | |
Total World Bond ETF
F. Transactions during the period in affiliated underlying Vanguard funds were as follows:
| | | | | Current Period Transactions | | | |
| | | Aug. 31, | | | | Proceeds | | Realized | | | | | | | | Aug. 31, | |
| | | 2019 | | | | from | | Net | | Change in | | | | Capital Gain | | 2020 | |
| | | Market | | Purchases | | Securities | | Gain | | Unrealized | | Distributions | | Market | |
| | | Value | | at Cost1 | | Sold2 | | (Loss) | | App. (Dep.) | | Income | | Received | | Value | |
| | | ($000) | | ($000) | | ($000) | | ($000) | | ($000) | | ($000) | | ($000) | | ($000) | |
| Vanguard Market Liquidity Fund | | 13 | | NA3 | | NA3 | | (1) | | — | | — | | — | | 14 | |
| Vanguard Total Bond Market ETF | | 77,146 | | 211,313 | | 84,793 | | 4,632 | | 2,265 | | 3,474 | | — | | 210,563 | |
| Vanguard Total International Bond ETF | | 82,757 | | 231,240 | | 74,796 | | 2,187 | | (4,218) | | 4,484 | | — | | 237,170 | |
| Total | | 159,916 | | 442,553 | | 159,589 | | 6,818 | | (1,953) | | 7,958 | | — | | 447,747 | |
| 1 | Includes $384,099,000 of portfolio securities received as a result of in-kind purchases of the fund’s capital shares. |
| 2 | Includes $101,025,000 of portfolio securities delivered as a result of in-kind redemptions of the fund’s capital shares. |
| 3 | Not applicable—purchases and sales are for temporary cash investment purposes. |
G. Management has determined that no events or transactions occurred subsequent to August 31, 2020, that would require recognition or disclosure in these financial statements.
Report of Independent Registered Public Accounting Firm
To the Board of Trustees of Vanguard Scottsdale Funds and Shareholders of Vanguard Total World Bond ETF
Opinion on the Financial Statements
We have audited the accompanying statement of assets and liabilities, including the schedule of investments, of Vanguard Total World Bond ETF (one of the funds constituting Vanguard Scottsdale Funds, referred to hereafter as the “Fund”) as of August 31, 2020, the related statement of operations for the year ended August 31, 2020, the statement of changes in net assets and the financial highlights for the year ended August 31, 2020 and for the period September 4, 2018 (inception) through August 31, 2019, including the related notes (collectively referred to as the “financial statements”). In our opinion, the financial statements present fairly, in all material respects, the financial position of the Fund as of August 31, 2020, the results of its operations for the year ended, and the changes in its net assets and the financial highlights for the year ended August 31, 2020 and for the period September 4, 2018 (inception) through August 31, 2019 in conformity with accounting principles generally accepted in the United States of America.
Basis for Opinion
These financial statements are the responsibility of the Fund’s management. Our responsibility is to express an opinion on the Fund’s financial statements based on our audits. We are a public accounting firm registered with the Public Company Accounting Oversight Board (United States) (“PCAOB”) and are required to be independent with respect to the Fund in accordance with the U.S. federal securities laws and the applicable rules and regulations of the Securities and Exchange Commission and the PCAOB.
We conducted our audits of these financial statements in accordance with the standards of the PCAOB. Those standards require that we plan and perform the audit to obtain reasonable assurance about whether the financial statements are free of material misstatement, whether due to error or fraud.
Our audits included performing procedures to assess the risks of material misstatement of the financial statements, whether due to error or fraud, and performing procedures that respond to those risks. Such procedures included examining, on a test basis, evidence regarding the amounts and disclosures in the financial statements. Our audits also included evaluating the accounting principles used and significant estimates made by management, as well as evaluating the overall presentation of the financial statements. Our procedures included confirmation of securities owned as of August 31, 2020 by correspondence with the custodian, transfer agent and brokers; when replies were not received from brokers, we performed other auditing procedures. We believe that our audits provide a reasonable basis for our opinion.
/s/PricewaterhouseCoopers LLP
Philadelphia, Pennsylvania
October 19, 2020
We have served as the auditor of one or more investment companies in The Vanguard Group of Funds since 1975.
Special 2020 tax information (unaudited) for Vanguard Total World Bond ETF
This information for the fiscal year ended August 31, 2020, is included pursuant to provisions of the Internal Revenue Code.
For nonresident alien shareholders, 32.3% of income dividends are interest-related dividends.
Trustees Approve Advisory Arrangement
The board of trustees of Vanguard Total World Bond ETF has renewed the fund’s investment advisory arrangement with The Vanguard Group, Inc. (Vanguard), through its Fixed Income Group. The board determined that continuing the fund’s internalized management structure was in the best interests of the fund and its shareholders.
The board based its decision upon an evaluation of the advisor’s investment staff, portfolio management process, and performance. This evaluation included information provided to the board by Vanguard’s Portfolio Review Department, which is responsible for fund and advisor oversight and product management. The Portfolio Review Department met regularly with the advisor and made monthly presentations to the board during the fiscal year that directed the board’s focus to relevant information and topics.
The board, or an investment committee made up of board members, also received information throughout the year during advisor presentations. For each advisor presentation, the board was provided with letters and reports that included information about, among other things, the advisory firm and the advisor’s assessment of the investment environment, portfolio performance, and portfolio characteristics.
In addition, the board received monthly reports, which included a Market and Economic Report, a Fund Dashboard Monthly Summary, and a Fund Performance Report.
Prior to their meeting, the trustees were provided with a memo and materials that summarized the information they received over the course of the year. They also considered the factors discussed below, among others. However, no single factor determined whether the board approved the arrangement. Rather, it was the totality of the circumstances that drove the board’s decision.
Nature, extent, and quality of services
The board considered the quality of the investment management services provided to the fund since its inception in 2018 and took into account the organizational depth and stability of the advisor. The board considered that Vanguard has been managing investments for more than four decades. The Fixed Income Group adheres to a sound, disciplined investment management process; the team has considerable experience, stability, and depth.
The board concluded that Vanguard’s experience, stability, depth, and performance, among other factors, warranted continuation of the advisory arrangement.
Investment performance
The board considered the fund’s performance since its inception, including any periods of outperformance or underperformance compared with its target index and peer group. The board concluded that the performance was such that the advisory arrangement should continue.
Cost
The board concluded that the fund’s estimated acquired fund fees and expenses for the current fiscal year were well below the average expense ratio charged by funds in its peer group. The fund does not incur advisory expenses directly; however, the board noted that each of the underlying funds in which the fund invests has advisory expenses well below the relevant peer-group average.
The board does not conduct a profitability analysis of Vanguard because of Vanguard’s unique structure. Unlike most other mutual fund management companies, Vanguard is owned by the funds it oversees.
The benefit of economies of scale
The board concluded that the fund’s arrangement with Vanguard ensures that the fund will realize economies of scale as the assets of the underlying funds grow, with the cost to shareholders declining as assets increase.
The board will consider whether to renew the advisory arrangement again after a one-year period.
Liquidity Risk Management
Vanguard funds (except for the money market funds) have adopted and implemented a written liquidity risk management program (the “Program”) as required by Rule 22e-4 under the Investment Company Act of 1940. Rule 22e-4 requires that each fund adopt a program that is reasonably designed to assess and manage the fund’s liquidity risk, which is the risk that the fund could not meet redemption requests without significant dilution of remaining investors’ interests in the fund.
Assessment and management of a fund’s liquidity risk under the Program take into consideration certain factors, such as the fund’s investment strategy and the liquidity of its portfolio investments during normal and reasonably foreseeable stressed conditions, its short- and long-term cash-flow projections during both normal and reasonably foreseeable stressed conditions, and its cash and cash-equivalent holdings and access to other funding sources. As required by the rule, the Program includes policies and procedures for classification of fund portfolio holdings in four liquidity categories, maintaining certain levels of highly liquid investments, and limiting holdings of illiquid investments.
The board of trustees of Vanguard Scottsdale Funds approved the appointment of liquidity risk management program administrators responsible for administering Vanguard Total World Bond ETF’s Program and for carrying out the specific responsibilities set forth in the Program, including reporting to the board on at least an annual basis regarding the Program’s operation, its adequacy, and the effectiveness of its implementation for the past year (the “Program Administrator Report”). The board has reviewed the Program Administrator Report covering the period from December 1, 2018, through December 31, 2019 (the “Review Period”). The Program Administrator Report stated that during the Review Period the Program operated and was implemented effectively to manage the fund’s liquidity risk.
BLOOMBERG is a trademark and service mark of Bloomberg Finance L.P. BARCLAYS is a trademark and service mark of Barclays Bank Plc, used under license. Bloomberg Finance L.P. and its affiliates, including Bloomberg Index Services Limited (BISL) (collectively, Bloomberg), or Bloomberg’s licensors, own all proprietary rights in the Bloomberg Barclays Global Aggregate Float Adjusted Composite Index (the Index or Bloomberg Barclays Index).
Neither Barclays Bank Plc, Barclays Capital Inc., or any affiliate (collectively Barclays) or Bloomberg is the issuer or producer of the Total World Bond ETF and neither Bloomberg nor Barclays has any responsibilities, obligations or duties to investors in the Total World Bond ETF. The Index is licensed for use by The Vanguard Group, Inc. (Vanguard) as the sponsor of the Total World Bond ETF. Bloomberg and Barclays’ only relationship with Vanguard in respect to the Index is the licensing of the Index, which is determined, composed and calculated by BISL, or any successor thereto, without regard to the Issuer or the Total World Bond ETF or the owners of the Total World Bond ETF.
Additionally, Vanguard may for itself execute transaction(s) with Barclays in or relating to the Index in connection with the Total World Bond ETF. Investors acquire the Total World Bond ETF from Vanguard and investors neither acquire any interest in the Index nor enter into any relationship of any kind whatsoever with Bloomberg or Barclays upon making an investment in the Total World Bond ETF. The Total World Bond ETF is not sponsored, endorsed, sold or promoted by Bloomberg or Barclays. Neither Bloomberg nor Barclays makes any representation or warranty, express or implied regarding the advisability of investing in the Total World Bond ETF or the advisability of investing in securities generally or the ability of the Index to track corresponding or relative market performance. Neither Bloomberg nor Barclays has passed on the legality or suitability of the Total World Bond ETF with respect to any person or entity. Neither Bloomberg nor Barclays is responsible for and has not participated in the determination of the timing of, prices at, or quantities of the Total World Bond ETF to be issued. Neither Bloomberg nor Barclays has any obligation to take the needs of the Issuer or the owners of the Total World Bond ETF or any other third party into consideration in determining, composing or calculating the Index. Neither Bloomberg nor Barclays has any obligation or liability in connection with administration, marketing or trading of the Total World Bond ETF.
The licensing agreement between Bloomberg and Barclays is solely for the benefit of Bloomberg and Barclays and not for the benefit of the owners of the Total World Bond ETF, investors or other third parties. In addition, the licensing agreement between Vanguard and Bloomberg is solely for the benefit of Vanguard and Bloomberg and not for the benefit of the owners of the Total World Bond ETF, investors or other third parties.
NEITHER BLOOMBERG NOR BARCLAYS SHALL HAVE ANY LIABILITY TO THE ISSUER, INVESTORS OR TO OTHER THIRD PARTIES FOR THE QUALITY, ACCURACY AND/OR COMPLETENESS OF THE BLOOMBERG BARCLAYS INDEX OR ANY DATA INCLUDED THEREIN OR FOR INTERRUPTIONS IN THE DELIVERY OF THE BLOOMBERG BARCLAYS INDEX. NEITHER BLOOMBERG NOR BARCLAYS MAKES ANY WARRANTY, EXPRESS OR IMPLIED, AS TO RESULTS TO BE OBTAINED BY THE ISSUER, THE INVESTORS OR ANY OTHER PERSON OR ENTITY FROM THE USE OF THE BLOOMBERG BARCLAYS INDEX OR ANY DATA INCLUDED THEREIN. NEITHER BLOOMBERG NOR BARCLAYS MAKES ANY EXPRESS OR IMPLIED WARRANTIES, AND EACH HEREBY EXPRESSLY DISCLAIMS ALL WARRANTIES OF MERCHANTABILITY OR FITNESS FOR A PARTICULAR PURPOSE OR USE WITH RESPECT TO THE BLOOMBERG BARCLAYS INDEX OR ANY DATA INCLUDED THEREIN. BLOOMBERG RESERVES THE RIGHT TO CHANGE THE METHODS OF CALCULATION OR PUBLICATION, OR TO CEASE THE CALCULATION OR PUBLICATION OF THE BLOOMBERG BARCLAYS INDEX, AND NEITHER BLOOMBERG NOR BARCLAYS SHALL BE LIABLE FOR ANY MISCALCULATION OF OR ANY INCORRECT, DELAYED OR INTERRUPTED PUBLICATION WITH RESPECT TO THE BLOOMBERG BARCLAYS INDEX. NEITHER BLOOMBERG NOR BARCLAYS SHALL BE LIABLE FOR ANY DAMAGES, INCLUDING, WITHOUT LIMITATION, ANY SPECIAL, INDIRECT OR CONSEQUENTIAL DAMAGES, OR ANY LOST PROFITS AND EVEN IF ADVISED OF THE POSSIBILITY OF SUCH, RESULTING FROM THE USE OF A BLOOMBERG BARCLAYS INDEX OR ANY DATA INCLUDED THEREIN OR WITH RESPECT TO THE TOTAL WORLD BOND ETF.
None of the information supplied by Bloomberg or Barclays and used in this publication may be reproduced in any manner without the prior written permission of both Bloomberg and Barclays Capital, the investment banking division of Barclays Bank Plc. Barclays Bank Plc is registered in England No. 1026167. Registered office 1 Churchill Place London E14 5HP
© 2020 Bloomberg. Used with Permission.
Source: Bloomberg Index Services Limited. Copyright 2020, Bloomberg. All rights reserved.
This page intentionally left blank.
The People Who Govern Your Fund
The trustees of your mutual fund are there to see that the fund is operated and managed in your best interests since, as a shareholder, you are a part owner of the fund. Your fund’s trustees also serve on the board of directors of The Vanguard Group, Inc., which is owned by the Vanguard funds and provides services to them.
A majority of Vanguard’s board members are independent, meaning that they have no affiliation with Vanguard or the funds they oversee, apart from the sizable personal investments they have made as private individuals. The independent board members have distinguished backgrounds in business, academia, and public service. Each of the trustees and executive officers oversees 212 Vanguard funds.
Information for each trustee and executive officer of the fund appears below. That information, as well as the Vanguard fund count, is as of the date on the cover of this fund report. The mailing address of the trustees and officers is P.O. Box 876, Valley Forge, PA 19482. More information about the trustees is in the Statement of Additional Information, which can be obtained, without charge, by contacting Vanguard at 800-662-7447, or online at vanguard.com.
Interested Trustee1
Mortimer J. Buckley
Born in 1969. Trustee since January 2018. Principal occupation(s) during the past five years and other experience: chairman of the board (2019–present) of Vanguard and of each of the investment companies served by Vanguard; chief executive officer (2018– present) of Vanguard; chief executive officer, president, and trustee (2018–present) of each of the investment companies served by Vanguard; president and director (2017–present) of Vanguard; and president (2018–present) of Vanguard Marketing Corporation. Chief investment officer (2013–2017), managing director (2002–2017), head of the Retail Investor Group (2006–2012), and chief information officer (2001–2006) of Vanguard. Chairman of the board (2011–2017) and trustee (2009–2017) of the Children’s Hospital of Philadelphia; and trustee (2018–present) and vice chair (2019–present) of The Shipley School.
Independent Trustees
Emerson U. Fullwood
Born in 1948. Trustee since January 2008. Principal occupation(s) during the past five years and other experience: executive chief staff and marketing officer for North America and corporate vice president (retired 2008) of Xerox Corporation (document management products and services). Former president of the Worldwide Channels Group, Latin America, and Worldwide Customer Service and executive chief staff officer of Developing Markets of Xerox. Executive in residence and 2009–2010 Distinguished Minett Professor at the Rochester Institute of Technology. Director of SPX FLOW, Inc. (multi-industry manufacturing). Director of the University of Rochester Medical Center, the Monroe Community College Foundation, the United Way of Rochester, North Carolina A&T University, and Roberts Wesleyan College. Trustee of the University of Rochester.
Amy Gutmann
Born in 1949. Trustee since June 2006. Principal occupation(s) during the past five years and other experience: president (2004–present) of the University of Pennsylvania. Christopher H. Browne Distinguished Professor of Political Science, School of Arts and Sciences, and professor of communication, Annenberg School for Communication, with secondary faculty appointments in the Department of Philosophy, School of Arts and Sciences, and at the Graduate School of Education, University of Pennsylvania.
F. Joseph Loughrey
Born in 1949. Trustee since October 2009. Principal occupation(s) during the past five years and other experience: president and chief operating officer (retired 2009) and vice chairman of the board (2008–2009) of Cummins Inc. (industrial machinery). Chairman of the board of Hillenbrand, Inc. (specialized consumer services) and the Lumina Foundation. Director of the V Foundation. Member of the advisory
| 1 | Mr. Buckley is considered an “interested person,” as defined in the Investment Company Act of 1940, because he is an officer of the Vanguard funds. |
council for the College of Arts and Letters and chair of the advisory board to the Kellogg Institute for International Studies, both at the University of Notre Dame.
Mark Loughridge
Born in 1953. Trustee since March 2012. Principal occupation(s) during the past five years and other experience: senior vice president and chief financial officer (retired 2013) of IBM (information technology services). Fiduciary member of IBM’s Retirement Plan Committee (2004–2013), senior vice president and general manager (2002–2004) of IBM Global Financing, vice president and controller (1998–2002) of IBM, and a variety of other prior management roles at IBM. Member of the Council on Chicago Booth.
Scott C. Malpass
Born in 1962. Trustee since March 2012. Principal occupation(s) during the past five years and other experience: chief investment officer (retired June 2020) and vice president (retired June 2020) of the University of Notre Dame. Assistant professor of finance at the Mendoza College of Business, University of Notre Dame, and member of the Notre Dame 403(b) Investment Committee (retired June 2020). Member of the board of Catholic Investment Services, Inc. (investment advisors) and the board of superintendence of the Institute for the Works of Religion.
Deanna Mulligan
Born in 1963. Trustee since January 2018. Principal occupation(s) during the past five years and other experience: chief executive officer (2011–present) of The Guardian Life Insurance Company of America. President (2010–2019), chief operating officer (2010–2011), and executive vice president (2008–2010) of Individual Life and Disability of The Guardian Life Insurance Company of America. Member of the board of The Guardian Life Insurance Company of America, the American Council of Life Insurers, and the Economic Club of New York. Trustee of the Partnership for New York City (business leadership), Chief Executives for Corporate Purpose, NewYork-Presbyterian Hospital, Catalyst, and the Bruce Museum (arts and science). Member of the Advisory Council for the Stanford Graduate School of Business.
André F. Perold
Born in 1952. Trustee since December 2004. Principal occupation(s) during the past five years and other experience: George Gund Professor of Finance and Banking, Emeritus at the Harvard Business School (retired 2011). Chief investment officer and co-managing partner of HighVista Strategies (private investment firm). Member of the board of advisors and member of the investment committee of the Museum of Fine Arts Boston. Member of the board (2018–present) of RIT Capital Partners (investment firm). Member of the investment committee of Partners Health Care System.
Sarah Bloom Raskin
Born in 1961. Trustee since January 2018. Principal occupation(s) during the past five years and other experience: deputy secretary (2014–2017) of the United States Department of the Treasury. Governor (2010–2014) of the Federal Reserve Board. Commissioner (2007–2010) of financial regulation for the State of Maryland. Member of the board of directors (2012–2014) of Neighborhood Reinvestment Corporation. Director (2017–present) of i(x) Investments, LLC; director (2017–present) of Reserve Trust. Rubenstein Fellow (2017–present) of Duke University; trustee (2017–present) of Amherst College, and trustee (2019–present) of the Folger Shakespeare Library.
Peter F. Volanakis
Born in 1955. Trustee since July 2009. Principal occupation(s) during the past five years and other experience: president and chief operating officer (retired 2010) of Corning Incorporated (communications equipment) and director of Corning Incorporated (2000–2010) and Dow Corning (2001–2010). Director (2012) of SPX Corporation (multi-industry manufacturing). Overseer of the Amos Tuck School of Business Administration, Dartmouth College (2001–2013). Chairman of the board of trustees of Colby-Sawyer College. Member of the board of Hypertherm Inc. (industrial cutting systems, software, and consumables).
Executive Officers
John Bendl
Born in 1970. Principal occupation(s) during the past five years and other experience: principal of Vanguard. Chief financial officer (2019–present) of each of the investment companies served by Vanguard. Chief accounting officer, treasurer, and controller of Vanguard (2017–present). Partner (2003–2016) at KPMG (audit, tax, and advisory services).
Glenn Booraem
Born in 1967. Principal occupation(s) during the past five years and other experience: principal of Vanguard. Investment stewardship officer (2017–present), treasurer (2015–2017), controller (2010–2015), and assistant controller (2001–2010) of each of the investment companies served by Vanguard.
Christine M. Buchanan
Born in 1970. Principal occupation(s) during the past five years and other experience: principal of Vanguard. Treasurer (2017–present) of each of the investment companies served by Vanguard. Partner (2005–2017) at KPMG (audit, tax, and advisory services).
David Cermak
Born in 1960. Principal occupation(s) during the past five years and other experience: principal of Vanguard. Finance director (2019–present) of each of the investment companies served by Vanguard. Managing director and head (2017–present) of Vanguard Investments Singapore. Managing director and head (2017–2019) of Vanguard Investments Hong Kong. Representative director and head (2014–2017) of Vanguard Investments Japan.
Thomas J. Higgins
Born in 1957. Principal occupation(s) during the past five years and other experience: principal of Vanguard. Finance director (2019–present), chief financial officer (2008–2019), and treasurer (1998–2008) of each of the investment companies served by Vanguard.
Peter Mahoney
Born in 1974. Principal occupation(s) during the past five years and other experience: principal of Vanguard. Controller (2015–present) of each of the investment companies served by Vanguard. Head of International Fund Services (2008–2014) at Vanguard.
Anne E. Robinson
Born in 1970. Principal occupation(s) during the past five years and other experience: general counsel (2016–present) of Vanguard. Secretary (2016–present) of Vanguard and of each of the investment companies served by Vanguard. Managing director (2016–present) of Vanguard. Managing director and general counsel of Global Cards and Consumer Services (2014–2016) at Citigroup. Counsel (2003–2014) at American Express.
Michael Rollings
Born in 1963. Principal occupation(s) during the past five years and other experience: finance director (2017–present) and treasurer (2017) of each of the investment companies served by Vanguard. Managing director (2016–present) of Vanguard. Chief financial officer (2016–present) of Vanguard. Director (2016–present) of Vanguard Marketing Corporation. Executive vice president and chief financial officer (2006–2016) of MassMutual Financial Group.
John E. Schadl
Born in 1972. Principal occupation(s) during the past five years and other experience: principal of Vanguard. Chief compliance officer (2019–present) of Vanguard and of each of the investment companies served by Vanguard. Assistant vice president (2019–present) of Vanguard Marketing Corporation.
Vanguard Senior Management Team
| Joseph Brennan | | Chris D. McIsaac |
| Mortimer J. Buckley | | James M. Norris |
| Gregory Davis | | Thomas M. Rampulla |
| John James | | Karin A. Risi |
| Martha G. King | | Anne E. Robinson |
| John T. Marcante | | Michael Rollings |

Connect with Vanguard® > vanguard com
Fund Information > 800-662-7447
Direct Investor Account Services > 800-662-2739
Institutional Investor Services > 800-523-1036
Text Telephone for People
Who Are Deaf or Hard of Hearing > 800-749-7273
This material may be used in conjunction with the offering of shares of any Vanguard fund only if preceded or accompanied by the fund’s current prospectus.
All comparative mutual fund data are from Morningstar, Inc., unless otherwise noted.
You can obtain a free copy of Vanguard’s proxy voting guidelines by visiting vanguard.com/proxyreporting or by calling Vanguard at 800-662-2739. The guidelines are also available from the SEC’s website, www.sec.gov. In addition, you may obtain a free report on how your fund voted the proxies for securities it owned during the 12 months ended June 30. To get the report, visit either vanguard.com/proxyreporting or www.sec.gov.
You can review information about your fund on the SEC’s website, and you can receive copies of this information, for a fee, by sending a request via email addressed to publicinfo@sec.gov.
| | © 2020 The Vanguard Group, Inc. | |
| | All rights reserved. | |
| | Vanguard Marketing Corporation, Distributor. | |
| | | |
| | Q30610 102020 | |
Item 2: Code of Ethics. The Registrant has adopted a code of ethics that applies to the Registrant’s principal executive officer, principal financial officer, principal accounting officer or controller or persons performing similar functions. The Code of Ethics was amended during the reporting period covered by this report to make certain technical, non-material changes.
Item 3: Audit Committee Financial Expert. All members of the Audit Committee have been determined by the Registrant’s Board of Trustees to be Audit Committee Financial Experts and to be independent: F. Joseph Loughrey, Mark Loughridge, Sarah Bloom Raskin, and Peter F. Volanakis.
Item 4: Principal Accountant Fees and Services.
(a) Audit Fees.
Audit Fees of the Registrant.
Fiscal Year Ended August 31, 2020: $580,000
Fiscal Year Ended August 31, 2019: $620,000
Aggregate Audit Fees of Registered Investment Companies in the Vanguard Group.
Fiscal Year Ended August 31, 2020: $10,761,407
Fiscal Year Ended August 31, 2019: $9,568,215
Includes fees billed in connection with audits of the Registrant, other registered investment companies in the Vanguard complex, The Vanguard Group, Inc., and Vanguard Marketing Corporation.
(b) Audit-Related Fees.
Fiscal Year Ended August 31, 2020: $2,915,863
Fiscal Year Ended August 31, 2019: $3,012,031
Includes fees billed in connection with assurance and related services provided to the Registrant, other registered investment companies in the Vanguard complex, The Vanguard Group, Inc., and Vanguard Marketing Corporation.
(c) Tax Fees.
Fiscal Year Ended August 31, 2020: $247,168
Fiscal Year Ended August 31, 2019: $357,238
Includes fees billed in connection with tax compliance, planning, and advice services provided to the Registrant, other registered investment companies in the Vanguard complex, The Vanguard Group, Inc., and Vanguard Marketing Corporation.
(d) All Other Fees.
Fiscal Year Ended August 31, 2020: $115,000
Fiscal Year Ended August 31, 2019: $0
Includes fees billed for services related to tax reported information provided to the Registrant, other registered investment companies in the Vanguard complex, The Vanguard Group, Inc., and Vanguard Marketing Corporation.
(e) (1) Pre-Approval Policies. The policy of the Registrant’s Audit Committee is to consider, and, if appropriate, approve before the principal accountant is engaged for such services, all specific audit and non-audit services provided to: the Registrant, other registered investment companies in the Vanguard complex, The Vanguard Group, Inc., and entities controlled by The Vanguard Group, Inc. that provide ongoing services to the Registrant. In making a determination, the Audit Committee considers whether the services are consistent with maintaining the principal accountant’s independence.
In the event of a contingency situation in which the principal accountant is needed to provide services in between scheduled Audit Committee meetings, the Chairman of the Audit Committee would be called on to consider and, if appropriate, pre-approve audit or permitted non-audit services in an amount sufficient to complete services through the next Audit Committee meeting, and to determine if such services would be consistent with maintaining the accountant’s independence. At the next scheduled Audit Committee meeting, services and fees would be presented to the Audit Committee for formal consideration, and, if appropriate, approval by the entire Audit Committee. The Audit Committee would again consider whether such services and fees are consistent with maintaining the principal accountant’s independence.
The Registrant’s Audit Committee is informed at least annually of all audit and non-audit services provided by the principal accountant to the Vanguard complex, whether such services are provided to: the Registrant, other registered investment companies in the Vanguard complex, The Vanguard Group, Inc., or other entities controlled by The Vanguard Group, Inc. that provide ongoing services to the Registrant.
(2) No percentage of the principal accountant’s fees or services were approved pursuant to the waiver provision of paragraph (c)(7)(i)(C) of Rule 2-01 of Regulation S-X.
(f) For the most recent fiscal year, over 50% of the hours worked under the principal accountant’s engagement were not performed by persons other than full-time, permanent employees of the principal accountant.
(g) Aggregate Non-Audit Fees.
Fiscal Year Ended August 31, 2020: $362,168
Fiscal Year Ended August 31, 2019: $357,238
Includes fees billed for non-audit services provided to the Registrant, other registered investment companies in the Vanguard complex, The Vanguard Group, Inc., and Vanguard Marketing Corporation.
(h) For the most recent fiscal year, the Audit Committee has determined that the provision of all non-audit services was consistent with maintaining the principal accountant’s independence.
Item 5: Audit Committee of Listed Registrants.
The Registrant is a listed issuer as defined in rule 10A-3 under the Securities Exchange Act of 1934 (“Exchange Act”). The Registrant has a separately-designated standing audit committee established in accordance with Section 3(a)(58)(A) of the Exchange Act. The Registrant’s audit committee members are: F. Joseph Loughrey, Mark Loughridge, Sarah Bloom Raskin, and Peter F. Volanakis.
Item 6: Investments.
Vanguard® Russell 1000 Index Fund
Schedule of Investments
August 31, 2020
| | | Market |
| | | Value |
| | Shares | ($000) |
| Common Stocks (99.8%) |
| Consumer Discretionary (16.8%) |
| * | Amazon.com Inc. | 54,550 | 188,250 |
| * | Tesla Inc. | 95,155 | 47,418 |
| | Home Depot Inc. | 138,093 | 39,362 |
| | Walt Disney Co. | 232,591 | 30,672 |
| * | Netflix Inc. | 54,718 | 28,976 |
| | Comcast Corp. Class A | 582,743 | 26,113 |
| | Walmart Inc. | 179,235 | 24,887 |
| | McDonald's Corp. | 95,809 | 20,457 |
| | Costco Wholesale Corp. | 56,789 | 19,743 |
| | NIKE Inc. Class B | 155,793 | 17,432 |
| | Lowe's Cos. Inc. | 97,225 | 16,012 |
| | Starbucks Corp. | 150,519 | 12,714 |
| * | Charter Communications Inc. Class A | 19,230 | 11,838 |
| * | Booking Holdings Inc. | 5,260 | 10,049 |
| | Target Corp. | 64,362 | 9,732 |
| | TJX Cos. Inc. | 154,248 | 8,451 |
| | Dollar General Corp. | 32,427 | 6,546 |
| | Estee Lauder Cos. Inc. Class A | 28,526 | 6,325 |
| * | Uber Technologies Inc. | 175,267 | 5,894 |
| * | Lululemon Athletica Inc. | 14,573 | 5,475 |
| | General Motors Co. | 160,614 | 4,759 |
| * | Spotify Technology SA | 16,838 | 4,751 |
| | eBay Inc. | 85,943 | 4,708 |
| * | Chipotle Mexican Grill Inc. Class A | 3,583 | 4,695 |
| * | O'Reilly Automotive Inc. | 9,390 | 4,372 |
| | Ross Stores Inc. | 45,000 | 4,099 |
| | Yum! Brands Inc. | 38,695 | 3,709 |
| * | AutoZone Inc. | 2,991 | 3,578 |
| | Marriott International Inc. Class A | 34,472 | 3,548 |
| | Ford Motor Co. | 499,255 | 3,405 |
| | Best Buy Co. Inc. | 29,253 | 3,244 |
| | Hilton Worldwide Holdings Inc. | 35,032 | 3,166 |
| | DR Horton Inc. | 42,538 | 3,036 |
| | Aptiv plc | 34,349 | 2,958 |
| * | Dollar Tree Inc. | 30,237 | 2,911 |
| | VF Corp. | 41,785 | 2,747 |
| | Yum China Holdings Inc. | 46,464 | 2,681 |
| | Lennar Corp. Class A | 34,907 | 2,612 |
| * | Wayfair Inc. | 8,439 | 2,503 |
| * | Trade Desk Inc. Class A | 5,199 | 2,502 |
| * | Roku Inc. | 13,043 | 2,263 |
| * | CarMax Inc. | 20,819 | 2,226 |
| | Tractor Supply Co. | 14,815 | 2,205 |
| | Las Vegas Sands Corp. | 42,551 | 2,158 |
| | Domino's Pizza Inc. | 4,998 | 2,044 |
| | Garmin Ltd. | 19,223 | 1,992 |
| | ViacomCBS Inc. Class B | 70,487 | 1,963 |
| | Tiffany & Co. | 15,607 | 1,912 |
| * | Liberty Broadband Corp. | 13,185 | 1,847 |
| * | Etsy Inc. | 15,150 | 1,813 |
| * | NVR Inc. | 431 | 1,797 |
| | Expedia Group Inc. | 17,486 | 1,716 |
| | Genuine Parts Co. | 18,019 | 1,702 |
| * | Burlington Stores Inc. | 8,317 | 1,638 |
| | Pool Corp. | 4,959 | 1,626 |
| * | Ulta Beauty Inc. | 6,888 | 1,599 |
| | PulteGroup Inc. | 34,490 | 1,538 |
| | Royal Caribbean Cruises Ltd. | 21,989 | 1,514 |
| * | Carvana Co. Class A | 7,003 | 1,512 |
| | Fortune Brands Home & Security Inc. | 17,545 | 1,475 |
| | Omnicom Group Inc. | 27,246 | 1,474 |
Vanguard® Russell 1000 Index Fund
Schedule of Investments
August 31, 2020
| | | Market |
| | | Value |
| | Shares | ($000) |
| | Darden Restaurants Inc. | 16,878 | 1,463 |
| | Whirlpool Corp. | 7,784 | 1,383 |
| | MGM Resorts International | 60,322 | 1,357 |
| | Advance Auto Parts Inc. | 8,636 | 1,350 |
| | Hasbro Inc. | 16,441 | 1,298 |
| | Fox Corp. Class A | 45,041 | 1,255 |
| * | LKQ Corp. | 38,531 | 1,223 |
| | Cable One Inc. | 661 | 1,216 |
| * | Chegg Inc. | 15,589 | 1,150 |
| * | Altice USA Inc. Class A | 41,526 | 1,145 |
| | Vail Resorts Inc. | 5,140 | 1,119 |
| * | DISH Network Corp. Class A | 31,489 | 1,119 |
| | Wynn Resorts Ltd. | 12,504 | 1,093 |
| | BorgWarner Inc. | 26,784 | 1,087 |
| | Rollins Inc. | 18,877 | 1,041 |
| * | Live Nation Entertainment Inc. | 18,171 | 1,032 |
| | Service Corp. International | 22,260 | 1,016 |
| * | Liberty Media Corp-Liberty Formula One Class C | 25,960 | 1,012 |
| | Carnival Corp. | 60,404 | 995 |
| * | Bright Horizons Family Solutions Inc. | 7,371 | 980 |
| * | Peloton Interactive Inc. Class A | 12,540 | 961 |
| | New York Times Co. Class A | 21,115 | 915 |
| * | Lyft Inc. Class A | 30,549 | 906 |
| * | IAA Inc. | 17,312 | 906 |
| | Interpublic Group of Cos. Inc. | 50,305 | 893 |
| | Sirius XM Holdings Inc. | 151,319 | 888 |
| | Williams-Sonoma Inc. | 9,979 | 876 |
| | Lear Corp. | 7,629 | 869 |
| | L Brands Inc. | 29,279 | 861 |
| | Gentex Corp. | 31,504 | 852 |
| * | Floor & Decor Holdings Inc. Class A | 11,159 | 817 |
| | Aramark | 29,230 | 806 |
| | Dunkin' Brands Group Inc. | 10,502 | 799 |
| | Newell Brands Inc. | 49,537 | 792 |
| | News Corp. Class A | 52,198 | 789 |
| * | Liberty Media Corp-Liberty SiriusXM Class C | 21,835 | 786 |
| * | Five Below Inc. | 7,116 | 779 |
| * | Discovery Communications Inc. Class C | 38,218 | 763 |
| | Polaris Inc. | 7,487 | 757 |
| | Nielsen Holdings plc | 46,384 | 709 |
| * | Mohawk Industries Inc. | 7,461 | 689 |
| | Leggett & Platt Inc. | 16,736 | 686 |
| | Hanesbrands Inc. | 44,317 | 678 |
| * | ServiceMaster Global Holdings Inc. | 16,977 | 677 |
| | Thor Industries Inc. | 7,113 | 672 |
| * | Ollie's Bargain Outlet Holdings Inc. | 6,702 | 640 |
| | Toll Brothers Inc. | 15,069 | 636 |
| * | Planet Fitness Inc. Class A | 10,136 | 616 |
| | Wyndham Hotels & Resorts Inc. | 11,704 | 613 |
| * | Norwegian Cruise Line Holdings Ltd. | 33,245 | 569 |
| * | Grand Canyon Education Inc. | 6,007 | 565 |
| * | Qurate Retail Group Inc. QVC Group Class A | 49,799 | 550 |
| | Harley-Davidson Inc. | 19,804 | 549 |
| | Tapestry Inc. | 36,031 | 531 |
| | Fox Corp. Class B | 19,014 | 529 |
| * | Discovery Inc. Class A | 23,433 | 517 |
| * | Skechers USA Inc. Class A | 17,091 | 510 |
| * | Tempur Sealy International Inc. | 5,939 | 508 |
| | PVH Corp. | 9,034 | 504 |
| | Nexstar Media Group Inc. Class A | 5,129 | 492 |
| | Wendy's Co. | 23,267 | 487 |
| * | Mattel Inc. | 45,109 | 485 |
| * | Liberty Broadband Corp. Class A | 3,500 | 484 |
| * | frontdoor Inc. | 10,905 | 475 |
Vanguard® Russell 1000 Index Fund
Schedule of Investments
August 31, 2020
| | | Market |
| | | Value |
| | Shares | ($000) |
| | Choice Hotels International Inc. | 4,479 | 445 |
| | Carter's Inc. | 5,576 | 444 |
| | Kohl's Corp. | 20,364 | 435 |
| | Dick's Sporting Goods Inc. | 7,984 | 432 |
| * | AutoNation Inc. | 7,417 | 422 |
| | Ralph Lauren Corp. Class A | 6,080 | 418 |
| | Amerco | 1,167 | 414 |
| * | Liberty Media Corp-Liberty SiriusXM Class A | 11,057 | 401 |
| * | Madison Square Garden Sport Corp. Class A | 2,446 | 401 |
| | Gap Inc. | 22,931 | 399 |
| | Foot Locker Inc. | 13,027 | 395 |
| | H&R Block Inc. | 25,447 | 369 |
| * | 2U Inc. | 8,477 | 351 |
| | Columbia Sportswear Co. | 3,887 | 333 |
| | TripAdvisor Inc. | 13,282 | 310 |
| | Wyndham Destinations Inc. | 10,695 | 310 |
| * | Capri Holdings Ltd. | 18,870 | 299 |
| | Extended Stay America Inc. | 22,457 | 281 |
| | World Wrestling Entertainment Inc. Class A | 5,700 | 251 |
| | Hyatt Hotels Corp. Class A | 4,362 | 246 |
| * | Under Armour Inc. Class A | 24,669 | 242 |
| | Graham Holdings Co. Class B | 544 | 233 |
| | Six Flags Entertainment Corp. | 10,247 | 223 |
| | Nordstrom Inc. | 13,815 | 221 |
| | News Corp. Class B | 13,778 | 208 |
| * | Under Armour Inc. Class C | 23,045 | 204 |
| | Penske Automotive Group Inc. | 4,290 | 202 |
| | Reynolds Consumer Products Inc. | 5,966 | 198 |
| * | Madison Square Garden Entertainment Corp. Class A | 2,446 | 184 |
| | John Wiley & Sons Inc. Class A | 5,485 | 174 |
| | Coty Inc. Class A | 37,490 | 134 |
| * | Lions Gate Entertainment Corp. Class A | 11,634 | 113 |
| | Lennar Corp. Class B | 1,896 | 112 |
| * | Liberty Media Corp-Liberty Formula One Class A | 2,449 | 89 |
| * | Lions Gate Entertainment Corp. Class B | 9,201 | 83 |
| | ViacomCBS Inc. Class A | 741 | 23 |
| | Warner Music Group Corp. Class A | 452 | 13 |
| * | Caesars Entertainment Inc. | 1 | — |
| | 708,076 |
| Consumer Staples (5.5%) |
| | Procter & Gamble Co. | 313,415 | 43,355 |
| | PepsiCo Inc. | 178,498 | 25,000 |
| | Coca-Cola Co. | 497,526 | 24,642 |
| | Philip Morris International Inc. | 200,183 | 15,973 |
| | Mondelez International Inc. Class A | 181,625 | 10,611 |
| | Altria Group Inc. | 239,435 | 10,473 |
| | CVS Health Corp. | 168,108 | 10,443 |
| | Colgate-Palmolive Co. | 108,537 | 8,603 |
| | Kimberly-Clark Corp. | 43,633 | 6,884 |
| | General Mills Inc. | 77,862 | 4,979 |
| * | Monster Beverage Corp. | 47,401 | 3,975 |
| | Constellation Brands Inc. Class A | 20,492 | 3,780 |
| | Sysco Corp. | 62,178 | 3,739 |
| | Clorox Co. | 16,238 | 3,629 |
| | Walgreens Boots Alliance Inc. | 94,041 | 3,575 |
| | Kroger Co. | 99,402 | 3,547 |
| | McCormick & Co. Inc. | 15,887 | 3,276 |
| | McKesson Corp. | 20,810 | 3,193 |
| | Archer-Daniels-Midland Co. | 71,066 | 3,181 |
| | Church & Dwight Co. Inc. | 31,514 | 3,020 |
| | Kraft Heinz Co. | 83,100 | 2,912 |
| | Hershey Co. | 18,996 | 2,824 |
| | Corteva Inc. | 96,210 | 2,747 |
| | Conagra Brands Inc. | 62,492 | 2,397 |
Vanguard® Russell 1000 Index Fund
Schedule of Investments
August 31, 2020
| | | Market |
| | | Value |
| | Shares | ($000) |
| | Tyson Foods Inc. Class A | 36,900 | 2,317 |
| | Kellogg Co. | 32,123 | 2,278 |
| | Hormel Foods Corp. | 35,716 | 1,821 |
| | Brown-Forman Corp. Class B | 23,976 | 1,754 |
| | J M Smucker Co. | 14,172 | 1,703 |
| | Keurig Dr Pepper Inc. | 49,654 | 1,481 |
| | Campbell Soup Co. | 22,562 | 1,187 |
| | Lamb Weston Holdings Inc. | 18,788 | 1,181 |
| * | Boston Beer Co. Inc. Class A | 1,114 | 983 |
| * | Beyond Meat Inc. | 6,611 | 898 |
| | Casey's General Stores Inc. | 4,745 | 844 |
| | Molson Coors Beverage Co. Class B | 22,186 | 835 |
| | Bunge Ltd. | 17,936 | 818 |
| * | Post Holdings Inc. | 8,080 | 711 |
| | Ingredion Inc. | 8,706 | 700 |
| * | US Foods Holding Corp. | 27,998 | 682 |
| *,^ | Herbalife Nutrition Ltd. | 13,063 | 642 |
| | Flowers Foods Inc. | 25,143 | 615 |
| * | Grocery Outlet Holding Corp. | 9,030 | 371 |
| | Energizer Holdings Inc. | 7,846 | 363 |
| * | Sprouts Farmers Market Inc. | 14,972 | 350 |
| * | Hain Celestial Group Inc. | 10,481 | 344 |
| | Spectrum Brands Holdings Inc | 5,483 | 327 |
| | Brown-Forman Corp. Class A | 4,840 | 322 |
| * | TreeHouse Foods Inc. | 7,310 | 313 |
| | Nu Skin Enterprises Inc. Class A | 6,414 | 303 |
| * | Pilgrim's Pride Corp. | 6,878 | 110 |
| | Seaboard Corp. | 30 | 80 |
| | 231,091 |
| Energy (2.3%) |
| | Exxon Mobil Corp. | 544,860 | 21,762 |
| | Chevron Corp. | 240,493 | 20,185 |
| | ConocoPhillips | 138,220 | 5,237 |
| | Kinder Morgan Inc. | 250,502 | 3,462 |
| | EOG Resources Inc. | 75,010 | 3,401 |
| | Schlumberger Ltd. | 178,124 | 3,386 |
| | Phillips 66 | 56,208 | 3,286 |
| | Williams Cos. Inc. | 156,114 | 3,241 |
| | Marathon Petroleum Corp. | 83,418 | 2,958 |
| | Valero Energy Corp. | 52,258 | 2,748 |
| | Pioneer Natural Resources Co. | 21,004 | 2,183 |
| | Halliburton Co. | 112,102 | 1,814 |
| | Hess Corp. | 35,381 | 1,629 |
| | ONEOK Inc. | 56,747 | 1,559 |
| * | Cheniere Energy Inc. | 29,636 | 1,543 |
| * | SolarEdge Technologies Inc. | 6,284 | 1,390 |
| | Occidental Petroleum Corp. | 103,811 | 1,323 |
| | Concho Resources Inc. | 24,858 | 1,292 |
| | Baker Hughes Co. Class A | 84,813 | 1,211 |
| * | Enphase Energy Inc. | 13,585 | 1,049 |
| | Cabot Oil & Gas Corp. | 50,196 | 952 |
| * | First Solar Inc. | 10,518 | 806 |
| | Diamondback Energy Inc. | 19,945 | 777 |
| | Apache Corp. | 48,772 | 722 |
| | National Oilwell Varco Inc. | 50,144 | 602 |
| | Noble Energy Inc. | 60,457 | 601 |
| | Devon Energy Corp. | 50,127 | 545 |
| | Equitrans Midstream Corp. | 52,846 | 543 |
| | Marathon Oil Corp. | 101,211 | 534 |
| | EQT Corp. | 32,952 | 523 |
| | Targa Resources Corp. | 29,321 | 499 |
| | Valvoline Inc. | 23,847 | 486 |
| | HollyFrontier Corp. | 19,299 | 461 |
| | Parsley Energy Inc. Class A | 37,846 | 407 |
Vanguard® Russell 1000 Index Fund
Schedule of Investments
August 31, 2020
| | | Market |
| | | Value |
| | Shares | ($000) |
| | Cimarex Energy Co. | 13,103 | 364 |
| * | WPX Energy Inc. | 51,043 | 284 |
| | Murphy Oil Corp. | 18,736 | 257 |
| | Antero Midstream Corp. | 36,041 | 244 |
| | Helmerich & Payne Inc. | 13,650 | 225 |
| | Continental Resources Inc. | 9,390 | 161 |
| | Chesapeake Energy Corp. | 1 | — |
| | 94,652 |
| Financial Services (16.7%) |
| * | Berkshire Hathaway Inc. Class B | 250,884 | 54,703 |
| | Visa Inc. Class A | 217,170 | 46,038 |
| | Mastercard Inc. Class A | 113,428 | 40,629 |
| | JPMorgan Chase & Co. | 389,186 | 38,993 |
| * | PayPal Holdings Inc. | 151,133 | 30,852 |
| | Bank of America Corp. | 995,542 | 25,625 |
| | American Tower Corp. | 56,739 | 14,137 |
| | Citigroup Inc. | 268,124 | 13,706 |
| | Fidelity National Information Services Inc. | 79,427 | 11,982 |
| | Wells Fargo & Co. | 482,990 | 11,664 |
| | S&P Global Inc. | 30,988 | 11,355 |
| | BlackRock Inc. | 18,942 | 11,255 |
| | Prologis Inc. | 94,637 | 9,640 |
| | Equinix Inc. | 11,261 | 8,894 |
| | Goldman Sachs Group Inc. | 42,591 | 8,726 |
| | Crown Castle International Corp. | 53,412 | 8,720 |
| | American Express Co. | 84,152 | 8,549 |
| | CME Group Inc. | 45,603 | 8,020 |
| | Marsh & McLennan Cos. Inc. | 65,087 | 7,479 |
| * | Square Inc. | 46,412 | 7,405 |
| | Intercontinental Exchange Inc. | 69,599 | 7,393 |
| | Morgan Stanley | 140,851 | 7,361 |
| | Chubb Ltd. | 57,899 | 7,237 |
| | Progressive Corp. | 75,158 | 7,143 |
| * | Fiserv Inc. | 71,404 | 7,110 |
| | Global Payments Inc. | 38,336 | 6,771 |
| | Truist Financial Corp. | 173,405 | 6,730 |
| | US Bancorp | 174,953 | 6,368 |
| | Moody's Corp. | 20,878 | 6,151 |
| | PNC Financial Services Group Inc. | 54,621 | 6,074 |
| | Aon plc Class A | 29,488 | 5,897 |
| | Digital Realty Trust Inc. | 34,325 | 5,343 |
| | Charles Schwab Corp. | 148,339 | 5,270 |
| | SBA Communications Corp. Class A | 14,197 | 4,345 |
| | Public Storage | 19,367 | 4,114 |
| | T. Rowe Price Group Inc. | 29,041 | 4,043 |
| | Capital One Financial Corp. | 58,116 | 4,012 |
| | MSCI Inc. Class A | 10,660 | 3,979 |
| | MetLife Inc. | 98,810 | 3,800 |
| | Bank of New York Mellon Corp. | 102,538 | 3,792 |
| | Travelers Cos. Inc. | 32,473 | 3,768 |
| | Allstate Corp. | 40,307 | 3,749 |
| | Prudential Financial Inc. | 50,708 | 3,436 |
| | Willis Towers Watson plc | 16,526 | 3,397 |
| | Aflac Inc. | 91,180 | 3,312 |
| | American International Group Inc. | 111,196 | 3,240 |
| | Welltower Inc. | 53,757 | 3,092 |
| | State Street Corp. | 45,158 | 3,075 |
| | Weyerhaeuser Co. | 96,253 | 2,917 |
| | AvalonBay Communities Inc. | 18,111 | 2,863 |
| | Realty Income Corp. | 44,133 | 2,738 |
| | Alexandria Real Estate Equities Inc. | 16,103 | 2,711 |
| | Equity Residential | 47,200 | 2,664 |
| * | FleetCor Technologies Inc. | 10,575 | 2,659 |
| | Simon Property Group Inc. | 39,006 | 2,647 |
Vanguard® Russell 1000 Index Fund
Schedule of Investments
August 31, 2020
| | | Market |
| | | Value |
| | Shares | ($000) |
| | Arthur J Gallagher & Co. | 24,180 | 2,546 |
| | Ameriprise Financial Inc. | 15,778 | 2,474 |
| | First Republic Bank | 21,897 | 2,472 |
| | KKR & Co. Inc. | 68,472 | 2,453 |
| | MarketAxess Holdings Inc. | 4,737 | 2,302 |
| | TransUnion | 24,402 | 2,116 |
| | Discover Financial Services | 39,286 | 2,085 |
| * | CBRE Group Inc. Class A | 43,148 | 2,029 |
| | Broadridge Financial Solutions Inc. | 14,688 | 2,018 |
| | Northern Trust Corp. | 24,625 | 2,017 |
| | Invitation Homes Inc. | 69,644 | 1,994 |
| | Ventas Inc. | 47,955 | 1,976 |
| | Nasdaq Inc. | 14,691 | 1,975 |
| | Healthpeak Properties Inc. | 69,131 | 1,911 |
| | Fifth Third Bancorp | 91,570 | 1,892 |
| * | Markel Corp. | 1,728 | 1,878 |
| | Hartford Financial Services Group Inc. | 46,057 | 1,863 |
| | Synchrony Financial | 74,787 | 1,855 |
| | Sun Communities Inc. | 12,418 | 1,851 |
| | Essex Property Trust Inc. | 8,376 | 1,813 |
| | Duke Realty Corp. | 46,863 | 1,807 |
| | Boston Properties Inc. | 19,963 | 1,734 |
| | Extra Space Storage Inc. | 16,165 | 1,722 |
| | Mid-America Apartment Communities Inc. | 14,646 | 1,715 |
| | M&T Bank Corp. | 16,365 | 1,690 |
| * | SVB Financial Group | 6,596 | 1,684 |
| | FactSet Research Systems Inc. | 4,761 | 1,668 |
| | Jack Henry & Associates Inc. | 9,832 | 1,626 |
| * | Arch Capital Group Ltd. | 50,595 | 1,596 |
| | E*TRADE Financial Corp. | 28,668 | 1,551 |
| | KeyCorp | 123,579 | 1,522 |
| | Cincinnati Financial Corp. | 19,167 | 1,522 |
| | WP Carey Inc. | 21,725 | 1,507 |
| * | Fair Isaac Corp. | 3,574 | 1,504 |
| * | Zillow Group Inc. Class C | 17,414 | 1,493 |
| | Equity LifeStyle Properties Inc. | 22,307 | 1,479 |
| | Principal Financial Group Inc. | 35,044 | 1,476 |
| | Regions Financial Corp. | 124,376 | 1,438 |
| | Citizens Financial Group Inc. | 54,452 | 1,409 |
| | Brown & Brown Inc. | 30,340 | 1,408 |
| | Annaly Capital Management Inc. | 183,886 | 1,352 |
| | VICI Properties Inc. | 59,800 | 1,336 |
| | UDR Inc. | 37,802 | 1,316 |
| | Cboe Global Markets Inc. | 14,043 | 1,289 |
| | TD Ameritrade Holding Corp. | 33,266 | 1,277 |
| | Medical Properties Trust Inc. | 66,885 | 1,243 |
| | Western Union Co. | 52,566 | 1,240 |
| | CyrusOne Inc. | 14,841 | 1,240 |
| | Huntington Bancshares Inc. | 130,600 | 1,229 |
| | Raymond James Financial Inc. | 15,688 | 1,188 |
| | Fidelity National Financial Inc. | 34,994 | 1,149 |
| | RenaissanceRe Holdings Ltd. | 6,251 | 1,149 |
| | Everest Re Group Ltd. | 5,158 | 1,135 |
| | Ally Financial Inc. | 48,669 | 1,114 |
| | W R Berkley Corp. | 17,910 | 1,111 |
| | Camden Property Trust | 12,175 | 1,107 |
| | Globe Life Inc. | 13,394 | 1,105 |
| | Equitable Holdings Inc. | 52,095 | 1,104 |
| | Loews Corp. | 30,675 | 1,100 |
| | Iron Mountain Inc. | 36,495 | 1,098 |
| | AGNC Investment Corp. | 73,687 | 1,040 |
| | Apollo Global Management LLC | 21,914 | 1,027 |
| | Host Hotels & Resorts Inc. | 90,055 | 1,011 |
| | Alleghany Corp. | 1,793 | 994 |
Vanguard® Russell 1000 Index Fund
Schedule of Investments
August 31, 2020
| | | Market |
| | | Value |
| | Shares | ($000) |
| | Americold Realty Trust | 25,866 | 992 |
| | American Homes 4 Rent Class A | 34,569 | 990 |
| | Gaming and Leisure Properties Inc. | 26,062 | 947 |
| | VEREIT Inc. | 137,373 | 923 |
| | Assurant Inc. | 7,539 | 916 |
| * | WEX Inc. | 5,585 | 892 |
| | Omega Healthcare Investors Inc. | 28,754 | 891 |
| | Lincoln National Corp. | 24,634 | 888 |
| | Kilroy Realty Corp. | 14,762 | 864 |
| | Regency Centers Corp. | 21,689 | 861 |
| | Voya Financial Inc. | 16,141 | 838 |
| | LPL Financial Holdings Inc. | 10,109 | 831 |
| | Vornado Realty Trust | 22,543 | 808 |
| | Reinsurance Group of America Inc. | 8,680 | 796 |
| | CubeSmart | 25,052 | 792 |
| | National Retail Properties Inc. | 22,293 | 790 |
| | SEI Investments Co. | 14,830 | 776 |
| | STORE Capital Corp. | 28,707 | 776 |
| | Federal Realty Investment Trust | 9,737 | 772 |
| | Commerce Bancshares Inc. | 12,921 | 770 |
| | Lamar Advertising Co. Class A | 11,009 | 762 |
| | Healthcare Trust of America Inc. Class A | 28,053 | 740 |
| | Franklin Resources Inc. | 35,081 | 739 |
| | First American Financial Corp. | 13,880 | 730 |
| | Rexford Industrial Realty Inc. | 14,983 | 719 |
| | First Industrial Realty Trust Inc. | 16,321 | 696 |
| | Apartment Investment and Management Co. | 19,269 | 694 |
| | Jones Lang LaSalle Inc. | 6,691 | 689 |
| | Comerica Inc. | 17,397 | 688 |
| | Erie Indemnity Co. Class A | 3,211 | 685 |
| * | Euronet Worldwide Inc. | 6,515 | 674 |
| | First Horizon National Corp. | 70,058 | 669 |
| | East West Bancorp Inc. | 17,913 | 659 |
| | Zions Bancorp NA | 20,137 | 648 |
| | Kimco Realty Corp. | 53,694 | 644 |
| | American Financial Group Inc. | 9,619 | 643 |
| | Signature Bank | 6,572 | 638 |
| | Life Storage Inc. | 6,032 | 636 |
| | CoreSite Realty Corp. | 5,174 | 634 |
| | Primerica Inc. | 5,044 | 630 |
| * | Zillow Group Inc. Class A | 7,316 | 624 |
| | Prosperity Bancshares Inc. | 11,266 | 614 |
| | Kemper Corp. | 7,888 | 613 |
| | Tradeweb Markets Inc. Class A | 10,620 | 608 |
| | American Campus Communities Inc. | 17,831 | 604 |
| | Douglas Emmett Inc. | 21,596 | 603 |
| | Old Republic International Corp. | 36,454 | 587 |
| | People's United Financial Inc. | 53,808 | 569 |
| | Eaton Vance Corp. | 13,834 | 567 |
| | Cousins Properties Inc. | 18,977 | 566 |
| * | Athene Holding Ltd. Class A | 14,807 | 541 |
| | Starwood Property Trust Inc. | 34,538 | 539 |
| | TCF Financial Corp. | 19,768 | 531 |
| | New York Community Bancorp Inc. | 57,540 | 521 |
| | Rayonier Inc. | 17,674 | 517 |
| | Cullen/Frost Bankers Inc. | 7,389 | 513 |
| | Jefferies Financial Group Inc. | 29,154 | 511 |
| | Ares Management Corp. Class A | 12,598 | 510 |
| * | Credit Acceptance Corp. | 1,316 | 509 |
| | Axis Capital Holdings Ltd. | 10,569 | 505 |
| | Hanover Insurance Group Inc. | 4,916 | 504 |
| | Invesco Ltd. | 48,884 | 499 |
| | Highwoods Properties Inc. | 13,318 | 496 |
| | Unum Group | 26,450 | 489 |
Vanguard® Russell 1000 Index Fund
Schedule of Investments
August 31, 2020
| | | Market |
| | | Value |
| | Shares | ($000) |
| | Interactive Brokers Group Inc. | 9,175 | 486 |
| | Spirit Realty Capital Inc. | 13,505 | 480 |
| | Equity Commonwealth | 15,101 | 474 |
| | SL Green Realty Corp. | 9,919 | 464 |
| | Hudson Pacific Properties Inc. | 19,270 | 452 |
| | Brixmor Property Group Inc. | 38,177 | 450 |
| | Morningstar Inc. | 2,783 | 446 |
| | JBG SMITH Properties | 15,859 | 439 |
| | Western Alliance Bancorp | 12,103 | 427 |
| | Lazard Ltd. Class A | 13,113 | 415 |
| | New Residential Investment Corp. | 53,322 | 413 |
| | Popular Inc. | 11,073 | 410 |
| | Affiliated Managers Group Inc. | 5,944 | 408 |
| | Synovus Financial Corp. | 18,082 | 395 |
| | MGIC Investment Corp. | 42,602 | 391 |
| | Pinnacle Financial Partners Inc. | 9,755 | 390 |
| | Carlyle Group Inc. | 14,929 | 385 |
| * | Brighthouse Financial Inc. | 12,506 | 380 |
| | Bank OZK | 16,096 | 371 |
| | SLM Corp. | 48,159 | 368 |
| | Corporate Office Properties Trust | 14,479 | 357 |
| | White Mountains Insurance Group Ltd. | 389 | 347 |
| | First Citizens BancShares Inc. Class A | 850 | 334 |
| | EPR Properties | 10,196 | 329 |
| | Webster Financial Corp. | 11,828 | 325 |
| | Umpqua Holdings Corp. | 28,611 | 323 |
| | Evercore Inc. Class A | 5,188 | 321 |
| | Outfront Media Inc. | 18,872 | 320 |
| | Wintrust Financial Corp. | 7,239 | 315 |
| | FNB Corp. | 41,501 | 311 |
| * | LendingTree Inc. | 992 | 306 |
| | Park Hotels & Resorts Inc. | 31,721 | 301 |
| | Taubman Centers Inc. | 7,855 | 301 |
| | Sterling Bancorp | 25,593 | 299 |
| | PacWest Bancorp | 15,637 | 298 |
| * | Howard Hughes Corp. | 4,938 | 292 |
| | First Hawaiian Inc. | 17,412 | 288 |
| | Bank of Hawaii Corp. | 5,060 | 279 |
| | Weingarten Realty Investors | 15,847 | 277 |
| | Alliance Data Systems Corp. | 6,098 | 275 |
| | Associated Banc-Corp | 20,104 | 270 |
| | Apple Hospitality REIT Inc. | 25,724 | 262 |
| | Brandywine Realty Trust | 22,546 | 251 |
| | OneMain Holdings Inc | 8,231 | 239 |
| | BOK Financial Corp. | 4,113 | 231 |
| | Assured Guaranty Ltd. | 10,398 | 223 |
| | Virtu Financial Inc. Class A | 8,219 | 212 |
| * | Bill.com Holdings Inc. | 2,052 | 203 |
| | Santander Consumer USA Holdings Inc. | 9,578 | 165 |
| | Mercury General Corp. | 3,677 | 164 |
| | Paramount Group Inc. | 21,316 | 158 |
| | Empire State Realty Trust Inc. | 19,217 | 121 |
| | CNA Financial Corp. | 3,499 | 113 |
| | TFS Financial Corp. | 6,251 | 97 |
| ^ | Brookfield Property REIT Inc. Class A | 6,497 | 75 |
| | American National Insurance Co. | 919 | 69 |
| | 699,963 |
| Health Care (13.4%) |
| | Johnson & Johnson | 339,193 | 52,036 |
| | UnitedHealth Group Inc. | 121,424 | 37,951 |
| | Merck & Co. Inc. | 325,094 | 27,721 |
| | Pfizer Inc. | 715,604 | 27,043 |
| | Abbott Laboratories | 222,262 | 24,331 |
| | Thermo Fisher Scientific Inc. | 50,798 | 21,791 |
Vanguard® Russell 1000 Index Fund
Schedule of Investments
August 31, 2020
| | | Market |
| | | Value |
| | Shares | ($000) |
| | AbbVie Inc. | 226,749 | 21,716 |
| | Amgen Inc. | 75,759 | 19,191 |
| | Medtronic plc | 172,428 | 18,531 |
| | Bristol-Myers Squibb Co. | 291,395 | 18,125 |
| | Danaher Corp. | 80,489 | 16,619 |
| | Eli Lilly and Co. | 108,405 | 16,086 |
| * | Intuitive Surgical Inc. | 14,898 | 10,888 |
| | Gilead Sciences Inc. | 161,515 | 10,781 |
| | Zoetis Inc. | 61,100 | 9,782 |
| * | Vertex Pharmaceuticals Inc. | 33,395 | 9,321 |
| | Anthem Inc. | 32,502 | 9,150 |
| | Stryker Corp. | 44,598 | 8,838 |
| | Becton Dickinson and Co. | 34,696 | 8,423 |
| | Cigna Corp. | 46,605 | 8,266 |
| * | Regeneron Pharmaceuticals Inc. | 12,430 | 7,706 |
| * | Boston Scientific Corp. | 179,990 | 7,383 |
| | Humana Inc. | 16,984 | 7,051 |
| * | Edwards Lifesciences Corp. | 79,251 | 6,803 |
| * | Illumina Inc. | 18,852 | 6,734 |
| * | Biogen Inc. | 20,896 | 6,011 |
| | Baxter International Inc. | 65,433 | 5,697 |
| * | DexCom Inc. | 11,825 | 5,031 |
| * | Veeva Systems Inc. Class A | 17,140 | 4,838 |
| | HCA Healthcare Inc. | 34,222 | 4,645 |
| * | Centene Corp. | 73,753 | 4,523 |
| * | IDEXX Laboratories Inc. | 10,799 | 4,223 |
| * | IQVIA Holdings Inc. | 24,392 | 3,994 |
| | Agilent Technologies Inc. | 39,711 | 3,988 |
| | Zimmer Biomet Holdings Inc. | 26,582 | 3,745 |
| | ResMed Inc. | 18,410 | 3,328 |
| * | Alexion Pharmaceuticals Inc. | 27,378 | 3,127 |
| * | Align Technology Inc. | 10,024 | 2,977 |
| | Cerner Corp. | 39,055 | 2,866 |
| | West Pharmaceutical Services Inc. | 9,459 | 2,686 |
| * | Seattle Genetics Inc. | 15,620 | 2,473 |
| | Teleflex Inc. | 5,971 | 2,346 |
| * | Incyte Corp. | 23,407 | 2,255 |
| * | Moderna Inc. | 34,476 | 2,237 |
| * | Laboratory Corp. of America Holdings | 12,454 | 2,189 |
| * | Teladoc Health Inc. | 9,496 | 2,048 |
| * | Varian Medical Systems Inc. | 11,693 | 2,031 |
| | Cooper Cos. Inc. | 6,285 | 1,976 |
| * | Hologic Inc. | 32,916 | 1,966 |
| * | Alnylam Pharmaceuticals Inc. | 14,662 | 1,945 |
| | Quest Diagnostics Inc. | 17,180 | 1,911 |
| | Cardinal Health Inc. | 37,623 | 1,910 |
| * | Horizon Therapeutics plc | 25,041 | 1,881 |
| * | Catalent Inc. | 19,682 | 1,821 |
| * | BioMarin Pharmaceutical Inc. | 23,274 | 1,816 |
| | AmerisourceBergen Corp. Class A | 18,695 | 1,814 |
| * | Insulet Corp. | 8,084 | 1,764 |
| * | ABIOMED Inc. | 5,722 | 1,760 |
| | STERIS plc | 10,822 | 1,728 |
| | PerkinElmer Inc. | 14,204 | 1,672 |
| * | Elanco Animal Health Inc. | 51,834 | 1,506 |
| * | QIAGEN NV | 28,905 | 1,473 |
| * | Exact Sciences Corp. | 19,057 | 1,435 |
| * | Sarepta Therapeutics Inc. | 9,543 | 1,397 |
| * | Molina Healthcare Inc. | 7,542 | 1,395 |
| * | Masimo Corp. | 6,198 | 1,388 |
| * | Bio-Rad Laboratories Inc. Class A | 2,728 | 1,387 |
| * | Neurocrine Biosciences Inc. | 11,907 | 1,386 |
| * | Charles River Laboratories International Inc. | 6,281 | 1,375 |
| * | Avantor Inc. | 57,471 | 1,297 |
Vanguard® Russell 1000 Index Fund
Schedule of Investments
August 31, 2020
| | | Market |
| | | Value |
| | Shares | ($000) |
| | Dentsply Sirona Inc. | 28,029 | 1,258 |
| | Bio-Techne Corp. | 4,892 | 1,250 |
| * | Henry Schein Inc. | 18,304 | 1,216 |
| * | Immunomedics Inc. | 26,474 | 1,180 |
| * | Mylan NV | 65,875 | 1,079 |
| * | Novocure Ltd. | 12,753 | 1,055 |
| | Universal Health Services Inc. Class B | 9,437 | 1,041 |
| * | Repligen Corp. | 6,715 | 1,040 |
| | Chemed Corp. | 1,988 | 1,028 |
| * | Amedisys Inc. | 4,061 | 982 |
| * | Livongo Health Inc. | 6,915 | 949 |
| * | DaVita Inc. | 10,662 | 925 |
| * | Jazz Pharmaceuticals plc | 6,881 | 925 |
| | Perrigo Co. plc | 17,495 | 915 |
| * | Ionis Pharmaceuticals Inc. | 16,695 | 910 |
| * | Guardant Health Inc. | 9,522 | 909 |
| * | PRA Health Sciences Inc. | 8,188 | 875 |
| * | Exelixis Inc. | 38,788 | 862 |
| * | Penumbra Inc. | 4,077 | 853 |
| * | Tandem Diabetes Care Inc. | 7,511 | 847 |
| * | Quidel Corp. | 4,773 | 840 |
| | Encompass Health Corp. | 12,484 | 815 |
| | Hill-Rom Holdings Inc. | 8,545 | 801 |
| * | 10X Genomics Inc. Class A | 6,978 | 800 |
| * | Acceleron Pharma Inc. | 6,204 | 605 |
| * | United Therapeutics Corp. | 5,556 | 594 |
| * | Iovance Biotherapeutics Inc. | 17,354 | 578 |
| * | Haemonetics Corp. | 6,393 | 573 |
| | Bruker Corp. | 13,313 | 559 |
| * | ACADIA Pharmaceuticals Inc. | 14,039 | 556 |
| * | Globus Medical Inc. | 9,536 | 539 |
| * | Syneos Health Inc. | 8,021 | 506 |
| * | Bluebird Bio Inc. | 8,337 | 494 |
| * | ICU Medical Inc. | 2,459 | 492 |
| * | Envista Holdings Corp. | 20,519 | 492 |
| * | Global Blood Therapeutics Inc. | 7,503 | 471 |
| * | Change Healthcare Inc. | 31,421 | 445 |
| * | Integra LifeSciences Holdings Corp. | 9,112 | 436 |
| * | Nektar Therapeutics Class A | 21,864 | 423 |
| * | Adaptive Biotechnologies Corp. | 9,235 | 384 |
| * | Sage Therapeutics Inc. | 6,798 | 357 |
| * | Acadia Healthcare Co. Inc. | 11,299 | 349 |
| * | Alkermes plc | 20,135 | 333 |
| * | Reata Pharmaceuticals Inc. Class A | 3,039 | 319 |
| * | Agios Pharmaceuticals Inc. | 7,775 | 319 |
| * | PPD Inc. | 7,707 | 265 |
| | Premier Inc. Class A | 7,846 | 257 |
| *,§ | Quorum Health Corp. | 35 | — |
| | 561,229 |
| Materials & Processing (3.0%) |
| | Linde plc | 67,577 | 16,877 |
| | Air Products & Chemicals Inc. | 28,398 | 8,300 |
| | Sherwin-Williams Co. | 10,594 | 7,109 |
| | Newmont Corp. | 103,128 | 6,938 |
| | Ecolab Inc. | 31,940 | 6,295 |
| | DuPont de Nemours Inc. | 94,724 | 5,282 |
| | Dow Inc. | 95,627 | 4,315 |
| | PPG Industries Inc. | 30,386 | 3,658 |
| | Trane Technologies plc | 30,795 | 3,646 |
| | Fastenal Co. | 73,559 | 3,594 |
| | Carrier Global Corp. | 111,441 | 3,326 |
| | Ball Corp. | 40,966 | 3,292 |
| | Freeport-McMoRan Inc. | 187,045 | 2,920 |
| | Amcor plc | 206,098 | 2,279 |
Vanguard® Russell 1000 Index Fund
Schedule of Investments
August 31, 2020
| | | Market |
| | | Value |
| | Shares | ($000) |
| | LyondellBasell Industries NV Class A | 32,859 | 2,152 |
| | Vulcan Materials Co. | 16,944 | 2,033 |
| | Masco Corp. | 33,751 | 1,968 |
| | International Paper Co. | 50,834 | 1,844 |
| | FMC Corp. | 16,688 | 1,783 |
| | Nucor Corp. | 38,434 | 1,747 |
| | International Flavors & Fragrances Inc. | 13,795 | 1,708 |
| | Martin Marietta Materials Inc. | 7,953 | 1,613 |
| | Celanese Corp. Class A | 15,310 | 1,549 |
| | RPM International Inc. | 16,410 | 1,391 |
| * | Crown Holdings Inc. | 16,669 | 1,281 |
| | Eastman Chemical Co. | 17,297 | 1,265 |
| | Lennox International Inc. | 4,412 | 1,237 |
| | Avery Dennison Corp. | 10,684 | 1,233 |
| | Albemarle Corp. | 13,481 | 1,227 |
| | Packaging Corp. of America | 12,033 | 1,218 |
| | Royal Gold Inc. | 8,370 | 1,141 |
| * | Trex Co. Inc. | 7,432 | 1,111 |
| | Watsco Inc. | 4,148 | 1,016 |
| | Westrock Co. | 33,222 | 1,008 |
| | AptarGroup Inc. | 8,202 | 971 |
| | Owens Corning | 13,907 | 941 |
| | Howmet Aerospace Inc. | 51,077 | 895 |
| | CF Industries Holdings Inc. | 27,140 | 886 |
| * | Berry Global Group Inc. | 17,129 | 883 |
| | Scotts Miracle-Gro Co. | 5,154 | 869 |
| | Reliance Steel & Aluminum Co. | 8,090 | 848 |
| | A O Smith Corp. | 16,794 | 822 |
| | Mosaic Co. | 45,044 | 821 |
| | Sealed Air Corp. | 19,737 | 776 |
| | Steel Dynamics Inc. | 25,906 | 765 |
| | Sonoco Products Co. | 12,935 | 686 |
| * | Axalta Coating Systems Ltd. | 26,648 | 635 |
| | MDU Resources Group Inc. | 25,941 | 613 |
| | Huntsman Corp. | 25,558 | 552 |
| | Acuity Brands Inc. | 4,971 | 543 |
| | Southern Copper Corp. | 10,848 | 522 |
| | Ashland Global Holdings Inc. | 7,012 | 517 |
| | Graphic Packaging Holding Co. | 34,439 | 481 |
| | Armstrong World Industries Inc. | 6,121 | 451 |
| | Chemours Co. | 21,023 | 434 |
| | Eagle Materials Inc. | 5,259 | 430 |
| | Timken Co. | 7,905 | 428 |
| | Hexcel Corp. | 10,543 | 415 |
| * | Univar Solutions Inc. | 21,639 | 394 |
| | Silgan Holdings Inc. | 9,990 | 380 |
| | NewMarket Corp. | 877 | 327 |
| * | Element Solutions Inc. | 28,809 | 310 |
| | W R Grace & Co. | 7,046 | 287 |
| | Cabot Corp. | 7,235 | 268 |
| | Westlake Chemical Corp. | 4,353 | 258 |
| | Olin Corp. | 18,499 | 208 |
| | GrafTech International Ltd. | 9,426 | 63 |
| | Ardagh Group SA | 2,067 | 31 |
| | 126,066 |
| Producer Durables (8.4%) |
| | Accenture plc Class A | 81,945 | 19,661 |
| | Union Pacific Corp. | 87,339 | 16,808 |
| | Honeywell International Inc. | 90,403 | 14,966 |
| | United Parcel Service Inc. Class B | 90,721 | 14,844 |
| | Lockheed Martin Corp. | 31,838 | 12,425 |
| | Boeing Co. | 68,700 | 11,804 |
| | 3M Co. | 72,372 | 11,798 |
| | Raytheon Technologies Corp. | 183,364 | 11,185 |
Vanguard® Russell 1000 Index Fund
Schedule of Investments
August 31, 2020
| | | Market |
| | | Value |
| | Shares | ($000) |
| | Caterpillar Inc. | 69,716 | 9,921 |
| | Illinois Tool Works Inc. | 40,518 | 8,004 |
| | Automatic Data Processing Inc. | 55,355 | 7,699 |
| | Deere & Co. | 36,297 | 7,625 |
| | CSX Corp. | 98,044 | 7,496 |
| | General Electric Co. | 1,118,897 | 7,094 |
| | Norfolk Southern Corp. | 32,991 | 7,012 |
| | Northrop Grumman Corp. | 20,072 | 6,877 |
| | FedEx Corp. | 31,039 | 6,824 |
| | Waste Management Inc. | 54,400 | 6,202 |
| | Roper Technologies Inc. | 13,416 | 5,731 |
| | Emerson Electric Co. | 76,668 | 5,326 |
| | Eaton Corp. plc | 51,552 | 5,263 |
| | General Dynamics Corp. | 32,689 | 4,882 |
| * | CoStar Group Inc. | 4,942 | 4,194 |
| | Cummins Inc. | 18,915 | 3,920 |
| | Johnson Controls International plc | 95,958 | 3,908 |
| | Verisk Analytics Inc. Class A | 20,361 | 3,801 |
| | Cintas Corp. | 11,316 | 3,771 |
| | PACCAR Inc. | 43,713 | 3,752 |
| | Rockwell Automation Inc. | 14,884 | 3,431 |
| | Parker-Hannifin Corp. | 16,388 | 3,376 |
| | TransDigm Group Inc. | 6,727 | 3,361 |
| | Otis Worldwide Corp. | 52,626 | 3,310 |
| | Stanley Black & Decker Inc. | 19,871 | 3,205 |
| | Paychex Inc. | 41,102 | 3,143 |
| | AMETEK Inc. | 29,442 | 2,965 |
| * | Mettler-Toledo International Inc. | 3,023 | 2,935 |
| | Southwest Airlines Co. | 75,628 | 2,842 |
| | Fortive Corp. | 38,234 | 2,757 |
| * | Copart Inc. | 25,998 | 2,686 |
| | Equifax Inc. | 15,580 | 2,622 |
| | Old Dominion Freight Line Inc. | 12,572 | 2,542 |
| | Delta Air Lines Inc. | 81,752 | 2,522 |
| | Republic Services Inc. Class A | 26,901 | 2,494 |
| * | Keysight Technologies Inc. | 23,943 | 2,359 |
| | Kansas City Southern | 12,232 | 2,227 |
| | WW Grainger Inc. | 5,704 | 2,084 |
| | Dover Corp. | 18,307 | 2,011 |
| * | Zebra Technologies Corp. | 6,735 | 1,930 |
| | Expeditors International of Washington Inc. | 21,360 | 1,888 |
| | Xylem Inc. | 22,760 | 1,825 |
| | IDEX Corp. | 9,715 | 1,751 |
| * | Waters Corp. | 7,841 | 1,696 |
| | CH Robinson Worldwide Inc. | 17,096 | 1,681 |
| * | Trimble Inc. | 31,882 | 1,671 |
| * | United Rentals Inc. | 9,233 | 1,635 |
| | Wabtec Corp. | 23,425 | 1,559 |
| * | Ingersoll Rand Inc. | 44,271 | 1,552 |
| | Booz Allen Hamilton Holding Corp. Class A | 17,557 | 1,546 |
| | JB Hunt Transport Services Inc. | 10,697 | 1,503 |
| * | Generac Holdings Inc. | 7,852 | 1,492 |
| * | Teledyne Technologies Inc. | 4,677 | 1,467 |
| | Jacobs Engineering Group Inc. | 16,009 | 1,445 |
| | Nordson Corp. | 7,368 | 1,374 |
| * | United Airlines Holdings Inc. | 37,181 | 1,338 |
| | Graco Inc. | 21,173 | 1,228 |
| | Allegion plc | 11,759 | 1,216 |
| | Textron Inc. | 28,925 | 1,140 |
| * | XPO Logistics Inc. | 11,699 | 1,033 |
| | Toro Co. | 13,700 | 1,031 |
| | Genpact Ltd. | 24,384 | 1,029 |
| | Snap-on Inc. | 6,798 | 1,008 |
| | Hubbell Inc. Class B | 6,773 | 982 |
Vanguard® Russell 1000 Index Fund
Schedule of Investments
August 31, 2020
| | | Market |
| | | Value |
| | Shares | ($000) |
| | Pentair plc | 20,813 | 939 |
| | HEICO Corp. Class A | 10,091 | 902 |
| | Carlisle Cos. Inc. | 6,853 | 897 |
| | Quanta Services Inc. | 17,427 | 893 |
| | Donaldson Co. Inc. | 16,407 | 826 |
| * | Sensata Technologies Holding plc | 19,841 | 826 |
| | American Airlines Group Inc. | 63,202 | 825 |
| * | HD Supply Holdings Inc. | 20,571 | 816 |
| * | Aecom | 19,572 | 773 |
| | Huntington Ingalls Industries Inc. | 5,002 | 758 |
| * | Stericycle Inc. | 11,786 | 756 |
| | Robert Half International Inc. | 14,058 | 748 |
| | Knight-Swift Transportation Holdings Inc. | 16,059 | 730 |
| * | Middleby Corp. | 7,126 | 698 |
| | Lincoln Electric Holdings Inc. | 7,190 | 695 |
| | ITT Inc. | 11,062 | 695 |
| | BWX Technologies Inc. | 12,293 | 684 |
| | Oshkosh Corp. | 8,856 | 682 |
| * | Axon Enterprise Inc. | 7,945 | 681 |
| | CoreLogic Inc. | 10,151 | 674 |
| * | Paylocity Holding Corp. | 4,474 | 659 |
| | Landstar System Inc. | 4,805 | 639 |
| | Brunswick Corp. | 9,997 | 619 |
| | HEICO Corp. | 5,619 | 618 |
| | FLIR Systems Inc. | 16,649 | 614 |
| | Woodward Inc. | 7,126 | 611 |
| | Alaska Air Group Inc. | 15,471 | 603 |
| | MSA Safety Inc. | 4,667 | 588 |
| | AGCO Corp. | 7,920 | 563 |
| | Littelfuse Inc. | 3,075 | 556 |
| | ManpowerGroup Inc. | 7,519 | 551 |
| | Curtiss-Wright Corp. | 5,318 | 544 |
| * | FTI Consulting Inc. | 4,695 | 539 |
| | Regal Beloit Corp. | 5,145 | 509 |
| | Flowserve Corp. | 17,072 | 507 |
| | Allison Transmission Holdings Inc. | 14,110 | 506 |
| | Xerox Holdings Corp. | 23,191 | 437 |
| | Air Lease Corp. Class A | 13,703 | 426 |
| * | Colfax Corp. | 12,548 | 418 |
| * | Clean Harbors Inc. | 6,695 | 409 |
| * | JetBlue Airways Corp. | 34,413 | 396 |
| | nVent Electric plc | 19,920 | 381 |
| | MSC Industrial Direct Co. Inc. Class A | 5,742 | 378 |
| | Crane Co. | 6,556 | 371 |
| | Valmont Industries Inc. | 2,642 | 336 |
| * | Kirby Corp. | 7,567 | 321 |
| | Ryder System Inc. | 6,798 | 278 |
| | Spirit AeroSystems Holdings Inc. Class A | 13,176 | 271 |
| | Macquarie Infrastructure Corp. | 9,468 | 265 |
| | Trinity Industries Inc. | 11,785 | 241 |
| * | Pluralsight Inc. Class A | 11,903 | 228 |
| | Copa Holdings SA Class A | 4,159 | 221 |
| | Schneider National Inc. Class B | 7,427 | 201 |
| | ADT Inc. | 13,598 | 145 |
| * | Virgin Galactic Holdings Inc. | 7,730 | 138 |
| * | Gates Industrial Corp. plc | 6,582 | 74 |
| | 352,344 |
| Technology (29.4%) |
| | Apple Inc. | 2,104,852 | 271,610 |
| | Microsoft Corp. | 963,462 | 217,290 |
| * | Facebook Inc. Class A | 308,845 | 90,553 |
| * | Alphabet Inc. Class A | 38,792 | 63,213 |
| * | Alphabet Inc. Class C | 37,943 | 62,006 |
| | NVIDIA Corp. | 75,925 | 40,618 |
Vanguard® Russell 1000 Index Fund
Schedule of Investments
August 31, 2020
| | | Market |
| | | Value |
| | Shares | ($000) |
| * | Adobe Inc. | 61,889 | 31,773 |
| * | salesforce.com Inc. | 111,422 | 30,379 |
| | Intel Corp. | 545,041 | 27,770 |
| | Cisco Systems Inc. | 546,267 | 23,063 |
| | Broadcom Inc. | 50,231 | 17,438 |
| | QUALCOMM Inc. | 144,832 | 17,250 |
| | Texas Instruments Inc. | 118,110 | 16,789 |
| | Oracle Corp. | 253,947 | 14,531 |
| | International Business Machines Corp. | 114,318 | 14,097 |
| * | Advanced Micro Devices Inc. | 150,033 | 13,626 |
| * | ServiceNow Inc. | 24,472 | 11,796 |
| | Intuit Inc. | 32,443 | 11,205 |
| | Activision Blizzard Inc. | 98,107 | 8,194 |
| | Applied Materials Inc. | 118,053 | 7,272 |
| * | Zoom Video Communications Inc. Class A | 21,493 | 6,987 |
| * | Autodesk Inc. | 28,238 | 6,938 |
| * | Micron Technology Inc. | 142,285 | 6,475 |
| | Lam Research Corp. | 18,636 | 6,268 |
| | Analog Devices Inc. | 47,395 | 5,540 |
| * | Workday Inc. Class A | 22,101 | 5,298 |
| * | Electronic Arts Inc. | 36,647 | 5,111 |
| * | DocuSign Inc. Class A | 22,646 | 5,050 |
| | L3Harris Technologies Inc. | 27,752 | 5,016 |
| | Cognizant Technology Solutions Corp. Class A | 69,313 | 4,634 |
| * | Twilio Inc. Class A | 17,147 | 4,626 |
| * | Splunk Inc. | 20,455 | 4,486 |
| * | Synopsys Inc. | 19,281 | 4,267 |
| | KLA Corp. | 19,923 | 4,087 |
| | IHS Markit Ltd. | 51,008 | 4,077 |
| | Amphenol Corp. Class A | 37,019 | 4,065 |
| * | Twitter Inc. | 99,107 | 4,022 |
| * | Cadence Design Systems Inc. | 35,339 | 3,919 |
| * | ANSYS Inc. | 10,981 | 3,723 |
| | HP Inc. | 183,507 | 3,588 |
| | Motorola Solutions Inc. | 21,794 | 3,373 |
| | Microchip Technology Inc. | 30,118 | 3,304 |
| | Marvell Technology Group Ltd. | 84,604 | 3,281 |
| | Xilinx Inc. | 31,335 | 3,264 |
| * | Palo Alto Networks Inc. | 12,533 | 3,226 |
| * | Okta Inc. | 14,758 | 3,178 |
| * | Match Group Inc. | 28,018 | 3,129 |
| | Corning Inc. | 96,037 | 3,117 |
| | Skyworks Solutions Inc. | 21,409 | 3,101 |
| * | Atlassian Corp. plc Class A | 16,028 | 3,074 |
| * | RingCentral Inc. Class A | 9,809 | 2,852 |
| * | VeriSign Inc. | 13,110 | 2,816 |
| * | Coupa Software Inc. | 8,519 | 2,792 |
| * | Take-Two Interactive Software Inc. | 14,503 | 2,483 |
| * | Akamai Technologies Inc. | 20,467 | 2,383 |
| | Maxim Integrated Products Inc. | 34,047 | 2,330 |
| | Citrix Systems Inc. | 15,812 | 2,296 |
| * | Fortinet Inc. | 17,053 | 2,251 |
| * | EPAM Systems Inc. | 6,817 | 2,230 |
| | CDW Corp. | 18,270 | 2,076 |
| * | Paycom Software Inc. | 6,357 | 1,904 |
| * | Qorvo Inc. | 14,824 | 1,901 |
| * | Pinterest Inc. Class A | 51,511 | 1,895 |
| * | Crowdstrike Holdings Inc. Class A | 14,817 | 1,863 |
| | SS&C Technologies Holdings Inc. | 28,687 | 1,828 |
| | Teradyne Inc. | 21,251 | 1,806 |
| * | GoDaddy Inc. Class A | 21,228 | 1,776 |
| * | Tyler Technologies Inc. | 5,053 | 1,745 |
| | NortonLifeLock Inc. | 71,513 | 1,682 |
| * | Arista Networks Inc. | 7,512 | 1,679 |
Vanguard® Russell 1000 Index Fund
Schedule of Investments
August 31, 2020
| | | Market |
| | | Value |
| | Shares | ($000) |
| * | Datadog Inc. Class A | 19,585 | 1,636 |
| * | HubSpot Inc. | 5,330 | 1,597 |
| | Hewlett Packard Enterprise Co. | 164,677 | 1,592 |
| * | Slack Technologies Inc. Class A | 48,162 | 1,582 |
| | Leidos Holdings Inc. | 17,416 | 1,576 |
| * | Black Knight Inc. | 18,504 | 1,556 |
| | Monolithic Power Systems Inc. | 5,600 | 1,496 |
| | Western Digital Corp. | 38,786 | 1,490 |
| * | VMware Inc. Class A | 10,143 | 1,465 |
| | Cognex Corp. | 21,099 | 1,460 |
| * | Gartner Inc. | 11,091 | 1,440 |
| * | Zendesk Inc. | 14,556 | 1,403 |
| * | Avalara Inc. | 10,375 | 1,374 |
| | NetApp Inc. | 28,299 | 1,341 |
| * | Dell Technologies Inc. | 19,759 | 1,306 |
| * | Zscaler Inc. | 9,092 | 1,303 |
| * | IAC/InterActiveCorp | 9,713 | 1,292 |
| * | MongoDB Inc. | 5,355 | 1,252 |
| * | PTC Inc. | 13,540 | 1,238 |
| * | Guidewire Software Inc. | 10,781 | 1,211 |
| * | StoneCo Ltd. Class A | 22,961 | 1,171 |
| | Entegris Inc. | 17,234 | 1,153 |
| * | Ceridian HCM Holding Inc. | 14,167 | 1,127 |
| * | ON Semiconductor Corp. | 52,203 | 1,116 |
| * | Ciena Corp. | 19,612 | 1,113 |
| * | Aspen Technology Inc. | 8,711 | 1,107 |
| * | Nuance Communications Inc. | 35,763 | 1,071 |
| | Amdocs Ltd. | 17,072 | 1,045 |
| | Juniper Networks Inc. | 41,709 | 1,043 |
| * | F5 Networks Inc. | 7,796 | 1,032 |
| * | Zynga Inc. Class A | 113,626 | 1,029 |
| * | Anaplan Inc. | 16,673 | 1,021 |
| * | Five9 Inc. | 7,929 | 1,010 |
| * | Dynatrace Inc. | 22,352 | 989 |
| | Universal Display Corp. | 5,555 | 975 |
| * | Cree Inc. | 13,915 | 878 |
| * | Fastly Inc. Class A | 9,360 | 869 |
| * | Grubhub Inc. | 11,885 | 860 |
| | MKS Instruments Inc. | 7,039 | 841 |
| * | Lumentum Holdings Inc. | 9,596 | 825 |
| * | Globant SA | 4,644 | 825 |
| * | Alteryx Inc. Class A | 6,737 | 814 |
| * | Proofpoint Inc. | 7,256 | 796 |
| * | Manhattan Associates Inc. | 8,097 | 787 |
| * | Smartsheet Inc. Class A | 14,130 | 771 |
| * | Arrow Electronics Inc. | 9,788 | 769 |
| * | Elastic NV | 7,011 | 761 |
| * | CACI International Inc. Class A | 3,204 | 750 |
| | CDK Global Inc. | 15,853 | 739 |
| * | IPG Photonics Corp. | 4,514 | 730 |
| * | RealPage Inc. | 11,426 | 716 |
| * | Inphi Corp. | 6,164 | 703 |
| | SYNNEX Corp. | 5,370 | 683 |
| * | Dropbox Inc. Class A | 31,421 | 665 |
| | DXC Technology Co. | 32,991 | 659 |
| * | Everbridge Inc. | 4,403 | 654 |
| * | Nutanix Inc. | 22,770 | 654 |
| | Pegasystems Inc. | 5,055 | 649 |
| | Jabil Inc. | 18,823 | 643 |
| | Science Applications International Corp. | 7,438 | 621 |
| | National Instruments Corp. | 16,492 | 592 |
| | Dolby Laboratories Inc. Class A | 8,200 | 573 |
| | LogMeIn Inc. | 6,223 | 536 |
| * | Cloudflare Inc. Class A | 13,985 | 535 |
Vanguard® Russell 1000 Index Fund
Schedule of Investments
August 31, 2020
| | | Market |
| | | Value |
| | Shares | ($000) |
| * | Mercury Systems Inc. | 7,002 | 530 |
| * | Pure Storage Inc. Class A | 30,390 | 464 |
| * | Cirrus Logic Inc. | 7,526 | 456 |
| * | Vertiv Holdings Co. Class A | 27,258 | 442 |
| * | FireEye Inc. | 28,761 | 422 |
| * | New Relic Inc. | 6,351 | 390 |
| * | Medallia Inc. | 10,439 | 378 |
| | Avnet Inc. | 12,987 | 357 |
| * | Coherent Inc. | 3,158 | 356 |
| * | Teradata Corp. | 13,818 | 336 |
| * | NCR Corp. | 16,045 | 328 |
| * | ViaSat Inc. | 7,226 | 287 |
| * | PagerDuty Inc. | 8,726 | 285 |
| * | CommScope Holding Co. Inc. | 24,556 | 253 |
| | Sabre Corp. | 34,686 | 242 |
| | Ubiquiti Inc. | 1,151 | 209 |
| | Switch Inc. | 11,345 | 195 |
| * | EchoStar Corp. Class A | 6,274 | 184 |
| * | SolarWinds Corp. | 5,601 | 118 |
| * | ZoomInfo Technologies Inc. Class A | 188 | 7 |
| | 1,235,034 |
| Utilities (4.3%) |
| | Verizon Communications Inc. | 532,802 | 31,579 |
| | AT&T Inc. | 917,276 | 27,344 |
| | NextEra Energy Inc. | 62,909 | 17,562 |
| | Dominion Energy Inc. | 107,751 | 8,452 |
| * | T-Mobile US Inc. | 70,844 | 8,266 |
| | Duke Energy Corp. | 94,558 | 7,597 |
| | Southern Co. | 135,926 | 7,093 |
| | American Electric Power Co. Inc. | 63,836 | 5,032 |
| | Xcel Energy Inc. | 67,483 | 4,688 |
| | Sempra Energy | 37,638 | 4,654 |
| | Exelon Corp. | 124,980 | 4,613 |
| | WEC Energy Group Inc. | 40,516 | 3,812 |
| | Eversource Energy | 43,280 | 3,709 |
| | Public Service Enterprise Group Inc. | 64,984 | 3,395 |
| | American Water Works Co. Inc. | 23,169 | 3,275 |
| | Consolidated Edison Inc. | 42,899 | 3,060 |
| | DTE Energy Co. | 24,635 | 2,923 |
| | PPL Corp. | 98,852 | 2,731 |
| | Entergy Corp. | 25,882 | 2,566 |
| | Ameren Corp. | 31,698 | 2,508 |
| | Edison International | 45,944 | 2,411 |
| | CMS Energy Corp. | 36,607 | 2,214 |
| | FirstEnergy Corp. | 69,489 | 1,987 |
| | Alliant Energy Corp. | 32,106 | 1,739 |
| | Atmos Energy Corp. | 15,540 | 1,551 |
| | Evergy Inc. | 29,082 | 1,548 |
| | AES Corp. | 85,056 | 1,510 |
| | CenturyLink Inc. | 140,153 | 1,507 |
| | CenterPoint Energy Inc. | 64,447 | 1,293 |
| | Essential Utilities Inc. | 28,799 | 1,224 |
| | Vistra Corp. | 62,655 | 1,205 |
| * | PG&E Corp. | 122,461 | 1,134 |
| | NiSource Inc. | 49,064 | 1,087 |
| | NRG Energy Inc. | 31,320 | 1,078 |
| | Pinnacle West Capital Corp. | 14,401 | 1,056 |
| * | GCI Liberty Inc. Class A | 12,788 | 1,033 |
| | UGI Corp. | 26,573 | 918 |
| | OGE Energy Corp. | 26,052 | 830 |
| | IDACORP Inc. | 6,562 | 590 |
| | Hawaiian Electric Industries Inc. | 14,133 | 489 |
| | National Fuel Gas Co. | 10,347 | 472 |
| | Avangrid Inc. | 7,349 | 353 |
Vanguard® Russell 1000 Index Fund
Schedule of Investments
August 31, 2020
| | | Market |
| | | Value |
| | Shares | ($000) |
| | Telephone and Data Systems Inc. | 13,342 | 309 |
| * | United States Cellular Corp. | 1,546 | 56 |
| | 182,453 |
| Total Common Stocks (Cost $2,727,749) | 4,190,908 |
| | Coupon | | | |
| Temporary Cash Investments (0.1%) |
| Money Market Fund (0.1%) |
| 1,2 | Vanguard Market Liquidity Fund | 0.147% | | 44,930 | 4,493 |
| | | | | | |
| | | | Face | |
| | | Maturity | Amount | |
| | | Date | ($000) | |
| U.S. Government and Agency Obligations (0.0%) |
| 3 | United States Cash Management Bill | 0.116% | 9/29/20 | 870 | 870 |
| Total Temporary Cash Investments (Cost $5,363) | 5,363 |
| Total Investments (99.9%) (Cost $2,733,112) | 4,196,271 |
| Other Assets and Liabilities—Net (0.1%) | 5,279 |
| Net Assets (100%) | 4,201,550 |
| Cost is in $000. |
| * | Non-income-producing security. |
| ^ | Includes partial security positions on loan to broker-dealers. The total value of securities on loan is $562,000. |
| § | Security value determined using significant unobservable inputs. |
| 1 | Affiliated money market fund available only to Vanguard funds and certain trusts and accounts managed by Vanguard. Rate shown is the 7-day yield. |
| 2 | Collateral of $590,000 was received for securities on loan. |
| 3 | Securities with a value of $707,000 have been segregated as initial margin for open futures contracts. |
| | REIT—Real Estate Investment Trust. |
Vanguard® Russell 1000 Value Index Fund
Schedule of Investments
August 31, 2020
| | | Market |
| | | Value |
| | Shares | ($000) |
| Common Stocks (99.9%) |
| Consumer Discretionary (12.7%) |
| | Walt Disney Co. | 457,406 | 60,318 |
| | Comcast Corp. Class A | 1,146,804 | 51,388 |
| | Walmart Inc. | 307,535 | 42,701 |
| | Home Depot Inc. | 135,966 | 38,756 |
| | McDonald's Corp. | 161,439 | 34,470 |
| | Target Corp. | 126,520 | 19,131 |
| | Starbucks Corp. | 124,891 | 10,550 |
| | General Motors Co. | 315,441 | 9,347 |
| | Marriott International Inc. Class A | 67,855 | 6,983 |
| | Yum! Brands Inc. | 70,286 | 6,737 |
| | Ford Motor Co. | 986,134 | 6,725 |
| | Hilton Worldwide Holdings Inc. | 69,134 | 6,247 |
| | DR Horton Inc. | 83,116 | 5,932 |
| | Aptiv plc | 67,743 | 5,834 |
| | Best Buy Co. Inc. | 47,341 | 5,251 |
| | VF Corp. | 77,712 | 5,110 |
| | Lennar Corp. Class A | 68,053 | 5,092 |
| | Yum China Holdings Inc. | 84,968 | 4,904 |
| | Costco Wholesale Corp. | 13,048 | 4,536 |
| * | CarMax Inc. | 38,022 | 4,066 |
| | Garmin Ltd. | 37,722 | 3,908 |
| | ViacomCBS Inc. Class B | 135,859 | 3,784 |
| | Tiffany & Co. | 30,548 | 3,742 |
| * | Liberty Broadband Corp. | 26,362 | 3,693 |
| | Genuine Parts Co. | 35,755 | 3,377 |
| * | NVR Inc. | 777 | 3,239 |
| | TJX Cos. Inc. | 57,901 | 3,172 |
| | PulteGroup Inc. | 68,131 | 3,038 |
| | Expedia Group Inc. | 30,440 | 2,988 |
| * | Dollar Tree Inc. | 31,009 | 2,985 |
| | Royal Caribbean Cruises Ltd. | 43,053 | 2,964 |
| | Fortune Brands Home & Security Inc. | 34,878 | 2,933 |
| | Omnicom Group Inc. | 53,956 | 2,919 |
| * | AutoZone Inc. | 2,407 | 2,880 |
| | Darden Restaurants Inc. | 32,924 | 2,854 |
| | Whirlpool Corp. | 15,429 | 2,742 |
| * | Uber Technologies Inc. | 80,060 | 2,692 |
| | MGM Resorts International | 119,245 | 2,683 |
| | Advance Auto Parts Inc. | 16,769 | 2,621 |
| | Hasbro Inc. | 32,271 | 2,548 |
| | Las Vegas Sands Corp. | 48,198 | 2,444 |
| * | LKQ Corp. | 76,294 | 2,422 |
| | Fox Corp. Class A | 85,427 | 2,380 |
| * | Charter Communications Inc. Class A | 3,650 | 2,247 |
| * | DISH Network Corp. Class A | 62,463 | 2,219 |
| | BorgWarner Inc. | 52,328 | 2,124 |
| | Vail Resorts Inc. | 9,234 | 2,010 |
| | Service Corp. International | 43,923 | 2,005 |
| | Carnival Corp. | 119,438 | 1,968 |
| * | Liberty Media Corp-Liberty Formula One Class C | 49,956 | 1,947 |
| * | Lyft Inc. Class A | 60,441 | 1,793 |
| | New York Times Co. Class A | 41,284 | 1,789 |
| | Interpublic Group of Cos. Inc. | 98,822 | 1,755 |
| | Lear Corp. | 15,179 | 1,729 |
| | L Brands Inc. | 57,805 | 1,699 |
| | Gentex Corp. | 62,609 | 1,694 |
| * | Discovery Communications Inc. Class C | 82,041 | 1,638 |
| | Wynn Resorts Ltd. | 18,481 | 1,616 |
| | Aramark | 57,933 | 1,597 |
| | Newell Brands Inc. | 97,394 | 1,556 |
| | Ross Stores Inc. | 16,757 | 1,526 |
Vanguard® Russell 1000 Value Index Fund
Schedule of Investments
August 31, 2020
| | | Market |
| | | Value |
| | Shares | ($000) |
| | News Corp. Class A | 98,778 | 1,494 |
| | Williams-Sonoma Inc. | 16,354 | 1,435 |
| * | Peloton Interactive Inc. Class A | 18,587 | 1,425 |
| * | Liberty Media Corp-Liberty SiriusXM Class C | 39,295 | 1,414 |
| | Nielsen Holdings plc | 90,272 | 1,379 |
| | Leggett & Platt Inc. | 32,951 | 1,351 |
| * | ServiceMaster Global Holdings Inc. | 33,670 | 1,343 |
| * | IAA Inc. | 25,675 | 1,343 |
| * | Mohawk Industries Inc. | 14,502 | 1,339 |
| | Hanesbrands Inc. | 86,945 | 1,329 |
| | Thor Industries Inc. | 13,997 | 1,322 |
| | Polaris Inc. | 13,078 | 1,321 |
| | Estee Lauder Cos. Inc. Class A | 5,909 | 1,310 |
| | Toll Brothers Inc. | 28,897 | 1,220 |
| | Wyndham Hotels & Resorts Inc. | 22,921 | 1,200 |
| | Fox Corp. Class B | 40,871 | 1,136 |
| * | Grand Canyon Education Inc. | 11,649 | 1,096 |
| * | Norwegian Cruise Line Holdings Ltd. | 63,976 | 1,095 |
| | Harley-Davidson Inc. | 38,176 | 1,058 |
| * | Qurate Retail Group Inc. QVC Group Class A | 94,997 | 1,050 |
| | Tapestry Inc. | 70,863 | 1,044 |
| * | Skechers USA Inc. Class A | 33,473 | 999 |
| | PVH Corp. | 17,530 | 978 |
| | Choice Hotels International Inc. | 9,144 | 908 |
| * | Liberty Broadband Corp. Class A | 6,405 | 885 |
| * | Discovery Inc. Class A | 40,104 | 885 |
| | Carter's Inc. | 10,910 | 869 |
| * | AutoNation Inc. | 14,690 | 835 |
| | Dick's Sporting Goods Inc. | 15,384 | 833 |
| | Kohl's Corp. | 38,653 | 826 |
| | Ralph Lauren Corp. Class A | 11,929 | 821 |
| | Amerco | 2,288 | 812 |
| | Gap Inc. | 45,489 | 791 |
| | eBay Inc. | 14,433 | 791 |
| | Foot Locker Inc. | 25,819 | 783 |
| * | frontdoor Inc. | 17,757 | 774 |
| * | Madison Square Garden Sport Corp. Class A | 4,685 | 768 |
| | Sirius XM Holdings Inc. | 117,810 | 692 |
| * | Liberty Media Corp-Liberty SiriusXM Class A | 18,277 | 664 |
| | Columbia Sportswear Co. | 7,213 | 617 |
| | Wyndham Destinations Inc. | 20,946 | 607 |
| * | Bright Horizons Family Solutions Inc. | 4,432 | 590 |
| | TripAdvisor Inc. | 25,210 | 589 |
| * | Capri Holdings Ltd. | 35,507 | 562 |
| | Extended Stay America Inc. | 44,153 | 551 |
| * | Planet Fitness Inc. Class A | 8,695 | 529 |
| | Hyatt Hotels Corp. Class A | 8,730 | 493 |
| * | 2U Inc. | 11,415 | 472 |
| * | Under Armour Inc. Class A | 46,771 | 459 |
| | Graham Holdings Co. Class B | 1,046 | 448 |
| | News Corp. Class B | 29,647 | 447 |
| | Nordstrom Inc. | 27,401 | 438 |
| * | Wayfair Inc. | 1,454 | 431 |
| * | Under Armour Inc. Class C | 47,942 | 424 |
| | Six Flags Entertainment Corp. | 19,060 | 414 |
| * | Mattel Inc. | 34,889 | 375 |
| | Penske Automotive Group Inc. | 7,917 | 373 |
| | Nexstar Media Group Inc. Class A | 3,626 | 348 |
| * | Burlington Stores Inc. | 1,732 | 341 |
| * | Madison Square Garden Entertainment Corp. Class A | 4,534 | 341 |
| | John Wiley & Sons Inc. Class A | 10,755 | 340 |
| | Reynolds Consumer Products Inc. | 9,266 | 308 |
| * | Lions Gate Entertainment Corp. Class B | 31,175 | 282 |
| * | Tempur Sealy International Inc. | 3,073 | 263 |
Vanguard® Russell 1000 Value Index Fund
Schedule of Investments
August 31, 2020
| | | Market |
| | | Value |
| | Shares | ($000) |
| | Coty Inc. Class A | 71,913 | 257 |
| | Rollins Inc. | 4,651 | 256 |
| | Lennar Corp. Class B | 4,005 | 238 |
| | Dunkin' Brands Group Inc. | 3,042 | 231 |
| * | Liberty Media Corp-Liberty Formula One Class A | 6,299 | 228 |
| * | Ulta Beauty Inc. | 955 | 222 |
| | H&R Block Inc. | 14,143 | 205 |
| * | Ollie's Bargain Outlet Holdings Inc. | 1,535 | 147 |
| * | Lions Gate Entertainment Corp. Class A | 12,250 | 119 |
| | ViacomCBS Inc. Class A | 3,402 | 104 |
| * | Caesars Entertainment Inc. | 1,268 | 58 |
| | Warner Music Group Corp. Class A | 244 | 7 |
| | 490,730 |
| Consumer Staples (7.6%) |
| | Procter & Gamble Co. | 340,843 | 47,149 |
| | Philip Morris International Inc. | 393,767 | 31,419 |
| | Mondelez International Inc. Class A | 357,074 | 20,860 |
| | CVS Health Corp. | 330,839 | 20,552 |
| | Coca-Cola Co. | 403,938 | 20,007 |
| | Colgate-Palmolive Co. | 213,210 | 16,899 |
| | Kimberly-Clark Corp. | 85,918 | 13,554 |
| | PepsiCo Inc. | 93,350 | 13,075 |
| | Altria Group Inc. | 265,514 | 11,614 |
| | General Mills Inc. | 153,438 | 9,812 |
| | Constellation Brands Inc. Class A | 40,375 | 7,448 |
| | Walgreens Boots Alliance Inc. | 185,563 | 7,055 |
| | Kroger Co. | 195,970 | 6,992 |
| | Archer-Daniels-Midland Co. | 140,161 | 6,274 |
| | Kraft Heinz Co. | 163,863 | 5,742 |
| | Corteva Inc. | 189,947 | 5,423 |
| | Conagra Brands Inc. | 123,256 | 4,728 |
| | Tyson Foods Inc. Class A | 72,713 | 4,566 |
| | Hormel Foods Corp. | 70,667 | 3,603 |
| | J M Smucker Co. | 27,920 | 3,355 |
| | Kellogg Co. | 41,992 | 2,978 |
| | Keurig Dr Pepper Inc. | 97,368 | 2,905 |
| | McCormick & Co. Inc. | 13,854 | 2,857 |
| | Sysco Corp. | 35,474 | 2,133 |
| | Clorox Co. | 9,287 | 2,076 |
| | Lamb Weston Holdings Inc. | 28,392 | 1,784 |
| | Casey's General Stores Inc. | 9,347 | 1,662 |
| | Molson Coors Beverage Co. Class B | 44,100 | 1,660 |
| | McKesson Corp. | 10,396 | 1,595 |
| | Bunge Ltd. | 34,889 | 1,592 |
| * | Post Holdings Inc. | 15,951 | 1,404 |
| | Ingredion Inc. | 16,999 | 1,367 |
| * | US Foods Holding Corp. | 55,869 | 1,360 |
| | Hershey Co. | 8,587 | 1,276 |
| | Flowers Foods Inc. | 49,148 | 1,202 |
| | Campbell Soup Co. | 22,087 | 1,162 |
| *,^ | Herbalife Nutrition Ltd. | 22,450 | 1,103 |
| * | Hain Celestial Group Inc. | 20,316 | 666 |
| | Spectrum Brands Holdings Inc | 10,585 | 631 |
| | Nu Skin Enterprises Inc. Class A | 12,803 | 605 |
| * | TreeHouse Foods Inc. | 14,093 | 603 |
| | Brown-Forman Corp. Class B | 7,060 | 517 |
| * | Beyond Meat Inc. | 2,541 | 345 |
| * | Grocery Outlet Holding Corp. | 8,047 | 331 |
| | Seaboard Corp. | 63 | 169 |
| | Energizer Holdings Inc. | 3,122 | 145 |
| * | Pilgrim's Pride Corp. | 8,971 | 144 |
| * | Sprouts Farmers Market Inc. | 4,561 | 107 |
Vanguard® Russell 1000 Value Index Fund
Schedule of Investments
August 31, 2020
| | | Market |
| | | Value |
| | Shares | ($000) |
| | Brown-Forman Corp. Class A | 1,241 | 83 |
| | 294,589 |
| Energy (4.6%) |
| | Exxon Mobil Corp. | 1,071,128 | 42,781 |
| | Chevron Corp. | 473,120 | 39,709 |
| | ConocoPhillips | 271,922 | 10,303 |
| | Kinder Morgan Inc. | 492,587 | 6,808 |
| | EOG Resources Inc. | 147,423 | 6,684 |
| | Schlumberger Ltd. | 350,786 | 6,668 |
| | Phillips 66 | 110,126 | 6,439 |
| | Williams Cos. Inc. | 307,563 | 6,385 |
| | Marathon Petroleum Corp. | 163,669 | 5,804 |
| | Valero Energy Corp. | 103,178 | 5,426 |
| | Pioneer Natural Resources Co. | 41,482 | 4,311 |
| | Halliburton Co. | 221,951 | 3,591 |
| | Hess Corp. | 69,511 | 3,200 |
| | ONEOK Inc. | 110,968 | 3,049 |
| | Occidental Petroleum Corp. | 205,834 | 2,622 |
| | Concho Resources Inc. | 49,479 | 2,572 |
| | Baker Hughes Co. Class A | 165,644 | 2,365 |
| | Cabot Oil & Gas Corp. | 99,500 | 1,888 |
| * | First Solar Inc. | 21,013 | 1,609 |
| | Diamondback Energy Inc. | 39,977 | 1,558 |
| | Apache Corp. | 95,941 | 1,420 |
| | Noble Energy Inc. | 121,325 | 1,207 |
| | National Oilwell Varco Inc. | 98,923 | 1,187 |
| | Devon Energy Corp. | 95,558 | 1,039 |
| | Marathon Oil Corp. | 196,649 | 1,038 |
| | EQT Corp. | 63,623 | 1,010 |
| | Targa Resources Corp. | 57,662 | 981 |
| | Equitrans Midstream Corp. | 92,465 | 951 |
| | Valvoline Inc. | 46,250 | 943 |
| | HollyFrontier Corp. | 37,265 | 890 |
| | Parsley Energy Inc. Class A | 75,348 | 810 |
| | Cimarex Energy Co. | 25,045 | 696 |
| * | WPX Energy Inc. | 100,314 | 558 |
| | Antero Midstream Corp. | 74,054 | 501 |
| | Murphy Oil Corp. | 36,265 | 498 |
| | Helmerich & Payne Inc. | 26,070 | 430 |
| | Continental Resources Inc. | 18,637 | 320 |
| | 178,251 |
| Financial Services (24.6%) |
| * | Berkshire Hathaway Inc. Class B | 493,294 | 107,558 |
| | JPMorgan Chase & Co. | 766,471 | 76,793 |
| | Bank of America Corp. | 1,957,343 | 50,382 |
| | Citigroup Inc. | 527,131 | 26,947 |
| | Fidelity National Information Services Inc. | 156,196 | 23,562 |
| | Wells Fargo & Co. | 950,460 | 22,954 |
| | BlackRock Inc. | 37,236 | 22,125 |
| | Prologis Inc. | 186,201 | 18,966 |
| | Goldman Sachs Group Inc. | 83,863 | 17,181 |
| | American Express Co. | 165,468 | 16,810 |
| | CME Group Inc. | 89,772 | 15,788 |
| | Morgan Stanley | 279,099 | 14,586 |
| | Chubb Ltd. | 113,704 | 14,213 |
| | Global Payments Inc. | 75,315 | 13,302 |
| | Truist Financial Corp. | 340,950 | 13,232 |
| | US Bancorp | 343,973 | 12,521 |
| | PNC Financial Services Group Inc. | 107,337 | 11,936 |
| | Digital Realty Trust Inc. | 67,570 | 10,517 |
| | Charles Schwab Corp. | 292,285 | 10,385 |
| | Progressive Corp. | 105,214 | 10,000 |
| * | Fiserv Inc. | 99,553 | 9,913 |
| | Intercontinental Exchange Inc. | 88,435 | 9,394 |
Vanguard® Russell 1000 Value Index Fund
Schedule of Investments
August 31, 2020
| | | Market |
| | | Value |
| | Shares | ($000) |
| | S&P Global Inc. | 24,975 | 9,151 |
| | Capital One Financial Corp. | 114,691 | 7,917 |
| | MetLife Inc. | 194,788 | 7,492 |
| | Bank of New York Mellon Corp. | 202,138 | 7,475 |
| | Travelers Cos. Inc. | 63,916 | 7,417 |
| | SBA Communications Corp. Class A | 24,185 | 7,402 |
| | Allstate Corp. | 79,279 | 7,373 |
| | Prudential Financial Inc. | 100,226 | 6,792 |
| | Willis Towers Watson plc | 32,533 | 6,687 |
| | Aflac Inc. | 179,097 | 6,505 |
| | American International Group Inc. | 217,879 | 6,349 |
| | Welltower Inc. | 105,554 | 6,071 |
| | State Street Corp. | 89,150 | 6,070 |
| | T. Rowe Price Group Inc. | 42,674 | 5,941 |
| | Weyerhaeuser Co. | 189,037 | 5,730 |
| | AvalonBay Communities Inc. | 35,586 | 5,625 |
| | Realty Income Corp. | 86,976 | 5,395 |
| | Alexandria Real Estate Equities Inc. | 31,684 | 5,335 |
| | Equity Residential | 93,074 | 5,254 |
| | Arthur J Gallagher & Co. | 47,648 | 5,017 |
| | Ameriprise Financial Inc. | 31,124 | 4,880 |
| | First Republic Bank | 42,961 | 4,851 |
| | KKR & Co. Inc. | 134,359 | 4,813 |
| | Discover Financial Services | 77,366 | 4,107 |
| | Northern Trust Corp. | 48,610 | 3,981 |
| * | CBRE Group Inc. Class A | 84,167 | 3,958 |
| | Invitation Homes Inc. | 137,155 | 3,927 |
| | Nasdaq Inc. | 28,857 | 3,879 |
| | Ventas Inc. | 94,110 | 3,878 |
| | Healthpeak Properties Inc. | 136,592 | 3,775 |
| | Fifth Third Bancorp | 180,171 | 3,722 |
| * | Markel Corp. | 3,413 | 3,709 |
| | Hartford Financial Services Group Inc. | 90,485 | 3,660 |
| | Synchrony Financial | 147,355 | 3,656 |
| | Sun Communities Inc. | 24,424 | 3,641 |
| | Duke Realty Corp. | 92,730 | 3,575 |
| | Essex Property Trust Inc. | 16,455 | 3,563 |
| | Boston Properties Inc. | 39,264 | 3,411 |
| | Mid-America Apartment Communities Inc. | 28,707 | 3,362 |
| | M&T Bank Corp. | 32,220 | 3,327 |
| * | SVB Financial Group | 12,998 | 3,319 |
| | Marsh & McLennan Cos. Inc. | 28,499 | 3,275 |
| * | Arch Capital Group Ltd. | 99,418 | 3,136 |
| | E*TRADE Financial Corp. | 55,761 | 3,017 |
| | KeyCorp | 244,676 | 3,014 |
| | Cincinnati Financial Corp. | 37,836 | 3,005 |
| | WP Carey Inc. | 43,139 | 2,993 |
| | Principal Financial Group Inc. | 68,364 | 2,879 |
| | Public Storage | 13,193 | 2,802 |
| | Regions Financial Corp. | 242,291 | 2,801 |
| | Citizens Financial Group Inc. | 107,419 | 2,779 |
| | Annaly Capital Management Inc. | 364,854 | 2,682 |
| | VICI Properties Inc. | 118,872 | 2,656 |
| * | Zillow Group Inc. Class C | 30,559 | 2,621 |
| | Brown & Brown Inc. | 56,261 | 2,611 |
| | UDR Inc. | 74,213 | 2,583 |
| | TD Ameritrade Holding Corp. | 65,798 | 2,525 |
| | Medical Properties Trust Inc. | 131,728 | 2,447 |
| | CyrusOne Inc. | 29,154 | 2,435 |
| | Huntington Bancshares Inc. | 254,936 | 2,399 |
| | Raymond James Financial Inc. | 31,146 | 2,358 |
| | Fidelity National Financial Inc. | 69,679 | 2,288 |
| | Everest Re Group Ltd. | 10,140 | 2,232 |
| | Globe Life Inc. | 26,644 | 2,198 |
Vanguard® Russell 1000 Value Index Fund
Schedule of Investments
August 31, 2020
| | | Market |
| | | Value |
| | Shares | ($000) |
| | Equitable Holdings Inc. | 103,308 | 2,189 |
| | W R Berkley Corp. | 35,171 | 2,182 |
| | Loews Corp. | 60,774 | 2,179 |
| | Ally Financial Inc. | 95,013 | 2,174 |
| | Camden Property Trust | 23,887 | 2,172 |
| | AGNC Investment Corp. | 143,812 | 2,029 |
| | Host Hotels & Resorts Inc. | 177,768 | 1,996 |
| | Cboe Global Markets Inc. | 21,610 | 1,984 |
| | Western Union Co. | 83,372 | 1,967 |
| | American Homes 4 Rent Class A | 67,067 | 1,921 |
| | Gaming and Leisure Properties Inc. | 51,275 | 1,864 |
| | VEREIT Inc. | 275,311 | 1,850 |
| | Assurant Inc. | 15,085 | 1,834 |
| | Alleghany Corp. | 3,193 | 1,771 |
| | Omega Healthcare Investors Inc. | 56,793 | 1,759 |
| | Americold Realty Trust | 45,297 | 1,737 |
| | Equity LifeStyle Properties Inc. | 26,054 | 1,727 |
| | Kilroy Realty Corp. | 29,137 | 1,705 |
| | Regency Centers Corp. | 42,915 | 1,704 |
| | Voya Financial Inc. | 31,376 | 1,629 |
| | Vornado Realty Trust | 44,583 | 1,597 |
| * | WEX Inc. | 9,934 | 1,587 |
| | Reinsurance Group of America Inc. | 17,119 | 1,569 |
| | National Retail Properties Inc. | 43,780 | 1,552 |
| | Lincoln National Corp. | 43,011 | 1,551 |
| | CubeSmart | 49,024 | 1,550 |
| | STORE Capital Corp. | 57,088 | 1,544 |
| | SEI Investments Co. | 29,346 | 1,537 |
| | Commerce Bancshares Inc. | 25,584 | 1,524 |
| | Federal Realty Investment Trust | 19,094 | 1,513 |
| | RenaissanceRe Holdings Ltd. | 8,232 | 1,513 |
| | Lamar Advertising Co. Class A | 21,578 | 1,494 |
| | LPL Financial Holdings Inc. | 18,151 | 1,491 |
| | Healthcare Trust of America Inc. Class A | 55,249 | 1,458 |
| | First American Financial Corp. | 27,567 | 1,449 |
| | Franklin Resources Inc. | 68,538 | 1,443 |
| | Comerica Inc. | 35,837 | 1,417 |
| | Rexford Industrial Realty Inc. | 29,042 | 1,393 |
| | Apartment Investment and Management Co. | 37,640 | 1,356 |
| | Jones Lang LaSalle Inc. | 13,135 | 1,353 |
| | First Industrial Realty Trust Inc. | 31,592 | 1,347 |
| | First Horizon National Corp. | 138,819 | 1,326 |
| | East West Bancorp Inc. | 35,988 | 1,324 |
| * | Euronet Worldwide Inc. | 12,615 | 1,304 |
| | Zions Bancorp NA | 40,311 | 1,296 |
| | Signature Bank | 13,019 | 1,263 |
| | Kimco Realty Corp. | 105,276 | 1,262 |
| | American Financial Group Inc. | 18,779 | 1,255 |
| | Life Storage Inc. | 11,887 | 1,253 |
| | Prosperity Bancshares Inc. | 22,742 | 1,240 |
| | Kemper Corp. | 15,584 | 1,210 |
| | Douglas Emmett Inc. | 41,521 | 1,159 |
| | American Campus Communities Inc. | 34,166 | 1,158 |
| | Crown Castle International Corp. | 7,002 | 1,143 |
| | People's United Financial Inc. | 107,907 | 1,142 |
| | Old Republic International Corp. | 70,580 | 1,137 |
| | Eaton Vance Corp. | 27,652 | 1,134 |
| | Cousins Properties Inc. | 36,947 | 1,103 |
| | Simon Property Group Inc. | 16,236 | 1,102 |
| * | Zillow Group Inc. Class A | 12,778 | 1,090 |
| | Starwood Property Trust Inc. | 68,222 | 1,064 |
| * | Athene Holding Ltd. Class A | 28,883 | 1,056 |
| | New York Community Bancorp Inc. | 114,964 | 1,040 |
| | TCF Financial Corp. | 38,588 | 1,037 |
Vanguard® Russell 1000 Value Index Fund
Schedule of Investments
August 31, 2020
| | | Market |
| | | Value |
| | Shares | ($000) |
| | Apollo Global Management LLC | 21,590 | 1,012 |
| | Rayonier Inc. | 34,044 | 997 |
| | Jefferies Financial Group Inc. | 56,750 | 995 |
| | Extra Space Storage Inc. | 9,333 | 994 |
| | Cullen/Frost Bankers Inc. | 13,966 | 970 |
| | Hanover Insurance Group Inc. | 9,442 | 968 |
| | Invesco Ltd. | 94,128 | 960 |
| | Highwoods Properties Inc. | 25,673 | 957 |
| | Interactive Brokers Group Inc. | 18,021 | 955 |
| | Equity Commonwealth | 29,965 | 941 |
| | Unum Group | 50,750 | 938 |
| *,^ | Credit Acceptance Corp. | 2,359 | 912 |
| | Spirit Realty Capital Inc. | 25,672 | 912 |
| | Iron Mountain Inc. | 30,188 | 908 |
| | SL Green Realty Corp. | 19,296 | 902 |
| | Axis Capital Holdings Ltd. | 18,870 | 901 |
| | Hudson Pacific Properties Inc. | 37,486 | 880 |
| | Brixmor Property Group Inc. | 73,929 | 872 |
| | Western Alliance Bancorp | 24,400 | 861 |
| | JBG SMITH Properties | 30,395 | 841 |
| | Popular Inc. | 22,320 | 827 |
| | Affiliated Managers Group Inc. | 11,705 | 804 |
| | New Residential Investment Corp. | 103,366 | 800 |
| | Lazard Ltd. Class A | 25,218 | 799 |
| | Synovus Financial Corp. | 36,501 | 798 |
| | MGIC Investment Corp. | 84,282 | 773 |
| * | Brighthouse Financial Inc. | 24,530 | 745 |
| | Pinnacle Financial Partners Inc. | 18,421 | 736 |
| | Bank OZK | 30,478 | 702 |
| | Corporate Office Properties Trust | 28,010 | 690 |
| | Jack Henry & Associates Inc. | 4,138 | 685 |
| | Carlyle Group Inc. | 26,496 | 684 |
| | White Mountains Insurance Group Ltd. | 766 | 683 |
| | Umpqua Holdings Corp. | 59,145 | 667 |
| | First Citizens BancShares Inc. Class A | 1,638 | 644 |
| | EPR Properties | 19,443 | 628 |
| | Outfront Media Inc. | 36,758 | 622 |
| | Wintrust Financial Corp. | 14,241 | 620 |
| | Webster Financial Corp. | 22,319 | 614 |
| | Evercore Inc. Class A | 9,872 | 611 |
| | FNB Corp. | 81,435 | 611 |
| | Erie Indemnity Co. Class A | 2,708 | 578 |
| * | Howard Hughes Corp. | 9,748 | 576 |
| | Taubman Centers Inc. | 14,935 | 572 |
| | Park Hotels & Resorts Inc. | 59,731 | 567 |
| | Sterling Bancorp | 48,186 | 562 |
| | PacWest Bancorp | 29,057 | 554 |
| | SLM Corp. | 71,633 | 547 |
| | Bank of Hawaii Corp. | 9,828 | 541 |
| | First Hawaiian Inc. | 32,319 | 534 |
| | Apple Hospitality REIT Inc. | 52,278 | 532 |
| | Alliance Data Systems Corp. | 11,767 | 531 |
| | Weingarten Realty Investors | 30,261 | 529 |
| | Associated Banc-Corp | 38,278 | 514 |
| | OneMain Holdings Inc | 16,208 | 471 |
| | Primerica Inc. | 3,765 | 470 |
| | Brandywine Realty Trust | 41,951 | 467 |
| | Assured Guaranty Ltd. | 20,930 | 449 |
| | BOK Financial Corp. | 7,820 | 439 |
| | CoreSite Realty Corp. | 3,281 | 402 |
| | TransUnion | 4,242 | 368 |
| | Paramount Group Inc. | 47,156 | 349 |
| | Santander Consumer USA Holdings Inc. | 18,758 | 323 |
| | Mercury General Corp. | 6,794 | 304 |
Vanguard® Russell 1000 Value Index Fund
Schedule of Investments
August 31, 2020
| | | Market |
| | | Value |
| | Shares | ($000) |
| | Empire State Realty Trust Inc. | 36,463 | 230 |
| | CNA Financial Corp. | 6,960 | 224 |
| | TFS Financial Corp. | 12,117 | 187 |
| | Tradeweb Markets Inc. Class A | 3,096 | 177 |
| | American National Insurance Co. | 2,064 | 155 |
| | Morningstar Inc. | 881 | 141 |
| | Virtu Financial Inc. Class A | 1,626 | 42 |
| * | LendingTree Inc. | 126 | 39 |
| ^ | Brookfield Property REIT Inc. Class A | 2,313 | 27 |
| | 945,322 |
| Health Care (13.6%) |
| | Johnson & Johnson | 577,816 | 88,643 |
| | Pfizer Inc. | 1,407,314 | 53,182 |
| | Medtronic plc | 339,398 | 36,475 |
| | Danaher Corp. | 158,364 | 32,697 |
| | Abbott Laboratories | 269,365 | 29,487 |
| | Bristol-Myers Squibb Co. | 364,994 | 22,703 |
| | Gilead Sciences Inc. | 317,793 | 21,213 |
| | Thermo Fisher Scientific Inc. | 41,261 | 17,700 |
| | Becton Dickinson and Co. | 68,262 | 16,572 |
| * | Boston Scientific Corp. | 353,626 | 14,506 |
| | Anthem Inc. | 47,453 | 13,359 |
| | UnitedHealth Group Inc. | 40,120 | 12,539 |
| | Cigna Corp. | 66,889 | 11,864 |
| | Stryker Corp. | 59,079 | 11,707 |
| | Humana Inc. | 20,695 | 8,592 |
| * | Biogen Inc. | 28,686 | 8,251 |
| | Zimmer Biomet Holdings Inc. | 52,412 | 7,384 |
| | Agilent Technologies Inc. | 71,452 | 7,175 |
| | Merck & Co. Inc. | 80,645 | 6,877 |
| | Baxter International Inc. | 74,898 | 6,521 |
| * | Centene Corp. | 102,486 | 6,284 |
| * | Alexion Pharmaceuticals Inc. | 45,440 | 5,190 |
| * | IQVIA Holdings Inc. | 29,900 | 4,896 |
| | HCA Healthcare Inc. | 32,233 | 4,375 |
| * | Laboratory Corp. of America Holdings | 23,219 | 4,081 |
| | Quest Diagnostics Inc. | 33,687 | 3,747 |
| * | Catalent Inc. | 38,759 | 3,585 |
| * | Varian Medical Systems Inc. | 20,041 | 3,481 |
| | Cooper Cos. Inc. | 10,838 | 3,407 |
| | STERIS plc | 20,122 | 3,212 |
| * | Elanco Animal Health Inc. | 101,270 | 2,943 |
| * | QIAGEN NV | 56,403 | 2,874 |
| * | Bio-Rad Laboratories Inc. Class A | 5,342 | 2,717 |
| | PerkinElmer Inc. | 22,720 | 2,675 |
| | AbbVie Inc. | 26,839 | 2,570 |
| | Dentsply Sirona Inc. | 55,413 | 2,486 |
| * | Henry Schein Inc. | 36,170 | 2,403 |
| * | Mylan NV | 131,055 | 2,147 |
| | Universal Health Services Inc. Class B | 18,723 | 2,066 |
| | AmerisourceBergen Corp. Class A | 19,032 | 1,847 |
| * | Jazz Pharmaceuticals plc | 13,578 | 1,825 |
| | Zoetis Inc. | 11,357 | 1,818 |
| | Perrigo Co. plc | 34,496 | 1,804 |
| | Teleflex Inc. | 4,326 | 1,700 |
| * | DaVita Inc. | 17,507 | 1,519 |
| | Hill-Rom Holdings Inc. | 14,999 | 1,407 |
| * | United Therapeutics Corp. | 11,064 | 1,183 |
| * | Hologic Inc. | 19,741 | 1,179 |
| * | Exelixis Inc. | 49,440 | 1,099 |
| * | Globus Medical Inc. | 18,611 | 1,052 |
| * | Envista Holdings Corp. | 39,983 | 959 |
| * | Ionis Pharmaceuticals Inc. | 16,653 | 908 |
| * | Molina Healthcare Inc. | 4,825 | 892 |
Vanguard® Russell 1000 Value Index Fund
Schedule of Investments
August 31, 2020
| | | Market |
| | | Value |
| | Shares | ($000) |
| * | Syneos Health Inc. | 14,019 | 885 |
| * | Integra LifeSciences Holdings Corp. | 18,283 | 874 |
| | Encompass Health Corp. | 13,340 | 870 |
| * | Nektar Therapeutics Class A | 44,394 | 859 |
| * | ICU Medical Inc. | 3,555 | 712 |
| * | Acadia Healthcare Co. Inc. | 21,933 | 678 |
| * | Alkermes plc | 39,379 | 651 |
| | Bruker Corp. | 14,908 | 626 |
| * | Sage Therapeutics Inc. | 11,897 | 624 |
| * | Agios Pharmaceuticals Inc. | 13,861 | 568 |
| * | Bluebird Bio Inc. | 8,870 | 526 |
| | Premier Inc. Class A | 15,352 | 503 |
| * | Teladoc Health Inc. | 1,784 | 385 |
| * | Exact Sciences Corp. | 4,895 | 369 |
| * | BioMarin Pharmaceutical Inc. | 4,217 | 329 |
| * | Charles River Laboratories International Inc. | 1,413 | 309 |
| * | Horizon Therapeutics plc | 3,641 | 274 |
| * | PRA Health Sciences Inc. | 2,357 | 252 |
| * | Change Healthcare Inc. | 15,946 | 226 |
| * | Tandem Diabetes Care Inc. | 1,602 | 181 |
| | Bio-Techne Corp. | 578 | 148 |
| * | PPD Inc. | 2,339 | 80 |
| * | Haemonetics Corp. | 845 | 76 |
| * | Acceleron Pharma Inc. | 700 | 68 |
| * | Reata Pharmaceuticals Inc. Class A | 632 | 66 |
| | 522,917 |
| Materials & Processing (5.3%) |
| | Linde plc | 132,889 | 33,188 |
| | Air Products & Chemicals Inc. | 48,764 | 14,252 |
| | Newmont Corp. | 203,116 | 13,666 |
| | DuPont de Nemours Inc. | 185,989 | 10,371 |
| | Ecolab Inc. | 50,474 | 9,947 |
| | Dow Inc. | 187,797 | 8,473 |
| | PPG Industries Inc. | 59,650 | 7,182 |
| | Trane Technologies plc | 60,535 | 7,167 |
| | Freeport-McMoRan Inc. | 366,993 | 5,729 |
| | LyondellBasell Industries NV Class A | 64,897 | 4,249 |
| | Carrier Global Corp. | 140,861 | 4,205 |
| | Vulcan Materials Co. | 33,436 | 4,012 |
| | Masco Corp. | 66,251 | 3,862 |
| | Amcor plc | 344,830 | 3,814 |
| | International Paper Co. | 99,215 | 3,598 |
| | Nucor Corp. | 75,832 | 3,447 |
| | International Flavors & Fragrances Inc. | 27,006 | 3,343 |
| | Martin Marietta Materials Inc. | 15,728 | 3,191 |
| | Celanese Corp. Class A | 30,029 | 3,037 |
| | FMC Corp. | 26,269 | 2,807 |
| | Eastman Chemical Co. | 34,377 | 2,513 |
| | Lennox International Inc. | 8,767 | 2,458 |
| | Albemarle Corp. | 26,579 | 2,419 |
| | Packaging Corp. of America | 23,785 | 2,408 |
| * | Crown Holdings Inc. | 29,459 | 2,264 |
| | Watsco Inc. | 8,285 | 2,030 |
| | Westrock Co. | 65,335 | 1,982 |
| | AptarGroup Inc. | 16,278 | 1,927 |
| | Owens Corning | 27,157 | 1,837 |
| | CF Industries Holdings Inc. | 53,905 | 1,759 |
| | Howmet Aerospace Inc. | 99,691 | 1,747 |
| | Reliance Steel & Aluminum Co. | 16,190 | 1,698 |
| | A O Smith Corp. | 33,564 | 1,644 |
| | Mosaic Co. | 87,307 | 1,592 |
| | Sealed Air Corp. | 39,291 | 1,544 |
| | Steel Dynamics Inc. | 51,196 | 1,511 |
| | Avery Dennison Corp. | 12,291 | 1,418 |
Vanguard® Russell 1000 Value Index Fund
Schedule of Investments
August 31, 2020
| | | Market |
| | | Value |
| | Shares | ($000) |
| | Sonoco Products Co. | 25,441 | 1,349 |
| | Fastenal Co. | 27,107 | 1,324 |
| * | Axalta Coating Systems Ltd. | 52,666 | 1,256 |
| | MDU Resources Group Inc. | 50,869 | 1,201 |
| * | Berry Global Group Inc. | 21,887 | 1,128 |
| | Huntsman Corp. | 49,959 | 1,080 |
| | Acuity Brands Inc. | 9,829 | 1,074 |
| | Ashland Global Holdings Inc. | 13,796 | 1,017 |
| | Southern Copper Corp. | 20,657 | 994 |
| | Timken Co. | 15,793 | 856 |
| | Eagle Materials Inc. | 10,352 | 846 |
| | Chemours Co. | 40,747 | 842 |
| | Hexcel Corp. | 20,910 | 824 |
| * | Univar Solutions Inc. | 41,608 | 757 |
| | Graphic Packaging Holding Co. | 54,131 | 757 |
| | Silgan Holdings Inc. | 19,614 | 746 |
| | Royal Gold Inc. | 4,615 | 629 |
| * | Element Solutions Inc. | 54,277 | 583 |
| | Armstrong World Industries Inc. | 7,539 | 556 |
| | Cabot Corp. | 13,874 | 513 |
| | Westlake Chemical Corp. | 8,456 | 502 |
| | RPM International Inc. | 5,415 | 459 |
| | Ball Corp. | 5,110 | 411 |
| | Olin Corp. | 35,551 | 400 |
| | W R Grace & Co. | 9,059 | 369 |
| | NewMarket Corp. | 308 | 115 |
| | GrafTech International Ltd. | 16,840 | 112 |
| | Scotts Miracle-Gro Co. | 648 | 109 |
| | Ardagh Group SA | 5,520 | 84 |
| | 203,184 |
| Producer Durables (11.9%) |
| | Honeywell International Inc. | 177,688 | 29,416 |
| | Boeing Co. | 135,140 | 23,220 |
| | Raytheon Technologies Corp. | 360,774 | 22,007 |
| | Caterpillar Inc. | 137,028 | 19,500 |
| | Union Pacific Corp. | 84,114 | 16,187 |
| | Deere & Co. | 71,343 | 14,986 |
| | CSX Corp. | 192,840 | 14,745 |
| | General Electric Co. | 2,200,010 | 13,948 |
| | Norfolk Southern Corp. | 64,728 | 13,757 |
| | FedEx Corp. | 61,114 | 13,435 |
| | Waste Management Inc. | 93,020 | 10,604 |
| | Emerson Electric Co. | 150,590 | 10,462 |
| | Eaton Corp. plc | 101,167 | 10,329 |
| | United Parcel Service Inc. Class B | 60,637 | 9,921 |
| | Roper Technologies Inc. | 22,694 | 9,695 |
| | General Dynamics Corp. | 64,139 | 9,579 |
| | Illinois Tool Works Inc. | 44,331 | 8,758 |
| | 3M Co. | 48,401 | 7,890 |
| | Cummins Inc. | 37,263 | 7,723 |
| | Johnson Controls International plc | 188,133 | 7,663 |
| | PACCAR Inc. | 85,740 | 7,360 |
| | Parker-Hannifin Corp. | 32,317 | 6,658 |
| | Otis Worldwide Corp. | 103,277 | 6,496 |
| | Stanley Black & Decker Inc. | 38,890 | 6,273 |
| | AMETEK Inc. | 58,045 | 5,845 |
| | Southwest Airlines Co. | 149,134 | 5,605 |
| | Fortive Corp. | 75,257 | 5,427 |
| | TransDigm Group Inc. | 10,285 | 5,139 |
| | Delta Air Lines Inc. | 161,826 | 4,992 |
| | Republic Services Inc. Class A | 53,030 | 4,917 |
| | Kansas City Southern | 23,964 | 4,362 |
| | Dover Corp. | 36,299 | 3,987 |
| | Xylem Inc. | 45,206 | 3,625 |
Vanguard® Russell 1000 Value Index Fund
Schedule of Investments
August 31, 2020
| | | Market |
| | | Value |
| | Shares | ($000) |
| | Rockwell Automation Inc. | 15,088 | 3,478 |
| | IDEX Corp. | 18,983 | 3,421 |
| * | Trimble Inc. | 63,086 | 3,306 |
| * | United Rentals Inc. | 18,193 | 3,221 |
| * | Keysight Technologies Inc. | 31,488 | 3,102 |
| * | Waters Corp. | 14,330 | 3,099 |
| * | Ingersoll Rand Inc. | 87,233 | 3,058 |
| | Wabtec Corp. | 45,811 | 3,049 |
| * | Teledyne Technologies Inc. | 9,173 | 2,877 |
| | Jacobs Engineering Group Inc. | 31,588 | 2,851 |
| | CH Robinson Worldwide Inc. | 28,299 | 2,782 |
| * | United Airlines Holdings Inc. | 73,122 | 2,632 |
| | Textron Inc. | 57,758 | 2,277 |
| | JB Hunt Transport Services Inc. | 15,564 | 2,187 |
| | Automatic Data Processing Inc. | 15,301 | 2,128 |
| | Snap-on Inc. | 13,568 | 2,012 |
| | Hubbell Inc. Class B | 13,708 | 1,987 |
| * | XPO Logistics Inc. | 21,909 | 1,934 |
| | Pentair plc | 42,050 | 1,898 |
| | Carlisle Cos. Inc. | 13,556 | 1,775 |
| | American Airlines Group Inc. | 125,473 | 1,637 |
| * | Sensata Technologies Holding plc | 39,235 | 1,634 |
| * | HD Supply Holdings Inc. | 40,647 | 1,612 |
| * | Aecom | 38,657 | 1,527 |
| | Robert Half International Inc. | 28,341 | 1,508 |
| * | Stericycle Inc. | 23,265 | 1,492 |
| | Expeditors International of Washington Inc. | 16,348 | 1,445 |
| | Knight-Swift Transportation Holdings Inc. | 31,754 | 1,444 |
| | Donaldson Co. Inc. | 28,576 | 1,439 |
| | Quanta Services Inc. | 27,731 | 1,421 |
| | ITT Inc. | 21,982 | 1,381 |
| | Huntington Ingalls Industries Inc. | 8,982 | 1,361 |
| * | Middleby Corp. | 13,825 | 1,354 |
| | Oshkosh Corp. | 17,224 | 1,326 |
| | Equifax Inc. | 7,817 | 1,315 |
| | Paychex Inc. | 16,916 | 1,294 |
| | CoreLogic Inc. | 19,131 | 1,270 |
| | Brunswick Corp. | 19,989 | 1,237 |
| | FLIR Systems Inc. | 33,257 | 1,227 |
| | Genpact Ltd. | 28,776 | 1,214 |
| | Graco Inc. | 20,729 | 1,203 |
| | Woodward Inc. | 13,948 | 1,195 |
| | Alaska Air Group Inc. | 30,014 | 1,169 |
| | AGCO Corp. | 15,759 | 1,121 |
| | Northrop Grumman Corp. | 3,185 | 1,091 |
| | Littelfuse Inc. | 6,015 | 1,088 |
| | WW Grainger Inc. | 2,974 | 1,087 |
| | Curtiss-Wright Corp. | 10,600 | 1,085 |
| | ManpowerGroup Inc. | 14,715 | 1,079 |
| * | FTI Consulting Inc. | 9,176 | 1,053 |
| | Regal Beloit Corp. | 10,109 | 999 |
| | Flowserve Corp. | 32,756 | 972 |
| | MSA Safety Inc. | 7,106 | 895 |
| | Xerox Holdings Corp. | 45,152 | 852 |
| | Cintas Corp. | 2,523 | 841 |
| | Allegion plc | 8,057 | 833 |
| | Air Lease Corp. Class A | 26,589 | 826 |
| * | Colfax Corp. | 24,740 | 823 |
| | Lincoln Electric Holdings Inc. | 8,214 | 794 |
| * | Clean Harbors Inc. | 12,839 | 785 |
| * | JetBlue Airways Corp. | 67,272 | 775 |
| | nVent Electric plc | 38,774 | 741 |
| | MSC Industrial Direct Co. Inc. Class A | 11,150 | 735 |
| | Old Dominion Freight Line Inc. | 3,406 | 689 |
Vanguard® Russell 1000 Value Index Fund
Schedule of Investments
August 31, 2020
| | | Market |
| | | Value |
| | Shares | ($000) |
| | Crane Co. | 12,129 | 686 |
| | Valmont Industries Inc. | 5,222 | 663 |
| * | Kirby Corp. | 14,875 | 631 |
| | Spirit AeroSystems Holdings Inc. Class A | 26,306 | 541 |
| | Ryder System Inc. | 13,072 | 535 |
| | Macquarie Infrastructure Corp. | 18,325 | 514 |
| | Nordson Corp. | 2,630 | 491 |
| | BWX Technologies Inc. | 8,539 | 475 |
| | Trinity Industries Inc. | 22,638 | 463 |
| | Copa Holdings SA Class A | 7,820 | 416 |
| | Schneider National Inc. Class B | 14,724 | 398 |
| | Allison Transmission Holdings Inc. | 9,951 | 357 |
| * | Mettler-Toledo International Inc. | 359 | 349 |
| | HEICO Corp. Class A | 3,794 | 339 |
| * | Zebra Technologies Corp. | 1,145 | 328 |
| | ADT Inc. | 27,895 | 297 |
| * | Generac Holdings Inc. | 1,365 | 259 |
| | HEICO Corp. | 2,214 | 243 |
| | Landstar System Inc. | 1,803 | 240 |
| | Toro Co. | 2,651 | 200 |
| * | Gates Industrial Corp. plc | 11,074 | 125 |
| * | Virgin Galactic Holdings Inc. | 2,120 | 38 |
| | 457,042 |
| Technology (10.3%) |
| | Intel Corp. | 1,072,699 | 54,654 |
| | Cisco Systems Inc. | 1,074,408 | 45,361 |
| | International Business Machines Corp. | 224,803 | 27,720 |
| * | Alphabet Inc. Class A | 16,971 | 27,655 |
| * | Alphabet Inc. Class C | 16,840 | 27,520 |
| | Texas Instruments Inc. | 116,580 | 16,572 |
| * | Micron Technology Inc. | 281,491 | 12,811 |
| | L3Harris Technologies Inc. | 54,469 | 9,845 |
| | Activision Blizzard Inc. | 116,978 | 9,770 |
| | Analog Devices Inc. | 81,841 | 9,566 |
| * | Electronic Arts Inc. | 62,101 | 8,661 |
| | Cognizant Technology Solutions Corp. Class A | 126,920 | 8,486 |
| * | Twitter Inc. | 194,638 | 7,898 |
| | HP Inc. | 362,359 | 7,084 |
| | Marvell Technology Group Ltd. | 166,683 | 6,464 |
| | Corning Inc. | 189,611 | 6,155 |
| | Skyworks Solutions Inc. | 42,169 | 6,108 |
| | Motorola Solutions Inc. | 38,621 | 5,977 |
| * | Autodesk Inc. | 18,506 | 4,547 |
| * | salesforce.com Inc. | 16,026 | 4,369 |
| * | Qorvo Inc. | 29,140 | 3,738 |
| | IHS Markit Ltd. | 45,605 | 3,645 |
| | Oracle Corp. | 59,953 | 3,430 |
| | Citrix Systems Inc. | 22,725 | 3,300 |
| | Amphenol Corp. Class A | 29,627 | 3,253 |
| | Hewlett Packard Enterprise Co. | 327,338 | 3,165 |
| | Maxim Integrated Products Inc. | 44,851 | 3,070 |
| | Western Digital Corp. | 75,882 | 2,915 |
| | SS&C Technologies Holdings Inc. | 45,059 | 2,871 |
| | Leidos Holdings Inc. | 30,721 | 2,780 |
| * | Dell Technologies Inc. | 36,453 | 2,409 |
| * | VeriSign Inc. | 10,500 | 2,255 |
| * | Ciena Corp. | 38,770 | 2,201 |
| * | ON Semiconductor Corp. | 102,205 | 2,184 |
| * | Nuance Communications Inc. | 71,116 | 2,131 |
| | Juniper Networks Inc. | 83,481 | 2,087 |
| | Amdocs Ltd. | 33,721 | 2,065 |
| * | F5 Networks Inc. | 15,468 | 2,047 |
| * | Guidewire Software Inc. | 17,026 | 1,912 |
| * | Advanced Micro Devices Inc. | 20,547 | 1,866 |
Vanguard® Russell 1000 Value Index Fund
Schedule of Investments
August 31, 2020
| | | Market |
| | | Value |
| | Shares | ($000) |
| | Broadcom Inc. | 5,176 | 1,797 |
| * | Cree Inc. | 27,300 | 1,723 |
| | Microchip Technology Inc. | 14,815 | 1,625 |
| * | Arrow Electronics Inc. | 19,789 | 1,555 |
| * | Twilio Inc. Class A | 5,693 | 1,536 |
| * | Grubhub Inc. | 20,864 | 1,509 |
| * | Lumentum Holdings Inc. | 16,768 | 1,442 |
| * | IPG Photonics Corp. | 8,439 | 1,365 |
| | SYNNEX Corp. | 10,570 | 1,344 |
| | DXC Technology Co. | 64,585 | 1,290 |
| | CDK Global Inc. | 26,688 | 1,244 |
| * | CACI International Inc. Class A | 5,299 | 1,241 |
| | NetApp Inc. | 25,455 | 1,206 |
| | National Instruments Corp. | 32,881 | 1,180 |
| | Science Applications International Corp. | 12,683 | 1,058 |
| | Jabil Inc. | 29,715 | 1,015 |
| * | Crowdstrike Holdings Inc. Class A | 7,930 | 997 |
| | Dolby Laboratories Inc. Class A | 13,870 | 969 |
| | LogMeIn Inc. | 11,123 | 957 |
| * | Cirrus Logic Inc. | 14,670 | 889 |
| * | Akamai Technologies Inc. | 7,048 | 821 |
| | Avnet Inc. | 24,451 | 673 |
| * | Ceridian HCM Holding Inc. | 8,210 | 653 |
| * | NCR Corp. | 31,910 | 652 |
| * | Pinterest Inc. Class A | 17,152 | 631 |
| * | FireEye Inc. | 42,577 | 625 |
| * | Synopsys Inc. | 2,706 | 599 |
| * | Arista Networks Inc. | 2,620 | 585 |
| * | ViaSat Inc. | 14,374 | 571 |
| | Sabre Corp. | 69,116 | 483 |
| * | CommScope Holding Co. Inc. | 45,192 | 465 |
| | MKS Instruments Inc. | 3,312 | 396 |
| * | Pure Storage Inc. Class A | 25,883 | 395 |
| * | Take-Two Interactive Software Inc. | 2,172 | 372 |
| * | Zynga Inc. Class A | 40,751 | 369 |
| * | EchoStar Corp. Class A | 11,994 | 352 |
| * | SolarWinds Corp. | 12,213 | 257 |
| * | Mercury Systems Inc. | 2,545 | 193 |
| * | RealPage Inc. | 2,773 | 174 |
| * | Manhattan Associates Inc. | 1,716 | 167 |
| * | Teradata Corp. | 6,391 | 156 |
| * | Aspen Technology Inc. | 1,163 | 148 |
| | Entegris Inc. | 2,104 | 141 |
| | Pegasystems Inc. | 1,008 | 129 |
| * | Coherent Inc. | 1,029 | 116 |
| | Ubiquiti Inc. | 400 | 73 |
| * | ZoomInfo Technologies Inc. Class A | 103 | 4 |
| | 396,689 |
| Utilities (9.3%) |
| | Verizon Communications Inc. | 1,048,186 | 62,126 |
| | AT&T Inc. | 1,804,559 | 53,794 |
| | NextEra Energy Inc. | 123,786 | 34,557 |
| | Dominion Energy Inc. | 212,073 | 16,635 |
| * | T-Mobile US Inc. | 139,151 | 16,236 |
| | Duke Energy Corp. | 185,751 | 14,923 |
| | Southern Co. | 267,114 | 13,938 |
| | American Electric Power Co. Inc. | 125,510 | 9,894 |
| | Xcel Energy Inc. | 132,720 | 9,221 |
| | Sempra Energy | 74,108 | 9,163 |
| | Exelon Corp. | 246,307 | 9,091 |
| | WEC Energy Group Inc. | 79,726 | 7,501 |
| | Eversource Energy | 85,144 | 7,298 |
| | Public Service Enterprise Group Inc. | 127,681 | 6,670 |
| | American Water Works Co. Inc. | 45,808 | 6,475 |
Vanguard® Russell 1000 Value Index Fund
Schedule of Investments
August 31, 2020
| | | Market |
| | | Value |
| | Shares | ($000) |
| | Consolidated Edison Inc. | 84,741 | 6,045 |
| | DTE Energy Co. | 48,572 | 5,764 |
| | PPL Corp. | 194,910 | 5,385 |
| | Entergy Corp. | 50,830 | 5,039 |
| | Ameren Corp. | 62,182 | 4,919 |
| | Edison International | 90,187 | 4,733 |
| | CMS Energy Corp. | 72,175 | 4,366 |
| | FirstEnergy Corp. | 137,396 | 3,928 |
| | Alliant Energy Corp. | 63,066 | 3,415 |
| | Atmos Energy Corp. | 30,610 | 3,056 |
| | Evergy Inc. | 57,197 | 3,044 |
| | CenturyLink Inc. | 276,655 | 2,974 |
| | AES Corp. | 167,238 | 2,969 |
| | CenterPoint Energy Inc. | 127,788 | 2,565 |
| | Essential Utilities Inc. | 56,634 | 2,407 |
| | Vistra Corp. | 122,881 | 2,363 |
| * | PG&E Corp. | 240,098 | 2,223 |
| | NiSource Inc. | 97,097 | 2,152 |
| | Pinnacle West Capital Corp. | 28,556 | 2,095 |
| * | GCI Liberty Inc. Class A | 25,072 | 2,025 |
| | UGI Corp. | 52,481 | 1,812 |
| | OGE Energy Corp. | 50,652 | 1,614 |
| | NRG Energy Inc. | 40,089 | 1,379 |
| | IDACORP Inc. | 12,572 | 1,130 |
| | National Fuel Gas Co. | 20,926 | 955 |
| | Hawaiian Electric Industries Inc. | 26,690 | 924 |
| | Avangrid Inc. | 14,129 | 679 |
| | Telephone and Data Systems Inc. | 25,031 | 579 |
| * | United States Cellular Corp. | 4,224 | 154 |
| | 358,215 |
| Total Common Stocks (Cost $3,635,834) | 3,846,939 |
| | Coupon | | | |
| Temporary Cash Investments (0.0%) |
| Money Market Fund (0.0%) |
| 1,2 | Vanguard Market Liquidity Fund | 0.147% | | 17,768 | 1,777 |
| | | | Face | |
| | | Maturity | Amount | |
| | | Date | ($000) | |
| U.S. Government and Agency Obligations (0.0%) |
| 3 | United States Cash Management Bill | 0.116% | 9/29/20 | 450 | 450 |
| Total Temporary Cash Investments (Cost $2,226) | 2,227 |
| Total Investments (99.9%) (Cost $3,638,060) | 3,849,166 |
| Other Assets and Liabilities—Net (0.1%) | 3,662 |
| Net Assets (100%) | 3,852,828 |
| Cost is in $000. |
| * | Non-income-producing security. |
| ^ | Includes partial security positions on loan to broker-dealers. The total value of securities on loan is $1,574,000. |
| 1 | Affiliated money market fund available only to Vanguard funds and certain trusts and accounts managed by Vanguard. Rate shown is the 7-day yield. |
| 2 | Collateral of $1,777,000 was received for securities on loan. |
| 3 | Securities with a value of $22,000 have been segregated as initial margin for open futures contracts. |
| | REIT—Real Estate Investment Trust. |
Vanguard® Russell 1000 Growth Index Fund
Schedule of Investments
August 31, 2020
| | | Market |
| | | Value |
| | Shares | ($000) |
| Common Stocks (99.9%) |
| Consumer Discretionary (20.4%) |
| * | Amazon.com Inc. | 207,375 | 715,643 |
| * | Tesla Inc. | 361,604 | 180,194 |
| * | Netflix Inc. | 207,989 | 110,143 |
| | Home Depot Inc. | 262,632 | 74,861 |
| | NIKE Inc. Class B | 592,407 | 66,284 |
| | Costco Wholesale Corp. | 190,529 | 66,239 |
| | Lowe's Cos. Inc. | 369,566 | 60,864 |
| * | Charter Communications Inc. Class A | 66,038 | 40,654 |
| * | Booking Holdings Inc. | 19,983 | 38,177 |
| | Starbucks Corp. | 329,812 | 27,859 |
| | TJX Cos. Inc. | 474,600 | 26,003 |
| | Dollar General Corp. | 122,981 | 24,827 |
| | Estee Lauder Cos. Inc. Class A | 96,815 | 21,466 |
| * | Lululemon Athletica Inc. | 55,487 | 20,845 |
| * | Spotify Technology SA | 63,947 | 18,043 |
| * | Chipotle Mexican Grill Inc. Class A | 13,601 | 17,821 |
| * | Uber Technologies Inc. | 513,135 | 17,257 |
| * | O'Reilly Automotive Inc. | 35,733 | 16,638 |
| | eBay Inc. | 298,274 | 16,339 |
| | Ross Stores Inc. | 138,063 | 12,575 |
| | McDonald's Corp. | 52,115 | 11,128 |
| * | Trade Desk Inc. Class A | 19,784 | 9,522 |
| * | Wayfair Inc. | 29,264 | 8,679 |
| * | Roku Inc. | 49,635 | 8,611 |
| | Tractor Supply Co. | 56,363 | 8,389 |
| * | AutoZone Inc. | 6,775 | 8,105 |
| | Domino's Pizza Inc. | 18,997 | 7,769 |
| * | Etsy Inc. | 57,528 | 6,886 |
| | Pool Corp. | 18,933 | 6,207 |
| * | Carvana Co. Class A | 26,699 | 5,766 |
| * | Ulta Beauty Inc. | 24,491 | 5,686 |
| * | Burlington Stores Inc. | 28,361 | 5,585 |
| * | Dollar Tree Inc. | 54,821 | 5,278 |
| | Cable One Inc. | 2,473 | 4,551 |
| * | Chegg Inc. | 59,235 | 4,368 |
| * | Altice USA Inc. Class A | 158,148 | 4,362 |
| * | Live Nation Entertainment Inc. | 69,418 | 3,943 |
| | Las Vegas Sands Corp. | 69,491 | 3,524 |
| | Rollins Inc. | 63,557 | 3,505 |
| * | Floor & Decor Holdings Inc. Class A | 42,316 | 3,099 |
| * | Five Below Inc. | 26,541 | 2,905 |
| | Dunkin' Brands Group Inc. | 34,305 | 2,610 |
| * | Bright Horizons Family Solutions Inc. | 19,458 | 2,588 |
| | Best Buy Co. Inc. | 20,133 | 2,233 |
| * | Ollie's Bargain Outlet Holdings Inc. | 22,955 | 2,193 |
| | Sirius XM Holdings Inc. | 344,383 | 2,022 |
| | Wendy's Co. | 87,098 | 1,824 |
| * | Tempur Sealy International Inc. | 16,975 | 1,452 |
| | Nexstar Media Group Inc. Class A | 14,168 | 1,360 |
| * | Planet Fitness Inc. Class A | 22,100 | 1,343 |
| | Yum! Brands Inc. | 11,196 | 1,073 |
| * | Mattel Inc. | 99,058 | 1,064 |
| | Wynn Resorts Ltd. | 11,707 | 1,024 |
| | World Wrestling Entertainment Inc. Class A | 22,307 | 983 |
| | H&R Block Inc. | 65,915 | 956 |
| * | Peloton Interactive Inc. Class A | 11,544 | 885 |
| * | IAA Inc. | 15,464 | 809 |
| | Expedia Group Inc. | 7,310 | 717 |
| * | NVR Inc. | 171 | 713 |
| | Yum China Holdings Inc. | 12,029 | 694 |
| * | CarMax Inc. | 5,947 | 636 |
Vanguard® Russell 1000 Growth Index Fund
Schedule of Investments
August 31, 2020
| | | Market |
| | | Value |
| | Shares | ($000) |
| | VF Corp. | 9,140 | 601 |
| | Williams-Sonoma Inc. | 6,188 | 543 |
| * | 2U Inc. | 10,685 | 442 |
| * | Liberty Media Corp-Liberty SiriusXM Class C | 10,385 | 374 |
| | Vail Resorts Inc. | 1,548 | 337 |
| * | frontdoor Inc. | 7,017 | 306 |
| | Polaris Inc. | 2,891 | 292 |
| | Reynolds Consumer Products Inc. | 6,327 | 210 |
| * | Liberty Media Corp-Liberty SiriusXM Class A | 4,042 | 147 |
| | Warner Music Group Corp. Class A | 856 | 25 |
| | 1,731,056 |
| Consumer Staples (3.6%) |
| | Procter & Gamble Co. | 532,587 | 73,673 |
| | PepsiCo Inc. | 498,113 | 69,766 |
| | Coca-Cola Co. | 1,109,633 | 54,960 |
| | Altria Group Inc. | 396,397 | 17,338 |
| * | Monster Beverage Corp. | 180,219 | 15,113 |
| | Church & Dwight Co. Inc. | 120,128 | 11,512 |
| | Sysco Corp. | 168,790 | 10,151 |
| | Clorox Co. | 43,727 | 9,773 |
| | McKesson Corp. | 59,011 | 9,055 |
| | Hershey Co. | 55,974 | 8,320 |
| | McCormick & Co. Inc. | 33,827 | 6,975 |
| | Brown-Forman Corp. Class B | 72,464 | 5,302 |
| * | Boston Beer Co. Inc. Class A | 4,242 | 3,741 |
| | Kellogg Co. | 41,473 | 2,941 |
| * | Beyond Meat Inc. | 19,964 | 2,712 |
| | Campbell Soup Co. | 42,756 | 2,249 |
| | Brown-Forman Corp. Class A | 21,832 | 1,451 |
| * | Sprouts Farmers Market Inc. | 48,259 | 1,127 |
| | Energizer Holdings Inc. | 23,888 | 1,106 |
| | Lamb Weston Holdings Inc. | 16,254 | 1,022 |
| * | Grocery Outlet Holding Corp. | 18,023 | 741 |
| *,^ | Herbalife Nutrition Ltd. | 6,602 | 325 |
| * | Pilgrim's Pride Corp. | 8,561 | 137 |
| | 309,490 |
| Energy (0.2%) |
| * | Cheniere Energy Inc. | 112,877 | 5,875 |
| * | SolarEdge Technologies Inc. | 23,896 | 5,285 |
| * | Enphase Energy Inc. | 51,704 | 3,993 |
| | Equitrans Midstream Corp. | 18,636 | 192 |
| | 15,345 |
| Financial Services (9.8%) |
| | Visa Inc. Class A | 825,702 | 175,041 |
| | Mastercard Inc. Class A | 431,429 | 154,534 |
| * | PayPal Holdings Inc. | 574,331 | 117,244 |
| | American Tower Corp. | 215,698 | 53,741 |
| | Equinix Inc. | 42,964 | 33,932 |
| | Crown Castle International Corp. | 189,532 | 30,941 |
| * | Square Inc. | 176,561 | 28,172 |
| | S&P Global Inc. | 69,476 | 25,457 |
| | Moody's Corp. | 79,378 | 23,388 |
| | Aon plc Class A | 112,059 | 22,411 |
| | Marsh & McLennan Cos. Inc. | 192,125 | 22,077 |
| | MSCI Inc. Class A | 40,424 | 15,089 |
| | Public Storage | 48,148 | 10,227 |
| * | FleetCor Technologies Inc. | 40,278 | 10,128 |
| | Intercontinental Exchange Inc. | 92,907 | 9,869 |
| | MarketAxess Holdings Inc. | 17,991 | 8,743 |
| * | Fiserv Inc. | 80,546 | 8,021 |
| | Simon Property Group Inc. | 117,128 | 7,947 |
| | Progressive Corp. | 82,246 | 7,817 |
| | Broadridge Financial Solutions Inc. | 55,793 | 7,666 |
Vanguard® Russell 1000 Growth Index Fund
Schedule of Investments
August 31, 2020
| | | Market |
| | | Value |
| | Shares | ($000) |
| | TransUnion | 84,402 | 7,319 |
| | FactSet Research Systems Inc. | 18,107 | 6,345 |
| * | Fair Isaac Corp. | 13,682 | 5,757 |
| | Jack Henry & Associates Inc. | 29,178 | 4,827 |
| | Extra Space Storage Inc. | 43,393 | 4,624 |
| | T. Rowe Price Group Inc. | 27,960 | 3,892 |
| | Iron Mountain Inc. | 81,404 | 2,449 |
| | Equity LifeStyle Properties Inc. | 34,611 | 2,294 |
| | SBA Communications Corp. Class A | 7,319 | 2,240 |
| | Tradeweb Markets Inc. Class A | 34,097 | 1,953 |
| | Ares Management Corp. Class A | 47,687 | 1,929 |
| | Apollo Global Management LLC | 41,092 | 1,926 |
| | CoreSite Realty Corp. | 13,161 | 1,612 |
| | Primerica Inc. | 12,085 | 1,509 |
| | Erie Indemnity Co. Class A | 6,969 | 1,487 |
| | RenaissanceRe Holdings Ltd. | 8,008 | 1,471 |
| | Morningstar Inc. | 8,941 | 1,432 |
| * | LendingTree Inc. | 3,677 | 1,136 |
| | Cboe Global Markets Inc. | 11,615 | 1,066 |
| | Western Union Co. | 39,215 | 925 |
| * | Bill.com Holdings Inc. | 7,827 | 775 |
| | Virtu Financial Inc. Class A | 27,108 | 700 |
| * | Zillow Group Inc. Class C | 7,043 | 604 |
| | Lincoln National Corp. | 11,529 | 416 |
| | Alleghany Corp. | 701 | 389 |
| | Americold Realty Trust | 9,582 | 367 |
| | SLM Corp. | 42,459 | 324 |
| | Brown & Brown Inc. | 6,326 | 294 |
| * | WEX Inc. | 1,798 | 287 |
| ^ | Brookfield Property REIT Inc. Class A | 24,733 | 285 |
| * | Zillow Group Inc. Class A | 3,275 | 279 |
| | LPL Financial Holdings Inc. | 3,003 | 247 |
| | Axis Capital Holdings Ltd. | 3,885 | 186 |
| | Carlyle Group Inc. | 5,355 | 138 |
| * | Credit Acceptance Corp. | 339 | 131 |
| | 834,060 |
| Health Care (13.2%) |
| | UnitedHealth Group Inc. | 384,064 | 120,039 |
| | Merck & Co. Inc. | 1,079,819 | 92,076 |
| | AbbVie Inc. | 809,951 | 77,569 |
| | Amgen Inc. | 287,901 | 72,931 |
| | Eli Lilly and Co. | 411,923 | 61,125 |
| | Thermo Fisher Scientific Inc. | 113,367 | 48,632 |
| * | Intuitive Surgical Inc. | 56,588 | 41,357 |
| | Abbott Laboratories | 324,524 | 35,526 |
| * | Vertex Pharmaceuticals Inc. | 126,971 | 35,440 |
| | Zoetis Inc. | 210,345 | 33,676 |
| * | Regeneron Pharmaceuticals Inc. | 47,287 | 29,315 |
| | Johnson & Johnson | 172,789 | 26,508 |
| * | Edwards Lifesciences Corp. | 301,397 | 25,872 |
| * | Illumina Inc. | 71,749 | 25,630 |
| | Bristol-Myers Squibb Co. | 401,935 | 25,000 |
| * | DexCom Inc. | 44,924 | 19,111 |
| * | Veeva Systems Inc. Class A | 65,241 | 18,416 |
| * | IDEXX Laboratories Inc. | 41,057 | 16,056 |
| | ResMed Inc. | 69,971 | 12,649 |
| * | Align Technology Inc. | 38,138 | 11,326 |
| | Stryker Corp. | 55,211 | 10,941 |
| | Cerner Corp. | 148,624 | 10,905 |
| | Humana Inc. | 24,635 | 10,228 |
| | West Pharmaceutical Services Inc. | 35,763 | 10,155 |
| * | Seattle Genetics Inc. | 59,473 | 9,417 |
| | HCA Healthcare Inc. | 67,785 | 9,200 |
| | Baxter International Inc. | 104,430 | 9,093 |
Vanguard® Russell 1000 Growth Index Fund
Schedule of Investments
August 31, 2020
| | | Market |
| | | Value |
| | Shares | ($000) |
| | Anthem Inc. | 31,758 | 8,940 |
| * | Incyte Corp. | 89,050 | 8,580 |
| * | Moderna Inc. | 131,025 | 8,502 |
| | Cigna Corp. | 47,852 | 8,487 |
| * | Alnylam Pharmaceuticals Inc. | 55,810 | 7,403 |
| | Cardinal Health Inc. | 142,743 | 7,246 |
| * | Teladoc Health Inc. | 32,555 | 7,022 |
| * | Biogen Inc. | 24,042 | 6,915 |
| * | Insulet Corp. | 30,754 | 6,712 |
| * | ABIOMED Inc. | 21,601 | 6,645 |
| * | Horizon Therapeutics plc | 88,202 | 6,626 |
| * | BioMarin Pharmaceutical Inc. | 79,784 | 6,226 |
| * | IQVIA Holdings Inc. | 35,184 | 5,761 |
| | Teleflex Inc. | 14,252 | 5,600 |
| * | Sarepta Therapeutics Inc. | 36,319 | 5,318 |
| * | Masimo Corp. | 23,519 | 5,268 |
| * | Neurocrine Biosciences Inc. | 44,877 | 5,225 |
| * | Hologic Inc. | 87,357 | 5,217 |
| * | Centene Corp. | 82,751 | 5,074 |
| * | Avantor Inc. | 218,069 | 4,922 |
| * | Exact Sciences Corp. | 63,090 | 4,750 |
| * | Charles River Laboratories International Inc. | 21,072 | 4,614 |
| * | Immunomedics Inc. | 100,788 | 4,491 |
| | Bio-Techne Corp. | 17,441 | 4,455 |
| * | Novocure Ltd. | 48,636 | 4,025 |
| * | Repligen Corp. | 25,554 | 3,959 |
| | Chemed Corp. | 7,541 | 3,899 |
| * | Amedisys Inc. | 15,464 | 3,741 |
| * | Livongo Health Inc. | 26,408 | 3,626 |
| * | Molina Healthcare Inc. | 19,191 | 3,550 |
| * | Guardant Health Inc. | 36,384 | 3,475 |
| | AmerisourceBergen Corp. Class A | 34,249 | 3,323 |
| * | Penumbra Inc. | 15,669 | 3,277 |
| * | Quidel Corp. | 18,153 | 3,194 |
| * | 10X Genomics Inc. Class A | 26,443 | 3,031 |
| * | Tandem Diabetes Care Inc. | 25,553 | 2,880 |
| * | PRA Health Sciences Inc. | 26,371 | 2,819 |
| * | Acceleron Pharma Inc. | 22,892 | 2,231 |
| * | Iovance Biotherapeutics Inc. | 65,678 | 2,189 |
| * | ACADIA Pharmaceuticals Inc. | 53,115 | 2,103 |
| * | Haemonetics Corp. | 22,552 | 2,022 |
| * | Alexion Pharmaceuticals Inc. | 16,133 | 1,843 |
| * | Global Blood Therapeutics Inc. | 28,407 | 1,783 |
| * | Ionis Pharmaceuticals Inc. | 31,130 | 1,697 |
| * | Adaptive Biotechnologies Corp. | 34,534 | 1,437 |
| | Encompass Health Corp. | 21,540 | 1,405 |
| | Agilent Technologies Inc. | 12,983 | 1,304 |
| | PerkinElmer Inc. | 10,538 | 1,240 |
| * | Change Healthcare Inc. | 86,341 | 1,222 |
| * | Exelixis Inc. | 53,545 | 1,190 |
| * | Reata Pharmaceuticals Inc. Class A | 10,313 | 1,082 |
| * | Varian Medical Systems Inc. | 5,516 | 958 |
| | Cooper Cos. Inc. | 2,919 | 918 |
| | Bruker Corp. | 21,256 | 893 |
| * | PPD Inc. | 25,370 | 871 |
| * | Bluebird Bio Inc. | 14,029 | 832 |
| * | DaVita Inc. | 6,727 | 584 |
| * | ICU Medical Inc. | 2,629 | 526 |
| * | Laboratory Corp. of America Holdings | 2,563 | 450 |
| | STERIS plc | 2,230 | 356 |
| | Hill-Rom Holdings Inc. | 3,760 | 353 |
| * | Syneos Health Inc. | 3,242 | 205 |
| * | Agios Pharmaceuticals Inc. | 2,737 | 112 |
Vanguard® Russell 1000 Growth Index Fund
Schedule of Investments
August 31, 2020
| | | Market |
| | | Value |
| | Shares | ($000) |
| * | Sage Therapeutics Inc. | 1,791 | 94 |
| | 1,122,891 |
| Materials & Processing (1.0%) |
| | Sherwin-Williams Co. | 40,297 | 27,041 |
| | Ball Corp. | 145,899 | 11,726 |
| | Fastenal Co. | 226,870 | 11,085 |
| | Ecolab Inc. | 24,182 | 4,766 |
| | Carrier Global Corp. | 152,561 | 4,554 |
| | RPM International Inc. | 52,265 | 4,431 |
| * | Trex Co. Inc. | 28,288 | 4,229 |
| | Air Products & Chemicals Inc. | 13,752 | 4,019 |
| | Royal Gold Inc. | 23,002 | 3,136 |
| | Scotts Miracle-Gro Co. | 18,598 | 3,134 |
| | Avery Dennison Corp. | 16,811 | 1,940 |
| | FMC Corp. | 12,366 | 1,321 |
| | Amcor plc | 116,501 | 1,288 |
| * | Berry Global Group Inc. | 22,121 | 1,140 |
| | NewMarket Corp. | 2,771 | 1,032 |
| | Armstrong World Industries Inc. | 8,561 | 631 |
| * | Crown Holdings Inc. | 6,667 | 512 |
| | Graphic Packaging Holding Co. | 28,759 | 402 |
| | W R Grace & Co. | 9,717 | 396 |
| | 86,783 |
| Producer Durables (5.4%) |
| | Accenture plc Class A | 311,682 | 74,782 |
| | Lockheed Martin Corp. | 121,002 | 47,222 |
| | United Parcel Service Inc. Class B | 227,580 | 37,237 |
| | Union Pacific Corp. | 169,311 | 32,582 |
| | 3M Co. | 181,359 | 29,565 |
| | Automatic Data Processing Inc. | 180,718 | 25,136 |
| | Northrop Grumman Corp. | 70,194 | 24,049 |
| * | CoStar Group Inc. | 18,773 | 15,931 |
| | Verisk Analytics Inc. Class A | 77,842 | 14,531 |
| | Illinois Tool Works Inc. | 68,101 | 13,453 |
| | Cintas Corp. | 38,194 | 12,728 |
| * | Mettler-Toledo International Inc. | 10,824 | 10,508 |
| * | Copart Inc. | 99,299 | 10,260 |
| | Paychex Inc. | 123,927 | 9,477 |
| | Old Dominion Freight Line Inc. | 41,032 | 8,296 |
| | Equifax Inc. | 43,781 | 7,367 |
| * | Zebra Technologies Corp. | 23,413 | 6,709 |
| | Rockwell Automation Inc. | 27,484 | 6,336 |
| | Booz Allen Hamilton Holding Corp. Class A | 67,214 | 5,919 |
| | WW Grainger Inc. | 15,958 | 5,832 |
| * | Generac Holdings Inc. | 27,227 | 5,173 |
| | Expeditors International of Washington Inc. | 49,759 | 4,398 |
| | Nordson Corp. | 22,940 | 4,278 |
| | Toro Co. | 47,189 | 3,552 |
| * | Keysight Technologies Inc. | 30,798 | 3,034 |
| | Waste Management Inc. | 26,452 | 3,016 |
| | Roper Technologies Inc. | 7,049 | 3,011 |
| | Allegion plc | 29,094 | 3,008 |
| | TransDigm Group Inc. | 5,677 | 2,837 |
| | HEICO Corp. Class A | 30,278 | 2,706 |
| * | Axon Enterprise Inc. | 30,071 | 2,576 |
| * | Paylocity Holding Corp. | 17,000 | 2,503 |
| | Graco Inc. | 40,086 | 2,326 |
| | Landstar System Inc. | 15,076 | 2,006 |
| | HEICO Corp. | 17,781 | 1,954 |
| | BWX Technologies Inc. | 29,603 | 1,646 |
| | JB Hunt Transport Services Inc. | 10,989 | 1,544 |
| | Genpact Ltd. | 35,411 | 1,494 |
| | Allison Transmission Holdings Inc. | 35,387 | 1,269 |
| | Lincoln Electric Holdings Inc. | 11,809 | 1,142 |
Vanguard® Russell 1000 Growth Index Fund
Schedule of Investments
August 31, 2020
| | | Market |
| | | Value |
| | Shares | ($000) |
| | CH Robinson Worldwide Inc. | 10,085 | 991 |
| * | Pluralsight Inc. Class A | 45,534 | 872 |
| | Quanta Services Inc. | 13,765 | 705 |
| | MSA Safety Inc. | 3,923 | 494 |
| * | Waters Corp. | 2,268 | 490 |
| *,^ | Virgin Galactic Holdings Inc. | 25,205 | 451 |
| | Donaldson Co. Inc. | 6,365 | 321 |
| | Huntington Ingalls Industries Inc. | 1,833 | 278 |
| * | XPO Logistics Inc. | 2,154 | 190 |
| | CoreLogic Inc. | 2,089 | 139 |
| | 456,324 |
| Technology (46.3%) |
| | Apple Inc. | 8,001,002 | 1,032,449 |
| | Microsoft Corp. | 3,662,330 | 825,965 |
| * | Facebook Inc. Class A | 1,174,370 | 344,325 |
| * | Alphabet Inc. Class A | 113,916 | 185,630 |
| * | Alphabet Inc. Class C | 112,461 | 183,781 |
| | NVIDIA Corp. | 288,700 | 154,449 |
| * | Adobe Inc. | 235,264 | 120,782 |
| * | salesforce.com Inc. | 392,643 | 107,054 |
| | QUALCOMM Inc. | 550,379 | 65,550 |
| | Broadcom Inc. | 180,968 | 62,823 |
| | Oracle Corp. | 849,426 | 48,604 |
| * | Advanced Micro Devices Inc. | 530,263 | 48,158 |
| * | ServiceNow Inc. | 92,929 | 44,794 |
| | Intuit Inc. | 123,168 | 42,541 |
| | Texas Instruments Inc. | 223,617 | 31,787 |
| | Applied Materials Inc. | 447,983 | 27,596 |
| * | Zoom Video Communications Inc. Class A | 81,663 | 26,549 |
| | Lam Research Corp. | 70,877 | 23,839 |
| * | Workday Inc. Class A | 83,844 | 20,098 |
| * | DocuSign Inc. Class A | 86,137 | 19,209 |
| * | Autodesk Inc. | 71,407 | 17,545 |
| * | Splunk Inc. | 77,691 | 17,040 |
| | KLA Corp. | 75,874 | 15,565 |
| * | Synopsys Inc. | 67,865 | 15,019 |
| * | Cadence Design Systems Inc. | 134,652 | 14,934 |
| * | Twilio Inc. Class A | 54,266 | 14,639 |
| * | ANSYS Inc. | 41,848 | 14,187 |
| | Xilinx Inc. | 119,282 | 12,424 |
| | Activision Blizzard Inc. | 147,518 | 12,321 |
| * | Palo Alto Networks Inc. | 47,759 | 12,294 |
| * | Okta Inc. | 56,161 | 12,095 |
| * | Match Group Inc. | 107,067 | 11,957 |
| * | Atlassian Corp. plc Class A | 61,045 | 11,706 |
| * | RingCentral Inc. Class A | 37,316 | 10,850 |
| * | Coupa Software Inc. | 32,388 | 10,615 |
| | Microchip Technology Inc. | 86,117 | 9,447 |
| | Amphenol Corp. Class A | 83,487 | 9,167 |
| * | Take-Two Interactive Software Inc. | 50,709 | 8,681 |
| * | Fortinet Inc. | 64,867 | 8,563 |
| * | EPAM Systems Inc. | 25,922 | 8,479 |
| | IHS Markit Ltd. | 105,462 | 8,429 |
| | CDW Corp. | 69,387 | 7,886 |
| * | Akamai Technologies Inc. | 64,279 | 7,484 |
| * | Paycom Software Inc. | 24,002 | 7,188 |
| | Teradyne Inc. | 80,663 | 6,854 |
| * | GoDaddy Inc. Class A | 80,732 | 6,756 |
| * | Tyler Technologies Inc. | 19,141 | 6,610 |
| | NortonLifeLock Inc. | 272,438 | 6,408 |
| * | VeriSign Inc. | 29,604 | 6,359 |
| * | Datadog Inc. Class A | 74,449 | 6,220 |
| * | HubSpot Inc. | 20,219 | 6,059 |
| * | Slack Technologies Inc. Class A | 183,208 | 6,017 |
Vanguard® Russell 1000 Growth Index Fund
Schedule of Investments
August 31, 2020
| | | Market |
| | | Value |
| | Shares | ($000) |
| * | Pinterest Inc. Class A | 162,927 | 5,994 |
| * | Black Knight Inc. | 70,533 | 5,932 |
| | Monolithic Power Systems Inc. | 21,238 | 5,673 |
| * | VMware Inc. Class A | 38,553 | 5,569 |
| | Cognex Corp. | 80,446 | 5,566 |
| * | Gartner Inc. | 42,265 | 5,487 |
| * | Zendesk Inc. | 55,260 | 5,326 |
| * | Arista Networks Inc. | 23,560 | 5,264 |
| * | Avalara Inc. | 39,503 | 5,231 |
| * | Crowdstrike Holdings Inc. Class A | 40,947 | 5,148 |
| * | Zscaler Inc. | 34,348 | 4,923 |
| * | IAC/InterActiveCorp | 36,611 | 4,869 |
| * | MongoDB Inc. | 20,438 | 4,778 |
| * | PTC Inc. | 50,989 | 4,661 |
| * | StoneCo Ltd. Class A | 87,087 | 4,441 |
| | Entegris Inc. | 61,189 | 4,093 |
| * | Aspen Technology Inc. | 30,831 | 3,916 |
| * | Anaplan Inc. | 63,769 | 3,906 |
| * | Five9 Inc. | 29,995 | 3,823 |
| * | Dynatrace Inc. | 84,697 | 3,746 |
| | Universal Display Corp. | 21,029 | 3,691 |
| * | Fastly Inc. Class A | 35,689 | 3,313 |
| * | Zynga Inc. Class A | 354,675 | 3,213 |
| * | Globant SA | 17,579 | 3,122 |
| * | Alteryx Inc. Class A | 25,807 | 3,118 |
| * | Proofpoint Inc. | 27,499 | 3,016 |
| * | Ceridian HCM Holding Inc. | 37,756 | 3,002 |
| | Maxim Integrated Products Inc. | 42,825 | 2,931 |
| * | Smartsheet Inc. Class A | 53,649 | 2,925 |
| * | Elastic NV | 26,557 | 2,884 |
| | NetApp Inc. | 58,914 | 2,792 |
| * | Electronic Arts Inc. | 19,249 | 2,685 |
| * | Manhattan Associates Inc. | 27,387 | 2,663 |
| * | Inphi Corp. | 23,241 | 2,649 |
| | Analog Devices Inc. | 21,647 | 2,530 |
| * | Dropbox Inc. Class A | 119,161 | 2,523 |
| * | Nutanix Inc. | 86,498 | 2,483 |
| * | Everbridge Inc. | 16,643 | 2,473 |
| | MKS Instruments Inc. | 19,971 | 2,387 |
| | Citrix Systems Inc. | 16,275 | 2,363 |
| * | RealPage Inc. | 37,506 | 2,349 |
| | Pegasystems Inc. | 17,261 | 2,218 |
| * | Cloudflare Inc. Class A | 52,968 | 2,027 |
| * | Vertiv Holdings Co. Class A | 106,772 | 1,733 |
| * | Mercury Systems Inc. | 21,595 | 1,636 |
| * | New Relic Inc. | 24,438 | 1,501 |
| | SS&C Technologies Holdings Inc. | 22,726 | 1,448 |
| * | Medallia Inc. | 39,745 | 1,438 |
| | Motorola Solutions Inc. | 8,559 | 1,324 |
| | Cognizant Technology Solutions Corp. Class A | 18,545 | 1,240 |
| * | Coherent Inc. | 9,661 | 1,088 |
| * | PagerDuty Inc. | 33,262 | 1,087 |
| * | Pure Storage Inc. Class A | 67,125 | 1,024 |
| * | Teradata Corp. | 40,821 | 994 |
| * | Guidewire Software Inc. | 7,674 | 862 |
| | Switch Inc. | 42,937 | 738 |
| | Ubiquiti Inc. | 3,379 | 614 |
| | Leidos Holdings Inc. | 6,374 | 577 |
| | Jabil Inc. | 13,621 | 465 |
| * | CACI International Inc. Class A | 1,968 | 461 |
| * | FireEye Inc. | 23,915 | 351 |
| | CDK Global Inc. | 7,491 | 349 |
| * | Lumentum Holdings Inc. | 3,856 | 332 |
| * | Grubhub Inc. | 4,251 | 308 |
Vanguard® Russell 1000 Growth Index Fund
Schedule of Investments
August 31, 2020
| | | Market |
| | | Value |
| | Shares | ($000) |
| | Science Applications International Corp. | 3,618 | 302 |
| * | Dell Technologies Inc. | 4,526 | 299 |
| | Dolby Laboratories Inc. Class A | 3,612 | 252 |
| * | IPG Photonics Corp. | 1,070 | 173 |
| | LogMeIn Inc. | 2,010 | 173 |
| * | CommScope Holding Co. Inc. | 4,998 | 51 |
| * | ZoomInfo Technologies Inc. Class A | 358 | 14 |
| | 3,928,318 |
| Utilities (0.0%) |
| | NRG Energy Inc. | 41,078 | 1,413 |
| | |
| Total Common Stocks (Cost $4,876,602) | 8,485,680 |
| | Coupon | | | |
| Temporary Cash Investments (0.0%) |
| Money Market Fund (0.0%) |
| 1,2 | Vanguard Market Liquidity Fund | 0.147% | | 15,804 | 1,580 |
| | | | Face | |
| | | Maturity | Amount | |
| | | Date | ($000) | |
| U.S. Government and Agency Obligations (0.0%) |
| 3 | United States Cash Management Bill | 0.210% | 9/15/20 | 121 | 121 |
| 3 | United States Cash Management Bill | 0.135% | 10/20/20 | 250 | 250 |
| | 371 |
| Total Temporary Cash Investments (Cost $1,951) | 1,951 |
| Total Investments (99.9%) (Cost $4,878,553) | 8,487,631 |
| Other Assets and Liabilities—Net (0.1%) | 5,128 |
| Net Assets (100%) | 8,492,759 |
| Cost is in $000. |
| * | Non-income-producing security. |
| ^ | Includes partial security positions on loan to broker-dealers. The total value of securities on loan is $709,000. |
| 1 | Affiliated money market fund available only to Vanguard funds and certain trusts and accounts managed by Vanguard. Rate shown is the 7-day yield. |
| 2 | Collateral of $752,000 was received for securities on loan. |
| 3 | Securities with a value of $371,000 have been segregated as initial margin for open futures contracts. |
| | REIT—Real Estate Investment Trust. |
| | © 2020 The Vanguard Group, Inc. |
| | All rights reserved. |
| | Vanguard Marketing Corporation, Distributor. |
| | |
| | SNA18480 102020 |
Vanguard® Russell 2000 Index Fund
Schedule of Investments
August 31, 2020
| | Shares | | Market
Value
($000 | ) |
| Common Stocks (99.7%) | |
| Consumer Discretionary (14.7%) | |
| * | Penn National Gaming Inc. | 169,574 | | 8,665 | |
| | Churchill Downs Inc. | 48,149 | | 8,415 | |
| * | Caesars Entertainment Inc. | 172,101 | | 7,882 | |
| * | BJ's Wholesale Club Holdings Inc. | 173,474 | | 7,704 | |
| * | Deckers Outdoor Corp. | 35,435 | | 7,224 | |
| * | Rh | 21,176 | | 7,000 | |
| * | SiteOne Landscape Supply Inc. | 55,652 | | 6,959 | |
| | Lithia Motors Inc. Class A | 27,944 | | 6,957 | |
| | Wingstop Inc. | 37,534 | | 6,133 | |
| | Texas Roadhouse Inc. Class A | 83,173 | | 5,239 | |
| * | Stamps.com Inc. | 20,931 | | 5,219 | |
| * | Fox Factory Holding Corp. | 48,790 | | 4,919 | |
| | Marriott Vacations Worldwide Corp. | 51,326 | | 4,859 | |
| * | YETI Holdings Inc. | 93,909 | | 4,825 | |
| | Aaron's Inc. | 85,400 | | 4,773 | |
| * | Murphy USA Inc. | 34,927 | | 4,710 | |
| * | Meritage Homes Corp. | 47,084 | | 4,521 | |
| * | Overstock.com Inc. | 50,610 | | 4,428 | |
| | Cracker Barrel Old Country Store Inc. | 30,366 | | 4,060 | |
| | Papa John's International Inc. | 40,976 | | 4,028 | |
| | KB Home | 111,699 | | 3,994 | |
| * | National Vision Holdings Inc. | 101,869 | | 3,827 | |
| * | Taylor Morrison Home Corp. Class A | 160,021 | | 3,765 | |
| | WillScot Mobile Mini Holdings Corp. Class A | 203,069 | | 3,635 | |
| | LCI Industries | 31,197 | | 3,545 | |
| | TEGNA Inc. | 278,152 | | 3,482 | |
| * | Crocs Inc. | 84,527 | | 3,373 | |
| * | LGI Homes Inc. | 28,261 | | 3,161 | |
| * | Shake Shack Inc. Class A | 44,479 | | 3,036 | |
| * | Dorman Products Inc. | 33,764 | | 2,859 | |
| | Strategic Education Inc. | 27,812 | | 2,853 | |
| | KAR Auction Services Inc. | 163,806 | | 2,840 | |
| | Goodyear Tire & Rubber Co. | 293,282 | | 2,814 | |
| | MDC Holdings Inc. | 64,414 | | 2,794 | |
| * | TRI Pointe Group Inc. | 164,264 | | 2,773 | |
| ^ | Macy's Inc. | 395,906 | | 2,759 | |
| | Boyd Gaming Corp. | 102,995 | | 2,758 | |
| * | Visteon Corp. | 35,155 | | 2,652 | |
| * | Asbury Automotive Group Inc. | 24,445 | | 2,586 | |
| | Dana Inc. | 183,371 | | 2,558 | |
| | Wolverine World Wide Inc. | 101,236 | | 2,529 | |
| | Brinker International Inc. | 55,467 | | 2,498 | |
| * | Cardlytics Inc. | 32,789 | | 2,487 | |
| | Callaway Golf Co. | 118,428 | | 2,470 | |
| | American Eagle Outfitters Inc. | 191,263 | | 2,412 | |
| * | Hilton Grand Vacations Inc. | 108,033 | | 2,367 | |
| | Jack in the Box Inc. | 28,727 | | 2,367 | |
| | Big Lots Inc. | 49,771 | | 2,347 | |
| * | Avis Budget Group Inc. | 66,852 | | 2,280 | |
| | Steven Madden Ltd. | 104,478 | | 2,211 | |
| | Cooper Tire & Rubber Co. | 63,923 | | 2,210 | |
| * | Adtalem Global Education Inc. | 65,940 | | 2,189 | |
| | Winnebago Industries Inc. | 39,509 | | 2,133 | |
| * | Cavco Industries Inc. | 10,986 | | 2,097 | |
| * | Urban Outfitters Inc. | 87,544 | | 2,061 | |
| * | Meritor Inc. | 87,949 | | 2,002 | |
| | Cinemark Holdings Inc. | 135,532 | | 1,986 | |
| * | Skyline Champion Corp. | 69,198 | | 1,975 | |
| ^ | Bed Bath & Beyond Inc. | 160,897 | | 1,960 | |
| * | Adient plc | 111,498 | | 1,933 | |
| | Monro Inc. | 41,825 | | 1,928 | |
Vanguard® Russell 2000 Index Fund
Schedule of Investments
August 31, 2020
| | Shares | | Market
Value
($000 | ) |
| * | Fitbit Inc. Class A | 302,155 | | 1,922 | |
| | Group 1 Automotive Inc. | 22,110 | | 1,911 | |
| * | Vivint Solar Inc. | 61,840 | | 1,910 | |
| | PriceSmart Inc. | 28,848 | | 1,897 | |
| | Core-Mark Holding Co. Inc. | 56,724 | | 1,896 | |
| | Rent-A-Center Inc. | 61,481 | | 1,887 | |
| * | K12 Inc. | 50,549 | | 1,881 | |
| * | American Woodmark Corp. | 21,488 | | 1,880 | |
| * | Gentherm Inc. | 41,448 | | 1,875 | |
| | La-Z-Boy Inc. | 56,588 | | 1,839 | |
| * | Central Garden & Pet Co. Class A | 49,295 | | 1,832 | |
| * | Gray Television Inc. | 113,355 | | 1,759 | |
| *,^ | Stitch Fix Inc. Class A | 71,328 | | 1,723 | |
| * | Laureate Education Inc. Class A | 136,192 | | 1,705 | |
| | ODP Corp. | 71,694 | | 1,676 | |
| * | Sleep Number Corp. | 34,370 | | 1,650 | |
| * | Sally Beauty Holdings Inc. | 143,118 | | 1,597 | |
| | Bloomin' Brands Inc. | 111,034 | | 1,592 | |
| | Cheesecake Factory Inc. | 53,741 | | 1,587 | |
| | Acushnet Holdings Corp. | 43,491 | | 1,535 | |
| | Sturm Ruger & Co. Inc. | 21,404 | | 1,517 | |
| * | M/I Homes Inc. | 35,363 | | 1,505 | |
| * | Scientific Games Corp. | 72,497 | | 1,500 | |
| | Kontoor Brands Inc. | 65,322 | | 1,444 | |
| * | Vista Outdoor Inc. | 73,976 | | 1,436 | |
| * | Sonos Inc. | 100,791 | | 1,418 | |
| | Red Rock Resorts Inc. Class A | 82,663 | | 1,411 | |
| * | WW International Inc. | 59,915 | | 1,407 | |
| | International Game Technology plc | 125,199 | | 1,393 | |
| * | Liberty Latin America Ltd. Class C | 142,961 | | 1,364 | |
| | Sinclair Broadcast Group Inc. Class A | 65,447 | | 1,362 | |
| * | Malibu Boats Inc. Class A | 26,113 | | 1,354 | |
| * | Century Communities Inc. | 37,075 | | 1,323 | |
| * | SeaWorld Entertainment Inc. | 64,389 | | 1,314 | |
| | Sonic Automotive Inc. Class A | 30,299 | | 1,280 | |
| * | RealReal Inc. | 79,087 | | 1,270 | |
| * | Smith & Wesson Brands Inc. | 69,080 | | 1,261 | |
| * | Perdoceo Education Corp. | 87,721 | | 1,261 | |
| | Standard Motor Products Inc. | 26,746 | | 1,215 | |
| | Camping World Holdings Inc. Class A | 41,612 | | 1,209 | |
| * | AMC Networks Inc. Class A | 49,197 | | 1,195 | |
| | Dine Brands Global Inc. | 19,548 | | 1,164 | |
| * | At Home Group Inc. | 60,235 | | 1,151 | |
| | Signet Jewelers Ltd. | 65,549 | | 1,132 | |
| * | American Axle & Manufacturing Holdings Inc. | 142,638 | | 1,110 | |
| * | Michaels Cos. Inc. | 93,545 | | 1,052 | |
| | Oxford Industries Inc. | 20,638 | | 1,022 | |
| | Tupperware Brands Corp. | 62,178 | | 1,013 | |
| * | Boot Barn Holdings Inc. | 35,861 | | 1,012 | |
| | Abercrombie & Fitch Co. | 77,369 | | 1,007 | |
| | Inter Parfums Inc. | 22,508 | | 1,005 | |
| ^ | Dave & Buster's Entertainment Inc. | 58,400 | | 971 | |
| * | IMAX Corp. | 62,149 | | 955 | |
| * | Quotient Technology Inc. | 107,937 | | 940 | |
| * | 1-800-Flowers.com Inc. Class A | 31,244 | | 935 | |
| * | Liberty Media Corp-Liberty Braves Class C | 46,125 | | 896 | |
| * | Rosetta Stone Inc. | 29,405 | | 893 | |
| * | Lumber Liquidators Holdings Inc. | 35,871 | | 861 | |
| * | Sportsman's Warehouse Holdings Inc. | 53,740 | | 843 | |
| | Matthews International Corp. Class A | 38,322 | | 839 | |
| | Scholastic Corp. | 37,026 | | 833 | |
| | EW Scripps Co. Class A | 70,416 | | 783 | |
| * | QuinStreet Inc. | 59,448 | | 782 | |
| * | Denny's Corp. | 68,095 | | 780 | |
Vanguard® Russell 2000 Index Fund
Schedule of Investments
August 31, 2020
| | Shares | | Market
Value
($000 | ) |
| * | America's Car-Mart Inc. | 7,679 | | 772 | |
| * | MarineMax Inc. | 25,912 | | 762 | |
| * | GoPro Inc. Class A | 162,448 | | 746 | |
| * | Cars.com Inc. | 84,821 | | 736 | |
| | BJ's Restaurants Inc. | 23,321 | | 735 | |
| * | Monarch Casino & Resort Inc. | 15,836 | | 729 | |
| | Meredith Corp. | 49,843 | | 698 | |
| * | Universal Electronics Inc. | 16,944 | | 696 | |
| * | iHeartMedia Inc. Class A | 75,337 | | 695 | |
| * | Hibbett Sports Inc. | 20,715 | | 691 | |
| * | Zumiez Inc. | 26,734 | | 687 | |
| | Buckle Inc. | 36,386 | | 682 | |
| * | Stoneridge Inc. | 32,683 | | 660 | |
| * | elf Beauty Inc. | 33,103 | | 647 | |
| | Guess? Inc. | 54,870 | | 631 | |
| * | Accel Entertainment Inc. | 53,116 | | 630 | |
| * | G-III Apparel Group Ltd. | 55,300 | | 612 | |
| | Franchise Group Inc. | 24,152 | | 593 | |
| * | SP Plus Corp. | 28,906 | | 593 | |
| | National Presto Industries Inc. | 6,407 | | 576 | |
| * | American Public Education Inc. | 18,161 | | 571 | |
| | Winmark Corp. | 3,690 | | 570 | |
| * | Liberty Latin America Ltd. Class A | 58,041 | | 569 | |
| | Johnson Outdoors Inc. Class A | 6,561 | | 562 | |
| | Interface Inc. Class A | 73,239 | | 554 | |
| | Twin River Worldwide Holdings Inc. | 23,124 | | 553 | |
| | Designer Brands Inc. Class A | 77,484 | | 546 | |
| | Viad Corp. | 25,350 | | 543 | |
| * | Central Garden & Pet Co. | 13,006 | | 529 | |
| * | XPEL Inc. | 21,030 | | 524 | |
| * | Tenneco Inc. Class A | 64,161 | | 522 | |
| | Collectors Universe Inc. | 11,531 | | 513 | |
| * | MasterCraft Boat Holdings Inc. | 23,285 | | 487 | |
| * | MSG Networks Inc. | 49,958 | | 487 | |
| *,^ | GameStop Corp. Class A | 71,860 | | 480 | |
| * | Central European Media Enterprises Ltd. Class A | 111,497 | | 462 | |
| | Carriage Services Inc. Class A | 20,746 | | 459 | |
| * | Chuy's Holdings Inc. | 20,531 | | 457 | |
| | Haverty Furniture Cos. Inc. | 21,143 | | 447 | |
| * | Nautilus Inc. | 37,332 | | 442 | |
| | Marcus Corp. | 28,038 | | 439 | |
| * | Beazer Homes USA Inc. | 35,873 | | 439 | |
| * | Green Brick Partners Inc. | 29,869 | | 425 | |
| | Ethan Allen Interiors Inc. | 29,181 | | 416 | |
| * | Motorcar Parts of America Inc. | 23,334 | | 406 | |
| * | El Pollo Loco Holdings Inc. | 22,473 | | 402 | |
| | OneSpaWorld Holdings Ltd. | 56,677 | | 393 | |
| * | Daily Journal Corp. | 1,423 | | 392 | |
| * | Cooper-Standard Holdings Inc. | 21,593 | | 391 | |
| | Shoe Carnival Inc. | 11,881 | | 391 | |
| * | Hudson Ltd. Class A | 50,205 | | 379 | |
| ^ | AMC Entertainment Holdings Inc. Class A | 64,216 | | 378 | |
| | Caleres Inc. | 48,234 | | 377 | |
| * | CarParts.com Inc. | 26,577 | | 373 | |
| | Hooker Furniture Corp. | 14,992 | | 370 | |
| * | Fossil Group Inc. | 56,748 | | 365 | |
| | Clarus Corp. | 28,991 | | 365 | |
| | Systemax Inc. | 16,021 | | 356 | |
| | Children's Place Inc. | 17,767 | | 355 | |
| * | Genesco Inc. | 17,772 | | 347 | |
| | Ruth's Hospitality Group Inc. | 33,301 | | 342 | |
| * | Purple Innovation Inc. Class A | 18,001 | | 340 | |
| * | Del Taco Restaurants Inc. | 38,954 | | 328 | |
| * | Lindblad Expeditions Holdings Inc. | 32,934 | | 326 | |
Vanguard® Russell 2000 Index Fund
Schedule of Investments
August 31, 2020
| | Shares | | Market
Value
($000 | ) |
| | Superior Group of Cos. Inc. | 13,855 | | 321 | |
| * | Houghton Mifflin Harcourt Co. | 134,734 | | 304 | |
| * | Carrols Restaurant Group Inc. | 45,331 | | 302 | |
| * | Aspen Group Inc. | 23,440 | | 300 | |
| * | Lovesac Co. | 11,283 | | 299 | |
| * | Noodles & Co. | 38,276 | | 291 | |
| | Gannett Co. Inc. | 167,866 | | 290 | |
| * | Conn's Inc. | 22,679 | | 290 | |
| *,^ | Eros International plc | 93,168 | | 290 | |
| | National CineMedia Inc. | 80,243 | | 290 | |
| ^ | Dillard's Inc. Class A | 9,475 | | 286 | |
| * | Golden Entertainment Inc | 21,915 | | 281 | |
| | Citi Trends Inc. | 14,057 | | 272 | |
| * | American Outdoor Brands Inc. | 17,270 | | 263 | |
| * | Liberty TripAdvisor Holdings Inc. Class A | 92,960 | | 260 | |
| * | Universal Technical Institute Inc. | 36,436 | | 257 | |
| * | Liberty Media Corp-Liberty Braves Class A | 12,883 | | 252 | |
| * | Liquidity Services Inc. | 34,868 | | 251 | |
| | Escalade Inc. | 13,321 | | 242 | |
| * | Boston Omaha Corp. Class A | 13,991 | | 228 | |
| * | Fiesta Restaurant Group Inc. | 22,582 | | 226 | |
| * | Regis Corp. | 30,404 | | 225 | |
| | Tribune Publishing Co. | 19,630 | | 223 | |
| | Movado Group Inc. | 20,195 | | 220 | |
| * | Century Casinos Inc. | 35,048 | | 216 | |
| | Entercom Communications Corp. Class A | 143,654 | | 215 | |
| | RCI Hospitality Holdings Inc. | 11,182 | | 214 | |
| | Rocky Brands Inc. | 8,813 | | 212 | |
| | Cato Corp. Class A | 26,265 | | 210 | |
| *,^ | Lakeland Industries Inc. | 9,654 | | 197 | |
| | Nathan's Famous Inc. | 3,737 | | 196 | |
| | Chico's FAS Inc. | 151,764 | | 194 | |
| * | Lands' End Inc. | 13,956 | | 187 | |
| | Tilly's Inc. Class A | 29,333 | | 186 | |
| | Hamilton Beach Brands Holding Co. Class A | 8,488 | | 185 | |
| * | Red Robin Gourmet Burgers Inc. | 16,529 | | 183 | |
| * | Hemisphere Media Group Inc. | 20,261 | | 180 | |
| * | Alta Equipment Group Inc. | 21,462 | | 179 | |
| * | OneWater Marine Inc. | 5,946 | | 170 | |
| * | Funko Inc. Class A | 29,009 | | 169 | |
| * | Biglari Holdings Inc. Class B | 1,694 | | 168 | |
| * | Fluent Inc. | 53,511 | | 166 | |
| * | Gaia Inc. | 14,168 | | 166 | |
| * | Hertz Global Holdings Inc. | 109,495 | | 160 | |
| * | Legacy Housing Corp. | 10,418 | | 159 | |
| * | VOXX International Corp. | 25,021 | | 157 | |
| | Lifetime Brands Inc. | 15,609 | | 153 | |
| * | A-Mark Precious Metals Inc. | 6,173 | | 148 | |
| * | Vera Bradley Inc. | 26,994 | | 142 | |
| | Weyco Group Inc. | 7,800 | | 140 | |
| * | Duluth Holdings Inc. | 14,199 | | 137 | |
| * | PlayAGS Inc. | 33,901 | | 136 | |
| | Marine Products Corp. | 9,190 | | 133 | |
| | Entravision Communications Corp. Class A | 79,447 | | 121 | |
| *,^ | Eastman Kodak Co. | 19,595 | | 117 | |
| | Saga Communications Inc. Class A | 4,941 | | 111 | |
| * | LiveXLive Media Inc. | 37,453 | | 101 | |
| * | Casper Sleep Inc. | 10,985 | | 100 | |
| * | Container Store Group Inc. | 21,883 | | 93 | |
| * | Express Inc. | 82,635 | | 92 | |
| | Emerald Holding Inc. | 32,813 | | 91 | |
| *,^ | Revlon Inc. Class A | 8,687 | | 64 | |
| * | Kura Sushi USA Inc. Class A | 4,464 | | 55 | |
| | Bluegreen Vacations Corp. | 7,248 | | 40 | |
Vanguard® Russell 2000 Index Fund
Schedule of Investments
August 31, 2020
| | Shares | | Market
Value
($000 | ) |
| * | Envela Corp. | 9,702 | | 38 | |
| | CompX International Inc. | 2,336 | | 32 | |
| | | 358,517 | |
| Consumer Staples (3.2%) | |
| * | Helen of Troy Ltd. | 32,018 | | 6,622 | |
| * | Darling Ingredients Inc. | 203,713 | | 6,513 | |
| * | Performance Food Group Co. | 165,954 | | 6,059 | |
| * | Freshpet Inc. | 49,047 | | 5,572 | |
| | Lancaster Colony Corp. | 23,983 | | 4,262 | |
| | WD-40 Co. | 17,261 | | 3,528 | |
| | Sanderson Farms Inc. | 25,496 | | 2,982 | |
| | Primo Water Corp. | 198,021 | | 2,709 | |
| * | Simply Good Foods Co. | 107,937 | | 2,682 | |
| | J&J Snack Foods Corp. | 18,967 | | 2,579 | |
| | B&G Foods Inc. | 80,839 | | 2,517 | |
| | Medifast Inc. | 14,318 | | 2,330 | |
| * | Hostess Brands Inc. Class A | 154,884 | | 1,989 | |
| * | Edgewell Personal Care Co. | 69,098 | | 1,984 | |
| | Vector Group Ltd. | 171,052 | | 1,722 | |
| | Coca-Cola Consolidated Inc. | 5,972 | | 1,632 | |
| * | Cal-Maine Foods Inc. | 40,143 | | 1,549 | |
| | Universal Corp. | 30,868 | | 1,340 | |
| | Calavo Growers Inc. | 20,838 | | 1,323 | |
| * | United Natural Foods Inc. | 67,694 | | 1,222 | |
| *,^ | National Beverage Corp. | 14,970 | | 1,217 | |
| * | USANA Health Sciences Inc. | 14,639 | | 1,148 | |
| * | BellRing Brands Inc. Class A | 50,478 | | 981 | |
| | Fresh Del Monte Produce Inc. | 39,441 | | 915 | |
| *,^ | Rite Aid Corp. | 69,414 | | 904 | |
| | SpartanNash Co. | 45,031 | | 900 | |
| | John B Sanfilippo & Son Inc. | 11,161 | | 889 | |
| | PetMed Express Inc. | 24,814 | | 863 | |
| * | Celsius Holdings Inc. | 43,143 | | 838 | |
| | Ingles Markets Inc. Class A | 17,907 | | 723 | |
| | Andersons Inc. | 39,116 | | 693 | |
| | Tootsie Roll Industries Inc. | 20,157 | | 645 | |
| | Weis Markets Inc. | 11,970 | | 589 | |
| * | GrowGeneration Corp. | 36,243 | | 578 | |
| | MGP Ingredients Inc. | 16,190 | | 576 | |
| * | Chefs' Warehouse Inc. | 30,889 | | 457 | |
| * | Seneca Foods Corp. Class A | 8,114 | | 384 | |
| | Turning Point Brands Inc. | 12,703 | | 367 | |
| *,^ | HF Foods Group Inc. | 44,666 | | 355 | |
| * | Landec Corp. | 33,365 | | 342 | |
| | Limoneira Co. | 20,820 | | 301 | |
| | Village Super Market Inc. Class A | 11,010 | | 280 | |
| * | Lifevantage Corp. | 16,939 | | 254 | |
| * | NewAge Inc. | 113,786 | | 247 | |
| | Oil-Dri Corp. of America | 6,656 | | 233 | |
| * | Craft Brew Alliance Inc. | 14,590 | | 228 | |
| | Alico Inc. | 6,673 | | 216 | |
| * | Veru Inc. | 62,434 | | 173 | |
| | Natural Grocers by Vitamin Cottage Inc. | 11,735 | | 137 | |
| * | Nature's Sunshine Products Inc. | 11,588 | | 128 | |
| * | Farmer Bros Co. | 20,169 | | 127 | |
| * | Calyxt Inc. | 12,368 | | 67 | |
| * | Greenlane Holdings Inc. Class A | 13,316 | | 41 | |
| * | Bridgford Foods Corp. | 2,296 | | 38 | |
| | | 77,950 | |
| Energy (2.7%) | |
| * | Sunrun Inc. | 147,108 | | 8,320 | |
| | Ovintiv Inc. | 331,833 | | 3,677 | |
| | Arcosa Inc. | 61,556 | | 2,849 | |
| * | CNX Resources Corp. | 235,264 | | 2,578 | |
| | | | | | |
Vanguard® Russell 2000 Index Fund
Schedule of Investments
August 31, 2020
| | Shares | | Market
Value
($000 | ) |
| * | ChampionX Corp. | 235,711 | | 2,414 | |
| | World Fuel Services Corp. | 79,208 | | 2,091 | |
| | Range Resources Corp. | 271,534 | | 2,026 | |
| * | PDC Energy Inc. | 126,678 | | 1,918 | |
| * | Southwestern Energy Co. | 689,230 | | 1,916 | |
| *,^ | Bloom Energy Corp. Class A | 106,990 | | 1,675 | |
| * | Renewable Energy Group Inc. | 48,462 | | 1,620 | |
| * | Dril-Quip Inc. | 44,444 | | 1,472 | |
| * | Matador Resources Co. | 139,831 | | 1,361 | |
| | Cactus Inc. | 60,638 | | 1,339 | |
| | Delek US Holdings Inc. | 79,382 | | 1,249 | |
| * | Golar LNG Ltd. | 114,366 | | 1,184 | |
| * | TPI Composites Inc. | 38,469 | | 1,181 | |
| * | SunPower Corp. | 96,144 | | 1,076 | |
| | Archrock Inc. | 163,301 | | 1,071 | |
| * | Ameresco Inc. Class A | 30,944 | | 1,056 | |
| | PBF Energy Inc. Class A | 121,660 | | 1,041 | |
| * | Magnolia Oil & Gas Corp. Class A | 157,637 | | 1,015 | |
| * | NOW Inc. | 138,911 | | 1,010 | |
| | Warrior Met Coal Inc. | 65,189 | | 1,008 | |
| * | Antero Resources Corp. | 305,807 | | 985 | |
| * | Transocean Ltd. | 741,521 | | 905 | |
| | Patterson-UTI Energy Inc. | 231,107 | | 890 | |
| *,^ | FuelCell Energy Inc. | 268,156 | | 762 | |
| | Kosmos Energy Ltd. | 507,839 | | 747 | |
| | Arch Coal Inc. Class A | 18,976 | | 715 | |
| * | Oceaneering International Inc. | 124,892 | | 673 | |
| | DMC Global Inc. | 18,313 | | 649 | |
| * | Helix Energy Solutions Group Inc. | 179,447 | | 642 | |
| * | ProPetro Holding Corp. | 100,784 | | 633 | |
| | CVR Energy Inc. | 37,198 | | 621 | |
| * | Green Plains Inc. | 42,970 | | 575 | |
| | Liberty Oilfield Services Inc. Class A | 79,351 | | 512 | |
| | NexTier Oilfield Solutions Inc. | 203,096 | | 512 | |
| * | Bonanza Creek Energy Inc. | 23,577 | | 472 | |
| | Brigham Minerals Inc. Class A | 38,908 | | 459 | |
| * | Frank's International NV | 195,088 | | 451 | |
| * | Par Pacific Holdings Inc. | 50,321 | | 437 | |
| * | REX American Resources Corp. | 7,068 | | 437 | |
| * | Clean Energy Fuels Corp. | 164,953 | | 435 | |
| | SunCoke Energy Inc. | 104,442 | | 374 | |
| * | Select Energy Services Inc. Class A | 75,892 | | 362 | |
| * | Tidewater Inc. | 52,493 | | 361 | |
| ^ | Nabors Industries Ltd. | 8,935 | | 357 | |
| | SM Energy Co. | 141,607 | | 344 | |
| | Berry Corp. | 87,016 | | 343 | |
| * | Oil States International Inc. | 75,959 | | 333 | |
| * | Matrix Service Co. | 32,632 | | 302 | |
| | Solaris Oilfield Infrastructure Inc. Class A | 36,459 | | 284 | |
| * | W&T Offshore Inc. | 122,525 | | 273 | |
| * | Maxeon Solar Technologies Ltd. | 12,018 | | 250 | |
| * | RPC Inc. | 73,767 | | 231 | |
| * | Newpark Resources Inc. | 112,865 | | 220 | |
| | Peabody Energy Corp. | 77,790 | | 203 | |
| * | Penn Virginia Corp. | 17,403 | | 199 | |
| * | National Energy Services Reunited Corp. | 26,042 | | 196 | |
| * | Contango Oil & Gas Co. | 112,962 | | 183 | |
| * | Trecora Resources | 29,495 | | 177 | |
| * | CONSOL Energy Inc. | 33,111 | | 171 | |
| *,^ | Tellurian Inc. | 183,632 | | 171 | |
| * | Bristow Group Inc. | 8,556 | | 162 | |
| * | Comstock Resources Inc. | 26,368 | | 152 | |
| * | Exterran Corp. | 32,805 | | 151 | |
| * | Gulfport Energy Corp. | 205,872 | | 145 | |
Vanguard® Russell 2000 Index Fund
Schedule of Investments
August 31, 2020
| | Shares | | Market
Value
($000 | ) |
| * | Montage Resources Corp. | 27,539 | | 142 | |
| | Falcon Minerals Corp. | 49,527 | | 139 | |
| * | Talos Energy Inc. | 13,804 | | 104 | |
| * | Goodrich Petroleum Corp. | 12,126 | | 100 | |
| | NACCO Industries Inc. Class A | 4,877 | | 100 | |
| | Evolution Petroleum Corp. | 36,340 | | 99 | |
| *,^ | Whiting Petroleum Corp. | 112,979 | | 90 | |
| * | Earthstone Energy Inc. Class A | 26,387 | | 77 | |
| | Adams Resources & Energy Inc. | 2,760 | | 59 | |
| * | PrimeEnergy Resources Corp. | 640 | | 43 | |
| * | NextDecade Corp. | 26,982 | | 36 | |
| * | Independence Contract Drilling Inc. | 361 | | 1 | |
| | | 65,593 | |
| Financial Services (22.4%) | |
| | EastGroup Properties Inc. | 48,902 | | 6,512 | |
| | STAG Industrial Inc. | 189,666 | | 6,126 | |
| * | Redfin Corp. | 121,534 | | 5,781 | |
| | Kinsale Capital Group Inc. | 26,363 | | 5,463 | |
| | QTS Realty Trust Inc. Class A | 76,036 | | 5,157 | |
| | Terreno Realty Corp. | 84,381 | | 5,032 | |
| | First Financial Bankshares Inc. | 163,436 | | 4,948 | |
| | South State Corp. | 88,655 | | 4,936 | |
| | Healthcare Realty Trust Inc. | 170,956 | | 4,932 | |
| | Essent Group Ltd. | 137,432 | | 4,906 | |
| | RLI Corp. | 50,124 | | 4,701 | |
| | Physicians Realty Trust | 257,022 | | 4,665 | |
| | Agree Realty Corp. | 67,354 | | 4,507 | |
| | Selective Insurance Group Inc. | 74,853 | | 4,477 | |
| | Stifel Financial Corp. | 84,339 | | 4,277 | |
| | Glacier Bancorp Inc. | 121,315 | | 4,256 | |
| | Blackstone Mortgage Trust Inc. Class A | 174,292 | | 4,143 | |
| | United Bankshares Inc. | 156,795 | | 4,099 | |
| * | Cannae Holdings Inc. | 107,219 | | 4,045 | |
| | Community Bank System Inc. | 65,013 | | 3,912 | |
| | Sabra Health Care REIT Inc. | 260,323 | | 3,861 | |
| | PotlatchDeltic Corp. | 83,030 | | 3,823 | |
| | Hannon Armstrong Sustainable Infrastructure Capital Inc. | 89,475 | | 3,799 | |
| | Valley National Bancorp | 504,361 | | 3,788 | |
| | Radian Group Inc. | 242,642 | | 3,746 | |
| | Lexington Realty Trust | 323,860 | | 3,682 | |
| | National Health Investors Inc. | 54,539 | | 3,395 | |
| * | Green Dot Corp. Class A | 64,451 | | 3,355 | |
| | Houlihan Lokey Inc. Class A | 55,988 | | 3,281 | |
| | PS Business Parks Inc. | 25,430 | | 3,209 | |
| | Home BancShares Inc. | 194,070 | | 3,146 | |
| | PennyMac Financial Services Inc. | 58,791 | | 3,099 | |
| | FirstCash Inc. | 51,476 | | 3,076 | |
| | CVB Financial Corp. | 163,727 | | 2,981 | |
| | UMB Financial Corp. | 55,260 | | 2,969 | |
| | CNO Financial Group Inc. | 181,571 | | 2,960 | |
| | National General Holdings Corp. | 86,449 | | 2,944 | |
| | Federated Hermes Inc. Class B | 122,436 | | 2,927 | |
| | Old National Bancorp | 207,933 | | 2,907 | |
| | American Equity Investment Life Holding Co. | 115,033 | | 2,750 | |
| * | Palomar Holdings Inc. | 24,439 | | 2,746 | |
| * | Enstar Group Ltd. | 15,248 | | 2,729 | |
| | BankUnited Inc. | 116,429 | | 2,722 | |
| | BancorpSouth Bank | 125,587 | | 2,710 | |
| | National Storage Affiliates Trust | 78,479 | | 2,693 | |
| | EVERTEC Inc. | 76,358 | | 2,674 | |
| * | PRA Group Inc. | 57,208 | | 2,670 | |
| | Artisan Partners Asset Management Inc. Class A | 68,745 | | 2,661 | |
| | Independent Bank Corp. | 41,646 | | 2,617 | |
| | Innovative Industrial Properties Inc. | 21,161 | | 2,605 | |
Vanguard® Russell 2000 Index Fund
Schedule of Investments
August 31, 2020
| | Shares | | Market
Value
($000 | ) |
| | Columbia Banking System Inc. | 91,049 | | 2,541 | |
| | CIT Group Inc. | 125,092 | | 2,461 | |
| | Piedmont Office Realty Trust Inc. Class A | 159,716 | | 2,445 | |
| | Ryman Hospitality Properties Inc. | 63,959 | | 2,441 | |
| | Pacific Premier Bancorp Inc. | 106,998 | | 2,417 | |
| | Uniti Group Inc. | 245,006 | | 2,406 | |
| | Cathay General Bancorp | 96,364 | | 2,379 | |
| * | Trupanion Inc. | 37,715 | | 2,366 | |
| | CareTrust REIT Inc. | 121,065 | | 2,345 | |
| | Simmons First National Corp. Class A | 137,187 | | 2,342 | |
| | Easterly Government Properties Inc. | 95,535 | | 2,311 | |
| | Atlantic Union Bankshares Corp. | 98,766 | | 2,297 | |
| | Washington REIT | 104,376 | | 2,290 | |
| | ServisFirst Bancshares Inc. | 61,865 | | 2,267 | |
| | Investors Bancorp Inc. | 292,561 | | 2,267 | |
| | Sunstone Hotel Investors Inc. | 272,056 | | 2,266 | |
| | Four Corners Property Trust Inc. | 89,195 | | 2,252 | |
| | Washington Federal Inc. | 95,594 | | 2,242 | |
| | Kennedy-Wilson Holdings Inc. | 154,746 | | 2,211 | |
| | Navient Corp. | 242,507 | | 2,204 | |
| | Hancock Whitney Corp. | 109,333 | | 2,188 | |
| | Independent Bank Group Inc. | 46,801 | | 2,176 | |
| | Chimera Investment Corp. | 242,780 | | 2,158 | |
| | PennyMac Mortgage Investment Trust | 125,519 | | 2,151 | |
| | International Bancshares Corp. | 67,725 | | 2,139 | |
| | Moelis & Co. Class A | 66,837 | | 2,133 | |
| * | Texas Capital Bancshares Inc. | 64,232 | | 2,080 | |
| | Pebblebrook Hotel Trust | 164,775 | | 2,079 | |
| | Ameris Bancorp | 84,121 | | 2,063 | |
| | Horace Mann Educators Corp. | 52,530 | | 2,052 | |
| | Hamilton Lane Inc. Class A | 27,904 | | 2,040 | |
| * | eHealth Inc. | 32,275 | | 2,037 | |
| | Westamerica BanCorp | 33,084 | | 2,013 | |
| | Global Net Lease Inc. | 114,262 | | 2,000 | |
| | Fulton Financial Corp. | 203,405 | | 1,989 | |
| | Essential Properties Realty Trust Inc. | 115,770 | | 1,965 | |
| | Walker & Dunlop Inc. | 35,856 | | 1,964 | |
| | RLJ Lodging Trust | 208,030 | | 1,964 | |
| * | Genworth Financial Inc. Class A | 639,826 | | 1,932 | |
| | Two Harbors Investment Corp. | 347,198 | | 1,892 | |
| | Hilltop Holdings Inc. | 91,430 | | 1,883 | |
| | Trustmark Corp. | 79,886 | | 1,876 | |
| | Cohen & Steers Inc. | 30,938 | | 1,872 | |
| | WSFS Financial Corp. | 63,651 | | 1,865 | |
| | James River Group Holdings Ltd. | 37,898 | | 1,846 | |
| | WesBanco Inc. | 82,676 | | 1,837 | |
| * | Axos Financial Inc. | 73,367 | | 1,818 | |
| * | Encore Capital Group Inc. | 39,514 | | 1,815 | |
| | First Midwest Bancorp Inc. | 144,393 | | 1,799 | |
| | LTC Properties Inc. | 49,281 | | 1,798 | |
| | United Community Banks Inc. | 99,063 | | 1,795 | |
| | Industrial Logistics Properties Trust | 82,371 | | 1,777 | |
| | First Interstate BancSystem Inc. Class A | 53,912 | | 1,768 | |
| | PJT Partners Inc. | 29,787 | | 1,763 | |
| * | Mr Cooper Group Inc. | 96,075 | | 1,761 | |
| | Apollo Commercial Real Estate Finance Inc. | 196,020 | | 1,752 | |
| | Renasant Corp. | 69,055 | | 1,752 | |
| | First Merchants Corp. | 68,402 | | 1,750 | |
| | Monmouth Real Estate Investment Corp. | 120,413 | | 1,747 | |
| | Retail Properties of America Inc. | 272,296 | | 1,718 | |
| | Columbia Property Trust Inc. | 145,073 | | 1,712 | |
| | Service Properties Trust | 207,994 | | 1,708 | |
| | First Financial Bancorp | 122,963 | | 1,687 | |
| | Goosehead Insurance Inc. Class A | 16,350 | | 1,680 | |
Vanguard® Russell 2000 Index Fund
Schedule of Investments
August 31, 2020
| | Shares | | Market
Value
($000 | ) |
| | Colony Capital Inc. | 615,697 | | 1,669 | |
| | GEO Group Inc. | 149,382 | | 1,667 | |
| | Piper Sandler Cos. | 22,092 | | 1,667 | |
| | Bank of NT Butterfield & Son Ltd. | 65,963 | | 1,662 | |
| | NBT Bancorp Inc. | 53,964 | | 1,644 | |
| | American Assets Trust Inc. | 63,775 | | 1,629 | |
| | Park National Corp. | 18,106 | | 1,628 | |
| * | Cushman & Wakefield plc | 140,156 | | 1,627 | |
| | AMERISAFE Inc. | 24,336 | | 1,624 | |
| | Retail Opportunity Investments Corp. | 144,845 | | 1,612 | |
| * | Realogy Holdings Corp. | 145,419 | | 1,611 | |
| | Broadmark Realty Capital Inc. | 162,822 | | 1,596 | |
| | Banner Corp. | 44,093 | | 1,593 | |
| | Capitol Federal Financial Inc. | 168,156 | | 1,571 | |
| | First BanCorp | 273,344 | | 1,566 | |
| | Urban Edge Properties | 147,192 | | 1,554 | |
| | MFA Financial Inc. | 572,584 | | 1,535 | |
| | Argo Group International Holdings Ltd. | 41,109 | | 1,527 | |
| | Heartland Financial USA Inc. | 44,098 | | 1,518 | |
| | Cadence BanCorp Class A | 159,530 | | 1,516 | |
| | Northwest Bancshares Inc. | 148,986 | | 1,506 | |
| | Towne Bank | 84,911 | | 1,505 | |
| * | Evo Payments Inc. Class A | 51,649 | | 1,484 | |
| | Arbor Realty Trust Inc. | 130,653 | | 1,479 | |
| | Nelnet Inc. Class A | 22,416 | | 1,468 | |
| | SITE Centers Corp. | 194,238 | | 1,459 | |
| | Mack-Cali Realty Corp. | 115,321 | | 1,456 | |
| * | NMI Holdings Inc. Class A | 84,575 | | 1,450 | |
| | Office Properties Income Trust | 60,722 | | 1,448 | |
| ^ | Macerich Co. | 179,885 | | 1,426 | |
| | Flagstar Bancorp Inc. | 45,398 | | 1,426 | |
| | CoreCivic Inc. | 151,961 | | 1,415 | |
| * | Focus Financial Partners Inc. Class A | 39,879 | | 1,411 | |
| | Independence Realty Trust Inc. | 120,484 | | 1,411 | |
| | Lakeland Financial Corp. | 30,828 | | 1,409 | |
| | Sandy Spring Bancorp Inc. | 58,553 | | 1,401 | |
| | Safety Insurance Group Inc. | 18,671 | | 1,352 | |
| | DiamondRock Hospitality Co. | 252,904 | | 1,340 | |
| * | eXp World Holdings Inc. | 30,007 | | 1,335 | |
| * | Seacoast Banking Corp. of Florida | 65,645 | | 1,329 | |
| | Virtus Investment Partners Inc. | 9,350 | | 1,327 | |
| | Xenia Hotels & Resorts Inc. | 143,490 | | 1,289 | |
| | Waddell & Reed Financial Inc. Class A | 81,676 | | 1,286 | |
| | City Holding Co. | 20,041 | | 1,282 | |
| | New York Mortgage Trust Inc. | 482,581 | | 1,274 | |
| | Stewart Information Services Corp. | 29,636 | | 1,265 | |
| | Hope Bancorp Inc. | 149,279 | | 1,263 | |
| | Getty Realty Corp. | 42,915 | | 1,257 | |
| | Community Healthcare Trust Inc. | 26,741 | | 1,249 | |
| | Employers Holdings Inc. | 37,872 | | 1,234 | |
| | Acadia Realty Trust | 107,790 | | 1,222 | |
| | Safehold Inc. | 21,911 | | 1,215 | |
| | Tompkins Financial Corp. | 18,235 | | 1,207 | |
| | Provident Financial Services Inc. | 91,160 | | 1,201 | |
| | Kite Realty Group Trust | 105,718 | | 1,188 | |
| * | Repay Holdings Corp. Class A | 46,435 | | 1,175 | |
| * | StoneX Group Inc. | 20,710 | | 1,174 | |
| | Eagle Bancorp Inc. | 40,691 | | 1,171 | |
| | iStar Inc. | 94,084 | | 1,165 | |
| | OceanFirst Financial Corp. | 73,245 | | 1,143 | |
| | First Busey Corp. | 64,119 | | 1,142 | |
| | Diversified Healthcare Trust | 300,376 | | 1,141 | |
| | NexPoint Residential Trust Inc. | 27,297 | | 1,130 | |
| | Stock Yards Bancorp Inc. | 26,038 | | 1,118 | |
Vanguard® Russell 2000 Index Fund
Schedule of Investments
August 31, 2020
| | Shares | | Market
Value
($000 | ) |
| | Southside Bancshares Inc. | 40,304 | | 1,111 | |
| | Alexander & Baldwin Inc. | 91,217 | | 1,105 | |
| | Veritex Holdings Inc. | 61,404 | | 1,104 | |
| | Investors Real Estate Trust | 15,434 | | 1,097 | |
| | Universal Health Realty Income Trust | 16,328 | | 1,089 | |
| | Brightsphere Investment Group Inc. | 78,592 | | 1,089 | |
| | National Bank Holdings Corp. Class A | 37,573 | | 1,069 | |
| | FB Financial Corp. | 39,527 | | 1,067 | |
| | BancFirst Corp. | 23,557 | | 1,037 | |
| | ProAssurance Corp. | 67,399 | | 1,033 | |
| | First Commonwealth Financial Corp. | 122,524 | | 1,005 | |
| | Redwood Trust Inc. | 144,782 | | 1,003 | |
| | Ladder Capital Corp. Class A | 134,003 | | 998 | |
| | S&T Bancorp Inc. | 49,216 | | 994 | |
| * | Cardtronics plc Class A | 45,623 | | 990 | |
| | Great Western Bancorp Inc. | 69,594 | | 969 | |
| | BGC Partners Inc. Class A | 384,108 | | 968 | |
| * | St. Joe Co. | 41,337 | | 959 | |
| | American Finance Trust Inc. | 138,512 | | 947 | |
| | Brookline Bancorp Inc. | 97,410 | | 935 | |
| | TriCo Bancshares | 33,726 | | 934 | |
| | Enterprise Financial Services Corp. | 30,186 | | 903 | |
| | Heritage Financial Corp. | 45,225 | | 902 | |
| | German American Bancorp Inc. | 31,418 | | 891 | |
| * | Third Point Reinsurance Ltd. | 102,734 | | 879 | |
| | Premier Financial Corp. | 46,525 | | 850 | |
| | Gladstone Commercial Corp. | 42,284 | | 829 | |
| * | Marcus & Millichap Inc. | 29,288 | | 826 | |
| | OFG Bancorp | 63,592 | | 817 | |
| | Meta Financial Group Inc. | 41,854 | | 807 | |
| | Newmark Group Inc. Class A | 181,530 | | 804 | |
| | HomeStreet Inc. | 29,082 | | 796 | |
| * | Triumph Bancorp Inc. | 27,625 | | 789 | |
| | Kearny Financial Corp. | 101,457 | | 787 | |
| | RE/MAX Holdings Inc. Class A | 22,394 | | 787 | |
| | ARMOUR Residential REIT Inc. | 80,676 | | 782 | |
| | Federal Agricultural Mortgage Corp. Class C | 11,415 | | 778 | |
| | Live Oak Bancshares Inc. | 35,037 | | 777 | |
| | Summit Hotel Properties Inc. | 129,936 | | 765 | |
| | First Foundation Inc. | 49,522 | | 752 | |
| | Capstead Mortgage Corp. | 120,149 | | 741 | |
| | First Bancorp | 36,008 | | 736 | |
| * | Ambac Financial Group Inc. | 57,055 | | 721 | |
| | Washington Trust Bancorp Inc. | 21,415 | | 715 | |
| | ConnectOne Bancorp Inc. | 47,083 | | 712 | |
| | Armada Hoffler Properties Inc. | 70,459 | | 712 | |
| | National Western Life Group Inc. Class A | 3,228 | | 710 | |
| * | MBIA Inc. | 87,481 | | 709 | |
| | TrustCo Bank Corp. NY | 119,012 | | 709 | |
| | 1st Source Corp. | 20,573 | | 709 | |
| * | Nicolet Bankshares Inc. | 11,712 | | 703 | |
| | Cass Information Systems Inc. | 17,864 | | 700 | |
| * | BRP Group Inc. Class A | 25,189 | | 693 | |
| | Alexander's Inc. | 2,700 | | 689 | |
| | WisdomTree Investments Inc. | 183,865 | | 688 | |
| | Meridian Bancorp Inc. | 58,736 | | 684 | |
| | Bryn Mawr Bank Corp. | 24,717 | | 671 | |
| | UMH Properties Inc. | 46,066 | | 670 | |
| | Global Medical REIT Inc. | 52,155 | | 667 | |
| | TPG RE Finance Trust Inc. | 75,610 | | 667 | |
| * | Columbia Financial Inc. | 62,474 | | 667 | |
| | United Fire Group Inc. | 26,376 | | 664 | |
| | Universal Insurance Holdings Inc. | 35,359 | | 656 | |
| | KKR Real Estate Finance Trust Inc. | 35,975 | | 655 | |
Vanguard® Russell 2000 Index Fund
Schedule of Investments
August 31, 2020
| | | Shares | | Market
Value
($000 | ) |
| | Origin Bancorp Inc. | 27,591 | | 653 | |
| | Ellington Financial Inc. | 52,409 | | 653 | |
| | B Riley Financial Inc. | 24,353 | | 652 | |
| | Lakeland Bancorp Inc. | 61,052 | | 649 | |
| ^ | Tanger Factory Outlet Centers Inc. | 113,830 | | 648 | |
| | Preferred Bank | 17,309 | | 647 | |
| | Colony Credit Real Estate Inc. | 107,153 | | 645 | |
| * | Enova International Inc. | 36,880 | | 630 | |
| ^ | Invesco Mortgage Capital Inc. | 209,949 | | 630 | |
| | Community Trust Bancorp Inc. | 19,460 | | 628 | |
| * | Bancorp Inc. | 65,328 | | 621 | |
| | Banc of California Inc. | 56,098 | | 617 | |
| | Front Yard Residential Corp. | 62,984 | | 614 | |
| | Boston Private Financial Holdings Inc. | 102,944 | | 611 | |
| | CatchMark Timber Trust Inc. Class A | 61,264 | | 608 | |
| | Cowen Inc. Class A | 33,587 | | 608 | |
| | Camden National Corp. | 18,506 | | 604 | |
| | RPT Realty | 103,005 | | 604 | |
| | Allegiance Bancshares Inc. | 23,743 | | 604 | |
| *,^ | Seritage Growth Properties Class A | 42,791 | | 600 | |
| | Horizon Bancorp Inc. | 53,649 | | 600 | |
| | Univest Financial Corp. | 36,101 | | 581 | |
| | First Financial Corp. | 16,864 | | 580 | |
| | Franklin Street Properties Corp. | 130,511 | | 578 | |
| | HarborOne Bancorp Inc. | 66,548 | | 576 | |
| * | World Acceptance Corp. | 6,229 | | 567 | |
| | First Bancshares Inc. | 26,063 | | 559 | |
| | QCR Holdings Inc. | 18,559 | | 556 | |
| * | CrossFirst Bankshares Inc. | 60,178 | | 555 | |
| | RMR Group Inc. Class A | 19,140 | | 540 | |
| | Northfield Bancorp Inc. | 55,584 | | 537 | |
| | Central Pacific Financial Corp. | 34,478 | | 534 | |
| | Great Southern Bancorp Inc. | 13,792 | | 532 | |
| | Bank of Marin Bancorp | 16,598 | | 528 | |
| * | I3 Verticals Inc. Class A | 18,565 | | 518 | |
| | Berkshire Hills Bancorp Inc. | 56,147 | | 515 | |
| | Heritage Commerce Corp. | 73,124 | | 507 | |
| | Bank First Corp. | 7,995 | | 499 | |
| | Peoples Bancorp Inc. | 23,533 | | 497 | |
| * | Assetmark Financial Holdings Inc. | 20,572 | | 497 | |
| | Diamond Hill Investment Group Inc. | 3,899 | | 483 | |
| | Jernigan Capital Inc. | 27,992 | | 483 | |
| * | TriState Capital Holdings Inc. | 34,605 | | 481 | |
| | First Mid Bancshares Inc. | 18,280 | | 476 | |
| | City Office REIT Inc. | 59,011 | | 474 | |
| | Banco Latinoamericano de Comercio Exterior SA | 38,885 | | 474 | |
| | Ready Capital Corp. | 46,053 | | 471 | |
| * | LendingClub Corp. | 87,556 | | 467 | |
| | Dime Community Bancshares Inc. | 35,983 | | 464 | |
| | Arrow Financial Corp. | 16,100 | | 461 | |
| * | Customers Bancorp Inc. | 35,972 | | 459 | |
| | Granite Point Mortgage Trust Inc. | 68,551 | | 455 | |
| | FBL Financial Group Inc. Class A | 12,185 | | 451 | |
| | New Senior Investment Group Inc. | 103,058 | | 451 | |
| | Cambridge Bancorp | 8,136 | | 446 | |
| | Waterstone Financial Inc. | 28,543 | | 442 | |
| | Dynex Capital Inc. | 27,865 | | 441 | |
| | First of Long Island Corp. | 28,556 | | 439 | |
| | Mercantile Bank Corp. | 19,796 | | 432 | |
| | Orchid Island Capital Inc. | 84,185 | | 430 | |
| | Bridge Bancorp Inc. | 21,278 | | 426 | |
| | Saul Centers Inc. | 14,973 | | 420 | |
| | First Community Bankshares Inc. | 21,701 | | 418 | |
| | HCI Group Inc. | 7,592 | | 415 | |
Vanguard® Russell 2000 Index Fund
Schedule of Investments
August 31, 2020
| | | Shares | | Market
Value
($000 | ) |
| | Chatham Lodging Trust | 59,552 | | 412 | |
| | Heritage Insurance Holdings Inc. | 31,533 | | 412 | |
| * | Donnelley Financial Solutions Inc. | 37,703 | | 411 | |
| | Altabancorp | 19,909 | | 411 | |
| | Flushing Financial Corp. | 33,825 | | 410 | |
| | Midland States Bancorp Inc. | 27,536 | | 402 | |
| | Preferred Apartment Communities Inc. Class A | 60,850 | | 402 | |
| | Independent Bank Corp. | 26,457 | | 394 | |
| | Byline Bancorp Inc. | 31,161 | | 394 | |
| | One Liberty Properties Inc. | 20,441 | | 392 | |
| | Bar Harbor Bankshares | 19,303 | | 391 | |
| | Peapack-Gladstone Financial Corp. | 22,932 | | 390 | |
| | Alerus Financial Corp. | 18,807 | | 387 | |
| | Ares Commercial Real Estate Corp. | 38,732 | | 386 | |
| | Gladstone Land Corp. | 24,417 | | 384 | |
| * | Tejon Ranch Co. | 26,267 | | 376 | |
| * | Amerant Bancorp Inc. | 28,452 | | 374 | |
| | Farmers National Banc Corp. | 32,036 | | 374 | |
| | Republic Bancorp Inc. Class A | 12,111 | | 373 | |
| * | Forestar Group Inc. | 20,694 | | 368 | |
| *,^ | Citizens Inc. Class A | 61,553 | | 360 | |
| | Hanmi Financial Corp. | 37,735 | | 360 | |
| | MidWestOne Financial Group Inc. | 18,385 | | 349 | |
| | CBTX Inc. | 22,138 | | 349 | |
| * | FRP Holdings Inc. | 8,463 | | 348 | |
| | Urstadt Biddle Properties Inc. Class A | 37,357 | | 347 | |
| | West BanCorp Inc. | 19,695 | | 347 | |
| | Financial Institutions Inc. | 20,069 | | 346 | |
| * | Watford Holdings Ltd. | 21,567 | | 345 | |
| * | GreenSky Inc. Class A | 78,181 | | 340 | |
| | State Auto Financial Corp. | 21,878 | | 338 | |
| | Capital City Bank Group Inc. | 16,617 | | 337 | |
| | Hingham Institution For Savings | 1,809 | | 332 | |
| | Whitestone REIT | 51,044 | | 328 | |
| * | EZCORP Inc. Class A | 60,814 | | 327 | |
| | Peoples Financial Services Corp. | 8,739 | | 318 | |
| | Sierra Bancorp | 17,282 | | 309 | |
| * | Oportun Financial Corp. | 24,470 | | 307 | |
| | CNB Financial Corp. | 19,175 | | 306 | |
| | Metrocity Bankshares Inc. | 22,121 | | 302 | |
| * | Atlantic Capital Bancshares Inc. | 26,047 | | 300 | |
| | American National Bankshares Inc. | 13,250 | | 299 | |
| | Citizens & Northern Corp. | 17,327 | | 297 | |
| | Oppenheimer Holdings Inc. Class A | 12,156 | | 297 | |
| * | Silvergate Capital Corp. Class A | 19,395 | | 290 | |
| * | Equity Bancshares Inc. Class A | 18,193 | | 289 | |
| | CorePoint Lodging Inc. | 50,859 | | 289 | |
| | Sculptor Capital Management Inc. Class A | 22,593 | | 289 | |
| | Old Second Bancorp Inc. | 35,159 | | 287 | |
| | HomeTrust Bancshares Inc. | 20,461 | | 287 | |
| * | International Money Express Inc. | 16,591 | | 281 | |
| | RBB Bancorp | 21,623 | | 280 | |
| | Reliant Bancorp Inc. | 19,280 | | 280 | |
| | Hersha Hospitality Trust Class A | 43,379 | | 279 | |
| * | Metropolitan Bank Holding Corp. | 8,958 | | 277 | |
| | First Bancorp Inc. | 13,014 | | 277 | |
| | Red River Bancshares Inc. | 6,314 | | 275 | |
| | Civista Bancshares Inc. | 20,455 | | 273 | |
| * | Greenlight Capital Re Ltd. Class A | 37,261 | | 271 | |
| | Farmers & Merchants Bancorp Inc. | 12,500 | | 269 | |
| | Retail Value Inc. | 20,827 | | 265 | |
| * | Bridgewater Bancshares Inc. | 27,029 | | 263 | |
| | Macatawa Bank Corp. | 34,661 | | 254 | |
| * | Paysign Inc. | 39,096 | | 252 | |
Vanguard® Russell 2000 Index Fund
Schedule of Investments
August 31, 2020
| | | Shares | | Market
Value
($000 | ) |
| | BBX Capital Corp. Class A | 16,123 | | 248 | |
| * | Dun & Bradstreet Holdings Inc. | 9,783 | | 248 | |
| | Enterprise Bancorp Inc. | 11,412 | | 248 | |
| | Plymouth Industrial REIT Inc. | 18,573 | | 248 | |
| | CTO Realty Growth Inc. | 5,869 | | 247 | |
| | Century Bancorp Inc. Class A | 3,490 | | 246 | |
| | SmartFinancial Inc. | 17,830 | | 246 | |
| | First Capital Inc. | 4,019 | | 245 | |
| | ChoiceOne Financial Services Inc. | 8,594 | | 245 | |
| | Home Bancorp Inc. | 10,087 | | 244 | |
| * | Southern First Bancshares Inc. | 9,396 | | 243 | |
| | Great Ajax Corp. | 26,426 | | 241 | |
| | Southern Missouri Bancorp Inc. | 9,930 | | 235 | |
| | PCSB Financial Corp. | 18,445 | | 234 | |
| | Guaranty Bancshares Inc. | 8,725 | | 231 | |
| | Merchants Bancorp | 11,251 | | 229 | |
| * | MoneyGram International Inc. | 78,373 | | 229 | |
| | LCNB Corp. | 15,351 | | 225 | |
| | ACNB Corp. | 10,670 | | 224 | |
| | Anworth Mortgage Asset Corp. | 129,531 | | 224 | |
| | Ames National Corp. | 11,232 | | 224 | |
| | Fidelity D&D Bancorp Inc. | 4,948 | | 224 | |
| | Investors Title Co. | 1,635 | | 222 | |
| | Farmland Partners Inc. | 32,780 | | 219 | |
| * | Spirit of Texas Bancshares Inc. | 17,434 | | 218 | |
| | Territorial Bancorp Inc. | 10,282 | | 218 | |
| | Luther Burbank Corp. | 23,259 | | 216 | |
| | Southern National Bancorp of Virginia Inc. | 25,249 | | 216 | |
| | Business First Bancshares Inc. | 14,908 | | 216 | |
| | Northrim BanCorp Inc. | 7,999 | | 215 | |
| | Summit Financial Group Inc. | 14,566 | | 215 | |
| | Bluerock Residential Growth REIT Inc. | 28,716 | | 213 | |
| | Premier Financial Bancorp Inc. | 16,589 | | 213 | |
| | Carter Bank & Trust | 28,753 | | 204 | |
| | National Bankshares Inc. | 8,196 | | 204 | |
| | Independence Holding Co. | 5,801 | | 203 | |
| * | Rafael Holdings Inc. Class B | 11,526 | | 201 | |
| * | Regional Management Corp. | 10,883 | | 199 | |
| | FS Bancorp Inc. | 4,970 | | 197 | |
| | Greenhill & Co. Inc. | 17,547 | | 197 | |
| | Capstar Financial Holdings Inc. | 19,310 | | 197 | |
| | United Insurance Holdings Corp. | 25,964 | | 197 | |
| | Donegal Group Inc. Class A | 13,608 | | 196 | |
| | South Plains Financial Inc. | 13,528 | | 193 | |
| | Cherry Hill Mortgage Investment Corp. | 20,091 | | 192 | |
| * | NI Holdings Inc. | 11,697 | | 191 | |
| | Amalgamated Bank Class A | 16,176 | | 190 | |
| | First Choice Bancorp | 13,377 | | 189 | |
| | Norwood Financial Corp. | 7,612 | | 188 | |
| | Orrstown Financial Services Inc. | 13,411 | | 185 | |
| * | PICO Holdings Inc. | 20,760 | | 185 | |
| | Penns Woods Bancorp Inc. | 8,881 | | 184 | |
| | Curo Group Holdings Corp. | 23,671 | | 182 | |
| | MVB Financial Corp. | 12,726 | | 181 | |
| | First Internet Bancorp | 12,215 | | 178 | |
| | Mid Penn Bancorp Inc. | 9,108 | | 175 | |
| * | BayCom Corp. | 15,104 | | 175 | |
| | Richmond Mutual BanCorp Inc. | 15,433 | | 175 | |
| | Griffin Industrial Realty Inc. | 3,265 | | 174 | |
| | Northeast Bank | 9,286 | | 173 | |
| | Tiptree Inc. | 30,250 | | 171 | |
| | BRT Apartments Corp. | 12,733 | | 170 | |
| | Timberland Bancorp Inc. | 9,557 | | 167 | |
| | Investar Holding Corp. | 12,276 | | 167 | |
Vanguard® Russell 2000 Index Fund
Schedule of Investments
August 31, 202
| | | Shares | | Market
Value
($000 | ) |
| * | Howard Bancorp Inc. | 16,969 | | 166 | |
| | Protective Insurance Corp. Class B | 11,410 | | 164 | |
| | First Business Financial Services Inc. | 10,569 | | 164 | |
| | Parke Bancorp Inc. | 13,149 | | 162 | |
| * | Coastal Financial Corp. | 11,735 | | 161 | |
| | Safeguard Scientifics Inc. | 25,849 | | 161 | |
| | BCB Bancorp Inc. | 19,688 | | 160 | |
| * | Select Bancorp Inc. | 20,872 | | 160 | |
| | Central Valley Community Bancorp | 13,197 | | 159 | |
| | Western Asset Mortgage Capital Corp. | 69,242 | | 157 | |
| | Codorus Valley Bancorp Inc. | 12,120 | | 156 | |
| | PCB Bancorp | 16,278 | | 155 | |
| | Shore Bancshares Inc. | 15,892 | | 155 | |
| | CorEnergy Infrastructure Trust Inc. | 17,191 | | 154 | |
| * | FVCBankcorp Inc. | 14,500 | | 153 | |
| * | Stratus Properties Inc. | 7,590 | | 149 | |
| | ESSA Bancorp Inc. | 11,597 | | 148 | |
| | Community Financial Corp. | 6,636 | | 148 | |
| | Community Bankers Trust Corp. | 28,631 | | 147 | |
| | CIM Commercial Trust Corp. | 14,151 | | 146 | |
| | Western New England Bancorp Inc. | 28,452 | | 146 | |
| * | MMA Capital Holdings Inc. | 6,178 | | 145 | |
| | Crawford & Co. Class A | 20,950 | | 144 | |
| | HBT Financial Inc. | 12,119 | | 144 | |
| | Bank of Princeton | 7,370 | | 144 | |
| | First Bank | 22,015 | | 144 | |
| | Silvercrest Asset Management Group Inc. Class A | 11,410 | | 143 | |
| | Bank of Commerce Holdings | 19,451 | | 143 | |
| | 1st Constitution Bancorp | 11,744 | | 143 | |
| | Middlefield Banc Corp. | 7,507 | | 143 | |
| | C&F Financial Corp. | 4,423 | | 141 | |
| * | Esquire Financial Holdings Inc. | 8,484 | | 140 | |
| | Eagle Bancorp Montana Inc. | 7,912 | | 139 | |
| | Unity Bancorp Inc. | 10,481 | | 139 | |
| | Hawthorn Bancshares Inc. | 7,522 | | 138 | |
| | Chemung Financial Corp. | 4,782 | | 137 | |
| | Bankwell Financial Group Inc. | 8,510 | | 133 | |
| | FNCB Bancorp Inc. | 22,659 | | 133 | |
| | Franklin Financial Services Corp. | 5,514 | | 131 | |
| | Evans Bancorp Inc. | 5,749 | | 131 | |
| | Ellington Residential Mortgage REIT | 11,462 | | 130 | |
| | Clipper Realty Inc. | 19,420 | | 130 | |
| | First Northwest Bancorp | 11,665 | | 129 | |
| | FedNat Holding Co. | 15,240 | | 129 | |
| | Arlington Asset Investment Corp. Class A | 47,496 | | 129 | |
| | Citizens Holding Co. | 5,884 | | 126 | |
| | Ohio Valley Banc Corp. | 5,509 | | 126 | |
| * | California Bancorp Inc. | 9,514 | | 124 | |
| * | Alpine Income Property Trust Inc. | 8,524 | | 124 | |
| | SB Financial Group Inc. | 8,935 | | 124 | |
| * | Republic First Bancorp Inc. | 58,803 | | 123 | |
| | BankFinancial Corp. | 16,784 | | 122 | |
| | County Bancorp Inc. | 6,298 | | 122 | |
| * | MainStreet Bancshares Inc. | 9,477 | | 121 | |
| | Auburn National BanCorp Inc. | 2,943 | | 120 | |
| * | Pioneer Bancorp Inc. | 14,897 | | 120 | |
| | Oak Valley Bancorp | 8,833 | | 119 | |
| | Mackinac Financial Corp. | 11,820 | | 118 | |
| | Riverview Bancorp Inc. | 28,330 | | 117 | |
| | CB Financial Services Inc. | 6,210 | | 116 | |
| | Plumas Bancorp | 5,834 | | 115 | |
| | Westwood Holdings Group Inc. | 10,126 | | 115 | |
| | First Community Corp. | 8,992 | | 114 | |
| | Salisbury Bancorp Inc. | 3,190 | | 114 | |
Vanguard® Russell 2000 Index Fund
Schedule of Investments
August 31, 2020
| | | Shares | | Market
Value
($000 | ) |
| * | ProSight Global Inc. | 11,822 | | 112 | |
| | Colony Bankcorp Inc. | 10,134 | | 111 | |
| * | Capital Bancorp Inc. | 10,676 | | 111 | |
| | Pzena Investment Management Inc. Class A | 22,170 | | 110 | |
| | Level One Bancorp Inc. | 6,774 | | 109 | |
| | United Security Bancshares | 17,688 | | 108 | |
| * | First Western Financial Inc. | 7,859 | | 106 | |
| * | Maui Land & Pineapple Co. Inc. | 9,061 | | 106 | |
| | Peoples Bancorp of North Carolina Inc. | 6,035 | | 103 | |
| | First Savings Financial Group Inc. | 2,336 | | 102 | |
| | Prudential Bancorp Inc. | 10,065 | | 100 | |
| | Landmark Bancorp Inc. | 4,720 | | 99 | |
| | Meridian Corp. | 6,735 | | 99 | |
| | OP Bancorp | 15,953 | | 97 | |
| | First United Corp. | 8,437 | | 97 | |
| | Provident Financial Holdings Inc. | 7,791 | | 93 | |
| | Greene County Bancorp Inc. | 3,912 | | 92 | |
| | Associated Capital Group Inc. Class A | 2,373 | | 92 | |
| | Provident Bancorp Inc. | 11,517 | | 90 | |
| | Standard AVB Financial Corp. | 4,856 | | 90 | |
| | GAMCO Investors Inc. Class A | 6,816 | | 86 | |
| * | PDL Community Bancorp | 9,389 | | 76 | |
| * | Security National Financial Corp. Class A | 11,992 | | 76 | |
| | Marlin Business Services Corp. | 10,864 | | 73 | |
| * | Professional Holding Corp. Class A | 6,226 | | 72 | |
| * | Limestone Bancorp Inc. | 6,340 | | 68 | |
| * | Partners Bancorp | 12,395 | | 68 | |
| * | Altisource Portfolio Solutions SA | 5,601 | | 63 | |
| | Sterling Bancorp Inc. | 20,973 | | 62 | |
| | First Guaranty Bancshares Inc. | 4,537 | | 58 | |
| * | SWK Holdings Corp. | 4,450 | | 57 | |
| * | Atlanticus Holdings Corp. | 6,364 | | 54 | |
| * | Bogota Financial Corp. | 7,279 | | 51 | |
| * | Siebert Financial Corp. | 11,249 | | 43 | |
| | Value Line Inc. | 1,454 | | 38 | |
| * | Transcontinental Realty Investors Inc. | 1,616 | | 37 | |
| *,^ | Avalon GloboCare Corp. | 25,370 | | 36 | |
| | Oconee Federal Financial Corp. | 1,307 | | 34 | |
| * | GWG Holdings Inc. | 3,844 | | 34 | |
| | Bank7 Corp. | 3,142 | | 32 | |
| * | Priority Technology Holdings Inc. | 9,366 | | 18 | |
| * | Vericity Inc. | 2,341 | | 17 | |
| * | American Realty Investors Inc. | 590 | | 5 | |
| * | Morgan Group Holding Co. | 52 | | — | |
| | | 544,186 | |
| Health Care (19.5%) | |
| * | Novavax Inc. | 73,804 | | 8,144 | |
| * | LHC Group Inc. | 38,440 | | 8,012 | |
| * | Momenta Pharmaceuticals Inc. | 149,348 | | 7,791 | |
| * | iRhythm Technologies Inc. | 34,267 | | 7,545 | |
| * | Mirati Therapeutics Inc. | 46,577 | | 6,957 | |
| * | MyoKardia Inc. | 62,953 | | 6,890 | |
| * | Emergent BioSolutions Inc. | 56,543 | | 6,449 | |
| * | Ultragenyx Pharmaceutical Inc. | 71,863 | | 6,113 | |
| * | Nevro Corp. | 42,514 | | 5,847 | |
| * | Natera Inc. | 88,365 | | 5,630 | |
| * | HealthEquity Inc. | 94,177 | | 5,413 | |
| * | Arrowhead Pharmaceuticals Inc. | 127,121 | | 5,370 | |
| * | Blueprint Medicines Corp. | 68,729 | | 5,322 | |
| * | Invitae Corp. | 146,216 | | 5,112 | |
| * | NeoGenomics Inc. | 131,177 | | 5,109 | |
| * | Neogen Corp. | 66,790 | | 5,089 | |
| * | Halozyme Therapeutics Inc. | 172,107 | | 4,990 | |
| * | Arena Pharmaceuticals Inc. | 71,366 | | 4,983 | |
Vanguard® Russell 2000 Index Fund
Schedule of Investments
August 31, 2020
| | Shares | | Market
Value
($000 | ) |
| * | Wright Medical Group NV | 162,717 | | 4,919 | |
| * | FibroGen Inc. | 105,269 | | 4,719 | |
| * | Amicus Therapeutics Inc. | 322,155 | | 4,703 | |
| * | Medpace Holdings Inc. | 34,571 | | 4,487 | |
| * | Inspire Medical Systems Inc. | 33,209 | | 3,967 | |
| * | PTC Therapeutics Inc. | 78,330 | | 3,871 | |
| | Ensign Group Inc. | 64,853 | | 3,797 | |
| * | Biohaven Pharmaceutical Holding Co. Ltd. | 59,797 | | 3,791 | |
| * | Tenet Healthcare Corp. | 132,552 | | 3,735 | |
| * | Principia Biopharma Inc. | 37,322 | | 3,733 | |
| * | Insmed Inc. | 128,294 | | 3,617 | |
| * | Omnicell Inc. | 53,782 | | 3,586 | |
| * | NuVasive Inc. | 65,054 | | 3,391 | |
| * | Merit Medical Systems Inc. | 68,674 | | 3,372 | |
| * | Pacira BioSciences Inc. | 52,479 | | 3,281 | |
| * | AMN Healthcare Services Inc. | 59,163 | | 3,185 | |
| | Patterson Cos. Inc. | 107,585 | | 3,121 | |
| * | HMS Holdings Corp. | 111,565 | | 3,112 | |
| * | TG Therapeutics Inc. | 122,318 | | 3,034 | |
| * | ChemoCentryx Inc. | 56,359 | | 3,015 | |
| | CONMED Corp. | 34,471 | | 2,975 | |
| * | LivaNova plc | 61,945 | | 2,905 | |
| * | Fate Therapeutics Inc. | 79,335 | | 2,888 | |
| * | Integer Holdings Corp. | 41,481 | | 2,873 | |
| * | Allakos Inc. | 30,900 | | 2,768 | |
| * | Select Medical Holdings Corp. | 137,798 | | 2,766 | |
| * | Turning Point Therapeutics Inc. | 35,355 | | 2,764 | |
| * | Bridgebio Pharma Inc. | 92,183 | | 2,753 | |
| * | STAAR Surgical Co. | 57,113 | | 2,739 | |
| * | Twist Bioscience Corp. | 37,957 | | 2,654 | |
| * | Axsome Therapeutics Inc. | 35,074 | | 2,571 | |
| * | Glaukos Corp. | 53,589 | | 2,563 | |
| * | Denali Therapeutics Inc. | 79,843 | | 2,547 | |
| | Cantel Medical Corp. | 48,027 | | 2,520 | |
| * | Xencor Inc. | 70,414 | | 2,517 | |
| * | Editas Medicine Inc. | 70,467 | | 2,483 | |
| * | Silk Road Medical Inc. | 40,360 | | 2,461 | |
| * | Vir Biotechnology Inc. | 58,586 | | 2,372 | |
| * | Apellis Pharmaceuticals Inc. | 76,063 | | 2,345 | |
| * | Prestige Consumer Healthcare Inc. | 63,871 | | 2,327 | |
| * | Magellan Health Inc. | 29,666 | | 2,239 | |
| * | AtriCure Inc. | 49,470 | | 2,213 | |
| * | Allogene Therapeutics Inc. | 61,462 | | 2,191 | |
| *,^ | Inovio Pharmaceuticals Inc. | 182,151 | | 2,184 | |
| * | Shockwave Medical Inc. | 33,828 | | 2,149 | |
| * | Deciphera Pharmaceuticals Inc. | 47,405 | | 2,134 | |
| * | Revance Therapeutics Inc. | 72,080 | | 2,107 | |
| * | Veracyte Inc. | 63,133 | | 2,103 | |
| * | Ironwood Pharmaceuticals Inc. Class A | 202,674 | | 2,047 | |
| * | Aimmune Therapeutics Inc. | 59,290 | | 2,029 | |
| | Healthcare Services Group Inc. | 94,654 | | 1,969 | |
| * | R1 RCM Inc. | 135,581 | | 1,966 | |
| * | MEDNAX Inc. | 105,428 | | 1,959 | |
| * | Avanos Medical Inc. | 60,356 | | 1,956 | |
| * | NanoString Technologies Inc. | 48,000 | | 1,943 | |
| * | Kodiak Sciences Inc. | 36,623 | | 1,926 | |
| * | Ligand Pharmaceuticals Inc. | 18,322 | | 1,869 | |
| * | CareDx Inc. | 54,355 | | 1,856 | |
| * | Allscripts Healthcare Solutions Inc. | 205,611 | | 1,836 | |
| *,^ | Sorrento Therapeutics Inc. | 222,215 | | 1,780 | |
| * | MacroGenics Inc. | 60,834 | | 1,761 | |
| * | Akebia Therapeutics Inc. | 165,205 | | 1,720 | |
| * | Cytokinetics Inc. | 71,103 | | 1,704 | |
| * | BioTelemetry Inc. | 42,598 | | 1,686 | |
Vanguard® Russell 2000 Index Fund
Schedule of Investments
August 31, 2020
| | Shares | | Market
Value
($000 | ) |
| * | Kura Oncology Inc. | 67,576 | | 1,682 | |
| * | Zogenix Inc. | 70,557 | | 1,670 | |
| * | Intercept Pharmaceuticals Inc. | 32,943 | | 1,643 | |
| * | Addus HomeCare Corp. | 17,525 | | 1,641 | |
| * | Y-mAbs Therapeutics Inc. | 38,039 | | 1,637 | |
| * | Axonics Modulation Technologies Inc. | 38,601 | | 1,631 | |
| *,^ | OPKO Health Inc. | 503,436 | | 1,631 | |
| * | Sangamo Therapeutics Inc. | 146,364 | | 1,615 | |
| * | Heron Therapeutics Inc. | 111,311 | | 1,592 | |
| * | Corcept Therapeutics Inc. | 121,765 | | 1,546 | |
| * | Dicerna Pharmaceuticals Inc. | 82,512 | | 1,528 | |
| * | Karuna Therapeutics Inc. | 19,620 | | 1,499 | |
| * | Epizyme Inc. | 113,242 | | 1,472 | |
| * | Seres Therapeutics Inc. | 55,221 | | 1,463 | |
| | Luminex Corp. | 53,888 | | 1,438 | |
| * | Cardiovascular Systems Inc. | 43,860 | | 1,433 | |
| | US Physical Therapy Inc. | 16,117 | | 1,433 | |
| * | Providence Service Corp. | 15,378 | | 1,424 | |
| * | Coherus Biosciences Inc. | 73,601 | | 1,396 | |
| * | Supernus Pharmaceuticals Inc. | 61,881 | | 1,361 | |
| * | Evolent Health Inc. Class A | 94,873 | | 1,360 | |
| * | Karyopharm Therapeutics Inc. | 89,062 | | 1,355 | |
| * | REGENXBIO Inc. | 43,256 | | 1,320 | |
| * | Tabula Rasa HealthCare Inc. | 25,963 | | 1,314 | |
| * | Cerus Corp. | 205,708 | | 1,310 | |
| | Owens & Minor Inc. | 78,188 | | 1,296 | |
| * | Health Catalyst Inc. | 40,904 | | 1,275 | |
| * | Intra-Cellular Therapies Inc. | 69,832 | | 1,272 | |
| * | Rhythm Pharmaceuticals Inc. | 42,892 | | 1,266 | |
| * | Enanta Pharmaceuticals Inc. | 24,220 | | 1,264 | |
| * | Myriad Genetics Inc. | 90,346 | | 1,208 | |
| * | Pacific Biosciences of California Inc. | 182,827 | | 1,207 | |
| * | Pennant Group Inc. | 32,560 | | 1,206 | |
| * | Intellia Therapeutics Inc. | 55,804 | | 1,204 | |
| * | Madrigal Pharmaceuticals Inc. | 11,128 | | 1,198 | |
| * | SpringWorks Therapeutics Inc. | 26,884 | | 1,194 | |
| *,^ | Esperion Therapeutics Inc. | 32,885 | | 1,187 | |
| * | Phreesia Inc. | 36,267 | | 1,144 | |
| * | Lantheus Holdings Inc. | 84,468 | | 1,134 | |
| * | Adverum Biotechnologies Inc | 92,651 | | 1,130 | |
| | Atrion Corp. | 1,788 | | 1,130 | |
| * | GenMark Diagnostics Inc. | 85,834 | | 1,113 | |
| * | Mersana Therapeutics Inc. | 58,080 | | 1,113 | |
| * | Rocket Pharmaceuticals Inc. | 43,172 | | 1,104 | |
| * | Athenex Inc. | 93,519 | | 1,075 | |
| * | Theravance Biopharma Inc. | 58,461 | | 1,072 | |
| * | Retrophin Inc. | 52,596 | | 1,030 | |
| * | Kadmon Holdings Inc. | 205,548 | | 1,028 | |
| | National HealthCare Corp. | 15,919 | | 1,014 | |
| * | Arcus Biosciences Inc. | 41,780 | | 994 | |
| * | Atara Biotherapeutics Inc. | 72,878 | | 982 | |
| * | Arvinas Inc. | 37,069 | | 962 | |
| | National Research Corp. | 16,926 | | 948 | |
| * | Progyny Inc. | 33,135 | | 946 | |
| * | CryoLife Inc. | 46,754 | | 945 | |
| * | Innoviva Inc. | 80,634 | | 944 | |
| * | Codexis Inc. | 67,373 | | 930 | |
| * | OraSure Technologies Inc. | 79,093 | | 927 | |
| * | CorVel Corp. | 11,131 | | 924 | |
| * | Amphastar Pharmaceuticals Inc. | 45,168 | | 921 | |
| * | VBI Vaccines Inc. | 215,790 | | 919 | |
| * | PetIQ Inc. Class A | 26,127 | | 919 | |
| * | Hanger Inc. | 46,460 | | 918 | |
| * | NextGen Healthcare Inc. | 69,022 | | 915 | |
Vanguard® Russell 2000 Index Fund
Schedule of Investments
August 31, 2020
| | Shares | | Market
Value
($000 | ) |
| * | Heska Corp. | 8,742 | | 906 | |
| * | Translate Bio Inc. | 64,078 | | 903 | |
| * | Vericel Corp. | 56,520 | | 896 | |
| * | Tactile Systems Technology Inc. | 23,298 | | 895 | |
| * | Tivity Health Inc. | 54,430 | | 890 | |
| * | Cortexyme Inc. | 19,950 | | 877 | |
| * | Gossamer Bio Inc. | 62,304 | | 866 | |
| * | Endo International plc | 287,204 | | 864 | |
| * | Viela Bio Inc. | 25,360 | | 854 | |
| * | Assembly Biosciences Inc. | 38,991 | | 853 | |
| * | Quanterix Corp. | 23,812 | | 848 | |
| * | Intersect ENT Inc. | 41,602 | | 835 | |
| * | Collegium Pharmaceutical Inc. | 43,102 | | 822 | |
| * | Immunovant Inc. | 24,065 | | 817 | |
| * | Cara Therapeutics Inc. | 52,527 | | 814 | |
| * | BioCryst Pharmaceuticals Inc. | 195,754 | | 812 | |
| * | ImmunoGen Inc. | 218,141 | | 807 | |
| *,^ | Omeros Corp. | 66,513 | | 795 | |
| * | Arcturus Therapeutics Holdings Inc. | 16,423 | | 792 | |
| * | 1Life Healthcare Inc. | 27,047 | | 789 | |
| * | Natus Medical Inc. | 42,699 | | 775 | |
| * | RadNet Inc. | 53,708 | | 774 | |
| * | Corbus Pharmaceuticals Holdings Inc. | 83,250 | | 773 | |
| *,^ | ZIOPHARM Oncology Inc. | 272,203 | | 765 | |
| * | Alector Inc. | 58,796 | | 760 | |
| * | Meridian Bioscience Inc. | 53,624 | | 758 | |
| * | Agenus Inc. | 174,032 | | 758 | |
| * | OrthoPediatrics Corp. | 15,030 | | 758 | |
| * | Vapotherm Inc. | 24,294 | | 756 | |
| * | Surmodics Inc. | 16,623 | | 752 | |
| *,^ | Ontrak Inc. | 10,024 | | 731 | |
| * | Constellation Pharmaceuticals Inc. | 34,289 | | 722 | |
| * | Krystal Biotech Inc. | 15,022 | | 718 | |
| * | Orthofix Medical Inc. | 23,443 | | 711 | |
| * | Radius Health Inc. | 57,092 | | 707 | |
| * | Inogen Inc. | 23,365 | | 706 | |
| * | Fluidigm Corp. | 89,928 | | 706 | |
| * | SI-BONE Inc. | 31,886 | | 696 | |
| * | Provention Bio Inc. | 53,340 | | 696 | |
| * | Vanda Pharmaceuticals Inc. | 67,478 | | 694 | |
| * | Syros Pharmaceuticals Inc. | 52,169 | | 691 | |
| * | Frequency Therapeutics Inc. | 35,457 | | 686 | |
| * | Anika Therapeutics Inc. | 17,764 | | 681 | |
| * | Dynavax Technologies Corp. | 113,486 | | 679 | |
| | LeMaitre Vascular Inc. | 20,847 | | 673 | |
| * | Avrobio Inc. | 38,827 | | 672 | |
| * | HealthStream Inc. | 32,346 | | 670 | |
| * | G1 Therapeutics Inc. | 43,479 | | 667 | |
| * | Protagonist Therapeutics Inc. | 28,377 | | 636 | |
| * | Brookdale Senior Living Inc. | 230,600 | | 634 | |
| * | Relmada Therapeutics Inc. | 17,696 | | 631 | |
| * | Cue Biopharma Inc. | 34,860 | | 623 | |
| *,^ | UroGen Pharma Ltd. | 24,757 | | 621 | |
| * | Spectrum Pharmaceuticals Inc. | 146,786 | | 618 | |
| * | Castle Biosciences Inc. | 13,089 | | 599 | |
| * | Eidos Therapeutics Inc. | 13,730 | | 594 | |
| * | Avid Bioservices Inc. | 70,786 | | 594 | |
| * | Replimune Group Inc. | 21,630 | | 584 | |
| * | Antares Pharma Inc. | 206,354 | | 584 | |
| * | Cymabay Therapeutics Inc. | 87,988 | | 569 | |
| * | Personalis Inc. | 24,784 | | 566 | |
| * | Ocular Therapeutix Inc. | 64,406 | | 560 | |
| * | Community Health Systems Inc. | 107,082 | | 554 | |
| * | Syndax Pharmaceuticals Inc. | 33,849 | | 552 | |
Vanguard® Russell 2000 Index Fund
Schedule of Investments
August 31, 2020
| | Shares | | Market
Value
($000 | ) |
| * | Viking Therapeutics Inc. | 82,386 | | 551 | |
| * | NGM Biopharmaceuticals Inc. | 29,462 | | 549 | |
| | Phibro Animal Health Corp. Class A | 25,566 | | 549 | |
| * | Crinetics Pharmaceuticals Inc. | 34,023 | | 545 | |
| * | Eagle Pharmaceuticals Inc. | 13,695 | | 543 | |
| * | Pfenex Inc. | 43,305 | | 543 | |
| * | Bioxcel Therapeutics Inc. | 13,308 | | 542 | |
| *,^ | CEL-SCI Corp. | 41,835 | | 541 | |
| * | Axogen Inc. | 45,549 | | 541 | |
| * | Surgery Partners Inc. | 28,307 | | 540 | |
| * | Triple-S Management Corp. Class B | 28,903 | | 538 | |
| * | REVOLUTION Medicines Inc. | 18,660 | | 529 | |
| * | Ardelyx Inc. | 91,827 | | 527 | |
| * | Rigel Pharmaceuticals Inc. | 211,097 | | 526 | |
| * | Varex Imaging Corp. | 47,176 | | 523 | |
| * | Amneal Pharmaceuticals Inc. | 124,443 | | 511 | |
| * | Aerie Pharmaceuticals Inc. | 46,045 | | 507 | |
| * | BioSpecifics Technologies Corp. | 7,805 | | 503 | |
| *,^ | Precigen Inc. | 83,173 | | 503 | |
| * | Flexion Therapeutics Inc. | 43,030 | | 502 | |
| * | Prothena Corp. plc | 38,613 | | 500 | |
| * | Option Care Health Inc. | 42,819 | | 498 | |
| * | Phathom Pharmaceuticals Inc. | 13,493 | | 496 | |
| * | PDL BioPharma Inc. | 146,904 | | 492 | |
| * | Geron Corp. | 232,924 | | 478 | |
| * | Neoleukin Therapeutics Inc. | 37,405 | | 475 | |
| * | Athersys Inc. | 217,991 | | 475 | |
| * | Albireo Pharma Inc. | 17,037 | | 474 | |
| *,^ | Clovis Oncology Inc. | 90,903 | | 474 | |
| *,^ | Accelerate Diagnostics Inc. | 38,646 | | 471 | |
| * | SIGA Technologies Inc. | 67,693 | | 470 | |
| * | Viemed Healthcare Inc. | 43,260 | | 470 | |
| * | Keros Therapeutics Inc. | 8,773 | | 470 | |
| * | AnaptysBio Inc. | 26,876 | | 466 | |
| * | MannKind Corp. | 267,404 | | 465 | |
| * | Akero Therapeutics Inc. | 14,052 | | 458 | |
| * | Morphic Holding Inc. | 17,206 | | 456 | |
| * | Homology Medicines Inc. | 42,722 | | 454 | |
| | Computer Programs and Systems Inc. | 16,466 | | 451 | |
| * | Stoke Therapeutics Inc. | 15,318 | | 450 | |
| * | Zentalis Pharmaceuticals Inc. | 13,017 | | 448 | |
| * | Black Diamond Therapeutics Inc. | 15,437 | | 444 | |
| * | TransMedics Group Inc. | 24,849 | | 443 | |
| * | Kala Pharmaceuticals Inc. | 49,759 | | 443 | |
| * | SeaSpine Holdings Corp. | 32,921 | | 438 | |
| * | BioDelivery Sciences International Inc. | 111,732 | | 437 | |
| *,^ | TherapeuticsMD Inc. | 296,402 | | 433 | |
| * | Durect Corp. | 248,964 | | 432 | |
| * | AngioDynamics Inc. | 46,039 | | 431 | |
| * | Scholar Rock Holding Corp. | 28,538 | | 431 | |
| *,^ | BrainStorm Cell Therapeutics Inc. | 33,582 | | 423 | |
| * | Kiniksa Pharmaceuticals Ltd. Class A | 23,897 | | 422 | |
| * | TCR2 Therapeutics Inc. | 20,481 | | 414 | |
| * | CytomX Therapeutics Inc. | 56,708 | | 414 | |
| * | Applied Therapeutics Inc. | 16,771 | | 404 | |
| * | AMAG Pharmaceuticals Inc. | 38,751 | | 401 | |
| * | Catalyst Pharmaceuticals Inc. | 121,923 | | 400 | |
| * | Puma Biotechnology Inc. | 38,378 | | 395 | |
| * | Beam Therapeutics Inc. | 15,470 | | 388 | |
| * | Quotient Ltd. | 76,188 | | 386 | |
| * | ViewRay Inc. | 141,617 | | 385 | |
| * | Aeglea BioTherapeutics Inc. | 52,796 | | 384 | |
| * | IGM Biosciences Inc. | 8,928 | | 384 | |
| * | Voyager Therapeutics Inc. | 32,330 | | 381 | |
Vanguard® Russell 2000 Index Fund
Schedule of Investments
August 31, 2020
| | Shares | | Market
Value
($000 | ) |
| * | Atreca Inc. Class A | 26,745 | | 380 | |
| * | Tricida Inc. | 35,885 | | 379 | |
| * | Akcea Therapeutics Inc. | 20,664 | | 378 | |
| * | ANI Pharmaceuticals Inc. | 12,033 | | 377 | |
| * | OptimizeRx Corp. | 18,481 | | 373 | |
| * | CytoSorbents Corp. | 43,731 | | 369 | |
| * | RAPT Therapeutics Inc. | 13,806 | | 367 | |
| * | Fulgent Genetics Inc. | 12,170 | | 360 | |
| *,^ | Co-Diagnostics Inc. | 32,661 | | 356 | |
| * | Molecular Templates Inc. | 30,473 | | 354 | |
| * | MEI Pharma Inc. | 129,593 | | 353 | |
| | Utah Medical Products Inc. | 4,276 | | 351 | |
| * | Concert Pharmaceuticals Inc. | 36,004 | | 346 | |
| * | Cutera Inc. | 21,061 | | 345 | |
| * | XBiotech Inc. | 18,056 | | 342 | |
| * | Alphatec Holdings Inc. | 56,951 | | 341 | |
| * | Eiger BioPharmaceuticals Inc. | 30,133 | | 337 | |
| * | MeiraGTx Holdings plc | 25,781 | | 335 | |
| * | Calithera Biosciences Inc. | 82,677 | | 333 | |
| * | Vaxart Inc. | 56,076 | | 333 | |
| * | Precision BioSciences Inc. | 57,395 | | 324 | |
| * | WaVe Life Sciences Ltd. | 25,776 | | 323 | |
| * | Affimed NV | 91,476 | | 316 | |
| * | Zynex Inc. | 21,118 | | 313 | |
| * | Ovid therapeutics Inc. | 53,936 | | 310 | |
| * | Joint Corp. | 16,999 | | 304 | |
| * | Arcutis Biotherapeutics Inc. | 11,905 | | 298 | |
| * | Cellular Biomedicine Group Inc. | 15,937 | | 296 | |
| | Invacare Corp. | 43,422 | | 294 | |
| * | Fortress Biotech Inc. | 73,169 | | 289 | |
| * | Passage Bio Inc. | 17,105 | | 283 | |
| * | MediciNova Inc. | 53,930 | | 283 | |
| *,^ | Anavex Life Sciences Corp. | 65,225 | | 277 | |
| * | ORIC Pharmaceuticals Inc. | 10,965 | | 275 | |
| * | iCAD Inc. | 25,308 | | 274 | |
| * | Agile Therapeutics Inc. | 85,493 | | 274 | |
| * | Accuray Inc. | 116,006 | | 270 | |
| * | Repro-Med Systems Inc. | 30,691 | | 267 | |
| * | Satsuma Pharmaceuticals Inc. | 11,550 | | 266 | |
| * | Odonate Therapeutics Inc. | 16,418 | | 265 | |
| * | InfuSystem Holdings Inc. | 18,196 | | 265 | |
| * | Aduro Biotech Inc. | 85,305 | | 264 | |
| * | NantKwest Inc. | 36,209 | | 264 | |
| * | ChromaDex Corp. | 52,705 | | 261 | |
| *,^ | Verastem Inc. | 206,046 | | 260 | |
| * | IVERIC bio Inc. | 56,833 | | 255 | |
| * | Chiasma Inc. | 45,788 | | 251 | |
| * | Aprea Therapeutics Inc. | 9,151 | | 248 | |
| * | Apollo Medical Holdings Inc. | 12,691 | | 240 | |
| * | Misonix Inc. | 18,160 | | 240 | |
| * | Kindred Biosciences Inc. | 48,012 | | 238 | |
| * | Paratek Pharmaceuticals Inc. | 51,235 | | 236 | |
| *,^ | Xeris Pharmaceuticals Inc. | 48,111 | | 226 | |
| * | Prevail Therapeutics Inc. | 18,298 | | 224 | |
| * | Sientra Inc. | 58,361 | | 224 | |
| * | Selecta Biosciences Inc. | 85,421 | | 222 | |
| * | Rubius Therapeutics Inc. | 45,516 | | 219 | |
| * | KalVista Pharmaceuticals Inc. | 16,708 | | 219 | |
| * | Beyondspring Inc. | 17,044 | | 212 | |
| * | Sutro Biopharma Inc. | 21,068 | | 211 | |
| * | Marinus Pharmaceuticals Inc. | 108,123 | | 210 | |
| * | AdaptHealth Corp. Class A | 9,846 | | 209 | |
| * | Lannett Co. Inc. | 39,633 | | 208 | |
| * | Menlo Therapeutics Inc. | 133,953 | | 205 | |
Vanguard® Russell 2000 Index Fund
Schedule of Investments
August 31, 2020
| | Shares | | Market
Value
($000 | ) |
| * | Spero Therapeutics Inc. | 18,809 | | 204 | |
| * | FONAR Corp. | 7,905 | | 201 | |
| * | BioLife Solutions Inc. | 9,309 | | 198 | |
| *,^ | BioSig Technologies Inc. | 26,648 | | 197 | |
| * | Aquestive Therapeutics Inc. | 25,031 | | 197 | |
| * | Stereotaxis Inc. | 55,624 | | 196 | |
| * | Apyx Medical Corp. | 42,551 | | 195 | |
| * | Evofem Biosciences Inc. | 58,817 | | 195 | |
| * | Harrow Health Inc. | 28,113 | | 194 | |
| * | Dyadic International Inc. | 24,271 | | 193 | |
| *,^ | ADMA Biologics Inc. | 75,590 | | 193 | |
| * | Cyclerion Therapeutics Inc. | 27,817 | | 190 | |
| * | NextCure Inc. | 20,703 | | 186 | |
| * | Ideaya Biosciences Inc. | 15,153 | | 183 | |
| * | Harpoon Therapeutics Inc. | 13,288 | | 183 | |
| * | Optinose Inc. | 39,546 | | 180 | |
| * | Pieris Pharmaceuticals Inc. | 62,268 | | 178 | |
| * | Strongbridge Biopharma plc | 46,228 | | 178 | |
| * | Mirum Pharmaceuticals Inc. | 6,837 | | 177 | |
| * | Abeona Therapeutics Inc. | 75,492 | | 177 | |
| * | Chimerix Inc. | 62,263 | | 175 | |
| * | Neubase Therapeutics Inc. | 21,749 | | 175 | |
| *,^ | Pulse Biosciences Inc. | 17,523 | | 173 | |
| *,^ | Mallinckrodt plc | 108,550 | | 172 | |
| * | Cabaletta Bio Inc. | 16,225 | | 171 | |
| * | X4 Pharmaceuticals Inc. | 20,408 | | 171 | |
| * | Aspira Women's Health Inc. | 59,381 | | 170 | |
| * | GlycoMimetics Inc. | 44,659 | | 165 | |
| * | Surgalign Holdings Inc. | 72,838 | | 162 | |
| * | Harvard Bioscience Inc. | 47,533 | | 159 | |
| * | Kezar Life Sciences Inc. | 32,441 | | 158 | |
| * | CorMedix Inc. | 33,724 | | 158 | |
| * | Magenta Therapeutics Inc. | 21,271 | | 155 | |
| * | iRadimed Corp. | 7,259 | | 154 | |
| * | Applied Genetic Technologies Corp. | 29,411 | | 151 | |
| * | Catabasis Pharmaceuticals Inc. | 22,739 | | 150 | |
| * | Fennec Pharmaceuticals Inc. | 27,189 | | 149 | |
| * | Exicure Inc. | 74,660 | | 149 | |
| *,^ | XOMA Corp. | 7,647 | | 145 | |
| * | IMARA Inc. | 6,221 | | 145 | |
| * | Eton Pharmaceuticals Inc. | 18,440 | | 145 | |
| * | 89bio Inc. | 3,753 | | 144 | |
| * | Five Prime Therapeutics Inc. | 33,632 | | 144 | |
| * | Oyster Point Pharma Inc. | 6,307 | | 144 | |
| *,^ | Genprex Inc. | 35,932 | | 142 | |
| * | Verrica Pharmaceuticals Inc. | 15,268 | | 140 | |
| * | Hookipa Pharma Inc. | 15,615 | | 140 | |
| * | IntriCon Corp. | 11,054 | | 134 | |
| * | Cidara Therapeutics Inc. | 42,114 | | 134 | |
| * | Liquidia Technologies Inc. | 25,576 | | 131 | |
| * | AcelRx Pharmaceuticals Inc. | 104,093 | | 130 | |
| * | UNITY Biotechnology Inc. | 41,346 | | 130 | |
| * | Nymox Pharmaceutical Corp. | 50,238 | | 127 | |
| *,^ | iBio Inc. | 60,514 | | 126 | |
| * | Minerva Neurosciences Inc. | 39,498 | | 126 | |
| * | Gritstone Oncology Inc. | 37,366 | | 124 | |
| * | Five Star Senior Living Inc. | 23,705 | | 123 | |
| * | Enzo Biochem Inc. | 56,766 | | 121 | |
| * | Mustang Bio Inc. | 36,936 | | 121 | |
| * | Orgenesis Inc. | 22,766 | | 120 | |
| * | DermTech Inc. | 10,193 | | 120 | |
| *,^ | Galectin Therapeutics Inc. | 44,609 | | 118 | |
| * | Checkpoint Therapeutics Inc. | 53,807 | | 117 | |
| * | American Renal Associates Holdings Inc. | 17,135 | | 115 | |
Vanguard® Russell 2000 Index Fund
Schedule of Investments
August 31, 2020
| | Shares | | Market
Value
($000 | ) |
| * | Catalyst Biosciences Inc. | 22,003 | | 115 | |
| * | CASI Pharmaceuticals Inc. | 67,044 | | 115 | |
| * | Fulcrum Therapeutics Inc. | 15,704 | | 114 | |
| * | Rockwell Medical Inc. | 86,595 | | 113 | |
| *,^ | Evolus Inc. | 28,920 | | 112 | |
| * | Organogenesis Holdings Inc. Class A | 25,406 | | 109 | |
| * | Electromed Inc. | 8,771 | | 109 | |
| * | NantHealth Inc. | 33,935 | | 108 | |
| * | Retractable Technologies Inc. | 16,726 | | 106 | |
| * | Jounce Therapeutics Inc. | 21,299 | | 103 | |
| * | Eloxx Pharmaceuticals Inc. | 33,260 | | 103 | |
| * | Aptinyx Inc. | 30,938 | | 102 | |
| *,^ | Chembio Diagnostics Inc. | 24,536 | | 101 | |
| * | VolitionRX Ltd. | 29,567 | | 100 | |
| * | Tela Bio Inc. | 6,827 | | 97 | |
| * | LogicBio Therapeutics Inc. | 15,122 | | 95 | |
| * | Osmotica Pharmaceuticals plc | 15,720 | | 93 | |
| * | Exagen Inc. | 6,461 | | 93 | |
| * | La Jolla Pharmaceutical Co. | 22,180 | | 93 | |
| * | ContraFect Corp. | 16,964 | | 93 | |
| * | Avenue Therapeutics Inc. | 8,310 | | 92 | |
| * | Lexicon Pharmaceuticals Inc. | 52,508 | | 92 | |
| * | Cassava Sciences Inc. | 29,185 | | 92 | |
| * | Cerecor Inc. | 37,185 | | 91 | |
| * | Beyond Air Inc. | 16,465 | | 91 | |
| * | Soleno Therapeutics Inc. | 42,130 | | 90 | |
| * | PAVmed Inc. | 45,203 | | 89 | |
| * | Aravive Inc. | 15,315 | | 87 | |
| * | Galera Therapeutics Inc. | 10,995 | | 86 | |
| * | Savara Inc. | 58,374 | | 85 | |
| *,^ | Evelo Biosciences Inc. | 18,430 | | 82 | |
| * | AVEO Pharmaceuticals Inc. | 17,131 | | 82 | |
| * | Tyme Technologies Inc. | 79,540 | | 80 | |
| * | Solid Biosciences Inc. | 31,826 | | 76 | |
| * | Champions Oncology Inc. | 9,075 | | 75 | |
| * | Enochian Biosciences Inc. | 18,284 | | 75 | |
| *,^ | Kaleido Biosciences Inc. | 11,601 | | 73 | |
| * | Immunic Inc. | 4,328 | | 69 | |
| *,^ | PhaseBio Pharmaceuticals Inc. | 17,958 | | 69 | |
| * | Recro Pharma Inc. | 24,976 | | 69 | |
| * | Oncocyte Corp. | 54,356 | | 68 | |
| * | Venus Concept Inc. | 23,489 | | 67 | |
| * | Lyra Therapeutics Inc. | 5,137 | | 67 | |
| * | Milestone Scientific Inc. | 44,124 | | 66 | |
| *,^ | Marker Therapeutics Inc. | 35,885 | | 65 | |
| * | Axcella Health Inc. | 12,216 | | 61 | |
| * | Centogene NV | 5,123 | | 59 | |
| * | scPharmaceuticals Inc. | 6,750 | | 58 | |
| * | Protara Therapeutics Inc. | 2,541 | | 54 | |
| * | Soliton Inc. | 7,605 | | 52 | |
| * | Bellerophon Therapeutics Inc. | 4,331 | | 47 | |
| * | NeuroBo Pharmaceuticals Inc. | 5,384 | | 33 | |
| * | Nemaura Medical Inc. | 8,447 | | 32 | |
| *,^ | Aytu BioScience Inc. | 28,797 | | 31 | |
| * | Cohbar Inc. | 30,678 | | 29 | |
| §,* | Alder BioPharmaceuticals CVR Exp. 12/31/2024 | 32,046 | | 28 | |
| *,^ | vTv Therapeutics Inc. Class A | 12,190 | | 25 | |
| §,* | Synergy Pharmaceuticals LLC | 224,815 | | 1 | |
| *,^ | Pulse Biosciences Inc. Warrants Exp. 12/31/2049 | 406 | | 1 | |
| §,* | Alexion Pharmaceuticals, Inc. CVR Exp. 06/29/2024 | 1,953 | | 1 | |
| §,* | Oncternal Therapeutics Inc. CVR | 846 | | 1 | |
| | | 474,482 | |
| Materials & Processing (6.9%) | |
| * | TopBuild Corp. | 41,903 | | 6,445 | |
Vanguard® Russell 2000 Index Fund
Schedule of Investments
August 31, 2020
| | Shares | | Market
Value
($000 | ) |
| | Simpson Manufacturing Co. Inc. | 55,144 | | 5,423 | |
| | Louisiana-Pacific Corp. | 142,922 | | 4,708 | |
| | UFP Industries Inc. | 75,720 | | 4,494 | |
| * | Builders FirstSource Inc. | 146,670 | | 4,491 | |
| * | RBC Bearings Inc. | 31,189 | | 4,118 | |
| | Hecla Mining Co. | 661,728 | | 3,984 | |
| | Balchem Corp. | 40,736 | | 3,980 | |
| | Rexnord Corp. | 134,763 | | 3,903 | |
| | Advanced Drainage Systems Inc. | 62,606 | | 3,473 | |
| * | Alcoa Corp. | 237,405 | | 3,471 | |
| * | BMC Stock Holdings Inc. | 85,292 | | 3,405 | |
| | Cleveland-Cliffs Inc. | 500,730 | | 3,295 | |
| | Quaker Chemical Corp. | 16,833 | | 3,198 | |
| * | Novagold Resources Inc. | 300,810 | | 3,186 | |
| | HB Fuller Co. | 65,308 | | 3,146 | |
| | Commercial Metals Co. | 150,728 | | 3,146 | |
| | Stepan Co. | 27,269 | | 3,144 | |
| | Sensient Technologies Corp. | 53,727 | | 2,967 | |
| * | Ingevity Corp. | 52,676 | | 2,959 | |
| | AAON Inc. | 51,964 | | 2,958 | |
| | Avient Corp. | 115,886 | | 2,957 | |
| * | Masonite International Corp. | 30,901 | | 2,821 | |
| * | Arconic Corp. | 126,041 | | 2,804 | |
| * | Coeur Mining Inc. | 306,374 | | 2,592 | |
| * | Gibraltar Industries Inc. | 41,362 | | 2,583 | |
| * | Installed Building Products Inc. | 28,985 | | 2,516 | |
| | Compass Minerals International Inc. | 43,284 | | 2,464 | |
| * | Beacon Roofing Supply Inc. | 69,241 | | 2,347 | |
| | Innospec Inc. | 31,041 | | 2,318 | |
| | Comfort Systems USA Inc. | 45,537 | | 2,307 | |
| | Boise Cascade Co. | 49,617 | | 2,272 | |
| * | Summit Materials Inc. Class A | 149,350 | | 2,224 | |
| | Minerals Technologies Inc. | 43,210 | | 2,193 | |
| | United States Steel Corp. | 278,225 | | 2,179 | |
| | O-I Glass Inc. | 198,597 | | 2,161 | |
| | Mueller Water Products Inc. Class A | 198,644 | | 2,145 | |
| | Mueller Industries Inc. | 70,866 | | 2,105 | |
| | Domtar Corp. | 69,234 | | 1,975 | |
| | Worthington Industries Inc. | 47,081 | | 1,955 | |
| * | JELD-WEN Holding Inc. | 86,314 | | 1,817 | |
| * | GCP Applied Technologies Inc. | 62,223 | | 1,622 | |
| | Patrick Industries Inc. | 28,329 | | 1,592 | |
| * | Livent Corp. | 186,014 | | 1,577 | |
| | Materion Corp. | 25,753 | | 1,406 | |
| * | GMS Inc. | 52,970 | | 1,403 | |
| * | PGT Innovations Inc. | 73,903 | | 1,340 | |
| * | Ferro Corp. | 103,748 | | 1,294 | |
| | Kaiser Aluminum Corp. | 19,970 | | 1,284 | |
| | Carpenter Technology Corp. | 60,297 | | 1,268 | |
| | Trinseo SA | 48,547 | | 1,209 | |
| | Schweitzer-Mauduit International Inc. | 39,484 | | 1,198 | |
| | Greif Inc. Class A | 32,346 | | 1,192 | |
| | Tronox Holdings plc Class A | 112,450 | | 1,008 | |
| | Griffon Corp. | 46,280 | | 1,006 | |
| | Neenah Inc. | 21,392 | | 947 | |
| | Orion Engineered Carbons SA | 75,727 | | 920 | |
| | Chase Corp. | 9,263 | | 904 | |
| | P H Glatfelter Co. | 55,040 | | 825 | |
| | Quanex Building Products Corp. | 41,292 | | 694 | |
| | Myers Industries Inc. | 45,011 | | 689 | |
| * | Clearwater Paper Corp. | 20,206 | | 680 | |
| | Apogee Enterprises Inc. | 32,317 | | 676 | |
| | Schnitzer Steel Industries Inc. | 32,396 | | 639 | |
| * | Koppers Holdings Inc. | 26,119 | | 628 | |
Vanguard® Russell 2000 Index Fund
Schedule of Investments
August 31, 2020
| | Shares | | Market
Value
($000 | ) |
| * | Century Aluminum Co. | 63,272 | | 624 | |
| | Hawkins Inc. | 12,150 | | 610 | |
| | Verso Corp. | 44,078 | | 578 | |
| * | MRC Global Inc. | 98,719 | | 562 | |
| * | PQ Group Holdings Inc. | 48,176 | | 561 | |
| | Tredegar Corp. | 32,850 | | 556 | |
| * | Kraton Corp. | 39,196 | | 550 | |
| * | US Concrete Inc. | 20,065 | | 536 | |
| | American Vanguard Corp. | 36,226 | | 513 | |
| | Omega Flex Inc. | 3,643 | | 480 | |
| * | AdvanSix Inc. | 34,393 | | 438 | |
| * | Cornerstone Building Brands Inc. | 54,962 | | 438 | |
| | Insteel Industries Inc. | 23,315 | | 430 | |
| | US Silica Holdings Inc. | 94,691 | | 422 | |
| * | Foundation Building Materials Inc. | 25,627 | | 416 | |
| | FutureFuel Corp. | 32,376 | | 392 | |
| * | UFP Technologies Inc. | 8,805 | | 363 | |
| * | Northwest Pipe Co. | 12,299 | | 348 | |
| | Kronos Worldwide Inc. | 27,507 | | 344 | |
| * | Ranpak Holdings Corp. Class A | 36,473 | | 326 | |
| | Gold Resource Corp. | 81,226 | | 323 | |
| * | Forterra Inc. | 24,174 | | 320 | |
| | Greif Inc. Class B | 7,686 | | 315 | |
| | Caesarstone Ltd. | 27,671 | | 305 | |
| | Haynes International Inc. | 15,548 | | 291 | |
| *,^ | Amyris Inc. | 88,258 | | 289 | |
| * | Veritiv Corp. | 16,602 | | 289 | |
| * | Uranium Energy Corp. | 233,254 | | 268 | |
| *,^ | Energy Fuels Inc. | 146,647 | | 267 | |
| | Caledonia Mining Corp. plc | 14,051 | | 255 | |
| * | Rayonier Advanced Materials Inc. | 77,933 | | 246 | |
| | NN Inc. | 53,638 | | 244 | |
| | United States Lime & Minerals Inc. | 2,561 | | 236 | |
| | LSI Industries Inc. | 32,349 | | 222 | |
| * | Aspen Aerogels Inc. | 25,840 | | 220 | |
| * | TimkenSteel Corp. | 57,333 | | 216 | |
| * | Alpha Pro Tech Ltd. | 15,404 | | 216 | |
| * | Unifi Inc. | 17,127 | | 209 | |
| * | LB Foster Co. Class A | 13,232 | | 198 | |
| | Eastern Co. | 7,116 | | 156 | |
| | Olympic Steel Inc. | 11,810 | | 130 | |
| * | Concrete Pumping Holdings Inc. | 34,859 | | 127 | |
| | Intrepid Potash Inc. | 12,633 | | 118 | |
| * | Ryerson Holding Corp. | 20,401 | | 112 | |
| * | Marrone Bio Innovations Inc. | 88,128 | | 112 | |
| * | AgroFresh Solutions Inc. | 37,392 | | 93 | |
| | NL Industries Inc. | 10,524 | | 37 | |
| | Valhi Inc. | 593 | | 8 | |
| | | 167,939 | |
| Other (0.1%)1 | |
| * | ALX Oncology Holdings Inc. | 3,351 | | 136 | |
| * | Rackspace Technology Inc. | 5,732 | | 122 | |
| * | Acutus Medical Inc. | 3,028 | | 106 | |
| * | Kymera Therapeutics Inc. | 2,729 | | 87 | |
| * | Vroom Inc. | 1,050 | | 72 | |
| * | GoHealth Inc. Class A | 4,952 | | 69 | |
| * | IBEX Ltd. | 3,475 | | 56 | |
| * | Selectquote Inc. | 3,017 | | 55 | |
| * | Allovir Inc. | 1,638 | | 53 | |
| * | Annexon Inc. | 2,131 | | 53 | |
| * | iTeos Therapeutics Inc. | 1,669 | | 48 | |
| * | Lemonade Inc. | 822 | | 48 | |
| * | Oak Street Health Inc. | 1,058 | | 47 | |
| * | Generation Bio Co. | 1,462 | | 46 | |
Vanguard® Russell 2000 Index Fund
Schedule of Investments
August 31, 2020
| | Shares | | Market
Value
($000 | ) |
| * | Albertsons Cos. Inc. Class A | 3,140 | | 43 | |
| * | Pandion Therapeutics Inc. | 2,288 | | 42 | |
| * | Vaxcyte Inc. | 872 | | 40 | |
| * | Nurix Therapeutics Inc. | 1,673 | | 39 | |
| * | Accolade Inc. | 1,153 | | 39 | |
| * | Shift4 Payments Inc. Class A | 756 | | 38 | |
| * | Duck Creek Technologies Inc. | 803 | | 31 | |
| * | Trean Insurance Group Inc. | 1,990 | | 31 | |
| §,*,^ | Tobira Therapeutics CVR Exp. 12/31/2028 | 6,201 | | 28 | |
| * | Montrose Environmental Group Inc. | 924 | | 26 | |
| * | Vital Farms Inc. | 659 | | 26 | |
| * | Applied Molecular Transport Inc. | 998 | | 26 | |
| * | Jamf Holding Corp. | 654 | | 25 | |
| * | Vertex Inc. | 984 | | 25 | |
| * | Inari Medical Inc. | 303 | | 24 | |
| * | Checkmate Pharmaceuticals Inc. | 1,524 | | 24 | |
| * | BigCommerce Holdings Inc. | 199 | | 23 | |
| * | nCino Inc. | 207 | | 19 | |
| * | Progenity Inc. | 2,016 | | 19 | |
| * | Pliant Therapeutics Inc. | 717 | | 18 | |
| * | Avidity Biosciences Inc. | 584 | | 17 | |
| * | Akouos Inc. | 723 | | 16 | |
| * | Inhibrx Inc. | 908 | | 16 | |
| * | Poseida Therapeutics Inc. | 940 | | 9 | |
| * | Harmony Biosciences Holdings Inc. | 203 | | 7 | |
| * | Inozyme Pharma Inc. | 216 | | 7 | |
| * | Berkeley Lights Inc. | 67 | | 4 | |
| §,* | Media General Inc. CVR | 85,418 | | 3 | |
| * | Relay Therapeutics Inc. | 67 | | 3 | |
| §,* | NewStar Financial Inc. CVR | 18,788 | | 2 | |
| §,* | Lantheus Holdings CVR | 110,304 | | — | |
| §,* | Clinical Data CVR | 913 | | — | |
| §,* | Omthera Pharmeceuticals CVR | 2,012 | | — | |
| | | 1,668 | |
| Producer Durables (12.7%) | |
| | Tetra Tech Inc. | 68,253 | | 6,300 | |
| | MAXIMUS Inc. | 77,354 | | 5,999 | |
| * | Plug Power Inc. | 449,505 | | 5,835 | |
| | Exponent Inc. | 64,984 | | 5,228 | |
| | EMCOR Group Inc. | 68,789 | | 5,160 | |
| * | Proto Labs Inc. | 33,844 | | 4,975 | |
| * | ASGN Inc. | 64,433 | | 4,624 | |
| | KBR Inc. | 180,363 | | 4,507 | |
| * | Saia Inc. | 33,273 | | 4,465 | |
| | John Bean Technologies Corp. | 39,701 | | 4,070 | |
| | EnerSys | 53,831 | | 3,875 | |
| * | Aerojet Rocketdyne Holdings Inc. | 92,885 | | 3,843 | |
| | UniFirst Corp. | 19,091 | | 3,677 | |
| | Werner Enterprises Inc. | 77,116 | | 3,548 | |
| * | TriNet Group Inc. | 52,136 | | 3,537 | |
| | Franklin Electric Co. Inc. | 58,352 | | 3,464 | |
| * | MasTec Inc. | 71,893 | | 3,322 | |
| | Watts Water Technologies Inc. Class A | 34,625 | | 3,315 | |
| * | Casella Waste Systems Inc. Class A | 58,397 | | 3,279 | |
| | ABM Industries Inc. | 84,978 | | 3,241 | |
| | Altra Industrial Motion Corp. | 81,744 | | 3,192 | |
| | Insperity Inc. | 45,910 | | 3,093 | |
| | Brink's Co. | 63,718 | | 3,081 | |
| | Kennametal Inc. | 105,283 | | 3,055 | |
| * | Itron Inc. | 50,863 | | 3,030 | |
| * | Chart Industries Inc. | 45,776 | | 3,008 | |
| | Hillenbrand Inc. | 93,847 | | 2,976 | |
| | Applied Industrial Technologies Inc. | 49,051 | | 2,953 | |
| | GATX Corp. | 44,137 | | 2,952 | |
Vanguard® Russell 2000 Index Fund
Schedule of Investments
August 31, 2020
| Shares | | Market
Value
($000 | ) |
| * | WESCO International Inc. | 62,247 | | 2,916 | |
| | ESCO Technologies Inc. | 32,367 | | 2,910 | |
| | Brady Corp. Class A | 61,459 | | 2,882 | |
| * | Advanced Disposal Services Inc. | 93,124 | | 2,806 | |
| * | ExlService Holdings Inc. | 42,520 | | 2,708 | |
| * | Kratos Defense & Security Solutions Inc. | 134,177 | | 2,623 | |
| *,2 | API Group Corp. | 177,633 | | 2,512 | |
| | Federal Signal Corp. | 75,826 | | 2,436 | |
| * | Dycom Industries Inc. | 38,955 | | 2,396 | |
| * | CryoPort Inc. | 42,658 | | 2,367 | |
| | Barnes Group Inc. | 59,517 | | 2,357 | |
| * | SPX FLOW Inc. | 53,960 | | 2,346 | |
| | Triton International Ltd. | 64,694 | | 2,333 | |
| * | SPX Corp. | 54,510 | | 2,280 | |
| | Badger Meter Inc. | 36,958 | | 2,280 | |
| | Moog Inc. Class A | 37,713 | | 2,274 | |
| * | Hub Group Inc. Class A | 41,526 | | 2,236 | |
| | Matson Inc. | 54,237 | | 2,173 | |
| | Allegiant Travel Co. Class A | 16,563 | | 2,130 | |
| | Korn Ferry | 69,531 | | 2,121 | |
| | SkyWest Inc. | 62,429 | | 2,101 | |
| * | AeroVironment Inc. | 27,452 | | 2,097 | |
| * | Resideo Technologies Inc. | 156,948 | | 2,097 | |
| * | Cimpress plc | 22,549 | | 2,090 | |
| | Forward Air Corp. | 35,266 | | 2,080 | |
| | McGrath RentCorp | 30,591 | | 2,030 | |
| | Albany International Corp. Class A | 38,982 | | 2,023 | |
| * | Navistar International Corp. | 63,167 | | 2,020 | |
| | Otter Tail Corp. | 50,787 | | 1,973 | |
| * | Vicor Corp. | 22,526 | | 1,960 | |
| *,^ | Spirit Airlines Inc. | 109,616 | | 1,960 | |
| * | Air Transport Services Group Inc. | 74,536 | | 1,895 | |
| | Belden Inc. | 55,973 | | 1,885 | |
| | Cubic Corp. | 39,820 | | 1,875 | |
| * | Atlas Air Worldwide Holdings Inc. | 32,595 | | 1,838 | |
| * | Verra Mobility Corp. Class A | 169,586 | | 1,792 | |
| | Herman Miller Inc. | 74,751 | | 1,781 | |
| | HNI Corp. | 54,066 | | 1,722 | |
| | Fluor Corp. | 178,854 | | 1,703 | |
| * | OSI Systems Inc. | 21,434 | | 1,688 | |
| | Kadant Inc. | 14,474 | | 1,685 | |
| | Terex Corp. | 85,331 | | 1,670 | |
| * | Sykes Enterprises Inc. | 49,665 | | 1,644 | |
| | Rush Enterprises Inc. Class A | 33,737 | | 1,630 | |
| | Kaman Corp. | 35,075 | | 1,622 | |
| * | Atkore International Group Inc. | 60,098 | | 1,606 | |
| | ICF International Inc. | 23,112 | | 1,579 | |
| * | CBIZ Inc. | 64,728 | | 1,574 | |
| * | Vivint Smart Home Inc. | 88,452 | | 1,570 | |
| | Tennant Co. | 23,207 | | 1,543 | |
| | EnPro Industries Inc. | 26,226 | | 1,535 | |
| | Helios Technologies Inc. | 37,306 | | 1,534 | |
| | Deluxe Corp. | 53,126 | | 1,509 | |
| | Astec Industries Inc. | 28,432 | | 1,499 | |
| | US Ecology Inc. | 39,624 | | 1,471 | |
| *,^ | Workhorse Group Inc. | 79,782 | | 1,445 | |
| | Enerpac Tool Group Corp. Class A | 68,691 | | 1,429 | |
| | Covanta Holding Corp. | 150,630 | | 1,422 | |
| * | Harsco Corp. | 99,398 | | 1,407 | |
| | Alamo Group Inc. | 12,522 | | 1,389 | |
| * | TriMas Corp. | 54,779 | | 1,385 | |
| | Lindsay Corp. | 13,737 | | 1,373 | |
| | Marten Transport Ltd. | 75,230 | | 1,366 | |
| * | Allegheny Technologies Inc. | 161,015 | | 1,341 | |
| | | | | | |
Vanguard® Russell 2000 Index Fund
Schedule of Investments
August 31, 2020
| Shares | | Market
Value
($000 | ) |
| | Encore Wire Corp. | 25,830 | | 1,333 | |
| | TTEC Holdings Inc. | 23,055 | | 1,307 | |
| | CSW Industrials Inc. | 17,823 | | 1,288 | |
| * | FARO Technologies Inc. | 22,607 | | 1,277 | |
| | Mesa Laboratories Inc. | 5,138 | | 1,264 | |
| * | Herc Holdings Inc. | 30,578 | | 1,252 | |
| * | Huron Consulting Group Inc. | 28,798 | | 1,249 | |
| * | Welbilt Inc. | 165,357 | | 1,220 | |
| | Pitney Bowes Inc. | 217,737 | | 1,195 | |
| | Heartland Express Inc. | 57,672 | | 1,193 | |
| | Frontline Ltd. | 148,558 | | 1,183 | |
| | Primoris Services Corp. | 60,820 | | 1,159 | |
| | AZZ Inc. | 33,037 | | 1,147 | |
| | Steelcase Inc. Class A | 109,675 | | 1,146 | |
| | Raven Industries Inc. | 44,789 | | 1,113 | |
| | Granite Construction Inc. | 59,426 | | 1,105 | |
| | Greenbrier Cos. Inc. | 40,507 | | 1,101 | |
| | Douglas Dynamics Inc. | 28,600 | | 1,098 | |
| | ArcBest Corp. | 31,623 | | 1,070 | |
| | Columbus McKinnon Corp. | 29,109 | | 1,059 | |
| | SFL Corp. Ltd. | 118,932 | | 1,044 | |
| * | Echo Global Logistics Inc. | 32,877 | | 898 | |
| | Standex International Corp. | 15,437 | | 893 | |
| | Shyft Group Inc. | 42,844 | | 856 | |
| | Kforce Inc. | 24,780 | | 851 | |
| | AAR Corp. | 42,165 | | 851 | |
| | H&E Equipment Services Inc. | 40,264 | | 816 | |
| | Wabash National Corp. | 66,496 | | 812 | |
| | Knoll Inc. | 62,925 | | 810 | |
| | Kelly Services Inc. Class A | 42,266 | | 803 | |
| | Nordic American Tankers Ltd. | 182,971 | | 798 | |
| * | MYR Group Inc. | 20,470 | | 794 | |
| | Argan Inc. | 18,718 | | 792 | |
| * | Textainer Group Holdings Ltd. | 66,813 | | 784 | |
| | Hawaiian Holdings Inc. | 57,135 | | 768 | |
| * | SEACOR Holdings Inc. | 24,152 | | 763 | |
| | Scorpio Tankers Inc. | 64,309 | | 761 | |
| * | TrueBlue Inc. | 44,981 | | 761 | |
| * | Great Lakes Dredge & Dock Corp. | 80,589 | | 755 | |
| * | CIRCOR International Inc. | 25,439 | | 754 | |
| | ACCO Brands Corp. | 115,981 | | 752 | |
| | DHT Holdings Inc. | 140,073 | | 741 | |
| | Gorman-Rupp Co. | 22,100 | | 706 | |
| * | Conduent Inc. | 207,316 | | 701 | |
| * | NV5 Global Inc. | 13,339 | | 691 | |
| * | PAE Inc. | 74,437 | | 658 | |
| * | Tutor Perini Corp. | 51,264 | | 643 | |
| * | Vectrus Inc. | 14,420 | | 626 | |
| * | Aegion Corp. Class A | 38,090 | | 617 | |
| | MTS Systems Corp. | 24,266 | | 592 | |
| | Ennis Inc. | 32,181 | | 590 | |
| * | Thermon Group Holdings Inc. | 41,167 | | 542 | |
| | Barrett Business Services Inc. | 9,349 | | 538 | |
| | International Seaways Inc. | 31,078 | | 527 | |
| | Heidrick & Struggles International Inc. | 24,084 | | 521 | |
| | Luxfer Holdings plc | 36,268 | | 516 | |
| | Kimball International Inc. Class B | 45,239 | | 507 | |
| * | Ducommun Inc. | 13,548 | | 506 | |
| | Hyster-Yale Materials Handling Inc. | 12,435 | | 502 | |
| * | Sterling Construction Co. Inc. | 34,847 | | 493 | |
| * | Forrester Research Inc. | 13,708 | | 486 | |
| * | BrightView Holdings Inc. | 39,182 | | 481 | |
| | Triumph Group Inc. | 65,394 | | 473 | |
| | Resources Connection Inc. | 38,290 | | 471 | |
| | | | | | |
Vanguard® Russell 2000 Index Fund
Schedule of Investments
August 31, 2020
| Shares | | Market
Value
($000 | ) |
| * | CAI International Inc. | 20,332 | | 443 | |
| * | Construction Partners Inc. Class A | 23,676 | | 443 | |
| | Miller Industries Inc. | 13,938 | | 437 | |
| * | Modine Manufacturing Co. | 63,043 | | 427 | |
| * | Lydall Inc. | 21,843 | | 410 | |
| * | Energy Recovery Inc. | 47,602 | | 405 | |
| | CRA International Inc. | 9,457 | | 402 | |
| * | Manitowoc Co. Inc. | 42,573 | | 401 | |
| | Allied Motion Technologies Inc. | 9,371 | | 399 | |
| | Hackett Group Inc. | 31,099 | | 392 | |
| * | DXP Enterprises Inc. | 20,368 | | 392 | |
| * | Vishay Precision Group Inc. | 15,624 | | 389 | |
| * | Willdan Group Inc. | 13,338 | | 376 | |
| * | Napco Security Technologies Inc. | 14,784 | | 368 | |
| * | Dorian LPG Ltd. | 43,426 | | 367 | |
| * | Daseke Inc. | 58,579 | | 360 | |
| * | American Superconductor Corp. | 28,219 | | 354 | |
| * | CECO Environmental Corp. | 39,890 | | 338 | |
| * | Titan Machinery Inc. | 24,445 | | 330 | |
| | VSE Corp. | 11,228 | | 326 | |
| | Costamare Inc. | 62,194 | | 314 | |
| * | Franklin Covey Co. | 15,744 | | 311 | |
| | Powell Industries Inc. | 11,449 | | 309 | |
| * | IES Holdings Inc. | 10,436 | | 301 | |
| * | Covenant Transportation Group Inc. Class A | 16,322 | | 299 | |
| * | Cross Country Healthcare Inc. | 45,415 | | 290 | |
| * | Diamond S Shipping Inc. | 34,770 | | 285 | |
| * | Heritage-Crystal Clean Inc. | 18,652 | | 274 | |
| * | US Xpress Enterprises Inc. Class A | 28,496 | | 273 | |
| | REV Group Inc. | 35,057 | | 272 | |
| * | Astronics Corp. | 29,481 | | 267 | |
| * | Radiant Logistics Inc. | 50,444 | | 266 | |
| | Park Aerospace Corp. | 23,939 | | 266 | |
| | Rush Enterprises Inc. Class B | 6,032 | | 252 | |
| * | Transcat Inc. | 8,472 | | 249 | |
| * | Team Inc. | 38,810 | | 247 | |
| * | Luna Innovations Inc. | 36,520 | | 234 | |
| * | Acacia Research Corp. | 59,370 | | 225 | |
| * | Blue Bird Corp. | 19,502 | | 222 | |
| | Hurco Cos. Inc. | 7,795 | | 220 | |
| * | Orion Energy Systems Inc. | 33,725 | | 215 | |
| | Universal Logistics Holdings Inc. | 10,006 | | 215 | |
| | Preformed Line Products Co. | 3,902 | | 212 | |
| * | Lawson Products Inc. | 5,582 | | 200 | |
| * | Overseas Shipholding Group Inc. Class A | 86,831 | | 183 | |
| | Park-Ohio Holdings Corp. | 11,070 | | 175 | |
| *,^ | ExOne Co. | 14,176 | | 173 | |
| | Graham Corp. | 12,653 | | 166 | |
| * | GP Strategies Corp. | 17,178 | | 166 | |
| * | ServiceSource International Inc. | 109,370 | | 165 | |
| | Ardmore Shipping Corp. | 43,041 | | 159 | |
| * | Eagle Bulk Shipping Inc. | 58,391 | | 154 | |
| * | DHI Group Inc | 62,816 | | 153 | |
| * | Gencor Industries Inc. | 12,002 | | 151 | |
| | Quad/Graphics Inc. | 43,011 | | 150 | |
| * | PFSweb Inc. | 17,596 | | 149 | |
| *,^ | EVI Industries Inc. | 6,032 | | 148 | |
| | Genco Shipping & Trading Ltd. | 20,509 | | 146 | |
| * | Mesa Air Group Inc. | 38,049 | | 139 | |
| * | HC2 Holdings Inc. | 55,241 | | 138 | |
| * | Sharps Compliance Corp. | 17,957 | | 137 | |
| *,^ | Wrap Technologies Inc. | 14,382 | | 125 | |
| | BG Staffing Inc. | 12,168 | | 114 | |
| * | Mistras Group Inc. | 23,935 | | 114 | |
| | | | | | |
Vanguard® Russell 2000 Index Fund
Schedule of Investments
August 31, 2020
| Shares | | Market
Value
($000 | ) |
| * | StarTek Inc. | 22,092 | | 110 | |
| | Scorpio Bulkers Inc. | 6,938 | | 97 | |
| * | Information Services Group Inc. | 45,127 | | 93 | |
| * | Mastech Digital Inc. | 4,915 | | 91 | |
| * | General Finance Corp. | 13,989 | | 91 | |
| * | PAM Transportation Services Inc. | 2,357 | | 86 | |
| * | Willis Lease Finance Corp. | 3,757 | | 80 | |
| | Advanced Emissions Solutions Inc. | 20,670 | | 80 | |
| * | Safe Bulkers Inc. | 69,162 | | 77 | |
| * | Ultralife Corp. | 11,471 | | 73 | |
| * | Mayville Engineering Co. Inc. | 8,428 | | 72 | |
| * | Nesco Holdings Inc. | 16,686 | | 67 | |
| * | Target Hospitality Corp. | 38,525 | | 56 | |
| | Pangaea Logistics Solutions Ltd. | 12,729 | | 31 | |
| | Teekay Tankers Ltd. Class A | 466 | | 6 | |
| | | 309,623 | |
| Technology (13.3%) | |
| * | Q2 Holdings Inc. | 62,811 | | 6,111 | |
| * | Silicon Laboratories Inc. | 54,888 | | 5,621 | |
| | Cabot Microelectronics Corp. | 36,759 | | 5,598 | |
| * | II-VI Inc. | 125,773 | | 5,597 | |
| * | Envestnet Inc. | 67,229 | | 5,579 | |
| * | Blackline Inc. | 63,530 | | 5,551 | |
| * | Varonis Systems Inc. | 39,477 | | 4,877 | |
| * | Lattice Semiconductor Corp. | 170,231 | | 4,869 | |
| * | Semtech Corp. | 81,765 | | 4,795 | |
| | Brooks Automation Inc. | 91,977 | | 4,749 | |
| * | Novanta Inc. | 43,325 | | 4,643 | |
| * | LiveRamp Holdings Inc. | 83,020 | | 4,636 | |
| * | LivePerson Inc. | 77,137 | | 4,602 | |
| * | Qualys Inc. | 43,083 | | 4,573 | |
| * | Sailpoint Technologies Holdings Inc. | 111,621 | | 4,379 | |
| * | ACI Worldwide Inc. | 144,978 | | 4,259 | |
| | Power Integrations Inc. | 74,622 | | 4,177 | |
| * | Rapid7 Inc. | 63,875 | | 4,124 | |
| * | J2 Global Inc. | 58,660 | | 4,106 | |
| | Blackbaud Inc. | 62,556 | | 3,994 | |
| * | Viavi Solutions Inc. | 289,809 | | 3,865 | |
| * | Verint Systems Inc. | 81,190 | | 3,861 | |
| * | Bandwidth Inc. Class A | 24,288 | | 3,825 | |
| * | SVMK Inc. | 150,983 | | 3,758 | |
| * | Synaptics Inc. | 43,082 | | 3,676 | |
| * | Box Inc. | 186,802 | | 3,667 | |
| | Perspecta Inc. | 176,321 | | 3,662 | |
| * | Advanced Energy Industries Inc. | 48,101 | | 3,565 | |
| * | SPS Commerce Inc. | 44,490 | | 3,554 | |
| * | Mimecast Ltd. | 71,559 | | 3,524 | |
| * | Alarm.com Holdings Inc. | 57,326 | | 3,432 | |
| * | Cloudera Inc. | 259,321 | | 3,426 | |
| * | Appfolio Inc. | 20,232 | | 3,400 | |
| * | Acacia Communications Inc. | 49,087 | | 3,312 | |
| * | Tenable Holdings Inc. | 87,364 | | 3,288 | |
| * | Fabrinet | 46,467 | | 3,242 | |
| * | Workiva Inc. Class A | 48,703 | | 2,873 | |
| * | Covetrus Inc. | 124,439 | | 2,851 | |
| * | Plexus Corp. | 36,388 | | 2,768 | |
| * | Cornerstone OnDemand Inc. | 76,871 | | 2,711 | |
| | Vishay Intertechnology Inc. | 168,451 | | 2,693 | |
| * | Rogers Corp. | 23,623 | | 2,677 | |
| * | Cargurus Inc. | 109,493 | | 2,669 | |
| * | Insight Enterprises Inc. | 43,917 | | 2,626 | |
| * | Diodes Inc. | 53,637 | | 2,621 | |
| * | Bottomline Technologies DE Inc. | 54,874 | | 2,614 | |
| * | iRobot Corp. | 34,980 | | 2,590 | |
| | | | | | |
Vanguard® Russell 2000 Index Fund
Schedule of Investments
August 31, 2020
| Shares | | Market
Value
($000 | ) |
| | ManTech International Corp. Class A | 34,348 | | 2,571 | |
| *,^ | Appian Corp. Class A | 41,657 | | 2,551 | |
| * | Yext Inc. | 128,189 | | 2,546 | |
| * | Digital Turbine Inc. | 104,441 | | 2,526 | |
| * | FormFactor Inc. | 96,626 | | 2,525 | |
| * | Cerence Inc. | 46,556 | | 2,477 | |
| * | Sanmina Corp. | 85,032 | | 2,406 | |
| | InterDigital Inc. | 39,017 | | 2,386 | |
| * | Inovalon Holdings Inc. Class A | 93,539 | | 2,315 | |
| * | CommVault Systems Inc. | 52,980 | | 2,290 | |
| * | Altair Engineering Inc. Class A | 53,185 | | 2,235 | |
| * | Ambarella Inc. | 41,954 | | 2,211 | |
| | Progress Software Corp. | 56,867 | | 2,155 | |
| * | MACOM Technology Solutions Holdings Inc. | 59,649 | | 2,125 | |
| * | NetScout Systems Inc. | 89,744 | | 2,077 | |
| * | MaxLinear Inc. | 84,774 | | 2,064 | |
| * | Yelp Inc. Class A | 88,704 | | 2,051 | |
| * | PROS Holdings Inc. | 49,781 | | 1,941 | |
| * | Rambus Inc. | 143,802 | | 1,931 | |
| * | Onto Innovation Inc. | 60,143 | | 1,879 | |
| * | Avaya Holdings Corp. | 117,668 | | 1,826 | |
| * | Upwork Inc. | 117,711 | | 1,793 | |
| | NIC Inc. | 83,456 | | 1,784 | |
| * | Perficient Inc. | 41,355 | | 1,775 | |
| | Maxar Technologies Inc. | 76,424 | | 1,769 | |
| | CSG Systems International Inc. | 41,461 | | 1,765 | |
| | Xperi Holding Corp. | 136,042 | | 1,705 | |
| * | Model N Inc. | 43,286 | | 1,702 | |
| * | Knowles Corp. | 112,352 | | 1,692 | |
| * | Zuora Inc. Class A | 123,943 | | 1,684 | |
| * | Amkor Technology Inc. | 126,711 | | 1,545 | |
| * | Super Micro Computer Inc. | 56,335 | | 1,543 | |
| * | TTM Technologies Inc. | 126,975 | | 1,455 | |
| * | Virtusa Corp. | 36,460 | | 1,442 | |
| * | Infinera Corp. | 197,214 | | 1,438 | |
| * | MicroStrategy Inc. Class A | 9,867 | | 1,425 | |
| * | Domo Inc. | 32,350 | | 1,317 | |
| * | Glu Mobile Inc. | 164,464 | | 1,306 | |
| | Methode Electronics Inc. | 46,076 | | 1,304 | |
| * | ePlus Inc. | 16,912 | | 1,297 | |
| * | NETGEAR Inc. | 36,979 | | 1,233 | |
| * | Ultra Clean Holdings Inc. | 50,244 | | 1,232 | |
| | Shutterstock Inc. | 24,432 | | 1,229 | |
| * | Calix Inc. | 61,642 | | 1,199 | |
| * | TechTarget Inc. | 29,808 | | 1,183 | |
| * | CEVA Inc. | 27,570 | | 1,165 | |
| * | Upland Software Inc. | 28,969 | | 1,136 | |
| * | Schrodinger Inc. | 18,758 | | 1,134 | |
| * | Vocera Communications Inc. | 39,913 | | 1,117 | |
| * | Ping Identity Holding Corp. | 31,609 | | 1,090 | |
| | Sapiens International Corp. NV | 32,274 | | 1,082 | |
| * | nLight Inc. | 43,875 | | 1,025 | |
| *,^ | Inseego Corp. | 86,483 | | 993 | |
| * | Axcelis Technologies Inc. | 41,442 | | 979 | |
| * | Magnite Inc. | 131,385 | | 966 | |
| | Simulations Plus Inc. | 15,991 | | 953 | |
| * | Parsons Corp. | 28,477 | | 947 | |
| * | Groupon Inc. Class A | 28,884 | | 919 | |
| * | OneSpan Inc. | 42,296 | | 911 | |
| * | Unisys Corp. | 77,766 | | 907 | |
| | Benchmark Electronics Inc. | 45,847 | | 899 | |
| | Cohu Inc. | 51,677 | | 889 | |
| * | Eventbrite Inc. Class A | 79,944 | | 859 | |
| | CTS Corp. | 39,996 | | 836 | |
| | | | | | |
Vanguard® Russell 2000 Index Fund
Schedule of Investments
August 31, 2020
| | | Shares | | Market
Value
($000 | ) |
| * | Limelight Networks Inc. | 147,103 | | 834 | |
| * | 3D Systems Corp. | 146,930 | | 807 | |
| * | Photronics Inc. | 79,495 | | 797 | |
| * | Everi Holdings Inc. | 102,047 | | 792 | |
| * | MobileIron Inc. | 120,907 | | 789 | |
| * | ScanSource Inc. | 31,767 | | 784 | |
| | Ebix Inc. | 33,117 | | 764 | |
| * | PAR Technology Corp. | 20,219 | | 755 | |
| * | PDF Solutions Inc. | 36,366 | | 753 | |
| * | Tucows Inc. Class A | 11,754 | | 743 | |
| * | Diebold Nixdorf Inc. | 88,178 | | 735 | |
| * | Veeco Instruments Inc. | 61,157 | | 727 | |
| * | Blucora Inc. | 60,596 | | 723 | |
| * | Harmonic Inc. | 120,278 | | 710 | |
| * | Ichor Holdings Ltd. | 27,817 | | 700 | |
| | ADTRAN Inc. | 60,114 | | 667 | |
| * | A10 Networks Inc. | 77,538 | | 663 | |
| | QAD Inc. Class A | 14,512 | | 660 | |
| * | TrueCar Inc. | 136,397 | | 645 | |
| * | Extreme Networks Inc. | 146,413 | | 640 | |
| * | Mitek Systems Inc. | 50,280 | | 638 | |
| * | EverQuote Inc. Class A | 17,796 | | 632 | |
| | PC Connection Inc. | 13,864 | | 614 | |
| * | ChannelAdvisor Corp. | 34,709 | | 584 | |
| * | Agilysys Inc. | 22,823 | | 579 | |
| * | Arlo Technologies Inc. | 99,925 | | 573 | |
| * | Meet Group Inc. | 86,469 | | 545 | |
| * | Brightcove Inc. | 48,767 | | 542 | |
| * | Endurance International Group Holdings Inc. | 83,204 | | 542 | |
| | American Software Inc. Class A | 37,606 | | 532 | |
| | Plantronics Inc. | 42,129 | | 521 | |
| * | Impinj Inc. | 21,177 | | 518 | |
| | Comtech Telecommunications Corp. | 30,542 | | 507 | |
| * | Digi International Inc. | 36,023 | | 491 | |
| * | SMART Global Holdings Inc. | 17,952 | | 452 | |
| * | SiTime Corp. | 6,476 | | 427 | |
| * | Zix Corp. | 69,909 | | 424 | |
| * | Kimball Electronics Inc. | 30,204 | | 407 | |
| * | NeoPhotonics Corp. | 60,718 | | 404 | |
| | VirnetX Holding Corp. | 80,732 | | 401 | |
| * | DSP Group Inc. | 27,595 | | 396 | |
| * | Sprout Social Inc. Class A | 10,009 | | 388 | |
| * | Waitr Holdings Inc. | 95,478 | | 385 | |
| * | Benefitfocus Inc. | 36,427 | | 377 | |
| | Loral Space & Communications Inc. | 15,886 | | 374 | |
| * | Ribbon Communications Inc. | 86,761 | | 371 | |
| * | Ooma Inc. | 26,380 | | 360 | |
| * | eGain Corp. | 26,740 | | 358 | |
| * | Alpha & Omega Semiconductor Ltd. | 26,122 | | 354 | |
| * | CalAmp Corp. | 42,661 | | 348 | |
| * | Intelligent Systems Corp. | 9,082 | | 341 | |
| * | Turtle Beach Corp. | 16,972 | | 332 | |
| * | Avid Technology Inc. | 39,553 | | 320 | |
| | NVE Corp. | 5,992 | | 320 | |
| *,^ | Akoustis Technologies Inc. | 39,431 | | 313 | |
| * | ShotSpotter Inc. | 10,214 | | 306 | |
| * | Applied Optoelectronics Inc. | 24,899 | | 290 | |
| * | CyberOptics Corp. | 8,875 | | 284 | |
| * | AXT Inc. | 49,719 | | 280 | |
| * | Clearfield Inc. | 14,761 | | 260 | |
| * | Digimarc Corp. | 15,339 | | 245 | |
| *,^ | Veritone Inc. | 28,926 | | 239 | |
| * | Iteris Inc. | 52,035 | | 238 | |
| *,^ | Atomera Inc. | 18,077 | | 230 | |
Vanguard® Russell 2000 Index Fund
Schedule of Investments
August 31, 2020
| | Shares | | Market
Value
($000 | ) |
| * | Synchronoss Technologies Inc. | 51,699 | | 227 | |
| | Daktronics Inc. | 48,553 | | 215 | |
| * | Immersion Corp. | 22,321 | | 212 | |
| * | Genasys Inc. | 41,416 | | 207 | |
| * | Grid Dynamics Holdings Inc. | 27,319 | | 203 | |
| * | Quantum Corp. | 36,846 | | 201 | |
| * | Powerfleet Inc. | 34,474 | | 194 | |
| * | comScore Inc. | 73,442 | | 193 | |
| * | GAN Ltd. | 9,324 | | 192 | |
| * | KVH Industries Inc. | 20,680 | | 186 | |
| * | GTY Technology Holdings Inc. | 56,880 | | 186 | |
| * | Telenav Inc. | 40,354 | | 185 | |
| * | Casa Systems Inc. | 40,688 | | 185 | |
| * | Intevac Inc. | 29,181 | | 175 | |
| * | Red Violet Inc. | 8,169 | | 170 | |
| * | Resonant Inc. | 62,449 | | 167 | |
| * | Smith Micro Software Inc. | 42,109 | | 162 | |
| * | Majesco | 9,897 | | 158 | |
| * | DZS Inc. | 15,130 | | 158 | |
| | Bel Fuse Inc. Class B | 12,699 | | 153 | |
| | PCTEL Inc. | 22,197 | | 141 | |
| * | SecureWorks Corp. Class A | 10,819 | | 140 | |
| * | GSI Technology Inc. | 20,736 | | 132 | |
| * | Intellicheck Inc. | 20,049 | | 126 | |
| * | Rimini Street Inc. | 27,575 | | 121 | |
| * | Asure Software Inc. | 16,928 | | 114 | |
| * | Pixelworks Inc. | 47,893 | | 109 | |
| * | Cambium Networks Corp. | 7,304 | | 95 | |
| * | Research Frontiers Inc. | 33,423 | | 78 | |
| * | Park City Group Inc. | 15,480 | | 77 | |
| *,^ | Akerna Corp. | 11,292 | | 68 | |
| * | SeaChange International Inc. | 37,907 | | 51 | |
| | | | | 323,013 | |
| Utilities (4.2%) | | | | |
| | ONE Gas Inc. | 66,358 | | 4,918 | |
| | Black Hills Corp. | 79,587 | | 4,463 | |
| | Brookfield Renewable Corp. Class A | 86,897 | | 4,425 | |
| | Southwest Gas Holdings Inc. | 69,914 | | 4,396 | |
| | PNM Resources Inc. | 100,587 | | 4,394 | |
| | Portland General Electric Co. | 113,871 | | 4,344 | |
| * | Iridium Communications Inc. | 149,164 | | 4,178 | |
| | Spire Inc. | 63,545 | | 3,699 | |
| | New Jersey Resources Corp. | 120,789 | | 3,641 | |
| | Cogent Communications Holdings Inc. | 53,837 | | 3,621 | |
| | ALLETE Inc. | 66,027 | | 3,563 | |
| | American States Water Co. | 46,663 | | 3,550 | |
| | Shenandoah Telecommunications Co. | 61,109 | | 3,379 | |
| * | Vonage Holdings Corp. | 293,708 | | 3,363 | |
| | NorthWestern Corp. | 64,240 | | 3,317 | |
| | Avista Corp. | 85,209 | | 3,141 | |
| | Ormat Technologies Inc. | 50,663 | | 3,084 | |
| | MGE Energy Inc. | 44,279 | | 2,878 | |
| | California Water Service Group | 61,706 | | 2,798 | |
| | South Jersey Industries Inc. | 117,519 | | 2,603 | |
| | Clearway Energy Inc. | 98,622 | | 2,516 | |
| * | Evoqua Water Technologies Corp. | 108,732 | | 2,225 | |
| * | 8x8 Inc. | 128,824 | | 2,175 | |
| | SJW Group | 33,473 | | 2,093 | |
| | Brookfield Infrastructure Corp. Class A | 41,182 | | 2,056 | |
| | Northwest Natural Holding Co. | 38,611 | | 1,973 | |
| | Chesapeake Utilities Corp. | 20,470 | | 1,674 | |
| | Middlesex Water Co. | 21,672 | | 1,390 | |
| | Clearway Energy Inc. Class A | 46,680 | | 1,127 | |
| * | Sunnova Energy International Inc. | 40,674 | | 965 | |
Vanguard® Russell 2000 Index Fund
Schedule of Investments
August 31, 2020
| | Shares | | Market
Value
($000 | ) |
| * | Cincinnati Bell Inc. | 63,619 | | 958 | |
| | ATN International Inc. | 14,056 | | 815 | |
| | Unitil Corp. | 18,532 | | 782 | |
| | York Water Co. | 16,317 | | 744 | |
| * | Anterix Inc. | 16,746 | | 733 | |
| * | Boingo Wireless Inc. | 55,029 | | 715 | |
| * | Consolidated Communications Holdings Inc. | 91,089 | | 709 | |
| * | WideOpenWest Inc. | 65,765 | | 378 | |
| *,^ | Gogo Inc. | 73,007 | | 375 | |
| * | ORBCOMM Inc. | 91,614 | | 367 | |
| | Artesian Resources Corp. Class A | 9,977 | | 351 | |
| *,^ | Cadiz Inc. | 25,096 | | 263 | |
| | Spok Holdings Inc. | 23,356 | | 253 | |
| * | Pure Cycle Corp. | 25,082 | | 245 | |
| * | Atlantic Power Corp. | 113,890 | | 236 | |
| | RGC Resources Inc. | 9,740 | | 227 | |
| | Consolidated Water Co. Ltd. | 17,741 | | 213 | |
| *,^ | GTT Communications Inc. | 40,012 | | 199 | |
| | Global Water Resources Inc. | 16,550 | | 183 | |
| | Genie Energy Ltd. Class B | 17,437 | | 154 | |
| | Alaska Communications Systems Group Inc. | 65,288 | | 146 | |
| | Spark Energy Inc. Class A | 15,050 | | 138 | |
| * | IDT Corp. Class B | 18,344 | | 120 | |
| | | | | 101,253 | |
| Total Common Stocks (Cost $2,418,947) | | | 2,424,224 | |
| | Coupon | | | | | | |
| Temporary Cash Investments (1.7%) |
| Money Market Fund (1.7%) |
| 3,4 | Vanguard Market Liquidity Fund | | 0.147% | | | | 412,345 | | 41,235 | |
| | | | | Maturity
Date | | Face
Amount
($000 | ) | | |
| U.S. Government and Agency Obligations (0.0%) | | | | | | | | | |
| 5 | United States Treasury Bill | | 0.116% | | 9/29/20 | | 640,000 | | 640 | |
| Total Temporary Cash Investments (Cost $41,862) | | | | | | | | 41,875 | |
| Total Investments (101.4%) (Cost $2,460,809) | | | | | | | | 2,466,099 | |
| Other Assets and Liabilities—Net (-1.4%) | | | | | | | | (33,500 | ) |
| Net Assets (100%) | | | | | | | | 2,432,599 | |
| Cost is in $000. |
| § | Security value determined using significant unobservable inputs. |
| * | Non-income-producing security. |
| ^ | Includes partial security positions on loan to broker-dealers. The total value of securities on loan is $34,746,000. |
| 1 | “Other” represents securities that are not classified by the fund's benchmark index. |
| 2 | Security exempt from registration under Rule 144A of the Securities Act of 1933. Such securities may be sold in transactions exempt from registration, normally to qualified institutional buyers. At August 31, 2020, the value of this security represented 0.1% of net assets. |
| 3 | Affiliated money market fund available only to Vanguard funds and certain trusts and accounts managed by Vanguard. Rate shown is the 7-day yield. |
| 4 | Collateral of $38,189,000 was received for securities on loan, of which $35,553,000 is held in Vanguard Market Liquidity Fund and $2,636,000 is held in cash. |
| 5 | Securities with a value of $629,000 have been segregated as initial margin for open futures contracts. |
| | CVR—Contingent Value Rights. |
| | REIT—Real Estate Investment Trust. |
Vanguard® Russell 2000 Value Index Fund
Schedule of Investments
August 31, 2020
| | Shares | | Market
Value
($000 | ) |
| Common Stocks (99.8%) | |
| Consumer Discretionary (15.2%) | |
| * | Penn National Gaming Inc. | 28,122 | | 1,437 | |
| * | Meritage Homes Corp. | 14,750 | | 1,416 | |
| | Marriott Vacations Worldwide Corp. | 14,855 | | 1,406 | |
| | Aaron's Inc. | 24,727 | | 1,382 | |
| | Lithia Motors Inc. Class A | 4,757 | | 1,184 | |
| | TEGNA Inc. | 92,238 | | 1,155 | |
| | KB Home | 31,797 | | 1,137 | |
| * | Taylor Morrison Home Corp. Class A | 47,944 | | 1,128 | |
| * | Caesars Entertainment Inc. | 23,690 | | 1,085 | |
| | KAR Auction Services Inc. | 54,484 | | 945 | |
| | Goodyear Tire & Rubber Co. | 97,488 | | 935 | |
| | MDC Holdings Inc. | 21,449 | | 930 | |
| * | TRI Pointe Group Inc. | 54,647 | | 922 | |
| | Boyd Gaming Corp. | 34,232 | | 917 | |
| ^ | Macy's Inc. | 130,734 | | 911 | |
| | Dana Inc. | 60,984 | | 851 | |
| | Wolverine World Wide Inc. | 33,671 | | 841 | |
| | Callaway Golf Co. | 39,385 | | 822 | |
| | American Eagle Outfitters Inc. | 63,760 | | 804 | |
| | WillScot Mobile Mini Holdings Corp. Class A | 43,904 | | 786 | |
| | Cracker Barrel Old Country Store Inc. | 5,786 | | 774 | |
| | Cooper Tire & Rubber Co. | 21,239 | | 734 | |
| * | Adtalem Global Education Inc. | 21,945 | | 729 | |
| | Big Lots Inc. | 15,242 | | 719 | |
| | Jack in the Box Inc. | 8,480 | | 699 | |
| * | Urban Outfitters Inc. | 29,071 | | 684 | |
| | Cinemark Holdings Inc. | 44,994 | | 659 | |
| | Bed Bath & Beyond Inc. | 53,416 | | 651 | |
| * | Adient plc | 37,045 | | 642 | |
| | Group 1 Automotive Inc. | 7,336 | | 634 | |
| * | K12 Inc. | 16,835 | | 626 | |
| * | American Woodmark Corp. | 7,126 | | 624 | |
| | La-Z-Boy Inc. | 18,752 | | 609 | |
| | PriceSmart Inc. | 8,986 | | 591 | |
| * | Laureate Education Inc. Class A | 45,280 | | 567 | |
| * | Sally Beauty Holdings Inc. | 47,151 | | 526 | |
| | Cheesecake Factory Inc. | 17,650 | | 521 | |
| * | Asbury Automotive Group Inc. | 4,887 | | 517 | |
| | ODP Corp. | 21,963 | | 514 | |
| * | M/I Homes Inc. | 11,726 | | 499 | |
| | Kontoor Brands Inc. | 21,651 | | 479 | |
| * | Vista Outdoor Inc. | 24,525 | | 476 | |
| | International Game Technology plc | 41,340 | | 460 | |
| * | Liberty Latin America Ltd. Class C | 47,811 | | 456 | |
| | Sinclair Broadcast Group Inc. Class A | 21,626 | | 450 | |
| * | Century Communities Inc. | 12,282 | | 438 | |
| | Sonic Automotive Inc. Class A | 9,930 | | 420 | |
| * | Smith & Wesson Brands Inc. | 22,875 | | 418 | |
| | Steven Madden Ltd. | 19,587 | | 414 | |
| * | Central Garden & Pet Co. Class A | 11,107 | | 413 | |
| * | Gray Television Inc. | 26,090 | | 405 | |
| | Acushnet Holdings Corp. | 11,021 | | 389 | |
| * | At Home Group Inc. | 20,350 | | 389 | |
| | Signet Jewelers Ltd. | 22,105 | | 382 | |
| * | American Axle & Manufacturing Holdings Inc. | 47,626 | | 371 | |
| | Dine Brands Global Inc. | 6,173 | | 368 | |
| * | WW International Inc. | 15,197 | | 357 | |
| * | Michaels Cos. Inc. | 31,573 | | 355 | |
| | Standard Motor Products Inc. | 7,497 | | 341 | |
| | Abercrombie & Fitch Co. | 26,080 | | 339 | |
| * | Sleep Number Corp. | 7,068 | | 339 | |
Vanguard® Russell 2000 Value Index Fund
Schedule of Investments
August 31, 2020
| | Shares | | Market
Value
($000 | ) |
| | Tupperware Brands Corp. | 20,783 | | 339 | |
| | Oxford Industries Inc. | 6,793 | | 336 | |
| | Monro Inc. | 7,016 | | 323 | |
| * | IMAX Corp. | 20,964 | | 322 | |
| | Brinker International Inc. | 6,253 | | 282 | |
| | Matthews International Corp. Class A | 12,752 | | 279 | |
| | Scholastic Corp. | 12,157 | | 274 | |
| * | Overstock.com Inc. | 3,053 | | 267 | |
| * | Rosetta Stone Inc. | 8,789 | | 267 | |
| | EW Scripps Co. Class A | 23,754 | | 264 | |
| * | MarineMax Inc. | 8,744 | | 257 | |
| * | Lumber Liquidators Holdings Inc. | 10,446 | | 251 | |
| * | Cars.com Inc. | 28,589 | | 248 | |
| | BJ's Restaurants Inc. | 7,872 | | 248 | |
| * | SeaWorld Entertainment Inc. | 12,102 | | 247 | |
| * | AMC Networks Inc. Class A | 9,781 | | 238 | |
| * | iHeartMedia Inc. Class A | 25,359 | | 234 | |
| * | Hibbett Sports Inc. | 6,994 | | 233 | |
| | Buckle Inc. | 12,286 | | 230 | |
| * | Zumiez Inc. | 8,870 | | 228 | |
| * | Stoneridge Inc. | 11,012 | | 222 | |
| * | National Vision Holdings Inc. | 5,865 | | 220 | |
| | Guess? Inc. | 18,514 | | 213 | |
| * | Fitbit Inc. Class A | 33,076 | | 210 | |
| | Dave & Buster's Entertainment Inc. | 12,535 | | 208 | |
| * | G-III Apparel Group Ltd. | 18,642 | | 206 | |
| | Papa John's International Inc. | 2,043 | | 201 | |
| * | SP Plus Corp. | 9,754 | | 200 | |
| * | American Public Education Inc. | 6,115 | | 192 | |
| | Designer Brands Inc. Class A | 26,133 | | 184 | |
| * | Liberty Latin America Ltd. Class A | 18,748 | | 184 | |
| | Viad Corp. | 8,552 | | 183 | |
| | National Presto Industries Inc. | 2,025 | | 182 | |
| * | QuinStreet Inc. | 13,601 | | 179 | |
| | Franchise Group Inc. | 7,206 | | 177 | |
| * | Tenneco Inc. Class A | 21,621 | | 176 | |
| * | MSG Networks Inc. | 16,876 | | 164 | |
| ^,* | GameStop Corp. Class A | 24,241 | | 162 | |
| * | Meritor Inc. | 6,877 | | 157 | |
| * | Chuy's Holdings Inc. | 7,023 | | 156 | |
| | Carriage Services Inc. Class A | 6,982 | | 155 | |
| | Interface Inc. Class A | 20,365 | | 154 | |
| | Haverty Furniture Cos. Inc. | 7,148 | | 151 | |
| | Marcus Corp. | 9,507 | | 149 | |
| * | Nautilus Inc. | 12,554 | | 149 | |
| * | Beazer Homes USA Inc. | 12,085 | | 148 | |
| * | Green Brick Partners Inc. | 10,074 | | 143 | |
| | Ethan Allen Interiors Inc. | 9,927 | | 141 | |
| * | Scientific Games Corp. | 6,828 | | 141 | |
| * | Quotient Technology Inc. | 16,039 | | 140 | |
| | Winmark Corp. | 896 | | 138 | |
| * | Central Garden & Pet Co. | 3,316 | | 135 | |
| * | Liberty Media Corp-Liberty Braves Class C | 6,903 | | 134 | |
| | OneSpaWorld Holdings Ltd. | 19,152 | | 133 | |
| | Shoe Carnival Inc. | 3,944 | | 130 | |
| ^ | AMC Entertainment Holdings Inc. Class A | 22,044 | | 130 | |
| * | Cooper-Standard Holdings Inc. | 7,091 | | 129 | |
| | Caleres Inc. | 16,264 | | 127 | |
| * | El Pollo Loco Holdings Inc. | 7,088 | | 127 | |
| * | Hudson Ltd. Class A | 16,795 | | 127 | |
| * | Fossil Group Inc. | 19,602 | | 126 | |
| * | Motorcar Parts of America Inc. | 6,958 | | 121 | |
| | Red Rock Resorts Inc. Class A | 6,974 | | 119 | |
| * | Genesco Inc. | 6,008 | | 117 | |
Vanguard® Russell 2000 Value Index Fund
Schedule of Investments
August 31, 2020
| | Shares | | Market
Value
($000 | ) |
| | Clarus Corp. | 9,238 | | 116 | |
| | Meredith Corp. | 8,301 | | 116 | |
| | Hooker Furniture Corp. | 4,671 | | 115 | |
| * | Del Taco Restaurants Inc. | 12,642 | | 106 | |
| * | Houghton Mifflin Harcourt Co. | 44,723 | | 101 | |
| * | Carrols Restaurant Group Inc. | 14,963 | | 100 | |
| ^ | Dillard's Inc. Class A | 3,199 | | 97 | |
| | Gannett Co. Inc. | 55,711 | | 96 | |
| ^,* | Eros International plc | 30,949 | | 96 | |
| | Johnson Outdoors Inc. Class A | 1,117 | | 96 | |
| | National CineMedia Inc. | 26,390 | | 95 | |
| * | Conn's Inc. | 7,404 | | 95 | |
| * | Denny's Corp. | 8,003 | | 92 | |
| | Citi Trends Inc. | 4,629 | | 89 | |
| * | Stitch Fix Inc. Class A | 3,695 | | 89 | |
| * | American Outdoor Brands Inc. | 5,779 | | 88 | |
| | Superior Group of Cos. Inc. | 3,778 | | 87 | |
| * | Liberty TripAdvisor Holdings Inc. Class A | 30,813 | | 86 | |
| * | Liquidity Services Inc. | 11,800 | | 85 | |
| * | Central European Media Enterprises Ltd. Class A | 19,674 | | 82 | |
| | Escalade Inc. | 4,379 | | 79 | |
| * | Boston Omaha Corp. Class A | 4,788 | | 78 | |
| * | Fiesta Restaurant Group Inc. | 7,633 | | 76 | |
| | Tribune Publishing Co. | 6,623 | | 75 | |
| | Entercom Communications Corp. Class A | 49,698 | | 75 | |
| * | Regis Corp. | 9,978 | | 74 | |
| | Movado Group Inc. | 6,661 | | 73 | |
| | Cato Corp. Class A | 8,878 | | 71 | |
| | Rent-A-Center Inc. | 2,303 | | 71 | |
| * | Century Casinos Inc. | 11,481 | | 71 | |
| * | Monarch Casino & Resort Inc. | 1,531 | | 70 | |
| | Rocky Brands Inc. | 2,914 | | 70 | |
| | RCI Hospitality Holdings Inc. | 3,649 | | 70 | |
| * | Lakeland Industries Inc. | 3,243 | | 66 | |
| * | Lands' End Inc. | 4,934 | | 66 | |
| | Nathan's Famous Inc. | 1,231 | | 65 | |
| | Chico's FAS Inc. | 50,394 | | 65 | |
| * | America's Car-Mart Inc. | 627 | | 63 | |
| * | Hemisphere Media Group Inc. | 6,963 | | 62 | |
| | Sturm Ruger & Co. Inc. | 857 | | 61 | |
| * | Alta Equipment Group Inc. | 7,226 | | 60 | |
| * | Red Robin Gourmet Burgers Inc. | 5,433 | | 60 | |
| | Tilly's Inc. Class A | 9,418 | | 60 | |
| * | Funko Inc. Class A | 10,188 | | 60 | |
| * | Gaia Inc. | 4,980 | | 58 | |
| * | Golden Entertainment Inc. | 4,441 | | 57 | |
| * | Fluent Inc. | 17,739 | | 55 | |
| * | Hertz Global Holdings Inc. | 36,925 | | 54 | |
| * | VOXX International Corp. | 8,405 | | 53 | |
| * | Noodles & Co. | 6,838 | | 52 | |
| | Lifetime Brands Inc. | 5,067 | | 50 | |
| * | A-Mark Precious Metals Inc. | 2,079 | | 50 | |
| | Weyco Group Inc. | 2,561 | | 46 | |
| * | Vera Bradley Inc. | 8,699 | | 46 | |
| * | Duluth Holdings Inc. | 4,700 | | 46 | |
| | Core-Mark Holding Co. Inc. | 1,309 | | 44 | |
| | Hamilton Beach Brands Holding Co. Class A | 1,943 | | 42 | |
| * | Legacy Housing Corp. | 2,668 | | 41 | |
| | Systemax Inc. | 1,763 | | 39 | |
| * | Eastman Kodak Co. | 6,525 | | 39 | |
| | Entravision Communications Corp. Class A | 24,953 | | 38 | |
| | Saga Communications Inc. Class A | 1,610 | | 36 | |
| | Children's Place Inc. | 1,774 | | 35 | |
| * | PlayAGS Inc. | 8,472 | | 34 | |
Vanguard® Russell 2000 Value Index Fund
Schedule of Investments
August 31, 2020
| | Shares | | Market
Value
($000 | ) |
| * | Universal Electronics Inc. | 743 | | 31 | |
| * | LiveXLive Media Inc. | 11,231 | | 30 | |
| * | Express Inc. | 26,966 | | 30 | |
| | Emerald Holding Inc. | 10,372 | | 29 | |
| * | GoPro Inc. Class A | 6,025 | | 28 | |
| * | Container Store Group Inc. | 6,479 | | 28 | |
| * | Daily Journal Corp. | 100 | | 28 | |
| * | Biglari Holdings Inc. Class B | 276 | | 27 | |
| * | Boot Barn Holdings Inc. | 958 | | 27 | |
| * | Casper Sleep Inc. | 2,797 | | 25 | |
| * | Biglari Holdings Inc. | 52 | | 24 | |
| * | Revlon Inc. Class A | 2,571 | | 19 | |
| * | Kura Sushi USA Inc. Class A | 1,430 | | 17 | |
| * | Liberty Media Corp-Liberty Braves Class A | 877 | | 17 | |
| | Collectors Universe Inc. | 340 | | 15 | |
| | Bluegreen Vacations Corp. | 2,201 | | 12 | |
| | CompX International Inc. | 662 | | 9 | |
| * | CarParts.com Inc. | 587 | | 8 | |
| * | Universal Technical Institute Inc. | 761 | | 5 | |
| | | 59,271 | |
| Consumer Staples (3.3%) | |
| * | Darling Ingredients Inc. | 67,866 | | 2,170 | |
| * | Performance Food Group Co. | 55,239 | | 2,017 | |
| | Primo Water Corp. | 65,942 | | 902 | |
| * | Simply Good Foods Co. | 35,913 | | 892 | |
| * | Edgewell Personal Care Co. | 22,973 | | 660 | |
| | J&J Snack Foods Corp. | 4,626 | | 629 | |
| | Vector Group Ltd. | 50,144 | | 505 | |
| | Universal Corp. | 10,205 | | 443 | |
| * | United Natural Foods Inc. | 22,445 | | 405 | |
| * | Hostess Brands Inc. Class A | 28,601 | | 367 | |
| * | Cal-Maine Foods Inc. | 8,790 | | 339 | |
| * | BellRing Brands Inc. Class A | 16,869 | | 328 | |
| * | Rite Aid Corp. | 23,198 | | 302 | |
| | Fresh Del Monte Produce Inc. | 13,013 | | 302 | |
| | SpartanNash Co. | 14,856 | | 297 | |
| | Ingles Markets Inc. Class A | 5,947 | | 240 | |
| | Andersons Inc. | 13,210 | | 234 | |
| | Sanderson Farms Inc. | 1,912 | | 224 | |
| | Weis Markets Inc. | 4,049 | | 199 | |
| * | Chefs' Warehouse Inc. | 10,504 | | 156 | |
| * | Seneca Foods Corp. Class A | 2,757 | | 131 | |
| * | HF Foods Group Inc. | 15,068 | | 120 | |
| * | Landec Corp. | 10,983 | | 112 | |
| | B&G Foods Inc. | 3,296 | | 103 | |
| | Village Super Market Inc. Class A | 3,567 | | 91 | |
| | Limoneira Co. | 5,390 | | 78 | |
| | Oil-Dri Corp. of America | 2,206 | | 77 | |
| | WD-40 Co. | 364 | | 74 | |
| * | Craft Brew Alliance Inc. | 4,583 | | 72 | |
| | Alico Inc. | 2,213 | | 71 | |
| | MGP Ingredients Inc. | 1,377 | | 49 | |
| * | NewAge Inc. | 20,600 | | 45 | |
| * | Farmer Bros Co. | 6,814 | | 43 | |
| * | Nature's Sunshine Products Inc. | 3,760 | | 41 | |
| | Tootsie Roll Industries Inc. | 1,109 | | 35 | |
| | Natural Grocers by Vitamin Cottage Inc. | 1,412 | | 16 | |
| * | Bridgford Foods Corp. | 358 | | 6 | |
| | | 12,775 | |
| Energy (4.2%) | |
| | Ovintiv Inc. | 109,986 | | 1,219 | |
| | Arcosa Inc. | 20,489 | | 948 | |
| * | CNX Resources Corp. | 78,189 | | 857 | |
| * | ChampionX Corp. | 77,823 | | 797 | |
Vanguard® Russell 2000 Value Index Fund
Schedule of Investments
August 31, 2020
| | Shares | | Market
Value
($000 | ) |
| | World Fuel Services Corp. | 26,257 | | 693 | |
| | Range Resources Corp. | 90,125 | | 672 | |
| * | Southwestern Energy Co. | 228,690 | | 636 | |
| * | PDC Energy Inc. | 41,944 | | 635 | |
| * | Renewable Energy Group Inc. | 16,089 | | 538 | |
| * | Dril-Quip Inc. | 14,630 | | 485 | |
| * | Matador Resources Co. | 46,167 | | 449 | |
| | Delek US Holdings Inc. | 26,230 | | 413 | |
| * | Golar LNG Ltd. | 38,570 | | 399 | |
| | Archrock Inc. | 53,899 | | 354 | |
| | PBF Energy Inc. Class A | 40,909 | | 350 | |
| | Warrior Met Coal Inc. | 21,787 | | 337 | |
| * | Antero Resources Corp. | 102,853 | | 331 | |
| * | NOW Inc. | 45,523 | | 331 | |
| * | Transocean Ltd. | 247,756 | | 302 | |
| | Patterson-UTI Energy Inc. | 77,593 | | 299 | |
| | Kosmos Energy Ltd. | 170,813 | | 251 | |
| | Arch Coal Inc. Class A | 6,398 | | 241 | |
| | Cactus Inc. | 10,768 | | 238 | |
| * | Oceaneering International Inc. | 42,057 | | 227 | |
| * | Helix Energy Solutions Group Inc. | 60,446 | | 216 | |
| * | ProPetro Holding Corp. | 33,958 | | 213 | |
| | CVR Energy Inc. | 12,543 | | 209 | |
| * | Green Plains Inc. | 14,480 | | 194 | |
| | NexTier Oilfield Solutions Inc. | 68,565 | | 173 | |
| | Liberty Oilfield Services Inc. Class A | 26,680 | | 172 | |
| * | Bonanza Creek Energy Inc. | 7,973 | | 160 | |
| * | Frank's International NV | 65,659 | | 152 | |
| | Brigham Minerals Inc. Class A | 12,819 | | 151 | |
| * | REX American Resources Corp. | 2,385 | | 147 | |
| * | Par Pacific Holdings Inc. | 16,956 | | 147 | |
| * | Clean Energy Fuels Corp. | 55,686 | | 147 | |
| | SunCoke Energy Inc. | 35,185 | | 126 | |
| * | Select Energy Services Inc. Class A | 24,973 | | 119 | |
| | Nabors Industries Ltd. | 2,977 | | 119 | |
| * | Tidewater Inc. | 17,121 | | 118 | |
| | DMC Global Inc | 3,314 | | 117 | |
| | SM Energy Co. | 47,733 | | 116 | |
| | Berry Corp. | 28,697 | | 113 | |
| * | Oil States International Inc. | 25,506 | | 112 | |
| * | SunPower Corp. | 9,920 | | 111 | |
| * | Matrix Service Co. | 10,974 | | 101 | |
| | Solaris Oilfield Infrastructure Inc. Class A | 12,205 | | 95 | |
| * | W&T Offshore Inc. | 39,942 | | 89 | |
| * | FuelCell Energy Inc. | 30,307 | | 86 | |
| * | RPC Inc. | 24,354 | | 76 | |
| * | Newpark Resources Inc. | 37,662 | | 73 | |
| | Peabody Energy Corp. | 26,586 | | 69 | |
| * | National Energy Services Reunited Corp. | 8,757 | | 66 | |
| * | Penn Virginia Corp. | 5,773 | | 66 | |
| * | Trecora Resources | 10,245 | | 62 | |
| ^,* | Tellurian Inc. | 61,832 | | 57 | |
| * | CONSOL Energy Inc. | 11,009 | | 57 | |
| * | Bristow Group Inc. | 2,799 | | 53 | |
| * | Contango Oil & Gas Co. | 31,476 | | 51 | |
| * | Exterran Corp. | 11,042 | | 51 | |
| * | Comstock Resources Inc. | 8,433 | | 49 | |
| * | Gulfport Energy Corp. | 68,146 | | 48 | |
| * | Montage Resources Corp. | 9,081 | | 47 | |
| | Falcon Minerals Corp. | 16,376 | | 46 | |
| * | Talos Energy Inc. | 4,660 | | 35 | |
| | Evolution Petroleum Corp. | 12,005 | | 33 | |
| | NACCO Industries Inc. Class A | 1,588 | | 33 | |
| * | Bloom Energy Corp. Class A | 2,004 | | 31 | |
Vanguard® Russell 2000 Value Index Fund
Schedule of Investments
August 31, 2020
| | Shares | | Market
Value
($000 | ) |
| ^,* | Whiting Petroleum Corp. | 37,672 | | 30 | |
| * | Earthstone Energy Inc. Class A | 9,870 | | 29 | |
| * | Maxeon Solar Technologies Ltd. | 1,240 | | 26 | |
| * | Magnolia Oil & Gas Corp. Class A | 3,680 | | 24 | |
| | Adams Resources & Energy Inc. | 872 | | 18 | |
| * | Goodrich Petroleum Corp. | 1,656 | | 14 | |
| * | PrimeEnergy Resources Corp. | 202 | | 14 | |
| * | NextDecade Corp. | 6,623 | | 9 | |
| | | 16,672 | |
| Financial Services (37.1%) | |
| | STAG Industrial Inc. | 58,132 | | 1,878 | |
| | Healthcare Realty Trust Inc. | 56,988 | | 1,644 | |
| | South State Corp. | 29,473 | | 1,641 | |
| | Essent Group Ltd. | 45,766 | | 1,634 | |
| | Physicians Realty Trust | 85,632 | | 1,554 | |
| | Agree Realty Corp. | 22,435 | | 1,501 | |
| | Selective Insurance Group Inc. | 24,915 | | 1,490 | |
| | Stifel Financial Corp. | 28,041 | | 1,422 | |
| | Blackstone Mortgage Trust Inc. Class A | 58,034 | | 1,379 | |
| | United Bankshares Inc. | 52,170 | | 1,364 | |
| * | Cannae Holdings Inc. | 35,683 | | 1,346 | |
| | Community Bank System Inc. | 21,623 | | 1,301 | |
| | Sabra Health Care REIT Inc. | 86,485 | | 1,283 | |
| | PotlatchDeltic Corp. | 27,581 | | 1,270 | |
| | Glacier Bancorp Inc. | 36,107 | | 1,267 | |
| | Valley National Bancorp | 167,801 | | 1,260 | |
| | Radian Group Inc. | 80,603 | | 1,245 | |
| | Lexington Realty Trust | 107,794 | | 1,226 | |
| | Hannon Armstrong Sustainable Infrastructure Capital Inc. | 28,175 | | 1,196 | |
| | Home BancShares Inc. | 64,355 | | 1,043 | |
| * | Green Dot Corp. Class A | 19,648 | | 1,023 | |
| | CVB Financial Corp. | 54,555 | | 993 | |
| | UMB Financial Corp. | 18,399 | | 988 | |
| | CNO Financial Group Inc. | 60,466 | | 986 | |
| | Old National Bancorp | 69,205 | | 968 | |
| | Terreno Realty Corp. | 16,187 | | 965 | |
| | American Equity Investment Life Holding Co. | 38,305 | | 916 | |
| * | Enstar Group Ltd. | 5,076 | | 909 | |
| | PennyMac Financial Services Inc. | 17,231 | | 908 | |
| | BankUnited Inc. | 38,701 | | 905 | |
| | BancorpSouth Bank | 41,782 | | 902 | |
| * | PRA Group Inc. | 19,029 | | 888 | |
| | Columbia Banking System Inc. | 30,294 | | 846 | |
| | CIT Group Inc. | 41,602 | | 818 | |
| | Piedmont Office Realty Trust Inc. Class A | 53,249 | | 815 | |
| | Independent Bank Corp. | 12,926 | | 812 | |
| | Pacific Premier Bancorp Inc. | 35,542 | | 803 | |
| | Cathay General Bancorp | 32,034 | | 791 | |
| | Simmons First National Corp. Class A | 45,634 | | 779 | |
| | Atlantic Union Bankshares Corp. | 32,857 | | 764 | |
| | Washington REIT | 34,794 | | 763 | |
| | National Health Investors Inc. | 12,242 | | 762 | |
| | Sunstone Hotel Investors Inc. | 90,581 | | 755 | |
| | Washington Federal Inc. | 31,831 | | 746 | |
| | Kennedy-Wilson Holdings Inc. | 51,554 | | 737 | |
| | Navient Corp. | 80,816 | | 735 | |
| | Hancock Whitney Corp. | 36,347 | | 727 | |
| | Independent Bank Group Inc. | 15,604 | | 726 | |
| | Chimera Investment Corp. | 80,898 | | 719 | |
| | PennyMac Mortgage Investment Trust | 41,757 | | 716 | |
| | International Bancshares Corp. | 22,524 | | 711 | |
| | Pebblebrook Hotel Trust | 54,799 | | 692 | |
| * | Texas Capital Bancshares Inc. | 21,321 | | 691 | |
| | Federated Hermes Inc. Class B | 28,833 | | 689 | |
Vanguard® Russell 2000 Value Index Fund
Schedule of Investments
August 31, 2020
| | | Shares | | Market
Value
($000 | ) |
| | Ameris Bancorp | 27,941 | | 685 | |
| | Horace Mann Educators Corp. | 17,465 | | 682 | |
| | CareTrust REIT Inc. | 34,692 | | 672 | |
| | Global Net Lease Inc. | 37,982 | | 665 | |
| | Fulton Financial Corp. | 67,605 | | 661 | |
| | Essential Properties Realty Trust Inc. | 38,474 | | 653 | |
| | RLJ Lodging Trust | 69,136 | | 653 | |
| * | Genworth Financial Inc. Class A | 212,200 | | 641 | |
| | Two Harbors Investment Corp. | 115,095 | | 627 | |
| | Hilltop Holdings Inc. | 30,359 | | 625 | |
| | Trustmark Corp. | 26,524 | | 623 | |
| | WSFS Financial Corp. | 21,139 | | 619 | |
| | WesBanco Inc. | 27,465 | | 610 | |
| * | Encore Capital Group Inc. | 13,139 | | 604 | |
| | First Midwest Bancorp Inc. | 47,990 | | 598 | |
| | United Community Banks Inc. | 32,886 | | 596 | |
| | Walker & Dunlop Inc. | 10,870 | | 595 | |
| * | Mr Cooper Group Inc. | 32,218 | | 590 | |
| | Industrial Logistics Properties Trust | 27,340 | | 590 | |
| | First Interstate BancSystem Inc. Class A | 17,886 | | 587 | |
| | Apollo Commercial Real Estate Finance Inc. | 65,099 | | 582 | |
| | Renasant Corp. | 22,916 | | 581 | |
| | First Merchants Corp. | 22,712 | | 581 | |
| | Westamerica BanCorp | 9,532 | | 580 | |
| | Columbia Property Trust Inc. | 48,372 | | 571 | |
| | Retail Properties of America Inc. | 90,257 | | 570 | |
| | Service Properties Trust | 68,995 | | 566 | |
| | First Financial Bancorp | 40,813 | | 560 | |
| * | Axos Financial Inc. | 22,347 | | 554 | |
| | Colony Capital Inc. | 204,336 | | 554 | |
| | Piper Sandler Cos. | 7,332 | | 553 | |
| | GEO Group Inc. | 49,559 | | 553 | |
| | Bank of NT Butterfield & Son Ltd. | 21,888 | | 552 | |
| | NBT Bancorp Inc. | 17,912 | | 546 | |
| | Park National Corp. | 6,031 | | 542 | |
| | American Assets Trust Inc. | 21,186 | | 541 | |
| | Investors Bancorp Inc. | 69,735 | | 540 | |
| | AMERISAFE Inc. | 8,057 | | 538 | |
| | Retail Opportunity Investments Corp. | 48,029 | | 535 | |
| * | Realogy Holdings Corp. | 48,234 | | 534 | |
| | Broadmark Realty Capital Inc. | 54,122 | | 530 | |
| | Banner Corp. | 14,619 | | 528 | |
| | Capitol Federal Financial Inc. | 55,817 | | 521 | |
| | First BanCorp | 90,756 | | 520 | |
| | Artisan Partners Asset Management Inc. Class A | 13,349 | | 517 | |
| | Urban Edge Properties | 48,828 | | 516 | |
| | National General Holdings Corp. | 15,079 | | 513 | |
| | MFA Financial Inc. | 190,876 | | 512 | |
| | Argo Group International Holdings Ltd. | 13,639 | | 507 | |
| | Innovative Industrial Properties Inc. | 4,094 | | 504 | |
| | Heartland Financial USA Inc. | 14,601 | | 503 | |
| | Towne Bank | 28,158 | | 499 | |
| | Northwest Bancshares Inc. | 49,291 | | 498 | |
| | Cadence BanCorp Class A | 52,447 | | 498 | |
| | Arbor Realty Trust Inc. | 43,347 | | 491 | |
| | Nelnet Inc. Class A | 7,440 | | 487 | |
| | Goosehead Insurance Inc. Class A | 4,721 | | 485 | |
| | Mack-Cali Realty Corp. | 38,284 | | 484 | |
| | SITE Centers Corp. | 64,373 | | 483 | |
| | Office Properties Income Trust | 20,122 | | 480 | |
| | Macerich Co. | 59,591 | | 473 | |
| | Flagstar Bancorp Inc. | 15,013 | | 472 | |
| | CoreCivic Inc. | 50,252 | | 468 | |
| | Independence Realty Trust Inc. | 39,840 | | 467 | |
Vanguard® Russell 2000 Value Index Fund
Schedule of Investments
August 31, 2020
| | | Shares | | Market
Value
($000 | ) |
| | Sandy Spring Bancorp Inc. | 19,357 | | 463 | |
| * | NMI Holdings Inc. Class A | 26,442 | | 453 | |
| | Safety Insurance Group Inc. | 6,174 | | 447 | |
| | DiamondRock Hospitality Co. | 83,845 | | 444 | |
| | Lakeland Financial Corp. | 9,593 | | 438 | |
| * | Seacoast Banking Corp. of Florida | 21,654 | | 438 | |
| | Xenia Hotels & Resorts Inc. | 47,495 | | 427 | |
| | Waddell & Reed Financial Inc. Class A | 27,048 | | 426 | |
| | City Holding Co. | 6,617 | | 423 | |
| | New York Mortgage Trust Inc. | 159,350 | | 421 | |
| | Stewart Information Services Corp. | 9,797 | | 418 | |
| | Hope Bancorp Inc. | 49,283 | | 417 | |
| | Getty Realty Corp. | 14,181 | | 415 | |
| | Employers Holdings Inc. | 12,535 | | 408 | |
| | Acadia Realty Trust | 35,633 | | 404 | |
| | Virtus Investment Partners Inc. | 2,811 | | 399 | |
| | Tompkins Financial Corp. | 6,013 | | 398 | |
| | Provident Financial Services Inc. | 30,181 | | 398 | |
| | Kite Realty Group Trust | 34,846 | | 392 | |
| | Eagle Bancorp Inc. | 13,436 | | 387 | |
| | iStar Inc. | 30,996 | | 384 | |
| | OceanFirst Financial Corp. | 24,378 | | 381 | |
| | Diversified Healthcare Trust | 99,384 | | 378 | |
| | First Busey Corp. | 21,088 | | 376 | |
| | LTC Properties Inc. | 10,264 | | 375 | |
| | Alexander & Baldwin Inc. | 30,231 | | 366 | |
| | Southside Bancshares Inc. | 13,255 | | 365 | |
| | Investors Real Estate Trust | 5,105 | | 363 | |
| | Veritex Holdings Inc. | 20,159 | | 362 | |
| * | StoneX Group Inc. | 6,343 | | 360 | |
| * | Cushman & Wakefield plc | 30,859 | | 358 | |
| | FB Financial Corp. | 13,055 | | 353 | |
| | BancFirst Corp. | 7,861 | | 346 | |
| | ProAssurance Corp. | 22,446 | | 344 | |
| | First Commonwealth Financial Corp. | 41,322 | | 339 | |
| | Redwood Trust Inc. | 48,708 | | 338 | |
| | Ladder Capital Corp. Class A | 44,249 | | 330 | |
| | S&T Bancorp Inc. | 16,172 | | 327 | |
| | BGC Partners Inc. Class A | 129,156 | | 325 | |
| | NexPoint Residential Trust Inc. | 7,786 | | 322 | |
| | Great Western Bancorp Inc. | 23,050 | | 321 | |
| | Stock Yards Bancorp Inc. | 7,313 | | 314 | |
| | American Finance Trust Inc. | 45,697 | | 312 | |
| | Brookline Bancorp Inc. | 32,441 | | 311 | |
| | TriCo Bancshares | 11,061 | | 306 | |
| | Heritage Financial Corp. | 15,059 | | 300 | |
| | Enterprise Financial Services Corp. | 10,037 | | 300 | |
| | German American Bancorp Inc. | 10,288 | | 292 | |
| * | Third Point Reinsurance Ltd. | 33,521 | | 287 | |
| | Premier Financial Corp. | 15,448 | | 282 | |
| | OFG Bancorp | 21,128 | | 271 | |
| | National Bank Holdings Corp. Class A | 9,487 | | 270 | |
| | Meta Financial Group Inc. | 13,916 | | 268 | |
| | Newmark Group Inc. Class A | 60,518 | | 268 | |
| | RE/MAX Holdings Inc. Class A | 7,545 | | 265 | |
| | ARMOUR Residential REIT Inc. | 27,119 | | 263 | |
| | HomeStreet Inc. | 9,569 | | 262 | |
| * | Triumph Bancorp Inc. | 9,155 | | 261 | |
| | Summit Hotel Properties Inc. | 43,809 | | 258 | |
| | Live Oak Bancshares Inc. | 11,582 | | 257 | |
| * | Marcus & Millichap Inc. | 8,822 | | 249 | |
| | Capstead Mortgage Corp. | 39,707 | | 245 | |
| | First Bancorp | 11,969 | | 245 | |
| * | Ambac Financial Group Inc. | 19,208 | | 243 | |
Vanguard® Russell 2000 Value Index Fund
Schedule of Investments
August 31, 2020
| | | Shares | | Market
Value
($000 | ) |
| | Washington Trust Bancorp Inc. | 7,225 | | 241 | |
| | Armada Hoffler Properties Inc. | 23,770 | | 240 | |
| | 1st Source Corp. | 6,953 | | 240 | |
| | TrustCo Bank Corp. NY | 40,143 | | 239 | |
| * | MBIA Inc. | 29,440 | | 239 | |
| | National Western Life Group Inc. Class A | 1,069 | | 235 | |
| | ConnectOne Bancorp Inc. | 15,418 | | 233 | |
| * | Nicolet Bankshares Inc. | 3,884 | | 233 | |
| | WisdomTree Investments Inc. | 61,564 | | 230 | |
| | Meridian Bancorp Inc. | 19,496 | | 227 | |
| | Bryn Mawr Bank Corp. | 8,348 | | 227 | |
| | TPG RE Finance Trust Inc. | 25,424 | | 224 | |
| | United Fire Group Inc. | 8,881 | | 224 | |
| | Global Medical REIT Inc. | 17,400 | | 223 | |
| | KKR Real Estate Finance Trust Inc. | 12,106 | | 220 | |
| | B Riley Financial Inc. | 8,212 | | 220 | |
| | Lakeland Bancorp Inc. | 20,653 | | 220 | |
| | Gladstone Commercial Corp. | 11,193 | | 220 | |
| | Preferred Bank | 5,839 | | 218 | |
| ^ | Tanger Factory Outlet Centers Inc. | 38,369 | | 218 | |
| | Ellington Financial Inc. | 17,493 | | 218 | |
| | Origin Bancorp Inc. | 9,146 | | 217 | |
| | Colony Credit Real Estate Inc. | 35,627 | | 214 | |
| * | Enova International Inc. | 12,441 | | 213 | |
| | Community Trust Bancorp Inc. | 6,578 | | 212 | |
| | Invesco Mortgage Capital Inc. | 70,388 | | 211 | |
| * | Bancorp Inc. | 21,846 | | 208 | |
| | Front Yard Residential Corp. | 21,220 | | 207 | |
| | Federal Agricultural Mortgage Corp. Class C | 3,006 | | 205 | |
| | Camden National Corp. | 6,256 | | 204 | |
| | Banc of California Inc. | 18,571 | | 204 | |
| | Allegiance Bancshares Inc. | 8,016 | | 204 | |
| | Horizon Bancorp Inc. | 18,121 | | 203 | |
| ^,* | Seritage Growth Properties Class A | 14,423 | | 202 | |
| | Boston Private Financial Holdings Inc. | 34,051 | | 202 | |
| | RPT Realty | 34,190 | | 200 | |
| | RLI Corp. | 2,111 | | 198 | |
| | Univest Financial Corp. | 12,194 | | 196 | |
| | First Financial Corp. | 5,697 | | 196 | |
| | Franklin Street Properties Corp. | 44,023 | | 195 | |
| | First Foundation Inc. | 12,817 | | 195 | |
| | ServisFirst Bancshares Inc. | 5,305 | | 194 | |
| | HarborOne Bancorp Inc. | 22,422 | | 194 | |
| | Kearny Financial Corp. | 24,877 | | 193 | |
| * | World Acceptance Corp. | 2,099 | | 191 | |
| | QCR Holdings Inc. | 6,276 | | 188 | |
| | First Bancshares Inc. | 8,762 | | 188 | |
| * | CrossFirst Bankshares Inc. | 20,311 | | 187 | |
| | Safehold Inc. | 3,326 | | 185 | |
| | CatchMark Timber Trust Inc. Class A | 18,515 | | 184 | |
| | Northfield Bancorp Inc. | 18,756 | | 181 | |
| | Central Pacific Financial Corp. | 11,625 | | 180 | |
| | Great Southern Bancorp Inc. | 4,669 | | 180 | |
| | Bank of Marin Bancorp | 5,608 | | 179 | |
| | Berkshire Hills Bancorp Inc. | 18,935 | | 174 | |
| | Heritage Commerce Corp. | 24,645 | | 171 | |
| | Universal Insurance Holdings Inc. | 8,949 | | 166 | |
| | Peoples Bancorp Inc. | 7,824 | | 165 | |
| * | St. Joe Co. | 7,060 | | 164 | |
| | Jernigan Capital Inc. | 9,464 | | 163 | |
| | Diamond Hill Investment Group Inc. | 1,316 | | 163 | |
| | First Mid Bancshares Inc. | 6,185 | | 161 | |
| | City Office REIT Inc. | 19,885 | | 160 | |
| | Banco Latinoamericano de Comercio Exterior SA | 13,117 | | 160 | |
Vanguard® Russell 2000 Value Index Fund
Schedule of Investments
August 31, 2020
| | | Shares | | Market
Value
($000 | ) |
| * | Columbia Financial Inc. | 14,909 | | 159 | |
| | Ready Capital Corp. | 15,506 | | 159 | |
| * | TriState Capital Holdings Inc. | 11,394 | | 158 | |
| | Dime Community Bancshares Inc. | 12,139 | | 157 | |
| | Arrow Financial Corp. | 5,458 | | 156 | |
| * | LendingClub Corp. | 29,206 | | 156 | |
| | Granite Point Mortgage Trust Inc. | 23,134 | | 154 | |
| | FBL Financial Group Inc. Class A | 4,114 | | 152 | |
| | New Senior Investment Group Inc. | 34,740 | | 152 | |
| | Dynex Capital Inc. | 9,379 | | 149 | |
| | First of Long Island Corp. | 9,652 | | 148 | |
| | Mercantile Bank Corp. | 6,700 | | 146 | |
| | Orchid Island Capital Inc. | 28,195 | | 144 | |
| * | Customers Bancorp Inc. | 11,276 | | 144 | |
| | Bridge Bancorp Inc. | 7,068 | | 141 | |
| | First Community Bankshares Inc. | 7,347 | | 141 | |
| | Waterstone Financial Inc. | 9,097 | | 141 | |
| * | Donnelley Financial Solutions Inc. | 12,726 | | 139 | |
| | Flushing Financial Corp. | 11,424 | | 139 | |
| | Chatham Lodging Trust | 19,638 | | 136 | |
| | Midland States Bancorp Inc. | 9,295 | | 136 | |
| | Independent Bank Corp. | 8,950 | | 133 | |
| | Preferred Apartment Communities Inc. Class A | 20,151 | | 133 | |
| | Cowen Inc. Class A | 7,326 | | 133 | |
| | Bar Harbor Bankshares | 6,518 | | 132 | |
| | Peapack-Gladstone Financial Corp. | 7,752 | | 132 | |
| | Altabancorp | 6,385 | | 132 | |
| | Alerus Financial Corp. | 6,337 | | 130 | |
| | Byline Bancorp Inc. | 10,290 | | 130 | |
| | Ares Commercial Real Estate Corp. | 13,035 | | 130 | |
| | Farmers National Banc Corp. | 11,001 | | 128 | |
| | Heritage Insurance Holdings Inc. | 9,788 | | 128 | |
| * | Tejon Ranch Co. | 8,868 | | 127 | |
| | Republic Bancorp Inc. Class A | 4,123 | | 127 | |
| * | Amerant Bancorp Inc. | 9,611 | | 126 | |
| | One Liberty Properties Inc. | 6,582 | | 126 | |
| * | Forestar Group Inc. | 7,061 | | 125 | |
| * | Citizens Inc. Class A | 21,015 | | 123 | |
| | MidWestOne Financial Group Inc. | 6,223 | | 118 | |
| | CBTX Inc. | 7,487 | | 118 | |
| | Cambridge Bancorp | 2,141 | | 117 | |
| | Urstadt Biddle Properties Inc. Class A | 12,603 | | 117 | |
| * | FRP Holdings Inc. | 2,851 | | 117 | |
| * | Watford Holdings Ltd. | 7,259 | | 116 | |
| | Financial Institutions Inc. | 6,716 | | 116 | |
| | Capital City Bank Group Inc. | 5,687 | | 115 | |
| | State Auto Financial Corp. | 7,441 | | 115 | |
| | Hanmi Financial Corp. | 11,895 | | 113 | |
| | EastGroup Properties Inc. | 834 | | 111 | |
| * | EZCORP Inc. Class A | 20,494 | | 110 | |
| | Ryman Hospitality Properties Inc. | 2,886 | | 110 | |
| | HCI Group Inc. | 1,992 | | 109 | |
| | Whitestone REIT | 16,885 | | 109 | |
| | Peoples Financial Services Corp. | 2,961 | | 108 | |
| | Sierra Bancorp | 5,923 | | 106 | |
| | Hingham Institution For Savings | 568 | | 104 | |
| * | Oportun Financial Corp. | 8,239 | | 103 | |
| * | Atlantic Capital Bancshares Inc. | 8,854 | | 102 | |
| | American National Bankshares Inc. | 4,517 | | 102 | |
| | West BanCorp Inc. | 5,779 | | 102 | |
| | Metrocity Bankshares Inc. | 7,339 | | 100 | |
| | CNB Financial Corp. | 6,276 | | 100 | |
| | Old Second Bancorp Inc. | 12,195 | | 100 | |
| | Sculptor Capital Management Inc. Class A | 7,716 | | 99 | |
Vanguard® Russell 2000 Value Index Fund
Schedule of Investments
August 31, 2020
| Shares | | Market
Value
($000 | ) |
| * | Equity Bancshares Inc. Class A | 6,150 | | 98 | |
| * | Silvergate Capital Corp. Class A | 6,531 | | 98 | |
| | Oppenheimer Holdings Inc. Class A | 3,981 | | 97 | |
| | Citizens & Northern Corp. | 5,663 | | 97 | |
| * | Assetmark Financial Holdings Inc. | 4,003 | | 97 | |
| | QTS Realty Trust Inc. Class A | 1,423 | | 97 | |
| | CorePoint Lodging Inc. | 16,637 | | 95 | |
| | HomeTrust Bancshares Inc. | 6,626 | | 93 | |
| | Hersha Hospitality Trust Class A | 14,423 | | 93 | |
| | Farmers & Merchants Bancorp Inc. | 4,291 | | 92 | |
| * | Metropolitan Bank Holding Corp. | 2,968 | | 92 | |
| | First Bancorp Inc. | 4,291 | | 91 | |
| | RBB Bancorp | 7,039 | | 91 | |
| | Red River Bancshares Inc. | 2,092 | | 91 | |
| * | Bridgewater Bancshares Inc. | 9,359 | | 91 | |
| * | Cardtronics plc Class A | 4,163 | | 90 | |
| | Reliant Bancorp Inc. | 6,175 | | 90 | |
| | Civista Bancshares Inc. | 6,699 | | 89 | |
| * | Greenlight Capital Re Ltd. Class A | 12,245 | | 89 | |
| | Retail Value Inc. | 6,955 | | 88 | |
| | First Capital Inc. | 1,381 | | 84 | |
| | CTO Realty Growth Inc. | 1,976 | | 83 | |
| | Enterprise Bancorp Inc. | 3,810 | | 83 | |
| | ChoiceOne Financial Services Inc. | 2,892 | | 82 | |
| | SmartFinancial Inc. | 5,943 | | 82 | |
| | BBX Capital Corp. Class A | 5,291 | | 81 | |
| | Macatawa Bank Corp. | 11,130 | | 81 | |
| | Great Ajax Corp. | 8,772 | | 80 | |
| * | Southern First Bancshares Inc. | 3,075 | | 80 | |
| | PCSB Financial Corp. | 6,277 | | 80 | |
| | Home Bancorp Inc. | 3,285 | | 79 | |
| | Guaranty Bancshares Inc. | 2,962 | | 78 | |
| | Southern Missouri Bancorp Inc. | 3,265 | | 77 | |
| | James River Group Holdings Ltd. | 1,580 | | 77 | |
| * | MoneyGram International Inc. | 26,283 | | 77 | |
| | LCNB Corp. | 5,159 | | 76 | |
| | Fidelity D&D Bancorp Inc. | 1,671 | | 76 | |
| | Merchants Bancorp | 3,706 | | 76 | |
| | ACNB Corp. | 3,587 | | 75 | |
| | Business First Bancshares Inc. | 5,155 | | 75 | |
| | Ames National Corp. | 3,728 | | 74 | |
| | Farmland Partners Inc. | 11,070 | | 74 | |
| | Century Bancorp Inc. Class A | 1,051 | | 74 | |
| | Anworth Mortgage Asset Corp. | 41,565 | | 72 | |
| | Southern National Bancorp of Virginia Inc. | 8,402 | | 72 | |
| * | Spirit of Texas Bancshares Inc. | 5,743 | | 72 | |
| | Northrim BanCorp Inc. | 2,650 | | 71 | |
| | Premier Financial Bancorp Inc. | 5,534 | | 71 | |
| | Territorial Bancorp Inc. | 3,329 | | 70 | |
| | Summit Financial Group Inc. | 4,735 | | 70 | |
| | Capstar Financial Holdings Inc. | 6,779 | | 69 | |
| | Luther Burbank Corp. | 7,414 | | 69 | |
| | Independence Holding Co. | 1,960 | | 69 | |
| | Carter Bank & Trust | 9,604 | | 68 | |
| * | Rafael Holdings Inc. Class B | 3,895 | | 68 | |
| | Monmouth Real Estate Investment Corp. | 4,670 | | 68 | |
| | National Bankshares Inc. | 2,713 | | 67 | |
| | Gladstone Land Corp. | 4,253 | | 67 | |
| | Donegal Group Inc. Class A | 4,636 | | 67 | |
| | Investors Title Co. | 485 | | 66 | |
| | Amalgamated Bank Class A | 5,600 | | 66 | |
| * | Regional Management Corp. | 3,575 | | 65 | |
| | United Insurance Holdings Corp. | 8,626 | | 65 | |
| * | PICO Holdings Inc. | 7,308 | | 65 | |
| | | | | | |
Vanguard® Russell 2000 Value Index Fund
Schedule of Investments
August 31, 2020
| Shares | | Market
Value
($000 | ) |
| | South Plains Financial Inc. | 4,494 | | 64 | |
| | Orrstown Financial Services Inc. | 4,616 | | 64 | |
| * | NI Holdings Inc. | 3,893 | | 64 | |
| | First Choice Bancorp | 4,395 | | 62 | |
| | Cherry Hill Mortgage Investment Corp. | 6,445 | | 62 | |
| | Norwood Financial Corp. | 2,468 | | 61 | |
| | Penns Woods Bancorp Inc. | 2,904 | | 60 | |
| | Tiptree Inc. | 10,572 | | 60 | |
| | MVB Financial Corp. | 4,184 | | 59 | |
| | Richmond Mutual BanCorp Inc. | 5,214 | | 59 | |
| | Investar Holding Corp. | 4,316 | | 59 | |
| | FS Bancorp Inc. | 1,480 | | 59 | |
| | First Internet Bancorp | 4,007 | | 59 | |
| | Mid Penn Bancorp Inc. | 2,944 | | 57 | |
| | Northeast Bank | 3,029 | | 57 | |
| | BRT Apartments Corp. | 4,216 | | 56 | |
| | Timberland Bancorp Inc. | 3,160 | | 55 | |
| | Parke Bancorp Inc. | 4,483 | | 55 | |
| * | Howard Bancorp Inc. | 5,584 | | 55 | |
| | Protective Insurance Corp. Class B | 3,812 | | 55 | |
| | Central Valley Community Bancorp | 4,486 | | 54 | |
| | First Business Financial Services Inc. | 3,456 | | 54 | |
| * | FVCBankcorp Inc. | 5,009 | | 53 | |
| | CorEnergy Infrastructure Trust Inc. | 5,866 | | 52 | |
| | Safeguard Scientifics Inc. | 8,300 | | 52 | |
| * | Select Bancorp Inc. | 6,730 | | 51 | |
| | Shore Bancshares Inc. | 5,261 | | 51 | |
| | Codorus Valley Bancorp Inc. | 3,970 | | 51 | |
| | ESSA Bancorp Inc. | 3,982 | | 51 | |
| | PCB Bancorp | 5,287 | | 51 | |
| | UMH Properties Inc. | 3,471 | | 50 | |
| | Western Asset Mortgage Capital Corp. | 22,158 | | 50 | |
| | BCB Bancorp Inc. | 6,172 | | 50 | |
| | Western New England Bancorp Inc. | 9,697 | | 50 | |
| | Bank of Commerce Holdings | 6,750 | | 50 | |
| | HBT Financial Inc. | 4,152 | | 49 | |
| | Community Financial Corp. | 2,209 | | 49 | |
| * | Stratus Properties Inc. | 2,497 | | 49 | |
| * | Coastal Financial Corp. | 3,518 | | 48 | |
| | Bluerock Residential Growth REIT Inc. | 6,500 | | 48 | |
| | Middlefield Banc Corp. | 2,534 | | 48 | |
| | Community Bankers Trust Corp. | 9,233 | | 47 | |
| * | MMA Capital Holdings Inc. | 2,014 | | 47 | |
| | C&F Financial Corp. | 1,474 | | 47 | |
| | Eagle Bancorp Montana Inc. | 2,671 | | 47 | |
| | Bank of Princeton | 2,416 | | 47 | |
| | Universal Health Realty Income Trust | 702 | | 47 | |
| | 1st Constitution Bancorp | 3,839 | | 47 | |
| | Evans Bancorp Inc. | 2,021 | | 46 | |
| | First Bank | 6,975 | | 45 | |
| | Hawthorn Bancshares Inc. | 2,480 | | 45 | |
| | Bankwell Financial Group Inc. | 2,810 | | 44 | |
| | Chemung Financial Corp. | 1,526 | | 44 | |
| | Ellington Residential Mortgage REIT | 3,826 | | 43 | |
| | Citizens Holding Co. | 1,985 | | 43 | |
| * | BayCom Corp. | 3,652 | | 42 | |
| | First Northwest Bancorp | 3,803 | | 42 | |
| | FedNat Holding Co. | 4,972 | | 42 | |
| | FNCB Bancorp Inc. | 7,200 | | 42 | |
| | Arlington Asset Investment Corp. Class A | 15,484 | | 42 | |
| | Unity Bancorp Inc. | 3,157 | | 42 | |
| | Franklin Financial Services Corp. | 1,754 | | 42 | |
| * | California Bancorp Inc. | 3,207 | | 42 | |
| * | Alpine Income Property Trust Inc. | 2,872 | | 42 | |
| | | | | | |
Vanguard® Russell 2000 Value Index Fund
Schedule of Investments
August 31, 2020
| Shares | | Market
Value
($000 | ) |
| | SB Financial Group Inc. | 3,011 | | 42 | |
| | Ohio Valley Banc Corp. | 1,823 | | 42 | |
| | BankFinancial Corp. | 5,692 | | 41 | |
| | County Bancorp Inc. | 2,122 | | 41 | |
| | Auburn National BanCorp Inc. | 992 | | 40 | |
| * | Republic First Bancorp Inc. | 19,279 | | 40 | |
| * | Pioneer Bancorp Inc. | 4,939 | | 40 | |
| | Oak Valley Bancorp | 2,901 | | 39 | |
| | Plumas Bancorp | 1,972 | | 39 | |
| | CB Financial Services Inc. | 2,093 | | 39 | |
| | Crawford & Co. Class A | 5,617 | | 39 | |
| * | MainStreet Bancshares Inc. | 3,004 | | 39 | |
| | First Community Corp. | 3,035 | | 38 | |
| | Salisbury Bancorp Inc. | 1,075 | | 38 | |
| | Mackinac Financial Corp. | 3,796 | | 38 | |
| | Riverview Bancorp Inc. | 9,180 | | 38 | |
| | Westwood Holdings Group Inc. | 3,315 | | 38 | |
| * | ProSight Global Inc. | 3,954 | | 37 | |
| | Prudential Bancorp Inc. | 3,649 | | 36 | |
| | Colony Bankcorp Inc. | 3,280 | | 36 | |
| * | First Western Financial Inc. | 2,648 | | 36 | |
| | Level One Bancorp Inc. | 2,176 | | 35 | |
| | United Security Bancshares | 5,717 | | 35 | |
| | First Savings Financial Group Inc. | 792 | | 34 | |
| * | Capital Bancorp Inc. | 3,262 | | 34 | |
| * | Esquire Financial Holdings Inc. | 2,030 | | 34 | |
| | Landmark Bancorp Inc. | 1,592 | | 33 | |
| | First United Corp. | 2,847 | | 33 | |
| | Peoples Bancorp of North Carolina Inc. | 1,882 | | 32 | |
| | OP Bancorp | 5,186 | | 32 | |
| | Provident Financial Holdings Inc. | 2,545 | | 30 | |
| | Associated Capital Group Inc. Class A | 784 | | 30 | |
| | Standard AVB Financial Corp. | 1,638 | | 30 | |
| | Provident Bancorp Inc. | 3,625 | | 28 | |
| | Meridian Corp. | 1,868 | | 27 | |
| | Greene County Bancorp Inc. | 1,142 | | 27 | |
| * | PDL Community Bancorp | 3,195 | | 26 | |
| * | Security National Financial Corp. Class A | 4,019 | | 25 | |
| | Silvercrest Asset Management Group Inc. Class A | 1,943 | | 24 | |
| | Marlin Business Services Corp. | 3,549 | | 24 | |
| * | Professional Holding Corp. Class A | 1,965 | | 23 | |
| * | Limestone Bancorp Inc. | 2,080 | | 22 | |
| * | Partners Bancorp | 4,079 | | 22 | |
| * | Altisource Portfolio Solutions SA | 1,844 | | 21 | |
| | Sterling Bancorp Inc. | 6,950 | | 21 | |
| | Griffin Industrial Realty Inc. | 376 | | 20 | |
| * | Dun & Bradstreet Holdings Inc. | 748 | | 19 | |
| | First Guaranty Bancshares Inc. | 1,458 | | 19 | |
| | Saul Centers Inc. | 659 | | 18 | |
| * | SWK Holdings Corp. | 1,431 | | 18 | |
| * | Maui Land & Pineapple Co. Inc. | 1,563 | | 18 | |
| * | Bogota Financial Corp. | 2,299 | | 16 | |
| | RMR Group Inc. Class A | 565 | | 16 | |
| * | Transcontinental Realty Investors Inc. | 588 | | 14 | |
| | Bank First Corp. | 203 | | 13 | |
| | Alexander's Inc. | 48 | | 12 | |
| | Oconee Federal Financial Corp. | 443 | | 12 | |
| | Bank7 Corp. | 817 | | 8 | |
| * | Vericity Inc. | 815 | | 6 | |
| | Clipper Realty Inc. | 768 | | 5 | |
| * | American Realty Investors Inc. | 538 | | 5 | |
| | Crawford & Co. Class B | 604 | | 4 | |
| | GAMCO Investors Inc. Class A | 264 | | 3 | |
| * | Avalon GloboCare Corp. | 1,461 | | 2 | |
| | | | | | |
Vanguard® Russell 2000 Value Index Fund
Schedule of Investments
August 31, 2020
| Shares | | Market
Value
($000 | ) |
| | Value Line Inc. | 38 | | | 1 | |
| | | 144,887 | |
| Health Care (6.1%) | |
| * | Novavax Inc. | 17,916 | | 1,977 | |
| * | Arena Pharmaceuticals Inc. | 21,746 | | 1,518 | |
| * | Tenet Healthcare Corp. | 39,639 | | 1,117 | |
| | Patterson Cos. Inc. | 35,796 | | 1,038 | |
| * | Avanos Medical Inc. | 20,057 | | 650 | |
| * | MEDNAX Inc. | 34,933 | | 649 | |
| * | Allscripts Healthcare Solutions Inc. | 64,373 | | 575 | |
| * | OPKO Health Inc. | 167,775 | | 544 | |
| * | Prestige Consumer Healthcare Inc. | 13,702 | | 499 | |
| | Owens & Minor Inc. | 26,143 | | 433 | |
| * | Magellan Health Inc. | 5,543 | | 418 | |
| * | Myriad Genetics Inc. | 29,752 | | 398 | |
| * | Evolent Health Inc. Class A | 26,839 | | 385 | |
| * | MacroGenics Inc. | 13,082 | | 379 | |
| * | Enanta Pharmaceuticals Inc. | 7,241 | | 378 | |
| * | Supernus Pharmaceuticals Inc. | 15,854 | | 349 | |
| * | Integer Holdings Corp. | 5,020 | | 348 | |
| | National HealthCare Corp. | 5,254 | | 335 | |
| * | NextGen Healthcare Inc. | 22,903 | | 304 | |
| * | MyoKardia Inc. | 2,632 | | 288 | |
| * | LivaNova plc | 6,086 | | 285 | |
| * | Hanger Inc. | 13,866 | | 274 | |
| * | Intra-Cellular Therapies Inc. | 14,457 | | 263 | |
| * | Orthofix Medical Inc. | 7,911 | | 240 | |
| * | Vanda Pharmaceuticals Inc. | 22,783 | | 234 | |
| * | Anika Therapeutics Inc. | 5,921 | | 227 | |
| * | HealthStream Inc. | 10,930 | | 226 | |
| * | FibroGen Inc. | 5,002 | | 224 | |
| * | Fluidigm Corp. | 27,483 | | 216 | |
| * | Brookdale Senior Living Inc. | 77,807 | | 214 | |
| * | Spectrum Pharmaceuticals Inc. | 48,873 | | 206 | |
| * | Heska Corp. | 1,891 | | 196 | |
| * | Cymabay Therapeutics Inc. | 29,360 | | 190 | |
| * | Community Health Systems Inc. | 36,109 | | 187 | |
| * | Epizyme Inc. | 13,991 | | 182 | |
| * | Varex Imaging Corp. | 15,920 | | 177 | |
| * | Natus Medical Inc. | 9,695 | | 176 | |
| * | Viking Therapeutics Inc. | 25,796 | | 173 | |
| * | Gossamer Bio Inc. | 12,234 | | 170 | |
| * | Prothena Corp. plc | 13,046 | | 169 | |
| * | Triple-S Management Corp. Class B | 8,955 | | 167 | |
| * | Endo International plc | 54,719 | | 165 | |
| * | Revance Therapeutics Inc. | 5,590 | | 163 | |
| * | Momenta Pharmaceuticals Inc. | 3,101 | | 162 | |
| * | PDL BioPharma Inc. | 48,224 | | 162 | |
| * | Geron Corp. | 78,621 | | 161 | |
| * | Tivity Health Inc. | 9,751 | | 160 | |
| * | AnaptysBio Inc. | 9,078 | | 157 | |
| * | ImmunoGen Inc. | 41,516 | | 154 | |
| | Computer Programs and Systems Inc. | 5,451 | | 149 | |
| * | TG Therapeutics Inc. | 5,981 | | 148 | |
| * | SeaSpine Holdings Corp. | 11,108 | | 148 | |
| * | AngioDynamics Inc. | 15,551 | | 146 | |
| * | Assembly Biosciences Inc. | 6,220 | | 136 | |
| * | AMAG Pharmaceuticals Inc. | 13,084 | | 136 | |
| * | TCR2 Therapeutics Inc. | 6,465 | | 131 | |
| * | OraSure Technologies Inc. | 10,354 | | 121 | |
| * | G1 Therapeutics Inc. | 7,696 | | 118 | |
| * | Concert Pharmaceuticals Inc. | 12,130 | | 117 | |
| * | Natera Inc. | 1,806 | | 115 | |
| * | XBiotech Inc. | 6,051 | | 114 | |
| | | | | | |
Vanguard® Russell 2000 Value Index Fund
Schedule of Investments
August 31, 2020
| Shares | | Market
Value
($000 | ) |
| * | Principia Biopharma Inc. | 1,072 | | 107 | |
| | Invacare Corp. | 14,316 | | 97 | |
| * | NanoString Technologies Inc. | 2,130 | | 86 | |
| * | IVERIC bio Inc. | 19,131 | | 86 | |
| * | Atara Biotherapeutics Inc. | 6,306 | | 85 | |
| * | ZIOPHARM Oncology Inc. | 29,589 | | 83 | |
| * | ViewRay Inc. | 29,714 | | 81 | |
| * | UroGen Pharma Ltd. | 3,210 | | 81 | |
| * | Inogen Inc. | 2,583 | | 78 | |
| * | Akcea Therapeutics Inc. | 3,926 | | 72 | |
| * | Lannett Co. Inc. | 13,491 | | 71 | |
| * | Cytokinetics Inc. | 2,899 | | 69 | |
| * | FONAR Corp. | 2,674 | | 68 | |
| * | Cyclerion Therapeutics Inc. | 9,396 | | 64 | |
| * | Turning Point Therapeutics Inc. | 793 | | 62 | |
| * | KalVista Pharmaceuticals Inc. | 4,686 | | 61 | |
| * | Rubius Therapeutics Inc. | 12,515 | | 60 | |
| * | CryoLife Inc. | 2,965 | | 60 | |
| * | Menlo Therapeutics Inc. | 38,879 | | 59 | |
| * | ANI Pharmaceuticals Inc. | 1,892 | | 59 | |
| * | Apyx Medical Corp. | 12,845 | | 59 | |
| * | VBI Vaccines Inc. | 13,615 | | 58 | |
| * | Cabaletta Bio Inc. | 5,475 | | 58 | |
| * | Chimerix Inc. | 20,529 | | 58 | |
| * | BioCryst Pharmaceuticals Inc. | 13,869 | | 58 | |
| * | X4 Pharmaceuticals Inc. | 6,829 | | 57 | |
| ^,* | Mallinckrodt plc | 35,904 | | 57 | |
| * | Harvard Bioscience Inc. | 15,998 | | 54 | |
| * | Surgalign Holdings Inc. | 24,074 | | 53 | |
| * | Kezar Life Sciences Inc. | 10,957 | | 53 | |
| * | GlycoMimetics Inc. | 14,365 | | 53 | |
| * | Adverum Biotechnologies Inc. | 4,304 | | 52 | |
| * | Verastem Inc. | 40,857 | | 51 | |
| * | Applied Genetic Technologies Corp. | 9,908 | | 51 | |
| * | Pacific Biosciences of California Inc. | 7,667 | | 51 | |
| * | Theravance Biopharma Inc. | 2,735 | | 50 | |
| * | Ideaya Biosciences Inc. | 4,131 | | 50 | |
| * | Five Prime Therapeutics Inc. | 11,360 | | 48 | |
| * | Albireo Pharma Inc. | 1,725 | | 48 | |
| * | Xencor Inc. | 1,322 | | 47 | |
| * | Misonix Inc. | 3,528 | | 47 | |
| | LeMaitre Vascular Inc. | 1,423 | | 46 | |
| * | IntriCon Corp. | 3,544 | | 43 | |
| * | Five Star Senior Living Inc. | 8,007 | | 41 | |
| * | Enzo Biochem Inc. | 18,822 | | 40 | |
| * | Abeona Therapeutics Inc. | 17,022 | | 40 | |
| * | Selecta Biosciences Inc. | 15,194 | | 39 | |
| * | Catalyst Biosciences Inc. | 7,405 | | 39 | |
| * | Passage Bio Inc. | 2,215 | | 37 | |
| * | Vericel Corp. | 2,256 | | 36 | |
| * | Mirum Pharmaceuticals Inc. | 1,358 | | 35 | |
| * | Jounce Therapeutics Inc. | 7,248 | | 35 | |
| * | Dynavax Technologies Corp. | 5,840 | | 35 | |
| * | Gritstone Oncology Inc. | 10,534 | | 35 | |
| * | Aptinyx Inc. | 10,430 | | 34 | |
| * | Cellular Biomedicine Group Inc. | 1,823 | | 34 | |
| * | Precigen Inc. | 5,447 | | 33 | |
| * | Meridian Bioscience Inc. | 2,316 | | 33 | |
| * | Orgenesis Inc. | 6,204 | | 33 | |
| * | AcelRx Pharmaceuticals Inc. | 25,720 | | 32 | |
| * | Savara Inc. | 19,708 | | 29 | |
| * | American Renal Associates Holdings Inc. | 3,933 | | 26 | |
| ^,* | CEL-SCI Corp. | 2,027 | | 26 | |
| | Utah Medical Products Inc. | 314 | | 26 | |
| | | | | | |
Vanguard® Russell 2000 Value Index Fund
Schedule of Investments
August 31, 2020
| Shares | | Market
Value
($000 | ) |
| * | Enochian Biosciences Inc. | 6,168 | | 25 | |
| * | Solid Biosciences Inc. | 9,278 | | 22 | |
| ^,* | TherapeuticsMD Inc. | 14,916 | | 22 | |
| ^,* | Evolus Inc. | 5,048 | | 19 | |
| * | Cortexyme Inc. | 433 | | 19 | |
| * | Cassava Sciences Inc. | 6,041 | | 19 | |
| * | Avid Bioservices Inc. | 2,208 | | 19 | |
| * | Aeglea BioTherapeutics Inc. | 2,457 | | 18 | |
| * | Vaxart Inc. | 2,832 | | 17 | |
| * | MEI Pharma Inc. | 6,127 | | 17 | |
| * | Alphatec Holdings Inc. | 2,315 | | 14 | |
| * | Sientra Inc. | 3,477 | | 13 | |
| | Phibro Animal Health Corp. Class A | 610 | | 13 | |
| * | NantKwest Inc. | 1,759 | | 13 | |
| * | NGM Biopharmaceuticals Inc. | 674 | | 13 | |
| * | Kindred Biosciences Inc. | 2,432 | | 12 | |
| * | Option Care Health Inc. | 1,000 | �� | 12 | |
| * | Sutro Biopharma Inc. | 1,158 | | 12 | |
| * | Kiniksa Pharmaceuticals Ltd. Class A | 651 | | 11 | |
| * | Aduro Biotech Inc. | 3,622 | | 11 | |
| * | MeiraGTx Holdings plc | 817 | | 11 | |
| * | Keros Therapeutics Inc. | 197 | | 11 | |
| * | Catabasis Pharmaceuticals Inc. | 1,581 | | 10 | |
| * | Osmotica Pharmaceuticals plc | 1,742 | | 10 | |
| * | Atreca Inc. Class A | 721 | | 10 | |
| * | Immunic Inc. | 593 | | 9 | |
| * | Dyadic International Inc. | 1,174 | | 9 | |
| * | AVEO Pharmaceuticals Inc. | 1,896 | | 9 | |
| * | Zentalis Pharmaceuticals Inc. | 261 | | 9 | |
| * | Cidara Therapeutics Inc. | 2,809 | | 9 | |
| * | Aytu BioScience Inc. | 8,399 | | 9 | |
| * | ADMA Biologics Inc. | 3,380 | | 9 | |
| * | XOMA Corp. | 440 | | 8 | |
| * | Spero Therapeutics Inc. | 719 | | 8 | |
| * | Magenta Therapeutics Inc. | 1,044 | | 8 | |
| * | Exicure Inc. | 3,596 | | 7 | |
| * | Venus Concept Inc. | 2,451 | | 7 | |
| * | Precision BioSciences Inc. | 1,115 | | 6 | |
| * | Marker Therapeutics Inc. | 3,403 | | 6 | |
| * | ORIC Pharmaceuticals Inc. | 244 | | 6 | |
| * | Agile Therapeutics Inc. | 1,797 | | 6 | |
| * | Soleno Therapeutics Inc. | 2,522 | | 5 | |
| * | Strongbridge Biopharma plc | 1,375 | | 5 | |
| ^,* | iBio Inc. | 2,506 | | 5 | |
| * | Paratek Pharmaceuticals Inc. | 1,069 | | 5 | |
| * | Chembio Diagnostics Inc. | 1,189 | | 5 | |
| * | CASI Pharmaceuticals Inc. | 2,716 | | 5 | |
| * | Nymox Pharmaceutical Corp. | 1,602 | | 4 | |
| * | Xeris Pharmaceuticals Inc. | 835 | | 4 | |
| * | Beyondspring Inc. | 313 | | 4 | |
| * | CorMedix Inc. | 822 | | 4 | |
| * | Hookipa Pharma Inc. | 422 | | 4 | |
| * | NextCure Inc. | 396 | | 4 | |
| * | Milestone Scientific Inc. | 2,301 | | 3 | |
| * | Rockwell Medical Inc. | 2,471 | | 3 | |
| * | Aspira Women's Health Inc. | 964 | | 3 | |
| * | Evofem Biosciences Inc. | 757 | | 2 | |
| * | Retractable Technologies Inc. | 390 | | | 2 | |
| | | 23,815 | |
| Materials & Processing (8.0%) | |
| | Hecla Mining Co. | 219,995 | | 1,324 | |
| | Rexnord Corp. | 41,387 | | 1,199 | |
| * | Alcoa Corp. | 79,003 | | 1,155 | |
| * | BMC Stock Holdings Inc. | 28,354 | | 1,132 | |
| | | | | | |
Vanguard® Russell 2000 Value Index Fund
Schedule of Investments
August 31, 2020
| | Shares | | Market
Value
($000 | ) |
| | Cleveland-Cliffs Inc. | 166,475 | | 1,095 | |
| | Commercial Metals Co. | 50,001 | | 1,044 | |
| | Avient Corp. | 38,566 | | 984 | |
| | Stepan Co. | 8,364 | | 964 | |
| * | Arconic Corp. | 41,929 | | 933 | |
| * | Coeur Mining Inc. | 102,140 | | 864 | |
| * | Beacon Roofing Supply Inc. | 23,024 | | 780 | |
| * | Summit Materials Inc. Class A | 49,665 | | 739 | |
| | Minerals Technologies Inc. | 14,359 | | 729 | |
| | United States Steel Corp. | 92,180 | | 722 | |
| | Mueller Industries Inc. | 23,560 | | 700 | |
| | Mueller Water Products Inc. Class A | 62,292 | | 673 | |
| * | Gibraltar Industries Inc. | 10,643 | | 665 | |
| | Domtar Corp. | 23,102 | | 659 | |
| | Worthington Industries Inc. | 15,638 | | 649 | |
| | Boise Cascade Co. | 13,653 | | 625 | |
| * | JELD-WEN Holding Inc. | 28,591 | | 602 | |
| | Sensient Technologies Corp. | 10,563 | | 583 | |
| | Comfort Systems USA Inc. | 10,720 | | 543 | |
| * | Livent Corp. | 61,681 | | 523 | |
| * | GMS Inc. | 17,495 | | 463 | |
| | Kaiser Aluminum Corp. | 6,600 | | 424 | |
| | Carpenter Technology Corp. | 19,840 | | 417 | |
| | Greif Inc. Class A | 10,788 | | 398 | |
| | Schweitzer-Mauduit International Inc. | 13,040 | | 395 | |
| | HB Fuller Co. | 7,655 | | 369 | |
| | Griffon Corp. | 15,417 | | 335 | |
| | Materion Corp. | 5,909 | | 323 | |
| | Neenah Inc. | 7,107 | | 315 | |
| | Trinseo SA | 11,139 | | 277 | |
| | P H Glatfelter Co. | 18,317 | | 275 | |
| * | PGT Innovations Inc. | 14,997 | | 272 | |
| | UFP Industries Inc. | 3,979 | | 236 | |
| * | Clearwater Paper Corp. | 6,816 | | 229 | |
| | Quanex Building Products Corp. | 13,634 | | 229 | |
| | Tronox Holdings plc Class A | 24,690 | | 221 | |
| | Schnitzer Steel Industries Inc. | 10,934 | | 216 | |
| * | Century Aluminum Co. | 21,404 | | 211 | |
| | Verso Corp. | 14,878 | | 195 | |
| | Apogee Enterprises Inc. | 9,265 | | 194 | |
| * | MRC Global Inc. | 33,298 | | 189 | |
| * | Kraton Corp. | 13,220 | | 186 | |
| | Tredegar Corp. | 10,857 | | 184 | |
| * | US Concrete Inc. | 6,766 | | 181 | |
| | O-I Glass Inc. | 15,009 | | 163 | |
| * | PQ Group Holdings Inc. | 13,322 | | 155 | |
| | Innospec Inc. | 1,981 | | 148 | |
| * | AdvanSix Inc. | 11,604 | | 148 | |
| | Myers Industries Inc. | 9,600 | | 147 | |
| | Insteel Industries Inc. | 7,865 | | 145 | |
| | American Vanguard Corp. | 9,932 | | 141 | |
| * | Builders FirstSource Inc. | 4,559 | | 140 | |
| | US Silica Holdings Inc. | 31,240 | | 139 | |
| | Orion Engineered Carbons SA | 11,316 | | 137 | |
| | FutureFuel Corp. | 10,963 | | 133 | |
| | Kronos Worldwide Inc. | 9,487 | | 118 | |
| * | GCP Applied Technologies Inc. | 4,539 | | 118 | |
| * | Northwest Pipe Co. | 4,080 | | 116 | |
| * | Ferro Corp. | 9,023 | | 113 | |
| * | UFP Technologies Inc. | 2,693 | | 111 | |
| * | Foundation Building Materials Inc. | 6,807 | | 110 | |
| | Gold Resource Corp. | 27,680 | | 110 | |
| * | Ranpak Holdings Corp. Class A | 12,275 | | 110 | |
| | Balchem Corp. | 1,118 | | 109 | |
Vanguard® Russell 2000 Value Index Fund
Schedule of Investments
August 31, 2020
| | Shares | | Market
Value
($000 | ) |
| | Caesarstone Ltd. | 9,431 | | 104 | |
| | Greif Inc. Class B | 2,530 | | 104 | |
| | Haynes International Inc. | 5,292 | | 99 | |
| * | Veritiv Corp. | 5,463 | | 95 | |
| | Hawkins Inc. | 1,887 | | 95 | |
| * | Energy Fuels Inc. | 49,437 | | 90 | |
| ^,* | Amyris Inc. | 26,987 | | 89 | |
| * | Cornerstone Building Brands Inc. | 10,978 | | 87 | |
| * | Rayonier Advanced Materials Inc. | 26,249 | | 83 | |
| * | Koppers Holdings Inc. | 3,428 | | 82 | |
| | NN Inc. | 17,790 | | 81 | |
| | United States Lime & Minerals Inc. | 809 | | 75 | |
| | LSI Industries Inc. | 10,862 | | 75 | |
| * | Novagold Resources Inc. | 6,849 | | 73 | |
| * | TimkenSteel Corp. | 19,057 | | 72 | |
| * | Unifi Inc. | 5,820 | | 71 | |
| * | Aspen Aerogels Inc. | 7,930 | | 67 | |
| * | LB Foster Co. Class A | 4,279 | | 64 | |
| | Caledonia Mining Corp. plc | 3,177 | | 58 | |
| * | Uranium Energy Corp. | 49,534 | | 57 | |
| | Eastern Co. | 2,290 | | 50 | |
| | Olympic Steel Inc. | 3,874 | | 43 | |
| * | Concrete Pumping Holdings Inc. | 11,360 | | 41 | |
| | Intrepid Potash Inc. | 4,034 | | 38 | |
| * | Ryerson Holding Corp. | 6,793 | | 37 | |
| * | AgroFresh Solutions Inc. | 11,986 | | 30 | |
| | Patrick Industries Inc. | 513 | | 29 | |
| | NL Industries Inc. | 3,551 | | 12 | |
| * | Marrone Bio Innovations Inc. | 1,572 | | 2 | |
| §,* | Ferroglobe Representation & Warranty | 19,424 | | — | |
| | | | | 31,134 | |
| Other (0.0%)1 | | | | |
| * | ALX Oncology Holdings Inc. | 245 | | 10 | |
| * | Rackspace Technology Inc. | 437 | | 9 | |
| * | Acutus Medical Inc. | 223 | | 8 | |
| * | Kymera Therapeutics Inc. | 199 | | 6 | |
| * | Vroom Inc. | 81 | | 6 | |
| * | GoHealth Inc. Class A | 381 | | 5 | |
| * | Selectquote Inc. | 245 | | 5 | |
| * | IBEX Ltd. | 273 | | 4 | |
| * | Annexon Inc. | 168 | | 4 | |
| * | Allovir Inc. | 127 | | 4 | |
| * | Lemonade Inc. | 64 | | 4 | |
| * | Generation Bio Co. | 118 | | 4 | |
| * | iTeos Therapeutics Inc. | 127 | | 4 | |
| * | Oak Street Health Inc. | 82 | | 4 | |
| * | Albertsons Cos. Inc. Class A | 258 | | 4 | |
| * | Pandion Therapeutics Inc. | 184 | | 3 | |
| * | Vaxcyte Inc. | 71 | | 3 | |
| * | Accolade Inc. | 90 | | 3 | |
| * | Shift4 Payments Inc. Class A | 60 | | 3 | |
| * | Nurix Therapeutics Inc. | 123 | | 3 | |
| * | Duck Creek Technologies Inc. | 61 | | 2 | |
| * | Applied Molecular Transport Inc. | 82 | | 2 | |
| * | Montrose Environmental Group Inc. | 74 | | 2 | |
| * | Vital Farms Inc. | 51 | | 2 | |
| * | Inari Medical Inc. | 24 | | 2 | |
| * | Vertex Inc. | 74 | | 2 | |
| * | Jamf Holding Corp. | 49 | | 2 | |
| * | Checkmate Pharmaceuticals Inc. | 113 | | 2 | |
| * | Progenity Inc. | 163 | | 2 | |
| * | Pliant Therapeutics Inc. | 57 | | 1 | |
| * | Trean Insurance Group Inc. | 91 | | 1 | |
| * | Akouos Inc. | 62 | | 1 | |
Vanguard® Russell 2000 Value Index Fund
Schedule of Investments
August 31, 2020
| | Shares | | Market
Value
($000 | ) |
| §,* | Media General Inc. CVR | 35,434 | | 1 | |
| * | Inhibrx Inc. | 74 | | 1 | |
| * | Poseida Therapeutics Inc. | 71 | | 1 | |
| §,* | NewStar Financial Inc. CVR | 6,148 | | 1 | |
| | | | | 121 | |
| Producer Durables (14.7%) | | | | |
| | EMCOR Group Inc. | 20,946 | | 1,571 | |
| | KBR Inc. | 52,444 | | 1,311 | |
| | EnerSys | 16,304 | | 1,174 | |
| | UniFirst Corp. | 5,993 | | 1,154 | |
| | ABM Industries Inc. | 28,197 | | 1,075 | |
| | Altra Industrial Motion Corp. | 27,223 | | 1,063 | |
| * | MasTec Inc. | 22,297 | | 1,030 | |
| | Kennametal Inc. | 35,055 | | 1,017 | |
| * | Chart Industries Inc. | 15,244 | | 1,002 | |
| | Hillenbrand Inc. | 31,272 | | 992 | |
| | GATX Corp. | 14,695 | | 983 | |
| * | WESCO International Inc. | 20,701 | | 970 | |
| *,2 | API Group Corp. | 59,072 | | 835 | |
| | Barnes Group Inc. | 19,808 | | 784 | |
| * | SPX FLOW Inc. | 17,941 | | 780 | |
| | Triton International Ltd. | 21,520 | | 776 | |
| | Moog Inc. Class A | 12,535 | | 756 | |
| * | Hub Group Inc. Class A | 13,810 | | 744 | |
| | Matson Inc. | 18,036 | | 723 | |
| | Korn Ferry | 23,113 | | 705 | |
| | SkyWest Inc. | 20,754 | | 698 | |
| * | Resideo Technologies Inc. | 52,228 | | 698 | |
| * | Navistar International Corp. | 21,037 | | 673 | |
| * | Spirit Airlines Inc. | 36,203 | | 647 | |
| | Belden Inc. | 18,585 | | 626 | |
| | Allegiant Travel Co. Class A | 4,851 | | 624 | |
| | Watts Water Technologies Inc. Class A | 6,405 | | 613 | |
| | Applied Industrial Technologies Inc. | 9,840 | | 592 | |
| | Herman Miller Inc. | 24,835 | | 592 | |
| | HNI Corp. | 17,948 | | 572 | |
| * | Atlas Air Worldwide Holdings Inc. | 10,129 | | 571 | |
| | Fluor Corp. | 59,186 | | 563 | |
| | Terex Corp. | 28,329 | | 554 | |
| | Cubic Corp. | 11,725 | | 552 | |
| | Rush Enterprises Inc. Class A | 11,151 | | 539 | |
| | Insperity Inc. | 7,658 | | 516 | |
| * | Sykes Enterprises Inc. | 15,525 | | 514 | |
| | EnPro Industries Inc. | 8,717 | | 510 | |
| | Deluxe Corp. | 17,559 | | 499 | |
| | Astec Industries Inc. | 9,440 | | 498 | |
| | US Ecology Inc. | 13,085 | | 486 | |
| ^,* | Workhorse Group Inc. | 26,584 | | 481 | |
| | Kaman Corp. | 10,398 | | 481 | |
| * | Cimpress plc | 5,046 | | 468 | |
| * | Harsco Corp. | 32,904 | | 466 | |
| * | TriMas Corp. | 18,211 | | 460 | |
| | Encore Wire Corp. | 8,573 | | 442 | |
| * | Allegheny Technologies Inc. | 53,110 | | 442 | |
| | Otter Tail Corp. | 11,237 | | 437 | |
| * | CBIZ Inc. | 17,871 | | 435 | |
| * | Vivint Smart Home Inc. | 23,086 | | 410 | |
| | Frontline Ltd. | 49,976 | | 398 | |
| * | Herc Holdings Inc. | 9,647 | | 395 | |
| | Heartland Express Inc. | 19,063 | | 394 | |
| | AZZ Inc. | 10,920 | | 379 | |
| | Steelcase Inc. Class A | 36,182 | | 378 | |
| * | Huron Consulting Group Inc. | 8,656 | | 376 | |
| | Greenbrier Cos. Inc. | 13,514 | | 367 | |
Vanguard® Russell 2000 Value Index Fund
Schedule of Investments
August 31, 2020
| | Shares | | Market
Value
($000 | ) |
| | ArcBest Corp. | 10,560 | | 357 | |
| | Columbus McKinnon Corp. | 9,710 | | 353 | |
| | SFL Corp. Ltd. | 39,079 | | 343 | |
| | Raven Industries Inc. | 13,686 | | 340 | |
| | Granite Construction Inc. | 17,504 | | 325 | |
| * | Echo Global Logistics Inc. | 10,953 | | 299 | |
| | Standex International Corp. | 5,141 | | 297 | |
| | Enerpac Tool Group Corp. Class A | 14,168 | | 295 | |
| * | Welbilt Inc. | 39,721 | | 293 | |
| | McGrath RentCorp | 4,369 | | 290 | |
| | Covanta Holding Corp. | 30,445 | | 287 | |
| | AAR Corp. | 14,197 | | 287 | |
| | Helios Technologies Inc. | 6,839 | | 281 | |
| | H&E Equipment Services Inc. | 13,576 | | 275 | |
| | Wabash National Corp. | 22,407 | | 274 | |
| | Knoll Inc. | 21,227 | | 273 | |
| * | ASGN Inc. | 3,731 | | 268 | |
| | Forward Air Corp. | 4,526 | | 267 | |
| | Kelly Services Inc. Class A | 14,050 | | 267 | |
| ^ | Nordic American Tankers Ltd. | 61,104 | | 266 | |
| | ICF International Inc. | 3,879 | | 265 | |
| * | Textainer Group Holdings Ltd. | 22,540 | | 265 | |
| | Argan Inc. | 6,153 | | 260 | |
| | Hawaiian Holdings Inc. | 19,279 | | 259 | |
| * | SEACOR Holdings Inc. | 8,133 | | 257 | |
| | Scorpio Tankers Inc. | 21,349 | | 253 | |
| * | TrueBlue Inc. | 14,922 | | 252 | |
| * | CIRCOR International Inc. | 8,454 | | 251 | |
| | DHT Holdings Inc. | 47,233 | | 250 | |
| | ACCO Brands Corp. | 38,448 | | 249 | |
| * | Great Lakes Dredge & Dock Corp. | 26,520 | | 248 | |
| | Pitney Bowes Inc. | 45,233 | | 248 | |
| | Brady Corp. Class A | 5,155 | | 242 | |
| * | Conduent Inc. | 69,921 | | 236 | |
| | Marten Transport Ltd. | 12,873 | | 234 | |
| * | Dycom Industries Inc. | 3,654 | | 225 | |
| * | Tutor Perini Corp. | 17,282 | | 217 | |
| * | Aegion Corp. Class A | 12,570 | | 203 | |
| | Gorman-Rupp Co. | 6,359 | | 203 | |
| | MTS Systems Corp. | 8,180 | | 200 | |
| | Ennis Inc. | 10,859 | | 199 | |
| * | SPX Corp. | 4,719 | | 197 | |
| * | Thermon Group Holdings Inc. | 13,871 | | 183 | |
| | International Seaways Inc. | 10,486 | | 178 | |
| | Heidrick & Struggles International Inc. | 8,128 | | 176 | |
| | Kimball International Inc. Class B | 15,278 | | 171 | |
| * | Ducommun Inc. | 4,564 | | 171 | |
| | Hyster-Yale Materials Handling Inc. | 4,199 | | 169 | |
| | Barrett Business Services Inc. | 2,931 | | 169 | |
| | Primoris Services Corp. | 8,849 | | 169 | |
| | Luxfer Holdings plc | 11,463 | | 163 | |
| * | BrightView Holdings Inc. | 13,222 | | 162 | |
| | Resources Connection Inc. | 12,934 | | 159 | |
| | Triumph Group Inc. | 21,826 | | 158 | |
| | Miller Industries Inc. | 4,703 | | 148 | |
| * | Casella Waste Systems Inc. Class A | 2,595 | | 146 | |
| * | Modine Manufacturing Co. | 20,988 | | 142 | |
| * | Sterling Construction Co. Inc. | 9,864 | | 139 | |
| * | Lydall Inc. | 7,247 | | 136 | |
| | Werner Enterprises Inc. | 2,943 | | 135 | |
| * | Manitowoc Co. Inc. | 14,364 | | 135 | |
| * | DXP Enterprises Inc. | 6,955 | | 134 | |
| * | Vectrus Inc. | 3,038 | | 132 | |
| * | Vishay Precision Group Inc. | 5,267 | | 131 | |
Vanguard® Russell 2000 Value Index Fund
Schedule of Investments
August 31, 2020
| | Shares | | Market
Value
($000 | ) |
| * | CAI International Inc. | 5,694 | | 124 | |
| | Albany International Corp. Class A | 2,292 | | 119 | |
| * | American Superconductor Corp. | 9,321 | | 117 | |
| * | CECO Environmental Corp. | 13,140 | | 111 | |
| | VSE Corp. | 3,760 | | 109 | |
| * | Titan Machinery Inc. | 8,073 | | 109 | |
| | Costamare Inc. | 21,053 | | 106 | |
| * | Dorian LPG Ltd. | 12,518 | | 106 | |
| | Powell Industries Inc. | 3,798 | | 103 | |
| * | Covenant Transportation Group Inc. Class A | 5,402 | | 99 | |
| * | MYR Group Inc. | 2,523 | | 98 | |
| * | Diamond S Shipping Inc. | 11,593 | | 95 | |
| * | Heritage-Crystal Clean Inc. | 6,426 | | 94 | |
| * | US Xpress Enterprises Inc. Class A | 9,391 | | 90 | |
| * | Astronics Corp. | 9,774 | | 88 | |
| | Park Aerospace Corp. | 7,942 | | 88 | |
| | Alamo Group Inc. | 792 | | 88 | |
| * | Radiant Logistics Inc. | 16,604 | | 88 | |
| * | Cross Country Healthcare Inc. | 13,560 | | 87 | |
| | Rush Enterprises Inc. Class B | 2,060 | | 86 | |
| | Franklin Electric Co. Inc. | 1,385 | | 82 | |
| * | Construction Partners Inc. Class A | 4,392 | | 82 | |
| * | Team Inc. | 12,714 | | 81 | |
| | REV Group Inc. | 10,242 | | 79 | |
| | ESCO Technologies Inc. | 867 | | 78 | |
| | Hurco Cos. Inc. | 2,710 | | 77 | |
| * | Acacia Research Corp. | 20,170 | | 77 | |
| * | Advanced Disposal Services Inc. | 2,488 | | 75 | |
| | Preformed Line Products Co. | 1,294 | | 70 | |
| * | IES Holdings Inc. | 2,233 | | 64 | |
| | Federal Signal Corp. | 1,977 | | 64 | |
| * | Overseas Shipholding Group Inc. Class A | 27,982 | | 59 | |
| | Park-Ohio Holdings Corp. | 3,658 | | 58 | |
| * | ServiceSource International Inc. | 36,852 | | 55 | |
| | Graham Corp. | 4,090 | | 54 | |
| * | GP Strategies Corp. | 5,536 | | 53 | |
| | Genco Shipping & Trading Ltd. | 7,265 | | 52 | |
| * | DHI Group Inc | 20,625 | | 50 | |
| * | Eagle Bulk Shipping Inc. | 18,778 | | 50 | |
| | Quad/Graphics Inc. | 14,093 | | 49 | |
| * | Blue Bird Corp. | 4,005 | | 46 | |
| | Ardmore Shipping Corp. | 12,268 | | 45 | |
| * | Mesa Air Group Inc. | 12,366 | | 45 | |
| * | Gencor Industries Inc. | 3,462 | | 44 | |
| * | Willdan Group Inc. | 1,340 | | 38 | |
| | BG Staffing Inc. | 3,910 | | 37 | |
| * | Mistras Group Inc. | 7,599 | | 36 | |
| * | StarTek Inc. | 6,962 | | 35 | |
| | CRA International Inc. | 788 | | 34 | |
| | Scorpio Bulkers Inc. | 2,297 | | 32 | |
| * | FARO Technologies Inc. | 557 | | 31 | |
| * | Information Services Group Inc. | 14,702 | | 30 | |
| * | General Finance Corp. | 4,462 | | 29 | |
| | Douglas Dynamics Inc. | 719 | | 28 | |
| * | Mayville Engineering Co. Inc. | 3,017 | | 26 | |
| | Advanced Emissions Solutions Inc. | 6,655 | | 26 | |
| * | Lawson Products Inc. | 709 | | 25 | |
| * | Willis Lease Finance Corp. | 1,174 | | 25 | |
| * | PAM Transportation Services Inc. | 666 | | 24 | |
| * | Ultralife Corp. | 3,827 | | 24 | |
| * | Safe Bulkers Inc. | 21,130 | | 23 | |
| * | Nesco Holdings Inc. | 5,255 | | 21 | |
| | Universal Logistics Holdings Inc. | 916 | | 20 | |
| | Hackett Group Inc. | 1,339 | | 17 | |
Vanguard® Russell 2000 Value Index Fund
Schedule of Investments
August 31, 2020
| | Shares | | Market
Value
($000 | ) |
| * | Target Hospitality Corp. | 11,606 | | 17 | |
| * | NV5 Global Inc. | 322 | | 17 | |
| | Allied Motion Technologies Inc. | 345 | | 15 | |
| * | ExOne Co. | 1,129 | | 14 | |
| * | PFSweb Inc. | 1,605 | | 14 | |
| | Pangaea Logistics Solutions Ltd. | 4,134 | | 10 | |
| | | | | 57,489 | |
| Technology (5.9%) | | | | |
| * | Covetrus Inc. | 41,402 | | 949 | |
| | Vishay Intertechnology Inc. | 55,901 | | 894 | |
| * | Cerence Inc. | 15,485 | | 824 | |
| * | Sanmina Corp. | 28,336 | | 802 | |
| * | Rogers Corp. | 6,490 | | 735 | |
| * | Diodes Inc. | 14,763 | | 721 | |
| * | Verint Systems Inc. | 14,874 | | 707 | |
| * | NetScout Systems Inc. | 29,876 | | 691 | |
| * | Rambus Inc. | 47,809 | | 642 | |
| * | Insight Enterprises Inc. | 10,599 | | 634 | |
| ^ | Maxar Technologies Inc. | 25,432 | | 589 | |
| * | Cloudera Inc. | 44,135 | | 583 | |
| * | Knowles Corp. | 37,278 | | 561 | |
| * | Yelp Inc. Class A | 23,964 | | 554 | |
| | InterDigital Inc. | 8,887 | | 543 | |
| | Xperi Holding Corp | 42,123 | | 528 | |
| * | Ambarella Inc. | 9,722 | | 512 | |
| | ManTech International Corp. Class A | 6,552 | | 490 | |
| * | TTM Technologies Inc. | 42,044 | | 482 | |
| * | Onto Innovation Inc. | 15,006 | | 469 | |
| * | Amkor Technology Inc. | 34,977 | | 427 | |
| * | NETGEAR Inc. | 12,221 | | 408 | |
| * | Super Micro Computer Inc. | 13,391 | | 367 | |
| | Methode Electronics Inc. | 12,566 | | 356 | |
| * | Groupon Inc. Class A | 9,743 | | 310 | |
| * | LiveRamp Holdings Inc. | 5,362 | | 299 | |
| | Benchmark Electronics Inc. | 15,240 | | 299 | |
| | Cohu Inc. | 16,325 | | 281 | |
| * | MaxLinear Inc. | 11,394 | | 277 | |
| * | Unisys Corp. | 23,676 | | 276 | |
| | CTS Corp. | 13,197 | | 276 | |
| * | 3D Systems Corp. | 49,052 | | 269 | |
| * | Photronics Inc. | 26,247 | | 263 | |
| * | ScanSource Inc. | 10,559 | | 261 | |
| * | Veeco Instruments Inc. | 20,618 | | 245 | |
| * | Blucora Inc. | 20,412 | | 244 | |
| * | Infinera Corp. | 32,982 | | 240 | |
| * | Harmonic Inc. | 40,216 | | 237 | |
| | ADTRAN Inc. | 20,266 | | 225 | |
| * | II-VI Inc. | 5,006 | | 223 | |
| * | TrueCar Inc. | 44,904 | | 212 | |
| | Perspecta Inc. | 10,149 | | 211 | |
| | PC Connection Inc. | 4,369 | | 194 | |
| * | Arlo Technologies Inc. | 32,848 | | 188 | |
| * | MicroStrategy Inc. Class A | 1,229 | | 178 | |
| * | Everi Holdings Inc. | 22,240 | | 173 | |
| * | Plexus Corp. | 2,249 | | 171 | |
| | Comtech Telecommunications Corp. | 10,299 | | 171 | |
| * | Digi International Inc. | 12,155 | | 166 | |
| * | Diebold Nixdorf Inc. | 17,876 | | 149 | |
| * | Magnite Inc. | 19,358 | | 142 | |
| * | Kimball Electronics Inc. | 10,200 | | 138 | |
| * | Ribbon Communications Inc. | 28,888 | | 124 | |
| | Plantronics Inc. | 9,559 | | 118 | |
| * | Alpha & Omega Semiconductor Ltd. | 8,607 | | 117 | |
| | Ebix Inc. | 5,008 | | 116 | |
Vanguard® Russell 2000 Value Index Fund
Schedule of Investments
August 31, 2020
| | Shares | | Market
Value
($000 | ) |
| * | Turtle Beach Corp. | 5,705 | | 112 | |
| | Loral Space & Communications Inc. | 4,274 | | 101 | |
| * | Applied Optoelectronics Inc. | 8,185 | | 95 | |
| * | AXT Inc. | 16,558 | | 93 | |
| * | Parsons Corp. | 2,666 | | 89 | |
| * | eGain Corp. | 5,631 | | 75 | |
| * | Synchronoss Technologies Inc. | 16,928 | | 74 | |
| * | ePlus Inc. | 934 | | 72 | |
| | Daktronics Inc. | 15,661 | | 69 | |
| * | Synaptics Inc. | 794 | | 68 | |
| * | Powerfleet Inc. | 11,598 | | 65 | |
| * | comScore Inc. | 24,766 | | 65 | |
| | VirnetX Holding Corp. | 12,940 | | 64 | |
| * | KVH Industries Inc. | 6,884 | | 62 | |
| * | GTY Technology Holdings Inc. | 18,810 | | 61 | |
| * | Quantum Corp. | 10,157 | | 55 | |
| * | DZS Inc. | 5,103 | | 53 | |
| | Bel Fuse Inc. Class B | 4,209 | | 51 | |
| | PCTEL Inc. | 7,468 | | 47 | |
| * | SecureWorks Corp. Class A | 3,530 | | 46 | |
| * | Intevac Inc. | 7,531 | | 45 | |
| * | GSI Technology Inc. | 6,888 | | 44 | |
| * | NeoPhotonics Corp. | 6,279 | | 42 | |
| * | CalAmp Corp. | 4,858 | | 40 | |
| * | Telenav Inc. | 8,617 | | 40 | |
| * | Asure Software Inc. | 5,706 | | 38 | |
| * | Axcelis Technologies Inc. | 1,045 | | 25 | |
| * | PDF Solutions Inc. | 941 | | 19 | |
| * | Park City Group Inc. | 3,882 | | 19 | |
| * | SeaChange International Inc. | 12,509 | | 17 | |
| * | Immersion Corp. | 1,614 | | 15 | |
| * | GAN Ltd. | 695 | | 14 | |
| * | DSP Group Inc. | 908 | | 13 | |
| | NVE Corp. | 197 | | 11 | |
| * | SMART Global Holdings Inc. | 332 | | 8 | |
| * | Digimarc Corp. | 357 | | 6 | |
| * | Pixelworks Inc. | 1,529 | | 3 | |
| | | | | 23,077 | |
| Utilities (5.3%) | | | | |
| | Black Hills Corp. | 26,519 | | 1,487 | |
| | PNM Resources Inc. | 33,487 | | 1,463 | |
| | ONE Gas Inc. | 19,580 | | 1,451 | |
| | Portland General Electric Co. | 37,942 | | 1,448 | |
| | Southwest Gas Holdings Inc. | 21,400 | | 1,345 | |
| | Brookfield Renewable Corp. Class A | 26,417 | | 1,345 | |
| | Spire Inc. | 21,146 | | 1,231 | |
| | New Jersey Resources Corp. | 40,139 | | 1,210 | |
| | ALLETE Inc. | 21,941 | | 1,184 | |
| | NorthWestern Corp. | 21,388 | | 1,105 | |
| | Avista Corp. | 28,428 | | 1,048 | |
| | MGE Energy Inc. | 10,781 | | 701 | |
| | Clearway Energy Inc. | 27,212 | | 694 | |
| | Northwest Natural Holding Co. | 11,472 | | 586 | |
| * | Iridium Communications Inc. | 17,548 | | 492 | |
| * | Vonage Holdings Corp. | 42,628 | | 488 | |
| | South Jersey Industries Inc. | 16,264 | | 360 | |
| | Brookfield Infrastructure Corp. Class A | 6,975 | | 348 | |
| | SJW Group | 5,267 | | 329 | |
| * | Sunnova Energy International Inc. | 12,057 | | 286 | |
| | Clearway Energy Inc. Class A | 11,508 | | 278 | |
| | Unitil Corp. | 6,162 | | 260 | |
| | ATN International Inc. | 4,420 | | 256 | |
| * | Consolidated Communications Holdings Inc. | 27,868 | | 217 | |
| * | Cincinnati Bell Inc. | 14,316 | | 216 | |
Vanguard® Russell 2000 Value Index Fund
Schedule of Investments
August 31, 2020
| | Shares | | Market
Value
($000 | ) |
| | Artesian Resources Corp. Class A | 3,217 | | 113 | |
| * | ORBCOMM Inc. | 27,259 | | 109 | |
| | Spok Holdings Inc. | 7,491 | | 81 | |
| | Consolidated Water Co. Ltd. | 6,149 | | 74 | |
| * | Atlantic Power Corp. | 35,532 | | 74 | |
| | California Water Service Group | 1,590 | | 72 | |
| * | WideOpenWest Inc. | 11,095 | | 64 | |
| | Alaska Communications Systems Group Inc. | 21,989 | | 49 | |
| * | Cadiz Inc. | 3,690 | | 39 | |
| | RGC Resources Inc. | 1,648 | | 38 | |
| | Chesapeake Utilities Corp. | 404 | | 33 | |
| * | IDT Corp. Class B | 2,346 | | 15 | |
| * | Gogo Inc. | 1,081 | | 6 | |
| | Global Water Resources Inc. | 162 | | 2 | |
| | | | | 20,597 | |
| Total Common Stocks (Cost $376,331) | | | 389,838 | |
| | | Coupon | |
| | | | | |
| Temporary Cash Investments (0.8%) | | | | | | | | | |
| Money Market Fund (0.8%) | | | | | | | | | |
| 3,4 | Vanguard Market Liquidity Fund | | 0.147% | | | | 30,380 | | 3,038 | |
| | | | | Maturity
Date | | Face
Amount
($000 | ) | | |
| U.S. Government and Agency Obligations (0.0%) | | | | | | | | | |
| 5 | United States Treasury Bill | | 0.210% | | 9/15/20 | | 84,500 | | 85 | |
| Total Temporary Cash Investments (Cost $3,122) | | | | | | | | 3,123 | |
| Total Investments (100.6%) (Cost $379,453) | | | | | | | | 392,961 | |
| Other Assets and Liabilities—Net (-0.6%) | | | | | | | | (2,513 | ) |
| Net Assets (100%) | | | | | | | | 390,448 | |
| Cost is in $000. |
| § | Security value determined using significant unobservable inputs. |
| * | Non-income-producing security. |
| ^ | Includes partial security positions on loan to broker-dealers. The total value of securities on loan is $2,763,000. |
| 1 | “Other” represents securities that are not classified by the fund's benchmark index. |
| 2 | Security exempt from registration under Rule 144A of the Securities Act of 1933. Such securities may be sold in transactions exempt from registration, normally to qualified institutional buyers. At August 31, 2020, the value of this security represented 0.2% of net assets. |
| 3 | Affiliated money market fund available only to Vanguard funds and certain trusts and accounts managed by Vanguard. Rate shown is the 7-day yield. |
| 4 | Collateral of $3,036,000 was received for securities on loan. |
| 5 | Securities with a value of $43,000 have been segregated as initial margin for open futures contracts. |
| | CVR—Contingent Value Rights. |
| | REIT—Real Estate Investment Trust. |
Vanguard® Russell 2000 Growth Index Fund
Schedule of Investments
August 31, 2020
| | Shares | | Market
Value
($000 | ) |
Common Stocks (99.9%) | |
| Consumer Discretionary (14.4%) | |
| | Churchill Downs Inc. | 33,408 | | 5,838 | |
| * | BJ's Wholesale Club Holdings Inc. | 120,408 | | 5,347 | |
| * | Deckers Outdoor Corp. | 24,618 | | 5,019 | |
| * | Rh | 14,697 | | 4,858 | |
| * | SiteOne Landscape Supply Inc. | 38,623 | | 4,830 | |
| | Wingstop Inc. | 26,055 | | 4,257 | |
| | Texas Roadhouse Inc. Class A | 57,700 | | 3,635 | |
| * | Stamps.com Inc. | 14,527 | | 3,622 | |
| * | Fox Factory Holding Corp. | 33,880 | | 3,415 | |
| * | YETI Holdings Inc. | 65,167 | | 3,348 | |
| * | Murphy USA Inc. | 24,248 | | 3,270 | |
| * | Caesars Entertainment Inc. | 70,272 | | 3,218 | |
| * | Penn National Gaming Inc. | 59,036 | | 3,017 | |
| * | Overstock.com Inc. | 28,922 | | 2,531 | |
| | LCI Industries | 21,699 | | 2,466 | |
| | Papa John's International Inc. | 24,177 | | 2,376 | |
| | Lithia Motors Inc. Class A | 9,499 | | 2,365 | |
| * | Crocs Inc. | 58,763 | | 2,345 | |
| * | National Vision Holdings Inc. | 58,516 | | 2,198 | |
| * | LGI Homes Inc. | 19,572 | | 2,189 | |
| * | Shake Shack Inc. Class A | 30,832 | | 2,104 | |
| * | Dorman Products Inc. | 23,423 | | 1,984 | |
| | Strategic Education Inc. | 19,289 | | 1,978 | |
| * | Visteon Corp. | 24,345 | | 1,836 | |
| * | Cardlytics Inc. | 22,718 | | 1,723 | |
| * | Hilton Grand Vacations Inc. | 74,635 | | 1,635 | |
| * | Avis Budget Group Inc. | 46,249 | | 1,578 | |
| | Winnebago Industries Inc. | 27,352 | | 1,476 | |
| * | Cavco Industries Inc. | 7,601 | | 1,451 | |
| * | Skyline Champion Corp. | 47,765 | | 1,363 | |
| * | Vivint Solar Inc. | 43,251 | | 1,336 | |
| * | Gentherm Inc. | 28,775 | | 1,302 | |
| | Core-Mark Holding Co. Inc. | 36,589 | | 1,223 | |
| | Cracker Barrel Old Country Store Inc. | 8,988 | | 1,202 | |
| | Rent-A-Center Inc. | 37,830 | | 1,161 | |
| | Brinker International Inc. | 25,564 | | 1,151 | |
| | Bloomin' Brands Inc. | 77,093 | | 1,106 | |
| * | Meritor Inc. | 46,623 | | 1,061 | |
| * | Stitch Fix Inc. Class A | 41,713 | | 1,007 | |
| * | Sonos Inc. | 69,796 | | 982 | |
| * | Malibu Boats Inc. Class A | 18,054 | | 936 | |
| | Sturm Ruger & Co. Inc. | 13,040 | | 924 | |
| * | Fitbit Inc. Class A | 141,681 | | 901 | |
| | WillScot Mobile Mini Holdings Corp. Class A | 49,359 | | 884 | |
| * | RealReal Inc. | 54,851 | | 881 | |
| * | Perdoceo Education Corp. | 60,921 | | 875 | |
| | Camping World Holdings Inc. Class A | 28,867 | | 839 | |
| * | Scientific Games Corp. | 36,128 | | 747 | |
| | Red Rock Resorts Inc. Class A | 43,469 | | 742 | |
| * | Asbury Automotive Group Inc. | 6,650 | | 704 | |
| | Inter Parfums Inc. | 15,674 | | 700 | |
| | Steven Madden Ltd. | 31,817 | | 673 | |
| | Monro Inc. | 14,276 | | 658 | |
| * | 1-800-Flowers.com Inc. Class A | 21,883 | | 655 | |
| * | Boot Barn Holdings Inc. | 23,008 | | 650 | |
| * | Sportsman's Warehouse Holdings Inc. | 37,667 | | 591 | |
| * | GoPro Inc. Class A | 101,075 | | 464 | |
| * | Central Garden & Pet Co. Class A | 12,360 | | 459 | |
| * | elf Beauty Inc. | 23,268 | | 454 | |
| * | Accel Entertainment Inc. | 37,259 | | 442 | |
| * | Sleep Number Corp. | 9,155 | | 439 | |
Vanguard® Russell 2000 Growth Index Fund
Schedule of Investments
August 31, 2020
| | Shares | | Market
Value
($000 | ) |
| | Marriott Vacations Worldwide Corp. | 4,639 | | 439 | |
| | Aaron's Inc. | 7,607 | | 425 | |
| * | Universal Electronics Inc. | 10,308 | | 423 | |
| * | America's Car-Mart Inc. | 4,094 | | 411 | |
| | KB Home | 11,334 | | 405 | |
| * | SeaWorld Entertainment Inc. | 19,646 | | 401 | |
| * | Liberty Media Corp-Liberty Braves Class C | 20,312 | | 395 | |
| | Twin River Worldwide Holdings Inc. | 16,082 | | 385 | |
| * | Gray Television Inc. | 23,923 | | 371 | |
| * | Quotient Technology Inc. | 42,377 | | 369 | |
| * | Monarch Casino & Resort Inc. | 7,960 | | 366 | |
| * | XPEL Inc. | 14,666 | | 365 | |
| * | Denny's Corp. | 31,287 | | 359 | |
| * | MasterCraft Boat Holdings Inc. | 16,279 | | 340 | |
| * | AMC Networks Inc. Class A | 13,771 | | 335 | |
| | Collectors Universe Inc. | 7,296 | | 325 | |
| * | Taylor Morrison Home Corp. Class A | 11,090 | | 261 | |
| | Acushnet Holdings Corp. | 7,016 | | 248 | |
| | Meredith Corp. | 17,661 | | 247 | |
| | Dave & Buster's Entertainment Inc. | 14,675 | | 244 | |
| * | CarParts.com Inc. | 17,104 | | 240 | |
| * | Purple Innovation Inc. Class A | 12,589 | | 238 | |
| * | WW International Inc. | 9,978 | | 234 | |
| | Ruth's Hospitality Group Inc. | 22,740 | | 234 | |
| * | Lindblad Expeditions Holdings Inc. | 22,678 | | 225 | |
| * | Daily Journal Corp. | 789 | | 217 | |
| * | Aspen Group Inc. | 16,396 | | 210 | |
| * | Lovesac Co. | 7,824 | | 207 | |
| | Johnson Outdoors Inc. Class A | 2,258 | | 194 | |
| | Jack in the Box Inc. | 2,194 | | 181 | |
| * | QuinStreet Inc. | 13,397 | | 176 | |
| | Children's Place Inc. | 8,749 | | 175 | |
| * | Universal Technical Institute Inc. | 24,416 | | 172 | |
| * | Meritage Homes Corp. | 1,716 | | 165 | |
| | Systemax Inc. | 7,378 | | 164 | |
| * | Central European Media Enterprises Ltd. Class A | 37,767 | | 157 | |
| | Big Lots Inc. | 2,748 | | 130 | |
| | Standard Motor Products Inc. | 2,837 | | 129 | |
| * | OneWater Marine Inc. | 4,105 | | 117 | |
| | Winmark Corp. | 728 | | 112 | |
| * | Noodles & Co. | 13,326 | | 101 | |
| | Marine Products Corp. | 6,405 | | 93 | |
| * | Liberty Media Corp-Liberty Braves Class A | 4,382 | | 86 | |
| | PriceSmart Inc. | 1,215 | | 80 | |
| * | Lumber Liquidators Holdings Inc. | 3,298 | | 79 | |
| | Interface Inc. Class A | 9,473 | | 72 | |
| * | Rosetta Stone Inc. | 2,353 | | 72 | |
| * | Golden Entertainment Inc | 5,173 | | 66 | |
| | Dine Brands Global Inc. | 879 | | 52 | |
| | Franchise Group Inc. | 1,985 | | 49 | |
| | Hamilton Beach Brands Holding Co. Class A | 2,090 | | 46 | |
| * | Motorcar Parts of America Inc. | 2,236 | | 39 | |
| | Superior Group of Cos. Inc. | 1,605 | | 37 | |
| * | Central Garden & Pet Co. | 831 | | 34 | |
| * | Legacy Housing Corp. | 1,938 | | 30 | |
| | National Presto Industries Inc. | 293 | | 26 | |
| * | Envela Corp. | 6,102 | | 24 | |
| * | PlayAGS Inc. | 5,894 | | 24 | |
| | Hooker Furniture Corp. | 761 | | 19 | |
| * | Casper Sleep Inc. | 1,979 | | 18 | |
| | Clarus Corp. | 1,393 | | 18 | |
| * | El Pollo Loco Holdings Inc. | 896 | | 16 | |
| * | LiveXLive Media Inc. | 3,241 | | 9 | |
| | | 125,302 | |
Vanguard® Russell 2000 Growth Index Fund
Schedule of Investments
August 31, 2020
| | Shares | | Market
Value
($000 | ) |
| Consumer Staples (3.2%) | |
| * | Helen of Troy Ltd. | 22,256 | | 4,603 | |
| * | Freshpet Inc. | 34,050 | | 3,868 | |
| | Lancaster Colony Corp. | 16,631 | | 2,956 | |
| | WD-40 Co. | 11,251 | | 2,299 | |
| | Medifast Inc. | 9,935 | | 1,617 | |
| | Sanderson Farms Inc. | 13,746 | | 1,608 | |
| | B&G Foods Inc. | 49,229 | | 1,533 | |
| | Coca-Cola Consolidated Inc. | 4,135 | | 1,130 | |
| | Calavo Growers Inc. | 14,487 | | 919 | |
| *,^ | National Beverage Corp. | 10,402 | | 846 | |
| * | USANA Health Sciences Inc. | 10,193 | | 799 | |
| * | Hostess Brands Inc. Class A | 48,394 | | 621 | |
| | John B Sanfilippo & Son Inc. | 7,755 | | 618 | |
| | PetMed Express Inc. | 17,201 | | 598 | |
| * | Celsius Holdings Inc. | 30,229 | | 587 | |
| | J&J Snack Foods Corp. | 3,506 | | 477 | |
| *,^ | GrowGeneration Corp. | 25,284 | | 403 | |
| | Tootsie Roll Industries Inc. | 11,883 | | 380 | |
| * | Cal-Maine Foods Inc. | 9,443 | | 364 | |
| | MGP Ingredients Inc. | 8,480 | | 301 | |
| | Turning Point Brands Inc. | 8,850 | | 256 | |
| * | Lifevantage Corp. | 12,056 | | 181 | |
| | Vector Group Ltd. | 13,745 | | 138 | |
| * | Veru Inc. | 43,865 | | 121 | |
| * | NewAge Inc. | 36,200 | | 79 | |
| | Natural Grocers by Vitamin Cottage Inc. | 5,270 | | 62 | |
| | Limoneira Co. | 3,221 | | 47 | |
| * | Calyxt Inc. | 8,022 | | 44 | |
| * | Greenlane Holdings Inc. Class A | 9,106 | | 28 | |
| * | Bridgford Foods Corp. | 717 | | 12 | |
| * | Craft Brew Alliance Inc. | 290 | | 5 | |
| | | 27,500 | |
| Energy (1.2%) | |
| * | Sunrun Inc. | 102,177 | | 5,779 | |
| *,^ | Bloom Energy Corp. Class A | 70,392 | | 1,102 | |
| * | TPI Composites Inc. | 26,678 | | 819 | |
| * | Ameresco Inc. Class A | 21,459 | | 733 | |
| * | Magnolia Oil & Gas Corp. Class A | 100,636 | | 648 | |
| * | SunPower Corp. | 46,673 | | 522 | |
| | Cactus Inc. | 19,416 | | 429 | |
| *,^ | FuelCell Energy Inc. | 124,309 | | 353 | |
| | DMC Global Inc. | 5,769 | | 204 | |
| * | Maxeon Solar Technologies Ltd. | 5,834 | | 121 | |
| * | Goodrich Petroleum Corp. | 5,040 | | 42 | |
| * | Contango Oil & Gas Co. | 14,278 | | 23 | |
| * | NextDecade Corp. | 1,453 | | 2 | |
| | | 10,777 | |
| Financial Services (8.7%) | |
| | EastGroup Properties Inc. | 32,300 | | 4,301 | |
| * | Redfin Corp. | 84,364 | | 4,013 | |
| | Kinsale Capital Group Inc. | 18,296 | | 3,791 | |
| | First Financial Bankshares Inc. | 113,533 | | 3,437 | |
| | QTS Realty Trust Inc. Class A | 49,854 | | 3,381 | |
| | RLI Corp. | 30,405 | | 2,852 | |
| | Houlihan Lokey Inc. Class A | 38,977 | | 2,284 | |
| | PS Business Parks Inc. | 17,677 | | 2,231 | |
| | FirstCash Inc. | 35,773 | | 2,137 | |
| * | Palomar Holdings Inc. | 16,965 | | 1,906 | |
| | National Storage Affiliates Trust | 54,429 | | 1,867 | |
| | EVERTEC Inc. | 52,976 | | 1,855 | |
| | Uniti Group Inc. | 169,889 | | 1,668 | |
| * | Trupanion Inc. | 26,125 | | 1,639 | |
| | Easterly Government Properties Inc. | 66,332 | | 1,605 | |
Vanguard® Russell 2000 Growth Index Fund
Schedule of Investments
August 31, 2020
| | Shares | | Market
Value
($000 | ) |
| | Four Corners Property Trust Inc. | 61,706 | | 1,558 | |
| | Terreno Realty Corp. | 24,946 | | 1,488 | |
| | Moelis & Co. Class A | 46,470 | | 1,483 | |
| | Ryman Hospitality Properties Inc. | 38,331 | | 1,463 | |
| | Hamilton Lane Inc. Class A | 19,364 | | 1,416 | |
| * | eHealth Inc. | 22,403 | | 1,414 | |
| | Cohen & Steers Inc. | 21,502 | | 1,301 | |
| | PJT Partners Inc. | 20,651 | | 1,222 | |
| | ServisFirst Bancshares Inc. | 31,850 | | 1,167 | |
| | James River Group Holdings Ltd. | 23,020 | | 1,121 | |
| | Monmouth Real Estate Investment Corp. | 73,885 | | 1,072 | |
| * | Evo Payments Inc. Class A | 35,893 | | 1,031 | |
| * | Focus Financial Partners Inc. Class A | 27,669 | | 979 | |
| | National General Holdings Corp. | 28,323 | | 964 | |
| * | eXp World Holdings Inc. | 20,963 | | 932 | |
| | Community Healthcare Trust Inc. | 18,540 | | 866 | |
| * | Repay Holdings Corp. Class A | 32,246 | | 816 | |
| | National Health Investors Inc. | 12,392 | | 771 | |
| | Artisan Partners Asset Management Inc. Class A | 19,906 | | 771 | |
| | Brightsphere Investment Group Inc. | 54,524 | | 756 | |
| | Innovative Industrial Properties Inc. | 6,082 | | 749 | |
| | Universal Health Realty Income Trust | 9,835 | | 656 | |
| | Federated Hermes Inc. Class B | 24,773 | | 592 | |
| * | Cardtronics plc Class A | 23,012 | | 500 | |
| | Cass Information Systems Inc. | 12,526 | | 491 | |
| * | BRP Group Inc. Class A | 17,517 | | 482 | |
| | LTC Properties Inc. | 12,897 | | 471 | |
| | Safehold Inc. | 8,311 | | 461 | |
| | Alexander's Inc. | 1,770 | | 451 | |
| | Investors Bancorp Inc. | 57,268 | | 444 | |
| * | Cushman & Wakefield plc | 32,994 | | 383 | |
| | UMH Properties Inc. | 25,067 | | 364 | |
| * | I3 Verticals Inc. Class A | 13,027 | | 363 | |
| | STAG Industrial Inc. | 10,695 | | 345 | |
| | RMR Group Inc. Class A | 12,031 | | 340 | |
| * | St. Joe Co. | 14,164 | | 329 | |
| | Bank First Corp. | 5,125 | | 320 | |
| | Glacier Bancorp Inc. | 8,861 | | 311 | |
| | PennyMac Financial Services Inc. | 4,974 | | 262 | |
| | Saul Centers Inc. | 9,122 | | 256 | |
| * | GreenSky Inc. Class A | 54,700 | | 238 | |
| | CareTrust REIT Inc. | 11,558 | | 224 | |
| * | Green Dot Corp. Class A | 3,821 | | 199 | |
| * | International Money Express Inc. | 11,688 | | 198 | |
| | Westamerica BanCorp | 2,943 | | 179 | |
| * | Paysign Inc. | 27,111 | | 175 | |
| | Plymouth Industrial REIT Inc. | 12,558 | | 168 | |
| | National Bank Holdings Corp. Class A | 5,857 | | 167 | |
| | Goosehead Insurance Inc. Class A | 1,461 | | 150 | |
| | Cowen Inc. Class A | 8,293 | | 150 | |
| * | Assetmark Financial Holdings Inc. | 5,922 | | 143 | |
| | Greenhill & Co. Inc. | 12,732 | | 143 | |
| | Kearny Financial Corp. | 17,831 | | 138 | |
| | Hannon Armstrong Sustainable Infrastructure Capital Inc. | 3,158 | | 134 | |
| * | Columbia Financial Inc. | 12,368 | | 132 | |
| | Gladstone Land Corp. | 7,847 | | 124 | |
| | Curo Group Holdings Corp. | 16,023 | | 123 | |
| | Gladstone Commercial Corp. | 6,197 | | 122 | |
| | Stock Yards Bancorp Inc. | 2,797 | | 120 | |
| | NexPoint Residential Trust Inc. | 2,899 | | 120 | |
| | Independent Bank Corp. | 1,904 | | 120 | |
| | First Foundation Inc. | 7,833 | | 119 | |
| | Federal Agricultural Mortgage Corp. Class C | 1,730 | | 118 | |
| | Walker & Dunlop Inc. | 2,147 | | 118 | |
Vanguard® Russell 2000 Growth Index Fund
Schedule of Investments
August 31, 2020
| | Shares | | Market
Value
($000 | ) |
| | Universal Insurance Holdings Inc. | 5,996 | | 111 | |
| | CIM Commercial Trust Corp. | 9,687 | | 100 | |
| * | Axos Financial Inc. | 4,013 | | 99 | |
| | Virtus Investment Partners Inc. | 616 | | 87 | |
| | Griffin Industrial Realty Inc. | 1,582 | | 84 | |
| * | Dun & Bradstreet Holdings Inc. | 3,184 | | 81 | |
| | Pzena Investment Management Inc. Class A | 15,962 | | 79 | |
| | Cambridge Bancorp | 1,296 | | 71 | |
| | Clipper Realty Inc. | 10,304 | | 69 | |
| | HCI Group Inc. | 1,188 | | 65 | |
| * | StoneX Group Inc. | 1,115 | | 63 | |
| | GAMCO Investors Inc. Class A | 4,568 | | 58 | |
| * | NMI Holdings Inc. Class A | 3,342 | | 57 | |
| | Silvercrest Asset Management Group Inc. Class A | 4,422 | | 55 | |
| * | Marcus & Millichap Inc. | 1,965 | | 55 | |
| | Bluerock Residential Growth REIT Inc. | 7,357 | | 55 | |
| | Lakeland Financial Corp. | 1,174 | | 54 | |
| * | Atlanticus Holdings Corp. | 4,639 | | 39 | |
| | CatchMark Timber Trust Inc. Class A | 3,825 | | 38 | |
| | West BanCorp Inc. | 2,143 | | 38 | |
| * | Siebert Financial Corp. | 9,339 | | 35 | |
| * | Maui Land & Pineapple Co. Inc. | 2,617 | | 31 | |
| * | GWG Holdings Inc. | 3,320 | | 29 | |
| * | Customers Bancorp Inc. | 2,237 | | 29 | |
| * | Esquire Financial Holdings Inc. | 1,706 | | 28 | |
| * | BayCom Corp. | 2,374 | | 28 | |
| * | Avalon GloboCare Corp. | 17,048 | | 24 | |
| | Investors Title Co. | 173 | | 24 | |
| | Heritage Insurance Holdings Inc. | 1,792 | | 23 | |
| | Value Line Inc. | 849 | | 22 | |
| | Waterstone Financial Inc. | 1,411 | | 22 | |
| | Altabancorp | 996 | | 21 | |
| | FS Bancorp Inc. | 448 | | 18 | |
| | Century Bancorp Inc. Class A | 230 | | 16 | |
| | Hanmi Financial Corp. | 1,310 | | 12 | |
| | Hingham Institution For Savings | 64 | | 12 | |
| * | Priority Technology Holdings Inc. | 5,887 | | 11 | |
| | Meridian Corp. | 769 | | 11 | |
| | Reliant Bancorp Inc. | 732 | | 11 | |
| | Bank7 Corp. | 991 | | 10 | |
| | Crawford & Co. Class A | 1,413 | | 10 | |
| * | Coastal Financial Corp. | 644 | | 9 | |
| | Unity Bancorp Inc. | 580 | | 8 | |
| | Luther Burbank Corp. | 805 | | 7 | |
| | Greene County Bancorp Inc. | 270 | | 6 | |
| * | Altisource Portfolio Solutions SA | 487 | | 5 | |
| | Northeast Bank | 280 | | 5 | |
| | FedNat Holding Co. | 461 | | 4 | |
| | | 75,579 | |
| Health Care (32.2%) | |
| * | LHC Group Inc. | 26,694 | | 5,564 | |
| * | iRhythm Technologies Inc. | 23,792 | | 5,239 | |
| * | Momenta Pharmaceuticals Inc. | 97,223 | | 5,072 | |
| * | Mirati Therapeutics Inc. | 32,322 | | 4,828 | |
| * | Emergent BioSolutions Inc. | 39,251 | | 4,477 | |
| * | Ultragenyx Pharmaceutical Inc. | 49,853 | | 4,240 | |
| * | MyoKardia Inc. | 38,277 | | 4,189 | |
| * | Nevro Corp. | 29,509 | | 4,059 | |
| * | HealthEquity Inc. | 65,457 | | 3,762 | |
| * | Arrowhead Pharmaceuticals Inc. | 88,246 | | 3,728 | |
| * | Blueprint Medicines Corp. | 47,695 | | 3,693 | |
| * | Natera Inc. | 57,588 | | 3,669 | |
| * | NeoGenomics Inc. | 91,220 | | 3,553 | |
| * | Invitae Corp. | 101,559 | | 3,550 | |
Vanguard® Russell 2000 Growth Index Fund
Schedule of Investments
August 31, 2020
| | Shares | | Market
Value
($000 | ) |
| * | Neogen Corp. | 46,353 | | 3,532 | |
| * | Halozyme Therapeutics Inc. | 119,576 | | 3,467 | |
| * | Wright Medical Group NV | 113,225 | | 3,423 | |
| * | Amicus Therapeutics Inc. | 223,451 | | 3,262 | |
| * | Medpace Holdings Inc. | 24,031 | | 3,119 | |
| * | FibroGen Inc. | 62,551 | | 2,804 | |
| * | Inspire Medical Systems Inc. | 22,989 | | 2,746 | |
| * | PTC Therapeutics Inc. | 54,196 | | 2,679 | |
| | Ensign Group Inc. | 45,013 | | 2,635 | |
| * | Biohaven Pharmaceutical Holding Co. Ltd. | 41,452 | | 2,628 | |
| * | Insmed Inc. | 88,951 | | 2,508 | |
| * | Omnicell Inc. | 37,300 | | 2,487 | |
| * | Principia Biopharma Inc. | 23,637 | | 2,364 | |
| * | NuVasive Inc. | 45,179 | | 2,355 | |
| * | Merit Medical Systems Inc. | 47,604 | | 2,337 | |
| * | Pacira BioSciences Inc. | 36,286 | | 2,269 | |
| * | AMN Healthcare Services Inc. | 41,010 | | 2,208 | |
| * | HMS Holdings Corp. | 77,381 | | 2,158 | |
| * | ChemoCentryx Inc. | 39,121 | | 2,093 | |
| | CONMED Corp. | 23,863 | | 2,060 | |
| * | Fate Therapeutics Inc. | 55,022 | | 2,003 | |
| * | Allakos Inc. | 21,408 | | 1,918 | |
| * | Select Medical Holdings Corp. | 95,453 | | 1,916 | |
| * | Bridgebio Pharma Inc. | 64,012 | | 1,911 | |
| * | STAAR Surgical Co. | 39,637 | | 1,901 | |
| * | Twist Bioscience Corp. | 26,244 | | 1,835 | |
| * | TG Therapeutics Inc. | 72,466 | | 1,798 | |
| * | Axsome Therapeutics Inc. | 24,344 | | 1,785 | |
| * | Turning Point Therapeutics Inc. | 22,822 | | 1,784 | |
| * | Glaukos Corp. | 37,143 | | 1,777 | |
| * | Denali Therapeutics Inc. | 55,248 | | 1,762 | |
| | Cantel Medical Corp. | 33,317 | | 1,748 | |
| * | Editas Medicine Inc. | 48,695 | | 1,716 | |
| * | Silk Road Medical Inc. | 27,898 | | 1,701 | |
| * | Vir Biotechnology Inc. | 40,708 | | 1,648 | |
| * | Xencor Inc. | 45,940 | | 1,642 | |
| * | Apellis Pharmaceuticals Inc. | 52,724 | | 1,625 | |
| * | AtriCure Inc. | 34,286 | | 1,534 | |
| * | Novavax Inc. | 13,827 | | 1,526 | |
| * | Allogene Therapeutics Inc. | 42,622 | | 1,519 | |
| *,^ | Inovio Pharmaceuticals Inc. | 126,433 | | 1,516 | |
| * | Shockwave Medical Inc. | 23,443 | | 1,490 | |
| * | Deciphera Pharmaceuticals Inc. | 32,853 | | 1,479 | |
| * | Veracyte Inc. | 43,895 | | 1,462 | |
| * | LivaNova plc | 30,281 | | 1,420 | |
| * | Ironwood Pharmaceuticals Inc. Class A | 140,095 | | 1,415 | |
| * | Aimmune Therapeutics Inc. | 40,897 | | 1,399 | |
| | Healthcare Services Group Inc. | 65,604 | | 1,365 | |
| * | R1 RCM Inc. | 94,022 | | 1,363 | |
| * | Kodiak Sciences Inc. | 25,396 | | 1,336 | |
| * | Ligand Pharmaceuticals Inc. | 12,669 | | 1,292 | |
| * | CareDx Inc. | 37,589 | | 1,284 | |
| * | Integer Holdings Corp. | 18,103 | | 1,254 | |
| *,^ | Sorrento Therapeutics Inc. | 153,971 | | 1,233 | |
| * | Akebia Therapeutics Inc. | 114,255 | | 1,189 | |
| * | BioTelemetry Inc. | 29,541 | | 1,169 | |
| * | NanoString Technologies Inc. | 28,767 | | 1,164 | |
| * | Kura Oncology Inc. | 46,561 | | 1,159 | |
| * | Zogenix Inc. | 48,692 | | 1,153 | |
| * | Addus HomeCare Corp. | 12,153 | | 1,138 | |
| * | Intercept Pharmaceuticals Inc. | 22,734 | | 1,134 | |
| * | Y-mAbs Therapeutics Inc. | 26,267 | | 1,130 | |
| * | Axonics Modulation Technologies Inc. | 26,737 | | 1,130 | |
| * | Revance Therapeutics Inc. | 38,404 | | 1,123 | |
Vanguard® Russell 2000 Growth Index Fund
Schedule of Investments
August 31, 2020
| Shares | | Market
Value
($000 | ) |
| * | Sangamo Therapeutics Inc. | 101,077 | | 1,115 | |
| * | Heron Therapeutics Inc. | 76,847 | | 1,099 | |
| * | Corcept Therapeutics Inc. | 84,437 | | 1,072 | |
| * | Dicerna Pharmaceuticals Inc. | 56,943 | | 1,055 | |
| * | Karuna Therapeutics Inc. | 13,634 | | 1,042 | |
| * | Cytokinetics Inc. | 43,005 | | 1,030 | |
| * | Seres Therapeutics Inc. | 38,669 | | 1,024 | |
| | Luminex Corp. | 37,311 | | 996 | |
| | US Physical Therapy Inc. | 11,160 | | 992 | |
| * | Cardiovascular Systems Inc. | 30,345 | | 991 | |
| * | Providence Service Corp. | 10,635 | | 985 | |
| * | Coherus Biosciences Inc. | 50,792 | | 964 | |
| * | Karyopharm Therapeutics Inc. | 61,669 | | 938 | |
| * | REGENXBIO Inc. | 29,926 | | 913 | |
| * | Tabula Rasa HealthCare Inc. | 18,009 | | 911 | |
| * | Cerus Corp. | 142,508 | | 908 | |
| * | Health Catalyst Inc. | 28,378 | | 885 | |
| * | Rhythm Pharmaceuticals Inc. | 29,536 | | 872 | |
| * | Pennant Group Inc. | 22,811 | | 845 | |
| * | Intellia Therapeutics Inc. | 38,517 | | 831 | |
| * | SpringWorks Therapeutics Inc. | 18,628 | | 827 | |
| * | Madrigal Pharmaceuticals Inc. | 7,668 | | 826 | |
| *,^ | Esperion Therapeutics Inc. | 22,767 | | 822 | |
| * | Phreesia Inc. | 25,153 | | 793 | |
| | Atrion Corp. | 1,241 | | 784 | |
| * | Lantheus Holdings Inc. | 58,341 | | 783 | |
| * | Mersana Therapeutics Inc. | 40,342 | | 773 | |
| * | GenMark Diagnostics Inc. | 59,578 | | 773 | |
| * | Rocket Pharmaceuticals Inc. | 29,947 | | 766 | |
| * | Athenex Inc. | 64,719 | | 744 | |
| * | Pacific Biosciences of California Inc. | 112,020 | | 739 | |
| * | Retrophin Inc. | 36,465 | | 714 | |
| * | Kadmon Holdings Inc. | 141,905 | | 710 | |
| * | Arcus Biosciences Inc. | 28,958 | | 689 | |
| * | Magellan Health Inc. | 8,961 | | 676 | |
| * | Adverum Biotechnologies Inc | 55,278 | | 674 | |
| * | Arvinas Inc. | 25,723 | | 668 | |
| | National Research Corp. | 11,870 | | 665 | |
| * | Progyny Inc. | 23,182 | | 662 | |
| * | Innoviva Inc. | 55,945 | | 655 | |
| * | Codexis Inc. | 47,095 | | 650 | |
| * | CorVel Corp. | 7,805 | | 648 | |
| * | Epizyme Inc. | 49,403 | | 642 | |
| * | Theravance Biopharma Inc. | 34,804 | | 638 | |
| * | PetIQ Inc. Class A | 18,110 | | 637 | |
| * | Amphastar Pharmaceuticals Inc. | 31,251 | | 637 | |
| * | Translate Bio Inc. | 44,497 | | 627 | |
| * | Tactile Systems Technology Inc. | 16,152 | | 621 | |
| * | Quanterix Corp. | 16,652 | | 593 | |
| * | Viela Bio Inc. | 17,575 | | 592 | |
| * | Collegium Pharmaceutical Inc. | 30,228 | | 576 | |
| * | Intersect ENT Inc. | 28,620 | | 575 | |
| * | Immunovant Inc. | 16,821 | | 571 | |
| * | Prestige Consumer Healthcare Inc. | 15,666 | | 571 | |
| * | Cortexyme Inc. | 12,897 | | 567 | |
| * | Cara Therapeutics Inc. | 36,256 | | 562 | |
| * | Arcturus Therapeutics Holdings Inc. | 11,468 | | 553 | |
| * | Vericel Corp | 34,899 | | 553 | |
| * | Omeros Corp. | 46,157 | | 552 | |
| * | 1Life Healthcare Inc. | 18,756 | | 547 | |
| * | RadNet Inc. | 37,661 | | 543 | |
| * | Corbus Pharmaceuticals Holdings Inc. | 58,233 | | 541 | |
| * | Agenus Inc. | 121,783 | | 530 | |
| * | CryoLife Inc. | 26,206 | | 530 | |
| | | | | | |
Vanguard® Russell 2000 Growth Index Fund
Schedule of Investments
August 31, 2020
| Shares | | Market
Value
($000 | ) |
| * | OrthoPediatrics Corp. | 10,511 | | 530 | |
| * | Surmodics Inc. | 11,639 | | 527 | |
| * | Alector Inc. | 40,673 | | 525 | |
| * | Vapotherm Inc. | 16,864 | | 525 | |
| * | VBI Vaccines Inc. | 122,756 | | 523 | |
| * | Ontrak Inc. | 6,914 | | 504 | |
| * | Atara Biotherapeutics Inc. | 37,392 | | 504 | |
| * | Krystal Biotech Inc. | 10,494 | | 502 | |
| * | Constellation Pharmaceuticals Inc. | 23,781 | | 501 | |
| * | Radius Health Inc. | 39,967 | | 495 | |
| * | SI-BONE Inc. | 22,332 | | 487 | |
| * | Provention Bio Inc. | 37,275 | | 486 | |
| * | Syros Pharmaceuticals Inc. | 36,480 | | 483 | |
| * | Frequency Therapeutics Inc. | 24,763 | | 479 | |
| * | Avrobio Inc. | 27,139 | | 470 | |
| * | Meridian Bioscience Inc. | 32,427 | | 459 | |
| * | Protagonist Therapeutics Inc. | 19,853 | | 445 | |
| * | BioCryst Pharmaceuticals Inc. | 106,871 | | 444 | |
| * | Relmada Therapeutics Inc. | 12,382 | | 442 | |
| * | Cue Biopharma Inc. | 24,400 | | 436 | |
| * | MacroGenics Inc. | 15,001 | | 434 | |
| * | Eidos Therapeutics Inc. | 9,602 | | 416 | |
| * | Castle Biosciences Inc. | 9,015 | | 412 | |
| * | Antares Pharma Inc. | 144,590 | | 409 | |
| * | Replimune Group Inc. | 15,134 | | 409 | |
| * | Dynavax Technologies Corp. | 66,548 | | 398 | |
| * | Ocular Therapeutix Inc. | 45,142 | | 393 | |
| * | Personalis Inc. | 17,181 | | 392 | |
| * | OraSure Technologies Inc. | 33,312 | | 390 | |
| * | Syndax Pharmaceuticals Inc. | 23,688 | | 386 | |
| * | Crinetics Pharmaceuticals Inc. | 23,737 | | 380 | |
| * | Eagle Pharmaceuticals Inc. | 9,575 | | 380 | |
| * | Pfenex Inc. | 30,298 | | 380 | |
| * | Axogen Inc. | 31,980 | | 380 | |
| * | Bioxcel Therapeutics Inc. | 9,307 | | 379 | |
| * | Surgery Partners Inc. | 19,837 | | 379 | |
| | LeMaitre Vascular Inc. | 11,649 | | 376 | |
| * | Avid Bioservices Inc. | 44,687 | | 375 | |
| * | Rigel Pharmaceuticals Inc. | 149,439 | | 372 | |
| * | Ardelyx Inc. | 64,220 | | 369 | |
| * | REVOLUTION Medicines Inc. | 12,872 | | 365 | |
| * | NGM Biopharmaceuticals Inc. | 19,276 | | 359 | |
| * | Amneal Pharmaceuticals Inc. | 87,229 | | 359 | |
| | Phibro Animal Health Corp. Class A | 16,640 | | 357 | |
| * | Aerie Pharmaceuticals Inc. | 32,305 | | 355 | |
| * | BioSpecifics Technologies Corp. | 5,486 | | 354 | |
| *,^ | ZIOPHARM Oncology Inc. | 125,794 | | 353 | |
| * | Flexion Therapeutics Inc. | 30,142 | | 351 | |
| * | Phathom Pharmaceuticals Inc. | 9,446 | | 347 | |
| * | Intra-Cellular Therapies Inc. | 18,455 | | 336 | |
| * | Athersys Inc. | 152,369 | | 332 | |
| * | Neoleukin Therapeutics Inc. | 26,115 | | 332 | |
| *,^ | Clovis Oncology Inc. | 63,598 | | 331 | |
| * | SIGA Technologies Inc. | 47,646 | | 331 | |
| * | Viemed Healthcare Inc. | 30,219 | | 328 | |
| * | Inogen Inc. | 10,828 | | 327 | |
| *,^ | Accelerate Diagnostics Inc. | 26,841 | | 327 | |
| * | MannKind Corp. | 187,224 | | 326 | |
| * | Option Care Health Inc. | 27,965 | | 325 | |
| * | Akero Therapeutics Inc. | 9,828 | | 320 | |
| *,^ | CEL-SCI Corp. | 24,682 | | 319 | |
| * | Morphic Holding Inc. | 12,032 | | 319 | |
| * | Homology Medicines Inc. | 29,871 | | 318 | |
| * | Stoke Therapeutics Inc. | 10,715 | | 315 | |
| | | | | | |
Vanguard® Russell 2000 Growth Index Fund
Schedule of Investments
August 31, 2020
| Shares | | Market
Value
($000 | ) |
| * | Black Diamond Therapeutics Inc. | 10,785 | | 310 | |
| * | Kala Pharmaceuticals Inc. | 34,849 | | 310 | |
| * | Keros Therapeutics Inc. | 5,786 | | 310 | |
| * | TransMedics Group Inc. | 17,371 | | 310 | |
| * | Assembly Biosciences Inc. | 14,084 | | 308 | |
| * | BioDelivery Sciences International Inc. | 78,305 | | 306 | |
| * | Durect Corp. | 173,988 | | 302 | |
| * | Scholar Rock Holding Corp. | 19,945 | | 301 | |
| *,^ | BrainStorm Cell Therapeutics Inc. | 23,464 | | 296 | |
| * | Tivity Health Inc. | 17,913 | | 293 | |
| * | Zentalis Pharmaceuticals Inc. | 8,497 | | 292 | |
| * | CytomX Therapeutics Inc. | 39,683 | | 290 | |
| * | Arena Pharmaceuticals Inc. | 4,057 | | 283 | |
| * | Applied Therapeutics Inc. | 11,732 | | 283 | |
| * | Catalyst Pharmaceuticals Inc. | 85,264 | | 280 | |
| * | Precigen Inc. | 46,141 | | 279 | |
| * | Puma Biotechnology Inc. | 26,856 | | 276 | |
| * | Kiniksa Pharmaceuticals Ltd. Class A | 15,375 | | 272 | |
| * | Beam Therapeutics Inc. | 10,809 | | 271 | |
| * | Quotient Ltd. | 53,209 | | 269 | |
| * | IGM Biosciences Inc. | 6,237 | | 268 | |
| * | Voyager Therapeutics Inc. | 22,727 | | 268 | |
| * | Tricida Inc. | 24,901 | | 263 | |
| *,^ | UroGen Pharma Ltd. | 10,400 | | 261 | |
| * | Tenet Healthcare Corp. | 9,212 | | 260 | |
| *,^ | TherapeuticsMD Inc. | 176,899 | | 258 | |
| * | Endo International plc | 85,787 | | 258 | |
| * | RAPT Therapeutics Inc. | 9,642 | | 256 | |
| * | CytoSorbents Corp. | 30,334 | | 256 | |
| * | Gossamer Bio Inc. | 18,179 | | 253 | |
| * | Fulgent Genetics Inc. | 8,509 | | 252 | |
| * | OptimizeRx Corp. | 12,420 | | 250 | |
| *,^ | Co-Diagnostics Inc. | 22,807 | | 249 | |
| * | Molecular Templates Inc. | 21,328 | | 248 | |
| * | Atreca Inc. Class A | 17,365 | | 247 | |
| * | ImmunoGen Inc. | 64,998 | | 240 | |
| * | Cutera Inc. | 14,691 | | 240 | |
| * | Calithera Biosciences Inc. | 57,797 | | 233 | |
| * | Eiger BioPharmaceuticals Inc. | 20,809 | | 232 | |
| * | WaVe Life Sciences Ltd. | 18,196 | | 228 | |
| * | Aeglea BioTherapeutics Inc. | 31,318 | | 228 | |
| * | Heska Corp. | 2,193 | | 227 | |
| * | Albireo Pharma Inc. | 8,156 | | 227 | |
| * | Affimed NV | 64,481 | | 222 | |
| * | MeiraGTx Holdings plc | 16,669 | | 217 | |
| * | Ovid therapeutics Inc. | 37,663 | | 216 | |
| * | Zynex Inc. | 14,584 | | 216 | |
| * | G1 Therapeutics Inc. | 14,003 | | 215 | |
| * | Precision BioSciences Inc. | 37,838 | | 213 | |
| * | Supernus Pharmaceuticals Inc. | 9,582 | | 211 | |
| * | MEI Pharma Inc. | 77,263 | | 210 | |
| * | Joint Corp. | 11,746 | | 210 | |
| * | Arcutis Biotherapeutics Inc. | 8,317 | | 209 | |
| * | Alphatec Holdings Inc. | 34,410 | | 206 | |
| * | Fortress Biotech Inc. | 51,670 | | 204 | |
| * | Vaxart Inc. | 33,282 | | 197 | |
| * | iCAD Inc. | 17,929 | | 194 | |
| * | MediciNova Inc. | 37,017 | | 194 | |
| | Utah Medical Products Inc. | 2,318 | | 190 | |
| *,^ | Anavex Life Sciences Corp. | 44,631 | | 189 | |
| * | Accuray Inc. | 80,492 | | 188 | |
| * | InfuSystem Holdings Inc. | 12,858 | | 187 | |
| * | Repro-Med Systems Inc. | 21,460 | | 186 | |
| * | Odonate Therapeutics Inc. | 11,505 | | 186 | |
| | | | | | |
Vanguard® Russell 2000 Growth Index Fund
Schedule of Investments
August 31, 2020
| Shares | | Market
Value
($000 | ) |
| * | Satsuma Pharmaceuticals Inc. | 7,999 | | 184 | |
| * | ORIC Pharmaceuticals Inc. | 7,184 | | 180 | |
| * | Agile Therapeutics Inc. | 55,821 | | 179 | |
| * | Chiasma Inc. | 32,158 | | 177 | |
| * | Aprea Therapeutics Inc. | 6,456 | | 175 | |
| * | ChromaDex Corp. | 35,235 | | 174 | |
| * | Natus Medical Inc. | 9,373 | | 170 | |
| * | Apollo Medical Holdings Inc. | 8,616 | | 163 | |
| * | Paratek Pharmaceuticals Inc. | 34,267 | | 158 | |
| * | NantKwest Inc. | 21,571 | | 157 | |
| * | Aduro Biotech Inc. | 50,294 | | 156 | |
| * | Evolent Health Inc. Class A | 10,756 | | 154 | |
| * | Prevail Therapeutics Inc. | 12,302 | | 151 | |
| * | AdaptHealth Corp. Class A | 6,950 | | 148 | |
| *,^ | Xeris Pharmaceuticals Inc. | 31,195 | | 147 | |
| *,^ | BioSig Technologies Inc. | 19,150 | | 142 | |
| * | Beyondspring Inc. | 11,139 | | 138 | |
| * | Kindred Biosciences Inc. | 27,895 | | 138 | |
| * | Stereotaxis Inc. | 39,249 | | 138 | |
| * | Aquestive Therapeutics Inc. | 17,526 | | 138 | |
| * | BioLife Solutions Inc. | 6,412 | | 137 | |
| * | ANI Pharmaceuticals Inc. | 4,328 | | 136 | |
| * | Marinus Pharmaceuticals Inc. | 69,105 | | 134 | |
| * | Evofem Biosciences Inc. | 38,504 | | 128 | |
| * | Cellular Biomedicine Group Inc. | 6,880 | | 128 | |
| * | Sutro Biopharma Inc. | 12,624 | | 126 | |
| * | Sientra Inc. | 32,679 | | 125 | |
| * | Harpoon Therapeutics Inc. | 9,112 | | 125 | |
| * | Optinose Inc. | 27,511 | | 125 | |
| * | Spero Therapeutics Inc. | 11,398 | | 124 | |
| * | Harrow Health Inc. | 17,708 | | 122 | |
| * | Passage Bio Inc. | 7,367 | | 122 | |
| * | NextCure Inc. | 13,543 | | 122 | |
| * | Akcea Therapeutics Inc. | 6,562 | | 120 | |
| * | Pulse Biosciences Inc. | 12,096 | | 120 | |
| * | Neubase Therapeutics Inc. | 14,842 | | 119 | |
| * | Pieris Pharmaceuticals Inc. | 40,527 | | 116 | |
| *,^ | ADMA Biologics Inc. | 44,535 | | 114 | |
| * | Dyadic International Inc. | 14,062 | | 112 | |
| * | Strongbridge Biopharma plc | 28,842 | | 111 | |
| * | iRadimed Corp. | 5,165 | | 109 | |
| * | Aspira Women's Health Inc. | 38,135 | | 109 | |
| * | Fennec Pharmaceuticals Inc. | 19,315 | | 106 | |
| * | Verrica Pharmaceuticals Inc. | 11,027 | | 101 | |
| * | Oyster Point Pharma Inc. | 4,423 | | 101 | |
| * | IMARA Inc. | 4,281 | | 99 | |
| * | 89bio Inc. | 2,554 | | 98 | |
| * | CorMedix Inc. | 21,053 | | 98 | |
| * | ViewRay Inc. | 36,061 | | 98 | |
| *,^ | Genprex Inc. | 24,696 | | 98 | |
| * | Eton Pharmaceuticals Inc. | 12,413 | | 97 | |
| * | Liquidia Technologies Inc. | 18,200 | | 93 | |
| * | Hookipa Pharma Inc. | 10,322 | | 92 | |
| * | Minerva Neurosciences Inc. | 28,908 | | 92 | |
| * | Magenta Therapeutics Inc. | 12,295 | | 89 | |
| * | UNITY Biotechnology Inc. | 28,455 | | 89 | |
| * | Exicure Inc. | 44,769 | | 89 | |
| *,^ | Galectin Therapeutics Inc. | 33,539 | | 89 | |
| *,^ | XOMA Corp. | 4,563 | | 87 | |
| * | DermTech Inc. | 7,229 | | 85 | |
| * | Mustang Bio Inc. | 25,227 | | 82 | |
| * | Checkpoint Therapeutics Inc. | 37,777 | | 82 | |
| * | Organogenesis Holdings Inc. Class A | 18,917 | | 81 | |
| * | Enanta Pharmaceuticals Inc. | 1,509 | | 79 | |
| | | | | | |
Vanguard® Russell 2000 Growth Index Fund
Schedule of Investments
August 31, 2020
| Shares | | Market
Value
($000 | ) |
| * | Catabasis Pharmaceuticals Inc. | 11,891 | | 78 | |
| * | Fulcrum Therapeutics Inc. | 10,693 | | 78 | |
| * | Nymox Pharmaceutical Corp. | 30,359 | | 76 | |
| * | Electromed Inc. | 6,163 | | 76 | |
| * | Verastem Inc. | 60,378 | | 76 | |
| * | NantHealth Inc. | 23,696 | | 75 | |
| * | Selecta Biosciences Inc. | 28,703 | | 75 | |
| *,^ | iBio Inc. | 35,493 | | 74 | |
| * | Cidara Therapeutics Inc. | 23,255 | | 74 | |
| * | Misonix Inc. | 5,603 | | 74 | |
| * | Allscripts Healthcare Solutions Inc. | 8,034 | | 72 | |
| * | Tela Bio Inc. | 5,028 | | 72 | |
| * | Rockwell Medical Inc. | 53,681 | | 70 | |
| *,^ | La Jolla Pharmaceutical Co. | 16,730 | | 70 | |
| * | Hanger Inc. | 3,531 | | 70 | |
| * | CASI Pharmaceuticals Inc. | 40,786 | | 70 | |
| * | Retractable Technologies Inc. | 10,858 | | 69 | |
| * | Eloxx Pharmaceuticals Inc. | 22,211 | | 69 | |
| * | VolitionRX Ltd. | 20,169 | | 68 | |
| * | LogicBio Therapeutics Inc. | 10,563 | | 67 | |
| * | ContraFect Corp. | 12,060 | | 66 | |
| * | Cerecor Inc. | 26,774 | | 66 | |
| * | PAVmed Inc. | 33,329 | | 66 | |
| *,^ | Chembio Diagnostics Inc. | 16,014 | | 66 | |
| * | Lexicon Pharmaceuticals Inc. | 37,099 | | 65 | |
| * | Beyond Air Inc. | 11,689 | | 65 | |
| * | Galera Therapeutics Inc. | 8,036 | | 63 | |
| * | Avenue Therapeutics Inc. | 5,624 | | 63 | |
| * | Aravive Inc. | 10,680 | | 61 | |
| * | Tyme Technologies Inc. | 59,729 | | 60 | |
| * | Exagen Inc. | 4,060 | | 59 | |
| * | Kaleido Biosciences Inc. | 9,183 | | 58 | |
| * | Soleno Therapeutics Inc. | 26,675 | | 57 | |
| * | Evelo Biosciences Inc. | 12,581 | | 56 | |
| * | Champions Oncology Inc. | 6,619 | | 55 | |
| * | PhaseBio Pharmaceuticals Inc. | 13,853 | | 53 | |
| * | Recro Pharma Inc. | 18,278 | | 50 | |
| * | Oncocyte Corp. | 38,536 | | 48 | |
| * | Mirum Pharmaceuticals Inc. | 1,835 | | 48 | |
| * | Osmotica Pharmaceuticals plc | 7,758 | | 46 | |
| * | Lyra Therapeutics Inc. | 3,485 | | 46 | |
| * | Centogene NV | 3,760 | | 44 | |
| * | Milestone Scientific Inc. | 28,979 | | 43 | |
| * | Abeona Therapeutics Inc. | 17,955 | | 42 | |
| * | scPharmaceuticals Inc. | 4,909 | | 42 | |
| * | Axcella Health Inc. | 8,244 | | 41 | |
| * | Fluidigm Corp. | 5,182 | | 41 | |
| * | Protara Therapeutics Inc. | 1,861 | | 40 | |
| * | AVEO Pharmaceuticals Inc. | 7,402 | | 35 | |
| * | Bellerophon Therapeutics Inc. | 3,189 | | 34 | |
| * | Soliton Inc. | 4,878 | | 33 | |
| * | Triple-S Management Corp. Class B | 1,764 | | 33 | |
| *,^ | Marker Therapeutics Inc. | 18,207 | | 33 | |
| *,^ | Evolus Inc. | 8,299 | | 32 | |
| * | Venus Concept Inc. | 10,820 | | 31 | |
| * | KalVista Pharmaceuticals Inc. | 2,360 | | 31 | |
| * | Viking Therapeutics Inc. | 4,588 | | 31 | |
| * | Immunic Inc. | 1,881 | | 30 | |
| * | Rubius Therapeutics Inc. | 5,778 | | 28 | |
| * | American Renal Associates Holdings Inc. | 3,938 | | 27 | |
| * | Ideaya Biosciences Inc. | 2,096 | | 25 | |
| * | Cassava Sciences Inc. | 7,779 | | 24 | |
| * | NeuroBo Pharmaceuticals Inc. | 3,936 | | 24 | |
| * | Nemaura Medical Inc. | 6,206 | | 23 | |
| | | | | | |
Vanguard® Russell 2000 Growth Index Fund
Schedule of Investments
August 31, 2020
| | Shares | | Market
Value
($000 | ) |
| *,^ | vTv Therapeutics Inc. Class A | 10,690 | | 22 | |
| * | AcelRx Pharmaceuticals Inc. | 17,498 | | 22 | |
| * | Cohbar Inc. | 22,497 | | 21 | |
| * | Menlo Therapeutics Inc. | 13,596 | | 21 | |
| * | TCR2 Therapeutics Inc. | 986 | | 20 | |
| * | Orgenesis Inc. | 3,774 | | 20 | |
| §,* | Alder BioPharmaceuticals CVR Exp. 12/31/2024 | 20,196 | | 18 | |
| * | Gritstone Oncology Inc. | 5,305 | | 18 | |
| * | Apyx Medical Corp. | 2,075 | | 10 | |
| * | Solid Biosciences Inc. | 3,100 | | 7 | |
| * | Pulse Biosciences Inc. Warrants Exp. 12/31/2049 | 286 | | 1 | |
| §,* | Synergy Pharmaceuticals LLC | 124,654 | | 1 | |
| §,*,^ | Oncternal Therapeutics Inc. CVR | 530 | | 1 | |
| | | 279,830 | |
| Materials & Processing (5.9%) | |
| * | TopBuild Corp. | 29,082 | | 4,473 | |
| | Simpson Manufacturing Co. Inc. | 38,291 | | 3,766 | |
| | Louisiana-Pacific Corp. | 99,285 | | 3,270 | |
| * | RBC Bearings Inc. | 21,679 | | 2,863 | |
| * | Builders FirstSource Inc. | 92,228 | | 2,824 | |
| | UFP Industries Inc. | 44,332 | | 2,631 | |
| | Balchem Corp. | 25,980 | | 2,538 | |
| | Advanced Drainage Systems Inc. | 43,516 | | 2,414 | |
| | Quaker Chemical Corp. | 11,685 | | 2,220 | |
| * | Novagold Resources Inc. | 194,724 | | 2,062 | |
| | AAON Inc. | 36,114 | | 2,056 | |
| * | Ingevity Corp. | 36,503 | | 2,050 | |
| * | Masonite International Corp. | 21,406 | | 1,954 | |
| * | Installed Building Products Inc. | 20,058 | | 1,741 | |
| | Compass Minerals International Inc. | 30,018 | | 1,709 | |
| | HB Fuller Co. | 29,350 | | 1,414 | |
| | Innospec Inc. | 17,376 | | 1,298 | |
| | O-I Glass Inc. | 106,541 | | 1,159 | |
| | Patrick Industries Inc. | 18,519 | | 1,041 | |
| * | GCP Applied Technologies Inc. | 33,486 | | 873 | |
| | Sensient Technologies Corp. | 15,216 | | 840 | |
| * | Ferro Corp. | 53,208 | | 664 | |
| | Chase Corp. | 6,475 | | 632 | |
| | Comfort Systems USA Inc. | 9,178 | | 465 | |
| * | Gibraltar Industries Inc. | 6,468 | | 404 | |
| | Orion Engineered Carbons SA | 29,475 | | 358 | |
| * | PGT Innovations Inc. | 19,027 | | 345 | |
| | Omega Flex Inc. | 2,551 | | 336 | |
| | Materion Corp. | 5,429 | | 296 | |
| | Boise Cascade Co. | 5,863 | | 269 | |
| * | Koppers Holdings Inc. | 10,980 | | 264 | |
| | Trinseo SA | 10,488 | | 261 | |
| | Tronox Holdings plc Class A | 27,407 | | 246 | |
| | Hawkins Inc. | 4,578 | | 230 | |
| * | Forterra Inc. | 16,697 | | 221 | |
| | Rexnord Corp. | 7,179 | | 208 | |
| | Myers Industries Inc. | 11,764 | | 180 | |
| | Stepan Co. | 1,538 | | 177 | |
| * | Alpha Pro Tech Ltd. | 10,749 | | 151 | |
| * | Cornerstone Building Brands Inc. | 15,661 | | 125 | |
| | Mueller Water Products Inc. Class A | 7,914 | | 85 | |
| | Apogee Enterprises Inc. | 3,543 | | 74 | |
| * | Marrone Bio Innovations Inc. | 57,466 | | 73 | |
| | American Vanguard Corp. | 4,965 | | 70 | |
| * | Uranium Energy Corp. | 59,858 | | 69 | |
| * | PQ Group Holdings Inc. | 5,710 | | 67 | |
| * | Foundation Building Materials Inc. | 3,938 | | 64 | |
| | Caledonia Mining Corp. plc | 3,321 | | 60 | |
| * | Amyris Inc. | 5,647 | | 19 | |
Vanguard® Russell 2000 Growth Index Fund
Schedule of Investments
August 31, 2020
| | Shares | | Market
Value
($000 | ) |
| * | UFP Technologies Inc. | 447 | | 18 | |
| * | Aspen Aerogels Inc. | 1,438 | | 12 | |
| | United States Lime & Minerals Inc. | 130 | | 12 | |
| * | AgroFresh Solutions Inc. | 1,848 | | 5 | |
| | | 51,656 | |
| Other (0.1%)1 | |
| * | ALX Oncology Holdings Inc. | 1,080 | | 44 | |
| * | Rackspace Technology Inc. | 1,843 | | 39 | |
| * | Acutus Medical Inc. | 956 | | 34 | |
| * | Kymera Therapeutics Inc. | 875 | | 28 | |
| * | Vroom Inc. | 323 | | 22 | |
| * | GoHealth Inc. Class A | 1,592 | | 22 | |
| §,*,^ | Tobira Therapeutics CVR Exp. 12/31/2028 | 3,989 | | 18 | |
| * | IBEX Ltd. | 1,090 | | 17 | |
| * | Allovir Inc. | 528 | | 17 | |
| * | Annexon Inc. | 684 | | 17 | |
| * | Selectquote Inc. | 910 | | 17 | |
| * | iTeos Therapeutics Inc. | 537 | | 16 | |
| * | Lemonade Inc. | 264 | | 15 | |
| * | Oak Street Health Inc. | 340 | | 15 | |
| * | Generation Bio Co. | 448 | | 14 | |
| * | Pandion Therapeutics Inc. | 738 | | 14 | |
| * | Albertsons Cos. Inc. Class A | 937 | | 13 | |
| * | Nurix Therapeutics Inc. | 544 | | 13 | |
| * | Accolade Inc. | 373 | | 13 | |
| * | Vaxcyte Inc. | 267 | | 12 | |
| * | Shift4 Payments Inc. Class A | 229 | | 12 | |
| * | Duck Creek Technologies Inc. | 261 | | 10 | |
| * | Trean Insurance Group Inc. | 641 | | 10 | |
| * | Montrose Environmental Group Inc. | 297 | | 8 | |
| * | Vital Farms Inc. | 209 | | 8 | |
| * | Jamf Holding Corp. | 211 | | 8 | |
| * | Vertex Inc. | 317 | | 8 | |
| * | Applied Molecular Transport Inc. | 309 | | 8 | |
| * | BigCommerce Holdings Inc. | 64 | | 8 | |
| * | Checkmate Pharmaceuticals Inc. | 480 | | 7 | |
| * | Inari Medical Inc. | 90 | | 7 | |
| * | nCino Inc. | 67 | | 6 | |
| * | Pliant Therapeutics Inc. | 220 | | 6 | |
| * | Progenity Inc. | 599 | | 6 | |
| * | Inhibrx Inc. | 294 | | 5 | |
| * | Avidity Biosciences Inc. | 176 | | 5 | |
| * | Akouos Inc. | 218 | | 5 | |
| * | Poseida Therapeutics Inc. | 300 | | 3 | |
| * | Harmony Biosciences Holdings Inc. | 65 | | 2 | |
| * | Inozyme Pharma Inc. | 69 | | 2 | |
| §,* | NewStar Financial Inc. CVR | 2,203 | | — | |
| §,* | Lantheus Holdings CVR | 71,640 | | — | |
| §,* | Clinical Data CVR | 367 | | — | |
| §,* | Omthera Pharmeceuticals CVR | 2,001 | | — | |
| | | 534 | |
| Producer Durables (10.9%) | |
| | Tetra Tech Inc. | 47,370 | | 4,373 | |
| | MAXIMUS Inc. | 53,813 | | 4,173 | |
| * | Plug Power Inc. | 311,870 | | 4,048 | |
| | Exponent Inc. | 45,164 | | 3,634 | |
| * | Proto Labs Inc. | 23,549 | | 3,462 | |
| * | Saia Inc. | 23,079 | | 3,097 | |
| | John Bean Technologies Corp. | 27,526 | | 2,822 | |
| * | Aerojet Rocketdyne Holdings Inc. | 64,586 | | 2,672 | |
| * | ASGN Inc. | 37,059 | | 2,660 | |
| * | TriNet Group Inc. | 36,253 | | 2,459 | |
| | Franklin Electric Co. Inc. | 37,611 | | 2,233 | |
| | Werner Enterprises Inc. | 47,519 | | 2,186 | |
Vanguard® Russell 2000 Growth Index Fund
Schedule of Investments
August 31, 2020
| | Shares | | Market
Value
($000 | ) |
| | Brink's Co. | 44,131 | | 2,134 | |
| * | Itron Inc. | 35,211 | | 2,098 | |
| * | Casella Waste Systems Inc. Class A | 35,088 | | 1,970 | |
| * | ExlService Holdings Inc. | 29,556 | | 1,882 | |
| | ESCO Technologies Inc. | 20,696 | | 1,861 | |
| * | Kratos Defense & Security Solutions Inc. | 93,118 | | 1,820 | |
| * | Advanced Disposal Services Inc. | 59,732 | | 1,800 | |
| * | CryoPort Inc. | 29,496 | | 1,636 | |
| | Badger Meter Inc. | 25,573 | | 1,578 | |
| | Federal Signal Corp. | 48,478 | | 1,557 | |
| | Brady Corp. Class A | 31,851 | | 1,494 | |
| * | AeroVironment Inc. | 19,018 | | 1,453 | |
| * | Vicor Corp. | 15,643 | | 1,361 | |
| * | Air Transport Services Group Inc. | 51,746 | | 1,315 | |
| * | Verra Mobility Corp. Class A | 117,338 | | 1,240 | |
| * | Dycom Industries Inc. | 19,401 | | 1,193 | |
| * | OSI Systems Inc. | 14,922 | | 1,175 | |
| * | SPX Corp. | 27,979 | | 1,170 | |
| | Kadant Inc. | 10,046 | | 1,170 | |
| | Albany International Corp. Class A | 22,275 | | 1,156 | |
| * | Atkore International Group Inc. | 41,559 | | 1,111 | |
| | Insperity Inc. | 15,876 | | 1,070 | |
| | Tennant Co. | 16,044 | | 1,066 | |
| | Watts Water Technologies Inc. Class A | 10,675 | | 1,022 | |
| | Lindsay Corp. | 9,525 | | 952 | |
| | TTEC Holdings Inc. | 15,978 | | 906 | |
| | Forward Air Corp. | 15,123 | | 892 | |
| | CSW Industrials Inc. | 12,344 | | 892 | |
| | Mesa Laboratories Inc. | 3,567 | | 877 | |
| * | FARO Technologies Inc. | 14,485 | | 818 | |
| | Applied Industrial Technologies Inc. | 13,456 | | 810 | |
| | McGrath RentCorp | 12,014 | | 797 | |
| | Alamo Group Inc. | 7,051 | | 782 | |
| | Douglas Dynamics Inc. | 18,290 | | 702 | |
| | Shyft Group Inc. | 29,962 | | 598 | |
| | Kforce Inc. | 17,357 | | 596 | |
| | ICF International Inc. | 7,951 | | 543 | |
| * | Cimpress plc | 5,083 | | 471 | |
| | Helios Technologies Inc. | 11,416 | | 469 | |
| | Marten Transport Ltd. | 25,423 | | 462 | |
| * | PAE Inc. | 51,982 | | 459 | |
| | Otter Tail Corp. | 11,696 | | 454 | |
| | Primoris Services Corp. | 23,786 | | 453 | |
| * | NV5 Global Inc. | 8,620 | | 446 | |
| | KBR Inc. | 15,552 | | 389 | |
| | Covanta Holding Corp. | 41,048 | | 388 | |
| | Enerpac Tool Group Corp. Class A | 17,825 | | 371 | |
| * | MYR Group Inc. | 9,084 | | 353 | |
| * | Forrester Research Inc. | 9,616 | | 341 | |
| | Pitney Bowes Inc. | 59,257 | | 325 | |
| | EMCOR Group Inc. | 4,045 | | 303 | |
| * | Energy Recovery Inc. | 33,238 | | 283 | |
| * | Napco Security Technologies Inc. | 10,239 | | 255 | |
| * | Daseke Inc. | 40,172 | | 247 | |
| | Allied Motion Technologies Inc. | 5,729 | | 244 | |
| | Hackett Group Inc. | 19,233 | | 243 | |
| | EnerSys | 3,302 | | 238 | |
| * | Welbilt Inc. | 32,003 | | 236 | |
| * | Vivint Smart Home Inc. | 12,846 | | 228 | |
| * | Franklin Covey Co. | 10,918 | | 216 | |
| | CRA International Inc. | 4,986 | | 212 | |
| * | CBIZ Inc. | 7,548 | | 184 | |
| * | Willdan Group Inc. | 6,343 | | 179 | |
| | Allegiant Travel Co. Class A | 1,380 | | 178 | |
| | | | | | |
Vanguard® Russell 2000 Growth Index Fund
Schedule of Investments
August 31, 2020
| | Shares | | Market
Value
($000 | ) |
| * | Transcat Inc. | 5,954 | | 175 | |
| * | Luna Innovations Inc. | 25,449 | | 163 | |
| * | Vectrus Inc. | 3,654 | | 159 | |
| * | MasTec Inc. | 3,372 | | 156 | |
| * | Orion Energy Systems Inc. | 23,479 | | 150 | |
| | Cubic Corp. | 3,121 | | 147 | |
| * | Construction Partners Inc. Class A | 7,676 | | 143 | |
| | UniFirst Corp. | 739 | | 142 | |
| | Kaman Corp. | 2,597 | | 120 | |
| * | EVI Industries Inc. | 4,280 | | 105 | |
| | Universal Logistics Holdings Inc. | 4,548 | | 98 | |
| *,^ | ExOne Co. | 7,907 | | 97 | |
| * | Sharps Compliance Corp. | 12,643 | | 97 | |
| * | HC2 Holdings Inc. | 36,314 | | 91 | |
| *,^ | Wrap Technologies Inc. | 10,324 | | 90 | |
| * | Lawson Products Inc. | 2,497 | | 90 | |
| * | Atlas Air Worldwide Holdings Inc. | 1,546 | | 87 | |
| * | Huron Consulting Group Inc. | 1,876 | | 81 | |
| | Granite Construction Inc. | 4,294 | | 80 | |
| * | PFSweb Inc. | 9,250 | | 78 | |
| * | IES Holdings Inc. | 2,652 | | 76 | |
| | Gorman-Rupp Co. | 2,367 | | 76 | |
| * | Mastech Digital Inc. | 3,605 | | 67 | |
| | Raven Industries Inc. | 2,661 | | 66 | |
| * | Sykes Enterprises Inc. | 1,949 | | 65 | |
| * | Blue Bird Corp. | 5,572 | | 63 | |
| * | CAI International Inc. | 2,754 | | 60 | |
| * | Sterling Construction Co. Inc. | 3,980 | | 56 | |
| * | Herc Holdings Inc. | 1,129 | | 46 | |
| * | Dorian LPG Ltd. | 5,024 | | 42 | |
| | Barrett Business Services Inc. | 489 | | 28 | |
| * | Cross Country Healthcare Inc. | 3,201 | | 20 | |
| | REV Group Inc. | 2,569 | | 20 | |
| | Luxfer Holdings plc | 1,341 | | 19 | |
| | Ardmore Shipping Corp. | 3,283 | | 12 | |
| * | Gencor Industries Inc. | 613 | | 8 | |
| * | PAM Transportation Services Inc. | 199 | | 7 | |
| | | 95,023 | |
| Technology (20.2%) | |
| * | Q2 Holdings Inc. | 43,595 | | 4,241 | |
| * | Silicon Laboratories Inc. | 38,116 | | 3,903 | |
| | Cabot Microelectronics Corp. | 25,524 | | 3,887 | |
| * | Envestnet Inc. | 46,660 | | 3,872 | |
| * | Blackline Inc. | 44,062 | | 3,850 | |
| * | II-VI Inc. | 77,038 | | 3,428 | |
| * | Varonis Systems Inc. | 27,416 | | 3,387 | |
| * | Lattice Semiconductor Corp. | 118,213 | | 3,381 | |
| * | Semtech Corp. | 56,772 | | 3,330 | |
| | Brooks Automation Inc. | 63,834 | | 3,296 | |
| * | Novanta Inc. | 30,064 | | 3,222 | |
| * | LivePerson Inc. | 53,640 | | 3,200 | |
| * | Qualys Inc. | 29,894 | | 3,173 | |
| * | Sailpoint Technologies Holdings Inc. | 77,488 | | 3,040 | |
| * | ACI Worldwide Inc. | 100,795 | | 2,961 | |
| | Power Integrations Inc. | 51,822 | | 2,900 | |
| * | Rapid7 Inc. | 44,299 | | 2,860 | |
| * | J2 Global Inc. | 40,806 | | 2,856 | |
| | Blackbaud Inc. | 43,477 | | 2,776 | |
| * | Viavi Solutions Inc. | 201,047 | | 2,681 | |
| * | Bandwidth Inc. Class A | 16,882 | | 2,659 | |
| * | SVMK Inc. | 104,935 | | 2,612 | |
| * | LiveRamp Holdings Inc. | 46,563 | | 2,600 | |
| * | Box Inc. | 129,667 | | 2,545 | |
| * | Advanced Energy Industries Inc. | 33,417 | | 2,477 | |
Vanguard® Russell 2000 Growth Index Fund
Schedule of Investments
August 31, 2020
| | Shares | | Market
Value
($000 | ) |
| * | SPS Commerce Inc. | 30,838 | | 2,463 | |
| * | Mimecast Ltd. | 49,642 | | 2,444 | |
| * | Synaptics Inc. | 28,236 | | 2,409 | |
| * | Alarm.com Holdings Inc. | 39,852 | | 2,386 | |
| * | Appfolio Inc. | 14,042 | | 2,359 | |
| * | Acacia Communications Inc. | 34,140 | | 2,304 | |
| * | Tenable Holdings Inc. | 60,575 | | 2,280 | |
| * | Fabrinet | 32,324 | | 2,256 | |
| | Perspecta Inc. | 101,334 | | 2,105 | |
| * | Workiva Inc. Class A | 33,733 | | 1,990 | |
| * | Cornerstone OnDemand Inc. | 53,205 | | 1,877 | |
| * | Cargurus Inc. | 75,839 | | 1,849 | |
| * | Bottomline Technologies DE Inc. | 38,005 | | 1,810 | |
| * | iRobot Corp. | 24,255 | | 1,796 | |
| *,^ | Appian Corp. Class A | 28,848 | | 1,767 | |
| * | Yext Inc. | 88,707 | | 1,762 | |
| * | FormFactor Inc. | 67,008 | | 1,751 | |
| * | Digital Turbine Inc. | 72,373 | | 1,751 | |
| * | Inovalon Holdings Inc. Class A | 64,894 | | 1,606 | |
| * | CommVault Systems Inc. | 36,738 | | 1,588 | |
| * | Plexus Corp. | 20,540 | | 1,562 | |
| * | Altair Engineering Inc. Class A | 36,938 | | 1,552 | |
| | Progress Software Corp. | 39,391 | | 1,493 | |
| * | MACOM Technology Solutions Holdings Inc. | 41,286 | | 1,471 | |
| * | PROS Holdings Inc. | 34,460 | | 1,344 | |
| * | Avaya Holdings Corp. | 81,409 | | 1,263 | |
| * | Upwork Inc. | 81,515 | | 1,241 | |
| | NIC Inc. | 57,882 | | 1,238 | |
| * | Perficient Inc. | 28,608 | | 1,228 | |
| | CSG Systems International Inc. | 28,769 | | 1,225 | |
| * | Verint Systems Inc. | 25,173 | | 1,197 | |
| * | Model N Inc. | 30,014 | | 1,180 | |
| * | Zuora Inc. Class A | 85,938 | | 1,168 | |
| * | Cloudera Inc. | 87,754 | | 1,159 | |
| * | Virtusa Corp. | 25,313 | | 1,001 | |
| * | Domo Inc. | 22,431 | | 913 | |
| * | Glu Mobile Inc. | 114,017 | | 905 | |
| | Shutterstock Inc. | 17,106 | | 861 | |
| * | MaxLinear Inc. | 35,174 | | 856 | |
| * | Ultra Clean Holdings Inc. | 34,865 | | 855 | |
| * | Calix Inc. | 42,803 | | 833 | |
| * | TechTarget Inc. | 20,570 | | 816 | |
| * | CEVA Inc. | 19,086 | | 806 | |
| * | Upland Software Inc. | 20,083 | | 788 | |
| * | Vocera Communications Inc. | 27,979 | | 783 | |
| | ManTech International Corp. Class A | 10,153 | | 760 | |
| * | Ping Identity Holding Corp. | 21,994 | | 758 | |
| | Sapiens International Corp. NV | 22,574 | | 757 | |
| * | ePlus Inc. | 9,757 | | 749 | |
| * | Schrodinger Inc. | 12,147 | | 734 | |
| * | nLight Inc. | 30,359 | | 709 | |
| *,^ | Inseego Corp. | 59,999 | | 689 | |
| | Simulations Plus Inc. | 11,092 | | 661 | |
| * | OneSpan Inc. | 29,366 | | 633 | |
| * | Axcelis Technologies Inc. | 26,469 | | 625 | |
| * | MicroStrategy Inc. Class A | 4,315 | | 623 | |
| * | Eventbrite Inc. Class A | 55,864 | | 601 | |
| * | Limelight Networks Inc. | 102,124 | | 579 | |
| * | MobileIron Inc. | 84,685 | | 553 | |
| * | PAR Technology Corp. | 14,159 | | 529 | |
| | InterDigital Inc. | 8,557 | | 523 | |
| * | Tucows Inc. Class A | 8,246 | | 521 | |
| * | Infinera Corp. | 68,568 | | 500 | |
| * | Insight Enterprises Inc. | 8,343 | | 499 | |
Vanguard® Russell 2000 Growth Index Fund
Schedule of Investments
August 31, 2020
| Shares | | Market
Value
($000 | ) |
| * | Ichor Holdings Ltd. | 19,484 | | 490 | |
| * | PDF Solutions Inc. | 23,556 | | 488 | |
| * | Parsons Corp. | 14,349 | | 477 | |
| * | A10 Networks Inc. | 54,366 | | 465 | |
| | QAD Inc. Class A | 10,210 | | 464 | |
| * | Ambarella Inc. | 8,751 | | 461 | |
| * | Extreme Networks Inc. | 102,716 | | 449 | |
| * | Mitek Systems Inc. | 35,308 | | 448 | |
| * | EverQuote Inc. Class A | 12,338 | | 438 | |
| * | Agilysys Inc. | 15,989 | | 406 | |
| * | ChannelAdvisor Corp. | 24,007 | | 404 | |
| * | Meet Group Inc. | 60,662 | | 382 | |
| * | Brightcove Inc. | 34,340 | | 382 | |
| * | Endurance International Group Holdings Inc. | 58,169 | | 379 | |
| | American Software Inc. Class A | 26,347 | | 373 | |
| * | Magnite Inc. | 50,499 | | 371 | |
| * | Impinj Inc. | 14,800 | | 362 | |
| * | Rogers Corp. | 2,857 | | 324 | |
| * | Onto Innovation Inc. | 10,314 | | 322 | |
| * | Diodes Inc. | 6,506 | | 318 | |
| * | Super Micro Computer Inc. | 11,372 | | 311 | |
| * | SMART Global Holdings Inc. | 11,763 | | 296 | |
| | Ebix Inc. | 12,795 | | 295 | |
| * | SiTime Corp. | 4,434 | | 292 | |
| * | Zix Corp. | 48,114 | | 292 | |
| * | Waitr Holdings Inc. | 66,786 | | 269 | |
| * | Sprout Social Inc. Class A | 6,931 | | 269 | |
| * | Yelp Inc. Class A | 11,451 | | 265 | |
| * | Benefitfocus Inc. | 25,502 | | 264 | |
| * | DSP Group Inc. | 17,561 | | 252 | |
| * | Ooma Inc. | 18,292 | | 249 | |
| * | Intelligent Systems Corp. | 6,239 | | 235 | |
| * | Avid Technology Inc. | 27,073 | | 219 | |
| *,^ | Akoustis Technologies Inc. | 27,373 | | 217 | |
| * | ShotSpotter Inc. | 7,090 | | 212 | |
| * | Diebold Nixdorf Inc. | 24,190 | | 202 | |
| | NVE Corp. | 3,730 | | 199 | |
| * | CyberOptics Corp. | 6,194 | | 199 | |
| * | Everi Holdings Inc. | 25,391 | | 197 | |
| * | NeoPhotonics Corp. | 29,461 | | 196 | |
| * | Amkor Technology Inc. | 14,510 | | 177 | |
| * | Clearfield Inc. | 9,861 | | 174 | |
| * | Veritone Inc. | 20,203 | | 167 | |
| * | Iteris Inc. | 35,869 | | 164 | |
| * | Atomera Inc. | 12,825 | | 163 | |
| * | CalAmp Corp. | 19,446 | | 159 | |
| | Methode Electronics Inc. | 5,611 | | 159 | |
| * | Digimarc Corp. | 9,695 | | 155 | |
| * | Genasys Inc. | 28,932 | | 145 | |
| | VirnetX Holding Corp. | 28,962 | | 144 | |
| * | Grid Dynamics Holdings Inc. | 19,090 | | 142 | |
| * | Casa Systems Inc. | 27,086 | | 123 | |
| * | Red Violet Inc. | 5,699 | | 118 | |
| | Plantronics Inc. | 9,554 | | 118 | |
| * | Resonant Inc. | 43,700 | | 117 | |
| * | Smith Micro Software Inc. | 29,378 | | 113 | |
| * | Immersion Corp. | 11,721 | | 111 | |
| * | GAN Ltd. | 5,190 | | 107 | |
| * | Majesco | 6,430 | | 103 | |
| * | eGain Corp. | 6,905 | | 92 | |
| * | Intellicheck Inc. | 14,029 | | 88 | |
| | Xperi Holding Corp | 6,697 | | 84 | |
| * | Rimini Street Inc. | 18,273 | | 80 | |
| * | Pixelworks Inc. | 31,081 | | 71 | |
| | | | | | |
Vanguard® Russell 2000 Growth Index Fund
Schedule of Investments
August 31, 2020
| Shares | | | Market
Value
($000 | ) |
| * | Unisys Corp. | 5,529 | | 64 | |
| * | Cambium Networks Corp. | 4,640 | | 61 | |
| | Loral Space & Communications Inc. | 2,500 | | 59 | |
| * | Research Frontiers Inc. | 24,197 | | 56 | |
| * | Telenav Inc. | 11,577 | | 53 | |
| * | Akerna Corp. | 8,462 | | 51 | |
| | Cohu Inc. | 2,365 | | 41 | |
| * | Intevac Inc. | 4,864 | | 29 | |
| | PC Connection Inc. | 651 | | 29 | |
| * | Quantum Corp. | 5,176 | | 28 | |
| * | Park City Group Inc. | 2,250 | | 11 | |
| * | SecureWorks Corp. Class A | 831 | | | 11 | |
| | | 176,131 | |
| Utilities (3.1%) | |
| | Cogent Communications Holdings Inc. | 37,411 | | 2,516 | |
| | American States Water Co. | 32,435 | | 2,468 | |
| | Shenandoah Telecommunications Co. | 42,327 | | 2,341 | |
| | Ormat Technologies Inc. | 35,190 | | 2,142 | |
| * | Iridium Communications Inc. | 66,508 | | 1,863 | |
| | California Water Service Group | 39,515 | | 1,792 | |
| * | Evoqua Water Technologies Corp. | 75,413 | | 1,543 | |
| * | 8x8 Inc. | 89,242 | | 1,506 | |
| * | Vonage Holdings Corp. | 114,479 | | 1,311 | |
| | Chesapeake Utilities Corp. | 13,342 | | 1,091 | |
| | South Jersey Industries Inc. | 47,714 | | 1,057 | |
| | Middlesex Water Co. | 14,968 | | 960 | |
| | SJW Group | 12,370 | | 773 | |
| | Brookfield Infrastructure Corp. Class A | 14,153 | | 707 | |
| | MGE Energy Inc. | 8,205 | | 533 | |
| | York Water Co. | 11,397 | | 520 | |
| * | Anterix Inc. | 11,726 | | 513 | |
| * | Boingo Wireless Inc. | 38,559 | | 501 | |
| | ONE Gas Inc. | 5,217 | | 387 | |
| | Clearway Energy Inc. | 13,806 | | 352 | |
| | Brookfield Renewable Corp. Class A | 5,117 | | 261 | |
| | Southwest Gas Holdings Inc. | 3,972 | | 250 | |
| *,^ | Gogo Inc. | 47,610 | | 245 | |
| * | Cincinnati Bell Inc. | 14,416 | | 217 | |
| * | Pure Cycle Corp. | 17,186 | | 168 | |
| | Clearway Energy Inc. Class A | 6,295 | | 152 | |
| | Northwest Natural Holding Co. | 2,858 | | 146 | |
| *,^ | GTT Communications Inc. | 27,372 | | 136 | |
| * | WideOpenWest Inc. | 23,019 | | 132 | |
| | Global Water Resources Inc. | 10,811 | | 119 | |
| * | Cadiz Inc. | 9,778 | | 102 | |
| | Genie Energy Ltd. Class B | 11,409 | | 101 | |
| | Spark Energy Inc. Class A | 10,255 | | 94 | |
| * | Sunnova Energy International Inc. | 3,615 | | 86 | |
| | RGC Resources Inc. | 3,212 | | 75 | |
| * | IDT Corp. Class B | 8,796 | | 57 | |
| * | Consolidated Communications Holdings Inc. | 6,494 | | 51 | |
| * | ORBCOMM Inc. | 8,844 | | 35 | |
| | ATN International Inc. | 562 | | 33 | |
| | Artesian Resources Corp. Class A | 428 | | 15 | |
| * | Atlantic Power Corp. | 5,976 | | | 12 | |
| | | | 27,363 | |
Total Common Stocks (Cost $672,008) | | 869,695 | |
| | | | | | |
Vanguard® Russell 2000 Growth Index Fund
Schedule of Investments
August 31, 2020
| Coupon | | Shares | | Market
Value
($000 | ) |
| Temporary Cash Investments (1.5%) | |
| Money Market Fund (1.5%) | |
| 2,3 | Vanguard Market Liquidity Fund | 0.147% | | 126,519 | | 12,652 | |
| | | |
| | | Maturity
Date | Face
Amount
($000 | ) | | |
| U.S. Government and Agency Obligations (0.0%) | |
| 4 | United States Treasury Bill | 0.210% | 9/15/20 | 93,500 | | 93 | |
| Total Temporary Cash Investments (Cost $12,742) | | 12,745 | |
| Total Investments (101.4%) (Cost $684,750) | | 882,440 | |
| Other Assets and Liabilities — Net (-1.4%) | | (11,934 | ) |
| Net Assets (100%) | | 870,506 | |
| Cost is in $000. |
| § | Security value determined using significant unobservable inputs. |
| * | Non-income-producing security. |
| ^ | Includes partial security positions on loan to broker-dealers. The total value of securities on loan is $10,826,000. |
| 1 | “Other” represents securities that are not classified by the fund's benchmark index. |
| 2 | Affiliated money market fund available only to Vanguard funds and certain trusts and accounts managed by Vanguard. Rate shown is the 7-day yield. |
| 3 | Collateral of $11,746,000 was received for securities on loan. |
| 4 | Securities with a value of $75,000 have been segregated as initial margin for open futures contracts. |
| | CVR—Contingent Value Rights. |
| | REIT—Real Estate Investment Trust. |
| | |
This page intentionally left blank.
| | © 2020 The Vanguard Group, Inc.
All rights reserved. |
| | Vanguard Marketing Corporation, Distributor. |
| | |
| | SNA18510 102020 |
Vanguard® Russell 3000 Index Fund
Schedule of Investments
August 31, 2020
| | | | Market |
| | | | Value |
| | | Shares | ($000) |
Common Stocks (99.8%) |
| Consumer Discretionary (16.8%) |
| * | Amazon.com Inc. | 21,207 | 73,185 |
| * | Tesla Inc. | 36,970 | 18,423 |
| | Home Depot Inc. | 53,722 | 15,313 |
| | Walt Disney Co. | 90,318 | 11,910 |
| * | Netflix Inc. | 21,257 | 11,257 |
| | Comcast Corp. Class A | 226,480 | 10,149 |
| | Walmart Inc. | 69,664 | 9,673 |
| | McDonald's Corp. | 37,212 | 7,946 |
| | Costco Wholesale Corp. | 22,055 | 7,668 |
| | NIKE Inc. Class B | 60,546 | 6,775 |
| | Lowe's Cos. Inc. | 37,767 | 6,220 |
| | Starbucks Corp. | 58,382 | 4,932 |
| * | Charter Communications Inc. Class A | 7,475 | 4,602 |
| * | Booking Holdings Inc. | 2,040 | 3,897 |
| | Target Corp. | 24,953 | 3,773 |
| | TJX Cos. Inc. | 59,784 | 3,276 |
| | Dollar General Corp. | 12,555 | 2,535 |
| | Estee Lauder Cos. Inc. Class A | 11,016 | 2,442 |
| * | Uber Technologies Inc. | 68,339 | 2,298 |
| * | Lululemon Athletica Inc. | 5,664 | 2,128 |
| * | Spotify Technology SA | 6,550 | 1,848 |
| | General Motors Co. | 62,240 | 1,844 |
| | eBay Inc. | 33,229 | 1,820 |
| * | Chipotle Mexican Grill Inc. Class A | 1,385 | 1,815 |
| * | O'Reilly Automotive Inc. | 3,674 | 1,711 |
| | Ross Stores Inc. | 17,567 | 1,600 |
| | Yum! Brands Inc. | 15,171 | 1,454 |
| | Marriott International Inc. Class A | 13,548 | 1,394 |
| * | AutoZone Inc. | 1,164 | 1,393 |
| | Ford Motor Co. | 194,155 | 1,324 |
| | Best Buy Co. Inc. | 11,340 | 1,258 |
| | Hilton Worldwide Holdings Inc. | 13,520 | 1,222 |
| | DR Horton Inc. | 16,490 | 1,177 |
| | Aptiv plc | 13,365 | 1,151 |
| * | Dollar Tree Inc. | 11,691 | 1,126 |
| | VF Corp. | 16,242 | 1,068 |
| | Yum China Holdings Inc. | 18,122 | 1,046 |
| | Lennar Corp. Class A | 13,274 | 993 |
| * | Trade Desk Inc. Class A | 2,045 | 984 |
| * | Wayfair Inc. | 3,304 | 980 |
| * | Roku Inc. | 5,088 | 883 |
| * | CarMax Inc. | 8,220 | 879 |
| | Tractor Supply Co. | 5,802 | 864 |
| | Las Vegas Sands Corp. | 16,731 | 848 |
| | Domino's Pizza Inc. | 1,964 | 803 |
| | Garmin Ltd. | 7,417 | 768 |
| | Tiffany & Co. | 6,074 | 744 |
| | ViacomCBS Inc. Class B | 26,715 | 744 |
| * | Etsy Inc. | 5,938 | 711 |
| * | Liberty Broadband Corp. | 5,040 | 706 |
| * | NVR Inc. | 161 | 671 |
| | Genuine Parts Co. | 7,093 | 670 |
| | Expedia Group Inc. | 6,769 | 664 |
| * | Burlington Stores Inc. | 3,290 | 648 |
| * | Ulta Beauty Inc. | 2,716 | 631 |
| | Pool Corp. | 1,907 | 625 |
| | Royal Caribbean Cruises Ltd. | 8,650 | 595 |
| | Fortune Brands Home & Security Inc. | 7,018 | 590 |
| * | Carvana Co. Class A | 2,729 | 589 |
| | PulteGroup Inc. | 13,053 | 582 |
| | Darden Restaurants Inc. | 6,557 | 568 |
Vanguard® Russell 3000 Index Fund
Schedule of Investments
August 31, 2020
| | | | Market |
| | | | Value |
| | | Shares | ($000) |
| | Omnicom Group Inc. | 10,342 | 559 |
| | Whirlpool Corp. | 3,064 | 545 |
| | MGM Resorts International | 23,911 | 538 |
| | Advance Auto Parts Inc. | 3,366 | 526 |
| | Hasbro Inc. | 6,468 | 511 |
| * | LKQ Corp. | 14,866 | 472 |
| | Fox Corp. Class A | 16,913 | 471 |
| | Cable One Inc. | 256 | 471 |
| * | DISH Network Corp. Class A | 12,449 | 442 |
| | Vail Resorts Inc. | 2,025 | 441 |
| * | Altice USA Inc. Class A | 15,933 | 439 |
| * | Chegg Inc. | 5,957 | 439 |
| | Wynn Resorts Ltd. | 4,979 | 435 |
| | BorgWarner Inc. | 10,561 | 429 |
| | Service Corp. International | 8,895 | 406 |
| | Rollins Inc. | 7,325 | 404 |
| * | Live Nation Entertainment Inc. | 7,036 | 400 |
| | Carnival Corp. | 23,545 | 388 |
| * | Bright Horizons Family Solutions Inc. | 2,908 | 387 |
| * | Peloton Interactive Inc. Class A | 4,904 | 376 |
| * | Liberty Media Corp-Liberty Formula One Class C | 9,387 | 366 |
| | Sirius XM Holdings Inc. | 60,537 | 355 |
| | New York Times Co. Class A | 8,181 | 355 |
| * | Lyft Inc. Class A | 11,937 | 354 |
| * | IAA Inc. | 6,715 | 351 |
| | Interpublic Group of Cos. Inc. | 19,763 | 351 |
| | Lear Corp. | 3,011 | 343 |
| | L Brands Inc. | 11,626 | 342 |
| * | Penn National Gaming Inc. | 6,677 | 341 |
| | Gentex Corp. | 12,435 | 336 |
| | Williams-Sonoma Inc. | 3,781 | 332 |
| * | Discovery Communications Inc. Class C | 16,590 | 331 |
| | Churchill Downs Inc. | 1,884 | 329 |
| | Aramark | 11,621 | 320 |
| | Dunkin' Brands Group Inc. | 4,154 | 316 |
| * | Floor & Decor Holdings Inc. Class A | 4,235 | 310 |
| | Newell Brands Inc. | 19,399 | 310 |
| * | Caesars Entertainment Inc. | 6,640 | 304 |
| * | Five Below Inc. | 2,759 | 302 |
| * | BJ's Wholesale Club Holdings Inc. | 6,784 | 301 |
| | Polaris Inc. | 2,952 | 298 |
| * | Liberty Media Corp-Liberty SiriusXM Class C | 8,261 | 297 |
| | News Corp. Class A | 19,489 | 295 |
| * | Deckers Outdoor Corp. | 1,405 | 286 |
| * | Rh | 863 | 285 |
| | Leggett & Platt Inc. | 6,784 | 278 |
| | Nielsen Holdings plc | 17,937 | 274 |
| * | ServiceMaster Global Holdings Inc. | 6,785 | 271 |
| | Hanesbrands Inc. | 17,638 | 270 |
| * | Mohawk Industries Inc. | 2,916 | 269 |
| | Lithia Motors Inc. Class A | 1,069 | 266 |
| | Thor Industries Inc. | 2,777 | 262 |
| * | Ollie's Bargain Outlet Holdings Inc. | 2,709 | 259 |
| * | SiteOne Landscape Supply Inc. | 2,066 | 258 |
| | Toll Brothers Inc. | 5,904 | 249 |
| * | Planet Fitness Inc. Class A | 4,031 | 245 |
| | Wingstop Inc. | 1,486 | 243 |
| | Wyndham Hotels & Resorts Inc. | 4,494 | 235 |
| | Fox Corp. Class B | 8,344 | 232 |
| * | Grand Canyon Education Inc. | 2,411 | 227 |
| * | Norwegian Cruise Line Holdings Ltd. | 12,626 | 216 |
| | Harley-Davidson Inc. | 7,776 | 215 |
| * | Stamps.com Inc. | 851 | 212 |
| | Nexstar Media Group Inc. Class A | 2,173 | 209 |
Vanguard® Russell 3000 Index Fund
Schedule of Investments
August 31, 2020
| | | | Market |
| | | | Value |
| | | Shares | ($000) |
| | Tapestry Inc. | 14,088 | 208 |
| * | Qurate Retail Group Inc. QVC Group Class A | 18,673 | 206 |
| * | Liberty Broadband Corp. Class A | 1,490 | 206 |
| * | Tempur Sealy International Inc. | 2,357 | 202 |
| | Texas Roadhouse Inc. Class A | 3,191 | 201 |
| | PVH Corp. | 3,539 | 197 |
| * | Fox Factory Holding Corp. | 1,945 | 196 |
| | Aaron's Inc. | 3,481 | 195 |
| * | YETI Holdings Inc. | 3,725 | 191 |
| * | Skechers USA Inc. Class A | 6,359 | 190 |
| * | Murphy USA Inc. | 1,393 | 188 |
| | Wendy's Co. | 8,966 | 188 |
| | Marriott Vacations Worldwide Corp. | 1,980 | 187 |
| * | Meritage Homes Corp. | 1,872 | 180 |
| * | frontdoor Inc. | 4,111 | 179 |
| * | Mattel Inc. | 16,631 | 179 |
| | Carter's Inc. | 2,212 | 176 |
| * | Liberty Media Corp-Liberty SiriusXM Class A | 4,850 | 176 |
| * | Discovery Inc. Class A | 7,830 | 173 |
| * | Overstock.com Inc. | 1,964 | 172 |
| | Dick's Sporting Goods Inc. | 3,056 | 165 |
| | Gap Inc. | 9,450 | 164 |
| | Kohl's Corp. | 7,628 | 163 |
| * | AutoNation Inc. | 2,854 | 162 |
| | Ralph Lauren Corp. Class A | 2,345 | 161 |
| | Choice Hotels International Inc. | 1,618 | 161 |
| * | Madison Square Garden Sport Corp. Class A | 969 | 159 |
| | Amerco | 447 | 159 |
| | KB Home | 4,415 | 158 |
| | Papa John's International Inc. | 1,593 | 157 |
| | Foot Locker Inc. | 5,118 | 155 |
| | Cracker Barrel Old Country Store Inc. | 1,159 | 155 |
| * | National Vision Holdings Inc. | 4,031 | 151 |
| * | Taylor Morrison Home Corp. Class A | 6,334 | 149 |
| | H&R Block Inc. | 9,690 | 141 |
| | WillScot Mobile Mini Holdings Corp. Class A | 7,616 | 136 |
| | LCI Industries | 1,179 | 134 |
| * | Crocs Inc. | 3,320 | 133 |
| | TEGNA Inc. | 10,534 | 132 |
| * | 2U Inc. | 3,099 | 128 |
| * | LGI Homes Inc. | 1,119 | 125 |
| | Wyndham Destinations Inc. | 4,301 | 125 |
| | Columbia Sportswear Co. | 1,430 | 122 |
| * | Shake Shack Inc. Class A | 1,760 | 120 |
| | TripAdvisor Inc. | 5,122 | 120 |
| * | TRI Pointe Group Inc. | 6,683 | 113 |
| | Strategic Education Inc. | 1,090 | 112 |
| * | Dorman Products Inc. | 1,309 | 111 |
| | Extended Stay America Inc. | 8,798 | 110 |
| * | Capri Holdings Ltd. | 6,918 | 110 |
| | Goodyear Tire & Rubber Co. | 11,296 | 108 |
| | Macy's Inc. | 15,549 | 108 |
| | KAR Auction Services Inc. | 6,188 | 107 |
| | MDC Holdings Inc. | 2,455 | 107 |
| | Boyd Gaming Corp. | 3,892 | 104 |
| | World Wrestling Entertainment Inc. Class A | 2,341 | 103 |
| * | Visteon Corp. | 1,354 | 102 |
| | Hyatt Hotels Corp. Class A | 1,760 | 99 |
| | Jack in the Box Inc. | 1,185 | 98 |
| * | Cardlytics Inc. | 1,286 | 98 |
| | Big Lots Inc. | 2,061 | 97 |
| | Wolverine World Wide Inc. | 3,879 | 97 |
| * | Asbury Automotive Group Inc. | 915 | 97 |
| | Brinker International Inc. | 2,145 | 97 |
Vanguard® Russell 3000 Index Fund
Schedule of Investments
August 31, 2020
| | | | Market |
| | | | Value |
| | | Shares | ($000) |
| | American Eagle Outfitters Inc. | 7,617 | 96 |
| * | Avis Budget Group Inc. | 2,812 | 96 |
| | Dana Inc. | 6,851 | 96 |
| | Callaway Golf Co. | 4,479 | 93 |
| * | Hilton Grand Vacations Inc. | 4,207 | 92 |
| * | Under Armour Inc. Class C | 10,182 | 90 |
| | Graham Holdings Co. Class B | 208 | 89 |
| | Penske Automotive Group Inc. | 1,885 | 89 |
| | Steven Madden Ltd. | 4,097 | 87 |
| * | Adtalem Global Education Inc. | 2,607 | 87 |
| | Winnebago Industries Inc. | 1,597 | 86 |
| * | Vivint Solar Inc. | 2,791 | 86 |
| | PriceSmart Inc. | 1,305 | 86 |
| | Cooper Tire & Rubber Co. | 2,471 | 85 |
| * | Cavco Industries Inc. | 444 | 85 |
| | Nordstrom Inc. | 5,270 | 84 |
| | Six Flags Entertainment Corp. | 3,871 | 84 |
| * | Meritor Inc. | 3,604 | 82 |
| | News Corp. Class B | 5,349 | 81 |
| * | Skyline Champion Corp. | 2,822 | 81 |
| | Reynolds Consumer Products Inc. | 2,378 | 79 |
| * | Under Armour Inc. Class A | 8,044 | 79 |
| * | Central Garden & Pet Co. Class A | 2,110 | 78 |
| * | Madison Square Garden Entertainment Corp. Class A | 1,034 | 78 |
| | Cinemark Holdings Inc. | 5,215 | 76 |
| | John Wiley & Sons Inc. Class A | 2,412 | 76 |
| * | Urban Outfitters Inc. | 3,232 | 76 |
| | Bed Bath & Beyond Inc. | 6,128 | 75 |
| | Rent-A-Center Inc. | 2,424 | 74 |
| * | Adient plc | 4,273 | 74 |
| | Core-Mark Holding Co. Inc. | 2,196 | 73 |
| | Monro Inc. | 1,587 | 73 |
| | Group 1 Automotive Inc. | 846 | 73 |
| * | Gentherm Inc. | 1,588 | 72 |
| * | American Woodmark Corp. | 819 | 72 |
| * | Laureate Education Inc. Class A | 5,652 | 71 |
| | La-Z-Boy Inc. | 2,166 | 70 |
| * | Gray Television Inc. | 4,498 | 70 |
| * | Fitbit Inc. Class A | 10,939 | 70 |
| * | Sleep Number Corp. | 1,434 | 69 |
| * | Stitch Fix Inc. Class A | 2,844 | 69 |
| * | K12 Inc. | 1,814 | 68 |
| * | Sally Beauty Holdings Inc. | 5,796 | 65 |
| | ODP Corp. | 2,754 | 64 |
| | Bloomin' Brands Inc. | 4,231 | 61 |
| * | Liberty Media Corp-Liberty Formula One Class A | 1,669 | 60 |
| | Lennar Corp. Class B | 1,013 | 60 |
| | Sinclair Broadcast Group Inc. Class A | 2,866 | 60 |
| * | Sonos Inc. | 4,224 | 59 |
| | Acushnet Holdings Corp. | 1,664 | 59 |
| | Cheesecake Factory Inc. | 1,944 | 57 |
| | Kontoor Brands Inc. | 2,583 | 57 |
| | Sturm Ruger & Co. Inc. | 772 | 55 |
| | Red Rock Resorts Inc. Class A | 3,187 | 54 |
| * | Century Communities Inc. | 1,520 | 54 |
| * | WW International Inc. | 2,274 | 53 |
| * | RealReal Inc. | 3,321 | 53 |
| * | M/I Homes Inc. | 1,248 | 53 |
| * | Scientific Games Corp. | 2,543 | 53 |
| * | Lions Gate Entertainment Corp. Class B | 5,773 | 52 |
| | International Game Technology plc | 4,584 | 51 |
| * | Vista Outdoor Inc. | 2,619 | 51 |
| | Coty Inc. Class A | 14,108 | 51 |
| * | Smith & Wesson Brands Inc. | 2,757 | 50 |
Vanguard® Russell 3000 Index Fund
Schedule of Investments
August 31, 2020
| | | | Market |
| | | | Value |
| | | Shares | ($000) |
| * | Liberty Latin America Ltd. Class C | 5,253 | 50 |
| * | Perdoceo Education Corp. | 3,439 | 49 |
| * | AMC Networks Inc. Class A | 1,971 | 48 |
| * | Malibu Boats Inc. Class A | 922 | 48 |
| | Sonic Automotive Inc. Class A | 1,092 | 46 |
| * | Michaels Cos. Inc. | 4,037 | 45 |
| | Standard Motor Products Inc. | 989 | 45 |
| | Camping World Holdings Inc. Class A | 1,523 | 44 |
| * | SeaWorld Entertainment Inc. | 2,141 | 44 |
| | Dine Brands Global Inc. | 725 | 43 |
| | Signet Jewelers Ltd. | 2,483 | 43 |
| * | American Axle & Manufacturing Holdings Inc. | 5,267 | 41 |
| * | At Home Group Inc. | 2,136 | 41 |
| * | Quotient Technology Inc. | 4,639 | 40 |
| * | Liberty Latin America Ltd. Class A | 3,984 | 39 |
| | Dave & Buster's Entertainment Inc. | 2,334 | 39 |
| | Tupperware Brands Corp. | 2,357 | 38 |
| | Oxford Industries Inc. | 762 | 38 |
| | Abercrombie & Fitch Co. | 2,862 | 37 |
| * | Boot Barn Holdings Inc. | 1,286 | 36 |
| | Inter Parfums Inc. | 807 | 36 |
| * | IMAX Corp. | 2,337 | 36 |
| * | 1-800-Flowers.com Inc. Class A | 1,174 | 35 |
| * | Liberty Media Corp-Liberty Braves Class C | 1,756 | 34 |
| * | Lions Gate Entertainment Corp. Class A | 3,442 | 34 |
| | ViacomCBS Inc. Class A | 1,091 | 33 |
| * | Lumber Liquidators Holdings Inc. | 1,340 | 32 |
| | Matthews International Corp. Class A | 1,447 | 32 |
| * | Denny's Corp. | 2,643 | 30 |
| * | America's Car-Mart Inc. | 300 | 30 |
| | Scholastic Corp. | 1,330 | 30 |
| * | Sportsman's Warehouse Holdings Inc. | 1,801 | 28 |
| | EW Scripps Co. Class A | 2,528 | 28 |
| * | Rosetta Stone Inc. | 913 | 28 |
| | BJ's Restaurants Inc. | 877 | 28 |
| | Meredith Corp. | 1,971 | 28 |
| * | iHeartMedia Inc. Class A | 2,912 | 27 |
| * | Accel Entertainment Inc. | 2,256 | 27 |
| * | QuinStreet Inc. | 2,022 | 27 |
| * | GoPro Inc. Class A | 5,781 | 27 |
| * | Cars.com Inc. | 3,051 | 27 |
| * | Hibbett Sports Inc. | 780 | 26 |
| * | Universal Electronics Inc. | 633 | 26 |
| | Buckle Inc. | 1,379 | 26 |
| * | elf Beauty Inc. | 1,317 | 26 |
| * | MarineMax Inc. | 874 | 26 |
| * | Stoneridge Inc. | 1,247 | 25 |
| | Guess? Inc. | 2,104 | 24 |
| * | Monarch Casino & Resort Inc. | 510 | 23 |
| | Franchise Group Inc. | 953 | 23 |
| * | G-III Apparel Group Ltd. | 2,040 | 23 |
| * | Zumiez Inc. | 870 | 22 |
| * | SP Plus Corp. | 1,068 | 22 |
| | National Presto Industries Inc. | 241 | 22 |
| * | American Public Education Inc. | 672 | 21 |
| | Designer Brands Inc. Class A | 2,979 | 21 |
| * | XPEL Inc. | 818 | 20 |
| | Viad Corp. | 931 | 20 |
| * | Tenneco Inc. Class A | 2,412 | 20 |
| | Interface Inc. Class A | 2,572 | 19 |
| * | MSG Networks Inc. | 1,966 | 19 |
| * | Central Garden & Pet Co. | 470 | 19 |
| * | Purple Innovation Inc. Class A | 976 | 18 |
| * | Hemisphere Media Group Inc. | 2,062 | 18 |
Vanguard® Russell 3000 Index Fund
Schedule of Investments
August 31, 2020
| | | | Market |
| | | | Value |
| | | Shares | ($000) |
| | Johnson Outdoors Inc. Class A | 212 | 18 |
| * | MasterCraft Boat Holdings Inc. | 868 | 18 |
| * | Liberty Media Corp-Liberty Braves Class A | 918 | 18 |
| | Carriage Services Inc. Class A | 812 | 18 |
| | Twin River Worldwide Holdings Inc. | 751 | 18 |
| * | Green Brick Partners Inc. | 1,257 | 18 |
| * | Nautilus Inc. | 1,504 | 18 |
| | Haverty Furniture Cos. Inc. | 843 | 18 |
| * | El Pollo Loco Holdings Inc. | 986 | 18 |
| * | Beazer Homes USA Inc. | 1,425 | 17 |
| | Escalade Inc. | 943 | 17 |
| | Winmark Corp. | 110 | 17 |
| * | Chuy's Holdings Inc. | 762 | 17 |
| * | Central European Media Enterprises Ltd. Class A | 3,967 | 16 |
| * | GameStop Corp. Class A | 2,338 | 16 |
| | Marcus Corp. | 986 | 15 |
| | Collectors Universe Inc. | 344 | 15 |
| ^ | AMC Entertainment Holdings Inc. Class A | 2,586 | 15 |
| | Shoe Carnival Inc. | 462 | 15 |
| * | CarParts.com Inc. | 1,079 | 15 |
| | Ethan Allen Interiors Inc. | 1,055 | 15 |
| * | Motorcar Parts of America Inc. | 855 | 15 |
| | Children's Place Inc. | 722 | 14 |
| | OneSpaWorld Holdings Ltd. | 2,075 | 14 |
| | Caleres Inc. | 1,806 | 14 |
| | Dillard's Inc. Class A | 456 | 14 |
| * | Fossil Group Inc. | 2,115 | 14 |
| * | Cooper-Standard Holdings Inc. | 747 | 14 |
| | Ruth's Hospitality Group Inc. | 1,298 | 13 |
| * | Hudson Ltd. Class A | 1,743 | 13 |
| | Hooker Furniture Corp. | 521 | 13 |
| * | Genesco Inc. | 656 | 13 |
| * | Daily Journal Corp. | 46 | 13 |
| * | Aspen Group Inc. | 977 | 13 |
| * | Conn's Inc. | 963 | 12 |
| | Clarus Corp. | 973 | 12 |
| | Superior Group of Cos. Inc. | 523 | 12 |
| * | Del Taco Restaurants Inc. | 1,417 | 12 |
| | Systemax Inc. | 528 | 12 |
| * | Houghton Mifflin Harcourt Co. | 4,943 | 11 |
| * | OneWater Marine Inc. | 384 | 11 |
| * | Lindblad Expeditions Holdings Inc. | 1,104 | 11 |
| * | Universal Technical Institute Inc. | 1,543 | 11 |
| * | Golden Entertainment Inc. | 831 | 11 |
| * | Lovesac Co. | 402 | 11 |
| * | Carrols Restaurant Group Inc. | 1,595 | 11 |
| * | Eros International plc | 3,379 | 11 |
| * | American Outdoor Brands Inc. | 689 | 11 |
| | National CineMedia Inc. | 2,831 | 10 |
| * | Fiesta Restaurant Group Inc. | 999 | 10 |
| | Marine Products Corp. | 684 | 10 |
| * | Liberty TripAdvisor Holdings Inc. Class A | 3,517 | 10 |
| * | VOXX International Corp. | 1,524 | 10 |
| | Gannett Co. Inc. | 5,491 | 10 |
| * | Noodles & Co. | 1,193 | 9 |
| * | Casper Sleep Inc. | 986 | 9 |
| | Tribune Publishing Co. | 780 | 9 |
| * | Liquidity Services Inc. | 1,227 | 9 |
| * | Century Casinos Inc. | 1,431 | 9 |
| | Citi Trends Inc. | 455 | 9 |
| | Cato Corp. Class A | 1,098 | 9 |
| | RCI Hospitality Holdings Inc. | 442 | 8 |
| * | Alta Equipment Group Inc. | 1,007 | 8 |
| | Entercom Communications Corp. Class A | 5,480 | 8 |
Vanguard® Russell 3000 Index Fund
Schedule of Investments
August 31, 2020
| | | | Market | |
| | | | Value | |
| | | Shares | ($000 | ) |
| * | Lakeland Industries Inc. | 395 | 8 | |
| * | Regis Corp. | 1,046 | 8 | |
| | Movado Group Inc. | 690 | 8 | |
| | Nathan's Famous Inc. | 141 | 7 | |
| | Tilly's Inc. Class A | 1,153 | 7 | |
| * | Boston Omaha Corp. Class A | 444 | 7 | |
| * | Lands' End Inc. | 541 | 7 | |
| | Rocky Brands Inc. | 296 | 7 | |
| * | Hertz Global Holdings Inc. | 4,604 | 7 | |
| | Chico's FAS Inc. | 4,986 | 6 | |
| * | Red Robin Gourmet Burgers Inc. | 573 | 6 | |
| | Hamilton Beach Brands Holding Co. Class A | 282 | 6 | |
| * | Funko Inc. Class A | 1,047 | 6 | |
| * | Vera Bradley Inc. | 1,033 | 5 | |
| * | Gaia Inc. | 465 | 5 | |
| * | PlayAGS Inc. | 1,339 | 5 | |
| | Lifetime Brands Inc. | 528 | 5 | |
| * | Fluent Inc. | 1,630 | 5 | |
| | Warner Music Group Corp. Class A | 170 | 5 | |
| | Weyco Group Inc. | 274 | 5 | |
| | Entravision Communications Corp. Class A | 3,094 | 5 | |
| * | Duluth Holdings Inc. | 427 | 4 | |
| * | LiveXLive Media Inc. | 1,466 | 4 | |
| * | Legacy Housing Corp. | 255 | 4 | |
| * | Container Store Group Inc. | 911 | 4 | |
| | Saga Communications Inc. Class A | 172 | 4 | |
| * | Biglari Holdings Inc. Class B | 37 | 4 | |
| * | Express Inc. | 2,792 | 3 | |
| | Emerald Holding Inc. | 1,078 | 3 | |
| *,^ | Revlon Inc. Class A | 358 | 3 | |
| * | Kura Sushi USA Inc. Class A | 174 | 2 | |
| | Bluegreen Vacations Corp. | 351 | 2 | |
| | 289,279 | |
| Consumer Staples (5.4%) | |
| | Procter & Gamble Co. | 121,889 | 16,861 | |
| | PepsiCo Inc. | 69,493 | 9,733 | |
| | Coca-Cola Co. | 193,150 | 9,567 | |
| | Philip Morris International Inc. | 77,889 | 6,215 | |
| | Mondelez International Inc. Class A | 70,745 | 4,133 | |
| | Altria Group Inc. | 92,910 | 4,064 | |
| | CVS Health Corp. | 65,386 | 4,062 | |
| | Colgate-Palmolive Co. | 42,205 | 3,345 | |
| | Kimberly-Clark Corp. | 16,975 | 2,678 | |
| | General Mills Inc. | 30,480 | 1,949 | |
| * | Monster Beverage Corp. | 18,498 | 1,551 | |
| | Constellation Brands Inc. Class A | 7,973 | 1,471 | |
| | Sysco Corp. | 24,243 | 1,458 | |
| | Clorox Co. | 6,348 | 1,419 | |
| | Walgreens Boots Alliance Inc. | 36,876 | 1,402 | |
| | Kroger Co. | 38,917 | 1,389 | |
| | McCormick & Co. Inc. | 6,165 | 1,271 | |
| | McKesson Corp. | 8,129 | 1,247 | |
| | Archer-Daniels-Midland Co. | 27,585 | 1,235 | |
| | Church & Dwight Co. Inc. | 12,273 | 1,176 | |
| | Kraft Heinz Co. | 32,070 | 1,124 | |
| | Hershey Co. | 7,296 | 1,084 | |
| | Corteva Inc. | 37,770 | 1,078 | |
| | Conagra Brands Inc. | 24,255 | 930 | |
| | Tyson Foods Inc. Class A | 14,466 | 908 | |
| | Kellogg Co. | 12,452 | 883 | |
| | Hormel Foods Corp. | 13,920 | 710 | |
| | J M Smucker Co. | 5,504 | 661 | |
| | Brown-Forman Corp. Class B | 8,822 | 646 | |
| | Keurig Dr Pepper Inc. | 19,344 | 577 | |
Vanguard® Russell 3000 Index Fund
Schedule of Investments
August 31, 2020
| | | | Market |
| | | | Value |
| | | Shares | ($000) |
| | Lamb Weston Holdings Inc. | 7,318 | 460 |
| | Campbell Soup Co. | 8,651 | 455 |
| * | Boston Beer Co. Inc. Class A | 426 | 376 |
| * | Beyond Meat Inc. | 2,581 | 351 |
| | Casey's General Stores Inc. | 1,867 | 332 |
| | Molson Coors Beverage Co. Class B | 8,737 | 329 |
| | Bunge Ltd. | 7,126 | 325 |
| * | Post Holdings Inc. | 3,338 | 294 |
| | Ingredion Inc. | 3,378 | 272 |
| * | US Foods Holding Corp. | 11,000 | 268 |
| * | Darling Ingredients Inc. | 8,347 | 267 |
| * | Helen of Troy Ltd. | 1,258 | 260 |
| *,^ | Herbalife Nutrition Ltd. | 5,058 | 249 |
| * | Performance Food Group Co. | 6,601 | 241 |
| | Flowers Foods Inc. | 9,753 | 239 |
| * | Freshpet Inc. | 1,926 | 219 |
| | Lancaster Colony Corp. | 968 | 172 |
| | Brown-Forman Corp. Class A | 2,381 | 158 |
| * | Grocery Outlet Holding Corp. | 3,529 | 145 |
| * | Sprouts Farmers Market Inc. | 6,179 | 144 |
| | Energizer Holdings Inc. | 3,072 | 142 |
| | WD-40 Co. | 666 | 136 |
| | Spectrum Brands Holdings Inc. | 2,261 | 135 |
| * | Hain Celestial Group Inc. | 4,037 | 132 |
| | Nu Skin Enterprises Inc. Class A | 2,695 | 127 |
| | Sanderson Farms Inc. | 1,021 | 119 |
| * | TreeHouse Foods Inc. | 2,713 | 116 |
| * | Simply Good Foods Co. | 4,446 | 111 |
| | Primo Water Corp. | 7,915 | 108 |
| | J&J Snack Foods Corp. | 738 | 100 |
| | B&G Foods Inc. | 3,149 | 98 |
| | Medifast Inc. | 600 | 98 |
| * | Hostess Brands Inc. Class A | 5,940 | 76 |
| * | Edgewell Personal Care Co. | 2,605 | 75 |
| | Vector Group Ltd. | 6,697 | 67 |
| | Coca-Cola Consolidated Inc. | 232 | 63 |
| * | Cal-Maine Foods Inc. | 1,505 | 58 |
| | Universal Corp. | 1,211 | 53 |
| * | United Natural Foods Inc. | 2,844 | 51 |
| | Calavo Growers Inc. | 756 | 48 |
| * | USANA Health Sciences Inc. | 588 | 46 |
| * | National Beverage Corp. | 566 | 46 |
| * | Celsius Holdings Inc. | 2,147 | 42 |
| * | Pilgrim's Pride Corp. | 2,452 | 39 |
| | PetMed Express Inc. | 1,065 | 37 |
| * | BellRing Brands Inc. Class A | 1,826 | 36 |
| | Fresh Del Monte Produce Inc. | 1,449 | 34 |
| * | Rite Aid Corp. | 2,526 | 33 |
| | SpartanNash Co. | 1,612 | 32 |
| | Seaboard Corp. | 12 | 32 |
| | John B Sanfilippo & Son Inc. | 395 | 31 |
| | Weis Markets Inc. | 588 | 29 |
| | Ingles Markets Inc. Class A | 679 | 27 |
| | Tootsie Roll Industries Inc. | 772 | 25 |
| | Andersons Inc. | 1,392 | 25 |
| * | GrowGeneration Corp. | 1,534 | 24 |
| | MGP Ingredients Inc. | 616 | 22 |
| * | Chefs' Warehouse Inc. | 1,073 | 16 |
| * | HF Foods Group Inc. | 1,690 | 13 |
| * | Seneca Foods Corp. Class A | 280 | 13 |
| * | Landec Corp. | 1,164 | 12 |
| | Turning Point Brands Inc. | 373 | 11 |
| | Limoneira Co. | 661 | 10 |
| | Village Super Market Inc. Class A | 353 | 9 |
Vanguard® Russell 3000 Index Fund
Schedule of Investments
August 31, 2020
| | | | Market | |
| | | | Value | |
| | | Shares | ($000 | ) |
| | Oil-Dri Corp. of America | 226 | 8 | |
| * | Lifevantage Corp. | 521 | 8 | |
| * | Craft Brew Alliance Inc. | 493 | 8 | |
| * | Veru Inc. | 2,628 | 7 | |
| * | NewAge Inc. | 2,986 | 7 | |
| | Natural Grocers by Vitamin Cottage Inc. | 516 | 6 | |
| | Alico Inc. | 182 | 6 | |
| * | Nature's Sunshine Products Inc. | 392 | 4 | |
| * | Farmer Bros Co. | 505 | 3 | |
| * | Calyxt Inc. | 501 | 3 | |
| * | Bridgford Foods Corp. | 96 | 2 | |
| | 93,002 | |
| Energy (2.3%) | |
| | Exxon Mobil Corp. | 211,383 | 8,443 | |
| | Chevron Corp. | 93,434 | 7,842 | |
| | ConocoPhillips | 53,513 | 2,028 | |
| | Kinder Morgan Inc. | 97,970 | 1,354 | |
| | EOG Resources Inc. | 29,281 | 1,328 | |
| | Schlumberger Ltd. | 68,838 | 1,309 | |
| | Phillips 66 | 21,945 | 1,283 | |
| | Williams Cos. Inc. | 60,955 | 1,265 | |
| | Marathon Petroleum Corp. | 32,547 | 1,154 | |
| | Valero Energy Corp. | 20,455 | 1,076 | |
| | Pioneer Natural Resources Co. | 8,238 | 856 | |
| | Halliburton Co. | 44,194 | 715 | |
| | Hess Corp. | 13,935 | 642 | |
| | ONEOK Inc. | 22,058 | 606 | |
| * | Cheniere Energy Inc. | 11,533 | 600 | |
| * | SolarEdge Technologies Inc. | 2,448 | 541 | |
| | Occidental Petroleum Corp. | 40,967 | 522 | |
| | Concho Resources Inc. | 9,974 | 518 | |
| | Baker Hughes Co. Class A | 32,740 | 468 | |
| * | Enphase Energy Inc. | 5,277 | 408 | |
| | Cabot Oil & Gas Corp. | 19,619 | 372 | |
| * | Sunrun Inc. | 5,799 | 328 | |
| * | First Solar Inc. | 4,085 | 313 | |
| | Diamondback Energy Inc. | 7,950 | 310 | |
| | Apache Corp. | 18,956 | 281 | |
| | Noble Energy Inc. | 24,004 | 239 | |
| | National Oilwell Varco Inc. | 19,515 | 234 | |
| | Devon Energy Corp. | 19,526 | 212 | |
| | Marathon Oil Corp. | 40,184 | 212 | |
| | Equitrans Midstream Corp. | 20,551 | 211 | |
| | EQT Corp. | 12,996 | 206 | |
| | Targa Resources Corp. | 11,616 | 198 | |
| | Valvoline Inc. | 9,062 | 185 | |
| | HollyFrontier Corp. | 7,525 | 180 | |
| | Parsley Energy Inc. Class A | 14,590 | 157 | |
| | Ovintiv Inc. | 13,156 | 146 | |
| | Cimarex Energy Co. | 4,891 | 136 | |
| * | WPX Energy Inc. | 20,066 | 112 | |
| | Arcosa Inc. | 2,392 | 111 | |
| | Murphy Oil Corp. | 7,281 | 100 | |
| * | CNX Resources Corp. | 9,069 | 99 | |
| | Antero Midstream Corp. | 14,499 | 98 | |
| *,^ | ChampionX Corp. | 9,091 | 93 | |
| | Helmerich & Payne Inc. | 5,446 | 90 | |
| | World Fuel Services Corp. | 3,152 | 83 | |
| | Range Resources Corp. | 10,556 | 79 | |
| * | Southwestern Energy Co. | 26,913 | 75 | |
| * | PDC Energy Inc. | 4,828 | 73 | |
| | Continental Resources Inc. | 4,144 | 71 | |
| * | Bloom Energy Corp. Class A | 4,260 | 67 | |
| * | Dril-Quip Inc. | 1,916 | 63 | |
Vanguard® Russell 3000 Index Fund
Schedule of Investments
August 31, 2020
| | | | Market |
| | | | Value |
| | | Shares | ($000) |
| | Cactus Inc. | 2,579 | 57 |
| * | Renewable Energy Group Inc. | 1,657 | 55 |
| * | Matador Resources Co. | 5,077 | 49 |
| | Delek US Holdings Inc. | 3,015 | 47 |
| * | Golar LNG Ltd. | 4,557 | 47 |
| | Archrock Inc. | 7,111 | 47 |
| * | SunPower Corp. | 4,052 | 45 |
| * | Ameresco Inc. Class A | 1,318 | 45 |
| * | Magnolia Oil & Gas Corp. Class A | 6,487 | 42 |
| | PBF Energy Inc. Class A | 4,775 | 41 |
| * | TPI Composites Inc. | 1,280 | 39 |
| * | Antero Resources Corp. | 11,875 | 38 |
| | Warrior Met Coal Inc. | 2,358 | 36 |
| * | NOW Inc. | 4,997 | 36 |
| * | Transocean Ltd. | 28,701 | 35 |
| | Patterson-UTI Energy Inc. | 8,865 | 34 |
| | Kosmos Energy Ltd. | 21,877 | 32 |
| * | FuelCell Energy Inc. | 10,317 | 29 |
| | Arch Coal Inc. Class A | 730 | 27 |
| * | Oceaneering International Inc. | 4,683 | 25 |
| * | Helix Energy Solutions Group Inc. | 6,369 | 23 |
| | CVR Energy Inc. | 1,359 | 23 |
| * | ProPetro Holding Corp. | 3,550 | 22 |
| | DMC Global Inc. | 627 | 22 |
| * | Green Plains Inc. | 1,580 | 21 |
| * | Frank's International NV | 9,069 | 21 |
| | NexTier Oilfield Solutions Inc. | 7,571 | 19 |
| | Brigham Minerals Inc. Class A | 1,521 | 18 |
| | Solaris Oilfield Infrastructure Inc. Class A | 2,249 | 17 |
| * | Bonanza Creek Energy Inc. | 855 | 17 |
| * | Clean Energy Fuels Corp. | 6,243 | 16 |
| | Liberty Oilfield Services Inc. Class A | 2,414 | 16 |
| * | REX American Resources Corp. | 239 | 15 |
| * | Trecora Resources | 2,311 | 14 |
| * | Par Pacific Holdings Inc. | 1,583 | 14 |
| * | Select Energy Services Inc. Class A | 2,683 | 13 |
| | Nabors Industries Ltd. | 315 | 13 |
| | SM Energy Co. | 5,110 | 12 |
| * | Oil States International Inc. | 2,811 | 12 |
| | SunCoke Energy Inc. | 3,396 | 12 |
| * | Tidewater Inc. | 1,721 | 12 |
| | Berry Corp. | 2,941 | 12 |
| * | Matrix Service Co. | 1,179 | 11 |
| * | Maxeon Solar Technologies Ltd. | 506 | 10 |
| * | W&T Offshore Inc. | 4,405 | 10 |
| * | National Energy Services Reunited Corp. | 1,148 | 9 |
| * | Newpark Resources Inc. | 4,225 | 8 |
| * | RPC Inc. | 2,494 | 8 |
| | Peabody Energy Corp. | 2,864 | 7 |
| * | Contango Oil & Gas Co. | 4,537 | 7 |
| * | Talos Energy Inc. | 965 | 7 |
| * | Exterran Corp. | 1,475 | 7 |
| * | Penn Virginia Corp. | 575 | 7 |
| * | CONSOL Energy Inc. | 1,183 | 6 |
| * | Gulfport Energy Corp. | 7,558 | 5 |
| | Falcon Minerals Corp. | 1,756 | 5 |
| * | Bristow Group Inc. | 239 | 5 |
| * | Tellurian Inc. | 4,378 | 4 |
| *,^ | Whiting Petroleum Corp. | 5,035 | 4 |
| | NACCO Industries Inc. Class A | 190 | 4 |
| * | Comstock Resources Inc. | 667 | 4 |
| | Evolution Petroleum Corp. | 1,382 | 4 |
| * | Montage Resources Corp. | 721 | 4 |
| * | Goodrich Petroleum Corp. | 444 | 4 |
Vanguard® Russell 3000 Index Fund
Schedule of Investments
August 31, 2020
| | | | Market | |
| | | | Value | |
| | | Shares | ($000 | ) |
| * | Earthstone Energy Inc. Class A | 958 | 3 | |
| * | PrimeEnergy Resources Corp. | 28 | 2 | |
| | 39,407 | |
| Financial Services (17.0%) | |
| * | Berkshire Hathaway Inc. Class B | 97,506 | 21,260 | |
| | Visa Inc. Class A | 84,424 | 17,897 | |
| | Mastercard Inc. Class A | 44,110 | 15,800 | |
| | JPMorgan Chase & Co. | 151,320 | 15,161 | |
| * | PayPal Holdings Inc. | 58,703 | 11,984 | |
| | Bank of America Corp. | 385,746 | 9,929 | |
| | American Tower Corp. | 22,067 | 5,498 | |
| | Citigroup Inc. | 103,703 | 5,301 | |
| | Fidelity National Information Services Inc. | 30,771 | 4,642 | |
| | Wells Fargo & Co. | 187,352 | 4,525 | |
| | S&P Global Inc. | 12,044 | 4,413 | |
| | BlackRock Inc. | 7,351 | 4,368 | |
| | Prologis Inc. | 36,779 | 3,746 | |
| | Equinix Inc. | 4,395 | 3,471 | |
| | Crown Castle International Corp. | 20,771 | 3,391 | |
| | Goldman Sachs Group Inc. | 16,460 | 3,372 | |
| | American Express Co. | 32,485 | 3,300 | |
| | CME Group Inc. | 17,718 | 3,116 | |
| | Marsh & McLennan Cos. Inc. | 25,215 | 2,897 | |
| * | Square Inc. | 18,079 | 2,885 | |
| | Morgan Stanley | 55,000 | 2,874 | |
| | Intercontinental Exchange Inc. | 26,979 | 2,866 | |
| | Chubb Ltd. | 22,424 | 2,803 | |
| * | Fiserv Inc. | 27,860 | 2,774 | |
| | Progressive Corp. | 29,149 | 2,770 | |
| | Global Payments Inc. | 14,845 | 2,622 | |
| | Truist Financial Corp. | 67,176 | 2,607 | |
| | US Bancorp | 67,467 | 2,456 | |
| | Moody's Corp. | 8,133 | 2,396 | |
| | PNC Financial Services Group Inc. | 21,070 | 2,343 | |
| | Aon plc Class A | 11,493 | 2,298 | |
| | Digital Realty Trust Inc. | 13,359 | 2,079 | |
| | Charles Schwab Corp. | 58,006 | 2,061 | |
| | SBA Communications Corp. Class A | 5,519 | 1,689 | |
| | Public Storage | 7,493 | 1,592 | |
| | Capital One Financial Corp. | 22,833 | 1,576 | |
| | T. Rowe Price Group Inc. | 11,259 | 1,567 | |
| | MSCI Inc. Class A | 4,134 | 1,543 | |
| | Travelers Cos. Inc. | 12,718 | 1,476 | |
| | Bank of New York Mellon Corp. | 39,726 | 1,469 | |
| | Allstate Corp. | 15,732 | 1,463 | |
| | MetLife Inc. | 37,941 | 1,459 | |
| | Prudential Financial Inc. | 19,852 | 1,345 | |
| | Willis Towers Watson plc | 6,425 | 1,321 | |
| | Aflac Inc. | 35,022 | 1,272 | |
| | American International Group Inc. | 43,403 | 1,265 | |
| | State Street Corp. | 17,723 | 1,207 | |
| | Welltower Inc. | 20,921 | 1,203 | |
| | Weyerhaeuser Co. | 37,390 | 1,133 | |
| | AvalonBay Communities Inc. | 7,048 | 1,114 | |
| | Realty Income Corp. | 17,164 | 1,065 | |
| * | FleetCor Technologies Inc. | 4,164 | 1,047 | |
| | Alexandria Real Estate Equities Inc. | 6,217 | 1,047 | |
| | Equity Residential | 18,507 | 1,045 | |
| | Simon Property Group Inc. | 15,084 | 1,023 | |
| | Arthur J Gallagher & Co. | 9,354 | 985 | |
| | Ameriprise Financial Inc. | 6,191 | 971 | |
| | First Republic Bank | 8,435 | 952 | |
| | KKR & Co. Inc. | 26,423 | 946 | |
| | MarketAxess Holdings Inc. | 1,861 | 904 | |
Vanguard® Russell 3000 Index Fund
Schedule of Investments
August 31, 2020
| | | | Market |
| | | | Value |
| | | Shares | ($000) |
| | Discover Financial Services | 15,493 | 822 |
| | TransUnion | 9,352 | 811 |
| | Northern Trust Corp. | 9,679 | 793 |
| | Invitation Homes Inc. | 27,652 | 792 |
| * | CBRE Group Inc. Class A | 16,813 | 791 |
| | Broadridge Financial Solutions Inc. | 5,716 | 785 |
| | Nasdaq Inc. | 5,759 | 774 |
| | Ventas Inc. | 18,649 | 769 |
| * | Markel Corp. | 682 | 741 |
| | Healthpeak Properties Inc. | 26,626 | 736 |
| | Hartford Financial Services Group Inc. | 18,087 | 732 |
| | Synchrony Financial | 29,381 | 729 |
| | Fifth Third Bancorp | 35,233 | 728 |
| | Sun Communities Inc. | 4,814 | 718 |
| | Duke Realty Corp. | 18,442 | 711 |
| | Essex Property Trust Inc. | 3,281 | 710 |
| | Boston Properties Inc. | 7,746 | 673 |
| | Extra Space Storage Inc. | 6,254 | 666 |
| | Mid-America Apartment Communities Inc. | 5,674 | 665 |
| | FactSet Research Systems Inc. | 1,885 | 661 |
| * | SVB Financial Group | 2,580 | 659 |
| | M&T Bank Corp. | 6,247 | 645 |
| | Jack Henry & Associates Inc. | 3,853 | 637 |
| * | Arch Capital Group Ltd. | 19,269 | 608 |
| | Cincinnati Financial Corp. | 7,559 | 600 |
| * | Fair Isaac Corp. | 1,423 | 599 |
| | KeyCorp | 48,531 | 598 |
| | WP Carey Inc. | 8,514 | 591 |
| | E*TRADE Financial Corp. | 10,904 | 590 |
| | Principal Financial Group Inc. | 13,652 | 575 |
| | Equity LifeStyle Properties Inc. | 8,657 | 574 |
| | Citizens Financial Group Inc. | 21,448 | 555 |
| | Regions Financial Corp. | 47,729 | 552 |
| | Brown & Brown Inc. | 11,607 | 539 |
| * | Zillow Group Inc. Class C | 6,232 | 534 |
| | Annaly Capital Management Inc. | 71,030 | 522 |
| | VICI Properties Inc. | 23,209 | 518 |
| | Cboe Global Markets Inc. | 5,528 | 507 |
| | UDR Inc. | 14,483 | 504 |
| | TD Ameritrade Holding Corp. | 13,114 | 503 |
| | Western Union Co. | 20,703 | 488 |
| | CyrusOne Inc. | 5,762 | 481 |
| | Medical Properties Trust Inc. | 25,656 | 477 |
| | Huntington Bancshares Inc. | 50,561 | 476 |
| | Raymond James Financial Inc. | 6,174 | 467 |
| | Fidelity National Financial Inc. | 13,823 | 454 |
| | RenaissanceRe Holdings Ltd. | 2,469 | 454 |
| | Everest Re Group Ltd. | 1,992 | 438 |
| | Loews Corp. | 12,199 | 437 |
| | Globe Life Inc. | 5,291 | 436 |
| | Ally Financial Inc. | 19,053 | 436 |
| | W R Berkley Corp. | 7,024 | 436 |
| | Equitable Holdings Inc. | 20,438 | 433 |
| | Iron Mountain Inc. | 14,278 | 430 |
| | Camden Property Trust | 4,640 | 422 |
| | Host Hotels & Resorts Inc. | 35,546 | 399 |
| | Apollo Global Management LLC | 8,440 | 396 |
| | AGNC Investment Corp. | 27,734 | 391 |
| | Alleghany Corp. | 697 | 387 |
| | Americold Realty Trust | 9,998 | 383 |
| | American Homes 4 Rent Class A | 13,085 | 375 |
| | Gaming and Leisure Properties Inc. | 10,268 | 373 |
| | Assurant Inc. | 3,031 | 368 |
| | VEREIT Inc. | 53,580 | 360 |
Vanguard® Russell 3000 Index Fund
Schedule of Investments
August 31, 2020
| | | | Market |
| | | | Value |
| | | Shares | ($000) |
| * | WEX Inc. | 2,210 | 353 |
| | Lincoln National Corp. | 9,766 | 352 |
| | Omega Healthcare Investors Inc. | 11,229 | 348 |
| | Voya Financial Inc. | 6,475 | 336 |
| | Regency Centers Corp. | 8,388 | 333 |
| | LPL Financial Holdings Inc. | 4,043 | 332 |
| | Kilroy Realty Corp. | 5,641 | 330 |
| | Reinsurance Group of America Inc. | 3,479 | 319 |
| | SEI Investments Co. | 5,928 | 310 |
| | National Retail Properties Inc. | 8,688 | 308 |
| | Vornado Realty Trust | 8,572 | 307 |
| | Commerce Bancshares Inc. | 5,112 | 305 |
| | STORE Capital Corp. | 11,199 | 303 |
| | CubeSmart | 9,524 | 301 |
| | Lamar Advertising Co. Class A | 4,330 | 300 |
| | Federal Realty Investment Trust | 3,777 | 299 |
| * | Zillow Group Inc. Class A | 3,426 | 292 |
| | Franklin Resources Inc. | 13,816 | 291 |
| | First American Financial Corp. | 5,506 | 289 |
| | Healthcare Trust of America Inc. Class A | 10,661 | 281 |
| | Rexford Industrial Realty Inc. | 5,677 | 272 |
| | Comerica Inc. | 6,872 | 272 |
| | Apartment Investment and Management Co. | 7,518 | 271 |
| | Erie Indemnity Co. Class A | 1,269 | 271 |
| | First Industrial Realty Trust Inc. | 6,269 | 267 |
| | Jones Lang LaSalle Inc. | 2,594 | 267 |
| * | Euronet Worldwide Inc. | 2,580 | 267 |
| | Zions Bancorp NA | 8,172 | 263 |
| | EastGroup Properties Inc. | 1,962 | 261 |
| | East West Bancorp Inc. | 7,096 | 261 |
| | Primerica Inc. | 2,013 | 251 |
| | Prosperity Bancshares Inc. | 4,607 | 251 |
| | First Horizon National Corp. | 26,237 | 251 |
| | American Financial Group Inc. | 3,740 | 250 |
| | Kimco Realty Corp. | 20,785 | 249 |
| | Signature Bank | 2,542 | 247 |
| | CoreSite Realty Corp. | 2,001 | 245 |
| | Kemper Corp. | 3,155 | 245 |
| | American Campus Communities Inc. | 7,141 | 242 |
| | Life Storage Inc. | 2,278 | 240 |
| | Douglas Emmett Inc. | 8,377 | 234 |
| | Tradeweb Markets Inc. Class A | 4,049 | 232 |
| | STAG Industrial Inc. | 7,137 | 231 |
| | Old Republic International Corp. | 14,179 | 228 |
| * | Redfin Corp. | 4,757 | 226 |
| | People's United Financial Inc. | 21,367 | 226 |
| | Cousins Properties Inc. | 7,330 | 219 |
| | Eaton Vance Corp. | 5,284 | 217 |
| * | Athene Holding Ltd. Class A | 5,918 | 216 |
| | Starwood Property Trust Inc. | 13,585 | 212 |
| | TCF Financial Corp. | 7,666 | 206 |
| | Kinsale Capital Group Inc. | 994 | 206 |
| | Rayonier Inc. | 7,019 | 206 |
| | Jefferies Financial Group Inc. | 11,656 | 204 |
| | Invesco Ltd. | 19,511 | 199 |
| | New York Community Bancorp Inc. | 21,826 | 198 |
| | QTS Realty Trust Inc. Class A | 2,907 | 197 |
| * | Credit Acceptance Corp. | 500 | 193 |
| | Ares Management Corp. Class A | 4,775 | 193 |
| | Essent Group Ltd. | 5,409 | 193 |
| | Interactive Brokers Group Inc. | 3,607 | 191 |
| | Axis Capital Holdings Ltd. | 3,993 | 191 |
| | Healthcare Realty Trust Inc. | 6,578 | 190 |
| | Cullen/Frost Bankers Inc. | 2,720 | 189 |
Vanguard® Russell 3000 Index Fund
Schedule of Investments
August 31, 2020
| | | | Market |
| | | | Value |
| | | Shares | ($000) |
| | SL Green Realty Corp. | 4,037 | 189 |
| | First Financial Bankshares Inc. | 6,226 | 188 |
| | Terreno Realty Corp. | 3,158 | 188 |
| | South State Corp. | 3,382 | 188 |
| | Hanover Insurance Group Inc. | 1,816 | 186 |
| | Highwoods Properties Inc. | 4,923 | 183 |
| | RLI Corp. | 1,954 | 183 |
| | Unum Group | 9,881 | 183 |
| | Physicians Realty Trust | 9,823 | 178 |
| | Equity Commonwealth | 5,627 | 177 |
| | Brixmor Property Group Inc. | 14,929 | 176 |
| | Hudson Pacific Properties Inc. | 7,450 | 175 |
| | Agree Realty Corp. | 2,612 | 175 |
| | JBG SMITH Properties | 6,314 | 175 |
| | Spirit Realty Capital Inc. | 4,911 | 174 |
| | Selective Insurance Group Inc. | 2,806 | 168 |
| | United Bankshares Inc. | 6,390 | 167 |
| | New Residential Investment Corp. | 21,103 | 163 |
| | Morningstar Inc. | 1,019 | 163 |
| | Affiliated Managers Group Inc. | 2,371 | 163 |
| | Stifel Financial Corp. | 3,193 | 162 |
| | Popular Inc. | 4,341 | 161 |
| | Western Alliance Bancorp | 4,550 | 161 |
| | Glacier Bancorp Inc. | 4,448 | 156 |
| * | Brighthouse Financial Inc. | 5,126 | 156 |
| | Lazard Ltd. Class A | 4,894 | 155 |
| | Valley National Bancorp | 20,500 | 154 |
| | Blackstone Mortgage Trust Inc. Class A | 6,476 | 154 |
| | MGIC Investment Corp. | 16,604 | 152 |
| * | Cannae Holdings Inc. | 4,026 | 152 |
| | Sabra Health Care REIT Inc. | 10,209 | 151 |
| | Radian Group Inc. | 9,660 | 149 |
| | PotlatchDeltic Corp. | 3,217 | 148 |
| | Community Bank System Inc. | 2,457 | 148 |
| | Synovus Financial Corp. | 6,740 | 147 |
| | Hannon Armstrong Sustainable Infrastructure Capital Inc. | 3,449 | 146 |
| | Pinnacle Financial Partners Inc. | 3,627 | 145 |
| | SLM Corp. | 18,939 | 145 |
| | Carlyle Group Inc. | 5,550 | 143 |
| | Lexington Realty Trust | 12,575 | 143 |
| | National Health Investors Inc. | 2,204 | 137 |
| | Bank OZK | 5,920 | 136 |
| | Corporate Office Properties Trust | 5,450 | 134 |
| | First Citizens BancShares Inc. Class A | 339 | 133 |
| | White Mountains Insurance Group Ltd. | 149 | 133 |
| * | Green Dot Corp. Class A | 2,526 | 132 |
| | EPR Properties | 4,013 | 130 |
| | Outfront Media Inc. | 7,508 | 127 |
| | Wintrust Financial Corp. | 2,909 | 127 |
| | Home BancShares Inc. | 7,645 | 124 |
| | Umpqua Holdings Corp. | 10,933 | 123 |
| | Webster Financial Corp. | 4,476 | 123 |
| | PS Business Parks Inc. | 971 | 123 |
| | CNO Financial Group Inc. | 7,479 | 122 |
| | PennyMac Financial Services Inc. | 2,275 | 120 |
| | FirstCash Inc. | 2,006 | 120 |
| | Associated Banc-Corp | 8,843 | 119 |
| | CVB Financial Corp. | 6,499 | 118 |
| | FNB Corp. | 15,738 | 118 |
| | Houlihan Lokey Inc. Class A | 2,012 | 118 |
| | Park Hotels & Resorts Inc. | 12,389 | 118 |
| * | LendingTree Inc. | 374 | 116 |
| | Old National Bancorp | 8,253 | 115 |
| | Evercore Inc. Class A | 1,864 | 115 |
Vanguard® Russell 3000 Index Fund
Schedule of Investments
August 31, 2020
| | | | Market |
| | | | Value |
| | | Shares | ($000) |
| | National General Holdings Corp. | 3,369 | 115 |
| | UMB Financial Corp. | 2,119 | 114 |
| * | Howard Hughes Corp. | 1,917 | 113 |
| | Sterling Bancorp | 9,632 | 112 |
| | Federated Hermes Inc. Class B | 4,675 | 112 |
| | Apple Hospitality REIT Inc. | 10,949 | 111 |
| | National Storage Affiliates Trust | 3,240 | 111 |
| | PacWest Bancorp | 5,763 | 110 |
| | Taubman Centers Inc. | 2,862 | 110 |
| | Innovative Industrial Properties Inc. | 879 | 108 |
| | BankUnited Inc. | 4,614 | 108 |
| | Cathay General Bancorp | 4,287 | 106 |
| | Bank of Hawaii Corp. | 1,914 | 105 |
| | Alliance Data Systems Corp. | 2,335 | 105 |
| | American Equity Investment Life Holding Co. | 4,385 | 105 |
| | BancorpSouth Bank | 4,858 | 105 |
| | EVERTEC Inc. | 2,993 | 105 |
| | First Hawaiian Inc. | 6,334 | 105 |
| * | PRA Group Inc. | 2,233 | 104 |
| | ServisFirst Bancshares Inc. | 2,837 | 104 |
| * | Enstar Group Ltd. | 575 | 103 |
| * | Palomar Holdings Inc. | 915 | 103 |
| | Independent Bank Corp. | 1,634 | 103 |
| | Weingarten Realty Investors | 5,822 | 102 |
| | Washington REIT | 4,599 | 101 |
| | Columbia Banking System Inc. | 3,532 | 99 |
| | Independent Bank Group Inc. | 2,079 | 97 |
| | Uniti Group Inc. | 9,836 | 97 |
| | Assured Guaranty Ltd. | 4,490 | 96 |
| | Brandywine Realty Trust | 8,574 | 95 |
| | Piedmont Office Realty Trust Inc. Class A | 6,231 | 95 |
| | Artisan Partners Asset Management Inc. Class A | 2,464 | 95 |
| | PennyMac Mortgage Investment Trust | 5,555 | 95 |
| | BOK Financial Corp. | 1,672 | 94 |
| | Ryman Hospitality Properties Inc. | 2,453 | 94 |
| | OneMain Holdings Inc. | 3,201 | 93 |
| | Sunstone Hotel Investors Inc. | 11,010 | 92 |
| | Washington Federal Inc. | 3,900 | 91 |
| | Atlantic Union Bankshares Corp. | 3,919 | 91 |
| | CIT Group Inc. | 4,607 | 91 |
| | CareTrust REIT Inc. | 4,668 | 90 |
| | Kennedy-Wilson Holdings Inc. | 6,202 | 89 |
| | International Bancshares Corp. | 2,793 | 88 |
| | Easterly Government Properties Inc. | 3,627 | 88 |
| | Ameris Bancorp | 3,552 | 87 |
| * | Trupanion Inc. | 1,388 | 87 |
| | Four Corners Property Trust Inc. | 3,439 | 87 |
| | Navient Corp. | 9,480 | 86 |
| | Pacific Premier Bancorp Inc. | 3,775 | 85 |
| | Investors Bancorp Inc. | 10,985 | 85 |
| | Hancock Whitney Corp. | 4,221 | 84 |
| | First Merchants Corp. | 3,271 | 84 |
| | First Midwest Bancorp Inc. | 6,712 | 84 |
| | Moelis & Co. Class A | 2,618 | 84 |
| | Horace Mann Educators Corp. | 2,072 | 81 |
| | Chimera Investment Corp. | 9,023 | 80 |
| | Pebblebrook Hotel Trust | 6,333 | 80 |
| | Simmons First National Corp. Class A | 4,670 | 80 |
| * | eHealth Inc. | 1,261 | 80 |
| * | Bill.com Holdings Inc. | 801 | 79 |
| | Westamerica Bancorporation | 1,301 | 79 |
| | Hamilton Lane Inc. Class A | 1,083 | 79 |
| | Essential Properties Realty Trust Inc. | 4,664 | 79 |
| | NBT Bancorp Inc. | 2,589 | 79 |
Vanguard® Russell 3000 Index Fund
Schedule of Investments
August 31, 2020
| | | | Market |
| | | | Value |
| | | Shares | ($000) |
| | Virtu Financial Inc. Class A | 3,048 | 79 |
| * | Texas Capital Bancshares Inc. | 2,421 | 78 |
| | Fulton Financial Corp. | 7,881 | 77 |
| | RLJ Lodging Trust | 8,131 | 77 |
| | Trustmark Corp. | 3,240 | 76 |
| | Banner Corp. | 2,070 | 75 |
| | Cohen & Steers Inc. | 1,233 | 75 |
| | Global Net Lease Inc. | 4,253 | 74 |
| * | Genworth Financial Inc. Class A | 24,629 | 74 |
| | WSFS Financial Corp. | 2,532 | 74 |
| | WesBanco Inc. | 3,308 | 74 |
| | Walker & Dunlop Inc. | 1,337 | 73 |
| | PJT Partners Inc. | 1,230 | 73 |
| | Paramount Group Inc. | 9,778 | 72 |
| | Capitol Federal Financial Inc. | 7,722 | 72 |
| | James River Group Holdings Ltd. | 1,478 | 72 |
| | Two Harbors Investment Corp. | 13,156 | 72 |
| | LTC Properties Inc. | 1,955 | 71 |
| | Park National Corp. | 793 | 71 |
| | United Community Banks Inc. | 3,898 | 71 |
| | Renasant Corp. | 2,784 | 71 |
| | Northwest Bancshares Inc. | 6,963 | 70 |
| | Hilltop Holdings Inc. | 3,414 | 70 |
| * | Axos Financial Inc. | 2,834 | 70 |
| | Monmouth Real Estate Investment Corp. | 4,786 | 69 |
| | Santander Consumer USA Holdings Inc. | 3,996 | 69 |
| | Bank of NT Butterfield & Son Ltd. | 2,709 | 68 |
| | Piper Sandler Cos. | 904 | 68 |
| | Apollo Commercial Real Estate Finance Inc. | 7,586 | 68 |
| | Industrial Logistics Properties Trust | 3,136 | 68 |
| | Columbia Property Trust Inc. | 5,704 | 67 |
| | First Financial Bancorp | 4,889 | 67 |
| | Retail Properties of America Inc. | 10,535 | 66 |
| * | Encore Capital Group Inc. | 1,443 | 66 |
| | GEO Group Inc. | 5,934 | 66 |
| | Flagstar Bancorp Inc. | 2,100 | 66 |
| | Colony Capital Inc. | 23,979 | 65 |
| | Service Properties Trust | 7,866 | 65 |
| | AMERISAFE Inc. | 960 | 64 |
| | First Busey Corp. | 3,594 | 64 |
| * | Mr Cooper Group Inc. | 3,477 | 64 |
| * | Cushman & Wakefield plc | 5,442 | 63 |
| | Office Properties Income Trust | 2,647 | 63 |
| | Heartland Financial USA Inc. | 1,825 | 63 |
| | City Holding Co. | 973 | 62 |
| | First Interstate BancSystem Inc. Class A | 1,896 | 62 |
| | Retail Opportunity Investments Corp. | 5,581 | 62 |
| | Broadmark Realty Capital Inc. | 6,328 | 62 |
| * | Evo Payments Inc. Class A | 2,156 | 62 |
| | New York Mortgage Trust Inc. | 23,423 | 62 |
| | American Assets Trust Inc. | 2,418 | 62 |
| | Mack-Cali Realty Corp. | 4,868 | 61 |
| | First BanCorp | 10,681 | 61 |
| | Stock Yards Bancorp Inc. | 1,423 | 61 |
| * | Realogy Holdings Corp. | 5,474 | 61 |
| | Argo Group International Holdings Ltd. | 1,629 | 61 |
| | Mercury General Corp. | 1,343 | 60 |
| | MFA Financial Inc. | 22,334 | 60 |
| | Urban Edge Properties | 5,668 | 60 |
| | Towne Bank | 3,372 | 60 |
| | Goosehead Insurance Inc. Class A | 575 | 59 |
| | Hope Bancorp Inc. | 6,915 | 59 |
| | Lakeland Financial Corp. | 1,273 | 58 |
| | Macerich Co. | 7,233 | 57 |
Vanguard® Russell 3000 Index Fund
Schedule of Investments
August 31, 2020
| | | | Market |
| | | | Value |
| | | Shares | ($000) |
| | Cadence BanCorp Class A | 5,956 | 57 |
| | CoreCivic Inc. | 6,008 | 56 |
| | SITE Centers Corp. | 7,336 | 55 |
| | Arbor Realty Trust Inc. | 4,819 | 55 |
| * | NMI Holdings Inc. Class A | 3,159 | 54 |
| | Nelnet Inc. Class A | 826 | 54 |
| | Independence Realty Trust Inc. | 4,610 | 54 |
| | Sandy Spring Bancorp Inc. | 2,209 | 53 |
| | First Commonwealth Financial Corp. | 6,403 | 53 |
| | Community Healthcare Trust Inc. | 1,123 | 52 |
| | DiamondRock Hospitality Co. | 9,891 | 52 |
| | Safety Insurance Group Inc. | 720 | 52 |
| | Waddell & Reed Financial Inc. Class A | 3,243 | 51 |
| | Getty Realty Corp. | 1,737 | 51 |
| | Xenia Hotels & Resorts Inc. | 5,662 | 51 |
| * | Focus Financial Partners Inc. Class A | 1,412 | 50 |
| * | Seacoast Banking Corp. of Florida | 2,424 | 49 |
| | NexPoint Residential Trust Inc. | 1,185 | 49 |
| | Employers Holdings Inc. | 1,505 | 49 |
| | Safehold Inc. | 882 | 49 |
| | Acadia Realty Trust | 4,242 | 48 |
| | Stewart Information Services Corp. | 1,114 | 48 |
| | Lakeland Bancorp Inc. | 4,443 | 47 |
| | iStar Inc. | 3,794 | 47 |
| * | eXp World Holdings Inc. | 1,030 | 46 |
| | S&T Bancorp Inc. | 2,237 | 45 |
| | Brookline Bancorp Inc. | 4,650 | 45 |
| | Kite Realty Group Trust | 3,952 | 44 |
| | Empire State Realty Trust Inc. | 7,007 | 44 |
| * | Repay Holdings Corp. Class A | 1,740 | 44 |
| | Virtus Investment Partners Inc. | 310 | 44 |
| | Provident Financial Services Inc. | 3,330 | 44 |
| | CNA Financial Corp. | 1,363 | 44 |
| | Diversified Healthcare Trust | 11,531 | 44 |
| | Tompkins Financial Corp. | 662 | 44 |
| | Eagle Bancorp Inc. | 1,522 | 44 |
| | Universal Health Realty Income Trust | 653 | 44 |
| * | StoneX Group Inc. | 763 | 43 |
| | Brightsphere Investment Group Inc. | 3,102 | 43 |
| | 1st Source Corp. | 1,248 | 43 |
| | Veritex Holdings Inc. | 2,335 | 42 |
| | Bryn Mawr Bank Corp. | 1,537 | 42 |
| | Southside Bancshares Inc. | 1,499 | 41 |
| | Horizon Bancorp Inc. | 3,586 | 40 |
| | Alexander & Baldwin Inc. | 3,291 | 40 |
| | BancFirst Corp. | 893 | 39 |
| | Investors Real Estate Trust | 546 | 39 |
| | ProAssurance Corp. | 2,514 | 39 |
| | Global Medical REIT Inc. | 2,982 | 38 |
| | OceanFirst Financial Corp. | 2,440 | 38 |
| | Redwood Trust Inc. | 5,487 | 38 |
| | United Fire Group Inc. | 1,500 | 38 |
| | National Bank Holdings Corp. Class A | 1,324 | 38 |
| | Gladstone Commercial Corp. | 1,892 | 37 |
| * | Cardtronics plc Class A | 1,708 | 37 |
| | Ladder Capital Corp. Class A | 4,899 | 37 |
| | FB Financial Corp. | 1,351 | 36 |
| | TFS Financial Corp. | 2,317 | 36 |
| | Great Western Bancorp Inc. | 2,564 | 36 |
| | BGC Partners Inc. Class A | 13,954 | 35 |
| | Arrow Financial Corp. | 1,227 | 35 |
| | TriCo Bancshares | 1,261 | 35 |
| * | St. Joe Co. | 1,504 | 35 |
| ^ | Brookfield Property REIT Inc. Class A | 3,020 | 35 |
Vanguard® Russell 3000 Index Fund
Schedule of Investments
August 31, 2020
| | | | Market |
| | | | Value |
| | | Shares | ($000) |
| | American Finance Trust Inc. | 5,075 | 35 |
| | CatchMark Timber Trust Inc. Class A | 3,413 | 34 |
| | Heritage Financial Corp. | 1,699 | 34 |
| | Ellington Financial Inc. | 2,699 | 34 |
| | Independent Bank Corp. | 2,254 | 34 |
| | Peoples Bancorp Inc. | 1,587 | 34 |
| | Enterprise Financial Services Corp. | 1,114 | 33 |
| | Mercantile Bank Corp. | 1,514 | 33 |
| | German American Bancorp Inc. | 1,148 | 33 |
| | Northfield Bancorp Inc. | 3,353 | 32 |
| | Colony Credit Real Estate Inc. | 5,331 | 32 |
| | Premier Financial Corp. | 1,756 | 32 |
| | Meta Financial Group Inc. | 1,609 | 31 |
| | Waterstone Financial Inc. | 1,997 | 31 |
| | Newmark Group Inc. Class A | 6,762 | 30 |
| | First Community Bankshares Inc. | 1,553 | 30 |
| * | Triumph Bancorp Inc. | 1,044 | 30 |
| * | Third Point Reinsurance Ltd. | 3,446 | 30 |
| * | Marcus & Millichap Inc. | 1,043 | 29 |
| | OFG Bancorp | 2,276 | 29 |
| | HomeStreet Inc. | 1,062 | 29 |
| | Heritage Commerce Corp. | 4,170 | 29 |
| | TPG RE Finance Trust Inc. | 3,218 | 28 |
| | Kearny Financial Corp. | 3,594 | 28 |
| | First Bancorp | 1,362 | 28 |
| | Summit Hotel Properties Inc. | 4,722 | 28 |
| | Federal Agricultural Mortgage Corp. Class C | 408 | 28 |
| | Invesco Mortgage Capital Inc. | 9,195 | 28 |
| | RE/MAX Holdings Inc. Class A | 777 | 27 |
| | Dynex Capital Inc. | 1,722 | 27 |
| * | MBIA Inc. | 3,342 | 27 |
| * | Enova International Inc. | 1,566 | 27 |
| | B Riley Financial Inc. | 992 | 27 |
| | Capstead Mortgage Corp. | 4,295 | 27 |
| * | Ambac Financial Group Inc. | 2,089 | 26 |
| | First Foundation Inc. | 1,730 | 26 |
| | Armada Hoffler Properties Inc. | 2,600 | 26 |
| | Cass Information Systems Inc. | 669 | 26 |
| | TrustCo Bank Corp. NY | 4,372 | 26 |
| | American National Insurance Co. | 347 | 26 |
| | ARMOUR Residential REIT Inc. | 2,686 | 26 |
| | Live Oak Bancshares Inc. | 1,158 | 26 |
| | Universal Insurance Holdings Inc. | 1,363 | 25 |
| | Meridian Bancorp Inc. | 2,159 | 25 |
| | Alexander's Inc. | 97 | 25 |
| | Tanger Factory Outlet Centers Inc. | 4,337 | 25 |
| | Preferred Bank | 659 | 25 |
| * | Nicolet Bankshares Inc. | 409 | 25 |
| | HarborOne Bancorp Inc. | 2,803 | 24 |
| | Hanmi Financial Corp. | 2,538 | 24 |
| | Community Trust Bancorp Inc. | 731 | 24 |
| | ConnectOne Bancorp Inc. | 1,530 | 23 |
| | National Western Life Group Inc. Class A | 105 | 23 |
| | Boston Private Financial Holdings Inc. | 3,878 | 23 |
| * | Columbia Financial Inc. | 2,156 | 23 |
| * | World Acceptance Corp. | 252 | 23 |
| | WisdomTree Investments Inc. | 6,122 | 23 |
| | Allegiance Bancshares Inc. | 898 | 23 |
| | Cowen Inc. Class A | 1,261 | 23 |
| | UMH Properties Inc. | 1,568 | 23 |
| * | Bridgewater Bancshares Inc. | 2,342 | 23 |
| | Camden National Corp. | 697 | 23 |
| | Washington Trust Bancorp Inc. | 681 | 23 |
| | Banc of California Inc. | 2,056 | 23 |
Vanguard® Russell 3000 Index Fund
Schedule of Investments
August 31, 2020
| | | | Market |
| | | | Value |
| | | Shares | ($000) |
| * | CrossFirst Bankshares Inc. | 2,441 | 23 |
| | Front Yard Residential Corp. | 2,244 | 22 |
| * | Bancorp Inc. | 2,287 | 22 |
| | Gladstone Land Corp. | 1,380 | 22 |
| * | Seritage Growth Properties Class A | 1,533 | 22 |
| | Bank of Marin Bancorp | 672 | 21 |
| | RPT Realty | 3,620 | 21 |
| | First Financial Corp. | 616 | 21 |
| | KKR Real Estate Finance Trust Inc. | 1,156 | 21 |
| | Franklin Street Properties Corp. | 4,706 | 21 |
| | Univest Financial Corp. | 1,295 | 21 |
| | QCR Holdings Inc. | 682 | 20 |
| | Origin Bancorp Inc. | 859 | 20 |
| | Central Pacific Financial Corp. | 1,299 | 20 |
| | RMR Group Inc. Class A | 701 | 20 |
| | Anworth Mortgage Asset Corp. | 11,269 | 19 |
| | Berkshire Hills Bancorp Inc. | 2,113 | 19 |
| | City Office REIT Inc. | 2,401 | 19 |
| | Ames National Corp. | 950 | 19 |
| * | BRP Group Inc. Class A | 688 | 19 |
| | Great Southern Bancorp Inc. | 490 | 19 |
| * | I3 Verticals Inc. Class A | 668 | 19 |
| | Dime Community Bancshares Inc. | 1,428 | 18 |
| | Jernigan Capital Inc. | 1,038 | 18 |
| | Banco Latinoamericano de Comercio Exterior SA | 1,469 | 18 |
| | Diamond Hill Investment Group Inc. | 144 | 18 |
| | First of Long Island Corp. | 1,149 | 18 |
| | First Mid Bancshares Inc. | 671 | 17 |
| * | Customers Bancorp Inc. | 1,339 | 17 |
| | Heritage Insurance Holdings Inc. | 1,286 | 17 |
| | Byline Bancorp Inc. | 1,322 | 17 |
| | Bank First Corp. | 266 | 17 |
| | FBL Financial Group Inc. Class A | 441 | 16 |
| | New Senior Investment Group Inc. | 3,730 | 16 |
| * | TriState Capital Holdings Inc. | 1,170 | 16 |
| * | LendingClub Corp. | 3,046 | 16 |
| | HCI Group Inc. | 293 | 16 |
| * | NI Holdings Inc. | 974 | 16 |
| | Granite Point Mortgage Trust Inc. | 2,392 | 16 |
| | First Bancshares Inc. | 734 | 16 |
| | Altabancorp | 757 | 16 |
| | Independence Holding Co. | 445 | 16 |
| * | Assetmark Financial Holdings Inc. | 635 | 15 |
| | Ready Capital Corp. | 1,492 | 15 |
| | Central Valley Community Bancorp | 1,266 | 15 |
| | Flushing Financial Corp. | 1,232 | 15 |
| | Peapack-Gladstone Financial Corp. | 879 | 15 |
| | Saul Centers Inc. | 532 | 15 |
| | Cherry Hill Mortgage Investment Corp. | 1,553 | 15 |
| | Farmland Partners Inc. | 2,203 | 15 |
| | Chatham Lodging Trust | 2,125 | 15 |
| | Republic Bancorp Inc. Class A | 475 | 15 |
| | Orchid Island Capital Inc. | 2,857 | 15 |
| | First Business Financial Services Inc. | 941 | 15 |
| | Preferred Apartment Communities Inc. Class A | 2,190 | 14 |
| | Midland States Bancorp Inc. | 979 | 14 |
| * | International Money Express Inc. | 845 | 14 |
| | Bridge Bancorp Inc. | 713 | 14 |
| * | Donnelley Financial Solutions Inc. | 1,291 | 14 |
| * | Watford Holdings Ltd. | 871 | 14 |
| | Bar Harbor Bankshares | 685 | 14 |
| | Alerus Financial Corp. | 672 | 14 |
| | Farmers National Banc Corp. | 1,180 | 14 |
| * | GreenSky Inc. Class A | 3,136 | 14 |
Vanguard® Russell 3000 Index Fund
Schedule of Investments
August 31, 2020
| | | | Market |
| | | | Value |
| | | Shares | ($000) |
| * | FRP Holdings Inc. | 329 | 14 |
| * | Tejon Ranch Co. | 938 | 13 |
| | CBTX Inc. | 837 | 13 |
| | 1st Constitution Bancorp | 1,079 | 13 |
| | Capital City Bank Group Inc. | 627 | 13 |
| * | Silvergate Capital Corp. Class A | 847 | 13 |
| | West BanCorp Inc. | 714 | 13 |
| | Urstadt Biddle Properties Inc. Class A | 1,341 | 12 |
| * | Oportun Financial Corp. | 992 | 12 |
| | Plymouth Industrial REIT Inc. | 930 | 12 |
| | Sierra Bancorp | 691 | 12 |
| * | Citizens Inc. Class A | 2,096 | 12 |
| * | Atlantic Capital Bancshares Inc. | 1,057 | 12 |
| * | Amerant Bancorp Inc. | 925 | 12 |
| | Ares Commercial Real Estate Corp. | 1,219 | 12 |
| | State Auto Financial Corp. | 782 | 12 |
| * | EZCORP Inc. Class A | 2,205 | 12 |
| | Financial Institutions Inc. | 688 | 12 |
| | BankFinancial Corp. | 1,594 | 12 |
| | Whitestone REIT | 1,797 | 12 |
| | One Liberty Properties Inc. | 603 | 12 |
| | Peoples Financial Services Corp. | 314 | 11 |
| | Oppenheimer Holdings Inc. Class A | 466 | 11 |
| | Old Second Bancorp Inc. | 1,349 | 11 |
| | Cambridge Bancorp | 198 | 11 |
| * | Forestar Group Inc. | 603 | 11 |
| | Sculptor Capital Management Inc. Class A | 839 | 11 |
| * | Equity Bancshares Inc. Class A | 671 | 11 |
| • | CorePoint Lodging Inc. | 1,878 | 11 |
| | Hingham Institution For Savings The | 57 | 10 |
| | Hersha Hospitality Trust Class A | 1,621 | 10 |
| | RBB Bancorp | 793 | 10 |
| | Farmers & Merchants Bancorp Inc. | 476 | 10 |
| | MidWestOne Financial Group Inc. | 533 | 10 |
| | CIM Commercial Trust Corp. | 979 | 10 |
| | CNB Financial Corp. | 633 | 10 |
| | Red River Bancshares Inc. | 231 | 10 |
| | Metrocity Bankshares Inc. | 735 | 10 |
| | American National Bankshares Inc. | 443 | 10 |
| | PCSB Financial Corp. | 778 | 10 |
| | Ellington Residential Mortgage REIT | 865 | 10 |
| | HomeTrust Bancshares Inc. | 686 | 10 |
| | Guaranty Bancshares Inc. | 362 | 10 |
| | CTO Realty Growth Inc. | 226 | 10 |
| * | Rafael Holdings Inc. Class B | 537 | 9 |
| | ChoiceOne Financial Services Inc. | 328 | 9 |
| | Clipper Realty Inc. | 1,390 | 9 |
| | Macatawa Bank Corp. | 1,254 | 9 |
| * | Paysign Inc. | 1,416 | 9 |
| * | MoneyGram International Inc. | 3,115 | 9 |
| | Century Bancorp Inc. Class A | 129 | 9 |
| | Greenhill & Co. Inc. | 808 | 9 |
| | Southern Missouri Bancorp Inc. | 377 | 9 |
| * | Southern First Bancshares Inc. | 344 | 9 |
| | Home Bancorp Inc. | 368 | 9 |
| | Enterprise Bancorp Inc. | 409 | 9 |
| * | Metropolitan Bank Holding Corp. | 284 | 9 |
| | First Bancorp Inc. | 411 | 9 |
| | Business First Bancshares Inc. | 603 | 9 |
| | Northrim BanCorp Inc. | 322 | 9 |
| | BBX Capital Corp. Class A | 562 | 9 |
| | Investors Title Co. | 63 | 9 |
| | Griffin Industrial Realty Inc. | 161 | 9 |
| | Penns Woods Bancorp Inc. | 410 | 9 |
Vanguard® Russell 3000 Index Fund
Schedule of Investments
August 31, 2020
| | | | Market |
| | | | Value |
| | | Shares | ($000) |
| | Civista Bancshares Inc. | 636 | 8 |
| | First Capital Inc. | 139 | 8 |
| | First Northwest Bancorp | 763 | 8 |
| | Retail Value Inc. | 666 | 8 |
| * | Greenlight Capital Re Ltd. Class A | 1,163 | 8 |
| | Luther Burbank Corp. | 906 | 8 |
| | Citizens & Northern Corp. | 489 | 8 |
| * | Alpine Income Property Trust Inc. | 573 | 8 |
| * | Spirit of Texas Bancshares Inc. | 662 | 8 |
| | Southern National Bancorp of Virginia Inc. | 966 | 8 |
| * | Dun & Bradstreet Holdings Inc. | 322 | 8 |
| | LCNB Corp. | 543 | 8 |
| | Merchants Bancorp | 390 | 8 |
| | Bluerock Residential Growth REIT Inc. | 1,054 | 8 |
| | Greene County Bancorp Inc. | 326 | 8 |
| * | BayCom Corp. | 651 | 8 |
| | Premier Financial Bancorp Inc. | 586 | 8 |
| | Middlefield Banc Corp. | 394 | 7 |
| * | Select Bancorp Inc. | 975 | 7 |
| | Citizens Holding Co. | 348 | 7 |
| | Summit Financial Group Inc. | 505 | 7 |
| | Great Ajax Corp. | 814 | 7 |
| * | California Bancorp Inc. | 570 | 7 |
| | County Bancorp Inc. | 384 | 7 |
| | Territorial Bancorp Inc. | 350 | 7 |
| * | PICO Holdings Inc. | 831 | 7 |
| | Carter Bank & Trust | 1,037 | 7 |
| | SB Financial Group Inc. | 526 | 7 |
| | SmartFinancial Inc. | 526 | 7 |
| | FS Bancorp Inc. | 180 | 7 |
| | MVB Financial Corp. | 495 | 7 |
| | Orrstown Financial Services Inc. | 508 | 7 |
| | United Insurance Holdings Corp. | 914 | 7 |
| | Donegal Group Inc. Class A | 470 | 7 |
| | Norwood Financial Corp. | 274 | 7 |
| | National Bankshares Inc. | 273 | 7 |
| | South Plains Financial Inc. | 474 | 7 |
| | Protective Insurance Corp. Class B | 471 | 7 |
| * | Regional Management Corp. | 367 | 7 |
| | Richmond Mutual BanCorp Inc. | 588 | 7 |
| * | Howard Bancorp Inc. | 678 | 7 |
| | Investar Holding Corp. | 488 | 7 |
| | Amalgamated Bank Class A | 558 | 7 |
| | Capstar Financial Holdings Inc. | 632 | 6 |
| | Reliant Bancorp Inc. | 442 | 6 |
| | Northeast Bank | 343 | 6 |
| | First Bank | 979 | 6 |
| | BRT Apartments Corp. | 474 | 6 |
| | Parke Bancorp Inc. | 511 | 6 |
| | Bank of Commerce Holdings | 843 | 6 |
| | First Choice Bancorp | 428 | 6 |
| | Hawthorn Bancshares Inc. | 329 | 6 |
| | Timberland Bancorp Inc. | 344 | 6 |
| | Tiptree Inc. | 1,054 | 6 |
| | Crawford & Co. Class A | 861 | 6 |
| * | Stratus Properties Inc. | 299 | 6 |
| | First Internet Bancorp | 401 | 6 |
| | Auburn National BanCorp Inc. | 143 | 6 |
| | Bank of Princeton | 298 | 6 |
| | Western New England Bancorp Inc. | 1,132 | 6 |
| | Shore Bancshares Inc. | 590 | 6 |
| | ACNB Corp. | 271 | 6 |
| | Curo Group Holdings Corp. | 734 | 6 |
| * | FVCBankcorp Inc. | 527 | 6 |
Vanguard® Russell 3000 Index Fund
Schedule of Investments
August 31, 2020
| | | | Market | |
| | | | Value | |
| | | Shares | ($000 | ) |
| | FNCB Bancorp Inc. | 938 | 5 | |
| | ESSA Bancorp Inc. | 428 | 5 | |
| | CorEnergy Infrastructure Trust Inc. | 611 | 5 | |
| | Fidelity D&D Bancorp Inc. | 119 | 5 | |
| | BCB Bancorp Inc. | 642 | 5 | |
| * | Coastal Financial Corp. | 380 | 5 | |
| | Community Bankers Trust Corp. | 1,001 | 5 | |
| | PCB Bancorp | 536 | 5 | |
| | Silvercrest Asset Management Group Inc. Class A | 407 | 5 | |
| * | MMA Capital Holdings Inc. | 215 | 5 | |
| | Evans Bancorp Inc. | 221 | 5 | |
| | HBT Financial Inc. | 424 | 5 | |
| | Mid Penn Bancorp Inc. | 259 | 5 | |
| | Safeguard Scientifics Inc. | 794 | 5 | |
| | Codorus Valley Bancorp Inc. | 381 | 5 | |
| * | Capital Bancorp Inc. | 468 | 5 | |
| | Bankwell Financial Group Inc. | 312 | 5 | |
| | Community Financial Corp. | 215 | 5 | |
| | Westwood Holdings Group Inc. | 419 | 5 | |
| | C&F Financial Corp. | 149 | 5 | |
| | Western Asset Mortgage Capital Corp. | 2,083 | 5 | |
| | Ohio Valley Banc Corp. | 205 | 5 | |
| | Chemung Financial Corp. | 161 | 5 | |
| | FedNat Holding Co. | 541 | 5 | |
| | Colony Bankcorp Inc. | 410 | 5 | |
| | Level One Bancorp Inc. | 280 | 5 | |
| | Unity Bancorp Inc. | 326 | 4 | |
| | Oak Valley Bancorp | 316 | 4 | |
| | Franklin Financial Services Corp. | 177 | 4 | |
| * | Republic First Bancorp Inc. | 1,992 | 4 | |
| | United Security Bancshares | 683 | 4 | |
| | OP Bancorp | 676 | 4 | |
| | Arlington Asset Investment Corp. Class A | 1,511 | 4 | |
| * | MainStreet Bancshares Inc. | 318 | 4 | |
| * | Pioneer Bancorp Inc. | 500 | 4 | |
| | Prudential Bancorp Inc. | 401 | 4 | |
| | Riverview Bancorp Inc. | 953 | 4 | |
| | Mackinac Financial Corp. | 389 | 4 | |
| * | Maui Land & Pineapple Co. Inc. | 334 | 4 | |
| | Provident Financial Holdings Inc. | 318 | 4 | |
| | Peoples Bancorp of North Carolina Inc. | 222 | 4 | |
| | Pzena Investment Management Inc. Class A | 726 | 4 | |
| * | Altisource Portfolio Solutions SA | 283 | 3 | |
| | Provident Bancorp Inc. | 389 | 3 | |
| * | ProSight Global Inc. | 306 | 3 | |
| | Marlin Business Services Corp. | 429 | 3 | |
| * | Esquire Financial Holdings Inc. | 174 | 3 | |
| | GAMCO Investors Inc. Class A | 224 | 3 | |
| | First Guaranty Bancshares Inc. | 218 | 3 | |
| | Sterling Bancorp Inc. | 879 | 3 | |
| * | PDL Community Bancorp | 273 | 2 | |
| * | Transcontinental Realty Investors Inc. | 95 | 2 | |
| * | Avalon GloboCare Corp. | 1,381 | 2 | |
| * | American Realty Investors Inc. | 208 | 2 | |
| | Bank7 Corp. | 100 | 1 | |
| | 293,427 | |
| Health Care (13.7%) | |
| | Johnson & Johnson | 131,941 | 20,241 | |
| | UnitedHealth Group Inc. | 47,211 | 14,756 | |
| | Merck & Co. Inc. | 126,417 | 10,780 | |
| | Pfizer Inc. | 278,086 | 10,509 | |
| | Abbott Laboratories | 86,477 | 9,467 | |
| | Thermo Fisher Scientific Inc. | 19,763 | 8,478 | |
| | AbbVie Inc. | 88,015 | 8,429 | |
Vanguard® Russell 3000 Index Fund
Schedule of Investments
August 31, 2020
| | | | Market |
| | | | Value |
| | | Shares | ($000) |
| | Amgen Inc. | 29,422 | 7,453 |
| | Medtronic plc | 67,062 | 7,207 |
| | Bristol-Myers Squibb Co. | 113,226 | 7,043 |
| | Danaher Corp. | 31,330 | 6,469 |
| | Eli Lilly and Co. | 42,156 | 6,256 |
| * | Intuitive Surgical Inc. | 5,794 | 4,234 |
| | Gilead Sciences Inc. | 62,751 | 4,189 |
| | Zoetis Inc. | 23,787 | 3,808 |
| * | Vertex Pharmaceuticals Inc. | 12,948 | 3,614 |
| | Anthem Inc. | 12,613 | 3,551 |
| | Stryker Corp. | 17,362 | 3,440 |
| | Becton Dickinson and Co. | 13,494 | 3,276 |
| | Cigna Corp. | 18,078 | 3,206 |
| * | Regeneron Pharmaceuticals Inc. | 4,837 | 2,999 |
| * | Boston Scientific Corp. | 69,786 | 2,863 |
| | Humana Inc. | 6,599 | 2,740 |
| * | Edwards Lifesciences Corp. | 30,826 | 2,646 |
| * | Illumina Inc. | 7,326 | 2,617 |
| * | Biogen Inc. | 8,108 | 2,332 |
| | Baxter International Inc. | 25,342 | 2,207 |
| * | DexCom Inc. | 4,607 | 1,960 |
| * | Veeva Systems Inc. Class A | 6,724 | 1,898 |
| | HCA Healthcare Inc. | 13,289 | 1,804 |
| * | Centene Corp. | 28,902 | 1,772 |
| * | IDEXX Laboratories Inc. | 4,205 | 1,644 |
| | Agilent Technologies Inc. | 15,603 | 1,567 |
| * | IQVIA Holdings Inc. | 9,450 | 1,547 |
| | Zimmer Biomet Holdings Inc. | 10,415 | 1,467 |
| | ResMed Inc. | 7,129 | 1,289 |
| * | Alexion Pharmaceuticals Inc. | 10,708 | 1,223 |
| * | Align Technology Inc. | 3,925 | 1,166 |
| | Cerner Corp. | 15,120 | 1,109 |
| | West Pharmaceutical Services Inc. | 3,660 | 1,039 |
| * | Seattle Genetics Inc. | 6,071 | 961 |
| | Teleflex Inc. | 2,321 | 912 |
| * | Incyte Corp. | 9,095 | 876 |
| * | Moderna Inc. | 13,448 | 873 |
| * | Laboratory Corp. of America Holdings | 4,851 | 853 |
| * | Varian Medical Systems Inc. | 4,595 | 798 |
| * | Teladoc Health Inc. | 3,696 | 797 |
| * | Hologic Inc. | 12,999 | 776 |
| | Cooper Cos. Inc. | 2,446 | 769 |
| * | Alnylam Pharmaceuticals Inc. | 5,711 | 757 |
| | Cardinal Health Inc. | 14,762 | 749 |
| | Quest Diagnostics Inc. | 6,670 | 742 |
| * | Horizon Therapeutics plc | 9,596 | 721 |
| * | Catalent Inc. | 7,749 | 717 |
| | AmerisourceBergen Corp. Class A | 7,363 | 714 |
| * | BioMarin Pharmaceutical Inc. | 9,090 | 709 |
| * | ABIOMED Inc. | 2,229 | 686 |
| * | Insulet Corp. | 3,140 | 685 |
| | STERIS plc | 4,191 | 669 |
| | PerkinElmer Inc. | 5,511 | 649 |
| * | Elanco Animal Health Inc. | 19,924 | 579 |
| * | Exact Sciences Corp. | 7,436 | 560 |
| * | QIAGEN NV | 10,916 | 556 |
| * | Molina Healthcare Inc. | 2,964 | 548 |
| * | Sarepta Therapeutics Inc. | 3,711 | 543 |
| * | Charles River Laboratories International Inc. | 2,478 | 543 |
| * | Neurocrine Biosciences Inc. | 4,633 | 539 |
| * | Bio-Rad Laboratories Inc. Class A | 1,052 | 535 |
| * | Masimo Corp. | 2,383 | 534 |
| | Dentsply Sirona Inc. | 11,113 | 499 |
| | Bio-Techne Corp. | 1,895 | 484 |
Vanguard® Russell 3000 Index Fund
Schedule of Investments
August 31, 2020
| | | | Market |
| | | | Value |
| | | Shares | ($000) |
| * | Henry Schein Inc. | 7,235 | 481 |
| * | Avantor Inc. | 21,098 | 476 |
| * | Immunomedics Inc. | 10,296 | 459 |
| * | Mylan NV | 25,761 | 422 |
| | Universal Health Services Inc. Class B | 3,762 | 415 |
| | Chemed Corp. | 793 | 410 |
| * | Novocure Ltd. | 4,954 | 410 |
| * | Repligen Corp. | 2,640 | 409 |
| * | Amedisys Inc. | 1,563 | 378 |
| * | Livongo Health Inc. | 2,691 | 369 |
| * | Jazz Pharmaceuticals plc | 2,727 | 366 |
| * | DaVita Inc. | 4,175 | 362 |
| * | Ionis Pharmaceuticals Inc. | 6,537 | 356 |
| | Perrigo Co. plc | 6,785 | 355 |
| * | Guardant Health Inc. | 3,710 | 354 |
| * | Exelixis Inc. | 15,592 | 346 |
| * | PRA Health Sciences Inc. | 3,202 | 342 |
| * | Penumbra Inc. | 1,592 | 333 |
| * | Quidel Corp. | 1,850 | 325 |
| * | Tandem Diabetes Care Inc. | 2,863 | 323 |
| * | Novavax Inc. | 2,909 | 321 |
| | Encompass Health Corp. | 4,869 | 318 |
| | Hill-Rom Holdings Inc. | 3,381 | 317 |
| * | LHC Group Inc. | 1,514 | 316 |
| * | 10X Genomics Inc. Class A | 2,707 | 310 |
| * | Momenta Pharmaceuticals Inc. | 5,901 | 308 |
| * | iRhythm Technologies Inc. | 1,343 | 296 |
| * | MyoKardia Inc. | 2,493 | 273 |
| * | Mirati Therapeutics Inc. | 1,825 | 273 |
| * | Emergent BioSolutions Inc. | 2,203 | 251 |
| * | Ultragenyx Pharmaceutical Inc. | 2,819 | 240 |
| * | United Therapeutics Corp. | 2,213 | 237 |
| * | Nevro Corp. | 1,647 | 227 |
| * | Acceleron Pharma Inc. | 2,318 | 226 |
| * | Iovance Biotherapeutics Inc. | 6,703 | 223 |
| * | Haemonetics Corp. | 2,471 | 222 |
| * | Natera Inc. | 3,463 | 221 |
| * | ACADIA Pharmaceuticals Inc. | 5,562 | 220 |
| * | Arrowhead Pharmaceuticals Inc. | 5,116 | 216 |
| * | Blueprint Medicines Corp. | 2,736 | 212 |
| | Bruker Corp. | 4,935 | 207 |
| * | Globus Medical Inc. | 3,660 | 207 |
| * | HealthEquity Inc. | 3,556 | 204 |
| * | Halozyme Therapeutics Inc. | 7,048 | 204 |
| * | Invitae Corp. | 5,786 | 202 |
| * | Arena Pharmaceuticals Inc. | 2,887 | 202 |
| * | Neogen Corp. | 2,627 | 200 |
| * | NeoGenomics Inc. | 5,114 | 199 |
| * | Bluebird Bio Inc. | 3,239 | 192 |
| * | Envista Holdings Corp. | 7,983 | 191 |
| * | Syneos Health Inc. | 2,995 | 189 |
| * | ICU Medical Inc. | 937 | 188 |
| * | FibroGen Inc. | 4,127 | 185 |
| * | Wright Medical Group NV | 6,070 | 183 |
| * | Amicus Therapeutics Inc. | 12,519 | 183 |
| * | Global Blood Therapeutics Inc. | 2,831 | 178 |
| * | Change Healthcare Inc. | 12,474 | 176 |
| * | Medpace Holdings Inc. | 1,341 | 174 |
| * | Nektar Therapeutics Class A | 8,673 | 168 |
| * | Integra LifeSciences Holdings Corp. | 3,437 | 164 |
| * | Inspire Medical Systems Inc. | 1,316 | 157 |
| * | Biohaven Pharmaceutical Holding Co. Ltd. | 2,420 | 153 |
| * | PTC Therapeutics Inc. | 3,101 | 153 |
| * | Adaptive Biotechnologies Corp. | 3,632 | 151 |
Vanguard® Russell 3000 Index Fund
Schedule of Investments
August 31, 2020
| | | | Market |
| | | | Value |
| | | Shares | ($000) |
| * | Principia Biopharma Inc. | 1,466 | 147 |
| | Ensign Group Inc. | 2,467 | 144 |
| * | Insmed Inc. | 5,094 | 144 |
| * | Omnicell Inc. | 2,140 | 143 |
| * | Tenet Healthcare Corp. | 4,985 | 140 |
| * | Acadia Healthcare Co. Inc. | 4,251 | 131 |
| * | NuVasive Inc. | 2,507 | 131 |
| * | Sage Therapeutics Inc. | 2,470 | 130 |
| * | Merit Medical Systems Inc. | 2,624 | 129 |
| * | Agios Pharmaceuticals Inc. | 3,101 | 127 |
| * | Alkermes plc | 7,650 | 127 |
| * | Pacira BioSciences Inc. | 2,009 | 126 |
| * | Reata Pharmaceuticals Inc. Class A | 1,182 | 124 |
| * | AMN Healthcare Services Inc. | 2,224 | 120 |
| * | TG Therapeutics Inc. | 4,821 | 120 |
| * | ChemoCentryx Inc. | 2,195 | 117 |
| * | HMS Holdings Corp. | 4,207 | 117 |
| * | Fate Therapeutics Inc. | 3,208 | 117 |
| | Patterson Cos. Inc. | 3,958 | 115 |
| | CONMED Corp. | 1,324 | 114 |
| * | Integer Holdings Corp. | 1,607 | 111 |
| * | LivaNova plc | 2,357 | 111 |
| * | Bridgebio Pharma Inc. | 3,669 | 110 |
| * | Twist Bioscience Corp. | 1,562 | 109 |
| * | Select Medical Holdings Corp. | 5,413 | 109 |
| * | STAAR Surgical Co. | 2,255 | 108 |
| * | Allakos Inc. | 1,201 | 108 |
| * | PPD Inc. | 3,095 | 106 |
| * | Axsome Therapeutics Inc. | 1,441 | 106 |
| * | Turning Point Therapeutics Inc. | 1,344 | 105 |
| * | Prestige Consumer Healthcare Inc. | 2,789 | 102 |
| * | Glaukos Corp. | 2,123 | 102 |
| * | Denali Therapeutics Inc. | 3,154 | 101 |
| * | Xencor Inc. | 2,808 | 100 |
| * | Editas Medicine Inc. | 2,804 | 99 |
| * | Silk Road Medical Inc. | 1,618 | 99 |
| | Premier Inc. Class A | 2,971 | 97 |
| * | Apellis Pharmaceuticals Inc. | 3,109 | 96 |
| | Cantel Medical Corp. | 1,804 | 95 |
| * | Vir Biotechnology Inc. | 2,317 | 94 |
| * | AtriCure Inc. | 2,031 | 91 |
| * | Shockwave Medical Inc. | 1,428 | 91 |
| * | Revance Therapeutics Inc. | 3,095 | 90 |
| * | Magellan Health Inc. | 1,176 | 89 |
| * | Inovio Pharmaceuticals Inc. | 7,176 | 86 |
| * | Allogene Therapeutics Inc. | 2,385 | 85 |
| * | Allscripts Healthcare Solutions Inc. | 9,500 | 85 |
| * | Deciphera Pharmaceuticals Inc. | 1,857 | 84 |
| * | Kodiak Sciences Inc. | 1,526 | 80 |
| * | Veracyte Inc. | 2,331 | 78 |
| * | NanoString Technologies Inc. | 1,907 | 77 |
| * | Ironwood Pharmaceuticals Inc. Class A | 7,597 | 77 |
| | Healthcare Services Group Inc. | 3,678 | 76 |
| * | CareDx Inc. | 2,226 | 76 |
| * | Ligand Pharmaceuticals Inc. | 744 | 76 |
| * | MEDNAX Inc. | 4,077 | 76 |
| * | Avanos Medical Inc. | 2,334 | 76 |
| * | R1 RCM Inc. | 5,016 | 73 |
| * | Aimmune Therapeutics Inc. | 2,101 | 72 |
| * | MacroGenics Inc. | 2,469 | 71 |
| * | Cytokinetics Inc. | 2,969 | 71 |
| * | Intercept Pharmaceuticals Inc. | 1,412 | 70 |
| * | Sorrento Therapeutics Inc. | 8,788 | 70 |
| * | Akebia Therapeutics Inc. | 6,557 | 68 |
Vanguard® Russell 3000 Index Fund
Schedule of Investments
August 31, 2020
| | | | Market |
| | | | Value |
| | | Shares | ($000) |
|
| * | Zogenix Inc. | 2,870 | 68 |
| * | Sangamo Therapeutics Inc. | 6,061 | 67 |
| * | Addus HomeCare Corp. | 707 | 66 |
| * | Axonics Modulation Technologies Inc. | 1,554 | 66 |
| * | Heron Therapeutics Inc. | 4,556 | 65 |
| * | Kura Oncology Inc. | 2,603 | 65 |
| * | Y-mAbs Therapeutics Inc. | 1,504 | 65 |
| * | BioTelemetry Inc. | 1,601 | 63 |
| * | Dicerna Pharmaceuticals Inc. | 3,338 | 62 |
| * | OPKO Health Inc. | 18,787 | 61 |
| * | Corcept Therapeutics Inc. | 4,721 | 60 |
| * | Epizyme Inc. | 4,528 | 59 |
| * | Karuna Therapeutics Inc. | 768 | 59 |
| * | REGENXBIO Inc. | 1,890 | 58 |
| * | Coherus Biosciences Inc. | 2,959 | 56 |
| * | Cardiovascular Systems Inc. | 1,706 | 56 |
| * | Cerus Corp. | 8,581 | 55 |
| * | Karyopharm Therapeutics Inc. | 3,592 | 55 |
| | Luminex Corp. | 2,046 | 55 |
| * | Phreesia Inc. | 1,707 | 54 |
| * | Tabula Rasa HealthCare Inc. | 1,050 | 53 |
| * | Supernus Pharmaceuticals Inc. | 2,373 | 52 |
| | US Physical Therapy Inc. | 582 | 52 |
| * | Intra-Cellular Therapies Inc. | 2,836 | 52 |
| * | Evolent Health Inc. Class A | 3,469 | 50 |
| * | Rhythm Pharmaceuticals Inc. | 1,683 | 50 |
| * | Health Catalyst Inc. | 1,589 | 50 |
| * | Providence Service Corp. | 535 | 50 |
| * | Seres Therapeutics Inc. | 1,844 | 49 |
| * | Intellia Therapeutics Inc. | 2,222 | 48 |
| | Owens & Minor Inc. | 2,819 | 47 |
| * | Adverum Biotechnologies Inc. | 3,808 | 46 |
| * | Madrigal Pharmaceuticals Inc. | 426 | 46 |
| * | SpringWorks Therapeutics Inc. | 1,029 | 46 |
| *,^ | Esperion Therapeutics Inc. | 1,261 | 45 |
| * | Rocket Pharmaceuticals Inc. | 1,780 | 45 |
| * | GenMark Diagnostics Inc. | 3,399 | 44 |
| * | Mersana Therapeutics Inc. | 2,290 | 44 |
| * | Myriad Genetics Inc. | 3,281 | 44 |
| * | Pacific Biosciences of California Inc. | 6,631 | 44 |
| * | Athenex Inc. | 3,771 | 43 |
| * | Pennant Group Inc. | 1,148 | 42 |
| * | Arcus Biosciences Inc. | 1,758 | 42 |
| * | Enanta Pharmaceuticals Inc. | 800 | 42 |
| | Atrion Corp. | 66 | 42 |
| * | Atara Biotherapeutics Inc. | 3,061 | 41 |
| * | Lantheus Holdings Inc. | 3,064 | 41 |
| | National Research Corp. | 694 | 39 |
| * | VBI Vaccines Inc. | 9,019 | 38 |
| * | Theravance Biopharma Inc. | 2,064 | 38 |
| * | Gossamer Bio Inc. | 2,672 | 37 |
| * | Arvinas Inc. | 1,413 | 37 |
| * | Tivity Health Inc. | 2,236 | 37 |
| * | Collegium Pharmaceutical Inc. | 1,913 | 36 |
| * | Progyny Inc. | 1,276 | 36 |
| | National HealthCare Corp. | 566 | 36 |
| * | Kadmon Holdings Inc. | 7,163 | 36 |
| * | Innoviva Inc. | 3,003 | 35 |
| * | Retrophin Inc. | 1,791 | 35 |
| * | OraSure Technologies Inc. | 2,945 | 34 |
| * | Translate Bio Inc. | 2,449 | 34 |
| * | Corbus Pharmaceuticals Holdings Inc. | 3,693 | 34 |
| * | Codexis Inc. | 2,479 | 34 |
| * | CorVel Corp. | 411 | 34 |
Vanguard® Russell 3000 Index Fund
Schedule of Investments
August 31, 2020
| | | | Market |
| | | | Value |
| | | Shares | ($000) |
| * | Assembly Biosciences Inc. | 1,559 | 34 |
| * | Amphastar Pharmaceuticals Inc. | 1,665 | 34 |
| * | NextGen Healthcare Inc. | 2,543 | 34 |
| * | Heska Corp. | 325 | 34 |
| * | Quanterix Corp. | 943 | 34 |
| * | CryoLife Inc. | 1,659 | 34 |
| * | PetIQ Inc. Class A | 948 | 33 |
| * | Cortexyme Inc. | 757 | 33 |
| * | Omeros Corp. | 2,780 | 33 |
| * | Viela Bio Inc. | 963 | 32 |
| * | Vericel Corp | 2,042 | 32 |
| * | Hanger Inc. | 1,623 | 32 |
| * | Syros Pharmaceuticals Inc. | 2,419 | 32 |
| * | Tactile Systems Technology Inc. | 830 | 32 |
| * | 1Life Healthcare Inc. | 1,083 | 32 |
| * | Immunovant Inc. | 927 | 31 |
| * | ImmunoGen Inc. | 8,489 | 31 |
| * | Agenus Inc. | 7,076 | 31 |
| * | Arcturus Therapeutics Holdings Inc. | 636 | 31 |
| * | Endo International plc | 10,155 | 31 |
| * | Alector Inc. | 2,349 | 30 |
| * | Meridian Bioscience Inc. | 2,085 | 29 |
| * | ZIOPHARM Oncology Inc. | 10,480 | 29 |
| * | Constellation Pharmaceuticals Inc. | 1,397 | 29 |
| * | OrthoPediatrics Corp. | 581 | 29 |
| * | Vapotherm Inc. | 935 | 29 |
| * | SI-BONE Inc. | 1,332 | 29 |
| * | Cara Therapeutics Inc. | 1,837 | 28 |
| * | Ontrak Inc. | 390 | 28 |
| * | Fluidigm Corp. | 3,605 | 28 |
| * | BioCryst Pharmaceuticals Inc. | 6,768 | 28 |
| * | Natus Medical Inc. | 1,539 | 28 |
| * | Protagonist Therapeutics Inc. | 1,246 | 28 |
| * | RadNet Inc. | 1,918 | 28 |
| * | Intersect ENT Inc. | 1,362 | 27 |
| * | Provention Bio Inc. | 2,073 | 27 |
| * | Frequency Therapeutics Inc. | 1,391 | 27 |
| * | Surmodics Inc. | 593 | 27 |
| * | Replimune Group Inc. | 992 | 27 |
| * | Avrobio Inc. | 1,510 | 26 |
| * | Radius Health Inc. | 2,103 | 26 |
| * | Inogen Inc. | 838 | 25 |
| * | Ocular Therapeutix Inc. | 2,844 | 25 |
| * | Personalis Inc. | 1,076 | 25 |
| * | Prothena Corp. plc | 1,885 | 24 |
| * | G1 Therapeutics Inc. | 1,590 | 24 |
| * | Orthofix Medical Inc. | 803 | 24 |
| * | Cue Biopharma Inc. | 1,361 | 24 |
| * | Relmada Therapeutics Inc. | 678 | 24 |
| * | Castle Biosciences Inc. | 528 | 24 |
| * | Vanda Pharmaceuticals Inc. | 2,328 | 24 |
| * | HealthStream Inc. | 1,152 | 24 |
| *,^ | CEL-SCI Corp. | 1,835 | 24 |
| * | Brookdale Senior Living Inc. | 8,562 | 24 |
| * | Syndax Pharmaceuticals Inc. | 1,428 | 23 |
| * | Anika Therapeutics Inc. | 605 | 23 |
| * | Krystal Biotech Inc. | 485 | 23 |
| * | Dynavax Technologies Corp. | 3,850 | 23 |
| | LeMaitre Vascular Inc. | 712 | 23 |
| * | Avid Bioservices Inc. | 2,709 | 23 |
| * | Option Care Health Inc. | 1,931 | 22 |
| * | Amneal Pharmaceuticals Inc. | 5,436 | 22 |
| * | Eidos Therapeutics Inc. | 511 | 22 |
| * | Aerie Pharmaceuticals Inc. | 1,995 | 22 |
Vanguard® Russell 3000 Index Fund
Schedule of Investments
August 31, 2020
| | | | Market |
| | | | Value |
| | | Shares | ($000) |
| * | UroGen Pharma Ltd. | 873 | 22 |
| * | Precigen Inc. | 3,604 | 22 |
| * | Athersys Inc. | 9,892 | 22 |
| * | Surgery Partners Inc. | 1,102 | 21 |
| * | Spectrum Pharmaceuticals Inc. | 4,990 | 21 |
| * | Crinetics Pharmaceuticals Inc. | 1,310 | 21 |
| * | TransMedics Group Inc. | 1,174 | 21 |
| * | Ardelyx Inc. | 3,643 | 21 |
| * | NGM Biopharmaceuticals Inc. | 1,121 | 21 |
| * | Bioxcel Therapeutics Inc. | 511 | 21 |
| * | Antares Pharma Inc. | 7,322 | 21 |
| * | Geron Corp. | 10,083 | 21 |
| * | AnaptysBio Inc. | 1,171 | 20 |
| * | Stoke Therapeutics Inc. | 690 | 20 |
| * | Community Health Systems Inc. | 3,913 | 20 |
| * | Cymabay Therapeutics Inc. | 3,124 | 20 |
| * | Rigel Pharmaceuticals Inc. | 8,116 | 20 |
| * | Viking Therapeutics Inc. | 3,013 | 20 |
| * | Akero Therapeutics Inc. | 612 | 20 |
| * | SeaSpine Holdings Corp. | 1,492 | 20 |
| * | REVOLUTION Medicines Inc. | 688 | 19 |
| * | Flexion Therapeutics Inc. | 1,640 | 19 |
| * | Triple-S Management Corp. Class B | 1,021 | 19 |
| * | Black Diamond Therapeutics Inc. | 657 | 19 |
| * | BioSpecifics Technologies Corp. | 293 | 19 |
| * | Cellular Biomedicine Group Inc. | 1,015 | 19 |
| | Phibro Animal Health Corp. Class A | 875 | 19 |
| * | Scholar Rock Holding Corp. | 1,237 | 19 |
| * | Clovis Oncology Inc. | 3,582 | 19 |
| * | Varex Imaging Corp. | 1,680 | 19 |
| * | Keros Therapeutics Inc. | 347 | 19 |
| * | PDL BioPharma Inc. | 5,544 | 19 |
| * | Neoleukin Therapeutics Inc. | 1,448 | 18 |
| * | Viemed Healthcare Inc. | 1,687 | 18 |
| * | Morphic Holding Inc. | 691 | 18 |
| * | Homology Medicines Inc. | 1,719 | 18 |
| * | Phathom Pharmaceuticals Inc. | 495 | 18 |
| * | Axogen Inc. | 1,495 | 18 |
| * | Kala Pharmaceuticals Inc. | 1,970 | 18 |
| * | Atreca Inc. Class A | 1,229 | 17 |
| * | AMAG Pharmaceuticals Inc. | 1,672 | 17 |
| * | Pfenex Inc. | 1,377 | 17 |
| * | Zentalis Pharmaceuticals Inc. | 501 | 17 |
| * | Eagle Pharmaceuticals Inc. | 434 | 17 |
| *,^ | BrainStorm Cell Therapeutics Inc. | 1,363 | 17 |
| * | Durect Corp. | 9,795 | 17 |
| * | SIGA Technologies Inc. | 2,399 | 17 |
| * | Beam Therapeutics Inc. | 663 | 17 |
| * | Vaxart Inc. | 2,757 | 16 |
| * | AngioDynamics Inc. | 1,731 | 16 |
| * | Kiniksa Pharmaceuticals Ltd. Class A | 914 | 16 |
| * | Fulgent Genetics Inc. | 544 | 16 |
| * | Molecular Templates Inc. | 1,371 | 16 |
| * | Calithera Biosciences Inc. | 3,933 | 16 |
| * | Accelerate Diagnostics Inc. | 1,288 | 16 |
| * | Albireo Pharma Inc. | 560 | 16 |
| * | Quotient Ltd. | 3,068 | 15 |
| * | Applied Therapeutics Inc. | 641 | 15 |
| * | BioDelivery Sciences International Inc. | 3,889 | 15 |
| * | MEI Pharma Inc. | 5,586 | 15 |
| *,^ | TherapeuticsMD Inc. | 10,315 | 15 |
| | Computer Programs and Systems Inc. | 548 | 15 |
| * | Precision BioSciences Inc. | 2,657 | 15 |
| * | CytomX Therapeutics Inc. | 2,012 | 15 |
Vanguard® Russell 3000 Index Fund
Schedule of Investments
August 31, 2020
| | | | Market |
| | | | Value |
| | | Shares | ($000) |
| * | IGM Biosciences Inc. | 340 | 15 |
| * | Tricida Inc. | 1,382 | 15 |
| * | RAPT Therapeutics Inc. | 540 | 14 |
| * | Aeglea BioTherapeutics Inc. | 1,968 | 14 |
| * | Catalyst Pharmaceuticals Inc. | 4,325 | 14 |
| * | MannKind Corp. | 8,065 | 14 |
| *,^ | Co-Diagnostics Inc. | 1,277 | 14 |
| * | Puma Biotechnology Inc. | 1,334 | 14 |
| * | Affimed NV | 3,967 | 14 |
| * | Kindred Biosciences Inc. | 2,745 | 14 |
| * | Misonix Inc. | 1,025 | 13 |
| * | WaVe Life Sciences Ltd. | 1,067 | 13 |
| * | Aquestive Therapeutics Inc. | 1,672 | 13 |
| * | ANI Pharmaceuticals Inc. | 414 | 13 |
| * | Satsuma Pharmaceuticals Inc. | 560 | 13 |
| * | CytoSorbents Corp. | 1,520 | 13 |
| * | Zynex Inc. | 854 | 13 |
| * | Arcutis Biotherapeutics Inc. | 500 | 13 |
| * | Voyager Therapeutics Inc. | 1,055 | 12 |
| * | Fortress Biotech Inc. | 3,086 | 12 |
| * | Alphatec Holdings Inc. | 2,034 | 12 |
| * | Ovid therapeutics Inc. | 2,115 | 12 |
| | Utah Medical Products Inc. | 147 | 12 |
| * | Eiger BioPharmaceuticals Inc. | 1,066 | 12 |
| * | Eton Pharmaceuticals Inc. | 1,501 | 12 |
| * | iCAD Inc. | 1,085 | 12 |
| * | OptimizeRx Corp. | 567 | 11 |
| * | Prevail Therapeutics Inc. | 917 | 11 |
| * | Passage Bio Inc. | 675 | 11 |
| * | TCR2 Therapeutics Inc. | 548 | 11 |
| * | Marinus Pharmaceuticals Inc. | 5,679 | 11 |
| * | Repro-Med Systems Inc. | 1,258 | 11 |
| * | Agile Therapeutics Inc. | 3,401 | 11 |
| * | InfuSystem Holdings Inc. | 747 | 11 |
| * | Cutera Inc. | 661 | 11 |
| * | Harrow Health Inc. | 1,565 | 11 |
| * | XBiotech Inc. | 564 | 11 |
| * | Akcea Therapeutics Inc. | 582 | 11 |
| * | Verastem Inc. | 8,439 | 11 |
| * | Joint Corp. | 594 | 11 |
| * | ORIC Pharmaceuticals Inc. | 422 | 11 |
| * | ChromaDex Corp. | 2,116 | 10 |
| * | NantKwest Inc. | 1,407 | 10 |
| * | Aduro Biotech Inc. | 3,282 | 10 |
| * | FONAR Corp. | 401 | 10 |
| * | IVERIC bio Inc. | 2,257 | 10 |
| * | Concert Pharmaceuticals Inc. | 1,051 | 10 |
| * | AdaptHealth Corp. Class A | 474 | 10 |
| | Invacare Corp. | 1,478 | 10 |
| * | ViewRay Inc. | 3,608 | 10 |
| * | Galectin Therapeutics Inc. | 3,622 | 10 |
| * | Anavex Life Sciences Corp. | 2,261 | 10 |
| *,^ | Genprex Inc. | 2,416 | 10 |
| * | Harvard Bioscience Inc. | 2,837 | 9 |
| * | MediciNova Inc. | 1,779 | 9 |
| * | Checkpoint Therapeutics Inc. | 4,248 | 9 |
| * | MeiraGTx Holdings plc | 709 | 9 |
| * | Accuray Inc. | 3,840 | 9 |
| * | Selecta Biosciences Inc. | 3,410 | 9 |
| * | Odonate Therapeutics Inc. | 544 | 9 |
| * | Avenue Therapeutics Inc. | 789 | 9 |
| * | Menlo Therapeutics Inc. | 5,517 | 8 |
| * | Dyadic International Inc. | 1,031 | 8 |
| * | Abeona Therapeutics Inc. | 3,472 | 8 |
Vanguard® Russell 3000 Index Fund
Schedule of Investments
August 31, 2020
| | | | Market |
| | | | Value |
| | | Shares | ($000) |
| * | Aprea Therapeutics Inc. | 294 | 8 |
| * | Catabasis Pharmaceuticals Inc. | 1,204 | 8 |
| * | Stereotaxis Inc. | 2,249 | 8 |
| * | Chiasma Inc. | 1,438 | 8 |
| * | Strongbridge Biopharma plc | 2,024 | 8 |
| * | VolitionRX Ltd. | 2,272 | 8 |
| * | Retractable Technologies Inc. | 1,215 | 8 |
| * | Apyx Medical Corp. | 1,669 | 8 |
| * | Lannett Co. Inc. | 1,456 | 8 |
| * | BioLife Solutions Inc. | 353 | 7 |
| * | Rubius Therapeutics Inc. | 1,548 | 7 |
| * | Neubase Therapeutics Inc. | 926 | 7 |
| * | PAVmed Inc. | 3,758 | 7 |
| * | Ideaya Biosciences Inc. | 608 | 7 |
| * | Electromed Inc. | 591 | 7 |
| * | Catalyst Biosciences Inc. | 1,396 | 7 |
| * | XOMA Corp. | 380 | 7 |
| * | Aptinyx Inc. | 2,161 | 7 |
| * | Magenta Therapeutics Inc. | 975 | 7 |
| * | Paratek Pharmaceuticals Inc. | 1,534 | 7 |
| * | Orgenesis Inc. | 1,332 | 7 |
| * | Cidara Therapeutics Inc. | 2,198 | 7 |
| * | DermTech Inc. | 591 | 7 |
| * | Cyclerion Therapeutics Inc. | 1,008 | 7 |
| * | Sientra Inc. | 1,785 | 7 |
| * | Beyondspring Inc. | 550 | 7 |
| * | Beyond Air Inc. | 1,225 | 7 |
| * | Aspira Women's Health Inc. | 2,370 | 7 |
| * | American Renal Associates Holdings Inc. | 1,000 | 7 |
| * | Nymox Pharmaceutical Corp. | 2,641 | 7 |
| * | Applied Genetic Technologies Corp. | 1,291 | 7 |
| * | BioSig Technologies Inc. | 888 | 7 |
| * | KalVista Pharmaceuticals Inc. | 502 | 7 |
| * | Five Prime Therapeutics Inc. | 1,533 | 7 |
| * | Kezar Life Sciences Inc. | 1,334 | 6 |
| * | Exicure Inc. | 3,202 | 6 |
| * | Tela Bio Inc. | 442 | 6 |
| * | Spero Therapeutics Inc. | 571 | 6 |
| * | ContraFect Corp. | 1,126 | 6 |
| * | Pulse Biosciences Inc. | 619 | 6 |
| * | Pieris Pharmaceuticals Inc. | 2,101 | 6 |
| * | ADMA Biologics Inc. | 2,351 | 6 |
| * | Fennec Pharmaceuticals Inc. | 1,081 | 6 |
| * | IMARA Inc. | 253 | 6 |
| * | GlycoMimetics Inc. | 1,587 | 6 |
| * | Liquidia Technologies Inc. | 1,138 | 6 |
| * | Xeris Pharmaceuticals Inc. | 1,237 | 6 |
| * | NextCure Inc. | 646 | 6 |
| * | Oyster Point Pharma Inc. | 251 | 6 |
| * | Sutro Biopharma Inc. | 569 | 6 |
| * | Surgalign Holdings Inc. | 2,555 | 6 |
| *,^ | Mallinckrodt plc | 3,586 | 6 |
| * | NantHealth Inc. | 1,762 | 6 |
| * | iRadimed Corp. | 262 | 6 |
| * | Milestone Scientific Inc. | 3,664 | 5 |
| * | Mirum Pharmaceuticals Inc. | 211 | 5 |
| * | Chimerix Inc. | 1,938 | 5 |
| * | AcelRx Pharmaceuticals Inc. | 4,174 | 5 |
| * | Mustang Bio Inc. | 1,545 | 5 |
| * | 89bio Inc. | 131 | 5 |
| * | Verrica Pharmaceuticals Inc. | 542 | 5 |
| * | Apollo Medical Holdings Inc. | 259 | 5 |
| * | X4 Pharmaceuticals Inc. | 556 | 5 |
| * | Optinose Inc. | 1,002 | 5 |
Vanguard® Russell 3000 Index Fund
Schedule of Investments
August 31, 2020
| | | | Market | |
| | | | Value | |
| | | Shares | ($000 | ) |
| * | Cabaletta Bio Inc. | 430 | 5 | |
| * | CorMedix Inc. | 944 | 4 | |
| * | Minerva Neurosciences Inc. | 1,384 | 4 | |
| * | Evofem Biosciences Inc. | 1,322 | 4 | |
| * | CASI Pharmaceuticals Inc. | 2,498 | 4 | |
| * | Hookipa Pharma Inc. | 473 | 4 | |
| * | Harpoon Therapeutics Inc. | 304 | 4 | |
| * | La Jolla Pharmaceutical Co. | 991 | 4 | |
| * | Enzo Biochem Inc. | 1,946 | 4 | |
| * | UNITY Biotechnology Inc. | 1,287 | 4 | |
| * | Fulcrum Therapeutics Inc. | 548 | 4 | |
| * | Gritstone Oncology Inc. | 1,201 | 4 | |
| * | Evolus Inc. | 992 | 4 | |
| * | IntriCon Corp. | 309 | 4 | |
| * | Evelo Biosciences Inc. | 837 | 4 | |
| * | Tyme Technologies Inc. | 3,607 | 4 | |
| * | Jounce Therapeutics Inc. | 739 | 4 | |
| * | Aravive Inc. | 626 | 4 | |
| * | Savara Inc. | 2,429 | 4 | |
| * | Eloxx Pharmaceuticals Inc. | 1,114 | 3 | |
| * | Lexicon Pharmaceuticals Inc. | 1,895 | 3 | |
| * | Osmotica Pharmaceuticals plc | 519 | 3 | |
| * | Rockwell Medical Inc. | 2,346 | 3 | |
| * | Exagen Inc. | 194 | 3 | |
| *,^ | Marker Therapeutics Inc. | 1,413 | 3 | |
| * | Enochian Biosciences Inc. | 621 | 3 | |
| * | Cerecor Inc. | 1,001 | 2 | |
| * | Kaleido Biosciences Inc. | 358 | 2 | |
| * | LogicBio Therapeutics Inc. | 357 | 2 | |
| * | Recro Pharma Inc. | 800 | 2 | |
| * | Solid Biosciences Inc. | 911 | 2 | |
| * | Oncocyte Corp. | 1,689 | 2 | |
| * | Soliton Inc. | 247 | 2 | |
| *,§ | Alder BioPharmaceuticals CVR Exp. 12/31/2024 | 1,247 | 1 | |
| *,§ | Synergy Pharmaceuticals LLC | 12,927 | — | |
| * | Pulse Biosciences Inc. Warrants Exp. 5/14/2025 | 15 | — | |
| | 236,751 | |
| Materials & Processing (3.2%) | |
| | Linde plc | 26,250 | 6,556 | |
| | Air Products & Chemicals Inc. | 11,057 | 3,232 | |
| | Sherwin-Williams Co. | 4,134 | 2,774 | |
| | Newmont Corp. | 40,311 | 2,712 | |
| | Ecolab Inc. | 12,406 | 2,445 | |
| | DuPont de Nemours Inc. | 36,623 | 2,042 | |
| | Dow Inc. | 36,892 | 1,665 | |
| | PPG Industries Inc. | 11,734 | 1,413 | |
| | Trane Technologies plc | 11,927 | 1,412 | |
| | Fastenal Co. | 28,853 | 1,410 | |
| | Ball Corp. | 16,068 | 1,291 | |
| | Carrier Global Corp. | 43,235 | 1,291 | |
| | Freeport-McMoRan Inc. | 73,292 | 1,144 | |
| | Amcor plc | 79,970 | 884 | |
| | LyondellBasell Industries NV Class A | 12,903 | 845 | |
| | Vulcan Materials Co. | 6,673 | 801 | |
| | Masco Corp. | 13,222 | 771 | |
| | International Paper Co. | 19,826 | 719 | |
| | FMC Corp. | 6,542 | 699 | |
| | Nucor Corp. | 14,837 | 675 | |
| | International Flavors & Fragrances Inc. | 5,364 | 664 | |
| | Martin Marietta Materials Inc. | 3,127 | 634 | |
| | Celanese Corp. Class A | 5,969 | 604 | |
| | RPM International Inc. | 6,364 | 539 | |
| * | Crown Holdings Inc. | 6,550 | 503 | |
| | Eastman Chemical Co. | 6,855 | 501 | |
Vanguard® Russell 3000 Index Fund
Schedule of Investments
August 31, 2020
| | | | Market |
| | | | Value |
| | | Shares | ($000) |
| | Albemarle Corp. | 5,278 | 480 |
| | Lennox International Inc. | 1,707 | 479 |
| | Avery Dennison Corp. | 4,090 | 472 |
| | Packaging Corp. of America | 4,646 | 470 |
| | Royal Gold Inc. | 3,315 | 452 |
| * | Trex Co. Inc. | 2,945 | 440 |
| | Watsco Inc. | 1,648 | 404 |
| | Westrock Co. | 13,050 | 396 |
| | AptarGroup Inc. | 3,209 | 380 |
| | Owens Corning | 5,551 | 375 |
| | CF Industries Holdings Inc. | 10,730 | 350 |
| | Howmet Aerospace Inc. | 19,811 | 347 |
| | Reliance Steel & Aluminum Co. | 3,273 | 343 |
| * | Berry Global Group Inc. | 6,527 | 336 |
| | Scotts Miracle-Gro Co. | 1,989 | 335 |
| | A O Smith Corp. | 6,661 | 326 |
| | Mosaic Co. | 17,624 | 321 |
| | Steel Dynamics Inc. | 10,430 | 308 |
| | Sealed Air Corp. | 7,754 | 305 |
| | Sonoco Products Co. | 4,790 | 254 |
| * | Axalta Coating Systems Ltd. | 10,381 | 248 |
| * | TopBuild Corp. | 1,605 | 247 |
| | MDU Resources Group Inc. | 10,232 | 242 |
| | Huntsman Corp. | 10,337 | 223 |
| | Acuity Brands Inc. | 2,001 | 219 |
| | Ashland Global Holdings Inc. | 2,917 | 215 |
| | Simpson Manufacturing Co. Inc. | 2,171 | 214 |
| | Graphic Packaging Holding Co. | 13,924 | 195 |
| | Southern Copper Corp. | 4,037 | 194 |
| | Louisiana-Pacific Corp. | 5,806 | 191 |
| | Armstrong World Industries Inc. | 2,533 | 187 |
| * | Builders FirstSource Inc. | 5,934 | 182 |
| | Timken Co. | 3,186 | 173 |
| | UFP Industries Inc. | 2,906 | 172 |
| | Eagle Materials Inc. | 2,024 | 166 |
| | Chemours Co. | 7,970 | 165 |
| | Hecla Mining Co. | 27,200 | 164 |
| | Hexcel Corp. | 4,087 | 161 |
| * | RBC Bearings Inc. | 1,176 | 155 |
| | Balchem Corp. | 1,553 | 152 |
| | Rexnord Corp. | 5,120 | 148 |
| * | Univar Solutions Inc. | 8,139 | 148 |
| | Silgan Holdings Inc. | 3,750 | 143 |
| | Advanced Drainage Systems Inc. | 2,413 | 134 |
| * | Alcoa Corp. | 8,922 | 130 |
| * | BMC Stock Holdings Inc. | 3,203 | 128 |
| | Quaker Chemical Corp. | 664 | 126 |
| | Cleveland-Cliffs Inc. | 19,064 | 125 |
| | Avient Corp. | 4,857 | 124 |
| * | Novagold Resources Inc. | 11,682 | 124 |
| | NewMarket Corp. | 332 | 124 |
| | HB Fuller Co. | 2,499 | 120 |
| | Commercial Metals Co. | 5,731 | 120 |
| | Stepan Co. | 1,010 | 116 |
| * | Element Solutions Inc. | 10,700 | 115 |
| | Sensient Technologies Corp. | 2,083 | 115 |
| * | Ingevity Corp. | 2,032 | 114 |
| | W R Grace & Co. | 2,765 | 113 |
| | AAON Inc. | 1,965 | 112 |
| * | Arconic Corp. | 4,909 | 109 |
| * | Masonite International Corp. | 1,191 | 109 |
| * | Beacon Roofing Supply Inc. | 3,069 | 104 |
| | Westlake Chemical Corp. | 1,726 | 102 |
| | Cabot Corp. | 2,707 | 100 |
Vanguard® Russell 3000 Index Fund
Schedule of Investments
August 31, 2020
| | | | Market |
| | | | Value |
| | | Shares | ($000) |
| * | Coeur Mining Inc. | 11,456 | 97 |
| * | Installed Building Products Inc. | 1,112 | 97 |
| * | Gibraltar Industries Inc. | 1,544 | 96 |
| | Compass Minerals International Inc. | 1,679 | 96 |
| | Comfort Systems USA Inc. | 1,792 | 91 |
| * | Summit Materials Inc. Class A | 6,071 | 90 |
| | Innospec Inc. | 1,199 | 90 |
| | United States Steel Corp. | 11,203 | 88 |
| | Boise Cascade Co. | 1,904 | 87 |
| | Olin Corp. | 7,698 | 87 |
| | Minerals Technologies Inc. | 1,685 | 86 |
| | O-I Glass Inc. | 7,677 | 84 |
| | Mueller Industries Inc. | 2,806 | 83 |
| | Mueller Water Products Inc. Class A | 7,605 | 82 |
| | Worthington Industries Inc. | 1,938 | 80 |
| | Domtar Corp. | 2,786 | 79 |
| * | JELD-WEN Holding Inc. | 3,246 | 68 |
| | Greif Inc. Class A | 1,838 | 68 |
| * | GCP Applied Technologies Inc. | 2,415 | 63 |
| | Patrick Industries Inc. | 1,064 | 60 |
| * | Livent Corp. | 6,975 | 59 |
| | Materion Corp. | 976 | 53 |
| | Kaiser Aluminum Corp. | 775 | 50 |
| | Carpenter Technology Corp. | 2,327 | 49 |
| * | GMS Inc. | 1,835 | 49 |
| * | Ferro Corp. | 3,883 | 48 |
| * | PGT Innovations Inc. | 2,606 | 47 |
| | Trinseo SA | 1,776 | 44 |
| | Schweitzer-Mauduit International Inc. | 1,444 | 44 |
| | Tronox Holdings plc Class A | 4,176 | 37 |
| | Griffon Corp. | 1,686 | 37 |
| | Neenah Inc. | 777 | 34 |
| | Orion Engineered Carbons SA | 2,708 | 33 |
| | Chase Corp. | 336 | 33 |
| | P H Glatfelter Co. | 1,961 | 29 |
| * | Clearwater Paper Corp. | 748 | 25 |
| | Quanex Building Products Corp. | 1,466 | 25 |
| | Apogee Enterprises Inc. | 1,177 | 25 |
| * | Century Aluminum Co. | 2,407 | 24 |
| | Schnitzer Steel Industries Inc. | 1,198 | 24 |
| | Myers Industries Inc. | 1,529 | 23 |
| | Hawkins Inc. | 454 | 23 |
| * | Koppers Holdings Inc. | 897 | 22 |
| | Tredegar Corp. | 1,263 | 21 |
| | Verso Corp. | 1,573 | 21 |
| * | US Concrete Inc. | 771 | 21 |
| * | MRC Global Inc. | 3,521 | 20 |
| * | PQ Group Holdings Inc. | 1,714 | 20 |
| | GrafTech International Ltd. | 2,921 | 19 |
| * | Kraton Corp. | 1,372 | 19 |
| | American Vanguard Corp. | 1,302 | 18 |
| | Omega Flex Inc. | 131 | 17 |
| * | Cornerstone Building Brands Inc. | 2,074 | 17 |
| * | AdvanSix Inc. | 1,257 | 16 |
| | Insteel Industries Inc. | 854 | 16 |
| * | Foundation Building Materials Inc. | 935 | 15 |
| | US Silica Holdings Inc. | 3,365 | 15 |
| | FutureFuel Corp. | 1,191 | 14 |
| | Kronos Worldwide Inc. | 1,086 | 14 |
| | Ardagh Group SA | 885 | 13 |
| * | Forterra Inc. | 999 | 13 |
| * | Ranpak Holdings Corp. Class A | 1,459 | 13 |
| * | UFP Technologies Inc. | 307 | 13 |
| * | Northwest Pipe Co. | 399 | 11 |
Vanguard® Russell 3000 Index Fund
Schedule of Investments
August 31, 2020
| | | | Market | |
| | | | Value | |
| | | Shares | ($000 | ) |
| | Caesarstone Ltd. | 1,004 | 11 | |
| | Caledonia Mining Corp. plc | 565 | 10 | |
| | Haynes International Inc. | 543 | 10 | |
| * | Aspen Aerogels Inc. | 1,187 | 10 | |
| | Gold Resource Corp. | 2,491 | 10 | |
| | LSI Industries Inc. | 1,412 | 10 | |
| * | Uranium Energy Corp. | 8,412 | 10 | |
| | United States Lime & Minerals Inc. | 102 | 9 | |
| * | Veritiv Corp. | 533 | 9 | |
| * | Amyris Inc. | 2,724 | 9 | |
| * | Unifi Inc. | 712 | 9 | |
| | NN Inc. | 1,893 | 9 | |
| * | Alpha Pro Tech Ltd. | 604 | 8 | |
| * | LB Foster Co. Class A | 495 | 7 | |
| * | Rayonier Advanced Materials Inc. | 2,304 | 7 | |
| * | TimkenSteel Corp. | 1,849 | 7 | |
| * | AgroFresh Solutions Inc. | 2,792 | 7 | |
| * | Energy Fuels Inc. | 3,791 | 7 | |
| | Eastern Co. | 272 | 6 | |
| | Olympic Steel Inc. | 514 | 6 | |
| * | Marrone Bio Innovations Inc. | 3,470 | 4 | |
| * | Ryerson Holding Corp. | 795 | 4 | |
| | Intrepid Potash Inc. | 458 | 4 | |
| * | Concrete Pumping Holdings Inc. | 795 | 3 | |
| | 55,608 | |
| Other (0.0%)1 | |
| * | ALX Oncology Holdings Inc. | 105 | 4 | |
| *,§ | Tobira Therapeutics CVR Exp. 12/31/2028 | 937 | 4 | |
| * | Rackspace Technology Inc. | 187 | 4 | |
| * | Acutus Medical Inc. | 96 | 3 | |
| * | Kymera Therapeutics Inc. | 99 | 3 | |
| * | IBEX Ltd. | 136 | 2 | |
| * | GoHealth Inc. Class A | 156 | 2 | |
| * | Selectquote Inc. | 102 | 2 | |
| * | iTeos Therapeutics Inc. | 57 | 2 | |
| * | Annexon Inc. | 64 | 2 | |
| * | Albertsons Cos. Inc. Class A | 107 | 2 | |
| * | Shift4 Payments Inc. Class A | 27 | 1 | |
| * | Nurix Therapeutics Inc. | 54 | 1 | |
| * | Pandion Therapeutics Inc. | 56 | 1 | |
| * | Inari Medical Inc. | 10 | 1 | |
| * | Progenity Inc. | 82 | 1 | |
| * | Pliant Therapeutics Inc. | 28 | 1 | |
| *,§ | Media General Inc. CVR | 5,133 | — | |
| *,§ | NewStar Financial Inc. CVR | 943 | — | |
| *,§ | Aratana Therapeutics Inc. CVR | 1,951 | — | |
| *,§ | Lantheus Holdings CVR | 4,323 | — | |
| *,§ | Clinical Data CVR | 32 | — | |
| *,§ | Omthera Pharmeceuticals Rights | 152 | — | |
| | 36 | |
| Producer Durables (8.6%) | |
| | Accenture plc Class A | 31,878 | 7,648 | |
| | Union Pacific Corp. | 33,951 | 6,534 | |
| | Honeywell International Inc. | 35,092 | 5,809 | |
| | United Parcel Service Inc. Class B | 35,271 | 5,771 | |
| | Lockheed Martin Corp. | 12,382 | 4,832 | |
| | Boeing Co. | 26,680 | 4,584 | |
| | 3M Co. | 28,116 | 4,583 | |
| | Raytheon Technologies Corp. | 71,220 | 4,344 | |
| | Caterpillar Inc. | 26,995 | 3,842 | |
| | Illinois Tool Works Inc. | 15,696 | 3,101 | |
| | Automatic Data Processing Inc. | 21,454 | 2,984 | |
| | Deere & Co. | 14,097 | 2,961 | |
| | CSX Corp. | 37,874 | 2,896 | |
Vanguard® Russell 3000 Index Fund
Schedule of Investments
August 31, 2020
| | | | Market |
| | | | Value |
| | | Shares | ($000) |
| | General Electric Co. | 436,386 | 2,767 |
| | Norfolk Southern Corp. | 12,784 | 2,717 |
| | Northrop Grumman Corp. | 7,803 | 2,673 |
| | FedEx Corp. | 12,118 | 2,664 |
| | Waste Management Inc. | 21,136 | 2,410 |
| | Roper Technologies Inc. | 5,171 | 2,209 |
| | Emerson Electric Co. | 29,904 | 2,077 |
| | Eaton Corp. plc | 20,111 | 2,053 |
| | General Dynamics Corp. | 12,654 | 1,890 |
| * | CoStar Group Inc. | 1,930 | 1,638 |
| | Cummins Inc. | 7,364 | 1,526 |
| | Johnson Controls International plc | 37,086 | 1,511 |
| | Verisk Analytics Inc. Class A | 7,929 | 1,480 |
| | Cintas Corp. | 4,384 | 1,461 |
| | PACCAR Inc. | 16,892 | 1,450 |
| | Rockwell Automation Inc. | 5,789 | 1,335 |
| | Parker-Hannifin Corp. | 6,445 | 1,328 |
| | TransDigm Group Inc. | 2,608 | 1,303 |
| | Otis Worldwide Corp. | 20,555 | 1,293 |
| | Paychex Inc. | 16,107 | 1,232 |
| | Stanley Black & Decker Inc. | 7,609 | 1,227 |
| | AMETEK Inc. | 11,500 | 1,158 |
| * | Mettler-Toledo International Inc. | 1,192 | 1,157 |
| | Southwest Airlines Co. | 29,357 | 1,103 |
| | Fortive Corp. | 15,005 | 1,082 |
| * | Copart Inc. | 10,051 | 1,038 |
| | Equifax Inc. | 6,085 | 1,024 |
| | Old Dominion Freight Line Inc. | 4,949 | 1,001 |
| | Republic Services Inc. Class A | 10,665 | 989 |
| | Delta Air Lines Inc. | 31,783 | 981 |
| * | Keysight Technologies Inc. | 9,440 | 930 |
| | Kansas City Southern | 4,718 | 859 |
| | Dover Corp. | 7,332 | 805 |
| | WW Grainger Inc. | 2,172 | 794 |
| * | Zebra Technologies Corp. | 2,650 | 759 |
| | Expeditors International of Washington Inc. | 8,244 | 729 |
| | Xylem Inc. | 9,046 | 725 |
| | IDEX Corp. | 3,796 | 684 |
| | CH Robinson Worldwide Inc. | 6,681 | 657 |
| * | Waters Corp. | 3,033 | 656 |
| * | Trimble Inc. | 12,513 | 656 |
| * | United Rentals Inc. | 3,647 | 646 |
| * | Ingersoll Rand Inc. | 17,455 | 612 |
| | Wabtec Corp. | 9,088 | 605 |
| | Booz Allen Hamilton Holding Corp. Class A | 6,793 | 598 |
| | JB Hunt Transport Services Inc. | 4,227 | 594 |
| * | Generac Holdings Inc. | 3,090 | 587 |
| | Jacobs Engineering Group Inc. | 6,369 | 575 |
| * | Teledyne Technologies Inc. | 1,785 | 560 |
| | Nordson Corp. | 2,873 | 536 |
| * | United Airlines Holdings Inc. | 14,504 | 522 |
| | Allegion plc | 4,636 | 479 |
| | Graco Inc. | 8,261 | 479 |
| | Textron Inc. | 11,414 | 450 |
| * | XPO Logistics Inc. | 4,631 | 409 |
| | Snap-on Inc. | 2,713 | 402 |
| | Toro Co. | 5,337 | 402 |
| | Genpact Ltd. | 9,510 | 401 |
| | Hubbell Inc. Class B | 2,730 | 396 |
| | Pentair plc | 8,097 | 365 |
| | HEICO Corp. Class A | 3,995 | 357 |
| | Carlisle Cos. Inc. | 2,711 | 355 |
| | Quanta Services Inc. | 6,753 | 346 |
| | Donaldson Co. Inc. | 6,430 | 324 |
Vanguard® Russell 3000 Index Fund
Schedule of Investments
August 31, 2020
| | | | Market |
| | | | Value |
| | | Shares | ($000) |
| * | Sensata Technologies Holding plc | 7,763 | 323 |
| | American Airlines Group Inc. | 24,726 | 323 |
| * | HD Supply Holdings Inc. | 7,961 | 316 |
| | Robert Half International Inc. | 5,693 | 303 |
| | Huntington Ingalls Industries Inc. | 1,987 | 301 |
| * | Aecom | 7,513 | 297 |
| * | Stericycle Inc. | 4,560 | 292 |
| | Knight-Swift Transportation Holdings Inc. | 6,201 | 282 |
| | Lincoln Electric Holdings Inc. | 2,898 | 280 |
| * | Middleby Corp. | 2,834 | 277 |
| | ITT Inc. | 4,417 | 277 |
| | CoreLogic Inc. | 4,024 | 267 |
| | Oshkosh Corp. | 3,466 | 267 |
| | BWX Technologies Inc. | 4,779 | 266 |
| * | Axon Enterprise Inc. | 3,088 | 265 |
| | Landstar System Inc. | 1,977 | 263 |
| | Tetra Tech Inc. | 2,802 | 259 |
| * | Paylocity Holding Corp. | 1,756 | 259 |
| | Brunswick Corp. | 3,998 | 247 |
| | FLIR Systems Inc. | 6,596 | 243 |
| | Woodward Inc. | 2,773 | 238 |
| | Alaska Air Group Inc. | 6,087 | 237 |
| | MAXIMUS Inc. | 2,962 | 230 |
| | HEICO Corp. | 2,072 | 228 |
| | AGCO Corp. | 3,184 | 226 |
| | MSA Safety Inc. | 1,769 | 223 |
| | Curtiss-Wright Corp. | 2,175 | 223 |
| | ManpowerGroup Inc. | 3,006 | 220 |
| * | FTI Consulting Inc. | 1,860 | 213 |
| * | Plug Power Inc. | 16,253 | 211 |
| | Exponent Inc. | 2,603 | 209 |
| | Littelfuse Inc. | 1,135 | 205 |
| | EMCOR Group Inc. | 2,731 | 205 |
| | Flowserve Corp. | 6,812 | 202 |
| | Allison Transmission Holdings Inc. | 5,506 | 197 |
| | Regal Beloit Corp. | 1,961 | 194 |
| * | ASGN Inc. | 2,691 | 193 |
| * | Proto Labs Inc. | 1,305 | 192 |
| * | Saia Inc. | 1,345 | 180 |
| | KBR Inc. | 6,827 | 171 |
| | Air Lease Corp. Class A | 5,438 | 169 |
| | John Bean Technologies Corp. | 1,642 | 168 |
| * | JetBlue Airways Corp. | 14,476 | 167 |
| | Xerox Holdings Corp. | 8,649 | 163 |
| * | Colfax Corp. | 4,881 | 162 |
| * | Clean Harbors Inc. | 2,505 | 153 |
| | EnerSys | 2,099 | 151 |
| | Franklin Electric Co. Inc. | 2,505 | 149 |
| * | Aerojet Rocketdyne Holdings Inc. | 3,540 | 146 |
| * | TriNet Group Inc. | 2,145 | 146 |
| | Werner Enterprises Inc. | 3,109 | 143 |
| | UniFirst Corp. | 731 | 141 |
| | nVent Electric plc | 7,363 | 141 |
| | MSC Industrial Direct Co. Inc. Class A | 2,110 | 139 |
| | Crane Co. | 2,426 | 137 |
| | Valmont Industries Inc. | 1,065 | 135 |
| * | MasTec Inc. | 2,889 | 134 |
| | Watts Water Technologies Inc. Class A | 1,355 | 130 |
| * | Kirby Corp. | 3,022 | 128 |
| | GATX Corp. | 1,916 | 128 |
| | Brink's Co. | 2,647 | 128 |
| | ABM Industries Inc. | 3,350 | 128 |
| | Brady Corp. Class A | 2,702 | 127 |
| * | Casella Waste Systems Inc. Class A | 2,256 | 127 |
Vanguard® Russell 3000 Index Fund
Schedule of Investments
August 31, 2020
| | | | Market |
| | | | Value |
| | | Shares | ($000) |
| | Altra Industrial Motion Corp. | 3,211 | 125 |
| * | Chart Industries Inc. | 1,904 | 125 |
| | Insperity Inc. | 1,840 | 124 |
| * | Itron Inc. | 1,994 | 119 |
| | Kennametal Inc. | 4,013 | 116 |
| | ESCO Technologies Inc. | 1,275 | 115 |
| | Hillenbrand Inc. | 3,564 | 113 |
| * | WESCO International Inc. | 2,386 | 112 |
| | Applied Industrial Technologies Inc. | 1,849 | 111 |
| | Spirit AeroSystems Holdings Inc. Class A | 5,320 | 109 |
| | Ryder System Inc. | 2,573 | 105 |
| * | ExlService Holdings Inc. | 1,652 | 105 |
| * | Advanced Disposal Services Inc. | 3,485 | 105 |
| * | Kratos Defense & Security Solutions Inc. | 5,327 | 104 |
| * | CryoPort Inc. | 1,810 | 100 |
| | Trinity Industries Inc. | 4,875 | 100 |
| | Macquarie Infrastructure Corp. | 3,546 | 99 |
| *,2 | API Group Corp. | 6,952 | 98 |
| | Triton International Ltd. | 2,654 | 96 |
| | Moog Inc. Class A | 1,571 | 95 |
| | Federal Signal Corp. | 2,938 | 94 |
| | Barnes Group Inc. | 2,324 | 92 |
| * | Pluralsight Inc. Class A | 4,785 | 92 |
| * | Dycom Industries Inc. | 1,476 | 91 |
| * | SPX Corp. | 2,160 | 90 |
| * | Cimpress plc | 946 | 88 |
| * | SPX FLOW Inc. | 2,012 | 87 |
| | Badger Meter Inc. | 1,384 | 85 |
| * | Hub Group Inc. Class A | 1,583 | 85 |
| | Matson Inc. | 2,115 | 85 |
| | Korn Ferry | 2,754 | 84 |
| | SkyWest Inc. | 2,483 | 84 |
| | Forward Air Corp. | 1,410 | 83 |
| | Copa Holdings SA Class A | 1,534 | 82 |
| | McGrath RentCorp | 1,216 | 81 |
| | Allegiant Travel Co. Class A | 626 | 81 |
| * | AeroVironment Inc. | 1,052 | 80 |
| * | Resideo Technologies Inc. | 6,003 | 80 |
| * | Sykes Enterprises Inc. | 2,401 | 79 |
| * | Spirit Airlines Inc. | 4,418 | 79 |
| | Albany International Corp. Class A | 1,510 | 78 |
| | Otter Tail Corp. | 1,995 | 78 |
| * | Navistar International Corp. | 2,383 | 76 |
| | Belden Inc. | 2,232 | 75 |
| * | Verra Mobility Corp. Class A | 7,061 | 75 |
| * | Vicor Corp. | 843 | 73 |
| * | Atlas Air Worldwide Holdings Inc. | 1,294 | 73 |
| | Schneider National Inc. Class B | 2,692 | 73 |
| | Cubic Corp. | 1,543 | 73 |
| * | Air Transport Services Group Inc. | 2,786 | 71 |
| | HNI Corp. | 2,155 | 69 |
| | Herman Miller Inc. | 2,873 | 68 |
| * | Atkore International Group Inc. | 2,505 | 67 |
| | Fluor Corp. | 6,965 | 66 |
| | Kadant Inc. | 554 | 65 |
| | EnPro Industries Inc. | 1,102 | 64 |
| | Kaman Corp. | 1,394 | 64 |
| * | OSI Systems Inc. | 815 | 64 |
| * | Vivint Smart Home Inc. | 3,598 | 64 |
| | ICF International Inc. | 920 | 63 |
| * | CBIZ Inc. | 2,540 | 62 |
| | US Ecology Inc. | 1,641 | 61 |
| | Terex Corp. | 3,107 | 61 |
| | Tennant Co. | 902 | 60 |
Vanguard® Russell 3000 Index Fund
Schedule of Investments
August 31, 2020
| | | | Market |
| | | | Value |
| | | Shares | ($000) |
| | Rush Enterprises Inc. Class A | 1,233 | 60 |
| | TTEC Holdings Inc. | 1,026 | 58 |
| * | TriMas Corp. | 2,297 | 58 |
| *,^ | Workhorse Group Inc. | 3,190 | 58 |
| | Helios Technologies Inc. | 1,389 | 57 |
| | Astec Industries Inc. | 1,058 | 56 |
| | Covanta Holding Corp. | 5,900 | 56 |
| | Deluxe Corp. | 1,947 | 55 |
| * | Virgin Galactic Holdings Inc. | 3,015 | 54 |
| | Enerpac Tool Group Corp. Class A | 2,567 | 53 |
| | ADT Inc. | 4,878 | 52 |
| * | Harsco Corp. | 3,657 | 52 |
| * | Allegheny Technologies Inc. | 6,127 | 51 |
| | CSW Industrials Inc. | 688 | 50 |
| | Marten Transport Ltd. | 2,727 | 50 |
| | Lindsay Corp. | 492 | 49 |
| | Alamo Group Inc. | 442 | 49 |
| | Encore Wire Corp. | 940 | 49 |
| | Primoris Services Corp. | 2,517 | 48 |
| * | Welbilt Inc. | 6,373 | 47 |
| | Mesa Laboratories Inc. | 190 | 47 |
| | Kforce Inc. | 1,359 | 47 |
| * | Herc Holdings Inc. | 1,127 | 46 |
| | Frontline Ltd. | 5,663 | 45 |
| * | FARO Technologies Inc. | 788 | 45 |
| * | Huron Consulting Group Inc. | 1,015 | 44 |
| | Heartland Express Inc. | 2,057 | 43 |
| | AZZ Inc. | 1,203 | 42 |
| | Pitney Bowes Inc. | 7,593 | 42 |
| | Steelcase Inc. Class A | 3,944 | 41 |
| | Raven Industries Inc. | 1,647 | 41 |
| | Greenbrier Cos. Inc. | 1,488 | 40 |
| | ArcBest Corp. | 1,190 | 40 |
| | Granite Construction Inc. | 2,155 | 40 |
| | Douglas Dynamics Inc. | 1,028 | 39 |
| | Columbus McKinnon Corp. | 1,069 | 39 |
| * | Echo Global Logistics Inc. | 1,313 | 36 |
| | SFL Corp. Ltd. | 3,796 | 33 |
| | Standex International Corp. | 562 | 33 |
| | Shyft Group Inc. | 1,625 | 32 |
| | AAR Corp. | 1,570 | 32 |
| | H&E Equipment Services Inc. | 1,513 | 31 |
| * | TrueBlue Inc. | 1,778 | 30 |
| | Wabash National Corp. | 2,381 | 29 |
| | Hawaiian Holdings Inc. | 2,144 | 29 |
| * | Textainer Group Holdings Ltd. | 2,442 | 29 |
| | Knoll Inc. | 2,226 | 29 |
| | ACCO Brands Corp. | 4,402 | 29 |
| | Kelly Services Inc. Class A | 1,494 | 28 |
| * | MYR Group Inc. | 730 | 28 |
| | Argan Inc. | 655 | 28 |
| ^ | Nordic American Tankers Ltd. | 6,160 | 27 |
| * | CIRCOR International Inc. | 903 | 27 |
| * | Conduent Inc. | 7,860 | 27 |
| * | Great Lakes Dredge & Dock Corp. | 2,813 | 26 |
| | DHT Holdings Inc. | 4,903 | 26 |
| | Scorpio Tankers Inc. | 2,145 | 25 |
| * | PAE Inc. | 2,862 | 25 |
| * | SEACOR Holdings Inc. | 799 | 25 |
| | Gorman-Rupp Co. | 790 | 25 |
| * | NV5 Global Inc. | 481 | 25 |
| * | Vectrus Inc. | 527 | 23 |
| * | Gates Industrial Corp. plc | 2,014 | 23 |
| * | Tutor Perini Corp. | 1,778 | 22 |
Vanguard® Russell 3000 Index Fund
Schedule of Investments
August 31, 2020
| | | | Market |
| | | | Value |
| | | Shares | ($000) |
| * | Aegion Corp. Class A | 1,362 | 22 |
| | Ennis Inc. | 1,139 | 21 |
| | MTS Systems Corp. | 831 | 20 |
| * | Thermon Group Holdings Inc. | 1,534 | 20 |
| | Barrett Business Services Inc. | 343 | 20 |
| | International Seaways Inc. | 1,133 | 19 |
| * | Ducommun Inc. | 513 | 19 |
| | Heidrick & Struggles International Inc. | 885 | 19 |
| | Hyster-Yale Materials Handling Inc. | 469 | 19 |
| * | Forrester Research Inc. | 522 | 19 |
| | Rush Enterprises Inc. Class B | 441 | 18 |
| | Kimball International Inc. Class B | 1,634 | 18 |
| * | BrightView Holdings Inc. | 1,463 | 18 |
| * | Sterling Construction Co. Inc. | 1,217 | 17 |
| * | Orion Energy Systems Inc. | 2,641 | 17 |
| | Resources Connection Inc. | 1,356 | 17 |
| | Triumph Group Inc. | 2,299 | 17 |
| | Luxfer Holdings plc | 1,163 | 17 |
| * | Construction Partners Inc. Class A | 884 | 17 |
| * | Lydall Inc. | 872 | 16 |
| | Miller Industries Inc. | 503 | 16 |
| * | CAI International Inc. | 709 | 15 |
| * | Modine Manufacturing Co. | 2,245 | 15 |
| * | Manitowoc Co. Inc. | 1,566 | 15 |
| * | American Superconductor Corp. | 1,127 | 14 |
| * | Energy Recovery Inc. | 1,662 | 14 |
| * | DXP Enterprises Inc. | 725 | 14 |
| | Hackett Group Inc. | 1,097 | 14 |
| | Allied Motion Technologies Inc. | 318 | 14 |
| | CRA International Inc. | 313 | 13 |
| * | Willdan Group Inc. | 461 | 13 |
| * | ExOne Co. | 988 | 12 |
| * | Napco Security Technologies Inc. | 479 | 12 |
| | Costamare Inc. | 2,282 | 12 |
| * | Vishay Precision Group Inc. | 454 | 11 |
| * | CECO Environmental Corp. | 1,327 | 11 |
| * | Titan Machinery Inc. | 818 | 11 |
| | Powell Industries Inc. | 401 | 11 |
| | REV Group Inc. | 1,390 | 11 |
| | VSE Corp. | 369 | 11 |
| * | Dorian LPG Ltd. | 1,258 | 11 |
| * | Heritage-Crystal Clean Inc. | 723 | 11 |
| * | Cross Country Healthcare Inc. | 1,644 | 11 |
| * | Luna Innovations Inc. | 1,629 | 10 |
| * | Daseke Inc. | 1,655 | 10 |
| * | PFSweb Inc. | 1,198 | 10 |
| * | IES Holdings Inc. | 339 | 10 |
| * | US Xpress Enterprises Inc. Class A | 991 | 9 |
| * | Team Inc. | 1,463 | 9 |
| * | Transcat Inc. | 315 | 9 |
| | Park Aerospace Corp. | 830 | 9 |
| * | Covenant Transportation Group Inc. Class A | 501 | 9 |
| * | Astronics Corp. | 1,006 | 9 |
| * | Radiant Logistics Inc. | 1,707 | 9 |
| * | Sharps Compliance Corp. | 1,142 | 9 |
| | Hurco Cos. Inc. | 306 | 9 |
| * | Acacia Research Corp. | 2,278 | 9 |
| | Universal Logistics Holdings Inc. | 391 | 8 |
| * | Franklin Covey Co. | 415 | 8 |
| * | Diamond S Shipping Inc. | 978 | 8 |
| * | Blue Bird Corp. | 687 | 8 |
| | Preformed Line Products Co. | 141 | 8 |
| * | ServiceSource International Inc. | 5,054 | 8 |
| * | Lawson Products Inc. | 194 | 7 |
Vanguard® Russell 3000 Index Fund
Schedule of Investments
August 31, 2020
| | | | Market | |
| | | | Value | |
| | | Shares | ($000 | ) |
| * | Mastech Digital Inc. | 364 | 7 | |
| * | HC2 Holdings Inc. | 2,609 | 7 | |
| | Park-Ohio Holdings Corp. | 406 | 6 | |
| * | Overseas Shipholding Group Inc. Class A | 3,028 | 6 | |
| | Graham Corp. | 452 | 6 | |
| | Genco Shipping & Trading Ltd. | 831 | 6 | |
| * | GP Strategies Corp. | 588 | 6 | |
| * | DHI Group Inc. | 2,292 | 6 | |
| | Quad/Graphics Inc. | 1,561 | 5 | |
| * | Willis Lease Finance Corp. | 253 | 5 | |
| * | Gencor Industries Inc. | 426 | 5 | |
| | Ardmore Shipping Corp. | 1,377 | 5 | |
| * | Eagle Bulk Shipping Inc. | 1,875 | 5 | |
| * | Wrap Technologies Inc. | 558 | 5 | |
| * | StarTek Inc. | 936 | 5 | |
| * | EVI Industries Inc. | 183 | 4 | |
| * | Mistras Group Inc. | 907 | 4 | |
| | BG Staffing Inc. | 449 | 4 | |
| * | Mesa Air Group Inc. | 961 | 4 | |
| | Scorpio Bulkers Inc. | 250 | 3 | |
| * | Information Services Group Inc. | 1,668 | 3 | |
| * | Mayville Engineering Co. Inc. | 367 | 3 | |
| | Advanced Emissions Solutions Inc. | 726 | 3 | |
| * | Safe Bulkers Inc. | 2,359 | 3 | |
| * | PAM Transportation Services Inc. | 68 | 2 | |
| * | Target Hospitality Corp. | 1,517 | 2 | |
| | 149,177 | |
| Technology (28.5%) | |
| | Apple Inc. | 818,240 | 105,586 | |
| | Microsoft Corp. | 374,523 | 84,466 | |
| * | Facebook Inc. Class A | 120,090 | 35,210 | |
| * | Alphabet Inc. Class C | 15,045 | 24,586 | |
| * | Alphabet Inc. Class A | 14,788 | 24,098 | |
| | NVIDIA Corp. | 29,512 | 15,788 | |
| * | Adobe Inc. | 24,051 | 12,348 | |
| * | salesforce.com Inc. | 43,298 | 11,805 | |
| | Intel Corp. | 212,002 | 10,802 | |
| | Cisco Systems Inc. | 212,198 | 8,959 | |
| | Broadcom Inc. | 19,539 | 6,783 | |
| | QUALCOMM Inc. | 56,276 | 6,702 | |
| | Texas Instruments Inc. | 45,958 | 6,533 | |
| | Oracle Corp. | 98,703 | 5,648 | |
| | International Business Machines Corp. | 44,348 | 5,469 | |
| * | Advanced Micro Devices Inc. | 58,396 | 5,304 | |
| * | ServiceNow Inc. | 9,524 | 4,591 | |
| | Intuit Inc. | 12,577 | 4,344 | |
| | Activision Blizzard Inc. | 38,208 | 3,191 | |
| | Applied Materials Inc. | 45,754 | 2,818 | |
| * | Zoom Video Communications Inc. Class A | 8,336 | 2,710 | |
| * | Autodesk Inc. | 10,957 | 2,692 | |
| * | Micron Technology Inc. | 55,525 | 2,527 | |
| | Lam Research Corp. | 7,232 | 2,432 | |
| | Analog Devices Inc. | 18,387 | 2,149 | |
| * | Workday Inc. Class A | 8,573 | 2,055 | |
| * | Electronic Arts Inc. | 14,239 | 1,986 | |
| * | DocuSign Inc. Class A | 8,807 | 1,964 | |
| | L3Harris Technologies Inc. | 10,772 | 1,947 | |
| * | Twilio Inc. Class A | 6,687 | 1,804 | |
| | Cognizant Technology Solutions Corp. Class A | 26,952 | 1,802 | |
| * | Splunk Inc. | 7,942 | 1,742 | |
| * | Synopsys Inc. | 7,497 | 1,659 | |
| | KLA Corp. | 7,821 | 1,604 | |
| | Amphenol Corp. Class A | 14,565 | 1,599 | |
| | IHS Markit Ltd. | 19,612 | 1,567 | |
Vanguard® Russell 3000 Index Fund
Schedule of Investments
August 31, 2020
| | | | Market |
| | | | Value |
| | | Shares | ($000) |
| * | Twitter Inc. | 38,371 | 1,557 |
| * | Cadence Design Systems Inc. | 13,739 | 1,524 |
| * | ANSYS Inc. | 4,268 | 1,447 |
| | HP Inc. | 71,957 | 1,407 |
| | Motorola Solutions Inc. | 8,582 | 1,328 |
| | Marvell Technology Group Ltd. | 33,232 | 1,289 |
| | Microchip Technology Inc. | 11,692 | 1,283 |
| | Xilinx Inc. | 12,172 | 1,268 |
| * | Palo Alto Networks Inc. | 4,865 | 1,252 |
| * | Okta Inc. | 5,732 | 1,235 |
| | Corning Inc. | 37,794 | 1,227 |
| * | Match Group Inc. | 10,904 | 1,218 |
| | Skyworks Solutions Inc. | 8,299 | 1,202 |
| * | Atlassian Corp. plc Class A | 6,223 | 1,193 |
| * | RingCentral Inc. Class A | 3,822 | 1,111 |
| * | VeriSign Inc. | 5,169 | 1,110 |
| * | Coupa Software Inc. | 3,320 | 1,088 |
| * | Take-Two Interactive Software Inc. | 5,609 | 960 |
| * | Akamai Technologies Inc. | 7,935 | 924 |
| | Maxim Integrated Products Inc. | 13,221 | 905 |
| | Citrix Systems Inc. | 6,134 | 891 |
| * | Fortinet Inc. | 6,709 | 886 |
| * | EPAM Systems Inc. | 2,633 | 861 |
| | CDW Corp. | 7,151 | 813 |
| * | Paycom Software Inc. | 2,498 | 748 |
| * | Qorvo Inc. | 5,819 | 746 |
| * | Pinterest Inc. Class A | 20,143 | 741 |
| * | Crowdstrike Holdings Inc. Class A | 5,777 | 726 |
| | Teradyne Inc. | 8,395 | 713 |
| | SS&C Technologies Holdings Inc. | 11,189 | 713 |
| * | GoDaddy Inc. Class A | 8,359 | 699 |
| * | Tyler Technologies Inc. | 1,942 | 671 |
| * | Arista Networks Inc. | 2,994 | 669 |
| | NortonLifeLock Inc. | 28,102 | 661 |
| * | Datadog Inc. Class A | 7,651 | 639 |
| * | HubSpot Inc. | 2,085 | 625 |
| | Leidos Holdings Inc. | 6,829 | 618 |
| * | Slack Technologies Inc. Class A | 18,804 | 618 |
| | Hewlett Packard Enterprise Co. | 63,263 | 612 |
| * | Black Knight Inc. | 7,175 | 603 |
| | Western Digital Corp. | 15,027 | 577 |
| | Cognex Corp. | 8,254 | 571 |
| | Monolithic Power Systems Inc. | 2,133 | 570 |
| * | VMware Inc. Class A | 3,927 | 567 |
| * | Gartner Inc. | 4,356 | 566 |
| * | Zendesk Inc. | 5,553 | 535 |
| | NetApp Inc. | 11,187 | 530 |
| * | Avalara Inc. | 3,845 | 509 |
| * | Zscaler Inc. | 3,505 | 502 |
| * | Dell Technologies Inc. | 7,581 | 501 |
| * | IAC/InterActiveCorp | 3,760 | 500 |
| * | MongoDB Inc. | 2,104 | 492 |
| * | PTC Inc. | 5,252 | 480 |
| * | Guidewire Software Inc. | 4,088 | 459 |
| | Entegris Inc. | 6,861 | 459 |
| * | StoneCo Ltd. Class A | 8,957 | 457 |
| * | Ciena Corp. | 7,774 | 441 |
| * | Aspen Technology Inc. | 3,447 | 438 |
| * | ON Semiconductor Corp. | 20,374 | 435 |
| * | Nuance Communications Inc. | 14,333 | 429 |
| * | Ceridian HCM Holding Inc. | 5,293 | 421 |
| | Juniper Networks Inc. | 16,724 | 418 |
| * | F5 Networks Inc. | 3,092 | 409 |
| | Amdocs Ltd. | 6,629 | 406 |
Vanguard® Russell 3000 Index Fund
Schedule of Investments
August 31, 2020
| | | | Market |
| | | | Value |
| | | Shares | ($000) |
| * | Anaplan Inc. | 6,484 | 397 |
| * | Zynga Inc. Class A | 43,616 | 395 |
| * | Five9 Inc. | 3,047 | 388 |
| | Universal Display Corp. | 2,168 | 380 |
| * | Dynatrace Inc. | 8,461 | 374 |
| * | Cree Inc. | 5,449 | 344 |
| | MKS Instruments Inc. | 2,833 | 339 |
| * | Fastly Inc. Class A | 3,646 | 339 |
| * | Grubhub Inc. | 4,638 | 336 |
| * | Globant SA | 1,808 | 321 |
| * | Arrow Electronics Inc. | 4,066 | 319 |
| * | Alteryx Inc. Class A | 2,626 | 317 |
| * | Lumentum Holdings Inc. | 3,684 | 317 |
| * | Manhattan Associates Inc. | 3,224 | 314 |
| * | Proofpoint Inc. | 2,818 | 309 |
| * | Elastic NV | 2,787 | 303 |
| * | Smartsheet Inc. Class A | 5,501 | 300 |
| | CDK Global Inc. | 6,318 | 295 |
| * | CACI International Inc. Class A | 1,255 | 294 |
| * | IPG Photonics Corp. | 1,792 | 290 |
| * | Inphi Corp. | 2,352 | 268 |
| | SYNNEX Corp. | 2,091 | 266 |
| * | RealPage Inc. | 4,235 | 265 |
| | DXC Technology Co. | 13,047 | 261 |
| * | Nutanix Inc. | 9,055 | 260 |
| | Jabil Inc. | 7,604 | 260 |
| * | Dropbox Inc. Class A | 12,132 | 257 |
| * | Everbridge Inc. | 1,699 | 253 |
| | Science Applications International Corp. | 2,925 | 244 |
| | Pegasystems Inc. | 1,850 | 238 |
| * | Q2 Holdings Inc. | 2,428 | 236 |
| | National Instruments Corp. | 6,539 | 235 |
| * | Silicon Laboratories Inc. | 2,268 | 232 |
| * | Envestnet Inc. | 2,646 | 220 |
| * | Mercury Systems Inc. | 2,866 | 217 |
| * | Blackline Inc. | 2,474 | 216 |
| | Cabot Microelectronics Corp. | 1,403 | 214 |
| | Dolby Laboratories Inc. Class A | 3,037 | 212 |
| * | Cloudflare Inc. Class A | 5,451 | 209 |
| | LogMeIn Inc. | 2,399 | 206 |
| * | II-VI Inc. | 4,583 | 204 |
| * | Pure Storage Inc. Class A | 12,689 | 194 |
| * | Varonis Systems Inc. | 1,562 | 193 |
| * | Semtech Corp. | 3,181 | 187 |
| * | Lattice Semiconductor Corp. | 6,479 | 185 |
| * | LiveRamp Holdings Inc. | 3,261 | 182 |
| * | LivePerson Inc. | 3,010 | 180 |
| | Brooks Automation Inc. | 3,446 | 178 |
| * | Novanta Inc. | 1,642 | 176 |
| * | Sailpoint Technologies Holdings Inc. | 4,459 | 175 |
| * | Qualys Inc. | 1,640 | 174 |
| * | Cirrus Logic Inc. | 2,808 | 170 |
| * | Rapid7 Inc. | 2,550 | 165 |
| * | ACI Worldwide Inc. | 5,569 | 164 |
| * | J2 Global Inc. | 2,337 | 164 |
| * | FireEye Inc. | 11,115 | 163 |
| * | Verint Systems Inc. | 3,402 | 162 |
| | Blackbaud Inc. | 2,517 | 161 |
| * | Vertiv Holdings Co. Class A | 9,759 | 158 |
| * | New Relic Inc. | 2,531 | 155 |
| | Power Integrations Inc. | 2,770 | 155 |
| * | Bandwidth Inc. Class A | 952 | 150 |
| * | SVMK Inc. | 5,996 | 149 |
| * | Viavi Solutions Inc. | 11,176 | 149 |
Vanguard® Russell 3000 Index Fund
Schedule of Investments
August 31, 2020
| | | | Market |
| | | | Value |
| | | Shares | ($000) |
| * | Medallia Inc. | 4,085 | 148 |
| * | Box Inc. | 7,419 | 146 |
| | Avnet Inc. | 5,284 | 145 |
| * | Teradata Corp. | 5,896 | 144 |
| * | SPS Commerce Inc. | 1,782 | 142 |
| * | Mimecast Ltd. | 2,883 | 142 |
| * | Synaptics Inc. | 1,643 | 140 |
| * | Cloudera Inc. | 10,571 | 140 |
| | Perspecta Inc. | 6,701 | 139 |
| * | Advanced Energy Industries Inc. | 1,866 | 138 |
| * | Alarm.com Holdings Inc. | 2,233 | 134 |
| * | Coherent Inc. | 1,165 | 131 |
| * | Appfolio Inc. | 777 | 131 |
| * | NCR Corp. | 6,178 | 126 |
| | Vishay Intertechnology Inc. | 7,825 | 125 |
| * | Acacia Communications Inc. | 1,825 | 123 |
| * | Fabrinet | 1,762 | 123 |
| * | Workiva Inc. Class A | 1,987 | 117 |
| * | Covetrus Inc. | 5,086 | 117 |
| * | Tenable Holdings Inc. | 3,066 | 115 |
| * | PagerDuty Inc. | 3,463 | 113 |
| * | ViaSat Inc. | 2,767 | 110 |
| * | Cornerstone OnDemand Inc. | 3,072 | 108 |
| * | Plexus Corp. | 1,422 | 108 |
| * | Cargurus Inc. | 4,403 | 107 |
| * | FormFactor Inc. | 4,065 | 106 |
| * | Digital Turbine Inc. | 4,352 | 105 |
| * | Sanmina Corp. | 3,716 | 105 |
| * | Yext Inc. | 5,184 | 103 |
| * | Rogers Corp. | 908 | 103 |
| * | Cerence Inc. | 1,927 | 103 |
| * | Appian Corp. Class A | 1,641 | 101 |
| * | Insight Enterprises Inc. | 1,672 | 100 |
| * | iRobot Corp. | 1,347 | 100 |
| * | Bottomline Technologies DE Inc. | 2,087 | 99 |
| | ManTech International Corp. Class A | 1,317 | 99 |
| * | Diodes Inc. | 2,014 | 98 |
| * | CommScope Holding Co. Inc. | 9,409 | 97 |
| | InterDigital Inc. | 1,558 | 95 |
| | Sabre Corp. | 13,149 | 92 |
| * | Altair Engineering Inc. Class A | 2,128 | 89 |
| * | MACOM Technology Solutions Holdings Inc. | 2,468 | 88 |
| * | Inovalon Holdings Inc. Class A | 3,537 | 88 |
| * | CommVault Systems Inc. | 1,976 | 85 |
| * | Yelp Inc. Class A | 3,682 | 85 |
| * | Ambarella Inc. | 1,550 | 82 |
| * | NetScout Systems Inc. | 3,490 | 81 |
| | Progress Software Corp. | 2,128 | 81 |
| * | MaxLinear Inc. | 3,295 | 80 |
| * | PROS Holdings Inc. | 2,023 | 79 |
| | Ubiquiti Inc. | 434 | 79 |
| * | Avaya Holdings Corp. | 4,924 | 76 |
| * | Model N Inc. | 1,886 | 74 |
| * | Rambus Inc. | 5,513 | 74 |
| * | EchoStar Corp. Class A | 2,459 | 72 |
| * | Onto Innovation Inc. | 2,267 | 71 |
| * | Upwork Inc. | 4,619 | 70 |
| | CSG Systems International Inc. | 1,640 | 70 |
| | Maxar Technologies Inc. | 2,979 | 69 |
| | Switch Inc. | 3,981 | 68 |
| | NIC Inc. | 3,157 | 68 |
| * | Zuora Inc. Class A | 4,965 | 67 |
| * | Perficient Inc. | 1,566 | 67 |
| | Xperi Holding Corp | 5,069 | 64 |
Vanguard® Russell 3000 Index Fund
Schedule of Investments
August 31, 2020
| | | | Market |
| | | | Value |
| | | Shares | ($000) |
| * | Super Micro Computer Inc. | 2,233 | 61 |
| * | Knowles Corp. | 4,044 | 61 |
| * | Infinera Corp. | 8,242 | 60 |
| * | Amkor Technology Inc. | 4,848 | 59 |
| * | TTM Technologies Inc. | 4,926 | 56 |
| * | MicroStrategy Inc. Class A | 376 | 54 |
| * | Glu Mobile Inc. | 6,742 | 54 |
| * | Domo Inc. | 1,276 | 52 |
| * | Virtusa Corp. | 1,314 | 52 |
| * | Calix Inc. | 2,648 | 52 |
| | Methode Electronics Inc. | 1,775 | 50 |
| * | ePlus Inc. | 617 | 47 |
| * | Schrodinger Inc. | 757 | 46 |
| | Shutterstock Inc. | 899 | 45 |
| * | SolarWinds Corp. | 2,081 | 44 |
| * | Upland Software Inc. | 1,101 | 43 |
| * | NETGEAR Inc. | 1,294 | 43 |
| * | Ultra Clean Holdings Inc. | 1,749 | 43 |
| * | CEVA Inc. | 1,012 | 43 |
| * | Magnite Inc. | 5,746 | 42 |
| | Sapiens International Corp. NV | 1,259 | 42 |
| * | TechTarget Inc. | 1,050 | 42 |
| * | Vocera Communications Inc. | 1,455 | 41 |
| *,^ | Inseego Corp. | 3,313 | 38 |
| * | nLight Inc. | 1,541 | 36 |
| * | Unisys Corp. | 3,082 | 36 |
| * | Groupon Inc. Class A | 1,120 | 36 |
| * | Eventbrite Inc. Class A | 3,202 | 34 |
| * | Axcelis Technologies Inc. | 1,434 | 34 |
| | Benchmark Electronics Inc. | 1,724 | 34 |
| | Simulations Plus Inc. | 562 | 33 |
| * | OneSpan Inc. | 1,545 | 33 |
| | Ebix Inc. | 1,441 | 33 |
| | Cohu Inc. | 1,891 | 33 |
| | CTS Corp. | 1,493 | 31 |
| * | Parsons Corp. | 912 | 30 |
| * | PAR Technology Corp. | 809 | 30 |
| * | 3D Systems Corp. | 5,403 | 30 |
| * | A10 Networks Inc. | 3,428 | 29 |
| * | Diebold Nixdorf Inc. | 3,503 | 29 |
| * | Photronics Inc. | 2,909 | 29 |
| * | Limelight Networks Inc. | 4,976 | 28 |
| * | PDF Solutions Inc. | 1,354 | 28 |
| * | MobileIron Inc. | 4,265 | 28 |
| * | ScanSource Inc. | 1,113 | 27 |
| * | Tucows Inc. Class A | 412 | 26 |
| * | Blucora Inc. | 2,180 | 26 |
| | ADTRAN Inc. | 2,287 | 25 |
| * | Veeco Instruments Inc. | 2,128 | 25 |
| * | Everi Holdings Inc. | 3,218 | 25 |
| | QAD Inc. Class A | 543 | 25 |
| * | Ichor Holdings Ltd. | 978 | 25 |
| * | Agilysys Inc. | 951 | 24 |
| * | EverQuote Inc. Class A | 678 | 24 |
| * | Extreme Networks Inc. | 5,468 | 24 |
| * | Mitek Systems Inc. | 1,852 | 24 |
| * | TrueCar Inc. | 4,870 | 23 |
| | PC Connection Inc. | 518 | 23 |
| * | Harmonic Inc. | 3,816 | 23 |
| * | Ping Identity Holding Corp. | 636 | 22 |
| * | Brightcove Inc. | 1,962 | 22 |
| * | SiTime Corp. | 324 | 21 |
| * | Sprout Social Inc. Class A | 547 | 21 |
| * | Endurance International Group Holdings Inc. | 3,209 | 21 |
Vanguard® Russell 3000 Index Fund
Schedule of Investments
August 31, 2020
| | | | Market |
| | | | Value |
| | | Shares | ($000) |
| * | Meet Group Inc. | 3,237 | 20 |
| * | ChannelAdvisor Corp. | 1,206 | 20 |
| * | Impinj Inc. | 822 | 20 |
| | Plantronics Inc. | 1,589 | 20 |
| | American Software Inc. Class A | 1,329 | 19 |
| * | Waitr Holdings Inc. | 4,587 | 18 |
| | Comtech Telecommunications Corp. | 1,112 | 18 |
| * | NeoPhotonics Corp. | 2,741 | 18 |
| * | Arlo Technologies Inc. | 3,179 | 18 |
| * | Digi International Inc. | 1,191 | 16 |
| * | Zix Corp. | 2,643 | 16 |
| * | SMART Global Holdings Inc. | 624 | 16 |
| | VirnetX Holding Corp. | 3,054 | 15 |
| * | DSP Group Inc. | 1,029 | 15 |
| | Loral Space & Communications Inc. | 620 | 15 |
| * | Kimball Electronics Inc. | 1,060 | 14 |
| * | Benefitfocus Inc. | 1,346 | 14 |
| * | Turtle Beach Corp. | 707 | 14 |
| * | eGain Corp. | 949 | 13 |
| * | ShotSpotter Inc. | 423 | 13 |
| * | CalAmp Corp. | 1,519 | 12 |
| * | Avid Technology Inc. | 1,512 | 12 |
| * | Immersion Corp. | 1,279 | 12 |
| * | Ooma Inc. | 868 | 12 |
| * | Alpha & Omega Semiconductor Ltd. | 864 | 12 |
| | NVE Corp. | 217 | 12 |
| * | Ribbon Communications Inc. | 2,678 | 11 |
| * | Intelligent Systems Corp. | 300 | 11 |
| * | AXT Inc. | 1,968 | 11 |
| * | Atomera Inc. | 858 | 11 |
| * | CyberOptics Corp. | 336 | 11 |
| * | Red Violet Inc. | 492 | 10 |
| * | Powerfleet Inc. | 1,798 | 10 |
| * | Quantum Corp. | 1,828 | 10 |
| * | Akoustis Technologies Inc. | 1,231 | 10 |
| * | Veritone Inc. | 1,157 | 10 |
| * | Intevac Inc. | 1,593 | 10 |
| * | Resonant Inc. | 3,462 | 9 |
| * | Applied Optoelectronics Inc. | 793 | 9 |
| * | Genasys Inc. | 1,844 | 9 |
| * | Grid Dynamics Holdings Inc. | 1,237 | 9 |
| * | Clearfield Inc. | 498 | 9 |
| * | Asure Software Inc. | 1,293 | 9 |
| * | Iteris Inc. | 1,854 | 8 |
| | PCTEL Inc. | 1,295 | 8 |
| * | Digimarc Corp. | 492 | 8 |
| * | Intellicheck Inc. | 1,228 | 8 |
| * | GAN Ltd. | 368 | 8 |
| * | Synchronoss Technologies Inc. | 1,706 | 8 |
| * | Smith Micro Software Inc. | 1,924 | 7 |
| * | Majesco | 460 | 7 |
| | Daktronics Inc. | 1,663 | 7 |
| * | KVH Industries Inc. | 798 | 7 |
| * | Casa Systems Inc. | 1,540 | 7 |
| * | comScore Inc. | 2,626 | 7 |
| * | Telenav Inc. | 1,416 | 7 |
| | Bel Fuse Inc. Class B | 501 | 6 |
| * | GTY Technology Holdings Inc. | 1,840 | 6 |
| * | Pixelworks Inc. | 2,633 | 6 |
| * | Rimini Street Inc. | 1,259 | 6 |
| * | DZS Inc. | 500 | 5 |
| * | SecureWorks Corp. Class A | 401 | 5 |
| * | GSI Technology Inc. | 789 | 5 |
| * | Research Frontiers Inc. | 1,617 | 4 |
Vanguard® Russell 3000 Index Fund
Schedule of Investments
August 31, 2020
| | | | Market | |
| | | | Value | |
| | | Shares | ($000 | ) |
| * | ZoomInfo Technologies Inc. Class A | 71 | 3 | |
| | 492,797 | |
| Utilities (4.3%) | |
| | Verizon Communications Inc. | 207,322 | 12,288 | |
| | AT&T Inc. | 356,252 | 10,620 | |
| | NextEra Energy Inc. | 24,507 | 6,842 | |
| | Dominion Energy Inc. | 41,754 | 3,275 | |
| * | T-Mobile US Inc. | 27,592 | 3,219 | |
| | Duke Energy Corp. | 36,534 | 2,935 | |
| | Southern Co. | 52,503 | 2,740 | |
| | American Electric Power Co. Inc. | 24,735 | 1,950 | |
| | Xcel Energy Inc. | 26,457 | 1,838 | |
| | Sempra Energy | 14,639 | 1,810 | |
| | Exelon Corp. | 48,754 | 1,800 | |
| | WEC Energy Group Inc. | 15,855 | 1,492 | |
| | Eversource Energy | 16,788 | 1,439 | |
| | Public Service Enterprise Group Inc. | 25,440 | 1,329 | |
| | American Water Works Co. Inc. | 9,102 | 1,286 | |
| | Consolidated Edison Inc. | 16,613 | 1,185 | |
| | DTE Energy Co. | 9,561 | 1,135 | |
| | PPL Corp. | 38,371 | 1,060 | |
| | Entergy Corp. | 10,268 | 1,018 | |
| | Ameren Corp. | 12,440 | 984 | |
| | Edison International | 17,842 | 936 | |
| | CMS Energy Corp. | 14,184 | 858 | |
| | FirstEnergy Corp. | 26,991 | 772 | |
| | Alliant Energy Corp. | 12,101 | 655 | |
| | Evergy Inc. | 11,535 | 614 | |
| | Atmos Energy Corp. | 6,042 | 603 | |
| | AES Corp. | 33,120 | 588 | |
| | CenturyLink Inc. | 54,260 | 583 | |
| | CenterPoint Energy Inc. | 24,858 | 499 | |
| | Vistra Corp. | 24,126 | 464 | |
| | Essential Utilities Inc. | 10,863 | 462 | |
| * | PG&E Corp. | 47,601 | 441 | |
| | NiSource Inc. | 18,707 | 415 | |
| | Pinnacle West Capital Corp. | 5,575 | 409 | |
| | NRG Energy Inc. | 11,854 | 408 | |
| * | GCI Liberty Inc. Class A | 4,966 | 401 | |
| | UGI Corp. | 10,451 | 361 | |
| | OGE Energy Corp. | 10,068 | 321 | |
| | IDACORP Inc. | 2,441 | 219 | |
| | ONE Gas Inc. | 2,709 | 201 | |
| | Hawaiian Electric Industries Inc. | 5,508 | 191 | |
| | National Fuel Gas Co. | 4,128 | 188 | |
| | Black Hills Corp. | 3,136 | 176 | |
| | Brookfield Renewable Corp. Class A | 3,392 | 173 | |
| | PNM Resources Inc. | 3,864 | 169 | |
| | Portland General Electric Co. | 4,369 | 167 | |
| * | Iridium Communications Inc. | 5,870 | 164 | |
| | Southwest Gas Holdings Inc. | 2,610 | 164 | |
| | New Jersey Resources Corp. | 5,295 | 160 | |
| | Cogent Communications Holdings Inc. | 2,162 | 145 | |
| | Spire Inc. | 2,403 | 140 | |
| * | Vonage Holdings Corp. | 11,979 | 137 | |
| | ALLETE Inc. | 2,521 | 136 | |
| | American States Water Co. | 1,784 | 136 | |
| | Avangrid Inc. | 2,792 | 134 | |
| | Shenandoah Telecommunications Co. | 2,352 | 130 | |
| | Avista Corp. | 3,450 | 127 | |
| | NorthWestern Corp. | 2,456 | 127 | |
| | Ormat Technologies Inc. | 1,924 | 117 | |
| | Telephone and Data Systems Inc. | 4,922 | 114 | |
| | MGE Energy Inc. | 1,729 | 112 | |
Vanguard® Russell 3000 Index Fund
Schedule of Investments
August 31, 2020
| | | | Market | |
| | | | Value | |
| | | Shares | ($000 | ) |
| | California Water Service Group | 2,369 | 107 | |
| | South Jersey Industries Inc. | 4,573 | 101 | |
| | Clearway Energy Inc. | 3,521 | 90 | |
| * | 8x8 Inc. | 5,182 | 87 | |
| * | Evoqua Water Technologies Corp. | 4,267 | 87 | |
| | SJW Group | 1,325 | 83 | |
| | Brookfield Infrastructure Corp. Class A | 1,649 | 82 | |
| | Northwest Natural Holding Co. | 1,472 | 75 | |
| | Chesapeake Utilities Corp. | 838 | 69 | |
| | Clearway Energy Inc. Class A | 2,569 | 62 | |
| | Middlesex Water Co. | 963 | 62 | |
| * | Sunnova Energy International Inc. | 1,734 | 41 | |
| * | Cincinnati Bell Inc. | 2,680 | 40 | |
| | Unitil Corp. | 876 | 37 | |
| | ATN International Inc. | 521 | 30 | |
| * | Anterix Inc. | 690 | 30 | |
| | York Water Co. | 583 | 27 | |
| * | Boingo Wireless Inc. | 2,045 | 27 | |
| * | United States Cellular Corp. | 720 | 26 | |
| * | Consolidated Communications Holdings Inc. | 3,248 | 25 | |
| * | WideOpenWest Inc. | 2,890 | 17 | |
| * | Pure Cycle Corp. | 1,671 | 16 | |
| * | Cadiz Inc. | 1,480 | 15 | |
| * | ORBCOMM Inc. | 3,564 | 14 | |
| | Artesian Resources Corp. Class A | 356 | 13 | |
| | Global Water Resources Inc. | 1,129 | 12 | |
| * | Gogo Inc. | 2,291 | 12 | |
| | Spok Holdings Inc. | 888 | 10 | |
| * | Atlantic Power Corp. | 4,607 | 10 | |
| | Consolidated Water Co. Ltd. | 712 | 9 | |
| | RGC Resources Inc. | 351 | 8 | |
| | Alaska Communications Systems Group Inc. | 3,532 | 8 | |
| *,^ | GTT Communications Inc. | 1,485 | 7 | |
| | Genie Energy Ltd. Class B | 824 | 7 | |
| | Spark Energy Inc. Class A | 617 | 6 | |
| * | IDT Corp. Class B | 759 | 5 | |
| | | | 74,919 | |
| Total Common Stocks (Cost $1,226,073) | | 1,724,403 | |
| | | Coupon | | | | |
| Temporary Cash Investments (0.1%) | | | | | |
| Money Market Fund (0.1%) | | | | | |
| 3,4 | Vanguard Market Liquidity Fund | 0.147% | | | 17,775 | 1,777 |
| | | | | | | |
| | | | | | | |
| | | | | Maturity | Face Amount | |
| | | | | Date | ($000) | |
| U.S. Government and Agency Obligations (0.0%) | | | | | |
| 5 | United States Cash Management Bill | 0.116% | | 9/29/20 | 400 | 400 |
| Total Temporary Cash Investments (Cost $2,177) | | | | | 2,177 |
| Total Investments (99.9%) (Cost $1,228,250) | | | | | 1,726,580 |
| Other Assets and Liabilities—Net (0.1%) | | | | | 1,668 |
| Net Assets (100%) | | | | | 1,728,248 |
Cost is in $000.
| * | Non-income-producing security. |
| ^ | Includes partial security positions on loan to broker-dealers. The total value of securities on loan is $483,000. |
| § | Security value determined using significant unobservable inputs. |
Vanguard® Russell 3000 Index Fund
Schedule of Investments
August 31, 2020
| 1 | “Other” represents securities that are not classified by the fund's benchmark index. |
| 2 | Security exempt from registration under Rule 144A of the Securities Act of 1933. Such securities may be sold in transactions exempt from registration, normally to qualified institutional buyers. At August 31, 2020, the value of this security represented 0.1% of net assets. |
| 3 | Affiliated money market fund available only to Vanguard funds and certain trusts and accounts managed by Vanguard. Rate shown is the 7-day yield. |
| 4 | Collateral of $509,000 was received for securities on loan. |
| 5 | Securities with a value of $251,000 have been segregated as initial margin for open futures contracts. |
| | CVR—Contingent Value Rights. |
| | REIT—Real Estate Investment Trust. |
This page intentionally left blank.
© 2020 The Vanguard Group, Inc.
All rights reserved.
Vanguard Marketing Corporation, Distributor.
SNA18540 102020
Vanguard® Short-Term Corporate Bond Index Fund
Schedule of Investments
August 31, 2020
| | Coupon | Maturity
Date | Face
Amount
($000 | ) | Market
Value
($000 | ) |
U.S. Government and Agency Obligations (0.1%) | |
| U.S. Government Securities (0.1%) | |
| | United States Treasury Note/Bond (Cost $14,263) | 0.125% | 8/15/23 | 14,290 | | 14,279 | |
Corporate Bonds (99.2%) | |
| Finance (41.1%) | |
| | Banking (32.7%) | |
| | Ally Financial Inc. | 4.125% | 2/13/22 | 15,417 | | 15,995 | |
| | Ally Financial Inc. | 4.625% | 5/19/22 | 6,405 | | 6,741 | |
| | Ally Financial Inc. | 3.875% | 5/21/24 | 18,363 | | 19,511 | |
| | Ally Financial Inc. | 5.125% | 9/30/24 | 20,279 | | 22,687 | |
| | Ally Financial Inc. | 4.625% | 3/30/25 | 11,400 | | 12,611 | |
| | Ally Financial Inc. | 5.800% | 5/1/25 | 500 | | 578 | |
| | American Express Co. | 3.700% | 11/5/21 | 13,129 | | 13,606 | |
| | American Express Co. | 2.750% | 5/20/22 | 35,042 | | 36,357 | |
| | American Express Co. | 2.500% | 8/1/22 | 47,621 | | 49,348 | |
| | American Express Co. | 2.650% | 12/2/22 | 31,444 | | 32,978 | |
| | American Express Co. | 3.400% | 2/27/23 | 31,165 | | 33,333 | |
| | American Express Co. | 3.700% | 8/3/23 | 20,058 | | 21,833 | |
| | American Express Co. | 3.400% | 2/22/24 | 26,245 | | 28,710 | |
| | American Express Co. | 2.500% | 7/30/24 | 16,349 | | 17,445 | |
| | American Express Co. | 3.000% | 10/30/24 | 24,405 | | 26,564 | |
| | American Express Co. | 3.625% | 12/5/24 | 9,342 | | 10,379 | |
| | American Express Credit Corp. | 2.700% | 3/3/22 | 29,401 | | 30,356 | |
| | Associated Bank NA | 3.500% | 8/13/21 | 4,740 | | 4,857 | |
| | Australia & New Zealand Banking Group Ltd. | 2.550% | 11/23/21 | 17,791 | | 18,281 | |
| | Australia & New Zealand Banking Group Ltd. | 2.625% | 5/19/22 | 8,542 | | 8,880 | |
| | Australia & New Zealand Banking Group Ltd. | 2.625% | 11/9/22 | 23,197 | | 24,326 | |
| | Australia & New Zealand Banking Group Ltd. | 2.050% | 11/21/22 | 5,291 | | 5,489 | |
| | Banco Santander SA | 3.500% | 4/11/22 | 21,598 | | 22,408 | |
| | Banco Santander SA | 3.125% | 2/23/23 | 15,049 | | 15,820 | |
| | Banco Santander SA | 3.848% | 4/12/23 | 14,587 | | 15,665 | |
| | Banco Santander SA | 2.706% | 6/27/24 | 29,238 | | 31,066 | |
| | Banco Santander SA | 2.746% | 5/28/25 | 20,000 | | 21,237 | |
| | Bancolombia SA | 3.000% | 1/29/25 | 13,895 | | 14,156 | |
| 1 | BancorpSouth Bank | 4.125% | 11/20/29 | 825 | | 826 | |
| | Bank of America Corp. | 5.000% | 5/13/21 | 466 | | 480 | |
| | Bank of America Corp. | 5.700% | 1/24/22 | 12,002 | | 12,867 | |
| | Bank of America Corp. | 2.503% | 10/21/22 | 7,461 | | 7,639 | |
| | Bank of America Corp. | 3.300% | 1/11/23 | 42,253 | | 44,972 | |
| 1 | Bank of America Corp. | 3.124% | 1/20/23 | 43,738 | | 45,281 | |
| 1 | Bank of America Corp. | 2.881% | 4/24/23 | 24,176 | | 25,052 | |
| 1 | Bank of America Corp. | 2.816% | 7/21/23 | 29,729 | | 30,948 | |
| | Bank of America Corp. | 4.100% | 7/24/23 | 34,982 | | 38,564 | |
| 1 | Bank of America Corp. | 3.004% | 12/20/23 | 114,451 | | 120,325 | |
| | Bank of America Corp. | 4.125% | 1/22/24 | 50,959 | | 56,781 | |
| 1 | Bank of America Corp. | 3.550% | 3/5/24 | 67,885 | | 72,588 | |
| | Bank of America Corp. | 4.000% | 4/1/24 | 20,580 | | 22,924 | |
| 1 | Bank of America Corp. | 1.486% | 5/19/24 | 9,150 | | 9,374 | |
| 1 | Bank of America Corp. | 3.864% | 7/23/24 | 59,136 | | 64,180 | |
| | Bank of America Corp. | 4.200% | 8/26/24 | 35,372 | | 39,619 | |
| | Bank of America Corp. | 4.000% | 1/22/25 | 59,272 | | 66,034 | |
| 1 | Bank of America Corp. | 3.458% | 3/15/25 | 55,529 | | 60,657 | |
| | Bank of America Corp. | 3.950% | 4/21/25 | 57,694 | | 64,890 | |
| | Bank of America Corp. | 3.875% | 8/1/25 | 21,668 | | 24,674 | |
| 1 | Bank of America Corp. | 3.093% | 10/1/25 | 47,477 | | 51,501 | |
| 1 | Bank of America Corp. | 2.456% | 10/22/25 | 36,290 | | 38,398 | |
| 1 | Bank of America Corp. | 3.366% | 1/23/26 | 33,436 | | 36,668 | |
| 1 | Bank of America Corp. | 2.015% | 2/13/26 | 43,387 | | 45,130 | |
| | Bank of America Corp. | 3.500% | 4/19/26 | 500 | | 566 | |
| 1 | Bank of America Corp. | 1.319% | 6/19/26 | 50,875 | | 51,511 | |
| 1 | Bank of America NA | 3.335% | 1/25/23 | 6,278 | | 6,529 | |
Vanguard® Short-Term Corporate Bond Index Fund
Schedule of Investments
August 31, 2020
| | Coupon | Maturity
Date | Face
Amount
($000 | ) | Market
Value
($000 | ) |
| | Bank of Montreal | 1.900% | 8/27/21 | 32,032 | | 32,555 | |
| | Bank of Montreal | 2.900% | 3/26/22 | 46,496 | | 48,351 | |
| | Bank of Montreal | 2.350% | 9/11/22 | 19,516 | | 20,316 | |
| | Bank of Montreal | 2.050% | 11/1/22 | 4,124 | | 4,270 | |
| | Bank of Montreal | 2.550% | 11/6/22 | 10,783 | | 11,272 | |
| | Bank of Montreal | 3.300% | 2/5/24 | 40,875 | | 44,568 | |
| | Bank of Montreal | 2.500% | 6/28/24 | 8,406 | | 8,985 | |
| | Bank of Montreal | 1.850% | 5/1/25 | 35,856 | | 37,505 | |
| 1 | Bank of Montreal | 4.338% | 10/5/28 | 5,220 | | 5,605 | |
| | Bank of New York Mellon Corp. | 3.550% | 9/23/21 | 9,567 | | 9,865 | |
| | Bank of New York Mellon Corp. | 2.600% | 2/7/22 | 40,578 | | 41,846 | |
| | Bank of New York Mellon Corp. | 1.950% | 8/23/22 | 25,773 | | 26,619 | |
| | Bank of New York Mellon Corp. | 1.850% | 1/27/23 | 12,873 | | 13,312 | |
| | Bank of New York Mellon Corp. | 2.950% | 1/29/23 | 16,653 | | 17,645 | |
| | Bank of New York Mellon Corp. | 3.500% | 4/28/23 | 13,900 | | 15,066 | |
| 1 | Bank of New York Mellon Corp. | 2.661% | 5/16/23 | 14,080 | | 14,592 | |
| | Bank of New York Mellon Corp. | 3.450% | 8/11/23 | 19,304 | | 21,041 | |
| | Bank of New York Mellon Corp. | 2.200% | 8/16/23 | 24,078 | | 25,252 | |
| | Bank of New York Mellon Corp. | 3.650% | 2/4/24 | 9,989 | | 11,013 | |
| | Bank of New York Mellon Corp. | 3.400% | 5/15/24 | 7,594 | | 8,393 | |
| | Bank of New York Mellon Corp. | 3.250% | 9/11/24 | 8,263 | | 9,103 | |
| | Bank of New York Mellon Corp. | 2.100% | 10/24/24 | 17,253 | | 18,382 | |
| | Bank of New York Mellon Corp. | 3.000% | 2/24/25 | 9,981 | | 10,986 | |
| | Bank of New York Mellon Corp. | 1.600% | 4/24/25 | 18,378 | | 19,143 | |
| | Bank of Nova Scotia | 2.700% | 3/7/22 | 37,513 | | 38,888 | |
| | Bank of Nova Scotia | 2.450% | 9/19/22 | 12,340 | | 12,865 | |
| | Bank of Nova Scotia | 2.000% | 11/15/22 | 15,165 | | 15,686 | |
| | Bank of Nova Scotia | 2.375% | 1/18/23 | 4,597 | | 4,804 | |
| | Bank of Nova Scotia | 1.950% | 2/1/23 | 17,594 | | 18,209 | |
| | Bank of Nova Scotia | 1.625% | 5/1/23 | 31,252 | | 32,054 | |
| | Bank of Nova Scotia | 3.400% | 2/11/24 | 14,866 | | 16,219 | |
| | Bank of Nova Scotia | 2.200% | 2/3/25 | 18,512 | | 19,584 | |
| | Bank of Nova Scotia | 1.300% | 6/11/25 | 22,543 | | 23,068 | |
| 1 | Bank of Nova Scotia | 4.650% | 12/31/49 | 4,050 | | 3,984 | |
| | Bank One Corp. | 7.750% | 7/15/25 | 1,336 | | 1,735 | |
| | Barclays Bank plc | 2.650% | 1/11/21 | 2 | | 2 | |
| | Barclays Bank plc | 1.700% | 5/12/22 | 3,200 | | 3,259 | |
| | Barclays Bank plc | 3.750% | 5/15/24 | 2,200 | | 2,415 | |
| | Barclays plc | 3.250% | 1/12/21 | 20 | | 20 | |
| | Barclays plc | 3.200% | 8/10/21 | 25,264 | | 25,903 | |
| | Barclays plc | 3.684% | 1/10/23 | 31,125 | | 32,252 | |
| 1 | Barclays plc | 4.610% | 2/15/23 | 37,080 | | 38,981 | |
| 1 | Barclays plc | 4.338% | 5/16/24 | 33,889 | | 36,642 | |
| | Barclays plc | 4.375% | 9/11/24 | 10,713 | | 11,612 | |
| | Barclays plc | 3.650% | 3/16/25 | 34,439 | | 37,494 | |
| 1 | Barclays plc | 3.932% | 5/7/25 | 31,754 | | 34,428 | |
| 1 | Barclays plc | 2.852% | 5/7/26 | 45,680 | | 48,195 | |
| | BBVA USA | 2.875% | 6/29/22 | 8,346 | | 8,585 | |
| | BBVA USA | 2.500% | 8/27/24 | 11,130 | | 11,479 | |
| | BBVA USA | 3.875% | 4/10/25 | 13,041 | | 13,840 | |
| | BNP Paribas SA | 3.250% | 3/3/23 | 11,612 | | 12,395 | |
| | BNP Paribas SA | 4.250% | 10/15/24 | 18,496 | | 20,536 | |
| 1,2 | BNP Paribas SA | 2.819% | 11/19/25 | 2,000 | | 2,126 | |
| | BPCE SA | 2.750% | 12/2/21 | 17,091 | | 17,600 | |
| 2 | BPCE SA | 3.000% | 5/22/22 | 4,300 | | 4,461 | |
| | BPCE SA | 4.000% | 4/15/24 | 32,088 | | 35,707 | |
| | Canadian Imperial Bank of Commerce | 2.550% | 6/16/22 | 23,607 | | 24,497 | |
| | Canadian Imperial Bank of Commerce | 0.950% | 6/23/23 | 11,800 | | 11,914 | |
| 1 | Canadian Imperial Bank of Commerce | 2.606% | 7/22/23 | 15,433 | | 16,034 | |
| | Canadian Imperial Bank of Commerce | 3.500% | 9/13/23 | 22,054 | | 24,093 | |
| | Canadian Imperial Bank of Commerce | 3.100% | 4/2/24 | 11,833 | | 12,809 | |
| | Canadian Imperial Bank of Commerce | 2.250% | 1/28/25 | 12,655 | | 13,407 | |
| 1 | Capital One Bank USA NA | 2.014% | 1/27/23 | 9,980 | | 10,148 | |
| | Capital One Bank USA NA | 3.375% | 2/15/23 | 29,295 | | 30,970 | |
Vanguard® Short-Term Corporate Bond Index Fund
Schedule of Investments
August 31, 2020
| | Coupon | Maturity
Date | Face
Amount
($000 | ) | Market
Value
($000 | ) |
| | Capital One Financial Corp. | 3.050% | 3/9/22 | 27,247 | | 28,201 | |
| | Capital One Financial Corp. | 3.200% | 1/30/23 | 14,906 | | 15,753 | |
| | Capital One Financial Corp. | 2.600% | 5/11/23 | 34,401 | | 36,069 | |
| | Capital One Financial Corp. | 3.500% | 6/15/23 | 29,968 | | 32,115 | |
| | Capital One Financial Corp. | 3.900% | 1/29/24 | 20,240 | | 22,040 | |
| | Capital One Financial Corp. | 3.750% | 4/24/24 | 18,293 | | 20,025 | |
| | Capital One Financial Corp. | 3.300% | 10/30/24 | 22,083 | | 24,016 | |
| | Capital One Financial Corp. | 3.200% | 2/5/25 | 33,963 | | 37,030 | |
| | Capital One Financial Corp. | 4.250% | 4/30/25 | 7,698 | | 8,790 | |
| | Capital One NA | 2.150% | 9/6/22 | 2,488 | | 2,562 | |
| | Citibank NA | 3.650% | 1/23/24 | 36,846 | | 40,518 | |
| | Citigroup Inc. | 2.350% | 8/2/21 | 39,133 | | 39,863 | |
| | Citigroup Inc. | 2.900% | 12/8/21 | 57,578 | | 59,289 | |
| | Citigroup Inc. | 4.500% | 1/14/22 | 40,087 | | 42,338 | |
| | Citigroup Inc. | 2.750% | 4/25/22 | 45,337 | | 46,976 | |
| | Citigroup Inc. | 4.050% | 7/30/22 | 16,619 | | 17,670 | |
| | Citigroup Inc. | 2.700% | 10/27/22 | 17,796 | | 18,596 | |
| 1 | Citigroup Inc. | 2.312% | 11/4/22 | 22,534 | | 22,956 | |
| 1 | Citigroup Inc. | 3.142% | 1/24/23 | 48,728 | | 50,314 | |
| | Citigroup Inc. | 3.375% | 3/1/23 | 7,580 | | 8,100 | |
| | Citigroup Inc. | 3.500% | 5/15/23 | 22,861 | | 24,516 | |
| 1 | Citigroup Inc. | 2.876% | 7/24/23 | 51,406 | | 53,575 | |
| | Citigroup Inc. | 3.875% | 10/25/23 | 13,912 | | 15,283 | |
| 1 | Citigroup Inc. | 1.678% | 5/15/24 | 15,800 | | 16,155 | |
| 1 | Citigroup Inc. | 4.044% | 6/1/24 | 36,517 | | 39,745 | |
| | Citigroup Inc. | 3.750% | 6/16/24 | 15,164 | | 16,788 | |
| | Citigroup Inc. | 4.000% | 8/5/24 | 6,326 | | 7,009 | |
| | Citigroup Inc. | 3.875% | 3/26/25 | 21,643 | | 24,053 | |
| 1 | Citigroup Inc. | 3.352% | 4/24/25 | 46,794 | | 50,717 | |
| | Citigroup Inc. | 3.300% | 4/27/25 | 22,991 | | 25,520 | |
| | Citigroup Inc. | 4.400% | 6/10/25 | 33,089 | | 37,711 | |
| 1 | Citigroup Inc. | 3.106% | 4/8/26 | 48,100 | | 52,228 | |
| | Citizens Bank NA | 2.650% | 5/26/22 | 13,241 | | 13,690 | |
| | Citizens Bank NA | 3.700% | 3/29/23 | 16,137 | | 17,334 | |
| | Citizens Bank NA | 3.250% | 2/14/22 | 16,321 | | 16,935 | |
| | Citizens Bank NA | 2.250% | 4/28/25 | 3,080 | | 3,270 | |
| | Comerica Bank | 2.500% | 7/23/24 | 9,289 | | 9,917 | |
| | Comerica Bank | 4.000% | 7/27/25 | 4,022 | | 4,454 | |
| | Comerica Inc. | 3.700% | 7/31/23 | 18,627 | | 20,199 | |
| 2 | Commonwealth Bank of Australia | 2.750% | 3/10/22 | 3,500 | | 3,627 | |
| 2 | Commonwealth Bank of Australia | 3.450% | 3/16/23 | 4,000 | | 4,295 | |
| 2 | Commonwealth Bank of Australia | 3.350% | 6/4/24 | 2,350 | | 2,577 | |
| | Cooperatieve Rabobank UA | 3.125% | 4/26/21 | 4,150 | | 4,228 | |
| | Cooperatieve Rabobank UA | 2.750% | 1/10/22 | 23,425 | | 24,128 | |
| | Cooperatieve Rabobank UA | 3.875% | 2/8/22 | 68,502 | | 71,991 | |
| | Cooperatieve Rabobank UA | 3.950% | 11/9/22 | 11,763 | | 12,541 | |
| | Cooperatieve Rabobank UA | 2.750% | 1/10/23 | 21,995 | | 23,121 | |
| | Cooperatieve Rabobank UA | 4.625% | 12/1/23 | 24,996 | | 27,814 | |
| | Cooperatieve Rabobank UA | 3.375% | 5/21/25 | 9,557 | | 10,645 | |
| | Cooperatieve Rabobank UA | 4.375% | 8/4/25 | 24,978 | | 28,431 | |
| | Credit Suisse AG | 3.000% | 10/29/21 | 49,931 | | 51,477 | |
| | Credit Suisse AG | 2.100% | 11/12/21 | 33,276 | | 33,986 | |
| | Credit Suisse AG | 3.625% | 9/9/24 | 54,186 | | 60,427 | |
| | Credit Suisse AG/New York NY | 2.800% | 4/8/22 | 13,850 | | 14,387 | |
| | Credit Suisse AG/New York NY | 1.000% | 5/5/23 | 19,093 | | 19,363 | |
| | Credit Suisse AG/New York NY | 2.950% | 4/9/25 | 42,800 | | 46,885 | |
| 2 | Credit Suisse Group AG | 3.574% | 1/9/23 | 7,175 | | 7,450 | |
| | Credit Suisse Group Funding Guernsey Ltd. | 3.800% | 9/15/22 | 29,117 | | 30,900 | |
| | Credit Suisse Group Funding Guernsey Ltd. | 3.800% | 6/9/23 | 25,660 | | 27,685 | |
| | Credit Suisse Group Funding Guernsey Ltd. | 3.750% | 3/26/25 | 35,179 | | 38,879 | |
| | Deutsche Bank AG | 4.250% | 10/14/21 | 48,978 | | 50,619 | |
| | Deutsche Bank AG | 3.300% | 11/16/22 | 10,580 | | 10,937 | |
| | Deutsche Bank AG | 3.950% | 2/27/23 | 16,710 | | 17,650 | |
| | Deutsche Bank AG | 3.700% | 5/30/24 | 30,865 | | 32,910 | |
Vanguard® Short-Term Corporate Bond Index Fund
Schedule of Investments
August 31, 2020
| | Coupon | Maturity
Date | Face
Amount
($000 | ) | Market
Value
($000 | ) |
| | Deutsche Bank AG | 3.700% | 5/30/24 | 6,742 | | 7,163 | |
| | Deutsche Bank AG | 5.000% | 2/14/22 | 15,664 | | 16,427 | |
| 1 | Deutsche Bank AG | 3.961% | 11/26/25 | 25,095 | | 26,894 | |
| | Discover Bank | 3.200% | 8/9/21 | 8,062 | | 8,247 | |
| | Discover Bank | 3.350% | 2/6/23 | 17,328 | | 18,394 | |
| | Discover Bank | 4.200% | 8/8/23 | 22,667 | | 24,959 | |
| | Discover Bank | 2.450% | 9/12/24 | 12,780 | | 13,523 | |
| 1 | Discover Bank | 4.682% | 8/9/28 | 11,761 | | 12,300 | |
| | Discover Financial Services | 5.200% | 4/27/22 | 7,353 | | 7,866 | |
| | Discover Financial Services | 3.850% | 11/21/22 | 14,136 | | 15,079 | |
| | Discover Financial Services | 3.950% | 11/6/24 | 10,880 | | 11,926 | |
| | Discover Financial Services | 3.750% | 3/4/25 | 9,950 | | 10,843 | |
| | Fifth Third Bancorp | 3.500% | 3/15/22 | 12,534 | | 13,081 | |
| | Fifth Third Bancorp | 2.600% | 6/15/22 | 9,930 | | 10,280 | |
| | Fifth Third Bancorp | 1.625% | 5/5/23 | 10,162 | | 10,419 | |
| | Fifth Third Bancorp | 4.300% | 1/16/24 | 15,660 | | 17,267 | |
| | Fifth Third Bancorp | 3.650% | 1/25/24 | 37,733 | | 41,266 | |
| | Fifth Third Bancorp | 2.375% | 1/28/25 | 5,018 | | 5,326 | |
| | Fifth Third Bank | 2.875% | 10/1/21 | 15,936 | | 16,320 | |
| | Fifth Third Bank | 3.950% | 7/28/25 | 10,804 | | 12,434 | |
| | Fifth Third Bank | 1.800% | 1/30/23 | 11,420 | | 11,752 | |
| | First Horizon National Corp. | 3.550% | 5/26/23 | 4,660 | | 4,905 | |
| | First Horizon National Corp. | 4.000% | 5/26/25 | 9,273 | | 10,099 | |
| | First Niagara Financial Group Inc. | 7.250% | 12/15/21 | 418 | | 451 | |
| | First Republic Bank | 2.500% | 6/6/22 | 6,663 | | 6,848 | |
| 1 | First Republic Bank | 1.912% | 2/12/24 | 10,700 | | 11,021 | |
| | FNB Corp. | 2.200% | 2/24/23 | 3,891 | | 3,907 | |
| | Goldman Sachs Group Inc. | 2.350% | 11/15/21 | 33,464 | | 33,588 | |
| | Goldman Sachs Group Inc. | 5.750% | 1/24/22 | 95,610 | | 102,645 | |
| | Goldman Sachs Group Inc. | 3.000% | 4/26/22 | 37,540 | | 38,127 | |
| 1 | Goldman Sachs Group Inc. | 2.876% | 10/31/22 | 66,686 | | 68,365 | |
| | Goldman Sachs Group Inc. | 3.625% | 1/22/23 | 29,920 | | 32,085 | |
| | Goldman Sachs Group Inc. | 3.200% | 2/23/23 | 26,829 | | 28,539 | |
| 1 | Goldman Sachs Group Inc. | 2.908% | 6/5/23 | 40,259 | | 41,857 | |
| 1 | Goldman Sachs Group Inc. | 2.905% | 7/24/23 | 45,992 | | 47,967 | |
| | Goldman Sachs Group Inc. | 3.625% | 2/20/24 | 42,095 | | 45,949 | |
| | Goldman Sachs Group Inc. | 4.000% | 3/3/24 | 44,567 | | 49,335 | |
| | Goldman Sachs Group Inc. | 3.850% | 7/8/24 | 46,025 | | 50,836 | |
| | Goldman Sachs Group Inc. | 3.500% | 1/23/25 | 58,054 | | 63,822 | |
| | Goldman Sachs Group Inc. | 3.500% | 4/1/25 | 85,930 | | 95,096 | |
| | Goldman Sachs Group Inc. | 3.750% | 5/22/25 | 11,406 | | 12,723 | |
| 1 | Goldman Sachs Group Inc. | 3.272% | 9/29/25 | 17,370 | | 18,904 | |
| | HSBC Holdings plc | 2.650% | 1/5/22 | 1,300 | | 1,336 | |
| | HSBC Holdings plc | 4.000% | 3/30/22 | 18,133 | | 19,112 | |
| 1 | HSBC Holdings plc | 3.262% | 3/13/23 | 62,030 | | 64,455 | |
| | HSBC Holdings plc | 3.600% | 5/25/23 | 33,568 | | 36,085 | |
| 1 | HSBC Holdings plc | 3.033% | 11/22/23 | 15,082 | | 15,780 | |
| | HSBC Holdings plc | 4.250% | 3/14/24 | 46,255 | | 50,473 | |
| 1 | HSBC Holdings plc | 3.950% | 5/18/24 | 21,915 | | 23,649 | |
| 1 | HSBC Holdings plc | 3.803% | 3/11/25 | 56,238 | | 60,932 | |
| | HSBC Holdings plc | 4.250% | 8/18/25 | 27,374 | | 30,283 | |
| 1 | HSBC Holdings plc | 2.633% | 11/7/25 | 16,865 | | 17,676 | |
| 1 | HSBC Holdings plc | 1.645% | 4/18/26 | 23,000 | | 23,191 | |
| 1 | HSBC Holdings plc | 2.099% | 6/4/26 | 55,438 | | 56,616 | |
| | HSBC USA Inc. | 3.500% | 6/23/24 | 20,657 | | 22,614 | |
| | Huntington Bancshares Inc. | 2.300% | 1/14/22 | 30,736 | | 31,475 | |
| | Huntington Bancshares Inc. | 2.625% | 8/6/24 | 15,961 | | 17,056 | |
| | Huntington Bancshares Inc. | 4.000% | 5/15/25 | 1,300 | | 1,479 | |
| | Huntington National Bank | 3.125% | 4/1/22 | 9,210 | | 9,576 | |
| | Huntington National Bank | 2.500% | 8/7/22 | 9,374 | | 9,741 | |
| | Huntington National Bank | 1.800% | 2/3/23 | 13,746 | | 14,141 | |
| | Huntington National Bank | 3.550% | 10/6/23 | 12,143 | | 13,232 | |
| | ING Groep NV | 3.150% | 3/29/22 | 26,231 | | 27,249 | |
| | ING Groep NV | 4.100% | 10/2/23 | 21,318 | | 23,478 | |
Vanguard® Short-Term Corporate Bond Index Fund
Schedule of Investments
August 31, 2020
| | Coupon | Maturity
Date | Face
Amount
($000 | ) | Market
Value
($000 | ) |
| | ING Groep NV | 3.550% | 4/9/24 | 22,105 | | 24,240 | |
| 2 | Intesa Sanpaolo SPA | 3.375% | 1/12/23 | 2,800 | | 2,911 | |
| | Intesa Sanpaolo SPA | 5.250% | 1/12/24 | 9,542 | | 10,620 | |
| | JPMorgan Chase & Co. | 4.500% | 1/24/22 | 63,562 | | 67,222 | |
| | JPMorgan Chase & Co. | 3.250% | 9/23/22 | 43,108 | | 45,587 | |
| | JPMorgan Chase & Co. | 2.972% | 1/15/23 | 44,438 | | 46,006 | |
| | JPMorgan Chase & Co. | 3.200% | 1/25/23 | 22,193 | | 23,635 | |
| 1 | JPMorgan Chase & Co. | 3.207% | 4/1/23 | 33,879 | | 35,331 | |
| 1 | JPMorgan Chase & Co. | 2.776% | 4/25/23 | 39,326 | | 40,797 | |
| | JPMorgan Chase & Co. | 3.375% | 5/1/23 | 46,323 | | 49,554 | |
| | JPMorgan Chase & Co. | 2.700% | 5/18/23 | 44,054 | | 46,513 | |
| | JPMorgan Chase & Co. | 3.875% | 2/1/24 | 25,158 | | 27,795 | |
| 1 | JPMorgan Chase & Co. | 3.559% | 4/23/24 | 41,818 | | 44,881 | |
| | JPMorgan Chase & Co. | 3.625% | 5/13/24 | 35,379 | | 39,005 | |
| 1 | JPMorgan Chase & Co. | 1.514% | 6/1/24 | 21,320 | | 21,746 | |
| 1 | JPMorgan Chase & Co. | 3.797% | 7/23/24 | 35,131 | | 38,175 | |
| | JPMorgan Chase & Co. | 3.875% | 9/10/24 | 38,201 | | 42,515 | |
| 1 | JPMorgan Chase & Co. | 4.023% | 12/5/24 | 45,015 | | 49,700 | |
| | JPMorgan Chase & Co. | 3.125% | 1/23/25 | 40,482 | | 44,165 | |
| 1 | JPMorgan Chase & Co. | 3.220% | 3/1/25 | 51,500 | | 55,635 | |
| | JPMorgan Chase & Co. | 3.900% | 7/15/25 | 22,325 | | 25,418 | |
| 1 | JPMorgan Chase & Co. | 2.301% | 10/15/25 | 31,830 | | 33,501 | |
| 1 | JPMorgan Chase & Co. | 2.005% | 3/13/26 | 55,558 | | 57,989 | |
| 1 | JPMorgan Chase & Co. | 2.083% | 4/22/26 | 88,045 | | 92,350 | |
| | JPMorgan Chase & Co. | 4.125% | 12/15/26 | 10,000 | | 11,650 | |
| | KeyBank NA | 2.500% | 11/22/21 | 15,219 | | 15,617 | |
| | KeyBank NA | 2.400% | 6/9/22 | 6,044 | | 6,246 | |
| | KeyBank NA | 2.300% | 9/14/22 | 17,523 | | 18,166 | |
| | KeyBank NA | 3.375% | 3/7/23 | 10,440 | | 11,146 | |
| | KeyBank NA | 3.300% | 6/1/25 | 5,185 | | 5,799 | |
| 1 | KeyBank NA | 3.180% | 10/15/27 | 4,775 | | 4,937 | |
| | KeyBank NA | 3.300% | 2/1/22 | 10,142 | | 10,556 | |
| | KeyBank NA | 1.250% | 3/10/23 | 13,555 | | 13,819 | |
| | Lloyds Bank plc | 6.375% | 1/21/21 | 14,860 | | 15,176 | |
| | Lloyds Bank plc | 2.250% | 8/14/22 | 1,600 | | 1,654 | |
| | Lloyds Banking Group plc | 3.100% | 7/6/21 | 17,644 | | 17,997 | |
| | Lloyds Banking Group plc | 3.000% | 1/11/22 | 29,317 | | 30,305 | |
| 1 | Lloyds Banking Group plc | 2.858% | 3/17/23 | 34,613 | | 35,749 | |
| 1 | Lloyds Banking Group plc | 1.326% | 6/15/23 | 15,900 | | 15,999 | |
| | Lloyds Banking Group plc | 4.050% | 8/16/23 | 31,751 | | 34,741 | |
| 1 | Lloyds Banking Group plc | 2.907% | 11/7/23 | 28,145 | | 29,376 | |
| | Lloyds Banking Group plc | 3.900% | 3/12/24 | 15,640 | | 17,183 | |
| | Lloyds Banking Group plc | 4.500% | 11/4/24 | 23,056 | | 25,397 | |
| | Lloyds Banking Group plc | 4.450% | 5/8/25 | 4,778 | | 5,471 | |
| 1 | Lloyds Banking Group plc | 3.870% | 7/9/25 | 30,612 | | 33,697 | |
| 1 | Lloyds Banking Group plc | 2.438% | 2/5/26 | 20,250 | | 21,263 | |
| | M&T Bank Corp. | 3.550% | 7/26/23 | 13,860 | | 15,069 | |
| | Manufacturers & Traders Trust Co. | 2.625% | 1/25/21 | 8,552 | | 8,634 | |
| | Manufacturers & Traders Trust Co. | 2.500% | 5/18/22 | 12,199 | | 12,613 | |
| | Manufacturers & Traders Trust Co. | 2.900% | 2/6/25 | 5,922 | | 6,481 | |
| | Mitsubishi UFJ Financial Group Inc. | 2.190% | 9/13/21 | 13,396 | | 13,636 | |
| | Mitsubishi UFJ Financial Group Inc. | 2.998% | 2/22/22 | 22,184 | | 22,987 | |
| | Mitsubishi UFJ Financial Group Inc. | 3.218% | 3/7/22 | 24,342 | | 25,349 | |
| | Mitsubishi UFJ Financial Group Inc. | 2.623% | 7/18/22 | 17,990 | | 18,715 | |
| | Mitsubishi UFJ Financial Group Inc. | 2.665% | 7/25/22 | 38,007 | | 39,477 | |
| | Mitsubishi UFJ Financial Group Inc. | 3.455% | 3/2/23 | 29,941 | | 32,014 | |
| | Mitsubishi UFJ Financial Group Inc. | 3.761% | 7/26/23 | 45,708 | | 49,717 | |
| | Mitsubishi UFJ Financial Group Inc. | 2.527% | 9/13/23 | 10,700 | | 11,250 | |
| | Mitsubishi UFJ Financial Group Inc. | 3.407% | 3/7/24 | 39,953 | | 43,502 | |
| | Mitsubishi UFJ Financial Group Inc. | 2.801% | 7/18/24 | 24,810 | | 26,607 | |
| | Mitsubishi UFJ Financial Group Inc. | 2.193% | 2/25/25 | 44,439 | | 46,702 | |
| | Mitsubishi UFJ Financial Group Inc. | 1.412% | 7/17/25 | 37,740 | | 38,474 | |
| | Mizuho Financial Group Inc. | 2.273% | 9/13/21 | 23,800 | | 24,218 | |
| | Mizuho Financial Group Inc. | 2.953% | 2/28/22 | 27,303 | | 28,303 | |
Vanguard® Short-Term Corporate Bond Index Fund
Schedule of Investments
August 31, 2020
| | Coupon | Maturity
Date | Face
Amount
($000 | ) | Market
Value
($000 | ) |
| | Mizuho Financial Group Inc. | 2.601% | 9/11/22 | 18,295 | | 19,026 | |
| | Mizuho Financial Group Inc. | 3.549% | 3/5/23 | 13,536 | | 14,485 | |
| 1 | Mizuho Financial Group Inc. | 2.721% | 7/16/23 | 7,580 | | 7,854 | |
| 1 | Mizuho Financial Group Inc. | 1.241% | 7/10/24 | 8,800 | | 8,886 | |
| 1 | Mizuho Financial Group Inc. | 3.922% | 9/11/24 | 24,675 | | 26,710 | |
| 1 | Mizuho Financial Group Inc. | 2.839% | 7/16/25 | 16,504 | | 17,463 | |
| 1 | Mizuho Financial Group Inc. | 2.555% | 9/13/25 | 9,825 | | 10,324 | |
| 1 | Mizuho Financial Group Inc. | 2.226% | 5/25/26 | 2,800 | | 2,926 | |
| | Morgan Stanley | 5.750% | 1/25/21 | 28 | | 28 | |
| | Morgan Stanley | 2.625% | 11/17/21 | 50,872 | | 52,245 | |
| | Morgan Stanley | 2.750% | 5/19/22 | 41,196 | | 42,805 | |
| | Morgan Stanley | 4.875% | 11/1/22 | 34,674 | | 37,686 | |
| | Morgan Stanley | 3.125% | 1/23/23 | 37,112 | | 39,342 | |
| | Morgan Stanley | 3.750% | 2/25/23 | 56,470 | | 60,941 | |
| | Morgan Stanley | 4.100% | 5/22/23 | 47,895 | | 52,050 | |
| 1 | Morgan Stanley | 3.737% | 4/24/24 | 59,413 | | 64,082 | |
| | Morgan Stanley | 3.875% | 4/29/24 | 52,225 | | 57,987 | |
| | Morgan Stanley | 3.700% | 10/23/24 | 52,128 | | 58,271 | |
| 1 | Morgan Stanley | 2.720% | 7/22/25 | 28,289 | | 30,236 | |
| | Morgan Stanley | 4.000% | 7/23/25 | 44,904 | | 51,383 | |
| | Morgan Stanley | 5.000% | 11/24/25 | 7,800 | | 9,220 | |
| 1 | Morgan Stanley | 2.188% | 4/28/26 | 58,115 | | 61,101 | |
| | MUFG Americas Holdings Corp. | 3.500% | 6/18/22 | 4,504 | | 4,739 | |
| | MUFG Americas Holdings Corp. | 3.000% | 2/10/25 | 9,341 | | 10,053 | |
| | MUFG Union Bank NA | 3.150% | 4/1/22 | 32,575 | | 33,886 | |
| | MUFG Union Bank NA | 2.100% | 12/9/22 | 10,398 | | 10,761 | |
| | National Australia Bank Ltd. | 2.625% | 1/14/21 | 30 | | 30 | |
| | National Australia Bank Ltd. | 3.375% | 9/20/21 | 13,486 | | 13,907 | |
| | National Australia Bank Ltd. | 3.700% | 11/4/21 | 14,621 | | 15,187 | |
| | National Australia Bank Ltd. | 2.800% | 1/10/22 | 16,898 | | 17,468 | |
| | National Australia Bank Ltd. | 2.500% | 5/22/22 | 12,521 | | 12,974 | |
| | National Australia Bank Ltd. | 3.000% | 1/20/23 | 12,808 | | 13,559 | |
| | National Australia Bank Ltd. | 2.875% | 4/12/23 | 8,972 | | 9,523 | |
| | National Australia Bank Ltd. | 3.625% | 6/20/23 | 16,880 | | 18,315 | |
| | National Australia Bank Ltd. | 1.875% | 12/13/22 | 3,890 | | 4,000 | |
| | National Bank of Canada | 2.100% | 2/1/23 | 23,980 | | 24,851 | |
| 1 | National Bank of Canada | 0.900% | 8/15/23 | 7,000 | | 7,018 | |
| | Natwest Group PLC | 6.125% | 12/15/22 | 15,233 | | 16,720 | |
| 1 | Natwest Group PLC | 3.498% | 5/15/23 | 27,051 | | 28,199 | |
| | Natwest Group PLC | 6.100% | 6/10/23 | 27,935 | | 30,906 | |
| | Natwest Group PLC | 3.875% | 9/12/23 | 54,394 | | 59,023 | |
| | Natwest Group PLC | 6.000% | 12/19/23 | 39,044 | | 43,933 | |
| 1 | Natwest Group PLC | 2.359% | 5/22/24 | 17,400 | | 18,001 | |
| 1 | Natwest Group PLC | 4.519% | 6/25/24 | 26,661 | | 29,035 | |
| 1 | Natwest Group PLC | 4.269% | 3/22/25 | 26,869 | | 29,457 | |
| 1 | New York Community Bancorp Inc. | 5.900% | 11/6/28 | 4,530 | | 4,651 | |
| | Northern Trust Corp. | 2.375% | 8/2/22 | 6,605 | | 6,876 | |
| | People's United Bank NA | 4.000% | 7/15/24 | 8,187 | | 8,757 | |
| | People's United Financial Inc. | 3.650% | 12/6/22 | 6,245 | | 6,632 | |
| | PNC Bank NA | 2.550% | 12/9/21 | 20,585 | | 21,059 | |
| | PNC Bank NA | 2.625% | 2/17/22 | 34,837 | | 35,820 | |
| | PNC Bank NA | 2.450% | 7/28/22 | 10,915 | | 11,311 | |
| | PNC Bank NA | 2.700% | 11/1/22 | 16,073 | | 16,785 | |
| 1 | PNC Bank NA | 2.028% | 12/9/22 | 16,590 | | 16,900 | |
| | PNC Bank NA | 2.950% | 1/30/23 | 6,510 | | 6,862 | |
| 1 | PNC Bank NA | 1.743% | 2/24/23 | 5,500 | | 5,604 | |
| | PNC Bank NA | 3.500% | 6/8/23 | 7,937 | | 8,572 | |
| | PNC Bank NA | 3.800% | 7/25/23 | 17,960 | | 19,554 | |
| | PNC Bank NA | 3.300% | 10/30/24 | 9,954 | | 11,034 | |
| | PNC Bank NA | 2.950% | 2/23/25 | 6,680 | | 7,318 | |
| | PNC Bank NA | 3.250% | 6/1/25 | 9,009 | | 10,054 | |
| | PNC Financial Services Group Inc. | 2.854% | 11/9/22 | 11,355 | | 11,957 | |
| | PNC Financial Services Group Inc. | 3.500% | 1/23/24 | 23,544 | | 25,719 | |
| | PNC Financial Services Group Inc. | 3.900% | 4/29/24 | 21,283 | | 23,589 | |
Vanguard® Short-Term Corporate Bond Index Fund
Schedule of Investments
August 31, 2020
| | Coupon | Maturity
Date | Face
Amount
($000 | ) | Market
Value
($000 | ) |
| | PNC Financial Services Group Inc. | 2.200% | 11/1/24 | 8,379 | | 8,925 | |
| | PNC Funding Corp. | 3.300% | 3/8/22 | 24,433 | | 25,466 | |
| | Regions Financial Corp. | 2.750% | 8/14/22 | 12,166 | | 12,667 | |
| | Regions Financial Corp. | 3.800% | 8/14/23 | 17,006 | | 18,545 | |
| | Regions Financial Corp. | 2.250% | 5/18/25 | 12,904 | | 13,696 | |
| | Royal Bank of Canada | 2.500% | 1/19/21 | 16 | | 16 | |
| | Royal Bank of Canada | 2.750% | 2/1/22 | 15,391 | | 15,932 | |
| | Royal Bank of Canada | 2.800% | 4/29/22 | 24,544 | | 25,525 | |
| | Royal Bank of Canada | 1.950% | 1/17/23 | 16,155 | | 16,723 | |
| | Royal Bank of Canada | 1.600% | 4/17/23 | 21,162 | | 21,770 | |
| | Royal Bank of Canada | 3.700% | 10/5/23 | 34,734 | | 38,129 | |
| | Royal Bank of Canada | 2.550% | 7/16/24 | 16,420 | | 17,617 | |
| | Royal Bank of Canada | 2.250% | 11/1/24 | 35,786 | | 37,995 | |
| | Royal Bank of Canada | 1.150% | 6/10/25 | 34,000 | | 34,505 | |
| | Royal Bank of Scotland Group plc | 5.125% | 5/28/24 | 32,251 | | 35,596 | |
| 1 | Royal Bank of Scotland Group plc | 3.754% | 11/1/29 | 14,009 | | 14,762 | |
| | Santander Holdings USA Inc. | 4.450% | 12/3/21 | 10,940 | | 11,365 | |
| | Santander Holdings USA Inc. | 3.700% | 3/28/22 | 4,218 | | 4,381 | |
| | Santander Holdings USA Inc. | 3.400% | 1/18/23 | 15,040 | | 15,755 | |
| | Santander Holdings USA Inc. | 3.500% | 6/7/24 | 12,706 | | 13,633 | |
| | Santander Holdings USA Inc. | 3.450% | 6/2/25 | 4,586 | | 4,942 | |
| | Santander Holdings USA Inc. | 4.500% | 7/17/25 | 14,593 | | 16,111 | |
| | Santander Holdings USA Inc. | 3.244% | 10/5/26 | 27,519 | | 29,170 | |
| | Santander UK Group Holdings plc | 3.571% | 1/10/23 | 16,234 | | 16,803 | |
| 1 | Santander UK Group Holdings plc | 3.373% | 1/5/24 | 12,530 | | 13,123 | |
| 1 | Santander UK Group Holdings plc | 4.796% | 11/15/24 | 27,117 | | 30,068 | |
| 1 | Santander UK Group Holdings plc | 1.532% | 8/21/26 | 16,000 | | 16,008 | |
| | Santander UK plc | 3.750% | 11/15/21 | 18,970 | | 19,682 | |
| | Santander UK plc | 2.100% | 1/13/23 | 21,588 | | 22,263 | |
| | Santander UK plc | 4.000% | 3/13/24 | 18,423 | | 20,406 | |
| | Santander UK plc | 2.875% | 6/18/24 | 10,961 | | 11,776 | |
| | Skandinaviska Enskilda Banken AB | 1.875% | 9/13/21 | 16,477 | | 16,704 | |
| | Skandinaviska Enskilda Banken AB | 2.800% | 3/11/22 | 6,686 | | 6,920 | |
| 1,2 | Standard Chartered plc | 2.819% | 1/30/26 | 2,000 | | 2,085 | |
| 1,2 | State Street Corp. | 2.825% | 3/30/23 | 6,130 | | 6,345 | |
| 1 | State Street Corp. | 2.653% | 5/15/23 | 22,046 | | 22,895 | |
| | State Street Corp. | 3.100% | 5/15/23 | 19,274 | | 20,609 | |
| | State Street Corp. | 3.700% | 11/20/23 | 9,979 | | 11,020 | |
| 1 | State Street Corp. | 3.776% | 12/3/24 | 16,078 | | 17,709 | |
| | State Street Corp. | 3.300% | 12/16/24 | 20,275 | | 22,615 | |
| | State Street Corp. | 3.550% | 8/18/25 | 17,817 | | 20,252 | |
| 1 | State Street Corp. | 2.354% | 11/1/25 | 16,144 | | 17,193 | |
| 1,2 | State Street Corp. | 2.901% | 3/30/26 | 13,336 | | 14,553 | |
| | Sumitomo Mitsui Banking Corp. | 3.200% | 7/18/22 | 13,267 | | 13,945 | |
| | Sumitomo Mitsui Banking Corp. | 3.000% | 1/18/23 | 3,890 | | 4,099 | |
| | Sumitomo Mitsui Banking Corp. | 3.950% | 7/19/23 | 7,975 | | 8,703 | |
| | Sumitomo Mitsui Banking Corp. | 3.950% | 1/10/24 | 5,960 | | 6,551 | |
| | Sumitomo Mitsui Banking Corp. | 3.400% | 7/11/24 | 7,475 | | 8,161 | |
| | Sumitomo Mitsui Banking Corp. | 3.650% | 7/23/25 | 992 | | 1,119 | |
| | Sumitomo Mitsui Financial Group Inc. | 2.442% | 10/19/21 | 41,545 | | 42,481 | |
| | Sumitomo Mitsui Financial Group Inc. | 2.846% | 1/11/22 | 20,142 | | 20,771 | |
| | Sumitomo Mitsui Financial Group Inc. | 2.784% | 7/12/22 | 41,837 | | 43,564 | |
| | Sumitomo Mitsui Financial Group Inc. | 2.778% | 10/18/22 | 21,999 | | 23,019 | |
| | Sumitomo Mitsui Financial Group Inc. | 3.102% | 1/17/23 | 11,253 | | 11,899 | |
| | Sumitomo Mitsui Financial Group Inc. | 3.748% | 7/19/23 | 14,933 | | 16,237 | |
| | Sumitomo Mitsui Financial Group Inc. | 3.936% | 10/16/23 | 14,097 | | 15,489 | |
| | Sumitomo Mitsui Financial Group Inc. | 2.696% | 7/16/24 | 38,786 | | 41,453 | |
| | Sumitomo Mitsui Financial Group Inc. | 2.448% | 9/27/24 | 17,273 | | 18,362 | |
| | Sumitomo Mitsui Financial Group Inc. | 2.348% | 1/15/25 | 18,787 | | 19,900 | |
| | Sumitomo Mitsui Financial Group Inc. | 1.474% | 7/8/25 | 28,565 | | 29,215 | |
| | SVB Financial Group | 3.500% | 1/29/25 | 1,546 | | 1,664 | |
| | Svenska Handelsbanken AB | 1.875% | 9/7/21 | 22,811 | | 23,180 | |
| | Svenska Handelsbanken AB | 3.900% | 11/20/23 | 15,611 | | 17,309 | |
| | Synchrony Bank | 3.000% | 6/15/22 | 15,059 | | 15,509 | |
Vanguard® Short-Term Corporate Bond Index Fund
Schedule of Investments
August 31, 2020
| | Coupon | Maturity
Date | Face
Amount
($000 | ) | Market
Value
($000 | ) |
| | Synchrony Financial | 2.850% | 7/25/22 | 10,743 | | 10,918 | |
| | Synchrony Financial | 4.375% | 3/19/24 | 21,183 | | 22,737 | |
| | Synchrony Financial | 4.250% | 8/15/24 | 22,177 | | 23,880 | |
| | Synchrony Financial | 4.500% | 7/23/25 | 14,632 | | 15,926 | |
| 1 | Synovus Bank | 2.289% | 2/10/23 | 7,300 | | 7,409 | |
| | Synovus Financial Corp. | 3.125% | 11/1/22 | 4,733 | | 4,891 | |
| | Toronto-Dominion Bank | 1.900% | 12/1/22 | 21,318 | | 22,042 | |
| | Toronto-Dominion Bank | 0.750% | 6/12/23 | 10,715 | | 10,818 | |
| | Toronto-Dominion Bank | 3.500% | 7/19/23 | 33,870 | | 36,925 | |
| | Toronto-Dominion Bank | 3.250% | 3/11/24 | 27,276 | | 29,798 | |
| | Toronto-Dominion Bank | 2.650% | 6/12/24 | 21,415 | | 23,019 | |
| | Toronto-Dominion Bank | 1.150% | 6/12/25 | 29,075 | | 29,727 | |
| 1 | Truist Bank | 3.525% | 10/26/21 | 2,983 | | 2,995 | |
| | Truist Bank | 2.625% | 1/15/22 | 16,193 | | 16,658 | |
| | Truist Bank | 2.800% | 5/17/22 | 24,162 | | 25,128 | |
| | Truist Bank | 2.450% | 8/1/22 | 14,193 | | 14,744 | |
| 1 | Truist Bank | 3.502% | 8/2/22 | 9,662 | | 9,933 | |
| | Truist Bank | 3.000% | 2/2/23 | 10,182 | | 10,772 | |
| | Truist Bank | 1.250% | 3/9/23 | 12,910 | | 13,158 | |
| | Truist Bank | 2.750% | 5/1/23 | 13,392 | | 14,157 | |
| | Truist Bank | 3.200% | 4/1/24 | 39,023 | | 42,440 | |
| 1 | Truist Bank | 3.689% | 8/2/24 | 12,383 | | 13,483 | |
| | Truist Bank | 2.150% | 12/6/24 | 36,474 | | 38,723 | |
| | Truist Bank | 1.500% | 3/10/25 | 24,716 | | 25,578 | |
| 1 | Truist Bank | 2.636% | 9/17/29 | 737 | | 758 | |
| | Truist Financial Corp. | 3.200% | 9/3/21 | 10,064 | | 10,327 | |
| | Truist Financial Corp. | 2.700% | 1/27/22 | 17,978 | | 18,530 | |
| | Truist Financial Corp. | 3.950% | 3/22/22 | 8,562 | | 8,978 | |
| | Truist Financial Corp. | 2.750% | 4/1/22 | 23,120 | | 23,931 | |
| | Truist Financial Corp. | 3.050% | 6/20/22 | 30,076 | | 31,409 | |
| | Truist Financial Corp. | 2.200% | 3/16/23 | 5,000 | | 5,210 | |
| | Truist Financial Corp. | 3.750% | 12/6/23 | 14,155 | | 15,593 | |
| | Truist Financial Corp. | 2.500% | 8/1/24 | 21,599 | | 23,073 | |
| | Truist Financial Corp. | 2.850% | 10/26/24 | 6,500 | | 7,104 | |
| | Truist Financial Corp. | 4.000% | 5/1/25 | 20,850 | | 23,784 | |
| | Truist Financial Corp. | 3.700% | 6/5/25 | 7,383 | | 8,404 | |
| | Truist Financial Corp. | 1.200% | 8/5/25 | 7,025 | | 7,185 | |
| | US Bancorp | 2.625% | 1/24/22 | 34,867 | | 35,892 | |
| | US Bancorp | 3.000% | 3/15/22 | 10,794 | | 11,219 | |
| | US Bancorp | 2.950% | 7/15/22 | 14,573 | | 15,228 | |
| | US Bancorp | 3.700% | 1/30/24 | 17,678 | | 19,489 | |
| | US Bancorp | 3.375% | 2/5/24 | 38,724 | | 42,320 | |
| | US Bancorp | 2.400% | 7/30/24 | 20,513 | | 21,850 | |
| | US Bancorp | 3.600% | 9/11/24 | 15,125 | | 16,796 | |
| | US Bancorp | 1.450% | 5/12/25 | 14,639 | | 15,169 | |
| | US Bank NA | 2.850% | 1/23/23 | 10,700 | | 11,306 | |
| | US Bank NA | 3.400% | 7/24/23 | 14,100 | | 15,281 | |
| | US Bank NA | 2.800% | 1/27/25 | 31,577 | | 34,394 | |
| | US Bank NA | 3.450% | 11/16/21 | 9,507 | | 9,844 | |
| | US Bank NA | 1.800% | 1/21/22 | 12,350 | | 12,614 | |
| | US Bank NA | 2.650% | 5/23/22 | 24,350 | | 25,295 | |
| | US Bank NA | 1.950% | 1/9/23 | 16,174 | | 16,741 | |
| | US Bank NA | 2.050% | 1/21/25 | 15,982 | | 16,934 | |
| | Wells Fargo & Co. | 3.000% | 1/22/21 | 11 | | 11 | |
| | Wells Fargo & Co. | 3.500% | 3/8/22 | 40,544 | | 42,419 | |
| | Wells Fargo & Co. | 2.625% | 7/22/22 | 63,522 | | 66,067 | |
| | Wells Fargo & Co. | 3.069% | 1/24/23 | 73,801 | | 76,377 | |
| | Wells Fargo & Co. | 3.450% | 2/13/23 | 40,443 | | 42,972 | |
| | Wells Fargo & Co. | 4.125% | 8/15/23 | 20,018 | | 21,882 | |
| | Wells Fargo & Co. | 4.480% | 1/16/24 | 9,906 | | 10,992 | |
| | Wells Fargo & Co. | 3.750% | 1/24/24 | 46,329 | | 50,604 | |
| 1 | Wells Fargo & Co. | 1.654% | 6/2/24 | 42,900 | | 43,812 | |
| | Wells Fargo & Co. | 3.300% | 9/9/24 | 42,894 | | 46,954 | |
| | Wells Fargo & Co. | 3.000% | 2/19/25 | 59,031 | | 63,849 | |
Vanguard® Short-Term Corporate Bond Index Fund
Schedule of Investments
August 31, 2020
| | Coupon | Maturity
Date | Face
Amount
($000 | ) | Market
Value
($000 | ) |
| 1 | Wells Fargo & Co. | 2.406% | 10/30/25 | 54,354 | | 57,256 | |
| 1 | Wells Fargo & Co. | 2.164% | 2/11/26 | 40,566 | | 42,163 | |
| 1 | Wells Fargo & Co. | 2.188% | 4/30/26 | 74,998 | | 78,373 | |
| | Wells Fargo Bank NA | 3.625% | 10/22/21 | 51,591 | | 53,393 | |
| 1 | Wells Fargo Bank NA | 2.082% | 9/9/22 | 27,744 | | 28,172 | |
| | Wells Fargo Bank NA | 3.550% | 8/14/23 | 38,498 | | 41,800 | |
| | Westpac Banking Corp. | 2.000% | 8/19/21 | 14,461 | | 14,703 | |
| | Westpac Banking Corp. | 2.800% | 1/11/22 | 15,082 | | 15,591 | |
| | Westpac Banking Corp. | 2.500% | 6/28/22 | 26,844 | | 27,913 | |
| | Westpac Banking Corp. | 2.750% | 1/11/23 | 20,931 | | 22,056 | |
| | Westpac Banking Corp. | 2.000% | 1/13/23 | 9,931 | | 10,261 | |
| | Westpac Banking Corp. | 3.650% | 5/15/23 | 17,551 | | 19,048 | |
| | Westpac Banking Corp. | 3.300% | 2/26/24 | 22,420 | | 24,427 | |
| | Westpac Banking Corp. | 2.350% | 2/19/25 | 23,248 | | 24,802 | |
| | Westpac Banking Corp. | 2.850% | 5/13/26 | 10,000 | | 11,079 | |
| 1 | Westpac Banking Corp. | 2.894% | 2/4/30 | 31,999 | | 32,723 | |
| | Brokerage (1.2%) | |
| | Affiliated Managers Group Inc. | 4.250% | 2/15/24 | 5,374 | | 5,917 | |
| | Affiliated Managers Group Inc. | 3.500% | 8/1/25 | 8,262 | | 9,035 | |
| | Ameriprise Financial Inc. | 3.000% | 3/22/22 | 13,333 | | 13,849 | |
| | Ameriprise Financial Inc. | 4.000% | 10/15/23 | 9,114 | | 10,082 | |
| | Ameriprise Financial Inc. | 3.700% | 10/15/24 | 11,148 | | 12,441 | |
| | Ameriprise Financial Inc. | 3.000% | 4/2/25 | 11,355 | | 12,446 | |
| | BGC Partners Inc. | 5.375% | 7/24/23 | 8,624 | | 9,060 | |
| | BGC Partners Inc. | 3.750% | 10/1/24 | 5,090 | | 5,094 | |
| | BlackRock Inc. | 3.375% | 6/1/22 | 8,430 | | 8,862 | |
| | BlackRock Inc. | 3.500% | 3/18/24 | 20,739 | | 22,856 | |
| | Brookfield Asset Management Inc. | 4.000% | 1/15/25 | 6,943 | | 7,729 | |
| | Brookfield Finance LLC | 4.000% | 4/1/24 | 13,944 | | 15,378 | |
| | Charles Schwab Corp. | 3.225% | 9/1/22 | 1,500 | | 1,592 | |
| | Charles Schwab Corp. | 2.650% | 1/25/23 | 14,411 | | 15,173 | |
| | Charles Schwab Corp. | 3.550% | 2/1/24 | 13,452 | | 14,748 | |
| | Charles Schwab Corp. | 3.000% | 3/10/25 | 7,495 | | 8,199 | |
| | Charles Schwab Corp. | 4.200% | 3/24/25 | 4,425 | | 5,108 | |
| | Charles Schwab Corp. | 3.850% | 5/21/25 | 12,351 | | 14,144 | |
| | CME Group Inc. | 3.000% | 9/15/22 | 13,703 | | 14,417 | |
| | CME Group Inc. | 3.000% | 3/15/25 | 12,542 | | 13,775 | |
| | E*TRADE Financial Corp. | 2.950% | 8/24/22 | 10,571 | | 11,041 | |
| | Eaton Vance Corp. | 3.625% | 6/15/23 | 4,680 | | 4,951 | |
| | Franklin Resources Inc. | 2.800% | 9/15/22 | 5,033 | | 5,253 | |
| | Franklin Resources Inc. | 2.850% | 3/30/25 | 7,038 | | 7,660 | |
| | Intercontinental Exchange Inc. | 2.350% | 9/15/22 | 11,034 | | 11,439 | |
| | Intercontinental Exchange Inc. | 0.700% | 6/15/23 | 17,000 | | 17,109 | |
| | Intercontinental Exchange Inc. | 3.450% | 9/21/23 | 7,860 | | 8,529 | |
| | Intercontinental Exchange Inc. | 4.000% | 10/15/23 | 13,268 | | 14,795 | |
| | Invesco Finance plc | 3.125% | 11/30/22 | 10,581 | | 11,190 | |
| | Invesco Finance plc | 4.000% | 1/30/24 | 11,013 | | 12,059 | |
| | Janus Capital Group Inc. | 4.875% | 8/1/25 | 5,065 | | 5,747 | |
| | Jefferies Financial Group Inc. | 5.500% | 10/18/23 | 12,891 | | 14,194 | |
| | Jefferies Group LLC | 5.125% | 1/20/23 | 9,496 | | 10,384 | |
| | Lazard Group LLC | 3.750% | 2/13/25 | 6,833 | | 7,367 | |
| | Nasdaq Inc. | 4.250% | 6/1/24 | 7,460 | | 8,347 | |
| | Nomura Holdings Inc. | 2.648% | 1/16/25 | 29,186 | | 30,748 | |
| | Nomura Holdings Inc. | 1.851% | 7/16/25 | 25,700 | | 26,144 | |
| | Stifel Financial Corp. | 4.250% | 7/18/24 | 5,837 | | 6,445 | |
| | TD Ameritrade Holding Corp. | 2.950% | 4/1/22 | 13,325 | | 13,791 | |
| | TD Ameritrade Holding Corp. | 3.750% | 4/1/24 | 8,258 | | 9,154 | |
| | TD Ameritrade Holding Corp. | 3.625% | 4/1/25 | 8,542 | | 9,610 | |
| | Finance Companies (1.4%) | |
| | AerCap Ireland Capital DAC / AerCap Global Aviation Trust | 5.000% | 10/1/21 | 11,437 | | 11,752 | |
| | AerCap Ireland Capital DAC / AerCap Global Aviation Trust | 4.450% | 12/16/21 | 10,240 | | 10,420 | |
Vanguard® Short-Term Corporate Bond Index Fund
Schedule of Investments
August 31, 2020
| | Coupon | Maturity
Date | Face
Amount
($000 | ) | Market
Value
($000 | ) |
| | AerCap Ireland Capital DAC / AerCap Global Aviation Trust | 3.950% | 2/1/22 | 22,743 | | 22,926 | |
| | AerCap Ireland Capital DAC / AerCap Global Aviation Trust | 3.500% | 5/26/22 | 13,443 | | 13,512 | |
| | AerCap Ireland Capital DAC / AerCap Global Aviation Trust | 4.625% | 7/1/22 | 11,472 | | 11,745 | |
| | AerCap Ireland Capital DAC / AerCap Global Aviation Trust | 3.300% | 1/23/23 | 14,227 | | 14,126 | |
| | AerCap Ireland Capital DAC / AerCap Global Aviation Trust | 4.125% | 7/3/23 | 13,460 | | 13,644 | |
| | AerCap Ireland Capital DAC / AerCap Global Aviation Trust | 4.500% | 9/15/23 | 14,900 | | 15,325 | |
| | AerCap Ireland Capital DAC / AerCap Global Aviation Trust | 4.875% | 1/16/24 | 19,626 | | 20,133 | |
| | AerCap Ireland Capital DAC / AerCap Global Aviation Trust | 2.875% | 8/14/24 | 11,385 | | 10,896 | |
| | AerCap Ireland Capital DAC / AerCap Global Aviation Trust | 3.500% | 1/15/25 | 7,821 | | 7,585 | |
| | AerCap Ireland Capital DAC / AerCap Global Aviation Trust | 6.500% | 7/15/25 | 22,033 | | 23,913 | |
| | Air Lease Corp. | 3.500% | 1/15/22 | 8,577 | | 8,760 | |
| | Air Lease Corp. | 3.750% | 2/1/22 | 11,775 | | 12,008 | |
| | Air Lease Corp. | 2.625% | 7/1/22 | 12,531 | | 12,626 | |
| | Air Lease Corp. | 2.250% | 1/15/23 | 1,507 | | 1,509 | |
| | Air Lease Corp. | 2.750% | 1/15/23 | 11,978 | | 12,041 | |
| | Air Lease Corp. | 3.875% | 7/3/23 | 10,195 | | 10,524 | |
| | Air Lease Corp. | 3.000% | 9/15/23 | 12,950 | | 12,989 | |
| | Air Lease Corp. | 4.250% | 2/1/24 | 17,821 | | 18,629 | |
| | Air Lease Corp. | 4.250% | 9/15/24 | 9,742 | | 10,117 | |
| | Air Lease Corp. | 2.300% | 2/1/25 | 13,183 | | 12,918 | |
| | Air Lease Corp. | 3.250% | 3/1/25 | 10,352 | | 10,480 | |
| | Air Lease Corp. | 3.375% | 7/1/25 | 17,000 | | 17,283 | |
| | Aircastle Ltd. | 5.500% | 2/15/22 | 7,420 | | 7,568 | |
| | Aircastle Ltd. | 5.000% | 4/1/23 | 6,707 | | 6,741 | |
| | Aircastle Ltd. | 4.400% | 9/25/23 | 20,016 | | 19,741 | |
| | Aircastle Ltd. | 4.125% | 5/1/24 | 5,159 | | 4,991 | |
| | Ares Capital Corp. | 3.625% | 1/19/22 | 11,860 | | 12,151 | |
| | Ares Capital Corp. | 3.500% | 2/10/23 | 12,227 | | 12,467 | |
| | Ares Capital Corp. | 4.200% | 6/10/24 | 13,968 | | 14,370 | |
| | Ares Capital Corp. | 4.250% | 3/1/25 | 12,943 | | 13,267 | |
| | Ares Capital Corp. | 3.250% | 7/15/25 | 11,274 | | 11,175 | |
| | FS KKR Capital Corp. | 4.750% | 5/15/22 | 7,565 | | 7,688 | |
| | FS KKR Capital Corp. | 4.625% | 7/15/24 | 8,610 | | 8,653 | |
| | FS KKR Capital Corp. | 4.125% | 2/1/25 | 8,400 | | 8,334 | |
| | GATX Corp. | 3.900% | 3/30/23 | 1,775 | | 1,875 | |
| | GATX Corp. | 4.350% | 2/15/24 | 5,433 | | 5,927 | |
| | GATX Corp. | 3.250% | 3/30/25 | 2,008 | | 2,128 | |
| 2 | GE Capital Funding LLC | 3.450% | 5/15/25 | 23,580 | | 24,976 | |
| | Goldman Sachs BDC Inc. | 3.750% | 2/10/25 | 7,600 | | 7,989 | |
| | International Lease Finance Corp. | 5.875% | 8/15/22 | 13,222 | | 14,296 | |
| | Main Street Capital Corp. | 5.200% | 5/1/24 | 6,868 | | 7,134 | |
| | Oaktree Specialty Lending Corp. | 3.500% | 2/25/25 | 5,770 | | 5,793 | |
| | Owl Rock Capital Corp. | 5.250% | 4/15/24 | 6,650 | | 7,024 | |
| | Owl Rock Capital Corp. | 4.000% | 3/30/25 | 7,955 | | 8,028 | |
| | Owl Rock Capital Corp. | 3.750% | 7/22/25 | 8,758 | | 8,727 | |
| | Prospect Capital Corp. | 5.875% | 3/15/23 | 5,564 | | 5,805 | |
| | Sixth Street Specialty Lending Inc. | 3.875% | 11/1/24 | 5,163 | | 5,181 | |
| | Insurance (3.3%) | |
| | Aetna Inc. | 2.750% | 11/15/22 | 17,596 | | 18,341 | |
| | Aetna Inc. | 2.800% | 6/15/23 | 14,239 | | 15,055 | |
| | Aetna Inc. | 3.500% | 11/15/24 | 13,924 | | 15,314 | |
| | Aflac Inc. | 3.625% | 6/15/23 | 13,221 | | 14,379 | |
| | Aflac Inc. | 3.625% | 11/15/24 | 19,564 | | 22,064 | |
Vanguard® Short-Term Corporate Bond Index Fund
Schedule of Investments
August 31, 2020
| | Coupon | Maturity
Date | Face
Amount
($000 | ) | Market
Value
($000 | ) |
| | Aflac Inc. | 3.250% | 3/17/25 | 9,620 | | 10,671 | |
| | Alleghany Corp. | 4.950% | 6/27/22 | 7,020 | | 7,516 | |
| | Allstate Corp. | 3.150% | 6/15/23 | 10,879 | | 11,726 | |
| 1 | Allstate Corp. | 5.750% | 8/15/53 | 10,734 | | 11,432 | |
| | American International Group Inc. | 4.875% | 6/1/22 | 19,418 | | 20,890 | |
| | American International Group Inc. | 4.125% | 2/15/24 | 20,687 | | 23,009 | |
| | American International Group Inc. | 2.500% | 6/30/25 | 39,782 | | 42,496 | |
| | American International Group Inc. | 3.750% | 7/10/25 | 13,294 | | 14,896 | |
| | Anthem Inc. | 3.700% | 8/15/21 | 1,808 | | 1,849 | |
| | Anthem Inc. | 3.125% | 5/15/22 | 14,251 | | 14,892 | |
| | Anthem Inc. | 2.950% | 12/1/22 | 14,044 | | 14,764 | |
| | Anthem Inc. | 3.300% | 1/15/23 | 18,646 | | 19,833 | |
| | Anthem Inc. | 3.500% | 8/15/24 | 27,767 | | 30,462 | |
| | Anthem Inc. | 3.350% | 12/1/24 | 21,666 | | 23,846 | |
| | Anthem Inc. | 2.375% | 1/15/25 | 27,037 | | 28,748 | |
| | Aon Corp. | 2.200% | 11/15/22 | 2,923 | | 3,032 | |
| | Aon plc | 2.800% | 3/15/21 | 6,399 | | 6,463 | |
| | Aon plc | 4.000% | 11/27/23 | 5,047 | | 5,526 | |
| | Aon plc | 3.500% | 6/14/24 | 10,712 | | 11,732 | |
| | Aspen Insurance Holdings Ltd. | 4.650% | 11/15/23 | 4,485 | | 4,823 | |
| | Assurant Inc. | 4.000% | 3/15/23 | 5,825 | | 6,185 | |
| | Assurant Inc. | 4.200% | 9/27/23 | 3,600 | | 3,867 | |
| | Assured Guaranty US Holdings Inc. | 5.000% | 7/1/24 | 4,955 | | 5,578 | |
| | Berkshire Hathaway Finance Corp. | 3.000% | 5/15/22 | 18,314 | | 19,144 | |
| | Berkshire Hathaway Inc. | 3.750% | 8/15/21 | 5,577 | | 5,767 | |
| | Berkshire Hathaway Inc. | 3.400% | 1/31/22 | 11,948 | | 12,480 | |
| | Berkshire Hathaway Inc. | 3.000% | 2/11/23 | 5,797 | | 6,173 | |
| | Berkshire Hathaway Inc. | 2.750% | 3/15/23 | 35,147 | | 37,125 | |
| | Brown & Brown Inc. | 4.200% | 9/15/24 | 7,254 | | 8,023 | |
| | Chubb INA Holdings Inc. | 2.875% | 11/3/22 | 16,592 | | 17,413 | |
| | Chubb INA Holdings Inc. | 2.700% | 3/13/23 | 12,311 | | 12,997 | |
| | Chubb INA Holdings Inc. | 3.350% | 5/15/24 | 15,498 | | 17,058 | |
| | Chubb INA Holdings Inc. | 3.150% | 3/15/25 | 16,195 | | 18,006 | |
| | CNA Financial Corp. | 5.750% | 8/15/21 | 5,825 | | 6,117 | |
| | CNA Financial Corp. | 3.950% | 5/15/24 | 9,498 | | 10,468 | |
| | CNO Financial Group Inc. | 5.250% | 5/30/25 | 6,075 | | 6,918 | |
| | Enstar Group Ltd. | 4.500% | 3/10/22 | 4,210 | | 4,320 | |
| | Equitable Holdings Inc. | 3.900% | 4/20/23 | 16,918 | | 18,229 | |
| | Fidelity National Financial Inc. | 5.500% | 9/1/22 | 4,430 | | 4,827 | |
| | First American Financial Corp. | 4.600% | 11/15/24 | 4,285 | | 4,680 | |
| | Globe Life Inc. | 3.800% | 9/15/22 | 3,870 | | 4,117 | |
| | Humana Inc. | 3.150% | 12/1/22 | 13,879 | | 14,675 | |
| | Humana Inc. | 2.900% | 12/15/22 | 8,789 | | 9,227 | |
| | Humana Inc. | 3.850% | 10/1/24 | 9,283 | | 10,253 | |
| | Humana Inc. | 4.500% | 4/1/25 | 12,961 | | 14,986 | |
| | Kemper Corp. | 4.350% | 2/15/25 | 7,139 | | 7,806 | |
| | Lincoln National Corp. | 4.200% | 3/15/22 | 6,728 | | 7,112 | |
| | Lincoln National Corp. | 4.000% | 9/1/23 | 8,987 | | 9,827 | |
| | Lincoln National Corp. | 3.350% | 3/9/25 | 2,533 | | 2,760 | |
| | Loews Corp. | 2.625% | 5/15/23 | 8,123 | | 8,553 | |
| | Markel Corp. | 4.900% | 7/1/22 | 5,405 | | 5,799 | |
| | Marsh & McLennan Cos. Inc. | 2.750% | 1/30/22 | 15,052 | | 15,511 | |
| | Marsh & McLennan Cos. Inc. | 3.300% | 3/14/23 | 5,641 | | 5,993 | |
| | Marsh & McLennan Cos. Inc. | 3.875% | 3/15/24 | 23,172 | | 25,629 | |
| | Marsh & McLennan Cos. Inc. | 3.500% | 6/3/24 | 10,967 | | 12,063 | |
| | Marsh & McLennan Cos. Inc. | 3.500% | 3/10/25 | 4,834 | | 5,364 | |
| | MetLife Inc. | 3.048% | 12/15/22 | 13,153 | | 13,958 | |
| | MetLife Inc. | 4.368% | 9/15/23 | 19,267 | | 21,526 | |
| | MetLife Inc. | 3.600% | 4/10/24 | 13,032 | | 14,489 | |
| | MetLife Inc. | 3.000% | 3/1/25 | 9,081 | | 10,041 | |
| | Old Republic International Corp. | 4.875% | 10/1/24 | 6,273 | | 6,977 | |
| | Primerica Inc. | 4.750% | 7/15/22 | 5,749 | | 6,134 | |
| | Principal Financial Group Inc. | 3.300% | 9/15/22 | 8,266 | | 8,716 | |
| | Principal Financial Group Inc. | 3.125% | 5/15/23 | 4,777 | | 5,092 | |
Vanguard® Short-Term Corporate Bond Index Fund
Schedule of Investments
August 31, 2020
| | Coupon | Maturity
Date | Face
Amount
($000 | ) | Market
Value
($000 | ) |
| | Principal Financial Group Inc. | 3.400% | 5/15/25 | 4,181 | | 4,644 | |
| | Progressive Corp. | 3.750% | 8/23/21 | 9,280 | | 9,596 | |
| | Prudential Financial Inc. | 4.500% | 11/16/21 | 5,947 | | 6,241 | |
| | Prudential Financial Inc. | 3.500% | 5/15/24 | 18,575 | | 20,591 | |
| 1 | Prudential Financial Inc. | 5.875% | 9/15/42 | 15,815 | | 16,879 | |
| 1 | Prudential Financial Inc. | 5.625% | 6/15/43 | 22,006 | | 23,629 | |
| 1 | Prudential Financial Inc. | 5.200% | 3/15/44 | 13,152 | | 13,908 | |
| 1 | Prudential Financial Inc. | 5.375% | 5/15/45 | 14,000 | | 15,155 | |
| | Reinsurance Group of America Inc. | 4.700% | 9/15/23 | 4,708 | | 5,215 | |
| | RenaissanceRe Finance Inc. | 3.700% | 4/1/25 | 4,485 | | 4,859 | |
| | Sompo International Holdings Ltd. | 4.700% | 10/15/22 | 70 | | 74 | |
| | Trinity Acquisition plc | 3.500% | 9/15/21 | 6,864 | | 7,027 | |
| | UnitedHealth Group Inc. | 3.375% | 11/15/21 | 12,356 | | 12,696 | |
| | UnitedHealth Group Inc. | 2.875% | 12/15/21 | 14,208 | | 14,669 | |
| | UnitedHealth Group Inc. | 2.875% | 3/15/22 | 25,080 | | 25,893 | |
| | UnitedHealth Group Inc. | 3.350% | 7/15/22 | 14,478 | | 15,275 | |
| | UnitedHealth Group Inc. | 2.375% | 10/15/22 | 19,411 | | 20,234 | |
| | UnitedHealth Group Inc. | 2.750% | 2/15/23 | 9,041 | | 9,561 | |
| | UnitedHealth Group Inc. | 2.875% | 3/15/23 | 14,934 | | 15,849 | |
| | UnitedHealth Group Inc. | 3.500% | 6/15/23 | 10,968 | | 11,884 | |
| | UnitedHealth Group Inc. | 3.500% | 2/15/24 | 12,302 | | 13,514 | |
| | UnitedHealth Group Inc. | 2.375% | 8/15/24 | 12,690 | | 13,558 | |
| | UnitedHealth Group Inc. | 3.750% | 7/15/25 | 30,897 | | 35,271 | |
| | UnitedHealth Group Inc. | 1.250% | 1/15/26 | 2,000 | | 2,049 | |
| | Unum Group | 4.000% | 3/15/24 | 8,034 | | 8,655 | |
| | Unum Group | 4.500% | 3/15/25 | 8,475 | | 9,426 | |
| | Voya Financial Inc. | 3.125% | 7/15/24 | 6,176 | | 6,637 | |
| 1 | Voya Financial Inc. | 5.650% | 5/15/53 | 10,369 | | 10,797 | |
| | Willis North America Inc. | 3.600% | 5/15/24 | 18,876 | | 20,572 | |
| | WR Berkley Corp. | 4.625% | 3/15/22 | 5,241 | | 5,543 | |
| | XLIT Ltd. | 4.450% | 3/31/25 | 6,639 | | 7,452 | |
| | Other Finance (0.1%) | |
| 2 | Blackstone / GSO Secured Lending Fund | 3.650% | 7/14/23 | 2,925 | | 2,922 | |
| | ORIX Corp. | 2.900% | 7/18/22 | 12,567 | | 13,069 | |
| | ORIX Corp. | 4.050% | 1/16/24 | 50 | | 55 | |
| | ORIX Corp. | 3.250% | 12/4/24 | 16,795 | | 18,244 | |
| | Real Estate Investment Trusts (2.4%) | |
| | Alexandria Real Estate Equities Inc. | 4.000% | 1/15/24 | 22,969 | | 25,387 | |
| | Alexandria Real Estate Equities Inc. | 3.450% | 4/30/25 | 16,698 | | 18,579 | |
| | American Campus Communities Operating Partnership LP | 3.750% | 4/15/23 | 5,950 | | 6,240 | |
| | American Campus Communities Operating Partnership LP | 4.125% | 7/1/24 | 8,496 | | 9,167 | |
| | AvalonBay Communities Inc. | 2.950% | 9/15/22 | 7,210 | | 7,516 | |
| | AvalonBay Communities Inc. | 4.200% | 12/15/23 | 4,733 | | 5,224 | |
| | AvalonBay Communities Inc. | 3.500% | 11/15/24 | 5,290 | | 5,846 | |
| | AvalonBay Communities Inc. | 3.450% | 6/1/25 | 8,522 | | 9,514 | |
| | Boston Properties LP | 3.850% | 2/1/23 | 10,768 | | 11,455 | |
| | Boston Properties LP | 3.125% | 9/1/23 | 13,114 | | 13,885 | |
| | Boston Properties LP | 3.800% | 2/1/24 | 14,835 | | 16,096 | |
| | Boston Properties LP | 3.200% | 1/15/25 | 15,438 | | 16,711 | |
| | Brandywine Operating Partnership LP | 3.950% | 2/15/23 | 4,973 | | 5,135 | |
| | Brandywine Operating Partnership LP | 4.100% | 10/1/24 | 6,335 | | 6,653 | |
| | Brixmor Operating Partnership LP | 3.875% | 8/15/22 | 666 | | 691 | |
| | Brixmor Operating Partnership LP | 3.250% | 9/15/23 | 8,828 | | 9,105 | |
| | Brixmor Operating Partnership LP | 3.650% | 6/15/24 | 10,061 | | 10,513 | |
| | Brixmor Operating Partnership LP | 3.850% | 2/1/25 | 11,825 | | 12,530 | |
| | Camden Property Trust | 2.950% | 12/15/22 | 6,687 | | 6,972 | |
| | Columbia Property Trust Operating Partnership LP | 4.150% | 4/1/25 | 6,098 | | 6,430 | |
| | Corporate Office Properties LP | 3.600% | 5/15/23 | 5,304 | | 5,483 | |
| | Corporate Office Properties LP | 5.000% | 7/1/25 | 3,217 | | 3,511 | |
| | CubeSmart LP | 4.375% | 12/15/23 | 4,645 | | 5,098 | |
| | CyrusOne LP / CyrusOne Finance Corp. | 2.900% | 11/15/24 | 11,863 | | 12,665 | |
Vanguard® Short-Term Corporate Bond Index Fund
Schedule of Investments
August 31, 2020
| | Coupon | Maturity
Date | Face
Amount
($000 | ) | Market
Value
($000 | ) |
| | Digital Realty Trust LP | 2.750% | 2/1/23 | 6,181 | | 6,474 | |
| | Duke Realty LP | 3.625% | 4/15/23 | 1,500 | | 1,596 | |
| | Duke Realty LP | 3.750% | 12/1/24 | 4,870 | | 5,376 | |
| | EPR Properties | 4.500% | 4/1/25 | 5,763 | | 5,540 | |
| | ERP Operating LP | 4.625% | 12/15/21 | 4,734 | | 4,936 | |
| | ERP Operating LP | 3.000% | 4/15/23 | 4,345 | | 4,585 | |
| | ERP Operating LP | 3.375% | 6/1/25 | 3,725 | | 4,117 | |
| | Essex Portfolio LP | 3.625% | 8/15/22 | 4,300 | | 4,528 | |
| | Essex Portfolio LP | 3.375% | 1/15/23 | 1,000 | | 1,048 | |
| | Essex Portfolio LP | 3.250% | 5/1/23 | 7,589 | | 8,026 | |
| | Essex Portfolio LP | 3.875% | 5/1/24 | 4,095 | | 4,489 | |
| | Essex Portfolio LP | 3.500% | 4/1/25 | 9,088 | | 9,986 | |
| | Federal Realty Investment Trust | 3.950% | 1/15/24 | 10,000 | | 10,839 | |
| | Healthcare Trust of America Holdings LP | 3.700% | 4/15/23 | 2,375 | | 2,502 | |
| | Healthpeak Properties Inc. | 4.250% | 11/15/23 | 1,281 | | 1,404 | |
| | Healthpeak Properties Inc. | 4.200% | 3/1/24 | 5,803 | | 6,384 | |
| | Healthpeak Properties Inc. | 3.875% | 8/15/24 | 17,572 | | 19,590 | |
| | Healthpeak Properties Inc. | 3.400% | 2/1/25 | 12,225 | | 13,374 | |
| | Healthpeak Properties Inc. | 4.000% | 6/1/25 | 10,332 | | 11,613 | |
| | Highwoods Realty LP | 3.625% | 1/15/23 | 1,360 | | 1,414 | |
| | Host Hotels & Resorts LP | 3.750% | 10/15/23 | 9,841 | | 10,202 | |
| | Host Hotels & Resorts LP | 3.875% | 4/1/24 | 8,907 | | 9,255 | |
| | Host Hotels & Resorts LP | 4.000% | 6/15/25 | 8,477 | | 8,859 | |
| | Kilroy Realty LP | 3.450% | 12/15/24 | 9,810 | | 10,337 | |
| | Kimco Realty Corp. | 3.400% | 11/1/22 | 5,506 | | 5,809 | |
| | Kimco Realty Corp. | 3.125% | 6/1/23 | 4,928 | | 5,194 | |
| | Kimco Realty Corp. | 2.700% | 3/1/24 | 5,843 | | 6,078 | |
| | Kimco Realty Corp. | 3.300% | 2/1/25 | 13,526 | | 14,509 | |
| | Mid-America Apartments LP | 4.300% | 10/15/23 | 7,080 | | 7,718 | |
| | Mid-America Apartments LP | 3.750% | 6/15/24 | 4,775 | | 5,192 | |
| | National Retail Properties Inc. | 3.300% | 4/15/23 | 4,690 | | 4,913 | |
| | National Retail Properties Inc. | 3.900% | 6/15/24 | 6,812 | | 7,409 | |
| | Office Properties Income Trust | 4.000% | 7/15/22 | 6,500 | | 6,500 | |
| | Omega Healthcare Investors Inc. | 4.375% | 8/1/23 | 11,031 | | 11,814 | |
| | Omega Healthcare Investors Inc. | 4.950% | 4/1/24 | 8,338 | | 8,898 | |
| | Omega Healthcare Investors Inc. | 4.500% | 1/15/25 | 5,053 | | 5,303 | |
| | Piedmont Operating Partnership LP | 3.400% | 6/1/23 | 4,466 | | 4,601 | |
| | Piedmont Operating Partnership LP | 4.450% | 3/15/24 | 6,395 | | 6,771 | |
| | Prologis LP | 4.250% | 8/15/23 | 20,099 | | 22,241 | |
| | Public Storage | 2.370% | 9/15/22 | 15,936 | | 16,528 | |
| | Realty Income Corp. | 3.250% | 10/15/22 | 11,339 | | 11,906 | |
| | Realty Income Corp. | 4.650% | 8/1/23 | 10,476 | | 11,635 | |
| | Realty Income Corp. | 3.875% | 7/15/24 | 7,986 | | 8,825 | |
| | Realty Income Corp. | 3.875% | 4/15/25 | 10,502 | | 11,892 | |
| | Regency Centers Corp. | 3.750% | 11/15/22 | 6,205 | | 6,605 | |
| | Sabra Health Care LP / Sabra Capital Corp. | 4.800% | 6/1/24 | 6,605 | | 6,923 | |
| | Select Income REIT | 4.150% | 2/1/22 | 6,765 | | 6,799 | |
| | Select Income REIT | 4.250% | 5/15/24 | 5,128 | | 5,206 | |
| | Select Income REIT | 4.500% | 2/1/25 | 5,425 | | 5,514 | |
| | Simon Property Group LP | 2.350% | 1/30/22 | 11,176 | | 11,372 | |
| | Simon Property Group LP | 2.625% | 6/15/22 | 7,400 | | 7,604 | |
| | Simon Property Group LP | 2.750% | 2/1/23 | 11,017 | | 11,443 | |
| | Simon Property Group LP | 2.750% | 6/1/23 | 10,312 | | 10,752 | |
| | Simon Property Group LP | 3.750% | 2/1/24 | 10,175 | | 10,991 | |
| | Simon Property Group LP | 2.000% | 9/13/24 | 23,162 | | 23,921 | |
| | Simon Property Group LP | 3.375% | 10/1/24 | 11,118 | | 12,024 | |
| | Simon Property Group LP | 3.500% | 9/1/25 | 2,000 | | 2,197 | |
| | SITE Centers Corp. | 3.625% | 2/1/25 | 7,924 | | 8,052 | |
| | SL Green Operating Partnership LP | 3.250% | 10/15/22 | 7,116 | | 7,259 | |
| | SL Green Realty Corp. | 4.500% | 12/1/22 | 6,133 | | 6,387 | |
| | Ventas Realty LP | 3.100% | 1/15/23 | 5,540 | | 5,742 | |
| | Ventas Realty LP | 3.125% | 6/15/23 | 9,672 | | 10,083 | |
| | Ventas Realty LP | 3.500% | 4/15/24 | 7,268 | | 7,741 | |
| | Ventas Realty LP | 3.750% | 5/1/24 | 6,634 | | 7,090 | |
Vanguard® Short-Term Corporate Bond Index Fund
Schedule of Investments
August 31, 2020
| | Coupon | Maturity
Date | Face
Amount
($000 | ) | Market
Value
($000 | ) |
| | Ventas Realty LP | 2.650% | 1/15/25 | 11,913 | | 12,498 | |
| | Ventas Realty LP | 3.500% | 2/1/25 | 5,031 | | 5,406 | |
| | Ventas Realty LP / Ventas Capital Corp. | 3.250% | 8/15/22 | 10,338 | | 10,686 | |
| | VEREIT Operating Partnership LP | 4.600% | 2/6/24 | 12,151 | | 13,001 | |
| | Vornado Realty LP | 3.500% | 1/15/25 | 8,719 | | 9,014 | |
| | Washington REIT | 3.950% | 10/15/22 | 2,660 | | 2,733 | |
| | Weingarten Realty Investors | 3.375% | 10/15/22 | 2,209 | | 2,261 | |
| | Weingarten Realty Investors | 3.500% | 4/15/23 | 3,465 | | 3,560 | |
| | Welltower Inc. | 4.500% | 1/15/24 | 8,859 | | 9,730 | |
| | Welltower Inc. | 3.625% | 3/15/24 | 22,848 | | 24,682 | |
| | Welltower Inc. | 4.000% | 6/1/25 | 33,766 | | 37,939 | |
| | WP Carey Inc. | 4.600% | 4/1/24 | 6,191 | | 6,803 | |
| | WP Carey Inc. | 4.000% | 2/1/25 | 6,806 | | 7,427 | |
| | | 15,665,449 | |
| Industrial (53.4%) | |
| | Basic Industry (2.2%) | |
| | Air Products & Chemicals Inc. | 3.000% | 11/3/21 | 5,934 | | 6,114 | |
| | Air Products & Chemicals Inc. | 2.750% | 2/3/23 | 5,799 | | 6,112 | |
| | Air Products & Chemicals Inc. | 3.350% | 7/31/24 | 9,170 | | 10,065 | |
| | Air Products and Chemicals Inc. | 1.500% | 10/15/25 | 3,500 | | 3,640 | |
| | Airgas Inc. | 3.650% | 7/15/24 | 4,670 | | 5,154 | |
| | Albemarle Corp. | 4.150% | 12/1/24 | 6,960 | | 7,573 | |
| | BHP Billiton Finance USA Ltd. | 3.250% | 11/21/21 | 1,250 | | 1,291 | |
| | BHP Billiton Finance USA Ltd. | 2.875% | 2/24/22 | 16,870 | | 17,460 | |
| | BHP Billiton Finance USA Ltd. | 3.850% | 9/30/23 | 8,722 | | 9,605 | |
| | Cabot Corp. | 3.700% | 7/15/22 | 5,845 | | 6,083 | |
| | Celanese US Holdings LLC | 4.625% | 11/15/22 | 5,865 | | 6,317 | |
| | Celanese US Holdings LLC | 3.500% | 5/8/24 | 7,575 | | 8,078 | |
| | Celulosa Arauco y Constitucion SA | 4.500% | 8/1/24 | 8,520 | | 9,255 | |
| | Domtar Corp. | 4.400% | 4/1/22 | 4,403 | | 4,473 | |
| | Dow Chemical Co. | 3.150% | 5/15/24 | 16,554 | | 17,864 | |
| | Dow Chemical Co. | 3.500% | 10/1/24 | 14,583 | | 15,963 | |
| | Dow Chemical Co. | 3.625% | 5/15/26 | 4,847 | | 5,412 | |
| | DuPont de Nemours Inc. | 2.169% | 5/1/23 | 38,548 | | 39,437 | |
| | DuPont de Nemours Inc. | 4.205% | 11/15/23 | 41,013 | | 45,222 | |
| | Eastman Chemical Co. | 3.500% | 12/1/21 | 6,991 | | 7,234 | |
| | Eastman Chemical Co. | 3.600% | 8/15/22 | 13,560 | | 14,210 | |
| | Eastman Chemical Co. | 3.800% | 3/15/25 | 16,301 | | 18,050 | |
| | Ecolab Inc. | 4.350% | 12/8/21 | 31,665 | | 33,200 | |
| | Ecolab Inc. | 2.375% | 8/10/22 | 14,963 | | 15,520 | |
| | Ecolab Inc. | 3.250% | 1/14/23 | 4,567 | | 4,843 | |
| | EI du Pont de Nemours & Co. | 1.700% | 7/15/25 | 9,101 | | 9,462 | |
| | Fibria Overseas Finance Ltd. | 5.250% | 5/12/24 | 6,663 | | 7,229 | |
| | Fibria Overseas Finance Ltd. | 4.000% | 1/14/25 | 13,135 | | 13,863 | |
| | FMC Corp. | 3.950% | 2/1/22 | 3,080 | | 3,186 | |
| | FMC Corp. | 4.100% | 2/1/24 | 7,443 | | 8,112 | |
| | Georgia-Pacific LLC | 8.000% | 1/15/24 | 3,695 | | 4,578 | |
| 2 | Georgia-Pacific LLC | 1.750% | 9/30/25 | 5,000 | | 5,230 | |
| | Huntsman International LLC | 5.125% | 11/15/22 | 398 | | 426 | |
| | International Flavors & Fragrances Inc. | 3.200% | 5/1/23 | 5,154 | | 5,360 | |
| | International Paper Co. | 3.650% | 6/15/24 | 12,146 | | 13,423 | |
| | Kinross Gold Corp. | 5.125% | 9/1/21 | 9,255 | | 9,556 | |
| | Kinross Gold Corp. | 5.950% | 3/15/24 | 7,486 | | 8,562 | |
| | LYB International Finance BV | 4.000% | 7/15/23 | 16,296 | | 17,723 | |
| | LYB International Finance III LLC | 2.875% | 5/1/25 | 11,784 | | 12,653 | |
| | LyondellBasell Industries NV | 6.000% | 11/15/21 | 11,878 | | 12,481 | |
| | LyondellBasell Industries NV | 5.750% | 4/15/24 | 10,239 | | 11,828 | |
| | Mosaic Co. | 3.750% | 11/15/21 | 2,280 | | 2,335 | |
| | Mosaic Co. | 3.250% | 11/15/22 | 15,775 | | 16,472 | |
| | Mosaic Co. | 4.250% | 11/15/23 | 16,241 | | 17,631 | |
| | NewMarket Corp. | 4.100% | 12/15/22 | 2,725 | | 2,914 | |
| | Newmont Corp. | 3.625% | 6/9/21 | 7,000 | | 7,131 | |
| | Newmont Corp. | 3.700% | 3/15/23 | 2,850 | | 3,003 | |
Vanguard® Short-Term Corporate Bond Index Fund
Schedule of Investments
August 31, 2020
| | Coupon | Maturity
Date | Face
Amount
($000 | ) | Market
Value
($000 | ) |
| | Nucor Corp. | 4.125% | 9/15/22 | 6,300 | | 6,720 | |
| | Nucor Corp. | 4.000% | 8/1/23 | 14,762 | | 16,112 | |
| | Nucor Corp. | 2.000% | 6/1/25 | 11,465 | | 12,023 | |
| | Nutrien Ltd. | 3.150% | 10/1/22 | 8,154 | | 8,532 | |
| | Nutrien Ltd. | 1.900% | 5/13/23 | 7,054 | | 7,293 | |
| | Nutrien Ltd. | 3.500% | 6/1/23 | 6,406 | | 6,846 | |
| | Nutrien Ltd. | 3.625% | 3/15/24 | 9,750 | | 10,642 | |
| | Nutrien Ltd. | 3.375% | 3/15/25 | 9,838 | | 10,874 | |
| | Nutrien Ltd. | 3.000% | 4/1/25 | 7,333 | | 7,948 | |
| | Packaging Corp. of America | 4.500% | 11/1/23 | 11,110 | | 12,236 | |
| | Packaging Corp. of America | 3.650% | 9/15/24 | 6,282 | | 6,885 | |
| | PPG Industries Inc. | 3.200% | 3/15/23 | 5,365 | | 5,673 | |
| | PPG Industries Inc. | 2.400% | 8/15/24 | 5,125 | | 5,447 | |
| | Praxair Inc. | 3.000% | 9/1/21 | 5,000 | | 5,134 | |
| | Praxair Inc. | 2.450% | 2/15/22 | 10,477 | | 10,737 | |
| | Praxair Inc. | 2.200% | 8/15/22 | 9,023 | | 9,299 | |
| | Praxair Inc. | 2.700% | 2/21/23 | 11,691 | | 12,251 | |
| | Praxair Inc. | 2.650% | 2/5/25 | 4,619 | | 4,985 | |
| | Rayonier Inc. | 3.750% | 4/1/22 | 4,100 | | 4,201 | |
| | Reliance Steel & Aluminum Co. | 4.500% | 4/15/23 | 5,083 | | 5,491 | |
| | Reliance Steel & Aluminum Co. | 1.300% | 8/15/25 | 5,000 | | 5,009 | |
| | Rio Tinto Finance USA Ltd. | 3.750% | 6/15/25 | 20,210 | | 22,876 | |
| | RPM International Inc. | 3.450% | 11/15/22 | 3,758 | | 3,867 | |
| | Sherwin-Williams Co. | 4.200% | 1/15/22 | 5,261 | | 5,479 | |
| | Sherwin-Williams Co. | 2.750% | 6/1/22 | 2,073 | | 2,151 | |
| | Sherwin-Williams Co. | 3.125% | 6/1/24 | 17,283 | | 18,736 | |
| | Sherwin-Williams Co. | 3.450% | 8/1/25 | 6,652 | | 7,388 | |
| | Southern Copper Corp. | 3.500% | 11/8/22 | 4,915 | | 5,173 | |
| | Southern Copper Corp. | 3.875% | 4/23/25 | 7,850 | | 8,668 | |
| | Steel Dynamics Inc. | 2.800% | 12/15/24 | 18,632 | | 19,750 | |
| | Steel Dynamics Inc. | 2.400% | 6/15/25 | 3,050 | | 3,206 | |
| | WestRock RKT Co. | 4.900% | 3/1/22 | 3,872 | | 4,115 | |
| | WestRock RKT Co. | 4.000% | 3/1/23 | 7,345 | | 7,874 | |
| | Weyerhaeuser Co. | 3.250% | 3/15/23 | 3,148 | | 3,352 | |
| | Weyerhaeuser Co. | 4.625% | 9/15/23 | 13,794 | | 15,394 | |
| | Weyerhaeuser Co. | 8.500% | 1/15/25 | 2,569 | | 3,325 | |
| | WRKCo Inc. | 3.000% | 9/15/24 | 18,372 | | 19,838 | |
| | WRKCo Inc. | 3.750% | 3/15/25 | 12,690 | | 14,195 | |
| | Capital Goods (5.6%) | |
| | 3M Co. | 3.000% | 9/14/21 | 604 | | 620 | |
| | 3M Co. | 1.625% | 9/19/21 | 10,777 | | 10,918 | |
| | 3M Co. | 2.750% | 3/1/22 | 4,970 | | 5,135 | |
| | 3M Co. | 2.000% | 6/26/22 | 9,782 | | 10,077 | |
| | 3M Co. | 1.750% | 2/14/23 | 7,920 | | 8,190 | |
| | 3M Co. | 2.250% | 3/15/23 | 15,616 | | 16,327 | |
| | 3M Co. | 3.250% | 2/14/24 | 13,376 | | 14,600 | |
| | 3M Co. | 2.000% | 2/14/25 | 11,654 | | 12,338 | |
| | 3M Co. | 2.650% | 4/15/25 | 10,793 | | 11,752 | |
| | 3M Co. | 3.000% | 8/7/25 | 4,859 | | 5,418 | |
| 3 | ABB Finance USA Inc. | 2.875% | 5/8/22 | 14,105 | | 14,651 | |
| | ABB Finance USA Inc. | 3.375% | 4/3/23 | 7,492 | | 7,988 | |
| | Allegion US Holding Co. Inc. | 3.200% | 10/1/24 | 6,750 | | 6,975 | |
| | Amphenol Corp. | 3.200% | 4/1/24 | 7,365 | | 7,973 | |
| | Amphenol Corp. | 2.050% | 3/1/25 | 6,762 | | 7,136 | |
| | Bemis Co. Inc. | 4.500% | 10/15/21 | 3,142 | | 3,229 | |
| | Boeing Co. | 2.350% | 10/30/21 | 6,675 | | 6,760 | |
| | Boeing Co. | 2.125% | 3/1/22 | 4,934 | | 4,967 | |
| | Boeing Co. | 2.700% | 5/1/22 | 9,541 | | 9,714 | |
| | Boeing Co. | 2.800% | 3/1/23 | 14,040 | | 14,205 | |
| | Boeing Co. | 4.508% | 5/1/23 | 42,278 | | 44,672 | |
| | Boeing Co. | 1.875% | 6/15/23 | 16,832 | | 16,834 | |
| | Boeing Co. | 2.800% | 3/1/24 | 6,691 | | 6,818 | |
| | Boeing Co. | 2.850% | 10/30/24 | 6,380 | | 6,432 | |
Vanguard® Short-Term Corporate Bond Index Fund
Schedule of Investments
August 31, 2020
| | Coupon | Maturity
Date | Face
Amount
($000 | ) | Market
Value
($000 | ) |
| | Boeing Co. | 4.875% | 5/1/25 | 61,353 | | 67,072 | |
| | Carlisle Cos. Inc. | 3.750% | 11/15/22 | 3,775 | | 3,913 | |
| | Carlisle Cos. Inc. | 3.500% | 12/1/24 | 7,353 | | 8,017 | |
| 2 | Carrier Global Corp. | 1.923% | 2/15/23 | 6,579 | | 6,751 | |
| 2 | Carrier Global Corp. | 2.242% | 2/15/25 | 36,903 | | 38,629 | |
| | Caterpillar Financial Services Corp. | 1.700% | 8/9/21 | 11,282 | | 11,437 | |
| | Caterpillar Financial Services Corp. | 2.750% | 8/20/21 | 2,000 | | 2,048 | |
| | Caterpillar Financial Services Corp. | 3.150% | 9/7/21 | 9,230 | | 9,498 | |
| | Caterpillar Financial Services Corp. | 1.931% | 10/1/21 | 8,054 | | 8,185 | |
| | Caterpillar Financial Services Corp. | 2.950% | 2/26/22 | 10,988 | | 11,401 | |
| | Caterpillar Financial Services Corp. | 0.950% | 5/13/22 | 28,428 | | 28,711 | |
| | Caterpillar Financial Services Corp. | 2.850% | 6/1/22 | 9,600 | | 10,007 | |
| | Caterpillar Financial Services Corp. | 2.400% | 6/6/22 | 12,025 | | 12,446 | |
| | Caterpillar Financial Services Corp. | 1.900% | 9/6/22 | 1,870 | | 1,926 | |
| | Caterpillar Financial Services Corp. | 1.950% | 11/18/22 | 18,911 | | 19,548 | |
| | Caterpillar Financial Services Corp. | 2.550% | 11/29/22 | 12,076 | | 12,671 | |
| | Caterpillar Financial Services Corp. | 2.625% | 3/1/23 | 7,970 | | 8,397 | |
| | Caterpillar Financial Services Corp. | 3.450% | 5/15/23 | 11,885 | | 12,820 | |
| | Caterpillar Financial Services Corp. | 0.650% | 7/7/23 | 8,597 | | 8,643 | |
| | Caterpillar Financial Services Corp. | 3.750% | 11/24/23 | 5,003 | | 5,527 | |
| | Caterpillar Financial Services Corp. | 3.650% | 12/7/23 | 7,227 | | 7,968 | |
| | Caterpillar Financial Services Corp. | 2.850% | 5/17/24 | 8,696 | | 9,377 | |
| | Caterpillar Financial Services Corp. | 3.300% | 6/9/24 | 10,902 | | 11,946 | |
| | Caterpillar Financial Services Corp. | 2.150% | 11/8/24 | 9,066 | | 9,629 | |
| | Caterpillar Financial Services Corp. | 3.250% | 12/1/24 | 9,459 | | 10,426 | |
| | Caterpillar Financial Services Corp. | 1.450% | 5/15/25 | 16,756 | | 17,375 | |
| | Caterpillar Inc. | 2.600% | 6/26/22 | 14,204 | | 14,703 | |
| | Caterpillar Inc. | 3.400% | 5/15/24 | 12,055 | | 13,212 | |
| | CNH Industrial Capital LLC | 3.875% | 10/15/21 | 7,108 | | 7,312 | |
| | CNH Industrial Capital LLC | 4.375% | 4/5/22 | 10,392 | | 10,807 | |
| | CNH Industrial Capital LLC | 1.950% | 7/2/23 | 8,560 | | 8,669 | |
| | CNH Industrial Capital LLC | 4.200% | 1/15/24 | 9,082 | | 9,737 | |
| | CNH Industrial NV | 4.500% | 8/15/23 | 17,477 | | 18,765 | |
| | Crane Co. | 4.450% | 12/15/23 | 4,590 | | 5,027 | |
| | CRH America Inc. | 5.750% | 1/15/21 | 2,809 | | 2,862 | |
| | Deere & Co. | 2.600% | 6/8/22 | 17,199 | | 17,817 | |
| | Deere & Co. | 2.750% | 4/15/25 | 15,231 | | 16,650 | |
| | Eaton Corp. | 2.750% | 11/2/22 | 28,325 | | 29,751 | |
| | Emerson Electric Co. | 4.250% | 11/15/20 | 5,925 | | 5,970 | |
| | Emerson Electric Co. | 2.625% | 12/1/21 | 6,073 | | 6,222 | |
| | Emerson Electric Co. | 2.625% | 2/15/23 | 6,230 | | 6,533 | |
| | Emerson Electric Co. | 3.150% | 6/1/25 | 6,270 | | 6,931 | |
| | Flowserve Corp. | 3.500% | 9/15/22 | 7,005 | | 7,209 | |
| | Flowserve Corp. | 4.000% | 11/15/23 | 6,400 | | 6,608 | |
| | Fortune Brands Home & Security Inc. | 4.000% | 9/21/23 | 10,298 | | 11,304 | |
| | Fortune Brands Home & Security Inc. | 4.000% | 6/15/25 | 8,830 | | 10,069 | |
| | General Dynamics Corp. | 3.875% | 7/15/21 | 11,744 | | 12,006 | |
| | General Dynamics Corp. | 2.250% | 11/15/22 | 12,902 | | 13,387 | |
| | General Dynamics Corp. | 3.375% | 5/15/23 | 18,981 | | 20,480 | |
| | General Dynamics Corp. | 1.875% | 8/15/23 | 5,994 | | 6,236 | |
| | General Dynamics Corp. | 2.375% | 11/15/24 | 9,076 | | 9,733 | |
| | General Dynamics Corp. | 3.250% | 4/1/25 | 11,200 | | 12,435 | |
| | General Dynamics Corp. | 3.500% | 5/15/25 | 9,971 | | 11,229 | |
| | General Electric Co. | 4.650% | 10/17/21 | 1,763 | | 1,819 | |
| | General Electric Co. | 3.150% | 9/7/22 | 11,061 | | 11,591 | |
| | General Electric Co. | 2.700% | 10/9/22 | 2,217 | | 2,303 | |
| | General Electric Co. | 3.100% | 1/9/23 | 29,278 | | 30,898 | |
| | General Electric Co. | 3.375% | 3/11/24 | 4,588 | | 4,933 | |
| | General Electric Co. | 3.450% | 5/15/24 | 18,325 | | 19,672 | |
| | Hexcel Corp. | 4.700% | 8/15/25 | 4,584 | | 5,091 | |
| | Honeywell International Inc. | 4.250% | 3/1/21 | 6,913 | | 7,051 | |
| | Honeywell International Inc. | 1.850% | 11/1/21 | 20,450 | | 20,797 | |
| | Honeywell International Inc. | 2.150% | 8/8/22 | 22,529 | | 23,310 | |
Vanguard® Short-Term Corporate Bond Index Fund
Schedule of Investments
August 31, 2020
| | Coupon | Maturity
Date | Face
Amount
($000 | ) | Market
Value
($000 | ) |
| | Honeywell International Inc. | 0.483% | 8/19/22 | 12,000 | | 12,021 | |
| | Honeywell International Inc. | 3.350% | 12/1/23 | 5,805 | | 6,337 | |
| | Honeywell International Inc. | 2.300% | 8/15/24 | 13,222 | | 14,093 | |
| | Honeywell International Inc. | 1.350% | 6/1/25 | 13,571 | | 13,976 | |
| | Howmet Aerospace Inc. | 5.125% | 10/1/24 | 3,000 | | 3,210 | |
| | Howmet Aerospace Inc. | 6.875% | 5/1/25 | 15,052 | | 17,046 | |
| | Hubbell Inc. | 3.625% | 11/15/22 | 5,500 | | 5,781 | |
| 2 | Huntington Ingalls Industries Inc. | 3.844% | 5/1/25 | 11,171 | | 12,302 | |
| | IDEX Corp. | 4.200% | 12/15/21 | 3,675 | | 3,799 | |
| | Illinois Tool Works Inc. | 3.375% | 9/15/21 | 4,247 | | 4,347 | |
| | Illinois Tool Works Inc. | 3.500% | 3/1/24 | 19,727 | | 21,699 | |
| | Ingersoll-Rand Luxembourg Finance SA | 3.550% | 11/1/24 | 8,226 | | 9,047 | |
| | John Deere Capital Corp. | 2.450% | 9/11/20 | 8,850 | | 8,855 | |
| | John Deere Capital Corp. | 2.800% | 3/4/21 | 1,263 | | 1,279 | |
| | John Deere Capital Corp. | 2.875% | 3/12/21 | 3,959 | | 4,014 | |
| | John Deere Capital Corp. | 3.900% | 7/12/21 | 5,673 | | 5,851 | |
| | John Deere Capital Corp. | 3.125% | 9/10/21 | 5,672 | | 5,835 | |
| | John Deere Capital Corp. | 3.150% | 10/15/21 | 4,593 | | 4,736 | |
| | John Deere Capital Corp. | 2.650% | 1/6/22 | 11,649 | | 12,014 | |
| | John Deere Capital Corp. | 3.200% | 1/10/22 | 7,440 | | 7,728 | |
| | John Deere Capital Corp. | 2.750% | 3/15/22 | 9,526 | | 9,872 | |
| | John Deere Capital Corp. | 2.950% | 4/1/22 | 5,478 | | 5,704 | |
| | John Deere Capital Corp. | 1.950% | 6/13/22 | 13,088 | | 13,464 | |
| | John Deere Capital Corp. | 2.150% | 9/8/22 | 7,615 | | 7,891 | |
| | John Deere Capital Corp. | 2.700% | 1/6/23 | 11,380 | | 11,977 | |
| | John Deere Capital Corp. | 2.800% | 1/27/23 | 10,767 | | 11,384 | |
| | John Deere Capital Corp. | 2.800% | 3/6/23 | 16,982 | | 17,998 | |
| | John Deere Capital Corp. | 1.200% | 4/6/23 | 2,368 | | 2,418 | |
| | John Deere Capital Corp. | 3.450% | 6/7/23 | 8,177 | | 8,851 | |
| | John Deere Capital Corp. | 0.700% | 7/5/23 | 10,025 | | 10,116 | |
| | John Deere Capital Corp. | 3.650% | 10/12/23 | 8,245 | | 9,038 | |
| | John Deere Capital Corp. | 3.450% | 1/10/24 | 7,461 | | 8,160 | |
| | John Deere Capital Corp. | 2.600% | 3/7/24 | 7,905 | | 8,468 | |
| | John Deere Capital Corp. | 3.350% | 6/12/24 | 12,525 | | 13,760 | |
| | John Deere Capital Corp. | 2.650% | 6/24/24 | 13,239 | | 14,243 | |
| | John Deere Capital Corp. | 2.050% | 1/9/25 | 10,309 | | 10,930 | |
| | John Deere Capital Corp. | 3.450% | 3/13/25 | 7,235 | | 8,131 | |
| | Johnson Controls International plc | 3.625% | 7/2/24 | 7,454 | | 8,073 | |
| | Kennametal Inc. | 3.875% | 2/15/22 | 4,725 | | 4,859 | |
| | L3Harris Technologies Inc. | 3.850% | 6/15/23 | 6,844 | | 7,424 | |
| | L3Harris Technologies Inc. | 3.950% | 5/28/24 | 6,754 | | 7,419 | |
| | L3Harris Technologies Inc. | 3.832% | 4/27/25 | 14,321 | | 16,020 | |
| | Leggett & Platt Inc. | 3.400% | 8/15/22 | 1,862 | | 1,900 | |
| | Leggett & Platt Inc. | 3.800% | 11/15/24 | 6,250 | | 6,556 | |
| | Legrand France SA | 8.500% | 2/15/25 | 6,486 | | 8,609 | |
| | Lennox International Inc. | 3.000% | 11/15/23 | 4,920 | | 5,196 | |
| | Lennox International Inc. | 1.350% | 8/1/25 | 6,380 | | 6,441 | |
| | Lockheed Martin Corp. | 3.350% | 9/15/21 | 5,438 | | 5,610 | |
| | Lockheed Martin Corp. | 3.100% | 1/15/23 | 20,103 | | 21,348 | |
| | Lockheed Martin Corp. | 2.900% | 3/1/25 | 19,246 | | 21,034 | |
| | Martin Marietta Materials Inc. | 4.250% | 7/2/24 | 4,975 | | 5,524 | |
| | Masco Corp. | 5.950% | 3/15/22 | 3,993 | | 4,307 | |
| | Masco Corp. | 4.450% | 4/1/25 | 10,032 | | 11,563 | |
| | Mohawk Industries Inc. | 3.850% | 2/1/23 | 10,718 | | 11,388 | |
| | Northrop Grumman Corp. | 2.550% | 10/15/22 | 33,162 | | 34,630 | |
| | Northrop Grumman Corp. | 3.250% | 8/1/23 | 18,720 | | 20,278 | |
| | Northrop Grumman Corp. | 2.930% | 1/15/25 | 36,393 | | 39,691 | |
| | Nvent Finance Sarl | 3.950% | 4/15/23 | 2,717 | | 2,866 | |
| 2 | Otis Worldwide Corp. | 2.056% | 4/5/25 | 30,566 | | 32,201 | |
| | Owens Corning | 4.200% | 12/1/24 | 6,119 | | 6,715 | |
| | Parker-Hannifin Corp. | 3.500% | 9/15/22 | 8,723 | | 9,201 | |
| | Parker-Hannifin Corp. | 2.700% | 6/14/24 | 10,731 | | 11,503 | |
| | Parker-Hannifin Corp. | 3.300% | 11/21/24 | 10,860 | | 11,896 | |
| | Precision Castparts Corp. | 2.500% | 1/15/23 | 17,864 | | 18,670 | |
Vanguard® Short-Term Corporate Bond Index Fund
Schedule of Investments
August 31, 2020
| | Coupon | Maturity
Date | Face
Amount
($000 | ) | Market
Value
($000 | ) |
| | Precision Castparts Corp. | 3.250% | 6/15/25 | 14,366 | | 16,023 | |
| 2 | Raytheon Technologies Corp. | 3.100% | 11/15/21 | 1,884 | | 1,928 | |
| 2 | Raytheon Technologies Corp. | 2.800% | 3/15/22 | 13,687 | | 14,145 | |
| 2 | Raytheon Technologies Corp. | 2.500% | 12/15/22 | 11,323 | | 11,722 | |
| | Raytheon Technologies Corp. | 3.650% | 8/16/23 | 3,876 | | 4,214 | |
| 2 | Raytheon Technologies Corp. | 3.700% | 12/15/23 | 8,050 | | 8,775 | |
| 2 | Raytheon Technologies Corp. | 3.200% | 3/15/24 | 22,328 | | 24,087 | |
| | Raytheon Technologies Corp. | 3.950% | 8/16/25 | 30,960 | | 35,356 | |
| | Republic Services Inc. | 5.250% | 11/15/21 | 7,870 | | 8,325 | |
| | Republic Services Inc. | 3.550% | 6/1/22 | 20,229 | | 21,160 | |
| | Republic Services Inc. | 4.750% | 5/15/23 | 10,260 | | 11,303 | |
| | Republic Services Inc. | 2.500% | 8/15/24 | 18,582 | | 19,838 | |
| | Republic Services Inc. | 3.200% | 3/15/25 | 8,801 | | 9,664 | |
| | Rockwell Automation Inc. | 2.875% | 3/1/25 | 4,076 | | 4,408 | |
| | Roper Technologies Inc. | 3.000% | 12/15/20 | 5,178 | | 5,206 | |
| | Roper Technologies Inc. | 2.800% | 12/15/21 | 10,423 | | 10,711 | |
| | Roper Technologies Inc. | 0.450% | 8/15/22 | 1,000 | | 1,001 | |
| | Roper Technologies Inc. | 3.125% | 11/15/22 | 7,104 | | 7,448 | |
| | Roper Technologies Inc. | 3.650% | 9/15/23 | 14,865 | | 16,187 | |
| | Roper Technologies Inc. | 2.350% | 9/15/24 | 8,627 | | 9,138 | |
| | Roper Technologies Inc. | 1.000% | 9/15/25 | 8,500 | | 8,554 | |
| | Snap-on Inc. | 6.125% | 9/1/21 | 3,000 | | 3,168 | |
| | Stanley Black & Decker Inc. | 3.400% | 12/1/21 | 7,350 | | 7,565 | |
| | Stanley Black & Decker Inc. | 2.900% | 11/1/22 | 12,786 | | 13,469 | |
| 1 | Stanley Black & Decker Inc. | 4.000% | 3/15/60 | 12,929 | | 13,547 | |
| | Textron Inc. | 4.300% | 3/1/24 | 7,106 | | 7,740 | |
| | Textron Inc. | 3.875% | 3/1/25 | 3,243 | | 3,528 | |
| | Timken Co. | 3.875% | 9/1/24 | 6,705 | | 7,105 | |
| | Trane Technologies Global Holding Co. Ltd. | 2.900% | 2/21/21 | 6,348 | | 6,423 | |
| | Trane Technologies Global Holding Co. Ltd. | 4.250% | 6/15/23 | 6,083 | | 6,720 | |
| | Vulcan Materials Co. | 4.500% | 4/1/25 | 5,368 | | 6,065 | |
| | Wabtec Corp. | 4.400% | 3/15/24 | 12,570 | | 13,655 | |
| | Waste Management Inc. | 2.900% | 9/15/22 | 12,006 | | 12,533 | |
| | Waste Management Inc. | 2.400% | 5/15/23 | 11,393 | | 11,968 | |
| | Waste Management Inc. | 3.500% | 5/15/24 | 7,510 | | 8,166 | |
| | Waste Management Inc. | 3.125% | 3/1/25 | 8,574 | | 9,397 | |
| | Westinghouse Air Brake Technologies Corp. | 3.200% | 6/15/25 | 7,840 | | 8,198 | |
| | WW Grainger Inc. | 1.850% | 2/15/25 | 8,675 | | 9,076 | |
| | Xylem Inc. | 4.875% | 10/1/21 | 10,194 | | 10,651 | |
| | Communication (5.0%) | |
| | Activision Blizzard Inc. | 2.300% | 9/15/21 | 8,825 | | 8,990 | |
| | Activision Blizzard Inc. | 2.600% | 6/15/22 | 8,912 | | 9,262 | |
| | America Movil SAB de CV | 3.125% | 7/16/22 | 28,760 | | 29,944 | |
| | American Tower Corp. | 2.250% | 1/15/22 | 12,046 | | 12,342 | |
| | American Tower Corp. | 4.700% | 3/15/22 | 14,238 | | 15,132 | |
| | American Tower Corp. | 3.500% | 1/31/23 | 20,349 | | 21,760 | |
| | American Tower Corp. | 3.000% | 6/15/23 | 11,682 | | 12,438 | |
| | American Tower Corp. | 5.000% | 2/15/24 | 15,833 | | 18,065 | |
| | American Tower Corp. | 3.375% | 5/15/24 | 16,165 | | 17,586 | |
| | American Tower Corp. | 2.950% | 1/15/25 | 12,264 | | 13,314 | |
| | American Tower Corp. | 2.400% | 3/15/25 | 10,849 | | 11,527 | |
| | American Tower Corp. | 4.000% | 6/1/25 | 6,599 | | 7,495 | |
| | AT&T Inc. | 3.000% | 6/30/22 | 26,957 | | 28,095 | |
| | AT&T Inc. | 2.625% | 12/1/22 | 13,079 | | 13,685 | |
| | AT&T Inc. | 3.600% | 2/17/23 | 22,865 | | 24,508 | |
| | AT&T Inc. | 4.050% | 12/15/23 | 8,787 | | 9,762 | |
| | AT&T Inc. | 4.450% | 4/1/24 | 8,172 | | 9,162 | |
| | AT&T Inc. | 3.950% | 1/15/25 | 13,172 | | 14,821 | |
| | AT&T Inc. | 3.400% | 5/15/25 | 77,371 | | 85,750 | |
| | AT&T Inc. | 3.600% | 7/15/25 | 29,174 | | 32,720 | |
| | British Telecommunications plc | 4.500% | 12/4/23 | 8,750 | | 9,722 | |
| | CC Holdings GS V LLC / Crown Castle GS III Corp. | 3.849% | 4/15/23 | 29,684 | | 32,021 | |
Vanguard® Short-Term Corporate Bond Index Fund
Schedule of Investments
August 31, 2020
| | Coupon | Maturity
Date | Face
Amount
($000 | ) | Market
Value
($000 | ) |
| | Charter Communications Operating LLC / Charter Communications Operating Capital | 4.464% | 7/23/22 | 40,975 | | 43,693 | |
| | Charter Communications Operating LLC / Charter Communications Operating Capital | 4.500% | 2/1/24 | 35,838 | | 39,818 | |
| | Charter Communications Operating LLC / Charter Communications Operating Capital | 4.908% | 7/23/25 | 74,182 | | 86,303 | |
| | Comcast Cable Communications Holdings Inc. | 9.455% | 11/15/22 | 17,188 | | 20,615 | |
| | Comcast Corp. | 3.125% | 7/15/22 | 10,100 | | 10,616 | |
| | Comcast Corp. | 2.850% | 1/15/23 | 2,682 | | 2,844 | |
| | Comcast Corp. | 2.750% | 3/1/23 | 21,864 | | 23,127 | |
| | Comcast Corp. | 3.000% | 2/1/24 | 23,260 | | 25,150 | |
| | Comcast Corp. | 3.600% | 3/1/24 | 32,682 | | 36,083 | |
| | Comcast Corp. | 3.700% | 4/15/24 | 45,681 | | 50,647 | |
| | Comcast Corp. | 3.375% | 2/15/25 | 19,585 | | 21,753 | |
| | Comcast Corp. | 3.100% | 4/1/25 | 16,525 | | 18,263 | |
| | Comcast Corp. | 3.375% | 8/15/25 | 25,096 | | 28,138 | |
| | Crown Castle International Corp. | 5.250% | 1/15/23 | 20,057 | | 22,198 | |
| | Crown Castle International Corp. | 3.150% | 7/15/23 | 9,916 | | 10,582 | |
| | Crown Castle International Corp. | 3.200% | 9/1/24 | 21,966 | | 23,834 | |
| | Crown Castle International Corp. | 1.350% | 7/15/25 | 7,441 | | 7,559 | |
| | Discovery Communications LLC | 2.950% | 3/20/23 | 14,870 | | 15,689 | |
| | Discovery Communications LLC | 3.800% | 3/13/24 | 7,720 | | 8,441 | |
| | Discovery Communications LLC | 3.900% | 11/15/24 | 7,819 | | 8,684 | |
| | Discovery Communications LLC | 3.450% | 3/15/25 | 5,636 | | 6,197 | |
| | Discovery Communications LLC | 3.950% | 6/15/25 | 9,238 | | 10,398 | |
| | Fox Corp. | 3.666% | 1/25/22 | 16,284 | | 17,011 | |
| | Fox Corp. | 4.030% | 1/25/24 | 24,721 | | 27,324 | |
| | Fox Corp. | 3.050% | 4/7/25 | 12,094 | | 13,250 | |
| | Grupo Televisa SAB | 6.625% | 3/18/25 | 6,700 | | 8,057 | |
| | Interpublic Group of Cos. Inc. | 3.750% | 10/1/21 | 8,651 | | 8,954 | |
| | Interpublic Group of Cos. Inc. | 3.750% | 2/15/23 | 8,508 | | 9,048 | |
| | Interpublic Group of Cos. Inc. | 4.200% | 4/15/24 | 7,034 | | 7,747 | |
| | Moody's Corp. | 2.750% | 12/15/21 | 7,771 | | 8,001 | |
| | Moody's Corp. | 4.500% | 9/1/22 | 14,774 | | 15,808 | |
| | Moody's Corp. | 2.625% | 1/15/23 | 13,818 | | 14,481 | |
| | Moody's Corp. | 4.875% | 2/15/24 | 7,635 | | 8,636 | |
| | Moody's Corp. | 3.750% | 3/24/25 | 10,396 | | 11,741 | |
| | NBCUniversal Media LLC | 2.875% | 1/15/23 | 23,267 | | 24,656 | |
| | Omnicom Group Inc. / Omnicom Capital Inc. | 3.625% | 5/1/22 | 17,411 | | 18,293 | |
| | Omnicom Group Inc. / Omnicom Capital Inc. | 3.650% | 11/1/24 | 17,238 | | 19,025 | |
| | Orange SA | 4.125% | 9/14/21 | 9,938 | | 10,311 | |
| | RELX Capital Inc. | 3.500% | 3/16/23 | 10,057 | | 10,748 | |
| | Rogers Communications Inc. | 3.000% | 3/15/23 | 7,193 | | 7,617 | |
| | Rogers Communications Inc. | 4.100% | 10/1/23 | 13,332 | | 14,684 | |
| | S&P Global Inc. | 4.000% | 6/15/25 | 11,716 | | 13,426 | |
| 2 | T-Mobile USA Inc. | 3.500% | 4/15/25 | 62,309 | | 68,812 | |
| | Telefonica Emisiones SAU | 4.570% | 4/27/23 | 18,412 | | 20,255 | |
| | Thomson Reuters Corp. | 4.300% | 11/23/23 | 8,544 | | 9,366 | |
| | Time Warner Cable LLC | 4.000% | 9/1/21 | 17,569 | | 17,990 | |
| | Time Warner Entertainment Co. LP | 8.375% | 3/15/23 | 15,216 | | 18,005 | |
| | Verizon Communications Inc. | 2.946% | 3/15/22 | 21,837 | | 22,649 | |
| | Verizon Communications Inc. | 2.450% | 11/1/22 | 19,752 | | 20,516 | |
| | Verizon Communications Inc. | 5.150% | 9/15/23 | 69,427 | | 79,083 | |
| | Verizon Communications Inc. | 4.150% | 3/15/24 | 3,768 | | 4,200 | |
| | Verizon Communications Inc. | 3.500% | 11/1/24 | 30,773 | | 34,085 | |
| | Verizon Communications Inc. | 3.376% | 2/15/25 | 37,414 | | 41,795 | |
| | ViacomCBS Inc. | 3.375% | 3/1/22 | 6,133 | | 6,336 | |
| | ViacomCBS Inc. | 2.900% | 6/1/23 | 4,421 | | 4,614 | |
| | ViacomCBS Inc. | 4.250% | 9/1/23 | 10,022 | | 10,937 | |
| | ViacomCBS Inc. | 3.875% | 4/1/24 | 10,590 | | 11,562 | |
| | ViacomCBS Inc. | 3.700% | 8/15/24 | 13,065 | | 14,327 | |
| | ViacomCBS Inc. | 3.500% | 1/15/25 | 13,430 | | 14,736 | |
| | ViacomCBS Inc. | 4.750% | 5/15/25 | 29,460 | | 34,010 | |
| | Vodafone Group plc | 2.500% | 9/26/22 | 3,829 | | 3,986 | |
Vanguard® Short-Term Corporate Bond Index Fund
Schedule of Investments
August 31, 2020
| | Coupon | Maturity
Date | Face
Amount
($000 | ) | Market
Value
($000 | ) |
| | Vodafone Group plc | 2.950% | 2/19/23 | 12,009 | | 12,698 | |
| | Vodafone Group plc | 3.750% | 1/16/24 | 38,022 | | 41,685 | |
| | Vodafone Group plc | 4.125% | 5/30/25 | 26,802 | | 30,681 | |
| | Walt Disney Co. | 2.550% | 2/15/22 | 8,655 | | 8,913 | |
| | Walt Disney Co. | 2.450% | 3/4/22 | 9,066 | | 9,363 | |
| | Walt Disney Co. | 1.650% | 9/1/22 | 13,967 | | 14,295 | |
| | Walt Disney Co. | 3.000% | 9/15/22 | 19,946 | | 20,964 | |
| | Walt Disney Co. | 2.350% | 12/1/22 | 19,680 | | 20,514 | |
| | Walt Disney Co. | 1.750% | 8/30/24 | 15,010 | | 15,600 | |
| | Walt Disney Co. | 3.700% | 9/15/24 | 15,481 | | 17,192 | |
| | Walt Disney Co. | 3.350% | 3/24/25 | 28,657 | | 31,903 | |
| | Walt Disney Co. | 1.750% | 1/13/26 | 2,000 | | 2,086 | |
| | Weibo Corp. | 3.500% | 7/5/24 | 13,600 | | 14,401 | |
| | WPP Finance 2010 | 3.625% | 9/7/22 | 7,615 | | 7,995 | |
| | WPP Finance 2010 | 3.750% | 9/19/24 | 11,833 | | 12,957 | |
| | Consumer Cyclical (8.1%) | |
| | Advance Auto Parts Inc. | 4.500% | 1/15/22 | 5,153 | | 5,378 | |
| | Advance Auto Parts Inc. | 4.500% | 12/1/23 | 7,243 | | 7,908 | |
| | Alibaba Group Holding Ltd. | 3.125% | 11/28/21 | 11,421 | | 11,721 | |
| | Alibaba Group Holding Ltd. | 2.800% | 6/6/23 | 14,280 | | 15,165 | |
| | Alibaba Group Holding Ltd. | 3.600% | 11/28/24 | 39,189 | | 43,206 | |
| | Amazon.com Inc. | 3.300% | 12/5/21 | 20,375 | | 21,006 | |
| | Amazon.com Inc. | 2.500% | 11/29/22 | 24,315 | | 25,407 | |
| | Amazon.com Inc. | 2.400% | 2/22/23 | 25,451 | | 26,752 | |
| | Amazon.com Inc. | 0.400% | 6/3/23 | 16,795 | | 16,855 | |
| | Amazon.com Inc. | 2.800% | 8/22/24 | 37,463 | | 40,774 | |
| | Amazon.com Inc. | 3.800% | 12/5/24 | 18,931 | | 21,433 | |
| | Amazon.com Inc. | 0.800% | 6/3/25 | 22,919 | | 23,215 | |
| | American Honda Finance Corp. | 3.150% | 1/8/21 | 4,450 | | 4,492 | |
| | American Honda Finance Corp. | 1.650% | 7/12/21 | 14,310 | | 14,461 | |
| | American Honda Finance Corp. | 1.700% | 9/9/21 | 11,919 | | 12,072 | |
| | American Honda Finance Corp. | 3.375% | 12/10/21 | 6,886 | | 7,141 | |
| | American Honda Finance Corp. | 1.950% | 5/20/22 | 10,204 | | 10,450 | |
| | American Honda Finance Corp. | 2.200% | 6/27/22 | 15,814 | | 16,290 | |
| | American Honda Finance Corp. | 2.600% | 11/16/22 | 12,731 | | 13,320 | |
| | American Honda Finance Corp. | 2.050% | 1/10/23 | 6,982 | | 7,218 | |
| | American Honda Finance Corp. | 1.950% | 5/10/23 | 10,183 | | 10,562 | |
| | American Honda Finance Corp. | 0.875% | 7/7/23 | 30,250 | | 30,509 | |
| | American Honda Finance Corp. | 3.450% | 7/14/23 | 4,550 | | 4,915 | |
| | American Honda Finance Corp. | 3.625% | 10/10/23 | 12,471 | | 13,620 | |
| | American Honda Finance Corp. | 3.550% | 1/12/24 | 10,517 | | 11,483 | |
| | American Honda Finance Corp. | 2.900% | 2/16/24 | 10,508 | | 11,279 | |
| | American Honda Finance Corp. | 2.400% | 6/27/24 | 12,765 | | 13,509 | |
| | American Honda Finance Corp. | 2.150% | 9/10/24 | 10,422 | | 11,009 | |
| | American Honda Finance Corp. | 1.200% | 7/8/25 | 5,100 | | 5,159 | |
| | Aptiv Corp. | 4.150% | 3/15/24 | 9,035 | | 9,960 | |
| | AutoNation Inc. | 3.500% | 11/15/24 | 8,243 | | 8,746 | |
| | AutoZone Inc. | 3.700% | 4/15/22 | 12,673 | | 13,226 | |
| | AutoZone Inc. | 2.875% | 1/15/23 | 9,685 | | 10,139 | |
| | AutoZone Inc. | 3.125% | 7/15/23 | 10,203 | | 10,863 | |
| | AutoZone Inc. | 3.125% | 4/18/24 | 5,130 | | 5,552 | |
| | AutoZone Inc. | 3.250% | 4/15/25 | 2,432 | | 2,676 | |
| | AutoZone Inc. | 3.625% | 4/15/25 | 13,758 | | 15,426 | |
| | Block Financial LLC | 5.500% | 11/1/22 | 7,734 | | 8,288 | |
| | Booking Holdings Inc. | 2.750% | 3/15/23 | 11,407 | | 11,994 | |
| | Booking Holdings Inc. | 3.650% | 3/15/25 | 8,423 | | 9,346 | |
| | Booking Holdings Inc. | 4.100% | 4/13/25 | 15,299 | | 17,334 | |
| | BorgWarner Inc. | 3.375% | 3/15/25 | 8,782 | | 9,562 | |
| | Costco Wholesale Corp. | 2.300% | 5/18/22 | 15,264 | | 15,793 | |
| | Costco Wholesale Corp. | 2.750% | 5/18/24 | 26,382 | | 28,498 | |
| | Cummins Inc. | 3.650% | 10/1/23 | 7,953 | | 8,683 | |
| 2 | Daimler Finance North America LLC | 2.125% | 3/10/25 | 2,000 | | 2,070 | |
| | Dollar General Corp. | 3.250% | 4/15/23 | 28,292 | | 30,020 | |
Vanguard® Short-Term Corporate Bond Index Fund
Schedule of Investments
August 31, 2020
| | Coupon | Maturity
Date | Face
Amount
($000 | ) | Market
Value
($000 | ) |
| | Dollar Tree Inc. | 3.700% | 5/15/23 | 17,707 | | 19,068 | |
| | Dollar Tree Inc. | 4.000% | 5/15/25 | 17,194 | | 19,489 | |
| | DR Horton Inc. | 2.550% | 12/1/20 | 6,245 | | 6,276 | |
| | DR Horton Inc. | 4.375% | 9/15/22 | 448 | | 475 | |
| | DR Horton Inc. | 4.750% | 2/15/23 | 4,430 | | 4,788 | |
| | DR Horton Inc. | 5.750% | 8/15/23 | 9,945 | | 11,300 | |
| | DR Horton Inc. | 2.500% | 10/15/24 | 11,917 | | 12,671 | |
| | eBay Inc. | 3.800% | 3/9/22 | 13,388 | | 14,024 | |
| | eBay Inc. | 2.600% | 7/15/22 | 14,565 | | 15,061 | |
| | eBay Inc. | 2.750% | 1/30/23 | 14,689 | | 15,440 | |
| | eBay Inc. | 3.450% | 8/1/24 | 11,334 | | 12,454 | |
| | eBay Inc. | 1.900% | 3/11/25 | 17,521 | | 18,374 | |
| 2 | Expedia Group Inc. | 3.600% | 12/15/23 | 8,300 | | 8,445 | |
| | Expedia Group Inc. | 4.500% | 8/15/24 | 9,253 | | 9,669 | |
| | General Motors Co. | 4.875% | 10/2/23 | 25,410 | | 27,752 | |
| | General Motors Co. | 5.400% | 10/2/23 | 8,555 | | 9,482 | |
| | General Motors Co. | 4.000% | 4/1/25 | 7,247 | | 7,828 | |
| | General Motors Co. | 6.125% | 10/1/25 | 10,000 | | 11,723 | |
| | General Motors Financial Co. Inc. | 4.200% | 3/1/21 | 12,354 | | 12,490 | |
| | General Motors Financial Co. Inc. | 3.200% | 7/6/21 | 20,249 | | 20,576 | |
| | General Motors Financial Co. Inc. | 4.375% | 9/25/21 | 17,380 | | 17,929 | |
| | General Motors Financial Co. Inc. | 4.200% | 11/6/21 | 21,946 | | 22,668 | |
| | General Motors Financial Co. Inc. | 3.450% | 1/14/22 | 19,315 | | 19,797 | |
| | General Motors Financial Co. Inc. | 3.450% | 4/10/22 | 27,135 | | 27,880 | |
| | General Motors Financial Co. Inc. | 3.150% | 6/30/22 | 17,860 | | 18,395 | |
| | General Motors Financial Co. Inc. | 3.550% | 7/8/22 | 21,394 | | 22,197 | |
| | General Motors Financial Co. Inc. | 3.250% | 1/5/23 | 9,675 | | 10,024 | |
| | General Motors Financial Co. Inc. | 5.200% | 3/20/23 | 31,695 | | 34,537 | |
| | General Motors Financial Co. Inc. | 3.700% | 5/9/23 | 25,394 | | 26,567 | |
| | General Motors Financial Co. Inc. | 4.250% | 5/15/23 | 11,387 | | 12,151 | |
| | General Motors Financial Co. Inc. | 4.150% | 6/19/23 | 23,734 | | 25,259 | |
| | General Motors Financial Co. Inc. | 1.700% | 8/18/23 | 12,000 | | 12,069 | |
| | General Motors Financial Co. Inc. | 5.100% | 1/17/24 | 28,585 | | 31,401 | |
| | General Motors Financial Co. Inc. | 3.950% | 4/13/24 | 19,520 | | 20,834 | |
| | General Motors Financial Co. Inc. | 3.500% | 11/7/24 | 15,210 | | 16,042 | |
| | General Motors Financial Co. Inc. | 4.000% | 1/15/25 | 15,084 | | 16,242 | |
| | General Motors Financial Co. Inc. | 2.900% | 2/26/25 | 27,618 | | 28,675 | |
| | General Motors Financial Co. Inc. | 4.350% | 4/9/25 | 28,608 | | 31,258 | |
| | General Motors Financial Co. Inc. | 2.750% | 6/20/25 | 16,773 | | 17,304 | |
| | General Motors Financial Co. Inc. | 4.300% | 7/13/25 | 243 | | 265 | |
| | GLP Capital LP / GLP Financing II Inc. | 5.375% | 11/1/23 | 6,708 | | 7,184 | |
| | GLP Capital LP / GLP Financing II Inc. | 3.350% | 9/1/24 | 6,000 | | 6,073 | |
| | GLP Capital LP / GLP Financing II Inc. | 5.250% | 6/1/25 | 14,029 | | 15,108 | |
| | Harley-Davidson Inc. | 3.500% | 7/28/25 | 9,699 | | 10,335 | |
| | Harman International Industries Inc. | 4.150% | 5/15/25 | 6,278 | | 7,026 | |
| | Home Depot Inc. | 3.250% | 3/1/22 | 15,292 | | 15,979 | |
| | Home Depot Inc. | 2.625% | 6/1/22 | 15,303 | | 15,902 | |
| | Home Depot Inc. | 2.700% | 4/1/23 | 27,814 | | 29,350 | |
| | Home Depot Inc. | 3.750% | 2/15/24 | 19,719 | | 21,814 | |
| | Hyatt Hotels Corp. | 5.375% | 8/15/21 | 2,125 | | 2,176 | |
| | Hyatt Hotels Corp. | 3.375% | 7/15/23 | 4,736 | | 4,809 | |
| | Hyatt Hotels Corp. | 5.375% | 4/23/25 | 7,625 | | 8,247 | |
| | IHS Markit Ltd. | 4.125% | 8/1/23 | 8,325 | | 9,053 | |
| | IHS Markit Ltd. | 3.625% | 5/1/24 | 6,600 | | 7,095 | |
| | JD.com Inc. | 3.125% | 4/29/21 | 2,554 | | 2,583 | |
| | Kohl's Corp. | 3.250% | 2/1/23 | 5,425 | | 5,432 | |
| | Kohl's Corp. | 9.500% | 5/15/25 | 6,800 | | 8,126 | |
| | Kohl's Corp. | 4.250% | 7/17/25 | 16,753 | | 16,502 | |
| | Las Vegas Sands Corp. | 3.200% | 8/8/24 | 25,730 | | 26,116 | |
| | Las Vegas Sands Corp. | 2.900% | 6/25/25 | 9,100 | | 9,066 | |
| | Lowe's Cos. Inc. | 3.800% | 11/15/21 | 8,336 | | 8,602 | |
| | Lowe's Cos. Inc. | 3.120% | 4/15/22 | 13,309 | | 13,814 | |
| | Lowe's Cos. Inc. | 3.875% | 9/15/23 | 7,345 | | 8,067 | |
| | Lowe's Cos. Inc. | 3.125% | 9/15/24 | 10,809 | | 11,801 | |
Vanguard® Short-Term Corporate Bond Index Fund
Schedule of Investments
August 31, 2020
| | Coupon | Maturity
Date | Face
Amount
($000 | ) | Market
Value
($000 | ) |
| | Lowe's Cos. Inc. | 4.000% | 4/15/25 | 11,810 | | 13,458 | |
| | Magna International Inc. | 3.625% | 6/15/24 | 9,377 | | 10,347 | |
| | Marriott International Inc. | 3.125% | 10/15/21 | 6,340 | | 6,432 | |
| | Marriott International Inc. | 3.250% | 9/15/22 | 9,650 | | 9,778 | |
| | Marriott International Inc. | 3.750% | 3/15/25 | 9,116 | | 9,437 | |
| | Marriott International Inc. | 3.125% | 6/15/26 | 3,000 | | 3,009 | |
| | Marriott International Inc. | 2.125% | 10/3/22 | 10,372 | | 10,417 | |
| | Marriott International Inc. | 4.150% | 12/1/23 | 7,722 | | 8,179 | |
| | Marriott International Inc. | 3.600% | 4/15/24 | 7,300 | | 7,531 | |
| | Marriott International Inc. | 5.750% | 5/1/25 | 15,608 | | 17,520 | |
| | Mastercard Inc. | 2.000% | 11/21/21 | 9,843 | | 10,028 | |
| | Mastercard Inc. | 3.375% | 4/1/24 | 21,346 | | 23,555 | |
| | Mastercard Inc. | 2.000% | 3/3/25 | 13,851 | | 14,748 | |
| | McDonald's Corp. | 2.625% | 1/15/22 | 18,204 | | 18,771 | |
| | McDonald's Corp. | 3.350% | 4/1/23 | 26,277 | | 28,173 | |
| | McDonald's Corp. | 3.250% | 6/10/24 | 6,250 | | 6,845 | |
| | McDonald's Corp. | 3.375% | 5/26/25 | 16,535 | | 18,450 | |
| | McDonald's Corp. | 3.300% | 7/1/25 | 13,489 | | 15,075 | |
| | NIKE Inc. | 2.250% | 5/1/23 | 8,791 | | 9,134 | |
| | NIKE Inc. | 2.400% | 3/27/25 | 17,563 | | 18,900 | |
| | Nordstrom Inc. | 4.000% | 10/15/21 | 7,907 | | 7,877 | |
| | NVR Inc. | 3.950% | 9/15/22 | 10,574 | | 11,205 | |
| | O'Reilly Automotive Inc. | 4.625% | 9/15/21 | 3,427 | | 3,535 | |
| | O'Reilly Automotive Inc. | 3.800% | 9/1/22 | 6,554 | | 6,916 | |
| | O'Reilly Automotive Inc. | 3.850% | 6/15/23 | 4,723 | | 5,087 | |
| | PACCAR Financial Corp. | 3.150% | 8/9/21 | 7,383 | | 7,579 | |
| | PACCAR Financial Corp. | 2.850% | 3/1/22 | 5,135 | | 5,321 | |
| | PACCAR Financial Corp. | 2.650% | 5/10/22 | 10,403 | | 10,793 | |
| | PACCAR Financial Corp. | 2.300% | 8/10/22 | 425 | | 440 | |
| | PACCAR Financial Corp. | 2.000% | 9/26/22 | 9,097 | | 9,397 | |
| | PACCAR Financial Corp. | 2.650% | 4/6/23 | 1,100 | | 1,163 | |
| | PACCAR Financial Corp. | 0.800% | 6/8/23 | 5,000 | | 5,023 | |
| | PACCAR Financial Corp. | 3.400% | 8/9/23 | 5,901 | | 6,401 | |
| | PACCAR Financial Corp. | 0.350% | 8/11/23 | 3,500 | | 3,495 | |
| | PACCAR Financial Corp. | 2.150% | 8/15/24 | 2,096 | | 2,213 | |
| | PACCAR Financial Corp. | 1.800% | 2/6/25 | 7,380 | | 7,727 | |
| 2 | PVH Corp. | 4.625% | 7/10/25 | 9,482 | | 9,808 | |
| | Ralph Lauren Corp. | 1.700% | 6/15/22 | 8,645 | | 8,809 | |
| | Ross Stores Inc. | 4.600% | 4/15/25 | 11,925 | | 13,745 | |
| | Sands China Ltd. | 4.600% | 8/8/23 | 26,687 | | 28,455 | |
| | Sands China Ltd. | 5.125% | 8/8/25 | 34,200 | | 37,620 | |
| | Starbucks Corp. | 1.300% | 5/7/22 | 5,800 | | 5,892 | |
| | Starbucks Corp. | 2.700% | 6/15/22 | 15,722 | | 16,274 | |
| | Starbucks Corp. | 3.100% | 3/1/23 | 18,565 | | 19,744 | |
| | Starbucks Corp. | 3.850% | 10/1/23 | 7,695 | | 8,410 | |
| | Starbucks Corp. | 3.800% | 8/15/25 | 20,921 | | 23,774 | |
| | Tapestry Inc. | 3.000% | 7/15/22 | 7,650 | | 7,573 | |
| | Tapestry Inc. | 4.250% | 4/1/25 | 9,720 | | 9,882 | |
| | Target Corp. | 2.900% | 1/15/22 | 16,904 | | 17,486 | |
| | Target Corp. | 3.500% | 7/1/24 | 17,588 | | 19,568 | |
| | Target Corp. | 2.250% | 4/15/25 | 26,246 | | 28,135 | |
| | TJX Cos. Inc. | 2.500% | 5/15/23 | 11,175 | | 11,680 | |
| | TJX Cos. Inc. | 3.500% | 4/15/25 | 30,759 | | 34,321 | |
| | Toyota Motor Corp. | 3.183% | 7/20/21 | 12,793 | | 13,116 | |
| | Toyota Motor Corp. | 2.157% | 7/2/22 | 12,454 | | 12,860 | |
| | Toyota Motor Corp. | 3.419% | 7/20/23 | 12,967 | | 14,033 | |
| | Toyota Motor Corp. | 2.358% | 7/2/24 | 4,940 | | 5,272 | |
| | Toyota Motor Credit Corp. | 3.400% | 9/15/21 | 13,273 | | 13,684 | |
| | Toyota Motor Credit Corp. | 1.800% | 10/7/21 | 8,475 | | 8,600 | |
| | Toyota Motor Credit Corp. | 2.600% | 1/11/22 | 21,601 | | 22,251 | |
| | Toyota Motor Credit Corp. | 3.300% | 1/12/22 | 16,744 | | 17,395 | |
| | Toyota Motor Credit Corp. | 2.650% | 4/12/22 | 16,000 | | 16,571 | |
| | Toyota Motor Credit Corp. | 1.150% | 5/26/22 | 18,179 | | 18,421 | |
| | Toyota Motor Credit Corp. | 2.800% | 7/13/22 | 21,436 | | 22,377 | |
Vanguard® Short-Term Corporate Bond Index Fund
Schedule of Investments
August 31, 2020
| | Coupon | Maturity
Date | Face
Amount
($000 | ) | Market
Value
($000 | ) |
| | Toyota Motor Credit Corp. | 0.450% | 7/22/22 | 8,500 | | 8,511 | |
| | Toyota Motor Credit Corp. | 2.150% | 9/8/22 | 19,362 | | 20,034 | |
| | Toyota Motor Credit Corp. | 2.625% | 1/10/23 | 12,230 | | 12,844 | |
| | Toyota Motor Credit Corp. | 2.700% | 1/11/23 | 8,250 | | 8,677 | |
| | Toyota Motor Credit Corp. | 2.900% | 3/30/23 | 12,831 | | 13,623 | |
| | Toyota Motor Credit Corp. | 0.500% | 8/14/23 | 12,000 | | 12,007 | |
| | Toyota Motor Credit Corp. | 1.350% | 8/25/23 | 21,601 | | 22,151 | |
| | Toyota Motor Credit Corp. | 3.450% | 9/20/23 | 6,032 | | 6,561 | |
| | Toyota Motor Credit Corp. | 2.250% | 10/18/23 | 8,716 | | 9,176 | |
| | Toyota Motor Credit Corp. | 3.350% | 1/8/24 | 10,963 | | 11,914 | |
| | Toyota Motor Credit Corp. | 2.900% | 4/17/24 | 13,669 | | 14,756 | |
| | Toyota Motor Credit Corp. | 2.000% | 10/7/24 | 5,300 | | 5,572 | |
| | Toyota Motor Credit Corp. | 1.800% | 2/13/25 | 38,964 | | 40,744 | |
| | Toyota Motor Credit Corp. | 3.000% | 4/1/25 | 16,953 | | 18,611 | |
| | Toyota Motor Credit Corp. | 3.400% | 4/14/25 | 12,923 | | 14,474 | |
| | VF Corp. | 2.050% | 4/23/22 | 16,335 | | 16,722 | |
| | VF Corp. | 2.400% | 4/23/25 | 14,318 | | 15,257 | |
| | Visa Inc. | 2.150% | 9/15/22 | 12,397 | | 12,830 | |
| | Visa Inc. | 2.800% | 12/14/22 | 47,736 | | 50,183 | |
| | Walgreen Co. | 3.100% | 9/15/22 | 29,813 | | 31,261 | |
| | Walgreens Boots Alliance Inc. | 3.300% | 11/18/21 | 19,106 | | 19,629 | |
| | Walgreens Boots Alliance Inc. | 3.800% | 11/18/24 | 29,081 | | 32,168 | |
| | Walmart Inc. | 2.350% | 12/15/22 | 15,374 | | 16,059 | |
| | Walmart Inc. | 2.550% | 4/11/23 | 27,643 | | 29,039 | |
| | Walmart Inc. | 3.400% | 6/26/23 | 48,825 | | 52,938 | |
| | Walmart Inc. | 3.300% | 4/22/24 | 19,172 | | 20,972 | |
| | Walmart Inc. | 2.850% | 7/8/24 | 44,319 | | 48,143 | |
| | Walmart Inc. | 2.650% | 12/15/24 | 23,487 | | 25,470 | |
| | Walmart Inc. | 3.550% | 6/26/25 | 25,050 | | 28,532 | |
| | Western Union Co. | 3.600% | 3/15/22 | 9,937 | | 10,341 | |
| | Western Union Co. | 2.850% | 1/10/25 | 13,961 | | 14,787 | |
| | Consumer Noncyclical (13.9%) | |
| | Abbott Laboratories | 2.550% | 3/15/22 | 11,956 | | 12,359 | |
| | Abbott Laboratories | 3.400% | 11/30/23 | 28,545 | | 31,110 | |
| | Abbott Laboratories | 2.950% | 3/15/25 | 11,922 | | 13,060 | |
| | Abbott Laboratories | 3.875% | 9/15/25 | 3,100 | | 3,547 | |
| | AbbVie Inc. | 3.375% | 11/14/21 | 10,014 | | 10,351 | |
| 2 | AbbVie Inc. | 2.150% | 11/19/21 | 41,239 | | 42,065 | |
| 2 | AbbVie Inc. | 3.450% | 3/15/22 | 40,946 | | 42,585 | |
| 2 | AbbVie Inc. | 3.250% | 10/1/22 | 37,360 | | 39,076 | |
| | AbbVie Inc. | 2.900% | 11/6/22 | 65,251 | | 68,513 | |
| | AbbVie Inc. | 3.200% | 11/6/22 | 35,721 | | 37,613 | |
| 2 | AbbVie Inc. | 2.300% | 11/21/22 | 50,871 | | 52,749 | |
| 2 | AbbVie Inc. | 2.800% | 3/15/23 | 9,612 | | 9,982 | |
| | AbbVie Inc. | 2.850% | 5/14/23 | 13,262 | | 14,015 | |
| | AbbVie Inc. | 3.750% | 11/14/23 | 10,407 | | 11,395 | |
| 2 | AbbVie Inc. | 3.850% | 6/15/24 | 18,656 | | 20,515 | |
| 2 | AbbVie Inc. | 2.600% | 11/21/24 | 65,003 | | 69,607 | |
| 2 | AbbVie Inc. | 3.800% | 3/15/25 | 58,930 | | 65,783 | |
| | AbbVie Inc. | 3.600% | 5/14/25 | 57,657 | | 64,214 | |
| | Agilent Technologies Inc. | 3.200% | 10/1/22 | 7,326 | | 7,725 | |
| | Agilent Technologies Inc. | 3.875% | 7/15/23 | 9,442 | | 10,250 | |
| | Altria Group Inc. | 3.490% | 2/14/22 | 17,220 | | 17,954 | |
| | Altria Group Inc. | 2.850% | 8/9/22 | 35,869 | | 37,455 | |
| | Altria Group Inc. | 2.950% | 5/2/23 | 7,384 | | 7,815 | |
| | Altria Group Inc. | 4.000% | 1/31/24 | 29,331 | | 32,462 | |
| | Altria Group Inc. | 3.800% | 2/14/24 | 20,540 | | 22,527 | |
| | Altria Group Inc. | 2.350% | 5/6/25 | 9,810 | | 10,423 | |
| | AmerisourceBergen Corp. | 3.400% | 5/15/24 | 5,422 | | 5,889 | |
| | AmerisourceBergen Corp. | 3.250% | 3/1/25 | 9,720 | | 10,687 | |
| | Amgen Inc. | 3.875% | 11/15/21 | 19,251 | | 19,877 | |
| | Amgen Inc. | 2.700% | 5/1/22 | 14,517 | | 15,006 | |
| | Amgen Inc. | 2.650% | 5/11/22 | 40,386 | | 41,847 | |
Vanguard® Short-Term Corporate Bond Index Fund
Schedule of Investments
August 31, 2020
| | Coupon | Maturity
Date | Face
Amount
($000 | ) | Market
Value
($000 | ) |
| | Amgen Inc. | 3.625% | 5/15/22 | 10,402 | | 10,883 | |
| | Amgen Inc. | 2.250% | 8/19/23 | 8,946 | | 9,370 | |
| | Amgen Inc. | 3.625% | 5/22/24 | 18,603 | | 20,507 | |
| | Amgen Inc. | 1.900% | 2/21/25 | 14,280 | | 14,997 | |
| | Amgen Inc. | 3.125% | 5/1/25 | 12,366 | | 13,630 | |
| | Anheuser-Busch InBev Finance Inc. | 2.625% | 1/17/23 | 3,476 | | 3,649 | |
| | Anheuser-Busch InBev Finance Inc. | 3.300% | 2/1/23 | 22,041 | | 23,460 | |
| | Anheuser-Busch InBev Finance Inc. | 3.700% | 2/1/24 | 19,979 | | 21,994 | |
| | Anheuser-Busch InBev Worldwide Inc. | 3.500% | 1/12/24 | 13,799 | | 15,049 | |
| | Anheuser-Busch InBev Worldwide Inc. | 4.150% | 1/23/25 | 43,222 | | 49,175 | |
| | Archer-Daniels-Midland Co. | 3.375% | 3/15/22 | 5,434 | | 5,662 | |
| | Archer-Daniels-Midland Co. | 2.750% | 3/27/25 | 9,910 | | 10,797 | |
| | AstraZeneca plc | 2.375% | 6/12/22 | 16,426 | | 16,981 | |
| | AstraZeneca plc | 3.500% | 8/17/23 | 20,297 | | 21,997 | |
| | BAT Capital Corp. | 2.764% | 8/15/22 | 24,225 | | 25,159 | |
| | BAT Capital Corp. | 3.222% | 8/15/24 | 47,594 | | 51,259 | |
| | BAT Capital Corp. | 2.789% | 9/6/24 | 20,067 | | 21,293 | |
| | Baxalta Inc. | 4.000% | 6/23/25 | 14,977 | | 17,098 | |
| | Beam Suntory Inc. | 3.250% | 5/15/22 | 3,703 | | 3,835 | |
| | Becton Dickinson & Co. | 3.125% | 11/8/21 | 14,073 | | 14,496 | |
| | Becton Dickinson & Co. | 2.894% | 6/6/22 | 37,719 | | 39,084 | |
| | Becton Dickinson & Co. | 3.363% | 6/6/24 | 29,653 | | 32,200 | |
| | Becton Dickinson & Co. | 3.734% | 12/15/24 | 26,878 | | 29,786 | |
| | Biogen Inc. | 3.625% | 9/15/22 | 19,263 | | 20,492 | |
| | Boston Scientific Corp. | 3.375% | 5/15/22 | 4,829 | | 5,052 | |
| | Boston Scientific Corp. | 3.450% | 3/1/24 | 20,519 | | 22,284 | |
| | Boston Scientific Corp. | 3.850% | 5/15/25 | 4,724 | | 5,335 | |
| | Boston Scientific Corp. | 1.900% | 6/1/25 | 14,051 | | 14,704 | |
| | Bristol-Myers Squibb Co. | 2.250% | 8/15/21 | 3,195 | | 3,258 | |
| | Bristol-Myers Squibb Co. | 2.600% | 5/16/22 | 21,017 | | 21,801 | |
| | Bristol-Myers Squibb Co. | 2.000% | 8/1/22 | 12,076 | | 12,453 | |
| | Bristol-Myers Squibb Co. | 3.250% | 8/15/22 | 21,317 | | 22,510 | |
| | Bristol-Myers Squibb Co. | 3.550% | 8/15/22 | 20,001 | | 21,055 | |
| | Bristol-Myers Squibb Co. | 2.750% | 2/15/23 | 18,991 | | 20,035 | |
| | Bristol-Myers Squibb Co. | 3.250% | 2/20/23 | 5,336 | | 5,701 | |
| | Bristol-Myers Squibb Co. | 7.150% | 6/15/23 | 2,585 | | 3,037 | |
| | Bristol-Myers Squibb Co. | 4.000% | 8/15/23 | 11,195 | | 12,321 | |
| | Bristol-Myers Squibb Co. | 3.250% | 11/1/23 | 10,214 | | 11,080 | |
| | Bristol-Myers Squibb Co. | 3.625% | 5/15/24 | 19,560 | | 21,634 | |
| | Bristol-Myers Squibb Co. | 2.900% | 7/26/24 | 52,491 | | 57,274 | |
| | Bristol-Myers Squibb Co. | 3.875% | 8/15/25 | 43,945 | | 50,648 | |
| | Brown-Forman Corp. | 3.500% | 4/15/25 | 4,401 | | 4,906 | |
| | Bunge Ltd. Finance Corp. | 3.000% | 9/25/22 | 7,355 | | 7,649 | |
| | Bunge Ltd. Finance Corp. | 4.350% | 3/15/24 | 9,599 | | 10,532 | |
| | Bunge Ltd. Finance Corp. | 1.630% | 8/17/25 | 4,875 | | 4,898 | |
| | Campbell Soup Co. | 2.500% | 8/2/22 | 11,657 | | 12,060 | |
| | Campbell Soup Co. | 3.650% | 3/15/23 | 4,235 | | 4,534 | |
| | Campbell Soup Co. | 3.950% | 3/15/25 | 12,181 | | 13,687 | |
| | Campbell Soup Co. | 3.300% | 3/19/25 | 8,485 | | 9,238 | |
| | Cardinal Health Inc. | 2.616% | 6/15/22 | 13,332 | | 13,771 | |
| | Cardinal Health Inc. | 3.200% | 3/15/23 | 11,234 | | 11,894 | |
| | Cardinal Health Inc. | 3.079% | 6/15/24 | 11,482 | | 12,353 | |
| | Cardinal Health Inc. | 3.500% | 11/15/24 | 7,298 | | 8,017 | |
| | Church & Dwight Co. Inc. | 2.450% | 8/1/22 | 7,123 | | 7,363 | |
| | Church & Dwight Co. Inc. | 2.875% | 10/1/22 | 4,242 | | 4,443 | |
| | Cigna Corp. | 3.400% | 9/17/21 | 21,239 | | 21,902 | |
| | Cigna Corp. | 3.900% | 2/15/22 | 6,007 | | 6,291 | |
| | Cigna Corp. | 3.050% | 11/30/22 | 16,526 | | 17,356 | |
| | Cigna Corp. | 3.000% | 7/15/23 | 21,330 | | 22,633 | |
| | Cigna Corp. | 3.750% | 7/15/23 | 32,568 | | 35,414 | |
| | Cigna Corp. | 3.500% | 6/15/24 | 14,540 | | 15,592 | |
| | Cigna Corp. | 3.250% | 4/15/25 | 6,976 | | 7,685 | |
| | Cigna Corp. | 4.125% | 11/15/25 | 7,000 | | 8,074 | |
| | Clorox Co. | 3.800% | 11/15/21 | 5,664 | | 5,892 | |
Vanguard® Short-Term Corporate Bond Index Fund
Schedule of Investments
August 31, 2020
| | Coupon | Maturity
Date | Face
Amount
($000 | ) | Market
Value
($000 | ) |
| | Clorox Co. | 3.050% | 9/15/22 | 6,920 | | 7,243 | |
| | Clorox Co. | 3.500% | 12/15/24 | 8,955 | | 9,916 | |
| | Coca-Cola Co. | 1.550% | 9/1/21 | 20,530 | | 20,794 | |
| | Coca-Cola Co. | 3.300% | 9/1/21 | 22,154 | | 22,829 | |
| | Coca-Cola Co. | 2.200% | 5/25/22 | 11,618 | | 12,015 | |
| | Coca-Cola Co. | 2.500% | 4/1/23 | 13,593 | | 14,321 | |
| | Coca-Cola Co. | 3.200% | 11/1/23 | 14,138 | | 15,387 | |
| | Coca-Cola Co. | 1.750% | 9/6/24 | 15,566 | | 16,307 | |
| | Coca-Cola Co. | 2.950% | 3/25/25 | 15,293 | | 16,908 | |
| | Coca-Cola Co. | 2.875% | 10/27/25 | 7,000 | | 7,760 | |
| | Coca-Cola European Partners plc | 3.250% | 8/19/21 | 674 | | 682 | |
| | Colgate-Palmolive Co. | 2.450% | 11/15/21 | 5,885 | | 6,039 | |
| | Colgate-Palmolive Co. | 2.300% | 5/3/22 | 6,916 | | 7,139 | |
| | Colgate-Palmolive Co. | 2.250% | 11/15/22 | 7,778 | | 8,109 | |
| | Colgate-Palmolive Co. | 1.950% | 2/1/23 | 1,835 | | 1,911 | |
| | Colgate-Palmolive Co. | 2.100% | 5/1/23 | 6,302 | | 6,599 | |
| | Colgate-Palmolive Co. | 3.250% | 3/15/24 | 6,188 | | 6,783 | |
| | CommonSpirit Health | 2.950% | 11/1/22 | 9,832 | | 10,292 | |
| | CommonSpirit Health | 2.760% | 10/1/24 | 11,957 | | 12,475 | |
| | Conagra Brands Inc. | 3.800% | 10/22/21 | 19,762 | | 20,501 | |
| | Conagra Brands Inc. | 3.250% | 9/15/22 | 1,200 | | 1,263 | |
| | Conagra Brands Inc. | 3.200% | 1/25/23 | 9,978 | | 10,529 | |
| | Conagra Brands Inc. | 4.300% | 5/1/24 | 20,704 | | 23,165 | |
| | Constellation Brands Inc. | 2.700% | 5/9/22 | 11,190 | | 11,582 | |
| | Constellation Brands Inc. | 2.650% | 11/7/22 | 22,228 | | 23,161 | |
| | Constellation Brands Inc. | 3.200% | 2/15/23 | 15,333 | | 16,262 | |
| | Constellation Brands Inc. | 4.250% | 5/1/23 | 14,532 | | 15,906 | |
| | Constellation Brands Inc. | 4.750% | 11/15/24 | 10,877 | | 12,588 | |
| | Covidien International Finance SA | 3.200% | 6/15/22 | 14,145 | | 14,745 | |
| | Covidien International Finance SA | 2.950% | 6/15/23 | 4,066 | | 4,314 | |
| | CVS Health Corp. | 3.500% | 7/20/22 | 27,781 | | 29,206 | |
| | CVS Health Corp. | 2.750% | 12/1/22 | 16,405 | | 17,143 | |
| | CVS Health Corp. | 4.750% | 12/1/22 | 7,593 | | 8,219 | |
| | CVS Health Corp. | 3.700% | 3/9/23 | 75,178 | | 80,783 | |
| | CVS Health Corp. | 4.000% | 12/5/23 | 8,745 | | 9,640 | |
| | CVS Health Corp. | 3.375% | 8/12/24 | 10,107 | | 11,062 | |
| | CVS Health Corp. | 2.625% | 8/15/24 | 18,555 | | 19,850 | |
| | CVS Health Corp. | 4.100% | 3/25/25 | 51,860 | | 58,974 | |
| | CVS Health Corp. | 3.875% | 7/20/25 | 43,458 | | 49,134 | |
| | DH Europe Finance II Sarl | 2.050% | 11/15/22 | 13,852 | | 14,306 | |
| | DH Europe Finance II Sarl | 2.200% | 11/15/24 | 12,173 | | 12,873 | |
| | Diageo Capital plc | 2.625% | 4/29/23 | 16,851 | | 17,694 | |
| | Diageo Capital plc | 3.500% | 9/18/23 | 7,380 | | 8,006 | |
| | Diageo Capital plc | 2.125% | 10/24/24 | 10,525 | | 11,087 | |
| | Diageo Investment Corp. | 2.875% | 5/11/22 | 19,593 | | 20,426 | |
| | Dignity Health | 3.125% | 11/1/22 | 4,389 | | 4,528 | |
| | Eli Lilly & Co. | 2.350% | 5/15/22 | 11,030 | | 11,402 | |
| | Eli Lilly & Co. | 2.750% | 6/1/25 | 8,430 | | 9,204 | |
| | Estee Lauder Cos. Inc. | 2.000% | 12/1/24 | 9,791 | | 10,357 | |
| | Flowers Foods Inc. | 4.375% | 4/1/22 | 2,955 | | 3,063 | |
| | Fomento Economico Mexicano SAB de CV | 2.875% | 5/10/23 | 3,050 | | 3,184 | |
| | General Mills Inc. | 3.150% | 12/15/21 | 7,553 | | 7,763 | |
| | General Mills Inc. | 2.600% | 10/12/22 | 14,058 | | 14,636 | |
| | General Mills Inc. | 3.700% | 10/17/23 | 17,202 | | 18,876 | |
| | General Mills Inc. | 3.650% | 2/15/24 | 11,127 | | 12,241 | |
| | General Mills Inc. | 4.000% | 4/17/25 | 13,768 | | 15,707 | |
| | Gilead Sciences Inc. | 4.400% | 12/1/21 | 17,516 | | 18,218 | |
| | Gilead Sciences Inc. | 1.950% | 3/1/22 | 3,171 | | 3,238 | |
| | Gilead Sciences Inc. | 3.250% | 9/1/22 | 28,266 | | 29,715 | |
| | Gilead Sciences Inc. | 2.500% | 9/1/23 | 19,345 | | 20,457 | |
| | Gilead Sciences Inc. | 3.700% | 4/1/24 | 33,384 | | 36,829 | |
| | Gilead Sciences Inc. | 3.500% | 2/1/25 | 20,092 | | 22,396 | |
| | GlaxoSmithKline Capital Inc. | 2.800% | 3/18/23 | 31,103 | | 32,969 | |
| | GlaxoSmithKline Capital Inc. | 3.375% | 5/15/23 | 17,121 | | 18,466 | |
Vanguard® Short-Term Corporate Bond Index Fund
Schedule of Investments
August 31, 2020
| | Coupon | Maturity
Date | Face
Amount
($000 | ) | Market
Value
($000 | ) |
| | GlaxoSmithKline Capital Inc. | 3.625% | 5/15/25 | 18,405 | | 20,860 | |
| | GlaxoSmithKline Capital plc | 2.850% | 5/8/22 | 30,646 | | 31,873 | |
| | GlaxoSmithKline Capital plc | 2.875% | 6/1/22 | 33,265 | | 34,638 | |
| | GlaxoSmithKline Capital plc | 3.000% | 6/1/24 | 14,116 | | 15,310 | |
| | Hasbro Inc. | 2.600% | 11/19/22 | 1,924 | | 1,988 | |
| | Hasbro Inc. | 3.000% | 11/19/24 | 7,649 | | 8,052 | |
| | HCA Inc. | 4.750% | 5/1/23 | 32,678 | | 35,823 | |
| | HCA Inc. | 5.000% | 3/15/24 | 12,441 | | 14,043 | |
| | HCA Inc. | 5.250% | 4/15/25 | 36,007 | | 41,948 | |
| | Hershey Co. | 2.625% | 5/1/23 | 750 | | 791 | |
| | Hershey Co. | 3.375% | 5/15/23 | 8,716 | | 9,386 | |
| | Hershey Co. | 2.050% | 11/15/24 | 8,000 | | 8,472 | |
| | Hershey Co. | 0.900% | 6/1/25 | 4,865 | | 4,919 | |
| | Hershey Co. | 3.200% | 8/21/25 | 2,667 | | 2,983 | |
| | JM Smucker Co. | 3.500% | 10/15/21 | 10,503 | | 10,864 | |
| | JM Smucker Co. | 3.000% | 3/15/22 | 10,609 | | 11,011 | |
| | JM Smucker Co. | 3.500% | 3/15/25 | 20,509 | | 23,158 | |
| | Johnson & Johnson | 2.450% | 12/5/21 | 5,272 | | 5,411 | |
| | Johnson & Johnson | 2.250% | 3/3/22 | 17,428 | | 17,906 | |
| | Johnson & Johnson | 2.050% | 3/1/23 | 6,452 | | 6,701 | |
| | Johnson & Johnson | 6.730% | 11/15/23 | 50 | | 59 | |
| | Johnson & Johnson | 3.375% | 12/5/23 | 12,992 | | 14,224 | |
| | Johnson & Johnson | 2.625% | 1/15/25 | 14,353 | | 15,618 | |
| | Johnson & Johnson | 0.550% | 9/1/25 | 18,325 | | 18,365 | |
| | Kaiser Foundation Hospitals | 3.500% | 4/1/22 | 6,272 | | 6,562 | |
| | Kellogg Co. | 3.125% | 5/17/22 | 3,495 | | 3,646 | |
| | Kellogg Co. | 2.650% | 12/1/23 | 11,472 | | 12,190 | |
| | Keurig Dr Pepper Inc. | 2.530% | 11/15/21 | 1,000 | | 1,022 | |
| | Keurig Dr Pepper Inc. | 4.057% | 5/25/23 | 31,124 | | 34,006 | |
| | Keurig Dr Pepper Inc. | 3.130% | 12/15/23 | 18,371 | | 19,792 | |
| | Keurig Dr Pepper Inc. | 4.417% | 5/25/25 | 9,865 | | 11,477 | |
| | Kimberly-Clark Corp. | 2.400% | 3/1/22 | 3,426 | | 3,525 | |
| | Kimberly-Clark Corp. | 2.400% | 6/1/23 | 5,267 | | 5,530 | |
| | Kimberly-Clark Corp. | 3.050% | 8/15/25 | 6,040 | | 6,671 | |
| | Kroger Co. | 2.950% | 11/1/21 | 7,365 | | 7,562 | |
| | Kroger Co. | 3.400% | 4/15/22 | 7,075 | | 7,359 | |
| | Kroger Co. | 2.800% | 8/1/22 | 12,479 | | 13,011 | |
| | Kroger Co. | 3.850% | 8/1/23 | 14,133 | | 15,350 | |
| | Kroger Co. | 4.000% | 2/1/24 | 10,328 | | 11,359 | |
| | Laboratory Corp. of America Holdings | 3.200% | 2/1/22 | 7,436 | | 7,706 | |
| | Laboratory Corp. of America Holdings | 3.750% | 8/23/22 | 12,734 | | 13,419 | |
| | Laboratory Corp. of America Holdings | 4.000% | 11/1/23 | 3,173 | | 3,473 | |
| | Laboratory Corp. of America Holdings | 3.250% | 9/1/24 | 12,045 | | 13,227 | |
| | Laboratory Corp. of America Holdings | 2.300% | 12/1/24 | 12,401 | | 13,174 | |
| | Laboratory Corp. of America Holdings | 3.600% | 2/1/25 | 14,932 | | 16,630 | |
| | McCormick & Co. Inc. | 3.900% | 7/15/21 | 2,755 | | 2,815 | |
| | McCormick & Co. Inc. | 2.700% | 8/15/22 | 16,142 | | 16,786 | |
| | McCormick & Co. Inc. | 3.150% | 8/15/24 | 18,075 | | 19,689 | |
| | McKesson Corp. | 2.700% | 12/15/22 | 4,683 | | 4,870 | |
| | McKesson Corp. | 2.850% | 3/15/23 | 10,490 | | 11,001 | |
| | McKesson Corp. | 3.796% | 3/15/24 | 17,653 | | 19,283 | |
| | Medtronic Inc. | 3.150% | 3/15/22 | 29,821 | | 31,086 | |
| | Medtronic Inc. | 2.750% | 4/1/23 | 6,179 | | 6,521 | |
| | Medtronic Inc. | 3.625% | 3/15/24 | 2,169 | | 2,380 | |
| | Medtronic Inc. | 3.500% | 3/15/25 | 45,230 | | 50,692 | |
| | Merck & Co. Inc. | 2.350% | 2/10/22 | 18,516 | | 19,072 | |
| | Merck & Co. Inc. | 2.400% | 9/15/22 | 21,507 | | 22,333 | |
| | Merck & Co. Inc. | 2.800% | 5/18/23 | 34,735 | | 36,945 | |
| | Merck & Co. Inc. | 2.900% | 3/7/24 | 13,094 | | 14,123 | |
| | Merck & Co. Inc. | 2.750% | 2/10/25 | 31,561 | | 34,416 | |
| | Molson Coors Beverage Co. | 3.500% | 5/1/22 | 5,670 | | 5,913 | |
| 2 | Mondelez International Holdings Netherlands BV | 2.125% | 9/19/22 | 6,150 | | 6,350 | |
| | Mondelez International Inc. | 0.625% | 7/1/22 | 12,897 | | 12,956 | |
| | Mondelez International Inc. | 2.125% | 4/13/23 | 8,269 | | 8,602 | |
Vanguard® Short-Term Corporate Bond Index Fund
Schedule of Investments
August 31, 2020
| | Coupon | Maturity
Date | Face
Amount
($000 | ) | Market
Value
($000 | ) |
| | Mondelez International Inc. | 3.625% | 5/7/23 | 11,648 | | 12,579 | |
| | Mondelez International Inc. | 4.000% | 2/1/24 | 8,399 | | 9,267 | |
| | Mondelez International Inc. | 1.500% | 5/4/25 | 15,520 | | 16,081 | |
| | Mylan Inc. | 4.200% | 11/29/23 | 10,878 | | 11,935 | |
| | Novartis Capital Corp. | 2.400% | 5/17/22 | 20,990 | | 21,803 | |
| | Novartis Capital Corp. | 2.400% | 9/21/22 | 26,398 | | 27,485 | |
| | Novartis Capital Corp. | 3.400% | 5/6/24 | 24,015 | | 26,472 | |
| | Novartis Capital Corp. | 1.750% | 2/14/25 | 27,053 | | 28,296 | |
| | PepsiCo Inc. | 1.700% | 10/6/21 | 17,240 | | 17,498 | |
| | PepsiCo Inc. | 2.750% | 3/5/22 | 23,905 | | 24,808 | |
| | PepsiCo Inc. | 2.250% | 5/2/22 | 15,100 | | 15,584 | |
| | PepsiCo Inc. | 3.100% | 7/17/22 | 20,782 | | 21,757 | |
| | PepsiCo Inc. | 2.750% | 3/1/23 | 19,471 | | 20,611 | |
| | PepsiCo Inc. | 0.750% | 5/1/23 | 16,124 | | 16,333 | |
| | PepsiCo Inc. | 3.600% | 3/1/24 | 7,286 | | 8,008 | |
| | PepsiCo Inc. | 2.250% | 3/19/25 | 41,210 | | 44,222 | |
| | PepsiCo Inc. | 2.750% | 4/30/25 | 18,528 | | 20,255 | |
| | PepsiCo Inc. | 3.500% | 7/17/25 | 7,130 | | 8,057 | |
| | Perrigo Finance Unlimited Co. | 3.900% | 12/15/24 | 11,460 | | 12,393 | |
| | Pfizer Inc. | 3.000% | 9/15/21 | 12,714 | | 13,078 | |
| | Pfizer Inc. | 2.200% | 12/15/21 | 15,028 | | 15,385 | |
| | Pfizer Inc. | 2.800% | 3/11/22 | 12,544 | | 13,013 | |
| | Pfizer Inc. | 3.000% | 6/15/23 | 10,777 | | 11,553 | |
| | Pfizer Inc. | 5.800% | 8/12/23 | 5,060 | | 5,812 | |
| | Pfizer Inc. | 3.200% | 9/15/23 | 14,644 | | 15,849 | |
| | Pfizer Inc. | 2.950% | 3/15/24 | 27,385 | | 29,608 | |
| | Pfizer Inc. | 3.400% | 5/15/24 | 18,731 | | 20,693 | |
| | Pfizer Inc. | 0.800% | 5/28/25 | 10,754 | | 10,859 | |
| | Philip Morris International Inc. | 2.900% | 11/15/21 | 12,672 | | 13,063 | |
| | Philip Morris International Inc. | 2.625% | 2/18/22 | 14,523 | | 14,971 | |
| | Philip Morris International Inc. | 2.375% | 8/17/22 | 18,645 | | 19,343 | |
| | Philip Morris International Inc. | 2.500% | 8/22/22 | 11,444 | | 11,939 | |
| | Philip Morris International Inc. | 2.500% | 11/2/22 | 11,821 | | 12,338 | |
| | Philip Morris International Inc. | 2.625% | 3/6/23 | 9,887 | | 10,405 | |
| | Philip Morris International Inc. | 1.125% | 5/1/23 | 14,995 | | 15,252 | |
| | Philip Morris International Inc. | 2.125% | 5/10/23 | 8,854 | | 9,209 | |
| | Philip Morris International Inc. | 3.600% | 11/15/23 | 8,654 | | 9,479 | |
| | Philip Morris International Inc. | 2.875% | 5/1/24 | 13,916 | | 15,015 | |
| | Philip Morris International Inc. | 3.250% | 11/10/24 | 17,513 | | 19,411 | |
| | Philip Morris International Inc. | 1.500% | 5/1/25 | 7,210 | | 7,460 | |
| | Philip Morris International Inc. | 3.375% | 8/11/25 | 11,704 | | 13,107 | |
| 1 | Procter & Gamble - Esop | 9.360% | 1/1/21 | 159 | | 162 | |
| | Procter & Gamble Co. | 1.700% | 11/3/21 | 15,989 | | 16,259 | |
| | Procter & Gamble Co. | 2.300% | 2/6/22 | 20,628 | | 21,224 | |
| | Procter & Gamble Co. | 2.150% | 8/11/22 | 13,858 | | 14,375 | |
| | Procter & Gamble Co. | 3.100% | 8/15/23 | 20,182 | | 21,888 | |
| | Procter & Gamble Co. | 2.450% | 3/25/25 | 20,256 | | 21,964 | |
| | Quest Diagnostics Inc. | 4.250% | 4/1/24 | 6,317 | | 7,019 | |
| | Quest Diagnostics Inc. | 3.500% | 3/30/25 | 8,450 | | 9,342 | |
| | Reynolds American Inc. | 4.000% | 6/12/22 | 16,077 | | 17,035 | |
| | Reynolds American Inc. | 4.850% | 9/15/23 | 17,680 | | 19,753 | |
| | Reynolds American Inc. | 4.450% | 6/12/25 | 48,314 | | 55,005 | |
| 2 | Royalty Pharma plc | 0.750% | 9/2/23 | 17,700 | | 17,688 | |
| 2 | Royalty Pharma plc | 1.200% | 9/2/25 | 5,000 | | 4,990 | |
| | Sanofi | 3.375% | 6/19/23 | 14,019 | | 15,154 | |
| | Shire Acquisitions Investments Ireland DAC | 2.400% | 9/23/21 | 14,266 | | 14,551 | |
| | Shire Acquisitions Investments Ireland DAC | 2.875% | 9/23/23 | 43,911 | | 46,745 | |
| | SSM Health Care Corp. | 3.688% | 6/1/23 | 8,175 | | 8,772 | |
| | Stryker Corp. | 3.375% | 5/15/24 | 9,125 | | 9,968 | |
| | Stryker Corp. | 1.150% | 6/15/25 | 9,074 | | 9,210 | |
| | Sysco Corp. | 2.600% | 6/12/22 | 11,258 | | 11,658 | |
| | Sysco Corp. | 3.550% | 3/15/25 | 9,525 | | 10,386 | |
| | Sysco Corp. | 5.650% | 4/1/25 | 6,619 | | 7,841 | |
| | Sysco Corp. | 3.750% | 10/1/25 | 3,000 | | 3,306 | |
Vanguard® Short-Term Corporate Bond Index Fund
Schedule of Investments
August 31, 2020
| | Coupon | Maturity
Date | Face
Amount
($000 | ) | Market
Value
($000 | ) |
| | Takeda Pharmaceutical Co. Ltd. | 4.000% | 11/26/21 | 27,837 | | 28,951 | |
| | Takeda Pharmaceutical Co. Ltd. | 4.400% | 11/26/23 | 28,118 | | 31,388 | |
| | Thermo Fisher Scientific Inc. | 3.000% | 4/15/23 | 18,905 | | 20,039 | |
| | Thermo Fisher Scientific Inc. | 4.150% | 2/1/24 | 14,341 | | 15,879 | |
| | Thermo Fisher Scientific Inc. | 4.133% | 3/25/25 | 26,549 | | 30,464 | |
| | Tyson Foods Inc. | 2.250% | 8/23/21 | 9,453 | | 9,610 | |
| | Tyson Foods Inc. | 4.500% | 6/15/22 | 26,100 | | 27,712 | |
| | Tyson Foods Inc. | 3.900% | 9/28/23 | 8,603 | | 9,405 | |
| | Tyson Foods Inc. | 3.950% | 8/15/24 | 22,328 | | 24,819 | |
| | Unilever Capital Corp. | 1.375% | 7/28/21 | 9,937 | | 10,036 | |
| | Unilever Capital Corp. | 3.000% | 3/7/22 | 8,330 | | 8,653 | |
| | Unilever Capital Corp. | 2.200% | 5/5/22 | 9,926 | | 10,211 | |
| | Unilever Capital Corp. | 3.125% | 3/22/23 | 11,965 | | 12,757 | |
| | Unilever Capital Corp. | 3.250% | 3/7/24 | 9,401 | | 10,234 | |
| | Unilever Capital Corp. | 2.600% | 5/5/24 | 9,210 | | 9,853 | |
| | Unilever Capital Corp. | 3.375% | 3/22/25 | 5,500 | | 6,123 | |
| | Unilever Capital Corp. | 3.100% | 7/30/25 | 8,949 | | 9,940 | |
| 2 | Upjohn Inc. | 1.125% | 6/22/22 | 22,830 | | 23,049 | |
| 2 | Upjohn Inc. | 1.650% | 6/22/25 | 15,722 | | 16,164 | |
| | UPMC | 3.600% | 4/3/25 | 6,100 | | 6,654 | |
| | Whirlpool Corp. | 4.700% | 6/1/22 | 5,075 | | 5,432 | |
| | Whirlpool Corp. | 4.000% | 3/1/24 | 5,550 | | 6,072 | |
| | Whirlpool Corp. | 3.700% | 5/1/25 | 3,479 | | 3,906 | |
| | Wyeth LLC | 6.450% | 2/1/24 | 7,235 | | 8,647 | |
| | Zimmer Biomet Holdings Inc. | 3.375% | 11/30/21 | 4,355 | | 4,469 | |
| | Zimmer Biomet Holdings Inc. | 3.150% | 4/1/22 | 12,146 | | 12,570 | |
| | Zimmer Biomet Holdings Inc. | 3.700% | 3/19/23 | 5,121 | | 5,486 | |
| | Zimmer Biomet Holdings Inc. | 3.550% | 4/1/25 | 29,465 | | 32,738 | |
| | Zoetis Inc. | 3.250% | 8/20/21 | 6,285 | | 6,464 | |
| | Zoetis Inc. | 3.250% | 2/1/23 | 16,938 | | 17,956 | |
| | Energy (7.6%) | |
| | Baker Hughes a GE Co. LLC / Baker Hughes Co-Obligor Inc. | 2.773% | 12/15/22 | 21,993 | | 23,036 | |
| | Boardwalk Pipelines LP | 3.375% | 2/1/23 | 7,345 | | 7,482 | |
| | Boardwalk Pipelines LP | 4.950% | 12/15/24 | 7,229 | | 7,849 | |
| | BP Capital Markets America Inc. | 3.245% | 5/6/22 | 32,357 | | 33,850 | |
| | BP Capital Markets America Inc. | 2.520% | 9/19/22 | 21,593 | | 22,429 | |
| | BP Capital Markets America Inc. | 2.937% | 4/6/23 | 8,762 | | 9,305 | |
| | BP Capital Markets America Inc. | 2.750% | 5/10/23 | 34,807 | | 36,969 | |
| | BP Capital Markets America Inc. | 3.216% | 11/28/23 | 9,808 | | 10,565 | |
| | BP Capital Markets America Inc. | 3.790% | 2/6/24 | 14,901 | | 16,368 | |
| | BP Capital Markets America Inc. | 3.224% | 4/14/24 | 15,534 | | 16,775 | |
| | BP Capital Markets America Inc. | 3.194% | 4/6/25 | 17,566 | | 19,334 | |
| | BP Capital Markets plc | 3.561% | 11/1/21 | 20,732 | | 21,484 | |
| | BP Capital Markets plc | 3.062% | 3/17/22 | 14,174 | | 14,740 | |
| | BP Capital Markets plc | 3.245% | 5/6/22 | 100 | | 105 | |
| | BP Capital Markets plc | 2.500% | 11/6/22 | 14,020 | | 14,596 | |
| | BP Capital Markets plc | 3.994% | 9/26/23 | 13,619 | | 15,012 | |
| | BP Capital Markets plc | 3.814% | 2/10/24 | 32,024 | | 35,256 | |
| | BP Capital Markets plc | 3.535% | 11/4/24 | 9,024 | | 9,979 | |
| | BP Capital Markets plc | 3.506% | 3/17/25 | 14,153 | | 15,774 | |
| 1 | BP Capital Markets plc | 4.375% | 12/31/49 | 3,175 | | 3,324 | |
| | Canadian Natural Resources Ltd. | 3.450% | 11/15/21 | 8,868 | | 9,090 | |
| | Canadian Natural Resources Ltd. | 2.950% | 1/15/23 | 17,966 | | 18,752 | |
| | Canadian Natural Resources Ltd. | 3.800% | 4/15/24 | 13,856 | | 14,930 | |
| | Canadian Natural Resources Ltd. | 3.900% | 2/1/25 | 10,689 | | 11,651 | |
| | Canadian Natural Resources Ltd. | 2.050% | 7/15/25 | 6,104 | | 6,234 | |
| | Cheniere Corpus Christi Holdings LLC | 7.000% | 6/30/24 | 23,026 | | 26,763 | |
| | Cheniere Corpus Christi Holdings LLC | 5.875% | 3/31/25 | 30,953 | | 35,635 | |
| | Chevron Corp. | 2.411% | 3/3/22 | 16,215 | | 16,662 | |
| | Chevron Corp. | 2.498% | 3/3/22 | 12,921 | | 13,325 | |
| | Chevron Corp. | 2.355% | 12/5/22 | 39,047 | | 40,610 | |
| | Chevron Corp. | 1.141% | 5/11/23 | 23,956 | | 24,436 | |
Vanguard® Short-Term Corporate Bond Index Fund
Schedule of Investments
August 31, 2020
| | Coupon | Maturity
Date | Face
Amount
($000 | ) | Market
Value
($000 | ) |
| | Chevron Corp. | 2.566% | 5/16/23 | 11,584 | | 12,224 | |
| | Chevron Corp. | 3.191% | 6/24/23 | 29,062 | | 31,133 | |
| | Chevron Corp. | 2.895% | 3/3/24 | 17,879 | | 19,221 | |
| | Chevron Corp. | 1.554% | 5/11/25 | 44,500 | | 46,288 | |
| | Chevron USA Inc. | 0.333% | 8/12/22 | 5,000 | | 5,000 | |
| | Chevron USA Inc. | 0.426% | 8/11/23 | 5,000 | | 5,008 | |
| | Chevron USA Inc. | 0.687% | 8/12/25 | 10,000 | | 9,998 | |
| | Cimarex Energy Co. | 4.375% | 6/1/24 | 12,933 | | 13,887 | |
| | Columbia Pipeline Group Inc. | 4.500% | 6/1/25 | 16,634 | | 19,289 | |
| | Concho Resources Inc. | 4.375% | 1/15/25 | 9,007 | | 9,289 | |
| | ConocoPhillips Co. | 2.400% | 12/15/22 | 2,315 | | 2,407 | |
| | ConocoPhillips Co. | 3.350% | 11/15/24 | 6,969 | | 7,650 | |
| | Diamondback Energy Inc. | 2.875% | 12/1/24 | 15,261 | | 15,719 | |
| | Diamondback Energy Inc. | 4.750% | 5/31/25 | 8,756 | | 9,594 | |
| | Diamondback Energy Inc. | 5.375% | 5/31/25 | 6,775 | | 7,038 | |
| | Diamondback Energy Inc. | 3.250% | 12/1/26 | 8,617 | | 8,811 | |
| | Dominion Energy Gas Holdings LLC | 3.550% | 11/1/23 | 6,015 | | 6,495 | |
| | Dominion Energy Gas Holdings LLC | 2.500% | 11/15/24 | 8,030 | | 8,578 | |
| | Dominion Energy Gas Holdings LLC | 3.600% | 12/15/24 | 5,621 | | 6,250 | |
| | Enable Midstream Partners LP | 3.900% | 5/15/24 | 15,387 | | 15,272 | |
| | Enbridge Energy Partners LP | 4.200% | 9/15/21 | 8,714 | | 8,949 | |
| | Enbridge Inc. | 2.900% | 7/15/22 | 9,245 | | 9,602 | |
| | Enbridge Inc. | 4.000% | 10/1/23 | 16,905 | | 18,386 | |
| | Enbridge Inc. | 3.500% | 6/10/24 | 9,149 | | 9,916 | |
| | Enbridge Inc. | 2.500% | 1/15/25 | 12,878 | | 13,594 | |
| | Energy Transfer Operating LP | 5.200% | 2/1/22 | 9,538 | | 9,943 | |
| | Energy Transfer Operating LP | 3.600% | 2/1/23 | 21,740 | | 22,528 | |
| | Energy Transfer Operating LP | 4.250% | 3/15/23 | 21,982 | | 23,164 | |
| | Energy Transfer Operating LP | 4.200% | 9/15/23 | 10,713 | | 11,369 | |
| | Energy Transfer Operating LP | 5.875% | 1/15/24 | 14,992 | | 16,641 | |
| | Energy Transfer Operating LP | 4.900% | 2/1/24 | 8,160 | | 8,792 | |
| | Energy Transfer Operating LP | 4.500% | 4/15/24 | 9,937 | | 10,682 | |
| | Energy Transfer Operating LP | 4.050% | 3/15/25 | 15,144 | | 16,147 | |
| | Energy Transfer Operating LP | 2.900% | 5/15/25 | 16,610 | | 17,067 | |
| | Enterprise Products Operating LLC | 3.500% | 2/1/22 | 6,800 | | 7,084 | |
| | Enterprise Products Operating LLC | 4.050% | 2/15/22 | 15,373 | | 16,142 | |
| | Enterprise Products Operating LLC | 3.350% | 3/15/23 | 28,293 | | 30,025 | |
| | Enterprise Products Operating LLC | 3.900% | 2/15/24 | 14,493 | | 15,899 | |
| | Enterprise Products Operating LLC | 3.750% | 2/15/25 | 26,045 | | 29,048 | |
| 1 | Enterprise Products Operating LLC | 4.875% | 8/16/77 | 8,850 | | 7,876 | |
| | EOG Resources Inc. | 4.100% | 2/1/21 | 9,319 | | 9,459 | |
| | EOG Resources Inc. | 2.625% | 3/15/23 | 12,412 | | 13,033 | |
| | EOG Resources Inc. | 3.150% | 4/1/25 | 5,330 | | 5,870 | |
| | Exxon Mobil Corp. | 2.397% | 3/6/22 | 23,270 | | 23,922 | |
| | Exxon Mobil Corp. | 1.902% | 8/16/22 | 14,770 | | 15,230 | |
| | Exxon Mobil Corp. | 2.726% | 3/1/23 | 27,411 | | 28,898 | |
| | Exxon Mobil Corp. | 1.571% | 4/15/23 | 41,577 | | 42,843 | |
| | Exxon Mobil Corp. | 3.176% | 3/15/24 | 8,137 | | 8,813 | |
| | Exxon Mobil Corp. | 2.019% | 8/16/24 | 25,235 | | 26,613 | |
| | Exxon Mobil Corp. | 2.709% | 3/6/25 | 16,438 | | 17,797 | |
| | Exxon Mobil Corp. | 2.992% | 3/19/25 | 68,771 | | 75,504 | |
| | Halliburton Co. | 3.250% | 11/15/21 | 8,620 | | 8,835 | |
| | Halliburton Co. | 3.500% | 8/1/23 | 11,866 | | 12,637 | |
| | Helmerich & Payne Inc. | 4.650% | 3/15/25 | 7,200 | | 7,920 | |
| | Hess Corp. | 3.500% | 7/15/24 | 6,743 | | 6,971 | |
| | Husky Energy Inc. | 3.950% | 4/15/22 | 9,669 | | 9,971 | |
| | Husky Energy Inc. | 4.000% | 4/15/24 | 12,255 | | 12,991 | |
| | Kinder Morgan Energy Partners LP | 5.000% | 10/1/21 | 9,030 | | 9,351 | |
| | Kinder Morgan Energy Partners LP | 4.150% | 3/1/22 | 5,782 | | 6,078 | |
| | Kinder Morgan Energy Partners LP | 3.950% | 9/1/22 | 15,153 | | 16,006 | |
| | Kinder Morgan Energy Partners LP | 3.450% | 2/15/23 | 11,528 | | 12,161 | |
| | Kinder Morgan Energy Partners LP | 3.500% | 9/1/23 | 9,600 | | 10,282 | |
| | Kinder Morgan Energy Partners LP | 4.150% | 2/1/24 | 10,443 | | 11,446 | |
| | Kinder Morgan Energy Partners LP | 4.300% | 5/1/24 | 11,360 | | 12,592 | |
Vanguard® Short-Term Corporate Bond Index Fund
Schedule of Investments
August 31, 2020
| | Coupon | Maturity
Date | Face
Amount
($000 | ) | Market
Value
($000 | ) |
| | Kinder Morgan Energy Partners LP | 4.250% | 9/1/24 | 12,824 | | 14,294 | |
| | Kinder Morgan Inc. | 3.150% | 1/15/23 | 14,677 | | 15,448 | |
| | Kinder Morgan Inc. | 4.300% | 6/1/25 | 27,186 | | 30,832 | |
| | Marathon Oil Corp. | 2.800% | 11/1/22 | 16,135 | | 16,458 | |
| | Marathon Oil Corp. | 3.850% | 6/1/25 | 14,609 | | 15,066 | |
| | Marathon Petroleum Corp. | 5.375% | 10/1/22 | 50 | | 50 | |
| | Marathon Petroleum Corp. | 4.500% | 5/1/23 | 15,595 | | 16,960 | |
| | Marathon Petroleum Corp. | 4.750% | 12/15/23 | 10,669 | | 11,829 | |
| | Marathon Petroleum Corp. | 3.625% | 9/15/24 | 8,032 | | 8,644 | |
| | Marathon Petroleum Corp. | 4.700% | 5/1/25 | 37,523 | | 42,729 | |
| | MPLX LP | 3.500% | 12/1/22 | 11,850 | | 12,413 | |
| | MPLX LP | 3.375% | 3/15/23 | 11,833 | | 12,469 | |
| | MPLX LP | 4.500% | 7/15/23 | 18,255 | | 19,784 | |
| | MPLX LP | 4.875% | 12/1/24 | 22,922 | | 25,845 | |
| | MPLX LP | 5.250% | 1/15/25 | 11,565 | | 12,013 | |
| | MPLX LP | 4.000% | 2/15/25 | 13,608 | | 14,850 | |
| | MPLX LP | 4.875% | 6/1/25 | 16,123 | | 18,380 | |
| | National Fuel Gas Co. | 4.900% | 12/1/21 | 8,564 | | 8,889 | |
| | National Fuel Gas Co. | 3.750% | 3/1/23 | 9,625 | | 9,961 | |
| | National Fuel Gas Co. | 5.200% | 7/15/25 | 6,528 | | 7,139 | |
| | Newfield Exploration Co. | 5.750% | 1/30/22 | 14,632 | | 14,943 | |
| | Newfield Exploration Co. | 5.625% | 7/1/24 | 13,196 | | 13,460 | |
| | Noble Energy Inc. | 3.900% | 11/15/24 | 7,584 | | 8,409 | |
| | ONEOK Inc. | 4.250% | 2/1/22 | 7,739 | | 8,029 | |
| | ONEOK Inc. | 7.500% | 9/1/23 | 8,980 | | 10,327 | |
| | ONEOK Inc. | 2.750% | 9/1/24 | 10,410 | | 10,725 | |
| | ONEOK Partners LP | 3.375% | 10/1/22 | 20,472 | | 21,316 | |
| | ONEOK Partners LP | 5.000% | 9/15/23 | 7,680 | | 8,342 | |
| | ONEOK Partners LP | 4.900% | 3/15/25 | 7,212 | | 7,894 | |
| | Ovintiv Inc. | 3.900% | 11/15/21 | 11,219 | | 11,303 | |
| | Petro-Canada | 9.250% | 10/15/21 | 5,436 | | 5,918 | |
| | Phillips 66 | 4.300% | 4/1/22 | 31,707 | | 33,571 | |
| | Phillips 66 | 3.700% | 4/6/23 | 5,519 | | 5,941 | |
| | Phillips 66 | 3.850% | 4/9/25 | 20,515 | | 22,930 | |
| | Phillips 66 Partners LP | 2.450% | 12/15/24 | 7,097 | | 7,337 | |
| | Phillips 66 Partners LP | 3.605% | 2/15/25 | 9,649 | | 10,359 | |
| | Plains All American Pipeline LP / PAA Finance Corp. | 3.650% | 6/1/22 | 9,017 | | 9,253 | |
| | Plains All American Pipeline LP / PAA Finance Corp. | 2.850% | 1/31/23 | 9,221 | | 9,395 | |
| | Plains All American Pipeline LP / PAA Finance Corp. | 3.850% | 10/15/23 | 12,693 | | 13,391 | |
| | Plains All American Pipeline LP / PAA Finance Corp. | 3.600% | 11/1/24 | 17,321 | | 18,052 | |
| | Regency Energy Partners LP / Regency Energy Finance Corp. | 5.875% | 3/1/22 | 11,625 | | 12,229 | |
| | Regency Energy Partners LP / Regency Energy Finance Corp. | 5.000% | 10/1/22 | 11,738 | | 12,431 | |
| | Regency Energy Partners LP / Regency Energy Finance Corp. | 4.500% | 11/1/23 | 13,782 | | 14,760 | |
| | Sabine Pass Liquefaction LLC | 6.250% | 3/15/22 | 11,588 | | 12,364 | |
| | Sabine Pass Liquefaction LLC | 5.625% | 4/15/23 | 25,806 | | 28,490 | |
| | Sabine Pass Liquefaction LLC | 5.750% | 5/15/24 | 29,682 | | 33,986 | |
| | Sabine Pass Liquefaction LLC | 5.625% | 3/1/25 | 43,648 | | 50,850 | |
| | Schlumberger Investment SA | 3.650% | 12/1/23 | 21,653 | | 23,473 | |
| | Shell International Finance BV | 1.750% | 9/12/21 | 10,000 | | 10,150 | |
| | Shell International Finance BV | 2.375% | 8/21/22 | 22,311 | | 23,178 | |
| | Shell International Finance BV | 2.250% | 1/6/23 | 18,174 | | 18,973 | |
| | Shell International Finance BV | 3.400% | 8/12/23 | 18,545 | | 20,143 | |
| | Shell International Finance BV | 3.500% | 11/13/23 | 8,253 | | 9,013 | |
| | Shell International Finance BV | 2.000% | 11/7/24 | 25,338 | | 26,711 | |
| | Shell International Finance BV | 2.375% | 4/6/25 | 29,646 | | 31,801 | |
| | Shell International Finance BV | 3.250% | 5/11/25 | 42,538 | | 47,381 | |
| | Spectra Energy Partners LP | 4.750% | 3/15/24 | 20,082 | | 22,527 | |
| | Spectra Energy Partners LP | 3.500% | 3/15/25 | 4,874 | | 5,345 | |
| | Suncor Energy Inc. | 2.800% | 5/15/23 | 6,870 | | 7,231 | |
| | Suncor Energy Inc. | 3.600% | 12/1/24 | 16,880 | | 18,591 | |
| | Suncor Energy Inc. | 3.100% | 5/15/25 | 6,464 | | 7,073 | |
Vanguard® Short-Term Corporate Bond Index Fund
Schedule of Investments
August 31, 2020
| | Coupon | Maturity
Date | Face
Amount
($000 | ) | Market
Value
($000 | ) |
| | Sunoco Logistics Partners Operations LP | 4.650% | 2/15/22 | 4,117 | | 4,297 | |
| | Sunoco Logistics Partners Operations LP | 3.450% | 1/15/23 | 4,020 | | 4,151 | |
| | Sunoco Logistics Partners Operations LP | 4.250% | 4/1/24 | 17,283 | | 18,298 | |
| | TechnipFMC plc | 3.450% | 10/1/22 | 6,629 | | 6,785 | |
| | Total Capital Canada Ltd. | 2.750% | 7/15/23 | 30,601 | | 32,650 | |
| | Total Capital International SA | 2.875% | 2/17/22 | 16,033 | | 16,614 | |
| | Total Capital International SA | 2.700% | 1/25/23 | 24,198 | | 25,504 | |
| | Total Capital International SA | 3.700% | 1/15/24 | 20,203 | | 22,290 | |
| | Total Capital International SA | 3.750% | 4/10/24 | 19,408 | | 21,496 | |
| | Total Capital International SA | 2.434% | 1/10/25 | 14,388 | | 15,377 | |
| | Total Capital SA | 4.250% | 12/15/21 | 5,728 | | 6,014 | |
| | TransCanada PipeLines Ltd. | 2.500% | 8/1/22 | 16,975 | | 17,551 | |
| | TransCanada PipeLines Ltd. | 3.750% | 10/16/23 | 14,306 | | 15,562 | |
| | Valero Energy Corp. | 2.700% | 4/15/23 | 21,720 | | 22,671 | |
| | Valero Energy Corp. | 3.650% | 3/15/25 | 12,802 | | 14,064 | |
| | Valero Energy Corp. | 2.850% | 4/15/25 | 8,744 | | 9,324 | |
| | Williams Cos. Inc. | 7.875% | 9/1/21 | 3,974 | | 4,258 | |
| | Williams Cos. Inc. | 4.000% | 11/15/21 | 10,000 | | 10,313 | |
| | Williams Cos. Inc. | 3.600% | 3/15/22 | 26,282 | | 27,300 | |
| | Williams Cos. Inc. | 3.350% | 8/15/22 | 18,205 | | 18,954 | |
| | Williams Cos. Inc. | 3.700% | 1/15/23 | 16,963 | | 17,959 | |
| | Williams Cos. Inc. | 4.500% | 11/15/23 | 12,171 | | 13,372 | |
| | Williams Cos. Inc. | 4.300% | 3/4/24 | 18,681 | | 20,528 | |
| | Williams Cos. Inc. | 4.550% | 6/24/24 | 16,438 | | 18,384 | |
| | Williams Cos. Inc. | 3.900% | 1/15/25 | 11,343 | | 12,459 | |
| | Other Industrial (0.1%) | |
| | CBRE Services Inc. | 5.250% | 3/15/25 | 6,309 | | 7,248 | |
| | Cintas Corp. No. 2 | 4.300% | 6/1/21 | 2,015 | | 2,067 | |
| | Cintas Corp. No. 2 | 2.900% | 4/1/22 | 5,451 | | 5,651 | |
| | Cintas Corp. No. 2 | 3.250% | 6/1/22 | 4,675 | | 4,860 | |
| | Fluor Corp. | 3.500% | 12/15/24 | 2,273 | | 1,773 | |
| | Yale University | 0.873% | 4/15/25 | 7,000 | | 7,080 | |
| | Technology (9.2%) | |
| | Adobe Inc. | 1.700% | 2/1/23 | 9,095 | | 9,405 | |
| | Adobe Inc. | 1.900% | 2/1/25 | 10,491 | | 11,103 | |
| | Adobe Inc. | 3.250% | 2/1/25 | 16,909 | | 18,781 | |
| | Alphabet Inc. | 3.375% | 2/25/24 | 14,906 | | 16,437 | |
| | Alphabet Inc. | 0.450% | 8/15/25 | 17,500 | | 17,461 | |
| | Altera Corp. | 4.100% | 11/15/23 | 11,177 | | 12,472 | |
| | Analog Devices Inc. | 2.500% | 12/5/21 | 10,645 | | 10,898 | |
| | Analog Devices Inc. | 2.875% | 6/1/23 | 5,506 | | 5,821 | |
| | Analog Devices Inc. | 3.125% | 12/5/23 | 6,498 | | 7,005 | |
| | Analog Devices Inc. | 2.950% | 4/1/25 | 4,982 | | 5,461 | |
| | Apple Inc. | 2.150% | 2/9/22 | 22,783 | | 23,379 | |
| | Apple Inc. | 2.500% | 2/9/22 | 26,576 | | 27,382 | |
| | Apple Inc. | 2.300% | 5/11/22 | 18,952 | | 19,569 | |
| | Apple Inc. | 2.700% | 5/13/22 | 20,658 | | 21,482 | |
| | Apple Inc. | 1.700% | 9/11/22 | 12,315 | | 12,660 | |
| | Apple Inc. | 2.100% | 9/12/22 | 15,925 | | 16,469 | |
| | Apple Inc. | 2.400% | 1/13/23 | 15,273 | | 15,998 | |
| | Apple Inc. | 2.850% | 2/23/23 | 22,978 | | 24,317 | |
| | Apple Inc. | 2.400% | 5/3/23 | 95,813 | | 101,137 | |
| | Apple Inc. | 0.750% | 5/11/23 | 31,240 | | 31,620 | |
| | Apple Inc. | 3.000% | 2/9/24 | 32,496 | | 35,069 | |
| | Apple Inc. | 3.450% | 5/6/24 | 40,285 | | 44,581 | |
| | Apple Inc. | 2.850% | 5/11/24 | 43,924 | | 47,459 | |
| | Apple Inc. | 1.800% | 9/11/24 | 12,409 | | 13,027 | |
| | Apple Inc. | 2.750% | 1/13/25 | 9,928 | | 10,823 | |
| | Apple Inc. | 2.500% | 2/9/25 | 22,714 | | 24,568 | |
| | Apple Inc. | 1.125% | 5/11/25 | 43,619 | | 44,738 | |
| | Apple Inc. | 3.200% | 5/13/25 | 48,542 | | 54,333 | |
| | Apple Inc. | 0.550% | 8/20/25 | 22,000 | | 22,022 | |
| | Arrow Electronics Inc. | 3.500% | 4/1/22 | 4,521 | | 4,650 | |
Vanguard® Short-Term Corporate Bond Index Fund
Schedule of Investments
August 31, 2020
| | Coupon | Maturity
Date | Face
Amount
($000 | ) | Market
Value
($000 | ) |
| | Arrow Electronics Inc. | 4.500% | 3/1/23 | 4,370 | | 4,670 | |
| | Arrow Electronics Inc. | 3.250% | 9/8/24 | 11,521 | | 12,355 | |
| | Arrow Electronics Inc. | 4.000% | 4/1/25 | 4,920 | | 5,298 | |
| | Autodesk Inc. | 3.600% | 12/15/22 | 2,993 | | 3,169 | |
| | Autodesk Inc. | 4.375% | 6/15/25 | 5,608 | | 6,356 | |
| | Avnet Inc. | 3.750% | 12/1/21 | 4,675 | | 4,796 | |
| | Avnet Inc. | 4.875% | 12/1/22 | 6,175 | | 6,650 | |
| | Baidu Inc. | 2.875% | 7/6/22 | 10,175 | | 10,479 | |
| | Baidu Inc. | 3.500% | 11/28/22 | 4,499 | | 4,724 | |
| | Baidu Inc. | 3.875% | 9/29/23 | 17,430 | | 18,778 | |
| | Baidu Inc. | 4.375% | 5/14/24 | 21,800 | | 24,031 | |
| | Baidu Inc. | 3.075% | 4/7/25 | 12,000 | | 12,830 | |
| | Baidu Inc. | 4.125% | 6/30/25 | 6,910 | | 7,720 | |
| | Broadcom Corp. / Broadcom Cayman Finance Ltd. | 3.000% | 1/15/22 | 13,000 | | 13,364 | |
| | Broadcom Corp. / Broadcom Cayman Finance Ltd. | 2.650% | 1/15/23 | 17,666 | | 18,374 | |
| | Broadcom Corp. / Broadcom Cayman Finance Ltd. | 3.625% | 1/15/24 | 29,549 | | 31,911 | |
| | Broadcom Corp. / Broadcom Cayman Finance Ltd. | 3.125% | 1/15/25 | 16,319 | | 17,505 | |
| | Broadcom Inc. | 3.125% | 10/15/22 | 11,120 | | 11,649 | |
| | Broadcom Inc. | 2.250% | 11/15/23 | 6,000 | | 6,228 | |
| | Broadcom Inc. | 3.625% | 10/15/24 | 25,540 | | 28,010 | |
| | Broadcom Inc. | 4.700% | 4/15/25 | 37,500 | | 42,849 | |
| | Broadcom Inc. | 3.150% | 11/15/25 | 2,000 | | 2,162 | |
| | Cadence Design Systems Inc. | 4.375% | 10/15/24 | 5,382 | | 6,039 | |
| | Cisco Systems Inc. | 1.850% | 9/20/21 | 36,117 | | 36,673 | |
| | Cisco Systems Inc. | 3.000% | 6/15/22 | 10,176 | | 10,683 | |
| | Cisco Systems Inc. | 2.600% | 2/28/23 | 8,140 | | 8,596 | |
| | Cisco Systems Inc. | 2.200% | 9/20/23 | 14,871 | | 15,671 | |
| | Cisco Systems Inc. | 3.625% | 3/4/24 | 14,168 | | 15,749 | |
| | Cisco Systems Inc. | 3.500% | 6/15/25 | 3,242 | | 3,706 | |
| | Corning Inc. | 2.900% | 5/15/22 | 6,788 | | 7,013 | |
| 2 | Dell International LLC / EMC Corp. | 5.450% | 6/15/23 | 70,778 | | 77,850 | |
| 2 | Dell International LLC / EMC Corp. | 4.000% | 7/15/24 | 16,105 | | 17,429 | |
| 2 | Dell International LLC / EMC Corp. | 5.850% | 7/15/25 | 12,942 | | 15,202 | |
| | DXC Technology Co. | 4.000% | 4/15/23 | 11,533 | | 12,160 | |
| | DXC Technology Co. | 4.250% | 4/15/24 | 12,838 | | 13,950 | |
| | DXC Technology Co. | 4.125% | 4/15/25 | 16,110 | | 17,431 | |
| | Equifax Inc. | 3.600% | 8/15/21 | 4,604 | | 4,739 | |
| | Equifax Inc. | 3.300% | 12/15/22 | 10,737 | | 11,305 | |
| | Equifax Inc. | 3.950% | 6/15/23 | 5,816 | | 6,296 | |
| | Equifax Inc. | 2.600% | 12/1/24 | 15,099 | | 16,092 | |
| | Equinix Inc. | 2.625% | 11/18/24 | 24,688 | | 26,487 | |
| | Equinix Inc. | 1.250% | 7/15/25 | 624 | | 633 | |
| | Fidelity National Information Services Inc. | 3.500% | 4/15/23 | 25,015 | | 26,702 | |
| | Fidelity National Information Services Inc. | 3.875% | 6/5/24 | 6,434 | | 7,100 | |
| | Fiserv Inc. | 3.500% | 10/1/22 | 15,993 | | 16,856 | |
| | Fiserv Inc. | 3.800% | 10/1/23 | 29,996 | | 32,843 | |
| | Fiserv Inc. | 2.750% | 7/1/24 | 46,041 | | 49,386 | |
| | Fiserv Inc. | 3.850% | 6/1/25 | 3,679 | | 4,171 | |
| | Flex Ltd. | 5.000% | 2/15/23 | 7,146 | | 7,798 | |
| | Flex Ltd. | 4.750% | 6/15/25 | 8,785 | | 9,856 | |
| | Global Payments Inc. | 3.750% | 6/1/23 | 9,641 | | 10,350 | |
| | Global Payments Inc. | 4.000% | 6/1/23 | 12,835 | | 13,924 | |
| | Global Payments Inc. | 2.650% | 2/15/25 | 21,482 | | 22,956 | |
| | Hewlett Packard Enterprise Co. | 3.500% | 10/5/21 | 6,763 | | 6,968 | |
| | Hewlett Packard Enterprise Co. | 4.400% | 10/15/22 | 33,685 | | 36,041 | |
| | Hewlett Packard Enterprise Co. | 2.250% | 4/1/23 | 11,475 | | 11,856 | |
| | Hewlett Packard Enterprise Co. | 4.450% | 10/2/23 | 20,100 | | 22,125 | |
| | Hewlett Packard Enterprise Co. | 1.450% | 4/1/24 | 18,855 | | 19,059 | |
| | Hewlett Packard Enterprise Co. | 4.650% | 10/1/24 | 17,765 | | 20,095 | |
| | HP Inc. | 4.050% | 9/15/22 | 8,050 | | 8,589 | |
| | HP Inc. | 2.200% | 6/17/25 | 20,300 | | 21,450 | |
| | IBM Credit LLC | 1.800% | 1/20/21 | 25 | | 25 | |
| | IBM Credit LLC | 3.600% | 11/30/21 | 8,800 | | 9,163 | |
| | IBM Credit LLC | 2.200% | 9/8/22 | 7,715 | | 7,993 | |
Vanguard® Short-Term Corporate Bond Index Fund
Schedule of Investments
August 31, 2020
| | Coupon | Maturity
Date | Face
Amount
($000 | ) | Market
Value
($000 | ) |
| | IBM Credit LLC | 3.000% | 2/6/23 | 9,077 | | 9,640 | |
| | Intel Corp. | 3.300% | 10/1/21 | 32,614 | | 33,708 | |
| | Intel Corp. | 2.350% | 5/11/22 | 12,167 | | 12,564 | |
| | Intel Corp. | 3.100% | 7/29/22 | 16,462 | | 17,346 | |
| | Intel Corp. | 2.700% | 12/15/22 | 29,890 | | 31,571 | |
| | Intel Corp. | 2.875% | 5/11/24 | 22,930 | | 24,806 | |
| | Intel Corp. | 3.400% | 3/25/25 | 36,152 | | 40,497 | |
| | Intel Corp. | 3.700% | 7/29/25 | 36,751 | | 41,835 | |
| | International Business Machines Corp. | 2.500% | 1/27/22 | 19,593 | | 20,201 | |
| | International Business Machines Corp. | 2.850% | 5/13/22 | 55,014 | | 57,365 | |
| | International Business Machines Corp. | 1.875% | 8/1/22 | 14,382 | | 14,804 | |
| | International Business Machines Corp. | 2.875% | 11/9/22 | 27,083 | | 28,520 | |
| | International Business Machines Corp. | 3.375% | 8/1/23 | 35,623 | | 38,668 | |
| | International Business Machines Corp. | 3.625% | 2/12/24 | 20,879 | | 23,015 | |
| | International Business Machines Corp. | 3.000% | 5/15/24 | 46,536 | | 50,624 | |
| | Intuit Inc. | 0.650% | 7/15/23 | 7,545 | | 7,590 | |
| | Intuit Inc. | 0.950% | 7/15/25 | 8,349 | | 8,444 | |
| | Jabil Inc. | 4.700% | 9/15/22 | 7,198 | | 7,698 | |
| | Juniper Networks Inc. | 4.500% | 3/15/24 | 10,765 | | 12,041 | |
| | Juniper Networks Inc. | 4.350% | 6/15/25 | 4,986 | | 5,615 | |
| | Keysight Technologies Inc. | 4.550% | 10/30/24 | 3,117 | | 3,519 | |
| | KLA Corp. | 4.650% | 11/1/24 | 22,361 | | 25,698 | |
| | Lam Research Corp. | 3.800% | 3/15/25 | 10,696 | | 12,136 | |
| 2 | Leidos Inc. | 2.950% | 5/15/23 | 8,000 | | 8,430 | |
| 2 | Leidos Inc. | 3.625% | 5/15/25 | 9,700 | | 10,815 | |
| | Marvell Technology Group Ltd. | 4.200% | 6/22/23 | 9,451 | | 10,207 | |
| | Maxim Integrated Products Inc. | 3.375% | 3/15/23 | 7,157 | | 7,583 | |
| | Microchip Technology Inc. | 4.333% | 6/1/23 | 21,414 | | 23,090 | |
| | Micron Technology Inc. | 2.497% | 4/24/23 | 20,230 | | 21,126 | |
| | Micron Technology Inc. | 4.640% | 2/6/24 | 7,281 | | 8,100 | |
| | Microsoft Corp. | 1.550% | 8/8/21 | 12,000 | | 12,136 | |
| | Microsoft Corp. | 2.400% | 2/6/22 | 39,339 | | 40,488 | |
| | Microsoft Corp. | 2.375% | 2/12/22 | 19,477 | | 20,048 | |
| | Microsoft Corp. | 2.650% | 11/3/22 | 23,089 | | 24,205 | |
| | Microsoft Corp. | 2.125% | 11/15/22 | 15,894 | | 16,510 | |
| | Microsoft Corp. | 2.375% | 5/1/23 | 20,697 | | 21,743 | |
| | Microsoft Corp. | 2.000% | 8/8/23 | 24,763 | | 25,937 | |
| | Microsoft Corp. | 3.625% | 12/15/23 | 22,930 | | 25,244 | |
| | Microsoft Corp. | 2.875% | 2/6/24 | 49,366 | | 53,280 | |
| | Microsoft Corp. | 2.700% | 2/12/25 | 39,447 | | 43,149 | |
| | Motorola Solutions Inc. | 3.750% | 5/15/22 | 9,768 | | 10,308 | |
| | Motorola Solutions Inc. | 3.500% | 3/1/23 | 5,753 | | 6,092 | |
| | Motorola Solutions Inc. | 4.000% | 9/1/24 | 8,614 | | 9,530 | |
| | NetApp Inc. | 3.300% | 9/29/24 | 6,932 | | 7,558 | |
| | NetApp Inc. | 1.875% | 6/22/25 | 12,559 | | 13,077 | |
| | NVIDIA Corp. | 2.200% | 9/16/21 | 14,122 | | 14,376 | |
| 2 | NXP BV / NXP Funding LLC | 4.875% | 3/1/24 | 14,742 | | 16,569 | |
| 2 | NXP BV / NXP Funding LLC / NXP USA Inc. | 2.700% | 5/1/25 | 10,974 | | 11,671 | |
| | Oracle Corp. | 1.900% | 9/15/21 | 69,665 | | 70,756 | |
| | Oracle Corp. | 2.500% | 5/15/22 | 41,355 | | 42,730 | |
| | Oracle Corp. | 2.500% | 10/15/22 | 57,700 | | 60,283 | |
| | Oracle Corp. | 2.625% | 2/15/23 | 32,969 | | 34,699 | |
| | Oracle Corp. | 3.625% | 7/15/23 | 17,930 | | 19,529 | |
| | Oracle Corp. | 2.400% | 9/15/23 | 44,383 | | 46,871 | |
| | Oracle Corp. | 3.400% | 7/8/24 | 33,437 | | 36,704 | |
| | Oracle Corp. | 2.950% | 11/15/24 | 35,752 | | 39,023 | |
| | Oracle Corp. | 2.500% | 4/1/25 | 53,432 | | 57,604 | |
| | Oracle Corp. | 2.950% | 5/15/25 | 37,038 | | 40,594 | |
| | PayPal Holdings Inc. | 2.200% | 9/26/22 | 28,963 | | 30,014 | |
| | PayPal Holdings Inc. | 1.350% | 6/1/23 | 15,178 | | 15,530 | |
| | PayPal Holdings Inc. | 2.400% | 10/1/24 | 21,721 | | 23,179 | |
| | PayPal Holdings Inc. | 1.650% | 6/1/25 | 9,275 | | 9,648 | |
| | QUALCOMM Inc. | 3.000% | 5/20/22 | 18,993 | | 19,852 | |
| | QUALCOMM Inc. | 2.600% | 1/30/23 | 4,406 | | 4,630 | |
Vanguard® Short-Term Corporate Bond Index Fund
Schedule of Investments
August 31, 2020
| | Coupon | Maturity
Date | Face
Amount
($000 | ) | Market
Value
($000 | ) |
| | QUALCOMM Inc. | 2.900% | 5/20/24 | 10,996 | | 11,846 | |
| | QUALCOMM Inc. | 3.450% | 5/20/25 | 20,501 | | 22,945 | |
| 2 | QUALCOMM Inc. | 1.300% | 5/20/28 | 13,346 | | 13,353 | |
| | salesforce.com Inc. | 3.250% | 4/11/23 | 18,075 | | 19,385 | |
| | Seagate HDD Cayman | 4.750% | 6/1/23 | 7,325 | | 7,893 | |
| | Seagate HDD Cayman | 4.875% | 3/1/24 | 11,986 | | 13,095 | |
| | Seagate HDD Cayman | 4.750% | 1/1/25 | 11,690 | | 12,742 | |
| | Texas Instruments Inc. | 1.850% | 5/15/22 | 9,709 | | 9,955 | |
| | Texas Instruments Inc. | 2.250% | 5/1/23 | 3,500 | | 3,657 | |
| | Texas Instruments Inc. | 2.625% | 5/15/24 | 12,060 | | 12,950 | |
| | Texas Instruments Inc. | 1.375% | 3/12/25 | 18,110 | | 18,774 | |
| | Trimble Inc. | 4.150% | 6/15/23 | 4,436 | | 4,762 | |
| | Trimble Inc. | 4.750% | 12/1/24 | 6,302 | | 6,972 | |
| | Tyco Electronics Group SA | 3.500% | 2/3/22 | 10,226 | | 10,589 | |
| | Tyco Electronics Group SA | 3.450% | 8/1/24 | 7,311 | | 7,933 | |
| | Verisk Analytics Inc. | 4.125% | 9/12/22 | 10,379 | | 11,060 | |
| | Verisk Analytics Inc. | 4.000% | 6/15/25 | 17,465 | | 19,953 | |
| | VMware Inc. | 2.950% | 8/21/22 | 34,238 | | 35,724 | |
| | VMware Inc. | 4.500% | 5/15/25 | 17,945 | | 20,457 | |
| | Xilinx Inc. | 2.950% | 6/1/24 | 9,185 | | 9,927 | |
| | Transportation (1.7%) | |
| | Burlington Northern Santa Fe LLC | 3.450% | 9/15/21 | 9,347 | | 9,584 | |
| | Burlington Northern Santa Fe LLC | 3.050% | 3/15/22 | 12,110 | | 12,529 | |
| | Burlington Northern Santa Fe LLC | 3.050% | 9/1/22 | 12,766 | | 13,352 | |
| | Burlington Northern Santa Fe LLC | 3.000% | 3/15/23 | 9,217 | | 9,782 | |
| | Burlington Northern Santa Fe LLC | 3.850% | 9/1/23 | 19,255 | | 21,048 | |
| | Burlington Northern Santa Fe LLC | 3.750% | 4/1/24 | 10,948 | | 12,095 | |
| | Burlington Northern Santa Fe LLC | 3.400% | 9/1/24 | 11,830 | | 13,071 | |
| | Burlington Northern Santa Fe LLC | 3.000% | 4/1/25 | 6,015 | | 6,601 | |
| | Burlington Northern Santa Fe LLC | 3.650% | 9/1/25 | 2,300 | | 2,626 | |
| | Canadian National Railway Co. | 2.850% | 12/15/21 | 9,925 | | 10,173 | |
| | Canadian National Railway Co. | 2.950% | 11/21/24 | 4,524 | | 4,850 | |
| | Canadian Pacific Railway Co. | 9.450% | 8/1/21 | 2,250 | | 2,407 | |
| | Canadian Pacific Railway Co. | 4.450% | 3/15/23 | 4,067 | | 4,398 | |
| | Canadian Pacific Railway Co. | 2.900% | 2/1/25 | 13,499 | | 14,725 | |
| 1 | Continental Airlines 2007-1 Class A Pass Through Trust | 5.983% | 10/19/23 | 4,326 | | 4,063 | |
| 1 | Continental Airlines 2012-1 Class A Pass Through Trust | 4.150% | 10/11/25 | 6,761 | | 6,308 | |
| 1 | Continental Airlines 2012-2 Class A Pass Through Trust | 4.000% | 4/29/26 | 1,222 | | 1,140 | |
| | CSX Corp. | 3.700% | 11/1/23 | 9,563 | | 10,445 | |
| | CSX Corp. | 3.400% | 8/1/24 | 14,806 | | 16,345 | |
| 1 | Delta Air Lines 2007-1 Class A Pass Through Trust | 6.821% | 2/10/24 | 3,372 | | 3,355 | |
| | Delta Air Lines 2019-1 Class AA Pass Through Trust | 3.204% | 4/25/24 | 4,716 | | 4,669 | |
| | FedEx Corp. | 3.400% | 1/14/22 | 6,524 | | 6,779 | |
| | FedEx Corp. | 2.625% | 8/1/22 | 13,131 | | 13,673 | |
| | FedEx Corp. | 4.000% | 1/15/24 | 8,237 | | 9,139 | |
| | FedEx Corp. | 3.200% | 2/1/25 | 8,497 | | 9,317 | |
| | FedEx Corp. | 3.800% | 5/15/25 | 24,369 | | 27,545 | |
| | JB Hunt Transport Services Inc. | 3.300% | 8/15/22 | 5,993 | | 6,269 | |
| | Kansas City Southern | 3.000% | 5/15/23 | 3,887 | | 4,005 | |
| | Norfolk Southern Corp. | 3.250% | 12/1/21 | 6,455 | | 6,647 | |
| | Norfolk Southern Corp. | 3.000% | 4/1/22 | 17,849 | | 18,461 | |
| | Norfolk Southern Corp. | 2.903% | 2/15/23 | 7,857 | | 8,277 | |
| | Norfolk Southern Corp. | 3.850% | 1/15/24 | 4,442 | | 4,875 | |
| | Norfolk Southern Corp. | 5.590% | 5/17/25 | 1,770 | | 2,100 | |
| | Norfolk Southern Corp. | 3.650% | 8/1/25 | 2,811 | | 3,176 | |
| | Ryder System Inc. | 2.250% | 9/1/21 | 5,907 | | 5,986 | |
| | Ryder System Inc. | 3.450% | 11/15/21 | 1,750 | | 1,807 | |
| | Ryder System Inc. | 2.800% | 3/1/22 | 5,907 | | 6,086 | |
| | Ryder System Inc. | 2.875% | 6/1/22 | 14,145 | | 14,672 | |
| | Ryder System Inc. | 2.500% | 9/1/22 | 2,585 | | 2,677 | |
| | Ryder System Inc. | 3.400% | 3/1/23 | 9,957 | | 10,577 | |
| | Ryder System Inc. | 3.750% | 6/9/23 | 9,789 | | 10,562 | |
| | Ryder System Inc. | 3.875% | 12/1/23 | 3,824 | | 4,170 | |
Vanguard® Short-Term Corporate Bond Index Fund
Schedule of Investments
August 31, 2020
| | Coupon | Maturity
Date | Face
Amount
($000 | ) | Market
Value
($000 | ) |
| | Ryder System Inc. | 3.650% | 3/18/24 | 13,391 | | 14,580 | |
| | Ryder System Inc. | 2.500% | 9/1/24 | 11,836 | | 12,488 | |
| | Southwest Airlines Co. | 2.750% | 11/16/22 | 6,450 | | 6,578 | |
| | Southwest Airlines Co. | 4.750% | 5/4/23 | 18,000 | | 19,080 | |
| | Southwest Airlines Co. | 5.250% | 5/4/25 | 25,742 | | 27,962 | |
| | Union Pacific Corp. | 2.950% | 3/1/22 | 14,004 | | 14,539 | |
| | Union Pacific Corp. | 4.163% | 7/15/22 | 14,608 | | 15,492 | |
| | Union Pacific Corp. | 2.950% | 1/15/23 | 8,617 | | 9,063 | |
| | Union Pacific Corp. | 2.750% | 4/15/23 | 5,804 | | 6,116 | |
| | Union Pacific Corp. | 3.500% | 6/8/23 | 8,013 | | 8,655 | |
| | Union Pacific Corp. | 3.646% | 2/15/24 | 8,175 | | 8,930 | |
| | Union Pacific Corp. | 3.150% | 3/1/24 | 7,958 | | 8,615 | |
| | Union Pacific Corp. | 3.750% | 3/15/24 | 8,168 | | 8,963 | |
| | Union Pacific Corp. | 3.250% | 1/15/25 | 4,661 | | 5,122 | |
| | Union Pacific Corp. | 3.750% | 7/15/25 | 4,153 | | 4,717 | |
| | Union Pacific Corp. | 3.250% | 8/15/25 | 8,024 | | 8,907 | |
| 1 | United Airlines 2013-1 Class A Pass Through Trust | 4.300% | 2/15/27 | 9,390 | | 8,710 | |
| | United Parcel Service Inc. | 2.350% | 5/16/22 | 10,633 | | 10,963 | |
| | United Parcel Service Inc. | 2.450% | 10/1/22 | 18,021 | | 18,812 | |
| | United Parcel Service Inc. | 2.500% | 4/1/23 | 21,310 | | 22,392 | |
| | United Parcel Service Inc. | 2.200% | 9/1/24 | 2,104 | | 2,229 | |
| | United Parcel Service Inc. | 2.800% | 11/15/24 | 12,874 | | 13,972 | |
| | United Parcel Service Inc. | 3.900% | 4/1/25 | 16,519 | | 18,772 | |
| | | 20,381,089 | |
| Utilities (4.7%) | |
| | Electric (4.4%) | |
| | AEP Texas Inc. | 2.400% | 10/1/22 | 5,975 | | 6,187 | |
| | Alabama Power Co. | 2.450% | 3/30/22 | 13,940 | | 14,345 | |
| | Alabama Power Co. | 3.550% | 12/1/23 | 5,980 | | 6,535 | |
| | Ameren Corp. | 2.500% | 9/15/24 | 9,710 | | 10,378 | |
| | Ameren Illinois Co. | 2.700% | 9/1/22 | 5,160 | | 5,360 | |
| | Ameren Illinois Co. | 3.250% | 3/1/25 | 4,627 | | 5,094 | |
| | American Electric Power Co. Inc. | 3.650% | 12/1/21 | 8,967 | | 9,327 | |
| | American Electric Power Co. Inc. | 2.950% | 12/15/22 | 15,985 | | 16,863 | |
| | Appalachian Power Co. | 3.400% | 6/1/25 | 2,472 | | 2,710 | |
| | Arizona Public Service Co. | 3.150% | 5/15/25 | 5,239 | | 5,772 | |
| | Avangrid Inc. | 3.150% | 12/1/24 | 10,151 | | 11,088 | |
| | Avangrid Inc. | 3.200% | 4/15/25 | 13,827 | | 15,248 | |
| | Baltimore Gas & Electric Co. | 3.500% | 11/15/21 | 5,918 | | 6,108 | |
| | Baltimore Gas & Electric Co. | 3.350% | 7/1/23 | 5,945 | | 6,370 | |
| | Berkshire Hathaway Energy Co. | 2.800% | 1/15/23 | 6,419 | | 6,774 | |
| | Berkshire Hathaway Energy Co. | 3.750% | 11/15/23 | 9,105 | | 9,967 | |
| | Berkshire Hathaway Energy Co. | 3.500% | 2/1/25 | 9,665 | | 10,738 | |
| 2 | Berkshire Hathaway Energy Co. | 4.050% | 4/15/25 | 11,518 | | 13,183 | |
| | Black Hills Corp. | 4.250% | 11/30/23 | 4,657 | | 5,092 | |
| | CenterPoint Energy Houston Electric LLC | 2.250% | 8/1/22 | 2,987 | | 3,073 | |
| | CenterPoint Energy Inc. | 3.600% | 11/1/21 | 7,515 | | 7,778 | |
| | CenterPoint Energy Inc. | 2.500% | 9/1/22 | 8,927 | | 9,250 | |
| | CenterPoint Energy Inc. | 3.850% | 2/1/24 | 7,523 | | 8,244 | |
| | CenterPoint Energy Inc. | 2.500% | 9/1/24 | 9,655 | | 10,271 | |
| | Cleveland Electric Illuminating Co. | 5.500% | 8/15/24 | 1,900 | | 2,206 | |
| | CMS Energy Corp. | 5.050% | 3/15/22 | 6,038 | | 6,362 | |
| | Commonwealth Edison Co. | 3.400% | 9/1/21 | 9,283 | | 9,501 | |
| | Connecticut Light & Power Co. | 2.500% | 1/15/23 | 8,068 | | 8,413 | |
| | Consumers Energy Co. | 2.850% | 5/15/22 | 8,069 | | 8,367 | |
| | Consumers Energy Co. | 3.375% | 8/15/23 | 9,105 | | 9,868 | |
| | Delmarva Power & Light Co. | 3.500% | 11/15/23 | 7,604 | | 8,268 | |
| | Dominion Energy Inc. | 4.104% | 4/1/21 | 7,680 | | 7,833 | |
| | Dominion Energy Inc. | 2.000% | 8/15/21 | 7,376 | | 7,479 | |
| | Dominion Energy Inc. | 2.715% | 8/15/21 | 7,515 | | 7,672 | |
| | Dominion Energy Inc. | 2.750% | 1/15/22 | 13,745 | | 14,260 | |
| | Dominion Energy Inc. | 2.750% | 9/15/22 | 5,003 | | 5,190 | |
| | Dominion Energy Inc. | 3.071% | 8/15/24 | 6,125 | | 6,628 | |
Vanguard® Short-Term Corporate Bond Index Fund
Schedule of Investments
August 31, 2020
| | Coupon | Maturity
Date | Face
Amount
($000 | ) | Market
Value
($000 | ) |
| | Dominion Energy Inc. | 3.300% | 3/15/25 | 967 | | 1,074 | |
| | Dominion Energy Inc. | 3.900% | 10/1/25 | 5,000 | | 5,708 | |
| 1 | Dominion Energy Inc. | 5.750% | 10/1/54 | 9,825 | | 10,415 | |
| | DTE Electric Co. | 3.650% | 3/15/24 | 7,055 | | 7,725 | |
| | DTE Electric Co. | 3.375% | 3/1/25 | 6,825 | | 7,435 | |
| | DTE Energy Co. | 2.600% | 6/15/22 | 4,815 | | 4,972 | |
| | DTE Energy Co. | 3.300% | 6/15/22 | 5,882 | | 6,131 | |
| | DTE Energy Co. | 2.250% | 11/1/22 | 10,891 | | 11,263 | |
| | DTE Energy Co. | 3.700% | 8/1/23 | 10,663 | | 11,542 | |
| | DTE Energy Co. | 3.850% | 12/1/23 | 7,431 | | 8,101 | |
| | DTE Energy Co. | 3.500% | 6/1/24 | 7,408 | | 8,072 | |
| | DTE Energy Co. | 2.529% | 10/1/24 | 8,474 | | 8,981 | |
| | DTE Energy Co. | 1.050% | 6/1/25 | 4,000 | | 4,020 | |
| | Duke Energy Carolinas LLC | 3.350% | 5/15/22 | 6,444 | | 6,768 | |
| | Duke Energy Carolinas LLC | 2.500% | 3/15/23 | 9,026 | | 9,454 | |
| | Duke Energy Carolinas LLC | 3.050% | 3/15/23 | 5,725 | | 6,075 | |
| | Duke Energy Corp. | 1.800% | 9/1/21 | 11,608 | | 11,765 | |
| | Duke Energy Corp. | 3.550% | 9/15/21 | 7,765 | | 7,954 | |
| | Duke Energy Corp. | 2.400% | 8/15/22 | 10,064 | | 10,417 | |
| | Duke Energy Corp. | 3.050% | 8/15/22 | 8,350 | | 8,695 | |
| | Duke Energy Corp. | 3.950% | 10/15/23 | 8,913 | | 9,758 | |
| | Duke Energy Corp. | 3.750% | 4/15/24 | 19,652 | | 21,619 | |
| | Duke Energy Corp. | 2.650% | 9/1/26 | 5,000 | | 5,436 | |
| | Duke Energy Florida LLC | 3.100% | 8/15/21 | 3,921 | | 4,000 | |
| | Duke Energy Ohio Inc. | 3.800% | 9/1/23 | 8,898 | | 9,694 | |
| | Duke Energy Progress Llc | 3.000% | 9/15/21 | 8,779 | | 8,963 | |
| | Duke Energy Progress Llc | 2.800% | 5/15/22 | 11,282 | | 11,676 | |
| | Duke Energy Progress LLC | 3.375% | 9/1/23 | 6,209 | | 6,704 | |
| | Duke Energy Progress LLC | 3.250% | 8/15/25 | 7,008 | | 7,800 | |
| | Edison International | 2.400% | 9/15/22 | 6,987 | | 7,109 | |
| | Edison International | 3.125% | 11/15/22 | 4,150 | | 4,295 | |
| | Edison International | 2.950% | 3/15/23 | 4,999 | | 5,104 | |
| | Edison International | 3.550% | 11/15/24 | 7,885 | | 8,334 | |
| | Edison International | 4.950% | 4/15/25 | 5,400 | | 5,943 | |
| | Enel Generacion Chile SA | 4.250% | 4/15/24 | 4,865 | | 5,345 | |
| | Entergy Arkansas Inc. | 3.700% | 6/1/24 | 2,710 | | 2,982 | |
| | Entergy Corp. | 4.000% | 7/15/22 | 12,046 | | 12,783 | |
| | Entergy Corp. | 0.900% | 9/15/25 | 5,000 | | 4,997 | |
| | Entergy Gulf States Louisiana LLC | 5.590% | 10/1/24 | 2,688 | | 3,183 | |
| | Entergy Louisiana LLC | 4.050% | 9/1/23 | 7,815 | | 8,553 | |
| | Entergy Louisiana LLC | 5.400% | 11/1/24 | 6,006 | | 7,129 | |
| | Evergy Inc. | 2.450% | 9/15/24 | 9,826 | | 10,387 | |
| | Eversource Energy | 2.750% | 3/15/22 | 7,798 | | 8,051 | |
| | Eversource Energy | 2.800% | 5/1/23 | 6,125 | | 6,445 | |
| | Eversource Energy | 3.800% | 12/1/23 | 9,650 | | 10,566 | |
| | Eversource Energy | 2.900% | 10/1/24 | 10,116 | | 10,920 | |
| | Eversource Energy | 3.150% | 1/15/25 | 7,232 | | 7,907 | |
| | Eversource Energy | 0.800% | 8/15/25 | 5,000 | | 5,005 | |
| | Exelon Corp. | 5.150% | 12/1/20 | 7,302 | | 7,325 | |
| | Exelon Corp. | 2.450% | 4/15/21 | 4,200 | | 4,242 | |
| | Exelon Corp. | 3.497% | 6/1/22 | 16,778 | | 17,570 | |
| | Exelon Corp. | 3.950% | 6/15/25 | 19,617 | | 22,276 | |
| | Exelon Generation Co. LLC | 3.400% | 3/15/22 | 5,940 | | 6,183 | |
| | Exelon Generation Co. LLC | 4.250% | 6/15/22 | 11,834 | | 12,461 | |
| | Exelon Generation Co. LLC | 3.250% | 6/1/25 | 1,912 | | 2,107 | |
| | FirstEnergy Corp. | 2.850% | 7/15/22 | 9,000 | | 9,236 | |
| | FirstEnergy Corp. | 4.250% | 3/15/23 | 22,476 | | 23,850 | |
| | FirstEnergy Corp. | 2.050% | 3/1/25 | 5,083 | | 5,186 | |
| | Florida Power & Light Co. | 2.750% | 6/1/23 | 7,918 | | 8,323 | |
| | Florida Power & Light Co. | 3.250% | 6/1/24 | 9,950 | | 10,780 | |
| | Florida Power & Light Co. | 2.850% | 4/1/25 | 21,197 | | 23,256 | |
| | Georgia Power Co. | 2.850% | 5/15/22 | 7,124 | | 7,407 | |
| | Georgia Power Co. | 2.100% | 7/30/23 | 23,896 | | 24,964 | |
| | Georgia Power Co. | 2.200% | 9/15/24 | 9,136 | | 9,643 | |
Vanguard® Short-Term Corporate Bond Index Fund
Schedule of Investments
August 31, 2020
| | Coupon | Maturity
Date | Face
Amount
($000 | ) | Market
Value
($000 | ) |
| | Interstate Power & Light Co. | 3.250% | 12/1/24 | 8,643 | | 9,483 | |
| | IPALCO Enterprises Inc. | 3.700% | 9/1/24 | 7,453 | | 8,077 | |
| | ITC Holdings Corp. | 2.700% | 11/15/22 | 8,325 | | 8,690 | |
| | ITC Holdings Corp. | 3.650% | 6/15/24 | 6,043 | | 6,598 | |
| | Kansas City Power & Light Co. | 3.150% | 3/15/23 | 4,365 | | 4,619 | |
| | Kansas City Power & Light Co. | 3.650% | 8/15/25 | 705 | | 798 | |
| | MidAmerican Energy Co. | 3.500% | 10/15/24 | 12,211 | | 13,565 | |
| | National Rural Utilities Cooperative Finance Corp. | 1.750% | 1/21/22 | 11,672 | | 11,907 | |
| | National Rural Utilities Cooperative Finance Corp. | 3.050% | 2/15/22 | 8,292 | | 8,561 | |
| | National Rural Utilities Cooperative Finance Corp. | 2.400% | 4/25/22 | 10,312 | | 10,635 | |
| | National Rural Utilities Cooperative Finance Corp. | 2.300% | 9/15/22 | 4,848 | | 5,023 | |
| | National Rural Utilities Cooperative Finance Corp. | 2.700% | 2/15/23 | 6,225 | | 6,544 | |
| | National Rural Utilities Cooperative Finance Corp. | 3.400% | 11/15/23 | 8,542 | | 9,255 | |
| | National Rural Utilities Cooperative Finance Corp. | 2.950% | 2/7/24 | 10,593 | | 11,373 | |
| | National Rural Utilities Cooperative Finance Corp. | 2.850% | 1/27/25 | 8,073 | | 8,767 | |
| 1 | National Rural Utilities Cooperative Finance Corp. | 4.750% | 4/30/43 | 4,625 | | 4,718 | |
| | NextEra Energy Capital Holdings Inc. | 2.403% | 9/1/21 | 16,917 | | 17,274 | |
| | NextEra Energy Capital Holdings Inc. | 2.900% | 4/1/22 | 29,120 | | 30,223 | |
| | NextEra Energy Capital Holdings Inc. | 3.300% | 8/15/22 | 2,200 | | 2,318 | |
| | NextEra Energy Capital Holdings Inc. | 1.950% | 9/1/22 | 850 | | 874 | |
| | NextEra Energy Capital Holdings Inc. | 2.800% | 1/15/23 | 6,935 | | 7,282 | |
| | NextEra Energy Capital Holdings Inc. | 3.150% | 4/1/24 | 32,896 | | 35,617 | |
| | NextEra Energy Capital Holdings Inc. | 2.750% | 5/1/25 | 26,127 | | 28,452 | |
| | Northern States Power Co. | 2.150% | 8/15/22 | 4,025 | | 4,127 | |
| | Northern States Power Co. | 2.600% | 5/15/23 | 12,206 | | 12,785 | |
| | NSTAR Electric Co. | 2.375% | 10/15/22 | 400 | | 414 | |
| | Ohio Power Co. | 5.375% | 10/1/21 | 7,629 | | 8,043 | |
| | Oncor Electric Delivery Co. LLC | 4.100% | 6/1/22 | 6,018 | | 6,335 | |
| | Oncor Electric Delivery Co. LLC | 7.000% | 9/1/22 | 700 | | 789 | |
| | Oncor Electric Delivery Co. LLC | 2.750% | 6/1/24 | 17,562 | | 18,829 | |
| | Oncor Electric Delivery Co. LLC | 2.950% | 4/1/25 | 5,653 | | 6,172 | |
| | Pacific Gas & Electric Co. | 3.850% | 11/15/23 | 14,757 | | 15,615 | |
| | Pacific Gas & Electric Co. | 3.750% | 2/15/24 | 3,058 | | 3,226 | |
| | Pacific Gas & Electric Co. | 3.500% | 6/15/25 | 8,940 | | 9,432 | |
| | Pacific Gas and Electric Co. | 1.750% | 6/16/22 | 33,000 | | 33,115 | |
| | Pacific Gas and Electric Co. | 3.450% | 7/1/25 | 27,050 | | 28,500 | |
| | Pacific Gas and Electric Co. | 3.150% | 1/1/26 | 5,000 | | 5,169 | |
| | PacifiCorp | 2.950% | 2/1/22 | 10,921 | | 11,248 | |
| | PacifiCorp | 2.950% | 6/1/23 | 3,650 | | 3,875 | |
| | PacifiCorp | 3.600% | 4/1/24 | 5,085 | | 5,571 | |
| | PECO Energy Co. | 1.700% | 9/15/21 | 4,929 | | 4,974 | |
| | PECO Energy Co. | 2.375% | 9/15/22 | 3,665 | | 3,799 | |
| | Pinnacle West Capital Corp. | 1.300% | 6/15/25 | 8,690 | | 8,859 | |
| | Potomac Electric Power Co. | 3.600% | 3/15/24 | 4,861 | | 5,309 | |
| | PPL Capital Funding Inc. | 4.200% | 6/15/22 | 16,073 | | 16,937 | |
| | PPL Capital Funding Inc. | 3.500% | 12/1/22 | 8,334 | | 8,802 | |
| | PPL Capital Funding Inc. | 3.400% | 6/1/23 | 7,369 | | 7,837 | |
| | PPL Capital Funding Inc. | 3.950% | 3/15/24 | 5,961 | | 6,519 | |
| | PPL Electric Utilities Corp. | 3.000% | 9/15/21 | 3,769 | | 3,844 | |
| | Progress Energy Inc. | 3.150% | 4/1/22 | 7,754 | | 8,035 | |
| | PSEG Power LLC | 3.850% | 6/1/23 | 11,372 | | 12,194 | |
| | Public Service Co. of Colorado | 2.250% | 9/15/22 | 7,672 | | 7,885 | |
| | Public Service Co. of New Hampshire | 3.500% | 11/1/23 | 9,318 | | 10,120 | |
| | Public Service Electric & Gas Co. | 2.375% | 5/15/23 | 8,425 | | 8,799 | |
| | Public Service Electric & Gas Co. | 3.250% | 9/1/23 | 3,240 | | 3,501 | |
| | Public Service Electric & Gas Co. | 3.000% | 5/15/25 | 4,966 | | 5,454 | |
| | Public Service Enterprise Group Inc. | 2.000% | 11/15/21 | 6,994 | | 7,099 | |
| | Public Service Enterprise Group Inc. | 2.650% | 11/15/22 | 6,980 | | 7,293 | |
| | Public Service Enterprise Group Inc. | 2.875% | 6/15/24 | 20,719 | | 22,318 | |
| | Public Service Enterprise Group Inc. | 0.800% | 8/15/25 | 5,500 | | 5,492 | |
| | Puget Energy Inc. | 6.000% | 9/1/21 | 9,332 | | 9,798 | |
| | Puget Energy Inc. | 5.625% | 7/15/22 | 6,176 | | 6,604 | |
| | Puget Energy Inc. | 3.650% | 5/15/25 | 9,582 | | 10,023 | |
| | San Diego Gas & Electric Co. | 3.000% | 8/15/21 | 3,506 | | 3,595 | |
Vanguard® Short-Term Corporate Bond Index Fund
Schedule of Investments
August 31, 2020
| | Coupon | Maturity
Date | Face
Amount
($000 | ) | Market
Value
($000 | ) |
| | San Diego Gas & Electric Co. | 3.600% | 9/1/23 | 5,270 | | 5,701 | |
| | Scottish Power Ltd. | 5.810% | 3/15/25 | 2,735 | | 3,238 | |
| | Southern California Edison Co. | 2.400% | 2/1/22 | 5,705 | | 5,830 | |
| | Southern California Edison Co. | 3.400% | 6/1/23 | 7,655 | | 8,133 | |
| | Southern California Edison Co. | 3.500% | 10/1/23 | 7,948 | | 8,556 | |
| | Southern California Edison Co. | 3.700% | 8/1/25 | 18,201 | | 20,254 | |
| | Southern Co. | 2.350% | 7/1/21 | 5,872 | | 5,931 | |
| | Southern Co. | 2.950% | 7/1/23 | 16,437 | | 17,463 | |
| 1 | Southern Co. | 5.500% | 3/15/57 | 6,700 | | 6,901 | |
| | Southern Power Co. | 2.500% | 12/15/21 | 6,200 | | 6,355 | |
| | Southwestern Public Service Co. | 3.300% | 6/15/24 | 5,367 | | 5,824 | |
| | Tucson Electric Power Co. | 3.050% | 3/15/25 | 4,600 | | 5,006 | |
| | Union Electric Co. | 3.500% | 4/15/24 | 6,218 | | 6,792 | |
| | Virginia Electric & Power Co. | 2.950% | 1/15/22 | 5,320 | | 5,460 | |
| | Virginia Electric & Power Co. | 3.450% | 9/1/22 | 6,764 | | 7,107 | |
| | Virginia Electric & Power Co. | 2.750% | 3/15/23 | 19,453 | | 20,392 | |
| | Virginia Electric & Power Co. | 3.450% | 2/15/24 | 5,166 | | 5,609 | |
| | Virginia Electric & Power Co. | 3.100% | 5/15/25 | 1,943 | | 2,139 | |
| | WEC Energy Group Inc. | 3.550% | 6/15/25 | 6,311 | | 7,058 | |
| | Wisconsin Electric Power Co. | 2.950% | 9/15/21 | 3,921 | | 3,999 | |
| | Wisconsin Electric Power Co. | 2.050% | 12/15/24 | 8,607 | | 9,100 | |
| | Wisconsin Public Service Corp. | 3.350% | 11/21/21 | 11,920 | | 12,332 | |
| | Xcel Energy Inc. | 2.600% | 3/15/22 | 4,400 | | 4,532 | |
| | Xcel Energy Inc. | 3.300% | 6/1/25 | 10,556 | | 11,693 | |
| | Natural Gas (0.3%) | |
| | CenterPoint Energy Resources Corp. | 3.550% | 4/1/23 | 5,335 | | 5,660 | |
| 2 | East Ohio Gas Co. | 1.300% | 6/15/25 | 3,000 | | 3,063 | |
| | NiSource Inc. | 0.950% | 8/15/25 | 22,000 | | 22,053 | |
| | ONE Gas Inc. | 3.610% | 2/1/24 | 2,334 | | 2,555 | |
| | Sempra Energy | 2.875% | 10/1/22 | 15,091 | | 15,675 | |
| | Sempra Energy | 2.900% | 2/1/23 | 11,412 | | 11,967 | |
| | Sempra Energy | 4.050% | 12/1/23 | 6,140 | | 6,722 | |
| | Sempra Energy | 3.550% | 6/15/24 | 9,938 | | 10,819 | |
| | Southern California Gas Co. | 3.150% | 9/15/24 | 7,497 | | 8,194 | |
| | Southern Co. Gas Capital Corp. | 3.500% | 9/15/21 | 4,641 | | 4,749 | |
| | Southern Co. Gas Capital Corp. | 2.450% | 10/1/23 | 9,246 | | 9,603 | |
| | Other Utility (0.0%) | |
| | American Water Capital Corp. | 3.850% | 3/1/24 | 3,861 | | 4,242 | |
| | American Water Capital Corp. | 3.400% | 3/1/25 | 11,972 | | 13,299 | |
| | | 1,812,860 | |
Total Corporate Bonds (Cost $36,533,820) | | 37,859,398 | |
| | | | |
| | | | Shares | | | |
Temporary Cash Investment (0.5%) | |
| Money Market Fund (0.5%) | |
| 4 | Vanguard Market Liquidity Fund (Cost $206,479) | 0.147% | | 2,064,876 | | 206,488 | |
Total Investments (99.8%) (Cost $36,754,562) | | 38,080,165 | |
| Other Assets and Liabilities—Net (0.2%) | | 80,689 | |
Net Assets (100%) | | 38,160,854 | |
| Cost is in $000s. | |
| 1 | The average or expected maturity is shorter than the final maturity shown because of the possibility of interim principal payments and prepayments or the possibility of the issue being called. | |
| 2 | Security exempt from registration under Rule 144A of the Securities Act of 1933. Such securities may be sold in transactions exempt from registration, normally to qualified institutional buyers. At August 31, 2020, the aggregate value of these securities was $921,401,000, representing 2.4% of net assets. | |
| 3 | Securities with a value of $1,558,000 have been segregated as initial margin for open futures contracts. | |
| 4 | Affiliated money market fund available only to Vanguard funds and certain trusts and accounts managed by Vanguard. Rate shown is the 7-day yield. | |
REIT—Real Estate Investment Trust.
Vanguard® Intermediate-Term Corporate Bond Index Fund
Schedule of Investments
August 31, 2020
| | Coupon | Maturity
Date | Face
Amount
($000 | ) | Market
Value
($000 | ) |
U.S. Government and Agency Obligations (0.1%) | |
| U.S. Government Securities (0.1%) | |
| | United States Treasury Note/Bond (Cost $22,405) | 0.500% | 8/31/27 | 22,380 | | 22,387 | |
Corporate Bonds (98.9%) | |
| Finance (34.5%) | |
| | Banking (23.5%) | |
| | Ally Financial Inc. | 4.625% | 3/30/25 | 2,075 | | 2,295 | |
| | Ally Financial Inc. | 8.000% | 11/1/31 | 3,000 | | 4,080 | |
| | American Express Co. | 4.200% | 11/6/25 | 27,610 | | 32,283 | |
| | American Express Co. | 3.125% | 5/20/26 | 15,808 | | 17,715 | |
| | American Express Credit Corp. | 3.300% | 5/3/27 | 35,313 | | 40,177 | |
| | Associated Banc-Corp | 4.250% | 1/15/25 | 500 | | 515 | |
| | Australia & New Zealand Banking Group Ltd. | 3.700% | 11/16/25 | 12,882 | | 14,913 | |
| | Banco Santander SA | 5.179% | 11/19/25 | 21,496 | | 24,445 | |
| | Banco Santander SA | 4.250% | 4/11/27 | 24,104 | | 27,383 | |
| | Banco Santander SA | 3.800% | 2/23/28 | 27,476 | | 30,112 | |
| | Banco Santander SA | 4.379% | 4/12/28 | 26,755 | | 30,617 | |
| | Banco Santander SA | 3.306% | 6/27/29 | 10,118 | | 11,028 | |
| | Banco Santander SA | 3.490% | 5/28/30 | 18,831 | | 20,667 | |
| | Bank of America Corp. | 4.450% | 3/3/26 | 36,890 | | 42,770 | |
| | Bank of America Corp. | 3.500% | 4/19/26 | 50,613 | | 57,334 | |
| | Bank of America Corp. | 6.220% | 9/15/26 | 5,874 | | 7,278 | |
| | Bank of America Corp. | 4.250% | 10/22/26 | 42,882 | | 49,562 | |
| 1 | Bank of America Corp. | 3.559% | 4/23/27 | 62,243 | | 69,937 | |
| | Bank of America Corp. | 3.248% | 10/21/27 | 43,908 | | 48,845 | |
| | Bank of America Corp. | 4.183% | 11/25/27 | 42,034 | | 48,418 | |
| 1 | Bank of America Corp. | 3.824% | 1/20/28 | 42,199 | | 47,986 | |
| 1 | Bank of America Corp. | 3.705% | 4/24/28 | 46,611 | | 52,683 | |
| 1 | Bank of America Corp. | 3.593% | 7/21/28 | 50,309 | | 56,904 | |
| 1 | Bank of America Corp. | 3.419% | 12/20/28 | 121,462 | | 135,480 | |
| 1 | Bank of America Corp. | 3.970% | 3/5/29 | 62,069 | | 71,539 | |
| 1 | Bank of America Corp. | 4.271% | 7/23/29 | 57,341 | | 67,677 | |
| 1 | Bank of America Corp. | 3.974% | 2/7/30 | 70,903 | | 82,672 | |
| 1 | Bank of America Corp. | 3.194% | 7/23/30 | 59,393 | | 65,734 | |
| 1 | Bank of America Corp. | 2.884% | 10/22/30 | 34,988 | | 38,019 | |
| 1 | Bank of America Corp. | 2.496% | 2/13/31 | 72,231 | | 75,814 | |
| 1 | Bank of America Corp. | 2.592% | 4/29/31 | 65,200 | | 69,166 | |
| 1 | Bank of America Corp. | 1.898% | 7/23/31 | 43,405 | | 43,676 | |
| | Bank of Montreal | 1.850% | 5/1/25 | 7,210 | | 7,542 | |
| 1 | Bank of Montreal | 3.803% | 12/15/32 | 20,447 | | 22,619 | |
| | Bank of New York Mellon Corp. | 3.950% | 11/18/25 | 6,819 | | 7,953 | |
| | Bank of New York Mellon Corp. | 2.800% | 5/4/26 | 25,266 | | 28,183 | |
| | Bank of New York Mellon Corp. | 2.450% | 8/17/26 | 15,526 | | 16,977 | |
| | Bank of New York Mellon Corp. | 3.250% | 5/16/27 | 16,109 | | 18,283 | |
| | Bank of New York Mellon Corp. | 3.400% | 1/29/28 | 17,371 | | 20,131 | |
| 1 | Bank of New York Mellon Corp. | 3.442% | 2/7/28 | 15,017 | | 17,319 | |
| | Bank of New York Mellon Corp. | 3.850% | 4/28/28 | 1,531 | | 1,850 | |
| | Bank of New York Mellon Corp. | 3.000% | 10/30/28 | 10,841 | | 12,118 | |
| | Bank of New York Mellon Corp. | 3.300% | 8/23/29 | 14,551 | | 16,781 | |
| | Bank of Nova Scotia | 4.500% | 12/16/25 | 21,911 | | 25,432 | |
| | Bank of Nova Scotia | 2.700% | 8/3/26 | 36,098 | | 39,979 | |
| | Bank One Corp. | 7.625% | 10/15/26 | 11,068 | | 14,829 | |
| | Bank One Corp. | 8.000% | 4/29/27 | 16,436 | | 22,781 | |
| | BankUnited Inc. | 4.875% | 11/17/25 | 7,225 | | 8,158 | |
| | BankUnited Inc. | 5.125% | 6/11/30 | 6,675 | | 7,121 | |
| | Barclays plc | 3.650% | 3/16/25 | 89 | | 97 | |
| | Barclays plc | 4.375% | 1/12/26 | 52,427 | | 59,623 | |
| | Barclays plc | 5.200% | 5/12/26 | 44,974 | | 51,075 | |
| | Barclays plc | 4.337% | 1/10/28 | 21,524 | | 24,247 | |
| | Barclays plc | 4.836% | 5/9/28 | 45,827 | | 50,871 | |
| 1 | Barclays plc | 4.972% | 5/16/29 | 25,687 | | 30,466 | |
Vanguard® Intermediate-Term Corporate Bond Index Fund
Schedule of Investments
August 31, 2020
| | Coupon | Maturity
Date | Face
Amount
($000 | ) | Market
Value
($000 | ) |
| 1 | Barclays plc | 5.088% | 6/20/30 | 27,320 | | 31,614 | |
| | Barclays plc | 2.645% | 6/24/31 | 26,856 | | 27,238 | |
| | BNP Paribas SA | 4.250% | 10/15/24 | 1 | | 1 | |
| | BPCE SA | 3.375% | 12/2/26 | 6,735 | | 7,604 | |
| 2 | BPCE SA | 3.250% | 1/11/28 | 3,975 | | 4,387 | |
| | Capital One Financial Corp. | 4.200% | 10/29/25 | 35,474 | | 39,773 | |
| | Capital One Financial Corp. | 3.750% | 7/28/26 | 33,802 | | 36,976 | |
| | Capital One Financial Corp. | 3.750% | 3/9/27 | 40,006 | | 44,467 | |
| | Capital One Financial Corp. | 3.650% | 5/11/27 | 15,469 | | 17,166 | |
| | Capital One Financial Corp. | 3.800% | 1/31/28 | 29,700 | | 33,135 | |
| | Citigroup Inc. | 5.500% | 9/13/25 | 18,673 | | 22,233 | |
| | Citigroup Inc. | 3.700% | 1/12/26 | 56,341 | | 63,779 | |
| | Citigroup Inc. | 4.600% | 3/9/26 | 37,274 | | 43,270 | |
| | Citigroup Inc. | 3.400% | 5/1/26 | 45,610 | | 51,168 | |
| | Citigroup Inc. | 3.200% | 10/21/26 | 36,715 | | 40,864 | |
| | Citigroup Inc. | 4.300% | 11/20/26 | 32,553 | | 37,447 | |
| | Citigroup Inc. | 4.450% | 9/29/27 | 90,172 | | 104,683 | |
| 1 | Citigroup Inc. | 3.887% | 1/10/28 | 52,878 | | 60,139 | |
| | Citigroup Inc. | 6.625% | 1/15/28 | 5,432 | | 7,166 | |
| 1 | Citigroup Inc. | 3.668% | 7/24/28 | 62,296 | | 70,148 | |
| | Citigroup Inc. | 4.125% | 7/25/28 | 42,360 | | 48,470 | |
| 1 | Citigroup Inc. | 3.520% | 10/27/28 | 39,355 | | 43,914 | |
| 1 | Citigroup Inc. | 4.075% | 4/23/29 | 40,123 | | 46,568 | |
| 1 | Citigroup Inc. | 3.980% | 3/20/30 | 71,909 | | 83,468 | |
| 1 | Citigroup Inc. | 2.976% | 11/5/30 | 20,062 | | 21,767 | |
| 1 | Citigroup Inc. | 2.666% | 1/29/31 | 35,845 | | 38,169 | |
| 1 | Citigroup Inc. | 4.412% | 3/31/31 | 83,922 | | 101,833 | |
| 1 | Citigroup Inc. | 2.572% | 6/3/31 | 48,535 | | 51,339 | |
| | Citizens Bank NA | 3.750% | 2/18/26 | 16,442 | | 18,893 | |
| | Citizens Financial Group Inc. | 4.300% | 12/3/25 | 11,389 | | 13,120 | |
| | Citizens Financial Group Inc. | 2.850% | 7/27/26 | 16,116 | | 17,769 | |
| | Citizens Financial Group Inc. | 2.500% | 2/6/30 | 12,283 | | 13,098 | |
| | Citizens Financial Group Inc. | 3.250% | 4/30/30 | 7,878 | | 8,731 | |
| | Comerica Inc. | 3.800% | 7/22/26 | 159 | | 172 | |
| | Comerica Inc. | 4.000% | 2/1/29 | 12,204 | | 14,157 | |
| | Cooperatieve Rabobank UA | 3.750% | 7/21/26 | 23,753 | | 26,411 | |
| | Credit Suisse Group Funding Guernsey Ltd. | 4.550% | 4/17/26 | 40,578 | | 47,476 | |
| | Deutsche Bank AG | 4.100% | 1/13/26 | 8,760 | | 9,399 | |
| | Deutsche Bank AG | 4.100% | 1/13/26 | 440 | | 473 | |
| | Discover Bank | 4.250% | 3/13/26 | 11,011 | | 12,486 | |
| | Discover Bank | 3.450% | 7/27/26 | 31,674 | | 34,657 | |
| | Discover Bank | 4.650% | 9/13/28 | 18,104 | | 21,227 | |
| | Discover Bank | 2.700% | 2/6/30 | 8,069 | | 8,359 | |
| | Discover Financial Services | 3.950% | 11/6/24 | 7 | | 8 | |
| | Discover Financial Services | 4.500% | 1/30/26 | 16,961 | | 19,427 | |
| | Discover Financial Services | 4.100% | 2/9/27 | 21,028 | | 23,370 | |
| | Fifth Third Bancorp | 2.550% | 5/5/27 | 12,034 | | 13,016 | |
| | Fifth Third Bancorp | 3.950% | 3/14/28 | 18,363 | | 21,592 | |
| | Fifth Third Bank | 3.850% | 3/15/26 | 18,440 | | 21,090 | |
| | Fifth Third Bank | 2.250% | 2/1/27 | 12,092 | | 12,906 | |
| | First Horizon Bank | 5.750% | 5/1/30 | 8,000 | | 9,057 | |
| | FirstMerit Bank NA | 4.270% | 11/25/26 | 450 | | 515 | |
| | Goldman Sachs Group Inc. | 4.250% | 10/21/25 | 55,475 | | 63,115 | |
| | Goldman Sachs Group Inc. | 3.750% | 2/25/26 | 24,414 | | 27,560 | |
| | Goldman Sachs Group Inc. | 3.500% | 11/16/26 | 29,863 | | 33,226 | |
| | Goldman Sachs Group Inc. | 5.950% | 1/15/27 | 11,538 | | 14,239 | |
| | Goldman Sachs Group Inc. | 3.850% | 1/26/27 | 78,157 | | 88,974 | |
| 1 | Goldman Sachs Group Inc. | 3.691% | 6/5/28 | 60,393 | | 68,377 | |
| 1 | Goldman Sachs Group Inc. | 3.814% | 4/23/29 | 63,390 | | 72,495 | |
| 1 | Goldman Sachs Group Inc. | 4.223% | 5/1/29 | 64,326 | | 75,250 | |
| | Goldman Sachs Group Inc. | 2.600% | 2/7/30 | 23,188 | | 24,634 | |
| | Goldman Sachs Group Inc. | 3.800% | 3/15/30 | 58,810 | | 68,190 | |
Vanguard® Intermediate-Term Corporate Bond Index Fund
Schedule of Investments
August 31, 2020
| | Coupon | Maturity
Date | Face
Amount
($000 | ) | Market
Value
($000 | ) |
| | HSBC Holdings plc | 4.300% | 3/8/26 | 62,892 | | 72,157 | |
| | HSBC Holdings plc | 3.900% | 5/25/26 | 48,021 | | 54,163 | |
| 1 | HSBC Holdings plc | 4.292% | 9/12/26 | 48,618 | | 54,748 | |
| | HSBC Holdings plc | 4.375% | 11/23/26 | 45,051 | | 50,948 | |
| 1 | HSBC Holdings plc | 4.041% | 3/13/28 | 66,051 | | 74,255 | |
| 1 | HSBC Holdings plc | 4.583% | 6/19/29 | 67,786 | | 78,879 | |
| | HSBC Holdings plc | 4.950% | 3/31/30 | 62,819 | | 77,401 | |
| 1 | HSBC Holdings plc | 3.973% | 5/22/30 | 42,727 | | 48,446 | |
| 1 | HSBC Holdings plc | 2.848% | 6/4/31 | 13,150 | | 13,807 | |
| 1 | HSBC Holdings plc | 2.357% | 8/18/31 | 23,000 | | 23,340 | |
| | Huntington Bancshares Inc. | 2.550% | 2/4/30 | 17,031 | | 17,826 | |
| | ING Groep NV | 3.950% | 3/29/27 | 28,519 | | 32,785 | |
| | ING Groep NV | 4.550% | 10/2/28 | 18,367 | | 22,312 | |
| | ING Groep NV | 4.050% | 4/9/29 | 16,783 | | 19,885 | |
| | JPMorgan Chase & Co. | 3.875% | 9/10/24 | 1 | | 1 | |
| | JPMorgan Chase & Co. | 3.300% | 4/1/26 | 60,429 | | 67,725 | |
| | JPMorgan Chase & Co. | 3.200% | 6/15/26 | 38,712 | | 43,350 | |
| | JPMorgan Chase & Co. | 2.950% | 10/1/26 | 67,806 | | 75,001 | |
| | JPMorgan Chase & Co. | 4.125% | 12/15/26 | 23,477 | | 27,351 | |
| 1 | JPMorgan Chase & Co. | 3.960% | 1/29/27 | 29,518 | | 33,774 | |
| | JPMorgan Chase & Co. | 4.250% | 10/1/27 | 40,208 | | 46,893 | |
| | JPMorgan Chase & Co. | 3.625% | 12/1/27 | 39,851 | | 44,789 | |
| 1 | JPMorgan Chase & Co. | 3.782% | 2/1/28 | 56,455 | | 64,320 | |
| 1 | JPMorgan Chase & Co. | 3.540% | 5/1/28 | 52,626 | | 59,296 | |
| 1 | JPMorgan Chase & Co. | 2.182% | 6/1/28 | 36,229 | | 37,525 | |
| 1 | JPMorgan Chase & Co. | 3.509% | 1/23/29 | 53,497 | | 60,316 | |
| 1 | JPMorgan Chase & Co. | 4.005% | 4/23/29 | 30,372 | | 35,276 | |
| 1 | JPMorgan Chase & Co. | 4.203% | 7/23/29 | 54,547 | | 64,473 | |
| 1 | JPMorgan Chase & Co. | 4.452% | 12/5/29 | 63,752 | | 76,782 | |
| 1 | JPMorgan Chase & Co. | 3.702% | 5/6/30 | 60,945 | | 70,405 | |
| 1 | JPMorgan Chase & Co. | 2.739% | 10/15/30 | 58,415 | | 62,895 | |
| 1 | JPMorgan Chase & Co. | 4.493% | 3/24/31 | 61,795 | | 75,677 | |
| 1 | JPMorgan Chase & Co. | 2.522% | 4/22/31 | 40,245 | | 42,950 | |
| 1 | JPMorgan Chase & Co. | 2.956% | 5/13/31 | 49,088 | | 52,607 | |
| | KeyBank NA | 3.300% | 6/1/25 | 466 | | 521 | |
| | KeyBank NA | 3.400% | 5/20/26 | 16,576 | | 18,612 | |
| | KeyBank NA | 6.950% | 2/1/28 | 5,220 | | 6,776 | |
| | KeyBank NA | 3.900% | 4/13/29 | 7,033 | | 8,053 | |
| | KeyCorp | 4.150% | 10/29/25 | 13,568 | | 15,660 | |
| | KeyCorp | 2.250% | 4/6/27 | 19,977 | | 21,080 | |
| | KeyCorp | 4.100% | 4/30/28 | 7,418 | | 8,697 | |
| | KeyCorp | 2.550% | 10/1/29 | 19,485 | | 20,694 | |
| | Lloyds Banking Group plc | 4.582% | 12/10/25 | 36,237 | | 40,775 | |
| | Lloyds Banking Group plc | 4.650% | 3/24/26 | 29,061 | | 32,891 | |
| | Lloyds Banking Group plc | 3.750% | 1/11/27 | 16,022 | | 18,015 | |
| | Lloyds Banking Group plc | 4.375% | 3/22/28 | 42,994 | | 50,561 | |
| | Lloyds Banking Group plc | 4.550% | 8/16/28 | 17,731 | | 21,208 | |
| 1 | Lloyds Banking Group plc | 3.574% | 11/7/28 | 31,630 | | 35,117 | |
| | Manufacturers & Traders Trust Co. | 3.400% | 8/17/27 | 12,924 | | 14,454 | |
| | Mitsubishi UFJ Financial Group Inc. | 3.850% | 3/1/26 | 16,327 | | 18,746 | |
| | Mitsubishi UFJ Financial Group Inc. | 2.757% | 9/13/26 | 22,746 | | 24,721 | |
| | Mitsubishi UFJ Financial Group Inc. | 3.677% | 2/22/27 | 11,299 | | 12,791 | |
| | Mitsubishi UFJ Financial Group Inc. | 3.287% | 7/25/27 | 18,212 | | 20,255 | |
| | Mitsubishi UFJ Financial Group Inc. | 3.961% | 3/2/28 | 28,744 | | 33,341 | |
| | Mitsubishi UFJ Financial Group Inc. | 4.050% | 9/11/28 | 15,179 | | 17,797 | |
| | Mitsubishi UFJ Financial Group Inc. | 3.741% | 3/7/29 | 37,377 | | 42,835 | |
| | Mitsubishi UFJ Financial Group Inc. | 3.195% | 7/18/29 | 52,570 | | 58,217 | |
| | Mitsubishi UFJ Financial Group Inc. | 2.559% | 2/25/30 | 32,251 | | 34,155 | |
| | Mitsubishi UFJ Financial Group Inc. | 2.048% | 7/17/30 | 18,404 | | 18,676 | |
| 1 | Mizuho Financial Group Inc. | 2.226% | 5/25/26 | 16,808 | | 17,565 | |
| | Mizuho Financial Group Inc. | 2.839% | 9/13/26 | 10,106 | | 11,044 | |
| | Mizuho Financial Group Inc. | 3.663% | 2/28/27 | 8,440 | | 9,438 | |
| | Mizuho Financial Group Inc. | 3.170% | 9/11/27 | 19,792 | | 21,611 | |
Vanguard® Intermediate-Term Corporate Bond Index Fund
Schedule of Investments
August 31, 2020
| | Coupon | Maturity
Date | Face
Amount
($000 | ) | Market
Value
($000 | ) |
| | Mizuho Financial Group Inc. | 4.018% | 3/5/28 | 15,393 | | 17,742 | |
| 1 | Mizuho Financial Group Inc. | 4.254% | 9/11/29 | 12,842 | | 15,116 | |
| 1 | Mizuho Financial Group Inc. | 3.153% | 7/16/30 | 22,467 | | 24,621 | |
| 1 | Mizuho Financial Group Inc. | 2.869% | 9/13/30 | 12,340 | | 13,302 | |
| 1 | Mizuho Financial Group Inc. | 2.591% | 5/25/31 | 3,901 | | 4,105 | |
| 1 | Mizuho Financial Group Inc. | 2.201% | 7/10/31 | 28,200 | | 28,697 | |
| | Morgan Stanley | 5.000% | 11/24/25 | 34,825 | | 41,167 | |
| | Morgan Stanley | 3.875% | 1/27/26 | 77,515 | | 88,974 | |
| | Morgan Stanley | 3.125% | 7/27/26 | 67,702 | | 75,545 | |
| | Morgan Stanley | 6.250% | 8/9/26 | 14,327 | | 18,397 | |
| | Morgan Stanley | 4.350% | 9/8/26 | 54,293 | | 63,277 | |
| | Morgan Stanley | 3.625% | 1/20/27 | 61,442 | | 69,775 | |
| | Morgan Stanley | 3.950% | 4/23/27 | 49,679 | | 56,351 | |
| 1 | Morgan Stanley | 3.591% | 7/22/28 | 67,642 | | 76,274 | |
| 1 | Morgan Stanley | 3.772% | 1/24/29 | 51,274 | | 58,878 | |
| 1 | Morgan Stanley | 4.431% | 1/23/30 | 48,799 | | 58,673 | |
| 1 | Morgan Stanley | 2.699% | 1/22/31 | 72,807 | | 78,399 | |
| 1 | Morgan Stanley | 3.622% | 4/1/31 | 43,805 | | 50,634 | |
| | National Australia Bank Ltd. | 3.375% | 1/14/26 | 12,645 | | 14,279 | |
| | National Australia Bank Ltd. | 2.500% | 7/12/26 | 20,101 | | 21,839 | |
| 1 | Natwest Group PLC | 3.073% | 5/22/28 | 31,250 | | 33,343 | |
| 1 | Natwest Group PLC | 4.892% | 5/18/29 | 34,391 | | 40,847 | |
| | Northern Trust Corp. | 3.950% | 10/30/25 | 16,152 | | 18,773 | |
| | Northern Trust Corp. | 3.650% | 8/3/28 | 10,085 | | 11,806 | |
| | Northern Trust Corp. | 3.150% | 5/3/29 | 10,965 | | 12,545 | |
| | Northern Trust Corp. | 1.950% | 5/1/30 | 18,395 | | 19,212 | |
| 1 | Northern Trust Corp. | 3.375% | 5/8/32 | 6,753 | | 7,356 | |
| | PNC Bank NA | 3.300% | 10/30/24 | 1 | | 1 | |
| | PNC Bank NA | 3.250% | 6/1/25 | 276 | | 308 | |
| | PNC Bank NA | 4.200% | 11/1/25 | 21,237 | | 24,743 | |
| | PNC Bank NA | 3.100% | 10/25/27 | 23,028 | | 26,056 | |
| | PNC Bank NA | 3.250% | 1/22/28 | 13,534 | | 15,413 | |
| | PNC Bank NA | 4.050% | 7/26/28 | 24,243 | | 28,769 | |
| | PNC Bank NA | 2.700% | 10/22/29 | 11,266 | | 12,159 | |
| | PNC Financial Services Group Inc. | 2.600% | 7/23/26 | 20,695 | | 22,751 | |
| | PNC Financial Services Group Inc. | 3.150% | 5/19/27 | 22,290 | | 25,038 | |
| | PNC Financial Services Group Inc. | 3.450% | 4/23/29 | 21,340 | | 24,647 | |
| | PNC Financial Services Group Inc. | 2.550% | 1/22/30 | 40,004 | | 43,430 | |
| | Royal Bank of Canada | 4.650% | 1/27/26 | 28,257 | | 33,430 | |
| | Royal Bank of Scotland Group plc | 4.800% | 4/5/26 | 18,255 | | 21,506 | |
| 1 | Royal Bank of Scotland Group plc | 5.076% | 1/27/30 | 34,695 | | 42,094 | |
| 1 | Royal Bank of Scotland Group plc | 4.445% | 5/8/30 | 32,824 | | 38,433 | |
| | Santander Holdings USA Inc. | 3.244% | 10/5/26 | 22,161 | | 23,491 | |
| | Santander Holdings USA Inc. | 4.400% | 7/13/27 | 22,898 | | 25,518 | |
| 1 | Santander UK Group Holdings plc | 3.823% | 11/3/28 | 16,867 | | 18,884 | |
| | State Street Corp. | 3.550% | 8/18/25 | 760 | | 864 | |
| | State Street Corp. | 2.650% | 5/19/26 | 17,682 | | 19,607 | |
| 1 | State Street Corp. | 4.141% | 12/3/29 | 8,000 | | 9,695 | |
| | State Street Corp. | 2.400% | 1/24/30 | 15,548 | | 16,865 | |
| 1,2 | State Street Corp. | 3.152% | 3/30/31 | 8,100 | | 9,244 | |
| 1 | State Street Corp. | 3.031% | 11/1/34 | 6,440 | | 7,076 | |
| | Sumitomo Mitsui Financial Group Inc. | 3.784% | 3/9/26 | 25,093 | | 28,560 | |
| | Sumitomo Mitsui Financial Group Inc. | 2.632% | 7/14/26 | 29,477 | | 31,881 | |
| | Sumitomo Mitsui Financial Group Inc. | 3.010% | 10/19/26 | 29,515 | | 32,639 | |
| | Sumitomo Mitsui Financial Group Inc. | 3.446% | 1/11/27 | 33,687 | | 37,618 | |
| | Sumitomo Mitsui Financial Group Inc. | 3.364% | 7/12/27 | 18,875 | | 21,189 | |
| | Sumitomo Mitsui Financial Group Inc. | 3.352% | 10/18/27 | 16,501 | | 18,329 | |
| | Sumitomo Mitsui Financial Group Inc. | 3.544% | 1/17/28 | 14,810 | | 16,626 | |
| | Sumitomo Mitsui Financial Group Inc. | 3.944% | 7/19/28 | 21,015 | | 24,351 | |
| | Sumitomo Mitsui Financial Group Inc. | 4.306% | 10/16/28 | 7,735 | | 9,182 | |
| | Sumitomo Mitsui Financial Group Inc. | 3.040% | 7/16/29 | 46,245 | | 50,588 | |
| | Sumitomo Mitsui Financial Group Inc. | 3.202% | 9/17/29 | 24,072 | | 25,601 | |
| | Sumitomo Mitsui Financial Group Inc. | 2.724% | 9/27/29 | 23,684 | | 25,337 | |
Vanguard® Intermediate-Term Corporate Bond Index Fund
Schedule of Investments
August 31, 2020
| | Coupon | Maturity
Date | Face
Amount
($000 | ) | Market
Value
($000 | ) |
| | Sumitomo Mitsui Financial Group Inc. | 2.750% | 1/15/30 | 26,311 | | 28,192 | |
| | Sumitomo Mitsui Financial Group Inc. | 2.130% | 7/8/30 | 16,623 | | 16,945 | |
| | SVB Financial Group | 3.500% | 1/29/25 | 3,640 | | 3,918 | |
| | SVB Financial Group | 3.125% | 6/5/30 | 6,528 | | 7,250 | |
| | Synchrony Financial | 3.700% | 8/4/26 | 14,404 | | 14,942 | |
| | Synchrony Financial | 3.950% | 12/1/27 | 23,055 | | 24,263 | |
| | Synchrony Financial | 5.150% | 3/19/29 | 13,942 | | 15,894 | |
| 1 | Toronto-Dominion Bank | 3.625% | 9/15/31 | 21,561 | | 24,418 | |
| | Truist Bank | 3.625% | 9/16/25 | 21,573 | | 24,410 | |
| | Truist Bank | 4.050% | 11/3/25 | 7,025 | | 8,167 | |
| | Truist Bank | 3.300% | 5/15/26 | 11,591 | | 13,019 | |
| | Truist Bank | 3.800% | 10/30/26 | 16,281 | | 18,870 | |
| | Truist Bank | 2.250% | 3/11/30 | 42,122 | | 43,784 | |
| | Truist Financial Corp. | 2.850% | 10/26/24 | 1 | | 1 | |
| | Truist Financial Corp. | 1.200% | 8/5/25 | 233 | | 238 | |
| | Truist Financial Corp. | 1.125% | 8/3/27 | 8,390 | | 8,363 | |
| | Truist Financial Corp. | 3.875% | 3/19/29 | 23,505 | | 27,199 | |
| | Truist Financial Corp. | 1.950% | 6/5/30 | 10,056 | | 10,350 | |
| | US Bancorp | 3.950% | 11/17/25 | 25,267 | | 29,270 | |
| | US Bancorp | 3.100% | 4/27/26 | 24,175 | | 27,091 | |
| | US Bancorp | 2.375% | 7/22/26 | 37,003 | | 40,478 | |
| | US Bancorp | 3.150% | 4/27/27 | 13,755 | | 15,575 | |
| | US Bancorp | 3.900% | 4/26/28 | 10,956 | | 13,176 | |
| | US Bancorp | 3.000% | 7/30/29 | 15,370 | | 16,966 | |
| | US Bancorp | 1.375% | 7/22/30 | 25,559 | | 25,268 | |
| | Wachovia Corp. | 7.574% | 8/1/26 | 4,939 | | 6,344 | |
| | Webster Financial Corp. | 4.100% | 3/25/29 | 4,708 | | 5,004 | |
| | Wells Fargo & Co. | 3.550% | 9/29/25 | 31,507 | | 35,191 | |
| 1 | Wells Fargo & Co. | 2.164% | 2/11/26 | 1,790 | | 1,860 | |
| | Wells Fargo & Co. | 3.000% | 4/22/26 | 80,211 | | 87,952 | |
| | Wells Fargo & Co. | 4.100% | 6/3/26 | 62,751 | | 70,728 | |
| | Wells Fargo & Co. | 3.000% | 10/23/26 | 77,567 | | 85,497 | |
| 1 | Wells Fargo & Co. | 3.196% | 6/17/27 | 57,544 | | 62,767 | |
| | Wells Fargo & Co. | 4.300% | 7/22/27 | 47,713 | | 54,886 | |
| 1 | Wells Fargo & Co. | 3.584% | 5/22/28 | 73,303 | | 82,047 | |
| 1 | Wells Fargo & Co. | 2.393% | 6/2/28 | 32,924 | | 34,364 | |
| | Wells Fargo & Co. | 4.150% | 1/24/29 | 51,920 | | 60,864 | |
| 1 | Wells Fargo & Co. | 2.879% | 10/30/30 | 88,700 | | 95,288 | |
| 1 | Wells Fargo & Co. | 2.572% | 2/11/31 | 56,423 | | 59,025 | |
| 1 | Wells Fargo & Co. | 4.478% | 4/4/31 | 47,885 | | 58,285 | |
| | Westpac Banking Corp. | 2.850% | 5/13/26 | 33,370 | | 36,970 | |
| | Westpac Banking Corp. | 2.700% | 8/19/26 | 26,012 | | 28,714 | |
| | Westpac Banking Corp. | 3.350% | 3/8/27 | 20,119 | | 23,055 | |
| | Westpac Banking Corp. | 3.400% | 1/25/28 | 11,438 | | 13,279 | |
| | Westpac Banking Corp. | 2.650% | 1/16/30 | 18,101 | | 19,993 | |
| 1 | Westpac Banking Corp. | 4.322% | 11/23/31 | 28,805 | | 32,550 | |
| | Westpac Banking Corp. | 4.110% | 7/24/34 | 25,550 | | 28,894 | |
| | Wintrust Financial Corp. | 4.850% | 6/6/29 | 5,133 | | 5,482 | |
| | Zions Bancorp NA | 3.250% | 10/29/29 | 11,230 | | 11,164 | |
| | Brokerage (1.5%) | | | |
| | Affiliated Managers Group Inc. | 3.500% | 8/1/25 | 641 | | 701 | |
| | Affiliated Managers Group Inc. | 3.300% | 6/15/30 | 6,525 | | 6,966 | |
| | Ameriprise Financial Inc. | 2.875% | 9/15/26 | 16,016 | | 17,605 | |
| 2 | BGC Partners Inc. | 4.375% | 12/15/25 | 5,000 | | 5,031 | |
| | BlackRock Inc. | 3.200% | 3/15/27 | 16,525 | | 18,741 | |
| | BlackRock Inc. | 3.250% | 4/30/29 | 16,917 | | 19,494 | |
| | BlackRock Inc. | 2.400% | 4/30/30 | 18,923 | | 20,600 | |
| | Brookfield Finance Inc. | 4.250% | 6/2/26 | 8,392 | | 9,509 | |
| | Brookfield Finance Inc. | 3.900% | 1/25/28 | 15,883 | | 17,924 | |
| | Brookfield Finance Inc. | 4.850% | 3/29/29 | 12,289 | | 14,632 | |
| | Brookfield Finance Inc. | 4.350% | 4/15/30 | 22,469 | | 26,038 | |
| | Cboe Global Markets Inc. | 3.650% | 1/12/27 | 10,029 | | 11,414 | |
Vanguard® Intermediate-Term Corporate Bond Index Fund
Schedule of Investments
August 31, 2020
| | Coupon | Maturity
Date | Face
Amount
($000 | ) | Market
Value
($000 | ) |
| | Charles Schwab Corp. | 3.450% | 2/13/26 | 3,898 | | 4,388 | |
| | Charles Schwab Corp. | 3.200% | 3/2/27 | 12,898 | | 14,544 | |
| | Charles Schwab Corp. | 3.200% | 1/25/28 | 12,124 | | 13,803 | |
| | Charles Schwab Corp. | 4.000% | 2/1/29 | 13,302 | | 15,925 | |
| | Charles Schwab Corp. | 3.250% | 5/22/29 | 15,171 | | 17,464 | |
| | Charles Schwab Corp. | 4.625% | 3/22/30 | 8,075 | | 10,272 | |
| | CME Group Inc. | 3.750% | 6/15/28 | 7,299 | | 8,635 | |
| | E*TRADE Financial Corp. | 3.800% | 8/24/27 | 8,263 | | 9,260 | |
| | E*TRADE Financial Corp. | 4.500% | 6/20/28 | 7,888 | | 9,278 | |
| | Eaton Vance Corp. | 3.500% | 4/6/27 | 5,733 | | 6,319 | |
| | Intercontinental Exchange Inc. | 3.750% | 12/1/25 | 25,487 | | 29,004 | |
| | Intercontinental Exchange Inc. | 3.100% | 9/15/27 | 9,015 | | 10,018 | |
| | Intercontinental Exchange Inc. | 3.750% | 9/21/28 | 16,941 | | 19,595 | |
| | Intercontinental Exchange Inc. | 2.100% | 6/15/30 | 20,168 | | 20,879 | |
| | Invesco Finance plc | 3.750% | 1/15/26 | 8,318 | | 9,333 | |
| | Janus Capital Group Inc. | 4.875% | 8/1/25 | 289 | | 328 | |
| | Jefferies Group LLC | 4.850% | 1/15/27 | 15,145 | | 17,214 | |
| | Jefferies Group LLC | 6.450% | 6/8/27 | 5,846 | | 7,057 | |
| | Jefferies Group LLC / Jefferies Group Capital Finance Inc. | 4.150% | 1/23/30 | 21,218 | | 23,883 | |
| | Lazard Group LLC | 3.625% | 3/1/27 | 11,002 | | 11,919 | |
| | Lazard Group LLC | 4.500% | 9/19/28 | 11,653 | | 13,505 | |
| | Lazard Group LLC | 4.375% | 3/11/29 | 3,856 | | 4,425 | |
| | Legg Mason Inc. | 4.750% | 3/15/26 | 8,054 | | 9,499 | |
| | Nasdaq Inc. | 3.850% | 6/30/26 | 9,953 | | 11,457 | |
| | Nomura Holdings Inc. | 3.103% | 1/16/30 | 38,011 | | 40,528 | |
| | Nomura Holdings Inc. | 2.679% | 7/16/30 | 12,200 | | 12,658 | |
| | Raymond James Financial Inc. | 3.625% | 9/15/26 | 9,580 | | 11,057 | |
| | Raymond James Financial Inc. | 4.650% | 4/1/30 | 18,454 | | 22,401 | |
| | Stifel Financial Corp. | 4.000% | 5/15/30 | 6,535 | | 6,999 | |
| | TD Ameritrade Holding Corp. | 3.300% | 4/1/27 | 16,990 | | 19,151 | |
| | TD Ameritrade Holding Corp. | 2.750% | 10/1/29 | 11,171 | | 12,525 | |
| | Finance Companies (0.8%) | | | | | | |
| | AerCap Ireland Capital DAC / AerCap Global Aviation Trust | 4.450% | 10/1/25 | 9,913 | | 9,912 | |
| | AerCap Ireland Capital DAC / AerCap Global Aviation Trust | 3.650% | 7/21/27 | 26,027 | | 24,154 | |
| | AerCap Ireland Capital DAC / AerCap Global Aviation Trust | 3.500% | 1/15/25 | 203 | | 197 | |
| | AerCap Ireland Capital DAC / AerCap Global Aviation Trust | 4.450% | 4/3/26 | 15,905 | | 15,705 | |
| | AerCap Ireland Capital DAC / AerCap Global Aviation Trust | 3.875% | 1/23/28 | 11,394 | | 10,343 | |
| | Air Lease Corp. | 3.250% | 3/1/25 | 2,283 | | 2,311 | |
| | Air Lease Corp. | 2.875% | 1/15/26 | 11,500 | | 11,384 | |
| | Air Lease Corp. | 3.750% | 6/1/26 | 9,683 | | 9,929 | |
| | Air Lease Corp. | 3.625% | 4/1/27 | 9,990 | | 9,878 | |
| | Air Lease Corp. | 3.625% | 12/1/27 | 13,882 | | 13,764 | |
| | Air Lease Corp. | 4.625% | 10/1/28 | 9,177 | | 9,496 | |
| | Air Lease Corp. | 3.250% | 10/1/29 | 11,025 | | 10,557 | |
| | Air Lease Corp. | 3.000% | 2/1/30 | 14,074 | | 13,341 | |
| | Aircastle Ltd. | 4.250% | 6/15/26 | 12,991 | | 12,065 | |
| | Ares Capital Corp. | 3.250% | 7/15/25 | 492 | | 488 | |
| | Ares Capital Corp. | 3.875% | 1/15/26 | 11,654 | | 11,761 | |
| | GATX Corp. | 3.250% | 9/15/26 | 5,745 | | 6,101 | |
| | GATX Corp. | 3.850% | 3/30/27 | 9,676 | | 10,440 | |
| | GATX Corp. | 3.500% | 3/15/28 | 5,025 | | 5,395 | |
| | GATX Corp. | 4.550% | 11/7/28 | 6,945 | | 7,919 | |
| | GATX Corp. | 4.700% | 4/1/29 | 4,656 | | 5,430 | |
| | GATX Corp. | 4.000% | 6/30/30 | 1,075 | | 1,229 | |
| 2 | GE Capital Funding LLC | 4.050% | 5/15/27 | 22,761 | | 24,177 | |
| 2 | GE Capital Funding LLC | 4.400% | 5/15/30 | 59,346 | | 62,346 | |
| | GE Capital International Funding Co. Unlimited Co. | 3.373% | 11/15/25 | 36,779 | | 39,014 | |
Vanguard® Intermediate-Term Corporate Bond Index Fund
Schedule of Investments
August 31, 2020
| | Coupon | | Maturity
Date | | Face
Amount
($000 | ) | Market
Value
($000 | ) |
| | Owl Rock Capital Corp. | 3.750% | | 7/22/25 | | 652 | | 650 | |
| | Owl Rock Capital Corp. | 4.250% | | 1/15/26 | | 10,554 | | 10,613 | |
| | Sixth Street Specialty Lending Inc. | 3.875% | | 11/1/24 | | 1 | | 1 | |
| | Insurance (4.2%) | |
| | ACE Capital Trust II | 9.700% | | 4/1/30 | | 2,905 | | 4,350 | |
| 1 | Aegon NV | 5.500% | | 4/11/48 | | 14,230 | | 15,582 | |
| | Aflac Inc. | 2.875% | | 10/15/26 | | 8,074 | | 8,926 | |
| | Aflac Inc. | 3.600% | | 4/1/30 | | 27,363 | | 31,977 | |
| | Alleghany Corp. | 3.625% | | 5/15/30 | | 9,585 | | 10,772 | |
| | Allied World Assurance Co. Holdings Ltd. | 4.350% | | 10/29/25 | | 7,574 | | 8,030 | |
| | Allstate Corp. | 3.280% | | 12/15/26 | | 9,532 | | 10,918 | |
| | American Equity Investment Life Holding Co. | 5.000% | | 6/15/27 | | 10,231 | | 11,165 | |
| | American Financial Group Inc. | 3.500% | | 8/15/26 | | 7,385 | | 7,961 | |
| | American Financial Group Inc. | 5.250% | | 4/2/30 | | 7,178 | | 8,716 | |
| | American International Group Inc. | 3.900% | | 4/1/26 | | 34,280 | | 39,214 | |
| | American International Group Inc. | 4.200% | | 4/1/28 | | 13,581 | | 15,726 | |
| | American International Group Inc. | 4.250% | | 3/15/29 | | 13,788 | | 16,083 | |
| | American International Group Inc. | 3.400% | | 6/30/30 | | 33,393 | | 36,975 | |
| 1 | American International Group Inc. | 5.750% | | 4/1/48 | | 13,831 | | 15,076 | |
| | Anthem Inc. | 2.375% | | 1/15/25 | | 4 | | 4 | |
| | Anthem Inc. | 3.650% | | 12/1/27 | | 23,110 | | 26,486 | |
| | Anthem Inc. | 4.101% | | 3/1/28 | | 29,479 | | 34,525 | |
| | Anthem Inc. | 2.875% | | 9/15/29 | | 27,199 | | 29,519 | |
| | Anthem Inc. | 2.250% | | 5/15/30 | | 32,411 | | 33,483 | |
| | Aon Corp. | 8.205% | | 1/1/27 | | 4,681 | | 6,062 | |
| | Aon Corp. | 4.500% | | 12/15/28 | | 8,968 | | 10,862 | |
| | Aon Corp. | 3.750% | | 5/2/29 | | 15,756 | | 18,201 | |
| | Aon Corp. | 2.800% | | 5/15/30 | | 24,080 | | 26,060 | |
| | Aon plc | 3.875% | | 12/15/25 | | 15,799 | | 18,058 | |
| | Arch Capital Finance LLC | 4.011% | | 12/15/26 | | 9,144 | | 10,531 | |
| | Assurant Inc. | 4.900% | | 3/27/28 | | 9,207 | | 10,214 | |
| | Assurant Inc. | 3.700% | | 2/22/30 | | 2,290 | | 2,290 | |
| | Athene Holding Ltd. | 4.125% | | 1/12/28 | | 13,066 | | 14,235 | |
| | Athene Holding Ltd. | 6.150% | | 4/3/30 | | 16,043 | | 19,388 | |
| | AXIS Specialty Finance LLC | 3.900% | | 7/15/29 | | 8,925 | | 9,674 | |
| 1 | AXIS Specialty Finance LLC | 4.900% | | 1/15/40 | | 5,651 | | 5,368 | |
| | AXIS Specialty Finance plc | 4.000% | | 12/6/27 | | 6,115 | | 6,664 | |
| | Berkshire Hathaway Finance Corp. | 1.850% | | 3/12/30 | | 9,362 | | 9,705 | |
| | Berkshire Hathaway Inc. | 3.125% | | 3/15/26 | | 58,373 | | 65,264 | |
| | Brighthouse Financial Inc. | 3.700% | | 6/22/27 | | 27,415 | | 28,667 | |
| | Brighthouse Financial Inc. | 5.625% | | 5/15/30 | | 12,848 | | 14,918 | |
| | Brown & Brown Inc. | 4.500% | | 3/15/29 | | 6,334 | | 7,020 | |
| | Chubb INA Holdings Inc. | 3.350% | | 5/3/26 | | 34,487 | | 39,296 | |
| | Cincinnati Financial Corp. | 6.920% | | 5/15/28 | | 5,050 | | 6,635 | |
| | CNA Financial Corp. | 4.500% | | 3/1/26 | | 7,995 | | 9,391 | |
| | CNA Financial Corp. | 3.450% | | 8/15/27 | | 11,743 | | 12,890 | |
| | CNA Financial Corp. | 3.900% | | 5/1/29 | | 9,709 | | 10,998 | |
| | CNA Financial Corp. | 2.050% | | 8/15/30 | | 11,460 | | 11,413 | |
| | CNO Financial Group Inc. | 5.250% | | 5/30/29 | | 6,090 | | 7,057 | |
| | Enstar Group Ltd. | 4.950% | | 6/1/29 | | 13,959 | | 15,389 | |
| | Equitable Holdings Inc. | 7.000% | | 4/1/28 | | 5,135 | | 6,493 | |
| | Equitable Holdings Inc. | 4.350% | | 4/20/28 | | 35,233 | | 40,098 | |
| | Fairfax Financial Holdings Ltd. | 4.850% | | 4/17/28 | | 11,092 | | 12,249 | |
| 2 | Fairfax Financial Holdings Ltd. | 4.625% | | 4/29/30 | | 14,319 | | 15,679 | |
| | Fidelity National Financial Inc. | 4.500% | | 8/15/28 | | 4,250 | | 4,858 | |
| | Fidelity National Financial Inc. | 3.400% | | 6/15/30 | | 18,208 | | 19,575 | |
| | First American Financial Corp. | 4.600% | | 11/15/24 | | 2 | | 2 | |
| | First American Financial Corp. | 4.000% | | 5/15/30 | | 3,715 | | 3,969 | |
| | Globe Life Inc. | 4.550% | | 9/15/28 | | 10,727 | | 12,633 | |
| | Globe Life Inc. | 2.150% | | 8/15/30 | | 6,000 | | 6,026 | |
| | Hanover Insurance Group Inc. | 4.500% | | 4/15/26 | | 4,725 | | 5,249 | |
| | Hanover Insurance Group Inc. | 2.500% | | 9/1/30 | | 6,000 | | 6,113 | |
| | Hartford Financial Services Group Inc. | 2.800% | | 8/19/29 | | 12,116 | | 13,042 | |
Vanguard® Intermediate-Term Corporate Bond Index Fund
Schedule of Investments
August 31, 2020
| | Coupon | | Maturity
Date | | Face
Amount
($000 | ) | Market
Value
($000 | ) |
| | Humana Inc. | 3.950% | | 3/15/27 | | 11,960 | | 13,711 | |
| | Humana Inc. | 3.125% | | 8/15/29 | | 12,494 | | 13,771 | |
| | Humana Inc. | 4.875% | | 4/1/30 | | 15,134 | | 18,977 | |
| | Lincoln National Corp. | 3.625% | | 12/12/26 | | 10,545 | | 11,825 | |
| | Lincoln National Corp. | 3.800% | | 3/1/28 | | 12,598 | | 14,084 | |
| | Lincoln National Corp. | 3.050% | | 1/15/30 | | 12,416 | | 13,387 | |
| | Loews Corp. | 3.750% | | 4/1/26 | | 8,952 | | 10,187 | |
| | Loews Corp. | 3.200% | | 5/15/30 | | 10,533 | | 11,668 | |
| | Manulife Financial Corp. | 4.150% | | 3/4/26 | | 18,960 | | 22,371 | |
| | Manulife Financial Corp. | 2.484% | | 5/19/27 | | 5,652 | | 6,060 | |
| 1 | Manulife Financial Corp. | 4.061% | | 2/24/32 | | 16,475 | | 17,583 | |
| | Markel Corp. | 3.500% | | 11/1/27 | | 5,861 | | 6,368 | |
| | Markel Corp. | 3.350% | | 9/17/29 | | 6,115 | | 6,649 | |
| | Marsh & McLennan Cos. Inc. | 3.750% | | 3/14/26 | | 12,080 | | 13,841 | |
| | Marsh & McLennan Cos. Inc. | 4.375% | | 3/15/29 | | 33,435 | | 40,535 | |
| | Mercury General Corp. | 4.400% | | 3/15/27 | | 3,892 | | 4,215 | |
| | MetLife Inc. | 3.600% | | 11/13/25 | | 10,635 | | 12,093 | |
| | MetLife Inc. | 4.550% | | 3/23/30 | | 21,530 | | 27,081 | |
| | Munich Re America Corp. | 7.450% | | 12/15/26 | | 2,408 | | 3,315 | |
| | Old Republic International Corp. | 3.875% | | 8/26/26 | | 7,015 | | 7,727 | |
| | PartnerRe Finance B LLC | 3.700% | | 7/2/29 | | 9,854 | | 10,942 | |
| | Principal Financial Group Inc. | 3.100% | | 11/15/26 | | 8,074 | | 8,924 | |
| | Principal Financial Group Inc. | 3.700% | | 5/15/29 | | 6,522 | | 7,493 | |
| | Principal Financial Group Inc. | 2.125% | | 6/15/30 | | 18,000 | | 18,595 | |
| | Progressive Corp. | 2.450% | | 1/15/27 | | 11,309 | | 12,119 | |
| | Progressive Corp. | 4.000% | | 3/1/29 | | 8,505 | | 10,198 | |
| | Progressive Corp. | 6.625% | | 3/1/29 | | 1,752 | | 2,396 | |
| | Progressive Corp. | 3.200% | | 3/26/30 | | 14,199 | | 16,339 | |
| | Prudential Financial Inc. | 1.500% | | 3/10/26 | | 9,169 | | 9,520 | |
| | Prudential Financial Inc. | 3.878% | | 3/27/28 | | 11,325 | | 13,380 | |
| | Prudential Financial Inc. | 2.100% | | 3/10/30 | | 8,710 | | 9,124 | |
| 1 | Prudential Financial Inc. | 4.500% | | 9/15/47 | | 16,538 | | 17,719 | |
| 1 | Prudential Financial Inc. | 5.700% | | 9/15/48 | | 21,775 | | 25,123 | |
| 1 | Prudential Financial Inc. | 3.700% | | 10/1/50 | | 14,000 | | 14,415 | |
| | Prudential plc | 3.125% | | 4/14/30 | | 17,111 | | 18,938 | |
| | Reinsurance Group of America Inc. | 3.950% | | 9/15/26 | | 7,765 | | 8,679 | |
| | Reinsurance Group of America Inc. | 3.900% | | 5/15/29 | | 13,505 | | 15,311 | |
| | Reinsurance Group of America Inc. | 3.150% | | 6/15/30 | | 11,000 | | 11,872 | |
| | RenaissanceRe Finance Inc. | 3.450% | | 7/1/27 | | 5,430 | | 5,739 | |
| | RenaissanceRe Holdings Ltd. | 3.600% | | 4/15/29 | | 4,950 | | 5,440 | |
| | Swiss Re Solutions Holding Corp. | 7.000% | | 2/15/26 | | 5,023 | | 6,394 | |
| | Trinity Acquisition plc | 4.400% | | 3/15/26 | | 10,250 | | 11,810 | |
| | UnitedHealth Group Inc. | 3.750% | | 7/15/25 | | 389 | | 444 | |
| | UnitedHealth Group Inc. | 3.700% | | 12/15/25 | | 8,868 | | 10,180 | |
| | UnitedHealth Group Inc. | 1.250% | | 1/15/26 | | 8,278 | | 8,483 | |
| | UnitedHealth Group Inc. | 3.100% | | 3/15/26 | | 16,082 | | 18,005 | |
| | UnitedHealth Group Inc. | 3.450% | | 1/15/27 | | 14,632 | | 16,611 | |
| | UnitedHealth Group Inc. | 3.375% | | 4/15/27 | | 7,139 | | 8,178 | |
| | UnitedHealth Group Inc. | 2.950% | | 10/15/27 | | 18,413 | | 20,427 | |
| | UnitedHealth Group Inc. | 3.850% | | 6/15/28 | | 31,986 | | 37,584 | |
| | UnitedHealth Group Inc. | 3.875% | | 12/15/28 | | 17,969 | | 21,266 | |
| | UnitedHealth Group Inc. | 2.875% | | 8/15/29 | | 27,948 | | 31,158 | |
| | UnitedHealth Group Inc. | 2.000% | | 5/15/30 | | 23,967 | | 25,020 | |
| | Unum Group | 4.000% | | 6/15/29 | | 7,970 | | 8,641 | |
| | Voya Financial Inc. | 3.650% | | 6/15/26 | | 7,946 | | 8,965 | |
| 1 | Voya Financial Inc. | 4.700% | | 1/23/48 | | 9,176 | | 9,210 | |
| | Willis North America Inc. | 4.500% | | 9/15/28 | | 19,047 | | 22,578 | |
| | Willis North America Inc. | 2.950% | | 9/15/29 | | 14,241 | | 15,323 | |
Vanguard® Intermediate-Term Corporate Bond Index Fund
Schedule of Investments
August 31, 2020
| | Coupon | | Maturity
Date | | Face
Amount
($000 | ) | Market
Value
($000 | ) |
| | Other Finance (0.0%) | |
| | ORIX Corp. | 3.700% | | 7/18/27 | | 7,291 | | 8,212 | |
| | Real Estate Investment Trusts (4.5%) | |
| | Alexandria Real Estate Equities Inc. | 4.300% | | 1/15/26 | | 5,872 | | 6,815 | |
| | Alexandria Real Estate Equities Inc. | 3.800% | | 4/15/26 | | 11,610 | | 13,266 | |
| | Alexandria Real Estate Equities Inc. | 3.950% | | 1/15/27 | | 5,553 | | 6,296 | |
| | Alexandria Real Estate Equities Inc. | 3.950% | | 1/15/28 | | 10,094 | | 11,598 | |
| | Alexandria Real Estate Equities Inc. | 4.500% | | 7/30/29 | | 3,279 | | 3,985 | |
| | Alexandria Real Estate Equities Inc. | 2.750% | | 12/15/29 | | 5,439 | | 5,889 | |
| | Alexandria Real Estate Equities Inc. | 4.700% | | 7/1/30 | | 8,224 | | 10,160 | |
| | American Campus Communities Operating Partnership LP | 3.300% | | 7/15/26 | | 7,324 | | 7,808 | |
| | American Campus Communities Operating Partnership LP | 3.625% | | 11/15/27 | | 9,098 | | 9,645 | |
| | American Campus Communities Operating Partnership LP | 2.850% | | 2/1/30 | | 7,753 | | 7,719 | |
| | American Homes 4 Rent LP | 4.250% | | 2/15/28 | | 7,448 | | 8,380 | |
| | American Homes 4 Rent LP | 4.900% | | 2/15/29 | | 6,700 | | 7,988 | |
| | AvalonBay Communities Inc. | 3.500% | | 11/15/25 | | 6,960 | | 7,838 | |
| | AvalonBay Communities Inc. | 2.950% | | 5/11/26 | | 6,711 | | 7,324 | |
| | AvalonBay Communities Inc. | 2.900% | | 10/15/26 | | 7,101 | | 7,768 | |
| | AvalonBay Communities Inc. | 3.350% | | 5/15/27 | | 8,899 | | 9,971 | |
| | AvalonBay Communities Inc. | 3.200% | | 1/15/28 | | 6,887 | | 7,684 | |
| | AvalonBay Communities Inc. | 3.300% | | 6/1/29 | | 9,008 | | 10,236 | |
| | AvalonBay Communities Inc. | 2.300% | | 3/1/30 | | 15,197 | | 16,067 | |
| | Boston Properties LP | 3.650% | | 2/1/26 | | 11,546 | | 12,859 | |
| | Boston Properties LP | 2.750% | | 10/1/26 | | 31,744 | | 34,247 | |
| | Boston Properties LP | 4.500% | | 12/1/28 | | 24,093 | | 28,495 | |
| | Boston Properties LP | 3.400% | | 6/21/29 | | 11,380 | | 12,455 | |
| | Boston Properties LP | 2.900% | | 3/15/30 | | 12,998 | | 13,741 | |
| | Brandywine Operating Partnership LP | 3.950% | | 11/15/27 | | 9,772 | | 10,136 | |
| | Brandywine Operating Partnership LP | 4.550% | | 10/1/29 | | 11,817 | | 12,605 | |
| | Brixmor Operating Partnership LP | 4.125% | | 6/15/26 | | 500 | | 540 | |
| | Brixmor Operating Partnership LP | 3.900% | | 3/15/27 | | 9,915 | | 10,403 | |
| | Brixmor Operating Partnership LP | 4.125% | | 5/15/29 | | 19,667 | | 21,065 | |
| | Brixmor Operating Partnership LP | 4.050% | | 7/1/30 | | 11,924 | | 12,768 | |
| | Camden Property Trust | 4.100% | | 10/15/28 | | 7,566 | | 8,980 | |
| | Camden Property Trust | 3.150% | | 7/1/29 | | 16,152 | | 18,050 | |
| | Camden Property Trust | 2.800% | | 5/15/30 | | 16,760 | | 18,364 | |
| | Columbia Property Trust Operating Partnership LP | 3.650% | | 8/15/26 | | 3,667 | | 3,833 | |
| | CubeSmart LP | 4.000% | | 11/15/25 | | 5,516 | | 6,166 | |
| | CubeSmart LP | 3.125% | | 9/1/26 | | 7,558 | | 8,155 | |
| | CubeSmart LP | 4.375% | | 2/15/29 | | 5,527 | | 6,481 | |
| | CubeSmart LP | 3.000% | | 2/15/30 | | 1,875 | | 2,011 | |
| | CyrusOne LP / CyrusOne Finance Corp. | 3.450% | | 11/15/29 | | 12,400 | | 13,512 | |
| | Digital Realty Trust LP | 4.750% | | 10/1/25 | | 3,405 | | 3,988 | |
| | Digital Realty Trust LP | 3.700% | | 8/15/27 | | 18,858 | | 21,453 | |
| | Digital Realty Trust LP | 4.450% | | 7/15/28 | | 16,321 | | 19,632 | |
| | Digital Realty Trust LP | 3.600% | | 7/1/29 | | 24,736 | | 28,464 | |
| | Duke Realty LP | 3.250% | | 6/30/26 | | 5,414 | | 5,955 | |
| | Duke Realty LP | 3.375% | | 12/15/27 | | 6,854 | | 7,709 | |
| | Duke Realty LP | 4.000% | | 9/15/28 | | 7,533 | | 8,859 | |
| | Duke Realty LP | 2.875% | | 11/15/29 | | 7,742 | | 8,490 | |
| | Duke Realty LP | 1.750% | | 7/1/30 | | 12,000 | | 12,017 | |
| | EPR Properties | 4.750% | | 12/15/26 | | 7,704 | | 7,398 | |
| | EPR Properties | 4.500% | | 6/1/27 | | 9,603 | | 9,003 | |
| | EPR Properties | 4.950% | | 4/15/28 | | 11,615 | | 11,293 | |
| | EPR Properties | 3.750% | | 8/15/29 | | 7,700 | | 6,805 | |
| | ERP Operating LP | 2.850% | | 11/1/26 | | 5,849 | | 6,471 | |
| | ERP Operating LP | 3.250% | | 8/1/27 | | 8,567 | | 9,544 | |
| | ERP Operating LP | 3.500% | | 3/1/28 | | 11,210 | | 12,745 | |
| | ERP Operating LP | 4.150% | | 12/1/28 | | 5,232 | | 6,237 | |
Vanguard® Intermediate-Term Corporate Bond Index Fund
Schedule of Investments
August 31, 2020
| | Coupon | | Maturity
Date | | Face
Amount
($000 | ) | Market
Value
($000 | ) |
| | ERP Operating LP | 3.000% | | 7/1/29 | | 18,121 | | 20,116 | |
| | ERP Operating LP | 2.500% | | 2/15/30 | | 16,946 | | 18,208 | |
| | Essex Portfolio LP | 3.500% | | 4/1/25 | | 10 | | 11 | |
| | Essex Portfolio LP | 3.375% | | 4/15/26 | | 9,583 | | 10,520 | |
| | Essex Portfolio LP | 3.625% | | 5/1/27 | | 6,561 | | 7,330 | |
| | Essex Portfolio LP | 4.000% | | 3/1/29 | | 7,973 | | 9,298 | |
| | Essex Portfolio LP | 3.000% | | 1/15/30 | | 16,798 | | 18,204 | |
| | Federal Realty Investment Trust | 3.250% | | 7/15/27 | | 8,817 | | 9,415 | |
| | Federal Realty Investment Trust | 3.200% | | 6/15/29 | | 6,370 | | 6,718 | |
| | Federal Realty Investment Trust | 3.500% | | 6/1/30 | | 10,505 | | 11,341 | |
| | Healthcare Realty Trust Inc. | 3.625% | | 1/15/28 | | 7,413 | | 7,907 | |
| | Healthcare Realty Trust Inc. | 2.400% | | 3/15/30 | | 3,729 | | 3,741 | |
| | Healthcare Trust of America Holdings LP | 3.500% | | 8/1/26 | | 14,636 | | 16,125 | |
| | Healthcare Trust of America Holdings LP | 3.750% | | 7/1/27 | | 9,402 | | 10,242 | |
| | Healthcare Trust of America Holdings LP | 3.100% | | 2/15/30 | | 5,174 | | 5,447 | |
| | Healthpeak Properties Inc. | 3.250% | | 7/15/26 | | 20,135 | | 22,468 | |
| | Healthpeak Properties Inc. | 3.500% | | 7/15/29 | | 11,679 | | 12,962 | |
| | Healthpeak Properties Inc. | 3.000% | | 1/15/30 | | 16,229 | | 17,427 | |
| | Highwoods Realty LP | 3.875% | | 3/1/27 | | 11,238 | | 12,162 | |
| | Highwoods Realty LP | 4.125% | | 3/15/28 | | 5,430 | | 5,991 | |
| | Highwoods Realty LP | 4.200% | | 4/15/29 | | 8,195 | | 9,169 | |
| | Highwoods Realty LP | 3.050% | | 2/15/30 | | 2,550 | | 2,647 | |
| | Host Hotels & Resorts LP | 4.500% | | 2/1/26 | | 7,294 | | 7,766 | |
| | Host Hotels & Resorts LP | 3.375% | | 12/15/29 | | 13,992 | | 13,630 | |
| | Host Hotels & Resorts LP | 3.500% | | 9/15/30 | | 3,000 | | 2,957 | |
| | Hudson Pacific Properties LP | 3.950% | | 11/1/27 | | 6,754 | | 7,283 | |
| | Hudson Pacific Properties LP | 4.650% | | 4/1/29 | | 8,218 | | 9,267 | |
| | Hudson Pacific Properties LP | 3.250% | | 1/15/30 | | 10,190 | | 10,470 | |
| | Kilroy Realty LP | 4.375% | | 10/1/25 | | 8,697 | | 9,632 | |
| | Kilroy Realty LP | 4.750% | | 12/15/28 | | 14,401 | | 16,730 | |
| | Kilroy Realty LP | 4.250% | | 8/15/29 | | 9,229 | | 10,440 | |
| | Kilroy Realty LP | 3.050% | | 2/15/30 | | 7,368 | | 7,660 | |
| | Kimco Realty Corp. | 2.800% | | 10/1/26 | | 8,962 | | 9,490 | |
| | Kimco Realty Corp. | 3.800% | | 4/1/27 | | 6,452 | | 7,040 | |
| | Kimco Realty Corp. | 1.900% | | 3/1/28 | | 2,000 | | 1,964 | |
| | Kimco Realty Corp. | 2.700% | | 10/1/30 | | 4,000 | | 4,085 | |
| | Kite Realty Group LP | 4.000% | | 10/1/26 | | 5,035 | | 4,778 | |
| | Lexington Realty Trust | 2.700% | | 9/15/30 | | 1,500 | | 1,517 | |
| | Life Storage LP | 3.500% | | 7/1/26 | | 9,191 | | 10,056 | |
| | Life Storage LP | 3.875% | | 12/15/27 | | 6,774 | | 7,484 | |
| | Life Storage LP | 4.000% | | 6/15/29 | | 9,450 | | 10,607 | |
| | Mid-America Apartments LP | 4.000% | | 11/15/25 | | 5,167 | | 5,833 | |
| | Mid-America Apartments LP | 3.600% | | 6/1/27 | | 13,633 | | 15,290 | |
| | Mid-America Apartments LP | 4.200% | | 6/15/28 | | 4,840 | | 5,632 | |
| | Mid-America Apartments LP | 3.950% | | 3/15/29 | | 19,305 | | 22,346 | |
| | Mid-America Apartments LP | 2.750% | | 3/15/30 | | 1,837 | | 1,970 | |
| | National Retail Properties Inc. | 4.000% | | 11/15/25 | | 6,767 | | 7,573 | |
| | National Retail Properties Inc. | 3.600% | | 12/15/26 | | 5,628 | | 6,094 | |
| | National Retail Properties Inc. | 3.500% | | 10/15/27 | | 8,400 | | 8,899 | |
| | National Retail Properties Inc. | 4.300% | | 10/15/28 | | 9,339 | | 10,430 | |
| | National Retail Properties Inc. | 2.500% | | 4/15/30 | | 5,864 | | 5,760 | |
| | Omega Healthcare Investors Inc. | 5.250% | | 1/15/26 | | 7,152 | | 7,810 | |
| | Omega Healthcare Investors Inc. | 4.500% | | 4/1/27 | | 9,738 | | 10,299 | |
| | Omega Healthcare Investors Inc. | 4.750% | | 1/15/28 | | 15,637 | | 16,756 | |
| | Omega Healthcare Investors Inc. | 3.625% | | 10/1/29 | | 17,958 | | 17,966 | |
| | Physicians Realty LP | 4.300% | | 3/15/27 | | 8,019 | | 8,510 | |
| | Physicians Realty LP | 3.950% | | 1/15/28 | | 5,235 | | 5,372 | |
| | Piedmont Operating Partnership LP | 3.150% | | 8/15/30 | | 6,000 | | 5,878 | |
| | Prologis LP | 3.750% | | 11/1/25 | | 8,991 | | 10,295 | |
| | Prologis LP | 3.250% | | 10/1/26 | | 10,720 | | 12,117 | |
| | Prologis LP | 2.125% | | 4/15/27 | | 18,621 | | 19,832 | |
| | Prologis LP | 3.875% | | 9/15/28 | | 7,618 | | 9,086 | |
| | Prologis LP | 4.375% | | 2/1/29 | | 2,417 | | 2,977 | |
| | Prologis LP | 2.250% | | 4/15/30 | | 21,919 | | 23,390 | |
Vanguard® Intermediate-Term Corporate Bond Index Fund
Schedule of Investments
August 31, 2020
| | Coupon | | Maturity
Date | | Face
Amount
($000 | ) | Market
Value
($000 | ) |
| | Public Storage | 3.094% | | 9/15/27 | | 10,819 | | 12,199 | |
| | Public Storage | 3.385% | | 5/1/29 | | 15,866 | | 18,365 | |
| | Realty Income Corp. | 4.125% | | 10/15/26 | | 12,657 | | 14,660 | |
| | Realty Income Corp. | 3.000% | | 1/15/27 | | 14,795 | | 15,954 | |
| | Realty Income Corp. | 3.650% | | 1/15/28 | | 11,821 | | 13,199 | |
| | Realty Income Corp. | 3.250% | | 6/15/29 | | 10,100 | | 11,114 | |
| | Regency Centers LP | 3.600% | | 2/1/27 | | 8,425 | | 9,068 | |
| | Regency Centers LP | 4.125% | | 3/15/28 | | 7,225 | | 8,015 | |
| | Regency Centers LP | 2.950% | | 9/15/29 | | 8,696 | | 8,965 | |
| | Regency Centers LP | 3.700% | | 6/15/30 | | 12,700 | | 14,025 | |
| | Sabra Health Care LP | 5.125% | | 8/15/26 | | 9,551 | | 10,363 | |
| | Sabra Health Care LP | 3.900% | | 10/15/29 | | 4,975 | | 4,782 | |
| | Simon Property Group LP | 3.375% | | 10/1/24 | | 1 | | 1 | |
| | Simon Property Group LP | 3.500% | | 9/1/25 | | 12,113 | | 13,305 | |
| | Simon Property Group LP | 3.300% | | 1/15/26 | | 14,538 | | 15,885 | |
| | Simon Property Group LP | 3.250% | | 11/30/26 | | 18,824 | | 20,521 | |
| | Simon Property Group LP | 3.375% | | 6/15/27 | | 10,246 | | 11,028 | |
| | Simon Property Group LP | 3.375% | | 12/1/27 | | 24,416 | | 26,398 | |
| | Simon Property Group LP | 2.450% | | 9/13/29 | | 28,588 | | 28,484 | |
| | Simon Property Group LP | 2.650% | | 7/15/30 | | 16,035 | | 16,039 | |
| | SITE Centers Corp. | 3.900% | | 8/15/24 | | 1,830 | | 1,805 | |
| | SITE Centers Corp. | 4.700% | | 6/1/27 | | 10,884 | | 11,443 | |
| | Spirit Realty LP | 4.450% | | 9/15/26 | | 2,529 | | 2,732 | |
| | Spirit Realty LP | 3.200% | | 1/15/27 | | 6,370 | | 6,427 | |
| | Spirit Realty LP | 4.000% | | 7/15/29 | | 9,900 | | 10,341 | |
| | Spirit Realty LP | 3.400% | | 1/15/30 | | 7,150 | | 7,116 | |
| | STORE Capital Corp. | 4.500% | | 3/15/28 | | 6,470 | | 6,818 | |
| | STORE Capital Corp. | 4.625% | | 3/15/29 | | 7,336 | | 7,815 | |
| | Tanger Properties LP | 3.125% | | 9/1/26 | | 6,489 | | 6,135 | |
| | Tanger Properties LP | 3.875% | | 7/15/27 | | 8,325 | | 8,015 | |
| | UDR Inc. | 4.000% | | 10/1/25 | | 5,030 | | 5,653 | |
| | UDR Inc. | 2.950% | | 9/1/26 | | 6,890 | | 7,450 | |
| | UDR Inc. | 3.500% | | 7/1/27 | | 4,584 | | 5,060 | |
| | UDR Inc. | 3.500% | | 1/15/28 | | 5,500 | | 6,100 | |
| | UDR Inc. | 4.400% | | 1/26/29 | | 7,922 | | 9,389 | |
| | UDR Inc. | 3.200% | | 1/15/30 | | 12,107 | | 13,451 | |
| | Ventas Realty LP | 4.125% | | 1/15/26 | | 10,616 | | 11,836 | |
| | Ventas Realty LP | 3.250% | | 10/15/26 | | 14,351 | | 15,284 | |
| | Ventas Realty LP | 3.850% | | 4/1/27 | | 4,096 | | 4,418 | |
| | Ventas Realty LP | 4.000% | | 3/1/28 | | 9,140 | | 9,860 | |
| | Ventas Realty LP | 4.400% | | 1/15/29 | | 17,813 | | 19,824 | |
| | Ventas Realty LP | 3.000% | | 1/15/30 | | 10,408 | | 10,478 | |
| | VEREIT Operating Partnership LP | 4.625% | | 11/1/25 | | 8,911 | | 9,850 | |
| | VEREIT Operating Partnership LP | 4.875% | | 6/1/26 | | 10,077 | | 11,188 | |
| | VEREIT Operating Partnership LP | 3.950% | | 8/15/27 | | 12,192 | | 13,006 | |
| | VEREIT Operating Partnership LP | 3.400% | | 1/15/28 | | 15,186 | | 15,741 | |
| | VEREIT Operating Partnership LP | 3.100% | | 12/15/29 | | 11,008 | | 11,047 | |
| | Welltower Inc. | 4.250% | | 4/1/26 | | 11,123 | | 12,654 | |
| | Welltower Inc. | 2.700% | | 2/15/27 | | 12,582 | | 13,368 | |
| | Welltower Inc. | 4.250% | | 4/15/28 | | 18,854 | | 21,239 | |
| | Welltower Inc. | 4.125% | | 3/15/29 | | 13,217 | | 14,835 | |
| | Welltower Inc. | 3.100% | | 1/15/30 | | 15,480 | | 16,265 | |
| | WP Carey Inc. | 4.250% | | 10/1/26 | | 3,205 | | 3,596 | |
| | WP Carey Inc. | 3.850% | | 7/15/29 | | 8,537 | | 9,175 | |
| | | | 14,095,253 | |
| Industrial (58.1%) | |
| | Basic Industry (2.7%) | |
| | Air Products and Chemicals Inc. | 1.500% | | 10/15/25 | | 16,323 | | 16,978 | |
| | Air Products and Chemicals Inc. | 1.850% | | 5/15/27 | | 17,038 | | 17,959 | |
| | Air Products and Chemicals Inc. | 2.050% | | 5/15/30 | | 14,284 | | 15,018 | |
| | Albemarle Wodgina Pty Ltd. | 3.450% | | 11/15/29 | | 5,525 | | 5,539 | |
| | BHP Billiton Finance USA Ltd. | 6.420% | | 3/1/26 | | 4,199 | | 5,344 | |
| | Cabot Corp. | 4.000% | | 7/1/29 | | 6,075 | | 6,488 | |
Vanguard® Intermediate-Term Corporate Bond Index Fund
Schedule of Investments
August 31, 2020
| | | | | Face | Market |
| | | | Maturity | Amount | Value |
| | | Coupon | Date | ($000) | ($000) |
| | Celulosa Arauco y Constitucion SA | 3.875% | 11/2/27 | 12,303 | 13,104 |
| | Dow Chemical Co. | 4.550% | 11/30/25 | 20,304 | 23,541 |
| | Dow Chemical Co. | 3.625% | 5/15/26 | 18,880 | 21,081 |
| | Dow Chemical Co. | 4.800% | 11/30/28 | 8,941 | 10,832 |
| | Dow Chemical Co. | 7.375% | 11/1/29 | 10,246 | 14,534 |
| | Dow Chemical Co. | 2.100% | 11/15/30 | 5,000 | 4,918 |
| | DuPont de Nemours Inc. | 4.493% | 11/15/25 | 39,403 | 45,744 |
| | DuPont de Nemours Inc. | 4.725% | 11/15/28 | 34,408 | 41,909 |
| | Eastman Chemical Co. | 4.500% | 12/1/28 | 11,179 | 13,153 |
| | Ecolab Inc. | 2.700% | 11/1/26 | 21,023 | 23,599 |
| | Ecolab Inc. | 3.250% | 12/1/27 | 11,512 | 12,997 |
| | Ecolab Inc. | 4.800% | 3/24/30 | 17,079 | 21,668 |
| | Ecolab Inc. | 1.300% | 1/30/31 | 3,000 | 2,912 |
| | EI du Pont de Nemours & Co. | 2.300% | 7/15/30 | 4,300 | 4,543 |
| | Fibria Overseas Finance Ltd. | 5.500% | 1/17/27 | 12,973 | 14,384 |
| | FMC Corp. | 3.200% | 10/1/26 | 12,747 | 14,184 |
| | FMC Corp. | 3.450% | 10/1/29 | 11,768 | 13,197 |
| | Georgia-Pacific LLC | 7.375% | 12/1/25 | 1,427 | 1,841 |
| | Georgia-Pacific LLC | 7.750% | 11/15/29 | 2,972 | 4,415 |
| 2 | Georgia-Pacific LLC | 2.300% | 4/30/30 | 5,000 | 5,296 |
| | Huntsman International LLC | 4.500% | 5/1/29 | 10,535 | 11,674 |
| | International Flavors & Fragrances Inc. | 4.450% | 9/26/28 | 6,492 | 7,536 |
| | International Paper Co. | 3.800% | 1/15/26 | 14,007 | 15,965 |
| | International Paper Co. | 3.000% | 2/15/27 | 16,247 | 17,841 |
| | Kinross Gold Corp. | 4.500% | 7/15/27 | 9,803 | 11,163 |
| | LYB International Finance II BV | 3.500% | 3/2/27 | 16,110 | 17,874 |
| | LYB International Finance III LLC | 3.375% | 5/1/30 | 13,750 | 14,896 |
| | Mosaic Co. | 4.050% | 11/15/27 | 15,505 | 17,064 |
| | Newmont Corp. | 2.800% | 10/1/29 | 22,509 | 24,370 |
| | Nucor Corp. | 3.950% | 5/1/28 | 9,298 | 10,857 |
| | Nucor Corp. | 2.700% | 6/1/30 | 9,647 | 10,382 |
| | Nutrien Ltd. | 4.000% | 12/15/26 | 8,380 | 9,675 |
| | Nutrien Ltd. | 4.200% | 4/1/29 | 9,580 | 11,290 |
| | Nutrien Ltd. | 2.950% | 5/13/30 | 12,845 | 13,971 |
| | Packaging Corp. of America | 3.400% | 12/15/27 | 11,395 | 12,711 |
| | Packaging Corp. of America | 3.000% | 12/15/29 | 9,373 | 10,258 |
| | PPG Industries Inc. | 3.750% | 3/15/28 | 2,200 | 2,655 |
| | PPG Industries Inc. | 2.800% | 8/15/29 | 7,443 | 8,043 |
| | PPG Industries Inc. | 2.550% | 6/15/30 | 7,700 | 8,215 |
| | Praxair Inc. | 3.200% | 1/30/26 | 9,563 | 10,709 |
| | Praxair Inc. | 1.100% | 8/10/30 | 10,000 | 9,764 |
| | Reliance Steel & Aluminum Co. | 2.150% | 8/15/30 | 9,603 | 9,504 |
| | Rio Tinto Finance USA Ltd. | 7.125% | 7/15/28 | 11,287 | 15,983 |
| | Rohm & Haas Co. | 7.850% | 7/15/29 | 18,349 | 25,929 |
| | RPM International Inc. | 3.750% | 3/15/27 | 7,927 | 8,602 |
| | RPM International Inc. | 4.550% | 3/1/29 | 10,620 | 12,360 |
| | Sherwin-Williams Co. | 3.950% | 1/15/26 | 7,787 | 8,852 |
| | Sherwin-Williams Co. | 3.450% | 6/1/27 | 30,748 | 34,855 |
| | Sherwin-Williams Co. | 2.950% | 8/15/29 | 30,141 | 33,060 |
| | Sherwin-Williams Co. | 2.300% | 5/15/30 | 8,323 | 8,650 |
| | Steel Dynamics Inc. | 4.125% | 9/15/25 | 6,000 | 6,090 |
| | Steel Dynamics Inc. | 3.450% | 4/15/30 | 15,362 | 16,783 |
| | Steel Dynamics Inc. | 3.250% | 1/15/31 | 1,000 | 1,075 |
| | Suzano Austria GmbH | 6.000% | 1/15/29 | 34,550 | 39,116 |
| | Suzano Austria GmbH | 5.000% | 1/15/30 | 19,173 | 20,473 |
| 2 | Teck Resources Ltd. | 3.900% | 7/15/30 | 9,600 | 9,838 |
| | Vale Overseas Ltd. | 6.250% | 8/10/26 | 31,765 | 37,800 |
| | Vale Overseas Ltd. | 3.750% | 7/8/30 | 32,400 | 33,910 |
| | Westlake Chemical Corp. | 3.600% | 8/15/26 | 12,001 | 13,083 |
| | Westlake Chemical Corp. | 3.375% | 6/15/30 | 900 | 956 |
| | Westrock MWV LLC | 8.200% | 1/15/30 | 2,128 | 3,022 |
| | Weyerhaeuser Co. | 6.950% | 10/1/27 | 3,364 | 4,247 |
| | Weyerhaeuser Co. | 4.000% | 11/15/29 | 16,375 | 18,835 |
| | Weyerhaeuser Co. | 4.000% | 4/15/30 | 17,585 | 20,484 |
Vanguard® Intermediate-Term Corporate Bond Index Fund
Schedule of Investments
August 31, 2020
| | | | | Face | Market |
| | | | Maturity | Amount | Value |
| | | Coupon | Date | ($000) | ($000) |
| | WRKCo Inc. | 4.650% | 3/15/26 | 15,690 | 18,435 |
| | WRKCo Inc. | 3.375% | 9/15/27 | 11,419 | 12,518 |
| | WRKCo Inc. | 4.000% | 3/15/28 | 10,925 | 12,476 |
| | WRKCo Inc. | 3.900% | 6/1/28 | 18,955 | 21,588 |
| | WRKCo Inc. | 4.900% | 3/15/29 | 25,032 | 30,747 |
| | Yamana Gold Inc. | 4.625% | 12/15/27 | 200 | 217 |
| | Capital Goods (5.6%) |
| | 3M Co. | 2.250% | 9/19/26 | 14,158 | 15,367 |
| | 3M Co. | 2.875% | 10/15/27 | 15,298 | 17,081 |
| | 3M Co. | 3.625% | 9/14/28 | 4,984 | 5,807 |
| | 3M Co. | 3.375% | 3/1/29 | 18,395 | 21,160 |
| | 3M Co. | 2.375% | 8/26/29 | 27,966 | 30,162 |
| | 3M Co. | 3.050% | 4/15/30 | 8,821 | 10,073 |
| | ABB Finance USA Inc. | 3.800% | 4/3/28 | 6,340 | 7,417 |
| | Allegion plc | 3.500% | 10/1/29 | 7,249 | 7,904 |
| | Allegion US Holding Co. Inc. | 3.550% | 10/1/27 | 6,700 | 7,171 |
| | Amcor Finance USA Inc. | 3.625% | 4/28/26 | 315 | 350 |
| | Amphenol Corp. | 4.350% | 6/1/29 | 8,539 | 10,365 |
| | Amphenol Corp. | 2.800% | 2/15/30 | 19,901 | 21,705 |
| | Avery Dennison Corp. | 4.875% | 12/6/28 | 8,875 | 10,852 |
| | Avery Dennison Corp. | 2.650% | 4/30/30 | 10,850 | 11,443 |
| | Bemis Co. Inc. | 3.100% | 9/15/26 | 6,673 | 7,196 |
| | Bemis Co. Inc. | 2.630% | 6/19/30 | 14,772 | 15,842 |
| | Boeing Co. | 2.600% | 10/30/25 | 6,237 | 6,210 |
| | Boeing Co. | 3.100% | 5/1/26 | 14,530 | 14,567 |
| | Boeing Co. | 2.250% | 6/15/26 | 13,806 | 13,587 |
| | Boeing Co. | 2.700% | 2/1/27 | 18,981 | 18,388 |
| | Boeing Co. | 2.800% | 3/1/27 | 17,773 | 17,298 |
| | Boeing Co. | 5.040% | 5/1/27 | 35,207 | 38,676 |
| | Boeing Co. | 3.250% | 3/1/28 | 16,259 | 16,163 |
| | Boeing Co. | 3.450% | 11/1/28 | 6,719 | 6,721 |
| | Boeing Co. | 3.200% | 3/1/29 | 14,386 | 14,251 |
| | Boeing Co. | 2.950% | 2/1/30 | 6,569 | 6,372 |
| | Boeing Co. | 5.150% | 5/1/30 | 85,271 | 95,408 |
| | Carlisle Cos. Inc. | 3.750% | 12/1/27 | 9,866 | 11,030 |
| | Carlisle Cos. Inc. | 2.750% | 3/1/30 | 23,042 | 24,372 |
| 2 | Carrier Global Corp. | 2.493% | 2/15/27 | 31,256 | 32,753 |
| 2 | Carrier Global Corp. | 2.722% | 2/15/30 | 40,074 | 42,007 |
| | Caterpillar Financial Services Corp. | 2.400% | 8/9/26 | 5,785 | 6,308 |
| | Caterpillar Inc. | 2.600% | 9/19/29 | 7,215 | 7,935 |
| | Caterpillar Inc. | 2.600% | 4/9/30 | 21,639 | 23,721 |
| | CNH Industrial NV | 3.850% | 11/15/27 | 17,586 | 18,960 |
| | Deere & Co. | 5.375% | 10/16/29 | 2,457 | 3,226 |
| | Deere & Co. | 3.100% | 4/15/30 | 17,664 | 20,083 |
| | Dover Corp. | 3.150% | 11/15/25 | 9,520 | 10,491 |
| | Dover Corp. | 2.950% | 11/4/29 | 6,482 | 7,051 |
| | Eagle Materials Inc. | 4.500% | 8/1/26 | 5,819 | 6,072 |
| | Eaton Corp. | 3.103% | 9/15/27 | 12,735 | 14,188 |
| | Emerson Electric Co. | 1.800% | 10/15/27 | 14,273 | 14,990 |
| | Fortive Corp. | 3.150% | 6/15/26 | 16,067 | 17,681 |
| | Fortune Brands Home & Security Inc. | 3.250% | 9/15/29 | 13,824 | 15,419 |
| | General Dynamics Corp. | 2.125% | 8/15/26 | 9,588 | 10,320 |
| | General Dynamics Corp. | 3.500% | 4/1/27 | 5,631 | 6,430 |
| | General Dynamics Corp. | 2.625% | 11/15/27 | 10,956 | 11,981 |
| | General Dynamics Corp. | 3.750% | 5/15/28 | 24,977 | 29,214 |
| | General Dynamics Corp. | 3.625% | 4/1/30 | 24,207 | 28,643 |
| | General Electric Co. | 5.550% | 1/5/26 | 8,325 | 9,673 |
| | General Electric Co. | 3.450% | 5/1/27 | 23,423 | 24,719 |
| | General Electric Co. | 3.625% | 5/1/30 | 25,626 | 26,469 |
| | Hexcel Corp. | 3.950% | 2/15/27 | 11,442 | 12,308 |
| | Honeywell International Inc. | 2.500% | 11/1/26 | 37,769 | 41,538 |
| | Honeywell International Inc. | 2.700% | 8/15/29 | 15,854 | 17,737 |
| | Honeywell International Inc. | 1.950% | 6/1/30 | 27,885 | 29,300 |
Vanguard® Intermediate-Term Corporate Bond Index Fund
Schedule of Investments
August 31, 2020
| | | | | Face | Market |
| | | | Maturity | Amount | Value |
| | | Coupon | Date | ($000) | ($000) |
| | Howmet Aerospace Inc. | 5.900% | 2/1/27 | 600 | 677 |
| | Howmet Aerospace Inc. | 6.750% | 1/15/28 | 3,809 | 4,385 |
| | Hubbell Inc. | 3.350% | 3/1/26 | 4,204 | 4,543 |
| | Hubbell Inc. | 3.150% | 8/15/27 | 5,578 | 5,892 |
| | Hubbell Inc. | 3.500% | 2/15/28 | 8,899 | 9,628 |
| | Huntington Ingalls Industries Inc. | 3.483% | 12/1/27 | 7,025 | 7,648 |
| 2 | Huntington Ingalls Industries Inc. | 4.200% | 5/1/30 | 13,058 | 14,941 |
| | IDEX Corp. | 3.000% | 5/1/30 | 7,020 | 7,685 |
| | Illinois Tool Works Inc. | 2.650% | 11/15/26 | 26,783 | 29,789 |
| | Ingersoll-Rand Global Holding Co. Ltd. | 3.750% | 8/21/28 | 7,495 | 8,610 |
| | Ingersoll-Rand Luxembourg Finance SA | 3.500% | 3/21/26 | 4,570 | 5,101 |
| | Ingersoll-Rand Luxembourg Finance SA | 3.800% | 3/21/29 | 15,077 | 17,581 |
| | John Deere Capital Corp. | 3.400% | 9/11/25 | 7,425 | 8,396 |
| | John Deere Capital Corp. | 2.650% | 6/10/26 | 9,751 | 10,756 |
| | John Deere Capital Corp. | 2.250% | 9/14/26 | 12,069 | 13,097 |
| | John Deere Capital Corp. | 1.750% | 3/9/27 | 3,971 | 4,143 |
| | John Deere Capital Corp. | 2.800% | 9/8/27 | 10,016 | 11,158 |
| | John Deere Capital Corp. | 3.050% | 1/6/28 | 7,440 | 8,288 |
| | John Deere Capital Corp. | 3.450% | 3/7/29 | 10,272 | 11,932 |
| | John Deere Capital Corp. | 2.800% | 7/18/29 | 13,815 | 15,346 |
| | John Deere Capital Corp. | 2.450% | 1/9/30 | 27,555 | 29,950 |
| | Johnson Controls International plc | 3.900% | 2/14/26 | 8,336 | 9,359 |
| | Kennametal Inc. | 4.625% | 6/15/28 | 5,808 | 6,327 |
| | L3Harris Technologies Inc. | 3.850% | 12/15/26 | 9,383 | 10,776 |
| | L3Harris Technologies Inc. | 4.400% | 6/15/28 | 20,597 | 24,506 |
| | L3Harris Technologies Inc. | 4.400% | 6/15/28 | 16,296 | 19,356 |
| | L3Harris Technologies Inc. | 2.900% | 12/15/29 | 10,217 | 11,118 |
| | Leggett & Platt Inc. | 3.500% | 11/15/27 | 8,272 | 8,554 |
| | Leggett & Platt Inc. | 4.400% | 3/15/29 | 11,227 | 12,345 |
| | Lennox International Inc. | 1.700% | 8/1/27 | 5,975 | 6,027 |
| | Lockheed Martin Corp. | 3.550% | 1/15/26 | 55,240 | 63,055 |
| | Lockheed Martin Corp. | 1.850% | 6/15/30 | 8,457 | 8,755 |
| | Martin Marietta Materials Inc. | 3.450% | 6/1/27 | 6,298 | 7,097 |
| | Martin Marietta Materials Inc. | 3.500% | 12/15/27 | 8,034 | 8,953 |
| | Martin Marietta Materials Inc. | 2.500% | 3/15/30 | 12,294 | 12,858 |
| | Masco Corp. | 4.375% | 4/1/26 | 9,660 | 11,321 |
| | Masco Corp. | 3.500% | 11/15/27 | 6,160 | 6,593 |
| | Mohawk Industries Inc. | 3.625% | 5/15/30 | 8,650 | 8,958 |
| | Northrop Grumman Corp. | 3.200% | 2/1/27 | 15,434 | 17,324 |
| | Northrop Grumman Corp. | 3.250% | 1/15/28 | 38,352 | 43,345 |
| | Northrop Grumman Corp. | 4.400% | 5/1/30 | 26,354 | 32,515 |
| | Nvent Finance Sarl | 4.550% | 4/15/28 | 6,070 | 6,479 |
| | Oshkosh Corp. | 4.600% | 5/15/28 | 4,000 | 4,550 |
| | Oshkosh Corp. | 3.100% | 3/1/30 | 2,750 | 2,884 |
| 2 | Otis Worldwide Corp. | 2.293% | 4/5/27 | 16,158 | 17,243 |
| 2 | Otis Worldwide Corp. | 2.565% | 2/15/30 | 41,723 | 44,508 |
| | Owens Corning | 3.400% | 8/15/26 | 6,745 | 7,234 |
| | Owens Corning | 3.950% | 8/15/29 | 8,200 | 9,066 |
| | Owens Corning | 3.875% | 6/1/30 | 5,479 | 6,155 |
| | Parker-Hannifin Corp. | 3.250% | 3/1/27 | 12,684 | 14,016 |
| | Parker-Hannifin Corp. | 3.250% | 6/14/29 | 28,431 | 32,007 |
| | Pentair Finance Sarl | 4.500% | 7/1/29 | 720 | 792 |
| | Raytheon Technologies Corp. | 2.650% | 11/1/26 | 2,339 | 2,582 |
| 2 | Raytheon Technologies Corp. | 3.500% | 3/15/27 | 30,367 | 34,374 |
| | Raytheon Technologies Corp. | 3.125% | 5/4/27 | 29,911 | 33,150 |
| 2 | Raytheon Technologies Corp. | 7.200% | 8/15/27 | 2,843 | 3,807 |
| | Raytheon Technologies Corp. | 6.700% | 8/1/28 | 4,151 | 5,637 |
| | Raytheon Technologies Corp. | 4.125% | 11/16/28 | 74,175 | 88,193 |
| | Raytheon Technologies Corp. | 7.500% | 9/15/29 | 10,178 | 14,899 |
| | Raytheon Technologies Corp. | 2.250% | 7/1/30 | 15,095 | 15,877 |
| | Republic Services Inc. | 2.900% | 7/1/26 | 13,554 | 15,056 |
| | Republic Services Inc. | 3.375% | 11/15/27 | 19,113 | 21,770 |
| | Republic Services Inc. | 3.950% | 5/15/28 | 8,640 | 10,197 |
| | Republic Services Inc. | 2.300% | 3/1/30 | 18,093 | 19,150 |
Vanguard® Intermediate-Term Corporate Bond Index Fund
Schedule of Investments
August 31, 2020
| | | | | Face | Market |
| | | | Maturity | Amount | Value |
| | | Coupon | Date | ($000) | ($000) |
| | Rockwell Automation Inc. | 3.500% | 3/1/29 | 5,851 | 6,749 |
| | Roper Technologies Inc. | 1.000% | 9/15/25 | 2,550 | 2,566 |
| | Roper Technologies Inc. | 3.850% | 12/15/25 | 6,482 | 7,390 |
| | Roper Technologies Inc. | 3.800% | 12/15/26 | 24,519 | 28,371 |
| | Roper Technologies Inc. | 1.400% | 9/15/27 | 9,000 | 9,129 |
| | Roper Technologies Inc. | 4.200% | 9/15/28 | 16,897 | 20,206 |
| | Roper Technologies Inc. | 2.950% | 9/15/29 | 13,961 | 15,302 |
| | Roper Technologies Inc. | 2.000% | 6/30/30 | 8,825 | 9,015 |
| | Snap-on Inc. | 3.250% | 3/1/27 | 2,715 | 3,007 |
| | Sonoco Products Co. | 3.125% | 5/1/30 | 11,099 | 12,139 |
| | Stanley Black & Decker Inc. | 3.400% | 3/1/26 | 14,329 | 16,150 |
| | Stanley Black & Decker Inc. | 4.250% | 11/15/28 | 9,879 | 11,956 |
| | Stanley Black & Decker Inc. | 2.300% | 3/15/30 | 12,058 | 12,853 |
| | Textron Inc. | 4.000% | 3/15/26 | 5,710 | 6,202 |
| | Textron Inc. | 3.650% | 3/15/27 | 14,983 | 16,031 |
| | Textron Inc. | 3.375% | 3/1/28 | 5,193 | 5,524 |
| | Textron Inc. | 3.900% | 9/17/29 | 6,176 | 6,780 |
| | Textron Inc. | 3.000% | 6/1/30 | 500 | 524 |
| | Timken Co. | 4.500% | 12/15/28 | 6,666 | 7,241 |
| | Vulcan Materials Co. | 3.900% | 4/1/27 | 7,849 | 8,837 |
| | Vulcan Materials Co. | 3.500% | 6/1/30 | 15,177 | 17,159 |
| | Wabtec Corp. | 3.450% | 11/15/26 | 15,849 | 16,757 |
| | Wabtec Corp. | 4.950% | 9/15/28 | 16,753 | 19,286 |
| | Waste Connections Inc. | 4.250% | 12/1/28 | 9,109 | 10,879 |
| | Waste Connections Inc. | 3.500% | 5/1/29 | 8,382 | 9,533 |
| | Waste Connections Inc. | 2.600% | 2/1/30 | 13,722 | 14,725 |
| | Waste Management Inc. | 3.150% | 11/15/27 | 18,393 | 20,435 |
| | Xylem Inc. | 3.250% | 11/1/26 | 11,347 | 12,670 |
| | Xylem Inc. | 1.950% | 1/30/28 | 10,000 | 10,413 |
| | Communication (7.7%) |
| | Activision Blizzard Inc. | 3.400% | 9/15/26 | 16,787 | 19,181 |
| | Activision Blizzard Inc. | 3.400% | 6/15/27 | 7,462 | 8,393 |
| | America Movil SAB de CV | 3.625% | 4/22/29 | 19,035 | 21,483 |
| | America Movil SAB de CV | 2.875% | 5/7/30 | 26,000 | 28,081 |
| | American Tower Corp. | 1.300% | 9/15/25 | 4,325 | 4,385 |
| | American Tower Corp. | 4.400% | 2/15/26 | 11,556 | 13,386 |
| | American Tower Corp. | 3.375% | 10/15/26 | 21,089 | 23,717 |
| | American Tower Corp. | 2.750% | 1/15/27 | 12,008 | 13,034 |
| | American Tower Corp. | 3.125% | 1/15/27 | 10,595 | 11,693 |
| | American Tower Corp. | 3.550% | 7/15/27 | 13,077 | 14,715 |
| | American Tower Corp. | 3.600% | 1/15/28 | 14,927 | 16,796 |
| | American Tower Corp. | 3.950% | 3/15/29 | 10,992 | 12,747 |
| | American Tower Corp. | 3.800% | 8/15/29 | 31,856 | 36,785 |
| | American Tower Corp. | 2.900% | 1/15/30 | 19,452 | 21,132 |
| | American Tower Corp. | 2.100% | 6/15/30 | 12,155 | 12,386 |
| | AT&T Inc. | 3.875% | 1/15/26 | 21,539 | 24,562 |
| | AT&T Inc. | 4.125% | 2/17/26 | 52,490 | 60,419 |
| | AT&T Inc. | 2.950% | 7/15/26 | 21,443 | 23,497 |
| | AT&T Inc. | 3.800% | 2/15/27 | 27,714 | 31,610 |
| | AT&T Inc. | 4.250% | 3/1/27 | 34,977 | 40,888 |
| | AT&T Inc. | 2.300% | 6/1/27 | 38,699 | 41,029 |
| | AT&T Inc. | 1.650% | 2/1/28 | 46,320 | 46,926 |
| | AT&T Inc. | 4.100% | 2/15/28 | 52,058 | 60,757 |
| | AT&T Inc. | 4.350% | 3/1/29 | 63,626 | 75,553 |
| | AT&T Inc. | 4.300% | 2/15/30 | 56,077 | 66,783 |
| | British Telecommunications plc | 5.125% | 12/4/28 | 14,634 | 18,031 |
| | Charter Communications Operating LLC / Charter Communications Operating Capital | 3.750% | 2/15/28 | 19,548 | 21,752 |
| | Charter Communications Operating LLC / Charter Communications Operating Capital | 4.200% | 3/15/28 | 24,713 | 28,290 |
| | Charter Communications Operating LLC / Charter Communications Operating Capital | 5.050% | 3/30/29 | 30,160 | 36,470 |
| | Comcast Corp. | 3.950% | 10/15/25 | 61,261 | 70,615 |
Vanguard® Intermediate-Term Corporate Bond Index Fund
Schedule of Investments
August 31, 2020
| | | | | Face | Market |
| | | | Maturity | Amount | Value |
| | | Coupon | Date | ($000) | ($000) |
| | Comcast Corp. | 3.150% | 3/1/26 | 44,503 | 49,804 |
| | Comcast Corp. | 2.350% | 1/15/27 | 28,257 | 30,234 |
| | Comcast Corp. | 3.300% | 2/1/27 | 27,269 | 30,846 |
| | Comcast Corp. | 3.300% | 4/1/27 | 9,548 | 10,826 |
| | Comcast Corp. | 3.150% | 2/15/28 | 37,721 | 42,734 |
| | Comcast Corp. | 3.550% | 5/1/28 | 17,737 | 20,578 |
| | Comcast Corp. | 4.150% | 10/15/28 | 78,316 | 94,509 |
| | Comcast Corp. | 2.650% | 2/1/30 | 37,665 | 41,066 |
| | Comcast Corp. | 3.400% | 4/1/30 | 30,462 | 35,038 |
| | Crown Castle International Corp. | 4.450% | 2/15/26 | 13,561 | 15,715 |
| | Crown Castle International Corp. | 3.700% | 6/15/26 | 22,460 | 25,281 |
| | Crown Castle International Corp. | 4.000% | 3/1/27 | 8,226 | 9,380 |
| | Crown Castle International Corp. | 3.650% | 9/1/27 | 16,261 | 18,387 |
| | Crown Castle International Corp. | 3.800% | 2/15/28 | 23,727 | 26,989 |
| | Crown Castle International Corp. | 4.300% | 2/15/29 | 17,605 | 20,646 |
| | Crown Castle International Corp. | 3.100% | 11/15/29 | 10,810 | 11,836 |
| | Crown Castle International Corp. | 3.300% | 7/1/30 | 16,720 | 18,566 |
| | Deutsche Telekom International Finance BV | 8.750% | 6/15/30 | 70,233 | 110,103 |
| | Discovery Communications LLC | 4.900% | 3/11/26 | 15,636 | 18,311 |
| | Discovery Communications LLC | 3.950% | 3/20/28 | 35,111 | 39,944 |
| | Discovery Communications LLC | 4.125% | 5/15/29 | 23,080 | 26,402 |
| | Discovery Communications LLC | 3.625% | 5/15/30 | 27,937 | 30,734 |
| | Electronic Arts Inc. | 4.800% | 3/1/26 | 5,852 | 6,954 |
| | Fox Corp. | 4.709% | 1/25/29 | 43,606 | 52,313 |
| | Fox Corp. | 3.500% | 4/8/30 | 15,593 | 17,551 |
| | Grupo Televisa SAB | 4.625% | 1/30/26 | 3,665 | 4,102 |
| | Interpublic Group of Cos. Inc. | 4.650% | 10/1/28 | 10,097 | 11,946 |
| | Interpublic Group of Cos. Inc. | 4.750% | 3/30/30 | 13,120 | 15,753 |
| | Moody's Corp. | 3.250% | 1/15/28 | 10,041 | 11,300 |
| | Moody's Corp. | 4.250% | 2/1/29 | 4,771 | 5,696 |
| | Omnicom Group Inc. | 2.450% | 4/30/30 | 1,692 | 1,739 |
| | Omnicom Group Inc. | 4.200% | 6/1/30 | 6,272 | 7,306 |
| | Omnicom Group Inc. / Omnicom Capital Inc. | 3.600% | 4/15/26 | 44,169 | 49,674 |
| | RELX Capital Inc. | 4.000% | 3/18/29 | 12,549 | 14,805 |
| | RELX Capital Inc. | 3.000% | 5/22/30 | 11,968 | 13,069 |
| | Rogers Communications Inc. | 3.625% | 12/15/25 | 16,163 | 18,322 |
| | Rogers Communications Inc. | 2.900% | 11/15/26 | 7,840 | 8,682 |
| | S&P Global Inc. | 4.400% | 2/15/26 | 10,600 | 12,617 |
| | S&P Global Inc. | 2.950% | 1/22/27 | 9,277 | 10,292 |
| | S&P Global Inc. | 2.500% | 12/1/29 | 9,134 | 9,886 |
| | S&P Global Inc. | 1.250% | 8/15/30 | 12,000 | 11,759 |
| 2 | T-Mobile USA Inc. | 1.500% | 2/15/26 | 19,575 | 19,835 |
| 2 | T-Mobile USA Inc. | 3.750% | 4/15/27 | 84,975 | 96,217 |
| 2 | T-Mobile USA Inc. | 2.050% | 2/15/28 | 28,640 | 29,358 |
| 2 | T-Mobile USA Inc. | 3.875% | 4/15/30 | 145,810 | 166,648 |
| | TCI Communications Inc. | 7.875% | 2/15/26 | 8,449 | 11,464 |
| | TCI Communications Inc. | 7.125% | 2/15/28 | 5,940 | 8,243 |
| | Telefonica Emisiones SAU | 4.103% | 3/8/27 | 39,634 | 45,294 |
| | TELUS Corp. | 2.800% | 2/16/27 | 9,188 | 9,842 |
| | TELUS Corp. | 3.700% | 9/15/27 | 4,187 | 4,707 |
| | Thomson Reuters Corp. | 3.350% | 5/15/26 | 11,276 | 12,578 |
| | TWDC Enterprises 18 Corp. | 2.950% | 6/15/27 | 4,257 | 4,722 |
| | Verizon Communications Inc. | 2.625% | 8/15/26 | 47,860 | 52,576 |
| | Verizon Communications Inc. | 4.125% | 3/16/27 | 54,778 | 64,723 |
| | Verizon Communications Inc. | 3.000% | 3/22/27 | 17,749 | 19,801 |
| | Verizon Communications Inc. | 4.329% | 9/21/28 | 88,636 | 107,342 |
| | Verizon Communications Inc. | 3.875% | 2/8/29 | 7,224 | 8,515 |
| | Verizon Communications Inc. | 4.016% | 12/3/29 | 78,669 | 94,493 |
| | Verizon Communications Inc. | 3.150% | 3/22/30 | 36,207 | 40,911 |
| | ViacomCBS Inc. | 4.000% | 1/15/26 | 12,213 | 13,792 |
| | ViacomCBS Inc. | 2.900% | 1/15/27 | 27,184 | 29,362 |
| | ViacomCBS Inc. | 3.375% | 2/15/28 | 15,308 | 16,715 |
| | ViacomCBS Inc. | 3.700% | 6/1/28 | 12,334 | 13,562 |
| | ViacomCBS Inc. | 4.200% | 6/1/29 | 10,524 | 12,079 |
Vanguard® Intermediate-Term Corporate Bond Index Fund
Schedule of Investments
August 31, 2020
| | | Coupon | Maturity
Date | Face
Amount
($000 | ) | Market
Value
($000 | ) |
| | ViacomCBS Inc. | 7.875% | 7/30/30 | 7,747 | | 11,186 | |
| | Vodafone Group plc | 4.375% | 5/30/28 | 69,410 | | 82,881 | |
| | Vodafone Group plc | 7.875% | 2/15/30 | 12,146 | | 17,579 | |
| | Walt Disney Co. | 3.150% | 9/17/25 | 14,318 | | 15,923 | |
| | Walt Disney Co. | 3.700% | 10/15/25 | 12,464 | | 14,166 | |
| | Walt Disney Co. | 1.750% | 1/13/26 | 28,030 | | 29,241 | |
| | Walt Disney Co. | 3.000% | 2/13/26 | 19,572 | | 21,749 | |
| | Walt Disney Co. | 1.850% | 7/30/26 | 24,424 | | 25,619 | |
| | Walt Disney Co. | 3.375% | 11/15/26 | 10,145 | | 11,493 | |
| | Walt Disney Co. | 3.700% | 3/23/27 | 15,866 | | 18,346 | |
| | Walt Disney Co. | 2.200% | 1/13/28 | 20,950 | | 22,196 | |
| | Walt Disney Co. | 2.000% | 9/1/29 | 42,951 | | 44,385 | |
| | Walt Disney Co. | 3.800% | 3/22/30 | 24,545 | | 29,039 | |
| | Weibo Corp. | 3.375% | 7/8/30 | 15,550 | | 16,243 | |
| | WPP Finance 2010 | 3.750% | 9/19/24 | 1 | | 1 | |
| | Consumer Cyclical (7.7%) | | | | | | |
| | Advance Auto Parts Inc. | 3.900% | 4/15/30 | 9,143 | | 10,069 | |
| | Alibaba Group Holding Ltd. | 3.400% | 12/6/27 | 46,190 | | 52,020 | |
| | Amazon.com Inc. | 5.200% | 12/3/25 | 15,333 | | 18,796 | |
| | Amazon.com Inc. | 1.200% | 6/3/27 | 24,965 | | 25,459 | |
| | Amazon.com Inc. | 3.150% | 8/22/27 | 71,775 | | 82,096 | |
| | Amazon.com Inc. | 1.500% | 6/3/30 | 45,276 | | 46,219 | |
| | American Honda Finance Corp. | 2.300% | 9/9/26 | 4,913 | | 5,254 | |
| | American Honda Finance Corp. | 2.350% | 1/8/27 | 14,153 | | 15,067 | |
| | American Honda Finance Corp. | 3.500% | 2/15/28 | 11,767 | | 13,578 | |
| | Aptiv plc | 4.250% | 1/15/26 | 11,624 | | 13,297 | |
| | Aptiv plc | 4.350% | 3/15/29 | 6,105 | | 6,790 | |
| | Automatic Data Processing Inc. | 3.375% | 9/15/25 | 17,099 | | 19,323 | |
| | Automatic Data Processing Inc. | 1.250% | 9/1/30 | 4,000 | | 3,942 | |
| | AutoNation Inc. | 4.500% | 10/1/25 | 7,872 | | 8,748 | |
| | AutoNation Inc. | 3.800% | 11/15/27 | 4,604 | | 4,944 | |
| | AutoNation Inc. | 4.750% | 6/1/30 | 500 | | 586 | |
| | AutoZone Inc. | 3.125% | 4/21/26 | 8,741 | | 9,624 | |
| | AutoZone Inc. | 3.750% | 6/1/27 | 12,954 | | 14,764 | |
| | AutoZone Inc. | 3.750% | 4/18/29 | 15,560 | | 17,927 | |
| | AutoZone Inc. | 4.000% | 4/15/30 | 12,933 | | 15,404 | |
| | Best Buy Co. Inc. | 4.450% | 10/1/28 | 9,895 | | 11,631 | |
| | Block Financial LLC | 5.250% | 10/1/25 | 4,157 | | 4,674 | |
| | Block Financial LLC | 3.875% | 8/15/30 | 13,500 | | 13,670 | |
| | Booking Holdings Inc. | 3.600% | 6/1/26 | 27,052 | | 30,293 | |
| | Booking Holdings Inc. | 4.500% | 4/13/27 | 10,350 | | 12,188 | |
| | Booking Holdings Inc. | 3.550% | 3/15/28 | 10,411 | | 11,585 | |
| | Booking Holdings Inc. | 4.625% | 4/13/30 | 25,820 | | 31,034 | |
| | BorgWarner Inc. | 3.375% | 3/15/25 | 1 | | 1 | |
| | BorgWarner Inc. | 2.650% | 7/1/27 | 21,836 | | 23,142 | |
| | Choice Hotels International Inc. | 3.700% | 12/1/29 | 3,219 | | 3,375 | |
| | Costco Wholesale Corp. | 3.000% | 5/18/27 | 15,267 | | 17,139 | |
| | Costco Wholesale Corp. | 1.375% | 6/20/27 | 32,241 | | 32,949 | |
| | Costco Wholesale Corp. | 1.600% | 4/20/30 | 39,927 | | 40,903 | |
| | Cummins Inc. | 0.750% | 9/1/25 | 6,000 | | 6,012 | |
| | Darden Restaurants Inc. | 3.850% | 5/1/27 | 8,906 | | 9,182 | |
| | Dollar General Corp. | 4.150% | 11/1/25 | 8,564 | | 9,895 | |
| | Dollar General Corp. | 3.875% | 4/15/27 | 20,773 | | 23,906 | |
| | Dollar General Corp. | 4.125% | 5/1/28 | 11,718 | | 13,783 | |
| | Dollar General Corp. | 3.500% | 4/3/30 | 28,037 | | 32,065 | |
| | Dollar Tree Inc. | 4.200% | 5/15/28 | 25,183 | | 29,659 | |
| | DR Horton Inc. | 2.600% | 10/15/25 | 6,750 | | 7,240 | |
| | eBay Inc. | 3.600% | 6/5/27 | 14,560 | | 16,391 | |
| | eBay Inc. | 2.700% | 3/11/30 | 21,936 | | 23,388 | |
| | Expedia Group Inc. | 5.000% | 2/15/26 | 15,270 | | 16,053 | |
| 2 | Expedia Group Inc. | 4.625% | 8/1/27 | 14,396 | | 14,972 | |
| | Expedia Group Inc. | 3.800% | 2/15/28 | 18,092 | | 18,047 | |
| | Expedia Group Inc. | 3.250% | 2/15/30 | 27,585 | | 26,102 | |
Vanguard® Intermediate-Term Corporate Bond Index Fund
Schedule of Investments
August 31, 2020
| | | Coupon | Maturity
Date | Face
Amount
($000 | ) | Market
Value
($000 | ) |
| | General Motors Co. | 6.125% | 10/1/25 | 30,100 | | 35,287 | |
| | General Motors Co. | 4.200% | 10/1/27 | 19,804 | | 21,099 | |
| | General Motors Co. | 6.800% | 10/1/27 | 26,350 | | 32,204 | |
| | General Motors Co. | 5.000% | 10/1/28 | 12,421 | | 13,838 | |
| | General Motors Financial Co. Inc. | 5.250% | 3/1/26 | 28,770 | | 32,636 | |
| | General Motors Financial Co. Inc. | 4.000% | 10/6/26 | 21,970 | | 23,700 | |
| | General Motors Financial Co. Inc. | 4.350% | 1/17/27 | 19,815 | | 21,449 | |
| | General Motors Financial Co. Inc. | 2.700% | 8/20/27 | 9,000 | | 8,974 | |
| | General Motors Financial Co. Inc. | 3.850% | 1/5/28 | 12,452 | | 13,110 | |
| | General Motors Financial Co. Inc. | 5.650% | 1/17/29 | 15,753 | | 18,452 | |
| | General Motors Financial Co. Inc. | 3.600% | 6/21/30 | 20,300 | | 21,100 | |
| | GLP Capital LP / GLP Financing II Inc. | 5.375% | 4/15/26 | 15,847 | | 17,520 | |
| | GLP Capital LP / GLP Financing II Inc. | 5.750% | 6/1/28 | 13,408 | | 15,182 | |
| | GLP Capital LP / GLP Financing II Inc. | 5.300% | 1/15/29 | 18,583 | | 20,612 | |
| | GLP Capital LP / GLP Financing II Inc. | 4.000% | 1/15/30 | 8,568 | | 8,887 | |
| | Home Depot Inc. | 3.350% | 9/15/25 | 12,850 | | 14,477 | |
| | Home Depot Inc. | 3.000% | 4/1/26 | 28,252 | | 31,878 | |
| | Home Depot Inc. | 2.125% | 9/15/26 | 19,325 | | 20,840 | |
| | Home Depot Inc. | 2.500% | 4/15/27 | 25,418 | | 27,809 | |
| | Home Depot Inc. | 2.800% | 9/14/27 | 20,295 | | 22,539 | |
| | Home Depot Inc. | 3.900% | 12/6/28 | 17,955 | | 21,414 | |
| | Home Depot Inc. | 2.950% | 6/15/29 | 39,683 | | 44,730 | |
| | Home Depot Inc. | 2.700% | 4/15/30 | 31,873 | | 35,301 | |
| | Hyatt Hotels Corp. | 4.850% | 3/15/26 | 12,781 | | 13,560 | |
| | Hyatt Hotels Corp. | 4.375% | 9/15/28 | 8,942 | | 9,190 | |
| | IHS Markit Ltd. | 4.750% | 8/1/28 | 13,378 | | 16,020 | |
| | IHS Markit Ltd. | 4.250% | 5/1/29 | 19,174 | | 22,458 | |
| | JD.com Inc. | 3.875% | 4/29/26 | 9,925 | | 11,036 | |
| | JD.com Inc. | 3.375% | 1/14/30 | 12,085 | | 13,100 | |
| | Las Vegas Sands Corp. | 3.500% | 8/18/26 | 18,816 | | 19,192 | |
| | Las Vegas Sands Corp. | 3.900% | 8/8/29 | 14,438 | | 14,564 | |
| | Lear Corp. | 3.800% | 9/15/27 | 6,401 | | 6,810 | |
| | Lear Corp. | 4.250% | 5/15/29 | 7,120 | | 7,473 | |
| | Lear Corp. | 3.500% | 5/30/30 | 5,925 | | 5,965 | |
| | Lowe's Cos. Inc. | 3.375% | 9/15/25 | 14,000 | | 15,703 | |
| | Lowe's Cos. Inc. | 2.500% | 4/15/26 | 40,830 | | 44,341 | |
| | Lowe's Cos. Inc. | 3.100% | 5/3/27 | 15,628 | | 17,391 | |
| | Lowe's Cos. Inc. | 3.650% | 4/5/29 | 40,509 | | 46,680 | |
| | Lowe's Cos. Inc. | 4.500% | 4/15/30 | 23,663 | | 29,270 | |
| | Magna International Inc. | 4.150% | 10/1/25 | 8,752 | | 10,002 | |
| | Magna International Inc. | 2.450% | 6/15/30 | 15,150 | | 15,985 | |
| | Marriott International Inc. | 3.750% | 10/1/25 | 5,900 | | 6,078 | |
| | Marriott International Inc. | 3.125% | 6/15/26 | 24,951 | | 25,024 | |
| | Marriott International Inc. | 4.000% | 4/15/28 | 9,384 | | 9,679 | |
| | Marriott International Inc. | 4.650% | 12/1/28 | 3,253 | | 3,449 | |
| | Marriott International Inc. | 4.625% | 6/15/30 | 25,500 | | 27,883 | |
| | Mastercard Inc. | 2.950% | 11/21/26 | 14,930 | | 16,898 | |
| | Mastercard Inc. | 3.300% | 3/26/27 | 25,930 | | 29,674 | |
| | Mastercard Inc. | 3.500% | 2/26/28 | 11,484 | | 13,323 | |
| | Mastercard Inc. | 2.950% | 6/1/29 | 12,928 | | 14,625 | |
| | Mastercard Inc. | 3.350% | 3/26/30 | 30,875 | | 36,153 | |
| | McDonald's Corp. | 1.450% | 9/1/25 | 1,652 | | 1,703 | |
| | McDonald's Corp. | 3.700% | 1/30/26 | 36,370 | | 41,458 | |
| | McDonald's Corp. | 3.500% | 3/1/27 | 24,202 | | 27,450 | |
| | McDonald's Corp. | 3.500% | 7/1/27 | 15,453 | | 17,599 | |
| | McDonald's Corp. | 3.800% | 4/1/28 | 25,004 | | 29,112 | |
| | McDonald's Corp. | 2.625% | 9/1/29 | 27,917 | | 30,371 | |
| | McDonald's Corp. | 2.125% | 3/1/30 | 9,159 | | 9,524 | |
| | McDonald's Corp. | 3.600% | 7/1/30 | 19,215 | | 22,345 | |
| | NIKE Inc. | 2.375% | 11/1/26 | 16,271 | | 17,715 | |
| | NIKE Inc. | 2.750% | 3/27/27 | 22,677 | | 25,124 | |
| | NIKE Inc. | 2.850% | 3/27/30 | 31,412 | | 34,958 | |
| | Nordstrom Inc. | 4.000% | 3/15/27 | 9,151 | | 8,030 | |
Vanguard® Intermediate-Term Corporate Bond Index Fund
Schedule of Investments
August 31, 2020
| | | Coupon | Maturity
Date | Face
Amount
($000 | ) | Market
Value
($000 | ) |
| | Nordstrom Inc. | 6.950% | 3/15/28 | 4,965 | | 4,965 | |
| | Nordstrom Inc. | 4.375% | 4/1/30 | 7,060 | | 5,701 | |
| | NVR Inc. | 3.000% | 5/15/30 | 11,325 | | 12,271 | |
| | O'Reilly Automotive Inc. | 3.550% | 3/15/26 | 9,523 | | 10,829 | |
| | O'Reilly Automotive Inc. | 3.600% | 9/1/27 | 12,301 | | 14,154 | |
| | O'Reilly Automotive Inc. | 4.350% | 6/1/28 | 15,877 | | 18,741 | |
| | O'Reilly Automotive Inc. | 3.900% | 6/1/29 | 11,693 | | 13,655 | |
| | O'Reilly Automotive Inc. | 4.200% | 4/1/30 | 9,745 | | 11,706 | |
| | Ralph Lauren Corp. | 3.750% | 9/15/25 | 7,075 | | 7,935 | |
| | Ralph Lauren Corp. | 2.950% | 6/15/30 | 6,968 | | 7,186 | |
| | Ross Stores Inc. | 4.700% | 4/15/27 | 6,039 | | 7,093 | |
| | Ross Stores Inc. | 4.800% | 4/15/30 | 10,050 | | 12,089 | |
| | Sands China Ltd. | 5.125% | 8/8/25 | 317 | | 349 | |
| 2 | Sands China Ltd. | 3.800% | 1/8/26 | 13,100 | | 13,755 | |
| | Sands China Ltd. | 5.400% | 8/8/28 | 43,120 | | 48,510 | |
| 2 | Sands China Ltd. | 4.375% | 6/18/30 | 14,600 | | 15,640 | |
| | Starbucks Corp. | 2.450% | 6/15/26 | 13,126 | | 14,191 | |
| | Starbucks Corp. | 2.000% | 3/12/27 | 8,063 | | 8,447 | |
| | Starbucks Corp. | 3.500% | 3/1/28 | 10,534 | | 11,906 | |
| | Starbucks Corp. | 4.000% | 11/15/28 | 17,334 | | 20,434 | |
| | Starbucks Corp. | 3.550% | 8/15/29 | 25,521 | | 29,305 | |
| | Starbucks Corp. | 2.250% | 3/12/30 | 11,708 | | 12,093 | |
| | Tapestry Inc. | 4.125% | 7/15/27 | 9,256 | | 9,009 | |
| | Target Corp. | 2.500% | 4/15/26 | 20,122 | | 22,016 | |
| | Target Corp. | 3.375% | 4/15/29 | 23,395 | | 27,227 | |
| | Target Corp. | 2.350% | 2/15/30 | 11,780 | | 12,769 | |
| | TJX Cos. Inc. | 2.250% | 9/15/26 | 20,531 | | 21,881 | |
| | TJX Cos. Inc. | 3.750% | 4/15/27 | 18,023 | | 20,728 | |
| | TJX Cos. Inc. | 3.875% | 4/15/30 | 32,171 | | 38,072 | |
| | Toyota Motor Corp. | 3.669% | 7/20/28 | 10,367 | | 12,269 | |
| | Toyota Motor Corp. | 2.760% | 7/2/29 | 8,475 | | 9,474 | |
| | Toyota Motor Credit Corp. | 3.200% | 1/11/27 | 16,767 | | 18,824 | |
| | Toyota Motor Credit Corp. | 1.150% | 8/13/27 | 5,000 | | 4,999 | |
| | Toyota Motor Credit Corp. | 3.050% | 1/11/28 | 9,765 | | 10,988 | |
| | Toyota Motor Credit Corp. | 3.650% | 1/8/29 | 10,710 | | 12,667 | |
| | Toyota Motor Credit Corp. | 2.150% | 2/13/30 | 23,345 | | 24,688 | |
| | Toyota Motor Credit Corp. | 3.375% | 4/1/30 | 19,840 | | 23,118 | |
| | VF Corp. | 2.800% | 4/23/27 | 5,770 | | 6,236 | |
| | VF Corp. | 2.950% | 4/23/30 | 19,365 | | 20,979 | |
| | Visa Inc. | 3.150% | 12/14/25 | 79,148 | | 88,830 | |
| | Visa Inc. | 1.900% | 4/15/27 | 37,734 | | 39,921 | |
| | Visa Inc. | 0.750% | 8/15/27 | 10,000 | | 9,923 | |
| | Visa Inc. | 2.750% | 9/15/27 | 15,057 | | 16,715 | |
| | Visa Inc. | 2.050% | 4/15/30 | 26,565 | | 28,167 | |
| | Walgreens Boots Alliance Inc. | 3.450% | 6/1/26 | 41,490 | | 45,522 | |
| | Walgreens Boots Alliance Inc. | 3.200% | 4/15/30 | 500 | | 529 | |
| | Walmart Inc. | 3.050% | 7/8/26 | 24,153 | | 27,223 | |
| | Walmart Inc. | 5.875% | 4/5/27 | 7,157 | | 9,271 | |
| | Walmart Inc. | 3.700% | 6/26/28 | 65,847 | | 78,036 | |
| | Walmart Inc. | 3.250% | 7/8/29 | 21,957 | | 25,573 | |
| | Walmart Inc. | 2.375% | 9/24/29 | 23,682 | | 26,023 | |
| | Walmart Inc. | 7.550% | 2/15/30 | 3,817 | | 5,895 | |
| | Consumer Noncyclical (15.4%) | |
| | Abbott Laboratories | 3.875% | 9/15/25 | 8,465 | | 9,686 | |
| | Abbott Laboratories | 3.750% | 11/30/26 | 46,599 | | 54,386 | |
| | Abbott Laboratories | 1.150% | 1/30/28 | 6,493 | | 6,562 | |
| | Abbott Laboratories | 1.400% | 6/30/30 | 15,056 | | 15,201 | |
| | AbbVie Inc. | 3.200% | 5/14/26 | 52,365 | | 58,346 | |
| 2 | AbbVie Inc. | 2.950% | 11/21/26 | 89,593 | | 98,464 | |
| | AbbVie Inc. | 4.250% | 11/14/28 | 35,332 | | 42,043 | |
| 2 | AbbVie Inc. | 3.200% | 11/21/29 | 108,860 | | 120,591 | |
Vanguard® Intermediate-Term Corporate Bond Index Fund
Schedule of Investments
August 31, 2020
| | | Coupon | Maturity
Date | Face
Amount
($000 | ) | Market
Value
($000 | ) |
| | Adventist Health System/West | 2.952% | 3/1/29 | 5,125 | | 5,339 | |
| | Advocate Health & Hospitals Corp. | 3.829% | 8/15/28 | 4,216 | | 4,828 | |
| | Advocate Health & Hospitals Corp. | 2.211% | 6/15/30 | 4,344 | | 4,471 | |
| | Agilent Technologies Inc. | 3.050% | 9/22/26 | 7,573 | | 8,356 | |
| | Agilent Technologies Inc. | 2.750% | 9/15/29 | 7,740 | | 8,380 | |
| | Agilent Technologies Inc. | 2.100% | 6/4/30 | 11,047 | | 11,321 | |
| | Ahold Finance USA LLC | 6.875% | 5/1/29 | 8,351 | | 11,657 | |
| | Altria Group Inc. | 4.400% | 2/14/26 | 43,901 | | 50,853 | |
| | Altria Group Inc. | 2.625% | 9/16/26 | 11,120 | | 11,923 | |
| | Altria Group Inc. | 4.800% | 2/14/29 | 53,004 | | 63,278 | |
| | Altria Group Inc. | 3.400% | 5/6/30 | 15,729 | | 17,309 | |
| | AmerisourceBergen Corp. | 3.450% | 12/15/27 | 13,893 | | 15,739 | |
| | AmerisourceBergen Corp. | 2.800% | 5/15/30 | 11,845 | | 12,754 | |
| | Amgen Inc. | 2.600% | 8/19/26 | 39,615 | | 43,479 | |
| | Amgen Inc. | 2.200% | 2/21/27 | 33,639 | | 35,454 | |
| | Amgen Inc. | 3.200% | 11/2/27 | 12,065 | | 13,490 | |
| | Amgen Inc. | 2.450% | 2/21/30 | 13,541 | | 14,429 | |
| | Anheuser-Busch Cos. LLC / Anheuser-Busch InBev Worldwide Inc. | 3.650% | 2/1/26 | 65,169 | | 73,768 | |
| | Anheuser-Busch InBev Finance Inc. | 3.650% | 2/1/26 | 34,858 | | 39,293 | |
| | Anheuser-Busch InBev Worldwide Inc. | 4.000% | 4/13/28 | 54,488 | | 63,120 | |
| | Anheuser-Busch InBev Worldwide Inc. | 4.750% | 1/23/29 | 82,903 | | 101,120 | |
| | Anheuser-Busch InBev Worldwide Inc. | 3.500% | 6/1/30 | 29,299 | | 33,476 | |
| | Archer-Daniels-Midland Co. | 2.500% | 8/11/26 | 17,372 | | 18,934 | |
| | Archer-Daniels-Midland Co. | 3.250% | 3/27/30 | 20,259 | | 23,259 | |
| | Ascension Health | 2.532% | 11/15/29 | 12,786 | | 14,277 | |
| | AstraZeneca plc | 3.375% | 11/16/25 | 39,958 | | 44,820 | |
| | AstraZeneca plc | 0.700% | 4/8/26 | 24,000 | | 23,840 | |
| | AstraZeneca plc | 3.125% | 6/12/27 | 10,123 | | 11,253 | |
| | AstraZeneca plc | 4.000% | 1/17/29 | 19,471 | | 23,195 | |
| | AstraZeneca plc | 1.375% | 8/6/30 | 25,545 | | 25,017 | |
| | Banner Health | 2.338% | 1/1/30 | 5,725 | | 5,961 | |
| | BAT Capital Corp. | 3.215% | 9/6/26 | 36,869 | | 39,865 | |
| | BAT Capital Corp. | 4.700% | 4/2/27 | 15,164 | | 17,560 | |
| | BAT Capital Corp. | 3.557% | 8/15/27 | 51,696 | | 56,228 | |
| | BAT Capital Corp. | 3.462% | 9/6/29 | 20,379 | | 21,997 | |
| | BAT Capital Corp. | 4.906% | 4/2/30 | 21,212 | | 25,166 | |
| 2 | Baxter International Inc. | 3.750% | 10/1/25 | 17,218 | | 19,659 | |
| | Baxter International Inc. | 2.600% | 8/15/26 | 13,977 | | 15,259 | |
| 2 | Baxter International Inc. | 3.950% | 4/1/30 | 10,450 | | 12,490 | |
| | Becton Dickinson & Co. | 3.700% | 6/6/27 | 40,684 | | 45,944 | |
| | Becton Dickinson & Co. | 2.823% | 5/20/30 | 10,139 | | 11,013 | |
| | Biogen Inc. | 4.050% | 9/15/25 | 28,357 | | 32,667 | |
| | Biogen Inc. | 2.250% | 5/1/30 | 40,908 | | 42,029 | |
| 1 | Bon Secours Mercy Health Inc. | 3.464% | 6/1/30 | 7,848 | | 8,927 | |
| | Boston Scientific Corp. | 3.750% | 3/1/26 | 26,356 | | 30,202 | |
| | Boston Scientific Corp. | 4.000% | 3/1/28 | 1,100 | | 1,279 | |
| | Boston Scientific Corp. | 4.000% | 3/1/29 | 22,479 | | 26,099 | |
| | Boston Scientific Corp. | 2.650% | 6/1/30 | 24,628 | | 26,214 | |
| | Bristol-Myers Squibb Co. | 3.875% | 8/15/25 | 400 | | 461 | |
| | Bristol-Myers Squibb Co. | 3.200% | 6/15/26 | 55,881 | | 62,130 | |
| | Bristol-Myers Squibb Co. | 3.250% | 2/27/27 | 9,578 | | 10,935 | |
| | Bristol-Myers Squibb Co. | 3.450% | 11/15/27 | 20,125 | | 23,119 | |
| | Bristol-Myers Squibb Co. | 3.900% | 2/20/28 | 33,051 | | 38,608 | |
| | Bristol-Myers Squibb Co. | 3.400% | 7/26/29 | 78,466 | | 91,450 | |
| | Bunge Ltd. Finance Corp. | 3.250% | 8/15/26 | 11,242 | | 12,054 | |
| | Bunge Ltd. Finance Corp. | 3.750% | 9/25/27 | 12,432 | | 13,490 | |
| | Campbell Soup Co. | 4.150% | 3/15/28 | 16,240 | | 18,887 | |
| | Campbell Soup Co. | 2.375% | 4/24/30 | 13,286 | | 13,819 | |
| | Cardinal Health Inc. | 3.750% | 9/15/25 | 7,120 | | 8,004 | |
| | Cardinal Health Inc. | 3.410% | 6/15/27 | 21,805 | | 24,375 | |
| | CHRISTUS Health | 4.341% | 7/1/28 | 5,616 | | 6,327 | |
| | Church & Dwight Co. Inc. | 3.150% | 8/1/27 | 7,735 | | 8,496 | |
| | Cigna Corp. | 4.125% | 11/15/25 | 41,241 | | 47,566 | |
Vanguard® Intermediate-Term Corporate Bond Index Fund
Schedule of Investments
August 31, 2020
| | | Coupon | Maturity
Date | Face
Amount
($000 | ) | Market
Value
($000 | ) |
| | Cigna Corp. | 4.500% | 2/25/26 | 18,731 | | 21,879 | |
| | Cigna Corp. | 3.400% | 3/1/27 | 28,758 | | 32,186 | |
| | Cigna Corp. | 7.875% | 5/15/27 | 836 | | 1,123 | |
| | Cigna Corp. | 3.050% | 10/15/27 | 7,757 | | 8,562 | |
| | Cigna Corp. | 4.375% | 10/15/28 | 90,937 | | 108,640 | |
| | Cigna Corp. | 2.400% | 3/15/30 | 40,430 | | 42,274 | |
| | Clorox Co. | 3.100% | 10/1/27 | 9,117 | | 10,198 | |
| | Clorox Co. | 3.900% | 5/15/28 | 6,005 | | 7,079 | |
| | Clorox Co. | 1.800% | 5/15/30 | 13,738 | | 14,019 | |
| | Coca-Cola Co. | 2.875% | 10/27/25 | 16,197 | | 17,956 | |
| | Coca-Cola Co. | 2.550% | 6/1/26 | 18,535 | | 20,382 | |
| | Coca-Cola Co. | 2.250% | 9/1/26 | 30,854 | | 33,538 | |
| | Coca-Cola Co. | 3.375% | 3/25/27 | 13,444 | | 15,434 | |
| | Coca-Cola Co. | 2.900% | 5/25/27 | 7,313 | | 8,170 | |
| | Coca-Cola Co. | 1.450% | 6/1/27 | 38,787 | | 40,094 | |
| | Coca-Cola Co. | 2.125% | 9/6/29 | 21,931 | | 23,435 | |
| | Coca-Cola Co. | 3.450% | 3/25/30 | 21,989 | | 26,247 | |
| | Coca-Cola Co. | 1.650% | 6/1/30 | 18,325 | | 18,992 | |
| | Coca-Cola Consolidated Inc. | 3.800% | 11/25/25 | 6,242 | | 6,952 | |
| | Coca-Cola Femsa SAB de CV | 2.750% | 1/22/30 | 19,716 | | 21,159 | |
| | CommonSpirit Health | 3.347% | 10/1/29 | 17,983 | | 18,931 | |
| | Conagra Brands Inc. | 4.600% | 11/1/25 | 15,200 | | 17,614 | |
| | Conagra Brands Inc. | 7.000% | 10/1/28 | 3,908 | | 5,326 | |
| | Conagra Brands Inc. | 4.850% | 11/1/28 | 24,516 | | 29,950 | |
| | Constellation Brands Inc. | 4.400% | 11/15/25 | 10,273 | | 11,992 | |
| | Constellation Brands Inc. | 4.750% | 12/1/25 | 5,585 | | 6,615 | |
| | Constellation Brands Inc. | 3.700% | 12/6/26 | 20,089 | | 23,070 | |
| | Constellation Brands Inc. | 3.500% | 5/9/27 | 13,263 | | 14,824 | |
| | Constellation Brands Inc. | 3.600% | 2/15/28 | 9,952 | | 11,191 | |
| | Constellation Brands Inc. | 4.650% | 11/15/28 | 12,178 | | 14,648 | |
| | Constellation Brands Inc. | 3.150% | 8/1/29 | 29,728 | | 32,345 | |
| | Constellation Brands Inc. | 2.875% | 5/1/30 | 9,372 | | 10,091 | |
| | CVS Health Corp. | 2.875% | 6/1/26 | 35,386 | | 38,451 | |
| | CVS Health Corp. | 3.000% | 8/15/26 | 18,003 | | 19,719 | |
| | CVS Health Corp. | 3.625% | 4/1/27 | 20,113 | | 22,740 | |
| | CVS Health Corp. | 6.250% | 6/1/27 | 2,610 | | 3,322 | |
| | CVS Health Corp. | 1.300% | 8/21/27 | 30,125 | | 29,874 | |
| | CVS Health Corp. | 4.300% | 3/25/28 | 183,253 | | 214,276 | |
| | CVS Health Corp. | 3.250% | 8/15/29 | 37,336 | | 41,340 | |
| | CVS Health Corp. | 3.750% | 4/1/30 | 32,145 | | 37,162 | |
| | CVS Health Corp. | 1.750% | 8/21/30 | 20,000 | | 19,706 | |
| | Danaher Corp. | 3.350% | 9/15/25 | 7,913 | | 8,839 | |
| | Delhaize America LLC | 9.000% | 4/15/31 | 350 | | 556 | |
| | DENTSPLY SIRONA Inc. | 3.250% | 6/1/30 | 15,220 | | 16,448 | |
| | DH Europe Finance II Sarl | 2.600% | 11/15/29 | 12,204 | | 13,225 | |
| | Diageo Capital plc | 1.375% | 9/29/25 | 14,025 | | 14,459 | |
| | Diageo Capital plc | 3.875% | 5/18/28 | 7,283 | | 8,530 | |
| | Diageo Capital plc | 2.375% | 10/24/29 | 21,359 | | 22,793 | |
| | Diageo Capital plc | 2.000% | 4/29/30 | 20,591 | | 21,395 | |
| | Edwards Lifesciences Corp. | 4.300% | 6/15/28 | 10,488 | | 12,593 | |
| | Eli Lilly & Co. | 3.375% | 3/15/29 | 26,808 | | 31,132 | |
| | Estee Lauder Cos. Inc. | 3.150% | 3/15/27 | 5,072 | | 5,725 | |
| | Estee Lauder Cos. Inc. | 2.375% | 12/1/29 | 12,649 | | 13,528 | |
| | Estee Lauder Cos. Inc. | 2.600% | 4/15/30 | 12,062 | | 13,199 | |
| | Flowers Foods Inc. | 3.500% | 10/1/26 | 5,545 | | 5,962 | |
| | General Mills Inc. | 3.200% | 2/10/27 | 17,039 | | 19,185 | |
| | General Mills Inc. | 4.200% | 4/17/28 | 27,275 | | 32,301 | |
| | General Mills Inc. | 2.875% | 4/15/30 | 21,674 | | 23,835 | |
| | Gilead Sciences Inc. | 3.650% | 3/1/26 | 62,423 | | 71,297 | |
| | Gilead Sciences Inc. | 2.950% | 3/1/27 | 21,461 | | 23,859 | |
| | GlaxoSmithKline Capital Inc. | 3.875% | 5/15/28 | 44,145 | | 52,000 | |
| | GlaxoSmithKline Capital plc | 3.375% | 6/1/29 | 8,760 | | 10,044 | |
| | Hasbro Inc. | 3.550% | 11/19/26 | 14,327 | | 15,100 | |
Vanguard® Intermediate-Term Corporate Bond Index Fund
Schedule of Investments
August 31, 2020
| | | Coupon | Maturity
Date | Face
Amount
($000 | ) | Market
Value
($000 | ) |
| | Hasbro Inc. | 3.500% | 9/15/27 | 6,807 | | 7,026 | |
| | Hasbro Inc. | 3.900% | 11/19/29 | 20,728 | | 21,627 | |
| | HCA Inc. | 5.250% | 6/15/26 | 32,930 | | 38,816 | |
| | HCA Inc. | 4.500% | 2/15/27 | 23,587 | | 26,919 | |
| | HCA Inc. | 4.125% | 6/15/29 | 38,878 | | 44,749 | |
| | Hershey Co. | 3.200% | 8/21/25 | 64 | | 72 | |
| | Hershey Co. | 2.300% | 8/15/26 | 10,411 | | 11,293 | |
| | Hershey Co. | 7.200% | 8/15/27 | 146 | | 204 | |
| | Hershey Co. | 2.450% | 11/15/29 | 6,622 | | 7,222 | |
| | Hershey Co. | 1.700% | 6/1/30 | 8,882 | | 9,138 | |
| | Hormel Foods Corp. | 1.800% | 6/11/30 | 20,185 | | 20,900 | |
| | Ingredion Inc. | 3.200% | 10/1/26 | 8,199 | | 8,995 | |
| | Ingredion Inc. | 2.900% | 6/1/30 | 9,976 | | 10,834 | |
| | JM Smucker Co. | 3.375% | 12/15/27 | 10,189 | | 11,350 | |
| | JM Smucker Co. | 2.375% | 3/15/30 | 11,091 | | 11,553 | |
| | Johnson & Johnson | 2.450% | 3/1/26 | 29,848 | | 32,708 | |
| | Johnson & Johnson | 2.950% | 3/3/27 | 29,244 | | 32,831 | |
| | Johnson & Johnson | 0.950% | 9/1/27 | 30,000 | | 30,245 | |
| | Johnson & Johnson | 2.900% | 1/15/28 | 16,933 | | 18,991 | |
| | Johnson & Johnson | 6.950% | 9/1/29 | 4,250 | | 6,223 | |
| | Johnson & Johnson | 1.300% | 9/1/30 | 20,000 | | 20,185 | |
| | Kaiser Foundation Hospitals | 3.150% | 5/1/27 | 9,201 | | 10,272 | |
| | Kellogg Co. | 3.250% | 4/1/26 | 18,747 | | 21,074 | |
| | Kellogg Co. | 3.400% | 11/15/27 | 9,156 | | 10,306 | |
| | Kellogg Co. | 4.300% | 5/15/28 | 9,156 | | 10,833 | |
| | Kellogg Co. | 2.100% | 6/1/30 | 7,523 | | 7,739 | |
| | Keurig Dr Pepper Inc. | 3.400% | 11/15/25 | 9,882 | | 11,096 | |
| | Keurig Dr Pepper Inc. | 2.550% | 9/15/26 | 8,956 | | 9,710 | |
| | Keurig Dr Pepper Inc. | 3.430% | 6/15/27 | 9,195 | | 10,323 | |
| | Keurig Dr Pepper Inc. | 4.597% | 5/25/28 | 40,487 | | 48,880 | |
| | Keurig Dr Pepper Inc. | 3.200% | 5/1/30 | 14,302 | | 15,993 | |
| | Kimberly-Clark Corp. | 2.750% | 2/15/26 | 5,782 | | 6,326 | |
| | Kimberly-Clark Corp. | 3.950% | 11/1/28 | 8,234 | | 9,840 | |
| | Kimberly-Clark Corp. | 3.200% | 4/25/29 | 11,598 | | 13,235 | |
| | Kimberly-Clark Corp. | 3.100% | 3/26/30 | 15,779 | | 18,004 | |
| | Kroger Co. | 3.500% | 2/1/26 | 10,999 | | 12,410 | |
| | Kroger Co. | 2.650% | 10/15/26 | 18,259 | | 19,931 | |
| | Kroger Co. | 3.700% | 8/1/27 | 10,075 | | 11,632 | |
| | Kroger Co. | 4.500% | 1/15/29 | 7,562 | | 9,269 | |
| | Kroger Co. | 7.700% | 6/1/29 | 3,705 | | 5,216 | |
| | Kroger Co. | 2.200% | 5/1/30 | 11,811 | | 12,352 | |
| | Laboratory Corp. of America Holdings | 3.600% | 9/1/27 | 8,195 | | 9,296 | |
| | Laboratory Corp. of America Holdings | 2.950% | 12/1/29 | 13,305 | | 14,522 | |
| | McCormick & Co. Inc. | 3.400% | 8/15/27 | 7,381 | | 8,285 | |
| | McCormick & Co. Inc. | 2.500% | 4/15/30 | 27,618 | | 29,664 | |
| | McKesson Corp. | 3.950% | 2/16/28 | 10,449 | | 12,233 | |
| | McKesson Corp. | 4.750% | 5/30/29 | 7,550 | | 9,118 | |
| | Mead Johnson Nutrition Co. | 4.125% | 11/15/25 | 19,736 | | 22,709 | |
| | Medtronic Global Holdings SCA | 3.350% | 4/1/27 | 4,901 | | 5,619 | |
| | Merck & Co. Inc. | 0.750% | 2/24/26 | 28,210 | | 28,314 | |
| | Merck & Co. Inc. | 3.400% | 3/7/29 | 31,710 | | 36,952 | |
| | Merck & Co. Inc. | 1.450% | 6/24/30 | 24,483 | | 24,776 | |
| | Mercy Health | 4.302% | 7/1/28 | 5,020 | | 5,757 | |
| | Molson Coors Beverage Co. | 3.000% | 7/15/26 | 40,537 | | 43,304 | |
| | Mondelez International Inc. | 3.625% | 2/13/26 | 19,321 | | 22,043 | |
| | Mondelez International Inc. | 4.125% | 5/7/28 | 278 | | 330 | |
| | Mondelez International Inc. | 2.750% | 4/13/30 | 30,624 | | 33,498 | |
| | Mylan Inc. | 4.550% | 4/15/28 | 14,518 | | 16,831 | |
| | Mylan NV | 3.950% | 6/15/26 | 47,929 | | 54,152 | |
| | Novartis Capital Corp. | 3.000% | 11/20/25 | 29,311 | | 32,558 | |
| | Novartis Capital Corp. | 2.000% | 2/14/27 | 32,948 | | 34,779 | |
| | Novartis Capital Corp. | 3.100% | 5/17/27 | 20,142 | | 22,514 | |
| | Novartis Capital Corp. | 2.200% | 8/14/30 | 8,230 | | 8,832 | |
Vanguard® Intermediate-Term Corporate Bond Index Fund
Schedule of Investments
August 31, 2020
| | | Coupon | Maturity
Date | Face
Amount
($000 | ) | Market
Value
($000 | ) |
| | PepsiCo Inc. | 2.850% | 2/24/26 | 17,240 | | 19,114 | |
| | PepsiCo Inc. | 2.375% | 10/6/26 | 18,743 | | 20,515 | |
| | PepsiCo Inc. | 2.625% | 3/19/27 | 13,476 | | 14,866 | |
| | PepsiCo Inc. | 3.000% | 10/15/27 | 37,245 | | 42,060 | |
| | PepsiCo Inc. | 7.000% | 3/1/29 | 250 | | 362 | |
| | PepsiCo Inc. | 2.625% | 7/29/29 | 25,351 | | 28,111 | |
| | PepsiCo Inc. | 2.750% | 3/19/30 | 31,479 | | 35,187 | |
| | PepsiCo Inc. | 1.625% | 5/1/30 | 27,292 | | 28,179 | |
| | PerkinElmer Inc. | 3.300% | 9/15/29 | 17,197 | | 18,953 | |
| | Perrigo Finance Unlimited Co. | 4.375% | 3/15/26 | 12,260 | | 13,713 | |
| | Perrigo Finance Unlimited Co. | 3.150% | 6/15/30 | 14,740 | | 15,445 | |
| | Pfizer Inc. | 2.750% | 6/3/26 | 32,865 | | 36,449 | |
| | Pfizer Inc. | 3.000% | 12/15/26 | 24,587 | | 27,928 | |
| | Pfizer Inc. | 3.600% | 9/15/28 | 11,011 | | 13,022 | |
| | Pfizer Inc. | 3.450% | 3/15/29 | 42,597 | | 49,679 | |
| | Pfizer Inc. | 2.625% | 4/1/30 | 16,870 | | 18,791 | |
| | Pfizer Inc. | 1.700% | 5/28/30 | 32,445 | | 33,495 | |
| | Pharmacia LLC | 6.600% | 12/1/28 | 9,752 | | 13,507 | |
| | Philip Morris International Inc. | 3.375% | 8/11/25 | 657 | | 736 | |
| | Philip Morris International Inc. | 2.750% | 2/25/26 | 14,832 | | 16,316 | |
| | Philip Morris International Inc. | 3.125% | 8/17/27 | 6,240 | | 6,968 | |
| | Philip Morris International Inc. | 3.125% | 3/2/28 | 19,461 | | 21,731 | |
| | Philip Morris International Inc. | 3.375% | 8/15/29 | 16,068 | | 18,295 | |
| | Philip Morris International Inc. | 2.100% | 5/1/30 | 16,807 | | 17,365 | |
| | Procter & Gamble Co. | 2.700% | 2/2/26 | 14,478 | | 16,241 | |
| | Procter & Gamble Co. | 2.450% | 11/3/26 | 21,326 | | 23,511 | |
| | Procter & Gamble Co. | 2.800% | 3/25/27 | 17,251 | | 19,271 | |
| | Procter & Gamble Co. | 2.850% | 8/11/27 | 11,623 | | 13,050 | |
| | Procter & Gamble Co. | 3.000% | 3/25/30 | 35,018 | | 40,439 | |
| | Providence St. Joseph Health Obligated Group | 2.746% | 10/1/26 | 6,498 | | 7,068 | |
| | Providence St. Joseph Health Obligated Group | 2.532% | 10/1/29 | 6,640 | | 7,029 | |
| | Quest Diagnostics Inc. | 3.450% | 6/1/26 | 15,891 | | 17,969 | |
| | Quest Diagnostics Inc. | 4.200% | 6/30/29 | 10,374 | | 12,258 | |
| | Quest Diagnostics Inc. | 2.950% | 6/30/30 | 11,476 | | 12,471 | |
| | Quest Diagnostics Inc. | 2.800% | 6/30/31 | 1,847 | | 1,998 | |
| | Regeneron Pharmaceuticals Inc. | 1.750% | 9/15/30 | 10,000 | | 9,752 | |
| 2 | Royalty Pharma plc | 1.750% | 9/2/27 | 25,000 | | 25,009 | |
| 2 | Royalty Pharma plc | 2.200% | 9/2/30 | 10,000 | | 9,861 | |
| | RUSH Obligated Group | 3.922% | 11/15/29 | 7,000 | | 8,151 | |
| | Sanofi | 3.625% | 6/19/28 | 14,158 | | 16,609 | |
| | Shire Acquisitions Investments Ireland DAC | 3.200% | 9/23/26 | 75,551 | | 84,536 | |
| | SSM Health Care Corp. | 3.823% | 6/1/27 | 6,659 | | 7,312 | |
| | Stanford Health Care | 3.310% | 8/15/30 | 300 | | 342 | |
| | Stryker Corp. | 3.375% | 11/1/25 | 13,315 | | 14,873 | |
| | Stryker Corp. | 3.500% | 3/15/26 | 16,920 | | 19,112 | |
| | Stryker Corp. | 3.650% | 3/7/28 | 8,361 | | 9,709 | |
| | Stryker Corp. | 1.950% | 6/15/30 | 20,230 | | 20,702 | |
| | Sutter Health | 3.695% | 8/15/28 | 6,295 | | 7,073 | |
| | Sysco Corp. | 3.750% | 10/1/25 | 15,215 | | 16,768 | |
| | Sysco Corp. | 3.300% | 7/15/26 | 15,461 | | 16,739 | |
| | Sysco Corp. | 3.250% | 7/15/27 | 16,527 | | 17,717 | |
| | Sysco Corp. | 2.400% | 2/15/30 | 10,447 | | 10,406 | |
| | Sysco Corp. | 5.950% | 4/1/30 | 24,303 | | 30,611 | |
| | Takeda Pharmaceutical Co. Ltd. | 5.000% | 11/26/28 | 25,766 | | 31,886 | |
| | Takeda Pharmaceutical Co. Ltd. | 2.050% | 3/31/30 | 51,905 | | 52,587 | |
| | Thermo Fisher Scientific Inc. | 3.650% | 12/15/25 | 9,951 | | 11,298 | |
| | Thermo Fisher Scientific Inc. | 2.950% | 9/19/26 | 23,640 | | 26,447 | |
| | Thermo Fisher Scientific Inc. | 3.200% | 8/15/27 | 15,324 | | 17,289 | |
| | Thermo Fisher Scientific Inc. | 2.600% | 10/1/29 | 21,329 | | 23,034 | |
| | Thermo Fisher Scientific Inc. | 4.497% | 3/25/30 | 23,598 | | 29,356 | |
| | Toledo Hospital | 5.325% | 11/15/28 | 6,277 | | 6,879 | |
| | Tyson Foods Inc. | 4.000% | 3/1/26 | 17,996 | | 20,694 | |
| | Tyson Foods Inc. | 3.550% | 6/2/27 | 33,381 | | 37,740 | |
| | Tyson Foods Inc. | 4.350% | 3/1/29 | 29,465 | | 35,674 | |
Vanguard® Intermediate-Term Corporate Bond Index Fund
Schedule of Investments
August 31, 2020
| | | Coupon | Maturity
Date | Face
Amount
($000 | ) | Market
Value
($000 | ) |
| | Unilever Capital Corp. | 2.000% | 7/28/26 | 20,546 | | 21,912 | |
| | Unilever Capital Corp. | 2.900% | 5/5/27 | 23,315 | | 25,835 | |
| | Unilever Capital Corp. | 3.500% | 3/22/28 | 9,747 | | 11,235 | |
| | Unilever Capital Corp. | 2.125% | 9/6/29 | 29,180 | | 30,984 | |
| 2 | Upjohn Inc. | 2.300% | 6/22/27 | 24,143 | | 25,130 | |
| 2 | Upjohn Inc. | 2.700% | 6/22/30 | 33,211 | | 34,625 | |
| | Whirlpool Corp. | 4.750% | 2/26/29 | 13,887 | | 16,973 | |
| | Zimmer Biomet Holdings Inc. | 3.050% | 1/15/26 | 12,713 | | 13,994 | |
| | Zimmer Biomet Holdings Inc. | 3.550% | 3/20/30 | 17,605 | | 19,621 | |
| | Zoetis Inc. | 4.500% | 11/13/25 | 7,838 | | 9,183 | |
| | Zoetis Inc. | 3.000% | 9/12/27 | 17,274 | | 19,206 | |
| | Zoetis Inc. | 3.900% | 8/20/28 | 15,319 | | 18,137 | |
| | Zoetis Inc. | 2.000% | 5/15/30 | 13,270 | | 13,777 | |
| | Energy (7.0%) | |
| | Baker Hughes a GE Co. LLC / Baker Hughes Co-Obligor Inc. | 3.337% | 12/15/27 | 24,294 | | 26,460 | |
| | Baker Hughes a GE Co. LLC / Baker Hughes Co-Obligor Inc. | 3.138% | 11/7/29 | 9,467 | | 10,131 | |
| | Baker Hughes a GE Co. LLC / Baker Hughes Co-Obligor Inc. | 4.486% | 5/1/30 | 9,831 | | 11,523 | |
| | Boardwalk Pipelines LP | 5.950% | 6/1/26 | 11,158 | | 13,127 | |
| | Boardwalk Pipelines LP | 4.450% | 7/15/27 | 6,197 | | 6,742 | |
| | Boardwalk Pipelines LP | 4.800% | 5/3/29 | 8,300 | | 9,086 | |
| | BP Capital Markets America Inc. | 3.796% | 9/21/25 | 15,521 | | 17,566 | |
| | BP Capital Markets America Inc. | 3.410% | 2/11/26 | 19,575 | | 21,879 | |
| | BP Capital Markets America Inc. | 3.119% | 5/4/26 | 27,205 | | 30,048 | |
| | BP Capital Markets America Inc. | 3.017% | 1/16/27 | 30,332 | | 33,067 | |
| | BP Capital Markets America Inc. | 3.543% | 4/6/27 | 7,290 | | 8,211 | |
| | BP Capital Markets America Inc. | 3.588% | 4/14/27 | 13,726 | | 15,412 | |
| | BP Capital Markets America Inc. | 3.937% | 9/21/28 | 22,373 | | 26,046 | |
| | BP Capital Markets America Inc. | 4.234% | 11/6/28 | 36,550 | | 43,463 | |
| | BP Capital Markets America Inc. | 3.633% | 4/6/30 | 25,518 | | 29,317 | |
| | BP Capital Markets America Inc. | 1.749% | 8/10/30 | 13,600 | | 13,511 | |
| | BP Capital Markets plc | 3.279% | 9/19/27 | 26,109 | | 29,021 | |
| | BP Capital Markets plc | 3.723% | 11/28/28 | 17,546 | | 20,185 | |
| | Canadian Natural Resources Ltd. | 3.850% | 6/1/27 | 25,651 | | 27,831 | |
| | Canadian Natural Resources Ltd. | 2.950% | 7/15/30 | 10,666 | | 10,874 | |
| | Cheniere Corpus Christi Holdings LLC | 5.125% | 6/30/27 | 28,219 | | 31,746 | |
| 2 | Cheniere Corpus Christi Holdings LLC | 3.700% | 11/15/29 | 34,659 | | 36,522 | |
| | Chevron Corp. | 3.326% | 11/17/25 | 17,920 | | 20,219 | |
| | Chevron Corp. | 2.954% | 5/16/26 | 44,183 | | 49,147 | |
| | Chevron Corp. | 1.995% | 5/11/27 | 23,977 | | 25,349 | |
| | Chevron Corp. | 2.236% | 5/11/30 | 28,762 | | 30,657 | |
| | Chevron USA Inc. | 1.018% | 8/12/27 | 5,000 | | 4,971 | |
| | Cimarex Energy Co. | 3.900% | 5/15/27 | 10,327 | | 10,611 | |
| | Cimarex Energy Co. | 4.375% | 3/15/29 | 11,450 | | 12,094 | |
| | Concho Resources Inc. | 3.750% | 10/1/27 | 24,300 | | 26,572 | |
| | Concho Resources Inc. | 4.300% | 8/15/28 | 28,122 | | 31,848 | |
| | ConocoPhillips Co. | 4.950% | 3/15/26 | 34,510 | | 41,544 | |
| | ConocoPhillips Holding Co. | 6.950% | 4/15/29 | 34,993 | | 48,849 | |
| | Devon Energy Corp. | 5.850% | 12/15/25 | 5,566 | | 6,373 | |
| | Diamondback Energy Inc. | 3.250% | 12/1/26 | 20,300 | | 20,757 | |
| | Diamondback Energy Inc. | 3.500% | 12/1/29 | 24,874 | | 25,247 | |
| | Dominion Energy Gas Holdings LLC | 3.000% | 11/15/29 | 6,695 | | 7,362 | |
| | Enable Midstream Partners LP | 4.400% | 3/15/27 | 9,043 | | 8,794 | |
| | Enable Midstream Partners LP | 4.950% | 5/15/28 | 15,709 | | 15,395 | |
| | Enable Midstream Partners LP | 4.150% | 9/15/29 | 17,277 | | 15,835 | |
| | Enbridge Energy Partners LP | 5.875% | 10/15/25 | 10,000 | | 12,057 | |
| | Enbridge Inc. | 4.250% | 12/1/26 | 16,290 | | 18,824 | |
| | Enbridge Inc. | 3.700% | 7/15/27 | 6,415 | | 7,132 | |
| | Enbridge Inc. | 3.125% | 11/15/29 | 25,632 | | 27,578 | |
| | Energy Transfer Operating LP | 4.750% | 1/15/26 | 13,163 | | 14,348 | |
Vanguard® Intermediate-Term Corporate Bond Index Fund
Schedule of Investments
August 31, 2020
| | | Coupon | Maturity
Date | Face
Amount
($000 | ) | Market
Value
($000 | ) |
| | Energy Transfer Operating LP | 4.200% | 4/15/27 | 12,101 | | 12,630 | |
| | Energy Transfer Operating LP | 5.500% | 6/1/27 | 19,175 | | 21,332 | |
| | Energy Transfer Operating LP | 5.250% | 4/15/29 | 32,952 | | 35,835 | |
| | Energy Transfer Operating LP | 3.750% | 5/15/30 | 27,470 | | 27,264 | |
| | Energy Transfer Partners LP | 4.950% | 6/15/28 | 22,979 | | 24,559 | |
| | Eni USA Inc. | 7.300% | 11/15/27 | 1,129 | | 1,410 | |
| | Enterprise Products Operating LLC | 3.700% | 2/15/26 | 18,065 | | 20,432 | |
| | Enterprise Products Operating LLC | 3.950% | 2/15/27 | 9,078 | | 10,366 | |
| | Enterprise Products Operating LLC | 4.150% | 10/16/28 | 11,626 | | 13,669 | |
| | Enterprise Products Operating LLC | 3.125% | 7/31/29 | 37,569 | | 40,993 | |
| | Enterprise Products Operating LLC | 2.800% | 1/31/30 | 30,005 | | 31,938 | |
| 1 | Enterprise Products Operating LLC | 5.250% | 8/16/77 | 13,556 | | 13,031 | |
| 1 | Enterprise Products Operating LLC | 5.375% | 2/15/78 | 19,745 | | 17,943 | |
| | EOG Resources Inc. | 4.150% | 1/15/26 | 9,458 | | 10,930 | |
| | EOG Resources Inc. | 4.375% | 4/15/30 | 12,585 | | 15,039 | |
| | Exxon Mobil Corp. | 3.043% | 3/1/26 | 62,377 | | 69,333 | |
| | Exxon Mobil Corp. | 2.275% | 8/16/26 | 36,495 | | 39,427 | |
| | Exxon Mobil Corp. | 3.294% | 3/19/27 | 3,815 | | 4,323 | |
| | Exxon Mobil Corp. | 2.440% | 8/16/29 | 15,989 | | 17,273 | |
| | Exxon Mobil Corp. | 3.482% | 3/19/30 | 36,476 | | 42,206 | |
| | Exxon Mobil Corp. | 2.610% | 10/15/30 | 10,000 | | 10,849 | |
| | Halliburton Co. | 3.800% | 11/15/25 | 15,230 | | 16,658 | |
| | Halliburton Co. | 2.920% | 3/1/30 | 24,000 | | 24,360 | |
| | Hess Corp. | 4.300% | 4/1/27 | 21,262 | | 22,538 | |
| | Hess Corp. | 7.875% | 10/1/29 | 7,070 | | 8,926 | |
| | HollyFrontier Corp. | 5.875% | 4/1/26 | 19,586 | | 21,569 | |
| | Husky Energy Inc. | 4.400% | 4/15/29 | 16,503 | | 17,576 | |
| | Kinder Morgan Inc. | 4.300% | 3/1/28 | 28,155 | | 32,448 | |
| | Magellan Midstream Partners LP | 5.000% | 3/1/26 | 14,327 | | 16,734 | |
| | Magellan Midstream Partners LP | 3.250% | 6/1/30 | 5,716 | | 6,165 | |
| | Marathon Oil Corp. | 4.400% | 7/15/27 | 21,000 | | 21,420 | |
| | Marathon Petroleum Corp. | 5.125% | 12/15/26 | 16,245 | | 19,230 | |
| | Marathon Petroleum Corp. | 3.800% | 4/1/28 | 14,275 | | 15,667 | |
| | MPLX LP | 1.750% | 3/1/26 | 24,000 | | 23,910 | |
| | MPLX LP | 4.125% | 3/1/27 | 16,250 | | 17,936 | |
| | MPLX LP | 4.250% | 12/1/27 | 17,604 | | 19,628 | |
| | MPLX LP | 4.000% | 3/15/28 | 27,704 | | 30,440 | |
| | MPLX LP | 4.800% | 2/15/29 | 22,979 | | 26,512 | |
| | MPLX LP | 2.650% | 8/15/30 | 25,000 | | 24,781 | |
| | National Fuel Gas Co. | 5.500% | 1/15/26 | 8,527 | | 9,331 | |
| | National Fuel Gas Co. | 3.950% | 9/15/27 | 7,055 | | 7,081 | |
| | National Fuel Gas Co. | 4.750% | 9/1/28 | 5,710 | | 5,940 | |
| | National Oilwell Varco Inc. | 3.600% | 12/1/29 | 8,387 | | 8,282 | |
| | Newfield Exploration Co. | 5.375% | 1/1/26 | 7,132 | | 7,061 | |
| | Noble Energy Inc. | 3.850% | 1/15/28 | 12,432 | | 14,048 | |
| | Noble Energy Inc. | 3.250% | 10/15/29 | 9,523 | | 10,547 | |
| | ONEOK Inc. | 2.200% | 9/15/25 | 5,699 | | 5,645 | |
| | ONEOK Inc. | 5.850% | 1/15/26 | 11,363 | | 13,078 | |
| | ONEOK Inc. | 4.000% | 7/13/27 | 12,723 | | 13,178 | |
| | ONEOK Inc. | 4.550% | 7/15/28 | 9,818 | | 10,213 | |
| | ONEOK Inc. | 4.350% | 3/15/29 | 21,519 | | 22,418 | |
| | ONEOK Inc. | 3.400% | 9/1/29 | 21,219 | | 21,105 | |
| | ONEOK Inc. | 3.100% | 3/15/30 | 9,645 | | 9,139 | |
| | Phillips 66 | 3.900% | 3/15/28 | 13,180 | | 14,909 | |
| | Phillips 66 | 2.150% | 12/15/30 | 5,000 | | 4,903 | |
| | Phillips 66 Partners LP | 3.550% | 10/1/26 | 10,140 | | 10,967 | |
| | Phillips 66 Partners LP | 3.750% | 3/1/28 | 10,025 | | 10,539 | |
| | Phillips 66 Partners LP | 3.150% | 12/15/29 | 12,250 | | 12,364 | |
| | Pioneer Natural Resources Co. | 4.450% | 1/15/26 | 11,275 | | 13,079 | |
| | Pioneer Natural Resources Co. | 1.900% | 8/15/30 | 21,600 | | 20,867 | |
| | Plains All American Pipeline LP | 3.800% | 9/15/30 | 6,250 | | 6,282 | |
| | Plains All American Pipeline LP / PAA Finance Corp. | 4.650% | 10/15/25 | 16,515 | | 18,022 | |
| | Plains All American Pipeline LP / PAA Finance Corp. | 4.500% | 12/15/26 | 19,173 | | 20,768 | |
| | Plains All American Pipeline LP / PAA Finance Corp. | 3.550% | 12/15/29 | 14,844 | | 14,759 | |
Vanguard® Intermediate-Term Corporate Bond Index Fund
Schedule of Investments
August 31, 2020
| | | Coupon | Maturity
Date | Face
Amount
($000 | ) | Market
Value
($000 | ) |
| | Sabine Pass Liquefaction LLC | 5.875% | 6/30/26 | 24,563 | | 29,500 | |
| | Sabine Pass Liquefaction LLC | 5.000% | 3/15/27 | 36,943 | | 42,023 | |
| | Sabine Pass Liquefaction LLC | 4.200% | 3/15/28 | 27,468 | | 30,146 | |
| 2 | Sabine Pass Liquefaction LLC | 4.500% | 5/15/30 | 39,454 | | 45,175 | |
| | Schlumberger Investment SA | 2.650% | 6/26/30 | 21,942 | | 22,413 | |
| | Shell International Finance BV | 2.875% | 5/10/26 | 42,361 | | 47,144 | |
| | Shell International Finance BV | 2.500% | 9/12/26 | 20,257 | | 22,145 | |
| | Shell International Finance BV | 3.875% | 11/13/28 | 13,533 | | 15,933 | |
| | Shell International Finance BV | 2.375% | 11/7/29 | 40,760 | | 43,246 | |
| | Shell International Finance BV | 2.750% | 4/6/30 | 14,750 | | 16,180 | |
| | Spectra Energy Partners LP | 3.375% | 10/15/26 | 14,374 | | 15,788 | |
| | Sunoco Logistics Partners Operations LP | 5.950% | 12/1/25 | 9,827 | | 11,387 | |
| | Sunoco Logistics Partners Operations LP | 3.900% | 7/15/26 | 13,979 | | 14,573 | |
| | Sunoco Logistics Partners Operations LP | 4.000% | 10/1/27 | 13,490 | | 13,827 | |
| | TC PipeLines LP | 3.900% | 5/25/27 | 6,283 | | 6,758 | |
| | Tennessee Gas Pipeline Co. LLC | 7.000% | 3/15/27 | 3,188 | | 3,954 | |
| | Tennessee Gas Pipeline Co. LLC | 7.000% | 10/15/28 | 8,585 | | 10,980 | |
| | Total Capital International SA | 3.455% | 2/19/29 | 28,493 | | 32,659 | |
| | Total Capital International SA | 2.829% | 1/10/30 | 24,024 | | 26,516 | |
| | Total Capital SA | 3.883% | 10/11/28 | 13,677 | | 16,088 | |
| | TransCanada PipeLines Ltd. | 4.875% | 1/15/26 | 17,200 | | 20,435 | |
| | TransCanada PipeLines Ltd. | 4.250% | 5/15/28 | 22,474 | | 25,812 | |
| | TransCanada PipeLines Ltd. | 4.100% | 4/15/30 | 34,737 | | 40,322 | |
| 1 | Transcanada Trust | 5.500% | 9/15/79 | 10,000 | | 10,712 | |
| | Transcontinental Gas Pipe Line Co. LLC | 7.850% | 2/1/26 | 10,864 | | 14,188 | |
| | Transcontinental Gas Pipe Line Co. LLC | 4.000% | 3/15/28 | 9,856 | | 11,065 | |
| 2 | Transcontinental Gas Pipe Line Co. LLC | 3.250% | 5/15/30 | 23,725 | | 25,776 | |
| | Valero Energy Corp. | 3.400% | 9/15/26 | 28,500 | | 31,358 | |
| | Valero Energy Corp. | 4.350% | 6/1/28 | 12,214 | | 13,888 | |
| | Valero Energy Corp. | 4.000% | 4/1/29 | 26,144 | | 29,307 | |
| | Valero Energy Partners LP | 4.375% | 12/15/26 | 10,308 | | 11,823 | |
| | Valero Energy Partners LP | 4.500% | 3/15/28 | 10,894 | | 12,499 | |
| | Williams Cos. Inc. | 4.000% | 9/15/25 | 22,000 | | 24,585 | |
| | Williams Cos. Inc. | 3.750% | 6/15/27 | 25,758 | | 28,364 | |
| | Williams Cos. Inc. | 3.500% | 11/15/30 | 1,800 | | 1,967 | |
| | Other Industrial (0.1%) | |
| | CBRE Services Inc. | 4.875% | 3/1/26 | 12,746 | | 14,785 | |
| | Cintas Corp. No. 2 | 3.700% | 4/1/27 | 14,256 | | 16,279 | |
| | Leland Stanford Junior University | 1.289% | 6/1/27 | 2,300 | | 2,344 | |
| | Steelcase Inc. | 5.125% | 1/18/29 | 9,015 | | 9,739 | |
| | Yale University | 1.482% | 4/15/30 | 5,515 | | 5,604 | |
| | Technology (9.9%) | |
| | Adobe Inc. | 2.150% | 2/1/27 | 21,848 | | 23,416 | |
| | Adobe Inc. | 2.300% | 2/1/30 | 14,925 | | 16,067 | |
| | Alphabet Inc. | 1.998% | 8/15/26 | 39,339 | | 42,270 | |
| | Alphabet Inc. | 0.800% | 8/15/27 | 20,000 | | 19,964 | |
| | Alphabet Inc. | 1.100% | 8/15/30 | 43,300 | | 43,057 | |
| | Amdocs Ltd. | 2.538% | 6/15/30 | 13,113 | | 13,615 | |
| | Analog Devices Inc. | 3.900% | 12/15/25 | 8,151 | | 9,353 | |
| | Analog Devices Inc. | 3.500% | 12/5/26 | 16,350 | | 18,525 | |
| | Apple Inc. | 3.250% | 2/23/26 | 75,900 | | 85,742 | |
| | Apple Inc. | 2.450% | 8/4/26 | 45,053 | | 49,306 | |
| | Apple Inc. | 2.050% | 9/11/26 | 46,827 | | 50,336 | |
| | Apple Inc. | 3.350% | 2/9/27 | 43,989 | | 50,094 | |
| 3 | Apple Inc. | 3.200% | 5/11/27 | 41,513 | | 47,213 | |
| | Apple Inc. | 3.000% | 6/20/27 | 9,461 | | 10,670 | |
| | Apple Inc. | 2.900% | 9/12/27 | 47,736 | | 53,676 | |
| | Apple Inc. | 3.000% | 11/13/27 | 15,212 | | 17,204 | |
| | Apple Inc. | 2.200% | 9/11/29 | 34,656 | | 37,409 | |
| | Apple Inc. | 1.650% | 5/11/30 | 40,672 | | 42,084 | |
| | Apple Inc. | 1.250% | 8/20/30 | 25,000 | | 25,029 | |
| | | | | | | | |
Vanguard® Intermediate-Term Corporate Bond Index Fund
Schedule of Investments
August 31, 2020
| | Coupon | | Maturity
Date | | Face
Amount
($000 | ) | Market
Value
($000 | ) |
| | Applied Materials Inc. | 3.900% | | 10/1/25 | | 14,401 | | 16,615 | |
| | Applied Materials Inc. | 3.300% | | 4/1/27 | | 18,314 | | 20,941 | |
| | Applied Materials Inc. | 1.750% | | 6/1/30 | | 16,646 | | 17,187 | |
| | Arrow Electronics Inc. | 3.875% | | 1/12/28 | | 9,527 | | 10,348 | |
| | Autodesk Inc. | 3.500% | | 6/15/27 | | 7,359 | | 8,345 | |
| | Autodesk Inc. | 2.850% | | 1/15/30 | | 10,383 | | 11,447 | |
| | Avnet Inc. | 4.625% | | 4/15/26 | | 11,100 | | 12,362 | |
| | Baidu Inc. | 3.625% | | 7/6/27 | | 8,375 | | 9,200 | |
| | Baidu Inc. | 4.375% | | 3/29/28 | | 6,300 | | 7,269 | |
| | Baidu Inc. | 4.875% | | 11/14/28 | | 17,425 | | 20,930 | |
| | Baidu Inc. | 3.425% | | 4/7/30 | | 4,555 | | 5,088 | |
| | Broadcom Corp. / Broadcom Cayman Finance Ltd. | 3.875% | | 1/15/27 | | 94,208 | | 104,393 | |
| | Broadcom Corp. / Broadcom Cayman Finance Ltd. | 3.500% | | 1/15/28 | | 32,000 | | 34,583 | |
| | Broadcom Inc. | 3.150% | | 11/15/25 | | 43,571 | | 47,098 | |
| | Broadcom Inc. | 4.250% | | 4/15/26 | | 49,061 | | 55,468 | |
| | Broadcom Inc. | 3.459% | | 9/15/26 | | 34,345 | | 37,348 | |
| | Broadcom Inc. | 4.110% | | 9/15/28 | | 39,500 | | 43,977 | |
| | Broadcom Inc. | 4.750% | | 4/15/29 | | 57,546 | | 67,068 | |
| | Broadcom Inc. | 5.000% | | 4/15/30 | | 43,350 | | 51,012 | |
| | Broadridge Financial Solutions Inc. | 3.400% | | 6/27/26 | | 10,229 | | 11,463 | |
| | Broadridge Financial Solutions Inc. | 2.900% | | 12/1/29 | | 15,501 | | 16,885 | |
| | CA Inc. | 4.700% | | 3/15/27 | | 6,619 | | 7,281 | |
| | Cisco Systems Inc. | 2.950% | | 2/28/26 | | 23,400 | | 26,379 | |
| | Cisco Systems Inc. | 2.500% | | 9/20/26 | | 22,122 | | 24,470 | |
| | Citrix Systems Inc. | 4.500% | | 12/1/27 | | 16,160 | | 18,463 | |
| | Citrix Systems Inc. | 3.300% | | 3/1/30 | | 13,962 | | 14,860 | |
| 2 | Dell International LLC / EMC Corp. | 4.900% | | 10/1/26 | | 44,371 | | 50,068 | |
| 2 | Dell International LLC / EMC Corp. | 6.100% | | 7/15/27 | | 10,385 | | 12,203 | |
| 2 | Dell International LLC / EMC Corp. | 5.300% | | 10/1/29 | | 38,140 | | 43,444 | |
| 2 | Dell International LLC / EMC Corp. | 6.200% | | 7/15/30 | | 11,601 | | 14,059 | |
| 2 | Diamond 1 Finance Corp / Diamond 2 Finance Corp | 6.020% | | 6/15/26 | | 77,351 | | 90,748 | |
| | DXC Technology Co. | 4.750% | | 4/15/27 | | 13,537 | | 15,088 | |
| | Equifax Inc. | 2.600% | | 12/15/25 | | 10,240 | | 10,994 | |
| | Equifax Inc. | 3.100% | | 5/15/30 | | 10,132 | | 11,260 | |
| | Equinix Inc. | 2.900% | | 11/18/26 | | 24,568 | | 26,696 | |
| | Equinix Inc. | 5.375% | | 5/15/27 | | 17,636 | | 19,311 | |
| | Equinix Inc. | 1.800% | | 7/15/27 | | 3,500 | | 3,569 | |
| | Equinix Inc. | 3.200% | | 11/18/29 | | 26,904 | | 29,732 | |
| | Equinix Inc. | 2.150% | | 7/15/30 | | 20,767 | | 21,238 | |
| | Fidelity National Information Services Inc. | 5.000% | | 10/15/25 | | 1,300 | | 1,553 | |
| | Fidelity National Information Services Inc. | 3.000% | | 8/15/26 | | 32,557 | | 36,193 | |
| | Fidelity National Information Services Inc. | 4.250% | | 5/15/28 | | 12,490 | | 14,957 | |
| | Fidelity National Information Services Inc. | 3.750% | | 5/21/29 | | 26,462 | | 31,041 | |
| | Fiserv Inc. | 3.200% | | 7/1/26 | | 50,505 | | 56,555 | |
| | Fiserv Inc. | 2.250% | | 6/1/27 | | 19,719 | | 20,922 | |
| | Fiserv Inc. | 4.200% | | 10/1/28 | | 24,178 | | 28,703 | |
| | Fiserv Inc. | 3.500% | | 7/1/29 | | 71,346 | | 81,110 | |
| | Fiserv Inc. | 2.650% | | 6/1/30 | | 9,406 | | 10,101 | |
| | Flex Ltd. | 3.750% | | 2/1/26 | | 7,022 | | 7,630 | |
| | Flex Ltd. | 4.875% | | 6/15/29 | | 17,692 | | 20,321 | |
| | Flex Ltd. | 4.875% | | 5/12/30 | | 4,452 | | 5,072 | |
| | FLIR Systems Inc. | 2.500% | | 8/1/30 | | 8,900 | | 9,126 | |
| | Global Payments Inc. | 4.800% | | 4/1/26 | | 10,501 | | 12,382 | |
| | Global Payments Inc. | 4.450% | | 6/1/28 | | 13,729 | | 16,066 | |
| | Global Payments Inc. | 3.200% | | 8/15/29 | | 29,361 | | 32,154 | |
| | Global Payments Inc. | 2.900% | | 5/15/30 | | 24,082 | | 25,913 | |
| | Hewlett Packard Enterprise Co. | 4.900% | | 10/15/25 | | 40,664 | | 46,922 | |
| | Hewlett Packard Enterprise Co. | 1.750% | | 4/1/26 | | 23,955 | | 24,037 | |
| | HP Inc. | 3.000% | | 6/17/27 | | 17,845 | | 19,335 | |
| | HP Inc. | 3.400% | | 6/17/30 | | 21,450 | | 23,127 | |
| | Intel Corp. | 2.600% | | 5/19/26 | | 21,249 | | 23,375 | |
| | Intel Corp. | 3.750% | | 3/25/27 | | 22,457 | | 26,189 | |
| | Intel Corp. | 3.150% | | 5/11/27 | | 11,321 | | 12,733 | |
Vanguard® Intermediate-Term Corporate Bond Index Fund
Schedule of Investments
August 31, 2020
| | Coupon | | Maturity
Date | | Face
Amount
($000 | ) | Market
Value
($000 | ) |
| | Intel Corp. | 2.450% | | 11/15/29 | | 40,768 | | 44,192 | |
| | Intel Corp. | 3.900% | | 3/25/30 | | 35,800 | | 43,456 | |
| | International Business Machines Corp. | 7.000% | | 10/30/25 | | 9,237 | | 12,067 | |
| | International Business Machines Corp. | 3.450% | | 2/19/26 | | 27,484 | | 31,293 | |
| | International Business Machines Corp. | 3.300% | | 5/15/26 | | 70,369 | | 79,872 | |
| | International Business Machines Corp. | 3.300% | | 1/27/27 | | 7,360 | | 8,310 | |
| | International Business Machines Corp. | 1.700% | | 5/15/27 | | 31,610 | | 32,711 | |
| | International Business Machines Corp. | 6.220% | | 8/1/27 | | 6,379 | | 8,410 | |
| | International Business Machines Corp. | 6.500% | | 1/15/28 | | 4,150 | | 5,595 | |
| | International Business Machines Corp. | 3.500% | | 5/15/29 | | 54,522 | | 63,132 | |
| | International Business Machines Corp. | 1.950% | | 5/15/30 | | 29,967 | | 30,965 | |
| | Intuit Inc. | 1.350% | | 7/15/27 | | 5,117 | | 5,226 | |
| | Intuit Inc. | 1.650% | | 7/15/30 | | 11,340 | | 11,571 | |
| | Jabil Inc. | 3.950% | | 1/12/28 | | 11,628 | | 12,815 | |
| | Jabil Inc. | 3.600% | | 1/15/30 | | 8,220 | | 8,767 | |
| | Juniper Networks Inc. | 3.750% | | 8/15/29 | | 20,317 | | 23,103 | |
| | Keysight Technologies Inc. | 4.600% | | 4/6/27 | | 7,254 | | 8,535 | |
| | Keysight Technologies Inc. | 3.000% | | 10/30/29 | | 14,644 | | 16,020 | |
| | KLA Corp. | 4.100% | | 3/15/29 | | 11,964 | | 14,318 | |
| | Lam Research Corp. | 3.750% | | 3/15/26 | | 19,305 | | 22,204 | |
| | Lam Research Corp. | 4.000% | | 3/15/29 | | 18,408 | | 22,044 | |
| | Lam Research Corp. | 1.900% | | 6/15/30 | | 14,000 | | 14,470 | |
| 2 | Leidos Inc. | 4.375% | | 5/15/30 | | 15,190 | | 17,715 | |
| | Marvell Technology Group Ltd. | 4.875% | | 6/22/28 | | 10,181 | | 12,192 | |
| | Maxim Integrated Products Inc. | 3.450% | | 6/15/27 | | 6,520 | | 7,217 | |
| | Micron Technology Inc. | 4.975% | | 2/6/26 | | 16,356 | | 19,034 | |
| | Micron Technology Inc. | 4.185% | | 2/15/27 | | 13,764 | | 15,708 | |
| | Micron Technology Inc. | 5.327% | | 2/6/29 | | 17,609 | | 21,043 | |
| | Micron Technology Inc. | 4.663% | | 2/15/30 | | 12,784 | | 14,829 | |
| | Microsoft Corp. | 3.125% | | 11/3/25 | | 52,628 | | 59,088 | |
| | Microsoft Corp. | 2.400% | | 8/8/26 | | 88,249 | | 96,475 | |
| | Microsoft Corp. | 3.300% | | 2/6/27 | | 76,291 | | 87,233 | |
| | Motorola Solutions Inc. | 4.600% | | 2/23/28 | | 18,998 | | 21,930 | |
| | Motorola Solutions Inc. | 4.600% | | 5/23/29 | | 10,936 | | 12,786 | |
| | NetApp Inc. | 2.375% | | 6/22/27 | | 12,500 | | 13,088 | |
| | NetApp Inc. | 2.700% | | 6/22/30 | | 13,190 | | 13,811 | |
| | NVIDIA Corp. | 3.200% | | 9/16/26 | | 28,544 | | 32,288 | |
| | NVIDIA Corp. | 2.850% | | 4/1/30 | | 28,976 | | 32,150 | |
| 2 | NXP BV / NXP Funding LLC | 5.350% | | 3/1/26 | | 11,170 | | 13,339 | |
| 2 | NXP BV / NXP Funding LLC | 5.550% | | 12/1/28 | | 7,350 | | 9,188 | |
| 2 | NXP BV / NXP Funding LLC / NXP USA Inc. | 3.875% | | 6/18/26 | | 10,630 | | 11,949 | |
| 2 | NXP BV / NXP Funding LLC / NXP USA Inc. | 3.150% | | 5/1/27 | | 11,378 | | 12,394 | |
| 2 | NXP BV / NXP Funding LLC / NXP USA Inc. | 4.300% | | 6/18/29 | | 19,284 | | 22,419 | |
| 2 | NXP BV / NXP Funding LLC / NXP USA Inc. | 3.400% | | 5/1/30 | | 22,433 | | 24,758 | |
| | Oracle Corp. | 2.650% | | 7/15/26 | | 63,021 | | 69,084 | |
| | Oracle Corp. | 2.800% | | 4/1/27 | | 48,087 | | 52,782 | |
| | Oracle Corp. | 3.250% | | 11/15/27 | | 51,589 | | 58,277 | |
| | Oracle Corp. | 2.950% | | 4/1/30 | | 67,916 | | 75,815 | |
| | Oracle Corp. | 3.250% | | 5/15/30 | | 2,186 | | 2,488 | |
| | PayPal Holdings Inc. | 2.650% | | 10/1/26 | | 29,300 | | 32,075 | |
| | PayPal Holdings Inc. | 2.850% | | 10/1/29 | | 31,163 | | 34,363 | |
| | PayPal Holdings Inc. | 2.300% | | 6/1/30 | | 14,461 | | 15,341 | |
| | QUALCOMM Inc. | 3.250% | | 5/20/27 | | 40,207 | | 45,360 | |
| 2 | QUALCOMM Inc. | 1.300% | | 5/20/28 | | 25,000 | | 25,013 | |
| | QUALCOMM Inc. | 2.150% | | 5/20/30 | | 21,921 | | 23,117 | |
| | salesforce.com Inc. | 3.700% | | 4/11/28 | | 30,083 | | 35,170 | |
| | Seagate HDD Cayman | 4.875% | | 6/1/27 | | 8,710 | | 9,712 | |
| 2 | Seagate HDD Cayman | 4.091% | | 6/1/29 | | 17,073 | | 18,183 | |
| 2 | Seagate HDD Cayman | 4.125% | | 1/15/31 | | 1,900 | | 2,052 | |
| | Texas Instruments Inc. | 2.900% | | 11/3/27 | | 9,844 | | 11,028 | |
| | Texas Instruments Inc. | 2.250% | | 9/4/29 | | 29,720 | | 31,808 | |
| | Texas Instruments Inc. | 1.750% | | 5/4/30 | | 17,066 | | 17,567 | |
| | Trimble Inc. | 4.900% | | 6/15/28 | | 9,024 | | 10,799 | |
| | Tyco Electronics Group SA | 3.700% | | 2/15/26 | | 5,153 | | 5,778 | |
Vanguard® Intermediate-Term Corporate Bond Index Fund
Schedule of Investments
August 31, 2020
| | Coupon | | Maturity
Date | | Face
Amount
($000 | ) | Market
Value
($000 | ) |
| | Tyco Electronics Group SA | 3.125% | | 8/15/27 | | 10,971 | | 11,886 | |
| | Verisk Analytics Inc. | 4.125% | | 3/15/29 | | 14,136 | | 16,838 | |
| | VMware Inc. | 4.650% | | 5/15/27 | | 16,448 | | 19,118 | |
| | VMware Inc. | 3.900% | | 8/21/27 | | 23,907 | | 26,411 | |
| | VMware Inc. | 4.700% | | 5/15/30 | | 19,610 | | 23,037 | |
| | Xilinx Inc. | 2.375% | | 6/1/30 | | 7,518 | | 8,020 | |
| | Transportation (2.0%) | |
| 1 | American Airlines 2013-1 Class A Pass Through Trust | 4.000% | | 1/15/27 | | 2,370 | | 1,874 | |
| 1 | American Airlines 2014-1 Class A Pass Through Trust | 3.700% | | 4/1/28 | | 4,718 | | 3,916 | |
| 1 | American Airlines 2015-1 Class A Pass Through Trust | 3.375% | | 11/1/28 | | 10,326 | | 8,578 | |
| 1 | American Airlines 2015-2 Class AA Pass Through Trust | 3.600% | | 9/22/27 | | 2,776 | | 2,610 | |
| 1 | American Airlines 2016-1 Class AA Pass Through Trust | 3.575% | | 1/15/28 | | 9,449 | | 9,084 | |
| 1 | American Airlines 2016-2 Class A Pass Through Trust | 3.650% | | 6/15/28 | | 3,307 | | 2,631 | |
| 1 | American Airlines 2016-2 Class AA Pass Through Trust | 3.200% | | 12/15/29 | | 6,261 | | 5,859 | |
| 1 | American Airlines 2016-3 Class A Pass Through Trust | 3.250% | | 4/15/30 | | 233 | | 185 | |
| | American Airlines 2016-3 Class AA Pass Through Trust | 3.000% | | 10/15/28 | | 4,975 | | 4,665 | |
| 1 | American Airlines 2017-1 Class AA Pass Through Trust | 3.650% | | 8/15/30 | | 7,086 | | 6,738 | |
| 1 | American Airlines 2017-2 Class AA Pass Through Trust | 3.350% | | 10/15/29 | | 10,980 | | 10,274 | |
| 1 | BNSF Funding Trust I | 6.613% | | 12/15/55 | | 1,990 | | 2,206 | |
| | Burlington Northern Santa Fe LLC | 3.650% | | 9/1/25 | | 7,087 | | 8,090 | |
| | Burlington Northern Santa Fe LLC | 7.000% | | 12/15/25 | | 3,496 | | 4,545 | |
| | Burlington Northern Santa Fe LLC | 3.250% | | 6/15/27 | | 23,451 | | 26,731 | |
| | Canadian National Railway Co. | 2.750% | | 3/1/26 | | 12,742 | | 13,937 | |
| | Canadian National Railway Co. | 6.900% | | 7/15/28 | | 5,641 | | 7,830 | |
| | Canadian Pacific Railway Co. | 4.000% | | 6/1/28 | | 7,163 | | 8,432 | |
| | Canadian Pacific Railway Co. | 2.050% | | 3/5/30 | | 29,336 | | 30,620 | |
| | CH Robinson Worldwide Inc. | 4.200% | | 4/15/28 | | 11,614 | | 13,607 | |
| | CSX Corp. | 3.350% | | 11/1/25 | | 8,526 | | 9,654 | |
| | CSX Corp. | 2.600% | | 11/1/26 | | 14,415 | | 15,813 | |
| | CSX Corp. | 3.250% | | 6/1/27 | | 17,801 | | 20,109 | |
| | CSX Corp. | 3.800% | | 3/1/28 | | 18,371 | | 21,495 | |
| | CSX Corp. | 4.250% | | 3/15/29 | | 26,455 | | 31,890 | |
| | CSX Corp. | 2.400% | | 2/15/30 | | 5,565 | | 5,905 | |
| 1 | CSX Transportation Inc. | 6.251% | | 1/15/23 | | 21 | | 24 | |
| 1 | Delta Air Lines 2015-1 Class AA Pass Through Trust | 3.625% | | 7/30/27 | | 294 | | 293 | |
| 1 | Delta Air Lines 2020-1 Class AA Pass Through Trust | 2.000% | | 6/10/28 | | 6,000 | | 5,762 | |
| | FedEx Corp. | 3.250% | | 4/1/26 | | 10,534 | | 11,704 | |
| | FedEx Corp. | 3.300% | | 3/15/27 | | 8,356 | | 9,210 | |
| | FedEx Corp. | 3.400% | | 2/15/28 | | 8,995 | | 10,019 | |
| �� | FedEx Corp. | 4.200% | | 10/17/28 | | 7,058 | | 8,289 | |
| | FedEx Corp. | 3.100% | | 8/5/29 | | 21,873 | | 24,061 | |
| | FedEx Corp. | 4.250% | | 5/15/30 | | 18,978 | | 22,755 | |
| | JB Hunt Transport Services Inc. | 3.875% | | 3/1/26 | | 25,855 | | 29,885 | |
| | Kansas City Southern | 2.875% | | 11/15/29 | | 9,943 | | 10,331 | |
| | Kirby Corp. | 4.200% | | 3/1/28 | | 10,805 | | 11,233 | |
| | Norfolk Southern Corp. | 2.900% | | 6/15/26 | | 14,169 | | 15,654 | |
| | Norfolk Southern Corp. | 7.800% | | 5/15/27 | | 4,117 | | 5,658 | |
| | Norfolk Southern Corp. | 3.150% | | 6/1/27 | | 7,206 | | 7,997 | |
| | Norfolk Southern Corp. | 3.800% | | 8/1/28 | | 12,460 | | 14,667 | |
| | Norfolk Southern Corp. | 2.550% | | 11/1/29 | | 9,395 | | 10,265 | |
| | Ryder System Inc. | 2.900% | | 12/1/26 | | 13,520 | | 14,369 | |
| | Southwest Airlines Co. | 5.250% | | 5/4/25 | | 10,000 | | 10,863 | |
| | Southwest Airlines Co. | 3.000% | | 11/15/26 | | 12,495 | | 12,558 | |
| | Southwest Airlines Co. | 5.125% | | 6/15/27 | | 23,884 | | 25,927 | |
| | Southwest Airlines Co. | 3.450% | | 11/16/27 | | 4,380 | | 4,355 | |
| | Southwest Airlines Co. | 2.625% | | 2/10/30 | | 11,000 | | 10,586 | |
| 1 | Spirit Airlines Class A Pass Through Certificates Series 2015-1 | 4.100% | | 10/1/29 | | 2,296 | | 1,997 | |
| | Union Pacific Corp. | 2.750% | | 3/1/26 | | 17,300 | | 18,976 | |
| | Union Pacific Corp. | 2.150% | | 2/5/27 | | 17,495 | | 18,684 | |
| | Union Pacific Corp. | 3.000% | | 4/15/27 | | 8,414 | | 9,401 | |
| | Union Pacific Corp. | 3.950% | | 9/10/28 | | 31,429 | | 37,223 | |
| | Union Pacific Corp. | 6.625% | | 2/1/29 | | 420 | | 573 | |
Vanguard® Intermediate-Term Corporate Bond Index Fund
Schedule of Investments
August 31, 2020
| | Coupon | | Maturity
Date | | Face
Amount
($000 | ) | Market
Value
($000 | ) |
| | Union Pacific Corp. | 3.700% | | 3/1/29 | | 14,261 | | 16,670 | |
| | Union Pacific Corp. | 2.400% | | 2/5/30 | | 20,303 | | 21,781 | |
| 1 | United Airlines 2014-1 Class A Pass Through Trust | 4.000% | | 10/11/27 | | 6,757 | | 6,327 | |
| 1 | United Airlines 2014-2 Class A Pass Through Trust | 3.750% | | 3/3/28 | | 9,707 | | 8,938 | |
| 1 | United Airlines 2015-1 Class AA Pass Through Trust | 3.450% | | 12/1/27 | | 6,796 | | 6,598 | |
| 1 | United Airlines 2016-1 Class A Pass Through Trust | 3.450% | | 1/7/30 | | 3,653 | | 3,089 | |
| 1 | United Airlines 2016-1 Class AA Pass Through Trust | 3.100% | | 7/7/28 | | 10,437 | | 10,084 | |
| 1 | United Airlines 2016-2 Class AA Pass Through Trust | 2.875% | | 10/7/28 | | 2,886 | | 2,745 | |
| 1 | United Airlines 2018-1 Class AA Pass Through Trust | 3.500% | | 3/1/30 | | 3,872 | | 3,605 | |
| | United Parcel Service Inc. | 2.400% | | 11/15/26 | | 14,398 | | 15,753 | |
| | United Parcel Service Inc. | 3.050% | | 11/15/27 | | 16,633 | | 18,803 | |
| | United Parcel Service Inc. | 3.400% | | 3/15/29 | | 17,483 | | 20,248 | |
| | United Parcel Service Inc. | 2.500% | | 9/1/29 | | 12,483 | | 13,650 | |
| | United Parcel Service Inc. | 4.450% | | 4/1/30 | | 15,487 | | 19,387 | |
| 1 | US Airways 2012-1 Class A Pass Through Trust | 5.900% | | 4/1/26 | | 648 | | 600 | |
| 1 | US Airways 2012-2 Class A Pass Through Trust | 4.625% | | 12/3/26 | | 1,549 | | 1,242 | |
| 1 | US Airways 2013-1 Class A Pass Through Trust | 3.950% | | 5/15/27 | | 2,189 | | 1,806 | |
| | | 23,768,555 | |
| Utilities (6.3%) | |
| | Electric (5.6%) | |
| | AEP Texas Inc. | 3.950% | | 6/1/28 | | 15,502 | | 17,932 | |
| | AEP Texas Inc. | 2.100% | | 7/1/30 | | 11,200 | | 11,488 | |
| | AEP Transmission Co. LLC | 3.100% | | 12/1/26 | | 3,690 | | 4,153 | |
| | Alabama Power Co. | 1.450% | | 9/15/30 | | 5,000 | | 4,966 | |
| | Ameren Corp. | 3.650% | | 2/15/26 | | 5,106 | | 5,720 | |
| | Ameren Corp. | 3.500% | | 1/15/31 | | 4,000 | | 4,582 | |
| | Ameren Illinois Co. | 3.800% | | 5/15/28 | | 7,589 | | 8,810 | |
| | American Electric Power Co. Inc. | 3.200% | | 11/13/27 | | 9,659 | | 10,554 | |
| | American Electric Power Co. Inc. | 4.300% | | 12/1/28 | | 11,370 | | 13,363 | |
| | American Electric Power Co. Inc. | 2.300% | | 3/1/30 | | 7,005 | | 7,190 | |
| | Appalachian Power Co. | 3.300% | | 6/1/27 | | 4,600 | | 5,017 | |
| | Arizona Public Service Co. | 2.950% | | 9/15/27 | | 3,994 | | 4,393 | |
| | Arizona Public Service Co. | 2.600% | | 8/15/29 | | 4,580 | | 4,894 | |
| | Atlantic City Electric Co. | 4.000% | | 10/15/28 | | 5,414 | | 6,407 | |
| | Avangrid Inc. | 3.800% | | 6/1/29 | | 15,804 | | 18,389 | |
| | Baltimore Gas & Electric Co. | 2.400% | | 8/15/26 | | 6,768 | | 7,244 | |
| | Berkshire Hathaway Energy Co. | 3.250% | | 4/15/28 | | 20,547 | | 23,266 | |
| 2 | Berkshire Hathaway Energy Co. | 3.700% | | 7/15/30 | | 18,920 | | 22,451 | |
| | Black Hills Corp. | 3.950% | | 1/15/26 | | 5,845 | | 6,434 | |
| | Black Hills Corp. | 3.150% | | 1/15/27 | | 4,435 | | 4,751 | |
| | Black Hills Corp. | 3.050% | | 10/15/29 | | 9,709 | | 10,569 | |
| | Black Hills Corp. | 2.500% | | 6/15/30 | | 375 | | 394 | |
| | CenterPoint Energy Houston Electric LLC | 2.400% | | 9/1/26 | | 2,565 | | 2,753 | |
| | CenterPoint Energy Houston Electric LLC | 3.000% | | 2/1/27 | | 4,221 | | 4,595 | |
| | CenterPoint Energy Inc. | 4.250% | | 11/1/28 | | 11,646 | | 13,724 | |
| | CenterPoint Energy Inc. | 2.950% | | 3/1/30 | | 5,069 | | 5,571 | |
| | Cleco Corporate Holdings LLC | 3.743% | | 5/1/26 | | 8,057 | | 8,564 | |
| | Cleco Corporate Holdings LLC | 3.375% | | 9/15/29 | | 3,510 | | 3,579 | |
| | CMS Energy Corp. | 3.000% | | 5/15/26 | | 6,456 | | 7,031 | |
| | CMS Energy Corp. | 3.450% | | 8/15/27 | | 7,336 | | 8,017 | |
| 1 | CMS Energy Corp. | 4.750% | | 6/1/50 | | 13,290 | | 14,473 | |
| | Commonwealth Edison Co. | 2.550% | | 6/15/26 | | 6,214 | | 6,736 | |
| | Commonwealth Edison Co. | 2.950% | | 8/15/27 | | 6,292 | | 6,913 | |
| | Commonwealth Edison Co. | 3.700% | | 8/15/28 | | 10,932 | | 12,617 | |
| | Commonwealth Edison Co. | 2.200% | | 3/1/30 | | 6,526 | | 6,969 | |
| | Connecticut Light & Power Co. | 3.200% | | 3/15/27 | | 8,835 | | 9,788 | |
| | Consolidated Edison Co. of New York Inc. | 3.125% | | 11/15/27 | | 7,353 | | 8,155 | |
| | Consolidated Edison Co. of New York Inc. | 3.800% | | 5/15/28 | | 7,217 | | 8,390 | |
| | Consolidated Edison Co. of New York Inc. | 4.000% | | 12/1/28 | | 6,350 | | 7,578 | |
| | Consolidated Edison Co. of New York Inc. | 3.350% | | 4/1/30 | | 8,880 | | 10,261 | |
| | Consumers Energy Co. | 3.800% | | 11/15/28 | | 4,704 | | 5,591 | |
| | Dominion Energy Inc. | 3.900% | | 10/1/25 | | 7,540 | | 8,608 | |
| | Dominion Energy Inc. | 2.850% | | 8/15/26 | | 8,306 | | 9,090 | |
Vanguard® Intermediate-Term Corporate Bond Index Fund
Schedule of Investments
August 31, 2020
| | Coupon | | Maturity
Date | | Face
Amount
($000 | ) | Market
Value
($000 | ) |
| | Dominion Energy Inc. | 3.600% | | 3/15/27 | | 390 | | 441 | |
| | Dominion Energy Inc. | 4.250% | | 6/1/28 | | 9,215 | | 10,797 | |
| | Dominion Energy Inc. | 3.375% | | 4/1/30 | | 31,822 | | 36,145 | |
| | DTE Electric Co. | 2.250% | | 3/1/30 | | 11,880 | | 12,706 | |
| | DTE Energy Co. | 2.850% | | 10/1/26 | | 16,007 | | 17,353 | |
| | DTE Energy Co. | 3.800% | | 3/15/27 | | 9,661 | | 10,751 | |
| | DTE Energy Co. | 3.400% | | 6/15/29 | | 12,921 | | 14,342 | |
| | DTE Energy Co. | 2.950% | | 3/1/30 | | 4,136 | | 4,437 | |
| | Duke Energy Carolinas LLC | 2.950% | | 12/1/26 | | 11,738 | | 13,172 | |
| | Duke Energy Carolinas LLC | 3.950% | | 11/15/28 | | 12,204 | | 14,763 | |
| | Duke Energy Carolinas LLC | 6.000% | | 12/1/28 | | 2,475 | | 3,239 | |
| | Duke Energy Carolinas LLC | 2.450% | | 8/15/29 | | 17,798 | | 19,335 | |
| | Duke Energy Carolinas LLC | 2.450% | | 2/1/30 | | 14,099 | | 15,228 | |
| | Duke Energy Corp. | 2.650% | | 9/1/26 | | 32,253 | | 35,065 | |
| | Duke Energy Corp. | 3.150% | | 8/15/27 | | 17,591 | | 19,487 | |
| | Duke Energy Corp. | 3.400% | | 6/15/29 | | 11,980 | | 13,659 | |
| | Duke Energy Corp. | 2.450% | | 6/1/30 | | 11,682 | | 12,312 | |
| | Duke Energy Florida LLC | 3.200% | | 1/15/27 | | 18,901 | | 21,360 | |
| | Duke Energy Florida LLC | 3.800% | | 7/15/28 | | 9,877 | | 11,597 | |
| | Duke Energy Florida LLC | 2.500% | | 12/1/29 | | 12,482 | | 13,647 | |
| | Duke Energy Florida LLC | 1.750% | | 6/15/30 | | 10,385 | | 10,646 | |
| 1 | Duke Energy Florida Project Finance LLC | 2.538% | | 9/1/29 | | 2,419 | | 2,656 | |
| | Duke Energy Ohio Inc. | 3.650% | | 2/1/29 | | 13,632 | | 16,035 | |
| | Duke Energy Ohio Inc. | 2.125% | | 6/1/30 | | 4,207 | | 4,432 | |
| | Duke Energy Progress LLC | 3.700% | | 9/1/28 | | 7,842 | | 9,145 | |
| | Duke Energy Progress LLC | 3.450% | | 3/15/29 | | 22,117 | | 25,717 | |
| | Edison International | 5.750% | | 6/15/27 | | 16,648 | | 18,815 | |
| | Edison International | 4.125% | | 3/15/28 | | 15,197 | | 15,847 | |
| | Emera US Finance LP | 3.550% | | 6/15/26 | | 22,444 | | 25,064 | |
| | Enel Americas SA | 4.000% | | 10/25/26 | | 11,739 | | 12,855 | |
| | Enel Chile SA | 4.875% | | 6/12/28 | | 15,634 | | 18,778 | |
| | Entergy Arkansas Inc. | 3.500% | | 4/1/26 | | 11,624 | | 13,271 | |
| | Entergy Corp. | 2.950% | | 9/1/26 | | 22,815 | | 25,325 | |
| | Entergy Corp. | 2.800% | | 6/15/30 | | 11,963 | | 13,006 | |
| | Entergy Louisiana LLC | 2.400% | | 10/1/26 | | 8,168 | | 8,830 | |
| | Entergy Louisiana LLC | 3.120% | | 9/1/27 | | 7,068 | | 7,866 | |
| | Entergy Louisiana LLC | 3.250% | | 4/1/28 | | 10,582 | | 11,745 | |
| | Entergy Mississippi LLC | 2.850% | | 6/1/28 | | 11,302 | | 12,292 | |
| | Entergy Texas Inc. | 4.000% | | 3/30/29 | | 7,082 | | 8,277 | |
| | Evergy Inc. | 2.900% | | 9/15/29 | | 15,181 | | 16,415 | |
| | Evergy Metro Inc. | 2.250% | | 6/1/30 | | 9,463 | | 10,066 | |
| | Eversource Energy | 3.300% | | 1/15/28 | | 9,148 | | 10,216 | |
| | Eversource Energy | 4.250% | | 4/1/29 | | 7,789 | | 9,333 | |
| | Eversource Energy | 1.650% | | 8/15/30 | | 5,500 | | 5,476 | |
| | Exelon Corp. | 3.400% | | 4/15/26 | | 23,283 | | 26,124 | |
| | Exelon Corp. | 4.050% | | 4/15/30 | | 39,041 | | 46,001 | |
| | FirstEnergy Corp. | 3.900% | | 7/15/27 | | 23,845 | | 26,096 | |
| | FirstEnergy Corp. | 2.650% | | 3/1/30 | | 8,525 | | 8,769 | |
| | FirstEnergy Corp. | 2.250% | | 9/1/30 | | 2,000 | | 1,989 | |
| | Florida Power & Light Co. | 3.125% | | 12/1/25 | | 16,181 | | 17,891 | |
| | Fortis Inc. | 3.055% | | 10/4/26 | | 19,708 | | 21,492 | |
| | Georgia Power Co. | 3.250% | | 4/1/26 | | 7,677 | | 8,527 | |
| | Georgia Power Co. | 3.250% | | 3/30/27 | | 7,967 | | 8,728 | |
| | Georgia Power Co. | 2.650% | | 9/15/29 | | 19,789 | | 21,181 | |
| | Gulf Power Co. | 3.300% | | 5/30/27 | | 6,385 | | 7,201 | |
| | Indiana Michigan Power Co. | 3.850% | | 5/15/28 | | 12,630 | | 14,307 | |
| | Interstate Power & Light Co. | 4.100% | | 9/26/28 | | 9,073 | | 10,796 | |
| | Interstate Power & Light Co. | 3.600% | | 4/1/29 | | 7,648 | | 8,795 | |
| | Interstate Power & Light Co. | 2.300% | | 6/1/30 | | 3,750 | | 3,930 | |
| | ITC Holdings Corp. | 3.250% | | 6/30/26 | | 5,368 | | 5,949 | |
| | ITC Holdings Corp. | 3.350% | | 11/15/27 | | 10,380 | | 11,631 | |
| | Louisville Gas & Electric Co. | 3.300% | | 10/1/25 | | 4,607 | | 5,118 | |
| | MidAmerican Energy Co. | 3.100% | | 5/1/27 | | 7,137 | | 7,953 | |
| | MidAmerican Energy Co. | 3.650% | | 4/15/29 | | 16,318 | | 19,410 | |
Vanguard® Intermediate-Term Corporate Bond Index Fund
Schedule of Investments
August 31, 2020
| | Coupon | | Maturity
Date | | Face
Amount
($000 | ) | Market
Value
($000 | ) |
| | Mississippi Power Co. | 3.950% | | 3/30/28 | | 3,581 | | 4,066 | |
| | National Rural Utilities Cooperative Finance Corp. | 3.250% | | 11/1/25 | | 9,911 | | 11,030 | |
| | National Rural Utilities Cooperative Finance Corp. | 3.050% | | 4/25/27 | | 6,662 | | 7,390 | |
| | National Rural Utilities Cooperative Finance Corp. | 3.400% | | 2/7/28 | | 15,094 | | 17,289 | |
| | National Rural Utilities Cooperative Finance Corp. | 3.900% | | 11/1/28 | | 6,785 | | 7,991 | |
| | National Rural Utilities Cooperative Finance Corp. | 3.700% | | 3/15/29 | | 14,569 | | 17,079 | |
| | National Rural Utilities Cooperative Finance Corp. | 2.400% | | 3/15/30 | | 7,653 | | 8,383 | |
| 1 | National Rural Utilities Cooperative Finance Corp. | 5.250% | | 4/20/46 | | 5,375 | | 5,789 | |
| | Nevada Power Co. | 3.700% | | 5/1/29 | | 10,820 | | 12,720 | |
| | NextEra Energy Capital Holdings Inc. | 3.250% | | 4/1/26 | | 7,742 | | 8,729 | |
| | NextEra Energy Capital Holdings Inc. | 3.550% | | 5/1/27 | | 15,273 | | 17,514 | |
| | NextEra Energy Capital Holdings Inc. | 3.500% | | 4/1/29 | | 12,487 | | 14,251 | |
| | NextEra Energy Capital Holdings Inc. | 2.750% | | 11/1/29 | | 18,246 | | 19,874 | |
| | NextEra Energy Capital Holdings Inc. | 2.250% | | 6/1/30 | | 49,305 | | 51,627 | |
| 1 | NextEra Energy Capital Holdings Inc. | 4.800% | | 12/1/77 | | 18,850 | | 20,264 | |
| 1 | NextEra Energy Capital Holdings Inc. | 5.650% | | 5/1/79 | | 7,095 | | 8,124 | |
| | NSTAR Electric Co. | 3.200% | | 5/15/27 | | 13,998 | | 15,630 | |
| | NSTAR Electric Co. | 3.250% | | 5/15/29 | | 5,302 | | 6,019 | |
| | NSTAR Electric Co. | 3.950% | | 4/1/30 | | 5,291 | | 6,426 | |
| | Ohio Power Co. | 2.600% | | 4/1/30 | | 1,715 | | 1,879 | |
| | Oklahoma Gas & Electric Co. | 3.800% | | 8/15/28 | | 9,495 | | 10,794 | |
| | Oklahoma Gas & Electric Co. | 3.300% | | 3/15/30 | | 1,409 | | 1,585 | |
| | Oklahoma Gas & Electric Co. | 3.250% | | 4/1/30 | | 9,197 | | 10,269 | |
| | Oncor Electric Delivery Co. LLC | 3.700% | | 11/15/28 | | 10,908 | | 12,843 | |
| | Oncor Electric Delivery Co. LLC | 5.750% | | 3/15/29 | | 2,753 | | 3,615 | |
| | Oncor Electric Delivery Co. LLC | 2.750% | | 5/15/30 | | 7,177 | | 8,003 | |
| | Pacific Gas & Electric Co. | 3.300% | | 12/1/27 | | 44,352 | | 45,606 | |
| | Pacific Gas & Electric Co. | 3.150% | | 1/1/26 | | 48,600 | | 50,240 | |
| | Pacific Gas & Electric Co. | 2.950% | | 3/1/26 | | 2,500 | | 2,554 | |
| | Pacific Gas & Electric Co. | 2.100% | | 8/1/27 | | 2,025 | | 1,979 | |
| | Pacific Gas & Electric Co. | 3.750% | | 7/1/28 | | 22,000 | | 22,912 | |
| | Pacific Gas & Electric Co. | 4.550% | | 7/1/30 | | 59,745 | | 65,375 | |
| | Pacific Gas & Electric Co. | 2.500% | | 2/1/31 | | 6,000 | | 5,771 | |
| | PacifiCorp | 3.500% | | 6/15/29 | | 17,105 | | 19,809 | |
| | PacifiCorp | 2.700% | | 9/15/30 | | 4,500 | | 4,987 | |
| | PECO Energy Co. | 3.150% | | 10/15/25 | | 6,194 | | 6,836 | |
| | PPL Capital Funding Inc. | 3.100% | | 5/15/26 | | 30,145 | | 33,450 | |
| | PPL Capital Funding Inc. | 4.125% | | 4/15/30 | | 10,574 | | 12,467 | |
| | Public Service Co. of Colorado | 3.700% | | 6/15/28 | | 8,215 | | 9,592 | |
| | Public Service Electric & Gas Co. | 2.250% | | 9/15/26 | | 6,714 | | 7,183 | |
| | Public Service Electric & Gas Co. | 3.000% | | 5/15/27 | | 3,362 | | 3,703 | |
| | Public Service Electric & Gas Co. | 3.700% | | 5/1/28 | | 7,680 | | 8,920 | |
| | Public Service Electric & Gas Co. | 3.650% | | 9/1/28 | | 7,722 | | 9,001 | |
| | Public Service Electric & Gas Co. | 3.200% | | 5/15/29 | | 8,513 | | 9,696 | |
| | Public Service Electric & Gas Co. | 2.450% | | 1/15/30 | | 5,387 | | 5,867 | |
| | Public Service Enterprise Group Inc. | 1.600% | | 8/15/30 | | 7,500 | | 7,426 | |
| 2 | Puget Energy Inc. | 4.100% | | 6/15/30 | | 13,805 | | 15,216 | |
| | San Diego Gas & Electric Co. | 2.500% | | 5/15/26 | | 3,868 | | 4,191 | |
| | Sierra Pacific Power Co. | 2.600% | | 5/1/26 | | 14,200 | | 15,471 | |
| | Southern California Edison Co. | 3.700% | | 8/1/25 | | 3,424 | | 3,810 | |
| | Southern California Edison Co. | 3.650% | | 3/1/28 | | 7,769 | | 8,667 | |
| | Southern California Edison Co. | 4.200% | | 3/1/29 | | 8,731 | | 10,061 | |
| | Southern California Edison Co. | 6.650% | | 4/1/29 | | 6,928 | | 8,400 | |
| | Southern California Edison Co. | 2.850% | | 8/1/29 | | 8,156 | | 8,644 | |
| | Southern California Edison Co. | 2.250% | | 6/1/30 | | 8,840 | | 8,977 | |
| | Southern Co. | 3.250% | | 7/1/26 | | 31,672 | | 35,384 | |
| | Southern Co. | 3.700% | | 4/30/30 | | 22,055 | | 25,265 | |
| | Southern Power Co. | 4.150% | | 12/1/25 | | 4,566 | | 5,246 | |
| | Southwestern Electric Power Co. | 2.750% | | 10/1/26 | | 8,150 | | 8,798 | |
| | Southwestern Electric Power Co. | 4.100% | | 9/15/28 | | 21,894 | | 25,553 | |
| | Tucson Electric Power Co. | 1.500% | | 8/1/30 | | 4,000 | | 3,948 | |
| | Union Electric Co. | 2.950% | | 6/15/27 | | 7,450 | | 8,209 | |
| | Union Electric Co. | 3.500% | | 3/15/29 | | 10,753 | | 12,453 | |
| | Union Electric Co. | 2.950% | | 3/15/30 | | 7,506 | | 8,475 | |
Vanguard® Intermediate-Term Corporate Bond Index Fund
Schedule of Investments
August 31, 2020
| | Coupon | | Maturity
Date | | Face
Amount
($000 | ) | Market
Value
($000 | ) |
| | Virginia Electric & Power Co. | 3.150% | | 1/15/26 | | 23,361 | | 26,055 | |
| | Virginia Electric & Power Co. | 2.950% | | 11/15/26 | | 10,029 | | 11,201 | |
| | Virginia Electric & Power Co. | 3.500% | | 3/15/27 | | 16,705 | | 18,907 | |
| | Virginia Electric & Power Co. | 3.800% | | 4/1/28 | | 23,288 | | 27,278 | |
| | Virginia Electric & Power Co. | 2.875% | | 7/15/29 | | 11,945 | | 13,385 | |
| | Westar Energy Inc. | 2.550% | | 7/1/26 | | 8,999 | | 9,508 | |
| | Westar Energy Inc. | 3.100% | | 4/1/27 | | 6,297 | | 6,977 | |
| | Wisconsin Power & Light Co. | 3.050% | | 10/15/27 | | 4,620 | | 5,071 | |
| | Wisconsin Power & Light Co. | 3.000% | | 7/1/29 | | 1,575 | | 1,761 | |
| | Xcel Energy Inc. | 3.350% | | 12/1/26 | | 10,880 | | 12,262 | |
| | Xcel Energy Inc. | 4.000% | | 6/15/28 | | 10,386 | | 12,226 | |
| | Xcel Energy Inc. | 2.600% | | 12/1/29 | | 14,276 | | 15,342 | |
| | Xcel Energy Inc. | 3.400% | | 6/1/30 | | 15,747 | | 18,168 | |
| | Natural Gas (0.5%) | |
| | Atmos Energy Corp. | 3.000% | | 6/15/27 | | 8,548 | | 9,437 | |
| | Atmos Energy Corp. | 2.625% | | 9/15/29 | | 8,107 | | 8,945 | |
| | CenterPoint Energy Resources Corp. | 4.000% | | 4/1/28 | | 5,796 | | 6,558 | |
| 2 | East Ohio Gas Co. | 2.000% | | 6/15/30 | | 3,150 | | 3,263 | |
| | NiSource Finance Corp. | 3.490% | | 5/15/27 | | 14,822 | | 16,643 | |
| | NiSource Inc. | 2.950% | | 9/1/29 | | 18,451 | | 20,185 | |
| | NiSource Inc. | 3.600% | | 5/1/30 | | 22,320 | | 25,734 | |
| | ONE Gas Inc. | 2.000% | | 5/15/30 | | 5,846 | | 6,070 | |
| | Piedmont Natural Gas Co. Inc. | 3.500% | | 6/1/29 | | 7,770 | | 8,924 | |
| | Sempra Energy | 3.750% | | 11/15/25 | | 6,696 | | 7,538 | |
| | Sempra Energy | 3.250% | | 6/15/27 | | 18,085 | | 19,879 | |
| | Sempra Energy | 3.400% | | 2/1/28 | | 32,716 | | 36,367 | |
| | Southern California Gas Co. | 2.600% | | 6/15/26 | | 9,600 | | 10,411 | |
| | Southern California Gas Co. | 2.550% | | 2/1/30 | | 13,230 | | 14,405 | |
| | Southern Co. Gas Capital Corp. | 3.250% | | 6/15/26 | | 7,017 | | 7,533 | |
| | Southwest Gas Corp. | 3.700% | | 4/1/28 | | 4,320 | | 4,899 | |
| | Southwest Gas Corp. | 2.200% | | 6/15/30 | | 617 | | 649 | |
| | Other Utility (0.2%) | |
| | American Water Capital Corp. | 2.950% | | 9/1/27 | | 4,297 | | 4,735 | |
| | American Water Capital Corp. | 3.750% | | 9/1/28 | | 9,554 | | 11,122 | |
| | American Water Capital Corp. | 3.450% | | 6/1/29 | | 17,001 | | 19,418 | |
| | American Water Capital Corp. | 2.800% | | 5/1/30 | | 11,675 | | 12,801 | |
| | Essential Utilities Inc. | 3.566% | | 5/1/29 | | 8,478 | | 9,646 | |
| | Essential Utilities Inc. | 2.704% | | 4/15/30 | | 8,040 | | 8,677 | |
| | United Utilities plc | 6.875% | | 8/15/28 | | 2,312 | | 2,990 | |
| | | | 2,580,097 | |
Total Corporate Bonds (Cost $38,085,587) | | 40,443,905 | |
| | | | | Shares | | | |
| Temporary Cash Investment (0.1%) | |
| Money Market Fund (0.1%) | |
| 4 | Vanguard Market Liquidity Fund (Cost $27,428) | 0.147% | | | | 274,280 | | 27,428 | |
| Total Investments (99.1%) (Cost $38,135,420) | | 40,493,720 | |
| Other Assets and Liabilities—Net (0.9%) | | 356,508 | |
| Net Assets (100%) | | 40,850,228 | |
Cost is in $000.
| 1 | The average or expected maturity is shorter than the final maturity shown because of the possibility of interim principal payments and prepayments or the possibility of the issue being called. |
| 2 | Security exempt from registration under Rule 144A of the Securities Act of 1933. Such securities may be sold in transactions exempt from registration, normally to qualified institutional buyers. At August 31, 2020, the aggregate value of these securities was $1,543,820,000, representing 3.8% of net assets. |
| 3 | Securities with a value of $5,141,000 have been segregated as initial margin for open futures contracts. |
| 4 | Affiliated money market fund available only to Vanguard funds and certain trusts and accounts managed by Vanguard. Rate shown is the 7-day yield. |
Vanguard® Long-Term Corporate Bond Index Fund
Schedule of Investments
August 31, 2020
| | | | Face | Market |
| | | Maturity | Amount | Value |
| | Coupon | Date | ($000) | ($000) |
U.S. Government and Agency Obligations (0.5%) |
| U.S. Government Securities (0.5%) |
| | United States Treasury Note/Bond | 0.625% | 8/15/30 | 27,960 | 27,724 |
| | United States Treasury Note/Bond | 1.250% | 5/15/50 | 465 | 438 |
Total U.S. Government and Agency Obligations (Cost $28,175) | 28,162 |
Corporate Bonds (98.2%) |
| Finance (16.6%) |
| | Banking (8.7%) |
| | Ally Financial Inc. | 8.000% | 11/1/31 | 3,273 | 4,451 |
| | Ally Financial Inc. | 8.000% | 11/1/31 | 2,075 | 2,734 |
| | American Express Co. | 4.050% | 12/3/42 | 3,242 | 3,997 |
| | Bank of America Corp. | 6.110% | 1/29/37 | 6,035 | 8,606 |
| 1 | Bank of America Corp. | 4.244% | 4/24/38 | 3,655 | 4,445 |
| | Bank of America Corp. | 7.750% | 5/14/38 | 3,260 | 5,423 |
| 1 | Bank of America Corp. | 4.078% | 4/23/40 | 880 | 1,064 |
| 1 | Bank of America Corp. | 2.676% | 6/19/41 | 12,902 | 13,176 |
| | Bank of America Corp. | 5.875% | 2/7/42 | 3,016 | 4,535 |
| | Bank of America Corp. | 5.000% | 1/21/44 | 3,594 | 4,948 |
| | Bank of America Corp. | 4.875% | 4/1/44 | 1,442 | 1,938 |
| | Bank of America Corp. | 4.750% | 4/21/45 | 1,956 | 2,624 |
| 1 | Bank of America Corp. | 4.443% | 1/20/48 | 5,947 | 7,704 |
| 1 | Bank of America Corp. | 3.946% | 1/23/49 | 2,890 | 3,516 |
| 1 | Bank of America Corp. | 4.330% | 3/15/50 | 8,539 | 10,865 |
| 1 | Bank of America Corp. | 4.083% | 3/20/51 | 11,740 | 14,653 |
| | Bank of America NA | 6.000% | 10/15/36 | 3,207 | 4,673 |
| | Barclays plc | 5.250% | 8/17/45 | 2,770 | 3,776 |
| | Barclays plc | 4.950% | 1/10/47 | 3,030 | 4,075 |
| | Citigroup Inc. | 6.625% | 6/15/32 | 1,602 | 2,244 |
| | Citigroup Inc. | 5.875% | 2/22/33 | 293 | 384 |
| | Citigroup Inc. | 6.000% | 10/31/33 | 2,417 | 3,283 |
| | Citigroup Inc. | 6.125% | 8/25/36 | 600 | 806 |
| 1 | Citigroup Inc. | 3.878% | 1/24/39 | 2,342 | 2,783 |
| | Citigroup Inc. | 8.125% | 7/15/39 | 3,908 | 6,863 |
| 1 | Citigroup Inc. | 5.316% | 3/26/41 | 795 | 1,115 |
| | Citigroup Inc. | 5.875% | 1/30/42 | 4,037 | 5,969 |
| | Citigroup Inc. | 6.675% | 9/13/43 | 2,750 | 4,277 |
| | Citigroup Inc. | 5.300% | 5/6/44 | 4,088 | 5,505 |
| | Citigroup Inc. | 4.650% | 7/30/45 | 2,697 | 3,463 |
| | Citigroup Inc. | 4.750% | 5/18/46 | 6,804 | 8,671 |
| 1 | Citigroup Inc. | 4.281% | 4/24/48 | 1,149 | 1,476 |
| | Citigroup Inc. | 4.650% | 7/23/48 | 2,627 | 3,508 |
| | Cooperatieve Rabobank UA | 5.250% | 5/24/41 | 4,951 | 7,232 |
| | Cooperatieve Rabobank UA | 5.750% | 12/1/43 | 2,010 | 2,932 |
| | Cooperatieve Rabobank UA | 5.250% | 8/4/45 | 1,959 | 2,703 |
| | Credit Suisse Group Funding Guernsey Ltd. | 4.875% | 5/15/45 | 5,355 | 7,241 |
| | Credit Suisse USA Inc. | 7.125% | 7/15/32 | 1,951 | 3,001 |
| | Fifth Third Bancorp | 8.250% | 3/1/38 | 2,137 | 3,532 |
| | First Republic Bank | 4.375% | 8/1/46 | 473 | 561 |
| | First Republic Bank | 4.625% | 2/13/47 | 570 | 705 |
| | Goldman Sachs Capital I | 6.345% | 2/15/34 | 1,431 | 2,011 |
| | Goldman Sachs Group Inc. | 6.125% | 2/15/33 | 3,002 | 4,240 |
| | Goldman Sachs Group Inc. | 6.450% | 5/1/36 | 3,279 | 4,543 |
| | Goldman Sachs Group Inc. | 6.750% | 10/1/37 | 13,886 | 20,220 |
| 1 | Goldman Sachs Group Inc. | 4.017% | 10/31/38 | 5,482 | 6,470 |
| 1 | Goldman Sachs Group Inc. | 4.411% | 4/23/39 | 2,704 | 3,310 |
| | Goldman Sachs Group Inc. | 6.250% | 2/1/41 | 2,412 | 3,631 |
| | Goldman Sachs Group Inc. | 4.800% | 7/8/44 | 5,643 | 7,405 |
| | Goldman Sachs Group Inc. | 5.150% | 5/22/45 | 5,584 | 7,383 |
| | Goldman Sachs Group Inc. | 4.750% | 10/21/45 | 2,951 | 3,906 |
| | HSBC Bank USA NA | 7.000% | 1/15/39 | 1,850 | 2,814 |
| | HSBC Bank USA NA | 5.875% | 11/1/34 | 150 | 204 |
| | HSBC Holdings plc | 7.625% | 5/17/32 | 1,651 | 2,281 |
Vanguard® Long-Term Corporate Bond Index Fund
Schedule of Investments
August 31, 2020
| | | | Face | Market |
| | | Maturity | Amount | Value |
| | Coupon | Date | ($000) | ($000) |
| | HSBC Holdings plc | 6.500% | 5/2/36 | 4,270 | 5,834 |
| | HSBC Holdings plc | 6.500% | 9/15/37 | 7,750 | 10,759 |
| | HSBC Holdings plc | 6.800% | 6/1/38 | 1,710 | 2,419 |
| | HSBC Holdings plc | 6.100% | 1/14/42 | 856 | 1,238 |
| | HSBC Holdings plc | 5.250% | 3/14/44 | 3,577 | 4,623 |
| | JPMorgan Chase & Co. | 8.750% | 9/1/30 | 218 | 322 |
| | JPMorgan Chase & Co. | 6.400% | 5/15/38 | 6,250 | 9,669 |
| 1 | JPMorgan Chase & Co. | 3.882% | 7/24/38 | 9,461 | 11,329 |
| | JPMorgan Chase & Co. | 5.500% | 10/15/40 | 4,220 | 6,085 |
| 1 | JPMorgan Chase & Co. | 3.109% | 4/22/41 | 3,150 | 3,448 |
| | JPMorgan Chase & Co. | 5.600% | 7/15/41 | 1,701 | 2,520 |
| | JPMorgan Chase & Co. | 5.400% | 1/6/42 | 2,555 | 3,707 |
| | JPMorgan Chase & Co. | 5.625% | 8/16/43 | 1,507 | 2,183 |
| | JPMorgan Chase & Co. | 4.850% | 2/1/44 | 2,015 | 2,766 |
| | JPMorgan Chase & Co. | 4.950% | 6/1/45 | 2,654 | 3,618 |
| 1 | JPMorgan Chase & Co. | 4.260% | 2/22/48 | 5,258 | 6,700 |
| 1 | JPMorgan Chase & Co. | 4.032% | 7/24/48 | 4,552 | 5,590 |
| 1 | JPMorgan Chase & Co. | 3.964% | 11/15/48 | 7,768 | 9,472 |
| 1 | JPMorgan Chase & Co. | 3.897% | 1/23/49 | 5,041 | 6,109 |
| 1 | JPMorgan Chase & Co. | 3.109% | 4/22/51 | 5,003 | 5,409 |
| | Lloyds Banking Group plc | 5.300% | 12/1/45 | 2,243 | 3,051 |
| | Lloyds Banking Group plc | 4.344% | 1/9/48 | 2,120 | 2,593 |
| | Mitsubishi UFJ Financial Group Inc. | 4.286% | 7/26/38 | 1,490 | 1,837 |
| | Mitsubishi UFJ Financial Group Inc. | 4.153% | 3/7/39 | 2,585 | 3,144 |
| | Mitsubishi UFJ Financial Group Inc. | 3.751% | 7/18/39 | 1,767 | 2,056 |
| 1 | Mizuho Financial Group Inc. | 2.591% | 5/25/31 | 100 | 105 |
| | Morgan Stanley | 7.250% | 4/1/32 | 4,135 | 6,297 |
| 1 | Morgan Stanley | 3.971% | 7/22/38 | 4,478 | 5,371 |
| 1 | Morgan Stanley | 4.457% | 4/22/39 | 3,135 | 3,961 |
| | Morgan Stanley | 6.375% | 7/24/42 | 1,541 | 2,438 |
| | Morgan Stanley | 4.300% | 1/27/45 | 7,560 | 9,844 |
| | Morgan Stanley | 4.375% | 1/22/47 | 1,670 | 2,217 |
| 1 | Morgan Stanley | 5.597% | 3/24/51 | 7,625 | 11,710 |
| 1 | Natwest Group plc | 3.032% | 11/28/35 | 1,000 | 998 |
| | Regions Bank | 6.450% | 6/26/37 | 830 | 1,153 |
| | Regions Financial Corp. | 7.375% | 12/10/37 | 516 | 754 |
| | Wachovia Corp. | 7.500% | 4/15/35 | 795 | 1,180 |
| | Wachovia Corp. | 5.500% | 8/1/35 | 2,193 | 2,917 |
| | Wells Fargo & Co. | 5.375% | 2/7/35 | 200 | 273 |
| 1 | Wells Fargo & Co. | 3.068% | 4/30/41 | 10,150 | 10,772 |
| | Wells Fargo & Co. | 5.375% | 11/2/43 | 6,104 | 8,110 |
| | Wells Fargo & Co. | 5.606% | 1/15/44 | 4,792 | 6,522 |
| | Wells Fargo & Co. | 4.650% | 11/4/44 | 4,921 | 6,057 |
| | Wells Fargo & Co. | 3.900% | 5/1/45 | 6,600 | 7,713 |
| | Wells Fargo & Co. | 4.900% | 11/17/45 | 4,795 | 6,124 |
| | Wells Fargo & Co. | 4.400% | 6/14/46 | 4,687 | 5,565 |
| | Wells Fargo & Co. | 4.750% | 12/7/46 | 4,404 | 5,568 |
| 1 | Wells Fargo & Co. | 5.013% | 4/4/51 | 10,560 | 14,475 |
| | Wells Fargo & Co. | 5.950% | 12/1/86 | 283 | 369 |
| | Wells Fargo Bank NA | 5.950% | 8/26/36 | 1,800 | 2,443 |
| | Wells Fargo Bank NA | 5.850% | 2/1/37 | 1,488 | 2,045 |
| | Wells Fargo Bank NA | 6.600% | 1/15/38 | 3,693 | 5,473 |
| | Westpac Banking Corp. | 4.421% | 7/24/39 | 2,181 | 2,696 |
| | Brokerage (0.6%) |
| | BlackRock Inc. | 1.900% | 1/28/31 | 3,840 | 4,000 |
| | Brookfield Finance Inc. | 4.700% | 9/20/47 | 1,898 | 2,207 |
| | Brookfield Finance LLC | 3.450% | 4/15/50 | 1,375 | 1,356 |
| | CME Group Inc. | 5.300% | 9/15/43 | 1,776 | 2,593 |
| | CME Group Inc. | 4.150% | 6/15/48 | 1,020 | 1,332 |
| | Intercontinental Exchange Inc. | 2.650% | 9/15/40 | 2,250 | 2,277 |
| | Intercontinental Exchange Inc. | 4.250% | 9/21/48 | 2,109 | 2,638 |
| | Intercontinental Exchange Inc. | 3.000% | 6/15/50 | 3,651 | 3,821 |
| | Intercontinental Exchange Inc. | 3.000% | 9/15/60 | 5,500 | 5,681 |
Vanguard® Long-Term Corporate Bond Index Fund
Schedule of Investments
August 31, 2020
| | | | Face | Market |
| | | Maturity | Amount | Value |
| | Coupon | Date | ($000) | ($000) |
| | Invesco Finance plc | 5.375% | 11/30/43 | 1,133 | 1,386 |
| | Jefferies Group LLC | 6.250% | 1/15/36 | 663 | 808 |
| | Jefferies Group LLC | 6.500% | 1/20/43 | 834 | 1,057 |
| | Legg Mason Inc. | 5.625% | 1/15/44 | 1,215 | 1,665 |
| | Nasdaq Inc. | 3.250% | 4/28/50 | 1,140 | 1,209 |
| | Raymond James Financial Inc. | 4.950% | 7/15/46 | 2,342 | 3,005 |
| | Finance Companies (0.5%) |
| | GATX Corp. | 5.200% | 3/15/44 | 580 | 679 |
| 2 | GE Capital Funding LLC | 4.550% | 5/15/32 | 1,705 | 1,796 |
| | GE Capital International Funding Co. Unlimited Co. | 4.418% | 11/15/35 | 26,475 | 27,303 |
| | Insurance (5.5%) |
| | Aetna Inc. | 6.625% | 6/15/36 | 1,286 | 1,827 |
| | Aetna Inc. | 6.750% | 12/15/37 | 541 | 775 |
| | Aetna Inc. | 4.500% | 5/15/42 | 1,302 | 1,535 |
| | Aetna Inc. | 4.125% | 11/15/42 | 1,728 | 1,976 |
| | Aetna Inc. | 4.750% | 3/15/44 | 1,732 | 2,165 |
| | Aetna Inc. | 3.875% | 8/15/47 | 1,990 | 2,280 |
| | Aflac Inc. | 4.000% | 10/15/46 | 768 | 872 |
| | Aflac Inc. | 4.750% | 1/15/49 | 2,505 | 3,237 |
| | Alleghany Corp. | 4.900% | 9/15/44 | 872 | 1,036 |
| | Allstate Corp. | 5.350% | 6/1/33 | 769 | 1,052 |
| | Allstate Corp. | 5.550% | 5/9/35 | 1,046 | 1,500 |
| | Allstate Corp. | 5.950% | 4/1/36 | 35 | 51 |
| | Allstate Corp. | 4.500% | 6/15/43 | 936 | 1,184 |
| | Allstate Corp. | 4.200% | 12/15/46 | 995 | 1,247 |
| | Allstate Corp. | 3.850% | 8/10/49 | 2,080 | 2,506 |
| 1 | Allstate Corp. | 6.500% | 5/15/67 | 1,070 | 1,354 |
| | American Financial Group Inc. | 4.500% | 6/15/47 | 983 | 1,063 |
| | American International Group Inc. | 3.875% | 1/15/35 | 2,343 | 2,686 |
| | American International Group Inc. | 4.700% | 7/10/35 | 1,909 | 2,358 |
| | American International Group Inc. | 6.250% | 5/1/36 | 1,095 | 1,535 |
| | American International Group Inc. | 4.500% | 7/16/44 | 3,222 | 3,778 |
| | American International Group Inc. | 4.800% | 7/10/45 | 1,900 | 2,319 |
| | American International Group Inc. | 4.750% | 4/1/48 | 2,477 | 3,007 |
| | American International Group Inc. | 4.375% | 6/30/50 | 3,365 | 4,013 |
| | American International Group Inc. | 4.375% | 1/15/55 | 3,405 | 3,934 |
| 1 | American International Group Inc. | 8.175% | 5/15/68 | 487 | 692 |
| | Anthem Inc. | 5.950% | 12/15/34 | 661 | 926 |
| | Anthem Inc. | 5.850% | 1/15/36 | 500 | 675 |
| | Anthem Inc. | 6.375% | 6/15/37 | 205 | 287 |
| | Anthem Inc. | 4.625% | 5/15/42 | 3,278 | 4,084 |
| | Anthem Inc. | 4.650% | 1/15/43 | 3,423 | 4,293 |
| | Anthem Inc. | 5.100% | 1/15/44 | 1,548 | 2,037 |
| | Anthem Inc. | 4.650% | 8/15/44 | 2,001 | 2,548 |
| | Anthem Inc. | 4.375% | 12/1/47 | 3,247 | 4,061 |
| | Anthem Inc. | 4.550% | 3/1/48 | 1,935 | 2,436 |
| | Anthem Inc. | 3.700% | 9/15/49 | 783 | 875 |
| | Anthem Inc. | 3.125% | 5/15/50 | 1,925 | 2,018 |
| | Aon Corp. | 6.250% | 9/30/40 | 930 | 1,353 |
| | Aon plc | 4.600% | 6/14/44 | 1,321 | 1,662 |
| | Aon plc | 4.750% | 5/15/45 | 1,184 | 1,535 |
| | Arch Capital Finance LLC | 5.031% | 12/15/46 | 1,178 | 1,491 |
| | Arch Capital Group Ltd. | 7.350% | 5/1/34 | 405 | 609 |
| | Arch Capital Group Ltd. | 3.635% | 6/30/50 | 1,525 | 1,619 |
| | Arch Capital Group US Inc. | 5.144% | 11/1/43 | 1,698 | 2,158 |
| | AXA SA | 8.600% | 12/15/30 | 2,023 | 3,045 |
| | Berkshire Hathaway Finance Corp. | 5.750% | 1/15/40 | 553 | 827 |
| | Berkshire Hathaway Finance Corp. | 4.400% | 5/15/42 | 3,359 | 4,360 |
| | Berkshire Hathaway Finance Corp. | 4.300% | 5/15/43 | 2,183 | 2,774 |
| | Berkshire Hathaway Finance Corp. | 4.200% | 8/15/48 | 3,778 | 4,775 |
| | Berkshire Hathaway Finance Corp. | 4.250% | 1/15/49 | 5,585 | 7,238 |
| | Berkshire Hathaway Inc. | 4.500% | 2/11/43 | 1,083 | 1,422 |
| | Brighthouse Financial Inc. | 4.700% | 6/22/47 | 3,150 | 2,983 |
Vanguard® Long-Term Corporate Bond Index Fund
Schedule of Investments
August 31, 2020
| | | | Face | Market |
| | | Maturity | Amount | Value |
| | Coupon | Date | ($000) | ($000) |
| | Chubb Corp. | 6.000% | 5/11/37 | 1,381 | 2,012 |
| | Chubb Corp. | 6.500% | 5/15/38 | 1,135 | 1,742 |
| | Chubb INA Holdings Inc. | 6.700% | 5/15/36 | 538 | 812 |
| | Chubb INA Holdings Inc. | 4.150% | 3/13/43 | 1,262 | 1,586 |
| | Chubb INA Holdings Inc. | 4.350% | 11/3/45 | 3,609 | 4,758 |
| | Cincinnati Financial Corp. | 6.125% | 11/1/34 | 769 | 1,088 |
| | Equitable Holdings Inc. | 5.000% | 4/20/48 | 3,254 | 3,800 |
| | Everest Reinsurance Holdings Inc. | 4.868% | 6/1/44 | 813 | 937 |
| | Hanover Insurance Group Inc. | 2.500% | 9/1/30 | 700 | 713 |
| | Hartford Financial Services Group Inc. | 5.950% | 10/15/36 | 369 | 494 |
| | Hartford Financial Services Group Inc. | 6.100% | 10/1/41 | 1,086 | 1,547 |
| | Hartford Financial Services Group Inc. | 4.300% | 4/15/43 | 913 | 1,065 |
| | Hartford Financial Services Group Inc. | 4.400% | 3/15/48 | 1,273 | 1,528 |
| | Hartford Financial Services Group Inc. | 3.600% | 8/19/49 | 1,103 | 1,230 |
| | Humana Inc. | 4.625% | 12/1/42 | 1,499 | 1,879 |
| | Humana Inc. | 4.950% | 10/1/44 | 1,139 | 1,506 |
| | Humana Inc. | 4.800% | 3/15/47 | 940 | 1,237 |
| | Humana Inc. | 3.950% | 8/15/49 | 1,140 | 1,375 |
| | Lincoln National Corp. | 3.400% | 1/15/31 | 1,000 | 1,119 |
| | Lincoln National Corp. | 6.300% | 10/9/37 | 1,037 | 1,347 |
| | Lincoln National Corp. | 7.000% | 6/15/40 | 968 | 1,424 |
| | Lincoln National Corp. | 4.350% | 3/1/48 | 861 | 978 |
| | Lincoln National Corp. | 4.375% | 6/15/50 | 831 | 973 |
| | Loews Corp. | 4.125% | 5/15/43 | 1,861 | 2,135 |
| | Manulife Financial Corp. | 5.375% | 3/4/46 | 1,440 | 1,952 |
| | Markel Corp. | 5.000% | 4/5/46 | 1,265 | 1,610 |
| | Markel Corp. | 4.300% | 11/1/47 | 725 | 843 |
| | Markel Corp. | 5.000% | 5/20/49 | 750 | 963 |
| | Markel Corp. | 4.150% | 9/17/50 | 1,132 | 1,313 |
| | Marsh & McLennan Cos. Inc. | 2.250% | 11/15/30 | 2,215 | 2,322 |
| | Marsh & McLennan Cos. Inc. | 5.875% | 8/1/33 | 933 | 1,317 |
| | Marsh & McLennan Cos. Inc. | 4.750% | 3/15/39 | 1,785 | 2,363 |
| | Marsh & McLennan Cos. Inc. | 4.350% | 1/30/47 | 985 | 1,272 |
| | Marsh & McLennan Cos. Inc. | 4.200% | 3/1/48 | 535 | 684 |
| | Marsh & McLennan Cos. Inc. | 4.900% | 3/15/49 | 2,535 | 3,519 |
| | MetLife Inc. | 6.500% | 12/15/32 | 619 | 924 |
| | MetLife Inc. | 6.375% | 6/15/34 | 650 | 986 |
| | MetLife Inc. | 5.700% | 6/15/35 | 2,968 | 4,346 |
| | MetLife Inc. | 5.875% | 2/6/41 | 994 | 1,448 |
| | MetLife Inc. | 4.125% | 8/13/42 | 2,235 | 2,718 |
| | MetLife Inc. | 4.875% | 11/13/43 | 2,555 | 3,421 |
| | MetLife Inc. | 4.721% | 12/15/44 | 1,017 | 1,321 |
| | MetLife Inc. | 4.050% | 3/1/45 | 3,274 | 3,990 |
| | MetLife Inc. | 4.600% | 5/13/46 | 2,429 | 3,180 |
| 1 | MetLife Inc. | 6.400% | 12/15/66 | 3,846 | 4,803 |
| 1 | MetLife Inc. | 10.750% | 8/1/69 | 378 | 617 |
| 1 | Nationwide Financial Services Inc. | 6.750% | 5/15/87 | 443 | 523 |
| | Principal Financial Group Inc. | 6.050% | 10/15/36 | 440 | 604 |
| | Principal Financial Group Inc. | 4.625% | 9/15/42 | 1,078 | 1,317 |
| | Principal Financial Group Inc. | 4.350% | 5/15/43 | 653 | 774 |
| | Principal Financial Group Inc. | 4.300% | 11/15/46 | 653 | 775 |
| | Progressive Corp. | 6.625% | 3/1/29 | 1 | 1 |
| | Progressive Corp. | 6.250% | 12/1/32 | 970 | 1,415 |
| | Progressive Corp. | 4.350% | 4/25/44 | 1,050 | 1,362 |
| | Progressive Corp. | 3.700% | 1/26/45 | 635 | 758 |
| | Progressive Corp. | 4.125% | 4/15/47 | 893 | 1,140 |
| | Progressive Corp. | 4.200% | 3/15/48 | 2,288 | 2,952 |
| | Progressive Corp. | 3.950% | 3/26/50 | 630 | 801 |
| | Prudential Financial Inc. | 5.750% | 7/15/33 | 999 | 1,348 |
| | Prudential Financial Inc. | 5.700% | 12/14/36 | 474 | 669 |
| | Prudential Financial Inc. | 6.625% | 12/1/37 | 1,233 | 1,827 |
| | Prudential Financial Inc. | 3.000% | 3/10/40 | 700 | 738 |
| | Prudential Financial Inc. | 6.625% | 6/21/40 | 690 | 1,042 |
| | Prudential Financial Inc. | 6.200% | 11/15/40 | 620 | 897 |
Vanguard® Long-Term Corporate Bond Index Fund
Schedule of Investments
August 31, 2020
| | | | Face | Market |
| | | Maturity | Amount | Value |
| | Coupon | Date | ($000) | ($000) |
| | Prudential Financial Inc. | 5.100% | 8/15/43 | 516 | 646 |
| | Prudential Financial Inc. | 4.600% | 5/15/44 | 979 | 1,218 |
| | Prudential Financial Inc. | 3.905% | 12/7/47 | 2,705 | 3,012 |
| | Prudential Financial Inc. | 4.418% | 3/27/48 | 1,325 | 1,576 |
| | Prudential Financial Inc. | 3.935% | 12/7/49 | 3,081 | 3,447 |
| | Prudential Financial Inc. | 4.350% | 2/25/50 | 2,470 | 2,923 |
| | Prudential Financial Inc. | 3.700% | 3/13/51 | 1,190 | 1,325 |
| | Selective Insurance Group Inc. | 5.375% | 3/1/49 | 580 | 687 |
| | Transatlantic Holdings Inc. | 8.000% | 11/30/39 | 583 | 894 |
| | Travelers Cos. Inc. | 6.750% | 6/20/36 | 385 | 579 |
| | Travelers Cos. Inc. | 6.250% | 6/15/37 | 113 | 169 |
| | Travelers Cos. Inc. | 5.350% | 11/1/40 | 1,635 | 2,277 |
| | Travelers Cos. Inc. | 4.600% | 8/1/43 | 1,533 | 1,981 |
| | Travelers Cos. Inc. | 4.300% | 8/25/45 | 1,083 | 1,382 |
| | Travelers Cos. Inc. | 3.750% | 5/15/46 | 1,343 | 1,574 |
| | Travelers Cos. Inc. | 4.000% | 5/30/47 | 2,161 | 2,649 |
| | Travelers Cos. Inc. | 4.050% | 3/7/48 | 2,461 | 3,022 |
| | Travelers Cos. Inc. | 4.100% | 3/4/49 | 619 | 765 |
| | Travelers Cos. Inc. | 2.550% | 4/27/50 | 930 | 916 |
| | Travelers Property Casualty Corp. | 6.375% | 3/15/33 | 1,110 | 1,641 |
| | UnitedHealth Group Inc. | 4.625% | 7/15/35 | 3,571 | 4,712 |
| | UnitedHealth Group Inc. | 5.800% | 3/15/36 | 1,542 | 2,220 |
| | UnitedHealth Group Inc. | 6.500% | 6/15/37 | 320 | 489 |
| | UnitedHealth Group Inc. | 6.625% | 11/15/37 | 2,319 | 3,596 |
| | UnitedHealth Group Inc. | 6.875% | 2/15/38 | 1,453 | 2,340 |
| | UnitedHealth Group Inc. | 3.500% | 8/15/39 | 3,947 | 4,507 |
| | UnitedHealth Group Inc. | 2.750% | 5/15/40 | 1,445 | 1,525 |
| | UnitedHealth Group Inc. | 5.700% | 10/15/40 | 629 | 912 |
| | UnitedHealth Group Inc. | 5.950% | 2/15/41 | 443 | 663 |
| | UnitedHealth Group Inc. | 4.625% | 11/15/41 | 1,878 | 2,479 |
| | UnitedHealth Group Inc. | 4.375% | 3/15/42 | 1,573 | 2,022 |
| | UnitedHealth Group Inc. | 3.950% | 10/15/42 | 2,223 | 2,624 |
| | UnitedHealth Group Inc. | 4.250% | 3/15/43 | 1,963 | 2,495 |
| | UnitedHealth Group Inc. | 4.750% | 7/15/45 | 4,852 | 6,572 |
| | UnitedHealth Group Inc. | 4.200% | 1/15/47 | 3,695 | 4,605 |
| | UnitedHealth Group Inc. | 4.250% | 4/15/47 | 655 | 823 |
| | UnitedHealth Group Inc. | 3.750% | 10/15/47 | 1,608 | 1,894 |
| | UnitedHealth Group Inc. | 4.250% | 6/15/48 | 1,340 | 1,700 |
| | UnitedHealth Group Inc. | 4.450% | 12/15/48 | 2,298 | 3,010 |
| | UnitedHealth Group Inc. | 3.700% | 8/15/49 | 1,670 | 1,988 |
| | UnitedHealth Group Inc. | 2.900% | 5/15/50 | 2,950 | 3,098 |
| | UnitedHealth Group Inc. | 3.875% | 8/15/59 | 3,688 | 4,549 |
| | UnitedHealth Group Inc. | 3.125% | 5/15/60 | 3,135 | 3,411 |
| | Unum Group | 5.750% | 8/15/42 | 1,060 | 1,186 |
| | Unum Group | 4.500% | 12/15/49 | 440 | 423 |
| | Voya Financial Inc. | 5.700% | 7/15/43 | 561 | 731 |
| | Voya Financial Inc. | 4.800% | 6/15/46 | 857 | 1,022 |
| | W R Berkley Corp. | 4.000% | 5/12/50 | 600 | 686 |
| | Willis North America Inc. | 5.050% | 9/15/48 | 1,830 | 2,429 |
| | Willis North America Inc. | 3.875% | 9/15/49 | 685 | 784 |
| | WR Berkley Corp. | 4.750% | 8/1/44 | 859 | 1,061 |
| | XLIT Ltd. | 5.250% | 12/15/43 | 562 | 764 |
| | XLIT Ltd. | 5.500% | 3/31/45 | 1,235 | 1,674 |
| | Real Estate Investment Trusts (1.3%) |
| | Alexandria Real Estate Equities Inc. | 4.900% | 12/15/30 | 1,176 | 1,491 |
| | Alexandria Real Estate Equities Inc. | 3.375% | 8/15/31 | 2,783 | 3,147 |
| | Alexandria Real Estate Equities Inc. | 1.875% | 2/1/33 | 2,500 | 2,470 |
| | Alexandria Real Estate Equities Inc. | 4.850% | 4/15/49 | 695 | 951 |
| | Alexandria Real Estate Equities Inc. | 4.000% | 2/1/50 | 980 | 1,189 |
| | American Campus Communities Operating Partnership LP | 3.875% | 1/30/31 | 225 | 244 |
| | AvalonBay Communities Inc. | 2.450% | 1/15/31 | 1,265 | 1,349 |
| | AvalonBay Communities Inc. | 3.900% | 10/15/46 | 1,030 | 1,253 |
Vanguard® Long-Term Corporate Bond Index Fund
Schedule of Investments
August 31, 2020
| | | | Face | Market | |
| | | Maturity | Amount | Value | |
| | Coupon | Date | ($000) | ($000 | ) |
| | AvalonBay Communities Inc. | 4.150% | 7/1/47 | 783 | 976 | |
| | Boston Properties LP | 3.250% | 1/30/31 | 2,540 | 2,761 | |
| | Camden Property Trust | 3.350% | 11/1/49 | 1,225 | 1,349 | |
| | Duke Realty LP | 3.050% | 3/1/50 | 615 | 665 | |
| | ERP Operating LP | 4.500% | 7/1/44 | 2,008 | 2,571 | |
| | ERP Operating LP | 4.500% | 6/1/45 | 608 | 790 | |
| | ERP Operating LP | 4.000% | 8/1/47 | 663 | 813 | |
| | Essex Portfolio LP | 1.650% | 1/15/31 | 750 | 727 | |
| | Essex Portfolio LP | 2.650% | 3/15/32 | 2,050 | 2,167 | |
| | Essex Portfolio LP | 4.500% | 3/15/48 | 205 | 261 | |
| | Essex Portfolio LP | 2.650% | 9/1/50 | 800 | 740 | |
| | Federal Realty Investment Trust | 4.500% | 12/1/44 | 1,463 | 1,689 | |
| | Healthpeak Properties Inc. | 2.875% | 1/15/31 | 200 | 213 | |
| | Healthpeak Properties Inc. | 6.750% | 2/1/41 | 756 | 1,082 | |
| | Highwoods Realty LP | 2.600% | 2/1/31 | 750 | 744 | |
| | Host Hotels & Resorts LP | 3.500% | 9/15/30 | 1,500 | 1,479 | |
| | Kilroy Realty LP | 2.500% | 11/15/32 | 1,300 | 1,269 | |
| | Kimco Realty Corp. | 2.700% | 10/1/30 | 1,800 | 1,838 | |
| | Kimco Realty Corp. | 4.250% | 4/1/45 | 937 | 988 | |
| | Kimco Realty Corp. | 4.125% | 12/1/46 | 508 | 529 | |
| | Kimco Realty Corp. | 4.450% | 9/1/47 | 645 | 705 | |
| | Kimco Realty Corp. | 3.700% | 10/1/49 | 1,060 | 1,042 | |
| | Lexington Realty Trust | 2.700% | 9/15/30 | 500 | 506 | |
| | Mid-America Apartments LP | 1.700% | 2/15/31 | 900 | 882 | |
| | National Retail Properties Inc. | 4.800% | 10/15/48 | 1,150 | 1,321 | |
| | National Retail Properties Inc. | 3.100% | 4/15/50 | 670 | 595 | |
| | Prologis LP | 4.375% | 9/15/48 | 390 | 527 | |
| | Prologis LP | 3.000% | 4/15/50 | 2,625 | 2,842 | |
| | Prologis LP | 2.125% | 10/15/50 | 1,500 | 1,374 | |
| | Realty Income Corp. | 3.250% | 1/15/31 | 1,920 | 2,133 | |
| | Realty Income Corp. | 4.650% | 3/15/47 | 1,760 | 2,299 | |
| | Regency Centers LP | 4.400% | 2/1/47 | 970 | 1,093 | |
| | Regency Centers LP | 4.650% | 3/15/49 | 285 | 329 | |
| | Retail Properties of America Inc. | 4.750% | 9/15/30 | 800 | 791 | |
| | Simon Property Group LP | 6.750% | 2/1/40 | 365 | 515 | |
| | Simon Property Group LP | 4.750% | 3/15/42 | 1,510 | 1,764 | |
| | Simon Property Group LP | 4.250% | 10/1/44 | 1,558 | 1,720 | |
| | Simon Property Group LP | 4.250% | 11/30/46 | 2,446 | 2,694 | |
| | Simon Property Group LP | 3.250% | 9/13/49 | 3,320 | 3,132 | |
| | Simon Property Group LP | 3.800% | 7/15/50 | 500 | 518 | |
| | Spirit Realty LP | 3.200% | 2/15/31 | 500 | 489 | |
| | UDR Inc. | 3.000% | 8/15/31 | 1,985 | 2,176 | |
| | UDR Inc. | 2.100% | 8/1/32 | 500 | 501 | |
| | UDR Inc. | 3.100% | 11/1/34 | 15 | 16 | |
| | Ventas Realty LP | 4.750% | 11/15/30 | 835 | 951 | |
| | Ventas Realty LP | 5.700% | 9/30/43 | 539 | 634 | |
| | Ventas Realty LP | 4.375% | 2/1/45 | 338 | 350 | |
| | Ventas Realty LP | 4.875% | 4/15/49 | 1,417 | 1,566 | |
| | Welltower Inc. | 6.500% | 3/15/41 | 1,760 | 2,350 | |
| | Welltower Inc. | 4.950% | 9/1/48 | 1,391 | 1,676 | |
| | 961,445 | |
| Industrial (69.5%) | |
| | Basic Industry (3.6%) | |
| | Air Products & Chemicals Inc. | 2.700% | 5/15/40 | 2,000 | 2,140 | |
| | Air Products & Chemicals Inc. | 2.800% | 5/15/50 | 1,785 | 1,875 | |
| | Albemarle Corp. | 5.450% | 12/1/44 | 685 | 750 | |
| | Barrick Gold Corp. | 6.450% | 10/15/35 | 254 | 347 | |
| | Barrick Gold Corp. | 5.250% | 4/1/42 | 1,445 | 1,964 | |
| | Barrick North America Finance LLC | 5.700% | 5/30/41 | 1,625 | 2,279 | |
| | Barrick North America Finance LLC | 5.750% | 5/1/43 | 2,159 | 3,127 | |
| | Barrick PD Australia Finance Pty Ltd. | 5.950% | 10/15/39 | 1,901 | 2,687 | |
| | BHP Billiton Finance USA Ltd. | 4.125% | 2/24/42 | 2,980 | 3,730 | |
| | BHP Billiton Finance USA Ltd. | 5.000% | 9/30/43 | 4,518 | 6,374 | |
Vanguard® Long-Term Corporate Bond Index Fund
Schedule of Investments
August 31, 2020
| | | | Face | Market |
| | | Maturity | Amount | Value |
| | Coupon | Date | ($000) | ($000) |
| | Celulosa Arauco y Constitucion SA | 5.500% | 11/2/47 | 1,150 | 1,267 |
| | Dow Chemical Co. | 2.100% | 11/15/30 | 1,500 | 1,475 |
| | Dow Chemical Co. | 4.250% | 10/1/34 | 2,673 | 3,157 |
| | Dow Chemical Co. | 9.400% | 5/15/39 | 959 | 1,617 |
| | Dow Chemical Co. | 5.250% | 11/15/41 | 931 | 1,127 |
| | Dow Chemical Co. | 4.375% | 11/15/42 | 3,279 | 3,686 |
| | Dow Chemical Co. | 4.625% | 10/1/44 | 2,065 | 2,372 |
| | Dow Chemical Co. | 5.550% | 11/30/48 | 2,039 | 2,673 |
| | Dow Chemical Co. | 4.800% | 5/15/49 | 1,730 | 2,063 |
| | Dow Chemical Co. | 3.600% | 11/15/50 | 1,900 | 1,935 |
| | DuPont de Nemours Inc. | 5.319% | 11/15/38 | 4,515 | 5,776 |
| | DuPont de Nemours Inc. | 5.419% | 11/15/48 | 3,412 | 4,561 |
| | Eastman Chemical Co. | 4.800% | 9/1/42 | 1,764 | 2,092 |
| | Eastman Chemical Co. | 4.650% | 10/15/44 | 2,177 | 2,566 |
| | Ecolab Inc. | 1.300% | 1/30/31 | 1,500 | 1,456 |
| | Ecolab Inc. | 5.500% | 12/8/41 | 850 | 1,227 |
| | Ecolab Inc. | 3.950% | 12/1/47 | 1,661 | 2,097 |
| | Ecolab Inc. | 2.125% | 8/15/50 | 1,000 | 923 |
| | FMC Corp. | 4.500% | 10/1/49 | 1,292 | 1,613 |
| | Georgia-Pacific LLC | 8.875% | 5/15/31 | 903 | 1,458 |
| | International Flavors & Fragrances Inc. | 4.375% | 6/1/47 | 660 | 750 |
| | International Flavors & Fragrances Inc. | 5.000% | 9/26/48 | 1,630 | 2,017 |
| | International Paper Co. | 5.000% | 9/15/35 | 1,916 | 2,433 |
| | International Paper Co. | 7.300% | 11/15/39 | 1,313 | 1,891 |
| | International Paper Co. | 6.000% | 11/15/41 | 1,055 | 1,421 |
| | International Paper Co. | 4.800% | 6/15/44 | 2,203 | 2,669 |
| | International Paper Co. | 5.150% | 5/15/46 | 2,313 | 2,947 |
| | International Paper Co. | 4.400% | 8/15/47 | 3,064 | 3,631 |
| | International Paper Co. | 4.350% | 8/15/48 | 690 | 825 |
| | Lubrizol Corp. | 6.500% | 10/1/34 | 658 | 1,016 |
| | LYB International Finance BV | 5.250% | 7/15/43 | 1,660 | 2,021 |
| | LYB International Finance BV | 4.875% | 3/15/44 | 2,300 | 2,712 |
| | LYB International Finance III LLC | 4.200% | 10/15/49 | 2,520 | 2,746 |
| | LYB International Finance III LLC | 4.200% | 5/1/50 | 3,791 | 4,163 |
| | LyondellBasell Industries NV | 4.625% | 2/26/55 | 1,514 | 1,710 |
| | Mosaic Co. | 5.450% | 11/15/33 | 960 | 1,094 |
| | Mosaic Co. | 4.875% | 11/15/41 | 895 | 929 |
| | Mosaic Co. | 5.625% | 11/15/43 | 1,350 | 1,542 |
| | Newmont Corp. | 2.250% | 10/1/30 | 2,378 | 2,478 |
| | Newmont Corp. | 5.875% | 4/1/35 | 1,262 | 1,819 |
| | Newmont Corp. | 6.250% | 10/1/39 | 2,503 | 3,671 |
| | Newmont Corp. | 4.875% | 3/15/42 | 2,856 | 3,848 |
| | Newmont Corp. | 5.450% | 6/9/44 | 1,076 | 1,507 |
| | Nucor Corp. | 6.400% | 12/1/37 | 478 | 683 |
| | Nucor Corp. | 5.200% | 8/1/43 | 1,745 | 2,301 |
| | Nucor Corp. | 4.400% | 5/1/48 | 1,071 | 1,347 |
| | Nutrien Ltd. | 4.125% | 3/15/35 | 859 | 986 |
| | Nutrien Ltd. | 7.125% | 5/23/36 | 880 | 1,173 |
| | Nutrien Ltd. | 5.875% | 12/1/36 | 1,086 | 1,337 |
| | Nutrien Ltd. | 5.625% | 12/1/40 | 455 | 574 |
| | Nutrien Ltd. | 6.125% | 1/15/41 | 643 | 845 |
| | Nutrien Ltd. | 4.900% | 6/1/43 | 1,099 | 1,357 |
| | Nutrien Ltd. | 5.250% | 1/15/45 | 353 | 442 |
| | Nutrien Ltd. | 5.000% | 4/1/49 | 1,202 | 1,559 |
| | Nutrien Ltd. | 3.950% | 5/13/50 | 1,250 | 1,441 |
| | Packaging Corp. of America | 4.050% | 12/15/49 | 540 | 644 |
| | Praxair Inc. | 3.550% | 11/7/42 | 2,024 | 2,404 |
| | Praxair Inc. | 2.000% | 8/10/50 | 500 | 460 |
| | Rio Tinto Alcan Inc. | 7.250% | 3/15/31 | 1,518 | 2,220 |
| | Rio Tinto Alcan Inc. | 6.125% | 12/15/33 | 349 | 505 |
| | Rio Tinto Alcan Inc. | 5.750% | 6/1/35 | 930 | 1,345 |
| | Rio Tinto Finance USA Ltd. | 5.200% | 11/2/40 | 2,077 | 2,945 |
| | Rio Tinto Finance USA plc | 4.750% | 3/22/42 | 2,035 | 2,737 |
| | Rio Tinto Finance USA plc | 4.125% | 8/21/42 | 1,749 | 2,206 |
Vanguard® Long-Term Corporate Bond Index Fund
Schedule of Investments
August 31, 2020
| | | | Face | Market |
| | | Maturity | Amount | Value |
| | Coupon | Date | ($000) | ($000) |
| | RPM International Inc. | 4.250% | 1/15/48 | 2,000 | 2,112 |
| | Sherwin-Williams Co. | 4.000% | 12/15/42 | 697 | 773 |
| | Sherwin-Williams Co. | 4.550% | 8/1/45 | 950 | 1,158 |
| | Sherwin-Williams Co. | 4.500% | 6/1/47 | 3,395 | 4,281 |
| | Sherwin-Williams Co. | 3.800% | 8/15/49 | 1,661 | 1,914 |
| | Sherwin-Williams Co. | 3.300% | 5/15/50 | 2,000 | 2,140 |
| | Southern Copper Corp. | 7.500% | 7/27/35 | 901 | 1,339 |
| | Southern Copper Corp. | 6.750% | 4/16/40 | 3,195 | 4,656 |
| | Southern Copper Corp. | 5.250% | 11/8/42 | 3,709 | 4,714 |
| | Southern Copper Corp. | 5.875% | 4/23/45 | 3,225 | 4,448 |
| | Steel Dynamics Inc. | 3.250% | 1/15/31 | 1,450 | 1,559 |
| | Teck Resources Ltd. | 6.125% | 10/1/35 | 1,500 | 1,755 |
| | Teck Resources Ltd. | 6.000% | 8/15/40 | 380 | 408 |
| | Teck Resources Ltd. | 6.250% | 7/15/41 | 1,975 | 2,195 |
| | Teck Resources Ltd. | 5.200% | 3/1/42 | 680 | 672 |
| | Teck Resources Ltd. | 5.400% | 2/1/43 | 850 | 865 |
| | Vale Overseas Ltd. | 8.250% | 1/17/34 | 608 | 870 |
| | Vale Overseas Ltd. | 6.875% | 11/21/36 | 4,606 | 6,103 |
| | Vale Overseas Ltd. | 6.875% | 11/10/39 | 3,712 | 4,983 |
| | Vale SA | 5.625% | 9/11/42 | 230 | 275 |
| | Westlake Chemical Corp. | 5.000% | 8/15/46 | 1,431 | 1,616 |
| | Westlake Chemical Corp. | 4.375% | 11/15/47 | 1,206 | 1,257 |
| | WestRock MWV LLC | 7.950% | 2/15/31 | 850 | 1,204 |
| | Weyerhaeuser Co. | 7.375% | 3/15/32 | 2,804 | 4,076 |
| | WRKCO Inc. | 4.200% | 6/1/32 | 1,620 | 1,942 |
| | WRKCo Inc. | 3.000% | 6/15/33 | 890 | 955 |
| | Capital Goods (5.8%) |
| | 3M Co. | 5.700% | 3/15/37 | 950 | 1,374 |
| | 3M Co. | 3.875% | 6/15/44 | 690 | 833 |
| | 3M Co. | 3.125% | 9/19/46 | 2,208 | 2,414 |
| | 3M Co. | 3.625% | 10/15/47 | 867 | 1,022 |
| 3 | 3M Co. | 4.000% | 9/14/48 | 2,315 | 2,934 |
| | 3M Co. | 3.250% | 8/26/49 | 2,500 | 2,819 |
| | 3M Co. | 3.700% | 4/15/50 | 1,110 | 1,353 |
| | ABB Finance USA Inc. | 4.375% | 5/8/42 | 409 | 517 |
| | Boeing Co. | 6.125% | 2/15/33 | 1,079 | 1,281 |
| | Boeing Co. | 3.600% | 5/1/34 | 1,495 | 1,460 |
| | Boeing Co. | 3.250% | 2/1/35 | 3,860 | 3,567 |
| | Boeing Co. | 6.625% | 2/15/38 | 548 | 662 |
| | Boeing Co. | 3.550% | 3/1/38 | 350 | 308 |
| | Boeing Co. | 3.500% | 3/1/39 | 1,552 | 1,366 |
| | Boeing Co. | 6.875% | 3/15/39 | 680 | 829 |
| | Boeing Co. | 5.875% | 2/15/40 | 1,465 | 1,665 |
| | Boeing Co. | 5.705% | 5/1/40 | 9,005 | 10,442 |
| | Boeing Co. | 3.375% | 6/15/46 | 823 | 690 |
| | Boeing Co. | 3.650% | 3/1/47 | 785 | 673 |
| | Boeing Co. | 3.625% | 3/1/48 | 1,256 | 1,082 |
| | Boeing Co. | 3.850% | 11/1/48 | 1,255 | 1,103 |
| | Boeing Co. | 3.900% | 5/1/49 | 2,843 | 2,582 |
| | Boeing Co. | 3.750% | 2/1/50 | 460 | 410 |
| | Boeing Co. | 5.805% | 5/1/50 | 9,410 | 11,232 |
| | Boeing Co. | 3.825% | 3/1/59 | 730 | 638 |
| | Boeing Co. | 3.950% | 8/1/59 | 391 | 354 |
| | Boeing Co. | 5.930% | 5/1/60 | 8,629 | 10,516 |
| 2 | Carrier Global Corp. | 2.700% | 2/15/31 | 1,525 | 1,588 |
| 2 | Carrier Global Corp. | 3.377% | 4/5/40 | 4,628 | 4,763 |
| 2 | Carrier Global Corp. | 3.577% | 4/5/50 | 4,040 | 4,251 |
| | Caterpillar Inc. | 5.300% | 9/15/35 | 678 | 939 |
| | Caterpillar Inc. | 6.050% | 8/15/36 | 683 | 982 |
| | Caterpillar Inc. | 5.200% | 5/27/41 | 1,634 | 2,258 |
| | Caterpillar Inc. | 3.803% | 8/15/42 | 3,229 | 3,953 |
| | Caterpillar Inc. | 4.300% | 5/15/44 | 440 | 552 |
| | Caterpillar Inc. | 3.250% | 9/19/49 | 3,366 | 3,745 |
Vanguard® Long-Term Corporate Bond Index Fund
Schedule of Investments
August 31, 2020
| | | | Face | Market |
| | | Maturity | Amount | Value |
| | Coupon | Date | ($000) | ($000) |
| | Caterpillar Inc. | 3.250% | 4/9/50 | 3,535 | 3,985 |
| | Caterpillar Inc. | 4.750% | 5/15/64 | 1,557 | 2,167 |
| | Crane Co. | 4.200% | 3/15/48 | 655 | 681 |
| | Deere & Co. | 7.125% | 3/3/31 | 278 | 404 |
| | Deere & Co. | 3.900% | 6/9/42 | 2,767 | 3,501 |
| | Deere & Co. | 2.875% | 9/7/49 | 1,380 | 1,488 |
| | Deere & Co. | 3.750% | 4/15/50 | 2,706 | 3,289 |
| | Dover Corp. | 5.375% | 10/15/35 | 710 | 948 |
| | Dover Corp. | 5.375% | 3/1/41 | 553 | 709 |
| | Eaton Corp. | 4.000% | 11/2/32 | 1,313 | 1,572 |
| | Eaton Corp. | 4.150% | 11/2/42 | 2,078 | 2,581 |
| | Eaton Corp. | 3.915% | 9/15/47 | 846 | 1,005 |
| | Emerson Electric Co. | 1.950% | 10/15/30 | 1,090 | 1,137 |
| | Emerson Electric Co. | 5.250% | 11/15/39 | 310 | 424 |
| | Emerson Electric Co. | 2.750% | 10/15/50 | 1,480 | 1,528 |
| | Fortive Corp. | 4.300% | 6/15/46 | 948 | 1,121 |
| | General Dynamics Corp. | 4.250% | 4/1/40 | 1,500 | 1,881 |
| | General Dynamics Corp. | 3.600% | 11/15/42 | 667 | 787 |
| | General Dynamics Corp. | 4.250% | 4/1/50 | 1,757 | 2,283 |
| | General Electric Co. | 6.750% | 3/15/32 | 6,227 | 7,751 |
| | General Electric Co. | 6.150% | 8/7/37 | 2,544 | 2,999 |
| | General Electric Co. | 5.875% | 1/14/38 | 6,629 | 7,632 |
| | General Electric Co. | 6.875% | 1/10/39 | 4,000 | 5,055 |
| | General Electric Co. | 4.250% | 5/1/40 | 3,360 | 3,400 |
| | General Electric Co. | 4.125% | 10/9/42 | 2,587 | 2,550 |
| | General Electric Co. | 4.500% | 3/11/44 | 2,248 | 2,310 |
| | General Electric Co. | 4.350% | 5/1/50 | 8,143 | 8,262 |
| | Honeywell International Inc. | 5.700% | 3/15/36 | 533 | 758 |
| | Honeywell International Inc. | 5.700% | 3/15/37 | 948 | 1,367 |
| | Honeywell International Inc. | 5.375% | 3/1/41 | 691 | 999 |
| | Honeywell International Inc. | 3.812% | 11/21/47 | 2,955 | 3,754 |
| | Honeywell International Inc. | 2.800% | 6/1/50 | 2,900 | 3,141 |
| | Howmet Aerospace Inc. | 5.950% | 2/1/37 | 1,300 | 1,471 |
| | Illinois Tool Works Inc. | 4.875% | 9/15/41 | 1,846 | 2,531 |
| | Illinois Tool Works Inc. | 3.900% | 9/1/42 | 1,816 | 2,285 |
| | Ingersoll-Rand Luxembourg Finance SA | 4.650% | 11/1/44 | 878 | 1,057 |
| | Ingersoll-Rand Luxembourg Finance SA | 4.500% | 3/21/49 | 230 | 289 |
| | Johnson Controls International plc | 6.000% | 1/15/36 | 795 | 1,045 |
| | Johnson Controls International plc | 4.625% | 7/2/44 | 3,111 | 3,763 |
| | Johnson Controls International plc | 4.500% | 2/15/47 | 591 | 710 |
| | Johnson Controls International plc | 4.950% | 7/2/64 | 1,465 | 1,796 |
| | L3Harris Technologies Inc. | 4.854% | 4/27/35 | 914 | 1,197 |
| | L3Harris Technologies Inc. | 6.150% | 12/15/40 | 848 | 1,252 |
| | L3Harris Technologies Inc. | 5.054% | 4/27/45 | 899 | 1,199 |
| | Lockheed Martin Corp. | 3.600% | 3/1/35 | 2,713 | 3,242 |
| | Lockheed Martin Corp. | 4.500% | 5/15/36 | 904 | 1,165 |
| | Lockheed Martin Corp. | 6.150% | 9/1/36 | 895 | 1,331 |
| | Lockheed Martin Corp. | 5.720% | 6/1/40 | 299 | 441 |
| | Lockheed Martin Corp. | 4.850% | 9/15/41 | 770 | 1,000 |
| | Lockheed Martin Corp. | 4.070% | 12/15/42 | 3,485 | 4,379 |
| | Lockheed Martin Corp. | 3.800% | 3/1/45 | 3,253 | 3,946 |
| | Lockheed Martin Corp. | 4.700% | 5/15/46 | 2,675 | 3,649 |
| | Lockheed Martin Corp. | 2.800% | 6/15/50 | 2,157 | 2,264 |
| | Lockheed Martin Corp. | 4.090% | 9/15/52 | 2,952 | 3,806 |
| | Martin Marietta Materials Inc. | 4.250% | 12/15/47 | 1,349 | 1,519 |
| | Masco Corp. | 6.500% | 8/15/32 | 140 | 173 |
| | Masco Corp. | 4.500% | 5/15/47 | 728 | 795 |
| | Northrop Grumman Corp. | 5.150% | 5/1/40 | 803 | 1,088 |
| | Northrop Grumman Corp. | 5.050% | 11/15/40 | 1,851 | 2,466 |
| | Northrop Grumman Corp. | 4.750% | 6/1/43 | 2,842 | 3,691 |
| | Northrop Grumman Corp. | 3.850% | 4/15/45 | 814 | 961 |
| | Northrop Grumman Corp. | 4.030% | 10/15/47 | 5,600 | 6,816 |
| | Northrop Grumman Corp. | 5.250% | 5/1/50 | 1,765 | 2,523 |
| | Northrop Grumman Systems Corp. | 7.750% | 2/15/31 | 1,362 | 2,082 |
Vanguard® Long-Term Corporate Bond Index Fund
Schedule of Investments
August 31, 2020
| | | | Face | Market |
| | | Maturity | Amount | Value |
| | Coupon | Date | ($000) | ($000) |
| 2 | Otis Worldwide Corp. | 3.112% | 2/15/40 | 1,725 | 1,847 |
| 2 | Otis Worldwide Corp. | 3.362% | 2/15/50 | 2,269 | 2,471 |
| | Owens Corning | 7.000% | 12/1/36 | 682 | 902 |
| | Owens Corning | 4.300% | 7/15/47 | 1,833 | 1,997 |
| | Owens Corning | 4.400% | 1/30/48 | 598 | 652 |
| | Parker-Hannifin Corp. | 4.200% | 11/21/34 | 998 | 1,223 |
| | Parker-Hannifin Corp. | 6.250% | 5/15/38 | 635 | 895 |
| | Parker-Hannifin Corp. | 4.450% | 11/21/44 | 1,877 | 2,336 |
| | Parker-Hannifin Corp. | 4.100% | 3/1/47 | 1,921 | 2,318 |
| | Parker-Hannifin Corp. | 4.000% | 6/14/49 | 1,390 | 1,655 |
| | Precision Castparts Corp. | 3.900% | 1/15/43 | 771 | 882 |
| | Precision Castparts Corp. | 4.375% | 6/15/45 | 1,255 | 1,557 |
| | Raytheon Technologies Corp. | 5.400% | 5/1/35 | 2,091 | 2,865 |
| | Raytheon Technologies Corp. | 6.050% | 6/1/36 | 995 | 1,414 |
| | Raytheon Technologies Corp. | 6.125% | 7/15/38 | 1,577 | 2,304 |
| | Raytheon Technologies Corp. | 4.450% | 11/16/38 | 1,470 | 1,815 |
| | Raytheon Technologies Corp. | 5.700% | 4/15/40 | 2,865 | 4,015 |
| 2 | Raytheon Technologies Corp. | 4.875% | 10/15/40 | 1,108 | 1,431 |
| 2 | Raytheon Technologies Corp. | 4.700% | 12/15/41 | 353 | 439 |
| | Raytheon Technologies Corp. | 4.500% | 6/1/42 | 7,840 | 9,883 |
| 2 | Raytheon Technologies Corp. | 4.800% | 12/15/43 | 1,463 | 1,867 |
| 2 | Raytheon Technologies Corp. | 4.200% | 12/15/44 | 553 | 639 |
| | Raytheon Technologies Corp. | 4.150% | 5/15/45 | 2,714 | 3,282 |
| | Raytheon Technologies Corp. | 3.750% | 11/1/46 | 2,891 | 3,335 |
| 2 | Raytheon Technologies Corp. | 4.350% | 4/15/47 | 3,649 | 4,511 |
| | Raytheon Technologies Corp. | 4.050% | 5/4/47 | 1,480 | 1,785 |
| | Raytheon Technologies Corp. | 4.625% | 11/16/48 | 2,385 | 3,124 |
| | Raytheon Technologies Corp. | 3.125% | 7/1/50 | 1,500 | 1,601 |
| | Republic Services Inc. | 1.450% | 2/15/31 | 1,300 | 1,281 |
| | Republic Services Inc. | 6.200% | 3/1/40 | 1,035 | 1,525 |
| | Republic Services Inc. | 5.700% | 5/15/41 | 635 | 895 |
| | Republic Services Inc. | 3.050% | 3/1/50 | 910 | 964 |
| | Rockwell Automation Inc. | 4.200% | 3/1/49 | 1,290 | 1,706 |
| | Roper Technologies Inc. | 1.750% | 2/15/31 | 2,900 | 2,912 |
| | Snap-on Inc. | 4.100% | 3/1/48 | 285 | 345 |
| | Snap-on Inc. | 3.100% | 5/1/50 | 1,850 | 1,941 |
| | Sonoco Products Co. | 5.750% | 11/1/40 | 1,168 | 1,472 |
| | Stanley Black & Decker Inc. | 5.200% | 9/1/40 | 1,090 | 1,472 |
| | Stanley Black & Decker Inc. | 4.850% | 11/15/48 | 880 | 1,242 |
| | Textron Inc. | 2.450% | 3/15/31 | 1,075 | 1,063 |
| | Trane Technologies Global Holding Co. Ltd. | 5.750% | 6/15/43 | 535 | 740 |
| | Trane Technologies Global Holding Co. Ltd. | 4.300% | 2/21/48 | 680 | 807 |
| | Valmont Industries Inc. | 5.000% | 10/1/44 | 975 | 1,072 |
| | Valmont Industries Inc. | 5.250% | 10/1/54 | 565 | 590 |
| | Vulcan Materials Co. | 4.500% | 6/15/47 | 1,151 | 1,335 |
| | Vulcan Materials Co. | 4.700% | 3/1/48 | 1,265 | 1,502 |
| | Waste Connections Inc. | 3.050% | 4/1/50 | 850 | 885 |
| | Waste Management Inc. | 3.900% | 3/1/35 | 709 | 838 |
| | Waste Management Inc. | 4.100% | 3/1/45 | 2,004 | 2,440 |
| | Waste Management Inc. | 4.150% | 7/15/49 | 2,860 | 3,580 |
| | WW Grainger Inc. | 4.600% | 6/15/45 | 1,706 | 2,197 |
| | WW Grainger Inc. | 3.750% | 5/15/46 | 1,090 | 1,246 |
| | WW Grainger Inc. | 4.200% | 5/15/47 | 730 | 893 |
| | Xylem Inc. | 4.375% | 11/1/46 | 284 | 325 |
| | Xylem Inc. | 2.250% | 1/30/31 | 1,700 | 1,793 |
| | Communication (13.8%) |
| | Activision Blizzard Inc. | 1.350% | 9/15/30 | 965 | 941 |
| | Activision Blizzard Inc. | 4.500% | 6/15/47 | 273 | 350 |
| | Activision Blizzard Inc. | 2.500% | 9/15/50 | 4,000 | 3,745 |
| | America Movil SAB de CV | 6.375% | 3/1/35 | 739 | 1,077 |
| | America Movil SAB de CV | 6.125% | 11/15/37 | 690 | 980 |
| | America Movil SAB de CV | 6.125% | 3/30/40 | 5,226 | 7,544 |
| | America Movil SAB de CV | 4.375% | 7/16/42 | 1,836 | 2,249 |
Vanguard® Long-Term Corporate Bond Index Fund
Schedule of Investments
August 31, 2020
| | | | | Face | Market |
| | | | Maturity | Amount | Value |
| | | Coupon | Date | ($000) | ($000) |
| | America Movil SAB de CV | 4.375% | 4/22/49 | 4,724 | 5,909 |
| | American Tower Corp. | 3.700% | 10/15/49 | 1,589 | 1,784 |
| | American Tower Corp. | 3.100% | 6/15/50 | 940 | 962 |
| | AT&T Inc. | 2.750% | 6/1/31 | 5,533 | 5,854 |
| | AT&T Inc. | 2.250% | 2/1/32 | 2,860 | 2,879 |
| | AT&T Inc. | 6.150% | 9/15/34 | 1,727 | 2,391 |
| | AT&T Inc. | 4.500% | 5/15/35 | 7,254 | 8,673 |
| | AT&T Inc. | 5.250% | 3/1/37 | 5,786 | 7,251 |
| | AT&T Inc. | 4.900% | 8/15/37 | 4,258 | 5,229 |
| | AT&T Inc. | 6.500% | 9/1/37 | 1,155 | 1,626 |
| | AT&T Inc. | 6.300% | 1/15/38 | 180 | 250 |
| | AT&T Inc. | 6.550% | 2/15/39 | 1,110 | 1,529 |
| | AT&T Inc. | 4.850% | 3/1/39 | 4,675 | 5,646 |
| | AT&T Inc. | 6.200% | 3/15/40 | 1,859 | 2,490 |
| | AT&T Inc. | 6.350% | 3/15/40 | 1,328 | 1,854 |
| | AT&T Inc. | 6.100% | 7/15/40 | 1,532 | 2,045 |
| | AT&T Inc. | 6.000% | 8/15/40 | 3,515 | 4,718 |
| | AT&T Inc. | 5.350% | 9/1/40 | 3,390 | 4,329 |
| | AT&T Inc. | 6.375% | 3/1/41 | 1,565 | 2,186 |
| | AT&T Inc. | 6.250% | 3/29/41 | 807 | 1,104 |
| | AT&T Inc. | 3.500% | 6/1/41 | 1,251 | 1,322 |
| | AT&T Inc. | 5.550% | 8/15/41 | 3,216 | 4,169 |
| | AT&T Inc. | 5.375% | 10/15/41 | 1,141 | 1,399 |
| | AT&T Inc. | 5.150% | 3/15/42 | 4,407 | 5,458 |
| | AT&T Inc. | 4.900% | 6/15/42 | 1,697 | 2,064 |
| | AT&T Inc. | 4.300% | 12/15/42 | 4,109 | 4,650 |
| | AT&T Inc. | 3.100% | 2/1/43 | 5,000 | 4,956 |
| | AT&T Inc. | 5.350% | 12/15/43 | 2,769 | 3,495 |
| | AT&T Inc. | 4.650% | 6/1/44 | 3,216 | 3,721 |
| | AT&T Inc. | 4.800% | 6/15/44 | 6,098 | 7,309 |
| | AT&T Inc. | 4.350% | 6/15/45 | 5,086 | 5,793 |
| | AT&T Inc. | 4.850% | 7/15/45 | 3,440 | 4,137 |
| | AT&T Inc. | 4.750% | 5/15/46 | 5,033 | 6,039 |
| | AT&T Inc. | 5.150% | 11/15/46 | 3,711 | 4,646 |
| | AT&T Inc. | 5.650% | 2/15/47 | 4,619 | 6,051 |
| | AT&T Inc. | 5.450% | 3/1/47 | 4,619 | 6,009 |
| | AT&T Inc. | 4.500% | 3/9/48 | 8,652 | 10,157 |
| | AT&T Inc. | 4.550% | 3/9/49 | 5,774 | 6,813 |
| | AT&T Inc. | 5.150% | 2/15/50 | 3,750 | 4,725 |
| | AT&T Inc. | 3.650% | 6/1/51 | 4,850 | 5,066 |
| | AT&T Inc. | 3.300% | 2/1/52 | 6,797 | 6,725 |
| | AT&T Inc. | 5.700% | 3/1/57 | 1,275 | 1,737 |
| | AT&T Inc. | 5.300% | 8/15/58 | 1,545 | 2,003 |
| | AT&T Inc. | 3.850% | 6/1/60 | 2,883 | 3,069 |
| | AT&T Inc. | 3.500% | 2/1/61 | 4,150 | 4,101 |
| | Bell Canada Inc. | 4.464% | 4/1/48 | 591 | 741 |
| | Bell Canada Inc. | 4.300% | 7/29/49 | 3,165 | 3,980 |
| | British Telecommunications plc | 9.625% | 12/15/30 | 5,099 | 8,274 |
| | Charter Communications Operating LLC / Charter Communications Operating Capital | 2.800% | 4/1/31 | 4,045 | 4,256 |
| | Charter Communications Operating LLC / Charter Communications Operating Capital | 6.384% | 10/23/35 | 4,947 | 6,767 |
| | Charter Communications Operating LLC / Charter Communications Operating Capital | 5.375% | 4/1/38 | 2,445 | 2,970 |
| | Charter Communications Operating LLC / Charter Communications Operating Capital | 6.484% | 10/23/45 | 4,918 | 6,610 |
| | Charter Communications Operating LLC / Charter Communications Operating Capital | 5.375% | 5/1/47 | 5,076 | 6,047 |
| | Charter Communications Operating LLC / Charter Communications Operating Capital | 5.750% | 4/1/48 | 5,111 | 6,353 |
| | Charter Communications Operating LLC / Charter Communications Operating Capital | 5.125% | 7/1/49 | 4,260 | 4,969 |
| | Charter Communications Operating LLC / Charter Communications Operating Capital | 4.800% | 3/1/50 | 6,055 | 6,905 |
Vanguard® Long-Term Corporate Bond Index Fund
Schedule of Investments
August 31, 2020
| | | | | Face | Market |
| | | | Maturity | Amount | Value |
| | | Coupon | Date | ($000) | ($000) |
| | Charter Communications Operating LLC / Charter Communications Operating Capital | 3.700% | 4/1/51 | 2,920 | 2,895 |
| | Charter Communications Operating LLC / Charter Communications Operating Capital | 6.834% | 10/23/55 | 1,985 | 2,725 |
| | Comcast Corp. | 4.250% | 10/15/30 | 3,239 | 4,001 |
| | Comcast Corp. | 1.950% | 1/15/31 | 4,023 | 4,141 |
| | Comcast Corp. | 1.500% | 2/15/31 | 4,000 | 3,971 |
| | Comcast Corp. | 4.250% | 1/15/33 | 5,504 | 6,862 |
| | Comcast Corp. | 7.050% | 3/15/33 | 655 | 1,005 |
| | Comcast Corp. | 4.200% | 8/15/34 | 1,790 | 2,226 |
| | Comcast Corp. | 5.650% | 6/15/35 | 2,740 | 3,891 |
| | Comcast Corp. | 4.400% | 8/15/35 | 1,749 | 2,222 |
| | Comcast Corp. | 6.500% | 11/15/35 | 1,893 | 2,884 |
| | Comcast Corp. | 3.200% | 7/15/36 | 1,751 | 1,956 |
| | Comcast Corp. | 6.450% | 3/15/37 | 3,031 | 4,550 |
| | Comcast Corp. | 6.950% | 8/15/37 | 1,911 | 3,001 |
| | Comcast Corp. | 3.900% | 3/1/38 | 1,326 | 1,586 |
| | Comcast Corp. | 6.400% | 5/15/38 | 1,861 | 2,807 |
| | Comcast Corp. | 4.600% | 10/15/38 | 7,321 | 9,354 |
| | Comcast Corp. | 3.250% | 11/1/39 | 3,835 | 4,232 |
| | Comcast Corp. | 6.400% | 3/1/40 | 1,725 | 2,653 |
| | Comcast Corp. | 3.750% | 4/1/40 | 430 | 504 |
| | Comcast Corp. | 4.650% | 7/15/42 | 4,259 | 5,534 |
| | Comcast Corp. | 4.500% | 1/15/43 | 2,806 | 3,584 |
| | Comcast Corp. | 4.750% | 3/1/44 | 1,347 | 1,776 |
| | Comcast Corp. | 4.600% | 8/15/45 | 2,561 | 3,328 |
| | Comcast Corp. | 3.400% | 7/15/46 | 1,429 | 1,583 |
| | Comcast Corp. | 4.000% | 8/15/47 | 2,716 | 3,279 |
| | Comcast Corp. | 3.969% | 11/1/47 | 4,589 | 5,531 |
| | Comcast Corp. | 4.000% | 3/1/48 | 3,261 | 3,928 |
| | Comcast Corp. | 4.700% | 10/15/48 | 7,146 | 9,574 |
| | Comcast Corp. | 3.999% | 11/1/49 | 3,888 | 4,689 |
| | Comcast Corp. | 3.450% | 2/1/50 | 4,765 | 5,345 |
| | Comcast Corp. | 2.800% | 1/15/51 | 3,471 | 3,470 |
| | Comcast Corp. | 2.450% | 8/15/52 | 3,275 | 3,082 |
| | Comcast Corp. | 4.049% | 11/1/52 | 5,013 | 6,110 |
| | Comcast Corp. | 4.950% | 10/15/58 | 5,201 | 7,413 |
| | Comcast Corp. | 2.650% | 8/15/62 | 3,000 | 2,840 |
| | Crown Castle International Corp. | 2.250% | 1/15/31 | 2,000 | 2,044 |
| | Crown Castle International Corp. | 4.750% | 5/15/47 | 673 | 849 |
| | Crown Castle International Corp. | 5.200% | 2/15/49 | 1,424 | 1,901 |
| | Crown Castle International Corp. | 4.000% | 11/15/49 | 390 | 449 |
| | Crown Castle International Corp. | 4.150% | 7/1/50 | 2,132 | 2,518 |
| | Crown Castle International Corp. | 3.250% | 1/15/51 | 2,350 | 2,425 |
| | Deutsche Telekom International Finance BV | 9.250% | 6/1/32 | 1,147 | 1,924 |
| | Discovery Communications LLC | 5.000% | 9/20/37 | 2,687 | 3,179 |
| | Discovery Communications LLC | 6.350% | 6/1/40 | 2,294 | 3,081 |
| | Discovery Communications LLC | 4.950% | 5/15/42 | 1,340 | 1,552 |
| | Discovery Communications LLC | 4.875% | 4/1/43 | 4,386 | 5,006 |
| | Discovery Communications LLC | 5.200% | 9/20/47 | 1,179 | 1,407 |
| | Discovery Communications LLC | 5.300% | 5/15/49 | 1,917 | 2,330 |
| | Discovery Communications LLC | 4.650% | 5/15/50 | 2,220 | 2,526 |
| | Fox Corp. | 5.476% | 1/25/39 | 2,550 | 3,375 |
| | Fox Corp. | 5.576% | 1/25/49 | 3,750 | 5,118 |
| | Grupo Televisa SAB | 8.500% | 3/11/32 | 150 | 221 |
| | Grupo Televisa SAB | 6.625% | 1/15/40 | 1,338 | 1,764 |
| | Grupo Televisa SAB | 5.000% | 5/13/45 | 2,343 | 2,651 |
| | Grupo Televisa SAB | 6.125% | 1/31/46 | 1,440 | 1,870 |
| | Grupo Televisa SAB | 5.250% | 5/24/49 | 2,430 | 2,868 |
| | Interpublic Group of Cos. Inc. | 5.400% | 10/1/48 | 1,053 | 1,245 |
| | Koninklijke KPN NV | 8.375% | 10/1/30 | 550 | 797 |
| | Moody's Corp. | 5.250% | 7/15/44 | 1,485 | 2,075 |
| | Moody's Corp. | 4.875% | 12/17/48 | 409 | 555 |
| | Moody's Corp. | 3.250% | 5/20/50 | 1,355 | 1,480 |
Vanguard® Long-Term Corporate Bond Index Fund
Schedule of Investments
August 31, 2020
| | | | | Face | Market |
| | | | Maturity | Amount | Value |
| | | Coupon | Date | ($000) | ($000) |
| | Moody's Corp. | 2.550% | 8/18/60 | 1,000 | 931 |
| | NBCUniversal Media LLC | 6.400% | 4/30/40 | 1,533 | 2,365 |
| | NBCUniversal Media LLC | 5.950% | 4/1/41 | 2,764 | 4,126 |
| | NBCUniversal Media LLC | 4.450% | 1/15/43 | 2,759 | 3,489 |
| | Orange SA | 9.000% | 3/1/31 | 7,139 | 11,664 |
| | Orange SA | 5.375% | 1/13/42 | 2,131 | 2,994 |
| | Orange SA | 5.500% | 2/6/44 | 950 | 1,375 |
| | Rogers Communications Inc. | 7.500% | 8/15/38 | 293 | 454 |
| | Rogers Communications Inc. | 4.500% | 3/15/43 | 2,254 | 2,716 |
| | Rogers Communications Inc. | 5.450% | 10/1/43 | 358 | 497 |
| | Rogers Communications Inc. | 5.000% | 3/15/44 | 574 | 739 |
| | Rogers Communications Inc. | 4.300% | 2/15/48 | 840 | 1,040 |
| | Rogers Communications Inc. | 4.350% | 5/1/49 | 2,928 | 3,668 |
| | Rogers Communications Inc. | 3.700% | 11/15/49 | 3,805 | 4,332 |
| | S&P Global Inc. | 3.250% | 12/1/49 | 1,232 | 1,407 |
| | S&P Global Inc. | 2.300% | 8/15/60 | 1,500 | 1,373 |
| 2 | T-Mobile USA Inc. | 2.550% | 2/15/31 | 3,335 | 3,474 |
| 2 | T-Mobile USA Inc. | 4.375% | 4/15/40 | 5,635 | 6,741 |
| 2 | T-Mobile USA Inc. | 4.500% | 4/15/50 | 6,581 | 8,045 |
| | Telefonica Emisiones SAU | 4.895% | 3/6/48 | 3,099 | 3,666 |
| | Telefonica Emisiones SAU | 7.045% | 6/20/36 | 2,863 | 4,159 |
| | Telefonica Emisiones SAU | 4.665% | 3/6/38 | 4,118 | 4,768 |
| | Telefonica Emisiones SAU | 5.213% | 3/8/47 | 5,682 | 6,840 |
| | Telefonica Emisiones SAU | 5.520% | 3/1/49 | 3,540 | 4,489 |
| | Telefonica Europe BV | 8.250% | 9/15/30 | 1,987 | 3,013 |
| | TELUS Corp. | 4.600% | 11/16/48 | 1,397 | 1,749 |
| | TELUS Corp. | 4.300% | 6/15/49 | 1,683 | 2,031 |
| | Thomson Reuters Corp. | 5.500% | 8/15/35 | 800 | 1,045 |
| | Thomson Reuters Corp. | 5.850% | 4/15/40 | 915 | 1,217 |
| | Thomson Reuters Corp. | 5.650% | 11/23/43 | 752 | 988 |
| | Time Warner Cable LLC | 6.550% | 5/1/37 | 3,043 | 4,079 |
| | Time Warner Cable LLC | 7.300% | 7/1/38 | 2,936 | 4,187 |
| | Time Warner Cable LLC | 6.750% | 6/15/39 | 4,174 | 5,816 |
| | Time Warner Cable LLC | 5.875% | 11/15/40 | 2,966 | 3,741 |
| | Time Warner Cable LLC | 5.500% | 9/1/41 | 2,293 | 2,801 |
| | Time Warner Cable LLC | 4.500% | 9/15/42 | 2,685 | 2,984 |
| | Time Warner Entertainment Co. LP | 8.375% | 7/15/33 | 3,208 | 4,988 |
| | Verizon Communications Inc. | 4.500% | 8/10/33 | 7,867 | 9,941 |
| | Verizon Communications Inc. | 6.400% | 9/15/33 | 355 | 512 |
| | Verizon Communications Inc. | 4.400% | 11/1/34 | 7,190 | 8,966 |
| | Verizon Communications Inc. | 4.272% | 1/15/36 | 6,045 | 7,366 |
| | Verizon Communications Inc. | 5.250% | 3/16/37 | 4,611 | 6,253 |
| | Verizon Communications Inc. | 4.812% | 3/15/39 | 4,112 | 5,416 |
| | Verizon Communications Inc. | 4.750% | 11/1/41 | 2,460 | 3,263 |
| | Verizon Communications Inc. | 3.850% | 11/1/42 | 4,411 | 5,208 |
| | Verizon Communications Inc. | 4.125% | 8/15/46 | 4,350 | 5,270 |
| | Verizon Communications Inc. | 4.862% | 8/21/46 | 8,428 | 11,387 |
| | Verizon Communications Inc. | 5.500% | 3/16/47 | 120 | 175 |
| | Verizon Communications Inc. | 4.522% | 9/15/48 | 9,992 | 13,090 |
| | Verizon Communications Inc. | 5.012% | 4/15/49 | 7,216 | 10,088 |
| | Verizon Communications Inc. | 4.000% | 3/22/50 | 1,075 | 1,339 |
| | Verizon Communications Inc. | 5.012% | 8/21/54 | 1,064 | 1,531 |
| | Verizon Communications Inc. | 4.672% | 3/15/55 | 6,870 | 9,393 |
| | ViacomCBS Inc. | 4.950% | 1/15/31 | 2,630 | 3,139 |
| | ViacomCBS Inc. | 4.200% | 5/19/32 | 2,234 | 2,535 |
| | ViacomCBS Inc. | 5.500% | 5/15/33 | 921 | 1,129 |
| | ViacomCBS Inc. | 6.875% | 4/30/36 | 2,583 | 3,513 |
| | ViacomCBS Inc. | 5.900% | 10/15/40 | 945 | 1,177 |
| | ViacomCBS Inc. | 4.850% | 7/1/42 | 1,071 | 1,182 |
| | ViacomCBS Inc. | 4.375% | 3/15/43 | 3,268 | 3,464 |
| | ViacomCBS Inc. | 5.850% | 9/1/43 | 3,193 | 3,941 |
| | ViacomCBS Inc. | 5.250% | 4/1/44 | 988 | 1,139 |
| | ViacomCBS Inc. | 4.900% | 8/15/44 | 769 | 860 |
| | ViacomCBS Inc. | 4.600% | 1/15/45 | 1,970 | 2,142 |
Vanguard® Long-Term Corporate Bond Index Fund
Schedule of Investments
August 31, 2020
| | | | | Face | Market |
| | | | Maturity | Amount | Value |
| | | Coupon | Date | ($000) | ($000) |
| | ViacomCBS Inc. | 4.950% | 5/19/50 | 1,725 | 2,005 |
| | Vodafone Group plc | 6.250% | 11/30/32 | 449 | 610 |
| | Vodafone Group plc | 6.150% | 2/27/37 | 3,895 | 5,510 |
| | Vodafone Group plc | 5.000% | 5/30/38 | 2,057 | 2,560 |
| | Vodafone Group plc | 4.375% | 2/19/43 | 3,280 | 3,833 |
| | Vodafone Group plc | 5.250% | 5/30/48 | 7,209 | 9,263 |
| | Vodafone Group plc | 4.875% | 6/19/49 | 4,786 | 5,935 |
| | Vodafone Group plc | 4.250% | 9/17/50 | 2,726 | 3,140 |
| | Vodafone Group plc | 5.125% | 6/19/59 | 1,502 | 1,866 |
| | Walt Disney Co. | 2.650% | 1/13/31 | 4,896 | 5,301 |
| | Walt Disney Co. | 7.000% | 3/1/32 | 998 | 1,512 |
| | Walt Disney Co. | 6.550% | 3/15/33 | 291 | 426 |
| | Walt Disney Co. | 6.200% | 12/15/34 | 3,655 | 5,370 |
| | Walt Disney Co. | 6.400% | 12/15/35 | 2,047 | 3,069 |
| | Walt Disney Co. | 6.150% | 3/1/37 | 1,637 | 2,326 |
| | Walt Disney Co. | 6.650% | 11/15/37 | 3,780 | 5,745 |
| | Walt Disney Co. | 4.625% | 3/23/40 | 1,470 | 1,860 |
| | Walt Disney Co. | 3.500% | 5/13/40 | 3,930 | 4,421 |
| | Walt Disney Co. | 6.150% | 2/15/41 | 300 | 436 |
| | Walt Disney Co. | 4.375% | 8/16/41 | 835 | 1,020 |
| | Walt Disney Co. | 4.125% | 12/1/41 | 1,256 | 1,498 |
| | Walt Disney Co. | 3.700% | 12/1/42 | 3,100 | 3,511 |
| | Walt Disney Co. | 5.400% | 10/1/43 | 1,446 | 1,989 |
| | Walt Disney Co. | 4.125% | 6/1/44 | 1,835 | 2,226 |
| | Walt Disney Co. | 4.750% | 9/15/44 | 2,890 | 3,689 |
| | Walt Disney Co. | 4.950% | 10/15/45 | 2,109 | 2,785 |
| | Walt Disney Co. | 7.750% | 12/1/45 | 100 | 171 |
| | Walt Disney Co. | 3.000% | 7/30/46 | 1,984 | 2,041 |
| | Walt Disney Co. | 4.750% | 11/15/46 | 931 | 1,190 |
| | Walt Disney Co. | 2.750% | 9/1/49 | 2,894 | 2,841 |
| | Walt Disney Co. | 4.700% | 3/23/50 | 3,270 | 4,327 |
| | Walt Disney Co. | 3.600% | 1/13/51 | 5,820 | 6,614 |
| | Walt Disney Co. | 3.800% | 5/13/60 | 630 | 736 |
| | Consumer Cyclical (6.0%) |
| | Alibaba Group Holding Ltd. | 4.500% | 11/28/34 | 516 | 650 |
| | Alibaba Group Holding Ltd. | 4.000% | 12/6/37 | 2,843 | 3,351 |
| | Alibaba Group Holding Ltd. | 4.200% | 12/6/47 | 3,030 | 3,853 |
| | Alibaba Group Holding Ltd. | 4.400% | 12/6/57 | 2,100 | 2,806 |
| | Amazon.com Inc. | 4.800% | 12/5/34 | 2,652 | 3,627 |
| | Amazon.com Inc. | 3.875% | 8/22/37 | 6,948 | 8,695 |
| | Amazon.com Inc. | 4.950% | 12/5/44 | 2,759 | 3,950 |
| | Amazon.com Inc. | 4.050% | 8/22/47 | 8,386 | 10,816 |
| | Amazon.com Inc. | 2.500% | 6/3/50 | 5,550 | 5,608 |
| | Amazon.com Inc. | 4.250% | 8/22/57 | 6,085 | 8,228 |
| | Amazon.com Inc. | 2.700% | 6/3/60 | 4,450 | 4,557 |
| | Aptiv plc | 4.400% | 10/1/46 | 655 | 641 |
| | Aptiv plc | 5.400% | 3/15/49 | 695 | 764 |
| | Automatic Data Processing Inc. | 1.250% | 9/1/30 | 2,000 | 1,971 |
| | AutoZone Inc. | 1.650% | 1/15/31 | 1,550 | 1,528 |
| | BorgWarner Inc. | 4.375% | 3/15/45 | 1,258 | 1,394 |
| | Costco Wholesale Corp. | 1.750% | 4/20/32 | 5,000 | 5,140 |
| | Cummins Inc. | 1.500% | 9/1/30 | 1,500 | 1,487 |
| | Cummins Inc. | 4.875% | 10/1/43 | 668 | 902 |
| | Cummins Inc. | 2.600% | 9/1/50 | 1,000 | 982 |
| | Daimler Finance North America LLC | 8.500% | 1/18/31 | 2,111 | 3,241 |
| | Darden Restaurants Inc. | 4.550% | 2/15/48 | 700 | 669 |
| | Dollar General Corp. | 4.125% | 4/3/50 | 1,290 | 1,552 |
| | eBay Inc. | 4.000% | 7/15/42 | 1,698 | 1,885 |
| | Ford Foundation | 2.815% | 6/1/70 | 1,925 | 2,032 |
| | General Motors Co. | 5.000% | 4/1/35 | 3,263 | 3,522 |
| | General Motors Co. | 6.600% | 4/1/36 | 2,629 | 3,129 |
| | General Motors Co. | 5.150% | 4/1/38 | 2,070 | 2,187 |
| | General Motors Co. | 6.250% | 10/2/43 | 3,167 | 3,669 |
Vanguard® Long-Term Corporate Bond Index Fund
Schedule of Investments
August 31, 2020
| | | | | Face | Market |
| | | | Maturity | Amount | Value |
| | | Coupon | Date | ($000) | ($000) |
| | General Motors Co. | 5.200% | 4/1/45 | 2,293 | 2,455 |
| | General Motors Co. | 6.750% | 4/1/46 | 2,654 | 3,196 |
| | General Motors Co. | 5.400% | 4/1/48 | 2,119 | 2,319 |
| | General Motors Co. | 5.950% | 4/1/49 | 2,708 | 3,183 |
| | Harley-Davidson Inc. | 4.625% | 7/28/45 | 393 | 430 |
| | Home Depot Inc. | 5.875% | 12/16/36 | 6,700 | 10,020 |
| | Home Depot Inc. | 3.300% | 4/15/40 | 1,880 | 2,140 |
| | Home Depot Inc. | 5.400% | 9/15/40 | 1,845 | 2,629 |
| | Home Depot Inc. | 5.950% | 4/1/41 | 2,428 | 3,662 |
| | Home Depot Inc. | 4.200% | 4/1/43 | 626 | 783 |
| | Home Depot Inc. | 4.875% | 2/15/44 | 3,406 | 4,604 |
| | Home Depot Inc. | 4.400% | 3/15/45 | 1,688 | 2,165 |
| | Home Depot Inc. | 4.250% | 4/1/46 | 5,144 | 6,558 |
| | Home Depot Inc. | 3.900% | 6/15/47 | 2,793 | 3,387 |
| | Home Depot Inc. | 4.500% | 12/6/48 | 3,419 | 4,538 |
| | Home Depot Inc. | 3.125% | 12/15/49 | 2,895 | 3,168 |
| | Home Depot Inc. | 3.350% | 4/15/50 | 2,234 | 2,543 |
| | Home Depot Inc. | 3.500% | 9/15/56 | 2,337 | 2,765 |
| | IHC Health Services Inc. | 4.131% | 5/15/48 | 675 | 885 |
| | JD.com Inc. | 4.125% | 1/14/50 | 1,375 | 1,523 |
| | Kohl's Corp. | 5.550% | 7/17/45 | 870 | 794 |
| | Lear Corp. | 5.250% | 5/15/49 | 1,195 | 1,265 |
| | Lowe's Cos. Inc. | 5.000% | 4/15/40 | 2,550 | 3,386 |
| | Lowe's Cos. Inc. | 4.650% | 4/15/42 | 3,735 | 4,711 |
| | Lowe's Cos. Inc. | 4.250% | 9/15/44 | 1,188 | 1,415 |
| | Lowe's Cos. Inc. | 4.375% | 9/15/45 | 1,791 | 2,175 |
| | Lowe's Cos. Inc. | 3.700% | 4/15/46 | 2,643 | 2,971 |
| | Lowe's Cos. Inc. | 4.050% | 5/3/47 | 3,022 | 3,586 |
| | Lowe's Cos. Inc. | 4.550% | 4/5/49 | 3,090 | 3,906 |
| | Lowe's Cos. Inc. | 5.125% | 4/15/50 | 1,380 | 1,908 |
| | Marriott International Inc. | 3.500% | 10/15/32 | 2,200 | 2,211 |
| | Mastercard Inc. | 3.800% | 11/21/46 | 2,279 | 2,753 |
| | Mastercard Inc. | 3.950% | 2/26/48 | 1,484 | 1,830 |
| | Mastercard Inc. | 3.650% | 6/1/49 | 1,139 | 1,355 |
| | Mastercard Inc. | 3.850% | 3/26/50 | 2,050 | 2,569 |
| | McDonald's Corp. | 4.700% | 12/9/35 | 3,205 | 4,090 |
| | McDonald's Corp. | 6.300% | 10/15/37 | 2,077 | 3,047 |
| | McDonald's Corp. | 6.300% | 3/1/38 | 500 | 738 |
| | McDonald's Corp. | 5.700% | 2/1/39 | 770 | 1,074 |
| | McDonald's Corp. | 4.875% | 7/15/40 | 1,100 | 1,427 |
| | McDonald's Corp. | 3.700% | 2/15/42 | 2,257 | 2,510 |
| | McDonald's Corp. | 3.625% | 5/1/43 | 1,581 | 1,749 |
| | McDonald's Corp. | 4.600% | 5/26/45 | 1,891 | 2,336 |
| | McDonald's Corp. | 4.875% | 12/9/45 | 283 | 367 |
| | McDonald's Corp. | 4.450% | 3/1/47 | 4,090 | 5,064 |
| | McDonald's Corp. | 4.450% | 9/1/48 | 1,701 | 2,112 |
| | McDonald's Corp. | 3.625% | 9/1/49 | 3,514 | 3,938 |
| | McDonald's Corp. | 4.200% | 4/1/50 | 2,418 | 2,948 |
| | NIKE Inc. | 3.250% | 3/27/40 | 2,960 | 3,338 |
| | NIKE Inc. | 3.625% | 5/1/43 | 886 | 1,027 |
| | NIKE Inc. | 3.875% | 11/1/45 | 892 | 1,077 |
| | NIKE Inc. | 3.375% | 11/1/46 | 1,166 | 1,302 |
| | NIKE Inc. | 3.375% | 3/27/50 | 3,375 | 3,840 |
| | Nordstrom Inc. | 5.000% | 1/15/44 | 2,145 | 1,507 |
| | Ross Stores Inc. | 5.450% | 4/15/50 | 1,150 | 1,473 |
| | Starbucks Corp. | 2.550% | 11/15/30 | 2,025 | 2,142 |
| | Starbucks Corp. | 4.300% | 6/15/45 | 1,557 | 1,809 |
| | Starbucks Corp. | 3.750% | 12/1/47 | 1,159 | 1,271 |
| | Starbucks Corp. | 4.500% | 11/15/48 | 3,350 | 4,076 |
| | Starbucks Corp. | 4.450% | 8/15/49 | 1,268 | 1,537 |
| | Starbucks Corp. | 3.350% | 3/12/50 | 1,145 | 1,176 |
| | Starbucks Corp. | 3.500% | 11/15/50 | 2,490 | 2,636 |
| | Target Corp. | 2.650% | 9/15/30 | 2,900 | 3,223 |
| | Target Corp. | 6.350% | 11/1/32 | 604 | 903 |
Vanguard® Long-Term Corporate Bond Index Fund
Schedule of Investments
August 31, 2020
| | | | | Face | Market |
| | | | Maturity | Amount | Value |
| | | Coupon | Date | ($000) | ($000) |
| | Target Corp. | 6.500% | 10/15/37 | 837 | 1,315 |
| | Target Corp. | 7.000% | 1/15/38 | 485 | 795 |
| | Target Corp. | 4.000% | 7/1/42 | 2,786 | 3,547 |
| | Target Corp. | 3.625% | 4/15/46 | 3,084 | 3,779 |
| | Target Corp. | 3.900% | 11/15/47 | 1,360 | 1,755 |
| | TJX Cos. Inc. | 4.500% | 4/15/50 | 2,880 | 3,651 |
| | Visa Inc. | 1.100% | 2/15/31 | 2,000 | 1,942 |
| | Visa Inc. | 4.150% | 12/14/35 | 3,996 | 5,199 |
| | Visa Inc. | 2.700% | 4/15/40 | 625 | 668 |
| | Visa Inc. | 4.300% | 12/14/45 | 9,106 | 12,061 |
| | Visa Inc. | 3.650% | 9/15/47 | 1,606 | 1,954 |
| | Visa Inc. | 2.000% | 8/15/50 | 3,675 | 3,421 |
| | Walgreen Co. | 4.400% | 9/15/42 | 2,375 | 2,524 |
| | Walgreens Boots Alliance Inc. | 4.500% | 11/18/34 | 542 | 618 |
| | Walgreens Boots Alliance Inc. | 4.800% | 11/18/44 | 2,630 | 2,876 |
| | Walgreens Boots Alliance Inc. | 4.650% | 6/1/46 | 2,235 | 2,397 |
| | Walgreens Boots Alliance Inc. | 4.100% | 4/15/50 | 1,866 | 1,866 |
| | Walmart Inc. | 5.250% | 9/1/35 | 3,739 | 5,408 |
| | Walmart Inc. | 6.500% | 8/15/37 | 1,240 | 1,975 |
| | Walmart Inc. | 6.200% | 4/15/38 | 690 | 1,085 |
| | Walmart Inc. | 3.950% | 6/28/38 | 3,499 | 4,341 |
| | Walmart Inc. | 5.625% | 4/1/40 | 2,363 | 3,508 |
| | Walmart Inc. | 5.000% | 10/25/40 | 2,788 | 3,903 |
| | Walmart Inc. | 5.625% | 4/15/41 | 2,336 | 3,543 |
| | Walmart Inc. | 4.000% | 4/11/43 | 2,924 | 3,671 |
| | Walmart Inc. | 4.300% | 4/22/44 | 1,189 | 1,579 |
| | Walmart Inc. | 3.625% | 12/15/47 | 2,520 | 3,066 |
| | Walmart Inc. | 4.050% | 6/29/48 | 6,643 | 8,547 |
| | Walmart Inc. | 2.950% | 9/24/49 | 1,959 | 2,164 |
| | Western Union Co. | 6.200% | 11/17/36 | 1,112 | 1,320 |
| | Consumer Noncyclical (19.4%) |
| | Abbott Laboratories | 4.750% | 11/30/36 | 3,855 | 5,183 |
| | Abbott Laboratories | 6.150% | 11/30/37 | 619 | 969 |
| | Abbott Laboratories | 6.000% | 4/1/39 | 954 | 1,475 |
| | Abbott Laboratories | 5.300% | 5/27/40 | 1,788 | 2,630 |
| | Abbott Laboratories | 4.750% | 4/15/43 | 4,651 | 6,347 |
| | Abbott Laboratories | 4.900% | 11/30/46 | 4,806 | 6,884 |
| 2 | AbbVie Inc. | 4.550% | 3/15/35 | 3,247 | 3,981 |
| | AbbVie Inc. | 4.500% | 5/14/35 | 5,394 | 6,646 |
| | AbbVie Inc. | 4.300% | 5/14/36 | 4,340 | 5,160 |
| 2 | AbbVie Inc. | 4.050% | 11/21/39 | 7,456 | 8,743 |
| 2 | AbbVie Inc. | 4.625% | 10/1/42 | 2,225 | 2,738 |
| | AbbVie Inc. | 4.400% | 11/6/42 | 4,960 | 5,930 |
| 2 | AbbVie Inc. | 4.850% | 6/15/44 | 277 | 348 |
| 2 | AbbVie Inc. | 4.750% | 3/15/45 | 2,963 | 3,679 |
| | AbbVie Inc. | 4.700% | 5/14/45 | 5,910 | 7,226 |
| | AbbVie Inc. | 4.450% | 5/14/46 | 6,041 | 7,220 |
| | AbbVie Inc. | 4.875% | 11/14/48 | 5,215 | 6,642 |
| 2 | AbbVie Inc. | 4.250% | 11/21/49 | 13,441 | 16,146 |
| | Adventist Health System/West | 3.630% | 3/1/49 | 775 | 841 |
| | Advocate Health & Hospitals Corp. | 4.272% | 8/15/48 | 1,100 | 1,398 |
| | Advocate Health & Hospitals Corp. | 3.387% | 10/15/49 | 650 | 732 |
| | Advocate Health & Hospitals Corp. | 3.008% | 6/15/50 | 900 | 951 |
| | AHS Hospital Corp. | 5.024% | 7/1/45 | 863 | 1,172 |
| | Allina Health System | 3.887% | 4/15/49 | 747 | 869 |
| | Altria Group Inc. | 5.800% | 2/14/39 | 4,128 | 5,253 |
| | Altria Group Inc. | 4.250% | 8/9/42 | 2,379 | 2,543 |
| | Altria Group Inc. | 4.500% | 5/2/43 | 3,508 | 3,878 |
| | Altria Group Inc. | 5.375% | 1/31/44 | 3,905 | 4,830 |
| | Altria Group Inc. | 3.875% | 9/16/46 | 4,899 | 5,090 |
| | Altria Group Inc. | 5.950% | 2/14/49 | 3,582 | 4,838 |
| | Altria Group Inc. | 4.450% | 5/6/50 | 350 | 399 |
| | Altria Group Inc. | 6.200% | 2/14/59 | 1,625 | 2,199 |
Vanguard® Long-Term Corporate Bond Index Fund
Schedule of Investments
August 31, 2020
| | Coupon | Maturity
Date | Face
Amount
($000 | ) | Market
Value
($000 | ) |
| | AmerisourceBergen Corp. | 4.250% | 3/1/45 | 1,375 | | 1,584 | |
| | AmerisourceBergen Corp. | 4.300% | 12/15/47 | 986 | | 1,131 | |
| | Amgen Inc. | 2.300% | 2/25/31 | 4,348 | | 4,550 | |
| | Amgen Inc. | 3.150% | 2/21/40 | 5,140 | | 5,423 | |
| | Amgen Inc. | 4.950% | 10/1/41 | 2,639 | | 3,537 | |
| | Amgen Inc. | 5.150% | 11/15/41 | 1,732 | | 2,309 | |
| | Amgen Inc. | 4.400% | 5/1/45 | 2,726 | | 3,376 | |
| | Amgen Inc. | 4.563% | 6/15/48 | 2,755 | | 3,552 | |
| | Amgen Inc. | 3.375% | 2/21/50 | 5,463 | | 5,970 | |
| | Amgen Inc. | 4.663% | 6/15/51 | 7,805 | | 10,303 | |
| 2 | Amgen Inc. | 2.770% | 9/1/53 | 6,275 | | 6,136 | |
| | Anheuser-Busch Cos. LLC / Anheuser-Busch InBev Worldwide Inc. | 4.900% | 2/1/46 | 19,769 | | 24,354 | |
| | Anheuser-Busch Cos. LLC / Anheuser-Busch InBev Worldwide Inc. | 4.700% | 2/1/36 | 9,500 | | 11,298 | |
| | Anheuser-Busch InBev Finance Inc. | 4.700% | 2/1/36 | 3,737 | | 4,443 | |
| | Anheuser-Busch InBev Finance Inc. | 4.000% | 1/17/43 | 4,285 | | 4,705 | |
| | Anheuser-Busch InBev Finance Inc. | 4.625% | 2/1/44 | 2,591 | | 3,044 | |
| | Anheuser-Busch InBev Finance Inc. | 4.900% | 2/1/46 | 5,430 | | 6,644 | |
| | Anheuser-Busch InBev Worldwide Inc. | 4.900% | 1/23/31 | 1,685 | | 2,126 | |
| | Anheuser-Busch InBev Worldwide Inc. | 5.875% | 6/15/35 | 1,720 | | 2,415 | |
| | Anheuser-Busch InBev Worldwide Inc. | 4.375% | 4/15/38 | 4,070 | | 4,668 | |
| | Anheuser-Busch InBev Worldwide Inc. | 8.200% | 1/15/39 | 2,332 | | 3,765 | |
| | Anheuser-Busch InBev Worldwide Inc. | 5.450% | 1/23/39 | 3,575 | | 4,541 | |
| | Anheuser-Busch InBev Worldwide Inc. | 8.000% | 11/15/39 | 2,568 | | 4,060 | |
| | Anheuser-Busch InBev Worldwide Inc. | 4.350% | 6/1/40 | 1,840 | | 2,137 | |
| | Anheuser-Busch InBev Worldwide Inc. | 4.950% | 1/15/42 | 3,441 | | 4,161 | |
| | Anheuser-Busch InBev Worldwide Inc. | 3.750% | 7/15/42 | 1,238 | | 1,318 | |
| | Anheuser-Busch InBev Worldwide Inc. | 4.600% | 4/15/48 | 6,475 | | 7,665 | |
| | Anheuser-Busch InBev Worldwide Inc. | 4.439% | 10/6/48 | 3,660 | | 4,260 | |
| | Anheuser-Busch InBev Worldwide Inc. | 5.550% | 1/23/49 | 7,430 | | 9,913 | |
| | Anheuser-Busch InBev Worldwide Inc. | 4.500% | 6/1/50 | 500 | | 601 | |
| | Anheuser-Busch InBev Worldwide Inc. | 4.750% | 4/15/58 | 5,510 | | 6,836 | |
| | Anheuser-Busch InBev Worldwide Inc. | 5.800% | 1/23/59 | 2,631 | | 3,798 | |
| | Anheuser-Busch InBev Worldwide Inc. | 4.600% | 6/1/60 | 2,471 | | 3,018 | |
| | Archer-Daniels-Midland Co. | 5.935% | 10/1/32 | 590 | | 858 | |
| | Archer-Daniels-Midland Co. | 5.375% | 9/15/35 | 316 | | 460 | |
| | Archer-Daniels-Midland Co. | 4.535% | 3/26/42 | 2,108 | | 2,798 | |
| | Archer-Daniels-Midland Co. | 4.016% | 4/16/43 | 2,472 | | 3,113 | |
| | Archer-Daniels-Midland Co. | 3.750% | 9/15/47 | 2,575 | | 3,206 | |
| | Archer-Daniels-Midland Co. | 4.500% | 3/15/49 | 223 | | 313 | |
| | Ascension Health | 3.106% | 11/15/39 | 1,195 | | 1,295 | |
| | Ascension Health | 3.945% | 11/15/46 | 2,338 | | 2,952 | |
| 1 | Ascension Health | 4.847% | 11/15/53 | 1,024 | | 1,528 | |
| | AstraZeneca plc | 6.450% | 9/15/37 | 6,605 | | 10,140 | |
| | AstraZeneca plc | 4.000% | 9/18/42 | 2,156 | | 2,654 | |
| | AstraZeneca plc | 4.375% | 11/16/45 | 434 | | 571 | |
| | AstraZeneca plc | 4.375% | 8/17/48 | 2,792 | | 3,741 | |
| | AstraZeneca plc | 2.125% | 8/6/50 | 1,100 | | 1,015 | |
| | Banner Health | 3.181% | 1/1/50 | 825 | | 886 | |
| | BAT Capital Corp. | 4.390% | 8/15/37 | 5,805 | | 6,294 | |
| | BAT Capital Corp. | 4.540% | 8/15/47 | 6,891 | | 7,487 | |
| | BAT Capital Corp. | 4.758% | 9/6/49 | 1,179 | | 1,296 | |
| | BAT Capital Corp. | 5.282% | 4/2/50 | 1,997 | | 2,376 | |
| | Baxalta Inc. | 5.250% | 6/23/45 | 1,666 | | 2,320 | |
| | Baxter International Inc. | 3.500% | 8/15/46 | 973 | | 1,088 | |
| | BayCare Health System Inc. | 3.831% | 11/15/50 | 1,075 | | 1,338 | |
| | Baylor Scott & White Holdings | 4.185% | 11/15/45 | 1,376 | | 1,714 | |
| | Baylor Scott & White Holdings | 3.967% | 11/15/46 | 253 | | 304 | |
| | Becton Dickinson & Co. | 4.685% | 12/15/44 | 2,739 | | 3,377 | |
| | Becton Dickinson & Co. | 4.669% | 6/6/47 | 4,606 | | 5,781 | |
| | Becton Dickinson & Co. | 3.794% | 5/20/50 | 850 | | 960 | |
| | Biogen Inc. | 5.200% | 9/15/45 | 3,843 | | 5,234 | |
| | Biogen Inc. | 3.150% | 5/1/50 | 4,569 | | 4,625 | |
Vanguard® Long-Term Corporate Bond Index Fund
Schedule of Investments
August 31, 2020
| | Coupon | Maturity
Date | Face
Amount
($000 | ) | Market
Value
($000 | ) |
| | Boston Scientific Corp. | 4.550% | 3/1/39 | 2,434 | | 3,015 | |
| | Boston Scientific Corp. | 7.375% | 1/15/40 | 360 | | 573 | |
| | Boston Scientific Corp. | 4.700% | 3/1/49 | 3,092 | | 4,104 | |
| | Bristol-Myers Squibb Co. | 4.125% | 6/15/39 | 4,296 | | 5,516 | |
| | Bristol-Myers Squibb Co. | 3.250% | 8/1/42 | 2,250 | | 2,612 | |
| | Bristol-Myers Squibb Co. | 5.250% | 8/15/43 | 2,298 | | 3,283 | |
| | Bristol-Myers Squibb Co. | 4.500% | 3/1/44 | 815 | | 1,132 | |
| | Bristol-Myers Squibb Co. | 4.625% | 5/15/44 | 3,675 | | 4,891 | |
| | Bristol-Myers Squibb Co. | 5.000% | 8/15/45 | 3,090 | | 4,417 | |
| | Bristol-Myers Squibb Co. | 4.350% | 11/15/47 | 1,670 | | 2,205 | |
| | Bristol-Myers Squibb Co. | 4.550% | 2/20/48 | 4,628 | | 6,372 | |
| | Bristol-Myers Squibb Co. | 4.250% | 10/26/49 | 8,241 | | 10,945 | |
| | Brown-Forman Corp. | 4.000% | 4/15/38 | 1,043 | | 1,254 | |
| | Brown-Forman Corp. | 4.500% | 7/15/45 | 611 | | 807 | |
| | Campbell Soup Co. | 4.800% | 3/15/48 | 1,876 | | 2,420 | |
| | Campbell Soup Co. | 3.125% | 4/24/50 | 775 | | 782 | |
| | Cardinal Health Inc. | 4.600% | 3/15/43 | 1,199 | | 1,327 | |
| | Cardinal Health Inc. | 4.500% | 11/15/44 | 1,019 | | 1,122 | |
| | Cardinal Health Inc. | 4.900% | 9/15/45 | 1,015 | | 1,194 | |
| | Cardinal Health Inc. | 4.368% | 6/15/47 | 676 | | 740 | |
| | Catholic Health Services of Long Island Obligated Group | 3.368% | 7/1/50 | 900 | | 899 | |
| | Children's Health System of Texas | 2.511% | 8/15/50 | 1,000 | | 980 | |
| | Children's Hospital Corp. | 4.115% | 1/1/47 | 305 | | 379 | |
| | Children's Hospital Corp. | 2.585% | 2/1/50 | 1,145 | | 1,121 | |
| | Children's Hospital Medical Center | 4.268% | 5/15/44 | 760 | | 978 | |
| | Children's Hospital | 2.928% | 7/15/50 | 725 | | 705 | |
| | Church & Dwight Co. Inc. | 3.950% | 8/1/47 | 813 | | 972 | |
| | Cigna Corp. | 4.800% | 8/15/38 | 4,276 | | 5,348 | |
| | Cigna Corp. | 3.200% | 3/15/40 | 2,848 | | 3,026 | |
| | Cigna Corp. | 6.125% | 11/15/41 | 1,538 | | 2,219 | |
| | Cigna Corp. | 4.800% | 7/15/46 | 3,402 | | 4,483 | |
| | Cigna Corp. | 3.875% | 10/15/47 | 3,156 | | 3,522 | |
| | Cigna Corp. | 4.900% | 12/15/48 | 6,405 | | 8,413 | |
| | Cigna Corp. | 3.400% | 3/15/50 | 3,640 | | 3,883 | |
| | City of Hope | 5.623% | 11/15/43 | 552 | | 770 | |
| | City of Hope | 4.378% | 8/15/48 | 790 | | 951 | |
| | Cleveland Clinic Foundation | 4.858% | 1/1/14 | 693 | | 979 | |
| | Coca-Cola Co. | 4.125% | 3/25/40 | 1,025 | | 1,310 | |
| | Coca-Cola Co. | 2.500% | 6/1/40 | 2,775 | | 2,871 | |
| | Coca-Cola Co. | 4.200% | 3/25/50 | 235 | | 308 | |
| | Coca-Cola Co. | 2.600% | 6/1/50 | 3,970 | | 4,034 | |
| | Coca-Cola Co. | 2.750% | 6/1/60 | 4,825 | | 4,868 | |
| | Coca-Cola Femsa SAB de CV | 1.850% | 9/1/32 | 500 | | 500 | |
| | Coca-Cola Femsa SAB de CV | 5.250% | 11/26/43 | 970 | | 1,347 | |
| | Colgate-Palmolive Co. | 4.000% | 8/15/45 | 753 | | 1,005 | |
| | Colgate-Palmolive Co. | 3.700% | 8/1/47 | 344 | | 449 | |
| 1 | CommonSpirit Health | 4.350% | 11/1/42 | 2,077 | | 2,286 | |
| | CommonSpirit Health | 3.817% | 10/1/49 | 400 | | 463 | |
| | CommonSpirit Health | 4.187% | 10/1/49 | 2,801 | | 2,968 | |
| | Community Health Network Inc. | 3.099% | 5/1/50 | 1,400 | | 1,382 | |
| | Conagra Brands Inc. | 8.250% | 9/15/30 | 693 | | 1,045 | |
| | Conagra Brands Inc. | 5.300% | 11/1/38 | 1,307 | | 1,685 | |
| | Conagra Brands Inc. | 5.400% | 11/1/48 | 3,050 | | 4,166 | |
| | Constellation Brands Inc. | 4.500% | 5/9/47 | 1,561 | | 1,886 | |
| | Constellation Brands Inc. | 4.100% | 2/15/48 | 1,581 | | 1,825 | |
| | Constellation Brands Inc. | 5.250% | 11/15/48 | 1,993 | | 2,669 | |
| | Constellation Brands Inc. | 3.750% | 5/1/50 | 1,600 | | 1,769 | |
| | Cottage Health Obligated Group | 3.304% | 11/1/49 | 1,050 | | 1,153 | |
| | CVS Health Corp. | 4.875% | 7/20/35 | 1,862 | | 2,369 | |
| | CVS Health Corp. | 4.780% | 3/25/38 | 11,172 | | 13,627 | |
| | CVS Health Corp. | 6.125% | 9/15/39 | 780 | | 1,070 | |
| | CVS Health Corp. | 4.125% | 4/1/40 | 3,750 | | 4,358 | |
| | CVS Health Corp. | 2.700% | 8/21/40 | 1,075 | | 1,046 | |
Vanguard® Long-Term Corporate Bond Index Fund
Schedule of Investments
August 31, 2020
| | Coupon | Maturity
Date | Face
Amount
($000 | ) | Market
Value
($000 | ) |
| | CVS Health Corp. | 5.300% | 12/5/43 | 3,015 | | 3,909 | |
| | CVS Health Corp. | 5.125% | 7/20/45 | 5,414 | | 6,859 | |
| | CVS Health Corp. | 5.050% | 3/25/48 | 17,303 | | 22,461 | |
| | CVS Health Corp. | 4.250% | 4/1/50 | 4,075 | | 4,849 | |
| | Danaher Corp. | 4.375% | 9/15/45 | 2,422 | | 3,122 | |
| | Dartmouth-Hitchcock Health | 4.178% | 8/1/48 | 675 | | 806 | |
| | Delhaize America LLC | 9.000% | 4/15/31 | 470 | | 746 | |
| | DH Europe Finance II Sarl | 3.250% | 11/15/39 | 2,772 | | 3,088 | |
| | DH Europe Finance II Sarl | 3.400% | 11/15/49 | 355 | | 413 | |
| | Diageo Capital plc | 2.125% | 4/29/32 | 3,525 | | 3,649 | |
| | Diageo Capital plc | 5.875% | 9/30/36 | 331 | | 476 | |
| | Diageo Capital plc | 3.875% | 4/29/43 | 1,069 | | 1,288 | |
| | Diageo Investment Corp. | 7.450% | 4/15/35 | 272 | | 451 | |
| | Diageo Investment Corp. | 4.250% | 5/11/42 | 1,885 | | 2,352 | |
| | Dignity Health | 4.500% | 11/1/42 | 1,050 | | 1,118 | |
| | Dignity Health | 5.267% | 11/1/64 | 353 | | 435 | |
| | Duke University Health System Inc. | 3.920% | 6/1/47 | 1,368 | | 1,723 | |
| | Eli Lilly & Co. | 3.875% | 3/15/39 | 150 | | 181 | |
| | Eli Lilly & Co. | 3.950% | 5/15/47 | 250 | | 311 | |
| | Eli Lilly & Co. | 3.950% | 3/15/49 | 4,613 | | 5,910 | |
| | Eli Lilly & Co. | 4.150% | 3/15/59 | 2,450 | | 3,154 | |
| | Eli Lilly & Co. | 2.250% | 5/15/50 | 2,070 | | 1,953 | |
| | Eli Lilly & Co. | 2.500% | 9/15/60 | 2,500 | | 2,356 | |
| | Estee Lauder Cos. Inc. | 6.000% | 5/15/37 | 420 | | 609 | |
| | Estee Lauder Cos. Inc. | 4.375% | 6/15/45 | 866 | | 1,132 | |
| | Estee Lauder Cos. Inc. | 4.150% | 3/15/47 | 898 | | 1,152 | |
| | Estee Lauder Cos. Inc. | 3.125% | 12/1/49 | 1,635 | | 1,811 | |
| | Fomento Economico Mexicano SAB de CV | 4.375% | 5/10/43 | 1,088 | | 1,332 | |
| | Fomento Economico Mexicano SAB de CV | 3.500% | 1/16/50 | 5,805 | | 6,188 | |
| | General Mills Inc. | 4.550% | 4/17/38 | 1,200 | | 1,552 | |
| | General Mills Inc. | 5.400% | 6/15/40 | 1,067 | | 1,470 | |
| | General Mills Inc. | 4.150% | 2/15/43 | 1,676 | | 2,063 | |
| | General Mills Inc. | 4.700% | 4/17/48 | 329 | | 444 | |
| | Gilead Sciences Inc. | 4.600% | 9/1/35 | 2,053 | | 2,718 | |
| | Gilead Sciences Inc. | 4.000% | 9/1/36 | 2,350 | | 2,871 | |
| | Gilead Sciences Inc. | 5.650% | 12/1/41 | 1,510 | | 2,197 | |
| | Gilead Sciences Inc. | 4.800% | 4/1/44 | 4,686 | | 6,214 | |
| | Gilead Sciences Inc. | 4.500% | 2/1/45 | 4,859 | | 6,285 | |
| | Gilead Sciences Inc. | 4.750% | 3/1/46 | 5,943 | | 7,912 | |
| | Gilead Sciences Inc. | 4.150% | 3/1/47 | 2,053 | | 2,562 | |
| | GlaxoSmithKline Capital Inc. | 5.375% | 4/15/34 | 1,475 | | 2,040 | |
| | GlaxoSmithKline Capital Inc. | 6.375% | 5/15/38 | 6,242 | | 9,677 | |
| | GlaxoSmithKline Capital Inc. | 4.200% | 3/18/43 | 1,672 | | 2,151 | |
| | Hackensack Meridian Health Inc. | 2.675% | 9/1/41 | 1,100 | | 1,086 | |
| | Hackensack Meridian Health Inc. | 4.211% | 7/1/48 | 1,150 | | 1,418 | |
| | Hackensack Meridian Health Inc. | 2.875% | 9/1/50 | 1,100 | | 1,107 | |
| | Hackensack Meridian Health Inc. | 4.500% | 7/1/57 | 353 | | 462 | |
| 1 | Hartford HealthCare Corp. | 3.447% | 7/1/54 | 815 | | 857 | |
| | Hasbro Inc. | 6.350% | 3/15/40 | 1,073 | | 1,271 | |
| | Hasbro Inc. | 5.100% | 5/15/44 | 743 | | 766 | |
| | HCA Inc. | 5.125% | 6/15/39 | 2,935 | | 3,610 | |
| | HCA Inc. | 5.500% | 6/15/47 | 1,837 | | 2,331 | |
| | HCA Inc. | 5.250% | 6/15/49 | 5,110 | | 6,375 | |
| | Hershey Co. | 3.375% | 8/15/46 | 1,293 | | 1,499 | |
| | Hershey Co. | 3.125% | 11/15/49 | 1,325 | | 1,456 | |
| | Hershey Co. | 2.650% | 6/1/50 | 920 | | 947 | |
| | Indiana University Health Inc. Obligated Group | 3.970% | 11/1/48 | 530 | | 664 | |
| | Ingredion Inc. | 3.900% | 6/1/50 | 598 | | 680 | |
| | Iowa Health System | 3.665% | 2/15/50 | 650 | | 743 | |
| | JM Smucker Co. | 4.250% | 3/15/35 | 2,534 | | 3,029 | |
| | JM Smucker Co. | 4.375% | 3/15/45 | 878 | | 1,055 | |
| | JM Smucker Co. | 3.550% | 3/15/50 | 730 | | 784 | |
| | Johns Hopkins Health System Corp. | 3.837% | 5/15/46 | 1,413 | | 1,710 | |
| | Johnson & Johnson | 4.950% | 5/15/33 | 759 | | 1,029 | |
Vanguard® Long-Term Corporate Bond Index Fund
Schedule of Investments
August 31, 2020
| | Coupon | Maturity
Date | Face
Amount
($000 | ) | Market
Value
($000 | ) |
| | Johnson & Johnson | 4.375% | 12/5/33 | 2,129 | | 2,775 | |
| | Johnson & Johnson | 3.550% | 3/1/36 | 3,179 | | 3,748 | |
| | Johnson & Johnson | 3.625% | 3/3/37 | 3,931 | | 4,771 | |
| | Johnson & Johnson | 5.950% | 8/15/37 | 2,488 | | 3,778 | |
| | Johnson & Johnson | 3.400% | 1/15/38 | 3,003 | | 3,551 | |
| | Johnson & Johnson | 5.850% | 7/15/38 | 996 | | 1,519 | |
| | Johnson & Johnson | 2.100% | 9/1/40 | 2,500 | | 2,490 | |
| | Johnson & Johnson | 4.500% | 9/1/40 | 782 | | 1,041 | |
| | Johnson & Johnson | 4.850% | 5/15/41 | 1,052 | | 1,460 | |
| | Johnson & Johnson | 4.500% | 12/5/43 | 325 | | 453 | |
| | Johnson & Johnson | 3.700% | 3/1/46 | 2,998 | | 3,665 | |
| | Johnson & Johnson | 3.750% | 3/3/47 | 3,885 | | 4,809 | |
| | Johnson & Johnson | 3.500% | 1/15/48 | 332 | | 399 | |
| | Johnson & Johnson | 2.250% | 9/1/50 | 2,500 | | 2,432 | |
| | Johnson & Johnson | 2.450% | 9/1/60 | 3,000 | | 2,941 | |
| | Kaiser Foundation Hospitals | 4.875% | 4/1/42 | 770 | | 1,051 | |
| | Kaiser Foundation Hospitals | 4.150% | 5/1/47 | 3,415 | | 4,368 | |
| | Kaiser Foundation Hospitals | 3.266% | 11/1/49 | 2,241 | | 2,450 | |
| | Kellogg Co. | 7.450% | 4/1/31 | 1,477 | | 2,159 | |
| | Kellogg Co. | 4.500% | 4/1/46 | 1,230 | | 1,554 | |
| | Keurig Dr Pepper Inc. | 4.985% | 5/25/38 | 1,465 | | 1,907 | |
| | Keurig Dr Pepper Inc. | 4.500% | 11/15/45 | 613 | | 775 | |
| | Keurig Dr Pepper Inc. | 4.420% | 12/15/46 | 2,109 | | 2,624 | |
| | Keurig Dr Pepper Inc. | 3.800% | 5/1/50 | 2,735 | | 3,161 | |
| | Kimberly-Clark Corp. | 6.625% | 8/1/37 | 553 | | 871 | |
| | Kimberly-Clark Corp. | 5.300% | 3/1/41 | 278 | | 394 | |
| | Kimberly-Clark Corp. | 3.200% | 7/30/46 | 1,770 | | 1,997 | |
| | Kimberly-Clark Corp. | 3.900% | 5/4/47 | 525 | | 655 | |
| | Kimberly-Clark Corp. | 2.875% | 2/7/50 | 1,905 | | 2,044 | |
| | Koninklijke Ahold Delhaize NV | 5.700% | 10/1/40 | 677 | | 947 | |
| | Koninklijke Philips NV | 6.875% | 3/11/38 | 1,335 | | 1,983 | |
| | Koninklijke Philips NV | 5.000% | 3/15/42 | 679 | | 875 | |
| | Kroger Co. | 7.500% | 4/1/31 | 1,083 | | 1,585 | |
| | Kroger Co. | 6.900% | 4/15/38 | 226 | | 330 | |
| | Kroger Co. | 5.400% | 7/15/40 | 1,128 | | 1,452 | |
| | Kroger Co. | 5.000% | 4/15/42 | 1,370 | | 1,729 | |
| | Kroger Co. | 5.150% | 8/1/43 | 1,406 | | 1,814 | |
| | Kroger Co. | 3.875% | 10/15/46 | 1,775 | | 2,022 | |
| | Kroger Co. | 4.650% | 1/15/48 | 2,776 | | 3,531 | |
| | Kroger Co. | 5.400% | 1/15/49 | 1,041 | | 1,437 | |
| | Kroger Co. | 3.950% | 1/15/50 | 1,694 | | 1,960 | |
| | Laboratory Corp. of America Holdings | 4.700% | 2/1/45 | 2,858 | | 3,610 | |
| 1 | Mayo Clinic | 3.774% | 11/15/43 | 830 | | 960 | |
| 1 | Mayo Clinic | 4.000% | 11/15/47 | 318 | | 385 | |
| 1 | Mayo Clinic | 4.128% | 11/15/52 | 1,125 | | 1,417 | |
| | McCormick & Co. Inc. | 4.200% | 8/15/47 | 1,140 | | 1,435 | |
| | McKesson Corp. | 6.000% | 3/1/41 | 656 | | 887 | |
| | McKesson Corp. | 4.883% | 3/15/44 | 925 | | 1,114 | |
| | McLaren Health Care Corp. | 4.386% | 5/15/48 | 600 | | 759 | |
| | Mead Johnson Nutrition Co. | 5.900% | 11/1/39 | 270 | | 384 | |
| | Mead Johnson Nutrition Co. | 4.600% | 6/1/44 | 1,781 | | 2,365 | |
| 1 | MedStar Health Inc. | 3.626% | 8/15/49 | 420 | | 473 | |
| | Medtronic Inc. | 4.375% | 3/15/35 | 4,180 | | 5,515 | |
| | Medtronic Inc. | 4.625% | 3/15/45 | 3,958 | | 5,511 | |
| | Memorial Health Services | 3.447% | 11/1/49 | 660 | | 690 | |
| | Memorial Sloan-Kettering Cancer Center | 5.000% | 7/1/42 | 325 | | 448 | |
| | Memorial Sloan-Kettering Cancer Center | 2.955% | 1/1/50 | 790 | | 853 | |
| | Memorial Sloan-Kettering Cancer Center | 4.125% | 7/1/52 | 1,770 | | 2,286 | |
| | Memorial Sloan-Kettering Cancer Center | 4.200% | 7/1/55 | 319 | | 438 | |
| | Merck & Co. Inc. | 6.500% | 12/1/33 | 1,325 | | 2,062 | |
| | Merck & Co. Inc. | 3.900% | 3/7/39 | 2,333 | | 2,843 | |
| | Merck & Co. Inc. | 2.350% | 6/24/40 | 4,010 | | 4,085 | |
| | Merck & Co. Inc. | 3.600% | 9/15/42 | 3,550 | | 4,336 | |
| | Merck & Co. Inc. | 4.150% | 5/18/43 | 3,041 | | 3,915 | |
Vanguard® Long-Term Corporate Bond Index Fund
Schedule of Investments
August 31, 2020
| | Coupon | Maturity
Date | Face
Amount
($000 | ) | Market
Value
($000 | ) |
| | Merck & Co. Inc. | 3.700% | 2/10/45 | 4,561 | | 5,513 | |
| | Merck & Co. Inc. | 4.000% | 3/7/49 | 2,311 | | 2,966 | |
| | Merck & Co. Inc. | 2.450% | 6/24/50 | 1,825 | | 1,835 | |
| | Merck Sharp & Dohme Corp. | 5.750% | 11/15/36 | 450 | | 641 | |
| | Methodist Hospital | 2.705% | 12/1/50 | 1,350 | | 1,337 | |
| | Molson Coors Beverage Co. | 5.000% | 5/1/42 | 2,338 | | 2,605 | |
| | Molson Coors Beverage Co. | 4.200% | 7/15/46 | 4,112 | | 4,234 | |
| | Mondelez International Inc. | 4.625% | 5/7/48 | 322 | | 428 | |
| 1 | Montefiore Obligated Group | 5.246% | 11/1/48 | 1,060 | | 1,182 | |
| | Montefiore Obligated Group | 4.287% | 9/1/50 | 750 | | 768 | |
| 1 | Mount Sinai Hospitals Group Inc. | 3.981% | 7/1/48 | 1,450 | | 1,674 | |
| 1 | Mount Sinai Hospitals Group Inc. | 3.737% | 7/1/49 | 460 | | 519 | |
| | MultiCare Health System | 2.803% | 8/15/50 | 650 | | 652 | |
| | Mylan Inc. | 5.400% | 11/29/43 | 1,289 | | 1,598 | |
| | Mylan Inc. | 5.200% | 4/15/48 | 2,570 | | 3,215 | |
| | Mylan NV | 5.250% | 6/15/46 | 1,470 | | 1,834 | |
| | New York & Presbyterian Hospital | 4.024% | 8/1/45 | 50 | | 63 | |
| | New York & Presbyterian Hospital | 4.063% | 8/1/56 | 773 | | 990 | |
| | New York & Presbyterian Hospital | 3.954% | 8/1/19 | 2,300 | | 2,614 | |
| | New York & Presbyterian Hospital | 2.256% | 8/1/40 | 800 | | 795 | |
| | New York & Presbyterian Hospital | 2.606% | 8/1/60 | 500 | | 493 | |
| | Northwell Healthcare Inc. | 3.979% | 11/1/46 | 325 | | 351 | |
| | Northwell Healthcare Inc. | 4.260% | 11/1/47 | 2,430 | | 2,836 | |
| | Northwell Healthcare Inc. | 3.809% | 11/1/49 | 1,150 | | 1,262 | |
| | Novartis Capital Corp. | 3.700% | 9/21/42 | 2,159 | | 2,527 | |
| | Novartis Capital Corp. | 4.400% | 5/6/44 | 4,875 | | 6,465 | |
| | Novartis Capital Corp. | 4.000% | 11/20/45 | 852 | | 1,056 | |
| | Novartis Capital Corp. | 2.750% | 8/14/50 | 4,077 | | 4,225 | |
| | NY Society for Relief of Ruptured & Crippled Maintaining Hosp Special Surgery | 2.667% | 10/1/50 | 620 | | 581 | |
| 1 | NYU Langone Hospitals | 4.368% | 7/1/47 | 298 | | 352 | |
| | NYU Langone Hospitals | 5.750% | 7/1/43 | 1,170 | | 1,544 | |
| | NYU Langone Hospitals | 4.784% | 7/1/44 | 573 | | 738 | |
| | NYU Langone Hospitals | 3.380% | 7/1/55 | 825 | | 829 | |
| 1 | OhioHealth Corp. | 3.042% | 11/15/50 | 650 | | 708 | |
| | Orlando Health Obligated Group | 4.089% | 10/1/48 | 648 | | 727 | |
| | Partners Healthcare System Inc. | 3.765% | 7/1/48 | 650 | | 777 | |
| | Partners Healthcare System Inc. | 3.192% | 7/1/49 | 855 | | 911 | |
| | Partners Healthcare System Inc. | 4.117% | 7/1/55 | 925 | | 1,147 | |
| | Partners Healthcare System Inc. | 3.342% | 7/1/60 | 890 | | 970 | |
| | PeaceHealth Obligated Group | 4.787% | 11/15/48 | 470 | | 617 | |
| | PepsiCo Inc. | 5.500% | 1/15/40 | 1,000 | | 1,467 | |
| | PepsiCo Inc. | 3.500% | 3/19/40 | 2,435 | | 2,853 | |
| | PepsiCo Inc. | 4.875% | 11/1/40 | 1,257 | | 1,718 | |
| | PepsiCo Inc. | 4.000% | 3/5/42 | 1,296 | | 1,608 | |
| | PepsiCo Inc. | 3.600% | 8/13/42 | 1,280 | | 1,567 | |
| | PepsiCo Inc. | 4.250% | 10/22/44 | 1,040 | | 1,344 | |
| | PepsiCo Inc. | 4.600% | 7/17/45 | 2,092 | | 2,832 | |
| | PepsiCo Inc. | 4.450% | 4/14/46 | 2,051 | | 2,719 | |
| | PepsiCo Inc. | 3.450% | 10/6/46 | 4,059 | | 4,751 | |
| | PepsiCo Inc. | 4.000% | 5/2/47 | 1,001 | | 1,249 | |
| | PepsiCo Inc. | 3.375% | 7/29/49 | 4,301 | | 4,905 | |
| | PepsiCo Inc. | 2.875% | 10/15/49 | 1,591 | | 1,686 | |
| | PepsiCo Inc. | 3.625% | 3/19/50 | 2,191 | | 2,636 | |
| | PepsiCo Inc. | 3.875% | 3/19/60 | 3,075 | | 3,920 | |
| | Perrigo Finance Unlimited Co. | 4.900% | 12/15/44 | 609 | | 655 | |
| | Pfizer Inc. | 4.000% | 12/15/36 | 1,453 | | 1,777 | |
| | Pfizer Inc. | 4.100% | 9/15/38 | 2,595 | | 3,256 | |
| | Pfizer Inc. | 3.900% | 3/15/39 | 3,247 | | 3,984 | |
| | Pfizer Inc. | 7.200% | 3/15/39 | 3,371 | | 5,607 | |
| | Pfizer Inc. | 2.550% | 5/28/40 | 1,864 | | 1,942 | |
| | Pfizer Inc. | 5.600% | 9/15/40 | 661 | | 948 | |
| | Pfizer Inc. | 4.300% | 6/15/43 | 3,263 | | 4,115 | |
| | Pfizer Inc. | 4.400% | 5/15/44 | 3,933 | | 5,179 | |
Vanguard® Long-Term Corporate Bond Index Fund
Schedule of Investments
August 31, 2020
| | | | Face | Market |
| | | Maturity | Amount | Value |
| | Coupon | Date | ($000) | ($000) |
| | Pfizer Inc. | 4.125% | 12/15/46 | 3,599 | 4,520 |
| | Pfizer Inc. | 4.200% | 9/15/48 | 2,694 | 3,441 |
| | Pfizer Inc. | 4.000% | 3/15/49 | 2,335 | 2,973 |
| | Pfizer Inc. | 2.700% | 5/28/50 | 2,500 | 2,589 |
| | Philip Morris International Inc. | 6.375% | 5/16/38 | 1,774 | 2,665 |
| | Philip Morris International Inc. | 4.375% | 11/15/41 | 2,555 | 3,105 |
| | Philip Morris International Inc. | 4.500% | 3/20/42 | 2,227 | 2,729 |
| | Philip Morris International Inc. | 3.875% | 8/21/42 | 2,642 | 3,018 |
| | Philip Morris International Inc. | 4.125% | 3/4/43 | 1,332 | 1,565 |
| | Philip Morris International Inc. | 4.875% | 11/15/43 | 2,424 | 3,142 |
| | Philip Morris International Inc. | 4.250% | 11/10/44 | 1,773 | 2,153 |
| | Procter & Gamble Co. | 5.500% | 2/1/34 | 470 | 683 |
| | Procter & Gamble Co. | 5.800% | 8/15/34 | 1,227 | 1,823 |
| | Procter & Gamble Co. | 5.550% | 3/5/37 | 735 | 1,110 |
| | Procter & Gamble Co. | 3.550% | 3/25/40 | 2,610 | 3,188 |
| | Procter & Gamble Co. | 3.500% | 10/25/47 | 2,943 | 3,626 |
| | Procter & Gamble Co. | 3.600% | 3/25/50 | 3,125 | 3,925 |
| 1 | Providence St. Joseph Health Obligated Group | 3.744% | 10/1/47 | 713 | 802 |
| 1 | Providence St. Joseph Health Obligated Group | 3.930% | 10/1/48 | 965 | 1,141 |
| | Quest Diagnostics Inc. | 2.800% | 6/30/31 | 1,780 | 1,925 |
| | Quest Diagnostics Inc. | 4.700% | 3/30/45 | 446 | 546 |
| | Regeneron Pharmaceuticals Inc. | 1.750% | 9/15/30 | 2,700 | 2,633 |
| | Regeneron Pharmaceuticals Inc. | 2.800% | 9/15/50 | 1,700 | 1,605 |
| | Reynolds American Inc. | 5.700% | 8/15/35 | 2,197 | 2,733 |
| | Reynolds American Inc. | 7.250% | 6/15/37 | 1,746 | 2,338 |
| | Reynolds American Inc. | 6.150% | 9/15/43 | 2,672 | 3,351 |
| | Reynolds American Inc. | 5.850% | 8/15/45 | 2,003 | 2,477 |
| 2 | Royalty Pharma plc | 2.200% | 9/2/30 | 2,750 | 2,712 |
| 2 | Royalty Pharma plc | 3.300% | 9/2/40 | 3,250 | 3,170 |
| 2 | Royalty Pharma plc | 3.550% | 9/2/50 | 1,000 | 966 |
| | RWJ Barnabas Health Inc. | 3.949% | 7/1/46 | 1,063 | 1,198 |
| | RWJ Barnabas Health Inc. | 3.477% | 7/1/49 | 380 | 408 |
| | Spectrum Health System Obligated Group | 3.487% | 7/15/49 | 850 | 965 |
| | Stanford Health Care | 3.795% | 11/15/48 | 1,300 | 1,614 |
| | Stryker Corp. | 4.100% | 4/1/43 | 1,938 | 2,295 |
| | Stryker Corp. | 4.375% | 5/15/44 | 385 | 473 |
| | Stryker Corp. | 4.625% | 3/15/46 | 900 | 1,170 |
| | Stryker Corp. | 2.900% | 6/15/50 | 800 | 824 |
| | Sutter Health | 4.091% | 8/15/48 | 915 | 1,082 |
| | Sysco Corp. | 5.375% | 9/21/35 | 261 | 318 |
| | Sysco Corp. | 6.600% | 4/1/40 | 1,765 | 2,350 |
| | Sysco Corp. | 4.850% | 10/1/45 | 3,515 | 3,997 |
| | Sysco Corp. | 4.500% | 4/1/46 | 494 | 533 |
| | Sysco Corp. | 4.450% | 3/15/48 | 760 | 826 |
| | Sysco Corp. | 3.300% | 2/15/50 | 1,235 | 1,143 |
| | Sysco Corp. | 6.600% | 4/1/50 | 2,095 | 2,870 |
| | Takeda Pharmaceutical Co. Ltd. | 3.025% | 7/9/40 | 3,787 | 3,911 |
| | Takeda Pharmaceutical Co. Ltd. | 3.175% | 7/9/50 | 4,075 | 4,137 |
| | Takeda Pharmaceutical Co. Ltd. | 3.375% | 7/9/60 | 2,875 | 2,925 |
| | Texas Health Resources | 2.328% | 11/15/50 | 800 | 750 |
| 1 | Texas Health Resources | 4.330% | 11/15/55 | 403 | 564 |
| | Thermo Fisher Scientific Inc. | 5.300% | 2/1/44 | 1,703 | 2,364 |
| | Thermo Fisher Scientific Inc. | 4.100% | 8/15/47 | 706 | 883 |
| | Toledo Hospital | 5.750% | 11/15/38 | 950 | 1,125 |
| | Toledo Hospital | 6.015% | 11/15/48 | 915 | 1,040 |
| | Trinity Health Corp. | 4.125% | 12/1/45 | 975 | 1,140 |
| 1 | Trinity Health Corp. | 3.434% | 12/1/48 | 875 | 909 |
| | Tyson Foods Inc. | 4.875% | 8/15/34 | 937 | 1,216 |
| | Tyson Foods Inc. | 5.150% | 8/15/44 | 385 | 503 |
| | Tyson Foods Inc. | 4.550% | 6/2/47 | 2,102 | 2,640 |
| | Tyson Foods Inc. | 5.100% | 9/28/48 | 4,115 | 5,619 |
| | Unilever Capital Corp. | 5.900% | 11/15/32 | 2,407 | 3,535 |
| 2 | Upjohn Inc. | 3.850% | 6/22/40 | 3,351 | 3,633 |
| 2 | Upjohn Inc. | 4.000% | 6/22/50 | 4,795 | 5,230 |
Vanguard® Long-Term Corporate Bond Index Fund
Schedule of Investments
August 31, 2020
| | | | Face | Market |
| | | Maturity | Amount | Value |
| | Coupon | Date | ($000) | ($000) |
| | Whirlpool Corp. | 4.500% | 6/1/46 | 585 | 677 |
| | Whirlpool Corp. | 4.600% | 5/15/50 | 600 | 737 |
| 1 | Willis-Knighton Medical Center | 4.813% | 9/1/48 | 975 | 1,221 |
| | Wyeth LLC | 6.500% | 2/1/34 | 1,556 | 2,386 |
| | Wyeth LLC | 6.000% | 2/15/36 | 687 | 994 |
| | Wyeth LLC | 5.950% | 4/1/37 | 3,633 | 5,325 |
| | Yale-New Haven Health Services Corp. | 2.496% | 7/1/50 | 1,375 | 1,340 |
| | Zimmer Biomet Holdings Inc. | 5.750% | 11/30/39 | 830 | 1,059 |
| | Zimmer Biomet Holdings Inc. | 4.450% | 8/15/45 | 557 | 620 |
| | Zoetis Inc. | 4.700% | 2/1/43 | 1,920 | 2,531 |
| | Zoetis Inc. | 3.950% | 9/12/47 | 1,621 | 1,974 |
| | Zoetis Inc. | 4.450% | 8/20/48 | 1,207 | 1,592 |
| | Zoetis Inc. | 3.000% | 5/15/50 | 1,150 | 1,248 |
| | Energy (8.8%) |
| | Baker Hughes a GE Co. LLC / Baker Hughes Co-Obligor Inc. | 4.080% | 12/15/47 | 2,699 | 2,841 |
| | Baker Hughes Holdings LLC | 5.125% | 9/15/40 | 1,660 | 2,020 |
| | BP Capital Markets America Inc. | 3.000% | 2/24/50 | 5,181 | 5,071 |
| | BP Capital Markets America Inc. | 2.772% | 11/10/50 | 500 | 471 |
| | Burlington Resources Finance Co. | 7.200% | 8/15/31 | 1,397 | 2,021 |
| | Burlington Resources Finance Co. | 7.400% | 12/1/31 | 854 | 1,262 |
| | Canadian Natural Resources Ltd. | 7.200% | 1/15/32 | 1,931 | 2,532 |
| | Canadian Natural Resources Ltd. | 6.450% | 6/30/33 | 1,598 | 2,004 |
| | Canadian Natural Resources Ltd. | 5.850% | 2/1/35 | 1,376 | 1,682 |
| | Canadian Natural Resources Ltd. | 6.500% | 2/15/37 | 631 | 788 |
| | Canadian Natural Resources Ltd. | 6.250% | 3/15/38 | 1,254 | 1,583 |
| | Canadian Natural Resources Ltd. | 6.750% | 2/1/39 | 1,220 | 1,563 |
| | Canadian Natural Resources Ltd. | 4.950% | 6/1/47 | 2,825 | 3,245 |
| | Chevron Corp. | 2.978% | 5/11/40 | 1,700 | 1,838 |
| | Chevron Corp. | 3.078% | 5/11/50 | 2,870 | 3,100 |
| | Chevron USA Inc. | 2.343% | 8/12/50 | 500 | 471 |
| | Columbia Pipeline Group Inc. | 5.800% | 6/1/45 | 760 | 970 |
| | Concho Resources Inc. | 4.875% | 10/1/47 | 3,641 | 4,219 |
| | Concho Resources Inc. | 4.850% | 8/15/48 | 2,165 | 2,528 |
| | Conoco Funding Co. | 7.250% | 10/15/31 | 2,388 | 3,573 |
| | ConocoPhillips | 5.900% | 10/15/32 | 1,069 | 1,484 |
| | ConocoPhillips | 5.900% | 5/15/38 | 989 | 1,390 |
| | ConocoPhillips | 6.500% | 2/1/39 | 4,175 | 6,307 |
| | ConocoPhillips Canada Funding Co. I | 5.950% | 10/15/36 | 1,408 | 1,945 |
| | ConocoPhillips Co. | 4.300% | 11/15/44 | 1,995 | 2,501 |
| | ConocoPhillips Co. | 5.950% | 3/15/46 | 1,250 | 1,877 |
| | Devon Energy Corp. | 7.950% | 4/15/32 | 1,440 | 1,872 |
| | Devon Energy Corp. | 5.600% | 7/15/41 | 1,832 | 1,921 |
| | Devon Energy Corp. | 4.750% | 5/15/42 | 2,151 | 2,086 |
| | Devon Energy Corp. | 5.000% | 6/15/45 | 1,400 | 1,398 |
| | Devon Financing Co. LLC | 7.875% | 9/30/31 | 1,535 | 2,003 |
| | Dominion Energy Gas Holdings LLC | 4.800% | 11/1/43 | 830 | 1,036 |
| | Dominion Energy Gas Holdings LLC | 4.600% | 12/15/44 | 730 | 901 |
| | Dominion Energy Gas Holdings LLC | 3.900% | 11/15/49 | 470 | 538 |
| | Enable Midstream Partners LP | 5.000% | 5/15/44 | 1,064 | 926 |
| | Enbridge Energy Partners LP | 7.500% | 4/15/38 | 1,292 | 1,759 |
| | Enbridge Energy Partners LP | 5.500% | 9/15/40 | 2,213 | 2,648 |
| | Enbridge Energy Partners LP | 7.375% | 10/15/45 | 1,710 | 2,543 |
| | Enbridge Inc. | 4.500% | 6/10/44 | 920 | 1,024 |
| | Enbridge Inc. | 5.500% | 12/1/46 | 1,325 | 1,746 |
| | Enbridge Inc. | 4.000% | 11/15/49 | 1,100 | 1,192 |
| | Energy Transfer Operating LP | 4.900% | 3/15/35 | 1,538 | 1,530 |
| | Energy Transfer Operating LP | 6.250% | 4/15/49 | 4,793 | 5,021 |
| | Energy Transfer Operating LP | 5.000% | 5/15/50 | 4,920 | 4,723 |
| | Energy Transfer Partners LP | 6.625% | 10/15/36 | 665 | 720 |
| | Energy Transfer Partners LP | 5.800% | 6/15/38 | 1,302 | 1,310 |
| | Energy Transfer Partners LP | 7.500% | 7/1/38 | 2,278 | 2,665 |
| | Energy Transfer Partners LP | 6.050% | 6/1/41 | 3,104 | 3,143 |
Vanguard® Long-Term Corporate Bond Index Fund
Schedule of Investments
August 31, 2020
| | | | Face | Market |
| | | Maturity | Amount | Value |
| | Coupon | Date | ($000) | ($000) |
| | Energy Transfer Partners LP | 6.500% | 2/1/42 | 219 | 234 |
| | Energy Transfer Partners LP | 5.150% | 2/1/43 | 1,295 | 1,209 |
| | Energy Transfer Partners LP | 5.950% | 10/1/43 | 1,932 | 1,901 |
| | Energy Transfer Partners LP | 5.150% | 3/15/45 | 3,826 | 3,630 |
| | Energy Transfer Partners LP | 6.125% | 12/15/45 | 1,414 | 1,439 |
| | Energy Transfer Partners LP | 5.300% | 4/15/47 | 842 | 801 |
| | Energy Transfer Partners LP | 6.000% | 6/15/48 | 2,330 | 2,409 |
| | Enterprise Products Operating LLC | 6.875% | 3/1/33 | 1,894 | 2,520 |
| | Enterprise Products Operating LLC | 6.650% | 10/15/34 | 340 | 457 |
| | Enterprise Products Operating LLC | 7.550% | 4/15/38 | 1,130 | 1,577 |
| | Enterprise Products Operating LLC | 6.125% | 10/15/39 | 1,836 | 2,360 |
| | Enterprise Products Operating LLC | 6.450% | 9/1/40 | 350 | 469 |
| | Enterprise Products Operating LLC | 5.950% | 2/1/41 | 324 | 415 |
| | Enterprise Products Operating LLC | 5.700% | 2/15/42 | 442 | 550 |
| | Enterprise Products Operating LLC | 4.850% | 8/15/42 | 2,996 | 3,471 |
| | Enterprise Products Operating LLC | 4.450% | 2/15/43 | 2,251 | 2,470 |
| | Enterprise Products Operating LLC | 4.850% | 3/15/44 | 2,376 | 2,727 |
| | Enterprise Products Operating LLC | 5.100% | 2/15/45 | 2,939 | 3,498 |
| | Enterprise Products Operating LLC | 4.900% | 5/15/46 | 3,060 | 3,550 |
| | Enterprise Products Operating LLC | 4.250% | 2/15/48 | 3,223 | 3,483 |
| | Enterprise Products Operating LLC | 4.800% | 2/1/49 | 2,270 | 2,655 |
| | Enterprise Products Operating LLC | 4.200% | 1/31/50 | 2,920 | 3,183 |
| | Enterprise Products Operating LLC | 3.700% | 1/31/51 | 1,912 | 1,934 |
| | Enterprise Products Operating LLC | 3.200% | 2/15/52 | 2,375 | 2,246 |
| | Enterprise Products Operating LLC | 4.950% | 10/15/54 | 1,946 | 2,242 |
| | Enterprise Products Operating LLC | 3.950% | 1/31/60 | 2,650 | 2,682 |
| | EOG Resources Inc. | 3.900% | 4/1/35 | 596 | 700 |
| | EOG Resources Inc. | 4.950% | 4/15/50 | 2,085 | 2,646 |
| | Exxon Mobil Corp. | 2.610% | 10/15/30 | 4,900 | 5,316 |
| | Exxon Mobil Corp. | 2.995% | 8/16/39 | 1,235 | 1,309 |
| | Exxon Mobil Corp. | 4.227% | 3/19/40 | 5,555 | 6,873 |
| | Exxon Mobil Corp. | 3.567% | 3/6/45 | 2,932 | 3,257 |
| | Exxon Mobil Corp. | 4.114% | 3/1/46 | 2,723 | 3,302 |
| | Exxon Mobil Corp. | 3.095% | 8/16/49 | 2,890 | 3,034 |
| | Exxon Mobil Corp. | 4.327% | 3/19/50 | 7,945 | 10,082 |
| | Exxon Mobil Corp. | 3.452% | 4/15/51 | 6,840 | 7,565 |
| | Halliburton Co. | 4.850% | 11/15/35 | 4,155 | 4,612 |
| | Halliburton Co. | 6.700% | 9/15/38 | 1,460 | 1,858 |
| | Halliburton Co. | 7.450% | 9/15/39 | 125 | 170 |
| | Halliburton Co. | 4.500% | 11/15/41 | 1,070 | 1,075 |
| | Halliburton Co. | 4.750% | 8/1/43 | 3,780 | 3,922 |
| | Halliburton Co. | 5.000% | 11/15/45 | 4,847 | 5,326 |
| | Hess Corp. | 7.300% | 8/15/31 | 1,880 | 2,296 |
| | Hess Corp. | 7.125% | 3/15/33 | 2,110 | 2,595 |
| | Hess Corp. | 6.000% | 1/15/40 | 877 | 995 |
| | Hess Corp. | 5.600% | 2/15/41 | 2,055 | 2,340 |
| | Hess Corp. | 5.800% | 4/1/47 | 708 | 802 |
| | Husky Energy Inc. | 6.800% | 9/15/37 | 565 | 692 |
| | Kinder Morgan Energy Partners LP | 7.400% | 3/15/31 | 1,251 | 1,691 |
| | Kinder Morgan Energy Partners LP | 7.750% | 3/15/32 | 1,441 | 1,986 |
| | Kinder Morgan Energy Partners LP | 7.300% | 8/15/33 | 1,646 | 2,252 |
| | Kinder Morgan Energy Partners LP | 5.800% | 3/15/35 | 1,413 | 1,740 |
| | Kinder Morgan Energy Partners LP | 6.500% | 2/1/37 | 538 | 668 |
| | Kinder Morgan Energy Partners LP | 6.950% | 1/15/38 | 2,985 | 3,979 |
| | Kinder Morgan Energy Partners LP | 6.500% | 9/1/39 | 403 | 515 |
| | Kinder Morgan Energy Partners LP | 6.550% | 9/15/40 | 1,506 | 1,924 |
| | Kinder Morgan Energy Partners LP | 7.500% | 11/15/40 | 2,269 | 3,141 |
| | Kinder Morgan Energy Partners LP | 6.375% | 3/1/41 | 1,943 | 2,462 |
| | Kinder Morgan Energy Partners LP | 5.625% | 9/1/41 | 1,341 | 1,590 |
| | Kinder Morgan Energy Partners LP | 4.700% | 11/1/42 | 1,627 | 1,762 |
| | Kinder Morgan Energy Partners LP | 5.000% | 3/1/43 | 2,072 | 2,304 |
| | Kinder Morgan Energy Partners LP | 5.500% | 3/1/44 | 2,540 | 3,006 |
| | Kinder Morgan Energy Partners LP | 5.400% | 9/1/44 | 1,612 | 1,925 |
| | Kinder Morgan Inc. | 3.250% | 8/1/50 | 1,375 | 1,292 |
Vanguard® Long-Term Corporate Bond Index Fund
Schedule of Investments
August 31, 2020
| | | | Face | Market |
| | | Maturity | Amount | Value |
| | Coupon | Date | ($000) | ($000) |
| | Kinder Morgan Inc. | 7.800% | 8/1/31 | 1,355 | 1,893 |
| | Kinder Morgan Inc. | 7.750% | 1/15/32 | 2,135 | 3,015 |
| | Kinder Morgan Inc. | 5.300% | 12/1/34 | 2,928 | 3,547 |
| | Kinder Morgan Inc. | 5.550% | 6/1/45 | 1,170 | 1,442 |
| | Kinder Morgan Inc. | 5.050% | 2/15/46 | 1,651 | 1,954 |
| | Kinder Morgan Inc. | 5.200% | 3/1/48 | 245 | 300 |
| | Magellan Midstream Partners LP | 5.150% | 10/15/43 | 1,625 | 1,911 |
| | Magellan Midstream Partners LP | 4.250% | 9/15/46 | 468 | 502 |
| | Magellan Midstream Partners LP | 4.200% | 10/3/47 | 1,945 | 2,097 |
| | Magellan Midstream Partners LP | 4.850% | 2/1/49 | 385 | 447 |
| | Magellan Midstream Partners LP | 3.950% | 3/1/50 | 1,404 | 1,473 |
| | Marathon Oil Corp. | 6.800% | 3/15/32 | 1,294 | 1,414 |
| | Marathon Oil Corp. | 6.600% | 10/1/37 | 2,071 | 2,226 |
| | Marathon Oil Corp. | 5.200% | 6/1/45 | 553 | 552 |
| | Marathon Petroleum Corp. | 6.500% | 3/1/41 | 2,609 | 3,340 |
| | Marathon Petroleum Corp. | 4.750% | 9/15/44 | 2,019 | 2,236 |
| | Marathon Petroleum Corp. | 4.500% | 4/1/48 | 1,650 | 1,757 |
| | Marathon Petroleum Corp. | 5.000% | 9/15/54 | 1,250 | 1,378 |
| | MPLX LP | 4.500% | 4/15/38 | 4,754 | 4,962 |
| | MPLX LP | 5.200% | 3/1/47 | 2,920 | 3,322 |
| | MPLX LP | 5.200% | 12/1/47 | 1,000 | 1,103 |
| | MPLX LP | 4.700% | 4/15/48 | 2,584 | 2,729 |
| | MPLX LP | 5.500% | 2/15/49 | 3,868 | 4,579 |
| | MPLX LP | 4.900% | 4/15/58 | 1,115 | 1,187 |
| | National Oilwell Varco Inc. | 3.950% | 12/1/42 | 1,850 | 1,570 |
| | Noble Energy Inc. | 6.000% | 3/1/41 | 420 | 575 |
| | Noble Energy Inc. | 5.250% | 11/15/43 | 1,616 | 2,125 |
| | Noble Energy Inc. | 5.050% | 11/15/44 | 2,035 | 2,615 |
| | Noble Energy Inc. | 4.950% | 8/15/47 | 1,714 | 2,232 |
| | Noble Energy Inc. | 4.200% | 10/15/49 | 1,240 | 1,502 |
| | ONEOK Inc. | 6.350% | 1/15/31 | 570 | 667 |
| | ONEOK Inc. | 6.000% | 6/15/35 | 1,747 | 1,939 |
| | ONEOK Inc. | 4.950% | 7/13/47 | 2,610 | 2,467 |
| | ONEOK Inc. | 5.200% | 7/15/48 | 2,905 | 2,819 |
| | ONEOK Inc. | 4.450% | 9/1/49 | 1,819 | 1,633 |
| | ONEOK Inc. | 4.500% | 3/15/50 | 550 | 498 |
| | ONEOK Inc. | 7.150% | 1/15/51 | 1,075 | 1,303 |
| | ONEOK Partners LP | 6.650% | 10/1/36 | 725 | 822 |
| | ONEOK Partners LP | 6.850% | 10/15/37 | 1,490 | 1,677 |
| | ONEOK Partners LP | 6.125% | 2/1/41 | 1,511 | 1,629 |
| | ONEOK Partners LP | 6.200% | 9/15/43 | 927 | 995 |
| | Ovintiv Inc. | 8.125% | 9/15/30 | 420 | 443 |
| | Ovintiv Inc. | 7.200% | 11/1/31 | 750 | 760 |
| | Ovintiv Inc. | 7.375% | 11/1/31 | 1,557 | 1,619 |
| | Ovintiv Inc. | 6.500% | 8/15/34 | 1,645 | 1,589 |
| | Ovintiv Inc. | 6.625% | 8/15/37 | 445 | 424 |
| | Ovintiv Inc. | 6.500% | 2/1/38 | 1,076 | 1,018 |
| | Petro-Canada | 5.350% | 7/15/33 | 503 | 585 |
| | Petro-Canada | 5.950% | 5/15/35 | 595 | 744 |
| | Petro-Canada | 6.800% | 5/15/38 | 2,134 | 2,899 |
| | Phillips 66 | 2.150% | 12/15/30 | 1,128 | 1,106 |
| | Phillips 66 | 4.650% | 11/15/34 | 2,268 | 2,765 |
| | Phillips 66 | 5.875% | 5/1/42 | 2,960 | 3,949 |
| | Phillips 66 | 4.875% | 11/15/44 | 3,543 | 4,299 |
| | Phillips 66 Partners LP | 4.680% | 2/15/45 | 1,172 | 1,228 |
| | Phillips 66 Partners LP | 4.900% | 10/1/46 | 1,300 | 1,391 |
| | Plains All American Pipeline LP | 3.800% | 9/15/30 | 1,000 | 1,005 |
| | Plains All American Pipeline LP / PAA Finance Corp. | 6.650% | 1/15/37 | 1,880 | 2,118 |
| | Plains All American Pipeline LP / PAA Finance Corp. | 5.150% | 6/1/42 | 2,246 | 2,187 |
| | Plains All American Pipeline LP / PAA Finance Corp. | 4.300% | 1/31/43 | 770 | 673 |
| | Plains All American Pipeline LP / PAA Finance Corp. | 4.700% | 6/15/44 | 1,255 | 1,155 |
| | Plains All American Pipeline LP / PAA Finance Corp. | 4.900% | 2/15/45 | 1,907 | 1,816 |
| | Shell International Finance BV | 4.125% | 5/11/35 | 4,066 | 5,032 |
| | Shell International Finance BV | 6.375% | 12/15/38 | 5,757 | 8,576 |
Vanguard® Long-Term Corporate Bond Index Fund
Schedule of Investments
August 31, 2020
| | | | Face | Market |
| | | Maturity | Amount | Value |
| | Coupon | Date | ($000) | ($000) |
| | Shell International Finance BV | 5.500% | 3/25/40 | 1,994 | 2,799 |
| | Shell International Finance BV | 3.625% | 8/21/42 | 2,255 | 2,492 |
| | Shell International Finance BV | 4.550% | 8/12/43 | 1,518 | 1,885 |
| | Shell International Finance BV | 4.375% | 5/11/45 | 6,131 | 7,605 |
| | Shell International Finance BV | 4.000% | 5/10/46 | 4,812 | 5,718 |
| �� | Shell International Finance BV | 3.750% | 9/12/46 | 3,034 | 3,440 |
| | Shell International Finance BV | 3.125% | 11/7/49 | 3,390 | 3,556 |
| | Shell International Finance BV | 3.250% | 4/6/50 | 3,103 | 3,308 |
| | Spectra Energy Partners LP | 5.950% | 9/25/43 | 551 | 723 |
| | Spectra Energy Partners LP | 4.500% | 3/15/45 | 984 | 1,109 |
| | Suncor Energy Inc. | 7.150% | 2/1/32 | 2,706 | 3,553 |
| | Suncor Energy Inc. | 5.950% | 12/1/34 | 2,120 | 2,587 |
| | Suncor Energy Inc. | 6.500% | 6/15/38 | 2,471 | 3,245 |
| | Suncor Energy Inc. | 6.850% | 6/1/39 | 603 | 811 |
| | Suncor Energy Inc. | 4.000% | 11/15/47 | 2,015 | 2,161 |
| | Sunoco Logistics Partners Operations LP | 6.100% | 2/15/42 | 1,336 | 1,378 |
| | Sunoco Logistics Partners Operations LP | 4.950% | 1/15/43 | 961 | 871 |
| | Sunoco Logistics Partners Operations LP | 5.300% | 4/1/44 | 941 | 887 |
| | Sunoco Logistics Partners Operations LP | 5.350% | 5/15/45 | 883 | 841 |
| | Sunoco Logistics Partners Operations LP | 5.400% | 10/1/47 | 1,533 | 1,481 |
| | Tennessee Gas Pipeline Co. LLC | 7.625% | 4/1/37 | 624 | 808 |
| | Texas Eastern Transmission LP | 7.000% | 7/15/32 | 929 | 1,232 |
| | Total Capital International SA | 2.986% | 6/29/41 | 2,000 | 2,075 |
| | Total Capital International SA | 3.461% | 7/12/49 | 1,615 | 1,771 |
| | Total Capital International SA | 3.127% | 5/29/50 | 5,869 | 6,163 |
| | Total Capital International SA | 3.386% | 6/29/60 | 1,500 | 1,617 |
| | TransCanada PipeLines Ltd. | 4.625% | 3/1/34 | 3,195 | 3,833 |
| | TransCanada PipeLines Ltd. | 5.600% | 3/31/34 | 100 | 130 |
| | TransCanada PipeLines Ltd. | 5.850% | 3/15/36 | 1,547 | 2,038 |
| | TransCanada PipeLines Ltd. | 6.200% | 10/15/37 | 2,945 | 3,969 |
| | TransCanada PipeLines Ltd. | 4.750% | 5/15/38 | 2,845 | 3,376 |
| | TransCanada PipeLines Ltd. | 7.250% | 8/15/38 | 1,104 | 1,623 |
| | TransCanada PipeLines Ltd. | 7.625% | 1/15/39 | 775 | 1,188 |
| | TransCanada PipeLines Ltd. | 6.100% | 6/1/40 | 1,473 | 1,964 |
| | TransCanada PipeLines Ltd. | 5.000% | 10/16/43 | 2,192 | 2,724 |
| | TransCanada PipeLines Ltd. | 4.875% | 5/15/48 | 2,840 | 3,642 |
| | TransCanada PipeLines Ltd. | 5.100% | 3/15/49 | 2,301 | 3,062 |
| | Transcontinental Gas Pipe Line Co. LLC | 5.400% | 8/15/41 | 1,985 | 2,344 |
| | Transcontinental Gas Pipe Line Co. LLC | 4.450% | 8/1/42 | 1,339 | 1,479 |
| 2 | Transcontinental Gas Pipe Line Co. LLC | 3.950% | 5/15/50 | 1,770 | 1,918 |
| | Valero Energy Corp. | 7.500% | 4/15/32 | 1,848 | 2,656 |
| | Valero Energy Corp. | 6.625% | 6/15/37 | 2,865 | 3,844 |
| | Valero Energy Corp. | 4.900% | 3/15/45 | 1,488 | 1,782 |
| | Williams Cos. Inc. | 3.500% | 11/15/30 | 1,860 | 2,033 |
| | Williams Cos. Inc. | 7.500% | 1/15/31 | 1,203 | 1,599 |
| | Williams Cos. Inc. | 8.750% | 3/15/32 | 1,220 | 1,759 |
| | Williams Cos. Inc. | 6.300% | 4/15/40 | 3,010 | 3,767 |
| | Williams Cos. Inc. | 5.800% | 11/15/43 | 1,541 | 1,819 |
| | Williams Cos. Inc. | 5.400% | 3/4/44 | 622 | 707 |
| | Williams Cos. Inc. | 5.750% | 6/24/44 | 150 | 180 |
| | Williams Cos. Inc. | 4.900% | 1/15/45 | 3,199 | 3,543 |
| | Williams Cos. Inc. | 5.100% | 9/15/45 | 2,099 | 2,418 |
| | Williams Cos. Inc. | 4.850% | 3/1/48 | 1,800 | 2,095 |
| | Other Industrial (0.8%) |
| 1 | American University | 3.672% | 4/1/49 | 700 | 778 |
| 1 | Boston University | 4.061% | 10/1/48 | 670 | 872 |
| | California Institute of Technology | 4.321% | 8/1/45 | 695 | 894 |
| | California Institute of Technology | 4.700% | 11/1/11 | 718 | 1,014 |
| | California Institute of Technology | 3.650% | 9/1/19 | 800 | 888 |
| 1 | Duke University | 2.682% | 10/1/44 | 720 | 763 |
| 1 | Duke University | 2.832% | 10/1/55 | 2,600 | 2,779 |
| | Emory University | 2.143% | 9/1/30 | 780 | 816 |
| | Emory University | 2.969% | 9/1/50 | 1,282 | 1,401 |
Vanguard® Long-Term Corporate Bond Index Fund
Schedule of Investments
August 31, 2020
| | | | Face | Market |
| | | Maturity | Amount | Value |
| | Coupon | Date | ($000) | ($000) |
| | Georgetown University | 4.315% | 4/1/49 | 392 | 500 |
| | Georgetown University | 2.943% | 4/1/50 | 335 | 344 |
| | Georgetown University | 5.215% | 10/1/18 | 991 | 1,342 |
| 1 | Johns Hopkins University | 4.083% | 7/1/53 | 710 | 944 |
| 1 | Johns Hopkins University | 2.813% | 1/1/60 | 825 | 856 |
| | Leland Stanford Junior University | 3.647% | 5/1/48 | 1,332 | 1,687 |
| | Leland Stanford Junior University | 2.413% | 6/1/50 | 675 | 689 |
| 1 | Massachusetts Institute of Technology | 3.959% | 7/1/38 | 335 | 417 |
| | Massachusetts Institute of Technology | 2.989% | 7/1/50 | 777 | 903 |
| | Massachusetts Institute of Technology | 2.294% | 7/1/51 | 300 | 300 |
| | Massachusetts Institute of Technology | 5.600% | 7/1/11 | 1,712 | 3,030 |
| | Massachusetts Institute of Technology | 4.678% | 7/1/14 | 1,340 | 2,040 |
| | Massachusetts Institute of Technology | 3.885% | 7/1/16 | 1,650 | 2,093 |
| 1 | Northeastern University | 2.894% | 10/1/50 | 200 | 207 |
| 1 | Northwestern University | 4.643% | 12/1/44 | 690 | 938 |
| 1 | Northwestern University | 2.640% | 12/1/50 | 720 | 759 |
| 1 | Northwestern University | 3.662% | 12/1/57 | 977 | 1,253 |
| | President & Fellows of Harvard College | 3.619% | 10/1/37 | 436 | 528 |
| | President & Fellows of Harvard College | 4.875% | 10/15/40 | 423 | 590 |
| | President & Fellows of Harvard College | 3.150% | 7/15/46 | 915 | 1,061 |
| | President & Fellows of Harvard College | 2.517% | 10/15/50 | 1,585 | 1,665 |
| | President & Fellows of Harvard College | 3.300% | 7/15/56 | 1,100 | 1,354 |
| 1 | Trustees of Boston College | 3.129% | 7/1/52 | 750 | 841 |
| | Trustees of the University of Pennsylvania | 2.396% | 10/1/50 | 900 | 904 |
| 1 | University of Chicago | 2.547% | 4/1/50 | 500 | 496 |
| 1 | University of Chicago | 4.003% | 10/1/53 | 1,360 | 1,698 |
| 1 | University of Notre Dame du Lac | 3.438% | 2/15/45 | 904 | 1,096 |
| | University of Notre Dame du Lac | 3.394% | 2/15/48 | 745 | 867 |
| | University of Pennsylvania | 4.674% | 9/1/12 | 600 | 858 |
| | University of Pennsylvania | 3.610% | 2/15/19 | 850 | 987 |
| 1 | University of Southern California | 3.028% | 10/1/39 | 2,546 | 2,780 |
| 1 | University of Southern California | 3.841% | 10/1/47 | 1,050 | 1,324 |
| | University of Southern California | 2.805% | 10/1/50 | 240 | 256 |
| | University of Southern California | 3.226% | 10/1/20 | 800 | 832 |
| 1 | William Marsh Rice University | 3.574% | 5/15/45 | 727 | 868 |
| 1 | William Marsh Rice University | 3.774% | 5/15/55 | 258 | 334 |
| | Yale University | 2.402% | 4/15/50 | 1,380 | 1,424 |
| | Technology (7.8%) |
| | Alphabet Inc. | 1.900% | 8/15/40 | 3,000 | 2,915 |
| | Alphabet Inc. | 2.050% | 8/15/50 | 5,800 | 5,479 |
| | Alphabet Inc. | 2.250% | 8/15/60 | 4,500 | 4,237 |
| | Analog Devices Inc. | 5.300% | 12/15/45 | 513 | 698 |
| | Apple Inc. | 4.500% | 2/23/36 | 1,129 | 1,498 |
| | Apple Inc. | 3.850% | 5/4/43 | 4,230 | 5,161 |
| | Apple Inc. | 4.450% | 5/6/44 | 3,641 | 4,844 |
| | Apple Inc. | 3.450% | 2/9/45 | 5,154 | 5,979 |
| | Apple Inc. | 4.375% | 5/13/45 | 5,298 | 6,951 |
| | Apple Inc. | 4.650% | 2/23/46 | 9,850 | 13,482 |
| | Apple Inc. | 3.850% | 8/4/46 | 2,906 | 3,563 |
| | Apple Inc. | 4.250% | 2/9/47 | 3,792 | 4,928 |
| | Apple Inc. | 3.750% | 9/12/47 | 4,581 | 5,535 |
| | Apple Inc. | 3.750% | 11/13/47 | 3,350 | 4,036 |
| | Apple Inc. | 2.950% | 9/11/49 | 3,473 | 3,746 |
| | Apple Inc. | 2.650% | 5/11/50 | 2,400 | 2,463 |
| | Apple Inc. | 2.400% | 8/20/50 | 3,000 | 2,971 |
| | Apple Inc. | 2.550% | 8/20/60 | 3,500 | 3,444 |
| | Applied Materials Inc. | 5.100% | 10/1/35 | 2,043 | 2,858 |
| | Applied Materials Inc. | 5.850% | 6/15/41 | 1,711 | 2,599 |
| | Applied Materials Inc. | 4.350% | 4/1/47 | 1,548 | 2,077 |
| | Applied Materials Inc. | 2.750% | 6/1/50 | 1,610 | 1,693 |
| | Broadcom Inc. | 4.150% | 11/15/30 | 5,285 | 5,901 |
| | Broadcom Inc. | 4.300% | 11/15/32 | 3,490 | 3,998 |
| | Cisco Systems Inc. | 5.900% | 2/15/39 | 3,475 | 5,263 |
| | Cisco Systems Inc. | 5.500% | 1/15/40 | 5,077 | 7,462 |
Vanguard® Long-Term Corporate Bond Index Fund
Schedule of Investments
August 31, 2020
| | | | Face | Market |
| | | Maturity | Amount | Value |
| | Coupon | Date | ($000) | ($000) |
| | Corning Inc. | 4.700% | 3/15/37 | 580 | 685 |
| | Corning Inc. | 5.750% | 8/15/40 | 244 | 329 |
| | Corning Inc. | 4.750% | 3/15/42 | 532 | 663 |
| | Corning Inc. | 5.350% | 11/15/48 | 778 | 1,041 |
| | Corning Inc. | 3.900% | 11/15/49 | 250 | 286 |
| | Corning Inc. | 4.375% | 11/15/57 | 2,860 | 3,497 |
| | Corning Inc. | 5.850% | 11/15/68 | 762 | 993 |
| | Corning Inc. | 5.450% | 11/15/79 | 2,717 | 3,360 |
| 2 | Dell International LLC / EMC Corp. | 8.100% | 7/15/36 | 3,365 | 4,431 |
| 2 | Dell International LLC / EMC Corp. | 8.350% | 7/15/46 | 4,566 | 6,107 |
| | Equinix Inc. | 3.000% | 7/15/50 | 1,225 | 1,247 |
| | Fidelity National Information Services Inc. | 4.500% | 8/15/46 | 658 | 833 |
| | Fiserv Inc. | 4.400% | 7/1/49 | 5,040 | 6,337 |
| | Global Payments Inc. | 4.150% | 8/15/49 | 2,590 | 3,049 |
| | Hewlett Packard Enterprise Co. | 6.200% | 10/15/35 | 1,233 | 1,533 |
| | Hewlett Packard Enterprise Co. | 6.350% | 10/15/45 | 3,807 | 4,793 |
| | HP Inc. | 6.000% | 9/15/41 | 3,464 | 4,244 |
| | Intel Corp. | 4.000% | 12/15/32 | 2,262 | 2,828 |
| | Intel Corp. | 4.600% | 3/25/40 | 1,255 | 1,672 |
| | Intel Corp. | 4.800% | 10/1/41 | 1,423 | 1,912 |
| | Intel Corp. | 4.250% | 12/15/42 | 2,055 | 2,590 |
| | Intel Corp. | 4.900% | 7/29/45 | 1,544 | 2,116 |
| | Intel Corp. | 4.100% | 5/19/46 | 2,432 | 3,023 |
| | Intel Corp. | 4.100% | 5/11/47 | 1,233 | 1,549 |
| | Intel Corp. | 3.734% | 12/8/47 | 4,230 | 5,013 |
| | Intel Corp. | 3.250% | 11/15/49 | 5,271 | 5,862 |
| | Intel Corp. | 4.750% | 3/25/50 | 5,255 | 7,212 |
| | Intel Corp. | 3.100% | 2/15/60 | 2,270 | 2,414 |
| | Intel Corp. | 4.950% | 3/25/60 | 3,230 | 4,646 |
| | International Business Machines Corp. | 5.875% | 11/29/32 | 1,265 | 1,837 |
| | International Business Machines Corp. | 4.150% | 5/15/39 | 4,612 | 5,630 |
| | International Business Machines Corp. | 5.600% | 11/30/39 | 940 | 1,337 |
| | International Business Machines Corp. | 2.850% | 5/15/40 | 327 | 342 |
| | International Business Machines Corp. | 4.000% | 6/20/42 | 3,872 | 4,639 |
| | International Business Machines Corp. | 4.700% | 2/19/46 | 1,910 | 2,536 |
| | International Business Machines Corp. | 4.250% | 5/15/49 | 6,721 | 8,472 |
| | International Business Machines Corp. | 2.950% | 5/15/50 | 890 | 920 |
| | International Business Machines Corp. | 7.125% | 12/1/96 | 300 | 522 |
| | Juniper Networks Inc. | 5.950% | 3/15/41 | 1,173 | 1,465 |
| | KLA Corp. | 5.000% | 3/15/49 | 1,449 | 1,940 |
| | KLA Corp. | 3.300% | 3/1/50 | 776 | 820 |
| | Lam Research Corp. | 4.875% | 3/15/49 | 1,565 | 2,229 |
| | Lam Research Corp. | 2.875% | 6/15/50 | 2,075 | 2,180 |
| | Lam Research Corp. | 3.125% | 6/15/60 | 770 | 843 |
| | Microsoft Corp. | 3.500% | 2/12/35 | 5,084 | 6,235 |
| | Microsoft Corp. | 4.200% | 11/3/35 | 1,568 | 2,054 |
| | Microsoft Corp. | 3.450% | 8/8/36 | 6,626 | 7,927 |
| | Microsoft Corp. | 4.100% | 2/6/37 | 5,201 | 6,713 |
| | Microsoft Corp. | 4.500% | 10/1/40 | 250 | 337 |
| | Microsoft Corp. | 3.500% | 11/15/42 | 3,564 | 4,233 |
| | Microsoft Corp. | 3.750% | 2/12/45 | 328 | 410 |
| | Microsoft Corp. | 4.450% | 11/3/45 | 2,802 | 3,898 |
| | Microsoft Corp. | 3.700% | 8/8/46 | 11,226 | 13,990 |
| | Microsoft Corp. | 4.250% | 2/6/47 | 3,294 | 4,490 |
| | Microsoft Corp. | 2.525% | 6/1/50 | 13,157 | 13,802 |
| | Microsoft Corp. | 4.000% | 2/12/55 | 3,273 | 4,346 |
| | Microsoft Corp. | 4.750% | 11/3/55 | 1,170 | 1,735 |
| | Microsoft Corp. | 3.950% | 8/8/56 | 3,520 | 4,551 |
| | Microsoft Corp. | 4.500% | 2/6/57 | 1,800 | 2,540 |
| | Microsoft Corp. | 2.675% | 6/1/60 | 8,623 | 9,061 |
| | Motorola Solutions Inc. | 2.300% | 11/15/30 | 1,000 | 994 |
| | Motorola Solutions Inc. | 5.500% | 9/1/44 | 1,138 | 1,323 |
| | NVIDIA Corp. | 3.500% | 4/1/40 | 1,885 | 2,165 |
| | NVIDIA Corp. | 3.500% | 4/1/50 | 5,015 | 5,659 |
Vanguard® Long-Term Corporate Bond Index Fund
Schedule of Investments
August 31, 2020
| | | | Face | Market |
| | | Maturity | Amount | Value |
| | Coupon | Date | ($000) | ($000) |
| | NVIDIA Corp. | 3.700% | 4/1/60 | 1,440 | 1,669 |
| | Oracle Corp. | 4.300% | 7/8/34 | 3,725 | 4,643 |
| | Oracle Corp. | 3.900% | 5/15/35 | 3,361 | 4,063 |
| | Oracle Corp. | 3.850% | 7/15/36 | 4,214 | 4,959 |
| | Oracle Corp. | 3.800% | 11/15/37 | 5,304 | 6,105 |
| | Oracle Corp. | 6.500% | 4/15/38 | 280 | 429 |
| | Oracle Corp. | 6.125% | 7/8/39 | 2,593 | 3,814 |
| | Oracle Corp. | 3.600% | 4/1/40 | 7,150 | 8,058 |
| | Oracle Corp. | 5.375% | 7/15/40 | 4,833 | 6,615 |
| | Oracle Corp. | 4.500% | 7/8/44 | 2,785 | 3,445 |
| | Oracle Corp. | 4.125% | 5/15/45 | 5,454 | 6,466 |
| | Oracle Corp. | 4.000% | 7/15/46 | 5,494 | 6,449 |
| | Oracle Corp. | 4.000% | 11/15/47 | 5,499 | 6,452 |
| | Oracle Corp. | 3.600% | 4/1/50 | 9,683 | 10,804 |
| | Oracle Corp. | 4.375% | 5/15/55 | 2,160 | 2,685 |
| | Oracle Corp. | 3.850% | 4/1/60 | 8,724 | 10,032 |
| | PayPal Holdings Inc. | 3.250% | 6/1/50 | 1,900 | 2,147 |
| | QUALCOMM Inc. | 4.650% | 5/20/35 | 3,938 | 5,316 |
| | QUALCOMM Inc. | 4.800% | 5/20/45 | 4,103 | 5,627 |
| | QUALCOMM Inc. | 4.300% | 5/20/47 | 1,011 | 1,282 |
| | QUALCOMM Inc. | 3.250% | 5/20/50 | 704 | 791 |
| 2 | Seagate HDD Cayman | 4.125% | 1/15/31 | 1,450 | 1,566 |
| | Seagate HDD Cayman | 5.750% | 12/1/34 | 2,110 | 2,390 |
| | ServiceNow Inc. | 1.400% | 9/1/30 | 3,500 | 3,432 |
| | Texas Instruments Inc. | 3.875% | 3/15/39 | 3,395 | 4,247 |
| | Texas Instruments Inc. | 4.150% | 5/15/48 | 3,265 | 4,274 |
| | Tyco Electronics Group SA | 7.125% | 10/1/37 | 1,000 | 1,498 |
| | Verisk Analytics Inc. | 5.500% | 6/15/45 | 778 | 1,085 |
| | Verisk Analytics Inc. | 3.625% | 5/15/50 | 1,000 | 1,136 |
| | Transportation (3.5%) |
| 1 | American Airlines 2019-1 Class AA Pass Through Trust | 3.150% | 8/15/33 | 965 | 893 |
| | Burlington Northern Santa Fe LLC | 6.200% | 8/15/36 | 608 | 895 |
| | Burlington Northern Santa Fe LLC | 6.150% | 5/1/37 | 1,530 | 2,283 |
| | Burlington Northern Santa Fe LLC | 5.750% | 5/1/40 | 1,821 | 2,648 |
| �� | Burlington Northern Santa Fe LLC | 5.050% | 3/1/41 | 1,804 | 2,465 |
| | Burlington Northern Santa Fe LLC | 5.400% | 6/1/41 | 1,393 | 1,964 |
| | Burlington Northern Santa Fe LLC | 4.950% | 9/15/41 | 1,366 | 1,844 |
| | Burlington Northern Santa Fe LLC | 4.400% | 3/15/42 | 1,138 | 1,449 |
| | Burlington Northern Santa Fe LLC | 4.375% | 9/1/42 | 3,034 | 3,893 |
| | Burlington Northern Santa Fe LLC | 4.450% | 3/15/43 | 2,699 | 3,492 |
| | Burlington Northern Santa Fe LLC | 5.150% | 9/1/43 | 890 | 1,252 |
| | Burlington Northern Santa Fe LLC | 4.900% | 4/1/44 | 752 | 1,034 |
| | Burlington Northern Santa Fe LLC | 4.550% | 9/1/44 | 430 | 566 |
| | Burlington Northern Santa Fe LLC | 4.150% | 4/1/45 | 2,702 | 3,413 |
| | Burlington Northern Santa Fe LLC | 4.700% | 9/1/45 | 2,000 | 2,706 |
| | Burlington Northern Santa Fe LLC | 3.900% | 8/1/46 | 1,713 | 2,121 |
| | Burlington Northern Santa Fe LLC | 4.125% | 6/15/47 | 2,020 | 2,555 |
| | Burlington Northern Santa Fe LLC | 4.050% | 6/15/48 | 802 | 1,010 |
| | Burlington Northern Santa Fe LLC | 4.150% | 12/15/48 | 1,136 | 1,458 |
| | Burlington Northern Santa Fe LLC | 3.550% | 2/15/50 | 800 | 947 |
| | Burlington Northern Santa Fe LLC | 3.050% | 2/15/51 | 2,780 | 3,058 |
| | Canadian National Railway Co. | 6.250% | 8/1/34 | 1,053 | 1,602 |
| | Canadian National Railway Co. | 6.200% | 6/1/36 | 369 | 560 |
| | Canadian National Railway Co. | 6.375% | 11/15/37 | 1,131 | 1,727 |
| | Canadian National Railway Co. | 4.500% | 11/7/43 | 200 | 255 |
| | Canadian National Railway Co. | 3.200% | 8/2/46 | 1,961 | 2,241 |
| | Canadian National Railway Co. | 3.650% | 2/3/48 | 2,127 | 2,556 |
| | Canadian National Railway Co. | 4.450% | 1/20/49 | 1,298 | 1,775 |
| | Canadian National Railway Co. | 2.450% | 5/1/50 | 1,345 | 1,352 |
| | Canadian Pacific Railway Co. | 7.125% | 10/15/31 | 196 | 282 |
| | Canadian Pacific Railway Co. | 4.800% | 9/15/35 | 1,242 | 1,626 |
| | Canadian Pacific Railway Co. | 5.950% | 5/15/37 | 2,580 | 3,742 |
| | Canadian Pacific Railway Co. | 4.800% | 8/1/45 | 2,039 | 2,781 |
Vanguard® Long-Term Corporate Bond Index Fund
Schedule of Investments
August 31, 2020
| | | | Face | Market |
| | | Maturity | Amount | Value |
| | Coupon | Date | ($000) | ($000) |
| | Canadian Pacific Railway Co. | 6.125% | 9/15/15 | 1,585 | 2,393 |
| | CSX Corp. | 6.000% | 10/1/36 | 468 | 647 |
| | CSX Corp. | 6.150% | 5/1/37 | 1,128 | 1,597 |
| | CSX Corp. | 6.220% | 4/30/40 | 652 | 960 |
| | CSX Corp. | 5.500% | 4/15/41 | 561 | 765 |
| | CSX Corp. | 4.750% | 5/30/42 | 2,205 | 2,828 |
| | CSX Corp. | 4.400% | 3/1/43 | 1,342 | 1,644 |
| | CSX Corp. | 4.100% | 3/15/44 | 1,154 | 1,401 |
| | CSX Corp. | 3.800% | 11/1/46 | 2,971 | 3,469 |
| | CSX Corp. | 4.300% | 3/1/48 | 2,163 | 2,719 |
| | CSX Corp. | 4.750% | 11/15/48 | 1,631 | 2,190 |
| | CSX Corp. | 4.500% | 3/15/49 | 600 | 784 |
| | CSX Corp. | 3.350% | 9/15/49 | 865 | 955 |
| | CSX Corp. | 3.800% | 4/15/50 | 1,050 | 1,263 |
| | CSX Corp. | 3.950% | 5/1/50 | 2,300 | 2,843 |
| | CSX Corp. | 4.500% | 8/1/54 | 1,436 | 1,864 |
| | CSX Corp. | 4.250% | 11/1/66 | 1,171 | 1,448 |
| | CSX Corp. | 4.650% | 3/1/68 | 946 | 1,254 |
| | FedEx Corp. | 4.900% | 1/15/34 | 1,066 | 1,347 |
| | FedEx Corp. | 3.900% | 2/1/35 | 845 | 961 |
| | FedEx Corp. | 3.875% | 8/1/42 | 354 | 376 |
| | FedEx Corp. | 4.100% | 4/15/43 | 1,668 | 1,869 |
| | FedEx Corp. | 5.100% | 1/15/44 | 1,443 | 1,797 |
| | FedEx Corp. | 4.750% | 11/15/45 | 1,730 | 2,099 |
| | FedEx Corp. | 4.550% | 4/1/46 | 2,888 | 3,395 |
| | FedEx Corp. | 4.400% | 1/15/47 | 3,171 | 3,609 |
| | FedEx Corp. | 4.050% | 2/15/48 | 3,340 | 3,717 |
| | FedEx Corp. | 4.950% | 10/17/48 | 1,755 | 2,184 |
| | FedEx Corp. | 5.250% | 5/15/50 | 2,825 | 3,714 |
| 1 | FedEx Corp. 2020-1 Class AA Pass Through Trust | 1.875% | 2/20/34 | 2,500 | 2,510 |
| 1 | JetBlue 2019-1 Class AA Pass Through Trust | 2.750% | 5/15/32 | 125 | 120 |
| 1 | JetBlue 2020-1 Class A Pass Through Trust | 4.000% | 11/15/32 | 2,350 | 2,403 |
| | Kansas City Southern | 4.300% | 5/15/43 | 379 | 387 |
| | Kansas City Southern | 4.950% | 8/15/45 | 723 | 774 |
| | Kansas City Southern | 4.700% | 5/1/48 | 1,095 | 1,208 |
| | Kansas City Southern | 3.500% | 5/1/50 | 583 | 598 |
| | Kansas City Southern | 4.200% | 11/15/69 | 1,602 | 1,641 |
| | Norfolk Southern Corp. | 7.050% | 5/1/37 | 172 | 257 |
| | Norfolk Southern Corp. | 4.837% | 10/1/41 | 1,625 | 2,120 |
| | Norfolk Southern Corp. | 3.950% | 10/1/42 | 872 | 1,039 |
| | Norfolk Southern Corp. | 4.450% | 6/15/45 | 1,198 | 1,534 |
| | Norfolk Southern Corp. | 4.650% | 1/15/46 | 1,245 | 1,618 |
| | Norfolk Southern Corp. | 3.942% | 11/1/47 | 1,411 | 1,680 |
| | Norfolk Southern Corp. | 4.150% | 2/28/48 | 1,165 | 1,445 |
| | Norfolk Southern Corp. | 4.100% | 5/15/49 | 1,330 | 1,640 |
| | Norfolk Southern Corp. | 3.400% | 11/1/49 | 1,822 | 2,047 |
| | Norfolk Southern Corp. | 3.050% | 5/15/50 | 1,700 | 1,786 |
| | Norfolk Southern Corp. | 4.050% | 8/15/52 | 1,918 | 2,312 |
| 2 | Norfolk Southern Corp. | 3.155% | 5/15/55 | 1,326 | 1,371 |
| | Union Pacific Corp. | 3.375% | 2/1/35 | 866 | 999 |
| | Union Pacific Corp. | 3.600% | 9/15/37 | 870 | 992 |
| | Union Pacific Corp. | 4.375% | 9/10/38 | 1,948 | 2,418 |
| | Union Pacific Corp. | 3.550% | 8/15/39 | 783 | 909 |
| | Union Pacific Corp. | 4.150% | 1/15/45 | 595 | 726 |
| | Union Pacific Corp. | 4.050% | 11/15/45 | 1,052 | 1,272 |
| | Union Pacific Corp. | 4.050% | 3/1/46 | 1,309 | 1,599 |
| | Union Pacific Corp. | 3.350% | 8/15/46 | 461 | 511 |
| | Union Pacific Corp. | 4.000% | 4/15/47 | 2,176 | 2,637 |
| | Union Pacific Corp. | 4.500% | 9/10/48 | 3,200 | 4,247 |
| | Union Pacific Corp. | 4.300% | 3/1/49 | 1,735 | 2,247 |
| | Union Pacific Corp. | 3.250% | 2/5/50 | 1,580 | 1,732 |
| | Union Pacific Corp. | 3.799% | 10/1/51 | 3,581 | 4,307 |
| | Union Pacific Corp. | 3.875% | 2/1/55 | 788 | 950 |
| | Union Pacific Corp. | 4.800% | 9/10/58 | 50 | 64 |
Vanguard® Long-Term Corporate Bond Index Fund
Schedule of Investments
August 31, 2020
| | | | Face | Market | |
| | | Maturity | Amount | Value | |
| | Coupon | Date | ($000) | ($000 | ) |
| | Union Pacific Corp. | 3.950% | 8/15/59 | 1,500 | 1,781 | |
| | Union Pacific Corp. | 3.839% | 3/20/60 | 3,488 | 4,081 | |
| | Union Pacific Corp. | 4.375% | 11/15/65 | 1,521 | 1,914 | |
| | Union Pacific Corp. | 4.100% | 9/15/67 | 945 | 1,133 | |
| | Union Pacific Corp. | 3.750% | 2/5/70 | 1,400 | 1,579 | |
| 1 | United Airlines 2019-1 Class AA Pass Through Trust | 4.150% | 8/25/31 | 151 | 150 | |
| 1 | United Airlines 2019-2 Class AA Pass Through Trust | 2.700% | 11/1/33 | 1,400 | 1,281 | |
| | United Parcel Service Inc. | 6.200% | 1/15/38 | 208 | 317 | |
| | United Parcel Service Inc. | 5.200% | 4/1/40 | 1,380 | 1,914 | |
| | United Parcel Service Inc. | 4.875% | 11/15/40 | 2,100 | 2,784 | |
| | United Parcel Service Inc. | 3.625% | 10/1/42 | 915 | 1,059 | |
| | United Parcel Service Inc. | 3.400% | 11/15/46 | 2,614 | 2,940 | |
| | United Parcel Service Inc. | 3.750% | 11/15/47 | 700 | 828 | |
| | United Parcel Service Inc. | 4.250% | 3/15/49 | 2,272 | 2,912 | |
| | United Parcel Service Inc. | 3.400% | 9/1/49 | 3,196 | 3,608 | |
| | United Parcel Service Inc. | 5.300% | 4/1/50 | 3,707 | 5,446 | |
| | 4,035,556 | |
| Utilities (12.1%) | |
| | Electric (10.9%) | |
| | AEP Texas Inc. | 3.800% | 10/1/47 | 504 | 580 | |
| | AEP Texas Inc. | 3.450% | 1/15/50 | 1,055 | 1,148 | |
| | AEP Transmission Co. LLC | 4.000% | 12/1/46 | 1,275 | 1,539 | |
| | AEP Transmission Co. LLC | 3.750% | 12/1/47 | 1,787 | 2,111 | |
| | AEP Transmission Co. LLC | 4.250% | 9/15/48 | 260 | 326 | |
| | AEP Transmission Co. LLC | 3.800% | 6/15/49 | 500 | 599 | |
| | AEP Transmission Co. LLC | 3.150% | 9/15/49 | 625 | 669 | |
| | AEP Transmission Co. LLC | 3.650% | 4/1/50 | 940 | 1,114 | |
| | Alabama Power Co. | 6.125% | 5/15/38 | 867 | 1,271 | |
| | Alabama Power Co. | 6.000% | 3/1/39 | 1,944 | 2,846 | |
| | Alabama Power Co. | 3.850% | 12/1/42 | 1,103 | 1,297 | |
| | Alabama Power Co. | 4.150% | 8/15/44 | 758 | 920 | |
| | Alabama Power Co. | 3.750% | 3/1/45 | 2,334 | 2,712 | |
| | Alabama Power Co. | 4.300% | 1/2/46 | 880 | 1,100 | |
| | Alabama Power Co. | 3.700% | 12/1/47 | 2,310 | 2,757 | |
| | Alabama Power Co. | 4.300% | 7/15/48 | 807 | 1,022 | |
| | Ameren Corp. | 3.500% | 1/15/31 | 1,810 | 2,073 | |
| | Ameren Illinois Co. | 4.150% | 3/15/46 | 176 | 219 | |
| | Ameren Illinois Co. | 3.700% | 12/1/47 | 1,660 | 1,949 | |
| | Ameren Illinois Co. | 4.500% | 3/15/49 | 1,410 | 1,875 | |
| | Ameren Illinois Co. | 3.250% | 3/15/50 | 2,050 | 2,349 | |
| | American Electric Power Co. Inc. | 3.250% | 3/1/50 | 1,535 | 1,611 | |
| | Appalachian Power Co. | 7.000% | 4/1/38 | 1,089 | 1,615 | |
| | Appalachian Power Co. | 4.400% | 5/15/44 | 1,578 | 1,910 | |
| | Appalachian Power Co. | 4.450% | 6/1/45 | 884 | 1,083 | |
| | Appalachian Power Co. | 4.500% | 3/1/49 | 1,272 | 1,566 | |
| | Appalachian Power Co. | 3.700% | 5/1/50 | 2,925 | 3,285 | |
| | Arizona Public Service Co. | 5.050% | 9/1/41 | 407 | 532 | |
| | Arizona Public Service Co. | 4.500% | 4/1/42 | 1,446 | 1,791 | |
| | Arizona Public Service Co. | 4.350% | 11/15/45 | 483 | 592 | |
| | Arizona Public Service Co. | 3.750% | 5/15/46 | 205 | 233 | |
| | Arizona Public Service Co. | 4.200% | 8/15/48 | 1,137 | 1,392 | |
| | Arizona Public Service Co. | 4.250% | 3/1/49 | 775 | 964 | |
| | Arizona Public Service Co. | 3.500% | 12/1/49 | 610 | 690 | |
| | Arizona Public Service Co. | 3.350% | 5/15/50 | 491 | 546 | |
| | Avista Corp. | 4.350% | 6/1/48 | 345 | 424 | |
| | Baltimore Gas & Electric Co. | 6.350% | 10/1/36 | 574 | 840 | |
| | Baltimore Gas & Electric Co. | 3.500% | 8/15/46 | 2,675 | 3,000 | |
| | Baltimore Gas & Electric Co. | 3.750% | 8/15/47 | 1,150 | 1,367 | |
| | Baltimore Gas & Electric Co. | 4.250% | 9/15/48 | 477 | 602 | |
| | Baltimore Gas & Electric Co. | 3.200% | 9/15/49 | 220 | 239 | |
| | Baltimore Gas & Electric Co. | 2.900% | 6/15/50 | 850 | 873 | |
| | Berkshire Hathaway Energy Co. | 6.125% | 4/1/36 | 2,700 | 3,867 | |
| | Berkshire Hathaway Energy Co. | 5.950% | 5/15/37 | 1,025 | 1,476 | |
Vanguard® Long-Term Corporate Bond Index Fund
Schedule of Investments
August 31, 2020
| | | | Face | Market |
| | | Maturity | Amount | Value |
| | Coupon | Date | ($000) | ($000) |
| | Berkshire Hathaway Energy Co. | 5.150% | 11/15/43 | 3,079 | 4,178 |
| | Berkshire Hathaway Energy Co. | 4.500% | 2/1/45 | 350 | 440 |
| | Berkshire Hathaway Energy Co. | 3.800% | 7/15/48 | 1,885 | 2,201 |
| | Berkshire Hathaway Energy Co. | 4.450% | 1/15/49 | 2,095 | 2,706 |
| 2 | Berkshire Hathaway Energy Co. | 4.250% | 10/15/50 | 2,075 | 2,633 |
| | Black Hills Corp. | 4.350% | 5/1/33 | 1,070 | 1,215 |
| | Black Hills Corp. | 4.200% | 9/15/46 | 356 | 422 |
| | Black Hills Corp. | 3.875% | 10/15/49 | 602 | 692 |
| | CenterPoint Energy Houston Electric LLC | 6.950% | 3/15/33 | 380 | 569 |
| | CenterPoint Energy Houston Electric LLC | 3.550% | 8/1/42 | 1,027 | 1,160 |
| | CenterPoint Energy Houston Electric LLC | 4.500% | 4/1/44 | 114 | 147 |
| | CenterPoint Energy Houston Electric LLC | 3.950% | 3/1/48 | 1,235 | 1,510 |
| | CenterPoint Energy Houston Electric LLC | 4.250% | 2/1/49 | 1,076 | 1,415 |
| | CenterPoint Energy Houston Electric LLC | 2.900% | 7/1/50 | 1,135 | 1,206 |
| | CenterPoint Energy Inc. | 3.700% | 9/1/49 | 1,255 | 1,413 |
| | Cleco Corporate Holdings LLC | 4.973% | 5/1/46 | 800 | 886 |
| | Cleveland Electric Illuminating Co. | 5.950% | 12/15/36 | 1,003 | 1,266 |
| | CMS Energy Corp. | 4.875% | 3/1/44 | 367 | 478 |
| | Commonwealth Edison Co. | 5.900% | 3/15/36 | 2,057 | 2,954 |
| | Commonwealth Edison Co. | 6.450% | 1/15/38 | 452 | 685 |
| | Commonwealth Edison Co. | 3.800% | 10/1/42 | 909 | 1,076 |
| | Commonwealth Edison Co. | 4.600% | 8/15/43 | 1,316 | 1,704 |
| | Commonwealth Edison Co. | 4.700% | 1/15/44 | 1,701 | 2,259 |
| | Commonwealth Edison Co. | 3.700% | 3/1/45 | 1,372 | 1,599 |
| | Commonwealth Edison Co. | 4.350% | 11/15/45 | 1,238 | 1,587 |
| | Commonwealth Edison Co. | 3.650% | 6/15/46 | 848 | 986 |
| | Commonwealth Edison Co. | 3.750% | 8/15/47 | 2,571 | 3,066 |
| | Commonwealth Edison Co. | 4.000% | 3/1/48 | 335 | 413 |
| | Commonwealth Edison Co. | 4.000% | 3/1/49 | 865 | 1,075 |
| | Commonwealth Edison Co. | 3.200% | 11/15/49 | 530 | 595 |
| | Commonwealth Edison Co. | 3.000% | 3/1/50 | 1,490 | 1,611 |
| | Connecticut Light & Power Co. | 4.300% | 4/15/44 | 238 | 301 |
| | Connecticut Light & Power Co. | 4.150% | 6/1/45 | 752 | 938 |
| | Connecticut Light & Power Co. | 4.000% | 4/1/48 | 3,510 | 4,401 |
| | Consolidated Edison Co. of New York Inc. | 5.300% | 3/1/35 | 829 | 1,119 |
| | Consolidated Edison Co. of New York Inc. | 5.850% | 3/15/36 | 1,348 | 1,831 |
| | Consolidated Edison Co. of New York Inc. | 6.200% | 6/15/36 | 1,105 | 1,559 |
| | Consolidated Edison Co. of New York Inc. | 6.300% | 8/15/37 | 1,460 | 2,115 |
| | Consolidated Edison Co. of New York Inc. | 6.750% | 4/1/38 | 1,169 | 1,795 |
| | Consolidated Edison Co. of New York Inc. | 5.500% | 12/1/39 | 530 | 732 |
| | Consolidated Edison Co. of New York Inc. | 5.700% | 6/15/40 | 1,563 | 2,205 |
| | Consolidated Edison Co. of New York Inc. | 4.200% | 3/15/42 | 1,486 | 1,801 |
| | Consolidated Edison Co. of New York Inc. | 3.950% | 3/1/43 | 1,312 | 1,524 |
| | Consolidated Edison Co. of New York Inc. | 4.450% | 3/15/44 | 2,396 | 2,935 |
| | Consolidated Edison Co. of New York Inc. | 4.500% | 12/1/45 | 989 | 1,233 |
| | Consolidated Edison Co. of New York Inc. | 3.850% | 6/15/46 | 1,358 | 1,582 |
| | Consolidated Edison Co. of New York Inc. | 3.875% | 6/15/47 | 2,131 | 2,436 |
| | Consolidated Edison Co. of New York Inc. | 4.650% | 12/1/48 | 1,300 | 1,700 |
| | Consolidated Edison Co. of New York Inc. | 4.125% | 5/15/49 | 295 | 354 |
| | Consolidated Edison Co. of New York Inc. | 3.950% | 4/1/50 | 1,000 | 1,197 |
| | Consolidated Edison Co. of New York Inc. | 4.625% | 12/1/54 | 890 | 1,143 |
| | Consolidated Edison Co. of New York Inc. | 4.300% | 12/1/56 | 2,100 | 2,575 |
| | Consolidated Edison Co. of New York Inc. | 4.000% | 11/15/57 | 1,075 | 1,247 |
| | Consolidated Edison Co. of New York Inc. | 4.500% | 5/15/58 | 2,067 | 2,645 |
| | Consolidated Edison Co. of New York Inc. | 3.700% | 11/15/59 | 725 | 835 |
| | Consumers Energy Co. | 3.950% | 5/15/43 | 200 | 242 |
| | Consumers Energy Co. | 3.250% | 8/15/46 | 2,021 | 2,266 |
| | Consumers Energy Co. | 4.050% | 5/15/48 | 803 | 1,007 |
| | Consumers Energy Co. | 4.350% | 4/15/49 | 3,188 | 4,260 |
| | Consumers Energy Co. | 3.750% | 2/15/50 | 250 | 306 |
| | Consumers Energy Co. | 3.100% | 8/15/50 | 2,089 | 2,294 |
| | Consumers Energy Co. | 3.500% | 8/1/51 | 700 | 834 |
| | Consumers Energy Co. | 2.500% | 5/1/60 | 1,830 | 1,769 |
| | Dayton Power & Light Co. | 3.950% | 6/15/49 | 930 | 992 |
Vanguard® Long-Term Corporate Bond Index Fund
Schedule of Investments
August 31, 2020
| | | | Face | Market |
| | | Maturity | Amount | Value |
| | Coupon | Date | ($000) | ($000) |
| | Delmarva Power & Light Co. | 4.150% | 5/15/45 | 1,338 | 1,604 |
| | Dominion Energy Inc. | 6.300% | 3/15/33 | 763 | 1,087 |
| | Dominion Energy Inc. | 5.250% | 8/1/33 | 569 | 722 |
| | Dominion Energy Inc. | 5.950% | 6/15/35 | 784 | 1,055 |
| | Dominion Energy Inc. | 7.000% | 6/15/38 | 476 | 695 |
| | Dominion Energy Inc. | 4.900% | 8/1/41 | 2,448 | 3,138 |
| | Dominion Energy Inc. | 4.050% | 9/15/42 | 1,214 | 1,418 |
| | Dominion Energy Inc. | 4.700% | 12/1/44 | 881 | 1,137 |
| | Dominion Energy Inc. | 4.600% | 3/15/49 | 790 | 1,055 |
| | Dominion Energy South Carolina Inc. | 6.625% | 2/1/32 | 1,183 | 1,701 |
| | Dominion Energy South Carolina Inc. | 5.300% | 5/15/33 | 705 | 942 |
| | Dominion Energy South Carolina Inc. | 6.050% | 1/15/38 | 325 | 467 |
| | Dominion Energy South Carolina Inc. | 5.450% | 2/1/41 | 1,526 | 2,119 |
| | Dominion Energy South Carolina Inc. | 4.600% | 6/15/43 | 2,046 | 2,675 |
| | Dominion Energy South Carolina Inc. | 5.100% | 6/1/65 | 687 | 1,017 |
| | DTE Electric Co. | 2.625% | 3/1/31 | 2,924 | 3,230 |
| | DTE Electric Co. | 4.000% | 4/1/43 | 530 | 640 |
| | DTE Electric Co. | 4.300% | 7/1/44 | 1,332 | 1,687 |
| | DTE Electric Co. | 3.700% | 3/15/45 | 333 | 385 |
| | DTE Electric Co. | 3.700% | 6/1/46 | 750 | 875 |
| | DTE Electric Co. | 3.750% | 8/15/47 | 1,063 | 1,261 |
| | DTE Electric Co. | 4.050% | 5/15/48 | 335 | 414 |
| | DTE Electric Co. | 3.950% | 3/1/49 | 1,970 | 2,466 |
| | DTE Electric Co. | 2.950% | 3/1/50 | 265 | 281 |
| | DTE Energy Co. | 6.375% | 4/15/33 | 1,193 | 1,663 |
| | Duke Energy Carolinas LLC | 6.450% | 10/15/32 | 168 | 240 |
| | Duke Energy Carolinas LLC | 6.100% | 6/1/37 | 1,860 | 2,770 |
| | Duke Energy Carolinas LLC | 6.000% | 1/15/38 | 981 | 1,467 |
| | Duke Energy Carolinas LLC | 6.050% | 4/15/38 | 1,152 | 1,737 |
| | Duke Energy Carolinas LLC | 5.300% | 2/15/40 | 2,007 | 2,828 |
| | Duke Energy Carolinas LLC | 4.250% | 12/15/41 | 836 | 1,043 |
| | Duke Energy Carolinas LLC | 4.000% | 9/30/42 | 1,915 | 2,322 |
| | Duke Energy Carolinas LLC | 3.750% | 6/1/45 | 295 | 349 |
| | Duke Energy Carolinas LLC | 3.875% | 3/15/46 | 1,150 | 1,390 |
| | Duke Energy Carolinas LLC | 3.700% | 12/1/47 | 1,200 | 1,430 |
| | Duke Energy Carolinas LLC | 3.950% | 3/15/48 | 278 | 342 |
| | Duke Energy Carolinas LLC | 3.200% | 8/15/49 | 1,133 | 1,271 |
| | Duke Energy Corp. | 4.800% | 12/15/45 | 3,502 | 4,551 |
| | Duke Energy Corp. | 3.750% | 9/1/46 | 1,869 | 2,145 |
| | Duke Energy Corp. | 3.950% | 8/15/47 | 2,007 | 2,343 |
| | Duke Energy Corp. | 4.200% | 6/15/49 | 840 | 1,037 |
| | Duke Energy Florida LLC | 6.350% | 9/15/37 | 2,993 | 4,542 |
| | Duke Energy Florida LLC | 6.400% | 6/15/38 | 101 | 157 |
| | Duke Energy Florida LLC | 5.650% | 4/1/40 | 1,125 | 1,622 |
| | Duke Energy Florida LLC | 3.850% | 11/15/42 | 925 | 1,095 |
| | Duke Energy Florida LLC | 3.400% | 10/1/46 | 1,593 | 1,786 |
| | Duke Energy Florida LLC | 4.200% | 7/15/48 | 1,801 | 2,280 |
| | Duke Energy Indiana LLC | 6.120% | 10/15/35 | 1,188 | 1,582 |
| | Duke Energy Indiana LLC | 6.350% | 8/15/38 | 856 | 1,293 |
| | Duke Energy Indiana LLC | 6.450% | 4/1/39 | 370 | 569 |
| | Duke Energy Indiana LLC | 4.900% | 7/15/43 | 1,093 | 1,462 |
| | Duke Energy Indiana LLC | 3.750% | 5/15/46 | 1,325 | 1,550 |
| | Duke Energy Indiana LLC | 3.250% | 10/1/49 | 824 | 916 |
| | Duke Energy Indiana LLC | 2.750% | 4/1/50 | 1,025 | 1,051 |
| | Duke Energy Ohio Inc. | 3.700% | 6/15/46 | 675 | 789 |
| | Duke Energy Ohio Inc. | 4.300% | 2/1/49 | 1,248 | 1,600 |
| | Duke Energy Progress LLC | 6.300% | 4/1/38 | 888 | 1,337 |
| | Duke Energy Progress LLC | 4.100% | 5/15/42 | 2,414 | 2,950 |
| | Duke Energy Progress LLC | 4.100% | 3/15/43 | 1,486 | 1,840 |
| | Duke Energy Progress LLC | 4.375% | 3/30/44 | 1,021 | 1,300 |
| | Duke Energy Progress LLC | 4.150% | 12/1/44 | 1,110 | 1,394 |
| | Duke Energy Progress LLC | 4.200% | 8/15/45 | 1,895 | 2,361 |
| | Duke Energy Progress LLC | 3.700% | 10/15/46 | 1,509 | 1,795 |
| | Duke Energy Progress LLC | 3.600% | 9/15/47 | 1,315 | 1,515 |
Vanguard® Long-Term Corporate Bond Index Fund
Schedule of Investments
August 31, 2020
| | | | Face | Market |
| | | Maturity | Amount | Value |
| | Coupon | Date | ($000) | ($000) |
| | El Paso Electric Co. | 6.000% | 5/15/35 | 749 | 993 |
| | El Paso Electric Co. | 5.000% | 12/1/44 | 663 | 798 |
| | Emera US Finance LP | 4.750% | 6/15/46 | 2,973 | 3,688 |
| | Entergy Arkansas LLC | 4.200% | 4/1/49 | 1,315 | 1,656 |
| | Entergy Corp. | 3.750% | 6/15/50 | 2,450 | 2,828 |
| | Entergy Louisiana LLC | 3.050% | 6/1/31 | 1,080 | 1,229 |
| | Entergy Louisiana LLC | 4.000% | 3/15/33 | 3,740 | 4,649 |
| | Entergy Louisiana LLC | 4.950% | 1/15/45 | 8 | 9 |
| | Entergy Louisiana LLC | 4.200% | 9/1/48 | 2,020 | 2,571 |
| | Entergy Louisiana LLC | 4.200% | 4/1/50 | 1,544 | 2,008 |
| | Entergy Louisiana LLC | 2.900% | 3/15/51 | 380 | 401 |
| | Entergy Mississippi LLC | 3.850% | 6/1/49 | 350 | 423 |
| | Entergy Texas Inc. | 4.500% | 3/30/39 | 200 | 247 |
| | Entergy Texas Inc. | 3.550% | 9/30/49 | 395 | 445 |
| | Evergy Kansas Central Inc. | 3.450% | 4/15/50 | 1,638 | 1,882 |
| | Eversource Energy | 3.450% | 1/15/50 | 730 | 815 |
| | Exelon Corp. | 4.950% | 6/15/35 | 965 | 1,201 |
| | Exelon Corp. | 5.625% | 6/15/35 | 2,103 | 2,778 |
| | Exelon Corp. | 5.100% | 6/15/45 | 1,239 | 1,588 |
| | Exelon Corp. | 4.450% | 4/15/46 | 1,885 | 2,310 |
| | Exelon Corp. | 4.700% | 4/15/50 | 1,340 | 1,724 |
| | Exelon Generation Co. LLC | 6.250% | 10/1/39 | 752 | 911 |
| | Exelon Generation Co. LLC | 5.750% | 10/1/41 | 1,617 | 1,895 |
| | Exelon Generation Co. LLC | 5.600% | 6/15/42 | 2,390 | 2,769 |
| | FirstEnergy Corp. | 2.250% | 9/1/30 | 1,000 | 994 |
| | FirstEnergy Corp. | 7.375% | 11/15/31 | 3,865 | 5,432 |
| | FirstEnergy Corp. | 4.850% | 7/15/47 | 2,000 | 2,449 |
| | FirstEnergy Corp. | 3.400% | 3/1/50 | 1,295 | 1,301 |
| | Florida Power & Light Co. | 5.625% | 4/1/34 | 210 | 306 |
| | Florida Power & Light Co. | 4.950% | 6/1/35 | 1,871 | 2,627 |
| | Florida Power & Light Co. | 5.650% | 2/1/37 | 1,138 | 1,639 |
| | Florida Power & Light Co. | 5.950% | 2/1/38 | 870 | 1,292 |
| | Florida Power & Light Co. | 5.960% | 4/1/39 | 295 | 443 |
| | Florida Power & Light Co. | 5.690% | 3/1/40 | 606 | 901 |
| | Florida Power & Light Co. | 5.250% | 2/1/41 | 1,024 | 1,451 |
| | Florida Power & Light Co. | 4.125% | 2/1/42 | 275 | 344 |
| | Florida Power & Light Co. | 4.050% | 6/1/42 | 1,145 | 1,422 |
| | Florida Power & Light Co. | 3.800% | 12/15/42 | 1,577 | 1,891 |
| | Florida Power & Light Co. | 4.050% | 10/1/44 | 1,392 | 1,733 |
| | Florida Power & Light Co. | 3.700% | 12/1/47 | 1,460 | 1,768 |
| | Florida Power & Light Co. | 3.950% | 3/1/48 | 1,146 | 1,441 |
| | Florida Power & Light Co. | 4.125% | 6/1/48 | 1,220 | 1,576 |
| | Florida Power & Light Co. | 3.990% | 3/1/49 | 2,920 | 3,773 |
| | Florida Power & Light Co. | 3.150% | 10/1/49 | 2,791 | 3,136 |
| | Georgia Power Co. | 4.750% | 9/1/40 | 1,522 | 1,837 |
| | Georgia Power Co. | 4.300% | 3/15/42 | 3,017 | 3,520 |
| | Georgia Power Co. | 4.300% | 3/15/43 | 578 | 677 |
| | Georgia Power Co. | 3.700% | 1/30/50 | 519 | 578 |
| | Iberdrola International BV | 6.750% | 7/15/36 | 1,196 | 1,692 |
| | Indiana Michigan Power Co. | 6.050% | 3/15/37 | 1,429 | 2,002 |
| | Indiana Michigan Power Co. | 4.550% | 3/15/46 | 1,733 | 2,215 |
| | Indiana Michigan Power Co. | 3.750% | 7/1/47 | 600 | 694 |
| | Indiana Michigan Power Co. | 4.250% | 8/15/48 | 819 | 1,012 |
| | Interstate Power & Light Co. | 6.250% | 7/15/39 | 240 | 346 |
| | Interstate Power & Light Co. | 3.700% | 9/15/46 | 280 | 325 |
| | Interstate Power & Light Co. | 3.500% | 9/30/49 | 625 | 712 |
| | ITC Holdings Corp. | 5.300% | 7/1/43 | 706 | 926 |
| 1 | John Sevier Combined Cycle Generation LLC | 4.626% | 1/15/42 | 812 | 1,038 |
| | Kansas City Power & Light Co. | 5.300% | 10/1/41 | 410 | 551 |
| | Kansas City Power & Light Co. | 4.200% | 6/15/47 | 670 | 851 |
| | Kansas City Power & Light Co. | 4.200% | 3/15/48 | 470 | 599 |
| | Kansas City Power & Light Co. | 4.125% | 4/1/49 | 966 | 1,209 |
| | Kentucky Utilities Co. | 5.125% | 11/1/40 | 252 | 339 |
| | Kentucky Utilities Co. | 4.375% | 10/1/45 | 460 | 570 |
Vanguard® Long-Term Corporate Bond Index Fund
Schedule of Investments
August 31, 2020
| | | | Face | Market |
| | | Maturity | Amount | Value |
| | Coupon | Date | ($000) | ($000) |
| | Kentucky Utilities Co. | 3.300% | 6/1/50 | 940 | 1,037 |
| | Louisville Gas & Electric Co. | 4.250% | 4/1/49 | 2,405 | 2,993 |
| | MidAmerican Energy Co. | 6.750% | 12/30/31 | 425 | 642 |
| | MidAmerican Energy Co. | 5.750% | 11/1/35 | 1,748 | 2,572 |
| | MidAmerican Energy Co. | 5.800% | 10/15/36 | 835 | 1,176 |
| | MidAmerican Energy Co. | 4.800% | 9/15/43 | 754 | 1,002 |
| | MidAmerican Energy Co. | 4.400% | 10/15/44 | 364 | 465 |
| | MidAmerican Energy Co. | 4.250% | 5/1/46 | 1,480 | 1,872 |
| | MidAmerican Energy Co. | 3.950% | 8/1/47 | 525 | 644 |
| | MidAmerican Energy Co. | 3.650% | 8/1/48 | 1,570 | 1,856 |
| | MidAmerican Energy Co. | 4.250% | 7/15/49 | 1,226 | 1,617 |
| | MidAmerican Energy Co. | 3.150% | 4/15/50 | 1,350 | 1,480 |
| | Mississippi Power Co. | 4.250% | 3/15/42 | 1,031 | 1,223 |
| | National Rural Utilities Cooperative Finance Corp. | 8.000% | 3/1/32 | 442 | 693 |
| | National Rural Utilities Cooperative Finance Corp. | 4.023% | 11/1/32 | 685 | 821 |
| | National Rural Utilities Cooperative Finance Corp. | 4.400% | 11/1/48 | 1,379 | 1,796 |
| | National Rural Utilities Cooperative Finance Corp. | 4.300% | 3/15/49 | 2,005 | 2,601 |
| | Nevada Power Co. | 6.650% | 4/1/36 | 593 | 873 |
| | Nevada Power Co. | 6.750% | 7/1/37 | 1,935 | 2,926 |
| | Nevada Power Co. | 3.125% | 8/1/50 | 2,292 | 2,488 |
| | Northern States Power Co. | 6.250% | 6/1/36 | 405 | 597 |
| | Northern States Power Co. | 6.200% | 7/1/37 | 915 | 1,403 |
| | Northern States Power Co. | 5.350% | 11/1/39 | 632 | 923 |
| | Northern States Power Co. | 3.400% | 8/15/42 | 1,125 | 1,275 |
| | Northern States Power Co. | 4.125% | 5/15/44 | 1,153 | 1,437 |
| | Northern States Power Co. | 4.000% | 8/15/45 | 1,045 | 1,288 |
| | Northern States Power Co. | 3.600% | 5/15/46 | 1,654 | 1,946 |
| | Northern States Power Co. | 3.600% | 9/15/47 | 1,757 | 2,078 |
| | Northern States Power Co. | 2.900% | 3/1/50 | 2,086 | 2,234 |
| | NorthWestern Corp. | 4.176% | 11/15/44 | 1,219 | 1,447 |
| | NSTAR Electric Co. | 5.500% | 3/15/40 | 933 | 1,316 |
| | NSTAR Electric Co. | 4.400% | 3/1/44 | 365 | 464 |
| | Oglethorpe Power Corp. | 5.950% | 11/1/39 | 790 | 998 |
| | Oglethorpe Power Corp. | 5.375% | 11/1/40 | 1,580 | 1,880 |
| | Oglethorpe Power Corp. | 5.050% | 10/1/48 | 585 | 697 |
| | Oglethorpe Power Corp. | 5.250% | 9/1/50 | 378 | 444 |
| | Ohio Power Co. | 4.150% | 4/1/48 | 375 | 462 |
| | Ohio Power Co. | 4.000% | 6/1/49 | 1,753 | 2,124 |
| | Oklahoma Gas & Electric Co. | 4.150% | 4/1/47 | 405 | 469 |
| | Oklahoma Gas & Electric Co. | 3.850% | 8/15/47 | 456 | 509 |
| | Oncor Electric Delivery Co. LLC | 7.000% | 5/1/32 | 389 | 575 |
| | Oncor Electric Delivery Co. LLC | 7.250% | 1/15/33 | 293 | 442 |
| | Oncor Electric Delivery Co. LLC | 7.500% | 9/1/38 | 970 | 1,601 |
| | Oncor Electric Delivery Co. LLC | 5.250% | 9/30/40 | 945 | 1,285 |
| | Oncor Electric Delivery Co. LLC | 4.550% | 12/1/41 | 425 | 545 |
| | Oncor Electric Delivery Co. LLC | 5.300% | 6/1/42 | 1,254 | 1,768 |
| | Oncor Electric Delivery Co. LLC | 3.750% | 4/1/45 | 1,402 | 1,662 |
| | Oncor Electric Delivery Co. LLC | 3.800% | 9/30/47 | 1,220 | 1,461 |
| | Oncor Electric Delivery Co. LLC | 4.100% | 11/15/48 | 1,625 | 2,068 |
| | Oncor Electric Delivery Co. LLC | 3.800% | 6/1/49 | 1,333 | 1,638 |
| | Oncor Electric Delivery Co. LLC | 3.100% | 9/15/49 | 1,050 | 1,143 |
| | Oncor Electric Delivery Co. LLC | 3.700% | 5/15/50 | 175 | 212 |
| | Pacific Gas & Electric Co. | 3.950% | 12/1/47 | 3,550 | 3,345 |
| | Pacific Gas & Electric Co. | 2.500% | 2/1/31 | 5,100 | 4,905 |
| | Pacific Gas & Electric Co. | 4.500% | 7/1/40 | 6,870 | 7,262 |
| | Pacific Gas & Electric Co. | 3.300% | 8/1/40 | 340 | 320 |
| | Pacific Gas & Electric Co. | 4.750% | 2/15/44 | 1,450 | 1,525 |
| | Pacific Gas & Electric Co. | 4.300% | 3/15/45 | 3,100 | 3,057 |
| | Pacific Gas & Electric Co. | 4.950% | 7/1/50 | 6,580 | 7,230 |
| | Pacific Gas & Electric Co. | 3.500% | 8/1/50 | 4,880 | 4,554 |
| | PacifiCorp | 2.700% | 9/15/30 | 1,400 | 1,551 |
| | PacifiCorp | 7.700% | 11/15/31 | 244 | 380 |
| | PacifiCorp | 5.250% | 6/15/35 | 936 | 1,314 |
| | PacifiCorp | 6.100% | 8/1/36 | 1,415 | 2,006 |
Vanguard® Long-Term Corporate Bond Index Fund
Schedule of Investments
August 31, 2020
| | | | Face | Market |
| | | Maturity | Amount | Value |
| | Coupon | Date | ($000) | ($000) |
| | PacifiCorp | 5.750% | 4/1/37 | 1,566 | 2,166 |
| | PacifiCorp | 6.250% | 10/15/37 | 1,240 | 1,803 |
| | PacifiCorp | 6.350% | 7/15/38 | 575 | 853 |
| | PacifiCorp | 6.000% | 1/15/39 | 1,412 | 2,038 |
| | PacifiCorp | 4.100% | 2/1/42 | 765 | 910 |
| | PacifiCorp | 4.125% | 1/15/49 | 1,842 | 2,262 |
| | PacifiCorp | 4.150% | 2/15/50 | 1,633 | 2,057 |
| | PacifiCorp | 3.300% | 3/15/51 | 1,300 | 1,466 |
| | PECO Energy Co. | 5.950% | 10/1/36 | 533 | 746 |
| | PECO Energy Co. | 4.150% | 10/1/44 | 802 | 996 |
| | PECO Energy Co. | 3.900% | 3/1/48 | 1,901 | 2,335 |
| | PECO Energy Co. | 3.000% | 9/15/49 | 499 | 538 |
| | PECO Energy Co. | 2.800% | 6/15/50 | 350 | 367 |
| | Potomac Electric Power Co. | 6.500% | 11/15/37 | 248 | 374 |
| | Potomac Electric Power Co. | 4.150% | 3/15/43 | 1,800 | 2,165 |
| | PPL Capital Funding Inc. | 4.700% | 6/1/43 | 1,016 | 1,242 |
| | PPL Capital Funding Inc. | 5.000% | 3/15/44 | 555 | 708 |
| | PPL Capital Funding Inc. | 4.000% | 9/15/47 | 1,000 | 1,146 |
| | PPL Electric Utilities Corp. | 6.250% | 5/15/39 | 250 | 368 |
| | PPL Electric Utilities Corp. | 4.750% | 7/15/43 | 1,000 | 1,345 |
| | PPL Electric Utilities Corp. | 4.125% | 6/15/44 | 1,110 | 1,353 |
| | PPL Electric Utilities Corp. | 4.150% | 10/1/45 | 1,390 | 1,716 |
| | PPL Electric Utilities Corp. | 3.950% | 6/1/47 | 2,265 | 2,794 |
| | PPL Electric Utilities Corp. | 4.150% | 6/15/48 | 595 | 755 |
| | PPL Electric Utilities Corp. | 3.000% | 10/1/49 | 515 | 565 |
| | Progress Energy Inc. | 7.750% | 3/1/31 | 1,135 | 1,671 |
| | Progress Energy Inc. | 6.000% | 12/1/39 | 1,832 | 2,579 |
| | PSEG Power LLC | 8.625% | 4/15/31 | 898 | 1,261 |
| | Public Service Co. of Colorado | 1.900% | 1/15/31 | 1,370 | 1,433 |
| | Public Service Co. of Colorado | 6.250% | 9/1/37 | 580 | 874 |
| | Public Service Co. of Colorado | 6.500% | 8/1/38 | 626 | 973 |
| | Public Service Co. of Colorado | 3.600% | 9/15/42 | 1,411 | 1,631 |
| | Public Service Co. of Colorado | 4.300% | 3/15/44 | 1,548 | 2,001 |
| | Public Service Co. of Colorado | 3.800% | 6/15/47 | 597 | 724 |
| | Public Service Co. of Colorado | 4.100% | 6/15/48 | 1,228 | 1,575 |
| | Public Service Co. of Colorado | 4.050% | 9/15/49 | 620 | 789 |
| | Public Service Co. of Colorado | 3.200% | 3/1/50 | 1,310 | 1,484 |
| | Public Service Co. of New Hampshire | 3.600% | 7/1/49 | 460 | 547 |
| | Public Service Electric & Gas Co. | 5.800% | 5/1/37 | 985 | 1,411 |
| | Public Service Electric & Gas Co. | 5.500% | 3/1/40 | 625 | 899 |
| | Public Service Electric & Gas Co. | 3.950% | 5/1/42 | 515 | 623 |
| | Public Service Electric & Gas Co. | 3.650% | 9/1/42 | 1,196 | 1,404 |
| | Public Service Electric & Gas Co. | 3.800% | 1/1/43 | 1,170 | 1,399 |
| | Public Service Electric & Gas Co. | 3.800% | 3/1/46 | 841 | 1,022 |
| | Public Service Electric & Gas Co. | 3.600% | 12/1/47 | 660 | 798 |
| | Public Service Electric & Gas Co. | 4.050% | 5/1/48 | 649 | 833 |
| | Public Service Electric & Gas Co. | 3.850% | 5/1/49 | 850 | 1,062 |
| | Public Service Electric & Gas Co. | 3.200% | 8/1/49 | 1,073 | 1,200 |
| | Public Service Electric & Gas Co. | 3.150% | 1/1/50 | 315 | 358 |
| | Public Service Electric & Gas Co. | 2.700% | 5/1/50 | 1,045 | 1,083 |
| | Public Service Electric & Gas Co. | 2.050% | 8/1/50 | 500 | 456 |
| | Puget Sound Energy Inc. | 6.274% | 3/15/37 | 441 | 642 |
| | Puget Sound Energy Inc. | 5.757% | 10/1/39 | 1,025 | 1,466 |
| | Puget Sound Energy Inc. | 5.795% | 3/15/40 | 613 | 881 |
| | Puget Sound Energy Inc. | 5.638% | 4/15/41 | 373 | 532 |
| | Puget Sound Energy Inc. | 4.300% | 5/20/45 | 1,116 | 1,387 |
| | Puget Sound Energy Inc. | 4.223% | 6/15/48 | 1,809 | 2,265 |
| | Puget Sound Energy Inc. | 3.250% | 9/15/49 | 1,104 | 1,232 |
| | San Diego Gas & Electric Co. | 6.000% | 6/1/39 | 694 | 1,008 |
| | San Diego Gas & Electric Co. | 4.500% | 8/15/40 | 286 | 358 |
| | San Diego Gas & Electric Co. | 3.750% | 6/1/47 | 815 | 946 |
| | San Diego Gas & Electric Co. | 4.150% | 5/15/48 | 755 | 923 |
| | San Diego Gas & Electric Co. | 4.100% | 6/15/49 | 1,000 | 1,220 |
| | San Diego Gas & Electric Co. | 3.320% | 4/15/50 | 1,275 | 1,412 |
Vanguard® Long-Term Corporate Bond Index Fund
Schedule of Investments
August 31, 2020
| | | | Face | Market |
| | | Maturity | Amount | Value |
| | Coupon | Date | ($000) | ($000) |
| | Southern California Edison Co. | 6.000% | 1/15/34 | 593 | 802 |
| | Southern California Edison Co. | 5.750% | 4/1/35 | 577 | 777 |
| | Southern California Edison Co. | 5.350% | 7/15/35 | 2,286 | 2,983 |
| | Southern California Edison Co. | 5.625% | 2/1/36 | 1,005 | 1,229 |
| | Southern California Edison Co. | 5.550% | 1/15/37 | 195 | 239 |
| | Southern California Edison Co. | 5.950% | 2/1/38 | 1,188 | 1,535 |
| | Southern California Edison Co. | 6.050% | 3/15/39 | 50 | 66 |
| | Southern California Edison Co. | 5.500% | 3/15/40 | 1,639 | 2,083 |
| | Southern California Edison Co. | 4.500% | 9/1/40 | 1,091 | 1,246 |
| | Southern California Edison Co. | 4.050% | 3/15/42 | 1,100 | 1,179 |
| | Southern California Edison Co. | 3.900% | 3/15/43 | 1,545 | 1,630 |
| | Southern California Edison Co. | 4.650% | 10/1/43 | 531 | 615 |
| | Southern California Edison Co. | 3.600% | 2/1/45 | 1,139 | 1,164 |
| | Southern California Edison Co. | 4.000% | 4/1/47 | 3,260 | 3,513 |
| | Southern California Edison Co. | 4.125% | 3/1/48 | 3,776 | 4,121 |
| | Southern California Edison Co. | 4.875% | 3/1/49 | 2,159 | 2,601 |
| | Southern California Edison Co. | 3.650% | 2/1/50 | 3,064 | 3,208 |
| | Southern Co. | 4.250% | 7/1/36 | 414 | 471 |
| | Southern Co. | 4.400% | 7/1/46 | 4,140 | 4,867 |
| | Southern Power Co. | 5.150% | 9/15/41 | 1,058 | 1,212 |
| | Southern Power Co. | 5.250% | 7/15/43 | 560 | 654 |
| | Southern Power Co. | 4.950% | 12/15/46 | 1,090 | 1,266 |
| | Southwestern Electric Power Co. | 6.200% | 3/15/40 | 412 | 567 |
| | Southwestern Electric Power Co. | 3.900% | 4/1/45 | 499 | 549 |
| | Southwestern Electric Power Co. | 3.850% | 2/1/48 | 282 | 307 |
| | Southwestern Public Service Co. | 4.500% | 8/15/41 | 386 | 473 |
| | Southwestern Public Service Co. | 3.400% | 8/15/46 | 1,150 | 1,260 |
| | Southwestern Public Service Co. | 3.700% | 8/15/47 | 1,538 | 1,772 |
| | Southwestern Public Service Co. | 4.400% | 11/15/48 | 190 | 247 |
| | Southwestern Public Service Co. | 3.750% | 6/15/49 | 663 | 785 |
| | Southwestern Public Service Co. | 3.150% | 5/1/50 | 1,556 | 1,687 |
| | Tampa Electric Co. | 4.100% | 6/15/42 | 220 | 258 |
| | Tampa Electric Co. | 4.350% | 5/15/44 | 815 | 1,000 |
| | Tampa Electric Co. | 4.300% | 6/15/48 | 410 | 510 |
| | Tampa Electric Co. | 4.450% | 6/15/49 | 1,000 | 1,278 |
| | Tampa Electric Co. | 3.625% | 6/15/50 | 1,050 | 1,231 |
| | Toledo Edison Co. | 6.150% | 5/15/37 | 313 | 448 |
| | Tucson Electric Power Co. | 4.850% | 12/1/48 | 615 | 817 |
| | Tucson Electric Power Co. | 4.000% | 6/15/50 | 500 | 601 |
| | Union Electric Co. | 5.300% | 8/1/37 | 298 | 399 |
| | Union Electric Co. | 8.450% | 3/15/39 | 377 | 640 |
| | Union Electric Co. | 3.900% | 9/15/42 | 1,631 | 1,938 |
| | Union Electric Co. | 3.650% | 4/15/45 | 320 | 376 |
| | Union Electric Co. | 4.000% | 4/1/48 | 1,005 | 1,233 |
| | Union Electric Co. | 3.250% | 10/1/49 | 1,300 | 1,462 |
| | Virginia Electric & Power Co. | 6.000% | 1/15/36 | 782 | 1,105 |
| | Virginia Electric & Power Co. | 6.000% | 5/15/37 | 309 | 446 |
| | Virginia Electric & Power Co. | 6.350% | 11/30/37 | 1,563 | 2,322 |
| | Virginia Electric & Power Co. | 8.875% | 11/15/38 | 8 | 15 |
| | Virginia Electric & Power Co. | 4.000% | 1/15/43 | 2,228 | 2,695 |
| | Virginia Electric & Power Co. | 4.650% | 8/15/43 | 637 | 840 |
| | Virginia Electric & Power Co. | 4.450% | 2/15/44 | 1,934 | 2,490 |
| | Virginia Electric & Power Co. | 4.200% | 5/15/45 | 1,100 | 1,381 |
| | Virginia Electric & Power Co. | 4.000% | 11/15/46 | 2,816 | 3,459 |
| | Virginia Electric & Power Co. | 3.800% | 9/15/47 | 1,763 | 2,111 |
| | Virginia Electric & Power Co. | 4.600% | 12/1/48 | 1,480 | 2,025 |
| | Virginia Electric & Power Co. | 3.300% | 12/1/49 | 1,456 | 1,691 |
| | Westar Energy Inc. | 4.125% | 3/1/42 | 998 | 1,191 |
| | Westar Energy Inc. | 4.100% | 4/1/43 | 1,934 | 2,315 |
| | Westar Energy Inc. | 4.250% | 12/1/45 | 1,324 | 1,652 |
| | Wisconsin Electric Power Co. | 5.625% | 5/15/33 | 1,010 | 1,383 |
| | Wisconsin Electric Power Co. | 5.700% | 12/1/36 | 300 | 422 |
| | Wisconsin Electric Power Co. | 4.300% | 10/15/48 | 1,180 | 1,481 |
| | Wisconsin Power & Light Co. | 6.375% | 8/15/37 | 689 | 1,000 |
Vanguard® Long-Term Corporate Bond Index Fund
Schedule of Investments
August 31, 2020
| | | | Face | Market | |
| | | Maturity | Amount | Value | |
| | Coupon | Date | ($000) | ($000 | ) |
| | Wisconsin Power & Light Co. | 3.650% | 4/1/50 | 1,650 | 1,944 | |
| | Wisconsin Public Service Corp. | 3.671% | 12/1/42 | 663 | 766 | |
| | Wisconsin Public Service Corp. | 4.752% | 11/1/44 | 773 | 995 | |
| | Wisconsin Public Service Corp. | 3.300% | 9/1/49 | 280 | 311 | |
| | Xcel Energy Inc. | 6.500% | 7/1/36 | 285 | 418 | |
| | Xcel Energy Inc. | 3.500% | 12/1/49 | 685 | 775 | |
| | Natural Gas (0.9%) | |
| | Atmos Energy Corp. | 5.500% | 6/15/41 | 620 | 864 | |
| | Atmos Energy Corp. | 4.150% | 1/15/43 | 1,537 | 1,864 | |
| | Atmos Energy Corp. | 4.125% | 10/15/44 | 780 | 951 | |
| | Atmos Energy Corp. | 4.300% | 10/1/48 | 375 | 482 | |
| | Atmos Energy Corp. | 4.125% | 3/15/49 | 1,182 | 1,490 | |
| | Atmos Energy Corp. | 3.375% | 9/15/49 | 2,996 | 3,402 | |
| | CenterPoint Energy Resources Corp. | 5.850% | 1/15/41 | 1,611 | 2,178 | |
| | CenterPoint Energy Resources Corp. | 4.100% | 9/1/47 | 719 | 821 | |
| | KeySpan Corp. | 5.803% | 4/1/35 | 679 | 879 | |
| | NiSource Finance Corp. | 5.950% | 6/15/41 | 953 | 1,316 | |
| | NiSource Finance Corp. | 5.250% | 2/15/43 | 648 | 842 | |
| | NiSource Finance Corp. | 4.800% | 2/15/44 | 1,189 | 1,498 | |
| | NiSource Finance Corp. | 5.650% | 2/1/45 | 625 | 863 | |
| | NiSource Finance Corp. | 4.375% | 5/15/47 | 3,745 | 4,615 | |
| | NiSource Finance Corp. | 3.950% | 3/30/48 | 1,175 | 1,381 | |
| | NiSource Inc. | 1.700% | 2/15/31 | 500 | 493 | |
| | ONE Gas Inc. | 4.658% | 2/1/44 | 1,836 | 2,351 | |
| | ONE Gas Inc. | 4.500% | 11/1/48 | 345 | 435 | |
| | Piedmont Natural Gas Co. Inc. | 4.650% | 8/1/43 | 255 | 328 | |
| | Piedmont Natural Gas Co. Inc. | 3.640% | 11/1/46 | 786 | 877 | |
| | Piedmont Natural Gas Co. Inc. | 3.350% | 6/1/50 | 1,575 | 1,734 | |
| | Sempra Energy | 3.800% | 2/1/38 | 2,541 | 2,906 | |
| | Sempra Energy | 6.000% | 10/15/39 | 2,892 | 4,054 | |
| | Sempra Energy | 4.000% | 2/1/48 | 2,285 | 2,600 | |
| | Southern California Gas Co. | 5.125% | 11/15/40 | 270 | 357 | |
| | Southern California Gas Co. | 3.750% | 9/15/42 | 758 | 886 | |
| | Southern California Gas Co. | 4.125% | 6/1/48 | 583 | 731 | |
| | Southern California Gas Co. | 4.300% | 1/15/49 | 1,090 | 1,425 | |
| | Southern California Gas Co. | 3.950% | 2/15/50 | 955 | 1,176 | |
| | Southern Co. Gas Capital Corp. | 1.750% | 1/15/31 | 1,000 | 990 | |
| | Southern Co. Gas Capital Corp. | 5.875% | 3/15/41 | 395 | 538 | |
| | Southern Co. Gas Capital Corp. | 4.400% | 6/1/43 | 2,128 | 2,498 | |
| | Southern Co. Gas Capital Corp. | 3.950% | 10/1/46 | 1,162 | 1,294 | |
| | Southern Co. Gas Capital Corp. | 4.400% | 5/30/47 | 548 | 654 | |
| | Southwest Gas Corp. | 3.800% | 9/29/46 | 580 | 649 | |
| | Southwest Gas Corp. | 4.150% | 6/1/49 | 735 | 860 | |
| | Washington Gas Light Co. | 3.796% | 9/15/46 | 1,238 | 1,414 | |
| | Other Utility (0.3%) | |
| | American Water Capital Corp. | 6.593% | 10/15/37 | 288 | 430 | |
| | American Water Capital Corp. | 4.300% | 12/1/42 | 1,115 | 1,368 | |
| | American Water Capital Corp. | 4.300% | 9/1/45 | 1,245 | 1,538 | |
| | American Water Capital Corp. | 4.000% | 12/1/46 | 1,085 | 1,303 | |
| | American Water Capital Corp. | 3.750% | 9/1/47 | 1,528 | 1,787 | |
| | American Water Capital Corp. | 4.200% | 9/1/48 | 1,940 | 2,400 | |
| | American Water Capital Corp. | 4.150% | 6/1/49 | 1,035 | 1,273 | |
| | American Water Capital Corp. | 3.450% | 5/1/50 | 2,020 | 2,298 | |
| | Essential Utilities Inc. | 4.276% | 5/1/49 | 1,100 | 1,369 | |
| | Essential Utilities Inc. | 3.351% | 4/15/50 | 1,400 | 1,512 | |
| | Veolia Environnement SA | 6.750% | 6/1/38 | 222 | 315 | |
| | 699,377 | |
Total Corporate Bonds (Cost $5,327,657) | 5,696,378 | |
Taxable Municipal Bonds (0.1%) | |
| | George Washington University | 4.300% | 9/15/44 | 655 | 816 | |
Vanguard® Long-Term Corporate Bond Index Fund
Schedule of Investments
August 31, 2020
| | | | Face | Market |
| | | Maturity | Amount | Value |
| | Coupon | Date | ($000) | ($000) |
| | George Washington University | 4.868% | 9/15/45 | 285 | 383 |
| | George Washington University | 4.126% | 9/15/48 | 2,011 | 2,595 |
| | Michigan Finance Authority Revenue (Trinity Health Credit Group) | 3.084% | 12/1/34 | 465 | 515 |
| | Princeton University | 5.700% | 3/1/39 | 1,070 | 1,642 |
| 1 | Princeton University | 2.516% | 7/1/50 | 1,575 | 1,646 |
| | University of Southern California | 5.250% | 10/1/11 | 538 | 858 |
| Total Taxable Municipal Bonds (Cost $8,058) | | | | 8,455 |
| | | | Shares | |
| Temporary Cash Investment (0.5%) |
| Money Market Fund (0.5%) |
| 4 | Vanguard Market Liquidity Fund (Cost $30,775) | 0.147% | | 307,753 | 30,775 |
| Total Investments (99.3%) (Cost $5,394,665) | | | | 5,763,770 |
| Other Assets and Liabilities—Net (0.7%) | | | | 37,815 |
| Net Assets (100%) | | | | 5,801,585 |
| Cost is in $000. | | | | |
| 1 | The average or expected maturity is shorter than the final maturity shown because of the possibility of interim principal payments and prepayments or the possibility of the issue being called. |
| 2 | Security exempt from registration under Rule 144A of the Securities Act of 1933. Such securities may be sold in transactions exempt from registration, normally to qualified institutional buyers. At August 31, 2020, the aggregate value of these securities was $119,371,000, representing 2.1% of net assets. |
| 3 | Securities with a value of $2,268,000 have been segregated as initial margin for open futures contracts. |
| 4 | Affiliated money market fund available only to Vanguard funds and certain trusts and accounts managed by Vanguard. Rate shown is the 7-day yield. |
© 2020 The Vanguard Group, Inc.
All rights reserved.
Vanguard Marketing Corporation, Distributor.
SNA16420 102020

Report of Independent Registered Public Accounting Firm
To the Board of Trustees of Vanguard Scottsdale Funds and Shareholders of Vanguard Russell 1000 Index Fund, Vanguard Russell 1000 Value Index Fund and Vanguard Russell 1000 Growth Index Fund
Opinions on the Financial Statements
We have audited the accompanying statements of assets and liabilities, including the schedules of investments—investments summary, of Vanguard Russell 1000 Index Fund, Vanguard Russell 1000 Value Index Fund and Vanguard Russell 1000 Growth Index Fund (three of the funds constituting Vanguard Scottsdale Funds, hereafter collectively referred to as the “Funds”) as of August 31, 2020, the related statements of operations for the year ended August 31, 2020, the statements of changes in net assets for each of the two years in the period ended August 31, 2020, including the related notes, and the financial highlights for each of the five years in the period ended August 31, 2020 (included in Item 1 of this Form N-CSR) and the schedules of investments (included in Item 6 of this Form N-CSR) as of August 31, 2020 (collectively referred to as the “financial statements”). In our opinion, the financial statements present fairly, in all material respects, the financial position of each of the Funds as of August 31, 2020, the results of each of their operations for the year then ended, the changes in each of their net assets for each of the two years in the period ended August 31, 20120 and each of the financial highlights for each of the five years in the period ended August 31, 2020 in conformity with accounting principles generally accepted in the United States of America.
Basis for Opinions
These financial statements are the responsibility of the Funds’ management. Our responsibility is to express an opinion on the Funds’ financial statements based on our audits. We are a public accounting firm registered with the Public Company Accounting Oversight Board (United States) (“PCAOB”) and are required to be independent with respect to the Funds in accordance with the U.S. federal securities laws and the applicable rules and regulations of the Securities and Exchange Commission and the PCAOB.
We conducted our audits of these financial statements in accordance with the standards of the PCAOB. Those standards require that we plan and perform the audit to obtain reasonable assurance about whether the financial statements are free of material misstatement, whether due to error or fraud.
Our audits included performing procedures to assess the risks of material misstatement of the financial statements, whether due to error or fraud, and performing procedures that respond to those risks. Such procedures included examining, on a test basis, evidence regarding the amounts and disclosures in the financial statements. Our audits also included evaluating the accounting principles used and significant estimates made by management, as well as evaluating the overall presentation of the financial statements. Our procedures included confirmation of securities owned as of August 31, 2020 by correspondence with the custodian and brokers and by agreement to the underlying ownership records of the transfer agent; when replies were not received from brokers, we performed other auditing procedures. We believe that our audits provide a reasonable basis for our opinions.

October 19, 2020
We have served as the auditor of one or more investment companies in The Vanguard Group of Funds since 1975.
PricewaterhouseCoopers LLP, Two Commerce Square, Suite 1800, 2001 Market Street, Philadelphia, PA 19103-7042 T: (267) 330 3000, F: (267) 330 3300, www.pwc.com/us
Report of Independent Registered Public Accounting Firm
To the Board of Trustees of Vanguard Scottsdale Funds and Shareholders of Vanguard Russell 2000 Index Fund, Vanguard Russell 2000 Value Index Fund and Vanguard Russell 2000 Growth Index Fund
Opinions on the Financial Statements
We have audited the accompanying statements of assets and liabilities, including the schedules of investments—investments summary, of Vanguard Russell 2000 Index Fund, Vanguard Russell 2000 Value Index Fund and Vanguard Russell 2000 Growth Index Fund (three of the funds constituting Vanguard Scottsdale Funds, hereafter collectively referred to as the "Funds”) as of August 31, 2020, the related statements of operations for the year ended August 31, 2020, the statements of changes in net assets for each of the two years in the period ended August 31, 2020, including the related notes, and the financial highlights for each of the five years in the period ended August 31, 2020 (included in Item 1 of this Form N-CSR) and the schedules of investments (included in Item 6 of this Form N-CSR) as of August 31, 2020 (collectively referred to as the “financial statements”). In our opinion, the financial statements present fairly, in all material respects, the financial position of each of the Funds as of August 31, 2020, the results of each of their operations for the year then ended, the changes in each of their net assets for each of the two years in the period ended August 31, 2020 and each of the financial highlights for each of the five years in the period ended August 31, 2020 in conformity with accounting principles generally accepted in the United States of America.
Basis for Opinions
These financial statements are the responsibility of the Funds’ management. Our responsibility is to express an opinion on the Funds’ financial statements based on our audits. We are a public accounting firm registered with the Public Company Accounting Oversight Board (United States) (“PCAOB”) and are required to be independent with respect to the Funds in accordance with the U.S. federal securities laws and the applicable rules and regulations of the Securities and Exchange Commission and the PCAOB.
We conducted our audits of these financial statements in accordance with the standards of the PCAOB. Those standards require that we plan and perform the audit to obtain reasonable assurance about whether the financial statements are free of material misstatement, whether due to error or fraud.
Our audits included performing procedures to assess the risks of material misstatement of the financial statements, whether due to error or fraud, and performing procedures that respond to those risks. Such procedures included examining, on a test basis, evidence regarding the amounts and disclosures in the financial statements. Our audits also included evaluating the accounting principles used and significant estimates made by management, as well as evaluating the overall presentation of the financial statements. Our procedures included confirmation of securities owned as of August 31, 2020 by correspondence with the custodian and brokers and by agreement to the underlying ownership records of the transfer agent; when replies were not received from brokers, we performed other auditing procedures. We believe that our audits provide a reasonable basis for our opinions.
October 19, 2020
We have served as the auditor of one or more investment companies in The Vanguard Group of Funds since 1975.
PricewaterhouseCoopers LLP, Two Commerce Square, Suite 1800, 2001 Market Street, Philadelphia, PA 19103-7042 T: (267) 330 3000, F: (267) 330 3300, www.pwc.com/us
Report of Independent Registered Public Accounting Firm
To the Board of Trustees of Vanguard Scottsdale Funds and Shareholders of Vanguard Russell 3000 Index Fund
Opinion on the Financial Statements
We have audited the accompanying statement of assets and liabilities, including the schedule of investments—investments summary, of Vanguard Russell 3000 Index Fund (one of the funds constituting Vanguard Scottsdale Funds, referred to hereafter as the “Fund”) as of August 31, 2020, the related statement of operations for the year ended August 31, 2020, the statement of changes in net assets for each of the two years in the period ended August 31, 2020, including the related notes, and the financial highlights for each of the five years in the period ended August 31, 2020 (included in Item 1 of this Form N-CSR) and the schedule of investments (included in Item 6 of this Form N-CSR) as of August 31, 2020 (collectively referred to as the “financial statements”). In our opinion, the financial statements present fairly, in all material respects, the financial position of the Fund as of August 31, 2020, the results of its operations for the year then ended, the changes in its net assets for each of the two years in the period ended August 31, 2020 and the financial highlights for each of the five years in the period ended August 31, 2020 in conformity with accounting principles generally accepted in the United States of America.
Basis for Opinion
These financial statements are the responsibility of the Fund’s management. Our responsibility is to express an opinion on the Fund’s financial statements based on our audits. We are a public accounting firm registered with the Public Company Accounting Oversight Board (United States) (“PCAOB”) and are required to be independent with respect to the Fund in accordance with the U.S. federal securities laws and the applicable rules and regulations of the Securities and Exchange Commission and the PCAOB.
We conducted our audits of these financial statements in accordance with the standards of the PCAOB. Those standards require that we plan and perform the audit to obtain reasonable assurance about whether the financial statements are free of material misstatement, whether due to error or fraud.
Our audits included performing procedures to assess the risks of material misstatement of the financial statements, whether due to error or fraud, and performing procedures that respond to those risks. Such procedures included examining, on a test basis, evidence regarding the amounts and disclosures in the financial statements. Our audits also included evaluating the accounting principles used and significant estimates made by management, as well as evaluating the overall presentation of the financial statements. Our procedures included confirmation of securities owned as of August 31, 2020 by correspondence with the custodian and brokers and by agreement to the underlying ownership records of the transfer agent; when replies were not received from brokers, we performed other auditing procedures. We believe that our audits provide a reasonable basis for our opinion.
October 19, 2020
We have served as the auditor of one or more investment companies in The Vanguard Group of Funds since 1975.
PricewaterhouseCoopers LLP, Two Commerce Square, Suite 1800, 2001 Market Street, Philadelphia, PA 19103-7042 T: (267) 330 3000, F: (267) 330 3300, www.pwc.com/us
Report of Independent Registered Public Accounting Firm
To the Board of Trustees of Vanguard Scottsdale Funds and Shareholders of Vanguard Short-Term Treasury Index Fund, Vanguard Intermediate-Term Treasury Index Fund, Vanguard Long-Term Treasury Index Fund, Vanguard Short-Term Corporate Bond Index Fund, Vanguard Intermediate-Term Corporate Bond Index Fund, Vanguard Long-Term Corporate Bond Index Fund and Vanguard Mortgage-Backed Securities Index Fund
Opinions on the Financial Statements
We have audited the accompanying statements of assets and liabilities, including the schedules of investments, of Vanguard Short-Term Treasury Index Fund, Vanguard Intermediate-Term Treasury Index Fund, Vanguard Long-Term Treasury Index Fund and Vanguard Mortgage-Backed Securities Index Fund, and the statements of assets and liabilities, including the schedules of investments—investments summary, of Vanguard Short-Term Corporate Bond Index Fund, Vanguard Intermediate-Term Corporate Bond Index Fund and Vanguard Long-Term Corporate Bond Index Fund (seven of the funds constituting Vanguard Scottsdale Funds, hereafter collectively referred to as the “Funds”) as of August 31, 2020, the related statements of operations for the year ended August 31, 2020, the statements of changes in net assets for each of the two years in the period ended August 31, 2020, including the related notes, and the financial highlights for each of the five years in the period ended August 31, 2020 (included in Item 1 of this Form N-CSR) and the schedules of investments of Vanguard Short-Term Corporate Bond Index Fund, Vanguard Intermediate-Term Corporate Bond Index Fund and Vanguard Long-Term Corporate Bond Index Fund (included in Item 6 of this Form N-CSR) as of August 31, 2020 (collectively referred to as the “financial statements”). In our opinion, the financial statements present fairly, in all material respects, the financial position of each of the Funds as of August 31, 2020, the results of each of their operations for the year then ended, the changes in each of their net assets for each of the two years in the period ended August 31, 2020 and each of the financial highlights for each of the five years in the period ended August 31, 2020 in conformity with accounting principles generally accepted in the United States of America.
Basis for Opinions
These financial statements are the responsibility of the Funds’ management. Our responsibility is to express an opinion on the Funds’ financial statements based on our audits. We are a public accounting firm registered with the Public Company Accounting Oversight Board (United States) (“PCAOB”) and are required to be independent with respect to the Funds in accordance with the U.S. federal securities laws and the applicable rules and regulations of the Securities and Exchange Commission and the PCAOB.
We conducted our audits of these financial statements in accordance with the standards of the PCAOB. Those standards require that we plan and perform the audit to obtain reasonable assurance about whether the financial statements are free of material misstatement, whether due to error or fraud.
Our audits included performing procedures to assess the risks of material misstatement of the financial statements, whether due to error or fraud, and performing procedures that respond to those risks. Such procedures included examining, on a test basis, evidence regarding the amounts and disclosures in the financial statements. Our audits also included evaluating the accounting principles used and significant estimates made by management, as well as evaluating the overall presentation of the financial
PricewaterhouseCoopers LLP, Two Commerce Square, Suite 1800, 2001 Market Street, Philadelphia, PA 19103-7042 T: (267) 330 3000, F: (267) 330 3300, www.pwc.com/us
statements. Our procedures included confirmation of securities owned as of August 31, 2020 by correspondence with the custodian, transfer agent and brokers; when replies were not received from brokers, we performed other auditing procedures. We believe that our audits provide a reasonable basis for our opinions.
October 19, 2020
We have served as the auditor of one or more investment companies in The Vanguard Group of Funds since 1975.
2
Item 7: Disclosure of Proxy Voting Policies and Procedures for Closed-End Management Investment Companies.
Not applicable.
Item 8: Portfolio Managers of Closed-End Management Investment Companies.
Not applicable.
Item 9: Purchase of Equity Securities by Closed-End Management Investment Company and Affiliated Purchasers.
Not applicable.
Item 10: Submission of Matters to a Vote of Security Holders.
Not applicable.
Item 11: Controls and Procedures.
(a) Disclosure Controls and Procedures. The Principal Executive and Financial Officers concluded that the Registrant’s Disclosure Controls and Procedures are effective based on their evaluation of the Disclosure Controls and Procedures as of a date within 90 days of the filing date of this report.
(b) Internal Control Over Financial Reporting. There were no significant changes in the Registrant’s Internal Control Over Financial Reporting or in other factors that could significantly affect this control subsequent to the date of the evaluation, including any corrective actions with regard to significant deficiencies and material weaknesses.
Item 12: Disclosure of Securities Lending Activities for Closed-End Management Investment Companies.
Not applicable.
Item 13: Exhibits.
Pursuant to the requirements of the Securities Exchange Act of 1934 and the Investment Company Act of 1940, the registrant has duly caused this report to be signed on its behalf by the undersigned, thereunto duly authorized.
| | VANGUARD SCOTTSDALE FUNDS | |
| | | |
| BY: | /s/ MORTIMER J. BUCKLEY* | |
| | | |
| | MORTIMER J. BUCKLEY | |
| | CHIEF EXECUTIVE OFFICER | |
Date: October 20, 2020
Pursuant to the requirements of the Securities Exchange Act of 1934 and the Investment Company Act of 1940, this report has been signed below by the following persons on behalf of the registrant and in the capacities and on the dates indicated.
| | VANGUARD SCOTTSDALE FUNDS | |
| | | |
| BY: | /s/ MORTIMER J. BUCKLEY* | |
| | | |
| | MORTIMER J. BUCKLEY | |
| | CHIEF EXECUTIVE OFFICER | |
Date: October 20, 2020
| | VANGUARD SCOTTSDALE FUNDS | |
| | | |
| BY: | /s/ JOHN BENDL* | |
| | | |
| | JOHN BENDL | |
| | CHIEF FINANCIAL OFFICER | |
Date: October 20, 2020
* By: /s/ Anne E. Robinson
Anne E. Robinson, pursuant to a Power of Attorney filed on October 23, 2020 (see File Number 2-52698), Incorporated by Reference.