UNITED STATES
SECURITIES AND EXCHANGE COMMISSION
Washington, D.C. 20549
FORM N-CSR
CERTIFIED SHAREHOLDER REPORT
OF
REGISTERED MANAGEMENT INVESTMENT COMPANIES
Investment Company Act file number: 811-07803
| Name of Registrant: | Vanguard Scottsdale Funds |
| Address of Registrant: | P.O. Box 2600 |
| Valley Forge, PA 19482 |
| Name and address of agent for service: | Anne E. Robinson, Esquire |
| P.O. Box 876 | |
Valley Forge, PA 19482 |
Registrant’s telephone number, including area code: (610) 669-1000
Date of fiscal year end: August 31
Date of reporting period: September 1, 2021—August 31, 2022
Item 1: Reports to Shareholders

Your Fund’s Performance at a Glance | 1 |
Advisors' Report | 2 |
About Your Fund’s Expenses | 7 |
Performance Summary | 9 |
Financial Statements | 11 |
Liquidity Risk Management | 25 |
| • | The 12 months ended August 31, 2022, were a very challenging period for financial markets. Vanguard Explorer Value Fund returned –10.05% for the period, lagging the –8.34% return of its benchmark, the Russell 2500 Value Index. |
| • | Early on, pent-up demand helped spur global growth and push unemployment rates down. The economic backdrop deteriorated, however, as inflation soared to multidecade highs, fueled in part by higher energy and food prices in the wake of Russia’s invasion of Ukraine. The Federal Reserve reacted by raising interest rates, which pushed borrowing costs higher and sparked fears of recession. |
| • | Negative double-digit returns in a handful of industry sectors, including consumer discretionary and health care, contributed to the poor return for the benchmark index. |
| • | Security selection in a number of sectors, including communication services and industrials, helped the fund’s performance compared with the benchmark. However, the fund’s underweight to the best-performing sector, energy, hurt performance, as did security selection in financials. |
| Average Annual Total Returns Periods Ended August 31, 2022 | |||
| One Year | Three Years | Five Years | |
| Stocks | |||
| Russell 1000 Index (Large-caps) | -12.96% | 12.14% | 11.61% |
| Russell 2000 Index (Small-caps) | -17.88 | 8.59 | 6.95 |
| Russell 3000 Index (Broad U.S. market) | -13.28 | 11.90 | 11.29 |
| FTSE All-World ex US Index (International) | -19.00 | 3.48 | 2.12 |
| Bonds | |||
| Bloomberg U.S. Aggregate Float Adjusted Index (Broad taxable market) | -11.65% | -2.01% | 0.54% |
| Bloomberg Municipal Bond Index (Broad tax-exempt market) | -8.63 | -0.83 | 1.28 |
| FTSE Three-Month U.S. Treasury Bill Index | 0.44 | 0.56 | 1.10 |
| CPI | |||
| Consumer Price Index | 8.26% | 4.90% | 3.82% |
| Fund Assets Managed | |||
| Investment Advisor | % | $ Million | Investment Strategy |
| Frontier Capital Management Co., LLC | 44 | 475 | The advisor selects stocks by identifying companies it believes are underpriced relative to their long-term value. These companies are generally inexpensive and have low price-to-book and price-to-earnings ratios. |
| Cardinal Capital Management, L.L.C. | 41 | 442 | The advisor seeks stocks that are able to generate excess cash flow and reinvest the cash to increase shareholder value. |
| Ariel Investments, LLC | 13 | 142 | The advisor seeks to take advantage of the market’s short-term view to drive long-term results for shareholders. It favors companies with strong brands and franchises that produce or deliver high-quality products or services. |
| Cash Investments | 2 | 24 | These short-term reserves are invested by Vanguard in equity index products to simulate investment in stocks. Each advisor may also maintain a modest cash position. |
| • | Based on actual fund return. This section helps you to estimate the actual expenses that you paid over the period. The ”Ending Account Value“ shown is derived from the fund‘s actual return, and the third column shows the dollar amount that would have been paid by an investor who started with $1,000 in the fund. You may use the information here, together with the amount you invested, to estimate the expenses that you paid over the period. |
| • | Based on hypothetical 5% yearly return. This section is intended to help you compare your fund‘s costs with those of other mutual funds. It assumes that the fund had a yearly return of 5% before expenses, but that the expense ratio is unchanged. In this case—because the return used is not the fund’s actual return—the results do not apply to your investment. The example is useful in making comparisons because the Securities and Exchange Commission requires all mutual funds to calculate expenses based on a 5% return. You can assess your fund’s costs by comparing this hypothetical example with the hypothetical examples that appear in shareholder reports of other funds. |
| Six Months Ended August 31, 2022 | |||
| Explorer Value Fund | Beginning Account Value 2/28/2022 | Ending Account Value 8/31/2022 | Expenses Paid During Period |
| Based on Actual Fund Return | $1,000.00 | $891.30 | $2.34 |
| Based on Hypothetical 5% Yearly Return | 1,000.00 | 1,022.74 | 2.50 |

| Average Annual Total Returns Periods Ended August 31, 2022 | |||||
| One Year | Five Years | Ten Years | Final Value of a $10,000 Investment | ||
 | Explorer Value Fund | -10.05% | 6.90% | 10.09% | $26,156 |
 | Russell 2500 Value Index | -8.34 | 7.03 | 9.88 | 25,662 |
 | Dow Jones U.S. Total Stock Market Float Adjusted Index | -13.73 | 11.16 | 12.66 | 32,942 |
| Communication Services | 7.2% |
| Consumer Discretionary | 12.2 |
| Consumer Staples | 1.2 |
| Energy | 5.4 |
| Financials | 18.9 |
| Health Care | 6.8 |
| Industrials | 17.4 |
| Information Technology | 10.3 |
| Materials | 9.3 |
| Real Estate | 9.6 |
| Utilities | 1.7 |
| Shares | Market Value• ($000) | ||
| Common Stocks (94.6%) | |||
| Communication Services (6.8%) | |||
| Nexstar Media Group Inc. Class A | 136,122 | 26,043 | |
| * | Ziff Davis Inc. | 202,166 | 15,624 |
| John Wiley & Sons Inc. Class A | 257,285 | 11,843 | |
| Madison Square Garden Entertainment Corp. | 104,754 | 5,820 | |
| Paramount Global Inc. Class B | 187,272 | 4,380 | |
| Interpublic Group of Cos. Inc. | 150,917 | 4,171 | |
| Manchester United plc Class A | 239,263 | 3,216 | |
| Madison Square Garden Sports Corp. | 17,346 | 2,780 | |
| 73,877 | |||
| Consumer Discretionary (11.5%) | |||
| Lithia Motors Inc. Class A | 54,737 | 14,529 | |
| * | Victoria's Secret & Co. | 419,138 | 14,016 |
| * | Adtalem Global Education Inc. | 275,758 | 10,393 |
| * | Modine Manufacturing Co. | 568,772 | 8,520 |
| Cheesecake Factory Inc. | 229,143 | 7,016 | |
| Kontoor Brands Inc. | 186,437 | 6,941 | |
| * | Leslie's Inc. | 484,098 | 6,865 |
| Mattel Inc. | 273,639 | 6,053 | |
| Royal Caribbean Cruises Ltd. | 143,354 | 5,856 | |
| OneSpaWorld Holdings Ltd. | 659,627 | 5,811 | |
| * | Helen of Troy Ltd. | 38,006 | 4,699 |
| LCI Industries | 35,517 | 4,115 | |
| ADT Inc. | 549,536 | 4,006 | |
| Boyd Gaming Corp. | 70,401 | 3,832 | |
| Gentex Corp. | 135,786 | 3,706 | |
| * | Perdoceo Education Corp. | 315,950 | 3,659 |
| * | Stoneridge Inc. | 181,552 | 3,450 |
| Mohawk Industries Inc. | 30,661 | 3,384 | |
| * | Lands' End Inc. | 236,324 | 3,266 |
| * | Under Armour Inc. Class A | 300,573 | 2,531 |
| * | LGI Homes Inc. | 22,151 | 2,102 |
| 124,750 | |||
| Consumer Staples (1.2%) | |||
| Spectrum Brands Holdings Inc. | 174,011 | 10,961 | |
| J M Smucker Co. | 9,574 | 1,340 | |
| 12,301 | |||
| Shares | Market Value• ($000) | ||
| Energy (5.1%) | |||
| DTE Midstream LLC | 218,568 | 12,067 | |
| Magnolia Oil & Gas Corp. Class A | 476,659 | 11,378 | |
| PDC Energy Inc. | 134,639 | 9,143 | |
| Viper Energy Partners LP | 264,280 | 8,066 | |
| Coterra Energy Inc. | 257,626 | 7,963 | |
| Core Laboratories NV | 146,091 | 2,359 | |
| Diamondback Energy Inc. | 17,411 | 2,321 | |
| International Seaways Inc. | 75,710 | 2,236 | |
| 55,533 | |||
| Financials (17.9%) | |||
| PacWest Bancorp | 593,323 | 15,622 | |
| Starwood Property Trust Inc. | 637,770 | 14,624 | |
| Popular Inc. | 138,712 | 10,711 | |
| Wintrust Financial Corp. | 116,934 | 9,862 | |
| Columbia Banking System Inc. | 320,739 | 9,606 | |
| First Merchants Corp. | 232,474 | 9,257 | |
| Pinnacle Financial Partners Inc. | 114,261 | 9,222 | |
| First BanCorp. (XNYS) | 644,682 | 9,219 | |
| * | Bancorp Inc. | 375,072 | 8,897 |
| BGC Partners Inc. Class A | 2,013,165 | 8,093 | |
| BankUnited Inc. | 208,857 | 7,738 | |
| Flushing Financial Corp. | 359,572 | 7,425 | |
| Washington Federal Inc. | 220,199 | 7,049 | |
| Pacific Premier Bancorp Inc. | 205,908 | 6,746 | |
| Webster Financial Corp. | 130,746 | 6,152 | |
| WSFS Financial Corp. | 120,253 | 5,814 | |
| * | NMI Holdings Inc. Class A | 265,828 | 5,457 |
| Renasant Corp. | 163,581 | 5,454 | |
| Northern Trust Corp. | 51,274 | 4,876 | |
| KKR & Co. Inc. | 95,575 | 4,832 | |
| PJT Partners Inc. Class A | 57,272 | 3,964 | |
| Evercore Inc. Class A | 40,951 | 3,837 | |
| BOK Financial Corp. | 41,768 | 3,712 | |
| Lazard Ltd. Class A | 96,057 | 3,492 | |
| First American Financial Corp. | 61,239 | 3,276 | |
| Affiliated Managers Group Inc. | 24,093 | 3,069 | |
| Argo Group International Holdings Ltd. | 123,955 | 2,433 | |
| * | Green Dot Corp. Class A | 92,025 | 1,867 |
| Janus Henderson Group plc | 50,771 | 1,188 | |
| 193,494 | |||
| Shares | Market Value• ($000) | ||
| Health Care (6.4%) | |||
| * | Syneos Health Inc. | 211,510 | 12,714 |
| * | Enovis Corp. | 161,886 | 8,199 |
| * | Envista Holdings Corp. | 218,115 | 8,090 |
| * | Varex Imaging Corp. | 298,941 | 6,305 |
| * | Acadia Healthcare Co. Inc. | 67,824 | 5,557 |
| * | Pacira BioSciences Inc. | 99,711 | 5,233 |
| * | LivaNova plc | 86,583 | 4,870 |
| * | NuVasive Inc. | 95,970 | 4,080 |
| Laboratory Corp. of America Holdings | 17,507 | 3,944 | |
| * | Merit Medical Systems Inc. | 59,045 | 3,497 |
| Charles River Laboratories International Inc. | 14,974 | 3,073 | |
| Bio-Rad Laboratories Inc. Class A | 3,966 | 1,924 | |
| Prestige Consumer Healthcare Inc. | 36,032 | 1,822 | |
| 69,308 | |||
| Industrials (16.5%) | |||
| * | KAR Auction Services Inc. | 869,736 | 12,698 |
| BWX Technologies Inc. | 224,408 | 11,698 | |
| * | Beacon Roofing Supply Inc. | 168,717 | 9,264 |
| * | GXO Logistics Inc. | 208,356 | 9,247 |
| MDU Resources Group Inc. | 306,336 | 9,236 | |
| * | WESCO International Inc. | 68,128 | 8,971 |
| KBR Inc. | 183,557 | 8,866 | |
| Applied Industrial Technologies Inc. | 80,626 | 8,548 | |
| * | Univar Solutions Inc. | 287,555 | 7,252 |
| * | Array Technologies Inc. | 332,450 | 6,948 |
| * | IAA Inc. | 181,309 | 6,756 |
| * | Stericycle Inc. | 131,660 | 6,595 |
| Esab Corp. | 153,641 | 6,313 | |
| Interface Inc. Class A | 544,484 | 6,082 | |
| * | XPO Logistics Inc. | 110,430 | 5,789 |
| EnerSys | 81,479 | 5,082 | |
| * | Builders FirstSource Inc. | 82,883 | 4,858 |
| Kaman Corp. | 141,342 | 4,483 | |
| HNI Corp. | 139,112 | 4,452 | |
| * | MRC Global Inc. | 437,002 | 4,252 |
| Resideo Technologies Inc. | 202,631 | 4,219 | |
| nVent Electric plc | 124,764 | 4,112 | |
| Kennametal Inc. | 168,561 | 3,951 | |
| Masco Corp. | 72,931 | 3,710 | |
| Altra Industrial Motion Corp. | 74,937 | 2,844 | |
| Brink's Co. | 51,264 | 2,834 | |
| * | Triumph Group Inc. | 202,896 | 2,636 |
| Snap-on Inc. | 11,307 | 2,463 | |
| Steelcase Inc. Class A | 164,883 | 1,843 | |
| Greenbrier Cos. Inc. | 62,731 | 1,788 | |
| Simpson Manufacturing Co. Inc. | 12,121 | 1,123 | |
| 178,913 | |||
| Information Technology (9.7%) | |||
| * | Verint Systems Inc. | 302,430 | 14,665 |
| * | ACI Worldwide Inc. | 457,703 | 10,848 |
| Jabil Inc. | 156,477 | 9,436 | |
| Belden Inc. | 141,446 | 9,262 | |
| * | Insight Enterprises Inc. | 97,526 | 8,887 |
| Concentrix Corp. | 58,820 | 7,398 | |
| * | Fabrinet | 70,575 | 7,258 |
| Silicon Motion Technology Corp. ADR | 90,526 | 6,980 | |
| TD SYNNEX Corp. | 72,164 | 6,948 | |
| * | Euronet Worldwide Inc. | 71,051 | 6,299 |
| Shares | Market Value• ($000) | ||
| * | Teledyne Technologies Inc. | 14,545 | 5,358 |
| Zebra Technologies Corp. Class A | 14,345 | 4,327 | |
| Keysight Technologies Inc. | 18,124 | 2,970 | |
| MKS Instruments Inc. | 26,544 | 2,644 | |
| * | MACOM Technology Solutions Holdings Inc. Class H | 35,054 | 1,933 |
| 105,213 | |||
| Materials (8.8%) | |||
| Silgan Holdings Inc. | 646,199 | 29,434 | |
| * | Axalta Coating Systems Ltd. | 614,059 | 15,812 |
| Ashland Inc. | 136,413 | 13,881 | |
| FMC Corp. | 85,866 | 9,280 | |
| Eagle Materials Inc. | 66,093 | 7,906 | |
| Pactiv Evergreen Inc. | 478,100 | 5,307 | |
| Graphic Packaging Holding Co. | 224,094 | 4,991 | |
| Carpenter Technology Corp. | 133,991 | 4,552 | |
| * | Diversey Holdings Ltd. | 637,847 | 3,910 |
| 95,073 | |||
| Real Estate (9.1%) | |||
| Gaming and Leisure Properties Inc. | 394,554 | 19,045 | |
| Medical Properties Trust Inc. | 849,450 | 12,410 | |
| Agree Realty Corp. | 122,463 | 9,224 | |
| Corporate Office Properties Trust | 312,790 | 8,083 | |
| Spirit Realty Capital Inc. | 188,985 | 7,720 | |
| SITE Centers Corp. | 594,384 | 7,703 | |
| STAG Industrial Inc. | 226,539 | 6,977 | |
| Newmark Group Inc. Class A | 620,491 | 6,360 | |
| * | Sunstone Hotel Investors Inc. | 466,526 | 5,081 |
| * | Howard Hughes Corp. | 76,767 | 4,885 |
| RPT Realty | 428,741 | 4,129 | |
| Jones Lang LaSalle Inc. | 19,079 | 3,301 | |
| CBRE Group Inc. Class A | 41,453 | 3,273 | |
| 98,191 | |||
| Utilities (1.6%) | |||
| Portland General Electric Co. | 171,380 | 8,855 | |
| ALLETE Inc. | 90,744 | 5,370 | |
| Unitil Corp. | 66,836 | 3,482 | |
| 17,707 | |||
| Total Common Stocks (Cost $922,209) | 1,024,360 | ||
| Shares | Market Value• ($000) | ||
| Temporary Cash Investments (5.3%) | |||
| Money Market Fund (5.3%) | |||
| 1 | Vanguard Market Liquidity Fund, 2.284% (Cost $57,072) | 570,956 | 57,078 |
| Total Investments (99.9%) (Cost $979,281) | 1,081,438 | ||
| Other Assets and Liabilities—Net (0.1%) | 1,097 | ||
| Net Assets (100%) | 1,082,535 | ||
| Cost is in $000. | |||
| • | See Note A in Notes to Financial Statements. |
| * | Non-income-producing security. |
| 1 | Affiliated money market fund available only to Vanguard funds and certain trusts and accounts managed by Vanguard. Rate shown is the 7-day yield. |
| ADR—American Depositary Receipt. |
| Futures Contracts | ||||
| ($000) | ||||
| Expiration | Number of Long (Short) Contracts | Notional Amount | Value and Unrealized Appreciation (Depreciation) | |
| Long Futures Contracts | ||||
| E-mini Russell 2000 Index | September 2022 | 253 | 23,334 | 1,336 |
| ($000s, except shares and per-share amounts) | Amount |
| Assets | |
| Investments in Securities, at Value | |
| Unaffiliated Issuers (Cost $922,209) | 1,024,360 |
| Affiliated Issuers (Cost $57,072) | 57,078 |
| Total Investments in Securities | 1,081,438 |
| Investment in Vanguard | 41 |
| Cash Collateral Pledged—Futures Contracts | 1,393 |
| Receivables for Investment Securities Sold | 995 |
| Receivables for Accrued Income | 1,004 |
| Receivables for Capital Shares Issued | 144 |
| Total Assets | 1,085,015 |
| Liabilities | |
| Payables for Investment Securities Purchased | 1,306 |
| Payables to Investment Advisor | 645 |
| Payables for Capital Shares Redeemed | 271 |
| Payables to Vanguard | 110 |
| Variation Margin Payable—Futures Contracts | 148 |
| Total Liabilities | 2,480 |
| Net Assets | 1,082,535 |
| At August 31, 2022, net assets consisted of: | |
| Paid-in Capital | 955,425 |
| Total Distributable Earnings (Loss) | 127,110 |
| Net Assets | 1,082,535 |
| Net Assets | |
| Applicable to 27,112,406 outstanding $.001 par value shares of beneficial interest (unlimited authorization) | 1,082,535 |
| Net Asset Value Per Share | $39.93 |
| Year Ended August 31, 2022 | |
| ($000) | |
| Investment Income | |
| Income | |
| Dividends1 | 17,818 |
| Interest2 | 414 |
| Securities Lending—Net | 1 |
| Total Income | 18,233 |
| Expenses | |
| Investment Advisory Fees—Note B | |
| Basic Fee | 3,363 |
| Performance Adjustment | 246 |
| The Vanguard Group—Note C | |
| Management and Administrative | 2,274 |
| Marketing and Distribution | 123 |
| Custodian Fees | 16 |
| Auditing Fees | 40 |
| Shareholders’ Reports | 63 |
| Trustees’ Fees and Expenses | — |
| Other Expenses | 14 |
| Total Expenses | 6,139 |
| Expenses Paid Indirectly | (3) |
| Net Expenses | 6,136 |
| Net Investment Income | 12,097 |
| Realized Net Gain (Loss) | |
| Investment Securities Sold2 | 38,593 |
| Futures Contracts | (12,980) |
| Realized Net Gain (Loss) | 25,613 |
| Change in Unrealized Appreciation (Depreciation) | |
| Investment Securities2 | (160,790) |
| Futures Contracts | 1,110 |
| Change in Unrealized Appreciation (Depreciation) | (159,680) |
| Net Increase (Decrease) in Net Assets Resulting from Operations | (121,970) |
| 1 | Dividends are net of foreign withholding taxes of $58,000. |
| 2 | Interest income, realized net gain (loss), capital gain distributions received, and change in unrealized appreciation (depreciation) from an affiliated company of the fund were $404,000, ($23,000), $2,000, and ($2,000), respectively. Purchases and sales are for temporary cash investment purposes. |
| Year Ended August 31, | ||
| 2022 ($000) | 2021 ($000) | |
| Increase (Decrease) in Net Assets | ||
| Operations | ||
| Net Investment Income | 12,097 | 7,595 |
| Realized Net Gain (Loss) | 25,613 | 65,789 |
| Change in Unrealized Appreciation (Depreciation) | (159,680) | 230,573 |
| Net Increase (Decrease) in Net Assets Resulting from Operations | (121,970) | 303,957 |
| Distributions | ||
| Total Distributions | (47,190) | (5,943) |
| Capital Share Transactions | ||
| Issued | 260,809 | 672,371 |
| Issued in Lieu of Cash Distributions | 44,561 | 5,616 |
| Redeemed | (218,148) | (374,152) |
| Net Increase (Decrease) from Capital Share Transactions | 87,222 | 303,835 |
| Total Increase (Decrease) | (81,938) | 601,849 |
| Net Assets | ||
| Beginning of Period | 1,164,473 | 562,624 |
| End of Period | 1,082,535 | 1,164,473 |
| For a Share Outstanding Throughout Each Period | Year Ended August 31, | ||||
| 2022 | 2021 | 2020 | 2019 | 2018 | |
| Net Asset Value, Beginning of Period | $46.26 | $30.32 | $33.49 | $40.53 | $34.45 |
| Investment Operations | |||||
| Net Investment Income1 | .461 | .351 | .400 | .494 | .355 |
| Net Realized and Unrealized Gain (Loss) on Investments | (4.910) | 15.911 | (3.032) | (4.921) | 7.112 |
| Total from Investment Operations | (4.449) | 16.262 | (2.632) | (4.427) | 7.467 |
| Distributions | |||||
| Dividends from Net Investment Income | (.352) | (.322) | (.538) | (.366) | (.288) |
| Distributions from Realized Capital Gains | (1.529) | — | — | (2.247) | (1.099) |
| Total Distributions | (1.881) | (.322) | (.538) | (2.613) | (1.387) |
| Net Asset Value, End of Period | $39.93 | $46.26 | $30.32 | $33.49 | $40.53 |
| Total Return2 | -10.05% | 53.90% | -8.12% | -10.10% | 22.10% |
| Ratios/Supplemental Data | |||||
| Net Assets, End of Period (Millions) | $1,083 | $1,164 | $563 | $655 | $768 |
| Ratio of Total Expenses to Average Net Assets3 | 0.53%4 | 0.52% | 0.64% | 0.55% | 0.56% |
| Ratio of Net Investment Income to Average Net Assets | 1.05% | 0.85% | 1.28% | 1.45% | 0.95% |
| Portfolio Turnover Rate | 31% | 41% | 42% | 27% | 31% |
| 1 | Calculated based on average shares outstanding. |
| 2 | Total returns do not include account service fees that may have applied in the periods shown. Fund prospectuses provide information about any applicable account service fees. |
| 3 | Includes performance-based investment advisory fee increases (decreases) of 0.02%, 0.01%, 0.09%, 0.01%, and 0.03%. |
| 4 | The ratio of expenses to average net assets for the period net of reduction from broker commission abatement arrangements was 0.53%. |
| A. | The following significant accounting policies conform to generally accepted accounting principles for U.S. investment companies. The fund consistently follows such policies in preparing its financial statements. |
| B. | The investment advisory firms Frontier Capital Management Co., LLC, Cardinal Capital Management, L.L.C., and, beginning January 2022, Ariel Investments, LLC, each provide investment advisory services to a portion of the fund for a fee calculated at an annual percentage rate of average net assets managed by the advisor. The basic fee of Frontier Capital Management Co., LLC, is subject to quarterly adjustments based on performance relative to the Russell 2000 Value Index for the preceding three years. The basic fee of Cardinal Capital Management, L.L.C., is subject to quarterly adjustments based on performance relative to the Russell 3000 Value Custom Index for periods prior to June 23, 2022, and to the new Russell 2500 Value Index, beginning June 23, 2022, for the preceding three years. The benchmark change will be fully phased in by August 2025. In accordance with the advisory contract entered into with Ariel Investments, LLC, beginning March 1, 2023, the investment advisory fee will be subject to quarterly adjustments based on performance relative to the Russell 2500 Value Index since February 28, 2022. |
| C. | In accordance with the terms of a Funds' Service Agreement (the “FSA”) between Vanguard and the fund, Vanguard furnishes to the fund corporate management, administrative, marketing, distribution and cash management services at Vanguard’s cost of operations (as defined by the FSA). These costs of operations are allocated to the fund based on methods and guidelines approved by the board of trustees and are generally settled twice a month. |
| D. | The fund has asked its investment advisors to direct certain security trades, subject to obtaining the best price and execution, to brokers who have agreed to rebate to the fund part of the commissions generated. Such rebates are used solely to reduce the fund’s management and administrative expenses. For the year ended August 31, 2022, these arrangements reduced the fund’s expenses by $3,000 (an annual rate of less than 0.01% of average net assets). |
| E. | Various inputs may be used to determine the value of the fund’s investments and derivatives. These inputs are summarized in three broad levels for financial statement purposes. The inputs or methodologies used to value securities are not necessarily an indication of the risk associated with investing in those securities. |
| F. | Permanent differences between book-basis and tax-basis components of net assets are reclassified among capital accounts in the financial statements to reflect their tax character. These reclassifications have no effect on net assets or net asset value per share. As of period end, permanent differences primarily attributable to the accounting for distributions in connection with fund share redemptions were reclassified between the following accounts: |
| Amount ($000) | |
| Paid-in Capital | 2,206 |
| Total Distributable Earnings (Loss) | (2,206) |
| Amount ($000) | |
| Undistributed Ordinary Income | 8,833 |
| Undistributed Long-Term Gains | 18,772 |
| Capital Loss Carryforwards | — |
| Qualified Late-Year Losses | — |
| Net Unrealized Gains (Losses) | 99,505 |
| Year Ended August 31, | ||
| 2022 Amount ($000) | 2021 Amount ($000) | |
| Ordinary Income* | 12,337 | 5,943 |
| Long-Term Capital Gains | 34,853 | — |
| Total | 47,190 | 5,943 |
| * | Includes short-term capital gains, if any. |
| Amount ($000) | |
| Tax Cost | 981,933 |
| Gross Unrealized Appreciation | 209,794 |
| Gross Unrealized Depreciation | (110,289) |
| Net Unrealized Appreciation (Depreciation) | 99,505 |
| G. | During the year ended August 31, 2022, the fund purchased $364,932,000 of investment securities and sold $309,145,000 of investment securities, other than temporary cash investments. |
| H. | Capital shares issued and redeemed were: |
| Year Ended August 31, | ||
| 2022 Shares (000) | 2021 Shares (000) | |
| Issued | 5,932 | 15,359 |
| Issued in Lieu of Cash Distributions | 997 | 152 |
| Redeemed | (4,988) | (8,893) |
| Net Increase (Decrease) in Shares Outstanding | 1,941 | 6,618 |
| I. | Management has determined that no events or transactions occurred subsequent to August 31, 2022, that would require recognition or disclosure in these financial statements. |
Philadelphia, Pennsylvania
October 20, 2022
| Matthew Benchener | Thomas M. Rampulla |
| Joseph Brennan | Karin A. Risi |
| Mortimer J. Buckley | Anne E. Robinson |
| Gregory Davis | Michael Rollings |
| John James | Nitin Tandon |
| Chris D. Mclsaac | Lauren Valente |

All rights reserved.
Vanguard Marketing Corporation, Distributor.

| Vanguard Russell 1000 Index Fund |
| Vanguard Russell 1000 Value Index Fund |
| Vanguard Russell 1000 Growth Index Fund |
Your Fund’s Performance at a Glance | 1 |
About Your Fund’s Expenses | 2 |
Russell 1000 Index Fund | 4 |
Russell 1000 Value Index Fund | 29 |
Russell 1000 Growth Index Fund | 54 |
Trustees Approve Advisory Arrangements | 75 |
Liquidity Risk Management | 77 |
| • | Returns for the three Vanguard Russell 1000 Index Funds for the 12 months ended August 31, 2022, ranged from about –19% for Vanguard Russell 1000 Growth Index Fund to about –6% for Vanguard Russell 1000 Value Index Fund. Vanguard Russell 1000 Index Fund returned about –13%. Each fund closely tracked its target index. |
| • | The investment outlook grew more challenging as the period progressed. Sentiment deteriorated as inflation rose, propelled in part by higher energy and food prices after Russia’s invasion of Ukraine. The Federal Reserve reacted by raising interest rates, which pushed borrowing costs higher and sparked fears of recession. |
| • | Large-capitalization stocks declined less than their mid- and small-cap counterparts, and value stocks held up better than growth. |
| • | Returns fell by double digits across most industry sectors for all three funds. The energy sector was a notable exception amid heightened demand for oil and gas and supply constraints related to the conflict in Ukraine. Technology, consumer discretionary, and industrial stocks detracted the most from both the Index Fund and the Growth Index Fund, while financial and technology stocks took the biggest bite from the Value Index Fund. |
| Average Annual Total Returns Periods Ended August 31, 2022 | |||
| One Year | Three Years | Five Years | |
| Stocks | |||
| Russell 1000 Index (Large-caps) | -12.96% | 12.14% | 11.61% |
| Russell 2000 Index (Small-caps) | -17.88 | 8.59 | 6.95 |
| Russell 3000 Index (Broad U.S. market) | -13.28 | 11.90 | 11.29 |
| FTSE All-World ex US Index (International) | -19.00 | 3.48 | 2.12 |
| Bonds | |||
| Bloomberg U.S. Aggregate Float Adjusted Index (Broad taxable market) | -11.65% | -2.01% | 0.54% |
| Bloomberg Municipal Bond Index (Broad tax-exempt market) | -8.63 | -0.83 | 1.28 |
| FTSE Three-Month U.S. Treasury Bill Index | 0.44 | 0.56 | 1.10 |
| CPI | |||
| Consumer Price Index | 8.26% | 4.90% | 3.82% |
| • | Based on actual fund return. This section helps you to estimate the actual expenses that you paid over the period. The ”Ending Account Value“ shown is derived from the fund‘s actual return, and the third column shows the dollar amount that would have been paid by an investor who started with $1,000 in the fund. You may use the information here, together with the amount you invested, to estimate the expenses that you paid over the period. |
| • | Based on hypothetical 5% yearly return. This section is intended to help you compare your fund‘s costs with those of other mutual funds. It assumes that the fund had a yearly return of 5% before expenses, but that the expense ratio is unchanged. In this case—because the return used is not the fund’s actual return—the results do not apply to your investment. The example is useful in making comparisons because the Securities and Exchange Commission requires all mutual funds to calculate expenses based on a 5% return. You can assess your fund’s costs by comparing this hypothetical example with the hypothetical examples that appear in shareholder reports of other funds. |
| Six Months Ended August 31, 2022 | |||
| Beginning Account Value 2/28/2022 | Ending Account Value 8/31/2022 | Expenses Paid During Period | |
| Based on Actual Fund Return | |||
| Russell 1000 Index Fund | |||
| ETF Shares | $1,000.00 | $905.10 | $0.38 |
| Institutional Shares | 1,000.00 | 905.20 | 0.34 |
| Russell 1000 Value Index Fund | |||
| ETF Shares | $1,000.00 | $933.40 | $0.39 |
| Institutional Shares | 1,000.00 | 933.50 | 0.34 |
| Russell 1000 Growth Index Fund | |||
| ETF Shares | $1,000.00 | $877.00 | $0.38 |
| Institutional Shares | 1,000.00 | 877.10 | 0.33 |
| Based on Hypothetical 5% Yearly Return | |||
| Russell 1000 Index Fund | |||
| ETF Shares | $1,000.00 | $1,024.80 | $0.41 |
| Institutional Shares | 1,000.00 | 1,024.85 | 0.36 |
| Russell 1000 Value Index Fund | |||
| ETF Shares | $1,000.00 | $1,024.80 | $0.41 |
| Institutional Shares | 1,000.00 | 1,024.85 | 0.36 |
| Russell 1000 Growth Index Fund | |||
| ETF Shares | $1,000.00 | $1,024.80 | $0.41 |
| Institutional Shares | 1,000.00 | 1,024.85 | 0.36 |

| Average Annual Total Returns Periods Ended August 31, 2022 | |||||
| One Year | Five Years | Ten Years | Final Value of a $10,000 Investment | ||
 | Russell 1000 Index Fund ETF Shares Net Asset Value | -13.02% | 11.52% | 12.85% | $33,498 |
| Russell 1000 Index Fund ETF Shares Market Price | -13.04 | 11.52 | 12.84 | 33,482 | |
 | Russell 1000 Index | -12.96 | 11.61 | 12.98 | 33,883 |
 | Dow Jones U.S. Total Stock Market Float Adjusted Index | -13.73 | 11.16 | 12.66 | 32,942 |
| One Year | Five Years | Ten Years | Final Value of a $5,000,000 Investment | ||
| Russell 1000 Index Fund Institutional Shares | -13.01% | 11.54% | 12.89% | $16,804,076 | |
| Russell 1000 Index | -12.96 | 11.61 | 12.98 | 16,941,527 | |
| Dow Jones U.S. Total Stock Market Float Adjusted Index | -13.73 | 11.16 | 12.66 | 16,470,991 | |
| One Year | Five Years | Ten Years | |
| Russell 1000 Index Fund ETF Shares Market Price | -13.04% | 72.49% | 234.82% |
| Russell 1000 Index Fund ETF Shares Net Asset Value | -13.02 | 72.47 | 234.98 |
| Russell 1000 Index | -12.96 | 73.16 | 238.83 |
| Basic Materials | 2.0% |
| Consumer Discretionary | 14.9 |
| Consumer Staples | 5.7 |
| Energy | 4.9 |
| Financials | 10.9 |
| Health Care | 13.0 |
| Industrials | 12.7 |
| Real Estate | 3.4 |
| Technology | 26.6 |
| Telecommunications | 2.5 |
| Utilities | 3.4 |
| Shares | Market Value• ($000) | ||
| Common Stocks (99.8%) | |||
| Basic Materials (2.0%) | |||
| Linde plc | 66,261 | 18,743 | |
| Air Products and Chemicals Inc. | 29,208 | 7,374 | |
| Freeport-McMoRan Inc. | 190,288 | 5,633 | |
| Ecolab Inc. | 32,698 | 5,357 | |
| Dow Inc. | 95,950 | 4,893 | |
| Nucor Corp. | 34,994 | 4,652 | |
| Newmont Corp. | 104,600 | 4,326 | |
| Albemarle Corp. | 15,371 | 4,119 | |
| Fastenal Co. | 76,047 | 3,827 | |
| International Flavors & Fragrances Inc. | 33,525 | 3,704 | |
| CF Industries Holdings Inc. | 27,533 | 2,849 | |
| LyondellBasell Industries NV Class A | 33,821 | 2,807 | |
| Mosaic Co. | 47,841 | 2,577 | |
| International Paper Co. | 49,057 | 2,042 | |
| Avery Dennison Corp. | 10,779 | 1,979 | |
| Steel Dynamics Inc. | 23,668 | 1,910 | |
| FMC Corp. | 16,652 | 1,800 | |
| Celanese Corp. Class A | 14,337 | 1,589 | |
| Eastman Chemical Co. | 16,962 | 1,544 | |
| Reliance Steel & Aluminum Co. | 8,132 | 1,529 | |
| Alcoa Corp. | 24,397 | 1,207 | |
| * | Cleveland-Cliffs Inc. | 68,674 | 1,186 |
| Olin Corp. | 18,579 | 1,016 | |
| US Steel Corp. | 34,365 | 786 | |
| Royal Gold Inc. | 8,525 | 783 | |
| Huntsman Corp. | 26,086 | 731 | |
| Chemours Co. | 20,221 | 682 | |
| Valvoline Inc. | 23,451 | 682 | |
| Ashland Inc. | 6,632 | 675 | |
| Hexcel Corp. | 11,107 | 652 | |
| Element Solutions Inc. | 29,829 | 557 | |
| * | Univar Solutions Inc. | 22,020 | 555 |
| Southern Copper Corp. | 11,331 | 533 | |
| Timken Co. | 8,147 | 513 | |
| Westlake Corp. | 4,391 | 433 | |
| * | MP Materials Corp. | 11,870 | 415 |
| SSR Mining Inc. (XTSE) | 27,660 | 373 | |
| Scotts Miracle-Gro Co. | 5,264 | 352 | |
| NewMarket Corp. | 784 | 225 | |
| SSR Mining Inc. | 52 | 1 | |
| 95,611 | |||
| Shares | Market Value• ($000) | ||
| Consumer Discretionary (14.9%) | |||
| * | Amazon.com Inc. | 1,172,477 | 148,635 |
| * | Tesla Inc. | 335,560 | 92,484 |
| Home Depot Inc. | 136,272 | 39,304 | |
| Costco Wholesale Corp. | 58,402 | 30,492 | |
| * | Walt Disney Co. | 240,263 | 26,929 |
| Walmart Inc. | 190,162 | 25,206 | |
| McDonald's Corp. | 97,472 | 24,590 | |
| NIKE Inc. Class B | 161,700 | 17,213 | |
| Lowe's Cos. Inc. | 87,247 | 16,938 | |
| * | Netflix Inc. | 57,739 | 12,908 |
| Starbucks Corp. | 151,291 | 12,719 | |
| * | Booking Holdings Inc. | 5,357 | 10,049 |
| Target Corp. | 61,133 | 9,802 | |
| TJX Cos. Inc. | 154,923 | 9,659 | |
| Activision Blizzard Inc. | 102,477 | 8,043 | |
| Ford Motor Co. | 519,388 | 7,915 | |
| Estee Lauder Cos. Inc. Class A | 30,297 | 7,707 | |
| General Motors Co. | 191,594 | 7,321 | |
| * | Uber Technologies Inc. | 249,251 | 7,168 |
| Dollar General Corp. | 30,140 | 7,156 | |
| * | O'Reilly Automotive Inc. | 8,608 | 6,001 |
| * | Chipotle Mexican Grill Inc. Class A | 3,664 | 5,851 |
| * | Airbnb Inc. Class A | 49,338 | 5,581 |
| Marriott International Inc. Class A | 36,097 | 5,550 | |
| * | AutoZone Inc. | 2,607 | 5,525 |
| Electronic Arts Inc. | 36,883 | 4,679 | |
| Hilton Worldwide Holdings Inc. | 36,044 | 4,591 | |
| * | Lululemon Athletica Inc. | 14,699 | 4,409 |
| Yum! Brands Inc. | 37,625 | 4,185 | |
| * | Warner Bros Discovery Inc. | 310,800 | 4,115 |
| Ross Stores Inc. | 45,349 | 3,912 | |
| * | Dollar Tree Inc. | 28,087 | 3,811 |
| * | Trade Desk Inc. Class A | 57,834 | 3,626 |
| * | Copart Inc. | 28,240 | 3,379 |
| * | Aptiv plc | 35,671 | 3,333 |
| eBay Inc. | 73,653 | 3,250 | |
| DR Horton Inc. | 42,492 | 3,023 | |
| * | Southwest Airlines Co. | 78,248 | 2,872 |
| Genuine Parts Co. | 18,330 | 2,860 | |
| * | Ulta Beauty Inc. | 6,794 | 2,853 |
| Tractor Supply Co. | 14,700 | 2,722 | |
| * | Delta Air Lines Inc. | 84,211 | 2,616 |
| Lennar Corp. Class A | 33,765 | 2,615 | |
| Shares | Market Value• ($000) | ||
| * | Take-Two Interactive Software Inc. | 20,750 | 2,543 |
| * | Roblox Corp. Class A | 58,149 | 2,274 |
| * | Expedia Group Inc. | 20,043 | 2,057 |
| Darden Restaurants Inc. | 16,506 | 2,042 | |
| * | Spotify Technology SA | 18,379 | 1,988 |
| VF Corp. | 46,192 | 1,915 | |
| Best Buy Co. Inc. | 26,662 | �� 1,885 | |
| * | CarMax Inc. | 21,227 | 1,877 |
| LKQ Corp. | 35,047 | 1,865 | |
| * | Live Nation Entertainment Inc. | 20,396 | 1,843 |
| Paramount Global Inc. Class B | 77,819 | 1,820 | |
| Garmin Ltd. | 20,351 | 1,801 | |
| Omnicom Group Inc. | 26,872 | 1,798 | |
| Domino's Pizza Inc. | 4,754 | 1,768 | |
| * | Etsy Inc. | 16,535 | 1,746 |
| Pool Corp. | 5,081 | 1,723 | |
| * | Liberty Media Corp.-Liberty Formula One Class C | 26,780 | 1,705 |
| * | Las Vegas Sands Corp. | 43,815 | 1,649 |
| * | NVR Inc. | 396 | 1,639 |
| MGM Resorts International | 47,265 | 1,543 | |
| * | United Airlines Holdings Inc. | 43,055 | 1,507 |
| Interpublic Group of Cos. Inc. | 52,101 | 1,440 | |
| Williams-Sonoma Inc. | 9,222 | 1,372 | |
| Fox Corp. Class A | 39,923 | 1,365 | |
| Advance Auto Parts Inc. | 8,075 | 1,362 | |
| Hasbro Inc. | 17,276 | 1,362 | |
| Nielsen Holdings plc | 47,482 | 1,322 | |
| * | BJ's Wholesale Club Holdings Inc. | 17,724 | 1,320 |
| PulteGroup Inc. | 31,410 | 1,277 | |
| Service Corp. International | 20,353 | 1,256 | |
| * | Burlington Stores Inc. | 8,726 | 1,223 |
| Tapestry Inc. | 34,569 | 1,201 | |
| BorgWarner Inc. (XNYS) | 31,818 | 1,200 | |
| Vail Resorts Inc. | 5,334 | 1,198 | |
| * | Carnival Corp. | 126,401 | 1,196 |
| * | Royal Caribbean Cruises Ltd. | 29,162 | 1,191 |
| Bath & Body Works Inc. | 31,729 | 1,184 | |
| * | Caesars Entertainment Inc. | 27,309 | 1,178 |
| * | Deckers Outdoor Corp. | 3,582 | 1,152 |
| Whirlpool Corp. | 7,290 | 1,142 | |
| * | Floor & Decor Holdings Inc. Class A | 13,684 | 1,113 |
| * | American Airlines Group Inc. | 85,388 | 1,109 |
| Aramark | 30,490 | 1,089 | |
| Lear Corp. | 7,840 | 1,087 | |
| *,1 | Lucid Group Inc. | 70,297 | 1,078 |
| * | Mattel Inc. | 46,685 | 1,033 |
| Rollins Inc. | 30,163 | 1,018 | |
| *,1 | GameStop Corp. Class A | 35,519 | 1,017 |
| Lithia Motors Inc. Class A | 3,765 | 999 | |
| Nexstar Media Group Inc. Class A | 5,147 | 985 | |
| H&R Block Inc. | 21,344 | 961 | |
| Churchill Downs Inc. | 4,790 | 944 | |
| * | Five Below Inc. | 7,100 | 908 |
| * | Capri Holdings Ltd. | 18,893 | 891 |
| Newell Brands Inc. | 49,879 | 890 | |
| Polaris Inc. | 7,529 | 853 | |
| News Corp. Class A | 50,302 | 851 |
| Shares | Market Value• ($000) | ||
| * | Liberty Media Corp.- Liberty SiriusXM Class C | 20,389 | 843 |
| Gentex Corp. | 30,477 | 832 | |
| * | Wynn Resorts Ltd. | 13,690 | 829 |
| * | DraftKings Inc. Class A | 49,630 | 797 |
| Wyndham Hotels & Resorts Inc. | 11,971 | 782 | |
| Dick's Sporting Goods Inc. | 7,279 | 774 | |
| Marriott Vacations Worldwide Corp. | 5,403 | 770 | |
| * | Rivian Automotive Inc. Class A | 23,347 | 764 |
| * | Planet Fitness Inc. Class A | 11,171 | 757 |
| * | SiteOne Landscape Supply Inc. | 5,872 | 735 |
| * | Norwegian Cruise Line Holdings Ltd. | 54,779 | 717 |
| * | Alaska Air Group Inc. | 15,950 | 695 |
| * | Terminix Global Holdings Inc. | 16,139 | 688 |
| Harley-Davidson Inc. | 17,616 | 679 | |
| * | Penn Entertainment Inc. | 21,526 | 672 |
| * | IAA Inc. | 18,015 | 671 |
| New York Times Co. Class A | 21,962 | 670 | |
| Leggett & Platt Inc. | 17,447 | 667 | |
| * | Skechers USA Inc. Class A | 17,314 | 654 |
| * | Avis Budget Group Inc. | 3,897 | 652 |
| * | AutoNation Inc. | 5,199 | 648 |
| Macy's Inc. | 37,301 | 646 | |
| AMERCO | 1,196 | 629 | |
| Fox Corp. Class B | 19,769 | 625 | |
| *,1 | AMC Entertainment Holdings Inc. Class A | 67,681 | 617 |
| Toll Brothers Inc. | 14,078 | 616 | |
| * | Hyatt Hotels Corp. Class A | 6,716 | 602 |
| * | Lyft Inc. Class A | 40,700 | 600 |
| * | RH | 2,318 | 593 |
| 1 | Sirius XM Holdings Inc. | 93,464 | 569 |
| Thor Industries Inc. | 7,019 | 569 | |
| Boyd Gaming Corp. | 10,429 | 568 | |
| * | Hertz Global Holdings Inc. | 30,494 | 563 |
| Tempur Sealy International Inc. | 22,461 | 562 | |
| Ralph Lauren Corp. Class A | 5,945 | 543 | |
| * | Wayfair Inc. Class A | 10,282 | 542 |
| * | Bright Horizons Family Solutions Inc. | 7,724 | 527 |
| Choice Hotels International Inc. | 4,378 | 502 | |
| PVH Corp. | 8,715 | 490 | |
| Travel + Leisure Co. | 11,362 | 482 | |
| Kohl's Corp. | 16,765 | 476 | |
| * | Ollie's Bargain Outlet Holdings Inc. | 8,225 | 455 |
| * | Carvana Co. Class A | 13,679 | 451 |
| Wendy's Co. | 22,496 | 431 | |
| Penske Automotive Group Inc. | 3,529 | 416 | |
| * | YETI Holdings Inc. | 11,122 | 410 |
| * | Peloton Interactive Inc. Class A | 40,181 | 409 |
| Hanesbrands Inc. | 46,358 | 404 | |
| * | Madison Square Garden Sports Corp. | 2,492 | 399 |
| Carter's Inc. | 5,329 | 394 | |
| * | Liberty Media Corp.- Liberty SiriusXM Class A | 9,415 | 391 |
| Shares | Market Value• ($000) | ||
| World Wrestling Entertainment Inc. Class A | 5,745 | 391 | |
| * | Victoria's Secret & Co. | 10,835 | 362 |
| *,1 | QuantumScape Corp. Class A | 32,770 | 361 |
| Columbia Sportswear Co. | 4,810 | 343 | |
| * | Coty Inc. Class A | 45,594 | 342 |
| * | Grand Canyon Education Inc. | 4,135 | 337 |
| * | JetBlue Airways Corp. | 42,646 | 332 |
| * | TripAdvisor Inc. | 13,481 | 321 |
| * | Leslie's Inc. | 21,428 | 304 |
| * | Copa Holdings SA Class A | 4,117 | 293 |
| * | Under Armour Inc. Class A | 34,660 | 292 |
| News Corp. Class B | 16,416 | 283 | |
| Nordstrom Inc. | 14,826 | 254 | |
| Gap Inc. | 25,329 | 232 | |
| * | Six Flags Entertainment Corp. | 10,083 | 223 |
| * | Driven Brands Holdings Inc. | 6,776 | 213 |
| * | Petco Health & Wellness Co. Inc. Class A | 10,546 | 157 |
| * | Playtika Holding Corp. | 13,766 | 145 |
| * | Liberty Media Corp.- Liberty Formula One Class A | 2,434 | 142 |
| * | Under Armour Inc. Class C | 16,818 | 128 |
| * | Mister Car Wash Inc. | 10,835 | 107 |
| Lennar Corp. Class B | 1,616 | 100 | |
| 729,791 | |||
| Consumer Staples (5.7%) | |||
| Procter & Gamble Co. | 315,316 | 43,495 | |
| Coca-Cola Co. | 515,186 | 31,792 | |
| PepsiCo Inc. | 182,415 | 31,425 | |
| Philip Morris International Inc. | 204,447 | 19,523 | |
| CVS Health Corp. | 172,931 | 16,973 | |
| Mondelez International Inc. Class A | 182,456 | 11,287 | |
| Altria Group Inc. | 238,410 | 10,757 | |
| Colgate-Palmolive Co. | 109,153 | 8,537 | |
| McKesson Corp. | 19,187 | 7,042 | |
| Archer-Daniels-Midland Co. | 73,728 | 6,480 | |
| General Mills Inc. | 79,296 | 6,090 | |
| Corteva Inc. | 95,797 | 5,885 | |
| Kimberly-Clark Corp. | 44,282 | 5,647 | |
| Sysco Corp. | 67,132 | 5,520 | |
| Constellation Brands Inc. Class A | 20,357 | 5,009 | |
| * | Monster Beverage Corp. | 48,999 | 4,353 |
| Hershey Co. | 19,276 | 4,331 | |
| Keurig Dr Pepper Inc. | 112,688 | 4,296 | |
| Kroger Co. | 86,284 | 4,136 | |
| Kraft Heinz Co. | 91,882 | 3,436 | |
| Walgreens Boots Alliance Inc. | 94,220 | 3,303 | |
| AmerisourceBergen Corp. Class A | 19,704 | 2,888 | |
| Tyson Foods Inc. Class A | 37,636 | 2,837 | |
| McCormick & Co. Inc. | 33,130 | 2,785 | |
| Church & Dwight Co. Inc. | 32,019 | 2,680 | |
| Kellogg Co. | 33,314 | 2,423 | |
| Clorox Co. | 16,118 | 2,326 | |
| Conagra Brands Inc. | 62,156 | 2,137 | |
| J M Smucker Co. | 13,882 | 1,943 | |
| Shares | Market Value• ($000) | ||
| Hormel Foods Corp. | 37,873 | 1,904 | |
| Bunge Ltd. | 18,508 | 1,835 | |
| Brown-Forman Corp. Class B | 24,351 | 1,770 | |
| * | Darling Ingredients Inc. | 21,156 | 1,609 |
| Lamb Weston Holdings Inc. | 19,029 | 1,513 | |
| Campbell Soup Co. | 25,245 | 1,272 | |
| Molson Coors Beverage Co. Class B | 23,183 | 1,198 | |
| Casey's General Stores Inc. | 4,924 | 1,053 | |
| * | Performance Food Group Co. | 19,909 | 995 |
| * | US Foods Holding Corp | 29,432 | 901 |
| Ingredion Inc. | 8,801 | 766 | |
| Flowers Foods Inc. | 24,497 | 669 | |
| * | Post Holdings Inc. | 7,340 | 651 |
| Albertsons Cos. Inc. Class A | 21,050 | 579 | |
| * | Grocery Outlet Holding Corp. | 11,512 | 462 |
| Brown-Forman Corp. Class A | 5,897 | 416 | |
| * | Boston Beer Co. Inc. Class A | 1,216 | 410 |
| Spectrum Brands Holdings Inc. | 5,330 | 336 | |
| * | Freshpet Inc. | 6,137 | 267 |
| * | Olaplex Holdings Inc. | 16,276 | 217 |
| Reynolds Consumer Products Inc. | 6,936 | 194 | |
| * | Pilgrim's Pride Corp. | 6,020 | 171 |
| Seaboard Corp. | 36 | 139 | |
| 278,663 | |||
| Energy (4.9%) | |||
| Exxon Mobil Corp. | 556,127 | 53,160 | |
| Chevron Corp. | 259,245 | 40,976 | |
| ConocoPhillips | 170,678 | 18,681 | |
| EOG Resources Inc. | 77,134 | 9,356 | |
| Pioneer Natural Resources Co. | 31,774 | 8,046 | |
| Occidental Petroleum Corp. | 107,837 | 7,656 | |
| Marathon Petroleum Corp. | 71,155 | 7,169 | |
| Schlumberger NV | 185,972 | 7,095 | |
| Valero Energy Corp. | 53,620 | 6,280 | |
| Devon Energy Corp. | 86,780 | 6,128 | |
| Phillips 66 | 63,432 | 5,675 | |
| Williams Cos. Inc. | 160,381 | 5,458 | |
| Cheniere Energy Inc. | 33,322 | 5,337 | |
| * | Enphase Energy Inc. | 17,217 | 4,932 |
| Kinder Morgan Inc. | 261,726 | 4,795 | |
| Hess Corp. | 36,974 | 4,466 | |
| ONEOK Inc. | 58,702 | 3,594 | |
| Halliburton Co. | 118,562 | 3,572 | |
| Coterra Energy Inc. | 104,267 | 3,223 | |
| Diamondback Energy Inc. | 23,390 | 3,117 | |
| Baker Hughes Co. Class A | 122,366 | 3,091 | |
| Marathon Oil Corp. | 93,129 | 2,383 | |
| EQT Corp. | 48,715 | 2,329 | |
| Targa Resources Corp. | 29,795 | 2,033 | |
| * | Plug Power Inc. | 68,894 | 1,932 |
| Ovintiv Inc. (XNYS) | 34,170 | 1,816 | |
| * | First Solar Inc. | 14,054 | 1,793 |
| APA Corp. | 44,439 | 1,738 | |
| Chesapeake Energy Corp. | 16,875 | 1,696 | |
| * | Antero Resources Corp. | 38,816 | 1,556 |
| Texas Pacific Land Corp. | 757 | 1,393 | |
| Shares | Market Value• ($000) | ||
| * | Range Resources Corp. | 34,440 | 1,132 |
| * | Southwestern Energy Co. | 147,184 | 1,102 |
| HF Sinclair Corp. | 19,841 | 1,044 | |
| NOV Inc. | 51,985 | 919 | |
| PDC Energy Inc. | 12,383 | 841 | |
| DTE Midstream LLC | 12,910 | 713 | |
| Antero Midstream Corp. | 44,612 | 449 | |
| * | ChargePoint Holdings Inc. | 26,054 | 424 |
| New Fortress Energy Inc. Class A | 6,309 | 362 | |
| Continental Resources Inc. | 4,687 | 327 | |
| Enviva Inc. | 4,004 | 278 | |
| 238,067 | |||
| Financials (10.9%) | |||
| * | Berkshire Hathaway Inc. Class B | 238,031 | 66,839 |
| JPMorgan Chase & Co. | 384,747 | 43,757 | |
| Bank of America Corp. | 926,382 | 31,136 | |
| Wells Fargo & Co. | 500,328 | 21,869 | |
| S&P Global Inc. | 44,818 | 15,784 | |
| Goldman Sachs Group Inc. | 43,873 | 14,595 | |
| Morgan Stanley | 168,338 | 14,346 | |
| Charles Schwab Corp. | 200,633 | 14,235 | |
| BlackRock Inc. | 19,797 | 13,193 | |
| Citigroup Inc. | 259,914 | 12,686 | |
| Marsh & McLennan Cos. Inc. | 66,078 | 10,663 | |
| Chubb Ltd. | 55,626 | 10,516 | |
| Progressive Corp. | 77,116 | 9,458 | |
| CME Group Inc. | 47,253 | 9,243 | |
| Blackstone Inc. | 92,182 | 8,660 | |
| PNC Financial Services Group Inc. | 54,398 | 8,595 | |
| Truist Financial Corp. | 175,576 | 8,224 | |
| US Bancorp | 176,782 | 8,063 | |
| Aon plc Class A (XNYS) | 27,774 | 7,756 | |
| Intercontinental Exchange Inc. | 72,842 | 7,346 | |
| Moody's Corp. | 21,094 | 6,002 | |
| MetLife Inc. | 90,393 | 5,815 | |
| American International Group Inc. | 104,510 | 5,408 | |
| Travelers Cos. Inc. | 31,583 | 5,105 | |
| Aflac Inc. | 84,043 | 4,994 | |
| Arthur J Gallagher & Co. | 27,377 | 4,971 | |
| Prudential Financial Inc. | 49,299 | 4,720 | |
| MSCI Inc. Class A | 10,354 | 4,651 | |
| Allstate Corp. | 36,149 | 4,356 | |
| M&T Bank Corp. | 23,626 | 4,295 | |
| Bank of New York Mellon Corp. | 96,694 | 4,016 | |
| Ameriprise Financial Inc. | 14,504 | 3,887 | |
| KKR & Co. Inc. | 75,130 | 3,799 | |
| Discover Financial Services | 36,832 | 3,701 | |
| First Republic Bank | 23,453 | 3,561 | |
| T Rowe Price Group Inc. | 29,486 | 3,538 | |
| Apollo Global Management Inc. | 60,735 | 3,376 | |
| State Street Corp. | 48,193 | 3,294 | |
| * | SVB Financial Group | 7,689 | 3,126 |
| Fifth Third Bancorp | 90,175 | 3,079 | |
| Willis Towers Watson plc | 14,586 | 3,017 | |
| Hartford Financial Services Group Inc. | 43,082 | 2,771 | |
| Nasdaq Inc. | 45,447 | 2,705 | |
| Raymond James Financial Inc. | 25,717 | 2,684 | |
| Shares | Market Value• ($000) | ||
| Regions Financial Corp. | 123,014 | 2,666 | |
| Broadridge Financial Solutions Inc. | 15,338 | 2,625 | |
| Northern Trust Corp. | 27,170 | 2,584 | |
| Huntington Bancshares Inc. | 189,822 | 2,544 | |
| Principal Financial Group Inc. | 33,049 | 2,471 | |
| Citizens Financial Group Inc. | 64,798 | 2,377 | |
| LPL Financial Holdings Inc. | 10,519 | 2,328 | |
| * | Arch Capital Group Ltd. | 47,669 | 2,179 |
| KeyCorp | 123,049 | 2,177 | |
| FactSet Research Systems Inc. | 5,011 | 2,171 | |
| * | Markel Corp. | 1,768 | 2,111 |
| Cincinnati Financial Corp. | 20,696 | 2,007 | |
| Brown & Brown Inc. | 30,856 | 1,945 | |
| W R Berkley Corp. | 27,109 | 1,757 | |
| Cboe Global Markets Inc. | 13,974 | 1,649 | |
| First Horizon Corp. | 69,843 | 1,580 | |
| Equitable Holdings Inc. | 50,620 | 1,506 | |
| Loews Corp. | 26,864 | 1,486 | |
| Ares Management Corp. Class A | 19,916 | 1,477 | |
| * | Alleghany Corp. | 1,730 | 1,455 |
| Signature Bank | 8,225 | 1,434 | |
| Ally Financial Inc. | 43,031 | 1,429 | |
| Annaly Capital Management Inc. | 218,278 | 1,408 | |
| Fidelity National Financial Inc. | 35,549 | 1,390 | |
| Everest Re Group Ltd. | 5,157 | 1,387 | |
| *,1 | Coinbase Global Inc. Class A | 20,564 | 1,374 |
| Comerica Inc. | 17,094 | 1,373 | |
| East West Bancorp Inc. | 18,681 | 1,348 | |
| First Citizens BancShares Inc. Class A | 1,610 | 1,307 | |
| MarketAxess Holdings Inc. | 4,925 | 1,224 | |
| Globe Life Inc. | 11,966 | 1,163 | |
| Assurant Inc. | 7,146 | 1,133 | |
| American Financial Group Inc. | 8,852 | 1,130 | |
| Webster Financial Corp. | 23,272 | 1,095 | |
| Reinsurance Group of America Inc. | 8,701 | 1,091 | |
| Zions Bancorp NA | 19,763 | 1,088 | |
| Western Alliance Bancorp | 14,022 | 1,076 | |
| Lincoln National Corp. | 22,795 | 1,050 | |
| Unum Group | 26,451 | 1,001 | |
| Cullen/Frost Bankers Inc. | 7,640 | 993 | |
| Tradeweb Markets Inc. Class A | 14,242 | 991 | |
| Commerce Bancshares Inc. | 14,307 | 984 | |
| Franklin Resources Inc. | 37,534 | 979 | |
| Jefferies Financial Group Inc. | 27,899 | 895 | |
| Starwood Property Trust Inc. | 38,643 | 886 | |
| Carlyle Group Inc. | 27,129 | 883 | |
| AGNC Investment Corp. | 70,243 | 839 | |
| Prosperity Bancshares Inc. | 11,564 | 820 | |
| Old Republic International Corp. | 37,078 | 810 | |
| Voya Financial Inc. | 13,152 | 809 |
| Shares | Market Value• ($000) | ||
| Pinnacle Financial Partners Inc. | 9,998 | 807 | |
| Invesco Ltd. | 48,896 | 805 | |
| Stifel Financial Corp. | 13,463 | 798 | |
| RenaissanceRe Holdings Ltd. | 5,787 | 783 | |
| Synovus Financial Corp. | 18,991 | 763 | |
| Popular Inc. | 9,808 | 757 | |
| Interactive Brokers Group Inc. Class A | 12,144 | 748 | |
| SEI Investments Co. | 13,598 | 744 | |
| Morningstar Inc. | 3,256 | 742 | |
| Erie Indemnity Co. Class A | 3,375 | 725 | |
| First American Financial Corp. | 13,436 | 719 | |
| * | Robinhood Markets Inc. Class A | 72,805 | 695 |
| Wintrust Financial Corp. | 7,809 | 659 | |
| Affiliated Managers Group Inc. | 5,020 | 639 | |
| Primerica Inc. | 5,008 | 635 | |
| Bank OZK | 15,480 | 627 | |
| * | SoFi Technologies Inc. | 104,169 | 617 |
| Hanover Insurance Group Inc. | 4,610 | 596 | |
| New York Community Bancorp Inc. | 60,770 | 595 | |
| Blue Owl Capital Inc. Class A | 52,790 | 586 | |
| MGIC Investment Corp. | 39,585 | 566 | |
| Axis Capital Holdings Ltd. | 10,192 | 542 | |
| FNB Corp. | 45,296 | 540 | |
| OneMain Holdings Inc. | 15,435 | 539 | |
| SLM Corp. | 35,153 | 537 | |
| Rithm Capital Corp. | 54,596 | 515 | |
| White Mountains Insurance Group Ltd. | 376 | 515 | |
| Umpqua Holdings Corp. | 27,868 | 494 | |
| * | Credit Acceptance Corp. | 901 | 479 |
| * | Brighthouse Financial Inc. | 9,810 | 466 |
| Evercore Inc. Class A | 4,956 | 464 | |
| * | Ryan Specialty Holdings Inc. | 10,787 | 457 |
| Lazard Ltd. Class A | 12,326 | 448 | |
| First Hawaiian Inc. | 17,130 | 440 | |
| Janus Henderson Group plc | 18,025 | 422 | |
| Assured Guaranty Ltd. | 8,009 | 409 | |
| Bank of Hawaii Corp. | 5,200 | 406 | |
| PacWest Bancorp | 15,315 | 403 | |
| Kemper Corp. | 8,491 | 391 | |
| BOK Financial Corp. | 3,930 | 349 | |
| Virtu Financial Inc. Class A | 13,057 | 300 | |
| *,1 | Upstart Holdings Inc. | 9,614 | 249 |
| CNA Financial Corp. | 3,512 | 135 | |
| 1 | Rocket Cos. Inc. Class A | 15,438 | 122 |
| TFS Financial Corp. | 6,357 | 91 | |
| UWM Holdings Corp. | 10,253 | 37 | |
| 532,676 | |||
| Health Care (13.0%) | |||
| UnitedHealth Group Inc. | 123,400 | 64,085 | |
| Johnson & Johnson | 347,157 | 56,010 | |
| Pfizer Inc. | 745,510 | 33,719 | |
| Eli Lilly & Co. | 111,150 | 33,482 | |
| AbbVie Inc. | 233,178 | 31,353 | |
| Merck & Co. Inc. | 333,681 | 28,483 | |
| Shares | Market Value• ($000) | ||
| Thermo Fisher Scientific Inc. | 51,620 | 28,149 | |
| Abbott Laboratories | 226,271 | 23,227 | |
| Danaher Corp. | 85,399 | 23,050 | |
| Bristol-Myers Squibb Co. | 280,874 | 18,934 | |
| Amgen Inc. | 70,453 | 16,930 | |
| Medtronic plc | 176,359 | 15,506 | |
| Elevance Health Inc. | 31,823 | 15,438 | |
| Cigna Corp. | 41,152 | 11,665 | |
| Gilead Sciences Inc. | 165,700 | 10,517 | |
| Zoetis Inc. | 62,130 | 9,725 | |
| * | Intuitive Surgical Inc. | 47,227 | 9,717 |
| Stryker Corp. | 46,352 | 9,511 | |
| * | Vertex Pharmaceuticals Inc. | 33,743 | 9,507 |
| Becton Dickinson and Co. | 37,480 | 9,461 | |
| Humana Inc. | 16,689 | 8,040 | |
| * | Regeneron Pharmaceuticals Inc. | 13,682 | 7,950 |
| * | Boston Scientific Corp. | 188,231 | 7,588 |
| * | Edwards Lifesciences Corp. | 81,409 | 7,335 |
| * | Centene Corp. | 76,682 | 6,881 |
| * | Moderna Inc. | 45,356 | 5,999 |
| HCA Healthcare Inc. | 29,699 | 5,877 | |
| * | IQVIA Holdings Inc. | 24,805 | 5,275 |
| Agilent Technologies Inc. | 39,485 | 5,064 | |
| * | DexCom Inc. | 51,448 | 4,230 |
| ResMed Inc. | 18,995 | 4,177 | |
| * | Illumina Inc. | 20,659 | 4,166 |
| * | IDEXX Laboratories Inc. | 10,958 | 3,809 |
| Baxter International Inc. | 66,095 | 3,798 | |
| * | Biogen Inc. | 19,143 | 3,740 |
| * | Veeva Systems Inc. Class A | 18,338 | 3,655 |
| * | Alnylam Pharmaceuticals Inc. | 15,830 | 3,272 |
| Zimmer Biomet Holdings Inc. | 27,739 | 2,949 | |
| West Pharmaceutical Services Inc. | 9,730 | 2,887 | |
| * | Seagen Inc. | 17,838 | 2,752 |
| Laboratory Corp. of America Holdings | 12,157 | 2,739 | |
| * | Molina Healthcare Inc. | 7,640 | 2,578 |
| Cardinal Health Inc. | 35,975 | 2,544 | |
| * | Align Technology Inc. | 10,290 | 2,508 |
| * | Insulet Corp. | 9,102 | 2,325 |
| STERIS plc | 11,221 | 2,260 | |
| PerkinElmer Inc. | 16,670 | 2,251 | |
| * | Hologic Inc. | 32,461 | 2,193 |
| * | BioMarin Pharmaceutical Inc. | 24,365 | 2,173 |
| Royalty Pharma plc Class A | 48,452 | 2,026 | |
| * | Avantor Inc. | 80,628 | 2,008 |
| * | Catalent Inc. | 22,561 | 1,985 |
| Quest Diagnostics Inc. | 15,464 | 1,938 | |
| Cooper Cos. Inc. | 6,407 | 1,842 | |
| * | Horizon Therapeutics plc | 29,682 | 1,757 |
| Bio-Techne Corp. | 5,159 | 1,712 | |
| * | Incyte Corp. | 24,093 | 1,697 |
| * | Repligen Corp. | 7,326 | 1,607 |
| * | ABIOMED Inc. | 5,910 | 1,532 |
| Viatris Inc. | 160,048 | 1,528 | |
| Teleflex Inc. | 6,202 | 1,403 | |
| * | Bio-Rad Laboratories Inc. Class A | 2,839 | 1,377 |
| * | Charles River Laboratories International Inc. | 6,685 | 1,372 |
| Shares | Market Value• ($000) | ||
| * | QIAGEN NV | 29,912 | 1,359 |
| * | United Therapeutics Corp. | 5,883 | 1,333 |
| * | Henry Schein Inc. | 18,099 | 1,329 |
| * | Neurocrine Biosciences Inc. | 12,596 | 1,318 |
| * | Jazz Pharmaceuticals plc | 8,068 | 1,252 |
| * | Sarepta Therapeutics Inc. | 11,015 | 1,205 |
| * | Novocure Ltd. | 13,664 | 1,122 |
| * | Masimo Corp. | 6,659 | 978 |
| * | Acadia Healthcare Co. Inc. | 11,603 | 951 |
| Organon & Co. | 33,208 | 947 | |
| DENTSPLY SIRONA Inc. | 28,475 | 933 | |
| Chemed Corp. | 1,948 | 928 | |
| * | Elanco Animal Health Inc. (XNYS) | 59,257 | 897 |
| Universal Health Services Inc. Class B | 8,481 | 830 | |
| * | Exact Sciences Corp. | 23,230 | 826 |
| * | Syneos Health Inc. | 13,613 | 818 |
| Bruker Corp. | 14,240 | 797 | |
| * | Tenet Healthcare Corp. | 13,930 | 787 |
| * | Envista Holdings Corp. | 21,163 | 785 |
| * | Ionis Pharmaceuticals Inc. | 18,372 | 781 |
| * | Penumbra Inc. | 4,739 | 778 |
| * | Exelixis Inc. | 41,638 | 739 |
| Perrigo Co. plc | 17,789 | 666 | |
| * | Teladoc Health Inc. | 21,061 | 654 |
| * | DaVita Inc. | 7,652 | 653 |
| * | Guardant Health Inc. | 12,766 | 639 |
| Encompass Health Corp. | 12,707 | 617 | |
| * | Globus Medical Inc. Class A | 10,233 | 606 |
| * | Natera Inc. | 11,168 | 550 |
| Premier Inc. Class A | 15,175 | 535 | |
| * | agilon health Inc. | 24,521 | 510 |
| * | QuidelOrtho Corp. | 6,426 | 509 |
| * | Amedisys Inc. | 4,236 | 502 |
| * | Mirati Therapeutics Inc. | 5,578 | 452 |
| * | Integra LifeSciences Holdings Corp. | 9,340 | 446 |
| * | Ultragenyx Pharmaceutical Inc. | 8,889 | 424 |
| * | Doximity Inc. Class A | 12,568 | 417 |
| * | ICU Medical Inc. | 2,615 | 416 |
| * | Oak Street Health Inc. | 15,278 | 400 |
| * | 10X Genomics Inc. Class A | 12,099 | 399 |
| * | Tandem Diabetes Care Inc. | 8,405 | 384 |
| * | Enovis Corp. | 6,804 | 345 |
| * | Novavax Inc. | 10,162 | 336 |
| * | Maravai LifeSciences Holdings Inc. Class A | 14,759 | 308 |
| * | Ginkgo Bioworks Holdings Inc. | 107,560 | 289 |
| * | Signify Health Inc. Class A | 9,963 | 278 |
| * | Certara Inc. | 15,816 | 248 |
| * | Sotera Health Co. | 12,912 | 218 |
| * | Enhabit Inc. | 6,347 | 105 |
| 636,867 | |||
| Industrials (12.6%) | |||
| Visa Inc. Class A | 217,170 | 43,154 | |
| Mastercard Inc. Class A | 113,555 | 36,834 | |
| Accenture plc Class A | 83,577 | 24,109 | |
| United Parcel Service Inc. Class B | 96,992 | 18,866 | |
| Union Pacific Corp. | 82,827 | 18,595 | |
| Raytheon Technologies Corp. | 196,115 | 17,601 | |
| Shares | Market Value• ($000) | ||
| Honeywell International Inc. | 89,759 | 16,996 | |
| * | PayPal Holdings Inc. | 152,658 | 14,264 |
| Deere & Co. | 36,944 | 13,494 | |
| Automatic Data Processing Inc. | 55,091 | 13,465 | |
| Lockheed Martin Corp. | 31,310 | 13,154 | |
| Caterpillar Inc. | 70,305 | 12,986 | |
| American Express Co. | 79,478 | 12,081 | |
| * | Boeing Co. | 72,314 | 11,588 |
| General Electric Co. | 144,498 | 10,612 | |
| 1 | 3M Co. | 74,750 | 9,295 |
| Northrop Grumman Corp. | 19,329 | 9,239 | |
| CSX Corp. | 286,650 | 9,072 | |
| Illinois Tool Works Inc. | 40,912 | 7,971 | |
| * | Fiserv Inc. | 78,402 | 7,933 |
| Norfolk Southern Corp. | 31,361 | 7,625 | |
| General Dynamics Corp. | 32,459 | 7,431 | |
| Fidelity National Information Services Inc. | 80,384 | 7,345 | |
| Sherwin-Williams Co. | 31,574 | 7,328 | |
| Eaton Corp. plc | 52,631 | 7,192 | |
| FedEx Corp. | 31,658 | 6,674 | |
| Emerson Electric Co. | 77,765 | 6,357 | |
| L3Harris Technologies Inc. | 25,342 | 5,783 | |
| Capital One Financial Corp. | 52,246 | 5,529 | |
| Paychex Inc. | 42,545 | 5,248 | |
| Johnson Controls International plc | 91,978 | 4,980 | |
| Trane Technologies plc | 30,847 | 4,753 | |
| * | Block Inc. (XNYS) | 68,188 | 4,699 |
| Cintas Corp. | 11,526 | 4,689 | |
| Global Payments Inc. | 36,824 | 4,575 | |
| Parker-Hannifin Corp. | 16,829 | 4,460 | |
| Carrier Global Corp. | 112,074 | 4,384 | |
| TransDigm Group Inc. | 6,914 | 4,151 | |
| Otis Worldwide Corp. | 55,672 | 4,021 | |
| Cummins Inc. | 18,533 | 3,991 | |
| PACCAR Inc. | 45,127 | 3,949 | |
| PPG Industries Inc. | 30,952 | 3,930 | |
| * | Keysight Technologies Inc. | 23,859 | 3,910 |
| Verisk Analytics Inc. Class A | 20,462 | 3,830 | |
| DuPont de Nemours Inc. | 66,992 | 3,727 | |
| AMETEK Inc. | 30,414 | 3,655 | |
| Old Dominion Freight Line Inc. | 13,400 | 3,637 | |
| Rockwell Automation Inc. | 15,289 | 3,623 | |
| * | Mettler-Toledo International Inc. | 2,942 | 3,567 |
| WW Grainger Inc. | 6,012 | 3,336 | |
| Equifax Inc. | 15,994 | 3,019 | |
| Fortive Corp. | 47,099 | 2,983 | |
| Vulcan Materials Co. | 17,361 | 2,890 | |
| Martin Marietta Materials Inc. | 8,218 | 2,857 | |
| * | United Rentals Inc. | 9,460 | 2,763 |
| Quanta Services Inc. | 18,787 | 2,655 | |
| Ingersoll Rand Inc. | 53,619 | 2,540 | |
| Amcor plc | 198,197 | 2,380 | |
| Dover Corp. | 19,036 | 2,379 | |
| * | Waters Corp. | 7,857 | 2,346 |
| Ball Corp. | 41,224 | 2,301 | |
| Expeditors International of Washington Inc. | 21,889 | 2,252 | |
| * | Teledyne Technologies Inc. | 6,081 | 2,240 |
| Synchrony Financial | 65,711 | 2,152 |
| Shares | Market Value• ($000) | ||
| Xylem Inc. | 23,406 | 2,132 | |
| * | FleetCor Technologies Inc. | 9,982 | 2,121 |
| Jacobs Solutions Inc. | 16,897 | 2,105 | |
| Westinghouse Air Brake Technologies Corp. | 23,921 | 2,097 | |
| * | Bill.com Holdings Inc. | 12,931 | 2,093 |
| * | Zebra Technologies Corp. Class A | 6,873 | 2,073 |
| * | Trimble Inc. | 32,707 | 2,069 |
| IDEX Corp. | 10,051 | 2,022 | |
| Carlisle Cos. Inc. | 6,745 | 1,994 | |
| JB Hunt Transport Services Inc. | 11,000 | 1,914 | |
| CH Robinson Worldwide Inc. | 16,614 | 1,896 | |
| TransUnion | 25,167 | 1,859 | |
| Jack Henry & Associates Inc. | 9,513 | 1,828 | |
| * | Generac Holdings Inc. | 8,260 | 1,821 |
| Textron Inc. | 28,374 | 1,770 | |
| Stanley Black & Decker Inc. | 19,999 | 1,762 | |
| Howmet Aerospace Inc. | 49,408 | 1,751 | |
| Nordson Corp. | 7,641 | 1,736 | |
| Packaging Corp. of America | 12,227 | 1,674 | |
| Booz Allen Hamilton Holding Corp. Class A | 17,389 | 1,664 | |
| Masco Corp. | 31,088 | 1,581 | |
| RPM International Inc. | 16,855 | 1,570 | |
| Snap-on Inc. | 6,932 | 1,510 | |
| * | Fair Isaac Corp. | 3,329 | 1,496 |
| Hubbell Inc. Class B | 7,043 | 1,453 | |
| Crown Holdings Inc. | 15,631 | 1,416 | |
| Graco Inc. | 21,983 | 1,403 | |
| Westrock Co. | 33,142 | 1,345 | |
| * | Builders FirstSource Inc. | 22,723 | 1,332 |
| AECOM | 17,594 | 1,287 | |
| HEICO Corp. Class A | 10,344 | 1,268 | |
| * | Paylocity Holding Corp. | 5,258 | 1,267 |
| Regal Rexnord Corp. | 8,723 | 1,200 | |
| Huntington Ingalls Industries Inc. | 5,207 | 1,199 | |
| Watsco Inc. | 4,367 | 1,188 | |
| Toro Co. | 13,815 | 1,146 | |
| * | WillScot Mobile Mini Holdings Corp. | 28,338 | 1,137 |
| Genpact Ltd. | 24,042 | 1,129 | |
| Advanced Drainage Systems Inc. | 8,124 | 1,102 | |
| Robert Half International Inc. | 14,293 | 1,100 | |
| Allegion plc | 11,474 | 1,091 | |
| Knight-Swift Transportation Holdings Inc. | 20,978 | 1,060 | |
| * | Axon Enterprise Inc. | 8,969 | 1,047 |
| Owens Corning | 12,788 | 1,045 | |
| Fortune Brands Home & Security Inc. | 16,983 | 1,043 | |
| Sealed Air Corp. | 19,017 | 1,023 | |
| Lennox International Inc. | 4,238 | 1,018 | |
| * | Middleby Corp. | 7,054 | 1,015 |
| Lincoln Electric Holdings Inc. | 7,323 | 1,001 | |
| Pentair plc | 21,883 | 974 | |
| Cognex Corp. | 22,628 | 953 | |
| Tetra Tech Inc. | 6,979 | 948 | |
| A O Smith Corp. | 16,765 | 946 |
| Shares | Market Value• ($000) | ||
| * | Berry Global Group Inc. | 17,319 | 941 |
| * | WEX Inc. | 5,967 | 920 |
| HEICO Corp. | 5,984 | 911 | |
| AGCO Corp. | 8,252 | 897 | |
| AptarGroup Inc. | 8,718 | 896 | |
| Graphic Packaging Holding Co. | 40,137 | 894 | |
| Donaldson Co. Inc. | 16,328 | 838 | |
| Sensata Technologies Holding plc | 20,634 | 831 | |
| MDU Resources Group Inc. | 26,852 | 810 | |
| Sonoco Products Co. | 12,703 | 801 | |
| * | TopBuild Corp. | 4,345 | 798 |
| ITT Inc. | 10,921 | 792 | |
| * | WESCO International Inc. | 5,845 | 770 |
| Valmont Industries Inc. | 2,767 | 766 | |
| * | Mohawk Industries Inc. | 6,887 | 760 |
| Brunswick Corp. | 10,140 | 758 | |
| Acuity Brands Inc. | 4,579 | 751 | |
| MKS Instruments Inc. | 7,543 | 751 | |
| Curtiss-Wright Corp. | 5,080 | 748 | |
| * | Axalta Coating Systems Ltd. | 28,915 | 745 |
| Littelfuse Inc. | 3,134 | 743 | |
| Western Union Co. | 50,147 | 743 | |
| nVent Electric plc | 21,921 | 723 | |
| * | FTI Consulting Inc. | 4,457 | 716 |
| Woodward Inc. | 7,694 | 716 | |
| Landstar System Inc. | 4,797 | 703 | |
| * | XPO Logistics Inc. | 13,373 | 701 |
| * | Trex Co. Inc. | 14,958 | 700 |
| Oshkosh Corp. | 8,713 | 695 | |
| Eagle Materials Inc. | 5,235 | 626 | |
| * | MasTec Inc. | 7,781 | 626 |
| BWX Technologies Inc. | 11,943 | 623 | |
| * | GXO Logistics Inc. | 13,889 | 616 |
| MSA Safety Inc. | 4,899 | 582 | |
| Crane Holdings Co. | 6,157 | 581 | |
| Louisiana-Pacific Corp. | 10,683 | 579 | |
| * | Euronet Worldwide Inc. | 6,302 | 559 |
| * | Affirm Holdings Inc. | 22,998 | 539 |
| Flowserve Corp. | 17,558 | 535 | |
| Armstrong World Industries Inc. | 6,147 | 516 | |
| * | Kirby Corp. | 7,698 | 516 |
| Silgan Holdings Inc. | 11,329 | 516 | |
| Air Lease Corp. Class A | 13,914 | 506 | |
| ManpowerGroup Inc. | 6,860 | 503 | |
| Ryder System Inc. | 6,443 | 493 | |
| MSC Industrial Direct Co. Inc. Class A | 5,928 | 470 | |
| Vontier Corp. | 21,048 | 461 | |
| Allison Transmission Holdings Inc. | 12,646 | 459 | |
| Spirit AeroSystems Holdings Inc. Class A | 13,922 | 419 | |
| * | Mercury Systems Inc. | 7,317 | 352 |
| * | Shift4 Payments Inc. Class A | 6,943 | 314 |
| * | AZEK Co. Inc. Class A | 15,663 | 286 |
| Esab Corp. | 6,929 | 285 | |
| ADT Inc. | 27,103 | 198 | |
| * | Core & Main Inc. Class A | 7,842 | 185 |
| Schneider National Inc. Class B | 7,466 | 171 | |
| * | Gates Industrial Corp. plc | 14,363 | 154 |
| Shares | Market Value• ($000) | ||
| Ardagh Metal Packaging SA | 19,585 | 120 | |
| * | Hayward Holdings Inc. | 9,583 | 101 |
| Ardagh Group SA | 2,011 | 28 | |
| 618,856 | |||
| Real Estate (3.4%) | |||
| American Tower Corp. | 61,219 | 15,553 | |
| Prologis Inc. | 97,436 | 12,132 | |
| Crown Castle Inc. | 56,988 | 9,735 | |
| Equinix Inc. | 11,992 | 7,883 | |
| Public Storage | 20,617 | 6,821 | |
| Realty Income Corp. | 79,232 | 5,410 | |
| Digital Realty Trust Inc. | 37,331 | 4,615 | |
| Welltower Inc. | 59,868 | 4,589 | |
| SBA Communications Corp. Class A | 14,034 | 4,565 | |
| Simon Property Group Inc. | 42,924 | 4,377 | |
| VICI Properties Inc. | 126,576 | 4,176 | |
| AvalonBay Communities Inc. | 18,424 | 3,702 | |
| * | CoStar Group Inc. | 51,578 | 3,592 |
| Equity Residential | 48,635 | 3,559 | |
| Extra Space Storage Inc. | 17,497 | 3,477 | |
| * | CBRE Group Inc. Class A | 43,444 | 3,430 |
| Weyerhaeuser Co. | 98,514 | 3,365 | |
| Alexandria Real Estate Equities Inc. | 21,372 | 3,278 | |
| Duke Realty Corp. | 50,743 | 2,986 | |
| Invitation Homes Inc. | 80,588 | 2,924 | |
| Ventas Inc. | 52,908 | 2,532 | |
| Mid-America Apartment Communities Inc. | 15,182 | 2,515 | |
| Sun Communities Inc. | 15,836 | 2,434 | |
| Essex Property Trust Inc. | 8,491 | 2,251 | |
| WP Carey Inc. | 24,847 | 2,088 | |
| Iron Mountain Inc. | 38,100 | 2,004 | |
| UDR Inc. | 42,030 | 1,886 | |
| Healthpeak Properties Inc. | 70,278 | 1,845 | |
| Camden Property Trust | 13,529 | 1,739 | |
| Kimco Realty Corp. | 79,850 | 1,683 | |
| Host Hotels & Resorts Inc. | 93,697 | 1,665 | |
| Boston Properties Inc. | 20,712 | 1,645 | |
| Equity LifeStyle Properties Inc. | 23,464 | 1,645 | |
| Gaming and Leisure Properties Inc. | 31,014 | 1,497 | |
| American Homes 4 Rent Class A | 40,179 | 1,429 | |
| Life Storage Inc. | 11,103 | 1,413 | |
| Regency Centers Corp. | 22,659 | 1,379 | |
| CubeSmart | 29,544 | 1,360 | |
| Rexford Industrial Realty Inc. | 21,804 | 1,356 | |
| Healthcare Realty Trust Inc. Class A Blank | 50,015 | 1,216 | |
| Medical Properties Trust Inc. | 79,053 | 1,155 | |
| * | Jones Lang LaSalle Inc. | 6,581 | 1,138 |
| Lamar Advertising Co. Class A | 11,249 | 1,056 | |
| Federal Realty Investment Trust | 10,371 | 1,050 | |
| Americold Realty Trust Inc. | 35,612 | 1,048 | |
| National Retail Properties Inc. | 22,954 | 1,031 | |
| Omega Healthcare Investors Inc. | 30,680 | 1,002 | |
| Shares | Market Value• ($000) | ||
| STORE Capital Corp. | 33,544 | 905 | |
| EastGroup Properties Inc. | 5,393 | 890 | |
| First Industrial Realty Trust Inc. | 17,513 | 888 | |
| Brixmor Property Group Inc. | 38,962 | 837 | |
| Apartment Income REIT Corp. | 20,388 | 833 | |
| Kilroy Realty Corp. | 15,370 | 750 | |
| Spirit Realty Capital Inc. | 17,522 | 716 | |
| Rayonier Inc. | 19,137 | 680 | |
| * | Zillow Group Inc. Class C | 18,606 | 623 |
| Vornado Realty Trust | 23,290 | 611 | |
| National Storage Affiliates Trust | 11,142 | 563 | |
| Cousins Properties Inc. | 19,771 | 531 | |
| Douglas Emmett Inc. | 22,651 | 442 | |
| Park Hotels & Resorts Inc. | 31,319 | 438 | |
| EPR Properties | 9,689 | 421 | |
| Highwoods Properties Inc. | 13,718 | 417 | |
| SL Green Realty Corp. | 8,244 | 364 | |
| * | Zillow Group Inc. Class A | 10,228 | 342 |
| JBG SMITH Properties | 15,070 | 331 | |
| * | Howard Hughes Corp. | 5,060 | 322 |
| * | Opendoor Technologies Inc. | 60,598 | 262 |
| Hudson Pacific Properties Inc. | 17,903 | 236 | |
| * | WeWork Inc. Class A | 17,099 | 70 |
| 165,703 | |||
| Technology (26.6%) | |||
| Apple Inc. | 2,017,170 | 317,139 | |
| Microsoft Corp. | 987,046 | 258,083 | |
| * | Alphabet Inc. Class A | 779,655 | 84,374 |
| * | Alphabet Inc. Class C | 738,515 | 80,609 |
| * | Meta Platforms Inc. Class A | 302,461 | 49,280 |
| NVIDIA Corp. | 317,666 | 47,949 | |
| Broadcom Inc. | 52,687 | 26,297 | |
| * | Adobe Inc. | 62,240 | 23,243 |
| Texas Instruments Inc. | 121,660 | 20,099 | |
| * | Salesforce Inc. | 126,932 | 19,817 |
| QUALCOMM Inc. | 147,823 | 19,553 | |
| * | Advanced Micro Devices Inc. | 213,024 | 18,079 |
| Intel Corp. | 539,780 | 17,230 | |
| Intuit Inc. | 36,342 | 15,692 | |
| International Business Machines Corp. | 118,802 | 15,260 | |
| Oracle Corp. | 199,560 | 14,797 | |
| * | ServiceNow Inc. | 26,368 | 11,460 |
| Applied Materials Inc. | 116,377 | 10,948 | |
| Analog Devices Inc. | 68,928 | 10,445 | |
| Micron Technology Inc. | 146,908 | 8,305 | |
| Lam Research Corp. | 18,273 | 8,002 | |
| * | Palo Alto Networks Inc. | 12,756 | 7,103 |
| * | Synopsys Inc. | 20,056 | 6,940 |
| KLA Corp. | 19,653 | 6,763 | |
| * | Cadence Design Systems Inc. | 35,876 | 6,234 |
| * | Autodesk Inc. | 28,680 | 5,786 |
| Amphenol Corp. Class A | 77,220 | 5,678 | |
| Roper Technologies Inc. | 13,915 | 5,602 | |
| Marvell Technology Inc. | 111,902 | 5,239 | |
| * | Crowdstrike Holdings Inc. Class A | 27,631 | 5,046 |
| * | Snowflake Inc. Class A | 25,756 | 4,661 |
| Microchip Technology Inc. | 70,984 | 4,632 | |
| Shares | Market Value• ($000) | ||
| * | Atlassian Corp. plc Class A | 18,024 | 4,464 |
| Cognizant Technology Solutions Corp. Class A | 68,635 | 4,336 | |
| * | Workday Inc. Class A | 25,621 | 4,216 |
| * | Fortinet Inc. | 86,215 | 4,198 |
| HP Inc. | 138,459 | 3,975 | |
| * | ON Semiconductor Corp. | 57,260 | 3,938 |
| * | Twitter Inc. | 98,358 | 3,811 |
| * | Datadog Inc. Class A | 33,913 | 3,559 |
| Corning Inc. | 99,343 | 3,409 | |
| VMware Inc. Class A | 27,405 | 3,180 | |
| * | EPAM Systems Inc. | 7,206 | 3,073 |
| CDW Corp. | 17,883 | 3,053 | |
| * | Gartner Inc. | 10,313 | 2,943 |
| * | ANSYS Inc. | 11,346 | 2,817 |
| Monolithic Power Systems Inc. | 6,002 | 2,720 | |
| * | MongoDB Inc. Class A | 8,294 | 2,678 |
| * | Zoom Video Communications Inc. Class A | 33,249 | 2,673 |
| * | Paycom Software Inc. | 6,786 | 2,383 |
| Hewlett Packard Enterprise Co. | 171,207 | 2,328 | |
| * | Cloudflare Inc. Class A | 36,899 | 2,309 |
| * | VeriSign Inc. | 12,602 | 2,296 |
| * | Match Group Inc. | 37,490 | 2,119 |
| NetApp Inc. | 29,270 | 2,111 | |
| Skyworks Solutions Inc. | 21,092 | 2,079 | |
| * | HubSpot Inc. | 6,040 | 2,036 |
| * | Tyler Technologies Inc. | 5,447 | 2,024 |
| * | DoorDash Inc. Class A | 32,772 | 1,963 |
| * | Splunk Inc. | 21,297 | 1,917 |
| * | Akamai Technologies Inc. | 20,834 | 1,881 |
| Entegris Inc. | 19,613 | 1,861 | |
| * | Palantir Technologies Inc. Class A | 239,594 | 1,850 |
| Teradyne Inc. | 20,950 | 1,773 | |
| * | Zscaler Inc. | 11,029 | 1,756 |
| * | Western Digital Corp. | 41,430 | 1,751 |
| * | Wolfspeed Inc. | 15,329 | 1,739 |
| * | Pinterest Inc. Class A | 75,418 | 1,738 |
| Leidos Holdings Inc. | 18,028 | 1,714 | |
| Citrix Systems Inc. | 16,614 | 1,707 | |
| NortonLifeLock Inc. | 74,545 | 1,684 | |
| SS&C Technologies Holdings Inc. | 29,622 | 1,652 | |
| * | ZoomInfo Technologies Inc. Class A | 36,017 | 1,636 |
| * | GoDaddy Inc. Class A | 21,504 | 1,630 |
| * | PTC Inc. | 13,948 | 1,602 |
| * | Twilio Inc. Class A | 22,820 | 1,588 |
| * | DocuSign Inc. Class A | 26,235 | 1,527 |
| * | Okta Inc. | 16,492 | 1,507 |
| Amdocs Ltd. | 16,251 | 1,389 | |
| * | Black Knight Inc. | 20,452 | 1,353 |
| Dell Technologies Inc. Class C | 35,327 | 1,353 | |
| * | Qorvo Inc. | 14,340 | 1,287 |
| * | F5 Inc. | 8,014 | 1,259 |
| * | Zendesk Inc. | 16,170 | 1,241 |
| * | Unity Software Inc. | 27,593 | 1,179 |
| * | Manhattan Associates Inc. | 8,311 | 1,174 |
| * | Globant SA | 5,425 | 1,143 |
| Jabil Inc. | 18,233 | 1,099 | |
| * | Pure Storage Inc. Class A | 37,085 | 1,074 |
| * | Ceridian HCM Holding Inc. | 17,690 | 1,055 |
| Shares | Market Value• ($000) | ||
| * | Avalara Inc. | 11,326 | 1,037 |
| * | Dynatrace Inc. | 26,401 | 1,008 |
| * | Lattice Semiconductor Corp. | 17,776 | 958 |
| * | Arrow Electronics Inc. | 8,735 | 916 |
| * | Five9 Inc. | 9,162 | 899 |
| KBR Inc. | 18,174 | 878 | |
| * | CACI International Inc. Class A | 3,079 | 865 |
| * | Elastic NV | 10,196 | 856 |
| * | UiPath Inc. Class A | 49,476 | 814 |
| Bentley Systems Inc. Class B | 22,085 | 812 | |
| * | DXC Technology Co. | 32,463 | 804 |
| * | Guidewire Software Inc. | 11,160 | 800 |
| * | Change Healthcare Inc. | 32,456 | 797 |
| * | II-VI Inc. | 16,628 | 785 |
| * | Dropbox Inc. Class A | 36,475 | 780 |
| * | Aspen Technology Inc. | 3,634 | 765 |
| * | Clarivate plc | 63,651 | 743 |
| * | AppLovin Corp. Class A | 29,780 | 733 |
| Concentrix Corp. | 5,671 | 713 | |
| * | Mandiant Inc. | 30,528 | 698 |
| National Instruments Corp. | 17,434 | 693 | |
| Science Applications International Corp. | 7,293 | 664 | |
| * | IAC Inc. | 10,168 | 654 |
| Universal Display Corp. | 5,768 | 644 | |
| Switch Inc. Class A | 18,950 | 643 | |
| Dolby Laboratories Inc. Class A | 8,549 | 626 | |
| * | SentinelOne Inc. Class A | 22,464 | 614 |
| * | Coupa Software Inc. | 10,074 | 588 |
| * | Cirrus Logic Inc. | 7,552 | 579 |
| * | Toast Inc. Class A | 29,609 | 561 |
| Avnet Inc. | 12,570 | 552 | |
| * | Smartsheet Inc. Class A | 16,566 | 551 |
| TD SYNNEX Corp. | 5,557 | 535 | |
| * | NCR Corp. | 17,129 | 532 |
| Azenta Inc. | 9,663 | 509 | |
| * | Alteryx Inc. Class A | 8,062 | 502 |
| * | Procore Technologies Inc. | 9,149 | 500 |
| * | Nutanix Inc. Class A | 28,304 | 490 |
| *,1 | GLOBALFOUNDRIES Inc. | 8,189 | 490 |
| * | RingCentral Inc. Class A | 11,175 | 481 |
| Dun & Bradstreet Holdings Inc. | 32,930 | 469 | |
| Vertiv Holdings Co. Class A | 39,691 | 458 | |
| * | Teradata Corp. | 13,871 | 456 |
| * | Wix.com Ltd. | 7,089 | 449 |
| * | Confluent Inc. Class A | 16,273 | 445 |
| * | New Relic Inc. | 6,857 | 416 |
| * | IPG Photonics Corp. | 4,524 | 410 |
| * | Kyndryl Holdings Inc. | 23,584 | 246 |
| * | nCino Inc. | 7,573 | 239 |
| * | DoubleVerify Holdings Inc. | 8,267 | 214 |
| * | CCC Intelligent Solutions Holdings Inc. | 22,137 | 212 |
| * | Jamf Holding Corp. | 8,534 | 204 |
| Pegasystems Inc. | 5,351 | 196 | |
| * | Paycor HCM Inc. | 5,760 | 171 |
| * | Thoughtworks Holding Inc. | 11,144 | 147 |
| * | Allegro MicroSystems Inc. | 6,198 | 145 |
| * | Informatica Inc. Class A | 4,566 | 101 |
| * | Definitive Healthcare Corp. Class A | 4,347 | 87 |
| 1,301,289 |
| Shares | Market Value• ($000) | ||
| Telecommunications (2.5%) | |||
| Cisco Systems Inc. | 548,524 | 24,530 | |
| Verizon Communications Inc. | 554,440 | 23,181 | |
| Comcast Corp. Class A | 586,658 | 21,231 | |
| AT&T Inc. | 944,880 | 16,573 | |
| * | T-Mobile US Inc. | 78,493 | 11,300 |
| * | Charter Communications Inc. Class A | 15,243 | 6,290 |
| Motorola Solutions Inc. | 21,761 | 5,297 | |
| * | Arista Networks Inc. | 32,762 | 3,928 |
| * | Liberty Broadband Corp. Class C | 17,524 | 1,782 |
| Lumen Technologies Inc. | 135,785 | 1,352 | |
| Juniper Networks Inc. | 42,333 | 1,203 | |
| * | Roku Inc. | 15,907 | 1,082 |
| * | Ciena Corp. | 19,737 | 1,001 |
| Cable One Inc. | 785 | 891 | |
| * | Frontier Communications Parent Inc. | 32,046 | 826 |
| * | Lumentum Holdings Inc. | 9,021 | 754 |
| * | DISH Network Corp. Class A | 33,416 | 580 |
| * | ViaSat Inc. | 9,423 | 358 |
| * | Altice USA Inc. Class A | 28,539 | 285 |
| Ubiquiti Inc. | 809 | 251 | |
| * | Liberty Broadband Corp. Class A | 2,106 | 212 |
| 122,907 | |||
| Utilities (3.3%) | |||
| NextEra Energy Inc. | 259,012 | 22,032 | |
| Duke Energy Corp. | 101,671 | 10,870 | |
| Southern Co. | 140,184 | 10,804 | |
| Waste Management Inc. | 54,753 | 9,255 | |
| Dominion Energy Inc. | 107,083 | 8,759 | |
| Sempra Energy (XNYS) | 41,464 | 6,840 | |
| American Electric Power Co. Inc. | 67,665 | 6,780 | |
| Exelon Corp. | 129,064 | 5,667 | |
| Xcel Energy Inc. | 71,639 | 5,319 | |
| Consolidated Edison Inc. | 46,874 | 4,581 | |
| WEC Energy Group Inc. | 41,486 | 4,279 | |
| Public Service Enterprise Group Inc. | 65,460 | 4,213 | |
| Eversource Energy | 45,386 | 4,071 | |
| Republic Services Inc. Class A | 27,196 | 3,881 | |
| American Water Works Co. Inc. | 23,951 | 3,556 | |
| Constellation Energy Corp. | 42,867 | 3,498 | |
| Edison International | 49,648 | 3,365 | |
| DTE Energy Co. | 25,416 | 3,313 | |
| Ameren Corp. | 33,857 | 3,136 | |
| Entergy Corp. | 26,843 | 3,095 | |
| Shares | Market Value• ($000) | ||
| FirstEnergy Corp. | 71,674 | 2,835 | |
| PPL Corp. | 96,662 | 2,811 | |
| CenterPoint Energy Inc. | 83,290 | 2,626 | |
| CMS Energy Corp. | 38,153 | 2,577 | |
| * | PG&E Corp. | 204,386 | 2,520 |
| AES Corp. | 88,299 | 2,247 | |
| Atmos Energy Corp. | 18,134 | 2,056 | |
| Alliant Energy Corp. | 33,241 | 2,029 | |
| Evergy Inc. | 29,267 | 2,006 | |
| NiSource Inc. | 53,423 | 1,576 | |
| Essential Utilities Inc. | 30,422 | 1,495 | |
| Vistra Corp. | 56,388 | 1,396 | |
| NRG Energy Inc. | 31,371 | 1,295 | |
| Pinnacle West Capital Corp. | 15,041 | 1,133 | |
| UGI Corp. | 27,900 | 1,102 | |
| OGE Energy Corp. | 26,201 | 1,062 | |
| * | Sunrun Inc. | 26,768 | 884 |
| National Fuel Gas Co. | 11,429 | 815 | |
| * | Clean Harbors Inc. | 6,703 | 787 |
| IDACORP Inc. | 6,703 | 732 | |
| Brookfield Renewable Corp. Class A | 16,419 | 630 | |
| * | Stericycle Inc. | 12,295 | 616 |
| Hawaiian Electric Industries Inc. | 14,425 | 564 | |
| Avangrid Inc. | 9,248 | 457 | |
| 163,565 | |||
| Total Common Stocks (Cost $3,564,796) | 4,883,995 | ||
| Temporary Cash Investments (0.3%) | |||
| Money Market Fund (0.3%) | |||
| 2,3 | Vanguard Market Liquidity Fund, 2.284% (Cost $16,475) | 164,803 | 16,475 |
| Total Investments (100.1%) (Cost $3,581,271) | 4,900,470 | ||
| Other Assets and Liabilities—Net (-0.1%) | (5,980) | ||
| Net Assets (100%) | 4,894,490 | ||
| Cost is in $000. | |||
| • | See Note A in Notes to Financial Statements. |
| * | Non-income-producing security. |
| 1 | Includes partial security positions on loan to broker-dealers. The total value of securities on loan is $13,650,000. |
| 2 | Affiliated money market fund available only to Vanguard funds and certain trusts and accounts managed by Vanguard. Rate shown is the 7-day yield. |
| 3 | Collateral of $14,224,000 was received for securities on loan. |
| REIT—Real Estate Investment Trust. |
| Futures Contracts | ||||
| ($000) | ||||
| Expiration | Number of Long (Short) Contracts | Notional Amount | Value and Unrealized Appreciation (Depreciation) | |
| Long Futures Contracts | ||||
| E-mini S&P 500 Index | September 2022 | 53 | 10,485 | (697) |
| ($000s, except shares and per-share amounts) | Amount |
| Assets | |
| Investments in Securities, at Value1 | |
| Unaffiliated Issuers (Cost $3,564,796) | 4,883,995 |
| Affiliated Issuers (Cost $16,475) | 16,475 |
| Total Investments in Securities | 4,900,470 |
| Investment in Vanguard | 183 |
| Cash Collateral Pledged—Futures Contracts | 450 |
| Receivables for Investment Securities Sold | 107 |
| Receivables for Accrued Income | 7,521 |
| Receivables for Capital Shares Issued | 508 |
| Total Assets | 4,909,239 |
| Liabilities | |
| Due to Custodian | 168 |
| Payables for Investment Securities Purchased | 4 |
| Collateral for Securities on Loan | 14,224 |
| Payables for Capital Shares Redeemed | 115 |
| Payables to Vanguard | 169 |
| Variation Margin Payable—Futures Contracts | 69 |
| Total Liabilities | 14,749 |
| Net Assets | 4,894,490 |
| 1 Includes $13,650 of securities on loan. | |
| At August 31, 2022, net assets consisted of: | |
| Paid-in Capital | 3,756,810 |
| Total Distributable Earnings (Loss) | 1,137,680 |
| Net Assets | 4,894,490 |
| ETF Shares—Net Assets | |
| Applicable to 15,075,000 outstanding $.001 par value shares of beneficial interest (unlimited authorization) | 2,720,622 |
| Net Asset Value Per Share—ETF Shares | $180.47 |
| Institutional Shares—Net Assets | |
| Applicable to 6,217,768 outstanding $.001 par value shares of beneficial interest (unlimited authorization) | 2,173,868 |
| Net Asset Value Per Share—Institutional Shares | $349.62 |
| Year Ended August 31, 2022 | |
| ($000) | |
| Investment Income | |
| Income | |
| Dividends1 | 77,297 |
| Interest2 | 22 |
| Securities Lending—Net | 203 |
| Total Income | 77,522 |
| Expenses | |
| The Vanguard Group—Note B | |
| Investment Advisory Services | 636 |
| Management and Administrative—ETF Shares | 1,507 |
| Management and Administrative—Institutional Shares | 1,230 |
| Marketing and Distribution—ETF Shares | 149 |
| Marketing and Distribution—Institutional Shares | 81 |
| Custodian Fees | 291 |
| Auditing Fees | 27 |
| Shareholders’ Reports—ETF Shares | 52 |
| Shareholders’ Reports—Institutional Shares | 1 |
| Trustees’ Fees and Expenses | 2 |
| Other Expenses | 14 |
| Total Expenses | 3,990 |
| Net Investment Income | 73,532 |
| Realized Net Gain (Loss) | |
| Investment Securities Sold2,3 | 159,080 |
| Futures Contracts | (436) |
| Realized Net Gain (Loss) | 158,644 |
| Change in Unrealized Appreciation (Depreciation) | |
| Investment Securities2 | (955,746) |
| Futures Contracts | (762) |
| Change in Unrealized Appreciation (Depreciation) | (956,508) |
| Net Increase (Decrease) in Net Assets Resulting from Operations | (724,332) |
| 1 | Dividends are net of foreign withholding taxes of $24,000. |
| 2 | Interest income, realized net gain (loss), capital gain distributions received, and change in unrealized appreciation (depreciation) from an affiliated company of the fund were $21,000, ($13,000), less than $1,000, and less than $1,000, respectively. Purchases and sales are for temporary cash investment purposes. |
| 3 | Includes $258,184,000 of net gain (loss) resulting from in-kind redemptions. |
| Year Ended August 31, | ||
| 2022 ($000) | 2021 ($000) | |
| Increase (Decrease) in Net Assets | ||
| Operations | ||
| Net Investment Income | 73,532 | 62,518 |
| Realized Net Gain (Loss) | 158,644 | 422,041 |
| Change in Unrealized Appreciation (Depreciation) | (956,508) | 811,144 |
| Net Increase (Decrease) in Net Assets Resulting from Operations | (724,332) | 1,295,703 |
| Distributions | ||
| ETF Shares | (37,346) | (28,487) |
| Institutional Shares | (34,230) | (33,459) |
| Total Distributions | (71,576) | (61,946) |
| Capital Share Transactions | ||
| ETF Shares | 455,983 | 414,276 |
| Institutional Shares | (268,964) | (346,204) |
| Net Increase (Decrease) from Capital Share Transactions | 187,019 | 68,072 |
| Total Increase (Decrease) | (608,889) | 1,301,829 |
| Net Assets | ||
| Beginning of Period | 5,503,379 | 4,201,550 |
| End of Period | 4,894,490 | 5,503,379 |
| ETF Shares | |||||
| For a Share Outstanding Throughout Each Period | Year Ended August 31, | ||||
| 2022 | 2021 | 2020 | 2019 | 2018 | |
| Net Asset Value, Beginning of Period | $210.32 | $161.36 | $134.37 | $133.57 | $113.60 |
| Investment Operations | |||||
| Net Investment Income1 | 2.757 | 2.459 | 2.525 | 2.395 | 2.209 |
| Net Realized and Unrealized Gain (Loss) on Investments | (29.909) | 48.925 | 27.028 | .759 | 19.896 |
| Total from Investment Operations | (27.152) | 51.384 | 29.553 | 3.154 | 22.105 |
| Distributions | |||||
| Dividends from Net Investment Income | (2.698) | (2.424) | (2.563) | (2.354) | (2.135) |
| Distributions from Realized Capital Gains | — | — | — | — | — |
| Total Distributions | (2.698) | (2.424) | (2.563) | (2.354) | (2.135) |
| Net Asset Value, End of Period | $180.47 | $210.32 | $161.36 | $134.37 | $133.57 |
| Total Return | -13.02% | 32.14% | 22.39% | 2.45% | 19.68% |
| Ratios/Supplemental Data | |||||
| Net Assets, End of Period (Millions) | $2,721 | $2,682 | $1,678 | $1,196 | $1,008 |
| Ratio of Total Expenses to Average Net Assets | 0.08% | 0.08% | 0.08% | 0.08% | 0.12% |
| Ratio of Net Investment Income to Average Net Assets | 1.39% | 1.34% | 1.79% | 1.85% | 1.78% |
| Portfolio Turnover Rate2 | 10% | 6% | 9% | 6% | 9% |
| 1 | Calculated based on average shares outstanding. |
| 2 | Excludes the value of portfolio securities received or delivered as a result of in-kind purchases or redemptions of the fund’s capital shares, including ETF Creation Units. |
| Institutional Shares | |||||
| For a Share Outstanding Throughout Each Period | Year Ended August 31, | ||||
| 2022 | 2021 | 2020 | 2019 | 2018 | |
| Net Asset Value, Beginning of Period | $407.44 | $312.59 | $260.26 | $258.75 | $220.06 |
| Investment Operations | |||||
| Net Investment Income1 | 5.354 | 4.807 | 4.927 | 4.645 | 4.345 |
| Net Realized and Unrealized Gain (Loss) on Investments | (57.922) | 94.766 | 52.362 | 1.483 | 38.573 |
| Total from Investment Operations | (52.568) | 99.573 | 57.289 | 6.128 | 42.918 |
| Distributions | |||||
| Dividends from Net Investment Income | (5.252) | (4.723) | (4.959) | (4.618) | (4.228) |
| Distributions from Realized Capital Gains | — | — | — | — | — |
| Total Distributions | (5.252) | (4.723) | (4.959) | (4.618) | (4.228) |
| Net Asset Value, End of Period | $349.62 | $407.44 | $312.59 | $260.26 | $258.75 |
| Total Return | -13.01% | 32.16% | 22.45% | 2.45% | 19.72% |
| Ratios/Supplemental Data | |||||
| Net Assets, End of Period (Millions) | $2,174 | $2,822 | $2,523 | $2,323 | $2,134 |
| Ratio of Total Expenses to Average Net Assets | 0.07% | 0.07% | 0.07% | 0.07% | 0.08% |
| Ratio of Net Investment Income to Average Net Assets | 1.39% | 1.36% | 1.81% | 1.86% | 1.82% |
| Portfolio Turnover Rate2 | 10% | 6% | 9% | 6% | 9% |
| 1 | Calculated based on average shares outstanding. |
| 2 | Excludes the value of portfolio securities received or delivered as a result of in-kind purchases or redemptions of the fund’s capital shares, including ETF Creation Units. |
| A. | The following significant accounting policies conform to generally accepted accounting principles for U.S. investment companies. The fund consistently follows such policies in preparing its financial statements. |
| B. | In accordance with the terms of a Funds' Service Agreement (the “FSA”) between Vanguard and the fund, Vanguard furnishes to the fund investment advisory, corporate management, administrative, marketing, and distribution services at Vanguard’s cost of operations (as defined by the FSA). These costs of operations are allocated to the fund based on methods and guidelines approved by the board of trustees and are generally settled twice a month. |
| C. | Various inputs may be used to determine the value of the fund’s investments and derivatives. These inputs are summarized in three broad levels for financial statement purposes. The inputs or methodologies used to value securities are not necessarily an indication of the risk associated with investing in those securities. |
| Level 1 ($000) | Level 2 ($000) | Level 3 ($000) | Total ($000) | |
| Investments | ||||
| Assets | ||||
| Common Stocks | 4,883,967 | 28 | — | 4,883,995 |
| Temporary Cash Investments | 16,475 | — | — | 16,475 |
| Total | 4,900,442 | 28 | — | 4,900,470 |
| Derivative Financial Instruments | ||||
| Liabilities | ||||
| Futures Contracts1 | 697 | — | — | 697 |
| 1 | Includes cumulative appreciation (depreciation) on futures contracts and centrally cleared swaps, if any, as reported in the Schedule of Investments. Only current day’s variation margin is reported within the Statement of Assets and Liabilities. |
| D. | Permanent differences between book-basis and tax-basis components of net assets are reclassified among capital accounts in the financial statements to reflect their tax character. These reclassifications have no effect on net assets or net asset value per share. As of period end, permanent differences primarily attributable to the accounting for applicable in-kind redemptions and passive foreign investment companies were reclassified between the following accounts: |
| Amount ($000) | |
| Paid-in Capital | 258,184 |
| Total Distributable Earnings (Loss) | (258,184) |
| Amount ($000) | |
| Undistributed Ordinary Income | 15,053 |
| Undistributed Long-Term Gains | — |
| Capital Loss Carryforwards | (153,032) |
| Qualified Late-Year Losses | — |
| Net Unrealized Gains (Losses) | 1,275,661 |
| Year Ended August 31, | ||
| 2022 Amount ($000) | 2021 Amount ($000) | |
| Ordinary Income* | 71,576 | 61,946 |
| Long-Term Capital Gains | — | — |
| Total | 71,576 | 61,946 |
| * | Includes short-term capital gains, if any. |
| Amount ($000) | |
| Tax Cost | 3,624,808 |
| Gross Unrealized Appreciation | 1,601,971 |
| Gross Unrealized Depreciation | (326,310) |
| Net Unrealized Appreciation (Depreciation) | 1,275,661 |
| E. | During the year ended August 31, 2022, the fund purchased $1,165,962,000 of investment securities and sold $983,317,000 of investment securities, other than temporary cash investments. Purchases and sales include $630,685,000 and $444,494,000, respectively, in connection with in-kind purchases and redemptions of the fund's capital shares. |
| F. | Capital share transactions for each class of shares were: |
| Year Ended August 31, | |||||
| 2022 | 2021 | ||||
| Amount ($000) | Shares (000) | Amount ($000) | Shares (000) | ||
| ETF Shares | |||||
| Issued | 905,986 | 4,600 | 1,203,957 | 6,875 | |
| Issued in Lieu of Cash Distributions | — | — | — | — | |
| Redeemed | (450,003) | (2,275) | (789,681) | (4,525) | |
| Net Increase (Decrease)—ETF Shares | 455,983 | 2,325 | 414,276 | 2,350 | |
| Institutional Shares | |||||
| Issued | 475,942 | 1,253 | 416,311 | 1,158 | |
| Issued in Lieu of Cash Distributions | 32,013 | 83 | 31,627 | 93 | |
| Redeemed | (776,919) | (2,044) | (794,142) | (2,397) | |
| Net Increase (Decrease)—Institutional Shares | (268,964) | (708) | (346,204) | (1,146) | |
| G. | Management has determined that no events or transactions occurred subsequent to August 31, 2022, that would require recognition or disclosure in these financial statements. |

| Average Annual Total Returns Periods Ended August 31, 2022 | |||||
| One Year | Five Years | Ten Years | Final Value of a $10,000 Investment | ||
| Russell 1000 Value Index Fund ETF Shares Net Asset Value | -6.32% | 7.78% | 10.40% | $26,888 |
| Russell 1000 Value Index Fund ETF Shares Market Price | -6.34 | 7.77 | 10.39 | 26,870 | |
| Russell 1000 Value Index | -6.23 | 7.86 | 10.52 | 27,199 |
| Dow Jones U.S. Total Stock Market Float Adjusted Index | -13.73 | 11.16 | 12.66 | 32,942 |
| One Year | Five Years | Ten Years | Final Value of a $5,000,000 Investment | ||
| Russell 1000 Value Index Fund Institutional Shares | -6.30% | 7.81% | 10.44% | $13,497,948 | |
| Russell 1000 Value Index | -6.23 | 7.86 | 10.52 | 13,599,298 | |
| Dow Jones U.S. Total Stock Market Float Adjusted Index | -13.73 | 11.16 | 12.66 | 16,470,991 | |
| One Year | Five Years | Ten Years | |
| Russell 1000 Value Index Fund ETF Shares Market Price | -6.34% | 45.40% | 168.70% |
| Russell 1000 Value Index Fund ETF Shares Net Asset Value | -6.32 | 45.44 | 168.88 |
| Russell 1000 Value Index | -6.23 | 46.01 | 171.99 |
| Basic Materials | 3.1% |
| Consumer Discretionary | 10.0 |
| Consumer Staples | 7.3 |
| Energy | 8.0 |
| Financials | 19.1 |
| Health Care | 15.3 |
| Industrials | 12.6 |
| Real Estate | 5.1 |
| Technology | 8.5 |
| Telecommunications | 4.6 |
| Utilities | 6.4 |
| Shares | Market Value• ($000) | ||
| Common Stocks (99.8%) | |||
| Basic Materials (3.1%) | |||
| Linde plc | 165,109 | 46,703 | |
| Air Products and Chemicals Inc. | 92,147 | 23,263 | |
| Freeport-McMoRan Inc. | 600,733 | 17,782 | |
| Dow Inc. | 302,796 | 15,443 | |
| Nucor Corp. | 110,358 | 14,671 | |
| Newmont Corp. | 330,340 | 13,663 | |
| International Flavors & Fragrances Inc. | 106,019 | 11,713 | |
| LyondellBasell Industries NV Class A | 106,857 | 8,869 | |
| Mosaic Co. | 131,259 | 7,071 | |
| International Paper Co. | 154,332 | 6,423 | |
| Albemarle Corp. | 23,486 | 6,293 | |
| Steel Dynamics Inc. | 74,469 | 6,011 | |
| Celanese Corp. Class A | 45,018 | 4,991 | |
| Eastman Chemical Co. | 53,272 | 4,848 | |
| Reliance Steel & Aluminum Co. | 25,683 | 4,828 | |
| Alcoa Corp. | 77,220 | 3,821 | |
| * | Cleveland-Cliffs Inc. | 217,147 | 3,750 |
| FMC Corp. | 34,671 | 3,747 | |
| Olin Corp. | 58,613 | 3,204 | |
| US Steel Corp. | 108,129 | 2,473 | |
| Avery Dennison Corp. | 13,018 | 2,390 | |
| Royal Gold Inc. | 25,609 | 2,354 | |
| Huntsman Corp. | 83,230 | 2,332 | |
| Ashland Inc. | 20,924 | 2,129 | |
| Hexcel Corp. | 34,635 | 2,032 | |
| Ecolab Inc. | 12,087 | 1,980 | |
| Element Solutions Inc. | 95,620 | 1,785 | |
| * | Univar Solutions Inc. | 69,052 | 1,742 |
| Timken Co. | 25,247 | 1,590 | |
| Westlake Corp. | 13,822 | 1,363 | |
| SSR Mining Inc. (XTSE) | 88,020 | 1,187 | |
| Chemours Co. | 25,433 | 858 | |
| Scotts Miracle-Gro Co. | 10,940 | 732 | |
| NewMarket Corp. | 2,399 | 689 | |
| Southern Copper Corp. | 11,968 | 563 | |
| 233,293 | |||
| Consumer Discretionary (10.0%) | |||
| Walmart Inc. | 600,223 | 79,560 | |
| * | Walt Disney Co. | 707,689 | 79,318 |
| McDonald's Corp. | 232,815 | 58,735 | |
| Home Depot Inc. | 180,506 | 52,062 | |
| Starbucks Corp. | 305,904 | 25,717 | |
| Shares | Market Value• ($000) | ||
| Activision Blizzard Inc. | 323,316 | 25,377 | |
| Ford Motor Co. | 1,644,264 | 25,059 | |
| General Motors Co. | 606,136 | 23,160 | |
| * | Netflix Inc. | 100,009 | 22,358 |
| Electronic Arts Inc. | 109,442 | 13,885 | |
| Target Corp. | 86,552 | 13,878 | |
| Yum! Brands Inc. | 105,429 | 11,728 | |
| * | O'Reilly Automotive Inc. | 16,076 | 11,207 |
| * | Southwest Airlines Co. | 246,890 | 9,061 |
| eBay Inc. | 201,818 | 8,906 | |
| Genuine Parts Co. | 53,345 | 8,322 | |
| * | Dollar Tree Inc. | 61,000 | 8,276 |
| Lennar Corp. Class A | 101,882 | 7,891 | |
| * | Aptiv plc | 83,957 | 7,844 |
| Lowe's Cos. Inc. | 37,435 | 7,268 | |
| Ross Stores Inc. | 82,697 | 7,134 | |
| VF Corp. | 144,909 | 6,006 | |
| LKQ Corp. | 110,304 | 5,870 | |
| Garmin Ltd. | 64,184 | 5,680 | |
| Omnicom Group Inc. | 84,541 | 5,656 | |
| Paramount Global Inc. Class B | 230,853 | 5,400 | |
| * | CarMax Inc. | 59,170 | 5,233 |
| * | Liberty Media Corp.-Liberty Formula One Class C | 80,837 | 5,148 |
| MGM Resorts International | 148,274 | 4,840 | |
| * | United Airlines Holdings Inc. | 135,365 | 4,739 |
| DR Horton Inc. | 63,808 | 4,540 | |
| Interpublic Group of Cos. Inc. | 162,780 | 4,499 | |
| Hasbro Inc. | 54,684 | 4,310 | |
| Fox Corp. Class A | 125,124 | 4,277 | |
| Nielsen Holdings plc | 149,856 | 4,172 | |
| Best Buy Co. Inc. | 57,616 | 4,073 | |
| Hilton Worldwide Holdings Inc. | 31,306 | 3,987 | |
| Service Corp. International | 64,147 | 3,959 | |
| Advance Auto Parts Inc. | 23,429 | 3,951 | |
| * | Carnival Corp. | 398,315 | 3,768 |
| BorgWarner Inc. (XNYS) | 99,590 | 3,755 | |
| * | Royal Caribbean Cruises Ltd. | 91,574 | 3,741 |
| Bath & Body Works Inc. | 99,495 | 3,714 | |
| Whirlpool Corp. | 22,832 | 3,575 | |
| * | Warner Bros Discovery Inc. | 262,920 | 3,481 |
| * | American Airlines Group Inc. | 266,547 | 3,462 |
| Lear Corp. | 24,830 | 3,442 | |
| Aramark | 95,587 | 3,413 |
| Shares | Market Value• ($000) | ||
| Tapestry Inc. | 94,866 | 3,295 | |
| * | Las Vegas Sands Corp. | 86,166 | 3,242 |
| *,1 | GameStop Corp. Class A | 112,060 | 3,209 |
| Lithia Motors Inc. Class A | 11,885 | 3,155 | |
| * | Uber Technologies Inc. | 105,712 | 3,040 |
| * | Live Nation Entertainment Inc. | 31,899 | 2,882 |
| * | Capri Holdings Ltd. | 59,831 | 2,823 |
| Newell Brands Inc. | 156,893 | 2,801 | |
| * | Liberty Media Corp.- Liberty SiriusXM Class C | 67,654 | 2,798 |
| Nexstar Media Group Inc. Class A | 14,535 | 2,781 | |
| Gentex Corp. | 98,141 | 2,678 | |
| News Corp. Class A | 157,097 | 2,658 | |
| Dick's Sporting Goods Inc. | 23,047 | 2,452 | |
| * | Rivian Automotive Inc. Class A | 74,317 | 2,431 |
| PulteGroup Inc. | 59,744 | 2,429 | |
| Marriott Vacations Worldwide Corp. | 16,700 | 2,378 | |
| * | Wynn Resorts Ltd. | 38,495 | 2,332 |
| * | Alaska Air Group Inc. | 51,047 | 2,224 |
| * | Penn Entertainment Inc. | 69,854 | 2,182 |
| Harley-Davidson Inc. | 56,108 | 2,164 | |
| Leggett & Platt Inc. | 56,378 | 2,155 | |
| * | Terminix Global Holdings Inc. | 49,815 | 2,125 |
| * | Norwegian Cruise Line Holdings Ltd. | 160,835 | 2,104 |
| * | Avis Budget Group Inc. | 12,393 | 2,074 |
| * | AutoNation Inc. | 16,509 | 2,057 |
| New York Times Co. Class A | 67,417 | 2,056 | |
| Macy's Inc. | 118,562 | 2,053 | |
| Fox Corp. Class B | 63,351 | 2,003 | |
| * | AMERCO | 3,779 | 1,986 |
| *,1 | AMC Entertainment Holdings Inc. Class A | 215,374 | 1,964 |
| * | Hyatt Hotels Corp. Class A | 21,370 | 1,915 |
| 1 | Sirius XM Holdings Inc. | 299,902 | 1,826 |
| Boyd Gaming Corp. | 33,010 | 1,797 | |
| * | Hertz Global Holdings Inc. | 96,964 | 1,790 |
| Thor Industries Inc. | 21,994 | 1,782 | |
| Ralph Lauren Corp. Class A | 19,399 | 1,772 | |
| Tempur Sealy International Inc. | 70,376 | 1,760 | |
| * | Skechers USA Inc. Class A | 46,347 | 1,752 |
| Darden Restaurants Inc. | 13,972 | 1,728 | |
| * | Mattel Inc. | 75,319 | 1,666 |
| * | AutoZone Inc. | 740 | 1,568 |
| PVH Corp. | 27,609 | 1,553 | |
| * | BJ's Wholesale Club Holdings Inc. | 20,575 | 1,533 |
| Domino's Pizza Inc. | 4,086 | 1,519 | |
| Kohl's Corp. | 53,436 | 1,519 | |
| * | NVR Inc. | 343 | 1,420 |
| * | Take-Two Interactive Software Inc. | 11,519 | 1,412 |
| * | Ollie's Bargain Outlet Holdings Inc. | 24,488 | 1,354 |
| Penske Automotive Group Inc. | 11,282 | 1,330 | |
| * | Peloton Interactive Inc. Class A | 123,432 | 1,258 |
| Carter's Inc. | 16,920 | 1,250 | |
| Hanesbrands Inc. | 142,097 | 1,238 |
| Shares | Market Value• ($000) | ||
| * | Bright Horizons Family Solutions Inc. | 17,439 | 1,189 |
| * | RH | 4,524 | 1,158 |
| * | Caesars Entertainment Inc. | 26,375 | 1,137 |
| Columbia Sportswear Co. | 15,926 | 1,135 | |
| *,1 | QuantumScape Corp. Class A | 101,253 | 1,117 |
| * | JetBlue Airways Corp. | 137,283 | 1,069 |
| * | Coty Inc. Class A | 141,566 | 1,063 |
| * | Grand Canyon Education Inc. | 12,783 | 1,040 |
| Toll Brothers Inc. | 23,320 | 1,021 | |
| * | TripAdvisor Inc. | 38,555 | 918 |
| News Corp. Class B | 52,308 | 902 | |
| Williams-Sonoma Inc. | 5,990 | 891 | |
| * | Copa Holdings SA Class A | 12,501 | 890 |
| * | SiteOne Landscape Supply Inc. | 6,997 | 876 |
| * | Driven Brands Holdings Inc. | 23,161 | 728 |
| Gap Inc. | 79,164 | 724 | |
| Wyndham Hotels & Resorts Inc. | 11,047 | 722 | |
| Lennar Corp. Class B | 11,165 | 689 | |
| * | Under Armour Inc. Class C | 90,726 | 689 |
| * | Under Armour Inc. Class A | 79,878 | 673 |
| Polaris Inc. | 5,914 | 670 | |
| * | Madison Square Garden Sports Corp. | 4,039 | 647 |
| * | Wayfair Inc. Class A | 11,684 | 616 |
| * | Planet Fitness Inc. Class A | 9,014 | 611 |
| H&R Block Inc. | 12,899 | 580 | |
| * | Petco Health & Wellness Co. Inc. Class A | 31,756 | 474 |
| * | Deckers Outdoor Corp. | 1,251 | 402 |
| Travel + Leisure Co. | 9,089 | 385 | |
| * | Lyft Inc. Class A | 24,461 | 360 |
| * | Six Flags Entertainment Corp. | 15,347 | 340 |
| * | IAA Inc. | 8,825 | 329 |
| Paramount Global Class A | 12,336 | 326 | |
| * | Victoria's Secret & Co. | 9,550 | 319 |
| * | Burlington Stores Inc. | 1,776 | 249 |
| Rollins Inc. | 7,233 | 244 | |
| *,1 | Lucid Group Inc. | 13,246 | 203 |
| Vail Resorts Inc. | 804 | 181 | |
| * | Liberty Media Corp.- Liberty SiriusXM Class A | 3,877 | 161 |
| Nordstrom Inc. | 7,505 | 128 | |
| * | Mister Car Wash Inc. | 12,848 | 127 |
| * | Leslie's Inc. | 7,962 | 113 |
| * | Playtika Holding Corp. | 5,515 | 58 |
| * | Liberty Media Corp.- Liberty Formula One Class A | 602 | 35 |
| 760,899 | |||
| Consumer Staples (7.3%) | |||
| Procter & Gamble Co. | 570,873 | 78,746 | |
| Philip Morris International Inc. | 644,764 | 61,568 | |
| CVS Health Corp. | 545,535 | 53,544 | |
| Mondelez International Inc. Class A | 575,314 | 35,589 | |
| Altria Group Inc. | 753,905 | 34,016 | |
| Coca-Cola Co. | 406,393 | 25,078 | |
| Archer-Daniels-Midland Co. | 233,394 | 20,513 | |
| General Mills Inc. | 250,246 | 19,219 | |
| Shares | Market Value• ($000) | ||
| Corteva Inc. | 300,840 | 18,481 | |
| McKesson Corp. | 48,427 | 17,773 | |
| Constellation Brands Inc. Class A | 64,466 | 15,862 | |
| PepsiCo Inc. | 89,132 | 15,355 | |
| Keurig Dr Pepper Inc. | 357,439 | 13,626 | |
| Kroger Co. | 272,855 | 13,081 | |
| Kraft Heinz Co. | 290,415 | 10,861 | |
| Walgreens Boots Alliance Inc. | 298,654 | 10,471 | |
| Colgate-Palmolive Co. | 132,612 | 10,372 | |
| Tyson Foods Inc. Class A | 118,215 | 8,911 | |
| McCormick & Co. Inc. | 104,681 | 8,801 | |
| Kimberly-Clark Corp. | 57,070 | 7,278 | |
| Conagra Brands Inc. | 196,615 | 6,760 | |
| J M Smucker Co. | 43,849 | 6,138 | |
| Hormel Foods Corp. | 119,371 | 6,002 | |
| Bunge Ltd. | 57,873 | 5,739 | |
| * | Darling Ingredients Inc. | 62,313 | 4,739 |
| Church & Dwight Co. Inc. | 54,753 | 4,583 | |
| Campbell Soup Co. | 81,073 | 4,084 | |
| Molson Coors Beverage Co. Class B | 72,710 | 3,757 | |
| Kellogg Co. | 47,724 | 3,471 | |
| Casey's General Stores Inc. | 15,414 | 3,295 | |
| * | US Foods Holding Corp | 92,451 | 2,831 |
| Brown-Forman Corp. Class B | 38,501 | 2,799 | |
| Ingredion Inc. | 27,400 | 2,386 | |
| * | Performance Food Group Co. | 43,563 | 2,177 |
| Flowers Foods Inc. | 77,315 | 2,111 | |
| * | Post Holdings Inc. | 22,868 | 2,030 |
| Albertsons Cos. Inc. Class A | 67,157 | 1,847 | |
| Hershey Co. | 8,172 | 1,836 | |
| * | Grocery Outlet Holding Corp. | 33,802 | 1,356 |
| Clorox Co. | 8,568 | 1,237 | |
| Spectrum Brands Holdings Inc. | 16,383 | 1,032 | |
| * | Monster Beverage Corp. | 11,592 | 1,030 |
| Reynolds Consumer Products Inc. | 23,517 | 657 | |
| Seaboard Corp. | 110 | 425 | |
| * | Freshpet Inc. | 8,103 | 353 |
| * | Pilgrim's Pride Corp. | 9,867 | 281 |
| * | Boston Beer Co. Inc. Class A | 237 | 80 |
| Brown-Forman Corp. Class A | 602 | 42 | |
| 552,223 | |||
| Energy (8.0%) | |||
| Exxon Mobil Corp. | 1,754,781 | 167,739 | |
| Chevron Corp. | 818,121 | 129,312 | |
| ConocoPhillips | 539,306 | 59,027 | |
| Marathon Petroleum Corp. | 225,002 | 22,669 | |
| Schlumberger NV | 589,170 | 22,477 | |
| Valero Energy Corp. | 169,822 | 19,890 | |
| Phillips 66 | 200,238 | 17,913 | |
| Williams Cos. Inc. | 506,160 | 17,225 | |
| Kinder Morgan Inc. | 825,604 | 15,125 | |
| Pioneer Natural Resources Co. | 45,020 | 11,400 | |
| ONEOK Inc. | 164,419 | 10,067 | |
| Devon Energy Corp. | 139,531 | 9,854 | |
| Shares | Market Value• ($000) | ||
| Baker Hughes Co. Class A | 384,943 | 9,724 | |
| Coterra Energy Inc. | 275,774 | 8,524 | |
| EOG Resources Inc. | 65,588 | 7,956 | |
| Marathon Oil Corp. | 292,024 | 7,473 | |
| EQT Corp. | 152,486 | 7,289 | |
| Cheniere Energy Inc. | 44,834 | 7,181 | |
| Halliburton Co. | 203,827 | 6,141 | |
| * | First Solar Inc. | 44,343 | 5,656 |
| APA Corp. | 139,050 | 5,438 | |
| Chesapeake Energy Corp. | 53,192 | 5,345 | |
| Diamondback Energy Inc. | 31,669 | 4,221 | |
| Occidental Petroleum Corp. | 59,049 | 4,192 | |
| HF Sinclair Corp. | 62,576 | 3,293 | |
| * | Southwestern Energy Co. | 430,654 | 3,226 |
| Hess Corp. | 25,579 | 3,089 | |
| * | Plug Power Inc. | 108,685 | 3,048 |
| NOV Inc. | 162,722 | 2,875 | |
| * | DTE Midstream LLC | 39,586 | 2,186 |
| * | Antero Resources Corp. | 42,682 | 1,711 |
| Ovintiv Inc. (XNYS) | 30,836 | 1,639 | |
| Antero Midstream Corp. | 137,671 | 1,386 | |
| PDC Energy Inc. | 18,095 | 1,229 | |
| * | Range Resources Corp. | 37,023 | 1,217 |
| Continental Resources Inc. | 3,523 | 246 | |
| 606,983 | |||
| Financials (19.0%) | |||
| * | Berkshire Hathaway Inc. Class B | 750,829 | 210,833 |
| JPMorgan Chase & Co. | 1,214,320 | 138,105 | |
| Bank of America Corp. | 2,925,078 | 98,312 | |
| Wells Fargo & Co. | 1,577,958 | 68,973 | |
| S&P Global Inc. | 141,457 | 49,818 | |
| Goldman Sachs Group Inc. | 138,447 | 46,057 | |
| Morgan Stanley | 531,263 | 45,274 | |
| BlackRock Inc. | 62,716 | 41,793 | |
| Citigroup Inc. | 820,208 | 40,034 | |
| Chubb Ltd. | 175,568 | 33,191 | |
| CME Group Inc. | 149,405 | 29,225 | |
| PNC Financial Services Group Inc. | 171,894 | 27,159 | |
| Truist Financial Corp. | 554,428 | 25,969 | |
| US Bancorp | 558,859 | 25,490 | |
| Intercontinental Exchange Inc. | 229,923 | 23,188 | |
| Charles Schwab Corp. | 282,259 | 20,026 | |
| MetLife Inc. | 284,792 | 18,321 | |
| American International Group Inc. | 329,742 | 17,064 | |
| Travelers Cos. Inc. | 99,580 | 16,096 | |
| Aflac Inc. | 265,905 | 15,800 | |
| Prudential Financial Inc. | 156,008 | 14,938 | |
| Arthur J Gallagher & Co. | 76,684 | 13,924 | |
| Allstate Corp. | 113,992 | 13,736 | |
| M&T Bank Corp. | 74,313 | 13,509 | |
| Bank of New York Mellon Corp. | 305,558 | 12,690 | |
| KKR & Co. Inc. | 237,701 | 12,018 | |
| Discover Financial Services | 116,364 | 11,693 | |
| First Republic Bank | 74,203 | 11,266 | |
| T Rowe Price Group Inc. | 93,123 | 11,175 | |
| State Street Corp. | 152,283 | 10,409 | |
| Fifth Third Bancorp | 283,675 | 9,687 | |
| Willis Towers Watson plc | 46,054 | 9,525 | |
| Hartford Financial Services Group Inc. | 135,998 | 8,746 | |
| Nasdaq Inc. | 142,441 | 8,480 | |
| Regions Financial Corp. | 388,956 | 8,429 | |
| Shares | Market Value• ($000) | ||
| Northern Trust Corp. | 85,095 | 8,092 | |
| Huntington Bancshares Inc. | 594,654 | 7,968 | |
| Principal Financial Group Inc. | 104,249 | 7,794 | |
| Raymond James Financial Inc. | 74,205 | 7,745 | |
| Citizens Financial Group Inc. | 202,617 | 7,432 | |
| KeyCorp | 385,091 | 6,812 | |
| Cincinnati Financial Corp. | 65,072 | 6,309 | |
| Brown & Brown Inc. | 91,215 | 5,750 | |
| W R Berkley Corp. | 85,202 | 5,521 | |
| Cboe Global Markets Inc. | 43,723 | 5,158 | |
| * | Markel Corp. | 4,251 | 5,076 |
| First Horizon Corp. | 221,569 | 5,012 | |
| Equitable Holdings Inc. | 159,278 | 4,739 | |
| Loews Corp. | 85,067 | 4,705 | |
| * | Arch Capital Group Ltd. | 100,335 | 4,587 |
| Ameriprise Financial Inc. | 16,627 | 4,456 | |
| Ally Financial Inc. | 134,155 | 4,454 | |
| Annaly Capital Management Inc. | 687,613 | 4,435 | |
| Fidelity National Financial Inc. | 111,813 | 4,372 | |
| Comerica Inc. | 54,377 | 4,366 | |
| *,1 | Coinbase Global Inc. Class A | 64,706 | 4,322 |
| Signature Bank | 24,562 | 4,283 | |
| East West Bancorp Inc. | 58,589 | 4,228 | |
| * | Alleghany Corp. | 4,682 | 3,938 |
| Progressive Corp. | 31,577 | 3,873 | |
| Globe Life Inc. | 37,623 | 3,657 | |
| MSCI Inc. Class A | 8,140 | 3,657 | |
| Marsh & McLennan Cos. Inc. | 22,509 | 3,632 | |
| * | SVB Financial Group | 8,887 | 3,613 |
| American Financial Group Inc. | 28,093 | 3,587 | |
| Reinsurance Group of America Inc. | 27,789 | 3,484 | |
| Webster Financial Corp. | 73,500 | 3,458 | |
| Zions Bancorp NA | 61,682 | 3,394 | |
| Assurant Inc. | 21,235 | 3,366 | |
| Unum Group | 83,214 | 3,150 | |
| Cullen/Frost Bankers Inc. | 24,193 | 3,144 | |
| First Citizens BancShares Inc. Class A | 3,836 | 3,115 | |
| Franklin Resources Inc. | 118,885 | 3,099 | |
| Commerce Bancshares Inc. | 44,939 | 3,090 | |
| Everest Re Group Ltd. | 11,232 | 3,022 | |
| Carlyle Group Inc. | 86,277 | 2,807 | |
| Starwood Property Trust Inc. | 121,124 | 2,777 | |
| Jefferies Financial Group Inc. | 86,452 | 2,774 | |
| AGNC Investment Corp. | 220,348 | 2,633 | |
| Prosperity Bancshares Inc. | 36,941 | 2,618 | |
| Lincoln National Corp. | 56,275 | 2,592 | |
| Voya Financial Inc. | 41,912 | 2,579 | |
| Invesco Ltd. | 154,004 | 2,536 | |
| Stifel Financial Corp. | 42,746 | 2,535 | |
| Old Republic International Corp. | 115,964 | 2,533 | |
| Apollo Global Management Inc. | 45,319 | 2,519 |
| Shares | Market Value• ($000) | ||
| Pinnacle Financial Partners Inc. | 30,848 | 2,490 | |
| Synovus Financial Corp. | 60,342 | 2,423 | |
| Interactive Brokers Group Inc. Class A | 38,694 | 2,383 | |
| Popular Inc. | 30,701 | 2,371 | |
| SEI Investments Co. | 43,351 | 2,371 | |
| First American Financial Corp. | 43,082 | 2,305 | |
| * | Robinhood Markets Inc. Class A | 230,883 | 2,205 |
| Wintrust Financial Corp. | 25,419 | 2,144 | |
| Affiliated Managers Group Inc. | 15,854 | 2,019 | |
| Bank OZK | 49,765 | 2,017 | |
| Primerica Inc. | 15,709 | 1,991 | |
| * | SoFi Technologies Inc. | 330,603 | 1,957 |
| New York Community Bancorp Inc. | 194,392 | 1,903 | |
| Hanover Insurance Group Inc. | 14,507 | 1,877 | |
| MGIC Investment Corp. | 128,207 | 1,832 | |
| FNB Corp. | 150,003 | 1,788 | |
| OneMain Holdings Inc. | 49,379 | 1,725 | |
| Axis Capital Holdings Ltd. | 32,395 | 1,722 | |
| SLM Corp. | 111,422 | 1,703 | |
| White Mountains Insurance Group Ltd. | 1,227 | 1,681 | |
| Rithm Capital Corp. | 170,574 | 1,609 | |
| Umpqua Holdings Corp. | 89,432 | 1,587 | |
| * | Brighthouse Financial Inc. | 31,916 | 1,518 |
| Evercore Inc. Class A | 15,801 | 1,480 | |
| Aon plc Class A (XNYS) | 4,995 | 1,395 | |
| Lazard Ltd. Class A | 38,339 | 1,394 | |
| * | Credit Acceptance Corp. | 2,576 | 1,371 |
| First Hawaiian Inc. | 51,971 | 1,336 | |
| Assured Guaranty Ltd. | 25,972 | 1,326 | |
| Janus Henderson Group plc | 56,543 | 1,323 | |
| PacWest Bancorp | 49,158 | 1,294 | |
| Western Alliance Bancorp | 16,658 | 1,278 | |
| Bank of Hawaii Corp. | 16,132 | 1,259 | |
| Kemper Corp. | 26,184 | 1,204 | |
| Tradeweb Markets Inc. Class A | 16,464 | 1,146 | |
| Moody's Corp. | 3,888 | 1,106 | |
| RenaissanceRe Holdings Ltd. | 8,085 | 1,094 | |
| BOK Financial Corp. | 12,057 | 1,071 | |
| Virtu Financial Inc. Class A | 41,411 | 951 | |
| Broadridge Financial Solutions Inc. | 4,595 | 787 | |
| *,1 | Upstart Holdings Inc. | 24,734 | 641 |
| Erie Indemnity Co. Class A | 2,606 | 560 | |
| CNA Financial Corp. | 12,176 | 468 | |
| TFS Financial Corp. | 21,565 | 308 | |
| Morningstar Inc. | 991 | 226 | |
| 1 | Rocket Cos. Inc. Class A | 18,771 | 148 |
| 1,444,538 | |||
| Health Care (15.2%) | |||
| Johnson & Johnson | 1,094,954 | 176,660 | |
| Pfizer Inc. | 2,352,631 | 106,409 | |
| Thermo Fisher Scientific Inc. | 142,963 | 77,961 | |
| Danaher Corp. | 251,069 | 67,766 | |
| Abbott Laboratories | 619,575 | 63,599 | |
| Bristol-Myers Squibb Co. | 886,269 | 59,743 | |
| Shares | Market Value• ($000) | ||
| Merck & Co. Inc. | 611,677 | 52,213 | |
| Medtronic plc | 556,331 | 48,913 | |
| Elevance Health Inc. | 69,898 | 33,908 | |
| Gilead Sciences Inc. | 522,945 | 33,191 | |
| Cigna Corp. | 109,458 | 31,026 | |
| Becton Dickinson and Co. | 118,213 | 29,839 | |
| * | Boston Scientific Corp. | 595,354 | 23,999 |
| * | Centene Corp. | 242,435 | 21,756 |
| * | Regeneron Pharmaceuticals Inc. | 36,900 | 21,441 |
| Eli Lilly & Co. | 65,306 | 19,672 | |
| UnitedHealth Group Inc. | 34,991 | 18,172 | |
| * | Moderna Inc. | 134,559 | 17,798 |
| HCA Healthcare Inc. | 88,231 | 17,458 | |
| Stryker Corp. | 68,456 | 14,047 | |
| * | Illumina Inc. | 65,260 | 13,159 |
| * | Biogen Inc. | 60,527 | 11,826 |
| Baxter International Inc. | 176,877 | 10,163 | |
| Zimmer Biomet Holdings Inc. | 86,916 | 9,241 | |
| Laboratory Corp. of America Holdings | 38,475 | 8,667 | |
| Amgen Inc. | 35,473 | 8,524 | |
| Cardinal Health Inc. | 112,735 | 7,973 | |
| Humana Inc. | 15,526 | 7,480 | |
| STERIS plc | 35,505 | 7,150 | |
| PerkinElmer Inc. | 52,747 | 7,124 | |
| * | Hologic Inc. | 102,008 | 6,892 |
| * | BioMarin Pharmaceutical Inc. | 76,902 | 6,860 |
| Royalty Pharma plc Class A | 152,538 | 6,378 | |
| Quest Diagnostics Inc. | 48,403 | 6,065 | |
| Cooper Cos. Inc. | 20,238 | 5,817 | |
| Viatris Inc. | 503,935 | 4,813 | |
| Teleflex Inc. | 19,577 | 4,429 | |
| * | Bio-Rad Laboratories Inc. Class A | 8,916 | 4,325 |
| * | QIAGEN NV | 94,580 | 4,297 |
| * | Catalent Inc. | 48,479 | 4,266 |
| * | United Therapeutics Corp. | 18,607 | 4,217 |
| * | Henry Schein Inc. | 57,259 | 4,203 |
| * | Jazz Pharmaceuticals plc | 25,341 | 3,933 |
| * | Acadia Healthcare Co. Inc. | 36,978 | 3,030 |
| Organon & Co. | 105,849 | 3,020 | |
| DENTSPLY SIRONA Inc. | 89,305 | 2,926 | |
| * | Elanco Animal Health Inc. (XNYS) | 184,874 | 2,797 |
| Universal Health Services Inc. Class B | 26,991 | 2,641 | |
| * | Tenet Healthcare Corp. | 44,213 | 2,498 |
| * | Envista Holdings Corp. | 67,104 | 2,489 |
| * | Intuitive Surgical Inc. | 11,729 | 2,413 |
| * | Syneos Health Inc. | 35,048 | 2,107 |
| * | Exact Sciences Corp. | 59,182 | 2,104 |
| Perrigo Co. plc | 55,396 | 2,073 | |
| * | Align Technology Inc. | 8,119 | 1,979 |
| Encompass Health Corp. | 40,533 | 1,969 | |
| Chemed Corp. | 3,908 | 1,861 | |
| * | Teladoc Health Inc. | 59,602 | 1,851 |
| * | Molina Healthcare Inc. | 5,423 | 1,830 |
| * | Globus Medical Inc. Class A | 30,234 | 1,790 |
| Premier Inc. Class A | 49,784 | 1,754 | |
| * | Vertex Pharmaceuticals Inc. | 5,852 | 1,649 |
| * | QuidelOrtho Corp. | 20,630 | 1,635 |
| Agilent Technologies Inc. | 12,703 | 1,629 | |
| * | Amedisys Inc. | 13,205 | 1,564 |
| Shares | Market Value• ($000) | ||
| * | Repligen Corp. | 6,589 | 1,445 |
| * | Integra LifeSciences Holdings Corp. | 30,000 | 1,431 |
| * | Mirati Therapeutics Inc. | 17,560 | 1,423 |
| * | Oak Street Health Inc. | 47,925 | 1,256 |
| * | Enovis Corp. | 21,453 | 1,087 |
| * | ICU Medical Inc. | 6,749 | 1,073 |
| * | Signify Health Inc. Class A | 27,680 | 772 |
| *,1 | Ginkgo Bioworks Holdings Inc. | 270,282 | 727 |
| * | Masimo Corp. | 4,832 | 710 |
| * | Doximity Inc. Class A | 21,168 | 703 |
| * | Incyte Corp. | 9,927 | 699 |
| * | Avantor Inc. | 17,707 | 441 |
| * | Horizon Therapeutics plc | 6,347 | 376 |
| * | Enhabit Inc. | 20,281 | 337 |
| * | Exelixis Inc. | 18,518 | 328 |
| * | Ultragenyx Pharmaceutical Inc. | 6,740 | 321 |
| * | Charles River Laboratories International Inc. | 1,441 | 296 |
| * | Certara Inc. | 15,571 | 244 |
| * | Ionis Pharmaceuticals Inc. | 4,487 | 191 |
| * | 10X Genomics Inc. Class A | 3,673 | 121 |
| * | Natera Inc. | 2,324 | 114 |
| * | agilon health Inc. | 4,517 | 94 |
| * | Tandem Diabetes Care Inc. | 1,730 | 79 |
| 1,155,250 | |||
| Industrials (12.6%) | |||
| Raytheon Technologies Corp. | 619,290 | 55,581 | |
| Honeywell International Inc. | 200,008 | 37,872 | |
| American Express Co. | 234,948 | 35,712 | |
| General Electric Co. | 430,867 | 31,643 | |
| * | PayPal Holdings Inc. | 334,692 | 31,274 |
| 1 | 3M Co. | 235,945 | 29,340 |
| Northrop Grumman Corp. | 53,900 | 25,764 | |
| * | Boeing Co. | 157,756 | 25,280 |
| Norfolk Southern Corp. | 98,902 | 24,046 | |
| General Dynamics Corp. | 102,529 | 23,472 | |
| Fidelity National Information Services Inc. | 254,338 | 23,239 | |
| * | Fiserv Inc. | 225,146 | 22,783 |
| Eaton Corp. plc | 166,093 | 22,695 | |
| CSX Corp. | 676,459 | 21,410 | |
| FedEx Corp. | 99,965 | 21,074 | |
| Capital One Financial Corp. | 164,549 | 17,413 | |
| Johnson Controls International plc | 289,288 | 15,662 | |
| * | Block Inc. (XNYS) | 214,637 | 14,791 |
| Global Payments Inc. | 116,364 | 14,456 | |
| Carrier Global Corp. | 352,292 | 13,782 | |
| Emerson Electric Co. | 167,154 | 13,663 | |
| Cummins Inc. | 58,611 | 12,623 | |
| PACCAR Inc. | 141,909 | 12,418 | |
| DuPont de Nemours Inc. | 211,453 | 11,765 | |
| AMETEK Inc. | 95,624 | 11,490 | |
| Otis Worldwide Corp. | 154,507 | 11,158 | |
| L3Harris Technologies Inc. | 47,945 | 10,941 | |
| Parker-Hannifin Corp. | 41,046 | 10,877 | |
| Fortive Corp. | 148,646 | 9,414 | |
| Martin Marietta Materials Inc. | 23,615 | 8,211 | |
| TransDigm Group Inc. | 13,367 | 8,025 | |
| Ingersoll Rand Inc. | 168,891 | ���8,000 | |
| Amcor plc | 621,299 | 7,462 | |
| Shares | Market Value• ($000) | ||
| Dover Corp. | 59,527 | 7,438 | |
| * | Teledyne Technologies Inc. | 19,346 | 7,126 |
| Synchrony Financial | 208,550 | 6,830 | |
| Jacobs Solutions Inc. | 53,291 | 6,639 | |
| * | Trimble Inc. | 104,045 | 6,581 |
| * | Bill.com Holdings Inc. | 40,644 | 6,579 |
| Westinghouse Air Brake Technologies Corp. | 74,815 | 6,558 | |
| United Parcel Service Inc. Class B | 33,091 | 6,437 | |
| Trane Technologies plc | 40,811 | 6,288 | |
| PPG Industries Inc. | 46,172 | 5,863 | |
| Xylem Inc. | 64,238 | 5,852 | |
| Textron Inc. | 89,440 | 5,579 | |
| Stanley Black & Decker Inc. | 62,404 | 5,498 | |
| Packaging Corp. of America | 38,648 | 5,292 | |
| Caterpillar Inc. | 28,567 | 5,277 | |
| IDEX Corp. | 26,115 | 5,255 | |
| Howmet Aerospace Inc. | 140,774 | 4,988 | |
| Expeditors International of Washington Inc. | 47,939 | 4,932 | |
| Snap-on Inc. | 21,988 | 4,790 | |
| Equifax Inc. | 25,365 | 4,788 | |
| Masco Corp. | 93,419 | 4,752 | |
| Vulcan Materials Co. | 28,307 | 4,713 | |
| RPM International Inc. | 50,447 | 4,700 | |
| * | United Rentals Inc. | 16,091 | 4,699 |
| Hubbell Inc. Class B | 22,372 | 4,615 | |
| Ball Corp. | 78,935 | 4,405 | |
| CH Robinson Worldwide Inc. | 38,324 | 4,375 | |
| Westrock Co. | 105,720 | 4,291 | |
| * | Builders FirstSource Inc. | 72,011 | 4,221 |
| Nordson Corp. | 18,497 | 4,202 | |
| * | Zebra Technologies Corp. Class A | 12,818 | 3,866 |
| Quanta Services Inc. | 27,238 | 3,849 | |
| Regal Rexnord Corp. | 27,890 | 3,837 | |
| AECOM | 51,950 | 3,800 | |
| Rockwell Automation Inc. | 15,809 | 3,746 | |
| Automatic Data Processing Inc. | 14,300 | 3,495 | |
| Knight-Swift Transportation Holdings Inc. | 65,678 | 3,317 | |
| Owens Corning | 40,386 | 3,301 | |
| Lennox International Inc. | 13,509 | 3,244 | |
| Pentair plc | 68,522 | 3,049 | |
| * | Middleby Corp. | 21,091 | 3,033 |
| Huntington Ingalls Industries Inc. | 12,740 | 2,934 | |
| AptarGroup Inc. | 26,971 | 2,773 | |
| Sensata Technologies Holding plc | 64,591 | 2,602 | |
| Illinois Tool Works Inc. | 13,067 | 2,546 | |
| MDU Resources Group Inc. | 83,603 | 2,521 | |
| Sonoco Products Co. | 39,880 | 2,513 | |
| ITT Inc. | 34,385 | 2,494 | |
| AGCO Corp. | 22,510 | 2,447 | |
| * | Mohawk Industries Inc. | 21,739 | 2,399 |
| MKS Instruments Inc. | 23,820 | 2,373 | |
| Littelfuse Inc. | 9,988 | 2,369 | |
| Acuity Brands Inc. | 14,377 | 2,357 | |
| Curtiss-Wright Corp. | 15,783 | 2,323 | |
| A O Smith Corp. | 40,476 | 2,285 | |
| Woodward Inc. | 24,295 | 2,261 |
| Shares | Market Value• ($000) | ||
| nVent Electric plc | 68,299 | 2,251 | |
| Fortune Brands Home & Security Inc. | 35,410 | 2,175 | |
| Oshkosh Corp. | 27,223 | 2,171 | |
| Donaldson Co. Inc. | 42,165 | 2,165 | |
| Valmont Industries Inc. | 7,444 | 2,061 | |
| * | XPO Logistics Inc. | 38,905 | 2,039 |
| * | MasTec Inc. | 24,931 | 2,007 |
| Brunswick Corp. | 25,851 | 1,931 | |
| Crane Holdings Co. | 19,348 | 1,826 | |
| * | Axalta Coating Systems Ltd. | 69,166 | 1,781 |
| Watsco Inc. | 6,448 | 1,754 | |
| Tetra Tech Inc. | 12,855 | 1,746 | |
| * | GXO Logistics Inc. | 38,897 | 1,726 |
| * | Affirm Holdings Inc. | 73,036 | 1,711 |
| * | WillScot Mobile Mini Holdings Corp. | 41,885 | 1,681 |
| * | Kirby Corp. | 25,044 | 1,679 |
| Louisiana-Pacific Corp. | 30,781 | 1,669 | |
| Genpact Ltd. | 35,023 | 1,645 | |
| Flowserve Corp. | 53,193 | 1,621 | |
| ManpowerGroup Inc. | 21,648 | 1,587 | |
| Western Union Co. | 106,270 | 1,575 | |
| TransUnion | 21,187 | 1,565 | |
| Silgan Holdings Inc. | 34,241 | 1,560 | |
| Ryder System Inc. | 20,169 | 1,542 | |
| MSC Industrial Direct Co. Inc. Class A | 19,456 | 1,541 | |
| Air Lease Corp. Class A | 42,257 | 1,536 | |
| * | Berry Global Group Inc. | 27,755 | 1,508 |
| Graco Inc. | 21,686 | 1,384 | |
| * | FTI Consulting Inc. | 8,057 | 1,294 |
| BWX Technologies Inc. | 22,736 | 1,185 | |
| * | WESCO International Inc. | 8,479 | 1,117 |
| MSA Safety Inc. | 9,310 | 1,107 | |
| * | Mercury Systems Inc. | 22,644 | 1,090 |
| Carlisle Cos. Inc. | 3,401 | 1,006 | |
| Cintas Corp. | 2,461 | 1,001 | |
| Esab Corp. | 21,816 | 896 | |
| * | Keysight Technologies Inc. | 5,460 | 895 |
| * | AZEK Co. Inc. Class A | 45,696 | 834 |
| * | WEX Inc. | 5,069 | 782 |
| * | Axon Enterprise Inc. | 6,146 | 717 |
| Allegion plc | 7,487 | 712 | |
| Armstrong World Industries Inc. | 8,424 | 708 | |
| JB Hunt Transport Services Inc. | 3,989 | 694 | |
| ADT Inc. | 91,130 | 664 | |
| Graphic Packaging Holding Co. | 28,132 | 626 | |
| Crown Holdings Inc. | 5,949 | 539 | |
| Vontier Corp. | 24,391 | 535 | |
| * | Gates Industrial Corp. plc | 48,444 | 519 |
| Schneider National Inc. Class B | 21,896 | 501 | |
| Robert Half International Inc. | 5,678 | 437 | |
| * | Euronet Worldwide Inc. | 4,890 | 434 |
| HEICO Corp. | 2,634 | 401 | |
| * | Core & Main Inc. Class A | 15,485 | 365 |
| * | TopBuild Corp. | 1,960 | 360 |
| Allison Transmission Holdings Inc. | 9,069 | 329 | |
| Eagle Materials Inc. | 2,711 | 324 | |
| * | Hayward Holdings Inc. | 29,926 | 315 |
| Shares | Market Value• ($000) | ||
| Ardagh Metal Packaging SA | 48,034 | 295 | |
| Landstar System Inc. | 1,581 | 232 | |
| Cognex Corp. | 4,688 | 197 | |
| * | Ardagh Group SA | 8,833 | 122 |
| Spirit AeroSystems Holdings Inc. Class A | 1,520 | 46 | |
| HEICO Corp. Class A | 65 | 8 | |
| 953,357 | |||
| Real Estate (5.1%) | |||
| Prologis Inc. | 307,806 | 38,325 | |
| Realty Income Corp. | 251,135 | 17,147 | |
| Digital Realty Trust Inc. | 118,380 | 14,635 | |
| Welltower Inc. | 189,310 | 14,511 | |
| VICI Properties Inc. | 399,633 | 13,184 | |
| AvalonBay Communities Inc. | 58,103 | 11,673 | |
| American Tower Corp. | 44,936 | 11,416 | |
| Equity Residential | 154,825 | 11,330 | |
| SBA Communications Corp. Class A | 34,287 | 11,152 | |
| Weyerhaeuser Co. | 309,387 | 10,569 | |
| Alexandria Real Estate Equities Inc. | 67,372 | 10,335 | |
| * | CoStar Group Inc. | 140,567 | 9,789 |
| Extra Space Storage Inc. | 48,330 | 9,605 | |
| Duke Realty Corp. | 159,063 | 9,361 | |
| Invitation Homes Inc. | 253,969 | 9,214 | |
| Mid-America Apartment Communities Inc. | 47,790 | 7,917 | |
| Ventas Inc. | 165,212 | 7,907 | |
| Sun Communities Inc. | 49,498 | 7,608 | |
| Essex Property Trust Inc. | 26,951 | 7,144 | |
| Simon Property Group Inc. | 70,018 | 7,140 | |
| WP Carey Inc. | 77,990 | 6,554 | |
| Equinix Inc. | 9,250 | 6,081 | |
| UDR Inc. | 132,275 | 5,935 | |
| Healthpeak Properties Inc. | 225,011 | 5,907 | |
| * | CBRE Group Inc. Class A | 70,118 | 5,537 |
| Kimco Realty Corp. | 252,616 | 5,325 | |
| Host Hotels & Resorts Inc. | 296,355 | 5,266 | |
| Boston Properties Inc. | 65,191 | 5,178 | |
| Camden Property Trust | 39,623 | 5,092 | |
| Gaming and Leisure Properties Inc. | 98,233 | 4,742 | |
| American Homes 4 Rent Class A | 126,936 | 4,514 | |
| Life Storage Inc. | 35,178 | 4,476 | |
| Public Storage | 13,268 | 4,389 | |
| Regency Centers Corp. | 71,042 | 4,322 | |
| Rexford Industrial Realty Inc. | 68,982 | 4,291 | |
| CubeSmart | 93,009 | 4,283 | |
| Healthcare Realty Trust Inc. Class A Blank | 157,648 | 3,834 | |
| Medical Properties Trust Inc. | 246,886 | 3,607 | |
| * | Jones Lang LaSalle Inc. | 20,673 | 3,576 |
| Federal Realty Investment Trust | 33,171 | 3,359 | |
| Americold Realty Trust Inc. | 111,729 | 3,287 | |
| National Retail Properties Inc. | 73,014 | 3,278 | |
| Omega Healthcare Investors Inc. | 97,581 | 3,187 | |
| STORE Capital Corp. | 106,400 | 2,871 | |
| Shares | Market Value• ($000) | ||
| First Industrial Realty Trust Inc. | 55,491 | 2,812 | |
| EastGroup Properties Inc. | 16,954 | 2,798 | |
| Brixmor Property Group Inc. | 125,992 | 2,706 | |
| Apartment Income REIT Corp. | 59,244 | 2,420 | |
| Kilroy Realty Corp. | 47,869 | 2,335 | |
| Spirit Realty Capital Inc. | 55,132 | 2,252 | |
| * | Zillow Group Inc. Class A | 65,231 | 2,179 |
| Rayonier Inc. | 59,341 | 2,108 | |
| Equity LifeStyle Properties Inc. | 28,335 | 1,986 | |
| Vornado Realty Trust | 74,030 | 1,941 | |
| National Storage Affiliates Trust | 34,828 | 1,760 | |
| Cousins Properties Inc. | 60,973 | 1,637 | |
| Iron Mountain Inc. | 30,046 | 1,581 | |
| Douglas Emmett Inc. | 71,649 | 1,399 | |
| EPR Properties | 31,222 | 1,358 | |
| Park Hotels & Resorts Inc. | 94,692 | 1,326 | |
| Highwoods Properties Inc. | 42,329 | 1,287 | |
| SL Green Realty Corp. | 26,843 | 1,186 | |
| * | Howard Hughes Corp. | 16,690 | 1,062 |
| JBG SMITH Properties | 47,838 | 1,051 | |
| Hudson Pacific Properties Inc. | 60,280 | 796 | |
| * | Zillow Group Inc. Class C | 23,391 | 783 |
| * | Opendoor Technologies Inc. | 137,667 | 596 |
| Lamar Advertising Co. Class A | 4,609 | 433 | |
| *,1 | WeWork Inc. Class A | 52,714 | 216 |
| 388,861 | |||
| Technology (8.5%) | |||
| * | Meta Platforms Inc. Class A | 750,918 | 122,347 |
| Intel Corp. | 1,702,587 | 54,347 | |
| * | Salesforce Inc. | 315,200 | 49,209 |
| * | Alphabet Inc. Class C | 310,036 | 33,840 |
| * | Alphabet Inc. Class A | 312,644 | 33,834 |
| Analog Devices Inc. | 173,658 | 26,314 | |
| Micron Technology Inc. | 376,760 | 21,298 | |
| Texas Instruments Inc. | 120,929 | 19,979 | |
| Roper Technologies Inc. | 43,933 | 17,687 | |
| Marvell Technology Inc. | 355,683 | 16,653 | |
| International Business Machines Corp. | 124,357 | 15,974 | |
| Oracle Corp. | 197,291 | 14,629 | |
| Cognizant Technology Solutions Corp. Class A | 216,357 | 13,667 | |
| * | Advanced Micro Devices Inc. | 142,514 | 12,095 |
| Corning Inc. | 294,783 | 10,117 | |
| Hewlett Packard Enterprise Co. | 541,950 | 7,370 | |
| HP Inc. | 237,019 | 6,805 | |
| Skyworks Solutions Inc. | 67,137 | 6,616 | |
| * | VeriSign Inc. | 35,681 | 6,502 |
| * | Akamai Technologies Inc. | 66,230 | 5,979 |
| * | Western Digital Corp. | 129,577 | 5,476 |
| * | Wolfspeed Inc. | 48,158 | 5,464 |
| Leidos Holdings Inc. | 56,266 | 5,348 | |
| SS&C Technologies Holdings Inc. | 93,036 | 5,188 | |
| VMware Inc. Class A | 44,201 | 5,129 | |
| * | ON Semiconductor Corp. | 68,253 | 4,694 |
| * | GoDaddy Inc. Class A | 58,294 | 4,420 |
| Shares | Market Value• ($000) | ||
| Amphenol Corp. Class A | 59,842 | 4,400 | |
| Amdocs Ltd. | 51,095 | 4,367 | |
| * | Pinterest Inc. Class A | 188,315 | 4,339 |
| * | ANSYS Inc. | 17,006 | 4,223 |
| * | Zoom Video Communications Inc. Class A | 52,262 | 4,202 |
| * | Okta Inc. | 44,655 | 4,081 |
| * | Qorvo Inc. | 45,110 | 4,050 |
| * | F5 Inc. | 25,207 | 3,959 |
| * | Black Knight Inc. | 58,610 | 3,878 |
| Dell Technologies Inc. Class C | 93,342 | 3,574 | |
| NortonLifeLock Inc. | 151,754 | 3,428 | |
| * | Twilio Inc. Class A | 44,439 | 3,092 |
| Citrix Systems Inc. | 27,978 | 2,875 | |
| * | Ceridian HCM Holding Inc. | 45,728 | 2,727 |
| * | Arrow Electronics Inc. | 25,988 | 2,724 |
| * | CACI International Inc. Class A | 9,623 | 2,703 |
| * | DXC Technology Co. | 102,027 | 2,528 |
| * | Guidewire Software Inc. | 34,350 | 2,463 |
| * | Change Healthcare Inc. | 95,877 | 2,356 |
| * | UiPath Inc. Class A | 140,933 | 2,318 |
| * | Clarivate plc | 197,242 | 2,302 |
| Concentrix Corp. | 17,696 | 2,226 | |
| * | Mandiant Inc. | 95,758 | 2,189 |
| Microchip Technology Inc. | 32,587 | 2,126 | |
| * | II-VI Inc. | 44,611 | 2,107 |
| Science Applications International Corp. | 23,011 | 2,096 | |
| * | IAC Inc. | 32,282 | 2,075 |
| Dolby Laboratories Inc. Class A | 26,584 | 1,947 | |
| National Instruments Corp. | 46,803 | 1,861 | |
| * | Cirrus Logic Inc. | 23,255 | 1,783 |
| Avnet Inc. | 39,707 | 1,743 | |
| TD SYNNEX Corp. | 17,974 | 1,731 | |
| Azenta Inc. | 30,625 | 1,614 | |
| * | NCR Corp. | 50,133 | 1,557 |
| Dun & Bradstreet Holdings Inc. | 103,449 | 1,474 | |
| * | Manhattan Associates Inc. | 9,792 | 1,383 |
| * | IPG Photonics Corp. | 14,530 | 1,316 |
| Vertiv Holdings Co. Class A | 105,136 | 1,212 | |
| * | Unity Software Inc. | 28,161 | 1,203 |
| *,1 | GLOBALFOUNDRIES Inc. | 19,624 | 1,174 |
| KBR Inc. | 20,145 | 973 | |
| * | Snowflake Inc. Class A | 5,199 | 941 |
| * | Twitter Inc. | 23,635 | 916 |
| Switch Inc. Class A | 24,651 | 837 | |
| * | Tyler Technologies Inc. | 2,220 | 825 |
| * | Coupa Software Inc. | 13,668 | 798 |
| * | Kyndryl Holdings Inc. | 74,307 | 774 |
| * | DoorDash Inc. Class A | 11,864 | 711 |
| * | Nutanix Inc. Class A | 40,282 | 697 |
| * | Teradata Corp. | 19,412 | 639 |
| Jabil Inc. | 10,274 | 619 | |
| * | nCino Inc. | 18,171 | 573 |
| * | SentinelOne Inc. Class A | 20,692 | 565 |
| * | Paycor HCM Inc. | 18,763 | 556 |
| Teradyne Inc. | 6,096 | 516 | |
| * | Procore Technologies Inc. | 8,837 | 482 |
| * | Match Group Inc. | 7,050 | 399 |
| * | CCC Intelligent Solutions Holdings Inc. | 40,822 | 390 |
| * | Wix.com Ltd. | 4,689 | 297 |
| Shares | Market Value• ($000) | ||
| * | Informatica Inc. Class A | 11,660 | 257 |
| * | Dropbox Inc. Class A | 7,302 | 156 |
| * | Definitive Healthcare Corp. Class A | 5,467 | 110 |
| * | Jamf Holding Corp. | 4,165 | 100 |
| * | DoubleVerify Holdings Inc. | 3,282 | 85 |
| 647,603 | |||
| Telecommunications (4.6%) | |||
| Cisco Systems Inc. | 1,731,426 | 77,429 | |
| Verizon Communications Inc. | 1,748,752 | 73,115 | |
| Comcast Corp. Class A | 1,850,281 | 66,962 | |
| AT&T Inc. | 2,979,257 | 52,256 | |
| * | T-Mobile US Inc. | 248,122 | 35,720 |
| Motorola Solutions Inc. | 68,496 | 16,673 | |
| Lumen Technologies Inc. | 428,725 | 4,270 | |
| Juniper Networks Inc. | 133,290 | 3,788 | |
| * | Liberty Broadband Corp. Class C | 32,991 | 3,355 |
| * | Ciena Corp. | 62,789 | 3,186 |
| * | Frontier Communications Parent Inc. | 101,487 | 2,614 |
| * | Roku Inc. | 35,711 | 2,428 |
| * | Lumentum Holdings Inc. | 28,659 | 2,394 |
| * | DISH Network Corp. Class A | 103,716 | 1,799 |
| * | ViaSat Inc. | 30,223 | 1,148 |
| Cable One Inc. | 938 | 1,065 | |
| * | Altice USA Inc. Class A | 85,251 | 853 |
| Ubiquiti Inc. | 1,719 | 534 | |
| * | Liberty Broadband Corp. Class A | 138 | 14 |
| 349,603 | |||
| Utilities (6.4%) | |||
| NextEra Energy Inc. | 817,076 | 69,501 | |
| Duke Energy Corp. | 320,536 | 34,269 | |
| Southern Co. | 441,984 | 34,064 | |
| Dominion Energy Inc. | 337,836 | 27,635 | |
| Sempra Energy (XNYS) | 131,138 | 21,634 | |
| American Electric Power Co. Inc. | 213,720 | 21,415 | |
| Exelon Corp. | 407,433 | 17,890 | |
| Xcel Energy Inc. | 226,564 | 16,822 | |
| Consolidated Edison Inc. | 147,725 | 14,439 | |
| WEC Energy Group Inc. | 131,149 | 13,527 | |
| Public Service Enterprise Group Inc. | 207,088 | 13,328 | |
| Eversource Energy | 143,117 | 12,836 | |
| Republic Services Inc. Class A | 80,523 | 11,492 | |
| American Water Works Co. Inc. | 75,665 | 11,233 | |
| Constellation Energy Corp. | 135,449 | 11,051 | |
| Edison International | 156,281 | 10,591 | |
| DTE Energy Co. | 79,939 | 10,419 | |
| Ameren Corp. | 107,211 | 9,930 | |
| Entergy Corp. | 84,164 | 9,704 | |
| FirstEnergy Corp. | 225,360 | 8,913 | |
| PPL Corp. | 305,377 | 8,880 | |
| CenterPoint Energy Inc. | 261,709 | 8,252 | |
| CMS Energy Corp. | 120,700 | 8,152 | |
| * | PG&E Corp. | 642,137 | 7,918 |
| Atmos Energy Corp. | 56,979 | 6,460 | |
| Alliant Energy Corp. | 103,720 | 6,331 | |
| Evergy Inc. | 91,780 | 6,290 | |
| AES Corp. | 228,783 | 5,823 | |
| NiSource Inc. | 169,481 | 5,001 | |
| Shares | Market Value• ($000) | ||
| Essential Utilities Inc. | 96,790 | 4,757 | |
| NRG Energy Inc. | 98,897 | 4,082 | |
| Pinnacle West Capital Corp. | 46,871 | 3,532 | |
| UGI Corp. | 87,106 | 3,441 | |
| OGE Energy Corp. | 82,837 | 3,358 | |
| * | Sunrun Inc. | 86,042 | 2,842 |
| * | Clean Harbors Inc. | 21,209 | 2,490 |
| National Fuel Gas Co. | 33,510 | 2,388 | |
| IDACORP Inc. | 21,216 | 2,318 | |
| Brookfield Renewable Corp. Class A | 52,543 | 2,017 | |
| Vistra Corp. | 75,802 | 1,876 | |
| * | Stericycle Inc. | 37,372 | 1,872 |
| Waste Management Inc. | 10,699 | 1,808 | |
| Hawaiian Electric Industries Inc. | 45,811 | 1,792 | |
| Avangrid Inc. | 30,294 | 1,497 | |
| 483,870 | |||
| Total Common Stocks (Cost $7,458,665) | 7,576,480 | ||
| Temporary Cash Investments (0.6%) | |||
| Money Market Fund (0.6%) | |||
| 2,3 | Vanguard Market Liquidity Fund, 2.284% (Cost $43,058) | 430,721 | 43,059 |
| Total Investments (100.4%) (Cost $7,501,723) | 7,619,539 | ||
| Other Assets and Liabilities—Net (-0.4%) | (31,143) | ||
| Net Assets (100%) | 7,588,396 | ||
| Cost is in $000. | |||
| • | See Note A in Notes to Financial Statements. |
| * | Non-income-producing security. |
| 1 | Includes partial security positions on loan to broker-dealers. The total value of securities on loan is $41,281,000. |
| 2 | Affiliated money market fund available only to Vanguard funds and certain trusts and accounts managed by Vanguard. Rate shown is the 7-day yield. |
| 3 | Collateral of $43,051,000 was received for securities on loan, of which $43,050,000 is held in Vanguard Market Liquidity Fund and $1,000 is held in cash. |
| REIT—Real Estate Investment Trust. |
| Futures Contracts | ||||
| ($000) | ||||
| Expiration | Number of Long (Short) Contracts | Notional Amount | Value and Unrealized Appreciation (Depreciation) | |
| Long Futures Contracts | ||||
| E-mini S&P 500 Index | September 2022 | 23 | 4,550 | (116) |
| Over-the-Counter Total Return Swaps | ||||||
| Reference Entity | Termination Date | Counterparty | Notional Amount ($000) | Floating Interest Rate Received (Paid)1 (%) | Value and Unrealized Appreciation ($000) | Value and Unrealized (Depreciation) ($000) |
| L3Harris Technologies Inc. | 8/31/23 | BANA | 7,302 | (0.023) | — | — |
| 1 | Based on 1M USD Overnight Bank Funding Rate as of the most recent payment date. Floating interest payment received/paid monthly. |
| 1M—1-month. | |
| BANA—Bank of America, N.A. |
| ($000s, except shares and per-share amounts) | Amount |
| Assets | |
| Investments in Securities, at Value1 | |
| Unaffiliated Issuers (Cost $7,458,665) | 7,576,480 |
| Affiliated Issuers (Cost $43,058) | 43,059 |
| Total Investments in Securities | 7,619,539 |
| Investment in Vanguard | 280 |
| Cash | 25,642 |
| Cash Collateral Pledged—Futures Contracts | 70 |
| Cash Collateral Pledged—Over-the-Counter Swap Contracts | 70 |
| Receivables for Accrued Income | 16,806 |
| Receivables for Capital Shares Issued | 407 |
| Total Assets | 7,662,814 |
| Liabilities | |
| Payables for Investment Securities Purchased | 30,788 |
| Collateral for Securities on Loan | 43,051 |
| Payables for Capital Shares Redeemed | 298 |
| Payables to Vanguard | 270 |
| Variation Margin Payable—Futures Contracts | 11 |
| Unrealized Depreciation—Over-the-Counter Swap Contracts | — |
| Total Liabilities | 74,418 |
| Net Assets | 7,588,396 |
| 1 Includes $41,281 of securities on loan. | |
| At August 31, 2022, net assets consisted of: | |
| Paid-in Capital | 8,040,657 |
| Total Distributable Earnings (Loss) | (452,261) |
| Net Assets | 7,588,396 |
| ETF Shares—Net Assets | |
| Applicable to 91,027,615 outstanding $.001 par value shares of beneficial interest (unlimited authorization) | 5,980,450 |
| Net Asset Value Per Share—ETF Shares | $65.70 |
| Institutional Shares—Net Assets | |
| Applicable to 6,266,108 outstanding $.001 par value shares of beneficial interest (unlimited authorization) | 1,607,946 |
| Net Asset Value Per Share—Institutional Shares | $256.61 |
| Year Ended August 31, 2022 | |
| ($000) | |
| Investment Income | |
| Income | |
| Dividends1 | 178,204 |
| Interest2 | 47 |
| Securities Lending—Net | 269 |
| Total Income | 178,520 |
| Expenses | |
| The Vanguard Group—Note B | |
| Investment Advisory Services | 1,051 |
| Management and Administrative—ETF Shares | 3,781 |
| Management and Administrative—Institutional Shares | 842 |
| Marketing and Distribution—ETF Shares | 363 |
| Marketing and Distribution—Institutional Shares | 72 |
| Custodian Fees | 377 |
| Auditing Fees | 27 |
| Shareholders’ Reports—ETF Shares | 106 |
| Shareholders’ Reports—Institutional Shares | 3 |
| Trustees’ Fees and Expenses | 3 |
| Other Expenses | 14 |
| Total Expenses | 6,639 |
| Net Investment Income | 171,881 |
| Realized Net Gain (Loss) | |
| Investment Securities Sold2,3 | 542,652 |
| Futures Contracts | (240) |
| Swap Contracts | 76 |
| Realized Net Gain (Loss) | 542,488 |
| Change in Unrealized Appreciation (Depreciation) | |
| Investment Securities2 | (1,251,560) |
| Futures Contracts | (465) |
| Swap Contracts | (25) |
| Change in Unrealized Appreciation (Depreciation) | (1,252,050) |
| Net Increase (Decrease) in Net Assets Resulting from Operations | (537,681) |
| 1 | Dividends are net of foreign withholding taxes of $58,000. |
| 2 | Interest income, realized net gain (loss), capital gain distributions received, and change in unrealized appreciation (depreciation) from an affiliated company of the fund were $45,000, $3,000, less than $1,000, and $1,000, respectively. Purchases and sales are for temporary cash investment purposes. |
| 3 | Includes $737,861,000 of net gain (loss) resulting from in-kind redemptions. |
| Year Ended August 31, | ||
| 2022 ($000) | 2021 ($000) | |
| Increase (Decrease) in Net Assets | ||
| Operations | ||
| Net Investment Income | 171,881 | 113,681 |
| Realized Net Gain (Loss) | 542,488 | 347,876 |
| Change in Unrealized Appreciation (Depreciation) | (1,252,050) | 1,158,191 |
| Net Increase (Decrease) in Net Assets Resulting from Operations | (537,681) | 1,619,748 |
| Distributions | ||
| ETF Shares | (132,812) | (75,646) |
| Institutional Shares | (34,153) | (27,447) |
| Total Distributions | (166,965) | (103,093) |
| Capital Share Transactions | ||
| ETF Shares | (28,099) | 2,819,628 |
| Institutional Shares | (20,655) | 152,685 |
| Net Increase (Decrease) from Capital Share Transactions | (48,754) | 2,972,313 |
| Total Increase (Decrease) | (753,400) | 4,488,968 |
| Net Assets | ||
| Beginning of Period | 8,341,796 | 3,852,828 |
| End of Period | 7,588,396 | 8,341,796 |
| ETF Shares | |||||
| For a Share Outstanding Throughout Each Period | Year Ended August 31, | ||||
| 2022 | 20211 | 20201 | 20191 | 20181 | |
| Net Asset Value, Beginning of Period | $71.54 | $53.52 | $54.61 | $55.60 | $50.66 |
| Investment Operations | |||||
| Net Investment Income2 | 1.415 | 1.282 | 1.408 | 1.357 | 1.261 |
| Net Realized and Unrealized Gain (Loss) on Investments | (5.875) | 17.932 | (1.056) | (1.054) | 4.918 |
| Total from Investment Operations | (4.460) | 19.214 | .352 | .303 | 6.179 |
| Distributions | |||||
| Dividends from Net Investment Income | (1.380) | (1.194) | (1.442) | (1.293) | (1.239) |
| Distributions from Realized Capital Gains | — | — | — | — | — |
| Total Distributions | (1.380) | (1.194) | (1.442) | (1.293) | (1.239) |
| Net Asset Value, End of Period | $65.70 | $71.54 | $53.52 | $54.61 | $55.60 |
| Total Return | -6.32% | 36.32% | 0.75% | 0.60% | 12.36% |
| Ratios/Supplemental Data | |||||
| Net Assets, End of Period (Millions) | $5,980 | $6,569 | $2,646 | $1,914 | $1,487 |
| Ratio of Total Expenses to Average Net Assets | 0.08% | 0.08% | 0.08% | 0.08% | 0.12% |
| Ratio of Net Investment Income to Average Net Assets | 2.02% | 1.99% | 2.65% | 2.51% | 2.35% |
| Portfolio Turnover Rate3 | 14% | 19% | 24% | 17% | 16% |
| 1 | Adjusted to reflect a 2-for-1 share split effective at the beginning of trading on April 20, 2021. |
| 2 | Calculated based on average shares outstanding. |
| 3 | Excludes the value of portfolio securities received or delivered as a result of in-kind purchases or redemptions of the fund’s capital shares, including ETF Creation Units. |
| Institutional Shares | |||||
| For a Share Outstanding Throughout Each Period | Year Ended August 31, | ||||
| 2022 | 2021 | 2020 | 2019 | 2018 | |
| Net Asset Value, Beginning of Period | $279.40 | $209.00 | $213.25 | $217.14 | $197.85 |
| Investment Operations | |||||
| Net Investment Income1 | 5.555 | 5.002 | 5.594 | 5.294 | 4.978 |
| Net Realized and Unrealized Gain (Loss) on Investments | (22.930) | 70.071 | (4.226) | (4.087) | 19.227 |
| Total from Investment Operations | (17.375) | 75.073 | 1.368 | 1.207 | 24.205 |
| Distributions | |||||
| Dividends from Net Investment Income | (5.415) | (4.673) | (5.618) | (5.097) | (4.915) |
| Distributions from Realized Capital Gains | — | — | — | — | — |
| Total Distributions | (5.415) | (4.673) | (5.618) | (5.097) | (4.915) |
| Net Asset Value, End of Period | $256.61 | $279.40 | $209.00 | $213.25 | $217.14 |
| Total Return | -6.30% | 36.35% | 0.81% | 0.61% | 12.39% |
| Ratios/Supplemental Data | |||||
| Net Assets, End of Period (Millions) | $1,608 | $1,773 | $1,207 | $1,889 | $1,603 |
| Ratio of Total Expenses to Average Net Assets | 0.07% | 0.07% | 0.07% | 0.07% | 0.08% |
| Ratio of Net Investment Income to Average Net Assets | 2.03% | 2.01% | 2.64% | 2.52% | 2.39% |
| Portfolio Turnover Rate2 | 14% | 19% | 24% | 17% | 16% |
| 1 | Calculated based on average shares outstanding. |
| 2 | Excludes the value of portfolio securities received or delivered as a result of in-kind purchases or redemptions of the fund’s capital shares, including ETF Creation Units. |
| A. | The following significant accounting policies conform to generally accepted accounting principles for U.S. investment companies. The fund consistently follows such policies in preparing its financial statements. |
| B. | In accordance with the terms of a Funds' Service Agreement (the “FSA”) between Vanguard and the fund, Vanguard furnishes to the fund investment advisory, corporate management, administrative, marketing, and distribution services at Vanguard’s cost of operations (as defined by the FSA). These costs of operations are allocated to the fund based on methods and guidelines approved by the board of trustees and are generally settled twice a month. |
| C. | Various inputs may be used to determine the value of the fund’s investments and derivatives. These inputs are summarized in three broad levels for financial statement purposes. The inputs or methodologies used to value securities are not necessarily an indication of the risk associated with investing in those securities. |
| Level 1 ($000) | Level 2 ($000) | Level 3 ($000) | Total ($000) | |
| Investments | ||||
| Assets | ||||
| Common Stocks | 7,576,358 | 122 | — | 7,576,480 |
| Temporary Cash Investments | 43,059 | — | — | 43,059 |
| Total | 7,619,417 | 122 | — | 7,619,539 |
| Derivative Financial Instruments | ||||
| Liabilities | ||||
| Futures Contracts1 | 116 | — | — | 116 |
| Swap Contracts | — | — | — | — |
| Total | 116 | — | — | 116 |
| 1 | Includes cumulative appreciation (depreciation) on futures contracts and centrally cleared swaps, if any, as reported in the Schedule of Investments. Only current day’s variation margin is reported within the Statement of Assets and Liabilities. |
| D. | Permanent differences between book-basis and tax-basis components of net assets are reclassified among capital accounts in the financial statements to reflect their tax character. These reclassifications have no effect on net assets or net asset value per share. As of period end, permanent differences primarily attributable to the accounting for applicable in-kind redemptions, passive foreign investment companies, and swap agreements were reclassified between the following accounts: |
| Amount ($000) | |
| Paid-in Capital | 737,790 |
| Total Distributable Earnings (Loss) | (737,790) |
| Amount ($000) | |
| Undistributed Ordinary Income | 34,908 |
| Undistributed Long-Term Gains | — |
| Capital Loss Carryforwards | (588,895) |
| Qualified Late-Year Losses | — |
| Net Unrealized Gains (Losses) | 101,726 |
| Year Ended August 31, | ||
| 2022 Amount ($000) | 2021 Amount ($000) | |
| Ordinary Income* | 166,965 | 103,093 |
| Long-Term Capital Gains | — | — |
| Total | 166,965 | 103,093 |
| * | Includes short-term capital gains, if any. |
| Amount ($000) | |
| Tax Cost | 7,517,813 |
| Gross Unrealized Appreciation | 797,528 |
| Gross Unrealized Depreciation | (695,802) |
| Net Unrealized Appreciation (Depreciation) | 101,726 |
| E. | During the year ended August 31, 2022, the fund purchased $3,616,082,000 of investment securities and sold $3,637,903,000 of investment securities, other than temporary cash investments. Purchases and sales include $2,280,175,000 and $2,476,280,000, respectively, in connection with in-kind purchases and redemptions of the fund's capital shares. |
| F. | During the year ended August 31, 2021, the fund’s ETF Shares underwent a 2-for-1 share split. Each shareholder of record as of the close of business on April 19, 2021, received 2 shares for every 1 ETF Share held on that date. The split had no effect on net assets or total return. Capital share transactions for each class of shares were: |
| Year Ended August 31, | |||||
| 2022 | 2021 | ||||
| Amount ($000) | Shares (000) | Amount ($000) | Shares (000) | ||
| ETF Shares1 | |||||
| Issued | 2,456,832 | 35,376 | 3,870,717 | 58,327 | |
| Issued in Lieu of Cash Distributions | — | — | — | — | |
| Redeemed | (2,484,931) | (36,175) | (1,051,089) | (15,950) | |
| Net Increase (Decrease)—ETF Shares | (28,099) | (799) | 2,819,628 | 42,377 | |
| Year Ended August 31, | |||||
| 2022 | 2021 | ||||
| Amount ($000) | Shares (000) | Amount ($000) | Shares (000) | ||
| Institutional Shares | |||||
| Issued | 344,309 | 1,268 | 565,635 | 2,234 | |
| Issued in Lieu of Cash Distributions | 29,650 | 110 | 24,296 | 102 | |
| Redeemed | (394,614) | (1,457) | (437,246) | (1,764) | |
| Net Increase (Decrease)—Institutional Shares | (20,655) | (79) | 152,685 | 572 | |
| 1 | Shares adjusted to reflect a 2-for-1 share split effective at the beginning of trading on April 20, 2021. |
| G. | Management has determined that no events or transactions occurred subsequent to August 31, 2022, that would require recognition or disclosure in these financial statements. |

| Average Annual Total Returns Periods Ended August 31, 2022 | |||||
| One Year | Five Years | Ten Years | Final Value of a $10,000 Investment | ||
| Russell 1000 Growth Index Fund ETF Shares Net Asset Value | -19.11% | 14.68% | 14.97% | $40,355 |
| Russell 1000 Growth Index Fund ETF Shares Market Price | -19.13 | 14.68 | 15.03 | 40,562 | |
| Russell 1000 Growth Index | -19.06 | 14.78 | 15.09 | 40,783 |
| Dow Jones U.S. Total Stock Market Float Adjusted Index | -13.73 | 11.16 | 12.66 | 32,942 |
| One Year | Five Years | Ten Years | Final Value of a $5,000,000 Investment | ||
| Russell 1000 Growth Index Fund Institutional Shares | -19.09% | 14.70% | 15.01% | $20,250,280 | |
| Russell 1000 Growth Index | -19.06 | 14.78 | 15.09 | 20,391,545 | |
| Dow Jones U.S. Total Stock Market Float Adjusted Index | -13.73 | 11.16 | 12.66 | 16,470,991 | |
| One Year | Five Years | Ten Years | |
| Russell 1000 Growth Index Fund ETF Shares Market Price | -19.13% | 98.32% | 305.62% |
| Russell 1000 Growth Index Fund ETF Shares Net Asset Value | -19.11 | 98.33 | 303.55 |
| Russell 1000 Growth Index | -19.06 | 99.21 | 307.83 |
| Basic Materials | 0.9% |
| Consumer Discretionary | 19.7 |
| Consumer Staples | 4.2 |
| Energy | 1.8 |
| Financials | 3.0 |
| Health Care | 10.9 |
| Industrials | 12.7 |
| Real Estate | 1.7 |
| Technology | 44.2 |
| Telecommunications | 0.5 |
| Utilities | 0.4 |
| Shares | Market Value• ($000) | ||
| Common Stocks (100.0%) | |||
| Basic Materials (0.9%) | |||
| Ecolab Inc. | 117,371 | 19,229 | |
| Linde plc | 56,602 | 16,010 | |
| Fastenal Co. | 308,085 | 15,506 | |
| CF Industries Holdings Inc. | 111,840 | 11,571 | |
| Albemarle Corp. | 32,085 | 8,597 | |
| Avery Dennison Corp. | 26,642 | 4,892 | |
| Valvoline Inc. | 95,077 | 2,764 | |
| FMC Corp. | 22,783 | 2,462 | |
| * | MP Materials Corp. | 48,117 | 1,684 |
| Chemours Co. | 49,907 | 1,683 | |
| Southern Copper Corp. | 29,724 | 1,399 | |
| Mosaic Co. | 23,789 | 1,282 | |
| Scotts Miracle-Gro Co. | 7,317 | 490 | |
| Royal Gold Inc. | 2,160 | 199 | |
| 87,768 | |||
| Consumer Discretionary (19.7%) | |||
| * | Amazon.com Inc. | 4,755,681 | 602,878 |
| * | Tesla Inc. | 1,361,133 | 375,142 |
| Costco Wholesale Corp. | 236,857 | 123,663 | |
| Home Depot Inc. | 320,855 | 92,541 | |
| NIKE Inc. Class B | 655,292 | 69,756 | |
| Lowe's Cos. Inc. | 305,320 | 59,275 | |
| * | Booking Holdings Inc. | 21,689 | 40,684 |
| TJX Cos. Inc. | 629,142 | 39,227 | |
| Estee Lauder Cos. Inc. Class A | 122,700 | 31,212 | |
| Dollar General Corp. | 122,502 | 29,084 | |
| * | Uber Technologies Inc. | 876,413 | 25,206 |
| McDonald's Corp. | 96,276 | 24,288 | |
| * | Chipotle Mexican Grill Inc. Class A | 14,882 | 23,764 |
| * | Netflix Inc. | 105,436 | 23,571 |
| * | Airbnb Inc. Class A | 200,469 | 22,677 |
| Marriott International Inc. Class A | 146,903 | 22,585 | |
| Target Corp. | 136,399 | 21,870 | |
| * | AutoZone Inc. | 9,601 | 20,347 |
| Starbucks Corp. | 220,521 | 18,539 | |
| * | Lululemon Athletica Inc. | 59,791 | 17,935 |
| * | Trade Desk Inc. Class A | 235,599 | 14,772 |
| * | Copart Inc. | 113,586 | 13,591 |
| Hilton Worldwide Holdings Inc. | 105,559 | 13,444 | |
| * | Warner Bros Discovery Inc. | 928,516 | 12,294 |
| * | Ulta Beauty Inc. | 27,589 | 11,584 |
| Shares | Market Value• ($000) | ||
| Tractor Supply Co. | 60,049 | 11,118 | |
| * | Delta Air Lines Inc. | 340,479 | 10,579 |
| * | O'Reilly Automotive Inc. | 14,307 | 9,974 |
| * | Roblox Corp. Class A | 236,458 | 9,248 |
| * | Take-Two Interactive Software Inc. | 70,284 | 8,614 |
| * | Expedia Group Inc. | 80,424 | 8,256 |
| * | Spotify Technology SA | 74,211 | 8,026 |
| * | Walt Disney Co. | 65,983 | 7,395 |
| * | Etsy Inc. | 67,242 | 7,101 |
| Pool Corp. | 20,715 | 7,026 | |
| Ross Stores Inc. | 78,185 | 6,745 | |
| DR Horton Inc. | 91,625 | 6,519 | |
| Darden Restaurants Inc. | 48,648 | 6,018 | |
| Domino's Pizza Inc. | 14,015 | 5,212 | |
| * | NVR Inc. | 1,148 | 4,753 |
| * | Dollar Tree Inc. | 34,951 | 4,742 |
| * | Burlington Stores Inc. | 32,849 | 4,605 |
| Vail Resorts Inc. | 20,218 | 4,543 | |
| * | Floor & Decor Holdings Inc. Class A | 54,848 | 4,462 |
| Williams-Sonoma Inc. | 29,151 | 4,336 | |
| * | Deckers Outdoor Corp. | 12,712 | 4,088 |
| *,1 | Lucid Group Inc. | 265,153 | 4,067 |
| Rollins Inc. | 114,016 | 3,849 | |
| Churchill Downs Inc. | 19,317 | 3,807 | |
| * | Five Below Inc. | 28,936 | 3,700 |
| * | Live Nation Entertainment Inc. | 40,889 | 3,695 |
| * | Aptiv plc | 35,934 | 3,357 |
| * | BJ's Wholesale Club Holdings Inc. | 45,001 | 3,352 |
| H&R Block Inc. | 74,111 | 3,335 | |
| * | DraftKings Inc. Class A | 201,455 | 3,235 |
| * | Caesars Entertainment Inc. | 74,765 | 3,224 |
| Polaris Inc. | 22,347 | 2,531 | |
| * | Las Vegas Sands Corp. | 65,849 | 2,478 |
| Best Buy Co. Inc. | 33,454 | 2,365 | |
| Wyndham Hotels & Resorts Inc. | 35,193 | 2,300 | |
| * | Planet Fitness Inc. Class A | 32,769 | 2,220 |
| * | IAA Inc. | 59,043 | 2,200 |
| Choice Hotels International Inc. | 17,988 | 2,063 | |
| * | Mattel Inc. | 90,386 | 1,999 |
| PulteGroup Inc. | 49,036 | 1,994 | |
| Yum! Brands Inc. | 17,617 | 1,960 | |
| * | Lyft Inc. Class A | 130,648 | 1,924 |
| Shares | Market Value• ($000) | ||
| *,1 | Carvana Co. Class A | 55,369 | 1,827 |
| * | SiteOne Landscape Supply Inc. | 14,341 | 1,795 |
| Wendy's Co. | 91,791 | 1,761 | |
| eBay Inc. | 39,272 | 1,733 | |
| * | YETI Holdings Inc. | 46,325 | 1,709 |
| World Wrestling Entertainment Inc. Class A | 22,488 | 1,529 | |
| * | Wayfair Inc. Class A | 26,336 | 1,388 |
| Travel + Leisure Co. | 32,318 | 1,370 | |
| Toll Brothers Inc. | 30,424 | 1,332 | |
| * | Liberty Media Corp.- Liberty SiriusXM Class C | 30,252 | 1,251 |
| Electronic Arts Inc. | 9,112 | 1,156 | |
| * | Victoria's Secret & Co. | 31,548 | 1,055 |
| * | Leslie's Inc. | 73,598 | 1,044 |
| Nordstrom Inc. | 53,453 | 915 | |
| Genuine Parts Co. | 5,704 | 890 | |
| * | Madison Square Garden Sports Corp. | 5,469 | 877 |
| * | CarMax Inc. | 9,749 | 862 |
| * | RH | 3,300 | 844 |
| * | Liberty Media Corp.-Liberty Formula One Class C | 13,051 | 831 |
| Tapestry Inc. | 18,990 | 660 | |
| * | Bright Horizons Family Solutions Inc. | 8,762 | 598 |
| * | Playtika Holding Corp. | 50,402 | 531 |
| * | Six Flags Entertainment Corp. | 20,696 | 458 |
| * | Wynn Resorts Ltd. | 7,170 | 434 |
| * | Skechers USA Inc. Class A | 10,926 | 413 |
| Advance Auto Parts Inc. | 2,444 | 412 | |
| Nexstar Media Group Inc. Class A | 1,885 | 361 | |
| * | Mister Car Wash Inc. | 34,242 | 339 |
| * | Norwegian Cruise Line Holdings Ltd. | 16,282 | 213 |
| * | Liberty Media Corp.- Liberty SiriusXM Class A | 3,771 | 157 |
| * | Driven Brands Holdings Inc. | 3,239 | 102 |
| * | TripAdvisor Inc. | 4,199 | 100 |
| * | Ollie's Bargain Outlet Holdings Inc. | 1,638 | 91 |
| 1,981,982 | |||
| Consumer Staples (4.2%) | |||
| PepsiCo Inc. | 625,064 | 107,680 | |
| Coca-Cola Co. | 1,568,292 | 96,779 | |
| Procter & Gamble Co. | 544,477 | 75,105 | |
| Sysco Corp. | 271,637 | 22,334 | |
| Colgate-Palmolive Co. | 272,276 | 21,295 | |
| * | Monster Beverage Corp. | 184,578 | 16,396 |
| Hershey Co. | 67,709 | 15,212 | |
| Kimberly-Clark Corp. | 106,874 | 13,629 | |
| AmerisourceBergen Corp. Class A | 79,915 | 11,712 | |
| Clorox Co. | 54,951 | 7,932 | |
| Lamb Weston Holdings Inc. | 76,734 | 6,103 | |
| McKesson Corp. | 15,062 | 5,528 | |
| Kellogg Co. | 73,470 | 5,344 | |
| Shares | Market Value• ($000) | ||
| Church & Dwight Co. Inc. | 58,506 | 4,897 | |
| Brown-Forman Corp. Class B | 58,275 | 4,237 | |
| * | Boston Beer Co. Inc. Class A | 4,804 | 1,619 |
| * | Performance Food Group Co. | 25,042 | 1,252 |
| Brown-Forman Corp. Class A | 13,377 | 944 | |
| * | Olaplex Holdings Inc. | 66,023 | 879 |
| * | Freshpet Inc. | 13,512 | 588 |
| * | Darling Ingredients Inc. | 5,574 | 424 |
| * | Pilgrim's Pride Corp. | 14,147 | 403 |
| * | Grocery Outlet Holding Corp. | 3,303 | 132 |
| 420,424 | |||
| Energy (1.8%) | |||
| EOG Resources Inc. | 228,828 | 27,757 | |
| Occidental Petroleum Corp. | 360,978 | 25,629 | |
| * | Enphase Energy Inc. | 69,983 | 20,046 |
| Pioneer Natural Resources Co. | 71,069 | 17,996 | |
| Hess Corp. | 118,198 | 14,276 | |
| Cheniere Energy Inc. | 77,708 | 12,447 | |
| Devon Energy Corp. | 172,709 | 12,197 | |
| Targa Resources Corp. | 121,598 | 8,297 | |
| Diamondback Energy Inc. | 53,769 | 7,166 | |
| Halliburton Co. | 220,219 | 6,635 | |
| Texas Pacific Land Corp. | 3,027 | 5,571 | |
| Ovintiv Inc. (XNYS) | 97,823 | 5,198 | |
| * | Antero Resources Corp. | 101,588 | 4,072 |
| * | Plug Power Inc. | 137,731 | 3,862 |
| Range Resources Corp. | 92,243 | 3,031 | |
| Coterra Energy Inc. | 68,884 | 2,129 | |
| PDC Energy Inc. | 26,925 | 1,828 | |
| *,1 | ChargePoint Holdings Inc. | 105,527 | 1,717 |
| ONEOK Inc. | 26,584 | 1,628 | |
| New Fortress Energy Inc. Class A | 25,658 | 1,472 | |
| Enviva Inc. | 16,108 | 1,120 | |
| Continental Resources Inc. | 14,358 | 1,003 | |
| * | Southwestern Energy Co. | 41,941 | 314 |
| 185,391 | |||
| Financials (3.0%) | |||
| Marsh & McLennan Cos. Inc. | 239,536 | 38,654 | |
| Blackstone Inc. | 373,728 | 35,108 | |
| Progressive Corp. | 271,482 | 33,297 | |
| Charles Schwab Corp. | 450,950 | 31,995 | |
| Aon plc Class A (XNYS) | 105,958 | 29,590 | |
| Moody's Corp. | 80,578 | 22,926 | |
| MSCI Inc. Class A | 31,701 | 14,241 | |
| Apollo Global Management Inc. | 186,097 | 10,343 | |
| Ameriprise Financial Inc. | 37,792 | 10,129 | |
| Broadridge Financial Solutions Inc. | 56,900 | 9,740 | |
| LPL Financial Holdings Inc. | 42,254 | 9,352 | |
| FactSet Research Systems Inc. | 20,188 | 8,748 | |
| Shares | Market Value• ($000) | ||
| * | SVB Financial Group | 20,137 | 8,186 |
| Ares Management Corp. Class A | 80,623 | 5,977 | |
| MarketAxess Holdings Inc. | 19,771 | 4,915 | |
| * | Arch Capital Group Ltd. | 62,170 | 2,843 |
| Morningstar Inc. | 12,357 | 2,817 | |
| Western Alliance Bancorp | 34,293 | 2,631 | |
| Tradeweb Markets Inc. Class A | 35,996 | 2,505 | |
| Blue Owl Capital Inc. Class A | 213,962 | 2,375 | |
| Arthur J Gallagher & Co. | 12,608 | 2,289 | |
| Erie Indemnity Co. Class A | 9,851 | 2,117 | |
| * | Markel Corp. | 1,647 | 1,967 |
| * | Ryan Specialty Holdings Inc. | 43,816 | 1,856 |
| Everest Re Group Ltd. | 6,464 | 1,739 | |
| RenaissanceRe Holdings Ltd. | 12,692 | 1,717 | |
| First Citizens BancShares Inc. Class A | 1,645 | 1,336 | |
| * | Alleghany Corp. | 1,115 | 938 |
| Lincoln National Corp. | 18,822 | 867 | |
| Raymond James Financial Inc. | 8,212 | 857 | |
| Brown & Brown Inc. | 9,512 | 600 | |
| Signature Bank | 1,584 | 276 | |
| 1 | Rocket Cos. Inc. Class A | 34,711 | 274 |
| Assurant Inc. | 1,661 | 263 | |
| 1 | UWM Holdings Corp. | 57,449 | 208 |
| *,1 | Upstart Holdings Inc. | 7,450 | 193 |
| * | Credit Acceptance Corp. | 334 | 178 |
| 304,047 | |||
| Health Care (10.9%) | |||
| UnitedHealth Group Inc. | 455,532 | 236,571 | |
| AbbVie Inc. | 945,193 | 127,091 | |
| Eli Lilly & Co. | 366,839 | 110,503 | |
| Amgen Inc. | 239,911 | 57,651 | |
| Merck & Co. Inc. | 566,782 | 48,381 | |
| Zoetis Inc. | 251,773 | 39,410 | |
| * | Vertex Pharmaceuticals Inc. | 128,906 | 36,321 |
| * | Intuitive Surgical Inc. | 176,186 | 36,248 |
| * | Edwards Lifesciences Corp. | 330,038 | 29,736 |
| Humana Inc. | 47,676 | 22,969 | |
| * | IQVIA Holdings Inc. | 100,539 | 21,381 |
| Stryker Corp. | 100,540 | 20,631 | |
| Elevance Health Inc. | 39,222 | 19,027 | |
| Agilent Technologies Inc. | 144,420 | 18,522 | |
| * | DexCom Inc. | 208,612 | 17,150 |
| ResMed Inc. | 77,480 | 17,039 | |
| * | IDEXX Laboratories Inc. | 44,546 | 15,485 |
| * | Veeva Systems Inc. Class A | 74,074 | 14,764 |
| Thermo Fisher Scientific Inc. | 25,484 | 13,897 | |
| * | Alnylam Pharmaceuticals Inc. | 64,981 | 13,430 |
| Abbott Laboratories | 121,174 | 12,438 | |
| West Pharmaceutical Services Inc. | 39,738 | 11,790 | |
| * | Seagen Inc. | 72,902 | 11,248 |
| * | Insulet Corp. | 36,801 | 9,402 |
| Shares | Market Value• ($000) | ||
| * | Molina Healthcare Inc. | 23,992 | 8,094 |
| * | Align Technology Inc. | 31,438 | 7,661 |
| Cigna Corp. | 26,770 | 7,588 | |
| * | Avantor Inc. | 301,454 | 7,509 |
| Bio-Techne Corp. | 20,660 | 6,855 | |
| * | Horizon Therapeutics plc | 112,205 | 6,644 |
| Danaher Corp. | 23,606 | 6,371 | |
| * | ABIOMED Inc. | 23,923 | 6,203 |
| * | Incyte Corp. | 84,167 | 5,928 |
| * | Neurocrine Biosciences Inc. | 50,589 | 5,293 |
| * | Charles River Laboratories International Inc. | 25,113 | 5,154 |
| * | Sarepta Therapeutics Inc. | 44,881 | 4,909 |
| * | Regeneron Pharmaceuticals Inc. | 7,983 | 4,639 |
| * | Repligen Corp. | 20,915 | 4,588 |
| * | Novocure Ltd. | 54,897 | 4,509 |
| Bruker Corp. | 58,293 | 3,264 | |
| * | Penumbra Inc. | 19,032 | 3,124 |
| * | Masimo Corp. | 20,563 | 3,020 |
| * | Ionis Pharmaceuticals Inc. | 68,968 | 2,933 |
| * | DaVita Inc. | 31,166 | 2,658 |
| * | Guardant Health Inc. | 52,409 | 2,624 |
| * | Exelixis Inc. | 145,711 | 2,585 |
| * | Catalent Inc. | 28,847 | 2,539 |
| Baxter International Inc. | 41,695 | 2,396 | |
| * | Natera Inc. | 43,113 | 2,124 |
| * | agilon health Inc. | 93,345 | 1,940 |
| * | Moderna Inc. | 11,384 | 1,506 |
| * | Tandem Diabetes Care Inc. | 32,853 | 1,503 |
| HCA Healthcare Inc. | 7,497 | 1,483 | |
| * | 10X Genomics Inc. Class A | 43,505 | 1,435 |
| * | Novavax Inc. | 42,238 | 1,396 |
| Chemed Corp. | 2,848 | 1,356 | |
| * | Ultragenyx Pharmaceutical Inc. | 27,204 | 1,297 |
| * | Maravai LifeSciences Holdings Inc. Class A | 58,495 | 1,221 |
| * | Sotera Health Co. | 55,806 | 944 |
| * | Doximity Inc. Class A | 23,873 | 792 |
| * | Certara Inc. | 39,890 | 625 |
| * | Exact Sciences Corp. | 17,121 | 609 |
| * | Syneos Health Inc. | 9,407 | 565 |
| * | ICU Medical Inc. | 1,910 | 304 |
| * | Teladoc Health Inc. | 8,099 | 252 |
| * | Ginkgo Bioworks Holdings Inc. | 87,920 | 236 |
| * | Globus Medical Inc. Class A | 3,908 | 231 |
| 1,097,992 | |||
| Industrials (12.7%) | |||
| Visa Inc. Class A | 880,912 | 175,046 | |
| Mastercard Inc. Class A | 460,644 | 149,419 | |
| Accenture plc Class A | 339,186 | 97,842 | |
| Union Pacific Corp. | 335,839 | 75,399 | |
| United Parcel Service Inc. Class B | 351,227 | 68,317 | |
| Deere & Co. | 150,057 | 54,808 | |
| Lockheed Martin Corp. | 126,922 | 53,321 | |
| Automatic Data Processing Inc. | 205,001 | 50,104 | |
| Caterpillar Inc. | 248,476 | 45,896 | |
| Shares | Market Value• ($000) | ||
| Sherwin-Williams Co. | 127,806 | 29,664 | |
| Illinois Tool Works Inc. | 149,002 | 29,030 | |
| Paychex Inc. | 172,495 | 21,276 | |
| Honeywell International Inc. | 107,098 | 20,279 | |
| Cintas Corp. | 43,855 | 17,842 | |
| * | PayPal Holdings Inc. | 190,833 | 17,831 |
| Verisk Analytics Inc. Class A | 82,984 | 15,531 | |
| Old Dominion Freight Line Inc. | 54,546 | 14,804 | |
| * | Keysight Technologies Inc. | 89,496 | 14,667 |
| * | Boeing Co. | 91,473 | 14,659 |
| * | Mettler-Toledo International Inc. | 11,984 | 14,530 |
| WW Grainger Inc. | 24,564 | 13,632 | |
| Trane Technologies plc | 72,421 | 11,158 | |
| Rockwell Automation Inc. | 42,141 | 9,985 | |
| * | Waters Corp. | 31,956 | 9,542 |
| CSX Corp. | 294,285 | 9,314 | |
| * | FleetCor Technologies Inc. | 40,427 | 8,592 |
| PPG Industries Inc. | 66,809 | 8,483 | |
| Emerson Electric Co. | 101,277 | 8,278 | |
| Jack Henry & Associates Inc. | 38,654 | 7,429 | |
| * | Generac Holdings Inc. | 33,152 | 7,307 |
| JB Hunt Transport Services Inc. | 39,566 | 6,885 | |
| Carlisle Cos. Inc. | 23,258 | 6,876 | |
| Booz Allen Hamilton Holding Corp. Class A | 69,947 | 6,694 | |
| TransDigm Group Inc. | 10,929 | 6,562 | |
| Equifax Inc. | 32,355 | 6,107 | |
| * | Fair Isaac Corp. | 13,409 | 6,026 |
| Quanta Services Inc. | 42,031 | 5,939 | |
| Vulcan Materials Co. | 34,263 | 5,704 | |
| TransUnion | 75,464 | 5,575 | |
| * | United Rentals Inc. | 17,571 | 5,131 |
| Crown Holdings Inc. | 56,244 | 5,095 | |
| * | Paylocity Holding Corp. | 21,061 | 5,076 |
| HEICO Corp. Class A | 40,272 | 4,937 | |
| Toro Co. | 56,142 | 4,656 | |
| Advanced Drainage Systems Inc. | 32,672 | 4,434 | |
| Northrop Grumman Corp. | 9,226 | 4,410 | |
| Sealed Air Corp. | 77,630 | 4,177 | |
| Lincoln Electric Holdings Inc. | 30,401 | 4,156 | |
| Parker-Hannifin Corp. | 15,345 | 4,066 | |
| Graco Inc. | 62,730 | 4,005 | |
| Robert Half International Inc. | 50,622 | 3,896 | |
| Ball Corp. | 66,433 | 3,708 | |
| Cognex Corp. | 86,105 | 3,626 | |
| Allegion plc | 37,075 | 3,526 | |
| * | Zebra Technologies Corp. Class A | 11,535 | 3,479 |
| HEICO Corp. | 22,236 | 3,387 | |
| * | Axon Enterprise Inc. | 27,757 | 3,239 |
| American Express Co. | 20,501 | 3,116 | |
| * | Fiserv Inc. | 28,734 | 2,908 |
| * | Trex Co. Inc. | 60,743 | 2,842 |
| Expeditors International of Washington Inc. | 27,471 | 2,826 |
| Shares | Market Value• ($000) | ||
| Graphic Packaging Holding Co. | 125,502 | 2,795 | |
| * | WEX Inc. | 17,434 | 2,689 |
| * | TopBuild Corp. | 14,619 | 2,686 |
| Landstar System Inc. | 17,602 | 2,581 | |
| Watsco Inc. | 9,131 | 2,484 | |
| * | WillScot Mobile Mini Holdings Corp. | 61,183 | 2,456 |
| General Electric Co. | 32,651 | 2,398 | |
| Genpact Ltd. | 50,788 | 2,386 | |
| Eagle Materials Inc. | 17,412 | 2,083 | |
| CH Robinson Worldwide Inc. | 18,048 | 2,060 | |
| Otis Worldwide Corp. | 27,377 | 1,977 | |
| * | Berry Global Group Inc. | 33,461 | 1,818 |
| * | Euronet Worldwide Inc. | 19,304 | 1,711 |
| * | WESCO International Inc. | 12,570 | 1,655 |
| Nordson Corp. | 7,172 | 1,629 | |
| Tetra Tech Inc. | 11,697 | 1,589 | |
| Spirit AeroSystems Holdings Inc. Class A | 52,647 | 1,585 | |
| Allison Transmission Holdings Inc. | 40,995 | 1,486 | |
| Fortune Brands Home & Security Inc. | 24,077 | 1,479 | |
| IDEX Corp. | 7,156 | 1,440 | |
| * | Shift4 Payments Inc. Class A | 28,104 | 1,273 |
| Xylem Inc. | 13,414 | 1,222 | |
| Armstrong World Industries Inc. | 14,331 | 1,204 | |
| * | FTI Consulting Inc. | 7,469 | 1,200 |
| Vontier Corp. | 52,402 | 1,149 | |
| Western Union Co. | 68,578 | 1,016 | |
| Huntington Ingalls Industries Inc. | 4,371 | 1,006 | |
| BWX Technologies Inc. | 19,004 | 991 | |
| Martin Marietta Materials Inc. | 2,769 | 963 | |
| A O Smith Corp. | 16,250 | 917 | |
| MSA Safety Inc. | 7,482 | 889 | |
| * | Axalta Coating Systems Ltd. | 28,497 | 734 |
| Howmet Aerospace Inc. | 19,562 | 693 | |
| Donaldson Co. Inc. | 11,079 | 569 | |
| Brunswick Corp. | 7,000 | 523 | |
| AGCO Corp. | 4,146 | 451 | |
| Valmont Industries Inc. | 1,470 | 407 | |
| Masco Corp. | 6,207 | 316 | |
| AECOM | 4,082 | 299 | |
| RPM International Inc. | 3,145 | 293 | |
| Louisiana-Pacific Corp. | 5,346 | 290 | |
| * | Middleby Corp. | 1,911 | 275 |
| * | GXO Logistics Inc. | 5,899 | 262 |
| * | Core & Main Inc. Class A | 11,086 | 261 |
| * | XPO Logistics Inc. | 3,999 | 210 |
| Ardagh Metal Packaging SA | 25,684 | 158 | |
| 1,275,607 | |||
| Real Estate (1.7%) | |||
| American Tower Corp. | 190,366 | 48,363 | |
| Crown Castle Inc. | 230,707 | 39,412 | |
| Equinix Inc. | 36,658 | 24,098 | |
| Public Storage | 66,391 | 21,964 | |
| Simon Property Group Inc. | 84,401 | 8,607 | |
| Shares | Market Value• ($000) | ||
| * | CBRE Group Inc. Class A | 86,746 | 6,849 |
| Iron Mountain Inc. | 116,834 | 6,147 | |
| SBA Communications Corp. Class A | 12,961 | 4,216 | |
| Equity LifeStyle Properties Inc. | 58,020 | 4,067 | |
| Lamar Advertising Co. Class A | 40,445 | 3,797 | |
| * | CoStar Group Inc. | 29,949 | 2,086 |
| Extra Space Storage Inc. | 8,287 | 1,647 | |
| Camden Property Trust | 4,430 | 569 | |
| * | Opendoor Technologies Inc. | 70,409 | 305 |
| Apartment Income REIT Corp. | 6,670 | 272 | |
| * | Zillow Group Inc. Class A | 6,713 | 224 |
| 172,623 | |||
| Technology (44.2%) | |||
| Apple Inc. | 8,181,584 | 1,286,309 | |
| Microsoft Corp. | 4,003,515 | 1,046,799 | |
| * | Alphabet Inc. Class A | 2,805,242 | 303,583 |
| * | Alphabet Inc. Class C | 2,552,148 | 278,567 |
| NVIDIA Corp. | 1,288,708 | 194,518 | |
| Broadcom Inc. | 213,613 | 106,616 | |
| * | Adobe Inc. | 252,497 | 94,292 |
| QUALCOMM Inc. | 599,295 | 79,269 | |
| Intuit Inc. | 147,435 | 63,659 | |
| * | Advanced Micro Devices Inc. | 680,202 | 57,729 |
| Texas Instruments Inc. | 338,454 | 55,916 | |
| * | ServiceNow Inc. | 107,105 | 46,550 |
| Applied Materials Inc. | 471,329 | 44,338 | |
| * | Meta Platforms Inc. Class A | 261,422 | 42,593 |
| International Business Machines Corp. | 321,438 | 41,289 | |
| Oracle Corp. | 555,324 | 41,177 | |
| Lam Research Corp. | 73,996 | 32,404 | |
| * | Palo Alto Networks Inc. | 51,879 | 28,887 |
| * | Synopsys Inc. | 81,489 | 28,197 |
| KLA Corp. | 79,865 | 27,484 | |
| * | Cadence Design Systems Inc. | 146,029 | 25,375 |
| * | Autodesk Inc. | 116,337 | 23,470 |
| * | Crowdstrike Holdings Inc. Class A | 112,520 | 20,547 |
| * | Atlassian Corp. plc Class A | 73,173 | 18,122 |
| * | Snowflake Inc. Class A | 98,570 | 17,836 |
| Amphenol Corp. Class A | 236,251 | 17,372 | |
| * | Workday Inc. Class A | 104,555 | 17,206 |
| * | Salesforce Inc. | 110,181 | 17,201 |
| * | Fortinet Inc. | 350,559 | 17,069 |
| Microchip Technology Inc. | 246,219 | 16,066 | |
| * | Datadog Inc. Class A | 138,717 | 14,558 |
| * | Twitter Inc. | 369,360 | 14,313 |
| * | EPAM Systems Inc. | 29,384 | 12,532 |
| CDW Corp. | 72,122 | 12,311 | |
| * | Gartner Inc. | 41,904 | 11,956 |
| Monolithic Power Systems Inc. | 24,221 | 10,976 | |
| * | MongoDB Inc. Class A | 33,766 | 10,902 |
| * | ON Semiconductor Corp. | 144,177 | 9,915 |
| * | Paycom Software Inc. | 27,527 | 9,667 |
| * | Cloudflare Inc. Class A | 148,551 | 9,295 |
| NetApp Inc. | 119,953 | 8,652 | |
| Shares | Market Value• ($000) | ||
| Analog Devices Inc. | 56,501 | 8,562 | |
| * | HubSpot Inc. | 24,641 | 8,305 |
| * | Match Group Inc. | 141,955 | 8,025 |
| * | Splunk Inc. | 86,672 | 7,803 |
| Entegris Inc. | 79,443 | 7,538 | |
| * | Palantir Technologies Inc. Class A | 972,382 | 7,507 |
| HP Inc. | 260,106 | 7,468 | |
| * | Tyler Technologies Inc. | 19,429 | 7,218 |
| * | Zscaler Inc. | 44,909 | 7,151 |
| * | DoorDash Inc. Class A | 119,050 | 7,131 |
| * | ZoomInfo Technologies Inc. Class A | 148,649 | 6,752 |
| Teradyne Inc. | 78,385 | 6,634 | |
| * | PTC Inc. | 55,912 | 6,424 |
| Micron Technology Inc. | 112,255 | 6,346 | |
| VMware Inc. Class A | 54,085 | 6,275 | |
| * | DocuSign Inc. Class A | 106,665 | 6,210 |
| * | ANSYS Inc. | 24,073 | 5,977 |
| * | Zoom Video Communications Inc. Class A | 67,753 | 5,447 |
| * | Zendesk Inc. | 64,770 | 4,972 |
| * | Globant SA | 21,576 | 4,548 |
| * | Pure Storage Inc. Class A | 149,841 | 4,341 |
| * | Avalara Inc. | 46,122 | 4,224 |
| * | Dynatrace Inc. | 106,049 | 4,049 |
| * | Lattice Semiconductor Corp. | 72,126 | 3,888 |
| * | Five9 Inc. | 36,904 | 3,621 |
| Jabil Inc. | 59,896 | 3,612 | |
| * | Elastic NV | 40,470 | 3,396 |
| Bentley Systems Inc. Class B | 89,493 | 3,291 | |
| Citrix Systems Inc. | 31,592 | 3,247 | |
| * | Unity Software Inc. | 74,531 | 3,184 |
| * | Aspen Technology Inc. | 14,781 | 3,113 |
| * | Dropbox Inc. Class A | 139,078 | 2,975 |
| * | AppLovin Corp. Class A | 119,485 | 2,943 |
| * | Manhattan Associates Inc. | 20,561 | 2,904 |
| Universal Display Corp. | 22,953 | 2,565 | |
| NortonLifeLock Inc. | 107,444 | 2,427 | |
| * | Twilio Inc. Class A | 34,421 | 2,395 |
| KBR Inc. | 47,643 | 2,301 | |
| * | Toast Inc. Class A | 120,044 | 2,272 |
| * | Smartsheet Inc. Class A | 68,155 | 2,267 |
| * | Alteryx Inc. Class A | 31,625 | 1,971 |
| * | RingCentral Inc. Class A | 44,874 | 1,931 |
| * | Confluent Inc. Class A | 65,981 | 1,805 |
| * | SentinelOne Inc. Class A | 64,122 | 1,751 |
| * | New Relic Inc. | 27,406 | 1,664 |
| Switch Inc. Class A | 47,114 | 1,599 | |
| * | Pinterest Inc. Class A | 64,948 | 1,496 |
| * | Procore Technologies Inc. | 26,729 | 1,459 |
| * | Wix.com Ltd. | 22,119 | 1,400 |
| * | Coupa Software Inc. | 22,167 | 1,295 |
| * | Nutanix Inc. Class A | 58,530 | 1,013 |
| * | Teradata Corp. | 30,247 | 995 |
| * | VeriSign Inc. | 5,189 | 946 |
| * | GoDaddy Inc. Class A | 11,962 | 907 |
| Dell Technologies Inc. Class C | 21,771 | 834 | |
| Corning Inc. | 24,039 | 825 | |
| * | Ceridian HCM Holding Inc. | 13,769 | 821 |
| * | Okta Inc. | 8,978 | 821 |
| Shares | Market Value• ($000) | ||
| Pegasystems Inc. | 21,320 | 780 | |
| * | DoubleVerify Holdings Inc. | 29,139 | 753 |
| * | Jamf Holding Corp. | 29,583 | 708 |
| * | Allegro MicroSystems Inc. | 26,597 | 620 |
| * | Thoughtworks Holding Inc. | 45,272 | 596 |
| * | II-VI Inc. | 10,848 | 512 |
| * | Black Knight Inc. | 7,589 | 502 |
| *,1 | GLOBALFOUNDRIES Inc. | 7,984 | 478 |
| National Instruments Corp. | 8,913 | 354 | |
| * | CCC Intelligent Solutions Holdings Inc. | 34,727 | 332 |
| * | UiPath Inc. Class A | 18,303 | 301 |
| Vertiv Holdings Co. Class A | 25,823 | 298 | |
| * | Change Healthcare Inc. | 10,770 | 265 |
| * | nCino Inc. | 5,661 | 179 |
| * | Arrow Electronics Inc. | 1,702 | 178 |
| * | Definitive Healthcare Corp. Class A | 8,711 | 175 |
| * | NCR Corp. | 3,387 | 105 |
| * | Informatica Inc. Class A | 3,153 | 70 |
| 4,445,564 | |||
| Telecommunications (0.5%) | |||
| * | Charter Communications Inc. Class A | 61,908 | 25,545 |
| * | Arista Networks Inc. | 133,652 | 16,022 |
| * | Liberty Broadband Corp. Class C | 33,395 | 3,396 |
| Cable One Inc. | 1,943 | 2,205 | |
| * | Roku Inc. | 18,197 | 1,238 |
| * | Liberty Broadband Corp. Class A | 3,338 | 337 |
| Shares | Market Value• ($000) | ||
| Ubiquiti Inc. | 870 | 270 | |
| 49,013 | |||
| Utilities (0.4%) | |||
| Waste Management Inc. | 207,991 | 35,157 | |
| Vistra Corp. | 130,792 | 3,237 | |
| AES Corp. | 63,860 | 1,625 | |
| Republic Services Inc. Class A | 6,942 | 991 | |
| National Fuel Gas Co. | 3,570 | 254 | |
| 41,264 | |||
| Total Common Stocks (Cost $7,413,848) | 10,061,675 | ||
| Temporary Cash Investments (0.0%) | |||
| Money Market Fund (0.0%) | |||
| 2,3 | Vanguard Market Liquidity Fund, 2.284% (Cost $5,810) | 58,129 | 5,811 |
| Total Investments (100.0%) (Cost $7,419,658) | 10,067,486 | ||
| Other Assets and Liabilities—Net (0.0%) | (2,573) | ||
| Net Assets (100%) | 10,064,913 | ||
| Cost is in $000. | |||
| • | See Note A in Notes to Financial Statements. |
| * | Non-income-producing security. |
| 1 | Includes partial security positions on loan to broker-dealers. The total value of securities on loan is $5,620,000. |
| 2 | Affiliated money market fund available only to Vanguard funds and certain trusts and accounts managed by Vanguard. Rate shown is the 7-day yield. |
| 3 | Collateral of $5,796,000 was received for securities on loan. |
| REIT—Real Estate Investment Trust. |
| Futures Contracts | ||||
| ($000) | ||||
| Expiration | Number of Long (Short) Contracts | Notional Amount | Value and Unrealized Appreciation (Depreciation) | |
| Long Futures Contracts | ||||
| E-mini S&P 500 Index | September 2022 | 21 | 4,154 | (193) |
| ($000s, except shares and per-share amounts) | Amount |
| Assets | |
| Investments in Securities, at Value1 | |
| Unaffiliated Issuers (Cost $7,413,848) | 10,061,675 |
| Affiliated Issuers (Cost $5,810) | 5,811 |
| Total Investments in Securities | 10,067,486 |
| Investment in Vanguard | 368 |
| Cash Collateral Pledged—Futures Contracts | 120 |
| Receivables for Investment Securities Sold | 306 |
| Receivables for Accrued Income | 8,790 |
| Receivables for Capital Shares Issued | 232 |
| Total Assets | 10,077,302 |
| Liabilities | |
| Due to Custodian | 5,118 |
| Payables for Investment Securities Purchased | 11 |
| Collateral for Securities on Loan | 5,796 |
| Payables for Capital Shares Redeemed | 1,085 |
| Payables to Vanguard | 361 |
| Variation Margin Payable—Futures Contracts | 18 |
| Total Liabilities | 12,389 |
| Net Assets | 10,064,913 |
| 1 Includes $5,620 of securities on loan. | |
| At August 31, 2022, net assets consisted of: | |
| Paid-in Capital | 8,099,505 |
| Total Distributable Earnings (Loss) | 1,965,408 |
| Net Assets | 10,064,913 |
| ETF Shares—Net Assets | |
| Applicable to 121,731,844 outstanding $.001 par value shares of beneficial interest (unlimited authorization) | 7,310,574 |
| Net Asset Value Per Share—ETF Shares | $60.05 |
| Institutional Shares—Net Assets | |
| Applicable to 5,962,648 outstanding $.001 par value shares of beneficial interest (unlimited authorization) | 2,754,339 |
| Net Asset Value Per Share—Institutional Shares | $461.93 |
| Year Ended August 31, 2022 | |
| ($000) | |
| Investment Income | |
| Income | |
| Dividends1 | 88,805 |
| Interest2 | 42 |
| Securities Lending—Net | 494 |
| Total Income | 89,341 |
| Expenses | |
| The Vanguard Group—Note B | |
| Investment Advisory Services | 1,235 |
| Management and Administrative—ETF Shares | 4,317 |
| Management and Administrative—Institutional Shares | 1,689 |
| Marketing and Distribution—ETF Shares | 378 |
| Marketing and Distribution—Institutional Shares | 95 |
| Custodian Fees | 220 |
| Auditing Fees | 27 |
| Shareholders’ Reports—ETF Shares | 179 |
| Shareholders’ Reports—Institutional Shares | 5 |
| Trustees’ Fees and Expenses | 4 |
| Other Expenses | 14 |
| Total Expenses | 8,163 |
| Net Investment Income | 81,178 |
| Realized Net Gain (Loss) | |
| Investment Securities Sold2,3 | 54,471 |
| Futures Contracts | 8 |
| Realized Net Gain (Loss) | 54,479 |
| Change in Unrealized Appreciation (Depreciation) | |
| Investment Securities2 | (2,333,289) |
| Futures Contracts | (499) |
| Change in Unrealized Appreciation (Depreciation) | (2,333,788) |
| Net Increase (Decrease) in Net Assets Resulting from Operations | (2,198,131) |
| 1 | Dividends are net of foreign withholding taxes of $22,000. |
| 2 | Interest income, realized net gain (loss), capital gain distributions received, and change in unrealized appreciation (depreciation) from an affiliated company of the fund were $41,000, $1,000, less than $1,000, and $1,000, respectively. Purchases and sales are for temporary cash investment purposes. |
| 3 | Includes $490,381,000 of net gain (loss) resulting from in-kind redemptions. |
| Year Ended August 31, | ||
| 2022 ($000) | 2021 ($000) | |
| Increase (Decrease) in Net Assets | ||
| Operations | ||
| Net Investment Income | 81,178 | 66,590 |
| Realized Net Gain (Loss) | 54,479 | 968,397 |
| Change in Unrealized Appreciation (Depreciation) | (2,333,788) | 1,372,233 |
| Net Increase (Decrease) in Net Assets Resulting from Operations | (2,198,131) | 2,407,220 |
| Distributions | ||
| ETF Shares | (52,400) | (40,214) |
| Institutional Shares | (23,165) | (24,518) |
| Total Distributions | (75,565) | (64,732) |
| Capital Share Transactions | ||
| ETF Shares | 1,452,751 | 978,964 |
| Institutional Shares | (142,339) | (786,014) |
| Net Increase (Decrease) from Capital Share Transactions | 1,310,412 | 192,950 |
| Total Increase (Decrease) | (963,284) | 2,535,438 |
| Net Assets | ||
| Beginning of Period | 11,028,197 | 8,492,759 |
| End of Period | 10,064,913 | 11,028,197 |
| ETF Shares | |||||
| For a Share Outstanding Throughout Each Period | Year Ended August 31, | ||||
| 2022 | 20211 | 20201 | 20191 | 20181 | |
| Net Asset Value, Beginning of Period | $74.77 | $58.66 | $41.14 | $39.89 | $31.77 |
| Investment Operations | |||||
| Net Investment Income2 | .523 | .460 | .475 | .481 | .441 |
| Net Realized and Unrealized Gain (Loss) on Investments | (14.754) | 16.099 | 17.530 | 1.177 | 8.096 |
| Total from Investment Operations | (14.231) | 16.559 | 18.005 | 1.658 | 8.537 |
| Distributions | |||||
| Dividends from Net Investment Income | (.489) | (.449) | (.485) | (.408) | (.417) |
| Distributions from Realized Capital Gains | — | — | — | — | — |
| Total Distributions | (.489) | (.449) | (.485) | (.408) | (.417) |
| Net Asset Value, End of Period | $60.05 | $74.77 | $58.66 | $41.14 | $39.89 |
| Total Return | -19.11% | 28.40% | 44.18% | 4.20% | 27.09% |
| Ratios/Supplemental Data | |||||
| Net Assets, End of Period (Millions) | $7,311 | $7,455 | $4,951 | $2,872 | $2,083 |
| Ratio of Total Expenses to Average Net Assets | 0.08% | 0.08% | 0.08% | 0.08% | 0.12% |
| Ratio of Net Investment Income to Average Net Assets | 0.77% | 0.72% | 1.04% | 1.25% | 1.24% |
| Portfolio Turnover Rate3 | 13% | 14% | 14% | 17% | 15% |
| 1 | Adjusted to reflect a 4-for-1 share split effective at the beginning of trading on April 20, 2021. |
| 2 | Calculated based on average shares outstanding. |
| 3 | Excludes the value of portfolio securities received or delivered as a result of in-kind purchases or redemptions of the fund’s capital shares, including ETF Creation Units. |
| Institutional Shares | |||||
| For a Share Outstanding Throughout Each Period | Year Ended August 31, | ||||
| 2022 | 2021 | 2020 | 2019 | 2018 | |
| Net Asset Value, Beginning of Period | $575.10 | $451.15 | $316.39 | $306.82 | $244.34 |
| Investment Operations | |||||
| Net Investment Income1 | 4.036 | 3.573 | 3.695 | 3.711 | 3.485 |
| Net Realized and Unrealized Gain (Loss) on Investments | (113.399) | 123.861 | 134.792 | 9.061 | 62.293 |
| Total from Investment Operations | (109.363) | 127.434 | 138.487 | 12.772 | 65.778 |
| Distributions | |||||
| Dividends from Net Investment Income | (3.807) | (3.484) | (3.727) | (3.202) | (3.298) |
| Distributions from Realized Capital Gains | — | — | — | — | — |
| Total Distributions | (3.807) | (3.484) | (3.727) | (3.202) | (3.298) |
| Net Asset Value, End of Period | $461.93 | $575.10 | $451.15 | $316.39 | $306.82 |
| Total Return | -19.09% | 28.42% | 44.24% | 4.21% | 27.14% |
| Ratios/Supplemental Data | |||||
| Net Assets, End of Period (Millions) | $2,754 | $3,573 | $3,542 | $3,076 | $3,182 |
| Ratio of Total Expenses to Average Net Assets | 0.07% | 0.07% | 0.07% | 0.07% | 0.08% |
| Ratio of Net Investment Income to Average Net Assets | 0.77% | 0.74% | 1.06% | 1.26% | 1.28% |
| Portfolio Turnover Rate2 | 13% | 14% | 14% | 17% | 15% |
| 1 | Calculated based on average shares outstanding. |
| 2 | Excludes the value of portfolio securities received or delivered as a result of in-kind purchases or redemptions of the fund’s capital shares, including ETF Creation Units. |
| A. | The following significant accounting policies conform to generally accepted accounting principles for U.S. investment companies. The fund consistently follows such policies in preparing its financial statements. |
| B. | In accordance with the terms of a Funds' Service Agreement (the “FSA”) between Vanguard and the fund, Vanguard furnishes to the fund investment advisory, corporate management, administrative, marketing, and distribution services at Vanguard’s cost of operations (as defined by the FSA). These costs of operations are allocated to the fund based on methods and guidelines approved by the board of trustees and are generally settled twice a month. |
| C. | Various inputs may be used to determine the value of the fund’s investments and derivatives. These inputs are summarized in three broad levels for financial statement purposes. The inputs or methodologies used to value securities are not necessarily an indication of the risk associated with investing in those securities. |
| D. | Permanent differences between book-basis and tax-basis components of net assets are reclassified among capital accounts in the financial statements to reflect their tax character. These reclassifications have no effect on net assets or net asset value per share. As of period end, permanent differences primarily attributable to the accounting for applicable in-kind redemptions and passive foreign investment companies were reclassified between the following accounts: |
| Amount ($000) | |
| Paid-in Capital | 490,365 |
| Total Distributable Earnings (Loss) | (490,365) |
| Amount ($000) | |
| Undistributed Ordinary Income | 18,879 |
| Undistributed Long-Term Gains | — |
| Capital Loss Carryforwards | (692,034) |
| Qualified Late-Year Losses | — |
| Net Unrealized Gains (Losses) | 2,638,563 |
| Year Ended August 31, | ||
| 2022 Amount ($000) | 2021 Amount ($000) | |
| Ordinary Income* | 75,565 | 64,732 |
| Long-Term Capital Gains | — | — |
| Total | 75,565 | 64,732 |
| * | Includes short-term capital gains, if any. |
| Amount ($000) | |
| Tax Cost | 7,428,923 |
| Gross Unrealized Appreciation | 3,098,495 |
| Gross Unrealized Depreciation | (459,932) |
| Net Unrealized Appreciation (Depreciation) | 2,638,563 |
| E. | During the year ended August 31, 2022, the fund purchased $3,630,791,000 of investment securities and sold $2,297,023,000 of investment securities, other than temporary cash investments. Purchases and sales include $2,200,784,000 and $862,424,000, respectively, in connection with in-kind purchases and redemptions of the fund's capital shares. |
| F. | During the year ended August 31, 2021, the fund’s ETF Shares underwent a 4-for-1 share split. Each shareholder of record as of the close of business on April 19, 2021, received 4 shares for every 1 ETF Share held on that date. The split had no effect on net assets or total return. Capital share transactions for each class of shares were: |
| Year Ended August 31, | |||||
| 2022 | 2021 | ||||
| Amount ($000) | Shares (000) | Amount ($000) | Shares (000) | ||
| ETF Shares1 | |||||
| Issued | 2,316,585 | 34,850 | 2,657,661 | 41,175 | |
| Issued in Lieu of Cash Distributions | — | — | — | — | |
| Redeemed | (863,834) | (12,825) | (1,678,697) | (25,875) | |
| Net Increase (Decrease)—ETF Shares | 1,452,751 | 22,025 | 978,964 | 15,300 | |
| Institutional Shares | |||||
| Issued | 370,624 | 724 | 382,523 | 806 | |
| Issued in Lieu of Cash Distributions | 21,117 | 40 | 21,838 | 47 | |
| Redeemed | (534,080) | (1,014) | (1,190,375) | (2,491) | |
| Net Increase (Decrease)—Institutional Shares | (142,339) | (250) | (786,014) | (1,638) | |
| 1 | Adjusted to reflect a 4-for-1 share split effective at the beginning of trading on April 20, 2021. |
| G. | Management has determined that no events or transactions occurred subsequent to August 31, 2022, that would require recognition or disclosure in these financial statements. |
Philadelphia, Pennsylvania
October 20, 2022
| Fund | Percentage |
| Russell 1000 Index Fund | 95.6% |
| Russell 1000 Value Index Fund | 93.3 |
| Russell 1000 Growth Index Fund | 100.0 |
| Fund | ($000) |
| Russell 1000 Index Fund | 70,843 |
| Russell 1000 Value Index Fund | 164,008 |
| Russell 1000 Growth Index Fund | 75,564 |
| Fund | ($000) |
| Russell 1000 Index Fund | 734 |
| Russell 1000 Value Index Fund | 2,958 |
| Russell 1000 Growth Index Fund | — |
| Fund | ($000) |
| Russell 1000 Index Fund | 8 |
| Russell 1000 Value Index Fund | 17 |
| Russell 1000 Growth Index Fund | 15 |
| Matthew Benchener | Thomas M. Rampulla |
| Joseph Brennan | Karin A. Risi |
| Mortimer J. Buckley | Anne E. Robinson |
| Gregory Davis | Michael Rollings |
| John James | Nitin Tandon |
| Chris D. Mclsaac | Lauren Valente |

All rights reserved.
U.S. Patent Nos. 6,879,964.
Vanguard Marketing Corporation, Distributor.

| Vanguard Russell 2000 Index Fund |
| Vanguard Russell 2000 Value Index Fund |
| Vanguard Russell 2000 Growth Index Fund |
Your Fund’s Performance at a Glance | 1 |
About Your Fund’s Expenses | 2 |
Russell 2000 Index Fund | 4 |
Russell 2000 Value Index Fund | 39 |
Russell 2000 Growth Index Fund | 67 |
Trustees Approve Advisory Arrangements | 95 |
Liquidity Risk Management | 97 |
| • | Returns for the three Vanguard Russell 2000 Index Funds for the 12 months ended August 31, 2022, ranged from about –25% for Vanguard Russell 2000 Growth Index Fund to about –10% for Vanguard Russell 2000 Value Index Fund. Vanguard Russell 2000 Index Fund returned about –18%. Each fund closely tracked its target index. |
| • | The investment outlook grew more challenging as the period progressed. Sentiment deteriorated as inflation rose, propelled in part by higher energy and food prices after Russia’s invasion of Ukraine. The Federal Reserve reacted by raising interest rates, which pushed borrowing costs higher and sparked fears of recession. |
| • | Large-capitalization stocks declined less than their mid- and small-cap counterparts, and value stocks held up better than growth. |
| • | Returns fell by double digits across most industry sectors for all three funds. The energy sector was a notable exception amid heightened demand for oil and gas and supply constraints related to the conflict in Ukraine. Health care stocks were the biggest detractor for both the Index Fund and the Growth Fund, while consumer discretionary stocks detracted the most from the Value Fund. |
| Average Annual Total Returns Periods Ended August 31, 2022 | |||
| One Year | Three Years | Five Years | |
| Stocks | |||
| Russell 1000 Index (Large-caps) | -12.96% | 12.14% | 11.61% |
| Russell 2000 Index (Small-caps) | -17.88 | 8.59 | 6.95 |
| Russell 3000 Index (Broad U.S. market) | -13.28 | 11.90 | 11.29 |
| FTSE All-World ex US Index (International) | -19.00 | 3.48 | 2.12 |
| Bonds | |||
| Bloomberg U.S. Aggregate Float Adjusted Index (Broad taxable market) | -11.65% | -2.01% | 0.54% |
| Bloomberg Municipal Bond Index (Broad tax-exempt market) | -8.63 | -0.83 | 1.28 |
| FTSE Three-Month U.S. Treasury Bill Index | 0.44 | 0.56 | 1.10 |
| CPI | |||
| Consumer Price Index | 8.26% | 4.90% | 3.82% |
| • | Based on actual fund return. This section helps you to estimate the actual expenses that you paid over the period. The ”Ending Account Value“ shown is derived from the fund‘s actual return, and the third column shows the dollar amount that would have been paid by an investor who started with $1,000 in the fund. You may use the information here, together with the amount you invested, to estimate the expenses that you paid over the period. |
| • | Based on hypothetical 5% yearly return. This section is intended to help you compare your fund‘s costs with those of other mutual funds. It assumes that the fund had a yearly return of 5% before expenses, but that the expense ratio is unchanged. In this case—because the return used is not the fund’s actual return—the results do not apply to your investment. The example is useful in making comparisons because the Securities and Exchange Commission requires all mutual funds to calculate expenses based on a 5% return. You can assess your fund’s costs by comparing this hypothetical example with the hypothetical examples that appear in shareholder reports of other funds. |
| Six Months Ended August 31, 2022 | |||
| Beginning Account Value 2/28/2022 | Ending Account Value 8/31/2022 | Expenses Paid During Period | |
| Based on Actual Fund Return | |||
| Russell 2000 Index Fund | |||
| ETF Shares | $1,000.00 | $907.20 | $0.48 |
| Institutional Shares | 1,000.00 | 907.20 | 0.38 |
| Russell 2000 Value Index Fund | |||
| ETF Shares | $1,000.00 | $917.20 | $0.72 |
| Institutional Shares | 1,000.00 | 917.50 | 0.39 |
| Russell 2000 Growth Index Fund | |||
| ETF Shares | $1,000.00 | $893.50 | $0.72 |
| Institutional Shares | 1,000.00 | 893.80 | 0.38 |
| Based on Hypothetical 5% Yearly Return | |||
| Russell 2000 Index Fund | |||
| ETF Shares | $1,000.00 | $1,024.70 | $0.51 |
| Institutional Shares | 1,000.00 | 1,024.80 | 0.41 |
| Russell 2000 Value Index Fund | |||
| ETF Shares | $1,000.00 | $1,024.45 | $0.77 |
| Institutional Shares | 1,000.00 | 1,024.80 | 0.41 |
| Russell 2000 Growth Index Fund | |||
| ETF Shares | $1,000.00 | $1,024.45 | $0.77 |
| Institutional Shares | 1,000.00 | 1,024.80 | 0.41 |

| Average Annual Total Returns Periods Ended August 31, 2022 | |||||
| One Year | Five Years | Ten Years | Final Value of a $10,000 Investment | ||
 | Russell 2000 Index Fund ETF Shares Net Asset Value | -17.88% | 7.00% | 10.04% | $26,026 |
| Russell 2000 Index Fund ETF Shares Market Price | -17.84 | 7.00 | 10.04 | 26,022 | |
 | Russell 2000 Index | -17.88 | 6.95 | 10.01 | 25,954 |
 | Dow Jones U.S. Total Stock Market Float Adjusted Index | -13.73 | 11.16 | 12.66 | 32,942 |
| One Year | Five Years | Ten Years | Final Value of a $5,000,000 Investment | ||
| Russell 2000 Index Fund Institutional Shares | -17.88% | 7.03% | 10.09% | $13,078,984 | |
| Russell 2000 Index | -17.88 | 6.95 | 10.01 | 12,976,814 | |
| Dow Jones U.S. Total Stock Market Float Adjusted Index | -13.73 | 11.16 | 12.66 | 16,470,991 | |
| One Year | Five Years | Ten Years | |
| Russell 2000 Index Fund ETF Shares Market Price | -17.84% | 40.28% | 160.22% |
| Russell 2000 Index Fund ETF Shares Net Asset Value | -17.88 | 40.27 | 160.26 |
| Russell 2000 Index | -17.88 | 39.92 | 159.54 |
| Basic Materials | 4.1% |
| Consumer Discretionary | 12.6 |
| Consumer Staples | 3.3 |
| Energy | 6.8 |
| Financials | 16.8 |
| Health Care | 17.1 |
| Industrials | 16.2 |
| Real Estate | 6.8 |
| Technology | 10.8 |
| Telecommunications | 1.7 |
| Utilities | 3.8 |
| Other | 0.0 |
| Shares | Market Value• ($000) | ||
| Common Stocks (99.6%) | |||
| Basic Materials (4.1%) | |||
| * | RBC Bearings Inc. | 67,504 | 16,247 |
| * | Livent Corp. | 383,980 | 12,357 |
| Commercial Metals Co. | 286,533 | 11,607 | |
| UFP Industries Inc. | 144,117 | 11,441 | |
| Balchem Corp. | 75,523 | 9,955 | |
| Cabot Corp. | 131,665 | 9,476 | |
| Avient Corp. | 215,567 | 9,448 | |
| Mueller Industries Inc. | 132,554 | 8,373 | |
| Sensient Technologies Corp. | 99,397 | 7,919 | |
| * | Ingevity Corp. | 92,219 | 6,468 |
| * | Arconic Corp. | 250,836 | 6,324 |
| Boise Cascade Co. | 93,479 | 5,827 | |
| Quaker Chemical Corp. | 32,097 | 5,595 | |
| Innospec Inc. | 58,573 | 5,474 | |
| Stepan Co. | 50,573 | 5,271 | |
| Hecla Mining Co. | 1,264,834 | 4,983 | |
| Minerals Technologies Inc. | 77,538 | 4,517 | |
| Materion Corp. | 48,236 | 4,163 | |
| Tronox Holdings plc Class A | 276,659 | 4,048 | |
| * | Constellium SE Class A | 293,648 | 3,911 |
| Worthington Industries Inc. | 75,529 | 3,851 | |
| Carpenter Technology Corp. | 113,082 | 3,841 | |
| Sylvamo Corp. | 84,090 | 3,737 | |
| * | GCP Applied Technologies Inc. | 118,054 | 3,709 |
| *,1 | Uranium Energy Corp. | 760,354 | 3,437 |
| Compass Minerals International Inc. | 81,293 | 3,292 | |
| Mativ Holdings Inc. | 129,151 | 3,051 | |
| *,1 | Energy Fuels Inc. | 370,628 | 3,010 |
| *,1 | Perimeter Solutions SA | 289,227 | 2,820 |
| GrafTech International Ltd. | 464,602 | 2,732 | |
| Kaiser Aluminum Corp. | 37,576 | 2,696 | |
| *,1 | Piedmont Lithium Inc. ADR | 41,087 | 2,513 |
| * | Novagold Resources Inc. | 565,995 | 2,507 |
| * | US Silica Holdings Inc. | 175,926 | 2,468 |
| Orion Engineered Carbons SA | 143,600 | 2,421 | |
| AdvanSix Inc. | 64,619 | 2,343 | |
| * | Resolute Forest Products Inc. | 108,515 | 2,199 |
| Shares | Market Value• ($000) | ||
| Schnitzer Steel Industries Inc. Class A | 61,264 | 2,024 | |
| * | Coeur Mining Inc. | 657,881 | 1,816 |
| Hawkins Inc. | 45,922 | 1,760 | |
| * | TimkenSteel Corp. | 109,420 | 1,679 |
| * | Clearwater Paper Corp. | 39,405 | 1,676 |
| * | Origin Materials Inc. | 253,046 | 1,582 |
| * | Ecovyst Inc. | 151,156 | 1,397 |
| *,1 | Amyris Inc. | 467,018 | 1,373 |
| American Vanguard Corp. | 68,820 | 1,372 | |
| * | Intrepid Potash Inc. | 26,388 | 1,233 |
| * | LSB Industries Inc. | 75,243 | 1,187 |
| Haynes International Inc. | 29,126 | 1,156 | |
| *,1 | 5e Advanced Materials Inc. | 76,535 | 1,148 |
| Koppers Holdings Inc. | 48,818 | 1,115 | |
| Ryerson Holding Corp. | 39,003 | 1,112 | |
| * | Century Aluminum Co. | 124,013 | 957 |
| Omega Flex Inc. | 7,741 | 782 | |
| * | Alto Ingredients Inc. | 170,538 | 737 |
| * | Northwest Pipe Co. | 23,162 | 733 |
| * | Ur-Energy Inc. | 497,128 | 686 |
| * | Rayonier Advanced Materials Inc. | 147,005 | 664 |
| Tredegar Corp. | 64,284 | 656 | |
| Olympic Steel Inc. | 22,779 | 600 | |
| Glatfelter Corp. | 104,105 | 507 | |
| FutureFuel Corp. | 61,832 | 451 | |
| *,1 | Dakota Gold Corp. | 121,027 | 413 |
| * | Unifi Inc. | 33,520 | 381 |
| * | Hycroft Mining Holding Corp. | 360,695 | 289 |
| * | Polymet Mining Corp. | 66,779 | 208 |
| Valhi Inc. | 5,526 | 193 | |
| 233,918 | |||
| Consumer Discretionary (12.5%) | |||
| Murphy USA Inc. | 53,064 | 15,398 | |
| Texas Roadhouse Inc. Class A | 161,924 | 14,372 | |
| * | Scientific Games Corp. Class A | 231,700 | 11,407 |
| TEGNA Inc. | 527,623 | 11,291 | |
| * | Crocs Inc. | 143,754 | 10,595 |
| * | Fox Factory Holding Corp. | 100,630 | 9,380 |
| * | Goodyear Tire & Rubber Co. | 664,462 | 9,322 |
| * | Asbury Automotive Group Inc. | 52,482 | 9,157 |
| Shares | Market Value• ($000) | ||
| * | Hilton Grand Vacations Inc. | 212,389 | 8,661 |
| Academy Sports & Outdoors Inc. | 198,743 | 8,562 | |
| Wingstop Inc. | 71,008 | 8,085 | |
| * | Visteon Corp. | 65,963 | 7,904 |
| * | Adient plc | 224,991 | 7,470 |
| * | Callaway Golf Co. | 331,503 | 7,336 |
| Foot Locker Inc. | 196,997 | 7,257 | |
| Signet Jewelers Ltd. | 110,555 | 7,227 | |
| * | Skyline Champion Corp. | 126,400 | 7,163 |
| * | Helen of Troy Ltd. | 56,374 | 6,970 |
| * | Taylor Morrison Home Corp. Class A | 273,883 | 6,877 |
| LCI Industries | 58,892 | 6,824 | |
| Group 1 Automotive Inc. | 38,074 | 6,800 | |
| * | Meritage Homes Corp. | 86,049 | 6,742 |
| * | National Vision Holdings Inc. | 192,391 | 6,393 |
| Papa John's International Inc. | 78,321 | 6,331 | |
| Cracker Barrel Old Country Store Inc. | 54,816 | 5,917 | |
| * | Spirit Airlines Inc. | 258,620 | 5,865 |
| * | Chegg Inc. | 294,207 | 5,790 |
| * | Dorman Products Inc. | 62,517 | 5,667 |
| * | Sabre Corp. | 773,217 | 5,559 |
| KB Home | 189,741 | 5,436 | |
| Steven Madden Ltd. | 186,716 | 5,435 | |
| * | SeaWorld Entertainment Inc. | 107,146 | 5,384 |
| * | Duolingo Inc. | 55,674 | 5,234 |
| * | Cavco Industries Inc. | 21,714 | 5,081 |
| Graham Holdings Co. Class B | 8,886 | 5,024 | |
| MillerKnoll Inc. | 179,789 | 4,977 | |
| Kontoor Brands Inc. | 133,400 | 4,966 | |
| *,1 | Luminar Technologies Inc. Class A | 564,587 | 4,867 |
| Red Rock Resorts Inc. Class A | 126,243 | 4,825 | |
| Rush Enterprises Inc. Class A | 100,743 | 4,741 | |
| Dana Inc. | 305,297 | 4,723 | |
| * | Gentherm Inc. | 78,410 | 4,697 |
| * | LGI Homes Inc. | 49,346 | 4,683 |
| John Wiley & Sons Inc. Class A | 101,604 | 4,677 | |
| * | Boot Barn Holdings Inc. | 69,790 | 4,649 |
| * | frontdoor Inc. | 195,797 | 4,597 |
| * | Sonos Inc. | 301,751 | 4,538 |
| * | elf Beauty Inc. | 114,493 | 4,366 |
| Winnebago Industries Inc. | 75,807 | 4,365 | |
| International Game Technology plc | 235,723 | 4,229 | |
| * | Shake Shack Inc. Class A | 88,657 | 4,225 |
| Bloomin' Brands Inc. | 208,801 | 4,222 | |
| * | Tri Pointe Homes Inc. | 243,020 | 4,212 |
| MDC Holdings Inc. | 135,200 | 4,202 | |
| * | Dave & Buster's Entertainment Inc. | 101,540 | 4,198 |
| * | KAR Auction Services Inc. | 285,169 | 4,163 |
| American Eagle Outfitters Inc. | 364,853 | 4,108 | |
| * | Adtalem Global Education Inc. | 106,287 | 4,006 |
| Jack in the Box Inc. | 50,113 | 4,002 | |
| Oxford Industries Inc. | 36,739 | 3,921 |
| Shares | Market Value• ($000) | ||
| Acushnet Holdings Corp. | 81,045 | 3,862 | |
| * | Everi Holdings Inc. | 208,147 | 3,851 |
| Gray Television Inc. | 200,370 | 3,827 | |
| * | Sally Beauty Holdings Inc. | 253,571 | 3,773 |
| * | iRobot Corp. | 63,417 | 3,734 |
| * | Vista Outdoor Inc. | 132,226 | 3,718 |
| Wolverine World Wide Inc. | 189,340 | 3,700 | |
| PriceSmart Inc. | 58,268 | 3,687 | |
| * | Tenneco Inc. Class A | 195,170 | 3,681 |
| * | Stride Inc. | 96,144 | 3,667 |
| * | Central Garden & Pet Co. Class A | 96,830 | 3,656 |
| Monro Inc. | 78,883 | 3,653 | |
| * | ODP Corp. | 101,767 | 3,638 |
| * | Cinemark Holdings Inc. | 257,909 | 3,631 |
| Cheesecake Factory Inc. | 118,066 | 3,615 | |
| * | Allegiant Travel Co. | 36,655 | 3,537 |
| Strategic Education Inc. | 54,467 | 3,524 | |
| * | XPEL Inc. | 51,093 | 3,501 |
| *,1 | Fisker Inc. | 387,531 | 3,499 |
| * | Figs Inc. Class A | 301,551 | 3,486 |
| * | Madison Square Garden Entertainment Corp. | 60,944 | 3,386 |
| Inter Parfums Inc. | 42,546 | 3,341 | |
| Rent-A-Center Inc. | 125,906 | 3,253 | |
| Century Communities Inc. | 69,266 | 3,234 | |
| * | Knowles Corp. | 211,979 | 3,211 |
| HNI Corp. | 100,115 | 3,204 | |
| * | Urban Outfitters Inc. | 156,307 | 3,146 |
| * | Coursera Inc. | 268,277 | 3,085 |
| Dillard's Inc. Class A | 10,260 | 3,039 | |
| Scholastic Corp. | 65,486 | 3,006 | |
| Laureate Education Inc. Class A | 267,893 | 2,952 | |
| * | Malibu Boats Inc. Class A | 49,146 | 2,950 |
| * | M/I Homes Inc. | 65,148 | 2,817 |
| * | American Axle & Manufacturing Holdings Inc. | 267,901 | 2,773 |
| 1 | Camping World Holdings Inc. Class A | 91,351 | 2,751 |
| * | Clean Energy Fuels Corp. | 401,960 | 2,701 |
| La-Z-Boy Inc. | 101,659 | 2,683 | |
| * | Overstock.com Inc. | 101,115 | 2,639 |
| * | Lions Gate Entertainment Corp. Class B | 279,621 | 2,609 |
| Qurate Retail Inc. Series A | 828,585 | 2,569 | |
| Sonic Automotive Inc. Class A | 47,760 | 2,540 | |
| * | iHeartMedia Inc. Class A | 286,636 | 2,537 |
| * | Udemy Inc. | 170,367 | 2,532 |
| * | Brinker International Inc. | 102,807 | 2,520 |
| * | SkyWest Inc. | 118,134 | 2,515 |
| Dine Brands Global Inc. | 37,372 | 2,489 | |
| * | Liberty Media Corp.- Liberty Braves Class C | 90,640 | 2,478 |
| * | PROG Holdings Inc. | 128,337 | 2,379 |
| Designer Brands Inc. Class A | 136,771 | 2,333 | |
| Buckle Inc. | 71,751 | 2,316 | |
| Steelcase Inc. Class A | 203,369 | 2,274 | |
| * | Revolve Group Inc. | 96,448 | 2,266 |
| * | ACV Auctions Inc. Class A | 266,219 | 2,266 |
| *,1 | Bally's Corp. | 94,036 | 2,228 |
| Franchise Group Inc. | 65,375 | 2,216 | |
| Caleres Inc. | 86,457 | 2,206 |
| Shares | Market Value• ($000) | ||
| * | G-III Apparel Group Ltd. | 103,584 | 2,183 |
| Sinclair Broadcast Group Inc. Class A | 98,414 | 2,174 | |
| Sturm Ruger & Co. Inc. | 40,830 | 2,133 | |
| * | Sleep Number Corp. | 51,014 | 2,113 |
| * | Cars.com Inc. | 164,094 | 2,092 |
| * | EW Scripps Co. Class A | 138,470 | 2,070 |
| Krispy Kreme Inc. | 170,320 | 2,001 | |
| * | PowerSchool Holdings Inc. Class A | 108,173 | 1,947 |
| * | AMC Networks Inc. Class A | 71,915 | 1,927 |
| Arko Corp. | 201,250 | 1,918 | |
| * | Monarch Casino & Resort Inc. | 31,525 | 1,904 |
| * | GoPro Inc. Class A | 309,686 | 1,886 |
| *,1 | Blink Charging Co. | 87,563 | 1,871 |
| * | Perdoceo Education Corp. | 161,360 | 1,869 |
| * | Golden Entertainment Inc. | 48,368 | 1,851 |
| * | Viad Corp. | 47,994 | 1,832 |
| * | Imax Corp. | 115,964 | 1,818 |
| * | MarineMax Inc. | 49,987 | 1,817 |
| Matthews International Corp. Class A | 72,298 | 1,808 | |
| * | Bed Bath & Beyond Inc. | 188,487 | 1,796 |
| * | Hawaiian Holdings Inc. | 119,631 | 1,793 |
| Standard Motor Products Inc. | 48,547 | 1,782 | |
| Hibbett Inc. | 30,262 | 1,773 | |
| * | Genesco Inc. | 31,052 | 1,757 |
| * | ContextLogic Inc. Class A | 1,344,532 | 1,748 |
| * | Vizio Holding Corp. Class A | 160,033 | 1,716 |
| * | Abercrombie & Fitch Co. Class A | 117,280 | 1,688 |
| * | Funko Inc. Class A | 75,549 | 1,682 |
| * | Chico's FAS Inc. | 290,765 | 1,652 |
| * | Green Brick Partners Inc. | 67,364 | 1,641 |
| * | TravelCenters of America Inc. | 29,897 | 1,617 |
| * | Sun Country Airlines Holdings Inc. | 78,880 | 1,571 |
| Interface Inc. Class A | 138,820 | 1,551 | |
| * | Thryv Holdings Inc. | 60,484 | 1,547 |
| * | QuinStreet Inc. | 122,727 | 1,474 |
| Smith & Wesson Brands Inc. | 107,081 | 1,424 | |
| Guess? Inc. | 81,055 | 1,416 | |
| Ruth's Hospitality Group Inc. | 77,123 | 1,405 | |
| Winmark Corp. | 6,758 | 1,395 | |
| * | Corsair Gaming Inc. | 90,563 | 1,394 |
| * | Clear Channel Outdoor Holdings Inc. | 865,593 | 1,385 |
| *,1 | OneSpaWorld Holdings Ltd. | 157,019 | 1,383 |
| Big Lots Inc. | 66,238 | 1,363 | |
| RCI Hospitality Holdings Inc. | 20,901 | 1,363 | |
| * | BJ's Restaurants Inc. | 53,733 | 1,348 |
| * | Denny's Corp. | 142,059 | 1,342 |
| * | Lions Gate Entertainment Corp. Class A | 134,692 | 1,327 |
| A-Mark Precious Metals Inc. | 42,657 | 1,319 | |
| * | Accel Entertainment Inc. Class A | 139,964 | 1,317 |
| * | Children's Place Inc. | 31,053 | 1,310 |
| Shares | Market Value• ($000) | ||
| * | Boston Omaha Corp. Class A | 48,273 | 1,295 |
| Ethan Allen Interiors Inc. | 53,627 | 1,275 | |
| * | 2U Inc. | 177,213 | 1,262 |
| * | Stagwell Inc. | 185,396 | 1,257 |
| * | Arlo Technologies Inc. | 201,507 | 1,227 |
| * | Tupperware Brands Corp. | 107,226 | 1,205 |
| * | Stoneridge Inc. | 62,390 | 1,185 |
| Movado Group Inc. | 36,998 | 1,180 | |
| * | Life Time Group Holdings Inc. | 99,205 | 1,176 |
| * | Poshmark Inc. Class A | 108,426 | 1,173 |
| 1 | Ermenegildo Zegna NV | 111,681 | 1,144 |
| * | Frontier Group Holdings Inc. | 88,330 | 1,139 |
| * | America's Car-Mart Inc. | 14,078 | 1,135 |
| Carriage Services Inc. Class A | 31,914 | 1,130 | |
| *,1 | Bowlero Corp. | 92,382 | 1,092 |
| European Wax Center Inc. Class A | 50,331 | 1,089 | |
| *,1 | Vuzix Corp. | 140,700 | 1,057 |
| * | Master Craft Boat Holdings Inc. | 43,459 | 1,047 |
| * | Portillo's Inc. Class A | 47,390 | 1,044 |
| * | OneWater Marine Inc. Class A | 26,082 | 1,039 |
| * | Cardlytics Inc. | 78,234 | 1,036 |
| Clarus Corp. | 68,069 | 1,033 | |
| * | Liquidity Services Inc. | 58,866 | 1,030 |
| * | Lovesac Co. | 33,057 | 1,020 |
| Shoe Carnival Inc. | 42,079 | 1,001 | |
| * | Beazer Homes USA Inc. | 69,990 | 997 |
| * | Chuy's Holdings Inc. | 44,366 | 991 |
| * | Stitch Fix Inc. Class A | 192,836 | 968 |
| * | Zumiez Inc. | 37,236 | 967 |
| Haverty Furniture Cos. Inc. | 35,455 | 951 | |
| * | Instructure Holdings Inc. | 41,249 | 938 |
| Global Industrial Co. | 30,921 | 930 | |
| * | Allbirds Inc. Class A | 224,317 | 922 |
| * | Central Garden & Pet Co. | 22,935 | 916 |
| Marcus Corp. | 56,084 | 902 | |
| *,1 | Canoo Inc. | 271,434 | 866 |
| Aaron's Co. Inc. | 72,028 | 857 | |
| * | Rover Group Inc. Class A | 221,109 | 842 |
| * | Sportsman's Warehouse Holdings Inc. | 103,398 | 823 |
| * | Kura Sushi USA Inc. Class A | 10,922 | 817 |
| *,1 | Lordstown Motors Corp. Class A | 375,841 | 804 |
| * | Gannett Co. Inc. | 345,189 | 801 |
| Rush Enterprises Inc. Class B | 15,801 | 800 | |
| * | Daily Journal Corp. | 3,050 | 797 |
| * | AMMO Inc. | 207,626 | 791 |
| * | CarParts.com Inc. | 121,298 | 786 |
| * | Destination XL Group Inc. | 141,000 | 777 |
| Johnson Outdoors Inc. Class A | 12,535 | 766 | |
| * | Integral Ad Science Holding Corp. | 91,709 | 746 |
| * | Xponential Fitness Inc. Class A | 40,138 | 736 |
| * | Eastman Kodak Co. | 134,681 | 729 |
| Shares | Market Value• ($000) | ||
| Entravision Communications Corp. Class A | 140,205 | 712 | |
| * | Wheels Up Experience Inc. | 379,774 | 710 |
| * | Rush Street Interactive Inc. | 142,778 | 691 |
| * | Holley Inc. | 121,008 | 686 |
| * | Playstudios Inc. | 185,742 | 672 |
| * | WW International Inc. | 127,311 | 665 |
| * | Motorcar Parts of America Inc. | 44,137 | 656 |
| Kimball International Inc. Class B | 85,304 | 653 | |
| * | Universal Electronics Inc. | 28,576 | 635 |
| * | Liberty Media Corp.- Liberty Braves Class A | 22,457 | 631 |
| Bluegreen Vacations Holding Class A | 30,105 | 627 | |
| 1 | Big 5 Sporting Goods Corp. | 50,775 | 621 |
| *,1 | Dream Finders Homes Inc. Class A | 49,495 | 611 |
| * | Latham Group Inc. | 103,794 | 593 |
| * | Lindblad Expeditions Holdings Inc. | 76,276 | 590 |
| Alta Equipment Group Inc. | 49,763 | 586 | |
| *,1 | Cenntro Electric Group Ltd. | 432,946 | 571 |
| * | LL Flooring Holdings Inc. | 69,001 | 562 |
| * | 1-800-Flowers.com Inc. Class A | 63,444 | 551 |
| * | Inspired Entertainment Inc. | 52,611 | 551 |
| * | Sweetgreen Inc. Class A | 32,315 | 546 |
| * | RumbleON Inc. Class B | 24,630 | 538 |
| * | Full House Resorts Inc. | 78,280 | 528 |
| * | Universal Technical Institute Inc. | 76,561 | 525 |
| * | Container Store Group Inc. | 77,128 | 523 |
| * | Party City Holdco Inc. | 263,863 | 520 |
| Build-A-Bear Workshop Inc. | 33,474 | 513 | |
| * | Neogames SA | 31,282 | 500 |
| * | Lands' End Inc. | 35,650 | 493 |
| *,1 | Rent the Runway Inc. Class A | 110,869 | 493 |
| * | Hovnanian Enterprises Inc. Class A | 12,239 | 491 |
| * | Snap One Holdings Corp. | 42,772 | 479 |
| * | Century Casinos Inc. | 64,767 | 477 |
| Cato Corp. Class A | 43,604 | 471 | |
| * | Fossil Group Inc. | 109,981 | 465 |
| * | Noodles & Co. Class A | 97,307 | 462 |
| 1 | Weber Inc. Class A | 64,354 | 462 |
| * | American Public Education Inc. | 44,209 | 457 |
| *,1 | Focus Universal Inc. | 41,805 | 449 |
| * | RealReal Inc. | 203,010 | 434 |
| Rocky Brands Inc. | 16,369 | 428 | |
| * | El Pollo Loco Holdings Inc. | 46,510 | 421 |
| * | Outbrain Inc. | 94,673 | 417 |
| * | Cumulus Media Inc. Class A | 44,459 | 414 |
| Tilly's Inc. Class A | 55,169 | 414 |
| Shares | Market Value• ($000) | ||
| * | First Watch Restaurant Group Inc. | 23,847 | 400 |
| * | Citi Trends Inc. | 19,660 | 397 |
| * | Nerdy Inc. | 129,687 | 397 |
| * | Quotient Technology Inc. | 211,088 | 393 |
| * | Vacasa Inc. | 97,653 | 391 |
| * | ONE Group Hospitality Inc. | 53,971 | 385 |
| * | Ondas Holdings Inc. | 81,520 | 385 |
| * | Purple Innovation Inc. Class A | 130,696 | 374 |
| Weyco Group Inc. | 14,139 | 362 | |
| * | Legacy Housing Corp. | 21,116 | 361 |
| * | Selectquote Inc. | 316,401 | 351 |
| Tile Shop Holdings Inc. | 87,915 | 345 | |
| * | Turtle Beach Corp. | 36,794 | 345 |
| * | ThredUP Inc. Class A | 140,280 | 338 |
| *,1 | Aterian Inc. | 145,850 | 333 |
| * | Reservoir Media Inc. | 47,178 | 309 |
| Superior Group of Cos. Inc. | 27,742 | 308 | |
| * | Conn's Inc. | 31,567 | 303 |
| * | BARK Inc. | 118,550 | 275 |
| * | Duluth Holdings Inc. Class B | 30,682 | 272 |
| Lifetime Brands Inc. | 29,517 | 263 | |
| *,1 | Faraday Future Intelligent Electric Inc. | 232,656 | 261 |
| * | Biglari Holdings Inc. Class B | 1,824 | 246 |
| * | Express Inc. | 155,591 | 236 |
| * | StoneMor Inc. | 62,893 | 216 |
| * | Solo Brands Inc. Class A | 50,648 | 210 |
| * | F45 Training Holdings Inc. | 83,619 | 209 |
| * | Traeger Inc. | 77,724 | 205 |
| Marine Products Corp. | 19,689 | 196 | |
| *,1 | Torrid Holdings Inc. | 34,458 | 193 |
| 1 | JOANN Inc. | 26,774 | 190 |
| *,1 | Sonder Holdings Inc. | 100,625 | 187 |
| NL Industries Inc. | 19,954 | 176 | |
| *,1 | Bird Global Inc. | 395,024 | 168 |
| * | Landsea Homes Corp. | 23,752 | 159 |
| * | Gambling.com Group Ltd. | 19,890 | 157 |
| * | Audacy Inc. Class A | 275,381 | 152 |
| * | Urban One Inc. (XNCM) | 21,981 | 120 |
| * | Urban One Inc. | 26,531 | 111 |
| CompX International Inc. | 3,944 | 95 | |
| * | Lulu's Fashion Lounge Holdings Inc. | 13,409 | 86 |
| * | Inspirato Inc. | 23,584 | 66 |
| *,1 | Owlet Inc. | 37,984 | 62 |
| * | aka Brands Holding Corp. | 27,305 | 57 |
| *,1 | Mullen Automotive Inc. | 34,974 | 23 |
| * | Eros Media World PLC | 43,959 | 4 |
| 720,309 | |||
| Consumer Staples (3.3%) | |||
| * | Celsius Holdings Inc. | 129,563 | 13,408 |
| Lancaster Colony Corp. | 45,977 | 7,749 | |
| * | Hostess Brands Inc. Class A | 326,615 | 7,571 |
| * | Sprouts Farmers Market Inc. | 260,131 | 7,518 |
| * | BellRing Brands Inc. | 312,612 | 7,406 |
| * | Simply Good Foods Co. | 213,502 | 6,523 |
| WD-40 Co. | 32,471 | 6,142 | |
| * | Herbalife Nutrition Ltd. | 234,300 | 6,113 |
| * | United Natural Foods Inc. | 137,725 | 6,071 |
| Shares | Market Value• ($000) | ||
| * | TreeHouse Foods Inc. | 120,317 | 5,607 |
| J & J Snack Foods Corp. | 35,914 | 5,352 | |
| Coca-Cola Consolidated Inc. | 11,076 | 5,254 | |
| Edgewell Personal Care Co. | 127,182 | 4,955 | |
| Primo Water Corp. | 372,622 | 4,896 | |
| Nu Skin Enterprises Inc. Class A | 118,177 | 4,838 | |
| Cal-Maine Foods Inc. | 89,695 | 4,809 | |
| Energizer Holdings Inc. | 157,765 | 4,433 | |
| MGP Ingredients Inc. | 33,253 | 3,640 | |
| * | Hain Celestial Group Inc. | 177,798 | 3,602 |
| *,1 | Beyond Meat Inc. | 145,230 | 3,544 |
| 1 | B&G Foods Inc. | 161,029 | 3,488 |
| Medifast Inc. | 26,918 | 3,378 | |
| Vector Group Ltd. | 340,704 | 3,339 | |
| National Beverage Corp. | 56,006 | 3,106 | |
| Weis Markets Inc. | 38,737 | 3,010 | |
| Ingles Markets Inc. Class A | 33,623 | 2,943 | |
| Universal Corp. | 57,178 | 2,918 | |
| Andersons Inc. | 75,735 | 2,804 | |
| * | Beauty Health Co. | 236,377 | 2,742 |
| * | Chefs' Warehouse Inc. | 80,867 | 2,696 |
| Utz Brands Inc. | 155,874 | 2,597 | |
| SpartanNash Co. | 84,413 | 2,569 | |
| *,1 | Veru Inc. | 153,502 | 2,349 |
| * | SunOpta Inc. | 231,561 | 2,299 |
| Fresh Del Monte Produce Inc. | 72,616 | 1,985 | |
| Calavo Growers Inc. | 40,941 | 1,721 | |
| * | USANA Health Sciences Inc. | 26,649 | 1,719 |
| John B Sanfilippo & Son Inc. | 21,226 | 1,714 | |
| * | Duckhorn Portfolio Inc. | 87,683 | 1,599 |
| * | Mission Produce Inc. | 94,643 | 1,524 |
| *,1 | Benson Hill Inc. | 404,569 | 1,436 |
| ACCO Brands Corp. | 225,399 | 1,337 | |
| Tootsie Roll Industries Inc. | 36,084 | 1,293 | |
| * | Sovos Brands Inc. | 67,894 | 1,037 |
| PetMed Express Inc. | 48,095 | 989 | |
| * | Vita Coco Co. Inc. | 65,589 | 983 |
| * | Rite Aid Corp. | 129,705 | 931 |
| * | Vital Farms Inc. | 70,646 | 915 |
| Turning Point Brands Inc. | 35,926 | 838 | |
| *,1 | Tattooed Chef Inc. | 115,766 | 771 |
| * | Seneca Foods Corp. Class A | 13,874 | 733 |
| * | Landec Corp. | 61,872 | 650 |
| *,1 | GrowGeneration Corp. | 135,531 | 644 |
| *,1 | BRC Inc. Class A | 60,759 | 592 |
| * | Honest Co. Inc. | 153,982 | 556 |
| * | 22nd Century Group Inc. | 381,496 | 511 |
| Alico Inc. | 14,783 | 502 | |
| * | Whole Earth Brands Inc. | 95,246 | 487 |
| *,1 | AppHarvest Inc. | 168,321 | 485 |
| * | Vintage Wine Estates Inc. | 76,508 | 452 |
| Village Super Market Inc. Class A | 20,382 | 448 | |
| * | HF Foods Group Inc. | 86,272 | 439 |
| * | PLBY Group Inc. | 73,493 | 331 |
| Natural Grocers by Vitamin Cottage Inc. | 22,521 | 323 | |
| * | Nature's Sunshine Products Inc. | 33,068 | 321 |
| *,1 | Local Bounti Corp. | 43,247 | 161 |
| Shares | Market Value• ($000) | ||
| * | Boxed Inc. | 26,531 | 28 |
| 188,124 | |||
| Energy (6.7%) | |||
| Matador Resources Co. | 266,485 | 15,882 | |
| Chord Energy Corp. | 100,406 | 14,212 | |
| Murphy Oil Corp. | 348,959 | 13,599 | |
| SM Energy Co. | 286,786 | 12,639 | |
| Civitas Resources Inc. | 174,721 | 11,739 | |
| * | Denbury Inc. | 120,223 | 10,691 |
| ChampionX Corp. | 484,254 | 10,562 | |
| Helmerich & Payne Inc. | 243,476 | 10,409 | |
| Magnolia Oil & Gas Corp. Class A | 395,162 | 9,433 | |
| California Resources Corp. | 185,337 | 9,259 | |
| Equitrans Midstream Corp. | 974,191 | 9,031 | |
| * | CNX Resources Corp. | 456,597 | 8,068 |
| * | PBF Energy Inc. Class A | 229,457 | 7,838 |
| Patterson-UTI Energy Inc. | 508,605 | 7,578 | |
| * | Kosmos Energy Ltd. | 1,070,385 | 7,568 |
| * | Array Technologies Inc. | 357,438 | 7,470 |
| * | Valaris Ltd. | 144,380 | 7,360 |
| * | Shoals Technologies Group Inc. Class A | 264,469 | 6,974 |
| * | Peabody Energy Corp. | 279,179 | 6,885 |
| Arcosa Inc. | 114,822 | 6,711 | |
| Alpha Metallurgical Resources Inc. | 42,258 | 6,641 | |
| * | Golar LNG Ltd. | 239,346 | 6,527 |
| CONSOL Energy Inc. | 81,219 | 5,830 | |
| Cactus Inc. Class A | 139,513 | 5,574 | |
| * | Stem Inc. | 341,301 | 5,365 |
| Arch Resources Inc. | 35,998 | 5,241 | |
| * | Ameresco Inc. Class A | 75,266 | 5,182 |
| * | Liberty Energy Inc. Class A | 337,826 | 5,067 |
| * | Callon Petroleum Co. | 116,362 | 4,952 |
| Northern Oil and Gas Inc. | 155,207 | 4,911 | |
| * | Tellurian Inc. | 1,206,632 | 4,827 |
| Delek US Holdings Inc. | 166,777 | 4,711 | |
| * | Weatherford International plc | 167,367 | 4,710 |
| * | SunPower Corp. | 193,461 | 4,643 |
| * | Green Plains Inc. | 124,775 | 4,571 |
| * | Comstock Resources Inc. | 217,025 | 4,254 |
| * | Centennial Resource Development Inc. Class A | 487,031 | 4,008 |
| Warrior Met Coal Inc. | 122,006 | 3,971 | |
| * | NexTier Oilfield Solutions Inc. | 416,413 | 3,902 |
| World Fuel Services Corp. | 147,647 | 3,809 | |
| * | FuelCell Energy Inc. | 874,901 | 3,666 |
| Brigham Minerals Inc. Class A | 120,770 | 3,593 | |
| * | Talos Energy Inc. | 156,388 | 3,242 |
| * | NOW Inc. | 261,030 | 3,164 |
| * | Laredo Petroleum Inc. | 40,465 | 3,140 |
| * | Nabors Industries Ltd. (XNYS) | 21,434 | 2,840 |
| * | Gulfport Energy Corp. | 28,207 | 2,758 |
| * | Montauk Renewables Inc. | 152,373 | 2,705 |
| * | Noble Corp. | 88,982 | 2,701 |
| * | Expro Group Holdings NV | 184,503 | 2,494 |
| Archrock Inc. | 319,880 | 2,364 | |
| CVR Energy Inc. | 70,210 | 2,293 | |
| Shares | Market Value• ($000) | ||
| * | Par Pacific Holdings Inc. | 115,693 | 2,175 |
| * | Oceaneering International Inc. | 237,126 | 2,099 |
| * | Tidewater Inc. | 90,338 | 2,002 |
| Ranger Oil Corp. Class A | 50,488 | 1,969 | |
| * | MRC Global Inc. | 196,004 | 1,907 |
| * | ProPetro Holding Corp. | 206,207 | 1,889 |
| * | Dril-Quip Inc. | 80,984 | 1,792 |
| Berry Corp. | 190,802 | 1,746 | |
| * | Fluence Energy Inc. | 85,112 | 1,698 |
| * | Diamond Offshore Drilling Inc. | 237,190 | 1,686 |
| * | Bristow Group Inc. | 55,893 | 1,621 |
| * | TPI Composites Inc. | 86,541 | 1,609 |
| * | SandRidge Energy Inc. | 74,995 | 1,573 |
| *,1 | Earthstone Energy Inc. Class A | 101,900 | 1,549 |
| *,1 | EVgo Inc. | 160,762 | 1,526 |
| * | Helix Energy Solutions Group Inc. | 338,565 | 1,463 |
| * | W&T Offshore Inc. | 224,469 | 1,459 |
| *,1 | Gevo Inc. | 465,894 | 1,458 |
| 1 | Kinetik Holdings Inc. | 39,039 | 1,439 |
| RPC Inc. | 175,668 | 1,397 | |
| Crescent Energy Inc. Class A | 77,269 | 1,324 | |
| SunCoke Energy Inc. | 196,638 | 1,296 | |
| *,1 | Borr Drilling Ltd. | 317,202 | 1,272 |
| * | Centrus Energy Corp. Class A | 25,096 | 1,250 |
| * | Select Energy Services Inc. Class A | 169,007 | 1,202 |
| * | TETRA Technologies Inc. | 294,554 | 1,172 |
| * | REX American Resources Corp. | 37,554 | 1,138 |
| * | SilverBow Resources Inc. | 27,850 | 1,107 |
| * | DMC Global Inc. | 44,904 | 1,002 |
| * | Solid Power Inc. | 133,289 | 877 |
| *,1 | ESS Tech Inc. | 189,887 | 843 |
| Solaris Oilfield Infrastructure Inc. Class A | 74,192 | 794 | |
| * | Oil States International Inc. | 143,320 | 702 |
| VAALCO Energy Inc. | 139,822 | 701 | |
| Sitio Royalties Corp. | 27,417 | 697 | |
| * | Ring Energy Inc. | 204,648 | 663 |
| * | National Energy Services Reunited Corp. | 90,216 | 633 |
| * | Aemetis Inc. | 69,066 | 630 |
| * | Amplify Energy Corp. | 84,448 | 629 |
| *,1 | Volta Inc. | 288,870 | 618 |
| Riley Exploration Permian Inc. | 24,551 | 617 | |
| * | Newpark Resources Inc. | 200,036 | 576 |
| Ramaco Resources Inc. | 52,719 | 556 | |
| * | NextDecade Corp. | 73,387 | 541 |
| NACCO Industries Inc. Class A | 9,731 | 438 | |
| * | FTC Solar Inc. | 98,671 | 408 |
| HighPeak Energy Inc. | 15,388 | 390 | |
| *,1 | Energy Vault Holdings Inc. | 61,010 | 336 |
| * | ProFrac Holding Corp. Class A | 13,490 | 266 |
| * | Empire Petroleum Corp. | 15,632 | 231 |
| *,1 | Nabors Industries Ltd. Warrants Exp. 6/11/26 | 5,784 | 198 |
| * | Heliogen Inc. | 44,110 | 106 |
| Shares | Market Value• ($000) | ||
| * | Battalion Oil Corp. | 5,761 | 76 |
| 384,910 | |||
| Financials (16.8%) | |||
| SouthState Corp. | 177,595 | 13,860 | |
| Glacier Bancorp Inc. | 263,206 | 13,339 | |
| First Financial Bankshares Inc. | 307,557 | 13,074 | |
| Kinsale Capital Group Inc. | 51,186 | 12,980 | |
| Valley National Bancorp | 1,019,877 | 11,851 | |
| Blackstone Mortgage Trust Inc. Class A | 403,187 | 11,684 | |
| United Bankshares Inc. | 313,760 | 11,641 | |
| Old National Bancorp | 694,333 | 11,588 | |
| Selective Insurance Group Inc. | 141,277 | 11,220 | |
| Cadence Bank | 434,200 | 11,063 | |
| Home BancShares Inc. | 450,204 | 10,593 | |
| RLI Corp. | 92,478 | 10,150 | |
| ServisFirst Bancshares Inc. | 118,893 | 10,030 | |
| Essent Group Ltd. | 249,522 | 9,978 | |
| Hancock Whitney Corp. | 204,184 | 9,848 | |
| Houlihan Lokey Inc. Class A | 120,814 | 9,484 | |
| UMB Financial Corp. | 104,220 | 9,325 | |
| First Interstate BancSystem Inc. Class A | 221,935 | 8,935 | |
| Radian Group Inc. | 410,358 | 8,663 | |
| Independent Bank Corp. (XNGS) | 110,591 | 8,652 | |
| United Community Banks Inc. | 251,989 | 8,449 | |
| CVB Financial Corp. | 320,200 | 8,402 | |
| Community Bank System Inc. | 126,436 | 8,266 | |
| Eastern Bankshares Inc. | 381,081 | 7,393 | |
| WSFS Financial Corp. | 152,435 | 7,370 | |
| Ameris Bancorp | 156,532 | 7,307 | |
| Walker & Dunlop Inc. | 72,667 | 7,300 | |
| Pacific Premier Bancorp Inc. | 222,420 | 7,286 | |
| * | Mr Cooper Group Inc. | 172,019 | 7,276 |
| BankUnited Inc. | 193,488 | 7,169 | |
| Cathay General Bancorp | 170,587 | 7,154 | |
| FirstCash Holdings Inc. | 91,441 | 7,129 | |
| * | Texas Capital Bancshares Inc. | 120,540 | 7,115 |
| Federated Hermes Inc. | 208,093 | 7,088 | |
| Associated Banc-Corp. | 353,564 | 7,085 | |
| American Equity Investment Life Holding Co. | 184,615 | 7,015 | |
| Simmons First National Corp. Class A | 296,484 | 6,994 | |
| * | Silvergate Capital Corp. Class A | 74,276 | 6,768 |
| First BanCorp. (XNYS) | 464,857 | 6,647 | |
| * | Trupanion Inc. | 92,434 | 6,524 |
| Moelis & Co. Class A | 152,880 | 6,369 | |
| Fulton Financial Corp. | 384,594 | 6,242 | |
| Independent Bank Group Inc. | 87,181 | 5,873 | |
| Hamilton Lane Inc. Class A | 83,686 | 5,823 | |
| Atlantic Union Bankshares Corp. | 177,229 | 5,751 | |
| * | Axos Financial Inc. | 135,552 | 5,663 |
| Shares | Market Value• ($000) | ||
| Jackson Financial Inc. Class A | 179,071 | 5,598 | |
| Columbia Banking System Inc. | 186,427 | 5,584 | |
| Arbor Realty Trust Inc. | 368,532 | 5,521 | |
| First Merchants Corp. | 135,403 | 5,392 | |
| * | Focus Financial Partners Inc. Class A | 137,592 | 5,387 |
| International Bancshares Corp. | 128,632 | 5,368 | |
| * | Enstar Group Ltd. | 27,413 | 5,188 |
| * | Genworth Financial Inc. Class A | 1,207,264 | 5,095 |
| CNO Financial Group Inc. | 272,787 | 5,022 | |
| BancFirst Corp. | 46,521 | 5,018 | |
| Washington Federal Inc. | 153,655 | 4,919 | |
| Banner Corp. | 80,904 | 4,916 | |
| Artisan Partners Asset Management Inc. Class A | 142,548 | 4,812 | |
| Chimera Investment Corp. | 562,664 | 4,783 | |
| Flagstar Bancorp Inc. | 123,714 | 4,767 | |
| First Financial Bancorp | 220,627 | 4,761 | |
| WesBanco Inc. | 138,058 | 4,723 | |
| Piper Sandler Cos. | 41,100 | 4,709 | |
| Seacoast Banking Corp. of Florida | 143,252 | 4,630 | |
| Trustmark Corp. | 145,264 | 4,582 | |
| * | Palomar Holdings Inc. | 57,445 | 4,555 |
| Towne Bank | 159,367 | 4,540 | |
| Stock Yards Bancorp Inc. | 67,751 | 4,489 | |
| Park National Corp. | 33,973 | 4,479 | |
| Lakeland Financial Corp. | 58,057 | 4,374 | |
| Heartland Financial USA Inc. | 97,312 | ��� 4,347 | |
| * | BRP Group Inc. Class A | 138,385 | 4,345 |
| Renasant Corp. | 129,583 | 4,320 | |
| Cohen & Steers Inc. | 60,137 | 4,293 | |
| Navient Corp. | 275,534 | 4,240 | |
| Provident Financial Services Inc. | 176,857 | 4,108 | |
| * | NMI Holdings Inc. Class A | 199,947 | 4,105 |
| Northwest Bancshares Inc. | 287,695 | 4,048 | |
| Sandy Spring Bancorp Inc. | 104,823 | 4,038 | |
| Hope Bancorp Inc. | 274,463 | 3,971 | |
| Two Harbors Investment Corp. | 817,575 | 3,965 | |
| PJT Partners Inc. Class A | 56,855 | 3,936 | |
| Apollo Commercial Real Estate Finance Inc. | 332,998 | 3,879 | |
| * | Cannae Holdings Inc. | 178,982 | 3,868 |
| NBT Bancorp Inc. | 98,988 | 3,839 | |
| Bank of NT Butterfield & Son Ltd. | 117,666 | 3,838 | |
| Hilltop Holdings Inc. | 145,228 | 3,834 | |
| Enterprise Financial Services Corp. | 83,540 | 3,819 | |
| * | StoneX Group Inc. | 40,822 | 3,790 |
| Veritex Holdings Inc. | 124,440 | 3,747 | |
| Claros Mortgage Trust Inc. | 217,921 | 3,724 | |
| PennyMac Financial Services Inc. | 70,013 | 3,719 | |
| Eagle Bancorp Inc. | 75,173 | 3,648 | |
| TriCo Bancshares | 75,018 | 3,540 | |
| * | Triumph Bancorp Inc. | 56,891 | 3,522 |
| Horace Mann Educators Corp. | 98,422 | 3,521 |
| Shares | Market Value• ($000) | ||
| * | PRA Group Inc. | 94,126 | 3,477 |
| Westamerica BanCorp. | 61,732 | 3,454 | |
| StepStone Group Inc. Class A | 124,869 | 3,408 | |
| FB Financial Corp. | 85,735 | 3,397 | |
| Virtus Investment Partners Inc. | 16,941 | 3,240 | |
| PennyMac Mortgage Investment Trust | 217,646 | 3,232 | |
| Stewart Information Services Corp. | 63,424 | 3,212 | |
| * | Bancorp Inc. | 132,192 | 3,136 |
| * | LendingClub Corp. | 239,490 | 3,130 |
| * | Encore Capital Group Inc. | 57,018 | 3,118 |
| Berkshire Hills Bancorp Inc. | 109,447 | 3,088 | |
| OFG Bancorp | 113,059 | 3,075 | |
| First Bancorp (XNGS) | 83,925 | 3,056 | |
| BGC Partners Inc. Class A | 754,672 | 3,034 | |
| Safety Insurance Group Inc. | 33,653 | 3,030 | |
| Compass Diversified Holdings | 143,397 | 2,991 | |
| Nelnet Inc. Class A | 35,402 | 2,982 | |
| First Commonwealth Financial Corp. | 221,129 | 2,981 | |
| Ladder Capital Corp. Class A | 269,510 | 2,981 | |
| City Holding Co. | 34,877 | 2,965 | |
| *,1 | Marathon Digital Holdings Inc. | 239,380 | 2,837 |
| First Busey Corp. | 122,144 | 2,809 | |
| Live Oak Bancshares Inc. | 77,423 | 2,806 | |
| Capitol Federal Financial Inc. | 307,975 | 2,790 | |
| National Bank Holdings Corp. Class A | 69,382 | 2,784 | |
| S&T Bancorp Inc. | 92,689 | 2,747 | |
| ProAssurance Corp. | 127,950 | 2,737 | |
| Southside Bancshares Inc. | 72,449 | 2,730 | |
| OceanFirst Financial Corp. | 137,788 | 2,679 | |
| MFA Financial Inc. REIT | 242,778 | 2,654 | |
| * | Enova International Inc. | 75,422 | 2,635 |
| Franklin BSP Realty Trust Inc. REIT | 199,402 | 2,572 | |
| Employers Holdings Inc. | 65,362 | 2,560 | |
| * | Customers Bancorp Inc. | 73,277 | 2,542 |
| New York Mortgage Trust Inc. | 897,845 | 2,514 | |
| German American Bancorp Inc. | 65,782 | 2,471 | |
| Dime Community Bancshares Inc. | 78,912 | 2,467 | |
| *,1 | Lemonade Inc. | 109,650 | 2,425 |
| * | Open Lending Corp. Class A | 249,528 | 2,423 |
| Lakeland Bancorp Inc. | 147,495 | 2,403 | |
| B Riley Financial Inc. | 48,115 | 2,395 | |
| Cowen Inc. Class A | 62,160 | 2,390 | |
| Tompkins Financial Corp. | 33,154 | 2,375 | |
| Federal Agricultural Mortgage Corp. Class C | 21,617 | 2,361 | |
| KKR Real Estate Finance Trust Inc. | 122,572 | 2,361 | |
| * | Goosehead Insurance Inc. Class A | 45,217 | 2,351 |
| Ready Capital Corp. | 175,608 | 2,300 |
| Shares | Market Value• ($000) | ||
| * | MoneyGram International Inc. | 222,510 | 2,292 |
| First Foundation Inc. | 120,798 | 2,290 | |
| Pathward Financial Inc. | 68,559 | 2,260 | |
| Premier Financial Corp. | 83,614 | 2,259 | |
| Brookline Bancorp Inc. | 179,861 | 2,243 | |
| * | Nicolet Bankshares Inc. | 29,238 | 2,239 |
| * | Blucora Inc. | 111,275 | 2,234 |
| Preferred Bank | 32,574 | 2,210 | |
| Banc of California Inc. | 130,568 | 2,204 | |
| ConnectOne Bancorp Inc. | 87,996 | 2,203 | |
| Redwood Trust Inc. | 283,825 | 2,200 | |
| QCR Holdings Inc. | 39,167 | 2,187 | |
| Origin Bancorp Inc. | 53,373 | 2,180 | |
| iStar Inc. | 157,331 | 2,166 | |
| AMERISAFE Inc. | 45,192 | 2,161 | |
| Heritage Financial Corp. | 82,110 | 2,134 | |
| Washington Trust Bancorp Inc. | 40,842 | 2,068 | |
| James River Group Holdings Ltd. | 86,861 | 2,064 | |
| Mercury General Corp. | 63,219 | 2,017 | |
| Broadmark Realty Capital Inc. | 308,411 | 1,989 | |
| *,1 | Riot Blockchain Inc. | 277,291 | 1,988 |
| Ellington Financial Inc. | 135,127 | 1,984 | |
| Peoples Bancorp Inc. | 65,976 | 1,972 | |
| Allegiance Bancshares Inc. | 45,844 | 1,942 | |
| Brightspire Capital Inc. Class A | 225,585 | 1,895 | |
| * | Oscar Health Inc. Class A | 280,373 | 1,859 |
| CBL & Associates Properties Inc. | 63,064 | 1,825 | |
| Enact Holdings Inc. | 71,204 | 1,809 | |
| Horizon Bancorp Inc. | 95,254 | 1,802 | |
| 1st Source Corp. | 38,127 | 1,799 | |
| Hanmi Financial Corp. | 71,830 | 1,776 | |
| * | Columbia Financial Inc. | 82,197 | 1,753 |
| Amerant Bancorp Inc. | 66,707 | 1,747 | |
| * | Metropolitan Bank Holding Corp. | 24,409 | 1,747 |
| ARMOUR Residential REIT Inc. | 243,042 | 1,726 | |
| Univest Financial Corp. | 69,319 | 1,719 | |
| Kearny Financial Corp. | 147,154 | 1,672 | |
| * | Ambac Financial Group Inc. | 108,469 | 1,637 |
| WisdomTree Investments Inc. | 323,646 | 1,621 | |
| Community Trust Bancorp Inc. | 37,291 | 1,576 | |
| Heritage Commerce Corp. | 138,824 | 1,567 | |
| First Mid Bancshares Inc. | 44,072 | 1,558 | |
| Camden National Corp. | 34,218 | 1,548 | |
| Northfield Bancorp Inc. | 104,623 | 1,542 | |
| TPG RE Finance Trust Inc. | 163,781 | 1,517 | |
| Brookfield Business Corp. Class A | 61,566 | 1,497 | |
| United Fire Group Inc. | 50,806 | 1,495 | |
| HomeStreet Inc. | 42,729 | 1,487 | |
| TrustCo Bank Corp. NY | 44,567 | 1,486 | |
| Argo Group International Holdings Ltd. | 75,472 | 1,482 | |
| HarborOne Bancorp Inc. | 107,714 | 1,469 | |
| * | CrossFirst Bankshares Inc. | 107,594 | 1,418 |
| Flushing Financial Corp. | 68,509 | 1,415 |
| Shares | Market Value• ($000) | ||
| First Bancorp Inc. (XNMS) | 46,731 | 1,397 | |
| Central Pacific Financial Corp. | 64,005 | 1,395 | |
| Peapack-Gladstone Financial Corp. | 41,164 | 1,386 | |
| Old Second Bancorp Inc. | 100,285 | 1,376 | |
| * | MBIA Inc. | 113,343 | 1,336 |
| Great Southern Bancorp Inc. | 22,693 | 1,334 | |
| Cambridge Bancorp | 16,180 | 1,331 | |
| Dynex Capital Inc. | 85,815 | 1,331 | |
| Brightsphere Investment Group Inc. | 76,289 | 1,304 | |
| CBTX Inc. | 43,487 | 1,296 | |
| Byline Bancorp Inc. | 58,093 | 1,267 | |
| First Financial Corp. | 27,006 | 1,256 | |
| Midland States Bancorp Inc. | 50,071 | 1,256 | |
| Invesco Mortgage Capital REIT | 78,884 | 1,253 | |
| Bank First Corp. | 15,323 | 1,245 | |
| Diamond Hill Investment Group Inc. | 7,212 | 1,234 | |
| First Community Bankshares Inc. | 38,389 | 1,210 | |
| Mercantile Bank Corp. | 36,558 | 1,209 | |
| Granite Point Mortgage Trust Inc. | 126,451 | 1,191 | |
| Business First Bancshares Inc. | 49,763 | 1,174 | |
| Bank of Marin Bancorp | 37,232 | 1,150 | |
| Equity Bancshares Inc. Class A | 36,466 | 1,139 | |
| * | World Acceptance Corp. | 9,650 | 1,122 |
| Farmers National Banc Corp. | 74,739 | 1,068 | |
| Arrow Financial Corp. | 32,671 | 1,049 | |
| Victory Capital Holdings Inc. Class A | 39,154 | 1,049 | |
| * | EZCorp. Inc. Class A | 118,971 | 1,041 |
| Hingham Institution for Savings | 3,499 | 1,039 | |
| MidWestOne Financial Group Inc. | 33,614 | 1,025 | |
| Capital City Bank Group Inc. | 31,790 | 1,015 | |
| National Western Life Group Inc. Class A | 5,325 | 1,013 | |
| CNB Financial Corp. | 38,427 | 1,011 | |
| Merchants Bancorp | 37,107 | 1,001 | |
| * | Coastal Financial Corp. | 24,830 | 998 |
| * | Assetmark Financial Holdings Inc. | 51,250 | 991 |
| Southern Missouri Bancorp Inc. | 18,740 | 988 | |
| Bar Harbor Bankshares | 34,795 | 986 | |
| Mid Penn Bancorp Inc. | 33,662 | 979 | |
| Capstar Financial Holdings Inc. | 48,463 | 977 | |
| Independent Bank Corp. | 47,396 | 973 | |
| First of Long Island Corp. | 52,651 | 969 | |
| * | SiriusPoint Ltd. | 216,515 | 968 |
| Banco Latinoamericano de Comercio Exterior SA Class E | 65,741 | 960 | |
| * | Carter Bankshares Inc. | 57,155 | 941 |
| West BanCorp. Inc. | 38,128 | 938 | |
| SmartFinancial Inc. | 36,969 | 928 |
| Shares | Market Value• ($000) | ||
| Financial Institutions Inc. | 35,456 | 923 | |
| Republic Bancorp Inc. Class A | 20,964 | 891 | |
| Metrocity Bankshares Inc. | 43,879 | 877 | |
| Alerus Financial Corp. | 36,122 | 858 | |
| * | Professional Holding Corp. Class A | 30,425 | 851 |
| Citizens & Northern Corp. | 35,425 | 850 | |
| * | Bridgewater Bancshares Inc. | 48,501 | 833 |
| 1 | Farmers & Merchants Bancorp Inc. | 28,895 | 825 |
| Waterstone Financial Inc. | 47,384 | 819 | |
| American National Bankshares Inc. | 24,673 | 813 | |
| HCI Group Inc. | 16,907 | 808 | |
| Peoples Financial Services Corp. | 16,504 | 803 | |
| Shore Bancshares Inc. | 41,857 | 797 | |
| HomeTrust Bancshares Inc. | 34,259 | 796 | |
| GCM Grosvenor Inc. Class A | 100,908 | 792 | |
| RBB Bancorp | 35,684 | 789 | |
| Perella Weinberg Partners Class A | 109,565 | 788 | |
| First Internet Bancorp | 21,384 | 784 | |
| * | Southern First Bancshares Inc. | 17,889 | 771 |
| MVB Financial Corp. | 24,038 | 769 | |
| * | LendingTree Inc. | 24,868 | 758 |
| Five Star Bancorp | 29,701 | 755 | |
| Oppenheimer Holdings Inc. Class A | 20,659 | 750 | |
| Summit Financial Group Inc. | 26,184 | 747 | |
| Amalgamated Financial Corp. | 33,207 | 747 | |
| Universal Insurance Holdings Inc. | 61,628 | 736 | |
| Civista Bancshares Inc. | 34,356 | 727 | |
| ACNB Corp. | 20,011 | 712 | |
| Enterprise Bancorp Inc. | 22,024 | 709 | |
| * | Blue Foundry Bancorp | 62,143 | 707 |
| Primis Financial Corp. | 52,222 | 685 | |
| Home Bancorp Inc. | 17,329 | 677 | |
| Guaranty Bancshares Inc. | 19,506 | 676 | |
| John Marshall Bancorp Inc. | 26,787 | 675 | |
| Tiptree Inc. | 56,289 | 673 | |
| Sierra Bancorp | 32,369 | 671 | |
| First Bancorp Inc. (XNGS) | 23,053 | 669 | |
| South Plains Financial Inc. | 24,005 | 651 | |
| AFC Gamma Inc. | 37,258 | 648 | |
| Orrstown Financial Services Inc. | 25,069 | 645 | |
| First Business Financial Services Inc. | 18,971 | 631 | |
| Northeast Bank | 15,880 | 616 | |
| Esquire Financial Holdings Inc. | 16,429 | 614 | |
| BCB Bancorp Inc. | 34,022 | 612 | |
| Regional Management Corp. | 18,090 | 609 | |
| Macatawa Bank Corp. | 62,265 | 593 | |
| Blue Ridge Bankshares Inc. | 40,288 | 591 |
| Shares | Market Value• ($000) | ||
| Sculptor Capital Management Inc. Class A | 62,143 | 586 | |
| * | Hippo Holdings Inc. | 604,261 | 586 |
| BayCom Corp. | 30,278 | 563 | |
| First Bank | 36,783 | 551 | |
| PCSB Financial Corp. | 29,700 | 550 | |
| Colony Bankcorp Inc. | 38,659 | 546 | |
| * | Third Coast Bancshares Inc. | 30,008 | 546 |
| * | FVCBankcorp Inc. | 28,310 | 545 |
| Red River Bancshares Inc. | 10,416 | 532 | |
| Parke Bancorp Inc. | 23,873 | 530 | |
| Capital Bancorp Inc. | 21,343 | 529 | |
| Donegal Group Inc. Class A | 35,766 | 519 | |
| PCB Bancorp | 27,541 | 517 | |
| Provident Bancorp Inc. | 34,300 | 497 | |
| * | First Western Financial Inc. | 18,693 | 496 |
| * | Greenlight Capital Re Ltd. Class A | 62,441 | 493 |
| Manning & Napier Inc. | 37,705 | 480 | |
| Investors Title Co. | 3,215 | 474 | |
| Unity Bancorp Inc. | 16,831 | 472 | |
| Luther Burbank Corp. | 35,477 | 465 | |
| HBT Financial Inc. | 24,204 | 438 | |
| Bankwell Financial Group Inc. | 13,496 | 425 | |
| Greene County Bancorp Inc. | 7,994 | 425 | |
| Silvercrest Asset Management Group Inc. Class A | 23,742 | 424 | |
| 1 | Angel Oak Mortgage Inc. | 29,348 | 407 |
| * | Consumer Portfolio Services Inc. | 34,149 | 398 |
| Pzena Investment Management Inc. Class A | 40,127 | 382 | |
| Nexpoint Real Estate Finance Inc. | 18,506 | 380 | |
| * | eHealth Inc. | 58,152 | 372 |
| * | Republic First Bancorp Inc. | 112,606 | 358 |
| *,1 | Bakkt Holdings Inc. | 135,770 | 352 |
| * | USCB Financial Holdings Inc. | 26,132 | 340 |
| Curo Group Holdings Corp. | 51,119 | 337 | |
| * | Oportun Financial Corp. | 65,758 | 336 |
| First Guaranty Bancshares Inc. | 14,461 | 322 | |
| *,1 | Rigetti Computing Inc. | 77,157 | 307 |
| * | NI Holdings Inc. | 19,645 | 258 |
| * | Pioneer Bancorp Inc. | 26,766 | 250 |
| Crawford & Co. Class A | 40,157 | 244 | |
| Chicago Atlantic Real Estate Finance Inc. | 15,901 | 243 | |
| * | Root Inc. Blank | 18,803 | 233 |
| * | Sterling Bancorp Inc. | 39,424 | 232 |
| * | Trean Insurance Group Inc. | 52,224 | 232 |
| * | Velocity Financial LLC | 19,734 | 225 |
| GAMCO Investors Inc. Class A | 10,969 | 222 | |
| * | Doma Holdings Inc. | 332,176 | 200 |
| Value Line Inc. | 2,287 | 188 |
| Shares | Market Value• ($000) | ||
| * | Sunlight Financial Holdings Inc. | 55,996 | 171 |
| Associated Capital Group Inc. Class A | 4,202 | 166 | |
| * | SWK Holdings Corp. | 8,134 | 142 |
| * | Finance of America Cos. Inc. Class A | 89,585 | 109 |
| * | MarketWise Inc. | 39,200 | 109 |
| *,1 | OppFi Inc. | 31,050 | 84 |
| 1 | Home Point Capital Inc. | 19,372 | 45 |
| 962,320 | |||
| Health Care (17.0%) | |||
| * | Shockwave Medical Inc. | 84,354 | 25,041 |
| * | Biohaven Pharmaceutical Holding Co. Ltd. | 147,482 | 22,026 |
| * | Karuna Therapeutics Inc. | 69,616 | 17,756 |
| * | Halozyme Therapeutics Inc. | 321,204 | 13,083 |
| * | Apellis Pharmaceuticals Inc. | 215,376 | 13,032 |
| * | HealthEquity Inc. | 196,618 | 12,993 |
| * | Lantheus Holdings Inc. | 161,829 | 12,752 |
| * | Inspire Medical Systems Inc. | 64,405 | 12,333 |
| * | LHC Group Inc. | 70,577 | 11,396 |
| * | Option Care Health Inc. | 366,304 | 11,341 |
| * | Intra-Cellular Therapies Inc. | 217,037 | 10,908 |
| Ensign Group Inc. | 127,609 | 10,885 | |
| * | STAAR Surgical Co. | 113,580 | 10,744 |
| * | Intellia Therapeutics Inc. | 178,721 | 10,734 |
| * | Omnicell Inc. | 103,931 | 10,631 |
| * | iRhythm Technologies Inc. | 70,658 | 10,419 |
| * | Blueprint Medicines Corp. | 141,668 | 10,373 |
| * | Cytokinetics Inc. | 194,534 | 10,303 |
| * | Global Blood Therapeutics Inc. | 147,603 | 10,022 |
| * | Arrowhead Pharmaceuticals Inc. | 244,022 | 9,690 |
| * | Medpace Holdings Inc. | 65,308 | 9,640 |
| * | Alkermes plc | 386,269 | 9,143 |
| * | Haemonetics Corp. | 120,294 | 9,026 |
| * | PTC Therapeutics Inc. | 166,497 | 8,315 |
| * | Beam Therapeutics Inc. | 150,669 | 8,227 |
| * | Axonics Inc. | 111,287 | 8,040 |
| * | Inari Medical Inc. | 114,309 | 7,927 |
| * | Merit Medical Systems Inc. | 132,402 | 7,842 |
| * | ChemoCentryx Inc. | 149,544 | 7,624 |
| * | 1Life Healthcare Inc. | 427,442 | 7,356 |
| * | Amicus Therapeutics Inc. | 653,764 | 7,342 |
| * | LivaNova plc | 127,202 | 7,155 |
| * | Progyny Inc. | 177,404 | 7,133 |
| * | Evolent Health Inc. Class A | 193,848 | 7,124 |
| * | R1 RCM Inc. | 320,335 | 6,999 |
| * | Insmed Inc. | 282,835 | 6,963 |
| Select Medical Holdings Corp. | 255,971 | 6,563 | |
| * | Denali Therapeutics Inc. | 233,773 | 6,468 |
| * | BioCryst Pharmaceuticals Inc. | 439,796 | 6,113 |
| * | Prestige Consumer Healthcare Inc. | 119,263 | 6,032 |
| CONMED Corp. | 66,794 | 5,916 | |
| Patterson Cos. Inc. | 206,627 | 5,763 | |
| * | Pacira BioSciences Inc. | 106,344 | 5,581 |
| Shares | Market Value• ($000) | ||
| *,1 | Neogen Corp. | 256,658 | 5,364 |
| * | Twist Bioscience Corp. | 133,146 | 5,342 |
| * | NuVasive Inc. | 124,137 | 5,277 |
| * | Glaukos Corp. | 108,488 | 5,267 |
| * | AbCellera Biologics Inc. | 489,686 | 5,230 |
| * | Corcept Therapeutics Inc. | 201,731 | 5,209 |
| Owens & Minor Inc. | 174,900 | 5,161 | |
| * | Fate Therapeutics Inc. | 197,264 | 5,156 |
| * | AtriCure Inc. | 108,089 | 4,931 |
| * | Integer Holdings Corp. | 77,951 | 4,916 |
| * | Arvinas Inc. | 115,095 | 4,873 |
| * | ACADIA Pharmaceuticals Inc. | 284,525 | 4,675 |
| * | Sage Therapeutics Inc. | 123,210 | 4,640 |
| * | Axsome Therapeutics Inc. | 68,136 | 4,347 |
| Embecta Corp. | 135,809 | 4,335 | |
| * | Myriad Genetics Inc. | 188,033 | 4,201 |
| * | Relay Therapeutics Inc. | 181,116 | 4,160 |
| * | Privia Health Group Inc. | 102,710 | 4,087 |
| * | Vir Biotechnology Inc. | 171,496 | 4,073 |
| * | Apollo Medical Holdings Inc. | 92,098 | 3,972 |
| * | Supernus Pharmaceuticals Inc. | 115,898 | 3,967 |
| * | Travere Thrapeutics Inc. | 144,177 | 3,858 |
| * | Iovance Biotherapeutics Inc. | 356,958 | 3,827 |
| * | Nevro Corp. | 82,575 | 3,742 |
| * | Cerevel Therapeutics Holdings Inc. | 128,499 | 3,739 |
| * | Prometheus Biosciences Inc. | 69,374 | 3,629 |
| * | Pediatrix Medical Group Inc. | 203,377 | 3,624 |
| * | Xencor Inc. | 135,909 | 3,587 |
| * | Ironwood Pharmaceuticals Inc. Class A | 323,487 | 3,481 |
| * | Krystal Biotech Inc. | 49,585 | 3,476 |
| * | Veracyte Inc. | 169,554 | 3,459 |
| * | Recursion Pharmaceuticals Inc. Class A | 319,671 | 3,360 |
| * | Verve Therapeutics Inc. | 87,367 | 3,351 |
| * | Meridian Bioscience Inc. | 101,799 | 3,318 |
| * | Ligand Pharmaceuticals Inc. | 35,856 | 3,313 |
| * | TransMedics Group Inc. | 63,645 | 3,311 |
| * | Celldex Therapeutics Inc. | 108,859 | 3,309 |
| * | Revance Therapeutics Inc. | 165,744 | 3,298 |
| * | CorVel Corp. | 21,201 | 3,294 |
| * | Agios Pharmaceuticals Inc. | 128,863 | 3,286 |
| * | Silk Road Medical Inc. | 81,864 | 3,261 |
| * | Addus HomeCare Corp. | 36,524 | 3,259 |
| * | Vaxcyte Inc. | 124,522 | 3,257 |
| * | ModivCare Inc. | 30,001 | 3,250 |
| * | Dynavax Technologies Corp. | 279,832 | 3,210 |
| * | Multiplan Corp. | 894,880 | 3,150 |
| * | Cytek Biosciences Inc. | 270,384 | 3,150 |
| * | Pacific Biosciences of California Inc. | 534,088 | 3,130 |
| * | REVOLUTION Medicines Inc. | 149,765 | 3,120 |
| * | AdaptHealth Corp. Class A | 171,002 | 3,073 |
| Shares | Market Value• ($000) | ||
| * | Catalyst Pharmaceuticals Inc. | 226,441 | 3,066 |
| * | Alignment Healthcare Inc. | 199,422 | 3,033 |
| * | Phreesia Inc. | 116,109 | 2,979 |
| * | ImmunoGen Inc. | 508,222 | 2,953 |
| * | NeoGenomics Inc. | 293,633 | 2,951 |
| * | Arcus Biosciences Inc. | 121,704 | 2,931 |
| * | Syndax Pharmaceuticals Inc. | 122,598 | 2,895 |
| * | Emergent BioSolutions Inc. | 119,195 | 2,863 |
| * | Enanta Pharmaceuticals Inc. | 46,360 | 2,822 |
| * | REGENXBIO Inc. | 94,817 | 2,797 |
| * | Vericel Corp. | 112,030 | 2,795 |
| * | Avanos Medical Inc. | 111,486 | 2,746 |
| *,1 | Lyell Immunopharma Inc. | 409,503 | 2,744 |
| * | IVERIC bio Inc. | 277,511 | 2,731 |
| * | Harmony Biosciences Holdings Inc. | 62,083 | 2,726 |
| * | Amphastar Pharmaceuticals Inc. | 90,908 | 2,691 |
| * | Bridgebio Pharma Inc. | 247,765 | 2,602 |
| * | Surgery Partners Inc. | 94,010 | 2,588 |
| * | Allogene Therapeutics Inc. | 188,443 | 2,584 |
| * | FibroGen Inc. | 206,942 | 2,574 |
| * | Kymera Therapeutics Inc. | 89,327 | 2,525 |
| US Physical Therapy Inc. | 30,497 | 2,519 | |
| * | Avid Bioservices Inc. | 144,417 | 2,487 |
| *,1 | Warby Parker Inc. Class A | 197,384 | 2,481 |
| Healthcare Services Group Inc. | 175,385 | 2,468 | |
| * | American Well Corp. Class A | 541,996 | 2,466 |
| *,1 | PROCEPT BioRobotics Corp. | 60,749 | 2,459 |
| * | Zentalis Pharmaceuticals Inc. | 90,877 | 2,436 |
| * | Editas Medicine Inc. Class A | 163,391 | 2,402 |
| * | Cano Health Inc. | 383,652 | 2,367 |
| * | CareDx Inc. | 120,251 | 2,356 |
| * | Crinetics Pharmaceuticals Inc. | 124,649 | 2,353 |
| * | Adaptive Biotechnologies Corp. | 263,617 | 2,351 |
| * | Clover Health Investments Corp. Class A | 900,609 | 2,351 |
| * | Aurinia Pharmaceuticals Inc. | 318,406 | 2,343 |
| * | RadNet Inc. | 116,202 | 2,334 |
| *,1 | Cassava Sciences Inc. | 90,598 | 2,331 |
| * | Prothena Corp. plc | 83,936 | 2,314 |
| LeMaitre Vascular Inc. | 46,246 | 2,284 | |
| * | SpringWorks Therapeutics Inc. | 82,184 | 2,282 |
| * | Avidity Biosciences Inc. | 115,665 | 2,269 |
| * | NextGen Healthcare Inc. | 131,930 | 2,261 |
| * | Aclaris Therapeutics Inc. | 141,222 | 2,247 |
| * | TG Therapeutics Inc. | 315,196 | 2,247 |
| * | Geron Corp. (XNGS) | 848,718 | 2,241 |
| * | Arcutis Biotherapeutics Inc. | 82,940 | 2,235 |
| * | Fulgent Genetics Inc. | 51,051 | 2,219 |
| * | Madrigal Pharmaceuticals Inc. | 30,082 | 2,170 |
| * | Chinook Therapeutics Inc. | 103,362 | 2,150 |
| Shares | Market Value• ($000) | ||
| * | MannKind Corp. | 587,119 | 2,143 |
| * | Heska Corp. | 22,888 | 2,084 |
| * | OPKO Health Inc. | 956,010 | 2,084 |
| * | Kura Oncology Inc. | 150,291 | 2,083 |
| * | Gossamer Bio Inc. | 148,755 | 2,075 |
| * | Outset Medical Inc. | 113,274 | 2,072 |
| National HealthCare Corp. | 29,766 | 2,067 | |
| * | Artivion Inc. | 92,281 | 2,045 |
| * | Innoviva Inc. | 150,117 | 1,976 |
| Atrion Corp. | 3,254 | 1,965 | |
| *,1 | Butterfly Network Inc. | 314,261 | 1,958 |
| * | AngioDynamics Inc. | 88,151 | 1,952 |
| * | DocGo Inc. | 190,982 | 1,948 |
| * | Coherus Biosciences Inc. | 174,015 | 1,945 |
| * | Brookdale Senior Living Inc. | 439,166 | 1,932 |
| *,1 | Senseonics Holdings Inc. | 1,083,161 | 1,928 |
| *,1 | Paragon 28 Inc. | 109,561 | 1,923 |
| * | Varex Imaging Corp. | 91,153 | 1,922 |
| * | Relmada Therapeutics Inc. | 65,393 | 1,906 |
| * | BioLife Solutions Inc. | 79,549 | 1,878 |
| * | Cutera Inc. | 39,122 | 1,868 |
| *,1 | Sorrento Therapeutics Inc. | 904,463 | 1,854 |
| * | Hims & Hers Health Inc. | 287,463 | 1,828 |
| * | Cogent Biosciences Inc. | 105,601 | 1,741 |
| * | Agenus Inc. | 643,332 | 1,737 |
| * | Deciphera Pharmaceuticals Inc. | 106,267 | 1,725 |
| *,1 | Bionano Genomics Inc. | 689,476 | 1,710 |
| *,1 | Point Biopharma Global Inc. | 174,484 | 1,701 |
| * | Nektar Therapeutics Class A | 429,302 | 1,691 |
| 1 | SIGA Technologies Inc. | 111,686 | 1,684 |
| * | Aerie Pharmaceuticals Inc. | 111,366 | 1,682 |
| * | OrthoPediatrics Corp. | 34,143 | 1,676 |
| * | Cerus Corp. | 407,292 | 1,674 |
| * | Morphic Holding Inc. | 60,774 | 1,672 |
| * | Hanger Inc. | 89,385 | 1,665 |
| * | Nurix Therapeutics Inc. | 105,719 | 1,663 |
| * | Invitae Corp. | 543,500 | 1,652 |
| * | Rapt Therapeutics Inc. | 61,460 | 1,642 |
| * | Castle Biosciences Inc. | 56,091 | 1,627 |
| * | Design Therapeutics Inc. | 80,118 | 1,623 |
| * | Rocket Pharmaceuticals Inc. | 103,836 | 1,600 |
| *,1 | EQRx Inc. | 324,319 | 1,586 |
| * | Treace Medical Concepts Inc. | 78,782 | 1,578 |
| * | Reata Pharmaceuticals Inc. Class A | 65,302 | 1,561 |
| * | Mersana Therapeutics Inc. | 207,642 | 1,557 |
| * | Inogen Inc. | 54,239 | 1,553 |
| * | Anavex Life Sciences Corp. | 161,859 | 1,552 |
| * | Health Catalyst Inc. | 128,502 | 1,542 |
| * | Sangamo Therapeutics Inc. | 284,293 | 1,535 |
| * | Alector Inc. | 147,023 | 1,522 |
| * | UFP Technologies Inc. | 16,190 | 1,506 |
| * | NanoString Technologies Inc. | 109,434 | 1,484 |
| * | Pulmonx Corp. | 80,804 | 1,484 |
| *,1 | Sana Biotechnology Inc. | 211,414 | 1,440 |
| * | Collegium Pharmaceutical Inc. | 80,204 | 1,410 |
| * | Accolade Inc. | 138,046 | 1,405 |
| Shares | Market Value• ($000) | ||
| * | Keros Therapeutics Inc. | 39,730 | 1,405 |
| * | Y-mAbs Therapeutics Inc. | 86,567 | 1,392 |
| *,1 | Erasca Inc. | 154,042 | 1,389 |
| * | Vanda Pharmaceuticals Inc. | 130,804 | 1,384 |
| * | 23andMe Holding Co. Class A | 407,418 | 1,373 |
| * | Theravance Biopharma Inc. | 152,225 | 1,372 |
| * | CTI BioPharma Corp. | 218,362 | 1,371 |
| * | Viridian Therapeutics Inc. | 61,392 | 1,364 |
| * | Replimune Group Inc. | 71,457 | 1,362 |
| * | Atea Pharmaceuticals Inc. | 180,130 | 1,351 |
| *,1 | Nano-X Imaging Ltd. | 99,137 | 1,320 |
| * | SI-BONE Inc. | 79,539 | 1,312 |
| * | NGM Biopharmaceuticals Inc. | 92,831 | 1,310 |
| *,1 | Ocugen Inc. | 506,062 | 1,306 |
| * | 2seventy bio Inc. | 88,408 | 1,302 |
| * | SomaLogic Inc. | 353,384 | 1,300 |
| * | Day One Biopharmaceuticals Inc. | 55,205 | 1,297 |
| * | Alphatec Holdings Inc. | 166,793 | 1,266 |
| * | HealthStream Inc. | 57,190 | 1,266 |
| * | Caribou Biosciences Inc. | 127,214 | 1,256 |
| * | Cardiovascular Systems Inc. | 93,681 | 1,238 |
| * | iTeos Therapeutics Inc. | 55,601 | 1,233 |
| * | Seer Inc. Class A | 121,985 | 1,232 |
| * | Inhibrx Inc. | 69,392 | 1,231 |
| * | ViewRay Inc. | 354,068 | 1,211 |
| * | PMV Pharmaceuticals Inc. | 86,945 | 1,210 |
| * | Inovio Pharmaceuticals Inc. | 520,814 | 1,193 |
| * | ADMA Biologics Inc. | 441,932 | 1,193 |
| National Research Corp. | 33,895 | 1,156 | |
| * | Forma Therapeutics Holdings Inc. | 85,988 | 1,152 |
| * | Kezar Life Sciences Inc. | 110,393 | 1,135 |
| * | AnaptysBio Inc. | 48,055 | 1,116 |
| * | Nkarta Inc. | 76,829 | 1,106 |
| * | Esperion Therapeutics Inc. | 148,124 | 1,105 |
| * | Cara Therapeutics Inc. | 106,507 | 1,099 |
| * | Surmodics Inc. | 32,480 | 1,094 |
| * | ANI Pharmaceuticals Inc. | 29,621 | 1,093 |
| * | LifeStance Health Group Inc. | 171,285 | 1,077 |
| * | MaxCyte Inc. | 206,997 | 1,076 |
| * | Ventyx Biosciences Inc. | 52,675 | 1,075 |
| * | Cincor Pharma Inc. | 31,560 | 1,066 |
| * | DICE Therapeutics Inc. | 67,307 | 1,057 |
| * | 908 Devices Inc. | 52,064 | 1,049 |
| * | Agiliti Inc. | 64,666 | 1,039 |
| * | Computer Programs and Systems Inc. | 33,781 | 1,031 |
| * | Codexis Inc. | 144,991 | 1,016 |
| * | C4 Therapeutics Inc. | 99,745 | 1,005 |
| * | Intercept Pharmaceuticals Inc. | 57,575 | 1,000 |
| * | Tricida Inc. | 79,446 | 995 |
| * | Kinnate Biopharma Inc. | 68,686 | 995 |
| * | Bluebird Bio Inc. | 169,698 | 991 |
| * | Heron Therapeutics Inc. | 242,338 | 991 |
| * | CareMax Inc. | 141,765 | 970 |
| * | Pennant Group Inc. | 61,442 | 963 |
| * | Protagonist Therapeutics Inc. | 109,377 | 954 |
| * | Adicet Bio Inc. | 67,299 | 953 |
| Shares | Market Value• ($000) | ||
| * | KalVista Pharmaceuticals Inc. | 57,624 | 949 |
| * | MiMedx Group Inc. | 268,558 | 948 |
| * | Cullinan Oncology Inc. | 70,010 | 944 |
| * | Mirum Pharmaceuticals Inc. | 37,332 | 933 |
| * | Ocular Therapeutix Inc. | 181,317 | 921 |
| * | Karyopharm Therapeutics Inc. | 181,459 | 918 |
| * | Orthofix Medical Inc. | 45,848 | 912 |
| *,1 | Vaxart Inc. | 294,142 | 912 |
| * | Imago Biosciences Inc. | 62,607 | 910 |
| * | Axogen Inc. | 95,361 | 894 |
| * | Affimed NV | 334,375 | 876 |
| * | Atara Biotherapeutics Inc. | 217,134 | 871 |
| * | Instil Bio Inc. | 165,711 | 862 |
| * | Seres Therapeutics Inc. | 166,521 | 856 |
| * | Kiniksa Pharmaceuticals Ltd. Class A | 73,061 | 856 |
| *,1 | Cue Health Inc. | 256,376 | 854 |
| * | Ideaya Biosciences Inc. | 83,870 | 824 |
| * | Evolus Inc. | 84,636 | 813 |
| * | Eagle Pharmaceuticals Inc. | 24,616 | 807 |
| * | Inotiv Inc. | 41,178 | 806 |
| * | Eiger BioPharmaceuticals Inc. | 96,338 | 796 |
| * | Stoke Therapeutics Inc. | 52,758 | 795 |
| * | Community Health Systems Inc. | 296,734 | 789 |
| * | Kodiak Sciences Inc. | 78,453 | 785 |
| * | Anika Therapeutics Inc. | 34,499 | 780 |
| * | Akero Therapeutics Inc. | 66,028 | 776 |
| *,1 | ImmunityBio Inc. | 192,235 | 769 |
| * | Nuvation Bio Inc. | 273,207 | 765 |
| * | Arcturus Therapeutics Holdings Inc. | 54,259 | 762 |
| * | Zimvie Inc. | 49,609 | 755 |
| * | Quanterix Corp. | 79,968 | 748 |
| Utah Medical Products Inc. | 8,035 | 738 | |
| * | Dyne Therapeutics Inc. | 74,653 | 732 |
| * | OraSure Technologies Inc. | 173,571 | 710 |
| * | Albireo Pharma Inc. | 40,572 | 710 |
| * | Vera Therapeutics Inc. Class A | 32,656 | 710 |
| Phibro Animal Health Corp. Class A | 47,864 | 709 | |
| * | Edgewise Therapeutics Inc. | 70,266 | 708 |
| * | Bright Health Group Inc. | 454,248 | 686 |
| *,1 | Amylyx Pharmaceuticals Inc. | 27,101 | 684 |
| *,1 | Nuvalent Inc. Class A | 39,900 | 674 |
| * | Quantum-Si Inc. | 215,144 | 671 |
| * | ALX Oncology Holdings Inc. | 50,819 | 661 |
| * | OptimizeRx Corp. | 41,305 | 656 |
| * | Tarsus Pharmaceuticals Inc. | 42,667 | 656 |
| *,1 | Liquidia Corp. | 112,477 | 649 |
| * | Bioxcel Therapeutics Inc. | 45,151 | 618 |
| * | EyePoint Pharmaceuticals Inc. | 61,371 | 614 |
| * | RxSight Inc. | 48,660 | 609 |
| * | Joint Corp. | 33,306 | 608 |
| * | PetIQ Inc. Class A | 64,902 | 606 |
| * | Fulcrum Therapeutics Inc. | 81,336 | 602 |
| Shares | Market Value• ($000) | ||
| * | MeiraGTx Holdings plc | 71,572 | 594 |
| * | Sutro Biopharma Inc. | 104,364 | 591 |
| * | Organogenesis Holdings Inc. Class A | 164,288 | 590 |
| * | Aura Biosciences Inc. | 43,756 | 585 |
| * | Rigel Pharmaceuticals Inc. | 410,564 | 583 |
| * | Provention Bio Inc. | 132,869 | 574 |
| * | MacroGenics Inc. | 143,233 | 569 |
| iRadimed Corp. | 16,935 | 568 | |
| * | Arbutus Biopharma Corp. | 255,502 | 567 |
| * | Generation Bio Co. | 109,939 | 563 |
| * | 4D Molecular Therapeutics Inc. | 70,890 | 557 |
| * | Adagio Therapeutics Inc. | 121,966 | 556 |
| * | Allovir Inc. | 73,957 | 555 |
| * | Bioventus Inc. Class A | 74,844 | 547 |
| * | SeaSpine Holdings Corp. | 84,338 | 540 |
| * | Monte Rosa Therapeutics Inc. | 67,489 | 535 |
| * | Precigen Inc. | 240,846 | 532 |
| * | Amneal Pharmaceuticals Inc. | 242,389 | 526 |
| * | Xeris Biopharma Holdings Inc. | 313,898 | 524 |
| *,1 | Century Therapeutics Inc. | 47,932 | 504 |
| * | Immunovant Inc. | 95,476 | 492 |
| * | Berkeley Lights Inc. | 132,045 | 485 |
| *,1 | Vicarious Surgical Inc. | 129,567 | 483 |
| 1 | Zynex Inc. | 53,675 | 480 |
| * | Lexicon Pharmaceuticals Inc. | 172,712 | 475 |
| * | Foghorn Therapeutics Inc. | 47,430 | 471 |
| * | Phathom Pharmaceuticals Inc. | 54,663 | 467 |
| * | Aadi Bioscience Inc. | 34,481 | 467 |
| * | IGM Biosciences Inc. | 23,742 | 461 |
| * | Tango Therapeutics Inc. | 110,711 | 454 |
| * | Chimerix Inc. | 201,864 | 444 |
| *,1 | Janux Therapeutics Inc. | 40,609 | 439 |
| * | Aerovate Therapeutics Inc. | 21,895 | 434 |
| * | Akoya Biosciences Inc. | 37,453 | 427 |
| * | Absci Corp. | 126,182 | 425 |
| * | Rallybio Corp. | 38,291 | 423 |
| * | Arcellx Inc. | 23,386 | 420 |
| * | VBI Vaccines Inc. | 459,720 | 412 |
| * | Convey Health Solutions Holdings Inc. | 38,861 | 408 |
| * | Kronos Bio Inc. | 97,290 | 389 |
| * | Tactile Systems Technology Inc. | 46,305 | 382 |
| * | Sema4 Holdings Corp. | 373,251 | 381 |
| * | Jounce Therapeutics Inc. | 100,782 | 369 |
| * | HilleVax Inc. | 30,998 | 369 |
| * | Sight Sciences Inc. | 51,173 | 357 |
| * | Singular Genomics Systems Inc. | 132,432 | 354 |
| *,1 | Outlook Therapeutics Inc. | 276,171 | 309 |
| * | P3 Health Partners Inc. | 61,719 | 304 |
| * | Tenaya Therapeutics Inc. | 67,540 | 297 |
| * | Praxis Precision Medicines Inc. | 88,416 | 276 |
| * | Oncology Institute Inc. | 43,320 | 275 |
| * | Alpine Immune Sciences Inc. | 36,038 | 271 |
| * | Athira Pharma Inc. | 80,020 | 270 |
| * | Theseus Pharmaceuticals Inc. | 39,594 | 270 |
| * | Sharecare Inc. | 141,437 | 259 |
| Shares | Market Value• ($000) | ||
| * | Nautilus Biotechnology Inc. | 115,533 | 255 |
| * | Icosavax Inc. | 53,172 | 251 |
| AirSculpt Technologies Inc. | 28,642 | 250 | |
| * | Pardes Biosciences Inc. | 65,332 | 229 |
| * | Science 37 Holdings Inc. | 143,344 | 226 |
| *,1 | Tyra Biosciences Inc. | 30,725 | 203 |
| * | Aveanna Healthcare Holdings Inc. | 102,948 | 187 |
| * | An2 Therapeutics Inc. | 10,727 | 184 |
| * | PepGen Inc. | 19,276 | 183 |
| * | Babylon Holdings Ltd. Classs A | 250,955 | 179 |
| * | Talaris Therapeutics Inc. | 52,909 | 175 |
| * | Innovage Holding Corp. | 45,548 | 167 |
| * | ATI Physical Therapy Inc. | 172,444 | 155 |
| * | Humacyte Inc. | 40,615 | 148 |
| * | Thorne HealthTech Inc. | 31,672 | 148 |
| *,1 | Enochian Biosciences Inc. | 45,529 | 112 |
| * | Celularity Inc. | 35,864 | 97 |
| *,1 | GreenLight Biosciences Holdings PBC | 32,279 | 92 |
| * | VistaGen Therapeutics Inc. | 450,216 | 83 |
| * | Alpha Teknova Inc. | 14,470 | 65 |
| *,1,2 | Tobira Therapeutics Inc. CVR | 6,201 | 28 |
| * | Gelesis Holdings Inc. | 22,741 | 28 |
| * | Tenon Medical Inc. | 7,535 | 15 |
| *,2 | PDL BioPharma Inc. | 712 | 1 |
| *,2 | Synergy Pharmaceuticals Inc. | 224,815 | — |
| *,2 | Progenics Pharmaceuticals Inc. CVR | 110,304 | — |
| *,2 | Achillion Pharma CVR Alexion Pharmaceuticals Inc. | 1,085 | — |
| 978,709 | |||
| Industrials (16.1%) | |||
| * | Chart Industries Inc. | 87,039 | 16,873 |
| EMCOR Group Inc. | 119,958 | 14,265 | |
| * | Saia Inc. | 62,971 | 13,024 |
| * | ExlService Holdings Inc. | 76,649 | 12,855 |
| * | ASGN Inc. | 118,884 | 11,496 |
| Exponent Inc. | 122,144 | 11,464 | |
| * | AMN Healthcare Services Inc. | 105,982 | 10,878 |
| * | Bloom Energy Corp. Class A | 416,351 | 10,579 |
| Applied Industrial Technologies Inc. | 90,704 | 9,616 | |
| Simpson Manufacturing Co. Inc. | 102,708 | 9,515 | |
| Franklin Electric Co. Inc. | 109,224 | 9,486 | |
| Insperity Inc. | 85,916 | 9,367 | |
| Triton International Ltd. | 150,661 | 8,978 | |
| Watts Water Technologies Inc. Class A | 64,804 | 8,977 | |
| * | Fluor Corp. | 337,374 | 8,920 |
| Maximus Inc. | 145,548 | 8,819 | |
| * | ATI Inc. | 294,102 | 8,802 |
| * | Atkore Inc. | 101,894 | 8,601 |
| Comfort Systems USA Inc. | 83,998 | 8,428 | |
| HB Fuller Co. | 125,675 | 8,151 | |
| GATX Corp. | 84,141 | 8,129 | |
| Shares | Market Value• ($000) | ||
| Zurn Elkay Water Solutions Corp. | 294,219 | 8,115 | |
| * | Aerojet Rocketdyne Holdings Inc. | 188,091 | 8,101 |
| * | Marqeta Inc. Class A | 1,028,775 | 8,014 |
| * | Summit Materials Inc. Class A | 280,926 | 7,984 |
| John Bean Technologies Corp. | 74,989 | 7,743 | |
| Korn Ferry | 126,931 | 7,733 | |
| * | Dycom Industries Inc. | 68,455 | 7,675 |
| * | API Group Corp. | 490,469 | 7,627 |
| ABM Industries Inc. | 158,969 | 7,376 | |
| Otter Tail Corp. | 97,404 | 7,358 | |
| * | TriNet Group Inc. | 88,675 | 7,307 |
| Hillenbrand Inc. | 172,060 | 7,170 | |
| * | Resideo Technologies Inc. | 342,705 | 7,135 |
| * | Beacon Roofing Supply Inc. | 128,648 | 7,064 |
| Matson Inc. | 94,884 | 6,989 | |
| Herc Holdings Inc. | 60,763 | 6,838 | |
| Belden Inc. | 103,942 | 6,806 | |
| ManTech International Corp. Class A | 70,860 | 6,796 | |
| * | Atlas Air Worldwide Holdings Inc. | 66,449 | 6,640 |
| Albany International Corp. Class A | 74,884 | 6,604 | |
| Badger Meter Inc. | 69,395 | 6,571 | |
| * | ACI Worldwide Inc. | 271,473 | 6,434 |
| UniFirst Corp. | 35,555 | 6,409 | |
| * | Hub Group Inc. Class A | 79,438 | 6,340 |
| * | Alight Inc. Class A | 802,968 | 6,327 |
| * | StoneCo. Ltd. Class A | 657,011 | 6,228 |
| Forward Air Corp. | 63,654 | 6,177 | |
| Werner Enterprises Inc. | 154,054 | 6,130 | |
| EnerSys | 98,215 | 6,126 | |
| Brink's Co. | 109,984 | 6,080 | |
| * | SPX Technologies Inc. | 104,943 | 5,988 |
| AAON Inc. | 103,730 | 5,962 | |
| Encore Wire Corp. | 44,978 | 5,852 | |
| Altra Industrial Motion Corp. | 154,102 | 5,848 | |
| * | Enovix Corp. | 257,932 | 5,705 |
| Federal Signal Corp. | 141,275 | 5,633 | |
| * | Verra Mobility Corp. Class A | 345,758 | 5,511 |
| Terex Corp. | 161,605 | 5,369 | |
| Installed Building Products Inc. | 57,305 | 5,190 | |
| Brady Corp. Class A | 111,121 | 5,172 | |
| Moog Inc. Class A | 67,874 | 5,089 | |
| * | CBIZ Inc. | 116,519 | 5,087 |
| * | Itron Inc. | 106,643 | 5,074 |
| ESCO Technologies Inc. | 60,932 | 4,962 | |
| * | GMS Inc. | 102,297 | 4,931 |
| Kadant Inc. | 27,440 | 4,924 | |
| Scorpio Tankers Inc. | 117,457 | 4,886 | |
| * | AeroVironment Inc. | 54,944 | 4,871 |
| McGrath RentCorp. | 57,250 | 4,839 | |
| Trinity Industries Inc. | 197,442 | 4,814 | |
| * | O-I Glass Inc. | 368,162 | 4,790 |
| EVERTEC Inc. | 142,194 | 4,778 | |
| ArcBest Corp. | 57,801 | 4,655 | |
| Kennametal Inc. | 195,546 | 4,584 | |
| Bread Financial Holdings Inc. | 118,822 | 4,566 | |
| * | NV5 Global Inc. | 32,058 | 4,512 |
| Shares | Market Value• ($000) | ||
| CSW Industrials Inc. | 35,542 | 4,500 | |
| EnPro Industries Inc. | 49,221 | 4,457 | |
| ICF International Inc. | 43,673 | 4,435 | |
| * | Masonite International Corp. | 53,368 | 4,367 |
| * | Air Transport Services Group Inc. | 139,746 | 4,211 |
| Helios Technologies Inc. | 76,946 | 4,203 | |
| Lindsay Corp. | 26,096 | 4,185 | |
| Mueller Water Products Inc. Class A | 368,782 | 4,160 | |
| * | Veritiv Corp. | 34,474 | 4,109 |
| Greif Inc. Class A | 61,111 | 4,097 | |
| Maxar Technologies Inc. | 171,926 | 4,097 | |
| * | Evo Payments Inc. Class A | 111,934 | 3,730 |
| * | Vicor Corp. | 52,057 | 3,703 |
| *,1 | Nikola Corp. | 690,801 | 3,703 |
| * | MYR Group Inc. | 39,616 | 3,682 |
| * | Kratos Defense & Security Solutions Inc. | 292,592 | 3,669 |
| Barnes Group Inc. | 116,003 | 3,602 | |
| *,1 | Frontline Ltd. | 296,023 | 3,511 |
| * | CryoPort Inc. | 105,384 | 3,442 |
| International Seaways Inc. | 116,517 | 3,441 | |
| * | AAR Corp. | 80,092 | 3,434 |
| Griffon Corp. | 109,045 | 3,419 | |
| * | Payoneer Global Inc. | 512,249 | 3,391 |
| Textainer Group Holdings Ltd. | 109,786 | 3,335 | |
| * | Huron Consulting Group Inc. | 49,819 | 3,333 |
| * | Gibraltar Industries Inc. | 78,025 | 3,265 |
| * | Flywire Corp. | 131,282 | 3,264 |
| Granite Construction Inc. | 107,682 | 3,228 | |
| * | OSI Systems Inc. | 38,384 | 3,198 |
| *,1 | Virgin Galactic Holdings Inc. | 540,749 | 3,196 |
| * | Proterra Inc. | 525,387 | 3,173 |
| * | ZipRecruiter Inc. Class A | 189,617 | 3,163 |
| *,1 | Joby Aviation Inc. | 595,230 | 3,155 |
| Alamo Group Inc. | 23,767 | 3,108 | |
| * | Energy Recovery Inc. | 132,419 | 3,038 |
| * | PGT Innovations Inc. | 139,529 | 2,919 |
| SFL Corp. Ltd. | 271,577 | 2,906 | |
| Enerpac Tool Group Corp. Class A | 144,430 | 2,802 | |
| * | Donnelley Financial Solutions Inc. | 65,727 | 2,790 |
| 1 | Golden Ocean Group Ltd. | 290,735 | 2,788 |
| * | Rocket Lab USA Inc. | 504,326 | 2,774 |
| TriMas Corp. | 100,602 | 2,769 | |
| Marten Transport Ltd. | 139,673 | 2,767 | |
| * | Construction Partners Inc. Class A | 94,207 | 2,756 |
| Patrick Industries Inc. | 52,000 | 2,754 | |
| * | CoreCivic Inc. | 286,324 | 2,729 |
| * | AvidXchange Holdings Inc. | 346,355 | 2,698 |
| * | Hillman Solutions Corp. | 319,740 | 2,683 |
| Tennant Co. | 43,968 | 2,653 | |
| Kforce Inc. | 48,340 | 2,645 | |
| * | Montrose Environmental Group Inc. | 64,983 | 2,613 |
| DHT Holdings Inc. | 332,934 | 2,600 | |
| Standex International Corp. | 28,319 | 2,560 | |
| Primoris Services Corp. | 125,484 | 2,544 |
| Shares | Market Value• ($000) | ||
| * | Proto Labs Inc. | 65,433 | 2,513 |
| AZZ Inc. | 57,967 | 2,470 | |
| * | Mirion Technologies Inc. | 323,288 | 2,447 |
| H&E Equipment Services Inc. | 75,741 | 2,398 | |
| * | Legalzoom.com Inc. | 231,301 | 2,382 |
| * | TuSimple Holdings Inc. Class A | 330,851 | 2,379 |
| TTEC Holdings Inc. | 44,774 | 2,344 | |
| * | Green Dot Corp. Class A | 114,724 | 2,328 |
| *,1 | PureCycle Technologies Inc. | 251,313 | 2,294 |
| * | JELD-WEN Holding Inc. | 204,368 | 2,279 |
| Trinseo plc | 85,537 | 2,269 | |
| *,1 | Flex LNG Ltd. | 67,523 | 2,233 |
| * | Cross Country Healthcare Inc. | 86,919 | 2,206 |
| * | Remitly Global Inc. | 198,817 | 2,187 |
| Apogee Enterprises Inc. | 52,788 | 2,156 | |
| Greenbrier Cos. Inc. | 75,444 | 2,151 | |
| Kaman Corp. | 66,424 | 2,107 | |
| Astec Industries Inc. | 54,329 | 2,074 | |
| * | Napco Security Technologies Inc. | 69,842 | 2,071 |
| * | American Woodmark Corp. | 39,289 | 2,036 |
| Columbus McKinnon Corp. | 66,278 | 2,030 | |
| Mesa Laboratories Inc. | 11,874 | 2,029 | |
| *,1 | Desktop Metal Inc. Class A | 627,659 | 1,996 |
| * | Janus International Group Inc. | 192,771 | 1,991 |
| * | Triumph Group Inc. | 152,150 | 1,976 |
| Deluxe Corp. | 102,244 | 1,967 | |
| Shyft Group Inc. | 81,822 | 1,960 | |
| * | Repay Holdings Corp. Class A | 206,967 | 1,923 |
| * | First Advantage Corp. | 138,752 | 1,920 |
| Wabash National Corp. | 115,221 | 1,895 | |
| * | SP Plus Corp. | 55,074 | 1,825 |
| * | Modine Manufacturing Co. | 117,529 | 1,761 |
| * | Sterling Infrastructure Inc. | 69,635 | 1,761 |
| Quanex Building Products Corp. | 78,454 | 1,750 | |
| * | International Money Express Inc. | 77,167 | 1,729 |
| * | Titan International Inc. | 121,289 | 1,702 |
| Heartland Express Inc. | 111,042 | 1,682 | |
| Myers Industries Inc. | 85,924 | 1,660 | |
| * | Conduent Inc. | 402,281 | 1,645 |
| * | BTRS Holdings Inc. Class A | 236,895 | 1,601 |
| * | TrueBlue Inc. | 77,234 | 1,586 |
| Chase Corp. | 17,896 | 1,578 | |
| * | BlueLinx Holdings Inc. | 22,261 | 1,560 |
| Douglas Dynamics Inc. | 53,450 | 1,555 | |
| CRA International Inc. | 16,925 | 1,547 | |
| * | Great Lakes Dredge & Dock Corp. | 154,980 | 1,483 |
| * | Titan Machinery Inc. | 47,845 | 1,473 |
| Resources Connection Inc. | 74,851 | 1,463 | |
| * | FARO Technologies Inc. | 43,388 | 1,456 |
| Costamare Inc. | 126,860 | 1,431 | |
| Gorman-Rupp Co. | 53,629 | 1,416 | |
| * | Franklin Covey Co. | 29,712 | 1,413 |
| Shares | Market Value• ($000) | ||
| * | Vivint Smart Home Inc. | 225,383 | 1,411 |
| * | Cimpress plc | 41,917 | 1,408 |
| Eagle Bulk Shipping Inc. | 31,901 | 1,386 | |
| * | Thermon Group Holdings Inc. | 78,529 | 1,378 |
| Barrett Business Services Inc. | 16,983 | 1,369 | |
| Kelly Services Inc. Class A | 83,679 | 1,348 | |
| * | Teekay Tankers Ltd. Class A | 54,311 | 1,336 |
| * | Paysafe Ltd. | 800,417 | 1,321 |
| Heidrick & Struggles International Inc. | 46,041 | 1,310 | |
| * | Paya Holdings Inc. | 206,641 | 1,296 |
| Ennis Inc. | 60,168 | 1,277 | |
| Insteel Industries Inc. | 44,146 | 1,276 | |
| * | Transcat Inc. | 17,000 | 1,260 |
| * | I3 Verticals Inc. Class A | 51,950 | 1,214 |
| * | Sterling Check Corp. | 56,233 | 1,197 |
| Pitney Bowes Inc. | 413,817 | 1,196 | |
| Genco Shipping & Trading Ltd. | 87,123 | 1,194 | |
| 1 | Nordic American Tankers Ltd. | 452,169 | 1,176 |
| Cass Information Systems Inc. | 31,630 | 1,160 | |
| * | Ducommun Inc. | 26,333 | 1,159 |
| Argan Inc. | 33,074 | 1,144 | |
| Pactiv Evergreen Inc. | 102,697 | 1,140 | |
| * | Babcock & Wilcox Enterprises Inc. | 141,619 | 1,130 |
| * | Diversey Holdings Ltd. | 184,142 | 1,129 |
| *,1 | Hyliion Holdings Corp. | 317,686 | 1,115 |
| * | Forrester Research Inc. | 26,693 | 1,110 |
| Luxfer Holdings plc | 65,807 | 1,083 | |
| *,1 | Workhorse Group Inc. | 345,313 | 1,081 |
| Allied Motion Technologies Inc. | 30,419 | 1,065 | |
| * | BrightView Holdings Inc. | 105,003 | 1,063 |
| Dorian LPG Ltd. | 72,878 | 1,060 | |
| VSE Corp. | 25,299 | 1,059 | |
| * | Archer Aviation Inc. Class A | 295,146 | 1,045 |
| * | Infrastructure and Energy Alternatives Inc. | 71,737 | 1,019 |
| * | Vishay Precision Group Inc. | 29,163 | 1,001 |
| *,1 | Microvast Holdings Inc. | 404,590 | 995 |
| Cadre Holdings Inc. | 38,798 | 989 | |
| * | Target Hospitality Corp. | 72,949 | 969 |
| REV Group Inc. | 83,232 | 959 | |
| * | V2X Inc. | 27,628 | 958 |
| *,1 | Danimer Scientific Inc. | 215,269 | 958 |
| * | DXP Enterprises Inc. | 35,719 | 949 |
| * | Custom Truck One Source Inc. | 140,520 | 925 |
| * | Cantaloupe Inc. | 137,476 | 876 |
| * | Hudson Technologies Inc. | 101,319 | 841 |
| * | Aspen Aerogels Inc. | 64,522 | 839 |
| Greif Inc. Class B | 12,709 | 830 | |
| National Presto Industries Inc. | 12,138 | 828 | |
| * | Hireright Holdings Corp. | 50,050 | 814 |
| * | Ardmore Shipping Corp. | 82,136 | 792 |
| * | Manitowoc Co. Inc. | 81,415 | 777 |
| Hyster-Yale Materials Handling Inc. | 25,759 | 750 |
| Shares | Market Value• ($000) | ||
| Covenant Logistics Group Inc. Class A | 26,140 | 735 | |
| * | CS Disco Inc. | 52,602 | 726 |
| * | Aersale Corp. | 37,572 | 724 |
| * | CIRCOR International Inc. | 43,603 | 711 |
| * | Advantage Solutions Inc. | 194,011 | 706 |
| * | ShotSpotter Inc. | 20,941 | 683 |
| * | Blade Air Mobility Inc. | 132,257 | 682 |
| * | Tutor Perini Corp. | 98,950 | 671 |
| Kronos Worldwide Inc. | 51,978 | 669 | |
| Universal Logistics Holdings Inc. | 17,329 | 633 | |
| * | Markforged Holding Corp. | 260,499 | 633 |
| * | IES Holdings Inc. | 20,723 | 630 |
| * | Radiant Logistics Inc. | 89,580 | 627 |
| * | Willdan Group Inc. | 27,336 | 622 |
| Miller Industries Inc. | 26,386 | 620 | |
| * | Skillsoft Corp. | 190,711 | 614 |
| *,1 | Sarcos Technology and Robotics Corp. | 179,323 | 588 |
| * | Daseke Inc. | 96,136 | 583 |
| * | Teekay Corp. | 166,194 | 580 |
| *,1 | Velo3D Inc. | 134,121 | 578 |
| * | Velodyne Lidar Inc. | 458,621 | 573 |
| Safe Bulkers Inc. | 173,334 | 553 | |
| * | Astronics Corp. | 59,936 | 552 |
| Caesarstone Ltd. | 53,897 | 549 | |
| * | Ranpak Holdings Corp. Class A | 102,622 | 543 |
| Park Aerospace Corp. | 46,614 | 537 | |
| Powell Industries Inc. | 21,702 | 535 | |
| * | DHI Group Inc. | 101,380 | 517 |
| * | Blue Bird Corp. | 41,848 | 497 |
| * | Moneylion Inc. | 342,072 | 489 |
| United States Lime & Minerals Inc. | 4,716 | 485 | |
| Information Services Group Inc. | 83,868 | 484 | |
| *,1 | View Inc. | 266,124 | 474 |
| * | PAM Transportation Services Inc. | 15,643 | 465 |
| Preformed Line Products Co. | 5,969 | 464 | |
| * | Distribution Solutions Group Inc. | 11,590 | 461 |
| Eneti Inc. | 55,003 | 460 | |
| * | Evolv Technologies Holdings Inc. | 199,221 | 452 |
| *,1 | Hyzon Motors Inc. | 206,498 | 440 |
| * | Concrete Pumping Holdings Inc. | 62,563 | 419 |
| * | Spire Global Inc. | 298,900 | 403 |
| * | PFSweb Inc. | 39,433 | 373 |
| * | Hydrofarm Holdings Group Inc. | 105,224 | 358 |
| * | Atlas Technical Consultants Inc. | 41,237 | 351 |
| *,1 | Cerberus Cyber Sentinel Corp. | 110,082 | 299 |
| *,1 | Astra Space Inc. | 341,043 | 291 |
| * | Atlanticus Holdings Corp. | 10,018 | 285 |
| *,1 | Lightning eMotors Inc. | 94,734 | 269 |
| * | Quad/Graphics Inc. | 84,305 | 266 |
| *,1 | Berkshire Grey Inc. | 118,135 | 239 |
| * | Karat Packaging Inc. | 13,174 | 236 |
| *,1 | Terran Orbital Corp. | 55,217 | 232 |
| * | IBEX Holdings Ltd. | 13,546 | 229 |
| * | Momentus Inc. | 125,567 | 222 |
| Shares | Market Value• ($000) | ||
| * | Xos Inc. | 126,108 | 192 |
| * | Latch Inc. | 162,104 | 173 |
| * | Priority Technology Holdings Inc. | 41,438 | 166 |
| * | Redwire Corp. | 44,506 | 123 |
| * | CompoSecure Inc. | 17,893 | 103 |
| * | AEye Inc. | 60,864 | 94 |
| * | Fathom Digital Manufacturing Corp. | 23,188 | 88 |
| * | Cepton Inc. | 17,966 | 32 |
| 925,507 | |||
| Other (0.0%)3 | |||
| 1 | Orchid Island Capital Inc. REIT | 83,729 | 1,132 |
| *,1,2 | Contra Zogenix Inc. CVR | 124,734 | 250 |
| *,2 | Aduro Biotech Inc. CVR | 17,431 | 3 |
| *,2 | GTX Inc. CVR | 846 | 1 |
| *,2 | Contra Flexion Therape CVR | 111 | — |
| 1,386 | |||
| Real Estate (6.8%) | |||
| Agree Realty Corp. | 175,892 | 13,248 | |
| STAG Industrial Inc. | 427,140 | 13,156 | |
| Terreno Realty Corp. | 176,033 | 10,736 | |
| * | Ryman Hospitality Properties Inc. | 127,469 | 10,480 |
| Independence Realty Trust Inc. | 525,030 | 10,212 | |
| Kite Realty Group Trust | 515,998 | 9,990 | |
| Physicians Realty Trust | 533,145 | 8,882 | |
| Phillips Edison & Co. Inc. | 270,938 | 8,852 | |
| Sabra Health Care REIT Inc. | 546,996 | 8,188 | |
| Apple Hospitality REIT Inc. | 509,774 | 8,110 | |
| Hannon Armstrong Sustainable Infrastructure Capital Inc. | 202,091 | 7,987 | |
| Broadstone Net Lease Inc. | 401,056 | 7,676 | |
| PotlatchDeltic Corp. | 161,950 | 7,518 | |
| Essential Properties Realty Trust Inc. | 309,401 | 7,005 | |
| Corporate Office Properties Trust | 267,183 | 6,904 | |
| National Health Investors Inc. | 104,409 | 6,840 | |
| LXP Industrial Trust | 670,530 | 6,746 | |
| * | Equity Commonwealth | 255,636 | 6,726 |
| * | DigitalBridge Group Inc. | 349,640 | 6,224 |
| Outfront Media Inc. | 347,244 | 6,146 | |
| Innovative Industrial Properties Inc. | 65,729 | 6,029 | |
| SITE Centers Corp. | 461,806 | 5,985 | |
| * | Cushman & Wakefield plc | 376,200 | 5,628 |
| * | Sunstone Hotel Investors Inc. | 508,449 | 5,537 |
| Pebblebrook Hotel Trust | 307,244 | 5,414 | |
| Uniti Group Inc. | 562,860 | 5,285 | |
| Four Corners Property Trust Inc. | 189,717 | 5,101 | |
| CareTrust REIT Inc. | 228,511 | 4,922 | |
| Kennedy-Wilson Holdings Inc. | 279,595 | 4,910 | |
| Macerich Co. | 510,941 | 4,890 | |
| Shares | Market Value• ($000) | ||
| Retail Opportunity Investments Corp. | 286,089 | 4,792 | |
| RLJ Lodging Trust | 389,045 | 4,692 | |
| * | DiamondRock Hospitality Co. | 496,178 | 4,332 |
| * | Xenia Hotels & Resorts Inc. | 270,669 | 4,293 |
| Urban Edge Properties | 270,618 | 4,257 | |
| InvenTrust Properties Corp. | 160,338 | 4,210 | |
| LTC Properties Inc. | 92,131 | 4,136 | |
| Washington REIT | 206,936 | 4,058 | |
| Easterly Government Properties Inc. Class A | 215,946 | 3,876 | |
| Tanger Factory Outlet Centers Inc. | 239,970 | 3,700 | |
| Newmark Group Inc. Class A | 350,971 | 3,597 | |
| Acadia Realty Trust | 220,764 | 3,517 | |
| Piedmont Office Realty Trust Inc. Class A | 291,445 | 3,433 | |
| Global Net Lease Inc. | 246,965 | 3,401 | |
| American Assets Trust Inc. | 117,036 | 3,249 | |
| Brandywine Realty Trust | 403,298 | 3,238 | |
| Alexander & Baldwin Inc. | 171,644 | 3,215 | |
| * | Apartment Investment and Management Co. Class A | 354,821 | 3,137 |
| St. Joe Co. | 81,656 | 3,119 | |
| Paramount Group Inc. | 442,049 | 3,063 | |
| Getty Realty Corp. | 100,215 | 3,014 | |
| NexPoint Residential Trust Inc. | 53,770 | 2,840 | |
| Centerspace | 36,343 | 2,740 | |
| * | Veris Residential Inc. | 203,764 | 2,739 |
| * | Anywhere Real Estate Inc. | 274,153 | 2,678 |
| Service Properties Trust | 387,846 | 2,653 | |
| * | Radius Global Infrastructure Inc. Class A (XNMS) | 176,379 | 2,429 |
| Necessity Retail REIT Inc. | 315,600 | 2,354 | |
| * | GEO Group Inc. | 280,256 | 2,292 |
| Empire State Realty Trust Inc. Class A | 328,066 | 2,287 | |
| NETSTREIT Corp. | 114,196 | 2,245 | |
| Marcus & Millichap Inc. | 59,028 | 2,206 | |
| eXp World Holdings Inc. | 163,315 | 2,112 | |
| UMH Properties Inc. | 116,900 | 2,109 | |
| Armada Hoffler Properties Inc. | 158,485 | 2,081 | |
| Community Healthcare Trust Inc. | 56,034 | 2,067 | |
| * | Redfin Corp. | 248,506 | 2,035 |
| Office Properties Income Trust | 112,889 | 1,983 | |
| Safehold Inc. | 51,348 | 1,953 | |
| Summit Hotel Properties Inc. | 247,964 | 1,949 | |
| RPT Realty | 197,627 | 1,903 | |
| Plymouth Industrial REIT Inc. | 89,479 | 1,814 | |
| Bluerock Residential Growth REIT Inc. Class A | 67,628 | 1,802 | |
| Gladstone Land Corp. | 76,358 | 1,795 | |
| * | Compass Inc. Class A | 615,489 | 1,760 |
| Shares | Market Value• ($000) | ||
| Gladstone Commercial Corp. | 90,814 | 1,732 | |
| Farmland Partners Inc. | 108,929 | 1,581 | |
| Global Medical REIT Inc. | 144,882 | 1,570 | |
| Universal Health Realty Income Trust | 30,430 | 1,549 | |
| Ares Commercial Real Estate Corp. | 105,556 | 1,392 | |
| * | Chatham Lodging Trust | 113,550 | 1,381 |
| Orion Office REIT Inc. | 135,539 | 1,338 | |
| * | Seritage Growth Properties Class A | 104,096 | 1,305 |
| Saul Centers Inc. | 27,904 | 1,236 | |
| CatchMark Timber Trust Inc. Class A | 115,780 | 1,233 | |
| Alexander's Inc. | 5,012 | 1,187 | |
| Urstadt Biddle Properties Inc. Class A | 70,670 | 1,182 | |
| City Office REIT Inc. | 100,783 | 1,164 | |
| Industrial Logistics Properties Trust | 154,319 | 1,156 | |
| Whitestone REIT | 111,141 | 1,094 | |
| RE/MAX Holdings Inc. Class A | 44,359 | 1,010 | |
| RMR Group Inc. Class A | 36,519 | 951 | |
| One Liberty Properties Inc. | 38,426 | 928 | |
| * | FRP Holdings Inc. | 16,007 | 921 |
| CTO Realty Growth Inc. | 41,072 | 867 | |
| Braemar Hotels & Resorts Inc. | 161,014 | 829 | |
| Diversified Healthcare Trust | 565,115 | 825 | |
| Douglas Elliman Inc. | 177,238 | 817 | |
| Indus Realty Trust Inc. | 12,594 | 773 | |
| * | Tejon Ranch Co. | 48,957 | 772 |
| * | Ashford Hospitality Trust Inc. | 81,045 | 744 |
| * | Hersha Hospitality Trust Class A | 74,136 | 719 |
| BRT Apartments Corp. | 27,954 | 667 | |
| Franklin Street Properties Corp. | 231,443 | 650 | |
| Postal Realty Trust Inc. Class A | 41,425 | 615 | |
| * | Forestar Group Inc. | 43,372 | 540 |
| * | Stratus Properties Inc. | 14,039 | 500 |
| * | Offerpad Solutions Inc. | 163,253 | 248 |
| Clipper Realty Inc. | 27,697 | 233 | |
| * | Transcontinental Realty Investors Inc. | 3,107 | 134 |
| * | American Realty Investors Inc. | 3,472 | 48 |
| 390,373 | |||
| Technology (10.8%) | |||
| * | Qualys Inc. | 92,423 | 14,039 |
| * | Novanta Inc. | 84,154 | 11,251 |
| * | Rogers Corp. | 44,460 | 11,138 |
| * | Synaptics Inc. | 94,047 | 10,873 |
| * | Silicon Laboratories Inc. | 85,944 | 10,771 |
| * | SPS Commerce Inc. | 85,882 | 10,488 |
| * | Tenable Holdings Inc. | 260,450 | 10,316 |
| Power Integrations Inc. | 137,100 | 9,807 | |
| * | Fabrinet | 87,548 | 9,003 |
| * | Blackline Inc. | 130,948 | 8,897 |
| * | Ziff Davis Inc. | 108,283 | 8,368 |
| * | Onto Innovation Inc. | 117,482 | 8,340 |
| Shares | Market Value• ($000) | ||
| Advanced Energy Industries Inc. | 89,068 | 7,997 | |
| * | Rapid7 Inc. | 137,760 | 7,921 |
| * | Box Inc. Class A | 305,857 | 7,876 |
| * | Workiva Inc. Class A | 112,997 | 7,671 |
| * | DigitalOcean Holdings Inc. | 180,909 | 7,614 |
| * | Alarm.com Holdings Inc. | 113,961 | 7,590 |
| * | Diodes Inc. | 105,605 | 7,516 |
| * | Verint Systems Inc. | 150,750 | 7,310 |
| * | Varonis Systems Inc. Class B | 258,519 | 7,070 |
| * | Super Micro Computer Inc. | 107,600 | 7,003 |
| * | Semtech Corp. | 150,060 | 6,931 |
| * | Sanmina Corp. | 142,251 | 6,902 |
| * | Envestnet Inc. | 130,296 | 6,824 |
| * | Insight Enterprises Inc. | 74,391 | 6,778 |
| * | Rambus Inc. | 259,747 | 6,699 |
| * | MACOM Technology Solutions Holdings Inc. Class H | 119,700 | 6,601 |
| * | Sprout Social Inc. Class A | 109,025 | 6,546 |
| * | Altair Engineering Inc. Class A | 122,904 | 6,392 |
| * | Perficient Inc. | 81,024 | 6,328 |
| Vishay Intertechnology Inc. | 313,515 | 6,167 | |
| * | MaxLinear Inc. | 169,848 | 6,103 |
| * | Plexus Corp. | 65,102 | 6,102 |
| * | Ambarella Inc. | 86,334 | 5,860 |
| Kulicke & Soffa Industries Inc. | 137,707 | 5,789 | |
| * | Blackbaud Inc. | 110,068 | 5,757 |
| * | CommVault Systems Inc. | 105,334 | 5,719 |
| * | Yelp Inc. Class A | 162,594 | 5,556 |
| * | FormFactor Inc. | 184,496 | 5,402 |
| * | NetScout Systems Inc. | 166,904 | 5,298 |
| * | Q2 Holdings Inc. | 132,110 | 5,247 |
| * | PagerDuty Inc. | 201,254 | 5,241 |
| * | Covetrus Inc. | 250,282 | 5,223 |
| * | Axcelis Technologies Inc. | 77,262 | 5,172 |
| *,1 | MicroStrategy Inc. Class A | 22,331 | 5,171 |
| * | Ping Identity Holding Corp. | 182,788 | 5,144 |
| * | Bumble Inc. Class A | 204,502 | 5,123 |
| Progress Software Corp. | 103,479 | 4,980 | |
| * | Upwork Inc. | 283,544 | 4,934 |
| Amkor Technology Inc. | 239,906 | 4,829 | |
| * | Allscripts Healthcare Solutions Inc. | 269,680 | 4,585 |
| * | Appfolio Inc. Class A | 45,037 | 4,566 |
| * | Cargurus Inc. | 241,401 | 4,514 |
| Xerox Holdings Corp. | 270,402 | 4,494 | |
| * | Appian Corp. Class A | 94,689 | 4,441 |
| * | Impinj Inc. | 49,713 | 4,438 |
| CSG Systems International Inc. | 75,689 | 4,379 | |
| * | TechTarget Inc. | 64,850 | 4,209 |
| * | Sitime Corp. | 37,911 | 4,034 |
| * | Digital Turbine Inc. | 217,934 | 4,025 |
| Xperi Holding Corp. | 246,927 | 3,929 | |
| *,1 | Xometry Inc. Class A | 80,131 | 3,927 |
| * | TTM Technologies Inc. | 240,094 | 3,777 |
| * | Everbridge Inc. | 94,105 | 3,743 |
| * | Schrodinger Inc. | 128,506 | 3,526 |
| Methode Electronics Inc. | 85,904 | 3,476 |
| Shares | Market Value• ($000) | ||
| * | Clear Secure Inc. Class A | 147,142 | 3,375 |
| * | Asana Inc. Class A | 174,282 | 3,337 |
| * | KnowBe4 Inc. Class A | 172,272 | 3,311 |
| * | Parsons Corp. | 79,622 | 3,295 |
| * | E2open Parent Holdings Inc. | 471,900 | 3,242 |
| CTS Corp. | 75,249 | 3,185 | |
| Shutterstock Inc. | 57,402 | 3,181 | |
| * | LiveRamp Holdings Inc. | 159,296 | 3,162 |
| * | Ultra Clean Holdings Inc. | 106,845 | 3,127 |
| * | Cohu Inc. | 114,034 | 3,060 |
| * | 3D Systems Corp. | 300,239 | 3,041 |
| * | ePlus Inc. | 62,831 | 2,961 |
| * | C3.ai Inc. Class A | 162,999 | 2,934 |
| * | Model N Inc. | 85,509 | 2,557 |
| * | BigCommerce Holdings Inc. Series 1 | 151,705 | 2,529 |
| * | Veeco Instruments Inc. | 118,149 | 2,498 |
| * | Fastly Inc. Class A | 265,288 | 2,480 |
| * | Agilysys Inc. | 46,364 | 2,400 |
| *,1 | Matterport Inc. | 517,767 | 2,387 |
| * | Photronics Inc. | 141,930 | 2,384 |
| * | Magnite Inc. | 309,675 | 2,332 |
| * | Avid Technology Inc. | 84,945 | 2,323 |
| * | Grid Dynamics Holdings Inc. | 114,837 | 2,321 |
| Benchmark Electronics Inc. | 82,633 | 2,268 | |
| * | Momentive Global Inc. | 312,895 | 2,218 |
| Simulations Plus Inc. | 36,834 | 2,212 | |
| * | PAR Technology Corp. | 62,612 | 2,204 |
| A10 Networks Inc. | 156,532 | 2,176 | |
| * | Duck Creek Technologies Inc. | 182,322 | 2,170 |
| * | SMART Global Holdings Inc. | 116,498 | 2,138 |
| * | Zuora Inc. Class A | 266,805 | 2,049 |
| * | Ichor Holdings Ltd. | 66,406 | 2,040 |
| * | PROS Holdings Inc. | 97,473 | 2,032 |
| *,1 | indie Semiconductor Inc. Class A | 236,591 | 2,013 |
| * | Planet Labs PBC | 367,008 | 2,011 |
| * | Alpha & Omega Semiconductor Ltd. | 51,996 | 2,010 |
| * | Amplitude Inc. Class A | 132,490 | 2,007 |
| * | Vimeo Inc. | 338,776 | 2,006 |
| * | PubMatic Inc. Class A | 98,698 | 1,931 |
| * | LivePerson Inc. | 166,060 | 1,926 |
| * | ACM Research Inc. Class A | 113,151 | 1,911 |
| * | Consensus Cloud Solutions Inc. | 37,859 | 1,906 |
| *,1 | MicroVision Inc. | 391,941 | 1,897 |
| * | PDF Solutions Inc. | 71,716 | 1,892 |
| * | Cerence Inc. | 93,079 | 1,862 |
| * | Sumo Logic Inc. | 204,522 | 1,796 |
| * | ScanSource Inc. | 60,605 | 1,756 |
| *,1 | IonQ Inc. | 282,401 | 1,677 |
| * | Olo Inc. Class A | 212,429 | 1,659 |
| * | EngageSmart Inc. | 82,195 | 1,641 |
| Ebix Inc. | 62,375 | 1,623 | |
| * | N-Able Inc. | 161,918 | 1,613 |
| Sapiens International Corp. NV | 72,826 | 1,611 | |
| * | CEVA Inc. | 54,187 | 1,586 |
| * | Squarespace Inc. Class A | 74,283 | 1,560 |
| * | Unisys Corp. | 156,466 | 1,457 |
| * | AvePoint Inc. | 305,669 | 1,431 |
| Shares | Market Value• ($000) | ||
| * | Domo Inc. Class B | 71,955 | 1,386 |
| * | Blend Labs Inc. Class A | 437,884 | 1,379 |
| PC Connection Inc. | 26,691 | 1,326 | |
| Hackett Group Inc. | 63,689 | 1,308 | |
| * | Eventbrite Inc. Class A | 183,078 | 1,302 |
| * | nLight Inc. | 104,036 | 1,299 |
| * | Telos Corp. | 127,901 | 1,266 |
| * | Yext Inc. | 283,480 | 1,261 |
| American Software Inc. Class A | 73,973 | 1,252 | |
| * | Alkami Technology Inc. | 85,007 | 1,233 |
| * | Kimball Electronics Inc. | 56,830 | 1,224 |
| * | Edgio Inc. | 323,678 | 1,191 |
| * | Core Scientific Inc. | 517,996 | 1,140 |
| * | ForgeRock Inc. Class A | 66,452 | 1,134 |
| * | Tucows Inc. Class A | 23,595 | 1,109 |
| * | OneSpan Inc. | 95,097 | 1,095 |
| * | ChannelAdvisor Corp. | 71,344 | 1,077 |
| * | Couchbase Inc. | 62,950 | 1,044 |
| * | SolarWinds Corp. | 113,939 | 1,033 |
| * | Mitek Systems Inc. | 100,426 | 1,026 |
| * | Cvent Holding Corp. | 199,427 | 1,009 |
| * | Skillz Inc. Class A | 724,229 | 963 |
| * | MeridianLink Inc. | 54,788 | 952 |
| * | CyberOptics Corp. | 17,007 | 905 |
| * | SmartRent Inc. | 280,347 | 905 |
| * | ON24 Inc. | 99,088 | 888 |
| * | Bandwidth Inc. Class A | 54,574 | 846 |
| * | AXT Inc. | 95,899 | 824 |
| * | Identiv Inc. | 52,123 | 778 |
| * | Credo Technology Group Holding Ltd. | 55,589 | 767 |
| * | Enfusion Inc. Class A | 60,020 | 744 |
| * | Upland Software Inc. | 68,331 | 715 |
| * | Aeva Technologies Inc. | 228,156 | 703 |
| * | EverCommerce Inc. | 57,321 | 667 |
| * | Brightcove Inc. | 97,330 | 646 |
| *,1 | Cyxtera Technologies Inc. | 100,517 | 637 |
| * | NerdWallet Inc. Class A | 60,590 | 630 |
| *,1 | Atomera Inc. | 48,443 | 626 |
| * | Diebold Nixdorf Inc. | 172,948 | 602 |
| * | Rackspace Technology Inc. | 134,991 | 602 |
| * | Rimini Street Inc. | 115,499 | 582 |
| *,1 | Digimarc Corp. | 32,041 | 571 |
| *,1 | Veritone Inc. | 74,116 | 545 |
| * | Zeta Global Holdings Corp. Class A | 74,528 | 522 |
| *,1 | Groupon Inc. Class A | 50,955 | 505 |
| * | Ouster Inc. | 323,763 | 486 |
| * | Intapp Inc. | 33,320 | 483 |
| * | TrueCar Inc. | 219,609 | 479 |
| Vivid Seats Inc. Class A | 58,558 | 474 | |
| * | Mediaalpha Inc. Class A | 56,117 | 469 |
| *,1 | UserTesting Inc. | 111,443 | 464 |
| * | eGain Corp. | 49,654 | 457 |
| * | Benefitfocus Inc. | 61,356 | 455 |
| * | WM Technology Inc. | 169,685 | 445 |
| *,1 | Vinco Ventures Inc. | 452,369 | 439 |
| * | Red Violet Inc. | 22,556 | 428 |
| *,1 | Cleanspark Inc. | 96,332 | 412 |
| * | Porch Group Inc. | 188,345 | 405 |
| * | EverQuote Inc. Class A | 45,965 | 398 |
| * | NextNav Inc. | 117,530 | 398 |
| * | 1stdibs.com Inc. | 56,124 | 380 |
| *,1 | Rockley Photonics Holdings Ltd. | 241,578 | 343 |
| Shares | Market Value• ($000) | ||
| * | SkyWater Technology Inc. | 26,106 | 339 |
| *,1 | Avaya Holdings Corp. | 198,693 | 316 |
| *,1 | IronNet Inc. | 155,987 | 315 |
| *,1 | Beachbody Co. Inc. | 252,007 | 292 |
| * | Arteris Inc. | 40,938 | 291 |
| * | Transphorm Inc. | 49,473 | 275 |
| * | Arena Group Holdings Inc. | 26,030 | 274 |
| *,1 | Nutex Health Inc. | 93,626 | 252 |
| * | KORE Group Holdings Inc. | 80,932 | 242 |
| * | SecureWorks Corp. Class A | 22,394 | 233 |
| * | Innovid Corp. | 51,587 | 189 |
| * | Cipher Mining Inc. | 90,072 | 181 |
| * | Viant Technology Inc. Class A | 32,242 | 146 |
| * | LiveVox Holdings Inc. | 51,173 | 109 |
| * | Loyalty Ventures Inc. | 46,266 | 98 |
| * | Adtheorent Holdings Co. Inc. | 36,982 | 98 |
| * | Terawulf Inc. | 49,290 | 73 |
| * | Greenidge Generation Holdings Inc. | 29,409 | 71 |
| * | Weave Communications Inc. | 11,054 | 64 |
| * | Wejo Group Ltd. | 52,770 | 60 |
| * | Applied Blockchain Inc. | 18,616 | 44 |
| *,1 | Cryptyde Inc. | 42,199 | 33 |
| *,1 | Leafly Holdings Inc. | 10,114 | 16 |
| 617,096 | |||
| Telecommunications (1.7%) | |||
| * | Iridium Communications Inc. | 301,930 | 13,403 |
| * | Calix Inc. | 134,612 | 7,922 |
| * | Viavi Solutions Inc. | 539,131 | 7,591 |
| * | CommScope Holding Co. Inc. | 485,105 | 5,482 |
| Cogent Communications Holdings Inc. | 101,798 | 5,421 | |
| * | Extreme Networks Inc. | 302,489 | 4,335 |
| Telephone and Data Systems Inc. | 239,560 | 3,898 | |
| Adtran Holdings Inc. | 166,449 | 3,868 | |
| InterDigital Inc. | 73,049 | 3,664 | |
| * | Globalstar Inc. | 1,618,752 | 3,238 |
| * | Clearfield Inc. | 27,378 | 3,179 |
| * | Digi International Inc. | 81,107 | 2,685 |
| Shenandoah Telecommunications Co. | 114,375 | 2,549 | |
| * | Liberty Latin America Ltd. Class C | 363,793 | 2,536 |
| * | Infinera Corp. | 450,393 | 2,468 |
| * | Harmonic Inc. | 217,357 | 2,447 |
| * | WideOpenWest Inc. | 127,036 | 2,261 |
| *,1 | Lightwave Logic Inc. | 263,900 | 2,103 |
| * | Gogo Inc. | 118,558 | 1,762 |
| * | NETGEAR Inc. | 67,018 | 1,581 |
| * | EchoStar Corp. Class A | 83,700 | 1,541 |
| *,1 | fuboTV Inc. | 421,293 | 1,525 |
| * | 8x8 Inc. | 259,441 | 1,352 |
| * | Anterix Inc. | 28,780 | 1,222 |
| ATN International Inc. | 25,824 | 1,210 | |
| * | United States Cellular Corp. | 35,742 | 1,022 |
| * | Consolidated Communications Holdings Inc. | 175,943 | 1,010 |
| Shares | Market Value• ($000) | ||
| * | IDT Corp. Class B | 34,081 | 871 |
| * | Aviat Networks Inc. | 26,109 | 817 |
| Comtech Telecommunications Corp. | 61,202 | 691 | |
| * | Ooma Inc. | 54,128 | 655 |
| *,1 | Charge Enterprises Inc. | 257,837 | 627 |
| * | Liberty Latin America Ltd. Class A | 89,464 | 626 |
| * | Ribbon Communications Inc. | 171,362 | 601 |
| *,1 | Inseego Corp. | 204,965 | 553 |
| * | DZS Inc. | 41,173 | 548 |
| * | Akoustis Technologies Inc. | 123,495 | 541 |
| * | Cambium Networks Corp. | 27,346 | 532 |
| * | Casa Systems Inc. | 85,405 | 331 |
| *,1 | Starry Group Holdings Inc. | 54,805 | 123 |
| * | Kaleyra Inc. | 67,867 | 108 |
| 98,899 | |||
| Utilities (3.8%) | |||
| Southwest Gas Holdings Inc. | 156,282 | 12,167 | |
| Black Hills Corp. | 153,909 | 11,617 | |
| Brookfield Infrastructure Corp. Class A (XTSE) | 231,930 | 11,040 | |
| Portland General Electric Co. | 211,786 | 10,943 | |
| New Jersey Resources Corp. | 227,983 | 10,063 | |
| Ormat Technologies Inc. (XNYS) | 107,461 | 10,045 | |
| ONE Gas Inc. | 127,412 | 9,972 | |
| South Jersey Industries Inc. | 290,719 | 9,841 | |
| * | Evoqua Water Technologies Corp. | 278,587 | 9,773 |
| * | Casella Waste Systems Inc. Class A | 118,317 | 9,694 |
| PNM Resources Inc. | 202,397 | 9,600 | |
| Spire Inc. | 120,821 | 8,444 | |
| ALLETE Inc. | 135,773 | 8,035 | |
| California Water Service Group | 127,276 | 7,449 | |
| American States Water Co. | 87,385 | 7,250 | |
| Clearway Energy Inc. Class C | 193,996 | 7,197 | |
| Avista Corp. | 171,816 | 6,981 | |
| NorthWestern Corp. | 128,519 | 6,809 | |
| MGE Energy Inc. | 86,266 | 6,644 | |
| * | Sunnova Energy International Inc. | 234,811 | 5,922 |
| Chesapeake Utilities Corp. | 41,256 | 5,211 | |
| SJW Group | 63,913 | 4,110 | |
| Northwest Natural Holding Co. | 80,769 | 3,845 | |
| Shares | Market Value• ($000) | ||
| Middlesex Water Co. | 41,316 | 3,668 | |
| Clearway Energy Inc. Class A | 82,813 | 2,855 | |
| * | Archaea Energy Inc. Class A | 140,824 | 2,783 |
| *,1 | Li-Cycle Holdings Corp. | 313,482 | 2,260 |
| Unitil Corp. | 37,713 | 1,964 | |
| York Water Co. | 33,433 | 1,470 | |
| * | Heritage-Crystal Clean Inc. | 37,169 | 1,211 |
| Excelerate Energy Inc. Class A | 44,119 | 1,133 | |
| *,1 | Vertex Energy Inc. | 127,133 | 1,081 |
| Artesian Resources Corp. Class A | 19,608 | 1,071 | |
| * | Harsco Corp. | 186,081 | 1,055 |
| *,1 | Altus Power Inc. | 98,752 | 1,035 |
| Aris Water Solution Inc. Class A | 52,539 | 893 | |
| *,1 | NuScale Power Corp. | 40,743 | 559 |
| * | Pure Cycle Corp. | 46,302 | 478 |
| Global Water Resources Inc. | 30,938 | 421 | |
| Via Renewables Inc. Class A | 29,616 | 253 | |
| 216,842 | |||
| Total Common Stocks (Cost $6,930,998) | 5,718,393 | ||
| Temporary Cash Investments (2.4%) | |||
| Money Market Fund (2.4%) | |||
| 4,5 | Vanguard Market Liquidity Fund, 2.284% (Cost $141,809) | 1,418,708 | 141,828 |
| Total Investments (102.0%) (Cost $7,072,807) | 5,860,221 | ||
| Other Assets and Liabilities—Net (-2.0%) | (117,696) | ||
| Net Assets (100%) | 5,742,525 | ||
| Cost is in $000. | |||
| • | See Note A in Notes to Financial Statements. |
| * | Non-income-producing security. |
| 1 | Includes partial security positions on loan to broker-dealers. The total value of securities on loan is $112,323,000. |
| 2 | Security value determined using significant unobservable inputs. |
| 3 | “Other” represents securities that are not classified by the fund’s benchmark index. |
| 4 | Affiliated money market fund available only to Vanguard funds and certain trusts and accounts managed by Vanguard. Rate shown is the 7-day yield. |
| 5 | Collateral of $123,388,000 was received for securities on loan. |
| ADR—American Depositary Receipt. | |
| CVR—Contingent Value Rights. | |
| REIT—Real Estate Investment Trust. |
| Futures Contracts | ||||
| ($000) | ||||
| Expiration | Number of Long (Short) Contracts | Notional Amount | Value and Unrealized Appreciation (Depreciation) | |
| Long Futures Contracts | ||||
| E-mini Russell 2000 Index | September 2022 | 262 | 24,164 | (284) |
| ($000s, except shares and per-share amounts) | Amount |
| Assets | |
| Investments in Securities, at Value1 | |
| Unaffiliated Issuers (Cost $6,930,998) | 5,718,393 |
| Affiliated Issuers (Cost $141,809) | 141,828 |
| Total Investments in Securities | 5,860,221 |
| Investment in Vanguard | 218 |
| Cash Collateral Pledged—Futures Contracts | 1,403 |
| Receivables for Investment Securities Sold | 1,226 |
| Receivables for Accrued Income | 4,615 |
| Receivables for Capital Shares Issued | 68 |
| Total Assets | 5,867,751 |
| Liabilities | |
| Due to Custodian | 1,247 |
| Payables for Investment Securities Purchased | 40 |
| Collateral for Securities on Loan | 123,388 |
| Payables for Capital Shares Redeemed | 137 |
| Payables to Vanguard | 266 |
| Variation Margin Payable—Futures Contracts | 148 |
| Total Liabilities | 125,226 |
| Net Assets | 5,742,525 |
| 1 Includes $112,323 of securities on loan. | |
| At August 31, 2022, net assets consisted of: | |
| Paid-in Capital | 7,689,185 |
| Total Distributable Earnings (Loss) | (1,946,660) |
| Net Assets | 5,742,525 |
| ETF Shares—Net Assets | |
| Applicable to 71,000,000 outstanding $.001 par value shares of beneficial interest (unlimited authorization) | 5,255,468 |
| Net Asset Value Per Share—ETF Shares | $74.02 |
| Institutional Shares—Net Assets | |
| Applicable to 1,719,687 outstanding $.001 par value shares of beneficial interest (unlimited authorization) | 487,057 |
| Net Asset Value Per Share—Institutional Shares | $283.22 |
| Year Ended August 31, 2022 | |
| ($000) | |
| Investment Income | |
| Income | |
| Dividends1 | 87,284 |
| Interest2 | 153 |
| Securities Lending—Net | 5,877 |
| Total Income | 93,314 |
| Expenses | |
| The Vanguard Group—Note B | |
| Investment Advisory Services | 828 |
| Management and Administrative—ETF Shares | 3,653 |
| Management and Administrative—Institutional Shares | 248 |
| Marketing and Distribution—ETF Shares | 339 |
| Marketing and Distribution—Institutional Shares | 20 |
| Custodian Fees | 1,220 |
| Auditing Fees | 27 |
| Shareholders’ Reports—ETF Shares | 395 |
| Shareholders’ Reports—Institutional Shares | 8 |
| Trustees’ Fees and Expenses | 3 |
| Other Expenses | 17 |
| Total Expenses | 6,758 |
| Expenses Paid Indirectly | (3) |
| Net Expenses | 6,755 |
| Net Investment Income | 86,559 |
| Realized Net Gain (Loss) | |
| Investment Securities Sold2,3 | 339,760 |
| Futures Contracts | (8,876) |
| Realized Net Gain (Loss) | 330,884 |
| Change in Unrealized Appreciation (Depreciation) | |
| Investment Securities2 | (1,857,019) |
| Futures Contracts | (493) |
| Change in Unrealized Appreciation (Depreciation) | (1,857,512) |
| Net Increase (Decrease) in Net Assets Resulting from Operations | (1,440,069) |
| 1 | Dividends are net of foreign withholding taxes of $121,000. |
| 2 | Interest income, realized net gain (loss), capital gain distributions received, and change in unrealized appreciation (depreciation) from an affiliated company of the fund were $145,000, ($43,000), less than $1,000, and $7,000, respectively. Purchases and sales are for temporary cash investment purposes. |
| 3 | Includes $748,103,000 of net gain (loss) resulting from in-kind redemptions. |
| Year Ended August 31, | ||
| 2022 ($000) | 2021 ($000) | |
| Increase (Decrease) in Net Assets | ||
| Operations | ||
| Net Investment Income | 86,559 | 48,702 |
| Realized Net Gain (Loss) | 330,884 | 727,841 |
| Change in Unrealized Appreciation (Depreciation) | (1,857,512) | 639,157 |
| Net Increase (Decrease) in Net Assets Resulting from Operations | (1,440,069) | 1,415,700 |
| Distributions | ||
| ETF Shares | (79,883) | (36,436) |
| Institutional Shares | (7,288) | (7,027) |
| Total Distributions | (87,171) | (43,463) |
| Capital Share Transactions | ||
| ETF Shares | 439,553 | 3,304,505 |
| Institutional Shares | (12,117) | (267,012) |
| Net Increase (Decrease) from Capital Share Transactions | 427,436 | 3,037,493 |
| Total Increase (Decrease) | (1,099,804) | 4,409,730 |
| Net Assets | ||
| Beginning of Period | 6,842,329 | 2,432,599 |
| End of Period | 5,742,525 | 6,842,329 |
| ETF Shares | |||||
| For a Share Outstanding Throughout Each Period | Year Ended August 31, | ||||
| 2022 | 20211 | 20201 | 20191 | 20181 | |
| Net Asset Value, Beginning of Period | $91.28 | $62.69 | $59.88 | $69.56 | $56.11 |
| Investment Operations | |||||
| Net Investment Income2 | 1.030 | .865 | .810 | .797 | .777 |
| Net Realized and Unrealized Gain (Loss) on Investments | (17.254) | 28.550 | 2.815 | (9.704) | 13.423 |
| Total from Investment Operations | (16.224) | 29.415 | 3.625 | (8.907) | 14.200 |
| Distributions | |||||
| Dividends from Net Investment Income | (1.036) | (.825) | (.815) | (.773) | (.750) |
| Distributions from Realized Capital Gains | — | — | — | — | — |
| Total Distributions | (1.036) | (.825) | (.815) | (.773) | (.750) |
| Net Asset Value, End of Period | $74.02 | $91.28 | $62.69 | $59.88 | $69.56 |
| Total Return | -17.88% | 47.15% | 6.12% | -12.83% | 25.49% |
| Ratios/Supplemental Data | |||||
| Net Assets, End of Period (Millions) | $5,255 | $6,223 | $1,802 | $1,464 | $1,715 |
| Ratio of Total Expenses to Average Net Assets | 0.10%3 | 0.10% | 0.10% | 0.10% | 0.15% |
| Ratio of Net Investment Income to Average Net Assets | 1.26% | 1.02% | 1.37% | 1.30% | 1.23% |
| Portfolio Turnover Rate4 | 19% | 23% | 19% | 16% | 19% |
| 1 | Adjusted to reflect a 2-for-1 share split effective at the beginning of trading on April 20, 2021. |
| 2 | Calculated based on average shares outstanding. |
| 3 | The ratio of expenses to average net assets for the period net of reduction from custody fee offset arrangements was 0.10%. |
| 4 | Excludes the value of portfolio securities received or delivered as a result of in-kind purchases or redemptions of the fund’s capital shares, including ETF Creation Units. |
| Institutional Shares | |||||
| For a Share Outstanding Throughout Each Period | Year Ended August 31, | ||||
| 2022 | 2021 | 2020 | 2019 | 2018 | |
| Net Asset Value, Beginning of Period | $349.26 | $239.84 | $229.03 | $266.12 | $214.65 |
| Investment Operations | |||||
| Net Investment Income1 | 4.063 | 3.360 | 3.208 | 3.078 | 3.129 |
| Net Realized and Unrealized Gain (Loss) on Investments | (66.085) | 109.242 | 10.710 | (37.106) | 51.369 |
| Total from Investment Operations | (62.022) | 112.602 | 13.918 | (34.028) | 54.498 |
| Distributions | |||||
| Dividends from Net Investment Income | (4.018) | (3.182) | (3.108) | (3.062) | (3.028) |
| Distributions from Realized Capital Gains | — | — | — | — | — |
| Total Distributions | (4.018) | (3.182) | (3.108) | (3.062) | (3.028) |
| Net Asset Value, End of Period | $283.22 | $349.26 | $239.84 | $229.03 | $266.12 |
| Total Return | -17.88% | 47.19% | 6.15% | -12.83% | 25.58% |
| Ratios/Supplemental Data | |||||
| Net Assets, End of Period (Millions) | $487 | $619 | $630 | $859 | $982 |
| Ratio of Total Expenses to Average Net Assets | 0.08%2 | 0.08% | 0.08% | 0.08% | 0.08% |
| Ratio of Net Investment Income to Average Net Assets | 1.29% | 1.08% | 1.41% | 1.32% | 1.30% |
| Portfolio Turnover Rate3 | 19% | 23% | 19% | 16% | 19% |
| 1 | Calculated based on average shares outstanding. |
| 2 | The ratio of expenses to average net assets for the period net of reduction from custody fee offset arrangements was 0.08%. |
| 3 | Excludes the value of portfolio securities received or delivered as a result of in-kind purchases or redemptions of the fund’s capital shares, including ETF Creation Units. |
| A. | The following significant accounting policies conform to generally accepted accounting principles for U.S. investment companies. The fund consistently follows such policies in preparing its financial statements. |
| B. | In accordance with the terms of a Funds' Service Agreement (the “FSA”) between Vanguard and the fund, Vanguard furnishes to the fund investment advisory, corporate management, administrative, marketing, and distribution services at Vanguard’s cost of operations (as defined by the FSA). These costs of operations are allocated to the fund based on methods and guidelines approved by the board of trustees and are generally settled twice a month. |
| C. | The fund’s custodian bank has agreed to reduce its fees when the fund maintains cash on deposit in the non-interest-bearing custody account. For the year ended August 31, 2022, custodian fee offset arrangements reduced the fund’s expenses by $3,000 (an annual rate of less than 0.01% of average net assets). |
| D. | Various inputs may be used to determine the value of the fund’s investments and derivatives. These inputs are summarized in three broad levels for financial statement purposes. The inputs or methodologies used to value securities are not necessarily an indication of the risk associated with investing in those securities. |
| Level 1 ($000) | Level 2 ($000) | Level 3 ($000) | Total ($000) | |
| Investments | ||||
| Assets | ||||
| Common Stocks | 5,718,110 | — | 283 | 5,718,393 |
| Temporary Cash Investments | 141,828 | — | — | 141,828 |
| Total | 5,859,938 | — | 283 | 5,860,221 |
| Derivative Financial Instruments | ||||
| Liabilities | ||||
| Futures Contracts1 | 284 | — | — | 284 |
| 1 | Includes cumulative appreciation (depreciation) on futures contracts and centrally cleared swaps, if any, as reported in the Schedule of Investments. Only current day’s variation margin is reported within the Statement of Assets and Liabilities. |
| E. | Permanent differences between book-basis and tax-basis components of net assets are reclassified among capital accounts in the financial statements to reflect their tax character. These reclassifications have no effect on net assets or net asset value per share. As of period end, permanent differences primarily attributable to the accounting for applicable in-kind redemptions and passive foreign investment companies were reclassified between the following accounts: |
| Amount ($000) | |
| Paid-in Capital | 747,331 |
| Total Distributable Earnings (Loss) | (747,331) |
| Amount ($000) | |
| Undistributed Ordinary Income | 18,147 |
| Undistributed Long-Term Gains | — |
| Capital Loss Carryforwards | (696,802) |
| Qualified Late-Year Losses | — |
| Net Unrealized Gains (Losses) | (1,268,005) |
| Year Ended August 31, | ||
| 2022 Amount ($000) | 2021 Amount ($000) | |
| Ordinary Income* | 87,171 | 43,463 |
| Long-Term Capital Gains | — | — |
| Total | 87,171 | 43,463 |
| * | Includes short-term capital gains, if any. |
| Amount ($000) | |
| Tax Cost | 7,128,226 |
| Gross Unrealized Appreciation | 388,791 |
| Gross Unrealized Depreciation | (1,656,796) |
| Net Unrealized Appreciation (Depreciation) | (1,268,005) |
| F. | During the year ended August 31, 2022, the fund purchased $5,057,155,000 of investment securities and sold $4,650,942,000 of investment securities, other than temporary cash investments. Purchases and sales include $3,759,890,000 and $3,321,896,000, respectively, in connection with in-kind purchases and redemptions of the fund's capital shares. |
| G. | Capital share transactions for each class of shares were: |
| Year Ended August 31, | |||||
| 2022 | 2021 | ||||
| Amount ($000) | Shares (000) | Amount ($000) | Shares (000) | ||
| ETF Shares1 | |||||
| Issued | 3,768,327 | 46,000 | 5,016,365 | 59,050 | |
| Issued in Lieu of Cash Distributions | — | — | — | — | |
| Redeemed | (3,328,774) | (43,175) | (1,711,860) | (19,625) | |
| Net Increase (Decrease)—ETF Shares | 439,553 | 2,825 | 3,304,505 | 39,425 | |
| Institutional Shares | |||||
| Issued | 137,297 | 417 | 87,649 | 270 | |
| Issued in Lieu of Cash Distributions | 6,909 | 22 | 6,712 | 23 | |
| Redeemed | (156,323) | (492) | (361,373) | (1,148) | |
| Net Increase (Decrease)—Institutional Shares | (12,117) | (53) | (267,012) | (855) | |
| 1 | 2021 Shares adjusted to reflect a 2-for-1 share split effective at the beginning of trading on April 20, 2021. |
| H. | Management has determined that no events or transactions occurred subsequent to August 31, 2022, that would require recognition or disclosure in these financial statements. |

| Average Annual Total Returns Periods Ended August 31, 2022 | |||||
| One Year | Five Years | Ten Years | Final Value of a $10,000 Investment | ||
| Russell 2000 Value Index Fund ETF Shares Net Asset Value | -10.28% | 6.51% | 9.39% | $24,537 |
| Russell 2000 Value Index Fund ETF Shares Market Price | -10.24 | 6.51 | 9.43 | 24,617 | |
| Russell 2000 Value Index | -10.18 | 6.56 | 9.49 | 24,767 |
| Dow Jones U.S. Total Stock Market Float Adjusted Index | -13.73 | 11.16 | 12.66 | 32,942 |
| One Year | Five Years | Ten Years | Final Value of a $5,000,000 Investment | ||
| Russell 2000 Value Index Fund Institutional Shares | -10.23% | 6.59% | 9.50% | $12,393,759 | |
| Russell 2000 Value Index | -10.18 | 6.56 | 9.49 | 12,383,539 | |
| Dow Jones U.S. Total Stock Market Float Adjusted Index | -13.73 | 11.16 | 12.66 | 16,470,991 | |
| One Year | Five Years | Ten Years | |
| Russell 2000 Value Index Fund ETF Shares Market Price | -10.24% | 37.09% | 146.17% |
| Russell 2000 Value Index Fund ETF Shares Net Asset Value | -10.28 | 37.07 | 145.37 |
| Russell 2000 Value Index | -10.18 | 37.37 | 147.67 |
| Basic Materials | 3.9% |
| Consumer Discretionary | 13.2 |
| Consumer Staples | 2.6 |
| Energy | 5.1 |
| Financials | 28.0 |
| Health Care | 10.8 |
| Industrials | 13.2 |
| Real Estate | 11.5 |
| Technology | 5.2 |
| Telecommunications | 1.2 |
| Utilities | 5.2 |
| Other | 0.1 |
| Shares | Market Value• ($000) | ||
| Common Stocks (99.9%) | |||
| Basic Materials (3.9%) | |||
| * | RBC Bearings Inc. | 20,891 | 5,028 |
| Commercial Metals Co. | 86,161 | 3,490 | |
| * | Arconic Corp. | 90,697 | 2,286 |
| Mueller Industries Inc. | 30,744 | 1,942 | |
| Hecla Mining Co. | 458,611 | 1,807 | |
| Stepan Co. | 16,500 | 1,720 | |
| Boise Cascade Co. | 26,809 | 1,671 | |
| Minerals Technologies Inc. | 28,097 | 1,637 | |
| Tronox Holdings plc Class A | 100,268 | 1,467 | |
| Carpenter Technology Corp. | 41,012 | 1,393 | |
| Worthington Industries Inc. | 27,147 | 1,384 | |
| Mativ Holdings Inc. | 43,545 | 1,029 | |
| * | Perimeter Solutions SA | 103,884 | 1,013 |
| Avient Corp. | 20,593 | 903 | |
| * | Resolute Forest Products Inc. | 39,341 | 797 |
| * | US Silica Holdings Inc. | 54,121 | 759 |
| Quaker Chemical Corp. | 4,001 | 697 | |
| Schnitzer Steel Industries Inc. Class A | 20,149 | 666 | |
| * | Coeur Mining Inc. | 239,598 | 661 |
| * | Constellium SE Class A | 49,415 | 658 |
| * | Piedmont Lithium Inc. ADR | 10,702 | 654 |
| * | Clearwater Paper Corp. | 14,308 | 609 |
| * | TimkenSteel Corp. | 39,616 | 608 |
| AdvanSix Inc. | 15,337 | 556 | |
| * | Ecovyst Inc. | 55,264 | 511 |
| UFP Industries Inc. | 6,425 | 510 | |
| * | Intrepid Potash Inc. | 9,657 | 451 |
| *,1 | Amyris Inc. | 148,605 | 437 |
| Haynes International Inc. | 10,432 | 414 | |
| Koppers Holdings Inc. | 17,591 | 402 | |
| Ryerson Holding Corp. | 13,317 | 380 | |
| Innospec Inc. | 3,221 | 301 | |
| * | Alto Ingredients Inc. | 62,358 | 269 |
| Hawkins Inc. | 6,441 | 247 | |
| Tredegar Corp. | 23,300 | 238 | |
| * | Rayonier Advanced Materials Inc. | 52,287 | 236 |
| * | Origin Materials Inc. | 35,177 | 220 |
| Olympic Steel Inc. | 8,045 | 212 | |
| * | Northwest Pipe Co. | 6,667 | 211 |
| * | Energy Fuels Inc. | 23,917 | 194 |
| Glatfelter Corp. | 38,764 | 189 | |
| FutureFuel Corp. | 21,686 | 158 | |
| Sensient Technologies Corp. | 1,977 | 158 | |
| * | Unifi Inc. | 11,772 | 134 |
| Shares | Market Value• ($000) | ||
| * | GCP Applied Technologies Inc. | 3,708 | 117 |
| Materion Corp. | 1,075 | 93 | |
| Sylvamo Corp. | 1,891 | 84 | |
| * | Polymet Mining Corp. | 26,049 | 81 |
| Valhi Inc. | 2,037 | 71 | |
| American Vanguard Corp. | 3,220 | 64 | |
| * | Novagold Resources Inc. | 10,877 | 48 |
| * | Ur-Energy Inc. | 17,602 | 24 |
| * | Hycroft Mining Holding Corp. | 21,037 | 17 |
| 39,906 | |||
| Consumer Discretionary (13.2%) | |||
| * | Scientific Games Corp. Class A | 83,860 | 4,128 |
| TEGNA Inc. | 190,401 | 4,075 | |
| * | Goodyear Tire & Rubber Co. | 240,338 | 3,372 |
| Academy Sports & Outdoors Inc. | 71,891 | 3,097 | |
| * | Adient plc | 81,397 | 2,702 |
| * | Callaway Golf Co. | 119,904 | 2,653 |
| Foot Locker Inc. | 71,659 | 2,640 | |
| Signet Jewelers Ltd. | 40,000 | 2,615 | |
| Group 1 Automotive Inc. | 13,769 | 2,459 | |
| * | Asbury Automotive Group Inc. | 13,479 | 2,352 |
| * | Meritage Homes Corp. | 29,030 | 2,274 |
| * | Taylor Morrison Home Corp. Class A | 86,684 | 2,177 |
| * | National Vision Holdings Inc. | 65,287 | 2,169 |
| * | Spirit Airlines Inc. | 93,325 | 2,117 |
| Graham Holdings Co. Class B | 3,232 | 1,827 | |
| Rush Enterprises Inc. Class A | 38,449 | 1,809 | |
| MillerKnoll Inc. | 65,201 | 1,805 | |
| Dana Inc. | 110,725 | 1,713 | |
| * | frontdoor Inc. | 71,063 | 1,669 |
| KB Home | 56,255 | 1,612 | |
| * | Sabre Corp. | 222,391 | 1,599 |
| * | LGI Homes Inc. | 16,704 | 1,585 |
| Winnebago Industries Inc. | 27,485 | 1,583 | |
| * | KAR Auction Services Inc. | 103,512 | 1,511 |
| American Eagle Outfitters Inc. | 132,150 | 1,488 | |
| * | Adtalem Global Education Inc. | 38,298 | 1,443 |
| * | Tri Pointe Homes Inc. | 80,858 | 1,401 |
| Shares | Market Value• ($000) | ||
| * | Vista Outdoor Inc. | 47,950 | 1,348 |
| Monro Inc. | 28,620 | 1,325 | |
| * | ODP Corp. | 36,953 | 1,321 |
| Strategic Education Inc. | 19,750 | 1,278 | |
| Jack in the Box Inc. | 15,629 | 1,248 | |
| * | Madison Square Garden Entertainment Corp. | 22,140 | 1,230 |
| International Game Technology plc | 65,956 | 1,183 | |
| * | Knowles Corp. | 76,822 | 1,164 |
| * | Urban Outfitters Inc. | 56,700 | 1,141 |
| MDC Holdings Inc. | 36,126 | 1,123 | |
| Century Communities Inc. | 23,538 | 1,099 | |
| Scholastic Corp. | 23,612 | 1,084 | |
| Laureate Education Inc. Class A | 96,647 | 1,065 | |
| Acushnet Holdings Corp. | 21,148 | 1,008 | |
| * | Clean Energy Fuels Corp. | 145,398 | 977 |
| La-Z-Boy Inc. | 36,755 | 970 | |
| * | SeaWorld Entertainment Inc. | 19,276 | 969 |
| * | Overstock.com Inc. | 36,580 | 955 |
| Red Rock Resorts Inc. Class A | 24,886 | 951 | |
| * | American Axle & Manufacturing Holdings Inc. | 91,346 | 945 |
| Qurate Retail Inc. Series A | 301,162 | 934 | |
| * | Lions Gate Entertainment Corp. Class B | 99,237 | 926 |
| * | iHeartMedia Inc. Class A | 103,423 | 915 |
| Sonic Automotive Inc. Class A | 17,185 | 914 | |
| * | SkyWest Inc. | 42,618 | 907 |
| * | M/I Homes Inc. | 20,305 | 878 |
| * | Central Garden & Pet Co. Class A | 23,212 | 876 |
| Steelcase Inc. Class A | 73,619 | 823 | |
| *,1 | Bally's Corp. | 34,027 | 806 |
| * | G-III Apparel Group Ltd. | 37,291 | 786 |
| Gray Television Inc. | 40,545 | 774 | |
| * | EW Scripps Co. Class A | 49,974 | 747 |
| * | Allegiant Travel Co. | 7,506 | 724 |
| * | PROG Holdings Inc. | 38,909 | 721 |
| * | AMC Networks Inc. Class A | 25,832 | 692 |
| * | GoPro Inc. Class A | 111,735 | 680 |
| * | Perdoceo Education Corp. | 58,208 | 674 |
| * | Viad Corp. | 17,355 | 663 |
| Matthews International Corp. Class A | 26,138 | 654 | |
| * | Cars.com Inc. | 51,208 | 653 |
| * | Hawaiian Holdings Inc. | 43,379 | 650 |
| Standard Motor Products Inc. | 17,589 | 646 | |
| Papa John's International Inc. | 7,910 | 639 | |
| * | Everi Holdings Inc. | 34,418 | 637 |
| * | ContextLogic Inc. Class A | 490,187 | 637 |
| * | Genesco Inc. | 11,176 | 632 |
| * | Abercrombie & Fitch Co. Class A | 42,578 | 613 |
| * | MarineMax Inc. | 16,607 | 603 |
| * | TravelCenters of America Inc. | 10,756 | 582 |
| Krispy Kreme Inc. | 45,641 | 536 | |
| * | QuinStreet Inc. | 41,686 | 501 |
| Winmark Corp. | 2,426 | 501 |
| Shares | Market Value• ($000) | ||
| * | Clear Channel Outdoor Holdings Inc. | 311,192 | 498 |
| * | Lions Gate Entertainment Corp. Class A | 50,570 | 498 |
| PriceSmart Inc. | 7,836 | 496 | |
| Big Lots Inc. | 23,909 | 492 | |
| * | BJ's Restaurants Inc. | 19,400 | 487 |
| Smith & Wesson Brands Inc. | 36,179 | 481 | |
| A-Mark Precious Metals Inc. | 15,437 | 477 | |
| Ethan Allen Interiors Inc. | 19,319 | 459 | |
| * | PowerSchool Holdings Inc. Class A | 25,394 | 457 |
| * | 2U Inc. | 63,714 | 454 |
| * | Boston Omaha Corp. Class A | 16,536 | 444 |
| * | Tupperware Brands Corp. | 38,875 | 437 |
| Oxford Industries Inc. | 4,083 | 436 | |
| * | Green Brick Partners Inc. | 17,804 | 434 |
| * | Sleep Number Corp. | 10,302 | 427 |
| Movado Group Inc. | 13,361 | 426 | |
| * | Life Time Group Holdings Inc. | 35,915 | 426 |
| * | Poshmark Inc. Class A | 39,241 | 425 |
| * | ACV Auctions Inc. Class A | 49,192 | 419 |
| * | Thryv Holdings Inc. | 16,349 | 418 |
| Bloomin' Brands Inc. | 20,542 | 415 | |
| * | Stagwell Inc. | 60,513 | 410 |
| * | America's Car-Mart Inc. | 5,076 | 409 |
| *,1 | Bowlero Corp. | 34,168 | 404 |
| * | Cardlytics Inc. | 28,585 | 378 |
| * | Beazer Homes USA Inc. | 25,561 | 364 |
| * | Chuy's Holdings Inc. | 16,155 | 361 |
| * | Stoneridge Inc. | 18,957 | 360 |
| Shoe Carnival Inc. | 15,009 | 357 | |
| * | Zumiez Inc. | 13,331 | 346 |
| Haverty Furniture Cos. Inc. | 12,874 | 345 | |
| * | OneWater Marine Inc. Class A | 8,636 | 344 |
| Marcus Corp. | 20,450 | 329 | |
| 1 | Ermenegildo Zegna NV | 31,308 | 321 |
| Aaron's Co. Inc. | 25,817 | 307 | |
| * | Lordstown Motors Corp. Class A | 138,137 | 296 |
| * | Sportsman's Warehouse Holdings Inc. | 37,103 | 295 |
| * | Gannett Co. Inc. | 125,331 | 291 |
| * | Instructure Holdings Inc. | 12,718 | 289 |
| * | AMMO Inc. | 74,439 | 284 |
| * | Cinemark Holdings Inc. | 19,746 | 278 |
| Johnson Outdoors Inc. Class A | 4,546 | 278 | |
| * | Daily Journal Corp. | 1,028 | 269 |
| * | Eastman Kodak Co. | 48,869 | 264 |
| * | Imax Corp. | 16,702 | 262 |
| * | Wheels Up Experience Inc. | 135,945 | 254 |
| * | Allbirds Inc. Class A | 59,399 | 244 |
| * | WW International Inc. | 46,304 | 242 |
| * | Motorcar Parts of America Inc. | 15,989 | 238 |
| Kimball International Inc. Class B | 30,921 | 237 | |
| * | Universal Electronics Inc. | 10,360 | 230 |
| 1 | Big 5 Sporting Goods Corp. | 18,706 | 229 |
| Designer Brands Inc. Class A | 13,428 | 229 | |
| * | Corsair Gaming Inc. | 14,490 | ��� 223 |
| Shares | Market Value• ($000) | ||
| * | Stitch Fix Inc. Class A | 41,764 | 210 |
| *,1 | Cenntro Electric Group Ltd. | 157,116 | 207 |
| * | LL Flooring Holdings Inc. | 24,812 | 202 |
| * | 1-800-Flowers.com Inc. Class A | 22,986 | 200 |
| Rush Enterprises Inc. Class B | 3,921 | 199 | |
| Bluegreen Vacations Holding Class A | 9,538 | 199 | |
| * | Lindblad Expeditions Holdings Inc. | 25,416 | 196 |
| * | RumbleON Inc. Class B | 8,838 | 193 |
| * | Figs Inc. Class A | 16,224 | 188 |
| * | Central Garden & Pet Co. | 4,643 | 185 |
| * | Container Store Group Inc. | 27,219 | 185 |
| * | Liquidity Services Inc. | 10,590 | 185 |
| * | Xponential Fitness Inc. Class A | 10,062 | 184 |
| *,1 | Bed Bath & Beyond Inc. | 19,013 | 181 |
| * | Integral Ad Science Holding Corp. | 22,071 | 179 |
| * | Lands' End Inc. | 12,914 | 178 |
| Alta Equipment Group Inc. | 14,857 | 175 | |
| * | Snap One Holdings Corp. | 15,370 | 172 |
| Cato Corp. Class A | 15,620 | 169 | |
| * | iRobot Corp. | 2,852 | 168 |
| * | American Public Education Inc. | 16,191 | 167 |
| * | Fossil Group Inc. | 39,490 | 167 |
| * | Children's Place Inc. | 3,933 | 166 |
| 1 | Weber Inc. Class A | 23,083 | 166 |
| * | Chico's FAS Inc. | 29,102 | 165 |
| Tilly's Inc. Class A | 20,367 | 153 | |
| * | Outbrain Inc. | 34,210 | 151 |
| * | Cumulus Media Inc. Class A | 15,814 | 147 |
| * | El Pollo Loco Holdings Inc. | 16,112 | 146 |
| Rocky Brands Inc. | 5,441 | 142 | |
| * | Vacasa Inc. | 35,010 | 140 |
| * | Full House Resorts Inc. | 20,532 | 138 |
| * | Citi Trends Inc. | 6,766 | 137 |
| * | Denny's Corp. | 14,436 | 136 |
| Hibbett Inc. | 2,306 | 135 | |
| * | Destination XL Group Inc. | 24,130 | 133 |
| * | RealReal Inc. | 60,691 | 130 |
| Weyco Group Inc. | 5,032 | 129 | |
| * | Legacy Housing Corp. | 7,516 | 128 |
| * | Selectquote Inc. | 114,083 | 127 |
| * | Quotient Technology Inc. | 67,538 | 126 |
| * | Purple Innovation Inc. Class A | 43,909 | 126 |
| * | Playstudios Inc. | 34,060 | 123 |
| Tile Shop Holdings Inc. | 31,065 | 122 | |
| * | Party City Holdco Inc. | 59,867 | 118 |
| Dine Brands Global Inc. | 1,739 | 116 | |
| Superior Group of Cos. Inc. | 10,006 | 111 | |
| *,1 | Aterian Inc. | 47,581 | 108 |
| * | Conn's Inc. | 11,097 | 107 |
| Interface Inc. Class A | 9,458 | 106 | |
| John Wiley & Sons Inc. Class A | 2,230 | 103 | |
| * | ThredUP Inc. Class A | 42,577 | 103 |
| * | BARK Inc. | 43,920 | 102 |
| * | Sally Beauty Holdings Inc. | 6,531 | 97 |
| * | Brinker International Inc. | 3,850 | 94 |
| Lifetime Brands Inc. | 10,507 | 94 | |
| * | First Watch Restaurant Group Inc. | 5,615 | 94 |
| Shares | Market Value• ($000) | ||
| Global Industrial Co. | 3,034 | 91 | |
| * | Biglari Holdings Inc. Class B | 621 | 84 |
| * | Express Inc. | 54,823 | 83 |
| * | StoneMor Inc. | 22,938 | 79 |
| * | Solo Brands Inc. Class A | 18,752 | 78 |
| * | Traeger Inc. | 27,289 | 72 |
| Entravision Communications Corp. Class A | 13,954 | 71 | |
| Sturm Ruger & Co. Inc. | 1,336 | 70 | |
| JOANN Inc. | 9,395 | 67 | |
| * | Landsea Homes Corp. | 9,561 | 64 |
| * | Urban One Inc. | 15,107 | 63 |
| * | Inspired Entertainment Inc. | 5,993 | 63 |
| NL Industries Inc. | 7,003 | 62 | |
| *,1 | Bird Global Inc. | 146,309 | 62 |
| Clarus Corp. | 3,933 | 60 | |
| Buckle Inc. | 1,770 | 57 | |
| * | Audacy Inc. Class A | 100,147 | 55 |
| Franchise Group Inc. | 1,570 | 53 | |
| * | Duluth Holdings Inc. Class B | 5,901 | 52 |
| Build-A-Bear Workshop Inc. | 3,319 | 51 | |
| *,1 | Vuzix Corp. | 6,485 | 49 |
| * | Faraday Future Intelligent Electric Inc. | 39,228 | 44 |
| RCI Hospitality Holdings Inc. | 578 | 38 | |
| * | Turtle Beach Corp. | 3,916 | 37 |
| * | Century Casinos Inc. | 4,128 | 30 |
| CompX International Inc. | 1,232 | 30 | |
| European Wax Center Inc. Class A | 1,376 | 30 | |
| * | Torrid Holdings Inc. | 5,108 | 29 |
| * | Inspirato Inc. | 9,091 | 25 |
| * | Urban One Inc. (XNCM) | 3,910 | 21 |
| * | aka Brands Holding Corp. | 8,408 | 17 |
| * | Rover Group Inc. Class A | 3,581 | 14 |
| * | Reservoir Media Inc. | 1,558 | 10 |
| 134,875 | |||
| Consumer Staples (2.6%) | |||
| * | Hostess Brands Inc. Class A | 118,022 | 2,736 |
| * | United Natural Foods Inc. | 46,344 | 2,043 |
| * | TreeHouse Foods Inc. | 43,574 | 2,031 |
| Edgewell Personal Care Co. | 46,153 | 1,798 | |
| Primo Water Corp. | 135,007 | 1,774 | |
| * | Hain Celestial Group Inc. | 64,539 | 1,308 |
| B&G Foods Inc. | 58,439 | 1,266 | |
| Weis Markets Inc. | 14,040 | 1,091 | |
| Ingles Markets Inc. Class A | 12,166 | 1,065 | |
| Universal Corp. | 20,714 | 1,057 | |
| Vector Group Ltd. | 105,173 | 1,031 | |
| Nu Skin Enterprises Inc. Class A | 25,096 | 1,027 | |
| Andersons Inc. | 27,377 | 1,014 | |
| SpartanNash Co. | 30,528 | 929 | |
| * | Herbalife Nutrition Ltd. | 28,485 | 743 |
| Fresh Del Monte Produce Inc. | 26,019 | 711 | |
| * | Mission Produce Inc. | 30,477 | 491 |
| ACCO Brands Corp. | 80,896 | 480 | |
| Lancaster Colony Corp. | 2,568 | 433 | |
| * | Chefs' Warehouse Inc. | 8,641 | 288 |
| * | Seneca Foods Corp. Class A | 5,083 | 268 |
| *,1 | Benson Hill Inc. | 74,832 | 266 |
| * | Landec Corp. | 22,913 | 241 |
| Shares | Market Value• ($000) | ||
| John B Sanfilippo & Son Inc. | 2,937 | 237 | |
| *,1 | GrowGeneration Corp. | 48,938 | 232 |
| * | Honest Co. Inc. | 55,526 | 200 |
| Alico Inc. | 5,329 | 181 | |
| * | Rite Aid Corp. | 25,119 | 180 |
| * | Whole Earth Brands Inc. | 35,083 | 179 |
| *,1 | AppHarvest Inc. | 60,943 | 175 |
| Village Super Market Inc. Class A | 7,455 | 164 | |
| * | HF Foods Group Inc. | 31,053 | 158 |
| * | Vintage Wine Estates Inc. | 24,060 | 142 |
| Cal-Maine Foods Inc. | 2,542 | 136 | |
| Utz Brands Inc. | 7,451 | 124 | |
| * | PLBY Group Inc. | 26,572 | 120 |
| * | Nature's Sunshine Products Inc. | 11,756 | 114 |
| * | Sovos Brands Inc. | 7,438 | 114 |
| * | Beauty Health Co. | 9,440 | 109 |
| Tootsie Roll Industries Inc. | 1,873 | 67 | |
| PetMed Express Inc. | 2,911 | 60 | |
| * | SunOpta Inc. | 5,621 | 56 |
| Natural Grocers by Vitamin Cottage Inc. | 988 | 14 | |
| * | Tattooed Chef Inc. | 2,083 | 14 |
| * | Boxed Inc. | 11,313 | 12 |
| 26,879 | |||
| Energy (5.1%) | |||
| Civitas Resources Inc. | 63,205 | 4,247 | |
| Helmerich & Payne Inc. | 88,125 | 3,767 | |
| California Resources Corp. | 66,986 | 3,347 | |
| Murphy Oil Corp. | 71,125 | 2,772 | |
| * | CNX Resources Corp. | 156,251 | 2,761 |
| Equitrans Midstream Corp. | 268,414 | 2,488 | |
| * | Peabody Energy Corp. | 100,712 | 2,484 |
| Arcosa Inc. | 41,504 | 2,426 | |
| * | Golar LNG Ltd. | 81,680 | 2,227 |
| * | PBF Energy Inc. Class A | 63,930 | 2,184 |
| Chord Energy Corp. | 14,758 | 2,089 | |
| * | Green Plains Inc. | 45,235 | 1,657 |
| World Fuel Services Corp. | 53,310 | 1,375 | |
| Warrior Met Coal Inc. | 39,270 | 1,278 | |
| * | Centennial Resource Development Inc. Class A | 152,710 | 1,257 |
| * | NOW Inc. | 94,140 | 1,141 |
| * | Expro Group Holdings NV | 66,302 | 896 |
| Patterson-UTI Energy Inc. | 59,677 | 889 | |
| Archrock Inc. | 115,678 | 855 | |
| * | Noble Corp. | 26,528 | 805 |
| * | Tidewater Inc. | 32,600 | 722 |
| * | ProPetro Holding Corp. | 74,694 | 684 |
| * | Dril-Quip Inc. | 29,151 | 645 |
| * | Diamond Offshore Drilling Inc. | 85,380 | 607 |
| * | Bristow Group Inc. | 20,229 | 587 |
| * | Helix Energy Solutions Group Inc. | 122,224 | 528 |
| * | Gevo Inc. | 168,102 | 526 |
| Berry Corp. | 56,970 | 521 | |
| *,1 | EVgo Inc. | 51,108 | 485 |
| Kinetik Holdings Inc. | 12,881 | 475 | |
| SunCoke Energy Inc. | 71,090 | 468 | |
| * | Centrus Energy Corp. Class A | 9,061 | 451 |
| * | Select Energy Services Inc. Class A | 60,427 | 430 |
| Shares | Market Value• ($000) | ||
| * | REX American Resources Corp. | 13,707 | 415 |
| * | FuelCell Energy Inc. | 86,661 | 363 |
| * | Callon Petroleum Co. | 7,106 | 302 |
| Northern Oil and Gas Inc. | 8,463 | 268 | |
| * | DMC Global Inc. | 11,972 | 267 |
| * | Oil States International Inc. | 51,759 | 254 |
| * | Borr Drilling Ltd. | 62,178 | 249 |
| * | National Energy Services Reunited Corp. | 32,727 | 230 |
| * | Aemetis Inc. | 24,971 | 228 |
| *,1 | Volta Inc. | 104,200 | 223 |
| * | Newpark Resources Inc. | 72,471 | 209 |
| * | Solid Power Inc. | 29,310 | 193 |
| NACCO Industries Inc. Class A | 3,460 | 156 | |
| * | Ring Energy Inc. | 43,973 | 142 |
| * | Nabors Industries Ltd. (XNYS) | 966 | 128 |
| CONSOL Energy Inc. | 1,703 | 122 | |
| * | Stem Inc. | 6,590 | 104 |
| * | W&T Offshore Inc. | 13,817 | 90 |
| Riley Exploration Permian Inc. | 3,292 | 83 | |
| * | Nabors Industries Ltd. Warrants Exp. 6/11/26 | 2,380 | 82 |
| * | Oceaneering International Inc. | 8,115 | 72 |
| * | Amplify Energy Corp. | 6,916 | 52 |
| * | NextDecade Corp. | 4,396 | 32 |
| * | ESS Tech Inc. | 6,917 | 31 |
| * | ProFrac Holding Corp. Class A | 944 | 19 |
| 52,388 | |||
| Financials (28.0%) | |||
| SouthState Corp. | 64,227 | 5,012 | |
| Valley National Bancorp | 368,704 | 4,284 | |
| Blackstone Mortgage Trust Inc. Class A | 145,579 | 4,219 | |
| United Bankshares Inc. | 113,369 | 4,206 | |
| Glacier Bancorp Inc. | 82,847 | 4,199 | |
| Old National Bancorp | 250,894 | 4,187 | |
| Selective Insurance Group Inc. | 51,129 | 4,061 | |
| Home BancShares Inc. | 162,854 | 3,832 | |
| Cadence Bank | 147,725 | 3,764 | |
| Essent Group Ltd. | 90,334 | 3,612 | |
| Hancock Whitney Corp. | 73,800 | 3,559 | |
| UMB Financial Corp. | 37,665 | 3,370 | |
| First Interstate BancSystem Inc. Class A | 80,208 | 3,229 | |
| Radian Group Inc. | 148,177 | 3,128 | |
| Independent Bank Corp. (XNGS) | 39,947 | 3,125 | |
| United Community Banks Inc. | 91,047 | 3,053 | |
| CVB Financial Corp. | 115,278 | 3,025 | |
| Community Bank System Inc. | 45,518 | 2,976 | |
| WSFS Financial Corp. | 55,215 | 2,670 | |
| Ameris Bancorp | 56,839 | 2,653 | |
| Pacific Premier Bancorp Inc. | 80,586 | 2,640 | |
| * | Mr Cooper Group Inc. | 62,165 | 2,630 |
| BankUnited Inc. | 69,899 | 2,590 | |
| Cathay General Bancorp | 61,642 | 2,585 | |
| * | Texas Capital Bancshares Inc. | 43,557 | 2,571 |
| Shares | Market Value• ($000) | ||
| Associated Banc-Corp. | 127,742 | 2,560 | |
| American Equity Investment Life Holding Co. | 66,740 | 2,536 | |
| Simmons First National Corp. Class A | 107,226 | 2,529 | |
| Fulton Financial Corp. | 138,919 | 2,255 | |
| First BanCorp. (XNYS) | 155,706 | 2,227 | |
| Independent Bank Group Inc. | 31,436 | 2,118 | |
| Eastern Bankshares Inc. | 109,003 | 2,115 | |
| Atlantic Union Bankshares Corp. | 64,052 | 2,078 | |
| Jackson Financial Inc. Class A | 64,808 | 2,026 | |
| Columbia Banking System Inc. | 67,505 | 2,022 | |
| Arbor Realty Trust Inc. | 132,953 | 1,992 | |
| First Merchants Corp. | 49,113 | 1,956 | |
| International Bancshares Corp. | 46,543 | 1,942 | |
| * | Enstar Group Ltd. | 9,906 | 1,875 |
| * | Axos Financial Inc. | 44,224 | 1,848 |
| * | Genworth Financial Inc. Class A | 435,528 | 1,838 |
| CNO Financial Group Inc. | 98,571 | 1,815 | |
| Banner Corp. | 29,275 | 1,779 | |
| Washington Federal Inc. | 55,466 | 1,775 | |
| Chimera Investment Corp. | 204,136 | 1,735 | |
| Flagstar Bancorp Inc. | 44,783 | 1,725 | |
| First Financial Bancorp | 79,741 | 1,721 | |
| Piper Sandler Cos. | 14,901 | 1,707 | |
| WesBanco Inc. | 49,892 | 1,707 | |
| Seacoast Banking Corp. of Florida | 51,888 | 1,677 | |
| Trustmark Corp. | 52,541 | 1,657 | |
| Towne Bank | 57,742 | 1,645 | |
| Park National Corp. | 12,310 | 1,623 | |
| Heartland Financial USA Inc. | 35,246 | 1,574 | |
| Renasant Corp. | 46,925 | 1,564 | |
| Navient Corp. | 99,187 | 1,526 | |
| Provident Financial Services Inc. | 63,806 | 1,482 | |
| Northwest Bancshares Inc. | 104,464 | 1,470 | |
| Sandy Spring Bancorp Inc. | 37,981 | 1,463 | |
| Hope Bancorp Inc. | 99,367 | 1,438 | |
| Two Harbors Investment Corp. | 296,593 | 1,438 | |
| Apollo Commercial Real Estate Finance Inc. | 120,937 | 1,409 | |
| * | Cannae Holdings Inc. | 65,039 | 1,405 |
| NBT Bancorp Inc. | 35,939 | 1,394 | |
| Hilltop Holdings Inc. | 52,529 | 1,387 | |
| * | NMI Holdings Inc. Class A | 67,566 | 1,387 |
| Enterprise Financial Services Corp. | 30,107 | ��� 1,376 | |
| Claros Mortgage Trust Inc. | 78,611 | 1,343 | |
| PennyMac Financial Services Inc. | 25,250 | 1,341 | |
| Eagle Bancorp Inc. | 27,258 | 1,323 | |
| Bank of NT Butterfield & Son Ltd. | 40,146 | 1,310 | |
| FirstCash Holdings Inc. | 16,624 | 1,296 | |
| TriCo Bancshares | 27,205 | 1,284 | |
| Horace Mann Educators Corp. | 35,512 | 1,270 | |
| * | PRA Group Inc. | 33,897 | 1,252 |
| Shares | Market Value• ($000) | ||
| * | StoneX Group Inc. | 13,330 | 1,238 |
| FB Financial Corp. | 31,165 | 1,235 | |
| Stewart Information Services Corp. | 23,102 | 1,170 | |
| Veritex Holdings Inc. | 38,703 | 1,165 | |
| Moelis & Co. Class A | 27,509 | 1,146 | |
| * | Encore Capital Group Inc. | 20,621 | 1,128 |
| OFG Bancorp | 40,966 | 1,114 | |
| Berkshire Hills Bancorp Inc. | 39,372 | 1,111 | |
| First Bancorp (XNGS) | 30,375 | 1,106 | |
| Safety Insurance Group Inc. | 12,224 | 1,101 | |
| BGC Partners Inc. Class A | 272,603 | 1,096 | |
| Compass Diversified Holdings | 52,092 | 1,087 | |
| Ladder Capital Corp. Class A | 97,390 | 1,077 | |
| * | LendingClub Corp. | 82,435 | 1,077 |
| First Commonwealth Financial Corp. | 79,730 | 1,075 | |
| Nelnet Inc. Class A | 12,745 | 1,074 | |
| City Holding Co. | 12,578 | 1,069 | |
| Virtus Investment Partners Inc. | 5,428 | 1,038 | |
| *,1 | Marathon Digital Holdings Inc. | 86,949 | 1,030 |
| First Busey Corp. | 44,074 | 1,014 | |
| Capitol Federal Financial Inc. | 111,154 | 1,007 | |
| S&T Bancorp Inc. | 33,364 | 989 | |
| ProAssurance Corp. | 46,037 | 985 | |
| Southside Bancshares Inc. | 26,149 | 985 | |
| OceanFirst Financial Corp. | 49,572 | 964 | |
| MFA Financial Inc. REIT | 87,677 | 958 | |
| * | Enova International Inc. | 27,148 | 949 |
| PennyMac Mortgage Investment Trust | 63,825 | 948 | |
| Westamerica BanCorp. | 16,802 | 940 | |
| National Bank Holdings Corp. Class A | 23,154 | 929 | |
| Franklin BSP Realty Trust Inc. REIT | 71,833 | 927 | |
| Employers Holdings Inc. | 23,575 | 923 | |
| * | Customers Bancorp Inc. | 26,428 | 917 |
| New York Mortgage Trust Inc. | 324,502 | 909 | |
| Dime Community Bancshares Inc. | 28,498 | 891 | |
| German American Bancorp Inc. | 23,684 | 890 | |
| *,1 | Lemonade Inc. | 39,639 | 877 |
| Lakeland Bancorp Inc. | 53,204 | 867 | |
| Cowen Inc. Class A | 22,431 | 862 | |
| Tompkins Financial Corp. | 12,001 | 860 | |
| KKR Real Estate Finance Trust Inc. | 44,234 | 852 | |
| Federal Agricultural Mortgage Corp. Class C | 7,775 | 849 | |
| * | MoneyGram International Inc. | 80,724 | 831 |
| First Foundation Inc. | 43,772 | 830 | |
| Ready Capital Corp. | 63,240 | 828 | |
| Premier Financial Corp. | 30,259 | 818 | |
| Brookline Bancorp Inc. | 65,314 | 814 | |
| Walker & Dunlop Inc. | 7,987 | 802 | |
| Redwood Trust Inc. | 103,316 | 801 | |
| * | Triumph Bancorp Inc. | 12,945 | 801 |
| Preferred Bank | 11,737 | 796 | |
| ConnectOne Bancorp Inc. | 31,717 | 794 |
| Shares | Market Value• ($000) | ||
| Banc of California Inc. | 46,956 | 793 | |
| QCR Holdings Inc. | 14,158 | 791 | |
| iStar Inc. | 57,031 | 785 | |
| Origin Bancorp Inc. | 19,224 | 785 | |
| AMERISAFE Inc. | 16,329 | 781 | |
| Heritage Financial Corp. | 29,543 | 768 | |
| Washington Trust Bancorp Inc. | 14,874 | 753 | |
| James River Group Holdings Ltd. | 31,390 | 746 | |
| BancFirst Corp. | 6,790 | 732 | |
| Mercury General Corp. | 22,821 | 728 | |
| * | Nicolet Bankshares Inc. | 9,399 | 720 |
| Broadmark Realty Capital Inc. | 111,290 | 718 | |
| *,1 | Riot Blockchain Inc. | 99,977 | 717 |
| Peoples Bancorp Inc. | 23,928 | 715 | |
| Ellington Financial Inc. | 48,467 | 711 | |
| Allegiance Bancshares Inc. | 16,582 | 702 | |
| Brightspire Capital Inc. Class A | 81,431 | 684 | |
| * | Oscar Health Inc. Class A | 100,816 | 668 |
| Horizon Bancorp Inc. | 34,441 | 652 | |
| 1st Source Corp. | 13,797 | 651 | |
| Enact Holdings Inc. | 25,632 | 651 | |
| Hanmi Financial Corp. | 25,840 | 639 | |
| Amerant Bancorp Inc. | 24,121 | 632 | |
| ARMOUR Residential REIT Inc. | 87,733 | 623 | |
| Univest Financial Corp. | 24,938 | 618 | |
| Kearny Financial Corp. | 52,987 | 602 | |
| Artisan Partners Asset Management Inc. Class A | 17,779 | 600 | |
| * | Ambac Financial Group Inc. | 39,126 | 590 |
| Pathward Financial Inc. | 17,890 | 590 | |
| * | Metropolitan Bank Holding Corp. | 8,151 | 584 |
| Community Trust Bancorp Inc. | 13,395 | 566 | |
| Heritage Commerce Corp. | 50,160 | 566 | |
| First Mid Bancshares Inc. | 15,969 | 565 | |
| Camden National Corp. | 12,306 | 557 | |
| CBL & Associates Properties Inc. | 19,077 | 552 | |
| Northfield Bancorp Inc. | 37,406 | 551 | |
| TPG RE Finance Trust Inc. | 59,007 | 546 | |
| United Fire Group Inc. | 18,200 | 536 | |
| TrustCo Bank Corp. NY | 16,041 | 535 | |
| HomeStreet Inc. | 15,337 | 534 | |
| HarborOne Bancorp Inc. | 39,042 | 533 | |
| Argo Group International Holdings Ltd. | 27,150 | 533 | |
| * | CrossFirst Bankshares Inc. | 39,418 | 520 |
| Flushing Financial Corp. | 24,607 | 508 | |
| * | Silvergate Capital Corp. Class A | 5,565 | 507 |
| Central Pacific Financial Corp. | 23,114 | 504 | |
| First Bancorp Inc. (XNMS) | 16,848 | 504 | |
| Peapack-Gladstone Financial Corp. | 14,873 | 501 | |
| Old Second Bancorp Inc. | 36,217 | 497 | |
| Dynex Capital Inc. | 31,115 | 483 | |
| Great Southern Bancorp Inc. | 8,216 | 483 | |
| * | MBIA Inc. | 40,993 | 483 |
| Cambridge Bancorp | 5,841 | 480 | |
| CBTX Inc. | 15,704 | 468 |
| Shares | Market Value• ($000) | ||
| * | Bancorp Inc. | 19,572 | 464 |
| Invesco Mortgage Capital REIT | 29,085 | 462 | |
| Byline Bancorp Inc. | 21,020 | 458 | |
| First Financial Corp. | 9,767 | 454 | |
| Midland States Bancorp Inc. | 18,085 | 454 | |
| Bank First Corp. | 5,545 | 451 | |
| First Community Bankshares Inc. | 13,951 | 440 | |
| Mercantile Bank Corp. | 13,165 | 435 | |
| Business First Bancshares Inc. | 18,362 | 433 | |
| Granite Point Mortgage Trust Inc. | 45,696 | 430 | |
| * | Columbia Financial Inc. | 19,562 | 417 |
| Equity Bancshares Inc. Class A | 13,281 | 415 | |
| Bank of Marin Bancorp | 13,396 | 414 | |
| Farmers National Banc Corp. | 26,828 | 383 | |
| Arrow Financial Corp. | 11,786 | 378 | |
| * | EZCorp. Inc. Class A | 42,465 | 372 |
| Capital City Bank Group Inc. | 11,575 | 370 | |
| MidWestOne Financial Group Inc. | 12,081 | 368 | |
| National Western Life Group Inc. Class A | 1,935 | 368 | |
| Merchants Bancorp | 13,625 | 367 | |
| CNB Financial Corp. | 13,781 | 363 | |
| Southern Missouri Bancorp Inc. | 6,888 | 363 | |
| Bar Harbor Bankshares | 12,635 | 358 | |
| * | Assetmark Financial Holdings Inc. | 18,420 | 356 |
| Mid Penn Bancorp Inc. | 12,252 | 356 | |
| Independent Bank Corp. | 17,215 | 353 | |
| Capstar Financial Holdings Inc. | 17,460 | 352 | |
| First of Long Island Corp. | 18,982 | 349 | |
| Hingham Institution for Savings | 1,164 | 346 | |
| Banco Latinoamericano de Comercio Exterior SA Class E | 23,466 | 343 | |
| * | Carter Bankshares Inc. | 20,791 | 342 |
| Financial Institutions Inc. | 12,924 | 336 | |
| SmartFinancial Inc. | 13,322 | 334 | |
| * | SiriusPoint Ltd. | 72,095 | 322 |
| Republic Bancorp Inc. Class A | 7,547 | 321 | |
| Citizens & Northern Corp. | 12,896 | 310 | |
| Alerus Financial Corp. | 12,991 | 309 | |
| American National Bankshares Inc. | 9,059 | 298 | |
| Waterstone Financial Inc. | 17,226 | 298 | |
| Peoples Financial Services Corp. | 5,975 | 291 | |
| Shore Bancshares Inc. | 15,214 | 290 | |
| * | Professional Holding Corp. Class A | 10,219 | 286 |
| West BanCorp. Inc. | 11,583 | 285 | |
| First Internet Bancorp | 7,751 | 284 | |
| RBB Bancorp | 12,778 | 282 | |
| * | Southern First Bancshares Inc. | 6,506 | 280 |
| MVB Financial Corp. | 8,701 | 278 | |
| Amalgamated Financial Corp. | 12,286 | 276 |
| Shares | Market Value• ($000) | ||
| Oppenheimer Holdings Inc. Class A | 7,528 | 273 | |
| Summit Financial Group Inc. | 9,498 | 271 | |
| Civista Bancshares Inc. | 12,760 | 270 | |
| Victory Capital Holdings Inc. Class A | 9,938 | 266 | |
| Enterprise Bancorp Inc. | 8,126 | 261 | |
| ACNB Corp. | 7,219 | 257 | |
| Stock Yards Bancorp Inc. | 3,840 | 254 | |
| * | Blue Foundry Bancorp | 22,107 | 251 |
| Home Bancorp Inc. | 6,385 | 249 | |
| Primis Financial Corp. | 18,953 | 248 | |
| John Marshall Bancorp Inc. | 9,742 | 246 | |
| Guaranty Bancshares Inc. | 7,040 | 244 | |
| Sierra Bancorp | 11,788 | 244 | |
| Metrocity Bankshares Inc. | 12,098 | 242 | |
| First Bancorp Inc. (XNGS) | 8,318 | 241 | |
| Tiptree Inc. | 20,092 | 240 | |
| South Plains Financial Inc. | 8,850 | 240 | |
| * | Bridgewater Bancshares Inc. | 13,823 | 237 |
| HomeTrust Bancshares Inc. | 10,224 | 237 | |
| AFC Gamma Inc. | 13,549 | 236 | |
| Orrstown Financial Services Inc. | 9,063 | 233 | |
| First Business Financial Services Inc. | 6,850 | 228 | |
| Northeast Bank | 5,760 | 223 | |
| Regional Management Corp. | 6,579 | 222 | |
| BCB Bancorp Inc. | 12,265 | 221 | |
| Universal Insurance Holdings Inc. | 18,296 | 218 | |
| Macatawa Bank Corp. | 22,527 | 214 | |
| Blue Ridge Bankshares Inc. | 14,521 | 213 | |
| Live Oak Bancshares Inc. | 5,841 | 212 | |
| * | Hippo Holdings Inc. | 217,195 | 211 |
| Farmers & Merchants Bancorp Inc. | 7,101 | 203 | |
| PCSB Financial Corp. | 10,839 | 201 | |
| First Bank | 13,249 | 199 | |
| Colony Bankcorp Inc. | 14,028 | 198 | |
| Parke Bancorp Inc. | 8,647 | 192 | |
| BayCom Corp. | 10,163 | 189 | |
| Capital Bancorp Inc. | 7,627 | 189 | |
| Red River Bancshares Inc. | 3,695 | 189 | |
| * | FVCBankcorp Inc. | 9,689 | 187 |
| PCB Bancorp | 9,939 | 187 | |
| * | Third Coast Bancshares Inc. | 10,270 | 187 |
| Donegal Group Inc. Class A | 12,680 | 184 | |
| * | First Western Financial Inc. | 6,751 | 179 |
| Five Star Bancorp | 6,947 | 177 | |
| Provident Bancorp Inc. | 12,116 | 176 | |
| * | Greenlight Capital Re Ltd. Class A | 22,216 | 175 |
| Luther Burbank Corp. | 13,147 | 172 | |
| Unity Bancorp Inc. | 6,021 | 169 | |
| HBT Financial Inc. | 8,554 | 155 | |
| Bankwell Financial Group Inc. | 4,822 | 152 | |
| Angel Oak Mortgage Inc. | 10,276 | 143 | |
| * | Consumer Portfolio Services Inc. | 12,202 | 142 |
| Nexpoint Real Estate Finance Inc. | 6,702 | 138 | |
| Investors Title Co. | 933 | 137 | |
| * | Republic First Bancorp Inc. | 42,993 | 137 |
| Lakeland Financial Corp. | 1,749 | 132 |
| Shares | Market Value• ($000) | ||
| *,1 | Bakkt Holdings Inc. | 48,468 | 126 |
| * | World Acceptance Corp. | 1,063 | 124 |
| * | Oportun Financial Corp. | 23,768 | 121 |
| * | USCB Financial Holdings Inc. | 9,223 | 120 |
| Sculptor Capital Management Inc. Class A | 11,601 | 109 | |
| *,1 | Rigetti Computing Inc. | 27,354 | 109 |
| Manning & Napier Inc. | 8,323 | 106 | |
| First Guaranty Bancshares Inc. | 4,669 | 104 | |
| * | Goosehead Insurance Inc. Class A | 1,995 | 104 |
| Crawford & Co. Class A | 15,424 | 94 | |
| * | eHealth Inc. | 14,653 | 94 |
| * | Pioneer Bancorp Inc. | 9,947 | 93 |
| * | NI Holdings Inc. | 7,013 | 92 |
| Chicago Atlantic Real Estate Finance Inc. | 5,866 | 90 | |
| * | Sterling Bancorp Inc. | 14,622 | 86 |
| * | Trean Insurance Group Inc. | 19,389 | 86 |
| * | Root Inc. Blank | 6,603 | 82 |
| * | Velocity Financial LLC | 6,670 | 76 |
| * | Doma Holdings Inc. | 105,853 | 64 |
| * | Sunlight Financial Holdings Inc. | 20,726 | 63 |
| Brookfield Business Corp. Class A | 2,576 | 63 | |
| Associated Capital Group Inc. Class A | 1,493 | 59 | |
| * | SWK Holdings Corp. | 3,069 | 54 |
| * | Finance of America Cos. Inc. Class A | 33,058 | 40 |
| GCM Grosvenor Inc. Class A | 4,919 | 39 | |
| Brightsphere Investment Group Inc. | 2,134 | 36 | |
| Esquire Financial Holdings Inc. | 876 | 33 | |
| * | MarketWise Inc. | 11,445 | 32 |
| * | OppFi Inc. | 11,546 | 31 |
| Curo Group Holdings Corp. | 4,280 | 28 | |
| Perella Weinberg Partners Class A | 3,844 | 28 | |
| Home Point Capital Inc. | 6,741 | 16 | |
| GAMCO Investors Inc. Class A | 524 | 11 | |
| Silvercrest Asset Management Group Inc. Class A | 561 | 10 | |
| Value Line Inc. | 44 | 4 | |
| 285,592 | |||
| Health Care (10.8%) | |||
| * | Biohaven Pharmaceutical Holding Co. Ltd. | 20,214 | 3,019 |
| * | 1Life Healthcare Inc. | 154,498 | 2,659 |
| * | Prestige Consumer Healthcare Inc. | 43,079 | 2,179 |
| * | Integer Holdings Corp. | 28,318 | 1,786 |
| * | Sage Therapeutics Inc. | 44,665 | 1,682 |
| Owens & Minor Inc. | 55,976 | 1,652 | |
| * | Myriad Genetics Inc. | 68,195 | 1,523 |
| * | Vir Biotechnology Inc. | 62,243 | 1,478 |
| * | Supernus Pharmaceuticals Inc. | 42,072 | 1,440 |
| * | Iovance Biotherapeutics Inc. | 129,504 | 1,388 |
| * | Relay Therapeutics Inc. | 60,354 | 1,386 |
| Shares | Market Value• ($000) | ||
| * | Intellia Therapeutics Inc. | 22,205 | 1,334 |
| * | Pediatrix Medical Group Inc. | 73,738 | 1,314 |
| * | Xencor Inc. | 49,240 | 1,299 |
| * | Veracyte Inc. | 61,489 | 1,254 |
| * | Agios Pharmaceuticals Inc. | 46,861 | 1,195 |
| * | Multiplan Corp. | 324,204 | 1,141 |
| * | Pacific Biosciences of California Inc. | 194,022 | 1,137 |
| * | AdaptHealth Corp. Class A | 62,034 | 1,115 |
| * | Recursion Pharmaceuticals Inc. Class A | 104,837 | 1,102 |
| * | AbCellera Biologics Inc. | 101,406 | 1,083 |
| * | NeoGenomics Inc. | 106,684 | 1,072 |
| * | Arcus Biosciences Inc. | 44,212 | 1,065 |
| * | Ligand Pharmaceuticals Inc. | 11,382 | 1,052 |
| * | Emergent BioSolutions Inc. | 43,173 | 1,037 |
| * | Verve Therapeutics Inc. | 26,738 | 1,026 |
| * | REGENXBIO Inc. | 34,237 | 1,010 |
| * | Avanos Medical Inc. | 40,548 | 999 |
| *,1 | Lyell Immunopharma Inc. | 148,415 | 994 |
| * | REVOLUTION Medicines Inc. | 46,125 | 961 |
| * | Celldex Therapeutics Inc. | 30,992 | 942 |
| * | Allogene Therapeutics Inc. | 68,036 | 933 |
| * | Kymera Therapeutics Inc. | 32,842 | 928 |
| * | Enanta Pharmaceuticals Inc. | 14,936 | 909 |
| * | American Well Corp. Class A | 195,975 | 892 |
| * | Editas Medicine Inc. Class A | 59,009 | 867 |
| * | Krystal Biotech Inc. | 11,984 | 840 |
| * | Avidity Biosciences Inc. | 41,769 | 819 |
| * | Adaptive Biotechnologies Corp. | 90,313 | 806 |
| * | ModivCare Inc. | 7,425 | 804 |
| * | Syndax Pharmaceuticals Inc. | 33,971 | 802 |
| * | Fulgent Genetics Inc. | 18,375 | 799 |
| * | Chinook Therapeutics Inc. | 37,257 | 775 |
| * | Kura Oncology Inc. | 54,506 | 755 |
| * | OPKO Health Inc. | 344,445 | 751 |
| National HealthCare Corp. | 10,747 | 746 | |
| * | Crinetics Pharmaceuticals Inc. | 39,281 | 742 |
| * | PTC Therapeutics Inc. | 14,642 | 731 |
| * | Addus HomeCare Corp. | 8,020 | 716 |
| * | ChemoCentryx Inc. | 14,026 | 715 |
| * | Butterfly Network Inc. | 113,454 | 707 |
| * | MannKind Corp. | 193,114 | 705 |
| * | AngioDynamics Inc. | 31,762 | 703 |
| * | Brookdale Senior Living Inc. | 158,925 | 699 |
| * | Varex Imaging Corp. | 32,979 | 695 |
| * | BioCryst Pharmaceuticals Inc. | 49,108 | 683 |
| * | SpringWorks Therapeutics Inc. | 23,874 | 663 |
| * | BioLife Solutions Inc. | 26,585 | 628 |
| * | Cogent Biosciences Inc. | 38,086 | 628 |
| * | AtriCure Inc. | 13,657 | 623 |
| *,1 | Bionano Genomics Inc. | 248,834 | 617 |
| * | LivaNova plc | 10,854 | 611 |
| * | Nektar Therapeutics Class A | 154,907 | 610 |
| * | Invitae Corp. | 196,363 | 597 |
| * | Nurix Therapeutics Inc. | 37,851 | 595 |
| * | Castle Biosciences Inc. | 20,291 | 588 |
| * | Twist Bioscience Corp. | 14,603 | 586 |
| * | Design Therapeutics Inc. | 28,922 | 586 |
| Shares | Market Value• ($000) | ||
| * | Rocket Pharmaceuticals Inc. | 37,357 | 576 |
| *,1 | EQRx Inc. | 116,852 | 571 |
| *,1 | Sorrento Therapeutics Inc. | 275,897 | 566 |
| * | Phreesia Inc. | 21,974 | 564 |
| * | Mersana Therapeutics Inc. | 74,821 | 561 |
| * | Health Catalyst Inc. | 46,209 | 554 |
| * | ImmunoGen Inc. | 92,944 | 540 |
| * | Inogen Inc. | 18,569 | 532 |
| * | Sangamo Therapeutics Inc. | 96,457 | 521 |
| * | Sana Biotechnology Inc. | 75,952 | 517 |
| * | Accolade Inc. | 49,792 | 507 |
| * | Vanda Pharmaceuticals Inc. | 47,421 | 502 |
| * | Erasca Inc. | 55,380 | 499 |
| * | Replimune Group Inc. | 25,743 | 491 |
| * | Atea Pharmaceuticals Inc. | 65,078 | 488 |
| Healthcare Services Group Inc. | 33,404 | 470 | |
| * | 2seventy bio Inc. | 31,915 | 470 |
| * | Day One Biopharmaceuticals Inc. | 19,939 | 468 |
| * | Caribou Biosciences Inc. | 46,079 | 455 |
| * | Inovio Pharmaceuticals Inc. | 195,062 | 447 |
| * | Deciphera Pharmaceuticals Inc. | 27,459 | 446 |
| * | iTeos Therapeutics Inc. | 20,101 | 446 |
| * | Seer Inc. Class A | 43,992 | 444 |
| Patterson Cos. Inc. | 15,835 | 442 | |
| * | PMV Pharmaceuticals Inc. | 31,450 | 438 |
| *,1 | Nano-X Imaging Ltd. | 32,663 | 435 |
| * | HealthStream Inc. | 19,453 | 430 |
| * | NextGen Healthcare Inc. | 24,574 | 421 |
| * | Forma Therapeutics Holdings Inc. | 31,369 | 420 |
| * | SomaLogic Inc. | 111,560 | 411 |
| * | Kezar Life Sciences Inc. | 39,695 | 408 |
| * | AnaptysBio Inc. | 17,463 | 405 |
| * | ANI Pharmaceuticals Inc. | 10,896 | 402 |
| * | CTI BioPharma Corp. | 63,654 | 400 |
| * | Nkarta Inc. | 27,657 | 398 |
| * | Merit Medical Systems Inc. | 6,674 | 395 |
| * | Cara Therapeutics Inc. | 38,058 | 393 |
| * | MaxCyte Inc. | 74,271 | 386 |
| * | Cincor Pharma Inc. | 11,429 | 386 |
| * | DICE Therapeutics Inc. | 24,214 | 380 |
| * | Computer Programs and Systems Inc. | 12,159 | 371 |
| * | C4 Therapeutics Inc. | 35,893 | 362 |
| * | LifeStance Health Group Inc. | 57,614 | 362 |
| * | Kinnate Biopharma Inc. | 24,949 | 361 |
| * | Bridgebio Pharma Inc. | 34,187 | 359 |
| Select Medical Holdings Corp. | 14,007 | 359 | |
| * | Cytokinetics Inc. | 6,716 | 356 |
| * | Bluebird Bio Inc. | 60,602 | 354 |
| * | Adicet Bio Inc. | 24,557 | 348 |
| * | CareMax Inc. | 50,930 | 348 |
| * | KalVista Pharmaceuticals Inc. | 20,887 | 344 |
| * | Cullinan Oncology Inc. | 25,458 | 343 |
| * | Protagonist Therapeutics Inc. | 39,270 | 342 |
| * | MiMedx Group Inc. | 96,305 | 340 |
| * | Orthofix Medical Inc. | 16,831 | 335 |
| * | Instil Bio Inc. | 59,398 | 309 |
| * | Cue Health Inc. | 92,016 | 306 |
| Shares | Market Value• ($000) | ||
| * | Ideaya Biosciences Inc. | 30,370 | 299 |
| * | Inotiv Inc. | 14,855 | 291 |
| * | Atara Biotherapeutics Inc. | 72,416 | 290 |
| * | Stoke Therapeutics Inc. | 19,167 | 289 |
| * | 908 Devices Inc. | 14,367 | 289 |
| * | Anika Therapeutics Inc. | 12,714 | 287 |
| * | Tricida Inc. | 22,846 | 286 |
| * | Kodiak Sciences Inc. | 28,472 | 285 |
| * | Community Health Systems Inc. | 106,842 | 284 |
| * | 23andMe Holding Co. Class A | 84,157 | 284 |
| * | Nuvation Bio Inc. | 99,261 | 278 |
| * | Zimvie Inc. | 17,776 | 271 |
| * | Dyne Therapeutics Inc. | 26,790 | 263 |
| * | Akero Therapeutics Inc. | 22,265 | 262 |
| * | OraSure Technologies Inc. | 63,515 | 260 |
| * | Vaxart Inc. | 83,922 | 260 |
| * | Edgewise Therapeutics Inc. | 25,333 | 255 |
| * | Inari Medical Inc. | 3,658 | 254 |
| * | Geron Corp. (XNGS) | 94,278 | 249 |
| * | Bright Health Group Inc. | 164,786 | 249 |
| * | Nuvalent Inc. Class A | 14,449 | 244 |
| * | Quantum-Si Inc. | 77,930 | 243 |
| * | ADMA Biologics Inc. | 88,116 | 238 |
| * | ALX Oncology Holdings Inc. | 18,275 | 238 |
| * | Tarsus Pharmaceuticals Inc. | 15,443 | 237 |
| * | Quanterix Corp. | 25,099 | 235 |
| * | Bioxcel Therapeutics Inc. | 16,315 | 223 |
| * | Fulcrum Therapeutics Inc. | 29,805 | 221 |
| * | Sutro Biopharma Inc. | 37,907 | 215 |
| Embecta Corp. | 6,661 | 213 | |
| * | Cardiovascular Systems Inc. | 15,505 | 205 |
| * | MacroGenics Inc. | 51,476 | 204 |
| * | 4D Molecular Therapeutics Inc. | 25,933 | 204 |
| * | Generation Bio Co. | 39,687 | 203 |
| * | Adagio Therapeutics Inc. | 43,839 | 200 |
| * | Allovir Inc. | 26,506 | 199 |
| *,1 | Amylyx Pharmaceuticals Inc. | 7,876 | 199 |
| * | Bioventus Inc. Class A | 26,982 | 197 |
| * | MeiraGTx Holdings plc | 23,570 | 196 |
| * | SeaSpine Holdings Corp. | 30,265 | 194 |
| * | Monte Rosa Therapeutics Inc. | 24,480 | 194 |
| * | NGM Biopharmaceuticals Inc. | 13,299 | 188 |
| * | Relmada Therapeutics Inc. | 6,311 | 184 |
| * | Rapt Therapeutics Inc. | 6,828 | 182 |
| * | Century Therapeutics Inc. | 17,196 | 181 |
| * | Immunovant Inc. | 34,156 | 176 |
| * | Berkeley Lights Inc. | 47,646 | 175 |
| * | Tango Therapeutics Inc. | 39,835 | 163 |
| * | Janux Therapeutics Inc. | 14,657 | 159 |
| *,1 | Neogen Corp. | 7,487 | 156 |
| * | Aerovate Therapeutics Inc. | 7,840 | 155 |
| * | Absci Corp. | 44,945 | 151 |
| * | Arcellx Inc. | 8,393 | 151 |
| * | VBI Vaccines Inc. | 164,420 | 147 |
| * | Convey Health Solutions Holdings Inc. | 13,778 | 145 |
| * | Kronos Bio Inc. | 35,851 | 143 |
| * | Sema4 Holdings Corp. | 134,871 | 138 |
| * | Jounce Therapeutics Inc. | 36,785 | 135 |
| * | Viridian Therapeutics Inc. | 5,936 | 132 |
| * | Imago Biosciences Inc. | 9,080 | 132 |
| Shares | Market Value• ($000) | ||
| * | Travere Thrapeutics Inc. | 4,770 | 128 |
| * | Singular Genomics Systems Inc. | 47,554 | 127 |
| * | EyePoint Pharmaceuticals Inc. | 12,008 | 120 |
| * | Artivion Inc. | 5,301 | 117 |
| * | Sight Sciences Inc. | 16,652 | 116 |
| * | Lexicon Pharmaceuticals Inc. | 40,573 | 112 |
| * | FibroGen Inc. | 8,735 | 109 |
| * | Surgery Partners Inc. | 3,922 | 108 |
| * | HilleVax Inc. | 8,906 | 106 |
| * | Tenaya Therapeutics Inc. | 23,844 | 105 |
| * | Reata Pharmaceuticals Inc. Class A | 4,279 | 102 |
| * | Hims & Hers Health Inc. | 15,875 | 101 |
| * | Theseus Pharmaceuticals Inc. | 14,473 | 99 |
| * | Athira Pharma Inc. | 28,980 | 98 |
| * | Sharecare Inc. | 52,399 | 96 |
| * | Arbutus Biopharma Corp. | 42,695 | 95 |
| * | Aerie Pharmaceuticals Inc. | 5,937 | 90 |
| * | Praxis Precision Medicines Inc. | 29,009 | 90 |
| * | Nautilus Biotechnology Inc. | 40,611 | 90 |
| * | Icosavax Inc. | 18,980 | 90 |
| * | Tactile Systems Technology Inc. | 10,734 | 89 |
| * | Morphic Holding Inc. | 3,195 | 88 |
| * | Liquidia Corp. | 14,887 | 86 |
| * | Pardes Biosciences Inc. | 24,219 | 85 |
| * | Tyra Biosciences Inc. | 11,212 | 74 |
| * | Aveanna Healthcare Holdings Inc. | 38,033 | 69 |
| * | ImmunityBio Inc. | 15,988 | 64 |
| * | Talaris Therapeutics Inc. | 19,140 | 63 |
| * | ATI Physical Therapy Inc. | 63,842 | 57 |
| * | An2 Therapeutics Inc. | 3,334 | 57 |
| * | NanoString Technologies Inc. | 4,145 | 56 |
| * | Alpine Immune Sciences Inc. | 7,359 | 55 |
| * | PepGen Inc. | 5,731 | 54 |
| * | Chimerix Inc. | 24,083 | 53 |
| * | Innovage Holding Corp. | 14,423 | 53 |
| * | Theravance Biopharma Inc. | 5,782 | 52 |
| * | Alphatec Holdings Inc. | 6,472 | 49 |
| * | ViewRay Inc. | 14,320 | 49 |
| * | PetIQ Inc. Class A | 4,861 | 45 |
| * | Zentalis Pharmaceuticals Inc. | 1,668 | 45 |
| *,1 | Enochian Biosciences Inc. | 16,860 | 42 |
| * | P3 Health Partners Inc. | 8,201 | 40 |
| * | IGM Biosciences Inc. | 1,952 | 38 |
| * | Point Biopharma Global Inc. | 3,864 | 38 |
| * | Precigen Inc. | 15,070 | 33 |
| * | Rallybio Corp. | 2,968 | 33 |
| * | Eiger BioPharmaceuticals Inc. | 3,590 | 30 |
| * | Keros Therapeutics Inc. | 850 | 30 |
| * | Provention Bio Inc. | 6,775 | 29 |
| * | Vera Therapeutics Inc. Class A | 1,105 | 24 |
| * | Arcturus Therapeutics Holdings Inc. | 1,646 | 23 |
| * | Alpha Teknova Inc. | 4,932 | 22 |
| Utah Medical Products Inc. | 232 | 21 |
| Shares | Market Value• ($000) | ||
| * | Kiniksa Pharmaceuticals Ltd. Class A | 1,344 | 16 |
| * | Affimed NV | 5,285 | 14 |
| Phibro Animal Health Corp. Class A | 856 | 13 | |
| * | RxSight Inc. | 775 | 10 |
| * | Gelesis Holdings Inc. | 6,810 | 8 |
| * | Science 37 Holdings Inc. | 4,659 | 7 |
| * | VistaGen Therapeutics Inc. | 27,753 | 5 |
| *,2 | PDL BioPharma Inc. | 270 | — |
| 110,460 | |||
| Industrials (13.1%) | |||
| Triton International Ltd. | 54,455 | 3,245 | |
| * | Summit Materials Inc. Class A | 101,650 | 2,889 |
| GATX Corp. | 28,736 | 2,776 | |
| * | API Group Corp. | 177,415 | 2,759 |
| ABM Industries Inc. | 57,451 | 2,666 | |
| * | Resideo Technologies Inc. | 124,015 | 2,582 |
| Matson Inc. | 34,383 | 2,533 | |
| * | Atlas Air Worldwide Holdings Inc. | 23,980 | 2,396 |
| UniFirst Corp. | 12,830 | 2,313 | |
| * | Hub Group Inc. Class A | 28,808 | 2,299 |
| * | Alight Inc. Class A | 291,613 | 2,298 |
| * | SPX Technologies Inc. | 37,931 | 2,164 |
| Encore Wire Corp. | 16,335 | 2,125 | |
| Altra Industrial Motion Corp. | 55,752 | 2,116 | |
| EnerSys | 31,493 | 1,964 | |
| Werner Enterprises Inc. | 48,877 | 1,945 | |
| Albany International Corp. Class A | 21,765 | 1,919 | |
| Scorpio Tankers Inc. | 42,564 | 1,771 | |
| * | Itron Inc. | 35,613 | 1,694 |
| Kennametal Inc. | 70,834 | 1,660 | |
| Bread Financial Holdings Inc. | 42,942 | 1,650 | |
| ESCO Technologies Inc. | 20,084 | 1,635 | |
| EnPro Industries Inc. | 17,848 | 1,616 | |
| Moog Inc. Class A | 20,474 | 1,535 | |
| ManTech International Corp. Class A | 15,683 | 1,504 | |
| Maxar Technologies Inc. | 62,728 | 1,495 | |
| Trinity Industries Inc. | 60,790 | 1,482 | |
| Otter Tail Corp. | 19,565 | 1,478 | |
| * | Kratos Defense & Security Solutions Inc. | 106,059 | 1,330 |
| Barnes Group Inc. | 42,079 | 1,307 | |
| Hillenbrand Inc. | 31,229 | 1,301 | |
| Greif Inc. Class A | 19,185 | 1,286 | |
| *,1 | Frontline Ltd. | 106,504 | 1,263 |
| * | AAR Corp. | 29,068 | 1,246 |
| International Seaways Inc. | 42,083 | 1,243 | |
| * | Gibraltar Industries Inc. | 28,309 | 1,185 |
| Granite Construction Inc. | 38,860 | 1,165 | |
| Belden Inc. | 17,635 | 1,155 | |
| ArcBest Corp. | 14,172 | 1,141 | |
| * | StoneCo. Ltd. Class A | 114,345 | 1,084 |
| SFL Corp. Ltd. | 98,715 | 1,056 | |
| Textainer Group Holdings Ltd. | 34,231 | 1,040 | |
| * | OSI Systems Inc. | 12,372 | 1,031 |
| 1 | Golden Ocean Group Ltd. | 104,735 | 1,004 |
| TriMas Corp. | 36,227 | 997 | |
| * | CoreCivic Inc. | 103,950 | 991 |
| Terex Corp. | 29,558 | 982 | |
| * | Hillman Solutions Corp. | 114,767 | 963 |
| Shares | Market Value• ($000) | ||
| * | Air Transport Services Group Inc. | 31,383 | 946 |
| DHT Holdings Inc. | 120,487 | 941 | |
| * | Donnelley Financial Solutions Inc. | 22,044 | 936 |
| Standex International Corp. | 10,201 | 922 | |
| AZZ Inc. | 21,087 | 899 | |
| Patrick Industries Inc. | 16,789 | 889 | |
| * | Mirion Technologies Inc. | 117,120 | 887 |
| Primoris Services Corp. | 43,240 | 876 | |
| * | TuSimple Holdings Inc. Class A | 120,166 | 864 |
| Trinseo plc | 30,792 | 817 | |
| *,1 | Flex LNG Ltd. | 24,345 | 805 |
| Greenbrier Cos. Inc. | 27,226 | 776 | |
| * | Beacon Roofing Supply Inc. | 13,886 | 762 |
| Kaman Corp. | 23,958 | 760 | |
| * | Proto Labs Inc. | 19,707 | 757 |
| * | Green Dot Corp. Class A | 36,950 | 750 |
| Astec Industries Inc. | 19,478 | 744 | |
| Columbus McKinnon Corp. | 23,921 | 733 | |
| * | Aerojet Rocketdyne Holdings Inc. | 16,811 | 724 |
| *,1 | Desktop Metal Inc. Class A | 225,831 | 718 |
| * | Triumph Group Inc. | 54,981 | 714 |
| Deluxe Corp. | 36,996 | 712 | |
| * | Repay Holdings Corp. Class A | 74,712 | 694 |
| * | American Woodmark Corp. | 13,300 | 689 |
| * | Cross Country Healthcare Inc. | 27,122 | 688 |
| * | Modine Manufacturing Co. | 42,764 | 641 |
| * | First Advantage Corp. | 46,295 | 641 |
| Quanex Building Products Corp. | 28,484 | 635 | |
| * | Proterra Inc. | 102,612 | 620 |
| *,1 | Virgin Galactic Holdings Inc. | 103,064 | 609 |
| Griffon Corp. | 19,287 | 605 | |
| Heartland Express Inc. | 39,900 | 604 | |
| * | Conduent Inc. | 145,123 | 594 |
| * | TrueBlue Inc. | 27,995 | 575 |
| * | BlueLinx Holdings Inc. | 7,995 | 560 |
| Tennant Co. | 8,831 | 533 | |
| * | Titan Machinery Inc. | 17,211 | 530 |
| Resources Connection Inc. | 27,057 | 529 | |
| Costamare Inc. | 46,005 | 519 | |
| * | JELD-WEN Holding Inc. | 46,346 | 517 |
| Eagle Bulk Shipping Inc. | 11,450 | 497 | |
| * | Thermon Group Holdings Inc. | 28,264 | 496 |
| * | FARO Technologies Inc. | 14,465 | 485 |
| * | Huron Consulting Group Inc. | 7,232 | 484 |
| Kelly Services Inc. Class A | 30,030 | 484 | |
| * | Teekay Tankers Ltd. Class A | 19,532 | 481 |
| * | Paysafe Ltd. | 291,789 | 481 |
| Heidrick & Struggles International Inc. | 16,700 | 475 | |
| ICF International Inc. | 4,681 | 475 | |
| Ennis Inc. | 21,726 | 461 | |
| Chase Corp. | 4,873 | 430 | |
| Genco Shipping & Trading Ltd. | 31,286 | 429 | |
| Nordic American Tankers Ltd. | 161,800 | 421 | |
| Brady Corp. Class A | 9,029 | 420 | |
| Gorman-Rupp Co. | 15,900 | 420 | |
| Argan Inc. | 11,995 | 415 |
| Shares | Market Value• ($000) | ||
| * | Ducommun Inc. | 9,389 | 413 |
| Pactiv Evergreen Inc. | 36,954 | 410 | |
| * | Great Lakes Dredge & Dock Corp. | 42,619 | 408 |
| HB Fuller Co. | 6,221 | 404 | |
| * | Hyliion Holdings Corp. | 113,236 | 397 |
| * | BrightView Holdings Inc. | 37,942 | 384 |
| * | Vivint Smart Home Inc. | 61,195 | 383 |
| Dorian LPG Ltd. | 26,255 | 382 | |
| VSE Corp. | 9,053 | 379 | |
| * | Archer Aviation Inc. Class A | 106,265 | 376 |
| * | Vishay Precision Group Inc. | 10,640 | 365 |
| Cass Information Systems Inc. | 9,661 | 354 | |
| * | DXP Enterprises Inc. | 13,018 | 346 |
| *,1 | Danimer Scientific Inc. | 77,333 | 344 |
| REV Group Inc. | 29,740 | 343 | |
| * | V2X Inc. | 9,829 | 341 |
| * | O-I Glass Inc. | 25,162 | 327 |
| National Presto Industries Inc. | 4,470 | 305 | |
| * | Manitowoc Co. Inc. | 30,176 | 288 |
| * | Ardmore Shipping Corp. | 29,800 | 287 |
| * | Fluor Corp. | 10,552 | 279 |
| Hyster-Yale Materials Handling Inc. | 9,256 | 270 | |
| Covenant Logistics Group Inc. Class A | 9,437 | 265 | |
| * | Aersale Corp. | 13,418 | 259 |
| * | Advantage Solutions Inc. | 70,472 | 257 |
| Marten Transport Ltd. | 12,808 | 254 | |
| * | Blade Air Mobility Inc. | 47,942 | 247 |
| Greif Inc. Class B | 3,691 | 241 | |
| * | Tutor Perini Corp. | 35,333 | 240 |
| * | Custom Truck One Source Inc. | 36,139 | 238 |
| Luxfer Holdings plc | 14,199 | 234 | |
| * | CryoPort Inc. | 6,974 | 228 |
| * | Skillsoft Corp. | 69,313 | 223 |
| Miller Industries Inc. | 8,847 | 208 | |
| * | Teekay Corp. | 59,084 | 206 |
| * | Velodyne Lidar Inc. | 164,779 | 206 |
| * | Willdan Group Inc. | 8,975 | 204 |
| Safe Bulkers Inc. | 63,933 | 204 | |
| * | Astronics Corp. | 21,526 | 198 |
| * | Markforged Holding Corp. | 81,569 | 198 |
| * | Ranpak Holdings Corp. Class A | 37,109 | 196 |
| Caesarstone Ltd. | 19,151 | 195 | |
| Park Aerospace Corp. | 16,676 | 192 | |
| Powell Industries Inc. | 7,671 | 189 | |
| * | CIRCOR International Inc. | 11,257 | 184 |
| Maximus Inc. | 2,964 | 180 | |
| * | PureCycle Technologies Inc. | 18,872 | 172 |
| * | Radiant Logistics Inc. | 24,356 | 171 |
| Alamo Group Inc. | 1,296 | 169 | |
| *,1 | View Inc. | 94,368 | 168 |
| Preformed Line Products Co. | 2,129 | 166 | |
| Eneti Inc. | 19,549 | 164 | |
| * | Moneylion Inc. | 115,010 | 164 |
| * | Evolv Technologies Holdings Inc. | 71,795 | 163 |
| * | Concrete Pumping Holdings Inc. | 22,958 | 154 |
| * | Microvast Holdings Inc. | 58,990 | 145 |
| * | Spire Global Inc. | 106,854 | 144 |
| Shares | Market Value• ($000) | ||
| * | PFSweb Inc. | 14,181 | 134 |
| * | Cantaloupe Inc. | 20,072 | 128 |
| * | Hydrofarm Holdings Group Inc. | 37,253 | 127 |
| * | AvidXchange Holdings Inc. | 13,543 | 106 |
| * | Astra Space Inc. | 122,737 | 105 |
| * | Joby Aviation Inc. | 19,491 | 103 |
| * | Sterling Infrastructure Inc. | 3,995 | 101 |
| Information Services Group Inc. | 16,584 | 96 | |
| * | Quad/Graphics Inc. | 29,703 | 94 |
| Wabash National Corp. | 5,425 | 89 | |
| *,1 | Terran Orbital Corp. | 20,460 | 86 |
| * | IES Holdings Inc. | 2,429 | 74 |
| * | Latch Inc. | 60,041 | 64 |
| Universal Logistics Holdings Inc. | 1,666 | 61 | |
| * | Momentus Inc. | 29,947 | 53 |
| Barrett Business Services Inc. | 591 | 48 | |
| United States Lime & Minerals Inc. | 397 | 41 | |
| * | Atlas Technical Consultants Inc. | 4,626 | 39 |
| * | Redwire Corp. | 13,918 | 38 |
| * | Atlanticus Holdings Corp. | 1,316 | 37 |
| * | Fathom Digital Manufacturing Corp. | 8,664 | 33 |
| * | Sterling Check Corp. | 1,388 | 30 |
| Allied Motion Technologies Inc. | 842 | 29 | |
| * | DHI Group Inc. | 5,721 | 29 |
| * | Workhorse Group Inc. | 8,428 | 26 |
| * | Distribution Solutions Group Inc. | 523 | 21 |
| * | CompoSecure Inc. | 1,627 | 9 |
| 133,960 | |||
| Other (0.1%)3 | |||
| 1 | Orchid Island Capital Inc. REIT | 30,388 | 411 |
| *,1,2 | Contra Zogenix Inc. CVR | 43,508 | 87 |
| *,2 | Aduro Biotech Inc. CVR | 724 | — |
| 498 | |||
| Real Estate (11.5%) | |||
| Agree Realty Corp. | 63,511 | 4,784 | |
| STAG Industrial Inc. | 154,308 | 4,753 | |
| Terreno Realty Corp. | 63,626 | 3,881 | |
| * | Ryman Hospitality Properties Inc. | 46,119 | 3,792 |
| Independence Realty Trust Inc. | 189,821 | 3,692 | |
| Kite Realty Group Trust | 186,633 | 3,613 | |
| Physicians Realty Trust | 192,203 | 3,202 | |
| Sabra Health Care REIT Inc. | 197,578 | 2,958 | |
| Apple Hospitality REIT Inc. | 184,236 | 2,931 | |
| Broadstone Net Lease Inc. | 145,494 | 2,785 | |
| PotlatchDeltic Corp. | 58,521 | 2,717 | |
| Hannon Armstrong Sustainable Infrastructure Capital Inc. | 68,302 | 2,699 | |
| National Health Investors Inc. | 37,793 | 2,476 | |
| LXP Industrial Trust | 242,478 | 2,439 | |
| * | Equity Commonwealth | 92,577 | 2,436 |
| Essential Properties Realty Trust Inc. | 101,257 | 2,292 | |
| Shares | Market Value• ($000) | ||
| Corporate Office Properties Trust | 85,136 | 2,200 | |
| SITE Centers Corp. | 166,742 | 2,161 | |
| * | Sunstone Hotel Investors Inc. | 184,162 | 2,006 |
| Pebblebrook Hotel Trust | 111,353 | 1,962 | |
| Uniti Group Inc. | 203,296 | 1,909 | |
| Kennedy-Wilson Holdings Inc. | 101,259 | 1,778 | |
| Macerich Co. | 184,572 | 1,766 | |
| Retail Opportunity Investments Corp. | 103,452 | 1,733 | |
| RLJ Lodging Trust | 141,011 | 1,701 | |
| Four Corners Property Trust Inc. | 62,471 | 1,680 | |
| CareTrust REIT Inc. | 75,974 | 1,636 | |
| * | DiamondRock Hospitality Co. | 181,102 | 1,581 |
| * | Xenia Hotels & Resorts Inc. | 98,099 | 1,556 |
| Urban Edge Properties | 98,133 | 1,544 | |
| InvenTrust Properties Corp. | 58,155 | 1,527 | |
| LTC Properties Inc. | 33,380 | 1,498 | |
| Washington REIT | 75,025 | 1,471 | |
| Easterly Government Properties Inc. Class A | 78,066 | 1,401 | |
| Acadia Realty Trust | 79,971 | 1,274 | |
| Piedmont Office Realty Trust Inc. Class A | 105,579 | 1,244 | |
| Global Net Lease Inc. | 89,760 | 1,236 | |
| Newmark Group Inc. Class A | 117,638 | 1,206 | |
| American Assets Trust Inc. | 42,158 | 1,170 | |
| Brandywine Realty Trust | 145,726 | 1,170 | |
| Alexander & Baldwin Inc. | 61,913 | 1,160 | |
| * | Apartment Investment and Management Co. Class A | 127,827 | 1,130 |
| Paramount Group Inc. | 160,154 | 1,110 | |
| Getty Realty Corp. | 36,066 | 1,085 | |
| Centerspace | 13,176 | 993 | |
| * | Veris Residential Inc. | 73,516 | 988 |
| * | Anywhere Real Estate Inc. | 98,903 | 966 |
| Service Properties Trust | 140,110 | 958 | |
| * | Radius Global Infrastructure Inc. Class A (XNMS) | 64,251 | 885 |
| Necessity Retail REIT Inc. | 114,811 | 857 | |
| * | GEO Group Inc. | 101,097 | 827 |
| Empire State Realty Trust Inc. Class A | 117,931 | 822 | |
| NETSTREIT Corp. | 41,150 | 809 | |
| Armada Hoffler Properties Inc. | 57,369 | 753 | |
| Office Properties Income Trust | 40,893 | 718 | |
| Summit Hotel Properties Inc. | 90,167 | 709 | |
| RPT Realty | 71,291 | 687 | |
| Plymouth Industrial REIT Inc. | 32,234 | 653 | |
| Farmland Partners Inc. | 39,175 | 568 | |
| Global Medical REIT Inc. | 52,119 | 565 | |
| Ares Commercial Real Estate Corp. | 38,079 | 502 | |
| * | Chatham Lodging Trust | 40,994 | 498 |
| Orion Office REIT Inc. | 48,815 | 482 | |
| * | Seritage Growth Properties Class A | 37,831 | 474 |
| Urstadt Biddle Properties Inc. Class A | 25,485 | 426 |
| Shares | Market Value• ($000) | ||
| City Office REIT Inc. | 36,482 | 421 | |
| Bluerock Residential Growth REIT Inc. Class A | 15,744 | 420 | |
| Industrial Logistics Properties Trust | 53,079 | 398 | |
| Whitestone REIT | 40,439 | 398 | |
| RE/MAX Holdings Inc. Class A | 15,921 | 362 | |
| One Liberty Properties Inc. | 13,847 | 334 | |
| * | FRP Holdings Inc. | 5,670 | 326 |
| CTO Realty Growth Inc. | 14,859 | 314 | |
| Community Healthcare Trust Inc. | 8,253 | 304 | |
| Braemar Hotels & Resorts Inc. | 58,497 | 301 | |
| Gladstone Land Corp. | 12,813 | 301 | |
| Diversified Healthcare Trust | 203,324 | 297 | |
| Indus Realty Trust Inc. | 4,581 | 281 | |
| * | Tejon Ranch Co. | 17,753 | 280 |
| Douglas Elliman Inc. | 59,834 | 276 | |
| * | Ashford Hospitality Trust Inc. | 29,394 | 270 |
| Safehold Inc. | 7,081 | 269 | |
| * | Hersha Hospitality Trust Class A | 25,333 | 246 |
| Franklin Street Properties Corp. | 84,322 | 237 | |
| BRT Apartments Corp. | 9,932 | 237 | |
| * | DigitalBridge Group Inc. | 13,178 | 235 |
| * | Stratus Properties Inc. | 5,061 | 180 |
| CatchMark Timber Trust Inc. Class A | 14,140 | 151 | |
| * | Forestar Group Inc. | 11,398 | 142 |
| UMH Properties Inc. | 7,608 | 137 | |
| RMR Group Inc. Class A | 4,973 | 130 | |
| Postal Realty Trust Inc. Class A | 6,596 | 98 | |
| NexPoint Residential Trust Inc. | 1,161 | 61 | |
| Gladstone Commercial Corp. | 2,689 | 51 | |
| Saul Centers Inc. | 1,050 | 47 | |
| * | Transcontinental Realty Investors Inc. | 1,093 | 47 |
| * | American Realty Investors Inc. | 1,440 | 20 |
| Clipper Realty Inc. | 1,260 | 11 | |
| 117,067 | |||
| Technology (5.2%) | |||
| * | Sanmina Corp. | 51,459 | 2,497 |
| * | Ziff Davis Inc. | 31,710 | 2,451 |
| Vishay Intertechnology Inc. | 113,406 | 2,231 | |
| * | NetScout Systems Inc. | 60,525 | 1,921 |
| * | Covetrus Inc. | 90,727 | 1,893 |
| * | Ping Identity Holding Corp. | 66,292 | 1,865 |
| * | Bumble Inc. Class A | 73,934 | 1,852 |
| * | Allscripts Healthcare Solutions Inc. | 97,840 | 1,663 |
| Xerox Holdings Corp. | 98,089 | 1,630 | |
| Xperi Holding Corp. | 89,394 | 1,422 | |
| Amkor Technology Inc. | 69,952 | 1,408 | |
| * | TTM Technologies Inc. | 86,491 | 1,361 |
| Methode Electronics Inc. | 30,931 | 1,251 | |
| * | Parsons Corp. | 28,710 | 1,188 |
| * | E2open Parent Holdings Inc. | 171,029 | 1,175 |
| * | LiveRamp Holdings Inc. | 57,168 | 1,135 |
| Shares | Market Value• ($000) | ||
| * | Cohu Inc. | 40,992 | 1,100 |
| * | 3D Systems Corp. | 108,595 | 1,100 |
| * | Fastly Inc. Class A | 95,860 | 896 |
| * | C3.ai Inc. Class A | 47,697 | 859 |
| * | Magnite Inc. | 112,472 | 847 |
| Benchmark Electronics Inc. | 29,862 | 820 | |
| *,1 | MicroStrategy Inc. Class A | 3,282 | 760 |
| * | Ultra Clean Holdings Inc. | 25,351 | 742 |
| * | Diodes Inc. | 10,342 | 736 |
| * | Ichor Holdings Ltd. | 23,947 | 736 |
| * | Cerence Inc. | 33,538 | 671 |
| * | ScanSource Inc. | 21,869 | 634 |
| * | ACM Research Inc. Class A | 35,462 | 599 |
| * | Olo Inc. Class A | 76,705 | 599 |
| *,1 | IonQ Inc. | 88,189 | 524 |
| * | PAR Technology Corp. | 14,173 | 499 |
| * | Blend Labs Inc. Class A | 158,002 | 498 |
| PC Connection Inc. | 9,623 | 478 | |
| * | nLight Inc. | 37,492 | 468 |
| Ebix Inc. | 17,730 | 461 | |
| * | Kimball Electronics Inc. | 20,389 | 439 |
| * | Squarespace Inc. Class A | 20,079 | 422 |
| * | ChannelAdvisor Corp. | 26,361 | 398 |
| * | Insight Enterprises Inc. | 4,220 | 385 |
| * | Rambus Inc. | 14,901 | 384 |
| * | SolarWinds Corp. | 42,240 | 383 |
| * | Core Scientific Inc. | 170,866 | 376 |
| * | Cvent Holding Corp. | 71,792 | 363 |
| * | Consensus Cloud Solutions Inc. | 7,135 | 359 |
| *,1 | Skillz Inc. Class A | 260,723 | 347 |
| * | Plexus Corp. | 3,431 | 322 |
| * | ON24 Inc. | 35,554 | 319 |
| * | Avid Technology Inc. | 11,389 | 311 |
| * | AXT Inc. | 34,220 | 294 |
| * | Upland Software Inc. | 24,903 | 261 |
| * | PROS Holdings Inc. | 12,382 | 258 |
| * | OneSpan Inc. | 22,137 | 255 |
| * | Bandwidth Inc. Class A | 16,033 | 249 |
| * | ePlus Inc. | 5,209 | 245 |
| * | Aeva Technologies Inc. | 77,163 | 238 |
| * | Matterport Inc. | 51,577 | 238 |
| * | Verint Systems Inc. | 4,896 | 237 |
| * | Photronics Inc. | 13,927 | 234 |
| * | Sumo Logic Inc. | 25,639 | 225 |
| * | Rackspace Technology Inc. | 49,245 | 220 |
| * | EverCommerce Inc. | 17,976 | 209 |
| * | Veeco Instruments Inc. | 8,702 | 184 |
| * | Ouster Inc. | 116,605 | 175 |
| * | TrueCar Inc. | 77,853 | 170 |
| * | Alpha & Omega Semiconductor Ltd. | 4,304 | 166 |
| * | Groupon Inc. Class A | 16,658 | 165 |
| A10 Networks Inc. | 11,591 | 161 | |
| Sapiens International Corp. NV | 7,299 | 161 | |
| * | Porch Group Inc. | 68,832 | 148 |
| * | Impinj Inc. | 1,639 | 146 |
| *,1 | Cleanspark Inc. | 33,631 | 144 |
| * | Unisys Corp. | 14,640 | 136 |
| * | 1stdibs.com Inc. | 19,954 | 135 |
| Vivid Seats Inc. Class A | 15,770 | 128 | |
| American Software Inc. Class A | 6,809 | 115 | |
| * | Avaya Holdings Corp. | 71,299 | 113 |
| * | ForgeRock Inc. Class A | 6,613 | 113 |
| * | Blackbaud Inc. | 2,099 | 110 |
| Shares | Market Value• ($000) | ||
| * | Planet Labs PBC | 16,849 | 92 |
| * | eGain Corp. | 9,809 | 90 |
| * | KORE Group Holdings Inc. | 30,024 | 90 |
| * | Beachbody Co. Inc. | 74,363 | 86 |
| * | SecureWorks Corp. Class A | 8,016 | 83 |
| * | Brightcove Inc. | 11,310 | 75 |
| * | N-Able Inc. | 7,424 | 74 |
| * | PubMatic Inc. Class A | 3,382 | 66 |
| *,1 | Vinco Ventures Inc. | 66,346 | 64 |
| * | Cipher Mining Inc. | 31,322 | 63 |
| * | Eventbrite Inc. Class A | 8,101 | 58 |
| * | Benefitfocus Inc. | 7,344 | 54 |
| * | Diebold Nixdorf Inc. | 15,376 | 54 |
| Hackett Group Inc. | 2,325 | 48 | |
| * | LiveVox Holdings Inc. | 19,083 | 41 |
| * | Mitek Systems Inc. | 3,876 | 40 |
| * | Edgio Inc. | 9,372 | 34 |
| * | Greenidge Generation Holdings Inc. | 10,924 | 27 |
| * | Loyalty Ventures Inc. | 11,650 | 25 |
| * | Arena Group Holdings Inc. | 2,419 | 25 |
| * | WM Technology Inc. | 8,648 | 23 |
| * | Terawulf Inc. | 14,266 | 21 |
| * | Digimarc Corp. | 726 | 13 |
| * | Applied Blockchain Inc. | 5,570 | 13 |
| * | Innovid Corp. | 2,273 | 8 |
| *,1 | Cryptyde Inc. | 6,611 | 5 |
| 52,683 | |||
| Telecommunications (1.2%) | |||
| Telephone and Data Systems Inc. | 86,328 | 1,405 | |
| Shenandoah Telecommunications Co. | 41,390 | 923 | |
| * | Liberty Latin America Ltd. Class C | 130,108 | 907 |
| Cogent Communications Holdings Inc. | 16,724 | 891 | |
| InterDigital Inc. | 16,494 | 827 | |
| * | Digi International Inc. | 19,189 | 635 |
| * | Calix Inc. | 10,304 | 606 |
| * | Gogo Inc. | 39,402 | 586 |
| * | NETGEAR Inc. | 24,145 | 570 |
| * | EchoStar Corp. Class A | 30,148 | 555 |
| *,1 | fuboTV Inc. | 152,168 | 551 |
| ATN International Inc. | 9,354 | 438 | |
| * | United States Cellular Corp. | 12,777 | 365 |
| * | WideOpenWest Inc. | 19,735 | 351 |
| * | Consolidated Communications Holdings Inc. | 57,429 | 330 |
| * | Anterix Inc. | 7,543 | 320 |
| * | Aviat Networks Inc. | 9,300 | 291 |
| Comtech Telecommunications Corp. | 22,594 | 255 | |
| * | Liberty Latin America Ltd. Class A | 33,687 | 236 |
| * | Ribbon Communications Inc. | 63,098 | 221 |
| * | Globalstar Inc. | 93,524 | 187 |
| * | Inseego Corp. | 60,057 | 162 |
| Adtran Holdings Inc. | 5,607 | 130 | |
| * | IDT Corp. Class B | 3,503 | 90 |
| * | Kaleyra Inc. | 25,209 | 40 |
| * | Akoustis Technologies Inc. | 2,456 | 11 |
| 11,883 | |||
| Shares | Market Value• ($000) | ||
| Utilities (5.2%) | |||
| Black Hills Corp. | 55,657 | 4,201 | |
| Southwest Gas Holdings Inc. | 51,395 | 4,001 | |
| Portland General Electric Co. | 76,544 | 3,955 | |
| ONE Gas Inc. | 46,017 | 3,602 | |
| South Jersey Industries Inc. | 105,033 | 3,555 | |
| PNM Resources Inc. | 73,107 | 3,467 | |
| New Jersey Resources Corp. | 75,896 | 3,350 | |
| Spire Inc. | 43,565 | 3,045 | |
| ALLETE Inc. | 49,091 | 2,905 | |
| Avista Corp. | 62,120 | 2,524 | |
| NorthWestern Corp. | 46,470 | 2,462 | |
| * | Sunnova Energy International Inc. | 85,143 | 2,147 |
| California Water Service Group | 34,052 | 1,993 | |
| Ormat Technologies Inc. (XNYS) | 17,161 | 1,604 | |
| SJW Group | 23,123 | 1,487 | |
| Northwest Natural Holding Co. | 29,271 | 1,394 | |
| American States Water Co. | 16,614 | 1,378 | |
| MGE Energy Inc. | 17,801 | 1,371 | |
| Chesapeake Utilities Corp. | 6,540 | 826 | |
| Unitil Corp. | 13,570 | 707 | |
| * | Archaea Energy Inc. Class A | 34,496 | 682 |
| * | Li-Cycle Holdings Corp. | 69,675 | 502 |
| * | Heritage-Crystal Clean Inc. | 13,406 | 437 |
| Excelerate Energy Inc. Class A | 15,851 | 407 | |
| * | Harsco Corp. | 67,161 | 381 |
| *,1 | Altus Power Inc. | 24,024 | 252 |
| *,1 | NuScale Power Corp. | 14,642 | 201 |
| Artesian Resources Corp. Class A | 2,391 | 131 | |
| Shares | Market Value• ($000) | ||
| * | Vertex Energy Inc. | 5,316 | 45 |
| Via Renewables Inc. Class A | 1,084 | 9 | |
| 53,021 | |||
| Total Common Stocks (Cost $1,138,363) | 1,019,212 | ||
| Temporary Cash Investments (1.1%) | |||
| Money Market Fund (1.1%) | |||
| 4,5 | Vanguard Market Liquidity Fund, 2.284% (Cost $11,642) | 116,474 | 11,644 |
| Total Investments (101.0%) (Cost $1,150,005) | 1,030,856 | ||
| Other Assets and Liabilities—Net (-1.0%) | (10,112) | ||
| Net Assets (100%) | 1,020,744 | ||
| Cost is in $000. | |||
| • | See Note A in Notes to Financial Statements. |
| * | Non-income-producing security. |
| 1 | Includes partial security positions on loan to broker-dealers. The total value of securities on loan is $10,281,000. |
| 2 | Security value determined using significant unobservable inputs. |
| 3 | “Other” represents securities that are not classified by the fund’s benchmark index. |
| 4 | Affiliated money market fund available only to Vanguard funds and certain trusts and accounts managed by Vanguard. Rate shown is the 7-day yield. |
| 5 | Collateral of $11,232,000 was received for securities on loan. |
| ADR—American Depositary Receipt. | |
| CVR—Contingent Value Rights. | |
| REIT—Real Estate Investment Trust. |
| Futures Contracts | ||||
| ($000) | ||||
| Expiration | Number of Long (Short) Contracts | Notional Amount | Value and Unrealized Appreciation (Depreciation) | |
| Long Futures Contracts | ||||
| E-mini Russell 2000 Index | September 2022 | 13 | 1,199 | (55) |
| ($000s, except shares and per-share amounts) | Amount |
| Assets | |
| Investments in Securities, at Value1 | |
| Unaffiliated Issuers (Cost $1,138,363) | 1,019,212 |
| Affiliated Issuers (Cost $11,642) | 11,644 |
| Total Investments in Securities | 1,030,856 |
| Investment in Vanguard | 38 |
| Cash Collateral Pledged—Futures Contracts | 80 |
| Receivables for Investment Securities Sold | 710 |
| Receivables for Accrued Income | 1,079 |
| Receivables for Capital Shares Issued | 13 |
| Total Assets | 1,032,776 |
| Liabilities | |
| Due to Custodian | 725 |
| Payables for Investment Securities Purchased | 1 |
| Collateral for Securities on Loan | 11,232 |
| Payables for Capital Shares Redeemed | 1 |
| Payables to Vanguard | 65 |
| Variation Margin Payable—Futures Contracts | 8 |
| Total Liabilities | 12,032 |
| Net Assets | 1,020,744 |
| 1 Includes $10,281 of securities on loan. | |
| At August 31, 2022, net assets consisted of: | |
| Paid-in Capital | 1,310,260 |
| Total Distributable Earnings (Loss) | (289,516) |
| Net Assets | 1,020,744 |
| ETF Shares—Net Assets | |
| Applicable to 6,600,000 outstanding $.001 par value shares of beneficial interest (unlimited authorization) | 836,680 |
| Net Asset Value Per Share—ETF Shares | $126.77 |
| Institutional Shares—Net Assets | |
| Applicable to 736,126 outstanding $.001 par value shares of beneficial interest (unlimited authorization) | 184,064 |
| Net Asset Value Per Share—Institutional Shares | $250.04 |
| Year Ended August 31, 2022 | |
| ($000) | |
| Investment Income | |
| Income | |
| Dividends1 | 21,346 |
| Interest2 | 7 |
| Securities Lending—Net | 514 |
| Total Income | 21,867 |
| Expenses | |
| The Vanguard Group—Note B | |
| Investment Advisory Services | 108 |
| Management and Administrative—ETF Shares | 1,106 |
| Management and Administrative—Institutional Shares | 99 |
| Marketing and Distribution—ETF Shares | 52 |
| Marketing and Distribution—Institutional Shares | 9 |
| Custodian Fees | 141 |
| Auditing Fees | 27 |
| Shareholders’ Reports—ETF Shares | 56 |
| Shareholders’ Reports—Institutional Shares | — |
| Trustees’ Fees and Expenses | — |
| Other Expenses | 19 |
| Total Expenses | 1,617 |
| Net Investment Income | 20,250 |
| Realized Net Gain (Loss) | |
| Investment Securities Sold2,3 | 124,085 |
| Futures Contracts | (316) |
| Realized Net Gain (Loss) | 123,769 |
| Change in Unrealized Appreciation (Depreciation) | |
| Investment Securities2 | (276,085) |
| Futures Contracts | (111) |
| Change in Unrealized Appreciation (Depreciation) | (276,196) |
| Net Increase (Decrease) in Net Assets Resulting from Operations | (132,177) |
| 1 | Dividends are net of foreign withholding taxes of $29,000. |
| 2 | Interest income, realized net gain (loss), capital gain distributions received, and change in unrealized appreciation (depreciation) from an affiliated company of the fund were $7,000, ($6,000), less than $1,000, and $1,000, respectively. Purchases and sales are for temporary cash investment purposes. |
| 3 | Includes $194,882,000 of net gain (loss) resulting from in-kind redemptions. |
| Year Ended August 31, | ||
| 2022 ($000) | 2021 ($000) | |
| Increase (Decrease) in Net Assets | ||
| Operations | ||
| Net Investment Income | 20,250 | 13,150 |
| Realized Net Gain (Loss) | 123,769 | 131,754 |
| Change in Unrealized Appreciation (Depreciation) | (276,196) | 143,464 |
| Net Increase (Decrease) in Net Assets Resulting from Operations | (132,177) | 288,368 |
| Distributions | ||
| ETF Shares | (17,288) | (9,366) |
| Institutional Shares | (3,679) | (1,795) |
| Total Distributions | (20,967) | (11,161) |
| Capital Share Transactions | ||
| ETF Shares | (71,282) | 496,571 |
| Institutional Shares | 7,217 | 73,727 |
| Net Increase (Decrease) from Capital Share Transactions | (64,065) | 570,298 |
| Total Increase (Decrease) | (217,209) | 847,505 |
| Net Assets | ||
| Beginning of Period | 1,237,953 | 390,448 |
| End of Period | 1,020,744 | 1,237,953 |
| ETF Shares | |||||
| For a Share Outstanding Throughout Each Period | Year Ended August 31, | ||||
| 2022 | 2021 | 2020 | 2019 | 2018 | |
| Net Asset Value, Beginning of Period | $143.88 | $91.76 | $99.51 | $119.05 | $100.96 |
| Investment Operations | |||||
| Net Investment Income1 | 2.353 | 1.998 | 1.868 | 1.912 | 1.905 |
| Net Realized and Unrealized Gain (Loss) on Investments | (16.986) | 51.982 | (7.771) | (19.589) | 18.070 |
| Total from Investment Operations | (14.633) | 53.980 | (5.903) | (17.677) | 19.975 |
| Distributions | |||||
| Dividends from Net Investment Income | (2.477) | (1.860) | (1.847) | (1.863) | (1.885) |
| Distributions from Realized Capital Gains | — | — | — | — | — |
| Total Distributions | (2.477) | (1.860) | (1.847) | (1.863) | (1.885) |
| Net Asset Value, End of Period | $126.77 | $143.88 | $91.76 | $99.51 | $119.05 |
| Total Return | -10.28% | 59.34% | -6.05% | -14.93% | 19.96% |
| Ratios/Supplemental Data | |||||
| Net Assets, End of Period (Millions) | $837 | $1,036 | $303 | $251 | $223 |
| Ratio of Total Expenses to Average Net Assets | 0.15% | 0.15% | 0.15% | 0.15% | 0.20% |
| Ratio of Net Investment Income to Average Net Assets | 1.71% | 1.52% | 1.99% | 1.83% | 1.73% |
| Portfolio Turnover Rate2 | 28% | 45% | 38% | 27% | 30% |
| 1 | Calculated based on average shares outstanding. |
| 2 | Excludes the value of portfolio securities received or delivered as a result of in-kind purchases or redemptions of the fund’s capital shares, including ETF Creation Units. |
| Institutional Shares | |||||
| For a Share Outstanding Throughout Each Period | Year Ended August 31, | ||||
| 2022 | 2021 | 2020 | 2019 | 2018 | |
| Net Asset Value, Beginning of Period | $283.82 | $180.98 | $196.24 | $234.81 | $199.13 |
| Investment Operations | |||||
| Net Investment Income1 | 4.918 | 4.212 | 3.783 | 3.966 | 4.029 |
| Net Realized and Unrealized Gain (Loss) on Investments | (33.609) | 102.428 | (15.303) | (38.670) | 35.618 |
| Total from Investment Operations | (28.691) | 106.640 | (11.520) | (34.704) | 39.647 |
| Distributions | |||||
| Dividends from Net Investment Income | (5.089) | (3.800) | (3.740) | (3.866) | (3.967) |
| Distributions from Realized Capital Gains | — | — | — | — | — |
| Total Distributions | (5.089) | (3.800) | (3.740) | (3.866) | (3.967) |
| Net Asset Value, End of Period | $250.04 | $283.82 | $180.98 | $196.24 | $234.81 |
| Total Return | -10.23% | 59.46% | -5.97% | -14.88% | 20.10% |
| Ratios/Supplemental Data | |||||
| Net Assets, End of Period (Millions) | $184 | $202 | $88 | $140 | $151 |
| Ratio of Total Expenses to Average Net Assets | 0.08% | 0.08% | 0.08% | 0.08% | 0.08% |
| Ratio of Net Investment Income to Average Net Assets | 1.82% | 1.67% | 2.04% | 1.90% | 1.85% |
| Portfolio Turnover Rate2 | 28% | 45% | 38% | 27% | 30% |
| 1 | Calculated based on average shares outstanding. |
| 2 | Excludes the value of portfolio securities received or delivered as a result of in-kind purchases or redemptions of the fund’s capital shares, including ETF Creation Units. |
| A. | The following significant accounting policies conform to generally accepted accounting principles for U.S. investment companies. The fund consistently follows such policies in preparing its financial statements. |
| B. | In accordance with the terms of a Funds' Service Agreement (the “FSA”) between Vanguard and the fund, Vanguard furnishes to the fund investment advisory, corporate management, administrative, marketing, and distribution services at Vanguard’s cost of operations (as defined by the FSA). These costs of operations are allocated to the fund based on methods and guidelines approved by the board of trustees and are generally settled twice a month. |
| C. | Various inputs may be used to determine the value of the fund’s investments and derivatives. These inputs are summarized in three broad levels for financial statement purposes. The inputs or methodologies used to value securities are not necessarily an indication of the risk associated with investing in those securities. |
| Level 1 ($000) | Level 2 ($000) | Level 3 ($000) | Total ($000) | |
| Investments | ||||
| Assets | ||||
| Common Stocks | 1,019,125 | — | 87 | 1,019,212 |
| Temporary Cash Investments | 11,644 | — | — | 11,644 |
| Total | 1,030,769 | — | 87 | 1,030,856 |
| Derivative Financial Instruments | ||||
| Liabilities | ||||
| Futures Contracts1 | 55 | — | — | 55 |
| 1 | Includes cumulative appreciation (depreciation) on futures contracts and centrally cleared swaps, if any, as reported in the Schedule of Investments. Only current day’s variation margin is reported within the Statement of Assets and Liabilities. |
| D. | Permanent differences between book-basis and tax-basis components of net assets are reclassified among capital accounts in the financial statements to reflect their tax character. These reclassifications have no effect on net assets or net asset value per share. As of period end, permanent differences primarily attributable to the accounting for applicable in-kind redemptions and passive foreign investment companies were reclassified between the following accounts: |
| Amount ($000) | |
| Paid-in Capital | 194,734 |
| Total Distributable Earnings (Loss) | (194,734) |
| Amount ($000) | |
| Undistributed Ordinary Income | 4,604 |
| Undistributed Long-Term Gains | — |
| Capital Loss Carryforwards | (169,174) |
| Qualified Late-Year Losses | — |
| Net Unrealized Gains (Losses) | (124,946) |
| Year Ended August 31, | ||
| 2022 Amount ($000) | 2021 Amount ($000) | |
| Ordinary Income* | 20,967 | 11,161 |
| Long-Term Capital Gains | — | — |
| Total | 20,967 | 11,161 |
| * | Includes short-term capital gains, if any. |
| Amount ($000) | |
| Tax Cost | 1,155,801 |
| Gross Unrealized Appreciation | 60,803 |
| Gross Unrealized Depreciation | (185,749) |
| Net Unrealized Appreciation (Depreciation) | (124,946) |
| E. | During the year ended August 31, 2022, the fund purchased $1,011,190,000 of investment securities and sold $1,074,800,000 of investment securities, other than temporary cash investments. Purchases and sales include $664,214,000 and $744,134,000, respectively, in connection with in-kind purchases and redemptions of the fund's capital shares. |
| F. | Capital share transactions for each class of shares were: |
| Year Ended August 31, | |||||
| 2022 | 2021 | ||||
| Amount ($000) | Shares (000) | Amount ($000) | Shares (000) | ||
| ETF Shares | |||||
| Issued | 678,843 | 4,950 | 880,493 | 6,600 | |
| Issued in Lieu of Cash Distributions | — | — | — | — | |
| Redeemed | (750,125) | (5,550) | (383,922) | (2,700) | |
| Net Increase (Decrease)—ETF Shares | (71,282) | (600) | 496,571 | 3,900 | |
| Year Ended August 31, | |||||
| 2022 | 2021 | ||||
| Amount ($000) | Shares (000) | Amount ($000) | Shares (000) | ||
| Institutional Shares | |||||
| Issued | 14,097 | 50 | 120,164 | 430 | |
| Issued in Lieu of Cash Distributions | 3,678 | 14 | 1,795 | 8 | |
| Redeemed | (10,558) | (40) | (48,232) | (210) | |
| Net Increase (Decrease)—Institutional Shares | 7,217 | 24 | 73,727 | 228 | |
| G. | Management has determined that no material events or transactions occurred subsequent to August 31, 2022, that would require recognition or disclosure in these financial statements. |

| Average Annual Total Returns Periods Ended August 31, 2022 | |||||
| One Year | Five Years | Ten Years | Final Value of a $10,000 Investment | ||
| Russell 2000 Growth Index Fund ETF Shares Net Asset Value | -25.28% | 6.71% | 10.18% | $26,368 |
| Russell 2000 Growth Index Fund ETF Shares Market Price | -25.28 | 6.71 | 10.18 | 26,361 | |
| Russell 2000 Growth Index | -25.26 | 6.69 | 10.16 | 26,325 |
| Dow Jones U.S. Total Stock Market Float Adjusted Index | -13.73 | 11.16 | 12.66 | 32,942 |
| One Year | Five Years | Ten Years | Final Value of a $5,000,000 Investment | ||
| Russell 2000 Growth Index Fund Institutional Shares | -25.24% | 6.80% | 10.29% | $13,316,900 | |
| Russell 2000 Growth Index | -25.26 | 6.69 | 10.16 | 13,162,520 | |
| Dow Jones U.S. Total Stock Market Float Adjusted Index | -13.73 | 11.16 | 12.66 | 16,470,991 | |
| One Year | Five Years | Ten Years | |
| Russell 2000 Growth Index Fund ETF Shares Market Price | -25.28% | 38.35% | 163.61% |
| Russell 2000 Growth Index Fund ETF Shares Net Asset Value | -25.28 | 38.39 | 163.68 |
| Russell 2000 Growth Index | -25.26 | 38.26 | 163.25 |
| Basic Materials | 4.3% |
| Consumer Discretionary | 12.0 |
| Consumer Staples | 3.9 |
| Energy | 8.3 |
| Financials | 5.9 |
| Health Care | 23.2 |
| Industrials | 19.1 |
| Real Estate | 2.3 |
| Technology | 16.3 |
| Telecommunications | 2.3 |
| Utilities | 2.4 |
| Other | 0.0 |
| Shares | Market Value• ($000) | ||
| Common Stocks (99.9%) | |||
| Basic Materials (4.3%) | |||
| * | Livent Corp. | 120,568 | 3,880 |
| UFP Industries Inc. | 39,657 | 3,148 | |
| Balchem Corp. | 23,715 | 3,126 | |
| Cabot Corp. | 41,354 | 2,976 | |
| Sensient Technologies Corp. | 29,508 | 2,351 | |
| Avient Corp. | 49,781 | 2,182 | |
| * | Ingevity Corp. | 28,965 | 2,032 |
| Innospec Inc. | 15,650 | 1,463 | |
| Materion Corp. | 14,289 | 1,233 | |
| Quaker Chemical Corp. | 6,661 | 1,161 | |
| Sylvamo Corp. | 24,900 | 1,107 | |
| * | Uranium Energy Corp. | 238,786 | 1,079 |
| * | GCP Applied Technologies Inc. | 34,300 | 1,078 |
| Compass Minerals International Inc. | 25,413 | 1,029 | |
| Mueller Industries Inc. | 15,058 | 951 | |
| GrafTech International Ltd. | 146,647 | 862 | |
| Kaiser Aluminum Corp. | 11,735 | 842 | |
| *,1 | Energy Fuels Inc. | 95,472 | 775 |
| Orion Engineered Carbons SA | 45,592 | 769 | |
| * | Novagold Resources Inc. | 167,636 | 743 |
| * | RBC Bearings Inc. | 3,051 | 734 |
| * | Constellium SE Class A | 48,905 | 651 |
| Commercial Metals Co. | 15,234 | 617 | |
| Boise Cascade Co. | 6,163 | 384 | |
| American Vanguard Corp. | 18,859 | 376 | |
| * | LSB Industries Inc. | 23,471 | 370 |
| * | 5e Advanced Materials Inc. | 23,979 | 360 |
| Hawkins Inc. | 8,854 | 339 | |
| * | Century Aluminum Co. | 39,032 | 301 |
| * | Origin Materials Inc. | 47,832 | 299 |
| AdvanSix Inc. | 6,800 | 247 | |
| Omega Flex Inc. | 2,415 | 244 | |
| * | Piedmont Lithium Inc. ADR | 3,544 | 217 |
| * | Ur-Energy Inc. | 140,057 | 193 |
| Stepan Co. | 1,571 | 164 | |
| *,1 | Dakota Gold Corp. | 38,311 | 131 |
| * | US Silica Holdings Inc. | 8,288 | 116 |
| * | Hycroft Mining Holding Corp. | 93,922 | 75 |
| Schnitzer Steel Industries Inc. Class A | 1,904 | 63 | |
| Mativ Holdings Inc. | 2,567 | 61 | |
| * | Amyris Inc. | 16,415 | 48 |
| * | Northwest Pipe Co. | 1,411 | 45 |
| Shares | Market Value• ($000) | ||
| Ryerson Holding Corp. | 716 | 20 | |
| 38,842 | |||
| Consumer Discretionary (12.0%) | |||
| Murphy USA Inc. | 16,687 | 4,842 | |
| Texas Roadhouse Inc. Class A | 50,862 | 4,515 | |
| * | Crocs Inc. | 45,118 | 3,325 |
| * | Fox Factory Holding Corp. | 31,548 | 2,941 |
| * | Hilton Grand Vacations Inc. | 66,715 | 2,721 |
| Wingstop Inc. | 22,302 | 2,539 | |
| * | Visteon Corp. | 20,684 | 2,479 |
| * | Skyline Champion Corp. | 39,674 | 2,248 |
| * | Helen of Troy Ltd. | 17,683 | 2,186 |
| LCI Industries | 18,471 | 2,140 | |
| Cracker Barrel Old Country Store Inc. | 17,208 | 1,857 | |
| * | Chegg Inc. | 92,576 | 1,822 |
| * | Dorman Products Inc. | 19,595 | 1,776 |
| Steven Madden Ltd. | 58,739 | 1,710 | |
| * | Duolingo Inc. | 17,517 | 1,647 |
| * | Cavco Industries Inc. | 6,830 | 1,598 |
| Kontoor Brands Inc. | 41,962 | 1,562 | |
| *,1 | Luminar Technologies Inc. Class A | 177,699 | 1,532 |
| * | Gentherm Inc. | 24,648 | 1,476 |
| * | Boot Barn Holdings Inc. | 21,999 | 1,466 |
| Papa John's International Inc. | 17,708 | 1,431 | |
| * | Sonos Inc. | 94,992 | 1,429 |
| John Wiley & Sons Inc. Class A | 30,063 | 1,384 | |
| * | elf Beauty Inc. | 35,901 | 1,369 |
| * | Shake Shack Inc. Class A | 27,842 | 1,327 |
| * | Dave & Buster's Entertainment Inc. | 32,020 | 1,324 |
| * | Tenneco Inc. Class A | 61,579 | 1,161 |
| Wolverine World Wide Inc. | 59,355 | 1,160 | |
| * | Stride Inc. | 30,271 | 1,155 |
| Cheesecake Factory Inc. | 37,056 | 1,135 | |
| * | Sally Beauty Holdings Inc. | 74,015 | 1,101 |
| * | XPEL Inc. | 16,018 | 1,098 |
| *,1 | Fisker Inc. | 121,046 | 1,093 |
| Inter Parfums Inc. | 13,420 | 1,054 | |
| * | iRobot Corp. | 17,628 | 1,038 |
| Rent-A-Center Inc. | 39,515 | 1,021 | |
| HNI Corp. | 31,303 | 1,002 | |
| Bloomin' Brands Inc. | 47,962 | 970 | |
| * | Coursera Inc. | 83,681 | 962 |
| Dillard's Inc. Class A | 3,191 | 945 | |
| Shares | Market Value• ($000) | ||
| * | Malibu Boats Inc. Class A | 15,584 | 936 |
| * | Figs Inc. Class A | 80,481 | 930 |
| * | Cinemark Holdings Inc. | 63,656 | 896 |
| 1 | Camping World Holdings Inc. Class A | 28,807 | 868 |
| Oxford Industries Inc. | 8,087 | 863 | |
| * | SeaWorld Entertainment Inc. | 16,957 | 852 |
| * | Asbury Automotive Group Inc. | 4,792 | 836 |
| * | Udemy Inc. | 53,533 | 795 |
| * | Liberty Media Corp.- Liberty Braves Class C | 28,374 | 776 |
| PriceSmart Inc. | 11,443 | 724 | |
| * | Brinker International Inc. | 29,133 | 714 |
| * | Revolve Group Inc. | 30,302 | 712 |
| Caleres Inc. | 27,247 | 695 | |
| Red Rock Resorts Inc. Class A | 17,947 | 686 | |
| Sinclair Broadcast Group Inc. Class A | 30,842 | 681 | |
| Dine Brands Global Inc. | 10,189 | 679 | |
| Buckle Inc. | 20,835 | 673 | |
| * | Everi Holdings Inc. | 35,281 | 653 |
| Franchise Group Inc. | 19,221 | 651 | |
| Sturm Ruger & Co. Inc. | 11,543 | 603 | |
| Arko Corp. | 62,988 | 600 | |
| * | Monarch Casino & Resort Inc. | 9,835 | 594 |
| *,1 | Blink Charging Co. | 27,586 | 590 |
| * | Golden Entertainment Inc. | 15,121 | 579 |
| Gray Television Inc. | 28,240 | 539 | |
| * | Vizio Holding Corp. Class A | 50,181 | 538 |
| Designer Brands Inc. Class A | 31,213 | 532 | |
| * | Funko Inc. Class A | 23,665 | 527 |
| * | Sun Country Airlines Holdings Inc. | 24,491 | 488 |
| * | Allegiant Travel Co. | 5,023 | 485 |
| Guess? Inc. | 25,557 | 446 | |
| Ruth's Hospitality Group Inc. | 24,392 | 444 | |
| Hibbett Inc. | 7,520 | 441 | |
| * | OneSpaWorld Holdings Ltd. | 49,507 | 436 |
| * | Accel Entertainment Inc. Class A | 43,340 | 408 |
| *,1 | Bed Bath & Beyond Inc. | 42,688 | 407 |
| * | Central Garden & Pet Co. Class A | 10,681 | 403 |
| RCI Hospitality Holdings Inc. | 6,131 | 400 | |
| Interface Inc. Class A | 35,025 | 391 | |
| * | Arlo Technologies Inc. | 63,067 | 384 |
| * | Chico's FAS Inc. | 66,017 | 375 |
| * | Frontier Group Holdings Inc. | 28,081 | 362 |
| * | Sabre Corp. | 49,579 | 356 |
| Carriage Services Inc. Class A | 9,978 | 353 | |
| * | ACV Auctions Inc. Class A | 40,905 | 348 |
| * | Imax Corp. | 21,997 | 345 |
| Acushnet Holdings Corp. | 7,205 | 343 | |
| MDC Holdings Inc. | 10,983 | 341 | |
| * | Portillo's Inc. Class A | 14,746 | 325 |
| * | Master Craft Boat Holdings Inc. | 13,422 | 323 |
| * | Lovesac Co. | 10,333 | 319 |
| European Wax Center Inc. Class A | 14,469 | 313 | |
| KB Home | 10,573 | 303 |
| Shares | Market Value• ($000) | ||
| International Game Technology plc | 16,627 | 298 | |
| * | Denny's Corp. | 31,472 | 297 |
| * | Sleep Number Corp. | 7,117 | 295 |
| *,1 | Vuzix Corp. | 38,232 | 287 |
| Clarus Corp. | 18,297 | 278 | |
| *,1 | Canoo Inc. | 84,393 | 269 |
| * | Children's Place Inc. | 6,301 | 266 |
| * | Taylor Morrison Home Corp. Class A | 10,580 | 266 |
| * | Kura Sushi USA Inc. Class A | 3,465 | 259 |
| * | Rover Group Inc. Class A | 64,490 | 246 |
| * | Corsair Gaming Inc. | 15,947 | 245 |
| * | CarParts.com Inc. | 37,365 | 242 |
| * | Rush Street Interactive Inc. | 45,013 | 218 |
| * | Holley Inc. | 37,925 | 215 |
| * | PowerSchool Holdings Inc. Class A | 11,878 | 214 |
| Global Industrial Co. | 7,018 | 211 | |
| * | Liberty Media Corp.- Liberty Braves Class A | 7,214 | 203 |
| * | Dream Finders Homes Inc. Class A | 15,592 | 193 |
| * | Latham Group Inc. | 33,307 | 190 |
| Jack in the Box Inc. | 2,181 | 174 | |
| * | Sweetgreen Inc. Class A | 10,142 | 171 |
| * | Neogames SA | 10,634 | 170 |
| Krispy Kreme Inc. | 14,192 | 167 | |
| Entravision Communications Corp. Class A | 32,408 | 165 | |
| * | Universal Technical Institute Inc. | 24,080 | 165 |
| * | Liquidity Services Inc. | 9,106 | 159 |
| *,1 | Rent the Runway Inc. Class A | 35,170 | 156 |
| * | Hovnanian Enterprises Inc. Class A | 3,788 | 152 |
| * | Noodles & Co. Class A | 30,829 | 146 |
| * | Green Brick Partners Inc. | 5,888 | 143 |
| * | Meritage Homes Corp. | 1,818 | 142 |
| *,1 | Focus Universal Inc. | 13,190 | 142 |
| * | ONE Group Hospitality Inc. | 18,867 | 135 |
| * | Destination XL Group Inc. | 23,540 | 130 |
| * | National Vision Holdings Inc. | 3,815 | 127 |
| * | Stitch Fix Inc. Class A | 24,645 | 124 |
| * | Nerdy Inc. | 40,325 | 123 |
| * | Century Casinos Inc. | 16,599 | 122 |
| * | Thryv Holdings Inc. | 4,759 | 122 |
| * | Ondas Holdings Inc. | 25,936 | 122 |
| Build-A-Bear Workshop Inc. | 7,827 | 120 | |
| * | Inspired Entertainment Inc. | 11,246 | 118 |
| * | PROG Holdings Inc. | 6,371 | 118 |
| * | M/I Homes Inc. | 2,645 | 114 |
| * | Central Garden & Pet Co. | 2,824 | 113 |
| * | Tri Pointe Homes Inc. | 6,147 | 107 |
| * | Playstudios Inc. | 29,228 | 106 |
| * | LGI Homes Inc. | 1,070 | 102 |
| * | Reservoir Media Inc. | 14,396 | 94 |
| * | Cars.com Inc. | 6,671 | 85 |
| * | Turtle Beach Corp. | 8,939 | 84 |
| Ermenegildo Zegna NV | 8,056 | 82 | |
| * | Allbirds Inc. Class A | 18,620 | 77 |
| Century Communities Inc. | 1,555 | ��� 73 | |
| * | Integral Ad Science Holding Corp. | 8,839 | 72 |
| Marine Products Corp. | 6,903 | 69 | |
| * | Xponential Fitness Inc. Class A | 3,698 | 68 |
| Shares | Market Value• ($000) | ||
| * | Stoneridge Inc. | 3,544 | 67 |
| * | F45 Training Holdings Inc. | 25,696 | 64 |
| * | Sonder Holdings Inc. | 30,942 | 58 |
| * | Party City Holdco Inc. | 28,021 | 55 |
| * | Gambling.com Group Ltd. | 6,158 | 49 |
| * | Boston Omaha Corp. Class A | 1,725 | 46 |
| * | American Axle & Manufacturing Holdings Inc. | 4,376 | 45 |
| * | MarineMax Inc. | 1,234 | 45 |
| * | Faraday Future Intelligent Electric Inc. | 38,987 | 44 |
| * | Full House Resorts Inc. | 6,401 | 43 |
| * | Instructure Holdings Inc. | 1,889 | 43 |
| * | Duluth Holdings Inc. Class B | 4,486 | 40 |
| * | First Watch Restaurant Group Inc. | 2,413 | 40 |
| * | Stagwell Inc. | 5,534 | 38 |
| Alta Equipment Group Inc. | 3,059 | 36 | |
| * | Torrid Holdings Inc. | 6,409 | 36 |
| Smith & Wesson Brands Inc. | 2,316 | 31 | |
| * | QuinStreet Inc. | 2,510 | 30 |
| * | OneWater Marine Inc. Class A | 716 | 29 |
| * | Lulu's Fashion Lounge Holdings Inc. | 4,254 | 27 |
| Bluegreen Vacations Holding Class A | 1,176 | 25 | |
| * | RealReal Inc. | 10,324 | 22 |
| * | Owlet Inc. | 12,883 | 21 |
| * | ThredUP Inc. Class A | 7,495 | 18 |
| * | Lindblad Expeditions Holdings Inc. | 1,868 | 14 |
| * | Quotient Technology Inc. | 7,785 | 14 |
| * | Mullen Automotive Inc. | 15,978 | 11 |
| * | Aterian Inc. | 3,780 | 9 |
| * | Purple Innovation Inc. Class A | 2,718 | 8 |
| * | Citi Trends Inc. | 341 | 7 |
| Rocky Brands Inc. | 208 | 5 | |
| * | aka Brands Holding Corp. | 36 | — |
| 109,173 | |||
| Consumer Staples (3.9%) | |||
| * | Celsius Holdings Inc. | 40,682 | 4,210 |
| * | Sprouts Farmers Market Inc. | 81,699 | 2,361 |
| * | BellRing Brands Inc. | 98,126 | 2,325 |
| Lancaster Colony Corp. | 12,249 | 2,065 | |
| * | Simply Good Foods Co. | 67,028 | 2,048 |
| WD-40 Co. | 10,167 | 1,923 | |
| J & J Snack Foods Corp. | 11,334 | 1,689 | |
| Coca-Cola Consolidated Inc. | 3,497 | 1,659 | |
| Energizer Holdings Inc. | 50,049 | 1,406 | |
| Cal-Maine Foods Inc. | 25,993 | 1,393 | |
| * | Herbalife Nutrition Ltd. | 48,959 | 1,277 |
| MGP Ingredients Inc. | 10,475 | 1,147 | |
| *,1 | Beyond Meat Inc. | 45,751 | 1,116 |
| Medifast Inc. | 8,490 | 1,065 | |
| National Beverage Corp. | 17,519 | 972 | |
| * | Beauty Health Co. | 65,804 | 763 |
| *,1 | Veru Inc. | 48,574 | 743 |
| Utz Brands Inc. | 42,298 | 705 | |
| * | SunOpta Inc. | 67,694 | 672 |
| Nu Skin Enterprises Inc. Class A | 15,206 | 623 | |
| * | Chefs' Warehouse Inc. | 17,767 | 592 |
| Calavo Growers Inc. | 12,916 | 543 | |
| Shares | Market Value• ($000) | ||
| * | USANA Health Sciences Inc. | 8,315 | 536 |
| * | Duckhorn Portfolio Inc. | 27,387 | 500 |
| Tootsie Roll Industries Inc. | 9,706 | 348 | |
| John B Sanfilippo & Son Inc. | 4,084 | 330 | |
| * | Vita Coco Co. Inc. | 20,731 | 311 |
| * | Vital Farms Inc. | 22,163 | 287 |
| Turning Point Brands Inc. | 11,241 | 262 | |
| PetMed Express Inc. | 12,275 | 252 | |
| *,1 | Tattooed Chef Inc. | 34,244 | 228 |
| * | Sovos Brands Inc. | 14,562 | 222 |
| *,1 | Benson Hill Inc. | 61,130 | 217 |
| *,1 | BRC Inc. Class A | 18,762 | 183 |
| * | 22nd Century Group Inc. | 117,916 | 158 |
| Vector Group Ltd. | 15,505 | 152 | |
| * | United Natural Foods Inc. | 3,102 | 137 |
| * | Rite Aid Corp. | 18,941 | 136 |
| Natural Grocers by Vitamin Cottage Inc. | 5,809 | 83 | |
| * | Mission Produce Inc. | 3,342 | 54 |
| *,1 | Local Bounti Corp. | 13,312 | 50 |
| * | Vintage Wine Estates Inc. | 2,991 | 18 |
| 35,761 | |||
| Energy (8.3%) | |||
| Matador Resources Co. | 83,729 | 4,990 | |
| SM Energy Co. | 90,096 | 3,971 | |
| * | Denbury Inc. | 37,778 | 3,360 |
| ChampionX Corp. | 152,136 | 3,318 | |
| Magnolia Oil & Gas Corp. Class A | 124,133 | 2,963 | |
| Chord Energy Corp. | 18,732 | 2,651 | |
| * | Kosmos Energy Ltd. | 335,893 | 2,375 |
| * | Array Technologies Inc. | 112,167 | 2,344 |
| * | Valaris Ltd. | 45,361 | 2,312 |
| * | Shoals Technologies Group Inc. Class A | 83,218 | 2,194 |
| Alpha Metallurgical Resources Inc. | 13,311 | 2,092 | |
| Murphy Oil Corp. | 47,959 | 1,869 | |
| Cactus Inc. Class A | 43,978 | 1,757 | |
| CONSOL Energy Inc. | 24,058 | 1,727 | |
| Arch Resources Inc. | 11,343 | 1,651 | |
| * | Ameresco Inc. Class A | 23,691 | 1,631 |
| Patterson-UTI Energy Inc. | 108,224 | 1,613 | |
| * | Liberty Energy Inc. Class A | 106,408 | 1,596 |
| * | Stem Inc. | 101,338 | 1,593 |
| * | Tellurian Inc. | 379,877 | 1,519 |
| * | Weatherford International plc | 53,055 | 1,493 |
| Delek US Holdings Inc. | 52,504 | 1,483 | |
| * | SunPower Corp. | 61,033 | 1,465 |
| * | Comstock Resources Inc. | 68,387 | 1,340 |
| Northern Oil and Gas Inc. | 41,443 | 1,311 | |
| * | Callon Petroleum Co. | 30,473 | 1,297 |
| * | NexTier Oilfield Solutions Inc. | 130,978 | 1,227 |
| Brigham Minerals Inc. Class A | 38,029 | 1,131 | |
| * | Talos Energy Inc. | 49,362 | 1,023 |
| * | Laredo Petroleum Inc. | 12,751 | 990 |
| * | Gulfport Energy Corp. | 8,801 | 860 |
| * | Montauk Renewables Inc. | 47,722 | 847 |
| * | FuelCell Energy Inc. | 199,944 | 838 |
| * | Nabors Industries Ltd. (XNYS) | 5,877 | 779 |
| CVR Energy Inc. | 21,886 | 715 | |
| * | Par Pacific Holdings Inc. | 36,170 | 680 |
| Equitrans Midstream Corp. | 72,469 | 672 | |
| Shares | Market Value• ($000) | ||
| Ranger Oil Corp. Class A | 15,741 | 614 | |
| * | MRC Global Inc. | 61,552 | 599 |
| * | Oceaneering International Inc. | 67,018 | 593 |
| * | PBF Energy Inc. Class A | 16,313 | 557 |
| * | Fluence Energy Inc. | 26,632 | 531 |
| * | TPI Composites Inc. | 26,996 | 502 |
| * | SandRidge Energy Inc. | 23,515 | 493 |
| * | Earthstone Energy Inc. Class A | 31,897 | 485 |
| RPC Inc. | 55,418 | 441 | |
| Crescent Energy Inc. Class A | 23,966 | 411 | |
| * | W&T Offshore Inc. | 58,325 | 379 |
| * | TETRA Technologies Inc. | 91,868 | 366 |
| * | SilverBow Resources Inc. | 8,669 | 345 |
| Solaris Oilfield Infrastructure Inc. Class A | 23,305 | 249 | |
| * | ESS Tech Inc. | 54,092 | 240 |
| Sitio Royalties Corp. | 8,660 | 220 | |
| VAALCO Energy Inc. | 43,493 | 218 | |
| * | Borr Drilling Ltd. | 45,107 | 181 |
| Ramaco Resources Inc. | 16,705 | 176 | |
| * | Centennial Resource Development Inc. Class A | 20,428 | 168 |
| * | Noble Corp. | 5,423 | 165 |
| * | Amplify Energy Corp. | 20,837 | 155 |
| * | NextDecade Corp. | 20,180 | 149 |
| * | CNX Resources Corp. | 7,811 | 138 |
| * | FTC Solar Inc. | 32,026 | 133 |
| Warrior Met Coal Inc. | 3,950 | 129 | |
| Riley Exploration Permian Inc. | 4,970 | 125 | |
| HighPeak Energy Inc. | 4,890 | 124 | |
| * | Golar LNG Ltd. | 4,207 | 115 |
| * | Solid Power Inc. | 16,654 | 110 |
| *,1 | Energy Vault Holdings Inc. | 18,328 | 101 |
| Berry Corp. | 9,500 | 87 | |
| * | Ring Energy Inc. | 24,771 | 80 |
| * | DMC Global Inc. | 3,465 | 77 |
| * | Empire Petroleum Corp. | 4,800 | 71 |
| *,1 | EVgo Inc. | 5,749 | 55 |
| Kinetik Holdings Inc. | 1,222 | 45 | |
| * | ProFrac Holding Corp. Class A | 1,860 | 37 |
| * | Battalion Oil Corp. | 2,747 | 36 |
| * | Heliogen Inc. | 13,544 | 32 |
| 75,409 | |||
| Financials (5.9%) | |||
| First Financial Bankshares Inc. | 96,665 | 4,109 | |
| Kinsale Capital Group Inc. | 16,101 | 4,083 | |
| RLI Corp. | 29,063 | 3,190 | |
| ServisFirst Bancshares Inc. | 37,327 | 3,149 | |
| Houlihan Lokey Inc. Class A | 37,926 | 2,977 | |
| Federated Hermes Inc. | 65,272 | 2,223 | |
| * | Trupanion Inc. | 29,015 | 2,048 |
| Hamilton Lane Inc. Class A | 26,261 | 1,827 | |
| * | Focus Financial Partners Inc. Class A | 43,202 | 1,691 |
| * | Silvergate Capital Corp. Class A | 18,465 | 1,683 |
| Walker & Dunlop Inc. | 15,879 | 1,595 | |
| * | Palomar Holdings Inc. | 18,082 | 1,434 |
| * | BRP Group Inc. Class A | 44,160 | 1,387 |
| Cohen & Steers Inc. | 18,945 | 1,352 | |
| Lakeland Financial Corp. | 16,783 | 1,264 | |
| Shares | Market Value• ($000) | ||
| PJT Partners Inc. Class A | 17,906 | 1,240 | |
| Stock Yards Bancorp Inc. | 17,993 | 1,192 | |
| FirstCash Holdings Inc. | 14,359 | 1,119 | |
| StepStone Group Inc. Class A | 39,309 | 1,073 | |
| Moelis & Co. Class A | 24,107 | 1,004 | |
| Artisan Partners Asset Management Inc. Class A | 29,117 | 983 | |
| BancFirst Corp. | 8,764 | 945 | |
| * | Open Lending Corp. Class A | 78,269 | 760 |
| B Riley Financial Inc. | 15,183 | 756 | |
| * | Blucora Inc. | 34,869 | 700 |
| Live Oak Bancshares Inc. | 19,220 | 697 | |
| * | Goosehead Insurance Inc. Class A | 12,423 | 646 |
| * | Bancorp Inc. | 24,311 | 577 |
| Glacier Bancorp Inc. | 10,819 | 548 | |
| WisdomTree Investments Inc. | 102,033 | 511 | |
| Eastern Bankshares Inc. | 24,732 | 480 | |
| Brookfield Business Corp. Class A | 16,986 | 413 | |
| * | Triumph Bancorp Inc. | 6,626 | 410 |
| Diamond Hill Investment Group Inc. | 2,241 | 383 | |
| Brightsphere Investment Group Inc. | 22,203 | 379 | |
| * | Coastal Financial Corp. | 7,643 | 307 |
| Westamerica BanCorp. | 4,778 | 267 | |
| HCI Group Inc. | 5,382 | 257 | |
| * | World Acceptance Corp. | 2,090 | 243 |
| * | LendingTree Inc. | 7,800 | 238 |
| Perella Weinberg Partners Class A | 31,838 | 229 | |
| GCM Grosvenor Inc. Class A | 27,063 | 212 | |
| Cadence Bank | 8,082 | 206 | |
| Pathward Financial Inc. | 5,929 | 195 | |
| PennyMac Mortgage Investment Trust | 13,107 | 195 | |
| * | Columbia Financial Inc. | 8,756 | 187 |
| * | Axos Financial Inc. | 4,271 | 178 |
| Veritex Holdings Inc. | 5,375 | 162 | |
| Esquire Financial Holdings Inc. | 4,340 | 162 | |
| First BanCorp. (XNYS) | 10,905 | 156 | |
| Greene County Bancorp Inc. | 2,421 | 129 | |
| Silvercrest Asset Management Group Inc. Class A | 6,622 | 118 | |
| Pzena Investment Management Inc. Class A | 12,036 | 115 | |
| Virtus Investment Partners Inc. | 576 | 110 | |
| * | StoneX Group Inc. | 1,189 | 110 |
| Victory Capital Holdings Inc. Class A | 3,624 | 97 | |
| * | NMI Holdings Inc. Class A | 4,592 | 94 |
| CBL & Associates Properties Inc. | 3,073 | 89 | |
| Sculptor Capital Management Inc. Class A | 8,990 | 85 | |
| Five Star Bancorp | 3,254 | 83 | |
| Curo Group Holdings Corp. | 12,450 | 82 | |
| Farmers & Merchants Bancorp Inc. | 2,696 | 77 | |
| * | Nicolet Bankshares Inc. | 984 | 75 |
| Bank of NT Butterfield & Son Ltd. | 2,129 | 69 |
| Shares | Market Value• ($000) | ||
| Metrocity Bankshares Inc. | 3,198 | 64 | |
| GAMCO Investors Inc. Class A | 3,100 | 63 | |
| West BanCorp. Inc. | 2,490 | 61 | |
| National Bank Holdings Corp. Class A | 1,486 | 60 | |
| Manning & Napier Inc. | 4,366 | 56 | |
| Value Line Inc. | 656 | 54 | |
| * | Bridgewater Bancshares Inc. | 3,091 | 53 |
| * | LendingClub Corp. | 3,748 | 49 |
| HomeTrust Bancshares Inc. | 1,916 | 45 | |
| Universal Insurance Holdings Inc. | 3,341 | 40 | |
| * | Metropolitan Bank Holding Corp. | 545 | 39 |
| * | Professional Holding Corp. Class A | 1,222 | 34 |
| * | eHealth Inc. | 4,926 | 32 |
| * | SiriusPoint Ltd. | 5,328 | 24 |
| BayCom Corp. | 1,191 | 22 | |
| Investors Title Co. | 143 | 21 | |
| * | Third Coast Bancshares Inc. | 1,058 | 19 |
| Hingham Institution for Savings | 59 | 18 | |
| First Guaranty Bancshares Inc. | 423 | 9 | |
| * | FVCBankcorp Inc. | 448 | 9 |
| * | Velocity Financial LLC | 750 | 9 |
| * | MarketWise Inc. | 2,715 | 8 |
| * | Doma Holdings Inc. | 9,527 | 6 |
| 54,150 | |||
| Health Care (23.2%) | |||
| * | Shockwave Medical Inc. | 26,484 | 7,862 |
| * | Karuna Therapeutics Inc. | 21,842 | 5,571 |
| * | Biohaven Pharmaceutical Holding Co. Ltd. | 28,779 | 4,298 |
| * | Halozyme Therapeutics Inc. | 100,948 | 4,112 |
| * | Apellis Pharmaceuticals Inc. | 67,651 | 4,094 |
| * | HealthEquity Inc. | 61,767 | 4,082 |
| * | Lantheus Holdings Inc. | 50,832 | 4,006 |
| * | Inspire Medical Systems Inc. | 20,239 | 3,876 |
| * | LHC Group Inc. | 22,234 | 3,590 |
| * | Option Care Health Inc. | 115,101 | 3,564 |
| * | Intra-Cellular Therapies Inc. | 68,165 | 3,426 |
| Ensign Group Inc. | 40,096 | 3,420 | |
| * | STAAR Surgical Co. | 35,681 | 3,375 |
| * | Omnicell Inc. | 32,679 | 3,343 |
| * | iRhythm Technologies Inc. | 22,202 | 3,274 |
| * | Blueprint Medicines Corp. | 44,472 | 3,256 |
| * | Global Blood Therapeutics Inc. | 46,363 | 3,148 |
| * | Arrowhead Pharmaceuticals Inc. | 76,612 | 3,042 |
| * | Medpace Holdings Inc. | 20,493 | 3,025 |
| * | Cytokinetics Inc. | 55,227 | 2,925 |
| * | Alkermes plc | 121,339 | 2,872 |
| * | Haemonetics Corp. | 37,800 | 2,836 |
| * | Beam Therapeutics Inc. | 47,294 | 2,582 |
| * | Axonics Inc. | 34,950 | 2,525 |
| * | Amicus Therapeutics Inc. | 205,247 | 2,305 |
| * | Inari Medical Inc. | 32,707 | 2,268 |
| * | Evolent Health Inc. Class A | 61,020 | 2,242 |
| * | Progyny Inc. | 55,666 | 2,238 |
| * | Intellia Therapeutics Inc. | 36,759 | 2,208 |
| * | R1 RCM Inc. | 100,568 | 2,197 |
| * | Insmed Inc. | 88,765 | 2,185 |
| Shares | Market Value• ($000) | ||
| * | Merit Medical Systems Inc. | 35,818 | 2,121 |
| * | Denali Therapeutics Inc. | 73,358 | 2,030 |
| * | PTC Therapeutics Inc. | 39,543 | 1,975 |
| CONMED Corp. | 21,003 | 1,860 | |
| * | ChemoCentryx Inc. | 34,806 | 1,774 |
| * | Pacira BioSciences Inc. | 33,465 | 1,756 |
| Select Medical Holdings Corp. | 68,188 | 1,748 | |
| * | LivaNova plc | 30,517 | 1,717 |
| * | NuVasive Inc. | 39,004 | 1,658 |
| * | Glaukos Corp. | 34,064 | 1,654 |
| *,1 | Corcept Therapeutics Inc. | 63,487 | 1,639 |
| * | Fate Therapeutics Inc. | 61,882 | 1,618 |
| *,1 | Neogen Corp. | 74,130 | 1,549 |
| * | Arvinas Inc. | 36,233 | 1,534 |
| * | ACADIA Pharmaceuticals Inc. | 89,589 | 1,472 |
| Patterson Cos. Inc. | 51,094 | 1,425 | |
| * | Axsome Therapeutics Inc. | 21,408 | 1,366 |
| * | BioCryst Pharmaceuticals Inc. | 95,440 | 1,327 |
| * | Privia Health Group Inc. | 32,123 | 1,278 |
| * | Apollo Medical Holdings Inc. | 28,999 | 1,251 |
| * | Nevro Corp. | 26,499 | 1,201 |
| * | Cerevel Therapeutics Holdings Inc. | 40,533 | 1,180 |
| Embecta Corp. | 36,969 | 1,180 | |
| * | Twist Bioscience Corp. | 29,084 | 1,167 |
| * | Prometheus Biosciences Inc. | 21,667 | 1,133 |
| * | Travere Thrapeutics Inc. | 40,997 | 1,097 |
| * | Ironwood Pharmaceuticals Inc. Class A | 101,395 | 1,091 |
| * | CorVel Corp. | 6,696 | 1,040 |
| * | Meridian Bioscience Inc. | 31,869 | 1,039 |
| * | Revance Therapeutics Inc. | 52,205 | 1,039 |
| * | TransMedics Group Inc. | 19,914 | 1,036 |
| * | Vaxcyte Inc. | 39,303 | 1,028 |
| * | Silk Road Medical Inc. | 25,760 | 1,026 |
| * | Dynavax Technologies Corp. | 88,199 | 1,012 |
| * | AtriCure Inc. | 22,076 | 1,007 |
| * | Cytek Biosciences Inc. | 85,020 | 990 |
| * | Catalyst Pharmaceuticals Inc. | 70,925 | 960 |
| * | Alignment Healthcare Inc. | 62,861 | 956 |
| * | Vericel Corp. | 34,976 | 873 |
| * | IVERIC bio Inc. | 87,032 | 856 |
| * | Harmony Biosciences Holdings Inc. | 19,449 | 854 |
| * | Amphastar Pharmaceuticals Inc. | 28,389 | 840 |
| US Physical Therapy Inc. | 9,511 | 786 | |
| *,1 | Warby Parker Inc. Class A | 62,255 | 783 |
| * | Avid Bioservices Inc. | 45,287 | 780 |
| * | PROCEPT BioRobotics Corp. | 18,991 | 769 |
| * | Prothena Corp. plc | 27,430 | 756 |
| * | Clover Health Investments Corp. Class A | 283,909 | 741 |
| * | CareDx Inc. | 37,696 | 738 |
| * | Cano Health Inc. | 119,685 | 738 |
| * | Aurinia Pharmaceuticals Inc. | 100,123 | 737 |
| * | RadNet Inc. | 36,624 | 736 |
| * | Zentalis Pharmaceuticals Inc. | 27,250 | 731 |
| *,1 | Cassava Sciences Inc. | 28,316 | 729 |
| * | FibroGen Inc. | 57,462 | 715 |
| * | Surgery Partners Inc. | 25,971 | 715 |
| LeMaitre Vascular Inc. | 14,465 | 714 |
| Shares | Market Value• ($000) | ||
| * | Aclaris Therapeutics Inc. | 44,475 | 708 |
| * | TG Therapeutics Inc. | 99,200 | 707 |
| * | AbCellera Biologics Inc. | 65,987 | 705 |
| * | Arcutis Biotherapeutics Inc. | 26,057 | 702 |
| * | Madrigal Pharmaceuticals Inc. | 9,472 | 683 |
| * | Gossamer Bio Inc. | 47,820 | 667 |
| * | Heska Corp. | 7,152 | 651 |
| * | Outset Medical Inc. | 35,454 | 648 |
| Atrion Corp. | 1,022 | 617 | |
| * | Innoviva Inc. | 46,812 | 616 |
| * | Coherus Biosciences Inc. | 55,053 | 615 |
| * | DocGo Inc. | 60,269 | 615 |
| *,1 | Senseonics Holdings Inc. | 338,732 | 603 |
| * | Paragon 28 Inc. | 34,217 | 600 |
| * | Cutera Inc. | 12,249 | 585 |
| * | Artivion Inc. | 24,458 | 542 |
| * | Agenus Inc. | 199,910 | 540 |
| 1 | SIGA Technologies Inc. | 35,195 | 531 |
| * | Cerus Corp. | 127,619 | 525 |
| * | Hanger Inc. | 28,094 | 523 |
| * | OrthoPediatrics Corp. | 10,634 | 522 |
| * | Bridgebio Pharma Inc. | 48,102 | 505 |
| * | Point Biopharma Global Inc. | 51,394 | 501 |
| * | Treace Medical Concepts Inc. | 24,834 | 497 |
| * | Anavex Life Sciences Corp. | 51,015 | 489 |
| * | Geron Corp. (XNGS) | 185,159 | 489 |
| * | Hims & Hers Health Inc. | 76,001 | 483 |
| * | Alector Inc. | 46,567 | 482 |
| * | UFP Technologies Inc. | 5,060 | 471 |
| * | Pulmonx Corp. | 25,369 | 466 |
| * | ImmunoGen Inc. | 78,667 | 457 |
| * | Aerie Pharmaceuticals Inc. | 29,881 | 451 |
| * | Morphic Holding Inc. | 16,395 | 451 |
| * | Phreesia Inc. | 17,506 | 449 |
| * | Collegium Pharmaceutical Inc. | 25,169 | 442 |
| * | Y-mAbs Therapeutics Inc. | 27,170 | 437 |
| * | Relmada Therapeutics Inc. | 14,708 | 429 |
| * | Keros Therapeutics Inc. | 11,937 | 422 |
| * | NanoString Technologies Inc. | 30,901 | 419 |
| * | SI-BONE Inc. | 25,221 | 416 |
| * | Reata Pharmaceuticals Inc. Class A | 17,083 | 408 |
| *,1 | Ocugen Inc. | 157,600 | 407 |
| * | Addus HomeCare Corp. | 4,512 | 403 |
| * | Theravance Biopharma Inc. | 42,728 | 385 |
| * | Inhibrx Inc. | 21,509 | 382 |
| Healthcare Services Group Inc. | 26,471 | 372 | |
| National Research Corp. | 10,764 | 367 | |
| * | Krystal Biotech Inc. | 5,196 | 364 |
| * | Alphatec Holdings Inc. | 46,961 | 356 |
| * | Rapt Therapeutics Inc. | 13,226 | 353 |
| * | Esperion Therapeutics Inc. | 46,728 | 349 |
| * | NextGen Healthcare Inc. | 20,013 | 343 |
| * | Surmodics Inc. | 10,098 | 340 |
| * | Ventyx Biosciences Inc. | 16,609 | 339 |
| * | ViewRay Inc. | 97,088 | 332 |
| * | Agiliti Inc. | 20,146 | 324 |
| * | Codexis Inc. | 45,478 | 319 |
| * | ModivCare Inc. | 2,907 | 315 |
| * | Heron Therapeutics Inc. | 76,778 | 314 |
| * | Intercept Pharmaceuticals Inc. | 18,007 | 313 |
| * | Viridian Therapeutics Inc. | 13,969 | 310 |
| Shares | Market Value• ($000) | ||
| * | Pennant Group Inc. | 19,348 | 303 |
| * | Mirum Pharmaceuticals Inc. | 11,676 | 292 |
| * | Ocular Therapeutix Inc. | 56,849 | 289 |
| * | Karyopharm Therapeutics Inc. | 55,879 | 283 |
| * | Axogen Inc. | 30,002 | 281 |
| * | Seres Therapeutics Inc. | 52,456 | 270 |
| * | Affimed NV | 99,148 | 260 |
| * | Kiniksa Pharmaceuticals Ltd. Class A | 21,764 | 255 |
| * | Evolus Inc. | 26,341 | 253 |
| * | Eagle Pharmaceuticals Inc. | 7,690 | 252 |
| * | NGM Biopharmaceuticals Inc. | 17,562 | 248 |
| * | Albireo Pharma Inc. | 12,885 | 225 |
| * | Eiger BioPharmaceuticals Inc. | 27,070 | 224 |
| Utah Medical Products Inc. | 2,422 | 223 | |
| * | Celldex Therapeutics Inc. | 7,302 | 222 |
| * | Arcturus Therapeutics Holdings Inc. | 15,655 | 220 |
| * | Syndax Pharmaceuticals Inc. | 9,100 | 215 |
| * | Cardiovascular Systems Inc. | 15,990 | 211 |
| Phibro Animal Health Corp. Class A | 14,184 | 210 | |
| * | OptimizeRx Corp. | 13,014 | 207 |
| * | Vera Therapeutics Inc. Class A | 9,222 | 200 |
| * | Joint Corp. | 10,553 | 192 |
| * | ImmunityBio Inc. | 46,801 | 187 |
| Owens & Minor Inc. | 6,269 | 185 | |
| * | Rigel Pharmaceuticals Inc. | 130,446 | 185 |
| * | Organogenesis Holdings Inc. Class A | 51,500 | 185 |
| * | 23andMe Holding Co. Class A | 54,896 | 185 |
| * | Aura Biosciences Inc. | 13,785 | 184 |
| iRadimed Corp. | 5,280 | 177 | |
| * | RxSight Inc. | 14,140 | 177 |
| * | Imago Biosciences Inc. | 11,846 | 172 |
| * | ADMA Biologics Inc. | 62,527 | 169 |
| * | Xeris Biopharma Holdings Inc. | 99,428 | 166 |
| * | Amneal Pharmaceuticals Inc. | 76,251 | 165 |
| * | Verve Therapeutics Inc. | 4,057 | 156 |
| * | Provention Bio Inc. | 35,966 | 155 |
| *,1 | Vicarious Surgical Inc. | 41,008 | 153 |
| * | Deciphera Pharmaceuticals Inc. | 9,244 | 150 |
| * | PetIQ Inc. Class A | 16,052 | 150 |
| * | Foghorn Therapeutics Inc. | 14,992 | 149 |
| * | Aadi Bioscience Inc. | 10,955 | 148 |
| Zynex Inc. | 16,432 | 147 | |
| * | Phathom Pharmaceuticals Inc. | 17,271 | 147 |
| * | SpringWorks Therapeutics Inc. | 4,903 | 136 |
| * | Precigen Inc. | 61,272 | 135 |
| * | REVOLUTION Medicines Inc. | 6,501 | 135 |
| * | Akoya Biosciences Inc. | 11,723 | 134 |
| * | Liquidia Corp. | 23,068 | 133 |
| * | Ligand Pharmaceuticals Inc. | 1,387 | 128 |
| * | IGM Biosciences Inc. | 5,867 | 114 |
| * | Enanta Pharmaceuticals Inc. | 1,795 | 109 |
| * | Rallybio Corp. | 9,644 | 107 |
| * | Relay Therapeutics Inc. | 4,613 | 106 |
| Shares | Market Value• ($000) | ||
| * | Crinetics Pharmaceuticals Inc. | 5,326 | 101 |
| *,1 | Outlook Therapeutics Inc. | 88,603 | 99 |
| * | Chimerix Inc. | 44,707 | 98 |
| * | Recursion Pharmaceuticals Inc. Class A | 9,095 | 96 |
| * | Arbutus Biopharma Corp. | 41,115 | 91 |
| * | Oncology Institute Inc. | 14,083 | 89 |
| * | CTI BioPharma Corp. | 13,518 | 85 |
| *,1 | Sorrento Therapeutics Inc. | 41,335 | 85 |
| * | EyePoint Pharmaceuticals Inc. | 8,442 | 84 |
| AirSculpt Technologies Inc. | 8,781 | 77 | |
| * | MannKind Corp. | 20,166 | 74 |
| * | 908 Devices Inc. | 3,649 | 74 |
| * | Science 37 Holdings Inc. | 42,221 | 67 |
| * | Lexicon Pharmaceuticals Inc. | 24,022 | 66 |
| * | Tricida Inc. | 4,603 | 58 |
| * | Vaxart Inc. | 18,479 | 57 |
| * | P3 Health Partners Inc. | 11,212 | 55 |
| * | Babylon Holdings Ltd. Classs A | 77,244 | 55 |
| * | SomaLogic Inc. | 13,452 | 49 |
| * | Humacyte Inc. | 12,513 | 46 |
| * | Thorne HealthTech Inc. | 9,791 | 46 |
| * | BioLife Solutions Inc. | 1,863 | 44 |
| * | HealthStream Inc. | 1,994 | 44 |
| * | Tactile Systems Technology Inc. | 4,922 | 41 |
| *,1 | Amylyx Pharmaceuticals Inc. | 1,605 | 41 |
| * | Alpine Immune Sciences Inc. | 4,994 | 37 |
| * | Adaptive Biotechnologies Corp. | 4,021 | 36 |
| * | Nano-X Imaging Ltd. | 2,691 | 36 |
| * | Quanterix Corp. | 3,310 | 31 |
| * | Celularity Inc. | 11,050 | 30 |
| * | Inogen Inc. | 963 | 28 |
| * | Sangamo Therapeutics Inc. | 5,118 | 28 |
| * | GreenLight Biosciences Holdings PBC | 9,954 | 28 |
| * | Atara Biotherapeutics Inc. | 6,124 | 25 |
| * | LifeStance Health Group Inc. | 3,519 | 22 |
| * | HilleVax Inc. | 1,812 | 22 |
| * | VistaGen Therapeutics Inc. | 110,729 | 20 |
| *,1,2 | Tobira Therapeutics Inc. CVR | 3,989 | 18 |
| * | Akero Therapeutics Inc. | 1,436 | 17 |
| * | MeiraGTx Holdings plc | 1,647 | 14 |
| * | Sight Sciences Inc. | 1,516 | 11 |
| * | An2 Therapeutics Inc. | 556 | 10 |
| * | PepGen Inc. | 983 | 9 |
| * | Praxis Precision Medicines Inc. | 2,428 | 8 |
| * | Tenon Medical Inc. | 3,454 | 7 |
| * | Innovage Holding Corp. | 1,635 | 6 |
| *,1,2 | Synergy Pharmaceuticals Inc. | 124,654 | — |
| *,2 | Progenics Pharmaceuticals Inc. CVR | 71,640 | — |
| *,2 | Prevail Therapeutics Inc. CVR | 58 | — |
| * | Gelesis Holdings Inc. | 42 | — |
| 211,557 | |||
| Industrials (19.1%) | |||
| * | Chart Industries Inc. | 27,326 | 5,297 |
| EMCOR Group Inc. | 37,852 | 4,501 | |
| Shares | Market Value• ($000) | ||
| * | Saia Inc. | 19,754 | 4,086 |
| * | ExlService Holdings Inc. | 24,087 | 4,040 |
| * | ASGN Inc. | 37,331 | 3,610 |
| Exponent Inc. | 38,359 | 3,600 | |
| * | AMN Healthcare Services Inc. | 33,273 | 3,415 |
| * | Bloom Energy Corp. Class A | 130,820 | 3,324 |
| Applied Industrial Technologies Inc. | 28,467 | 3,018 | |
| Franklin Electric Co. Inc. | 34,612 | 3,006 | |
| Simpson Manufacturing Co. Inc. | 32,390 | 3,001 | |
| Insperity Inc. | 27,093 | 2,954 | |
| Watts Water Technologies Inc. Class A | 20,355 | 2,820 | |
| * | ATI Inc. | 92,433 | 2,767 |
| * | Atkore Inc. | 31,982 | 2,700 |
| Comfort Systems USA Inc. | 26,378 | 2,647 | |
| Maximus Inc. | 43,161 | 2,615 | |
| * | Fluor Corp. | 96,713 | 2,557 |
| Zurn Elkay Water Solutions Corp. | 92,382 | 2,548 | |
| * | Marqeta Inc. Class A | 322,955 | 2,516 |
| John Bean Technologies Corp. | 23,540 | 2,431 | |
| Korn Ferry | 39,854 | 2,428 | |
| * | Dycom Industries Inc. | 21,487 | 2,409 |
| * | TriNet Group Inc. | 27,858 | 2,295 |
| HB Fuller Co. | 34,087 | 2,211 | |
| Herc Holdings Inc. | 19,085 | 2,148 | |
| Badger Meter Inc. | 21,777 | 2,062 | |
| * | ACI Worldwide Inc. | 85,238 | 2,020 |
| Forward Air Corp. | 20,006 | 1,941 | |
| * | Aerojet Rocketdyne Holdings Inc. | 44,433 | 1,914 |
| Brink's Co. | 34,535 | 1,909 | |
| AAON Inc. | 32,664 | 1,878 | |
| * | Enovix Corp. | 81,054 | 1,793 |
| Federal Signal Corp. | 44,497 | 1,774 | |
| * | Verra Mobility Corp. Class A | 108,760 | 1,734 |
| Installed Building Products Inc. | 18,046 | 1,634 | |
| * | CBIZ Inc. | 36,585 | 1,597 |
| * | Beacon Roofing Supply Inc. | 28,343 | 1,556 |
| * | GMS Inc. | 32,217 | 1,553 |
| Kadant Inc. | 8,645 | 1,551 | |
| * | AeroVironment Inc. | 17,325 | 1,536 |
| McGrath RentCorp. | 18,039 | 1,525 | |
| EVERTEC Inc. | 44,771 | 1,504 | |
| * | NV5 Global Inc. | 10,088 | 1,420 |
| CSW Industrials Inc. | 11,168 | 1,414 | |
| * | Masonite International Corp. | 16,806 | 1,375 |
| Helios Technologies Inc. | 24,222 | 1,323 | |
| Lindsay Corp. | 8,205 | 1,316 | |
| Mueller Water Products Inc. Class A | 116,082 | 1,309 | |
| * | Veritiv Corp. | 10,847 | 1,293 |
| Brady Corp. Class A | 27,166 | 1,264 | |
| * | O-I Glass Inc. | 94,199 | 1,226 |
| * | Evo Payments Inc. Class A | 35,298 | 1,176 |
| * | Vicor Corp. | 16,407 | 1,167 |
| *,1 | Nikola Corp. | 217,658 | 1,167 |
| * | MYR Group Inc. | 12,501 | 1,162 |
| Belden Inc. | 17,425 | 1,141 | |
| Hillenbrand Inc. | 27,077 | 1,128 | |
| * | Payoneer Global Inc. | 161,527 | 1,069 |
| Otter Tail Corp. | 13,587 | 1,026 |
| Shares | Market Value• ($000) | ||
| * | Flywire Corp. | 41,190 | 1,024 |
| * | StoneCo. Ltd. Class A | 107,289 | 1,017 |
| * | ZipRecruiter Inc. Class A | 59,236 | 988 |
| ICF International Inc. | 9,686 | 984 | |
| * | Energy Recovery Inc. | 41,630 | 955 |
| * | PGT Innovations Inc. | 43,906 | 918 |
| *,1 | Joby Aviation Inc. | 170,445 | 903 |
| * | CryoPort Inc. | 27,072 | 884 |
| Enerpac Tool Group Corp. Class A | 45,406 | 881 | |
| * | Rocket Lab USA Inc. | 158,274 | 870 |
| * | Construction Partners Inc. Class A | 29,655 | 868 |
| Alamo Group Inc. | 6,381 | 834 | |
| Kforce Inc. | 15,239 | 834 | |
| ManTech International Corp. Class A | 8,662 | 831 | |
| Terex Corp. | 24,911 | 828 | |
| * | Montrose Environmental Group Inc. | 20,511 | 825 |
| * | AvidXchange Holdings Inc. | 97,125 | 757 |
| * | Legalzoom.com Inc. | 73,131 | 753 |
| H&E Equipment Services Inc. | 23,670 | 749 | |
| TTEC Holdings Inc. | 14,112 | 739 | |
| * | Remitly Global Inc. | 62,197 | 684 |
| Apogee Enterprises Inc. | 16,485 | 673 | |
| * | Napco Security Technologies Inc. | 21,696 | 643 |
| Marten Transport Ltd. | 32,409 | 642 | |
| Mesa Laboratories Inc. | 3,729 | 637 | |
| * | Janus International Group Inc. | 60,707 | 627 |
| * | Huron Consulting Group Inc. | 9,336 | 625 |
| Shyft Group Inc. | 25,800 | 618 | |
| * | SP Plus Corp. | 17,382 | 576 |
| *,1 | PureCycle Technologies Inc. | 62,975 | 575 |
| Griffon Corp. | 17,551 | 550 | |
| * | International Money Express Inc. | 23,982 | 537 |
| * | Titan International Inc. | 37,829 | 531 |
| Myers Industries Inc. | 26,820 | 518 | |
| Wabash National Corp. | 31,184 | 513 | |
| * | BTRS Holdings Inc. Class A | 74,903 | 506 |
| * | Air Transport Services Group Inc. | 16,564 | 499 |
| Douglas Dynamics Inc. | 16,655 | 485 | |
| CRA International Inc. | 5,289 | 483 | |
| ArcBest Corp. | 5,981 | 482 | |
| * | Virgin Galactic Holdings Inc. | 80,413 | 475 |
| * | Sterling Infrastructure Inc. | 18,266 | 462 |
| * | Proterra Inc. | 75,014 | 453 |
| * | Franklin Covey Co. | 9,365 | 445 |
| * | Cimpress plc | 13,045 | 438 |
| Albany International Corp. Class A | 4,619 | 407 | |
| * | Paya Holdings Inc. | 64,870 | 407 |
| Insteel Industries Inc. | 13,912 | 402 | |
| * | Transcat Inc. | 5,314 | 394 |
| Barrett Business Services Inc. | 4,797 | 387 | |
| * | I3 Verticals Inc. Class A | 16,298 | 381 |
| Pitney Bowes Inc. | 127,731 | 369 | |
| Tennant Co. | 6,035 | 364 | |
| * | Diversey Holdings Ltd. | 57,684 | 354 |
| * | Babcock & Wilcox Enterprises Inc. | 44,252 | 353 |
| * | Forrester Research Inc. | 8,374 | 348 |
| Shares | Market Value• ($000) | ||
| * | Sterling Check Corp. | 16,165 | 344 |
| *,1 | Workhorse Group Inc. | 107,307 | 336 |
| * | Infrastructure and Energy Alternatives Inc. | 22,515 | 320 |
| Cadre Holdings Inc. | 12,165 | 310 | |
| Allied Motion Technologies Inc. | 8,765 | 307 | |
| * | Target Hospitality Corp. | 22,748 | 302 |
| Moog Inc. Class A | 3,627 | 272 | |
| * | Hudson Technologies Inc. | 32,107 | 266 |
| * | JELD-WEN Holding Inc. | 23,842 | 266 |
| * | Aspen Aerogels Inc. | 20,378 | 265 |
| * | Hireright Holdings Corp. | 15,782 | 257 |
| Werner Enterprises Inc. | 5,879 | 234 | |
| * | CS Disco Inc. | 16,424 | 227 |
| Trinity Industries Inc. | 9,245 | 225 | |
| EnerSys | 3,484 | 217 | |
| * | ShotSpotter Inc. | 6,622 | 216 |
| Kronos Worldwide Inc. | 16,173 | 208 | |
| * | Sarcos Technology and Robotics Corp. | 56,634 | 186 |
| *,1 | Velo3D Inc. | 42,656 | 184 |
| * | Daseke Inc. | 30,215 | 183 |
| * | Microvast Holdings Inc. | 74,267 | 183 |
| Greif Inc. Class A | 2,660 | 178 | |
| * | Cantaloupe Inc. | 25,965 | 165 |
| Universal Logistics Holdings Inc. | 4,293 | 157 | |
| * | Blue Bird Corp. | 12,922 | 153 |
| * | PAM Transportation Services Inc. | 4,949 | 147 |
| Textainer Group Holdings Ltd. | 4,806 | 146 | |
| GATX Corp. | 1,479 | 143 | |
| ESCO Technologies Inc. | 1,689 | 138 | |
| *,1 | Hyzon Motors Inc. | 64,589 | 138 |
| * | DHI Group Inc. | 26,739 | 136 |
| * | IES Holdings Inc. | 4,434 | 135 |
| * | Proto Labs Inc. | 3,405 | 131 |
| Luxfer Holdings plc | 7,940 | 131 | |
| Chase Corp. | 1,461 | 129 | |
| * | Itron Inc. | 2,720 | 129 |
| * | Distribution Solutions Group Inc. | 3,255 | 129 |
| United States Lime & Minerals Inc. | 1,166 | 120 | |
| * | Great Lakes Dredge & Dock Corp. | 11,769 | 113 |
| * | OSI Systems Inc. | 1,347 | 112 |
| * | Vivint Smart Home Inc. | 17,520 | 110 |
| * | Cross Country Healthcare Inc. | 4,093 | 104 |
| *,1 | Cerberus Cyber Sentinel Corp. | 33,960 | 92 |
| Patrick Industries Inc. | 1,668 | 88 | |
| * | Custom Truck One Source Inc. | 13,061 | 86 |
| * | Lightning eMotors Inc. | 29,240 | 83 |
| Gorman-Rupp Co. | 3,050 | 81 | |
| * | Donnelley Financial Solutions Inc. | 1,798 | 76 |
| * | Atlas Technical Consultants Inc. | 8,865 | 76 |
| * | Green Dot Corp. Class A | 3,717 | 75 |
| * | Karat Packaging Inc. | 4,107 | 73 |
| * | Berkshire Grey Inc. | 34,651 | 70 |
| * | IBEX Holdings Ltd. | 4,097 | 69 |
| Shares | Market Value• ($000) | ||
| Information Services Group Inc. | 11,537 | 67 | |
| * | Atlanticus Holdings Corp. | 2,312 | 66 |
| * | CIRCOR International Inc. | 3,840 | 63 |
| * | Xos Inc. | 38,854 | 59 |
| * | Priority Technology Holdings Inc. | 14,405 | 58 |
| Cass Information Systems Inc. | 1,568 | 57 | |
| Greif Inc. Class B | 717 | 47 | |
| * | Radiant Logistics Inc. | 6,674 | 47 |
| * | First Advantage Corp. | 3,408 | 47 |
| Primoris Services Corp. | 2,121 | 43 | |
| * | American Woodmark Corp. | 667 | 35 |
| * | FARO Technologies Inc. | 1,009 | 34 |
| * | AEye Inc. | 18,734 | 29 |
| * | Markforged Holding Corp. | 11,601 | 28 |
| * | CompoSecure Inc. | 4,812 | 28 |
| * | Cepton Inc. | 13,932 | 25 |
| * | Momentus Inc. | 13,802 | 24 |
| * | Willdan Group Inc. | 829 | 19 |
| Miller Industries Inc. | 589 | 14 | |
| * | Moneylion Inc. | 7,072 | 10 |
| * | Redwire Corp. | 2,499 | 7 |
| ���174,514 | |||
| Other (0.0%)3 | |||
| *,2 | Aduro Biotech Inc. CVR | 9,451 | 2 |
| *,1,2 | GTX Inc. CVR | 530 | — |
| 2 | |||
| Real Estate (2.3%) | |||
| Phillips Edison & Co. Inc. | 85,086 | 2,780 | |
| Outfront Media Inc. | 108,999 | 1,929 | |
| Innovative Industrial Properties Inc. | 20,675 | 1,896 | |
| * | Cushman & Wakefield plc | 118,274 | 1,769 |
| * | DigitalBridge Group Inc. | 98,578 | 1,755 |
| Tanger Factory Outlet Centers Inc. | 75,679 | 1,167 | |
| St. Joe Co. | 25,620 | 979 | |
| NexPoint Residential Trust Inc. | 15,886 | 839 | |
| Marcus & Millichap Inc. | 18,381 | 687 | |
| eXp World Holdings Inc. | 50,775 | 657 | |
| * | Redfin Corp. | 78,371 | 642 |
| * | Compass Inc. Class A | 194,632 | 557 |
| UMH Properties Inc. | 30,050 | 542 | |
| Gladstone Commercial Corp. | 26,449 | 504 | |
| Universal Health Realty Income Trust | 9,477 | 482 | |
| Safehold Inc. | 10,101 | 384 | |
| Community Healthcare Trust Inc. | 10,374 | 383 | |
| Alexander's Inc. | 1,586 | 376 | |
| Saul Centers Inc. | 7,794 | 345 | |
| Gladstone Land Corp. | 12,835 | 302 | |
| Corporate Office Properties Trust | 9,939 | 257 | |
| CatchMark Timber Trust Inc. Class A | 23,803 | 253 | |
| Essential Properties Realty Trust Inc. | 9,010 | 204 | |
| Bluerock Residential Growth REIT Inc. Class A | 7,580 | 202 | |
| RMR Group Inc. Class A | 7,018 | 183 | |
| Hannon Armstrong Sustainable Infrastructure Capital Inc. | 4,039 | 160 | |
| Shares | Market Value• ($000) | ||
| Four Corners Property Trust Inc. | 5,594 | 150 | |
| CareTrust REIT Inc. | 5,610 | 121 | |
| Postal Realty Trust Inc. Class A | 7,490 | 111 | |
| Newmark Group Inc. Class A | 8,418 | 86 | |
| * | Offerpad Solutions Inc. | 50,835 | 77 |
| Clipper Realty Inc. | 7,412 | 62 | |
| * | Forestar Group Inc. | 4,628 | 58 |
| Douglas Elliman Inc. | 4,047 | 19 | |
| Industrial Logistics Properties Trust | 2,461 | 18 | |
| * | Hersha Hospitality Trust Class A | 1,249 | 12 |
| 20,948 | |||
| Technology (16.2%) | |||
| * | Qualys Inc. | 29,041 | 4,411 |
| * | Novanta Inc. | 26,421 | 3,532 |
| * | Rogers Corp. | 13,980 | 3,502 |
| * | Synaptics Inc. | 29,504 | 3,411 |
| * | Silicon Laboratories Inc. | 27,000 | 3,384 |
| * | SPS Commerce Inc. | 26,991 | 3,296 |
| * | Tenable Holdings Inc. | 81,782 | 3,239 |
| Power Integrations Inc. | 43,029 | 3,078 | |
| * | Fabrinet | 27,483 | 2,826 |
| * | Blackline Inc. | 41,096 | 2,792 |
| * | Onto Innovation Inc. | 36,886 | 2,619 |
| Advanced Energy Industries Inc. | 27,965 | 2,511 | |
| * | Rapid7 Inc. | 43,222 | 2,485 |
| * | Box Inc. Class A | 96,051 | 2,473 |
| * | Workiva Inc. Class A | 35,485 | 2,409 |
| * | DigitalOcean Holdings Inc. | 56,764 | 2,389 |
| * | Alarm.com Holdings Inc. | 35,811 | 2,385 |
| * | Varonis Systems Inc. Class B | 81,092 | 2,218 |
| * | Super Micro Computer Inc. | 33,784 | 2,199 |
| * | Semtech Corp. | 47,089 | 2,175 |
| * | Envestnet Inc. | 40,904 | 2,142 |
| * | Verint Systems Inc. | 43,089 | 2,089 |
| * | MACOM Technology Solutions Holdings Inc. Class H | 37,607 | 2,074 |
| * | Sprout Social Inc. Class A | 34,194 | 2,053 |
| * | Altair Engineering Inc. Class A | 38,694 | 2,012 |
| * | Perficient Inc. | 25,426 | 1,986 |
| * | MaxLinear Inc. | 53,432 | 1,920 |
| * | Ambarella Inc. | 27,098 | 1,839 |
| Kulicke & Soffa Industries Inc. | 43,234 | 1,818 | |
| * | CommVault Systems Inc. | 33,144 | 1,799 |
| * | Insight Enterprises Inc. | 19,710 | 1,796 |
| * | Rambus Inc. | 68,523 | 1,767 |
| * | Yelp Inc. Class A | 51,253 | 1,751 |
| * | Diodes Inc. | 24,099 | 1,715 |
| * | Blackbaud Inc. | 32,768 | 1,714 |
| * | FormFactor Inc. | 58,086 | 1,701 |
| * | Q2 Holdings Inc. | 41,590 | 1,652 |
| * | PagerDuty Inc. | 63,350 | 1,650 |
| * | Plexus Corp. | 17,455 | 1,636 |
| * | Axcelis Technologies Inc. | 24,306 | 1,627 |
| Progress Software Corp. | 32,566 | 1,567 | |
| * | Upwork Inc. | 89,235 | 1,553 |
| * | Appfolio Inc. Class A | 14,204 | 1,440 |
| * | Cargurus Inc. | 75,999 | 1,421 |
| Shares | Market Value• ($000) | ||
| * | Appian Corp. Class A | 29,711 | 1,393 |
| CSG Systems International Inc. | 23,900 | 1,383 | |
| * | TechTarget Inc. | 20,434 | 1,326 |
| * | Digital Turbine Inc. | 70,100 | 1,295 |
| * | Impinj Inc. | 14,218 | 1,269 |
| * | Sitime Corp. | 11,930 | 1,269 |
| *,1 | Xometry Inc. Class A | 25,196 | 1,235 |
| * | Everbridge Inc. | 29,541 | 1,175 |
| * | Schrodinger Inc. | 40,073 | 1,100 |
| * | Clear Secure Inc. Class A | 46,428 | 1,065 |
| * | Asana Inc. Class A | 54,799 | 1,049 |
| * | KnowBe4 Inc. Class A | 54,343 | 1,044 |
| CTS Corp. | 23,633 | 1,000 | |
| Shutterstock Inc. | 17,981 | 996 | |
| *,1 | MicroStrategy Inc. Class A | 4,149 | 961 |
| * | Model N Inc. | 26,714 | 799 |
| * | BigCommerce Holdings Inc. Series 1 | 47,847 | 798 |
| * | Agilysys Inc. | 14,519 | 752 |
| * | Grid Dynamics Holdings Inc. | 36,052 | 729 |
| * | ePlus Inc. | 15,126 | 713 |
| Simulations Plus Inc. | 11,589 | 696 | |
| * | Momentive Global Inc. | 97,873 | 694 |
| * | Duck Creek Technologies Inc. | 57,112 | 680 |
| * | SMART Global Holdings Inc. | 36,411 | 668 |
| * | Zuora Inc. Class A | 84,272 | 647 |
| * | indie Semiconductor Inc. Class A | 74,637 | 635 |
| * | Amplitude Inc. Class A | 41,565 | 630 |
| * | Vimeo Inc. | 105,951 | 627 |
| * | Veeco Instruments Inc. | 29,499 | 624 |
| * | LivePerson Inc. | 52,036 | 604 |
| * | PDF Solutions Inc. | 22,605 | 596 |
| *,1 | MicroVision Inc. | 122,640 | 594 |
| A10 Networks Inc. | 40,517 | 563 | |
| * | PubMatic Inc. Class A | 28,216 | 552 |
| * | Planet Labs PBC | 100,687 | 552 |
| * | Matterport Inc. | 118,132 | 545 |
| * | Photronics Inc. | 32,299 | 543 |
| * | EngageSmart Inc. | 25,758 | 514 |
| * | Ziff Davis Inc. | 6,471 | 500 |
| * | CEVA Inc. | 16,920 | 495 |
| * | Alpha & Omega Semiconductor Ltd. | 12,684 | 490 |
| * | Avid Technology Inc. | 16,691 | 457 |
| * | AvePoint Inc. | 96,773 | 453 |
| * | N-Able Inc. | 44,000 | 438 |
| * | Domo Inc. Class B | 22,688 | 437 |
| * | PROS Holdings Inc. | 19,562 | 408 |
| * | Telos Corp. | 40,560 | 402 |
| * | Yext Inc. | 89,322 | 398 |
| * | Alkami Technology Inc. | 26,501 | 384 |
| Hackett Group Inc. | 18,015 | 370 | |
| Sapiens International Corp. NV | 16,584 | 367 | |
| * | Sumo Logic Inc. | 41,124 | 361 |
| * | Eventbrite Inc. Class A | 49,998 | 356 |
| * | Tucows Inc. Class A | 7,447 | 350 |
| * | Edgio Inc. | 93,226 | 343 |
| * | Unisys Corp. | 36,408 | 339 |
| * | Ultra Clean Holdings Inc. | 11,388 | 333 |
| Amkor Technology Inc. | 16,405 | 330 | |
| * | Couchbase Inc. | 19,635 | 326 |
| * | Mitek Systems Inc. | 28,910 | 295 |
| * | MeridianLink Inc. | 16,841 | 293 |
| Shares | Market Value• ($000) | ||
| American Software Inc. Class A | 17,026 | 288 | |
| * | Consensus Cloud Solutions Inc. | 5,666 | 285 |
| * | CyberOptics Corp. | 5,330 | 284 |
| * | SmartRent Inc. | 87,731 | 283 |
| *,1 | PAR Technology Corp. | 7,363 | 259 |
| * | ForgeRock Inc. Class A | 14,879 | 254 |
| * | Identiv Inc. | 16,288 | 243 |
| * | Credo Technology Group Holding Ltd. | 17,485 | 241 |
| * | Enfusion Inc. Class A | 18,937 | 235 |
| * | Cyxtera Technologies Inc. | 31,491 | 200 |
| * | NerdWallet Inc. Class A | 19,163 | 199 |
| *,1 | Atomera Inc. | 15,311 | 198 |
| * | Rimini Street Inc. | 36,496 | 184 |
| * | C3.ai Inc. Class A | 9,602 | 173 |
| * | Veritone Inc. | 23,259 | 171 |
| * | Digimarc Corp. | 9,527 | 170 |
| * | Zeta Global Holdings Corp. Class A | 23,024 | 161 |
| * | Intapp Inc. | 10,196 | 148 |
| * | Mediaalpha Inc. Class A | 17,369 | 145 |
| *,1 | UserTesting Inc. | 34,577 | 144 |
| * | Diebold Nixdorf Inc. | 40,942 | 142 |
| * | Red Violet Inc. | 7,145 | 136 |
| * | Brightcove Inc. | 20,135 | 134 |
| * | WM Technology Inc. | 49,564 | 130 |
| * | EverQuote Inc. Class A | 14,645 | 127 |
| * | NextNav Inc. | 36,485 | 124 |
| * | Squarespace Inc. Class A | 5,797 | 122 |
| * | OneSpan Inc. | 10,242 | 118 |
| Ebix Inc. | 4,196 | 109 | |
| *,1 | Rockley Photonics Holdings Ltd. | 76,276 | 108 |
| *,1 | SkyWater Technology Inc. | 7,799 | 101 |
| *,1 | IronNet Inc. | 48,233 | 97 |
| * | Benefitfocus Inc. | 12,742 | 94 |
| * | Arteris Inc. | 12,650 | 90 |
| * | Transphorm Inc. | 15,221 | 84 |
| * | ACM Research Inc. Class A | 4,856 | 82 |
| * | Nutex Health Inc. | 29,220 | 79 |
| *,1 | Vinco Ventures Inc. | 76,675 | 74 |
| * | IonQ Inc. | 11,042 | 66 |
| * | Arena Group Holdings Inc. | 6,048 | 64 |
| * | eGain Corp. | 6,714 | 62 |
| * | Innovid Corp. | 14,057 | 52 |
| * | Bandwidth Inc. Class A | 3,232 | 50 |
| * | Viant Technology Inc. Class A | 9,819 | 44 |
| Vivid Seats Inc. Class A | 4,519 | 37 | |
| * | Adtheorent Holdings Co. Inc. | 11,395 | 30 |
| * | Core Scientific Inc. | 13,394 | 29 |
| * | EverCommerce Inc. | 2,346 | 27 |
| * | Aeva Technologies Inc. | 7,482 | 23 |
| * | Beachbody Co. Inc. | 19,786 | 23 |
| * | Weave Communications Inc. | 4,024 | 23 |
| * | Wejo Group Ltd. | 18,390 | 21 |
| * | Groupon Inc. Class A | 1,546 | 15 |
| * | Loyalty Ventures Inc. | 5,562 | 12 |
| * | Applied Blockchain Inc. | 4,127 | 10 |
| * | Terawulf Inc. | 5,482 | 8 |
| *,1 | Cryptyde Inc. | 7,521 | 6 |
| * | Leafly Holdings Inc. | 2,448 | 4 |
| * | Cipher Mining Inc. | 56 | — |
| 148,118 |
| Shares | Market Value• ($000) | ||
| Telecommunications (2.3%) | |||
| * | Iridium Communications Inc. | 94,825 | 4,209 |
| * | Viavi Solutions Inc. | 169,203 | 2,382 |
| * | Calix Inc. | 33,235 | 1,956 |
| * | CommScope Holding Co. Inc. | 152,643 | 1,725 |
| * | Extreme Networks Inc. | 95,228 | 1,365 |
| Adtran Holdings Inc. | 47,437 | 1,102 | |
| * | Clearfield Inc. | 8,631 | 1,002 |
| Cogent Communications Holdings Inc. | 17,499 | 932 | |
| * | Globalstar Inc. | 425,544 | 851 |
| * | Harmonic Inc. | 68,341 | 770 |
| * | Infinera Corp. | 139,872 | 766 |
| *,1 | Lightwave Logic Inc. | 83,531 | 666 |
| * | 8x8 Inc. | 81,868 | 427 |
| InterDigital Inc. | 8,490 | 426 | |
| * | WideOpenWest Inc. | 22,735 | 405 |
| * | Digi International Inc. | 8,570 | 284 |
| * | Ooma Inc. | 17,059 | 206 |
| * | Charge Enterprises Inc. | 80,611 | 196 |
| * | IDT Corp. Class B | 7,643 | 195 |
| * | DZS Inc. | 12,694 | 169 |
| * | Cambium Networks Corp. | 8,553 | 166 |
| * | Akoustis Technologies Inc. | 36,290 | 159 |
| * | Casa Systems Inc. | 30,134 | 117 |
| * | Anterix Inc. | 2,522 | 107 |
| * | Inseego Corp. | 19,128 | 52 |
| * | Gogo Inc. | 3,047 | 45 |
| *,1 | Starry Group Holdings Inc. | 15,863 | 36 |
| * | Consolidated Communications Holdings Inc. | 5,036 | 29 |
| 20,745 | |||
| Utilities (2.4%) | |||
| Brookfield Infrastructure Corp. Class A (XTSE) | 72,886 | 3,469 | |
| * | Evoqua Water Technologies Corp. | 87,499 | 3,069 |
| * | Casella Waste Systems Inc. Class A | 37,168 | 3,045 |
| Clearway Energy Inc. Class C | 61,147 | 2,269 | |
| Ormat Technologies Inc. (XNYS) | 18,883 | 1,765 | |
| Middlesex Water Co. | 12,876 | 1,143 | |
| American States Water Co. | 13,145 | 1,091 | |
| Chesapeake Utilities Corp. | 7,306 | 923 | |
| MGE Energy Inc. | 11,623 | 895 | |
| Clearway Energy Inc. Class A | 25,829 | 891 | |
| Shares | Market Value• ($000) | ||
| California Water Service Group | 10,385 | 608 | |
| York Water Co. | 10,497 | 462 | |
| Southwest Gas Holdings Inc. | 4,455 | 347 | |
| * | Vertex Energy Inc. | 35,373 | 301 |
| * | Archaea Energy Inc. Class A | 14,100 | 279 |
| Aris Water Solution Inc. Class A | 16,158 | 275 | |
| * | Li-Cycle Holdings Corp. | 36,994 | 267 |
| New Jersey Resources Corp. | 5,782 | 255 | |
| Artesian Resources Corp. Class A | 4,049 | 221 | |
| * | Pure Cycle Corp. | 14,479 | 149 |
| Global Water Resources Inc. | 9,974 | 136 | |
| * | Altus Power Inc. | 9,781 | 102 |
| Via Renewables Inc. Class A | 7,801 | 66 | |
| 22,028 | |||
| Total Common Stocks (Cost $837,213) | 911,247 | ||
| Temporary Cash Investments (1.9%) | |||
| Money Market Fund (1.9%) | |||
| 4,5 | Vanguard Market Liquidity Fund, 2.284% (Cost $17,157) | 171,651 | 17,160 |
| Total Investments (101.8%) (Cost $854,370) | 928,407 | ||
| Other Assets and Liabilities—Net (-1.8%) | (16,032) | ||
| Net Assets (100%) | 912,375 | ||
| Cost is in $000. | |||
| • | See Note A in Notes to Financial Statements. |
| * | Non-income-producing security. |
| 1 | Includes partial security positions on loan to broker-dealers. The total value of securities on loan is $14,665,000. |
| 2 | Security value determined using significant unobservable inputs. |
| 3 | “Other” represents securities that are not classified by the fund’s benchmark index. |
| 4 | Affiliated money market fund available only to Vanguard funds and certain trusts and accounts managed by Vanguard. Rate shown is the 7-day yield. |
| 5 | Collateral of $16,083,000 was received for securities on loan. |
| ADR—American Depositary Receipt. | |
| CVR—Contingent Value Rights. | |
| REIT—Real Estate Investment Trust. |
| Futures Contracts | ||||
| ($000) | ||||
| Expiration | Number of Long (Short) Contracts | Notional Amount | Value and Unrealized Appreciation (Depreciation) | |
| Long Futures Contracts | ||||
| E-mini Russell 2000 Index | September 2022 | 11 | 1,015 | (28) |
| ($000s, except shares and per-share amounts) | Amount |
| Assets | |
| Investments in Securities, at Value1 | |
| Unaffiliated Issuers (Cost $837,213) | 911,247 |
| Affiliated Issuers (Cost $17,157) | 17,160 |
| Total Investments in Securities | 928,407 |
| Investment in Vanguard | 33 |
| Cash Collateral Pledged—Futures Contracts | 70 |
| Receivables for Investment Securities Sold | 909 |
| Receivables for Accrued Income | 496 |
| Receivables for Capital Shares Issued | 285 |
| Total Assets | 930,200 |
| Liabilities | |
| Due to Custodian | 1,123 |
| Payables for Investment Securities Purchased | 481 |
| Collateral for Securities on Loan | 16,083 |
| Payables for Capital Shares Redeemed | 76 |
| Payables to Vanguard | 56 |
| Variation Margin Payable—Futures Contracts | 6 |
| Total Liabilities | 17,825 |
| Net Assets | 912,375 |
| 1 Includes $14,665 of securities on loan. | |
| At August 31, 2022, net assets consisted of: | |
| Paid-in Capital | 1,143,111 |
| Total Distributable Earnings (Loss) | (230,736) |
| Net Assets | 912,375 |
| ETF Shares—Net Assets | |
| Applicable to 3,975,393 outstanding $.001 par value shares of beneficial interest (unlimited authorization) | 657,735 |
| Net Asset Value Per Share—ETF Shares | $165.45 |
| Institutional Shares—Net Assets | |
| Applicable to 807,863 outstanding $.001 par value shares of beneficial interest (unlimited authorization) | 254,640 |
| Net Asset Value Per Share—Institutional Shares | $315.20 |
| Year Ended August 31, 2022 | |
| ($000) | |
| Investment Income | |
| Income | |
| Dividends1 | 6,091 |
| Non-Cash Dividends | 1,004 |
| Interest2 | 6 |
| Securities Lending—Net | 1,243 |
| Total Income | 8,344 |
| Expenses | |
| The Vanguard Group—Note B | |
| Investment Advisory Services | 93 |
| Management and Administrative—ETF Shares | 788 |
| Management and Administrative—Institutional Shares | 233 |
| Marketing and Distribution—ETF Shares | 34 |
| Marketing and Distribution—Institutional Shares | 17 |
| Custodian Fees | 68 |
| Auditing Fees | 27 |
| Shareholders’ Reports—ETF Shares | 35 |
| Shareholders’ Reports—Institutional Shares | 9 |
| Trustees’ Fees and Expenses | — |
| Other Expenses | 15 |
| Total Expenses | 1,319 |
| Net Investment Income | 7,025 |
| Realized Net Gain (Loss) | |
| Investment Securities Sold2,3 | 31,032 |
| Futures Contracts | 180 |
| Realized Net Gain (Loss) | 31,212 |
| Change in Unrealized Appreciation (Depreciation) | |
| Investment Securities2 | (327,648) |
| Futures Contracts | (61) |
| Change in Unrealized Appreciation (Depreciation) | (327,709) |
| Net Increase (Decrease) in Net Assets Resulting from Operations | (289,472) |
| 1 | Dividends are net of foreign withholding taxes of $10,000. |
| 2 | Interest income, realized net gain (loss), capital gain distributions received, and change in unrealized appreciation (depreciation) from an affiliated company of the fund were $6,000, ($6,000), less than $1,000, and less than $1,000, respectively. Purchases and sales are for temporary cash investment purposes. |
| 3 | Includes $188,903,000 of net gain (loss) resulting from in-kind redemptions. |
| Year Ended August 31, | ||
| 2022 ($000) | 2021 ($000) | |
| Increase (Decrease) in Net Assets | ||
| Operations | ||
| Net Investment Income | 7,025 | 5,841 |
| Realized Net Gain (Loss) | 31,212 | 120,421 |
| Change in Unrealized Appreciation (Depreciation) | (327,709) | 204,030 |
| Net Increase (Decrease) in Net Assets Resulting from Operations | (289,472) | 330,292 |
| Distributions | ||
| ETF Shares | (3,596) | (2,369) |
| Institutional Shares | (3,487) | (3,418) |
| Total Distributions | (7,083) | (5,787) |
| Capital Share Transactions | ||
| ETF Shares | 102,858 | 230,394 |
| Institutional Shares | (380,738) | 61,405 |
| Net Increase (Decrease) from Capital Share Transactions | (277,880) | 291,799 |
| Total Increase (Decrease) | (574,435) | 616,304 |
| Net Assets | ||
| Beginning of Period | 1,486,810 | 870,506 |
| End of Period | 912,375 | 1,486,810 |
| ETF Shares | |||||
| For a Share Outstanding Throughout Each Period | Year Ended August 31, | ||||
| 2022 | 2021 | 2020 | 2019 | 2018 | |
| Net Asset Value, Beginning of Period | $222.64 | $164.83 | $141.63 | $160.12 | $123.26 |
| Investment Operations | |||||
| Net Investment Income1 | 1.137 | .839 | 1.097 | .971 | .895 |
| Net Realized and Unrealized Gain (Loss) on Investments | (57.266) | 57.852 | 23.237 | (18.527) | 36.791 |
| Total from Investment Operations | (56.129) | 58.691 | 24.334 | (17.556) | 37.686 |
| Distributions | |||||
| Dividends from Net Investment Income | (1.061) | (.881) | (1.134) | (.934) | (.826) |
| Distributions from Realized Capital Gains | — | — | — | — | — |
| Total Distributions | (1.061) | (.881) | (1.134) | (.934) | (.826) |
| Net Asset Value, End of Period | $165.45 | $222.64 | $164.83 | $141.63 | $160.12 |
| Total Return | -25.28% | 35.67% | 17.32% | -10.97% | 30.69% |
| Ratios/Supplemental Data | |||||
| Net Assets, End of Period (Millions) | $658 | $735 | $371 | $301 | $328 |
| Ratio of Total Expenses to Average Net Assets | 0.15% | 0.15% | 0.15% | 0.15% | 0.20% |
| Ratio of Net Investment Income to Average Net Assets | 0.61% | 0.40% | 0.75% | 0.68% | 0.64% |
| Portfolio Turnover Rate2 | 33% | 47% | 38% | 28% | 35% |
| 1 | Calculated based on average shares outstanding. |
| 2 | Excludes the value of portfolio securities received or delivered as a result of in-kind purchases or redemptions of the fund’s capital shares, including ETF Creation Units. |
| Institutional Shares | |||||
| For a Share Outstanding Throughout Each Period | Year Ended August 31, | ||||
| 2022 | 2021 | 2020 | 2019 | 2018 | |
| Net Asset Value, Beginning of Period | $424.16 | $314.01 | $269.76 | $305.04 | $234.80 |
| Investment Operations | |||||
| Net Investment Income1 | 2.706 | 1.912 | 2.275 | 2.021 | 2.026 |
| Net Realized and Unrealized Gain (Loss) on Investments | (109.390) | 110.162 | 44.269 | (35.267) | 70.080 |
| Total from Investment Operations | (106.684) | 112.074 | 46.544 | (33.246) | 72.106 |
| Distributions | |||||
| Dividends from Net Investment Income | (2.276) | (1.924) | (2.294) | (2.034) | (1.866) |
| Distributions from Realized Capital Gains | — | — | — | — | — |
| Total Distributions | (2.276) | (1.924) | (2.294) | (2.034) | (1.866) |
| Net Asset Value, End of Period | $315.20 | $424.16 | $314.01 | $269.76 | $305.04 |
| Total Return | -25.24% | 35.77% | 17.42% | -10.91% | 30.85% |
| Ratios/Supplemental Data | |||||
| Net Assets, End of Period (Millions) | $255 | $752 | $500 | $472 | $545 |
| Ratio of Total Expenses to Average Net Assets | 0.08% | 0.08% | 0.08% | 0.08% | 0.08% |
| Ratio of Net Investment Income to Average Net Assets | 0.72% | 0.48% | 0.82% | 0.75% | 0.76% |
| Portfolio Turnover Rate2 | 33% | 47% | 38% | 28% | 35% |
| 1 | Calculated based on average shares outstanding. |
| 2 | Excludes the value of portfolio securities received or delivered as a result of in-kind purchases or redemptions of the fund’s capital shares, including ETF Creation Units. |
| A. | The following significant accounting policies conform to generally accepted accounting principles for U.S. investment companies. The fund consistently follows such policies in preparing its financial statements. |
| B. | In accordance with the terms of a Funds' Service Agreement (the “FSA”) between Vanguard and the fund, Vanguard furnishes to the fund investment advisory, corporate management, administrative, marketing, and distribution services at Vanguard’s cost of operations (as defined by the FSA). These costs of operations are allocated to the fund based on methods and guidelines approved by the board of trustees and are generally settled twice a month. |
| C. | Various inputs may be used to determine the value of the fund’s investments and derivatives. These inputs are summarized in three broad levels for financial statement purposes. The inputs or methodologies used to value securities are not necessarily an indication of the risk associated with investing in those securities. |
| Level 1 ($000) | Level 2 ($000) | Level 3 ($000) | Total ($000) | |
| Investments | ||||
| Assets | ||||
| Common Stocks | 911,227 | — | 20 | 911,247 |
| Temporary Cash Investments | 17,160 | — | — | 17,160 |
| Total | 928,387 | — | 20 | 928,407 |
| Derivative Financial Instruments | ||||
| Liabilities | ||||
| Futures Contracts1 | 28 | — | — | 28 |
| 1 | Includes cumulative appreciation (depreciation) on futures contracts and centrally cleared swaps, if any, as reported in the Schedule of Investments. Only current day’s variation margin is reported within the Statement of Assets and Liabilities. |
| D. | Permanent differences between book-basis and tax-basis components of net assets are reclassified among capital accounts in the financial statements to reflect their tax character. These reclassifications have no effect on net assets or net asset value per share. As of period end, permanent differences primarily attributable to the accounting for applicable in-kind redemptions and passive foreign investment companies were reclassified between the following accounts: |
| Amount ($000) | |
| Paid-in Capital | 188,657 |
| Total Distributable Earnings (Loss) | (188,657) |
| Amount ($000) | |
| Undistributed Ordinary Income | 1,908 |
| Undistributed Long-Term Gains | — |
| Capital Loss Carryforwards | (300,171) |
| Qualified Late-Year Losses | — |
| Net Unrealized Gains (Losses) | 67,527 |
| Year Ended August 31, | ||
| 2022 Amount ($000) | 2021 Amount ($000) | |
| Ordinary Income* | 7,083 | 5,787 |
| Long-Term Capital Gains | — | — |
| Total | 7,083 | 5,787 |
| * | Includes short-term capital gains, if any. |
| Amount ($000) | |
| Tax Cost | 860,879 |
| Gross Unrealized Appreciation | 184,568 |
| Gross Unrealized Depreciation | (117,041) |
| Net Unrealized Appreciation (Depreciation) | 67,527 |
| E. | During the year ended August 31, 2022, the fund purchased $565,098,000 of investment securities and sold $843,403,000 of investment securities, other than temporary cash investments. Purchases and sales include $205,623,000 and $474,320,000, respectively, in connection with in-kind purchases and redemptions of the fund's capital shares. |
| F. | Capital share transactions for each class of shares were: |
| Year Ended August 31, | |||||
| 2022 | 2021 | ||||
| Amount ($000) | Shares (000) | Amount ($000) | Shares (000) | ||
| ETF Shares | |||||
| Issued | 578,438 | 3,075 | 399,369 | 1,800 | |
| Issued in Lieu of Cash Distributions | — | — | — | — | |
| Redeemed | (475,580) | (2,400) | (168,975) | (750) | |
| Net Increase (Decrease)—ETF Shares | 102,858 | 675 | 230,394 | 1,050 | |
| Year Ended August 31, | |||||
| 2022 | 2021 | ||||
| Amount ($000) | Shares (000) | Amount ($000) | Shares (000) | ||
| Institutional Shares | |||||
| Issued | 29,035 | 81 | 170,590 | 475 | |
| Issued in Lieu of Cash Distributions | 3,298 | 9 | 3,267 | 9 | |
| Redeemed | (413,071) | (1,055) | (112,452) | (302) | |
| Net Increase (Decrease)—Institutional Shares | (380,738) | (965) | 61,405 | 182 | |
| G. | Management has determined that no events or transactions occurred subsequent to August 31, 2022, that would require recognition or disclosure in these financial statements. |
Philadelphia, Pennsylvania
October 20, 2022
| Fund | Percentage |
| Russell 2000 Index Fund | 76.7% |
| Russell 2000 Value Index Fund | 73.7 |
| Russell 2000 Growth Index Fund | 95.0 |
| Fund | ($000) |
| Russell 2000 Index Fund | 66,007 |
| Russell 2000 Value Index Fund | 16,151 |
| Russell 2000 Growth Index Fund | 6,402 |
| Fund | ($000) |
| Russell 2000 Index Fund | 6,858 |
| Russell 2000 Value Index Fund | 2,029 |
| Russell 2000 Growth Index Fund | 600 |
| Fund | ($000) |
| Russell 2000 Index Fund | 54 |
| Russell 2000 Value Index Fund | 3 |
| Russell 2000 Growth Index Fund | 2 |
| Matthew Benchener | Thomas M. Rampulla |
| Joseph Brennan | Karin A. Risi |
| Mortimer J. Buckley | Anne E. Robinson |
| Gregory Davis | Michael Rollings |
| John James | Nitin Tandon |
| Chris D. Mclsaac | Lauren Valente |

All rights reserved.
U.S. Patent Nos. 6,879,964.
Vanguard Marketing Corporation, Distributor.

Your Fund’s Performance at a Glance | 1 |
About Your Fund’s Expenses | 2 |
Performance Summary | 4 |
Financial Statements | 7 |
Trustees Approve Advisory Arrangement | 49 |
Liquidity Risk Management | 51 |
| • | Vanguard Russell 3000 Index Fund, which represents the broad U.S. stock market, returned –13.36% for ETF Shares (based on net asset value) and –13.34% for Institutional Shares for the 12 months ended August 31, 2022. The fund’s returns closely tracked its target index. |
| • | The investment outlook grew more challenging as the period progressed. Sentiment deteriorated as inflation rose, propelled in part by higher energy and food prices after Russia’s invasion of Ukraine. The Federal Reserve reacted by raising interest rates, which pushed borrowing costs higher and sparked fears of recession. |
| • | Large-capitalization stocks declined less than their mid- and small-cap counterparts, and value stocks held up better than growth. |
| • | Returns fell sharply across eight of the 11 industry sectors represented in the fund. The biggest detractors were technology, consumer discretionary, industrial, health care, and financial stocks. The top contributor was the energy sector. |
| Average Annual Total Returns Periods Ended August 31, 2022 | |||
| One Year | Three Years | Five Years | |
| Stocks | |||
| Russell 1000 Index (Large-caps) | -12.96% | 12.14% | 11.61% |
| Russell 2000 Index (Small-caps) | -17.88 | 8.59 | 6.95 |
| Russell 3000 Index (Broad U.S. market) | -13.28 | 11.90 | 11.29 |
| FTSE All-World ex US Index (International) | -19.00 | 3.48 | 2.12 |
| Bonds | |||
| Bloomberg U.S. Aggregate Float Adjusted Index (Broad taxable market) | -11.65% | -2.01% | 0.54% |
| Bloomberg Municipal Bond Index (Broad tax-exempt market) | -8.63 | -0.83 | 1.28 |
| FTSE Three-Month U.S. Treasury Bill Index | 0.44 | 0.56 | 1.10 |
| CPI | |||
| Consumer Price Index | 8.26% | 4.90% | 3.82% |
| • | Based on actual fund return. This section helps you to estimate the actual expenses that you paid over the period. The ”Ending Account Value“ shown is derived from the fund‘s actual return, and the third column shows the dollar amount that would have been paid by an investor who started with $1,000 in the fund. You may use the information here, together with the amount you invested, to estimate the expenses that you paid over the period. |
| • | Based on hypothetical 5% yearly return. This section is intended to help you compare your fund‘s costs with those of other mutual funds. It assumes that the fund had a yearly return of 5% before expenses, but that the expense ratio is unchanged. In this case—because the return used is not the fund’s actual return—the results do not apply to your investment. The example is useful in making comparisons because the Securities and Exchange Commission requires all mutual funds to calculate expenses based on a 5% return. You can assess your fund’s costs by comparing this hypothetical example with the hypothetical examples that appear in shareholder reports of other funds. |
| Six Months Ended August 31, 2022 | |||
| Beginning Account Value 2/28/2022 | Ending Account Value 8/31/2022 | Expenses Paid During Period | |
| Based on Actual Fund Return | |||
| Russell 3000 Index Fund | |||
| ETF Shares | $1,000.00 | $905.30 | $0.48 |
| Institutional Shares | 1,000.00 | 905.40 | 0.38 |
| Based on Hypothetical 5% Yearly Return | |||
| Russell 3000 Index Fund | |||
| ETF Shares | $1,000.00 | $1,024.70 | $0.51 |
| Institutional Shares | 1,000.00 | 1,024.80 | 0.41 |

| Average Annual Total Returns Periods Ended August 31, 2022 | |||||
| One Year | Five Years | Ten Years | Final Value of a $10,000 Investment | ||
 | Russell 3000 Index Fund ETF Shares Net Asset Value | -13.36% | 11.17% | 12.62% | $32,832 |
| Russell 3000 Index Fund ETF Shares Market Price | -13.37 | 11.18 | 12.67 | 32,976 | |
 | Russell 3000 Index | -13.28 | 11.29 | 12.77 | 33,251 |
 | Dow Jones U.S. Total Stock Market Float Adjusted Index | -13.73 | 11.16 | 12.66 | 32,942 |
| One Year | Five Years | Ten Years | Final Value of a $5,000,000 Investment | ||
| Russell 3000 Index Fund Institutional Shares | -13.34% | 11.22% | 12.68% | $16,504,799 | |
| Russell 3000 Index | -13.28 | 11.29 | 12.77 | 16,625,314 | |
| Dow Jones U.S. Total Stock Market Float Adjusted Index | -13.73 | 11.16 | 12.66 | 16,470,991 | |
| One Year | Five Years | Ten Years | |
| Russell 3000 Index Fund ETF Shares Market Price | -13.37% | 69.89% | 229.76% |
| Russell 3000 Index Fund ETF Shares Net Asset Value | -13.36 | 69.83 | 228.32 |
| Russell 3000 Index | -13.28 | 70.69 | 232.51 |
| Basic Materials | 2.1% |
| Consumer Discretionary | 14.8 |
| Consumer Staples | 5.5 |
| Energy | 5.0 |
| Financials | 11.2 |
| Health Care | 13.3 |
| Industrials | 12.9 |
| Real Estate | 3.6 |
| Technology | 25.7 |
| Telecommunications | 2.5 |
| Utilities | 3.4 |
| Other | 0.0 |
| Shares | Market Value• ($000) | ||
| Common Stocks (99.7%) | |||
| Basic Materials (2.1%) | |||
| Linde plc | 33,828 | 9,569 | |
| Air Products and Chemicals Inc. | 14,911 | 3,764 | |
| Freeport-McMoRan Inc. | 97,386 | 2,883 | |
| Ecolab Inc. | 16,725 | 2,740 | |
| Dow Inc. | 48,969 | 2,497 | |
| Nucor Corp. | 17,877 | 2,377 | |
| Newmont Corp. | 53,611 | 2,217 | |
| Albemarle Corp. | 7,878 | 2,111 | |
| Fastenal Co. | 38,730 | 1,949 | |
| International Flavors & Fragrances Inc. | 17,191 | 1,899 | |
| CF Industries Holdings Inc. | 14,024 | 1,451 | |
| LyondellBasell Industries NV Class A | 17,278 | 1,434 | |
| Mosaic Co. | 24,356 | 1,312 | |
| International Paper Co. | 24,863 | 1,035 | |
| Avery Dennison Corp. | 5,468 | 1,004 | |
| Steel Dynamics Inc. | 11,953 | 965 | |
| FMC Corp. | 8,470 | 915 | |
| Celanese Corp. Class A | 7,237 | 802 | |
| Eastman Chemical Co. | 8,562 | 779 | |
| Reliance Steel & Aluminum Co. | 4,116 | 774 | |
| Alcoa Corp. | 12,417 | 614 | |
| * | Cleveland-Cliffs Inc. | 34,665 | 599 |
| Olin Corp. | 9,345 | 511 | |
| * | RBC Bearings Inc. | 1,912 | 460 |
| Royal Gold Inc. | 4,440 | 408 | |
| US Steel Corp. | 17,375 | 397 | |
| Huntsman Corp. | 13,438 | 377 | |
| * | Livent Corp. | 11,037 | 355 |
| Chemours Co. | 10,434 | 352 | |
| Valvoline Inc. | 12,002 | 349 | |
| Ashland Inc. | 3,413 | 347 | |
| Hexcel Corp. | 5,722 | 336 | |
| Commercial Metals Co. | 8,156 | 330 | |
| UFP Industries Inc. | 4,135 | 328 | |
| Element Solutions Inc. | 15,779 | 295 | |
| * | Univar Solutions Inc. | 11,377 | 287 |
| Balchem Corp. | 2,116 | 279 | |
| Southern Copper Corp. | 5,683 | 268 | |
| Timken Co. | 4,260 | 268 | |
| Avient Corp. | 6,044 | 265 | |
| Cabot Corp. | 3,642 | 262 | |
| Mueller Industries Inc. | 3,704 | 234 | |
| Shares | Market Value• ($000) | ||
| Sensient Technologies Corp. | 2,889 | 230 | |
| * | MP Materials Corp. | 6,214 | 217 |
| Westlake Corp. | 2,157 | 213 | |
| SSR Mining Inc. (XTSE) | 14,334 | 193 | |
| * | Arconic Corp. | 7,319 | 185 |
| * | Ingevity Corp. | 2,589 | 182 |
| Scotts Miracle-Gro Co. | 2,708 | 181 | |
| Boise Cascade Co. | 2,734 | 170 | |
| Quaker Chemical Corp. | 924 | 161 | |
| Innospec Inc. | 1,691 | 158 | |
| Stepan Co. | 1,454 | 152 | |
| Hecla Mining Co. | 35,867 | 141 | |
| Minerals Technologies Inc. | 2,258 | 132 | |
| Materion Corp. | 1,373 | 119 | |
| NewMarket Corp. | 414 | 119 | |
| Carpenter Technology Corp. | 3,268 | 111 | |
| Tronox Holdings plc Class A | 7,530 | 110 | |
| Worthington Industries Inc. | 2,115 | 108 | |
| * | Constellium SE Class A | 8,105 | 108 |
| Sylvamo Corp. | 2,372 | 105 | |
| * | GCP Applied Technologies Inc. | 3,174 | 100 |
| Compass Minerals International Inc. | 2,401 | 97 | |
| * | Uranium Energy Corp. | 21,439 | 97 |
| Mativ Holdings Inc. | 3,802 | 90 | |
| * | Perimeter Solutions SA | 8,289 | 81 |
| * | Energy Fuels Inc. | 9,785 | 79 |
| Kaiser Aluminum Corp. | 1,104 | 79 | |
| GrafTech International Ltd. | 13,214 | 78 | |
| * | Piedmont Lithium Inc. ADR | 1,183 | 72 |
| AdvanSix Inc. | 1,784 | 65 | |
| * | US Silica Holdings Inc. | 4,662 | 65 |
| * | Novagold Resources Inc. | 14,588 | 65 |
| Orion Engineered Carbons SA | 3,640 | 61 | |
| * | Resolute Forest Products Inc. | 2,837 | 57 |
| * | Coeur Mining Inc. | 19,761 | 55 |
| Hawkins Inc. | 1,379 | 53 | |
| Schnitzer Steel Industries Inc. Class A | 1,589 | 53 | |
| * | Clearwater Paper Corp. | 1,198 | 51 |
| * | Origin Materials Inc. | 7,576 | 47 |
| * | Ecovyst Inc. | 4,883 | 45 |
| American Vanguard Corp. | 2,214 | 44 | |
| * | TimkenSteel Corp. | 2,810 | 43 |
| * | Amyris Inc. | 13,974 | 41 |
| Shares | Market Value• ($000) | ||
| * | Intrepid Potash Inc. | 844 | 39 |
| * | LSB Industries Inc. | 2,425 | 38 |
| Koppers Holdings Inc. | 1,624 | 37 | |
| Ryerson Holding Corp. | 1,260 | 36 | |
| * | 5e Advanced Materials Inc. | 2,358 | 35 |
| Haynes International Inc. | 868 | 34 | |
| * | Century Aluminum Co. | 3,960 | 31 |
| Omega Flex Inc. | 270 | 27 | |
| * | Northwest Pipe Co. | 581 | 18 |
| * | Rayonier Advanced Materials Inc. | 3,249 | 15 |
| * | Alto Ingredients Inc. | 3,473 | 15 |
| Olympic Steel Inc. | 514 | 14 | |
| Tredegar Corp. | 1,211 | 12 | |
| * | Ur-Energy Inc. | 8,792 | 12 |
| Glatfelter Corp. | 2,239 | 11 | |
| FutureFuel Corp. | 1,191 | 9 | |
| * | Dakota Gold Corp. | 2,536 | 9 |
| * | Unifi Inc. | 686 | 8 |
| * | Hycroft Mining Holding Corp. | 7,500 | 6 |
| Valhi Inc. | 130 | 5 | |
| * | Polymet Mining Corp. | 1,458 | 5 |
| 55,427 | |||
| Consumer Discretionary (14.8%) | |||
| * | Amazon.com Inc. | 598,901 | 75,923 |
| * | Tesla Inc. | 171,410 | 47,242 |
| Home Depot Inc. | 69,600 | 20,074 | |
| Costco Wholesale Corp. | 29,822 | 15,570 | |
| * | Walt Disney Co. | 122,770 | 13,760 |
| Walmart Inc. | 97,126 | 12,874 | |
| McDonald's Corp. | 49,756 | 12,552 | |
| NIKE Inc. Class B | 82,551 | 8,788 | |
| Lowe's Cos. Inc. | 44,541 | 8,647 | |
| * | Netflix Inc. | 29,505 | 6,596 |
| Starbucks Corp. | 77,237 | 6,493 | |
| * | Booking Holdings Inc. | 2,740 | 5,140 |
| Target Corp. | 31,234 | 5,008 | |
| TJX Cos. Inc. | 79,120 | 4,933 | |
| �� | Activision Blizzard Inc. | 52,192 | 4,097 |
| Ford Motor Co. | 265,625 | 4,048 | |
| Estee Lauder Cos. Inc. Class A | 15,464 | 3,934 | |
| General Motors Co. | 98,121 | 3,749 | |
| * | Uber Technologies Inc. | 127,400 | 3,664 |
| Dollar General Corp. | 15,417 | 3,660 | |
| * | O'Reilly Automotive Inc. | 4,391 | 3,061 |
| * | Chipotle Mexican Grill Inc. Class A | 1,871 | 2,988 |
| * | Airbnb Inc. Class A | 25,232 | 2,854 |
| Marriott International Inc. Class A | 18,470 | 2,840 | |
| * | AutoZone Inc. | 1,331 | 2,821 |
| Electronic Arts Inc. | 18,853 | 2,392 | |
| Hilton Worldwide Holdings Inc. | 18,491 | 2,355 | |
| * | Lululemon Athletica Inc. | 7,526 | 2,258 |
| Yum! Brands Inc. | 19,227 | 2,139 | |
| * | Warner Bros Discovery Inc. | 159,196 | 2,108 |
| Ross Stores Inc. | 23,309 | 2,011 | |
| * | Dollar Tree Inc. | 14,301 | 1,940 |
| * | Trade Desk Inc. Class A | 29,574 | 1,854 |
| * | Copart Inc. | 14,337 | 1,715 |
| * | Aptiv plc | 18,238 | 1,704 |
| eBay Inc. | 37,921 | 1,673 | |
| DR Horton Inc. | 21,691 | 1,543 | |
| * | Southwest Airlines Co. | 39,972 | 1,467 |
| Shares | Market Value• ($000) | ||
| Genuine Parts Co. | 9,308 | 1,452 | |
| * | Ulta Beauty Inc. | 3,458 | 1,452 |
| Tractor Supply Co. | 7,538 | 1,396 | |
| * | Delta Air Lines Inc. | 43,234 | 1,343 |
| * | Take-Two Interactive Software Inc. | 10,670 | 1,308 |
| Lennar Corp. Class A | 16,525 | 1,280 | |
| * | Roblox Corp. Class A | 29,675 | 1,161 |
| * | Expedia Group Inc. | 10,203 | 1,047 |
| Darden Restaurants Inc. | 8,370 | 1,035 | |
| * | Spotify Technology SA | 9,491 | 1,026 |
| VF Corp. | 23,639 | 980 | |
| Best Buy Co. Inc. | 13,557 | 958 | |
| * | CarMax Inc. | 10,835 | 958 |
| LKQ Corp. | 17,735 | 944 | |
| * | Live Nation Entertainment Inc. | 10,414 | 941 |
| Garmin Ltd. | 10,412 | 921 | |
| Omnicom Group Inc. | 13,658 | 914 | |
| * | Etsy Inc. | 8,539 | 902 |
| Domino's Pizza Inc. | 2,410 | 896 | |
| Pool Corp. | 2,637 | 894 | |
| * | Las Vegas Sands Corp. | 22,352 | 841 |
| * | NVR Inc. | 198 | 820 |
| * | Liberty Media Corp.-Liberty Formula One Class C | 12,679 | 807 |
| Paramount Global Inc. Class B | 34,233 | 801 | |
| MGM Resorts International | 23,817 | 777 | |
| * | United Airlines Holdings Inc. | 22,019 | 771 |
| Interpublic Group of Cos. Inc. | 26,406 | 730 | |
| Williams-Sonoma Inc. | 4,697 | 699 | |
| Fox Corp. Class A | 20,408 | 698 | |
| Advance Auto Parts Inc. | 4,111 | 693 | |
| Hasbro Inc. | 8,794 | 693 | |
| * | BJ's Wholesale Club Holdings Inc. | 9,022 | 672 |
| Nielsen Holdings plc | 24,032 | 669 | |
| Service Corp. International | 10,408 | 642 | |
| PulteGroup Inc. | 15,719 | 639 | |
| * | Burlington Stores Inc. | 4,451 | 624 |
| * | Carnival Corp. | 65,227 | 617 |
| Tapestry Inc. | 17,718 | 615 | |
| Vail Resorts Inc. | 2,718 | 611 | |
| * | Royal Caribbean Cruises Ltd. | 14,969 | 611 |
| Bath & Body Works Inc. | 16,143 | 603 | |
| * | Caesars Entertainment Inc. | 13,934 | 601 |
| BorgWarner Inc. (XNYS) | 15,884 | 599 | |
| * | Deckers Outdoor Corp. | 1,820 | 585 |
| Whirlpool Corp. | 3,703 | 580 | |
| * | American Airlines Group Inc. | 43,891 | 570 |
| * | Floor & Decor Holdings Inc. Class A | 6,995 | 569 |
| Lear Corp. | 4,004 | 555 | |
| Aramark | 15,513 | 554 | |
| *,1 | Lucid Group Inc. | 36,101 | 554 |
| Rollins Inc. | 15,609 | 527 | |
| * | Mattel Inc. | 23,494 | 520 |
| *,1 | GameStop Corp. Class A | 18,115 | 519 |
| Lithia Motors Inc. Class A | 1,921 | 510 | |
| H&R Block Inc. | 11,055 | 497 | |
| Nexstar Media Group Inc. Class A | 2,599 | 497 | |
| Churchill Downs Inc. | 2,449 | 483 |
| Shares | Market Value• ($000) | ||
| * | Five Below Inc. | 3,702 | 473 |
| News Corp. Class A | 26,972 | 456 | |
| Newell Brands Inc. | 25,515 | 455 | |
| * | Capri Holdings Ltd. | 9,621 | 454 |
| * | Liberty Media Corp.- Liberty SiriusXM Class C | 10,881 | 450 |
| * | Wynn Resorts Ltd. | 7,198 | 436 |
| Murphy USA Inc. | 1,499 | 435 | |
| Polaris Inc. | 3,818 | 432 | |
| Gentex Corp. | 15,771 | 430 | |
| * | DraftKings Inc. Class A | 25,791 | 414 |
| Texas Roadhouse Inc. Class A | 4,619 | 410 | |
| Dick's Sporting Goods Inc. | 3,747 | 399 | |
| Wyndham Hotels & Resorts Inc. | 6,102 | 399 | |
| * | Rivian Automotive Inc. Class A | 12,143 | 397 |
| Marriott Vacations Worldwide Corp. | 2,783 | 396 | |
| * | Planet Fitness Inc. Class A | 5,664 | 384 |
| * | SiteOne Landscape Supply Inc. | 3,026 | 379 |
| * | Alaska Air Group Inc. | 8,345 | 364 |
| * | Norwegian Cruise Line Holdings Ltd. | 27,756 | 363 |
| Harley-Davidson Inc. | 9,157 | 353 | |
| * | Penn Entertainment Inc. | 11,310 | 353 |
| * | Terminix Global Holdings Inc. | 8,283 | 353 |
| Leggett & Platt Inc. | 9,050 | 346 | |
| * | Skechers USA Inc. Class A | 9,085 | 343 |
| New York Times Co. Class A | 11,218 | 342 | |
| * | Avis Budget Group Inc. | 2,023 | 339 |
| * | IAA Inc. | 9,111 | 339 |
| * | AutoNation Inc. | 2,706 | 337 |
| Macy's Inc. | 19,266 | 334 | |
| Fox Corp. Class B | 10,374 | 328 | |
| * | Scientific Games Corp. Class A | 6,664 | 328 |
| Toll Brothers Inc. | 7,424 | 325 | |
| *,1 | AMC Entertainment Holdings Inc. Class A | 35,213 | 321 |
| AMERCO | 609 | 320 | |
| TEGNA Inc. | 14,848 | 318 | |
| * | Crocs Inc. | 4,127 | 304 |
| * | RH | 1,188 | 304 |
| * | Hyatt Hotels Corp. Class A | 3,365 | 302 |
| * | Lyft Inc. Class A | 20,312 | 299 |
| Boyd Gaming Corp. | 5,474 | 298 | |
| Tempur Sealy International Inc. | 11,775 | 294 | |
| * | Hertz Global Holdings Inc. | 15,929 | 294 |
| 1 | Sirius XM Holdings Inc. | 47,987 | 292 |
| Thor Industries Inc. | 3,505 | 284 | |
| Ralph Lauren Corp. Class A | 3,102 | 283 | |
| * | Bright Horizons Family Solutions Inc. | 4,088 | 279 |
| * | Wayfair Inc. Class A | 5,118 | 270 |
| Choice Hotels International Inc. | 2,319 | 266 | |
| * | Fox Factory Holding Corp. | 2,806 | 262 |
| * | Goodyear Tire & Rubber Co. | 18,485 | 259 |
| PVH Corp. | 4,606 | 259 | |
| * | Asbury Automotive Group Inc. | 1,469 | 256 |
| Shares | Market Value• ($000) | ||
| * | Hilton Grand Vacations Inc. | 5,941 | 242 |
| Kohl's Corp. | 8,471 | 241 | |
| Academy Sports & Outdoors Inc. | 5,561 | 240 | |
| Travel + Leisure Co. | 5,625 | 239 | |
| * | Carvana Co. Class A | 7,083 | 234 |
| * | Ollie's Bargain Outlet Holdings Inc. | 4,207 | 233 |
| Wingstop Inc. | 2,031 | 231 | |
| * | Visteon Corp. | 1,882 | 226 |
| Penske Automotive Group Inc. | 1,861 | 219 | |
| Wendy's Co. | 11,367 | 218 | |
| * | Adient plc | 6,447 | 214 |
| Foot Locker Inc. | 5,778 | 213 | |
| * | YETI Holdings Inc. | 5,774 | 213 |
| * | Callaway Golf Co. | 9,508 | 210 |
| Signet Jewelers Ltd. | 3,192 | 209 | |
| * | Peloton Interactive Inc. Class A | 20,403 | 208 |
| * | Skyline Champion Corp. | 3,645 | 207 |
| * | Madison Square Garden Sports Corp. | 1,276 | 205 |
| Hanesbrands Inc. | 23,074 | 201 | |
| Carter's Inc. | 2,708 | 200 | |
| World Wrestling Entertainment Inc. Class A | 2,935 | 200 | |
| Group 1 Automotive Inc. | 1,108 | 198 | |
| * | Helen of Troy Ltd. | 1,605 | 198 |
| LCI Industries | 1,696 | 197 | |
| * | Taylor Morrison Home Corp. Class A | 7,795 | 196 |
| * | Meritage Homes Corp. | 2,456 | 192 |
| * | Victoria's Secret & Co. | 5,681 | 190 |
| * | National Vision Holdings Inc. | 5,635 | 187 |
| * | QuantumScape Corp. Class A | 16,944 | 187 |
| * | Liberty Media Corp.- Liberty SiriusXM Class A | 4,411 | 183 |
| Papa John's International Inc. | 2,257 | 182 | |
| * | Grand Canyon Education Inc. | 2,220 | 181 |
| * | Coty Inc. Class A | 23,877 | 179 |
| Columbia Sportswear Co. | 2,457 | 175 | |
| Cracker Barrel Old Country Store Inc. | 1,575 | 170 | |
| * | JetBlue Airways Corp. | 21,710 | 169 |
| * | Dorman Products Inc. | 1,841 | 167 |
| * | TripAdvisor Inc. | 6,861 | 163 |
| * | Spirit Airlines Inc. | 7,043 | 160 |
| * | Chegg Inc. | 8,078 | 159 |
| KB Home | 5,553 | 159 | |
| * | Sabre Corp. | 21,753 | 156 |
| * | SeaWorld Entertainment Inc. | 3,099 | 156 |
| Steven Madden Ltd. | 5,321 | 155 | |
| * | Copa Holdings SA Class A | 2,099 | 149 |
| * | Leslie's Inc. | 10,436 | 148 |
| * | Cavco Industries Inc. | 626 | 146 |
| Graham Holdings Co. Class B | 255 | 144 | |
| MillerKnoll Inc. | 5,191 | 144 | |
| * | Duolingo Inc. | 1,533 | 144 |
| Kontoor Brands Inc. | 3,776 | 141 |
| Shares | Market Value• ($000) | ||
| * | Luminar Technologies Inc. Class A | 16,368 | 141 |
| Dana Inc. | 8,775 | 136 | |
| * | Liberty Media Corp.- Liberty Formula One Class A | 2,335 | 136 |
| Nordstrom Inc. | 7,923 | 136 | |
| Red Rock Resorts Inc. Class A | 3,549 | 136 | |
| * | LGI Homes Inc. | 1,419 | 135 |
| Rush Enterprises Inc. Class A | 2,840 | 134 | |
| John Wiley & Sons Inc. Class A | 2,895 | 133 | |
| * | Gentherm Inc. | 2,135 | 128 |
| * | Boot Barn Holdings Inc. | 1,891 | 126 |
| Paramount Global Class A | 4,718 | 125 | |
| News Corp. Class B | 7,106 | 123 | |
| * | Sonos Inc. | 8,178 | 123 |
| * | frontdoor Inc. | 5,184 | 122 |
| MDC Holdings Inc. | 3,884 | 121 | |
| * | elf Beauty Inc. | 3,142 | 120 |
| Winnebago Industries Inc. | 2,089 | 120 | |
| Gap Inc. | 12,989 | 119 | |
| * | Shake Shack Inc. Class A | 2,467 | 118 |
| Bloomin' Brands Inc. | 5,727 | 116 | |
| * | Dave & Buster's Entertainment Inc. | 2,801 | 116 |
| International Game Technology plc | 6,438 | 116 | |
| * | Adtalem Global Education Inc. | 3,058 | 115 |
| Jack in the Box Inc. | 1,440 | 115 | |
| * | Driven Brands Holdings Inc. | 3,667 | 115 |
| American Eagle Outfitters Inc. | 10,002 | 113 | |
| * | KAR Auction Services Inc. | 7,750 | 113 |
| Oxford Industries Inc. | 1,059 | 113 | |
| * | Tri Pointe Homes Inc. | 6,454 | 112 |
| * | Under Armour Inc. Class A | 13,309 | 112 |
| Acushnet Holdings Corp. | 2,324 | 111 | |
| * | Six Flags Entertainment Corp. | 5,010 | 111 |
| * | Everi Holdings Inc. | 5,869 | 109 |
| * | iRobot Corp. | 1,846 | 109 |
| Wolverine World Wide Inc. | 5,582 | 109 | |
| Gray Television Inc. | 5,614 | 107 | |
| * | Sally Beauty Holdings Inc. | 7,197 | 107 |
| Cheesecake Factory Inc. | 3,465 | 106 | |
| * | Vista Outdoor Inc. | 3,735 | 105 |
| *,1 | Fisker Inc. | 11,603 | 105 |
| Lennar Corp. Class B | 1,694 | 104 | |
| PriceSmart Inc. | 1,645 | 104 | |
| * | Under Armour Inc. Class C | 13,661 | 104 |
| * | Central Garden & Pet Co. Class A | 2,731 | 103 |
| Monro Inc. | 2,218 | 103 | |
| * | Tenneco Inc. Class A | 5,412 | 102 |
| * | ODP Corp. | 2,858 | 102 |
| * | Stride Inc. | 2,673 | 102 |
| * | XPEL Inc. | 1,476 | 101 |
| * | Figs Inc. Class A | 8,717 | 101 |
| * | Madison Square Garden Entertainment Corp. | 1,797 | 100 |
| * | Cinemark Holdings Inc. | 7,026 | 99 |
| * | Allegiant Travel Co. | 1,017 | 98 |
| Rent-A-Center Inc. | 3,779 | 98 |
| Shares | Market Value• ($000) | ||
| Strategic Education Inc. | 1,519 | 98 | |
| HNI Corp. | 2,976 | 95 | |
| Inter Parfums Inc. | 1,187 | 93 | |
| * | Liberty Media Corp.- Liberty Braves Class C | 3,364 | 92 |
| Century Communities Inc. | 1,939 | 91 | |
| Scholastic Corp. | 1,982 | 91 | |
| * | Urban Outfitters Inc. | 4,515 | 91 |
| * | Knowles Corp. | 5,846 | 89 |
| Laureate Education Inc. Class A | 7,707 | 85 | |
| * | Malibu Boats Inc. Class A | 1,411 | 85 |
| * | Petco Health & Wellness Co. Inc. Class A | 5,688 | 85 |
| * | Coursera Inc. | 7,380 | 85 |
| * | M/I Homes Inc. | 1,944 | 84 |
| Camping World Holdings Inc. Class A | 2,685 | 81 | |
| Dillard's Inc. Class A | 266 | 79 | |
| La-Z-Boy Inc. | 3,001 | 79 | |
| * | Overstock.com Inc. | 3,008 | 79 |
| * | iHeartMedia Inc. Class A | 8,734 | 77 |
| * | Playtika Holding Corp. | 7,342 | 77 |
| Sonic Automotive Inc. Class A | 1,354 | 72 | |
| * | American Axle & Manufacturing Holdings Inc. | 6,892 | 71 |
| * | Clean Energy Fuels Corp. | 10,608 | 71 |
| * | Lions Gate Entertainment Corp. Class B | 7,637 | 71 |
| * | Viad Corp. | 1,797 | 69 |
| Caleres Inc. | 2,636 | 67 | |
| Qurate Retail Inc. Series A | 21,696 | 67 | |
| * | Udemy Inc. | 4,524 | 67 |
| * | Brinker International Inc. | 2,685 | 66 |
| * | SkyWest Inc. | 3,077 | 66 |
| Dine Brands Global Inc. | 954 | 64 | |
| * | Sleep Number Corp. | 1,511 | 63 |
| Designer Brands Inc. Class A | 3,632 | 62 | |
| * | PROG Holdings Inc. | 3,287 | 61 |
| * | ACV Auctions Inc. Class A | 7,169 | 61 |
| Buckle Inc. | 1,819 | 59 | |
| Steelcase Inc. Class A | 5,250 | 59 | |
| *,1 | Bally's Corp. | 2,505 | 59 |
| Franchise Group Inc. | 1,700 | 58 | |
| * | Revolve Group Inc. | 2,428 | 57 |
| Sinclair Broadcast Group Inc. Class A | 2,573 | 57 | |
| * | G-III Apparel Group Ltd. | 2,659 | 56 |
| Arko Corp. | 5,892 | 56 | |
| * | Cars.com Inc. | 4,322 | 55 |
| * | Hawaiian Holdings Inc. | 3,591 | 54 |
| * | Imax Corp. | 3,450 | 54 |
| * | PowerSchool Holdings Inc. Class A | 2,987 | 54 |
| * | EW Scripps Co. Class A | 3,573 | 53 |
| Sturm Ruger & Co. Inc. | 1,015 | 53 | |
| Hibbett Inc. | 891 | 52 | |
| *,1 | Bed Bath & Beyond Inc. | 5,313 | 51 |
| Standard Motor Products Inc. | 1,386 | 51 | |
| *,1 | Blink Charging Co. | 2,383 | 51 |
| * | Vizio Holding Corp. Class A | 4,744 | 51 |
| Krispy Kreme Inc. | 4,346 | 51 | |
| * | BJ's Restaurants Inc. | 2,012 | 50 |
| * | Golden Entertainment Inc. | 1,300 | 50 |
| Shares | Market Value• ($000) | ||
| * | AMC Networks Inc. Class A | 1,848 | 50 |
| Matthews International Corp. Class A | 1,949 | 49 | |
| * | Monarch Casino & Resort Inc. | 814 | 49 |
| * | GoPro Inc. Class A | 7,961 | 48 |
| * | Green Brick Partners Inc. | 1,975 | 48 |
| * | MarineMax Inc. | 1,308 | 48 |
| * | Perdoceo Education Corp. | 4,178 | 48 |
| * | TravelCenters of America Inc. | 892 | 48 |
| * | Sun Country Airlines Holdings Inc. | 2,402 | 48 |
| * | Mister Car Wash Inc. | 4,804 | 48 |
| * | Funko Inc. Class A | 2,050 | 46 |
| * | Genesco Inc. | 808 | 46 |
| * | Lions Gate Entertainment Corp. Class A | 4,543 | 45 |
| * | QuinStreet Inc. | 3,737 | 45 |
| * | ContextLogic Inc. Class A | 34,885 | 45 |
| * | Thryv Holdings Inc. | 1,768 | 45 |
| * | Abercrombie & Fitch Co. Class A | 3,086 | 44 |
| Ruth's Hospitality Group Inc. | 2,432 | 44 | |
| * | Boston Omaha Corp. Class A | 1,587 | 43 |
| * | Chico's FAS Inc. | 7,647 | 43 |
| * | Children's Place Inc. | 1,008 | 43 |
| * | Clear Channel Outdoor Holdings Inc. | 26,849 | 43 |
| * | OneSpaWorld Holdings Ltd. | 4,854 | 43 |
| * | Corsair Gaming Inc. | 2,808 | 43 |
| RCI Hospitality Holdings Inc. | 642 | 42 | |
| Smith & Wesson Brands Inc. | 3,140 | 42 | |
| * | Frontier Group Holdings Inc. | 3,293 | 42 |
| Guess? Inc. | 2,326 | 41 | |
| Interface Inc. Class A | 3,636 | 41 | |
| Winmark Corp. | 197 | 41 | |
| * | Stagwell Inc. | 5,921 | 40 |
| Big Lots Inc. | 1,843 | 38 | |
| * | Denny's Corp. | 4,043 | 38 |
| Movado Group Inc. | 1,183 | 38 | |
| * | Tupperware Brands Corp. | 3,418 | 38 |
| A-Mark Precious Metals Inc. | 1,244 | 38 | |
| European Wax Center Inc. Class A | 1,711 | 37 | |
| * | Bowlero Corp. | 3,165 | 37 |
| Carriage Services Inc. Class A | 1,004 | 36 | |
| Ethan Allen Interiors Inc. | 1,505 | 36 | |
| * | Poshmark Inc. Class A | 3,370 | 36 |
| * | Cardlytics Inc. | 2,612 | 35 |
| * | Accel Entertainment Inc. Class A | 3,741 | 35 |
| Ermenegildo Zegna NV | 3,452 | 35 | |
| Shoe Carnival Inc. | 1,428 | 34 | |
| * | Stoneridge Inc. | 1,813 | 34 |
| * | 2U Inc. | 4,743 | 34 |
| *,1 | Vuzix Corp. | 4,507 | 34 |
| * | OneWater Marine Inc. Class A | 854 | 34 |
| Shares | Market Value• ($000) | ||
| * | Arlo Technologies Inc. | 5,486 | 33 |
| * | Instructure Holdings Inc. | 1,463 | 33 |
| * | America's Car-Mart Inc. | 398 | 32 |
| * | Central Garden & Pet Co. | 800 | 32 |
| Clarus Corp. | 2,124 | 32 | |
| * | Master Craft Boat Holdings Inc. | 1,340 | 32 |
| * | Life Time Group Holdings Inc. | 2,728 | 32 |
| * | Beazer Homes USA Inc. | 2,157 | 31 |
| * | Liquidity Services Inc. | 1,795 | 31 |
| * | Stitch Fix Inc. Class A | 6,173 | 31 |
| * | Lovesac Co. | 925 | 29 |
| Aaron's Co. Inc. | 2,402 | 29 | |
| * | Portillo's Inc. Class A | 1,328 | 29 |
| * | Sportsman's Warehouse Holdings Inc. | 3,203 | 26 |
| * | AMMO Inc. | 6,813 | 26 |
| * | Gannett Co. Inc. | 10,957 | 25 |
| * | Kura Sushi USA Inc. Class A | 319 | 24 |
| * | CarParts.com Inc. | 3,721 | 24 |
| * | Rush Street Interactive Inc. | 5,041 | 24 |
| * | Motorcar Parts of America Inc. | 1,559 | 23 |
| Rush Enterprises Inc. Class B | 446 | 23 | |
| * | Chuy's Holdings Inc. | 978 | 22 |
| Haverty Furniture Cos. Inc. | 810 | 22 | |
| * | Zumiez Inc. | 795 | 21 |
| * | LL Flooring Holdings Inc. | 2,495 | 20 |
| Global Industrial Co. | 653 | 20 | |
| * | Holley Inc. | 3,560 | 20 |
| Marcus Corp. | 1,198 | 19 | |
| * | Allbirds Inc. Class A | 4,693 | 19 |
| * | Canoo Inc. | 5,624 | 18 |
| * | Xponential Fitness Inc. Class A | 995 | 18 |
| * | Rover Group Inc. Class A | 4,662 | 18 |
| * | Eastman Kodak Co. | 3,188 | 17 |
| * | Destination XL Group Inc. | 3,033 | 17 |
| * | Lordstown Motors Corp. Class A | 7,859 | 17 |
| * | Integral Ad Science Holding Corp. | 2,150 | 17 |
| * | Daily Journal Corp. | 61 | 16 |
| Johnson Outdoors Inc. Class A | 257 | 16 | |
| Entravision Communications Corp. Class A | 2,974 | 15 | |
| Bluegreen Vacations Holding Class A | 712 | 15 | |
| * | Wheels Up Experience Inc. | 7,902 | 15 |
| * | Universal Electronics Inc. | 607 | 14 |
| * | WW International Inc. | 2,751 | 14 |
| * | Latham Group Inc. | 2,536 | 14 |
| * | Playstudios Inc. | 3,962 | 14 |
| Kimball International Inc. Class B | 1,654 | 13 | |
| * | Dream Finders Homes Inc. Class A | 1,077 | 13 |
| * | Snap One Holdings Corp. | 1,146 | 13 |
| 1 | Big 5 Sporting Goods Corp. | 1,010 | 12 |
| * | Inspired Entertainment Inc. | 1,134 | 12 |
| * | Cenntro Electric Group Ltd. | 9,197 | 12 |
| Cato Corp. Class A | 1,059 | 11 |
| Shares | Market Value• ($000) | ||
| * | Lindblad Expeditions Holdings Inc. | 1,482 | 11 |
| * | 1-800-Flowers.com Inc. Class A | 1,294 | 11 |
| * | Party City Holdco Inc. | 5,358 | 11 |
| * | Universal Technical Institute Inc. | 1,632 | 11 |
| * | RumbleON Inc. Class B | 514 | 11 |
| Build-A-Bear Workshop Inc. | 719 | 11 | |
| * | Full House Resorts Inc. | 1,583 | 11 |
| Alta Equipment Group Inc. | 969 | 11 | |
| * | Rent the Runway Inc. Class A | 2,484 | 11 |
| * | Sweetgreen Inc. Class A | 671 | 11 |
| * | Century Casinos Inc. | 1,377 | 10 |
| * | Container Store Group Inc. | 1,541 | 10 |
| * | Fossil Group Inc. | 2,433 | 10 |
| * | Hovnanian Enterprises Inc. Class A | 249 | 10 |
| * | Lands' End Inc. | 694 | 10 |
| 1 | Weber Inc. Class A | 1,445 | 10 |
| * | Focus Universal Inc. | 888 | 10 |
| * | American Public Education Inc. | 912 | 9 |
| * | Citi Trends Inc. | 438 | 9 |
| * | Conn's Inc. | 928 | 9 |
| * | Cumulus Media Inc. Class A | 916 | 9 |
| * | El Pollo Loco Holdings Inc. | 948 | 9 |
| * | Noodles & Co. Class A | 1,968 | 9 |
| * | Neogames SA | 542 | 9 |
| * | BARK Inc. | 3,832 | 9 |
| * | First Watch Restaurant Group Inc. | 541 | 9 |
| * | Quotient Technology Inc. | 4,462 | 8 |
| * | RealReal Inc. | 3,816 | 8 |
| Tilly's Inc. Class A | 1,108 | 8 | |
| Weyco Group Inc. | 309 | 8 | |
| * | Purple Innovation Inc. Class A | 2,705 | 8 |
| * | Selectquote Inc. | 6,909 | 8 |
| * | Aterian Inc. | 3,341 | 8 |
| * | Ondas Holdings Inc. | 1,729 | 8 |
| * | Nerdy Inc. | 2,741 | 8 |
| * | Vacasa Inc. | 2,114 | 8 |
| * | Sonder Holdings Inc. | 4,337 | 8 |
| * | Duluth Holdings Inc. Class B | 760 | 7 |
| Rocky Brands Inc. | 282 | 7 | |
| Tile Shop Holdings Inc. | 1,892 | 7 | |
| * | ONE Group Hospitality Inc. | 983 | 7 |
| * | ThredUP Inc. Class A | 2,931 | 7 |
| * | StoneMor Inc. | 2,084 | 7 |
| * | Outbrain Inc. | 1,473 | 7 |
| * | Reservoir Media Inc. | 1,024 | 7 |
| Superior Group of Cos. Inc. | 500 | 6 | |
| * | Turtle Beach Corp. | 677 | 6 |
| * | F45 Training Holdings Inc. | 2,210 | 6 |
| * | Faraday Future Intelligent Electric Inc. | 4,984 | 6 |
| * | Biglari Holdings Inc. Class B | 37 | 5 |
| * | Express Inc. | 3,256 | 5 |
| Lifetime Brands Inc. | 528 | 5 | |
| * | Urban One Inc. | 1,235 | 5 |
| * | Gambling.com Group Ltd. | 588 | 5 |
| * | Legacy Housing Corp. | 255 | 4 |
| Marine Products Corp. | 357 | 4 |
| Shares | Market Value• ($000) | ||
| JOANN Inc. | 585 | 4 | |
| * | Landsea Homes Corp. | 645 | 4 |
| * | Bird Global Inc. | 10,554 | 4 |
| * | Audacy Inc. Class A | 5,246 | 3 |
| * | Torrid Holdings Inc. | 617 | 3 |
| * | Traeger Inc. | 1,061 | 3 |
| * | Lulu's Fashion Lounge Holdings Inc. | 487 | 3 |
| * | Solo Brands Inc. Class A | 552 | 2 |
| NL Industries Inc. | 169 | 1 | |
| * | aka Brands Holding Corp. | 601 | 1 |
| 393,070 | |||
| Consumer Staples (5.5%) | |||
| Procter & Gamble Co. | 160,953 | 22,202 | |
| Coca-Cola Co. | 262,845 | 16,220 | |
| PepsiCo Inc. | 93,051 | 16,030 | |
| Philip Morris International Inc. | 104,461 | 9,975 | |
| CVS Health Corp. | 88,318 | 8,668 | |
| Mondelez International Inc. Class A | 92,886 | 5,746 | |
| Altria Group Inc. | 122,201 | 5,514 | |
| Colgate-Palmolive Co. | 55,603 | 4,349 | |
| McKesson Corp. | 9,753 | 3,579 | |
| Archer-Daniels-Midland Co. | 37,754 | 3,318 | |
| General Mills Inc. | 40,500 | 3,110 | |
| Corteva Inc. | 48,751 | 2,995 | |
| Kimberly-Clark Corp. | 22,672 | 2,891 | |
| Sysco Corp. | 34,198 | 2,812 | |
| Constellation Brands Inc. Class A | 10,430 | 2,566 | |
| * | Monster Beverage Corp. | 25,098 | 2,229 |
| Hershey Co. | 9,790 | 2,199 | |
| Keurig Dr Pepper Inc. | 57,691 | 2,199 | |
| Kroger Co. | 44,223 | 2,120 | |
| Kraft Heinz Co. | 47,175 | 1,764 | |
| Walgreens Boots Alliance Inc. | 48,324 | 1,694 | |
| AmerisourceBergen Corp. Class A | 10,000 | 1,466 | |
| Tyson Foods Inc. Class A | 19,138 | 1,443 | |
| McCormick & Co. Inc. | 16,937 | 1,424 | |
| Church & Dwight Co. Inc. | 16,384 | 1,371 | |
| Kellogg Co. | 17,010 | 1,237 | |
| Clorox Co. | 8,347 | 1,205 | |
| Conagra Brands Inc. | 31,676 | 1,089 | |
| J M Smucker Co. | 7,069 | 990 | |
| Hormel Foods Corp. | 19,388 | 975 | |
| Bunge Ltd. | 9,448 | 937 | |
| Brown-Forman Corp. Class B | 12,404 | 902 | |
| * | Darling Ingredients Inc. | 10,787 | 820 |
| Lamb Weston Holdings Inc. | 9,661 | 768 | |
| Campbell Soup Co. | 12,943 | 652 | |
| Molson Coors Beverage Co. Class B | 11,826 | 611 | |
| Casey's General Stores Inc. | 2,484 | 531 | |
| * | Performance Food Group Co. | 10,260 | 513 |
| * | US Foods Holding Corp | 15,038 | 460 |
| Ingredion Inc. | 4,449 | 387 | |
| * | Celsius Holdings Inc. | 3,696 | 382 |
| Flowers Foods Inc. | 12,712 | 347 | |
| * | Post Holdings Inc. | 3,773 | 335 |
| Albertsons Cos. Inc. Class A | 11,046 | 304 | |
| Shares | Market Value• ($000) | ||
| * | Grocery Outlet Holding Corp. | 5,944 | 238 |
| Lancaster Colony Corp. | 1,333 | 225 | |
| * | Boston Beer Co. Inc. Class A | 659 | 222 |
| * | Hostess Brands Inc. Class A | 9,496 | 220 |
| * | Sprouts Farmers Market Inc. | 7,605 | 220 |
| Brown-Forman Corp. Class A | 3,101 | 219 | |
| * | BellRing Brands Inc. | 8,993 | 213 |
| * | Simply Good Foods Co. | 6,283 | 192 |
| Spectrum Brands Holdings Inc. | 2,806 | 177 | |
| WD-40 Co. | 922 | 174 | |
| * | Herbalife Nutrition Ltd. | 6,464 | 169 |
| * | United Natural Foods Inc. | 3,802 | 168 |
| * | TreeHouse Foods Inc. | 3,432 | 160 |
| J & J Snack Foods Corp. | 1,058 | 158 | |
| Coca-Cola Consolidated Inc. | 316 | 150 | |
| Edgewell Personal Care Co. | 3,722 | 145 | |
| Primo Water Corp. | 10,789 | 142 | |
| Nu Skin Enterprises Inc. Class A | 3,322 | 136 | |
| * | Freshpet Inc. | 3,032 | 132 |
| Cal-Maine Foods Inc. | 2,451 | 131 | |
| Energizer Holdings Inc. | 4,620 | 130 | |
| Reynolds Consumer Products Inc. | 4,429 | 124 | |
| * | Olaplex Holdings Inc. | 8,006 | 107 |
| MGP Ingredients Inc. | 945 | 103 | |
| *,1 | Beyond Meat Inc. | 4,118 | 100 |
| * | Hain Celestial Group Inc. | 4,899 | 99 |
| B&G Foods Inc. | 4,506 | 98 | |
| Vector Group Ltd. | 9,644 | 94 | |
| Weis Markets Inc. | 1,192 | 93 | |
| Medifast Inc. | 732 | 92 | |
| * | Pilgrim's Pride Corp. | 3,147 | 90 |
| Ingles Markets Inc. Class A | 987 | 86 | |
| Universal Corp. | 1,687 | 86 | |
| Andersons Inc. | 2,233 | 83 | |
| National Beverage Corp. | 1,442 | 80 | |
| * | Chefs' Warehouse Inc. | 2,329 | 78 |
| * | Beauty Health Co. | 6,762 | 78 |
| * | Veru Inc. | 4,660 | 71 |
| Seaboard Corp. | 18 | 70 | |
| Utz Brands Inc. | 4,067 | 68 | |
| SpartanNash Co. | 2,152 | 65 | |
| * | SunOpta Inc. | 6,128 | 61 |
| Fresh Del Monte Produce Inc. | 2,046 | 56 | |
| John B Sanfilippo & Son Inc. | 665 | 54 | |
| * | Mission Produce Inc. | 3,184 | 51 |
| * | USANA Health Sciences Inc. | 696 | 45 |
| * | Benson Hill Inc. | 12,664 | 45 |
| Calavo Growers Inc. | 1,048 | 44 | |
| * | Duckhorn Portfolio Inc. | 2,394 | 44 |
| ACCO Brands Corp. | 7,257 | 43 | |
| PetMed Express Inc. | 1,610 | 33 | |
| * | Sovos Brands Inc. | 2,144 | 33 |
| * | Rite Aid Corp. | 4,271 | 31 |
| * | Vital Farms Inc. | 2,396 | 31 |
| Tootsie Roll Industries Inc. | 786 | 28 |
| Shares | Market Value• ($000) | ||
| * | Seneca Foods Corp. Class A | 476 | 25 |
| Turning Point Brands Inc. | 1,062 | 25 | |
| * | Vita Coco Co. Inc. | 1,405 | 21 |
| * | Honest Co. Inc. | 5,172 | 19 |
| * | Tattooed Chef Inc. | 2,273 | 15 |
| * | GrowGeneration Corp. | 2,934 | 14 |
| * | BRC Inc. Class A | 1,289 | 13 |
| * | Landec Corp. | 1,164 | 12 |
| Alico Inc. | 325 | 11 | |
| * | 22nd Century Group Inc. | 7,305 | 10 |
| * | Vintage Wine Estates Inc. | 1,643 | 10 |
| * | HF Foods Group Inc. | 1,690 | 9 |
| * | Whole Earth Brands Inc. | 1,819 | 9 |
| * | AppHarvest Inc. | 3,250 | 9 |
| Village Super Market Inc. Class A | 353 | 8 | |
| Natural Grocers by Vitamin Cottage Inc. | 516 | 7 | |
| * | Nature's Sunshine Products Inc. | 687 | 7 |
| * | PLBY Group Inc. | 1,450 | 7 |
| * | Local Bounti Corp. | 1,721 | 6 |
| 147,651 | |||
| Energy (5.0%) | |||
| Exxon Mobil Corp. | 283,982 | 27,146 | |
| Chevron Corp. | 132,389 | 20,925 | |
| ConocoPhillips | 87,181 | 9,542 | |
| EOG Resources Inc. | 39,460 | 4,787 | |
| Pioneer Natural Resources Co. | 16,223 | 4,108 | |
| Occidental Petroleum Corp. | 55,095 | 3,912 | |
| Marathon Petroleum Corp. | 36,339 | 3,661 | |
| Schlumberger NV | 95,280 | 3,635 | |
| Valero Energy Corp. | 27,435 | 3,213 | |
| Devon Energy Corp. | 44,252 | 3,125 | |
| Phillips 66 | 32,432 | 2,901 | |
| Williams Cos. Inc. | 82,009 | 2,791 | |
| Cheniere Energy Inc. | 17,078 | 2,736 | |
| * | Enphase Energy Inc. | 8,811 | 2,524 |
| Kinder Morgan Inc. | 133,792 | 2,451 | |
| Hess Corp. | 19,002 | 2,295 | |
| ONEOK Inc. | 29,964 | 1,835 | |
| Halliburton Co. | 60,683 | 1,828 | |
| Coterra Energy Inc. | 53,589 | 1,656 | |
| Diamondback Energy Inc. | 11,941 | 1,591 | |
| Baker Hughes Co. Class A | 62,564 | 1,580 | |
| Marathon Oil Corp. | 47,396 | 1,213 | |
| EQT Corp. | 24,829 | 1,187 | |
| Targa Resources Corp. | 15,207 | 1,038 | |
| * | Plug Power Inc. | 35,009 | 982 |
| Ovintiv Inc. (XNYS) | 17,381 | 924 | |
| * | First Solar Inc. | 7,153 | 912 |
| APA Corp. | 22,582 | 883 | |
| Chesapeake Energy Corp. | 8,591 | 863 | |
| * | Antero Resources Corp. | 19,780 | 793 |
| Texas Pacific Land Corp. | 389 | 716 | |
| * | Range Resources Corp. | 17,730 | 583 |
| * | Southwestern Energy Co. | 75,103 | 563 |
| HF Sinclair Corp. | 10,108 | 532 | |
| NOV Inc. | 26,571 | 470 | |
| Matador Resources Co. | 7,537 | 449 | |
| PDC Energy Inc. | 6,376 | 433 | |
| Chord Energy Corp. | 2,872 | 407 | |
| Murphy Oil Corp. | 9,975 | 389 | |
| DTE Midstream LLC | 6,549 | 362 | |
| SM Energy Co. | 8,186 | 361 | |
| Shares | Market Value• ($000) | ||
| Civitas Resources Inc. | 5,016 | 337 | |
| ChampionX Corp. | 14,051 | 306 | |
| * | Denbury Inc. | 3,430 | 305 |
| Helmerich & Payne Inc. | 7,035 | 301 | |
| Magnolia Oil & Gas Corp. Class A | 11,037 | 263 | |
| Equitrans Midstream Corp. | 28,251 | 262 | |
| California Resources Corp. | 5,246 | 262 | |
| * | CNX Resources Corp. | 13,368 | 236 |
| Antero Midstream Corp. | 22,344 | 225 | |
| * | PBF Energy Inc. Class A | 6,566 | 224 |
| * | ChargePoint Holdings Inc. | 13,673 | 222 |
| Patterson-UTI Energy Inc. | 14,776 | 220 | |
| * | Kosmos Energy Ltd. | 30,889 | 218 |
| * | Array Technologies Inc. | 9,962 | 208 |
| * | Valaris Ltd. | 3,975 | 203 |
| * | Peabody Energy Corp. | 8,058 | 199 |
| * | Shoals Technologies Group Inc. Class A | 7,395 | 195 |
| Alpha Metallurgical Resources Inc. | 1,238 | 195 | |
| Arcosa Inc. | 3,290 | 192 | |
| * | Golar LNG Ltd. | 6,680 | 182 |
| New Fortress Energy Inc. Class A | 3,155 | 181 | |
| Continental Resources Inc. | 2,395 | 167 | |
| Cactus Inc. Class A | 4,074 | 163 | |
| CONSOL Energy Inc. | 2,257 | 162 | |
| * | Stem Inc. | 9,897 | 156 |
| * | Ameresco Inc. Class A | 2,165 | 149 |
| Arch Resources Inc. | 996 | 145 | |
| * | Liberty Energy Inc. Class A | 9,256 | 139 |
| Enviva Inc. | 1,964 | 137 | |
| * | SunPower Corp. | 5,677 | 136 |
| * | Tellurian Inc. | 33,907 | 136 |
| Northern Oil and Gas Inc. | 4,286 | 136 | |
| * | Weatherford International plc | 4,787 | 135 |
| * | Callon Petroleum Co. | 3,113 | 132 |
| Delek US Holdings Inc. | 4,616 | 130 | |
| * | Green Plains Inc. | 3,475 | 127 |
| * | Comstock Resources Inc. | 6,166 | 121 |
| * | Centennial Resource Development Inc. Class A | 13,837 | 114 |
| Warrior Met Coal Inc. | 3,414 | 111 | |
| World Fuel Services Corp. | 4,159 | 107 | |
| * | NexTier Oilfield Solutions Inc. | 11,469 | 107 |
| Brigham Minerals Inc. Class A | 3,579 | 106 | |
| * | FuelCell Energy Inc. | 25,207 | 106 |
| * | Talos Energy Inc. | 4,626 | 96 |
| * | NOW Inc. | 7,498 | 91 |
| * | Laredo Petroleum Inc. | 1,141 | 89 |
| * | Nabors Industries Ltd. (XNYS) | 640 | 85 |
| * | Montauk Renewables Inc. | 4,296 | 76 |
| * | Gulfport Energy Corp. | 723 | 71 |
| * | Noble Corp. | 2,288 | 69 |
| * | Expro Group Holdings NV | 4,912 | 66 |
| * | Par Pacific Holdings Inc. | 3,388 | 64 |
| Archrock Inc. | 8,120 | 60 | |
| CVR Energy Inc. | 1,839 | 60 | |
| * | TPI Composites Inc. | 3,154 | 59 |
| Ranger Oil Corp. Class A | 1,437 | 56 | |
| * | Oceaneering International Inc. | 6,093 | 54 |
| Shares | Market Value• ($000) | ||
| * | Tidewater Inc. | 2,386 | 53 |
| Berry Corp. | 5,666 | 52 | |
| * | ProPetro Holding Corp. | 5,528 | 51 |
| * | Bristow Group Inc. | 1,775 | 51 |
| * | Diamond Offshore Drilling Inc. | 7,152 | 51 |
| * | Fluence Energy Inc. | 2,515 | 50 |
| * | Dril-Quip Inc. | 2,158 | 48 |
| * | MRC Global Inc. | 4,972 | 48 |
| * | SandRidge Energy Inc. | 2,266 | 48 |
| *,1 | EVgo Inc. | 5,085 | 48 |
| * | Earthstone Energy Inc. Class A | 3,116 | 47 |
| * | W&T Offshore Inc. | 7,294 | 47 |
| * | Gevo Inc. | 14,728 | 46 |
| * | Helix Energy Solutions Group Inc. | 10,651 | 46 |
| RPC Inc. | 5,713 | 45 | |
| * | Centrus Energy Corp. Class A | 874 | 44 |
| Kinetik Holdings Inc. | 1,169 | 43 | |
| SunCoke Energy Inc. | 5,857 | 39 | |
| Crescent Energy Inc. Class A | 2,258 | 39 | |
| * | Borr Drilling Ltd. | 9,763 | 39 |
| * | Select Energy Services Inc. Class A | 5,314 | 38 |
| * | REX American Resources Corp. | 1,227 | 37 |
| * | TETRA Technologies Inc. | 9,139 | 36 |
| * | SilverBow Resources Inc. | 884 | 35 |
| * | DMC Global Inc. | 1,489 | 33 |
| * | Solid Power Inc. | 2,841 | 19 |
| * | ESS Tech Inc. | 4,038 | 18 |
| Solaris Oilfield Infrastructure Inc. Class A | 1,597 | 17 | |
| Sitio Royalties Corp. | 684 | 17 | |
| * | Oil States International Inc. | 3,074 | 15 |
| VAALCO Energy Inc. | 2,922 | 15 | |
| * | Aemetis Inc. | 1,528 | 14 |
| * | Ring Energy Inc. | 4,366 | 14 |
| * | National Energy Services Reunited Corp. | 1,953 | 14 |
| * | Amplify Energy Corp. | 1,796 | 13 |
| Riley Exploration Permian Inc. | 521 | 13 | |
| * | Volta Inc. | 6,132 | 13 |
| * | Newpark Resources Inc. | 4,289 | 12 |
| Ramaco Resources Inc. | 1,120 | 12 | |
| * | NextDecade Corp. | 1,561 | 12 |
| NACCO Industries Inc. Class A | 206 | 9 | |
| * | FTC Solar Inc. | 2,141 | 9 |
| HighPeak Energy Inc. | 323 | 8 | |
| * | Energy Vault Holdings Inc. | 1,270 | 7 |
| * | Empire Petroleum Corp. | 399 | 6 |
| * | ProFrac Holding Corp. Class A | 266 | 5 |
| * | Nabors Industries Ltd. Warrants Exp. 6/11/26 | 126 | 4 |
| * | Heliogen Inc. | 1,782 | 4 |
| 132,540 | |||
| Financials (11.2%) | |||
| * | Berkshire Hathaway Inc. Class B | 121,453 | 34,104 |
| JPMorgan Chase & Co. | 196,435 | 22,341 | |
| Shares | Market Value• ($000) | ||
| Bank of America Corp. | 472,845 | 15,892 | |
| Wells Fargo & Co. | 255,407 | 11,164 | |
| S&P Global Inc. | 22,873 | 8,055 | |
| Goldman Sachs Group Inc. | 22,367 | 7,441 | |
| Morgan Stanley | 85,904 | 7,321 | |
| Charles Schwab Corp. | 102,430 | 7,267 | |
| BlackRock Inc. | 10,111 | 6,738 | |
| Citigroup Inc. | 132,756 | 6,480 | |
| Marsh & McLennan Cos. Inc. | 33,709 | 5,440 | |
| Chubb Ltd. | 28,327 | 5,355 | |
| Progressive Corp. | 39,378 | 4,830 | |
| CME Group Inc. | 24,168 | 4,728 | |
| Blackstone Inc. | 47,169 | 4,431 | |
| PNC Financial Services Group Inc. | 27,765 | 4,387 | |
| Truist Financial Corp. | 89,479 | 4,191 | |
| US Bancorp | 90,314 | 4,119 | |
| Aon plc Class A (XNYS) | 14,159 | 3,954 | |
| Intercontinental Exchange Inc. | 37,186 | 3,750 | |
| Moody's Corp. | 10,764 | 3,063 | |
| MetLife Inc. | 46,018 | 2,960 | |
| American International Group Inc. | 53,261 | 2,756 | |
| Travelers Cos. Inc. | 16,143 | 2,609 | |
| Aflac Inc. | 42,870 | 2,547 | |
| Arthur J Gallagher & Co. | 14,015 | 2,545 | |
| Prudential Financial Inc. | 25,300 | 2,422 | |
| MSCI Inc. Class A | 5,312 | 2,386 | |
| Allstate Corp. | 18,522 | 2,232 | |
| M&T Bank Corp. | 12,037 | 2,188 | |
| Bank of New York Mellon Corp. | 49,538 | 2,057 | |
| Ameriprise Financial Inc. | 7,374 | 1,976 | |
| KKR & Co. Inc. | 38,624 | 1,953 | |
| Discover Financial Services | 18,942 | 1,903 | |
| First Republic Bank | 12,032 | 1,827 | |
| T Rowe Price Group Inc. | 15,108 | 1,813 | |
| Apollo Global Management Inc. | 31,141 | 1,731 | |
| State Street Corp. | 24,782 | 1,694 | |
| * | SVB Financial Group | 3,964 | 1,611 |
| Fifth Third Bancorp | 46,042 | 1,572 | |
| Willis Towers Watson plc | 7,480 | 1,547 | |
| Hartford Financial Services Group Inc. | 22,154 | 1,425 | |
| Nasdaq Inc. | 23,104 | 1,375 | |
| Raymond James Financial Inc. | 13,092 | 1,366 | |
| Regions Financial Corp. | 63,054 | 1,366 | |
| Broadridge Financial Solutions Inc. | 7,860 | 1,345 | |
| Northern Trust Corp. | 13,868 | 1,319 | |
| Huntington Bancshares Inc. | 96,932 | 1,299 | |
| Principal Financial Group Inc. | 16,721 | 1,250 | |
| Citizens Financial Group Inc. | 33,091 | 1,214 | |
| LPL Financial Holdings Inc. | 5,352 | 1,185 | |
| * | Arch Capital Group Ltd. | 24,116 | 1,103 |
| FactSet Research Systems Inc. | 2,543 | 1,102 | |
| KeyCorp | 62,217 | 1,101 | |
| * | Markel Corp. | 908 | 1,084 |
| Cincinnati Financial Corp. | 10,634 | 1,031 | |
| Brown & Brown Inc. | 15,891 | 1,002 |
| Shares | Market Value• ($000) | ||
| W R Berkley Corp. | 13,817 | 895 | |
| Cboe Global Markets Inc. | 7,131 | 841 | |
| First Horizon Corp. | 34,995 | 792 | |
| Ares Management Corp. Class A | 10,300 | 764 | |
| Equitable Holdings Inc. | 25,548 | 760 | |
| Loews Corp. | 13,376 | 740 | |
| Signature Bank | 4,173 | 728 | |
| Ally Financial Inc. | 21,748 | 722 | |
| * | Alleghany Corp. | 857 | 721 |
| Comerica Inc. | 8,771 | 704 | |
| Everest Re Group Ltd. | 2,606 | 701 | |
| Fidelity National Financial Inc. | 17,851 | 698 | |
| *,1 | Coinbase Global Inc. Class A | 10,449 | 698 |
| Annaly Capital Management Inc. | 108,039 | 697 | |
| East West Bancorp Inc. | 9,508 | 686 | |
| First Citizens BancShares Inc. Class A | 817 | 663 | |
| MarketAxess Holdings Inc. | 2,511 | 624 | |
| Globe Life Inc. | 6,058 | 589 | |
| Assurant Inc. | 3,631 | 575 | |
| American Financial Group Inc. | 4,498 | 574 | |
| Webster Financial Corp. | 12,101 | 569 | |
| Reinsurance Group of America Inc. | 4,517 | 566 | |
| Zions Bancorp NA | 10,020 | 551 | |
| Western Alliance Bancorp | 7,147 | 548 | |
| Lincoln National Corp. | 11,605 | 535 | |
| Unum Group | 13,542 | 513 | |
| Cullen/Frost Bankers Inc. | 3,916 | 509 | |
| Tradeweb Markets Inc. Class A | 7,308 | 509 | |
| Franklin Resources Inc. | 19,078 | 497 | |
| Commerce Bancshares Inc. | 7,182 | 494 | |
| Jefferies Financial Group Inc. | 14,109 | 453 | |
| Starwood Property Trust Inc. | 19,744 | 453 | |
| Carlyle Group Inc. | 13,921 | 453 | |
| AGNC Investment Corp. | 36,556 | 437 | |
| Voya Financial Inc. | 6,874 | 423 | |
| Prosperity Bancshares Inc. | 5,868 | 416 | |
| Stifel Financial Corp. | 6,958 | 413 | |
| Invesco Ltd. | 25,047 | 413 | |
| Old Republic International Corp. | 18,826 | 411 | |
| Pinnacle Financial Partners Inc. | 5,049 | 408 | |
| RenaissanceRe Holdings Ltd. | 2,982 | 403 | |
| SouthState Corp. | 5,015 | 391 | |
| Synovus Financial Corp. | 9,725 | 391 | |
| Morningstar Inc. | 1,707 | 389 | |
| Interactive Brokers Group Inc. Class A | 6,291 | 387 | |
| Glacier Bancorp Inc. | 7,575 | 384 | |
| Popular Inc. | 4,950 | 382 | |
| First American Financial Corp. | 6,988 | 374 | |
| Kinsale Capital Group Inc. | 1,467 | 372 | |
| Erie Indemnity Co. Class A | 1,711 | 368 | |
| First Financial Bankshares Inc. | 8,654 | 368 |
| Shares | Market Value• ($000) | ||
| SEI Investments Co. | 6,714 | 367 | |
| * | Robinhood Markets Inc. Class A | 38,051 | 363 |
| Wintrust Financial Corp. | 4,032 | 340 | |
| Valley National Bancorp | 29,001 | 337 | |
| Primerica Inc. | 2,619 | 332 | |
| Affiliated Managers Group Inc. | 2,594 | 330 | |
| Old National Bancorp | 19,753 | 330 | |
| Blackstone Mortgage Trust Inc. Class A | 11,283 | 327 | |
| United Bankshares Inc. | 8,796 | 326 | |
| Selective Insurance Group Inc. | 4,074 | 324 | |
| Bank OZK | 7,953 | 322 | |
| * | SoFi Technologies Inc. | 54,421 | 322 |
| Cadence Bank | 12,448 | 317 | |
| New York Community Bancorp Inc. | 31,341 | 307 | |
| Hanover Insurance Group Inc. | 2,338 | 303 | |
| Blue Owl Capital Inc. Class A | 26,680 | 296 | |
| FNB Corp. | 24,736 | 295 | |
| Home BancShares Inc. | 12,495 | 294 | |
| MGIC Investment Corp. | 20,342 | 291 | |
| Hancock Whitney Corp. | 6,008 | 290 | |
| RLI Corp. | 2,594 | 285 | |
| Axis Capital Holdings Ltd. | 5,365 | 285 | |
| Essent Group Ltd. | 7,137 | 285 | |
| SLM Corp. | 18,586 | 284 | |
| OneMain Holdings Inc. | 8,059 | 282 | |
| ServisFirst Bancshares Inc. | 3,289 | 277 | |
| White Mountains Insurance Group Ltd. | 202 | 277 | |
| Houlihan Lokey Inc. Class A | 3,490 | 274 | |
| Rithm Capital Corp. | 28,079 | 265 | |
| UMB Financial Corp. | 2,939 | 263 | |
| Independent Bank Corp. (XNGS) | 3,265 | 255 | |
| Umpqua Holdings Corp. | 14,370 | 255 | |
| First Interstate BancSystem Inc. Class A | 6,199 | 250 | |
| Radian Group Inc. | 11,666 | 246 | |
| * | Credit Acceptance Corp. | 460 | 245 |
| Evercore Inc. Class A | 2,620 | 245 | |
| * | Brighthouse Financial Inc. | 5,047 | 240 |
| Lazard Ltd. Class A | 6,609 | 240 | |
| CVB Financial Corp. | 8,993 | 236 | |
| United Community Banks Inc. | 7,015 | 235 | |
| First Hawaiian Inc. | 9,091 | 234 | |
| * | Ryan Specialty Holdings Inc. | 5,517 | 234 |
| Community Bank System Inc. | 3,471 | 227 | |
| Assured Guaranty Ltd. | 4,283 | 219 | |
| Eastern Bankshares Inc. | 11,239 | 218 | |
| Janus Henderson Group plc | 9,245 | 216 | |
| PacWest Bancorp | 8,173 | 215 | |
| Associated Banc-Corp. | 10,626 | 213 | |
| Walker & Dunlop Inc. | 2,120 | 213 | |
| Pacific Premier Bancorp Inc. | 6,475 | 212 | |
| WSFS Financial Corp. | 4,387 | 212 |
| Shares | Market Value• ($000) | ||
| * | Texas Capital Bancshares Inc. | 3,531 | 208 |
| Ameris Bancorp | 4,419 | 206 | |
| Federated Hermes Inc. | 6,042 | 206 | |
| BankUnited Inc. | 5,536 | 205 | |
| * | Mr Cooper Group Inc. | 4,846 | 205 |
| American Equity Investment Life Holding Co. | 5,356 | 204 | |
| Bank of Hawaii Corp. | 2,605 | 203 | |
| Kemper Corp. | 4,343 | 200 | |
| Cathay General Bancorp | 4,746 | 199 | |
| FirstCash Holdings Inc. | 2,534 | 198 | |
| First BanCorp. (XNYS) | 13,572 | 194 | |
| * | Silvergate Capital Corp. Class A | 2,133 | 194 |
| Simmons First National Corp. Class A | 8,180 | 193 | |
| * | Trupanion Inc. | 2,707 | 191 |
| Moelis & Co. Class A | 4,411 | 184 | |
| Fulton Financial Corp. | 10,910 | 177 | |
| Independent Bank Group Inc. | 2,549 | 172 | |
| Atlantic Union Bankshares Corp. | 5,224 | 170 | |
| BOK Financial Corp. | 1,902 | 169 | |
| * | Enstar Group Ltd. | 888 | 168 |
| Hamilton Lane Inc. Class A | 2,387 | 166 | |
| * | Axos Financial Inc. | 3,903 | 163 |
| Columbia Banking System Inc. | 5,428 | 163 | |
| Jackson Financial Inc. Class A | 5,175 | 162 | |
| International Bancshares Corp. | 3,822 | 160 | |
| First Merchants Corp. | 3,983 | 159 | |
| Arbor Realty Trust Inc. | 10,047 | 151 | |
| CNO Financial Group Inc. | 8,070 | 149 | |
| Banner Corp. | 2,428 | 148 | |
| * | Focus Financial Partners Inc. Class A | 3,771 | 148 |
| * | Genworth Financial Inc. Class A | 35,146 | 148 |
| Virtu Financial Inc. Class A | 6,389 | 147 | |
| Chimera Investment Corp. | 16,740 | 142 | |
| WesBanco Inc. | 4,134 | 141 | |
| BancFirst Corp. | 1,295 | 140 | |
| Washington Federal Inc. | 4,363 | 140 | |
| Seacoast Banking Corp. of Florida | 4,309 | 139 | |
| Flagstar Bancorp Inc. | 3,574 | 138 | |
| Heartland Financial USA Inc. | 3,094 | 138 | |
| Trustmark Corp. | 4,203 | 133 | |
| Artisan Partners Asset Management Inc. Class A | 3,924 | 132 | |
| First Financial Bancorp | 6,097 | 132 | |
| Stock Yards Bancorp Inc. | 1,995 | 132 | |
| Lakeland Financial Corp. | 1,737 | 131 | |
| * | Palomar Holdings Inc. | 1,644 | 130 |
| Cohen & Steers Inc. | 1,777 | 127 | |
| Piper Sandler Cos. | 1,100 | 126 | |
| *,1 | Upstart Holdings Inc. | 4,877 | 126 |
| Park National Corp. | 948 | 125 | |
| Towne Bank | 4,353 | 124 | |
| Provident Financial Services Inc. | 5,263 | 122 |
| Shares | Market Value• ($000) | ||
| * | BRP Group Inc. Class A | 3,872 | 122 |
| Hope Bancorp Inc. | 8,229 | 119 | |
| Two Harbors Investment Corp. | 24,327 | 118 | |
| Renasant Corp. | 3,523 | 117 | |
| * | NMI Holdings Inc. Class A | 5,621 | 115 |
| Navient Corp. | 7,396 | 114 | |
| Northwest Bancshares Inc. | 8,134 | 114 | |
| Veritex Holdings Inc. | 3,773 | 114 | |
| Bank of NT Butterfield & Son Ltd. | 3,473 | 113 | |
| Sandy Spring Bancorp Inc. | 2,912 | 112 | |
| PJT Partners Inc. Class A | 1,589 | 110 | |
| Eagle Bancorp Inc. | 2,256 | 109 | |
| Hilltop Holdings Inc. | 4,047 | 107 | |
| * | Cannae Holdings Inc. | 4,911 | 106 |
| Enterprise Financial Services Corp. | 2,310 | 106 | |
| Horace Mann Educators Corp. | 2,959 | 106 | |
| * | StoneX Group Inc. | 1,146 | 106 |
| Apollo Commercial Real Estate Finance Inc. | 9,014 | 105 | |
| NBT Bancorp Inc. | 2,708 | 105 | |
| Claros Mortgage Trust Inc. | 6,110 | 104 | |
| PennyMac Financial Services Inc. | 1,919 | 102 | |
| TriCo Bancshares | 2,112 | 100 | |
| * | Triumph Bancorp Inc. | 1,584 | 98 |
| Westamerica BanCorp. | 1,748 | 98 | |
| StepStone Group Inc. Class A | 3,593 | 98 | |
| * | PRA Group Inc. | 2,624 | 97 |
| FB Financial Corp. | 2,350 | 93 | |
| PennyMac Mortgage Investment Trust | 6,239 | 93 | |
| * | Bancorp Inc. | 3,896 | 92 |
| BGC Partners Inc. Class A | 22,530 | 91 | |
| Employers Holdings Inc. | 2,319 | 91 | |
| Capitol Federal Financial Inc. | 9,905 | 90 | |
| Berkshire Hills Bancorp Inc. | 3,149 | 89 | |
| OFG Bancorp | 3,241 | 88 | |
| First Bancorp (XNGS) | 2,385 | 87 | |
| * | Encore Capital Group Inc. | 1,580 | 86 |
| * | LendingClub Corp. | 6,607 | 86 |
| ProAssurance Corp. | 3,950 | 85 | |
| Compass Diversified Holdings | 4,092 | 85 | |
| Ladder Capital Corp. Class A | 7,592 | 84 | |
| Live Oak Bancshares Inc. | 2,313 | 84 | |
| Nelnet Inc. Class A | 999 | 84 | |
| Safety Insurance Group Inc. | 930 | 84 | |
| First Commonwealth Financial Corp. | 6,154 | 83 | |
| Stewart Information Services Corp. | 1,643 | 83 | |
| Virtus Investment Partners Inc. | 435 | 83 | |
| * | Enova International Inc. | 2,285 | 80 |
| *,1 | Marathon Digital Holdings Inc. | 6,776 | 80 |
| First Busey Corp. | 3,441 | 79 | |
| Dime Community Bancshares Inc. | 2,490 | 78 | |
| S&T Bancorp Inc. | 2,611 | 77 |
| Shares | Market Value• ($000) | ||
| City Holding Co. | 887 | 75 | |
| New York Mortgage Trust Inc. | 26,428 | 74 | |
| * | Customers Bancorp Inc. | 2,068 | 72 |
| * | Goosehead Insurance Inc. Class A | 1,366 | 71 |
| Tompkins Financial Corp. | 992 | 71 | |
| * | Lemonade Inc. | 3,197 | 71 |
| Pathward Financial Inc. | 2,112 | 70 | |
| * | MoneyGram International Inc. | 6,792 | 70 |
| National Bank Holdings Corp. Class A | 1,751 | 70 | |
| Redwood Trust Inc. | 9,043 | 70 | |
| Preferred Bank | 1,010 | 69 | |
| Southside Bancshares Inc. | 1,819 | 69 | |
| OceanFirst Financial Corp. | 3,504 | 68 | |
| CNA Financial Corp. | 1,743 | 67 | |
| MFA Financial Inc. REIT | 6,103 | 67 | |
| Cowen Inc. Class A | 1,728 | 66 | |
| German American Bancorp Inc. | 1,719 | 65 | |
| Franklin BSP Realty Trust Inc. REIT | 5,010 | 65 | |
| Lakeland Bancorp Inc. | 3,906 | 64 | |
| B Riley Financial Inc. | 1,271 | 63 | |
| KKR Real Estate Finance Trust Inc. | 3,225 | 62 | |
| Origin Bancorp Inc. | 1,526 | 62 | |
| QCR Holdings Inc. | 1,111 | 62 | |
| * | Open Lending Corp. Class A | 6,419 | 62 |
| CBL & Associates Properties Inc. | 2,156 | 62 | |
| Federal Agricultural Mortgage Corp. Class C | 556 | 61 | |
| Horizon Bancorp Inc. | 3,241 | 61 | |
| Northfield Bancorp Inc. | 4,118 | 61 | |
| Ready Capital Corp. | 4,626 | 61 | |
| Premier Financial Corp. | 2,250 | 61 | |
| * | Blucora Inc. | 2,987 | 60 |
| Washington Trust Bancorp Inc. | 1,175 | 60 | |
| Enact Holdings Inc. | 2,371 | 60 | |
| ConnectOne Bancorp Inc. | 2,345 | 59 | |
| First Foundation Inc. | 3,132 | 59 | |
| Granite Point Mortgage Trust Inc. | 6,278 | 59 | |
| Brightspire Capital Inc. Class A | 6,976 | 59 | |
| AMERISAFE Inc. | 1,209 | 58 | |
| Banc of California Inc. | 3,383 | 57 | |
| Brookline Bancorp Inc. | 4,565 | 57 | |
| HarborOne Bancorp Inc. | 4,214 | 57 | |
| * | Nicolet Bankshares Inc. | 738 | 57 |
| First Mid Bancshares Inc. | 1,576 | 56 | |
| Heritage Financial Corp. | 2,143 | 56 | |
| Rocket Cos. Inc. Class A | 7,136 | 56 | |
| iStar Inc. | 3,971 | 55 | |
| * | Oscar Health Inc. Class A | 8,227 | 55 |
| Peoples Bancorp Inc. | 1,811 | 54 | |
| Hanmi Financial Corp. | 2,136 | 53 | |
| James River Group Holdings Ltd. | 2,246 | 53 | |
| Allegiance Bancshares Inc. | 1,230 | 52 | |
| Mercury General Corp. | 1,632 | 52 | |
| WisdomTree Investments Inc. | 10,402 | 52 |
| Shares | Market Value• ($000) | ||
| * | Ambac Financial Group Inc. | 3,383 | 51 |
| Community Trust Bancorp Inc. | 1,201 | 51 | |
| 1st Source Corp. | 1,080 | 51 | |
| * | Riot Blockchain Inc. | 7,149 | 51 |
| Broadmark Realty Capital Inc. | 7,735 | 50 | |
| Ellington Financial Inc. | 3,366 | 49 | |
| First Bancorp Inc. (XNMS) | 1,640 | 49 | |
| Camden National Corp. | 1,064 | 48 | |
| Peapack-Gladstone Financial Corp. | 1,438 | 48 | |
| ARMOUR Residential REIT Inc. | 6,666 | 47 | |
| Brookfield Business Corp. Class A | 1,932 | 47 | |
| * | Columbia Financial Inc. | 2,175 | 46 |
| * | Metropolitan Bank Holding Corp. | 646 | 46 |
| Midland States Bancorp Inc. | 1,815 | 46 | |
| TFS Financial Corp. | 3,251 | 46 | |
| Univest Financial Corp. | 1,853 | 46 | |
| Bank First Corp. | 553 | 45 | |
| Flushing Financial Corp. | 2,185 | 45 | |
| Kearny Financial Corp. | 3,943 | 45 | |
| TrustCo Bank Corp. NY | 1,353 | 45 | |
| Amerant Bancorp Inc. | 1,695 | 44 | |
| First Community Bankshares Inc. | 1,402 | 44 | |
| Old Second Bancorp Inc. | 3,237 | 44 | |
| TPG RE Finance Trust Inc. | 4,738 | 44 | |
| * | CrossFirst Bankshares Inc. | 3,318 | 44 |
| Cambridge Bancorp | 528 | 43 | |
| Heritage Commerce Corp. | 3,831 | 43 | |
| HomeStreet Inc. | 1,165 | 41 | |
| Brightsphere Investment Group Inc. | 2,374 | 41 | |
| Mid Penn Bancorp Inc. | 1,406 | 41 | |
| First Financial Corp. | 865 | 40 | |
| United Fire Group Inc. | 1,362 | 40 | |
| Invesco Mortgage Capital REIT | 2,506 | 40 | |
| Byline Bancorp Inc. | 1,799 | 39 | |
| * | MBIA Inc. | 3,324 | 39 |
| Central Pacific Financial Corp. | 1,744 | 38 | |
| * | World Acceptance Corp. | 324 | 38 |
| Dynex Capital Inc. | 2,379 | 37 | |
| Southern Missouri Bancorp Inc. | 705 | 37 | |
| Argo Group International Holdings Ltd. | 1,901 | 37 | |
| Hingham Institution for Savings | 119 | 35 | |
| Victory Capital Holdings Inc. Class A | 1,325 | 35 | |
| * | SiriusPoint Ltd. | 7,816 | 35 |
| Business First Bancshares Inc. | 1,460 | 34 | |
| CNB Financial Corp. | 1,305 | 34 | |
| Diamond Hill Investment Group Inc. | 198 | 34 | |
| Farmers National Banc Corp. | 2,219 | 32 | |
| Capstar Financial Holdings Inc. | 1,601 | 32 | |
| * | Coastal Financial Corp. | 801 | 32 |
| Shares | Market Value• ($000) | ||
| Great Southern Bancorp Inc. | 519 | 31 | |
| SmartFinancial Inc. | 1,222 | 31 | |
| Bar Harbor Bankshares | 1,058 | 30 | |
| CBTX Inc. | 1,003 | 30 | |
| Capital City Bank Group Inc. | 954 | 30 | |
| MVB Financial Corp. | 926 | 30 | |
| GCM Grosvenor Inc. Class A | 3,874 | 30 | |
| Arrow Financial Corp. | 897 | 29 | |
| Financial Institutions Inc. | 1,084 | 28 | |
| HomeTrust Bancshares Inc. | 1,202 | 28 | |
| Enterprise Bancorp Inc. | 840 | 27 | |
| HCI Group Inc. | 555 | 27 | |
| Mercantile Bank Corp. | 805 | 27 | |
| * | Southern First Bancshares Inc. | 624 | 27 |
| Equity Bancshares Inc. Class A | 823 | 26 | |
| Summit Financial Group Inc. | 896 | 26 | |
| Tiptree Inc. | 2,159 | 26 | |
| Bank of Marin Bancorp | 799 | 25 | |
| * | EZCorp. Inc. Class A | 2,851 | 25 |
| First Internet Bancorp | 673 | 25 | |
| Peoples Financial Services Corp. | 513 | 25 | |
| AFC Gamma Inc. | 1,451 | 25 | |
| Civista Bancshares Inc. | 1,128 | 24 | |
| National Western Life Group Inc. Class A | 124 | 24 | |
| Regional Management Corp. | 668 | 23 | |
| * | Carter Bankshares Inc. | 1,413 | 23 |
| * | LendingTree Inc. | 711 | 22 |
| MidWestOne Financial Group Inc. | 705 | 22 | |
| PCSB Financial Corp. | 1,205 | 22 | |
| West BanCorp. Inc. | 913 | 22 | |
| Sculptor Capital Management Inc. Class A | 2,360 | 22 | |
| * | Assetmark Financial Holdings Inc. | 1,106 | 21 |
| Independent Bank Corp. | 1,025 | 21 | |
| Banco Latinoamericano de Comercio Exterior SA Class E | 1,407 | 21 | |
| First of Long Island Corp. | 1,104 | 20 | |
| Merchants Bancorp | 759 | 20 | |
| Alerus Financial Corp. | 849 | 20 | |
| American National Bankshares Inc. | 576 | 19 | |
| Republic Bancorp Inc. Class A | 456 | 19 | |
| Metrocity Bankshares Inc. | 964 | 19 | |
| * | Professional Holding Corp. Class A | 665 | 19 |
| Amalgamated Financial Corp. | 834 | 19 | |
| * | Bridgewater Bancshares Inc. | 1,055 | 18 |
| Citizens & Northern Corp. | 756 | 18 | |
| RBB Bancorp | 802 | 18 | |
| Farmers & Merchants Bancorp Inc. | 609 | 17 | |
| Shore Bancshares Inc. | 887 | 17 |
| Shares | Market Value• ($000) | ||
| Waterstone Financial Inc. | 989 | 17 | |
| Primis Financial Corp. | 1,278 | 17 | |
| 1 | UWM Holdings Corp. | 4,739 | 17 |
| Perella Weinberg Partners Class A | 2,352 | 17 | |
| Oppenheimer Holdings Inc. Class A | 448 | 16 | |
| Universal Insurance Holdings Inc. | 1,309 | 16 | |
| Five Star Bancorp | 620 | 16 | |
| ACNB Corp. | 426 | 15 | |
| * | Blue Foundry Bancorp | 1,317 | 15 |
| First Bancorp Inc. (XNGS) | 471 | 14 | |
| First Bank | 943 | 14 | |
| First Business Financial Services Inc. | 409 | 14 | |
| Home Bancorp Inc. | 353 | 14 | |
| Sierra Bancorp | 663 | 14 | |
| John Marshall Bancorp Inc. | 567 | 14 | |
| BCB Bancorp Inc. | 736 | 13 | |
| Guaranty Bancshares Inc. | 382 | 13 | |
| Northeast Bank | 344 | 13 | |
| Orrstown Financial Services Inc. | 486 | 13 | |
| Macatawa Bank Corp. | 1,351 | 13 | |
| Esquire Financial Holdings Inc. | 354 | 13 | |
| BayCom Corp. | 639 | 12 | |
| Donegal Group Inc. Class A | 840 | 12 | |
| * | FVCBankcorp Inc. | 608 | 12 |
| Luther Burbank Corp. | 902 | 12 | |
| Capital Bancorp Inc. | 468 | 12 | |
| South Plains Financial Inc. | 453 | 12 | |
| Colony Bankcorp Inc. | 832 | 12 | |
| Blue Ridge Bankshares Inc. | 839 | 12 | |
| * | Hippo Holdings Inc. | 12,760 | 12 |
| * | Third Coast Bancshares Inc. | 642 | 12 |
| PCB Bancorp | 605 | 11 | |
| Parke Bancorp Inc. | 518 | 11 | |
| * | First Western Financial Inc. | 405 | 11 |
| Provident Bancorp Inc. | 763 | 11 | |
| Unity Bancorp Inc. | 361 | 10 | |
| Manning & Napier Inc. | 787 | 10 | |
| Red River Bancshares Inc. | 192 | 10 | |
| Bankwell Financial Group Inc. | 288 | 9 | |
| Investors Title Co. | 63 | 9 | |
| * | Greenlight Capital Re Ltd. Class A | 1,163 | 9 |
| Greene County Bancorp Inc. | 176 | 9 | |
| Silvercrest Asset Management Group Inc. Class A | 521 | 9 | |
| Nexpoint Real Estate Finance Inc. | 424 | 9 | |
| Angel Oak Mortgage Inc. | 678 | 9 | |
| * | eHealth Inc. | 1,174 | 8 |
| * | Oportun Financial Corp. | 1,595 | 8 |
| * | Consumer Portfolio Services Inc. | 721 | 8 |
| HBT Financial Inc. | 424 | 8 | |
| Curo Group Holdings Corp. | 1,028 | 7 | |
| First Guaranty Bancshares Inc. | 315 | 7 |
| Shares | Market Value• ($000) | ||
| Pzena Investment Management Inc. Class A | 726 | 7 | |
| * | Bakkt Holdings Inc. | 2,827 | 7 |
| * | USCB Financial Holdings Inc. | 564 | 7 |
| Associated Capital Group Inc. Class A | 145 | 6 | |
| * | Republic First Bancorp Inc. | 1,992 | 6 |
| Chicago Atlantic Real Estate Finance Inc. | 375 | 6 | |
| * | Rigetti Computing Inc. | 1,619 | 6 |
| Crawford & Co. Class A | 861 | 5 | |
| GAMCO Investors Inc. Class A | 224 | 5 | |
| * | Sterling Bancorp Inc. | 932 | 5 |
| * | Pioneer Bancorp Inc. | 500 | 5 |
| * | Velocity Financial LLC | 431 | 5 |
| * | SWK Holdings Corp. | 300 | 5 |
| * | Sunlight Financial Holdings Inc. | 1,701 | 5 |
| * | Root Inc. Blank | 393 | 5 |
| * | NI Holdings Inc. | 304 | 4 |
| * | Trean Insurance Group Inc. | 788 | 4 |
| * | Finance of America Cos. Inc. Class A | 3,215 | 4 |
| * | Doma Holdings Inc. | 6,944 | 4 |
| * | MarketWise Inc. | 1,554 | 4 |
| 299,318 | |||
| Health Care (13.2%) | |||
| UnitedHealth Group Inc. | 63,007 | 32,721 | |
| Johnson & Johnson | 177,298 | 28,605 | |
| Pfizer Inc. | 380,885 | 17,227 | |
| Eli Lilly & Co. | 56,778 | 17,103 | |
| AbbVie Inc. | 119,075 | 16,011 | |
| Merck & Co. Inc. | 170,414 | 14,547 | |
| Thermo Fisher Scientific Inc. | 26,356 | 14,372 | |
| Abbott Laboratories | 115,446 | 11,851 | |
| Danaher Corp. | 43,599 | 11,768 | |
| Bristol-Myers Squibb Co. | 143,419 | 9,668 | |
| Amgen Inc. | 35,942 | 8,637 | |
| Medtronic plc | 90,010 | 7,914 | |
| Elevance Health Inc. | 16,239 | 7,878 | |
| Cigna Corp. | 21,036 | 5,963 | |
| Gilead Sciences Inc. | 84,611 | 5,370 | |
| Zoetis Inc. | 31,772 | 4,973 | |
| * | Intuitive Surgical Inc. | 24,125 | 4,963 |
| Stryker Corp. | 23,657 | 4,854 | |
| * | Vertex Pharmaceuticals Inc. | 17,229 | 4,854 |
| Becton Dickinson and Co. | 19,125 | 4,828 | |
| Humana Inc. | 8,511 | 4,100 | |
| * | Regeneron Pharmaceuticals Inc. | 6,988 | 4,060 |
| * | Boston Scientific Corp. | 96,017 | 3,870 |
| * | Edwards Lifesciences Corp. | 41,614 | 3,749 |
| * | Centene Corp. | 39,185 | 3,516 |
| * | Moderna Inc. | 23,154 | 3,063 |
| HCA Healthcare Inc. | 15,206 | 3,009 | |
| * | IQVIA Holdings Inc. | 12,665 | 2,693 |
| Agilent Technologies Inc. | 20,226 | 2,594 | |
| * | DexCom Inc. | 26,425 | 2,172 |
| ResMed Inc. | 9,744 | 2,143 | |
| * | Illumina Inc. | 10,594 | 2,136 |
| * | IDEXX Laboratories Inc. | 5,619 | 1,953 |
| Baxter International Inc. | 33,935 | 1,950 | |
| Shares | Market Value• ($000) | ||
| * | Biogen Inc. | 9,851 | 1,925 |
| * | Veeva Systems Inc. Class A | 9,434 | 1,880 |
| * | Alnylam Pharmaceuticals Inc. | 8,147 | 1,684 |
| Zimmer Biomet Holdings Inc. | 14,105 | 1,500 | |
| West Pharmaceutical Services Inc. | 5,001 | 1,484 | |
| * | Seagen Inc. | 9,179 | 1,416 |
| Laboratory Corp. of America Holdings | 6,249 | 1,408 | |
| * | Molina Healthcare Inc. | 3,897 | 1,315 |
| Cardinal Health Inc. | 18,346 | 1,297 | |
| * | Align Technology Inc. | 5,293 | 1,290 |
| * | Insulet Corp. | 4,638 | 1,185 |
| STERIS plc | 5,747 | 1,157 | |
| PerkinElmer Inc. | 8,538 | 1,153 | |
| * | Hologic Inc. | 16,521 | 1,116 |
| * | BioMarin Pharmaceutical Inc. | 12,472 | 1,113 |
| Royalty Pharma plc Class A | 24,790 | 1,036 | |
| * | Avantor Inc. | 41,186 | 1,026 |
| * | Catalent Inc. | 11,549 | 1,016 |
| Quest Diagnostics Inc. | 7,869 | 986 | |
| Cooper Cos. Inc. | 3,251 | 934 | |
| * | Horizon Therapeutics plc | 15,194 | 900 |
| * | Incyte Corp. | 12,335 | 869 |
| Bio-Techne Corp. | 2,614 | 867 | |
| * | Repligen Corp. | 3,735 | 819 |
| Viatris Inc. | 81,914 | 782 | |
| * | ABIOMED Inc. | 3,007 | 780 |
| Teleflex Inc. | 3,158 | 715 | |
| * | Shockwave Medical Inc. | 2,383 | 707 |
| * | Bio-Rad Laboratories Inc. Class A | 1,456 | 706 |
| * | Charles River Laboratories International Inc. | 3,404 | 699 |
| * | QIAGEN NV | 15,201 | 691 |
| * | United Therapeutics Corp. | 3,007 | 681 |
| * | Henry Schein Inc. | 9,219 | 677 |
| * | Neurocrine Biosciences Inc. | 6,411 | 671 |
| * | Jazz Pharmaceuticals plc | 4,117 | 639 |
| * | Biohaven Pharmaceutical Holding Co. Ltd. | 4,191 | 626 |
| * | Sarepta Therapeutics Inc. | 5,704 | 624 |
| * | Novocure Ltd. | 6,985 | 574 |
| * | Karuna Therapeutics Inc. | 1,988 | 507 |
| * | Masimo Corp. | 3,391 | 498 |
| * | Acadia Healthcare Co. Inc. | 6,033 | 494 |
| Organon & Co. | 17,164 | 490 | |
| Chemed Corp. | 991 | 472 | |
| DENTSPLY SIRONA Inc. | 14,387 | 471 | |
| * | Elanco Animal Health Inc. (XNYS) | 30,301 | 458 |
| Universal Health Services Inc. Class B | 4,400 | 430 | |
| * | Exact Sciences Corp. | 11,963 | 425 |
| * | Syneos Health Inc. | 6,933 | 417 |
| Bruker Corp. | 7,371 | 413 | |
| * | Ionis Pharmaceuticals Inc. | 9,632 | 410 |
| * | Tenet Healthcare Corp. | 7,182 | 406 |
| * | Envista Holdings Corp. | 10,938 | 406 |
| * | Penumbra Inc. | 2,429 | 399 |
| * | Exelixis Inc. | 21,426 | 380 |
| * | HealthEquity Inc. | 5,655 | 374 |
| * | Halozyme Therapeutics Inc. | 9,131 | 372 |
| * | Lantheus Holdings Inc. | 4,622 | 364 |
| Shares | Market Value• ($000) | ||
| * | Apellis Pharmaceuticals Inc. | 5,973 | 361 |
| * | Inspire Medical Systems Inc. | 1,845 | 353 |
| Perrigo Co. plc | 9,202 | 344 | |
| * | DaVita Inc. | 3,982 | 340 |
| * | Guardant Health Inc. | 6,684 | 335 |
| * | Teladoc Health Inc. | 10,715 | 333 |
| Encompass Health Corp. | 6,674 | 324 | |
| * | Option Care Health Inc. | 10,467 | 324 |
| * | LHC Group Inc. | 1,993 | 322 |
| * | Globus Medical Inc. Class A | 5,348 | 317 |
| Ensign Group Inc. | 3,576 | 305 | |
| * | Omnicell Inc. | 2,977 | 305 |
| * | Intra-Cellular Therapies Inc. | 6,015 | 302 |
| * | iRhythm Technologies Inc. | 2,039 | 301 |
| * | STAAR Surgical Co. | 3,177 | 301 |
| * | Blueprint Medicines Corp. | 4,100 | 300 |
| * | Intellia Therapeutics Inc. | 4,987 | 300 |
| * | Cytokinetics Inc. | 5,595 | 296 |
| * | Natera Inc. | 5,967 | 294 |
| * | Arrowhead Pharmaceuticals Inc. | 7,126 | 283 |
| * | Global Blood Therapeutics Inc. | 4,131 | 280 |
| Premier Inc. Class A | 7,769 | 274 | |
| * | QuidelOrtho Corp. | 3,400 | 269 |
| * | Medpace Holdings Inc. | 1,807 | 267 |
| * | agilon health Inc. | 12,359 | 257 |
| * | Alkermes plc | 10,779 | 255 |
| * | Haemonetics Corp. | 3,391 | 254 |
| * | Amedisys Inc. | 2,128 | 252 |
| * | Mirati Therapeutics Inc. | 2,998 | 243 |
| * | Beam Therapeutics Inc. | 4,377 | 239 |
| * | Axonics Inc. | 3,193 | 231 |
| * | PTC Therapeutics Inc. | 4,598 | 230 |
| * | Integra LifeSciences Holdings Corp. | 4,780 | 228 |
| * | Merit Medical Systems Inc. | 3,837 | 227 |
| * | ChemoCentryx Inc. | 4,363 | 222 |
| * | Ultragenyx Pharmaceutical Inc. | 4,660 | 222 |
| * | Inari Medical Inc. | 3,191 | 221 |
| * | ICU Medical Inc. | 1,346 | 214 |
| * | Amicus Therapeutics Inc. | 19,011 | 213 |
| * | 1Life Healthcare Inc. | 12,264 | 211 |
| * | Doximity Inc. Class A | 6,354 | 211 |
| * | Oak Street Health Inc. | 7,966 | 209 |
| * | Evolent Health Inc. Class A | 5,650 | 208 |
| * | Progyny Inc. | 5,167 | 208 |
| * | LivaNova plc | 3,680 | 207 |
| * | R1 RCM Inc. | 9,249 | 202 |
| * | 10X Genomics Inc. Class A | 6,107 | 201 |
| * | Insmed Inc. | 8,041 | 198 |
| Select Medical Holdings Corp. | 7,537 | 193 | |
| * | Tandem Diabetes Care Inc. | 4,217 | 193 |
| * | Denali Therapeutics Inc. | 6,607 | 183 |
| * | Enovis Corp. | 3,558 | 180 |
| * | Prestige Consumer Healthcare Inc. | 3,433 | 174 |
| * | BioCryst Pharmaceuticals Inc. | 12,396 | 172 |
| CONMED Corp. | 1,947 | 172 | |
| * | Novavax Inc. | 5,135 | 170 |
| * | Pacira BioSciences Inc. | 3,048 | 160 |
| Shares | Market Value• ($000) | ||
| Patterson Cos. Inc. | 5,735 | 160 | |
| * | Maravai LifeSciences Holdings Inc. Class A | 7,655 | 160 |
| Owens & Minor Inc. | 5,185 | 153 | |
| * | Twist Bioscience Corp. | 3,755 | 151 |
| * | NuVasive Inc. | 3,518 | 150 |
| * | Fate Therapeutics Inc. | 5,645 | 148 |
| *,1 | Neogen Corp. | 7,078 | 148 |
| * | Corcept Therapeutics Inc. | 5,698 | 147 |
| * | Glaukos Corp. | 3,028 | 147 |
| * | AbCellera Biologics Inc. | 13,630 | 146 |
| * | Ginkgo Bioworks Holdings Inc. | 53,401 | 144 |
| * | Integer Holdings Corp. | 2,256 | 142 |
| * | Arvinas Inc. | 3,330 | 141 |
| * | AtriCure Inc. | 3,077 | 140 |
| * | ACADIA Pharmaceuticals Inc. | 8,261 | 136 |
| * | Sage Therapeutics Inc. | 3,607 | 136 |
| * | Signify Health Inc. Class A | 4,874 | 136 |
| Embecta Corp. | 3,937 | 126 | |
| * | Axsome Therapeutics Inc. | 1,951 | 124 |
| * | Relay Therapeutics Inc. | 5,260 | 121 |
| * | Myriad Genetics Inc. | 5,355 | 120 |
| * | Certara Inc. | 7,667 | 120 |
| * | Supernus Pharmaceuticals Inc. | 3,400 | 116 |
| * | Travere Thrapeutics Inc. | 4,288 | 115 |
| * | Privia Health Group Inc. | 2,890 | 115 |
| * | Vir Biotechnology Inc. | 4,809 | 114 |
| * | Apollo Medical Holdings Inc. | 2,604 | 112 |
| * | Iovance Biotherapeutics Inc. | 10,340 | 111 |
| * | Cerevel Therapeutics Holdings Inc. | 3,799 | 111 |
| * | Xencor Inc. | 4,121 | 109 |
| * | Sotera Health Co. | 6,408 | 108 |
| * | Agios Pharmaceuticals Inc. | 4,166 | 106 |
| * | Nevro Corp. | 2,339 | 106 |
| * | Prometheus Biosciences Inc. | 1,962 | 103 |
| * | Recursion Pharmaceuticals Inc. Class A | 9,675 | 102 |
| * | Ligand Pharmaceuticals Inc. | 1,077 | 100 |
| * | Veracyte Inc. | 4,897 | 100 |
| * | Pediatrix Medical Group Inc. | 5,582 | 99 |
| * | Verve Therapeutics Inc. | 2,575 | 99 |
| * | Krystal Biotech Inc. | 1,404 | 98 |
| * | TransMedics Group Inc. | 1,878 | 98 |
| * | Revance Therapeutics Inc. | 4,861 | 97 |
| * | Ironwood Pharmaceuticals Inc. Class A | 8,906 | 96 |
| * | Meridian Bioscience Inc. | 2,949 | 96 |
| * | Silk Road Medical Inc. | 2,398 | 96 |
| * | ModivCare Inc. | 888 | 96 |
| * | Celldex Therapeutics Inc. | 3,104 | 94 |
| * | CorVel Corp. | 606 | 94 |
| * | Vaxcyte Inc. | 3,604 | 94 |
| * | Cytek Biosciences Inc. | 7,947 | 93 |
| * | Addus HomeCare Corp. | 1,030 | 92 |
| * | Alignment Healthcare Inc. | 6,074 | 92 |
| * | Dynavax Technologies Corp. | 7,933 | 91 |
| * | Phreesia Inc. | 3,513 | 90 |
| * | NeoGenomics Inc. | 8,827 | 89 |
| Shares | Market Value• ($000) | ||
| * | REVOLUTION Medicines Inc. | 4,251 | 89 |
| * | Multiplan Corp. | 25,387 | 89 |
| * | ImmunoGen Inc. | 14,979 | 87 |
| * | Catalyst Pharmaceuticals Inc. | 6,343 | 86 |
| * | AdaptHealth Corp. Class A | 4,796 | 86 |
| * | Emergent BioSolutions Inc. | 3,486 | 84 |
| * | Arcus Biosciences Inc. | 3,455 | 83 |
| * | REGENXBIO Inc. | 2,817 | 83 |
| * | Pacific Biosciences of California Inc. | 13,772 | 81 |
| * | Amphastar Pharmaceuticals Inc. | 2,714 | 80 |
| * | Enanta Pharmaceuticals Inc. | 1,307 | 80 |
| * | Vericel Corp. | 3,195 | 80 |
| * | Avanos Medical Inc. | 3,215 | 79 |
| * | IVERIC bio Inc. | 7,968 | 78 |
| * | Harmony Biosciences Holdings Inc. | 1,768 | 78 |
| * | FibroGen Inc. | 6,219 | 77 |
| Healthcare Services Group Inc. | 5,376 | 76 | |
| * | Syndax Pharmaceuticals Inc. | 3,169 | 75 |
| * | Lyell Immunopharma Inc. | 11,110 | 74 |
| * | Surgery Partners Inc. | 2,666 | 73 |
| * | Avid Bioservices Inc. | 4,173 | 72 |
| US Physical Therapy Inc. | 857 | 71 | |
| * | Zentalis Pharmaceuticals Inc. | 2,648 | 71 |
| * | Aurinia Pharmaceuticals Inc. | 9,653 | 71 |
| * | Kymera Therapeutics Inc. | 2,401 | 68 |
| * | Bridgebio Pharma Inc. | 6,360 | 67 |
| * | Geron Corp. (XNGS) | 25,436 | 67 |
| LeMaitre Vascular Inc. | 1,333 | 66 | |
| * | Allogene Therapeutics Inc. | 4,766 | 65 |
| * | OPKO Health Inc. | 29,371 | 64 |
| * | PROCEPT BioRobotics Corp. | 1,590 | 64 |
| * | Warby Parker Inc. Class A | 5,064 | 64 |
| * | Fulgent Genetics Inc. | 1,456 | 63 |
| * | American Well Corp. Class A | 13,936 | 63 |
| * | AngioDynamics Inc. | 2,800 | 62 |
| *,1 | Cassava Sciences Inc. | 2,409 | 62 |
| * | Cano Health Inc. | 10,067 | 62 |
| * | MannKind Corp. | 16,598 | 61 |
| * | RadNet Inc. | 3,059 | 61 |
| * | Chinook Therapeutics Inc. | 2,956 | 61 |
| * | Clover Health Investments Corp. Class A | 23,245 | 61 |
| * | Adaptive Biotechnologies Corp. | 6,727 | 60 |
| * | Crinetics Pharmaceuticals Inc. | 3,165 | 60 |
| * | Editas Medicine Inc. Class A | 4,084 | 60 |
| * | Prothena Corp. plc | 2,177 | 60 |
| * | Avidity Biosciences Inc. | 3,043 | 60 |
| * | Arcutis Biotherapeutics Inc. | 2,216 | 60 |
| * | Butterfly Network Inc. | 9,649 | 60 |
| * | Aclaris Therapeutics Inc. | 3,691 | 59 |
| * | CareDx Inc. | 2,989 | 59 |
| * | Gossamer Bio Inc. | 4,257 | 59 |
| * | TG Therapeutics Inc. | 8,251 | 59 |
| Shares | Market Value• ($000) | ||
| * | Relmada Therapeutics Inc. | 2,014 | 59 |
| * | NextGen Healthcare Inc. | 3,397 | 58 |
| * | SpringWorks Therapeutics Inc. | 2,094 | 58 |
| * | DocGo Inc. | 5,691 | 58 |
| * | BioLife Solutions Inc. | 2,366 | 56 |
| * | Madrigal Pharmaceuticals Inc. | 779 | 56 |
| *,1 | Senseonics Holdings Inc. | 31,214 | 56 |
| National HealthCare Corp. | 785 | 55 | |
| * | Outset Medical Inc. | 3,027 | 55 |
| * | Artivion Inc. | 2,445 | 54 |
| * | Cutera Inc. | 1,129 | 54 |
| * | Deciphera Pharmaceuticals Inc. | 3,315 | 54 |
| * | Heska Corp. | 592 | 54 |
| * | Coherus Biosciences Inc. | 4,776 | 53 |
| *,1 | Bionano Genomics Inc. | 21,468 | 53 |
| * | Cogent Biosciences Inc. | 3,223 | 53 |
| * | Innoviva Inc. | 3,955 | 52 |
| * | Invitae Corp. | 17,063 | 52 |
| * | Kura Oncology Inc. | 3,740 | 52 |
| * | Rapt Therapeutics Inc. | 1,930 | 52 |
| * | Hims & Hers Health Inc. | 8,182 | 52 |
| * | Point Biopharma Global Inc. | 5,348 | 52 |
| * | Agenus Inc. | 18,915 | 51 |
| * | Anavex Life Sciences Corp. | 5,354 | 51 |
| * | Paragon 28 Inc. | 2,917 | 51 |
| Atrion Corp. | 83 | 50 | |
| * | Brookdale Senior Living Inc. | 11,338 | 50 |
| * | Mersana Therapeutics Inc. | 6,628 | 50 |
| * | Varex Imaging Corp. | 2,362 | 50 |
| * | Morphic Holding Inc. | 1,819 | 50 |
| * | Enhabit Inc. | 3,041 | 50 |
| * | Hanger Inc. | 2,581 | 48 |
| * | Nektar Therapeutics Class A | 11,863 | 47 |
| * | Rocket Pharmaceuticals Inc. | 3,018 | 47 |
| SIGA Technologies Inc. | 3,123 | 47 | |
| *,1 | Sorrento Therapeutics Inc. | 22,806 | 47 |
| * | UFP Technologies Inc. | 503 | 47 |
| * | Design Therapeutics Inc. | 2,331 | 47 |
| * | AnaptysBio Inc. | 1,962 | 46 |
| * | Inogen Inc. | 1,612 | 46 |
| * | Pulmonx Corp. | 2,489 | 46 |
| * | EQRx Inc. | 9,419 | 46 |
| * | NanoString Technologies Inc. | 3,306 | 45 |
| * | OrthoPediatrics Corp. | 926 | 45 |
| * | Alector Inc. | 4,381 | 45 |
| * | Nurix Therapeutics Inc. | 2,877 | 45 |
| * | Treace Medical Concepts Inc. | 2,224 | 45 |
| * | Erasca Inc. | 4,924 | 44 |
| * | 23andMe Holding Co. Class A | 13,142 | 44 |
| * | Keros Therapeutics Inc. | 1,209 | 43 |
| * | Cerus Corp. | 10,215 | 42 |
| * | Reata Pharmaceuticals Inc. Class A | 1,752 | 42 |
| * | Castle Biosciences Inc. | 1,453 | 42 |
| * | Aerie Pharmaceuticals Inc. | 2,736 | 41 |
| * | CTI BioPharma Corp. | 6,553 | 41 |
| * | Viridian Therapeutics Inc. | 1,847 | 41 |
| * | Day One Biopharmaceuticals Inc. | 1,732 | 41 |
| Shares | Market Value• ($000) | ||
| * | Nano-X Imaging Ltd. | 3,096 | 41 |
| * | Collegium Pharmaceutical Inc. | 2,257 | 40 |
| * | Health Catalyst Inc. | 3,316 | 40 |
| * | Sangamo Therapeutics Inc. | 7,497 | 40 |
| * | SI-BONE Inc. | 2,412 | 40 |
| * | Theravance Biopharma Inc. | 4,391 | 40 |
| * | NGM Biopharmaceuticals Inc. | 2,868 | 40 |
| * | Atea Pharmaceuticals Inc. | 5,308 | 40 |
| * | 2seventy bio Inc. | 2,730 | 40 |
| * | Vanda Pharmaceuticals Inc. | 3,695 | 39 |
| * | Accolade Inc. | 3,838 | 39 |
| * | Caribou Biosciences Inc. | 3,996 | 39 |
| * | Alphatec Holdings Inc. | 4,987 | 38 |
| * | Cardiovascular Systems Inc. | 2,866 | 38 |
| * | Inovio Pharmaceuticals Inc. | 16,617 | 38 |
| * | Replimune Group Inc. | 1,987 | 38 |
| * | ADMA Biologics Inc. | 14,196 | 38 |
| * | Sana Biotechnology Inc. | 5,627 | 38 |
| * | Cara Therapeutics Inc. | 3,537 | 37 |
| * | ViewRay Inc. | 10,964 | 37 |
| * | Y-mAbs Therapeutics Inc. | 2,309 | 37 |
| * | Esperion Therapeutics Inc. | 4,804 | 36 |
| * | LifeStance Health Group Inc. | 5,709 | 36 |
| * | Ventyx Biosciences Inc. | 1,774 | 36 |
| * | HealthStream Inc. | 1,564 | 35 |
| * | Surmodics Inc. | 1,046 | 35 |
| * | SomaLogic Inc. | 9,530 | 35 |
| * | Inhibrx Inc. | 1,905 | 34 |
| * | DICE Therapeutics Inc. | 2,171 | 34 |
| * | Cincor Pharma Inc. | 1,021 | 34 |
| * | Codexis Inc. | 4,706 | 33 |
| National Research Corp. | 965 | 33 | |
| * | ANI Pharmaceuticals Inc. | 897 | 33 |
| * | Pennant Group Inc. | 2,075 | 33 |
| * | Computer Programs and Systems Inc. | 1,064 | 32 |
| * | Ocular Therapeutix Inc. | 6,261 | 32 |
| * | MiMedx Group Inc. | 8,944 | 32 |
| * | Nkarta Inc. | 2,230 | 32 |
| * | C4 Therapeutics Inc. | 3,187 | 32 |
| * | Karyopharm Therapeutics Inc. | 6,216 | 31 |
| * | Kiniksa Pharmaceuticals Ltd. Class A | 2,607 | 31 |
| * | Agiliti Inc. | 1,954 | 31 |
| * | Axogen Inc. | 3,201 | 30 |
| * | KalVista Pharmaceuticals Inc. | 1,804 | 30 |
| * | 908 Devices Inc. | 1,472 | 30 |
| * | Seer Inc. Class A | 2,922 | 30 |
| * | Ocugen Inc. | 11,373 | 29 |
| * | iTeos Therapeutics Inc. | 1,276 | 28 |
| * | Kezar Life Sciences Inc. | 2,745 | 28 |
| * | PMV Pharmaceuticals Inc. | 2,044 | 28 |
| * | Inotiv Inc. | 1,431 | 28 |
| * | Orthofix Medical Inc. | 1,354 | 27 |
| * | Protagonist Therapeutics Inc. | 3,105 | 27 |
| * | Akero Therapeutics Inc. | 2,334 | 27 |
| * | Eiger BioPharmaceuticals Inc. | 3,168 | 26 |
| * | Vaxart Inc. | 8,457 | 26 |
| * | Vera Therapeutics Inc. Class A | 1,201 | 26 |
| Shares | Market Value• ($000) | ||
| * | ALX Oncology Holdings Inc. | 1,927 | 25 |
| * | Forma Therapeutics Holdings Inc. | 1,898 | 25 |
| * | Kinnate Biopharma Inc. | 1,709 | 25 |
| * | MaxCyte Inc. | 4,851 | 25 |
| * | Edgewise Therapeutics Inc. | 2,471 | 25 |
| * | Stoke Therapeutics Inc. | 1,608 | 24 |
| * | Community Health Systems Inc. | 8,468 | 23 |
| * | Evolus Inc. | 2,392 | 23 |
| * | Intercept Pharmaceuticals Inc. | 1,348 | 23 |
| * | Albireo Pharma Inc. | 1,320 | 23 |
| * | Ideaya Biosciences Inc. | 2,299 | 23 |
| * | OptimizeRx Corp. | 1,369 | 22 |
| * | Arcturus Therapeutics Holdings Inc. | 1,579 | 22 |
| * | Adicet Bio Inc. | 1,527 | 22 |
| * | Cullinan Oncology Inc. | 1,646 | 22 |
| * | Imago Biosciences Inc. | 1,519 | 22 |
| * | Bluebird Bio Inc. | 3,566 | 21 |
| * | Heron Therapeutics Inc. | 5,131 | 21 |
| * | Tricida Inc. | 1,668 | 21 |
| * | CareMax Inc. | 3,010 | 21 |
| * | Affimed NV | 7,680 | 20 |
| * | Organogenesis Holdings Inc. Class A | 5,493 | 20 |
| * | Mirum Pharmaceuticals Inc. | 798 | 20 |
| * | Generation Bio Co. | 3,963 | 20 |
| * | Instil Bio Inc. | 3,901 | 20 |
| * | Eagle Pharmaceuticals Inc. | 569 | 19 |
| * | PetIQ Inc. Class A | 1,991 | 19 |
| * | ImmunityBio Inc. | 4,806 | 19 |
| * | Monte Rosa Therapeutics Inc. | 2,381 | 19 |
| * | Atara Biotherapeutics Inc. | 4,439 | 18 |
| Utah Medical Products Inc. | 195 | 18 | |
| * | Cue Health Inc. | 5,376 | 18 |
| * | Kodiak Sciences Inc. | 1,659 | 17 |
| * | Quanterix Corp. | 1,823 | 17 |
| * | Seres Therapeutics Inc. | 3,373 | 17 |
| * | Anika Therapeutics Inc. | 704 | 16 |
| * | Nuvation Bio Inc. | 5,848 | 16 |
| * | Nuvalent Inc. Class A | 967 | 16 |
| iRadimed Corp. | 435 | 15 | |
| Phibro Animal Health Corp. Class A | 1,028 | 15 | |
| * | Dyne Therapeutics Inc. | 1,518 | 15 |
| * | Bright Health Group Inc. | 9,625 | 15 |
| * | Zimvie Inc. | 993 | 15 |
| * | Liquidia Corp. | 2,395 | 14 |
| * | Tarsus Pharmaceuticals Inc. | 918 | 14 |
| * | Bioventus Inc. Class A | 1,856 | 14 |
| * | Quantum-Si Inc. | 4,606 | 14 |
| *,1 | Amylyx Pharmaceuticals Inc. | 574 | 14 |
| * | OraSure Technologies Inc. | 3,300 | 13 |
| * | Arbutus Biopharma Corp. | 5,805 | 13 |
| * | Bioxcel Therapeutics Inc. | 956 | 13 |
| * | RxSight Inc. | 1,037 | 13 |
| * | Joint Corp. | 664 | 12 |
| * | MacroGenics Inc. | 3,131 | 12 |
| * | Provention Bio Inc. | 2,693 | 12 |
| * | Sutro Biopharma Inc. | 2,103 | 12 |
| * | MeiraGTx Holdings plc | 1,440 | 12 |
| Shares | Market Value• ($000) | ||
| * | Century Therapeutics Inc. | 1,146 | 12 |
| * | Janux Therapeutics Inc. | 1,071 | 12 |
| * | Aura Biosciences Inc. | 920 | 12 |
| * | Amneal Pharmaceuticals Inc. | 5,238 | 11 |
| * | Rigel Pharmaceuticals Inc. | 7,776 | 11 |
| * | Allovir Inc. | 1,484 | 11 |
| * | 4D Molecular Therapeutics Inc. | 1,418 | 11 |
| * | EyePoint Pharmaceuticals Inc. | 1,066 | 11 |
| * | Absci Corp. | 3,347 | 11 |
| * | Xeris Biopharma Holdings Inc. | 6,638 | 11 |
| * | IGM Biosciences Inc. | 500 | 10 |
| * | Precigen Inc. | 4,601 | 10 |
| * | Fulcrum Therapeutics Inc. | 1,317 | 10 |
| * | Immunovant Inc. | 1,845 | 10 |
| * | Akoya Biosciences Inc. | 865 | 10 |
| * | Aerovate Therapeutics Inc. | 488 | 10 |
| * | Adagio Therapeutics Inc. | 2,165 | 10 |
| * | Aadi Bioscience Inc. | 737 | 10 |
| * | Tango Therapeutics Inc. | 2,346 | 10 |
| * | Vicarious Surgical Inc. | 2,781 | 10 |
| * | Lexicon Pharmaceuticals Inc. | 3,282 | 9 |
| * | SeaSpine Holdings Corp. | 1,429 | 9 |
| * | Berkeley Lights Inc. | 2,368 | 9 |
| * | Foghorn Therapeutics Inc. | 947 | 9 |
| * | Singular Genomics Systems Inc. | 3,259 | 9 |
| * | Convey Health Solutions Holdings Inc. | 836 | 9 |
| * | Arcellx Inc. | 491 | 9 |
| * | Chimerix Inc. | 3,642 | 8 |
| * | Tactile Systems Technology Inc. | 934 | 8 |
| Zynex Inc. | 939 | 8 | |
| * | VBI Vaccines Inc. | 8,649 | 8 |
| * | Phathom Pharmaceuticals Inc. | 983 | 8 |
| * | Kronos Bio Inc. | 1,885 | 8 |
| * | Sight Sciences Inc. | 1,094 | 8 |
| * | Sema4 Holdings Corp. | 8,025 | 8 |
| * | HilleVax Inc. | 655 | 8 |
| * | Tenaya Therapeutics Inc. | 1,587 | 7 |
| * | P3 Health Partners Inc. | 1,366 | 7 |
| * | Jounce Therapeutics Inc. | 1,596 | 6 |
| * | Praxis Precision Medicines Inc. | 1,837 | 6 |
| * | Rallybio Corp. | 498 | 6 |
| * | Sharecare Inc. | 3,157 | 6 |
| * | Humacyte Inc. | 1,603 | 6 |
| * | Oncology Institute Inc. | 965 | 6 |
| * | PepGen Inc. | 616 | 6 |
| * | Outlook Therapeutics Inc. | 4,413 | 5 |
| * | Alpine Immune Sciences Inc. | 599 | 5 |
| * | Athira Pharma Inc. | 1,570 | 5 |
| * | Nautilus Biotechnology Inc. | 2,441 | 5 |
| * | Icosavax Inc. | ��� 1,108 | 5 |
| * | Thorne HealthTech Inc. | 1,058 | 5 |
| * | Science 37 Holdings Inc. | 3,130 | 5 |
| * | Pardes Biosciences Inc. | 1,452 | 5 |
| * | Enochian Biosciences Inc. | 1,776 | 4 |
| *,2 | Tobira Therapeutics Inc. CVR | 937 | 4 |
| * | Talaris Therapeutics Inc. | 1,109 | 4 |
| Shares | Market Value• ($000) | ||
| * | Theseus Pharmaceuticals Inc. | 598 | 4 |
| * | Tyra Biosciences Inc. | 620 | 4 |
| AirSculpt Technologies Inc. | 469 | 4 | |
| * | Babylon Holdings Ltd. Classs A | 5,658 | 4 |
| * | Innovage Holding Corp. | 929 | 3 |
| * | Aveanna Healthcare Holdings Inc. | 1,874 | 3 |
| * | ATI Physical Therapy Inc. | 3,817 | 3 |
| * | VistaGen Therapeutics Inc. | 9,268 | 2 |
| * | Alpha Teknova Inc. | 333 | 2 |
| * | An2 Therapeutics Inc. | 76 | 1 |
| *,2 | Synergy Pharmaceuticals Inc. | 12,927 | — |
| *,2 | Progenics Pharmaceuticals Inc. CVR | 4,323 | — |
| 352,985 | |||
| Industrials (12.8%) | |||
| Visa Inc. Class A | 110,900 | 22,037 | |
| Mastercard Inc. Class A | 57,974 | 18,805 | |
| Accenture plc Class A | 42,666 | 12,307 | |
| United Parcel Service Inc. Class B | 49,479 | 9,624 | |
| Union Pacific Corp. | 42,272 | 9,490 | |
| Raytheon Technologies Corp. | 100,133 | 8,987 | |
| Honeywell International Inc. | 45,885 | 8,688 | |
| * | PayPal Holdings Inc. | 78,050 | 7,293 |
| Deere & Co. | 18,894 | 6,901 | |
| Automatic Data Processing Inc. | 28,112 | 6,871 | |
| Lockheed Martin Corp. | 16,000 | 6,722 | |
| Caterpillar Inc. | 35,937 | 6,638 | |
| American Express Co. | 40,562 | 6,165 | |
| * | Boeing Co. | 36,934 | 5,919 |
| General Electric Co. | 73,858 | 5,424 | |
| 1 | 3M Co. | 38,215 | 4,752 |
| Northrop Grumman Corp. | 9,872 | 4,719 | |
| CSX Corp. | 146,111 | 4,624 | |
| Illinois Tool Works Inc. | 20,843 | 4,061 | |
| * | Fiserv Inc. | 40,051 | 4,053 |
| Norfolk Southern Corp. | 16,007 | 3,892 | |
| General Dynamics Corp. | 16,607 | 3,802 | |
| Fidelity National Information Services Inc. | 41,074 | 3,753 | |
| Sherwin-Williams Co. | 16,122 | 3,742 | |
| Eaton Corp. plc | 26,898 | 3,675 | |
| FedEx Corp. | 16,203 | 3,416 | |
| Emerson Electric Co. | 39,741 | 3,248 | |
| L3Harris Technologies Inc. | 13,010 | 2,969 | |
| Capital One Financial Corp. | 26,685 | 2,824 | |
| Paychex Inc. | 21,673 | 2,673 | |
| Johnson Controls International plc | 46,878 | 2,538 | |
| Trane Technologies plc | 15,709 | 2,420 | |
| * | Block Inc. (XNYS) | 34,898 | 2,405 |
| Cintas Corp. | 5,874 | 2,390 | |
| Global Payments Inc. | 18,828 | 2,339 | |
| Parker-Hannifin Corp. | 8,599 | 2,279 | |
| Carrier Global Corp. | 57,060 | 2,232 | |
| TransDigm Group Inc. | 3,540 | 2,125 | |
| Otis Worldwide Corp. | 28,458 | 2,055 | |
| Cummins Inc. | 9,491 | 2,044 | |
| PPG Industries Inc. | 15,892 | 2,018 | |
| PACCAR Inc. | 22,936 | 2,007 | |
| Shares | Market Value• ($000) | ||
| * | Keysight Technologies Inc. | 12,215 | 2,002 |
| Verisk Analytics Inc. Class A | 10,470 | 1,960 | |
| DuPont de Nemours Inc. | 34,301 | 1,909 | |
| Old Dominion Freight Line Inc. | 6,870 | 1,865 | |
| AMETEK Inc. | 15,506 | 1,863 | |
| Rockwell Automation Inc. | 7,854 | 1,861 | |
| * | Mettler-Toledo International Inc. | 1,499 | 1,817 |
| WW Grainger Inc. | 3,062 | 1,699 | |
| Equifax Inc. | 8,205 | 1,549 | |
| Fortive Corp. | 24,158 | 1,530 | |
| Vulcan Materials Co. | 8,886 | 1,479 | |
| Martin Marietta Materials Inc. | 4,166 | 1,449 | |
| * | United Rentals Inc. | 4,804 | 1,403 |
| Quanta Services Inc. | 9,578 | 1,353 | |
| Ingersoll Rand Inc. | 27,398 | 1,298 | |
| Amcor plc | 101,354 | 1,217 | |
| Dover Corp. | 9,678 | 1,209 | |
| * | Waters Corp. | 4,036 | 1,205 |
| Ball Corp. | 21,217 | 1,184 | |
| Expeditors International of Washington Inc. | 11,258 | 1,158 | |
| * | Teledyne Technologies Inc. | 3,121 | 1,150 |
| Synchrony Financial | 33,697 | 1,104 | |
| Xylem Inc. | 12,068 | 1,099 | |
| * | FleetCor Technologies Inc. | 5,063 | 1,076 |
| Jacobs Solutions Inc. | 8,596 | 1,071 | |
| Westinghouse Air Brake Technologies Corp. | 12,174 | 1,067 | |
| * | Bill.com Holdings Inc. | 6,585 | 1,066 |
| * | Trimble Inc. | 16,842 | 1,065 |
| * | Zebra Technologies Corp. Class A | 3,529 | 1,064 |
| IDEX Corp. | 5,074 | 1,021 | |
| Carlisle Cos. Inc. | 3,432 | 1,015 | |
| JB Hunt Transport Services Inc. | 5,626 | 979 | |
| CH Robinson Worldwide Inc. | 8,442 | 964 | |
| TransUnion | 12,975 | 958 | |
| Jack Henry & Associates Inc. | 4,839 | 930 | |
| * | Generac Holdings Inc. | 4,202 | 926 |
| Textron Inc. | 14,461 | 902 | |
| Stanley Black & Decker Inc. | 10,181 | 897 | |
| Howmet Aerospace Inc. | 25,191 | 893 | |
| Nordson Corp. | 3,866 | 878 | |
| Packaging Corp. of America | 6,202 | 849 | |
| Booz Allen Hamilton Holding Corp. Class A | 8,814 | 844 | |
| Masco Corp. | 15,773 | 802 | |
| RPM International Inc. | 8,567 | 798 | |
| Snap-on Inc. | 3,508 | 764 | |
| * | Fair Isaac Corp. | 1,693 | 761 |
| Hubbell Inc. Class B | 3,604 | 744 | |
| Crown Holdings Inc. | 7,931 | 718 | |
| Graco Inc. | 11,210 | 716 | |
| Westrock Co. | 17,073 | 693 | |
| * | Builders FirstSource Inc. | 11,494 | 674 |
| AECOM | 8,929 | 653 | |
| * | Paylocity Holding Corp. | 2,686 | 647 |
| HEICO Corp. Class A | 5,190 | 636 | |
| Regal Rexnord Corp. | 4,509 | 620 |
| Shares | Market Value• ($000) | ||
| Huntington Ingalls Industries Inc. | 2,659 | 612 | |
| Watsco Inc. | 2,221 | 604 | |
| Toro Co. | 7,037 | 584 | |
| * | WillScot Mobile Mini Holdings Corp. | 14,555 | 584 |
| Genpact Ltd. | 12,088 | 568 | |
| Advanced Drainage Systems Inc. | 4,120 | 559 | |
| Allegion plc | 5,878 | 559 | |
| Robert Half International Inc. | 7,245 | 558 | |
| Fortune Brands Home & Security Inc. | 8,813 | 541 | |
| Knight-Swift Transportation Holdings Inc. | 10,707 | 541 | |
| * | Axon Enterprise Inc. | 4,587 | 535 |
| Owens Corning | 6,472 | 529 | |
| * | Middleby Corp. | 3,651 | 525 |
| Sealed Air Corp. | 9,740 | 524 | |
| Lennox International Inc. | 2,180 | 523 | |
| Lincoln Electric Holdings Inc. | 3,711 | 507 | |
| Cognex Corp. | 11,742 | 494 | |
| Pentair plc | 11,032 | 491 | |
| A O Smith Corp. | 8,647 | 488 | |
| Tetra Tech Inc. | 3,568 | 485 | |
| * | Chart Industries Inc. | 2,476 | 480 |
| HEICO Corp. | 3,149 | 480 | |
| * | Berry Global Group Inc. | 8,744 | 475 |
| * | WEX Inc. | 3,036 | 468 |
| AptarGroup Inc. | 4,478 | 460 | |
| AGCO Corp. | 4,181 | 455 | |
| Graphic Packaging Holding Co. | 20,403 | 454 | |
| Donaldson Co. Inc. | 8,290 | 426 | |
| Sensata Technologies Holding plc | 10,535 | 424 | |
| Sonoco Products Co. | 6,543 | 412 | |
| MDU Resources Group Inc. | 13,628 | 411 | |
| ITT Inc. | 5,640 | 409 | |
| * | TopBuild Corp. | 2,216 | 407 |
| EMCOR Group Inc. | 3,390 | 403 | |
| Valmont Industries Inc. | 1,432 | 396 | |
| * | WESCO International Inc. | 3,004 | 396 |
| * | Mohawk Industries Inc. | 3,559 | 393 |
| Littelfuse Inc. | 1,644 | 390 | |
| MKS Instruments Inc. | 3,910 | 389 | |
| Brunswick Corp. | 5,162 | 386 | |
| Western Union Co. | 25,929 | 384 | |
| * | Axalta Coating Systems Ltd. | 14,900 | 384 |
| Acuity Brands Inc. | 2,338 | 383 | |
| Curtiss-Wright Corp. | 2,603 | 383 | |
| Woodward Inc. | 4,016 | 374 | |
| nVent Electric plc | 11,311 | 373 | |
| * | Saia Inc. | 1,789 | 370 |
| Landstar System Inc. | 2,503 | 367 | |
| * | ExlService Holdings Inc. | 2,183 | 366 |
| * | FTI Consulting Inc. | 2,278 | 366 |
| * | Trex Co. Inc. | 7,787 | 364 |
| * | XPO Logistics Inc. | 6,943 | 364 |
| Oshkosh Corp. | 4,474 | 357 | |
| * | ASGN Inc. | 3,415 | 330 |
| Exponent Inc. | 3,500 | 329 | |
| BWX Technologies Inc. | 6,260 | 326 | |
| * | GXO Logistics Inc. | 7,215 | 320 |
| Shares | Market Value• ($000) | ||
| Eagle Materials Inc. | 2,654 | 317 | |
| * | MasTec Inc. | 3,939 | 317 |
| * | AMN Healthcare Services Inc. | 3,052 | 313 |
| Crane Holdings Co. | 3,211 | 303 | |
| * | Bloom Energy Corp. Class A | 11,881 | 302 |
| MSA Safety Inc. | 2,530 | 301 | |
| Louisiana-Pacific Corp. | 5,519 | 299 | |
| * | Euronet Worldwide Inc. | 3,302 | 293 |
| * | Affirm Holdings Inc. | 12,040 | 282 |
| Franklin Electric Co. Inc. | 3,198 | 278 | |
| Applied Industrial Technologies Inc. | 2,572 | 273 | |
| * | Kirby Corp. | 4,001 | 268 |
| Flowserve Corp. | 8,771 | 267 | |
| Armstrong World Industries Inc. | 3,135 | 263 | |
| Simpson Manufacturing Co. Inc. | 2,841 | 263 | |
| Insperity Inc. | 2,391 | 261 | |
| Ryder System Inc. | 3,396 | 260 | |
| ManpowerGroup Inc. | 3,486 | 256 | |
| Watts Water Technologies Inc. Class A | 1,848 | 256 | |
| Air Lease Corp. Class A | 7,000 | 255 | |
| * | Fluor Corp. | 9,599 | 254 |
| Silgan Holdings Inc. | 5,564 | 253 | |
| * | ATI Inc. | 8,407 | 252 |
| MSC Industrial Direct Co. Inc. Class A | 3,174 | 251 | |
| Triton International Ltd. | 4,194 | 250 | |
| Maximus Inc. | 4,116 | 249 | |
| Vontier Corp. | 11,168 | 245 | |
| Comfort Systems USA Inc. | 2,421 | 243 | |
| Allison Transmission Holdings Inc. | 6,642 | 241 | |
| * | Atkore Inc. | 2,812 | 237 |
| HB Fuller Co. | 3,658 | 237 | |
| GATX Corp. | 2,453 | 237 | |
| * | Aerojet Rocketdyne Holdings Inc. | 5,468 | 236 |
| * | Summit Materials Inc. Class A | 8,118 | 231 |
| John Bean Technologies Corp. | 2,180 | 225 | |
| * | API Group Corp. | 14,386 | 224 |
| Zurn Elkay Water Solutions Corp. | 8,125 | 224 | |
| * | Dycom Industries Inc. | 1,969 | 221 |
| * | Marqeta Inc. Class A | 28,424 | 221 |
| Korn Ferry | 3,580 | 218 | |
| Otter Tail Corp. | 2,827 | 214 | |
| Spirit AeroSystems Holdings Inc. Class A | 7,070 | 213 | |
| ABM Industries Inc. | 4,590 | 213 | |
| Hillenbrand Inc. | 5,083 | 212 | |
| * | Resideo Technologies Inc. | 10,042 | 209 |
| * | TriNet Group Inc. | 2,513 | 207 |
| * | Beacon Roofing Supply Inc. | 3,634 | 200 |
| Herc Holdings Inc. | 1,755 | 197 | |
| Matson Inc. | 2,676 | 197 | |
| ManTech International Corp. Class A | 2,026 | 194 | |
| Badger Meter Inc. | 2,029 | 192 | |
| Albany International Corp. Class A | 2,138 | 189 | |
| Belden Inc. | 2,870 | 188 |
| Shares | Market Value• ($000) | ||
| * | Mercury Systems Inc. | 3,893 | 187 |
| * | Alight Inc. Class A | 23,788 | 187 |
| UniFirst Corp. | 1,026 | 185 | |
| * | ACI Worldwide Inc. | 7,715 | 183 |
| * | StoneCo. Ltd. Class A | 19,187 | 182 |
| Werner Enterprises Inc. | 4,538 | 181 | |
| * | Hub Group Inc. Class A | 2,251 | 180 |
| * | Atlas Air Worldwide Holdings Inc. | 1,780 | 178 |
| Brink's Co. | 3,221 | 178 | |
| EnerSys | 2,850 | 178 | |
| Forward Air Corp. | 1,802 | 175 | |
| AAON Inc. | 3,021 | 174 | |
| * | SPX Technologies Inc. | 3,012 | 172 |
| Federal Signal Corp. | 4,162 | 166 | |
| * | Enovix Corp. | 7,360 | 163 |
| Altra Industrial Motion Corp. | 4,276 | 162 | |
| * | Shift4 Payments Inc. Class A | 3,557 | 161 |
| Encore Wire Corp. | 1,219 | 159 | |
| * | Verra Mobility Corp. Class A | 9,560 | 152 |
| Installed Building Products Inc. | 1,640 | 149 | |
| Brady Corp. Class A | 3,188 | 148 | |
| ESCO Technologies Inc. | 1,812 | 148 | |
| Terex Corp. | 4,456 | 148 | |
| * | Itron Inc. | 3,081 | 147 |
| * | CBIZ Inc. | 3,315 | 145 |
| Kadant Inc. | 801 | 144 | |
| Moog Inc. Class A | 1,896 | 142 | |
| McGrath RentCorp. | 1,674 | 141 | |
| Trinity Industries Inc. | 5,687 | 139 | |
| * | GMS Inc. | 2,833 | 137 |
| * | AZEK Co. Inc. Class A | 7,485 | 137 |
| CSW Industrials Inc. | 1,078 | 136 | |
| EVERTEC Inc. | 4,046 | 136 | |
| * | AeroVironment Inc. | 1,516 | 134 |
| Kennametal Inc. | 5,717 | 134 | |
| Bread Financial Holdings Inc. | 3,471 | 133 | |
| Scorpio Tankers Inc. | 3,197 | 133 | |
| Esab Corp. | 3,228 | 133 | |
| EnPro Industries Inc. | 1,452 | 132 | |
| * | O-I Glass Inc. | 10,030 | 130 |
| ArcBest Corp. | 1,569 | 126 | |
| * | Masonite International Corp. | 1,538 | 126 |
| * | NV5 Global Inc. | 884 | 124 |
| * | Air Transport Services Group Inc. | 4,090 | 123 |
| ICF International Inc. | 1,195 | 121 | |
| Helios Technologies Inc. | 2,206 | 120 | |
| Mueller Water Products Inc. Class A | 10,667 | 120 | |
| Lindsay Corp. | 725 | 116 | |
| Greif Inc. Class A | 1,688 | 113 | |
| * | Veritiv Corp. | 944 | 113 |
| Maxar Technologies Inc. | 4,678 | 111 | |
| * | Vicor Corp. | 1,509 | 107 |
| * | Evo Payments Inc. Class A | 3,192 | 106 |
| *,1 | Nikola Corp. | 19,862 | 106 |
| * | Kratos Defense & Security Solutions Inc. | 8,213 | 103 |
| * | MYR Group Inc. | 1,106 | 103 |
| International Seaways Inc. | 3,437 | 102 |
| Shares | Market Value• ($000) | ||
| ADT Inc. | 13,963 | 102 | |
| * | Frontline Ltd. | 8,480 | 101 |
| * | Payoneer Global Inc. | 14,947 | 99 |
| Granite Construction Inc. | 3,266 | 98 | |
| Griffon Corp. | 3,116 | 98 | |
| * | Huron Consulting Group Inc. | 1,463 | 98 |
| Barnes Group Inc. | 3,131 | 97 | |
| * | CryoPort Inc. | 2,939 | 96 |
| * | AAR Corp. | 2,228 | 96 |
| * | Core & Main Inc. Class A | 4,090 | 96 |
| Alamo Group Inc. | 728 | 95 | |
| * | Gibraltar Industries Inc. | 2,235 | 94 |
| Textainer Group Holdings Ltd. | 3,086 | 94 | |
| * | Flywire Corp. | 3,796 | 94 |
| * | Proterra Inc. | 15,332 | 93 |
| * | OSI Systems Inc. | 1,086 | 90 |
| * | Virgin Galactic Holdings Inc. | 15,221 | 90 |
| * | ZipRecruiter Inc. Class A | 5,355 | 89 |
| * | Joby Aviation Inc. | 16,870 | 89 |
| Schneider National Inc. Class B | 3,846 | 88 | |
| * | PGT Innovations Inc. | 4,180 | 87 |
| TriMas Corp. | 3,079 | 85 | |
| SFL Corp. Ltd. | 7,931 | 85 | |
| Enerpac Tool Group Corp. Class A | 4,367 | 85 | |
| Golden Ocean Group Ltd. | 8,257 | 79 | |
| * | CoreCivic Inc. | 8,194 | 78 |
| * | Donnelley Financial Solutions Inc. | 1,840 | 78 |
| * | Montrose Environmental Group Inc. | 1,931 | 78 |
| * | Energy Recovery Inc. | 3,338 | 77 |
| Primoris Services Corp. | 3,778 | 77 | |
| * | Hillman Solutions Corp. | 9,178 | 77 |
| * | Proto Labs Inc. | 1,984 | 76 |
| Kforce Inc. | 1,379 | 75 | |
| * | Construction Partners Inc. Class A | 2,509 | 73 |
| * | Rocket Lab USA Inc. | 13,204 | 73 |
| Patrick Industries Inc. | 1,341 | 71 | |
| * | Gates Industrial Corp. plc | 6,621 | 71 |
| Marten Transport Ltd. | 3,518 | 70 | |
| * | AvidXchange Holdings Inc. | 8,886 | 69 |
| Tennant Co. | 1,119 | 68 | |
| DHT Holdings Inc. | 8,712 | 68 | |
| * | TuSimple Holdings Inc. Class A | 9,418 | 68 |
| TTEC Holdings Inc. | 1,283 | 67 | |
| Standex International Corp. | 727 | 66 | |
| Astec Industries Inc. | 1,694 | 65 | |
| * | Napco Security Technologies Inc. | 2,198 | 65 |
| * | Mirion Technologies Inc. | 8,636 | 65 |
| AZZ Inc. | 1,486 | 63 | |
| H&E Equipment Services Inc. | 1,972 | 62 | |
| * | PureCycle Technologies Inc. | 6,798 | 62 |
| Apogee Enterprises Inc. | 1,471 | 60 | |
| * | Legalzoom.com Inc. | 5,855 | 60 |
| * | Flex LNG Ltd. | 1,811 | 60 |
| * | Green Dot Corp. Class A | 2,916 | 59 |
| * | Desktop Metal Inc. Class A | 18,467 | 59 |
| * | Remitly Global Inc. | 5,347 | 59 |
| Shares | Market Value• ($000) | ||
| Ardagh Metal Packaging SA | 9,351 | 58 | |
| * | Cross Country Healthcare Inc. | 2,244 | 57 |
| * | JELD-WEN Holding Inc. | 5,139 | 57 |
| Trinseo plc | 2,164 | 57 | |
| * | American Woodmark Corp. | 1,070 | 55 |
| Greenbrier Cos. Inc. | 1,931 | 55 | |
| Kaman Corp. | 1,712 | 54 | |
| * | Janus International Group Inc. | 5,202 | 54 |
| Columbus McKinnon Corp. | 1,720 | 53 | |
| * | SP Plus Corp. | 1,590 | 53 |
| * | Modine Manufacturing Co. | 3,466 | 52 |
| Deluxe Corp. | 2,672 | 51 | |
| Quanex Building Products Corp. | 2,274 | 51 | |
| Mesa Laboratories Inc. | 295 | 50 | |
| Shyft Group Inc. | 2,079 | 50 | |
| * | First Advantage Corp. | 3,585 | 50 |
| Wabash National Corp. | 2,960 | 49 | |
| * | Sterling Infrastructure Inc. | 1,903 | 48 |
| * | Triumph Group Inc. | 3,727 | 48 |
| * | Repay Holdings Corp. Class A | 5,212 | 48 |
| Douglas Dynamics Inc. | 1,616 | 47 | |
| * | TrueBlue Inc. | 2,303 | 47 |
| * | FARO Technologies Inc. | 1,357 | 46 |
| * | International Money Express Inc. | 2,060 | 46 |
| * | BTRS Holdings Inc. Class A | 6,758 | 46 |
| CRA International Inc. | 495 | 45 | |
| Heartland Express Inc. | 2,979 | 45 | |
| * | Titan Machinery Inc. | 1,450 | 45 |
| * | Vivint Smart Home Inc. | 7,206 | 45 |
| * | Conduent Inc. | 10,724 | 44 |
| Gorman-Rupp Co. | 1,659 | 44 | |
| * | Titan International Inc. | 3,161 | 44 |
| Ennis Inc. | 2,004 | 43 | |
| Myers Industries Inc. | 2,212 | 43 | |
| Resources Connection Inc. | 2,215 | 43 | |
| * | Cimpress plc | 1,271 | 43 |
| * | Teekay Tankers Ltd. Class A | 1,763 | 43 |
| * | Hayward Holdings Inc. | 4,099 | 43 |
| Chase Corp. | 471 | 42 | |
| * | BlueLinx Holdings Inc. | 580 | 41 |
| Costamare Inc. | 3,636 | 41 | |
| Insteel Industries Inc. | 1,385 | 40 | |
| * | Transcat Inc. | 544 | 40 |
| * | Franklin Covey Co. | 826 | 39 |
| * | Great Lakes Dredge & Dock Corp. | 4,061 | 39 |
| Eagle Bulk Shipping Inc. | 888 | 39 | |
| * | Sterling Check Corp. | 1,811 | 39 |
| Barrett Business Services Inc. | 475 | 38 | |
| Cass Information Systems Inc. | 1,036 | 38 | |
| Heidrick & Struggles International Inc. | 1,341 | 38 | |
| Pitney Bowes Inc. | 13,106 | 38 | |
| Pactiv Evergreen Inc. | 3,395 | 38 | |
| Kelly Services Inc. Class A | 2,247 | 36 | |
| Luxfer Holdings plc | 2,186 | 36 | |
| Allied Motion Technologies Inc. | 1,001 | 35 | |
| * | Babcock & Wilcox Enterprises Inc. | 4,371 | 35 |
| Shares | Market Value• ($000) | ||
| * | BrightView Holdings Inc. | 3,427 | 35 |
| VSE Corp. | 839 | 35 | |
| * | Vishay Precision Group Inc. | 1,024 | 35 |
| * | Paya Holdings Inc. | 5,658 | 35 |
| * | Paysafe Ltd. | 21,361 | 35 |
| Genco Shipping & Trading Ltd. | 2,501 | 34 | |
| * | Infrastructure and Energy Alternatives Inc. | 2,371 | 34 |
| * | Diversey Holdings Ltd. | 5,503 | 34 |
| * | Microvast Holdings Inc. | 13,738 | 34 |
| * | Archer Aviation Inc. Class A | 9,704 | 34 |
| * | I3 Verticals Inc. Class A | 1,426 | 33 |
| * | Target Hospitality Corp. | 2,483 | 33 |
| Dorian LPG Ltd. | 2,295 | 33 | |
| * | Thermon Group Holdings Inc. | 1,838 | 32 |
| * | Cantaloupe Inc. | 4,990 | 32 |
| * | V2X Inc. | 853 | 30 |
| Greif Inc. Class B | 435 | 28 | |
| * | DXP Enterprises Inc. | 1,031 | 27 |
| * | Ducommun Inc. | 624 | 27 |
| * | Manitowoc Co. Inc. | 2,868 | 27 |
| Nordic American Tankers Ltd. | 10,221 | 27 | |
| Argan Inc. | 744 | 26 | |
| * | Forrester Research Inc. | 623 | 26 |
| Covenant Logistics Group Inc. Class A | 883 | 25 | |
| * | Workhorse Group Inc. | 7,930 | 25 |
| * | Hyliion Holdings Corp. | 7,202 | 25 |
| * | Advantage Solutions Inc. | 6,500 | 24 |
| * | Radiant Logistics Inc. | 3,289 | 23 |
| Caesarstone Ltd. | 2,247 | 23 | |
| * | CS Disco Inc. | 1,646 | 23 |
| * | Custom Truck One Source Inc. | 3,270 | 22 |
| REV Group Inc. | 1,861 | 21 | |
| Cadre Holdings Inc. | 830 | 21 | |
| * | Aspen Aerogels Inc. | 1,506 | 20 |
| *,1 | Danimer Scientific Inc. | 4,537 | 20 |
| * | Hudson Technologies Inc. | 2,155 | 18 |
| Hyster-Yale Materials Handling Inc. | 613 | 18 | |
| * | Hireright Holdings Corp. | 1,089 | 18 |
| * | Distribution Solutions Group Inc. | 429 | 17 |
| * | Ardmore Shipping Corp. | 1,751 | 17 |
| * | Aersale Corp. | 864 | 17 |
| National Presto Industries Inc. | 231 | 16 | |
| Kronos Worldwide Inc. | 1,131 | 15 | |
| * | Blade Air Mobility Inc. | 2,809 | 15 |
| * | CIRCOR International Inc. | 866 | 14 |
| * | Tutor Perini Corp. | 2,107 | 14 |
| Universal Logistics Holdings Inc. | 391 | 14 | |
| * | Markforged Holding Corp. | 5,554 | 14 |
| * | Velo3D Inc. | 3,215 | 14 |
| * | IES Holdings Inc. | 429 | 13 |
| Miller Industries Inc. | 544 | 13 | |
| * | Ranpak Holdings Corp. Class A | 2,406 | 13 |
| * | ShotSpotter Inc. | 406 | 13 |
| * | Willdan Group Inc. | 590 | 13 |
| *,1 | View Inc. | 7,026 | 13 |
| * | Skillsoft Corp. | 4,082 | 13 |
| Shares | Market Value• ($000) | ||
| * | Sarcos Technology and Robotics Corp. | 3,815 | 13 |
| * | Astronics Corp. | 1,267 | 12 |
| * | Teekay Corp. | 3,395 | 12 |
| Ardagh Group SA | 848 | 12 | |
| * | Velodyne Lidar Inc. | 9,672 | 12 |
| * | DHI Group Inc. | 2,151 | 11 |
| * | Daseke Inc. | 1,767 | 11 |
| Information Services Group Inc. | 1,830 | 11 | |
| Preformed Line Products Co. | 141 | 11 | |
| Safe Bulkers Inc. | 3,405 | 11 | |
| * | Blue Bird Corp. | 867 | 10 |
| * | Concrete Pumping Holdings Inc. | 1,463 | 10 |
| Powell Industries Inc. | 401 | 10 | |
| United States Lime & Minerals Inc. | 102 | 10 | |
| Eneti Inc. | 1,142 | 10 | |
| * | Evolv Technologies Holdings Inc. | 4,204 | 10 |
| * | Moneylion Inc. | 7,290 | 10 |
| Park Aerospace Corp. | 791 | 9 | |
| * | Hyzon Motors Inc. | 4,393 | 9 |
| * | Spire Global Inc. | 6,331 | 9 |
| * | PFSweb Inc. | 848 | 8 |
| * | PAM Transportation Services Inc. | 272 | 8 |
| * | Hydrofarm Holdings Group Inc. | 2,051 | 7 |
| * | Quad/Graphics Inc. | 1,804 | 6 |
| * | Atlanticus Holdings Corp. | 225 | 6 |
| * | Atlas Technical Consultants Inc. | 686 | 6 |
| * | Lightning eMotors Inc. | 2,004 | 6 |
| * | Astra Space Inc. | 7,192 | 6 |
| * | Berkshire Grey Inc. | 3,108 | 6 |
| * | Cerberus Cyber Sentinel Corp. | 2,290 | 6 |
| * | Karat Packaging Inc. | 268 | 5 |
| * | Latch Inc. | 4,440 | 5 |
| * | Momentus Inc. | 2,739 | 5 |
| * | Terran Orbital Corp. | 1,211 | 5 |
| * | Redwire Corp. | 1,580 | 4 |
| * | Xos Inc. | 2,810 | 4 |
| * | Priority Technology Holdings Inc. | 713 | 3 |
| * | AEye Inc. | 2,256 | 3 |
| * | IBEX Holdings Ltd. | 123 | 2 |
| 342,220 | |||
| Other (0.0%)3 | |||
| Orchid Island Capital Inc. REIT | 1,829 | 25 | |
| *,2 | Aduro Biotech Inc. CVR | 656 | — |
| 25 | |||
| Real Estate (3.6%) | |||
| American Tower Corp. | 31,257 | 7,941 | |
| Prologis Inc. | 49,742 | 6,193 | |
| Crown Castle Inc. | 29,066 | 4,965 | |
| Equinix Inc. | 6,123 | 4,025 | |
| Public Storage | 10,513 | 3,478 | |
| Realty Income Corp. | 40,380 | 2,757 | |
| Digital Realty Trust Inc. | 19,166 | 2,369 | |
| Welltower Inc. | 30,618 | 2,347 | |
| SBA Communications Corp. Class A | 7,179 | 2,335 | |
| Shares | Market Value• ($000) | ||
| Simon Property Group Inc. | 21,969 | 2,240 | |
| VICI Properties Inc. | 64,482 | 2,127 | |
| AvalonBay Communities Inc. | 9,435 | 1,896 | |
| * | CoStar Group Inc. | 26,515 | 1,846 |
| Equity Residential | 25,018 | 1,831 | |
| Extra Space Storage Inc. | 8,927 | 1,774 | |
| * | CBRE Group Inc. Class A | 22,176 | 1,751 |
| Weyerhaeuser Co. | 50,004 | 1,708 | |
| Alexandria Real Estate Equities Inc. | 10,933 | 1,677 | |
| Duke Realty Corp. | 25,833 | 1,520 | |
| Invitation Homes Inc. | 41,042 | 1,489 | |
| Ventas Inc. | 26,998 | 1,292 | |
| Mid-America Apartment Communities Inc. | 7,730 | 1,281 | |
| Sun Communities Inc. | 8,088 | 1,243 | |
| Essex Property Trust Inc. | 4,401 | 1,167 | |
| WP Carey Inc. | 12,618 | 1,060 | |
| Iron Mountain Inc. | 19,383 | 1,020 | |
| UDR Inc. | 21,203 | 951 | |
| Healthpeak Properties Inc. | 36,223 | 951 | |
| Camden Property Trust | 6,874 | 883 | |
| Kimco Realty Corp. | 40,497 | 854 | |
| Host Hotels & Resorts Inc. | 47,650 | 847 | |
| Boston Properties Inc. | 10,528 | 836 | |
| Equity LifeStyle Properties Inc. | 11,913 | 835 | |
| Gaming and Leisure Properties Inc. | 15,722 | 759 | |
| Life Storage Inc. | 5,646 | 718 | |
| American Homes 4 Rent Class A | 20,152 | 717 | |
| Regency Centers Corp. | 11,524 | 701 | |
| CubeSmart | 15,054 | 693 | |
| Rexford Industrial Realty Inc. | 11,033 | 686 | |
| Healthcare Realty Trust Inc. Class A Blank | 25,325 | 616 | |
| Medical Properties Trust Inc. | 39,960 | 584 | |
| * | Jones Lang LaSalle Inc. | 3,313 | 573 |
| Lamar Advertising Co. Class A | 5,788 | 543 | |
| Americold Realty Trust Inc. | 18,170 | 535 | |
| Federal Realty Investment Trust | 5,273 | 534 | |
| National Retail Properties Inc. | 11,694 | 525 | |
| Omega Healthcare Investors Inc. | 15,891 | 519 | |
| EastGroup Properties Inc. | 2,762 | 456 | |
| STORE Capital Corp. | 16,679 | 450 | |
| First Industrial Realty Trust Inc. | 8,760 | 444 | |
| Brixmor Property Group Inc. | 20,092 | 432 | |
| Apartment Income REIT Corp. | 10,455 | 427 | |
| Kilroy Realty Corp. | 7,910 | 386 | |
| STAG Industrial Inc. | 12,135 | 374 | |
| Agree Realty Corp. | 4,946 | 373 | |
| Spirit Realty Capital Inc. | 9,053 | 370 | |
| Rayonier Inc. | 9,880 | 351 | |
| * | Zillow Group Inc. Class C | 10,482 | 351 |
| Vornado Realty Trust | 11,613 | 304 | |
| Terreno Realty Corp. | 4,868 | 297 |
| Shares | Market Value• ($000) | ||
| Independence Realty Trust Inc. | 15,157 | 295 | |
| National Storage Affiliates Trust | 5,786 | 292 | |
| * | Ryman Hospitality Properties Inc. | 3,532 | 290 |
| Kite Realty Group Trust | 14,547 | 282 | |
| Physicians Realty Trust | 15,877 | 265 | |
| Cousins Properties Inc. | 9,741 | 262 | |
| Phillips Edison & Co. Inc. | 7,570 | 247 | |
| Sabra Health Care REIT Inc. | 16,028 | 240 | |
| Apple Hospitality REIT Inc. | 14,928 | 237 | |
| Hannon Armstrong Sustainable Infrastructure Capital Inc. | 5,833 | 231 | |
| Broadstone Net Lease Inc. | 11,940 | 229 | |
| Highwoods Properties Inc. | 7,472 | 227 | |
| EPR Properties | 5,144 | 224 | |
| Park Hotels & Resorts Inc. | 16,002 | 224 | |
| Douglas Emmett Inc. | 11,230 | 219 | |
| PotlatchDeltic Corp. | 4,548 | 211 | |
| Essential Properties Realty Trust Inc. | 9,139 | 207 | |
| LXP Industrial Trust | 19,987 | 201 | |
| Corporate Office Properties Trust | 7,657 | 198 | |
| * | Equity Commonwealth | 7,512 | 198 |
| National Health Investors Inc. | 3,017 | 198 | |
| * | DigitalBridge Group Inc. | 10,303 | 183 |
| SL Green Realty Corp. | 4,113 | 182 | |
| Innovative Industrial Properties Inc. | 1,926 | 177 | |
| JBG SMITH Properties | 8,029 | 176 | |
| Outfront Media Inc. | 9,507 | 168 | |
| * | Howard Hughes Corp. | 2,622 | 167 |
| SITE Centers Corp. | 12,703 | 165 | |
| * | Sunstone Hotel Investors Inc. | 14,309 | 156 |
| Pebblebrook Hotel Trust | 8,784 | 155 | |
| * | Zillow Group Inc. Class A | 4,646 | 155 |
| * | Cushman & Wakefield plc | 10,320 | 154 |
| Four Corners Property Trust Inc. | 5,561 | 150 | |
| CareTrust REIT Inc. | 6,709 | 145 | |
| Kennedy-Wilson Holdings Inc. | 8,245 | 145 | |
| Uniti Group Inc. | 15,340 | 144 | |
| Retail Opportunity Investments Corp. | 8,358 | 140 | |
| Macerich Co. | 14,529 | 139 | |
| RLJ Lodging Trust | 11,337 | 137 | |
| * | Opendoor Technologies Inc. | 30,064 | 130 |
| Hudson Pacific Properties Inc. | 9,635 | 127 | |
| LTC Properties Inc. | 2,826 | 127 | |
| * | Xenia Hotels & Resorts Inc. | 7,991 | 127 |
| Urban Edge Properties | 7,901 | 124 | |
| * | DiamondRock Hospitality Co. | 13,654 | 119 |
| InvenTrust Properties Corp. | 4,438 | 117 | |
| Washington REIT | 5,650 | 111 | |
| Easterly Government Properties Inc. Class A | 6,109 | 110 | |
| Tanger Factory Outlet Centers Inc. | 6,735 | 104 | |
| Global Net Lease Inc. | 7,301 | 101 |
| Shares | Market Value• ($000) | ||
| Acadia Realty Trust | 6,205 | 99 | |
| Newmark Group Inc. Class A | 9,652 | 99 | |
| Piedmont Office Realty Trust Inc. Class A | 8,064 | 95 | |
| American Assets Trust Inc. | 3,315 | 92 | |
| Paramount Group Inc. | 13,162 | 91 | |
| * | Apartment Investment and Management Co. Class A | 10,342 | 91 |
| * | Alexander & Baldwin Inc. | 4,822 | 90 |
| * | Veris Residential Inc. | 6,511 | 88 |
| St. Joe Co. | 2,306 | 88 | |
| Brandywine Realty Trust | 10,884 | 87 | |
| Service Properties Trust | 11,832 | 81 | |
| * | Anywhere Real Estate Inc. | 8,123 | 79 |
| Centerspace | 1,042 | 79 | |
| NexPoint Residential Trust Inc. | 1,482 | 78 | |
| Getty Realty Corp. | 2,556 | 77 | |
| Necessity Retail REIT Inc. | 9,392 | 70 | |
| Armada Hoffler Properties Inc. | 5,275 | 69 | |
| Community Healthcare Trust Inc. | 1,705 | 63 | |
| Office Properties Income Trust | 3,487 | 61 | |
| * | Radius Global Infrastructure Inc. Class A (XNMS) | 4,451 | 61 |
| * | GEO Group Inc. | 7,345 | 60 |
| eXp World Holdings Inc. | 4,464 | 58 | |
| NETSTREIT Corp. | 2,956 | 58 | |
| Empire State Realty Trust Inc. Class A | 8,183 | 57 | |
| UMH Properties Inc. | 3,092 | 56 | |
| Marcus & Millichap Inc. | 1,479 | 55 | |
| Plymouth Industrial REIT Inc. | 2,682 | 54 | |
| Global Medical REIT Inc. | 4,876 | 53 | |
| Summit Hotel Properties Inc. | 6,683 | 53 | |
| * | Redfin Corp. | 6,370 | 52 |
| Alexander's Inc. | 214 | 51 | |
| RPT Realty | 5,300 | 51 | |
| Safehold Inc. | 1,333 | 51 | |
| Farmland Partners Inc. | 3,474 | 50 | |
| Bluerock Residential Growth REIT Inc. Class A | 1,854 | 49 | |
| Universal Health Realty Income Trust | 968 | 49 | |
| Gladstone Land Corp. | 2,012 | 47 | |
| Gladstone Commercial Corp. | 2,414 | 46 | |
| * | Compass Inc. Class A | 15,695 | 45 |
| * | Chatham Lodging Trust | 3,545 | 43 |
| Ares Commercial Real Estate Corp. | 3,126 | 41 | |
| CatchMark Timber Trust Inc. Class A | 3,698 | 39 | |
| RE/MAX Holdings Inc. Class A | 1,715 | 39 | |
| Orion Office REIT Inc. | 3,807 | 38 | |
| City Office REIT Inc. | 3,154 | 36 | |
| Industrial Logistics Properties Trust | 4,745 | 36 | |
| * | WeWork Inc. Class A | 8,851 | 36 |
| * | Tejon Ranch Co. | 2,164 | 34 |
| Shares | Market Value• ($000) | ||
| * | Seritage Growth Properties Class A | 2,670 | 33 |
| * | FRP Holdings Inc. | 532 | 31 |
| Saul Centers Inc. | 625 | 28 | |
| Urstadt Biddle Properties Inc. Class A | 1,569 | 26 | |
| Diversified Healthcare Trust | 17,635 | 26 | |
| Douglas Elliman Inc. | 5,684 | 26 | |
| Whitestone REIT | 2,502 | 25 | |
| RMR Group Inc. Class A | 873 | 23 | |
| One Liberty Properties Inc. | 778 | 19 | |
| Indus Realty Trust Inc. | 312 | 19 | |
| Braemar Hotels & Resorts Inc. | 3,409 | 18 | |
| BRT Apartments Corp. | 726 | 17 | |
| CTO Realty Growth Inc. | 801 | 17 | |
| * | Ashford Hospitality Trust Inc. | 1,897 | 17 |
| Franklin Street Properties Corp. | 5,505 | 15 | |
| * | Hersha Hospitality Trust Class A | 1,557 | 15 |
| Postal Realty Trust Inc. Class A | 998 | 15 | |
| * | Forestar Group Inc. | 857 | 11 |
| * | Stratus Properties Inc. | 305 | 11 |
| * | Transcontinental Realty Investors Inc. | 137 | 6 |
| Clipper Realty Inc. | 607 | 5 | |
| * | Offerpad Solutions Inc. | 3,453 | 5 |
| 95,702 | |||
| Technology (25.6%) | |||
| Apple Inc. | 1,030,274 | 161,980 | |
| Microsoft Corp. | 504,124 | 131,813 | |
| * | Alphabet Inc. Class A | 406,757 | 44,019 |
| * | Alphabet Inc. Class C | 368,672 | 40,241 |
| * | Meta Platforms Inc. Class A | 154,512 | 25,175 |
| NVIDIA Corp. | 162,247 | 24,490 | |
| Broadcom Inc. | 26,891 | 13,422 | |
| * | Adobe Inc. | 31,788 | 11,871 |
| Texas Instruments Inc. | 62,066 | 10,254 | |
| * | Salesforce Inc. | 64,848 | 10,124 |
| QUALCOMM Inc. | 75,488 | 9,985 | |
| * | Advanced Micro Devices Inc. | 108,783 | 9,232 |
| Intel Corp. | 275,674 | 8,800 | |
| Intuit Inc. | 18,566 | 8,016 | |
| International Business Machines Corp. | 60,607 | 7,785 | |
| Oracle Corp. | 101,888 | 7,555 | |
| * | ServiceNow Inc. | 13,494 | 5,865 |
| Applied Materials Inc. | 59,393 | 5,587 | |
| Analog Devices Inc. | 35,138 | 5,324 | |
| Micron Technology Inc. | 75,086 | 4,245 | |
| Lam Research Corp. | 9,340 | 4,090 | |
| * | Palo Alto Networks Inc. | 6,524 | 3,633 |
| * | Synopsys Inc. | 10,256 | 3,549 |
| KLA Corp. | 10,048 | 3,458 | |
| * | Cadence Design Systems Inc. | 18,351 | 3,189 |
| * | Autodesk Inc. | 14,657 | 2,957 |
| Amphenol Corp. Class A | 39,368 | 2,895 | |
| Roper Technologies Inc. | 7,104 | 2,860 | |
| Marvell Technology Inc. | 57,235 | 2,680 | |
| * | Crowdstrike Holdings Inc. Class A | 14,163 | 2,586 |
| Shares | Market Value• ($000) | ||
| * | Snowflake Inc. Class A | 13,217 | 2,392 |
| Microchip Technology Inc. | 36,250 | 2,365 | |
| * | Atlassian Corp. plc Class A | 9,230 | 2,286 |
| Cognizant Technology Solutions Corp. Class A | 34,996 | 2,211 | |
| * | Workday Inc. Class A | 13,139 | 2,162 |
| * | Fortinet Inc. | 44,150 | 2,150 |
| HP Inc. | 71,142 | 2,042 | |
| * | ON Semiconductor Corp. | 29,203 | 2,008 |
| * | Twitter Inc. | 50,289 | 1,949 |
| * | Datadog Inc. Class A | 17,423 | 1,829 |
| Corning Inc. | 50,920 | 1,748 | |
| VMware Inc. Class A | 14,041 | 1,629 | |
| * | EPAM Systems Inc. | 3,697 | 1,577 |
| CDW Corp. | 9,078 | 1,550 | |
| * | Gartner Inc. | 5,252 | 1,498 |
| * | ANSYS Inc. | 5,877 | 1,459 |
| Monolithic Power Systems Inc. | 3,060 | 1,387 | |
| * | Zoom Video Communications Inc. Class A | 17,051 | 1,371 |
| * | MongoDB Inc. Class A | 4,235 | 1,367 |
| * | Paycom Software Inc. | 3,459 | 1,215 |
| Hewlett Packard Enterprise Co. | 88,087 | 1,198 | |
| * | Cloudflare Inc. Class A | 18,838 | 1,179 |
| * | VeriSign Inc. | 6,451 | 1,175 |
| * | Match Group Inc. | 19,285 | 1,090 |
| NetApp Inc. | 15,044 | 1,085 | |
| Skyworks Solutions Inc. | 10,828 | 1,067 | |
| * | HubSpot Inc. | 3,082 | 1,039 |
| * | Tyler Technologies Inc. | 2,768 | 1,028 |
| * | DoorDash Inc. Class A | 16,913 | 1,013 |
| * | Splunk Inc. | 10,862 | 978 |
| * | Akamai Technologies Inc. | 10,610 | 958 |
| Entegris Inc. | 9,997 | 949 | |
| * | Palantir Technologies Inc. Class A | 122,071 | 942 |
| Teradyne Inc. | 10,751 | 910 | |
| * | Zscaler Inc. | 5,626 | 896 |
| * | Pinterest Inc. Class A | 38,796 | 894 |
| * | Western Digital Corp. | 21,159 | 894 |
| * | Wolfspeed Inc. | 7,798 | 885 |
| Leidos Holdings Inc. | 9,126 | 867 | |
| Citrix Systems Inc. | 8,379 | 861 | |
| NortonLifeLock Inc. | 37,886 | 856 | |
| * | ZoomInfo Technologies Inc. Class A | 18,561 | 843 |
| SS&C Technologies Holdings Inc. | 14,927 | 832 | |
| * | GoDaddy Inc. Class A | 10,893 | 826 |
| * | PTC Inc. | 7,078 | 813 |
| * | Twilio Inc. Class A | 11,613 | 808 |
| * | DocuSign Inc. Class A | 13,355 | 778 |
| * | Okta Inc. | 8,415 | 769 |
| Amdocs Ltd. | 8,084 | 691 | |
| * | Black Knight Inc. | 10,409 | 689 |
| Dell Technologies Inc. Class C | 17,900 | 685 | |
| * | Qorvo Inc. | 7,291 | 655 |
| * | F5 Inc. | 4,083 | 641 |
| * | Zendesk Inc. | 8,177 | 628 |
| * | Unity Software Inc. | 14,068 | 601 |
| * | Manhattan Associates Inc. | 4,232 | 598 |
| * | Globant SA | 2,749 | 579 |
| Jabil Inc. | 9,199 | 555 |
| Shares | Market Value• ($000) | ||
| * | Ceridian HCM Holding Inc. | 9,276 | 553 |
| * | Pure Storage Inc. Class A | 19,098 | 553 |
| * | Avalara Inc. | 5,862 | 537 |
| * | Dynatrace Inc. | 13,458 | 514 |
| * | Lattice Semiconductor Corp. | 9,164 | 494 |
| * | Five9 Inc. | 4,685 | 460 |
| * | Arrow Electronics Inc. | 4,382 | 459 |
| KBR Inc. | 9,328 | 451 | |
| * | CACI International Inc. Class A | 1,564 | 439 |
| * | Elastic NV | 5,179 | 435 |
| Bentley Systems Inc. Class B | 11,439 | 421 | |
| * | UiPath Inc. Class A | 25,382 | 418 |
| * | Change Healthcare Inc. | 16,955 | 417 |
| * | DXC Technology Co. | 16,534 | 410 |
| * | Guidewire Software Inc. | 5,716 | 410 |
| * | II-VI Inc. | 8,627 | 407 |
| * | Dropbox Inc. Class A | 18,706 | 400 |
| * | Aspen Technology Inc. | 1,900 | 400 |
| * | Qualys Inc. | 2,623 | 398 |
| * | Clarivate plc | 32,495 | 379 |
| * | AppLovin Corp. Class A | 15,242 | 375 |
| Concentrix Corp. | 2,926 | 368 | |
| National Instruments Corp. | 8,933 | 355 | |
| * | Mandiant Inc. | 15,354 | 351 |
| Science Applications International Corp. | 3,786 | 345 | |
| * | IAC Inc. | 5,369 | 345 |
| Universal Display Corp. | 2,984 | 333 | |
| Switch Inc. Class A | 9,665 | 328 | |
| * | Novanta Inc. | 2,406 | 322 |
| * | SentinelOne Inc. Class A | 11,769 | 321 |
| Dolby Laboratories Inc. Class A | 4,262 | 312 | |
| * | Synaptics Inc. | 2,695 | 312 |
| * | Rogers Corp. | 1,243 | 311 |
| * | Silicon Laboratories Inc. | 2,382 | 299 |
| * | Cirrus Logic Inc. | 3,885 | 298 |
| * | Tenable Holdings Inc. | 7,512 | 298 |
| * | SPS Commerce Inc. | 2,403 | 293 |
| Avnet Inc. | 6,639 | 291 | |
| * | Coupa Software Inc. | 4,970 | 290 |
| * | Toast Inc. Class A | 15,110 | 286 |
| TD SYNNEX Corp. | 2,934 | 282 | |
| * | Smartsheet Inc. Class A | 8,361 | 278 |
| Power Integrations Inc. | 3,812 | 273 | |
| * | NCR Corp. | 8,751 | 272 |
| Azenta Inc. | 5,112 | 269 | |
| * | Procore Technologies Inc. | 4,796 | 262 |
| * | Fabrinet | 2,539 | 261 |
| * | Nutanix Inc. Class A | 14,741 | 255 |
| * | Alteryx Inc. Class A | 4,077 | 254 |
| * | GLOBALFOUNDRIES Inc. | 4,244 | 254 |
| * | Blackline Inc. | 3,672 | 249 |
| * | RingCentral Inc. Class A | 5,607 | 241 |
| Vertiv Holdings Co. Class A | 20,803 | 240 | |
| * | Ziff Davis Inc. | 3,074 | 238 |
| Dun & Bradstreet Holdings Inc. | 16,708 | 238 | |
| * | Wix.com Ltd. | 3,744 | 237 |
| * | Onto Innovation Inc. | 3,331 | 236 |
| * | Confluent Inc. Class A | 8,357 | 229 |
| * | Teradata Corp. | 6,836 | 225 |
| * | Workiva Inc. Class A | 3,300 | 224 |
| Shares | Market Value• ($000) | ||
| Advanced Energy Industries Inc. | 2,477 | 222 | |
| * | Rapid7 Inc. | 3,856 | 222 |
| * | Alarm.com Holdings Inc. | 3,323 | 221 |
| * | Box Inc. Class A | 8,555 | 220 |
| * | Diodes Inc. | 3,050 | 217 |
| * | DigitalOcean Holdings Inc. | 5,157 | 217 |
| * | New Relic Inc. | 3,537 | 215 |
| * | IPG Photonics Corp. | 2,328 | 211 |
| * | Verint Systems Inc. | 4,280 | 208 |
| * | Varonis Systems Inc. Class B | 7,551 | 207 |
| * | Semtech Corp. | 4,397 | 203 |
| * | Sanmina Corp. | 4,105 | 199 |
| * | Envestnet Inc. | 3,695 | 193 |
| * | Super Micro Computer Inc. | 2,963 | 193 |
| * | Insight Enterprises Inc. | 2,111 | 192 |
| * | Sprout Social Inc. Class A | 3,205 | 192 |
| * | Rambus Inc. | 7,400 | 191 |
| * | Altair Engineering Inc. Class A | 3,613 | 188 |
| * | MACOM Technology Solutions Holdings Inc. Class H | 3,389 | 187 |
| * | Perficient Inc. | 2,353 | 184 |
| * | MaxLinear Inc. | 4,956 | 178 |
| * | Plexus Corp. | 1,867 | 175 |
| Vishay Intertechnology Inc. | 8,705 | 171 | |
| * | Ambarella Inc. | 2,492 | 169 |
| * | Blackbaud Inc. | 3,221 | 168 |
| * | CommVault Systems Inc. | 3,084 | 167 |
| Kulicke & Soffa Industries Inc. | 3,982 | 167 | |
| * | Yelp Inc. Class A | 4,689 | 160 |
| * | NetScout Systems Inc. | 4,761 | 151 |
| * | PagerDuty Inc. | 5,789 | 151 |
| * | FormFactor Inc. | 5,107 | 150 |
| *,1 | MicroStrategy Inc. Class A | 649 | 150 |
| * | Bumble Inc. Class A | 5,982 | 150 |
| * | Q2 Holdings Inc. | 3,760 | 149 |
| * | Axcelis Technologies Inc. | 2,188 | 146 |
| * | Ping Identity Holding Corp. | 5,169 | 145 |
| * | Covetrus Inc. | 6,662 | 139 |
| Amkor Technology Inc. | 6,741 | 136 | |
| * | Upwork Inc. | 7,764 | 135 |
| Progress Software Corp. | 2,757 | 133 | |
| Xerox Holdings Corp. | 7,977 | 133 | |
| * | Impinj Inc. | 1,443 | 129 |
| * | Appian Corp. Class A | 2,728 | 128 |
| * | Kyndryl Holdings Inc. | 12,199 | 127 |
| * | Allscripts Healthcare Solutions Inc. | 7,407 | 126 |
| * | Appfolio Inc. Class A | 1,243 | 126 |
| CSG Systems International Inc. | 2,183 | 126 | |
| * | Cargurus Inc. | 6,626 | 124 |
| * | nCino Inc. | 3,889 | 123 |
| * | Sitime Corp. | 1,131 | 120 |
| * | Xometry Inc. Class A | 2,407 | 118 |
| * | TechTarget Inc. | 1,807 | 117 |
| * | Digital Turbine Inc. | 5,931 | 110 |
| * | DoubleVerify Holdings Inc. | 4,257 | 110 |
| * | TTM Technologies Inc. | 6,924 | 109 |
| Xperi Holding Corp. | 6,844 | 109 | |
| * | CCC Intelligent Solutions Holdings Inc. | 11,304 | 108 |
| * | Everbridge Inc. | 2,678 | 107 |
| Shares | Market Value• ($000) | ||
| * | Jamf Holding Corp. | 4,367 | 105 |
| Methode Electronics Inc. | 2,539 | 103 | |
| * | Asana Inc. Class A | 5,164 | 99 |
| Pegasystems Inc. | 2,680 | 98 | |
| * | Schrodinger Inc. | 3,564 | 98 |
| * | Paycor HCM Inc. | 3,259 | 97 |
| Shutterstock Inc. | 1,734 | 96 | |
| CTS Corp. | 2,240 | 95 | |
| * | KnowBe4 Inc. Class A | 4,951 | 95 |
| * | Clear Secure Inc. Class A | 4,126 | 95 |
| * | Parsons Corp. | 2,259 | 93 |
| * | E2open Parent Holdings Inc. | 13,597 | 93 |
| * | Ultra Clean Holdings Inc. | 2,975 | 87 |
| * | Cohu Inc. | 3,219 | 86 |
| * | LiveRamp Holdings Inc. | 4,348 | 86 |
| * | 3D Systems Corp. | 8,536 | 86 |
| * | C3.ai Inc. Class A | 4,662 | 84 |
| * | ePlus Inc. | 1,769 | 83 |
| * | Thoughtworks Holding Inc. | 6,035 | 79 |
| * | Model N Inc. | 2,567 | 77 |
| * | Veeco Instruments Inc. | 3,571 | 75 |
| * | BigCommerce Holdings Inc. Series 1 | 4,520 | 75 |
| * | Agilysys Inc. | 1,422 | 74 |
| * | Fastly Inc. Class A | 7,633 | 71 |
| * | Photronics Inc. | 4,209 | 71 |
| * | Allegro MicroSystems Inc. | 2,899 | 68 |
| * | Matterport Inc. | 13,458 | 62 |
| * | Avid Technology Inc. | 2,148 | 59 |
| Benchmark Electronics Inc. | 2,134 | 59 | |
| * | Grid Dynamics Holdings Inc. | 2,939 | 59 |
| * | Magnite Inc. | 7,863 | 59 |
| * | SMART Global Holdings Inc. | 3,167 | 58 |
| * | indie Semiconductor Inc. Class A | 6,767 | 58 |
| A10 Networks Inc. | 4,073 | 57 | |
| Simulations Plus Inc. | 928 | 56 | |
| * | Duck Creek Technologies Inc. | 4,678 | 56 |
| * | Vimeo Inc. | 9,432 | 56 |
| * | Momentive Global Inc. | 7,864 | 56 |
| * | PAR Technology Corp. | 1,564 | 55 |
| * | Sumo Logic Inc. | 6,253 | 55 |
| * | Planet Labs PBC | 9,962 | 55 |
| *,1 | MicroVision Inc. | 11,180 | 54 |
| * | PubMatic Inc. Class A | 2,737 | 54 |
| * | Informatica Inc. Class A | 2,425 | 54 |
| * | PROS Holdings Inc. | 2,549 | 53 |
| * | Zuora Inc. Class A | 6,966 | 53 |
| * | Ichor Holdings Ltd. | 1,716 | 53 |
| * | Amplitude Inc. Class A | 3,472 | 53 |
| * | PDF Solutions Inc. | 1,986 | 52 |
| * | ACM Research Inc. Class A | 3,074 | 52 |
| * | Alpha & Omega Semiconductor Ltd. | 1,314 | 51 |
| * | Consensus Cloud Solutions Inc. | 1,019 | 51 |
| * | IonQ Inc. | 8,366 | 50 |
| * | LivePerson Inc. | 4,226 | 49 |
| * | EngageSmart Inc. | 2,441 | 49 |
| * | ScanSource Inc. | 1,608 | 47 |
| * | Cerence Inc. | 2,364 | 47 |
| Ebix Inc. | 1,771 | 46 | |
| * | N-Able Inc. | 4,618 | �� 46 |
| Shares | Market Value• ($000) | ||
| * | Squarespace Inc. Class A | 2,165 | 45 |
| * | Definitive Healthcare Corp. Class A | 2,220 | 45 |
| Sapiens International Corp. NV | 1,951 | 43 | |
| * | Tucows Inc. Class A | 888 | 42 |
| * | Telos Corp. | 4,272 | 42 |
| * | Olo Inc. Class A | 5,407 | 42 |
| * | AvePoint Inc. | 8,887 | 42 |
| * | CEVA Inc. | 1,404 | 41 |
| Hackett Group Inc. | 1,974 | 41 | |
| * | Blend Labs Inc. Class A | 13,138 | 41 |
| * | Alkami Technology Inc. | 2,788 | 40 |
| American Software Inc. Class A | 2,322 | 39 | |
| * | nLight Inc. | 3,125 | 39 |
| * | Unisys Corp. | 4,029 | 38 |
| * | ChannelAdvisor Corp. | 2,445 | 37 |
| * | Edgio Inc. | 10,003 | 37 |
| * | Core Scientific Inc. | 17,007 | 37 |
| * | Domo Inc. Class B | 1,779 | 34 |
| * | Mitek Systems Inc. | 3,348 | 34 |
| * | MeridianLink Inc. | 1,936 | 34 |
| * | Eventbrite Inc. Class A | 4,622 | 33 |
| * | ForgeRock Inc. Class A | 1,934 | 33 |
| * | Skillz Inc. Class A | 23,879 | 32 |
| * | SolarWinds Corp. | 3,526 | 32 |
| * | Cvent Holding Corp. | 6,348 | 32 |
| PC Connection Inc. | 623 | 31 | |
| * | Couchbase Inc. | 1,806 | 30 |
| * | AXT Inc. | 3,354 | 29 |
| * | Yext Inc. | 6,443 | 29 |
| * | Kimball Electronics Inc. | 1,314 | 28 |
| * | Identiv Inc. | 1,890 | 28 |
| * | SmartRent Inc. | 8,389 | 27 |
| * | Enfusion Inc. Class A | 2,212 | 27 |
| * | Credo Technology Group Holding Ltd. | 1,947 | 27 |
| * | OneSpan Inc. | 2,182 | 25 |
| * | EverCommerce Inc. | 2,001 | 23 |
| * | Rackspace Technology Inc. | 4,643 | 21 |
| * | Rimini Street Inc. | 3,927 | 20 |
| * | Cyxtera Technologies Inc. | 3,222 | 20 |
| * | CyberOptics Corp. | 364 | 19 |
| * | ON24 Inc. | 2,082 | 19 |
| * | Bandwidth Inc. Class A | 1,165 | 18 |
| * | Mediaalpha Inc. Class A | 1,977 | 17 |
| * | Aeva Technologies Inc. | 5,329 | 16 |
| * | Upland Software Inc. | 1,389 | 15 |
| * | Atomera Inc. | 1,040 | 13 |
| * | NerdWallet Inc. Class A | 1,291 | 13 |
| * | Brightcove Inc. | 1,881 | 12 |
| * | Diebold Nixdorf Inc. | 3,360 | 12 |
| * | Ouster Inc. | 7,731 | 12 |
| * | Intapp Inc. | 863 | 12 |
| * | Digimarc Corp. | 632 | 11 |
| * | Groupon Inc. Class A | 1,073 | 11 |
| * | Zeta Global Holdings Corp. Class A | 1,573 | 11 |
| * | Benefitfocus Inc. | 1,296 | 10 |
| * | TrueCar Inc. | 4,681 | 10 |
| * | Veritone Inc. | 1,379 | 10 |
| * | UserTesting Inc. | 2,381 | 10 |
| Vivid Seats Inc. Class A | 1,246 | 10 | |
| * | eGain Corp. | 949 | 9 |
| * | Red Violet Inc. | 482 | 9 |
| *,1 | Cleanspark Inc. | 2,012 | 9 |
| Shares | Market Value• ($000) | ||
| * | Porch Group Inc. | 3,964 | 9 |
| * | Vinco Ventures Inc. | 9,105 | 9 |
| * | 1stdibs.com Inc. | 1,386 | 9 |
| * | WM Technology Inc. | 3,615 | 9 |
| * | NextNav Inc. | 2,566 | 9 |
| * | EverQuote Inc. Class A | 921 | 8 |
| * | IronNet Inc. | 3,240 | 7 |
| * | Arteris Inc. | 972 | 7 |
| *,1 | Cipher Mining Inc. | 3,610 | 7 |
| * | Rockley Photonics Holdings Ltd. | 5,110 | 7 |
| * | Avaya Holdings Corp. | 4,038 | 6 |
| * | Beachbody Co. Inc. | 5,263 | 6 |
| * | Transphorm Inc. | 1,106 | 6 |
| * | Arena Group Holdings Inc. | 569 | 6 |
| * | SkyWater Technology Inc. | 397 | 5 |
| * | KORE Group Holdings Inc. | 1,790 | 5 |
| * | Nutex Health Inc. | 1,948 | 5 |
| * | SecureWorks Corp. Class A | 401 | 4 |
| * | Viant Technology Inc. Class A | 543 | 2 |
| * | Loyalty Ventures Inc. | 936 | 2 |
| * | Weave Communications Inc. | 398 | 2 |
| *,1 | Cryptyde Inc. | 910 | 1 |
| 682,139 | |||
| Telecommunications (2.5%) | |||
| Cisco Systems Inc. | 280,132 | 12,528 | |
| Verizon Communications Inc. | 283,293 | 11,844 | |
| Comcast Corp. Class A | 299,623 | 10,843 | |
| AT&T Inc. | 482,636 | 8,465 | |
| * | T-Mobile US Inc. | 40,135 | 5,778 |
| * | Charter Communications Inc. Class A | 7,794 | 3,216 |
| Motorola Solutions Inc. | 11,096 | 2,701 | |
| * | Arista Networks Inc. | 16,813 | 2,016 |
| * | Liberty Broadband Corp. Class C | 8,218 | 836 |
| Lumen Technologies Inc. | 69,454 | 692 | |
| Juniper Networks Inc. | 21,522 | 612 | |
| * | Roku Inc. | 8,106 | 551 |
| * | Ciena Corp. | 10,240 | 520 |
| Cable One Inc. | 406 | 461 | |
| * | Frontier Communications Parent Inc. | 16,691 | 430 |
| * | Lumentum Holdings Inc. | 4,696 | 392 |
| * | Iridium Communications Inc. | 8,429 | 374 |
| * | DISH Network Corp. Class A | 17,143 | 297 |
| * | Calix Inc. | 3,883 | 229 |
| * | Viavi Solutions Inc. | 15,784 | 222 |
| * | Liberty Broadband Corp. Class A | 1,922 | 194 |
| * | ViaSat Inc. | 4,769 | 181 |
| * | CommScope Holding Co. Inc. | 14,029 | 159 |
| Cogent Communications Holdings Inc. | 2,963 | 158 | |
| * | Altice USA Inc. Class A | 13,815 | 138 |
| Ubiquiti Inc. | 398 | 124 | |
| * | Extreme Networks Inc. | 8,556 | 123 |
| Telephone and Data Systems Inc. | 6,714 | 109 | |
| Adtran Holdings Inc. | 4,604 | 107 | |
| InterDigital Inc. | 1,997 | 100 | |
| Shares | Market Value• ($000) | ||
| * | Globalstar Inc. | 42,487 | 85 |
| * | Clearfield Inc. | 720 | 84 |
| * | Liberty Latin America Ltd. Class C | 11,171 | 78 |
| * | Infinera Corp. | 13,594 | 74 |
| * | Digi International Inc. | 2,057 | 68 |
| Shenandoah Telecommunications Co. | 2,980 | 66 | |
| *,1 | Lightwave Logic Inc. | 7,915 | 63 |
| * | WideOpenWest Inc. | 3,510 | 62 |
| * | Harmonic Inc. | 5,461 | 61 |
| * | NETGEAR Inc. | 2,068 | 49 |
| *,1 | fuboTV Inc. | 13,472 | 49 |
| ATN International Inc. | 1,026 | 48 | |
| * | Gogo Inc. | 3,223 | 48 |
| * | EchoStar Corp. Class A | 2,424 | 45 |
| * | Liberty Latin America Ltd. Class A | 5,976 | 42 |
| * | United States Cellular Corp. | 1,358 | 39 |
| * | Anterix Inc. | 817 | 35 |
| * | 8x8 Inc. | 5,909 | 31 |
| * | Aviat Networks Inc. | 895 | 28 |
| * | Consolidated Communications Holdings Inc. | 3,889 | 22 |
| * | IDT Corp. Class B | 762 | 19 |
| Comtech Telecommunications Corp. | 1,274 | 14 | |
| * | Ooma Inc. | 1,091 | 13 |
| * | Charge Enterprises Inc. | 5,369 | 13 |
| * | Ribbon Communications Inc. | 3,408 | 12 |
| * | Inseego Corp. | 4,042 | 11 |
| * | DZS Inc. | 846 | 11 |
| * | Akoustis Technologies Inc. | 2,107 | 9 |
| * | Cambium Networks Corp. | 467 | 9 |
| * | Casa Systems Inc. | 1,540 | 6 |
| * | Kaleyra Inc. | 2,443 | 4 |
| * | Starry Group Holdings Inc. | 1,218 | 3 |
| 65,601 | |||
| Utilities (3.4%) | |||
| NextEra Energy Inc. | 132,252 | 11,249 | |
| Duke Energy Corp. | 51,777 | 5,536 | |
| Southern Co. | 71,343 | 5,498 | |
| Waste Management Inc. | 27,915 | 4,718 | |
| Dominion Energy Inc. | 54,491 | 4,457 | |
| Sempra Energy (XNYS) | 21,171 | 3,493 | |
| American Electric Power Co. Inc. | 34,523 | 3,459 | |
| Exelon Corp. | 65,923 | 2,895 | |
| Xcel Energy Inc. | 36,685 | 2,724 | |
| Consolidated Edison Inc. | 23,860 | 2,332 | |
| WEC Energy Group Inc. | 21,351 | 2,202 | |
| Public Service Enterprise Group Inc. | 33,603 | 2,163 | |
| Eversource Energy | 23,256 | 2,086 | |
| Republic Services Inc. Class A | 13,847 | 1,976 | |
| American Water Works Co. Inc. | 12,220 | 1,814 | |
| Constellation Energy Corp. | 22,018 | 1,796 | |
| Edison International | 25,451 | 1,725 | |
| DTE Energy Co. | 12,959 | 1,689 | |
| Ameren Corp. | 17,154 | 1,589 | |
| Entergy Corp. | 13,717 | 1,582 | |
| Shares | Market Value• ($000) | ||
| FirstEnergy Corp. | 36,578 | 1,447 | |
| PPL Corp. | 49,693 | 1,445 | |
| CMS Energy Corp. | 19,604 | 1,324 | |
| CenterPoint Energy Inc. | 41,912 | 1,322 | |
| * | PG&E Corp. | 104,790 | 1,292 |
| AES Corp. | 44,893 | 1,143 | |
| Atmos Energy Corp. | 9,064 | 1,028 | |
| Alliant Energy Corp. | 16,813 | 1,026 | |
| Evergy Inc. | 14,706 | 1,008 | |
| NiSource Inc. | 26,561 | 784 | |
| Essential Utilities Inc. | 15,334 | 754 | |
| Vistra Corp. | 28,742 | 711 | |
| NRG Energy Inc. | 15,804 | 652 | |
| Pinnacle West Capital Corp. | 7,635 | 575 | |
| UGI Corp. | 13,942 | 551 | |
| OGE Energy Corp. | 13,100 | 531 | |
| * | Sunrun Inc. | 13,904 | 459 |
| National Fuel Gas Co. | 5,836 | 416 | |
| * | Clean Harbors Inc. | 3,426 | 402 |
| IDACORP Inc. | 3,446 | 376 | |
| * | Southwest Gas Holdings Inc. | 4,479 | 349 |
| Brookfield Renewable Corp. Class A | 8,758 | 336 | |
| Black Hills Corp. | 4,322 | 326 | |
| Portland General Electric Co. | 6,103 | 315 | |
| Brookfield Infrastructure Corp. Class A (XTSE) | 6,496 | 309 | |
| * | Stericycle Inc. | 6,106 | 306 |
| Hawaiian Electric Industries Inc. | 7,496 | 293 | |
| ONE Gas Inc. | 3,675 | 288 | |
| New Jersey Resources Corp. | 6,467 | 285 | |
| * | Evoqua Water Technologies Corp. | 8,062 | 283 |
| Ormat Technologies Inc. (XNYS) | 3,011 | 281 | |
| South Jersey Industries Inc. | 8,313 | 281 | |
| * | Casella Waste Systems Inc. Class A | 3,416 | 280 |
| PNM Resources Inc. | 5,731 | 272 | |
| Spire Inc. | 3,469 | 242 | |
| Avangrid Inc. | 4,782 | 236 | |
| ALLETE Inc. | 3,888 | 230 | |
| American States Water Co. | 2,756 | 229 | |
| California Water Service Group | 3,745 | 219 | |
| Avista Corp. | 5,342 | 217 | |
| NorthWestern Corp. | 3,886 | 206 | |
| MGE Energy Inc. | 2,520 | 194 | |
| * | Sunnova Energy International Inc. | 6,647 | 168 |
| Clearway Energy Inc. Class C | 4,415 | 164 | |
| Chesapeake Utilities Corp. | 1,235 | 156 | |
| Clearway Energy Inc. Class A | 3,409 | 118 |
| Shares | Market Value• ($000) | ||
| Northwest Natural Holding Co. | 2,422 | 115 | |
| SJW Group | 1,790 | 115 | |
| Middlesex Water Co. | 1,124 | 100 | |
| * | Archaea Energy Inc. Class A | 3,717 | 73 |
| Unitil Corp. | 1,150 | 60 | |
| * | Li-Cycle Holdings Corp. | 8,211 | 59 |
| York Water Co. | 1,173 | 52 | |
| Artesian Resources Corp. Class A | 663 | 36 | |
| Excelerate Energy Inc. Class A | 1,402 | 36 | |
| * | Harsco Corp. | 6,081 | 35 |
| * | Heritage-Crystal Clean Inc. | 1,077 | 35 |
| * | Altus Power Inc. | 3,378 | 35 |
| * | Vertex Energy Inc. | 3,823 | 33 |
| Aris Water Solution Inc. Class A | 1,233 | 21 | |
| * | NuScale Power Corp. | 857 | 12 |
| * | Pure Cycle Corp. | 931 | 10 |
| Global Water Resources Inc. | 630 | 9 | |
| Via Renewables Inc. Class A | 617 | 5 | |
| 89,653 | |||
| Total Common Stocks (Cost $2,324,388) | 2,656,331 | ||
| Temporary Cash Investments (3.5%) | |||
| Money Market Fund (3.5%) | |||
| 4,5 | Vanguard Market Liquidity Fund, 2.284% (Cost $92,896) | 929,245 | 92,897 |
| Total Investments (103.2%) (Cost $2,417,284) | 2,749,228 | ||
| Other Assets and Liabilities—Net (-3.2%) | (84,678) | ||
| Net Assets (100%) | 2,664,550 | ||
| Cost is in $000. | |||
| • | See Note A in Notes to Financial Statements. |
| * | Non-income-producing security. |
| 1 | Includes partial security positions on loan to broker-dealers. The total value of securities on loan is $3,697,000. |
| 2 | Security value determined using significant unobservable inputs. |
| 3 | “Other” represents securities that are not classified by the fund’s benchmark index. |
| 4 | Affiliated money market fund available only to Vanguard funds and certain trusts and accounts managed by Vanguard. Rate shown is the 7-day yield. |
| 5 | Collateral of $3,939,000 was received for securities on loan. |
| ADR—American Depositary Receipt. | |
| CVR—Contingent Value Rights. | |
| REIT—Real Estate Investment Trust. |
| Futures Contracts | ||||
| ($000) | ||||
| Expiration | Number of Long (Short) Contracts | Notional Amount | Value and Unrealized Appreciation (Depreciation) | |
| Long Futures Contracts | ||||
| E-mini Russell 2000 Index | September 2022 | 12 | 1,107 | (47) |
| E-mini S&P 500 Index | September 2022 | 36 | 7,122 | (281) |
| (328) | ||||
| ($000s, except shares and per-share amounts) | Amount |
| Assets | |
| Investments in Securities, at Value1 | |
| Unaffiliated Issuers (Cost $2,324,388) | 2,656,331 |
| Affiliated Issuers (Cost $92,896) | 92,897 |
| Total Investments in Securities | 2,749,228 |
| Investment in Vanguard | 94 |
| Cash Collateral Pledged—Futures Contracts | 380 |
| Receivables for Investment Securities Sold | 127 |
| Receivables for Accrued Income | 3,809 |
| Receivables for Capital Shares Issued | 5 |
| Total Assets | 2,753,643 |
| Liabilities | |
| Due to Custodian | 203 |
| Payables for Investment Securities Purchased | 84,788 |
| Collateral for Securities on Loan | 3,939 |
| Payables for Capital Shares Redeemed | 4 |
| Payables to Vanguard | 104 |
| Variation Margin Payable—Futures Contracts | 55 |
| Total Liabilities | 89,093 |
| Net Assets | 2,664,550 |
| 1 Includes $3,697 of securities on loan. | |
| At August 31, 2022, net assets consisted of: | |
| Paid-in Capital | 2,399,519 |
| Total Distributable Earnings (Loss) | 265,031 |
| Net Assets | 2,664,550 |
| ETF Shares—Net Assets | |
| Applicable to 6,850,000 outstanding $.001 par value shares of beneficial interest (unlimited authorization) | 1,219,080 |
| Net Asset Value Per Share—ETF Shares | $177.97 |
| Institutional Shares—Net Assets | |
| Applicable to 4,196,097 outstanding $.001 par value shares of beneficial interest (unlimited authorization) | 1,445,470 |
| Net Asset Value Per Share—Institutional Shares | $344.48 |
| Year Ended August 31, 2022 | |
| ($000) | |
| Investment Income | |
| Income | |
| Dividends1 | 32,141 |
| Interest2 | 92 |
| Securities Lending—Net | 147 |
| Total Income | 32,380 |
| Expenses | |
| The Vanguard Group—Note B | |
| Investment Advisory Services | 233 |
| Management and Administrative—ETF Shares | 801 |
| Management and Administrative—Institutional Shares | 622 |
| Marketing and Distribution—ETF Shares | 64 |
| Marketing and Distribution—Institutional Shares | 44 |
| Custodian Fees | 69 |
| Auditing Fees | 27 |
| Shareholders’ Reports—ETF Shares | 38 |
| Shareholders’ Reports—Institutional Shares | 1 |
| Trustees’ Fees and Expenses | 1 |
| Other Expenses | 96 |
| Total Expenses | 1,996 |
| Net Investment Income | 30,384 |
| Realized Net Gain (Loss) | |
| Investment Securities Sold2,3 | 198,531 |
| Futures Contracts | (1,347) |
| Realized Net Gain (Loss) | 197,184 |
| Change in Unrealized Appreciation (Depreciation) | |
| Investment Securities2 | (538,065) |
| Futures Contracts | (626) |
| Change in Unrealized Appreciation (Depreciation) | (538,691) |
| Net Increase (Decrease) in Net Assets Resulting from Operations | (311,123) |
| 1 | Dividends are net of foreign withholding taxes of $12,000. |
| 2 | Interest income, realized net gain (loss), capital gain distributions received, and change in unrealized appreciation (depreciation) from an affiliated company of the fund were $91,000, less than $1,000, less than $1,000, and $1,000, respectively. Purchases and sales are for temporary cash investment purposes. |
| 3 | Includes $233,200,000 of net gain (loss) resulting from in-kind redemptions. |
| Year Ended August 31, | ||
| 2022 ($000) | 2021 ($000) | |
| Increase (Decrease) in Net Assets | ||
| Operations | ||
| Net Investment Income | 30,384 | 26,666 |
| Realized Net Gain (Loss) | 197,184 | 176,329 |
| Change in Unrealized Appreciation (Depreciation) | (538,691) | 371,737 |
| Net Increase (Decrease) in Net Assets Resulting from Operations | (311,123) | 574,732 |
| Distributions | ||
| ETF Shares | (15,187) | (11,774) |
| Institutional Shares | (13,526) | (14,477) |
| Total Distributions | (28,713) | (26,251) |
| Capital Share Transactions | ||
| ETF Shares | 275,640 | 160,316 |
| Institutional Shares | 450,842 | (159,141) |
| Net Increase (Decrease) from Capital Share Transactions | 726,482 | 1,175 |
| Total Increase (Decrease) | 386,646 | 549,656 |
| Net Assets | ||
| Beginning of Period | 2,277,904 | 1,728,248 |
| End of Period | 2,664,550 | 2,277,904 |
| ETF Shares | |||||
| For a Share Outstanding Throughout Each Period | Year Ended August 31, | ||||
| 2022 | 2021 | 2020 | 2019 | 2018 | |
| Net Asset Value, Beginning of Period | $208.13 | $158.71 | $133.26 | $133.98 | $113.52 |
| Investment Operations | |||||
| Net Investment Income1 | 2.662 | 2.385 | 2.416 | 2.312 | 2.099 |
| Net Realized and Unrealized Gain (Loss) on Investments | (30.247) | 49.386 | 25.494 | (.730) | 20.442 |
| Total from Investment Operations | (27.585) | 51.771 | 27.910 | 1.582 | 22.541 |
| Distributions | |||||
| Dividends from Net Investment Income | (2.575) | (2.351) | (2.460) | (2.302) | (2.081) |
| Distributions from Realized Capital Gains | — | — | — | — | — |
| Total Distributions | (2.575) | (2.351) | (2.460) | (2.302) | (2.081) |
| Net Asset Value, End of Period | $177.97 | $208.13 | $158.71 | $133.26 | $133.98 |
| Total Return | -13.36% | 32.90% | 21.31% | 1.25% | 20.07% |
| Ratios/Supplemental Data | |||||
| Net Assets, End of Period (Millions) | $1,219 | $1,124 | $710 | $463 | $412 |
| Ratio of Total Expenses to Average Net Assets | 0.10% | 0.10% | 0.10% | 0.10% | 0.15% |
| Ratio of Net Investment Income to Average Net Assets | 1.36% | 1.31% | 1.74% | 1.79% | 1.70% |
| Portfolio Turnover Rate2 | 8% | 10% | 8% | 10% | 14% |
| 1 | Calculated based on average shares outstanding. |
| 2 | Excludes the value of portfolio securities received or delivered as a result of in-kind purchases or redemptions of the fund’s capital shares, including ETF Creation Units. |
| Institutional Shares | |||||
| For a Share Outstanding Throughout Each Period | Year Ended August 31, | ||||
| 2022 | 2021 | 2020 | 2019 | 2018 | |
| Net Asset Value, Beginning of Period | $402.86 | $307.19 | $257.87 | $259.33 | $219.72 |
| Investment Operations | |||||
| Net Investment Income1 | 5.323 | 4.689 | 4.739 | 4.499 | 4.220 |
| Net Realized and Unrealized Gain (Loss) on Investments | (58.648) | 95.580 | 49.347 | (1.394) | 39.578 |
| Total from Investment Operations | (53.325) | 100.269 | 54.086 | 3.105 | 43.798 |
| Distributions | |||||
| Dividends from Net Investment Income | (5.055) | (4.599) | (4.766) | (4.565) | (4.188) |
| Distributions from Realized Capital Gains | — | — | — | — | — |
| Total Distributions | (5.055) | (4.599) | (4.766) | (4.565) | (4.188) |
| Net Asset Value, End of Period | $344.48 | $402.86 | $307.19 | $257.87 | $259.33 |
| Total Return | -13.34% | 32.94% | 21.38% | 1.27% | 20.15% |
| Ratios/Supplemental Data | |||||
| Net Assets, End of Period (Millions) | $1,445 | $1,154 | $1,018 | $871 | $879 |
| Ratio of Total Expenses to Average Net Assets | 0.08% | 0.08% | 0.08% | 0.08% | 0.08% |
| Ratio of Net Investment Income to Average Net Assets | 1.40% | 1.34% | 1.76% | 1.81% | 1.77% |
| Portfolio Turnover Rate2 | 8% | 10% | 8% | 10% | 14% |
| 1 | Calculated based on average shares outstanding. |
| 2 | Excludes the value of portfolio securities received or delivered as a result of in-kind purchases or redemptions of the fund’s capital shares, including ETF Creation Units. |
| A. | The following significant accounting policies conform to generally accepted accounting principles for U.S. investment companies. The fund consistently follows such policies in preparing its financial statements. |
| B. | In accordance with the terms of a Funds' Service Agreement (the “FSA”) between Vanguard and the fund, Vanguard furnishes to the fund investment advisory, corporate management, administrative, marketing, and distribution services at Vanguard’s cost of operations (as defined by the FSA). These costs of operations are allocated to the fund based on methods and guidelines approved by the board of trustees and are generally settled twice a month. |
| C. | Various inputs may be used to determine the value of the fund’s investments and derivatives. These inputs are summarized in three broad levels for financial statement purposes. The inputs or methodologies used to value securities are not necessarily an indication of the risk associated with investing in those securities. |
| Level 1 ($000) | Level 2 ($000) | Level 3 ($000) | Total ($000) | |
| Investments | ||||
| Assets | ||||
| Common Stocks | 2,656,315 | 12 | 4 | 2,656,331 |
| Temporary Cash Investments | 92,897 | — | — | 92,897 |
| Total | 2,749,212 | 12 | 4 | 2,749,228 |
| Derivative Financial Instruments | ||||
| Liabilities | ||||
| Futures Contracts1 | 328 | — | — | 328 |
| 1 | Includes cumulative appreciation (depreciation) on futures contracts and centrally cleared swaps, if any, as reported in the Schedule of Investments. Only current day’s variation margin is reported within the Statement of Assets and Liabilities. |
| D. | Permanent differences between book-basis and tax-basis components of net assets are reclassified among capital accounts in the financial statements to reflect their tax character. These reclassifications have no effect on net assets or net asset value per share. As of period end, permanent differences primarily attributable to the accounting for applicable in-kind redemptions and passive foreign investment companies were reclassified between the following accounts: |
| Amount ($000) | |
| Paid-in Capital | 233,185 |
| Total Distributable Earnings (Loss) | (233,185) |
| Amount ($000) | |
| Undistributed Ordinary Income | 7,283 |
| Undistributed Long-Term Gains | — |
| Capital Loss Carryforwards | (57,192) |
| Qualified Late-Year Losses | — |
| Net Unrealized Gains (Losses) | 314,940 |
| Year Ended August 31, | ||
| 2022 Amount ($000) | 2021 Amount ($000) | |
| Ordinary Income* | 28,713 | 26,251 |
| Long-Term Capital Gains | — | — |
| Total | 28,713 | 26,251 |
| * | Includes short-term capital gains, if any. |
| Amount ($000) | |
| Tax Cost | 2,434,288 |
| Gross Unrealized Appreciation | 530,069 |
| Gross Unrealized Depreciation | (215,129) |
| Net Unrealized Appreciation (Depreciation) | 314,940 |
| E. | During the year ended August 31, 2022, the fund purchased $1,319,849,000 of investment securities and sold $592,419,000 of investment securities, other than temporary cash investments. Purchases and sales include $416,123,000 and $415,568,000, respectively, in connection with in-kind purchases and redemptions of the fund's capital shares. |
| F. | Capital share transactions for each class of shares were: |
| Year Ended August 31, | |||||
| 2022 | 2021 | ||||
| Amount ($000) | Shares (000) | Amount ($000) | Shares (000) | ||
| ETF Shares | |||||
| Issued | 604,261 | 3,075 | 478,092 | 2,675 | |
| Issued in Lieu of Cash Distributions | — | — | — | — | |
| Redeemed | (328,621) | (1,625) | (317,776) | (1,750) | |
| Net Increase (Decrease)—ETF Shares | 275,640 | 1,450 | 160,316 | 925 | |
| Year Ended August 31, | |||||
| 2022 | 2021 | ||||
| Amount ($000) | Shares (000) | Amount ($000) | Shares (000) | ||
| Institutional Shares | |||||
| Issued | 858,256 | 2,365 | 264,939 | 764 | |
| Issued in Lieu of Cash Distributions | 11,990 | 31 | 12,831 | 38 | |
| Redeemed | (419,404) | (1,064) | (436,911) | (1,252) | |
| Net Increase (Decrease)—Institutional Shares | 450,842 | 1,332 | (159,141) | (450) | |
| G. | Management has determined that no events or transactions occurred subsequent to August 31, 2022, that would require recognition or disclosure in these financial statements. |
Philadelphia, Pennsylvania
October 20, 2022
| Matthew Benchener | Thomas M. Rampulla |
| Joseph Brennan | Karin A. Risi |
| Mortimer J. Buckley | Anne E. Robinson |
| Gregory Davis | Michael Rollings |
| John James | Nitin Tandon |
| Chris D. Mclsaac | Lauren Valente |

All rights reserved.
U.S. Patent Nos. 6,879,964.
Vanguard Marketing Corporation, Distributor.

| Vanguard Short-Term Treasury Index Fund |
| Vanguard Intermediate-Term Treasury Index Fund |
| Vanguard Long-Term Treasury Index Fund |
| 1 | |
| 2 | |
| 4 | |
| 21 | |
| 39 | |
| 58 | |
| 60 |
| • | For the 12 months ended August 31, 2022, returns for the three Vanguard Treasury bond index funds ranged from –22.69% for all share classes of the Long-Term Treasury Index Fund to –4.07% for ETF Shares (based on net value) of the Short-Term Treasury Index Fund. All three funds’ returns were in line with their target indexes. |
| • | The investment outlook grew more challenging during the 12-month period. Sentiment deteriorated as inflation soared to multidecade highs, fueled in part by higher energy and food prices after Russia’s invasion of Ukraine. The Federal Reserve reacted by raising interest rates, which weighed on bond prices and sparked fears of recession. |
| • | Yields of U.S. Treasuries rose across the maturity spectrum, with more movement at the shorter end of the yield curve, given the prospect of more Fed rate hikes. The broad U.S. investment-grade bond market returned –11.65%, as measured by the Bloomberg U.S. Aggregate Float Adjusted Index. |
| • | Treasuries, as measured by the Bloomberg U.S. Treasury Index, returned –10.80%. Corporate bonds, as measured by the Bloomberg U.S. Corporate Bond Index, returned –14.91%. |
| Average Annual Total Returns Periods Ended August 31, 2022 | |||
| One Year | Three Years | Five Years | |
| Stocks | |||
| Russell 1000 Index (Large-caps) | -12.96% | 12.14% | 11.61% |
| Russell 2000 Index (Small-caps) | -17.88 | 8.59 | 6.95 |
| Russell 3000 Index (Broad U.S. market) | -13.28 | 11.90 | 11.29 |
| FTSE All-World ex US Index (International) | -19.00 | 3.48 | 2.12 |
| Bonds | |||
| Bloomberg U.S. Aggregate Float Adjusted Index (Broad taxable market) | -11.65% | -2.01% | 0.54% |
| Bloomberg Municipal Bond Index (Broad tax-exempt market) | -8.63 | -0.83 | 1.28 |
| FTSE Three-Month U.S. Treasury Bill Index | 0.44 | 0.56 | 1.10 |
| CPI | |||
| Consumer Price Index | 8.26% | 4.90% | 3.82% |
| • | Based on actual fund return. This section helps you to estimate the actual expenses that you paid over the period. The ”Ending Account Value“ shown is derived from the fund’s actual return, and the third column shows the dollar amount that would have been paid by an investor who started with $1,000 in the fund. You may use the information here, together with the amount you invested, to estimate the expenses that you paid over the period. |
| • | Based on hypothetical 5% yearly return. This section is intended to help you compare your fund‘s costs with those of other mutual funds. It assumes that the fund had a yearly return of 5% before expenses, but that the expense ratio is unchanged. In this case—because the return used is not the fund’s actual return—the results do not apply to your investment. The example is useful in making comparisons because the Securities and Exchange Commission requires all mutual funds to calculate expenses based on a 5% return. You can assess your fund’s costs by comparing this hypothetical example with the hypothetical examples that appear in shareholder reports of other funds. |
| Six Months Ended August 31, 2022 | |||
| Beginning Account Value 2/28/2022 | Ending Account Value 8/31/2022 | Expenses Paid During Period | |
| Based on Actual Fund Return | |||
| Short-Term Treasury Index Fund | |||
| ETF Shares | $1,000.00 | $976.90 | $0.20 |
| Admiral™ Shares | 1,000.00 | 976.70 | 0.35 |
| Institutional Shares | 1,000.00 | 976.80 | 0.25 |
| Intermediate-Term Treasury Index Fund | |||
| ETF Shares | $1,000.00 | $934.20 | $0.20 |
| Admiral Shares | 1,000.00 | 934.00 | 0.34 |
| Institutional Shares | 1,000.00 | 934.30 | 0.24 |
| Long-Term Treasury Index Fund | |||
| ETF Shares | $1,000.00 | $818.00 | $0.18 |
| Admiral Shares | 1,000.00 | 818.10 | 0.32 |
| Institutional Shares | 1,000.00 | 817.80 | 0.23 |
| Based on Hypothetical 5% Yearly Return | |||
| Short-Term Treasury Index Fund | |||
| ETF Shares | $1,000.00 | $1,025.00 | $0.20 |
| Admiral Shares | 1,000.00 | 1,024.85 | 0.36 |
| Institutional Shares | 1,000.00 | 1,024.95 | 0.26 |
| Intermediate-Term Treasury Index Fund | |||
| ETF Shares | $1,000.00 | $1,025.00 | $0.20 |
| Admiral Shares | 1,000.00 | 1,024.85 | 0.36 |
| Institutional Shares | 1,000.00 | 1,024.95 | 0.26 |
| Long-Term Treasury Index Fund | |||
| ETF Shares | $1,000.00 | $1,025.00 | $0.20 |
| Admiral Shares | 1,000.00 | 1,024.85 | 0.36 |
| Institutional Shares | 1,000.00 | 1,024.95 | 0.26 |

| Average Annual Total Returns Periods Ended August 31, 2022 | |||||
| One Year | Five Years | Ten Years | Final Value of a $10,000 Investment | ||
 | Short-Term Treasury Index Fund ETF Shares Net Asset Value | -4.07% | 0.70% | 0.64% | $10,663 |
| Short-Term Treasury Index Fund ETF Shares Market Price | -4.04 | 0.70 | 0.64 | 10,662 | |
 | Spliced Bloomberg U.S. Treasury 1–3 Year Index | -4.03 | 0.74 | 0.71 | 10,738 |
 | Bloomberg U.S. Aggregate Float Adjusted Index | -11.65 | 0.54 | 1.36 | 11,452 |
| Average Annual Total Returns Periods Ended August 31, 2022 | |||||
| One Year | Five Years | Ten Years | Final Value of a $10,000 Investment | ||
| Short-Term Treasury Index Fund Admiral Shares | -4.09% | 0.67% | 0.63% | $10,649 | |
| Spliced Bloomberg U.S. Treasury 1–3 Year Index | -4.03 | 0.74 | 0.71 | 10,738 | |
| Bloomberg U.S. Aggregate Float Adjusted Index | -11.65 | 0.54 | 1.36 | 11,452 | |
| One Year | Five Years | Ten Years | Final Value of a $5,000,000 Investment | ||
| Short-Term Treasury Index Fund Institutional Shares | -4.08% | 0.69% | 0.66% | $5,338,076 | |
| Spliced Bloomberg U.S. Treasury 1–3 Year Index | -4.03 | 0.74 | 0.71 | 5,369,046 | |
| Bloomberg U.S. Aggregate Float Adjusted Index | -11.65 | 0.54 | 1.36 | 5,725,801 | |
| Cumulative Returns of ETF Shares: August 31, 2012, Through August 31, 2022 | |||
| One Year | Five Years | Ten Years | |
| Short-Term Treasury Index Fund ETF Shares Market Price | -4.04% | 3.53% | 6.62% |
| Short-Term Treasury Index Fund ETF Shares Net Asset Value | -4.07 | 3.53 | 6.63 |
| Spliced Bloomberg U.S. Treasury 1–3 Year Index | -4.03 | 3.78 | 7.38 |
| Under 1 Year | 0.1% |
| 1 - 2 Years | 57.0 |
| 2 - 3 Years | 42.6 |
| 3 - 4 Years | 0.3 |
| Coupon | Maturity Date | Face Amount ($000) | Market Value• ($000) | |||
| U.S. Government and Agency Obligations (99.5%) | ||||||
| U.S. Government Securities (99.5%) | ||||||
| United States Treasury Note/Bond | 6.250% | 8/15/23 | 18,790 | 19,268 | ||
| United States Treasury Note/Bond | 0.125% | 9/15/23 | 196,330 | 189,643 | ||
| United States Treasury Note/Bond | 0.250% | 9/30/23 | 198,815 | 192,043 | ||
| United States Treasury Note/Bond | 1.375% | 9/30/23 | 143,782 | 140,569 | ||
| United States Treasury Note/Bond | 2.875% | 9/30/23 | 127,820 | 127,001 | ||
| United States Treasury Note/Bond | 0.125% | 10/15/23 | 298,352 | 287,397 | ||
| United States Treasury Note/Bond | 0.375% | 10/31/23 | 212,067 | 204,645 | ||
| United States Treasury Note/Bond | 1.625% | 10/31/23 | 208,798 | 204,426 | ||
| United States Treasury Note/Bond | 2.875% | 10/31/23 | 236,674 | 235,084 | ||
| United States Treasury Note/Bond | 0.250% | 11/15/23 | 391,510 | 376,767 | ||
| United States Treasury Note/Bond | 2.750% | 11/15/23 | 308,192 | 305,495 | ||
| United States Treasury Note/Bond | 0.500% | 11/30/23 | 181,163 | 174,624 | ||
| United States Treasury Note/Bond | 2.125% | 11/30/23 | 135,600 | 133,354 | ||
| United States Treasury Note/Bond | 2.875% | 11/30/23 | 93,555 | 92,868 | ||
| United States Treasury Note/Bond | 0.125% | 12/15/23 | 350,891 | 336,197 | ||
| United States Treasury Note/Bond | 0.750% | 12/31/23 | 221,300 | 213,451 | ||
| United States Treasury Note/Bond | 2.250% | 12/31/23 | 58,723 | 57,769 | ||
| United States Treasury Note/Bond | 2.625% | 12/31/23 | 88,169 | 87,218 | ||
| United States Treasury Note/Bond | 0.125% | 1/15/24 | 383,598 | 366,396 | ||
| United States Treasury Note/Bond | 0.875% | 1/31/24 | 243,433 | 234,609 | ||
| United States Treasury Note/Bond | 2.250% | 1/31/24 | 172,478 | 169,540 | ||
| United States Treasury Note/Bond | 2.500% | 1/31/24 | 96,140 | 94,818 | ||
| United States Treasury Note/Bond | 0.125% | 2/15/24 | 433,552 | 413,026 | ||
| United States Treasury Note/Bond | 2.750% | 2/15/24 | 368,989 | 365,126 | ||
| United States Treasury Note/Bond | 1.500% | 2/29/24 | 114,545 | 111,252 | ||
| United States Treasury Note/Bond | 2.125% | 2/29/24 | 121,818 | 119,420 | ||
| United States Treasury Note/Bond | 2.375% | 2/29/24 | 126,111 | 124,081 | ||
| United States Treasury Note/Bond | 0.250% | 3/15/24 | 318,886 | 303,490 | ||
| United States Treasury Note/Bond | 2.125% | 3/31/24 | 125,971 | 123,353 | ||
| United States Treasury Note/Bond | 2.250% | 3/31/24 | 365,466 | 358,442 | ||
| United States Treasury Note/Bond | 0.375% | 4/15/24 | 307,202 | 292,178 | ||
| United States Treasury Note/Bond | 2.000% | 4/30/24 | 67,522 | 65,929 | ||
| United States Treasury Note/Bond | 2.250% | 4/30/24 | 195,851 | 191,965 | ||
| United States Treasury Note/Bond | 2.500% | 4/30/24 | 321,250 | 316,130 | ||
| United States Treasury Note/Bond | 0.250% | 5/15/24 | 415,906 | 393,811 | ||
| United States Treasury Note/Bond | 2.500% | 5/15/24 | 330,435 | 325,065 | ||
| United States Treasury Note/Bond | 2.000% | 5/31/24 | 190,884 | 186,112 | ||
| United States Treasury Note/Bond | 2.500% | 5/31/24 | 227,244 | 223,480 | ||
| United States Treasury Note/Bond | 0.250% | 6/15/24 | 281,696 | 265,983 | ||
| Coupon | Maturity Date | Face Amount ($000) | Market Value• ($000) | |||
| United States Treasury Note/Bond | 1.750% | 6/30/24 | 178,944 | 173,492 | ||
| United States Treasury Note/Bond | 2.000% | 6/30/24 | 64,616 | 62,930 | ||
| United States Treasury Note/Bond | 3.000% | 6/30/24 | 257,367 | 255,115 | ||
| United States Treasury Note/Bond | 0.375% | 7/15/24 | 315,946 | 298,372 | ||
| United States Treasury Note/Bond | 1.750% | 7/31/24 | 149,180 | 144,472 | ||
| United States Treasury Note/Bond | 2.125% | 7/31/24 | 66,454 | 64,803 | ||
| United States Treasury Note/Bond | 3.000% | 7/31/24 | 252,536 | 250,326 | ||
| United States Treasury Note/Bond | 0.375% | 8/15/24 | 495,676 | 466,865 | ||
| United States Treasury Note/Bond | 2.375% | 8/15/24 | 338,362 | 331,383 | ||
| United States Treasury Note/Bond | 1.250% | 8/31/24 | 143,022 | 136,944 | ||
| United States Treasury Note/Bond | 1.875% | 8/31/24 | 110,362 | 106,999 | ||
| United States Treasury Note/Bond | 3.250% | 8/31/24 | 176,862 | 176,116 | ||
| United States Treasury Note/Bond | 0.375% | 9/15/24 | 398,304 | 374,032 | ||
| United States Treasury Note/Bond | 1.500% | 9/30/24 | 130,978 | 125,821 | ||
| United States Treasury Note/Bond | 2.125% | 9/30/24 | 60,781 | 59,167 | ||
| United States Treasury Note/Bond | 0.625% | 10/15/24 | 364,149 | 343,040 | ||
| United States Treasury Note/Bond | 1.500% | 10/31/24 | 135,483 | 129,979 | ||
| United States Treasury Note/Bond | 2.250% | 10/31/24 | 70,325 | 68,534 | ||
| United States Treasury Note/Bond | 0.750% | 11/15/24 | 565,939 | 533,221 | ||
| United States Treasury Note/Bond | 2.250% | 11/15/24 | 208,157 | 202,758 | ||
| United States Treasury Note/Bond | 7.500% | 11/15/24 | 1,748 | 1,893 | ||
| United States Treasury Note/Bond | 1.500% | 11/30/24 | 140,028 | 134,055 | ||
| United States Treasury Note/Bond | 2.125% | 11/30/24 | 95,148 | 92,353 | ||
| United States Treasury Note/Bond | 1.000% | 12/15/24 | 328,481 | 310,620 | ||
| United States Treasury Note/Bond | 1.750% | 12/31/24 | 119,322 | 114,736 | ||
| United States Treasury Note/Bond | 2.250% | 12/31/24 | 88,023 | 85,602 | ||
| United States Treasury Note/Bond | 1.125% | 1/15/25 | 325,278 | 307,845 | ||
| United States Treasury Note/Bond | 1.375% | 1/31/25 | 136,860 | 130,209 | ||
| United States Treasury Note/Bond | 2.500% | 1/31/25 | 30,750 | 30,044 | ||
| United States Treasury Note/Bond | 1.500% | 2/15/25 | 465,108 | 443,306 | ||
| United States Treasury Note/Bond | 2.000% | 2/15/25 | 300,820 | 290,338 | ||
| United States Treasury Note/Bond | 7.625% | 2/15/25 | 1,748 | 1,912 | ||
| United States Treasury Note/Bond | 1.125% | 2/28/25 | 176,181 | 166,298 | ||
| United States Treasury Note/Bond | 2.750% | 2/28/25 | 124,167 | 121,955 | ||
| United States Treasury Note/Bond | 1.750% | 3/15/25 | 338,142 | 323,982 | ||
| United States Treasury Note/Bond | 0.500% | 3/31/25 | 173,528 | 160,812 | ||
| United States Treasury Note/Bond | 2.625% | 3/31/25 | 65,478 | 64,087 | ||
| United States Treasury Note/Bond | 2.625% | 4/15/25 | 295,822 | 289,397 | ||
| United States Treasury Note/Bond | 0.375% | 4/30/25 | 232,951 | 214,570 | ||
| United States Treasury Note/Bond | 2.875% | 4/30/25 | 136,047 | 133,879 | ||
| United States Treasury Note/Bond | 2.125% | 5/15/25 | 203,383 | 196,201 | ||
| United States Treasury Note/Bond | 2.750% | 5/15/25 | 333,244 | 326,839 | ||
| United States Treasury Note/Bond | 0.250% | 5/31/25 | 207,745 | 190,152 | ||
| United States Treasury Note/Bond | 2.875% | 5/31/25 | 141,166 | 138,850 | ||
| United States Treasury Note/Bond | 2.875% | 6/15/25 | 269,151 | 264,693 | ||
| United States Treasury Note/Bond | 0.250% | 6/30/25 | 260,514 | 238,004 | ||
| United States Treasury Note/Bond | 2.750% | 6/30/25 | 58,184 | 57,038 | ||
| United States Treasury Note/Bond | 3.000% | 7/15/25 | 240,915 | 237,715 | ||
| United States Treasury Note/Bond | 0.250% | 7/31/25 | 254,678 | 231,916 | ||
| United States Treasury Note/Bond | 2.875% | 7/31/25 | 155,151 | 152,533 | ||
| United States Treasury Note/Bond | 2.000% | 8/15/25 | 200,531 | 192,134 | ||
| United States Treasury Note/Bond | 3.125% | 8/15/25 | 310,186 | 307,084 | ||
| United States Treasury Note/Bond | 6.875% | 8/15/25 | 501 | 547 | ||
| United States Treasury Note/Bond | 0.250% | 8/31/25 | 245,067 | 222,513 | ||
| United States Treasury Note/Bond | 2.750% | 8/31/25 | 100,980 | 98,850 | ||
| Coupon | Maturity Date | Face Amount ($000) | Market Value• ($000) | |||
| United States Treasury Note/Bond | 3.000% | 10/31/25 | 20,000 | 19,712 | ||
| United States Treasury Note/Bond | 2.250% | 11/15/25 | 20,000 | 19,244 | ||
| United States Treasury Note/Bond | 0.375% | 11/30/25 | 20,000 | 18,097 | ||
| Total U.S. Government and Agency Obligations (Cost $19,711,618) | 19,056,409 | |||||
| Shares | ||||||
| Temporary Cash Investments (0.1%) | ||||||
| Money Market Fund (0.1%) | ||||||
| 1 | Vanguard Market Liquidity Fund (Cost $23,574) | 2.284% | 235,826 | 23,575 | ||
| Total Investments (99.6%) (Cost $19,735,192) | 19,079,984 | |||||
| Other Assets and Liabilities—Net (0.4%) | 83,534 | |||||
| Net Assets (100%) | 19,163,518 | |||||
| Cost is in $000. |
| • | See Note A in Notes to Financial Statements. |
| 1 | Affiliated money market fund available only to Vanguard funds and certain trusts and accounts managed by Vanguard. Rate shown is the 7-day yield. |
| ($000s, except shares and per-share amounts) | Amount |
| Assets | |
| Investments in Securities, at Value | |
| Unaffiliated Issuers (Cost $19,711,618) | 19,056,409 |
| Affiliated Issuers (Cost $23,574) | 23,575 |
| Total Investments in Securities | 19,079,984 |
| Investment in Vanguard | 658 |
| Cash Collateral Received for ETF Capital Activity | 11,176 |
| Receivables for Investment Securities Sold | 1,091,200 |
| Receivables for Accrued Income | 60,865 |
| Receivables for Capital Shares Issued | 4,882 |
| Total Assets | 20,248,765 |
| Liabilities | |
| Due to Custodian | 2 |
| Payables for Investment Securities Purchased | 1,065,466 |
| Collateral for ETF Capital Activity | 11,176 |
| Payables for Capital Shares Redeemed | 7,428 |
| Payables for Distributions | 808 |
| Payables to Vanguard | 367 |
| Total Liabilities | 1,085,247 |
| Net Assets | 19,163,518 |
| At August 31, 2022, net assets consisted of: | |
| Paid-in Capital | 19,940,836 |
| Total Distributable Earnings (Loss) | (777,318) |
| Net Assets | 19,163,518 |
| ETF Shares—Net Assets | |
| Applicable to 266,047,259 outstanding $.001 par value shares of beneficial interest (unlimited authorization) | 15,565,421 |
| Net Asset Value Per Share—ETF Shares | $58.51 |
| Admiral Shares—Net Assets | |
| Applicable to 128,526,399 outstanding $.001 par value shares of beneficial interest (unlimited authorization) | 2,506,058 |
| Net Asset Value Per Share—Admiral Shares | $19.50 |
| Institutional Shares—Net Assets | |
| Applicable to 44,579,836 outstanding $.001 par value shares of beneficial interest (unlimited authorization) | 1,092,039 |
| Net Asset Value Per Share—Institutional Shares | $24.50 |
| Year Ended August 31, 2022 | |
| ($000) | |
| Investment Income | |
| Income | |
| Interest1 | 113,662 |
| Total Income | 113,662 |
| Expenses | |
| The Vanguard Group—Note B | |
| Investment Advisory Services | 331 |
| Management and Administrative—ETF Shares | 4,259 |
| Management and Administrative—Admiral Shares | 1,412 |
| Management and Administrative—Institutional Shares | 488 |
| Marketing and Distribution—ETF Shares | 759 |
| Marketing and Distribution—Admiral Shares | 124 |
| Marketing and Distribution—Institutional Shares | 50 |
| Custodian Fees | 66 |
| Auditing Fees | 39 |
| Shareholders’ Reports—ETF Shares | 247 |
| Shareholders’ Reports—Admiral Shares | 19 |
| Shareholders’ Reports—Institutional Shares | 1 |
| Trustees’ Fees and Expenses | 7 |
| Other Expenses | 13 |
| Total Expenses | 7,815 |
| Expenses Paid Indirectly | (20) |
| Net Expenses | 7,795 |
| Net Investment Income | 105,867 |
| Realized Net Gain (Loss) on Investment Securities Sold1,2 | (147,549) |
| Change in Unrealized Appreciation (Depreciation) of Investment Securities1 | (676,009) |
| Net Increase (Decrease) in Net Assets Resulting from Operations | (717,691) |
| 1 | Interest income, realized net gain (loss), capital gain distributions received, and change in unrealized appreciation (depreciation) from an affiliated company of the fund were $158,000, ($5,000), $2,000, and $1,000, respectively. Purchases and sales are for temporary cash investment purposes. |
| 2 | Includes ($15,130,000) of net gain (loss) resulting from in-kind redemptions. |
| Year Ended August 31, | ||
| 2022 ($000) | 2021 ($000) | |
| Increase (Decrease) in Net Assets | ||
| Operations | ||
| Net Investment Income | 105,867 | 68,639 |
| Realized Net Gain (Loss) | (147,549) | 81,417 |
| Change in Unrealized Appreciation (Depreciation) | (676,009) | (133,475) |
| Net Increase (Decrease) in Net Assets Resulting from Operations | (717,691) | 16,581 |
| Distributions | ||
| ETF Shares | (116,564) | (110,961) |
| Admiral Shares | (20,209) | (27,852) |
| Institutional Shares | (10,271) | (12,476) |
| Total Distributions | (147,044) | (151,289) |
| Capital Share Transactions | ||
| ETF Shares | 2,863,266 | 4,351,856 |
| Admiral Shares | 190,909 | (291,770) |
| Institutional Shares | 12,395 | 44,764 |
| Net Increase (Decrease) from Capital Share Transactions | 3,066,570 | 4,104,850 |
| Total Increase (Decrease) | 2,201,835 | 3,970,142 |
| Net Assets | ||
| Beginning of Period | 16,961,683 | 12,991,541 |
| End of Period | 19,163,518 | 16,961,683 |
| ETF Shares | |||||
| For a Share Outstanding Throughout Each Period | Year Ended August 31, | ||||
| 2022 | 2021 | 2020 | 2019 | 2018 | |
| Net Asset Value, Beginning of Period | $61.50 | $62.13 | $61.12 | $59.89 | $60.86 |
| Investment Operations | |||||
| Net Investment Income1 | .368 | .288 | .956 | 1.430 | .965 |
| Net Realized and Unrealized Gain (Loss) on Investments | (2.860) | (.220) | 1.115 | 1.165 | (1.062) |
| Total from Investment Operations | (2.492) | .068 | 2.071 | 2.595 | (.097) |
| Distributions | |||||
| Dividends from Net Investment Income | (.310) | (.325) | (1.061) | (1.365) | (.873) |
| Distributions from Realized Capital Gains | (.188) | (.373) | — | — | — |
| Total Distributions | (.498) | (.698) | (1.061) | (1.365) | (.873) |
| Net Asset Value, End of Period | $58.51 | $61.50 | $62.13 | $61.12 | $59.89 |
| Total Return | -4.07% | 0.11% | 3.43% | 4.39% | -0.15% |
| Ratios/Supplemental Data | |||||
| Net Assets, End of Period (Millions) | $15,565 | $13,394 | $9,140 | $5,334 | $3,080 |
| Ratio of Total Expenses to Average Net Assets | 0.04%2 | 0.04% | 0.05% | 0.05% | 0.07% |
| Ratio of Net Investment Income to Average Net Assets | 0.61% | 0.47% | 1.55% | 2.37% | 1.61% |
| Portfolio Turnover Rate3 | 59% | 66% | 67% | 55% | 67% |
| 1 | Calculated based on average shares outstanding. |
| 2 | The ratio of expenses to average net assets for the period net of reduction from custody fee offset arrangements was 0.04%. |
| 3 | Excludes the value of portfolio securities received or delivered as a result of in-kind purchases or redemptions of the fund’s capital shares, including ETF Creation Units. |
| Admiral Shares | |||||
| For a Share Outstanding Throughout Each Period | Year Ended August 31, | ||||
| 2022 | 2021 | 2020 | 2019 | 2018 | |
| Net Asset Value, Beginning of Period | $20.51 | $20.71 | $20.35 | $19.95 | $20.29 |
| Investment Operations | |||||
| Net Investment Income1 | .114 | .095 | .312 | .472 | .324 |
| Net Realized and Unrealized Gain (Loss) on Investments | (.949) | (.078) | .375 | .384 | (.358) |
| Total from Investment Operations | (.835) | .017 | .687 | .856 | (.034) |
| Distributions | |||||
| Dividends from Net Investment Income | (.112) | (.093) | (.327) | (.456) | (.306) |
| Distributions from Realized Capital Gains | (.063) | (.124) | — | — | — |
| Total Distributions | (.175) | (.217) | (.327) | (.456) | (.306) |
| Net Asset Value, End of Period | $19.50 | $20.51 | $20.71 | $20.35 | $19.95 |
| Total Return2 | -4.09% | 0.08% | 3.41% | 4.34% | -0.16% |
| Ratios/Supplemental Data | |||||
| Net Assets, End of Period (Millions) | $2,506 | $2,430 | $2,748 | $1,596 | $929 |
| Ratio of Total Expenses to Average Net Assets | 0.07%3 | 0.07% | 0.07% | 0.07% | 0.07% |
| Ratio of Net Investment Income to Average Net Assets | 0.57% | 0.46% | 1.52% | 2.35% | 1.61% |
| Portfolio Turnover Rate4 | 59% | 66% | 67% | 55% | 67% |
| 1 | Calculated based on average shares outstanding. |
| 2 | Total returns do not include account service fees that may have applied in the periods shown. Fund prospectuses provide information about any applicable account service fees. |
| 3 | The ratio of expenses to average net assets for the period net of reduction from custody fee offset arrangements was 0.07%. |
| 4 | Excludes the value of portfolio securities received or delivered as a result of in-kind purchases or redemptions of the fund’s capital shares, including ETF Creation Units. |
| Institutional Shares | |||||
| For a Share Outstanding Throughout Each Period | Year Ended August 31, | ||||
| 2022 | 2021 | 2020 | 2019 | 2018 | |
| Net Asset Value, Beginning of Period | $25.77 | $26.02 | $25.57 | $25.06 | $25.49 |
| Investment Operations | |||||
| Net Investment Income1 | .145 | .120 | .421 | .598 | .425 |
| Net Realized and Unrealized Gain (Loss) on Investments | (1.191) | (.092) | .445 | .490 | (.467) |
| Total from Investment Operations | (1.046) | .028 | .866 | 1.088 | (.042) |
| Distributions | |||||
| Dividends from Net Investment Income | (.145) | (.122) | (.416) | (.578) | (.388) |
| Distributions from Realized Capital Gains | (.079) | (.156) | — | — | — |
| Total Distributions | (.224) | (.278) | (.416) | (.578) | (.388) |
| Net Asset Value, End of Period | $24.50 | $25.77 | $26.02 | $25.57 | $25.06 |
| Total Return | -4.08% | 0.11% | 3.42% | 4.40% | -0.16% |
| Ratios/Supplemental Data | |||||
| Net Assets, End of Period (Millions) | $1,092 | $1,138 | $1,104 | $974 | $508 |
| Ratio of Total Expenses to Average Net Assets | 0.05%2 | 0.05% | 0.05% | 0.05% | 0.05% |
| Ratio of Net Investment Income to Average Net Assets | 0.58% | 0.47% | 1.63% | 2.37% | 1.63% |
| Portfolio Turnover Rate3 | 59% | 66% | 67% | 55% | 67% |
| 1 | Calculated based on average shares outstanding. |
| 2 | The ratio of expenses to average net assets for the period net of reduction from custody fee offset arrangements was 0.05%. |
| 3 | Excludes the value of portfolio securities received or delivered as a result of in-kind purchases or redemptions of the fund’s capital shares, including ETF Creation Units. |
| A. | The following significant accounting policies conform to generally accepted accounting principles for U.S. investment companies. The fund consistently follows such policies in preparing its financial statements. |
| B. | In accordance with the terms of a Funds’ Service Agreement (the “FSA”) between Vanguard and the fund, Vanguard furnishes to the fund investment advisory, corporate management, |
| C. | The fund’s custodian bank has agreed to reduce its fees when the fund maintains cash on deposit in the non-interest-bearing custody account. For the year ended August 31, 2022, custodian fee offset arrangements reduced the fund’s expenses by $20,000 (an annual rate of less than 0.01% of average net assets). |
| D. | Various inputs may be used to determine the value of the fund’s investments. These inputs are summarized in three broad levels for financial statement purposes. The inputs or methodologies used to value securities are not necessarily an indication of the risk associated with investing in those securities. |
| Level 1 ($000) | Level 2 ($000) | Level 3 ($000) | Total ($000) | |
| Investments | ||||
| Assets | ||||
| U.S. Government and Agency Obligations | — | 19,056,409 | — | 19,056,409 |
| Temporary Cash Investments | 23,575 | — | — | 23,575 |
| Total | 23,575 | 19,056,409 | — | 19,079,984 |
| E. | Permanent differences between book-basis and tax-basis components of net assets are reclassified among capital accounts in the financial statements to reflect their tax character. These reclassifications have no effect on net assets or net asset value per share. As of period end, permanent differences primarily attributable to the accounting for applicable in-kind redemptions were reclassified between the following accounts: |
| Amount ($000) | |
| Paid-in Capital | (15,131) |
| Total Distributable Earnings (Loss) | 15,131 |
| Amount ($000) | |
| Undistributed Ordinary Income | 16,599 |
| Undistributed Long-Term Gains | — |
| Capital Loss Carryforwards | — |
| Qualified Late-Year Losses | (137,243) |
| Net Unrealized Gains (Losses) | (655,866) |
| Year Ended August 31, | ||
| 2022 Amount ($000) | 2021 Amount ($000) | |
| Ordinary Income* | 100,391 | 118,534 |
| Long-Term Capital Gains | 46,653 | 32,755 |
| Total | 147,044 | 151,289 |
| * | Includes short-term capital gains, if any. |
| Amount ($000) | |
| Tax Cost | 19,735,850 |
| Gross Unrealized Appreciation | 6 |
| Gross Unrealized Depreciation | (655,872) |
| Net Unrealized Appreciation (Depreciation) | (655,866) |
| F. | During the year ended August 31, 2022, the fund purchased $18,129,438,000 of investment securities and sold $15,080,321,000 of investment securities, other than temporary cash investments. Purchases and sales include $7,564,060,000 and $4,752,208,000, respectively, in connection with in-kind purchases and redemptions of the fund’s capital shares. |
| G. | Capital share transactions for each class of shares were: |
| Year Ended August 31, | |||||
| 2022 | 2021 | ||||
| Amount ($000) | Shares (000) | Amount ($000) | Shares (000) | ||
| ETF Shares | |||||
| Issued | 7,645,151 | 128,173 | 5,990,667 | 97,261 | |
| Issued in Lieu of Cash Distributions | — | — | — | — | |
| Redeemed | (4,781,885) | (79,925) | (1,638,811) | (26,575) | |
| Net Increase (Decrease)—ETF Shares | 2,863,266 | 48,248 | 4,351,856 | 70,686 | |
| Admiral Shares | |||||
| Issued | 1,386,561 | 69,862 | 989,015 | 48,049 | |
| Issued in Lieu of Cash Distributions | 15,276 | 765 | 22,569 | 1,097 | |
| Redeemed | (1,210,928) | (60,577) | (1,303,354) | (63,333) | |
| Net Increase (Decrease)—Admiral Shares | 190,909 | 10,050 | (291,770) | (14,187) | |
| Institutional Shares | |||||
| Issued | 585,141 | 23,322 | 632,092 | 24,453 | |
| Issued in Lieu of Cash Distributions | 8,407 | 335 | 10,629 | 412 | |
| Redeemed | (581,153) | (23,235) | (597,957) | (23,156) | |
| Net Increase (Decrease)—Institutional Shares | 12,395 | 422 | 44,764 | 1,709 | |
| H. | Management has determined that no events or transactions occurred subsequent to August 31, 2022, that would require recognition or disclosure in these financial statements. |

| Average Annual Total Returns Periods Ended August 31, 2022 | |||||
| One Year | Five Years | Ten Years | Final Value of a $10,000 Investment | ||
| Intermediate-Term Treasury Index Fund ETF Shares Net Asset Value | -10.01% | 0.38% | 0.89% | $10,923 |
| Intermediate-Term Treasury Index Fund ETF Shares Market Price | -9.98 | 0.37 | 0.89 | 10,922 | |
| Spliced Bloomberg U.S.Treasury 3–10 Year Index | -9.99 | 0.42 | 0.96 | 10,998 |
| Bloomberg U.S. Aggregate Float Adjusted Index | -11.65 | 0.54 | 1.36 | 11,452 |
| Average Annual Total Returns Periods Ended August 31, 2022 | |||||
| One Year | Five Years | Ten Years | Final Value of a $10,000 Investment | ||
| Intermediate-Term Treasury Index Fund Admiral Shares | -10.05% | 0.35% | 0.87% | $10,909 | |
| Spliced Bloomberg U.S.Treasury 3–10 Year Index | -9.99 | 0.42 | 0.96 | 10,998 | |
| Bloomberg U.S. Aggregate Float Adjusted Index | -11.65 | 0.54 | 1.36 | 11,452 | |
| One Year | Five Years | Ten Years | Final Value of a $5,000,000 Investment | ||
| Intermediate-Term Treasury Index Fund Institutional Shares | -10.03% | 0.38% | 0.90% | $5,468,272 | |
| Spliced Bloomberg U.S.Treasury 3–10 Year Index | -9.99 | 0.42 | 0.96 | 5,499,068 | |
| Bloomberg U.S. Aggregate Float Adjusted Index | -11.65 | 0.54 | 1.36 | 5,725,801 | |
| Cumulative Returns of ETF Shares: August 31, 2012, Through August 31, 2022 | |||
| One Year | Five Years | Ten Years | |
| Intermediate-Term Treasury Index Fund ETF Shares Market Price | -9.98% | 1.89% | 9.22% |
| Intermediate-Term Treasury Index Fund ETF Shares Net Asset Value | -10.01 | 1.89 | 9.23 |
| Spliced Bloomberg U.S.Treasury 3–10 Year Index | -9.99 | 2.12 | 9.98 |
| 0 - 2 Years | 0.0% |
| 2 - 4 Years | 23.1 |
| 4 - 6 Years | 40.6 |
| 6 - 8 Years | 21.5 |
| 8 - 10 Years | 14.8 |
| Coupon | Maturity Date | Face Amount ($000) | Market Value• ($000) | |||
| U.S. Government and Agency Obligations (99.5%) | ||||||
| U.S. Government Securities (99.5%) | ||||||
| United States Treasury Note/Bond | 0.250% | 9/30/25 | 175,478 | 159,027 | ||
| United States Treasury Note/Bond | 3.000% | 9/30/25 | 75,877 | 74,798 | ||
| United States Treasury Note/Bond | 0.250% | 10/31/25 | 185,123 | 167,247 | ||
| United States Treasury Note/Bond | 3.000% | 10/31/25 | 54,001 | 53,225 | ||
| United States Treasury Note/Bond | 2.250% | 11/15/25 | 203,667 | 195,966 | ||
| United States Treasury Note/Bond | 0.375% | 11/30/25 | 176,564 | 159,763 | ||
| United States Treasury Note/Bond | 2.875% | 11/30/25 | 101,367 | 99,466 | ||
| United States Treasury Note/Bond | 0.375% | 12/31/25 | 178,933 | 161,487 | ||
| United States Treasury Note/Bond | 2.625% | 12/31/25 | 73,425 | 71,475 | ||
| United States Treasury Note/Bond | 0.375% | 1/31/26 | 175,246 | 157,749 | ||
| United States Treasury Note/Bond | 2.625% | 1/31/26 | 106,029 | 103,163 | ||
| United States Treasury Note/Bond | 1.625% | 2/15/26 | 234,947 | 220,703 | ||
| United States Treasury Note/Bond | 6.000% | 2/15/26 | 15,815 | 17,060 | ||
| United States Treasury Note/Bond | 0.500% | 2/28/26 | 233,708 | 210,848 | ||
| United States Treasury Note/Bond | 2.500% | 2/28/26 | 43,805 | 42,409 | ||
| United States Treasury Note/Bond | 0.750% | 3/31/26 | 158,258 | 143,817 | ||
| United States Treasury Note/Bond | 2.250% | 3/31/26 | 89,587 | 85,976 | ||
| United States Treasury Note/Bond | 0.750% | 4/30/26 | 149,110 | 135,271 | ||
| United States Treasury Note/Bond | 2.375% | 4/30/26 | 99,503 | 95,927 | ||
| United States Treasury Note/Bond | 1.625% | 5/15/26 | 221,189 | 207,261 | ||
| United States Treasury Note/Bond | 0.750% | 5/31/26 | 175,045 | 158,470 | ||
| United States Treasury Note/Bond | 2.125% | 5/31/26 | 70,849 | 67,572 | ||
| United States Treasury Note/Bond | 0.875% | 6/30/26 | 153,388 | 139,272 | ||
| United States Treasury Note/Bond | 1.875% | 6/30/26 | 104,210 | 98,446 | ||
| United States Treasury Note/Bond | 0.625% | 7/31/26 | 154,349 | 138,480 | ||
| United States Treasury Note/Bond | 1.875% | 7/31/26 | 136,031 | 128,379 | ||
| United States Treasury Note/Bond | 1.500% | 8/15/26 | 228,890 | 212,474 | ||
| United States Treasury Note/Bond | 6.750% | 8/15/26 | 8,107 | 9,098 | ||
| United States Treasury Note/Bond | 0.750% | 8/31/26 | 207,843 | 187,091 | ||
| United States Treasury Note/Bond | 1.375% | 8/31/26 | 50,710 | 46,851 | ||
| United States Treasury Note/Bond | 0.875% | 9/30/26 | 172,137 | 155,488 | ||
| United States Treasury Note/Bond | 1.625% | 9/30/26 | 67,636 | 63,071 | ||
| United States Treasury Note/Bond | 1.125% | 10/31/26 | 172,891 | 157,520 | ||
| United States Treasury Note/Bond | 1.625% | 10/31/26 | 81,777 | 76,117 | ||
| United States Treasury Note/Bond | 2.000% | 11/15/26 | 224,407 | 211,854 | ||
| United States Treasury Note/Bond | 6.500% | 11/15/26 | 11,479 | 12,839 | ||
| United States Treasury Note/Bond | 1.250% | 11/30/26 | 203,456 | 186,162 | ||
| United States Treasury Note/Bond | 1.625% | 11/30/26 | 82,494 | 76,771 | ||
| United States Treasury Note/Bond | 1.250% | 12/31/26 | 195,525 | 178,630 | ||
| Coupon | Maturity Date | Face Amount ($000) | Market Value• ($000) | |||
| United States Treasury Note/Bond | 1.750% | 12/31/26 | 84,123 | 78,616 | ||
| United States Treasury Note/Bond | 1.500% | 1/31/27 | 266,407 | 245,844 | ||
| United States Treasury Note/Bond | 2.250% | 2/15/27 | 158,030 | 150,474 | ||
| United States Treasury Note/Bond | 6.625% | 2/15/27 | 7,105 | 8,022 | ||
| United States Treasury Note/Bond | 1.125% | 2/28/27 | 52,762 | 47,857 | ||
| United States Treasury Note/Bond | 1.875% | 2/28/27 | 185,753 | 174,201 | ||
| United States Treasury Note/Bond | 0.625% | 3/31/27 | 84,291 | 74,519 | ||
| United States Treasury Note/Bond | 2.500% | 3/31/27 | 161,626 | 155,641 | ||
| United States Treasury Note/Bond | 0.500% | 4/30/27 | 112,356 | 98,522 | ||
| United States Treasury Note/Bond | 2.750% | 4/30/27 | 176,441 | 171,727 | ||
| United States Treasury Note/Bond | 2.375% | 5/15/27 | 195,413 | 186,833 | ||
| United States Treasury Note/Bond | 0.500% | 5/31/27 | 130,133 | 113,866 | ||
| United States Treasury Note/Bond | 2.625% | 5/31/27 | 167,225 | 161,947 | ||
| United States Treasury Note/Bond | 0.500% | 6/30/27 | 134,190 | 117,165 | ||
| United States Treasury Note/Bond | 3.250% | 6/30/27 | 178,949 | 178,054 | ||
| United States Treasury Note/Bond | 0.375% | 7/31/27 | 156,446 | 135,644 | ||
| United States Treasury Note/Bond | 2.750% | 7/31/27 | 159,166 | 154,888 | ||
| United States Treasury Note/Bond | 2.250% | 8/15/27 | 157,795 | 149,856 | ||
| United States Treasury Note/Bond | 6.375% | 8/15/27 | 10,146 | 11,497 | ||
| United States Treasury Note/Bond | 0.500% | 8/31/27 | 131,289 | 114,201 | ||
| United States Treasury Note/Bond | 3.125% | 8/31/27 | 157,102 | 155,703 | ||
| United States Treasury Note/Bond | 0.375% | 9/30/27 | 170,493 | 146,944 | ||
| United States Treasury Note/Bond | 0.500% | 10/31/27 | 145,031 | 125,542 | ||
| United States Treasury Note/Bond | 2.250% | 11/15/27 | 154,309 | 146,160 | ||
| United States Treasury Note/Bond | 6.125% | 11/15/27 | 20,774 | 23,423 | ||
| United States Treasury Note/Bond | 0.625% | 11/30/27 | 174,060 | 151,323 | ||
| United States Treasury Note/Bond | 0.625% | 12/31/27 | 163,701 | 141,959 | ||
| United States Treasury Note/Bond | 0.750% | 1/31/28 | 212,036 | 184,769 | ||
| United States Treasury Note/Bond | 2.750% | 2/15/28 | 174,656 | 169,225 | ||
| United States Treasury Note/Bond | 1.125% | 2/29/28 | 252,710 | 224,557 | ||
| United States Treasury Note/Bond | 1.250% | 3/31/28 | 190,358 | 169,954 | ||
| United States Treasury Note/Bond | 1.250% | 4/30/28 | 183,704 | 163,755 | ||
| United States Treasury Note/Bond | 2.875% | 5/15/28 | 187,923 | 183,049 | ||
| United States Treasury Note/Bond | 1.250% | 5/31/28 | 234,168 | 208,556 | ||
| United States Treasury Note/Bond | 1.250% | 6/30/28 | 167,673 | 148,993 | ||
| United States Treasury Note/Bond | 1.000% | 7/31/28 | 193,237 | 168,901 | ||
| United States Treasury Note/Bond | 2.875% | 8/15/28 | 224,731 | 218,762 | ||
| United States Treasury Note/Bond | 5.500% | 8/15/28 | 26,649 | 29,655 | ||
| United States Treasury Note/Bond | 1.125% | 8/31/28 | 201,926 | 177,632 | ||
| United States Treasury Note/Bond | 1.250% | 9/30/28 | 169,143 | 149,586 | ||
| United States Treasury Note/Bond | 1.375% | 10/31/28 | 181,168 | 161,296 | ||
| United States Treasury Note/Bond | 3.125% | 11/15/28 | 203,760 | 201,149 | ||
| United States Treasury Note/Bond | 5.250% | 11/15/28 | 32,813 | 36,217 | ||
| United States Treasury Note/Bond | 1.500% | 11/30/28 | 204,997 | 183,697 | ||
| United States Treasury Note/Bond | 1.375% | 12/31/28 | 196,334 | 174,615 | ||
| United States Treasury Note/Bond | 1.750% | 1/31/29 | 196,230 | 178,385 | ||
| United States Treasury Note/Bond | 2.625% | 2/15/29 | 202,184 | 193,876 | ||
| United States Treasury Note/Bond | 5.250% | 2/15/29 | 19,526 | 21,656 | ||
| United States Treasury Note/Bond | 1.875% | 2/28/29 | 165,407 | 151,606 | ||
| United States Treasury Note/Bond | 2.375% | 3/31/29 | 167,825 | 158,280 | ||
| United States Treasury Note/Bond | 2.875% | 4/30/29 | 154,099 | 149,861 | ||
| United States Treasury Note/Bond | 2.375% | 5/15/29 | 199,045 | 187,693 | ||
| United States Treasury Note/Bond | 2.750% | 5/31/29 | 146,047 | 140,935 | ||
| United States Treasury Note/Bond | 3.250% | 6/30/29 | 140,663 | 140,114 | ||
| United States Treasury Note/Bond | 2.625% | 7/31/29 | 154,463 | 148,091 | ||
| Coupon | Maturity Date | Face Amount ($000) | Market Value• ($000) | |||
| United States Treasury Note/Bond | 1.625% | 8/15/29 | 149,830 | 134,800 | ||
| United States Treasury Note/Bond | 6.125% | 8/15/29 | 18,758 | 22,026 | ||
| United States Treasury Note/Bond | 3.125% | 8/31/29 | 135,072 | 133,763 | ||
| United States Treasury Note/Bond | 1.750% | 11/15/29 | 104,520 | 94,868 | ||
| United States Treasury Note/Bond | 1.500% | 2/15/30 | 198,762 | 176,277 | ||
| United States Treasury Note/Bond | 0.625% | 5/15/30 | 274,538 | 226,236 | ||
| United States Treasury Note/Bond | 6.250% | 5/15/30 | 22,368 | 26,891 | ||
| United States Treasury Note/Bond | 0.625% | 8/15/30 | 365,285 | 299,648 | ||
| United States Treasury Note/Bond | 0.875% | 11/15/30 | 377,919 | 315,858 | ||
| United States Treasury Note/Bond | 1.125% | 2/15/31 | 355,734 | 302,485 | ||
| United States Treasury Note/Bond | 5.375% | 2/15/31 | 22,548 | 26,085 | ||
| United States Treasury Note/Bond | 1.625% | 5/15/31 | 353,850 | 312,549 | ||
| United States Treasury Note/Bond | 1.250% | 8/15/31 | 393,027 | 334,564 | ||
| United States Treasury Note/Bond | 1.375% | 11/15/31 | 378,405 | 324,187 | ||
| United States Treasury Note/Bond | 1.875% | 2/15/32 | 366,942 | 328,069 | ||
| United States Treasury Note/Bond | 2.875% | 5/15/32 | 354,749 | 345,769 | ||
| United States Treasury Note/Bond | 2.750% | 8/15/32 | 125,072 | 120,694 | ||
| Total U.S. Government and Agency Obligations (Cost $17,457,262) | 16,237,285 | |||||
| Shares | ||||||
| Temporary Cash Investments (0.3%) | ||||||
| Money Market Fund (0.3%) | ||||||
| 1 | Vanguard Market Liquidity Fund (Cost $46,804) | 2.284% | 468,184 | 46,805 | ||
| Total Investments (99.8%) (Cost $17,504,066) | 16,284,090 | |||||
| Other Assets and Liabilities—Net (0.2%) | 28,040 | |||||
| Net Assets (100%) | 16,312,130 | |||||
| Cost is in $000. |
| • | See Note A in Notes to Financial Statements. |
| 1 | Affiliated money market fund available only to Vanguard funds and certain trusts and accounts managed by Vanguard. Rate shown is the 7-day yield. |
| ($000s, except shares and per-share amounts) | Amount |
| Assets | |
| Investments in Securities, at Value | |
| Unaffiliated Issuers (Cost $17,457,262) | 16,237,285 |
| Affiliated Issuers (Cost $46,804) | 46,805 |
| Total Investments in Securities | 16,284,090 |
| Investment in Vanguard | 533 |
| Cash | 166 |
| Cash Collateral Received for ETF Capital Activity | 15,133 |
| Receivables for Investment Securities Sold | 382,213 |
| Receivables for Accrued Income | 55,442 |
| Receivables for Capital Shares Issued | 5,109 |
| Total Assets | 16,742,686 |
| Liabilities | |
| Payables for Investment Securities Purchased | 410,391 |
| Collateral for ETF Capital Activity | 15,133 |
| Payables for Capital Shares Redeemed | 4,005 |
| Payables for Distributions | 697 |
| Payables to Vanguard | 330 |
| Total Liabilities | 430,556 |
| Net Assets | 16,312,130 |
| At August 31, 2022, net assets consisted of: | |
| Paid-in Capital | 17,759,890 |
| Total Distributable Earnings (Loss) | (1,447,760) |
| Net Assets | 16,312,130 |
| ETF Shares—Net Assets | |
| Applicable to 194,345,351 outstanding $.001 par value shares of beneficial interest (unlimited authorization) | 11,726,161 |
| Net Asset Value Per Share—ETF Shares | $60.34 |
| Admiral Shares—Net Assets | |
| Applicable to 141,782,691 outstanding $.001 par value shares of beneficial interest (unlimited authorization) | 2,885,767 |
| Net Asset Value Per Share—Admiral Shares | $20.35 |
| Institutional Shares—Net Assets | |
| Applicable to 67,312,391 outstanding $.001 par value shares of beneficial interest (unlimited authorization) | 1,700,202 |
| Net Asset Value Per Share—Institutional Shares | $25.26 |
| Year Ended August 31, 2022 | |
| ($000) | |
| Investment Income | |
| Income | |
| Interest1 | 187,940 |
| Total Income | 187,940 |
| Expenses | |
| The Vanguard Group—Note B | |
| Investment Advisory Services | 258 |
| Management and Administrative—ETF Shares | 2,736 |
| Management and Administrative—Admiral Shares | 1,626 |
| Management and Administrative—Institutional Shares | 769 |
| Marketing and Distribution—ETF Shares | 496 |
| Marketing and Distribution—Admiral Shares | 144 |
| Marketing and Distribution—Institutional Shares | 78 |
| Custodian Fees | 44 |
| Auditing Fees | 38 |
| Shareholders’ Reports—ETF Shares | 211 |
| Shareholders’ Reports—Admiral Shares | 28 |
| Shareholders’ Reports—Institutional Shares | 4 |
| Trustees’ Fees and Expenses | 5 |
| Other Expenses | 13 |
| Total Expenses | 6,450 |
| Expenses Paid Indirectly | (15) |
| Net Expenses | 6,435 |
| Net Investment Income | 181,505 |
| Realized Net Gain (Loss) | |
| Investment Securities Sold1,2 | (248,171) |
| Futures Contracts | (110) |
| Realized Net Gain (Loss) | (248,281) |
| Change in Unrealized Appreciation (Depreciation) of Investment Securities1 | (1,386,084) |
| Net Increase (Decrease) in Net Assets Resulting from Operations | (1,452,860) |
| 1 | Interest income, realized net gain (loss), capital gain distributions received, and change in unrealized appreciation (depreciation) from an affiliated company of the fund were $81,000, $1,000, $1,000, and $1,000, respectively. Purchases and sales are for temporary cash investment purposes. |
| 2 | Includes ($12,796,000) of net gain (loss) resulting from in-kind redemptions. |
| Year Ended August 31, | ||
| 2022 ($000) | 2021 ($000) | |
| Increase (Decrease) in Net Assets | ||
| Operations | ||
| Net Investment Income | 181,505 | 135,171 |
| Realized Net Gain (Loss) | (248,281) | 147,291 |
| Change in Unrealized Appreciation (Depreciation) | (1,386,084) | (417,388) |
| Net Increase (Decrease) in Net Assets Resulting from Operations | (1,452,860) | (134,926) |
| Distributions | ||
| ETF Shares | (165,364) | (132,684) |
| Admiral Shares | (48,477) | (49,704) |
| Institutional Shares | (33,566) | (31,298) |
| Total Distributions | (247,407) | (213,686) |
| Capital Share Transactions | ||
| ETF Shares | 4,723,604 | 1,812,764 |
| Admiral Shares | 574,795 | (8,693) |
| Institutional Shares | 195,879 | 217,704 |
| Net Increase (Decrease) from Capital Share Transactions | 5,494,278 | 2,021,775 |
| Total Increase (Decrease) | 3,794,011 | 1,673,163 |
| Net Assets | ||
| Beginning of Period | 12,518,119 | 10,844,956 |
| End of Period | 16,312,130 | 12,518,119 |
| ETF Shares | |||||
| For a Share Outstanding Throughout Each Period | Year Ended August 31, | ||||
| 2022 | 2021 | 2020 | 2019 | 2018 | |
| Net Asset Value, Beginning of Period | $68.27 | $70.46 | $67.26 | $62.67 | $65.29 |
| Investment Operations | |||||
| Net Investment Income1 | .858 | .809 | 1.239 | 1.515 | 1.250 |
| Net Realized and Unrealized Gain (Loss) on Investments | (7.617) | (1.692) | 3.248 | 4.552 | (2.691) |
| Total from Investment Operations | (6.759) | (.883) | 4.487 | 6.067 | (1.441) |
| Distributions | |||||
| Dividends from Net Investment Income | (.805) | (.820) | (1.287) | (1.477) | (1.179) |
| Distributions from Realized Capital Gains | (.366) | (.487) | — | — | — |
| Total Distributions | (1.171) | (1.307) | (1.287) | (1.477) | (1.179) |
| Net Asset Value, End of Period | $60.34 | $68.27 | $70.46 | $67.26 | $62.67 |
| Total Return | -10.01% | -1.26% | 6.76% | 9.84% | -2.21% |
| Ratios/Supplemental Data | |||||
| Net Assets, End of Period (Millions) | $11,726 | $8,147 | $6,547 | $4,353 | $2,680 |
| Ratio of Total Expenses to Average Net Assets | 0.04%2 | 0.04% | 0.05% | 0.05% | 0.07% |
| Ratio of Net Investment Income to Average Net Assets | 1.34% | 1.18% | 1.80% | 2.36% | 1.97% |
| Portfolio Turnover Rate3 | 36% | 33% | 28% | 29% | 31% |
| 1 | Calculated based on average shares outstanding. |
| 2 | The ratio of expenses to average net assets for the period net of reduction from custody fee offset arrangements was 0.04%. |
| 3 | Excludes the value of portfolio securities received or delivered as a result of in-kind purchases or redemptions of the fund’s capital shares, including ETF Creation Units. |
| Admiral Shares | |||||
| For a Share Outstanding Throughout Each Period | Year Ended August 31, | ||||
| 2022 | 2021 | 2020 | 2019 | 2018 | |
| Net Asset Value, Beginning of Period | $23.04 | $23.78 | $22.68 | $21.13 | $22.03 |
| Investment Operations | |||||
| Net Investment Income1 | .283 | .267 | .416 | .507 | .418 |
| Net Realized and Unrealized Gain (Loss) on Investments | (2.575) | (.577) | 1.101 | 1.540 | (.911) |
| Total from Investment Operations | (2.292) | (.310) | 1.517 | 2.047 | (.493) |
| Distributions | |||||
| Dividends from Net Investment Income | (.274) | (.265) | (.417) | (.497) | (.407) |
| Distributions from Realized Capital Gains | (.124) | (.165) | — | — | — |
| Total Distributions | (.398) | (.430) | (.417) | (.497) | (.407) |
| Net Asset Value, End of Period | $20.35 | $23.04 | $23.78 | $22.68 | $21.13 |
| Total Return2 | -10.05% | -1.31% | 6.76% | 9.83% | -2.24% |
| Ratios/Supplemental Data | |||||
| Net Assets, End of Period (Millions) | $2,886 | $2,646 | $2,740 | $1,887 | $1,104 |
| Ratio of Total Expenses to Average Net Assets | 0.07%3 | 0.07% | 0.07% | 0.07% | 0.07% |
| Ratio of Net Investment Income to Average Net Assets | 1.31% | 1.15% | 1.79% | 2.34% | 1.97% |
| Portfolio Turnover Rate4 | 36% | 33% | 28% | 29% | 31% |
| 1 | Calculated based on average shares outstanding. |
| 2 | Total returns do not include account service fees that may have applied in the periods shown. Fund prospectuses provide information about any applicable account service fees. |
| 3 | The ratio of expenses to average net assets for the period net of reduction from custody fee offset arrangements was 0.07%. |
| 4 | Excludes the value of portfolio securities received or delivered as a result of in-kind purchases or redemptions of the fund’s capital shares, including ETF Creation Units. |
| Institutional Shares | |||||
| For a Share Outstanding Throughout Each Period | Year Ended August 31, | ||||
| 2022 | 2021 | 2020 | 2019 | 2018 | |
| Net Asset Value, Beginning of Period | $28.60 | $29.51 | $28.15 | $26.23 | $27.33 |
| Investment Operations | |||||
| Net Investment Income1 | .355 | .337 | .527 | .634 | .524 |
| Net Realized and Unrealized Gain (Loss) on Investments | (3.195) | (.709) | 1.355 | 1.908 | (1.114) |
| Total from Investment Operations | (2.840) | (.372) | 1.882 | 2.542 | (.590) |
| Distributions | |||||
| Dividends from Net Investment Income | (.346) | (.334) | (.522) | (.622) | (.510) |
| Distributions from Realized Capital Gains | (.154) | (.204) | — | — | — |
| Total Distributions | (.500) | (.538) | (.522) | (.622) | (.510) |
| Net Asset Value, End of Period | $25.26 | $28.60 | $29.51 | $28.15 | $26.23 |
| Total Return | -10.03% | -1.26% | 6.76% | 9.83% | -2.16% |
| Ratios/Supplemental Data | |||||
| Net Assets, End of Period (Millions) | $1,700 | $1,725 | $1,558 | $1,183 | $390 |
| Ratio of Total Expenses to Average Net Assets | 0.05%2 | 0.05% | 0.05% | 0.05% | 0.05% |
| Ratio of Net Investment Income to Average Net Assets | 1.32% | 1.17% | 1.83% | 2.36% | 1.99% |
| Portfolio Turnover Rate3 | 36% | 33% | 28% | 29% | 31% |
| 1 | Calculated based on average shares outstanding. |
| 2 | The ratio of expenses to average net assets for the period net of reduction from custody fee offset arrangements was 0.05%. |
| 3 | Excludes the value of portfolio securities received or delivered as a result of in-kind purchases or redemptions of the fund’s capital shares, including ETF Creation Units. |
| A. | The following significant accounting policies conform to generally accepted accounting principles for U.S. investment companies. The fund consistently follows such policies in preparing its financial statements. |
| B. | In accordance with the terms of a Funds’ Service Agreement (the “FSA”) between Vanguard and the fund, Vanguard furnishes to the fund investment advisory, corporate management, administrative, marketing, and distribution services at Vanguard’s cost of operations (as defined by the FSA). These costs of operations are allocated to the fund based on methods and guidelines approved by the board of trustees and are generally settled twice a month. |
| C. | The fund’s custodian bank has agreed to reduce its fees when the fund maintains cash on deposit in the non-interest-bearing custody account. For the year ended August 31, 2022, custodian fee offset arrangements reduced the fund’s expenses by $15,000 (an annual rate of less than 0.01% of average net assets). |
| D. | Various inputs may be used to determine the value of the fund’s investments. These inputs are summarized in three broad levels for financial statement purposes. The inputs or methodologies used to value securities are not necessarily an indication of the risk associated with investing in those securities. |
| Level 1 ($000) | Level 2 ($000) | Level 3 ($000) | Total ($000) | |
| Investments | ||||
| Assets | ||||
| U.S. Government and Agency Obligations | — | 16,237,285 | — | 16,237,285 |
| Temporary Cash Investments | 46,805 | — | — | 46,805 |
| Total | 46,805 | 16,237,285 | — | 16,284,090 |
| E. | Permanent differences between book-basis and tax-basis components of net assets are reclassified among capital accounts in the financial statements to reflect their tax character. These reclassifications have no effect on net assets or net asset value per share. As of period end, permanent differences primarily attributable to the accounting for applicable in-kind redemptions were reclassified between the following accounts: |
| Amount ($000) | |
| Paid-in Capital | (12,878) |
| Total Distributable Earnings (Loss) | 12,878 |
| Amount ($000) | |
| Undistributed Ordinary Income | 18,112 |
| Undistributed Long-Term Gains | — |
| Capital Loss Carryforwards | — |
| Qualified Late-Year Losses | (237,587) |
| Net Unrealized Gains (Losses) | (1,227,588) |
| Year Ended August 31, | ||
| 2022 Amount ($000) | 2021 Amount ($000) | |
| Ordinary Income* | 171,935 | 157,013 |
| Long-Term Capital Gains | 75,472 | 56,673 |
| Total | 247,407 | 213,686 |
| * | Includes short-term capital gains, if any. |
| Amount ($000) | |
| Tax Cost | 17,511,678 |
| Gross Unrealized Appreciation | 33 |
| Gross Unrealized Depreciation | (1,227,621) |
| Net Unrealized Appreciation (Depreciation) | (1,227,588) |
| F. | During the year ended August 31, 2022, the fund purchased $12,663,944,000 of investment securities and sold $7,251,675,000 of investment securities, other than temporary cash investments. Purchases and sales include $6,981,717,000 and $2,293,827,000, respectively, in connection with in-kind purchases and redemptions of the fund’s capital shares. |
| G. | Capital share transactions for each class of shares were: |
| Year Ended August 31, | |||||
| 2022 | 2021 | ||||
| Amount ($000) | Shares (000) | Amount ($000) | Shares (000) | ||
| ETF Shares | |||||
| Issued | 7,033,079 | 111,240 | 2,747,217 | 39,988 | |
| Issued in Lieu of Cash Distributions | — | — | — | — | |
| Redeemed | (2,309,475) | (36,225) | (934,453) | (13,575) | |
| Net Increase (Decrease)—ETF Shares | 4,723,604 | 75,015 | 1,812,764 | 26,413 | |
| Year Ended August 31, | |||||
| 2022 | 2021 | ||||
| Amount ($000) | Shares (000) | Amount ($000) | Shares (000) | ||
| Admiral Shares | |||||
| Issued | 1,661,411 | 77,397 | 1,271,727 | 54,762 | |
| Issued in Lieu of Cash Distributions | 42,941 | 1,980 | 42,708 | 1,834 | |
| Redeemed | (1,129,557) | (52,417) | (1,323,128) | (57,010) | |
| Net Increase (Decrease)—Admiral Shares | 574,795 | 26,960 | (8,693) | (414) | |
| Institutional Shares | |||||
| Issued | 737,363 | 27,430 | 551,440 | 19,124 | |
| Issued in Lieu of Cash Distributions | 30,431 | 1,128 | 27,778 | 961 | |
| Redeemed | (571,915) | (21,578) | (361,514) | (12,570) | |
| Net Increase (Decrease)—Institutional Shares | 195,879 | 6,980 | 217,704 | 7,515 | |
| H. | Management has determined that no events or transactions occurred subsequent to August 31, 2022, that would require recognition or disclosure in these financial statements. |

| Average Annual Total Returns Periods Ended August 31, 2022 | |||||
| One Year | Five Years | Ten Years | Final Value of a $10,000 Investment | ||
| Long-Term Treasury Index Fund ETF Shares Net Asset Value | -22.69% | -0.48% | 1.15% | $11,208 |
| Long-Term Treasury Index Fund ETF Shares Market Price | -22.63 | -0.47 | 1.15 | 11,215 | |
| Spliced Bloomberg U.S. Long Treasury Index | -22.64 | -0.42 | 1.24 | 11,309 |
| Bloomberg U.S. Aggregate Float Adjusted Index | -11.65 | 0.54 | 1.36 | 11,452 |
| Average Annual Total Returns Periods Ended August 31, 2022 | |||||
| One Year | Five Years | Ten Years | Final Value of a $10,000 Investment | ||
| Long-Term Treasury Index Fund Admiral Shares | -22.69% | -0.49% | 1.14% | $11,197 | |
| Spliced Bloomberg U.S. Long Treasury Index | -22.64 | -0.42 | 1.24 | 11,309 | |
| Bloomberg U.S. Aggregate Float Adjusted Index | -11.65 | 0.54 | 1.36 | 11,452 | |
| One Year | Five Years | Ten Years | Final Value of a $5,000,000 Investment | ||
| Long-Term Treasury Index Fund Institutional Shares | -22.69% | -0.48% | 1.16% | $5,611,346 | |
| Spliced Bloomberg U.S. Long Treasury Index | -22.64 | -0.42 | 1.24 | 5,654,696 | |
| Bloomberg U.S. Aggregate Float Adjusted Index | -11.65 | 0.54 | 1.36 | 5,725,801 | |
| Cumulative Returns of ETF Shares: August 31, 2012, Through August 31, 2022 | |||
| One Year | Five Years | Ten Years | |
| Long-Term Treasury Index Fund ETF Shares Market Price | -22.63% | -2.33% | 12.15% |
| Long-Term Treasury Index Fund ETF Shares Net Asset Value | -22.69 | -2.37 | 12.08 |
| Spliced Bloomberg U.S. Long Treasury Index | -22.64 | -2.09 | 13.09 |
| 10 - 15 Years | 1.1% |
| 15 - 20 Years | 32.4 |
| 20 - 25 Years | 22.4 |
| Over 25 Years | 44.1 |
| Coupon | Maturity Date | Face Amount ($000) | Market Value• ($000) | |||
| U.S. Government and Agency Obligations (99.4%) | ||||||
| U.S. Government Securities (99.4%) | ||||||
| United States Treasury Note/Bond | 4.500% | 2/15/36 | 26,929 | 31,023 | ||
| United States Treasury Note/Bond | 4.750% | 2/15/37 | 19,931 | 23,587 | ||
| United States Treasury Note/Bond | 5.000% | 5/15/37 | 25,413 | 30,805 | ||
| United States Treasury Note/Bond | 4.375% | 2/15/38 | 27,107 | 30,936 | ||
| United States Treasury Note/Bond | 4.500% | 5/15/38 | 31,729 | 36,667 | ||
| United States Treasury Note/Bond | 3.500% | 2/15/39 | 31,168 | 31,933 | ||
| United States Treasury Note/Bond | 4.250% | 5/15/39 | 48,085 | 53,946 | ||
| United States Treasury Note/Bond | 4.500% | 8/15/39 | 50,451 | 58,255 | ||
| United States Treasury Note/Bond | 4.375% | 11/15/39 | 54,872 | 62,348 | ||
| United States Treasury Note/Bond | 4.625% | 2/15/40 | 53,543 | 62,679 | ||
| United States Treasury Note/Bond | 1.125% | 5/15/40 | 158,601 | 107,948 | ||
| United States Treasury Note/Bond | 4.375% | 5/15/40 | 52,637 | 59,628 | ||
| United States Treasury Note/Bond | 1.125% | 8/15/40 | 200,011 | 134,914 | ||
| United States Treasury Note/Bond | 3.875% | 8/15/40 | 52,007 | 55,030 | ||
| United States Treasury Note/Bond | 1.375% | 11/15/40 | 219,589 | 154,501 | ||
| United States Treasury Note/Bond | 4.250% | 11/15/40 | 54,252 | 60,237 | ||
| United States Treasury Note/Bond | 1.875% | 2/15/41 | 265,952 | 203,786 | ||
| United States Treasury Note/Bond | 4.750% | 2/15/41 | 54,256 | 64,217 | ||
| United States Treasury Note/Bond | 2.250% | 5/15/41 | 232,286 | 189,386 | ||
| United States Treasury Note/Bond | 4.375% | 5/15/41 | 48,673 | 54,826 | ||
| United States Treasury Note/Bond | 1.750% | 8/15/41 | 308,829 | 229,499 | ||
| United States Treasury Note/Bond | 3.750% | 8/15/41 | 51,170 | 52,793 | ||
| United States Treasury Note/Bond | 2.000% | 11/15/41 | 249,824 | 194,043 | ||
| United States Treasury Note/Bond | 3.125% | 11/15/41 | 51,970 | 48,893 | ||
| United States Treasury Note/Bond | 2.375% | 2/15/42 | 200,418 | 166,190 | ||
| United States Treasury Note/Bond | 3.125% | 2/15/42 | 56,266 | 52,854 | ||
| United States Treasury Note/Bond | 3.000% | 5/15/42 | 53,536 | 49,178 | ||
| United States Treasury Note/Bond | 3.250% | 5/15/42 | 195,017 | 186,546 | ||
| United States Treasury Note/Bond | 2.750% | 8/15/42 | 61,128 | 53,688 | ||
| United States Treasury Note/Bond | 3.375% | 8/15/42 | 46,341 | 45,233 | ||
| United States Treasury Note/Bond | 2.750% | 11/15/42 | 90,137 | 78,996 | ||
| United States Treasury Note/Bond | 3.125% | 2/15/43 | 78,478 | 72,924 | ||
| United States Treasury Note/Bond | 2.875% | 5/15/43 | 119,052 | 106,105 | ||
| United States Treasury Note/Bond | 3.625% | 8/15/43 | 86,336 | 86,727 | ||
| United States Treasury Note/Bond | 3.750% | 11/15/43 | 90,600 | 92,737 | ||
| United States Treasury Note/Bond | 3.625% | 2/15/44 | 91,782 | 92,040 | ||
| United States Treasury Note/Bond | 3.375% | 5/15/44 | 85,199 | 82,177 | ||
| United States Treasury Note/Bond | 3.125% | 8/15/44 | 115,481 | 106,748 | ||
| United States Treasury Note/Bond | 3.000% | 11/15/44 | 100,883 | 91,204 | ||
| Coupon | Maturity Date | Face Amount ($000) | Market Value• ($000) | |||
| United States Treasury Note/Bond | 2.500% | 2/15/45 | 132,462 | 109,468 | ||
| United States Treasury Note/Bond | 3.000% | 5/15/45 | 64,632 | 58,401 | ||
| United States Treasury Note/Bond | 2.875% | 8/15/45 | 87,728 | 77,543 | ||
| United States Treasury Note/Bond | 3.000% | 11/15/45 | 54,050 | 48,881 | ||
| United States Treasury Note/Bond | 2.500% | 2/15/46 | 103,467 | 85,264 | ||
| United States Treasury Note/Bond | 2.500% | 5/15/46 | 108,564 | 89,430 | ||
| United States Treasury Note/Bond | 2.250% | 8/15/46 | 130,606 | 102,219 | ||
| United States Treasury Note/Bond | 2.875% | 11/15/46 | 61,035 | 54,074 | ||
| United States Treasury Note/Bond | 3.000% | 2/15/47 | 116,077 | 105,285 | ||
| United States Treasury Note/Bond | 3.000% | 5/15/47 | 87,792 | 79,754 | ||
| United States Treasury Note/Bond | 2.750% | 8/15/47 | 126,754 | 110,157 | ||
| United States Treasury Note/Bond | 2.750% | 11/15/47 | 131,080 | 114,080 | ||
| United States Treasury Note/Bond | 3.000% | 2/15/48 | 151,014 | 138,319 | ||
| United States Treasury Note/Bond | 3.125% | 5/15/48 | 158,496 | 149,184 | ||
| United States Treasury Note/Bond | 3.000% | 8/15/48 | 177,616 | 163,573 | ||
| United States Treasury Note/Bond | 3.375% | 11/15/48 | 179,964 | 178,277 | ||
| United States Treasury Note/Bond | 3.000% | 2/15/49 | 187,346 | 174,232 | ||
| United States Treasury Note/Bond | 2.875% | 5/15/49 | 183,303 | 166,748 | ||
| United States Treasury Note/Bond | 2.250% | 8/15/49 | 175,723 | 140,771 | ||
| United States Treasury Note/Bond | 2.375% | 11/15/49 | 161,617 | 133,183 | ||
| United States Treasury Note/Bond | 2.000% | 2/15/50 | 207,285 | 156,824 | ||
| United States Treasury Note/Bond | 1.250% | 5/15/50 | 241,399 | 149,253 | ||
| United States Treasury Note/Bond | 1.375% | 8/15/50 | 272,071 | 173,955 | ||
| United States Treasury Note/Bond | 1.625% | 11/15/50 | 270,727 | 185,236 | ||
| United States Treasury Note/Bond | 1.875% | 2/15/51 | 297,105 | 216,794 | ||
| United States Treasury Note/Bond | 2.375% | 5/15/51 | 303,196 | 249,663 | ||
| United States Treasury Note/Bond | 2.000% | 8/15/51 | 296,655 | 222,908 | ||
| United States Treasury Note/Bond | 1.875% | 11/15/51 | 275,391 | 200,605 | ||
| United States Treasury Note/Bond | 2.250% | 2/15/52 | 256,233 | 204,746 | ||
| United States Treasury Note/Bond | 2.875% | 5/15/52 | 240,589 | 221,793 | ||
| United States Treasury Note/Bond | 3.000% | 8/15/52 | 67,200 | 63,714 | ||
| Total U.S. Government and Agency Obligations (Cost $9,625,653) | 7,719,561 | |||||
| Shares | ||||||
| Temporary Cash Investments (0.7%) | ||||||
| Money Market Fund (0.7%) | ||||||
| 1 | Vanguard Market Liquidity Fund (Cost $57,200) | 2.284% | 572,173 | 57,200 | ||
| Total Investments (100.1%) (Cost $9,682,853) | 7,776,761 | |||||
| Other Assets and Liabilities—Net (-0.1%) | (8,459) | |||||
| Net Assets (100%) | 7,768,302 | |||||
| Cost is in $000. |
| • | See Note A in Notes to Financial Statements. |
| 1 | Affiliated money market fund available only to Vanguard funds and certain trusts and accounts managed by Vanguard. Rate shown is the 7-day yield. |
| ($000s, except shares and per-share amounts) | Amount |
| Assets | |
| Investments in Securities, at Value | |
| Unaffiliated Issuers (Cost $9,625,653) | 7,719,561 |
| Affiliated Issuers (Cost $57,200) | 57,200 |
| Total Investments in Securities | 7,776,761 |
| Investment in Vanguard | 298 |
| Cash | 86 |
| Receivables for Investment Securities Sold | 57,648 |
| Receivables for Accrued Income | 39,520 |
| Receivables for Capital Shares Issued | 146,785 |
| Total Assets | 8,021,098 |
| Liabilities | |
| Payables for Investment Securities Purchased | 97,244 |
| Payables for Capital Shares Redeemed | 154,269 |
| Payables for Distributions | 1,115 |
| Payables to Vanguard | 168 |
| Total Liabilities | 252,796 |
| Net Assets | 7,768,302 |
| At August 31, 2022, net assets consisted of: | |
| Paid-in Capital | 9,944,742 |
| Total Distributable Earnings (Loss) | (2,176,440) |
| Net Assets | 7,768,302 |
| ETF Shares—Net Assets | |
| Applicable to 55,712,503 outstanding $.001 par value shares of beneficial interest (unlimited authorization) | 3,813,406 |
| Net Asset Value Per Share—ETF Shares | $68.45 |
| Admiral Shares—Net Assets | |
| Applicable to 59,588,684 outstanding $.001 par value shares of beneficial interest (unlimited authorization) | 1,369,106 |
| Net Asset Value Per Share—Admiral Shares | $22.98 |
| Institutional Shares—Net Assets | |
| Applicable to 88,672,243 outstanding $.001 par value shares of beneficial interest (unlimited authorization) | 2,585,790 |
| Net Asset Value Per Share—Institutional Shares | $29.16 |
| Year Ended August 31, 2022 | |
| ($000) | |
| Investment Income | |
| Income | |
| Interest1 | 161,218 |
| Total Income | 161,218 |
| Expenses | |
| The Vanguard Group—Note B | |
| Investment Advisory Services | 140 |
| Management and Administrative—ETF Shares | 1,026 |
| Management and Administrative—Admiral Shares | 978 |
| Management and Administrative—Institutional Shares | 962 |
| Marketing and Distribution—ETF Shares | 188 |
| Marketing and Distribution—Admiral Shares | 88 |
| Marketing and Distribution—Institutional Shares | 100 |
| Custodian Fees | 31 |
| Auditing Fees | 39 |
| Shareholders’ Reports—ETF Shares | 53 |
| Shareholders’ Reports—Admiral Shares | 31 |
| Shareholders’ Reports—Institutional Shares | 1 |
| Trustees’ Fees and Expenses | 3 |
| Other Expenses | 13 |
| Total Expenses | 3,653 |
| Expenses Paid Indirectly | (10) |
| Net Expenses | 3,643 |
| Net Investment Income | 157,575 |
| Realized Net Gain (Loss) on Investment Securities Sold1,2 | (183,420) |
| Change in Unrealized Appreciation (Depreciation) of Investment Securities1 | (1,918,080) |
| Net Increase (Decrease) in Net Assets Resulting from Operations | (1,943,925) |
| 1 | Interest income, realized net gain (loss), capital gain distributions received, and change in unrealized appreciation (depreciation) from an affiliated company of the fund were $97,000, $4,000, less than $1,000, and less than $1,000, respectively. Purchases and sales are for temporary cash investment purposes. |
| 2 | Includes $31,245,000 of net gain (loss) resulting from in-kind redemptions. |
| Year Ended August 31, | ||
| 2022 ($000) | 2021 ($000) | |
| Increase (Decrease) in Net Assets | ||
| Operations | ||
| Net Investment Income | 157,575 | 104,838 |
| Realized Net Gain (Loss) | (183,420) | 77,835 |
| Change in Unrealized Appreciation (Depreciation) | (1,918,080) | (562,635) |
| Net Increase (Decrease) in Net Assets Resulting from Operations | (1,943,925) | (379,962) |
| Distributions | ||
| ETF Shares | (71,135) | (47,982) |
| Admiral Shares | (33,426) | (38,865) |
| Institutional Shares | (48,139) | (35,145) |
| Total Distributions | (152,700) | (121,992) |
| Capital Share Transactions | ||
| ETF Shares | 2,485,336 | 441,919 |
| Admiral Shares | (145,223) | 316,183 |
| Institutional Shares | 1,174,488 | 922,191 |
| Net Increase (Decrease) from Capital Share Transactions | 3,514,601 | 1,680,293 |
| Total Increase (Decrease) | 1,417,976 | 1,178,339 |
| Net Assets | ||
| Beginning of Period | 6,350,326 | 5,171,987 |
| End of Period | 7,768,302 | 6,350,326 |
| ETF Shares | |||||
| For a Share Outstanding Throughout Each Period | Year Ended August 31, | ||||
| 2022 | 2021 | 2020 | 2019 | 2018 | |
| Net Asset Value, Beginning of Period | $90.37 | $98.93 | $90.17 | $74.33 | $78.76 |
| Investment Operations | |||||
| Net Investment Income1 | 1.718 | 1.645 | 1.915 | 2.115 | 2.050 |
| Net Realized and Unrealized Gain (Loss) on Investments | (21.974) | (8.289) | 8.772 | 15.798 | (4.469) |
| Total from Investment Operations | (20.256) | (6.644) | 10.687 | 17.913 | (2.419) |
| Distributions | |||||
| Dividends from Net Investment Income | (1.664) | (1.625) | (1.927) | (2.073) | (2.011) |
| Distributions from Realized Capital Gains | — | (.291) | — | — | — |
| Total Distributions | (1.664) | (1.916) | (1.927) | (2.073) | (2.011) |
| Net Asset Value, End of Period | $68.45 | $90.37 | $98.93 | $90.17 | $74.33 |
| Total Return | -22.69% | -6.73% | 12.02% | 24.69% | -3.07% |
| Ratios/Supplemental Data | |||||
| Net Assets, End of Period (Millions) | $3,813 | $2,366 | $2,138 | $1,282 | $676 |
| Ratio of Total Expenses to Average Net Assets | 0.04%2 | 0.04% | 0.05% | 0.05% | 0.07% |
| Ratio of Net Investment Income to Average Net Assets | 2.19% | 1.81% | 2.03% | 2.75% | 2.73% |
| Portfolio Turnover Rate3 | 19% | 22% | 29% | 16% | 19% |
| 1 | Calculated based on average shares outstanding. |
| 2 | The ratio of expenses to average net assets for the period net of reduction from custody fee offset arrangements was 0.04%. |
| 3 | Excludes the value of portfolio securities received or delivered as a result of in-kind purchases or redemptions of the fund’s capital shares, including ETF Creation Units. |
| Admiral Shares | |||||
| For a Share Outstanding Throughout Each Period | Year Ended August 31, | ||||
| 2022 | 2021 | 2020 | 2019 | 2018 | |
| Net Asset Value, Beginning of Period | $30.35 | $33.24 | $30.28 | $24.95 | $26.44 |
| Investment Operations | |||||
| Net Investment Income1 | .565 | .545 | .637 | .706 | .690 |
| Net Realized and Unrealized Gain (Loss) on Investments | (7.380) | (2.799) | 2.955 | 5.316 | (1.501) |
| Total from Investment Operations | (6.815) | (2.254) | 3.592 | 6.022 | (.811) |
| Distributions | |||||
| Dividends from Net Investment Income | (.555) | (.538) | (.632) | (.692) | (.679) |
| Distributions from Realized Capital Gains | — | (.098) | — | — | — |
| Total Distributions | (.555) | (.636) | (.632) | (.692) | (.679) |
| Net Asset Value, End of Period | $22.98 | $30.35 | $33.24 | $30.28 | $24.95 |
| Total Return2 | -22.69% | -6.78% | 12.00% | 24.67% | -3.06% |
| Ratios/Supplemental Data | |||||
| Net Assets, End of Period (Millions) | $1,369 | $1,947 | $1,800 | $1,053 | $559 |
| Ratio of Total Expenses to Average Net Assets | 0.07%3 | 0.07% | 0.07% | 0.07% | 0.07% |
| Ratio of Net Investment Income to Average Net Assets | 2.09% | 1.79% | 2.01% | 2.73% | 2.73% |
| Portfolio Turnover Rate4 | 19% | 22% | 29% | 16% | 19% |
| 1 | Calculated based on average shares outstanding. |
| 2 | Total returns do not include account service fees that may have applied in the periods shown. Fund prospectuses provide information about any applicable account service fees. |
| 3 | The ratio of expenses to average net assets for the period net of reduction from custody fee offset arrangements was 0.07%. |
| 4 | Excludes the value of portfolio securities received or delivered as a result of in-kind purchases or redemptions of the fund’s capital shares, including ETF Creation Units. |
| Institutional Shares | |||||
| For a Share Outstanding Throughout Each Period | Year Ended August 31, | ||||
| 2022 | 2021 | 2020 | 2019 | 2018 | |
| Net Asset Value, Beginning of Period | $38.52 | $42.19 | $38.43 | $31.66 | $33.56 |
| Investment Operations | |||||
| Net Investment Income1 | .727 | .699 | .822 | .902 | .883 |
| Net Realized and Unrealized Gain (Loss) on Investments | (9.376) | (3.554) | 3.748 | 6.753 | (1.915) |
| Total from Investment Operations | (8.649) | (2.855) | 4.570 | 7.655 | (1.032) |
| Distributions | |||||
| Dividends from Net Investment Income | (.711) | (.691) | (.810) | (.885) | (.868) |
| Distributions from Realized Capital Gains | — | (.124) | — | — | — |
| Total Distributions | (.711) | (.815) | (.810) | (.885) | (.868) |
| Net Asset Value, End of Period | $29.16 | $38.52 | $42.19 | $38.43 | $31.66 |
| Total Return | -22.69% | -6.77% | 12.03% | 24.71% | -3.07% |
| Ratios/Supplemental Data | |||||
| Net Assets, End of Period (Millions) | $2,586 | $2,038 | $1,234 | $1,054 | $452 |
| Ratio of Total Expenses to Average Net Assets | 0.05%2 | 0.05% | 0.05% | 0.05% | 0.05% |
| Ratio of Net Investment Income to Average Net Assets | 2.15% | 1.82% | 2.06% | 2.75% | 2.75% |
| Portfolio Turnover Rate3 | 19% | 22% | 29% | 16% | 19% |
| 1 | Calculated based on average shares outstanding. |
| 2 | The ratio of expenses to average net assets for the period net of reduction from custody fee offset arrangements was 0.05%. |
| 3 | Excludes the value of portfolio securities received or delivered as a result of in-kind purchases or redemptions of the fund’s capital shares, including ETF Creation Units. |
| A. | The following significant accounting policies conform to generally accepted accounting principles for U.S. investment companies. The fund consistently follows such policies in preparing its financial statements. |
| B. | In accordance with the terms of a Funds’ Service Agreement (the “FSA”) between Vanguard and the fund, Vanguard furnishes to the fund investment advisory, corporate management, administrative, marketing, and distribution services at Vanguard’s cost of operations (as defined by the FSA). These costs of operations are allocated to the fund based on methods and guidelines approved by the board of trustees and are generally settled twice a month. |
| C. | The fund’s custodian bank has agreed to reduce its fees when the fund maintains cash on deposit in the non-interest-bearing custody account. For the year ended August 31, 2022, custodian fee offset arrangements reduced the fund’s expenses by $10,000 (an annual rate of less than 0.01% of average net assets). |
| D. | Various inputs may be used to determine the value of the fund’s investments. These inputs are summarized in three broad levels for financial statement purposes. The inputs or methodologies used to value securities are not necessarily an indication of the risk associated with investing in those securities. |
| Level 1 ($000) | Level 2 ($000) | Level 3 ($000) | Total ($000) | |
| Investments | ||||
| Assets | ||||
| U.S. Government and Agency Obligations | — | 7,719,561 | — | 7,719,561 |
| Temporary Cash Investments | 57,200 | — | — | 57,200 |
| Total | 57,200 | 7,719,561 | — | 7,776,761 |
| E. | Permanent differences between book-basis and tax-basis components of net assets are reclassified among capital accounts in the financial statements to reflect their tax character. These reclassifications have no effect on net assets or net asset value per share. As of period end, permanent differences primarily attributable to the accounting for applicable in-kind redemptions were reclassified between the following accounts: |
| Amount ($000) | |
| Paid-in Capital | 30,827 |
| Total Distributable Earnings (Loss) | (30,827) |
| Amount ($000) | |
| Undistributed Ordinary Income | 9,787 |
| Undistributed Long-Term Gains | — |
| Capital Loss Carryforwards | (188,095) |
| Qualified Late-Year Losses | — |
| Net Unrealized Gains (Losses) | (1,997,017) |
| Year Ended August 31, | ||
| 2022 Amount ($000) | 2021 Amount ($000) | |
| Ordinary Income* | 152,700 | 112,376 |
| Long-Term Capital Gains | — | 9,616 |
| Total | 152,700 | 121,992 |
| * | Includes short-term capital gains, if any. |
| Amount ($000) | |
| Tax Cost | 9,773,778 |
| Gross Unrealized Appreciation | 64 |
| Gross Unrealized Depreciation | (1,997,081) |
| Net Unrealized Appreciation (Depreciation) | (1,997,017) |
| F. | During the year ended August 31, 2022, the fund purchased $7,213,514,000 of investment securities and sold $3,694,558,000 of investment securities, other than temporary cash investments. Purchases and sales include $4,601,009,000 and $2,296,125,000, respectively, in connection with in-kind purchases and redemptions of the fund’s capital shares. |
| G. | Capital share transactions for each class of shares were: |
| Year Ended August 31, | |||||
| 2022 | 2021 | ||||
| Amount ($000) | Shares (000) | Amount ($000) | Shares (000) | ||
| ETF Shares | |||||
| Issued | 4,802,980 | 59,507 | 1,825,922 | 19,897 | |
| Issued in Lieu of Cash Distributions | — | — | — | — | |
| Redeemed | (2,317,644) | (29,975) | (1,384,003) | (15,325) | |
| Net Increase (Decrease)—ETF Shares | 2,485,336 | 29,532 | 441,919 | 4,572 | |
| Admiral Shares | |||||
| Issued | 630,037 | 24,179 | 1,358,427 | 44,281 | |
| Issued in Lieu of Cash Distributions | 21,430 | 814 | 32,758 | 1,071 | |
| Redeemed | (796,690) | (29,534) | (1,075,002) | (35,381) | |
| Net Increase (Decrease)—Admiral Shares | (145,223) | (4,541) | 316,183 | 9,971 | |
| Institutional Shares | |||||
| Issued | 1,496,186 | 44,963 | 1,174,115 | 30,064 | |
| Issued in Lieu of Cash Distributions | 47,733 | 1,439 | 34,906 | 905 | |
| Redeemed | (369,431) | (10,630) | (286,830) | (7,322) | |
| Net Increase (Decrease)—Institutional Shares | 1,174,488 | 35,772 | 922,191 | 23,647 | |
| H. | Management has determined that no events or transactions occurred subsequent to August 31, 2022, that would require recognition or disclosure in these financial statements. |
Philadelphia, Pennsylvania
October 20, 2022
| Matthew Benchener | Thomas M. Rampulla |
| Joseph Brennan | Karin A. Risi |
| Mortimer J. Buckley | Anne E. Robinson |
| Gregory Davis | Michael Rollings |
| John James | Nitin Tandon |
| Chris D. McIsaac | Lauren Valente |

Who Are Deaf or Hard of Hearing > 800-749-7273
All rights reserved.
U.S. Patent No. 6,879,964.
Vanguard Marketing Corporation, Distributor.

| Vanguard Short-Term Corporate Bond Index Fund |
| Vanguard Intermediate-Term Corporate Bond Index Fund |
| Vanguard Long-Term Corporate Bond Index Fund |
Your Fund’s Performance at a Glance | 1 |
About Your Fund's Expenses | 2 |
Short-Term Corporate Bond Index Fund | 4 |
Intermediate-Term Corporate Bond Index Fund | 36 |
Long-Term Corporate Bond Index Fund | 66 |
Trustees Approve Advisory Arrangements | 103 |
Liquidity Risk Management | 104 |
| • | For the 12 months ended August 31, 2022, returns for the three Vanguard Corporate Bond Index Funds ranged from –23.86% for Admiral Shares of the Long-Term Corporate Bond Index Fund to –6.19% for ETF Shares (based on net asset value) of the Short-Term Corporate Bond Index Fund. All three funds closely tracked their target indexes. |
| • | The investment outlook grew more challenging during the fiscal year. Sentiment deteriorated as inflation soared to multidecade highs, fueled in part by higher energy and food prices in the wake of Russia’s invasion of Ukraine. The Federal Reserve reacted by raising interest rates, which weighed on bond prices and sparked fears of recession. |
| • | The yield of the bellwether 10-year U.S. Treasury bond rose significantly over the 12 months, from 1.31% to 3.19%. With yield spreads widening for corporate bonds, they underperformed both Treasuries and mortgage-backed securities. |
| • | By maturity, longer-term corporates suffered more than their shorter-term counterparts. By credit quality, bonds rated A held up the best but still averaged a decline of more than –14%. |
| • | By sector, bonds issued by industrial companies and utilities weighed more on returns than those of financial institutions. |
| Average Annual Total Returns Periods Ended August 31, 2022 | |||
| One Year | Three Years | Five Years | |
| Stocks | |||
| Russell 1000 Index (Large-caps) | -12.96% | 12.14% | 11.61% |
| Russell 2000 Index (Small-caps) | -17.88 | 8.59 | 6.95 |
| Russell 3000 Index (Broad U.S. market) | -13.28 | 11.90 | 11.29 |
| FTSE All-World ex US Index (International) | -19.00 | 3.48 | 2.12 |
| Bonds | |||
| Bloomberg U.S. Aggregate Float Adjusted Index (Broad taxable market) | -11.65% | -2.01% | 0.54% |
| Bloomberg Municipal Bond Index (Broad tax-exempt market) | -8.63 | -0.83 | 1.28 |
| FTSE Three-Month U.S. Treasury Bill Index | 0.44 | 0.56 | 1.10 |
| CPI | |||
| Consumer Price Index | 8.26% | 4.90% | 3.82% |
| • | Based on actual fund return. This section helps you to estimate the actual expenses that you paid over the period. The ”Ending Account Value“ shown is derived from the fund’s actual return, and the third column shows the dollar amount that would have been paid by an investor who started with $1,000 in the fund. You may use the information here, together with the amount you invested, to estimate the expenses that you paid over the period. |
| • | Based on hypothetical 5% yearly return. This section is intended to help you compare your fund‘s costs with those of other mutual funds. It assumes that the fund had a yearly return of 5% before expenses, but that the expense ratio is unchanged. In this case—because the return used is not the fund’s actual return—the results do not apply to your investment. The example is useful in making comparisons because the Securities and Exchange Commission requires all mutual funds to calculate expenses based on a 5% return. You can assess your fund’s costs by comparing this hypothetical example with the hypothetical examples that appear in shareholder reports of other funds. |
| Six Months Ended August 31, 2022 | |||
| Beginning Account Value 2/28/2022 | Ending Account Value 8/31/2022 | Expenses Paid During Period | |
| Based on Actual Fund Return | |||
| Short-Term Corporate Bond Index Fund | |||
| ETF Shares | $1,000.00 | $ 965.40 | $0.20 |
| Admiral™ Shares | 1,000.00 | 965.30 | 0.35 |
| Institutional Shares | 1,000.00 | 965.40 | 0.25 |
| Intermediate-Term Corporate Bond Index Fund | |||
| ETF Shares | $1,000.00 | $ 910.30 | $ 0.19 |
| Admiral Shares | 1,000.00 | 910.20 | 0.34 |
| Institutional Shares | 1,000.00 | 910.60 | 0.24 |
| Long-Term Corporate Bond Index Fund | |||
| ETF Shares | $1,000.00 | $ 848.50 | $ 0.19 |
| Admiral Shares | 1,000.00 | 848.20 | 0.33 |
| Institutional Shares | 1,000.00 | 848.60 | 0.23 |
| Based on Hypothetical 5% Yearly Return | |||
| Short-Term Corporate Bond Index Fund | |||
| ETF Shares | $1,000.00 | $1,025.00 | $0.20 |
| Admiral Shares | 1,000.00 | 1,024.85 | 0.36 |
| Institutional Shares | 1,000.00 | 1,024.95 | 0.26 |
| Intermediate-Term Corporate Bond Index Fund | |||
| ETF Shares | $1,000.00 | $1,025.00 | $0.20 |
| Admiral Shares | 1,000.00 | 1,024.85 | 0.36 |
| Institutional Shares | 1,000.00 | 1,024.95 | 0.26 |
| Long-Term Corporate Bond Index Fund | |||
| ETF Shares | $1,000.00 | $1,025.00 | $0.20 |
| Admiral Shares | 1,000.00 | 1,024.85 | 0.36 |
| Institutional Shares | 1,000.00 | 1,024.95 | 0.26 |

| Average Annual Total Returns Periods Ended August 31, 2022 | |||||
| One Year | Five Years | Ten Years | Final Value of a $10,000 Investment | ||
 | Short-Term Corporate Bond Index Fund ETF Shares Net Asset Value | -6.19% | 1.28% | 1.74% | $ 11,880 |
| Short-Term Corporate Bond Index Fund ETF Shares Market Price | -6.35 | 1.22 | 1.68 | 11,817 | |
 | Bloomberg U.S. 1–5 Year Corporate Bond Index | -6.19 | 1.37 | 1.86 | 12,022 |
 | Bloomberg U.S. Aggregate Float Adjusted Index | -11.65 | 0.54 | 1.36 | 11,452 |
| Average Annual Total Returns Periods Ended August 31, 2022 | |||||
| One Year | Five Years | Ten Years | Final Value of a $10,000 Investment | ||
| Short-Term Corporate Bond Index Fund Admiral Shares | -6.24% | 1.26% | 1.73% | $ 11,868 | |
| Bloomberg U.S. 1–5 Year Corporate Bond Index | -6.19 | 1.37 | 1.86 | 12,022 | |
| Bloomberg U.S. Aggregate Float Adjusted Index | -11.65 | 0.54 | 1.36 | 11,452 | |
| One Year | Five Years | Ten Years | Final Value of a $5,000,000 Investment | ||
| Short-Term Corporate Bond Index Fund Institutional Shares | -6.21% | 1.28% | 1.75% | $5,948,142 | |
| Bloomberg U.S. 1–5 Year Corporate Bond Index | -6.19 | 1.37 | 1.86 | 6,011,065 | |
| Bloomberg U.S. Aggregate Float Adjusted Index | -11.65 | 0.54 | 1.36 | 5,725,801 | |
| Cumulative Returns of ETF Shares: August 31, 2012, Through August 31, 2022 | |||
| One Year | Five Years | Ten Years | |
| Short-Term Corporate Bond Index Fund ETF Shares Market Price | -6.35% | 6.26% | 18.17% |
| Short-Term Corporate Bond Index Fund ETF Shares Net Asset Value | -6.19 | 6.56 | 18.80 |
| Bloomberg U.S. 1–5 Year Corporate Bond Index | -6.19 | 7.02 | 20.22 |
| Corporate Bonds – Communications | 4.9% |
| Corporate Bonds – Consumer Discretionary | 6.1 |
| Corporate Bonds – Consumer Staples | 5.1 |
| Corporate Bonds – Energy | 6.0 |
| Corporate Bonds – Financials | 44.3 |
| Corporate Bonds – Health Care | 8.0 |
| Corporate Bonds – Industrials | 6.1 |
| Corporate Bonds – Materials | 1.9 |
| Corporate Bonds – Real Estate | 3.7 |
| Corporate Bonds – Technology | 8.6 |
| Corporate Bonds – Utilities | 5.2 |
| U.S. Government and Agency Obligations | 0.1 |
| Coupon | Maturity Date | Face Amount ($000) | Market Value• ($000) | |||
| U.S. Government and Agency Obligations (0.0%) | ||||||
| U.S. Government Securities (0.0%) | ||||||
| United States Treasury Note/Bond | 3.250% | 8/31/24 | 9,890 | 9,848 | ||
| United States Treasury Note/Bond | 3.125% | 8/31/27 | 15,680 | 15,541 | ||
| Total U.S. Government and Agency Obligations (Cost $25,386) | 25,389 | |||||
| Corporate Bonds (98.9%) | ||||||
| Communications (4.9%) | ||||||
| Activision Blizzard Inc. | 3.400% | 9/15/26 | 25,913 | 25,282 | ||
| Activision Blizzard Inc. | 3.400% | 6/15/27 | 8,515 | 8,207 | ||
| Alphabet Inc. | 3.375% | 2/25/24 | 21,883 | 21,827 | ||
| Alphabet Inc. | 0.450% | 8/15/25 | 9,342 | 8,535 | ||
| Alphabet Inc. | 1.998% | 8/15/26 | 52,458 | 49,449 | ||
| Alphabet Inc. | 0.800% | 8/15/27 | 25,209 | 22,028 | ||
| AT&T Inc. | 0.900% | 3/25/24 | 48,281 | 46,196 | ||
| AT&T Inc. | 1.700% | 3/25/26 | 70,380 | 64,434 | ||
| AT&T Inc. | 2.950% | 7/15/26 | 5,150 | 4,893 | ||
| AT&T Inc. | 3.800% | 2/15/27 | 22,108 | 21,554 | ||
| AT&T Inc. | 4.250% | 3/1/27 | 36,769 | 36,444 | ||
| AT&T Inc. | 2.300% | 6/1/27 | 63,657 | 57,902 | ||
| Baidu Inc. | 3.875% | 9/29/23 | 14,959 | 14,911 | ||
| Baidu Inc. | 4.375% | 5/14/24 | 21,763 | 21,774 | ||
| Baidu Inc. | 3.075% | 4/7/25 | 23,395 | 22,494 | ||
| Baidu Inc. | 4.125% | 6/30/25 | 7,325 | 7,225 | ||
| Baidu Inc. | 1.720% | 4/9/26 | 9,628 | 8,733 | ||
| Baidu Inc. | 1.625% | 2/23/27 | 5,000 | 4,385 | ||
| Baidu Inc. | 3.625% | 7/6/27 | 16,535 | 15,749 | ||
| 1 | Bell Telephone Co. of Canada or Bell Canada | 0.750% | 3/17/24 | 3,188 | 3,030 | |
| Booking Holdings Inc. | 3.650% | 3/15/25 | 7,215 | 7,165 | ||
| Booking Holdings Inc. | 3.600% | 6/1/26 | 23,032 | 22,681 | ||
| British Telecommunications plc | 4.500% | 12/4/23 | 3,976 | 3,980 | ||
| 1 | Charter Communications Operating LLC | 4.500% | 2/1/24 | 37,197 | 37,159 | |
| Charter Communications Operating LLC | 4.908% | 7/23/25 | 102,901 | 102,661 | ||
| Comcast Corp. | 3.700% | 4/15/24 | 55,204 | 55,098 | ||
| Comcast Corp. | 3.375% | 2/15/25 | 26,738 | 26,360 | ||
| Comcast Corp. | 3.375% | 8/15/25 | 24,594 | 24,188 | ||
| Comcast Corp. | 3.950% | 10/15/25 | 69,226 | 69,103 | ||
| Comcast Corp. | 3.150% | 3/1/26 | 49,595 | 48,222 | ||
| Comcast Corp. | 2.350% | 1/15/27 | 34,706 | 32,313 | ||
| Comcast Corp. | 3.300% | 2/1/27 | 30,917 | 29,844 | ||
| Comcast Corp. | 3.300% | 4/1/27 | 22,560 | 21,786 | ||
| Discovery Communications LLC | 3.800% | 3/13/24 | 12,242 | 12,112 | ||
| Discovery Communications LLC | 3.900% | 11/15/24 | 14,919 | 14,603 | ||
| Discovery Communications LLC | 3.450% | 3/15/25 | 5,155 | 4,988 | ||
| Discovery Communications LLC | 3.950% | 6/15/25 | 12,455 | 12,151 | ||
| Discovery Communications LLC | 4.900% | 3/11/26 | 20,068 | 20,040 | ||
| Electronic Arts Inc. | 4.800% | 3/1/26 | 10,516 | 10,696 | ||
| Expedia Group Inc. | 5.000% | 2/15/26 | 19,196 | 19,222 | ||
| Expedia Group Inc. | 4.625% | 8/1/27 | 15,000 | 14,630 | ||
| FactSet Research Systems Inc. | 2.900% | 3/1/27 | 9,680 | 9,064 | ||
| Fox Corp. | 4.030% | 1/25/24 | 35,001 | 34,871 | ||
| Fox Corp. | 3.050% | 4/7/25 | 11,333 | 10,957 | ||
| Grupo Televisa SAB | 4.625% | 1/30/26 | 7,675 | 7,666 | ||
| Coupon | Maturity Date | Face Amount ($000) | Market Value• ($000) | |||
| Interpublic Group of Cos. Inc. | 4.200% | 4/15/24 | 942 | 937 | ||
| 2 | Magallanes Inc. | 3.428% | 3/15/24 | 36,198 | 35,387 | |
| 2 | Magallanes Inc. | 3.528% | 3/15/24 | 13,182 | 12,861 | |
| 2 | Magallanes Inc. | 3.638% | 3/15/25 | 42,899 | 41,434 | |
| 2 | Magallanes Inc. | 3.788% | 3/15/25 | 9,950 | 9,589 | |
| 2 | Magallanes Inc. | 3.755% | 3/15/27 | 94,763 | 88,514 | |
| 2 | Meta Platforms Inc. | 3.500% | 8/15/27 | 25,000 | 24,218 | |
| Omnicom Group Inc. | 3.650% | 11/1/24 | 23,804 | 23,554 | ||
| Omnicom Group Inc. | 3.600% | 4/15/26 | 34,576 | 33,798 | ||
| Paramount Global | 4.750% | 5/15/25 | 11,704 | 11,783 | ||
| Paramount Global | 4.000% | 1/15/26 | 19,135 | 18,822 | ||
| Paramount Global | 2.900% | 1/15/27 | 20,830 | 19,332 | ||
| Rogers Communications Inc. | 4.100% | 10/1/23 | 17,385 | 17,393 | ||
| 2 | Rogers Communications Inc. | 2.950% | 3/15/25 | 11,561 | 11,195 | |
| Rogers Communications Inc. | 3.625% | 12/15/25 | 18,716 | 18,103 | ||
| Rogers Communications Inc. | 2.900% | 11/15/26 | 7,871 | 7,394 | ||
| 2 | Rogers Communications Inc. | 3.200% | 3/15/27 | 20,330 | 19,346 | |
| Sprint Corp. | 7.875% | 9/15/23 | 8,000 | 8,244 | ||
| Sprint Corp. | 7.125% | 6/15/24 | 2,000 | 2,069 | ||
| Take-Two Interactive Software Inc. | 3.300% | 3/28/24 | 13,040 | 12,852 | ||
| Take-Two Interactive Software Inc. | 3.550% | 4/14/25 | 12,780 | 12,522 | ||
| Take-Two Interactive Software Inc. | 3.700% | 4/14/27 | 8,979 | 8,645 | ||
| TCI Communications Inc. | 7.875% | 2/15/26 | 14,534 | 16,229 | ||
| Telefonica Emisiones SA | 4.103% | 3/8/27 | 37,330 | 36,215 | ||
| TELUS Corp. | 2.800% | 2/16/27 | 13,815 | 12,979 | ||
| Tencent Music Entertainment Group | 1.375% | 9/3/25 | 6,542 | 5,896 | ||
| Thomson Reuters Corp. | 4.300% | 11/23/23 | 11,610 | 11,650 | ||
| Thomson Reuters Corp. | 3.350% | 5/15/26 | 13,260 | 12,843 | ||
| T-Mobile USA Inc. | 3.500% | 4/15/25 | 76,293 | 74,542 | ||
| T-Mobile USA Inc. | 1.500% | 2/15/26 | 23,416 | 21,109 | ||
| T-Mobile USA Inc. | 2.250% | 2/15/26 | 4,465 | 4,101 | ||
| T-Mobile USA Inc. | 2.625% | 4/15/26 | 36,364 | 33,727 | ||
| T-Mobile USA Inc. | 3.750% | 4/15/27 | 90,805 | 87,102 | ||
| T-Mobile USA Inc. | 5.375% | 4/15/27 | 9,225 | 9,257 | ||
| 1 | TWDC Enterprises 18 Corp. | 3.150% | 9/17/25 | 18,626 | 18,214 | |
| TWDC Enterprises 18 Corp. | 3.000% | 2/13/26 | 22,518 | 21,780 | ||
| 1 | TWDC Enterprises 18 Corp. | 1.850% | 7/30/26 | 19,949 | 18,372 | |
| 1 | TWDC Enterprises 18 Corp. | 2.950% | 6/15/27 | 20,414 | 19,596 | |
| Verizon Communications Inc. | 0.750% | 3/22/24 | 6,360 | 6,070 | ||
| Verizon Communications Inc. | 3.376% | 2/15/25 | 33,417 | 32,979 | ||
| Verizon Communications Inc. | 0.850% | 11/20/25 | 44,996 | 40,576 | ||
| Verizon Communications Inc. | 1.450% | 3/20/26 | 61,029 | 55,664 | ||
| Verizon Communications Inc. | 2.625% | 8/15/26 | 53,368 | 50,321 | ||
| Verizon Communications Inc. | 4.125% | 3/16/27 | 73,667 | 73,213 | ||
| Verizon Communications Inc. | 3.000% | 3/22/27 | 22,590 | 21,403 | ||
| Vodafone Group plc | 3.750% | 1/16/24 | 26,025 | 26,035 | ||
| Vodafone Group plc | 4.125% | 5/30/25 | 35,340 | 35,214 | ||
| Walt Disney Co. | 1.750% | 8/30/24 | 28,999 | 27,854 | ||
| Walt Disney Co. | 3.700% | 9/15/24 | 9,671 | 9,632 | ||
| Walt Disney Co. | 3.350% | 3/24/25 | 35,916 | 35,414 | ||
| Walt Disney Co. | 3.700% | 10/15/25 | 14,822 | 14,708 | ||
| Walt Disney Co. | 1.750% | 1/13/26 | 37,298 | 34,739 | ||
| Walt Disney Co. | 3.375% | 11/15/26 | 11,823 | 11,533 | ||
| Walt Disney Co. | 3.700% | 3/23/27 | 18,251 | 18,017 | ||
| Coupon | Maturity Date | Face Amount ($000) | Market Value• ($000) | |||
| Weibo Corp. | 3.500% | 7/5/24 | 14,030 | 13,557 | ||
| WPP Finance 2010 | 3.750% | 9/19/24 | 18,105 | 17,823 | ||
| 2,482,968 | ||||||
| Consumer Discretionary (6.0%) | ||||||
| Alibaba Group Holding Ltd. | 3.600% | 11/28/24 | 48,391 | 47,678 | ||
| Amazon.com Inc. | 2.730% | 4/13/24 | 12,035 | 11,891 | ||
| Amazon.com Inc. | 0.450% | 5/12/24 | 60,801 | 57,687 | ||
| Amazon.com Inc. | 2.800% | 8/22/24 | 45,875 | 45,302 | ||
| Amazon.com Inc. | 3.800% | 12/5/24 | 24,995 | 25,119 | ||
| Amazon.com Inc. | 3.000% | 4/13/25 | 14,633 | 14,405 | ||
| Amazon.com Inc. | 0.800% | 6/3/25 | 36,611 | 33,863 | ||
| Amazon.com Inc. | 5.200% | 12/3/25 | 13,301 | 13,834 | ||
| Amazon.com Inc. | 1.000% | 5/12/26 | 49,546 | 44,879 | ||
| Amazon.com Inc. | 3.300% | 4/13/27 | 61,138 | 59,726 | ||
| Amazon.com Inc. | 1.200% | 6/3/27 | 17,430 | 15,509 | ||
| Amazon.com Inc. | 3.150% | 8/22/27 | 73,000 | 70,539 | ||
| 1 | American Honda Finance Corp. | 3.625% | 10/10/23 | 18,593 | 18,562 | |
| 1 | American Honda Finance Corp. | 3.550% | 1/12/24 | 19,353 | 19,289 | |
| 1 | American Honda Finance Corp. | 2.900% | 2/16/24 | 17,773 | 17,542 | |
| 1 | American Honda Finance Corp. | 2.400% | 6/27/24 | 18,915 | 18,450 | |
| 1 | American Honda Finance Corp. | 0.550% | 7/12/24 | 26,096 | 24,577 | |
| 1 | American Honda Finance Corp. | 2.150% | 9/10/24 | 26,733 | 25,853 | |
| 1 | American Honda Finance Corp. | 1.200% | 7/8/25 | 12,321 | 11,415 | |
| 1 | American Honda Finance Corp. | 1.000% | 9/10/25 | 7,432 | 6,794 | |
| 1 | American Honda Finance Corp. | 2.300% | 9/9/26 | 15,580 | 14,538 | |
| 1 | American Honda Finance Corp. | 2.350% | 1/8/27 | 26,070 | 24,176 | |
| Aptiv plc | 2.396% | 2/18/25 | 9,667 | 9,204 | ||
| AutoNation Inc. | 3.500% | 11/15/24 | 8,361 | 8,159 | ||
| AutoNation Inc. | 4.500% | 10/1/25 | 12,897 | 12,835 | ||
| AutoZone Inc. | 3.125% | 4/18/24 | 9,882 | 9,723 | ||
| AutoZone Inc. | 3.250% | 4/15/25 | 3,217 | 3,127 | ||
| AutoZone Inc. | 3.625% | 4/15/25 | 13,765 | 13,542 | ||
| AutoZone Inc. | 3.125% | 4/21/26 | 12,527 | 12,021 | ||
| AutoZone Inc. | 3.750% | 6/1/27 | 13,792 | 13,434 | ||
| Block Financial LLC | 5.250% | 10/1/25 | 8,291 | 8,379 | ||
| BorgWarner Inc. | 3.375% | 3/15/25 | 13,535 | 13,278 | ||
| BorgWarner Inc. | 2.650% | 7/1/27 | 23,321 | 21,228 | ||
| Brunswick Corp. | 0.850% | 8/18/24 | 8,825 | 8,196 | ||
| Darden Restaurants Inc. | 3.850% | 5/1/27 | 10,628 | 10,260 | ||
| DR Horton Inc. | 5.750% | 8/15/23 | 8,614 | 8,711 | ||
| DR Horton Inc. | 2.500% | 10/15/24 | 17,005 | 16,332 | ||
| DR Horton Inc. | 2.600% | 10/15/25 | 17,509 | 16,454 | ||
| eBay Inc. | 3.450% | 8/1/24 | 11,029 | 10,903 | ||
| eBay Inc. | 1.900% | 3/11/25 | 23,301 | 21,995 | ||
| eBay Inc. | 1.400% | 5/10/26 | 18,345 | 16,568 | ||
| eBay Inc. | 3.600% | 6/5/27 | 19,105 | 18,459 | ||
| Fortune Brands Home & Security Inc. | 4.000% | 9/21/23 | 16,405 | 16,367 | ||
| Fortune Brands Home & Security Inc. | 4.000% | 6/15/25 | 8,648 | 8,505 | ||
| General Motors Co. | 4.875% | 10/2/23 | 40,434 | 40,630 | ||
| General Motors Co. | 5.400% | 10/2/23 | 19,827 | 20,027 | ||
| General Motors Co. | 4.000% | 4/1/25 | 13,639 | 13,424 | ||
| General Motors Co. | 6.125% | 10/1/25 | 51,724 | 53,268 | ||
| General Motors Financial Co. Inc. | 5.100% | 1/17/24 | 37,713 | 38,048 | ||
| General Motors Financial Co. Inc. | 1.050% | 3/8/24 | 17,989 | 17,085 | ||
| General Motors Financial Co. Inc. | 3.950% | 4/13/24 | 21,428 | 21,268 | ||
| General Motors Financial Co. Inc. | 1.200% | 10/15/24 | 25,960 | 24,268 | ||
| General Motors Financial Co. Inc. | 3.500% | 11/7/24 | 23,376 | 22,903 | ||
| General Motors Financial Co. Inc. | 4.000% | 1/15/25 | 27,188 | 26,821 | ||
| General Motors Financial Co. Inc. | 2.900% | 2/26/25 | 38,897 | 37,222 | ||
| General Motors Financial Co. Inc. | 3.800% | 4/7/25 | 7,298 | ��� 7,116 | ||
| General Motors Financial Co. Inc. | 4.350% | 4/9/25 | 38,371 | 37,913 | ||
| General Motors Financial Co. Inc. | 2.750% | 6/20/25 | 27,848 | 26,343 | ||
| General Motors Financial Co. Inc. | 4.300% | 7/13/25 | 12,382 | 12,196 | ||
| General Motors Financial Co. Inc. | 1.250% | 1/8/26 | 13,951 | 12,314 | ||
| General Motors Financial Co. Inc. | 5.250% | 3/1/26 | 28,902 | 29,057 | ||
| Coupon | Maturity Date | Face Amount ($000) | Market Value• ($000) | |||
| General Motors Financial Co. Inc. | 1.500% | 6/10/26 | 12,648 | 11,112 | ||
| General Motors Financial Co. Inc. | 4.000% | 10/6/26 | 18,216 | 17,525 | ||
| General Motors Financial Co. Inc. | 4.350% | 1/17/27 | 39,730 | 38,352 | ||
| General Motors Financial Co. Inc. | 2.350% | 2/26/27 | 21,998 | 19,532 | ||
| General Motors Financial Co. Inc. | 5.000% | 4/9/27 | 44,344 | 43,719 | ||
| General Motors Financial Co. Inc. | 2.700% | 8/20/27 | 15,000 | 13,334 | ||
| Genuine Parts Co. | 1.750% | 2/1/25 | 3,335 | 3,137 | ||
| Harley-Davidson Inc. | 3.500% | 7/28/25 | 11,679 | 11,257 | ||
| Hasbro Inc. | 3.000% | 11/19/24 | 15,217 | 14,813 | ||
| Hasbro Inc. | 3.550% | 11/19/26 | 19,416 | 18,490 | ||
| Home Depot Inc. | 3.750% | 2/15/24 | 24,984 | 25,027 | ||
| Home Depot Inc. | 2.700% | 4/15/25 | 5,050 | 4,931 | ||
| Home Depot Inc. | 3.350% | 9/15/25 | 27,994 | 27,711 | ||
| Home Depot Inc. | 3.000% | 4/1/26 | 32,106 | 31,220 | ||
| Home Depot Inc. | 2.125% | 9/15/26 | 15,237 | 14,281 | ||
| Home Depot Inc. | 2.500% | 4/15/27 | 39,083 | 36,892 | ||
| Home Depot Inc. | 2.875% | 4/15/27 | 6,955 | 6,684 | ||
| Home Depot Inc. | 2.800% | 9/14/27 | 6,000 | 5,700 | ||
| Honda Motor Co. Ltd. | 2.271% | 3/10/25 | 23,085 | 22,147 | ||
| Honda Motor Co. Ltd. | 2.534% | 3/10/27 | 33,880 | 31,649 | ||
| Hyatt Hotels Corp. | 1.300% | 10/1/23 | 6,880 | 6,666 | ||
| Hyatt Hotels Corp. | 1.800% | 10/1/24 | 3,950 | 3,749 | ||
| Hyatt Hotels Corp. | 5.625% | 4/23/25 | 13,372 | 13,511 | ||
| Hyatt Hotels Corp. | 4.850% | 3/15/26 | 15,606 | 15,707 | ||
| JD.com Inc. | 3.875% | 4/29/26 | 10,724 | 10,466 | ||
| Kohl's Corp. | 4.250% | 7/17/25 | 3,186 | 3,059 | ||
| Leggett & Platt Inc. | 3.800% | 11/15/24 | 7,391 | 7,294 | ||
| Leland Stanford Junior University | 1.289% | 6/1/27 | 7,554 | 6,706 | ||
| Lennar Corp. | 4.875% | 12/15/23 | 14,952 | 15,028 | ||
| Lennar Corp. | 4.500% | 4/30/24 | 18,489 | 18,515 | ||
| Lennar Corp. | 5.875% | 11/15/24 | 10,780 | 11,039 | ||
| Lennar Corp. | 4.750% | 5/30/25 | 13,763 | 13,846 | ||
| Lennar Corp. | 5.250% | 6/1/26 | 7,080 | 7,133 | ||
| Lennar Corp. | 5.000% | 6/15/27 | 3,844 | 3,816 | ||
| Lennar Corp. | 4.750% | 11/29/27 | 3,000 | 2,930 | ||
| Lowe's Cos. Inc. | 3.875% | 9/15/23 | 6,658 | 6,661 | ||
| Lowe's Cos. Inc. | 3.125% | 9/15/24 | 4,401 | 4,332 | ||
| Lowe's Cos. Inc. | 4.000% | 4/15/25 | 21,688 | 21,682 | ||
| Lowe's Cos. Inc. | 3.375% | 9/15/25 | 20,082 | 19,675 | ||
| Lowe's Cos. Inc. | 2.500% | 4/15/26 | 32,174 | 30,617 | ||
| Lowe's Cos. Inc. | 3.350% | 4/1/27 | 22,949 | 22,112 | ||
| Lowe's Cos. Inc. | 3.100% | 5/3/27 | 28,187 | 26,809 | ||
| Magna International Inc. | 3.625% | 6/15/24 | 12,692 | 12,591 | ||
| Magna International Inc. | 4.150% | 10/1/25 | 16,316 | 16,249 | ||
| 1 | Marriott International Inc. | 4.150% | 12/1/23 | 7,442 | 7,446 | |
| Marriott International Inc. | 3.600% | 4/15/24 | 16,127 | 15,973 | ||
| Marriott International Inc. | 3.750% | 3/15/25 | 8,583 | 8,448 | ||
| 1 | Marriott International Inc. | 5.750% | 5/1/25 | 5,519 | 5,688 | |
| Marriott International Inc. | 3.750% | 10/1/25 | 7,627 | 7,448 | ||
| 1 | Marriott International Inc. | 3.125% | 6/15/26 | 32,065 | 30,422 | |
| 1 | McDonald's Corp. | 3.250% | 6/10/24 | 10,880 | 10,789 | |
| 1 | McDonald's Corp. | 3.375% | 5/26/25 | 15,815 | 15,533 | |
| 1 | McDonald's Corp. | 3.300% | 7/1/25 | 22,979 | 22,557 | |
| 1 | McDonald's Corp. | 1.450% | 9/1/25 | 13,043 | 12,134 | |
| 1 | McDonald's Corp. | 3.700% | 1/30/26 | 36,166 | 35,824 | |
| 1 | McDonald's Corp. | 3.500% | 3/1/27 | 17,913 | 17,535 | |
| 2 | Mercedes-Benz Finance North America LLC | 0.750% | 3/1/24 | 6,000 | 5,704 | |
| NIKE Inc. | 2.400% | 3/27/25 | 16,208 | 15,693 | ||
| NIKE Inc. | 2.375% | 11/1/26 | 21,263 | 20,158 | ||
| NIKE Inc. | 2.750% | 3/27/27 | 30,997 | ��� 29,639 | ||
| O'Reilly Automotive Inc. | 3.850% | 6/15/23 | 5,904 | 5,888 | ||
| O'Reilly Automotive Inc. | 3.550% | 3/15/26 | 12,154 | 11,840 | ||
| Owens Corning | 4.200% | 12/1/24 | 7,421 | 7,410 | ||
| Owens Corning | 3.400% | 8/15/26 | 10,966 | 10,446 | ||
| PulteGroup Inc. | 5.500% | 3/1/26 | 14,420 | 14,600 | ||
| PulteGroup Inc. | 5.000% | 1/15/27 | 5,580 | 5,594 | ||
| Coupon | Maturity Date | Face Amount ($000) | Market Value• ($000) | |||
| PVH Corp. | 4.625% | 7/10/25 | 12,002 | 11,939 | ||
| Ralph Lauren Corp. | 3.750% | 9/15/25 | 8,979 | 8,896 | ||
| Ross Stores Inc. | 4.600% | 4/15/25 | 16,850 | 16,940 | ||
| Ross Stores Inc. | 0.875% | 4/15/26 | 14,646 | 12,932 | ||
| Snap-on Inc. | 3.250% | 3/1/27 | 1,841 | 1,797 | ||
| Stanley Black & Decker Inc. | 3.400% | 3/1/26 | 18,570 | 18,130 | ||
| 1 | Stanley Black & Decker Inc. | 4.000% | 3/15/60 | 16,849 | 15,427 | |
| Starbucks Corp. | 3.850% | 10/1/23 | 9,583 | 9,580 | ||
| Starbucks Corp. | 3.800% | 8/15/25 | 33,026 | 32,822 | ||
| Starbucks Corp. | 2.450% | 6/15/26 | 10,105 | 9,579 | ||
| Starbucks Corp. | 2.000% | 3/12/27 | 18,284 | 16,669 | ||
| Tapestry Inc. | 4.125% | 7/15/27 | 914 | 874 | ||
| TJX Cos. Inc. | 2.250% | 9/15/26 | 17,585 | 16,567 | ||
| Toll Brothers Finance Corp. | 4.875% | 11/15/25 | 10,425 | 10,325 | ||
| Toyota Motor Corp. | 0.681% | 3/25/24 | 39,143 | 37,345 | ||
| Toyota Motor Corp. | 2.358% | 7/2/24 | 8,901 | 8,687 | ||
| Toyota Motor Corp. | 1.339% | 3/25/26 | 27,088 | 24,799 | ||
| 1 | Toyota Motor Credit Corp. | 3.450% | 9/20/23 | 12,024 | 11,994 | |
| 1 | Toyota Motor Credit Corp. | 2.250% | 10/18/23 | 15,743 | 15,509 | |
| Toyota Motor Credit Corp. | 3.350% | 1/8/24 | 11,876 | 11,827 | ||
| 1 | Toyota Motor Credit Corp. | 0.450% | 1/11/24 | 26,047 | 24,939 | |
| Toyota Motor Credit Corp. | 2.500% | 3/22/24 | 12,900 | 12,669 | ||
| 1 | Toyota Motor Credit Corp. | 2.900% | 4/17/24 | 15,771 | 15,572 | |
| 1 | Toyota Motor Credit Corp. | 0.500% | 6/18/24 | 13,666 | 12,912 | |
| Toyota Motor Credit Corp. | 0.625% | 9/13/24 | 18,232 | 17,125 | ||
| 1 | Toyota Motor Credit Corp. | 2.000% | 10/7/24 | 9,931 | 9,577 | |
| 1 | Toyota Motor Credit Corp. | 1.450% | 1/13/25 | 12,985 | 12,274 | |
| 1 | Toyota Motor Credit Corp. | 1.800% | 2/13/25 | 54,446 | 51,786 | |
| 1 | Toyota Motor Credit Corp. | 3.000% | 4/1/25 | 31,915 | 31,197 | |
| 1 | Toyota Motor Credit Corp. | 3.400% | 4/14/25 | 16,448 | 16,243 | |
| Toyota Motor Credit Corp. | 3.950% | 6/30/25 | 11,980 | 11,968 | ||
| 1 | Toyota Motor Credit Corp. | 0.800% | 10/16/25 | 12,656 | 11,512 | |
| 1 | Toyota Motor Credit Corp. | 0.800% | 1/9/26 | 10,565 | 9,555 | |
| 1 | Toyota Motor Credit Corp. | 1.125% | 6/18/26 | 25,674 | 23,213 | |
| 1 | Toyota Motor Credit Corp. | 3.200% | 1/11/27 | 35,960 | 34,805 | |
| 1 | Toyota Motor Credit Corp. | 1.900% | 1/13/27 | 9,982 | 9,176 | |
| Toyota Motor Credit Corp. | 3.050% | 3/22/27 | 34,132 | 32,733 | ||
| 1 | Toyota Motor Credit Corp. | 1.150% | 8/13/27 | 13,318 | 11,598 | |
| VF Corp. | 2.400% | 4/23/25 | 19,396 | 18,509 | ||
| VF Corp. | 2.800% | 4/23/27 | 9,422 | 8,806 | ||
| Whirlpool Corp. | 4.000% | 3/1/24 | 8,025 | 8,019 | ||
| Whirlpool Corp. | 3.700% | 5/1/25 | 5,612 | 5,529 | ||
| 1 | Yale University | 0.873% | 4/15/25 | 11,406 | 10,598 | |
| 3,046,639 | ||||||
| Consumer Staples (5.0%) | ||||||
| Altria Group Inc. | 4.000% | 1/31/24 | 15,398 | 15,397 | ||
| Altria Group Inc. | 3.800% | 2/14/24 | 11,027 | 10,963 | ||
| Altria Group Inc. | 2.350% | 5/6/25 | 13,760 | 13,083 | ||
| Altria Group Inc. | 4.400% | 2/14/26 | 34,056 | 33,910 | ||
| Altria Group Inc. | 2.625% | 9/16/26 | 3,994 | 3,730 | ||
| 1 | Anheuser-Busch Cos. LLC | 3.650% | 2/1/26 | 74,068 | 72,847 | |
| Archer-Daniels-Midland Co. | 2.500% | 8/11/26 | 24,708 | 23,528 | ||
| Avery Dennison Corp. | 0.850% | 8/15/24 | 60 | 56 | ||
| BAT Capital Corp. | 3.222% | 8/15/24 | 44,283 | 43,256 | ||
| BAT Capital Corp. | 2.789% | 9/6/24 | 21,559 | 20,880 | ||
| BAT Capital Corp. | 3.215% | 9/6/26 | 24,346 | 22,690 | ||
| BAT Capital Corp. | 4.700% | 4/2/27 | 12,090 | 11,775 | ||
| BAT Capital Corp. | 3.557% | 8/15/27 | 65,000 | 59,746 | ||
| BAT Capital Corp. | 2.259% | 3/25/28 | 10,000 | 8,406 | ||
| BAT International Finance plc | 1.668% | 3/25/26 | 36,913 | 32,895 | ||
| Brown-Forman Corp. | 3.500% | 4/15/25 | 5,630 | 5,568 | ||
| Bunge Ltd. Finance Corp. | 1.630% | 8/17/25 | 12,701 | 11,791 | ||
| Bunge Ltd. Finance Corp. | 3.250% | 8/15/26 | 18,890 | 18,156 | ||
| Campbell Soup Co. | 3.950% | 3/15/25 | 25,618 | 25,403 | ||
| Campbell Soup Co. | 3.300% | 3/19/25 | 6,106 | 5,961 | ||
| Church & Dwight Co. Inc. | 3.150% | 8/1/27 | 10,000 | 9,490 | ||
| Coca-Cola Co. | 1.750% | 9/6/24 | 15,461 | 14,992 | ||
| Coupon | Maturity Date | Face Amount ($000) | Market Value• ($000) | |||
| Coca-Cola Co. | 3.375% | 3/25/27 | 24,639 | 24,348 | ||
| Coca-Cola Co. | 2.900% | 5/25/27 | 6,509 | 6,282 | ||
| Coca-Cola Co. | 1.450% | 6/1/27 | 36,010 | 32,585 | ||
| Coca-Cola Consolidated Inc. | 3.800% | 11/25/25 | 8,465 | 8,312 | ||
| 1 | Colgate-Palmolive Co. | 3.250% | 3/15/24 | 12,249 | 12,187 | |
| Colgate-Palmolive Co. | 3.100% | 8/15/27 | 17,900 | 17,414 | ||
| Conagra Brands Inc. | 4.300% | 5/1/24 | 22,306 | 22,292 | ||
| Conagra Brands Inc. | 4.600% | 11/1/25 | 25,199 | 25,159 | ||
| Constellation Brands Inc. | 4.750% | 11/15/24 | 5,702 | 5,774 | ||
| Constellation Brands Inc. | 4.400% | 11/15/25 | 13,220 | 13,248 | ||
| Constellation Brands Inc. | 4.750% | 12/1/25 | 9,646 | 9,783 | ||
| Constellation Brands Inc. | 3.700% | 12/6/26 | 12,851 | 12,448 | ||
| Constellation Brands Inc. | 3.500% | 5/9/27 | 26,002 | 24,865 | ||
| Constellation Brands Inc. | 4.350% | 5/9/27 | 12,860 | 12,767 | ||
| Costco Wholesale Corp. | 2.750% | 5/18/24 | 33,191 | 32,812 | ||
| Costco Wholesale Corp. | 3.000% | 5/18/27 | 22,677 | 22,043 | ||
| Costco Wholesale Corp. | 1.375% | 6/20/27 | 31,496 | 28,287 | ||
| Diageo Capital plc | 3.500% | 9/18/23 | 12,429 | 12,392 | ||
| Diageo Capital plc | 2.125% | 10/24/24 | 6,664 | 6,429 | ||
| Diageo Capital plc | 1.375% | 9/29/25 | 20,469 | 18,973 | ||
| Dollar General Corp. | 4.150% | 11/1/25 | 11,350 | 11,304 | ||
| Dollar General Corp. | 3.875% | 4/15/27 | 14,530 | 14,270 | ||
| Dollar Tree Inc. | 4.000% | 5/15/25 | 23,079 | 22,848 | ||
| Estee Lauder Cos. Inc. | 2.000% | 12/1/24 | 14,776 | 14,335 | ||
| Estee Lauder Cos. Inc. | 3.150% | 3/15/27 | 5,141 | 5,006 | ||
| Flowers Foods Inc. | 3.500% | 10/1/26 | 8,099 | 7,704 | ||
| General Mills Inc. | 3.650% | 2/15/24 | 14,387 | 14,343 | ||
| General Mills Inc. | 4.000% | 4/17/25 | 16,683 | 16,632 | ||
| General Mills Inc. | 3.200% | 2/10/27 | 16,978 | 16,364 | ||
| 2 | GSK Consumer Healthcare Capital UK plc | 3.125% | 3/24/25 | 18,749 | 18,074 | |
| 2 | GSK Consumer Healthcare Capital US LLC | 3.024% | 3/24/24 | 8,625 | 8,439 | |
| 2 | GSK Consumer Healthcare Capital US LLC | 3.375% | 3/24/27 | 53,190 | 50,031 | |
| Hershey Co. | 2.625% | 5/1/23 | 635 | 630 | ||
| Hershey Co. | 2.050% | 11/15/24 | 1,624 | 1,570 | ||
| Hershey Co. | 0.900% | 6/1/25 | 8,750 | 8,078 | ||
| Hershey Co. | 3.200% | 8/21/25 | 4,076 | 4,002 | ||
| Hershey Co. | 2.300% | 8/15/26 | 16,630 | 15,707 | ||
| Hormel Foods Corp. | 0.650% | 6/3/24 | 15,927 | 15,129 | ||
| Ingredion Inc. | 3.200% | 10/1/26 | 11,224 | 10,757 | ||
| J M Smucker Co. | 3.500% | 3/15/25 | 23,848 | 23,530 | ||
| Kellogg Co. | 2.650% | 12/1/23 | 14,597 | 14,396 | ||
| Kellogg Co. | 3.250% | 4/1/26 | 15,082 | 14,634 | ||
| Keurig Dr Pepper Inc. | 3.130% | 12/15/23 | 19,900 | 19,708 | ||
| Keurig Dr Pepper Inc. | 0.750% | 3/15/24 | 12,153 | 11,557 | ||
| Keurig Dr Pepper Inc. | 4.417% | 5/25/25 | 11,599 | 11,637 | ||
| Keurig Dr Pepper Inc. | 3.400% | 11/15/25 | 11,961 | 11,683 | ||
| Keurig Dr Pepper Inc. | 2.550% | 9/15/26 | 15,685 | 14,666 | ||
| Keurig Dr Pepper Inc. | 3.430% | 6/15/27 | 6,385 | 6,103 | ||
| Kimberly-Clark Corp. | 3.050% | 8/15/25 | 6,120 | 5,998 | ||
| Kimberly-Clark Corp. | 2.750% | 2/15/26 | 11,789 | 11,391 | ||
| Kraft Heinz Foods Co. | 3.000% | 6/1/26 | 42,972 | 40,635 | ||
| Kraft Heinz Foods Co. | 3.875% | 5/15/27 | 34,498 | 33,324 | ||
| Kroger Co. | 4.000% | 2/1/24 | 16,256 | 16,258 | ||
| Kroger Co. | 3.500% | 2/1/26 | 11,992 | 11,714 | ||
| Kroger Co. | 2.650% | 10/15/26 | 18,105 | 17,098 | ||
| Kroger Co. | 3.700% | 8/1/27 | 15,500 | 15,059 | ||
| McCormick & Co. Inc. | 3.150% | 8/15/24 | 23,921 | 23,540 | ||
| McCormick & Co. Inc. | 0.900% | 2/15/26 | 12,027 | 10,719 | ||
| McCormick & Co. Inc. | 3.400% | 8/15/27 | 10,000 | 9,605 | ||
| Mead Johnson Nutrition Co. | 4.125% | 11/15/25 | 29,363 | 29,442 | ||
| Molson Coors Beverage Co. | 3.000% | 7/15/26 | 48,956 | 45,900 | ||
| Mondelez International Inc. | 2.125% | 3/17/24 | 9,146 | 8,905 | ||
| Mondelez International Inc. | 1.500% | 5/4/25 | 24,017 | 22,476 | ||
| Mondelez International Inc. | 2.625% | 3/17/27 | 10,290 | 9,601 | ||
| Coupon | Maturity Date | Face Amount ($000) | Market Value• ($000) | |||
| PepsiCo Inc. | 0.400% | 10/7/23 | 14,674 | 14,171 | ||
| PepsiCo Inc. | 3.600% | 3/1/24 | 10,657 | 10,663 | ||
| PepsiCo Inc. | 2.250% | 3/19/25 | 42,287 | 40,787 | ||
| PepsiCo Inc. | 2.750% | 4/30/25 | 23,492 | 22,913 | ||
| PepsiCo Inc. | 3.500% | 7/17/25 | 17,408 | 17,324 | ||
| PepsiCo Inc. | 2.850% | 2/24/26 | 25,670 | 25,000 | ||
| PepsiCo Inc. | 2.375% | 10/6/26 | 19,086 | 18,113 | ||
| PepsiCo Inc. | 2.625% | 3/19/27 | 20,241 | 19,210 | ||
| Philip Morris International Inc. | 3.600% | 11/15/23 | 13,617 | 13,585 | ||
| Philip Morris International Inc. | 2.875% | 5/1/24 | 23,810 | 23,436 | ||
| Philip Morris International Inc. | 3.250% | 11/10/24 | 7,036 | 6,934 | ||
| Philip Morris International Inc. | 1.500% | 5/1/25 | 5,630 | 5,280 | ||
| Philip Morris International Inc. | 3.375% | 8/11/25 | 18,965 | 18,660 | ||
| Philip Morris International Inc. | 2.750% | 2/25/26 | 26,758 | 25,394 | ||
| Philip Morris International Inc. | 0.875% | 5/1/26 | 17,830 | 15,838 | ||
| Procter & Gamble Co. | 3.100% | 8/15/23 | 37,025 | 36,888 | ||
| Procter & Gamble Co. | 0.550% | 10/29/25 | 26,069 | 23,689 | ||
| Procter & Gamble Co. | 2.700% | 2/2/26 | 11,699 | 11,447 | ||
| Procter & Gamble Co. | 2.450% | 11/3/26 | 32,024 | 30,650 | ||
| Procter & Gamble Co. | 1.900% | 2/1/27 | 8,807 | 8,242 | ||
| Procter & Gamble Co. | 2.800% | 3/25/27 | 9,422 | 9,064 | ||
| Procter & Gamble Co. | 2.850% | 8/11/27 | 10,000 | 9,600 | ||
| Reynolds American Inc. | 4.850% | 9/15/23 | 9,151 | 9,200 | ||
| Reynolds American Inc. | 4.450% | 6/12/25 | 77,810 | 77,115 | ||
| Sysco Corp. | 3.750% | 10/1/25 | 20,512 | 20,224 | ||
| Sysco Corp. | 3.300% | 7/15/26 | 22,181 | 21,460 | ||
| Target Corp. | 3.500% | 7/1/24 | 16,940 | 16,907 | ||
| Target Corp. | 2.250% | 4/15/25 | 20,645 | 19,835 | ||
| Target Corp. | 2.500% | 4/15/26 | 24,164 | 23,180 | ||
| Target Corp. | 1.950% | 1/15/27 | 33,355 | 31,029 | ||
| Tyson Foods Inc. | 3.900% | 9/28/23 | 4,323 | 4,321 | ||
| Tyson Foods Inc. | 3.950% | 8/15/24 | 14,741 | 14,698 | ||
| Tyson Foods Inc. | 4.000% | 3/1/26 | 28,392 | 28,066 | ||
| Tyson Foods Inc. | 3.550% | 6/2/27 | 27,325 | 26,201 | ||
| Unilever Capital Corp. | 0.375% | 9/14/23 | 16,055 | 15,524 | ||
| Unilever Capital Corp. | 3.250% | 3/7/24 | 14,999 | 14,909 | ||
| Unilever Capital Corp. | 2.600% | 5/5/24 | 11,886 | 11,664 | ||
| Unilever Capital Corp. | 0.626% | 8/12/24 | 5,070 | 4,783 | ||
| Unilever Capital Corp. | 3.375% | 3/22/25 | 7,786 | 7,677 | ||
| Unilever Capital Corp. | 3.100% | 7/30/25 | 9,019 | 8,836 | ||
| Unilever Capital Corp. | 2.000% | 7/28/26 | 20,665 | 19,294 | ||
| Unilever Capital Corp. | 2.900% | 5/5/27 | 12,085 | 11,554 | ||
| Walgreens Boots Alliance Inc. | 0.950% | 11/17/23 | 4,088 | 3,944 | ||
| Walgreens Boots Alliance Inc. | 3.800% | 11/18/24 | 23,185 | 23,029 | ||
| Walgreens Boots Alliance Inc. | 3.450% | 6/1/26 | 34,604 | 33,514 | ||
| Walmart Inc. | 3.400% | 6/26/23 | 47,689 | 47,681 | ||
| Walmart Inc. | 3.300% | 4/22/24 | 37,574 | 37,425 | ||
| Walmart Inc. | 2.850% | 7/8/24 | 30,644 | 30,195 | ||
| Walmart Inc. | 2.650% | 12/15/24 | 14,848 | 14,569 | ||
| Walmart Inc. | 3.550% | 6/26/25 | 20,412 | 20,396 | ||
| Walmart Inc. | 3.050% | 7/8/26 | 24,666 | 24,350 | ||
| Walmart Inc. | 1.050% | 9/17/26 | 6,900 | 6,251 | ||
| 2,542,444 | ||||||
| Energy (5.9%) | ||||||
| Baker Hughes Holdings LLC | 1.231% | 12/15/23 | 12,202 | 11,806 | ||
| Baker Hughes Holdings LLC | 2.061% | 12/15/26 | 11,608 | 10,571 | ||
| Boardwalk Pipelines LP | 4.950% | 12/15/24 | 6,021 | 6,066 | ||
| Boardwalk Pipelines LP | 5.950% | 6/1/26 | 17,528 | 18,117 | ||
| Boardwalk Pipelines LP | 4.450% | 7/15/27 | 6,758 | 6,489 | ||
| BP Capital Markets America Inc. | 3.796% | 9/21/25 | 18,797 | 18,754 | ||
| BP Capital Markets America Inc. | 3.410% | 2/11/26 | 19,605 | 19,242 | ||
| 1 | BP Capital Markets America Inc. | 3.119% | 5/4/26 | 18,750 | 18,148 | |
| 1 | BP Capital Markets America Inc. | 3.017% | 1/16/27 | 26,343 | 25,206 | |
| BP Capital Markets America Inc. | 3.543% | 4/6/27 | 15,255 | 14,869 | ||
| 1 | BP Capital Markets America Inc. | 3.588% | 4/14/27 | 13,405 | 13,055 | |
| Canadian Natural Resources Ltd. | 3.800% | 4/15/24 | 18,050 | 17,865 | ||
| Canadian Natural Resources Ltd. | 3.900% | 2/1/25 | 14,550 | 14,331 | ||
| Coupon | Maturity Date | Face Amount ($000) | Market Value• ($000) | |||
| Canadian Natural Resources Ltd. | 2.050% | 7/15/25 | 15,959 | 14,888 | ||
| Canadian Natural Resources Ltd. | 3.850% | 6/1/27 | 26,845 | 25,648 | ||
| Cenovus Energy Inc. | 5.375% | 7/15/25 | 18,310 | 18,795 | ||
| Cenovus Energy Inc. | 4.250% | 4/15/27 | 22,708 | 22,357 | ||
| Cheniere Corpus Christi Holdings LLC | 7.000% | 6/30/24 | 26,736 | 27,521 | ||
| Cheniere Corpus Christi Holdings LLC | 5.875% | 3/31/25 | 47,728 | 48,694 | ||
| Cheniere Corpus Christi Holdings LLC | 5.125% | 6/30/27 | 33,775 | 33,741 | ||
| Chevron Corp. | 2.895% | 3/3/24 | 28,914 | 28,604 | ||
| Chevron Corp. | 1.554% | 5/11/25 | 56,173 | 53,004 | ||
| Chevron Corp. | 3.326% | 11/17/25 | 14,817 | 14,614 | ||
| Chevron Corp. | 2.954% | 5/16/26 | 41,590 | 40,275 | ||
| Chevron Corp. | 1.995% | 5/11/27 | 23,790 | 21,978 | ||
| Chevron USA Inc. | 3.900% | 11/15/24 | 16,265 | 16,398 | ||
| Chevron USA Inc. | 0.687% | 8/12/25 | 19,834 | 18,119 | ||
| Chevron USA Inc. | 1.018% | 8/12/27 | 5,868 | 5,117 | ||
| Columbia Pipeline Group Inc. | 4.500% | 6/1/25 | 22,698 | 22,634 | ||
| ConocoPhillips Co. | 2.125% | 3/8/24 | 10,660 | 10,424 | ||
| ConocoPhillips Co. | 3.350% | 11/15/24 | 6,969 | 6,905 | ||
| ConocoPhillips Co. | 2.400% | 3/7/25 | 10,050 | 9,715 | ||
| Continental Resources Inc. | 3.800% | 6/1/24 | 21,660 | 21,350 | ||
| 2 | Coterra Energy Inc. | 4.375% | 6/1/24 | 21,187 | 21,056 | |
| 2 | Coterra Energy Inc. | 3.900% | 5/15/27 | 18,015 | 17,198 | |
| DCP Midstream Operating LP | 5.375% | 7/15/25 | 6,716 | 6,735 | ||
| DCP Midstream Operating LP | 5.625% | 7/15/27 | 5,175 | 5,241 | ||
| Devon Energy Corp. | 5.250% | 9/15/24 | 16,570 | 16,851 | ||
| Devon Energy Corp. | 5.850% | 12/15/25 | 12,076 | 12,491 | ||
| Diamondback Energy Inc. | 3.250% | 12/1/26 | 20,152 | 19,337 | ||
| 1 | Eastern Gas Transmission & Storage Inc. | 3.600% | 12/15/24 | 3,906 | 3,844 | |
| Enbridge Energy Partners LP | 5.875% | 10/15/25 | 8,362 | 8,639 | ||
| Enbridge Inc. | 4.000% | 10/1/23 | 21,861 | 21,799 | ||
| Enbridge Inc. | 0.550% | 10/4/23 | 2,461 | 2,366 | ||
| Enbridge Inc. | 2.150% | 2/16/24 | 6,549 | 6,353 | ||
| Enbridge Inc. | 3.500% | 6/10/24 | 14,321 | 14,142 | ||
| Enbridge Inc. | 2.500% | 1/15/25 | 11,791 | 11,299 | ||
| Enbridge Inc. | 2.500% | 2/14/25 | 2,782 | 2,666 | ||
| Enbridge Inc. | 1.600% | 10/4/26 | 6,775 | 6,021 | ||
| Enbridge Inc. | 4.250% | 12/1/26 | 22,942 | 22,606 | ||
| Enbridge Inc. | 3.700% | 7/15/27 | 14,025 | 13,425 | ||
| 1 | Energy Transfer LP | 4.200% | 9/15/23 | 14,937 | 14,913 | |
| Energy Transfer LP | 4.500% | 11/1/23 | 18,799 | 18,796 | ||
| 1 | Energy Transfer LP | 5.875% | 1/15/24 | 22,598 | 22,901 | |
| Energy Transfer LP | 4.900% | 2/1/24 | 9,132 | 9,149 | ||
| Energy Transfer LP | 4.250% | 4/1/24 | 19,073 | 18,941 | ||
| Energy Transfer LP | 4.500% | 4/15/24 | 20,436 | 20,391 | ||
| Energy Transfer LP | 3.900% | 5/15/24 | 12,510 | 12,337 | ||
| Energy Transfer LP | 4.050% | 3/15/25 | 17,704 | 17,387 | ||
| Energy Transfer LP | 2.900% | 5/15/25 | 18,781 | 17,810 | ||
| Energy Transfer LP | 5.950% | 12/1/25 | 11,592 | 11,855 | ||
| Energy Transfer LP | 4.750% | 1/15/26 | 24,124 | 23,945 | ||
| Energy Transfer LP | 3.900% | 7/15/26 | 13,749 | 13,154 | ||
| Energy Transfer LP | 4.400% | 3/15/27 | 21,591 | 20,914 | ||
| Energy Transfer LP | 4.200% | 4/15/27 | 15,896 | 15,255 | ||
| 1 | Energy Transfer LP | 5.500% | 6/1/27 | 22,235 | 22,503 | |
| Enterprise Products Operating LLC | 3.900% | 2/15/24 | 13,791 | 13,742 | ||
| Enterprise Products Operating LLC | 3.750% | 2/15/25 | 29,447 | 29,246 | ||
| Enterprise Products Operating LLC | 3.700% | 2/15/26 | 21,213 | 20,943 | ||
| Enterprise Products Operating LLC | 3.950% | 2/15/27 | 13,471 | 13,295 | ||
| 1 | Enterprise Products Operating LLC | 5.250% | 8/16/77 | 13,146 | 11,493 | |
| EOG Resources Inc. | 3.150% | 4/1/25 | 11,857 | 11,654 | ||
| EOG Resources Inc. | 4.150% | 1/15/26 | 23,873 | 23,898 | ||
| EQT Corp. | 6.125% | 2/1/25 | 17,924 | 18,418 | ||
| Exxon Mobil Corp. | 3.176% | 3/15/24 | 15,747 | 15,670 | ||
| Exxon Mobil Corp. | 2.019% | 8/16/24 | 23,286 | 22,578 | ||
| Coupon | Maturity Date | Face Amount ($000) | Market Value• ($000) | |||
| Exxon Mobil Corp. | 2.709% | 3/6/25 | 30,465 | 29,666 | ||
| Exxon Mobil Corp. | 2.992% | 3/19/25 | 85,047 | 83,207 | ||
| Exxon Mobil Corp. | 3.043% | 3/1/26 | 59,446 | 57,892 | ||
| Exxon Mobil Corp. | 2.275% | 8/16/26 | 24,107 | 22,769 | ||
| Exxon Mobil Corp. | 3.294% | 3/19/27 | 14,115 | 13,835 | ||
| Halliburton Co. | 3.500% | 8/1/23 | 14,027 | 14,037 | ||
| Halliburton Co. | 3.800% | 11/15/25 | 7,899 | 7,815 | ||
| Hess Corp. | 3.500% | 7/15/24 | 8,000 | 7,871 | ||
| Hess Corp. | 4.300% | 4/1/27 | 23,580 | 23,019 | ||
| 2 | HF Sinclair Corp. | 2.625% | 10/1/23 | 5,247 | 5,088 | |
| 2 | HF Sinclair Corp. | 5.875% | 4/1/26 | 25,497 | 25,633 | |
| Kinder Morgan Energy Partners LP | 3.500% | 9/1/23 | 18,833 | 18,749 | ||
| Kinder Morgan Energy Partners LP | 4.150% | 2/1/24 | 15,675 | 15,678 | ||
| Kinder Morgan Energy Partners LP | 4.300% | 5/1/24 | 16,692 | 16,756 | ||
| Kinder Morgan Energy Partners LP | 4.250% | 9/1/24 | 8,897 | 8,887 | ||
| Kinder Morgan Inc. | 4.300% | 6/1/25 | 27,665 | 27,583 | ||
| Kinder Morgan Inc. | 1.750% | 11/15/26 | 11,453 | 10,238 | ||
| Magellan Midstream Partners LP | 5.000% | 3/1/26 | 15,487 | 15,685 | ||
| Marathon Oil Corp. | 4.400% | 7/15/27 | 590 | 574 | ||
| Marathon Petroleum Corp. | 3.625% | 9/15/24 | 7,259 | 7,190 | ||
| Marathon Petroleum Corp. | 4.700% | 5/1/25 | 40,842 | 41,108 | ||
| Marathon Petroleum Corp. | 5.125% | 12/15/26 | 27,012 | 27,760 | ||
| MPLX LP | 4.875% | 12/1/24 | 26,046 | 26,227 | ||
| MPLX LP | 4.000% | 2/15/25 | 11,045 | 10,884 | ||
| MPLX LP | 4.875% | 6/1/25 | 24,900 | 25,025 | ||
| MPLX LP | 1.750% | 3/1/26 | 37,186 | 33,656 | ||
| MPLX LP | 4.125% | 3/1/27 | 31,311 | 30,308 | ||
| Northwest Pipeline LLC | 4.000% | 4/1/27 | 1,582 | 1,524 | ||
| ONEOK Inc. | 7.500% | 9/1/23 | 7,200 | 7,373 | ||
| ONEOK Inc. | 2.750% | 9/1/24 | 9,820 | 9,496 | ||
| ONEOK Inc. | 2.200% | 9/15/25 | 10,581 | 9,876 | ||
| ONEOK Inc. | 5.850% | 1/15/26 | 14,507 | 14,881 | ||
| ONEOK Inc. | 4.000% | 7/13/27 | 10,685 | 10,218 | ||
| ONEOK Partners LP | 5.000% | 9/15/23 | 9,492 | 9,540 | ||
| ONEOK Partners LP | 4.900% | 3/15/25 | 15,970 | 15,978 | ||
| Ovintiv Exploration Inc. | 5.375% | 1/1/26 | 17,240 | 17,505 | ||
| Phillips 66 | 0.900% | 2/15/24 | 6,874 | 6,576 | ||
| Phillips 66 | 3.850% | 4/9/25 | 24,062 | 23,854 | ||
| Phillips 66 | 1.300% | 2/15/26 | 10,926 | 9,886 | ||
| 2 | Phillips 66 Co. | 2.450% | 12/15/24 | 7,201 | 6,852 | |
| 2 | Phillips 66 Co. | 3.605% | 2/15/25 | 10,972 | 10,745 | |
| 2 | Phillips 66 Co. | 3.550% | 10/1/26 | 10,652 | 10,237 | |
| Pioneer Natural Resources Co. | 1.125% | 1/15/26 | 19,434 | 17,366 | ||
| Plains All American Pipeline LP | 3.850% | 10/15/23 | 16,175 | 16,049 | ||
| Plains All American Pipeline LP | 3.600% | 11/1/24 | 10,228 | 10,000 | ||
| Plains All American Pipeline LP | 4.650% | 10/15/25 | 29,363 | 29,073 | ||
| Plains All American Pipeline LP | 4.500% | 12/15/26 | 16,646 | 16,224 | ||
| Sabine Pass Liquefaction LLC | 5.750% | 5/15/24 | 55,908 | 56,755 | ||
| Sabine Pass Liquefaction LLC | 5.625% | 3/1/25 | 61,242 | 62,401 | ||
| Sabine Pass Liquefaction LLC | 5.875% | 6/30/26 | 21,966 | 22,598 | ||
| Sabine Pass Liquefaction LLC | 5.000% | 3/15/27 | 36,451 | 36,339 | ||
| Schlumberger Finance Canada Ltd. | 1.400% | 9/17/25 | 14,000 | 13,064 | ||
| Schlumberger Investment SA | 3.650% | 12/1/23 | 36,774 | 36,757 | ||
| Shell International Finance BV | 0.375% | 9/15/23 | 21,121 | 20,408 | ||
| Shell International Finance BV | 3.500% | 11/13/23 | 22,846 | 22,812 | ||
| Shell International Finance BV | 2.000% | 11/7/24 | 23,371 | 22,621 | ||
| �� | Shell International Finance BV | 3.250% | 5/11/25 | 60,153 | 59,229 | |
| Shell International Finance BV | 2.875% | 5/10/26 | 42,341 | 40,847 | ||
| Shell International Finance BV | 2.500% | 9/12/26 | 26,664 | 25,253 | ||
| Spectra Energy Partners LP | 4.750% | 3/15/24 | 30,356 | 30,516 | ||
| Spectra Energy Partners LP | 3.500% | 3/15/25 | 9,012 | 8,814 | ||
| Spectra Energy Partners LP | 3.375% | 10/15/26 | 22,365 | 21,297 | ||
| Targa Resources Partners LP | 6.500% | 7/15/27 | 18,280 | 18,802 | ||
| TC PipeLines LP | 4.375% | 3/13/25 | 6,987 | 6,969 | ||
| TC PipeLines LP | 3.900% | 5/25/27 | 12,738 | 12,363 | ||
| Tennessee Gas Pipeline Co. LLC | 7.000% | 3/15/27 | 4,518 | 4,823 | ||
| Coupon | Maturity Date | Face Amount ($000) | Market Value• ($000) | |||
| TotalEnergies Capital International SA | 3.700% | 1/15/24 | 28,864 | 28,875 | ||
| TotalEnergies Capital International SA | 3.750% | 4/10/24 | 14,641 | 14,670 | ||
| TotalEnergies Capital International SA | 2.434% | 1/10/25 | 24,102 | 23,340 | ||
| TransCanada PipeLines Ltd. | 3.750% | 10/16/23 | 13,866 | 13,819 | ||
| TransCanada PipeLines Ltd. | 1.000% | 10/12/24 | 24,583 | 22,925 | ||
| TransCanada PipeLines Ltd. | 4.875% | 1/15/26 | 22,508 | 22,707 | ||
| Transcontinental Gas Pipe Line Co. LLC | 7.850% | 2/1/26 | 26,051 | 28,472 | ||
| Valero Energy Corp. | 2.850% | 4/15/25 | 10,313 | 9,978 | ||
| Williams Cos. Inc. | 4.500% | 11/15/23 | 12,480 | 12,517 | ||
| Williams Cos. Inc. | 4.300% | 3/4/24 | 30,974 | 30,969 | ||
| Williams Cos. Inc. | 4.550% | 6/24/24 | 26,900 | 26,965 | ||
| Williams Cos. Inc. | 3.900% | 1/15/25 | 9,758 | 9,635 | ||
| Williams Cos. Inc. | 4.000% | 9/15/25 | 24,590 | 24,243 | ||
| Williams Cos. Inc. | 3.750% | 6/15/27 | 30,713 | 29,655 | ||
| 2,990,388 | ||||||
| Financials (43.9%) | ||||||
| AerCap Ireland Capital DAC | 4.500% | 9/15/23 | 36,327 | 36,138 | ||
| AerCap Ireland Capital DAC | 1.150% | 10/29/23 | 33,277 | 31,843 | ||
| AerCap Ireland Capital DAC | 4.875% | 1/16/24 | 32,387 | 32,223 | ||
| AerCap Ireland Capital DAC | 3.150% | 2/15/24 | 21,462 | 20,793 | ||
| AerCap Ireland Capital DAC | 2.875% | 8/14/24 | 20,284 | 19,409 | ||
| AerCap Ireland Capital DAC | 1.650% | 10/29/24 | 71,875 | 66,555 | ||
| 1 | AerCap Ireland Capital DAC | 1.750% | 10/29/24 | 23,675 | 21,905 | |
| AerCap Ireland Capital DAC | 3.500% | 1/15/25 | 19,752 | 18,970 | ||
| AerCap Ireland Capital DAC | 6.500% | 7/15/25 | 31,306 | 32,065 | ||
| AerCap Ireland Capital DAC | 4.450% | 10/1/25 | 21,957 | 21,293 | ||
| AerCap Ireland Capital DAC | 1.750% | 1/30/26 | 16,417 | 14,490 | ||
| AerCap Ireland Capital DAC | 4.450% | 4/3/26 | 3,247 | 3,139 | ||
| AerCap Ireland Capital DAC | 2.450% | 10/29/26 | 95,540 | 84,201 | ||
| AerCap Ireland Capital DAC | 3.650% | 7/21/27 | 12,104 | 11,015 | ||
| Affiliated Managers Group Inc. | 4.250% | 2/15/24 | 5,941 | 5,941 | ||
| Affiliated Managers Group Inc. | 3.500% | 8/1/25 | 10,132 | 9,938 | ||
| Aflac Inc. | 3.625% | 11/15/24 | 33,502 | 33,363 | ||
| Aflac Inc. | 3.250% | 3/17/25 | 12,619 | 12,422 | ||
| Aflac Inc. | 1.125% | 3/15/26 | 19,676 | 17,793 | ||
| Air Lease Corp. | 3.000% | 9/15/23 | 13,994 | 13,803 | ||
| 1 | Air Lease Corp. | 4.250% | 2/1/24 | 25,366 | 25,222 | |
| 1 | Air Lease Corp. | 0.700% | 2/15/24 | 17,379 | 16,409 | |
| Air Lease Corp. | 0.800% | 8/18/24 | 18,354 | 16,951 | ||
| Air Lease Corp. | 4.250% | 9/15/24 | 15,338 | 15,166 | ||
| 1 | Air Lease Corp. | 2.300% | 2/1/25 | 17,996 | 16,870 | |
| Air Lease Corp. | 3.250% | 3/1/25 | 12,625 | 12,103 | ||
| Air Lease Corp. | 3.375% | 7/1/25 | 12,309 | 11,683 | ||
| 1 | Air Lease Corp. | 2.875% | 1/15/26 | 30,183 | 27,841 | |
| 1 | Air Lease Corp. | 3.750% | 6/1/26 | 15,576 | 14,727 | |
| Air Lease Corp. | 1.875% | 8/15/26 | 30,204 | 26,393 | ||
| Air Lease Corp. | 2.200% | 1/15/27 | 14,826 | 13,014 | ||
| Air Lease Corp. | 3.625% | 4/1/27 | 16,070 | 14,888 | ||
| Aircastle Ltd. | 4.400% | 9/25/23 | 15,050 | 14,984 | ||
| Aircastle Ltd. | 4.125% | 5/1/24 | 12,418 | 12,130 | ||
| Aircastle Ltd. | 4.250% | 6/15/26 | 16,076 | 14,808 | ||
| Allied World Assurance Co. Holdings Ltd. | 4.350% | 10/29/25 | 11,250 | 10,941 | ||
| Allstate Corp. | 0.750% | 12/15/25 | 9,610 | 8,614 | ||
| Allstate Corp. | 3.280% | 12/15/26 | 8,752 | 8,505 | ||
| 1 | Allstate Corp. | 5.750% | 8/15/53 | 14,287 | 13,100 | |
| Ally Financial Inc. | 1.450% | 10/2/23 | 34,214 | 33,146 | ||
| Ally Financial Inc. | 3.875% | 5/21/24 | 15,178 | 15,034 | ||
| Ally Financial Inc. | 5.125% | 9/30/24 | 31,117 | 31,561 | ||
| Ally Financial Inc. | 4.625% | 3/30/25 | 22,758 | 22,700 | ||
| Ally Financial Inc. | 5.800% | 5/1/25 | 19,050 | 19,501 | ||
| Ally Financial Inc. | 4.750% | 6/9/27 | 10,455 | 10,198 | ||
| Coupon | Maturity Date | Face Amount ($000) | Market Value• ($000) | |||
| American Equity Investment Life Holding Co. | 5.000% | 6/15/27 | 11,249 | 10,958 | ||
| American Express Co. | 0.750% | 11/3/23 | 22,716 | 21,950 | ||
| American Express Co. | 3.400% | 2/22/24 | 40,484 | 40,160 | ||
| American Express Co. | 3.375% | 5/3/24 | 7,430 | 7,346 | ||
| American Express Co. | 2.500% | 7/30/24 | 33,970 | 33,049 | ||
| American Express Co. | 3.000% | 10/30/24 | 39,123 | 38,343 | ||
| American Express Co. | 3.625% | 12/5/24 | 14,354 | 14,273 | ||
| American Express Co. | 2.250% | 3/4/25 | 38,755 | 36,989 | ||
| American Express Co. | 3.950% | 8/1/25 | 23,380 | 23,136 | ||
| American Express Co. | 4.200% | 11/6/25 | 15,891 | 15,917 | ||
| American Express Co. | 3.125% | 5/20/26 | 19,751 | 19,064 | ||
| American Express Co. | 1.650% | 11/4/26 | 25,789 | 23,309 | ||
| American Express Co. | 2.550% | 3/4/27 | 41,970 | 38,973 | ||
| American Express Co. | 3.300% | 5/3/27 | 70,194 | 67,171 | ||
| 1 | American Express Credit Corp. | 3.300% | 5/3/27 | 1,650 | 1,588 | |
| American International Group Inc. | 4.125% | 2/15/24 | 17,621 | 17,664 | ||
| American International Group Inc. | 2.500% | 6/30/25 | 41,255 | 39,327 | ||
| American International Group Inc. | 3.750% | 7/10/25 | 12,077 | 11,923 | ||
| American International Group Inc. | 3.900% | 4/1/26 | 31,248 | 30,699 | ||
| Ameriprise Financial Inc. | 4.000% | 10/15/23 | 20,590 | 20,601 | ||
| Ameriprise Financial Inc. | 3.700% | 10/15/24 | 13,108 | 13,006 | ||
| Ameriprise Financial Inc. | 3.000% | 4/2/25 | 18,276 | 17,799 | ||
| Ameriprise Financial Inc. | 2.875% | 9/15/26 | 4,172 | 3,969 | ||
| 1 | Aon Corp. | 8.205% | 1/1/27 | 10,581 | 11,356 | |
| Aon Corp. | 2.850% | 5/28/27 | 12,757 | 11,879 | ||
| Aon Global Ltd. | 4.000% | 11/27/23 | 7,907 | 7,910 | ||
| Aon Global Ltd. | 3.500% | 6/14/24 | 6,345 | 6,283 | ||
| Aon Global Ltd. | 3.875% | 12/15/25 | 26,569 | 26,257 | ||
| Arch Capital Finance LLC | 4.011% | 12/15/26 | 11,580 | 11,366 | ||
| Ares Capital Corp. | 4.200% | 6/10/24 | 14,072 | 13,947 | ||
| Ares Capital Corp. | 4.250% | 3/1/25 | 13,183 | 12,825 | ||
| Ares Capital Corp. | 3.250% | 7/15/25 | 23,035 | 21,606 | ||
| Ares Capital Corp. | 3.875% | 1/15/26 | 31,162 | 29,380 | ||
| Ares Capital Corp. | 2.150% | 7/15/26 | 32,544 | 28,247 | ||
| Ares Capital Corp. | 2.875% | 6/15/27 | 9,689 | 8,485 | ||
| Aspen Insurance Holdings Ltd. | 4.650% | 11/15/23 | 5,728 | 5,717 | ||
| Assured Guaranty US Holdings Inc. | 5.000% | 7/1/24 | 2,579 | 2,618 | ||
| 1 | Australia & New Zealand Banking Group Ltd. | 3.700% | 11/16/25 | 18,469 | 18,286 | |
| Bain Capital Specialty Finance Inc. | 2.950% | 3/10/26 | 7,833 | 6,964 | ||
| Bain Capital Specialty Finance Inc. | 2.550% | 10/13/26 | 8,659 | 7,337 | ||
| Banco Bilbao Vizcaya Argentaria SA | 0.875% | 9/18/23 | 20,915 | 20,196 | ||
| Banco Bilbao Vizcaya Argentaria SA | 1.125% | 9/18/25 | 21,367 | 19,363 | ||
| Banco Santander SA | 3.892% | 5/24/24 | 2,000 | 1,981 | ||
| Banco Santander SA | 2.706% | 6/27/24 | 42,364 | 41,105 | ||
| Banco Santander SA | 2.746% | 5/28/25 | 45,938 | 43,238 | ||
| Banco Santander SA | 5.147% | 8/18/25 | 40,000 | 39,812 | ||
| Banco Santander SA | 5.179% | 11/19/25 | 37,293 | 36,923 | ||
| Banco Santander SA | 1.849% | 3/25/26 | 32,587 | 29,001 | ||
| Banco Santander SA | 4.250% | 4/11/27 | 30,175 | 29,017 | ||
| Banco Santander SA | 5.294% | 8/18/27 | 39,975 | 39,161 | ||
| Banco Santander SA | 1.722% | 9/14/27 | 25,700 | 22,176 | ||
| Banco Santander SA | 4.175% | 3/24/28 | 35,545 | 33,449 | ||
| 1 | Bank of America Corp. | 4.125% | 1/22/24 | 59,137 | 59,375 | |
| 1 | Bank of America Corp. | 4.000% | 4/1/24 | 31,395 | 31,455 | |
| 1 | Bank of America Corp. | 4.200% | 8/26/24 | 62,584 | 62,539 | |
| 1 | Bank of America Corp. | 0.810% | 10/24/24 | 52,633 | 50,516 | |
| 1 | Bank of America Corp. | 4.000% | 1/22/25 | 65,106 | 64,564 | |
| Bank of America Corp. | 1.843% | 2/4/25 | 12,161 | ��� 11,692 | ||
| 1 | Bank of America Corp. | 3.458% | 3/15/25 | 73,919 | 72,688 | |
| 1 | Bank of America Corp. | 3.950% | 4/21/25 | 68,951 | 68,220 | |
| Bank of America Corp. | 0.976% | 4/22/25 | 60,326 | 56,901 | ||
| Bank of America Corp. | 3.841% | 4/25/25 | 37,915 | 37,534 | ||
| 1 | Bank of America Corp. | 3.875% | 8/1/25 | 24,405 | 24,355 | |
| 1 | Bank of America Corp. | 0.981% | 9/25/25 | 49,510 | 45,975 | |
| 1 | Bank of America Corp. | 3.093% | 10/1/25 | 63,797 | 61,816 | |
| Coupon | Maturity Date | Face Amount ($000) | Market Value• ($000) | |||
| 1 | Bank of America Corp. | 2.456% | 10/22/25 | 44,159 | 42,154 | |
| 1 | Bank of America Corp. | 1.530% | 12/6/25 | 26,305 | 24,543 | |
| 1 | Bank of America Corp. | 3.366% | 1/23/26 | 58,512 | 56,604 | |
| 1 | Bank of America Corp. | 2.015% | 2/13/26 | 47,692 | 44,604 | |
| 1 | Bank of America Corp. | 4.450% | 3/3/26 | 61,253 | 61,005 | |
| 1 | Bank of America Corp. | 3.384% | 4/2/26 | 31,860 | 30,774 | |
| 1 | Bank of America Corp. | 3.500% | 4/19/26 | 91,472 | 89,165 | |
| 1 | Bank of America Corp. | 1.319% | 6/19/26 | 82,348 | 74,817 | |
| Bank of America Corp. | 4.827% | 7/22/26 | 2,420 | 2,424 | ||
| Bank of America Corp. | 6.220% | 9/15/26 | 8,123 | 8,535 | ||
| 1 | Bank of America Corp. | 4.250% | 10/22/26 | 54,870 | 54,042 | |
| 1 | Bank of America Corp. | 1.197% | 10/24/26 | 75,079 | 67,145 | |
| 1 | Bank of America Corp. | 1.658% | 3/11/27 | 77,302 | 69,099 | |
| 1 | Bank of America Corp. | 3.559% | 4/23/27 | 44,431 | 42,343 | |
| Bank of America Corp. | 1.734% | 7/22/27 | 111,042 | 98,550 | ||
| 1 | Bank of America Corp. | 4.183% | 11/25/27 | 50,547 | 49,332 | |
| 1 | Bank of America Corp. | 3.824% | 1/20/28 | 54,969 | 52,602 | |
| Bank of America Corp. | 2.551% | 2/4/28 | 33,200 | 30,097 | ||
| 1 | Bank of America Corp. | 3.705% | 4/24/28 | 55,259 | 52,482 | |
| Bank of America Corp. | 4.376% | 4/27/28 | 44,640 | 43,562 | ||
| 1 | Bank of America Corp. | 3.593% | 7/21/28 | 43,257 | 40,716 | |
| Bank of America Corp. | 4.948% | 7/22/28 | 76,816 | 76,732 | ||
| 1 | Bank of Montreal | 0.400% | 9/15/23 | 33,609 | 32,440 | |
| Bank of Montreal | 0.450% | 12/8/23 | 30,430 | 29,180 | ||
| 1 | Bank of Montreal | 3.300% | 2/5/24 | 59,840 | 59,299 | |
| 1 | Bank of Montreal | 2.150% | 3/8/24 | 13,613 | 13,264 | |
| 1 | Bank of Montreal | 2.500% | 6/28/24 | 19,647 | 19,162 | |
| 1 | Bank of Montreal | 1.500% | 1/10/25 | 24,830 | 23,365 | |
| 1 | Bank of Montreal | 1.850% | 5/1/25 | 41,529 | 39,140 | |
| 1 | Bank of Montreal | 3.700% | 6/7/25 | 34,024 | 33,575 | |
| 1 | Bank of Montreal | 1.250% | 9/15/26 | 16,318 | 14,551 | |
| 1 | Bank of Montreal | 0.949% | 1/22/27 | 23,831 | 21,240 | |
| 1 | Bank of Montreal | 2.650% | 3/8/27 | 29,034 | 27,011 | |
| 1 | Bank of Montreal | 4.338% | 10/5/28 | 5,985 | 5,962 | |
| 1 | Bank of New York Mellon Corp. | 0.350% | 12/7/23 | 27,857 | 26,736 | |
| 1 | Bank of New York Mellon Corp. | 3.650% | 2/4/24 | 20,082 | 20,080 | |
| 1 | Bank of New York Mellon Corp. | 0.500% | 4/26/24 | 14,584 | 13,851 | |
| Bank of New York Mellon Corp. | 3.400% | 5/15/24 | 12,791 | 12,724 | ||
| 1 | Bank of New York Mellon Corp. | 3.250% | 9/11/24 | 10,864 | 10,782 | |
| 1 | Bank of New York Mellon Corp. | 2.100% | 10/24/24 | 20,551 | 19,898 | |
| 1 | Bank of New York Mellon Corp. | 3.000% | 2/24/25 | 18,503 | 18,146 | |
| 1 | Bank of New York Mellon Corp. | 1.600% | 4/24/25 | 25,779 | 24,274 | |
| 1 | Bank of New York Mellon Corp. | 3.950% | 11/18/25 | 12,512 | 12,492 | |
| 1 | Bank of New York Mellon Corp. | 0.750% | 1/28/26 | 8,001 | 7,219 | |
| 1 | Bank of New York Mellon Corp. | 2.800% | 5/4/26 | 25,032 | 24,143 | |
| Bank of New York Mellon Corp. | 4.414% | 7/24/26 | 15,697 | 15,770 | ||
| 1 | Bank of New York Mellon Corp. | 2.450% | 8/17/26 | 19,319 | 18,182 | |
| 1 | Bank of New York Mellon Corp. | 1.050% | 10/15/26 | 2,775 | 2,468 | |
| Bank of New York Mellon Corp. | 2.050% | 1/26/27 | 8,795 | 8,087 | ||
| 1 | Bank of New York Mellon Corp. | 3.250% | 5/16/27 | 25,475 | 24,657 | |
| 1 | Bank of New York Mellon Corp. | 3.442% | 2/7/28 | 34,095 | 32,731 | |
| 1 | Bank of New York Mellon Corp. | 3.992% | 6/13/28 | 5,300 | 5,191 | |
| Bank of Nova Scotia | 0.400% | 9/15/23 | 40,950 | 39,498 | ||
| Bank of Nova Scotia | 0.550% | 9/15/23 | 19,418 | 18,760 | ||
| Bank of Nova Scotia | 3.400% | 2/11/24 | 30,949 | 30,705 | ||
| Bank of Nova Scotia | 2.440% | 3/11/24 | 17,462 | 17,067 | ||
| Bank of Nova Scotia | 0.700% | 4/15/24 | 17,064 | 16,180 | ||
| Bank of Nova Scotia | 0.650% | 7/31/24 | 24,281 | 22,736 | ||
| Bank of Nova Scotia | 1.450% | 1/10/25 | 10,409 | 9,781 | ||
| Bank of Nova Scotia | 2.200% | 2/3/25 | 25,889 | 24,670 | ||
| Bank of Nova Scotia | 3.450% | 4/11/25 | 33,484 | 32,749 | ||
| Bank of Nova Scotia | 1.300% | 6/11/25 | 36,603 | 33,845 | ||
| Bank of Nova Scotia | 4.500% | 12/16/25 | 16,028 | 15,982 | ||
| Bank of Nova Scotia | 1.050% | 3/2/26 | 22,485 | 20,168 | ||
| Bank of Nova Scotia | 1.350% | 6/24/26 | 25,146 | 22,562 | ||
| Bank of Nova Scotia | 2.700% | 8/3/26 | 31,544 | 29,709 | ||
| Bank of Nova Scotia | 1.300% | 9/15/26 | 21,854 | 19,398 | ||
| Coupon | Maturity Date | Face Amount ($000) | Market Value• ($000) | |||
| Bank of Nova Scotia | 1.950% | 2/2/27 | 16,850 | 15,168 | ||
| 1 | Bank of Nova Scotia | 4.650% | Perpetual | 3,800 | 3,375 | |
| BankUnited Inc. | 4.875% | 11/17/25 | 9,496 | 9,468 | ||
| 1 | Barclays Bank plc | 3.750% | 5/15/24 | 9,983 | 9,920 | |
| Barclays plc | 4.375% | 9/11/24 | 23,689 | 23,415 | ||
| Barclays plc | 1.007% | 12/10/24 | 30,488 | 28,906 | ||
| Barclays plc | 3.650% | 3/16/25 | 54,934 | 53,369 | ||
| 1 | Barclays plc | 3.932% | 5/7/25 | 53,411 | 52,234 | |
| Barclays plc | 4.375% | 1/12/26 | 66,331 | 64,975 | ||
| 1 | Barclays plc | 2.852% | 5/7/26 | 61,205 | 57,299 | |
| Barclays plc | 5.200% | 5/12/26 | 21,889 | 21,674 | ||
| Barclays plc | 5.304% | 8/9/26 | 17,185 | 17,047 | ||
| Barclays plc | 2.279% | 11/24/27 | 19,359 | 17,005 | ||
| Barclays plc | 5.501% | 8/9/28 | 61,139 | 60,148 | ||
| Berkshire Hathaway Finance Corp. | 2.300% | 3/15/27 | 1,355 | 1,276 | ||
| Berkshire Hathaway Inc. | 3.125% | 3/15/26 | 62,727 | 61,404 | ||
| BGC Partners Inc. | 3.750% | 10/1/24 | 6,757 | 6,545 | ||
| BlackRock Inc. | 3.500% | 3/18/24 | 17,196 | 17,143 | ||
| BlackRock Inc. | 3.200% | 3/15/27 | 22,083 | 21,667 | ||
| Blackstone Private Credit Fund | 2.350% | 11/22/24 | 20,955 | 19,455 | ||
| Blackstone Private Credit Fund | 2.700% | 1/15/25 | 5,055 | 4,690 | ||
| Blackstone Private Credit Fund | 2.625% | 12/15/26 | 30,795 | 26,009 | ||
| Blackstone Private Credit Fund | 3.250% | 3/15/27 | 32,286 | 27,703 | ||
| Blackstone Secured Lending Fund | 3.625% | 1/15/26 | 16,744 | 15,696 | ||
| Blackstone Secured Lending Fund | 2.750% | 9/16/26 | 19,208 | 16,993 | ||
| Blackstone Secured Lending Fund | 2.125% | 2/15/27 | 18,452 | 15,302 | ||
| 1 | BNP Paribas SA | 4.250% | 10/15/24 | 24,459 | 24,376 | |
| 2 | BNP Paribas SA | 2.819% | 11/19/25 | 1,400 | 1,331 | |
| BPCE SA | 4.000% | 4/15/24 | 33,975 | 33,801 | ||
| 1 | BPCE SA | 3.375% | 12/2/26 | 16,211 | 15,439 | |
| Brighthouse Financial Inc. | 3.700% | 6/22/27 | 10,000 | 9,450 | ||
| Brookfield Asset Management Inc. | 4.000% | 1/15/25 | 12,445 | 12,331 | ||
| Brookfield Finance Inc. | 4.000% | 4/1/24 | 17,826 | 17,751 | ||
| Brookfield Finance Inc. | 4.250% | 6/2/26 | 10,047 | 9,905 | ||
| Brown & Brown Inc. | 4.200% | 9/15/24 | 10,404 | 10,340 | ||
| 1 | Cadence Bank | 4.125% | 11/20/29 | 1,275 | 1,239 | |
| 1 | Canadian Imperial Bank of Commerce | 3.500% | 9/13/23 | 34,548 | 34,449 | |
| Canadian Imperial Bank of Commerce | 0.500% | 12/14/23 | 31,242 | 29,940 | ||
| Canadian Imperial Bank of Commerce | 3.100% | 4/2/24 | 21,249 | 20,953 | ||
| Canadian Imperial Bank of Commerce | 1.000% | 10/18/24 | 16,370 | 15,312 | ||
| Canadian Imperial Bank of Commerce | 2.250% | 1/28/25 | 17,916 | 17,083 | ||
| Canadian Imperial Bank of Commerce | 3.300% | 4/7/25 | 15,125 | 14,741 | ||
| Canadian Imperial Bank of Commerce | 3.945% | 8/4/25 | 29,695 | 29,348 | ||
| Canadian Imperial Bank of Commerce | 0.950% | 10/23/25 | 5,494 | 4,996 | ||
| Canadian Imperial Bank of Commerce | 1.250% | 6/22/26 | 26,226 | 23,446 | ||
| Canadian Imperial Bank of Commerce | 3.450% | 4/7/27 | 25,332 | 24,293 | ||
| 1 | Capital One Bank USA NA | 2.280% | 1/28/26 | 3,686 | 3,484 | |
| Capital One Financial Corp. | 3.900% | 1/29/24 | 34,581 | 34,473 | ||
| Capital One Financial Corp. | 3.750% | 4/24/24 | 20,762 | 20,607 | ||
| Capital One Financial Corp. | 3.300% | 10/30/24 | 28,500 | 27,956 | ||
| Capital One Financial Corp. | 1.343% | 12/6/24 | 20,945 | 20,098 | ||
| Capital One Financial Corp. | 3.200% | 2/5/25 | 22,860 | 22,288 | ||
| Capital One Financial Corp. | 4.250% | 4/30/25 | 11,406 | 11,375 | ||
| Capital One Financial Corp. | 4.166% | 5/9/25 | 25,847 | 25,635 | ||
| Capital One Financial Corp. | 4.200% | 10/29/25 | 25,080 | 24,767 | ||
| Capital One Financial Corp. | 2.636% | 3/3/26 | 25,275 | 23,930 | ||
| Capital One Financial Corp. | 4.985% | 7/24/26 | 674 | 674 | ||
| Capital One Financial Corp. | 3.750% | 7/28/26 | 36,745 | 35,369 | ||
| Coupon | Maturity Date | Face Amount ($000) | Market Value• ($000) | |||
| Capital One Financial Corp. | 3.750% | 3/9/27 | 54,977 | 52,782 | ||
| Capital One Financial Corp. | 3.650% | 5/11/27 | 34,518 | 32,969 | ||
| Capital One Financial Corp. | 1.878% | 11/2/27 | 20,437 | 17,982 | ||
| Capital One Financial Corp. | 4.927% | 5/10/28 | 30,920 | 30,554 | ||
| Cboe Global Markets Inc. | 3.650% | 1/12/27 | 10,451 | 10,213 | ||
| Charles Schwab Corp. | 3.550% | 2/1/24 | 8,783 | 8,756 | ||
| Charles Schwab Corp. | 0.750% | 3/18/24 | 38,719 | 37,055 | ||
| Charles Schwab Corp. | 3.750% | 4/1/24 | 11,892 | 11,873 | ||
| Charles Schwab Corp. | 3.000% | 3/10/25 | 8,928 | 8,737 | ||
| Charles Schwab Corp. | 4.200% | 3/24/25 | 11,786 | 11,839 | ||
| Charles Schwab Corp. | 3.625% | 4/1/25 | 12,242 | 12,082 | ||
| Charles Schwab Corp. | 3.850% | 5/21/25 | 23,462 | 23,500 | ||
| Charles Schwab Corp. | 3.450% | 2/13/26 | 12,278 | 12,113 | ||
| Charles Schwab Corp. | 0.900% | 3/11/26 | 12,548 | 11,291 | ||
| Charles Schwab Corp. | 1.150% | 5/13/26 | 31,300 | 28,225 | ||
| Charles Schwab Corp. | 3.200% | 3/2/27 | 16,853 | 16,316 | ||
| Charles Schwab Corp. | 2.450% | 3/3/27 | 33,836 | 31,575 | ||
| Charles Schwab Corp. | 3.300% | 4/1/27 | 12,576 | 12,197 | ||
| Chubb INA Holdings Inc. | 3.350% | 5/15/24 | 25,885 | 25,734 | ||
| Chubb INA Holdings Inc. | 3.150% | 3/15/25 | 23,953 | 23,615 | ||
| Chubb INA Holdings Inc. | 3.350% | 5/3/26 | 40,170 | 39,307 | ||
| 1 | Citibank NA | 3.650% | 1/23/24 | 48,683 | 48,623 | |
| Citigroup Inc. | 3.875% | 10/25/23 | 26,188 | 26,289 | ||
| Citigroup Inc. | 3.750% | 6/16/24 | 24,488 | 24,469 | ||
| Citigroup Inc. | 4.000% | 8/5/24 | 14,847 | 14,788 | ||
| Citigroup Inc. | 0.776% | 10/30/24 | 67,903 | 65,115 | ||
| Citigroup Inc. | 3.875% | 3/26/25 | 41,097 | 40,588 | ||
| 1 | Citigroup Inc. | 3.352% | 4/24/25 | 76,452 | 74,913 | |
| Citigroup Inc. | 3.300% | 4/27/25 | 20,971 | 20,473 | ||
| Citigroup Inc. | 0.981% | 5/1/25 | 16,562 | 15,598 | ||
| Citigroup Inc. | 4.140% | 5/24/25 | 27,980 | 27,792 | ||
| Citigroup Inc. | 4.400% | 6/10/25 | 63,631 | 63,381 | ||
| Citigroup Inc. | 5.500% | 9/13/25 | 40,658 | 41,722 | ||
| Citigroup Inc. | 1.281% | 11/3/25 | 22,797 | 21,213 | ||
| Citigroup Inc. | 3.700% | 1/12/26 | 50,961 | 49,780 | ||
| Citigroup Inc. | 2.014% | 1/25/26 | 54,091 | 50,832 | ||
| Citigroup Inc. | 4.600% | 3/9/26 | 47,534 | 47,473 | ||
| 1 | Citigroup Inc. | 3.106% | 4/8/26 | 81,500 | 78,239 | |
| Citigroup Inc. | 3.400% | 5/1/26 | 54,528 | 52,672 | ||
| Citigroup Inc. | 3.200% | 10/21/26 | 92,772 | 88,350 | ||
| Citigroup Inc. | 4.300% | 11/20/26 | 21,570 | 21,299 | ||
| Citigroup Inc. | 1.122% | 1/28/27 | 59,816 | 52,753 | ||
| Citigroup Inc. | 1.462% | 6/9/27 | 29,000 | 25,578 | ||
| 1 | Citigroup Inc. | 3.887% | 1/10/28 | 42,524 | 40,777 | |
| 1 | Citigroup Inc. | 3.070% | 2/24/28 | 51,179 | 47,385 | |
| Citigroup Inc. | 4.658% | 5/24/28 | 71,397 | 70,517 | ||
| 1 | Citigroup Inc. | 3.668% | 7/24/28 | 29,070 | 27,268 | |
| 1 | Citizens Bank NA | 2.250% | 4/28/25 | 9,648 | 9,135 | |
| Citizens Bank NA | 4.119% | 5/23/25 | 7,741 | 7,659 | ||
| 1 | Citizens Bank NA | 3.750% | 2/18/26 | 19,957 | 19,544 | |
| Citizens Bank NA | 4.575% | 8/9/28 | 14,400 | 14,234 | ||
| Citizens Financial Group Inc. | 4.300% | 12/3/25 | 5,636 | 5,571 | ||
| Citizens Financial Group Inc. | 2.850% | 7/27/26 | 17,878 | 16,931 | ||
| Citizens Financial Group Inc. | 4.300% | 2/11/31 | 3,661 | 3,577 | ||
| CME Group Inc. | 3.000% | 3/15/25 | 17,079 | 16,750 | ||
| CNA Financial Corp. | 3.950% | 5/15/24 | 13,326 | 13,276 | ||
| CNA Financial Corp. | 4.500% | 3/1/26 | 10,902 | 10,926 | ||
| CNA Financial Corp. | 3.450% | 8/15/27 | 17,262 | 16,289 | ||
| CNO Financial Group Inc. | 5.250% | 5/30/25 | 14,275 | 14,320 | ||
| 1 | Comerica Bank | 2.500% | 7/23/24 | 14,559 | 14,124 | |
| 1 | Comerica Bank | 4.000% | 7/27/25 | 7,885 | 7,781 | |
| Cooperatieve Rabobank UA | 0.375% | 1/12/24 | 29,060 | 27,650 | ||
| Cooperatieve Rabobank UA | 3.875% | 8/22/24 | 20,000 | 19,930 | ||
| Cooperatieve Rabobank UA | 1.375% | 1/10/25 | 25,174 | 23,616 | ||
| 1 | Cooperatieve Rabobank UA | 3.375% | 5/21/25 | 33,056 | 32,363 | |
| Cooperatieve Rabobank UA | 4.375% | 8/4/25 | 27,039 | 26,609 | ||
| 1 | Cooperatieve Rabobank UA | 3.750% | 7/21/26 | 37,086 | 35,382 | |
| Coupon | Maturity Date | Face Amount ($000) | Market Value• ($000) | |||
| 2 | Corebridge Financial Inc. | 3.650% | 4/5/27 | 28,179 | 26,494 | |
| Credit Suisse AG | 0.495% | 2/2/24 | 25,665 | 24,171 | ||
| Credit Suisse AG | 4.750% | 8/9/24 | 24,670 | 24,519 | ||
| 1 | Credit Suisse AG | 3.625% | 9/9/24 | 87,595 | 85,503 | |
| Credit Suisse AG | 3.700% | 2/21/25 | 12,730 | 12,317 | ||
| Credit Suisse AG | 2.950% | 4/9/25 | 45,357 | 43,041 | ||
| Credit Suisse AG | 1.250% | 8/7/26 | 28,670 | 24,735 | ||
| Credit Suisse AG | 5.000% | 7/9/27 | 25,000 | 24,280 | ||
| Credit Suisse Group AG | 3.750% | 3/26/25 | 56,176 | 53,735 | ||
| Credit Suisse Group AG | 4.550% | 4/17/26 | 54,949 | 52,669 | ||
| 1 | Deutsche Bank AG | 0.962% | 11/8/23 | 29,703 | 28,512 | |
| Deutsche Bank AG | 0.898% | 5/28/24 | 10,068 | 9,464 | ||
| 1 | Deutsche Bank AG | 3.700% | 5/30/24 | 32,676 | 32,133 | |
| Deutsche Bank AG | 3.700% | 5/30/24 | 14,211 | 14,008 | ||
| 1 | Deutsche Bank AG | 2.222% | 9/18/24 | 61,852 | 59,608 | |
| Deutsche Bank AG | 1.447% | 4/1/25 | 10,977 | 10,236 | ||
| 1 | Deutsche Bank AG | 3.961% | 11/26/25 | 29,692 | 28,446 | |
| Deutsche Bank AG | 4.100% | 1/13/26 | 5,473 | 5,338 | ||
| 1 | Deutsche Bank AG | 4.100% | 1/13/26 | 24,382 | 23,728 | |
| Deutsche Bank AG | 1.686% | 3/19/26 | 24,001 | 21,633 | ||
| Deutsche Bank AG | 6.119% | 7/14/26 | 21,255 | 21,265 | ||
| Deutsche Bank AG | 2.129% | 11/24/26 | 50,232 | 44,251 | ||
| Deutsche Bank AG | 2.311% | 11/16/27 | 37,724 | 32,069 | ||
| Deutsche Bank AG | 2.552% | 1/7/28 | 19,940 | 16,974 | ||
| Discover Bank | 2.450% | 9/12/24 | 20,163 | 19,379 | ||
| 1 | Discover Bank | 4.250% | 3/13/26 | 3,742 | 3,655 | |
| 1 | Discover Bank | 3.450% | 7/27/26 | 26,531 | 25,138 | |
| 1 | Discover Bank | 4.682% | 8/9/28 | 10,633 | 10,296 | |
| Discover Financial Services | 3.950% | 11/6/24 | 11,465 | 11,345 | ||
| Discover Financial Services | 3.750% | 3/4/25 | 12,814 | 12,492 | ||
| Discover Financial Services | 4.500% | 1/30/26 | 26,345 | 25,935 | ||
| Discover Financial Services | 4.100% | 2/9/27 | 21,638 | 20,836 | ||
| Eaton Vance Corp. | 3.500% | 4/6/27 | 4,922 | 4,711 | ||
| Fifth Third Bancorp | 4.300% | 1/16/24 | 19,053 | 19,074 | ||
| Fifth Third Bancorp | 3.650% | 1/25/24 | 59,672 | 59,302 | ||
| Fifth Third Bancorp | 2.375% | 1/28/25 | 14,563 | 13,922 | ||
| Fifth Third Bancorp | 2.550% | 5/5/27 | 20,074 | 18,485 | ||
| Fifth Third Bancorp | 1.707% | 11/1/27 | 1,660 | 1,488 | ||
| Fifth Third Bancorp | 4.055% | 4/25/28 | 3,575 | 3,485 | ||
| 1 | Fifth Third Bank NA | 3.950% | 7/28/25 | 6,107 | 6,088 | |
| 1 | Fifth Third Bank NA | 3.850% | 3/15/26 | 16,964 | 16,502 | |
| 1 | Fifth Third Bank NA | 2.250% | 2/1/27 | 18,253 | 16,809 | |
| First American Financial Corp. | 4.600% | 11/15/24 | 6,839 | 6,834 | ||
| First Horizon Corp. | 4.000% | 5/26/25 | 12,976 | 12,696 | ||
| 1 | First-Citizens Bank & Trust Co. | 2.969% | 9/27/25 | 10,724 | 10,239 | |
| Franklin BSP Lending Corp. | 3.250% | 3/30/26 | 7,763 | 6,848 | ||
| Franklin Resources Inc. | 2.850% | 3/30/25 | 10,418 | 10,085 | ||
| FS KKR Capital Corp. | 4.625% | 7/15/24 | 14,417 | 14,286 | ||
| FS KKR Capital Corp. | 4.125% | 2/1/25 | 11,845 | 11,452 | ||
| FS KKR Capital Corp. | 3.400% | 1/15/26 | 26,517 | 24,125 | ||
| FS KKR Capital Corp. | 2.625% | 1/15/27 | 9,164 | 7,768 | ||
| GATX Corp. | 4.350% | 2/15/24 | 9,182 | 9,175 | ||
| GATX Corp. | 3.250% | 3/30/25 | 7,066 | 6,822 | ||
| GATX Corp. | 3.250% | 9/15/26 | 9,910 | 9,362 | ||
| GATX Corp. | 3.850% | 3/30/27 | 5,266 | 4,997 | ||
| GE Capital Funding LLC | 3.450% | 5/15/25 | 27,303 | 26,485 | ||
| Global Payments Inc. | 1.500% | 11/15/24 | 15,482 | 14,480 | ||
| Global Payments Inc. | 2.650% | 2/15/25 | 15,446 | 14,709 | ||
| Global Payments Inc. | 1.200% | 3/1/26 | 25,804 | 22,766 | ||
| Global Payments Inc. | 4.800% | 4/1/26 | 17,558 | 17,420 | ||
| Global Payments Inc. | 2.150% | 1/15/27 | 20,182 | 17,900 | ||
| Global Payments Inc. | 4.950% | 8/15/27 | 5,000 | 4,957 | ||
| Goldman Sachs BDC Inc. | 3.750% | 2/10/25 | 8,537 | 8,350 | ||
| Goldman Sachs BDC Inc. | 2.875% | 1/15/26 | 12,075 | 11,205 | ||
| Goldman Sachs Group Inc. | 1.217% | 12/6/23 | 12,655 | 12,231 | ||
| Goldman Sachs Group Inc. | 3.625% | 2/20/24 | 50,064 | 49,737 | ||
| Goldman Sachs Group Inc. | 4.000% | 3/3/24 | 67,480 | 67,444 | ||
| Coupon | Maturity Date | Face Amount ($000) | Market Value• ($000) | |||
| Goldman Sachs Group Inc. | 3.000% | 3/15/24 | 37,710 | 37,089 | ||
| 1 | Goldman Sachs Group Inc. | 3.850% | 7/8/24 | 36,933 | 36,796 | |
| 1 | Goldman Sachs Group Inc. | 0.657% | 9/10/24 | 59,038 | 56,571 | |
| Goldman Sachs Group Inc. | 0.925% | 10/21/24 | 47,776 | 45,761 | ||
| Goldman Sachs Group Inc. | 3.500% | 1/23/25 | 71,758 | 70,357 | ||
| Goldman Sachs Group Inc. | 1.757% | 1/24/25 | 49,707 | 47,748 | ||
| Goldman Sachs Group Inc. | 3.500% | 4/1/25 | 96,791 | 94,650 | ||
| Goldman Sachs Group Inc. | 3.750% | 5/22/25 | 43,423 | 42,668 | ||
| 1 | Goldman Sachs Group Inc. | 3.272% | 9/29/25 | 46,565 | 45,359 | |
| Goldman Sachs Group Inc. | 4.250% | 10/21/25 | 63,647 | 62,920 | ||
| Goldman Sachs Group Inc. | 0.855% | 2/12/26 | 16,415 | 14,929 | ||
| Goldman Sachs Group Inc. | 3.750% | 2/25/26 | 49,371 | 48,357 | ||
| Goldman Sachs Group Inc. | 3.500% | 11/16/26 | 70,638 | 67,843 | ||
| 1 | Goldman Sachs Group Inc. | 1.093% | 12/9/26 | 73,150 | 64,859 | |
| Goldman Sachs Group Inc. | 5.950% | 1/15/27 | 22,411 | 23,360 | ||
| Goldman Sachs Group Inc. | 3.850% | 1/26/27 | 80,287 | 77,811 | ||
| Goldman Sachs Group Inc. | 1.431% | 3/9/27 | 72,360 | 64,364 | ||
| Goldman Sachs Group Inc. | 4.387% | 6/15/27 | 19,155 | 18,805 | ||
| Goldman Sachs Group Inc. | 1.542% | 9/10/27 | 51,874 | 45,524 | ||
| Goldman Sachs Group Inc. | 1.948% | 10/21/27 | 75,991 | 67,419 | ||
| Goldman Sachs Group Inc. | 2.640% | 2/24/28 | 88,090 | 79,911 | ||
| Goldman Sachs Group Inc. | 3.615% | 3/15/28 | 58,031 | 54,892 | ||
| 1 | Goldman Sachs Group Inc. | 3.691% | 6/5/28 | 39,212 | 37,044 | |
| Goldman Sachs Group Inc. | 4.482% | 8/23/28 | 40,000 | 39,082 | ||
| Golub Capital BDC Inc. | 3.375% | 4/15/24 | 14,241 | 13,869 | ||
| Golub Capital BDC Inc. | 2.500% | 8/24/26 | 14,052 | 12,213 | ||
| Golub Capital BDC Inc. | 2.050% | 2/15/27 | 6,537 | 5,442 | ||
| Hanover Insurance Group Inc. | 4.500% | 4/15/26 | 8,571 | 8,492 | ||
| Hercules Capital Inc. | 2.625% | 9/16/26 | 885 | 744 | ||
| HSBC Holdings plc | 4.250% | 3/14/24 | 55,134 | 54,936 | ||
| HSBC Holdings plc | 1.162% | 11/22/24 | 18,658 | 17,818 | ||
| 1 | HSBC Holdings plc | 3.803% | 3/11/25 | 64,460 | 63,228 | |
| HSBC Holdings plc | 0.976% | 5/24/25 | 53,575 | 49,987 | ||
| HSBC Holdings plc | 4.250% | 8/18/25 | 25,626 | 25,179 | ||
| 1 | HSBC Holdings plc | 2.633% | 11/7/25 | 42,727 | 40,551 | |
| HSBC Holdings plc | 4.180% | 12/9/25 | 23,225 | 22,769 | ||
| HSBC Holdings plc | 4.300% | 3/8/26 | 63,257 | 62,515 | ||
| HSBC Holdings plc | 2.999% | 3/10/26 | 46,282 | 43,853 | ||
| 1 | HSBC Holdings plc | 1.645% | 4/18/26 | 52,611 | 47,959 | |
| HSBC Holdings plc | 3.900% | 5/25/26 | 52,255 | 50,805 | ||
| 1 | HSBC Holdings plc | 2.099% | 6/4/26 | 62,300 | 57,227 | |
| 1 | HSBC Holdings plc | 4.292% | 9/12/26 | 67,410 | 65,496 | |
| HSBC Holdings plc | 4.375% | 11/23/26 | 44,394 | 43,444 | ||
| HSBC Holdings plc | 1.589% | 5/24/27 | 39,550 | 34,460 | ||
| HSBC Holdings plc | 2.251% | 11/22/27 | 56,389 | 49,692 | ||
| 1 | HSBC Holdings plc | 4.041% | 3/13/28 | 63,256 | 59,494 | |
| HSBC Holdings plc | 4.755% | 6/9/28 | 50,690 | 48,832 | ||
| HSBC Holdings plc | 5.210% | 8/11/28 | 45,020 | 43,943 | ||
| HSBC USA Inc. | 3.750% | 5/24/24 | 6,629 | 6,585 | ||
| HSBC USA Inc. | 3.500% | 6/23/24 | 26,206 | 25,837 | ||
| Huntington Bancshares Inc. | 2.625% | 8/6/24 | 19,865 | 19,296 | ||
| Huntington Bancshares Inc. | 4.000% | 5/15/25 | 7,364 | 7,296 | ||
| Huntington Bancshares Inc. | 4.443% | 8/4/28 | 15,000 | 14,692 | ||
| 1 | Huntington National Bank | 3.550% | 10/6/23 | 13,564 | 13,511 | |
| Huntington National Bank | 4.008% | 5/16/25 | 10,174 | 10,104 | ||
| Huntington National Bank | 4.552% | 5/17/28 | 14,670 | 14,573 | ||
| ING Groep NV | 4.100% | 10/2/23 | 32,354 | 32,346 | ||
| ING Groep NV | 3.550% | 4/9/24 | 22,269 | 22,018 | ||
| ING Groep NV | 3.869% | 3/28/26 | 22,790 | 22,216 | ||
| ING Groep NV | 3.950% | 3/29/27 | 45,446 | 43,618 | ||
| ING Groep NV | 1.726% | 4/1/27 | 25,552 | 22,669 | ||
| ING Groep NV | 4.017% | 3/28/28 | 23,400 | 22,191 | ||
| Intercontinental Exchange Inc. | 3.650% | 5/23/25 | 31,034 | 30,700 | ||
| Intercontinental Exchange Inc. | 3.750% | 12/1/25 | 28,475 | 28,202 | ||
| Intesa Sanpaolo SpA | 5.250% | 1/12/24 | 13,520 | 13,532 | ||
| Invesco Finance plc | 4.000% | 1/30/24 | 10,985 | 10,929 | ||
| Invesco Finance plc | 3.750% | 1/15/26 | 10,748 | 10,493 | ||
| Coupon | Maturity Date | Face Amount ($000) | Market Value• ($000) | |||
| 2 | Jackson Financial Inc. | 1.125% | 11/22/23 | 15,848 | 15,221 | |
| Janus Henderson US Holdings Inc. | 4.875% | 8/1/25 | 6,716 | 6,735 | ||
| Jefferies Financial Group Inc. | 5.500% | 10/18/23 | 17,048 | 17,151 | ||
| Jefferies Group LLC | 4.850% | 1/15/27 | 12,668 | 12,572 | ||
| Jefferies Group LLC | 6.450% | 6/8/27 | 6,560 | 6,907 | ||
| JPMorgan Chase & Co. | 3.875% | 2/1/24 | 22,450 | 22,533 | ||
| JPMorgan Chase & Co. | 3.625% | 5/13/24 | 46,310 | 46,195 | ||
| JPMorgan Chase & Co. | 3.875% | 9/10/24 | 62,852 | 62,593 | ||
| 1 | JPMorgan Chase & Co. | 0.653% | 9/16/24 | 40,890 | 39,308 | |
| 1 | JPMorgan Chase & Co. | 4.023% | 12/5/24 | 80,786 | 80,366 | |
| JPMorgan Chase & Co. | 3.125% | 1/23/25 | 51,839 | 51,039 | ||
| JPMorgan Chase & Co. | 0.563% | 2/16/25 | 17,424 | 16,464 | ||
| 1 | JPMorgan Chase & Co. | 3.220% | 3/1/25 | 49,855 | 48,897 | |
| JPMorgan Chase & Co. | 0.824% | 6/1/25 | 45,230 | 42,359 | ||
| JPMorgan Chase & Co. | 3.845% | 6/14/25 | 2,830 | 2,800 | ||
| JPMorgan Chase & Co. | 0.969% | 6/23/25 | 56,800 | 53,208 | ||
| JPMorgan Chase & Co. | 3.900% | 7/15/25 | 54,380 | 54,140 | ||
| JPMorgan Chase & Co. | 7.750% | 7/15/25 | 1,759 | 1,921 | ||
| JPMorgan Chase & Co. | 0.768% | 8/9/25 | 14,887 | 13,865 | ||
| 1 | JPMorgan Chase & Co. | 2.301% | 10/15/25 | 43,047 | 41,084 | |
| JPMorgan Chase & Co. | 1.561% | 12/10/25 | 56,916 | 53,095 | ||
| JPMorgan Chase & Co. | 2.595% | 2/24/26 | 27,490 | 26,109 | ||
| 1 | JPMorgan Chase & Co. | 2.005% | 3/13/26 | 74,595 | 69,749 | |
| JPMorgan Chase & Co. | 3.300% | 4/1/26 | 70,882 | 68,557 | ||
| 1 | JPMorgan Chase & Co. | 2.083% | 4/22/26 | 101,198 | 94,693 | |
| JPMorgan Chase & Co. | 4.080% | 4/26/26 | 30,975 | 30,570 | ||
| JPMorgan Chase & Co. | 3.200% | 6/15/26 | 28,267 | 27,205 | ||
| JPMorgan Chase & Co. | 2.950% | 10/1/26 | 76,093 | 72,335 | ||
| JPMorgan Chase & Co. | 7.625% | 10/15/26 | 16,328 | 18,324 | ||
| JPMorgan Chase & Co. | 1.045% | 11/19/26 | 59,807 | 53,170 | ||
| JPMorgan Chase & Co. | 4.125% | 12/15/26 | 51,945 | 51,350 | ||
| 1 | JPMorgan Chase & Co. | 3.960% | 1/29/27 | 25,341 | 24,657 | |
| JPMorgan Chase & Co. | 1.040% | 2/4/27 | 71,870 | 63,276 | ||
| JPMorgan Chase & Co. | 1.578% | 4/22/27 | 108,387 | 96,839 | ||
| JPMorgan Chase & Co. | 8.000% | 4/29/27 | 24,136 | 27,746 | ||
| JPMorgan Chase & Co. | 1.470% | 9/22/27 | 60,700 | 53,212 | ||
| 1 | JPMorgan Chase & Co. | 3.782% | 2/1/28 | 76,035 | 72,963 | |
| JPMorgan Chase & Co. | 2.947% | 2/24/28 | 27,468 | 25,413 | ||
| JPMorgan Chase & Co. | 4.323% | 4/26/28 | 35,232 | 34,427 | ||
| 1 | JPMorgan Chase & Co. | 3.540% | 5/1/28 | 76,949 | 72,503 | |
| 1 | JPMorgan Chase & Co. | 2.182% | 6/1/28 | 1,555 | 1,380 | |
| JPMorgan Chase & Co. | 4.851% | 7/25/28 | 116,195 | 116,067 | ||
| Kemper Corp. | 4.350% | 2/15/25 | 9,448 | 9,368 | ||
| 1 | KeyBank NA | 3.300% | 6/1/25 | 12,037 | 11,726 | |
| 1 | KeyBank NA | 4.150% | 8/8/25 | 22,805 | 22,631 | |
| 1 | KeyBank NA | 3.400% | 5/20/26 | 23,205 | 22,167 | |
| 1 | KeyCorp | 3.878% | 5/23/25 | 15,615 | 15,481 | |
| 1 | KeyCorp | 4.150% | 10/29/25 | 10,942 | 10,833 | |
| 1 | KeyCorp | 2.250% | 4/6/27 | 18,194 | 16,368 | |
| Lazard Group LLC | 3.750% | 2/13/25 | 9,884 | 9,726 | ||
| Lazard Group LLC | 3.625% | 3/1/27 | 11,920 | 11,264 | ||
| Legg Mason Inc. | 4.750% | 3/15/26 | 10,388 | 10,503 | ||
| Lincoln National Corp. | 4.000% | 9/1/23 | 5,765 | 5,766 | ||
| Lincoln National Corp. | 3.350% | 3/9/25 | 4,067 | 3,987 | ||
| Lincoln National Corp. | 3.625% | 12/12/26 | 11,111 | 10,761 | ||
| Lloyds Bank plc | 3.500% | 5/14/25 | 2,584 | 2,506 | ||
| Lloyds Banking Group plc | 3.900% | 3/12/24 | 32,804 | 32,648 | ||
| Lloyds Banking Group plc | 4.500% | 11/4/24 | 31,859 | 31,687 | ||
| Lloyds Banking Group plc | 4.450% | 5/8/25 | 22,798 | 22,613 | ||
| 1 | Lloyds Banking Group plc | 3.870% | 7/9/25 | 58,682 | 57,549 | |
| Lloyds Banking Group plc | 4.582% | 12/10/25 | 36,762 | 36,012 | ||
| 1 | Lloyds Banking Group plc | 2.438% | 2/5/26 | 31,641 | 29,775 | |
| Lloyds Banking Group plc | 3.511% | 3/18/26 | 10,798 | 10,404 | ||
| Lloyds Banking Group plc | 4.650% | 3/24/26 | 22,207 | 21,710 | ||
| Lloyds Banking Group plc | 4.716% | 8/11/26 | 27,784 | 27,417 | ||
| Lloyds Banking Group plc | 3.750% | 1/11/27 | 31,111 | 29,678 | ||
| Lloyds Banking Group plc | 1.627% | 5/11/27 | 7,979 | 7,058 | ||
| Coupon | Maturity Date | Face Amount ($000) | Market Value• ($000) | |||
| Lloyds Banking Group plc | 3.750% | 3/18/28 | 20,505 | 19,352 | ||
| Loews Corp. | 3.750% | 4/1/26 | 11,120 | 10,957 | ||
| M&T Bank Corp. | 4.000% | 7/15/24 | 9,891 | 9,846 | ||
| M&T Bank Corp. | 4.553% | 8/16/28 | 11,300 | 11,301 | ||
| Main Street Capital Corp. | 5.200% | 5/1/24 | 10,710 | 10,746 | ||
| Main Street Capital Corp. | 3.000% | 7/14/26 | 11,814 | 10,301 | ||
| 1 | Manufacturers & Traders Trust Co. | 2.900% | 2/6/25 | 11,385 | 11,049 | |
| 1 | Manufacturers & Traders Trust Co. | 3.400% | 8/17/27 | 14,650 | 13,764 | |
| Manulife Financial Corp. | 4.150% | 3/4/26 | 26,730 | 26,492 | ||
| Manulife Financial Corp. | 2.484% | 5/19/27 | 13,475 | 12,378 | ||
| 1 | Manulife Financial Corp. | 4.061% | 2/24/32 | 11,167 | 10,347 | |
| Marsh & McLennan Cos. Inc. | 3.875% | 3/15/24 | 20,029 | 20,004 | ||
| Marsh & McLennan Cos. Inc. | 3.500% | 6/3/24 | 15,629 | 15,523 | ||
| Marsh & McLennan Cos. Inc. | 3.500% | 3/10/25 | 16,892 | 16,636 | ||
| Marsh & McLennan Cos. Inc. | 3.750% | 3/14/26 | 19,388 | 19,210 | ||
| Mastercard Inc. | 3.375% | 4/1/24 | 29,261 | 29,166 | ||
| Mastercard Inc. | 2.000% | 3/3/25 | 16,876 | 16,188 | ||
| Mastercard Inc. | 2.950% | 11/21/26 | 20,974 | 20,276 | ||
| Mastercard Inc. | 3.300% | 3/26/27 | 37,037 | 36,249 | ||
| Mercury General Corp. | 4.400% | 3/15/27 | 9,125 | 8,754 | ||
| 1 | MetLife Inc. | 4.368% | 9/15/23 | 25,403 | 25,536 | |
| MetLife Inc. | 3.600% | 4/10/24 | 16,548 | 16,554 | ||
| MetLife Inc. | 3.000% | 3/1/25 | 18,191 | 17,816 | ||
| MetLife Inc. | 3.600% | 11/13/25 | 8,874 | 8,776 | ||
| Mitsubishi UFJ Financial Group Inc. | 2.527% | 9/13/23 | 7,775 | 7,662 | ||
| Mitsubishi UFJ Financial Group Inc. | 3.407% | 3/7/24 | 47,143 | 46,681 | ||
| Mitsubishi UFJ Financial Group Inc. | 2.801% | 7/18/24 | 30,212 | 29,383 | ||
| 1 | Mitsubishi UFJ Financial Group Inc. | 0.848% | 9/15/24 | 36,240 | 34,952 | |
| Mitsubishi UFJ Financial Group Inc. | 2.193% | 2/25/25 | 74,006 | 70,120 | ||
| Mitsubishi UFJ Financial Group Inc. | 3.777% | 3/2/25 | 2,333 | 2,304 | ||
| Mitsubishi UFJ Financial Group Inc. | 1.412% | 7/17/25 | 36,292 | 33,296 | ||
| Mitsubishi UFJ Financial Group Inc. | 4.788% | 7/18/25 | 18,640 | 18,702 | ||
| Mitsubishi UFJ Financial Group Inc. | 0.953% | 7/19/25 | 52,919 | 49,362 | ||
| Mitsubishi UFJ Financial Group Inc. | 0.962% | 10/11/25 | 21,456 | 19,845 | ||
| Mitsubishi UFJ Financial Group Inc. | 3.850% | 3/1/26 | 35,203 | 34,376 | ||
| Mitsubishi UFJ Financial Group Inc. | 3.837% | 4/17/26 | 680 | 665 | ||
| Mitsubishi UFJ Financial Group Inc. | 2.757% | 9/13/26 | 1,265 | 1,179 | ||
| Mitsubishi UFJ Financial Group Inc. | 3.677% | 2/22/27 | 29,459 | 28,391 | ||
| Mitsubishi UFJ Financial Group Inc. | 1.538% | 7/20/27 | 87,610 | 77,344 | ||
| Mitsubishi UFJ Financial Group Inc. | 3.287% | 7/25/27 | 22,206 | 20,919 | ||
| Mitsubishi UFJ Financial Group Inc. | 1.640% | 10/13/27 | 19,695 | 17,325 | ||
| Mitsubishi UFJ Financial Group Inc. | 2.341% | 1/19/28 | 37,080 | 33,333 | ||
| Mitsubishi UFJ Financial Group Inc. | 4.080% | 4/19/28 | 1,761 | 1,701 | ||
| Mitsubishi UFJ Financial Group Inc. | 5.017% | 7/20/28 | 42,290 | 42,495 | ||
| 1 | Mizuho Financial Group Inc. | 0.849% | 9/8/24 | 21,675 | 20,858 | |
| 1 | Mizuho Financial Group Inc. | 3.922% | 9/11/24 | 27,235 | 27,030 | |
| 1 | Mizuho Financial Group Inc. | 2.839% | 7/16/25 | 20,288 | 19,519 | |
| 1 | Mizuho Financial Group Inc. | 2.555% | 9/13/25 | 16,066 | 15,324 | |
| Mizuho Financial Group Inc. | 2.651% | 5/22/26 | 12,021 | 11,298 | ||
| 1 | Mizuho Financial Group Inc. | 2.226% | 5/25/26 | 18,704 | 17,356 | |
| Mizuho Financial Group Inc. | 2.839% | 9/13/26 | 18,903 | 17,495 | ||
| Mizuho Financial Group Inc. | 3.663% | 2/28/27 | 15,888 | 15,143 | ||
| Mizuho Financial Group Inc. | 1.234% | 5/22/27 | 32,535 | 28,375 | ||
| Mizuho Financial Group Inc. | 1.554% | 7/9/27 | 6,964 | 6,109 | ||
| 1 | Morgan Stanley | 3.875% | 4/29/24 | 76,777 | 76,636 | |
| 1 | Morgan Stanley | 3.700% | 10/23/24 | 56,497 | 56,145 | |
| 1 | Morgan Stanley | 0.791% | 1/22/25 | 5,110 | 4,845 | |
| Morgan Stanley | 3.620% | 4/17/25 | 28,618 | 28,220 | ||
| Morgan Stanley | 0.790% | 5/30/25 | 89,929 | 84,095 | ||
| 1 | Morgan Stanley | 2.720% | 7/22/25 | 53,435 | 51,672 | |
| 1 | Morgan Stanley | 4.000% | 7/23/25 | 71,726 | 71,341 | |
| 1 | Morgan Stanley | 0.864% | 10/21/25 | 35,351 | 32,681 | |
| 1 | Morgan Stanley | 1.164% | 10/21/25 | 43,417 | 40,337 | |
| Morgan Stanley | 5.000% | 11/24/25 | 56,335 | 57,226 | ||
| 1 | Morgan Stanley | 3.875% | 1/27/26 | 80,708 | 79,622 | |
| Morgan Stanley | 2.630% | 2/18/26 | 24,988 | 23,788 | ||
| 1 | Morgan Stanley | 2.188% | 4/28/26 | 66,756 | 62,692 | |
| Coupon | Maturity Date | Face Amount ($000) | Market Value• ($000) | |||
| Morgan Stanley | 4.679% | 7/17/26 | 25,680 | 25,705 | ||
| 1 | Morgan Stanley | 3.125% | 7/27/26 | 92,131 | 87,778 | |
| 1 | Morgan Stanley | 6.250% | 8/9/26 | 17,430 | 18,526 | |
| 1 | Morgan Stanley | 4.350% | 9/8/26 | 63,912 | 63,179 | |
| Morgan Stanley | 0.985% | 12/10/26 | 67,922 | 60,157 | ||
| Morgan Stanley | 3.625% | 1/20/27 | 73,856 | 71,733 | ||
| Morgan Stanley | 3.950% | 4/23/27 | 52,635 | 51,016 | ||
| Morgan Stanley | 1.593% | 5/4/27 | 84,167 | 75,064 | ||
| 1 | Morgan Stanley | 1.512% | 7/20/27 | 67,859 | 60,127 | |
| Morgan Stanley | 2.475% | 1/21/28 | 40,300 | 36,631 | ||
| Morgan Stanley | 4.210% | 4/20/28 | 62,105 | 60,462 | ||
| 1 | Morgan Stanley | 3.591% | 7/22/28 | 33,740 | 31,871 | |
| Morgan Stanley Direct Lending Fund | 4.500% | 2/11/27 | 1,150 | 1,058 | ||
| Morgan Stanley Domestic Holdings Inc. | 3.800% | 8/24/27 | 10,330 | 9,957 | ||
| Nasdaq Inc. | 3.850% | 6/30/26 | 10,695 | 10,532 | ||
| National Australia Bank Ltd. | 3.375% | 1/14/26 | 19,477 | 18,965 | ||
| 1 | National Australia Bank Ltd. | 2.500% | 7/12/26 | 25,350 | 23,822 | |
| National Australia Bank Ltd. | 3.905% | 6/9/27 | 10,245 | 10,092 | ||
| 1 | National Bank of Canada | 0.550% | 11/15/24 | 21,654 | 20,653 | |
| National Bank of Canada | 3.750% | 6/9/25 | 16,525 | 16,280 | ||
| 1 | NatWest Group plc | 4.269% | 3/22/25 | 50,730 | 50,124 | |
| NatWest Group plc | 4.800% | 4/5/26 | 38,673 | 38,458 | ||
| NatWest Group plc | 1.642% | 6/14/27 | 24,515 | 21,428 | ||
| 1 | NatWest Group plc | 3.073% | 5/22/28 | 12,189 | 11,019 | |
| 1 | NatWest Group plc | 3.754% | 11/1/29 | 24,702 | 23,462 | |
| 1 | New York Community Bancorp Inc. | 5.900% | 11/6/28 | 5,009 | 4,990 | |
| Nomura Holdings Inc. | 2.648% | 1/16/25 | 37,346 | 35,555 | ||
| Nomura Holdings Inc. | 5.099% | 7/3/25 | 13,730 | 13,831 | ||
| Nomura Holdings Inc. | 1.851% | 7/16/25 | 39,052 | 35,943 | ||
| Nomura Holdings Inc. | 1.653% | 7/14/26 | 15,180 | 13,384 | ||
| Nomura Holdings Inc. | 2.329% | 1/22/27 | 36,420 | 32,467 | ||
| Nomura Holdings Inc. | 5.386% | 7/6/27 | 11,895 | 11,971 | ||
| Northern Trust Corp. | 3.950% | 10/30/25 | 17,738 | 17,668 | ||
| Northern Trust Corp. | 4.000% | 5/10/27 | 14,045 | 13,997 | ||
| 1 | Northern Trust Corp. | 3.375% | 5/8/32 | 12,810 | 11,939 | |
| Oaktree Specialty Lending Corp. | 3.500% | 2/25/25 | 10,906 | 10,503 | ||
| Oaktree Specialty Lending Corp. | 2.700% | 1/15/27 | 3,402 | 3,010 | ||
| Old Republic International Corp. | 4.875% | 10/1/24 | 5,073 | 5,112 | ||
| Old Republic International Corp. | 3.875% | 8/26/26 | 15,550 | 15,012 | ||
| ORIX Corp. | 4.050% | 1/16/24 | 2,455 | 2,449 | ||
| ORIX Corp. | 3.250% | 12/4/24 | 18,377 | 17,978 | ||
| ORIX Corp. | 3.700% | 7/18/27 | 1,000 | 963 | ||
| Owl Rock Capital Corp. | 5.250% | 4/15/24 | 11,458 | 11,453 | ||
| Owl Rock Capital Corp. | 4.000% | 3/30/25 | 6,329 | 6,141 | ||
| Owl Rock Capital Corp. | 3.750% | 7/22/25 | 16,485 | 15,487 | ||
| Owl Rock Capital Corp. | 4.250% | 1/15/26 | 14,563 | 13,723 | ||
| Owl Rock Capital Corp. | 3.400% | 7/15/26 | 24,738 | 22,139 | ||
| Owl Rock Capital Corp. | 2.625% | 1/15/27 | 10,467 | 8,851 | ||
| 1 | OWL Rock Core Income Corp. | 5.500% | 3/21/25 | 7,575 | 7,257 | |
| 1 | OWL Rock Core Income Corp. | 4.700% | 2/8/27 | 8,835 | 8,023 | |
| Owl Rock Technology Finance Corp. | 2.500% | 1/15/27 | 7,962 | 6,708 | ||
| PayPal Holdings Inc. | 2.400% | 10/1/24 | 36,976 | 35,991 | ||
| PayPal Holdings Inc. | 1.650% | 6/1/25 | 13,965 | 13,155 | ||
| PayPal Holdings Inc. | 2.650% | 10/1/26 | 35,570 | 33,760 | ||
| PNC Bank NA | 2.500% | 8/27/24 | 17,072 | 16,600 | ||
| 1 | PNC Bank NA | 3.300% | 10/30/24 | 14,234 | 14,005 | |
| 1 | PNC Bank NA | 2.950% | 2/23/25 | 12,299 | 11,967 | |
| 1 | PNC Bank NA | 3.875% | 4/10/25 | 14,008 | 13,839 | |
| 1 | PNC Bank NA | 3.250% | 6/1/25 | 13,064 | 12,786 | |
| 1 | PNC Bank NA | 4.200% | 11/1/25 | 14,011 | 13,909 | |
| PNC Financial Services Group Inc. | 3.500% | 1/23/24 | 35,711 | 35,595 | ||
| PNC Financial Services Group Inc. | 3.900% | 4/29/24 | 16,601 | 16,603 | ||
| PNC Financial Services Group Inc. | 2.200% | 11/1/24 | 15,453 | 14,939 | ||
| PNC Financial Services Group Inc. | 2.600% | 7/23/26 | 26,598 | 25,158 | ||
| Coupon | Maturity Date | Face Amount ($000) | Market Value• ($000) | |||
| PNC Financial Services Group Inc. | 1.150% | 8/13/26 | 17,140 | 15,365 | ||
| PNC Financial Services Group Inc. | 3.150% | 5/19/27 | 10,963 | 10,496 | ||
| Principal Financial Group Inc. | 3.400% | 5/15/25 | 8,574 | 8,392 | ||
| Principal Financial Group Inc. | 3.100% | 11/15/26 | 7,426 | 6,988 | ||
| Progressive Corp. | 2.450% | 1/15/27 | 19,220 | 18,129 | ||
| Progressive Corp. | 2.500% | 3/15/27 | 8,081 | 7,602 | ||
| Prospect Capital Corp. | 3.706% | 1/22/26 | 7,205 | 6,481 | ||
| Prospect Capital Corp. | 3.364% | 11/15/26 | 9,271 | 7,962 | ||
| 1 | Prudential Financial Inc. | 1.500% | 3/10/26 | 18,528 | 16,976 | |
| 1 | Prudential Financial Inc. | 5.200% | 3/15/44 | 10,552 | 10,248 | |
| 1 | Prudential Financial Inc. | 5.375% | 5/15/45 | 18,850 | 18,531 | |
| Regions Financial Corp. | 2.250% | 5/18/25 | 16,752 | 15,955 | ||
| 1 | Reinsurance Group of America Inc. | 4.700% | 9/15/23 | 1,348 | 1,355 | |
| Reinsurance Group of America Inc. | 3.950% | 9/15/26 | 11,075 | 10,881 | ||
| RenaissanceRe Finance Inc. | 3.700% | 4/1/25 | 7,775 | 7,606 | ||
| RenaissanceRe Finance Inc. | 3.450% | 7/1/27 | 7,096 | 6,701 | ||
| 1 | Royal Bank of Canada | 3.700% | 10/5/23 | 46,276 | 46,271 | |
| 1 | Royal Bank of Canada | 0.500% | 10/26/23 | 28,961 | 27,928 | |
| 1 | Royal Bank of Canada | 0.425% | 1/19/24 | 23,080 | 22,033 | |
| 1 | Royal Bank of Canada | 2.550% | 7/16/24 | 30,613 | 29,785 | |
| Royal Bank of Canada | 0.650% | 7/29/24 | 13,252 | 12,443 | ||
| 1 | Royal Bank of Canada | 0.750% | 10/7/24 | 18,347 | 17,113 | |
| 1 | Royal Bank of Canada | 2.250% | 11/1/24 | 49,555 | 47,672 | |
| 1 | Royal Bank of Canada | 1.600% | 1/21/25 | 8,975 | 8,473 | |
| Royal Bank of Canada | 3.375% | 4/14/25 | 24,295 | 23,863 | ||
| 1 | Royal Bank of Canada | 1.150% | 6/10/25 | 42,272 | 38,968 | |
| 1 | Royal Bank of Canada | 0.875% | 1/20/26 | 33,676 | 30,174 | |
| 1 | Royal Bank of Canada | 4.650% | 1/27/26 | 38,480 | 38,711 | |
| Royal Bank of Canada | 1.200% | 4/27/26 | 44,671 | 40,158 | ||
| 1 | Royal Bank of Canada | 1.150% | 7/14/26 | 16,807 | 14,983 | |
| 1 | Royal Bank of Canada | 1.400% | 11/2/26 | 17,619 | 15,676 | |
| 1 | Royal Bank of Canada | 2.050% | 1/21/27 | 9,190 | 8,384 | |
| Royal Bank of Canada | 3.625% | 5/4/27 | 20,598 | 19,875 | ||
| 1 | Royal Bank of Canada | 4.240% | 8/3/27 | 51,425 | 50,706 | |
| Santander Holdings USA Inc. | 3.500% | 6/7/24 | 35,824 | 35,174 | ||
| Santander Holdings USA Inc. | 3.450% | 6/2/25 | 12,991 | 12,423 | ||
| Santander Holdings USA Inc. | 4.260% | 6/9/25 | 6,260 | 6,130 | ||
| Santander Holdings USA Inc. | 4.500% | 7/17/25 | 27,232 | 26,963 | ||
| Santander Holdings USA Inc. | 3.244% | 10/5/26 | 40,832 | 38,004 | ||
| Santander Holdings USA Inc. | 4.400% | 7/13/27 | 26,254 | 25,281 | ||
| Santander Holdings USA Inc. | 2.490% | 1/6/28 | 10,375 | 9,021 | ||
| 1 | Santander UK Group Holdings plc | 4.796% | 11/15/24 | 29,372 | 29,221 | |
| Santander UK Group Holdings plc | 1.089% | 3/15/25 | 23,930 | 22,397 | ||
| 1 | Santander UK Group Holdings plc | 1.532% | 8/21/26 | 15,550 | 13,896 | |
| Santander UK Group Holdings plc | 1.673% | 6/14/27 | 28,255 | 24,496 | ||
| Santander UK Group Holdings plc | 2.469% | 1/11/28 | 16,410 | 14,380 | ||
| Santander UK plc | 4.000% | 3/13/24 | 29,977 | 29,947 | ||
| Santander UK plc | 2.875% | 6/18/24 | 16,411 | 16,001 | ||
| 1 | Signature Bank | 4.000% | 10/15/30 | 8,030 | 7,587 | |
| Sixth Street Specialty Lending Inc. | 3.875% | 11/1/24 | 7,390 | 7,149 | ||
| Sixth Street Specialty Lending Inc. | 2.500% | 8/1/26 | 8,622 | 7,534 | ||
| 2 | Standard Chartered plc | 2.819% | 1/30/26 | 1,650 | 1,554 | |
| State Street Corp. | 3.700% | 11/20/23 | 29,695 | 29,735 | ||
| 1 | State Street Corp. | 3.776% | 12/3/24 | 26,062 | 25,998 | |
| State Street Corp. | 3.300% | 12/16/24 | 29,765 | 29,508 | ||
| State Street Corp. | 3.550% | 8/18/25 | 32,491 | 32,206 | ||
| 1 | State Street Corp. | 2.354% | 11/1/25 | 24,524 | 23,678 | |
| State Street Corp. | 2.901% | 3/30/26 | 17,804 | 17,119 | ||
| State Street Corp. | 2.650% | 5/19/26 | 19,870 | 19,120 | ||
| State Street Corp. | 2.203% | 2/7/28 | 14,150 | 12,968 | ||
| Stifel Financial Corp. | 4.250% | 7/18/24 | 7,318 | 7,291 | ||
| Sumitomo Mitsui Banking Corp. | 3.950% | 1/10/24 | 7,452 | 7,429 | ||
| 1 | Sumitomo Mitsui Banking Corp. | 3.400% | 7/11/24 | 9,460 | 9,293 | |
| 1 | Sumitomo Mitsui Banking Corp. | 3.650% | 7/23/25 | 4,017 | 3,913 | |
| Sumitomo Mitsui Financial Group Inc. | 3.936% | 10/16/23 | 13,740 | 13,735 | ||
| Coupon | Maturity Date | Face Amount ($000) | Market Value• ($000) | |||
| Sumitomo Mitsui Financial Group Inc. | 0.508% | 1/12/24 | 16,763 | 15,969 | ||
| Sumitomo Mitsui Financial Group Inc. | 2.696% | 7/16/24 | 60,379 | 58,566 | ||
| Sumitomo Mitsui Financial Group Inc. | 2.448% | 9/27/24 | 25,863 | 24,795 | ||
| Sumitomo Mitsui Financial Group Inc. | 2.348% | 1/15/25 | 32,237 | 30,701 | ||
| Sumitomo Mitsui Financial Group Inc. | 1.474% | 7/8/25 | 70,450 | 64,832 | ||
| Sumitomo Mitsui Financial Group Inc. | 0.948% | 1/12/26 | 31,226 | 27,786 | ||
| Sumitomo Mitsui Financial Group Inc. | 3.784% | 3/9/26 | 31,423 | 30,671 | ||
| Sumitomo Mitsui Financial Group Inc. | 2.632% | 7/14/26 | 41,000 | 38,178 | ||
| Sumitomo Mitsui Financial Group Inc. | 1.402% | 9/17/26 | 53,667 | 47,351 | ||
| Sumitomo Mitsui Financial Group Inc. | 3.010% | 10/19/26 | 35,120 | 33,057 | ||
| Sumitomo Mitsui Financial Group Inc. | 3.446% | 1/11/27 | 37,273 | 35,510 | ||
| Sumitomo Mitsui Financial Group Inc. | 2.174% | 1/14/27 | 21,890 | 19,767 | ||
| Sumitomo Mitsui Financial Group Inc. | 3.364% | 7/12/27 | 15,047 | 14,202 | ||
| SVB Financial Group | 3.500% | 1/29/25 | 4,921 | 4,783 | ||
| SVB Financial Group | 1.800% | 10/28/26 | 19,505 | 17,307 | ||
| SVB Financial Group | 4.345% | 4/29/28 | 9,645 | 9,314 | ||
| 1 | Svenska Handelsbanken AB | 3.900% | 11/20/23 | 43,108 | 43,149 | |
| Swiss Re America Holding Corp. | 7.000% | 2/15/26 | 7,165 | 7,756 | ||
| Synchrony Bank | 5.400% | 8/22/25 | 10,000 | 9,984 | ||
| Synchrony Bank | 5.625% | 8/23/27 | 8,000 | 7,938 | ||
| Synchrony Financial | 4.375% | 3/19/24 | 22,258 | 22,173 | ||
| Synchrony Financial | 4.250% | 8/15/24 | 24,219 | 23,936 | ||
| Synchrony Financial | 4.500% | 7/23/25 | 20,423 | 19,968 | ||
| Synchrony Financial | 3.700% | 8/4/26 | 18,038 | 16,898 | ||
| 1 | Toronto-Dominion Bank | 0.450% | 9/11/23 | 16,783 | 16,209 | |
| Toronto-Dominion Bank | 0.550% | 3/4/24 | 15,213 | 14,465 | ||
| 1 | Toronto-Dominion Bank | 2.350% | 3/8/24 | 7,571 | 7,392 | |
| 1 | Toronto-Dominion Bank | 3.250% | 3/11/24 | 47,499 | 46,975 | |
| 1 | Toronto-Dominion Bank | 2.650% | 6/12/24 | 38,324 | 37,423 | |
| Toronto-Dominion Bank | 1.250% | 12/13/24 | 16,265 | 15,282 | ||
| 1 | Toronto-Dominion Bank | 1.450% | 1/10/25 | 16,660 | 15,742 | |
| Toronto-Dominion Bank | 3.766% | 6/6/25 | 37,450 | 37,005 | ||
| 1 | Toronto-Dominion Bank | 1.150% | 6/12/25 | 33,248 | 30,658 | |
| 1 | Toronto-Dominion Bank | 0.750% | 9/11/25 | 25,024 | 22,602 | |
| 1 | Toronto-Dominion Bank | 0.750% | 1/6/26 | 12,101 | 10,810 | |
| 1 | Toronto-Dominion Bank | 1.200% | 6/3/26 | 23,015 | 20,582 | |
| 1 | Toronto-Dominion Bank | 1.250% | 9/10/26 | 37,242 | 33,075 | |
| 1 | Toronto-Dominion Bank | 1.950% | 1/12/27 | 14,875 | 13,477 | |
| 1 | Toronto-Dominion Bank | 2.800% | 3/10/27 | 30,920 | 28,998 | |
| Toronto-Dominion Bank | 4.108% | 6/8/27 | 43,015 | 42,577 | ||
| 1 | Toronto-Dominion Bank | 3.625% | 9/15/31 | 44,830 | 42,589 | |
| Trinity Acquisition plc | 4.400% | 3/15/26 | 8,284 | 8,159 | ||
| 1 | Truist Bank | 3.200% | 4/1/24 | 38,606 | 38,208 | |
| 1 | Truist Bank | 2.150% | 12/6/24 | 46,303 | 44,418 | |
| 1 | Truist Bank | 1.500% | 3/10/25 | 26,850 | 25,174 | |
| 1 | Truist Bank | 3.625% | 9/16/25 | 29,890 | 29,259 | |
| 1 | Truist Bank | 4.050% | 11/3/25 | 8,371 | 8,357 | |
| 1 | Truist Bank | 3.300% | 5/15/26 | 13,429 | 12,914 | |
| 1 | Truist Bank | 3.800% | 10/30/26 | 17,366 | 16,953 | |
| 1 | Truist Bank | 2.636% | 9/17/29 | 7,137 | 6,761 | |
| 1 | Truist Financial Corp. | 3.750% | 12/6/23 | 28,312 | 28,354 | |
| 1 | Truist Financial Corp. | 2.500% | 8/1/24 | 30,246 | 29,452 | |
| 1 | Truist Financial Corp. | 2.850% | 10/26/24 | 14,501 | 14,249 | |
| Truist Financial Corp. | 4.000% | 5/1/25 | 28,798 | 28,721 | ||
| 1 | Truist Financial Corp. | 3.700% | 6/5/25 | 22,733 | 22,487 | |
| Coupon | Maturity Date | Face Amount ($000) | Market Value• ($000) | |||
| 1 | Truist Financial Corp. | 1.200% | 8/5/25 | 7,142 | 6,562 | |
| 1 | Truist Financial Corp. | 4.260% | 7/28/26 | 7,905 | 7,896 | |
| 1 | Truist Financial Corp. | 1.267% | 3/2/27 | 39,740 | 35,742 | |
| 1 | Truist Financial Corp. | 1.125% | 8/3/27 | 12,526 | 10,754 | |
| 1 | Truist Financial Corp. | 4.123% | 6/6/28 | 20,000 | 19,637 | |
| Unum Group | 4.000% | 3/15/24 | 8,550 | 8,610 | ||
| 1 | US Bancorp | 3.700% | 1/30/24 | 24,793 | 24,812 | |
| US Bancorp | 3.375% | 2/5/24 | 48,513 | 48,280 | ||
| US Bancorp | 2.400% | 7/30/24 | 33,766 | 32,952 | ||
| 1 | US Bancorp | 3.600% | 9/11/24 | 18,903 | 18,819 | |
| US Bancorp | 1.450% | 5/12/25 | 14,168 | 13,283 | ||
| 1 | US Bancorp | 3.950% | 11/17/25 | 15,814 | 15,830 | |
| 1 | US Bancorp | 3.100% | 4/27/26 | 26,513 | 25,518 | |
| 1 | US Bancorp | 2.375% | 7/22/26 | 32,580 | 30,705 | |
| 1 | US Bancorp | 3.150% | 4/27/27 | 17,109 | 16,473 | |
| 1 | US Bancorp | 2.215% | 1/27/28 | 8,345 | 7,627 | |
| US Bancorp | 4.548% | 7/22/28 | 39,800 | 39,932 | ||
| 1 | US Bank NA | 2.050% | 1/21/25 | 22,928 | 21,966 | |
| 1 | US Bank NA | 2.800% | 1/27/25 | 39,073 | 38,087 | |
| Valley National Bancorp | 3.000% | 6/15/31 | 985 | 880 | ||
| Visa Inc. | 3.150% | 12/14/25 | 92,379 | 90,423 | ||
| Visa Inc. | 1.900% | 4/15/27 | 31,700 | 29,260 | ||
| Visa Inc. | 0.750% | 8/15/27 | 16,389 | 14,208 | ||
| Voya Financial Inc. | 3.650% | 6/15/26 | 20,183 | 19,526 | ||
| Wachovia Corp. | 7.574% | 8/1/26 | 1,283 | 1,398 | ||
| 1 | Wells Fargo & Co. | 3.450% | 2/13/23 | 1 | 1 | |
| Wells Fargo & Co. | 4.480% | 1/16/24 | 17,584 | 17,667 | ||
| 1 | Wells Fargo & Co. | 3.750% | 1/24/24 | 73,776 | 73,590 | |
| 1 | Wells Fargo & Co. | 3.300% | 9/9/24 | 52,051 | 51,435 | |
| 1 | Wells Fargo & Co. | 3.000% | 2/19/25 | 66,448 | 64,676 | |
| 1 | Wells Fargo & Co. | 0.805% | 5/19/25 | 9,505 | 8,917 | |
| 1 | Wells Fargo & Co. | 3.550% | 9/29/25 | 68,286 | 67,070 | |
| 1 | Wells Fargo & Co. | 2.406% | 10/30/25 | 67,966 | 64,919 | |
| 1 | Wells Fargo & Co. | 2.164% | 2/11/26 | 70,225 | 65,992 | |
| Wells Fargo & Co. | 3.000% | 4/22/26 | 82,879 | 78,827 | ||
| 1 | Wells Fargo & Co. | 3.908% | 4/25/26 | 47,743 | 46,765 | |
| 1 | Wells Fargo & Co. | 2.188% | 4/30/26 | 80,392 | 75,236 | |
| 1 | Wells Fargo & Co. | 4.100% | 6/3/26 | 18,681 | 18,343 | |
| 1 | Wells Fargo & Co. | 4.540% | 8/15/26 | 33,800 | 33,565 | |
| Wells Fargo & Co. | 3.000% | 10/23/26 | 101,032 | 95,326 | ||
| 1 | Wells Fargo & Co. | 3.196% | 6/17/27 | 83,224 | 78,379 | |
| 1 | Wells Fargo & Co. | 4.300% | 7/22/27 | 77,244 | 75,880 | |
| 1 | Wells Fargo & Co. | 3.526% | 3/24/28 | 90,765 | 85,713 | |
| 1 | Wells Fargo & Co. | 3.584% | 5/22/28 | 68,092 | 64,217 | |
| 1 | Wells Fargo & Co. | 2.393% | 6/2/28 | 45,433 | 40,641 | |
| 1 | Wells Fargo & Co. | 4.808% | 7/25/28 | 65,244 | 64,899 | |
| Western Alliance Bancorp | 3.000% | 6/15/31 | 12,730 | 11,255 | ||
| Western Union Co. | 2.850% | 1/10/25 | 18,609 | 17,863 | ||
| Western Union Co. | 1.350% | 3/15/26 | 12,493 | 11,063 | ||
| Westpac Banking Corp. | 3.300% | 2/26/24 | 33,391 | 33,247 | ||
| Westpac Banking Corp. | 1.019% | 11/18/24 | 530 | 500 | ||
| Westpac Banking Corp. | 2.350% | 2/19/25 | 31,580 | 30,372 | ||
| Westpac Banking Corp. | 2.850% | 5/13/26 | 33,449 | 31,944 | ||
| Westpac Banking Corp. | 1.150% | 6/3/26 | 27,549 | 24,708 | ||
| Westpac Banking Corp. | 2.700% | 8/19/26 | 24,191 | 22,882 | ||
| Westpac Banking Corp. | 3.350% | 3/8/27 | 18,281 | 17,640 | ||
| 1 | Westpac Banking Corp. | 2.894% | 2/4/30 | 33,540 | 31,536 | |
| 1 | Westpac Banking Corp. | 4.322% | 11/23/31 | 51,928 | 49,408 | |
| Willis North America Inc. | 3.600% | 5/15/24 | 27,175 | 26,812 | ||
| Willis North America Inc. | 4.650% | 6/15/27 | 10,225 | 10,034 | ||
| 22,188,042 | ||||||
| Health Care (8.0%) | ||||||
| Abbott Laboratories | 3.400% | 11/30/23 | 24,419 | 24,359 | ||
| Abbott Laboratories | 2.950% | 3/15/25 | 18,561 | 18,254 | ||
| Abbott Laboratories | 3.875% | 9/15/25 | 7,197 | 7,230 | ||
| 3 | Abbott Laboratories | 3.750% | 11/30/26 | 50,282 | 50,407 | |
| AbbVie Inc. | 3.750% | 11/14/23 | 25,063 | 25,021 | ||
| Coupon | Maturity Date | Face Amount ($000) | Market Value• ($000) | |||
| AbbVie Inc. | 3.850% | 6/15/24 | 27,713 | 27,577 | ||
| AbbVie Inc. | 2.600% | 11/21/24 | 82,667 | 79,898 | ||
| AbbVie Inc. | 3.800% | 3/15/25 | 72,588 | 71,620 | ||
| AbbVie Inc. | 3.600% | 5/14/25 | 89,118 | 87,569 | ||
| AbbVie Inc. | 3.200% | 5/14/26 | 49,992 | 47,832 | ||
| AbbVie Inc. | 2.950% | 11/21/26 | 93,920 | 88,665 | ||
| Aetna Inc. | 3.500% | 11/15/24 | 27,449 | 27,077 | ||
| Agilent Technologies Inc. | 3.050% | 9/22/26 | 7,450 | 7,079 | ||
| AmerisourceBergen Corp. | 3.400% | 5/15/24 | 21,781 | 21,473 | ||
| AmerisourceBergen Corp. | 3.250% | 3/1/25 | 13,773 | 13,445 | ||
| Amgen Inc. | 3.625% | 5/22/24 | 32,990 | 32,854 | ||
| Amgen Inc. | 1.900% | 2/21/25 | 21,720 | 20,684 | ||
| Amgen Inc. | 3.125% | 5/1/25 | 18,000 | 17,639 | ||
| Amgen Inc. | 2.600% | 8/19/26 | 27,777 | 26,301 | ||
| Amgen Inc. | 2.200% | 2/21/27 | 43,913 | 40,375 | ||
| AstraZeneca Finance LLC | 0.700% | 5/28/24 | 35,005 | 33,182 | ||
| AstraZeneca Finance LLC | 1.200% | 5/28/26 | 54,001 | 48,753 | ||
| AstraZeneca plc | 3.375% | 11/16/25 | 49,684 | 48,792 | ||
| AstraZeneca plc | 0.700% | 4/8/26 | 14,624 | 13,022 | ||
| AstraZeneca plc | 3.125% | 6/12/27 | 11,100 | 10,710 | ||
| Baxalta Inc. | 4.000% | 6/23/25 | 12,010 | 11,921 | ||
| Baxter International Inc. | 0.868% | 12/1/23 | 19,583 | 18,835 | ||
| Baxter International Inc. | 1.322% | 11/29/24 | 32,479 | 30,561 | ||
| Baxter International Inc. | 2.600% | 8/15/26 | 17,447 | 16,297 | ||
| Baxter International Inc. | 1.915% | 2/1/27 | 42,070 | 37,809 | ||
| Becton Dickinson & Co. | 3.363% | 6/6/24 | 36,291 | 35,879 | ||
| Becton Dickinson & Co. | 3.734% | 12/15/24 | 13,092 | 12,925 | ||
| Becton Dickinson & Co. | 3.700% | 6/6/27 | 30,000 | 29,104 | ||
| Biogen Inc. | 4.050% | 9/15/25 | 33,121 | 32,968 | ||
| Bio-Rad Laboratories Inc. | 3.300% | 3/15/27 | 9,400 | 8,875 | ||
| Boston Scientific Corp. | 3.450% | 3/1/24 | 9,541 | 9,468 | ||
| Boston Scientific Corp. | 1.900% | 6/1/25 | 26,006 | 24,500 | ||
| Bristol-Myers Squibb Co. | 3.250% | 11/1/23 | 11,824 | 11,786 | ||
| Bristol-Myers Squibb Co. | 0.537% | 11/13/23 | 16,570 | 16,016 | ||
| Bristol-Myers Squibb Co. | 3.625% | 5/15/24 | 850 | 848 | ||
| Bristol-Myers Squibb Co. | 2.900% | 7/26/24 | 60,930 | 60,055 | ||
| Bristol-Myers Squibb Co. | 0.750% | 11/13/25 | 18,309 | 16,659 | ||
| Bristol-Myers Squibb Co. | 3.200% | 6/15/26 | 41,742 | 40,820 | ||
| Bristol-Myers Squibb Co. | 3.250% | 2/27/27 | 18,302 | 17,965 | ||
| Bristol-Myers Squibb Co. | 3.450% | 11/15/27 | 12,000 | 11,726 | ||
| Cardinal Health Inc. | 3.079% | 6/15/24 | 17,584 | 17,293 | ||
| Cardinal Health Inc. | 3.500% | 11/15/24 | 1,173 | 1,158 | ||
| Cardinal Health Inc. | 3.750% | 9/15/25 | 10,235 | 10,146 | ||
| Cardinal Health Inc. | 3.410% | 6/15/27 | 24,915 | 24,001 | ||
| Cigna Corp. | 0.613% | 3/15/24 | 3,475 | 3,307 | ||
| 1 | Cigna Corp. | 3.500% | 6/15/24 | 19,780 | 19,584 | |
| 1 | Cigna Corp. | 3.250% | 4/15/25 | 19,790 | 19,309 | |
| Cigna Corp. | 4.125% | 11/15/25 | 71,016 | 70,540 | ||
| 1 | Cigna Corp. | 4.500% | 2/25/26 | 26,662 | 26,771 | |
| Cigna Corp. | 1.250% | 3/15/26 | 8,664 | 7,800 | ||
| 1 | Cigna Corp. | 3.400% | 3/1/27 | 30,187 | 28,864 | |
| CommonSpirit Health | 2.760% | 10/1/24 | 12,872 | 12,470 | ||
| CommonSpirit Health | 1.547% | 10/1/25 | 16,750 | 15,259 | ||
| CVS Health Corp. | 3.375% | 8/12/24 | 21,436 | 21,231 | ||
| CVS Health Corp. | 2.625% | 8/15/24 | 14,527 | 14,188 | ||
| CVS Health Corp. | 4.100% | 3/25/25 | 12,701 | 12,722 | ||
| CVS Health Corp. | 3.875% | 7/20/25 | 63,076 | 62,627 | ||
| CVS Health Corp. | 2.875% | 6/1/26 | 39,410 | 37,637 | ||
| CVS Health Corp. | 3.000% | 8/15/26 | 17,039 | 16,333 | ||
| CVS Health Corp. | 3.625% | 4/1/27 | 31,916 | 31,053 | ||
| CVS Health Corp. | 1.300% | 8/21/27 | 50,000 | 43,300 | ||
| Danaher Corp. | 3.350% | 9/15/25 | 8,730 | 8,586 | ||
| DH Europe Finance II Sarl | 2.200% | 11/15/24 | 8,451 | 8,115 | ||
| Elevance Health Inc. | 3.500% | 8/15/24 | 26,727 | 26,432 | ||
| Elevance Health Inc. | 3.350% | 12/1/24 | 22,493 | 22,124 | ||
| Elevance Health Inc. | 2.375% | 1/15/25 | 37,396 | 35,915 | ||
| Elevance Health Inc. | 1.500% | 3/15/26 | 22,572 | 20,594 | ||
| Coupon | Maturity Date | Face Amount ($000) | Market Value• ($000) | |||
| Eli Lilly & Co. | 2.750% | 6/1/25 | 9,143 | 8,960 | ||
| Gilead Sciences Inc. | 2.500% | 9/1/23 | 29,698 | 29,319 | ||
| Gilead Sciences Inc. | 0.750% | 9/29/23 | 15,820 | 15,304 | ||
| Gilead Sciences Inc. | 3.700% | 4/1/24 | 53,690 | 53,563 | ||
| Gilead Sciences Inc. | 3.500% | 2/1/25 | 40,255 | 39,712 | ||
| Gilead Sciences Inc. | 3.650% | 3/1/26 | 51,853 | 50,925 | ||
| Gilead Sciences Inc. | 2.950% | 3/1/27 | 29,659 | 28,108 | ||
| GlaxoSmithKline Capital Inc. | 2.800% | 3/18/23 | 86 | 86 | ||
| GlaxoSmithKline Capital Inc. | 3.625% | 5/15/25 | 20,060 | 19,964 | ||
| GlaxoSmithKline Capital plc | 0.534% | 10/1/23 | 26,523 | 25,673 | ||
| GlaxoSmithKline Capital plc | 3.000% | 6/1/24 | 23,186 | 22,945 | ||
| HCA Inc. | 5.000% | 3/15/24 | 39,249 | 39,465 | ||
| HCA Inc. | 5.375% | 2/1/25 | 60,824 | 61,356 | ||
| HCA Inc. | 5.250% | 4/15/25 | 43,982 | 44,373 | ||
| HCA Inc. | 5.875% | 2/15/26 | 30,190 | 30,805 | ||
| HCA Inc. | 5.250% | 6/15/26 | 37,525 | 37,643 | ||
| HCA Inc. | 5.375% | 9/1/26 | 22,595 | 22,743 | ||
| HCA Inc. | 4.500% | 2/15/27 | 20,431 | 19,968 | ||
| 2 | HCA Inc. | 3.125% | 3/15/27 | 23,074 | 21,199 | |
| Humana Inc. | 3.850% | 10/1/24 | 15,912 | 15,829 | ||
| Humana Inc. | 4.500% | 4/1/25 | 16,322 | 16,429 | ||
| Humana Inc. | 1.350% | 2/3/27 | 6,333 | 5,534 | ||
| Humana Inc. | 3.950% | 3/15/27 | 15,545 | 15,122 | ||
| Johnson & Johnson | 3.375% | 12/5/23 | 18,065 | 18,035 | ||
| Johnson & Johnson | 2.625% | 1/15/25 | 10,324 | 10,116 | ||
| Johnson & Johnson | 0.550% | 9/1/25 | 18,258 | 16,722 | ||
| Johnson & Johnson | 2.450% | 3/1/26 | 50,660 | 48,697 | ||
| Johnson & Johnson | 2.950% | 3/3/27 | 12,045 | 11,712 | ||
| Kaiser Foundation Hospitals | 3.150% | 5/1/27 | 12,047 | 11,600 | ||
| Laboratory Corp. of America Holdings | 4.000% | 11/1/23 | 1,072 | 1,070 | ||
| Laboratory Corp. of America Holdings | 3.250% | 9/1/24 | 8,020 | 7,879 | ||
| Laboratory Corp. of America Holdings | 2.300% | 12/1/24 | 12,224 | 11,728 | ||
| Laboratory Corp. of America Holdings | 3.600% | 2/1/25 | 16,683 | 16,435 | ||
| Laboratory Corp. of America Holdings | 1.550% | 6/1/26 | 20,598 | 18,555 | ||
| McKesson Corp. | 3.796% | 3/15/24 | 27,984 | 27,942 | ||
| McKesson Corp. | 0.900% | 12/3/25 | 16,886 | 15,186 | ||
| McKesson Corp. | 1.300% | 8/15/26 | 5,205 | 4,637 | ||
| Merck & Co. Inc. | 2.900% | 3/7/24 | 17,220 | 17,048 | ||
| Merck & Co. Inc. | 2.750% | 2/10/25 | 35,378 | 34,607 | ||
| Merck & Co. Inc. | 0.750% | 2/24/26 | 33,649 | 30,438 | ||
| Merck & Co. Inc. | 1.700% | 6/10/27 | 48,965 | 44,480 | ||
| Mylan Inc. | 4.200% | 11/29/23 | 16,061 | 16,048 | ||
| Novartis Capital Corp. | 3.400% | 5/6/24 | 40,650 | 40,448 | ||
| Novartis Capital Corp. | 1.750% | 2/14/25 | 37,067 | 35,503 | ||
| Novartis Capital Corp. | 3.000% | 11/20/25 | 30,092 | 29,495 | ||
| Novartis Capital Corp. | 2.000% | 2/14/27 | 42,606 | 39,592 | ||
| Novartis Capital Corp. | 3.100% | 5/17/27 | 15,336 | 14,900 | ||
| 1 | PeaceHealth Obligated Group | 1.375% | 11/15/25 | 7,545 | 6,842 | |
| PerkinElmer Inc. | 0.550% | 9/15/23 | 8,350 | 8,011 | ||
| PerkinElmer Inc. | 0.850% | 9/15/24 | 13,350 | 12,444 | ||
| Pfizer Inc. | 3.200% | 9/15/23 | 18,136 | 18,059 | ||
| Pfizer Inc. | 2.950% | 3/15/24 | 16,769 | 16,604 | ||
| Pfizer Inc. | 3.400% | 5/15/24 | 22,849 | 22,766 | ||
| Pfizer Inc. | 0.800% | 5/28/25 | 15,171 | 14,044 | ||
| Pfizer Inc. | 2.750% | 6/3/26 | 25,708 | 24,927 | ||
| Pfizer Inc. | 3.000% | 12/15/26 | 32,990 | 32,096 | ||
| 1 | Providence St. Joseph Health Obligated Group | 2.746% | 10/1/26 | 6,633 | 6,268 | |
| Quest Diagnostics Inc. | 4.250% | 4/1/24 | 9,636 | 9,644 | ||
| Quest Diagnostics Inc. | 3.500% | 3/30/25 | 17,015 | 16,729 | ||
| Quest Diagnostics Inc. | 3.450% | 6/1/26 | 15,210 | 14,827 | ||
| Royalty Pharma plc | 0.750% | 9/2/23 | 20,436 | 19,704 | ||
| Royalty Pharma plc | 1.200% | 9/2/25 | 24,627 | 22,388 | ||
| Coupon | Maturity Date | Face Amount ($000) | Market Value• ($000) | |||
| Sanofi | 3.375% | 6/19/23 | 9,912 | 9,896 | ||
| Shire Acquisitions Investments Ireland DAC | 2.875% | 9/23/23 | 27,429 | 27,077 | ||
| Shire Acquisitions Investments Ireland DAC | 3.200% | 9/23/26 | 72,596 | 69,374 | ||
| 1 | SSM Health Care Corp. | 3.688% | 6/1/23 | 8,483 | 8,471 | |
| 1 | SSM Health Care Corp. | 3.823% | 6/1/27 | 12,077 | 11,856 | |
| Stryker Corp. | 0.600% | 12/1/23 | 7,889 | 7,577 | ||
| Stryker Corp. | 3.375% | 5/15/24 | 20,586 | 20,390 | ||
| Stryker Corp. | 1.150% | 6/15/25 | 5,602 | 5,172 | ||
| Stryker Corp. | 3.375% | 11/1/25 | 23,709 | 23,106 | ||
| Stryker Corp. | 3.500% | 3/15/26 | 20,599 | 20,120 | ||
| 1 | Sutter Health | 1.321% | 8/15/25 | 6,431 | 5,908 | |
| Takeda Pharmaceutical Co. Ltd. | 4.400% | 11/26/23 | 53,369 | 53,470 | ||
| Thermo Fisher Scientific Inc. | 0.797% | 10/18/23 | 24,290 | 23,509 | ||
| Thermo Fisher Scientific Inc. | 1.215% | 10/18/24 | 39,875 | 37,727 | ||
| UnitedHealth Group Inc. | 3.500% | 2/15/24 | 26,922 | 26,860 | ||
| UnitedHealth Group Inc. | 2.375% | 8/15/24 | 17,683 | 17,255 | ||
| UnitedHealth Group Inc. | 3.750% | 7/15/25 | 49,454 | 49,324 | ||
| UnitedHealth Group Inc. | 3.700% | 12/15/25 | 6,354 | 6,320 | ||
| UnitedHealth Group Inc. | 1.250% | 1/15/26 | 7,924 | 7,262 | ||
| UnitedHealth Group Inc. | 3.100% | 3/15/26 | 23,638 | 23,102 | ||
| UnitedHealth Group Inc. | 1.150% | 5/15/26 | 23,868 | 21,679 | ||
| UnitedHealth Group Inc. | 3.450% | 1/15/27 | 22,474 | 22,064 | ||
| UnitedHealth Group Inc. | 3.375% | 4/15/27 | 9,990 | 9,769 | ||
| UnitedHealth Group Inc. | 3.700% | 5/15/27 | 14,058 | 13,875 | ||
| 2 | Universal Health Services Inc. | 1.650% | 9/1/26 | 16,004 | 13,795 | |
| 1 | UPMC | 3.600% | 4/3/25 | 7,980 | 7,876 | |
| Utah Acquisition Sub Inc. | 3.950% | 6/15/26 | 45,995 | 43,232 | ||
| Viatris Inc. | 1.650% | 6/22/25 | 15,251 | 13,915 | ||
| Viatris Inc. | 2.300% | 6/22/27 | 10,000 | 8,595 | ||
| Wyeth LLC | 6.450% | 2/1/24 | 19,515 | 20,230 | ||
| Zimmer Biomet Holdings Inc. | 1.450% | 11/22/24 | 15,257 | 14,336 | ||
| Zimmer Biomet Holdings Inc. | 3.550% | 4/1/25 | 1,550 | 1,515 | ||
| Zimmer Biomet Holdings Inc. | 3.050% | 1/15/26 | 25,425 | 24,333 | ||
| Zoetis Inc. | 4.500% | 11/13/25 | 18,114 | 18,332 | ||
| 4,032,767 | ||||||
| Industrials (6.1%) | ||||||
| 1 | 3M Co. | 3.250% | 2/14/24 | 28,254 | 28,067 | |
| 3M Co. | 2.000% | 2/14/25 | 18,829 | 17,941 | ||
| 3M Co. | 2.650% | 4/15/25 | 1,435 | 1,391 | ||
| 1 | 3M Co. | 3.000% | 8/7/25 | 8,338 | 8,128 | |
| 1 | 3M Co. | 2.250% | 9/19/26 | 6,841 | 6,378 | |
| Allegion US Holding Co. Inc. | 3.200% | 10/1/24 | 8,971 | 8,720 | ||
| Amphenol Corp. | 3.200% | 4/1/24 | 7,997 | 7,917 | ||
| Amphenol Corp. | 2.050% | 3/1/25 | 9,317 | 8,861 | ||
| 1 | BNSF Funding Trust I | 6.613% | 12/15/55 | 8,661 | 8,526 | |
| Boeing Co. | 1.950% | 2/1/24 | 26,669 | 25,799 | ||
| Boeing Co. | 1.433% | 2/4/24 | 37,475 | 35,932 | ||
| Boeing Co. | 2.800% | 3/1/24 | 15,088 | 14,740 | ||
| Boeing Co. | 2.850% | 10/30/24 | 8,202 | 7,925 | ||
| Boeing Co. | 4.875% | 5/1/25 | 90,312 | 90,627 | ||
| Boeing Co. | 2.600% | 10/30/25 | 9,031 | 8,476 | ||
| Boeing Co. | 2.750% | 2/1/26 | 40,791 | 38,225 | ||
| Boeing Co. | 2.196% | 2/4/26 | 122,541 | 112,168 | ||
| Boeing Co. | 3.100% | 5/1/26 | 23,222 | 21,948 | ||
| Boeing Co. | 2.250% | 6/15/26 | 11,845 | 10,777 | ||
| Boeing Co. | 2.700% | 2/1/27 | 19,010 | 17,240 | ||
| Boeing Co. | 2.800% | 3/1/27 | 10,633 | 9,662 | ||
| Boeing Co. | 5.040% | 5/1/27 | 41,638 | 41,512 | ||
| Burlington Northern Santa Fe LLC | 3.850% | 9/1/23 | 24,549 | 24,595 | ||
| Burlington Northern Santa Fe LLC | 3.750% | 4/1/24 | 21,157 | 21,142 | ||
| Burlington Northern Santa Fe LLC | 3.400% | 9/1/24 | 20,367 | 20,275 | ||
| Burlington Northern Santa Fe LLC | 3.000% | 4/1/25 | 8,634 | 8,479 | ||
| Burlington Northern Santa Fe LLC | 3.650% | 9/1/25 | 12,617 | 12,548 | ||
| Burlington Northern Santa Fe LLC | 7.000% | 12/15/25 | 7,875 | 8,588 | ||
| Burlington Northern Santa Fe LLC | 3.250% | 6/15/27 | 11,050 | 10,788 | ||
| Coupon | Maturity Date | Face Amount ($000) | Market Value• ($000) | |||
| Canadian National Railway Co. | 2.950% | 11/21/24 | 5,582 | 5,470 | ||
| Canadian National Railway Co. | 2.750% | 3/1/26 | 14,228 | 13,626 | ||
| Canadian Pacific Railway Co. | 1.350% | 12/2/24 | 31,942 | 30,027 | ||
| Canadian Pacific Railway Co. | 2.900% | 2/1/25 | 18,038 | 17,518 | ||
| Canadian Pacific Railway Co. | 1.750% | 12/2/26 | 28,806 | 26,114 | ||
| Carrier Global Corp. | 2.242% | 2/15/25 | 34,730 | 33,023 | ||
| Carrier Global Corp. | 2.493% | 2/15/27 | 28,441 | 26,167 | ||
| 1 | Caterpillar Financial Services Corp. | 0.450% | 9/14/23 | 25,614 | 24,796 | |
| 1 | Caterpillar Financial Services Corp. | 3.750% | 11/24/23 | 16,041 | 16,068 | |
| 1 | Caterpillar Financial Services Corp. | 3.650% | 12/7/23 | 18,467 | 18,483 | |
| 1 | Caterpillar Financial Services Corp. | 0.950% | 1/10/24 | 25,509 | 24,634 | |
| 1 | Caterpillar Financial Services Corp. | 2.850% | 5/17/24 | 14,715 | 14,514 | |
| 1 | Caterpillar Financial Services Corp. | 3.300% | 6/9/24 | 13,239 | 13,150 | |
| 1 | Caterpillar Financial Services Corp. | 0.600% | 9/13/24 | 13,099 | 12,312 | |
| 1 | Caterpillar Financial Services Corp. | 2.150% | 11/8/24 | 17,322 | 16,742 | |
| 1 | Caterpillar Financial Services Corp. | 3.250% | 12/1/24 | 14,904 | 14,751 | |
| 1 | Caterpillar Financial Services Corp. | 1.450% | 5/15/25 | 21,171 | 19,917 | |
| 1 | Caterpillar Financial Services Corp. | 3.650% | 8/12/25 | 13,750 | 13,662 | |
| 1 | Caterpillar Financial Services Corp. | 0.800% | 11/13/25 | 18,238 | 16,520 | |
| Caterpillar Financial Services Corp. | 0.900% | 3/2/26 | 23,001 | 20,867 | ||
| Caterpillar Financial Services Corp. | 2.400% | 8/9/26 | 16,385 | 15,495 | ||
| 1 | Caterpillar Financial Services Corp. | 1.150% | 9/14/26 | 38,495 | 34,494 | |
| 1 | Caterpillar Financial Services Corp. | 1.700% | 1/8/27 | 9,535 | 8,725 | |
| 1 | Caterpillar Financial Services Corp. | 3.600% | 8/12/27 | 14,000 | 13,741 | |
| Caterpillar Inc. | 3.400% | 5/15/24 | 19,418 | 19,357 | ||
| CNH Industrial Capital LLC | 4.200% | 1/15/24 | 15,456 | 15,409 | ||
| CNH Industrial Capital LLC | 1.875% | 1/15/26 | 15,042 | 13,666 | ||
| CNH Industrial Capital LLC | 1.450% | 7/15/26 | 10,276 | 9,118 | ||
| 1 | Continental Airlines Pass-Through Trust Class A Series 2012-2 | 4.000% | 10/29/24 | 5,336 | 5,078 | |
| Crane Holdings Co. | 4.450% | 12/15/23 | 5,141 | 5,159 | ||
| CSX Corp. | 3.400% | 8/1/24 | 16,640 | 16,473 | ||
| CSX Corp. | 3.350% | 11/1/25 | 9,713 | 9,499 | ||
| CSX Corp. | 2.600% | 11/1/26 | 15,810 | 14,958 | ||
| CSX Corp. | 3.250% | 6/1/27 | 19,476 | 18,755 | ||
| Cummins Inc. | 3.650% | 10/1/23 | 5,358 | 5,357 | ||
| Cummins Inc. | 0.750% | 9/1/25 | 14,105 | 12,930 | ||
| Deere & Co. | 2.750% | 4/15/25 | 21,275 | 20,705 | ||
| 1 | Delta Air Lines Pass-Through Trust Class AA Series 2019-1 | 3.204% | 4/25/24 | 6,816 | 6,566 | |
| Dover Corp. | 3.150% | 11/15/25 | 8,762 | 8,478 | ||
| Emerson Electric Co. | 3.150% | 6/1/25 | 8,666 | 8,525 | ||
| Emerson Electric Co. | 0.875% | 10/15/26 | 20,628 | 18,381 | ||
| FedEx Corp. | 3.250% | 4/1/26 | 16,900 | 16,458 | ||
| Fortive Corp. | 3.150% | 6/15/26 | 20,578 | 19,690 | ||
| General Dynamics Corp. | 3.250% | 4/1/25 | 14,943 | 14,720 | ||
| General Dynamics Corp. | 3.500% | 5/15/25 | 12,002 | 11,930 | ||
| General Dynamics Corp. | 2.125% | 8/15/26 | 21,397 | 20,079 | ||
| General Dynamics Corp. | 3.500% | 4/1/27 | 23,287 | 22,785 | ||
| 1 | General Electric Co. | 3.150% | 9/7/22 | 2 | 2 | |
| Honeywell International Inc. | 3.350% | 12/1/23 | 7,180 | 7,162 | ||
| Honeywell International Inc. | 2.300% | 8/15/24 | 19,103 | 18,635 | ||
| Honeywell International Inc. | 1.350% | 6/1/25 | 25,602 | 24,032 | ||
| Honeywell International Inc. | 2.500% | 11/1/26 | 36,071 | 34,242 | ||
| Honeywell International Inc. | 1.100% | 3/1/27 | 7,940 | 7,085 | ||
| Huntington Ingalls Industries Inc. | 3.844% | 5/1/25 | 13,416 | 13,127 | ||
| Illinois Tool Works Inc. | 3.500% | 3/1/24 | 22,641 | 22,582 | ||
| Illinois Tool Works Inc. | 2.650% | 11/15/26 | 21,458 | 20,589 | ||
| JB Hunt Transport Services Inc. | 3.875% | 3/1/26 | 21,867 | 21,470 | ||
| 1 | John Deere Capital Corp. | 3.450% | 6/7/23 | 9,523 | 9,515 | |
| 1 | John Deere Capital Corp. | 0.400% | 10/10/23 | 10,005 | 9,663 | |
| John Deere Capital Corp. | 3.650% | 10/12/23 | 11,157 | 11,162 | ||
| 1 | John Deere Capital Corp. | 0.900% | 1/10/24 | 11,845 | 11,430 | |
| 1 | John Deere Capital Corp. | 3.450% | 1/10/24 | 10,967 | 10,934 | |
| 1 | John Deere Capital Corp. | 0.450% | 1/17/24 | 12,071 | 11,555 | |
| 1 | John Deere Capital Corp. | 2.600% | 3/7/24 | 16,113 | 15,859 | |
| 1 | John Deere Capital Corp. | 0.450% | 6/7/24 | 13,357 | 12,653 | |
| Coupon | Maturity Date | Face Amount ($000) | Market Value• ($000) | |||
| 1 | John Deere Capital Corp. | 3.350% | 6/12/24 | 14,640 | 14,561 | |
| 1 | John Deere Capital Corp. | 2.650% | 6/24/24 | 19,132 | 18,818 | |
| 1 | John Deere Capital Corp. | 0.625% | 9/10/24 | 7,297 | 6,870 | |
| 1 | John Deere Capital Corp. | 2.050% | 1/9/25 | 13,604 | 13,079 | |
| 1 | John Deere Capital Corp. | 1.250% | 1/10/25 | 6,617 | 6,254 | |
| 1 | John Deere Capital Corp. | 3.450% | 3/13/25 | 12,166 | 12,102 | |
| John Deere Capital Corp. | 3.400% | 6/6/25 | 11,536 | 11,428 | ||
| 1 | John Deere Capital Corp. | 3.400% | 9/11/25 | 12,600 | 12,438 | |
| 1 | John Deere Capital Corp. | 0.700% | 1/15/26 | 19,951 | 18,034 | |
| 1 | John Deere Capital Corp. | 2.650% | 6/10/26 | 14,533 | 13,940 | |
| 1 | John Deere Capital Corp. | 1.050% | 6/17/26 | 16,190 | 14,687 | |
| 1 | John Deere Capital Corp. | 2.250% | 9/14/26 | 13,108 | 12,409 | |
| 1 | John Deere Capital Corp. | 1.300% | 10/13/26 | 8,681 | 7,840 | |
| 1 | John Deere Capital Corp. | 1.700% | 1/11/27 | 3,561 | 3,257 | |
| 1 | John Deere Capital Corp. | 2.350% | 3/8/27 | 14,015 | 13,121 | |
| 1 | John Deere Capital Corp. | 1.750% | 3/9/27 | 20,434 | 18,651 | |
| 1 | Johnson Controls International plc | 3.625% | 7/2/24 | 4,402 | 4,356 | |
| 1 | Johnson Controls International plc | 3.900% | 2/14/26 | 13,989 | 13,817 | |
| Keysight Technologies Inc. | 4.550% | 10/30/24 | 13,401 | 13,473 | ||
| Keysight Technologies Inc. | 4.600% | 4/6/27 | 16,180 | 16,234 | ||
| L3Harris Technologies Inc. | 3.950% | 5/28/24 | 10,510 | 10,436 | ||
| L3Harris Technologies Inc. | 3.832% | 4/27/25 | 15,832 | 15,546 | ||
| L3Harris Technologies Inc. | 3.850% | 12/15/26 | 4,360 | 4,240 | ||
| Lennox International Inc. | 3.000% | 11/15/23 | 5,851 | 5,760 | ||
| Lennox International Inc. | 1.350% | 8/1/25 | 9,059 | 8,228 | ||
| Lockheed Martin Corp. | 3.550% | 1/15/26 | 26,526 | 26,320 | ||
| 2 | Mileage Plus Holdings LLC | 6.500% | 6/20/27 | 5,000 | 5,015 | |
| Norfolk Southern Corp. | 3.850% | 1/15/24 | 7,983 | 7,982 | ||
| Norfolk Southern Corp. | 3.650% | 8/1/25 | 5,126 | 5,063 | ||
| Norfolk Southern Corp. | 2.900% | 6/15/26 | 18,169 | 17,351 | ||
| Norfolk Southern Corp. | 7.800% | 5/15/27 | 4,542 | 5,180 | ||
| Norfolk Southern Corp. | 3.150% | 6/1/27 | 6,500 | 6,188 | ||
| Northrop Grumman Corp. | 2.930% | 1/15/25 | 29,838 | 29,070 | ||
| Northrop Grumman Corp. | 3.200% | 2/1/27 | 19,606 | 18,832 | ||
| Otis Worldwide Corp. | 2.056% | 4/5/25 | 39,245 | 37,080 | ||
| Otis Worldwide Corp. | 2.293% | 4/5/27 | 13,614 | 12,416 | ||
| PACCAR Financial Corp. | 3.400% | 8/9/23 | 9,281 | 9,262 | ||
| 1 | PACCAR Financial Corp. | 0.350% | 8/11/23 | 5,143 | 4,987 | |
| 1 | PACCAR Financial Corp. | 0.350% | 2/2/24 | 8,229 | 7,845 | |
| 1 | PACCAR Financial Corp. | 3.150% | 6/13/24 | 12,144 | 12,028 | |
| 1 | PACCAR Financial Corp. | 2.150% | 8/15/24 | 9,467 | 9,169 | |
| 1 | PACCAR Financial Corp. | 0.900% | 11/8/24 | 8,091 | 7,595 | |
| 1 | PACCAR Financial Corp. | 1.800% | 2/6/25 | 14,436 | 13,759 | |
| Parker-Hannifin Corp. | 2.700% | 6/14/24 | 16,952 | 16,518 | ||
| Parker-Hannifin Corp. | 3.650% | 6/15/24 | 30,507 | 30,230 | ||
| 1 | Parker-Hannifin Corp. | 3.300% | 11/21/24 | 9,418 | 9,261 | |
| Parker-Hannifin Corp. | 3.250% | 3/1/27 | 3,336 | 3,198 | ||
| Parker-Hannifin Corp. | 4.250% | 9/15/27 | 13,000 | 12,851 | ||
| Precision Castparts Corp. | 3.250% | 6/15/25 | 27,957 | 27,595 | ||
| Raytheon Technologies Corp. | 3.700% | 12/15/23 | 9,856 | 9,851 | ||
| Raytheon Technologies Corp. | 3.200% | 3/15/24 | 31,914 | 31,618 | ||
| Raytheon Technologies Corp. | 3.950% | 8/16/25 | 44,800 | 44,796 | ||
| Raytheon Technologies Corp. | 3.500% | 3/15/27 | 27,157 | 26,346 | ||
| Raytheon Technologies Corp. | 3.125% | 5/4/27 | 20,686 | 19,751 | ||
| Republic Services Inc. | 2.500% | 8/15/24 | 28,234 | 27,386 | ||
| Republic Services Inc. | 3.200% | 3/15/25 | 16,668 | 16,290 | ||
| Republic Services Inc. | 0.875% | 11/15/25 | 9,565 | 8,602 | ||
| Republic Services Inc. | 2.900% | 7/1/26 | 6,716 | 6,388 | ||
| Rockwell Automation Inc. | 2.875% | 3/1/25 | 6,297 | 6,131 | ||
| 1 | Ryder System Inc. | 3.750% | 6/9/23 | 9,884 | 9,858 | |
| 1 | Ryder System Inc. | 3.875% | 12/1/23 | 2,887 | 2,875 | |
| 1 | Ryder System Inc. | 3.650% | 3/18/24 | 23,917 | 23,702 | |
| 1 | Ryder System Inc. | 2.500% | 9/1/24 | 3,276 | 3,167 | |
| 1 | Ryder System Inc. | 4.625% | 6/1/25 | 7,321 | 7,312 | |
| 1 | Ryder System Inc. | 3.350% | 9/1/25 | 12,801 | 12,336 | |
| 1 | Ryder System Inc. | 1.750% | 9/1/26 | 7,212 | 6,483 | |
| 1 | Ryder System Inc. | 2.900% | 12/1/26 | 11,405 | 10,576 | |
| Coupon | Maturity Date | Face Amount ($000) | Market Value• ($000) | |||
| 1 | Ryder System Inc. | 2.850% | 3/1/27 | 5,835 | 5,388 | |
| Southwest Airlines Co. | 5.250% | 5/4/25 | 42,516 | 43,620 | ||
| Southwest Airlines Co. | 3.000% | 11/15/26 | 3,500 | 3,298 | ||
| Southwest Airlines Co. | 5.125% | 6/15/27 | 39,438 | 40,245 | ||
| Teledyne Technologies Inc. | 0.650% | 4/1/23 | 11,647 | 11,385 | ||
| Teledyne Technologies Inc. | 0.950% | 4/1/24 | 19,336 | 18,257 | ||
| Teledyne Technologies Inc. | 1.600% | 4/1/26 | 17,029 | 15,278 | ||
| Textron Inc. | 4.300% | 3/1/24 | 8,654 | 8,655 | ||
| Textron Inc. | 3.875% | 3/1/25 | 6,517 | 6,429 | ||
| Textron Inc. | 4.000% | 3/15/26 | 12,097 | 11,846 | ||
| Textron Inc. | 3.650% | 3/15/27 | 4,753 | 4,531 | ||
| Timken Co. | 3.875% | 9/1/24 | 3,590 | 3,542 | ||
| Trane Technologies Global Holding Co. Ltd. | 4.250% | 6/15/23 | 14,764 | 14,802 | ||
| Trane Technologies Luxembourg Finance SA | 3.550% | 11/1/24 | 6,266 | 6,180 | ||
| Trane Technologies Luxembourg Finance SA | 3.500% | 3/21/26 | 11,873 | 11,440 | ||
| Trimble Inc. | 4.750% | 12/1/24 | 8,802 | 8,838 | ||
| Tyco Electronics Group SA | 3.450% | 8/1/24 | 9,966 | 9,881 | ||
| Tyco Electronics Group SA | 3.700% | 2/15/26 | 8,325 | 8,207 | ||
| Tyco Electronics Group SA | 3.125% | 8/15/27 | 16,440 | 15,614 | ||
| Union Pacific Corp. | 3.646% | 2/15/24 | 13,874 | 13,827 | ||
| Union Pacific Corp. | 3.150% | 3/1/24 | 19,322 | 19,146 | ||
| Union Pacific Corp. | 3.750% | 3/15/24 | 12,590 | 12,589 | ||
| Union Pacific Corp. | 3.250% | 1/15/25 | 6,381 | 6,300 | ||
| Union Pacific Corp. | 3.750% | 7/15/25 | 6,939 | 6,922 | ||
| Union Pacific Corp. | 3.250% | 8/15/25 | 9,779 | 9,620 | ||
| Union Pacific Corp. | 2.750% | 3/1/26 | 17,358 | 16,666 | ||
| 1 | United Airlines Pass-Through Trust Class A Series 2012-1 | 4.150% | 4/11/24 | 6,465 | 6,210 | |
| 1 | United Airlines Pass-Through Trust Class A Series 2013-1 | 4.300% | 8/15/25 | 8,088 | 7,630 | |
| 1 | United Airlines Pass-Through Trust Class A Series 2014-1 | 4.000% | 4/11/26 | 9,826 | 9,108 | |
| 1 | United Airlines Pass-Through Trust Class A Series 2014-2 | 3.750% | 9/3/26 | 8,280 | 7,670 | |
| 1 | United Airlines Pass-Through Trust Class B Series 2020-1 | 4.875% | 1/15/26 | 16,079 | 15,189 | |
| United Parcel Service Inc. | 2.200% | 9/1/24 | 10,682 | 10,359 | ||
| United Parcel Service Inc. | 2.800% | 11/15/24 | 16,994 | 16,675 | ||
| United Parcel Service Inc. | 3.900% | 4/1/25 | 14,793 | 14,820 | ||
| United Parcel Service Inc. | 2.400% | 11/15/26 | 7,247 | 6,882 | ||
| Vontier Corp. | 1.800% | 4/1/26 | 12,315 | 10,773 | ||
| Waste Management Inc. | 0.750% | 11/15/25 | 10,933 | 9,880 | ||
| Westinghouse Air Brake Technologies Corp. | 4.400% | 3/15/24 | 14,027 | 13,953 | ||
| Westinghouse Air Brake Technologies Corp. | 3.200% | 6/15/25 | 14,332 | 13,671 | ||
| Westinghouse Air Brake Technologies Corp. | 3.450% | 11/15/26 | 17,408 | 16,341 | ||
| WW Grainger Inc. | 1.850% | 2/15/25 | 11,179 | 10,623 | ||
| Xylem Inc. | 3.250% | 11/1/26 | 11,140 | 10,648 | ||
| 3,074,744 | ||||||
| Materials (1.9%) | ||||||
| Air Products and Chemicals Inc. | 3.350% | 7/31/24 | 8,308 | 8,262 | ||
| Air Products and Chemicals Inc. | 1.500% | 10/15/25 | 15,087 | 14,051 | ||
| Air Products and Chemicals Inc. | 1.850% | 5/15/27 | 15,001 | 13,671 | ||
| Albemarle Corp. | 4.650% | 6/1/27 | 8,500 | 8,442 | ||
| Amcor Finance USA Inc. | 3.625% | 4/28/26 | 1,321 | 1,259 | ||
| Amcor Flexibles North America Inc. | 4.000% | 5/17/25 | 11,432 | 11,212 | ||
| ArcelorMittal SA | 4.550% | 3/11/26 | 15,241 | 14,955 | ||
| Berry Global Inc. | 0.950% | 2/15/24 | 19,496 | 18,473 | ||
| Berry Global Inc. | 1.570% | 1/15/26 | 39,978 | 35,654 | ||
| Berry Global Inc. | 1.650% | 1/15/27 | 5,045 | 4,344 | ||
| BHP Billiton Finance USA Ltd. | 3.850% | 9/30/23 | 9,840 | 9,846 | ||
| BHP Billiton Finance USA Ltd. | 6.420% | 3/1/26 | 8,464 | 9,052 | ||
| Carlisle Cos. Inc. | 3.500% | 12/1/24 | 10,616 | 10,440 | ||
| Coupon | Maturity Date | Face Amount ($000) | Market Value• ($000) | |||
| Celanese US Holdings LLC | 3.500% | 5/8/24 | 13,276 | 12,927 | ||
| Celanese US Holdings LLC | 5.900% | 7/5/24 | 35,730 | 36,018 | ||
| Celanese US Holdings LLC | 6.050% | 3/15/25 | 37,800 | 37,904 | ||
| Celanese US Holdings LLC | 1.400% | 8/5/26 | 11,189 | 9,408 | ||
| Celanese US Holdings LLC | 6.165% | 7/15/27 | 44,840 | 44,908 | ||
| Celulosa Arauco y Constitucion SA | 4.500% | 8/1/24 | 9,050 | 9,058 | ||
| Dow Chemical Co. | 4.550% | 11/30/25 | 427 | 431 | ||
| DuPont de Nemours Inc. | 4.205% | 11/15/23 | 49,784 | 49,906 | ||
| DuPont de Nemours Inc. | 4.493% | 11/15/25 | 42,740 | 43,085 | ||
| Eastman Chemical Co. | 3.800% | 3/15/25 | 16,405 | 16,152 | ||
| Ecolab Inc. | 0.900% | 12/15/23 | 5,834 | 5,644 | ||
| Ecolab Inc. | 2.700% | 11/1/26 | 19,130 | 18,388 | ||
| Ecolab Inc. | 1.650% | 2/1/27 | 10,126 | 9,222 | ||
| EI du Pont de Nemours & Co. | 1.700% | 7/15/25 | 11,378 | 10,695 | ||
| Fibria Overseas Finance Ltd. | 4.000% | 1/14/25 | 7,945 | 7,881 | ||
| Fibria Overseas Finance Ltd. | 5.500% | 1/17/27 | 15,658 | 15,818 | ||
| FMC Corp. | 4.100% | 2/1/24 | 4,693 | 4,674 | ||
| FMC Corp. | 3.200% | 10/1/26 | 14,370 | 13,612 | ||
| Freeport-McMoRan Inc. | 4.550% | 11/14/24 | 2,851 | 2,870 | ||
| Freeport-McMoRan Inc. | 5.000% | 9/1/27 | 3,800 | 3,839 | ||
| Freeport-McMoRan Inc. | 4.125% | 3/1/28 | 450 | 421 | ||
| Georgia-Pacific LLC | 8.000% | 1/15/24 | 13,429 | 14,127 | ||
| 2 | Georgia-Pacific LLC | 0.625% | 5/15/24 | 3,075 | 2,894 | |
| 2 | Georgia-Pacific LLC | 2.100% | 4/30/27 | 4,400 | 4,009 | |
| Kinross Gold Corp. | 5.950% | 3/15/24 | 10,428 | 10,604 | ||
| Kinross Gold Corp. | 4.500% | 7/15/27 | 11,300 | 10,944 | ||
| Linde Inc. | 2.650% | 2/5/25 | 8,382 | 8,157 | ||
| Linde Inc. | 3.200% | 1/30/26 | 15,410 | 15,108 | ||
| LYB International Finance III LLC | 1.250% | 10/1/25 | 19,895 | 17,990 | ||
| LyondellBasell Industries NV | 5.750% | 4/15/24 | 10,137 | 10,346 | ||
| Martin Marietta Materials Inc. | 4.250% | 7/2/24 | 10,091 | 10,066 | ||
| Martin Marietta Materials Inc. | 3.450% | 6/1/27 | 10,023 | 9,524 | ||
| Mosaic Co. | 4.250% | 11/15/23 | 25,946 | 25,978 | ||
| Nucor Corp. | 3.950% | 5/23/25 | 6,120 | 6,075 | ||
| Nucor Corp. | 2.000% | 6/1/25 | 18,828 | 17,728 | ||
| Nucor Corp. | 4.300% | 5/23/27 | 6,290 | 6,256 | ||
| Nutrien Ltd. | 3.000% | 4/1/25 | 10,106 | 9,805 | ||
| Nutrien Ltd. | 4.000% | 12/15/26 | 15,281 | 15,026 | ||
| Packaging Corp. of America | 3.650% | 9/15/24 | 4,264 | 4,229 | ||
| PPG Industries Inc. | 2.400% | 8/15/24 | 6,256 | 6,068 | ||
| PPG Industries Inc. | 1.200% | 3/15/26 | 20,658 | 18,506 | ||
| Reliance Steel & Aluminum Co. | 1.300% | 8/15/25 | 5,850 | 5,339 | ||
| RPM International Inc. | 3.750% | 3/15/27 | 16,033 | 15,275 | ||
| Sherwin-Williams Co. | 3.125% | 6/1/24 | 25,069 | 24,692 | ||
| Sherwin-Williams Co. | 4.050% | 8/8/24 | 3,505 | 3,501 | ||
| Sherwin-Williams Co. | 3.450% | 8/1/25 | 9,374 | 9,173 | ||
| Sherwin-Williams Co. | 4.250% | 8/8/25 | 3,305 | 3,302 | ||
| Sherwin-Williams Co. | 3.450% | 6/1/27 | 24,055 | 23,025 | ||
| Southern Copper Corp. | 3.875% | 4/23/25 | 8,474 | 8,299 | ||
| Steel Dynamics Inc. | 2.800% | 12/15/24 | 11,191 | 10,820 | ||
| Steel Dynamics Inc. | 2.400% | 6/15/25 | 17,500 | 16,568 | ||
| Vale Overseas Ltd. | 6.250% | 8/10/26 | 33,439 | 35,060 | ||
| Vulcan Materials Co. | 4.500% | 4/1/25 | 7,256 | 7,273 | ||
| Vulcan Materials Co. | 3.900% | 4/1/27 | 8,987 | 8,816 | ||
| Westlake Corp. | 0.875% | 8/15/24 | 90 | 85 | ||
| Westlake Corp. | 3.600% | 8/15/26 | 21,245 | 20,535 | ||
| WRKCo Inc. | 3.000% | 9/15/24 | 11,264 | 10,965 | ||
| WRKCo Inc. | 3.750% | 3/15/25 | 22,758 | 22,372 | ||
| WRKCo Inc. | 4.650% | 3/15/26 | 18,045 | 18,155 | ||
| 979,217 | ||||||
| Real Estate (3.6%) | ||||||
| Alexandria Real Estate Equities Inc. | 3.450% | 4/30/25 | 24,233 | 23,812 | ||
| Alexandria Real Estate Equities Inc. | 4.300% | 1/15/26 | 4,933 | 4,897 | ||
| Alexandria Real Estate Equities Inc. | 3.800% | 4/15/26 | 6,766 | 6,615 | ||
| Alexandria Real Estate Equities Inc. | 3.950% | 1/15/27 | 7,074 | 6,910 | ||
| American Tower Corp. | 3.000% | 6/15/23 | 18,766 | 18,600 | ||
| American Tower Corp. | 0.600% | 1/15/24 | 6,153 | 5,853 | ||
| Coupon | Maturity Date | Face Amount ($000) | Market Value• ($000) | |||
| American Tower Corp. | 5.000% | 2/15/24 | 27,290 | 27,570 | ||
| American Tower Corp. | 3.375% | 5/15/24 | 16,986 | 16,777 | ||
| American Tower Corp. | 2.950% | 1/15/25 | 14,229 | 13,669 | ||
| American Tower Corp. | 2.400% | 3/15/25 | 16,115 | 15,277 | ||
| American Tower Corp. | 4.000% | 6/1/25 | 16,469 | 16,200 | ||
| American Tower Corp. | 1.300% | 9/15/25 | 11,103 | 10,078 | ||
| American Tower Corp. | 4.400% | 2/15/26 | 11,214 | 11,117 | ||
| American Tower Corp. | 1.600% | 4/15/26 | 13,225 | 11,859 | ||
| American Tower Corp. | 1.450% | 9/15/26 | 12,323 | 10,830 | ||
| American Tower Corp. | 3.375% | 10/15/26 | 22,016 | 20,802 | ||
| American Tower Corp. | 2.750% | 1/15/27 | 12,383 | 11,346 | ||
| American Tower Corp. | 3.125% | 1/15/27 | 8,539 | 7,957 | ||
| American Tower Corp. | 3.650% | 3/15/27 | 4,950 | 4,707 | ||
| American Tower Corp. | 3.550% | 7/15/27 | 20,760 | 19,610 | ||
| 1 | AvalonBay Communities Inc. | 4.200% | 12/15/23 | 8,480 | 8,519 | |
| 1 | AvalonBay Communities Inc. | 3.500% | 11/15/24 | 9,250 | 9,129 | |
| 1 | AvalonBay Communities Inc. | 3.450% | 6/1/25 | 12,454 | 12,246 | |
| 1 | AvalonBay Communities Inc. | 3.500% | 11/15/25 | 7,410 | 7,237 | |
| 1 | AvalonBay Communities Inc. | 2.950% | 5/11/26 | 15,490 | 14,720 | |
| 1 | AvalonBay Communities Inc. | 2.900% | 10/15/26 | 5,017 | 4,715 | |
| 1 | AvalonBay Communities Inc. | 3.350% | 5/15/27 | 3,840 | 3,656 | |
| Boston Properties LP | 3.125% | 9/1/23 | 19,159 | 18,971 | ||
| Boston Properties LP | 3.800% | 2/1/24 | 16,945 | 16,824 | ||
| Boston Properties LP | 3.200% | 1/15/25 | 12,820 | 12,499 | ||
| Boston Properties LP | 3.650% | 2/1/26 | 24,909 | 24,206 | ||
| Boston Properties LP | 2.750% | 10/1/26 | 18,309 | 16,983 | ||
| Brandywine Operating Partnership LP | 4.100% | 10/1/24 | 10,334 | 10,149 | ||
| Brixmor Operating Partnership LP | 3.650% | 6/15/24 | 15,358 | 15,003 | ||
| Brixmor Operating Partnership LP | 3.850% | 2/1/25 | 15,110 | 14,715 | ||
| Brixmor Operating Partnership LP | 4.125% | 6/15/26 | 12,686 | 12,268 | ||
| Brixmor Operating Partnership LP | 3.900% | 3/15/27 | 3,163 | 2,988 | ||
| CBRE Services Inc. | 4.875% | 3/1/26 | 13,839 | 13,927 | ||
| Corporate Office Properties LP | 2.250% | 3/15/26 | 13,393 | 11,982 | ||
| Crown Castle Inc. | 3.200% | 9/1/24 | 24,838 | 24,442 | ||
| Crown Castle Inc. | 1.350% | 7/15/25 | 2,674 | 2,452 | ||
| Crown Castle Inc. | 4.450% | 2/15/26 | 27,369 | 27,233 | ||
| Crown Castle Inc. | 3.700% | 6/15/26 | 25,226 | 24,435 | ||
| Crown Castle Inc. | 1.050% | 7/15/26 | 14,292 | 12,529 | ||
| Crown Castle Inc. | 4.000% | 3/1/27 | 13,744 | 13,359 | ||
| Crown Castle Inc. | 2.900% | 3/15/27 | 3,060 | 2,834 | ||
| CubeSmart LP | 4.000% | 11/15/25 | 7,006 | 6,820 | ||
| CubeSmart LP | 3.125% | 9/1/26 | 7,598 | 7,153 | ||
| Digital Realty Trust LP | 3.700% | 8/15/27 | 19,304 | 18,429 | ||
| Duke Realty LP | 3.250% | 6/30/26 | 7,928 | 7,584 | ||
| EPR Properties | 4.500% | 4/1/25 | 3,220 | 3,109 | ||
| EPR Properties | 4.500% | 6/1/27 | 18,142 | 16,517 | ||
| Equinix Inc. | 2.625% | 11/18/24 | 20,759 | 20,001 | ||
| Equinix Inc. | 1.250% | 7/15/25 | 5,101 | 4,669 | ||
| Equinix Inc. | 1.000% | 9/15/25 | 18,663 | 16,832 | ||
| Equinix Inc. | 1.450% | 5/15/26 | 16,241 | 14,523 | ||
| Equinix Inc. | 2.900% | 11/18/26 | 17,493 | 16,332 | ||
| Equinix Inc. | 1.800% | 7/15/27 | 15,650 | 13,686 | ||
| ERP Operating LP | 3.375% | 6/1/25 | 15,519 | 15,117 | ||
| ERP Operating LP | 2.850% | 11/1/26 | 9,069 | 8,612 | ||
| Essex Portfolio LP | 3.875% | 5/1/24 | 7,812 | 7,748 | ||
| Essex Portfolio LP | 3.500% | 4/1/25 | 16,984 | 16,642 | ||
| Essex Portfolio LP | 3.375% | 4/15/26 | 5,855 | 5,622 | ||
| Essex Portfolio LP | 3.625% | 5/1/27 | 7,677 | 7,349 | ||
| Federal Realty Investment Trust | 3.950% | 1/15/24 | 10,766 | 10,714 | ||
| Federal Realty Investment Trust | 1.250% | 2/15/26 | 12,117 | 10,890 | ||
| Federal Realty Investment Trust | 3.250% | 7/15/27 | 5,029 | 4,739 | ||
| GLP Capital LP | 5.375% | 11/1/23 | 10,258 | 10,219 | ||
| GLP Capital LP | 3.350% | 9/1/24 | 12,793 | 12,174 | ||
| GLP Capital LP | 5.250% | 6/1/25 | 18,903 | 18,646 | ||
| GLP Capital LP | 5.375% | 4/15/26 | 20,066 | 19,760 | ||
| Healthcare Realty Holdings LP | 3.500% | 8/1/26 | 20,304 | 19,363 | ||
| Coupon | Maturity Date | Face Amount ($000) | Market Value• ($000) | |||
| Healthcare Realty Holdings LP | 3.750% | 7/1/27 | 9,345 | 8,946 | ||
| Healthpeak Properties Inc. | 3.400% | 2/1/25 | 8,932 | 8,731 | ||
| Healthpeak Properties Inc. | 4.000% | 6/1/25 | 4,817 | 4,761 | ||
| Healthpeak Properties Inc. | 3.250% | 7/15/26 | 14,522 | 13,942 | ||
| Healthpeak Properties Inc. | 1.350% | 2/1/27 | 3,170 | 2,782 | ||
| Highwoods Realty LP | 3.875% | 3/1/27 | 11,393 | 10,849 | ||
| Host Hotels & Resorts LP | 3.875% | 4/1/24 | 6,029 | 5,948 | ||
| 1 | Host Hotels & Resorts LP | 4.000% | 6/15/25 | 12,075 | 11,729 | |
| 1 | Host Hotels & Resorts LP | 4.500% | 2/1/26 | 9,285 | 9,078 | |
| Kilroy Realty LP | 3.450% | 12/15/24 | 9,030 | 8,825 | ||
| Kilroy Realty LP | 4.375% | 10/1/25 | 12,768 | 12,582 | ||
| Kimco Realty Corp. | 2.700% | 3/1/24 | 9,687 | 9,485 | ||
| Kimco Realty Corp. | 3.300% | 2/1/25 | 14,465 | 14,119 | ||
| Kimco Realty Corp. | 2.800% | 10/1/26 | 7,783 | 7,301 | ||
| Kimco Realty Corp. | 3.800% | 4/1/27 | 11,240 | 10,785 | ||
| Kite Realty Group LP | 4.000% | 10/1/26 | 10,032 | 9,540 | ||
| Kite Realty Group Trust | 4.000% | 3/15/25 | 2,720 | 2,651 | ||
| LifeStorage LP | 3.500% | 7/1/26 | 14,328 | 13,773 | ||
| Mid-America Apartments LP | 4.300% | 10/15/23 | 8,139 | 8,151 | ||
| Mid-America Apartments LP | 3.750% | 6/15/24 | 8,907 | 8,828 | ||
| Mid-America Apartments LP | 4.000% | 11/15/25 | 11,482 | 11,264 | ||
| Mid-America Apartments LP | 1.100% | 9/15/26 | 9,884 | 8,647 | ||
| Mid-America Apartments LP | 3.600% | 6/1/27 | 9,314 | 8,915 | ||
| National Retail Properties Inc. | 3.900% | 6/15/24 | 11,924 | 11,823 | ||
| National Retail Properties Inc. | 4.000% | 11/15/25 | 12,072 | 11,843 | ||
| National Retail Properties Inc. | 3.600% | 12/15/26 | 5,824 | 5,542 | ||
| Office Properties Income Trust | 4.250% | 5/15/24 | 7,382 | 7,027 | ||
| Office Properties Income Trust | 4.500% | 2/1/25 | 15,501 | 14,536 | ||
| Office Properties Income Trust | 2.650% | 6/15/26 | 5,254 | 4,230 | ||
| Office Properties Income Trust | 2.400% | 2/1/27 | 12,188 | 9,250 | ||
| Omega Healthcare Investors Inc. | 4.950% | 4/1/24 | 5,006 | 5,015 | ||
| Omega Healthcare Investors Inc. | 4.500% | 1/15/25 | 9,954 | 9,858 | ||
| Omega Healthcare Investors Inc. | 5.250% | 1/15/26 | 14,919 | 14,800 | ||
| Omega Healthcare Investors Inc. | 4.500% | 4/1/27 | 15,502 | 14,824 | ||
| Physicians Realty LP | 4.300% | 3/15/27 | 5,959 | 5,785 | ||
| Piedmont Operating Partnership LP | 3.400% | 6/1/23 | 6,202 | 6,159 | ||
| Piedmont Operating Partnership LP | 4.450% | 3/15/24 | 8,039 | 8,029 | ||
| Prologis LP | 3.250% | 10/1/26 | 12,871 | 12,381 | ||
| Prologis LP | 2.125% | 4/15/27 | 9,271 | 8,540 | ||
| Public Storage | 0.875% | 2/15/26 | 11,531 | 10,391 | ||
| Public Storage | 1.500% | 11/9/26 | 17,711 | 16,071 | ||
| Realty Income Corp. | 4.600% | 2/6/24 | 13,292 | 13,386 | ||
| Realty Income Corp. | 3.875% | 7/15/24 | 6,200 | 6,175 | ||
| Realty Income Corp. | 3.875% | 4/15/25 | 16,542 | 16,402 | ||
| Realty Income Corp. | 4.625% | 11/1/25 | 10,972 | 11,092 | ||
| Realty Income Corp. | 0.750% | 3/15/26 | 2,247 | 1,977 | ||
| Realty Income Corp. | 4.875% | 6/1/26 | 14,156 | 14,375 | ||
| Realty Income Corp. | 4.125% | 10/15/26 | 10,257 | 10,155 | ||
| Realty Income Corp. | 3.000% | 1/15/27 | 9,398 | 8,853 | ||
| Realty Income Corp. | 3.950% | 8/15/27 | 17,898 | 17,505 | ||
| Regency Centers LP | 3.600% | 2/1/27 | 10,197 | 9,758 | ||
| Sabra Health Care LP | 5.125% | 8/15/26 | 12,541 | 12,153 | ||
| Simon Property Group LP | 3.750% | 2/1/24 | 17,646 | 17,570 | ||
| Simon Property Group LP | 2.000% | 9/13/24 | 25,953 | 24,983 | ||
| Simon Property Group LP | 3.375% | 10/1/24 | 17,408 | 17,206 | ||
| Simon Property Group LP | 3.500% | 9/1/25 | 34,859 | 34,389 | ||
| Simon Property Group LP | 3.300% | 1/15/26 | 16,255 | 15,769 | ||
| Simon Property Group LP | 3.250% | 11/30/26 | 19,947 | 19,160 | ||
| Simon Property Group LP | 1.375% | 1/15/27 | 1,897 | 1,674 | ||
| SITE Centers Corp. | 3.625% | 2/1/25 | 8,795 | 8,455 | ||
| SITE Centers Corp. | 4.250% | 2/1/26 | 3,587 | 3,492 | ||
| SITE Centers Corp. | 4.700% | 6/1/27 | 9,351 | 9,024 | ||
| SL Green Realty Corp. | 4.500% | 12/1/22 | 6,258 | 6,258 | ||
| Spirit Realty LP | 4.450% | 9/15/26 | 3,857 | 3,776 | ||
| Spirit Realty LP | 3.200% | 1/15/27 | 10,233 | 9,374 | ||
| Tanger Properties LP | 3.125% | 9/1/26 | 7,304 | 6,783 | ||
| Tanger Properties LP | 3.875% | 7/15/27 | 7,723 | 7,123 | ||
| Coupon | Maturity Date | Face Amount ($000) | Market Value• ($000) | |||
| 1 | UDR Inc. | 2.950% | 9/1/26 | 6,703 | 6,260 | |
| Ventas Realty LP | 3.500% | 4/15/24 | 10,363 | 10,219 | ||
| Ventas Realty LP | 3.750% | 5/1/24 | 12,227 | 12,094 | ||
| Ventas Realty LP | 2.650% | 1/15/25 | 5,213 | 4,990 | ||
| Ventas Realty LP | 3.500% | 2/1/25 | 14,620 | 14,257 | ||
| Ventas Realty LP | 4.125% | 1/15/26 | 12,680 | 12,432 | ||
| Ventas Realty LP | 3.250% | 10/15/26 | 8,711 | 8,223 | ||
| Ventas Realty LP | 3.850% | 4/1/27 | 9,348 | 8,967 | ||
| VICI Properties LP | 4.375% | 5/15/25 | 11,585 | 11,335 | ||
| Vornado Realty LP | 3.500% | 1/15/25 | 10,973 | 10,495 | ||
| Vornado Realty LP | 2.150% | 6/1/26 | 8,265 | 7,278 | ||
| Welltower Inc. | 4.500% | 1/15/24 | 11,734 | 11,765 | ||
| Welltower Inc. | 3.625% | 3/15/24 | 27,549 | 27,310 | ||
| Welltower Inc. | 4.000% | 6/1/25 | 39,567 | 39,098 | ||
| Welltower Inc. | 4.250% | 4/1/26 | 7,576 | 7,504 | ||
| Welltower Inc. | 2.700% | 2/15/27 | 10,015 | 9,293 | ||
| WP Carey Inc. | 4.600% | 4/1/24 | 7,814 | 7,857 | ||
| WP Carey Inc. | 4.000% | 2/1/25 | 11,899 | 11,771 | ||
| WP Carey Inc. | 4.250% | 10/1/26 | 8,955 | 8,743 | ||
| 1,840,251 | ||||||
| Technology (8.5%) | ||||||
| Adobe Inc. | 1.900% | 2/1/25 | 15,935 | 15,275 | ||
| Adobe Inc. | 3.250% | 2/1/25 | 23,590 | 23,353 | ||
| Adobe Inc. | 2.150% | 2/1/27 | 25,761 | 24,117 | ||
| Altera Corp. | 4.100% | 11/15/23 | 16,077 | 16,159 | ||
| Analog Devices Inc. | 2.950% | 4/1/25 | 15,812 | 15,455 | ||
| Analog Devices Inc. | 3.500% | 12/5/26 | 23,958 | 23,534 | ||
| Apple Inc. | 3.000% | 2/9/24 | 2,560 | 2,539 | ||
| Apple Inc. | 3.450% | 5/6/24 | 61,541 | 61,453 | ||
| Apple Inc. | 2.850% | 5/11/24 | 56,364 | 55,683 | ||
| Apple Inc. | 1.800% | 9/11/24 | 13,872 | 13,407 | ||
| Apple Inc. | 2.750% | 1/13/25 | 28,520 | 27,967 | ||
| Apple Inc. | 2.500% | 2/9/25 | 29,203 | 28,443 | ||
| Apple Inc. | 1.125% | 5/11/25 | 56,039 | 52,355 | ||
| Apple Inc. | 3.200% | 5/13/25 | 57,717 | 56,973 | ||
| Apple Inc. | 0.550% | 8/20/25 | 17,643 | 16,098 | ||
| Apple Inc. | 0.700% | 2/8/26 | 49,945 | 45,128 | ||
| Apple Inc. | 3.250% | 2/23/26 | 80,359 | 79,110 | ||
| Apple Inc. | 2.450% | 8/4/26 | 51,378 | 48,865 | ||
| Apple Inc. | 2.050% | 9/11/26 | 48,129 | 45,000 | ||
| Apple Inc. | 3.350% | 2/9/27 | 51,812 | 50,968 | ||
| Apple Inc. | 3.200% | 5/11/27 | 48,675 | 47,470 | ||
| Apple Inc. | 3.000% | 6/20/27 | 23,927 | 23,241 | ||
| Applied Materials Inc. | 3.900% | 10/1/25 | 17,131 | 17,167 | ||
| Applied Materials Inc. | 3.300% | 4/1/27 | 28,791 | 28,164 | ||
| Arrow Electronics Inc. | 3.250% | 9/8/24 | 14,075 | 13,745 | ||
| Arrow Electronics Inc. | 4.000% | 4/1/25 | 5,154 | 5,058 | ||
| Autodesk Inc. | 4.375% | 6/15/25 | 10,444 | 10,510 | ||
| Autodesk Inc. | 3.500% | 6/15/27 | 12,096 | 11,639 | ||
| Automatic Data Processing Inc. | 3.375% | 9/15/25 | 26,576 | 26,319 | ||
| Avnet Inc. | 4.625% | 4/15/26 | 14,237 | 14,083 | ||
| Broadcom Corp. | 3.625% | 1/15/24 | 10,190 | 10,115 | ||
| Broadcom Corp. | 3.875% | 1/15/27 | 67,029 | 64,449 | ||
| Broadcom Inc. | 2.250% | 11/15/23 | 7,176 | 7,017 | ||
| Broadcom Inc. | 3.625% | 10/15/24 | 15,590 | 15,418 | ||
| Broadcom Inc. | 3.150% | 11/15/25 | 24,476 | 23,584 | ||
| Broadcom Inc. | 3.459% | 9/15/26 | 27,123 | 26,009 | ||
| Broadridge Financial Solutions Inc. | 3.400% | 6/27/26 | 11,471 | 11,089 | ||
| Cadence Design Systems Inc. | 4.375% | 10/15/24 | 7,216 | 7,262 | ||
| CDW LLC | 4.125% | 5/1/25 | 9,135 | 9,003 | ||
| CGI Inc. | 1.450% | 9/14/26 | 13,943 | 12,284 | ||
| Cintas Corp. No. 2 | 3.700% | 4/1/27 | 24,009 | 23,671 | ||
| Cisco Systems Inc. | 2.200% | 9/20/23 | 16,019 | 15,809 | ||
| Cisco Systems Inc. | 3.625% | 3/4/24 | 19,512 | 19,526 | ||
| Cisco Systems Inc. | 3.500% | 6/15/25 | 9,066 | 9,050 | ||
| Cisco Systems Inc. | 2.950% | 2/28/26 | 20,993 | 20,547 | ||
| Cisco Systems Inc. | 2.500% | 9/20/26 | 36,622 | 35,159 | ||
| Coupon | Maturity Date | Face Amount ($000) | Market Value• ($000) | |||
| Citrix Systems Inc. | 1.250% | 3/1/26 | 17,225 | 16,886 | ||
| Dell International LLC | 5.450% | 6/15/23 | 21,721 | 21,938 | ||
| Dell International LLC | 4.000% | 7/15/24 | 24,770 | 24,678 | ||
| Dell International LLC | 5.850% | 7/15/25 | 35,200 | 36,446 | ||
| Dell International LLC | 6.020% | 6/15/26 | 93,974 | 97,638 | ||
| Dell International LLC | 4.900% | 10/1/26 | 65,378 | 65,647 | ||
| Dell International LLC | 6.100% | 7/15/27 | 12,641 | 13,311 | ||
| DXC Technology Co. | 1.800% | 9/15/26 | 24,650 | 21,712 | ||
| Equifax Inc. | 2.600% | 12/1/24 | 20,778 | 20,079 | ||
| Equifax Inc. | 2.600% | 12/15/25 | 15,777 | 14,777 | ||
| Fidelity National Information Services Inc. | 0.600% | 3/1/24 | 9,362 | 8,875 | ||
| Fidelity National Information Services Inc. | 4.500% | 7/15/25 | 13,499 | 13,533 | ||
| Fidelity National Information Services Inc. | 1.150% | 3/1/26 | 41,248 | 36,580 | ||
| Fidelity National Information Services Inc. | 4.700% | 7/15/27 | 1,503 | 1,501 | ||
| Fiserv Inc. | 3.800% | 10/1/23 | 36,472 | 36,403 | ||
| Fiserv Inc. | 2.750% | 7/1/24 | 56,658 | 55,259 | ||
| Fiserv Inc. | 3.850% | 6/1/25 | 2,068 | 2,035 | ||
| Fiserv Inc. | 3.200% | 7/1/26 | 47,987 | 45,671 | ||
| Fiserv Inc. | 2.250% | 6/1/27 | 23,752 | 21,359 | ||
| Flex Ltd. | 4.750% | 6/15/25 | 13,411 | 13,314 | ||
| Flex Ltd. | 3.750% | 2/1/26 | 18,942 | 18,056 | ||
| Fortinet Inc. | 1.000% | 3/15/26 | 12,088 | 10,677 | ||
| Genpact Luxembourg Sarl | 3.375% | 12/1/24 | 9,571 | 9,343 | ||
| GXO Logistics Inc. | 1.650% | 7/15/26 | 11,465 | 9,695 | ||
| Harman International Industries Inc. | 4.150% | 5/15/25 | 7,319 | 7,257 | ||
| Hewlett Packard Enterprise Co. | 4.450% | 10/2/23 | 24,016 | 24,116 | ||
| Hewlett Packard Enterprise Co. | 1.450% | 4/1/24 | 21,466 | 20,619 | ||
| Hewlett Packard Enterprise Co. | 4.900% | 10/15/25 | 56,501 | 57,381 | ||
| Hewlett Packard Enterprise Co. | 1.750% | 4/1/26 | 22,423 | 20,555 | ||
| HP Inc. | 2.200% | 6/17/25 | 30,671 | 28,934 | ||
| HP Inc. | 1.450% | 6/17/26 | 27,232 | 24,268 | ||
| HP Inc. | 3.000% | 6/17/27 | 25,888 | 23,970 | ||
| Hubbell Inc. | 3.350% | 3/1/26 | 9,055 | 8,774 | ||
| Intel Corp. | 2.875% | 5/11/24 | 33,466 | 33,027 | ||
| Intel Corp. | 3.400% | 3/25/25 | 28,748 | 28,399 | ||
| Intel Corp. | 3.700% | 7/29/25 | 49,354 | 49,128 | ||
| Intel Corp. | 2.600% | 5/19/26 | 23,478 | 22,486 | ||
| Intel Corp. | 3.750% | 3/25/27 | 25,392 | 25,075 | ||
| Intel Corp. | 3.150% | 5/11/27 | 22,517 | 21,720 | ||
| Intel Corp. | 3.750% | 8/5/27 | 15,000 | 14,731 | ||
| International Business Machines Corp. | 3.625% | 2/12/24 | 42,761 | 42,658 | ||
| International Business Machines Corp. | 3.000% | 5/15/24 | 66,327 | 65,470 | ||
| International Business Machines Corp. | 7.000% | 10/30/25 | 12,548 | 13,615 | ||
| International Business Machines Corp. | 3.450% | 2/19/26 | 33,049 | 32,393 | ||
| International Business Machines Corp. | 3.300% | 5/15/26 | 85,791 | 83,186 | ||
| International Business Machines Corp. | 3.300% | 1/27/27 | 11,553 | 11,184 | ||
| International Business Machines Corp. | 1.700% | 5/15/27 | 31,458 | 28,254 | ||
| International Business Machines Corp. | 4.150% | 7/27/27 | 8,471 | 8,419 | ||
| International Business Machines Corp. | 6.220% | 8/1/27 | 6,499 | 7,083 | ||
| Intuit Inc. | 0.950% | 7/15/25 | 11,872 | 10,925 | ||
| 1 | J Paul Getty Trust | 0.391% | 1/1/24 | 1,425 | 1,364 | |
| Jabil Inc. | 1.700% | 4/15/26 | 12,350 | 11,028 | ||
| Juniper Networks Inc. | 1.200% | 12/10/25 | 15,608 | 13,972 | ||
| KLA Corp. | 4.650% | 11/1/24 | 10,290 | 10,446 | ||
| 2 | Kyndryl Holdings Inc. | 2.050% | 10/15/26 | 13,670 | 11,329 | |
| Coupon | Maturity Date | Face Amount ($000) | Market Value• ($000) | |||
| Lam Research Corp. | 3.800% | 3/15/25 | 10,653 | 10,604 | ||
| Lam Research Corp. | 3.750% | 3/15/26 | 16,752 | 16,693 | ||
| Legrand France SA | 8.500% | 2/15/25 | 9,075 | 9,994 | ||
| Leidos Inc. | 3.625% | 5/15/25 | 10,740 | 10,492 | ||
| Marvell Technology Inc. | 1.650% | 4/15/26 | 650 | 585 | ||
| Maxim Integrated Products Inc. | 3.450% | 6/15/27 | 9,868 | 9,460 | ||
| Microchip Technology Inc. | 2.670% | 9/1/23 | 4,074 | 4,015 | ||
| Microchip Technology Inc. | 4.250% | 9/1/25 | 23,885 | 23,726 | ||
| Micron Technology Inc. | 4.975% | 2/6/26 | 13,210 | 13,229 | ||
| Micron Technology Inc. | 4.185% | 2/15/27 | 19,784 | 19,274 | ||
| Microsoft Corp. | 2.875% | 2/6/24 | 53,374 | 52,840 | ||
| Microsoft Corp. | 2.700% | 2/12/25 | 41,680 | 40,981 | ||
| Microsoft Corp. | 3.125% | 11/3/25 | 63,387 | 62,361 | ||
| Microsoft Corp. | 2.400% | 8/8/26 | 90,155 | 86,143 | ||
| Microsoft Corp. | 3.300% | 2/6/27 | 108,505 | 106,716 | ||
| Moody's Corp. | 4.875% | 2/15/24 | 17,427 | 17,611 | ||
| Moody's Corp. | 3.750% | 3/24/25 | 9,513 | 9,411 | ||
| Motorola Solutions Inc. | 4.000% | 9/1/24 | 1,485 | 1,473 | ||
| NetApp Inc. | 3.300% | 9/29/24 | 9,854 | 9,676 | ||
| NetApp Inc. | 1.875% | 6/22/25 | 17,651 | 16,486 | ||
| NetApp Inc. | 2.375% | 6/22/27 | 13,015 | 11,951 | ||
| NVIDIA Corp. | 0.309% | 6/15/23 | 19,765 | 19,249 | ||
| NVIDIA Corp. | 0.584% | 6/14/24 | 14,189 | 13,452 | ||
| NVIDIA Corp. | 3.200% | 9/16/26 | 25,983 | 25,577 | ||
| NXP BV | 4.875% | 3/1/24 | 29,588 | 29,733 | ||
| NXP BV | 2.700% | 5/1/25 | 20,225 | 19,200 | ||
| NXP BV | 5.350% | 3/1/26 | 10,899 | 11,089 | ||
| NXP BV | 3.875% | 6/18/26 | 18,321 | 17,722 | ||
| NXP BV | 3.150% | 5/1/27 | 16,409 | 15,283 | ||
| NXP BV | 4.400% | 6/1/27 | 5,124 | 4,971 | ||
| Oracle Corp. | 2.400% | 9/15/23 | 57,878 | 56,861 | ||
| Oracle Corp. | 3.400% | 7/8/24 | 49,387 | 48,690 | ||
| Oracle Corp. | 2.950% | 11/15/24 | 48,710 | 47,353 | ||
| Oracle Corp. | 2.500% | 4/1/25 | 79,538 | 75,494 | ||
| Oracle Corp. | 2.950% | 5/15/25 | 56,053 | 53,758 | ||
| Oracle Corp. | 1.650% | 3/25/26 | 60,273 | 54,368 | ||
| Oracle Corp. | 2.650% | 7/15/26 | 69,755 | 64,345 | ||
| Oracle Corp. | 2.800% | 4/1/27 | 57,434 | 52,616 | ||
| 2 | Qorvo Inc. | 1.750% | 12/15/24 | 8,620 | 8,054 | |
| QUALCOMM Inc. | 2.900% | 5/20/24 | 16,321 | 16,070 | ||
| QUALCOMM Inc. | 3.450% | 5/20/25 | 32,544 | 32,182 | ||
| QUALCOMM Inc. | 3.250% | 5/20/27 | 47,820 | 46,679 | ||
| Quanta Services Inc. | 0.950% | 10/1/24 | 700 | 653 | ||
| Roper Technologies Inc. | 3.650% | 9/15/23 | 13,570 | 13,517 | ||
| Roper Technologies Inc. | 2.350% | 9/15/24 | 10,907 | 10,520 | ||
| Roper Technologies Inc. | 1.000% | 9/15/25 | 20,502 | 18,552 | ||
| Roper Technologies Inc. | 3.850% | 12/15/25 | 5,565 | 5,463 | ||
| Roper Technologies Inc. | 3.800% | 12/15/26 | 15,809 | 15,472 | ||
| S&P Global Inc. | 2.950% | 1/22/27 | 12,666 | 12,155 | ||
| 2 | S&P Global Inc. | 2.450% | 3/1/27 | 12,725 | 11,873 | |
| Skyworks Solutions Inc. | 1.800% | 6/1/26 | 28,264 | 25,179 | ||
| TD SYNNEX Corp. | 1.250% | 8/9/24 | 18,175 | 16,863 | ||
| TD SYNNEX Corp. | 1.750% | 8/9/26 | 15,243 | 13,339 | ||
| Texas Instruments Inc. | 2.625% | 5/15/24 | 12,741 | 12,528 | ||
| Texas Instruments Inc. | 1.375% | 3/12/25 | 25,296 | 23,849 | ||
| Texas Instruments Inc. | 1.125% | 9/15/26 | 10,750 | 9,755 | ||
| TSMC Arizona Corp. | 1.750% | 10/25/26 | 28,990 | 26,192 | ||
| TSMC Arizona Corp. | 3.875% | 4/22/27 | 17,875 | 17,577 | ||
| Verisk Analytics Inc. | 4.000% | 6/15/25 | 25,418 | 25,121 | ||
| VMware Inc. | 1.000% | 8/15/24 | 9,775 | 9,167 | ||
| VMware Inc. | 4.500% | 5/15/25 | 24,455 | 24,430 | ||
| VMware Inc. | 1.400% | 8/15/26 | 41,997 | 37,057 | ||
| VMware Inc. | 4.650% | 5/15/27 | 13,007 | 12,900 | ||
| VMware Inc. | 3.900% | 8/21/27 | 26,801 | 25,589 | ||
| Western Digital Corp. | 4.750% | 2/15/26 | 54,040 | 52,059 | ||
| Coupon | Maturity Date | Face Amount ($000) | Market Value• ($000) | |||
| Workday Inc. | 3.500% | 4/1/27 | 31,067 | 29,665 | ||
| Xilinx Inc. | 2.950% | 6/1/24 | 13,131 | 12,999 | ||
| 4,295,390 | ||||||
| Utilities (5.1%) | ||||||
| AEP Transmission Co. LLC | 3.100% | 12/1/26 | 10,618 | 10,180 | ||
| AES Corp. | 1.375% | 1/15/26 | 18,606 | 16,527 | ||
| 1 | Alabama Power Co. | 3.550% | 12/1/23 | 7,259 | 7,220 | |
| Alabama Power Co. | 3.750% | 9/1/27 | 11,300 | 11,089 | ||
| Ameren Corp. | 2.500% | 9/15/24 | 14,419 | 13,902 | ||
| Ameren Corp. | 3.650% | 2/15/26 | 9,849 | 9,585 | ||
| Ameren Corp. | 1.950% | 3/15/27 | 7,009 | 6,268 | ||
| Ameren Illinois Co. | 3.250% | 3/1/25 | 5,877 | 5,771 | ||
| 1 | American Electric Power Co. Inc. | 2.950% | 12/15/22 | 21,153 | 21,079 | |
| 1 | American Electric Power Co. Inc. | 0.750% | 11/1/23 | 2,550 | 2,454 | |
| American Electric Power Co. Inc. | 2.031% | 3/15/24 | 5,101 | 4,940 | ||
| 1 | American Electric Power Co. Inc. | 1.000% | 11/1/25 | 3,957 | 3,549 | |
| American Electric Power Co. Inc. | 3.875% | 2/15/62 | 5,700 | 4,851 | ||
| American Water Capital Corp. | 3.850% | 3/1/24 | 5,231 | 5,226 | ||
| American Water Capital Corp. | 3.400% | 3/1/25 | 15,817 | 15,581 | ||
| Appalachian Power Co. | 3.400% | 6/1/25 | 7,968 | 7,802 | ||
| 1 | Appalachian Power Co. | 3.300% | 6/1/27 | 7,714 | 7,336 | |
| Arizona Public Service Co. | 3.150% | 5/15/25 | 5,644 | 5,471 | ||
| Atmos Energy Corp. | 3.000% | 6/15/27 | 11,903 | 11,368 | ||
| Avangrid Inc. | 3.150% | 12/1/24 | 14,807 | 14,397 | ||
| Avangrid Inc. | 3.200% | 4/15/25 | 16,135 | 15,622 | ||
| Baltimore Gas & Electric Co. | 2.400% | 8/15/26 | 11,029 | 10,337 | ||
| Berkshire Hathaway Energy Co. | 3.750% | 11/15/23 | 16,703 | 16,706 | ||
| Berkshire Hathaway Energy Co. | 3.500% | 2/1/25 | 9,403 | 9,316 | ||
| Berkshire Hathaway Energy Co. | 4.050% | 4/15/25 | 18,109 | 18,131 | ||
| Black Hills Corp. | 4.250% | 11/30/23 | 9,375 | 9,383 | ||
| Black Hills Corp. | 1.037% | 8/23/24 | 12,530 | 11,716 | ||
| Black Hills Corp. | 3.950% | 1/15/26 | 9,677 | 9,481 | ||
| Black Hills Corp. | 3.150% | 1/15/27 | 7,072 | 6,680 | ||
| 1 | CenterPoint Energy Houston Electric LLC | 2.400% | 9/1/26 | 11,699 | 10,937 | |
| 1 | CenterPoint Energy Houston Electric LLC | 3.000% | 2/1/27 | 7,982 | 7,633 | |
| CenterPoint Energy Inc. | 2.500% | 9/1/24 | 15,338 | 14,816 | ||
| CenterPoint Energy Inc. | 1.450% | 6/1/26 | 5,428 | 4,893 | ||
| Cleco Corporate Holdings LLC | 3.743% | 5/1/26 | 12,691 | 12,174 | ||
| Cleveland Electric Illuminating Co. | 5.500% | 8/15/24 | 3,686 | 3,779 | ||
| CMS Energy Corp. | 3.000% | 5/15/26 | 14,023 | 13,320 | ||
| Commonwealth Edison Co. | 2.550% | 6/15/26 | 6,662 | 6,322 | ||
| 1 | Connecticut Light & Power Co. | 0.750% | 12/1/25 | 8,873 | 7,967 | |
| 1 | Connecticut Light & Power Co. | 3.200% | 3/15/27 | 23,728 | 22,898 | |
| 1 | Consolidated Edison Inc. | 0.650% | 12/1/23 | 5,951 | 5,712 | |
| Constellation Energy Generation LLC | 3.250% | 6/1/25 | 20,348 | 19,744 | ||
| Delmarva Power & Light Co. | 3.500% | 11/15/23 | 15,479 | 15,443 | ||
| Dominion Energy Inc. | 3.071% | 8/15/24 | 9,116 | 8,846 | ||
| 1 | Dominion Energy Inc. | 3.300% | 3/15/25 | 10,887 | 10,636 | |
| Dominion Energy Inc. | 3.900% | 10/1/25 | 23,653 | 23,371 | ||
| 1 | Dominion Energy Inc. | 1.450% | 4/15/26 | 27,597 | 25,100 | |
| 1 | Dominion Energy Inc. | 2.850% | 8/15/26 | 13,629 | 12,871 | |
| 1 | Dominion Energy Inc. | 3.600% | 3/15/27 | 5,320 | 5,123 | |
| 1 | Dominion Energy Inc. | 5.750% | 10/1/54 | 9,875 | 9,451 | |
| DTE Electric Co. | 3.650% | 3/15/24 | 6,931 | 6,916 | ||
| DTE Electric Co. | 3.375% | 3/1/25 | 8,899 | 8,750 | ||
| 1 | DTE Energy Co. | 2.529% | 10/1/24 | 23,749 | 22,885 | |
| DTE Energy Co. | 4.220% | 11/1/24 | 20,880 | 20,801 | ||
| 1 | DTE Energy Co. | 1.050% | 6/1/25 | 27,171 | 24,899 | |
| DTE Energy Co. | 2.850% | 10/1/26 | 10,879 | 10,220 | ||
| Duke Energy Carolinas LLC | 2.950% | 12/1/26 | 19,639 | 18,887 | ||
| Duke Energy Corp. | 3.950% | 10/15/23 | 7,386 | 7,387 | ||
| Duke Energy Corp. | 3.750% | 4/15/24 | 22,796 | 22,706 | ||
| Duke Energy Corp. | 0.900% | 9/15/25 | 9,926 | 9,009 | ||
| Duke Energy Corp. | 2.650% | 9/1/26 | 35,882 | 33,570 | ||
| Coupon | Maturity Date | Face Amount ($000) | Market Value• ($000) | |||
| Duke Energy Corp. | 3.250% | 1/15/82 | 13,000 | 10,509 | ||
| Duke Energy Florida LLC | 3.200% | 1/15/27 | 24,434 | 23,610 | ||
| Duke Energy Ohio Inc. | 3.800% | 9/1/23 | 8,274 | 8,268 | ||
| Duke Energy Progress LLC | 3.375% | 9/1/23 | 6,965 | 6,946 | ||
| Duke Energy Progress LLC | 3.250% | 8/15/25 | 7,423 | 7,314 | ||
| Eastern Energy Gas Holdings LLC | 3.550% | 11/1/23 | 7,505 | 7,469 | ||
| 1 | Eastern Energy Gas Holdings LLC | 2.500% | 11/15/24 | 8,861 | 8,528 | |
| Eastern Energy Gas Holdings LLC | 3.600% | 12/15/24 | 7,314 | 7,236 | ||
| Edison International | 3.125% | 11/15/22 | 5,451 | 5,439 | ||
| Edison International | 3.550% | 11/15/24 | 15,101 | 14,770 | ||
| Edison International | 4.950% | 4/15/25 | 3,802 | 3,804 | ||
| Edison International | 5.750% | 6/15/27 | 17,040 | 17,277 | ||
| Emera US Finance LP | 3.550% | 6/15/26 | 23,131 | 22,130 | ||
| Enel Americas SA | 4.000% | 10/25/26 | 12,489 | 12,262 | ||
| Enel Generacion Chile SA | 4.250% | 4/15/24 | 6,960 | 6,855 | ||
| Entergy Arkansas LLC | 3.700% | 6/1/24 | 8,135 | 8,106 | ||
| Entergy Arkansas LLC | 3.500% | 4/1/26 | 14,758 | 14,469 | ||
| Entergy Corp. | 0.900% | 9/15/25 | 18,234 | 16,379 | ||
| Entergy Corp. | 2.950% | 9/1/26 | 31,571 | 29,702 | ||
| Entergy Gulf States Louisiana LLC | 5.590% | 10/1/24 | 5,353 | 5,519 | ||
| Entergy Louisiana LLC | 4.050% | 9/1/23 | 12,424 | 12,452 | ||
| Entergy Louisiana LLC | 0.620% | 11/17/23 | 6,333 | 6,117 | ||
| Entergy Louisiana LLC | 0.950% | 10/1/24 | 15,230 | 14,326 | ||
| Entergy Louisiana LLC | 5.400% | 11/1/24 | 8,488 | 8,730 | ||
| Entergy Louisiana LLC | 2.400% | 10/1/26 | 12,778 | 11,821 | ||
| Evergy Inc. | 2.450% | 9/15/24 | 21,483 | 20,707 | ||
| Evergy Kansas Central Inc. | 2.550% | 7/1/26 | 14,885 | 14,000 | ||
| Evergy Kansas Central Inc. | 3.100% | 4/1/27 | 5,157 | 4,895 | ||
| Evergy Metro Inc. | 3.650% | 8/15/25 | 1,917 | 1,887 | ||
| 1 | Eversource Energy | 3.800% | 12/1/23 | 11,809 | 11,757 | |
| 1 | Eversource Energy | 2.900% | 10/1/24 | 11,035 | 10,734 | |
| 1 | Eversource Energy | 3.150% | 1/15/25 | 2,961 | 2,874 | |
| 1 | Eversource Energy | 0.800% | 8/15/25 | 7,973 | 7,205 | |
| 1 | Eversource Energy | 1.400% | 8/15/26 | 4,858 | 4,322 | |
| Eversource Energy | 2.900% | 3/1/27 | 12,512 | 11,740 | ||
| Eversource Energy | 4.600% | 7/1/27 | 2,280 | 2,285 | ||
| 1 | Exelon Corp. | 3.950% | 6/15/25 | 18,010 | 17,869 | |
| Exelon Corp. | 3.400% | 4/15/26 | 21,761 | 21,081 | ||
| 2 | Exelon Corp. | 2.750% | 3/15/27 | 14,866 | 13,913 | |
| Florida Power & Light Co. | 2.750% | 6/1/23 | 5,118 | 5,092 | ||
| Florida Power & Light Co. | 3.250% | 6/1/24 | 15,829 | 15,711 | ||
| Florida Power & Light Co. | 2.850% | 4/1/25 | 27,689 | 27,080 | ||
| Florida Power & Light Co. | 3.125% | 12/1/25 | 15,898 | 15,676 | ||
| Fortis Inc. | 3.055% | 10/4/26 | 23,834 | 22,312 | ||
| 1 | Georgia Power Co. | 2.200% | 9/15/24 | 10,840 | 10,479 | |
| Georgia Power Co. | 3.250% | 4/1/26 | 9,065 | 8,728 | ||
| Georgia Power Co. | 3.250% | 3/30/27 | 11,548 | 10,895 | ||
| 1 | Gulf Power Co. | 3.300% | 5/30/27 | 9,193 | 8,848 | |
| Iberdrola International BV | 5.810% | 3/15/25 | 4,901 | 5,107 | ||
| Interstate Power & Light Co. | 3.250% | 12/1/24 | 11,117 | 10,906 | ||
| IPALCO Enterprises Inc. | 3.700% | 9/1/24 | 10,540 | 10,291 | ||
| ITC Holdings Corp. | 3.650% | 6/15/24 | 9,399 | 9,264 | ||
| ITC Holdings Corp. | 3.250% | 6/30/26 | 9,838 | 9,376 | ||
| 1 | Louisville Gas & Electric Co. | 3.300% | 10/1/25 | 3,466 | 3,384 | |
| MidAmerican Energy Co. | 3.500% | 10/15/24 | 18,193 | 18,102 | ||
| MidAmerican Energy Co. | 3.100% | 5/1/27 | 11,267 | 10,815 | ||
| National Fuel Gas Co. | 5.200% | 7/15/25 | 10,017 | 10,049 | ||
| National Fuel Gas Co. | 5.500% | 1/15/26 | 15,832 | 15,989 | ||
| National Rural Utilities Cooperative Finance Corp. | 3.400% | 11/15/23 | 13,103 | 13,045 | ||
| National Rural Utilities Cooperative Finance Corp. | 2.950% | 2/7/24 | 19,778 | 19,567 | ||
| National Rural Utilities Cooperative Finance Corp. | 0.350% | 2/8/24 | 13,363 | 12,722 | ||
| 1 | National Rural Utilities Cooperative Finance Corp. | 1.000% | 10/18/24 | 530 | 498 | |
| National Rural Utilities Cooperative Finance Corp. | 2.850% | 1/27/25 | 11,314 | 11,008 | ||
| Coupon | Maturity Date | Face Amount ($000) | Market Value• ($000) | |||
| 1 | National Rural Utilities Cooperative Finance Corp. | 3.450% | 6/15/25 | 6,377 | 6,268 | |
| 1 | National Rural Utilities Cooperative Finance Corp. | 3.250% | 11/1/25 | 13,797 | 13,447 | |
| National Rural Utilities Cooperative Finance Corp. | 1.000% | 6/15/26 | 9,477 | 8,487 | ||
| National Rural Utilities Cooperative Finance Corp. | 3.050% | 4/25/27 | 10,360 | 9,916 | ||
| 1 | National Rural Utilities Cooperative Finance Corp. | 5.250% | 4/20/46 | 5,350 | 4,998 | |
| NextEra Energy Capital Holdings Inc. | 2.940% | 3/21/24 | 26,070 | 25,616 | ||
| NextEra Energy Capital Holdings Inc. | 4.200% | 6/20/24 | 10,095 | 10,104 | ||
| NextEra Energy Capital Holdings Inc. | 4.450% | 6/20/25 | 11,575 | 11,633 | ||
| NextEra Energy Capital Holdings Inc. | 1.875% | 1/15/27 | 10,602 | 9,514 | ||
| NextEra Energy Capital Holdings Inc. | 3.550% | 5/1/27 | 23,524 | 22,630 | ||
| NextEra Energy Capital Holdings Inc. | 4.625% | 7/15/27 | 22,650 | 22,757 | ||
| NextEra Energy Capital Holdings Inc. | 3.800% | 3/15/82 | 13,100 | 11,012 | ||
| NiSource Inc. | 0.950% | 8/15/25 | 36,057 | 32,805 | ||
| NiSource Inc. | 3.490% | 5/15/27 | 19,572 | 18,733 | ||
| Northern States Power Co. | 2.600% | 5/15/23 | 13,615 | 13,494 | ||
| NSTAR Electric Co. | 3.200% | 5/15/27 | 14,930 | 14,400 | ||
| Oncor Electric Delivery Co. LLC | 2.750% | 6/1/24 | 12,515 | 12,262 | ||
| Oncor Electric Delivery Co. LLC | 2.950% | 4/1/25 | 6,949 | 6,756 | ||
| Oncor Electric Delivery Co. LLC | 0.550% | 10/1/25 | 8,800 | 7,907 | ||
| ONE Gas Inc. | 3.610% | 2/1/24 | 17,106 | 16,958 | ||
| ONE Gas Inc. | 1.100% | 3/11/24 | 9,000 | 8,660 | ||
| Pacific Gas & Electric Co. | 1.700% | 11/15/23 | 12,850 | 12,419 | ||
| Pacific Gas & Electric Co. | 3.850% | 11/15/23 | 17,814 | 17,589 | ||
| Pacific Gas & Electric Co. | 3.750% | 2/15/24 | 8,033 | 7,883 | ||
| Pacific Gas & Electric Co. | 3.250% | 2/16/24 | 500 | 489 | ||
| Pacific Gas & Electric Co. | 4.950% | 6/8/25 | 2,425 | 2,411 | ||
| Pacific Gas & Electric Co. | 3.500% | 6/15/25 | 16,714 | 15,827 | ||
| Pacific Gas & Electric Co. | 3.450% | 7/1/25 | 27,523 | 26,194 | ||
| Pacific Gas & Electric Co. | 3.150% | 1/1/26 | 69,002 | 63,627 | ||
| PacifiCorp | 3.600% | 4/1/24 | 6,124 | 6,110 | ||
| PECO Energy Co. | 3.150% | 10/15/25 | 1,269 | 1,236 | ||
| Pinnacle West Capital Corp. | 1.300% | 6/15/25 | 12,064 | 10,994 | ||
| Potomac Electric Power Co. | 3.600% | 3/15/24 | 6,506 | 6,470 | ||
| PPL Capital Funding Inc. | 3.100% | 5/15/26 | 21,394 | 20,295 | ||
| Public Service Co. of New Hampshire | 3.500% | 11/1/23 | 7,978 | 7,953 | ||
| 1 | Public Service Electric & Gas Co. | 2.375% | 5/15/23 | 10,272 | 10,165 | |
| 1 | Public Service Electric & Gas Co. | 3.250% | 9/1/23 | 3,149 | 3,133 | |
| 1 | Public Service Electric & Gas Co. | 3.000% | 5/15/25 | 4,136 | 4,027 | |
| 1 | Public Service Electric & Gas Co. | 0.950% | 3/15/26 | 7,715 | 6,949 | |
| 1 | Public Service Electric & Gas Co. | 2.250% | 9/15/26 | 15,080 | 14,081 | |
| 1 | Public Service Electric & Gas Co. | 3.000% | 5/15/27 | 5,741 | 5,501 | |
| Public Service Enterprise Group Inc. | 0.841% | 11/8/23 | 13,849 | 13,304 | ||
| Public Service Enterprise Group Inc. | 2.875% | 6/15/24 | 26,613 | 26,009 | ||
| Public Service Enterprise Group Inc. | 0.800% | 8/15/25 | 11,267 | 10,173 | ||
| Puget Energy Inc. | 3.650% | 5/15/25 | 8,913 | 8,622 | ||
| 1 | San Diego Gas & Electric Co. | 3.600% | 9/1/23 | 6,289 | 6,277 | |
| San Diego Gas & Electric Co. | 2.500% | 5/15/26 | 8,992 | 8,485 | ||
| Sempra Energy | 3.300% | 4/1/25 | 17,851 | 17,368 | ||
| Sempra Energy | 3.250% | 6/15/27 | 20,074 | 18,993 | ||
| Sempra Energy | 4.125% | 4/1/52 | 20,260 | 17,142 | ||
| Sierra Pacific Power Co. | 2.600% | 5/1/26 | 22,805 | 21,596 | ||
| Coupon | Maturity Date | Face Amount ($000) | Market Value• ($000) | |||
| 1 | Southern California Edison Co. | 3.500% | 10/1/23 | 7,106 | 7,073 | |
| Southern California Edison Co. | 1.100% | 4/1/24 | 18,162 | 17,285 | ||
| 1 | Southern California Edison Co. | 0.975% | 8/1/24 | 5,307 | 5,002 | |
| 1 | Southern California Edison Co. | 3.700% | 8/1/25 | 24,211 | 23,858 | |
| 1 | Southern California Edison Co. | 1.200% | 2/1/26 | 20,502 | 18,488 | |
| 1 | Southern California Edison Co. | 4.700% | 6/1/27 | 1,100 | 1,100 | |
| Southern California Gas Co. | 3.150% | 9/15/24 | 12,019 | 11,849 | ||
| Southern California Gas Co. | 3.200% | 6/15/25 | 4,423 | 4,315 | ||
| 1 | Southern California Gas Co. | 2.600% | 6/15/26 | 12,842 | 12,130 | |
| Southern California Gas Co. | 2.950% | 4/15/27 | 14,537 | 13,856 | ||
| 1 | Southern Co. | 0.600% | 2/26/24 | 3,709 | 3,522 | |
| Southern Co. | 4.475% | 8/1/24 | 12,750 | 12,768 | ||
| Southern Co. | 3.250% | 7/1/26 | 38,510 | 36,822 | ||
| 1 | Southern Co. | 4.000% | 1/15/51 | 23,743 | 22,069 | |
| 1 | Southern Co. | 3.750% | 9/15/51 | 26,432 | 22,946 | |
| Southern Co. Gas Capital Corp. | 2.450% | 10/1/23 | 7,011 | 6,893 | ||
| Southern Co. Gas Capital Corp. | 3.250% | 6/15/26 | 10,519 | 10,032 | ||
| Southern Power Co. | 4.150% | 12/1/25 | 21,451 | 21,308 | ||
| Southern Power Co. | 0.900% | 1/15/26 | 5,900 | 5,277 | ||
| 1 | Southwestern Electric Power Co. | 1.650% | 3/15/26 | 27,942 | 25,332 | |
| 1 | Southwestern Electric Power Co. | 2.750% | 10/1/26 | 7,694 | 7,171 | |
| Southwestern Public Service Co. | 3.300% | 6/15/24 | 5,093 | 5,023 | ||
| Tampa Electric Co. | 3.875% | 7/12/24 | 3,325 | 3,323 | ||
| Tucson Electric Power Co. | 3.050% | 3/15/25 | 7,973 | 7,737 | ||
| Union Electric Co. | 3.500% | 4/15/24 | 8,283 | 8,246 | ||
| Union Electric Co. | 2.950% | 6/15/27 | 8,292 | 7,869 | ||
| Virginia Electric & Power Co. | 3.450% | 2/15/24 | 10,276 | 10,208 | ||
| 1 | Virginia Electric & Power Co. | 3.100% | 5/15/25 | 4,494 | 4,376 | |
| 1 | Virginia Electric & Power Co. | 3.150% | 1/15/26 | 26,589 | 25,808 | |
| 1 | Virginia Electric & Power Co. | 2.950% | 11/15/26 | 4,824 | 4,610 | |
| 1 | Virginia Electric & Power Co. | 3.500% | 3/15/27 | 24,570 | 23,889 | |
| WEC Energy Group Inc. | 0.550% | 9/15/23 | 12,693 | 12,259 | ||
| WEC Energy Group Inc. | 0.800% | 3/15/24 | 10,088 | 9,613 | ||
| WEC Energy Group Inc. | 3.550% | 6/15/25 | 3,178 | 3,088 | ||
| Wisconsin Electric Power Co. | 2.050% | 12/15/24 | 10,252 | 9,846 | ||
| Xcel Energy Inc. | 0.500% | 10/15/23 | 12,086 | 11,649 | ||
| Xcel Energy Inc. | 3.300% | 6/1/25 | 14,407 | 14,054 | ||
| Xcel Energy Inc. | 3.350% | 12/1/26 | 15,342 | 14,742 | ||
| Xcel Energy Inc. | 1.750% | 3/15/27 | 3,830 | 3,428 | ||
| 2,587,828 | ||||||
| Total Corporate Bonds (Cost $53,115,136) | 50,060,678 | |||||
| Shares | ||||||
| Temporary Cash Investments (0.4%) | ||||||
| Money Market Fund (0.4%) | ||||||
| 4 | Vanguard Market Liquidity Fund (Cost $191,240) | 2.284% | 1,913,033 | 191,246 | ||
| Total Investments (99.3%) (Cost $53,331,762) | 50,277,313 | |||||
| Other Assets and Liabilities—Net (0.7%) | 331,413 | |||||
| Net Assets (100%) | 50,608,726 | |||||
| Cost is in $000. |
| • | See Note A in Notes to Financial Statements. |
| 1 | The average or expected maturity is shorter than the final maturity shown because of the possibility of interim principal payments and prepayments or the possibility of the issue being called. |
| 2 | Security exempt from registration under Rule 144A of the Securities Act of 1933. Such securities may be sold in transactions exempt from registration, normally to qualified institutional buyers. At August 31, 2022, the aggregate value was $558,282,000, representing 1.1% of net assets. |
| 3 | Securities with a value of $3,700,000 have been segregated as initial margin for open futures contracts. |
| 4 | Affiliated money market fund available only to Vanguard funds and certain trusts and accounts managed by Vanguard. Rate shown is the 7-day yield. |
| Futures Contracts | ||||
| ($000) | ||||
| Expiration | Number of Long (Short) Contracts | Notional Amount | Value and Unrealized Appreciation (Depreciation) | |
| Long Futures Contracts | ||||
| 5-Year U.S. Treasury Note | December 2022 | 1,320 | 146,283 | 48 |
| ($000s, except shares and per-share amounts) | Amount |
| Assets | |
| Investments in Securities, at Value | |
| Unaffiliated Issuers (Cost $53,140,522) | 50,086,067 |
| Affiliated Issuers (Cost $191,240) | 191,246 |
| Total Investments in Securities | 50,277,313 |
| Investment in Vanguard | 1,759 |
| Cash | 918 |
| Receivables for Investment Securities Sold | 727,275 |
| Receivables for Accrued Income | 439,854 |
| Receivables for Capital Shares Issued | 5,239 |
| Variation Margin Receivable—Futures Contracts | 31 |
| Total Assets | 51,452,389 |
| Liabilities | |
| Payables for Investment Securities Purchased | 832,494 |
| Payables for Capital Shares Redeemed | 8,509 |
| Payables for Distributions | 1,697 |
| Payables to Vanguard | 963 |
| Total Liabilities | 843,663 |
| Net Assets | 50,608,726 |
At August 31, 2022, net assets consisted of: | |
| Paid-in Capital | 53,780,476 |
| Total Distributable Earnings (Loss) | (3,171,750) |
| Net Assets | 50,608,726 |
| ETF Shares—Net Assets | |
| Applicable to 574,228,155 outstanding $.001 par value shares of beneficial interest (unlimited authorization) | 43,722,760 |
| Net Asset Value Per Share—ETF Shares | $76.14 |
| Admiral Shares—Net Assets | |
| Applicable to 224,491,612 outstanding $.001 par value shares of beneficial interest (unlimited authorization) | 4,647,060 |
| Net Asset Value Per Share—Admiral Shares | $20.70 |
| Institutional Shares—Net Assets | |
| Applicable to 88,355,007 outstanding $.001 par value shares of beneficial interest (unlimited authorization) | 2,238,906 |
| Net Asset Value Per Share—Institutional Shares | $25.34 |
| Year Ended August 31, 2022 | |
| ($000) | |
| Investment Income | |
| Income | |
| Interest 1 | 834,148 |
| Total Income | 834,148 |
| Expenses | |
| The Vanguard Group—Note B | |
| Investment Advisory Services | 925 |
| Management and Administrative—ETF Shares | 12,701 |
| Management and Administrative—Admiral Shares | 3,104 |
| Management and Administrative—Institutional Shares | 969 |
| Marketing and Distribution—ETF Shares | 2,233 |
| Marketing and Distribution—Admiral Shares | 272 |
| Marketing and Distribution—Institutional Shares | 93 |
| Custodian Fees | 117 |
| Auditing Fees | 52 |
| Shareholders’ Reports—ETF Shares | 786 |
| Shareholders’ Reports—Admiral Shares | 62 |
| Shareholders’ Reports—Institutional Shares | 1 |
| Trustees’ Fees and Expenses | 19 |
| Other Expenses | 19 |
| Total Expenses | 21,353 |
| Expenses Paid Indirectly | (43) |
| Net Expenses | 21,310 |
| Net Investment Income | 812,838 |
| Realized Net Gain (Loss) | |
| Investment Securities Sold1,2 | (165,095) |
| Futures Contracts | (4,918) |
| Realized Net Gain (Loss) | (170,013) |
| Change in Unrealized Appreciation (Depreciation) | |
| Investment Securities1 | (3,794,937) |
| Futures Contracts | (99) |
| Change in Unrealized Appreciation (Depreciation) | (3,795,036) |
| Net Increase (Decrease) in Net Assets Resulting from Operations | (3,152,211) |
| 1 | Interest income, realized net gain (loss), capital gain distributions received, and change in unrealized appreciation (depreciation) from an affiliated company of the fund were $879,000, ($79,000), $16,000, and $6,000, respectively. Purchases and sales are for temporary cash investment purposes. |
| 2 | Includes ($2,526,000) of net gain (loss) resulting from in-kind redemptions. |
| Year Ended August 31, | ||
| 2022 ($000) | 2021 ($000) | |
| Increase (Decrease) in Net Assets | ||
| Operations | ||
| Net Investment Income | 812,838 | 765,496 |
| Realized Net Gain (Loss) | (170,013) | 444,696 |
| Change in Unrealized Appreciation (Depreciation) | (3,795,036) | (584,977) |
| Net Increase (Decrease) in Net Assets Resulting from Operations | (3,152,211) | 625,215 |
| Distributions | ||
| ETF Shares | (762,716) | (645,913) |
| Admiral Shares | (93,551) | (85,363) |
| Institutional Shares | (41,778) | (33,937) |
| Total Distributions | (898,045) | (765,213) |
| Capital Share Transactions | ||
| ETF Shares | 5,597,297 | 9,889,691 |
| Admiral Shares | (365,977) | 746,963 |
| Institutional Shares | 166,453 | 603,699 |
| Net Increase (Decrease) from Capital Share Transactions | 5,397,773 | 11,240,353 |
| Total Increase (Decrease) | 1,347,517 | 11,100,355 |
| Net Assets | ||
| Beginning of Period | 49,261,209 | 38,160,854 |
| End of Period | 50,608,726 | 49,261,209 |
| ETF Shares | |||||
| For a Share Outstanding Throughout Each Period | Year Ended August 31, | ||||
| 2022 | 2021 | 2020 | 2019 | 2018 | |
| Net Asset Value, Beginning of Period | $82.67 | $82.95 | $81.18 | $78.32 | $80.25 |
| Investment Operations | |||||
| Net Investment Income1 | 1.319 | 1.433 | 2.127 | 2.311 | 1.950 |
| Net Realized and Unrealized Gain (Loss) on Investments | (6.388) | (.250) | 1.815 | 2.826 | (1.953) |
| Total from Investment Operations | (5.069) | 1.183 | 3.942 | 5.137 | (.003) |
| Distributions | |||||
| Dividends from Net Investment Income | (1.279) | (1.463) | (2.172) | (2.277) | (1.927) |
| Distributions from Realized Capital Gains | (.182) | — | — | — | — |
| Total Distributions | (1.461) | (1.463) | (2.172) | (2.277) | (1.927) |
| Net Asset Value, End of Period | $76.14 | $82.67 | $82.95 | $81.18 | $78.32 |
| Total Return | -6.19% | 1.44% | 4.95% | 6.68% | 0.01% |
| Ratios/Supplemental Data | |||||
| Net Assets, End of Period (Millions) | $43,723 | $41,569 | $31,797 | $24,537 | $21,511 |
| Ratio of Total Expenses to Average Net Assets | 0.04% 2 | 0.04% | 0.05% | 0.05% | 0.07% |
| Ratio of Net Investment Income to Average Net Assets | 1.67% | 1.73% | 2.62% | 2.92% | 2.48% |
| Portfolio Turnover Rate3 | 50% | 42% | 56% | 51% | 56% |
| 1 | Calculated based on average shares outstanding. |
| 2 | The ratio of expenses to average net assets for the period net of reduction from custody fee offset arrangements was 0.04%. |
| 3 | Excludes the value of portfolio securities received or delivered as a result of in-kind purchases or redemptions of the fund’s capital shares, including ETF Creation Units. |
| Admiral Shares | |||||
| For a Share Outstanding Throughout Each Period | Year Ended August 31, | ||||
| 2022 | 2021 | 2020 | 2019 | 2018 | |
| Net Asset Value, Beginning of Period | $22.49 | $22.55 | $22.06 | $21.28 | $21.81 |
| Investment Operations | |||||
| Net Investment Income1 | .351 | .385 | .578 | .625 | .532 |
| Net Realized and Unrealized Gain (Loss) on Investments | (1.741) | (.063) | .485 | .777 | (.531) |
| Total from Investment Operations | (1.390) | .322 | 1.063 | 1.402 | .001 |
| Distributions | |||||
| Dividends from Net Investment Income | (.350) | (.382) | (.573) | (.622) | (.531) |
| Distributions from Realized Capital Gains | (.050) | — | — | — | — |
| Total Distributions | (.400) | (.382) | (.573) | (.622) | (.531) |
| Net Asset Value, End of Period | $20.70 | $22.49 | $22.55 | $22.06 | $21.28 |
| Total Return2 | -6.24% | 1.44% | 4.90% | 6.70% | 0.02% |
| Ratios/Supplemental Data | |||||
| Net Assets, End of Period (Millions) | $4,647 | $5,435 | $4,703 | $4,312 | $3,533 |
| Ratio of Total Expenses to Average Net Assets | 0.07% 3 | 0.07% | 0.07% | 0.07% | 0.07% |
| Ratio of Net Investment Income to Average Net Assets | 1.63% | 1.71% | 2.61% | 2.90% | 2.48% |
| Portfolio Turnover Rate4 | 50% | 42% | 56% | 51% | 56% |
| 1 | Calculated based on average shares outstanding. |
| 2 | Total returns do not include account service fees that may have applied in the periods shown. Fund prospectuses provide information about any applicable account service fees. |
| 3 | The ratio of expenses to average net assets for the period net of reduction from custody fee offset arrangements was 0.07%. |
| 4 | Excludes the value of portfolio securities received or delivered as a result of in-kind purchases or redemptions of the fund’s capital shares, including ETF Creation Units. |
| Institutional Shares | |||||
| For a Share Outstanding Throughout Each Period | Year Ended August 31, | ||||
| 2022 | 2021 | 2020 | 2019 | 2018 | |
| Net Asset Value, Beginning of Period | $27.53 | $27.61 | $27.00 | $26.06 | $26.70 |
| Investment Operations | |||||
| Net Investment Income1 | .436 | .473 | .713 | .768 | .656 |
| Net Realized and Unrealized Gain (Loss) on Investments | (2.131) | (.080) | .604 | .939 | (.641) |
| Total from Investment Operations | (1.695) | .393 | 1.317 | 1.707 | .015 |
| Distributions | |||||
| Dividends from Net Investment Income | (.434) | (.473) | (.707) | (.767) | (.655) |
| Distributions from Realized Capital Gains | (.061) | — | — | — | — |
| Total Distributions | (.495) | (.473) | (.707) | (.767) | (.655) |
| Net Asset Value, End of Period | $25.34 | $27.53 | $27.61 | $27.00 | $26.06 |
| Total Return | -6.21% | 1.44% | 4.96% | 6.66% | 0.07% |
| Ratios/Supplemental Data | |||||
| Net Assets, End of Period (Millions) | $2,239 | $2,258 | $1,661 | $1,633 | $1,706 |
| Ratio of Total Expenses to Average Net Assets | 0.05% 2 | 0.05% | 0.05% | 0.05% | 0.05% |
| Ratio of Net Investment Income to Average Net Assets | 1.65% | 1.72% | 2.63% | 2.92% | 2.50% |
| Portfolio Turnover Rate3 | 50% | 42% | 56% | 51% | 56% |
| 1 | Calculated based on average shares outstanding. |
| 2 | The ratio of expenses to average net assets for the period net of reduction from custody fee offset arrangements was 0.05%. |
| 3 | Excludes the value of portfolio securities received or delivered as a result of in-kind purchases or redemptions of the fund’s capital shares, including ETF Creation Units. |
| A. | The following significant accounting policies conform to generally accepted accounting principles for U.S. investment companies. The fund consistently follows such policies in preparing its financial statements. |
| B. | In accordance with the terms of a Funds’ Service Agreement (the “FSA”) between Vanguard and the fund, Vanguard furnishes to the fund investment advisory, corporate management, administrative, marketing, and distribution services at Vanguard’s cost of operations (as defined by the FSA). These costs of operations are allocated to the fund based on methods and guidelines approved by the board of trustees and are generally settled twice a month. |
| C. | The fund’s custodian bank has agreed to reduce its fees when the fund maintains cash on deposit in the non-interest-bearing custody account. For the year ended August 31, 2022, custodian fee offset arrangements reduced the fund’s expenses by $43,000 (an annual rate of less than 0.01% of average net assets). |
| D. | Various inputs may be used to determine the value of the fund’s investments and derivatives. These inputs are summarized in three broad levels for financial statement purposes. The inputs or methodologies used to value securities are not necessarily an indication of the risk associated with investing in those securities. |
| Level 1 ($000) | Level 2 ($000) | Level 3 ($000) | Total ($000) | |
| Investments | ||||
| Assets | ||||
| U.S. Government and Agency Obligations | — | 25,389 | — | 25,389 |
| Corporate Bonds | — | 50,060,678 | — | 50,060,678 |
| Temporary Cash Investments | 191,246 | — | — | 191,246 |
| Total | 191,246 | 50,086,067 | — | 50,277,313 |
| Derivative Financial Instruments | ||||
| Assets | ||||
| Futures Contracts1 | 48 | — | — | 48 |
| 1 | Includes cumulative appreciation (depreciation) on futures contracts and centrally cleared swaps, if any, as reported in the Schedule of Investments. Only current day’s variation margin is reported within the Statement of Assets and Liabilities. |
| E. | Permanent differences between book-basis and tax-basis components of net assets are reclassified among capital accounts in the financial statements to reflect their tax character. These reclassifications have no effect on net assets or net asset value per share. As of period end, permanent differences primarily attributable to the accounting for applicable in-kind redemptions were reclassified between the following accounts: |
| Amount ($000) | |
| Paid-in Capital | (2,552) |
| Total Distributable Earnings (Loss) | 2,552 |
| Amount ($000) | |
| Undistributed Ordinary Income | 80,954 |
| Undistributed Long-Term Gains | — |
| Capital Loss Carryforwards | — |
| Qualified Late-Year Losses | (193,347) |
| Net Unrealized Gains (Losses) | (3,057,660) |
| Year Ended August 31, | ||
| 2022 Amount ($000) | 2021 Amount ($000) | |
| Ordinary Income* | 787,576 | 765,213 |
| Long-Term Capital Gains | 110,469 | — |
| Total | 898,045 | 765,213 |
| * | Includes short-term capital gains, if any. |
| Amount ($000) | |
| Tax Cost | 53,334,973 |
| Gross Unrealized Appreciation | 4,778 |
| Gross Unrealized Depreciation | (3,062,438) |
| Net Unrealized Appreciation (Depreciation) | (3,057,660) |
| F. | During the year ended August 31, 2022, the fund purchased $32,659,518,000 of investment securities and sold $26,887,903,000 of investment securities, other than U.S. government securities and temporary cash investments. Purchases and sales of U.S. government securities were $8,195,569,000 and $8,189,553,000, respectively. Purchases and sales include $16,360,551,000 and $10,906,384,000, respectively, in connection with in-kind purchases and redemptions of the fund’s capital shares. |
| G. | Capital share transactions for each class of shares were: |
| Year Ended August 31, | |||||
| 2022 | 2021 | ||||
| Amount ($000) | Shares (000) | Amount ($000) | Shares (000) | ||
| ETF Shares | |||||
| Issued | 16,731,847 | 212,128 | 15,422,692 | 186,381 | |
| Issued in Lieu of Cash Distributions | — | — | — | — | |
| Redeemed | (11,134,550) | (140,700) | (5,533,001) | (66,900) | |
| Net Increase (Decrease)—ETF Shares | 5,597,297 | 71,428 | 9,889,691 | 119,481 | |
| Admiral Shares | |||||
| Issued | 1,793,345 | 83,336 | 2,599,871 | 115,389 | |
| Issued in Lieu of Cash Distributions | 75,187 | 3,492 | 66,646 | 2,960 | |
| Redeemed | (2,234,509) | (104,008) | (1,919,554) | (85,219) | |
| Net Increase (Decrease)—Admiral Shares | (365,977) | (17,180) | 746,963 | 33,130 | |
| Institutional Shares | |||||
| Issued | 623,048 | 23,568 | 991,645 | 35,943 | |
| Issued in Lieu of Cash Distributions | 39,344 | 1,494 | 30,224 | 1,097 | |
| Redeemed | (495,939) | (18,721) | (418,170) | (15,180) | |
| Net Increase (Decrease)—Institutional Shares | 166,453 | 6,341 | 603,699 | 21,860 | |
| H. | Management has determined that no events or transactions occurred subsequent to August 31, 2022, that would require recognition or disclosure in these financial statements. |

| Average Annual Total Returns Periods Ended August 31, 2022 | |||||
| One Year | Five Years | Ten Years | Final Value of a $10,000 Investment | ||
| Intermediate-Term Corporate Bond Index Fund ETF Shares Net Asset Value | -13.86% | 1.11% | 2.47% | $ 12,769 |
| Intermediate-Term Corporate Bond Index Fund ETF Shares Market Price | -14.11 | 1.01 | 2.40 | 12,671 | |
| Bloomberg U.S. 5–10 Year Corporate Bond Index | -13.83 | 1.19 | 2.57 | 12,892 |
| Bloomberg U.S. Aggregate Float Adjusted Index | -11.65 | 0.54 | 1.36 | 11,452 |
| Average Annual Total Returns Periods Ended August 31, 2022 | |||||
| One Year | Five Years | Ten Years | Final Value of a $10,000 Investment | ||
| Intermediate-Term Corporate Bond Index Fund Admiral Shares | -14.12% | 1.04% | 2.45% | $12,734 | |
| Bloomberg U.S. 5–10 Year Corporate Bond Index | -13.83 | 1.19 | 2.57 | 12,892 | |
| Bloomberg U.S. Aggregate Float Adjusted Index | -11.65 | 0.54 | 1.36 | 11,452 | |
| One Year | Five Years | Ten Years | Final Value of a $5,000,000 Investment | ||
| Intermediate-Term Corporate Bond Index Fund Institutional Shares | -14.08% | 1.06% | 2.47% | $6,379,253 | |
| Bloomberg U.S. 5–10 Year Corporate Bond Index | -13.83 | 1.19 | 2.57 | 6,445,989 | |
| Bloomberg U.S. Aggregate Float Adjusted Index | -11.65 | 0.54 | 1.36 | 5,725,801 | |
| Cumulative Returns of ETF Shares: August 31, 2012, Through August 31, 2022 | |||
| One Year | Five Years | Ten Years | |
| Intermediate-Term Corporate Bond Index Fund ETF Shares Market Price | -14.11% | 5.14% | 26.71% |
| Intermediate-Term Corporate Bond Index Fund ETF Shares Net Asset Value | -13.86 | 5.66 | 27.69 |
| Bloomberg U.S. 5–10 Year Corporate Bond Index | -13.83 | 6.07 | 28.92 |
| Corporate Bonds – Communications | 8.7% |
| Corporate Bonds – Consumer Discretionary | 6.1 |
| Corporate Bonds – Consumer Staples | 6.6 |
| Corporate Bonds – Energy | 6.2 |
| Corporate Bonds – Financials | 30.6 |
| Corporate Bonds – Health Care | 8.4 |
| Corporate Bonds – Industrials | 6.9 |
| Corporate Bonds – Materials | 3.1 |
| Corporate Bonds – Real Estate | 6.8 |
| Corporate Bonds – Technology | 8.5 |
| Corporate Bonds – Utilities | 7.5 |
| U.S. Government and Agency Obligations | 0.6 |
| Coupon | Maturity Date | Face Amount ($000) | Market Value• ($000) | |||
| U.S. Government and Agency Obligations (0.6%) | ||||||
| U.S. Government Securities (0.6%) | ||||||
| United States Treasury Note/Bond | 2.750% | 7/31/27 | 66,880 | 65,083 | ||
| United States Treasury Note/Bond | 3.125% | 8/31/27 | 8,620 | 8,543 | ||
| United States Treasury Note/Bond | 2.750% | 8/15/32 | 175,639 | 169,491 | ||
| Total U.S. Government and Agency Obligations (Cost $243,862) | 243,117 | |||||
| Corporate Bonds (98.1%) | ||||||
| Communications (8.6%) | ||||||
| Activision Blizzard Inc. | 1.350% | 9/15/30 | 1,207 | 953 | ||
| Alphabet Inc. | 1.100% | 8/15/30 | 56,932 | 46,442 | ||
| America Movil SAB de CV | 3.625% | 4/22/29 | 18,774 | 17,754 | ||
| America Movil SAB de CV | 2.875% | 5/7/30 | 28,128 | 24,904 | ||
| America Movil SAB de CV | 4.700% | 7/21/32 | 17,566 | 17,542 | ||
| AT&T Inc. | 1.650% | 2/1/28 | 43,083 | 37,015 | ||
| 1 | AT&T Inc. | 4.100% | 2/15/28 | 48,105 | 46,858 | |
| AT&T Inc. | 4.350% | 3/1/29 | 85,557 | 83,377 | ||
| 1 | AT&T Inc. | 4.300% | 2/15/30 | 82,399 | 79,243 | |
| AT&T Inc. | 2.750% | 6/1/31 | 76,009 | 65,026 | ||
| AT&T Inc. | 2.250% | 2/1/32 | 54,041 | 43,735 | ||
| Baidu Inc. | 4.375% | 3/29/28 | 3,645 | 3,544 | ||
| Baidu Inc. | 4.875% | 11/14/28 | 18,545 | 18,466 | ||
| Baidu Inc. | 3.425% | 4/7/30 | 10,434 | 9,445 | ||
| Baidu Inc. | 2.375% | 10/9/30 | 7,500 | 6,254 | ||
| Baidu Inc. | 2.375% | 8/23/31 | 17,655 | 14,511 | ||
| Booking Holdings Inc. | 3.550% | 3/15/28 | 17,436 | 16,775 | ||
| Booking Holdings Inc. | 4.625% | 4/13/30 | 35,104 | 35,264 | ||
| British Telecommunications plc | 5.125% | 12/4/28 | 4,293 | 4,223 | ||
| British Telecommunications plc | 9.625% | 12/15/30 | 61,922 | 76,195 | ||
| Charter Communications Operating LLC | 3.750% | 2/15/28 | 40,397 | 37,374 | ||
| Charter Communications Operating LLC | 4.200% | 3/15/28 | 45,500 | 42,911 | ||
| Charter Communications Operating LLC | 2.250% | 1/15/29 | 30,970 | 25,391 | ||
| Charter Communications Operating LLC | 5.050% | 3/30/29 | 37,581 | 36,079 | ||
| Charter Communications Operating LLC | 2.800% | 4/1/31 | 42,917 | 34,774 | ||
| Charter Communications Operating LLC | 2.300% | 2/1/32 | 15,822 | 12,025 | ||
| Comcast Corp. | 3.150% | 2/15/28 | 40,560 | 38,500 | ||
| Comcast Corp. | 3.550% | 5/1/28 | 17,844 | 17,209 | ||
| Comcast Corp. | 4.150% | 10/15/28 | 100,543 | 99,705 | ||
| Comcast Corp. | 2.650% | 2/1/30 | 44,427 | 39,350 | ||
| Comcast Corp. | 3.400% | 4/1/30 | 45,034 | 42,006 | ||
| Comcast Corp. | 4.250% | 10/15/30 | 41,616 | 41,083 | ||
| Comcast Corp. | 1.950% | 1/15/31 | 34,892 | 28,897 | ||
| Comcast Corp. | 1.500% | 2/15/31 | 47,366 | 37,979 | ||
| Deutsche Telekom International Finance BV | 8.750% | 6/15/30 | 96,740 | 119,081 | ||
| Deutsche Telekom International Finance BV | 9.250% | 6/1/32 | 11,457 | 15,107 | ||
| Discovery Communications LLC | 3.950% | 3/20/28 | 45,777 | 42,032 | ||
| Discovery Communications LLC | 4.125% | 5/15/29 | 28,037 | 25,566 | ||
| Discovery Communications LLC | 3.625% | 5/15/30 | 29,436 | 25,688 | ||
| Electronic Arts Inc. | 1.850% | 2/15/31 | 15,665 | 12,817 | ||
| Coupon | Maturity Date | Face Amount ($000) | Market Value• ($000) | |||
| Expedia Group Inc. | 4.625% | 8/1/27 | 8,880 | 8,661 | ||
| Expedia Group Inc. | 3.800% | 2/15/28 | 22,550 | 20,986 | ||
| Expedia Group Inc. | 3.250% | 2/15/30 | 25,425 | 22,003 | ||
| Expedia Group Inc. | 2.950% | 3/15/31 | 28,802 | 23,824 | ||
| Fox Corp. | 4.709% | 1/25/29 | 59,351 | 58,746 | ||
| Fox Corp. | 3.500% | 4/8/30 | 15,056 | 13,663 | ||
| Grupo Televisa SAB | 8.500% | 3/11/32 | 4,550 | 5,562 | ||
| Interpublic Group of Cos. Inc. | 4.650% | 10/1/28 | 6,925 | 6,735 | ||
| Interpublic Group of Cos. Inc. | 4.750% | 3/30/30 | 14,773 | 14,192 | ||
| Interpublic Group of Cos. Inc. | 2.400% | 3/1/31 | 13,530 | 10,781 | ||
| Koninklijke KPN NV | 8.375% | 10/1/30 | 15,414 | 17,882 | ||
| 2 | Magallanes Inc. | 4.054% | 3/15/29 | 43,886 | 39,863 | |
| 2 | Magallanes Inc. | 4.279% | 3/15/32 | 135,756 | 117,925 | |
| 2 | Meta Platforms Inc. | 3.850% | 8/15/32 | 43,000 | 40,435 | |
| Omnicom Group Inc. | 2.450% | 4/30/30 | 15,290 | 12,828 | ||
| Omnicom Group Inc. | 4.200% | 6/1/30 | 17,158 | 16,314 | ||
| Omnicom Group Inc. | 2.600% | 8/1/31 | 14,926 | 12,464 | ||
| Orange SA | 9.000% | 3/1/31 | 60,608 | 77,450 | ||
| Paramount Global | 3.375% | 2/15/28 | 13,169 | 12,298 | ||
| Paramount Global | 3.700% | 6/1/28 | 17,796 | 16,797 | ||
| Paramount Global | 4.200% | 6/1/29 | 13,386 | 12,674 | ||
| Paramount Global | 7.875% | 7/30/30 | 13,931 | 15,635 | ||
| Paramount Global | 4.950% | 1/15/31 | 41,822 | 39,683 | ||
| Paramount Global | 4.200% | 5/19/32 | 31,732 | 27,920 | ||
| 2 | Rogers Communications Inc. | 3.800% | 3/15/32 | 47,751 | 43,471 | |
| Sprint Capital Corp. | 8.750% | 3/15/32 | 500 | 603 | ||
| Take-Two Interactive Software Inc. | 4.000% | 4/14/32 | 9,816 | 9,051 | ||
| TCI Communications Inc. | 7.125% | 2/15/28 | 2,300 | 2,593 | ||
| Telefonica Europe BV | 8.250% | 9/15/30 | 34,069 | 39,821 | ||
| TELUS Corp. | 3.700% | 9/15/27 | 1,956 | 1,905 | ||
| TELUS Corp. | 3.400% | 5/13/32 | 22,456 | 19,964 | ||
| Tencent Music Entertainment Group | 2.000% | 9/3/30 | 9,390 | 7,093 | ||
| T-Mobile USA Inc. | 4.750% | 2/1/28 | 31,990 | 31,265 | ||
| T-Mobile USA Inc. | 2.050% | 2/15/28 | 52,132 | 45,285 | ||
| T-Mobile USA Inc. | 2.625% | 2/15/29 | 26,775 | 22,982 | ||
| T-Mobile USA Inc. | 2.400% | 3/15/29 | 10,365 | 8,895 | ||
| T-Mobile USA Inc. | 3.375% | 4/15/29 | 46,210 | 41,593 | ||
| T-Mobile USA Inc. | 3.875% | 4/15/30 | 185,754 | 171,702 | ||
| T-Mobile USA Inc. | 2.550% | 2/15/31 | 73,019 | 60,834 | ||
| T-Mobile USA Inc. | 2.875% | 2/15/31 | 32,395 | 27,389 | ||
| T-Mobile USA Inc. | 3.500% | 4/15/31 | 71,248 | 63,090 | ||
| T-Mobile USA Inc. | 2.250% | 11/15/31 | 10,444 | 8,403 | ||
| T-Mobile USA Inc. | 2.700% | 3/15/32 | 34,185 | 28,472 | ||
| 1 | TWDC Enterprises 18 Corp. | 7.000% | 3/1/32 | 2,168 | 2,558 | |
| VeriSign Inc. | 2.700% | 6/15/31 | 21,729 | 17,869 | ||
| Verizon Communications Inc. | 2.100% | 3/22/28 | 70,199 | 62,093 | ||
| Verizon Communications Inc. | 4.329% | 9/21/28 | 106,927 | 105,480 | ||
| Verizon Communications Inc. | 3.875% | 2/8/29 | 18,586 | 17,860 | ||
| Verizon Communications Inc. | 4.016% | 12/3/29 | 96,861 | 92,920 | ||
| Verizon Communications Inc. | 3.150% | 3/22/30 | 45,205 | 40,576 | ||
| Verizon Communications Inc. | 1.500% | 9/18/30 | 27,003 | 21,484 | ||
| Verizon Communications Inc. | 1.680% | 10/30/30 | 42,386 | 33,701 | ||
| Verizon Communications Inc. | 7.750% | 12/1/30 | 3,157 | 3,749 | ||
| Verizon Communications Inc. | 1.750% | 1/20/31 | 66,101 | 52,579 | ||
| Verizon Communications Inc. | 2.550% | 3/21/31 | 129,479 | 109,508 | ||
| Coupon | Maturity Date | Face Amount ($000) | Market Value• ($000) | |||
| Verizon Communications Inc. | 2.355% | 3/15/32 | 133,675 | 109,624 | ||
| Vodafone Group plc | 4.375% | 5/30/28 | 85,830 | 84,817 | ||
| Vodafone Group plc | 7.875% | 2/15/30 | 11,088 | 12,870 | ||
| Walt Disney Co. | 2.200% | 1/13/28 | 33,786 | 30,743 | ||
| Walt Disney Co. | 2.000% | 9/1/29 | 50,929 | 44,054 | ||
| Walt Disney Co. | 3.800% | 3/22/30 | 31,090 | 30,044 | ||
| Walt Disney Co. | 2.650% | 1/13/31 | 63,991 | 56,741 | ||
| Weibo Corp. | 3.375% | 7/8/30 | 15,640 | 12,384 | ||
| WPP Finance 2010 | 3.750% | 9/19/24 | 1 | — | ||
| 3,642,486 | ||||||
| Consumer Discretionary (6.0%) | ||||||
| Advance Auto Parts Inc. | 1.750% | 10/1/27 | 6,125 | 5,222 | ||
| Advance Auto Parts Inc. | 3.900% | 4/15/30 | 16,682 | 15,082 | ||
| Advance Auto Parts Inc. | 3.500% | 3/15/32 | 7,695 | 6,537 | ||
| Alibaba Group Holding Ltd. | 3.400% | 12/6/27 | 62,446 | 58,971 | ||
| Alibaba Group Holding Ltd. | 2.125% | 2/9/31 | 38,198 | 31,745 | ||
| Amazon.com Inc. | 1.650% | 5/12/28 | 61,425 | 54,465 | ||
| Amazon.com Inc. | 3.450% | 4/13/29 | 26,380 | 25,500 | ||
| Amazon.com Inc. | 1.500% | 6/3/30 | 45,840 | 38,068 | ||
| Amazon.com Inc. | 2.100% | 5/12/31 | 90,236 | 77,459 | ||
| Amazon.com Inc. | 3.600% | 4/13/32 | 64,154 | 61,643 | ||
| 1 | American Honda Finance Corp. | 2.000% | 3/24/28 | 26,115 | 23,196 | |
| 1 | American Honda Finance Corp. | 2.250% | 1/12/29 | 11,590 | 10,191 | |
| 1 | American Honda Finance Corp. | 1.800% | 1/13/31 | 11,672 | 9,593 | |
| Aptiv plc | 4.350% | 3/15/29 | 5,799 | 5,438 | ||
| Aptiv plc | 3.250% | 3/1/32 | 19,450 | 16,403 | ||
| AutoNation Inc. | 3.800% | 11/15/27 | 9,888 | 9,100 | ||
| AutoNation Inc. | 4.750% | 6/1/30 | 13,267 | 12,427 | ||
| AutoNation Inc. | 2.400% | 8/1/31 | 17,035 | 13,065 | ||
| AutoNation Inc. | 3.850% | 3/1/32 | 17,260 | 14,834 | ||
| AutoZone Inc. | 3.750% | 4/18/29 | 24,657 | 23,240 | ||
| AutoZone Inc. | 4.000% | 4/15/30 | 13,095 | 12,435 | ||
| AutoZone Inc. | 1.650% | 1/15/31 | 15,655 | 12,319 | ||
| AutoZone Inc. | 4.750% | 8/1/32 | 12,000 | 11,898 | ||
| Best Buy Co. Inc. | 4.450% | 10/1/28 | 17,699 | 17,370 | ||
| Best Buy Co. Inc. | 1.950% | 10/1/30 | 9,181 | 7,347 | ||
| Block Financial LLC | 2.500% | 7/15/28 | 10,256 | 8,906 | ||
| Block Financial LLC | 3.875% | 8/15/30 | 17,506 | 15,891 | ||
| BorgWarner Inc. | 3.375% | 3/15/25 | 1 | 1 | ||
| BorgWarner Inc. | 2.650% | 7/1/27 | 1 | — | ||
| Brunswick Corp. | 2.400% | 8/18/31 | 13,810 | 10,229 | ||
| Choice Hotels International Inc. | 3.700% | 12/1/29 | 7,991 | 7,084 | ||
| Choice Hotels International Inc. | 3.700% | 1/15/31 | 12,359 | 10,779 | ||
| Dick's Sporting Goods Inc. | 3.150% | 1/15/32 | 16,982 | 13,428 | ||
| DR Horton Inc. | 1.400% | 10/15/27 | 8,104 | 6,793 | ||
| eBay Inc. | 2.700% | 3/11/30 | 24,288 | 20,956 | ||
| eBay Inc. | 2.600% | 5/10/31 | 12,686 | 10,529 | ||
| 1 | Emory University | 2.143% | 9/1/30 | 10,295 | 8,917 | |
| Fortune Brands Home & Security Inc. | 3.250% | 9/15/29 | 18,245 | 15,926 | ||
| Fortune Brands Home & Security Inc. | 4.000% | 3/25/32 | 10,370 | 9,190 | ||
| General Motors Co. | 4.200% | 10/1/27 | 18,904 | 18,161 | ||
| General Motors Co. | 6.800% | 10/1/27 | 26,776 | 28,414 | ||
| General Motors Co. | 5.000% | 10/1/28 | 25,238 | 24,495 | ||
| General Motors Co. | 5.400% | 10/15/29 | 13,035 | 12,714 | ||
| General Motors Co. | 5.600% | 10/15/32 | 5,000 | 4,793 | ||
| General Motors Financial Co. Inc. | 2.700% | 8/20/27 | 9,809 | 8,719 | ||
| General Motors Financial Co. Inc. | 3.850% | 1/5/28 | 13,093 | 12,029 | ||
| General Motors Financial Co. Inc. | 2.400% | 4/10/28 | 24,847 | 21,040 | ||
| General Motors Financial Co. Inc. | 2.400% | 10/15/28 | 29,014 | 24,158 | ||
| General Motors Financial Co. Inc. | 5.650% | 1/17/29 | 15,800 | 15,733 | ||
| General Motors Financial Co. Inc. | 4.300% | 4/6/29 | 28,152 | 25,988 | ||
| General Motors Financial Co. Inc. | 3.600% | 6/21/30 | 25,400 | 21,964 | ||
| General Motors Financial Co. Inc. | 2.350% | 1/8/31 | 16,842 | 13,053 | ||
| General Motors Financial Co. Inc. | 2.700% | 6/10/31 | 24,070 | 19,056 | ||
| General Motors Financial Co. Inc. | 3.100% | 1/12/32 | 44,425 | 35,930 | ||
| Coupon | Maturity Date | Face Amount ($000) | Market Value• ($000) | |||
| Genuine Parts Co. | 1.875% | 11/1/30 | 14,658 | 11,593 | ||
| Genuine Parts Co. | 2.750% | 2/1/32 | 11,255 | 9,340 | ||
| Hasbro Inc. | 3.500% | 9/15/27 | 8,204 | 7,731 | ||
| Hasbro Inc. | 3.900% | 11/19/29 | 26,831 | 24,688 | ||
| Home Depot Inc. | 2.800% | 9/14/27 | 34,115 | 32,409 | ||
| Home Depot Inc. | 0.900% | 3/15/28 | 16,469 | 14,020 | ||
| Home Depot Inc. | 1.500% | 9/15/28 | 18,610 | 16,185 | ||
| Home Depot Inc. | 3.900% | 12/6/28 | 15,686 | 15,543 | ||
| Home Depot Inc. | 2.950% | 6/15/29 | 35,647 | 33,151 | ||
| Home Depot Inc. | 2.700% | 4/15/30 | 29,251 | 26,369 | ||
| Home Depot Inc. | 1.375% | 3/15/31 | 36,078 | 28,945 | ||
| Home Depot Inc. | 1.875% | 9/15/31 | 34,774 | 28,732 | ||
| Home Depot Inc. | 3.250% | 4/15/32 | 48,817 | 45,136 | ||
| Honda Motor Co. Ltd. | 2.967% | 3/10/32 | 23,771 | 21,381 | ||
| Hyatt Hotels Corp. | 4.375% | 9/15/28 | 11,707 | 11,079 | ||
| Hyatt Hotels Corp. | 6.000% | 4/23/30 | 11,260 | 11,472 | ||
| JD.com Inc. | 3.375% | 1/14/30 | 15,268 | 13,949 | ||
| Kohl's Corp. | 3.375% | 5/1/31 | 10,129 | 7,279 | ||
| Lear Corp. | 3.800% | 9/15/27 | 5,000 | 4,715 | ||
| Lear Corp. | 4.250% | 5/15/29 | 11,054 | 10,137 | ||
| Lear Corp. | 3.500% | 5/30/30 | 13,375 | 11,635 | ||
| Lear Corp. | 2.600% | 1/15/32 | 5,580 | 4,327 | ||
| Leggett & Platt Inc. | 3.500% | 11/15/27 | 9,717 | 9,038 | ||
| Leggett & Platt Inc. | 4.400% | 3/15/29 | 16,196 | 15,683 | ||
| Lennar Corp. | 4.750% | 11/29/27 | 28,340 | 27,678 | ||
| Lowe's Cos. Inc. | 1.300% | 4/15/28 | 28,401 | 24,103 | ||
| Lowe's Cos. Inc. | 1.700% | 9/15/28 | 26,135 | 22,441 | ||
| Lowe's Cos. Inc. | 6.500% | 3/15/29 | 1,885 | 2,072 | ||
| Lowe's Cos. Inc. | 3.650% | 4/5/29 | 39,271 | 37,155 | ||
| Lowe's Cos. Inc. | 4.500% | 4/15/30 | 30,805 | 30,497 | ||
| Lowe's Cos. Inc. | 1.700% | 10/15/30 | 34,252 | 27,466 | ||
| Lowe's Cos. Inc. | 2.625% | 4/1/31 | 44,687 | 38,320 | ||
| Lowe's Cos. Inc. | 3.750% | 4/1/32 | 48,928 | 45,248 | ||
| Magna International Inc. | 2.450% | 6/15/30 | 16,141 | 13,786 | ||
| 1 | Marriott International Inc. | 4.000% | 4/15/28 | 11,465 | 10,887 | |
| 1 | Marriott International Inc. | 4.650% | 12/1/28 | 7,077 | 6,931 | |
| 1 | Marriott International Inc. | 4.625% | 6/15/30 | 28,079 | 26,812 | |
| 1 | Marriott International Inc. | 2.850% | 4/15/31 | 28,395 | 23,635 | |
| Masco Corp. | 3.500% | 11/15/27 | 8,020 | 7,473 | ||
| Masco Corp. | 1.500% | 2/15/28 | 8,311 | 7,002 | ||
| Masco Corp. | 2.000% | 10/1/30 | 9,003 | 7,138 | ||
| Masco Corp. | 2.000% | 2/15/31 | 14,423 | 11,509 | ||
| 1 | McDonald's Corp. | 3.500% | 7/1/27 | 361 | 350 | |
| 1 | McDonald's Corp. | 3.800% | 4/1/28 | 31,467 | 30,868 | |
| 1 | McDonald's Corp. | 2.625% | 9/1/29 | 32,833 | 29,521 | |
| 1 | McDonald's Corp. | 2.125% | 3/1/30 | 16,540 | 14,209 | |
| 1 | McDonald's Corp. | 3.600% | 7/1/30 | 20,010 | 18,997 | |
| MDC Holdings Inc. | 2.500% | 1/15/31 | 17,209 | 12,365 | ||
| 2 | Mercedes-Benz Finance North America LLC | 3.100% | 8/15/29 | 14,387 | 13,062 | |
| Mercedes-Benz Finance North America LLC | 8.500% | 1/18/31 | 26,290 | 33,233 | ||
| 2 | Mercedes-Benz Finance North America LLC | 2.450% | 3/2/31 | 7,045 | 5,958 | |
| Mohawk Industries Inc. | 3.625% | 5/15/30 | 12,280 | 10,931 | ||
| NIKE Inc. | 2.850% | 3/27/30 | 34,567 | 31,725 | ||
| NVR Inc. | 3.000% | 5/15/30 | 23,832 | 20,369 | ||
| O'Reilly Automotive Inc. | 3.600% | 9/1/27 | 15,845 | 15,265 | ||
| O'Reilly Automotive Inc. | 4.350% | 6/1/28 | 18,505 | 18,298 | ||
| O'Reilly Automotive Inc. | 3.900% | 6/1/29 | 9,735 | 9,219 | ||
| O'Reilly Automotive Inc. | 4.200% | 4/1/30 | 12,544 | 12,061 | ||
| O'Reilly Automotive Inc. | 1.750% | 3/15/31 | 4,473 | 3,555 | ||
| O'Reilly Automotive Inc. | 4.700% | 6/15/32 | 25,245 | 24,997 | ||
| Owens Corning | 3.950% | 8/15/29 | 10,526 | 9,869 | ||
| Owens Corning | 3.875% | 6/1/30 | 8,496 | 7,737 | ||
| PulteGroup Inc. | 7.875% | 6/15/32 | 4,079 | 4,549 | ||
| Ralph Lauren Corp. | 2.950% | 6/15/30 | 15,047 | 13,405 | ||
| Coupon | Maturity Date | Face Amount ($000) | Market Value• ($000) | |||
| Ross Stores Inc. | 1.875% | 4/15/31 | 12,925 | 10,274 | ||
| Stanley Black & Decker Inc. | 4.250% | 11/15/28 | 14,903 | 14,751 | ||
| Stanley Black & Decker Inc. | 2.300% | 3/15/30 | 13,599 | 11,630 | ||
| Starbucks Corp. | 3.500% | 3/1/28 | 15,678 | 15,087 | ||
| Starbucks Corp. | 4.000% | 11/15/28 | 18,348 | 18,007 | ||
| Starbucks Corp. | 3.550% | 8/15/29 | 16,086 | 15,149 | ||
| Starbucks Corp. | 2.250% | 3/12/30 | 17,988 | 15,285 | ||
| Starbucks Corp. | 2.550% | 11/15/30 | 42,024 | 36,019 | ||
| Starbucks Corp. | 3.000% | 2/14/32 | 20,856 | 18,245 | ||
| Tapestry Inc. | 4.125% | 7/15/27 | 3,395 | 3,246 | ||
| Tapestry Inc. | 3.050% | 3/15/32 | 11,200 | 8,930 | ||
| TJX Cos. Inc. | 1.150% | 5/15/28 | 5,562 | 4,742 | ||
| TJX Cos. Inc. | 3.875% | 4/15/30 | 14,205 | 13,809 | ||
| TJX Cos. Inc. | 1.600% | 5/15/31 | 1,790 | 1,438 | ||
| Toll Brothers Finance Corp. | 4.350% | 2/15/28 | 8,640 | 7,948 | ||
| Toll Brothers Finance Corp. | 3.800% | 11/1/29 | 10,300 | 8,760 | ||
| Toyota Motor Corp. | 3.669% | 7/20/28 | 5,904 | 5,794 | ||
| Toyota Motor Corp. | 2.760% | 7/2/29 | 9,000 | 8,247 | ||
| Toyota Motor Corp. | 2.362% | 3/25/31 | 9,516 | 8,328 | ||
| 1 | Toyota Motor Credit Corp. | 3.050% | 1/11/28 | 15,159 | 14,467 | |
| 1 | Toyota Motor Credit Corp. | 1.900% | 4/6/28 | 13,318 | 11,847 | |
| Toyota Motor Credit Corp. | 3.650% | 1/8/29 | 12,648 | 12,247 | ||
| Toyota Motor Credit Corp. | 4.450% | 6/29/29 | 20,285 | 20,418 | ||
| 1 | Toyota Motor Credit Corp. | 2.150% | 2/13/30 | 14,291 | 12,395 | |
| 1 | Toyota Motor Credit Corp. | 3.375% | 4/1/30 | 25,829 | 24,380 | |
| 1 | Toyota Motor Credit Corp. | 1.650% | 1/10/31 | 24,349 | 19,860 | |
| Toyota Motor Credit Corp. | 1.900% | 9/12/31 | 13,330 | 11,031 | ||
| 1 | Toyota Motor Credit Corp. | 2.400% | 1/13/32 | 10,353 | 8,863 | |
| Tractor Supply Co. | 1.750% | 11/1/30 | 16,388 | 12,954 | ||
| VF Corp. | 2.950% | 4/23/30 | 18,678 | 16,239 | ||
| Whirlpool Corp. | 4.750% | 2/26/29 | 18,513 | 18,221 | ||
| Whirlpool Corp. | 2.400% | 5/15/31 | 6,500 | 5,340 | ||
| Whirlpool Corp. | 4.700% | 5/14/32 | 5,992 | 5,824 | ||
| 1 | Yale University | 1.482% | 4/15/30 | 11,865 | 9,956 | |
| 2,553,388 | ||||||
| Consumer Staples (6.5%) | ||||||
| Ahold Finance USA LLC | 6.875% | 5/1/29 | 11,795 | 12,901 | ||
| Altria Group Inc. | 4.800% | 2/14/29 | 36,757 | 35,588 | ||
| Altria Group Inc. | 3.400% | 5/6/30 | 14,330 | 12,402 | ||
| Altria Group Inc. | 2.450% | 2/4/32 | 55,620 | 42,029 | ||
| Anheuser-Busch InBev Worldwide Inc. | 4.000% | 4/13/28 | 78,368 | 77,403 | ||
| Anheuser-Busch InBev Worldwide Inc. | 4.750% | 1/23/29 | 94,995 | 96,913 | ||
| Anheuser-Busch InBev Worldwide Inc. | 3.500% | 6/1/30 | 55,636 | 52,372 | ||
| Anheuser-Busch InBev Worldwide Inc. | 4.900% | 1/23/31 | 14,325 | 14,734 | ||
| Archer-Daniels-Midland Co. | 3.250% | 3/27/30 | 19,958 | 18,775 | ||
| Archer-Daniels-Midland Co. | 2.900% | 3/1/32 | 16,959 | 15,334 | ||
| Avery Dennison Corp. | 4.875% | 12/6/28 | 11,982 | 12,100 | ||
| Avery Dennison Corp. | 2.650% | 4/30/30 | 20,862 | 17,584 | ||
| Avery Dennison Corp. | 2.250% | 2/15/32 | 995 | 780 | ||
| BAT Capital Corp. | 2.259% | 3/25/28 | 48,974 | 41,168 | ||
| BAT Capital Corp. | 3.462% | 9/6/29 | 7,668 | 6,611 | ||
| BAT Capital Corp. | 4.906% | 4/2/30 | 30,039 | 28,293 | ||
| BAT Capital Corp. | 2.726% | 3/25/31 | 25,924 | 20,742 | ||
| BAT Capital Corp. | 4.742% | 3/16/32 | 24,229 | 21,806 | ||
| BAT International Finance plc | 4.448% | 3/16/28 | 25,343 | 23,991 | ||
| Bunge Ltd. Finance Corp. | 3.750% | 9/25/27 | 10,910 | 10,570 | ||
| Bunge Ltd. Finance Corp. | 2.750% | 5/14/31 | 26,132 | 21,904 | ||
| Campbell Soup Co. | 4.150% | 3/15/28 | 30,199 | 29,657 | ||
| Campbell Soup Co. | 2.375% | 4/24/30 | 12,591 | 10,658 | ||
| Clorox Co. | 3.100% | 10/1/27 | 13,388 | 12,695 | ||
| Clorox Co. | 3.900% | 5/15/28 | 8,378 | 8,236 | ||
| Clorox Co. | 4.400% | 5/1/29 | 7,733 | 7,636 | ||
| Clorox Co. | 1.800% | 5/15/30 | 15,637 | 12,768 | ||
| Coupon | Maturity Date | Face Amount ($000) | Market Value• ($000) | |||
| Clorox Co. | 4.600% | 5/1/32 | 17,180 | 16,998 | ||
| Coca-Cola Co. | 1.500% | 3/5/28 | 8,592 | 7,679 | ||
| Coca-Cola Co. | 1.000% | 3/15/28 | 39,459 | 34,068 | ||
| Coca-Cola Co. | 2.125% | 9/6/29 | 16,069 | 14,320 | ||
| Coca-Cola Co. | 3.450% | 3/25/30 | 25,166 | 24,243 | ||
| Coca-Cola Co. | 1.650% | 6/1/30 | 46,541 | 39,289 | ||
| Coca-Cola Co. | 2.000% | 3/5/31 | 25,333 | 21,698 | ||
| Coca-Cola Co. | 1.375% | 3/15/31 | 55,314 | 45,067 | ||
| Coca-Cola Co. | 2.250% | 1/5/32 | 41,230 | 35,844 | ||
| Coca-Cola Femsa SAB de CV | 2.750% | 1/22/30 | 28,806 | 25,929 | ||
| Colgate-Palmolive Co. | 3.250% | 8/15/32 | 13,300 | 12,579 | ||
| Conagra Brands Inc. | 1.375% | 11/1/27 | 20,673 | 17,300 | ||
| Conagra Brands Inc. | 7.000% | 10/1/28 | 1,331 | 1,437 | ||
| Conagra Brands Inc. | 4.850% | 11/1/28 | 35,605 | 35,234 | ||
| Conagra Brands Inc. | 8.250% | 9/15/30 | 2,411 | 2,803 | ||
| Constellation Brands Inc. | 3.600% | 2/15/28 | 23,485 | 22,313 | ||
| Constellation Brands Inc. | 4.650% | 11/15/28 | 15,521 | 15,412 | ||
| Constellation Brands Inc. | 3.150% | 8/1/29 | 26,113 | 23,482 | ||
| Constellation Brands Inc. | 2.875% | 5/1/30 | 17,559 | 15,257 | ||
| Constellation Brands Inc. | 2.250% | 8/1/31 | 31,508 | 25,653 | ||
| Constellation Brands Inc. | 4.750% | 5/9/32 | 21,331 | 21,014 | ||
| Costco Wholesale Corp. | 1.600% | 4/20/30 | 51,608 | 43,565 | ||
| Costco Wholesale Corp. | 1.750% | 4/20/32 | 30,438 | 25,053 | ||
| Diageo Capital plc | 3.875% | 5/18/28 | 8,478 | 8,426 | ||
| Diageo Capital plc | 2.375% | 10/24/29 | 23,116 | 20,503 | ||
| Diageo Capital plc | 2.000% | 4/29/30 | 23,327 | 19,973 | ||
| Diageo Capital plc | 2.125% | 4/29/32 | 18,231 | 15,158 | ||
| Dollar General Corp. | 4.125% | 5/1/28 | 8,766 | 8,623 | ||
| Dollar General Corp. | 3.500% | 4/3/30 | 31,982 | 29,500 | ||
| Dollar Tree Inc. | 4.200% | 5/15/28 | 34,188 | 33,324 | ||
| Dollar Tree Inc. | 2.650% | 12/1/31 | 18,757 | 15,627 | ||
| Estee Lauder Cos. Inc. | 2.375% | 12/1/29 | 16,573 | 14,735 | ||
| Estee Lauder Cos. Inc. | 2.600% | 4/15/30 | 19,059 | 17,105 | ||
| Estee Lauder Cos. Inc. | 1.950% | 3/15/31 | 15,620 | 13,158 | ||
| Flowers Foods Inc. | 2.400% | 3/15/31 | 13,039 | 10,823 | ||
| General Mills Inc. | 4.200% | 4/17/28 | 34,099 | 33,915 | ||
| General Mills Inc. | 2.875% | 4/15/30 | 10,979 | 9,821 | ||
| General Mills Inc. | 2.250% | 10/14/31 | 12,943 | 10,720 | ||
| 2 | GSK Consumer Healthcare Capital US LLC | 3.375% | 3/24/29 | 21,225 | 19,323 | |
| 2 | GSK Consumer Healthcare Capital US LLC | 3.625% | 3/24/32 | 52,450 | 46,768 | |
| Hershey Co. | 2.450% | 11/15/29 | 5,282 | 4,718 | ||
| Hershey Co. | 1.700% | 6/1/30 | 7,208 | 6,024 | ||
| Hormel Foods Corp. | 1.700% | 6/3/28 | 11,415 | 10,148 | ||
| Hormel Foods Corp. | 1.800% | 6/11/30 | 28,232 | 23,869 | ||
| Ingredion Inc. | 2.900% | 6/1/30 | 15,231 | 13,257 | ||
| J M Smucker Co. | 3.375% | 12/15/27 | 11,964 | 11,388 | ||
| J M Smucker Co. | 2.375% | 3/15/30 | 8,546 | 7,266 | ||
| J M Smucker Co. | 2.125% | 3/15/32 | 7,707 | 6,175 | ||
| 2 | JBS USA LUX SA | 6.500% | 4/15/29 | 1,976 | 2,029 | |
| 2 | JBS USA LUX SA | 5.500% | 1/15/30 | 32,500 | 32,508 | |
| 2 | JBS USA LUX SA | 3.750% | 12/1/31 | 12,000 | 10,468 | |
| 2 | JBS USA LUX SA | 3.625% | 1/15/32 | 19,325 | 16,731 | |
| 2 | JBS USA LUX SA | 3.000% | 5/15/32 | 27,000 | 22,241 | |
| Kellogg Co. | 3.400% | 11/15/27 | 19,290 | 18,348 | ||
| Kellogg Co. | 4.300% | 5/15/28 | 11,562 | 11,430 | ||
| Kellogg Co. | 2.100% | 6/1/30 | 20,454 | 16,970 | ||
| 1 | Kellogg Co. | 7.450% | 4/1/31 | 7,600 | 8,731 | |
| Keurig Dr Pepper Inc. | 3.430% | 6/15/27 | 5,000 | 4,779 | ||
| Keurig Dr Pepper Inc. | 3.950% | 4/15/29 | 34,662 | 32,984 | ||
| Keurig Dr Pepper Inc. | 3.200% | 5/1/30 | 24,851 | 22,314 | ||
| Keurig Dr Pepper Inc. | 2.250% | 3/15/31 | 9,698 | 7,980 | ||
| Keurig Dr Pepper Inc. | 4.050% | 4/15/32 | 36,470 | 34,009 | ||
| Kimberly-Clark Corp. | 1.050% | 9/15/27 | 17,797 | 15,568 | ||
| Kimberly-Clark Corp. | 3.950% | 11/1/28 | 8,076 | 8,038 | ||
| Kimberly-Clark Corp. | 3.200% | 4/25/29 | 7,749 | 7,307 | ||
| Coupon | Maturity Date | Face Amount ($000) | Market Value• ($000) | |||
| Kimberly-Clark Corp. | 3.100% | 3/26/30 | 26,650 | 24,796 | ||
| Kimberly-Clark Corp. | 2.000% | 11/2/31 | 15,134 | 12,768 | ||
| Kraft Heinz Foods Co. | 4.625% | 1/30/29 | 4,250 | 4,206 | ||
| Kraft Heinz Foods Co. | 3.750% | 4/1/30 | 33,351 | 30,819 | ||
| Kraft Heinz Foods Co. | 4.250% | 3/1/31 | 21,270 | 20,176 | ||
| Kraft Heinz Foods Co. | 6.750% | 3/15/32 | 1,105 | 1,225 | ||
| Kroger Co. | 4.500% | 1/15/29 | 10,387 | 10,314 | ||
| 1 | Kroger Co. | 7.700% | 6/1/29 | 1,805 | 2,071 | |
| Kroger Co. | 2.200% | 5/1/30 | 16,344 | 13,743 | ||
| Kroger Co. | 1.700% | 1/15/31 | 14,305 | 11,415 | ||
| Kroger Co. | 7.500% | 4/1/31 | 2,908 | 3,442 | ||
| McCormick & Co. Inc. | 3.400% | 8/15/27 | 9,255 | 8,889 | ||
| McCormick & Co. Inc. | 2.500% | 4/15/30 | 14,429 | 12,441 | ||
| McCormick & Co. Inc. | 1.850% | 2/15/31 | 7,514 | 5,982 | ||
| Mondelez International Inc. | 4.125% | 5/7/28 | 779 | 773 | ||
| Mondelez International Inc. | 2.750% | 4/13/30 | 21,690 | 19,169 | ||
| Mondelez International Inc. | 1.500% | 2/4/31 | 10,831 | 8,556 | ||
| Mondelez International Inc. | 3.000% | 3/17/32 | 20,361 | 17,850 | ||
| PepsiCo Inc. | 3.000% | 10/15/27 | 25,704 | 24,837 | ||
| PepsiCo Inc. | 3.600% | 2/18/28 | 13,850 | 13,591 | ||
| PepsiCo Inc. | 7.000% | 3/1/29 | 9,981 | 11,652 | ||
| PepsiCo Inc. | 2.625% | 7/29/29 | 22,645 | 20,746 | ||
| PepsiCo Inc. | 2.750% | 3/19/30 | 31,539 | 28,874 | ||
| PepsiCo Inc. | 1.625% | 5/1/30 | 44,345 | 37,428 | ||
| PepsiCo Inc. | 1.400% | 2/25/31 | 19,437 | 15,883 | ||
| PepsiCo Inc. | 1.950% | 10/21/31 | 30,065 | 25,459 | ||
| PepsiCo Inc. | 3.900% | 7/18/32 | 27,590 | 27,026 | ||
| Philip Morris International Inc. | 3.125% | 3/2/28 | 14,188 | 13,035 | ||
| Philip Morris International Inc. | 3.375% | 8/15/29 | 19,332 | 17,441 | ||
| Philip Morris International Inc. | 2.100% | 5/1/30 | 24,741 | 19,924 | ||
| Philip Morris International Inc. | 1.750% | 11/1/30 | 9,130 | 7,064 | ||
| Procter & Gamble Co. | 2.850% | 8/11/27 | 6,082 | 5,839 | ||
| Procter & Gamble Co. | 3.000% | 3/25/30 | 42,585 | 40,173 | ||
| Procter & Gamble Co. | 1.200% | 10/29/30 | 34,137 | 27,859 | ||
| Procter & Gamble Co. | 1.950% | 4/23/31 | 22,140 | 19,135 | ||
| Procter & Gamble Co. | 2.300% | 2/1/32 | 7,657 | 6,788 | ||
| Sysco Corp. | 3.250% | 7/15/27 | 5,898 | 5,594 | ||
| Sysco Corp. | 2.400% | 2/15/30 | 13,375 | 11,505 | ||
| Sysco Corp. | 5.950% | 4/1/30 | 26,392 | 28,096 | ||
| Sysco Corp. | 2.450% | 12/14/31 | 9,555 | 7,996 | ||
| Target Corp. | 3.375% | 4/15/29 | 28,677 | 27,547 | ||
| Target Corp. | 2.350% | 2/15/30 | 13,263 | 11,677 | ||
| Target Corp. | 2.650% | 9/15/30 | 8,914 | 7,954 | ||
| Tyson Foods Inc. | 4.350% | 3/1/29 | 30,568 | 30,249 | ||
| Unilever Capital Corp. | 2.900% | 5/5/27 | 23,350 | 22,323 | ||
| Unilever Capital Corp. | 3.500% | 3/22/28 | 3,034 | 2,957 | ||
| Unilever Capital Corp. | 2.125% | 9/6/29 | 22,434 | 19,653 | ||
| Unilever Capital Corp. | 1.375% | 9/14/30 | 12,100 | 9,766 | ||
| Unilever Capital Corp. | 1.750% | 8/12/31 | 18,270 | 14,975 | ||
| Walgreens Boots Alliance Inc. | 3.200% | 4/15/30 | 8,169 | 7,285 | ||
| Walmart Inc. | 3.700% | 6/26/28 | 52,698 | 51,972 | ||
| Walmart Inc. | 1.500% | 9/22/28 | 11,430 | 9,982 | ||
| Walmart Inc. | 3.250% | 7/8/29 | 27,787 | 26,670 | ||
| Walmart Inc. | 2.375% | 9/24/29 | 11,165 | 10,047 | ||
| Walmart Inc. | 1.800% | 9/22/31 | 43,719 | 36,862 | ||
| 2,789,168 | ||||||
| Energy (6.1%) | ||||||
| Baker Hughes Holdings LLC | 3.337% | 12/15/27 | 26,727 | 25,066 | ||
| Baker Hughes Holdings LLC | 3.138% | 11/7/29 | 2,775 | 2,489 | ||
| Baker Hughes Holdings LLC | 4.486% | 5/1/30 | 16,568 | 16,175 | ||
| Boardwalk Pipelines LP | 4.800% | 5/3/29 | 3,764 | 3,617 | ||
| Boardwalk Pipelines LP | 3.400% | 2/15/31 | 13,136 | 11,155 | ||
| BP Capital Markets America Inc. | 3.937% | 9/21/28 | 30,343 | 29,676 | ||
| BP Capital Markets America Inc. | 4.234% | 11/6/28 | 48,156 | 47,637 | ||
| BP Capital Markets America Inc. | 3.633% | 4/6/30 | 40,287 | 38,291 | ||
| BP Capital Markets America Inc. | 1.749% | 8/10/30 | 22,303 | 18,486 | ||
| BP Capital Markets America Inc. | 2.721% | 1/12/32 | 54,952 | 47,905 | ||
| Coupon | Maturity Date | Face Amount ($000) | Market Value• ($000) | |||
| BP Capital Markets plc | 3.279% | 9/19/27 | 38,278 | 36,682 | ||
| BP Capital Markets plc | 3.723% | 11/28/28 | 21,333 | 20,676 | ||
| Burlington Resources LLC | 7.200% | 8/15/31 | 4,006 | 4,700 | ||
| Burlington Resources LLC | 7.400% | 12/1/31 | 4,182 | 5,028 | ||
| Canadian Natural Resources Ltd. | 2.950% | 7/15/30 | 12,251 | 10,683 | ||
| Canadian Natural Resources Ltd. | 7.200% | 1/15/32 | 9,693 | 10,858 | ||
| Cenovus Energy Inc. | 4.400% | 4/15/29 | 23,483 | 22,697 | ||
| Cenovus Energy Inc. | 2.650% | 1/15/32 | 8,670 | 7,127 | ||
| Cheniere Corpus Christi Holdings LLC | 5.125% | 6/30/27 | 4,226 | 4,222 | ||
| Cheniere Corpus Christi Holdings LLC | 3.700% | 11/15/29 | 47,850 | 44,050 | ||
| Chevron Corp. | 1.995% | 5/11/27 | 13,391 | 12,371 | ||
| Chevron Corp. | 2.236% | 5/11/30 | 37,413 | 32,821 | ||
| Chevron USA Inc. | 3.850% | 1/15/28 | 8,027 | 7,939 | ||
| Chevron USA Inc. | 3.250% | 10/15/29 | 16,462 | 15,432 | ||
| Conoco Funding Co. | 7.250% | 10/15/31 | 6,118 | 7,202 | ||
| ConocoPhillips | 4.300% | 8/15/28 | 15,354 | 15,299 | ||
| ConocoPhillips | 2.400% | 2/15/31 | 24,057 | 20,193 | ||
| ConocoPhillips Co. | 6.950% | 4/15/29 | 32,011 | 36,593 | ||
| Continental Resources Inc. | 4.375% | 1/15/28 | 20,608 | 19,349 | ||
| 2 | Coterra Energy Inc. | 3.900% | 5/15/27 | 3,690 | 3,523 | |
| 2 | Coterra Energy Inc. | 4.375% | 3/15/29 | 16,275 | 15,722 | |
| DCP Midstream Operating LP | 5.125% | 5/15/29 | 9,129 | 8,909 | ||
| DCP Midstream Operating LP | 3.250% | 2/15/32 | 6,905 | 5,777 | ||
| Devon Energy Corp. | 5.250% | 10/15/27 | 13,783 | 13,799 | ||
| Devon Energy Corp. | 5.875% | 6/15/28 | 9,818 | 10,003 | ||
| Devon Energy Corp. | 4.500% | 1/15/30 | 17,218 | 16,451 | ||
| Devon Energy Corp. | 7.875% | 9/30/31 | 12,663 | 14,675 | ||
| Devon Energy Corp. | 7.950% | 4/15/32 | 2,955 | 3,432 | ||
| Diamondback Energy Inc. | 3.500% | 12/1/29 | 29,754 | 27,045 | ||
| Diamondback Energy Inc. | 3.125% | 3/24/31 | 22,122 | 19,173 | ||
| Eastern Gas Transmission & Storage Inc. | 3.000% | 11/15/29 | 8,381 | 7,537 | ||
| Enbridge Inc. | 1.600% | 10/4/26 | 100 | 89 | ||
| Enbridge Inc. | 3.700% | 7/15/27 | 5,235 | 5,011 | ||
| Enbridge Inc. | 3.125% | 11/15/29 | 26,212 | 23,715 | ||
| Energy Transfer LP | 4.000% | 10/1/27 | 17,007 | 16,143 | ||
| Energy Transfer LP | 4.950% | 5/15/28 | 20,435 | 19,951 | ||
| Energy Transfer LP | 4.950% | 6/15/28 | 30,883 | 30,382 | ||
| Energy Transfer LP | 5.250% | 4/15/29 | 45,043 | 44,457 | ||
| Energy Transfer LP | 4.150% | 9/15/29 | 15,829 | 14,534 | ||
| Energy Transfer LP | 3.750% | 5/15/30 | 35,627 | 32,107 | ||
| Eni USA Inc. | 7.300% | 11/15/27 | 2,678 | 2,962 | ||
| Enterprise Products Operating LLC | 4.150% | 10/16/28 | 19,744 | 19,371 | ||
| Enterprise Products Operating LLC | 3.125% | 7/31/29 | 42,447 | 38,506 | ||
| Enterprise Products Operating LLC | 2.800% | 1/31/30 | 24,534 | 21,601 | ||
| 1 | Enterprise Products Operating LLC | 5.375% | 2/15/78 | 18,170 | 15,012 | |
| EOG Resources Inc. | 4.375% | 4/15/30 | 24,615 | 24,682 | ||
| EQT Corp. | 3.900% | 10/1/27 | 23,655 | 22,417 | ||
| EQT Corp. | 5.000% | 1/15/29 | 17,980 | 17,608 | ||
| EQT Corp. | 7.000% | 2/1/30 | 26,475 | 28,347 | ||
| Exxon Mobil Corp. | 2.440% | 8/16/29 | 30,199 | 27,238 | ||
| Exxon Mobil Corp. | 3.482% | 3/19/30 | 52,219 | 50,023 | ||
| Exxon Mobil Corp. | 2.610% | 10/15/30 | 61,695 | 55,319 | ||
| Halliburton Co. | 2.920% | 3/1/30 | 24,767 | 21,925 | ||
| Helmerich & Payne Inc. | 2.900% | 9/29/31 | 14,750 | 12,472 | ||
| Hess Corp. | 7.875% | 10/1/29 | 8,717 | 9,958 | ||
| Hess Corp. | 7.300% | 8/15/31 | 10,001 | 11,167 | ||
| Hess Corp. | 7.125% | 3/15/33 | 3,000 | 3,333 | ||
| 2 | HF Sinclair Corp. | 4.500% | 10/1/30 | 10,073 | 9,050 | |
| Kinder Morgan Energy Partners LP | 7.400% | 3/15/31 | 4,011 | 4,415 | ||
| Kinder Morgan Energy Partners LP | 7.750% | 3/15/32 | 2,586 | 2,936 | ||
| Kinder Morgan Inc. | 4.300% | 3/1/28 | 40,048 | 39,137 | ||
| Kinder Morgan Inc. | 2.000% | 2/15/31 | 29,407 | 23,384 | ||
| 1 | Kinder Morgan Inc. | 7.800% | 8/1/31 | 10,968 | 12,636 | |
| 1 | Kinder Morgan Inc. | 7.750% | 1/15/32 | 12,760 | 14,806 | |
| Coupon | Maturity Date | Face Amount ($000) | Market Value• ($000) | |||
| Magellan Midstream Partners LP | 3.250% | 6/1/30 | 6,227 | 5,525 | ||
| Marathon Oil Corp. | 4.400% | 7/15/27 | 12,150 | 11,817 | ||
| Marathon Oil Corp. | 6.800% | 3/15/32 | 13,864 | 14,821 | ||
| Marathon Petroleum Corp. | 3.800% | 4/1/28 | 21,376 | 20,184 | ||
| MPLX LP | 4.250% | 12/1/27 | 13,029 | 12,616 | ||
| MPLX LP | 4.000% | 3/15/28 | 31,761 | 30,395 | ||
| MPLX LP | 4.800% | 2/15/29 | 26,631 | 26,056 | ||
| MPLX LP | 2.650% | 8/15/30 | 32,596 | 27,204 | ||
| NOV Inc. | 3.600% | 12/1/29 | 10,859 | 9,595 | ||
| ONEOK Inc. | 4.550% | 7/15/28 | 24,601 | 23,859 | ||
| ONEOK Inc. | 4.350% | 3/15/29 | 28,797 | 27,192 | ||
| ONEOK Inc. | 3.400% | 9/1/29 | 25,828 | 22,862 | ||
| ONEOK Inc. | 3.100% | 3/15/30 | 16,553 | 14,295 | ||
| ONEOK Inc. | 6.350% | 1/15/31 | 4,713 | 4,927 | ||
| Ovintiv Inc. | 8.125% | 9/15/30 | 3,972 | 4,416 | ||
| Ovintiv Inc. | 7.200% | 11/1/31 | 15,549 | 16,632 | ||
| Ovintiv Inc. | 7.375% | 11/1/31 | 14,580 | 15,864 | ||
| Phillips 66 | 3.900% | 3/15/28 | 14,154 | 13,599 | ||
| Phillips 66 | 2.150% | 12/15/30 | 20,961 | 17,197 | ||
| 2 | Phillips 66 Co. | 3.750% | 3/1/28 | 14,591 | 13,749 | |
| 2 | Phillips 66 Co. | 3.150% | 12/15/29 | 14,782 | 13,127 | |
| Pioneer Natural Resources Co. | 1.900% | 8/15/30 | 31,048 | 25,326 | ||
| Pioneer Natural Resources Co. | 2.150% | 1/15/31 | 30,745 | 25,309 | ||
| Plains All American Pipeline LP | 3.550% | 12/15/29 | 21,686 | 19,012 | ||
| Plains All American Pipeline LP | 3.800% | 9/15/30 | 20,399 | 18,076 | ||
| Sabine Pass Liquefaction LLC | 4.200% | 3/15/28 | 50,306 | 47,984 | ||
| Sabine Pass Liquefaction LLC | 4.500% | 5/15/30 | 56,710 | 54,295 | ||
| Schlumberger Investment SA | 2.650% | 6/26/30 | 31,231 | 27,566 | ||
| Shell International Finance BV | 3.875% | 11/13/28 | 34,854 | 34,174 | ||
| Shell International Finance BV | 2.375% | 11/7/29 | 38,505 | 33,984 | ||
| Shell International Finance BV | 2.750% | 4/6/30 | 45,629 | 41,082 | ||
| Suncor Energy Inc. | 7.150% | 2/1/32 | 19,575 | 21,839 | ||
| Targa Resources Corp. | 4.200% | 2/1/33 | 9,920 | 8,918 | ||
| Targa Resources Partners LP | 5.000% | 1/15/28 | 14,570 | 14,192 | ||
| Targa Resources Partners LP | 6.875% | 1/15/29 | 17,500 | 17,823 | ||
| Targa Resources Partners LP | 5.500% | 3/1/30 | 23,755 | 22,992 | ||
| Targa Resources Partners LP | 4.875% | 2/1/31 | 23,210 | 21,555 | ||
| Targa Resources Partners LP | 4.000% | 1/15/32 | 29,918 | 26,331 | ||
| Tennessee Gas Pipeline Co. LLC | 7.000% | 10/15/28 | 14,532 | 15,650 | ||
| TotalEnergies Capital International SA | 3.455% | 2/19/29 | 21,596 | 20,671 | ||
| TotalEnergies Capital International SA | 2.829% | 1/10/30 | 28,553 | 25,883 | ||
| TotalEnergies Capital SA | 3.883% | 10/11/28 | 24,092 | 23,624 | ||
| TransCanada PipeLines Ltd. | 4.250% | 5/15/28 | 21,764 | 21,234 | ||
| TransCanada PipeLines Ltd. | 4.100% | 4/15/30 | 39,658 | 37,686 | ||
| TransCanada PipeLines Ltd. | 2.500% | 10/12/31 | 43,670 | 35,974 | ||
| Transcontinental Gas Pipe Line Co. LLC | 4.000% | 3/15/28 | 8,772 | 8,430 | ||
| Transcontinental Gas Pipe Line Co. LLC | 3.250% | 5/15/30 | 19,728 | 17,616 | ||
| Valero Energy Corp. | 2.150% | 9/15/27 | 15,051 | 13,407 | ||
| Valero Energy Corp. | 4.350% | 6/1/28 | 23,839 | 23,417 | ||
| Valero Energy Corp. | 4.000% | 4/1/29 | 24,918 | 23,863 | ||
| Valero Energy Corp. | 2.800% | 12/1/31 | 24,400 | 20,537 | ||
| Valero Energy Corp. | 7.500% | 4/15/32 | 3,163 | 3,663 | ||
| Valero Energy Partners LP | 4.500% | 3/15/28 | 19,236 | 19,002 | ||
| Williams Cos. Inc. | 3.500% | 11/15/30 | 34,449 | 31,018 | ||
| Williams Cos. Inc. | 2.600% | 3/15/31 | 42,050 | 35,118 | ||
| Williams Cos. Inc. | 8.750% | 3/15/32 | 13,135 | 16,218 | ||
| Williams Cos. Inc. | 4.650% | 8/15/32 | 11,087 | 10,692 | ||
| 2,605,252 | ||||||
| Financials (30.2%) | ||||||
| ACE Capital Trust II | 9.700% | 4/1/30 | 3,828 | 4,912 | ||
| 1 | Aegon NV | 5.500% | 4/11/48 | 17,130 | 16,383 | |
| AerCap Ireland Capital DAC | 4.625% | 10/15/27 | 20,345 | 19,340 | ||
| AerCap Ireland Capital DAC | 3.875% | 1/23/28 | 22,729 | 20,654 | ||
| Coupon | Maturity Date | Face Amount ($000) | Market Value• ($000) | |||
| AerCap Ireland Capital DAC | 3.000% | 10/29/28 | 99,315 | 85,120 | ||
| AerCap Ireland Capital DAC | 3.300% | 1/30/32 | 102,480 | 82,426 | ||
| Affiliated Managers Group Inc. | 3.300% | 6/15/30 | 9,483 | 8,357 | ||
| Aflac Inc. | 3.600% | 4/1/30 | 44,075 | 41,938 | ||
| Air Lease Corp. | 3.625% | 12/1/27 | 5,728 | 5,208 | ||
| Air Lease Corp. | 2.100% | 9/1/28 | 17,718 | 14,553 | ||
| Air Lease Corp. | 4.625% | 10/1/28 | 7,539 | 7,103 | ||
| Air Lease Corp. | 3.250% | 10/1/29 | 13,477 | 11,558 | ||
| 1 | Air Lease Corp. | 3.000% | 2/1/30 | 19,025 | 15,970 | |
| Air Lease Corp. | 3.125% | 12/1/30 | 15,618 | 13,010 | ||
| Air Lease Corp. | 2.875% | 1/15/32 | 13,346 | 10,728 | ||
| Alleghany Corp. | 3.625% | 5/15/30 | 13,454 | 12,638 | ||
| Allstate Corp. | 1.450% | 12/15/30 | 8,045 | 6,411 | ||
| Ally Financial Inc. | 2.200% | 11/2/28 | 16,498 | 13,620 | ||
| 1 | Ally Financial Inc. | 8.000% | 11/1/31 | 69,385 | 77,240 | |
| Ally Financial Inc. | 8.000% | 11/1/31 | 5,248 | 5,794 | ||
| American Express Co. | 4.050% | 5/3/29 | 15,416 | 14,958 | ||
| American Express Co. | 4.989% | 5/26/33 | 18,546 | 18,420 | ||
| American Express Co. | 4.420% | 8/3/33 | 12,000 | 11,585 | ||
| American Financial Group Inc. | 5.250% | 4/2/30 | 7,342 | 7,359 | ||
| American International Group Inc. | 4.200% | 4/1/28 | 9,155 | 8,978 | ||
| American International Group Inc. | 4.250% | 3/15/29 | 4,961 | 4,753 | ||
| American International Group Inc. | 3.400% | 6/30/30 | 25,297 | 23,192 | ||
| 1 | American International Group Inc. | 5.750% | 4/1/48 | 13,875 | 13,049 | |
| Ameriprise Financial Inc. | 4.500% | 5/13/32 | 17,250 | 17,205 | ||
| 1 | Andrew W Mellon Foundation | 0.947% | 8/1/27 | 8,190 | 7,177 | |
| Aon Corp. | 4.500% | 12/15/28 | 16,298 | 16,143 | ||
| Aon Corp. | 3.750% | 5/2/29 | 13,187 | 12,506 | ||
| Aon Corp. | 2.800% | 5/15/30 | 30,290 | 26,449 | ||
| Aon Corp. | 2.050% | 8/23/31 | 5,489 | 4,442 | ||
| Aon Corp. | 2.600% | 12/2/31 | 11,695 | 9,840 | ||
| Ares Capital Corp. | 2.875% | 6/15/28 | 26,151 | 21,674 | ||
| Ares Capital Corp. | 3.200% | 11/15/31 | 22,118 | 17,120 | ||
| Arthur J Gallagher & Co. | 2.400% | 11/9/31 | 10,615 | 8,662 | ||
| Assurant Inc. | 4.900% | 3/27/28 | 8,090 | 7,992 | ||
| Assurant Inc. | 3.700% | 2/22/30 | 13,359 | 11,824 | ||
| Assured Guaranty US Holdings Inc. | 3.150% | 6/15/31 | 8,614 | 7,420 | ||
| Athene Holding Ltd. | 4.125% | 1/12/28 | 30,449 | 28,611 | ||
| Athene Holding Ltd. | 6.150% | 4/3/30 | 12,198 | 12,340 | ||
| Athene Holding Ltd. | 3.500% | 1/15/31 | 25,452 | 21,682 | ||
| AXA SA | 8.600% | 12/15/30 | 31,526 | 39,140 | ||
| AXIS Specialty Finance LLC | 3.900% | 7/15/29 | 15,110 | 13,979 | ||
| 1 | AXIS Specialty Finance LLC | 4.900% | 1/15/40 | 5,236 | 4,472 | |
| AXIS Specialty Finance plc | 4.000% | 12/6/27 | 6,759 | 6,504 | ||
| Banco Santander SA | 3.800% | 2/23/28 | 22,884 | 20,952 | ||
| Banco Santander SA | 4.379% | 4/12/28 | 31,098 | 29,340 | ||
| Banco Santander SA | 3.306% | 6/27/29 | 19,034 | 17,180 | ||
| Banco Santander SA | 3.490% | 5/28/30 | 20,554 | 17,667 | ||
| Banco Santander SA | 2.749% | 12/3/30 | 51,525 | 39,846 | ||
| Banco Santander SA | 2.958% | 3/25/31 | 10,901 | 8,897 | ||
| Banco Santander SA | 3.225% | 11/22/32 | 19,155 | 14,606 | ||
| 1 | Bank of America Corp. | 3.248% | 10/21/27 | 53,425 | 50,418 | |
| 1 | Bank of America Corp. | 3.593% | 7/21/28 | 4,840 | 4,556 | |
| 1 | Bank of America Corp. | 3.419% | 12/20/28 | 153,413 | 142,372 | |
| 1 | Bank of America Corp. | 3.970% | 3/5/29 | 67,356 | 63,546 | |
| 1 | Bank of America Corp. | 2.087% | 6/14/29 | 90,320 | 76,845 | |
| 1 | Bank of America Corp. | 4.271% | 7/23/29 | 81,730 | 78,422 | |
| 1 | Bank of America Corp. | 3.974% | 2/7/30 | 77,827 | 72,923 | |
| 1 | Bank of America Corp. | 3.194% | 7/23/30 | 71,640 | 63,762 | |
| 1 | Bank of America Corp. | 2.884% | 10/22/30 | 41,361 | 35,936 | |
| 1 | Bank of America Corp. | 2.496% | 2/13/31 | 87,626 | 73,561 | |
| 1 | Bank of America Corp. | 2.592% | 4/29/31 | 83,242 | 70,270 | |
| 1 | Bank of America Corp. | 1.898% | 7/23/31 | 80,621 | 63,707 | |
| 1 | Bank of America Corp. | 1.922% | 10/24/31 | 63,619 | 50,374 | |
| 1 | Bank of America Corp. | 2.651% | 3/11/32 | 55,055 | 45,709 | |
| Bank of America Corp. | 2.687% | 4/22/32 | 132,958 | 110,453 | ||
| Bank of America Corp. | 2.299% | 7/21/32 | 107,461 | 85,843 | ||
| Coupon | Maturity Date | Face Amount ($000) | Market Value• ($000) | |||
| Bank of America Corp. | 2.572% | 10/20/32 | 72,779 | 59,644 | ||
| Bank of America Corp. | 2.972% | 2/4/33 | 84,233 | 71,080 | ||
| Bank of America Corp. | 4.571% | 4/27/33 | 96,270 | 92,073 | ||
| Bank of America Corp. | 5.015% | 7/22/33 | 121,284 | 120,314 | ||
| Bank of America Corp. | 2.482% | 9/21/36 | 53,775 | 41,595 | ||
| Bank of America Corp. | 3.846% | 3/8/37 | 64,153 | 55,487 | ||
| 1 | Bank of Montreal | 3.803% | 12/15/32 | 20,153 | 18,396 | |
| Bank of Montreal | 3.088% | 1/10/37 | 28,705 | 23,131 | ||
| 1 | Bank of New York Mellon Corp. | 3.400% | 1/29/28 | 29,486 | 28,184 | |
| 1 | Bank of New York Mellon Corp. | 3.442% | 2/7/28 | 1 | 1 | |
| 1 | Bank of New York Mellon Corp. | 3.850% | 4/28/28 | 15,115 | 14,834 | |
| 1 | Bank of New York Mellon Corp. | 1.650% | 7/14/28 | 10,910 | 9,433 | |
| 1 | Bank of New York Mellon Corp. | 3.000% | 10/30/28 | 6,254 | 5,727 | |
| 1 | Bank of New York Mellon Corp. | 3.300% | 8/23/29 | 14,303 | 13,322 | |
| Bank of New York Mellon Corp. | 4.596% | 7/26/30 | 12,532 | 12,532 | ||
| 1 | Bank of New York Mellon Corp. | 1.650% | 1/28/31 | 3,715 | 3,002 | |
| 1 | Bank of New York Mellon Corp. | 1.800% | 7/28/31 | 23,030 | 18,559 | |
| Bank of New York Mellon Corp. | 2.500% | 1/26/32 | 13,458 | 11,388 | ||
| 1 | Bank of New York Mellon Corp. | 4.289% | 6/13/33 | 25,260 | 24,624 | |
| Bank of Nova Scotia | 2.150% | 8/1/31 | 18,030 | 14,764 | ||
| Bank of Nova Scotia | 2.450% | 2/2/32 | 10,988 | 9,137 | ||
| Bank of Nova Scotia | 4.588% | 5/4/37 | 31,574 | 28,514 | ||
| BankUnited Inc. | 5.125% | 6/11/30 | 6,019 | 5,812 | ||
| Barclays plc | 4.337% | 1/10/28 | 34,633 | 32,809 | ||
| Barclays plc | 4.836% | 5/9/28 | 50,304 | 47,625 | ||
| 1 | Barclays plc | 4.972% | 5/16/29 | 49,424 | 47,218 | |
| 1 | Barclays plc | 5.088% | 6/20/30 | 31,355 | 29,297 | |
| Barclays plc | 2.645% | 6/24/31 | 11,593 | 9,231 | ||
| Barclays plc | 2.667% | 3/10/32 | 16,490 | 12,900 | ||
| Barclays plc | 2.894% | 11/24/32 | 41,475 | 32,491 | ||
| Barclays plc | 5.746% | 8/9/33 | 38,475 | 37,683 | ||
| Barclays plc | 3.564% | 9/23/35 | 26,620 | 21,459 | ||
| Berkshire Hathaway Finance Corp. | 1.850% | 3/12/30 | 14,567 | 12,479 | ||
| Berkshire Hathaway Finance Corp. | 1.450% | 10/15/30 | 17,497 | 14,280 | ||
| Berkshire Hathaway Finance Corp. | 2.875% | 3/15/32 | 19,430 | 17,305 | ||
| BlackRock Inc. | 3.250% | 4/30/29 | 19,388 | 18,437 | ||
| BlackRock Inc. | 2.400% | 4/30/30 | 25,997 | 22,843 | ||
| BlackRock Inc. | 1.900% | 1/28/31 | 34,195 | 28,483 | ||
| BlackRock Inc. | 2.100% | 2/25/32 | 15,911 | 13,208 | ||
| Blackstone Private Credit Fund | 4.000% | 1/15/29 | 16,210 | 13,983 | ||
| Blackstone Secured Lending Fund | 2.850% | 9/30/28 | 17,240 | 13,709 | ||
| 2 | BPCE SA | 3.250% | 1/11/28 | 695 | 636 | |
| Brighthouse Financial Inc. | 5.625% | 5/15/30 | 21,561 | 21,351 | ||
| Brookfield Finance I UK plc | 2.340% | 1/30/32 | 3,780 | 3,026 | ||
| Brookfield Finance Inc. | 3.900% | 1/25/28 | 21,642 | 20,391 | ||
| Brookfield Finance Inc. | 4.850% | 3/29/29 | 26,688 | 26,172 | ||
| Brookfield Finance Inc. | 4.350% | 4/15/30 | 26,302 | 24,835 | ||
| Brookfield Finance Inc. | 2.724% | 4/15/31 | 13,732 | 11,589 | ||
| Brown & Brown Inc. | 4.500% | 3/15/29 | 9,314 | 9,057 | ||
| Brown & Brown Inc. | 2.375% | 3/15/31 | 8,002 | 6,347 | ||
| Brown & Brown Inc. | 4.200% | 3/17/32 | 21,110 | 19,274 | ||
| Canadian Imperial Bank of Commerce | 3.600% | 4/7/32 | 35,963 | 32,832 | ||
| Capital One Financial Corp. | 3.800% | 1/31/28 | 48,329 | 45,774 | ||
| Capital One Financial Corp. | 3.273% | 3/1/30 | 15,328 | 13,479 | ||
| Capital One Financial Corp. | 5.247% | 7/26/30 | 20,670 | 20,387 | ||
| Capital One Financial Corp. | 2.359% | 7/29/32 | 26,605 | 20,534 | ||
| Capital One Financial Corp. | 2.618% | 11/2/32 | 12,790 | 10,159 | ||
| Capital One Financial Corp. | 5.268% | 5/10/33 | 32,282 | 31,519 | ||
| Cboe Global Markets Inc. | 1.625% | 12/15/30 | 12,675 | 10,215 | ||
| Cboe Global Markets Inc. | 3.000% | 3/16/32 | 1,165 | 1,032 | ||
| Charles Schwab Corp. | 3.200% | 1/25/28 | 25,611 | 24,435 | ||
| Charles Schwab Corp. | 2.000% | 3/20/28 | 34,636 | 31,140 | ||
| Charles Schwab Corp. | 4.000% | 2/1/29 | 18,762 | 18,454 | ||
| Charles Schwab Corp. | 3.250% | 5/22/29 | 22,965 | 21,526 | ||
| Charles Schwab Corp. | 2.750% | 10/1/29 | 14,391 | 12,964 | ||
| Charles Schwab Corp. | 4.625% | 3/22/30 | 4,472 | 4,532 | ||
| Coupon | Maturity Date | Face Amount ($000) | Market Value• ($000) | |||
| Charles Schwab Corp. | 1.650% | 3/11/31 | 5,906 | 4,768 | ||
| Charles Schwab Corp. | 2.300% | 5/13/31 | 39,103 | 33,297 | ||
| Charles Schwab Corp. | 1.950% | 12/1/31 | 15,901 | 12,977 | ||
| Charles Schwab Corp. | 2.900% | 3/3/32 | 15,065 | 13,293 | ||
| Chubb INA Holdings Inc. | 1.375% | 9/15/30 | 35,485 | 28,386 | ||
| CI Financial Corp. | 3.200% | 12/17/30 | 24,391 | 18,504 | ||
| 1 | Cincinnati Financial Corp. | 6.920% | 5/15/28 | 7,901 | 8,695 | |
| Citigroup Inc. | 4.450% | 9/29/27 | 97,705 | 95,311 | ||
| Citigroup Inc. | 6.625% | 1/15/28 | 1,979 | 2,152 | ||
| 1 | Citigroup Inc. | 3.668% | 7/24/28 | 1,039 | 975 | |
| Citigroup Inc. | 4.125% | 7/25/28 | 62,008 | 59,132 | ||
| 1 | Citigroup Inc. | 3.520% | 10/27/28 | 49,605 | 46,180 | |
| 1 | Citigroup Inc. | 4.075% | 4/23/29 | 39,620 | 37,694 | |
| 1 | Citigroup Inc. | 3.980% | 3/20/30 | 54,127 | 50,573 | |
| 1 | Citigroup Inc. | 2.976% | 11/5/30 | 52,948 | 46,113 | |
| 1 | Citigroup Inc. | 2.666% | 1/29/31 | 68,841 | 58,397 | |
| 1 | Citigroup Inc. | 4.412% | 3/31/31 | 112,138 | 106,694 | |
| 1 | Citigroup Inc. | 2.572% | 6/3/31 | 107,831 | 90,145 | |
| Citigroup Inc. | 2.561% | 5/1/32 | 58,401 | 47,875 | ||
| Citigroup Inc. | 6.625% | 6/15/32 | 19,194 | 20,837 | ||
| Citigroup Inc. | 2.520% | 11/3/32 | 34,180 | 27,548 | ||
| Citigroup Inc. | 3.057% | 1/25/33 | 94,728 | 80,255 | ||
| Citigroup Inc. | 3.785% | 3/17/33 | 76,790 | 69,084 | ||
| Citigroup Inc. | 4.910% | 5/24/33 | 64,705 | 63,523 | ||
| Citizens Financial Group Inc. | 2.500% | 2/6/30 | 12,426 | 10,429 | ||
| Citizens Financial Group Inc. | 3.250% | 4/30/30 | 20,259 | 17,787 | ||
| Citizens Financial Group Inc. | 5.641% | 5/21/37 | 7,830 | 7,643 | ||
| CME Group Inc. | 3.750% | 6/15/28 | 4,867 | 4,781 | ||
| CME Group Inc. | 2.650% | 3/15/32 | 15,030 | 13,232 | ||
| CNA Financial Corp. | 3.900% | 5/1/29 | 16,463 | 15,435 | ||
| CNA Financial Corp. | 2.050% | 8/15/30 | 2,377 | 1,904 | ||
| CNO Financial Group Inc. | 5.250% | 5/30/29 | 13,471 | 13,018 | ||
| Comerica Bank | 5.332% | 8/25/33 | 5,000 | 4,925 | ||
| Comerica Inc. | 4.000% | 2/1/29 | 14,344 | 13,864 | ||
| 2 | Corebridge Financial Inc. | 3.850% | 4/5/29 | 25,271 | 23,258 | |
| 2 | Corebridge Financial Inc. | 3.900% | 4/5/32 | 42,251 | 37,977 | |
| 2 | Corebridge Financial Inc. | 6.875% | 12/15/52 | 13,835 | 13,440 | |
| 2 | Credit Suisse Group AG | 6.537% | 8/12/33 | 14,000 | 13,399 | |
| 1 | Deutsche Bank AG | 3.547% | 9/18/31 | 38,673 | 31,750 | |
| Deutsche Bank AG | 3.035% | 5/28/32 | 25,928 | 20,189 | ||
| 1 | Discover Bank | 4.650% | 9/13/28 | 34,397 | 33,079 | |
| 1 | Discover Bank | 2.700% | 2/6/30 | 11,053 | 9,211 | |
| Enstar Group Ltd. | 4.950% | 6/1/29 | 24,175 | 22,672 | ||
| Enstar Group Ltd. | 3.100% | 9/1/31 | 16,013 | 12,189 | ||
| Equitable Holdings Inc. | 7.000% | 4/1/28 | 7,928 | 8,779 | ||
| Equitable Holdings Inc. | 4.350% | 4/20/28 | 41,064 | 40,384 | ||
| Fairfax Financial Holdings Ltd. | 4.850% | 4/17/28 | 9,377 | 9,184 | ||
| Fairfax Financial Holdings Ltd. | 4.625% | 4/29/30 | 19,398 | 18,270 | ||
| Fairfax Financial Holdings Ltd. | 3.375% | 3/3/31 | 16,430 | 14,006 | ||
| 2 | Fairfax Financial Holdings Ltd. | 5.625% | 8/16/32 | 15,475 | 15,159 | |
| Fidelity National Financial Inc. | 4.500% | 8/15/28 | 16,747 | 16,308 | ||
| Fidelity National Financial Inc. | 3.400% | 6/15/30 | 12,367 | 10,728 | ||
| Fidelity National Financial Inc. | 2.450% | 3/15/31 | 13,026 | 10,327 | ||
| Fifth Third Bancorp | 3.950% | 3/14/28 | 17,021 | 16,522 | ||
| Fifth Third Bancorp | 4.772% | 7/28/30 | 10,915 | 10,863 | ||
| Fifth Third Bancorp | 4.337% | 4/25/33 | 11,955 | 11,348 | ||
| First American Financial Corp. | 4.000% | 5/15/30 | 11,620 | 10,326 | ||
| First American Financial Corp. | 2.400% | 8/15/31 | 17,084 | 13,138 | ||
| 1 | First Horizon Bank | 5.750% | 5/1/30 | 11,350 | 11,518 | |
| First-Citizens Bank & Trust Co. | 6.125% | 3/9/28 | 9,130 | 9,365 | ||
| Franklin Resources Inc. | 1.600% | 10/30/30 | 19,574 | 15,551 | ||
| FS KKR Capital Corp. | 3.250% | 7/15/27 | 1 | 1 | ||
| FS KKR Capital Corp. | 3.125% | 10/12/28 | 16,773 | 13,678 | ||
| GATX Corp. | 3.500% | 3/15/28 | 7,513 | 6,928 | ||
| GATX Corp. | 4.550% | 11/7/28 | 9,091 | 8,782 | ||
| GATX Corp. | 4.700% | 4/1/29 | 6,245 | 6,052 | ||
| GATX Corp. | 4.000% | 6/30/30 | 16,930 | 15,513 | ||
| Coupon | Maturity Date | Face Amount ($000) | Market Value• ($000) | |||
| GATX Corp. | 1.900% | 6/1/31 | 8,473 | 6,528 | ||
| GATX Corp. | 3.500% | 6/1/32 | 2,730 | 2,350 | ||
| GE Capital Funding LLC | 4.550% | 5/15/32 | 21,375 | 20,622 | ||
| GE Capital International Funding Co. Unlimited Co. | 4.418% | 11/15/35 | 23,955 | 22,590 | ||
| Global Payments Inc. | 4.450% | 6/1/28 | 11,828 | 11,366 | ||
| Global Payments Inc. | 3.200% | 8/15/29 | 34,959 | 30,556 | ||
| Global Payments Inc. | 2.900% | 5/15/30 | 30,891 | 25,922 | ||
| Global Payments Inc. | 2.900% | 11/15/31 | 21,049 | 17,059 | ||
| Global Payments Inc. | 5.400% | 8/15/32 | 4,500 | 4,410 | ||
| Globe Life Inc. | 4.550% | 9/15/28 | 17,489 | 17,188 | ||
| Globe Life Inc. | 2.150% | 8/15/30 | 2,910 | 2,359 | ||
| Globe Life Inc. | 4.800% | 6/15/32 | 4,720 | 4,586 | ||
| 1 | Goldman Sachs Group Inc. | 3.814% | 4/23/29 | 62,609 | 58,750 | |
| 1 | Goldman Sachs Group Inc. | 4.223% | 5/1/29 | 90,287 | 86,301 | |
| Goldman Sachs Group Inc. | 2.600% | 2/7/30 | 45,975 | 39,363 | ||
| Goldman Sachs Group Inc. | 3.800% | 3/15/30 | 88,550 | 82,027 | ||
| Goldman Sachs Group Inc. | 1.992% | 1/27/32 | 57,637 | 45,510 | ||
| Goldman Sachs Group Inc. | 2.615% | 4/22/32 | 114,565 | 94,369 | ||
| Goldman Sachs Group Inc. | 2.383% | 7/21/32 | 94,886 | 76,576 | ||
| Goldman Sachs Group Inc. | 2.650% | 10/21/32 | 66,735 | 54,860 | ||
| Goldman Sachs Group Inc. | 3.102% | 2/24/33 | 96,965 | 82,516 | ||
| Hanover Insurance Group Inc. | 2.500% | 9/1/30 | 4,057 | 3,281 | ||
| Hartford Financial Services Group Inc. | 2.800% | 8/19/29 | 15,620 | 13,843 | ||
| 1 | HSBC Holdings plc | 2.013% | 9/22/28 | 39,283 | 33,123 | |
| 1 | HSBC Holdings plc | 4.583% | 6/19/29 | 86,541 | 81,675 | |
| HSBC Holdings plc | 2.206% | 8/17/29 | 75,455 | 62,478 | ||
| HSBC Holdings plc | 4.950% | 3/31/30 | 66,326 | 64,572 | ||
| 1 | HSBC Holdings plc | 3.973% | 5/22/30 | 77,989 | 70,474 | |
| 1 | HSBC Holdings plc | 2.848% | 6/4/31 | 38,053 | 31,440 | |
| 1 | HSBC Holdings plc | 2.357% | 8/18/31 | 29,312 | 23,176 | |
| 1 | HSBC Holdings plc | 7.625% | 5/17/32 | 2,690 | 3,052 | |
| HSBC Holdings plc | 2.804% | 5/24/32 | 93,595 | 74,362 | ||
| HSBC Holdings plc | 2.871% | 11/22/32 | 38,370 | 30,509 | ||
| HSBC Holdings plc | 4.762% | 3/29/33 | 46,905 | 41,867 | ||
| HSBC Holdings plc | 5.402% | 8/11/33 | 64,667 | 61,475 | ||
| Huntington Bancshares Inc. | 2.550% | 2/4/30 | 21,919 | 18,737 | ||
| Huntington Bancshares Inc. | 5.023% | 5/17/33 | 13,150 | 13,004 | ||
| Huntington Bancshares Inc. | 2.487% | 8/15/36 | 8,816 | 6,676 | ||
| ING Groep NV | 4.550% | 10/2/28 | 26,614 | 25,763 | ||
| ING Groep NV | 4.050% | 4/9/29 | 17,414 | 16,330 | ||
| ING Groep NV | 2.727% | 4/1/32 | 15,545 | 12,853 | ||
| ING Groep NV | 4.252% | 3/28/33 | 31,920 | 29,440 | ||
| Intercontinental Exchange Inc. | 3.100% | 9/15/27 | 6,996 | 6,626 | ||
| Intercontinental Exchange Inc. | 4.000% | 9/15/27 | 37,600 | 37,033 | ||
| Intercontinental Exchange Inc. | 3.750% | 9/21/28 | 17,238 | 16,679 | ||
| Intercontinental Exchange Inc. | 4.350% | 6/15/29 | 42,350 | 41,805 | ||
| Intercontinental Exchange Inc. | 2.100% | 6/15/30 | 25,850 | 21,829 | ||
| 2 | Jackson Financial Inc. | 3.125% | 11/23/31 | 13,449 | 10,749 | |
| Jackson Financial Inc. | 5.670% | 6/8/32 | 8,095 | 7,897 | ||
| Jefferies Group LLC | 4.150% | 1/23/30 | 24,681 | 22,234 | ||
| Jefferies Group LLC | 2.625% | 10/15/31 | 21,268 | 16,506 | ||
| JPMorgan Chase & Co. | 3.875% | 9/10/24 | 1 | 1 | ||
| JPMorgan Chase & Co. | 1.040% | 2/4/27 | 82 | 72 | ||
| JPMorgan Chase & Co. | 4.250% | 10/1/27 | 36,605 | 36,225 | ||
| JPMorgan Chase & Co. | 3.625% | 12/1/27 | 30,974 | 29,602 | ||
| 1 | JPMorgan Chase & Co. | 3.509% | 1/23/29 | 58,678 | 54,364 | |
| 1 | JPMorgan Chase & Co. | 4.005% | 4/23/29 | 57,983 | 54,928 | |
| JPMorgan Chase & Co. | 2.069% | 6/1/29 | 47,537 | 40,661 | ||
| 1 | JPMorgan Chase & Co. | 4.203% | 7/23/29 | 61,461 | 58,751 | |
| 1 | JPMorgan Chase & Co. | 4.452% | 12/5/29 | 80,038 | 77,451 | |
| 1 | JPMorgan Chase & Co. | 3.702% | 5/6/30 | 73,103 | 67,364 | |
| JPMorgan Chase & Co. | 4.565% | 6/14/30 | 41,910 | 40,774 | ||
| 1 | JPMorgan Chase & Co. | 8.750% | 9/1/30 | 1,543 | 1,871 | |
| 1 | JPMorgan Chase & Co. | 2.739% | 10/15/30 | 94,497 | 81,841 | |
| 1 | JPMorgan Chase & Co. | 4.493% | 3/24/31 | 70,810 | 68,735 | |
| Coupon | Maturity Date | Face Amount ($000) | Market Value• ($000) | |||
| 1 | JPMorgan Chase & Co. | 2.522% | 4/22/31 | 66,012 | 55,845 | |
| 1 | JPMorgan Chase & Co. | 2.956% | 5/13/31 | 81,104 | 69,913 | |
| JPMorgan Chase & Co. | 1.764% | 11/19/31 | 34,827 | 27,384 | ||
| JPMorgan Chase & Co. | 1.953% | 2/4/32 | 81,790 | 64,864 | ||
| JPMorgan Chase & Co. | 2.580% | 4/22/32 | 110,582 | 92,265 | ||
| JPMorgan Chase & Co. | 2.545% | 11/8/32 | 70,985 | 58,487 | ||
| JPMorgan Chase & Co. | 2.963% | 1/25/33 | 88,365 | 75,094 | ||
| JPMorgan Chase & Co. | 4.586% | 4/26/33 | 50,280 | 48,589 | ||
| JPMorgan Chase & Co. | 4.912% | 7/25/33 | 133,340 | 132,183 | ||
| Kemper Corp. | 2.400% | 9/30/30 | 11,587 | 9,322 | ||
| Kemper Corp. | 3.800% | 2/23/32 | 8,046 | 7,085 | ||
| 1 | KeyBank NA | 4.390% | 12/14/27 | 6,625 | 6,565 | |
| 1 | KeyBank NA | 6.950% | 2/1/28 | 1,738 | 1,865 | |
| 1 | KeyBank NA | 3.900% | 4/13/29 | 7,589 | 6,950 | |
| 1 | KeyBank NA | 4.900% | 8/8/32 | 15,000 | 14,318 | |
| 1 | KeyCorp | 4.100% | 4/30/28 | 19,481 | 18,918 | |
| 1 | KeyCorp | 2.550% | 10/1/29 | 21,333 | 18,275 | |
| 1 | KeyCorp | 4.789% | 6/1/33 | 21,145 | 20,510 | |
| Lazard Group LLC | 4.500% | 9/19/28 | 6,719 | 6,419 | ||
| Lazard Group LLC | 4.375% | 3/11/29 | 8,685 | 8,336 | ||
| Lincoln National Corp. | 3.800% | 3/1/28 | 15,064 | 14,412 | ||
| Lincoln National Corp. | 3.050% | 1/15/30 | 11,235 | 9,858 | ||
| Lincoln National Corp. | 3.400% | 1/15/31 | 15,292 | 13,637 | ||
| Lloyds Banking Group plc | 4.375% | 3/22/28 | 50,336 | 48,520 | ||
| Lloyds Banking Group plc | 4.550% | 8/16/28 | 28,521 | 27,617 | ||
| 1 | Lloyds Banking Group plc | 3.574% | 11/7/28 | 38,884 | 35,944 | |
| Lloyds Banking Group plc | 4.976% | 8/11/33 | 31,469 | 29,909 | ||
| Loews Corp. | 3.200% | 5/15/30 | 11,851 | 10,654 | ||
| Manulife Financial Corp. | 3.703% | 3/16/32 | 14,335 | 13,201 | ||
| Markel Corp. | 3.500% | 11/1/27 | 4,195 | 3,964 | ||
| Markel Corp. | 3.350% | 9/17/29 | 9,180 | 8,317 | ||
| Marsh & McLennan Cos. Inc. | 4.375% | 3/15/29 | 43,505 | 43,232 | ||
| Marsh & McLennan Cos. Inc. | 2.250% | 11/15/30 | 16,716 | 14,187 | ||
| Marsh & McLennan Cos. Inc. | 2.375% | 12/15/31 | 8,753 | 7,416 | ||
| Mastercard Inc. | 3.500% | 2/26/28 | 17,185 | 16,840 | ||
| Mastercard Inc. | 2.950% | 6/1/29 | 31,864 | 29,757 | ||
| Mastercard Inc. | 3.350% | 3/26/30 | 39,973 | 38,017 | ||
| Mastercard Inc. | 1.900% | 3/15/31 | 8,383 | 7,165 | ||
| Mastercard Inc. | 2.000% | 11/18/31 | 21,361 | 17,979 | ||
| MetLife Inc. | 4.550% | 3/23/30 | 31,213 | 31,528 | ||
| Mitsubishi UFJ Financial Group Inc. | 3.961% | 3/2/28 | 33,681 | 32,441 | ||
| Mitsubishi UFJ Financial Group Inc. | 4.050% | 9/11/28 | 11,817 | 11,348 | ||
| Mitsubishi UFJ Financial Group Inc. | 3.741% | 3/7/29 | 41,375 | 38,991 | ||
| Mitsubishi UFJ Financial Group Inc. | 3.195% | 7/18/29 | 54,723 | 49,610 | ||
| Mitsubishi UFJ Financial Group Inc. | 2.559% | 2/25/30 | 31,767 | 27,180 | ||
| Mitsubishi UFJ Financial Group Inc. | 2.048% | 7/17/30 | 42,858 | 34,957 | ||
| Mitsubishi UFJ Financial Group Inc. | 2.309% | 7/20/32 | 61,812 | 49,958 | ||
| Mitsubishi UFJ Financial Group Inc. | 2.494% | 10/13/32 | 10,356 | 8,448 | ||
| Mitsubishi UFJ Financial Group Inc. | 2.852% | 1/19/33 | 21,015 | 17,627 | ||
| Mitsubishi UFJ Financial Group Inc. | 4.315% | 4/19/33 | 16,038 | 15,218 | ||
| Mitsubishi UFJ Financial Group Inc. | 5.133% | 7/20/33 | 39,725 | 39,893 | ||
| Mizuho Financial Group Inc. | 3.170% | 9/11/27 | 6,744 | 6,220 | ||
| Mizuho Financial Group Inc. | 4.018% | 3/5/28 | 29,890 | 28,494 | ||
| 1 | Mizuho Financial Group Inc. | 4.254% | 9/11/29 | 20,083 | 19,071 | |
| 1 | Mizuho Financial Group Inc. | 3.153% | 7/16/30 | 25,332 | 22,327 | |
| 1 | Mizuho Financial Group Inc. | 2.869% | 9/13/30 | 22,495 | 19,424 | |
| 1 | Mizuho Financial Group Inc. | 2.591% | 5/25/31 | 13,939 | 11,582 | |
| 1 | Mizuho Financial Group Inc. | 2.201% | 7/10/31 | 24,228 | 19,483 | |
| 1 | Mizuho Financial Group Inc. | 1.979% | 9/8/31 | 29,625 | 23,405 | |
| Mizuho Financial Group Inc. | 2.564% | 9/13/31 | 31,856 | 25,107 | ||
| Mizuho Financial Group Inc. | 2.172% | 5/22/32 | 8,141 | 6,415 | ||
| Mizuho Financial Group Inc. | 2.260% | 7/9/32 | 5,028 | 3,983 | ||
| Moody's Corp. | 4.250% | 8/8/32 | 4,505 | 4,355 | ||
| Morgan Stanley | 1.593% | 5/4/27 | 311 | 277 | ||
| 1 | Morgan Stanley | 3.591% | 7/22/28 | 10,835 | 10,235 | |
| 1 | Morgan Stanley | 3.772% | 1/24/29 | 72,394 | 68,160 | |
| 1 | Morgan Stanley | 4.431% | 1/23/30 | 74,635 | 72,685 | |
| Coupon | Maturity Date | Face Amount ($000) | Market Value• ($000) | |||
| 1 | Morgan Stanley | 2.699% | 1/22/31 | 96,060 | 83,170 | |
| 1 | Morgan Stanley | 3.622% | 4/1/31 | 91,490 | 83,926 | |
| 1 | Morgan Stanley | 1.794% | 2/13/32 | 67,406 | 53,105 | |
| Morgan Stanley | 7.250% | 4/1/32 | 8,455 | 9,997 | ||
| 1 | Morgan Stanley | 1.928% | 4/28/32 | 51,380 | 40,589 | |
| 1 | Morgan Stanley | 2.239% | 7/21/32 | 91,074 | 73,448 | |
| 1 | Morgan Stanley | 2.511% | 10/20/32 | 61,800 | 50,677 | |
| Morgan Stanley | 2.943% | 1/21/33 | 82,570 | 70,426 | ||
| Morgan Stanley | 4.889% | 7/20/33 | 53,736 | 53,505 | ||
| Morgan Stanley | 2.484% | 9/16/36 | 74,402 | 57,542 | ||
| Morgan Stanley | 5.297% | 4/20/37 | 51,630 | 49,584 | ||
| Morgan Stanley Domestic Holdings Inc. | 4.500% | 6/20/28 | 9,482 | 9,388 | ||
| Nasdaq Inc. | 1.650% | 1/15/31 | 17,645 | 14,049 | ||
| NatWest Group plc | 5.516% | 9/30/28 | 25,200 | 25,224 | ||
| 1 | NatWest Group plc | 4.892% | 5/18/29 | 47,835 | 45,922 | |
| 1 | NatWest Group plc | 5.076% | 1/27/30 | 48,875 | 47,438 | |
| 1 | NatWest Group plc | 4.445% | 5/8/30 | 25,142 | 23,471 | |
| 1 | NatWest Group plc | 3.032% | 11/28/35 | 18,531 | 14,514 | |
| Nomura Holdings Inc. | 2.172% | 7/14/28 | 29,010 | 24,309 | ||
| Nomura Holdings Inc. | 2.710% | 1/22/29 | 11,679 | 9,994 | ||
| Nomura Holdings Inc. | 5.605% | 7/6/29 | 1,885 | 1,888 | ||
| Nomura Holdings Inc. | 3.103% | 1/16/30 | 50,193 | 42,863 | ||
| Nomura Holdings Inc. | 2.679% | 7/16/30 | 10,592 | 8,655 | ||
| Nomura Holdings Inc. | 2.608% | 7/14/31 | 30,996 | 24,808 | ||
| Nomura Holdings Inc. | 2.999% | 1/22/32 | 34,770 | 28,556 | ||
| Northern Trust Corp. | 3.650% | 8/3/28 | 9,460 | 9,212 | ||
| Northern Trust Corp. | 3.150% | 5/3/29 | 10,260 | 9,590 | ||
| Northern Trust Corp. | 1.950% | 5/1/30 | 20,904 | 17,660 | ||
| ORIX Corp. | 3.700% | 7/18/27 | 1 | 1 | ||
| ORIX Corp. | 2.250% | 3/9/31 | 11,974 | 9,970 | ||
| ORIX Corp. | 4.000% | 4/13/32 | 14,908 | 14,086 | ||
| Owl Rock Capital Corp. | 2.875% | 6/11/28 | 23,048 | 18,644 | ||
| PartnerRe Finance B LLC | 3.700% | 7/2/29 | 11,888 | 11,125 | ||
| PartnerRe Finance B LLC | 4.500% | 10/1/50 | 12,724 | 11,461 | ||
| PayPal Holdings Inc. | 2.850% | 10/1/29 | 39,740 | 35,987 | ||
| PayPal Holdings Inc. | 2.300% | 6/1/30 | 21,875 | 18,815 | ||
| PayPal Holdings Inc. | 4.400% | 6/1/32 | 29,815 | 29,365 | ||
| 1 | PNC Bank NA | 3.100% | 10/25/27 | 18,109 | 17,213 | |
| 1 | PNC Bank NA | 3.250% | 1/22/28 | 17,213 | 16,325 | |
| 1 | PNC Bank NA | 4.050% | 7/26/28 | 39,890 | 38,528 | |
| 1 | PNC Bank NA | 2.700% | 10/22/29 | 17,235 | 15,022 | |
| PNC Financial Services Group Inc. | 3.150% | 5/19/27 | 8,210 | 7,860 | ||
| PNC Financial Services Group Inc. | 3.450% | 4/23/29 | 34,753 | 32,899 | ||
| PNC Financial Services Group Inc. | 2.550% | 1/22/30 | 37,438 | 32,870 | ||
| PNC Financial Services Group Inc. | 2.307% | 4/23/32 | 25,030 | 21,034 | ||
| PNC Financial Services Group Inc. | 4.626% | 6/6/33 | 22,055 | 20,910 | ||
| Primerica Inc. | 2.800% | 11/19/31 | 15,654 | 13,075 | ||
| Principal Financial Group Inc. | 3.100% | 11/15/26 | 10,123 | 9,526 | ||
| Principal Financial Group Inc. | 3.700% | 5/15/29 | 14,238 | 13,409 | ||
| Principal Financial Group Inc. | 2.125% | 6/15/30 | 2,919 | 2,426 | ||
| Progressive Corp. | 4.000% | 3/1/29 | 14,192 | 14,052 | ||
| Progressive Corp. | 6.625% | 3/1/29 | 4,297 | 4,846 | ||
| Progressive Corp. | 3.200% | 3/26/30 | 21,923 | 20,386 | ||
| Progressive Corp. | 3.000% | 3/15/32 | 8,366 | 7,523 | ||
| Prospect Capital Corp. | 3.437% | 10/15/28 | 5,580 | 4,286 | ||
| 1 | Prudential Financial Inc. | 3.878% | 3/27/28 | 10,351 | 10,160 | |
| 1 | Prudential Financial Inc. | 2.100% | 3/10/30 | 4,055 | 3,447 | |
| 1 | Prudential Financial Inc. | 4.500% | 9/15/47 | 13,797 | 13,119 | |
| 1 | Prudential Financial Inc. | 5.700% | 9/15/48 | 18,987 | 18,629 | |
| 1 | Prudential Financial Inc. | 3.700% | 10/1/50 | 23,409 | 20,237 | |
| Prudential Financial Inc. | 5.125% | 3/1/52 | 29,923 | 27,951 | ||
| Prudential plc | 3.125% | 4/14/30 | 23,793 | 21,195 | ||
| Prudential plc | 3.625% | 3/24/32 | 7,586 | 6,854 | ||
| Raymond James Financial Inc. | 4.650% | 4/1/30 | 22,137 | 21,739 | ||
| Regions Financial Corp. | 1.800% | 8/12/28 | 16,140 | 13,896 | ||
| Reinsurance Group of America Inc. | 3.900% | 5/15/29 | 18,055 | 16,908 | ||
| Coupon | Maturity Date | Face Amount ($000) | Market Value• ($000) | |||
| Reinsurance Group of America Inc. | 3.150% | 6/15/30 | 11,135 | 9,800 | ||
| RenaissanceRe Holdings Ltd. | 3.600% | 4/15/29 | 9,231 | 8,595 | ||
| Royal Bank of Canada | 3.625% | 5/4/27 | 5,486 | 5,293 | ||
| 1 | Royal Bank of Canada | 2.300% | 11/3/31 | 46,981 | 39,140 | |
| Royal Bank of Canada | 3.875% | 5/4/32 | 16,848 | 15,918 | ||
| Santander Holdings USA Inc. | 4.400% | 7/13/27 | 10,038 | 9,666 | ||
| 1 | Santander UK Group Holdings plc | 3.823% | 11/3/28 | 19,939 | 18,244 | |
| Santander UK Group Holdings plc | 2.896% | 3/15/32 | 20,505 | 16,520 | ||
| 1 | State Street Corp. | 4.141% | 12/3/29 | 14,594 | 14,271 | |
| State Street Corp. | 2.400% | 1/24/30 | 24,873 | 21,866 | ||
| State Street Corp. | 2.200% | 3/3/31 | 30,198 | 25,128 | ||
| State Street Corp. | 3.152% | 3/30/31 | 15,438 | 14,029 | ||
| State Street Corp. | 2.623% | 2/7/33 | 875 | 745 | ||
| State Street Corp. | 4.421% | 5/13/33 | 9,573 | 9,443 | ||
| State Street Corp. | 4.164% | 8/4/33 | 14,610 | 14,118 | ||
| 1 | State Street Corp. | 3.031% | 11/1/34 | 5,725 | 5,009 | |
| Stewart Information Services Corp. | 3.600% | 11/15/31 | 12,155 | 9,969 | ||
| Stifel Financial Corp. | 4.000% | 5/15/30 | 11,001 | 9,971 | ||
| Sumitomo Mitsui Financial Group Inc. | 3.352% | 10/18/27 | 21,043 | 19,762 | ||
| Sumitomo Mitsui Financial Group Inc. | 3.544% | 1/17/28 | 20,465 | 19,382 | ||
| Sumitomo Mitsui Financial Group Inc. | 3.944% | 7/19/28 | 21,070 | 20,057 | ||
| Sumitomo Mitsui Financial Group Inc. | 1.902% | 9/17/28 | 54,825 | 46,016 | ||
| Sumitomo Mitsui Financial Group Inc. | 4.306% | 10/16/28 | 10,967 | 10,682 | ||
| Sumitomo Mitsui Financial Group Inc. | 3.040% | 7/16/29 | 68,762 | 61,042 | ||
| Sumitomo Mitsui Financial Group Inc. | 3.202% | 9/17/29 | 11,475 | 10,133 | ||
| Sumitomo Mitsui Financial Group Inc. | 2.724% | 9/27/29 | 13,755 | 11,940 | ||
| Sumitomo Mitsui Financial Group Inc. | 2.750% | 1/15/30 | 36,240 | 31,343 | ||
| Sumitomo Mitsui Financial Group Inc. | 2.130% | 7/8/30 | 46,855 | 38,408 | ||
| Sumitomo Mitsui Financial Group Inc. | 2.142% | 9/23/30 | 28,775 | 22,905 | ||
| Sumitomo Mitsui Financial Group Inc. | 1.710% | 1/12/31 | 13,795 | 10,702 | ||
| Sumitomo Mitsui Financial Group Inc. | 2.222% | 9/17/31 | 12,014 | 9,704 | ||
| SVB Financial Group | 2.100% | 5/15/28 | 2,695 | 2,284 | ||
| SVB Financial Group | 3.125% | 6/5/30 | 12,235 | 10,473 | ||
| SVB Financial Group | 1.800% | 2/2/31 | 18,074 | 13,629 | ||
| SVB Financial Group | 4.570% | 4/29/33 | 13,375 | 12,461 | ||
| Synchrony Financial | 3.950% | 12/1/27 | 27,132 | 24,678 | ||
| Synchrony Financial | 5.150% | 3/19/29 | 10,265 | 9,770 | ||
| Synchrony Financial | 2.875% | 10/28/31 | 11,808 | 9,108 | ||
| 1 | Toronto-Dominion Bank | 2.000% | 9/10/31 | 30,115 | 24,430 | |
| 1 | Toronto-Dominion Bank | 2.450% | 1/12/32 | 20,130 | 16,787 | |
| 1 | Toronto-Dominion Bank | 3.200% | 3/10/32 | 45,705 | 40,610 | |
| Toronto-Dominion Bank | 4.456% | 6/8/32 | 55,115 | 54,066 | ||
| 1 | Truist Bank | 2.250% | 3/11/30 | 32,523 | 27,161 | |
| 1 | Truist Financial Corp. | 3.875% | 3/19/29 | 20,877 | 19,750 | |
| 1 | Truist Financial Corp. | 1.887% | 6/7/29 | 28,870 | 24,766 | |
| 1 | Truist Financial Corp. | 1.950% | 6/5/30 | 6,431 | 5,337 | |
| 1 | Truist Financial Corp. | 4.916% | 7/28/33 | 22,355 | 21,477 | |
| Unum Group | 4.000% | 6/15/29 | 10,114 | 9,367 | ||
| 1 | US Bancorp | 3.900% | 4/26/28 | 22,101 | 21,720 | |
| 1 | US Bancorp | 3.000% | 7/30/29 | 26,309 | 23,670 | |
| 1 | US Bancorp | 1.375% | 7/22/30 | 27,494 | 21,978 | |
| 1 | US Bancorp | 2.677% | 1/27/33 | 15,190 | 13,069 | |
| US Bancorp | 4.967% | 7/22/33 | 26,780 | 26,543 | ||
| US Bancorp | 2.491% | 11/3/36 | 32,005 | 25,805 | ||
| Visa Inc. | 2.750% | 9/15/27 | 14,146 | 13,480 | ||
| Coupon | Maturity Date | Face Amount ($000) | Market Value• ($000) | |||
| Visa Inc. | 2.050% | 4/15/30 | 38,211 | 33,503 | ||
| Visa Inc. | 1.100% | 2/15/31 | 22,257 | 17,789 | ||
| 1 | Voya Financial Inc. | 4.700% | 1/23/48 | 8,411 | 6,979 | |
| Webster Financial Corp. | 4.100% | 3/25/29 | 6,724 | 6,294 | ||
| 1 | Wells Fargo & Co. | 3.196% | 6/17/27 | 184 | 173 | |
| 1 | Wells Fargo & Co. | 4.150% | 1/24/29 | 58,263 | 56,429 | |
| 1 | Wells Fargo & Co. | 7.950% | 11/15/29 | 1,905 | 2,192 | |
| 1 | Wells Fargo & Co. | 2.879% | 10/30/30 | 96,837 | 84,914 | |
| 1 | Wells Fargo & Co. | 2.572% | 2/11/31 | 81,301 | 69,232 | |
| 1 | Wells Fargo & Co. | 4.478% | 4/4/31 | 66,469 | 63,961 | |
| 1 | Wells Fargo & Co. | 3.350% | 3/2/33 | 97,778 | 85,273 | |
| 1 | Wells Fargo & Co. | 4.897% | 7/25/33 | 109,096 | 107,496 | |
| Western Union Co. | 2.750% | 3/15/31 | 3,554 | 2,837 | ||
| Westpac Banking Corp. | 3.400% | 1/25/28 | 14,377 | 13,746 | ||
| Westpac Banking Corp. | 1.953% | 11/20/28 | 41,335 | 35,971 | ||
| Westpac Banking Corp. | 2.650% | 1/16/30 | 17,067 | 15,210 | ||
| Westpac Banking Corp. | 2.150% | 6/3/31 | 32,115 | 27,061 | ||
| Westpac Banking Corp. | 5.405% | 8/10/33 | 25,000 | 24,195 | ||
| Westpac Banking Corp. | 4.110% | 7/24/34 | 37,160 | 33,508 | ||
| Westpac Banking Corp. | 2.668% | 11/15/35 | 28,219 | 22,310 | ||
| Westpac Banking Corp. | 3.020% | 11/18/36 | 29,470 | 23,481 | ||
| Willis North America Inc. | 4.500% | 9/15/28 | 18,841 | 18,233 | ||
| Willis North America Inc. | 2.950% | 9/15/29 | 17,727 | 15,291 | ||
| Wintrust Financial Corp. | 4.850% | 6/6/29 | 3,898 | 3,795 | ||
| Zions Bancorp NA | 3.250% | 10/29/29 | 12,033 | 10,220 | ||
| 12,833,370 | ||||||
| Health Care (8.3%) | ||||||
| 3 | Abbott Laboratories | 1.150% | 1/30/28 | 20,596 | 18,003 | |
| Abbott Laboratories | 1.400% | 6/30/30 | 5,371 | 4,451 | ||
| AbbVie Inc. | 4.250% | 11/14/28 | 57,896 | 56,936 | ||
| AbbVie Inc. | 3.200% | 11/21/29 | 141,822 | 129,644 | ||
| Adventist Health System | 2.952% | 3/1/29 | 7,089 | 6,382 | ||
| Advocate Health & Hospitals Corp. | 3.829% | 8/15/28 | 7,959 | 7,797 | ||
| 1 | Advocate Health & Hospitals Corp. | 2.211% | 6/15/30 | 9,153 | 7,822 | |
| Agilent Technologies Inc. | 2.750% | 9/15/29 | 4,168 | 3,655 | ||
| Agilent Technologies Inc. | 2.100% | 6/4/30 | 10,588 | 8,726 | ||
| Agilent Technologies Inc. | 2.300% | 3/12/31 | 28,970 | 23,839 | ||
| AmerisourceBergen Corp. | 3.450% | 12/15/27 | 28,619 | 27,327 | ||
| AmerisourceBergen Corp. | 2.800% | 5/15/30 | 7,566 | 6,580 | ||
| AmerisourceBergen Corp. | 2.700% | 3/15/31 | 32,231 | 27,391 | ||
| Amgen Inc. | 3.200% | 11/2/27 | 17,080 | 16,334 | ||
| Amgen Inc. | 1.650% | 8/15/28 | 33,895 | 29,289 | ||
| Amgen Inc. | 3.000% | 2/22/29 | 8,840 | 8,128 | ||
| Amgen Inc. | 4.050% | 8/18/29 | 17,250 | 16,781 | ||
| Amgen Inc. | 2.450% | 2/21/30 | 35,264 | 30,874 | ||
| Amgen Inc. | 2.300% | 2/25/31 | 44,503 | 37,695 | ||
| Amgen Inc. | 2.000% | 1/15/32 | 22,514 | 18,297 | ||
| Amgen Inc. | 3.350% | 2/22/32 | 34,279 | 31,051 | ||
| Amgen Inc. | 4.200% | 3/1/33 | 13,000 | 12,557 | ||
| 1 | Ascension Health | 2.532% | 11/15/29 | 18,580 | 16,622 | |
| AstraZeneca Finance LLC | 1.750% | 5/28/28 | 33,900 | 29,935 | ||
| AstraZeneca Finance LLC | 2.250% | 5/28/31 | 16,709 | 14,486 | ||
| AstraZeneca plc | 4.000% | 1/17/29 | 31,576 | 31,510 | ||
| AstraZeneca plc | 1.375% | 8/6/30 | 45,715 | 37,475 | ||
| Banner Health | 2.338% | 1/1/30 | 6,986 | 6,028 | ||
| Banner Health | 1.897% | 1/1/31 | 7,865 | 6,404 | ||
| Baxter International Inc. | 2.272% | 12/1/28 | 40,150 | 34,780 | ||
| Baxter International Inc. | 3.950% | 4/1/30 | 17,148 | 16,159 | ||
| Baxter International Inc. | 1.730% | 4/1/31 | 13,477 | 10,623 | ||
| Baxter International Inc. | 2.539% | 2/1/32 | 45,203 | 37,445 | ||
| 1 | Baylor Scott & White Holdings | 1.777% | 11/15/30 | 4,303 | 3,503 | |
| Becton Dickinson & Co. | 3.700% | 6/6/27 | 6,000 | 5,821 | ||
| Becton Dickinson & Co. | 2.823% | 5/20/30 | 7,116 | 6,294 | ||
| Becton Dickinson & Co. | 1.957% | 2/11/31 | 30,547 | 24,929 | ||
| Becton Dickinson & Co. | 4.298% | 8/22/32 | 19,000 | 18,476 | ||
| Biogen Inc. | 2.250% | 5/1/30 | 30,811 | 25,240 | ||
| Bio-Rad Laboratories Inc. | 3.700% | 3/15/32 | 20,240 | 18,078 | ||
| Coupon | Maturity Date | Face Amount ($000) | Market Value• ($000) | |||
| 1 | Bon Secours Mercy Health Inc. | 3.464% | 6/1/30 | 11,627 | 10,855 | |
| 1 | Bon Secours Mercy Health Inc. | 2.095% | 6/1/31 | 2,574 | 2,102 | |
| Boston Scientific Corp. | 4.000% | 3/1/28 | 50 | 49 | ||
| Boston Scientific Corp. | 2.650% | 6/1/30 | 37,327 | 32,598 | ||
| Bristol-Myers Squibb Co. | 1.125% | 11/13/27 | 6,170 | 5,440 | ||
| Bristol-Myers Squibb Co. | 3.450% | 11/15/27 | 19,490 | 19,045 | ||
| Bristol-Myers Squibb Co. | 3.900% | 2/20/28 | 52,532 | 52,181 | ||
| Bristol-Myers Squibb Co. | 3.400% | 7/26/29 | 49,539 | 47,302 | ||
| Bristol-Myers Squibb Co. | 1.450% | 11/13/30 | 28,636 | 23,387 | ||
| Bristol-Myers Squibb Co. | 2.950% | 3/15/32 | 48,371 | 43,877 | ||
| 1 | Cedars-Sinai Health System | 2.288% | 8/15/31 | 8,250 | 6,990 | |
| 1 | CHRISTUS Health | 4.341% | 7/1/28 | 7,418 | 7,380 | |
| 1 | Cigna Corp. | 3.050% | 10/15/27 | 11,537 | 10,745 | |
| Cigna Corp. | 4.375% | 10/15/28 | 89,399 | 88,097 | ||
| Cigna Corp. | 2.400% | 3/15/30 | 47,169 | 40,426 | ||
| Cigna Corp. | 2.375% | 3/15/31 | 39,156 | 32,944 | ||
| CommonSpirit Health | 3.347% | 10/1/29 | 23,759 | 21,230 | ||
| CommonSpirit Health | 2.782% | 10/1/30 | 1,661 | 1,393 | ||
| CVS Health Corp. | 4.300% | 3/25/28 | 76,766 | 75,921 | ||
| CVS Health Corp. | 3.250% | 8/15/29 | 64,026 | 58,599 | ||
| CVS Health Corp. | 3.750% | 4/1/30 | 34,149 | 32,040 | ||
| CVS Health Corp. | 1.750% | 8/21/30 | 46,181 | 37,208 | ||
| CVS Health Corp. | 1.875% | 2/28/31 | 54,648 | 44,132 | ||
| CVS Health Corp. | 2.125% | 9/15/31 | 10,965 | 8,934 | ||
| DENTSPLY SIRONA Inc. | 3.250% | 6/1/30 | 19,815 | 16,328 | ||
| DH Europe Finance II Sarl | 2.600% | 11/15/29 | 20,451 | 18,398 | ||
| Edwards Lifesciences Corp. | 4.300% | 6/15/28 | 13,443 | 13,368 | ||
| Elevance Health Inc. | 3.650% | 12/1/27 | 42,647 | 41,330 | ||
| Elevance Health Inc. | 4.101% | 3/1/28 | 33,396 | 32,715 | ||
| Elevance Health Inc. | 2.875% | 9/15/29 | 28,046 | 25,184 | ||
| Elevance Health Inc. | 2.250% | 5/15/30 | 30,785 | 26,215 | ||
| Elevance Health Inc. | 2.550% | 3/15/31 | 27,530 | 23,613 | ||
| Elevance Health Inc. | 4.100% | 5/15/32 | 4,285 | 4,122 | ||
| Eli Lilly & Co. | 3.375% | 3/15/29 | 11,186 | 10,841 | ||
| Gilead Sciences Inc. | 1.200% | 10/1/27 | 24,305 | 20,957 | ||
| Gilead Sciences Inc. | 1.650% | 10/1/30 | 17,561 | 14,290 | ||
| GlaxoSmithKline Capital Inc. | 3.875% | 5/15/28 | 54,974 | 53,986 | ||
| GlaxoSmithKline Capital plc | 3.375% | 6/1/29 | 17,644 | 16,790 | ||
| HCA Inc. | 5.625% | 9/1/28 | 35,315 | 35,518 | ||
| HCA Inc. | 5.875% | 2/1/29 | 22,550 | 22,946 | ||
| 2 | HCA Inc. | 3.375% | 3/15/29 | 17,775 | 15,720 | |
| HCA Inc. | 4.125% | 6/15/29 | 42,795 | 39,664 | ||
| HCA Inc. | 3.500% | 9/1/30 | 68,765 | 59,812 | ||
| HCA Inc. | 2.375% | 7/15/31 | 27,490 | 21,813 | ||
| 2 | HCA Inc. | 3.625% | 3/15/32 | 54,430 | 47,042 | |
| Humana Inc. | 3.700% | 3/23/29 | 10,525 | 9,938 | ||
| Humana Inc. | 3.125% | 8/15/29 | 14,010 | 12,732 | ||
| Humana Inc. | 4.875% | 4/1/30 | 13,655 | 13,746 | ||
| Humana Inc. | 2.150% | 2/3/32 | 16,661 | 13,511 | ||
| Illumina Inc. | 2.550% | 3/23/31 | 13,445 | 10,940 | ||
| Johnson & Johnson | 0.950% | 9/1/27 | 35,293 | 31,100 | ||
| Johnson & Johnson | 2.900% | 1/15/28 | 37,346 | 35,808 | ||
| Johnson & Johnson | 6.950% | 9/1/29 | 3,100 | 3,728 | ||
| Johnson & Johnson | 1.300% | 9/1/30 | 36,137 | 30,335 | ||
| Laboratory Corp. of America Holdings | 3.600% | 9/1/27 | 13,150 | 12,766 | ||
| Laboratory Corp. of America Holdings | 2.950% | 12/1/29 | 11,264 | 10,082 | ||
| Laboratory Corp. of America Holdings | 2.700% | 6/1/31 | 14,383 | 12,257 | ||
| Merck & Co. Inc. | 1.900% | 12/10/28 | 8,245 | 7,289 | ||
| Merck & Co. Inc. | 3.400% | 3/7/29 | 47,023 | 45,301 | ||
| Merck & Co. Inc. | 1.450% | 6/24/30 | 30,025 | 24,791 | ||
| Merck & Co. Inc. | 2.150% | 12/10/31 | 75,295 | 64,105 | ||
| 1 | Mercy Health | 4.302% | 7/1/28 | 5,870 | 5,773 | |
| Mylan Inc. | 4.550% | 4/15/28 | 17,315 | 16,293 | ||
| Novartis Capital Corp. | 2.200% | 8/14/30 | 31,707 | 27,893 | ||
| Coupon | Maturity Date | Face Amount ($000) | Market Value• ($000) | |||
| 1 | Ochsner LSU Health System of North Louisiana | 2.510% | 5/15/31 | 6,995 | 5,657 | |
| OhioHealth Corp. | 2.297% | 11/15/31 | 7,350 | 6,184 | ||
| PerkinElmer Inc. | 1.900% | 9/15/28 | 16,333 | 13,798 | ||
| PerkinElmer Inc. | 3.300% | 9/15/29 | 19,378 | 17,297 | ||
| PerkinElmer Inc. | 2.550% | 3/15/31 | 10,827 | 8,899 | ||
| PerkinElmer Inc. | 2.250% | 9/15/31 | 13,005 | 10,414 | ||
| Pfizer Inc. | 3.600% | 9/15/28 | 6,145 | 6,095 | ||
| Pfizer Inc. | 3.450% | 3/15/29 | 61,569 | 59,424 | ||
| Pfizer Inc. | 2.625% | 4/1/30 | 36,997 | 33,453 | ||
| Pfizer Inc. | 1.700% | 5/28/30 | 25,014 | 21,182 | ||
| Pfizer Inc. | 1.750% | 8/18/31 | 29,021 | 24,094 | ||
| Pharmacia LLC | 6.600% | 12/1/28 | 11,603 | 12,946 | ||
| 1 | Piedmont Healthcare Inc. | 2.044% | 1/1/32 | 3,581 | 2,888 | |
| 1 | Providence St. Joseph Health Obligated Group | 2.532% | 10/1/29 | 11,897 | 10,463 | |
| Quest Diagnostics Inc. | 4.200% | 6/30/29 | 13,747 | 13,183 | ||
| Quest Diagnostics Inc. | 2.950% | 6/30/30 | 21,778 | 19,204 | ||
| Quest Diagnostics Inc. | 2.800% | 6/30/31 | 6,229 | 5,321 | ||
| Regeneron Pharmaceuticals Inc. | 1.750% | 9/15/30 | 32,521 | 25,859 | ||
| Royalty Pharma plc | 1.750% | 9/2/27 | 8,743 | 7,603 | ||
| Royalty Pharma plc | 2.200% | 9/2/30 | 31,330 | 25,395 | ||
| Royalty Pharma plc | 2.150% | 9/2/31 | 19,355 | 15,257 | ||
| 1 | Rush Obligated Group | 3.922% | 11/15/29 | 8,231 | 7,869 | |
| Sanofi | 3.625% | 6/19/28 | 22,806 | 22,158 | ||
| Smith & Nephew plc | 2.032% | 10/14/30 | 23,457 | 18,554 | ||
| 1 | Stanford Health Care | 3.310% | 8/15/30 | 6,540 | 6,024 | |
| STERIS Irish FinCo Unltd. Co. | 2.700% | 3/15/31 | 29,180 | 24,431 | ||
| Stryker Corp. | 3.650% | 3/7/28 | 14,367 | 14,001 | ||
| Stryker Corp. | 1.950% | 6/15/30 | 17,592 | 14,657 | ||
| 1 | Sutter Health | 3.695% | 8/15/28 | 7,064 | 6,760 | |
| 1 | Sutter Health | 2.294% | 8/15/30 | 16,330 | 13,799 | |
| Takeda Pharmaceutical Co. Ltd. | 5.000% | 11/26/28 | 54,512 | 55,212 | ||
| Takeda Pharmaceutical Co. Ltd. | 2.050% | 3/31/30 | 59,901 | 50,147 | ||
| Thermo Fisher Scientific Inc. | 1.750% | 10/15/28 | 30,035 | 26,436 | ||
| Thermo Fisher Scientific Inc. | 2.600% | 10/1/29 | 17,992 | 16,432 | ||
| Thermo Fisher Scientific Inc. | 2.000% | 10/15/31 | 37,146 | 31,287 | ||
| UnitedHealth Group Inc. | 3.450% | 1/15/27 | 90 | 88 | ||
| UnitedHealth Group Inc. | 2.950% | 10/15/27 | 27,952 | 26,507 | ||
| UnitedHealth Group Inc. | 3.850% | 6/15/28 | 32,452 | 32,024 | ||
| UnitedHealth Group Inc. | 3.875% | 12/15/28 | 15,434 | 15,163 | ||
| UnitedHealth Group Inc. | 2.875% | 8/15/29 | 33,556 | 30,800 | ||
| UnitedHealth Group Inc. | 2.000% | 5/15/30 | 10,223 | 8,711 | ||
| UnitedHealth Group Inc. | 2.300% | 5/15/31 | 55,305 | 47,477 | ||
| UnitedHealth Group Inc. | 4.200% | 5/15/32 | 51,948 | 51,521 | ||
| 2 | Universal Health Services Inc. | 2.650% | 10/15/30 | 21,643 | 17,030 | |
| 2 | Universal Health Services Inc. | 2.650% | 1/15/32 | 12,297 | 9,342 | |
| Viatris Inc. | 2.300% | 6/22/27 | 7,125 | 6,124 | ||
| Viatris Inc. | 2.700% | 6/22/30 | 28,295 | 22,316 | ||
| Zimmer Biomet Holdings Inc. | 3.550% | 3/20/30 | 9,156 | 8,309 | ||
| Zimmer Biomet Holdings Inc. | 2.600% | 11/24/31 | 12,511 | 10,417 | ||
| Zoetis Inc. | 3.000% | 9/12/27 | 22,263 | 21,069 | ||
| Zoetis Inc. | 3.900% | 8/20/28 | 14,688 | 14,311 | ||
| Zoetis Inc. | 2.000% | 5/15/30 | 18,639 | 15,656 | ||
| 3,514,530 | ||||||
| Industrials (6.8%) | ||||||
| 3M Co. | 2.875% | 10/15/27 | 18,768 | 17,649 | ||
| 1 | 3M Co. | 3.625% | 9/14/28 | 6,774 | 6,478 | |
| 1 | 3M Co. | 3.375% | 3/1/29 | 21,796 | 20,239 | |
| 3M Co. | 2.375% | 8/26/29 | 27,594 | 23,714 | ||
| 3M Co. | 3.050% | 4/15/30 | 13,733 | 12,230 | ||
| Acuity Brands Lighting Inc. | 2.150% | 12/15/30 | 12,902 | 10,254 | ||
| Allegion plc | 3.500% | 10/1/29 | 12,309 | 10,862 | ||
| Allegion US Holding Co. Inc. | 3.550% | 10/1/27 | 5,135 | 4,735 | ||
| Allegion US Holding Co. Inc. | 5.411% | 7/1/32 | 12,385 | 12,199 | ||
| 1 | American Airlines Pass-Through Trust Class A Series 2021-1 | 2.875% | 7/11/34 | 1,235 | 1,033 | |
| Coupon | Maturity Date | Face Amount ($000) | Market Value• ($000) | |||
| 1 | American Airlines Pass-Through Trust Class AA Series 2015-2 | 3.600% | 9/22/27 | 3,434 | 3,172 | |
| 1 | American Airlines Pass-Through Trust Class AA Series 2016-1 | 3.575% | 1/15/28 | 8,769 | 7,985 | |
| 1 | American Airlines Pass-Through Trust Class AA Series 2016-2 | 3.200% | 6/15/28 | 10,086 | 9,004 | |
| 1 | American Airlines Pass-Through Trust Class AA Series 2016-3 | 3.000% | 10/15/28 | 6,773 | 6,093 | |
| 1 | American Airlines Pass-Through Trust Class AA Series 2017-1 | 3.650% | 2/15/29 | 10,126 | 9,295 | |
| 1 | American Airlines Pass-Through Trust Class AA Series 2017-2 | 3.350% | 10/15/29 | 10,274 | 9,172 | |
| 1 | American Airlines Pass-Through Trust Class AA Series 2019-1 | 3.150% | 2/15/32 | 6,915 | 6,101 | |
| Amphenol Corp. | 4.350% | 6/1/29 | 11,691 | 11,547 | ||
| Amphenol Corp. | 2.800% | 2/15/30 | 26,918 | 23,541 | ||
| Amphenol Corp. | 2.200% | 9/15/31 | 12,926 | 10,659 | ||
| Boeing Co. | 3.250% | 2/1/28 | 16,010 | 14,518 | ||
| Boeing Co. | 3.250% | 3/1/28 | 19,281 | 17,572 | ||
| Boeing Co. | 3.450% | 11/1/28 | 16,036 | 14,611 | ||
| Boeing Co. | 3.200% | 3/1/29 | 26,760 | 23,723 | ||
| Boeing Co. | 2.950% | 2/1/30 | 33,884 | 29,009 | ||
| Boeing Co. | 5.150% | 5/1/30 | 114,246 | 112,410 | ||
| Boeing Co. | 3.625% | 2/1/31 | 37,350 | 33,143 | ||
| Burlington Northern Santa Fe LLC | 3.250% | 6/15/27 | 2,546 | 2,486 | ||
| Canadian National Railway Co. | 6.900% | 7/15/28 | 6,731 | 7,615 | ||
| Canadian National Railway Co. | 3.850% | 8/5/32 | 12,580 | 12,175 | ||
| Canadian Pacific Railway Co. | 4.000% | 6/1/28 | 9,078 | 8,902 | ||
| Canadian Pacific Railway Co. | 2.050% | 3/5/30 | 26,492 | 22,456 | ||
| Canadian Pacific Railway Co. | 7.125% | 10/15/31 | 5,600 | 6,486 | ||
| Canadian Pacific Railway Co. | 2.450% | 12/2/31 | 39,980 | 34,204 | ||
| Carrier Global Corp. | 2.722% | 2/15/30 | 75,057 | 64,916 | ||
| Carrier Global Corp. | 2.700% | 2/15/31 | 19,935 | 16,991 | ||
| 1 | Caterpillar Financial Services Corp. | 1.100% | 9/14/27 | 17,115 | 14,985 | |
| Caterpillar Inc. | 2.600% | 9/19/29 | 5,865 | 5,349 | ||
| Caterpillar Inc. | 2.600% | 4/9/30 | 32,974 | 29,906 | ||
| Caterpillar Inc. | 1.900% | 3/12/31 | 5,541 | 4,711 | ||
| CH Robinson Worldwide Inc. | 4.200% | 4/15/28 | 13,341 | 12,883 | ||
| 1 | CNH Industrial NV | 3.850% | 11/15/27 | 21,543 | 20,404 | |
| CSX Corp. | 3.250% | 6/1/27 | 16,668 | 16,051 | ||
| CSX Corp. | 3.800% | 3/1/28 | 17,551 | 17,173 | ||
| CSX Corp. | 4.250% | 3/15/29 | 26,431 | 26,191 | ||
| CSX Corp. | 2.400% | 2/15/30 | 7,709 | 6,733 | ||
| Cummins Inc. | 1.500% | 9/1/30 | 11,436 | 9,321 | ||
| Deere & Co. | 5.375% | 10/16/29 | 8,225 | 8,861 | ||
| Deere & Co. | 3.100% | 4/15/30 | 29,724 | 27,962 | ||
| 2 | Delta Air Lines Inc. | 4.750% | 10/20/28 | 21,000 | 20,094 | |
| 1 | Delta Air Lines Pass-Through Trust Class AA Series 2020-1 | 2.000% | 6/10/28 | 14,884 | 13,043 | |
| Dover Corp. | 2.950% | 11/4/29 | 1,004 | 909 | ||
| Eaton Corp. | 3.103% | 9/15/27 | 16,706 | 15,880 | ||
| Emerson Electric Co. | 1.800% | 10/15/27 | 18,188 | 16,348 | ||
| Emerson Electric Co. | 2.000% | 12/21/28 | 25,235 | 22,434 | ||
| Emerson Electric Co. | 1.950% | 10/15/30 | 8,028 | 6,818 | ||
| Emerson Electric Co. | 2.200% | 12/21/31 | 38,415 | 32,609 | ||
| FedEx Corp. | 3.400% | 2/15/28 | 15,815 | 15,141 | ||
| FedEx Corp. | 4.200% | 10/17/28 | 11,707 | 11,499 | ||
| FedEx Corp. | 3.100% | 8/5/29 | 18,556 | 16,963 | ||
| FedEx Corp. | 4.250% | 5/15/30 | 23,424 | 22,883 | ||
| FedEx Corp. | 2.400% | 5/15/31 | 19,955 | 16,841 | ||
| Flowserve Corp. | 3.500% | 10/1/30 | 22,576 | 19,366 | ||
| General Dynamics Corp. | 2.625% | 11/15/27 | 11,216 | 10,415 | ||
| General Dynamics Corp. | 3.750% | 5/15/28 | 26,709 | 26,261 | ||
| General Dynamics Corp. | 3.625% | 4/1/30 | 30,874 | 29,799 | ||
| General Dynamics Corp. | 2.250% | 6/1/31 | 5,534 | 4,803 | ||
| 1 | General Electric Co. | 6.750% | 3/15/32 | 36,667 | 41,561 | |
| Honeywell International Inc. | 2.700% | 8/15/29 | 10,581 | 9,728 | ||
| Honeywell International Inc. | 1.950% | 6/1/30 | 35,335 | 30,453 | ||
| Coupon | Maturity Date | Face Amount ($000) | Market Value• ($000) | |||
| Honeywell International Inc. | 1.750% | 9/1/31 | 44,815 | 37,099 | ||
| Huntington Ingalls Industries Inc. | 3.483% | 12/1/27 | 13,842 | 12,869 | ||
| Huntington Ingalls Industries Inc. | 2.043% | 8/16/28 | 10,120 | 8,584 | ||
| Huntington Ingalls Industries Inc. | 4.200% | 5/1/30 | 13,483 | 12,557 | ||
| IDEX Corp. | 3.000% | 5/1/30 | 23,236 | 20,423 | ||
| 1 | JetBlue Pass-Through Trust Class A Series 2020-1 | 4.000% | 11/15/32 | 1,646 | 1,502 | |
| 1 | JetBlue Pass-Through Trust Class AA Series 2019-1 | 2.750% | 5/15/32 | 1,978 | 1,686 | |
| 1 | John Deere Capital Corp. | 2.800% | 9/8/27 | 15,578 | 14,808 | |
| 1 | John Deere Capital Corp. | 3.050% | 1/6/28 | 9,350 | 8,986 | |
| 1 | John Deere Capital Corp. | 1.500% | 3/6/28 | 11,838 | 10,414 | |
| 1 | John Deere Capital Corp. | 3.450% | 3/7/29 | 15,312 | 14,826 | |
| 1 | John Deere Capital Corp. | 2.800% | 7/18/29 | 15,885 | 14,708 | |
| 1 | John Deere Capital Corp. | 2.450% | 1/9/30 | 25,435 | 22,568 | |
| John Deere Capital Corp. | 1.450% | 1/15/31 | 12,397 | 10,122 | ||
| John Deere Capital Corp. | 3.900% | 6/7/32 | 38,990 | 38,418 | ||
| Johnson Controls International plc | 1.750% | 9/15/30 | 21,835 | 17,859 | ||
| Johnson Controls International plc | 2.000% | 9/16/31 | 5,482 | 4,403 | ||
| Kansas City Southern | 2.875% | 11/15/29 | 11,369 | 10,218 | ||
| Kennametal Inc. | 4.625% | 6/15/28 | 9,540 | 9,169 | ||
| Kennametal Inc. | 2.800% | 3/1/31 | 2,995 | 2,370 | ||
| Keysight Technologies Inc. | 3.000% | 10/30/29 | 14,284 | 12,522 | ||
| Kirby Corp. | 4.200% | 3/1/28 | 11,850 | 10,988 | ||
| L3Harris Technologies Inc. | 4.400% | 6/15/28 | 21,991 | 21,617 | ||
| 1 | L3Harris Technologies Inc. | 4.400% | 6/15/28 | 23,418 | 23,049 | |
| L3Harris Technologies Inc. | 1.800% | 1/15/31 | 14,962 | 11,904 | ||
| Lennox International Inc. | 1.700% | 8/1/27 | 7,214 | 6,276 | ||
| Lockheed Martin Corp. | 1.850% | 6/15/30 | 21,273 | 18,311 | ||
| Lockheed Martin Corp. | 3.900% | 6/15/32 | 23,441 | 22,991 | ||
| 2 | Mileage Plus Holdings LLC | 6.500% | 6/20/27 | 16,000 | 16,048 | |
| Norfolk Southern Corp. | 3.150% | 6/1/27 | 3,130 | 2,980 | ||
| Norfolk Southern Corp. | 3.800% | 8/1/28 | 20,050 | 19,552 | ||
| Norfolk Southern Corp. | 2.550% | 11/1/29 | 14,904 | 13,236 | ||
| Norfolk Southern Corp. | 2.300% | 5/15/31 | 3,639 | 3,116 | ||
| Norfolk Southern Corp. | 3.000% | 3/15/32 | 14,530 | 13,048 | ||
| Northrop Grumman Corp. | 3.250% | 1/15/28 | 40,821 | 38,763 | ||
| Northrop Grumman Corp. | 4.400% | 5/1/30 | 28,885 | 28,895 | ||
| 1 | Northrop Grumman Corp. | 7.750% | 2/15/31 | 4,902 | 5,850 | |
| nVent Finance Sarl | 4.550% | 4/15/28 | 13,207 | 12,454 | ||
| nVent Finance Sarl | 2.750% | 11/15/31 | 5,854 | 4,603 | ||
| Oshkosh Corp. | 4.600% | 5/15/28 | 7,165 | 6,891 | ||
| Oshkosh Corp. | 3.100% | 3/1/30 | 8,110 | 6,870 | ||
| Otis Worldwide Corp. | 2.565% | 2/15/30 | 40,321 | 34,742 | ||
| Parker-Hannifin Corp. | 3.250% | 3/1/27 | 17,920 | 17,178 | ||
| Parker-Hannifin Corp. | 4.250% | 9/15/27 | 12,833 | 12,686 | ||
| Parker-Hannifin Corp. | 3.250% | 6/14/29 | 27,394 | 25,079 | ||
| Parker-Hannifin Corp. | 4.500% | 9/15/29 | 29,395 | 28,925 | ||
| Pentair Finance Sarl | 4.500% | 7/1/29 | 12,471 | 11,658 | ||
| Pentair Finance Sarl | 5.900% | 7/15/32 | 3,890 | 3,876 | ||
| Raytheon Technologies Corp. | 3.125% | 5/4/27 | 11,045 | 10,546 | ||
| Raytheon Technologies Corp. | 4.125% | 11/16/28 | 89,379 | 87,262 | ||
| Raytheon Technologies Corp. | 2.250% | 7/1/30 | 23,735 | 20,275 | ||
| Raytheon Technologies Corp. | 1.900% | 9/1/31 | 21,873 | 17,673 | ||
| Raytheon Technologies Corp. | 2.375% | 3/15/32 | 37,927 | 31,849 | ||
| Republic Services Inc. | 3.375% | 11/15/27 | 16,000 | 15,238 | ||
| Republic Services Inc. | 3.950% | 5/15/28 | 12,689 | 12,426 | ||
| Republic Services Inc. | 2.300% | 3/1/30 | 18,573 | 15,943 | ||
| Republic Services Inc. | 1.450% | 2/15/31 | 19,799 | 15,580 | ||
| Republic Services Inc. | 1.750% | 2/15/32 | 11,300 | 8,844 | ||
| Rockwell Automation Inc. | 3.500% | 3/1/29 | 12,886 | 12,360 | ||
| Rockwell Automation Inc. | 1.750% | 8/15/31 | 7,070 | 5,784 | ||
| Southwest Airlines Co. | 3.000% | 11/15/26 | 9,695 | 9,135 | ||
| Southwest Airlines Co. | 5.125% | 6/15/27 | 16,452 | 16,789 | ||
| Southwest Airlines Co. | 3.450% | 11/16/27 | 2,190 | 2,066 | ||
| Southwest Airlines Co. | 2.625% | 2/10/30 | 9,670 | 8,125 | ||
| Coupon | Maturity Date | Face Amount ($000) | Market Value• ($000) | |||
| 1 | Spirit Airlines Pass-Through Trust Class A Series 2015-1 | 4.100% | 4/1/28 | 1,993 | 1,754 | |
| Teledyne Technologies Inc. | 2.250% | 4/1/28 | 19,696 | 17,077 | ||
| Teledyne Technologies Inc. | 2.750% | 4/1/31 | 33,862 | 28,172 | ||
| Textron Inc. | 3.375% | 3/1/28 | 12,518 | 11,512 | ||
| Textron Inc. | 3.900% | 9/17/29 | 12,726 | 11,883 | ||
| Textron Inc. | 3.000% | 6/1/30 | 9,603 | 8,310 | ||
| Textron Inc. | 2.450% | 3/15/31 | 10,340 | 8,425 | ||
| Timken Co. | 4.500% | 12/15/28 | 8,523 | 8,150 | ||
| Timken Co. | 4.125% | 4/1/32 | 8,150 | 7,389 | ||
| Trane Technologies Global Holding Co. Ltd. | 3.750% | 8/21/28 | 11,942 | 11,476 | ||
| Trane Technologies Luxembourg Finance SA | 3.800% | 3/21/29 | 20,528 | 19,337 | ||
| Trimble Inc. | 4.900% | 6/15/28 | 15,128 | 14,933 | ||
| 2 | Triton Container International Ltd. | 3.150% | 6/15/31 | 10,945 | 8,556 | |
| Triton Container International Ltd. | 3.250% | 3/15/32 | 5,117 | 4,050 | ||
| Tyco Electronics Group SA | 2.500% | 2/4/32 | 14,628 | 12,701 | ||
| Union Pacific Corp. | 2.150% | 2/5/27 | 9,239 | 8,583 | ||
| Union Pacific Corp. | 3.950% | 9/10/28 | 30,341 | 29,918 | ||
| Union Pacific Corp. | 6.625% | 2/1/29 | 3,432 | 3,873 | ||
| Union Pacific Corp. | 3.700% | 3/1/29 | 16,950 | 16,495 | ||
| Union Pacific Corp. | 2.400% | 2/5/30 | 17,136 | 15,110 | ||
| Union Pacific Corp. | 2.375% | 5/20/31 | 21,040 | 18,265 | ||
| Union Pacific Corp. | 2.800% | 2/14/32 | 28,626 | 25,478 | ||
| Union Pacific Corp. | 2.891% | 4/6/36 | 4,125 | 3,438 | ||
| 1 | United Airlines Pass-Through Trust Class A Series 2016-1 | 3.450% | 7/7/28 | 3,195 | 2,668 | |
| 1 | United Airlines Pass-Through Trust Class A Series 2020-1 | 5.875% | 10/15/27 | 68,514 | 68,018 | |
| 1 | United Airlines Pass-Through Trust Class AA Series 2015-1 | 3.450% | 12/1/27 | 5,981 | 5,482 | |
| 1 | United Airlines Pass-Through Trust Class AA Series 2016-1 | 3.100% | 7/7/28 | 9,460 | 8,515 | |
| 1 | United Airlines Pass-Through Trust Class AA Series 2016-2 | 2.875% | 10/7/28 | 8,045 | 7,104 | |
| 1 | United Airlines Pass-Through Trust Class AA Series 2018-1 | 3.500% | 3/1/30 | 3,753 | 3,351 | |
| 1 | United Airlines Pass-Through Trust Class AA Series 2019-1 | 4.150% | 8/25/31 | 7,280 | 6,693 | |
| 1 | United Airlines Pass-Through Trust Class AA Series 2019-2 | 2.700% | 5/1/32 | 3,552 | 2,992 | |
| United Parcel Service Inc. | 3.050% | 11/15/27 | 12,115 | 11,757 | ||
| United Parcel Service Inc. | 3.400% | 3/15/29 | 21,372 | 20,683 | ||
| United Parcel Service Inc. | 2.500% | 9/1/29 | 10,762 | 9,725 | ||
| United Parcel Service Inc. | 4.450% | 4/1/30 | 19,674 | 20,151 | ||
| United Rentals North America Inc. | 3.875% | 11/15/27 | 17,500 | 16,212 | ||
| 1 | US Airways Pass-Through Trust Class A Series 2012-1 | 5.900% | 10/1/24 | 500 | 487 | |
| Vontier Corp. | 2.400% | 4/1/28 | 11,045 | 8,979 | ||
| Vontier Corp. | 2.950% | 4/1/31 | 17,002 | 13,073 | ||
| Waste Connections Inc. | 4.250% | 12/1/28 | 10,914 | 10,726 | ||
| Waste Connections Inc. | 3.500% | 5/1/29 | 16,450 | 15,513 | ||
| Waste Connections Inc. | 2.600% | 2/1/30 | 17,862 | 15,664 | ||
| Waste Connections Inc. | 2.200% | 1/15/32 | 14,778 | 12,175 | ||
| Waste Connections Inc. | 3.200% | 6/1/32 | 6,235 | 5,549 | ||
| Waste Management Inc. | 3.150% | 11/15/27 | 28,781 | 27,453 | ||
| Waste Management Inc. | 1.150% | 3/15/28 | 17,125 | 14,498 | ||
| Waste Management Inc. | 2.000% | 6/1/29 | 5,460 | 4,724 | ||
| Waste Management Inc. | 1.500% | 3/15/31 | 25,696 | 20,529 | ||
| Waste Management Inc. | 4.150% | 4/15/32 | 17,402 | 17,001 | ||
| Westinghouse Air Brake Technologies Corp. | 4.950% | 9/15/28 | 29,562 | 28,737 | ||
| Xylem Inc. | 1.950% | 1/30/28 | 14,338 | 12,617 | ||
| Xylem Inc. | 2.250% | 1/30/31 | 11,227 | 9,382 | ||
| 2,914,492 | ||||||
| Materials (3.1%) | ||||||
| Air Products and Chemicals Inc. | 2.050% | 5/15/30 | 22,479 | 19,405 | ||
| Coupon | Maturity Date | Face Amount ($000) | Market Value• ($000) | |||
| Albemarle Corp. | 5.050% | 6/1/32 | 13,000 | 12,699 | ||
| Amcor Finance USA Inc. | 4.500% | 5/15/28 | 9,520 | 9,187 | ||
| 1 | Amcor Flexibles North America Inc. | 3.100% | 9/15/26 | 6,123 | 5,815 | |
| Amcor Flexibles North America Inc. | 2.630% | 6/19/30 | 23,026 | 19,105 | ||
| Amcor Flexibles North America Inc. | 2.690% | 5/25/31 | 7,902 | 6,487 | ||
| AngloGold Ashanti Holdings plc | 3.375% | 11/1/28 | 17,320 | 15,212 | ||
| AngloGold Ashanti Holdings plc | 3.750% | 10/1/30 | 17,218 | 14,706 | ||
| ArcelorMittal SA | 4.250% | 7/16/29 | 11,725 | 11,099 | ||
| Cabot Corp. | 4.000% | 7/1/29 | 6,075 | 5,580 | ||
| Cabot Corp. | 5.000% | 6/30/32 | 11,033 | 10,566 | ||
| Carlisle Cos. Inc. | 3.750% | 12/1/27 | 7,237 | 6,865 | ||
| Carlisle Cos. Inc. | 2.750% | 3/1/30 | 17,125 | 14,648 | ||
| Celanese US Holdings LLC | 1.400% | 8/5/26 | 8,800 | 7,399 | ||
| Celanese US Holdings LLC | 6.330% | 7/15/29 | 13,730 | 13,648 | ||
| Celanese US Holdings LLC | 6.379% | 7/15/32 | 25,800 | 25,627 | ||
| Celulosa Arauco y Constitucion SA | 3.875% | 11/2/27 | 9,473 | 8,747 | ||
| Dow Chemical Co. | 4.800% | 11/30/28 | 14,908 | 14,999 | ||
| Dow Chemical Co. | 7.375% | 11/1/29 | 13,277 | 15,279 | ||
| Dow Chemical Co. | 2.100% | 11/15/30 | 29,297 | 23,973 | ||
| DuPont de Nemours Inc. | 4.725% | 11/15/28 | 40,709 | 41,112 | ||
| Eagle Materials Inc. | 2.500% | 7/1/31 | 18,783 | 14,693 | ||
| Eastman Chemical Co. | 4.500% | 12/1/28 | 3,232 | 3,157 | ||
| Ecolab Inc. | 3.250% | 12/1/27 | 11,902 | 11,537 | ||
| Ecolab Inc. | 4.800% | 3/24/30 | 16,861 | 17,374 | ||
| Ecolab Inc. | 1.300% | 1/30/31 | 10,408 | 8,323 | ||
| Ecolab Inc. | 2.125% | 2/1/32 | 22,835 | 19,200 | ||
| EI du Pont de Nemours & Co. | 2.300% | 7/15/30 | 12,861 | 11,119 | ||
| FMC Corp. | 3.450% | 10/1/29 | 9,222 | 8,260 | ||
| Freeport-McMoRan Inc. | 5.000% | 9/1/27 | 7,000 | 7,072 | ||
| Freeport-McMoRan Inc. | 4.125% | 3/1/28 | 17,900 | 16,751 | ||
| Freeport-McMoRan Inc. | 4.375% | 8/1/28 | 16,000 | 15,084 | ||
| Freeport-McMoRan Inc. | 5.250% | 9/1/29 | 14,069 | 13,651 | ||
| Freeport-McMoRan Inc. | 4.250% | 3/1/30 | 17,323 | 15,735 | ||
| Freeport-McMoRan Inc. | 4.625% | 8/1/30 | 21,345 | 19,733 | ||
| Georgia-Pacific LLC | 7.750% | 11/15/29 | 14,987 | 17,792 | ||
| 2 | Georgia-Pacific LLC | 2.300% | 4/30/30 | 6,440 | 5,565 | |
| Georgia-Pacific LLC | 8.875% | 5/15/31 | 2,022 | 2,599 | ||
| Huntsman International LLC | 4.500% | 5/1/29 | 18,409 | 16,953 | ||
| Huntsman International LLC | 2.950% | 6/15/31 | 9,798 | 7,829 | ||
| International Flavors & Fragrances Inc. | 4.450% | 9/26/28 | 5,347 | 5,192 | ||
| Kinross Gold Corp. | 4.500% | 7/15/27 | 1,729 | 1,675 | ||
| Linde Inc. | 1.100% | 8/10/30 | 12,545 | 10,046 | ||
| LYB International Finance III LLC | 2.250% | 10/1/30 | 15,634 | 12,822 | ||
| Martin Marietta Materials Inc. | 3.500% | 12/15/27 | 20,961 | 20,037 | ||
| 1 | Martin Marietta Materials Inc. | 2.500% | 3/15/30 | 13,775 | 11,617 | |
| Martin Marietta Materials Inc. | 2.400% | 7/15/31 | 19,012 | 15,647 | ||
| Mosaic Co. | 4.050% | 11/15/27 | 16,839 | 16,353 | ||
| NewMarket Corp. | 2.700% | 3/18/31 | 8,875 | 7,144 | ||
| Newmont Corp. | 2.800% | 10/1/29 | 22,081 | 19,276 | ||
| Newmont Corp. | 2.250% | 10/1/30 | 28,698 | 23,584 | ||
| Newmont Corp. | 2.600% | 7/15/32 | 22,615 | 18,488 | ||
| Nucor Corp. | 3.950% | 5/1/28 | 4,301 | 4,176 | ||
| Nucor Corp. | 2.700% | 6/1/30 | 14,777 | 12,897 | ||
| Nucor Corp. | 3.125% | 4/1/32 | 12,246 | 10,766 | ||
| Nutrien Ltd. | 4.200% | 4/1/29 | 18,148 | 17,620 | ||
| Nutrien Ltd. | 2.950% | 5/13/30 | 18,614 | 16,483 | ||
| Packaging Corp. of America | 3.400% | 12/15/27 | 12,712 | 12,008 | ||
| Packaging Corp. of America | 3.000% | 12/15/29 | 9,691 | 8,605 | ||
| PPG Industries Inc. | 3.750% | 3/15/28 | 17,423 | 16,877 | ||
| PPG Industries Inc. | 2.800% | 8/15/29 | 11,600 | 10,442 | ||
| PPG Industries Inc. | 2.550% | 6/15/30 | 14,889 | 13,010 | ||
| Reliance Steel & Aluminum Co. | 2.150% | 8/15/30 | 12,449 | 10,054 | ||
| Rio Tinto Alcan Inc. | 7.250% | 3/15/31 | 8,476 | 10,038 | ||
| Rio Tinto Finance USA Ltd. | 7.125% | 7/15/28 | 17,495 | 19,760 | ||
| Rohm & Haas Co. | 7.850% | 7/15/29 | 15,727 | 18,362 | ||
| RPM International Inc. | 4.550% | 3/1/29 | 18,513 | 17,723 | ||
| Coupon | Maturity Date | Face Amount ($000) | Market Value• ($000) | |||
| RPM International Inc. | 2.950% | 1/15/32 | 7,810 | 6,357 | ||
| Sherwin-Williams Co. | 2.950% | 8/15/29 | 38,010 | 34,138 | ||
| Sherwin-Williams Co. | 2.300% | 5/15/30 | 20,107 | 16,955 | ||
| Sherwin-Williams Co. | 2.200% | 3/15/32 | 11,080 | 8,989 | ||
| Sonoco Products Co. | 3.125% | 5/1/30 | 16,536 | 14,335 | ||
| Sonoco Products Co. | 2.850% | 2/1/32 | 9,278 | 7,749 | ||
| Steel Dynamics Inc. | 1.650% | 10/15/27 | 9,766 | 8,344 | ||
| Steel Dynamics Inc. | 3.450% | 4/15/30 | 27,549 | 24,552 | ||
| Steel Dynamics Inc. | 3.250% | 1/15/31 | 24,153 | 20,868 | ||
| Suzano Austria GmbH | 2.500% | 9/15/28 | 7,435 | 6,275 | ||
| Suzano Austria GmbH | 6.000% | 1/15/29 | 41,159 | 41,144 | ||
| Suzano Austria GmbH | 5.000% | 1/15/30 | 29,573 | 27,653 | ||
| Suzano Austria GmbH | 3.750% | 1/15/31 | 25,889 | 21,927 | ||
| 1 | Suzano Austria GmbH | 3.125% | 1/15/32 | 31,740 | 25,047 | |
| Teck Resources Ltd. | 3.900% | 7/15/30 | 13,900 | 12,583 | ||
| Vale Overseas Ltd. | 3.750% | 7/8/30 | 32,595 | 28,289 | ||
| Vulcan Materials Co. | 3.500% | 6/1/30 | 13,840 | 12,506 | ||
| Westlake Corp. | 3.375% | 6/15/30 | 8,580 | 7,698 | ||
| WestRock MWV LLC | 8.200% | 1/15/30 | 4,078 | 4,774 | ||
| WestRock MWV LLC | 7.950% | 2/15/31 | 5,384 | 6,292 | ||
| WRKCo Inc. | 3.375% | 9/15/27 | 13,825 | 13,013 | ||
| WRKCo Inc. | 4.000% | 3/15/28 | 14,184 | 13,689 | ||
| WRKCo Inc. | 3.900% | 6/1/28 | 22,324 | 21,436 | ||
| WRKCo Inc. | 4.900% | 3/15/29 | 36,769 | 36,744 | ||
| 1,316,644 | ||||||
| Real Estate (6.7%) | ||||||
| Agree LP | 2.000% | 6/15/28 | 8,771 | 7,393 | ||
| Agree LP | 2.900% | 10/1/30 | 6,108 | 5,174 | ||
| Agree LP | 4.800% | 10/1/32 | 4,000 | 3,845 | ||
| Alexandria Real Estate Equities Inc. | 3.950% | 1/15/28 | 12,706 | 12,230 | ||
| Alexandria Real Estate Equities Inc. | 4.500% | 7/30/29 | 6,406 | 6,225 | ||
| Alexandria Real Estate Equities Inc. | 2.750% | 12/15/29 | 19,171 | 16,726 | ||
| Alexandria Real Estate Equities Inc. | 4.700% | 7/1/30 | 14,318 | 14,083 | ||
| Alexandria Real Estate Equities Inc. | 4.900% | 12/15/30 | 22,645 | 22,518 | ||
| Alexandria Real Estate Equities Inc. | 3.375% | 8/15/31 | 4,276 | 3,807 | ||
| Alexandria Real Estate Equities Inc. | 2.000% | 5/18/32 | 22,733 | 17,929 | ||
| American Assets Trust LP | 3.375% | 2/1/31 | 13,446 | 11,253 | ||
| American Homes 4 Rent LP | 4.250% | 2/15/28 | 12,796 | 12,358 | ||
| American Homes 4 Rent LP | 4.900% | 2/15/29 | 12,512 | 12,217 | ||
| American Homes 4 Rent LP | 2.375% | 7/15/31 | 16,060 | 12,845 | ||
| American Homes 4 Rent LP | 3.625% | 4/15/32 | 16,721 | 14,598 | ||
| American Tower Corp. | 3.600% | 1/15/28 | 17,155 | 15,961 | ||
| American Tower Corp. | 1.500% | 1/31/28 | 17,540 | 14,718 | ||
| American Tower Corp. | 3.950% | 3/15/29 | 17,597 | 16,494 | ||
| American Tower Corp. | 3.800% | 8/15/29 | 33,993 | 31,341 | ||
| American Tower Corp. | 2.900% | 1/15/30 | 17,755 | 15,301 | ||
| American Tower Corp. | 2.100% | 6/15/30 | 15,729 | 12,710 | ||
| American Tower Corp. | 1.875% | 10/15/30 | 12,623 | 9,960 | ||
| American Tower Corp. | 2.700% | 4/15/31 | 30,579 | 25,371 | ||
| American Tower Corp. | 2.300% | 9/15/31 | 16,670 | 13,238 | ||
| American Tower Corp. | 4.050% | 3/15/32 | 15,150 | 13,922 | ||
| 1 | AvalonBay Communities Inc. | 3.200% | 1/15/28 | 10,735 | 10,053 | |
| AvalonBay Communities Inc. | 1.900% | 12/1/28 | 17,743 | 15,274 | ||
| 1 | AvalonBay Communities Inc. | 3.300% | 6/1/29 | 6,431 | 5,968 | |
| 1 | AvalonBay Communities Inc. | 2.300% | 3/1/30 | 16,872 | 14,672 | |
| 1 | AvalonBay Communities Inc. | 2.450% | 1/15/31 | 12,380 | 10,712 | |
| AvalonBay Communities Inc. | 2.050% | 1/15/32 | 5,045 | 4,149 | ||
| Boston Properties LP | 4.500% | 12/1/28 | 7,587 | 7,381 | ||
| Boston Properties LP | 3.400% | 6/21/29 | 21,957 | 19,645 | ||
| Boston Properties LP | 2.900% | 3/15/30 | 14,792 | 12,593 | ||
| Boston Properties LP | 3.250% | 1/30/31 | 49,329 | 42,458 | ||
| Boston Properties LP | 2.550% | 4/1/32 | 20,951 | 16,665 | ||
| Brandywine Operating Partnership LP | 3.950% | 11/15/27 | 7,397 | 6,824 | ||
| Brandywine Operating Partnership LP | 4.550% | 10/1/29 | 11,632 | 10,923 | ||
| Brixmor Operating Partnership LP | 2.250% | 4/1/28 | 3,145 | 2,662 | ||
| Coupon | Maturity Date | Face Amount ($000) | Market Value• ($000) | |||
| Brixmor Operating Partnership LP | 4.125% | 5/15/29 | 15,998 | 14,570 | ||
| Brixmor Operating Partnership LP | 4.050% | 7/1/30 | 29,653 | 26,383 | ||
| Brixmor Operating Partnership LP | 2.500% | 8/16/31 | 12,755 | 9,877 | ||
| Broadstone Net Lease LLC | 2.600% | 9/15/31 | 9,855 | 7,755 | ||
| Camden Property Trust | 4.100% | 10/15/28 | 9,626 | 9,401 | ||
| Camden Property Trust | 3.150% | 7/1/29 | 23,296 | 21,311 | ||
| Camden Property Trust | 2.800% | 5/15/30 | 18,003 | 15,945 | ||
| CBRE Services Inc. | 2.500% | 4/1/31 | 12,925 | 10,360 | ||
| Corporate Office Properties LP | 2.250% | 3/15/26 | 432 | 387 | ||
| Corporate Office Properties LP | 2.000% | 1/15/29 | 18,124 | 14,329 | ||
| Corporate Office Properties LP | 2.750% | 4/15/31 | 18,546 | 14,588 | ||
| Crown Castle Inc. | 3.650% | 9/1/27 | 24,631 | 23,421 | ||
| Crown Castle Inc. | 3.800% | 2/15/28 | 26,122 | 24,662 | ||
| Crown Castle Inc. | 4.300% | 2/15/29 | 19,485 | 18,719 | ||
| Crown Castle Inc. | 3.100% | 11/15/29 | 10,802 | 9,544 | ||
| Crown Castle Inc. | 3.300% | 7/1/30 | 22,617 | 20,081 | ||
| Crown Castle Inc. | 2.250% | 1/15/31 | 19,455 | 15,763 | ||
| Crown Castle Inc. | 2.100% | 4/1/31 | 26,042 | 20,737 | ||
| Crown Castle Inc. | 2.500% | 7/15/31 | 21,793 | 17,903 | ||
| CubeSmart LP | 2.250% | 12/15/28 | 16,100 | 13,610 | ||
| CubeSmart LP | 4.375% | 2/15/29 | 9,601 | 9,241 | ||
| CubeSmart LP | 3.000% | 2/15/30 | 3,471 | 3,032 | ||
| CubeSmart LP | 2.000% | 2/15/31 | 15,608 | 12,340 | ||
| CubeSmart LP | 2.500% | 2/15/32 | 9,818 | 7,920 | ||
| Digital Realty Trust LP | 4.450% | 7/15/28 | 13,500 | 13,201 | ||
| Digital Realty Trust LP | 3.600% | 7/1/29 | 36,693 | 33,789 | ||
| Duke Realty LP | 3.375% | 12/15/27 | 10,494 | 9,910 | ||
| Duke Realty LP | 4.000% | 9/15/28 | 13,219 | 12,809 | ||
| Duke Realty LP | 2.875% | 11/15/29 | 10,384 | 9,265 | ||
| Duke Realty LP | 1.750% | 7/1/30 | 11,877 | 9,702 | ||
| Duke Realty LP | 1.750% | 2/1/31 | 7,050 | 5,679 | ||
| Duke Realty LP | 2.250% | 1/15/32 | 11,335 | 9,420 | ||
| EPR Properties | 3.750% | 8/15/29 | 24,200 | 20,312 | ||
| EPR Properties | 3.600% | 11/15/31 | 7,375 | 5,769 | ||
| Equinix Inc. | 1.550% | 3/15/28 | 9,727 | 8,247 | ||
| Equinix Inc. | 2.000% | 5/15/28 | 10,945 | 9,408 | ||
| Equinix Inc. | 3.200% | 11/18/29 | 25,114 | 22,491 | ||
| Equinix Inc. | 2.150% | 7/15/30 | 27,255 | 22,234 | ||
| Equinix Inc. | 2.500% | 5/15/31 | 23,445 | 19,272 | ||
| Equinix Inc. | 3.900% | 4/15/32 | 29,730 | 26,985 | ||
| ERP Operating LP | 3.500% | 3/1/28 | 13,401 | 12,629 | ||
| ERP Operating LP | 4.150% | 12/1/28 | 8,502 | 8,213 | ||
| ERP Operating LP | 3.000% | 7/1/29 | 13,668 | 12,375 | ||
| ERP Operating LP | 2.500% | 2/15/30 | 21,108 | 18,372 | ||
| ERP Operating LP | 1.850% | 8/1/31 | 15,785 | 12,785 | ||
| Essential Properties LP | 2.950% | 7/15/31 | 10,324 | 7,928 | ||
| Essex Portfolio LP | 1.700% | 3/1/28 | 5,122 | 4,360 | ||
| Essex Portfolio LP | 4.000% | 3/1/29 | 11,135 | 10,513 | ||
| Essex Portfolio LP | 3.000% | 1/15/30 | 21,336 | 18,663 | ||
| Essex Portfolio LP | 1.650% | 1/15/31 | 9,839 | 7,632 | ||
| Essex Portfolio LP | 2.550% | 6/15/31 | 3,305 | 2,745 | ||
| Essex Portfolio LP | 2.650% | 3/15/32 | 4,785 | 3,918 | ||
| Extra Space Storage LP | 3.900% | 4/1/29 | 4,458 | 4,144 | ||
| Extra Space Storage LP | 2.550% | 6/1/31 | 14,482 | 11,832 | ||
| Extra Space Storage LP | 2.350% | 3/15/32 | 11,663 | 9,172 | ||
| Federal Realty Investment Trust | 3.200% | 6/15/29 | 9,082 | 8,113 | ||
| Federal Realty Investment Trust | 3.500% | 6/1/30 | 9,629 | 8,624 | ||
| GLP Capital LP | 5.750% | 6/1/28 | 17,983 | 17,833 | ||
| GLP Capital LP | 5.300% | 1/15/29 | 21,672 | 20,999 | ||
| GLP Capital LP | 4.000% | 1/15/30 | 20,283 | 17,778 | ||
| GLP Capital LP | 4.000% | 1/15/31 | 12,098 | 10,532 | ||
| GLP Capital LP | 3.250% | 1/15/32 | 16,510 | 13,363 | ||
| Healthcare Realty Holdings LP | 3.625% | 1/15/28 | 13,804 | 12,652 | ||
| Healthcare Realty Holdings LP | 3.100% | 2/15/30 | 14,151 | 12,168 | ||
| Healthcare Realty Holdings LP | 2.000% | 3/15/31 | 21,816 | 16,987 | ||
| Healthcare Realty Holdings LP | 2.050% | 3/15/31 | 5,891 | 4,542 | ||
| Healthpeak Properties Inc. | 2.125% | 12/1/28 | 4,895 | 4,224 | ||
| Coupon | Maturity Date | Face Amount ($000) | Market Value• ($000) | |||
| Healthpeak Properties Inc. | 3.500% | 7/15/29 | 13,569 | 12,494 | ||
| Healthpeak Properties Inc. | 3.000% | 1/15/30 | 28,219 | 24,968 | ||
| Healthpeak Properties Inc. | 2.875% | 1/15/31 | 16,228 | 14,010 | ||
| Highwoods Realty LP | 4.125% | 3/15/28 | 11,973 | 11,305 | ||
| Highwoods Realty LP | 4.200% | 4/15/29 | 13,216 | 12,185 | ||
| Highwoods Realty LP | 3.050% | 2/15/30 | 14,786 | 12,602 | ||
| Highwoods Realty LP | 2.600% | 2/1/31 | 3,558 | 2,830 | ||
| 1 | Host Hotels & Resorts LP | 3.375% | 12/15/29 | 16,564 | 14,120 | |
| 1 | Host Hotels & Resorts LP | 3.500% | 9/15/30 | 16,691 | 14,109 | |
| 1 | Host Hotels & Resorts LP | 2.900% | 12/15/31 | 15,022 | 11,700 | |
| Hudson Pacific Properties LP | 3.950% | 11/1/27 | 6,382 | 5,982 | ||
| Hudson Pacific Properties LP | 4.650% | 4/1/29 | 14,486 | 13,613 | ||
| Hudson Pacific Properties LP | 3.250% | 1/15/30 | 13,595 | 11,502 | ||
| Invitation Homes Operating Partnership LP | 2.300% | 11/15/28 | 16,270 | 13,580 | ||
| Invitation Homes Operating Partnership LP | 2.000% | 8/15/31 | 16,330 | 12,378 | ||
| Invitation Homes Operating Partnership LP | 4.150% | 4/15/32 | 14,508 | 12,978 | ||
| Kilroy Realty LP | 4.750% | 12/15/28 | 10,438 | 10,034 | ||
| Kilroy Realty LP | 4.250% | 8/15/29 | 3,029 | 2,815 | ||
| Kilroy Realty LP | 3.050% | 2/15/30 | 14,301 | 12,106 | ||
| Kimco Realty Corp. | 1.900% | 3/1/28 | 15,430 | 13,242 | ||
| Kimco Realty Corp. | 2.700% | 10/1/30 | 9,363 | 7,954 | ||
| Kimco Realty Corp. | 2.250% | 12/1/31 | 2,642 | 2,119 | ||
| Kimco Realty Corp. | 3.200% | 4/1/32 | 10,779 | 9,332 | ||
| Kite Realty Group Trust | 4.750% | 9/15/30 | 10,412 | 9,526 | ||
| Life Storage LP | 3.875% | 12/15/27 | 9,768 | 9,223 | ||
| Life Storage LP | 4.000% | 6/15/29 | 12,155 | 11,315 | ||
| Life Storage LP | 2.200% | 10/15/30 | 9,750 | 7,836 | ||
| Life Storage LP | 2.400% | 10/15/31 | 15,155 | 12,113 | ||
| LXP Industrial Trust | 2.700% | 9/15/30 | 11,731 | 9,482 | ||
| LXP Industrial Trust | 2.375% | 10/1/31 | 8,769 | 6,691 | ||
| Mid-America Apartments LP | 4.200% | 6/15/28 | 12,616 | 12,286 | ||
| Mid-America Apartments LP | 3.950% | 3/15/29 | 25,640 | 24,456 | ||
| Mid-America Apartments LP | 2.750% | 3/15/30 | 5,033 | 4,377 | ||
| Mid-America Apartments LP | 1.700% | 2/15/31 | 7,035 | 5,600 | ||
| National Health Investors Inc. | 3.000% | 2/1/31 | 13,653 | 10,339 | ||
| National Retail Properties Inc. | 3.500% | 10/15/27 | 9,554 | 8,866 | ||
| National Retail Properties Inc. | 4.300% | 10/15/28 | 15,714 | 15,025 | ||
| National Retail Properties Inc. | 2.500% | 4/15/30 | 9,804 | 8,281 | ||
| Office Properties Income Trust | 3.450% | 10/15/31 | 10,550 | 6,998 | ||
| Omega Healthcare Investors Inc. | 4.750% | 1/15/28 | 13,244 | 12,649 | ||
| Omega Healthcare Investors Inc. | 3.625% | 10/1/29 | 19,167 | 16,356 | ||
| Omega Healthcare Investors Inc. | 3.375% | 2/1/31 | 5,316 | 4,329 | ||
| Phillips Edison Grocery Center Operating Partnership I LP | 2.625% | 11/15/31 | 3,468 | 2,655 | ||
| Physicians Realty LP | 3.950% | 1/15/28 | 12,668 | 11,954 | ||
| Physicians Realty LP | 2.625% | 11/1/31 | 30,581 | 24,687 | ||
| Piedmont Operating Partnership LP | 3.150% | 8/15/30 | 5,854 | 4,824 | ||
| Piedmont Operating Partnership LP | 2.750% | 4/1/32 | 8,181 | 6,240 | ||
| Prologis LP | 2.125% | 4/15/27 | 7,510 | 6,918 | ||
| Prologis LP | 3.875% | 9/15/28 | 10,660 | 10,332 | ||
| Prologis LP | 4.375% | 2/1/29 | 3,997 | 3,948 | ||
| Prologis LP | 2.250% | 4/15/30 | 25,379 | 22,000 | ||
| Prologis LP | 1.250% | 10/15/30 | 16,505 | 13,205 | ||
| Prologis LP | 1.625% | 3/15/31 | 10,535 | 8,595 | ||
| Public Storage | 3.094% | 9/15/27 | 7,101 | 6,773 | ||
| Public Storage | 1.850% | 5/1/28 | 13,772 | 12,185 | ||
| Public Storage | 1.950% | 11/9/28 | 7,029 | 6,167 | ||
| Public Storage | 3.385% | 5/1/29 | 16,183 | 15,253 | ||
| Public Storage | 2.300% | 5/1/31 | 6,451 | 5,493 | ||
| Public Storage | 2.250% | 11/9/31 | 37,090 | 31,097 | ||
| Rayonier LP | 2.750% | 5/17/31 | 8,975 | 7,379 | ||
| Realty Income Corp. | 3.400% | 1/15/28 | 18,433 | 17,292 | ||
| Realty Income Corp. | 3.650% | 1/15/28 | 10,327 | 9,901 | ||
| Realty Income Corp. | 2.200% | 6/15/28 | 13,198 | 11,586 | ||
| Coupon | Maturity Date | Face Amount ($000) | Market Value• ($000) | |||
| Realty Income Corp. | 3.250% | 6/15/29 | 5,712 | 5,263 | ||
| Realty Income Corp. | 3.100% | 12/15/29 | 13,944 | 12,678 | ||
| Realty Income Corp. | 3.250% | 1/15/31 | 20,139 | 18,081 | ||
| Regency Centers LP | 4.125% | 3/15/28 | 12,056 | 11,603 | ||
| Regency Centers LP | 2.950% | 9/15/29 | 10,798 | 9,412 | ||
| Regency Centers LP | 3.700% | 6/15/30 | 8,300 | 7,523 | ||
| Rexford Industrial Realty LP | 2.125% | 12/1/30 | 7,016 | 5,656 | ||
| Rexford Industrial Realty LP | 2.150% | 9/1/31 | 13,860 | 11,054 | ||
| Sabra Health Care LP | 3.900% | 10/15/29 | 15,493 | 13,611 | ||
| Sabra Health Care LP | 3.200% | 12/1/31 | 14,105 | 11,205 | ||
| Safehold Operating Partnership LP | 2.800% | 6/15/31 | 11,030 | 8,857 | ||
| Safehold Operating Partnership LP | 2.850% | 1/15/32 | 3,465 | 2,763 | ||
| Simon Property Group LP | 3.375% | 6/15/27 | 13,381 | 12,781 | ||
| Simon Property Group LP | 3.375% | 12/1/27 | 19,377 | 18,320 | ||
| Simon Property Group LP | 1.750% | 2/1/28 | 16,470 | 14,261 | ||
| Simon Property Group LP | 2.450% | 9/13/29 | 19,933 | 17,188 | ||
| Simon Property Group LP | 2.650% | 7/15/30 | 24,429 | 21,030 | ||
| Simon Property Group LP | 2.200% | 2/1/31 | 19,152 | 15,686 | ||
| Simon Property Group LP | 2.250% | 1/15/32 | 34,755 | 27,885 | ||
| Simon Property Group LP | 2.650% | 2/1/32 | 2,165 | 1,803 | ||
| Spirit Realty LP | 3.200% | 1/15/27 | 9 | 8 | ||
| Spirit Realty LP | 2.100% | 3/15/28 | 13,999 | 11,685 | ||
| Spirit Realty LP | 4.000% | 7/15/29 | 16,489 | 14,961 | ||
| Spirit Realty LP | 3.400% | 1/15/30 | 11,928 | 10,274 | ||
| Spirit Realty LP | 3.200% | 2/15/31 | 4,735 | 3,934 | ||
| Spirit Realty LP | 2.700% | 2/15/32 | 5,429 | 4,209 | ||
| STORE Capital Corp. | 4.500% | 3/15/28 | 8,366 | 8,034 | ||
| STORE Capital Corp. | 4.625% | 3/15/29 | 8,281 | 8,018 | ||
| STORE Capital Corp. | 2.750% | 11/18/30 | 9,976 | 8,100 | ||
| STORE Capital Corp. | 2.700% | 12/1/31 | 9,595 | 7,593 | ||
| Sun Communities Operating LP | 2.300% | 11/1/28 | 7,950 | 6,718 | ||
| Sun Communities Operating LP | 2.700% | 7/15/31 | 33,727 | 27,060 | ||
| Sun Communities Operating LP | 4.200% | 4/15/32 | 7,843 | 7,007 | ||
| Tanger Properties LP | 2.750% | 9/1/31 | 9,889 | 7,507 | ||
| 1 | UDR Inc. | 3.500% | 1/15/28 | 8,312 | 7,722 | |
| 1 | UDR Inc. | 4.400% | 1/26/29 | 12,890 | 12,424 | |
| 1 | UDR Inc. | 3.200% | 1/15/30 | 13,494 | 11,936 | |
| UDR Inc. | 3.000% | 8/15/31 | 7,632 | 6,514 | ||
| 1 | UDR Inc. | 2.100% | 8/1/32 | 5,096 | 3,946 | |
| Ventas Realty LP | 4.000% | 3/1/28 | 13,718 | 13,070 | ||
| Ventas Realty LP | 4.400% | 1/15/29 | 26,472 | 25,517 | ||
| Ventas Realty LP | 3.000% | 1/15/30 | 16,425 | 14,313 | ||
| Ventas Realty LP | 4.750% | 11/15/30 | 5,596 | 5,425 | ||
| Ventas Realty LP | 2.500% | 9/1/31 | 4,170 | 3,408 | ||
| VICI Properties LP | 4.750% | 2/15/28 | 31,955 | 30,707 | ||
| VICI Properties LP | 4.950% | 2/15/30 | 24,623 | 23,510 | ||
| VICI Properties LP | 5.125% | 5/15/32 | 39,835 | 37,961 | ||
| Vornado Realty LP | 3.400% | 6/1/31 | 11,375 | 9,236 | ||
| Welltower Inc. | 4.250% | 4/15/28 | 16,906 | 16,446 | ||
| Welltower Inc. | 4.125% | 3/15/29 | 14,494 | 13,764 | ||
| Welltower Inc. | 3.100% | 1/15/30 | 23,958 | 21,091 | ||
| Welltower Inc. | 2.750% | 1/15/31 | 28,698 | 24,114 | ||
| Welltower Inc. | 2.800% | 6/1/31 | 16,032 | 13,549 | ||
| Welltower Inc. | 2.750% | 1/15/32 | 12,725 | 10,527 | ||
| Welltower Inc. | 3.850% | 6/15/32 | 7,766 | 7,066 | ||
| Weyerhaeuser Co. | 6.950% | 10/1/27 | 4,574 | 5,035 | ||
| Weyerhaeuser Co. | 4.000% | 11/15/29 | 18,732 | 17,732 | ||
| Weyerhaeuser Co. | 4.000% | 4/15/30 | 34,561 | 32,577 | ||
| Weyerhaeuser Co. | 7.375% | 3/15/32 | 3,649 | 4,213 | ||
| WP Carey Inc. | 3.850% | 7/15/29 | 7,152 | 6,631 | ||
| WP Carey Inc. | 2.400% | 2/1/31 | 13,034 | 10,602 | ||
| WP Carey Inc. | 2.450% | 2/1/32 | 9,755 | 7,776 | ||
| 2,856,434 | ||||||
| Technology (8.4%) | ||||||
| Adobe Inc. | 2.300% | 2/1/30 | 34,375 | 30,432 | ||
| Advanced Micro Devices Inc. | 3.924% | 6/1/32 | 25,250 | 24,418 | ||
| Amdocs Ltd. | 2.538% | 6/15/30 | 13,003 | 10,817 | ||
| Coupon | Maturity Date | Face Amount ($000) | Market Value• ($000) | |||
| Analog Devices Inc. | 1.700% | 10/1/28 | 23,845 | 20,894 | ||
| Analog Devices Inc. | 2.100% | 10/1/31 | 26,942 | 22,878 | ||
| Apple Inc. | 2.900% | 9/12/27 | 56,063 | 53,644 | ||
| Apple Inc. | 3.000% | 11/13/27 | 34,844 | 33,476 | ||
| Apple Inc. | 1.200% | 2/8/28 | 68,992 | 60,003 | ||
| Apple Inc. | 1.400% | 8/5/28 | 56,394 | 49,080 | ||
| Apple Inc. | 2.200% | 9/11/29 | 40,357 | 36,087 | ||
| Apple Inc. | 1.650% | 5/11/30 | 39,212 | 33,290 | ||
| Apple Inc. | 1.250% | 8/20/30 | 31,808 | 25,984 | ||
| Apple Inc. | 1.650% | 2/8/31 | 82,550 | 68,640 | ||
| Apple Inc. | 1.700% | 8/5/31 | 20,992 | 17,486 | ||
| Apple Inc. | 3.350% | 8/8/32 | 29,400 | 27,797 | ||
| Applied Materials Inc. | 1.750% | 6/1/30 | 21,331 | 17,910 | ||
| Arrow Electronics Inc. | 3.875% | 1/12/28 | 12,604 | 11,897 | ||
| Autodesk Inc. | 2.850% | 1/15/30 | 11,875 | 10,533 | ||
| Autodesk Inc. | 2.400% | 12/15/31 | 19,865 | 16,408 | ||
| Automatic Data Processing Inc. | 1.700% | 5/15/28 | 33,940 | 30,388 | ||
| Automatic Data Processing Inc. | 1.250% | 9/1/30 | 23,940 | 19,580 | ||
| Avnet Inc. | 3.000% | 5/15/31 | 8,410 | 6,679 | ||
| Avnet Inc. | 5.500% | 6/1/32 | 3,084 | 2,940 | ||
| Broadcom Corp. | 3.500% | 1/15/28 | 18,165 | 16,797 | ||
| 2 | Broadcom Inc. | 1.950% | 2/15/28 | 14,420 | 12,367 | |
| Broadcom Inc. | 4.110% | 9/15/28 | 43,508 | 41,410 | ||
| 2 | Broadcom Inc. | 4.000% | 4/15/29 | 6,914 | 6,409 | |
| Broadcom Inc. | 4.750% | 4/15/29 | 55,766 | 54,819 | ||
| Broadcom Inc. | 5.000% | 4/15/30 | 24,579 | 24,025 | ||
| Broadcom Inc. | 4.150% | 11/15/30 | 57,923 | 52,824 | ||
| 2 | Broadcom Inc. | 2.450% | 2/15/31 | 63,762 | 50,881 | |
| 2 | Broadcom Inc. | 4.150% | 4/15/32 | 10,000 | 8,955 | |
| Broadridge Financial Solutions Inc. | 2.900% | 12/1/29 | 17,595 | 15,488 | ||
| Broadridge Financial Solutions Inc. | 2.600% | 5/1/31 | 26,935 | 22,666 | ||
| CDW LLC | 4.250% | 4/1/28 | 8,539 | 7,892 | ||
| CDW LLC | 3.250% | 2/15/29 | 13,934 | 12,118 | ||
| CDW LLC | 3.569% | 12/1/31 | 30,320 | 25,519 | ||
| 2 | CGI Inc. | 2.300% | 9/14/31 | 1 | — | |
| CGI Inc. | 2.300% | 9/14/31 | 10,642 | 8,427 | ||
| Cintas Corp. No. 2 | 4.000% | 5/1/32 | 800 | 782 | ||
| Citrix Systems Inc. | 4.500% | 12/1/27 | 18,505 | 18,455 | ||
| Citrix Systems Inc. | 3.300% | 3/1/30 | 19,776 | 19,418 | ||
| Dell Inc. | 7.100% | 4/15/28 | 1,715 | 1,868 | ||
| Dell International LLC | 5.300% | 10/1/29 | 50,646 | 50,349 | ||
| Dell International LLC | 6.200% | 7/15/30 | 14,723 | 15,309 | ||
| DXC Technology Co. | 2.375% | 9/15/28 | 28,730 | 24,445 | ||
| Equifax Inc. | 3.100% | 5/15/30 | 15,027 | 13,116 | ||
| Equifax Inc. | 2.350% | 9/15/31 | 36,546 | 29,461 | ||
| Fidelity National Information Services Inc. | 1.650% | 3/1/28 | 19,455 | 16,632 | ||
| Fidelity National Information Services Inc. | 3.750% | 5/21/29 | 15,997 | 15,030 | ||
| Fidelity National Information Services Inc. | 2.250% | 3/1/31 | 36,620 | 29,757 | ||
| Fiserv Inc. | 4.200% | 10/1/28 | 33,590 | 32,575 | ||
| Fiserv Inc. | 3.500% | 7/1/29 | 75,883 | 69,354 | ||
| Fiserv Inc. | 2.650% | 6/1/30 | 20,896 | 17,865 | ||
| Flex Ltd. | 4.875% | 6/15/29 | 15,022 | 14,190 | ||
| Flex Ltd. | 4.875% | 5/12/30 | 15,145 | 14,297 | ||
| Fortinet Inc. | 2.200% | 3/15/31 | 9,913 | 7,850 | ||
| GXO Logistics Inc. | 2.650% | 7/15/31 | 11,955 | 9,144 | ||
| HP Inc. | 4.750% | 1/15/28 | 23,848 | 23,485 | ||
| HP Inc. | 4.000% | 4/15/29 | 23,072 | 21,639 | ||
| HP Inc. | 3.400% | 6/17/30 | 25,310 | 21,894 | ||
| HP Inc. | 2.650% | 6/17/31 | 32,153 | 25,550 | ||
| HP Inc. | 4.200% | 4/15/32 | 28,870 | 25,492 | ||
| Hubbell Inc. | 3.150% | 8/15/27 | 3,628 | 3,396 | ||
| Hubbell Inc. | 3.500% | 2/15/28 | 12,124 | 11,567 | ||
| Hubbell Inc. | 2.300% | 3/15/31 | 7,739 | 6,471 | ||
| Intel Corp. | 1.600% | 8/12/28 | 28,689 | 24,870 | ||
| Coupon | Maturity Date | Face Amount ($000) | Market Value• ($000) | |||
| Intel Corp. | 4.000% | 8/5/29 | 16,500 | 16,046 | ||
| Intel Corp. | 2.450% | 11/15/29 | 46,261 | 40,617 | ||
| Intel Corp. | 3.900% | 3/25/30 | 26,976 | 26,087 | ||
| Intel Corp. | 2.000% | 8/12/31 | 33,480 | 27,611 | ||
| Intel Corp. | 4.150% | 8/5/32 | 28,000 | 27,089 | ||
| International Business Machines Corp. | 6.500% | 1/15/28 | 5,235 | 5,731 | ||
| International Business Machines Corp. | 3.500% | 5/15/29 | 79,488 | 75,043 | ||
| International Business Machines Corp. | 1.950% | 5/15/30 | 37,238 | 31,089 | ||
| International Business Machines Corp. | 2.720% | 2/9/32 | 8,295 | 7,190 | ||
| International Business Machines Corp. | 4.400% | 7/27/32 | 10,875 | 10,695 | ||
| Intuit Inc. | 1.650% | 7/15/30 | 9,640 | 7,942 | ||
| Jabil Inc. | 3.950% | 1/12/28 | 11,176 | 10,535 | ||
| Jabil Inc. | 3.600% | 1/15/30 | 11,610 | 10,165 | ||
| Jabil Inc. | 3.000% | 1/15/31 | 15,662 | 13,050 | ||
| Juniper Networks Inc. | 3.750% | 8/15/29 | 11,511 | 10,460 | ||
| Juniper Networks Inc. | 2.000% | 12/10/30 | 17,494 | 13,624 | ||
| KLA Corp. | 4.100% | 3/15/29 | 22,870 | 22,737 | ||
| KLA Corp. | 4.650% | 7/15/32 | 8,675 | 8,824 | ||
| 2 | Kyndryl Holdings Inc. | 2.700% | 10/15/28 | 12,854 | 9,937 | |
| 2 | Kyndryl Holdings Inc. | 3.150% | 10/15/31 | 17,159 | 12,019 | |
| Lam Research Corp. | 4.000% | 3/15/29 | 14,166 | 13,920 | ||
| Lam Research Corp. | 1.900% | 6/15/30 | 25,680 | 21,579 | ||
| Leidos Inc. | 4.375% | 5/15/30 | 20,388 | 18,875 | ||
| Leidos Inc. | 2.300% | 2/15/31 | 26,977 | 21,182 | ||
| Marvell Technology Inc. | 2.450% | 4/15/28 | 17,780 | 15,442 | ||
| 1 | Marvell Technology Inc. | 4.875% | 6/22/28 | 13,510 | 13,254 | |
| Marvell Technology Inc. | 2.950% | 4/15/31 | 18,442 | 15,187 | ||
| Micron Technology Inc. | 5.327% | 2/6/29 | 15,350 | 15,147 | ||
| Micron Technology Inc. | 4.663% | 2/15/30 | 18,860 | 17,751 | ||
| Micron Technology Inc. | 2.703% | 4/15/32 | 20,835 | 16,212 | ||
| Moody's Corp. | 3.250% | 1/15/28 | 8,276 | 7,801 | ||
| Moody's Corp. | 4.250% | 2/1/29 | 14,571 | 14,389 | ||
| Moody's Corp. | 2.000% | 8/19/31 | 7,065 | 5,701 | ||
| Motorola Solutions Inc. | 4.600% | 2/23/28 | 17,933 | 17,644 | ||
| Motorola Solutions Inc. | 4.600% | 5/23/29 | 17,577 | 16,936 | ||
| Motorola Solutions Inc. | 2.300% | 11/15/30 | 25,979 | 20,665 | ||
| Motorola Solutions Inc. | 2.750% | 5/24/31 | 15,825 | 12,865 | ||
| Motorola Solutions Inc. | 5.600% | 6/1/32 | 17,610 | 17,671 | ||
| NetApp Inc. | 2.700% | 6/22/30 | 16,731 | 14,375 | ||
| NVIDIA Corp. | 1.550% | 6/15/28 | 35,520 | 30,955 | ||
| NVIDIA Corp. | 2.850% | 4/1/30 | 31,102 | 28,101 | ||
| NVIDIA Corp. | 2.000% | 6/15/31 | 35,140 | 29,675 | ||
| NXP BV | 5.550% | 12/1/28 | 11,764 | 11,988 | ||
| NXP BV | 4.300% | 6/18/29 | 27,117 | 25,615 | ||
| NXP BV | 3.400% | 5/1/30 | 23,560 | 20,856 | ||
| NXP BV | 2.500% | 5/11/31 | 36,365 | 29,356 | ||
| NXP BV | 2.650% | 2/15/32 | 23,740 | 19,170 | ||
| Oracle Corp. | 3.250% | 11/15/27 | 65,011 | 60,116 | ||
| Oracle Corp. | 2.300% | 3/25/28 | 52,114 | 45,339 | ||
| Oracle Corp. | 2.950% | 4/1/30 | 83,269 | 70,974 | ||
| Oracle Corp. | 3.250% | 5/15/30 | 13,072 | 11,367 | ||
| Oracle Corp. | 2.875% | 3/25/31 | 86,064 | 71,355 | ||
| Qorvo Inc. | 4.375% | 10/15/29 | 19,805 | 17,630 | ||
| QUALCOMM Inc. | 1.300% | 5/20/28 | 23,108 | 19,947 | ||
| QUALCOMM Inc. | 2.150% | 5/20/30 | 27,542 | 24,107 | ||
| QUALCOMM Inc. | 1.650% | 5/20/32 | 22,384 | 17,982 | ||
| QUALCOMM Inc. | 4.250% | 5/20/32 | 11,294 | 11,397 | ||
| Quanta Services Inc. | 2.900% | 10/1/30 | 26,473 | 22,473 | ||
| Quanta Services Inc. | 2.350% | 1/15/32 | 2,211 | 1,744 | ||
| RELX Capital Inc. | 4.000% | 3/18/29 | 20,268 | 19,528 | ||
| RELX Capital Inc. | 3.000% | 5/22/30 | 20,915 | 18,716 | ||
| RELX Capital Inc. | 4.750% | 5/20/32 | 14,731 | 14,796 | ||
| Roper Technologies Inc. | 1.400% | 9/15/27 | 24,860 | 21,292 | ||
| Coupon | Maturity Date | Face Amount ($000) | Market Value• ($000) | |||
| Roper Technologies Inc. | 4.200% | 9/15/28 | 7,599 | 7,417 | ||
| Roper Technologies Inc. | 2.950% | 9/15/29 | 18,439 | 16,251 | ||
| Roper Technologies Inc. | 2.000% | 6/30/30 | 12,230 | 9,962 | ||
| Roper Technologies Inc. | 1.750% | 2/15/31 | 40,631 | 31,893 | ||
| 2 | S&P Global Inc. | 4.750% | 8/1/28 | 21,022 | 21,537 | |
| 2 | S&P Global Inc. | 2.700% | 3/1/29 | 28,385 | 25,846 | |
| 2 | S&P Global Inc. | 4.250% | 5/1/29 | 27,171 | 26,819 | |
| S&P Global Inc. | 2.500% | 12/1/29 | 15,491 | 13,707 | ||
| S&P Global Inc. | 1.250% | 8/15/30 | 14,215 | 11,375 | ||
| 2 | S&P Global Inc. | 2.900% | 3/1/32 | 41,341 | 36,696 | |
| Salesforce Inc. | 3.700% | 4/11/28 | 33,707 | 33,338 | ||
| Salesforce Inc. | 1.500% | 7/15/28 | 33,115 | 29,041 | ||
| Salesforce Inc. | 1.950% | 7/15/31 | 41,149 | 34,723 | ||
| ServiceNow Inc. | 1.400% | 9/1/30 | 37,502 | 29,450 | ||
| Skyworks Solutions Inc. | 3.000% | 6/1/31 | 20,114 | 16,388 | ||
| TD SYNNEX Corp. | 2.375% | 8/9/28 | 14,155 | 11,875 | ||
| TD SYNNEX Corp. | 2.650% | 8/9/31 | 14,773 | 11,739 | ||
| Teledyne FLIR LLC | 2.500% | 8/1/30 | 15,279 | 12,552 | ||
| Texas Instruments Inc. | 2.900% | 11/3/27 | 9,484 | 9,041 | ||
| Texas Instruments Inc. | 2.250% | 9/4/29 | 11,315 | 10,085 | ||
| Texas Instruments Inc. | 1.750% | 5/4/30 | 18,899 | 16,086 | ||
| Texas Instruments Inc. | 1.900% | 9/15/31 | 14,963 | 12,605 | ||
| TSMC Arizona Corp. | 4.125% | 4/22/29 | 11,751 | 11,554 | ||
| TSMC Arizona Corp. | 2.500% | 10/25/31 | 31,125 | 26,348 | ||
| TSMC Arizona Corp. | 4.250% | 4/22/32 | 28,439 | 28,004 | ||
| Verisk Analytics Inc. | 4.125% | 3/15/29 | 24,066 | 23,013 | ||
| VMware Inc. | 1.800% | 8/15/28 | 24,428 | 20,333 | ||
| VMware Inc. | 4.700% | 5/15/30 | 31,876 | 30,249 | ||
| VMware Inc. | 2.200% | 8/15/31 | 35,807 | 27,951 | ||
| Western Digital Corp. | 2.850% | 2/1/29 | 17,628 | 14,373 | ||
| Western Digital Corp. | 3.100% | 2/1/32 | 8,622 | 6,499 | ||
| Workday Inc. | 3.700% | 4/1/29 | 11,921 | 11,182 | ||
| Workday Inc. | 3.800% | 4/1/32 | 45,050 | 41,138 | ||
| Xilinx Inc. | 2.375% | 6/1/30 | 12,628 | 11,032 | ||
| 3,563,787 | ||||||
| Utilities (7.4%) | ||||||
| AEP Texas Inc. | 3.950% | 6/1/28 | 16,934 | 16,314 | ||
| 1 | AEP Texas Inc. | 2.100% | 7/1/30 | 15,443 | 12,759 | |
| AEP Texas Inc. | 4.700% | 5/15/32 | 9,565 | 9,297 | ||
| AES Corp. | 2.450% | 1/15/31 | 23,975 | 19,801 | ||
| Alabama Power Co. | 3.750% | 9/1/27 | 7,805 | 7,659 | ||
| 1 | Alabama Power Co. | 1.450% | 9/15/30 | 16,859 | 13,719 | |
| Alabama Power Co. | 3.050% | 3/15/32 | 10,710 | 9,761 | ||
| Alabama Power Co. | 3.940% | 9/1/32 | 11,000 | 10,625 | ||
| Ameren Corp. | 1.750% | 3/15/28 | 15,370 | 13,185 | ||
| Ameren Corp. | 3.500% | 1/15/31 | 22,366 | 20,395 | ||
| Ameren Illinois Co. | 3.800% | 5/15/28 | 6,050 | 5,903 | ||
| Ameren Illinois Co. | 1.550% | 11/15/30 | 10,649 | 8,685 | ||
| Ameren Illinois Co. | 3.850% | 9/1/32 | 11,950 | 11,492 | ||
| American Electric Power Co. Inc. | 3.200% | 11/13/27 | 8,991 | 8,461 | ||
| 1 | American Electric Power Co. Inc. | 4.300% | 12/1/28 | 9,335 | 9,065 | |
| American Electric Power Co. Inc. | 2.300% | 3/1/30 | 9,381 | 7,879 | ||
| American Water Capital Corp. | 2.950% | 9/1/27 | 6,662 | 6,268 | ||
| American Water Capital Corp. | 3.750% | 9/1/28 | 11,288 | 10,936 | ||
| American Water Capital Corp. | 3.450% | 6/1/29 | 12,126 | 11,302 | ||
| American Water Capital Corp. | 2.800% | 5/1/30 | 15,975 | 14,300 | ||
| American Water Capital Corp. | 2.300% | 6/1/31 | 15,805 | 13,403 | ||
| American Water Capital Corp. | 4.450% | 6/1/32 | 21,065 | 20,906 | ||
| 1 | Appalachian Power Co. | 2.700% | 4/1/31 | 29,271 | 24,869 | |
| 1 | Appalachian Power Co. | 4.500% | 8/1/32 | 8,872 | 8,551 | |
| Arizona Public Service Co. | 2.950% | 9/15/27 | 5,288 | 4,881 | ||
| Arizona Public Service Co. | 2.600% | 8/15/29 | 12,691 | 10,958 | ||
| Arizona Public Service Co. | 2.200% | 12/15/31 | 745 | 596 | ||
| Atlantic City Electric Co. | 4.000% | 10/15/28 | 5,989 | 5,858 | ||
| Atlantic City Electric Co. | 2.300% | 3/15/31 | 14,769 | 12,778 | ||
| Atmos Energy Corp. | 2.625% | 9/15/29 | 12,187 | 10,881 | ||
| Atmos Energy Corp. | 1.500% | 1/15/31 | 13,030 | 10,399 | ||
| Coupon | Maturity Date | Face Amount ($000) | Market Value• ($000) | |||
| Avangrid Inc. | 3.800% | 6/1/29 | 18,291 | 17,096 | ||
| Baltimore Gas & Electric Co. | 2.250% | 6/15/31 | 17,200 | 14,588 | ||
| Berkshire Hathaway Energy Co. | 3.250% | 4/15/28 | 16,504 | 15,596 | ||
| Berkshire Hathaway Energy Co. | 3.700% | 7/15/30 | 24,675 | 23,499 | ||
| Berkshire Hathaway Energy Co. | 1.650% | 5/15/31 | 16,895 | 13,542 | ||
| Black Hills Corp. | 3.050% | 10/15/29 | 14,421 | 12,593 | ||
| Black Hills Corp. | 2.500% | 6/15/30 | 9,172 | 7,594 | ||
| 1 | CenterPoint Energy Houston Electric LLC | 2.350% | 4/1/31 | 12,003 | 10,391 | |
| 1 | CenterPoint Energy Houston Electric LLC | 3.000% | 3/1/32 | 7,912 | 7,178 | |
| CenterPoint Energy Inc. | 4.250% | 11/1/28 | 3,850 | 3,692 | ||
| CenterPoint Energy Inc. | 2.950% | 3/1/30 | 17,800 | 15,849 | ||
| CenterPoint Energy Inc. | 2.650% | 6/1/31 | 20,725 | 17,703 | ||
| CenterPoint Energy Resources Corp. | 4.000% | 4/1/28 | 2,451 | 2,374 | ||
| CenterPoint Energy Resources Corp. | 1.750% | 10/1/30 | 10,622 | 8,671 | ||
| Cleco Corporate Holdings LLC | 3.375% | 9/15/29 | 2,030 | 1,793 | ||
| CMS Energy Corp. | 3.450% | 8/15/27 | 7,687 | 7,302 | ||
| 1 | CMS Energy Corp. | 4.750% | 6/1/50 | 17,667 | 16,268 | |
| CMS Energy Corp. | 3.750% | 12/1/50 | 9,418 | 7,626 | ||
| 1 | Commonwealth Edison Co. | 2.950% | 8/15/27 | 9,096 | 8,633 | |
| Commonwealth Edison Co. | 3.700% | 8/15/28 | 3,246 | 3,150 | ||
| Commonwealth Edison Co. | 2.200% | 3/1/30 | 7,303 | 6,375 | ||
| 1 | Commonwealth Edison Co. | 3.150% | 3/15/32 | 5,885 | 5,380 | |
| 1 | Connecticut Light & Power Co. | 2.050% | 7/1/31 | 15,606 | 13,163 | |
| 1 | Consolidated Edison Co. of New York Inc. | 3.125% | 11/15/27 | 7,490 | 7,118 | |
| Consolidated Edison Co. of New York Inc. | 3.800% | 5/15/28 | 6,130 | 5,969 | ||
| 1 | Consolidated Edison Co. of New York Inc. | 4.000% | 12/1/28 | 7,885 | 7,755 | |
| 1 | Consolidated Edison Co. of New York Inc. | 3.350% | 4/1/30 | 12,514 | 11,684 | |
| Consolidated Edison Co. of New York Inc. | 2.400% | 6/15/31 | 25,153 | 21,495 | ||
| Consumers Energy Co. | 3.800% | 11/15/28 | 7,105 | 6,898 | ||
| Consumers Energy Co. | 3.600% | 8/15/32 | 2,626 | 2,497 | ||
| Dominion Energy Inc. | 4.250% | 6/1/28 | 11,422 | 11,226 | ||
| 1 | Dominion Energy Inc. | 3.375% | 4/1/30 | 37,581 | 34,235 | |
| 1 | Dominion Energy Inc. | 2.250% | 8/15/31 | 14,745 | 12,225 | |
| 1 | Dominion Energy Inc. | 4.350% | 8/15/32 | 10,370 | 10,008 | |
| 1 | Dominion Energy South Carolina Inc. | 2.300% | 12/1/31 | 14,720 | 12,438 | |
| Dominion Energy South Carolina Inc. | 6.625% | 2/1/32 | 3,278 | 3,764 | ||
| 1 | DTE Electric Co. | 1.900% | 4/1/28 | 9,620 | 8,534 | |
| DTE Electric Co. | 2.250% | 3/1/30 | 11,620 | 10,108 | ||
| 1 | DTE Electric Co. | 2.625% | 3/1/31 | 13,661 | 12,090 | |
| 1 | DTE Electric Co. | 3.000% | 3/1/32 | 10,660 | 9,636 | |
| 1 | DTE Energy Co. | 3.400% | 6/15/29 | 23,654 | 21,652 | |
| DTE Energy Co. | 2.950% | 3/1/30 | 12,966 | 11,429 | ||
| Duke Energy Carolinas LLC | 3.950% | 11/15/28 | 19,560 | 19,220 | ||
| 1 | Duke Energy Carolinas LLC | 6.000% | 12/1/28 | 6,090 | 6,526 | |
| Duke Energy Carolinas LLC | 2.450% | 8/15/29 | 18,804 | 16,763 | ||
| Duke Energy Carolinas LLC | 2.450% | 2/1/30 | 9,470 | 8,388 | ||
| Duke Energy Carolinas LLC | 2.550% | 4/15/31 | 18,315 | 16,019 | ||
| Duke Energy Carolinas LLC | 2.850% | 3/15/32 | 14,415 | 12,785 | ||
| Duke Energy Corp. | 2.650% | 9/1/26 | 16,212 | 15,168 | ||
| Duke Energy Corp. | 3.150% | 8/15/27 | 8,527 | 8,040 | ||
| Duke Energy Corp. | 4.300% | 3/15/28 | 8,310 | 8,144 | ||
| Duke Energy Corp. | 3.400% | 6/15/29 | 7,648 | 7,059 | ||
| Duke Energy Corp. | 2.450% | 6/1/30 | 22,933 | 19,389 | ||
| Duke Energy Corp. | 2.550% | 6/15/31 | 28,307 | 23,629 | ||
| Duke Energy Florida LLC | 3.800% | 7/15/28 | 6,447 | 6,311 | ||
| Duke Energy Florida LLC | 2.500% | 12/1/29 | 14,114 | 12,553 | ||
| Duke Energy Florida LLC | 1.750% | 6/15/30 | 24,737 | 20,556 | ||
| Coupon | Maturity Date | Face Amount ($000) | Market Value• ($000) | |||
| Duke Energy Florida LLC | 2.400% | 12/15/31 | 19,213 | 16,358 | ||
| 1 | Duke Energy Florida Project Finance LLC | 2.538% | 9/1/29 | 2,414 | 2,264 | |
| Duke Energy Ohio Inc. | 3.650% | 2/1/29 | 16,546 | 15,785 | ||
| Duke Energy Ohio Inc. | 2.125% | 6/1/30 | 8,484 | 7,169 | ||
| Duke Energy Progress LLC | 3.700% | 9/1/28 | 7,202 | 7,028 | ||
| Duke Energy Progress LLC | 3.450% | 3/15/29 | 26,184 | 24,945 | ||
| Duke Energy Progress LLC | 2.000% | 8/15/31 | 20,455 | 16,979 | ||
| 2 | East Ohio Gas Co. | 2.000% | 6/15/30 | 1,875 | 1,539 | |
| Edison International | 4.125% | 3/15/28 | 17,428 | 16,393 | ||
| Emera US Finance LP | 2.639% | 6/15/31 | 13,740 | 11,347 | ||
| Enel Chile SA | 4.875% | 6/12/28 | 23,231 | 22,822 | ||
| Entergy Corp. | 1.900% | 6/15/28 | 14,255 | 12,298 | ||
| Entergy Corp. | 2.800% | 6/15/30 | 17,254 | 14,757 | ||
| Entergy Corp. | 2.400% | 6/15/31 | 24,068 | 19,553 | ||
| Entergy Louisiana LLC | 3.120% | 9/1/27 | 16,554 | 15,648 | ||
| Entergy Louisiana LLC | 3.250% | 4/1/28 | 10,480 | 9,794 | ||
| Entergy Louisiana LLC | 1.600% | 12/15/30 | 12,386 | 9,864 | ||
| Entergy Louisiana LLC | 3.050% | 6/1/31 | 9,845 | 8,793 | ||
| Entergy Louisiana LLC | 2.350% | 6/15/32 | 9,560 | 7,910 | ||
| Entergy Mississippi LLC | 2.850% | 6/1/28 | 14,587 | 13,305 | ||
| Entergy Texas Inc. | 4.000% | 3/30/29 | 12,611 | 12,237 | ||
| Entergy Texas Inc. | 1.750% | 3/15/31 | 9,355 | 7,516 | ||
| Essential Utilities Inc. | 3.566% | 5/1/29 | 11,588 | 10,772 | ||
| Essential Utilities Inc. | 2.704% | 4/15/30 | 22,982 | 19,844 | ||
| Evergy Inc. | 2.900% | 9/15/29 | 11,524 | 10,098 | ||
| 1 | Evergy Metro Inc. | 2.250% | 6/1/30 | 19,957 | 17,043 | |
| 1 | Eversource Energy | 3.300% | 1/15/28 | 12,744 | 12,011 | |
| 1 | Eversource Energy | 4.250% | 4/1/29 | 14,131 | 13,771 | |
| 1 | Eversource Energy | 1.650% | 8/15/30 | 12,818 | 10,259 | |
| Eversource Energy | 2.550% | 3/15/31 | 9,412 | 7,988 | ||
| Exelon Corp. | 4.050% | 4/15/30 | 42,539 | 40,882 | ||
| 2 | Exelon Corp. | 3.350% | 3/15/32 | 23,019 | 20,664 | |
| Florida Power & Light Co. | 2.450% | 2/3/32 | 41,900 | 36,409 | ||
| 1 | Georgia Power Co. | 2.650% | 9/15/29 | 22,728 | 19,870 | |
| Georgia Power Co. | 4.700% | 5/15/32 | 14,205 | 14,131 | ||
| Indiana Michigan Power Co. | 3.850% | 5/15/28 | 16,366 | 15,807 | ||
| Interstate Power & Light Co. | 4.100% | 9/26/28 | 19,794 | 19,547 | ||
| Interstate Power & Light Co. | 3.600% | 4/1/29 | 9,332 | 8,792 | ||
| Interstate Power & Light Co. | 2.300% | 6/1/30 | 7,871 | 6,665 | ||
| IPALCO Enterprises Inc. | 4.250% | 5/1/30 | 13,999 | 12,917 | ||
| ITC Holdings Corp. | 3.350% | 11/15/27 | 18,052 | 17,102 | ||
| MidAmerican Energy Co. | 3.100% | 5/1/27 | 3,000 | 2,880 | ||
| MidAmerican Energy Co. | 3.650% | 4/15/29 | 31,119 | 30,099 | ||
| MidAmerican Energy Co. | 6.750% | 12/30/31 | 7,452 | 8,676 | ||
| Mississippi Power Co. | 3.950% | 3/30/28 | 6,406 | 6,158 | ||
| National Fuel Gas Co. | 3.950% | 9/15/27 | 7,434 | 6,851 | ||
| National Fuel Gas Co. | 4.750% | 9/1/28 | 6,870 | 6,617 | ||
| National Fuel Gas Co. | 2.950% | 3/1/31 | 8,301 | 6,783 | ||
| National Rural Utilities Cooperative Finance Corp. | 3.400% | 2/7/28 | 24,380 | 23,408 | ||
| National Rural Utilities Cooperative Finance Corp. | 3.900% | 11/1/28 | 8,405 | 8,154 | ||
| National Rural Utilities Cooperative Finance Corp. | 3.700% | 3/15/29 | 15,153 | 14,406 | ||
| National Rural Utilities Cooperative Finance Corp. | 2.400% | 3/15/30 | 13,467 | 11,744 | ||
| National Rural Utilities Cooperative Finance Corp. | 1.350% | 3/15/31 | 9,264 | 7,132 | ||
| 1 | National Rural Utilities Cooperative Finance Corp. | 1.650% | 6/15/31 | 7,296 | 5,788 | |
| 1 | National Rural Utilities Cooperative Finance Corp. | 8.000% | 3/1/32 | 6,752 | 8,304 | |
| National Rural Utilities Cooperative Finance Corp. | 2.750% | 4/15/32 | 11,893 | 10,270 | ||
| National Rural Utilities Cooperative Finance Corp. | 4.023% | 11/1/32 | 3,000 | 2,827 | ||
| 1 | Nevada Power Co. | 3.700% | 5/1/29 | 18,514 | 17,756 | |
| Coupon | Maturity Date | Face Amount ($000) | Market Value• ($000) | |||
| 1 | Nevada Power Co. | 2.400% | 5/1/30 | 7,920 | 6,881 | |
| NextEra Energy Capital Holdings Inc. | 1.900% | 6/15/28 | 42,220 | 36,561 | ||
| NextEra Energy Capital Holdings Inc. | 3.500% | 4/1/29 | 20,809 | 19,472 | ||
| NextEra Energy Capital Holdings Inc. | 2.750% | 11/1/29 | 25,921 | 23,081 | ||
| NextEra Energy Capital Holdings Inc. | 2.250% | 6/1/30 | 59,564 | 50,293 | ||
| NextEra Energy Capital Holdings Inc. | 2.440% | 1/15/32 | 26,047 | 21,716 | ||
| NextEra Energy Capital Holdings Inc. | 5.000% | 7/15/32 | 13,069 | 13,311 | ||
| 1 | NextEra Energy Capital Holdings Inc. | 4.800% | 12/1/77 | 13,574 | 11,337 | |
| 1 | NextEra Energy Capital Holdings Inc. | 5.650% | 5/1/79 | 7,622 | 6,987 | |
| NiSource Inc. | 2.950% | 9/1/29 | 21,635 | 19,258 | ||
| NiSource Inc. | 3.600% | 5/1/30 | 31,091 | 28,653 | ||
| NiSource Inc. | 1.700% | 2/15/31 | 21,440 | 16,850 | ||
| Northern States Power Co. | 2.250% | 4/1/31 | 13,335 | 11,569 | ||
| NSTAR Electric Co. | 3.200% | 5/15/27 | 5,071 | 4,891 | ||
| NSTAR Electric Co. | 3.250% | 5/15/29 | 6,767 | 6,381 | ||
| NSTAR Electric Co. | 3.950% | 4/1/30 | 13,508 | 13,215 | ||
| 1 | Ohio Power Co. | 2.600% | 4/1/30 | 8,002 | 6,997 | |
| 1 | Ohio Power Co. | 1.625% | 1/15/31 | 14,876 | 11,914 | |
| Oklahoma Gas & Electric Co. | 3.800% | 8/15/28 | 6,574 | 6,339 | ||
| Oklahoma Gas & Electric Co. | 3.300% | 3/15/30 | 6,417 | 5,882 | ||
| Oklahoma Gas & Electric Co. | 3.250% | 4/1/30 | 13,081 | 11,920 | ||
| Oncor Electric Delivery Co. LLC | 3.700% | 11/15/28 | 6,896 | 6,679 | ||
| Oncor Electric Delivery Co. LLC | 5.750% | 3/15/29 | 7,031 | 7,566 | ||
| Oncor Electric Delivery Co. LLC | 2.750% | 5/15/30 | 23,917 | 21,728 | ||
| Oncor Electric Delivery Co. LLC | 7.000% | 5/1/32 | 1,589 | 1,903 | ||
| 2 | Oncor Electric Delivery Co. LLC | 4.150% | 6/1/32 | 16,830 | 16,836 | |
| ONE Gas Inc. | 2.000% | 5/15/30 | 7,406 | 6,122 | ||
| Pacific Gas & Electric Co. | 2.100% | 8/1/27 | 4,565 | 3,860 | ||
| Pacific Gas & Electric Co. | 3.300% | 12/1/27 | 33,692 | 29,700 | ||
| Pacific Gas & Electric Co. | 3.000% | 6/15/28 | 12,886 | 11,034 | ||
| Pacific Gas & Electric Co. | 3.750% | 7/1/28 | 33,662 | 29,814 | ||
| Pacific Gas & Electric Co. | 4.200% | 3/1/29 | 450 | 403 | ||
| Pacific Gas & Electric Co. | 4.550% | 7/1/30 | 88,690 | 78,942 | ||
| Pacific Gas & Electric Co. | 2.500% | 2/1/31 | 64,501 | 49,327 | ||
| Pacific Gas & Electric Co. | 3.250% | 6/1/31 | 17,029 | 13,725 | ||
| Pacific Gas & Electric Co. | 4.400% | 3/1/32 | 2,140 | 1,876 | ||
| Pacific Gas & Electric Co. | 5.900% | 6/15/32 | 25,395 | 24,539 | ||
| PacifiCorp | 3.500% | 6/15/29 | 16,642 | 15,737 | ||
| PacifiCorp | 2.700% | 9/15/30 | 20,698 | 18,220 | ||
| 1 | PG&E Wildfire Recovery Funding LLC | 3.594% | 6/1/30 | 11,700 | 11,563 | |
| Piedmont Natural Gas Co. Inc. | 3.500% | 6/1/29 | 8,970 | 8,354 | ||
| Piedmont Natural Gas Co. Inc. | 2.500% | 3/15/31 | 16,604 | 14,003 | ||
| Progress Energy Inc. | 7.750% | 3/1/31 | 12,480 | 14,428 | ||
| Progress Energy Inc. | 7.000% | 10/30/31 | 12,649 | 14,067 | ||
| Public Service Co. of Colorado | 3.700% | 6/15/28 | 7,771 | 7,559 | ||
| 1 | Public Service Co. of Colorado | 1.900% | 1/15/31 | 5,654 | 4,748 | |
| Public Service Co. of Colorado | 1.875% | 6/15/31 | 18,335 | 15,278 | ||
| 1 | Public Service Co. of Colorado | 4.100% | 6/1/32 | 8,375 | 8,242 | |
| 1 | Public Service Electric & Gas Co. | 3.700% | 5/1/28 | 11,430 | 11,168 | |
| 1 | Public Service Electric & Gas Co. | 3.650% | 9/1/28 | 8,008 | 7,748 | |
| 1 | Public Service Electric & Gas Co. | 3.200% | 5/15/29 | 9,888 | 9,343 | |
| 1 | Public Service Electric & Gas Co. | 2.450% | 1/15/30 | 7,504 | 6,682 | |
| 1 | Public Service Electric & Gas Co. | 1.900% | 8/15/31 | 9,130 | 7,619 | |
| 1 | Public Service Electric & Gas Co. | 3.100% | 3/15/32 | 11,346 | 10,391 | |
| Public Service Enterprise Group Inc. | 1.600% | 8/15/30 | 13,136 | 10,492 | ||
| Public Service Enterprise Group Inc. | 2.450% | 11/15/31 | 18,045 | 15,044 | ||
| Puget Energy Inc. | 2.379% | 6/15/28 | 10,708 | 9,330 | ||
| Puget Energy Inc. | 4.100% | 6/15/30 | 15,827 | 14,642 | ||
| Puget Energy Inc. | 4.224% | 3/15/32 | 12,035 | 11,124 | ||
| Coupon | Maturity Date | Face Amount ($000) | Market Value• ($000) | |||
| 1 | San Diego Gas & Electric Co. | 1.700% | 10/1/30 | 13,150 | 10,820 | |
| 1 | San Diego Gas & Electric Co. | 3.000% | 3/15/32 | 9,364 | 8,348 | |
| Sempra Energy | 3.400% | 2/1/28 | 21,458 | 20,324 | ||
| Sempra Energy | 3.700% | 4/1/29 | 13,022 | 12,189 | ||
| 1 | Southern California Edison Co. | 3.650% | 3/1/28 | 9,136 | 8,697 | |
| 1 | Southern California Edison Co. | 4.200% | 3/1/29 | 14,879 | 14,411 | |
| Southern California Edison Co. | 6.650% | 4/1/29 | 5,781 | 6,053 | ||
| Southern California Edison Co. | 2.850% | 8/1/29 | 10,954 | 9,671 | ||
| Southern California Edison Co. | 2.250% | 6/1/30 | 16,943 | 14,185 | ||
| 1 | Southern California Edison Co. | 2.500% | 6/1/31 | 13,450 | 11,289 | |
| Southern California Edison Co. | 2.750% | 2/1/32 | 9,245 | 7,840 | ||
| Southern California Gas Co. | 2.950% | 4/15/27 | 200 | 191 | ||
| 1 | Southern California Gas Co. | 2.550% | 2/1/30 | 17,660 | 15,740 | |
| Southern Co. | 5.113% | 8/1/27 | 4,935 | 4,936 | ||
| 1 | Southern Co. | 1.750% | 3/15/28 | 8,168 | 6,990 | |
| 1 | Southern Co. | 3.700% | 4/30/30 | 26,142 | 24,402 | |
| 1 | Southern Co. Gas Capital Corp. | 1.750% | 1/15/31 | 16,205 | 12,841 | |
| Southwest Gas Corp. | 3.700% | 4/1/28 | 5,864 | 5,442 | ||
| Southwest Gas Corp. | 2.200% | 6/15/30 | 9,929 | 7,840 | ||
| Southwest Gas Corp. | 4.050% | 3/15/32 | 16,795 | 15,289 | ||
| 1 | Southwestern Electric Power Co. | 4.100% | 9/15/28 | 18,680 | 18,075 | |
| Tampa Electric Co. | 2.400% | 3/15/31 | 10,670 | 9,174 | ||
| Tucson Electric Power Co. | 1.500% | 8/1/30 | 8,319 | 6,623 | ||
| Tucson Electric Power Co. | 3.250% | 5/15/32 | 2,842 | 2,531 | ||
| Union Electric Co. | 2.950% | 6/15/27 | 2,502 | 2,374 | ||
| Union Electric Co. | 3.500% | 3/15/29 | 20,048 | 19,140 | ||
| Union Electric Co. | 2.950% | 3/15/30 | 9,522 | 8,658 | ||
| Union Electric Co. | 2.150% | 3/15/32 | 11,030 | 9,091 | ||
| United Utilities plc | 6.875% | 8/15/28 | 5,017 | 5,446 | ||
| 1 | Virginia Electric & Power Co. | 3.800% | 4/1/28 | 17,912 | 17,511 | |
| 1 | Virginia Electric & Power Co. | 2.875% | 7/15/29 | 15,459 | 14,130 | |
| Virginia Electric & Power Co. | 2.300% | 11/15/31 | 17,476 | 14,910 | ||
| Virginia Electric & Power Co. | 2.400% | 3/30/32 | 19,081 | 16,326 | ||
| WEC Energy Group Inc. | 1.375% | 10/15/27 | 8,756 | 7,557 | ||
| WEC Energy Group Inc. | 2.200% | 12/15/28 | 11,530 | 10,003 | ||
| WEC Energy Group Inc. | 1.800% | 10/15/30 | 11,624 | 9,394 | ||
| Wisconsin Electric Power Co. | 1.700% | 6/15/28 | 10,045 | 8,756 | ||
| Wisconsin Power & Light Co. | 3.050% | 10/15/27 | 7,892 | 7,506 | ||
| Wisconsin Power & Light Co. | 3.000% | 7/1/29 | 4,634 | 4,223 | ||
| Wisconsin Power & Light Co. | 1.950% | 9/16/31 | 1,415 | 1,156 | ||
| Xcel Energy Inc. | 4.000% | 6/15/28 | 15,149 | 14,848 | ||
| Xcel Energy Inc. | 2.600% | 12/1/29 | 5,177 | 4,533 | ||
| Xcel Energy Inc. | 3.400% | 6/1/30 | 16,473 | 15,107 | ||
| Xcel Energy Inc. | 2.350% | 11/15/31 | 3,955 | 3,260 | ||
| Xcel Energy Inc. | 4.600% | 6/1/32 | 26,450 | 26,235 | ||
| 3,137,391 | ||||||
| Total Corporate Bonds (Cost $47,815,284) | 41,726,942 | |||||
| Coupon | Shares | Market Value• ($000) | ||||
| Temporary Cash Investments (0.2%) | ||||||
| Money Market Fund (0.2%) | ||||||
| 4 | Vanguard Market Liquidity Fund (Cost $77,144) | 2.284% | 771,686 | 77,146 | ||
| Total Investments (98.9%) (Cost $48,136,290) | 42,047,205 | |||||
| Other Assets and Liabilities—Net (1.1%) | 487,909 | |||||
| Net Assets (100%) | 42,535,114 | |||||
| Cost is in $000. |
| • | See Note A in Notes to Financial Statements. |
| 1 | The average or expected maturity is shorter than the final maturity shown because of the possibility of interim principal payments and prepayments or the possibility of the issue being called. |
| 2 | Security exempt from registration under Rule 144A of the Securities Act of 1933. Such securities may be sold in transactions exempt from registration, normally to qualified institutional buyers. At August 31, 2022, the aggregate value was $970,473,000, representing 2.3% of net assets. |
| 3 | Securities with a value of $5,514,000 have been segregated as initial margin for open futures contracts. |
| 4 | Affiliated money market fund available only to Vanguard funds and certain trusts and accounts managed by Vanguard. Rate shown is the 7-day yield. |
| Futures Contracts | ||||
| ($000) | ||||
| Expiration | Number of Long (Short) Contracts | Notional Amount | Value and Unrealized Appreciation (Depreciation) | |
| Long Futures Contracts | ||||
| 5-Year U.S. Treasury Note | December 2022 | 128 | 14,185 | (4) |
| Ultra 10-Year U.S. Treasury Note | December 2022 | 1,088 | 136,204 | 319 |
| 315 | ||||
| Short Futures Contracts | ||||
| 10-Year U.S. Treasury Note | December 2022 | (883) | (103,228) | 727 |
| Long U.S. Treasury Bond | December 2022 | (130) | (17,660) | 163 |
| 890 | ||||
| 1,205 | ||||
| ($000s, except shares and per-share amounts) | Amount |
| Assets | |
| Investments in Securities, at Value | |
| Unaffiliated Issuers (Cost $48,059,146) | 41,970,059 |
| Affiliated Issuers (Cost $77,144) | 77,146 |
| Total Investments in Securities | 42,047,205 |
| Investment in Vanguard | 1,583 |
| Receivables for Investment Securities Sold | 942,093 |
| Receivables for Accrued Income | 440,648 |
| Receivables for Capital Shares Issued | 182 |
| Variation Margin Receivable—Futures Contracts | 657 |
| Total Assets | 43,432,368 |
| Liabilities | |
| Due to Custodian | 22,461 |
| Payables for Investment Securities Purchased | 866,071 |
| Payables for Capital Shares Redeemed | 7,072 |
| Payables for Distributions | 857 |
| Payables to Vanguard | 793 |
| Total Liabilities | 897,254 |
| Net Assets | 42,535,114 |
At August 31, 2022, net assets consisted of: | |
| Paid-in Capital | 49,301,067 |
| Total Distributable Earnings (Loss) | (6,765,953) |
| Net Assets | 42,535,114 |
| ETF Shares—Net Assets | |
| Applicable to 514,296,665 outstanding $.001 par value shares of beneficial interest (unlimited authorization) | 41,057,757 |
| Net Asset Value Per Share—ETF Shares | $79.83 |
| Admiral Shares—Net Assets | |
| Applicable to 52,994,329 outstanding $.001 par value shares of beneficial interest (unlimited authorization) | 1,139,055 |
| Net Asset Value Per Share—Admiral Shares | $21.49 |
| Institutional Shares—Net Assets | |
| Applicable to 12,738,519 outstanding $.001 par value shares of beneficial interest (unlimited authorization) | 338,302 |
| Net Asset Value Per Share—Institutional Shares | $26.56 |
| Year Ended August 31, 2022 | |
| ($000) | |
| Investment Income | |
| Income | |
| Interest 1 | 1,171,662 |
| Total Income | 1,171,662 |
| Expenses | |
| The Vanguard Group—Note B | |
| Investment Advisory Services | 876 |
| Management and Administrative—ETF Shares | 13,417 |
| Management and Administrative—Admiral Shares | 842 |
| Management and Administrative—Institutional Shares | 167 |
| Marketing and Distribution—ETF Shares | 2,419 |
| Marketing and Distribution—Admiral Shares | 71 |
| Marketing and Distribution—Institutional Shares | 15 |
| Custodian Fees | 161 |
| Auditing Fees | 50 |
| Shareholders’ Reports—ETF Shares | 1,018 |
| Shareholders’ Reports—Admiral Shares | 17 |
| Shareholders’ Reports—Institutional Shares | — |
| Trustees’ Fees and Expenses | 18 |
| Other Expenses | 18 |
| Total Expenses | 19,089 |
| Expenses Paid Indirectly | (60) |
| Net Expenses | 19,029 |
| Net Investment Income | 1,152,633 |
| Realized Net Gain (Loss) | |
| Investment Securities Sold1,2 | (1,023,789) |
| Futures Contracts | (11,039) |
| Realized Net Gain (Loss) | (1,034,828) |
| Change in Unrealized Appreciation (Depreciation) | |
| Investment Securities1 | (7,149,138) |
| Futures Contracts | 1,206 |
| Change in Unrealized Appreciation (Depreciation) | (7,147,932) |
| Net Increase (Decrease) in Net Assets Resulting from Operations | (7,030,127) |
| 1 | Interest income, realized net gain (loss), capital gain distributions received, and change in unrealized appreciation (depreciation) from an affiliated company of the fund were $552,000, $11,000, $9,000, and $2,000, respectively. Purchases and sales are for temporary cash investment purposes. |
| 2 | Includes ($282,817,000) of net gain (loss) resulting from in-kind redemptions. |
| Year Ended August 31, | ||
| 2022 ($000) | 2021 ($000) | |
| Increase (Decrease) in Net Assets | ||
| Operations | ||
| Net Investment Income | 1,152,633 | 1,026,879 |
| Realized Net Gain (Loss) | (1,034,828) | 1,235,740 |
| Change in Unrealized Appreciation (Depreciation) | (7,147,932) | (1,298,229) |
| Net Increase (Decrease) in Net Assets Resulting from Operations | (7,030,127) | 964,390 |
| Distributions | ||
| ETF Shares | (1,391,106) | (1,059,945) |
| Admiral Shares | (42,805) | (38,281) |
| Institutional Shares | (11,765) | (10,049) |
| Total Distributions | (1,445,676) | (1,108,275) |
| Capital Share Transactions | ||
| ETF Shares | 2,345,913 | 8,062,666 |
| Admiral Shares | (199,618) | 45,641 |
| Institutional Shares | (38,320) | 88,292 |
| Net Increase (Decrease) from Capital Share Transactions | 2,107,975 | 8,196,599 |
| Total Increase (Decrease) | (6,367,828) | 8,052,714 |
| Net Assets | ||
| Beginning of Period | 48,902,942 | 40,850,228 |
| End of Period | 42,535,114 | 48,902,942 |
| ETF Shares | |||||
| For a Share Outstanding Throughout Each Period | Year Ended August 31, | ||||
| 2022 | 2021 | 2020 | 2019 | 2018 | |
| Net Asset Value, Beginning of Period | $95.57 | $95.98 | $91.82 | $84.02 | $88.35 |
| Investment Operations | |||||
| Net Investment Income1 | 2.171 | 2.163 | 2.761 | 3.132 | 2.935 |
| Net Realized and Unrealized Gain (Loss) on Investments | (15.176) | (.205) | 4.205 | 7.768 | (4.362) |
| Total from Investment Operations | (13.005) | 1.958 | 6.966 | 10.900 | (1.427) |
| Distributions | |||||
| Dividends from Net Investment Income | (2.141) | (2.169) | (2.806) | (3.100) | (2.903) |
| Distributions from Realized Capital Gains | (.594) | (.199) | — | — | — |
| Total Distributions | (2.735) | (2.368) | (2.806) | (3.100) | (2.903) |
| Net Asset Value, End of Period | $79.83 | $95.57 | $95.98 | $91.82 | $84.02 |
| Total Return | -13.86% | 2.08% | 7.78% | 13.33% | -1.62% |
| Ratios/Supplemental Data | |||||
| Net Assets, End of Period (Millions) | $41,058 | $46,873 | $38,944 | $24,080 | $19,302 |
| Ratio of Total Expenses to Average Net Assets | 0.04% 2 | 0.04% | 0.05% | 0.05% | 0.07% |
| Ratio of Net Investment Income to Average Net Assets | 2.48% | 2.27% | 2.99% | 3.65% | 3.44% |
| Portfolio Turnover Rate3 | 58% | 53% | 72% | 59% | 65% |
| 1 | Calculated based on average shares outstanding. |
| 2 | The ratio of expenses to average net assets for the period net of reduction from custody fee offset arrangements was 0.04%. |
| 3 | Excludes the value of portfolio securities received or delivered as a result of in-kind purchases or redemptions of the fund’s capital shares, including ETF Creation Units. |
| Admiral Shares | |||||
| For a Share Outstanding Throughout Each Period | Year Ended August 31, | ||||
| 2022 | 2021 | 2020 | 2019 | 2018 | |
| Net Asset Value, Beginning of Period | $25.75 | $25.86 | $24.71 | $22.61 | $23.78 |
| Investment Operations | |||||
| Net Investment Income1 | .577 | .578 | .747 | .839 | .792 |
| Net Realized and Unrealized Gain (Loss) on Investments | (4.098) | (.062) | 1.138 | 2.097 | (1.175) |
| Total from Investment Operations | (3.521) | .516 | 1.885 | 2.936 | (.383) |
| Distributions | |||||
| Dividends from Net Investment Income | (.579) | (.572) | (.735) | (.836) | (.787) |
| Distributions from Realized Capital Gains | (.160) | (.054) | — | — | — |
| Total Distributions | (.739) | (.626) | (.735) | (.836) | (.787) |
| Net Asset Value, End of Period | $21.49 | $25.75 | $25.86 | $24.71 | $22.61 |
| Total Return2 | -13.90% | 2.03% | 7.79% | 13.30% | -1.61% |
| Ratios/Supplemental Data | |||||
| Net Assets, End of Period (Millions) | $1,139 | $1,587 | $1,549 | $1,381 | $1,076 |
| Ratio of Total Expenses to Average Net Assets | 0.07% 3 | 0.07% | 0.07% | 0.07% | 0.07% |
| Ratio of Net Investment Income to Average Net Assets | 2.44% | 2.25% | 3.01% | 3.63% | 3.44% |
| Portfolio Turnover Rate4 | 58% | 53% | 72% | 59% | 65% |
| 1 | Calculated based on average shares outstanding. |
| 2 | Total returns do not include transaction or account service fees that may have applied in the periods shown. Fund prospectuses provide information about any applicable transaction and account service fees. |
| 3 | The ratio of expenses to average net assets for the period net of reduction from custody fee offset arrangements was 0.07%. |
| 4 | Excludes the value of portfolio securities received or delivered as a result of in-kind purchases or redemptions of the fund’s capital shares, including ETF Creation Units. |
| Institutional Shares | |||||
| For a Share Outstanding Throughout Each Period | Year Ended August 31, | ||||
| 2022 | 2021 | 2020 | 2019 | 2018 | |
| Net Asset Value, Beginning of Period | $31.82 | $31.95 | $30.53 | $27.94 | $29.38 |
| Investment Operations | |||||
| Net Investment Income1 | .720 | .720 | .940 | 1.044 | .983 |
| Net Realized and Unrealized Gain (Loss) on Investments | (5.061) | (.070) | 1.394 | 2.584 | (1.446) |
| Total from Investment Operations | (4.341) | .650 | 2.334 | 3.628 | (.463) |
| Distributions | |||||
| Dividends from Net Investment Income | (.721) | (.714) | (.914) | (1.038) | (.977) |
| Distributions from Realized Capital Gains | (.198) | (.066) | — | — | — |
| Total Distributions | (.919) | (.780) | (.914) | (1.038) | (.977) |
| Net Asset Value, End of Period | $26.56 | $31.82 | $31.95 | $30.53 | $27.94 |
| Total Return2 | -13.87% | 2.07% | 7.81% | 13.30% | -1.57% |
| Ratios/Supplemental Data | |||||
| Net Assets, End of Period (Millions) | $338 | $443 | $357 | $406 | $492 |
| Ratio of Total Expenses to Average Net Assets | 0.05% 3 | 0.05% | 0.05% | 0.05% | 0.05% |
| Ratio of Net Investment Income to Average Net Assets | 2.46% | 2.27% | 3.07% | 3.65% | 3.46% |
| Portfolio Turnover Rate4 | 58% | 53% | 72% | 59% | 65% |
| 1 | Calculated based on average shares outstanding. |
| 2 | Total returns do not include transaction fees that may have applied in the periods shown. Fund prospectuses provide information about any applicable transaction fees. |
| 3 | The ratio of expenses to average net assets for the period net of reduction from custody fee offset arrangements was 0.05%. |
| 4 | Excludes the value of portfolio securities received or delivered as a result of in-kind purchases or redemptions of the fund’s capital shares, including ETF Creation Units. |
| A. | The following significant accounting policies conform to generally accepted accounting principles for U.S. investment companies. The fund consistently follows such policies in preparing its financial statements. |
| B. | In accordance with the terms of a Funds’ Service Agreement (the “FSA”) between Vanguard and the fund, Vanguard furnishes to the fund investment advisory, corporate management, administrative, marketing, and distribution services at Vanguard’s cost of operations (as defined by the FSA). These costs of operations are allocated to the fund based on methods and guidelines approved by the board of trustees and are generally settled twice a month. |
| C. | The fund’s custodian bank has agreed to reduce its fees when the fund maintains cash on deposit in the non-interest-bearing custody account. For the year ended August 31, 2022, custodian fee offset arrangements reduced the fund’s expenses by $60,000 (an annual rate of less than 0.01% of average net assets). |
| D. | Various inputs may be used to determine the value of the fund’s investments and derivatives. These inputs are summarized in three broad levels for financial statement purposes. The inputs or methodologies used to value securities are not necessarily an indication of the risk associated with investing in those securities. |
| Level 1 ($000) | Level 2 ($000) | Level 3 ($000) | Total ($000) | |
| Investments | ||||
| Assets | ||||
| U.S. Government and Agency Obligations | — | 243,117 | — | 243,117 |
| Corporate Bonds | — | 41,726,942 | — | 41,726,942 |
| Temporary Cash Investments | 77,146 | — | — | 77,146 |
| Total | 77,146 | 41,970,059 | — | 42,047,205 |
| Derivative Financial Instruments | ||||
| Assets | ||||
| Futures Contracts1 | 1,209 | — | — | 1,209 |
| Liabilities | ||||
| Futures Contracts1 | 4 | — | — | 4 |
| 1 | Includes cumulative appreciation (depreciation) on futures contracts and centrally cleared swaps, if any, as reported in the Schedule of Investments. Only current day’s variation margin is reported within the Statement of Assets and Liabilities. |
| E. | Permanent differences between book-basis and tax-basis components of net assets are reclassified among capital accounts in the financial statements to reflect their tax character. These reclassifications have no effect on net assets or net asset value per share. As of period end, permanent differences primarily attributable to the accounting for applicable in-kind redemptions were reclassified between the following accounts: |
| Amount ($000) | |
| Paid-in Capital | (282,876) |
| Total Distributable Earnings (Loss) | 282,876 |
| Amount ($000) | |
| Undistributed Ordinary Income | 107,606 |
| Undistributed Long-Term Gains | — |
| Capital Loss Carryforwards | — |
| Qualified Late-Year Losses | (767,890) |
| Net Unrealized Gains (Losses) | (6,104,812) |
| Year Ended August 31, | ||
| 2022 Amount ($000) | 2021 Amount ($000) | |
| Ordinary Income* | 1,156,420 | 1,043,345 |
| Long-Term Capital Gains | 289,256 | 64,930 |
| Total | 1,445,676 | 1,108,275 |
| * | Includes short-term capital gains, if any. |
| Amount ($000) | |
| Tax Cost | 48,152,017 |
| Gross Unrealized Appreciation | 21,879 |
| Gross Unrealized Depreciation | (6,126,691) |
| Net Unrealized Appreciation (Depreciation) | (6,104,812) |
| F. | During the year ended August 31, 2022, the fund purchased $28,066,316,000 of investment securities and sold $25,753,309,000 of investment securities, other than U.S. government securities and temporary cash investments. Purchases and sales of U.S. government securities were $13,196,941,000 and $13,442,530,000, respectively. Purchases and sales include $14,527,780,000 and $12,373,250,000, respectively, in connection with in-kind purchases and redemptions of the fund’s capital shares. |
| G. | Capital share transactions for each class of shares were: |
| Year Ended August 31, | |||||
| 2022 | 2021 | ||||
| Amount ($000) | Shares (000) | Amount ($000) | Shares (000) | ||
| ETF Shares | |||||
| Issued 1 | 14,929,685 | 172,762 | 20,684,453 | 217,097 | |
| Issued in Lieu of Cash Distributions | — | — | — | — | |
| Redeemed | (12,583,772) | (148,900) | (12,621,787) | (132,400) | |
| Net Increase (Decrease)—ETF Shares | 2,345,913 | 23,862 | 8,062,666 | 84,697 | |
| Admiral Shares | |||||
| Issued 1 | 209,913 | 8,814 | 392,434 | 15,237 | |
| Issued in Lieu of Cash Distributions | 34,023 | 1,432 | 30,298 | 1,179 | |
| Redeemed | (443,554) | (18,893) | (377,091) | (14,690) | |
| Net Increase (Decrease)—Admiral Shares | (199,618) | (8,647) | 45,641 | 1,726 | |
| Institutional Shares | |||||
| Issued 1 | 56,884 | 1,961 | 141,963 | 4,463 | |
| Issued in Lieu of Cash Distributions | 8,074 | 277 | 6,380 | 201 | |
| Redeemed | (103,278) | (3,421) | (60,051) | (1,906) | |
| Net Increase (Decrease)—Institutional Shares | (38,320) | (1,183) | 88,292 | 2,758 | |
| 1 | Includes purchase fees for fiscal 2022 and 2021 of $653,000 and $1,285,000, respectively (fund totals). |
| H. | Management has determined that no events or transactions occurred subsequent to August 31, 2022, that would require recognition or disclosure in these financial statements. |

| Average Annual Total Returns Periods Ended August 31, 2022 | |||||
| One Year | Five Years | Ten Years | Final Value of a $10,000 Investment | ||
| Long-Term Corporate Bond Index Fund ETF Shares Net Asset Value | -23.06% | 0.65% | 2.76% | $ 13,133 |
| Long-Term Corporate Bond Index Fund ETF Shares Market Price | -23.27 | 0.49 | 2.62 | 12,947 | |
| Bloomberg U.S. 10+ Year Corporate Bond Index | -23.03 | 0.67 | 2.78 | 13,154 |
| Bloomberg U.S. Aggregate Float Adjusted Index | -11.65 | 0.54 | 1.36 | 11,452 |
| Average Annual Total Returns Periods Ended August 31, 2022 | |||||
| One Year | Five Years | Ten Years | Final Value of a $10,000 Investment | ||
| Long-Term Corporate Bond Index Fund Admiral Shares | -23.86% | 0.43% | 2.65% | $12,995 | |
| Bloomberg U.S. 10+ Year Corporate Bond Index | -23.03 | 0.67 | 2.78 | 13,154 | |
| Bloomberg U.S. Aggregate Float Adjusted Index | -11.65 | 0.54 | 1.36 | 11,452 | |
| One Year | Five Years | Ten Years | Final Value of a $5,000,000 Investment | ||
| Long-Term Corporate Bond Index Fund Institutional Shares | -23.82% | 0.45% | 2.68% | $ 6,511,150 | |
| Bloomberg U.S. 10+ Year Corporate Bond Index | -23.03 | 0.67 | 2.78 | 6,577,016 | |
| Bloomberg U.S. Aggregate Float Adjusted Index | -11.65 | 0.54 | 1.36 | 5,725,801 | |
| Cumulative Returns of ETF Shares: August 31, 2012, Through August 31, 2022 | |||
| One Year | Five Years | Ten Years | |
| Long-Term Corporate Bond Index Fund ETF Shares Market Price | -23.27% | 2.50% | 29.47% |
| Long-Term Corporate Bond Index Fund ETF Shares Net Asset Value | -23.06 | 3.27 | 31.33 |
| Bloomberg U.S. 10+ Year Corporate Bond Index | -23.03 | 3.39 | 31.54 |
| Corporate Bonds – Communications | 12.7% |
| Corporate Bonds – Consumer Discretionary | 6.0 |
| Corporate Bonds – Consumer Staples | 7.7 |
| Corporate Bonds – Energy | 9.0 |
| Corporate Bonds – Financials | 14.8 |
| Corporate Bonds – Health Care | 14.6 |
| Corporate Bonds – Industrials | 8.5 |
| Corporate Bonds – Materials | 3.7 |
| Corporate Bonds – Real Estate | 1.5 |
| Corporate Bonds – Technology | 9.0 |
| Corporate Bonds – Utilities | 12.4 |
| U.S. Government and Agency Obligations | 0.1 |
| Coupon | Maturity Date | Face Amount ($000) | Market Value• ($000) | |||
| U.S. Government and Agency Obligations (0.1%) | ||||||
| U.S. Government Securities (0.1%) | ||||||
| United States Treasury Note/Bond | 3.375% | 8/15/42 | 4,600 | 4,490 | ||
| United States Treasury Note/Bond | 2.875% | 5/15/52 | 2,399 | 2,212 | ||
| Total U.S. Government and Agency Obligations (Cost $6,728) | 6,702 | |||||
| Corporate Bonds (98.3%) | ||||||
| Communications (12.5%) | ||||||
| Activision Blizzard Inc. | 4.500% | 6/15/47 | 2,822 | 2,680 | ||
| Activision Blizzard Inc. | 2.500% | 9/15/50 | 2,559 | 1,713 | ||
| Alphabet Inc. | 1.900% | 8/15/40 | 2,685 | 1,898 | ||
| Alphabet Inc. | 2.050% | 8/15/50 | 6,354 | 4,187 | ||
| Alphabet Inc. | 2.250% | 8/15/60 | 3,817 | 2,441 | ||
| America Movil SAB de CV | 6.375% | 3/1/35 | 1,315 | 1,485 | ||
| America Movil SAB de CV | 6.125% | 11/15/37 | 1,164 | 1,253 | ||
| America Movil SAB de CV | 6.125% | 3/30/40 | 5,245 | 5,749 | ||
| America Movil SAB de CV | 4.375% | 7/16/42 | 2,141 | 1,920 | ||
| America Movil SAB de CV | 4.375% | 4/22/49 | 3,140 | 2,876 | ||
| AT&T Inc. | 2.550% | 12/1/33 | 9,852 | 7,864 | ||
| AT&T Inc. | 4.500% | 5/15/35 | 6,039 | 5,670 | ||
| AT&T Inc. | 5.250% | 3/1/37 | 485 | 486 | ||
| AT&T Inc. | 4.900% | 8/15/37 | 3,003 | 2,931 | ||
| AT&T Inc. | 4.850% | 3/1/39 | 6,083 | 5,718 | ||
| AT&T Inc. | 5.350% | 9/1/40 | 1,420 | 1,404 | ||
| AT&T Inc. | 3.500% | 6/1/41 | 6,108 | 4,818 | ||
| AT&T Inc. | 4.300% | 12/15/42 | 3,246 | 2,814 | ||
| AT&T Inc. | 3.100% | 2/1/43 | 1,630 | 1,199 | ||
| AT&T Inc. | 4.650% | 6/1/44 | 2,724 | 2,437 | ||
| AT&T Inc. | 4.350% | 6/15/45 | 2,638 | 2,258 | ||
| AT&T Inc. | 4.850% | 7/15/45 | 65 | 60 | ||
| AT&T Inc. | 4.750% | 5/15/46 | 4,988 | 4,588 | ||
| 1 | AT&T Inc. | 5.150% | 11/15/46 | 3,016 | 2,924 | |
| AT&T Inc. | 4.500% | 3/9/48 | 5,957 | 5,171 | ||
| AT&T Inc. | 4.550% | 3/9/49 | 5,309 | 4,737 | ||
| AT&T Inc. | 5.150% | 2/15/50 | 595 | 574 | ||
| AT&T Inc. | 3.650% | 6/1/51 | 4,446 | 3,400 | ||
| AT&T Inc. | 3.500% | 9/15/53 | 18,381 | 13,652 | ||
| AT&T Inc. | 3.550% | 9/15/55 | 21,535 | 15,734 | ||
| AT&T Inc. | 3.800% | 12/1/57 | 15,617 | 11,809 | ||
| AT&T Inc. | 3.650% | 9/15/59 | 15,980 | 11,581 | ||
| AT&T Inc. | 3.850% | 6/1/60 | 4,505 | 3,383 | ||
| Bell Telephone Co. of Canada or Bell Canada | 4.464% | 4/1/48 | 2,270 | 2,080 | ||
| Bell Telephone Co. of Canada or Bell Canada | 4.300% | 7/29/49 | 2,117 | 1,874 | ||
| 1 | Bell Telephone Co. of Canada or Bell Canada | 3.650% | 3/17/51 | 833 | 654 | |
| 1 | Bell Telephone Co. of Canada or Bell Canada | 3.200% | 2/15/52 | 1,095 | 799 | |
| Bell Telephone Co. of Canada or Bell Canada | 3.650% | 8/15/52 | 677 | 535 | ||
| Charter Communications Operating LLC | 4.400% | 4/1/33 | 1,285 | 1,135 | ||
| Charter Communications Operating LLC | 6.384% | 10/23/35 | 4,332 | 4,316 | ||
| Charter Communications Operating LLC | 5.375% | 4/1/38 | 2,295 | 2,013 | ||
| Coupon | Maturity Date | Face Amount ($000) | Market Value• ($000) | |||
| Charter Communications Operating LLC | 3.500% | 6/1/41 | 2,532 | 1,756 | ||
| Charter Communications Operating LLC | 3.500% | 3/1/42 | 4,409 | 3,068 | ||
| Charter Communications Operating LLC | 6.484% | 10/23/45 | 5,741 | 5,467 | ||
| Charter Communications Operating LLC | 5.375% | 5/1/47 | 4,345 | 3,703 | ||
| Charter Communications Operating LLC | 5.750% | 4/1/48 | 4,190 | 3,708 | ||
| Charter Communications Operating LLC | 5.125% | 7/1/49 | 3,669 | 2,988 | ||
| Charter Communications Operating LLC | 4.800% | 3/1/50 | 7,538 | 5,922 | ||
| Charter Communications Operating LLC | 3.700% | 4/1/51 | 5,241 | 3,490 | ||
| Charter Communications Operating LLC | 3.900% | 6/1/52 | 5,590 | 3,792 | ||
| Charter Communications Operating LLC | 5.250% | 4/1/53 | 4,430 | 3,712 | ||
| Charter Communications Operating LLC | 6.834% | 10/23/55 | 3,933 | 3,959 | ||
| Charter Communications Operating LLC | 3.850% | 4/1/61 | 4,883 | 3,177 | ||
| Charter Communications Operating LLC | 4.400% | 12/1/61 | 5,385 | 3,813 | ||
| Charter Communications Operating LLC | 3.950% | 6/30/62 | 1,343 | 889 | ||
| Charter Communications Operating LLC | 5.500% | 4/1/63 | 3,130 | 2,619 | ||
| Comcast Corp. | 4.250% | 1/15/33 | 4,221 | 4,111 | ||
| Comcast Corp. | 7.050% | 3/15/33 | 1,492 | 1,770 | ||
| Comcast Corp. | 4.200% | 8/15/34 | 2,569 | 2,454 | ||
| Comcast Corp. | 5.650% | 6/15/35 | 370 | 399 | ||
| Comcast Corp. | 4.400% | 8/15/35 | 568 | 549 | ||
| Comcast Corp. | 6.500% | 11/15/35 | 1,248 | 1,427 | ||
| Comcast Corp. | 3.200% | 7/15/36 | 2,066 | 1,739 | ||
| Comcast Corp. | 6.450% | 3/15/37 | 1,474 | 1,716 | ||
| Comcast Corp. | 6.950% | 8/15/37 | 1,015 | 1,213 | ||
| Comcast Corp. | 3.900% | 3/1/38 | 4,516 | 4,066 | ||
| Comcast Corp. | 4.600% | 10/15/38 | 1,644 | 1,582 | ||
| Comcast Corp. | 6.550% | 7/1/39 | 1,732 | 2,065 | ||
| Comcast Corp. | 3.250% | 11/1/39 | 2,608 | 2,123 | ||
| Comcast Corp. | 3.750% | 4/1/40 | 3,085 | 2,674 | ||
| Comcast Corp. | 4.650% | 7/15/42 | 2,539 | 2,390 | ||
| Comcast Corp. | 4.600% | 8/15/45 | 2,141 | 1,989 | ||
| Comcast Corp. | 3.400% | 7/15/46 | 2,954 | 2,310 | ||
| Comcast Corp. | 4.000% | 8/15/47 | 2,630 | 2,277 | ||
| Comcast Corp. | 3.969% | 11/1/47 | 6,080 | 5,219 | ||
| Comcast Corp. | 4.000% | 3/1/48 | 2,275 | 1,951 | ||
| Comcast Corp. | 4.700% | 10/15/48 | 3,501 | 3,355 | ||
| Comcast Corp. | 3.999% | 11/1/49 | 5,798 | 4,969 | ||
| Comcast Corp. | 3.450% | 2/1/50 | 5,373 | 4,228 | ||
| Comcast Corp. | 2.800% | 1/15/51 | 4,401 | 3,050 | ||
| Comcast Corp. | 2.887% | 11/1/51 | 10,650 | 7,516 | ||
| Comcast Corp. | 2.450% | 8/15/52 | 2,095 | 1,355 | ||
| Comcast Corp. | 4.049% | 11/1/52 | 4,095 | 3,518 | ||
| Comcast Corp. | 2.937% | 11/1/56 | 15,805 | 10,784 | ||
| Coupon | Maturity Date | Face Amount ($000) | Market Value• ($000) | |||
| Comcast Corp. | 4.950% | 10/15/58 | 2,371 | 2,325 | ||
| Comcast Corp. | 2.650% | 8/15/62 | 2,785 | 1,753 | ||
| Comcast Corp. | 2.987% | 11/1/63 | 9,438 | 6,322 | ||
| Discovery Communications LLC | 5.000% | 9/20/37 | 2,107 | 1,837 | ||
| Discovery Communications LLC | 6.350% | 6/1/40 | 994 | 953 | ||
| Discovery Communications LLC | 4.875% | 4/1/43 | 1,568 | 1,248 | ||
| Discovery Communications LLC | 5.200% | 9/20/47 | 3,050 | 2,487 | ||
| Discovery Communications LLC | 5.300% | 5/15/49 | 914 | 753 | ||
| Discovery Communications LLC | 4.650% | 5/15/50 | 2,304 | 1,749 | ||
| Discovery Communications LLC | 4.000% | 9/15/55 | 3,559 | 2,354 | ||
| Electronic Arts Inc. | 2.950% | 2/15/51 | 2,195 | 1,600 | ||
| Fox Corp. | 5.476% | 1/25/39 | 3,370 | 3,290 | ||
| Fox Corp. | 5.576% | 1/25/49 | 2,827 | 2,758 | ||
| Grupo Televisa SAB | 6.625% | 1/15/40 | 1,901 | 2,043 | ||
| Grupo Televisa SAB | 5.000% | 5/13/45 | 2,045 | 1,894 | ||
| Grupo Televisa SAB | 6.125% | 1/31/46 | 1,445 | 1,576 | ||
| Grupo Televisa SAB | 5.250% | 5/24/49 | 2,145 | 2,094 | ||
| Interpublic Group of Cos. Inc. | 3.375% | 3/1/41 | 1,095 | 784 | ||
| Interpublic Group of Cos. Inc. | 5.400% | 10/1/48 | 1,326 | 1,277 | ||
| 2 | Magallanes Inc. | 5.050% | 3/15/42 | 11,820 | 9,659 | |
| 2 | Magallanes Inc. | 5.141% | 3/15/52 | 15,647 | 12,597 | |
| 2 | Magallanes Inc. | 5.391% | 3/15/62 | 7,865 | 6,325 | |
| 2 | Meta Platforms Inc. | 4.450% | 8/15/52 | 3,000 | 2,730 | |
| 2 | Meta Platforms Inc. | 4.650% | 8/15/62 | 3,000 | 2,704 | |
| NBCUniversal Media LLC | 5.950% | 4/1/41 | 610 | 675 | ||
| NBCUniversal Media LLC | 4.450% | 1/15/43 | 2,776 | 2,542 | ||
| Orange SA | 5.375% | 1/13/42 | 1,844 | 1,907 | ||
| Orange SA | 5.500% | 2/6/44 | 1,397 | 1,472 | ||
| Paramount Global | 5.500% | 5/15/33 | 690 | 665 | ||
| Paramount Global | 6.875% | 4/30/36 | 2,583 | 2,666 | ||
| Paramount Global | 5.900% | 10/15/40 | 2,231 | 2,043 | ||
| Paramount Global | 4.850% | 7/1/42 | 4,067 | 3,325 | ||
| Paramount Global | 4.375% | 3/15/43 | 1,573 | 1,179 | ||
| Paramount Global | 5.850% | 9/1/43 | 3,036 | 2,745 | ||
| Paramount Global | 5.250% | 4/1/44 | 467 | 396 | ||
| Paramount Global | 4.900% | 8/15/44 | 696 | 555 | ||
| Paramount Global | 4.600% | 1/15/45 | 1,324 | 1,017 | ||
| Paramount Global | 4.950% | 5/19/50 | 2,395 | 1,950 | ||
| Rogers Communications Inc. | 7.500% | 8/15/38 | 1,721 | 2,061 | ||
| 2 | Rogers Communications Inc. | 4.500% | 3/15/42 | 1,805 | 1,591 | |
| Rogers Communications Inc. | 4.500% | 3/15/43 | 1,044 | 900 | ||
| Rogers Communications Inc. | 5.450% | 10/1/43 | 1,050 | 1,024 | ||
| Rogers Communications Inc. | 5.000% | 3/15/44 | 1,427 | 1,305 | ||
| Rogers Communications Inc. | 4.300% | 2/15/48 | 1,670 | 1,387 | ||
| Rogers Communications Inc. | 4.350% | 5/1/49 | 2,842 | 2,382 | ||
| Rogers Communications Inc. | 3.700% | 11/15/49 | 3,579 | 2,721 | ||
| 2 | Rogers Communications Inc. | 4.550% | 3/15/52 | 4,475 | 3,940 | |
| Telefonica Emisiones SA | 7.045% | 6/20/36 | 5,429 | 5,924 | ||
| Telefonica Emisiones SA | 4.665% | 3/6/38 | 1,135 | 981 | ||
| Telefonica Emisiones SA | 5.213% | 3/8/47 | 5,718 | 4,934 | ||
| Telefonica Emisiones SA | 4.895% | 3/6/48 | 3,619 | 3,008 | ||
| Telefonica Emisiones SA | 5.520% | 3/1/49 | 2,804 | 2,516 | ||
| TELUS Corp. | 4.600% | 11/16/48 | 1,819 | 1,694 | ||
| TELUS Corp. | 4.300% | 6/15/49 | 932 | 829 | ||
| Thomson Reuters Corp. | 5.500% | 8/15/35 | 1,295 | 1,303 | ||
| Thomson Reuters Corp. | 5.850% | 4/15/40 | 575 | 594 | ||
| Thomson Reuters Corp. | 5.650% | 11/23/43 | 1,200 | 1,206 | ||
| Time Warner Cable LLC | 6.550% | 5/1/37 | 3,274 | 3,220 | ||
| Time Warner Cable LLC | 7.300% | 7/1/38 | 3,669 | 3,773 | ||
| Time Warner Cable LLC | 6.750% | 6/15/39 | 1,335 | 1,302 | ||
| Time Warner Cable LLC | 5.875% | 11/15/40 | 3,871 | 3,479 | ||
| Time Warner Cable LLC | 5.500% | 9/1/41 | 1,608 | 1,389 | ||
| Time Warner Cable LLC | 4.500% | 9/15/42 | 5,050 | 3,825 | ||
| Time Warner Entertainment Co. LP | 8.375% | 7/15/33 | 4,326 | 4,965 | ||
| T-Mobile USA Inc. | 4.375% | 4/15/40 | 5,719 | 5,048 | ||
| T-Mobile USA Inc. | 3.000% | 2/15/41 | 6,125 | 4,441 | ||
| T-Mobile USA Inc. | 4.500% | 4/15/50 | 6,769 | 5,903 | ||
| Coupon | Maturity Date | Face Amount ($000) | Market Value• ($000) | |||
| T-Mobile USA Inc. | 3.300% | 2/15/51 | 8,261 | 5,901 | ||
| T-Mobile USA Inc. | 3.400% | 10/15/52 | 4,253 | 3,079 | ||
| T-Mobile USA Inc. | 3.600% | 11/15/60 | 5,040 | 3,630 | ||
| TWDC Enterprises 18 Corp. | 4.375% | 8/16/41 | 1,108 | 1,050 | ||
| 1 | TWDC Enterprises 18 Corp. | 4.125% | 12/1/41 | 945 | 861 | |
| 1 | TWDC Enterprises 18 Corp. | 3.700% | 12/1/42 | 2,220 | 1,899 | |
| 1 | TWDC Enterprises 18 Corp. | 4.125% | 6/1/44 | 1,494 | 1,370 | |
| 1 | TWDC Enterprises 18 Corp. | 3.000% | 7/30/46 | 889 | 674 | |
| Verizon Communications Inc. | 4.500% | 8/10/33 | 5,245 | 5,061 | ||
| Verizon Communications Inc. | 6.400% | 9/15/33 | 515 | 570 | ||
| Verizon Communications Inc. | 4.400% | 11/1/34 | 5,543 | 5,242 | ||
| Verizon Communications Inc. | 5.850% | 9/15/35 | 200 | 212 | ||
| Verizon Communications Inc. | 4.272% | 1/15/36 | 3,642 | 3,365 | ||
| Verizon Communications Inc. | 5.250% | 3/16/37 | 3,615 | 3,682 | ||
| Verizon Communications Inc. | 4.812% | 3/15/39 | 4,780 | 4,657 | ||
| Verizon Communications Inc. | 2.650% | 11/20/40 | 7,351 | 5,312 | ||
| Verizon Communications Inc. | 3.400% | 3/22/41 | 9,165 | 7,382 | ||
| Verizon Communications Inc. | 2.850% | 9/3/41 | 3,320 | 2,462 | ||
| Verizon Communications Inc. | 4.750% | 11/1/41 | 1,455 | 1,381 | ||
| Verizon Communications Inc. | 3.850% | 11/1/42 | 1,480 | 1,241 | ||
| Verizon Communications Inc. | 6.550% | 9/15/43 | 330 | 395 | ||
| Verizon Communications Inc. | 4.125% | 8/15/46 | 2,701 | 2,382 | ||
| Verizon Communications Inc. | 4.862% | 8/21/46 | 4,611 | 4,505 | ||
| Verizon Communications Inc. | 5.500% | 3/16/47 | 1,203 | 1,276 | ||
| Verizon Communications Inc. | 4.522% | 9/15/48 | 4,809 | 4,475 | ||
| Verizon Communications Inc. | 4.000% | 3/22/50 | 3,044 | 2,592 | ||
| Verizon Communications Inc. | 2.875% | 11/20/50 | 6,175 | 4,246 | ||
| Verizon Communications Inc. | 3.550% | 3/22/51 | 9,735 | 7,650 | ||
| Verizon Communications Inc. | 3.875% | 3/1/52 | 2,295 | 1,906 | ||
| Verizon Communications Inc. | 5.012% | 8/21/54 | 1,415 | 1,416 | ||
| Verizon Communications Inc. | 4.672% | 3/15/55 | 2,230 | 2,096 | ||
| Verizon Communications Inc. | 2.987% | 10/30/56 | 10,326 | 6,954 | ||
| Verizon Communications Inc. | 3.000% | 11/20/60 | 5,739 | 3,826 | ||
| Verizon Communications Inc. | 3.700% | 3/22/61 | 7,730 | 5,966 | ||
| Vodafone Group plc | 6.250% | 11/30/32 | 761 | 815 | ||
| Vodafone Group plc | 6.150% | 2/27/37 | 2,004 | 2,101 | ||
| Vodafone Group plc | 5.000% | 5/30/38 | 3,454 | 3,274 | ||
| Vodafone Group plc | 4.375% | 2/19/43 | 3,075 | 2,632 | ||
| Vodafone Group plc | 5.250% | 5/30/48 | 5,739 | 5,364 | ||
| Vodafone Group plc | 4.875% | 6/19/49 | 4,643 | 4,131 | ||
| Vodafone Group plc | 4.250% | 9/17/50 | 4,994 | 4,062 | ||
| Vodafone Group plc | 5.125% | 6/19/59 | 2,095 | 1,900 | ||
| Walt Disney Co. | 6.550% | 3/15/33 | 2,531 | 2,929 | ||
| Walt Disney Co. | 6.200% | 12/15/34 | 2,514 | 2,848 | ||
| Walt Disney Co. | 6.400% | 12/15/35 | 1,410 | 1,623 | ||
| Walt Disney Co. | 6.150% | 3/1/37 | 1,067 | 1,202 | ||
| Walt Disney Co. | 6.650% | 11/15/37 | 3,442 | 4,102 | ||
| Walt Disney Co. | 4.625% | 3/23/40 | 822 | 806 | ||
| Walt Disney Co. | 3.500% | 5/13/40 | 3,678 | 3,144 | ||
| Walt Disney Co. | 6.150% | 2/15/41 | 925 | 1,061 | ||
| Walt Disney Co. | 5.400% | 10/1/43 | 2,695 | 2,866 | ||
| Walt Disney Co. | 4.750% | 9/15/44 | 2,704 | 2,644 | ||
| Walt Disney Co. | 4.950% | 10/15/45 | 700 | 696 | ||
| Walt Disney Co. | 7.750% | 12/1/45 | 1,475 | 1,966 | ||
| Walt Disney Co. | 4.750% | 11/15/46 | 699 | 692 | ||
| Walt Disney Co. | 2.750% | 9/1/49 | 4,171 | 2,996 | ||
| Walt Disney Co. | 4.700% | 3/23/50 | 4,820 | 4,817 | ||
| Walt Disney Co. | 3.600% | 1/13/51 | 2,646 | 2,217 | ||
| Walt Disney Co. | 3.800% | 5/13/60 | 4,298 | 3,611 | ||
| 636,791 | ||||||
| Consumer Discretionary (5.9%) | ||||||
| Alibaba Group Holding Ltd. | 4.500% | 11/28/34 | 1,988 | 1,815 | ||
| Alibaba Group Holding Ltd. | 4.000% | 12/6/37 | 3,417 | 2,863 | ||
| Alibaba Group Holding Ltd. | 2.700% | 2/9/41 | 1,047 | 710 | ||
| Alibaba Group Holding Ltd. | 4.200% | 12/6/47 | 3,410 | 2,739 | ||
| Alibaba Group Holding Ltd. | 3.150% | 2/9/51 | 2,400 | 1,591 | ||
| Alibaba Group Holding Ltd. | 4.400% | 12/6/57 | 3,156 | 2,522 | ||
| Coupon | Maturity Date | Face Amount ($000) | Market Value• ($000) | |||
| Alibaba Group Holding Ltd. | 3.250% | 2/9/61 | 2,665 | 1,719 | ||
| Amazon.com Inc. | 4.800% | 12/5/34 | 3,182 | 3,350 | ||
| Amazon.com Inc. | 3.875% | 8/22/37 | 8,899 | 8,348 | ||
| Amazon.com Inc. | 2.875% | 5/12/41 | 1,538 | 1,228 | ||
| Amazon.com Inc. | 4.950% | 12/5/44 | 2,141 | 2,235 | ||
| Amazon.com Inc. | 4.050% | 8/22/47 | 9,569 | 8,871 | ||
| Amazon.com Inc. | 2.500% | 6/3/50 | 5,282 | 3,680 | ||
| Amazon.com Inc. | 3.100% | 5/12/51 | 6,375 | 4,990 | ||
| Amazon.com Inc. | 3.950% | 4/13/52 | 6,865 | 6,241 | ||
| Amazon.com Inc. | 4.250% | 8/22/57 | 5,385 | 5,086 | ||
| Amazon.com Inc. | 2.700% | 6/3/60 | 4,831 | 3,231 | ||
| Amazon.com Inc. | 3.250% | 5/12/61 | 4,706 | 3,582 | ||
| Amazon.com Inc. | 4.100% | 4/13/62 | 3,223 | 2,915 | ||
| 1 | American University | 3.672% | 4/1/49 | 1,181 | 992 | |
| Aptiv plc | 4.400% | 10/1/46 | 810 | 636 | ||
| Aptiv plc | 5.400% | 3/15/49 | 1,078 | 951 | ||
| Aptiv plc | 3.100% | 12/1/51 | 2,747 | 1,715 | ||
| Aptiv plc | 4.150% | 5/1/52 | 2,720 | 2,016 | ||
| BorgWarner Inc. | 4.375% | 3/15/45 | 1,298 | 1,044 | ||
| 1 | Brown University in Providence in the State of Rhode Island & Providence Plant | 2.924% | 9/1/50 | 1,301 | 1,018 | |
| Brunswick Corp. | 4.400% | 9/15/32 | 800 | 690 | ||
| Brunswick Corp. | 5.100% | 4/1/52 | 945 | 702 | ||
| 1 | California Endowment | 2.498% | 4/1/51 | 645 | 455 | |
| California Institute of Technology | 4.321% | 8/1/45 | 795 | 766 | ||
| California Institute of Technology | 4.700% | 11/1/11 | 803 | 744 | ||
| California Institute of Technology | 3.650% | 9/1/19 | 1,134 | 813 | ||
| 1 | Case Western Reserve University | 5.405% | 6/1/22 | 890 | 888 | |
| Claremont Mckenna College | 3.775% | 1/1/22 | 700 | 491 | ||
| Cleveland Clinic Foundation | 4.858% | 1/1/14 | 985 | 951 | ||
| Darden Restaurants Inc. | 4.550% | 2/15/48 | 665 | 539 | ||
| Dick's Sporting Goods Inc. | 4.100% | 1/15/52 | 1,935 | 1,293 | ||
| 1 | Duke University | 2.682% | 10/1/44 | 1,231 | 974 | |
| 1 | Duke University | 2.832% | 10/1/55 | 1,765 | 1,322 | |
| eBay Inc. | 4.000% | 7/15/42 | 1,182 | 980 | ||
| eBay Inc. | 3.650% | 5/10/51 | 2,830 | 2,121 | ||
| 1 | Emory University | 2.969% | 9/1/50 | 1,065 | 823 | |
| 1 | Ford Foundation | 2.415% | 6/1/50 | 250 | 174 | |
| 1 | Ford Foundation | 2.815% | 6/1/70 | 1,800 | 1,213 | |
| Fortune Brands Home & Security Inc. | 4.500% | 3/25/52 | 1,050 | 799 | ||
| General Motors Co. | 5.600% | 10/15/32 | 2,500 | 2,396 | ||
| General Motors Co. | 5.000% | 4/1/35 | 1,170 | 1,051 | ||
| General Motors Co. | 6.600% | 4/1/36 | 3,468 | 3,509 | ||
| General Motors Co. | 5.150% | 4/1/38 | 3,333 | 2,932 | ||
| General Motors Co. | 6.250% | 10/2/43 | 4,153 | 3,969 | ||
| General Motors Co. | 5.200% | 4/1/45 | 764 | 649 | ||
| General Motors Co. | 6.750% | 4/1/46 | 1,884 | 1,888 | ||
| General Motors Co. | 5.400% | 4/1/48 | 2,016 | 1,774 | ||
| General Motors Co. | 5.950% | 4/1/49 | 2,477 | 2,300 | ||
| 1 | George Washington University | 4.300% | 9/15/44 | 1,400 | 1,269 | |
| George Washington University | 4.868% | 9/15/45 | 1,157 | 1,159 | ||
| 1 | George Washington University | 4.126% | 9/15/48 | 925 | 839 | |
| 1 | Georgetown University | 4.315% | 4/1/49 | 757 | 685 | |
| 1 | Georgetown University | 2.943% | 4/1/50 | 775 | 552 | |
| 1 | Georgetown University | 5.215% | 10/1/18 | 791 | 748 | |
| Harley-Davidson Inc. | 4.625% | 7/28/45 | 921 | 717 | ||
| Hasbro Inc. | 6.350% | 3/15/40 | 1,117 | 1,147 | ||
| Hasbro Inc. | 5.100% | 5/15/44 | 818 | 731 | ||
| Home Depot Inc. | 5.875% | 12/16/36 | 7,565 | 8,500 | ||
| Home Depot Inc. | 3.300% | 4/15/40 | 3,215 | 2,700 | ||
| Home Depot Inc. | 5.400% | 9/15/40 | 2,667 | 2,847 | ||
| Home Depot Inc. | 5.950% | 4/1/41 | 3,146 | 3,558 | ||
| Home Depot Inc. | 4.200% | 4/1/43 | 2,082 | 1,915 | ||
| Home Depot Inc. | 4.875% | 2/15/44 | 2,630 | 2,633 | ||
| Home Depot Inc. | 4.400% | 3/15/45 | 703 | 664 | ||
| Coupon | Maturity Date | Face Amount ($000) | Market Value• ($000) | |||
| Home Depot Inc. | 4.250% | 4/1/46 | 5,069 | 4,694 | ||
| Home Depot Inc. | 3.900% | 6/15/47 | 2,016 | 1,782 | ||
| Home Depot Inc. | 4.500% | 12/6/48 | 4,301 | 4,145 | ||
| Home Depot Inc. | 3.125% | 12/15/49 | 905 | 693 | ||
| Home Depot Inc. | 3.350% | 4/15/50 | 3,498 | 2,786 | ||
| Home Depot Inc. | 2.375% | 3/15/51 | 2,640 | 1,745 | ||
| Home Depot Inc. | 2.750% | 9/15/51 | 2,047 | 1,461 | ||
| Home Depot Inc. | 3.625% | 4/15/52 | 4,200 | 3,521 | ||
| Home Depot Inc. | 3.500% | 9/15/56 | 3,242 | 2,592 | ||
| 1 | Howard University | 5.209% | 10/1/52 | 725 | 660 | |
| JD.com Inc. | 4.125% | 1/14/50 | 545 | 423 | ||
| 1 | Johns Hopkins University | 4.083% | 7/1/53 | 962 | 907 | |
| 1 | Johns Hopkins University | 2.813% | 1/1/60 | 965 | 682 | |
| Kohl's Corp. | 5.550% | 7/17/45 | 1,065 | 747 | ||
| Lear Corp. | 5.250% | 5/15/49 | 1,400 | 1,211 | ||
| Lear Corp. | 3.550% | 1/15/52 | 895 | 584 | ||
| Leggett & Platt Inc. | 3.500% | 11/15/51 | 1,275 | 969 | ||
| Leland Stanford Junior University | 3.647% | 5/1/48 | 1,287 | 1,179 | ||
| Leland Stanford Junior University | 2.413% | 6/1/50 | 1,728 | 1,223 | ||
| Lowe's Cos. Inc. | 5.500% | 10/15/35 | 1,070 | 1,098 | ||
| Lowe's Cos. Inc. | 5.000% | 4/15/40 | 1,434 | 1,386 | ||
| Lowe's Cos. Inc. | 2.800% | 9/15/41 | 2,856 | 2,031 | ||
| Lowe's Cos. Inc. | 4.650% | 4/15/42 | 1,242 | 1,140 | ||
| Lowe's Cos. Inc. | 4.250% | 9/15/44 | 347 | 283 | ||
| Lowe's Cos. Inc. | 4.375% | 9/15/45 | 980 | 844 | ||
| Lowe's Cos. Inc. | 3.700% | 4/15/46 | 1,495 | 1,185 | ||
| Lowe's Cos. Inc. | 4.050% | 5/3/47 | 3,118 | 2,592 | ||
| Lowe's Cos. Inc. | 4.550% | 4/5/49 | 2,480 | 2,210 | ||
| Lowe's Cos. Inc. | 5.125% | 4/15/50 | 1,505 | 1,466 | ||
| Lowe's Cos. Inc. | 3.000% | 10/15/50 | 3,563 | 2,444 | ||
| Lowe's Cos. Inc. | 3.500% | 4/1/51 | 1,430 | 1,082 | ||
| Lowe's Cos. Inc. | 4.250% | 4/1/52 | 2,655 | 2,265 | ||
| Lowe's Cos. Inc. | 4.450% | 4/1/62 | 2,980 | 2,509 | ||
| 1 | Marriott International Inc. | 3.500% | 10/15/32 | 1,840 | 1,578 | |
| 1 | Marriott International Inc. | 2.750% | 10/15/33 | 2,189 | 1,721 | |
| Masco Corp. | 4.500% | 5/15/47 | 638 | 541 | ||
| Masco Corp. | 3.125% | 2/15/51 | 1,100 | 734 | ||
| 1 | Massachusetts Institute of Technology | 3.959% | 7/1/38 | 1,180 | 1,139 | |
| 1 | Massachusetts Institute of Technology | 2.989% | 7/1/50 | 787 | 632 | |
| 1 | Massachusetts Institute of Technology | 2.294% | 7/1/51 | 312 | 214 | |
| Massachusetts Institute of Technology | 3.067% | 4/1/52 | 1,880 | 1,519 | ||
| Massachusetts Institute of Technology | 5.600% | 7/1/11 | 1,966 | 2,299 | ||
| Massachusetts Institute of Technology | 4.678% | 7/1/14 | 1,645 | 1,604 | ||
| Massachusetts Institute of Technology | 3.885% | 7/1/16 | 585 | 469 | ||
| 1 | McDonald's Corp. | 4.700% | 12/9/35 | 4,000 | 3,970 | |
| 1 | McDonald's Corp. | 6.300% | 10/15/37 | 2,400 | 2,711 | |
| 1 | McDonald's Corp. | 6.300% | 3/1/38 | 617 | 703 | |
| 1 | McDonald's Corp. | 5.700% | 2/1/39 | 1,359 | 1,451 | |
| 1 | McDonald's Corp. | 4.875% | 7/15/40 | 1,135 | 1,111 | |
| 1 | McDonald's Corp. | 3.700% | 2/15/42 | 2,677 | 2,231 | |
| 1 | McDonald's Corp. | 3.625% | 5/1/43 | 1,588 | 1,300 | |
| 1 | McDonald's Corp. | 4.600% | 5/26/45 | 1,436 | 1,343 | |
| 1 | McDonald's Corp. | 4.875% | 12/9/45 | 2,165 | 2,110 | |
| 1 | McDonald's Corp. | 4.450% | 3/1/47 | 850 | 786 | |
| 1 | McDonald's Corp. | 4.450% | 9/1/48 | 431 | 398 | |
| 1 | McDonald's Corp. | 3.625% | 9/1/49 | 5,469 | 4,435 | |
| 1 | McDonald's Corp. | 4.200% | 4/1/50 | 2,358 | 2,100 | |
| MDC Holdings Inc. | 6.000% | 1/15/43 | 1,485 | 1,218 | ||
| NIKE Inc. | 3.250% | 3/27/40 | 3,388 | 2,874 | ||
| NIKE Inc. | 3.625% | 5/1/43 | 817 | 720 | ||
| NIKE Inc. | 3.875% | 11/1/45 | 1,363 | 1,235 | ||
| Coupon | Maturity Date | Face Amount ($000) | Market Value• ($000) | |||
| NIKE Inc. | 3.375% | 11/1/46 | 765 | 641 | ||
| NIKE Inc. | 3.375% | 3/27/50 | 3,840 | 3,206 | ||
| 1 | Northeastern University | 2.894% | 10/1/50 | 665 | 479 | |
| 1 | Northwestern University | 4.643% | 12/1/44 | 820 | 837 | |
| 1 | Northwestern University | 2.640% | 12/1/50 | 390 | 292 | |
| 1 | Northwestern University | 3.662% | 12/1/57 | 1,251 | 1,094 | |
| Owens Corning | 7.000% | 12/1/36 | 977 | 1,056 | ||
| Owens Corning | 4.300% | 7/15/47 | 1,112 | 908 | ||
| Owens Corning | 4.400% | 1/30/48 | 1,183 | 970 | ||
| President & Fellows of Harvard College | 4.875% | 10/15/40 | 766 | 816 | ||
| President & Fellows of Harvard College | 3.150% | 7/15/46 | 680 | 573 | ||
| President & Fellows of Harvard College | 2.517% | 10/15/50 | 475 | 347 | ||
| President & Fellows of Harvard College | 3.745% | 11/15/52 | 2,100 | 1,942 | ||
| President & Fellows of Harvard College | 3.300% | 7/15/56 | 1,396 | 1,152 | ||
| PulteGroup Inc. | 6.375% | 5/15/33 | 925 | 938 | ||
| PulteGroup Inc. | 6.000% | 2/15/35 | 400 | 389 | ||
| 1 | Rockefeller Foundation | 2.492% | 10/1/50 | 925 | 657 | |
| Snap-on Inc. | 4.100% | 3/1/48 | 638 | 583 | ||
| Snap-on Inc. | 3.100% | 5/1/50 | 1,580 | 1,246 | ||
| Stanley Black & Decker Inc. | 5.200% | 9/1/40 | 675 | 679 | ||
| Stanley Black & Decker Inc. | 4.850% | 11/15/48 | 1,485 | 1,459 | ||
| Stanley Black & Decker Inc. | 2.750% | 11/15/50 | 1,617 | 1,099 | ||
| Starbucks Corp. | 4.300% | 6/15/45 | 812 | 715 | ||
| Starbucks Corp. | 3.750% | 12/1/47 | 2,214 | 1,797 | ||
| Starbucks Corp. | 4.500% | 11/15/48 | 1,122 | 1,017 | ||
| Starbucks Corp. | 4.450% | 8/15/49 | 3,001 | 2,683 | ||
| Starbucks Corp. | 3.350% | 3/12/50 | 691 | 516 | ||
| Starbucks Corp. | 3.500% | 11/15/50 | 3,320 | 2,559 | ||
| Thomas Jefferson University | 3.847% | 11/1/57 | 1,240 | 1,017 | ||
| TJX Cos. Inc. | 4.500% | 4/15/50 | 702 | 696 | ||
| 1 | Trustees of Boston College | 3.129% | 7/1/52 | 812 | 602 | |
| 1 | Trustees of Boston University | 4.061% | 10/1/48 | 793 | 736 | |
| Trustees of Princeton University | 5.700% | 3/1/39 | 1,360 | 1,556 | ||
| 1 | Trustees of Princeton University | 2.516% | 7/1/50 | 879 | 655 | |
| Trustees of Princeton University | 4.201% | 3/1/52 | 1,380 | 1,378 | ||
| 1 | Trustees of the University of Pennsylvania | 2.396% | 10/1/50 | 1,118 | 780 | |
| Trustees of the University of Pennsylvania | 4.674% | 9/1/12 | 740 | 702 | ||
| Trustees of the University of Pennsylvania | 3.610% | 2/15/19 | 650 | 474 | ||
| 1 | University of Chicago | 2.761% | 4/1/45 | 105 | 84 | |
| 1 | University of Chicago | 2.547% | 4/1/50 | 1,105 | 804 | |
| University of Chicago | 3.000% | 10/1/52 | 905 | 708 | ||
| 1 | University of Chicago | 4.003% | 10/1/53 | 1,270 | 1,176 | |
| 1 | University of Miami | 4.063% | 4/1/52 | 1,230 | 1,074 | |
| 1 | University of Notre Dame du Lac | 3.438% | 2/15/45 | 1,243 | 1,084 | |
| 1 | University of Notre Dame du Lac | 3.394% | 2/15/48 | 829 | 718 | |
| 1 | University of Southern California | 3.028% | 10/1/39 | 802 | 677 | |
| 1 | University of Southern California | 3.841% | 10/1/47 | 467 | 425 | |
| University of Southern California | 2.805% | 10/1/50 | 1,565 | 1,169 | ||
| 1 | University of Southern California | 2.945% | 10/1/51 | 1,125 | 852 | |
| University of Southern California | 5.250% | 10/1/11 | 738 | 767 | ||
| 1 | University of Southern California | 3.226% | 10/1/20 | 880 | 570 | |
| 1 | Washington University | 3.524% | 4/15/54 | 1,680 | 1,444 | |
| Washington University | 4.349% | 4/15/22 | 840 | 710 | ||
| Whirlpool Corp. | 4.500% | 6/1/46 | 1,361 | 1,130 | ||
| Whirlpool Corp. | 4.600% | 5/15/50 | 1,095 | 911 | ||
| 1 | William Marsh Rice University | 3.574% | 5/15/45 | 1,300 | 1,154 | |
| 1 | William Marsh Rice University | 3.774% | 5/15/55 | 423 | 380 | |
| 1 | Yale University | 2.402% | 4/15/50 | 1,140 | 816 | |
| 297,542 | ||||||
| Coupon | Maturity Date | Face Amount ($000) | Market Value• ($000) | |||
| Consumer Staples (7.6%) | ||||||
| Altria Group Inc. | 5.800% | 2/14/39 | 4,927 | 4,571 | ||
| Altria Group Inc. | 3.400% | 2/4/41 | 3,940 | 2,659 | ||
| Altria Group Inc. | 4.250% | 8/9/42 | 1,796 | 1,333 | ||
| Altria Group Inc. | 4.500% | 5/2/43 | 1,862 | 1,414 | ||
| Altria Group Inc. | 5.375% | 1/31/44 | 4,265 | 3,769 | ||
| Altria Group Inc. | 3.875% | 9/16/46 | 4,030 | 2,770 | ||
| Altria Group Inc. | 5.950% | 2/14/49 | 4,873 | 4,373 | ||
| Altria Group Inc. | 4.450% | 5/6/50 | 1,445 | 1,060 | ||
| Altria Group Inc. | 3.700% | 2/4/51 | 3,225 | 2,100 | ||
| Altria Group Inc. | 6.200% | 2/14/59 | 360 | 343 | ||
| Altria Group Inc. | 4.000% | 2/4/61 | 1,710 | 1,161 | ||
| 1 | Anheuser-Busch Cos. LLC | 4.700% | 2/1/36 | 9,607 | 9,255 | |
| 1 | Anheuser-Busch Cos. LLC | 4.900% | 2/1/46 | 22,533 | 21,395 | |
| Anheuser-Busch InBev Finance Inc. | 4.700% | 2/1/36 | 1,071 | 1,035 | ||
| Anheuser-Busch InBev Finance Inc. | 4.000% | 1/17/43 | 3,487 | 2,913 | ||
| Anheuser-Busch InBev Finance Inc. | 4.625% | 2/1/44 | 1,250 | 1,144 | ||
| Anheuser-Busch InBev Finance Inc. | 4.900% | 2/1/46 | 4,535 | 4,245 | ||
| Anheuser-Busch InBev Worldwide Inc. | 5.875% | 6/15/35 | 1,465 | 1,558 | ||
| Anheuser-Busch InBev Worldwide Inc. | 4.375% | 4/15/38 | 4,090 | 3,794 | ||
| Anheuser-Busch InBev Worldwide Inc. | 8.200% | 1/15/39 | 2,607 | 3,378 | ||
| Anheuser-Busch InBev Worldwide Inc. | 5.450% | 1/23/39 | 4,779 | 4,904 | ||
| Anheuser-Busch InBev Worldwide Inc. | 8.000% | 11/15/39 | 1,731 | 2,210 | ||
| Anheuser-Busch InBev Worldwide Inc. | 4.350% | 6/1/40 | 2,405 | 2,188 | ||
| Anheuser-Busch InBev Worldwide Inc. | 4.950% | 1/15/42 | 3,221 | 3,138 | ||
| Anheuser-Busch InBev Worldwide Inc. | 3.750% | 7/15/42 | 2,791 | 2,307 | ||
| Anheuser-Busch InBev Worldwide Inc. | 4.600% | 4/15/48 | 6,354 | 5,778 | ||
| Anheuser-Busch InBev Worldwide Inc. | 4.439% | 10/6/48 | 4,182 | 3,725 | ||
| Anheuser-Busch InBev Worldwide Inc. | 5.550% | 1/23/49 | 8,655 | 8,995 | ||
| Anheuser-Busch InBev Worldwide Inc. | 4.500% | 6/1/50 | 6,185 | 5,611 | ||
| Anheuser-Busch InBev Worldwide Inc. | 4.750% | 4/15/58 | 4,588 | 4,191 | ||
| Anheuser-Busch InBev Worldwide Inc. | 5.800% | 1/23/59 | 4,241 | 4,528 | ||
| Anheuser-Busch InBev Worldwide Inc. | 4.600% | 6/1/60 | 2,464 | 2,197 | ||
| Archer-Daniels-Midland Co. | 5.935% | 10/1/32 | 540 | 607 | ||
| Archer-Daniels-Midland Co. | 5.375% | 9/15/35 | 1,090 | 1,183 | ||
| Archer-Daniels-Midland Co. | 3.750% | 9/15/47 | 2,097 | 1,883 | ||
| Archer-Daniels-Midland Co. | 4.500% | 3/15/49 | 2,668 | 2,686 | ||
| Archer-Daniels-Midland Co. | 2.700% | 9/15/51 | 1,374 | 1,030 | ||
| BAT Capital Corp. | 4.390% | 8/15/37 | 3,681 | 2,913 | ||
| BAT Capital Corp. | 3.734% | 9/25/40 | 380 | 265 | ||
| BAT Capital Corp. | 4.540% | 8/15/47 | 6,187 | 4,521 | ||
| BAT Capital Corp. | 4.758% | 9/6/49 | 1,700 | 1,285 | ||
| BAT Capital Corp. | 5.282% | 4/2/50 | 2,461 | 1,970 | ||
| BAT Capital Corp. | 3.984% | 9/25/50 | 2,711 | 1,834 | ||
| BAT Capital Corp. | 5.650% | 3/16/52 | 1,165 | 994 | ||
| Brown-Forman Corp. | 4.000% | 4/15/38 | 1,163 | 1,053 | ||
| Brown-Forman Corp. | 4.500% | 7/15/45 | 896 | 837 | ||
| Campbell Soup Co. | 4.800% | 3/15/48 | 739 | 688 | ||
| Campbell Soup Co. | 3.125% | 4/24/50 | 1,695 | 1,200 | ||
| Church & Dwight Co. Inc. | 3.950% | 8/1/47 | 1,033 | 901 | ||
| Church & Dwight Co. Inc. | 5.000% | 6/15/52 | 1,175 | 1,204 | ||
| Coca-Cola Co. | 2.500% | 6/1/40 | 1,773 | 1,375 | ||
| Coca-Cola Co. | 2.875% | 5/5/41 | 853 | 694 | ||
| Coca-Cola Co. | 4.200% | 3/25/50 | 2,368 | 2,306 | ||
| Coupon | Maturity Date | Face Amount ($000) | Market Value• ($000) | |||
| Coca-Cola Co. | 2.600% | 6/1/50 | 5,110 | 3,759 | ||
| Coca-Cola Co. | 3.000% | 3/5/51 | 2,865 | 2,245 | ||
| Coca-Cola Co. | 2.500% | 3/15/51 | 4,615 | 3,283 | ||
| Coca-Cola Co. | 2.750% | 6/1/60 | 2,305 | 1,644 | ||
| Coca-Cola Femsa SAB de CV | 1.850% | 9/1/32 | 1,416 | 1,111 | ||
| Coca-Cola Femsa SAB de CV | 5.250% | 11/26/43 | 905 | 912 | ||
| 1 | Colgate-Palmolive Co. | 4.000% | 8/15/45 | 1,304 | 1,203 | |
| 1 | Colgate-Palmolive Co. | 3.700% | 8/1/47 | 890 | 797 | |
| Conagra Brands Inc. | 5.300% | 11/1/38 | 2,635 | 2,509 | ||
| Conagra Brands Inc. | 5.400% | 11/1/48 | 1,169 | 1,109 | ||
| Constellation Brands Inc. | 4.500% | 5/9/47 | 687 | 610 | ||
| Constellation Brands Inc. | 4.100% | 2/15/48 | 1,452 | 1,218 | ||
| Constellation Brands Inc. | 5.250% | 11/15/48 | 2,614 | 2,557 | ||
| Constellation Brands Inc. | 3.750% | 5/1/50 | 805 | 641 | ||
| Delhaize America LLC | 9.000% | 4/15/31 | 210 | 271 | ||
| Diageo Capital plc | 5.875% | 9/30/36 | 519 | 578 | ||
| Diageo Capital plc | 3.875% | 4/29/43 | 1,994 | 1,767 | ||
| Diageo Investment Corp. | 7.450% | 4/15/35 | 1,392 | 1,758 | ||
| Diageo Investment Corp. | 4.250% | 5/11/42 | 170 | 159 | ||
| Dollar General Corp. | 4.125% | 4/3/50 | 1,170 | 985 | ||
| Dollar Tree Inc. | 3.375% | 12/1/51 | 1,005 | 712 | ||
| Estee Lauder Cos. Inc. | 6.000% | 5/15/37 | 927 | 1,051 | ||
| Estee Lauder Cos. Inc. | 4.375% | 6/15/45 | 1,318 | 1,221 | ||
| Estee Lauder Cos. Inc. | 4.150% | 3/15/47 | 1,073 | 991 | ||
| Estee Lauder Cos. Inc. | 3.125% | 12/1/49 | 1,405 | 1,107 | ||
| Fomento Economico Mexicano SAB de CV | 4.375% | 5/10/43 | 1,684 | 1,477 | ||
| Fomento Economico Mexicano SAB de CV | 3.500% | 1/16/50 | 5,878 | 4,543 | ||
| General Mills Inc. | 5.400% | 6/15/40 | 363 | 375 | ||
| General Mills Inc. | 4.700% | 4/17/48 | 400 | 380 | ||
| General Mills Inc. | 3.000% | 2/1/51 | 3,011 | 2,189 | ||
| 2 | GSK Consumer Healthcare Capital US LLC | 4.000% | 3/24/52 | 2,340 | 1,899 | |
| Hershey Co. | 3.375% | 8/15/46 | 1,478 | 1,239 | ||
| Hershey Co. | 3.125% | 11/15/49 | 1,091 | 865 | ||
| Hormel Foods Corp. | 3.050% | 6/3/51 | 976 | 757 | ||
| Ingredion Inc. | 3.900% | 6/1/50 | 1,130 | 893 | ||
| J M Smucker Co. | 4.250% | 3/15/35 | 2,705 | 2,491 | ||
| J M Smucker Co. | 2.750% | 9/15/41 | 495 | 349 | ||
| J M Smucker Co. | 3.550% | 3/15/50 | 471 | 350 | ||
| 2 | JBS USA LUX SA | 4.375% | 2/2/52 | 1,700 | 1,336 | |
| 2 | JBS USA LUX SA | 6.500% | 12/1/52 | 1,750 | 1,829 | |
| Kellogg Co. | 4.500% | 4/1/46 | 1,541 | 1,410 | ||
| Keurig Dr Pepper Inc. | 4.500% | 11/15/45 | 1,594 | 1,409 | ||
| Keurig Dr Pepper Inc. | 4.420% | 12/15/46 | 2,079 | 1,815 | ||
| Keurig Dr Pepper Inc. | 3.800% | 5/1/50 | 1,800 | 1,402 | ||
| Keurig Dr Pepper Inc. | 3.350% | 3/15/51 | 1,210 | 882 | ||
| Keurig Dr Pepper Inc. | 4.500% | 4/15/52 | 2,409 | 2,096 | ||
| Kimberly-Clark Corp. | 6.625% | 8/1/37 | 2,183 | 2,628 | ||
| Kimberly-Clark Corp. | 5.300% | 3/1/41 | 453 | 476 | ||
| Kimberly-Clark Corp. | 3.200% | 7/30/46 | 1,460 | 1,158 | ||
| Kimberly-Clark Corp. | 3.900% | 5/4/47 | 445 | 390 | ||
| Kimberly-Clark Corp. | 2.875% | 2/7/50 | 1,434 | 1,069 | ||
| Koninklijke Ahold Delhaize NV | 5.700% | 10/1/40 | 722 | 758 | ||
| Kraft Heinz Foods Co. | 5.000% | 7/15/35 | 2,230 | 2,167 | ||
| Kraft Heinz Foods Co. | 6.875% | 1/26/39 | 1,495 | 1,654 | ||
| Kraft Heinz Foods Co. | 6.500% | 2/9/40 | 2,350 | 2,515 | ||
| Kraft Heinz Foods Co. | 5.000% | 6/4/42 | 2,470 | 2,304 | ||
| Kraft Heinz Foods Co. | 5.200% | 7/15/45 | 4,690 | 4,408 | ||
| Kraft Heinz Foods Co. | 4.375% | 6/1/46 | 7,195 | 6,106 | ||
| Kraft Heinz Foods Co. | 4.875% | 10/1/49 | 3,955 | 3,586 | ||
| Kraft Heinz Foods Co. | 5.500% | 6/1/50 | 2,373 | 2,351 | ||
| Kroger Co. | 6.900% | 4/15/38 | 536 | 619 | ||
| Kroger Co. | 5.400% | 7/15/40 | 718 | 723 | ||
| Kroger Co. | 5.000% | 4/15/42 | 1,158 | 1,106 | ||
| Kroger Co. | 5.150% | 8/1/43 | 2,816 | 2,762 | ||
| Coupon | Maturity Date | Face Amount ($000) | Market Value• ($000) | |||
| Kroger Co. | 3.875% | 10/15/46 | 1,768 | 1,474 | ||
| Kroger Co. | 4.450% | 2/1/47 | 1,805 | 1,637 | ||
| Kroger Co. | 4.650% | 1/15/48 | 749 | 695 | ||
| Kroger Co. | 3.950% | 1/15/50 | 2,262 | 1,918 | ||
| McCormick & Co. Inc. | 4.200% | 8/15/47 | 1,300 | 1,137 | ||
| Mead Johnson Nutrition Co. | 5.900% | 11/1/39 | 1,345 | 1,481 | ||
| Mead Johnson Nutrition Co. | 4.600% | 6/1/44 | 546 | 527 | ||
| Molson Coors Beverage Co. | 5.000% | 5/1/42 | 3,004 | 2,770 | ||
| Molson Coors Beverage Co. | 4.200% | 7/15/46 | 4,199 | 3,444 | ||
| Mondelez International Inc. | 1.875% | 10/15/32 | 1,738 | 1,363 | ||
| Mondelez International Inc. | 2.625% | 9/4/50 | 2,295 | 1,542 | ||
| PepsiCo Inc. | 3.500% | 3/19/40 | 1,614 | 1,438 | ||
| PepsiCo Inc. | 4.875% | 11/1/40 | 145 | 151 | ||
| PepsiCo Inc. | 2.625% | 10/21/41 | 2,015 | 1,581 | ||
| PepsiCo Inc. | 4.000% | 3/5/42 | 1,123 | 1,057 | ||
| PepsiCo Inc. | 3.600% | 8/13/42 | 2,025 | 1,790 | ||
| PepsiCo Inc. | 4.250% | 10/22/44 | 899 | 853 | ||
| PepsiCo Inc. | 4.450% | 4/14/46 | 2,469 | 2,495 | ||
| PepsiCo Inc. | 3.450% | 10/6/46 | 925 | 806 | ||
| PepsiCo Inc. | 4.000% | 5/2/47 | 1,295 | 1,219 | ||
| PepsiCo Inc. | 3.375% | 7/29/49 | 1,900 | 1,605 | ||
| PepsiCo Inc. | 2.875% | 10/15/49 | 2,111 | 1,647 | ||
| PepsiCo Inc. | 3.625% | 3/19/50 | 2,546 | 2,275 | ||
| PepsiCo Inc. | 2.750% | 10/21/51 | 1,810 | 1,370 | ||
| PepsiCo Inc. | 4.200% | 7/18/52 | 1,775 | 1,739 | ||
| PepsiCo Inc. | 3.875% | 3/19/60 | 1,620 | 1,534 | ||
| Philip Morris International Inc. | 6.375% | 5/16/38 | 3,974 | 4,120 | ||
| Philip Morris International Inc. | 4.375% | 11/15/41 | 1,141 | 941 | ||
| Philip Morris International Inc. | 4.500% | 3/20/42 | 1,975 | 1,628 | ||
| Philip Morris International Inc. | 3.875% | 8/21/42 | 1,872 | 1,420 | ||
| Philip Morris International Inc. | 4.125% | 3/4/43 | 2,902 | 2,262 | ||
| Philip Morris International Inc. | 4.875% | 11/15/43 | 2,616 | 2,267 | ||
| Philip Morris International Inc. | 4.250% | 11/10/44 | 800 | 633 | ||
| Procter & Gamble Co. | 5.800% | 8/15/34 | 379 | 435 | ||
| Procter & Gamble Co. | 5.550% | 3/5/37 | 595 | 678 | ||
| Procter & Gamble Co. | 3.550% | 3/25/40 | 2,095 | 1,900 | ||
| Procter & Gamble Co. | 3.500% | 10/25/47 | 1,895 | 1,689 | ||
| Procter & Gamble Co. | 3.600% | 3/25/50 | 395 | 363 | ||
| Reynolds American Inc. | 5.700% | 8/15/35 | 1,691 | 1,555 | ||
| Reynolds American Inc. | 7.250% | 6/15/37 | 1,595 | 1,644 | ||
| Reynolds American Inc. | 6.150% | 9/15/43 | 2,767 | 2,519 | ||
| Reynolds American Inc. | 5.850% | 8/15/45 | 5,368 | 4,584 | ||
| Sysco Corp. | 5.375% | 9/21/35 | 541 | 555 | ||
| Sysco Corp. | 6.600% | 4/1/40 | 3,052 | 3,486 | ||
| Sysco Corp. | 4.850% | 10/1/45 | 1,261 | 1,175 | ||
| Sysco Corp. | 4.500% | 4/1/46 | 1,726 | 1,533 | ||
| Sysco Corp. | 4.450% | 3/15/48 | 1,860 | 1,646 | ||
| Sysco Corp. | 3.300% | 2/15/50 | 135 | 100 | ||
| Sysco Corp. | 6.600% | 4/1/50 | 2,238 | 2,614 | ||
| Sysco Corp. | 3.150% | 12/14/51 | 740 | 532 | ||
| Target Corp. | 6.500% | 10/15/37 | 1,165 | 1,363 | ||
| Target Corp. | 7.000% | 1/15/38 | 1,155 | 1,424 | ||
| Target Corp. | 4.000% | 7/1/42 | 1,240 | 1,145 | ||
| Target Corp. | 3.625% | 4/15/46 | 855 | 729 | ||
| Target Corp. | 3.900% | 11/15/47 | 2,090 | 1,857 | ||
| Target Corp. | 2.950% | 1/15/52 | 2,910 | 2,193 | ||
| Tyson Foods Inc. | 4.875% | 8/15/34 | 2,039 | 2,023 | ||
| Tyson Foods Inc. | 5.150% | 8/15/44 | 1,397 | 1,369 | ||
| Tyson Foods Inc. | 4.550% | 6/2/47 | 394 | 361 | ||
| Tyson Foods Inc. | 5.100% | 9/28/48 | 3,583 | 3,537 | ||
| Unilever Capital Corp. | 5.900% | 11/15/32 | 2,567 | 2,908 | ||
| 1 | Unilever Capital Corp. | 2.625% | 8/12/51 | 735 | 525 | |
| Walgreens Boots Alliance Inc. | 4.800% | 11/18/44 | 2,393 | 2,112 | ||
| Walgreens Boots Alliance Inc. | 4.100% | 4/15/50 | 2,696 | 2,136 | ||
| Walmart Inc. | 5.250% | 9/1/35 | 3,141 | 3,457 | ||
| Walmart Inc. | 6.200% | 4/15/38 | 1,387 | 1,672 | ||
| Walmart Inc. | 3.950% | 6/28/38 | 3,424 | 3,309 | ||
| Coupon | Maturity Date | Face Amount ($000) | Market Value• ($000) | |||
| Walmart Inc. | 5.625% | 4/1/40 | 1,441 | 1,662 | ||
| Walmart Inc. | 5.000% | 10/25/40 | 1,493 | 1,573 | ||
| Walmart Inc. | 5.625% | 4/15/41 | 2,948 | 3,355 | ||
| Walmart Inc. | 2.500% | 9/22/41 | 195 | 151 | ||
| Walmart Inc. | 4.000% | 4/11/43 | 2,402 | 2,255 | ||
| Walmart Inc. | 3.625% | 12/15/47 | 2,598 | 2,316 | ||
| Walmart Inc. | 4.050% | 6/29/48 | 2,724 | 2,604 | ||
| Walmart Inc. | 2.950% | 9/24/49 | 1,179 | 941 | ||
| Walmart Inc. | 2.650% | 9/22/51 | 3,189 | 2,393 | ||
| 385,632 | ||||||
| Energy (8.8%) | ||||||
| Baker Hughes Holdings LLC | 5.125% | 9/15/40 | 2,710 | 2,621 | ||
| Baker Hughes Holdings LLC | 4.080% | 12/15/47 | 3,284 | 2,731 | ||
| Boardwalk Pipelines LP | 3.600% | 9/1/32 | 1,320 | 1,114 | ||
| BP Capital Markets America Inc. | 3.060% | 6/17/41 | 1,909 | 1,500 | ||
| BP Capital Markets America Inc. | 3.000% | 2/24/50 | 5,405 | 3,953 | ||
| BP Capital Markets America Inc. | 2.772% | 11/10/50 | 5,072 | 3,560 | ||
| BP Capital Markets America Inc. | 2.939% | 6/4/51 | 5,260 | 3,795 | ||
| BP Capital Markets America Inc. | 3.001% | 3/17/52 | 3,417 | 2,475 | ||
| BP Capital Markets America Inc. | 3.379% | 2/8/61 | 4,557 | 3,414 | ||
| Canadian Natural Resources Ltd. | 6.450% | 6/30/33 | 600 | 633 | ||
| Canadian Natural Resources Ltd. | 5.850% | 2/1/35 | 2,617 | 2,590 | ||
| Canadian Natural Resources Ltd. | 6.500% | 2/15/37 | 2,083 | 2,179 | ||
| Canadian Natural Resources Ltd. | 6.250% | 3/15/38 | 895 | 935 | ||
| Canadian Natural Resources Ltd. | 6.750% | 2/1/39 | 1,795 | 1,942 | ||
| 1 | Canadian Natural Resources Ltd. | 4.950% | 6/1/47 | 590 | 558 | |
| Cenovus Energy Inc. | 5.250% | 6/15/37 | 1,845 | 1,770 | ||
| Cenovus Energy Inc. | 6.800% | 9/15/37 | 1,473 | 1,593 | ||
| Cenovus Energy Inc. | 6.750% | 11/15/39 | 2,380 | 2,592 | ||
| Cenovus Energy Inc. | 5.400% | 6/15/47 | 2,150 | 2,093 | ||
| Cenovus Energy Inc. | 3.750% | 2/15/52 | 2,183 | 1,679 | ||
| Cheniere Corpus Christi Holdings LLC | 2.742% | 12/31/39 | 2,395 | 1,871 | ||
| Chevron Corp. | 3.078% | 5/11/50 | 2,203 | 1,752 | ||
| Chevron USA Inc. | 5.250% | 11/15/43 | 2,523 | 2,661 | ||
| Chevron USA Inc. | 2.343% | 8/12/50 | 580 | 400 | ||
| Columbia Pipeline Group Inc. | 5.800% | 6/1/45 | 1,422 | 1,454 | ||
| ConocoPhillips | 5.900% | 10/15/32 | 651 | 720 | ||
| ConocoPhillips | 5.900% | 5/15/38 | 2,845 | 3,118 | ||
| ConocoPhillips | 6.500% | 2/1/39 | 2,619 | 3,073 | ||
| ConocoPhillips | 4.875% | 10/1/47 | 1,475 | 1,454 | ||
| 2 | ConocoPhillips Co. | 3.758% | 3/15/42 | 2,210 | 1,942 | |
| ConocoPhillips Co. | 4.300% | 11/15/44 | 760 | 700 | ||
| ConocoPhillips Co. | 3.800% | 3/15/52 | 4,045 | 3,489 | ||
| 2 | ConocoPhillips Co. | 4.025% | 3/15/62 | 4,928 | 4,201 | |
| Continental Resources Inc. | 4.900% | 6/1/44 | 754 | 589 | ||
| DCP Midstream Operating LP | 5.600% | 4/1/44 | 1,000 | 960 | ||
| Devon Energy Corp. | 5.600% | 7/15/41 | 3,124 | 3,090 | ||
| Devon Energy Corp. | 4.750% | 5/15/42 | 732 | 661 | ||
| Devon Energy Corp. | 5.000% | 6/15/45 | 2,265 | 2,090 | ||
| Diamondback Energy Inc. | 4.400% | 3/24/51 | 1,133 | 965 | ||
| Diamondback Energy Inc. | 4.250% | 3/15/52 | 2,475 | 2,046 | ||
| 1 | Eastern Gas Transmission & Storage Inc. | 4.800% | 11/1/43 | 880 | 813 | |
| 1 | Eastern Gas Transmission & Storage Inc. | 4.600% | 12/15/44 | 705 | 636 | |
| 1 | Eastern Gas Transmission & Storage Inc. | 3.900% | 11/15/49 | 825 | 651 | |
| 1 | Enbridge Energy Partners LP | 7.500% | 4/15/38 | 1,271 | 1,465 | |
| Enbridge Energy Partners LP | 5.500% | 9/15/40 | 1,473 | 1,460 | ||
| Enbridge Energy Partners LP | 7.375% | 10/15/45 | 638 | 760 | ||
| Enbridge Inc. | 2.500% | 8/1/33 | 1,083 | 876 | ||
| Enbridge Inc. | 4.500% | 6/10/44 | 540 | 474 | ||
| Enbridge Inc. | 5.500% | 12/1/46 | 2,252 | 2,303 | ||
| Enbridge Inc. | 4.000% | 11/15/49 | 434 | 358 | ||
| Enbridge Inc. | 3.400% | 8/1/51 | 3,325 | 2,496 | ||
| Energy Transfer LP | 4.900% | 3/15/35 | 2,308 | 2,100 | ||
| Coupon | Maturity Date | Face Amount ($000) | Market Value• ($000) | |||
| Energy Transfer LP | 6.625% | 10/15/36 | 1,970 | 1,997 | ||
| 1 | Energy Transfer LP | 5.800% | 6/15/38 | 1,517 | 1,421 | |
| Energy Transfer LP | 7.500% | 7/1/38 | 389 | 421 | ||
| Energy Transfer LP | 6.050% | 6/1/41 | 1,194 | 1,162 | ||
| Energy Transfer LP | 6.500% | 2/1/42 | 3,257 | 3,284 | ||
| Energy Transfer LP | 6.100% | 2/15/42 | 1,924 | 1,824 | ||
| Energy Transfer LP | 4.950% | 1/15/43 | 733 | 612 | ||
| Energy Transfer LP | 5.150% | 2/1/43 | 2,585 | 2,210 | ||
| Energy Transfer LP | 5.950% | 10/1/43 | 2,873 | 2,708 | ||
| Energy Transfer LP | 5.300% | 4/1/44 | 724 | 636 | ||
| Energy Transfer LP | 5.000% | 5/15/44 | 285 | 243 | ||
| Energy Transfer LP | 5.150% | 3/15/45 | 2,959 | 2,569 | ||
| Energy Transfer LP | 5.350% | 5/15/45 | 970 | 858 | ||
| Energy Transfer LP | 6.125% | 12/15/45 | 2,535 | 2,436 | ||
| Energy Transfer LP | 5.300% | 4/15/47 | 3,634 | 3,178 | ||
| Energy Transfer LP | 5.400% | 10/1/47 | 1,733 | 1,542 | ||
| Energy Transfer LP | 6.000% | 6/15/48 | 1,697 | 1,616 | ||
| Energy Transfer LP | 6.250% | 4/15/49 | 1,534 | 1,506 | ||
| Energy Transfer LP | 5.000% | 5/15/50 | 4,250 | 3,648 | ||
| 1 | Enterprise Products Operating LLC | 6.875% | 3/1/33 | 1,323 | 1,504 | |
| 1 | Enterprise Products Operating LLC | 6.650% | 10/15/34 | 1,830 | 2,030 | |
| Enterprise Products Operating LLC | 7.550% | 4/15/38 | 2,196 | 2,577 | ||
| Enterprise Products Operating LLC | 6.125% | 10/15/39 | 2,071 | 2,203 | ||
| Enterprise Products Operating LLC | 6.450% | 9/1/40 | 920 | 1,003 | ||
| Enterprise Products Operating LLC | 5.950% | 2/1/41 | 1,030 | 1,079 | ||
| Enterprise Products Operating LLC | 5.700% | 2/15/42 | 760 | 775 | ||
| Enterprise Products Operating LLC | 4.850% | 8/15/42 | 2,251 | 2,115 | ||
| Enterprise Products Operating LLC | 4.450% | 2/15/43 | 3,081 | 2,735 | ||
| Enterprise Products Operating LLC | 4.850% | 3/15/44 | 3,010 | 2,803 | ||
| Enterprise Products Operating LLC | 5.100% | 2/15/45 | 3,834 | 3,665 | ||
| Enterprise Products Operating LLC | 4.900% | 5/15/46 | 622 | 580 | ||
| Enterprise Products Operating LLC | 4.250% | 2/15/48 | 1,445 | 1,237 | ||
| Enterprise Products Operating LLC | 4.800% | 2/1/49 | 3,546 | 3,263 | ||
| Enterprise Products Operating LLC | 4.200% | 1/31/50 | 2,998 | 2,538 | ||
| Enterprise Products Operating LLC | 3.700% | 1/31/51 | 922 | 724 | ||
| Enterprise Products Operating LLC | 3.200% | 2/15/52 | 1,416 | 1,021 | ||
| Enterprise Products Operating LLC | 3.300% | 2/15/53 | 2,809 | 2,079 | ||
| Enterprise Products Operating LLC | 4.950% | 10/15/54 | 2,417 | 2,203 | ||
| Enterprise Products Operating LLC | 3.950% | 1/31/60 | 1,660 | 1,295 | ||
| EOG Resources Inc. | 3.900% | 4/1/35 | 2,309 | 2,127 | ||
| EOG Resources Inc. | 4.950% | 4/15/50 | 1,785 | 1,844 | ||
| Exxon Mobil Corp. | 2.995% | 8/16/39 | 1,868 | 1,530 | ||
| Exxon Mobil Corp. | 4.227% | 3/19/40 | 5,068 | 4,830 | ||
| Exxon Mobil Corp. | 3.567% | 3/6/45 | 3,772 | 3,192 | ||
| Exxon Mobil Corp. | 4.114% | 3/1/46 | 6,797 | 6,262 | ||
| Exxon Mobil Corp. | 3.095% | 8/16/49 | 5,034 | 3,936 | ||
| Exxon Mobil Corp. | 4.327% | 3/19/50 | 6,301 | 6,008 | ||
| Exxon Mobil Corp. | 3.452% | 4/15/51 | 5,575 | 4,608 | ||
| Halliburton Co. | 4.850% | 11/15/35 | 3,455 | 3,288 | ||
| Halliburton Co. | 6.700% | 9/15/38 | 890 | 965 | ||
| Halliburton Co. | 7.450% | 9/15/39 | 1,394 | 1,619 | ||
| Halliburton Co. | 4.500% | 11/15/41 | 1,995 | 1,721 | ||
| Halliburton Co. | 4.750% | 8/1/43 | 3,154 | 2,800 | ||
| Halliburton Co. | 5.000% | 11/15/45 | 3,969 | 3,615 | ||
| Hess Corp. | 7.125% | 3/15/33 | 1,555 | 1,727 | ||
| Hess Corp. | 6.000% | 1/15/40 | 822 | 839 | ||
| Hess Corp. | 5.600% | 2/15/41 | 1,690 | 1,627 | ||
| Hess Corp. | 5.800% | 4/1/47 | 2,454 | 2,446 | ||
| Kinder Morgan Energy Partners LP | 7.300% | 8/15/33 | 711 | 789 | ||
| Kinder Morgan Energy Partners LP | 5.800% | 3/15/35 | 1,221 | 1,225 | ||
| Kinder Morgan Energy Partners LP | 6.500% | 2/1/37 | 1,678 | 1,757 | ||
| 1 | Kinder Morgan Energy Partners LP | 6.950% | 1/15/38 | 1,702 | 1,842 | |
| Kinder Morgan Energy Partners LP | 6.500% | 9/1/39 | 2,150 | 2,215 | ||
| Kinder Morgan Energy Partners LP | 6.550% | 9/15/40 | 3,211 | 3,320 | ||
| Kinder Morgan Energy Partners LP | 7.500% | 11/15/40 | 2,364 | 2,648 | ||
| Kinder Morgan Energy Partners LP | 5.625% | 9/1/41 | 825 | 770 | ||
| Kinder Morgan Energy Partners LP | 5.000% | 8/15/42 | 2,205 | 1,978 | ||
| Coupon | Maturity Date | Face Amount ($000) | Market Value• ($000) | |||
| Kinder Morgan Energy Partners LP | 4.700% | 11/1/42 | 1,602 | 1,370 | ||
| Kinder Morgan Energy Partners LP | 5.000% | 3/1/43 | 1,568 | 1,404 | ||
| Kinder Morgan Energy Partners LP | 5.500% | 3/1/44 | 3,385 | 3,170 | ||
| Kinder Morgan Energy Partners LP | 5.400% | 9/1/44 | 3,086 | 2,856 | ||
| Kinder Morgan Inc. | 5.300% | 12/1/34 | 773 | 756 | ||
| Kinder Morgan Inc. | 5.550% | 6/1/45 | 2,132 | 2,073 | ||
| Kinder Morgan Inc. | 5.050% | 2/15/46 | 921 | 837 | ||
| Kinder Morgan Inc. | 5.200% | 3/1/48 | 1,086 | 1,009 | ||
| Kinder Morgan Inc. | 3.250% | 8/1/50 | 1,091 | 759 | ||
| Kinder Morgan Inc. | 3.600% | 2/15/51 | 1,569 | 1,168 | ||
| Kinder Morgan Inc. | 5.450% | 8/1/52 | 1,565 | 1,520 | ||
| Magellan Midstream Partners LP | 5.150% | 10/15/43 | 1,225 | 1,125 | ||
| Magellan Midstream Partners LP | 4.250% | 9/15/46 | 335 | 276 | ||
| Magellan Midstream Partners LP | 4.200% | 10/3/47 | 1,537 | 1,252 | ||
| Magellan Midstream Partners LP | 4.850% | 2/1/49 | 620 | 550 | ||
| Magellan Midstream Partners LP | 3.950% | 3/1/50 | 2,642 | 2,075 | ||
| Marathon Oil Corp. | 6.600% | 10/1/37 | 1,957 | 2,053 | ||
| Marathon Oil Corp. | 5.200% | 6/1/45 | 1,418 | 1,297 | ||
| Marathon Petroleum Corp. | 6.500% | 3/1/41 | 1,177 | 1,263 | ||
| Marathon Petroleum Corp. | 4.750% | 9/15/44 | 2,821 | 2,486 | ||
| Marathon Petroleum Corp. | 4.500% | 4/1/48 | 2,170 | 1,818 | ||
| Marathon Petroleum Corp. | 5.000% | 9/15/54 | 1,695 | 1,506 | ||
| MPLX LP | 4.500% | 4/15/38 | 3,992 | 3,530 | ||
| MPLX LP | 5.200% | 3/1/47 | 1,499 | 1,360 | ||
| MPLX LP | 5.200% | 12/1/47 | 1,938 | 1,746 | ||
| MPLX LP | 4.700% | 4/15/48 | 1,846 | 1,577 | ||
| MPLX LP | 5.500% | 2/15/49 | 5,688 | 5,416 | ||
| MPLX LP | 4.950% | 3/14/52 | 3,080 | 2,712 | ||
| MPLX LP | 4.900% | 4/15/58 | 1,114 | 932 | ||
| NOV Inc. | 3.950% | 12/1/42 | 1,800 | 1,304 | ||
| ONEOK Inc. | 6.000% | 6/15/35 | 1,283 | 1,252 | ||
| ONEOK Inc. | 4.950% | 7/13/47 | 1,730 | 1,492 | ||
| ONEOK Inc. | 5.200% | 7/15/48 | 2,408 | 2,163 | ||
| ONEOK Inc. | 4.450% | 9/1/49 | 2,010 | 1,602 | ||
| ONEOK Inc. | 4.500% | 3/15/50 | 1,365 | 1,098 | ||
| ONEOK Inc. | 7.150% | 1/15/51 | 995 | 1,062 | ||
| ONEOK Partners LP | 6.650% | 10/1/36 | 1,730 | 1,768 | ||
| ONEOK Partners LP | 6.850% | 10/15/37 | 491 | 511 | ||
| ONEOK Partners LP | 6.125% | 2/1/41 | 1,257 | 1,214 | ||
| ONEOK Partners LP | 6.200% | 9/15/43 | 1,540 | 1,462 | ||
| Ovintiv Inc. | 6.500% | 8/15/34 | 1,476 | 1,524 | ||
| Ovintiv Inc. | 6.625% | 8/15/37 | 1,650 | 1,697 | ||
| Ovintiv Inc. | 6.500% | 2/1/38 | 1,131 | 1,155 | ||
| Phillips 66 | 4.650% | 11/15/34 | 1,082 | 1,042 | ||
| Phillips 66 | 5.875% | 5/1/42 | 2,252 | 2,401 | ||
| Phillips 66 | 4.875% | 11/15/44 | 3,649 | 3,497 | ||
| Phillips 66 | 3.300% | 3/15/52 | 4,100 | 3,053 | ||
| 2 | Phillips 66 Co. | 4.680% | 2/15/45 | 852 | 775 | |
| 2 | Phillips 66 Co. | 4.900% | 10/1/46 | 1,830 | 1,721 | |
| Plains All American Pipeline LP | 6.650% | 1/15/37 | 1,319 | 1,323 | ||
| Plains All American Pipeline LP | 5.150% | 6/1/42 | 2,566 | 2,147 | ||
| Plains All American Pipeline LP | 4.300% | 1/31/43 | 1,232 | 924 | ||
| Plains All American Pipeline LP | 4.700% | 6/15/44 | 665 | 525 | ||
| Plains All American Pipeline LP | 4.900% | 2/15/45 | 957 | 778 | ||
| Shell International Finance BV | 4.125% | 5/11/35 | 6,276 | 5,974 | ||
| Shell International Finance BV | 6.375% | 12/15/38 | 4,139 | 4,818 | ||
| Shell International Finance BV | 5.500% | 3/25/40 | 3,369 | 3,637 | ||
| Shell International Finance BV | 2.875% | 11/26/41 | 1,852 | 1,437 | ||
| Shell International Finance BV | 3.625% | 8/21/42 | 2,660 | 2,255 | ||
| Shell International Finance BV | 4.550% | 8/12/43 | 4,051 | 3,895 | ||
| Shell International Finance BV | 4.375% | 5/11/45 | 8,552 | 8,001 | ||
| Shell International Finance BV | 4.000% | 5/10/46 | 2,907 | 2,565 | ||
| Shell International Finance BV | 3.750% | 9/12/46 | 1,634 | 1,405 | ||
| Shell International Finance BV | 3.125% | 11/7/49 | 3,772 | 2,925 | ||
| Shell International Finance BV | 3.250% | 4/6/50 | 4,529 | 3,598 | ||
| Shell International Finance BV | 3.000% | 11/26/51 | 855 | 644 | ||
| Spectra Energy Partners LP | 5.950% | 9/25/43 | 1,857 | 1,918 | ||
| Coupon | Maturity Date | Face Amount ($000) | Market Value• ($000) | |||
| Spectra Energy Partners LP | 4.500% | 3/15/45 | 2,403 | 2,095 | ||
| Suncor Energy Inc. | 5.350% | 7/15/33 | 1,003 | 992 | ||
| Suncor Energy Inc. | 5.950% | 12/1/34 | 842 | 872 | ||
| Suncor Energy Inc. | 5.950% | 5/15/35 | 2,513 | 2,566 | ||
| Suncor Energy Inc. | 6.800% | 5/15/38 | 1,469 | 1,621 | ||
| Suncor Energy Inc. | 6.500% | 6/15/38 | 3,269 | 3,522 | ||
| Suncor Energy Inc. | 6.850% | 6/1/39 | 1,474 | 1,645 | ||
| Suncor Energy Inc. | 4.000% | 11/15/47 | 2,705 | 2,262 | ||
| Suncor Energy Inc. | 3.750% | 3/4/51 | 1,035 | 825 | ||
| Targa Resources Corp. | 4.200% | 2/1/33 | 2,623 | 2,358 | ||
| Targa Resources Corp. | 4.950% | 4/15/52 | 2,515 | 2,171 | ||
| TotalEnergies Capital International SA | 2.986% | 6/29/41 | 1,609 | 1,284 | ||
| TotalEnergies Capital International SA | 3.461% | 7/12/49 | 1,340 | 1,103 | ||
| TotalEnergies Capital International SA | 3.127% | 5/29/50 | 6,431 | 4,987 | ||
| TotalEnergies Capital International SA | 3.386% | 6/29/60 | 770 | 598 | ||
| TransCanada PipeLines Ltd. | 4.625% | 3/1/34 | 1,255 | 1,200 | ||
| TransCanada PipeLines Ltd. | 5.600% | 3/31/34 | 1,031 | 1,039 | ||
| TransCanada PipeLines Ltd. | 5.850% | 3/15/36 | 2,320 | 2,394 | ||
| TransCanada PipeLines Ltd. | 6.200% | 10/15/37 | 2,795 | 3,001 | ||
| TransCanada PipeLines Ltd. | 4.750% | 5/15/38 | 1,305 | 1,236 | ||
| TransCanada PipeLines Ltd. | 7.250% | 8/15/38 | 2,331 | 2,754 | ||
| TransCanada PipeLines Ltd. | 7.625% | 1/15/39 | 1,879 | 2,292 | ||
| TransCanada PipeLines Ltd. | 6.100% | 6/1/40 | 1,886 | 2,005 | ||
| TransCanada PipeLines Ltd. | 5.000% | 10/16/43 | 3,243 | 3,077 | ||
| TransCanada PipeLines Ltd. | 4.875% | 5/15/48 | 3,440 | 3,297 | ||
| TransCanada PipeLines Ltd. | 5.100% | 3/15/49 | 529 | 525 | ||
| Transcontinental Gas Pipe Line Co. LLC | 5.400% | 8/15/41 | 1,490 | 1,480 | ||
| Transcontinental Gas Pipe Line Co. LLC | 4.450% | 8/1/42 | 690 | 621 | ||
| Transcontinental Gas Pipe Line Co. LLC | 4.600% | 3/15/48 | 2,004 | 1,814 | ||
| Transcontinental Gas Pipe Line Co. LLC | 3.950% | 5/15/50 | 3,849 | 3,195 | ||
| Valero Energy Corp. | 6.625% | 6/15/37 | 2,952 | 3,201 | ||
| Valero Energy Corp. | 4.900% | 3/15/45 | 360 | 331 | ||
| Valero Energy Corp. | 3.650% | 12/1/51 | 3,055 | 2,328 | ||
| Valero Energy Corp. | 4.000% | 6/1/52 | 3,375 | 2,735 | ||
| Williams Cos. Inc. | 6.300% | 4/15/40 | 2,258 | 2,408 | ||
| Williams Cos. Inc. | 5.800% | 11/15/43 | 1,008 | 999 | ||
| Williams Cos. Inc. | 5.400% | 3/4/44 | 801 | 764 | ||
| Williams Cos. Inc. | 5.750% | 6/24/44 | 657 | 660 | ||
| Williams Cos. Inc. | 4.900% | 1/15/45 | 816 | 732 | ||
| Williams Cos. Inc. | 5.100% | 9/15/45 | 1,697 | 1,588 | ||
| Williams Cos. Inc. | 4.850% | 3/1/48 | 1,855 | 1,681 | ||
| Williams Cos. Inc. | 3.500% | 10/15/51 | 2,314 | 1,727 | ||
| Williams Cos. Inc. | 5.300% | 8/15/52 | 1,000 | 975 | ||
| 447,601 | ||||||
| Financials (14.6%) | ||||||
| AerCap Ireland Capital DAC | 3.400% | 10/29/33 | 4,246 | 3,354 | ||
| AerCap Ireland Capital DAC | 3.850% | 10/29/41 | 2,883 | 2,137 | ||
| Aflac Inc. | 4.000% | 10/15/46 | 1,413 | 1,208 | ||
| Aflac Inc. | 4.750% | 1/15/49 | 2,224 | 2,139 | ||
| Alleghany Corp. | 4.900% | 9/15/44 | 1,162 | 1,120 | ||
| Alleghany Corp. | 3.250% | 8/15/51 | 985 | 747 | ||
| Allstate Corp. | 5.350% | 6/1/33 | 879 | 929 | ||
| Allstate Corp. | 5.550% | 5/9/35 | 961 | 1,031 | ||
| Allstate Corp. | 4.500% | 6/15/43 | 1,568 | 1,462 | ||
| Allstate Corp. | 4.200% | 12/15/46 | 2,330 | 2,109 | ||
| Allstate Corp. | 3.850% | 8/10/49 | 1,300 | 1,107 | ||
| 1 | Allstate Corp. | 6.500% | 5/15/57 | 986 | 1,004 | |
| American Express Co. | 4.050% | 12/3/42 | 1,937 | 1,760 | ||
| American Financial Group Inc. | 4.500% | 6/15/47 | 768 | 651 | ||
| American International Group Inc. | 3.875% | 1/15/35 | 909 | 828 | ||
| Coupon | Maturity Date | Face Amount ($000) | Market Value• ($000) | |||
| American International Group Inc. | 4.700% | 7/10/35 | 936 | 894 | ||
| American International Group Inc. | 6.250% | 5/1/36 | 1,810 | 2,013 | ||
| American International Group Inc. | 4.500% | 7/16/44 | 2,635 | 2,373 | ||
| American International Group Inc. | 4.800% | 7/10/45 | 508 | 474 | ||
| American International Group Inc. | 4.750% | 4/1/48 | 800 | 757 | ||
| American International Group Inc. | 4.375% | 6/30/50 | 2,570 | 2,307 | ||
| Aon Corp. | 6.250% | 9/30/40 | 1,262 | 1,381 | ||
| Aon Corp. | 2.900% | 8/23/51 | 720 | 499 | ||
| Aon Corp. | 3.900% | 2/28/52 | 2,050 | 1,705 | ||
| Aon Global Ltd. | 4.600% | 6/14/44 | 553 | 506 | ||
| Aon Global Ltd. | 4.750% | 5/15/45 | 2,380 | 2,209 | ||
| Arch Capital Finance LLC | 5.031% | 12/15/46 | 1,422 | 1,331 | ||
| Arch Capital Group Ltd. | 7.350% | 5/1/34 | 767 | 915 | ||
| Arch Capital Group Ltd. | 3.635% | 6/30/50 | 438 | 340 | ||
| Arch Capital Group US Inc. | 5.144% | 11/1/43 | 1,175 | 1,131 | ||
| Arthur J Gallagher & Co. | 3.500% | 5/20/51 | 2,190 | 1,667 | ||
| Arthur J Gallagher & Co. | 3.050% | 3/9/52 | 615 | 428 | ||
| Assured Guaranty US Holdings Inc. | 3.600% | 9/15/51 | 950 | 699 | ||
| Athene Holding Ltd. | 3.950% | 5/25/51 | 1,557 | 1,153 | ||
| Athene Holding Ltd. | 3.450% | 5/15/52 | 1,960 | 1,344 | ||
| Bank of America Corp. | 6.110% | 1/29/37 | 2,567 | 2,719 | ||
| 1 | Bank of America Corp. | 4.244% | 4/24/38 | 3,761 | 3,397 | |
| Bank of America Corp. | 7.750% | 5/14/38 | 3,718 | 4,590 | ||
| 1 | Bank of America Corp. | 4.078% | 4/23/40 | 5,035 | 4,396 | |
| 1 | Bank of America Corp. | 2.676% | 6/19/41 | 10,287 | 7,381 | |
| 1 | Bank of America Corp. | 5.875% | 2/7/42 | 2,659 | 2,899 | |
| Bank of America Corp. | 3.311% | 4/22/42 | 6,200 | 4,853 | ||
| 1 | Bank of America Corp. | 5.000% | 1/21/44 | 6,509 | 6,323 | |
| 1 | Bank of America Corp. | 4.875% | 4/1/44 | 1,366 | 1,313 | |
| 1 | Bank of America Corp. | 4.750% | 4/21/45 | 1,306 | 1,183 | |
| 1 | Bank of America Corp. | 4.443% | 1/20/48 | 7,925 | 7,260 | |
| 1 | Bank of America Corp. | 3.946% | 1/23/49 | 4,099 | 3,466 | |
| 1 | Bank of America Corp. | 4.330% | 3/15/50 | 7,325 | 6,567 | |
| 1 | Bank of America Corp. | 4.083% | 3/20/51 | 15,567 | 13,332 | |
| 1 | Bank of America Corp. | 2.831% | 10/24/51 | 913 | 620 | |
| 1 | Bank of America Corp. | 3.483% | 3/13/52 | 2,470 | 1,912 | |
| Bank of America Corp. | 2.972% | 7/21/52 | 3,468 | 2,422 | ||
| 1 | Bank of America NA | 6.000% | 10/15/36 | 3,237 | 3,484 | |
| Barclays plc | 3.811% | 3/10/42 | 2,495 | 1,812 | ||
| Barclays plc | 3.330% | 11/24/42 | 2,040 | 1,469 | ||
| Barclays plc | 5.250% | 8/17/45 | 2,751 | 2,580 | ||
| Barclays plc | 4.950% | 1/10/47 | 4,697 | 4,284 | ||
| Berkshire Hathaway Finance Corp. | 5.750% | 1/15/40 | 729 | 821 | ||
| Berkshire Hathaway Finance Corp. | 4.400% | 5/15/42 | 2,554 | 2,449 | ||
| Berkshire Hathaway Finance Corp. | 4.300% | 5/15/43 | 1,879 | 1,774 | ||
| Berkshire Hathaway Finance Corp. | 4.200% | 8/15/48 | 6,801 | 6,321 | ||
| Berkshire Hathaway Finance Corp. | 4.250% | 1/15/49 | 4,022 | 3,776 | ||
| Berkshire Hathaway Finance Corp. | 2.850% | 10/15/50 | 4,082 | 2,978 | ||
| Berkshire Hathaway Finance Corp. | 2.500% | 1/15/51 | 1,160 | 794 | ||
| Berkshire Hathaway Finance Corp. | 3.850% | 3/15/52 | 8,565 | 7,379 | ||
| Berkshire Hathaway Inc. | 4.500% | 2/11/43 | 1,915 | 1,859 | ||
| Brighthouse Financial Inc. | 4.700% | 6/22/47 | 748 | 592 | ||
| Brighthouse Financial Inc. | 3.850% | 12/22/51 | 515 | 355 | ||
| Brookfield Finance Inc. | 4.700% | 9/20/47 | 2,204 | 1,903 | ||
| Brookfield Finance Inc. | 3.500% | 3/30/51 | 1,823 | 1,310 | ||
| Brookfield Finance Inc. | 3.625% | 2/15/52 | 1,281 | 944 | ||
| Brookfield Finance LLC | 3.450% | 4/15/50 | 1,345 | 953 | ||
| Brown & Brown Inc. | 4.950% | 3/17/52 | 1,585 | 1,411 | ||
| Chubb Corp. | 6.000% | 5/11/37 | 2,426 | 2,739 | ||
| 1 | Chubb Corp. | 6.500% | 5/15/38 | 1,505 | 1,763 | |
| Chubb INA Holdings Inc. | 6.700% | 5/15/36 | 1,979 | 2,317 | ||
| Chubb INA Holdings Inc. | 4.150% | 3/13/43 | 2,574 | 2,323 | ||
| Chubb INA Holdings Inc. | 4.350% | 11/3/45 | 1,624 | 1,526 | ||
| Chubb INA Holdings Inc. | 2.850% | 12/15/51 | 1,560 | 1,140 | ||
| Chubb INA Holdings Inc. | 3.050% | 12/15/61 | 1,865 | 1,317 | ||
| CI Financial Corp. | 4.100% | 6/15/51 | 1,980 | 1,296 | ||
| Cincinnati Financial Corp. | 6.125% | 11/1/34 | 1,189 | 1,304 | ||
| Coupon | Maturity Date | Face Amount ($000) | Market Value• ($000) | |||
| Citigroup Inc. | 5.875% | 2/22/33 | 1,597 | 1,646 | ||
| Citigroup Inc. | 6.000% | 10/31/33 | 2,452 | 2,558 | ||
| Citigroup Inc. | 6.125% | 8/25/36 | 1,890 | 1,996 | ||
| 1 | Citigroup Inc. | 3.878% | 1/24/39 | 1,943 | 1,689 | |
| Citigroup Inc. | 8.125% | 7/15/39 | 4,236 | 5,555 | ||
| 1 | Citigroup Inc. | 5.316% | 3/26/41 | 2,197 | 2,195 | |
| Citigroup Inc. | 5.875% | 1/30/42 | 4,781 | 5,081 | ||
| Citigroup Inc. | 2.904% | 11/3/42 | 802 | 584 | ||
| Citigroup Inc. | 6.675% | 9/13/43 | 1,929 | 2,178 | ||
| Citigroup Inc. | 5.300% | 5/6/44 | 2,455 | 2,389 | ||
| Citigroup Inc. | 4.650% | 7/30/45 | 3,353 | 3,104 | ||
| Citigroup Inc. | 4.750% | 5/18/46 | 4,385 | 3,949 | ||
| 1 | Citigroup Inc. | 4.281% | 4/24/48 | 2,453 | 2,202 | |
| Citigroup Inc. | 4.650% | 7/23/48 | 4,373 | 4,118 | ||
| Citizens Financial Group Inc. | 2.638% | 9/30/32 | 793 | 628 | ||
| CME Group Inc. | 5.300% | 9/15/43 | 1,051 | 1,143 | ||
| CME Group Inc. | 4.150% | 6/15/48 | 1,927 | 1,834 | ||
| 1 | Cooperatieve Rabobank UA | 5.250% | 5/24/41 | 5,119 | 5,570 | |
| Cooperatieve Rabobank UA | 5.750% | 12/1/43 | 2,335 | 2,425 | ||
| Cooperatieve Rabobank UA | 5.250% | 8/4/45 | 2,654 | 2,578 | ||
| 2 | Corebridge Financial Inc. | 4.350% | 4/5/42 | 1,935 | 1,639 | |
| 2 | Corebridge Financial Inc. | 4.400% | 4/5/52 | 3,830 | 3,149 | |
| Credit Suisse Group AG | 4.875% | 5/15/45 | 4,883 | 3,937 | ||
| Equitable Holdings Inc. | 5.000% | 4/20/48 | 3,967 | 3,713 | ||
| Everest Reinsurance Holdings Inc. | 4.868% | 6/1/44 | 1,357 | 1,244 | ||
| Everest Reinsurance Holdings Inc. | 3.500% | 10/15/50 | 1,425 | 1,065 | ||
| Everest Reinsurance Holdings Inc. | 3.125% | 10/15/52 | 2,565 | 1,781 | ||
| Fidelity National Financial Inc. | 3.200% | 9/17/51 | 1,133 | 713 | ||
| Fifth Third Bancorp | 8.250% | 3/1/38 | 2,384 | 3,077 | ||
| 1 | First Republic Bank | 4.375% | 8/1/46 | 1,730 | 1,480 | |
| Franklin Resources Inc. | 2.950% | 8/12/51 | 914 | 633 | ||
| GATX Corp. | 5.200% | 3/15/44 | 897 | 823 | ||
| GATX Corp. | 3.100% | 6/1/51 | 1,323 | 866 | ||
| GE Capital International Funding Co. Unlimited Co. | 4.418% | 11/15/35 | 17,578 | 16,576 | ||
| Global Payments Inc. | 4.150% | 8/15/49 | 2,970 | 2,268 | ||
| Global Payments Inc. | 5.950% | 8/15/52 | 100 | 97 | ||
| Goldman Sachs Capital I | 6.345% | 2/15/34 | 1,398 | 1,464 | ||
| Goldman Sachs Group Inc. | 6.125% | 2/15/33 | 3,893 | 4,235 | ||
| Goldman Sachs Group Inc. | 6.450% | 5/1/36 | 3,115 | 3,355 | ||
| Goldman Sachs Group Inc. | 6.750% | 10/1/37 | 13,860 | 15,370 | ||
| 1 | Goldman Sachs Group Inc. | 4.017% | 10/31/38 | 4,778 | 4,169 | |
| 1 | Goldman Sachs Group Inc. | 4.411% | 4/23/39 | 3,728 | 3,402 | |
| Goldman Sachs Group Inc. | 6.250% | 2/1/41 | 6,537 | 7,273 | ||
| Goldman Sachs Group Inc. | 3.210% | 4/22/42 | 3,517 | 2,707 | ||
| Goldman Sachs Group Inc. | 2.908% | 7/21/42 | 935 | 682 | ||
| Goldman Sachs Group Inc. | 3.436% | 2/24/43 | 5,695 | 4,491 | ||
| 1 | Goldman Sachs Group Inc. | 4.800% | 7/8/44 | 6,113 | 5,857 | |
| Goldman Sachs Group Inc. | 5.150% | 5/22/45 | 3,901 | 3,697 | ||
| Goldman Sachs Group Inc. | 4.750% | 10/21/45 | 3,291 | 3,085 | ||
| Hartford Financial Services Group Inc. | 5.950% | 10/15/36 | 708 | 758 | ||
| Hartford Financial Services Group Inc. | 6.100% | 10/1/41 | 1,186 | 1,276 | ||
| Hartford Financial Services Group Inc. | 4.300% | 4/15/43 | 1,236 | 1,077 | ||
| Hartford Financial Services Group Inc. | 4.400% | 3/15/48 | 1,100 | 997 | ||
| Hartford Financial Services Group Inc. | 3.600% | 8/19/49 | 1,838 | 1,448 | ||
| Hartford Financial Services Group Inc. | 2.900% | 9/15/51 | 745 | 511 | ||
| 1 | HSBC Bank USA NA | 5.875% | 11/1/34 | 550 | 553 | |
| 1 | HSBC Bank USA NA | 5.625% | 8/15/35 | 995 | 990 | |
| 1 | HSBC Bank USA NA | 7.000% | 1/15/39 | 2,761 | 3,176 | |
| HSBC Holdings plc | 6.500% | 5/2/36 | 5,399 | 5,662 | ||
| HSBC Holdings plc | 6.500% | 9/15/37 | 3,725 | 3,888 | ||
| HSBC Holdings plc | 6.800% | 6/1/38 | 2,966 | 3,197 | ||
| Coupon | Maturity Date | Face Amount ($000) | Market Value• ($000) | |||
| HSBC Holdings plc | 6.100% | 1/14/42 | 2,246 | 2,456 | ||
| HSBC Holdings plc | 5.250% | 3/14/44 | 3,748 | 3,445 | ||
| Intercontinental Exchange Inc. | 1.850% | 9/15/32 | 2,730 | 2,154 | ||
| Intercontinental Exchange Inc. | 4.600% | 3/15/33 | 5,246 | 5,194 | ||
| Intercontinental Exchange Inc. | 2.650% | 9/15/40 | 3,600 | 2,669 | ||
| Intercontinental Exchange Inc. | 4.250% | 9/21/48 | 4,441 | 3,982 | ||
| Intercontinental Exchange Inc. | 3.000% | 6/15/50 | 2,841 | 2,072 | ||
| Intercontinental Exchange Inc. | 4.950% | 6/15/52 | 4,295 | 4,223 | ||
| Intercontinental Exchange Inc. | 3.000% | 9/15/60 | 1,000 | 678 | ||
| Intercontinental Exchange Inc. | 5.200% | 6/15/62 | 2,970 | 2,922 | ||
| Invesco Finance plc | 5.375% | 11/30/43 | 398 | 392 | ||
| 2 | Jackson Financial Inc. | 4.000% | 11/23/51 | 1,205 | 836 | |
| Jefferies Group LLC | 2.750% | 10/15/32 | 1,140 | 873 | ||
| Jefferies Group LLC | 6.250% | 1/15/36 | 1,659 | 1,674 | ||
| Jefferies Group LLC | 6.500% | 1/20/43 | 384 | 388 | ||
| JPMorgan Chase & Co. | 1.953% | 2/4/32 | 85 | 67 | ||
| JPMorgan Chase & Co. | 6.400% | 5/15/38 | 5,632 | 6,412 | ||
| 1 | JPMorgan Chase & Co. | 3.882% | 7/24/38 | 2,495 | 2,194 | |
| JPMorgan Chase & Co. | 5.500% | 10/15/40 | 4,335 | 4,535 | ||
| 1 | JPMorgan Chase & Co. | 3.109% | 4/22/41 | 5,063 | 3,907 | |
| JPMorgan Chase & Co. | 5.600% | 7/15/41 | 4,772 | 5,045 | ||
| JPMorgan Chase & Co. | 2.525% | 11/19/41 | 888 | 620 | ||
| JPMorgan Chase & Co. | 5.400% | 1/6/42 | 4,687 | 4,826 | ||
| JPMorgan Chase & Co. | 3.157% | 4/22/42 | 1,668 | 1,293 | ||
| JPMorgan Chase & Co. | 5.625% | 8/16/43 | 4,684 | 4,892 | ||
| JPMorgan Chase & Co. | 4.850% | 2/1/44 | 4,401 | 4,370 | ||
| JPMorgan Chase & Co. | 4.950% | 6/1/45 | 2,751 | 2,633 | ||
| 1 | JPMorgan Chase & Co. | 4.260% | 2/22/48 | 6,511 | 5,735 | |
| 1 | JPMorgan Chase & Co. | 4.032% | 7/24/48 | 3,065 | 2,629 | |
| 1 | JPMorgan Chase & Co. | 3.964% | 11/15/48 | 7,108 | 5,952 | |
| 1 | JPMorgan Chase & Co. | 3.897% | 1/23/49 | 5,413 | 4,520 | |
| 1 | JPMorgan Chase & Co. | 3.109% | 4/22/51 | 4,400 | 3,190 | |
| JPMorgan Chase & Co. | 3.328% | 4/22/52 | 9,230 | 6,967 | ||
| Legg Mason Inc. | 5.625% | 1/15/44 | 1,373 | 1,417 | ||
| Lincoln National Corp. | 6.300% | 10/9/37 | 1,279 | 1,385 | ||
| Lincoln National Corp. | 7.000% | 6/15/40 | 1,348 | 1,524 | ||
| Lincoln National Corp. | 4.350% | 3/1/48 | 1,291 | 1,104 | ||
| Lloyds Banking Group plc | 5.300% | 12/1/45 | 1,310 | 1,190 | ||
| Lloyds Banking Group plc | 3.369% | 12/14/46 | 70 | 49 | ||
| Lloyds Banking Group plc | 4.344% | 1/9/48 | 4,512 | 3,647 | ||
| Loews Corp. | 4.125% | 5/15/43 | 2,081 | 1,760 | ||
| Manulife Financial Corp. | 5.375% | 3/4/46 | 740 | 771 | ||
| Markel Corp. | 5.000% | 4/5/46 | 1,360 | 1,269 | ||
| Markel Corp. | 4.300% | 11/1/47 | 1,123 | 952 | ||
| Markel Corp. | 5.000% | 5/20/49 | 1,743 | 1,649 | ||
| Markel Corp. | 4.150% | 9/17/50 | 427 | 350 | ||
| Markel Corp. | 3.450% | 5/7/52 | 1,360 | 1,005 | ||
| Marsh & McLennan Cos. Inc. | 5.875% | 8/1/33 | 1,618 | 1,751 | ||
| Marsh & McLennan Cos. Inc. | 4.750% | 3/15/39 | 2,001 | 1,953 | ||
| Marsh & McLennan Cos. Inc. | 4.350% | 1/30/47 | 2,418 | 2,209 | ||
| Marsh & McLennan Cos. Inc. | 4.200% | 3/1/48 | 430 | 384 | ||
| Marsh & McLennan Cos. Inc. | 4.900% | 3/15/49 | 2,214 | 2,212 | ||
| Marsh & McLennan Cos. Inc. | 2.900% | 12/15/51 | 755 | 542 | ||
| Mastercard Inc. | 3.800% | 11/21/46 | 424 | 384 | ||
| Mastercard Inc. | 3.950% | 2/26/48 | 2,445 | 2,245 | ||
| Mastercard Inc. | 3.650% | 6/1/49 | 1,496 | 1,309 | ||
| Mastercard Inc. | 3.850% | 3/26/50 | 4,516 | 4,082 | ||
| Mastercard Inc. | 2.950% | 3/15/51 | 2,260 | 1,737 | ||
| MetLife Inc. | 6.500% | 12/15/32 | 1,599 | 1,823 | ||
| MetLife Inc. | 6.375% | 6/15/34 | 1,030 | 1,181 | ||
| MetLife Inc. | 5.700% | 6/15/35 | 3,061 | 3,326 | ||
| 1 | MetLife Inc. | 6.400% | 12/15/36 | 1,248 | 1,286 | |
| 1 | MetLife Inc. | 10.750% | 8/1/39 | 749 | 1,021 | |
| MetLife Inc. | 5.875% | 2/6/41 | 3,841 | 4,193 | ||
| MetLife Inc. | 4.125% | 8/13/42 | 1,289 | 1,154 | ||
| MetLife Inc. | 4.875% | 11/13/43 | 2,209 | 2,177 | ||
| MetLife Inc. | 4.721% | 12/15/44 | 1,957 | 1,862 | ||
| Coupon | Maturity Date | Face Amount ($000) | Market Value• ($000) | |||
| MetLife Inc. | 4.050% | 3/1/45 | 2,636 | 2,322 | ||
| MetLife Inc. | 4.600% | 5/13/46 | 390 | 376 | ||
| MetLife Inc. | 5.000% | 7/15/52 | 3,840 | 3,884 | ||
| Mitsubishi UFJ Financial Group Inc. | 4.286% | 7/26/38 | 1,908 | 1,783 | ||
| Mitsubishi UFJ Financial Group Inc. | 4.153% | 3/7/39 | 1,524 | 1,388 | ||
| Mitsubishi UFJ Financial Group Inc. | 3.751% | 7/18/39 | 3,295 | 2,851 | ||
| 1 | Morgan Stanley | 3.971% | 7/22/38 | 7,122 | 6,353 | |
| 1 | Morgan Stanley | 4.457% | 4/22/39 | 3,403 | 3,174 | |
| Morgan Stanley | 3.217% | 4/22/42 | 6,773 | 5,287 | ||
| Morgan Stanley | 6.375% | 7/24/42 | 3,301 | 3,779 | ||
| Morgan Stanley | 4.300% | 1/27/45 | 5,267 | 4,708 | ||
| Morgan Stanley | 4.375% | 1/22/47 | 7,406 | 6,742 | ||
| 1 | Morgan Stanley | 5.597% | 3/24/51 | 3,278 | 3,539 | |
| 1 | Morgan Stanley | 2.802% | 1/25/52 | 2,044 | 1,388 | |
| Nasdaq Inc. | 2.500% | 12/21/40 | 1,103 | 767 | ||
| Nasdaq Inc. | 3.250% | 4/28/50 | 1,335 | 993 | ||
| Nasdaq Inc. | 3.950% | 3/7/52 | 1,425 | 1,191 | ||
| 1 | Nationwide Financial Services Inc. | 6.750% | 5/15/37 | 936 | 927 | |
| Old Republic International Corp. | 3.850% | 6/11/51 | 1,580 | 1,197 | ||
| PayPal Holdings Inc. | 3.250% | 6/1/50 | 2,430 | 1,836 | ||
| PayPal Holdings Inc. | 5.050% | 6/1/52 | 2,580 | 2,529 | ||
| PayPal Holdings Inc. | 5.250% | 6/1/62 | 1,605 | 1,589 | ||
| Principal Financial Group Inc. | 6.050% | 10/15/36 | 365 | 397 | ||
| Principal Financial Group Inc. | 4.625% | 9/15/42 | 807 | 742 | ||
| Principal Financial Group Inc. | 4.350% | 5/15/43 | 1,129 | 1,002 | ||
| Principal Financial Group Inc. | 4.300% | 11/15/46 | 1,320 | 1,167 | ||
| Progressive Corp. | 6.625% | 3/1/29 | 1 | 1 | ||
| Progressive Corp. | 6.250% | 12/1/32 | 1,270 | 1,449 | ||
| Progressive Corp. | 4.350% | 4/25/44 | 1,490 | 1,376 | ||
| Progressive Corp. | 3.700% | 1/26/45 | 1,560 | 1,296 | ||
| Progressive Corp. | 4.125% | 4/15/47 | 1,629 | 1,484 | ||
| Progressive Corp. | 4.200% | 3/15/48 | 1,670 | 1,532 | ||
| Progressive Corp. | 3.950% | 3/26/50 | 497 | 439 | ||
| 1 | Prudential Financial Inc. | 5.700% | 12/14/36 | 1,040 | 1,119 | |
| 1 | Prudential Financial Inc. | 6.625% | 12/1/37 | 866 | 998 | |
| 1 | Prudential Financial Inc. | 3.000% | 3/10/40 | 505 | 405 | |
| 1 | Prudential Financial Inc. | 6.625% | 6/21/40 | 1,156 | 1,321 | |
| 1 | Prudential Financial Inc. | 6.200% | 11/15/40 | 545 | 584 | |
| 1 | Prudential Financial Inc. | 5.100% | 8/15/43 | 516 | 477 | |
| 1 | Prudential Financial Inc. | 4.600% | 5/15/44 | 1,833 | 1,754 | |
| Prudential Financial Inc. | 3.905% | 12/7/47 | 3,110 | 2,701 | ||
| 1 | Prudential Financial Inc. | 4.418% | 3/27/48 | 1,247 | 1,151 | |
| Prudential Financial Inc. | 3.935% | 12/7/49 | 3,656 | 3,171 | ||
| 1 | Prudential Financial Inc. | 4.350% | 2/25/50 | 1,630 | 1,500 | |
| 1 | Prudential Financial Inc. | 3.700% | 3/13/51 | 1,120 | 929 | |
| Raymond James Financial Inc. | 4.950% | 7/15/46 | 747 | 728 | ||
| Raymond James Financial Inc. | 3.750% | 4/1/51 | 3,298 | 2,664 | ||
| 1 | Regions Bank | 6.450% | 6/26/37 | 1,500 | 1,672 | |
| Regions Financial Corp. | 7.375% | 12/10/37 | 600 | 706 | ||
| Selective Insurance Group Inc. | 5.375% | 3/1/49 | 715 | 671 | ||
| Sumitomo Mitsui Financial Group Inc. | 2.296% | 1/12/41 | 1,620 | 1,097 | ||
| Sumitomo Mitsui Financial Group Inc. | 2.930% | 9/17/41 | 2,095 | 1,520 | ||
| Transatlantic Holdings Inc. | 8.000% | 11/30/39 | 828 | 1,045 | ||
| Travelers Cos. Inc. | 6.750% | 6/20/36 | 1,716 | 2,053 | ||
| 1 | Travelers Cos. Inc. | 6.250% | 6/15/37 | 1,795 | 2,098 | |
| Travelers Cos. Inc. | 5.350% | 11/1/40 | 934 | 989 | ||
| Travelers Cos. Inc. | 4.300% | 8/25/45 | 2,983 | 2,714 | ||
| Travelers Cos. Inc. | 3.750% | 5/15/46 | 945 | 807 | ||
| Travelers Cos. Inc. | 4.000% | 5/30/47 | 379 | 338 | ||
| Travelers Cos. Inc. | 4.050% | 3/7/48 | 1,986 | 1,778 | ||
| Travelers Cos. Inc. | 4.100% | 3/4/49 | 1,666 | 1,497 | ||
| Travelers Cos. Inc. | 2.550% | 4/27/50 | 1,685 | 1,174 | ||
| Travelers Cos. Inc. | 3.050% | 6/8/51 | 2,210 | 1,686 | ||
| Travelers Property Casualty Corp. | 6.375% | 3/15/33 | 418 | 488 | ||
| Unum Group | 5.750% | 8/15/42 | 1,034 | 963 | ||
| Coupon | Maturity Date | Face Amount ($000) | Market Value• ($000) | |||
| Unum Group | 4.500% | 12/15/49 | 1,718 | 1,333 | ||
| Unum Group | 4.125% | 6/15/51 | 896 | 658 | ||
| Visa Inc. | 4.150% | 12/14/35 | 5,022 | 4,977 | ||
| Visa Inc. | 2.700% | 4/15/40 | 1,690 | 1,352 | ||
| Visa Inc. | 4.300% | 12/14/45 | 7,359 | 7,102 | ||
| Visa Inc. | 3.650% | 9/15/47 | 1,855 | 1,643 | ||
| Visa Inc. | 2.000% | 8/15/50 | 3,349 | 2,188 | ||
| Voya Financial Inc. | 5.700% | 7/15/43 | 1,487 | 1,464 | ||
| Voya Financial Inc. | 4.800% | 6/15/46 | 392 | 348 | ||
| W R Berkley Corp. | 4.750% | 8/1/44 | 1,069 | 988 | ||
| W R Berkley Corp. | 4.000% | 5/12/50 | 590 | 489 | ||
| W R Berkley Corp. | 3.150% | 9/30/61 | 1,325 | 890 | ||
| Wachovia Corp. | 7.500% | 4/15/35 | 305 | 354 | ||
| Wachovia Corp. | 5.500% | 8/1/35 | 1,293 | 1,307 | ||
| 1 | Wells Fargo & Co. | 3.068% | 4/30/41 | 11,126 | 8,541 | |
| Wells Fargo & Co. | 5.375% | 11/2/43 | 6,224 | 6,205 | ||
| Wells Fargo & Co. | 5.606% | 1/15/44 | 7,875 | 7,964 | ||
| 1 | Wells Fargo & Co. | 4.650% | 11/4/44 | 6,740 | 6,099 | |
| Wells Fargo & Co. | 3.900% | 5/1/45 | 5,540 | 4,638 | ||
| 1 | Wells Fargo & Co. | 4.900% | 11/17/45 | 6,344 | 5,883 | |
| 1 | Wells Fargo & Co. | 4.400% | 6/14/46 | 2,587 | 2,260 | |
| 1 | Wells Fargo & Co. | 4.750% | 12/7/46 | 3,018 | 2,754 | |
| 1 | Wells Fargo & Co. | 5.013% | 4/4/51 | 10,822 | 10,685 | |
| 1 | Wells Fargo & Co. | 4.611% | 4/25/53 | 8,520 | 7,856 | |
| Wells Fargo Bank NA | 5.950% | 8/26/36 | 771 | 818 | ||
| 1 | Wells Fargo Bank NA | 5.850% | 2/1/37 | 433 | 459 | |
| 1 | Wells Fargo Bank NA | 6.600% | 1/15/38 | 3,618 | 4,167 | |
| Western Union Co. | 6.200% | 11/17/36 | 1,487 | 1,472 | ||
| Westpac Banking Corp. | 4.421% | 7/24/39 | 3,083 | 2,717 | ||
| Westpac Banking Corp. | 2.963% | 11/16/40 | 723 | 515 | ||
| Westpac Banking Corp. | 3.133% | 11/18/41 | 3,705 | 2,677 | ||
| Willis North America Inc. | 5.050% | 9/15/48 | 1,604 | 1,477 | ||
| Willis North America Inc. | 3.875% | 9/15/49 | 1,514 | 1,168 | ||
| XLIT Ltd. | 5.250% | 12/15/43 | 662 | 692 | ||
| XLIT Ltd. | 5.500% | 3/31/45 | 1,305 | 1,327 | ||
| 741,522 | ||||||
| Health Care (14.4%) | ||||||
| Abbott Laboratories | 4.750% | 11/30/36 | 3,120 | 3,285 | ||
| Abbott Laboratories | 6.150% | 11/30/37 | 948 | 1,121 | ||
| Abbott Laboratories | 6.000% | 4/1/39 | 1,290 | 1,488 | ||
| Abbott Laboratories | 5.300% | 5/27/40 | 1,828 | 1,975 | ||
| Abbott Laboratories | 4.750% | 4/15/43 | 1,739 | 1,756 | ||
| 3 | Abbott Laboratories | 4.900% | 11/30/46 | 8,078 | 8,510 | |
| AbbVie Inc. | 4.550% | 3/15/35 | 4,296 | 4,120 | ||
| AbbVie Inc. | 4.500% | 5/14/35 | 5,750 | 5,473 | ||
| AbbVie Inc. | 4.300% | 5/14/36 | 6,004 | 5,604 | ||
| AbbVie Inc. | 4.050% | 11/21/39 | 7,251 | 6,395 | ||
| AbbVie Inc. | 4.625% | 10/1/42 | 2,065 | 1,897 | ||
| AbbVie Inc. | 4.400% | 11/6/42 | 5,221 | 4,719 | ||
| AbbVie Inc. | 4.850% | 6/15/44 | 2,761 | 2,620 | ||
| AbbVie Inc. | 4.750% | 3/15/45 | 747 | 698 | ||
| AbbVie Inc. | 4.700% | 5/14/45 | 2,750 | 2,571 | ||
| AbbVie Inc. | 4.450% | 5/14/46 | 8,189 | 7,427 | ||
| AbbVie Inc. | 4.875% | 11/14/48 | 5,616 | 5,419 | ||
| AbbVie Inc. | 4.250% | 11/21/49 | 14,732 | 12,961 | ||
| 1 | AdventHealth Obligated Group | 2.795% | 11/15/51 | 550 | 386 | |
| Adventist Health System | 3.630% | 3/1/49 | 810 | 624 | ||
| Advocate Health & Hospitals Corp. | 4.272% | 8/15/48 | 544 | 502 | ||
| Advocate Health & Hospitals Corp. | 3.387% | 10/15/49 | 740 | 592 | ||
| 1 | Advocate Health & Hospitals Corp. | 3.008% | 6/15/50 | 1,963 | 1,438 | |
| Aetna Inc. | 6.625% | 6/15/36 | 2,419 | 2,702 | ||
| Aetna Inc. | 6.750% | 12/15/37 | 402 | 450 | ||
| Aetna Inc. | 4.500% | 5/15/42 | 1,515 | 1,352 | ||
| Aetna Inc. | 4.125% | 11/15/42 | 1,247 | 1,063 | ||
| Aetna Inc. | 4.750% | 3/15/44 | 2,643 | 2,413 | ||
| Aetna Inc. | 3.875% | 8/15/47 | 866 | 706 | ||
| AHS Hospital Corp. | 5.024% | 7/1/45 | 1,248 | 1,276 | ||
| Coupon | Maturity Date | Face Amount ($000) | Market Value• ($000) | |||
| 1 | AHS Hospital Corp. | 2.780% | 7/1/51 | 570 | 399 | |
| 1 | Allina Health System | 3.887% | 4/15/49 | 767 | 663 | |
| 1 | Allina Health System | 2.902% | 11/15/51 | 730 | 520 | |
| AmerisourceBergen Corp. | 4.250% | 3/1/45 | 1,420 | 1,230 | ||
| AmerisourceBergen Corp. | 4.300% | 12/15/47 | 1,881 | 1,695 | ||
| Amgen Inc. | 4.200% | 3/1/33 | 2,000 | 1,932 | ||
| Amgen Inc. | 6.375% | 6/1/37 | 150 | 173 | ||
| Amgen Inc. | 6.400% | 2/1/39 | 804 | 900 | ||
| Amgen Inc. | 3.150% | 2/21/40 | 4,295 | 3,399 | ||
| Amgen Inc. | 5.750% | 3/15/40 | 799 | 844 | ||
| Amgen Inc. | 2.800% | 8/15/41 | 3,093 | 2,321 | ||
| Amgen Inc. | 4.950% | 10/1/41 | 2,556 | 2,484 | ||
| Amgen Inc. | 5.150% | 11/15/41 | 902 | 893 | ||
| Amgen Inc. | 5.650% | 6/15/42 | 870 | 917 | ||
| Amgen Inc. | 4.400% | 5/1/45 | 4,940 | 4,447 | ||
| Amgen Inc. | 4.563% | 6/15/48 | 3,891 | 3,595 | ||
| Amgen Inc. | 3.375% | 2/21/50 | 6,443 | 4,888 | ||
| Amgen Inc. | 4.663% | 6/15/51 | 8,807 | 8,259 | ||
| Amgen Inc. | 3.000% | 1/15/52 | 3,420 | 2,410 | ||
| Amgen Inc. | 4.200% | 2/22/52 | 3,344 | 2,915 | ||
| Amgen Inc. | 4.875% | 3/1/53 | 2,625 | 2,547 | ||
| Amgen Inc. | 2.770% | 9/1/53 | 1,411 | 937 | ||
| Amgen Inc. | 4.400% | 2/22/62 | 2,245 | 1,947 | ||
| 1 | Ascension Health | 3.106% | 11/15/39 | 1,200 | 985 | |
| Ascension Health | 3.945% | 11/15/46 | 2,537 | 2,311 | ||
| 1 | Ascension Health | 4.847% | 11/15/53 | 1,140 | 1,187 | |
| AstraZeneca plc | 6.450% | 9/15/37 | 5,340 | 6,289 | ||
| AstraZeneca plc | 4.000% | 9/18/42 | 3,444 | 3,164 | ||
| AstraZeneca plc | 4.375% | 11/16/45 | 2,458 | 2,369 | ||
| AstraZeneca plc | 4.375% | 8/17/48 | 2,704 | 2,617 | ||
| AstraZeneca plc | 2.125% | 8/6/50 | 1,305 | 852 | ||
| AstraZeneca plc | 3.000% | 5/28/51 | 1,270 | 987 | ||
| Banner Health | 2.907% | 1/1/42 | 485 | 371 | ||
| 1 | Banner Health | 3.181% | 1/1/50 | 440 | 340 | |
| Banner Health | 2.913% | 1/1/51 | 1,398 | 1,017 | ||
| 1 | Baptist Health South Florida Obligated Group | 3.115% | 11/15/71 | 655 | 439 | |
| 1 | Baptist Healthcare System Obligated Group | 3.540% | 8/15/50 | 371 | 290 | |
| Baxalta Inc. | 5.250% | 6/23/45 | 2,385 | 2,362 | ||
| Baxter International Inc. | 3.500% | 8/15/46 | 1,668 | 1,286 | ||
| Baxter International Inc. | 3.132% | 12/1/51 | 2,385 | 1,671 | ||
| 1 | BayCare Health System Inc. | 3.831% | 11/15/50 | 1,363 | 1,191 | |
| Baylor Scott & White Holdings | 4.185% | 11/15/45 | 1,716 | 1,582 | ||
| Baylor Scott & White Holdings | 3.967% | 11/15/46 | 848 | 765 | ||
| 1 | Baylor Scott & White Holdings | 2.839% | 11/15/50 | 1,732 | 1,260 | |
| Becton Dickinson & Co. | 4.685% | 12/15/44 | 2,074 | 1,966 | ||
| Becton Dickinson & Co. | 4.669% | 6/6/47 | 4,340 | 4,135 | ||
| Becton Dickinson & Co. | 3.794% | 5/20/50 | 1,314 | 1,089 | ||
| 1 | Beth Israel Lahey Health Inc. | 3.080% | 7/1/51 | 1,120 | 797 | |
| 1 | BHSH System Obligated Group | 3.487% | 7/15/49 | 860 | 696 | |
| Biogen Inc. | 3.150% | 5/1/50 | 4,799 | 3,266 | ||
| Biogen Inc. | 3.250% | 2/15/51 | 2,035 | 1,420 | ||
| 1 | Bon Secours Mercy Health Inc. | 3.205% | 6/1/50 | 860 | 649 | |
| Boston Scientific Corp. | 6.750% | 11/15/35 | 425 | 482 | ||
| Boston Scientific Corp. | 4.550% | 3/1/39 | 888 | 824 | ||
| Boston Scientific Corp. | 7.375% | 1/15/40 | 1,000 | 1,202 | ||
| Boston Scientific Corp. | 4.700% | 3/1/49 | 1,795 | 1,708 | ||
| Bristol-Myers Squibb Co. | 4.125% | 6/15/39 | 3,536 | 3,306 | ||
| Bristol-Myers Squibb Co. | 2.350% | 11/13/40 | 1,552 | 1,135 | ||
| Bristol-Myers Squibb Co. | 3.550% | 3/15/42 | 3,123 | 2,686 | ||
| Bristol-Myers Squibb Co. | 3.250% | 8/1/42 | 1,705 | 1,391 | ||
| Bristol-Myers Squibb Co. | 4.500% | 3/1/44 | 410 | 390 | ||
| Bristol-Myers Squibb Co. | 4.625% | 5/15/44 | 1,841 | 1,798 | ||
| Bristol-Myers Squibb Co. | 4.350% | 11/15/47 | 3,705 | 3,489 | ||
| Bristol-Myers Squibb Co. | 4.550% | 2/20/48 | 5,219 | 5,063 | ||
| Bristol-Myers Squibb Co. | 4.250% | 10/26/49 | 9,207 | 8,525 | ||
| Coupon | Maturity Date | Face Amount ($000) | Market Value• ($000) | |||
| Bristol-Myers Squibb Co. | 2.550% | 11/13/50 | 3,200 | 2,203 | ||
| Bristol-Myers Squibb Co. | 3.700% | 3/15/52 | 5,930 | 5,026 | ||
| Bristol-Myers Squibb Co. | 3.900% | 3/15/62 | 2,580 | 2,170 | ||
| Cardinal Health Inc. | 4.600% | 3/15/43 | 470 | 410 | ||
| Cardinal Health Inc. | 4.500% | 11/15/44 | 574 | 488 | ||
| Cardinal Health Inc. | 4.900% | 9/15/45 | 1,955 | 1,768 | ||
| Cardinal Health Inc. | 4.368% | 6/15/47 | 1,076 | 913 | ||
| 1 | Catholic Health Services of Long Island Obligated Group | 3.368% | 7/1/50 | 1,090 | 803 | |
| Children's Health System of Texas | 2.511% | 8/15/50 | 1,305 | 874 | ||
| 1 | Children's Hospital | 2.928% | 7/15/50 | 840 | 591 | |
| 1 | Children's Hospital Corp. | 4.115% | 1/1/47 | 650 | 602 | |
| 1 | Children's Hospital Corp. | 2.585% | 2/1/50 | 1,145 | 782 | |
| Children's Hospital Medical Center | 4.268% | 5/15/44 | 801 | 757 | ||
| 1 | Children's Hospital of Philadelphia | 2.704% | 7/1/50 | 1,117 | 780 | |
| Cigna Corp. | 4.800% | 8/15/38 | 5,019 | 4,843 | ||
| Cigna Corp. | 3.200% | 3/15/40 | 883 | 695 | ||
| 1 | Cigna Corp. | 6.125% | 11/15/41 | 1,968 | 2,134 | |
| 1 | Cigna Corp. | 4.800% | 7/15/46 | 4,150 | 3,872 | |
| 1 | Cigna Corp. | 3.875% | 10/15/47 | 2,898 | 2,338 | |
| Cigna Corp. | 4.900% | 12/15/48 | 7,218 | 6,869 | ||
| Cigna Corp. | 3.400% | 3/15/50 | 4,190 | 3,153 | ||
| Cigna Corp. | 3.400% | 3/15/51 | 895 | 675 | ||
| 1 | City of Hope | 5.623% | 11/15/43 | 567 | 609 | |
| 1 | City of Hope | 4.378% | 8/15/48 | 1,380 | 1,276 | |
| 1 | CommonSpirit Health | 4.350% | 11/1/42 | 2,357 | 2,110 | |
| CommonSpirit Health | 3.817% | 10/1/49 | 2,475 | 2,024 | ||
| CommonSpirit Health | 4.187% | 10/1/49 | 1,599 | 1,321 | ||
| CommonSpirit Health | 3.910% | 10/1/50 | 557 | 434 | ||
| 1 | Community Health Network Inc. | 3.099% | 5/1/50 | 1,227 | 867 | |
| 1 | Cottage Health Obligated Group | 3.304% | 11/1/49 | 1,624 | 1,273 | |
| CVS Health Corp. | 4.875% | 7/20/35 | 2,202 | 2,146 | ||
| CVS Health Corp. | 4.780% | 3/25/38 | 11,311 | 10,830 | ||
| CVS Health Corp. | 6.125% | 9/15/39 | 1,584 | 1,698 | ||
| CVS Health Corp. | 4.125% | 4/1/40 | 3,332 | 2,910 | ||
| CVS Health Corp. | 2.700% | 8/21/40 | 2,029 | 1,456 | ||
| CVS Health Corp. | 5.300% | 12/5/43 | 1,955 | 1,942 | ||
| CVS Health Corp. | 5.125% | 7/20/45 | 7,030 | 6,730 | ||
| CVS Health Corp. | 5.050% | 3/25/48 | 19,302 | 18,579 | ||
| CVS Health Corp. | 4.250% | 4/1/50 | 1,935 | 1,663 | ||
| Danaher Corp. | 4.375% | 9/15/45 | 1,505 | 1,382 | ||
| Danaher Corp. | 2.600% | 10/1/50 | 2,875 | 1,981 | ||
| Danaher Corp. | 2.800% | 12/10/51 | 2,365 | 1,690 | ||
| 1 | Dartmouth-Hitchcock Health | 4.178% | 8/1/48 | 1,143 | 1,010 | |
| DH Europe Finance II Sarl | 3.250% | 11/15/39 | 1,547 | 1,281 | ||
| DH Europe Finance II Sarl | 3.400% | 11/15/49 | 2,210 | 1,784 | ||
| Dignity Health | 4.500% | 11/1/42 | 1,010 | 927 | ||
| Dignity Health | 5.267% | 11/1/64 | 984 | 919 | ||
| 1 | Duke University Health System Inc. | 3.920% | 6/1/47 | 872 | 776 | |
| Elevance Health Inc. | 5.950% | 12/15/34 | 921 | 990 | ||
| Elevance Health Inc. | 5.850% | 1/15/36 | 1,820 | 1,948 | ||
| Elevance Health Inc. | 4.625% | 5/15/42 | 2,417 | 2,299 | ||
| Elevance Health Inc. | 4.650% | 1/15/43 | 994 | 939 | ||
| Elevance Health Inc. | 5.100% | 1/15/44 | 3,273 | 3,268 | ||
| Elevance Health Inc. | 4.650% | 8/15/44 | 2,901 | 2,715 | ||
| Elevance Health Inc. | 4.375% | 12/1/47 | 810 | 748 | ||
| Elevance Health Inc. | 4.550% | 3/1/48 | 2,065 | 1,934 | ||
| Elevance Health Inc. | 3.700% | 9/15/49 | 3,072 | 2,512 | ||
| Elevance Health Inc. | 3.125% | 5/15/50 | 2,316 | 1,733 | ||
| Elevance Health Inc. | 3.600% | 3/15/51 | 3,025 | 2,433 | ||
| Elevance Health Inc. | 4.550% | 5/15/52 | 2,609 | 2,450 | ||
| Eli Lilly & Co. | 3.950% | 5/15/47 | 700 | 662 | ||
| Eli Lilly & Co. | 3.950% | 3/15/49 | 2,028 | 1,948 | ||
| Eli Lilly & Co. | 2.250% | 5/15/50 | 4,805 | 3,325 | ||
| Eli Lilly & Co. | 2.500% | 9/15/60 | 2,550 | 1,717 | ||
| 1 | Franciscan Missionaries of Our Lady Health System Inc. | 3.914% | 7/1/49 | 960 | 789 | |
| Coupon | Maturity Date | Face Amount ($000) | Market Value• ($000) | |||
| Gilead Sciences Inc. | 4.600% | 9/1/35 | 3,525 | 3,449 | ||
| Gilead Sciences Inc. | 4.000% | 9/1/36 | 752 | 686 | ||
| Gilead Sciences Inc. | 2.600% | 10/1/40 | 892 | 647 | ||
| Gilead Sciences Inc. | 5.650% | 12/1/41 | 3,633 | 3,838 | ||
| Gilead Sciences Inc. | 4.800% | 4/1/44 | 5,990 | 5,677 | ||
| Gilead Sciences Inc. | 4.500% | 2/1/45 | 4,411 | 4,012 | ||
| Gilead Sciences Inc. | 4.750% | 3/1/46 | 4,858 | 4,644 | ||
| Gilead Sciences Inc. | 4.150% | 3/1/47 | 1,917 | 1,669 | ||
| Gilead Sciences Inc. | 2.800% | 10/1/50 | 3,095 | 2,125 | ||
| GlaxoSmithKline Capital Inc. | 5.375% | 4/15/34 | 357 | 383 | ||
| GlaxoSmithKline Capital Inc. | 6.375% | 5/15/38 | 6,740 | 7,908 | ||
| GlaxoSmithKline Capital Inc. | 4.200% | 3/18/43 | 1,459 | 1,336 | ||
| 1 | Hackensack Meridian Health Inc. | 2.675% | 9/1/41 | 752 | 559 | |
| Hackensack Meridian Health Inc. | 4.211% | 7/1/48 | 950 | 875 | ||
| 1 | Hackensack Meridian Health Inc. | 2.875% | 9/1/50 | 1,085 | 778 | |
| Hackensack Meridian Health Inc. | 4.500% | 7/1/57 | 1,228 | 1,195 | ||
| 1 | Hartford HealthCare Corp. | 3.447% | 7/1/54 | 601 | 481 | |
| HCA Inc. | 5.125% | 6/15/39 | 3,195 | 2,879 | ||
| 2 | HCA Inc. | 4.375% | 3/15/42 | 2,650 | 2,169 | |
| HCA Inc. | 5.500% | 6/15/47 | 3,109 | 2,868 | ||
| HCA Inc. | 5.250% | 6/15/49 | 4,985 | 4,456 | ||
| HCA Inc. | 3.500% | 7/15/51 | 2,920 | 1,999 | ||
| 2 | HCA Inc. | 4.625% | 3/15/52 | 4,300 | 3,559 | |
| Humana Inc. | 4.625% | 12/1/42 | 818 | 757 | ||
| Humana Inc. | 4.950% | 10/1/44 | 1,547 | 1,494 | ||
| Humana Inc. | 4.800% | 3/15/47 | 990 | 949 | ||
| Humana Inc. | 3.950% | 8/15/49 | 410 | 346 | ||
| IHC Health Services Inc. | 4.131% | 5/15/48 | 636 | 590 | ||
| Indiana University Health Inc. Obligated Group | 3.970% | 11/1/48 | 1,131 | 1,033 | ||
| 1 | Indiana University Health Inc. Obligated Group | 2.852% | 11/1/51 | 510 | 366 | |
| Inova Health System Foundation | 4.068% | 5/15/52 | 990 | 899 | ||
| 1 | Integris Baptist Medical Center Inc. | 3.875% | 8/15/50 | 787 | 653 | |
| 1 | Iowa Health System | 3.665% | 2/15/50 | 380 | 312 | |
| Johns Hopkins Health System Corp. | 3.837% | 5/15/46 | 1,691 | 1,500 | ||
| Johnson & Johnson | 4.950% | 5/15/33 | 1,274 | 1,380 | ||
| Johnson & Johnson | 4.375% | 12/5/33 | 2,909 | 2,967 | ||
| Johnson & Johnson | 3.550% | 3/1/36 | 2,959 | 2,756 | ||
| Johnson & Johnson | 3.625% | 3/3/37 | 3,522 | 3,271 | ||
| Johnson & Johnson | 5.950% | 8/15/37 | 2,622 | 3,064 | ||
| Johnson & Johnson | 3.400% | 1/15/38 | 2,696 | 2,416 | ||
| Johnson & Johnson | 5.850% | 7/15/38 | 1,107 | 1,279 | ||
| Johnson & Johnson | 2.100% | 9/1/40 | 902 | 656 | ||
| Johnson & Johnson | 4.500% | 9/1/40 | 1,827 | 1,823 | ||
| Johnson & Johnson | 4.850% | 5/15/41 | 2,196 | 2,276 | ||
| Johnson & Johnson | 4.500% | 12/5/43 | 1,740 | 1,747 | ||
| Johnson & Johnson | 3.700% | 3/1/46 | 4,718 | 4,214 | ||
| Johnson & Johnson | 3.750% | 3/3/47 | 2,073 | 1,865 | ||
| Johnson & Johnson | 3.500% | 1/15/48 | 623 | 547 | ||
| Johnson & Johnson | 2.250% | 9/1/50 | 2,039 | 1,408 | ||
| Johnson & Johnson | 2.450% | 9/1/60 | 1,682 | 1,122 | ||
| 1 | Kaiser Foundation Hospitals | 2.810% | 6/1/41 | 1,786 | 1,364 | |
| Kaiser Foundation Hospitals | 4.875% | 4/1/42 | 1,830 | 1,856 | ||
| Kaiser Foundation Hospitals | 4.150% | 5/1/47 | 3,744 | 3,467 | ||
| 1 | Kaiser Foundation Hospitals | 3.266% | 11/1/49 | 2,401 | 1,876 | |
| 1 | Kaiser Foundation Hospitals | 3.002% | 6/1/51 | 2,659 | 1,979 | |
| Koninklijke Philips NV | 6.875% | 3/11/38 | 1,501 | 1,714 | ||
| Koninklijke Philips NV | 5.000% | 3/15/42 | 964 | 906 | ||
| Laboratory Corp. of America Holdings | 4.700% | 2/1/45 | 1,600 | 1,452 | ||
| 1 | Mass General Brigham Inc. | 3.765% | 7/1/48 | 800 | 691 | |
| 1 | Mass General Brigham Inc. | 3.192% | 7/1/49 | 1,227 | 943 | |
| 1 | Mass General Brigham Inc. | 4.117% | 7/1/55 | 405 | 361 | |
| 1 | Mass General Brigham Inc. | 3.342% | 7/1/60 | 1,627 | 1,230 | |
| 1 | Mayo Clinic | 4.000% | 11/15/47 | 928 | 845 | |
| 1 | Mayo Clinic | 4.128% | 11/15/52 | 920 | 858 | |
| Coupon | Maturity Date | Face Amount ($000) | Market Value• ($000) | |||
| 1 | Mayo Clinic | 3.196% | 11/15/61 | 1,665 | 1,246 | |
| 1 | McLaren Health Care Corp. | 4.386% | 5/15/48 | 1,025 | 957 | |
| 1 | MedStar Health Inc. | 3.626% | 8/15/49 | 980 | 800 | |
| Medtronic Inc. | 4.375% | 3/15/35 | 7,180 | 7,124 | ||
| Medtronic Inc. | 4.625% | 3/15/45 | 2,646 | 2,653 | ||
| Memorial Health Services | 3.447% | 11/1/49 | 872 | 701 | ||
| Memorial Sloan-Kettering Cancer Center | 5.000% | 7/1/42 | 1,070 | 1,099 | ||
| 1 | Memorial Sloan-Kettering Cancer Center | 2.955% | 1/1/50 | 1,665 | 1,222 | |
| Memorial Sloan-Kettering Cancer Center | 4.125% | 7/1/52 | 2,015 | 1,846 | ||
| 1 | Memorial Sloan-Kettering Cancer Center | 4.200% | 7/1/55 | 374 | 341 | |
| Merck & Co. Inc. | 6.500% | 12/1/33 | 2,328 | 2,763 | ||
| Merck & Co. Inc. | 3.900% | 3/7/39 | 2,918 | 2,693 | ||
| Merck & Co. Inc. | 2.350% | 6/24/40 | 2,267 | 1,672 | ||
| Merck & Co. Inc. | 3.600% | 9/15/42 | 2,490 | 2,153 | ||
| Merck & Co. Inc. | 4.150% | 5/18/43 | 952 | 889 | ||
| Merck & Co. Inc. | 3.700% | 2/10/45 | 5,566 | 4,820 | ||
| Merck & Co. Inc. | 4.000% | 3/7/49 | 1,783 | 1,616 | ||
| Merck & Co. Inc. | 2.450% | 6/24/50 | 2,141 | �� 1,482 | ||
| Merck & Co. Inc. | 2.750% | 12/10/51 | 6,680 | 4,836 | ||
| Merck & Co. Inc. | 2.900% | 12/10/61 | 4,160 | 2,891 | ||
| Merck Sharp & Dohme Corp. | 5.750% | 11/15/36 | 1,434 | 1,617 | ||
| 1 | Methodist Hospital | 2.705% | 12/1/50 | 1,325 | 918 | |
| 1 | MidMichigan Health | 3.409% | 6/1/50 | 845 | 644 | |
| 1 | Montefiore Obligated Group | 5.246% | 11/1/48 | 1,065 | 841 | |
| Montefiore Obligated Group | 4.287% | 9/1/50 | 907 | 649 | ||
| 1 | Mount Sinai Hospitals Group Inc. | 3.981% | 7/1/48 | 725 | 649 | |
| 1 | Mount Sinai Hospitals Group Inc. | 3.737% | 7/1/49 | 868 | 704 | |
| 1 | Mount Sinai Hospitals Group Inc. | 3.391% | 7/1/50 | 1,480 | 1,136 | |
| MultiCare Health System | 2.803% | 8/15/50 | 750 | 524 | ||
| Mylan Inc. | 5.400% | 11/29/43 | 1,050 | 851 | ||
| Mylan Inc. | 5.200% | 4/15/48 | 1,119 | 866 | ||
| New York & Presbyterian Hospital | 2.256% | 8/1/40 | 866 | 612 | ||
| New York & Presbyterian Hospital | 4.024% | 8/1/45 | 488 | 447 | ||
| New York & Presbyterian Hospital | 4.063% | 8/1/56 | 1,129 | 1,010 | ||
| New York & Presbyterian Hospital | 2.606% | 8/1/60 | 1,378 | 885 | ||
| 1 | New York & Presbyterian Hospital | 3.954% | 8/1/19 | 1,128 | 881 | |
| Northwell Healthcare Inc. | 3.979% | 11/1/46 | 1,230 | 1,036 | ||
| Northwell Healthcare Inc. | 4.260% | 11/1/47 | 1,349 | 1,201 | ||
| Northwell Healthcare Inc. | 3.809% | 11/1/49 | 2,123 | 1,760 | ||
| 1 | Northwestern Memorial Healthcare Obligated Group | 2.633% | 7/15/51 | 1,211 | 846 | |
| Novant Health Inc. | 2.637% | 11/1/36 | 760 | 600 | ||
| Novant Health Inc. | 3.168% | 11/1/51 | 2,183 | 1,674 | ||
| Novant Health Inc. | 3.318% | 11/1/61 | 315 | 234 | ||
| Novartis Capital Corp. | 3.700% | 9/21/42 | 1,484 | 1,327 | ||
| Novartis Capital Corp. | 4.400% | 5/6/44 | 4,008 | 3,945 | ||
| Novartis Capital Corp. | 4.000% | 11/20/45 | 2,931 | 2,709 | ||
| Novartis Capital Corp. | 2.750% | 8/14/50 | 2,848 | 2,165 | ||
| 1 | NY Society for Relief of Ruptured & Crippled Maintaining Hosp Special Surgery | 2.667% | 10/1/50 | 875 | 602 | |
| 1 | NYU Langone Hospitals | 5.750% | 7/1/43 | 1,305 | 1,411 | |
| NYU Langone Hospitals | 4.784% | 7/1/44 | 992 | 969 | ||
| 1 | NYU Langone Hospitals | 4.368% | 7/1/47 | 1,223 | 1,104 | |
| 1 | NYU Langone Hospitals | 3.380% | 7/1/55 | 522 | 388 | |
| OhioHealth Corp. | 2.834% | 11/15/41 | 645 | 485 | ||
| 1 | OhioHealth Corp. | 3.042% | 11/15/50 | 801 | 613 | |
| Orlando Health Obligated Group | 4.089% | 10/1/48 | 698 | 629 | ||
| Orlando Health Obligated Group | 3.327% | 10/1/50 | 925 | 734 | ||
| 1 | PeaceHealth Obligated Group | 4.787% | 11/15/48 | 433 | 418 | |
| 1 | PeaceHealth Obligated Group | 3.218% | 11/15/50 | 1,040 | 758 | |
| PerkinElmer Inc. | 3.625% | 3/15/51 | 1,844 | 1,414 | ||
| Pfizer Inc. | 4.000% | 12/15/36 | 4,084 | 3,895 | ||
| Pfizer Inc. | 4.100% | 9/15/38 | 2,542 | 2,435 | ||
| Coupon | Maturity Date | Face Amount ($000) | Market Value• ($000) | |||
| Pfizer Inc. | 3.900% | 3/15/39 | 3,862 | 3,587 | ||
| Pfizer Inc. | 7.200% | 3/15/39 | 3,871 | 4,971 | ||
| Pfizer Inc. | 2.550% | 5/28/40 | 2,408 | 1,850 | ||
| Pfizer Inc. | 4.300% | 6/15/43 | 3,791 | 3,630 | ||
| Pfizer Inc. | 4.400% | 5/15/44 | 1,325 | 1,284 | ||
| Pfizer Inc. | 4.125% | 12/15/46 | 1,497 | 1,421 | ||
| Pfizer Inc. | 4.200% | 9/15/48 | 2,677 | 2,586 | ||
| Pfizer Inc. | 4.000% | 3/15/49 | 3,123 | 2,933 | ||
| Pfizer Inc. | 2.700% | 5/28/50 | 3,591 | 2,676 | ||
| Piedmont Healthcare Inc. | 2.864% | 1/1/52 | 1,355 | 930 | ||
| Presbyterian Healthcare Services | 4.875% | 8/1/52 | 850 | 868 | ||
| 1 | Providence St. Joseph Health Obligated Group | 3.744% | 10/1/47 | 1,495 | 1,261 | |
| 1 | Providence St. Joseph Health Obligated Group | 3.930% | 10/1/48 | 1,390 | 1,167 | |
| 1 | Providence St. Joseph Health Obligated Group | 2.700% | 10/1/51 | 512 | 339 | |
| Queen's Health Systems | 4.810% | 7/1/52 | 515 | 520 | ||
| Quest Diagnostics Inc. | 4.700% | 3/30/45 | 990 | 886 | ||
| 1 | Rady Children's Hospital-San Diego | 3.154% | 8/15/51 | 1,000 | 773 | |
| Regeneron Pharmaceuticals Inc. | 2.800% | 9/15/50 | 1,938 | 1,303 | ||
| Royalty Pharma plc | 3.300% | 9/2/40 | 2,760 | 2,062 | ||
| Royalty Pharma plc | 3.550% | 9/2/50 | 2,876 | 1,982 | ||
| Royalty Pharma plc | 3.350% | 9/2/51 | 865 | 579 | ||
| RWJ Barnabas Health Inc. | 3.949% | 7/1/46 | 1,201 | 1,074 | ||
| RWJ Barnabas Health Inc. | 3.477% | 7/1/49 | 490 | 398 | ||
| 1 | Seattle Children's Hospital | 2.719% | 10/1/50 | 875 | 620 | |
| 1 | Sentara Healthcare | 2.927% | 11/1/51 | 785 | 578 | |
| 1 | Sharp HealthCare | 2.680% | 8/1/50 | 725 | 495 | |
| 1 | Stanford Health Care | 3.795% | 11/15/48 | 1,175 | 1,051 | |
| Stanford Health Care | 3.027% | 8/15/51 | 1,228 | 905 | ||
| STERIS Irish FinCo Unltd. Co. | 3.750% | 3/15/51 | 2,003 | 1,539 | ||
| Stryker Corp. | 4.100% | 4/1/43 | 1,492 | 1,297 | ||
| Stryker Corp. | 4.375% | 5/15/44 | 1,754 | 1,580 | ||
| Stryker Corp. | 4.625% | 3/15/46 | 1,213 | 1,151 | ||
| Stryker Corp. | 2.900% | 6/15/50 | 454 | 325 | ||
| Summa Health | 3.511% | 11/15/51 | 805 | 602 | ||
| 1 | Sutter Health | 3.161% | 8/15/40 | 960 | 735 | |
| 1 | Sutter Health | 4.091% | 8/15/48 | 1,460 | 1,261 | |
| 1 | Sutter Health | 3.361% | 8/15/50 | 880 | 662 | |
| Takeda Pharmaceutical Co. Ltd. | 3.025% | 7/9/40 | 1,016 | 787 | ||
| Takeda Pharmaceutical Co. Ltd. | 3.175% | 7/9/50 | 5,571 | 4,099 | ||
| Takeda Pharmaceutical Co. Ltd. | 3.375% | 7/9/60 | 2,740 | 1,992 | ||
| Texas Health Resources | 2.328% | 11/15/50 | 615 | 394 | ||
| 1 | Texas Health Resources | 4.330% | 11/15/55 | 551 | 529 | |
| Thermo Fisher Scientific Inc. | 2.800% | 10/15/41 | 2,770 | 2,148 | ||
| Thermo Fisher Scientific Inc. | 5.300% | 2/1/44 | 1,794 | 1,920 | ||
| Thermo Fisher Scientific Inc. | 4.100% | 8/15/47 | 1,061 | 990 | ||
| Toledo Hospital | 5.750% | 11/15/38 | 610 | 584 | ||
| 1 | Trinity Health Corp. | 2.632% | 12/1/40 | 970 | 720 | |
| Trinity Health Corp. | 4.125% | 12/1/45 | 765 | 705 | ||
| 1 | Trinity Health Corp. | 3.434% | 12/1/48 | 970 | 806 | |
| UnitedHealth Group Inc. | 4.625% | 7/15/35 | 2,489 | 2,486 | ||
| UnitedHealth Group Inc. | 5.800% | 3/15/36 | 591 | 651 | ||
| UnitedHealth Group Inc. | 6.500% | 6/15/37 | 1,747 | 2,061 | ||
| UnitedHealth Group Inc. | 6.625% | 11/15/37 | 709 | 844 | ||
| UnitedHealth Group Inc. | 6.875% | 2/15/38 | 2,315 | 2,820 | ||
| UnitedHealth Group Inc. | 3.500% | 8/15/39 | 2,976 | 2,557 | ||
| UnitedHealth Group Inc. | 2.750% | 5/15/40 | 782 | 605 | ||
| UnitedHealth Group Inc. | 5.700% | 10/15/40 | 1,700 | 1,866 | ||
| UnitedHealth Group Inc. | 5.950% | 2/15/41 | 1,657 | 1,858 | ||
| UnitedHealth Group Inc. | 3.050% | 5/15/41 | 975 | 780 | ||
| UnitedHealth Group Inc. | 4.625% | 11/15/41 | 2,258 | 2,214 | ||
| UnitedHealth Group Inc. | 4.375% | 3/15/42 | 2,513 | 2,380 | ||
| UnitedHealth Group Inc. | 3.950% | 10/15/42 | 1,921 | 1,722 | ||
| UnitedHealth Group Inc. | 4.250% | 3/15/43 | 2,266 | 2,120 | ||
| UnitedHealth Group Inc. | 4.750% | 7/15/45 | 3,389 | 3,353 | ||
| Coupon | Maturity Date | Face Amount ($000) | Market Value• ($000) | |||
| UnitedHealth Group Inc. | 4.200% | 1/15/47 | 2,368 | 2,194 | ||
| UnitedHealth Group Inc. | 4.250% | 4/15/47 | 930 | 866 | ||
| UnitedHealth Group Inc. | 3.750% | 10/15/47 | 2,983 | 2,568 | ||
| UnitedHealth Group Inc. | 4.250% | 6/15/48 | 2,388 | 2,195 | ||
| UnitedHealth Group Inc. | 4.450% | 12/15/48 | 2,850 | 2,710 | ||
| UnitedHealth Group Inc. | 3.700% | 8/15/49 | 4,295 | 3,654 | ||
| UnitedHealth Group Inc. | 2.900% | 5/15/50 | 3,102 | 2,268 | ||
| UnitedHealth Group Inc. | 3.250% | 5/15/51 | 5,720 | 4,481 | ||
| UnitedHealth Group Inc. | 4.750% | 5/15/52 | 5,293 | 5,253 | ||
| UnitedHealth Group Inc. | 3.875% | 8/15/59 | 2,264 | 1,929 | ||
| UnitedHealth Group Inc. | 3.125% | 5/15/60 | 1,108 | 811 | ||
| UnitedHealth Group Inc. | 4.950% | 5/15/62 | 3,515 | 3,527 | ||
| Utah Acquisition Sub Inc. | 5.250% | 6/15/46 | 2,395 | 1,890 | ||
| Viatris Inc. | 3.850% | 6/22/40 | 3,870 | 2,687 | ||
| Viatris Inc. | 4.000% | 6/22/50 | 4,253 | 2,751 | ||
| 1 | WakeMed | 3.286% | 10/1/52 | 665 | 498 | |
| 1 | West Virginia United Health System Obligated Group | 3.129% | 6/1/50 | 1,065 | 765 | |
| 1 | Willis-Knighton Medical Center | 4.813% | 9/1/48 | 510 | 496 | |
| 1 | Willis-Knighton Medical Center | 3.065% | 3/1/51 | 1,355 | ��� 954 | |
| Wyeth LLC | 6.500% | 2/1/34 | 2,355 | 2,761 | ||
| Wyeth LLC | 6.000% | 2/15/36 | 572 | 641 | ||
| Wyeth LLC | 5.950% | 4/1/37 | 5,098 | 5,787 | ||
| 1 | Yale-New Haven Health Services Corp. | 2.496% | 7/1/50 | 1,100 | 738 | |
| Zimmer Biomet Holdings Inc. | 5.750% | 11/30/39 | 810 | 816 | ||
| Zimmer Biomet Holdings Inc. | 4.450% | 8/15/45 | 962 | 816 | ||
| Zoetis Inc. | 4.700% | 2/1/43 | 1,615 | 1,538 | ||
| Zoetis Inc. | 3.950% | 9/12/47 | 2,166 | 1,876 | ||
| Zoetis Inc. | 4.450% | 8/20/48 | 1,986 | 1,853 | ||
| Zoetis Inc. | 3.000% | 5/15/50 | 550 | 405 | ||
| 731,398 | ||||||
| Industrials (8.3%) | ||||||
| 1 | 3M Co. | 5.700% | 3/15/37 | 1,291 | 1,374 | |
| 1 | 3M Co. | 3.875% | 6/15/44 | 870 | 726 | |
| 1 | 3M Co. | 3.125% | 9/19/46 | 1,627 | 1,188 | |
| 1 | 3M Co. | 3.625% | 10/15/47 | 2,032 | 1,626 | |
| 1 | 3M Co. | 4.000% | 9/14/48 | 442 | 373 | |
| 3M Co. | 3.250% | 8/26/49 | 880 | 659 | ||
| 3M Co. | 3.700% | 4/15/50 | 3,676 | 2,950 | ||
| ABB Finance USA Inc. | 4.375% | 5/8/42 | 633 | 585 | ||
| 1 | American Airlines Pass-Through Trust Class A Series 2021-1 | 2.875% | 7/11/34 | 750 | 627 | |
| Boeing Co. | 6.125% | 2/15/33 | 1,125 | 1,167 | ||
| Boeing Co. | 3.600% | 5/1/34 | 2,592 | 2,106 | ||
| Boeing Co. | 3.250% | 2/1/35 | 763 | 589 | ||
| Boeing Co. | 6.625% | 2/15/38 | 1,335 | 1,403 | ||
| Boeing Co. | 3.550% | 3/1/38 | 2,277 | 1,704 | ||
| Boeing Co. | 3.500% | 3/1/39 | 1,479 | 1,093 | ||
| Boeing Co. | 6.875% | 3/15/39 | 2,459 | 2,633 | ||
| Boeing Co. | 5.875% | 2/15/40 | 1,767 | 1,727 | ||
| Boeing Co. | 5.705% | 5/1/40 | 5,630 | 5,386 | ||
| Boeing Co. | 3.650% | 3/1/47 | 2,035 | 1,428 | ||
| Boeing Co. | 3.625% | 3/1/48 | 1,698 | 1,168 | ||
| Boeing Co. | 3.850% | 11/1/48 | 590 | 420 | ||
| Boeing Co. | 3.900% | 5/1/49 | 1,770 | 1,281 | ||
| Boeing Co. | 3.750% | 2/1/50 | 2,916 | 2,089 | ||
| Boeing Co. | 5.805% | 5/1/50 | 12,717 | 12,198 | ||
| Boeing Co. | 3.825% | 3/1/59 | 695 | 477 | ||
| Boeing Co. | 3.950% | 8/1/59 | 520 | 363 | ||
| Boeing Co. | 5.930% | 5/1/60 | 8,515 | 8,130 | ||
| Burlington Northern Santa Fe LLC | 6.200% | 8/15/36 | 815 | 936 | ||
| Burlington Northern Santa Fe LLC | 6.150% | 5/1/37 | 636 | 730 | ||
| Burlington Northern Santa Fe LLC | 5.750% | 5/1/40 | 2,046 | 2,248 | ||
| Burlington Northern Santa Fe LLC | 5.050% | 3/1/41 | 2,356 | 2,417 | ||
| Burlington Northern Santa Fe LLC | 5.400% | 6/1/41 | 1,163 | 1,235 | ||
| Burlington Northern Santa Fe LLC | 4.950% | 9/15/41 | 1,111 | 1,123 | ||
| Coupon | Maturity Date | Face Amount ($000) | Market Value• ($000) | |||
| Burlington Northern Santa Fe LLC | 4.400% | 3/15/42 | 1,672 | 1,578 | ||
| Burlington Northern Santa Fe LLC | 4.450% | 3/15/43 | 2,834 | 2,712 | ||
| Burlington Northern Santa Fe LLC | 5.150% | 9/1/43 | 2,324 | 2,416 | ||
| Burlington Northern Santa Fe LLC | 4.900% | 4/1/44 | 1,667 | 1,668 | ||
| Burlington Northern Santa Fe LLC | 4.550% | 9/1/44 | 2,688 | 2,594 | ||
| Burlington Northern Santa Fe LLC | 4.150% | 4/1/45 | 784 | 715 | ||
| Burlington Northern Santa Fe LLC | 4.700% | 9/1/45 | 2,390 | 2,332 | ||
| Burlington Northern Santa Fe LLC | 3.900% | 8/1/46 | 755 | 666 | ||
| Burlington Northern Santa Fe LLC | 4.125% | 6/15/47 | 2,834 | 2,613 | ||
| Burlington Northern Santa Fe LLC | 4.050% | 6/15/48 | 1,260 | 1,145 | ||
| Burlington Northern Santa Fe LLC | 3.550% | 2/15/50 | 1,996 | 1,672 | ||
| Burlington Northern Santa Fe LLC | 3.050% | 2/15/51 | 2,855 | 2,189 | ||
| Burlington Northern Santa Fe LLC | 3.300% | 9/15/51 | 2,957 | 2,370 | ||
| Burlington Northern Santa Fe LLC | 2.875% | 6/15/52 | 1,320 | 976 | ||
| Burlington Northern Santa Fe LLC | 4.450% | 1/15/53 | 3,060 | 2,960 | ||
| Canadian National Railway Co. | 6.250% | 8/1/34 | 603 | 686 | ||
| Canadian National Railway Co. | 6.200% | 6/1/36 | 1,116 | 1,264 | ||
| Canadian National Railway Co. | 6.375% | 11/15/37 | 1,316 | 1,504 | ||
| Canadian National Railway Co. | 4.500% | 11/7/43 | 200 | 182 | ||
| Canadian National Railway Co. | 3.200% | 8/2/46 | 1,646 | 1,297 | ||
| Canadian National Railway Co. | 3.650% | 2/3/48 | 977 | 828 | ||
| Canadian National Railway Co. | 4.450% | 1/20/49 | 1,655 | 1,590 | ||
| Canadian National Railway Co. | 2.450% | 5/1/50 | 592 | 404 | ||
| Canadian National Railway Co. | 4.400% | 8/5/52 | 1,200 | 1,148 | ||
| Canadian Pacific Railway Co. | 4.800% | 9/15/35 | 952 | 943 | ||
| Canadian Pacific Railway Co. | 5.950% | 5/15/37 | 2,016 | 2,211 | ||
| Canadian Pacific Railway Co. | 3.000% | 12/2/41 | 3,000 | 2,357 | ||
| Canadian Pacific Railway Co. | 4.800% | 8/1/45 | 1,120 | 1,087 | ||
| Canadian Pacific Railway Co. | 3.100% | 12/2/51 | 4,641 | 3,432 | ||
| Canadian Pacific Railway Co. | 6.125% | 9/15/15 | 1,733 | 1,822 | ||
| Carrier Global Corp. | 3.377% | 4/5/40 | 2,894 | 2,285 | ||
| Carrier Global Corp. | 3.577% | 4/5/50 | 6,305 | 4,805 | ||
| Caterpillar Inc. | 5.300% | 9/15/35 | 413 | 445 | ||
| Caterpillar Inc. | 6.050% | 8/15/36 | 620 | 712 | ||
| Caterpillar Inc. | 5.200% | 5/27/41 | 1,791 | 1,934 | ||
| Caterpillar Inc. | 3.803% | 8/15/42 | 4,395 | 4,014 | ||
| Caterpillar Inc. | 4.300% | 5/15/44 | 1,295 | 1,254 | ||
| Caterpillar Inc. | 3.250% | 9/19/49 | 3,657 | 3,012 | ||
| Caterpillar Inc. | 3.250% | 4/9/50 | 1,848 | 1,527 | ||
| Caterpillar Inc. | 4.750% | 5/15/64 | 675 | 688 | ||
| Crane Holdings Co. | 4.200% | 3/15/48 | 819 | 650 | ||
| CSX Corp. | 4.100% | 11/15/32 | 1,100 | 1,062 | ||
| CSX Corp. | 6.000% | 10/1/36 | 150 | 164 | ||
| CSX Corp. | 6.150% | 5/1/37 | 1,814 | 2,032 | ||
| CSX Corp. | 6.220% | 4/30/40 | 1,229 | 1,399 | ||
| CSX Corp. | 5.500% | 4/15/41 | 536 | 565 | ||
| CSX Corp. | 4.750% | 5/30/42 | 2,165 | 2,084 | ||
| CSX Corp. | 4.400% | 3/1/43 | 752 | 687 | ||
| CSX Corp. | 4.100% | 3/15/44 | 2,022 | 1,792 | ||
| CSX Corp. | 3.800% | 11/1/46 | 2,521 | 2,146 | ||
| CSX Corp. | 4.300% | 3/1/48 | 743 | 678 | ||
| CSX Corp. | 4.750% | 11/15/48 | 1,093 | 1,067 | ||
| CSX Corp. | 4.500% | 3/15/49 | 1,601 | 1,501 | ||
| CSX Corp. | 3.350% | 9/15/49 | 2,600 | 2,042 | ||
| CSX Corp. | 3.800% | 4/15/50 | 1,841 | 1,553 | ||
| CSX Corp. | 3.950% | 5/1/50 | 865 | 750 | ||
| CSX Corp. | 2.500% | 5/15/51 | 490 | 325 | ||
| CSX Corp. | 4.500% | 11/15/52 | 2,220 | 2,069 | ||
| CSX Corp. | 4.500% | 8/1/54 | 1,241 | 1,150 | ||
| CSX Corp. | 4.250% | 11/1/66 | 2,321 | 1,986 | ||
| CSX Corp. | 4.650% | 3/1/68 | 1,324 | 1,218 | ||
| Cummins Inc. | 4.875% | 10/1/43 | 673 | 676 | ||
| Cummins Inc. | 2.600% | 9/1/50 | 2,455 | 1,703 | ||
| Deere & Co. | 3.900% | 6/9/42 | 2,707 | 2,542 | ||
| Deere & Co. | 2.875% | 9/7/49 | 2,146 | 1,676 | ||
| Deere & Co. | 3.750% | 4/15/50 | 1,488 | 1,370 | ||
| Dover Corp. | 5.375% | 10/15/35 | 755 | 760 | ||
| Coupon | Maturity Date | Face Amount ($000) | Market Value• ($000) | |||
| Dover Corp. | 5.375% | 3/1/41 | 938 | 924 | ||
| Eaton Corp. | 4.000% | 11/2/32 | 1,493 | 1,430 | ||
| Eaton Corp. | 4.150% | 3/15/33 | 2,911 | 2,807 | ||
| Eaton Corp. | 4.150% | 11/2/42 | 3,047 | 2,737 | ||
| Eaton Corp. | 3.915% | 9/15/47 | 936 | 802 | ||
| Eaton Corp. | 4.700% | 8/23/52 | 1,500 | 1,459 | ||
| Emerson Electric Co. | 5.250% | 11/15/39 | 485 | 506 | ||
| Emerson Electric Co. | 2.750% | 10/15/50 | 965 | 706 | ||
| Emerson Electric Co. | 2.800% | 12/21/51 | 2,928 | 2,129 | ||
| FedEx Corp. | 4.900% | 1/15/34 | 1,216 | 1,225 | ||
| FedEx Corp. | 3.900% | 2/1/35 | 1,820 | 1,656 | ||
| FedEx Corp. | 3.250% | 5/15/41 | 990 | 771 | ||
| FedEx Corp. | 3.875% | 8/1/42 | 746 | 624 | ||
| FedEx Corp. | 4.100% | 4/15/43 | 2,613 | 2,232 | ||
| FedEx Corp. | 5.100% | 1/15/44 | 1,793 | 1,734 | ||
| FedEx Corp. | 4.100% | 2/1/45 | 725 | 613 | ||
| FedEx Corp. | 4.750% | 11/15/45 | 2,740 | 2,540 | ||
| FedEx Corp. | 4.550% | 4/1/46 | 3,600 | 3,232 | ||
| FedEx Corp. | 4.400% | 1/15/47 | 1,459 | 1,290 | ||
| FedEx Corp. | 4.050% | 2/15/48 | 2,020 | 1,707 | ||
| FedEx Corp. | 4.950% | 10/17/48 | 3,092 | 2,948 | ||
| FedEx Corp. | 5.250% | 5/15/50 | 2,431 | 2,406 | ||
| 1 | FedEx Corp. Pass-Through Trust Class AA Series 2020-1 | 1.875% | 2/20/34 | 1,277 | 1,107 | |
| Fortive Corp. | 4.300% | 6/15/46 | 1,593 | 1,397 | ||
| General Dynamics Corp. | 4.250% | 4/1/40 | 2,510 | 2,418 | ||
| General Dynamics Corp. | 2.850% | 6/1/41 | 2,069 | 1,626 | ||
| General Dynamics Corp. | 3.600% | 11/15/42 | 702 | 613 | ||
| General Dynamics Corp. | 4.250% | 4/1/50 | 727 | 697 | ||
| 1 | General Electric Co. | 5.875% | 1/14/38 | 1,100 | 1,158 | |
| 1 | General Electric Co. | 6.875% | 1/10/39 | 1,185 | 1,358 | |
| General Electric Co. | 4.500% | 3/11/44 | 755 | 680 | ||
| General Electric Co. | 4.350% | 5/1/50 | 923 | 814 | ||
| Honeywell International Inc. | 5.700% | 3/15/36 | 743 | 829 | ||
| Honeywell International Inc. | 5.700% | 3/15/37 | 473 | 534 | ||
| Honeywell International Inc. | 5.375% | 3/1/41 | 1,056 | 1,148 | ||
| Honeywell International Inc. | 3.812% | 11/21/47 | 2,799 | 2,524 | ||
| Illinois Tool Works Inc. | 4.875% | 9/15/41 | 1,304 | 1,319 | ||
| Illinois Tool Works Inc. | 3.900% | 9/1/42 | 3,095 | 2,734 | ||
| 1 | JetBlue Pass-Through Trust Class A Series 2020-1 | 4.000% | 11/15/32 | 812 | 740 | |
| 1 | JetBlue Pass-Through Trust Class AA Series 2019-1 | 2.750% | 5/15/32 | 2 | 2 | |
| 1 | Johnson Controls International plc | 6.000% | 1/15/36 | 1,140 | 1,221 | |
| 1 | Johnson Controls International plc | 4.625% | 7/2/44 | 2,980 | 2,629 | |
| Johnson Controls International plc | 4.500% | 2/15/47 | 705 | 615 | ||
| 1 | Johnson Controls International plc | 4.950% | 7/2/64 | 1,216 | 1,057 | |
| 1 | Kansas City Southern | 4.300% | 5/15/43 | 754 | 664 | |
| 1 | Kansas City Southern | 4.950% | 8/15/45 | 1,045 | 1,006 | |
| Kansas City Southern | 4.700% | 5/1/48 | 1,740 | 1,642 | ||
| Kansas City Southern | 3.500% | 5/1/50 | 1,178 | 918 | ||
| Kansas City Southern | 4.200% | 11/15/69 | 1,134 | 933 | ||
| L3Harris Technologies Inc. | 4.854% | 4/27/35 | 2,210 | 2,184 | ||
| L3Harris Technologies Inc. | 6.150% | 12/15/40 | 150 | 163 | ||
| Lockheed Martin Corp. | 3.600% | 3/1/35 | 1,423 | 1,316 | ||
| Lockheed Martin Corp. | 4.500% | 5/15/36 | 2,402 | 2,397 | ||
| 1 | Lockheed Martin Corp. | 6.150% | 9/1/36 | 1,576 | 1,811 | |
| Lockheed Martin Corp. | 5.720% | 6/1/40 | 384 | 422 | ||
| Lockheed Martin Corp. | 4.850% | 9/15/41 | 330 | 327 | ||
| Lockheed Martin Corp. | 4.070% | 12/15/42 | 3,683 | 3,424 | ||
| Lockheed Martin Corp. | 3.800% | 3/1/45 | 2,540 | 2,241 | ||
| Lockheed Martin Corp. | 4.700% | 5/15/46 | 3,127 | 3,157 | ||
| Lockheed Martin Corp. | 2.800% | 6/15/50 | 889 | 663 | ||
| Lockheed Martin Corp. | 4.090% | 9/15/52 | 4,467 | 4,153 | ||
| Lockheed Martin Corp. | 4.150% | 6/15/53 | 2,024 | 1,890 | ||
| Lockheed Martin Corp. | 4.300% | 6/15/62 | 880 | 817 | ||
| Norfolk Southern Corp. | 7.050% | 5/1/37 | 172 | 199 | ||
| Coupon | Maturity Date | Face Amount ($000) | Market Value• ($000) | |||
| Norfolk Southern Corp. | 4.837% | 10/1/41 | 1,045 | 1,024 | ||
| Norfolk Southern Corp. | 3.950% | 10/1/42 | 817 | 715 | ||
| Norfolk Southern Corp. | 4.450% | 6/15/45 | 613 | 570 | ||
| Norfolk Southern Corp. | 4.650% | 1/15/46 | 1,125 | 1,077 | ||
| Norfolk Southern Corp. | 3.942% | 11/1/47 | 2,487 | 2,157 | ||
| Norfolk Southern Corp. | 4.150% | 2/28/48 | 945 | 844 | ||
| Norfolk Southern Corp. | 4.100% | 5/15/49 | 1,340 | 1,186 | ||
| Norfolk Southern Corp. | 3.400% | 11/1/49 | 2,611 | 2,048 | ||
| Norfolk Southern Corp. | 3.050% | 5/15/50 | 2,559 | 1,882 | ||
| Norfolk Southern Corp. | 4.050% | 8/15/52 | 2,772 | 2,408 | ||
| Norfolk Southern Corp. | 3.700% | 3/15/53 | 1,350 | 1,105 | ||
| Norfolk Southern Corp. | 4.550% | 6/1/53 | 1,289 | 1,216 | ||
| Norfolk Southern Corp. | 3.155% | 5/15/55 | 3,275 | 2,370 | ||
| Norfolk Southern Corp. | 4.100% | 5/15/21 | 1,165 | 868 | ||
| Northrop Grumman Corp. | 5.150% | 5/1/40 | 1,732 | 1,765 | ||
| Northrop Grumman Corp. | 5.050% | 11/15/40 | 2,002 | 2,002 | ||
| Northrop Grumman Corp. | 4.750% | 6/1/43 | 1,761 | 1,703 | ||
| Northrop Grumman Corp. | 3.850% | 4/15/45 | 1,934 | 1,646 | ||
| Northrop Grumman Corp. | 4.030% | 10/15/47 | 5,445 | 4,805 | ||
| Northrop Grumman Corp. | 5.250% | 5/1/50 | 772 | 812 | ||
| Otis Worldwide Corp. | 3.112% | 2/15/40 | 2,186 | 1,680 | ||
| Otis Worldwide Corp. | 3.362% | 2/15/50 | 3,192 | 2,376 | ||
| 1 | Parker-Hannifin Corp. | 4.200% | 11/21/34 | 915 | 852 | |
| 1 | Parker-Hannifin Corp. | 6.250% | 5/15/38 | 1,145 | 1,224 | |
| 1 | Parker-Hannifin Corp. | 4.450% | 11/21/44 | 1,035 | 934 | |
| Parker-Hannifin Corp. | 4.100% | 3/1/47 | 1,628 | 1,414 | ||
| Parker-Hannifin Corp. | 4.000% | 6/14/49 | 1,812 | 1,537 | ||
| Precision Castparts Corp. | 3.900% | 1/15/43 | 1,660 | 1,458 | ||
| Precision Castparts Corp. | 4.375% | 6/15/45 | 661 | 622 | ||
| Raytheon Technologies Corp. | 5.400% | 5/1/35 | 747 | 780 | ||
| Raytheon Technologies Corp. | 6.050% | 6/1/36 | 2,332 | 2,585 | ||
| Raytheon Technologies Corp. | 6.125% | 7/15/38 | 2,862 | 3,184 | ||
| Raytheon Technologies Corp. | 4.450% | 11/16/38 | 1,857 | 1,755 | ||
| Raytheon Technologies Corp. | 4.875% | 10/15/40 | 1,078 | 1,062 | ||
| Raytheon Technologies Corp. | 4.700% | 12/15/41 | 1,363 | 1,298 | ||
| Raytheon Technologies Corp. | 4.500% | 6/1/42 | 7,980 | 7,561 | ||
| Raytheon Technologies Corp. | 4.800% | 12/15/43 | 2,258 | 2,175 | ||
| Raytheon Technologies Corp. | 4.150% | 5/15/45 | 2,881 | 2,534 | ||
| Raytheon Technologies Corp. | 3.750% | 11/1/46 | 4,036 | 3,360 | ||
| Raytheon Technologies Corp. | 4.350% | 4/15/47 | 3,417 | 3,101 | ||
| Raytheon Technologies Corp. | 4.050% | 5/4/47 | 890 | 779 | ||
| Raytheon Technologies Corp. | 4.625% | 11/16/48 | 4,074 | 3,890 | ||
| Raytheon Technologies Corp. | 3.125% | 7/1/50 | 660 | 491 | ||
| Raytheon Technologies Corp. | 2.820% | 9/1/51 | 895 | 622 | ||
| Raytheon Technologies Corp. | 3.030% | 3/15/52 | 1,010 | 736 | ||
| Republic Services Inc. | 2.375% | 3/15/33 | 1,450 | 1,184 | ||
| Republic Services Inc. | 6.200% | 3/1/40 | 1,370 | 1,509 | ||
| Republic Services Inc. | 5.700% | 5/15/41 | 1,190 | 1,267 | ||
| Republic Services Inc. | 3.050% | 3/1/50 | 1,220 | 911 | ||
| Rockwell Automation Inc. | 4.200% | 3/1/49 | 1,180 | 1,090 | ||
| Rockwell Automation Inc. | 2.800% | 8/15/61 | 1,115 | 727 | ||
| Trane Technologies Global Holding Co. Ltd. | 5.750% | 6/15/43 | 411 | 417 | ||
| Trane Technologies Global Holding Co. Ltd. | 4.300% | 2/21/48 | 1,440 | 1,200 | ||
| Trane Technologies Luxembourg Finance SA | 4.650% | 11/1/44 | 981 | 861 | ||
| Trane Technologies Luxembourg Finance SA | 4.500% | 3/21/49 | 405 | 350 | ||
| Tyco Electronics Group SA | 7.125% | 10/1/37 | 760 | 928 | ||
| Union Pacific Corp. | 3.375% | 2/1/35 | 2,266 | 2,014 | ||
| Union Pacific Corp. | 2.891% | 4/6/36 | 1,995 | 1,663 | ||
| Union Pacific Corp. | 3.600% | 9/15/37 | 1,025 | 914 | ||
| 1 | Union Pacific Corp. | 3.550% | 8/15/39 | 1,923 | 1,666 | |
| Union Pacific Corp. | 3.200% | 5/20/41 | 3,480 | 2,866 | ||
| Union Pacific Corp. | 4.050% | 3/1/46 | 2,119 | 1,922 | ||
| Union Pacific Corp. | 3.350% | 8/15/46 | 1,360 | 1,093 | ||
| Coupon | Maturity Date | Face Amount ($000) | Market Value• ($000) | |||
| Union Pacific Corp. | 4.000% | 4/15/47 | 2,941 | 2,613 | ||
| Union Pacific Corp. | 3.250% | 2/5/50 | 3,588 | 2,830 | ||
| Union Pacific Corp. | 3.799% | 10/1/51 | 2,001 | 1,722 | ||
| Union Pacific Corp. | 2.950% | 3/10/52 | 4,545 | 3,343 | ||
| Union Pacific Corp. | 3.500% | 2/14/53 | 1,632 | 1,324 | ||
| Union Pacific Corp. | 3.875% | 2/1/55 | 1,222 | 1,053 | ||
| Union Pacific Corp. | 3.950% | 8/15/59 | 3,155 | 2,711 | ||
| Union Pacific Corp. | 3.839% | 3/20/60 | 1,249 | 1,049 | ||
| Union Pacific Corp. | 3.550% | 5/20/61 | 805 | 636 | ||
| Union Pacific Corp. | 2.973% | 9/16/62 | 2,547 | 1,758 | ||
| Union Pacific Corp. | 4.100% | 9/15/67 | 500 | 429 | ||
| Union Pacific Corp. | 3.750% | 2/5/70 | 716 | 572 | ||
| Union Pacific Corp. | 3.799% | 4/6/71 | 4,381 | 3,520 | ||
| Union Pacific Corp. | 3.850% | 2/14/72 | 1,605 | 1,307 | ||
| United Parcel Service Inc. | 6.200% | 1/15/38 | 2,273 | 2,670 | ||
| United Parcel Service Inc. | 5.200% | 4/1/40 | 2,794 | 2,976 | ||
| United Parcel Service Inc. | 4.875% | 11/15/40 | 1,598 | 1,642 | ||
| United Parcel Service Inc. | 3.625% | 10/1/42 | 1,300 | 1,144 | ||
| United Parcel Service Inc. | 3.400% | 11/15/46 | 1,590 | 1,321 | ||
| United Parcel Service Inc. | 3.750% | 11/15/47 | 2,485 | 2,212 | ||
| United Parcel Service Inc. | 4.250% | 3/15/49 | 3,071 | 2,962 | ||
| United Parcel Service Inc. | 3.400% | 9/1/49 | 1,994 | 1,691 | ||
| United Parcel Service Inc. | 5.300% | 4/1/50 | 1,095 | 1,221 | ||
| Valmont Industries Inc. | 5.000% | 10/1/44 | 1,140 | 1,044 | ||
| Valmont Industries Inc. | 5.250% | 10/1/54 | 788 | 745 | ||
| Waste Connections Inc. | 3.050% | 4/1/50 | 1,329 | 987 | ||
| Waste Connections Inc. | 2.950% | 1/15/52 | 725 | 522 | ||
| Waste Management Inc. | 2.950% | 6/1/41 | 2,340 | 1,823 | ||
| Waste Management Inc. | 4.150% | 7/15/49 | 1,965 | 1,814 | ||
| Waste Management Inc. | 2.500% | 11/15/50 | 1,150 | 773 | ||
| WW Grainger Inc. | 4.600% | 6/15/45 | 1,954 | 1,889 | ||
| WW Grainger Inc. | 3.750% | 5/15/46 | 1,076 | 915 | ||
| WW Grainger Inc. | 4.200% | 5/15/47 | 1,425 | 1,298 | ||
| Xylem Inc. | 4.375% | 11/1/46 | 1,203 | 1,074 | ||
| 422,253 | ||||||
| Materials (3.6%) | ||||||
| Air Products and Chemicals Inc. | 2.700% | 5/15/40 | 1,990 | 1,568 | ||
| Air Products and Chemicals Inc. | 2.800% | 5/15/50 | 795 | 592 | ||
| Albemarle Corp. | 5.450% | 12/1/44 | 685 | 659 | ||
| Albemarle Corp. | 5.650% | 6/1/52 | 1,000 | 982 | ||
| ArcelorMittal SA | 7.000% | 10/15/39 | 1,563 | 1,584 | ||
| ArcelorMittal SA | 6.750% | 3/1/41 | 1,360 | 1,337 | ||
| Barrick Gold Corp. | 6.450% | 10/15/35 | 1,575 | 1,731 | ||
| Barrick Gold Corp. | 5.250% | 4/1/42 | 1,765 | 1,720 | ||
| Barrick North America Finance LLC | 5.700% | 5/30/41 | 457 | 470 | ||
| Barrick North America Finance LLC | 5.750% | 5/1/43 | 1,928 | 1,980 | ||
| Barrick PD Australia Finance Pty. Ltd. | 5.950% | 10/15/39 | 3,879 | 4,087 | ||
| BHP Billiton Finance USA Ltd. | 4.125% | 2/24/42 | 2,075 | 1,901 | ||
| BHP Billiton Finance USA Ltd. | 5.000% | 9/30/43 | 4,848 | 4,916 | ||
| Celulosa Arauco y Constitucion SA | 5.500% | 11/2/47 | 933 | 801 | ||
| CF Industries Inc. | 5.150% | 3/15/34 | 1,510 | 1,457 | ||
| CF Industries Inc. | 4.950% | 6/1/43 | 2,025 | 1,802 | ||
| CF Industries Inc. | 5.375% | 3/15/44 | 1,815 | 1,700 | ||
| Dow Chemical Co. | 4.250% | 10/1/34 | 2,875 | 2,664 | ||
| Dow Chemical Co. | 9.400% | 5/15/39 | 359 | 496 | ||
| Dow Chemical Co. | 5.250% | 11/15/41 | 1,367 | 1,344 | ||
| Dow Chemical Co. | 4.375% | 11/15/42 | 1,262 | 1,105 | ||
| Dow Chemical Co. | 4.625% | 10/1/44 | 3,089 | 2,761 | ||
| Dow Chemical Co. | 5.550% | 11/30/48 | 1,458 | 1,474 | ||
| Dow Chemical Co. | 4.800% | 5/15/49 | 3,014 | 2,741 | ||
| Dow Chemical Co. | 3.600% | 11/15/50 | 2,925 | 2,237 | ||
| DuPont de Nemours Inc. | 5.319% | 11/15/38 | 2,948 | 2,938 | ||
| DuPont de Nemours Inc. | 5.419% | 11/15/48 | 4,072 | 4,007 | ||
| Eastman Chemical Co. | 4.800% | 9/1/42 | 1,292 | 1,131 | ||
| Eastman Chemical Co. | 4.650% | 10/15/44 | 1,408 | 1,229 | ||
| Ecolab Inc. | 3.950% | 12/1/47 | 250 | 227 | ||
| Coupon | Maturity Date | Face Amount ($000) | Market Value• ($000) | |||
| Ecolab Inc. | 2.125% | 8/15/50 | 1,648 | 1,054 | ||
| Ecolab Inc. | 2.700% | 12/15/51 | 2,005 | 1,422 | ||
| Ecolab Inc. | 2.750% | 8/18/55 | 3,457 | 2,438 | ||
| FMC Corp. | 4.500% | 10/1/49 | 2,177 | 1,834 | ||
| Freeport-McMoRan Inc. | 5.400% | 11/14/34 | 1,899 | 1,797 | ||
| Freeport-McMoRan Inc. | 5.450% | 3/15/43 | 4,365 | 3,919 | ||
| International Flavors & Fragrances Inc. | 4.375% | 6/1/47 | 885 | 747 | ||
| International Flavors & Fragrances Inc. | 5.000% | 9/26/48 | 1,830 | 1,694 | ||
| International Paper Co. | 5.000% | 9/15/35 | 2,760 | 2,753 | ||
| International Paper Co. | 7.300% | 11/15/39 | 844 | 974 | ||
| International Paper Co. | 6.000% | 11/15/41 | 1,432 | 1,465 | ||
| International Paper Co. | 4.800% | 6/15/44 | 1,218 | 1,104 | ||
| International Paper Co. | 4.400% | 8/15/47 | 750 | 658 | ||
| International Paper Co. | 4.350% | 8/15/48 | 1,355 | 1,197 | ||
| Lafarge SA | 7.125% | 7/15/36 | 1,025 | 1,149 | ||
| Linde Inc. | 3.550% | 11/7/42 | 803 | 691 | ||
| Linde Inc. | 2.000% | 8/10/50 | 1,005 | 628 | ||
| Lubrizol Corp. | 6.500% | 10/1/34 | 1,183 | 1,386 | ||
| LYB International Finance BV | 5.250% | 7/15/43 | 880 | 822 | ||
| LYB International Finance BV | 4.875% | 3/15/44 | 2,977 | 2,700 | ||
| LYB International Finance III LLC | 3.375% | 10/1/40 | 2,611 | 1,989 | ||
| LYB International Finance III LLC | 4.200% | 10/15/49 | 3,480 | 2,797 | ||
| LYB International Finance III LLC | 4.200% | 5/1/50 | 2,675 | 2,167 | ||
| LYB International Finance III LLC | 3.625% | 4/1/51 | 1,550 | 1,150 | ||
| LYB International Finance III LLC | 3.800% | 10/1/60 | 2,591 | 1,842 | ||
| LyondellBasell Industries NV | 4.625% | 2/26/55 | 621 | 523 | ||
| Martin Marietta Materials Inc. | 4.250% | 12/15/47 | 2,428 | 2,036 | ||
| Martin Marietta Materials Inc. | 3.200% | 7/15/51 | 645 | 453 | ||
| Mosaic Co. | 5.450% | 11/15/33 | 1,630 | 1,658 | ||
| Mosaic Co. | 4.875% | 11/15/41 | 1,551 | 1,365 | ||
| Mosaic Co. | 5.625% | 11/15/43 | 1,389 | 1,374 | ||
| 1 | Newmont Corp. | 5.875% | 4/1/35 | 1,387 | 1,440 | |
| Newmont Corp. | 6.250% | 10/1/39 | 2,167 | 2,332 | ||
| Newmont Corp. | 4.875% | 3/15/42 | 1,771 | 1,683 | ||
| Newmont Corp. | 5.450% | 6/9/44 | 1,710 | 1,695 | ||
| Nucor Corp. | 5.200% | 8/1/43 | 945 | 929 | ||
| Nucor Corp. | 2.979% | 12/15/55 | 3,431 | 2,291 | ||
| Nutrien Ltd. | 4.125% | 3/15/35 | 925 | 843 | ||
| Nutrien Ltd. | 5.875% | 12/1/36 | 1,383 | 1,478 | ||
| Nutrien Ltd. | 5.625% | 12/1/40 | 820 | 845 | ||
| Nutrien Ltd. | 4.900% | 6/1/43 | 2,686 | 2,574 | ||
| Nutrien Ltd. | 5.250% | 1/15/45 | 2,057 | 2,011 | ||
| Nutrien Ltd. | 5.000% | 4/1/49 | 1,086 | 1,073 | ||
| Nutrien Ltd. | 3.950% | 5/13/50 | 1,935 | 1,649 | ||
| Packaging Corp. of America | 4.050% | 12/15/49 | 1,521 | 1,258 | ||
| Packaging Corp. of America | 3.050% | 10/1/51 | 2,205 | 1,551 | ||
| Rio Tinto Alcan Inc. | 6.125% | 12/15/33 | 1,469 | 1,669 | ||
| Rio Tinto Alcan Inc. | 5.750% | 6/1/35 | 3,112 | 3,368 | ||
| Rio Tinto Finance USA Ltd. | 5.200% | 11/2/40 | 3,424 | 3,577 | ||
| Rio Tinto Finance USA Ltd. | 2.750% | 11/2/51 | 1,490 | 1,080 | ||
| Rio Tinto Finance USA plc | 4.750% | 3/22/42 | 967 | 961 | ||
| Rio Tinto Finance USA plc | 4.125% | 8/21/42 | 1,028 | 944 | ||
| RPM International Inc. | 5.250% | 6/1/45 | 305 | 281 | ||
| RPM International Inc. | 4.250% | 1/15/48 | 2,000 | 1,597 | ||
| Sherwin-Williams Co. | 4.000% | 12/15/42 | 612 | 498 | ||
| Sherwin-Williams Co. | 4.550% | 8/1/45 | 1,586 | 1,387 | ||
| Sherwin-Williams Co. | 4.500% | 6/1/47 | 1,010 | 901 | ||
| Sherwin-Williams Co. | 3.800% | 8/15/49 | 1,858 | 1,480 | ||
| Sherwin-Williams Co. | 3.300% | 5/15/50 | 1,091 | 800 | ||
| Sherwin-Williams Co. | 2.900% | 3/15/52 | 1,970 | 1,311 | ||
| Sonoco Products Co. | 5.750% | 11/1/40 | 1,120 | 1,121 | ||
| Southern Copper Corp. | 7.500% | 7/27/35 | 3,363 | 3,956 | ||
| Southern Copper Corp. | 6.750% | 4/16/40 | 1,704 | 1,917 | ||
| Southern Copper Corp. | 5.250% | 11/8/42 | 1,657 | 1,602 | ||
| Southern Copper Corp. | 5.875% | 4/23/45 | 4,512 | 4,700 | ||
| Coupon | Maturity Date | Face Amount ($000) | Market Value• ($000) | |||
| Steel Dynamics Inc. | 3.250% | 10/15/50 | 1,975 | 1,348 | ||
| Teck Resources Ltd. | 6.000% | 8/15/40 | 1,034 | 987 | ||
| Teck Resources Ltd. | 5.200% | 3/1/42 | 1,600 | 1,392 | ||
| Teck Resources Ltd. | 5.400% | 2/1/43 | 1,215 | 1,079 | ||
| Vale Overseas Ltd. | 8.250% | 1/17/34 | 1,794 | 2,134 | ||
| Vale Overseas Ltd. | 6.875% | 11/21/36 | 5,606 | 5,785 | ||
| Vale Overseas Ltd. | 6.875% | 11/10/39 | 1,903 | 1,970 | ||
| Vale SA | 5.625% | 9/11/42 | 980 | 915 | ||
| Vulcan Materials Co. | 4.500% | 6/15/47 | 2,072 | 1,835 | ||
| Vulcan Materials Co. | 4.700% | 3/1/48 | 565 | 514 | ||
| Westlake Corp. | 2.875% | 8/15/41 | 1,455 | 1,028 | ||
| Westlake Corp. | 5.000% | 8/15/46 | 1,738 | 1,624 | ||
| Westlake Corp. | 4.375% | 11/15/47 | 638 | 545 | ||
| Westlake Corp. | 3.125% | 8/15/51 | 1,625 | 1,118 | ||
| Westlake Corp. | 3.375% | 8/15/61 | 1,154 | 763 | ||
| WRKCo Inc. | 3.000% | 6/15/33 | 2,704 | 2,257 | ||
| 183,523 | ||||||
| Real Estate (1.5%) | ||||||
| Agree LP | 4.800% | 10/1/32 | 825 | 793 | ||
| Agree LP | 2.600% | 6/15/33 | 750 | 589 | ||
| Alexandria Real Estate Equities Inc. | 1.875% | 2/1/33 | 837 | 631 | ||
| Alexandria Real Estate Equities Inc. | 2.950% | 3/15/34 | 2,768 | 2,333 | ||
| Alexandria Real Estate Equities Inc. | 4.850% | 4/15/49 | 3,192 | 2,957 | ||
| Alexandria Real Estate Equities Inc. | 4.000% | 2/1/50 | 1,959 | 1,616 | ||
| Alexandria Real Estate Equities Inc. | 3.000% | 5/18/51 | 564 | 381 | ||
| Alexandria Real Estate Equities Inc. | 3.550% | 3/15/52 | 1,340 | 1,013 | ||
| American Homes 4 Rent LP | 3.375% | 7/15/51 | 416 | 283 | ||
| American Homes 4 Rent LP | 4.300% | 4/15/52 | 1,010 | 813 | ||
| American Tower Corp. | 3.700% | 10/15/49 | 2,766 | 2,102 | ||
| American Tower Corp. | 3.100% | 6/15/50 | 1,885 | 1,312 | ||
| American Tower Corp. | 2.950% | 1/15/51 | 1,725 | 1,161 | ||
| 1 | AvalonBay Communities Inc. | 3.900% | 10/15/46 | 2,900 | 2,471 | |
| 1 | AvalonBay Communities Inc. | 4.350% | 4/15/48 | 355 | 323 | |
| Boston Properties LP | 2.450% | 10/1/33 | 2,156 | 1,633 | ||
| Camden Property Trust | 3.350% | 11/1/49 | 697 | 541 | ||
| Corporate Office Properties LP | 2.900% | 12/1/33 | 1,390 | 1,037 | ||
| Crown Castle Inc. | 2.900% | 4/1/41 | 2,127 | 1,535 | ||
| Crown Castle Inc. | 4.750% | 5/15/47 | 1,300 | 1,170 | ||
| Crown Castle Inc. | 5.200% | 2/15/49 | 1,489 | 1,410 | ||
| Crown Castle Inc. | 4.000% | 11/15/49 | 1,285 | 1,030 | ||
| Crown Castle Inc. | 4.150% | 7/1/50 | 1,312 | 1,089 | ||
| Crown Castle Inc. | 3.250% | 1/15/51 | 2,194 | 1,560 | ||
| Duke Realty LP | 3.050% | 3/1/50 | 555 | 414 | ||
| Equinix Inc. | 3.000% | 7/15/50 | 1,562 | 1,071 | ||
| Equinix Inc. | 2.950% | 9/15/51 | 1,482 | 1,000 | ||
| Equinix Inc. | 3.400% | 2/15/52 | 575 | 422 | ||
| ERP Operating LP | 4.500% | 7/1/44 | 1,145 | 1,068 | ||
| ERP Operating LP | 4.500% | 6/1/45 | 1,217 | 1,118 | ||
| ERP Operating LP | 4.000% | 8/1/47 | 488 | 421 | ||
| Essex Portfolio LP | 1.650% | 1/15/31 | 303 | 235 | ||
| Essex Portfolio LP | 4.500% | 3/15/48 | 915 | 807 | ||
| Essex Portfolio LP | 2.650% | 9/1/50 | 657 | 404 | ||
| Federal Realty Investment Trust | 4.500% | 12/1/44 | 805 | 706 | ||
| Healthpeak Properties Inc. | 6.750% | 2/1/41 | 671 | 746 | ||
| Highwoods Realty LP | 2.600% | 2/1/31 | 222 | 177 | ||
| Invitation Homes Operating Partnership LP | 2.700% | 1/15/34 | 995 | 754 | ||
| Kilroy Realty LP | 2.500% | 11/15/32 | 952 | 738 | ||
| Kilroy Realty LP | 2.650% | 11/15/33 | 1,140 | 865 | ||
| Kimco Realty Corp. | 4.600% | 2/1/33 | 1,200 | 1,160 | ||
| Kimco Realty Corp. | 4.250% | 4/1/45 | 578 | 478 | ||
| Kimco Realty Corp. | 4.125% | 12/1/46 | 643 | 529 | ||
| Kimco Realty Corp. | 4.450% | 9/1/47 | 1,220 | 1,055 | ||
| Kimco Realty Corp. | 3.700% | 10/1/49 | 1,477 | 1,134 | ||
| Mid-America Apartments LP | 2.875% | 9/15/51 | 525 | 365 | ||
| National Retail Properties Inc. | 4.800% | 10/15/48 | 2,376 | 2,167 | ||
| National Retail Properties Inc. | 3.100% | 4/15/50 | 702 | 477 | ||
| Coupon | Maturity Date | Face Amount ($000) | Market Value• ($000) | |||
| National Retail Properties Inc. | 3.000% | 4/15/52 | 967 | 650 | ||
| Omega Healthcare Investors Inc. | 3.250% | 4/15/33 | 692 | 527 | ||
| Prologis LP | 4.375% | 9/15/48 | 1,365 | 1,275 | ||
| Prologis LP | 3.000% | 4/15/50 | 1,345 | 1,008 | ||
| Prologis LP | 2.125% | 10/15/50 | 884 | 561 | ||
| Realty Income Corp. | 2.850% | 12/15/32 | 1,119 | 960 | ||
| Realty Income Corp. | 1.800% | 3/15/33 | 488 | 370 | ||
| Realty Income Corp. | 4.650% | 3/15/47 | 1,145 | 1,100 | ||
| Regency Centers LP | 4.400% | 2/1/47 | 840 | 726 | ||
| Regency Centers LP | 4.650% | 3/15/49 | 985 | 877 | ||
| Simon Property Group LP | 6.750% | 2/1/40 | 630 | 712 | ||
| Simon Property Group LP | 4.750% | 3/15/42 | 2,070 | 1,928 | ||
| Simon Property Group LP | 4.250% | 10/1/44 | 2,128 | 1,836 | ||
| Simon Property Group LP | 4.250% | 11/30/46 | 722 | 630 | ||
| Simon Property Group LP | 3.250% | 9/13/49 | 1,127 | 819 | ||
| Simon Property Group LP | 3.800% | 7/15/50 | 3,174 | 2,564 | ||
| 1 | UDR Inc. | 1.900% | 3/15/33 | 1,084 | 811 | |
| 1 | UDR Inc. | 2.100% | 6/15/33 | 925 | 696 | |
| UDR Inc. | 3.100% | 11/1/34 | 920 | 752 | ||
| Ventas Realty LP | 5.700% | 9/30/43 | 874 | 876 | ||
| Ventas Realty LP | 4.375% | 2/1/45 | 413 | 348 | ||
| Ventas Realty LP | 4.875% | 4/15/49 | 1,072 | 992 | ||
| VICI Properties LP | 5.625% | 5/15/52 | 1,850 | 1,712 | ||
| Welltower Inc. | 6.500% | 3/15/41 | 1,500 | 1,640 | ||
| Welltower Inc. | 4.950% | 9/1/48 | 870 | 819 | ||
| Weyerhaeuser Co. | 4.000% | 3/9/52 | 2,115 | 1,744 | ||
| WP Carey Inc. | 2.250% | 4/1/33 | 975 | 742 | ||
| 75,769 | ||||||
| Technology (8.9%) | ||||||
| Analog Devices Inc. | 2.800% | 10/1/41 | 2,905 | 2,267 | ||
| Analog Devices Inc. | 5.300% | 12/15/45 | 150 | 158 | ||
| Analog Devices Inc. | 2.950% | 10/1/51 | 1,089 | 823 | ||
| Apple Inc. | 4.500% | 2/23/36 | 1,426 | 1,473 | ||
| Apple Inc. | 2.375% | 2/8/41 | 3,320 | 2,503 | ||
| Apple Inc. | 3.850% | 5/4/43 | 8,307 | 7,625 | ||
| Apple Inc. | 4.450% | 5/6/44 | 2,373 | 2,370 | ||
| Apple Inc. | 3.450% | 2/9/45 | 4,634 | 4,019 | ||
| Apple Inc. | 4.375% | 5/13/45 | 4,965 | 4,872 | ||
| Apple Inc. | 4.650% | 2/23/46 | 11,319 | 11,586 | ||
| Apple Inc. | 3.850% | 8/4/46 | 6,040 | 5,496 | ||
| Apple Inc. | 4.250% | 2/9/47 | 1,410 | 1,376 | ||
| Apple Inc. | 3.750% | 9/12/47 | 3,808 | 3,412 | ||
| Apple Inc. | 3.750% | 11/13/47 | 4,612 | 4,139 | ||
| Apple Inc. | 2.950% | 9/11/49 | 1,115 | 868 | ||
| Apple Inc. | 2.650% | 5/11/50 | 6,781 | 4,961 | ||
| Apple Inc. | 2.400% | 8/20/50 | 4,478 | 3,110 | ||
| Apple Inc. | 2.650% | 2/8/51 | 7,055 | 5,158 | ||
| Apple Inc. | 2.700% | 8/5/51 | 4,477 | 3,304 | ||
| Apple Inc. | 3.950% | 8/8/52 | 2,000 | 1,845 | ||
| Apple Inc. | 2.550% | 8/20/60 | 3,234 | 2,195 | ||
| Apple Inc. | 2.800% | 2/8/61 | 3,162 | 2,222 | ||
| Apple Inc. | 2.850% | 8/5/61 | 1,970 | 1,398 | ||
| Apple Inc. | 4.100% | 8/8/62 | 3,200 | 2,940 | ||
| Applied Materials Inc. | 5.100% | 10/1/35 | 998 | 1,051 | ||
| Applied Materials Inc. | 5.850% | 6/15/41 | 2,068 | 2,365 | ||
| Applied Materials Inc. | 4.350% | 4/1/47 | 2,444 | 2,357 | ||
| Applied Materials Inc. | 2.750% | 6/1/50 | 721 | 537 | ||
| Broadcom Inc. | 4.300% | 11/15/32 | 4,316 | 3,893 | ||
| 2 | Broadcom Inc. | 2.600% | 2/15/33 | 4,708 | 3,621 | |
| 2 | Broadcom Inc. | 3.419% | 4/15/33 | 6,957 | 5,738 | |
| 2 | Broadcom Inc. | 3.469% | 4/15/34 | 8,210 | 6,653 | |
| 2 | Broadcom Inc. | 3.137% | 11/15/35 | 7,494 | 5,681 | |
| 2 | Broadcom Inc. | 3.187% | 11/15/36 | 6,115 | 4,537 | |
| 2 | Broadcom Inc. | 4.926% | 5/15/37 | 4,630 | 4,131 | |
| 2 | Broadcom Inc. | 3.500% | 2/15/41 | 6,656 | 5,005 | |
| 2 | Broadcom Inc. | 3.750% | 2/15/51 | 3,900 | 2,879 | |
| Cisco Systems Inc. | 5.900% | 2/15/39 | 4,897 | 5,560 | ||
| Coupon | Maturity Date | Face Amount ($000) | Market Value• ($000) | |||
| Cisco Systems Inc. | 5.500% | 1/15/40 | 4,343 | 4,736 | ||
| Corning Inc. | 4.700% | 3/15/37 | 1,085 | 1,022 | ||
| Corning Inc. | 5.750% | 8/15/40 | 969 | 1,003 | ||
| Corning Inc. | 4.750% | 3/15/42 | 487 | 452 | ||
| Corning Inc. | 5.350% | 11/15/48 | 794 | 782 | ||
| Corning Inc. | 3.900% | 11/15/49 | 915 | 712 | ||
| Corning Inc. | 4.375% | 11/15/57 | 2,300 | 1,890 | ||
| Corning Inc. | 5.850% | 11/15/68 | 1,897 | 1,823 | ||
| Corning Inc. | 5.450% | 11/15/79 | 2,049 | 1,881 | ||
| Dell Inc. | 6.500% | 4/15/38 | 1,635 | 1,647 | ||
| Dell International LLC | 8.100% | 7/15/36 | 2,001 | 2,325 | ||
| 2 | Dell International LLC | 3.375% | 12/15/41 | 1,850 | 1,297 | |
| Dell International LLC | 8.350% | 7/15/46 | 2,031 | 2,470 | ||
| 2 | Dell International LLC | 3.450% | 12/15/51 | 3,725 | 2,430 | |
| Fidelity National Information Services Inc. | 3.100% | 3/1/41 | 2,180 | 1,585 | ||
| Fidelity National Information Services Inc. | 4.500% | 8/15/46 | 1,298 | 1,125 | ||
| Fiserv Inc. | 4.400% | 7/1/49 | 4,408 | 3,810 | ||
| Hewlett Packard Enterprise Co. | 6.200% | 10/15/35 | 2,162 | 2,301 | ||
| Hewlett Packard Enterprise Co. | 6.350% | 10/15/45 | 2,471 | 2,480 | ||
| HP Inc. | 5.500% | 1/15/33 | 825 | 793 | ||
| HP Inc. | 6.000% | 9/15/41 | 3,564 | 3,460 | ||
| Intel Corp. | 4.000% | 12/15/32 | 1,453 | 1,396 | ||
| Intel Corp. | 4.600% | 3/25/40 | 1,715 | 1,634 | ||
| Intel Corp. | 2.800% | 8/12/41 | 1,265 | 939 | ||
| Intel Corp. | 4.800% | 10/1/41 | 2,093 | 2,054 | ||
| Intel Corp. | 4.250% | 12/15/42 | 1,107 | 996 | ||
| Intel Corp. | 4.900% | 7/29/45 | 1,594 | 1,560 | ||
| Intel Corp. | 4.100% | 5/19/46 | 3,118 | 2,756 | ||
| Intel Corp. | 4.100% | 5/11/47 | 1,055 | 924 | ||
| Intel Corp. | 3.734% | 12/8/47 | 4,539 | 3,704 | ||
| Intel Corp. | 3.250% | 11/15/49 | 6,922 | 5,156 | ||
| Intel Corp. | 4.750% | 3/25/50 | 5,301 | 5,058 | ||
| Intel Corp. | 3.050% | 8/12/51 | 3,843 | 2,761 | ||
| Intel Corp. | 4.900% | 8/5/52 | 4,500 | 4,389 | ||
| Intel Corp. | 3.100% | 2/15/60 | 1,900 | 1,301 | ||
| Intel Corp. | 3.200% | 8/12/61 | 2,365 | 1,663 | ||
| Intel Corp. | 5.050% | 8/5/62 | 3,000 | 2,908 | ||
| International Business Machines Corp. | 5.875% | 11/29/32 | 800 | 876 | ||
| International Business Machines Corp. | 4.150% | 5/15/39 | 5,813 | 5,248 | ||
| International Business Machines Corp. | 5.600% | 11/30/39 | 775 | 817 | ||
| International Business Machines Corp. | 2.850% | 5/15/40 | 1,810 | 1,381 | ||
| International Business Machines Corp. | 4.000% | 6/20/42 | 2,121 | 1,831 | ||
| International Business Machines Corp. | 4.700% | 2/19/46 | 3,393 | 3,206 | ||
| International Business Machines Corp. | 4.250% | 5/15/49 | 7,205 | 6,387 | ||
| International Business Machines Corp. | 2.950% | 5/15/50 | 1,010 | 714 | ||
| International Business Machines Corp. | 3.430% | 2/9/52 | 1,615 | 1,241 | ||
| International Business Machines Corp. | 7.125% | 12/1/96 | 665 | 861 | ||
| Juniper Networks Inc. | 5.950% | 3/15/41 | 508 | 488 | ||
| KLA Corp. | 4.650% | 7/15/32 | 2,000 | 2,034 | ||
| KLA Corp. | 5.000% | 3/15/49 | 1,555 | 1,571 | ||
| KLA Corp. | 3.300% | 3/1/50 | 2,474 | 1,935 | ||
| KLA Corp. | 4.950% | 7/15/52 | 3,020 | 3,040 | ||
| KLA Corp. | 5.250% | 7/15/62 | 2,040 | 2,079 | ||
| 2 | Kyndryl Holdings Inc. | 4.100% | 10/15/41 | 1,065 | 648 | |
| Lam Research Corp. | 4.875% | 3/15/49 | 1,792 | 1,835 | ||
| Lam Research Corp. | 2.875% | 6/15/50 | 1,420 | 1,043 | ||
| Coupon | Maturity Date | Face Amount ($000) | Market Value• ($000) | |||
| Lam Research Corp. | 3.125% | 6/15/60 | 1,642 | 1,206 | ||
| Micron Technology Inc. | 3.366% | 11/1/41 | 445 | 314 | ||
| Micron Technology Inc. | 3.477% | 11/1/51 | 1,505 | 1,002 | ||
| Microsoft Corp. | 3.500% | 2/12/35 | 2,169 | 2,076 | ||
| Microsoft Corp. | 4.200% | 11/3/35 | 2,867 | 2,916 | ||
| Microsoft Corp. | 3.450% | 8/8/36 | 3,436 | 3,236 | ||
| Microsoft Corp. | 4.100% | 2/6/37 | 4,011 | 4,028 | ||
| Microsoft Corp. | 4.500% | 10/1/40 | 1,174 | 1,203 | ||
| Microsoft Corp. | 5.300% | 2/8/41 | 735 | 830 | ||
| Microsoft Corp. | 3.500% | 11/15/42 | 1,335 | 1,195 | ||
| Microsoft Corp. | 3.750% | 2/12/45 | 2,250 | 2,057 | ||
| Microsoft Corp. | 3.700% | 8/8/46 | 7,451 | 6,861 | ||
| Microsoft Corp. | 4.250% | 2/6/47 | 2,868 | 2,870 | ||
| Microsoft Corp. | 2.525% | 6/1/50 | 17,088 | 12,447 | ||
| Microsoft Corp. | 2.921% | 3/17/52 | 15,044 | 11,866 | ||
| Microsoft Corp. | 3.950% | 8/8/56 | 1,645 | 1,535 | ||
| Microsoft Corp. | 2.675% | 6/1/60 | 9,816 | 6,983 | ||
| Microsoft Corp. | 3.041% | 3/17/62 | 5,640 | 4,317 | ||
| Moody's Corp. | 2.750% | 8/19/41 | 1,450 | 1,061 | ||
| Moody's Corp. | 5.250% | 7/15/44 | 1,113 | 1,124 | ||
| Moody's Corp. | 4.875% | 12/17/48 | 1,476 | 1,433 | ||
| Moody's Corp. | 3.250% | 5/20/50 | 565 | 421 | ||
| Moody's Corp. | 3.750% | 2/25/52 | 485 | 396 | ||
| Moody's Corp. | 2.550% | 8/18/60 | 1,345 | 821 | ||
| Moody's Corp. | 3.100% | 11/29/61 | 1,832 | 1,260 | ||
| Motorola Solutions Inc. | 5.500% | 9/1/44 | 1,049 | 983 | ||
| NVIDIA Corp. | 3.500% | 4/1/40 | 2,591 | 2,230 | ||
| NVIDIA Corp. | 3.500% | 4/1/50 | 3,387 | 2,820 | ||
| NVIDIA Corp. | 3.700% | 4/1/60 | 2,865 | 2,340 | ||
| NXP BV | 5.000% | 1/15/33 | 2,980 | 2,884 | ||
| NXP BV | 3.250% | 5/11/41 | 1,360 | 984 | ||
| NXP BV | 3.125% | 2/15/42 | 1,100 | 786 | ||
| NXP BV | 3.250% | 11/30/51 | 1,552 | 1,054 | ||
| Oracle Corp. | 4.300% | 7/8/34 | 5,326 | 4,641 | ||
| Oracle Corp. | 3.900% | 5/15/35 | 2,559 | 2,082 | ||
| Oracle Corp. | 3.850% | 7/15/36 | 2,326 | 1,855 | ||
| Oracle Corp. | 3.800% | 11/15/37 | 5,415 | 4,220 | ||
| Oracle Corp. | 6.500% | 4/15/38 | 1,746 | 1,794 | ||
| Oracle Corp. | 6.125% | 7/8/39 | 2,855 | 2,822 | ||
| Oracle Corp. | 3.600% | 4/1/40 | 7,205 | 5,248 | ||
| Oracle Corp. | 5.375% | 7/15/40 | 5,245 | 4,727 | ||
| Oracle Corp. | 3.650% | 3/25/41 | 5,860 | 4,285 | ||
| Oracle Corp. | 4.500% | 7/8/44 | 4,124 | 3,302 | ||
| Oracle Corp. | 4.125% | 5/15/45 | 4,277 | 3,192 | ||
| Oracle Corp. | 4.000% | 7/15/46 | 4,093 | 2,995 | ||
| Oracle Corp. | 4.000% | 11/15/47 | 5,612 | 4,073 | ||
| Oracle Corp. | 3.600% | 4/1/50 | 11,698 | 7,972 | ||
| Oracle Corp. | 3.950% | 3/25/51 | 8,950 | 6,437 | ||
| Oracle Corp. | 4.375% | 5/15/55 | 4,577 | 3,430 | ||
| Oracle Corp. | 3.850% | 4/1/60 | 5,741 | 3,811 | ||
| Oracle Corp. | 4.100% | 3/25/61 | 4,655 | 3,246 | ||
| QUALCOMM Inc. | 4.650% | 5/20/35 | 4,291 | 4,332 | ||
| QUALCOMM Inc. | 4.800% | 5/20/45 | 1,680 | 1,692 | ||
| QUALCOMM Inc. | 4.300% | 5/20/47 | 2,865 | 2,689 | ||
| QUALCOMM Inc. | 3.250% | 5/20/50 | 2,374 | 1,931 | ||
| QUALCOMM Inc. | 4.500% | 5/20/52 | 2,785 | 2,697 | ||
| Quanta Services Inc. | 3.050% | 10/1/41 | 1,225 | 853 | ||
| S&P Global Inc. | 3.250% | 12/1/49 | 1,944 | 1,524 | ||
| 2 | S&P Global Inc. | 3.700% | 3/1/52 | 2,614 | 2,249 | |
| S&P Global Inc. | 2.300% | 8/15/60 | 1,406 | 852 | ||
| 2 | S&P Global Inc. | 3.900% | 3/1/62 | 1,650 | 1,420 | |
| Salesforce Inc. | 2.700% | 7/15/41 | 3,400 | 2,593 | ||
| Salesforce Inc. | 2.900% | 7/15/51 | 5,056 | 3,739 | ||
| Salesforce Inc. | 3.050% | 7/15/61 | 3,375 | 2,420 | ||
| Texas Instruments Inc. | 3.875% | 3/15/39 | 2,199 | 2,056 | ||
| Texas Instruments Inc. | 4.150% | 5/15/48 | 3,142 | 3,002 | ||
| Texas Instruments Inc. | 2.700% | 9/15/51 | 977 | 730 | ||
| Coupon | Maturity Date | Face Amount ($000) | Market Value• ($000) | |||
| TSMC Arizona Corp. | 3.125% | 10/25/41 | 2,380 | 1,944 | ||
| TSMC Arizona Corp. | 3.250% | 10/25/51 | 1,910 | 1,523 | ||
| TSMC Arizona Corp. | 4.500% | 4/22/52 | 2,665 | 2,609 | ||
| Verisk Analytics Inc. | 5.500% | 6/15/45 | 1,331 | 1,342 | ||
| Verisk Analytics Inc. | 3.625% | 5/15/50 | 1,501 | 1,164 | ||
| Workday Inc. | 3.800% | 4/1/32 | 100 | 91 | ||
| 451,709 | ||||||
| Utilities (12.2%) | ||||||
| AEP Texas Inc. | 3.800% | 10/1/47 | 669 | 537 | ||
| 1 | AEP Texas Inc. | 3.450% | 1/15/50 | 700 | 532 | |
| AEP Texas Inc. | 3.450% | 5/15/51 | 500 | 386 | ||
| AEP Texas Inc. | 5.250% | 5/15/52 | 1,045 | 1,054 | ||
| AEP Transmission Co. LLC | 4.000% | 12/1/46 | 1,070 | 933 | ||
| AEP Transmission Co. LLC | 3.750% | 12/1/47 | 1,397 | 1,162 | ||
| AEP Transmission Co. LLC | 4.250% | 9/15/48 | 1,581 | 1,422 | ||
| AEP Transmission Co. LLC | 3.800% | 6/15/49 | 2,098 | 1,761 | ||
| 1 | AEP Transmission Co. LLC | 3.650% | 4/1/50 | 1,080 | 891 | |
| 1 | AEP Transmission Co. LLC | 2.750% | 8/15/51 | 1,210 | 843 | |
| 1 | AEP Transmission Co. LLC | 4.500% | 6/15/52 | 2,110 | 2,010 | |
| Alabama Power Co. | 6.125% | 5/15/38 | 757 | 831 | ||
| Alabama Power Co. | 6.000% | 3/1/39 | 969 | 1,063 | ||
| Alabama Power Co. | 3.850% | 12/1/42 | 703 | 606 | ||
| Alabama Power Co. | 4.150% | 8/15/44 | 2,244 | 1,995 | ||
| Alabama Power Co. | 3.750% | 3/1/45 | 2,588 | 2,152 | ||
| Alabama Power Co. | 4.300% | 1/2/46 | 1,536 | 1,384 | ||
| 1 | Alabama Power Co. | 3.700% | 12/1/47 | 559 | 467 | |
| 1 | Alabama Power Co. | 4.300% | 7/15/48 | 944 | 854 | |
| Alabama Power Co. | 3.450% | 10/1/49 | 1,495 | 1,177 | ||
| Alabama Power Co. | 3.125% | 7/15/51 | 1,755 | 1,322 | ||
| Alabama Power Co. | 3.000% | 3/15/52 | 2,420 | 1,787 | ||
| Ameren Illinois Co. | 4.150% | 3/15/46 | 1,517 | 1,373 | ||
| Ameren Illinois Co. | 3.700% | 12/1/47 | 382 | 325 | ||
| Ameren Illinois Co. | 4.500% | 3/15/49 | 705 | 676 | ||
| Ameren Illinois Co. | 3.250% | 3/15/50 | 1,540 | 1,192 | ||
| Ameren Illinois Co. | 2.900% | 6/15/51 | 950 | 690 | ||
| American Electric Power Co. Inc. | 3.250% | 3/1/50 | 382 | 272 | ||
| American Water Capital Corp. | 6.593% | 10/15/37 | 891 | 1,017 | ||
| American Water Capital Corp. | 4.300% | 12/1/42 | 1,005 | 915 | ||
| American Water Capital Corp. | 4.300% | 9/1/45 | 969 | 865 | ||
| American Water Capital Corp. | 4.000% | 12/1/46 | 587 | 501 | ||
| American Water Capital Corp. | 3.750% | 9/1/47 | 987 | 832 | ||
| American Water Capital Corp. | 4.200% | 9/1/48 | 2,790 | 2,498 | ||
| American Water Capital Corp. | 4.150% | 6/1/49 | 1,660 | 1,476 | ||
| American Water Capital Corp. | 3.450% | 5/1/50 | 1,785 | 1,405 | ||
| American Water Capital Corp. | 3.250% | 6/1/51 | 1,370 | 1,067 | ||
| Appalachian Power Co. | 7.000% | 4/1/38 | 1,094 | 1,281 | ||
| Appalachian Power Co. | 4.400% | 5/15/44 | 1,308 | 1,139 | ||
| Appalachian Power Co. | 4.450% | 6/1/45 | 935 | 815 | ||
| 1 | Appalachian Power Co. | 4.500% | 3/1/49 | 1,906 | 1,694 | |
| 1 | Appalachian Power Co. | 3.700% | 5/1/50 | 2,394 | 1,893 | |
| Arizona Public Service Co. | 5.050% | 9/1/41 | 1,047 | 973 | ||
| Arizona Public Service Co. | 4.500% | 4/1/42 | 1,596 | 1,376 | ||
| Arizona Public Service Co. | 4.350% | 11/15/45 | 560 | 472 | ||
| Arizona Public Service Co. | 3.750% | 5/15/46 | 700 | 549 | ||
| Arizona Public Service Co. | 4.200% | 8/15/48 | 1,432 | 1,194 | ||
| Arizona Public Service Co. | 4.250% | 3/1/49 | 781 | 652 | ||
| Arizona Public Service Co. | 3.500% | 12/1/49 | 933 | 688 | ||
| Arizona Public Service Co. | 3.350% | 5/15/50 | 608 | 436 | ||
| Arizona Public Service Co. | 2.650% | 9/15/50 | 610 | 382 | ||
| Atmos Energy Corp. | 5.500% | 6/15/41 | 887 | 925 | ||
| Atmos Energy Corp. | 4.150% | 1/15/43 | 562 | 501 | ||
| Atmos Energy Corp. | 4.125% | 10/15/44 | 872 | 768 | ||
| Atmos Energy Corp. | 4.300% | 10/1/48 | 1,240 | 1,142 | ||
| Atmos Energy Corp. | 4.125% | 3/15/49 | 2,312 | 2,074 | ||
| Atmos Energy Corp. | 3.375% | 9/15/49 | 2,831 | 2,242 | ||
| Atmos Energy Corp. | 2.850% | 2/15/52 | 1,850 | 1,322 | ||
| Avista Corp. | 4.350% | 6/1/48 | 743 | 676 | ||
| Coupon | Maturity Date | Face Amount ($000) | Market Value• ($000) | |||
| Baltimore Gas & Electric Co. | 6.350% | 10/1/36 | 800 | 908 | ||
| Baltimore Gas & Electric Co. | 3.500% | 8/15/46 | 1,085 | 885 | ||
| 1 | Baltimore Gas & Electric Co. | 3.750% | 8/15/47 | 2,600 | 2,205 | |
| Baltimore Gas & Electric Co. | 4.250% | 9/15/48 | 891 | 814 | ||
| Baltimore Gas & Electric Co. | 3.200% | 9/15/49 | 575 | 448 | ||
| Baltimore Gas & Electric Co. | 2.900% | 6/15/50 | 1,760 | 1,287 | ||
| Baltimore Gas & Electric Co. | 4.550% | 6/1/52 | 1,650 | 1,575 | ||
| Berkshire Hathaway Energy Co. | 6.125% | 4/1/36 | 4,227 | 4,646 | ||
| Berkshire Hathaway Energy Co. | 5.950% | 5/15/37 | 666 | 718 | ||
| Berkshire Hathaway Energy Co. | 5.150% | 11/15/43 | 627 | 635 | ||
| Berkshire Hathaway Energy Co. | 4.500% | 2/1/45 | 1,633 | 1,521 | ||
| Berkshire Hathaway Energy Co. | 3.800% | 7/15/48 | 523 | 441 | ||
| Berkshire Hathaway Energy Co. | 4.450% | 1/15/49 | 796 | 740 | ||
| Berkshire Hathaway Energy Co. | 4.250% | 10/15/50 | 2,835 | 2,597 | ||
| Berkshire Hathaway Energy Co. | 2.850% | 5/15/51 | 3,605 | 2,570 | ||
| 2 | Berkshire Hathaway Energy Co. | 4.600% | 5/1/53 | 2,710 | 2,587 | |
| Black Hills Corp. | 4.350% | 5/1/33 | 398 | 364 | ||
| Black Hills Corp. | 4.200% | 9/15/46 | 971 | 801 | ||
| Black Hills Corp. | 3.875% | 10/15/49 | 1,287 | 1,019 | ||
| 1 | CenterPoint Energy Houston Electric LLC | 6.950% | 3/15/33 | 1,325 | 1,578 | |
| CenterPoint Energy Houston Electric LLC | 3.550% | 8/1/42 | 1,122 | 954 | ||
| CenterPoint Energy Houston Electric LLC | 4.500% | 4/1/44 | 719 | 684 | ||
| CenterPoint Energy Houston Electric LLC | 3.950% | 3/1/48 | 1,774 | 1,576 | ||
| 1 | CenterPoint Energy Houston Electric LLC | 4.250% | 2/1/49 | 766 | 714 | |
| 1 | CenterPoint Energy Houston Electric LLC | 2.900% | 7/1/50 | 1,987 | 1,476 | |
| 1 | CenterPoint Energy Houston Electric LLC | 3.350% | 4/1/51 | 1,990 | 1,612 | |
| CenterPoint Energy Inc. | 3.700% | 9/1/49 | 2,337 | 1,853 | ||
| CenterPoint Energy Resources Corp. | 5.850% | 1/15/41 | 634 | 670 | ||
| CenterPoint Energy Resources Corp. | 4.100% | 9/1/47 | 1,069 | 950 | ||
| Cleco Corporate Holdings LLC | 4.973% | 5/1/46 | 831 | 760 | ||
| Cleveland Electric Illuminating Co. | 5.950% | 12/15/36 | 1,200 | 1,253 | ||
| CMS Energy Corp. | 4.875% | 3/1/44 | 1,542 | 1,447 | ||
| Commonwealth Edison Co. | 5.900% | 3/15/36 | 835 | 927 | ||
| Commonwealth Edison Co. | 6.450% | 1/15/38 | 1,600 | 1,834 | ||
| Commonwealth Edison Co. | 4.600% | 8/15/43 | 981 | 934 | ||
| Commonwealth Edison Co. | 4.700% | 1/15/44 | 1,371 | 1,332 | ||
| Commonwealth Edison Co. | 3.700% | 3/1/45 | 1,417 | 1,180 | ||
| Commonwealth Edison Co. | 4.350% | 11/15/45 | 1,288 | 1,193 | ||
| Commonwealth Edison Co. | 3.650% | 6/15/46 | 1,263 | 1,058 | ||
| 1 | Commonwealth Edison Co. | 3.750% | 8/15/47 | 2,165 | 1,856 | |
| Commonwealth Edison Co. | 4.000% | 3/1/48 | 557 | 500 | ||
| Commonwealth Edison Co. | 4.000% | 3/1/49 | 2,005 | 1,781 | ||
| 1 | Commonwealth Edison Co. | 3.200% | 11/15/49 | 617 | 480 | |
| Commonwealth Edison Co. | 3.000% | 3/1/50 | 430 | 323 | ||
| 1 | Commonwealth Edison Co. | 3.125% | 3/15/51 | 1,150 | 879 | |
| 1 | Commonwealth Edison Co. | 2.750% | 9/1/51 | 360 | 255 | |
| Connecticut Light & Power Co. | 4.300% | 4/15/44 | 1,344 | 1,249 | ||
| 1 | Connecticut Light & Power Co. | 4.150% | 6/1/45 | 437 | 394 | |
| Connecticut Light & Power Co. | 4.000% | 4/1/48 | 530 | 485 | ||
| 1 | Consolidated Edison Co. of New York Inc. | 5.300% | 3/1/35 | 733 | 749 | |
| 1 | Consolidated Edison Co. of New York Inc. | 5.850% | 3/15/36 | 1,183 | 1,259 | |
| 1 | Consolidated Edison Co. of New York Inc. | 6.200% | 6/15/36 | 1,065 | 1,170 | |
| 1 | Consolidated Edison Co. of New York Inc. | 6.300% | 8/15/37 | 390 | 433 | |
| 1 | Consolidated Edison Co. of New York Inc. | 6.750% | 4/1/38 | 809 | 926 | |
| 1 | Consolidated Edison Co. of New York Inc. | 5.500% | 12/1/39 | 274 | 279 | |
| Coupon | Maturity Date | Face Amount ($000) | Market Value• ($000) | |||
| Consolidated Edison Co. of New York Inc. | 5.700% | 6/15/40 | 2,759 | 2,889 | ||
| 1 | Consolidated Edison Co. of New York Inc. | 4.200% | 3/15/42 | 2,156 | 1,911 | |
| Consolidated Edison Co. of New York Inc. | 3.950% | 3/1/43 | 1,087 | 935 | ||
| Consolidated Edison Co. of New York Inc. | 4.450% | 3/15/44 | 2,958 | 2,742 | ||
| Consolidated Edison Co. of New York Inc. | 4.500% | 12/1/45 | 3,739 | 3,436 | ||
| Consolidated Edison Co. of New York Inc. | 3.850% | 6/15/46 | 1,493 | 1,254 | ||
| 1 | Consolidated Edison Co. of New York Inc. | 3.875% | 6/15/47 | 2,092 | 1,752 | |
| 1 | Consolidated Edison Co. of New York Inc. | 4.650% | 12/1/48 | 1,550 | 1,454 | |
| 1 | Consolidated Edison Co. of New York Inc. | 3.950% | 4/1/50 | 1,350 | 1,167 | |
| Consolidated Edison Co. of New York Inc. | 3.200% | 12/1/51 | 2,195 | 1,657 | ||
| Consolidated Edison Co. of New York Inc. | 4.625% | 12/1/54 | 390 | 363 | ||
| 1 | Consolidated Edison Co. of New York Inc. | 4.300% | 12/1/56 | 910 | 792 | |
| 1 | Consolidated Edison Co. of New York Inc. | 4.000% | 11/15/57 | 1,370 | 1,123 | |
| Consolidated Edison Co. of New York Inc. | 4.500% | 5/15/58 | 1,297 | 1,166 | ||
| Consolidated Edison Co. of New York Inc. | 3.700% | 11/15/59 | 820 | 643 | ||
| 1 | Consolidated Edison Co. of New York Inc. | 3.000% | 12/1/60 | 535 | 362 | |
| Consolidated Edison Co. of New York Inc. | 3.600% | 6/15/61 | 1,960 | 1,537 | ||
| Constellation Energy Generation LLC | 6.250% | 10/1/39 | 1,050 | 1,103 | ||
| Constellation Energy Generation LLC | 5.750% | 10/1/41 | 2,074 | 2,055 | ||
| Constellation Energy Generation LLC | 5.600% | 6/15/42 | 686 | 679 | ||
| Consumers Energy Co. | 3.950% | 5/15/43 | 500 | 443 | ||
| Consumers Energy Co. | 3.250% | 8/15/46 | 1,256 | 1,001 | ||
| Consumers Energy Co. | 3.950% | 7/15/47 | 1,345 | 1,184 | ||
| Consumers Energy Co. | 4.050% | 5/15/48 | 671 | 608 | ||
| Consumers Energy Co. | 4.350% | 4/15/49 | 368 | 351 | ||
| Consumers Energy Co. | 3.750% | 2/15/50 | 1,539 | 1,315 | ||
| Consumers Energy Co. | 3.100% | 8/15/50 | 1,459 | 1,121 | ||
| Consumers Energy Co. | 3.500% | 8/1/51 | 1,645 | 1,362 | ||
| Consumers Energy Co. | 2.650% | 8/15/52 | 1,440 | 1,010 | ||
| Consumers Energy Co. | 4.200% | 9/1/52 | 1,177 | 1,096 | ||
| Consumers Energy Co. | 2.500% | 5/1/60 | 617 | 391 | ||
| Dayton Power & Light Co. | 3.950% | 6/15/49 | 367 | 310 | ||
| Delmarva Power & Light Co. | 4.150% | 5/15/45 | 2,091 | 1,831 | ||
| 1 | Dominion Energy Inc. | 6.300% | 3/15/33 | 845 | 918 | |
| 1 | Dominion Energy Inc. | 5.250% | 8/1/33 | 619 | 626 | |
| 1 | Dominion Energy Inc. | 5.950% | 6/15/35 | 809 | 855 | |
| Dominion Energy Inc. | 7.000% | 6/15/38 | 800 | 903 | ||
| 1 | Dominion Energy Inc. | 3.300% | 4/15/41 | 2,025 | 1,604 | |
| 1 | Dominion Energy Inc. | 4.900% | 8/1/41 | 837 | 802 | |
| 1 | Dominion Energy Inc. | 4.050% | 9/15/42 | 1,024 | 868 | |
| Dominion Energy Inc. | 4.700% | 12/1/44 | 1,821 | 1,673 | ||
| 1 | Dominion Energy Inc. | 4.600% | 3/15/49 | 743 | 688 | |
| 1 | Dominion Energy Inc. | 4.850% | 8/15/52 | 1,454 | 1,389 | |
| Dominion Energy South Carolina Inc. | 5.300% | 5/15/33 | 2,530 | 2,680 | ||
| Dominion Energy South Carolina Inc. | 6.050% | 1/15/38 | 1,015 | 1,123 | ||
| Dominion Energy South Carolina Inc. | 5.450% | 2/1/41 | 1,780 | 1,844 | ||
| Dominion Energy South Carolina Inc. | 4.600% | 6/15/43 | 1,136 | 1,078 | ||
| Dominion Energy South Carolina Inc. | 5.100% | 6/1/65 | 670 | 680 | ||
| 1 | DTE Electric Co. | 4.000% | 4/1/43 | 500 | 445 | |
| Coupon | Maturity Date | Face Amount ($000) | Market Value• ($000) | |||
| DTE Electric Co. | 4.300% | 7/1/44 | 2,182 | 2,009 | ||
| DTE Electric Co. | 3.700% | 3/15/45 | 534 | 452 | ||
| DTE Electric Co. | 3.700% | 6/1/46 | 1,032 | 881 | ||
| DTE Electric Co. | 3.750% | 8/15/47 | 2,330 | 2,016 | ||
| 1 | DTE Electric Co. | 4.050% | 5/15/48 | 840 | 764 | |
| DTE Electric Co. | 3.950% | 3/1/49 | 990 | 889 | ||
| DTE Electric Co. | 2.950% | 3/1/50 | 774 | 588 | ||
| 1 | DTE Electric Co. | 3.250% | 4/1/51 | 1,075 | 853 | |
| Duke Energy Carolinas LLC | 6.450% | 10/15/32 | 1,633 | 1,810 | ||
| Duke Energy Carolinas LLC | 6.100% | 6/1/37 | 664 | 711 | ||
| Duke Energy Carolinas LLC | 6.000% | 1/15/38 | 426 | 472 | ||
| Duke Energy Carolinas LLC | 6.050% | 4/15/38 | 833 | 922 | ||
| Duke Energy Carolinas LLC | 5.300% | 2/15/40 | 1,403 | 1,457 | ||
| Duke Energy Carolinas LLC | 4.250% | 12/15/41 | 1,131 | 1,037 | ||
| Duke Energy Carolinas LLC | 4.000% | 9/30/42 | 1,675 | 1,481 | ||
| Duke Energy Carolinas LLC | 3.750% | 6/1/45 | 415 | 351 | ||
| Duke Energy Carolinas LLC | 3.875% | 3/15/46 | 1,530 | 1,324 | ||
| Duke Energy Carolinas LLC | 3.700% | 12/1/47 | 1,570 | 1,296 | ||
| Duke Energy Carolinas LLC | 3.950% | 3/15/48 | 1,356 | 1,179 | ||
| Duke Energy Carolinas LLC | 3.200% | 8/15/49 | 1,151 | 895 | ||
| Duke Energy Carolinas LLC | 3.450% | 4/15/51 | 1,655 | 1,342 | ||
| Duke Energy Carolinas LLC | 3.550% | 3/15/52 | 2,360 | 1,942 | ||
| Duke Energy Corp. | 3.300% | 6/15/41 | 500 | 385 | ||
| Duke Energy Corp. | 4.800% | 12/15/45 | 275 | 255 | ||
| Duke Energy Corp. | 3.750% | 9/1/46 | 3,216 | 2,524 | ||
| Duke Energy Corp. | 3.950% | 8/15/47 | 1,397 | 1,129 | ||
| Duke Energy Corp. | 4.200% | 6/15/49 | 1,502 | 1,268 | ||
| Duke Energy Corp. | 3.500% | 6/15/51 | 1,935 | 1,470 | ||
| Duke Energy Corp. | 5.000% | 8/15/52 | 1,000 | 950 | ||
| Duke Energy Florida LLC | 6.350% | 9/15/37 | 2,796 | 3,151 | ||
| Duke Energy Florida LLC | 6.400% | 6/15/38 | 506 | 584 | ||
| Duke Energy Florida LLC | 5.650% | 4/1/40 | 1,795 | 1,898 | ||
| Duke Energy Florida LLC | 3.850% | 11/15/42 | 925 | 793 | ||
| Duke Energy Florida LLC | 3.400% | 10/1/46 | 1,631 | 1,289 | ||
| Duke Energy Florida LLC | 4.200% | 7/15/48 | 1,596 | 1,443 | ||
| Duke Energy Florida LLC | 3.000% | 12/15/51 | 880 | 654 | ||
| Duke Energy Indiana LLC | 6.120% | 10/15/35 | 1,288 | 1,392 | ||
| Duke Energy Indiana LLC | 6.350% | 8/15/38 | 1,446 | 1,630 | ||
| Duke Energy Indiana LLC | 6.450% | 4/1/39 | 1,276 | 1,436 | ||
| 1 | Duke Energy Indiana LLC | 4.900% | 7/15/43 | 1,762 | 1,695 | |
| Duke Energy Indiana LLC | 3.750% | 5/15/46 | 1,355 | 1,106 | ||
| 1 | Duke Energy Indiana LLC | 3.250% | 10/1/49 | 1,325 | 1,010 | |
| Duke Energy Indiana LLC | 2.750% | 4/1/50 | 1,280 | 892 | ||
| Duke Energy Ohio Inc. | 3.700% | 6/15/46 | 100 | 82 | ||
| Duke Energy Ohio Inc. | 4.300% | 2/1/49 | 1,523 | 1,372 | ||
| Duke Energy Progress LLC | 6.300% | 4/1/38 | 1,268 | 1,431 | ||
| Duke Energy Progress LLC | 4.100% | 5/15/42 | 1,494 | 1,336 | ||
| Duke Energy Progress LLC | 4.100% | 3/15/43 | 490 | 441 | ||
| Duke Energy Progress LLC | 4.375% | 3/30/44 | 1,971 | 1,818 | ||
| Duke Energy Progress LLC | 4.150% | 12/1/44 | 1,850 | 1,644 | ||
| Duke Energy Progress LLC | 4.200% | 8/15/45 | 719 | 645 | ||
| Duke Energy Progress LLC | 3.700% | 10/15/46 | 2,405 | 1,986 | ||
| Duke Energy Progress LLC | 3.600% | 9/15/47 | 1,575 | 1,309 | ||
| Duke Energy Progress LLC | 2.500% | 8/15/50 | 150 | 102 | ||
| Duke Energy Progress LLC | 2.900% | 8/15/51 | 1,980 | 1,439 | ||
| Duke Energy Progress LLC | 4.000% | 4/1/52 | 1,647 | 1,447 | ||
| 1 | Duke Energy Progress NC Storm Funding LLC | 2.387% | 7/1/37 | 825 | 745 | |
| El Paso Electric Co. | 6.000% | 5/15/35 | 1,084 | 1,112 | ||
| El Paso Electric Co. | 5.000% | 12/1/44 | 688 | 645 | ||
| Emera US Finance LP | 4.750% | 6/15/46 | 2,682 | 2,355 | ||
| Entergy Arkansas LLC | 4.200% | 4/1/49 | 1,633 | 1,482 | ||
| Entergy Arkansas LLC | 2.650% | 6/15/51 | 1,510 | 1,033 | ||
| Entergy Arkansas LLC | 3.350% | 6/15/52 | 1,825 | 1,414 | ||
| Entergy Corp. | 3.750% | 6/15/50 | 554 | 436 | ||
| Entergy Louisiana LLC | 4.000% | 3/15/33 | 1,948 | 1,848 | ||
| Entergy Louisiana LLC | 3.100% | 6/15/41 | 1,035 | 818 | ||
| Coupon | Maturity Date | Face Amount ($000) | Market Value• ($000) | |||
| Entergy Louisiana LLC | 4.200% | 9/1/48 | 2,779 | 2,487 | ||
| Entergy Louisiana LLC | 4.200% | 4/1/50 | 1,961 | 1,751 | ||
| Entergy Louisiana LLC | 2.900% | 3/15/51 | 2,055 | 1,476 | ||
| Entergy Louisiana LLC | 4.750% | 9/15/52 | 600 | 582 | ||
| Entergy Mississippi LLC | 3.850% | 6/1/49 | 1,742 | 1,453 | ||
| Entergy Mississippi LLC | 3.500% | 6/1/51 | 145 | 117 | ||
| Entergy Texas Inc. | 3.550% | 9/30/49 | 1,395 | 1,103 | ||
| Essential Utilities Inc. | 4.276% | 5/1/49 | 1,420 | 1,226 | ||
| Essential Utilities Inc. | 3.351% | 4/15/50 | 619 | 455 | ||
| Essential Utilities Inc. | 5.300% | 5/1/52 | 1,305 | 1,304 | ||
| Evergy Kansas Central Inc. | 4.125% | 3/1/42 | 443 | 394 | ||
| Evergy Kansas Central Inc. | 4.100% | 4/1/43 | 1,809 | 1,574 | ||
| Evergy Kansas Central Inc. | 4.250% | 12/1/45 | 1,359 | 1,204 | ||
| Evergy Kansas Central Inc. | 3.450% | 4/15/50 | 883 | 704 | ||
| Evergy Metro Inc. | 5.300% | 10/1/41 | 675 | 687 | ||
| Evergy Metro Inc. | 4.200% | 6/15/47 | 1,325 | 1,181 | ||
| Evergy Metro Inc. | 4.200% | 3/15/48 | 1,041 | 930 | ||
| 1 | Evergy Metro Inc. | 4.125% | 4/1/49 | 1,991 | 1,745 | |
| Eversource Energy | 3.450% | 1/15/50 | 550 | 431 | ||
| 1 | Exelon Corp. | 4.950% | 6/15/35 | 1,690 | 1,650 | |
| Exelon Corp. | 5.625% | 6/15/35 | 770 | 810 | ||
| Exelon Corp. | 5.100% | 6/15/45 | 1,504 | 1,493 | ||
| Exelon Corp. | 4.450% | 4/15/46 | 1,655 | 1,483 | ||
| Exelon Corp. | 4.700% | 4/15/50 | 2,202 | 2,056 | ||
| 2 | Exelon Corp. | 4.100% | 3/15/52 | 2,005 | 1,733 | |
| Florida Power & Light Co. | 5.625% | 4/1/34 | 637 | 694 | ||
| Florida Power & Light Co. | 4.950% | 6/1/35 | 2,142 | 2,203 | ||
| Florida Power & Light Co. | 5.650% | 2/1/37 | 1,038 | 1,120 | ||
| Florida Power & Light Co. | 5.950% | 2/1/38 | 902 | 1,006 | ||
| Florida Power & Light Co. | 5.960% | 4/1/39 | 850 | 957 | ||
| Florida Power & Light Co. | 5.690% | 3/1/40 | 955 | 1,042 | ||
| Florida Power & Light Co. | 5.250% | 2/1/41 | 1,981 | 2,073 | ||
| Florida Power & Light Co. | 4.125% | 2/1/42 | 1,639 | 1,520 | ||
| Florida Power & Light Co. | 4.050% | 6/1/42 | 1,384 | 1,278 | ||
| Florida Power & Light Co. | 3.800% | 12/15/42 | 1,484 | 1,325 | ||
| Florida Power & Light Co. | 4.050% | 10/1/44 | 667 | 608 | ||
| Florida Power & Light Co. | 3.700% | 12/1/47 | 787 | 686 | ||
| Florida Power & Light Co. | 3.950% | 3/1/48 | 1,699 | 1,547 | ||
| Florida Power & Light Co. | 4.125% | 6/1/48 | 2,326 | 2,173 | ||
| Florida Power & Light Co. | 3.990% | 3/1/49 | 535 | 489 | ||
| Florida Power & Light Co. | 3.150% | 10/1/49 | 1,617 | 1,292 | ||
| Florida Power & Light Co. | 2.875% | 12/4/51 | 2,867 | 2,139 | ||
| 1 | Georgia Power Co. | 4.750% | 9/1/40 | 1,321 | 1,206 | |
| Georgia Power Co. | 4.300% | 3/15/42 | 1,493 | 1,327 | ||
| Georgia Power Co. | 4.300% | 3/15/43 | 728 | 637 | ||
| 1 | Georgia Power Co. | 3.700% | 1/30/50 | 2,335 | 1,863 | |
| 1 | Georgia Power Co. | 3.250% | 3/15/51 | 1,788 | 1,324 | |
| Georgia Power Co. | 5.125% | 5/15/52 | 1,800 | 1,812 | ||
| Iberdrola International BV | 6.750% | 7/15/36 | 614 | 686 | ||
| 1 | Idaho Power Co. | 4.200% | 3/1/48 | 1,170 | 1,036 | |
| Indiana Michigan Power Co. | 6.050% | 3/15/37 | 978 | 1,068 | ||
| 1 | Indiana Michigan Power Co. | 4.550% | 3/15/46 | 1,343 | 1,228 | |
| 1 | Indiana Michigan Power Co. | 3.750% | 7/1/47 | 1,394 | 1,135 | |
| Indiana Michigan Power Co. | 4.250% | 8/15/48 | 1,141 | 991 | ||
| Indiana Michigan Power Co. | 3.250% | 5/1/51 | 735 | 551 | ||
| Interstate Power & Light Co. | 6.250% | 7/15/39 | 377 | 409 | ||
| Interstate Power & Light Co. | 3.700% | 9/15/46 | 419 | 340 | ||
| Interstate Power & Light Co. | 3.500% | 9/30/49 | 680 | 538 | ||
| Interstate Power & Light Co. | 3.100% | 11/30/51 | 620 | 447 | ||
| ITC Holdings Corp. | 5.300% | 7/1/43 | 1,849 | 1,799 | ||
| 1 | John Sevier Combined Cycle Generation LLC | 4.626% | 1/15/42 | 826 | 820 | |
| Kentucky Utilities Co. | 5.125% | 11/1/40 | 636 | 634 | ||
| Kentucky Utilities Co. | 4.375% | 10/1/45 | 465 | 422 | ||
| Kentucky Utilities Co. | 3.300% | 6/1/50 | 440 | 343 | ||
| Louisville Gas & Electric Co. | 4.250% | 4/1/49 | 3,022 | 2,696 | ||
| 1 | MidAmerican Energy Co. | 5.750% | 11/1/35 | 1,443 | 1,575 | |
| Coupon | Maturity Date | Face Amount ($000) | Market Value• ($000) | |||
| 1 | MidAmerican Energy Co. | 5.800% | 10/15/36 | 1,674 | 1,837 | |
| MidAmerican Energy Co. | 4.800% | 9/15/43 | 1,869 | 1,836 | ||
| MidAmerican Energy Co. | 4.400% | 10/15/44 | 1,529 | 1,431 | ||
| MidAmerican Energy Co. | 4.250% | 5/1/46 | 1,162 | 1,075 | ||
| MidAmerican Energy Co. | 3.650% | 8/1/48 | 1,096 | 923 | ||
| MidAmerican Energy Co. | 4.250% | 7/15/49 | 1,802 | 1,672 | ||
| MidAmerican Energy Co. | 3.150% | 4/15/50 | 1,400 | 1,086 | ||
| MidAmerican Energy Co. | 2.700% | 8/1/52 | 1,265 | 899 | ||
| 1 | Mississippi Power Co. | 4.250% | 3/15/42 | 976 | 851 | |
| 1 | Mississippi Power Co. | 3.100% | 7/30/51 | 290 | 206 | |
| National Grid USA | 5.803% | 4/1/35 | 522 | 549 | ||
| National Rural Utilities Cooperative Finance Corp. | 4.023% | 11/1/32 | 1,216 | 1,146 | ||
| National Rural Utilities Cooperative Finance Corp. | 4.150% | 12/15/32 | 680 | 661 | ||
| National Rural Utilities Cooperative Finance Corp. | 4.400% | 11/1/48 | 1,649 | 1,514 | ||
| National Rural Utilities Cooperative Finance Corp. | 4.300% | 3/15/49 | 1,408 | 1,280 | ||
| 1 | Nevada Power Co. | 6.650% | 4/1/36 | 1,640 | 1,881 | |
| 1 | Nevada Power Co. | 6.750% | 7/1/37 | 2,000 | 2,275 | |
| 1 | Nevada Power Co. | 3.125% | 8/1/50 | 2,434 | 1,799 | |
| NextEra Energy Capital Holdings Inc. | 3.000% | 1/15/52 | 1,795 | 1,290 | ||
| NiSource Inc. | 5.950% | 6/15/41 | 1,483 | 1,527 | ||
| NiSource Inc. | 5.250% | 2/15/43 | 766 | 747 | ||
| NiSource Inc. | 4.800% | 2/15/44 | 1,304 | 1,196 | ||
| NiSource Inc. | 5.650% | 2/1/45 | 1,975 | 2,007 | ||
| NiSource Inc. | 4.375% | 5/15/47 | 2,080 | 1,835 | ||
| NiSource Inc. | 3.950% | 3/30/48 | 2,202 | 1,811 | ||
| Northern States Power Co. | 6.250% | 6/1/36 | 385 | 442 | ||
| Northern States Power Co. | 6.200% | 7/1/37 | 625 | 713 | ||
| Northern States Power Co. | 5.350% | 11/1/39 | 757 | 810 | ||
| Northern States Power Co. | 3.400% | 8/15/42 | 390 | 329 | ||
| Northern States Power Co. | 4.125% | 5/15/44 | 593 | 542 | ||
| Northern States Power Co. | 4.000% | 8/15/45 | 970 | 844 | ||
| Northern States Power Co. | 3.600% | 5/15/46 | 1,639 | 1,390 | ||
| Northern States Power Co. | 3.600% | 9/15/47 | 557 | 468 | ||
| Northern States Power Co. | 2.900% | 3/1/50 | 1,156 | 871 | ||
| Northern States Power Co. | 2.600% | 6/1/51 | 820 | 577 | ||
| Northern States Power Co. | 3.200% | 4/1/52 | 755 | 594 | ||
| Northern States Power Co. | 4.500% | 6/1/52 | 1,612 | 1,565 | ||
| NorthWestern Corp. | 4.176% | 11/15/44 | 1,069 | 926 | ||
| NSTAR Electric Co. | 5.500% | 3/15/40 | 1,838 | 1,941 | ||
| NSTAR Electric Co. | 4.400% | 3/1/44 | 467 | 433 | ||
| Oglethorpe Power Corp. | 5.950% | 11/1/39 | 1,915 | 1,961 | ||
| Oglethorpe Power Corp. | 5.375% | 11/1/40 | 1,880 | 1,809 | ||
| 2 | Oglethorpe Power Corp. | 4.500% | 4/1/47 | 1,120 | 966 | |
| Oglethorpe Power Corp. | 5.050% | 10/1/48 | 255 | 235 | ||
| Oglethorpe Power Corp. | 5.250% | 9/1/50 | 798 | 742 | ||
| Ohio Power Co. | 4.150% | 4/1/48 | 1,335 | 1,160 | ||
| Ohio Power Co. | 4.000% | 6/1/49 | 1,593 | 1,341 | ||
| 1 | Ohio Power Co. | 2.900% | 10/1/51 | 555 | 397 | |
| Oklahoma Gas & Electric Co. | 4.150% | 4/1/47 | 855 | 755 | ||
| Oklahoma Gas & Electric Co. | 3.850% | 8/15/47 | 656 | 552 | ||
| Oncor Electric Delivery Co. LLC | 7.250% | 1/15/33 | 845 | 1,036 | ||
| Oncor Electric Delivery Co. LLC | 7.500% | 9/1/38 | 795 | 1,006 | ||
| Oncor Electric Delivery Co. LLC | 5.250% | 9/30/40 | 475 | 494 | ||
| Oncor Electric Delivery Co. LLC | 4.550% | 12/1/41 | 992 | 959 | ||
| Oncor Electric Delivery Co. LLC | 5.300% | 6/1/42 | 774 | 813 | ||
| Oncor Electric Delivery Co. LLC | 3.750% | 4/1/45 | 1,707 | 1,461 | ||
| Oncor Electric Delivery Co. LLC | 3.800% | 9/30/47 | 1,673 | 1,462 | ||
| Oncor Electric Delivery Co. LLC | 4.100% | 11/15/48 | 1,920 | 1,747 | ||
| Oncor Electric Delivery Co. LLC | 3.800% | 6/1/49 | 2,280 | 1,986 | ||
| 1 | Oncor Electric Delivery Co. LLC | 3.100% | 9/15/49 | 525 | 406 | |
| Oncor Electric Delivery Co. LLC | 2.700% | 11/15/51 | 470 | 334 | ||
| 2 | Oncor Electric Delivery Co. LLC | 4.600% | 6/1/52 | 250 | 246 | |
| Oncor Electric Delivery Co. LLC | 5.350% | 10/1/52 | 476 | 503 | ||
| Coupon | Maturity Date | Face Amount ($000) | Market Value• ($000) | |||
| ONE Gas Inc. | 4.658% | 2/1/44 | 750 | 687 | ||
| ONE Gas Inc. | 4.500% | 11/1/48 | 925 | 809 | ||
| Pacific Gas & Electric Co. | 3.250% | 6/1/31 | 62 | 50 | ||
| Pacific Gas & Electric Co. | 4.500% | 7/1/40 | 4,510 | 3,527 | ||
| Pacific Gas & Electric Co. | 3.300% | 8/1/40 | 2,246 | 1,578 | ||
| Pacific Gas & Electric Co. | 4.200% | 6/1/41 | 3,663 | 2,741 | ||
| Pacific Gas & Electric Co. | 4.750% | 2/15/44 | 1,262 | 981 | ||
| Pacific Gas & Electric Co. | 4.300% | 3/15/45 | 1,076 | 790 | ||
| Pacific Gas & Electric Co. | 4.000% | 12/1/46 | 155 | 108 | ||
| Pacific Gas & Electric Co. | 3.950% | 12/1/47 | 2,426 | 1,677 | ||
| Pacific Gas & Electric Co. | 4.950% | 7/1/50 | 9,240 | 7,393 | ||
| Pacific Gas & Electric Co. | 3.500% | 8/1/50 | 3,845 | 2,554 | ||
| Pacific Gas & Electric Co. | 5.250% | 3/1/52 | 2,173 | 1,818 | ||
| PacifiCorp | 5.250% | 6/15/35 | 2,392 | 2,403 | ||
| PacifiCorp | 6.100% | 8/1/36 | 1,270 | 1,363 | ||
| PacifiCorp | 5.750% | 4/1/37 | 1,151 | 1,200 | ||
| PacifiCorp | 6.250% | 10/15/37 | 790 | 871 | ||
| PacifiCorp | 6.350% | 7/15/38 | 630 | 704 | ||
| PacifiCorp | 6.000% | 1/15/39 | 779 | 847 | ||
| PacifiCorp | 4.100% | 2/1/42 | 720 | 622 | ||
| PacifiCorp | 4.125% | 1/15/49 | 1,635 | 1,447 | ||
| PacifiCorp | 4.150% | 2/15/50 | 2,173 | 1,943 | ||
| PacifiCorp | 3.300% | 3/15/51 | 2,065 | 1,600 | ||
| PacifiCorp | 2.900% | 6/15/52 | 710 | 512 | ||
| PECO Energy Co. | 5.950% | 10/1/36 | 548 | 602 | ||
| PECO Energy Co. | 4.150% | 10/1/44 | 1,171 | 1,060 | ||
| PECO Energy Co. | 3.900% | 3/1/48 | 872 | 775 | ||
| PECO Energy Co. | 3.000% | 9/15/49 | 484 | 363 | ||
| PECO Energy Co. | 2.800% | 6/15/50 | 1,236 | 892 | ||
| PECO Energy Co. | 3.050% | 3/15/51 | 1,905 | 1,449 | ||
| PECO Energy Co. | 2.850% | 9/15/51 | 790 | 575 | ||
| PECO Energy Co. | 4.600% | 5/15/52 | 1,710 | 1,689 | ||
| 1 | PG&E Wildfire Recovery Funding LLC | 4.263% | 6/1/36 | 2,795 | 2,716 | |
| 1 | PG&E Wildfire Recovery Funding LLC | 4.451% | 12/1/47 | 2,125 | 1,973 | |
| 1 | PG&E Wildfire Recovery Funding LLC | 4.674% | 12/1/51 | 675 | 664 | |
| Piedmont Natural Gas Co. Inc. | 4.650% | 8/1/43 | 860 | 775 | ||
| Piedmont Natural Gas Co. Inc. | 3.640% | 11/1/46 | 811 | 626 | ||
| Piedmont Natural Gas Co. Inc. | 3.350% | 6/1/50 | 1,410 | 1,037 | ||
| Potomac Electric Power Co. | 6.500% | 11/15/37 | 713 | 824 | ||
| Potomac Electric Power Co. | 4.150% | 3/15/43 | 645 | 583 | ||
| PPL Electric Utilities Corp. | 6.250% | 5/15/39 | 428 | 480 | ||
| PPL Electric Utilities Corp. | 4.750% | 7/15/43 | 380 | 372 | ||
| PPL Electric Utilities Corp. | 4.125% | 6/15/44 | 1,112 | 989 | ||
| PPL Electric Utilities Corp. | 4.150% | 10/1/45 | 1,191 | 1,051 | ||
| PPL Electric Utilities Corp. | 3.950% | 6/1/47 | 1,535 | 1,359 | ||
| PPL Electric Utilities Corp. | 4.150% | 6/15/48 | 1,445 | 1,309 | ||
| PPL Electric Utilities Corp. | 3.000% | 10/1/49 | 1,070 | 799 | ||
| Progress Energy Inc. | 6.000% | 12/1/39 | 1,392 | 1,449 | ||
| 1 | Public Service Co. of Colorado | 6.250% | 9/1/37 | 2,300 | 2,650 | |
| Public Service Co. of Colorado | 6.500% | 8/1/38 | 486 | 566 | ||
| Public Service Co. of Colorado | 3.600% | 9/15/42 | 601 | 510 | ||
| Public Service Co. of Colorado | 4.300% | 3/15/44 | 1,135 | 1,034 | ||
| Public Service Co. of Colorado | 3.800% | 6/15/47 | 1,570 | 1,355 | ||
| Public Service Co. of Colorado | 4.100% | 6/15/48 | 519 | 469 | ||
| Public Service Co. of Colorado | 4.050% | 9/15/49 | 2,190 | 1,948 | ||
| 1 | Public Service Co. of Colorado | 3.200% | 3/1/50 | 468 | 368 | |
| 1 | Public Service Co. of Colorado | 2.700% | 1/15/51 | 1,105 | 785 | |
| 1 | Public Service Co. of Colorado | 4.500% | 6/1/52 | 1,655 | 1,602 | |
| Public Service Co. of New Hampshire | 3.600% | 7/1/49 | 2,525 | 2,114 | ||
| 1 | Public Service Electric & Gas Co. | 5.800% | 5/1/37 | 460 | 504 | |
| 1 | Public Service Electric & Gas Co. | 5.500% | 3/1/40 | 1,100 | 1,166 | |
| 1 | Public Service Electric & Gas Co. | 3.950% | 5/1/42 | 1,040 | 936 | |
| 1 | Public Service Electric & Gas Co. | 3.650% | 9/1/42 | 1,113 | 950 | |
| Coupon | Maturity Date | Face Amount ($000) | Market Value• ($000) | |||
| 1 | Public Service Electric & Gas Co. | 3.800% | 1/1/43 | 335 | 290 | |
| 1 | Public Service Electric & Gas Co. | 3.800% | 3/1/46 | 557 | 481 | |
| 1 | Public Service Electric & Gas Co. | 3.600% | 12/1/47 | 730 | 612 | |
| 1 | Public Service Electric & Gas Co. | 4.050% | 5/1/48 | 1,229 | 1,106 | |
| 1 | Public Service Electric & Gas Co. | 3.850% | 5/1/49 | 967 | 840 | |
| 1 | Public Service Electric & Gas Co. | 3.200% | 8/1/49 | 1,185 | 929 | |
| 1 | Public Service Electric & Gas Co. | 3.150% | 1/1/50 | 744 | 572 | |
| 1 | Public Service Electric & Gas Co. | 2.700% | 5/1/50 | 976 | 694 | |
| 1 | Public Service Electric & Gas Co. | 2.050% | 8/1/50 | 1,135 | 699 | |
| Puget Sound Energy Inc. | 6.274% | 3/15/37 | 1,017 | 1,119 | ||
| Puget Sound Energy Inc. | 5.757% | 10/1/39 | 671 | 713 | ||
| Puget Sound Energy Inc. | 5.795% | 3/15/40 | 1,015 | 1,078 | ||
| Puget Sound Energy Inc. | 5.638% | 4/15/41 | 753 | 781 | ||
| Puget Sound Energy Inc. | 4.300% | 5/20/45 | 898 | 794 | ||
| Puget Sound Energy Inc. | 4.223% | 6/15/48 | 630 | 562 | ||
| Puget Sound Energy Inc. | 3.250% | 9/15/49 | 1,479 | 1,114 | ||
| Puget Sound Energy Inc. | 2.893% | 9/15/51 | 600 | 430 | ||
| San Diego Gas & Electric Co. | 6.000% | 6/1/39 | 944 | 1,032 | ||
| San Diego Gas & Electric Co. | 4.500% | 8/15/40 | 546 | 516 | ||
| 1 | San Diego Gas & Electric Co. | 3.750% | 6/1/47 | 2,010 | 1,699 | |
| San Diego Gas & Electric Co. | 4.150% | 5/15/48 | 670 | 608 | ||
| 1 | San Diego Gas & Electric Co. | 4.100% | 6/15/49 | 1,994 | 1,765 | |
| 1 | San Diego Gas & Electric Co. | 3.320% | 4/15/50 | 555 | 432 | |
| 1 | San Diego Gas & Electric Co. | 2.950% | 8/15/51 | 535 | 396 | |
| San Diego Gas & Electric Co. | 3.700% | 3/15/52 | 150 | 128 | ||
| 1 | SCE Recovery Funding LLC | 2.943% | 11/15/42 | 525 | 479 | |
| Sempra Energy | 3.800% | 2/1/38 | 2,038 | 1,745 | ||
| Sempra Energy | 6.000% | 10/15/39 | 1,689 | 1,794 | ||
| Sempra Energy | 4.000% | 2/1/48 | 2,425 | 2,024 | ||
| Southern California Edison Co. | 6.000% | 1/15/34 | 1,728 | 1,818 | ||
| 1 | Southern California Edison Co. | 5.750% | 4/1/35 | 743 | 757 | |
| 1 | Southern California Edison Co. | 5.350% | 7/15/35 | 811 | 801 | |
| Southern California Edison Co. | 5.625% | 2/1/36 | 934 | 935 | ||
| 1 | Southern California Edison Co. | 5.550% | 1/15/37 | 1,523 | 1,507 | |
| 1 | Southern California Edison Co. | 5.950% | 2/1/38 | 1,209 | 1,247 | |
| Southern California Edison Co. | 6.050% | 3/15/39 | 1,854 | 1,942 | ||
| Southern California Edison Co. | 5.500% | 3/15/40 | 2,548 | 2,513 | ||
| Southern California Edison Co. | 4.500% | 9/1/40 | 1,786 | 1,572 | ||
| Southern California Edison Co. | 4.050% | 3/15/42 | 1,275 | 1,050 | ||
| 1 | Southern California Edison Co. | 3.900% | 3/15/43 | 1,333 | 1,076 | |
| Southern California Edison Co. | 4.650% | 10/1/43 | 640 | �� 577 | ||
| 1 | Southern California Edison Co. | 3.600% | 2/1/45 | 2,954 | 2,216 | |
| Southern California Edison Co. | 4.000% | 4/1/47 | 1,117 | 901 | ||
| 1 | Southern California Edison Co. | 4.125% | 3/1/48 | 1,803 | 1,496 | |
| 1 | Southern California Edison Co. | 4.875% | 3/1/49 | 2,026 | 1,868 | |
| Southern California Edison Co. | 3.650% | 2/1/50 | 3,038 | 2,328 | ||
| 1 | Southern California Edison Co. | 2.950% | 2/1/51 | 729 | 492 | |
| 1 | Southern California Edison Co. | 3.650% | 6/1/51 | 1,505 | 1,176 | |
| Southern California Edison Co. | 3.450% | 2/1/52 | 725 | 556 | ||
| 1 | Southern California Edison Co. | 5.450% | 6/1/52 | 1,310 | 1,307 | |
| Southern California Gas Co. | 5.125% | 11/15/40 | 645 | 635 | ||
| Southern California Gas Co. | 3.750% | 9/15/42 | 1,400 | 1,165 | ||
| 1 | Southern California Gas Co. | 4.125% | 6/1/48 | 1,511 | 1,305 | |
| 1 | Southern California Gas Co. | 4.300% | 1/15/49 | 1,015 | 908 | |
| 1 | Southern California Gas Co. | 3.950% | 2/15/50 | 1,250 | 1,059 | |
| Southern Co. | 4.250% | 7/1/36 | 926 | 849 | ||
| Southern Co. | 4.400% | 7/1/46 | 3,910 | 3,448 | ||
| Southern Co. Gas Capital Corp. | 5.875% | 3/15/41 | 503 | 523 | ||
| Southern Co. Gas Capital Corp. | 4.400% | 6/1/43 | 2,858 | 2,473 | ||
| Southern Co. Gas Capital Corp. | 3.950% | 10/1/46 | 1,363 | 1,094 | ||
| Southern Co. Gas Capital Corp. | 4.400% | 5/30/47 | 2,143 | 1,855 | ||
| Southern Power Co. | 5.150% | 9/15/41 | 923 | 885 | ||
| Southern Power Co. | 5.250% | 7/15/43 | 250 | 236 | ||
| 1 | Southern Power Co. | 4.950% | 12/15/46 | 1,356 | 1,244 | |
| Southwest Gas Corp. | 3.800% | 9/29/46 | 884 | 663 | ||
| Southwest Gas Corp. | 4.150% | 6/1/49 | 395 | 315 | ||
| Southwestern Electric Power Co. | 6.200% | 3/15/40 | 852 | 901 | ||
| Coupon | Maturity Date | Face Amount ($000) | Market Value• ($000) | |||
| 1 | Southwestern Electric Power Co. | 3.900% | 4/1/45 | 1,424 | 1,140 | |
| 1 | Southwestern Electric Power Co. | 3.850% | 2/1/48 | 927 | 739 | |
| Southwestern Electric Power Co. | 3.250% | 11/1/51 | 1,330 | 961 | ||
| Southwestern Public Service Co. | 4.500% | 8/15/41 | 660 | 612 | ||
| Southwestern Public Service Co. | 3.400% | 8/15/46 | 360 | 280 | ||
| Southwestern Public Service Co. | 3.700% | 8/15/47 | 1,025 | 832 | ||
| 1 | Southwestern Public Service Co. | 4.400% | 11/15/48 | 1,090 | 987 | |
| Southwestern Public Service Co. | 3.750% | 6/15/49 | 1,208 | 1,009 | ||
| 1 | Southwestern Public Service Co. | 3.150% | 5/1/50 | 788 | 604 | |
| Tampa Electric Co. | 4.100% | 6/15/42 | 900 | 789 | ||
| Tampa Electric Co. | 4.350% | 5/15/44 | 225 | 203 | ||
| Tampa Electric Co. | 4.300% | 6/15/48 | 949 | 853 | ||
| Tampa Electric Co. | 4.450% | 6/15/49 | 1,052 | 970 | ||
| Tampa Electric Co. | 3.625% | 6/15/50 | 1,220 | 980 | ||
| Tampa Electric Co. | 3.450% | 3/15/51 | 1,145 | 906 | ||
| Toledo Edison Co. | 6.150% | 5/15/37 | 631 | 702 | ||
| Tucson Electric Power Co. | 4.850% | 12/1/48 | 1,030 | 993 | ||
| Tucson Electric Power Co. | 4.000% | 6/15/50 | 1,280 | 1,059 | ||
| Union Electric Co. | 5.300% | 8/1/37 | 476 | 486 | ||
| Union Electric Co. | 3.900% | 9/15/42 | 1,605 | 1,398 | ||
| Union Electric Co. | 3.650% | 4/15/45 | 2,002 | 1,655 | ||
| Union Electric Co. | 4.000% | 4/1/48 | 1,869 | 1,638 | ||
| Union Electric Co. | 3.250% | 10/1/49 | 2,140 | 1,653 | ||
| Union Electric Co. | 2.625% | 3/15/51 | 460 | 318 | ||
| Union Electric Co. | 3.900% | 4/1/52 | 1,045 | 919 | ||
| Veolia Environnement SA | 6.750% | 6/1/38 | 772 | 907 | ||
| 1 | Virginia Electric & Power Co. | 6.000% | 1/15/36 | 1,067 | 1,160 | |
| 1 | Virginia Electric & Power Co. | 6.000% | 5/15/37 | 1,361 | 1,478 | |
| Virginia Electric & Power Co. | 6.350% | 11/30/37 | 1,667 | 1,877 | ||
| Virginia Electric & Power Co. | 8.875% | 11/15/38 | 559 | 781 | ||
| Virginia Electric & Power Co. | 4.000% | 1/15/43 | 1,994 | 1,766 | ||
| 1 | Virginia Electric & Power Co. | 4.650% | 8/15/43 | 1,935 | 1,839 | |
| Virginia Electric & Power Co. | 4.450% | 2/15/44 | 1,049 | 970 | ||
| 1 | Virginia Electric & Power Co. | 4.200% | 5/15/45 | 2,975 | 2,639 | |
| 1 | Virginia Electric & Power Co. | 4.000% | 11/15/46 | 823 | 723 | |
| 1 | Virginia Electric & Power Co. | 3.800% | 9/15/47 | 508 | 433 | |
| Virginia Electric & Power Co. | 4.600% | 12/1/48 | 2,160 | 2,065 | ||
| Virginia Electric & Power Co. | 3.300% | 12/1/49 | 1,890 | 1,503 | ||
| Virginia Electric & Power Co. | 2.450% | 12/15/50 | 560 | 376 | ||
| Virginia Electric & Power Co. | 2.950% | 11/15/51 | 580 | 430 | ||
| Coupon | Maturity Date | Face Amount ($000) | Market Value• ($000) | |||
| 1 | Virginia Electric & Power Co. | 4.625% | 5/15/52 | 2,580 | 2,504 | |
| 1 | Washington Gas Light Co. | 3.796% | 9/15/46 | 888 | 742 | |
| 1 | Washington Gas Light Co. | 3.650% | 9/15/49 | 1,188 | 967 | |
| Wisconsin Electric Power Co. | 5.625% | 5/15/33 | 562 | 603 | ||
| Wisconsin Electric Power Co. | 5.700% | 12/1/36 | 390 | 415 | ||
| Wisconsin Electric Power Co. | 4.300% | 10/15/48 | 1,355 | 1,230 | ||
| Wisconsin Power & Light Co. | 6.375% | 8/15/37 | 569 | 635 | ||
| Wisconsin Power & Light Co. | 3.650% | 4/1/50 | 1,960 | 1,575 | ||
| Wisconsin Public Service Corp. | 3.671% | 12/1/42 | 1,174 | 980 | ||
| Wisconsin Public Service Corp. | 4.752% | 11/1/44 | 1,118 | 1,066 | ||
| Wisconsin Public Service Corp. | 3.300% | 9/1/49 | 860 | 675 | ||
| Wisconsin Public Service Corp. | 2.850% | 12/1/51 | 390 | 282 | ||
| Xcel Energy Inc. | 6.500% | 7/1/36 | 1,435 | 1,610 | ||
| Xcel Energy Inc. | 3.500% | 12/1/49 | 513 | 405 | ||
| 618,273 | ||||||
| Total Corporate Bonds (Cost $6,281,531) | 4,992,013 | |||||
| Shares | ||||||
| Temporary Cash Investments (0.3%) | ||||||
| Money Market Fund (0.3%) | ||||||
| 4 | Vanguard Market Liquidity Fund (Cost $16,085) | 2.284% | 160,913 | 16,086 | ||
| Total Investments (98.7%) (Cost $6,304,344) | 5,014,801 | |||||
| Other Assets and Liabilities—Net (1.3%) | 67,009 | |||||
| Net Assets (100%) | 5,081,810 | |||||
| Cost is in $000. |
| • | See Note A in Notes to Financial Statements. |
| 1 | The average or expected maturity is shorter than the final maturity shown because of the possibility of interim principal payments and prepayments or the possibility of the issue being called. |
| 2 | Security exempt from registration under Rule 144A of the Securities Act of 1933. Such securities may be sold in transactions exempt from registration, normally to qualified institutional buyers. At August 31, 2022, the aggregate value was $116,422,000, representing 2.3% of net assets. |
| 3 | Securities with a value of $237,000 have been segregated as initial margin for open futures contracts. |
| 4 | Affiliated money market fund available only to Vanguard funds and certain trusts and accounts managed by Vanguard. Rate shown is the 7-day yield. |
| Futures Contracts | ||||
| ($000) | ||||
| Expiration | Number of Long (Short) Contracts | Notional Amount | Value and Unrealized Appreciation (Depreciation) | |
| Long Futures Contracts | ||||
| Long U.S. Treasury Bond | December 2022 | 8 | 1,087 | (1) |
| Ultra Long U.S. Treasury Bond | December 2022 | 1 | 149 | 2 |
| 1 | ||||
| ($000s, except shares and per-share amounts) | Amount |
| Assets | |
| Investments in Securities, at Value | |
| Unaffiliated Issuers (Cost $6,288,259) | 4,998,715 |
| Affiliated Issuers (Cost $16,085) | 16,086 |
| Total Investments in Securities | 5,014,801 |
| Investment in Vanguard | 192 |
| Cash | 517 |
| Receivables for Investment Securities Sold | 48,095 |
| Receivables for Accrued Income | 70,488 |
| Receivables for Capital Shares Issued | 679 |
| Total Assets | 5,134,772 |
| Liabilities | |
| Payables for Investment Securities Purchased | 52,460 |
| Payables for Capital Shares Redeemed | 117 |
| Payables for Distributions | 283 |
| Payables to Vanguard | 96 |
| Variation Margin Payable—Futures Contracts | 6 |
| Total Liabilities | 52,962 |
| Net Assets | 5,081,810 |
At August 31, 2022, net assets consisted of: | |
| Paid-in Capital | 6,501,849 |
| Total Distributable Earnings (Loss) | (1,420,039) |
| Net Assets | 5,081,810 |
| ETF Shares—Net Assets | |
| Applicable to 56,433,186 outstanding $.001 par value shares of beneficial interest (unlimited authorization) | 4,545,185 |
| Net Asset Value Per Share—ETF Shares | $80.54 |
| Admiral Shares—Net Assets | |
| Applicable to 12,625,482 outstanding $.001 par value shares of beneficial interest (unlimited authorization) | 272,256 |
| Net Asset Value Per Share—Admiral Shares | $21.56 |
| Institutional Shares—Net Assets | |
| Applicable to 9,879,709 outstanding $.001 par value shares of beneficial interest (unlimited authorization) | 264,369 |
| Net Asset Value Per Share—Institutional Shares | $26.76 |
| Year Ended August 31, 2022 | |
| ($000) | |
| Investment Income | |
| Income | |
| Interest 1 | 192,111 |
| Total Income | 192,111 |
| Expenses | |
| The Vanguard Group—Note B | |
| Investment Advisory Services | 104 |
| Management and Administrative—ETF Shares | 1,358 |
| Management and Administrative—Admiral Shares | 167 |
| Management and Administrative—Institutional Shares | 131 |
| Marketing and Distribution—ETF Shares | 267 |
| Marketing and Distribution—Admiral Shares | 15 |
| Marketing and Distribution—Institutional Shares | 9 |
| Custodian Fees | 85 |
| Auditing Fees | 52 |
| Shareholders’ Reports—ETF Shares | 115 |
| Shareholders’ Reports—Admiral Shares | 5 |
| Shareholders’ Reports—Institutional Shares | — |
| Trustees’ Fees and Expenses | 2 |
| Other Expenses | 19 |
| Total Expenses | 2,329 |
| Expenses Paid Indirectly | (25) |
| Net Expenses | 2,304 |
| Net Investment Income | 189,807 |
| Realized Net Gain (Loss) | |
| Investment Securities Sold1,2 | (184,136) |
| Futures Contracts | (867) |
| Realized Net Gain (Loss) | (185,003) |
| Change in Unrealized Appreciation (Depreciation) | |
| Investment Securities1 | (1,393,902) |
| Futures Contracts | 1 |
| Change in Unrealized Appreciation (Depreciation) | (1,393,901) |
| Net Increase (Decrease) in Net Assets Resulting from Operations | (1,389,097) |
| 1 | Interest income, realized net gain (loss), capital gain distributions received, and change in unrealized appreciation (depreciation) from an affiliated company of the fund were $82,000, ($2,000), $1,000, and $1,000, respectively. Purchases and sales are for temporary cash investment purposes. |
| 2 | Includes ($89,533,000) of net gain (loss) resulting from in-kind redemptions. |
| Year Ended August 31, | ||
| 2022 ($000) | 2021 ($000) | |
| Increase (Decrease) in Net Assets | ||
| Operations | ||
| Net Investment Income | 189,807 | 191,927 |
| Realized Net Gain (Loss) | (185,003) | 318,126 |
| Change in Unrealized Appreciation (Depreciation) | (1,393,901) | (264,772) |
| Net Increase (Decrease) in Net Assets Resulting from Operations | (1,389,097) | 245,281 |
| Distributions | ||
| ETF Shares | (167,480) | (171,844) |
| Admiral Shares | (9,804) | (10,118) |
| Institutional Shares | (10,486) | (8,735) |
| Total Distributions | (187,770) | (190,697) |
| Capital Share Transactions | ||
| ETF Shares | 432,025 | 255,122 |
| Admiral Shares | 42,334 | (9,215) |
| Institutional Shares | 13,539 | 68,703 |
| Net Increase (Decrease) from Capital Share Transactions | 487,898 | 314,610 |
| Total Increase (Decrease) | (1,088,969) | 369,194 |
| Net Assets | ||
| Beginning of Period | 6,170,779 | 5,801,585 |
| End of Period | 5,081,810 | 6,170,779 |
| ETF Shares | |||||
| For a Share Outstanding Throughout Each Period | Year Ended August 31, | ||||
| 2022 | 2021 | 2020 | 2019 | 2018 | |
| Net Asset Value, Beginning of Period | $108.31 | $107.01 | $102.86 | $88.35 | $94.07 |
| Investment Operations | |||||
| Net Investment Income1 | 3.286 | 3.294 | 3.701 | 3.936 | 3.880 |
| Net Realized and Unrealized Gain (Loss) on Investments2 | (27.794) | 1.288 | 4.189 | 14.458 | (5.722) |
| Total from Investment Operations | (24.508) | 4.582 | 7.890 | 18.394 | (1.842) |
| Distributions | |||||
| Dividends from Net Investment Income | (3.262) | (3.282) | (3.740) | (3.884) | (3.878) |
| Distributions from Realized Capital Gains | — | — | — | — | — |
| Total Distributions | (3.262) | (3.282) | (3.740) | (3.884) | (3.878) |
| Net Asset Value, End of Period | $80.54 | $108.31 | $107.01 | $102.86 | $88.35 |
| Total Return | -23.06% | 4.39% | 7.90% | 21.60% | -2.01% |
| Ratios/Supplemental Data | |||||
| Net Assets, End of Period (Millions) | $4,545 | $5,517 | $5,214 | $4,074 | $2,509 |
| Ratio of Total Expenses to Average Net Assets | 0.04% 3 | 0.04% | 0.05% | 0.05% | 0.07% |
| Ratio of Net Investment Income to Average Net Assets | 3.47% | 3.10% | 3.60% | 4.36% | 4.26% |
| Portfolio Turnover Rate4 | 31% | 36% | 62% | 47% | 48% |
| 1 | Calculated based on average shares outstanding. |
| 2 | Includes increases from purchase fees of $.01, $.03, $.00, $.00, and $.09. |
| 3 | The ratio of expenses to average net assets for the period net of reduction from custody fee offset arrangements was 0.04%. |
| 4 | Excludes the value of portfolio securities received or delivered as a result of in-kind purchases or redemptions of the fund’s capital shares, including ETF Creation Units. |
| Admiral Shares | |||||
| For a Share Outstanding Throughout Each Period | Year Ended August 31, | ||||
| 2022 | 2021 | 2020 | 2019 | 2018 | |
| Net Asset Value, Beginning of Period | $29.03 | $28.68 | $27.55 | $23.65 | $25.18 |
| Investment Operations | |||||
| Net Investment Income1 | .875 | .877 | .988 | 1.053 | 1.043 |
| Net Realized and Unrealized Gain (Loss) on Investments2 | (7.473) | .345 | 1.125 | 3.895 | (1.536) |
| Total from Investment Operations | (6.598) | 1.222 | 2.113 | 4.948 | (.493) |
| Distributions | |||||
| Dividends from Net Investment Income | (.872) | (.872) | (.983) | (1.048) | (1.037) |
| Distributions from Realized Capital Gains | — | — | — | — | — |
| Total Distributions | (.872) | (.872) | (.983) | (1.048) | (1.037) |
| Net Asset Value, End of Period | $21.56 | $29.03 | $28.68 | $27.55 | $23.65 |
| Total Return3 | -23.10% | 4.37% | 7.87% | 21.64% | -2.00% |
| Ratios/Supplemental Data | |||||
| Net Assets, End of Period (Millions) | $272 | $314 | $320 | $256 | $186 |
| Ratio of Total Expenses to Average Net Assets | 0.07% 4 | 0.07% | 0.07% | 0.07% | 0.07% |
| Ratio of Net Investment Income to Average Net Assets | 3.44% | 3.08% | 3.58% | 4.34% | 4.26% |
| Portfolio Turnover Rate5 | 31% | 36% | 62% | 47% | 48% |
| 1 | Calculated based on average shares outstanding. |
| 2 | Includes increases from purchase fees of $.00, $.01, $.00, $.00, and $.03. |
| 3 | Total returns do not include transaction or account service fees that may have applied in the periods shown. Fund prospectuses provide information about any applicable transaction and account service fees. |
| 4 | The ratio of expenses to average net assets for the period net of reduction from custody fee offset arrangements was 0.07%. |
| 5 | Excludes the value of portfolio securities received or delivered as a result of in-kind purchases or redemptions of the fund’s capital shares, including ETF Creation Units. |
| Institutional Shares | |||||
| For a Share Outstanding Throughout Each Period | Year Ended August 31, | ||||
| 2022 | 2021 | 2020 | 2019 | 2018 | |
| Net Asset Value, Beginning of Period | $36.02 | $35.59 | $34.18 | $29.36 | $31.25 |
| Investment Operations | |||||
| Net Investment Income1 | 1.092 | 1.095 | 1.250 | 1.314 | 1.299 |
| Net Realized and Unrealized Gain (Loss) on Investments2 | (9.264) | .425 | 1.387 | 4.812 | (1.895) |
| Total from Investment Operations | (8.172) | 1.520 | 2.637 | 6.126 | (.596) |
| Distributions | |||||
| Dividends from Net Investment Income | (1.088) | (1.090) | (1.227) | (1.306) | (1.294) |
| Distributions from Realized Capital Gains | — | — | — | — | — |
| Total Distributions | (1.088) | (1.090) | (1.227) | (1.306) | (1.294) |
| Net Asset Value, End of Period | $26.76 | $36.02 | $35.59 | $34.18 | $29.36 |
| Total Return3 | -23.05% | 4.37% | 7.91% | 21.58% | -1.95% |
| Ratios/Supplemental Data | |||||
| Net Assets, End of Period (Millions) | $264 | $340 | $268 | $541 | $786 |
| Ratio of Total Expenses to Average Net Assets | 0.05% 4 | 0.05% | 0.05% | 0.05% | 0.05% |
| Ratio of Net Investment Income to Average Net Assets | 3.46% | 3.09% | 3.68% | 4.36% | 4.28% |
| Portfolio Turnover Rate5 | 31% | 36% | 62% | 47% | 48% |
| 1 | Calculated based on average shares outstanding. |
| 2 | Includes increases from purchase fees of $.00, $.01, $.00, $.00, and $.03. |
| 3 | Total returns do not include transaction or account service fees that may have applied in the periods shown. Fund prospectuses provide information about any applicable transaction and account service fees. |
| 4 | The ratio of expenses to average net assets for the period net of reduction from custody fee offset arrangements was 0.05%. |
| 5 | Excludes the value of portfolio securities received or delivered as a result of in-kind purchases or redemptions of the fund’s capital shares, including ETF Creation Units. |
| A. | The following significant accounting policies conform to generally accepted accounting principles for U.S. investment companies. The fund consistently follows such policies in preparing its financial statements. |
| B. | In accordance with the terms of a Funds’ Service Agreement (the “FSA”) between Vanguard and the fund, Vanguard furnishes to the fund investment advisory, corporate management, administrative, marketing, and distribution services at Vanguard’s cost of operations (as defined by the FSA). These costs of operations are allocated to the fund based on methods and guidelines approved by the board of trustees and are generally settled twice a month. |
| C. | The fund’s custodian bank has agreed to reduce its fees when the fund maintains cash on deposit in the non-interest-bearing custody account. For the year ended August 31, 2022, custodian fee offset arrangements reduced the fund’s expenses by $25,000 (an annual rate of less than 0.01% of average net assets). |
| D. | Various inputs may be used to determine the value of the fund’s investments and derivatives. These inputs are summarized in three broad levels for financial statement purposes. The inputs or methodologies used to value securities are not necessarily an indication of the risk associated with investing in those securities. |
| Level 1 ($000) | Level 2 ($000) | Level 3 ($000) | Total ($000) | |
| Investments | ||||
| Assets | ||||
| U.S. Government and Agency Obligations | — | 6,702 | — | 6,702 |
| Corporate Bonds | — | 4,992,013 | — | 4,992,013 |
| Temporary Cash Investments | 16,086 | — | — | 16,086 |
| Total | 16,086 | 4,998,715 | — | 5,014,801 |
| Derivative Financial Instruments | ||||
| Assets | ||||
| Futures Contracts1 | 2 | — | — | 2 |
| Liabilities | ||||
| Futures Contracts1 | 1 | — | — | 1 |
| 1 | Includes cumulative appreciation (depreciation) on futures contracts and centrally cleared swaps, if any, as reported in the Schedule of Investments. Only current day’s variation margin is reported within the Statement of Assets and Liabilities. |
| E. | Permanent differences between book-basis and tax-basis components of net assets are reclassified among capital accounts in the financial statements to reflect their tax character. These reclassifications have no effect on net assets or net asset value per share. As of period end, permanent differences primarily attributable to the accounting for applicable in-kind redemptions were reclassified between the following accounts: |
| Amount ($000) | |
| Paid-in Capital | (89,720) |
| Total Distributable Earnings (Loss) | 89,720 |
| Amount ($000) | |
| Undistributed Ordinary Income | 16,575 |
| Undistributed Long-Term Gains | — |
| Capital Loss Carryforwards | (143,266) |
| Qualified Late-Year Losses | — |
| Net Unrealized Gains (Losses) | (1,293,065) |
| Year Ended August 31, | ||
| 2022 Amount ($000) | 2021 Amount ($000) | |
| Ordinary Income* | 187,770 | 190,697 |
| Long-Term Capital Gains | — | — |
| Total | 187,770 | 190,697 |
| * | Includes short-term capital gains, if any. |
| Amount ($000) | |
| Tax Cost | 6,307,866 |
| Gross Unrealized Appreciation | 1,029 |
| Gross Unrealized Depreciation | (1,294,094) |
| Net Unrealized Appreciation (Depreciation) | (1,293,065) |
| F. | During the year ended August 31, 2022, the fund purchased $5,345,051,000 of investment securities and sold $4,839,941,000 of investment securities, other than U.S. government securities and temporary cash investments. Purchases and sales of U.S. government securities were $794,903,000 and $802,179,000, respectively. Purchases and sales include $4,304,772,000 and $3,930,663,000, respectively, in connection with in-kind purchases and redemptions of the fund’s capital shares. |
| G. | Capital share transactions for each class of shares were: |
| Year Ended August 31, | |||||
| 2022 | 2021 | ||||
| Amount ($000) | Shares (000) | Amount ($000) | Shares (000) | ||
| ETF Shares | |||||
| Issued 1 | 4,419,636 | 47,501 | 5,694,795 | 53,910 | |
| Issued in Lieu of Cash Distributions | — | — | — | — | |
| Redeemed | (3,987,611) | (42,000) | (5,439,673) | (51,700) | |
| Net Increase (Decrease)—ETF Shares | 432,025 | 5,501 | 255,122 | 2,210 | |
| Admiral Shares | |||||
| Issued 1 | 99,673 | 4,069 | 114,076 | 3,986 | |
| Issued in Lieu of Cash Distributions | 7,137 | 287 | 7,862 | 276 | |
| Redeemed | (64,476) | (2,565) | (131,153) | (4,585) | |
| Net Increase (Decrease)—Admiral Shares | 42,334 | 1,791 | (9,215) | (323) | |
| Institutional Shares | |||||
| Issued 1 | 15,822 | 511 | 79,701 | 2,217 | |
| Issued in Lieu of Cash Distributions | 10,486 | 339 | 8,735 | 247 | |
| Redeemed | (12,769) | (401) | (19,733) | (566) | |
| Net Increase (Decrease)—Institutional Shares | 13,539 | 449 | 68,703 | 1,898 | |
| 1 | Includes purchase fees for fiscal 2022 and 2021 of $706,000 and $1,995,000, respectively (fund totals). |
| H. | Management has determined that no events or transactions occurred subsequent to August 31, 2022, that would require recognition or disclosure in these financial statements. |
Philadelphia, Pennsylvania
October 20, 2022
| Matthew Benchener | Thomas M. Rampulla |
| Joseph Brennan | Karin A. Risi |
| Mortimer J. Buckley | Anne E. Robinson |
| Gregory Davis | Michael Rollings |
| John James | Nitin Tandon |
| Chris D. McIsaac | Lauren Valente |

Who Are Deaf or Hard of Hearing > 800-749-7273
All rights reserved.
U.S. Patent No. 6,879,964.
Vanguard Marketing Corporation, Distributor.

| 1 | |
| 2 | |
| 4 | |
| 7 | |
| 25 | |
| 27 |
| • | For the 12 months ended August 31, 2022, Vanguard Mortgage-Backed Securities Index Fund returned –9.70% for Institutional Shares, –9.71% for ETF Shares (based on net asset value), and –9.72% for Admiral Shares. |
| • | The Bloomberg U.S. MBS Float Adjusted Index, the expense-free benchmark for the fund, returned –9.46% for the 12-month period. By comparison, the U.S. government bond market, as measured by the Bloomberg U.S. Government Float Adjusted Index, returned –10.70%. |
| • | The investment outlook grew more challenging during the 12-month period. Sentiment deteriorated as inflation soared to multidecade highs, fueled in part by higher energy and food prices in the wake of Russia’s invasion of Ukraine. The Federal Reserve reacted by raising interest rates, which weighed on bond prices and sparked fears of recession. |
| • | The yield of the bellwether 10-year U.S. Treasury bond rose significantly over the period, from 1.31% to 3.19%. Mortgage-backed securities held up better than both Treasuries and corporate bonds. |
| • | The average interest rate for 30-year fixed-rate mortgages rose from 2.87% for the week ended August 31, 2021, to 5.55% for the week ended August 31, 2022. |
| Average Annual Total Returns Periods Ended August 31, 2022 | |||
| One Year | Three Years | Five Years | |
| Stocks | |||
| Russell 1000 Index (Large-caps) | -12.96% | 12.14% | 11.61% |
| Russell 2000 Index (Small-caps) | -17.88 | 8.59 | 6.95 |
| Russell 3000 Index (Broad U.S. market) | -13.28 | 11.90 | 11.29 |
| FTSE All-World ex US Index (International) | -19.00 | 3.48 | 2.12 |
| Bonds | |||
| Bloomberg U.S. Aggregate Float Adjusted Index (Broad taxable market) | -11.65% | -2.01% | 0.54% |
| Bloomberg Municipal Bond Index (Broad tax-exempt market) | -8.63 | -0.83 | 1.28 |
| FTSE Three-Month U.S. Treasury Bill Index | 0.44 | 0.56 | 1.10 |
| CPI | |||
| Consumer Price Index | 8.26% | 4.90% | 3.82% |
| • | Based on actual fund return. This section helps you to estimate the actual expenses that you paid over the period. The ”Ending Account Value“ shown is derived from the fund’s actual return, and the third column shows the dollar amount that would have been paid by an investor who started with $1,000 in the fund. You may use the information here, together with the amount you invested, to estimate the expenses that you paid over the period. |
| • | Based on hypothetical 5% yearly return. This section is intended to help you compare your fund‘s costs with those of other mutual funds. It assumes that the fund had a yearly return of 5% before expenses, but that the expense ratio is unchanged. In this case—because the return used is not the fund’s actual return—the results do not apply to your investment. The example is useful in making comparisons because the Securities and Exchange Commission requires all mutual funds to calculate expenses based on a 5% return. You can assess your fund’s costs by comparing this hypothetical example with the hypothetical examples that appear in shareholder reports of other funds. |
| Six Months Ended August 31, 2022 | |||
| Beginning Account Value 2/28/2022 | Ending Account Value 8/31/2022 | Expenses Paid During Period | |
| Based on Actual Fund Return | |||
| Mortgage-Backed Securities Index Fund | |||
| ETF Shares | $1,000.00 | $932.90 | $0.19 |
| Admiral™ Shares | 1,000.00 | 932.70 | 0.34 |
| Institutional Shares | 1,000.00 | 932.90 | 0.24 |
| Based on Hypothetical 5% Yearly Return | |||
| Mortgage-Backed Securities Index Fund | |||
| ETF Shares | $1,000.00 | $1,025.00 | $0.20 |
| Admiral Shares | 1,000.00 | 1,024.85 | 0.36 |
| Institutional Shares | 1,000.00 | 1,024.95 | 0.26 |
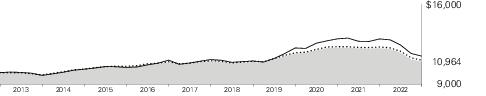
| Average Annual Total Returns Periods Ended August 31, 2022 | |||||
| One Year | Five Years | Ten Years | Final Value of a $10,000 Investment | ||
 | Mortgage-Backed Securities Index Fund ETF Shares Net Asset Value | -9.71% | -0.06% | 0.92% | $10,964 |
| Mortgage-Backed Securities Index Fund ETF Shares Market Price | -9.72 | -0.06 | 0.92 | 10,960 | |
 | Bloomberg U.S. MBS Float Adjusted Index | -9.46 | 0.09 | 1.04 | 11,094 |
 | Bloomberg U.S. Aggregate Float Adjusted Index | -11.65 | 0.54 | 1.36 | 11,452 |
| Average Annual Total Returns Periods Ended August 31, 2022 | |||||
| One Year | Five Years | Ten Years | Final Value of a $10,000 Investment | ||
| Mortgage-Backed Securities Index Fund Admiral Shares | -9.72% | -0.08% | 0.92% | $10,955 | |
| Bloomberg U.S. MBS Float Adjusted Index | -9.46 | 0.09 | 1.04 | 11,094 | |
| Bloomberg U.S. Aggregate Float Adjusted Index | -11.65 | 0.54 | 1.36 | 11,452 | |
| One Year | Five Years | Since Inception (10/31/2013) | Final Value of a $5,000,000 Investment | ||
| Mortgage-Backed Securities Index Fund Institutional Shares | -9.70% | -0.06% | 1.11% | $5,512,000 | |
| Bloomberg U.S. MBS Float Adjusted Index | -9.46 | 0.09 | 1.20 | 5,555,946 | |
| Bloomberg U.S. Aggregate Float Adjusted Index | -11.65 | 0.54 | 1.63 | 5,769,363 | |
| Cumulative Returns of ETF Shares: August 31, 2012, Through August 31, 2022 | |||
| One Year | Five Years | Ten Years | |
| Mortgage-Backed Securities Index Fund ETF Shares Market Price | -9.72% | -0.30% | 9.60% |
| Mortgage-Backed Securities Index Fund ETF Shares Net Asset Value | -9.71 | -0.31 | 9.64 |
| Bloomberg U.S. MBS Float Adjusted Index | -9.46 | 0.44 | 10.94 |
| 0 - 10 Years | 2.4% |
| 10 - 20 Years | 17.3 |
| 20 - 30 Years | 78.2 |
| 30 - 40 Years | 2.1 |
| Coupon | Maturity Date | Face Amount ($000) | Market Value• ($000) | |||
| U.S. Government and Agency Obligations (99.5%) | ||||||
| Conventional Mortgage-Backed Securities (99.5%) | ||||||
| 1,2 | Freddie Mac Gold Pool | 2.000% | 1/1/28–12/1/31 | 5,228 | 4,828 | |
| 1,2 | Freddie Mac Gold Pool | 2.500% | 11/1/22–2/1/43 | 80,352 | 76,614 | |
| 1,2 | Freddie Mac Gold Pool | 3.000% | 1/1/26–6/1/49 | 282,448 | 267,970 | |
| 1,2 | Freddie Mac Gold Pool | 3.500% | 9/1/25–2/1/49 | 256,658 | 248,876 | |
| 1,2 | Freddie Mac Gold Pool | 4.000% | 3/1/24–6/1/49 | 149,419 | 148,571 | |
| 1,2 | Freddie Mac Gold Pool | 4.500% | 7/1/23–11/1/48 | 76,314 | 77,414 | |
| 1,2 | Freddie Mac Gold Pool | 5.000% | 4/1/23–11/1/48 | 24,105 | 24,958 | |
| 1,2 | Freddie Mac Gold Pool | 5.500% | 10/1/26–6/1/41 | 21,781 | 23,079 | |
| 1,2 | Freddie Mac Gold Pool | 6.000% | 11/1/28–5/1/40 | 11,344 | 12,299 | |
| 1,2 | Freddie Mac Gold Pool | 7.000% | 7/1/28–12/1/38 | 106 | 109 | |
| 1 | Ginnie Mae I Pool | 2.500% | 6/15/27–6/15/28 | 169 | 159 | |
| 1 | Ginnie Mae I Pool | 3.000% | 1/15/26–3/15/45 | 13,234 | 12,397 | |
| 1 | Ginnie Mae I Pool | 3.500% | 2/15/26–9/15/49 | 22,514 | 22,112 | |
| 1 | Ginnie Mae I Pool | 4.000% | 7/15/24–6/15/49 | 15,898 | 16,030 | |
| 1 | Ginnie Mae I Pool | 4.500% | 8/15/33–7/15/49 | 21,357 | 21,950 | |
| 1 | Ginnie Mae I Pool | 5.000% | 3/15/34–4/15/41 | 9,087 | 9,516 | |
| 1 | Ginnie Mae I Pool | 6.500% | 10/15/28–1/15/39 | 67 | 71 | |
| 1 | Ginnie Mae I Pool | 7.000% | 10/15/27 | 1 | 1 | |
| 1 | Ginnie Mae II Pool | 1.500% | 2/20/51–12/20/51 | 17,888 | 14,962 | |
| 1,3,4 | Ginnie Mae II Pool | 2.000% | 8/20/50–9/15/52 | 757,174 | 670,750 | |
| 1,4 | Ginnie Mae II Pool | 2.500% | 6/20/27–9/15/52 | 760,722 | 695,283 | |
| 1,3 | Ginnie Mae II Pool | 3.000% | 10/20/26–6/20/52 | 764,895 | 722,986 | |
| 1 | Ginnie Mae II Pool | 3.500% | ��12/20/25–7/20/52 | 561,194 | 546,516 | |
| 1,4 | Ginnie Mae II Pool | 4.000% | 9/20/25–9/15/52 | 321,782 | 320,804 | |
| 1,4 | Ginnie Mae II Pool | 4.500% | 2/20/39–9/15/52 | 175,649 | 178,773 | |
| 1,4 | Ginnie Mae II Pool | 5.000% | 2/20/39–9/15/52 | 67,343 | 69,930 | |
| 1 | Ginnie Mae II Pool | 5.500% | 2/20/49–7/20/49 | 497 | 504 | |
| 1 | Ginnie Mae II Pool | 6.500% | 10/20/28–9/20/40 | 359 | 399 | |
| 1 | Ginnie Mae II Pool | 7.000% | 4/20/38–11/20/38 | 32 | 36 | |
| 1,2,4 | UMBS Pool | 1.500% | 7/1/35–8/1/51 | 981,408 | 833,340 | |
| 1,2,4 | UMBS Pool | 2.000% | 4/1/23–9/25/52 | 4,100,209 | 3,587,572 | |
| 1,2,4 | UMBS Pool | 2.500% | 3/1/27–9/25/52 | 2,965,647 | 2,681,638 | |
| 1,2,4 | UMBS Pool | 3.000% | 10/1/26–9/25/52 | 1,877,593 | 1,759,261 | |
| 1,2,4 | UMBS Pool | 3.500% | 8/1/25–9/25/52 | 1,169,259 | 1,128,801 | |
| 1,2,4 | UMBS Pool | 4.000% | 4/1/24–9/25/52 | 836,043 | 824,555 | |
| 1,2,4 | UMBS Pool | 4.500% | 6/1/23–9/25/52 | 437,118 | 438,909 | |
| 1,2,4 | UMBS Pool | 5.000% | 8/1/23–9/25/52 | 197,616 | 201,958 | |
| 1,2,4 | UMBS Pool | 5.500% | 2/1/23–9/25/52 | 54,658 | 57,311 | |
| Coupon | Maturity Date | Face Amount ($000) | Market Value• ($000) | |||
| 1,2 | UMBS Pool | 6.000% | 12/1/25–6/1/41 | 19,579 | 21,134 | |
| 1,2 | UMBS Pool | 7.000% | 10/1/33–10/1/37 | 250 | 278 | |
| 15,722,654 | ||||||
| Nonconventional Mortgage-Backed Securities (0.0%) | ||||||
| 1,2 | Fannie Mae Pool | 2.308% | 7/1/43 | 235 | 241 | |
| 1,2,5 | Fannie Mae Pool, 12M USD LIBOR + 1.290% | 1.779% | 12/1/41 | 21 | 22 | |
| 1,2,5 | Fannie Mae Pool, 12M USD LIBOR + 1.310% | 2.762% | 9/1/37 | 10 | 10 | |
| 1,2,5 | Fannie Mae Pool, 12M USD LIBOR + 1.479% | 1.849% | 3/1/43 | 93 | 93 | |
| 1,2,5 | Fannie Mae Pool, 12M USD LIBOR + 1.552% | 3.417% | 10/1/37 | 18 | 19 | |
| 1,2,5 | Fannie Mae Pool, 12M USD LIBOR + 1.606% | 3.028% | 6/1/43 | 28 | 29 | |
| 1,2,5 | Fannie Mae Pool, 12M USD LIBOR + 1.627% | 2.127% | 3/1/38 | 3 | 3 | |
| 1,2,5 | Fannie Mae Pool, 12M USD LIBOR + 1.670% | 3.377% | 10/1/42 | 40 | 42 | |
| 1,2,5 | Fannie Mae Pool, 12M USD LIBOR + 1.683% | 2.844% | 8/1/39 | 18 | 18 | |
| 1,2,5 | Fannie Mae Pool, 12M USD LIBOR + 1.690% | 2.259% | 10/1/39 | 8 | 8 | |
| 1,2,5 | Fannie Mae Pool, 12M USD LIBOR + 1.690% | 3.940% | 9/1/42 | 142 | 148 | |
| 1,2,5 | Fannie Mae Pool, 12M USD LIBOR + 1.700% | 1.950% | 12/1/40 | 43 | 43 | |
| 1,2,5 | Fannie Mae Pool, 12M USD LIBOR + 1.722% | 2.529% | 5/1/42 | 12 | 12 | |
| 1,2,5 | Fannie Mae Pool, 12M USD LIBOR + 1.764% | 2.094% | 11/1/39 | 6 | 6 | |
| 1,2,5 | Fannie Mae Pool, 12M USD LIBOR + 1.771% | 2.432% | 5/1/42 | 8 | 8 | |
| 1,2,5 | Fannie Mae Pool, 12M USD LIBOR + 1.794% | 3.359% | 3/1/42 | 16 | 17 | |
| 1,2,5 | Fannie Mae Pool, 12M USD LIBOR + 1.797% | 2.465% | 8/1/42 | 42 | 44 | |
| 1,2,5 | Fannie Mae Pool, 12M USD LIBOR + 1.805% | 2.055% | 11/1/41 | 23 | 24 | |
| 1,2,5 | Fannie Mae Pool, 12M USD LIBOR + 1.810% | 2.060% | 10/1/40–12/1/40 | 3 | 3 | |
| 1,2,5 | Fannie Mae Pool, 12M USD LIBOR + 1.813% | 2.063% | 11/1/41 | 6 | 6 | |
| 1,2,5 | Fannie Mae Pool, 12M USD LIBOR + 1.813% | 2.075% | 1/1/42 | 32 | 32 | |
| 1,2,5 | Fannie Mae Pool, 12M USD LIBOR + 1.813% | 2.207% | 3/1/41 | 27 | 27 | |
| 1,2,5 | Fannie Mae Pool, 12M USD LIBOR + 1.815% | 2.065% | 11/1/40 | 2 | 2 | |
| 1,2,5 | Fannie Mae Pool, 12M USD LIBOR + 1.815% | 2.107% | 12/1/41 | 21 | 21 | |
| 1,2,5 | Fannie Mae Pool, 12M USD LIBOR + 1.815% | 3.446% | 5/1/41 | 11 | 12 | |
| 1,2,5 | Fannie Mae Pool, 12M USD LIBOR + 1.824% | 3.618% | 9/1/40 | 31 | 31 | |
| 1,2,5 | Fannie Mae Pool, 12M USD LIBOR + 1.825% | 3.314% | 2/1/42 | 26 | 27 | |
| 1,2,5 | Fannie Mae Pool, 12M USD LIBOR + 1.830% | 2.308% | 4/1/41 | 16 | 17 | |
| 1,2,5 | Fannie Mae Pool, 12M USD LIBOR + 1.834% | 2.153% | 2/1/41 | 1 | 1 | |
| 1,2,5 | Fannie Mae Pool, 12M USD LIBOR + 1.835% | 2.107% | �� 1/1/40 | 1 | 1 | |
| 1,2,5 | Fannie Mae Pool, 12M USD LIBOR + 1.835% | 3.210% | 5/1/40 | 1 | 1 | |
| 1,2,5 | Fannie Mae Pool, 12M USD LIBOR + 1.839% | 2.089% | 12/1/39 | 34 | 34 | |
| 1,2,5 | Fannie Mae Pool, 12M USD LIBOR + 1.914% | 3.289% | 4/1/37 | 3 | 3 | |
| 1,2,5 | Freddie Mac Non Gold Pool, 12M USD LIBOR + 1.640% | 1.890% | 11/1/43 | 46 | 47 | |
| 1,2,5 | Freddie Mac Non Gold Pool, 12M USD LIBOR + 1.660% | 1.910% | 10/1/37 | 2 | 2 | |
| 1,2,5 | Freddie Mac Non Gold Pool, 12M USD LIBOR + 1.695% | 2.074% | 2/1/37 | 9 | 9 | |
| 1,2,5 | Freddie Mac Non Gold Pool, 12M USD LIBOR + 1.745% | 1.995% | 12/1/40 | 6 | 6 | |
| 1,2,5 | Freddie Mac Non Gold Pool, 12M USD LIBOR + 1.846% | 2.141% | 2/1/42 | 7 | 7 | |
| 1,2,5 | Freddie Mac Non Gold Pool, 12M USD LIBOR + 1.880% | 3.612% | 6/1/40 | 7 | 7 | |
| 1,2,5 | Freddie Mac Non Gold Pool, 12M USD LIBOR + 1.880% | 3.860% | 6/1/41 | 12 | 12 | |
| 1,2,5 | Freddie Mac Non Gold Pool, 12M USD LIBOR + 1.891% | 3.000% | 9/1/40 | 8 | 8 | |
| 1,2,5 | Freddie Mac Non Gold Pool, 12M USD LIBOR + 1.899% | 2.663% | 12/1/39 | 4 | 4 | |
| Coupon | Maturity Date | Face Amount ($000) | Market Value• ($000) | |||
| 1,2,5 | Freddie Mac Non Gold Pool, 12M USD LIBOR + 1.900% | 4.150% | 6/1/40 | 1 | 2 | |
| 1,2,5 | Freddie Mac Non Gold Pool, 12M USD LIBOR + 1.910% | 2.390% | 2/1/41 | 26 | 26 | |
| 1,2,5 | Freddie Mac Non Gold Pool, 12M USD LIBOR + 1.910% | 2.410% | 2/1/41 | 1 | — | |
| 1,2,5 | Freddie Mac Non Gold Pool, 12M USD LIBOR + 2.085% | 2.585% | 3/1/38 | 5 | 5 | |
| 1,5 | Ginnie Mae II Pool, 1YR CMT + 1.500% | 1.625% | 7/20/41–8/20/41 | 35 | 34 | |
| 1,5 | Ginnie Mae II Pool, 1YR CMT + 1.500% | 1.750% | 11/20/40–12/20/42 | 119 | 117 | |
| 1,5 | Ginnie Mae II Pool, 1YR CMT + 1.500% | 2.625% | 1/20/41–2/20/41 | 110 | 111 | |
| 1,5 | Ginnie Mae II Pool, 1YR CMT + 1.500% | 2.875% | 4/20/41 | 2 | 2 | |
| 1,5 | Ginnie Mae II Pool, 1YR CMT + 2.000% | 2.250% | 11/20/40 | 2 | 3 | |
| 1,5 | Ginnie Mae II Pool, 1YR CMT + 2.000% | 3.375% | 5/20/41 | 1 | 1 | |
| 1,408 | ||||||
| Total U.S. Government and Agency Obligations (Cost $17,287,509) | 15,724,062 | |||||
| Shares | ||||||
| Temporary Cash Investments (2.4%) | ||||||
| Money Market Fund (2.4%) | ||||||
| 6 | Vanguard Market Liquidity Fund (Cost $380,571) | 2.284% | 3,808,004 | 380,686 | ||
| Total Investments (101.9%) (Cost $17,668,080) | 16,104,748 | |||||
| Other Assets and Liabilities—Net (-1.9%) | (301,649) | |||||
| Net Assets (100%) | 15,803,099 | |||||
| Cost is in $000. |
| • | See Note A in Notes to Financial Statements. |
| 1 | The average or expected maturity is shorter than the final maturity shown because of the possibility of interim principal payments and prepayments or the possibility of the issue being called. |
| 2 | The issuer was placed under federal conservatorship in September 2008; since that time, its daily operations have been managed by the Federal Housing Finance Agency and it receives capital from the U.S. Treasury, as needed to maintain a positive net worth, in exchange for senior preferred stock. |
| 3 | Securities with a value of $4,694,000 have been segregated as collateral for certain open To Be Announced (TBA) transactions. |
| 4 | Includes securities purchased on a when-issued or delayed-delivery basis for which the fund has not taken delivery as of August 31, 2022. |
| 5 | Variable-rate security; rate shown is effective rate at period end. Certain variable-rate securities are not based on a published reference rate and spread but are determined by the issuer or agent based on current market conditions. |
| 6 | Affiliated money market fund available only to Vanguard funds and certain trusts and accounts managed by Vanguard. Rate shown is the 7-day yield. |
| 12M—12-month. | |
| 1YR—1-year. | |
| CMT—Constant Maturing Treasury Rate. | |
| LIBOR—London Interbank Offered Rate. | |
| UMBS—Uniform Mortgage-Backed Securities. | |
| USD—U.S. dollar. |
| ($000s, except shares and per-share amounts) | Amount |
| Assets | |
| Investments in Securities, at Value | |
| Unaffiliated Issuers (Cost $17,287,509) | 15,724,062 |
| Affiliated Issuers (Cost $380,571) | 380,686 |
| Total Investments in Securities | 16,104,748 |
| Investment in Vanguard | 587 |
| Cash | 976 |
| Cash Collateral Pledged—To Be Announced Transactions | 179 |
| Receivables for Investment Securities Sold | 152,309 |
| Receivables for Accrued Income | 38,591 |
| Receivables for Capital Shares Issued | 5,547 |
| Total Assets | 16,302,937 |
| Liabilities | |
| Payables for Investment Securities Purchased | 492,407 |
| Payables for Capital Shares Redeemed | 6,571 |
| Payables for Distributions | 563 |
| Payables to Vanguard | 297 |
| Total Liabilities | 499,838 |
| Net Assets | 15,803,099 |
| Statement of Assets and Liabilities (continued) | |
| At August 31, 2022, net assets consisted of: | |
| ($000s, except shares and per-share amounts) | Amount |
| Paid-in Capital | 17,472,829 |
| Total Distributable Earnings (Loss) | (1,669,730) |
| Net Assets | 15,803,099 |
| ETF Shares—Net Assets | |
| Applicable to 303,050,602 outstanding $.001 par value shares of beneficial interest (unlimited authorization) | 14,405,327 |
| Net Asset Value Per Share—ETF Shares | $47.53 |
| Admiral Shares—Net Assets | |
| Applicable to 64,226,094 outstanding $.001 par value shares of beneficial interest (unlimited authorization) | 1,218,961 |
| Net Asset Value Per Share—Admiral Shares | $18.98 |
| Institutional Shares—Net Assets | |
| Applicable to 6,952,774 outstanding $.001 par value shares of beneficial interest (unlimited authorization) | 178,811 |
| Net Asset Value Per Share—Institutional Shares | $25.72 |
| Year Ended August 31, 2022 | |
| ($000) | |
| Investment Income | |
| Income | |
| Interest1 | 276,146 |
| Total Income | 276,146 |
| Expenses | |
| The Vanguard Group—Note B | |
| Investment Advisory Services | 308 |
| Management and Administrative—ETF Shares | 4,017 |
| Management and Administrative—Admiral Shares | 779 |
| Management and Administrative—Institutional Shares | 57 |
| Marketing and Distribution—ETF Shares | 688 |
| Marketing and Distribution—Admiral Shares | 73 |
| Marketing and Distribution—Institutional Shares | 6 |
| Custodian Fees | 131 |
| Auditing Fees | 37 |
| Shareholders’ Reports—ETF Shares | 736 |
| Shareholders’ Reports—Admiral Shares | 53 |
| Shareholders’ Reports—Institutional Shares | — |
| Trustees’ Fees and Expenses | 6 |
| Other Expenses | 14 |
| Total Expenses | 6,905 |
| Expenses Paid Indirectly | (5) |
| Net Expenses | 6,900 |
| Net Investment Income | 269,246 |
| Realized Net Gain (Loss) | |
| Investment Securities Sold1 | (124,365) |
| Futures Contracts | 320 |
| Realized Net Gain (Loss) | (124,045) |
| Change in Unrealized Appreciation (Depreciation) of Investment Securities1 | (1,756,647) |
| Net Increase (Decrease) in Net Assets Resulting from Operations | (1,611,446) |
| 1 | Interest income, realized net gain (loss), capital gain distributions received, and change in unrealized appreciation (depreciation) from an affiliated company of the fund were $2,532,000, ($22,000), $31,000, and ($289,000), respectively. Purchases and sales are for temporary cash investment purposes. |
| Year Ended August 31, | ||
| 2022 ($000) | 2021 ($000) | |
| Increase (Decrease) in Net Assets | ||
| Operations | ||
| Net Investment Income | 269,246 | 161,830 |
| Realized Net Gain (Loss) | (124,045) | (11,804) |
| Change in Unrealized Appreciation (Depreciation) | (1,756,647) | (200,070) |
| Net Increase (Decrease) in Net Assets Resulting from Operations | (1,611,446) | (50,044) |
| Distributions | ||
| ETF Shares | (229,467) | (172,665) |
| Admiral Shares | (21,594) | (15,250) |
| Institutional Shares | (2,331) | (2,046) |
| Total Distributions | (253,392) | (189,961) |
| Capital Share Transactions | ||
| ETF Shares | 1,036,092 | 3,630,070 |
| Admiral Shares | (37,825) | 278,308 |
| Institutional Shares | 73,757 | (45,377) |
| Net Increase (Decrease) from Capital Share Transactions | 1,072,024 | 3,863,001 |
| Total Increase (Decrease) | (792,814) | 3,622,996 |
| Net Assets | ||
| Beginning of Period | 16,595,913 | 12,972,917 |
| End of Period | 15,803,099 | 16,595,913 |
| ETF Shares | |||||
| For a Share Outstanding Throughout Each Period | Year Ended August 31, | ||||
| 2022 | 2021 | 2020 | 2019 | 2018 | |
| Net Asset Value, Beginning of Period | $53.47 | $54.36 | $53.26 | $51.38 | $53.00 |
| Investment Operations | |||||
| Net Investment Income1 | .842 | .581 | 1.197 | 1.564 | 1.325 |
| Net Realized and Unrealized Gain (Loss) on Investments | (5.995) | (.768) | 1.146 | 1.859 | (1.683) |
| Total from Investment Operations | (5.153) | (.187) | 2.343 | 3.423 | (.358) |
| Distributions | |||||
| Dividends from Net Investment Income | (.787) | (.594) | (1.243) | (1.543) | (1.262) |
| Distributions from Realized Capital Gains | — | (.109) | — | — | — |
| Total Distributions | (.787) | (.703) | (1.243) | (1.543) | (1.262) |
| Net Asset Value, End of Period | $47.53 | $53.47 | $54.36 | $53.26 | $51.38 |
| Total Return | -9.71% | -0.35% | 4.45% | 6.80% | -0.67% |
| Ratios/Supplemental Data | |||||
| Net Assets, End of Period (Millions) | $14,405 | $15,055 | $11,643 | $10,316 | $7,193 |
| Ratio of Total Expenses to Average Net Assets | 0.04%2 | 0.04% | 0.05% | 0.05% | 0.07% |
| Ratio of Net Investment Income to Average Net Assets | 1.67% | 1.08% | 2.22% | 3.01% | 2.56% |
| Portfolio Turnover Rate3 | 170% | 316% | 218% | 190% | 279% |
| 1 | Calculated based on average shares outstanding. |
| 2 | The ratio of expenses to average net assets for the period net of reduction from custody fee offset arrangements was 0.04%. |
| 3 | Includes 113%, 237%, 11%, 34%, and 78%, respectively, attributable to mortgage-dollar-roll activity. |
| Admiral Shares | |||||
| For a Share Outstanding Throughout Each Period | Year Ended August 31, | ||||
| 2022 | 2021 | 2020 | 2019 | 2018 | |
| Net Asset Value, Beginning of Period | $21.37 | $21.72 | $21.26 | $20.51 | $21.17 |
| Investment Operations | |||||
| Net Investment Income1 | .328 | .211 | .470 | .622 | .528 |
| Net Realized and Unrealized Gain (Loss) on Investments | (2.391) | (.292) | .463 | .742 | (.674) |
| Total from Investment Operations | (2.063) | (.081) | .933 | 1.364 | (.146) |
| Distributions | |||||
| Dividends from Net Investment Income | (.327) | (.225) | (.473) | (.614) | (.514) |
| Distributions from Realized Capital Gains | — | (.044) | — | — | — |
| Total Distributions | (.327) | (.269) | (.473) | (.614) | (.514) |
| Net Asset Value, End of Period | $18.98 | $21.37 | $21.72 | $21.26 | $20.51 |
| Total Return2 | -9.72% | -0.38% | 4.43% | 6.77% | -0.68% |
| Ratios/Supplemental Data | |||||
| Net Assets, End of Period (Millions) | $1,219 | $1,419 | $1,159 | $841 | $725 |
| Ratio of Total Expenses to Average Net Assets | 0.07%3 | 0.07% | 0.07% | 0.07% | 0.07% |
| Ratio of Net Investment Income to Average Net Assets | 1.62% | 0.98% | 2.18% | 2.99% | 2.56% |
| Portfolio Turnover Rate4 | 170% | 316% | 218% | 190% | 279% |
| 1 | Calculated based on average shares outstanding. |
| 2 | Total returns do not include account service fees that may have applied in the periods shown. Fund prospectuses provide information about any applicable account service fees. |
| 3 | The ratio of expenses to average net assets for the period net of reduction from custody fee offset arrangements was 0.07%. |
| 4 | Includes 113%, 237%, 11%, 34%, and 78%, respectively, attributable to mortgage-dollar-roll activity. |
| Institutional Shares | |||||
| For a Share Outstanding Throughout Each Period | Year Ended August 31, | ||||
| 2022 | 2021 | 2020 | 2019 | 2018 | |
| Net Asset Value, Beginning of Period | $28.96 | $29.44 | $28.81 | $27.79 | $28.69 |
| Investment Operations | |||||
| Net Investment Income1 | .467 | .393 | .641 | .846 | .721 |
| Net Realized and Unrealized Gain (Loss) on Investments | (3.258) | (.503) | .636 | 1.011 | (.920) |
| Total from Investment Operations | (2.791) | (.110) | 1.277 | 1.857 | (.199) |
| Distributions | |||||
| Dividends from Net Investment Income | (.449) | (.311) | (.647) | (.837) | (.701) |
| Distributions from Realized Capital Gains | — | (.059) | — | — | — |
| Total Distributions | (.449) | (.370) | (.647) | (.837) | (.701) |
| Net Asset Value, End of Period | $25.72 | $28.96 | $29.44 | $28.81 | $27.79 |
| Total Return | -9.70% | -0.38% | 4.48% | 6.80% | -0.68% |
| Ratios/Supplemental Data | |||||
| Net Assets, End of Period (Millions) | $179 | $122 | $171 | $119 | $70 |
| Ratio of Total Expenses to Average Net Assets | 0.05%2 | 0.05% | 0.05% | 0.05% | 0.05% |
| Ratio of Net Investment Income to Average Net Assets | 1.71% | 1.35% | 2.20% | 3.01% | 2.58% |
| Portfolio Turnover Rate3 | 170% | 316% | 218% | 190% | 279% |
| 1 | Calculated based on average shares outstanding. |
| 2 | The ratio of expenses to average net assets for the period net of reduction from custody fee offset arrangements was 0.05%. |
| 3 | Includes 113%, 237%, 11%, 34%, and 78%, respectively, attributable to mortgage-dollar-roll activity. |
| Level 1 ($000) | Level 2 ($000) | Level 3 ($000) | Total ($000) | |
| Investments | ||||
| Assets | ||||
| U.S. Government and Agency Obligations | — | 15,724,062 | — | 15,724,062 |
| Temporary Cash Investments | 380,686 | — | — | 380,686 |
| Total | 380,686 | 15,724,062 | — | 16,104,748 |
| Amount ($000) | |
| Undistributed Ordinary Income | 30,771 |
| Undistributed Long-Term Gains | — |
| Capital Loss Carryforwards | (122,392) |
| Qualified Late-Year Losses | — |
| Net Unrealized Gains (Losses) | (1,577,546) |
| Year Ended August 31, | ||
| 2022 Amount ($000) | 2021 Amount ($000) | |
| Ordinary Income* | 253,392 | 187,294 |
| Long-Term Capital Gains | — | 2,667 |
| Total | 253,392 | 189,961 |
| * | Includes short-term capital gains, if any. |
| Amount ($000) | |
| Tax Cost | 17,682,294 |
| Gross Unrealized Appreciation | 4,392 |
| Gross Unrealized Depreciation | (1,581,938) |
| Net Unrealized Appreciation (Depreciation) | (1,577,546) |
| Year Ended August 31, | |||||
| 2022 | 2021 | ||||
| Amount ($000) | Shares (000) | Amount ($000) | Shares (000) | ||
| ETF Shares | |||||
| Issued | 3,012,787 | 60,434 | 4,732,739 | 87,937 | |
| Issued in Lieu of Cash Distributions | — | — | — | — | |
| Redeemed | (1,976,695) | (38,950) | (1,102,669) | (20,550) | |
| Net Increase (Decrease)—ETF Shares | 1,036,092 | 21,484 | 3,630,070 | 67,387 | |
| Admiral Shares | |||||
| Issued | 518,758 | 25,847 | 811,357 | 37,785 | |
| Issued in Lieu of Cash Distributions | 16,300 | 816 | 10,095 | 470 | |
| Redeemed | (572,883) | (28,821) | (543,144) | (25,236) | |
| Net Increase (Decrease)—Admiral Shares | (37,825) | (2,158) | 278,308 | 13,019 | |
| Institutional Shares | |||||
| Issued | 95,097 | 3,492 | 48,026 | 1,650 | |
| Issued in Lieu of Cash Distributions | 2,331 | 87 | 1,521 | 52 | |
| Redeemed | (23,671) | (853) | (94,924) | (3,272) | |
| Net Increase (Decrease)—Institutional Shares | 73,757 | 2,726 | (45,377) | (1,570) | |
Philadelphia, Pennsylvania
October 20, 2022
| Matthew Benchener | Thomas M. Rampulla |
| Joseph Brennan | Karin A. Risi |
| Mortimer J. Buckley | Anne E. Robinson |
| Gregory Davis | Michael Rollings |
| John James | Nitin Tandon |
| Chris D. McIsaac | Lauren Valente |

Who Are Deaf or Hard of Hearing > 800-749-7273
All rights reserved.
U.S. Patent No. 6,879,964.
Vanguard Marketing Corporation, Distributor.

| 1 | |
| 2 | |
| 4 | |
| 7 | |
| 18 | |
| 20 |
| • | The 12 months ended August 31, 2022, were a very challenging period for financial markets. Vanguard Total Corporate Bond ETF returned –15.11% (based on net asset value), roughly in line with the expense-free –14.91% return of its benchmark. |
| • | Early on, pent-up demand helped spur global growth and push unemployment rates down. The economic backdrop deteriorated, however, as inflation soared to multidecade highs, fueled in part by higher energy and food prices in the wake of Russia’s invasion of Ukraine. The Federal Reserve reacted by raising interest rates, which weighed on bond prices and sparked fears of recession. |
| • | The yield of the bellwether 10-year U.S. Treasury bond rose significantly over the period, from 1.31% to 3.19%. As yield spreads widened for corporate bonds, they underperformed both Treasuries and mortgage-backed securities. |
| • | By maturity, longer-term corporates suffered more than their shorter-term counterparts. By credit quality, bonds rated A held up the best but still averaged a decline of more than –14%. |
| • | By sector, bonds issued by industrial companies and utilities weighed more on returns than those of financial institutions. |
| Average Annual Total Returns Periods Ended August 31, 2022 | |||
| One Year | Three Years | Five Years | |
| Stocks | |||
| Russell 1000 Index (Large-caps) | -12.96% | 12.14% | 11.61% |
| Russell 2000 Index (Small-caps) | -17.88 | 8.59 | 6.95 |
| Russell 3000 Index (Broad U.S. market) | -13.28 | 11.90 | 11.29 |
| FTSE All-World ex US Index (International) | -19.00 | 3.48 | 2.12 |
| Bonds | |||
| Bloomberg U.S. Aggregate Float Adjusted Index (Broad taxable market) | -11.65% | -2.01% | 0.54% |
| Bloomberg Municipal Bond Index (Broad tax-exempt market) | -8.63 | -0.83 | 1.28 |
| FTSE Three-Month U.S. Treasury Bill Index | 0.44 | 0.56 | 1.10 |
| CPI | |||
| Consumer Price Index | 8.26% | 4.90% | 3.82% |
| • | Based on actual fund return. This section helps you to estimate the actual expenses that you paid over the period. The ”Ending Account Value“ shown is derived from the fund’s actual return, and the third column shows the dollar amount that would have been paid by an investor who started with $1,000 in the fund. You may use the information here, together with the amount you invested, to estimate the expenses that you paid over the period. |
| • | Based on hypothetical 5% yearly return. This section is intended to help you compare your fund‘s costs with those of other mutual funds. It assumes that the fund had a yearly return of 5% before expenses, but that the expense ratio is unchanged. In this case—because the return used is not the fund’s actual return—the results do not apply to your investment. The example is useful in making comparisons because the Securities and Exchange Commission requires all mutual funds to calculate expenses based on a 5% return. You can assess your fund’s costs by comparing this hypothetical example with the hypothetical examples that appear in shareholder reports of other funds. |
| Six Months Ended August 31, 2022 | |||
| Total Corporate Bond ETF | Beginning Account Value 2/28/2022 | Ending Account Value 8/31/2022 | Expenses Paid During Period |
| Based on Actual Fund Return | $1,000.00 | $ 902.10 | $0.19 |
| Based on Hypothetical 5% Yearly Return | 1,000.00 | 1,025.00 | 0.20 |
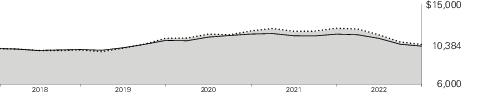
| Average Annual Total Returns Periods Ended August 31, 2022 | ||||
| One Year | Since Inception (11/7/2017) | Final Value of a $10,000 Investment | ||
 | Total Corporate Bond ETF Net Asset Value | -15.11% | 0.79% | $10,384 |
| Total Corporate Bond ETF Market Price | -15.16 | 0.78 | 10,381 | |
 | Bloomberg U.S. Corporate Bond Index | -14.91 | 0.96 | 10,471 |
 | Bloomberg U.S. Aggregate Float Adjusted Index | -11.65 | 0.58 | 10,283 |
| Cumulative Returns of ETF Shares: November 7, 2017, Through August 31, 2022 | ||
| One Year | Since Inception (11/7/2017) | |
| Total Corporate Bond ETF Market Price | -15.16% | 3.81% |
| Total Corporate Bond ETF Net Asset Value | -15.11 | 3.84 |
| Bloomberg U.S. Corporate Bond Index | -14.91 | 4.71 |
| Vanguard Short-Term Corporate Bond ETF | 37.2% |
| Vanguard Long-Term Corporate Bond ETF | 35.2 |
| Vanguard Intermediate-Term Corporate Bond ETF | 27.6 |
| Shares | Market Value• ($000) | |||||
| Investment Companies (100.0%) | ||||||
| U.S. Bond Funds (100.0%) | ||||||
| Vanguard Short-Term Corporate Bond ETF | 2,832,757 | 215,431 | ||||
| Vanguard Long-Term Corporate Bond ETF | 2,532,363 | 203,399 | ||||
| Vanguard Intermediate-Term Corporate Bond ETF | 2,008,986 | 159,976 | ||||
| Total Investment Companies (Cost $687,897) | 578,806 | |||||
| Temporary Cash Investments (0.0%) | ||||||
| Money Market Fund (0.0%) | ||||||
| 1 | Vanguard Market Liquidity Fund, 2.284% (Cost $281) | 2,810 | 281 | |||
| Total Investments (100.0%) (Cost $688,178) | 579,087 | |||||
| Other Assets and Liabilities—Net (0.0%) | (18) | |||||
| Net Assets (100%) | 579,069 | |||||
| Cost is in $000. |
| • | See Note A in Notes to Financial Statements. |
| 1 | Affiliated money market fund available only to Vanguard funds and certain trusts and accounts managed by Vanguard. Rate shown is the 7-day yield. |
| ($000s, except shares and per-share amounts) | Amount |
| Assets | |
| Investments in Securities, at Value—Affiliated Funds (Cost $688,178) | 579,087 |
| Receivables for Investment Securities Sold | 1,194 |
| Receivables for Accrued Income | 1 |
| Total Assets | 580,282 |
| Liabilities | |
| Due to Custodian | 15 |
| Payables for Investment Securities Purchased | 1,198 |
| Total Liabilities | 1,213 |
| Net Assets | 579,069 |
| At August 31, 2022, net assets consisted of: | |
| Paid-in Capital | 693,467 |
| Total Distributable Earnings (Loss) | (114,398) |
| Net Assets | 579,069 |
| Net Assets | |
| Applicable to 7,560,000 outstanding $.001 par value shares of beneficial interest (unlimited authorization) | 579,069 |
| Net Asset Value Per Share | $76.60 |
| Year Ended August 31, 2022 | |
| ($000) | |
| Investment Income | |
| Income | |
| Income Distributions Received from Affiliated Funds | 16,032 |
| Net Investment Income—Note B | 16,032 |
| Realized Net Gain (Loss) | |
| Capital Gain Distributions Received from Affiliated Funds | 1,772 |
| Affiliated Funds Sold1 | (10,788) |
| Realized Net Gain (Loss) | (9,016) |
| Change in Unrealized Appreciation (Depreciation) from Affiliated Funds | (111,968) |
| Net Increase (Decrease) in Net Assets Resulting from Operations | (104,952) |
| 1 | Includes ($4,532,000) of net gain (loss) resulting from in-kind redemptions. |
| Year Ended August 31, | ||
| 2022 ($000) | 2021 ($000) | |
| Increase (Decrease) in Net Assets | ||
| Operations | ||
| Net Investment Income | 16,032 | 17,944 |
| Realized Net Gain (Loss) | (9,016) | 10,516 |
| Change in Unrealized Appreciation (Depreciation) | (111,968) | (18,980) |
| Net Increase (Decrease) in Net Assets Resulting from Operations | (104,952) | 9,480 |
| Distributions | ||
| Total Distributions | (16,149) | (17,930) |
| Capital Share Transactions | ||
| Issued | 108,869 | 389,344 |
| Issued in Lieu of Cash Distributions | — | — |
| Redeemed | (103,767) | (304,510) |
| Net Increase (Decrease) from Capital Share Transactions | 5,102 | 84,834 |
| Total Increase (Decrease) | (115,999) | 76,384 |
| Net Assets | ||
| Beginning of Period | 695,068 | 618,684 |
| End of Period | 579,069 | 695,068 |
| For a Share Outstanding Throughout Each Period | Year Ended August 31, | November 7, 20171 to August 31, 2018 | |||
| 2022 | 2021 | 2020 | 2019 | ||
| Net Asset Value, Beginning of Period | $92.55 | $92.62 | $89.19 | $81.59 | $85.00 |
| Investment Operations | |||||
| Net Investment Income2 | 2.141 | 2.229 | 2.638 | 2.825 | 2.081 |
| Capital Gain Distributions Received2 | .237 | .053 | — | — | — |
| Net Realized and Unrealized Gain (Loss) on Investments | (16.168) | (.131) | 3.614 | 7.717 | (3.445) |
| Total from Investment Operations | (13.790) | 2.151 | 6.252 | 10.542 | (1.364) |
| Distributions | |||||
| Dividends from Net Investment Income | (2.148) | (2.221) | (2.822) | (2.942) | (2.046) |
| Distributions from Realized Capital Gains | (.012) | — | — | — | — |
| Total Distributions | (2.160) | (2.221) | (2.822) | (2.942) | (2.046) |
| Net Asset Value, End of Period | $76.60 | $92.55 | $92.62 | $89.19 | $81.59 |
| Total Return | -15.11% | 2.37% | 7.18% | 13.29% | -1.60% |
| Ratios/Supplemental Data | |||||
| Net Assets, End of Period (Millions) | $579 | $695 | $619 | $203 | $55 |
| Ratio of Total Expenses to Average Net Assets | — | — | — | — | — 3 |
| Acquired Fund Fees and Expenses | 0.04% | 0.04% | 0.05% | 0.05% | 0.07% 3 |
| Ratio of Net Investment Income to Average Net Assets | 2.52% | 2.43% | 2.94% | 3.38% | 3.10% 3 |
| Portfolio Turnover Rate4 | 14% | 10% | 40% | 12% | 4% |
| 1 | Inception. |
| 2 | Calculated based on average shares outstanding. |
| 3 | Annualized. |
| 4 | Excludes the value of portfolio securities received or delivered as a result of in-kind purchases or redemptions of the fund’s capital shares, including ETF Creation Units. |
| Amount ($000) | |
| Paid-in Capital | (4,532) |
| Total Distributable Earnings (Loss) | 4,532 |
| Amount ($000) | |
| Undistributed Ordinary Income | 127 |
| Undistributed Long-Term Gains | — |
| Capital Loss Carryforwards | (2,232) |
| Qualified Late-Year Losses | — |
| Net Unrealized Gains (Losses) | (112,293) |
| Year Ended August 31, | ||
| 2022 Amount ($000) | 2021 Amount ($000) | |
| Ordinary Income* | 16,149 | 17,930 |
| Long-Term Capital Gains | — | — |
| Total | 16,149 | 17,930 |
| * | Includes short-term capital gains, if any. |
| Amount ($000) | |
| Tax Cost | 691,380 |
| Gross Unrealized Appreciation | 22 |
| Gross Unrealized Depreciation | (112,315) |
| Net Unrealized Appreciation (Depreciation) | (112,293) |
| Year Ended August 31, | ||||
| 2022 Shares (000) | 2021 Shares (000) | |||
| Issued | 1,310 | 4,200 | ||
| Issued in Lieu of Cash Distributions | — | — | ||
| Redeemed | (1,260) | (3,370) | ||
| Net Increase (Decrease) in Shares Outstanding | 50 | 830 | ||
| Current Period Transactions | ||||||||
| Aug. 31, 2021 Market Value ($000) | Purchases at Cost1 ($000) | Proceeds from Securities Sold2 ($000) | Realized Net Gain (Loss) ($000) | Change in Unrealized App. (Dep.) ($000) | Income ($000) | Capital Gain Distributions Received ($000) | Aug. 31, 2022 Market Value ($000) | |
| Vanguard Intermediate-Term Corporate Bond ETF | 197,418 | 46,969 | 51,354 | (3,172) | (29,885) | 4,345 | 1,252 | 159,976 |
| Vanguard Long-Term Corporate Bond ETF | 270,620 | 83,009 | 79,004 | (6,156) | (65,070) | 8,172 | — | 203,399 |
| Vanguard Market Liquidity Fund | 24 | NA 3 | NA 3 | — | — | 1 | — | 281 |
| Vanguard Short-Term Corporate Bond ETF | 226,998 | 71,397 | 64,491 | (1,460) | (17,013) | 3,514 | 520 | 215,431 |
| Total | 695,060 | 201,375 | 194,849 | (10,788) | (111,968) | 16,032 | 1,772 | 579,087 |
| 1 | Includes $108,836,000 of portfolio securities received as a result of in-kind purchases of the fund’s capital shares. |
| 2 | Includes $103,735,000 of portfolio securities delivered as a result of in-kind redemptions of the fund’s capital shares. |
| 3 | Not applicable—purchases and sales are for temporary cash investment purposes. |
Philadelphia, Pennsylvania
October 18, 2022
| Matthew Benchener | Thomas M. Rampulla |
| Joseph Brennan | Karin A. Risi |
| Mortimer J. Buckley | Anne E. Robinson |
| Gregory Davis | Michael Rollings |
| John James | Nitin Tandon |
| Chris D. McIsaac | Lauren Valente |

Who Are Deaf or Hard of Hearing > 800-749-7273
All rights reserved.
Vanguard Marketing Corporation, Distributor.

| 1 | |
| 2 | |
| 4 | |
| 7 | |
| 18 | |
| 20 |
| • | The 12 months ended August 31, 2022, were a challenging time for financial markets. For the period, Vanguard Total World Bond ETF returned –11.51%, roughly in line with the –11.48% return of its expense-free benchmark. |
| • | Early in the period, pent-up demand helped spur global growth and push down unemployment rates. The economic backdrop deteriorated, however, as inflation soared to multidecade highs, fueled in part by higher energy and food prices in the wake of Russia’s invasion of Ukraine. Many central banks reacted by raising interest rates, which weighed on bond prices and sparked fears of recession. |
| • | Bonds from the United States, which accounted for just over half of the ETF’s assets at the end of the period, performed roughly in line with the index as a whole. European bonds performed poorly, particularly those of the United Kingdom, Italy, and Belgium. On the other hand, Japan, a heavyweight in the index, outperformed the index but still finished in negative territory. |
| • | Government bonds and mortgage-backed securities held up better than corporate bonds. By maturity, longer-term bonds slid more than their shorter-term counterparts. And by quality, bonds rated A fared better than those rated lower and higher within the investment-grade universe. |
| Average Annual Total Returns Periods Ended August 31, 2022 | |||
| One Year | Three Years | Five Years | |
| Stocks | |||
| Russell 1000 Index (Large-caps) | -12.96% | 12.14% | 11.61% |
| Russell 2000 Index (Small-caps) | -17.88 | 8.59 | 6.95 |
| Russell 3000 Index (Broad U.S. market) | -13.28 | 11.90 | 11.29 |
| FTSE All-World ex US Index (International) | -19.00 | 3.48 | 2.12 |
| Bonds | |||
| Bloomberg U.S. Aggregate Float Adjusted Index (Broad taxable market) | -11.65% | -2.01% | 0.54% |
| Bloomberg Municipal Bond Index (Broad tax-exempt market) | -8.63 | -0.83 | 1.28 |
| FTSE Three-Month U.S. Treasury Bill Index | 0.44 | 0.56 | 1.10 |
| CPI | |||
| Consumer Price Index | 8.26% | 4.90% | 3.82% |
| • | Based on actual fund return. This section helps you to estimate the actual expenses that you paid over the period. The ”Ending Account Value“ shown is derived from the fund’s actual return, and the third column shows the dollar amount that would have been paid by an investor who started with $1,000 in the fund. You may use the information here, together with the amount you invested, to estimate the expenses that you paid over the period. |
| • | Based on hypothetical 5% yearly return. This section is intended to help you compare your fund‘s costs with those of other mutual funds. It assumes that the fund had a yearly return of 5% before expenses, but that the expense ratio is unchanged. In this case—because the return used is not the fund’s actual return—the results do not apply to your investment. The example is useful in making comparisons because the Securities and Exchange Commission requires all mutual funds to calculate expenses based on a 5% return. You can assess your fund’s costs by comparing this hypothetical example with the hypothetical examples that appear in shareholder reports of other funds. |
| Six Months Ended August 31, 2022 | |||
| Total World Bond ETF | Beginning Account Value 2/28/2022 | Ending Account Value 8/31/2022 | Expenses Paid During Period |
| Based on Actual Fund Return | $1,000.00 | $ 921.60 | $0.24 |
| Based on Hypothetical 5% Yearly Return | 1,000.00 | 1,024.95 | 0.26 |
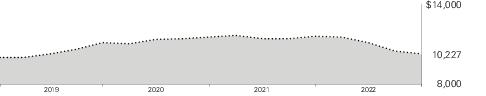
| Average Annual Total Returns Periods Ended August 31, 2022 | ||||
| One Year | Since Inception (9/4/2018) | Final Value of a $10,000 Investment | ||
 | Total World Bond ETF Net Asset Value | -11.51% | 0.56% | $10,227 |
| Total World Bond ETF Market Price | -11.53 | 0.56 | 10,227 | |
 | Bloomberg Global Aggregate Float Adjusted Composite Index | -11.48 | 0.66 | 10,268 |
| Cumulative Returns of ETF Shares: September 4, 2018, Through August 31, 2022 | ||
| One Year | Since Inception (9/4/2018) | |
| Total World Bond ETF Market Price | -11.53% | 2.27% |
| Total World Bond ETF Net Asset Value | -11.51 | 2.27 |
| Bloomberg Global Aggregate Float Adjusted Composite Index | -11.48 | 2.68 |
| Vanguard Total Bond Market ETF | 52.5% |
| Vanguard Total International Bond ETF | 47.5 |
| Shares | Market Value• ($000) | |||||
| Investment Companies (99.9%) | ||||||
| U.S. Bond Fund (52.4%) | ||||||
| Vanguard Total Bond Market ETF | 4,004,050 | 298,702 | ||||
| International Bond Fund (47.5%) | ||||||
| Vanguard Total International Bond ETF | 5,502,315 | 270,714 | ||||
| Total Investment Companies (Cost $651,849) | 569,416 | |||||
| Temporary Cash Investments (0.1%) | ||||||
| Money Market Fund (0.1%) | ||||||
| 1 | Vanguard Market Liquidity Fund, 2.284% (Cost $410) | 4,102 | 410 | |||
| Total Investments (100.0%) (Cost $652,259) | 569,826 | |||||
| Other Assets and Liabilities—Net (0.0%) | 3 | |||||
| Net Assets (100%) | 569,829 | |||||
| Cost is in $000. |
| • | See Note A in Notes to Financial Statements. |
| 1 | Affiliated money market fund available only to Vanguard funds and certain trusts and accounts managed by Vanguard. Rate shown is the 7-day yield. |
| ($000s, except shares and per-share amounts) | Amount |
| Assets | |
| Investments in Securities, at Value—Affiliated Funds (Cost $652,259) | 569,826 |
| Receivables for Investment Securities Sold | 3,431 |
| Receivables for Accrued Income | 1 |
| Total Assets | 573,258 |
| Liabilities | |
| Payables for Investment Securities Purchased | 3,429 |
| Total Liabilities | 3,429 |
| Net Assets | 569,829 |
| At August 31, 2022, net assets consisted of: | |
| Paid-in Capital | 656,157 |
| Total Distributable Earnings (Loss) | (86,328) |
| Net Assets | 569,829 |
| Net Assets | |
| Applicable to 8,190,000 outstanding $.001 par value shares of beneficial interest (unlimited authorization) | 569,829 |
| Net Asset Value Per Share | $69.58 |
| Year Ended August 31, 2022 | |
| ($000) | |
| Investment Income | |
| Income | |
| Income Distributions Received from Affiliated Funds | 15,064 |
| Net Investment Income—Note B | 15,064 |
| Realized Net Gain (Loss) | |
| Capital Gain Distributions Received from Affiliated Funds | 2,573 |
| Affiliated Funds Sold1 | (6,294) |
| Realized Net Gain (Loss) | (3,721) |
| Change in Unrealized Appreciation (Depreciation) from Affiliated Funds | (84,542) |
| Net Increase (Decrease) in Net Assets Resulting from Operations | (73,199) |
| 1 | Includes ($430,000) of net gain (loss) resulting from in-kind redemptions. |
| Year Ended August 31, | ||
| 2022 ($000) | 2021 ($000) | |
| Increase (Decrease) in Net Assets | ||
| Operations | ||
| Net Investment Income | 15,064 | 7,151 |
| Realized Net Gain (Loss) | (3,721) | 659 |
| Change in Unrealized Appreciation (Depreciation) | (84,542) | (6,066) |
| Net Increase (Decrease) in Net Assets Resulting from Operations | (73,199) | 1,744 |
| Distributions | ||
| Total Distributions | (15,650) | (7,139) |
| Capital Share Transactions | ||
| Issued | 209,449 | 151,909 |
| Issued in Lieu of Cash Distributions | — | — |
| Redeemed | (132,239) | (12,797) |
| Net Increase (Decrease) from Capital Share Transactions | 77,210 | 139,112 |
| Total Increase (Decrease) | (11,639) | 133,717 |
| Net Assets | ||
| Beginning of Period | 581,468 | 447,751 |
| End of Period | 569,829 | 581,468 |
| For a Share Outstanding Throughout Each Period | Year Ended August 31, | September 4, 20181 to August 31, 2019 | ||
| 2022 | 2021 | 2020 | ||
| Net Asset Value, Beginning of Period | $80.76 | $81.56 | $80.97 | $75.00 |
| Investment Operations | ||||
| Net Investment Income2 | 1.912 | 1.108 | 2.125 | 2.004 |
| Capital Gain Distributions Received2 | .327 | .146 | — | — |
| Net Realized and Unrealized Gain (Loss) on Investments | (11.356) | (.929) | .782 | 6.071 |
| Total from Investment Operations | (9.117) | .325 | 2.907 | 8.075 |
| Distributions | ||||
| Dividends from Net Investment Income | (1.984) | (1.125) | (2.317) | (2.105) |
| Distributions from Realized Capital Gains | (.079) | — | — | — |
| Total Distributions | (2.063) | (1.125) | (2.317) | (2.105) |
| Net Asset Value, End of Period | $69.58 | $80.76 | $81.56 | $80.97 |
| Total Return | -11.51% | 0.40% | 3.69% | 11.00% |
| Ratios/Supplemental Data | ||||
| Net Assets, End of Period (Millions) | $570 | $581 | $448 | $160 |
| Ratio of Total Expenses to Average Net Assets | — | — | — | — 3 |
| Acquired Fund Fees and Expenses | 0.05% | 0.06% | 0.06% | 0.06% 3 |
| Ratio of Net Investment Income to Average Net Assets | 2.55% | 1.37% | 2.64% | 2.62% 3 |
| Portfolio Turnover Rate4 | 13% | 10% | 19% | 8% |
| 1 | Inception. |
| 2 | Calculated based on average shares outstanding. |
| 3 | Annualized. |
| 4 | Excludes the value of portfolio securities received or delivered as a result of in-kind purchases or redemptions of the fund’s capital shares. |
| Amount ($000) | |
| Paid-in Capital | (430) |
| Total Distributable Earnings (Loss) | 430 |
| Amount ($000) | |
| Undistributed Ordinary Income | 115 |
| Undistributed Long-Term Gains | — |
| Capital Loss Carryforwards | (1,889) |
| Qualified Late-Year Losses | — |
| Net Unrealized Gains (Losses) | (84,554) |
| Year Ended August 31, | ||
| 2022 Amount ($000) | 2021 Amount ($000) | |
| Ordinary Income* | 15,101 | 7,139 |
| Long-Term Capital Gains | 549 | — |
| Total | 15,650 | 7,139 |
| * | Includes short-term capital gains, if any. |
| Amount ($000) | |
| Tax Cost | 654,380 |
| Gross Unrealized Appreciation | 21 |
| Gross Unrealized Depreciation | (84,575) |
| Net Unrealized Appreciation (Depreciation) | (84,554) |
| Year Ended August 31, | ||||
| 2022 Shares (000) | 2021 Shares (000) | |||
| Issued | 2,810 | 1,870 | ||
| Issued in Lieu of Cash Distributions | — | — | ||
| Redeemed | (1,820) | (160) | ||
| Net Increase (Decrease) in Shares Outstanding | 990 | 1,710 | ||
| Current Period Transactions | ||||||||
| Aug. 31, 2021 Market Value ($000) | Purchases at Cost1 ($000) | Proceeds from Securities Sold2 ($000) | Realized Net Gain (Loss) ($000) | Change in Unrealized App. (Dep.) ($000) | Income ($000) | Capital Gain Distributions Received ($000) | Aug. 31, 2022 Market Value ($000) | |
| Vanguard Market Liquidity Fund | 20 | NA 3 | NA 3 | — | — | 2 | — | 410 |
| Vanguard Total Bond Market ETF | 276,830 | 155,465 | 90,484 | (507) | (42,602) | 6,028 | 653 | 298,702 |
| Vanguard Total International Bond ETF | 304,590 | 131,634 | 117,783 | (5,787) | (41,940) | 9,034 | 1,920 | 270,714 |
| Total | 581,440 | 287,099 | 208,267 | (6,294) | (84,542) | 15,064 | 2,573 | 569,826 |
| 1 | Includes $209,421,000 of portfolio securities received as a result of in-kind purchases of the fund’s capital shares. |
| 2 | Includes $132,221,000 of portfolio securities delivered as a result of in-kind redemptions of the fund’s capital shares. |
| 3 | Not applicable—purchases and sales are for temporary cash investment purposes. |
Philadelphia, Pennsylvania
October 20, 2022
| Matthew Benchener | Thomas M. Rampulla |
| Joseph Brennan | Karin A. Risi |
| Mortimer J. Buckley | Anne E. Robinson |
| Gregory Davis | Michael Rollings |
| John James | Nitin Tandon |
| Chris D. McIsaac | Lauren Valente |

Who Are Deaf or Hard of Hearing > 800-749-7273
All rights reserved.
Vanguard Marketing Corporation, Distributor.
Item 2: Code of Ethics.
The Registrant has adopted a code of ethics that applies to the Registrant’s principal executive officer, principal financial officer, principal accounting officer or controller or persons performing similar functions. The Code of Ethics was amended during the reporting period covered by this report to make certain technical, non-material changes.
Item 3: Audit Committee Financial Expert.
All members of the Audit Committee have been determined by the Registrant’s Board of Trustees to be Audit Committee Financial Experts and to be independent: F. Joseph Loughrey, Mark Loughridge, Sarah Bloom Raskin, and Peter F. Volanakis.
Item 4: Principal Accountant Fees and Services.
(a) Audit Fees.
Audit Fees of the Registrant.
Fiscal Year Ended August 31, 2022: $536,000
Fiscal Year Ended August 31, 2021: $566,000
Aggregate Audit Fees of Registered Investment Companies in the Vanguard Group.
Fiscal Year Ended August 31, 2022: $10,494,508
Fiscal Year Ended August 31, 2021: $11,244,694
Includes fees billed in connection with audits of the Registrant, other registered investment companies in the Vanguard complex, The Vanguard Group, Inc., and Vanguard Marketing Corporation.
(b) Audit-Related Fees.
Fiscal Year Ended August 31, 2022: $2,757,764
Fiscal Year Ended August 31, 2021: $2,955,181
Includes fees billed in connection with assurance and related services provided to the Registrant, other registered investment companies in the Vanguard complex, The Vanguard Group, Inc., and Vanguard Marketing Corporation.
(c) Tax Fees.
Fiscal Year Ended August 31, 2022: $5,202,689
Fiscal Year Ended August 31, 2021: $2,047,574
Includes fees billed in connection with tax compliance, planning, and advice services provided to the Registrant, other registered investment companies in the Vanguard complex, The Vanguard Group, Inc., and Vanguard Marketing Corporation.
(d) All Other Fees.
Fiscal Year Ended August 31, 2022: $298,000
Fiscal Year Ended August 31, 2021: $280,000
Includes fees billed for services related to tax reported information provided to the Registrant, other registered investment companies in the Vanguard complex, The Vanguard Group, Inc., and Vanguard Marketing Corporation.
(e) (1) Pre-Approval Policies. The policy of the Registrant’s Audit Committee is to consider, and, if appropriate, approve before the principal accountant is engaged for such services, all specific audit and non-audit services provided to: the Registrant, other registered investment companies in the Vanguard complex, The Vanguard Group, Inc., and entities controlled by The Vanguard Group, Inc. that provide ongoing services to the Registrant. In making a determination, the Audit Committee considers whether the services are consistent with maintaining the principal accountant’s independence.
In the event of a contingency situation in which the principal accountant is needed to provide services in between scheduled Audit Committee meetings, the Chairman of the Audit Committee would be called on to consider and, if appropriate, pre-approve audit or permitted non-audit services in an amount sufficient to complete services through the next Audit Committee meeting, and to determine if such services would be consistent with maintaining the accountant’s independence. At the next scheduled Audit Committee meeting, services and fees would be presented to the Audit Committee for formal consideration, and, if appropriate, approval by the entire Audit Committee. The Audit Committee would again consider whether such services and fees are consistent with maintaining the principal accountant’s independence.
The Registrant’s Audit Committee is informed at least annually of all audit and non-audit services provided by the principal accountant to the Vanguard complex, whether such services are provided to: the Registrant, other registered investment companies in the Vanguard complex, The Vanguard Group, Inc., or other entities controlled by The Vanguard Group, Inc. that provide ongoing services to the Registrant.
(2) No percentage of the principal accountant’s fees or services were approved pursuant to the waiver provision of paragraph (c)(7)(i)(C) of Rule 2-01 of Regulation S-X.
(f) For the most recent fiscal year, over 50% of the hours worked under the principal accountant’s engagement were not performed by persons other than full-time, permanent employees of the principal accountant.
(g) Aggregate Non-Audit Fees.
Fiscal Year Ended August 31, 2022: $5,500,689
Fiscal Year Ended August 31, 2021: $2,327,574
Includes fees billed for non-audit services provided to the Registrant, other registered investment companies in the Vanguard complex, The Vanguard Group, Inc., and Vanguard Marketing Corporation.
(h) For the most recent fiscal year, the Audit Committee has determined that the provision of all non-audit services was consistent with maintaining the principal accountant’s independence.
Item 5: Audit Committee of Listed Registrants.
The Registrant is a listed issuer as defined in rule 10A-3 under the Securities Exchange Act of 1934 (“Exchange Act”). The Registrant has a separately-designated standing audit committee established in accordance with Section 3(a)(58)(A) of the Exchange Act. The Registrant’s audit committee members are: F. Joseph Loughrey, Mark Loughridge, Sarah Bloom Raskin, and Peter F. Volanakis.
Item 6: Investments.
Not applicable. The complete schedule of investments is included as part of the report to shareholders filed under Item 1 of this Form.
Item 7: Disclosure of Proxy Voting Policies and Procedures for Closed-End Management Investment Companies.
Not applicable.
Item 8: Portfolio Managers of Closed-End Management Investment Companies.
Not applicable.
Item 9: Purchase of Equity Securities by Closed-End Management Investment Company and Affiliated Purchasers.
Not applicable.
Item 10: Submission of Matters to a Vote of Security Holders.
Not applicable.
Item 11: Controls and Procedures.
(a) Disclosure Controls and Procedures. The Principal Executive and Financial Officers concluded that the Registrant’s Disclosure Controls and Procedures are effective based on their evaluation of the Disclosure Controls and Procedures as of a date within 90 days of the filing date of this report.
(b) Internal Control Over Financial Reporting. There were no significant changes in the Registrant’s Internal Control Over Financial Reporting or in other factors that could significantly affect this control subsequent to the date of the evaluation, including any corrective actions with regard to significant deficiencies and material weaknesses.
Item 12: Disclosure of Securities Lending Activities for Closed-End Management Investment Companies.
Not applicable.
Item 13: Exhibits.
(a)(1) Code of Ethics filed herewith.
(a)(2) Certifications filed herewith.
(b) Certifications field herewith.
Pursuant to the requirements of the Securities Exchange Act of 1934 and the Investment Company Act of 1940, the registrant has duly caused this report to be signed on its behalf by the undersigned, thereunto duly authorized.
| VANGUARD SCOTTSDALE FUNDS | ||
| BY: | /s/ MORTIMER J. BUCKLEY* | |
| MORTIMER J. BUCKLEY | ||
| CHIEF EXECUTIVE OFFICER |
Date: October 18, 2022
Pursuant to the requirements of the Securities Exchange Act of 1934 and the Investment Company Act of 1940, this report has been signed below by the following persons on behalf of the registrant and in the capacities and on the dates indicated.
| VANGUARD SCOTTSDALE FUNDS | ||
| BY: | /s/ MORTIMER J. BUCKLEY* | |
| MORTIMER J. BUCKLEY | ||
| CHIEF EXECUTIVE OFFICER |
Date: October 18, 2022
| VANGUARD SCOTTSDALE FUNDS | ||
| BY: | /s/ CHRISTINE BUCHANAN* | |
| CHRISTINE BUCHANAN | ||
| CHIEF FINANCIAL OFFICER |
Date: October 18, 2022
| * By: | /s/ Anne E. Robinson |
Anne E. Robinson, pursuant to a Power of Attorney filed on October 11, 2022 (see File Number 333-11763), Incorporated by Reference.