
Exhibit (c)(4)
Project North
CONFIDENTIAL
Presentation to the Board of Directors
April 27, 2006
PRELIMINARY | SUBJECT TO FURTHER REVIEW AND EVALUATION
THESE MATERIALS MAY NOT BE USED OR RELIED UPON FOR ANY PURPOSE OTHER THAN AS SPECIFICALLY CONTEMPLATED BY A
WRITTEN AGREEMENT WITH CREDIT SUISSE.

Table of Contents
1. Executive Summary
2. Financial Analysis
3. Buyer Analysis
Appendix
A. Preliminary Valuation
B. Recent Trading Performance
C. Industry Perspectives
CONFIDENTIAL
1

1. Executive Summary
CONFIDENTIAL
2

Executive Summary
ARM and Portfolio Management substantially unchanged
CONFIDENTIAL
CRM ramp has moderated as a result of slower customer buildouts
Highlights risk / lack of predictability in CRM
CRM remains a small contributor to the total business
What Has
Changed Since
Prior Meeting
Financial
Analysis /
Impact on
Sale Timing
Should provide potential buyers with three to four quarters of strong
performance (Q4 FY05 to Q3 FY06)
Increase confidence / visibility in Q3 and Q4 FY06
Prove that business has recovered from miss in Q3 FY05
Eliminate Q3 FY05 from the LTM period, increasing potential leverage
in an LBO
Decision regarding timing of a potential sale must balance providing
shareholders certainty of value today v. expected value in the future, taking
into account execution and market risks
“Rolling” LBO analysis suggests inflection point is Q2 / Q3 FY06
M&A, debt and equity markets are currently strong
A sale process could commence with calls to potential buyers in mid- to
late-June and conclude by early- to mid-September
Buyers could be provided preliminary Q3 FY06 results before submitting
final bids
3

CONFIDENTIAL
2. Financial Analysis
4
CONFIDENTIAL
Comparison of Management Projections
Observations
ARM: No material
change
CRM: Projections
have decreased as a
result of delays with
ramp in new
customers
PM: Q1 exceeded
prior plan; outlook for
2H FY06 appears
stable
($ in million)
Current Forecast
March Forecast
Q1:06
Q2:06
Q3:06
Q4:06
CY2006
CY2007
Q1:06
Q2:06
Q3:06
Q4:06
CY2006
CY2007
Revenue
ARM
$235.2
$234.0
$233.3
$232.5
$935.0
$985.9
$236.6
$234.0
$233.3
$232.5
$936.4
$987.3
vs. Prior
-1.5
0.0
0.0
0.0
-1.5
-1.4
(0.6%)
0.0%
0.0%
0.0%
(0.2%)
(0.1%)
CRM
59.3
62.6
71.6
81.3
274.8
325.0
59.3
67.9
77.6
84.3
289.1
348.9
vs. Prior
0.0
-5.3
-6.0
-3.0
-14.3
-23.9
0.1%
(7.8%)
(7.8%)
(3.6%)
(4.9%)
(6.8%)
Portfolio Management
50.0
47.7
46.7
45.2
189.7
189.2
48.1
47.0
45.9
44.3
185.3
189.2
vs. Prior
2.0
0.8
0.9
0.9
4.4
0.0
4.1%
1.6%
1.9%
1.9%
2.4%
0.0%
Total
(1)
312.0
311.4
321.5
330.1
1,275.0
1,374.3
311.4
315.9
326.6
332.3
1,286.2
1,399.5
vs. Prior
0.6
-4.5
-5.2
-2.2
-11.2
-25.3
0.2%
(1.4%)
(1.6%)
(0.7%)
(0.9%)
(1.8%)
EBITDA
ARM
$29.0
$26.7
$30.2
$28.9
$114.8
$135.7
$28.5
$26.7
$30.2
$28.9
$114.2
$135.9
% Margin
12.3%
11.4%
12.9%
12.4%
12.3%
13.8%
12.0%
11.4%
12.9%
12.4%
12.2%
13.8%
vs. Prior
0.5
0.0
0.0
0.0
0.5
-0.2
30 bps
0 bps
0 bps
0 bps
8 bps
0 bps
CRM
(0.5)
0.9
4.6
9.8
14.8
30.8
1.4
4.8
6.2
8.7
21.2
37.0
% Margin
(0.2%)
0.4%
2.0%
4.2%
1.6%
3.1%
0.6%
2.0%
2.7%
3.8%
2.3%
3.7%
vs. Prior
-1.9
-3.9
-1.6
1.1
-6.3
-6.2
-82 bps
-165 bps
-70 bps
47 bps
-67 bps
-63 bps
Portfolio Management
14.5
10.4
12.7
12.3
49.9
46.8
11.7
9.6
11.8
11.5
44.7
46.8
% Margin
6.2%
4.4%
5.4%
5.3%
5.3%
4.8%
5.0%
4.1%
5.1%
4.9%
4.8%
4.7%
vs. Prior
2.8
0.8
0.9
0.9
5.2
0.0
121 bps
32 bps
36 bps
37 bps
57 bps
1 bps
Total
43.0
38.0
47.5
51.0
179.5
213.3
41.6
41.1
48.2
49.1
180.1
219.8
% Margin
18.3%
16.3%
20.3%
21.9%
19.2%
21.6%
17.6%
17.6%
20.7%
21.1%
19.2%
22.3%
vs. Prior
1.3
-3.1
-0.8
2.0
-0.6
-6.4
68 bps
-133 bps
-33 bps
84 bps
-3 bps
-62 bps
(1) Net of intracompany eliminations.
5
($ in millions)
Q1:05
Q2:05
Q3:05
Q4:05
Q1:06
Q2:06
Q3:06
Q4:06
FY05
FY06
FY07
Revenue
$201.5
$195.8
$190.3
$216.8
$235.2
$234.0
$233.3
$232.5
$804.5
$935.0
$985.9
% growth (Q/Q Y/Y)
12.0%
(2.8%)
(2.8%)
13.9%
8.5%
(0.5%)
(0.3%)
(0.3%)
7.8%
16.2%
5.4%
EBITDA
$25.1
$24.8
$18.1
$22.2
$29.0
$26.7
$30.2
$28.9
$90.2
$114.8
$135.7
% margin
12.5%
12.7%
9.5%
10.2%
12.3%
11.4%
12.9%
12.4%
11.2%
12.3%
13.8%
Source: Company filings and North management.
CONFIDENTIAL
ARM Overview
Earnings miss in Q3 FY2005
ARM business was negatively impacted in Q3 FY05 by deteriorating economic conditions and
hurricanes Katrina and Rita
Strong performance expected through all of FY2006
Historically seasonal earnings with strength in Q1
Customer pricing pressure appears to have bottomed
Summary Financials
Significant ARM earnings miss, but
business rebounded in Q4
Strong performance expected to
continue through FY06
Note: Includes ARM NA and ARM International. Does not reflect intercompany eliminations.
6
CONFIDENTIAL
CRM Overview
Significant turnaround in CRM performance Q1 FY06 to Q3 FY06
Performance in 2005 negatively impacted as a result of customer losses
Investment in seat deployment for new customer ramp resulted in lower Q3 and Q4 FY05 EBITDA
Performance improvements from new customer wins demonstrated in strong Q2 to Q4 FY06 results
CRM earnings remain inherently volatile
North has 60% of FY06 revenue from top 3 customers and has suffered key customer losses in
past
Industry history of cyclical earnings and performance misses
Summary Financials
LTM 9/30/06 demonstrates turnaround and
provides confidence in Q4 FY06, but CRM
remains a difficult business model to predict
CRM is a profitable business --
decrease in profitability in Q3 FY05
reflects investment in future growth
($ in millions)
Q1:05
Q2:05
Q3:05
Q4:05
Q1:06
Q2:06
Q3:06
Q4:06
FY05
FY06
FY07
Revenue
$47.6
$43.8
$44.9
$54.1
$59.3
$62.6
$71.6
$81.3
$190.4
$274.8
$325.0
% growth (Q/Q Y/Y)
1.8%
(8.0%)
2.6%
20.4%
9.7%
5.6%
14.3%
13.6%
19.7%
44.3%
18.3%
EBITDA
$5.4
$3.0
$0.6
($0.0)
($0.5)
$0.9
$4.6
$9.8
$9.1
$14.8
$30.8
% margin
11.4%
6.9%
1.3%
(0.0%)
(0.9%)
1.5%
6.4%
12.1%
4.8%
5.4%
9.5%
Source: Company filings and North management.
7

CONFIDENTIAL
Portfolio Management Overview
Portfolio Management earnings highly dependent on purchases
Nature of business is that earnings depend on ability to continually replace / grow receivables
portfolios
Returns on new acquisitions lower as a result of highly competitive market
Earnings more volatile as a result of new accounting rules
Potential buyers will focus on underlying portfolio profile
Buyers will focus on capital requirements to achieve projected earnings
Summary Financials
Strongest consecutive four
quarter period in 2005 / 2006
($ in millions)
Q1:05
Q2:05
Q3:05
Q4:05
Q1:06
Q2:06
Q3:06
Q4:06
FY05
FY06
FY07
Revenue
$27.8
$33.0
$35.1
$48.8
$50.0
$47.7
$46.7
$45.2
$144.7
$189.7
$189.2
% growth (Q/Q Y/Y)
7.1%
18.8%
6.4%
38.9%
2.6%
(4.6%)
(2.1%)
(3.3%)
47.6%
31.1%
(0.2%)
EBITDA
$9.0
$10.8
$11.2
$16.5
$14.5
$10.4
$12.7
$12.3
$47.5
$49.9
$46.8
% margin
32.5%
32.6%
31.9%
33.8%
29.0%
21.8%
27.2%
27.3%
32.8%
26.3%
24.8%
Source: Company filings and North management.
8
($ in millions)
Q1:05
Q2:05
Q3:05
Q4:05
Q1:06
Q2:06
Q3:06
Q4:06
FY05
FY06
FY07
Revenue
$260.3
$252.4
$249.2
$290.3
$312.0
$311.4
$321.5
$330.1
$1,052.3
$1,275.0
$1,374.3
% growth (Q/Q Y/Y)
9.7%
(3.0%)
(1.3%)
16.5%
7.5%
(0.2%)
3.2%
2.7%
12.0%
21.2%
7.8%
EBITDA
$39.6
$38.6
$29.8
$38.7
$43.0
$38.0
$47.5
$51.0
$146.7
$179.5
$213.3
% margin
15.2%
15.3%
12.0%
13.3%
13.8%
12.2%
14.8%
15.5%
13.9%
14.1%
15.5%
EBIT
$28.8
$27.7
$18.5
$25.9
$29.8
$24.9
$34.1
$37.5
$101.0
$126.4
$165.5
% margin
11.1%
11.0%
7.4%
8.9%
9.6%
8.0%
10.6%
11.4%
9.6%
9.9%
12.0%
Net Income
$15.3
$14.1
$7.6
$7.5
$14.0
$11.0
$16.4
$18.6
$44.5
$60.1
$83.7
% margin
5.9%
5.6%
3.1%
2.6%
4.5%
3.5%
5.1%
5.6%
4.2%
4.7%
6.1%
EPS
$0.45
$0.42
$0.24
$0.23
$0.41
$0.33
$0.50
$0.56
$1.33
$1.80
2.44
$
Source: Company filings and North management.
CONFIDENTIAL
Consolidated Perspective
On an LTM basis, results improve significantly through Q3 FY2006
If management is able to execute on plan through Q2 FY2006, proves turnaround from FY2005
and gives credibility to Q3 and Q4 projections
Summary Financials
Successful sale requires providing buyers
with visibility into Q3 and Q4 FY06 during
the sale process
9
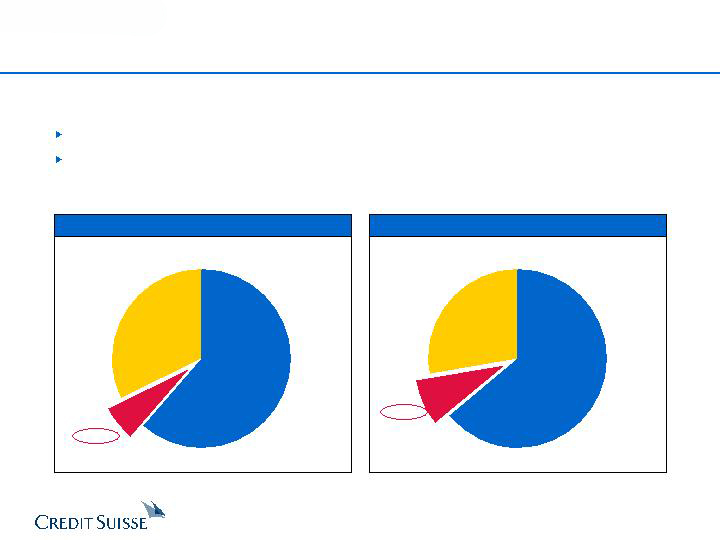
$9.1
$47.5
$90.2
ARM
61.4%
CRM
6.2%
Portfolio
Management
32.4%
CONFIDENTIAL
North Profitability by Segment
FY05 EBITDA Contribution
FY06 EBITDA Contribution
$49.9
$14.8
$114.8
ARM
64.0%
Portfolio
Management
27.8%
CRM
8.2%
($ in millions)
($ in millions)
Source: Company filings.
Source: North management.
While CRM is showing strong growth, it is not yet a significant enough contributor to overall
profitability to drive North’s current valuation
CRM represents a small part of North’s overall business profitability
Within the CRM industry, North is a smaller player and has not attracted the same trading
multiples as the CRM leaders
10

CONFIDENTIAL
3. Buyer Analysis
11
CONFIDENTIAL
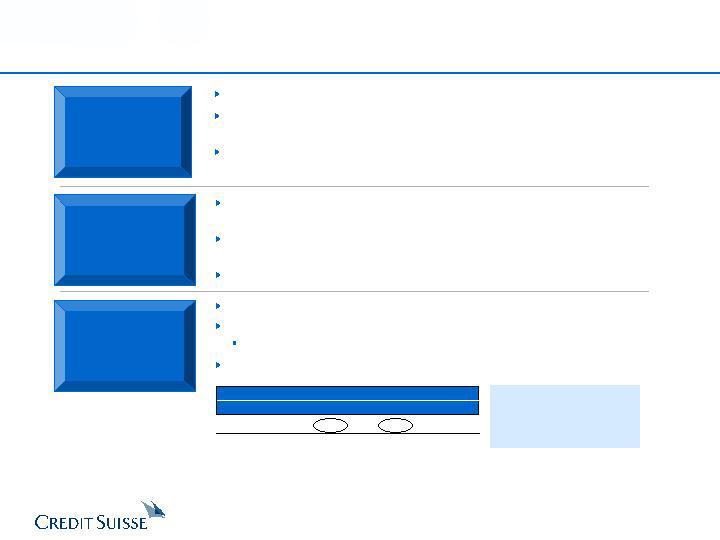
Key Buyer Perspectives
North projections show a strong turnaround from FY2005 to FY2006
Buyer may need to see four quarters of demonstrated improvement (Q4 FY05 to Q3
FY06) to give credit to North’s growth plan
By end of Q3 FY06, North should be able to provide buyer with visibility and
confidence in Q4 projections; CRM backlog for Q4 FY06 will be critical
North
Projections
Financial
Sponsor
Considerations
Sponsors focus on leverage capacity and five-year IRR analysis
Bank debt markets primarily rely on LTM EBITDA to determine level of leverage
North LTM EBITDA improves significantly in Q3 FY06
“Rolling” LBO analysis suggests inflection point is Q2 / Q3 FY06
Strategic Buyer
Considerations
Strategic buyers focus on intrinsic valuation (DCF) as well as multiples-based
approach
Demonstrating turnaround with several quarters of growth provides confidence in
management plan
Will value business on its long-term growth and profitability potential
Significant improvement in
LTM EBITDA from 6/30 to
9/30 may enable sponsor to
increase leverage in an LBO
($ in millions)
LTM EBITDA as of
3/31/06
6/30/06
9/30/06
12/31/06
$150.1
$149.6
$167.2
$179.5
Source: Actuals from company filings, projections from North management.
12

North Base Case Projections
CONFIDENTIAL
Updated Preliminary LBO Assumptions
CS has performed a preliminary LBO analysis based on the following assumptions:
Total leverage 5.0x LTM EBITDA:
3.0x LTM EBITDA Term Loan A, price of L + 325 bps
2.0x LTM EBITDA Term Loan B, price of L + 725 bps
3-month LIBOR of 5.10%
CS has evaluated an LBO at 6/30/06 as well as a “rolling” LBO taking place at 9/30/06 and
12/31/06
($ in millions)
FYE December 31,
'06E - '11E
2006E
2007E
2008E
2009E
2010E
2011E
CAGR
Revenue
$1,275.0
$1,374.3
$1,463.3
$1,567.4
$1,684.9
$1,811.6
7.3%
% growth
21.2%
7.8%
6.5%
7.1%
7.5%
7.5%
Gross Profit
605.0
654.0
693.4
741.0
794.4
851.6
7.1%
% margin
47.5%
47.6%
47.4%
47.3%
47.1%
47.0%
EBITDA
179.5
213.3
235.5
252.9
271.0
292.4
10.3%
% margin
14.1%
15.5%
16.1%
16.1%
16.1%
16.1%
EBIT
126.4
165.5
190.7
208.8
229.8
253.3
14.9%
% margin
9.9%
12.0%
13.0%
13.3%
13.6%
14.0%
Source: North Management.
13

CONFIDENTIAL
Updated Preliminary LBO Analysis (cont’d)
Sponsor may
view risk in
management
plan and build
adjusted case
Illustrative LBO Sensitivity Analysis
Transaction Assumptions
Financing Assumptions
(1) Fees and expenses equal to 2% of debt offered plus $10MM.
Purchase Price
$28.00
Premium to Current
28.4%
Equity Purchase Price
$927.8
Plus: Revolving Debt
249.7
Plus: Non-Recourse Debt
54.1
Plus: Capital Leases
2.7
Plus: Minority Interest
39.4
Less: Existing Cash
(36.0)
Aggregate Value
$1,237.7
LTM EBITDA (6/30/06)
149.6
Implied Purchase Multiple
8.3x
Sources:
Leverage
Rate
Term Loan A
3.0x
8.35%
$448.7
Term Loan B
2.0x
12.35%
299.1
New Non-Recourse Debt
54.1
Common Equity
454.6
Total Sources
$1,256.6
Uses:
Purchase of Equity
$927.8
Refinance Revolving Debt
249.7
Refinance Non-Recourse Debt
54.1
Transaction Expenses
(1)
25.0
Total Uses
$1,256.6
Imp. AV
$1,166.3
$1,202.0
$1,237.7
$1,273.4
$1,309.1
Shr. Price
$26.00
$27.00
$28.00
$29.00
$30.00
EBITDA Purchase Price Multiple
7.8x
8.0x
8.3x
8.5x
8.8x
CY06-CY10
0.0%
34.7%
32.3%
30.1%
28.2%
26.4%
Change in
(2.5%)
30.6%
28.3%
26.2%
24.3%
22.6%
Rev. Growth v.
(5.0%)
26.4%
24.2%
22.2%
20.3%
18.6%
Mgmt. Case
(7.5%)
21.9%
19.8%
17.8%
16.1%
14.4%
14
CONFIDENTIAL
Preliminary “Rolling” LBO Analysis
Assumes sponsor applies 5% discount to Base Case revenue growth
(+$88.2)
(+$61.4)
($ in millions, except per share amounts)
LBO Date
As of 6/30/06
As of 9/30/06
As of 12/31/06
LTM EBITDA
$149.6
$167.2
$179.5
Debt Capacity (@ 5.0x Leverage)
$747.8
$836.0
$897.4
Targeted IRR
20.0%
Stock Price
$29.18
$30.83
$32.22
PV Stock Price
(1)
$29.18
$29.64
$29.77
Implied LTM EBITDA Multiple
8.6x
7.8x
7.4x
25.0%
Stock Price
$26.61
$28.53
$30.12
PV Stock Price
(1)
$26.61
$27.43
$27.83
Implied LTM EBITDA Multiple
7.9x
7.3x
6.9x
Note: Exit multiple assumed to be 8.0x LTM EBITDA. Assumes 5% discount to revenue growth v. North base case.
(1) Discounted from time of LBO to June 30, 2006 at 17% discount rate.
Q3 FY05 still in LTM period -- greater potential
a buyer will view risk in management plan and
assume lower long term growth potential
15

CONFIDENTIAL
CS Preliminary Conclusions
If North’s Board decides to proceed with a potential sale, CS believes that the
timetable should be constructed so that a buyer has full confidence in the Q3
FY 06 results
Sale process timetable should enable North to capture the value in
performance improvements
Should have four quarters (Q4 FY05 to Q3 FY06) to demonstrate the turnaround
from Q3 FY05
Provide potential buyer with confidence in Q3 and Q4 FY06, supported by
contracted revenue / backlog
Eliminate Q3 FY05 from the LTM period
Decision on process timing must take account of execution risk in the North’s
plan
ARM has stabilized but remains highly competitive and has experienced
setbacks in the past
Portfolio Management earnings dependent on ability to find attractive portfolio
purchases in the future (increasingly competitive)
CRM has significant customer concentration with contracts that are easily
terminable
M&A and LBO markets are currently strong and will be conducive to
competitive process
Record levels of leveraged loans
Strategic and financial buyers are actively acquiring companies
16
CONFIDENTIAL
2
Data room / due
diligence
Management
presentations
1
4
3
5
Data room / due
diligence
Management
presentations
7
6
9
8
11
10
12
Data room / due
diligence
14
13
16
15
18
17
19
31
28
27
30
29
21
20
23
22
24
26
25
SUNDAY
MONDAY
TUESDAY
WEDNESDAY
THURSDAY
FRIDAY
SATURDAY
2
Data room / due
diligence
Management
presentations
1
4
3
5
Data room / due
diligence
Management
presentations
7
6
9
8
11
10
12
Data room / due
diligence
14
13
16
15
18
17
19
31
28
27
30
29
21
20
23
22
24
26
25
2
Data room / due
diligence
Management
presentations
1
4
3
5
2
2
Data room / due
diligence
Management
presentations
1
Data room / due
diligence
Management
presentations
1
4
4
3
3
5
5
Data room / due
diligence
Management
presentations
7
6
9
8
11
10
12
Data room / due
diligence
Management
presentations
7
Data room / due
diligence
Management
presentations
7
6
6
9
9
8
8
11
11
10
10
12
12
Data room / due
diligence
14
13
16
15
18
17
19
Data room / due
diligence
14
Data room / due
diligence
14
13
13
16
16
15
15
18
18
17
17
19
19
31
28
27
30
29
31
31
28
28
27
27
30
30
29
29
21
20
23
22
24
26
25
21
21
20
20
23
23
22
22
24
24
26
26
25
25
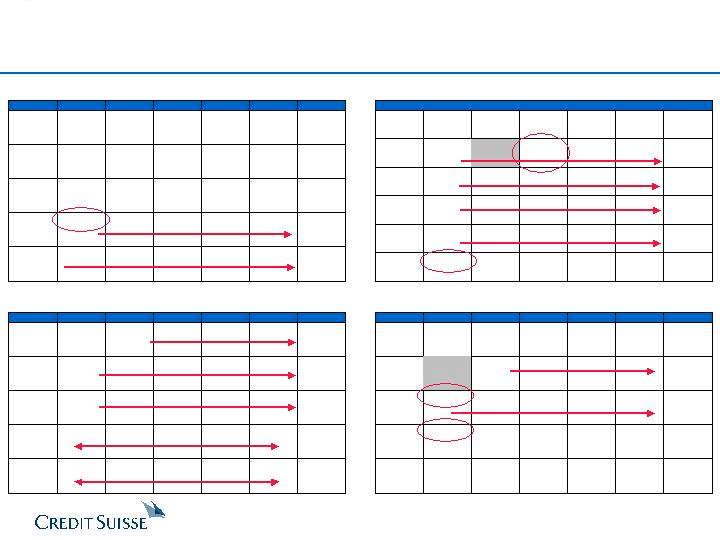
Summer market slowdown
Summer market slowdown
Preliminary Process Timetable
June 2006 (Start initial work end of May)
August 2006
July 2006
September 2006
SUNDAY
MONDAY
TUESDAY
WEDNESDAY
THURSDAY
FRIDAY
SATURDAY
2
1
3
12
11
14
13
16
15
17
Start calls to
strategic buyers
Meetings with
strategic buyers
19
18
21
20
23
22
24
26
25
28
27
30
29
7
6
9
8
10
4
5
2
3
12
11
14
13
16
15
17
Start calls to
strategic buyers
Meetings with
strategic buyers
19
18
21
20
23
22
24
26
25
28
27
30
29
7
6
9
8
10
4
5
2
3
2
2
3
3
12
11
14
13
16
15
17
12
12
11
11
14
14
13
13
16
16
15
15
17
17
Start calls to
strategic buyers
Meetings with
strategic buyers
19
18
21
20
23
22
24
Start calls to
strategic buyers
Meetings with
strategic buyers
19
Start calls to
strategic buyers
Meetings with
strategic buyers
19
18
18
21
21
20
20
23
23
22
22
24
24
26
25
28
27
30
29
26
26
25
25
28
28
27
27
30
30
29
29
7
6
9
8
10
4
5
7
7
6
6
9
9
8
8
10
10
4
4
5
5
SUNDAY
MONDAY
TUESDAY
WEDNESDAY
THURSDAY
FRIDAY
SATURDAY
1
2
Final bids
11
10
13
12
15
14
16
Announcement
18
17
20
19
22
21
23
25
24
27
26
29
28
30
7
3
6
Due diligence
5
8
9
Labor
Day
4
1
2
Final bids
11
10
13
12
15
14
16
Announcement
18
17
20
19
22
21
23
25
24
27
26
29
28
30
7
3
6
Due diligence
5
8
9
Labor
Day
4
1
2
1
1
2
2
Final bids
11
10
13
12
15
14
16
Final bids
11
Final bids
11
10
10
13
13
12
12
15
15
14
14
16
16
Announcement
18
17
20
19
22
21
23
Announcement
18
Announcement
18
17
17
20
20
19
19
22
22
21
21
23
23
25
24
27
26
29
28
30
25
25
24
24
27
27
26
26
29
29
28
28
30
30
7
3
6
Due diligence
5
8
9
Labor
Day
4
7
7
3
3
6
6
Due diligence
5
Due diligence
5
8
8
9
9
4
4
4
Final negotiations
SUNDAY
MONDAY
TUESDAY
WEDNESDAY
THURSDAY
FRIDAY
SATURDAY
9
12
11
Meetings with
financial buyers
10
13
15
14
Independence
Day
4
Meetings with
strategic buyers
3
2
Distribute
CIM
Start calls to
financial
sponsors
5
7
6
8
1
Respond to
diligence
questions
24
23
26
25
28
27
29
16
19
18
21
20
22
17
30
First round
bids
31
9
12
11
Meetings with
financial buyers
10
13
15
14
Independence
Day
4
Meetings with
strategic buyers
3
2
Distribute
CIM
Start calls to
financial
sponsors
5
7
6
8
1
Respond to
diligence
questions
24
23
26
25
28
27
29
16
19
18
21
20
22
17
30
First round
bids
31
9
12
11
Meetings with
financial buyers
10
13
15
14
Independence
Day
4
Meetings with
strategic buyers
3
2
Distribute
CIM
Start calls to
financial
sponsors
5
7
6
8
1
Respond to
diligence
questions
24
23
26
25
28
27
29
16
19
18
21
20
22
17
30
First round
bids
31
9
12
11
Meetings with
financial buyers
10
13
15
14
9
12
12
11
11
financial buyers
10
13
13
15
15
14
14
Independence
Day
4
Meetings with
strategic buyers
3
2
Distribute
CIM
Start calls to
financial
sponsors
5
7
6
8
Independence
Day
4
Independence
Day
4
Meetings with
3
Meetings with
2
Distribute
CIM
Start calls to
financial
sponsors
5
Distribute
CIM
Start calls to
financial
sponsors
5
7
7
6
6
8
8
1
1
Respond to
diligence
questions
24
23
26
25
28
27
29
Respond to
diligence
questions
24
Respond to
diligence
questions
24
23
23
26
26
25
25
28
28
27
27
29
29
16
19
18
21
20
22
17
16
16
19
19
18
18
21
21
20
20
22
22
17
17
30
First round
bids
31
30
30
First round
bids
31
First round
bids
31
17
CONFIDENTIAL
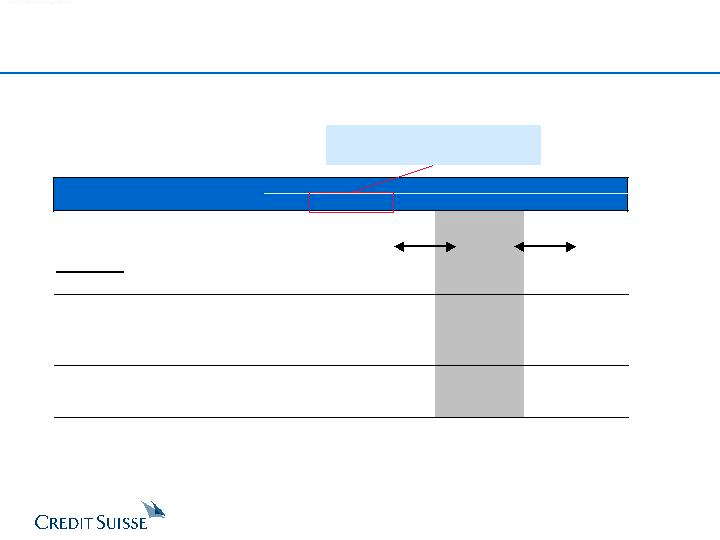
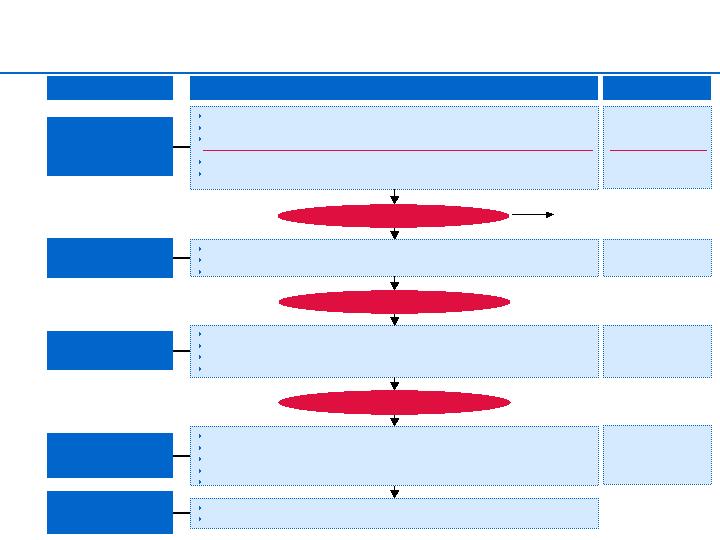
Preliminary Process Timetable (cont’d)
Closing
Anti-trust and other regulatory approvals, as necessary
Closing
Stage 1: Initial Due
Diligence / Market
Assessment
Conduct management presentations
Provide data room access / assist buyers with due diligence
Distribution of process letter and draft SPA
Provide parties preliminary Q3 results
Stage 3: Due
Diligence
CS receives initial indications and reports to Board
Selection of preferred buyer(s)
SPA negotiation with preferred buyer(s)
Board approvals
Execution of definitive agreements
Transaction announcement
Stage 4: Negotiation
/ Announcement
Stage
Description
Timing
Start end of May
3 weeks
(Weeks of Jun 19 - Jul 3)
6 Weeks
(Weeks of Jul 31 - Sep 11)
Receive final bids from potential buyers
Due diligence
Preparation of marketing materials (teaser, info memo, short-form management presentation)
Determine targeted buyers
Conduct short-form management presentation to selected group of Tier 1 strategic buyers
Determine level of Tier 1 strategic buyer interest
2 Weeks
(Weeks of Sep 11 - 18)
18
If limited Tier 1 strategic interest indicated, go broad
Contact Tier 2 strategic and all financial buyers and execute NDAs if decision to go broad
Contact financial buyers
Distribute info memo to all contacted buyers (include Q2 results)
Stage 2: Distribute
Info Memorandum
5 Weeks
(Weeks of Jul 3 - Jul 31)
Discuss with Board next steps

CONFIDENTIAL
Appendix
19

CONFIDENTIAL
A. Preliminary Valuation
20
$26.50
$25.00
$26.00
$30.00
$31.00
$29.00
$10
$20
$30
$40
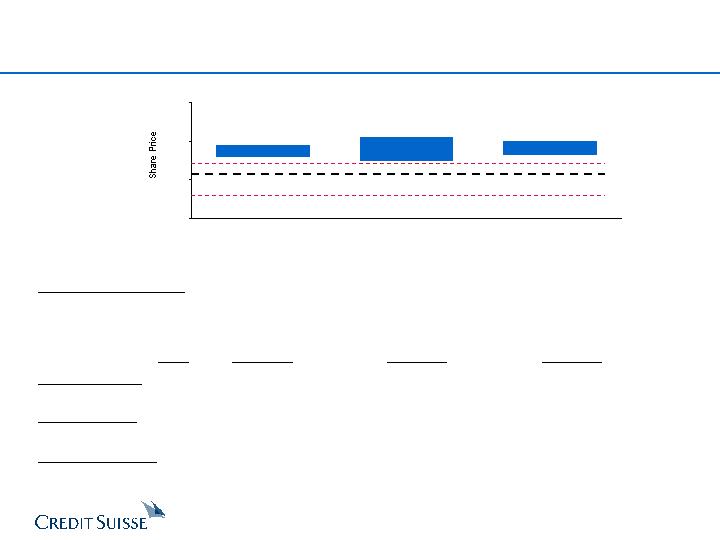
Selected
Acquisitions
DCF
Leveraged
Buyout
Preliminary Valuation Summary
($ in millions, except per share amounts)
Current: $21.80
52 Week Lo: $15.28
52 Week Hi: $24.31
Note: Assumes debt of $345.8MM (includes minority interest) and cash of $36.0 million, as of 6/30/06.
Share Price
$26.00
-
$29.00
$25.00
-
$31.00
$26.50
-
$30.00
Equity Value
$856.4
-
$963.5
$820.7
-
$1,035.4
$874.3
-
$999.2
Enterprise Value
$1,166.3
-
$1,273.4
$1,130.6
-
$1,345.3
$1,184.1
-
$1,309.1
Prem. to Avg. Stock Price over Period:
30 Day Average
$22.51
15.5%
-
28.8%
11.1%
-
37.7%
17.7%
-
33.3%
60 Day Average
$21.61
20.3%
-
34.2%
15.7%
-
43.4%
22.6%
-
38.8%
90 Day Average
$20.00
30.0%
-
45.0%
25.0%
-
55.0%
32.5%
-
50.0%
120 Day Average
$19.16
35.7%
-
51.3%
30.5%
-
61.8%
38.3%
-
56.5%
Statistic
Implied Multiple
Implied Multiple
Implied Multiple
Enterprise Value / Revenue
CY2006E Revenue
$1,275
0.9x
-
1.0x
0.9x
-
1.1x
0.9x
-
1.0x
CY2007E Revenue
1,374
0.8x
-
0.9x
0.8x
-
1.0x
0.9x
-
1.0x
Enterprise Value / EBITDA
CY2006E EBITDA
$179
6.5x
-
7.1x
6.3x
-
7.5x
6.6x
-
7.3x
CY2007E EBITDA
213
5.5x
-
6.0x
5.3x
-
6.3x
5.6x
-
6.1x
Enterprise Value / Unlevered NI
CY2006E Unlevered NI
$79
14.8x
-
16.2x
14.4x
-
17.1x
15.0x
-
16.6x
CY2007E Unlevered NI
$102
11.4x
-
12.4x
11.0x
-
13.1x
11.6x
-
12.8x
21
CONFIDENTIAL

Preliminary Selected Acquisitions Analysis
($ in millions)
Date
Acquirer
Target
1/30/06
West Corp
Intrado
9/22/05
CVC International
Dun & Bradstreet - (ARM business)
9/12/05
NCO Group
Risk Management Alternatives
7/14/05
Genpact
Creditek Corp
6/30/05
Affiliated Computer Services
LiveBridge Corp
5/16/05
H-Cube LLC
Zenta Group
2/2/05
IBM Corp
Equitant
11/16/04
Mellon
SourceNet Solutions
11/8/04
Medassist
Argent
10/8/04
ICICI OneSource
Account Solutions Group
9/17/04
SLM Corp
Arrow Financial Services
7/23/04
West Corp
Worldwide Asset Management
5/25/04
Vertex
First Revenue Assurance
5/4/04
Convergys Corp
Encore Receivable Management
4/6/04
Daksh eServices
IBM Corp
3/22/04
ECE Holdings (H.I.G. Capital)
Stream International
2/2/04
Barclays Private Equity / Vision Capital
Cabot Financial (Europe)
1/15/04
CFSI
Genesis Financial Solutions
12/4/03
AllianceOne
TCH Group
11/18/03
NCO Group
RMH Teleservices
1/17/03
Affiliated Computer Services
CyberRep.com
8/1/02
Parthenon Capital
Arrow Financial Services
7/23/02
West Corp
Attention LLC
9/25/01
Solectron
Stream International
7/17/01
SNT Group NV
KPN NV - (CRM business)
7/17/01
SNT Group NV
Atos SA (CRM business)
3/13/01
Management Group / Intrum Justitia BV
Dun & Bradstreet - (ARM business)
(1) H-Cube acquired an 80% stake in Zenta Group for $80 million. GTCR Golder Rauner invested a further $20 million for a 20% stake.
(2) SLM Corp acquired a 64% stake in Arrow Financial Services and has the option to purchase the remaining interest over a three-year period.
Enterprise Value
Enterprise
as a multiple of
Target Description / Rationale
Value
Revenues
EBITDA
EBIT
Global provider of integrated data and telecommunications solutions.
$478
3.2x
13.5x
25.7x
Provides receivable management services worldwide.
NA
NA
NA
NA
Provider of debt collection and accounts receivable management services.
$119
0.5x
4.0x
NA
Supplies outsourced accounts receivable consultation and management services to accounts receivable departments of small to mid-sized
corporations.
NA
NA
NA
NA
Offers outsourced and professional services to the contact center and business process markets.
$32
NA
NA
NA
Operates as a business process outsourcing company.
$100
(1)
NA
NA
NA
Expands business consulting unit by acquiring provider of finance and accounting outsourcing services
NA
NA
NA
NA
Adds accounts payable processing capability
NA
NA
NA
NA
Acquisition of Argent HFS adds complementary business and increases geographic reach, customer services and resources
NA
NA
NA
NA
Operates as a consumer collections agency.
NA
NA
NA
NA
Engages in purchasing and servicing performing and non-performing consumer debt.
NA
(2)
NA
NA
NA
Purchaser and collector of delinquent accounts receivable portfolios from consumer credit originators.
$178
1.7x
NA
NA
Acquisition of FRA (U.S. based debt collection agency) followed Vertex’s announcement of the establishment of Vertex Outsourcing, a North
American management subsidiary; $12 million of revenue in 2003
NA
NA
NA
NA
Provides receivable management solutions.
$68
NA
NA
NA
Offers online customer relationship management services.
$155
3.0x
8.0x
NA
Provides technical support and customer service outsourcing for the high-tech industry in the U.S. and Europe.
NA
NA
NA
NA
Provides debt purchasing and credit management solutions in the U.K.
£100
NA
NA
NA
TxCollect, a subsidiary of Collins, acquired consumer debt collection debt collection facility of Genesis Financial Solutions, which will expand
TxCollect’s rapidly growing contingency business
NA
NA
NA
NA
Expand Alliance’s outsourcing capabilities and enhances its near shore international offerings
NA
NA
NA
NA
Provides CRM solutions through various cannels including voice, VoIP, email, chat and self-help.
$109
0.4x
9.9x
NM
Provider of outsourced customer service, technical support and CRM solutions.
NA
NA
NA
NA
Engages in purchasing and servicing performing and non-performing consumer debt.
$45
NA
NA
NA
Accounts receivable management company.
$40
NA
NA
NA
Provides CRM solutions through various cannels including voice, VoIP, email, chat and self-help.
$329
1.0x
7.9x
13.8x
Provides call centers, inbound services, conferencing services and consulting and CRM training.
€180
NA
NA
NA
Provides customer call centers.
€ 69
NA
NA
NA
Provider of debt collection and accounts receivable management services.
$120
0.8x
4.9x
NA
Mean
1.5x
8.0x
19.8x
Median
1.0x
7.9x
19.8x
Note: Assumes debt of $345.8MM (includes minority interest) and cash of $36.0 million, as of 6/30/06.
($ in millions, except per share amounts)
Statistic
Multiple Range
Implied Enterprise Value
Implied Equity Value
Implied Share Price
CY2005 Revenue
$1,052.3
1.0x
-
1.5x
$1,052
-
$1,578
$742
-
$1,269
$22.81
-
$37.38
CY2005 EBITDA
$146.7
7.0x
-
9.5x
$1,027
-
$1,394
$717
-
$1,084
$22.11
-
$32.34
Preliminary Valuation Reference Range
$1,250
-
$1,350
$940
-
$1,040
$28.34
-
$31.13
22
CONFIDENTIAL
Preliminary Discounted Cash Flow Analysis
DCF Assumptions
DCF Sensitivity
Discount
Terminal Multiple of 2011E EBITDA
Rate
5.5x
6.0x
6.5x
14.0%
$478
$478
$478
Present Value of Free Cash Flow
1,608
1,754
1,901
Terminal Value
835
911
987
Present Value of Terminal Value
$1,313
$1,389
$1,465
Implied Aggregate Value
1,003
1,079
1,155
Implied Equity Value
$30.10
$32.19
$34.26
Equity Value Per Share
5.4%
6.1%
6.6%
Perpetuity Growth
15.0%
$467
$467
$467
Present Value of Free Cash Flow
1,608
1,754
1,901
Terminal Value
799
872
945
Present Value of Terminal Value
$1,267
$1,339
$1,412
Implied Aggregate Value
957
1,029
1,102
Implied Equity Value
$28.81
$30.84
$32.82
Equity Value Per Share
6.3%
7.0%
7.6%
Perpetuity Growth
16.0%
$457
$457
$457
Present Value of Free Cash Flow
1,608
1,754
1,901
Terminal Value
765
835
905
Present Value of Terminal Value
$1,223
$1,292
$1,362
Implied Aggregate Value
913
982
1,052
Implied Equity Value
$27.58
$29.53
$31.46
Equity Value Per Share
7.2%
7.9%
8.5%
Perpetuity Growth
($ in millions)
FYE Dec 31,
2H:2006
2007
2008
2009
2010
1H:2011
Revenue
$652
$1,374
$1,463
$1,567
$1,685
$906
% Growth
4.5%
7.8%
6.5%
7.1%
7.5%
7.5%
Gross Profit
$309
$654
$693
$741
$794
$426
% of Revenue
47.4%
47.6%
47.4%
47.3%
47.1%
47.0%
EBIT
$72
$165
$191
$209
$230
$127
% Margin
11.0%
12.0%
13.0%
13.3%
13.6%
14.0%
After-Tax Unlev. FCF
$95.4
$135.8
$132.1
$123.7
$125.3
$65.6
23
CONFIDENTIAL
CONFIDENTIAL
Preliminary DCF Sensitivity Analysis
Sale price dependent on ability to prove margin and growth of business
DCF Sensitivity - 6.0x terminal EBITDA Multiple; 15.0% WACC
A potential acquiror’s ability to pay a substantial premium will be driven by their ability to
establish synergy opportunities
However, risk exists potential acquiror will create their own lower financial plan
Incremental Revenue Growth
(1.00%)
(0.75%)
(0.50%)
(0.25%)
0.00%
(1.00%)
$26.76
$27.15
$27.54
$27.94
$28.34
Incremental
(0.75%)
$27.36
$27.76
$28.16
$28.56
$28.97
EBIT Margin
(0.50%)
$27.96
$28.36
$28.77
$29.18
$29.59
(0.25%)
$28.56
$28.97
$29.38
$29.80
$30.22
0.00%
$29.16
$29.57
$29.99
$30.42
$30.84
24
CONFIDENTIAL
Preliminary LBO Analysis - As of 9/30/06
Sponsor may
view risk in
management
plan and build
adjusted case
Illustrative LBO Sensitivity Analysis
Transaction Assumptions
Financing Assumptions
(1) Fees and expenses equal to 2% of debt offered plus $10MM.
Sources:
Leverage
Rate
Term Loan A
3.0x
8.35%
$501.6
Term Loan B
2.0x
12.35%
334.4
New Non-Recourse Debt
47.7
Common Equity
345.2
Total Sources
$1,228.9
Uses:
Purchase of Equity
$927.8
Refinance Revolving Debt
226.6
Refinance Non-Recourse Debt
47.7
Transaction Expenses
(1)
26.7
Total Uses
$1,228.9
Purchase Price
$28.00
Premium to Current
28.4%
Equity Purchase Price
$927.8
Plus: Revolving Debt
226.6
Plus: Non-Recourse Debt
47.7
Plus: Capital Leases
1.6
Plus: Minority Interest
41.8
Less: Existing Cash
(42.1)
Aggregate Value
$1,203.4
LTM EBITDA (9/30/06)
167.2
Implied Purchase Multiple
7.2x
Imp. AV
$1,131.9
$1,167.6
$1,203.4
$1,239.1
$1,274.8
Shr. Price
$26.00
$27.00
$28.00
$29.00
$30.00
EBITDA Purchase Price Multiple
26.3%
6.8x
7.0x
7.2x
7.4x
7.6x
CY06-CY10
0.0%
42.5%
39.0%
36.0%
33.4%
31.0%
Change in
(2.5%)
37.6%
34.2%
31.3%
28.8%
26.5%
Rev. Growth v.
(5.0%)
32.3%
29.1%
26.3%
23.9%
21.7%
Mgmt. Case
(7.5%)
26.7%
23.6%
21.0%
18.6%
16.5%
25

CONFIDENTIAL
Preliminary LBO Analysis - As of 12/31/06
Illustrative LBO Sensitivity Analysis
Transaction Assumptions
Financing Assumptions
Sponsor may
view risk in
management
plan and build
adjusted case
(1) Fees and expenses equal to 2% of debt offered plus $10MM.
Imp. AV
$1,097.6
$1,133.3
$1,169.0
$1,204.7
$1,240.4
Shr. Price
$26.00
$27.00
$28.00
$29.00
$30.00
EBITDA Purchase Price Multiple
31.5%
6.1x
6.3x
6.5x
6.7x
6.9x
CY06-CY10
0.0%
52.3%
47.1%
42.9%
39.3%
36.2%
Change in
(2.5%)
46.4%
41.5%
37.4%
34.0%
31.0%
Rev. Growth v.
(5.0%)
40.2%
35.4%
31.5%
28.2%
25.3%
Mgmt. Case
(7.5%)
33.2%
28.7%
25.0%
21.8%
19.1%
Purchase Price
$28.00
Premium to Current
28.4%
Equity Purchase Price
$927.8
Plus: Revolving Debt
203.6
Plus: Non-Recourse Debt
41.3
Plus: Capital Leases
0.4
Plus: Minority Interest
44.1
Less: Existing Cash
(48.2)
Aggregate Value
$1,169.0
LTM EBITDA (12/31/06)
179.5
Implied Purchase Multiple
6.5x
Sources:
Leverage
Rate
Term Loan A
3.0x
8.35%
$538.5
Term Loan B
2.0x
12.35%
359.0
New Non-Recourse Debt
41.3
Common Equity
261.9
Total Sources
$1,200.6
Uses:
Purchase of Equity
$927.8
Refinance Revolving Debt
203.6
Refinance Non-Recourse Debt
41.3
Transaction Expenses
(1)
27.9
Total Uses
$1,200.6
26
CONFIDENTIAL
Weighted Average Cost of Capital Analysis
Assumptions
Cost of Equity
Tax Rate
35.00%
Cost of Equity = Risk Free Rate + Beta * Equity Risk Premium + Size Premium
Risk Free Rate (20 year)
(1)
5.11%
= 5.11% + 1.10 * 7.2% + 4.02%
Equity Risk Premium
(2)
7.20%
= 17.0%
Size Premium
4.02%
Industry Statistics
Debt /
Levering
Unlevered
Cost of
Beta
(3)
Mkt Eq.
Factor
(4)
Beta
(5)
Equity
NCOG
1.42
57.1%
1.37
1.03
12.6%
APAC
1.40
11.4%
1.07
1.31
14.5%
CVG
1.14
15.5%
1.10
1.03
12.5%
ICTG
1.09
9.5%
1.06
1.03
12.5%
737143
0.99
25.2%
1.16
0.85
11.2%
PSPT
1.03
0.0%
1.00
1.03
12.5%
SWW
1.12
44.0%
1.29
0.87
11.4%
599933
2.11
29.5%
1.19
1.77
17.8%
SRT
0.99
1.6%
1.01
0.97
12.1%
SYKE
1.11
0.0%
1.00
1.11
13.1%
TTEC
1.25
3.8%
1.02
1.22
13.9%
AACC
1.41
0.0%
1.00
1.41
15.3%
PRAA
0.99
2.1%
1.01
0.98
12.1%
ECPG
1.14
56.6%
1.37
0.83
11.1%
ASFI
1.14
18.2%
1.12
1.02
12.5%
Average
18.3%
1.10
13.0%
Plus: Size Premium
4.0%
Cost of Equity
17.0%
Cost of Capital
Pre-tax Cost of Debt
6.0%
6.5%
7.0%
7.5%
8.0%
8.5%
9.0%
9.5%
10.0%
10.5%
11.0%
After-tax Cost of Debt
3.9%
4.2%
4.6%
4.9%
5.2%
5.5%
5.9%
6.2%
6.5%
6.8%
7.2%
Debt/
Debt/
Average
Lev.
Levered
Cost of
Debt/
Size
Capital
Equity
Unlev. Beta
Factor
Beta
(6)
Equity
(7)
Capital
Premium
WEIGHTED AVERAGE COST OF CAPITAL
(8)
0.0%
0.0%
1.10
1.00
1.10
13.0%
0.0%
4.02%
17.0%
17.0%
17.0%
17.0%
17.0%
17.0%
17.0%
17.0%
17.0%
17.0%
17.0%
5.0%
5.3%
1.10
1.03
1.14
13.3%
5.0%
4.02%
16.6%
16.6%
16.7%
16.7%
16.7%
16.7%
16.7%
16.7%
16.8%
16.8%
16.8%
10.0%
11.1%
1.10
1.07
1.18
13.6%
10.0%
4.02%
16.2%
16.3%
16.3%
16.3%
16.4%
16.4%
16.4%
16.5%
16.5%
16.5%
16.6%
15.0%
17.6%
1.10
1.11
1.22
13.9%
15.0%
4.02%
15.8%
15.9%
15.9%
16.0%
16.0%
16.1%
16.1%
16.2%
16.2%
16.3%
16.3%
20.0%
25.0%
1.10
1.16
1.28
14.3%
20.0%
4.02%
15.4%
15.5%
15.6%
15.6%
15.7%
15.8%
15.8%
15.9%
16.0%
16.0%
16.1%
25.0%
33.3%
1.10
1.22
1.34
14.7%
25.0%
4.02%
15.0%
15.1%
15.2%
15.3%
15.4%
15.4%
15.5%
15.6%
15.7%
15.8%
15.8%
30.0%
42.9%
1.10
1.28
1.40
15.2%
30.0%
4.02%
14.6%
14.7%
14.8%
14.9%
15.0%
15.1%
15.2%
15.3%
15.4%
15.5%
15.6%
35.0%
53.8%
1.10
1.35
1.48
15.8%
35.0%
4.02%
14.2%
14.3%
14.5%
14.6%
14.7%
14.8%
14.9%
15.0%
15.1%
15.3%
15.4%
40.0%
66.7%
1.10
1.43
1.57
16.4%
40.0%
4.02%
13.8%
14.0%
14.1%
14.2%
14.4%
14.5%
14.6%
14.7%
14.9%
15.0%
15.1%
45.0%
81.8%
1.10
1.53
1.68
17.2%
45.0%
4.02%
13.4%
13.6%
13.7%
13.9%
14.0%
14.2%
14.3%
14.5%
14.6%
14.8%
14.9%
50.0%
100.0%
1.10
1.65
1.81
18.1%
50.0%
4.02%
13.0%
13.2%
13.4%
13.5%
13.7%
13.8%
14.0%
14.2%
14.3%
14.5%
14.7%
(1)
Interpolated yield on the 20-year U.S. Treasury bond (4/25/06).
(7)
Cost of Equity: Rf + B ( Rm - Rf ).
(2)
The average historic spread between the return on stocks and l-t bonds (Ibbotson Ass.)
(8)
WACC: Rd = Return on Debt Re = Return on Equity
(3)
Barra U.S. Equity Beta Book predictions
[ Rd * ( 1 - tax rate ) * ( D / (D + E) ) ] + [ Re * ( E / (D+E) ) ]
(4)
Levering Factor: 1 + [ ( 1 - tax rate ) * ( debt / equity ratio ) ]
(5)
Unlevered Beta: ( Beta / Levering Factor )
(6)
Levered Beta: ( Beta * Levering Factor )
27

CONFIDENTIAL
B. Recent Trading Performance
28
CONFIDENTIAL
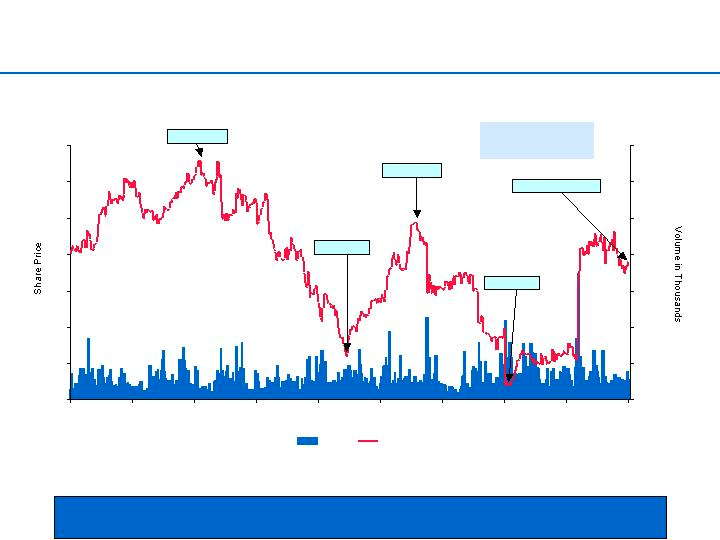
North’s Stock Price Has Recently Rebounded
North’s stock price has recently rebounded as a result of exceeding analysts
expectations in Q4 and providing strong guidance for 2006
April 20, 2004 to April 21, 2006
Source: FactSet.
Note: Outsourced CRM Services composite includes APAC, Convergys, ICT Group, Intrum Justitia, PeopleSupport, Sitel, SR Teleperformance, Startek, Sykes Enterprises, Teletech
$15
$17
$19
$21
$23
$25
$27
$29
4/20/04
7/12/04
9/29/04
12/17/04
3/10/05
5/31/05
8/18/05
11/7/05
1/30/06
4/20/06
0
300
600
900
1,200
1,500
1,800
2,100
Volume
North
NTM P/E: 15.1x
NTM P/E: 9.2x
NTM P/E: 13.1x
NTM P/E: 8.4x
Current NTM P/E: 12.8x
Current NTM P/E Multiples
Outsourced CRM:
Portfolio Purchasers:
12.7x
21.3x
and West.
Portfolio Purchasers composite includes Asset Acceptance, Asta Funding, Encore Capital and Portfolio Recovery.
29
CONFIDENTIAL
Trading Statistics of Comparable Companies
(USD millions, except per share amounts)
Trading Performance
FD Capitalization
Stock
Disc.
/ Prem.
Equity
Aggr.
FD Aggregate Value /
LT
CY2007
Price
to LTM
Market
Market
P/E Multiples
Revenue
EBITDA
Gr. Rate
PE /
COMPANY (FYE)
4/25/06
High
Low
Value
Value
CY06
CY07
CY06
CY07
CY06
CY07
(LTGR)
LTGR
NORTH (MANAGEMENT) (Dec.)
$21.80
(10.3%)
42.7%
$704
$1,082
12.1x
8.9x
0.8x
0.8x
6.0x
5.1x
12.0%
0.7x
NORTH (STREET) (Dec.)
$21.80
(10.3%)
42.7%
$704
$1,082
12.7x
11.5x
0.9x
0.9x
6.2x
6.0x
12.0%
1.0x
Outsourced CRM Services
WEST CORP (Dec.)
$47.07
(4.9%)
51.0%
$3,458
$3,703
20.9x
18.8x
2.2x
2.1x
8.9x
8.5x
16.6%
1.1x
CONVERGYS CORP (Dec.)
19.60
0.0%
55.8%
2,780
3,016
18.0x
16.1x
1.1x
1.0x
7.3x
6.8x
11.9%
1.4x
SR TELEPERFORMANCE (Dec.)
40.05
0.0%
43.3%
1,429
1,642
19.3x
17.1x
1.0x
0.9x
7.6x
6.9x
9.6%
1.8x
TELETECH HOLDINGS INC (Dec.)
12.70
(2.4%)
73.0%
908
910
26.5x
19.5x
0.8x
0.7x
8.4x
7.4x
23.3%
0.8x
INTRUM JUSTITIA NV (Dec.)
9.34
(5.2%)
41.2%
732
890
14.2x
13.3x
2.2x
2.1x
10.2x
9.6x
NA
NA
SYKES ENTERPRISES INC (Dec.)
16.00
(1.4%)
136.0%
648
520
27.6x
22.2x
1.0x
0.9x
10.1x
8.8x
NA
NM
ICT GROUP INC (Dec.)
27.20
(2.0%)
205.6%
369
393
24.3x
19.2x
0.9x
0.8x
9.1x
7.9x
20.0%
1.0x
STARTEK INC (Dec.)
23.02
(5.0%)
100.2%
343
303
24.5x
21.1x
1.3x
1.2x
8.0x
7.4x
15.5%
1.4x
SITEL CORP (Dec.)
4.47
0.0%
181.1%
338
449
14.9x
NA
NA
NA
5.2x
NA
NA
NM
PEOPLESUPPORT INC (Dec.)
11.25
(1.1%)
57.1%
217
175
28.1x
22.5x
2.0x
1.6x
10.4x
8.4x
23.8%
0.9x
APAC CUSTOMER SERVICES INC (Dec.)
2.12
(12.4%)
207.2%
105
116
35.3x
21.2x
0.5x
0.5x
6.2x
5.2x
15.0%
1.4x
Median
(2.0%)
73.0%
24.3x
19.3x
1.1x
1.0x
8.4x
7.7x
16.0%
1.2x
Mean
(3.1%)
104.7%
23.1x
19.1x
1.3x
1.2x
8.3x
7.7x
17.0%
1.2x
Portfolio Purchasers
PORTFOLIO RECOVRY ASSOC INC (Dec.)
$48.33
(6.4%)
39.7%
$784
$784
18.2x
14.9x
4.2x
3.5x
9.3x
7.7x
18.4%
0.8x
ASSET ACCEPTANCE CAPITL CP (Dec.)
20.41
(35.1%)
17.7%
760
710
14.1x
12.4x
2.6x
2.3x
8.1x
7.1x
14.6%
0.8x
ASTA FUNDING INC (Sep.)
34.17
(2.9%)
67.5%
504
593
12.1x
NA
6.6x
NA
NA
NA
20.0%
NM
ENCORE CAPITAL GROUP INC (Dec.)
14.43
(26.2%)
11.0%
344
526
9.2x
NA
2.4x
NA
6.4x
NA
15.1%
NM
Median
(16.3%)
28.7%
13.1x
13.6x
3.4x
2.9x
8.1x
7.4x
16.8%
0.8x
Mean
(17.7%)
34.0%
13.4x
13.6x
3.9x
2.9x
7.9x
7.4x
17.0%
0.8x
Overall Median
(2.9%)
57.1%
19.3x
19.0x
1.6x
1.1x
8.2x
7.5x
16.0%
1.0x
Overall Mean
(7.0%)
85.8%
20.5x
18.2x
2.1x
1.5x
8.2x
7.6x
17.0%
1.1x
Source: IBES consensus estimates and Wall Street Research
30
CONFIDENTIAL
Management vs. Street Projections
($ in millions, except per share amounts)
Management Forecast
Wall Street Estimates
(1)
Q1:06
Q2:06
Q3:06
Q4:06
CY2006
CY2007
Q1:06
Q2:06
Q3:06
Q4:06
CY2006
CY2007
Revenue
$312
$311
$321
$330
$1,275
$1,374
$311
$311
$308
$307
$1,237
$1,279
vs. Street
1.2
0.2
13.5
23.2
38.2
95.6
0.4%
0.1%
4.4%
7.6%
3.1%
7.5%
EBITDA
43.0
38.0
47.5
51.0
179.5
213.3
38.3
45.2
45.0
44.1
175.1
191.6
vs. Street
4.6
-7.2
2.5
6.9
4.4
21.7
12.1%
(15.9%)
5.6%
15.7%
2.5%
11.3%
EPS
$0.41
$0.33
$0.50
$0.56
$1.80
$2.44
$0.29
$0.45
$0.45
$0.46
$1.65
$1.96
vs. Street
0.12
(0.12)
0.05
0.11
0.15
0.48
42.6%
(26.2%)
10.3%
23.6%
9.4%
24.3%
(1) Based on an average of Boenning & Scattergood, CIBC, First Analysis, JMP Securities, Suntrust Robinson Humphrey and William Blair reports.
31

CONFIDENTIAL
C. Industry Perspectives
32

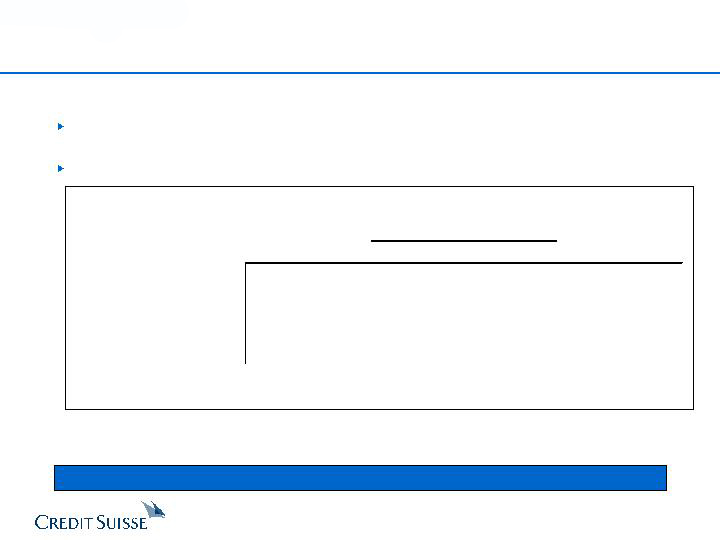
CONFIDENTIAL
CRM Companies Have Experienced Volatile
Earnings Results
0
100
200
300
400
500
600
700
800
900
4/23/93
7/23/96
10/24/99
1/23/03
4/25/06
S&P 500
Outsourced CRM
Outsourced CRM Services v. S&P 1993 - Current
Source: FactSet.
Note: Outsourced CRM composite includes APAC, Convergys, ICT Group, Intrum Justitia, PeopleSupport, Sitel, SR Teleperformance, Startek, Sykes Enterprises, Teletech and West.
CRM industry over-capacity
Internet bubble
Peak of
another cycle?
8.1%
7.7%
7.7%
9.5%
10.5%
12.4%
12.7%
13.5%
14.4%
1997
1998
1999
2000
2001
2002
2003
2004
2005
33
IPO market
focus
Source: Company filings. Not adjusted for acquisitions.
Note: Based on Teletech, Sykes and Sitel.
Source: Company filings. Not adjusted for acquisitions.
Note: Based on Teletech, Sykes and Sitel.
North ‘07 CRM EBITDA
Margin: 9.5%
North CRM ‘05-’11 Rev
CAGR: 16.5%
CRM Historical EBITDA Margin
CRM Historical Y / Y Revenue Growth
55.7%
5.9%
5.1%
4.8%
2.8%
(6.5%)
27.6%
28.6%
28.4%
1997
1998
1999
2000
2001
2002
2003
2004
2005
33

30.0%
63.0%
45.0%
49.0%
33.5%
41.7%
67.4%
76.9%
78.0%
61.0%
89.3%
11.0%
12.0%
15.1%
17.3%
18.9%
24.0%
28.5%
45.0%
47.0%
54.3%
0%
10%
20%
30%
40%
50%
60%
70%
80%
90%
100%
Top 5 Clients
Largest Client
Largest
Client
:
CONFIDENTIAL
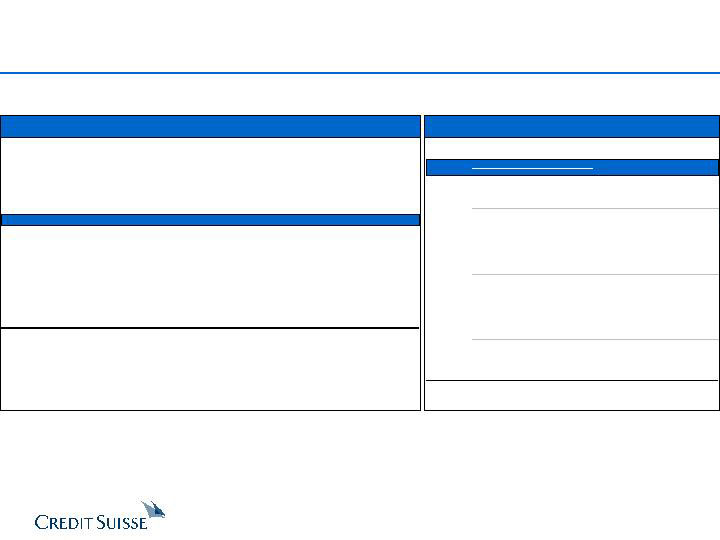
Customer Concentration in CRM Is A Focus
for the Investment Community
“TeleTech’s five largest clients account for
about 50% of revenue. While we believe the
company's relationship with these customers is
good, the company is obviously exposed to
some risk given its revenue concentration with
these clients.”
David J. Koning,
Robert W. Baird (11/4/05)
“While the Sprint Nextel billing contract remains
a wildcard, we note that Convergys has more or
less quantified the expected impact of the
Cingular migration. The fact that the migration
could cost Convergys more than $30 million in
operating income next year is not happy news,
but putting a number on the damage is a
healthy first step towards getting beyond this
loss and starting to focus on new opportunities.”
Shaul Eyal
CIBC (11/18/05)
“Startek’s customer base is highly
concentrated. While this is a risk, it also
provides SRT the ability to concentrate on key
customers and deliver outstanding
service…However, we are optimistic the firm
can diversify its customer base in 2005 via new
business and/or expanding into other verticals,
which could ease revenue concentration.”
Tom Carpenter,
Hilliard Lyons (April 14, 2005)
Source: SEC Public filings and Credit Suisse Investment Banking estimates
(1) WSTC top 100 clients account for 63% of revenues.
(2) Accenture and Microsoft account for 7.8% and 7.3% of revenues and
top 10 clients account for 45% of revenues.
(3) Convergys top 3 clients account for 33.5% of revenues.
(4) GM and HP both account for 12% of revenues. Top 20 clients account for 67.4%.
(5) North represents 2006 estimates for CRM business.
(6) PeopleSupport top 2 clients account for 47% of revenues.
(7) Startek top 3 customers account for 89.3% of revenues.
North total business:
Top 5 Clients: 37.0%
Largest Client: 10.7%
15.7%
West
Sykes
ClientLogic
Convergys
Convergys
Sitel
Minacs
Peoplsupport
(4)
(1)
(2)
(3)
(6)
(7)
North(5)
34
CONFIDENTIAL
Large Players Entering North’s Core ARM Market
In late 2004, acquired Arrow Financial Services, a purchaser of performing and non-
performing consumer debt and provider of contingency collection services, to gain
entrance to the debt recovery industry
In May 2004, acquired Encore Receivable Management for up to $68 million, to enter the
accounts receivable management business
In 2002, acquired Attention LLC for an initial payment of $35.7 million plus future
payments between $21.5 and $50 million, to capitalize on the opportunities in the
accounts receivable management arena
In late 2004, acquired Account Solutions Group, a credit card debt collection company, to
establish a footprint in the US accounts receivable industry
In March 2006, reached a five-year agreement to provide Microsoft with credit and
collection services in Europe, the Middle East and Africa
Equity Value
$3,458
CY06E Revenues
1,692.7
CY07E Revenues
1,781.6
Equity Value
$2,780
CY06E Revenues
2,701.7
CY07E Revenues
2,877.8
Equity Value
$26,076
CY06E Revenues
17,486.6
CY07E Revenues
18,906.4
Equity Value
$11,118
CY06E Revenues
2,024.4
CY07E Revenues
2,892.0
Equity Value
$22,583
CY06E Revenues
3,450.8
CY07E Revenues
4,033.8
35

CONFIDENTIAL
CS does not provide any tax advice. Any tax statement herein regarding any US federal tax is not intended or
written to be used, and cannot be used, by any taxpayer for the purpose of avoiding any penalties. Any such
statement herein was written to support the marketing or promotion of the transaction(s) or matter(s) to which the
statement relates. Each taxpayer should seek advice based on the taxpayer's particular circumstances from an
independent tax advisor.
These materials have been provided to you by Credit Suisse (“CS”) in connection with an actual or potential mandate or engagement and
may not be used or relied upon for any purpose other than as specifically contemplated by a written agreement with CS. In addition, these
materials may not be disclosed, in whole or in part, or summarized or otherwise referred to except as agreed in writing by CS. The
information used in preparing these materials was obtained from or through you or your representatives or from public sources. CS
assumes no responsibility for independent verification of such information and has relied on such information being complete and accurate
in all material respects. To the extent such information includes estimates and forecasts of future financial performance (including
estimates of potential cost savings and synergies) prepared by or reviewed or discussed with the managements of your company and/or
other potential transaction participants or obtained from public sources, we have assumed that such estimates and forecasts have been
reasonably prepared on bases reflecting the best currently available estimates and judgments of such managements (or, with respect to
estimates and forecasts obtained from public sources, represent reasonable estimates). These materials were designed for use by specific
persons familiar with the business and the affairs of your company and CS assumes no obligation to update or otherwise revise these
materials. Nothing contained herein should be construed as tax, accounting or legal advice. You (and each of your employees,
representatives or other agents) may disclose to any and all persons, without limitation of any kind, the tax treatment and tax structure of
the transactions contemplated by these materials and all materials of any kind (including opinions or other tax analyses) that are provided
to you relating to such tax treatment and structure. For this purpose, the tax treatment of a transaction is the purported or claimed U.S.
federal income tax treatment of the transaction and the tax structure of a transaction is any fact that may be relevant to understanding the
purported or claimed U.S. federal income tax treatment of the transaction.
CS has adopted policies and guidelines designed to preserve the independence of its research analysts. CS’s policies prohibit employees
from directly or indirectly offering a favorable research rating or specific price target, or offering to change a research rating or price target,
as consideration for or an inducement to obtain business or other compensation. CS’s policies prohibit research analysts from being
compensated for their involvement in investment banking transactions.
36