
Exhibit (c)(5)
Project North
CONFIDENTIAL
Materials for Discussion
March 22, 2006
PRELIMINARY | SUBJECT TO FURTHER REVIEW AND EVALUATION
THESE MATERIALS MAY NOT BE USED OR RELIED UPON FOR ANY PURPOSE OTHER THAN AS SPECIFICALLY CONTEMPLATED BY A
WRITTEN AGREEMENT WITH CREDIT SUISSE.

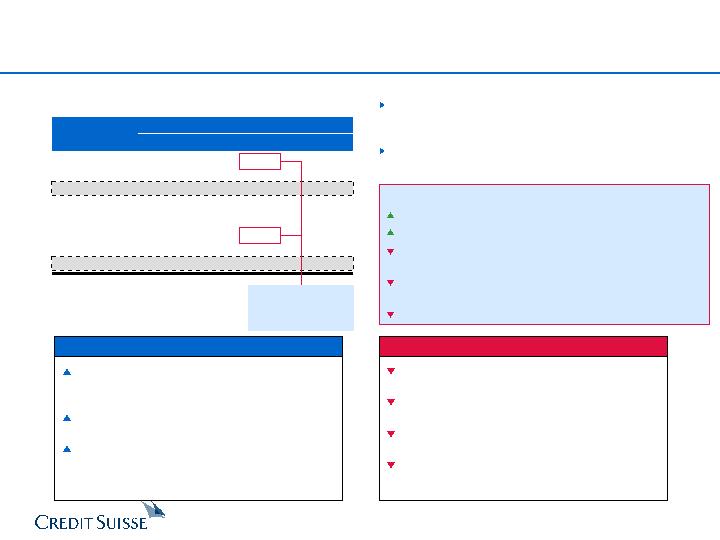
Table of Contents
1. Overview
2. Stand-Alone Assessment
3. Acquisition Alternatives
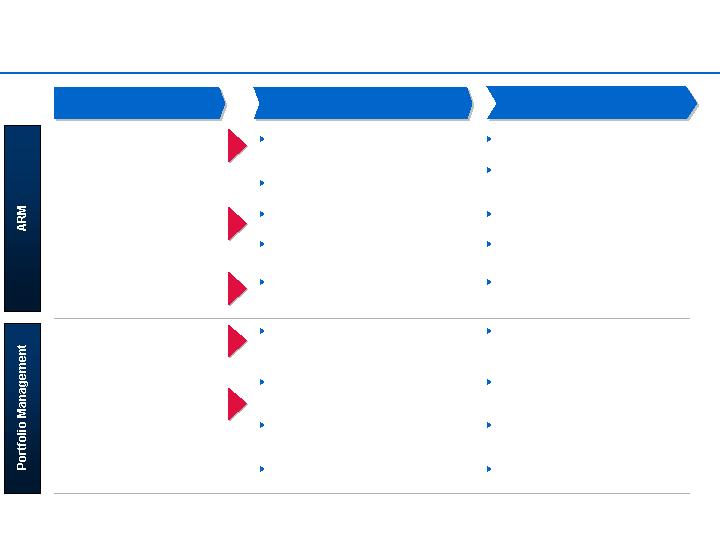
A. Consolidate in ARM
B. Consolidate in CRM
C. Enter BPO
4. Sale Alternative
Appendix
A. North Situation Overview
B. Comparable Company Analysis
C. Additional Materials
CONFIDENTIAL
1

1. Overview
CONFIDENTIAL
2

Executive Summary
CS appreciates the opportunity to review with North’s Board of Directors its various
strategic alternatives. The purpose of today’s meeting is to discuss the following topics:
Assess North’s stand-alone plan
Industry trends and drivers impacting North
The Street’s view of the Company and recent trading performance
Opportunities and issues surrounding North’s business segments
Assess consolidation alternatives in ARM / CRM / Portfolio Management and explore BPO
acquisitions
As a part of the review conducted, CS has:
Met with Management on multiple occasions to discuss the business and possible strategic
options
Undertaken a review of the 2006-2011 financial plan of the Company
Benchmarked North against its industry peers
Obtained perspectives on the industry and company from CS Debt and Equity Capital Markets
teams
Performed a range of financial analysis including discounted cash flow, business segment
acquisition analysis and an LBO analysis
CONFIDENTIAL
3
Overview of Strategic Alternatives
Sell the Company
CS Assessment
Stand-alone plan shows significant growth and margin expansion
Growth enhanced by additional portfolio acquisitions and CRM
Market has penalized Company for prior earnings misses
Execution risk remains a concern
Stand-Alone
Potential to provide shareholders a premium today
Strong rationale exists for both sponsors and strategic buyers to pay premium to
current market
Delivers value without execution risk
May preclude ability to fully capture upside potential of business plan
Consolidate
in ARM
Fully leverages Management expertise
Few attractive targets of size (all have operational issues)
Requires significant restructuring
Consolidation unlikely to improve pricing / margins
Consolidate
in CRM
CRM market exhibiting strong growth
Multiple acquisitions / transformational deal required to have meaningful impact on North
Higher valuations make deals less accretive
Acquisition strategy risky if market continues to value North with ARM/PM peers
Historically volatile supply and demand market
Consolidate
in Portfolio
Management
Potential for attractive returns from purchasing A/R portfolios
Complimentary service line to ARM
Competition remains high for attractive assets
Enter into
BPO
Large market opportunity
Fiercely competitive - focus of many IT companies
Lack of experience / expertise
Likely to have high value expectations
CONFIDENTIAL
4

2. Stand-Alone Assessment
CONFIDENTIAL
5
Industry Trends and Drivers Affecting North
Clients Driving Cost Savings
Nature of transaction management has
led to cost being the primary reason for
outsourcing
First party collection work has
commoditized
Trends
Observation / Expectation
Impact on North
North has faced downward pricing
pressure, but may be stabilizing
Focused on using less labor and
improving collection rates
Increasing M&A Activity,
Though Still Highly
Fragmented
~95% of market participants generate
less than $8MM annual revenue
(1)
Industry expertise, scale, opportunity to
cross-sell are competitive advantages
North is industry leader; however, few
attractive opportunities
Acquisitions unlikely to “move the
needle”
Growth in Credit Economy
Revolving consumer debt outstanding
~$800 billion as of December 2005;
growth of ~7% per year since 1994
(2)
Growth in consumer debt increases
available A/R portfolios
Increasing Competition for
Portfolios
Experience in purchasing at right price,
collecting efficiently and network to
source purchase opportunities is critical
Only handful of companies achieve
highest levels of returns and are highly
profitable
Financial services pricing becoming ultra
competitive
Disciplined bidding critical; experience
from ARM business provides
competitive advantage
Having scale permits North to bid on
larger assets where there is less
competition
Unpredictability leads to volatility in
earnings
(1) Source: Kaulkin Ginsberg, 2005.
(2) Source: Federal Reserve, 2006.
Strong Momentum in
Outsourcing
Increasing consumer, business and
government debt being outsourced to
ARM providers
Strong long-term growth expectations
CONFIDENTIAL
6

Industry Trends and Drivers Affecting North (cont’d)
Trends
Observation / Expectation
Impact on North
CRM Market is Experiencing
a Rebirth
Sykes and ICT experiencing double-digit
revenue growth
Multiples have expanded ~20% since
October
Unclear if market rewards North for
CRM potential
Two biggest peers are buying into BPO
Increasing Near-shore /
Offshore / At-home Delivery
First rush of offshore demand has been
met
Continued surge in demand being
experienced
Need significant presence offshore to
compete in long-run
Potential targets for North should
include offshore players
Domestic Outbound Capacity
Has Been Rationalized
Existing CRM vendors have added
collections or switched to inbound
capabilities
Offshore players profile increasing
Substantial rationalization already
undertaken
Domestic capacity near equilibrium
Buyers Looking for Fewer
Outsource Providers
Increasingly, service providers need to
offer a broader suite of BPO services
North’s ability to offer “bundle” of
collections and help desk services
should reduce sales cycles
Likely to require North to “acquire”
additional offerings
CONFIDENTIAL
7
8.1%
7.7%
7.7%
9.5%
10.5%
12.4%
12.7%
13.5%
14.4%
1997
1998
1999
2000
2001
2002
2003
2004
2005
55.7%
5.9%
5.1%
4.8%
2.8%
(6.5%)
27.6%
28.6%
28.4%
1997
1998
1999
2000
2001
2002
2003
2004
2005
0
100
200
300
400
500
600
700
800
900
3/18/93
6/16/96
9/16/99
12/16/02
3/17/06
S&P 500
Outsourced CRM
CONFIDENTIAL
CRM Has Historically Been Very Volatile
Outsourced CRM Services v.
S&P 1993 - Current
Observations
Source: FactSet.
Note: Outsourced CRM composite includes APAC, Convergys, ICT Group, Intrum Justitia,
PeopleSupport, Sitel, SR Teleperformance, Startek, Sykes Enterprises, Teletech and
West.
CRM industry participants have learned from past
mistakes, which should partially mitigate historical
sector volatility going forward
Decreased customer / end-market concentration
Broader service offering
However, CRM growth cycles are short-lived;
momentum not sustainable over the long-term
CRM revenue growth has moderated and margins
have compressed over the last several years, but
have begun to rebound
CRM industry over-capacity
Internet bubble
Peak of
another cycle?
CRM Historical Y / Y Revenue Growth
CRM Historical EBITDA Margin
North CRM ‘05-’11 Rev
CAGR: 17.9%
North ‘07 CRM EBITDA
Margin: 10.6%
IPO market
focus
Source: Company filings. Not adjusted for acquisitions.
Note: Based on Teletech, Sykes and Sitel.
Source: Company filings. Not adjusted for acquisitions.
Note: Based on Teletech, Sykes and Sitel.
8
Review of North’s ARM Business
Street Commentary on ARM
“We think the benefits of the RMA
restructuring/integration, combined with some
return from the Department of Ed investment in
2005, and the additional emphasis on off-shore
support and technology...will probably more than
offset continued pricing pressures and increased
service demands such as security.”
“We have estimated North's sustainable organic
growth profile [with] ARM at approximately 5%"
Summary Financials of ARM Business
Wall Street Estimate:
Revenue: $818.9MM
EBITDA: $107.7MM
% margin: 13.1%
North has leading market position and is
diversified across many verticals
Scale provides a competitive advantage
Opportunity to stabilize margins as discounting
appears to have reached bottom
Top five in UK, Europe is a growth opportunity
Key Attributes
Customers use multiple vendors
Significant price competition
Investors have penalized North in the past for
disappointments in core ARM business
North strategy focused on using less labor,
price stabilization and improving collection rates
Not selected for IRS trial, but should still benefit
Considerations
($ in millions)
ARM Financial Performance
2005A
2006E
2007E
Revenue
$804.5
$936.4
$987.3
% growth
7.8%
16.4%
5.4%
Gross Profit
427.2
488.5
514.8
% margin
53.1%
52.2%
52.1%
EBITDA
90.2
114.2
135.9
% margin
11.2%
12.2%
13.8%
Note: Based on Management projections. Includes ARM international
CONFIDENTIAL
9
($ in millions)
PM Financial Performance
2005A
2006E
2007E
Revenue
$144.7
$185.3
$189.2
% growth
47.6%
28.0%
2.1%
PM Comparables
12.9%
14.6%
Gross Profit
130.9
176.1
179.5
% margin
90.5%
95.0%
94.8%
EBITDA
47.5
44.7
46.8
% margin
32.8%
24.1%
24.8%
PM Comparables
38.0%
39.3%
Note: Based on Management projections.
Review of North’s Portfolio Management Business
Street Commentary on Portfolio Management
“Q4 EBITDA was $16.5 MM, or 33.8% of revenue, due to strong
collections, lower impairment allowances and the portfolio sale
of older, nearly zero-basis accounts.”
“We have estimated North's sustainable organic growth profile
[with] Portfolio Management at low double-digit”
Summary Financials of Portfolio Management
Business
Wall Street Estimate:
Revenue: $190.7MM
EBITDA: $62.0MM
% margin: 32.5%
North is a leading portfolio purchaser -
partnership with Cargill provides significant
opportunity to grow
Ability to leverage experience and expertise
from ARM business
Growth driven by higher collection rates and
ability to rapidly re-sell difficult portfolios
Key Attributes
Wall Street applies lower multiple to portfolio
purchasers
Earnings more volatile under new accounting
methods as a result of treatment of impairments
Returns on new acquisitions lower due to highly
competitive market
Need to continually reinvest capital in new
portfolios
Considerations
Should North Divest Portfolio Management?
Unpredictable business, dependent on portfolio buys
Value investors do not like volatility
Complimentary business to ARM as identified by other
players (e.g. West)
Highest margin segment contributing ~25% of total
EBITDA in 2006
Helps North cross-sell ARM services
CONFIDENTIAL
10

($ in millions)
CRM Financial Performance
2005A
2006E
2007E
Revenue
$190.4
$289.1
$348.9
% growth
19.7%
51.8%
20.7%
CRM Comparables
9.9%
7.8%
Gross Profit
44.5
63.4
92.6
% margin
23.4%
21.9%
26.5%
EBITDA
9.1
21.2
37.0
% margin
4.8%
7.3%
10.6%
CRM Comparables
14.7%
15.2%
Note: Based on Management projections.
Review of North’s CRM Business
Street Commentary on CRM
“We have estimated North's sustainable organic growth profile
[with] CRM of 10% to 15%"
“The company is ramping up operations with a number of new
customers and should show improving revenue through 2006”
“The largest customer is now approaching annualized revenue
of $60MM and could reach $100MM.”
“Q4 EBITDA was break-even mainly due to the cost pressures
of ramping new business on an expedited schedule.”
Summary Financials of CRM Business
Wall Street Estimate:
Revenue: $242.9MM
EBITDA: $6.6MM
% margin: 2.7%
Relatively new business
Significant momentum in Q4:2005 driven by
new client wins
Long-term contracts provide revenue visibility
Opportunity to significantly grow business in
2006 and capitalize on seat deployment
Offshore facilities in Philippines, Caribbean and
Panama; near-shore in Canada
Key Attributes
Current CRM offering lacks stickiness in
economic downturn
Substantial revenue from few key clients makes
vulnerable to customer losses
Margin pressure while new customers ramp-up
Focus on near-shore labor in Canada
negatively impacted by currency movements
CRM segment still lacks scale to "move the
needle" for overall business
Considerations
CONFIDENTIAL
11
gement

Key Take Aways
Market leader
Historical pricing pressure has stabilized
Highly complementary to ARM
Attractive margins
Volatile earnings profile
New customer wins
Driving growth
Creating upside potential
North’s Business is well positioned
…However, North’s business potential has not been reflected in its past
historical financial performance
CONFIDENTIAL
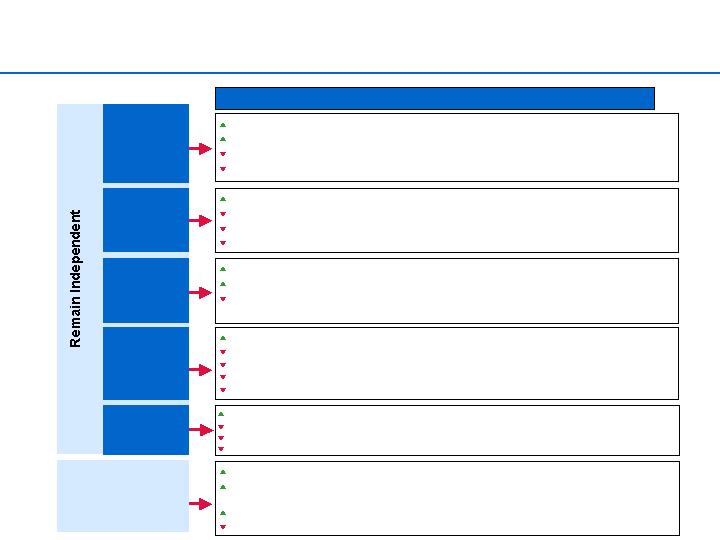
ARM
Portfolio
Management
CRM
12
Overview of North Financial Plan
Growth of core ARM business in line
with overall growth in consumer debt
CRM is a key driver of growth
Ramping with key customer wins
but least profitable business
Customer concentration remains
significant risk
Projected growth faster than
peers, with higher margins than
peers
Margin expansion driven by (i)
stabilization of pricing in ARM and (ii)
scaling of CRM business following
prior investment in seat deployments
Portfolio Management remains key
contributor to EBITDA margin
However, business is very volatile
– sustainability depends on future
portfolio buys
Observations
2005 PF for acquisitions:
Rev: $1,198
NI: $ 35
Implies 06 organic revenue
growth of 7.4%
($ in millions)
Fiscal Year Ended December 31,
'05E - '11E
2005A
2006E
2007E
2008E
2009E
2010E
2011E
CAGR
Revenue:
ARM
$804.5
$936.4
$987.3
$1,039.7
$1,101.4
$1,173.6
$1,250.8
7.6%
% growth
7.8%
16.4%
5.4%
5.3%
5.9%
6.6%
6.6%
CRM
190.4
289.1
348.9
383.7
422.1
464.3
510.8
17.9%
% growth
19.7%
51.8%
20.7%
10.0%
10.0%
10.0%
10.0%
Portfolio Management
144.7
185.3
189.2
193.2
205.6
224.5
244.9
9.2%
% growth
47.6%
28.0%
2.1%
2.1%
6.4%
9.2%
9.1%
Eliminations
(87.3)
(124.6)
(125.9)
(125.5)
(131.3)
(144.1)
(158.2)
Total Revenue
$1,052.3
$1,286.2
$1,399.5
$1,491.0
$1,597.8
$1,718.4
$1,848.4
9.8%
% growth
12.0%
22.2%
8.8%
6.5%
7.2%
7.5%
7.6%
EBITDA
ARM
90.2
114.2
135.9
149.4
164.7
180.1
191.9
13.4%
% margin
11.2%
12.2%
13.8%
14.4%
15.0%
15.3%
15.3%
CRM
9.1
21.2
37.0
42.2
48.5
55.7
63.8
38.5%
% margin
4.8%
7.3%
10.6%
11.0%
11.5%
12.0%
12.5%
Portfolio Management
47.5
44.7
46.8
50.6
56.5
62.1
67.8
6.1%
% margin
32.8%
24.1%
24.8%
26.2%
27.5%
27.7%
27.7%
Total EBITDA
146.7
180.1
219.8
242.2
269.8
297.9
323.6
14.1%
% margin
13.9%
14.0%
15.7%
16.2%
16.9%
17.3%
17.5%
Net Income
44.5
60.7
86.7
102.1
118.2
135.6
149.5
22.4%
EPS
$1.33
$1.82
$2.52
$2.94
$3.36
$3.81
$4.16
20.9%
Note: ARM includes ARM International. Q2 and Q4 FY2005 reflect reclassification of gains on sales of aged portfolios into Portfolio Management revenue.
CONFIDENTIAL
13
Overview of North Financial Plan (cont’d)
($ in millions)
Quarterly FY2005A
Quarterly FY2006E
(1)
FYE December 31,
Q1:05A
Q2:05A
Q3:05A
Q4:05A
Q1:06E
Q2:06E
Q3:06E
Q4:06E
2005A
2006E
Revenue:
ARM
$201.5
$195.8
$190.3
$216.8
$236.6
$234.0
$233.3
$232.5
$804.5
$936.4
% growth
3.5%
3.9%
4.0%
20.5%
17.4%
19.5%
22.6%
7.2%
7.8%
16.4%
CRM
47.6
43.8
44.9
54.1
59.3
67.9
77.6
84.3
190.4
289.1
% growth
NM
(26.3%)
(14.9%)
15.6%
24.5%
55.1%
72.7%
55.9%
19.7%
51.8%
Portfolio Management
27.8
33.0
35.1
48.8
48.1
47.0
45.9
44.3
144.7
185.3
% growth
28.7%
36.8%
33.4%
87.9%
73.0%
42.3%
30.6%
(9.1%)
47.6%
28.0%
Eliminations
(16.6)
(20.2)
(21.2)
(29.3)
(32.6)
(33.0)
(30.1)
(28.9)
(87.3)
(124.6)
Total Revenue
$260.3
$252.4
$249.2
$290.3
$311.4
$315.9
$326.6
$332.3
$1,052.3
$1,286.2
% Y-o-Y growth
29.4%
(1.1%)
1.3%
22.4%
19.6%
25.1%
31.1%
14.4%
12.0%
22.2%
% Q-o-Q growth
9.7%
(3.0%)
(1.3%)
16.5%
7.2%
1.5%
3.4%
1.7%
EBITDA
ARM
25.1
24.8
18.1
22.2
28.5
26.7
30.2
28.9
90.2
114.2
% margin
12.5%
12.7%
9.5%
10.2%
12.0%
11.4%
12.9%
12.4%
11.2%
12.2%
CRM
5.4
3.0
0.6
(0.0)
1.4
4.8
6.2
8.7
9.1
21.2
% margin
11.4%
6.9%
1.3%
(0.0%)
2.4%
7.0%
8.0%
10.3%
4.8%
7.3%
Portfolio Management
9.0
10.8
11.2
16.5
11.7
9.6
11.8
11.5
47.5
44.7
% margin
32.5%
32.6%
31.9%
33.8%
24.4%
20.5%
25.8%
25.9%
32.8%
24.1%
Total EBITDA
39.6
38.6
29.8
38.7
41.6
41.1
48.2
49.1
146.7
180.1
% margin
15.2%
15.3%
12.0%
13.3%
13.4%
13.0%
14.8%
14.8%
13.9%
14.0%
Net Income
15.3
14.1
7.6
7.5
13.4
13.0
16.9
17.5
44.5
60.7
EPS
$0.45
$0.42
$0.24
$0.23
$0.40
$0.39
$0.51
$0.52
$1.33
$1.82
Note: ARM includes ARM International. Q2 and Q4 FY2005 reflect reclassification of gains on sales of aged portfolios into Portfolio Management revenue.
(1) Quarterly EPS estimated based on 33.4M average shares outstanding.
Significant EBITDA growth
in CRM as new customers
ramp during 2006
Portfolio Management
EBITDA boosted from sales
of near zero-cost portfolios
ARM negatively impacted
from impact of hurricanes
Katrina and Rita as well as
lower collection rates due to
high gas costs
CONFIDENTIAL
14
North Expects to Exceed Current Street Expectations
Management revenue estimates
exceed Street by 6% in 2006
2006 EBITDA margin in line with
Street
Management EPS estimates
exceed Street by 6% in 2006
Street does not have clear picture
of 2007 performance
EPS estimates vary
considerably (high of $2.12 v.
low of $1.70)
Analysts remain cautious about the prospect of North executing its plan in the current
market
Observations
($ in millions, except per share amounts)
Internal Mgmt.
Avg. Street
Projections
Estimates
Diff. ($)
Diff. (%)
CY2006E
Revenue
$1,286.2
$1,211.8
$74.4
6.1%
% growth
22.2%
15.2%
EBITDA
180.1
175.9
4.2
2.4%
% margin
14.0%
14.5%
Net Income
60.7
57.8
2.9
5.0%
% margin
4.7%
4.8%
EPS
$1.82
$1.71
$0.11
6.3%
Note: Average Street Estimates include Boenning & Scattergood, CIBC, First Analysis and JMP.
Street estimates are pro forma for Q1:06 expected restructuring charge.
CONFIDENTIAL
15
$0.41
$0.39
$0.47
$0.41
$0.42
$0.11
$0.45
$0.36
$0.39
$0.45
$0.24
$0.23
$0.00
$0.10
$0.20
$0.30
$0.40
$0.50
Sep-04A
Dec-04A
Mar-05A
Jun-05A
Sep-05A
Dec-05A
Estimate
Actual
$12.00
$14.00
$16.00
$18.00
$20.00
$22.00
$24.00
$26.00
$28.00
$30.00
$32.00
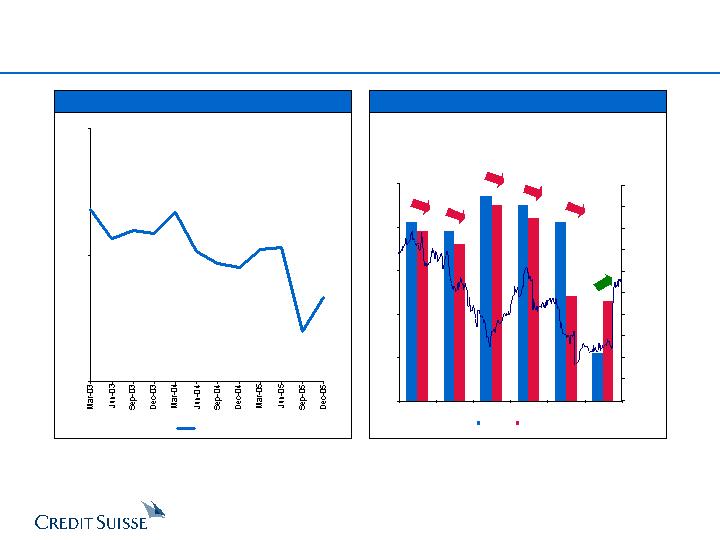
North Has Faced Challenges. . .
EBITDA Margins Have Compressed . . .
. . . With Volatile Earnings Results
10.0%
15.0%
20.0%
North
North Estimates vs. Actual Results
EPS
Stock Price
$0.02
$0.12
$0.03
$0.03
$0.17
Source: Company filings.
Source: Company filings and IBES consensus estimates.
$0.02
CONFIDENTIAL
16
5x
10x
15x
20x
25x
30x
3/17/03
12/16/03
9/15/04
6/16/05
3/17/06
North
S&P 500
Outsourced CRM
Portfolio Purchasers
5x
10x
15x
20x
25x
30x
3/17/05
6/16/05
9/15/05
12/15/05
3/16/06
North
S&P 500
Outsourced CRM
Portfolio Purchasers
CRM
Average
19.4x
. . . Resulting in Lower Valuations From Investors
NTM P/E Multiple - Last Twelve Months
NTM P/E Multiple - Last 3 Years
Portfolio
Purchasers
Average
13.4x
Source: FactSet.
Note: Outsourced CRM Services composite includes APAC, Convergys, ICT Group, Intrum
Justitia, PeopleSupport, Sitel, SR Teleperformance, Startek, Sykes Enterprises,
Teletech and West.
Portfolio Purchasers composite includes Asset Acceptance, Asta Funding, Encore
Capital and Portfolio Recovery.
S&P 500
Average
17.8x
CRM
Average
19.8x
Portfolio
Purchasers
Average
14.1x
S&P 500
Average
19.0x
North
Average
11.1x
North
Average
12.3x
CONFIDENTIAL
17
10x
15x
20x
25x
5.0%
10.0%
15.0%
20.0%
25.0%
West
Convergys
SR Tele.
Teletech
PSPT
ICT
Portfolio Recovery
Startek
North
Asset Acceptance
ASTA
Encore Capital
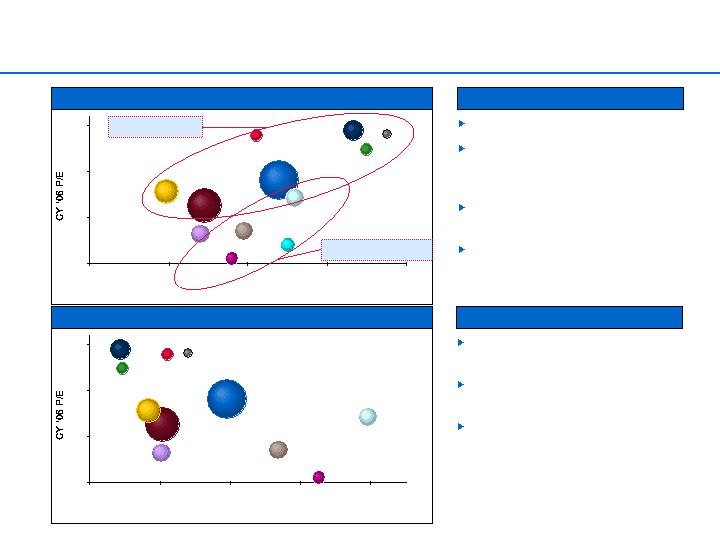
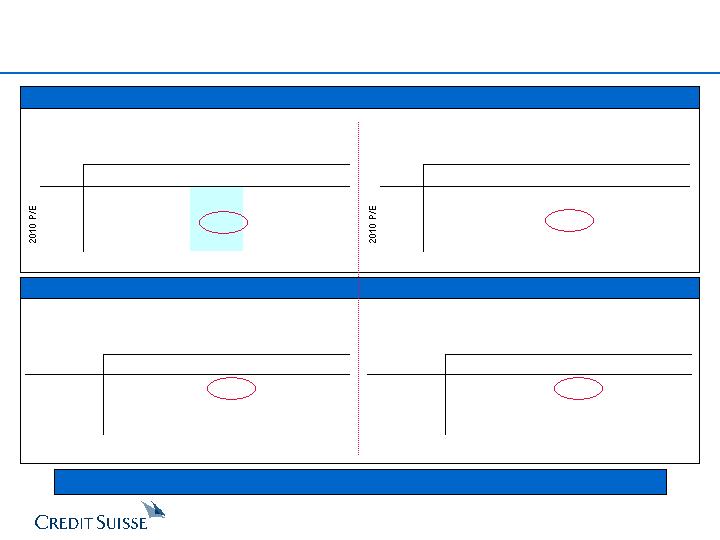
Comparable Company Benchmarking
Source: IBES consensus estimates, Wall Street research.
Note: Bubble size represents relative market capitalization. APAC excluded assumed not meaningful.
CY06 P/E and LTGR
I/B/E/S LT Growth Rate
Market rewards higher growth
North trades below its CRM
peers and closer to Portfolio
Purchasers
Significant work and execution
risk to move up the P/E curve
North’s shareholder base is
primarily value-focused investors
Observations
10x
15x
20x
25x
5.0%
15.0%
25.0%
35.0%
45.0%
West
Convergys
SR Tele.
Teletech
PSPT
ICT
Portfolio Recovery
Startek
North
Asset Acceptance
Encore Capital
CY06 P/E and CY06 EBITDA Margin
CY06 EBITDA Margin
Portfolio Purchasers
CRM Comparables
Market penalizes volatility of PM
business, despite higher margins
Market rewards improved
prospects of CRM
To achieve P/E expansion, North
will need to: 1) deliver results that
consistently meet or exceed
expectations; 2) deliver
consistent growth, and; 3) drive
revenue growth and meaningful
diversification into CRM
Observations
CONFIDENTIAL
18
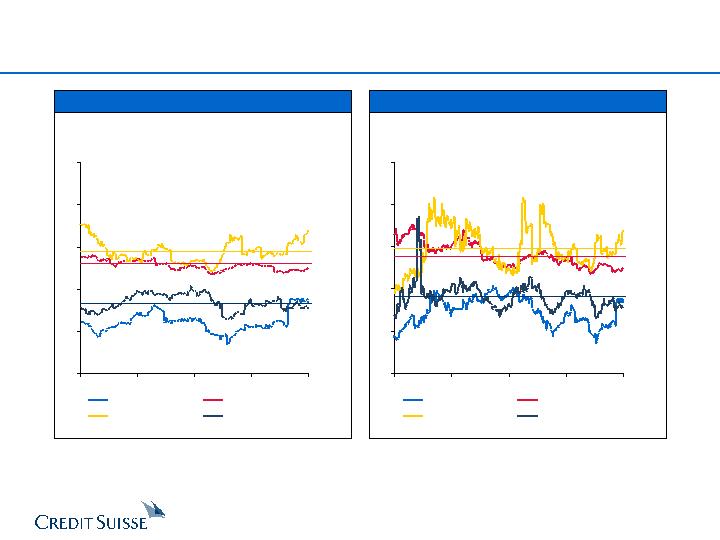
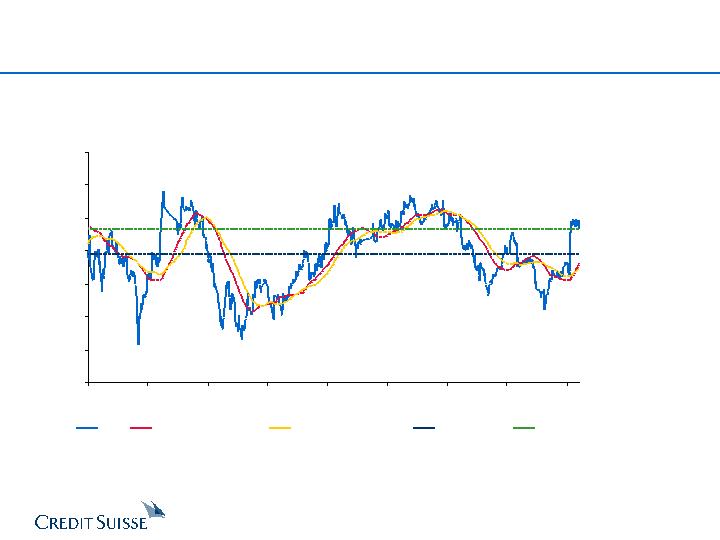
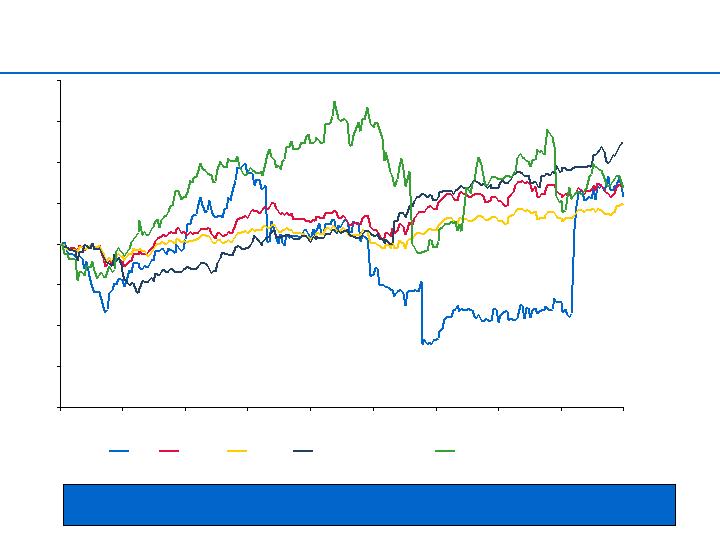
North’s Stock Price Has Recently Rebounded
North’s stock price has recently rebounded as a result of exceeding analysts
expectations in Q4 and providing strong guidance for 2006
March 19, 2004 to March 17, 2006
Source: FactSet.
Note: Outsourced CRM Services composite includes APAC, Convergys, ICT Group, Intrum Justitia, PeopleSupport, Sitel, SR Teleperformance, Startek, Sykes Enterprises, Teletech
and West.
Portfolio Purchasers composite includes Asset Acceptance, Asta Funding, Encore Capital and Portfolio Recovery.
$15
$17
$19
$21
$23
$25
$27
$29
3/19/04
7/1/04
10/12/04
1/24/05
5/5/05
8/16/05
11/25/05
3/10/06
0
300
600
900
1,200
1,500
1,800
2,100
Volume
North
NTM P/E: 9.2x
NTM P/E: 13.1x
NTM P/E: 8.4x
Current NTM P/E: 13.3x
NTM P/E: 15.1x
Current NTM P/E Multiples
Outsourced CRM: 21.8x
Portfolio Purchasers: 12.6x
CONFIDENTIAL
19
5-Year Historical NTM PE Performance
NTM Price / Earnings Multiple - March 16, 2001 to March 17, 2006
North
Current NTM P/E
13.3x
North Average
NTM P/E 11.8x
4.0x
6.0x
8.0x
10.0x
12.0x
14.0x
16.0x
18.0x
3/16/01
10/29/01
6/10/02
1/16/03
8/26/03
4/5/04
11/11/04
6/22/05
1/31/06
North
90-Day Rolling Average
120-Day Rolling Average
Period Average
Current
CONFIDENTIAL
20

Stand-Alone Plan:
Driving Shareholder Value Through Improved Growth
Share Price Sensitivity
Management Case
Future Stock Price - 2009EPS
Implied Stock Price -
2006EPS
Given current street outlook, North’s stock price may not reflect Management’s plan for a
number of quarters
Public market
unable to
identify
performance
improvements
from new
contract wins
($ in millions, except per share amounts)
FY05-10E Revenue CAGR
6.3%
8.3%
10.3%
12.0x
P/E
Implied FY09E Share Price
38.05
$
41.76
$ ��
45.76
$
Implied Current Share Price
(1)
21.10
23.16
25.38
Implied FY06E PEG
0.8x
0.7x
0.6x
13.0x
P/E
Implied FY09E Share Price
41.22
$
45.24
$
49.58
$
Implied Current Share Price
(1)
22.85
25.09
27.49
Implied FY06E PEG
0.9x
0.7x
0.6x
14.0x
P/E
Implied FY09E Share Price
44.39
$
48.72
$
53.39
$
Implied Current Share Price
(1)
24.61
27.02
29.60
Implied FY06E PEG
0.9x
0.8x
0.7x
Note: Assumes Net Income margin of 7.9% in 2010E based on Management projections
(1) Discounted from December 31, 2009 to March 31, 2006 assuming cost of equity of 17.0%.
Stock Price
Street
Mgmt.
FY 2006 EPS
1.71
$
1.82
$
20.55
21.84
22.26
23.66
23.98
25.48
21

Assumes $100MM buyback (4MM shares) at
10% premium to current
Buyback could be accomplished through open
market repurchase program or tender
Return Cash to Shareholders:
Preliminary Leveraged Recap Analysis
Illustrative Leveraged Recap Analysis
Observations
Strong signal to market that Company believes that shares
are undervalued
However, preliminary analysis suggests that shares may
be reasonably valued
Company should undertake buyback only when holding
excess capital vs. redeploying capital to grow existing
business
Fails to achieve a significant premium for exiting
shareholders
Repurchase program limited by liquidity issues
$100 million repurchase would represent 14% of float
($ in millions, except per share amounts)
Current Share Price
$22.64
Share Repurchase Premium
10.0%
Implied Repurchase Price
$24.90
Purchase of Shares
(1)
$100.0
Shares Repurchased
4.0
% of float
(2)
13.6%
New Debt Issued
$102.6
Pro Forma
Debt / LTM EBITDA
3.2x
PF 06E EPS
(3)
$1.88
% acr./(dil.)
3.3%
(1) Assumes fees and expense of 2.5% on new debt
(2) Based on 32.3MM shares outstanding (2.8MM held
by insiders).
(3) Assumes 7% interest on new debt.
CONFIDENTIAL
22

3. Acquisition Alternatives
A. Consolidate in ARM
CONFIDENTIAL
23

Should North Consolidate the ARM Market?
Consolidate in ARM:
Rationale / Considerations
Growth outlook for Transaction Management
continues to exceed other Finance &
Accounting BPO functions
Increased adoption rates in key verticals
Potential for significant cost and revenue
synergies
Ability to improve collection rates
May help stabilize prices
Creates opportunity to cross sell services
Continue to expand distance between next-
closest competitor
What makes it difficult
Most potential targets have inefficient operating
models
Many VC-backed with unrealistically high value
expectations
Potential strain on internal resources and
initiatives
Moves North farther away from “BPO
perception” objective
Minimal improvement to revenue visibility
Expect to continue to experience pricing
pressure
Selected Acquisition Opportunities:
CONFIDENTIAL
24

Financial Analysis of All Cash Illustrative Acquisition
Assumes an acquisition for $450MM (1.0x 06 Rev of $450MM / 12.5x 06 EBITDA of $36MM)
Incremental revenue of $450MM (2006); revenue loss of 15% in 2007 and 10% in 2008 as a result of
cannibalization
Incremental EBITDA margin of 8%, increasing to 12.5% by 2008
No synergies associated with the acquisition
Stand-Alone
Consolidate in ARM:
With Acquisition
(1) PV of Future Share price based on cost of equity of 17.0%.
An ARM acquisition at 1x revenue does not materially impact share price
10% Discount to
FY10 EPS implies:
Stand-Alone $24.74
With Acquisition $25.06
($ in millions, except per share data)
'06-'10
PF2006
PF2010
CAGR
Incremental Revenue
$450.0
$361.5
(5.3%)
Pro Forma Revenue
$1,736.2
$2,079.8
4.6%
% Growth
NM
7.1%
Incremental EBITDA
$36.0
$45.2
5.8%
% Margin
8.0%
12.5%
Synergies
$0.0
$0.0
Pro Forma EBITDA
$216.1
$343.1
12.3%
% Margin
12.4%
16.5%
Incremental A/T Int.
19.6
19.4
Pro Forma Net Income
$55.1
$137.4
25.6%
% Margin
3.2%
6.6%
Stand-Alone EPS
$1.82
$3.81
20.3%
PF EPS
(1)
$1.66
$3.86
23.6%
Accretion / (Dilution)
(9.0%)
1.4%
(1) Assumes acquisition financed through debt at a rate of 7.0%.
2010 EPS
$3.81
12.0x P/E
Implied FY09E Share Price
$45.76
Implied Current Share Price
(1)
$25.38
Implied FY06E PEG
0.6x
13.0x P/E
Implied FY09E Share Price
$49.58
Implied Current Share Price
(1)
$27.49
Implied FY06E PEG
0.6x
14.0x P/E
Implied FY09E Share Price
$53.39
Implied Current Share Price
(1)
$29.60
Implied FY06E PEG
0.7x
$3.86
$46.36
$25.70
0.5x
$50.22
$27.84
0.6x
$54.08
$29.99
0.6x
CONFIDENTIAL
25
EBITDA Margin in 2008-10
$27.84
9.5%
11.0%
12.5%
14.0%
15.5%
12.0x
$24.45
$25.08
$25.70
$26.33
$26.95
13.0x
26.49
27.17
27.84
28.52
29.20
14.0x
28.53
29.26
29.99
30.72
31.45
Implied Share Price Sensitivity Analysis
Consolidate in ARM:
2010 P/E / EBITDA Margin Sensitivity
Purchase Price Multiple / EBITDA Margin Sensitivity
An ARM acquisition will enhance shareholder value only at the right price
Present Value of Future Stock Price
Present Value of Future Stock Price - 13x P/E
EBITDA Margin in 2008-10
$0.00
9.5%
11.0%
12.5%
14.0%
15.5%
12.0x
($3.04)
($2.41)
($1.79)
($1.16)
($0.54)
13.0x
(1.00)
(0.32)
0.35
1.03
1.71
14.0x
1.04
1.77
2.50
3.23
3.96
Purch. Price /
EBITDA Margin in 2008-10
Rev Mult.
#####
9.5%
11.0%
12.5%
14.0%
15.5%
$450
1.00x
$26.49
$27.17
$27.84
$28.52
$29.20
338
0.75x
27.47
28.15
28.83
29.51
30.18
225
0.50x
28.46
29.14
29.81
30.49
31.17
Purch. Price /
EBITDA Margin in 2008-10
Rev Mult.
$0.00
9.5%
11.0%
12.5%
14.0%
15.5%
$450
1.00x
($1.00)
($0.32)
$0.35
$1.03
$1.71
338
0.75x
(0.02)
0.66
1.34
2.02
2.69
225
0.50x
0.97
1.65
2.32
3.00
3.68
Difference v. Base Case ($27.49)
Difference v. Base Case ($27.49)
CONFIDENTIAL
26

B. Consolidate in CRM
CONFIDENTIAL
27
Should North Consolidate the CRM Market?
Consolidate in CRM:
Rationale / Considerations
Successful integration of multiple tack-ons or
transformational deal
Revenue opportunities through sale of new
services to North’s existing customers
Acquired businesses have a positive
financial impact on North’s growth profile and
profitability
Attempt to achieve P/E expansion in line
with premier CRM firms
Additional CRM services expand depth of
customer relationships and strengthen
competitive position
What makes it difficult
Multiple transactions may be required to
transform North’s business model profile
Availability of attractive targets is limited
Targets currently trade at higher valuations
than historical norms
May not be anticipated by North shareholders
Have to create, or acquire and integrate,
additional internal competencies to optimize
value of acquisitions
Require additional sales and marketing
expertise and channel strategy
Need significant offshore presence
Potential dilution in the near-term
Selected Acquisition Opportunities:
CONFIDENTIAL
28
($ in millions, except per share data)
'06-'10
PF2006
PF2010
CAGR
Incremental Revenue
$88.9
$131.9
10.4%
Pro Forma Revenue
$1,375.1
$1,850.3
7.7%
% Growth
NM
7.4%
Incremental EBITDA
$16.9
$25.9
11.3%
% Margin
19.0%
19.6%
Synergies
$0.9
$3.6
Pro Forma EBITDA
$197.9
$327.4
13.4%
% Margin
14.4%
17.7%
Incremental A/T Int.
8.8
8.7
Pro Forma Net Income
$58.3
$138.1
24.1%
% Margin
4.2%
7.5%
Stand-Alone EPS
$1.82
$3.81
20.3%
PF EPS
(1)
$1.75
$3.88
22.1%
Accretion / (Dilution)
(4.0%)
1.9%
(1) Assumes acquisition financed through debt at a rate of 7.0%.
10% Discount to
FY10 EPS implies:
Stand-Alone $24.74
With Acquisition $25.19
Financial Analysis of All Cash Acquisition - PeopleSupport
Assumes an acquisition of PeopleSupport for $192MM (30% premium over current stock price, 11.4x 2006
EBITDA of $16.9MM)
Incremental revenue of $88.9MM (Year 1), growing to $131.9MM in 2010
EBITDA margin of 19.0%, growing to 19.6%
Synergies equal to $3.6MM (5% of total costs), phased in over three years
Consolidate in CRM:
Stand-Alone
With Acquisition
(1) PV of Future Share price based on cost of equity of 17.0%.
Total CRM revenue of $586MM,
represents 32% of total.
2010 EPS
$3.81
12.0x P/E
Implied FY09E Share Price
$45.76
Implied Current Share Price
(1)
$25.38
Implied FY06E PEG
0.6x
13.0x P/E
Implied FY09E Share Price
$49.58
Implied Current Share Price
(1)
$27.49
Implied FY06E PEG
0.6x
14.0x P/E
Implied FY09E Share Price
$53.39
Implied Current Share Price
(1)
$29.60
Implied FY06E PEG
0.7x
$3.88
$46.60
$25.84
0.5x
$50.49
$27.99
0.6x
$54.37
$30.15
0.6x
Note: PeopleSupport projections based on Piper Jaffray research report, dated March 7, 2006.
CONFIDENTIAL
29
Implied Future Share Price Sensitivity Analysis
Consolidate in CRM:
Public markets may not afford North a CRM multiple without a meaningful proportion of
CRM revenue
Based on stand-alone plan, CRM represents approximately 27% of total revenue by 2010
A meaningful CRM revenue mix would require significant acquisitions
Valuations currently high
Dilutive to EPS
Significant integration risk
Achieving scale in CRM and P/E multiple expansion would require a substantial capital
investment which will also result in significant short term dilution especially given
current growth trajectory of the CRM business
($ in millions)
Targeted FY10 Rev Mix
(1)(2)
Required 2010 P/E to Achieve Premium Valuation
(3)
Target CRM
CRM Rev.
Required
FY2010
$1 Above
$5 Above
Revenue
Acquired
Acq. Cost
Acr. / (Dil.)
Base Case
Base Case
27%
$0.0
$0.0
0%
13.5x
15.4x
35%
210.9
207.5
(5%)
14.1
16.1
45%
561.7
552.5
(11%)
15.1
17.2
55%
1,068.4
1,050.8
(16%)
16.1
18.4
(1) Assumes total FY2010 revenue of $1,718MM ($464MM from CRM)
(2) Assumes 12x EBITDA purchase price (12% margin), acquired CRM revenue growth of 10% per year and net income margin of 7%
(assumes synergies).
(3) Base Case represents present value of future stock price - 2009 Management Case EPS at 13x P/E. Assumes no synergies, 7% cost of
debt, 35.6MM shares outstanding in FY2010 based on standalone plan, 17% cost of equity and 50/50 cash/stock acquisition.
Compares to current
P/E of 13.2x
CONFIDENTIAL
30

C. Enter BPO
CONFIDENTIAL
31

Should North Enter the BPO Market?
Enter into BPO:
Rationale / Considerations
Beachhead transaction required to acquire
capabilities and expertise
Revenue synergies through sale of new
services to North’s existing customers
Acquisitions would require additional
managerial focus / skill sets
Acquired businesses impact would depend
on vertical
Additional BPO services expand depth of
customer relationships and strengthen
competitive position
BPO typically “stickier” revenue
What makes it difficult
Very sought-after companies
Focus of every IT services, call center and
processing company
Acquiring BPO companies is expensive:
North less experienced with BPO business
Need significant offshore capability
Difficult to acquire when market is waiting to see
demonstrated earnings improvement
Selected Acquisition Opportunities:
Announce
Transaction Value /
Date
Acquiror
Target
LTM EBITDA
02/09/06
Solera
ADP Claims Services
10.0x
01/30/06
West
Intrado
13.2
01/09/06
Sage Group PLC
(1)
Verus Financial Management
13.5
12/27/05
Fidelity National Financial
Sedgwick CMS Holdings
12.7
09/22/05
Investcorp
CCC Information Services
12.4
09/15/05
Fidelity National Info Services
Certegy
10.5
07/05/05
Carlyle Group
SS&C Technologies
23.2
05/10/05
Metavante
MBI
8.3
04/18/05
R.R. Donnelley & Sons
The Astron Group
13.6
03/28/05
Sungard
Private Equity Consortium
10.8
Mean
12.8x
Median
12.6x
North Current
7.6x
North should be opportunistic, but not focus on BPO acquisitions
CONFIDENTIAL
32

4. Sale Alternative
CONFIDENTIAL
33
Evaluation of Sale Alternative
Stand-Alone Plan
Alternative
Present Value of Share Price
Consolidate ARM
Consolidate CRM
Future Value of Share Price
$22.50 - $27.50
$23.00 - $28.00
$23.00 - $28.00
$41.00 - $50.00
$42.00 - $51.00
$42.00 - $51.00
Analysis assumes North does not execute multiple alternatives simultaneously
Analysis is not probability adjusted for the execution risk of each alternative or for the availability
of potential targets
Sale analysis must be evaluated in the context of North’s strategic alternatives
CONFIDENTIAL
34
$26.50
$25.00
$26.00
$30.00
$31.00
$29.00
$10
$20
$30
$40
Selected
Acquisitions
DCF
Leveraged
Buyout
35
CONFIDENTIAL
17.4x
-
15.8x
17.8x
-
15.1x
16.9x
-
15.6x
$79
CY2006E Unlevered NI
Enterprise Value / Unlevered NI
7.7x
-
7.0x
7.9x
-
6.7x
7.5x
-
6.9x
$180
CY2006E EBITDA
Enterprise Value / EBITDA
1.1x
-
1.0x
1.1x
-
0.9x
1.0x
-
1.0x
$1,286
CY2006E Revenue
Enterprise Value / Revenue
Implied Multiple
Implied Multiple
Implied Multiple
Statistic
63.1%
-
44.1%
68.5%
-
35.9%
57.7%
-
41.3%
$18.39
120 Day Average
64.1%
-
45.0%
69.6%
-
36.8%
58.6%
-
42.2%
$18.28
90 Day Average
56.3%
-
38.1%
61.6%
-
30.3%
51.1%
-
35.5%
$19.19
60 Day Average
39.5%
-
23.3%
44.2%
-
16.3%
34.9%
-
20.9%
$21.50
30 Day Average
Prem. to Avg. Stock Price over Period:
$1,377.6
-
$1,252.6
$1,413.8
-
$1,199.0
$1,341.9
-
$1,234.8
Enterprise Value
$999.2
-
$874.3
$1,035.4
-
$820.7
$963.5
-
$856.4
Equity Value
$30.00
-
$26.50
$31.00
-
$25.00
$29.00
-
$26.00
Share Price
Note: Assumes debt of $402.1MM (includes minority interest and out-of-the-money convertible securities) and cash of $23.7 million, based on 12/31/05 10-K.
52 Week Hi: $24.31
52 Week Lo: $15.28
Current: $22.64
($ in millions, except per share amounts)
Sale Alternative:
Preliminary Valuation Summary
Sale Alternative:
Preliminary Discounted Cash Flow Analysis
DCF Assumptions
DCF Sensitivity
($ in millions)
2006E
2007E
2008E
2009E
2010E
Total Revenue
$1,286.2
$1,399.5
$1,491.0
$1,597.8
$1,718.4
% growth
22.2%
8.8%
6.5%
7.2%
7.5%
Gross Profit
603.4
661.0
701.2
749.6
804.0
% margin
46.9%
47.2%
47.0%
46.9%
46.8%
EBITDA
180.1
219.8
242.2
269.8
297.9
% margin
14.0%
15.7%
16.2%
16.9%
17.3%
EBIT
127.7
170.9
196.3
224.4
255.3
% margin
9.9%
12.2%
13.2%
14.0%
14.9%
Cash Taxes
34.0
52.1
60.9
69.5
80.1
Tax Rate
26.6%
30.5%
31.0%
31.0%
31.4%
Unlevered Free Cash Flow
137.8
135.6
124.6
131.4
138.8
Note: Unlevered free cash flow is before subtraction of minority interest (minority interest is included in debt).
Discount
Terminal EBITDA Multiple
Rate
5.5x
6.0x
6.5x
14.0%
$459.3
$459.3
$459.3
PV Free Cash Flow
924.2
1008.3
1092.3
PV Terminal Value
1383.5
1467.5
1551.5
Aggregate Value
1005.1
1089.2
1173.2
Equity Value
$30.16
$32.47
$34.77
Equity Value per Share
5.8%
6.5%
7.0%
Implied Perpertuity Growth
15.0%
$448.5
$448.5
$448.5
PV Free Cash Flow
884.7
965.2
1045.6
PV Terminal Value
1333.2
1413.6
1494.1
Aggregate Value
954.9
1035.3
1115.7
Equity Value
$28.76
$31.00
$33.20
Equity Value per Share
6.8%
7.5%
8.0%
Implied Perpertuity Growth
16.0%
$438.1
$438.1
$438.1
PV Free Cash Flow
847.3
924.3
1001.3
PV Terminal Value
1285.4
1362.4
1439.4
Aggregate Value
907.0
984.0
1061.0
Equity Value
$27.42
$29.57
$31.70
Equity Value per Share
7.8%
8.5%
9.0%
Implied Perpertuity Growth
CONFIDENTIAL
36

Sale Alternative:
Illustrative DCF Sensitivity Analysis
Sale price dependent on ability to prove margin and growth of business
DCF Sensitivity - 6.0x FY2011E EBITDA Multiple; 15.0% WACC
A potential acquiror’s ability to pay a substantial premium will be driven by their ability to
establish synergy opportunities
However, risk exists potential acquiror will create their own lower financial plan
Cost
synergy
value
CY06-CY10 Change in Rev. Growth vs. Mgmt. Case
$28.50
(2.0%)
(1.5%)
(1.0%)
(0.5%)
0.0%
CY06 - CY10
(1.0%)
$25.10
$25.92
$26.76
$27.62
$28.50
Change in
(0.5%)
$26.25
$27.10
$27.97
$28.85
$29.75
EBITDA Margin
0.0%
$27.40
$28.27
$29.17
$30.08
$31.00
vs. Mgmt. Case
0.5%
$28.55
$29.45
$30.37
$31.29
$32.22
1.0%
$29.70
$30.62
$31.55
$32.49
$33.45
CONFIDENTIAL
37
Sale Alternative:
Preliminary Leveraged Buyout Analysis
Parameter
Range
Drivers
Equity Investment Horizon
~ 5 years
Investment horizon considerations
Equity Rate of Return
20 - 25%
Market conditions
Equity Capitalization
20 - 30%
Market conditions
Rate of returns criteria
Total Leverage
(Total Debt / EBITDA)
~5.0x
Amount / level of equity
Business valuation and market conditions
Comparable companies capital structure
Senior leverage: 3x
Subordinated leverage: 2x
CONFIDENTIAL
38
Sale Alternative:
Illustrative LBO Sensitivity Analysis
A financial sponsor may view risk in the management plan and have a downside case with
conservative EBITDA / cash flow assumptions
Imp. AV
$1,234.8
$1,270.5
$1,306.2
$1,341.9
$1,377.6
Shr. Price
$26.00
$27.00
$28.00
$29.00
$30.00
EBITDA Purchase / Exit Price Multiple
8.4x
8.7x
8.9x
9.1x
9.4x
CY06-CY10
0.0%
33.5%
32.3%
31.3%
30.4%
29.6%
Change in
(2.5%)
29.0%
27.9%
27.0%
26.2%
25.4%
Rev. Growth v.
(5.0%)
24.3%
23.3%
22.5%
21.7%
21.0%
Mgmt. Case
(7.5%)
19.2%
18.4%
17.6%
17.0%
16.4%
CONFIDENTIAL
39

Sale Alternative:
LBO Leverage Analysis
LBO Leverage Analysis - Change in Timing
Debt Capacity at
5x Leverage
LBO Using LTM
6/30/06 EBITDA
LBO Using 1H:06
Run-Rate EBITDA
$755MM
$830MM
LBO Using LTM
12/31/06 EBITDA
$900MM
EBITDA
$151MM
$166MM
$180MM
$70MM difference
represents PV of
$13MM(1) in EBITDA,
or approximately 13%
of 2H:06 EBITDA
$70MM difference
represents PV $2 per
share(2)
Observations
Board needs to evaluate
potential to generate additional
value per share v. timing risks
(execution of business plan,
change in credit markets)
(1) Represents difference of $14MM in EBITDA discounted 6 months at 17%.
(2) Represents difference in debt capacity per share (based on 32MM shares) discounted 6 months at 17%.
CONFIDENTIAL
40

Strong Syndicated Loan Market
Cash Inflows vs. New Issue Volume
New Issue Volume
Commentary
($ in billions)
Source: Loan Pricing Corp.
1999
2000
2001
2002
2003
2004
2005
Leveraged
$320
$310
$218
$260
$329
$480
$501
Non-Leveraged
697
886
889
709
601
867
994
Total
$1,017
$1,196
$1,107
$969
$930
$1,348
$1,495
After a record year in overall Leveraged Loan
issuance, 2006 has continued to be strong with heavy
volume from large LBO and M&A executions
2005 Market Headlines:
Institutional volume: a record $241 billion versus
$223 billion in 2004, and new money issuance
up 20% in ‘05 to $183 billion
LBO volume: surged 36% to $65 billion as large
LBO transactions (SunGard, Hertz, Neiman
Marcus, e.g.) became more commonplace
Second lien: niche category continued to flourish
to a new high of $16 billion.
Funds flow continued to be strong in 2005, with
inflows exceeding supply by $9.5 billion.
CLO vehicles are the principle source of inflows,
and hedge funds continue to increase presence
Market pricing is issuer friendly
BB institutional loan pricing still near record lows
(L+166bps) at 170bps
B institutional loan pricing of L+257bps is only 22bps
off its record low of L+235bps set in March 2005
Sale Alternative:
Source: Standard & Poor’s PMD.
121.5
157.7
74.4
91.4
55.9
35.5
50.8
57.7
123.2
148.3
75.4
69.1
49.8
33.5
45.7
59.7
Total Flows Into Institutional Accounts
New Issue Institutional Volume
1999
2000
2001
2002
2003
2004
1H05
2005
($ in billions)
CONFIDENTIAL
41
Review of Key Considerations
Issues for consideration
Execution risk in the current management plan
Achieving long term EPS growth targets will be challenging, particularly in core ARM
business
Past performance has been volatile
Shareholders subject to share price volatility if further “misses” occur
Other strategies available to North do not significantly enhance shareholder value
Shareholders receive a premium today
M&A market is strong allowing sellers to achieve competitive pricing
Strong LBO market
May be able to attract a strategic buyer
Process launched in the short-term should capture expected near-term performance
improvements
Sale process should likely be concluded after Q2/06 with significant visibility for the Q3 and
Q4 results
Private market should give credit to performance improvements on a forward basis
Pipeline of CRM / ARM providers expected to come to market in next 12-18 months
Sale processes likely to be related to operational issues
Acquisition multiples of “broken” competitors may taint M&A market in the sector
Sale Alternative:
A market test could be conducted on an expedited time frame
CONFIDENTIAL
42
Potential Acquirors: Financial
We believe that North will be highly attractive to financial buyers
Preliminary screening criteria
Fund size – financial buyer must be large enough to make the equity investment
Fund focus – understand the business services sector
Targeted Financial Buyers
Tier 2
Advent International Corporation
Bear Stearns Merchant Banking
Cerberus Capital Management
Code Hennessey & Simmons
Francisco Partners
Leonard Green & Partners
Oak Hill Capital
Oaktree Capital Management
Parthenon Capital
Platinum Equity
Temasek
Vista Equity Partners
Warburg Pincus
Tier 1
Apax Partners Worldwide
Bain Capital
Blackstone
The Carlyle Group
Citigroup Venture Capital
General Atlantic
Golden Gate Capital
Hellman & Friedman
New Mountain Capital
One Equity
Silver Lake Partners
Thomas H. Lee
Texas Pacific Group
Sale Alternative:
CONFIDENTIAL
43
COMPANY
CS RELATIONSHIP
MARKET CAP
CY2006 P/E
Tier 1
ACS
John Rexford, Head of Corp. Development
$8,239MM
17.3x
ADP
Jan Siegmund, Head of Strategy
$27,783MM
22.6x
Convergys
Sajid Malhotra, Head of M&A
Earl Shanks, CFO
$2,513MM
16.3x
Teletech
Kennet
h Tuchman, CEO
$836MM
24.5x
Sallie Mae
Thomas Fitzpatrick, CEO
$24,138MM
19.5x
West Corp
Thomas B. Barker, CEO
Rob Johnson, M&A
$3,150MM
19.1x
Tier 2
Cargill
William W. Veazey, SVP and CFO
Private
Ceridian
Douglas Neve, CFO
$3,883MM
24.5x
H&R Bl
ock
Mark Ernst, Chairman and CEO
$6,978MM
11.2x
Potential Acquirors: Strategic
We believe that North will be highly attractive to certain strategic buyers
Rationale
Extend capabilities in F&A BPO and CRM
Establish leadership in Transaction Mgmt
Attractive top line growth
BPO / Call Center
Rationale
Extend capabilities in F&A BPO and CRM
Reduce capital intensity in current business model
More favorable industry trends than in core North
America ITO market
IT Outsourcing
COMPANY
CS RELATIONSHIP
MARKET CAP
CY2006 P/E
Tier 1
Fidelity National
Bill Foley, Chairman and CEO
Brent Bickett, Head of M&A
$6,939MM
10.5x
Hewlett Packard
Hans Lidforss, Head of M&A
$101,513MM
17.1x
IBM
Dave Johnson, EVP, Corp. Development
$133,6
26MM
14.4x
Tier 2
Bertelsmann
(Arvato)
Joachim Arenth, SVP, Corp Development
Private
Perot
Peter Altabef, President and CEO
$1,897MM
16.5x
Sale Alternative:
CONFIDENTIAL
44
Potential Acquirors: Strategic (cont’d)
Rationale
Establish F&A BPO capabilities
Potential to accelerate margin improvements
Leadership position in North American market with recognized brand
Offshore
Rationale
Extend capabilities in F&A BPO and CRM
Establish leadership in Transaction Management
Avoid upfront capital investment in CRM
Installed large customer base may allow immediate "upside" opportunities for North
Consulting / SI
COMPANY
CS RELATIONSHIP
MARKET CAP
CY2006 P/E
Tier 1
Accenture
Tim Breene, Head of M&A
$27,797MM
19.2x
EDS
Tom Haubenstricker, Co-
CFO
$15,038MM
31.3x
Tier 2
Cap Gemini
Tim Critchfield, Finance Director, North America
$6,841MM
25.0x
CGI Group
Cl
aude S
é
guin, SVP, Corp Development
$2,517MM
13.3x
COMPANY
CS RELATIONSHIP
MARKET CAP
CY2006 P/E
Tier 1
HCL Technologies
Anil Chanana, Head of M&A
Shiv Nadar, CEO
$4,388MM
17.5x
ICICI Onesource
(1)
Anada Mukerji, CEO
Rajesh Subramaqnian, Head of Corp. Dev.
$12,158MM
17.0x
Wipro Spectramind
(1)
Sudip
Nandy, Head of M&A
Suresh Senapaty, CFO
$19,106MM
35.1x
Tier 2
Intelenet
Susir Kumar, CEO
Private
Genpact
Pramod Bhasin, CEO
Private
Sale Alternative:
(1) Parent company.
CONFIDENTIAL
45
Preliminary Process Outline / Transaction Timetable
Closing
Anti-trust and other regulatory approvals, as necessary
Closing
Stage 1: Initial Due
Diligence / Market
Assessment
Conduct management presentations
Provide data room access
Distribution of process letter and draft SPA
Provide parties Q2 results
Stage 3: Due
Diligence
CS receives initial indications and reports to Board
Selection of preferred buyer(s)
SPA negotiation with preferred buyer(s)
Board approvals
Execution of definitive agreements
Transaction announcement
Stage 4: Negotiation
/ Announcement
Stage
Description
Timing
4 Weeks
(April 3 - 24)
4 weeks
(Weeks of May 1 - 22)
5 Weeks
(Weeks of June 26 - July 24)
Receive final bids from potential buyers
Due diligence
Preparation of marketing materials (teaser, info memo, short-form management presentation)
Conduct short-form management presentation to selected group of Tier 1 strategic buyers
Determine level of Tier 1 buyer interest
3 Weeks
(Weeks of July 31 - Aug 14)
46
If limited Tier 1 strategic interest indicated, go broad
Contact Tier 2 buyers and execute confidentiality agreements if decision to go broad
Distribute info memo to all contacted buyers (include Q1 results and visibility into Q2)
Stage 2: Approach
Buyers
4 Weeks
(Weeks of May 29 - Jun 19)
Discuss with Board next steps
Sale Alternative:
CONFIDENTIAL

Appendix
A. North Situation Overview
CONFIDENTIAL
47

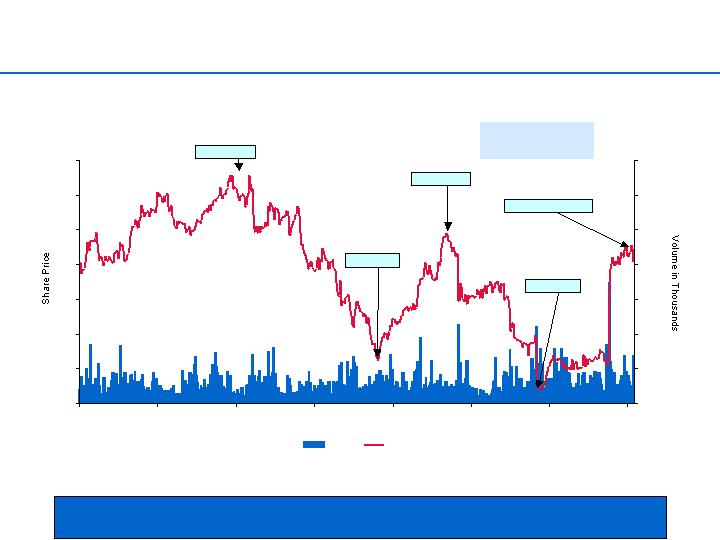
$15
$17
$19
$21
$23
$25
$27
3/17/05
4/27/05
6/7/05
7/18/05
8/25/05
10/5/05
11/14/05
12/23/05
2/6/06
3/17/06
0
300
600
900
1,200
1,500
1,800
2,100
Volume
North
7/7/2005: Announced $119MM
acquisition of Risk Management
Alternatives, a leading provider of
debt collection and accounts
receivable management services.
North Stock Price Performance
North’s stock price has recently rebounded back to levels from early last year as a result
of improved revenue and earnings performance
March 17, 2005 to March 17, 2006
Mar-05 Earnings
Date
5/3/05
EPS
$0.45
Revenue
$260.3
Q/Q Growth
25%
Y/Y Growth
5%
Jun-05 Earnings
Date
7/29/05
EPS
$0.42
Revenue
$247.2
Q/Q Growth
(7%)
Y/Y Growth
(2%)
Sep-05 Earnings
Date
11/7/05
EPS
$0.24
Revenue
$246.3
Q/Q Growth
(43%)
Y/Y Growth
(38%)
Dec-05 Earnings
Date
2/13/06
EPS
$0.23
Revenue
$290.3
Q/Q Growth
(4%)
Y/Y Growth
(36%)
Average Statistics
Period
Price
Volume
(000s)
Current
$22.64
402.8
Last 5 Days
23.17
191.7
Last 10 Days
23.17
226.2
Last 30 Days
21.50
234.4
Last 60 Days
19.19
202.1
Last 90 Days
18.28
224.0
CONFIDENTIAL
48
60
70
80
90
100
110
120
130
140
3/17/05
4/27/05
6/7/05
7/18/05
8/26/05
10/6/05
11/16/05
12/27/05
2/6/06
3/17/06
North
NASDAQ
S&P 500
Outsourced CRM Services
Portfolio Purchasers
Indexed Stock Price Performance
Note: Outsourced CRM Services composite includes APAC, Convergys, ICT Group, Intrum Justitia, PeopleSupport, Sitel, SR Teleperformance, Startek, Sykes Enterprises, Teletech and West.
Portfolio Purchasers composite includes Asset Acceptance, Asta Funding, Encore Capital and Portfolio Recovery.
Outsourced CRM
Services
+24.6%
NASDAQ
+14.4%
Portfolio
Purchasers
+13.8%
North
+11.5%
Due to strong recent earnings report, North’s stock price performance has improved
relative to both its peers and the broader market
S&P 500
+9.8%
CONFIDENTIAL
49
Boenning & Scattergood
CIBC
Deutsche Bank
JMP Securities
SunTrust Robinson
Humphrey
Analyst
Sutherland
Thompson
Sakakeeny
Scharf
Hughes
Latest
2/15/2006
2/14/2006
2/14/2006
2/14/2006
2/14/2006
Comments
Price Target
$26.00
NA
$17.00
$25.00
$26.00
Methodology
CY06 P/E (supported by
DCF)
NA
DCF
CY07 P/E and EBITDA
CY06 P/E
Metrics
$1.72 CY06 EPS
NA
Terminal value growth
of 4%, risk premium of
6%, WACC of 12%
$1.92 CY07 EPS
$188.7M CY07
EBITDA
$1.60 CY06 EPS
Multiples Used
15x EPS
NA
NA
13x EPS; 6x EBITDA
16x EPS
Rating
Market OutPerform
Sector Performer
Hold
Market Outperform
Buy
Recent Analyst Commentary
While the Street was positive on the results for the recent quarter, analysts will likely
remain cautious for the next few quarters
Stated Valuation
Methodologies
CONFIDENTIAL
50
Our estimate is quite
conservative relative to
management’s guidance
range, which is
deliberate based on on-
going concerns about
pricing and cost
pressures in the core
ARM business.
Skepticism is likely to
linger in the shares,
given the company’s
multi- year record
earnings misses and
lower expectations.
This creates, in our
view, an excellent
buying opportunity.
Despite the lingering
hurricane-related impact
on operations in the Gulf
Coast region, and a
deterioration in the
amount of payments
received from
consumers, North
managed EPS of $0.38
(excluding ~$0.15 in
restructuring charges),
well ahead of our $0.28
est.
Given the lack of
evidence pointing to any
easing of a tough
operating environment,
we are hesitant to
herald 4Q05 as the
turning point in North’s
fortunes. However, we
applaud the impressive
4Q05 outperformance,
which certainly bodes
well for 2006.
Topline grew 23% YoY
but were almost entirely
attributed to
acquisitions. Higher fuel
costs and the overhang
from recent hurricanes
continue to weigh on
results.
We are lowering
adjusted 1Q06 and
2006 EPS from $0.42
and $1.65 to $0.37 and
$1.60. Our 1Q06 and
2006 revenue forecasts
are unchanged at
$275.0mm and $1,065.7
mm.
We believe that a
difficult sub-prime
market will continue to
limit share appreciation
and reiterate our Hold
rating.
Despite an almost 20%
rise in shares of North
today, we have
increased conviction in
the company’s
surprisingly strong 2006
guidance. The
combination of better
visibility in North
Portfolio from forward
flow deals, higher
volumes and debt sales,
the ongoing ramping of
big client wins in CRM,
and our no-growth,
cautious assumptions in
the ARM segment
combine to form
achievable estimates
with a compelling cash
flow-based valuation.
The company benefited
from acquisitions closed
in 3Q including Marlin
and RMA.
Our $26 per share price
target assumes the
current-year P/E
multiple expands to
around 16x our 2006E
EPS of $1.60. We
believe that high quality
business services
companies should trade
at P/E multiples that are
in line or slightly ahead
of their trendline growth
rates.
0.4x
0.6x
0.8x
1.0x
1.2x
1.4x
1.6x
3/17/05
4/27/05
6/7/05
7/18/05
8/26/05
10/6/05
11/16/05
12/27/05
2/6/06
3/17/06
North
Outsourced CRM Services
Portfolio Purchasers
0.0x
5.0x
10.0x
15.0x
20.0x
25.0x
30.0x
3/17/05
4/27/05
6/7/05
7/18/05
8/26/05
10/6/05
11/16/05
12/27/05
2/6/06
3/17/06
North
Outsourced CRM Services
Portfolio Purchasers
Historical NTM PE Performance
NTM Price / Earnings Multiple
CRM
Average 1.1x
North
Average 0.9x
North
Average 11.1x
CRM
Average 19.4x
NTM PEG Ratio
Portfolio
Purchasers
Average 13.4x
Portfolio Purchasers
Average 0.8x
Note: Outsourced CRM Services composite includes APAC, Convergys, ICT Group, Intrum Justitia, PeopleSupport, Sitel, SR Teleperformance, Startek, Sykes Enterprises, Teletech and West.
Portfolio Purchasers composite includes Asset Acceptance, Asta Funding, Encore Capital and Portfolio Recovery.
North has historically traded at a discount to its peers, but has recently seen its
NTM P/E improve significantly
CONFIDENTIAL
51

Appendix
B. Comparable Company Analysis
CONFIDENTIAL
52
Trading Statistics of Comparable Companies
(USD millions, except per share amounts)
Trading Performance
FD Capitalization
Stock
Disc.
/ Prem.
Equity
Aggr.
FD Aggregate Value /
LT
CY2007
Price
to LTM
Market
Market
P/E Multiples
Revenue
EBITDA
Gr. Rate
PE /
COMPANY (FYE)
3/17/06
High
Low
Value
Value
CY06
CY07
CY06
CY07
CY06
CY07
(LTGR)
LTGR
NORTH (MANAGEMENT) (Dec.)
$22.64
(6.9%)
48.2%
$733
$1,112
12.4x
9.0x
0.9x
0.8x
6.2x
5.1x
12.0%
0.7x
NORTH (STREET) (Dec.)
$22.64
(6.9%)
48.2%
$733
$1,112
13.2x
11.9x
0.9x
0.9x
6.3x
6.1x
12.0%
1.0x
Outsourced CRM Services
WEST CORP (Dec.)
$43.03
(1.1%)
38.0%
$3,150
$3,395
19.1x
17.2x
2.0x
1.9x
8.2x
7.8x
17.0%
1.0x
CONVERGYS CORP (Dec.)
17.78
(0.7%)
41.3%
2,513
2,750
16.3x
14.6x
1.0x
1.0x
6.6x
6.2x
12.2%
1.2x
SR TELEPERFORMANCE (Dec.)
36.23
(1.1%)
29.7%
1,290
1,498
17.8x
15.8x
0.9x
0.9x
7.0x
6.4x
9.8%
1.6x
TELETECH HOLDINGS INC (Dec.)
11.76
(9.8%)
60.2%
836
838
24.5x
18.1x
0.7x
0.7x
7.8x
6.8x
21.7%
0.8x
INTRUM JUSTITIA NV (Dec.)
8.99
(8.8%)
35.9%
705
859
13.9x
13.0x
2.2x
2.1x
10.0x
9.4x
NA
NA
SYKES ENTERPRISES INC (Dec.)
14.34
(2.8%)
114.7%
578
451
24.7x
19.9x
0.9x
0.8x
8.8x
7.6x
NA
NM
ICT GROUP INC (Dec.)
25.10
0.0%
190.2%
339
364
22.4x
17.7x
0.8x
0.8x
8.4x
7.3x
22.5%
0.8x
STARTEK INC (Dec.)
22.52
0.0%
95.8%
335
295
24.0x
20.7x
1.3x
1.2x
7.8x
7.2x
15.5%
1.3x
SITEL CORP (Dec.)
3.99
(2.2%)
150.9%
300
412
24.9x
NA
NA
NA
5.2x
NA
NA
NM
PEOPLESUPPORT INC (Dec.)
9.66
(9.7%)
34.9%
185
143
24.2x
19.3x
1.6x
1.3x
8.5x
6.8x
23.8%
0.8x
APAC CUSTOMER SERVICES INC (Dec.)
2.31
(4.5%)
234.8%
114
125
38.5x
23.1x
0.6x
0.5x
6.7x
5.6x
15.0%
1.5x
Median
(2.2%)
60.2%
24.0x
17.9x
1.0x
0.9x
7.8x
7.0x
16.3%
1.1x
Mean
(3.7%)
93.3%
22.8x
17.9x
1.2x
1.1x
7.7x
7.1x
17.2%
1.1x
Portfolio Purchasers
PORTFOLIO RECOVRY ASSOC INC (Dec.)
$45.35
(12.2%)
40.3%
$735
$736
17.1x
14.0x
3.9x
3.3x
8.7x
7.2x
18.0%
0.8x
ASSET ACCEPTANCE CAPITAL CP (Dec.)
19.65
(37.5%)
13.3%
731
681
13.6x
11.9x
2.5x
2.2x
7.7x
6.8x
14.8%
0.8x
ASTA FUNDING INC (Sep.)
33.76
(4.1%)
74.3%
498
586
12.0x
NA
6.6x
NA
NA
NA
17.5%
NM
ENCORE CAPITAL GROUP INC (Dec.)
16.48
(15.7%)
26.8%
393
575
10.5x
NA
2.6x
NA
7.0x
NA
14.0%
NM
Median
(14.0%)
33.5%
12.8x
12.9x
3.3x
2.8x
7.7x
7.0x
16.1%
0.8x
Mean
(17.4%)
38.7%
13.3x
12.9x
3.9x
2.8x
7.8x
7.0x
16.1%
0.8x
Overall Median
(4.1%)
41.3%
19.1x
17.4x
1.4x
1.1x
7.8x
7.0x
16.3%
0.9x
Overall Mean
(7.4%)
78.7%
20.2x
17.1x
2.0x
1.4x
7.7x
7.1x
16.8%
1.1x
Source: IBES consensus estimates and Wall Street Research
CONFIDENTIAL
53
Operating Statistics of Comparable Companies
(USD millions, except per share amounts)
Y/Y Revenue Growth
Y/Y EPS Growth
Revenue
CY06/
CY07/
EBIT Margin
EBITDA Margin
Net Margin
CY06/
CY07/
COMPANY (FYE)
CY06
CY07
CY05
CY06
CY06
CY07
CY06
CY07
CY06
CY07
CY05
CY06
NORTH (MANAGEMENT) (Dec.)
$1,286.2
$1,399.5
22.2%
8.8%
10.2%
13.0%
14.0%
15.7%
4.7%
6.2%
13.8%
38.5%
NORTH (STREET) (Dec.)
$1,211.8
$1,241.8
15.2%
2.5%
NM
NM
14.5%
14.6%
4.8%
4.9%
7.0%
10.8%
Outsourced CRM Services
WEST CORP (Dec.)
$1,692.7
$1,781.6
11.1%
5.3%
17.8%
18.1%
24.5%
24.4%
9.6%
10.2%
6.6%
11.1%
CONVERGYS CORP (Dec.)
2,701.7
2,877.8
4.6%
6.5%
9.9%
10.5%
15.3%
15.5%
5.9%
6.3%
26.7%
11.9%
SR TELEPERFORMANCE (Dec.)
1,593.2
1,704.0
9.5%
7.0%
9.3%
9.6%
13.4%
13.7%
5.5%
5.8%
19.3%
13.2%
TELETECH HOLDINGS INC (Dec.)
1,146.8
1,216.0
5.5%
6.0%
5.1%
6.3%
9.4%
10.1%
3.0%
3.8%
54.8%
35.4%
INTRUM JUSTITIA NV (Dec.)
393.4
417.1
6.9%
6.0%
18.7%
18.6%
21.8%
21.8%
12.8%
12.8%
25.6%
7.1%
SYKES ENTERPRISES INC (Dec.)
527.8
562.5
6.6%
6.6%
5.1%
6.6%
9.7%
10.5%
4.4%
5.1%
(1.7%)
24.1%
ICT GROUP INC (Dec.)
444.8
481.2
10.8%
8.2%
4.7%
5.5%
9.7%
10.3%
3.3%
3.9%
53.4%
26.8%
STARTEK INC (Dec.)
235.9
254.2
7.4%
7.8%
9.0%
9.8%
16.1%
16.1%
5.8%
6.4%
3.3%
16.0%
SITEL CORP (Dec.)
NA
NA
NM
NM
NA
NA
NA
NA
NA
NA
0.0%
NM
PEOPLESUPPORT INC (Dec.)
88.9
106.7
43.1%
20.0%
10.4%
11.3%
19.0%
19.6%
8.6%
9.2%
(20.0%)
25.0%
APAC CUSTOMER SERVICES INC (Dec.)
222.9
234.0
(7.1%)
5.0%
NM
NM
8.4%
9.6%
1.2%
2.2%
NM
66.7%
Median
7.2%
6.5%
9.3%
9.8%
14.3%
14.6%
5.7%
6.1%
13.0%
20.0%
Mean
9.9%
7.8%
10.0%
10.7%
14.7%
15.2%
6.0%
6.6%
16.8%
23.7%
Portfolio Purchasers
PORTFOLIO RECOVRY ASSOC INC (Dec.)
$189.0
$223.0
25.8%
18.0%
41.0%
42.0%
44.6%
46.0%
23.0%
24.6%
16.2%
22.6%
ASSET ACCEPTANCE CAPITAL CP (Dec.)
276.4
307.4
9.4%
11.2%
30.7%
31.5%
31.8%
32.7%
19.5%
20.1%
5.1%
13.8%
ASTA FUNDING INC (Sep.)
89.2
NA
17.5%
NM
80.5%
NA
NA
NA
45.8%
NA
23.5%
NM
ENCORE CAPITAL GROUP INC (Dec.)
219.8
NA
(1.0%)
NM
36.7%
NA
37.6%
NA
17.7%
NA
20.8%
NM
Median
13.4%
14.6%
38.8%
36.8%
37.6%
39.3%
21.3%
22.3%
18.5%
18.2%
Mean
12.9%
14.6%
47.2%
36.8%
38.0%
39.3%
26.5%
22.3%
16.4%
18.2%
Source: IBES consensus estimates and Wall Street Research
CONFIDENTIAL
54

Appendix
C. Additional Materials
CONFIDENTIAL
55
North
Shares
Percent
Investment
Rank
Shareholder
Held
Primary
Orientation
1
Dimensional Fund Advisors, Inc.
2,629,437
8.1%
2
Barclays Global Investors NA (CA)
1,921,857
5.9%
3
Ark Asset Management Co., Inc.
1,452,200
4.5%
4
AXA Rosenberg Investment Management LLC
1,398,113
4.3%
5
Columbia Management Advisors, Inc.
1,289,359
4.0%
6
Fisher Investments, Inc.
1,193,900
3.7%
7
Wentworth, Hauser & Violich, Inc.
1,078,267
3.3%
8
Merrill Lynch Investment Managers, Inc./Mercury Advisors
1,062,321
3.3%
9
State Teachers Retirement System of Ohio
999,061
3.1%
10
Brandywine Asset Management, Inc.
846,077
2.6%
Total Institutional Ownership
28,757,010
89.0%
North Shareholder Profile
North Top 10 Shareholders
Growth
Index
Value
GARP
Legend
$
Source: Thomson One Banker and FactSet. As of 12/31/2005.
$
$
$
$
$
$
$
Observations
North’s shareholders
are primarily value
investors
Do not see value
of CRM growth
opportunity
56

Cross Shareholder Analysis
Equity Assets
Peer Value ($MM)
Total Peer
Institutional Investor
Style
City
($MM)
NCOG
CVG
TTEC
SYKE
ICTG
SRT
PSPT
SWW
APAC
Holdings ($MM)
Dimensional Fund Advisors, Inc.
Deep Value
Santa Monica
$66,356.8
$44.5
$10.2
$16.7
$26.5
$3.7
$4.6
-
$12.6
$1.3
$75.5
Barclays Global Investors, N.A.
Index
San Francisco
645,206.6
32.5
204.1
47.6
25.1
1.4
15.1
0.7
3.2
0.7
297.8
Ark Asset Management Company, Inc.
Deep Value
New York
12,116.8
24.6
5.3
-
-
-
-
-
-
-
5.3
AXA Rosenberg Investment Management LLC
Core Value
Orinda
26,836.2
23.7
6.2
10.4
19.6
1.9
-
-
-
-
38.2
Columbia Management Advisors, Inc.
GARP
Boston
108,799.4
21.7
1.6
11.4
3.3
-
14.9
-
-
-
31.2
Fisher Investments, Inc.
Deep Value
Woodside
21,931.1
20.2
-
-
-
-
-
-
-
-
-
Wentworth, Hauser & Violich, Inc.
GARP
San Francisco
6,194.8
18.2
-
-
-
-
-
-
-
-
-
Merrill Lynch Investment Managers (NJ)
Deep Value
Plainsboro
114,263.1
18.0
154.2
1.3
1.1
0.0
0.6
-
0.0
0.2
157.5
State Teachers Retirement System of Ohio
Core Value
Columbus
28,062.5
16.9
2.9
0.5
1.8
-
0.2
-
-
-
5.4
Brandywine Asset Management, LLC
Deep Value
Wilmington
11,661.7
14.3
44.5
-
-
-
3.7
-
-
-
48.2
Peregrine Capital Management, Inc.
Core Growth
Minneapolis
10,095.1
13.7
-
-
-
-
-
-
-
-
-
Sterling Capital Management, LLC
Core Value
Charlotte
1,837.4
12.9
-
-
-
-
-
-
-
-
-
Vanguard Group, Inc.
Index
Malvern
381,092.3
12.2
74.1
14.6
9.5
1.6
2.4
0.4
1.8
0.7
105.2
Gannett Welsh & Kotler, LLC
Core Growth
Boston
967.0
12.1
-
-
-
-
-
-
-
-
-
Botti Brown Asset Management L.L.C.
Core Value
San Francisco
494.5
11.8
-
-
-
-
-
-
-
-
-
New Jersey Division of Investment
Core Growth
Trenton
36,078.2
14.7
0.1
-
-
-
-
-
-
-
0.1
Frontier Capital Management Company, LLC
GARP
Boston
5,441.8
9.9
-
0.3
0.3
-
-
-
-
-
0.6
Byram Capital Management, L.L.C.
Core Value
Greenwich
1,083.2
9.6
-
-
-
-
-
-
-
-
-
Rothschild Asset Management, Inc.
Deep Value
New York
4,432.4
8.7
-
-
15.3
-
-
-
-
-
15.3
AIC Ltd.
Core Value
Burlington
6,429.0
8.4
-
-
-
-
-
-
-
-
-
Wellington Management Company, LLP
Core Value
Boston
305,215.1
8.2
-
-
0.2
15.0
-
-
-
-
15.2
Royce & Associates, LLC
Deep Value
New York
21,567.4
8.0
1.9
-
0.1
-
0.5
-
-
-
2.5
State Street Global Advisors (US)
Index
Boston
462,405.9
7.8
65.9
12.8
6.9
1.9
3.1
-
0.2
0.0
90.8
Goldman Sachs Asset Management (US)
Core Growth
New York
118,469.2
6.9
14.1
16.0
5.4
-
0.4
-
-
-
35.9
Segall, Bryant & Hamill Investment Counsel
Core Growth
Chicago
2,627.8
6.8
-
-
-
-
-
-
-
-
-
College Retirement Equities Fund
GARP
New York
153,629.9
5.7
13.6
5.2
4.3
-
2.0
-
0.2
-
25.2
Martingale Asset Management, L.P.
Deep Value
Boston
3,810.9
5.5
-
2.6
-
-
3.9
-
-
-
6.5
New York State Teachers' Retirement System
Index
Albany
49,748.8
5.3
10.4
-
-
-
1.7
-
-
-
12.1
Teacher Retirement System of Texas
GARP
Austin
64,797.4
4.5
6.3
-
-
-
1.8
-
-
-
8.1
Northern Trust Investments, N.A.
Index
Chicago
116,007.1
3.6
19.9
3.2
2.5
0.3
1.6
0.1
0.3
0.1
28.0
Top 30 Institution Total
$410.9
$635.3
$142.6
$121.8
$25.8
$56.5
$1.2
$18.2
$3.1
$1,004.4
Total
$496.2
$862.7
$234.9
$195.6
$31.0
$107.8
$9.9
$49.3
$12.7
$1,503.9
Source: Thomson One Banker; 13F filings as of 12/31/05.
57
Cross Shareholder Analysis (cont’d)
Equity Assets
Peer Value ($MM)
Total Peer
Institutional Investor
Style
City
($MM)
NCOG
PRAA
AACC
ASFI
ECPG
Holdings ($MM)
Dimensional Fund Advisors, Inc.
Deep Value
Santa Monica
$66,356.8
$44.5
$13.6
$0.0
$6.5
$7.4
$27.4
Barclays Global Investors, N.A.
Index
San Francisco
645,206.6
32.5
30.6
6.3
9.0
8.4
54.3
Ark Asset Management Company, Inc.
Deep Value
New York
12,116.8
24.6
-
-
-
-
-
AXA Rosenberg Investment Management LLC
Core Value
Orinda
26,836.2
23.7
-
-
-
-
-
Columbia Management Advisors, Inc.
GARP
Boston
108,799.4
21.7
2.4
-
-
0.1
2.5
Fisher Investments, Inc.
Deep Value
Woodside
21,931.1
20.2
-
-
-
-
-
Wentworth, Hauser & Violich, Inc.
GARP
San Francisco
6,194.8
18.2
-
-
-
-
-
Merrill Lynch Investment Managers (NJ)
Deep Value
Plainsboro
114,263.1
18.0
3.4
0.2
0.7
0.5
4.9
State Teachers Retirement System of Ohio
Core Value
Columbus
28,062.5
16.9
0.8
0.5
0.6
0.3
2.1
Brandywine Asset Management, LLC
Deep Value
Wilmington
11,661.7
14.3
-
2.6
-
5.5
8.0
Peregrine Capital Management, Inc.
Core Growth
Minneapolis
10,095.1
13.7
-
9.2
-
-
9.2
Sterling Capital Management, LLC
Core Value
Charlotte
1,837.4
12.9
-
-
-
-
-
Vanguard Group, Inc.
Index
Malvern
381,092.3
12.2
22.2
14.7
3.2
6.7
46.7
Gannett Welsh & Kotler, LLC
Core Growth
Boston
967.0
12.1
-
-
-
-
-
Botti Brown Asset Management L.L.C.
Core Value
San Francisco
494.5
11.8
-
-
-
-
-
New Jersey Division of Investment
Core Growth
Trenton
36,078.2
14.7
-
-
-
-
-
Frontier Capital Management Company, LLC
GARP
Boston
5,441.8
9.9
6.9
0.2
0.1
-
7.2
Byram Capital Management, L.L.C.
Core Value
Greenwich
1,083.2
9.6
-
-
-
-
-
Rothschild Asset Management, Inc.
Deep Value
New York
4,432.4
8.7
-
-
-
-
-
AIC Ltd.
Core Value
Burlington
6,429.0
8.4
-
-
-
-
-
Wellington Management Company, LLP
Core Value
Boston
305,215.1
8.2
0.9
4.1
1.0
-
5.9
Royce & Associates, LLC
Deep Value
New York
21,567.4
8.0
-
-
-
-
-
State Street Global Advisors (US)
Index
Boston
462,405.9
7.8
17.2
8.4
3.3
3.3
32.1
Goldman Sachs Asset Management (US)
Core Growth
New York
118,469.2
6.9
20.5
1.5
5.4
-
27.3
Segall, Bryant & Hamill Investment Counsel
Core Growth
Chicago
2,627.8
6.8
-
-
-
-
-
College Retirement Equities Fund
GARP
New York
153,629.9
5.7
5.2
3.4
2.0
1.8
12.5
Martingale Asset Management, L.P.
Deep Value
Boston
3,810.9
5.5
2.8
2.7
1.1
-
6.5
New York State Teachers' Retirement System
Index
Albany
49,748.8
5.3
2.2
-
-
-
2.2
Teacher Retirement System of Texas
GARP
Austin
64,797.4
4.5
6.1
-
-
-
6.1
Northern Trust Investments, N.A.
Index
Chicago
116,007.1
3.6
5.3
1.4
2.4
1.7
10.9
Top 30 Institution Total
$410.9
$140.1
$55.0
$35.1
$35.5
$265.7
Total
$496.2
$275.7
$130.8
$108.4
$80.2
$595.1
Source: Thomson One Banker; 13F filings as of 12/31/05.
58
CRM Acquisition Sensitivity Analysis
($ in millions)
Targeted FY10 Rev Mix
(1)(2)
CRM Acquisition
(3)
Target CRM
Standalone
Standalone
CRM Rev.
Total CRM
Total
FY06 Acquired
FY06 Acquired
Required
Shares
Debt
Revenue
CRM Rev.
Non-CRM
Acquired
Revenue
Revenue
Sales
EBITDA
Acq. Cost
Issued
Issued
27%
$464.3
$1,254.0
$0.0
$464.3
$1,718.4
$0.0
$0.0
$0.0
0.0
$0.0
35%
464.3
1,254.0
210.9
675.3
1,929.3
144.1
17.3
207.5
4.6
103.7
45%
464.3
1,254.0
561.7
1,026.0
2,280.1
383.7
46.0
552.5
12.2
276.2
55%
464.3
1,254.0
1,068.4
1,532.7
2,786.8
729.7
87.6
1,050.8
23.2
525.4
Required 2010 P/E to Achieve Premium Valuation
(3)
PF EPS
FY2010
$1 Above
$5 Above
FY10
Acr. / (Dil.)
Base Case
Base Case
$3.81
0%
13.5x
15.4x
3.63
(5%)
14.1
16.1
3.41
(11%)
15.1
17.2
3.19
(16%)
16.1
18.4
(1) Assumes total FY2010 revenue of $1,718MM ($464MM from CRM)
(2) Assumes 12x EBITDA purchase price (12% margin), acquired CRM revenue growth of 10% per year and net income margin of 7% (assumes synergies).
(3) Base Case represents present value of future stock price - 2009 Management Case EPS at 13x P/E. Assumes no synergies, 7% cost of debt, 35.6MM shares outstanding
in FY2010 based on standalone plan, 17% cost of equity and 50/50 cash/stock acquisition.
CONFIDENTIAL
59

Preliminary Selected Acquisitions Analysis
($ in millions)
Date
Acquirer
Target
1/30/06
West Corp
Intrado
9/22/05
CVC International
Dun & Bradstreet - (ARM business)
9/12/05
NCO Group
Risk Management Alternatives
7/14/05
Genpact
Creditek Corp
6/30/05
Affiliated Computer Services
LiveBridge Corp
5/16/05
H-Cube LLC
Zenta Group
2/2/05
IBM Corp
Equitant
11/16/04
Mellon
SourceNet Solutions
11/8/04
Medassist
Argent
10/8/04
ICICI OneSource
Account Solutions Group
9/17/04
SLM Corp
Arrow Financial Services
7/23/04
West Corp
Worldwide Asset Management
5/25/04
Vertex
First Revenue Assurance
5/4/04
Convergys Corp
Encore Receivable Management
4/6/04
Daksh eServices
IBM Corp
3/22/04
ECE Holdings (H.I.G. Capital)
Stream International
2/2/04
Barclays Private Equity / Vision Capital
Cabot Financial (Europe)
1/15/04
CFSI
Genesis Financial Solutions
12/4/03
AllianceOne
TCH Group
11/18/03
NCO Group
RMH Teleservices
1/17/03
Affiliated Computer Services
CyberRep.com
8/1/02
Parthenon Capital
Arrow Financial Services
7/23/02
West Corp
Attention LLC
9/25/01
Solectron
Stream International
7/17/01
SNT Group NV
KPN NV - (CRM business)
7/17/01
SNT Group NV
Atos SA (CRM business)
3/13/01
Management Group / Intrum Justitia BV
Dun & Bradstreet - (ARM business)
(1) H-Cube acquired an 80% stake in Zenta Group for $80 million. GTCR Golder Rauner invested a further $20 million for a 20% stake.
(2) SLM Corp acquired a 64% stake in Arrow Financial Services and has the option to purchase the remaining interest over a three-year period.
Enterprise Value
Enterprise
as a multiple of
Target Description / Rationale
Value
Revenues
EBITDA
EBIT
Global provider of integrated data and telecommunications solutions.
$478
3.2x
13.5x
25.7x
Provides receivable management services worldwide.0
NA
NA
NA
NA
Provider of debt collection and accounts receivable management services.
$119
0.5x
4.0x
NA
Supplies outsourced accounts receivable consultation and management services to accounts receivable departments of small to mid-sized
corporations.
NA
NA
NA
NA
Offers outsourced and professional services to the contact center and business process markets.
$32
NA
NA
NA
Operates as a business process outsourcing company.
$100
(1)
NA
NA
NA
Expands business consulting unit by acquiring provider of finance and accounting outsourcing services
NA
NA
NA
NA
Adds accounts payable processing capability
NA
NA
NA
NA
Acquisition of Argent HFS adds complementary business and increases geographic reach, customer services and resources
NA
NA
NA
NA
Operates as a consumer collections agency.
NA
NA
NA
NA
Engages in purchasing and servicing performing and non-performing consumer debt.
NA
(2)
NA
NA
NA
Purchaser and collector of delinquent accounts receivable portfolios from consumer credit originators.
$178
1.7x
NA
NA
Acquisition of FRA (U.S. based debt collection agency) followed Vertex’s announcement of the establishment of Vertex Outsourcing, a North
American management subsidiary; $12 million of revenue in 2003
NA
NA
NA
NA
Provides receivable management solutions.
$68
NA
NA
NA
Offers online customer relationship management services.
$155
3.0x
8.0x
NA
Provides technical support and customer service outsourcing for the high-tech industry in the U.S. and Europe.
NA
NA
NA
NA
Provides debt purchasing and credit management solutions in the U.K.
£100
NA
NA
NA
TxCollect, a subsidiary of Collins, acquired consumer debt collection debt collection facility of Genesis Financial Solutions, which will expand
TxCollect’s rapidly growing contingency business
NA
NA
NA
NA
Expand Alliance’s outsourcing capabilities and enhances its near shore international offerings
NA
NA
NA
NA
Provides CRM solutions through various cannels including voice, VoIP, email, chat and self-help.
$109
0.4x
9.9x
NM
Provider of outsourced customer service, technical support and CRM solutions.
NA
NA
NA
NA
Engages in purchasing and servicing performing and non-performing consumer debt.
$45
NA
NA
NA
Accounts receivable management company.
$40
NA
NA
NA
Provides CRM solutions through various cannels including voice, VoIP, email, chat and self-help.
$329
1.0x
7.9x
13.8x
Provides call centers, inbound services, conferencing services and consulting and CRM training.
€ 180
NA
NA
NA
Provides customer call centers.
€ 69
NA
NA
NA
Provider of debt collection and accounts receivable management services.
$120
0.8x
4.9x
NA
Mean
1.5x
8.0x
19.8x
Median
1.0x
7.9x
19.8x
Note: Assumes debt of $411.8MM (includes minority interest and out-of-the-money convertible securities) and cash of $23.3 million, based on 12/31/05 10-K.
($ in millions, except per share amounts)
Statistic
Multiple Range
Implied Enterprise Value
Implied Equity Value
Implied Share Price
CY2005 Revenue
$1,052.3
1.0x
-
1.5x
$1,052
-
$1,578
$674
-
$1,200
$20.80
-
$35.50
CY2005 EBITDA
$146.7
7.0x
-
9.5x
$1,027
-
$1,394
$649
-
$1,016
$20.03
-
$30.46
Preliminary Valuation Reference Range
$1,250
-
$1,350
$872
-
$972
$26.43
-
$29.23
60

Weighted Average Cost of Capital Analysis
Assumptions
Cost of Equity
Tax Rate
35.00%
Cost of Equity = Risk Free Rate + Beta * Equity Risk Premium
+ Size Premium
Risk Free Rate (20 year)
(1)
4.66%
= 4.66% + 1.10 * 7.2% + 4.02%
Equity Risk Premium
(2)
7.20%
= 16.6%
Size Premium
4.02%
Industry Statistics
Debt /
Levering
Unlevered
Cost of
Beta
(3)
Mkt Eq.
Factor
(4)
Beta
(5)
Equity
NCOG
1.42
54.8%
1.36
1.05
12.2%
APAC
1.40
10.5%
1.07
1.31
14.1%
CVG
1.14
17.2%
1.11
1.02
12.0%
ICTG
1.09
10.3%
1.07
1.03
12.0%
737143
0.99
25.6%
1.17
0.85
10.8%
PSPT
1.03
0.0%
1.00
1.03
12.1%
SWW
1.12
49.5%
1.32
0.85
10.8%
599933
2.11
32.1%
1.21
1.74
17.2%
SRT
0.99
1.7%
1.01
0.97
11.7%
SYKE
1.11
0.0%
1.00
1.11
12.6%
TTEC
1.25
4.1%
1.03
1.22
13.4%
AACC
1.41
0.0%
1.00
1.41
14.8%
PRAA
0.99
2.2%
1.01
0.98
11.7%
ECPG
1.14
49.5%
1.32
0.86
10.8%
ASFI
1.14
18.4%
1.12
1.02
12.0%
Average
18.4%
1.10
12.6%
Plus: Size Premium
4.0%
Cost of Equity
16.6%
Cost of Capital
Pre-tax Cost of Debt
6.0%
6.5%
7.0%
7.5%
8.0%
8.5%
9.0%
9.5%
10.0%
10.5%
11.0%
After-tax Cost of Debt
3.9%
4.2%
4.6%
4.9%
5.2%
5.5%
5.9%
6.2%
6.5%
6.8%
7.2%
Debt/
Debt/
Average
Lev.
Levered
Cost of
Debt/
Size
Capital
Equity
Unlev. Beta
Factor
Beta
(6)
Equity
(7)
Capital
Premium
WEIGHTED AVERAGE COST OF CAPITAL
(8)
0.0%
0.0%
1.10
1.00
1.10
12.6%
0.0%
4.02%
16.6%
16.6%
16.6%
16.6%
16.6%
16.6%
16.6%
16.6%
16.6%
16.6%
16.6%
5.0%
5.3%
1.10
1.03
1.13
12.8%
5.0%
4.02%
16.2%
16.2%
16.2%
16.2%
16.3%
16.3%
16.3%
16.3%
16.3%
16.3%
16.4%
10.0%
11.1%
1.10
1.07
1.18
13.1%
10.0%
4.02%
15.8%
15.9%
15.9%
15.9%
15.9%
16.0%
16.0%
16.0%
16.1%
16.1%
16.1%
15.0%
17.6%
1.10
1.11
1.22
13.5%
15.0%
4.02%
15.4%
15.5%
15.5%
15.6%
15.6%
15.7%
15.7%
15.8%
15.8%
15.9%
15.9%
20.0%
25.0%
1.10
1.16
1.27
13.8%
20.0%
4.02%
15.1%
15.1%
15.2%
15.3%
15.3%
15.4%
15.5%
15.5%
15.6%
15.6%
15.7%
25.0%
33.3%
1.10
1.22
1.33
14.3%
25.0%
4.02%
14.7%
14.8%
14.8%
14.9%
15.0%
15.1%
15.2%
15.3%
15.3%
15.4%
15.5%
30.0%
42.9%
1.10
1.28
1.40
14.8%
30.0%
4.02%
14.3%
14.4%
14.5%
14.6%
14.7%
14.8%
14.9%
15.0%
15.1%
15.2%
15.3%
35.0%
53.8%
1.10
1.35
1.48
15.3%
35.0%
4.02%
13.9%
14.0%
14.2%
14.3%
14.4%
14.5%
14.6%
14.7%
14.8%
15.0%
15.1%
40.0%
66.7%
1.10
1.43
1.57
16.0%
40.0%
4.02%
13.6%
13.7%
13.8%
13.9%
14.1%
14.2%
14.3%
14.5%
14.6%
14.7%
14.9%
45.0%
81.8%
1.10
1.53
1.68
16.7%
45.0%
4.02%
13.2%
13.3%
13.5%
13.6%
13.8%
13.9%
14.1%
14.2%
14.3%
14.5%
14.6%
50.0%
100.0%
1.10
1.65
1.81
17.7%
50.0%
4.02%
12.8%
13.0%
13.1%
13.3%
13.5%
13.6%
13.8%
13.9%
14.1%
14.3%
14.4%
(1)
Interpolated yield on the 20-year U.S. Treasury bond (3/17/06).
(7)
Cost of Equity: Rf + B ( Rm - Rf ).
(2)
The average historic spread between the return on stocks and l-t bonds (Ibbotson Ass.)
(8)
WACC: Rd = Return on Debt Re = Return on Equity
(3)
Barra U.S. Equity Beta Book predictions
[ Rd * ( 1 - tax rate ) * ( D / (D + E) ) ] + [ Re * ( E / (D+E) ) ]
(4)
Levering Factor: 1 + [ ( 1 - tax rate ) * ( debt / equity ratio ) ]
(5)
Unlevered Beta: ( Beta / Levering Factor )
(6)
Levered Beta: ( Beta * Levering Factor )
CONFIDENTIAL
61

CS does not provide any tax advice. Any tax statement herein regarding any US federal tax is not intended or
written to be used, and cannot be used, by any taxpayer for the purpose of avoiding any penalties. Any such
statement herein was written to support the marketing or promotion of the transaction(s) or matter(s) to which the
statement relates. Each taxpayer should seek advice based on the taxpayer's particular circumstances from an
independent tax advisor.
These materials have been provided to you by Credit Suisse ("CS") in connection with an actual or potential mandate or engagement and
may not be used or relied upon for any purpose other than as specifically contemplated by a written agreement with CS. In addition, these
materials may not be disclosed, in whole or in part, or summarized or otherwise referred to except as agreed in writing by CS. The
information used in preparing these materials was obtained from or through you or your representatives or from public sources. CS
assumes no responsibility for independent verification of such information and has relied on such information being complete and accurate
in all material respects. To the extent such information includes estimates and forecasts of future financial performance (including
estimates of potential cost savings and synergies) prepared by or reviewed or discussed with the managements of your company and/or
other potential transaction participants or obtained from public sources, we have assumed that such estimates and forecasts have been
reasonably prepared on bases reflecting the best currently available estimates and judgments of such managements (or, with respect to
estimates and forecasts obtained from public sources, represent reasonable estimates). These materials were designed for use by specific
persons familiar with the business and the affairs of your company and CS assumes no obligation to update or otherwise revise these
materials. Nothing contained herein should be construed as tax, accounting or legal advice. You (and each of your employees,
representatives or other agents) may disclose to any and all persons, without limitation of any kind, the tax treatment and tax structure of
the transactions contemplated by these materials and all materials of any kind (including opinions or other tax analyses) that are provided
to you relating to such tax treatment and structure. For this purpose, the tax treatment of a transaction is the purported or claimed U.S.
federal income tax treatment of the transaction and the tax structure of a transaction is any fact that may be relevant to understanding the
purported or claimed U.S. federal income tax treatment of the transaction.
CS has adopted policies and guidelines designed to preserve the independence of its research analysts. CS’s policies prohibit employees
from directly or indirectly offering a favorable research rating or specific price target, or offering to change a research rating or price target,
as consideration for or an inducement to obtain business or other compensation. CS’s policies prohibit research analysts from being
compensated for their involvement in investment banking transactions.
CONFIDENTIAL
62