UNITED STATES
SECURITIES AND EXCHANGE COMMISSION
Washington, D.C. 20549
FORM N-CSR
CERTIFIED SHAREHOLDER REPORT OF REGISTERED
MANAGEMENT INVESTMENT COMPANIES
| | |
Investment Company Act file number: | | 811-07811 |
| |
Exact name of registrant as specified in charter: | | Jennison Mid-Cap Growth Fund, Inc. (f/k/a Jennison U.S. Emerging Growth Fund, Inc.) |
| |
Address of principal executive offices: | | Gateway Center 3, 100 Mulberry Street, Newark, New Jersey 07102 |
| |
Name and address of agent for service: | | Deborah A. Docs Gateway Center 3, 100 Mulberry Street, Newark, New Jersey 07102 |
| |
Registrant’s telephone number, including area code: | | 800-225-1852 |
| |
Date of fiscal year end: | | 8/31/2007 (Registrant changed its fiscal year end from October 31) |
| |
Date of reporting period: | | 8/31/2007 |
Item 1 – Reports to Stockholders


(Formerly known as Jennison U.S. Emerging Growth Fund, Inc.)
| | |
| AUGUST 31, 2007 | | ANNUAL REPORT |
Jennison Mid-Cap Growth Fund, Inc.
FUND TYPE
Small- to mid-capitalization stock
OBJECTIVE
Long-term capital appreciation
This report is not authorized for distribution to prospective investors unless preceded or accompanied by a current prospectus.
The views expressed in this report and information about the Fund’s portfolio holdings are for the period covered by this report and are subject to change thereafter.
JennisonDryden, Jennison, Prudential Financial and the Rock Prudential logo are registered service marks of The Prudential Insurance Company of America, Newark, NJ, and its affiliates.

October 15, 2007
Dear Shareholder:
On the following pages, you’ll find your annual report for the Jennison Mid-Cap Growth Fund, which includes performance data, an analysis of Fund performance, and a listing of its holdings at period-end. The Fund’s fiscal year has changed from a reporting period that ends October 31 to one that ends August 31. This change should have no impact on the way the Fund is managed. Shareholders will receive future annual and semiannual reports on the new fiscal year-end schedule.
Mutual fund prices and returns will rise or fall over time, and asset managers tend to have periods when they perform better or worse than their long-term average. The best measures of a mutual fund’s quality are its return compared to that of similar investments and the variability of its return over the long term. We recommend that you review your portfolio regularly with your financial adviser.
Sincerely,

Judy A. Rice, President
Jennison Mid-Cap Growth Fund, Inc.
| | |
| Jennison Mid-Cap Growth Fund, Inc. | | 1 |
Your Fund’s Performance
Fund objective
The investment objective of the Jennison Mid-Cap Growth Fund, Inc. is long-term capital appreciation. There can be no assurance that the Fund will achieve its investment objective.
Performance data quoted represent past performance. Past performance does not guarantee future results. The investment return and principal value of an investment will fluctuate, so that an investor’s shares, when redeemed, may be worth more or less than their original cost. Current performance may be lower or higher than the past performance data quoted. An investor may obtain performance data as of the most recent month-end by visiting our website at www.jennisondryden.com or by calling (800) 225-1852. Class A and Class L shares have a maximum initial sales charge of 5.50% and 5.75%, respectively. Gross operating expenses: Class A, 1.13%; Class B, 1.83%; Class C, 1.83%; Class L, 1.33%; Class M, 1.83%; Class R, 1.58%; Class X, 1.83%; Class Z, 0.83%. Net operating expenses apply to: Class A, 1.08%; Class B, 1.83%; Class C, 1.83; Class L, 1.33%; Class M, 1.83%; Class R, 1.33%; Class X, 1.83%; Class Z, 0.83%, after contractual reduction through 2/28/2008.
| | | | | | | | | | | |
| Cumulative Total Returns as of 8/31/07 |
| | | One Year | | | Five Years | | | Ten Years | | | Since Inception1 |
Class A | | 18.77 | % | | 141.28 | % | | 175.04 | % | | — |
Class B | | 17.89 | | | 132.37 | | | 154.91 | | | — |
Class C | | 17.89 | | | 132.37 | | | 154.91 | | | — |
Class L | | 18.49 | | | N/A | | | N/A | | | 20.71% (6/12/06) |
Class M | | 17.91 | | | N/A | | | N/A | | | 19.87 (6/12/06) |
Class R | | 18.55 | | | N/A | | | N/A | | | 42.98 (6/3/05) |
Class X | | 17.89 | | | N/A | | | N/A | | | 19.98 (6/12/06) |
Class Z | | 19.10 | | | 144.09 | | | 182.27 | | | — |
S&P MidCap 400 Index2 | | 16.48 | | | 106.42 | | | 208.62 | | | ** |
Russell Midcap Growth Index3 | | 19.31 | | | 124.06 | | | 107.82 | | | *** |
Lipper Mid-Cap Growth Funds Avg.4 | | 21.41 | | | 100.74 | | | 112.49 | | | **** |
Russell Midcap Index5 | | 16.18 | | | 127.01 | | | 176.05 | | | ***** |
| | |
| 2 | | Visit our website at www.jennisondryden.com |
| | | | | | | | | | | |
| Average Annual Total Returns6 as of 9/30/07 | | | |
| | | One Year | | | Five Years | | | Ten Years | | | Since Inception1 |
Class A | | 16.43 | % | | 21.76 | % | | 9.78 | % | | — |
Class B | | 17.31 | | | 22.14 | | | 9.57 | | | — |
Class C | | 21.30 | | | 22.24 | | | 9.57 | | | — |
Class L | | 15.87 | | | N/A | | | N/A | | | 15.27% (6/12/06) |
Class M | | 16.27 | | | N/A | | | N/A | | | 16.28 (6/12/06) |
Class R | | 22.91 | | | N/A | | | N/A | | | 19.44 (6/3/05) |
Class X | | 16.31 | | | N/A | | | N/A | | | 16.36 (6/12/06) |
Class Z | | 23.55 | | | 23.44 | | | 10.69 | | | — |
S&P MidCap 400 Index2 | | 18.76 | | | 18.17 | | | 11.60 | | | ** |
Russell Midcap Growth Index3 | | 21.22 | | | 20.39 | | | 7.47 | | | *** |
Lipper Mid-Cap Growth Funds Avg.4 | | 25.55 | | | 17.64 | | | 7.43 | | | **** |
Russell Midcap Index5 | | 17.87 | | | 20.90 | | | 10.43 | | | ***** |
The cumulative total returns do not reflect the deduction of applicable sales charges. If reflected, the applicable sales charges would reduce the cumulative total returns performance quoted. The average annual total returns assume the payment of the maximum applicable sales charge. Class A and Class L shares are subject to a maximum front-end sales charge of 5.50% and 5.75%, respectively. Under certain circumstances, Class A shares may be subject to a contingent deferred sales charge (CDSC) of 1%. Class B, Class C, Class L, Class M, and Class X shares are subject to a maximum CDSC of 5%, 1%, 1%, 6%, and 6%, respectively. Class R and Class Z shares are not subject to a sales charge. Class L shares are closed to most new purchases (with the exception of exchanges from the same class of shares offered by certain other JennisonDryden Funds).
Source: Prudential Investments LLC and Lipper Inc. Performance figures may reflect fee waivers and/or expense reimbursements. In the absence of such fee waivers and/or expense reimbursements, total returns would be lower.
1Inception date returns are provided for any share class with less than 10 years of returns. The Since Inception returns for the S&P MidCap 400 Index, (S&P MidCap 400 Index) Russell Midcap Growth Index, and the Lipper Mid-Cap Growth Funds Average (Lipper Average) are measured from the closest month-end to inception date, and not from the Fund’s actual inception date.
2The S&P MidCap 400 Index is an unmanaged index of 400 domestic stocks chosen for market size, liquidity, and industry group representation. It gives a broad look at how U.S. mid-cap stock prices have performed.
3The Russell Midcap Growth Index is an unmanaged index that measures the performance of those Russell Midcap companies with higher price-to-book ratios and higher forecasted growth values.
4The Lipper Average represents returns based on an average return of all funds in the Lipper Mid-Cap Growth Funds category for the periods noted. Funds in the Lipper Average invest at least 75% of their equity assets in companies with market capitalizations (on a three-year weighted basis) less than 300% of the dollar-weighted median market capitalization of the middle 1,000 securities of the S&P SuperComposite 1500 Index. Mid-cap growth funds typically have an above-average price-to-earnings ratio, price-to-book ratio, and three-year sales-per-share growth value compared with the S&P MidCap 400 Index.
| | |
| Jennison Mid-Cap Growth Fund, Inc. | | 3 |
Your Fund’s Performance (continued)
5The Russell Midcap Index measures the performance of the 800 smallest companies in the Russell 1000 Index, which represent approximately 25% of the total market capitalization of the Russell 1000 Index.
6The average annual total returns take into account applicable sales charges. Class A, Class B, Class C, Class L, Class M, Class R, and Class X shares are subject to an annual distribution and service (12b-1) fee of up to 0.30%, 1.00%, 1.00%, 0.50%, 1.00%, 0.75%, and 1.00%, respectively. Approximately seven years after purchase, Class B shares will automatically convert to Class A shares on a quarterly basis. Class Z shares are not subject to a 12b-1 fee. The returns in the tables do not reflect the deduction of taxes that a shareholder would pay on Fund distributions or following the redemption of Fund shares.
**S&P MidCap 400 Index Closest Month-End to Inception cumulative total returns as of 8/31/07 are 14.47% for Class L, Class M, and Class X; and 32.30% for Class R. S&P MidCap 400 Index Closest Month-End to Inception average annual total returns as of 9/30/07 are 12.86% for Class L, Class M, and Class X; and 14.02% for Class R.
***Russell Midcap Growth Index Closest Month-End to Inception cumulative total returns as of 8/31/07 are 17.20% for Class L, Class M, and Class X; and 35.50% for Class R. Russell Midcap Growth Index Closest Month-End to Inception average annual total returns as of 9/30/07 are 15.94% for Class L, Class M, and Class X; and 15.80% for Class R.
****Lipper Average Closest Month-End to Inception cumulative total returns as of 8/31/07 are 17.60% for Class L, Class M, and Class X; and 35.79% for Class R. Lipper Average Closest Month-End to Inception average annual total returns as of 9/30/07 are 17.35% for Class L, Class M, and Class X; and 16.45% for Class R.
*****Russell Midcap Index Closest Month-End to Inception cumulative total returns as of 8/31/07 are 16.66% for Class L, Class M, and Class X; and 36.00% for Class R. Russell Midcap Index Closest Month-End to Inception average annual total returns as of 9/30/07 are 15.01% for Class L, Class M, and Class X; and 15.68% for Class R.
Investors cannot invest directly in an index. The S&P MidCap 400 Index and the Russell Midcap Growth Index do not bear sales charges, operating expenses of a mutual fund, or deductions for taxes. Returns for these indexes would be lower if they were subject to these deductions. Returns for the Lipper Average reflect the deduction of mutual fund operating expenses, but not sales charges or taxes.
| | | |
| Five Largest Holdings expressed as a percentage of net assets as of 8/31/07 | |
NII Holdings, Inc., Wireless Telecommunication Services | | 3.6 | % |
DaVita, Inc., Health Care Providers & Services | | 2.6 | |
Ametek, Inc., Electrical Equipment | | 2.2 | |
American Tower Corp., (Class A) Wireless Telecommunication Services | | 2.2 | |
Quest Diagnostics, Inc., Health Care Providers & Services | | 2.1 | |
Holdings reflect only long-term investments and are subject to change.
| | | |
| Five Largest Industries expressed as a percentage of net assets as of 8/31/07 | |
Health Care Providers & Services | | 9.1 | % |
Software | | 8.5 | |
Wireless Telecommunication Services | | 7.8 | |
Machinery | | 7.7 | |
Commercial Services & Supplies | | 7.3 | |
Industry weightings reflect only long-term investments and are subject to change.
| | |
| 4 | | Visit our website at www.jennisondryden.com |
Strategy and Performance Overview
How did the Fund perform during the reporting period?
The Jennison Mid-Cap Growth Fund’s Class A shares returned 14.81% for the 10-month reporting period from November 1, 2006, through August 31, 2007*, outperforming the 12.33% return of its benchmark, the Russell Midcap Growth Index (the Midcap Growth Index), but lagging the 15.29% return of the Lipper Mid-Cap Growth Funds Average.
Many sectors in the Fund generated returns of more than 15%, including energy, consumer discretionary, industrials, materials, healthcare, financials, and telecom services. Compared to the Midcap Growth Index, the Fund had an underweight exposure to the consumer and financials sectors that helped its relative performance. The Fund also benefited from an overweight exposure to the energy sector versus its benchmark as well as good stock selection among energy shares. However, its significant overweight exposure to information technology versus the Midcap Growth Index and weak stock selection in the sector detracted the most from the Fund’s relative performance. Consumer staples was the only sector in the Fund that had a negative total return for the period.
What was the market environment like for mid-cap growth stocks?
The U.S. equity market posted strong returns in the first few months of the reporting period that began in November 2006 and the Midcap Growth Index was one of the best performing Russell indexes. However, the U.S. mid-cap growth sector was volatile for most of the remainder of the period, moving in tandem with the broader market. The recent credit concerns prompted defensive investor behavior such as aggressive selling by “quant” hedge funds, which rely on computer programs to uncover attractive investment opportunities in stocks, bonds, and other assets. This triggered a downturn in less-liquid equities, most notably smaller-cap stocks. The credit problems that spread from the market for U.S. subprime mortgages (home loans made to the least creditworthy borrowers) prompted central banks around the world to inject money into their monetary systems in an effort to ensure that financial markets had enough liquidity.
What holdings made the largest positive contributions to the Fund’s returns?
Fund strength was broad across industries and the top five contributors to performance each came from a different sector of the Fund, demonstrating our broad investment approach.
| * | Fund changed its fiscal year-end to August 31. Refer to the Fund’s previous annual report for performance information prior to November 1, 2006. |
| | |
| Jennison Mid-Cap Growth Fund, Inc. | | 5 |
Strategy and Performance Overview (continued)
From the energy sector, Cameron International Corp. is an international manufacturer of oil and gas equipment for drilling, production, and transmission used in onshore, offshore, and subsea applications. The company helps meet the unrelenting growth in demand for materials and commodities in emerging market nations, where supply is limited. We continue to like Cameron for its strength in the steady subsea business as evidenced by its growing backlog of business. Steady increases in its share price during the reporting period ultimately resulted in a 63% total return.
Express Scripts, a full-service pharmacy benefit company for the North American region, was also a notable contributor. We are very positive on the prospects for pharmacy benefit managers, given the strong incentives to curb escalating health care costs. Shares ended August at their highest closing level ever following strong quarterly profits, boosted by higher sales of generic drugs, and a raised forecast for the year.
We believe NII Holdings (formerly Nextel International) is one of the fastest growing wireless companies in the world; therefore, it is the largest position in the Fund at this time. (Please see Comments on Largest Holdings below.)
Eaton Vance was a top performer over the reporting period, as it has been over the last several years. Like other asset management firms, it is benefiting from the accumulation of investment assets from Baby Boomers as they plan for their retirement. Although the company experienced a sell-off recently in sympathy with broad market volatility, assets under management continue to grow at impressive rates, and we remain confident in its management and strategy for growth.
Monsanto Company provides agricultural products for farmers globally. We believe Monsanto is well positioned to benefit from a bullish agriculture cycle based on its leading market share, brand strength, operational performance, and technological innovation. Shares rose after the company raised its biotech corn seed forecasts to reflect surging demand for grain-based ethanol. We believe the company is benefiting from higher corn prices, market share gains, and higher margins from products that help combat insects and control weeds.
What holdings detracted most from the Fund’s returns?
The information technology sector was disappointing as several of the Fund’s IT positions were among the greatest detractors from its returns.
The single largest detractor was BEA Systems Inc., a provider of enterprise application and service infrastructure software. In our opinion, the company is an attractive acquisition candidate for a larger software concern. Shares of BEA began to decline in
| | |
| 6 | | Visit our website at www.jennisondryden.com |
November 2006; however, its stock performed well in May and June 2007 following better than expected first-quarter reporting and an announcement that BEA had increased its stock buyback program. The stock also gained in early July on rumors of a potential buyout, but then tapered off in the second half of the month along with the broader U.S. equity market.
Comverse Technology provides software, systems, and related services for multimedia communication and information processing. Shares of Comverse declined significantly in June, July, and August, which was likely the result of market turmoil. Prior to that, the stock had been trending upwards. Since the end of the period, rumors about a possible acquisition have helped the shares recover most of the losses. In our opinion, several favorable developments may occur during the remainder of the year, including, the potential sale of the company, an improvement in operating margin, a possible stock buyback, or some other type of capital restructuring.
Shares of Digital River, a provider of e-commerce tools, declined 22% for the period. While we believe Digital River’s long-term outlook is strong, changes in management left us concerned that the company is not properly focused on future growth strategies. Additionally, because the second quarter is typically the firm’s weakest, we sold our position during the summer.
Another technology company that detracted from Fund performance was Amdocs Ltd., a global provider of software and service tools for customer management. Shares of Amdocs declined in early 2007 following its announcement of plans to acquire SigValue Technologies and earnings guidance issued below expectations. After completing the acquisition, the company reported improved profits from strong sales. Still, performance suffered during recent months due to market volatility.
Did anything else materially affect the Fund’s relative performance?
The Fund’s underweight exposure to the financials sector, particularly shares of banks and homebuilders, contributed significantly to its strong performance relative to the Midcap Growth Index. While the impact of the recent U.S. subprime mortgage problem and credit crunch is most apparent when looking at the past few months, the overall effects have been building for quite some time. Our outlook continued to be cautious as we anticipated and experienced slowing economic growth with some acceleration in the core inflation rate this year. The impact of past increases in short-term interest rates by the Federal Open Market Committee (FOMC), a significant slowdown in the housing sector, and rising energy and other commodity prices have resulted in a slowdown in economic activity. The Fund was underweight in the consumer areas and overweight in energy for these reasons, which contributed positively to its relative performance.
| | |
| Jennison Mid-Cap Growth Fund, Inc. | | 7 |
Strategy and Performance Overview (continued)
Were there significant changes to the portfolio?
We took profits in some shares and used the proceeds to either add to existing holdings or purchase new positions. For example, we sold Medco Health Solutions, a company that provides prescription drug benefit programs and services to its clients, for more than $78 per share, resulting in a gain of approximately 44%. We believe it had reached a full valuation and wanted to focus on other fundamentally strong mid-cap opportunities. This was consistent with our sell discipline, which encourages profit taking when a company exceeds our price target.
Lazard is an international financial advisory and asset management firm that serves corporations, partnerships, institutions, government, and high-net worth individuals. We initiated a position in Lazard after its stock price dropped close to 20% below its IPO price and traded at 13 times estimated earnings for the coming year, which was half the multiple of other banks involved in the merger and acquisition (M&A) business. Shares of Lazard gained ground as the company reported solid profits amid strong M&A activity, and we sold our position at a profit as the stock became fairly valued.
On the other hand, Choicepoint Inc. represented a loss when we sold its shares in April 2007 due to diminished growth prospects and poor execution by its management. The company provides identification and credential verification services. Its shares declined as lower-than-expected hiring trends, especially at retailers, led to weaker-than-expected results in the company’s employment screening business. Choicepoint also experienced slower growth in its property insurance business due to the pullout of a large insurer from the Florida market after the previous year’s hurricanes.
One of our successful purchases was oilfield services capital equipment provider National Oilwell Varco, up over 90% since we bought its shares in December 2006. We believe the company should continue to do well in an uncertain business environment, based on the visibility and growth in its backlog of orders and its unique position as one of the only manufacturers of state-of-the-art equipment in this area. The company’s second-quarter profit in 2007 more than doubled, citing strong demand.
The Portfolio of Investments following this report shows the size of the Fund’s positions at period-end.
| | |
| 8 | | Visit our website at www.jennisondryden.com |
Comments on Largest Holdings
| 3.6% | NII Holdings, Inc./Wireless Telecommunication Services |
NII Holdings, a digital wireless communications provider focused on business customers located in Latin America, primarily Mexico and Brazil, is one of the fastest growing wireless companies in the world. In these rapidly growing emerging markets, the company is one of the only post-paid wireless providers (extends credit to subscribers to increase business) and benefits from its premium product positioning serving many business customers.
| 2.6% | DaVita, Inc./Health Care Providers & Services |
DaVita Inc., a provider of dialysis services in the United States for patients suffering from chronic kidney failure, is currently the biggest operator of dialysis clinics in the country. As a strong franchise with modest valuation, DaVita has been an attractive investment in the recent unstable markets, and recorded strong second-quarter results. Given the company’s stable growth in an industry that is expanding organically and caters to patients who receive treatments several times per week, we expect earnings per share (EPS) to increase more than 20% and DaVita to continue to perform well in the future.
| 2.2% | Ametek, Inc./Electrical Equipment |
Ametek, Inc. is a manufacturer of electronic instruments and electromechanical devices with operations around the world. We like Ametek’s consistent growth and the strong demand for its products, which we believe adds value to its top-line as defined by revenues. The company recently announced the acquisition of Paris-based CAMECA SAS, which manufactures specialized analysis systems. The deal with CAMECA is in-line with Ametek’s strategy of building on its portfolio of high margin niche businesses and we remain bullish on the company’s future performance.
| 2.2% | American Tower Corp./Wireless Telecommunication Services |
American Tower, a leading owner and operator of wireless and broadcast communications sites in North America, owns and operates more than 30,000 sites in the United States, Mexico, and Brazil. Two factors continue to drive increased demand for tower space: mobile and fixed wireless operators offering an alternative to wired telephone and cable services as well as spending on new third generation (3G) wireless services such as Internet access.
| 2.1% | Quest Diagnostics, Inc./Health Care Providers & Services |
Quest Diagnostics is a provider of diagnostic testing, information, and services. The company has a national presence, giving it an advantage over smaller labs because it can process a larger scale of business in less time. Shares were volatile amid buyout rumors and increased concern about company debt levels, which had doubled when Quest Diagnostics acquired specialty lab company AmeriPath earlier this year.
| | |
| Jennison Mid-Cap Growth Fund, Inc. | | 9 |
Fees and Expenses (Unaudited)
As a shareholder of the Fund, you incur two types of costs: (1) transaction costs, including sales charges (loads) on purchase payments and redemptions, as applicable, and (2) ongoing costs, including management fees, distribution and/or service (12b-1) fees, and other Fund expenses, as applicable. This example is intended to help you understand your ongoing costs (in dollars) of investing in the Fund and to compare these costs with the ongoing costs of investing in other mutual funds.
The example is based on an investment of $1,000 invested on March 1, 2007, at the beginning of the period, and held through the six-month period ended August 31, 2007. The example is for illustrative purposes only; you should consult the Prospectus for information on initial and subsequent minimum investment requirements.
The Fund’s transfer agent may charge additional fees to holders of certain accounts that are not included in the expenses shown in the table on the following page. These fees apply to Individual Retirement Accounts (IRAs) and Section 403(b) accounts. As of the close of the six-month period covered by the table, IRA fees included an annual maintenance fee of $15 per account (subject to a maximum annual maintenance fee of $25 for all accounts held by the same shareholder). Section 403(b) accounts are charged an annual $25 fiduciary maintenance fee. Some of the fees may vary in amount, or may be waived, based on your total account balance or the number of JennisonDryden Funds, including the Fund, that you own. You should consider the additional fees that were charged to your Fund account over the six-month period when you estimate the total ongoing expenses paid over the period and the impact of these fees on your ending account value, as these additional expenses are not reflected in the information provided in the expense table. Additional fees have the effect of reducing investment returns.
Actual Expenses
The first line for each share class in the table on the following page provides information about actual account values and actual expenses. You may use the information on this line, together with the amount you invested, to estimate the expenses that you paid over the period. Simply divide your account value by $1,000 (for example, an $8,600 account value ÷ $1,000 = 8.6), then multiply the result by the number on the first line under the heading “Expenses Paid During the Six-Month Period” to estimate the expenses you paid on your account during this period.
Hypothetical Example for Comparison Purposes
The second line for each share class in the table on the following page provides information about hypothetical account values and hypothetical expenses based on the Fund’s actual expense ratio and an assumed rate of return of 5% per year before expenses, which is not the Fund’s actual return. The hypothetical account values and expenses may not be used to estimate the actual ending account balance or expenses you paid for the period. You may use this information to compare the ongoing costs of investing in the Fund and other funds. To do so, compare this 5% hypothetical example with the 5% hypothetical examples that appear in the shareholder reports of the other funds.
| | |
| 10 | | Visit our website at www.jennisondryden.com |
Please note that the expenses shown in the table are meant to highlight your ongoing costs only, and do not reflect any transactional costs such as sales charges (loads). Therefore the second line for each share class in the table is useful in comparing ongoing costs only, and will not help you determine the relative total costs of owning different funds. In addition, if these transactional costs were included, your costs would have been higher.
| | | | | | | | | | | | | | |
| | | Beginning Account
Value
March 1, 2007 | | Ending Account
Value August 31, 2007 | | Annualized
Expense Ratio | | | Expenses Paid
During the
Six-Month Period* |
| | | | | | | | | | | | | | |
| Class A | | Actual | | $ | 1,000.00 | | $ | 1,079.30 | | 1.06 | % | | $ | 5.56 |
| | | Hypothetical | | $ | 1,000.00 | | $ | 1,019.86 | | 1.06 | % | | $ | 5.40 |
| | | | | | | | | | | | | | |
| Class B | | Actual | | $ | 1,000.00 | | $ | 1,075.40 | | 1.81 | % | | $ | 9.47 |
| | | Hypothetical | | $ | 1,000.00 | | $ | 1,016.08 | | 1.81 | % | | $ | 9.20 |
| | | | | | | | | | | | | | |
| Class C | | Actual | | $ | 1,000.00 | | $ | 1,075.40 | | 1.81 | % | | $ | 9.47 |
| | | Hypothetical | | $ | 1,000.00 | | $ | 1,016.08 | | 1.81 | % | | $ | 9.20 |
| | | | | | | | | | | | | | |
| Class L | | Actual | | $ | 1,000.00 | | $ | 1,078.10 | | 1.31 | % | | $ | 6.86 |
| | | Hypothetical | | $ | 1,000.00 | | $ | 1,018.60 | | 1.31 | % | | $ | 6.67 |
| | | | | | | | | | | | | | |
| Class M | | Actual | | $ | 1,000.00 | | $ | 1,075.40 | | 1.81 | % | | $ | 9.47 |
| | | Hypothetical | | $ | 1,000.00 | | $ | 1,016.08 | | 1.81 | % | | $ | 9.20 |
| | | | | | | | | | | | | | |
| Class R | | Actual | | $ | 1,000.00 | | $ | 1,078.40 | | 1.31 | % | | $ | 6.86 |
| | | Hypothetical | | $ | 1,000.00 | | $ | 1,018.60 | | 1.31 | % | | $ | 6.67 |
| | | | | | | | | | | | | | |
| Class X | | Actual | | $ | 1,000.00 | | $ | 1,075.40 | | 1.81 | % | | $ | 9.47 |
| | | Hypothetical | | $ | 1,000.00 | | $ | 1,016.08 | | 1.81 | % | | $ | 9.20 |
| | | | | | | | | | | | | | |
| Class Z | | Actual | | $ | 1,000.00 | | $ | 1,081.10 | | 0.81 | % | | $ | 4.25 |
| | | Hypothetical | | $ | 1,000.00 | | $ | 1,021.12 | | 0.81 | % | | $ | 4.13 |
* Fund expenses (net of fee waivers or subsidies, if any) for each share class are equal to the annualized expense ratio for each share class (provided in the table), multiplied by the average account value over the period, multiplied by the 184 days in the six-month period ended August 31, 2007, and divided by 365 days. Expenses presented in the table include the expenses of any underlying portfolios in which the Fund may invest.
| | |
| Jennison Mid-Cap Growth Fund, Inc. | | 11 |
Portfolio of Investments
as of August 31, 2007
| | | | | |
| Shares | | Description | | Value (Note 1) |
| | | | | |
LONG-TERM INVESTMENTS 97.3% | | | |
COMMON STOCKS | | | |
| |
Aerospace & Defense 0.6% | | | |
| 153,200 | | Spirit AeroSystems Holdings, Inc. (Class A)(a) | | $ | 5,476,900 |
| |
Capital Markets 4.7% | | | |
| 306,900 | | Eaton Vance Corp. | | | 11,781,891 |
| 139,200 | | Nuveen Investments, Inc. (Class A)(b) | | | 8,655,456 |
| 124,200 | | T. Rowe Price Group, Inc. | | | 6,373,944 |
| 767,400 | | TD Ameritrade Holding Corp.(a)(b) | | | 13,928,310 |
| | | | | |
| | | | | 40,739,601 |
| |
Chemicals 4.5% | | | |
| 303,300 | | Ecolab, Inc. | | | 12,635,478 |
| 93,000 | | Monsanto Co. | | | 6,485,820 |
| 355,800 | | Nalco Holdings Co. | | | 8,895,000 |
| 245,500 | | Sigma-Aldrich Corp.(b) | | | 10,998,400 |
| | | | | |
| | | | | 39,014,698 |
| |
Commercial Services & Supplies 7.3% | | | |
| 907,200 | | Allied Waste Industries, Inc.(a)(b) | | | 11,584,944 |
| 98,700 | | Corporate Executive Board Co. (The) | | | 6,714,561 |
| 588,405 | | Iron Mountain, Inc.(a)(b) | | | 16,628,325 |
| 261,415 | | Paychex, Inc. | | | 11,614,668 |
| 330,800 | | Stericycle, Inc.(a) | | | 16,506,920 |
| | | | | |
| | | | | 63,049,418 |
| |
Communications Equipment 1.8% | | | |
| 560,870 | | Comverse Technology, Inc.(a) | | | 9,394,573 |
| 187,900 | | Juniper Networks, Inc.(a)(b) | | | 6,185,668 |
| | | | | |
| | | | | 15,580,241 |
| |
Consumer Finance 1.0% | | | |
| 112,875 | | Alliance Data Systems Corp.(a)(b) | | | 8,855,044 |
| |
Diversified Consumer Services 1.4% | | | |
| 73,700 | | Apollo Group, Inc. (Class A)(a)(b) | | | 4,323,979 |
| 141,700 | | Weight Watchers International, Inc.(b) | | | 7,359,898 |
| | | | | |
| | | | | 11,683,877 |
| |
Diversified Telecommunication Services 0.1% | | | |
| 46,300 | | Time Warner Telecom, Inc. (Class A)(a) | | | 1,016,285 |
See Notes to Financial Statements.
| | |
| Jennison Mid-Cap Growth Fund, Inc. | | 13 |
Portfolio of Investments
as of August 31, 2007 continued
| | | | | |
| Shares | | Description | | Value (Note 1) |
| | | | | |
Electrical Equipment 2.2% | | | |
| 485,650 | | Ametek, Inc. | | $ | 19,421,144 |
| |
Electronic Equipment & Instruments 2.8% | | | |
| 272,500 | | Amphenol Corp. (Class A)(b) | | | 9,839,975 |
| 269,100 | | Insight Enterprises, Inc.(a) | | | 6,383,052 |
| 256,100 | | Tektronix, Inc. | | | 8,233,615 |
| | | | | |
| | | | | 24,456,642 |
| |
Energy Equipment & Services 6.7% | | | |
| 205,700 | | Cameron International Corp.(a) | | | 16,820,089 |
| 144,500 | | FMC Technologies, Inc.(a) | | | 13,684,150 |
| 78,500 | | Grant Prideco, Inc.(a)(b) | | | 4,341,050 |
| 194,400 | | Nabors Industries Ltd.(a)(b) | | | 5,752,296 |
| 57,100 | | National-Oilwell Varco, Inc.(a) | | | 7,308,800 |
| 293,900 | | Pride International, Inc.(a)(b) | | | 10,336,463 |
| | | | | |
| | | | | 58,242,848 |
| |
Food Products 1.7% | | | |
| 572,700 | | ConAgra Foods, Inc. | | | 14,724,117 |
| |
Health Care Equipment & Supplies 3.6% | | | |
| 271,565 | | DENTSPLY International, Inc. | | | 10,694,230 |
| 200,400 | | Resmed, Inc.(a)(b) | | | 8,148,264 |
| 251,400 | | Respironics, Inc.(a) | | | 11,923,902 |
| | | | | |
| | | | | 30,766,396 |
| |
Health Care Providers & Services 9.1% | | | |
| 387,000 | | DaVita, Inc.(a) | | | 22,260,240 |
| 204,100 | | Express Scripts, Inc.(a)(b) | | | 11,174,475 |
| 165,100 | | Henry Schein, Inc.(a)(b) | | | 9,607,169 |
| 316,200 | | Omnicare, Inc.(b) | | | 10,317,606 |
| 196,000 | | Patterson Companies, Inc.(a) | | | 7,208,880 |
| 327,800 | | Quest Diagnostics, Inc.(b) | | | 17,947,050 |
| | | | | |
| | | | | 78,515,420 |
| |
Health Care Technology 0.8% | | | |
| 122,900 | | Cerner Corp.(a)(b) | | | 7,010,216 |
| |
Hotels, Restaurants & Leisure 3.0% | | | |
| 161,100 | | Hilton Hotels Corp. | | | 7,402,545 |
| 324,500 | | Tim Hortons, Inc.(b) | | | 10,744,195 |
| 234,200 | | YUM! Brands, Inc. | | | 7,663,024 |
| | | | | |
| | | | | 25,809,764 |
See Notes to Financial Statements.
| | |
| 14 | | Visit our website at www.jennisondryden.com |
| | | | | |
| Shares | | Description | | Value (Note 1) |
| | | | | |
Household Products 1.0% | | | |
| 143,300 | | Clorox Co. (The) | | $ | 8,569,340 |
| |
Insurance 1.9% | | | |
| 214,600 | | Axis Capital Holdings Ltd. | | | 7,747,060 |
| 281,900 | | W.R. Berkley Corp. | | | 8,425,991 |
| | | | | |
| | | | | 16,173,051 |
| |
Internet & Catalog Retail 0.7% | | | |
| 272,600 | | GSI Commerce, Inc.(a)(b) | | | 6,272,526 |
| |
Internet Software & Services 0.5% | | | |
| 51,500 | | Equinix, Inc.(a)(b) | | | 4,558,265 |
| |
IT Services 1.0% | | | |
| 177,310 | | CheckFree Corp.(a)(b) | | | 8,197,041 |
| |
Leisure Equipment & Products 0.6% | | | |
| 242,233 | | Activision, Inc.(a) | | | 4,721,121 |
| |
Machinery 7.7% | | | |
| 180,200 | | Danaher Corp. | | | 13,994,332 |
| 230,100 | | Dover Corp.(b) | | | 11,366,940 |
| 371,400 | | IDEX Corp. | | | 14,287,758 |
| 248,900 | | ITT Corp. | | | 16,922,711 |
| 155,900 | | Roper Industries, Inc.(b) | | | 9,866,911 |
| | | | | |
| | | | | 66,438,652 |
| |
Media 1.6% | | | |
| 196,625 | | Entravision Communications Corp. (Class A)(a)(b) | | | 1,771,591 |
| 536,300 | | Regal Entertainment Group (Class A)(b) | | | 12,088,202 |
| | | | | |
| | | | | 13,859,793 |
| |
Metals & Mining 1.1% | | | |
| 414,200 | | Goldcorp, Inc. | | | 9,762,694 |
| |
Oil, Gas & Consumable Fuels 3.9% | | | |
| 69,100 | | Noble Energy, Inc. | | | 4,150,837 |
| 375,900 | | Southwestern Energy Co.(a)(b) | | | 13,979,721 |
| 278,600 | | XTO Energy, Inc. | | | 15,144,696 |
| | | | | |
| | | | | 33,275,254 |
| |
Pharmaceuticals 0.7% | | | |
| 184,000 | | Endo Pharmaceuticals Holdings, Inc.(a) | | | 5,865,920 |
See Notes to Financial Statements.
| | |
| Jennison Mid-Cap Growth Fund, Inc. | | 15 |
Portfolio of Investments
as of August 31, 2007 continued
| | | | | |
| Shares | | Description | | Value (Note 1) |
| | | | | |
Semiconductors & Semiconductor Equipment 5.5% | | | |
| 333,095 | | Broadcom Corp. (Class A)(a) | | $ | 11,491,778 |
| 852,100 | | Integrated Device Technology, Inc.(a) | | | 13,326,844 |
| 73,600 | | KLA-Tencor Corp.(b) | | | 4,229,792 |
| 552,400 | | Marvell Technology Group Ltd.(a) | | | 9,153,268 |
| 187,400 | | NVIDIA Corp.(a) | | | 9,587,384 |
| | | | | |
| | | | | 47,789,066 |
| |
Software 8.5% | | | |
| 351,776 | | Adobe Systems, Inc.(a) | | | 15,038,424 |
| 347,700 | | Amdocs Ltd.(a) | | | 12,273,810 |
| 127,900 | | Autodesk, Inc.(a) | | | 5,924,328 |
| 739,915 | | BEA Systems, Inc.(a) | | | 9,026,963 |
| 382,800 | | Check Point Software Technologies Ltd.(a)(b) | | | 8,980,488 |
| 326,170 | | Citrix Systems, Inc.(a) | | | 11,856,280 |
| 176,700 | | Electronic Arts, Inc.(a) | | | 9,354,498 |
| 8,500 | | Vmware, Inc.(a) | | | 585,565 |
| | | | | |
| | | | | 73,040,356 |
| |
Specialty Retail 1.8% | | | |
| 242,635 | | Ross Stores, Inc. | | | 6,752,532 |
| 393,020 | | Urban Outfitters, Inc.(a)(b) | | | 9,000,158 |
| | | | | |
| | | | | 15,752,690 |
| |
Textiles, Apparel & Luxury Goods 0.9% | | | |
| 124,500 | | Phillips-Van Heusen Corp. | | | 7,249,635 |
| |
Trading Companies & Distributors 0.8% | | | |
| 160,600 | | Fastenal Co.(b) | | | 7,324,966 |
| |
Wireless Telecommunication Services 7.8% | | | |
| 481,900 | | American Tower Corp. (Class A)(a) | | | 19,092,878 |
| 168,200 | | Clearwire Corp. (Class A)(a)(b) | | | 3,599,480 |
| 353,650 | | Crown Castle International Corp.(a)(b) | | | 13,000,174 |
| 394,490 | | NII Holdings, Inc.(a)(b) | | | 31,235,717 |
| | | | | |
| | | | | 66,928,249 |
| | | | | |
| | Total long-term investments
(cost $665,109,366) | | | 840,141,230 |
| | | | | |
See Notes to Financial Statements.
| | |
| 16 | | Visit our website at www.jennisondryden.com |
| | | | | | |
| Shares | | Description | | Value (Note 1) | |
| | | | | | |
SHORT-TERM INVESTMENT 25.1% | | | | |
| |
Affiliated Money Market Mutual Fund | | | | |
| 216,852,594 | | Dryden Core Investment Fund - Taxable Money Market Series
(cost $216,852,594; includes $191,808,537 of cash collateral received for securities on loan) (Note 3)(c)(d) | | $ | 216,852,594 | |
| | | | | | |
| | Total Investments 122.4%
(cost $881,961,960; Note 5) | | | 1,056,993,824 | |
| | Liabilities in excess of other assets (22.4%) | | | (193,242,641 | ) |
| | | | | | |
| | Net Assets 100.0% | | $ | 863,751,183 | |
| | | | | | |
| (a) | Non-income producing security. |
| (b) | All or a portion of security is on loan. The aggregate market value of such securities is $187,851,185; cash collateral of $191,808,537 (included in liabilities) was received with which the Fund purchased highly liquid short-term investments. |
| (c) | Represents security, or portion thereof, purchased with cash collateral received for securities on loan. |
| (d) | Prudential Investments LLC, the manager of the Fund, also serves as manager of the Dryden Core Investment Fund—Taxable Money Market Series. |
See Notes to Financial Statements.
| | |
| Jennison Mid-Cap Growth Fund, Inc. | | 17 |
Portfolio of Investments
as of August 31, 2007 continued
The industry classification of portfolio holdings and liabilities in excess of other assets shown as a percentage of net assets as of August 31, 2007 were as follows:
| | | |
Affiliated Money Market Mutual Fund (including 21.7% of collateral received for securities on loan) | | 25.1 | % |
Health Care Providers & Services | | 9.1 | |
Software | | 8.5 | |
Wireless Telecommunication Services | | 7.8 | |
Machinery | | 7.7 | |
Commercial Services & Supplies | | 7.3 | |
Energy Equipment & Services | | 6.7 | |
Semiconductors & Semiconductor Equipment | | 5.5 | |
Capital Markets | | 4.7 | |
Chemicals | | 4.5 | |
Oil, Gas & Consumable Fuels | | 3.9 | |
Health Care Equipment & Supplies | | 3.6 | |
Hotels, Restaurants & Leisure | | 3.0 | |
Electronic Equipment & Instruments | | 2.8 | |
Electrical Equipment | | 2.2 | |
Insurance | | 1.9 | |
Communications Equipment | | 1.8 | |
Specialty Retail | | 1.8 | |
Food Products | | 1.7 | |
Media | | 1.6 | |
Diversified Consumer Services | | 1.4 | |
Metals & Mining | | 1.1 | |
Consumer Finance | | 1.0 | |
Household Products | | 1.0 | |
IT Services | | 1.0 | |
Textiles, Apparel & Luxury Goods | | 0.9 | |
Health Care Technology | | 0.8 | |
Trading Companies & Distributors | | 0.8 | |
Internet & Catalog Retail | | 0.7 | |
Pharmaceuticals | | 0.7 | |
Aerospace & Defense | | 0.6 | |
Leisure Equipment & Products | | 0.6 | |
Internet Software & Services | | 0.5 | |
Diversified Telecommunication Services | | 0.1 | |
| | | |
| | 122.4 | |
Liabilities in excess of other assets | | (22.4 | ) |
| | | |
| | 100.0 | % |
| | | |
See Notes to Financial Statements.
| | |
| 18 | | Visit our website at www.jennisondryden.com |
Financial Statements
| | |
| AUGUST 31, 2007 | | ANNUAL REPORT |
Jennison Mid-Cap Growth Fund, Inc.
Statement of Assets and Liabilities
as of August 31, 2007
| | | | |
Assets | | | | |
Investments at value, including securities on loan of $187,851,185: | | | | |
Unaffiliated investments (cost $665,109,366) | | $ | 840,141,230 | |
Affiliated investments (cost $216,852,594) | | | 216,852,594 | |
Cash | | | 97,315 | |
Receivable for Fund shares sold | | | 1,131,330 | |
Dividends receivable | | | 324,529 | |
Prepaid expenses | | | 17,758 | |
| | | | |
Total assets | | | 1,058,564,756 | |
| | | | |
| |
Liabilities | | | | |
Payable to broker for collateral for securities on loan (Note 4) | | | 191,808,537 | |
Payable for Fund shares Reacquired | | | 1,969,061 | |
Management fee payable | | | 434,268 | |
Distribution fee payable | | | 252,643 | |
Accrued expenses | | | 170,422 | |
Transfer agent fee payable | | | 158,842 | |
Deferred directors’ fees | | | 19,800 | |
| | | | |
Total liabilities | | | 194,813,573 | |
| | | | |
| |
Net Assets | | $ | 863,751,183 | |
| | | | |
| | | | | |
Net assets were comprised of: | | | | |
Common stock, at par | | $ | 35,914 | |
Paid-in capital in excess of par | | | 789,962,360 | |
| | | | |
| | | 789,998,274 | |
Accumulated net investment loss | | | (19,800 | ) |
Accumulated net realized loss on investments | | | (101,259,155 | ) |
Net unrealized appreciation on investments | | | 175,031,864 | |
| | | | |
Net assets, August 31, 2007 | | $ | 863,751,183 | |
| | | | |
See Notes to Financial Statements.
| | |
| 20 | | Visit our website at www.jennisondryden.com |
| | | |
Class A | | | |
Net asset value and redemption price per share
($429,993,040 ÷ 17,555,664 shares of common stock issued and outstanding) | | $ | 24.49 |
Maximum sales charge (5.50% of offering price) | | | 1.43 |
| | | |
Maximum offering price to public | | $ | 25.92 |
| | | |
| |
Class B | | | |
Net asset value, offering price and redemption price per share
($94,868,830 ÷ 4,234,904 shares of common stock issued and outstanding) | | $ | 22.40 |
| | | |
| |
Class C | | | |
Net asset value, offering price and redemption price per share
($73,977,390 ÷ 3,301,543 shares of common stock issued and outstanding) | | $ | 22.41 |
| | | |
| |
Class L | | | |
Net asset value, offering price and redemption price per share
($19,557,806 ÷ 800,864 shares of common stock issued and outstanding) | | $ | 24.42 |
| | | |
| |
Class M | | | |
Net asset value, offering price and redemption price per share
($46,713,406 ÷ 2,086,789 shares of common stock issued and outstanding) | | $ | 22.39 |
| | | |
| |
Class R | | | |
Net asset value, offering price and redemption price per share
($1,217,098 ÷ 49,987 shares of common stock issued and outstanding) | | $ | 24.35 |
| | | |
| |
Class X | | | |
Net asset value, offering price and redemption price per share
($9,449,535 ÷ 421,787 shares of common stock issued and outstanding) | | $ | 22.40 |
| | | |
| |
Class Z | | | |
Net asset value, offering price and redemption price per share
($187,974,078 ÷ 7,462,784 shares of common stock issued and outstanding) | | $ | 25.19 |
| | | |
See Notes to Financial Statements.
| | |
| Jennison Mid-Cap Growth Fund, Inc. | | 21 |
Statement of Operations
| | | | | | | | |
| | | Ten Months
Ended
August 31, 2007 | | | Year
Ended
October 31, 2006 | |
Net Investment Loss | | | | | | | | |
Income | | | | | | | | |
Unaffiliated dividend income (net of foreign withholding
taxes of $8,423 and $8,301, respectively) | | $ | 4,457,109 | | | $ | 4,677,673 | |
Affiliated dividend income | | | 1,041,905 | | | | 1,265,647 | |
Affiliated income from securities loaned, net | | | 247,998 | | | | 337,384 | |
| | | | | | | | |
Total income | | | 5,747,012 | | | | 6,280,704 | |
| | | | | | | | |
| | |
Expenses | | | | | | | | |
Management fee | | | 3,925,065 | | | | 3,858,189 | |
Distribution fee—Class A | | | 824,052 | | | | 841,867 | |
Distribution fee—Class B | | | 788,564 | | | | 1,021,146 | |
Distribution fee—Class C | | | 512,351 | | | | 369,470 | |
Distribution fee—Class L | | | 58,886 | | | | 9,531 | |
Distribution fee—Class M | | | 289,552 | | | | 44,894 | |
Distribution fee—Class R | | | 2,699 | | | | 18 | |
Distribution fee—Class X | | | 53,077 | | | | 5,635 | |
Transfer agent’s fees and expenses (including affiliated expenses of $1,104,800 and $1,255,000, respectively)
(Note 3) | | | 1,135,000 | | | | 1,480,000 | |
Reports to shareholders | | | 105,000 | | | | 153,000 | |
Registration fees | | | 103,000 | | | | 113,000 | |
Custodian’s fees and expenses | | | 72,000 | | | | 90,000 | |
Directors’ fees | | | 20,000 | | | | 24,000 | |
Audit fee | | | 20,000 | | | | 34,000 | |
Legal fees and expenses | | | 18,000 | | | | 50,000 | |
Insurance | | | 16,000 | | | | 16,000 | |
Interest expense | | | 13,000 | | | | — | |
Miscellaneous | | | 12,860 | | | | 17,283 | |
| | | | | | | | |
Total expenses | | | 7,969,106 | | | | 8,128,033 | |
| | | | | | | | |
Net investment loss | | | (2,222,094 | ) | | | (1,847,329 | ) |
| | | | | | | | |
| | |
Realized And Unrealized Gain (Loss) On Investments | | | | | | | | |
Net realized gain on investment transactions | | | 56,488,120 | | | | 95,095,546 | |
Net change in unrealized appreciation (depreciation)
on investments | | | 55,964,905 | | | | (8,406,146 | ) |
| | | | | | | | |
Net gain on investments | | | 112,453,025 | | | | 86,689,400 | |
| | | | | | | | |
Net Increase In Net Assets Resulting From Operations | | $ | 110,230,931 | | | $ | 84,842,071 | |
| | | | | | | | |
See Notes to Financial Statements.
| | |
| 22 | | Visit our website at www.jennisondryden.com |
Statement of Changes in Net Assets
| | | | | | | | | | | | |
| | | Ten Months
Ended
August 31, 2007 | | | Year Ended October 31, | |
| | | | 2006 | | | 2005 | |
Increase In Net Assets | | | | | | | | | | | | |
Operations | | | | | | | | | | | | |
Net investment loss | | $ | (2,222,094 | ) | | $ | (1,847,329 | ) | | $ | (5,060,651 | ) |
Net realized gain on investments and foreign currency transactions | | | 56,488,120 | | | | 95,095,546 | | | | 83,104,475 | |
Net change in unrealized appreciation (depreciation) on investments | | | 55,964,905 | | | | (8,406,146 | ) | | | 24,670,796 | |
| | | | | | | | | | | | |
Net increase in net assets resulting from operations | | | 110,230,931 | | | | 84,842,071 | | | | 102,714,620 | |
| | | | | | | | | | | | |
| | | |
Fund share transactions (net of share conversions) (Note 6) | | | | | | | | | | | | |
Net proceeds from shares sold | | | 134,515,150 | | | | 167,036,895 | | | | 116,674,581 | |
Net asset value of shares issued in connection with merger (Note 7) | | | 155,184,371 | | | | 33,442,147 | | | | — | |
Cost of shares reacquired | | | (196,781,915 | ) | | | (181,679,956 | ) | | | (194,769,949 | ) |
| | | | | | | | | | | | |
Net increase in net assets from Fund share transactions | | | 92,917,606 | | | | 18,799,086 | | | | (78,095,368 | ) |
| | | | | | | | | | | | |
Total increase | | | 203,148,537 | | | | 103,641,157 | | | | 24,619,252 | |
| | | |
Net Assets | | | | | | | | | | | | |
Beginning of period | | | 660,602,646 | | | | 556,961,489 | | | | 532,342,237 | |
| | | | | | | | | | | | |
End of period | | $ | 863,751,183 | | | $ | 660,602,646 | | | $ | 556,961,489 | |
| | | | | | | | | | | | |
See Notes to Financial Statements.
| | |
| Jennison Mid-Cap Growth Fund, Inc. | | 23 |
Notes to Financial Statements
Jennison Mid-Cap Growth Fund, Inc. (the “Fund”) (formerly known as Jennison U.S. Emerging Growth Fund, Inc.) is registered under the Investment Company Act of 1940 as a diversified, open-end, management investment company. The Fund was incorporated in Maryland on August 23, 1996. The Fund issued 2,500 shares each of Class A, Class B, Class C and Class Z common stock for $100,000 on October 21, 1996 to Prudential Investments, LLC, (“PI” or “Manager”). Investment operations commenced on December 31, 1996. The Fund issued 250 shares each of Class L, Class M and Class X common stock for $7,500 on June 12, 2006 to PI.
The Fund’s investment objective is to achieve long-term capital appreciation. It invests primarily in equity securities of small and medium-sized U.S. companies, which will generally have a market capitalization less than the largest capitalization of the Standard & Poor’s Mid-Cap 400 Stock Index, with the potential for above average growth.
The Fund’s fiscal year has changed from an annual reporting period that ends October 31 to one that ends August 31. This change should have no impact on the way the Fund is managed. Shareholders will receive future annual and semiannual reports on the new fiscal year-end schedule.
Note 1. Accounting Policies
The following is a summary of significant accounting policies followed by the Fund in the preparation of its financial statements.
Securities Valuation: Securities listed on a securities exchange (other than options on securities and indices) are valued at the last sale price on such exchange on the day of valuation or, if there was no sale on such day, at the mean between the last reported bid and ask prices, or at the last bid price on such day in the absence of an asked price. Securities traded via Nasdaq are valued at the Nasdaq official closing price (NOCP) on the day of valuation, or if there was no NOCP, at the last sale price. Securities that are actively traded in the over-the-counter market, including listed securities for which the primary market is believed by Prudential Investments LLC (“PI” or “Manager”), in consultation with the subadvisers; to be over-the-counter, are valued at market value using prices provided by an independent pricing agent or principal market maker. Options on securities and indices traded on an exchange are valued at the last sale price as of the close of trading on the applicable exchange or, if there was no sale, at the mean between the most recently quoted bid and asked prices on such exchange. Futures contracts and options thereon traded on a
| | |
| 24 | | Visit our website at www.jennisondryden.com |
commodities exchange or board of trade are valued at the last sale price at the close of trading on such exchange or board of trade or, if there was no sale on the applicable commodities exchange or board of trade on such day, at the mean between the most recently quoted bid and asked prices on such exchange or board of trade or at the last bid price in the absence of an asked price. Prices may be obtained from independent pricing services which use information provided by market makers or estimates of market values obtained from yield data relating to investments or securities with similar characteristics. Securities for which reliable market quotations are not readily available, or whose values have been affected by events occurring after the close of the security’s foreign market and before the Funds’ normal pricing time, are valued at fair value in accordance with the Board of Directors’ approved fair valuation procedures. When determining the fair valuation of securities some of the factors influencing the valuation include, the nature of any restrictions on disposition of the securities; assessment of the general liquidity of the securities; the issuer’s financial condition and the markets in which it does business; the cost of the investment; the size of the holding and the capitalization of issuer; the prices of any recent transactions or bids/offers for such securities or any comparable securities; any available analyst media or other reports or information deemed reliable by the investment adviser regarding the issuer or the markets or industry in which it operates. Using fair value to price securities may result in a value that is different from a security’s most recent closing price and from the price used by other mutual funds to calculate their net asset values.
Investments in mutual funds are valued at their net asset value as of the close of the New York Stock Exchange on the date of valuation.
Short-term debt securities which mature in 60 days or less are valued at amortized cost, which approximates market value. The amortized cost method involves valuing a security at its cost on the date of purchase and thereafter assuming a constant amortization to maturity of the difference between the principal amount due at maturity and cost. Short-term debt securities which mature in more than 60 days are valued at current market quotations.
Foreign Currency Translation: The books and records of the Fund are maintained in U.S. dollars. Foreign currency amounts are translated into U.S. dollars on the following basis:
(i) market value of investment securities, other assets and liabilities-at the current daily rate of exchange.
(ii) purchases and sales of investment securities, income and expenses-at the rates of exchange prevailing on the respective dates of such transactions.
| | |
| Jennison Mid-Cap Growth Fund, Inc. | | 25 |
Notes to Financial Statements
continued
The Fund does not isolate that portion of the results of operations arising as a result of changes in the foreign exchange rates from the fluctuations arising from changes in the market prices of long-term securities held at the end of the period. Similarly, the Fund does not isolate the effect of changes in foreign exchange rates from the fluctuations arising from changes in the market prices of portfolio securities sold during the period. Accordingly, realized foreign currency gains or losses are included in the reported net realized gains or losses on investment transactions.
Net realized gains or losses on foreign currency transactions represent net foreign exchange gains or losses from the holding of foreign currencies, currency gains or losses realized between the trade and settlement dates on security transactions, and the difference between the amounts of dividends, interest and foreign taxes recorded on the Fund’s books and the U.S. dollar equivalent amounts actually received or paid. Net unrealized currency gains or losses from valuing foreign currency denominated assets and liabilities (other than investments) at period end exchange rates are reflected as a component of net unrealized appreciation (depreciation) on investments and foreign currencies.
Foreign security and currency transactions may involve certain considerations and risks not typically associated with those of domestic origin as a result of, among other factors, the possibility of political and economic instability or the level of governmental supervision and regulation of foreign securities markets.
Securities Lending: The Fund may lend its portfolio securities to broker-dealers. The loans are secured by collateral at least equal, at all times, to the market value of the securities loaned. Loans are subject to termination at the option of the borrower or the Fund. Upon termination of the loan, the borrower will return to the lender securities identical to the loaned securities. Should the borrower of the securities fail financially, the Fund has the right to repurchase the securities using the collateral in the open market. The Fund recognizes income, net of any rebate and securities lending agent fees, for lending its securities in the form of fees or interest on the investment of any cash received as collateral. The Fund also continues to receive dividends or amounts equivalent thereto, on the securities loaned and recognizes any unrealized gains or loss in the market price of the securities loaned that may occur during the term of the loan.
| | |
| 26 | | Visit our website at www.jennisondryden.com |
Securities Transactions and Net Investment Income: Securities transactions are recorded on the trade date. Realized and unrealized gains and losses on sales of portfolio securities are calculated on the identified cost basis. Dividend income is recorded on the ex-dividend date. Interest income, including amortization of premium and accretion of discounts on debt securities, as required, is recorded on the accrual basis. Expenses are recorded on the accrual basis.
Net investment income or loss, (other than distribution fees which are charged directly to the respective class) and unrealized and realized gains or losses are allocated daily to each class of shares based upon the relative proportion of net assets of each class at the beginning of the day.
Dividends and Distributions: The Fund expects to pay dividends of net investment income and distributions of net realized capital and currency gains, if any, annually. Dividends and distributions to shareholders, which are determined in accordance with federal income tax regulations and which may differ from generally accepted accounting principles, are recorded on the ex-dividend date. Permanent book/tax differences relating to income and gains are reclassified amongst undistributed net investment income, accumulated net realized gain or loss and paid-in capital in excess of par, as appropriate.
Taxes: It is the Fund’s policy to continue to meet the requirements of the Internal Revenue Code applicable to regulated investment companies and to distribute all of its taxable net investment income and capital gains, if any, to its shareholders. Therefore, no federal income tax provision is required.
Withholding taxes on foreign dividends are recorded, net of reclaimable amounts, at the time the related income is earned.
Estimates: The preparation of the financial statements requires management to make estimates and assumptions that affect the reported amounts and disclosures in the financial statements. Actual results could differ from those estimates.
Note 2. Agreements
The Fund has a management agreement with PI. Pursuant to this agreement, PI has responsibility for all investment advisory services and supervises the subadvisor’s performance of such services. PI has entered into a subadvisory agreement with Jennison Associates LLC (“Jennison”). The subadvisory agreement provides that Jennison furnishes investment advisory services in connection with the management of the Fund. In connection therewith, Jennison is obligated to keep certain books and
| | |
| Jennison Mid-Cap Growth Fund, Inc. | | 27 |
Notes to Financial Statements
continued
records of the Fund. PI pays for the services of Jennison, the cost of compensation of officers and employees of the Fund, occupancy and certain clerical and bookkeeping costs of the Fund. The Fund bears all other costs and expenses.
The management fee paid to PI is computed daily and payable monthly, at an annual rate of .60 of 1% of the Fund’s average daily net assets up to $1 billion and .55 of 1% of the average daily net assets in excess of $1 billion. The effective management fee rate was .60 of 1% for the ten months ended August 31, 2007. For the period June 16, 2006 to June 17, 2007, the Manager has contractually agreed to waive up to .08% of the Fund’s management fee so that the Fund’s operating expenses during such period, exclusive of taxes, interest, brokerage, distribution fees and non-routine expenses do not exceed .83% of the Fund’s average daily net assets. Effective March 2, 2007 through March 31, 2008, such waiver has been amended to .05% for such adjusted operating expenses in excess of .83%.
The Fund has a distribution agreement with Prudential Investment Management Services LLC (“PIMS”), which acts as the distributor of the Class A, Class B, Class C, Class L, Class M, Class R, Class X and Class Z shares of the Fund. The Fund compensates PIMS for distributing and servicing the Fund’s Class A, Class B, Class C, Class L, Class M, Class R, Class X and Class Z shares, pursuant to plans of distribution (the “Class A, B, C, L, M, R, X and Z Plans”), regardless of expenses actually incurred by PIMS. The distribution fees are accrued daily and payable monthly. No distribution or service fees are paid to PIMS as distributor of the Class Z shares of the Fund.
Pursuant to the Class A, B, C, L, M, R, X and Z Plans, the Fund compensates PIMS for distribution related activities at an annual rate of up to .30 of 1%, 1%, 1%, .50 of 1%, 1%, .75 of 1% and 1% of the average daily net assets of the Class A, B, C, L, M, R and X shares, respectively. PIMS contractually agreed to limit such fees to .25 of 1% and .50% of 1% of the average daily net assets of Class A and Class R shares, respectively.
PIMS has advised the Fund that it received approximately $202,400 in front-end sales charges resulting from sales of Class A shares during the ten months ended August 31, 2007. From these fees, PIMS paid such sales charges to affiliated broker-dealers, which in turn paid commissions to salespersons and incurred other distribution costs.
PIMS has advised the Fund that for the ten months ended August 31, 2007, it received approximately $94,200, $5,100, $114,300 and $23,900 in contingent deferred sales charges imposed upon redemptions by certain Class B, Class C, Class M and Class X shareholders, respectively.
| | |
| 28 | | Visit our website at www.jennisondryden.com |
PI, PIMS and Jennison are indirect, wholly-owned subsidiaries of Prudential Financial, Inc. (“Prudential”).
The Fund, along with other affiliated registered investment companies (the “Funds”), is a party to a Syndicated Credit Agreement (“SCA”) with two banks. The SCA provides for a commitment of $500 million. Interest on any borrowings under the SCA is incurred at market rates and a commitment fee for the unused amount is accrued daily and paid quarterly. The Funds pay a commitment fee of .07 of 1% of the unused portion of the renewed SCA. The expiration date of the renewed SCA is October 26, 2007. The SCA is in the process of being renewed through October 24, 2008. The purpose of the SCA is to provide an alternative source of temporary funding for capital share redemptions. The Fund did not borrow any amounts pursuant to the SCA during the ten months ended August 31, 2007.
Note 3. Other Transactions with Affiliates
Prudential Mutual Fund Services LLC (“PMFS”), an affiliate of PI and an indirect, wholly-owned subsidiary of Prudential, serves as the Fund’s transfer agent. Transfer agent’s fees and expenses in the Statement of Operations include certain out-of-pocket expenses paid to non-affiliates, where applicable.
The Fund pays networking fees to affiliated and unaffiliated broker/dealers, including fees relating to the services of First Clearing, LLC (“First Clearing”), an affiliate of PI. These networking fees are payments made to broker/dealers that clear mutual fund transactions through a national clearing system. For the ten months ended August 31, 2007 and the year ended October 31, 2006, the Fund incurred approximately $301,500 and $250,000, respectively, in total networking fees, of which $138,400 and $158,600, respectively, was paid to First Clearing. These amounts are included in transfer agent’s fees and expenses in the Statement of Operations.
Prudential Investment Management, Inc., (“PIM”), an indirect, wholly-owned subsidiary of Prudential, is the Fund’s security lending agent. For the ten months ended August 31, 2007 and the year ended October 31, 2006, PIM has been compensated approximately $107,000 and $144,400, respectively, for these services.
The Fund invests in the Taxable Money Market Series (the “Portfolio”), a portfolio of Dryden Core Investment Fund, pursuant to an exemptive order received from the Securities and Exchange Commission. The Portfolio is a money market mutual fund registered under the Investment Company Act of 1940, as amended, and managed by PI.
| | |
| Jennison Mid-Cap Growth Fund, Inc. | | 29 |
Notes to Financial Statements
continued
Note 4. Portfolio Securities
Purchases, including the value of securities acquired pursuant to the merger, and sales of investment securities, other than short-term investments, for the ten months ended August 31, 2007 were $480,386,393 and $467,711,995, respectively.
Note 5. Distributions and Tax Information
In order to present accumulated net investment loss, accumulated net realized loss on investments and paid-in capital in excess of par on the Statement of Assets and Liabilities that more closely represent their tax character, certain adjustments have been made to paid-in-capital in excess of par, accumulated net investment loss and accumulated net realized loss on investments. For the ten months period ended August 31, 2007, the adjustments were to decrease accumulated net investment loss by $2,204,506, increase accumulated net realized loss on investments by $36,434,516 and increase paid-in-capital in excess of par by $34,230,010 due to the reclassification of a net operating loss, reclassification of capital loss carryforward from reorganization, reclassification of deferred director’s compensation from reorganization, reclassification of disallowed losses from wash sales due to reorganization, write-off of capital loss carryforward due to loss limitations and other adjustments related to reorganization. Net investment loss, net realized gains and net assets were not affected by this change.
As of August 31, 2007, the Fund had a capital loss carryforward for tax purposes of approximately $100,200,000 of which $23,800,000 expires in 2008, $8,400,000 expires in 2009, $62,400,000 expires in 2010, $4,000,000 expires in 2011, $500,000 expires in 2012 and $1,100,000 expires in 2013. The Fund utilized approximately $56,500,000 of its capital loss carryforward to offset net taxable gains realized in the fiscal period ended August 31, 2007. Certain portions of the capital loss carryforwards were assumed by the Fund as a result of acquisitions. Utilization of these capital loss carryforwards were limited in accordance with income tax regulations. As of August 31, 2007, approximately $189,157,000 of its capital loss carryovers were written-off due to loss limitations. No capital gains distributions are expected to be paid to shareholders until net gains have been realized in excess of such carryforward. It is uncertain whether the Fund will be able to realize the full benefit prior to the expiration dates.
| | |
| 30 | | Visit our website at www.jennisondryden.com |
There were no distributions paid during the fiscal periods ended August 31, 2007 and October 31, 2006.
At August 31, 2007, the Fund did not have any distributable earnings on a tax basis.
The United States federal income tax basis of the Fund’s investments and the net unrealized appreciation as of August 31, 2007 were as follows:
| | | | | | |
Tax Basis
of Investments | | Appreciation | | Depreciation | | Net Unrealized
Appreciation |
| $883,001,900 | | $184,519,861 | | $(10,527,937) | | $173,991,924 |
The difference between book basis and tax basis was primarily attributable to deferred losses on wash sales.
Note 6. Capital
The Fund offers Class A, Class B, Class C, Class L, Class M , Class R, Class X and Class Z shares. Class A and Class L shares are sold with a front-end sales charge of up to 5.5% and 5.75%, respectively. All investors who purchase Class A or Class L shares in an amount of $1 million or more and sell these shares within 12 months of purchase are subject to a contingent deferred sales charge (CDSC) of 1%, including investors who purchase their shares through broker-dealers affiliated with Prudential Financial, Inc. Class B shares are sold with a CDSC which declines from 5% to zero depending on the period of time the shares are held. Class M and Class X shares are sold with a CDSC which declines from 6% to zero depending on the period of time the shares are held. Class C shares purchased are not subject to an initial sales charge and the CDSC for Class C shares will be 12 months from the date of purchase. Class B shares will automatically convert to Class A shares on a quarterly basis approximately seven years after purchase. A special exchange privilege is also available for shareholders who qualified to purchase Class A shares at net asset value. Class M shares will automatically convert to Class A shares approximately eight years after purchase. Class L shares are closed to most new purchases (with the exception of reinvested dividends). Class L and Class M shares are only exchangeable with Class L and Class M shares, respectively, offered by certain other Strategic Partners Funds. Class X shares are closed to new purchases. Class R and Class Z shares are not subject to any sales or redemption charge and are offered exclusively for sale to a limited group of investors.
There are 2 billion shares of $.001 par value common stock authorized divided into eight classes, designated Class A, Class B, Class C, Class L, Class M, Class R, Class X and Class Z, which consists of 800 million, 400 million, 300 million, 100 million, 100 million, 100 million, 100 million and 100 million authorized shares, respectively.
| | |
| Jennison Mid-Cap Growth Fund, Inc. | | 31 |
Notes to Financial Statements
continued
Transactions in shares of common stock were as follows:
| | | | | | | |
Class A | | Shares | | | Amount | |
Ten months ended August 31, 2007: | | | | | | | |
Shares sold | | 3,119,383 | | | $ | 71,930,325 | |
Shares issued in connection with the merger | | 1,167,959 | | | | 25,871,568 | |
Shares reacquired | | (4,296,007 | ) | | | (98,871,431 | ) |
| | | | | | | |
Net increase (decrease) in shares outstanding before conversion | | (8,665 | ) | | | (1,069,538 | ) |
Shares issued upon conversion from Class B, Class M and Class X | | 1,026,446 | | | | 23,607,542 | |
| | | | | | | |
Net increase (decrease) in shares outstanding | | 1,017,781 | | | $ | 22,538,004 | |
| | | | | | | |
Year ended October 31, 2006: | | | | | | | |
Shares sold | | 4,368,006 | | | $ | 90,842,509 | |
Shares issued in connection with the merger | | 228,701 | | | | 4,572,744 | |
Shares reacquired | | (4,465,013 | ) | | | (92,753,489 | ) |
| | | | | | | |
Net increase (decrease) in shares outstanding before conversion | | 131,694 | | | | 2,661,764 | |
Shares issued upon conversion from Class B | | 804,433 | | | | 16,469,349 | |
| | | | | | | |
Net increase (decrease) in shares outstanding | | 936,127 | | | $ | 19,131,113 | |
| | | | | | | |
Year ended October 31, 2005: | | | | | | | |
Shares sold | | 3,499,224 | | | $ | 60,094,027 | |
Shares reacquired | | (5,582,038 | ) | | | (95,074,141 | ) |
| | | | | | | |
Net increase (decrease) in shares outstanding before conversion | | (2,082,814 | ) | | | (34,980,114 | ) |
Shares issued upon conversion from Class B | | 1,133,114 | | | | 19,602,520 | |
| | | | | | | |
Net increase (decrease) in shares outstanding | | (949,700 | ) | | $ | (15,377,594 | ) |
| | | | | | | |
| | |
| 32 | | Visit our website at www.jennisondryden.com |
| | | | | | | |
Class B | | Shares | | | Amount | |
Ten months ended August 31, 2007: | | | | | | | |
Shares sold | | 180,043 | | | $ | 3,829,761 | |
Shares issued in connection with the merger | | 1,379,308 | | | | 28,045,273 | |
Shares reacquired | | (884,913 | ) | | | (18,771,688 | ) |
| | | | | | | |
Net increase (decrease) in shares outstanding before conversion | | 674,438 | | | | 13,103,346 | |
Shares issued upon conversion from Class A | | (951,474 | ) | | | (19,946,237 | ) |
| | | | | | | |
Net increase (decrease) in shares outstanding | | (277,036 | ) | | $ | (6,842,891 | ) |
| | | | | | | |
Year ended October 31, 2006: | | | | | | | |
Shares sold | | 373,503 | | | $ | 7,218,123 | |
Shares issued in connection with the merger | | 68,138 | | | | 1,260,008 | |
Shares reacquired | | (1,074,263 | ) | | | (20,561,852 | ) |
| | | | | | | |
Net increase (decrease) in shares outstanding before conversion | �� | (632,622 | ) | | | (12,083,721 | ) |
Shares reacquired upon conversion into Class A | | (871,124 | ) | | | (16,469,349 | ) |
| | | | | | | |
Net increase (decrease) in shares outstanding | | (1,503,746 | ) | | $ | (28,553,070 | ) |
| | | | | | | |
Year ended October 31, 2005: | | | | | | | |
Shares sold | | 357,407 | | | $ | 5,607,955 | |
Shares reacquired | | (1,633,055 | ) | | | (25,780,312 | ) |
| | | | | | | |
Net increase (decrease) in shares outstanding before conversion | | (1,275,648 | ) | | | (20,172,357 | ) |
Shares reacquired upon conversion into Class A | | (1,217,319 | ) | | | (19,602,520 | ) |
| | | | | | | |
Net increase (decrease) in shares outstanding | | (2,492,967 | ) | | $ | (39,774,877 | ) |
| | | | | | | |
Class C | | | | | | |
Ten months ended August 31, 2007: | | | | | | | |
Shares sold | | 235,202 | | | $ | 5,015,070 | |
Shares issued in connection with the merger | | 1,626,621 | | | | 33,072,236 | |
Shares reacquired | | (658,334 | ) | | | (14,034,561 | ) |
| | | | | | | |
Net increase (decrease) in shares outstanding | | 1,203,489 | | | $ | 24,052,745 | |
| | | | | | | |
Year ended October 31, 2006: | | | | | | | |
Shares sold | | 380,865 | | | $ | 7,447,129 | |
Shares issued in connection with the merger | | 449,164 | | | | 8,260,125 | |
Shares reacquired | | (544,196 | ) | | | (10,432,304 | ) |
| | | | | | | |
Net increase (decrease) in shares outstanding | | 285,833 | | | $ | 5,274,950 | |
| | | | | | | |
Year ended October 31, 2005: | | | | | | | |
Shares sold | | 249,797 | | | $ | 3,956,839 | |
Shares reacquired | | (681,813 | ) | | | (10,822,496 | ) |
| | | | | | | |
Net increase (decrease) in shares outstanding | | (432,016 | ) | | $ | (6,865,657 | ) |
| | | | | | | |
| | |
| Jennison Mid-Cap Growth Fund, Inc. | | 33 |
Notes to Financial Statements
continued
| | | | | | | |
Class L | | Shares | | | Amount | |
Ten months ended August 31, 2007: | | | | | | | |
Shares sold | | 5,222 | | | $ | 120,216 | |
Shares issued in connection with the merger | | 727,429 | | | | 16,083,444 | |
Shares reacquired | | (167,606 | ) | | | (3,908,616 | ) |
| | | | | | | |
Net increase (decrease) in shares outstanding | | 565,045 | | | $ | 12,295,044 | |
| | | | | | | |
June 12, 2006* through October 31, 2006: | | | | | | | |
Shares sold | | 1,577 | | | $ | 42,308 | |
Shares issued in connection with the merger | | 262,497 | | | | 5,254,249 | |
Shares reacquired | | (28,255 | ) | | | (583,456 | ) |
| | | | | | | |
Net increase (decrease) in shares outstanding | | 235,819 | | | $ | 4,713,101 | |
| | | | | | | |
Class M | | | | | | |
Ten months ended August 31, 2007: | | | | | | | |
Shares sold | | 21,313 | | | $ | 457,238 | |
Shares issued in connection with the merger | | 2,012,488 | | | | 40,898,191 | |
Shares reacquired | | (387,012 | ) | | | (8,303,029 | ) |
| | | | | | | |
Net increase (decrease) in shares outstanding before conversion | | 1,646,789 | | | | 33,052,400 | |
Shares reacquired upon conversion into Class A | | (163,535 | ) | | | (3,575,145 | ) |
| | | | | | | |
Net increase (decrease) in shares outstanding | | 1,483,254 | | | $ | 29,477,255 | |
| | | | | | | |
June 12, 2006* through October 31, 2006: | | | | | | | |
Shares sold | | 6,889 | | | $ | 61,270 | |
Shares issued in connection with the merger | | 673,089 | | | | 12,518,962 | |
Shares reacquired | | (76,443 | ) | | | (1,432,144 | ) |
| | | | | | | |
Net increase (decrease) in shares outstanding | | 603,535 | | | $ | 11,148,088 | |
| | | | | | | |
Class R | | | | | | |
Ten months ended August 31, 2007: | | | | | | | |
Shares sold | | 64,338 | | | $ | 1,488,728 | |
Shares reacquired | | (15,377 | ) | | | (360,002 | ) |
| | | | | | | |
Net increase (decrease) in shares outstanding | | 48,961 | | | $ | 1,128,726 | |
| | | | | | | |
Year ended October 31, 2006: | | | | | | | |
Shares sold | | 879 | | | $ | 18,658 | |
Shares reacquired | | — | | | | — | |
| | | | | | | |
Net increase (decrease) in shares outstanding | | 879 | | | $ | 18,658 | |
| | | | | | | |
June 3, 2005* through October 31, 2005: | | | | | | | |
Shares sold | | 147 | | | $ | 2,500 | |
Shares reacquired | | — | | | | — | |
| | | | | | | |
Net increase (decrease) in shares outstanding | | 147 | | | $ | 2,500 | |
| | | | | | | |
| | |
| 34 | | Visit our website at www.jennisondryden.com |
| | | | | | | |
Class X | | Shares | | | Amount | |
Ten months ended August 31, 2007: | | | | | | | |
Shares sold | | 11,793 | | | $ | 254,780 | |
Shares issued in connection with the merger | | 411,393 | | | | 8,363,620 | |
Shares reacquired | | (71,743 | ) | | | (1,539,605 | ) |
| | | | | | | |
Net increase (decrease) in shares outstanding before conversion | | 351,443 | | | | 7,078,795 | |
Shares reacquired upon conversion into Class A | | (3,933 | ) | | | (86,160 | ) |
| | | | | | | |
Net increase (decrease) in shares outstanding | | 347,510 | | | $ | 6,992,635 | |
| | | | | | | |
June 12, 2006* through October 31, 2006: | | | | | | | |
Shares sold | | 1,251 | | | $ | 16,016 | |
Shares issued in connection with the merger | | 84,794 | | | | 1,576,059 | |
Shares reacquired | | (11,768 | ) | | | (221,899 | ) |
| | | | | | | |
Net increase (decrease) in shares outstanding | | 74,277 | | | $ | 1,370,176 | |
| | | | | | | |
Class Z | | | | | | |
Ten months ended August 31, 2007: | | | | | | | |
Shares sold | | 2,186,006 | | | $ | 51,419,032 | |
Shares issued in connection with the merger | | 125,340 | | | | 2,850,039 | |
Shares reacquired | | (2,153,555 | ) | | | (50,992,983 | ) |
| | | | | | | |
Net increase (decrease) in shares outstanding | | 157,791 | | | $ | 3,276,088 | |
| | | | | | | |
Year ended October 31, 2006: | | | | | | | |
Shares sold | | 2,871,984 | | | $ | 61,390,882 | |
Shares reacquired | | (2,620,284 | ) | | | (55,694,812 | ) |
| | | | | | | |
Net increase (decrease) in shares outstanding | | 251,700 | | | $ | 5,696,070 | |
| | | | | | | |
Year ended October 31, 2005: | | | | | | | |
Shares sold | | 2,688,718 | | | $ | 47,013,260 | |
Shares reacquired | | (3,686,438 | ) | | | (63,093,000 | ) |
| | | | | | | |
Net increase (decrease) in shares outstanding | | (997,720 | ) | | $ | (16,079,740 | ) |
| | | | | | | |
Note 7. Reorganization
On March 2, 2007, the Fund acquired all of the net assets of Strategic Partners Mid-Cap Growth Fund and Strategic Partners New Era Growth Fund (“the Merged Funds”) pursuant to a plan of reorganization approved by the Strategic Partners Mid-Cap Growth Fund and Strategic Partners New Era Growth Fund shareholders on December 7, 2006. The acquisition was accomplished by a tax-free issue of Class A, Class B, Class C, Class L, Class M, Class X and Class Z shares for the corresponding classes of shares of Strategic Partners Mid-Cap Growth Fund and Strategic Partners New Era Growth Fund. The following table shows the number of shares of the merged funds and how many shares they became in the Jennison Mid-Cap Growth Fund and the total value.
| | |
| Jennison Mid-Cap Growth Fund, Inc. | | 35 |
Notes to Financial Statements
continued
| | | | | | | | | | | |
Strategic Partners Mid-Cap Growth Fund | | | | Jennison Mid-Cap Growth Fund |
Class | | Shares | | | | Class | | Shares | | Value |
A | | 2,607,184 | | | | A | | 619,306 | | $ | 13,718,483 |
B | | 512,042 | | | | B | | 127,938 | | | 2,600,783 |
C | | 2,993,608 | | | | C | | 743,365 | | | 15,112,179 |
L | | 3,087,033 | | | | L | | 727,429 | | | 16,083,444 |
M | | 8,081,768 | | | | M | | 2,012,488 | | | 40,898,191 |
X | | 1,656,162 | | | | X | | 411,393 | | | 8,363,620 |
| | | | | | | | | | | |
Strategic Partners New Era Growth Fund | | | | Jennison Mid-Cap Growth Fund |
Class | | Shares | | | | Class | | Shares | | Value |
A | | 1,323,923 | | | | A | | 548,653 | | $ | 12,153,085 |
B | | 2,903,086 | | | | B | | 1,251,370 | | | 25,444,490 |
C | | 2,048,773 | | | | C | | 883,256 | | | 17,960,057 |
Z | | 305,299 | | | | Z | | 125,340 | | | 2,850,039 |
The net assets and net unrealized appreciation of the Merged funds immediately before the acquisition were:
| | | | | | |
| | | Net
Assets | | Net
Unrealized
Appreciation |
Strategic Partners Mid-Cap Growth Fund | | $ | 96,776,700 | | $ | 16,189,779 |
Strategic Partners New Era Growth Fund | | | 58,407,671 | | | 8,049,817 |
The net assets of Jennison Mid-Cap Growth Fund immediately before the acquisition were $663,276,721.
The Fund acquired capital loss carryforward from the merger with Strategic Partners Mid-Cap Growth Fund and Strategic Partners New Era Growth Fund in the amounts of $138,153,151 and $86,888,036, respectively (amounts included in Note 5). The future utilization of the acquired capital loss carryforwards may be limited under certain conditions defined in the Internal Revenue Code of 1986, as amended.
| | |
| 36 | | Visit our website at www.jennisondryden.com |
Note 8. New Accounting Pronouncements
On July 13, 2006, the Financial Accounting Standards Board (FASB) released FASB Interpretation No. 48 “Accounting for Uncertainty in Income Taxes” (FIN 48). FIN 48 provides guidance for how uncertain tax positions should be recognized, measured, presented and disclosed in the financial statements. FIN 48 requires the evaluation of tax positions taken or expected to be taken in the course of preparing the Fund’s tax returns to determine whether the tax positions are “more-likely-than-not” of being sustained by the applicable tax authority. Tax benefits or expenses resulting from tax positions not deemed to meet the more-likely-than-not threshold would be recorded in the year in which they arise. On December 22, 2006 the Securities and Exchange Commission delayed the effective date until the last net asset value calculation in the first required financial reporting period for its fiscal year beginning after December 15, 2006. The Fund’s financial statements have not been impacted by the adoption of FIN 48. However, the conclusions regarding FIN 48 may be subject to review and adjustment at a later date based on factors including but not limited to further implementation guidance expected from FASB, and on-going analysis of tax laws, regulations, and interpretations thereof.
On September 20, 2006, the FASB released Statement of Financial Accounting Standards No. 157 “Fair Value Measurements” (FAS 157). FAS 157 establishes an authoritative definition of fair value, sets out a framework for measuring fair value, and requires additional disclosures about fair-value measurements. The application of FAS 157 is required for fiscal years beginning after November 15, 2007 and interim periods within those fiscal years. At this time, management is evaluating the implications of FAS 157 and its impact, if any, in the financial statements has not yet been determined.
| | |
| Jennison Mid-Cap Growth Fund, Inc. | | 37 |
Financial Highlights
| | | | |
| | | Class A | |
| | | Ten Months Ended
August 31, 2007(a)(b) | |
Per Share Operating Performance: | | | | |
Net Asset Value, Beginning Of Period | | $ | 21.33 | |
| | | | |
Income (loss) from investment operations: | | | | |
Net investment loss | | | (.04 | ) |
Net realized and unrealized gain (loss) on investment transactions | | | 3.20 | |
| | | | |
Total from investment operations | | | 3.16 | |
| | | | |
Net asset value, end of period | | $ | 24.49 | |
| | | | |
Total Return(c): | | | 14.81 | % |
Ratios/Supplemental Data: | | | | |
Net assets, end of period (000) | | $ | 429,993 | |
Average net assets (000) | | $ | 395,762 | |
Ratios to average net assets: | | | | |
Expenses, including distribution and service (12b-1) fees(d) | | | 1.08 | %(e) |
Expenses, excluding distribution and service (12b-1) fees | | | .83 | %(e) |
Net investment loss | | | (.21 | )%(e) |
Portfolio turnover rate | | | 62 | %(f) |
| (a) | Calculated based upon average shares outstanding during the period. |
| (b) | For the period ended August 31, 2007. The Fund changed its fiscal year end from October 31 to August 31, effective August 31, 2007. |
| (c) | Total return does not consider the effects of sales loads. Total return is calculated assuming a purchase of a share on the first day and a sale on the last day of each period reported, and includes reinvestment of dividends and distributions. Total investment returns may reflect adjustments to conform to generally accepted accounting principles. Total returns for periods less than a full year are not annualized. |
| (d) | The distributor of the Fund has contractually agreed to limit its distribution and service (12b-1) fees to .25 of 1% of the average daily net assets of the Class A shares. |
See Notes to Financial Statements.
| | |
| 38 | | Visit our website at www.jennisondryden.com |
| | | | | | | | | | | | | | | | | | |
| Class A | |
| Year Ended October 31, | |
| 2006(a) | | | 2005(a) | | | 2004(a) | | | 2003(a) | | | 2002(a) | |
| | | | | | | | | | | | | | | | | | |
| $ | 18.52 | | | $ | 15.29 | | | $ | 14.10 | | | $ | 9.93 | | | $ | 13.15 | |
| | | | | | | | | | | | | | | | | | | |
| | | | | | | | | | | | | | | | | | |
| | (.04 | ) | | | (.14 | ) | | | (.14 | ) | | | (.12 | ) | | | (.12 | ) |
| | 2.85 | | | | 3.37 | | | | 1.33 | | | | 4.29 | | | | (3.10 | ) |
| | | | | | | | | | | | | | | | | | | |
| | 2.81 | | | | 3.23 | | | | 1.19 | | | | 4.17 | | | | (3.22 | ) |
| | | | | | | | | | | | | | | | | | | |
| $ | 21.33 | | | $ | 18.52 | | | $ | 15.29 | | | $ | 14.10 | | | $ | 9.93 | |
| | | | | | | | | | | | | | | | | | | |
| | 15.17 | % | | | 21.12 | % | | | 8.44 | % | | | 41.99 | % | | | (24.49 | )% |
| | | | | | | | | | | | | | | | | | |
| $ | 352,670 | | | $ | 288,885 | | | $ | 253,031 | | | $ | 204,685 | | | $ | 141,331 | |
| $ | 336,747 | | | $ | 269,109 | | | $ | 234,527 | | | $ | 165,609 | | | $ | 181,454 | |
| | | | | | | | | | | | | | | | | | |
| | 1.16 | % | | | 1.21 | % | | | 1.20 | % | | | 1.33 | % | | | 1.31 | % |
| | .91 | % | | | .96 | % | | | .95 | % | | | 1.08 | % | | | 1.06 | % |
| | (.18 | )% | | | (.79 | )% | | | (.97 | )% | | | (1.08 | )% | | | (.99 | )% |
| | | | | | | | | | | | | | | | | | |
| | 86 | % | | | 136 | % | | | 178 | % | | | 231 | % | | | 337 | % |
See Notes to Financial Statements.
| | |
| Jennison Mid-Cap Growth Fund, Inc. | | 39 |
Financial Highlights
continued
| | | | |
| | | Class B | |
| | | Ten Months Ended
August 31, 2007(a)(b) | |
Per Share Operating Performance: | | | | |
Net Asset Value, Beginning Of Period | | $ | 19.63 | |
| | | | |
Income (loss) from investment operations: | | | | |
Net investment loss | | | (.17 | ) |
Net realized and unrealized gain (loss) on investment transactions | | | 2.94 | |
| | | | |
Total from investment operations | | | 2.77 | |
| | | | |
Net asset value, end of period | | $ | 22.40 | |
| | | | |
Total Return(c): | | | 14.11 | % |
Ratios/Supplemental Data: | | | | |
Net assets, end of period (000) | | $ | 94,869 | |
Average net assets (000) | | $ | 94,680 | |
Ratios to average net assets: | | | | |
Expenses, including distribution and service (12b-1) fees | | | 1.83 | %(d) |
Expenses, excluding distribution and service (12b-1) fees | | | .83 | %(d) |
Net investment loss | | | (.95 | )%(d) |
| (a) | Calculated based upon average shares outstanding during the period. |
| (b) | For the period ended August 31, 2007. The Fund changed its fiscal year end from October 31 to August 31, effective August 31, 2007. |
| (c) | Total return does not consider the effects of sales loads. Total return is calculated assuming a purchase of a share on the first day and a sale on the last day of each period reported, and includes reinvestment of dividends and distributions. Total investment returns may reflect adjustments to conform to generally accepted accounting principles. Total returns for periods less than a full year are not annualized. |
See Notes to Financial Statements.
| | |
| 40 | | Visit our website at www.jennisondryden.com |
| | | | | | | | | | | | | | | | | | |
| Class B | |
| Year Ended October 31, | |
| 2006(a) | | | 2005(a) | | | 2004(a) | | | 2003(a) | | | 2002(a) | |
| | | | | | | | | | | | | | | | | | |
| $ | 17.17 | | | $ | 14.28 | | | $ | 13.27 | | | $ | 9.42 | | | $ | 12.57 | |
| | | | | | | | | | | | | | | | | | | |
| | | | | | | | | | | | | | | | | | |
| | (.18 | ) | | | (.24 | ) | | | (.24 | ) | | | (.20 | ) | | | (.21 | ) |
| | 2.64 | | | | 3.13 | | | | 1.25 | | | | 4.05 | | | | (2.94 | ) |
| | | | | | | | | | | | | | | | | | | |
| | 2.46 | | | | 2.89 | | | | 1.01 | | | | 3.85 | | | | (3.15 | ) |
| | | | | | | | | | | | | | | | | | | |
| $ | 19.63 | | | $ | 17.17 | | | $ | 14.28 | | | $ | 13.27 | | | $ | 9.42 | |
| | | | | | | | | | | | | | | | | | | |
| | 14.33 | % | | | 20.24 | % | | | 7.61 | % | | | 40.87 | % | | | (25.06 | )% |
| | | | | | | | | | | | | | | | | | |
| $ | 88,552 | | | $ | 103,285 | | | $ | 121,525 | | | $ | 159,782 | | | $ | 130,225 | |
| $ | 102,115 | | | $ | 114,179 | | | $ | 140,185 | | | $ | 138,327 | | | $ | 189,651 | |
| | | | | | | | | | | | | | | | | | |
| | 1.91 | % | | | 1.96 | % | | | 1.95 | % | | | 2.08 | % | | | 2.06 | % |
| | .91 | % | | | .96 | % | | | .95 | % | | | 1.08 | % | | | 1.06 | % |
| | (.91 | )% | | | (1.54 | )% | | | (1.72 | )% | | | (1.83 | )% | | | (1.74 | )% |
See Notes to Financial Statements.
| | |
| Jennison Mid-Cap Growth Fund, Inc. | | 41 |
Financial Highlights
continued
| | | | |
| | | Class C | |
| | | Ten Months Ended
August 31, 2007(a)(b) | |
Per Share Operating Performance: | | | | |
Net Asset Value, Beginning Of Period | | $ | 19.63 | |
| | | | |
Income (loss) from investment operations: | | | | |
Net investment loss | | | (.17 | ) |
Net realized and unrealized gain (loss) on investment transactions | | | 2.95 | |
| | | | |
Total from investment operations | | | 2.78 | |
| | | | |
Net asset value, end of period | | $ | 22.41 | |
| | | | |
Total Return(c): | | | 14.11 | % |
Ratios/Supplemental Data: | | | | |
Net assets, end of period (000) | | $ | 73,977 | |
Average net assets (000) | | $ | 61,516 | |
Ratios to average net assets: | | | | |
Expenses, including distribution and service (12b-1) fees | | | 1.83 | %(d) |
Expenses, excluding distribution and service (12b-1) fees | | | .83 | %(d) |
Net investment loss | | | (.93 | )%(d) |
| (a) | Calculated based upon average shares outstanding during the period. |
| (b) | For the period ended August 31, 2007. The Fund changed its fiscal year end from October 31 to August 31, effective August 31, 2007. |
| (c) | Total return does not consider the effects of sales loads. Total return is calculated assuming a purchase of a share on the first day and a sale on the last day of each period reported, and includes reinvestment of dividends and distributions. Total investment returns may reflect adjustments to conform to generally accepted accounting principles. Total returns for periods less than a full year are not annualized. |
See Notes to Financial Statements.
| | |
| 42 | | Visit our website at www.jennisondryden.com |
| | | | | | | | | | | | | | | | | | |
| Class C | |
| Year Ended October 31, | |
| 2006(a) | | | 2005(a) | | | 2004(a) | | | 2003(a) | | | 2002(a) | |
| | | | | | | | | | | | | | | | | | |
| $ | 17.17 | | | $ | 14.28 | | | $ | 13.27 | | | $ | 9.42 | | | $ | 12.57 | |
| | | | | | | | | | | | | | | | | | | |
| | | | | | | | | | | | | | | | | | |
| | (.18 | ) | | | (.24 | ) | | | (.24 | ) | | | (.20 | ) | | | (.21 | ) |
| | 2.64 | | | | 3.13 | | | | 1.25 | | | | 4.05 | | | | (2.94 | ) |
| | | | | | | | | | | | | | | | | | | |
| | 2.46 | | | | 2.89 | | | | 1.01 | | | | 3.85 | | | | (3.15 | ) |
| | | | | | | | | | | | | | | | | | | |
| $ | 19.63 | | | $ | 17.17 | | | $ | 14.28 | | | $ | 13.27 | | | $ | 9.42 | |
| | | | | | | | | | | | | | | | | | | |
| | 14.33 | % | | | 20.24 | % | | | 7.61 | % | | | 40.87 | % | | | (25.06 | )% |
| | | | | | | | | | | | | | | | | | |
| $ | 41,185 | | | $ | 31,114 | | | $ | 32,054 | | | $ | 35,212 | | | $ | 28,577 | |
| $ | 36,947 | | | $ | 32,206 | | | $ | 34,207 | | | $ | 30,253 | | | $ | 41,014 | |
| | | | | | | | | | | | | | | | | | |
| | 1.91 | % | | | 1.96 | % | | | 1.95 | % | | | 2.08 | % | | | 2.06 | % |
| | .91 | % | | | .96 | % | | | .95 | % | | | 1.08 | % | | | 1.06 | % |
| | (.95 | )% | | | (1.54 | )% | | | (1.72 | )% | | | (1.83 | )% | | | (1.74 | )% |
See Notes to Financial Statements.
| | |
| Jennison Mid-Cap Growth Fund, Inc. | | 43 |
Financial Highlights
continued
| | | | | | | | |
| | | Class L | |
| | | Ten Months Ended
August 31, 2007(b)(c) | | | June 12, 2006(a)
Through
October 31, 2006(b) | |
Per Share Operating Performance: | | | | | | | | |
Net Asset Value, Beginning Of Period | | $ | 21.31 | | | $ | 20.23 | |
| | | | | | | | |
Income from investment operations: | | | | | | | | |
Net investment loss | | | (.08 | ) | | | (.05 | ) |
Net realized and unrealized gain on investment transactions | | | 3.19 | | | | 1.13 | |
| | | | | | | | |
Total from investment operations | | | 3.11 | | | | 1.08 | |
| | | | | | | | |
Net asset value, end of period | | $ | 24.42 | | | $ | 21.31 | |
| | | | | | | | |
Total Return(d): | | | 14.59 | % | | | 5.34 | % |
Ratios/Supplemental Data: | | | | | | | | |
Net assets, end of period (000) | | $ | 19,558 | | | $ | 5,025 | |
Average net assets (000) | | $ | 14,140 | | | $ | 4,900 | |
Ratios to average net assets: | | | | | | | | |
Expenses, including distribution and service (12b-1) fees | | | 1.33 | %(e) | | | 1.41 | %(e) |
Expenses, excluding distribution and service (12b-1) fees | | | .83 | %(e) | | | .91 | %(e) |
Net investment loss | | | (.38 | )%(e) | | | (.71 | )%(e) |
| (a) | Inception date of Class L shares. |
| (b) | Calculated based upon average shares outstanding during the period. |
| (c) | For the period ended August 31, 2007. The Fund changed its fiscal year end from October 31 to August 31, effective August 31, 2007. |
| (d) | Total return does not consider the effects of sales loads. Total return is calculated assuming a purchase of a share on the first day and a sale on the last day of each period reported, and includes reinvestment of dividends and distributions. Total investment returns may reflect adjustments to conform to generally accepted accounting principles. Total returns for periods less than a full year are not annualized. |
See Notes to Financial Statements.
| | |
| 44 | | Visit our website at www.jennisondryden.com |
| | | | | | | | |
| | | Class M | |
| | | Ten Months Ended
August 31, 2007(b)(c) | | | June 12, 2006(a)
Through
October 31, 2006(b) | |
Per Share Operating Performance: | | | | | | | | |
Net Asset Value, Beginning Of Period | | $ | 19.61 | | | $ | 18.67 | |
| | | | | | | | |
Income from investment operations: | | | | | | | | |
Net investment loss | | | (.17 | ) | | | (.08 | ) |
Net realized and unrealized gain on investment transactions | | | 2.95 | | | | 1.02 | |
| | | | | | | | |
Total from investment operations | | | 2.78 | | | | .94 | |
| | | | | | | | |
Net asset value, end of period | | $ | 22.39 | | | $ | 19.61 | |
| | | | | | | | |
Total Return(d): | | | 14.13 | % | | | 5.03 | % |
Ratios/Supplemental Data: | | | | | | | | |
Net assets, end of period (000) | | $ | 46,713 | | | $ | 11,836 | |
Average net assets (000) | | $ | 34,765 | | | $ | 11,540 | |
Ratios to average net assets: | | | | | | | | |
Expenses, including distribution and service (12b-1) fees | | | 1.83 | %(e) | | | 1.91 | %(e) |
Expenses, excluding distribution and service (12b-1) fees | | | .83 | %(e) | | | .91 | %(e) |
Net investment loss | | | (.88 | )%(e) | | | (1.20 | )%(e) |
| (a) | Inception date of Class M shares. |
| (b) | Calculated based upon average shares outstanding during the period. |
| (c) | For the period ended August 31, 2007. The Fund changed its fiscal year end from October 31 to August 31, effective August 31, 2007. |
| (d) | Total return does not consider the effects of sales loads. Total return is calculated assuming a purchase of a share on the first day and a sale on the last day of each period reported, and includes reinvestment of dividends and distributions. Total investment returns may reflect adjustments to conform to generally accepted accounting principles. Total returns for periods less than a full year are not annualized. |
See Notes to Financial Statements.
| | |
| Jennison Mid-Cap Growth Fund, Inc. | | 45 |
Financial Highlights
continued
| | | | | | | | | | | | |
| | | Class R | |
| | | Ten Months Ended
August 31, 2007(b)(c) | | | Year Ended
October 31, 2006(b) | | | June 3, 2005(a)
Through
October 31, 2005(b) | |
Per Share Operating Performance: | | | | | | | | | | | | |
Net Asset Value, Beginning Of Period | | $ | 21.24 | | | $ | 18.49 | | | $ | 17.03 | |
| | | | | | | | | | | | |
Income (loss) from investment operations: | | | | | | | | | | | | |
Net investment loss | | | (.09 | ) | | | (.07 | ) | | | (.07 | ) |
Net realized and unrealized gain on investment transactions | | | 3.20 | | | | 2.82 | | | | 1.53 | |
| | | | | | | | | | | | |
Total from investment operations | | | 3.11 | | | | 2.75 | | | | 1.46 | |
| | | | | | | | | | | | |
Net asset value, end of period | | $ | 24.35 | | | $ | 21.24 | | | $ | 18.49 | |
| | | | | | | | | | | | |
Total Return(d): | | | 14.64 | % | | | 14.87 | % | | | 8.57 | % |
Ratios/Supplemental Data: | | | | | | | | | | | | |
Net assets, end of period (000) | | $ | 1,217 | | | $ | 22 | | | $ | 3 | |
Average net assets (000) | | $ | 648 | | | $ | 4 | | | $ | 3 | |
Ratios to average net assets: | | | | | | | | | | | | |
Expenses, including distribution and service (12b-1) fees(e) | | | 1.33 | %(f) | | | 1.41 | % | | | 1.46 | %(f) |
Expenses, excluding distribution and service (12b-1) fees | | | .83 | %(f) | | | .91 | % | | | .96 | %(f) |
Net investment loss | | | (.45 | )%(f) | | | (.45 | )% | | | (.96 | )%(f) |
| (a) | Inception date of Class R shares. |
| (b) | Calculated based upon average shares outstanding during the period. |
| (c) | For the period ended August 31, 2007. The Fund changed its fiscal year end from October 31 to August 31, effective August 31, 2007. |
| (d) | Total return does not consider the effects of sales loads. Total return is calculated assuming a purchase of a share on the first day and a sale on the last day of each period reported, and includes reinvestment of dividends and distributions. Total investment returns may reflect adjustments to conform to generally accepted accounting principles. Total returns for periods less than a full year are not annualized. |
| (e) | During the period, the distributor of the Fund has contractually agreed to limit its distribution and service (12b-1) fees to .50 of 1% of the average daily net assets of the Class R shares. |
See Notes to Financial Statements.
| | |
| 46 | | Visit our website at www.jennisondryden.com |
| | | | | | | | |
| | | Class X | |
| | | Ten Months Ended
August 31, 2007(b)(c) | | | June 12, 2006(a)
Through
October 31, 2006(b) | |
Per Share Operating Performance: | | | | | | | | |
Net Asset Value, Beginning Of Period | | $ | 19.63 | | | $ | 18.67 | |
| | | | | | | | |
Income from investment operations: | | | | | | | | |
Net investment loss | | | (.17 | ) | | | (.09 | ) |
Net realized and unrealized gain on investment transactions | | | 2.94 | | | | 1.05 | |
| | | | | | | | |
Total from investment operations | | | 2.77 | | | | .96 | |
| | | | | | | | |
Net asset value, end of period | | $ | 22.40 | | | $ | 19.63 | |
| | | | | | | | |
Total Return(d): | | | 14.11 | % | | | 5.14 | % |
Ratios/Supplemental Data: | | | | | | | | |
Net assets, end of period (000) | | $ | 9,450 | | | $ | 1,458 | |
Average net assets (000) | | $ | 6,373 | | | $ | 1,448 | |
Ratios to average net assets: | | | | | | | | |
Expenses, including distribution and service (12b-1) fees | | | 1.83 | %(e) | | | 1.91 | %(e) |
Expenses, excluding distribution and service (12b-1) fees | | | .83 | %(e) | | | .91 | %(e) |
Net investment loss | | | (.87 | )%(e) | | | (1.20 | )%(e) |
| (a) | Inception date of Class X shares. |
| (b) | Calculated based upon average shares outstanding during the period. |
| (c) | For the period ended August 31, 2007. The Fund changed its fiscal year end from October 31 to August 31, effective August 31, 2007. |
| (d) | Total return does not consider the effects of sales loads. Total return is calculated assuming a purchase of a share on the first day and a sale on the last day of each period reported, and includes reinvestment of dividends and distributions. Total investment returns may reflect adjustments to conform to generally accepted accounting principles. Total returns for periods less than a full year are not annualized. |
See Notes to Financial Statements.
| | |
| Jennison Mid-Cap Growth Fund, Inc. | | 47 |
Financial Highlights
continued
| | | | |
| | | Class Z | |
| | | Ten Months Ended
August 31, 2007(a)(b) | |
Per Share Operating Performance: | | | | |
Net Asset Value, Beginning Of Period | | $ | 21.88 | |
| | | | |
Income (loss) from investment operations: | | | | |
Net investment income (loss) | | | .01 | |
Net realized and unrealized gain (loss) on investment transactions | | | 3.30 | |
| | | | |
Total from investment operations | | | 3.31 | |
| | | | |
Net asset value, end of period | | $ | 25.19 | |
| | | | |
Total Return(c): | | | 15.13 | % |
Ratios/Supplemental Data: | | | | |
Net assets, end of period (000) | | $ | 187,974 | |
Average net assets (000) | | $ | 177,560 | |
Ratios to average net assets: | | | | |
Expenses, including distribution and service (12b-1) fees | | | .83 | %(d) |
Expenses, excluding distribution and service (12b-1) fees | | | .83 | %(d) |
Net investment income (loss) | | | .03 | %(d) |
| (a) | Calculated based upon average shares outstanding during the period. |
| (b) | For the period ended August 31, 2007. The Fund changed its fiscal year end from October 31 to August 31, effective August 31, 2007. |
| (c) | Total return does not consider the effects of sales loads. Total return is calculated assuming a purchase of a share on the first day and a sale on the last day of each period reported, and includes reinvestment of dividends and distributions. Total investment returns may reflect adjustments to conform to generally accepted accounting principles. Total returns for periods less than a full year are not annualized. |
See Notes to Financial Statements.
| | |
| 48 | | Visit our website at www.jennisondryden.com |
| | | | | | | | | | | | | | | | | | |
| Class Z | |
| Year Ended October 31, | |
| 2006(a) | | | 2005(a) | | | 2004(a) | | | 2003(a) | | | 2002(a) | |
| | | | | | | | | | | | | | | | | | |
| $ | 18.95 | | | $ | 15.62 | | | $ | 14.37 | | | $ | 10.09 | | | $ | 13.34 | |
| | | | | | | | | | | | | | | | | | | |
| | | | | | | | | | | | | | | | | | |
| | .02 | | | | (.09 | ) | | | (.11 | ) | | | (.10 | ) | | | (.09 | ) |
| | 2.91 | | | | 3.42 | | | | 1.36 | | | | 4.38 | | | | (3.16 | ) |
| | | | | | | | | | | | | | | | | | | |
| | 2.93 | | | | 3.33 | | | | 1.25 | | | | 4.28 | | | | (3.25 | ) |
| | | | | | | | | | | | | | | | | | | |
| $ | 21.88 | | | $ | 18.95 | | | $ | 15.62 | | | $ | 14.37 | | | $ | 10.09 | |
| | | | | | | | | | | | | | | | | | | |
| | 15.46 | % | | | 21.32 | % | | | 8.70 | % | | | 42.42 | % | | | (24.36 | )% |
| | | | | | | | | | | | | | | | | | |
| $ | 159,855 | | | $ | 133,674 | | | $ | 125,732 | | | $ | 112,963 | | | $ | 66,193 | |
| $ | 160,261 | | | $ | 126,649 | | | $ | 119,263 | | | $ | 81,458 | | | $ | 79,868 | |
| | | | | | | | | | | | | | | | | | |
| | .91 | % | | | .96 | % | | | .95 | % | | | 1.08 | % | | | 1.06 | % |
| | .91 | % | | | .96 | % | | | .95 | % | | | 1.08 | % | | | 1.06 | % |
| | .07 | % | | | (.54 | )% | | | (.72 | )% | | | (.82 | )% | | | (.74 | )% |
See Notes to Financial Statements.
| | |
| Jennison Mid-Cap Growth Fund, Inc. | | 49 |
Report of Independent Registered Public
Accounting Firm
The Board of Directors and Shareholders of
Jennison Mid-Cap Growth Fund, Inc.:
We have audited the accompanying statement of assets and liabilities of Jennison Mid-Cap Growth Fund, Inc. (hereafter referred to as the “Fund”), including the portfolio of investments, as of August 31, 2007, and the related statement of operations for the period ended August 31, 2007 and the year ended October 31, 2006, the statement of changes in net assets for the period ended August 31, 2007 and each of the years in the two-year period ended October 31, 2006 and the financial highlights for the period ended August 31, 2007 and each of the years in the three-year period ended October 31, 2006. These financial statements and financial highlights are the responsibility of the Fund’s management. Our responsibility is to express an opinion on these financial statements and financial highlights based on our audits. The financial highlights for the years presented prior to the year ended October 31, 2004 were audited by another independent registered public accounting firm, whose report dated December 22, 2003, expressed an unqualified opinion thereon.
We conducted our audits in accordance with the standards of the Public Company Accounting Oversight Board (United States). Those standards require that we plan and perform the audit to obtain reasonable assurance about whether the financial statements and financial highlights are free of material misstatement. An audit includes examining, on a test basis, evidence supporting the amounts and disclosures in the financial statements. Our procedures included confirmation of securities owned as of August 31, 2007, by correspondence with the custodian. An audit also includes assessing the accounting principles used and significant estimates made by management, as well as evaluating the overall financial statement presentation. We believe that our audits provide a reasonable basis for our opinion.
In our opinion, the financial statements and financial highlights referred to above present fairly, in all material respects, the financial position of the Fund as of August 31, 2007, and the results of its operations for the period ended August 31, 2007 and the year ended October 31, 2006, the changes in its net assets for the period ended August 31, 2007 and each of the years in the two-year period ended October 31, 2006 and the financial highlights for the period ended August 31, 2007 and each of the years in the three-year period ended October 31, 2006, in conformity with U.S. generally accepted accounting principles.

New York, New York
October 26, 2007
| | |
| 50 | | Visit our website at www.jennisondryden.com |
Management of the Fund
(Unaudited)
Information pertaining to the Directors of the Jennison Mid-Cap Growth Fund, Inc. (the “Fund”) is set forth below. Directors who are not deemed to be “interested persons” of the Fund, as defined in the Investment Company Act of 1940 (the 1940 Act), are referred to as “Independent Directors.” Directors who are deemed to be “interested persons” of the Fund are referred to as “Interested Directors.” “Fund Complex”† consists of the Fund and any other investment companies managed by PI.
Independent Directors(2)
Linda W. Bynoe (55), Director since 2005(3) Oversees 60 portfolios in Fund complex
Principal occupations (last 5 years): President and Chief Executive Officer (since March 1995) of Telemat, Ltd. (management consulting); formerly Vice President at Morgan Stanley & Co.
Other Directorships held: Director of Simon Property Group, Inc. (real estate investment trust) (since May 2003); Anixter International (communication products distributor) (since January 2006); Director of Northern Trust Corporation (since April 2006).
David E.A. Carson (73), Director since 2003(3) Oversees 64 portfolios in Fund complex
Principal occupations (last 5 years): Formerly Director (January 2000 - May 2000), Chairman (January 1999 - December 1999), Chairman and Chief Executive Officer (January 1998-December 1998) and President, Chairman and Chief Executive Officer of People’s Bank (1983-1997).
Robert E. La Blanc (73), Director since 2003(3) Oversees 62 portfolios in Fund complex
Principal occupations (last 5 years): President (since 1981) of Robert E. La Blanc Associates, Inc. (telecommunications).
Other Directorships held:(4) Director, CA, Inc. (since 2002) (software company); FiberNet Telecom Group, Inc. (since 2003) (telecom company).
Douglas H. McCorkindale (68), Director since 1996(3) Oversees 60 portfolios in Fund complex
Principal occupations (last 5 years): Formerly Chairman (February 2001-June 2006), Chief Executive Officer (June 2000-July 2005), President (September 1997-July 2005) and Vice Chairman (March 1984-May 2000) of Gannett Co. Inc. (publishing and media).
Other Directorships held:(4) Director of Continental Airlines, Inc. (since May 1993); Director of Lockheed Martin Corp. (aerospace and defense) (since May 2001).
Richard A. Redeker (64), Director since 1996(3) Oversees 61 portfolios in Fund complex
Principal occupations (last 5 years): Management Consultant; Director (since 2001); Director of Penn Tank Lines, Inc. (since 1999).
Robin B. Smith (67), Director since 1996(3) Oversees 62 portfolios in Fund complex
Principal occupations (last 5 years): Chairman of the Board (since January 2003) of Publishers Clearing House (direct marketing); formerly Chairman and Chief Executive Officer (August 1996-January 2003) of Publishers Clearing House.
Other Directorships held:(4) Formerly Director of BellSouth Corporation (1992-2006).
| | |
| Jennison Mid-Cap Growth Fund, Inc. | | 51 |
Stephen G. Stoneburn (64), Director since 2003(3) Oversees 62 portfolios in Fund complex
Principal occupations (last 5 years): President and Chief Executive Officer (since June 1996) of Quadrant Media Corp. (publishing company); formerly President (June 1995-June 1996) of Argus Integrated Media, Inc.; Senior Vice President and Managing Director (January 1993-1995) of Cowles Business Media; Senior Vice President of Fairchild Publications, Inc. (1975-1989).
Clay T. Whitehead (68), Director since 1996(3) Oversees 62 portfolios in Fund complex
Principal occupations (last 5 years): President (since 1983) of YCO (new business development firm).
Interested Trustees(1)
Judy A. Rice (59), President since 2003 and Director since 2000(3) Oversees 60 portfolios in Fund complex
Principal occupations (last 5 years): President, Chief Executive Officer, Chief Operating Officer and Officer-In-Charge (since February 2003) of Prudential Investments LLC; Vice President (since February 1999) of Prudential Investment Management Services LLC; President, Chief Executive Officer and Officer-In-Charge (since April 2003) of Prudential Mutual Fund Services LLC; formerly Director (May 2003-March 2006) and Executive Vice President (June 2005-March 2006) of AST Investment Services, Inc.; formerly Executive Vice President (September 1999-February 2003) of Prudential Investments LLC; Member of Board of Governors of the Investment Company Institute.
Robert F. Gunia (60), Vice President since 1999 and Director since 1996(3) Oversees 140 portfolios in Fund complex
Principal occupations (last 5 years): Chief Administrative Officer (since September 1999) and Executive Vice President (since December 1996) of Prudential Investments LLC; President (since April 1999) of Prudential Investment Management Services LLC; Executive Vice President (since March 1999) and Treasurer (since May 2000) of Prudential Mutual Fund Services LLC; Chief Administrative Officer, Executive Vice President and Director (since May 2003) of AST Investment Services, Inc.
Other Directorships held:(4) Vice President and Director (since May 1989) and Treasurer (since 1999) of The Asia Pacific Fund, Inc.
Information pertaining to the Officers of the Fund who are not also Directors is set forth below.
Officers(2)
Kathryn L. Quirk (54), Chief Legal Officer since 2005(3)
Principal occupations (last 5 years): Vice President and Corporate Counsel (since September 2004) of Prudential; Executive Vice President, Chief Legal Officer and Secretary (since July 2005) of Prudential Investments LLC and Prudential Mutual Fund Services LLC; formerly Managing Director, General Counsel, Chief Compliance Officer, Chief Risk Officer and Corporate Secretary (1997-2002) of Zurich Scudder Investments, Inc.
Deborah A. Docs (49), Secretary since 2005(3)
Principal occupations (last 5 years): Vice President and Corporate Counsel (since January 2001) of Prudential; Vice President (since December 1996) and Assistant Secretary (since March 1999) of PI; formerly Vice President and Assistant Secretary (May 2003-June 2005) of AST Investment Services, Inc.
Jonathan D. Shain (49), Assistant Secretary since 2005(3)
Principal occupations (last 5 years): Vice President and Corporate Counsel (since August 1998) of Prudential; Vice President and Assistant Secretary (since May 2001) of PI; Vice President and Assistant Secretary (since February 2001) of PMFS; formerly Vice President and Assistant Secretary (May 2003-June 2005) of AST Investment Services, Inc.
| | |
| 52 | | Visit our website at www.jennisondryden.com |
Claudia DiGiacomo (32), Assistant Secretary since 2005(3)
Principal occupations (last 5 years): Vice President and Corporate Counsel (since January 2005) of Prudential; Vice President and Assistant Secretary of PI (since December 2005); Associate at Sidley Austin Brown & Wood LLP (1999-2004).
Timothy J. Knierim (48), Chief Compliance Officer since 2007(3)
Principal occupations (last 5 years): Chief Compliance Officer of Prudential Investment Management, Inc. (since July 2007); formerly Chief Risk Officer of PIM and PI (2002-2007) and formerly Chief Ethics Officer of PIM and PI (2006-2007).
Valerie M. Simpson (49), Deputy Chief Compliance Officer since 2007(3)
Principal occupations (last 5 years): Vice President and Senior Compliance Officer (since March 2006) of PI; Vice President-Financial Reporting (since March 2006) for Prudential Life and Annuities Finance.
Noreen M. Fierro (43), Anti-Money Laundering Compliance Officer since 2006(3)
Principal occupations (last 5 years): Vice President, Corporate Compliance (since May 2006) of Prudential; formerly Corporate Vice President, Associate General Counsel (April 2002-May 2005) of UBS Financial Services, Inc., in their Money Laundering Prevention Group; Senior Manager (May 2005-May 2006) of Deloitte Financial Advisory Services, LLP, in their Forensic and Dispute Services. Anti-Money Laundering Group.
Grace C. Torres (48), Treasurer and Principal Financial and Accounting Officer since 1996(3)
Principal occupations (last 5 years): Assistant Treasurer (since March 1999) and Senior Vice President (since September 1999) of PI; Assistant Treasurer (since May 2003) and Vice President (since June 2005) of AST Investment Services, Inc.; Senior Vice President and Assistant Treasurer (since May 2003) of Prudential Annuities Advisory Services, Inc.; formerly Senior Vice President (May 2003-June 2005) of AST Investment Services, Inc.
John P. Schwartz (36), Assistant Secretary since 2006(3)
Principal occupations (last 5 years): Vice President and Corporate Counsel (since April 2005) of Prudential; Vice President and Assistant Secretary of PI (since December 2005); Associate at Sidley, Austin Brown & Wood LLP (1997-2005).
Andrew R. French (44), Assistant Secretary since 2006(3)
Principal occupations (last 5 years): Director and Corporate Counsel (since May 2006) of Prudential; Vice President and Assistant Secretary (since January 2007) of PI; Vice President and Assistant Secretary (since January 2007) of PMFS; formerly Senior Legal Analyst of Prudential Mutual Fund Law Department (1997-2006).
M. Sadiq Peshimam (43), Assistant Treasurer since 2006(3)
Principal occupations (last 5 years): Vice President (since 2005) and Director (2000-2005) within Prudential Mutual Fund Administration.
Peter Parrella (49), Assistant Treasurer since 2007(3)
Principal occupations (last 5 years): Vice President (since 2007) and Director (2004-2007) within Prudential Mutual Fund Administration; formerly Tax Manager at SSB Citi Fund Management LLC (1997-2004).
| | |
| Jennison Mid-Cap Growth Fund, Inc. | | 53 |
† | The Fund Complex consists of all investment companies managed by PI. The Funds for which PI serves as manager include Jennison Dryden Mutual Funds, Strategic Partners Funds, The Prudential Variable Contract Accounts 2, 10, 11. The Target Portfolio Trust, The Prudential Series Fund, The High Yield Income Fund, Inc., The High Yield Plus Fund, Inc., Nicholas-Applegate Fund, Inc., American Skandia Trust, and Prudential’s Gibraltar Fund, Inc. |
(1) | “Interested” Director, as defined in the 1940 Act, by reason of employment with the Manager, a Subadvisor or the Distributor. |
(2) | Unless otherwise noted, the address of the Directors and Officers is c/o: Prudential Investments LLC, Gateway Center Three, 100 Mulberry Street, Newark, NJ 07102. |
(3) | There is no set term of office for Directors and Officers. The Independent Directors have adopted a retirement policy, which calls for the retirement of Directors on December 31 of the year in which they reach the age of 75. The table shows the individual’s length of service as Director and/or Officer. |
(4) | This includes only directorships of companies required to register, or file reports with the SEC under the Securities and Exchange Act of 1934 (that is, “public companies”) or other investment companies registered under the 1940 Act. |
Additional Information about the Trustees is included in the Statement of Additional Information which is available without charge, upon request, by calling (800) 521-7466 or (732) 482-7555 (Calling from outside the U.S.)
| | |
| 54 | | Visit our website at www.jennisondryden.com |
Approval of Advisory Agreements
The Board of Directors (the “Board”) of Jennison Mid-Cap Growth Fund, Inc. (formerly, Jennison U.S. Emerging Growth Fund, Inc.) (the “Fund”) oversees the management of the Fund and, as required by law, determines annually whether to renew the Fund’s management agreement with Prudential Investments LLC (“PI”) and the Fund’s subadvisory agreement with Jennison Associates LLC (“Jennison”). In considering the renewal of the agreements, the Board, including all of the Independent Directors, met on June 6-7, 2007 and approved the renewal of the agreements through July 31, 2008, after concluding that renewal of the agreements was in the best interests of the Fund and its shareholders.
In advance of the meetings, the Board received materials relating to the agreements, and had the opportunity to ask questions and request further information in connection with their consideration. Among other things, the Board considered comparisons with other mutual funds in relevant Peer Universes and Peer Groups. The mutual funds included in each Peer Universe or Peer Group were objectively determined solely by Lipper Inc., an independent provider of mutual fund data. The comparisons placed the Fund in various quartiles over the one-, three, five- and ten-year periods ending December 31, 2006, with the first quartile being the best 25% of the mutual funds (for performance, the best performing mutual funds and, for expenses, the lowest cost mutual funds).
In approving the agreements, the Board, including the Independent Directors advised by independent legal counsel, considered the factors they deemed relevant, including the nature, quality and extent of services provided, the performance of the Fund, the profitability of PI and its affiliates, expenses and fees, and the potential for economies of scale that may be shared with the Fund and its shareholders. In their deliberations, the Directors did not identify any single factor which alone was responsible for the Board’s decision to approve the agreements with respect to the Fund. In connection with their deliberations, the Board considered information provided by PI throughout the year at regular Board meetings, presentations from portfolio managers and other information, as well as information furnished at or in advance of the meetings on June 6-7, 2007.
The Directors determined that the overall arrangements between the Fund and PI, which serves as the Fund’s investment manager pursuant to a management agreement, and between PI and Jennison, which serves as the Fund’s subadviser pursuant to the terms of a subadvisory agreement with PI, are fair and reasonable in light of the services performed, fees charged and such other matters as the Directors considered relevant in the exercise of their business judgment.
| | |
| Jennison Mid-Cap Growth Fund, Inc. | | |
Approval of Advisory Agreements (continued)
The material factors and conclusions that formed the basis for the Directors’ reaching their determinations to approve the continuance of the agreements are separately discussed below.
Nature, Quality and Extent of Services
The Board received and considered information regarding the nature and extent of services provided to the Fund by PI and Jennison. The Board considered the services provided by PI, including but not limited to the oversight of the subadviser for the Fund, as well as the provision of fund recordkeeping, compliance, and other services to the Fund. With respect to PI’s oversight of the subadviser, the Board noted that PI’s Strategic Investment Research Group (“SIRG”), which is a business unit of PI, is responsible for monitoring and reporting to PI’s senior management on the performance and operations of the subadviser. The Board also considered that PI pays the salaries of all of the officers and non-independent Directors of the Fund. The Board also considered the investment subadvisory services provided by Jennison, as well as adherence to the Fund’s investment restrictions and compliance with applicable Fund policies and procedures. The Board considered PI’s evaluation of the subadviser, as well as PI’s recommendation, based on its review of the subadviser, to renew the subadvisory agreement.
The Board reviewed the qualifications, backgrounds and responsibilities of PI’s senior management responsible for the oversight of the Fund and Jennison, and also reviewed the qualifications, backgrounds and responsibilities of Jennison’s portfolio managers who are responsible for the day-to-day management of the Fund’s portfolio. The Board was provided with information pertaining to PI’s and Jennison’s organizational structure, senior management, investment operations, and other relevant information pertaining to both PI and Jennison. The Board also noted that it received favorable compliance reports from the Fund’s Chief Compliance Officer (“CCO”) as to both PI and Jennison. The Board noted that Jennison is affiliated with PI.
The Board concluded that it was satisfied with the nature, extent and quality of the investment management services provided by PI and the subadvisory services provided to the Fund by Jennison, and that there was a reasonable basis on which to conclude that the Fund benefits from the services provided by PI and Jennison under the management and subadvisory agreements.
Performance of Jennison Mid-Cap Growth Fund
The Board received and considered information about the Fund’s historical performance. The Board considered that the Fund’s gross performance in relation to
| | |
| | Visit our website at www.jennisondryden.com |
its Peer Universe (the Lipper Retail and Institutional Mid-Cap Growth Funds Performance Universe) was in the second quartile for the one- and five-year periods, and was in the first quartile for the three- and ten-year periods. The Board further considered that the Fund’s net performance (which reflects any subsidies, expense caps or waivers) was in the first quartile for the three-, five- and ten-year periods, and that it was in the second quartile for the one-year period. The Board also noted that the Fund outperformed its benchmark index during all periods. The Board concluded that, in light of the Fund’s competitive performance, it would be in the interest of the Fund and its shareholders for the Fund to renew the agreements.
Fees and Expenses
The Board considered that the Fund’s contractual management fee ranked in the Expense Group’s first quartile and that the Fund’s actual management fee (which reflects any subsidies, expense caps or waivers) ranked in the Expense Group’s second quartile. The Board also considered that the Fund’s total expenses ranked in the Expense Group’s first quartile. The Board concluded that the management and subadvisory fees are reasonable in light of the services provided.
Costs of Services and Profits Realized by PI
The Board was provided with information on the profitability of PI and its affiliates in serving as the Fund’s investment manager. The Board discussed with PI the methodology utilized in assembling the information regarding profitability and considered its reasonableness. The Board recognized that it is difficult to make comparisons of profitability from fund management contracts because comparative information is not generally publicly available and is affected by numerous factors, including the structure of the particular adviser, the types of funds it manages, its business mix, numerous assumptions regarding allocations and the adviser’s capital structure and cost of capital. The Board did not separately consider the profitability of the subadviser, an affiliate of PI, as its profitability was reflected in the profitability report for PI. Taking these factors into account, the Board concluded that the profitability of PI and its affiliates in relation to the services rendered was not unreasonable.
Economies of Scale
The Board noted that the management fee schedule for the Fund includes breakpoints, which have the effect of decreasing the fee rate as assets increase, but at the current level of assets the Fund does not realize the effect of those rate reductions. The Board received and discussed information concerning whether PI realizes economies of scale as the Fund’s assets grow beyond current levels. The Board took
| | |
| Jennison Mid-Cap Growth Fund, Inc. | | |
Approval of Advisory Agreements (continued)
note that the Fund’s fee structure would result in benefits to Fund shareholders when (and if) assets reach the levels at which the fee rate is reduced. These benefits will accrue whether or not PI is then realizing any economies of scale.
Other Benefits to PI and Jennison
The Board considered potential ancillary benefits that might be received by PI and Jennison and their affiliates as a result of their relationship with the Fund. The Board concluded that potential benefits to be derived by PI included brokerage commissions received by affiliates of PI, transfer agency fees received by the Fund’s transfer agent (which is affiliated with PI), as well as reputational or other intangible benefits resulting from PI’s association with the Fund. The Board concluded that the potential benefits to be derived by Jennison included its ability to use soft dollar credits, brokerage commissions received by affiliates of Jennison, as well as the potential benefits consistent with those generally resulting from an increase in assets under management, specifically, potential access to additional research resources and reputational benefits. The Board concluded that the benefits derived by PI and Jennison were consistent with the types of benefits generally derived by investment managers and subadvisers to mutual funds.
After full consideration of these factors, the Board concluded that the approval of the agreements was in the best interest of the Fund and its shareholders.
| | |
| | Visit our website at www.jennisondryden.com |
Growth of a $10,000 Investment
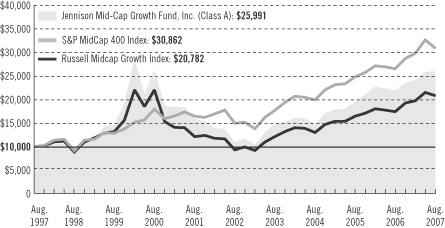
| | | | | | | | |
| Average Annual Total Returns (With Sales Charges) as of 8/31/07 |
| | | One Year | | | Five Years | | | Since Inception |
Class A | | 12.24 | % | | 17.92 | % | | — |
Class B | | 12.89 | | | 18.27 | | | — |
Class C | | 16.89 | | | 18.37 | | | — |
Class L | | 11.67 | | | N/A | | | 11.14% (6/12/06) |
Class M | | 11.91 | | | N/A | | | 12.02 (6/12/06) |
Class R | | 18.55 | | | N/A | | | 17.26 (6/3/05) |
Class X | | 11.89 | | | N/A | | | 12.11 (6/12/06) |
Class Z | | 19.10 | | | 19.54 | | | — |
| | | | | | | | |
| Average Annual Total Returns (Without Sales Charges) as of 8/31/07 |
| | | One Year | | | Five Years | | | Since Inception |
Class A | | 18.77 | % | | 19.26 | % | | — |
Class B | | 17.89 | | | 18.37 | | | — |
Class C | | 17.89 | | | 18.37 | | | — |
Class L | | 18.49 | | | N/A | | | 16.67% (6/12/06) |
Class M | | 17.91 | | | N/A | | | 16.00 (6/12/06) |
Class R | | 18.55 | | | N/A | | | 17.26 (6/3/05) |
Class X | | 17.89 | | | N/A | | | 16.09 (6/12/06) |
Class Z | | 19.10 | | | 19.54 | | | — |
Performance data quoted represent past performance. Past performance does not guarantee future results. The investment return and principal value of an investment will fluctuate, so that an investor’s shares, when redeemed, may be worth more or
| | |
| | Visit our website at www.jennisondryden.com |
less than their original cost. Current performance may be lower or higher than the past performance data quoted. An investor may obtain performance data as of the most recent month-end by visiting our website at www.jennisondryden.com or by calling (800) 225-1852. Class A and Class L shares have a maximum initial sales charge of 5.50% and 5.75%, respectively. Gross operating expenses: Class A, 1.13%; Class B, 1.83%; Class C, 1.83%; Class L, 1.33%; Class M, 1.83%; Class R, 1.58%; Class X, 1.83%; Class Z, 0.83%. Net operating expenses apply to: Class A, 1.08%; Class B, 1.83%; Class C, 1.83; Class L, 1.33%; Class M, 1.83%; Class R, 1.33%; Class X, 1.83%; Class Z, 0.83%, after contractual reduction through 2/28/2008.
The returns in the graph and the tables do not reflect the deduction of taxes that a shareholder would pay on Fund distributions or following the redemption of Fund shares.
Source: Prudential Investments LLC and Lipper Inc. Inception date returns are provided for any share class with less than 10 years of returns.
The graph compares a $10,000 investment in the Jennison U.S. Emerging Growth Fund, Inc. (Class A shares) with a similar investment in the S&P MidCap 400 Index and the Russell Midcap Growth Index by portraying the initial account values at the commencement of operations of Class A shares (December 31, 1997) and the account values at the end of the current fiscal year (August 31, 2007) as measured on a quarterly basis. For purposes of the graph, and unless otherwise indicated, it has been assumed that (a) the maximum applicable front-end sales charge was deducted from the initial $10,000 investment in Class A shares; (b) all recurring fees (including management fees) were deducted; and (c) all dividends and distributions were reinvested. The line graph provides information for Class A shares only. As indicated in the tables provided earlier, performance for Class B, Class C, Class L, Class M, Class R, Class X, and Class Z shares will vary due to the differing charges and expenses applicable to each share class (as indicated in the following paragraphs). Without a distribution and service (12b-1) fee waiver of 0.05% for Class A shares through August 31, 2007, the returns shown in the graph and for Class A shares in the tables would have been lower.
The S&P MidCap 400 Index is an unmanaged index of 400 domestic stocks chosen for market size, liquidity, and industry group representation. It gives a broad look at how U.S. mid-cap stock prices have performed. The Russell Midcap Growth Index is an unmanaged index that measures the performance of those Russell Midcap companies with higher price-to-book ratios and higher forecasted growth values. The Indexes’ total returns include the reinvestment of all dividends, but do not include the effects of sales charges, operating expenses of a mutual fund, or taxes. The returns for the Indexes would be lower if they included the effects of sales charges, operating expenses, or taxes. The securities that comprise these indexes may differ substantially from the securities in the Fund. These are not the only indexes that may be used to characterize performance of small- to mid-capitalization stock funds. Other indexes may portray different comparative performance. Investors cannot invest directly in an index.
Class A and Class L shares are subject to a maximum front-end sales charge of 5.50% and 5.75%, respectively, and an annual 12b-1 fee of up to 0.30% and 0.50%, respectively. Investors who purchase Class A and Class L shares in an amount of $1 million or more and sell these shares within 12 months of purchase are subject to a contingent deferred sales charge (CDSC) of 1%, in certain circumstances. Class B shares are subject to a declining CDSC of 5%, 4%, 3%, 2%, 1%, and 1%, respectively, for the first six years after purchase and a 12b-1 fee of 1% annually. Approximately seven years after purchase, Class B shares will automatically convert to Class A shares on a quarterly basis. Class C shares purchased are not subject to a front-end sales charge, but are subject to a CDSC of 1% for shares sold within 12 months from the date of purchase, and an annual 12b-1 fee of 1%. Class M and Class X shares are not subject to a front-end sales charge, but are subject to a CDSC of 6% and a 12b-1 fee of 1%. The CDSC for Class M shares decreases by 1% annually to 2% in the fifth and sixth years after purchase, 1% in the seventh year and 0% in the eighth year after purchase. The CDSC for Class X shares decreases by 1% annually to 4% in the third and fourth years after purchase, 3% in the fifth year after purchase, 2% in the sixth and seventh years after purchase, 1% in the eighth year and 0% in the ninth and tenth years after purchase. Class M and Class X shares convert to Class A shares approximately eight years after purchase. Class R and Z shares are not subject to a sales charge or 12b-1 fees. The returns in the graph and tables reflect the share class expense structure in effect at the close of the fiscal period.
| | |
| Jennison Mid-Cap Growth Fund, Inc. | | |
| | | | |
| n MAIL | | n TELEPHONE | | n WEBSITE |
Gateway Center Three 100 Mulberry Street Newark, NJ 07102 | | (800) 225-1852 | | www.jennisondryden.com |
|
| PROXY VOTING |
| The Board of Directors of the Fund has delegated to the Fund’s investment subadviser the responsibility for voting any proxies and maintaining proxy recordkeeping with respect to the Fund. A description of these proxy voting policies and procedures is available without charge, upon request, by calling (800) 225-1852 or by visiting the Securities and Exchange Commission’s website at www.sec.gov. Information regarding how the Fund voted proxies relating to portfolio securities during the most recent 12-month period ended June 30 is available on the Fund’s website and on the Commission’s website. |
|
| DIRECTORS |
| Linda W. Bynoe • David E.A. Carson • Robert F. Gunia • Robert E. La Blanc • Douglas H. McCorkindale • Richard A. Redeker • Judy A. Rice • Robin B. Smith • Stephen G. Stoneburn • Clay T. Whitehead |
|
| OFFICERS |
| Judy A. Rice, President • Robert F. Gunia, Vice President • Grace C. Torres, Treasurer and Principal Financial and Accounting Officer • Kathryn L. Quirk, Chief Legal Officer • Deborah A. Docs, Secretary • Timothy J. Knierim, Chief Compliance Officer • Valerie M. Simpson, Deputy Chief Compliance Officer • Noreen M. Fierro, Anti-Money Laundering Compliance Officer • Jonathan Shain, Assistant Secretary • Claudia DiGiacomo, Assistant Secretary • John P. Schwartz, Assistant Secretary • Andrew R. French, Assistant Secretary • M. Sadiq Peshimam, Assistant Treasurer • Peter Parrella, Assistant Treasurer |
| | | | |
| MANAGER | | Prudential Investments LLC | | Gateway Center Three
100 Mulberry Street
Newark, NJ 07102 |
|
| INVESTMENT SUBADVISER | | Jennison Associates LLC | | 466 Lexington Avenue
New York, NY 10017 |
|
| DISTRIBUTOR | | Prudential Investment
Management Services LLC | | Gateway Center Three
100 Mulberry Street
Newark, NJ 07102 |
|
| CUSTODIAN | | The Bank of New York
Mellon Corp. | | One Wall Street
New York, NY 10286 |
|
| TRANSFER AGENT | | Prudential Mutual Fund
Services LLC | | P.O. Box 9658
Providence, RI 02940 |
|
| INDEPENDENT REGISTERED PUBLIC ACCOUNTING FIRM | | KPMG LLP | | 345 Park Avenue
New York, NY 10154 |
|
| FUND COUNSEL | | Willkie Farr & Gallagher LLP | | 787 Seventh Avenue
New York, NY 10019 |
|
| An investor should consider the investment objectives, risks, charges, and expenses of the Fund carefully before investing. The prospectus for the Fund contains this and other information about the Fund. An investor may obtain a prospectus by visiting our website at www.jennisondryden.com or by calling (800) 225-1852. The prospectus should be read carefully before investing. |
|
| E-DELIVERY |
To receive your mutual fund documents on-line, go to www.icsdelivery.com/prudential/funds
and enroll. Instead of receiving printed documents by mail, you will receive notification via e-mail when new materials are available. You can cancel your enrollment or change your e-mail
address at any time by clicking on the change/cancel enrollment option at the icsdelivery website address. |
|
| SHAREHOLDER COMMUNICATIONS WITH DIRECTORS |
| Shareholders can communicate directly with the Board of Directors by writing to the Chair of the Board, Jennison Mid-Cap Growth Fund, Inc., Prudential Investments, Attn: Board of Directors, 100 Mulberry Street, Gateway Center Three, Newark, NJ 07102. Shareholders can communicate directly with an individual Director by writing to the same address. Communications are not screened before being delivered to the addressee. |
|
| AVAILABILITY OF PORTFOLIO SCHEDULE |
| The Fund files its complete schedule of portfolio holdings with the Securities and Exchange Commission for the first and third quarters of each fiscal year on Form N-Q. The Fund’s Forms N-Q are available on the Commission’s website at www.sec.gov. The Fund’s Forms N-Q may also be reviewed and copied at the Commission’s Public Reference Room in Washington, D.C. Information on the operation and location of the Public Reference Room may be obtained by calling (800) SEC-0330 (732-0330). The Fund’s schedule of portfolio holdings is also available on the Fund’s website as of the end of each fiscal quarter. |
|
| The Fund’s Statement of Additional Information contains additional information about the Fund’s Directors and is available without charge, upon request, by calling (800) 225-1852. |
Mutual Funds:
| | | | |
| ARE NOT INSURED BY THE FDIC OR ANY FEDERAL GOVERNMENT AGENCY | | MAY LOSE VALUE | | ARE NOT A DEPOSIT OF OR GUARANTEED BY ANY BANK OR ANY BANK AFFILIATE |

| | | | | | | | | | | | | | | | | | | | |
| Jennison Mid-Cap Growth Fund, Inc. | | | | | | | | | | | | |
| | | Share Class | | A | | B | | C | | L | | M | | R | | X | | Z | | |
| | NASDAQ | | PEEAX | | PEEBX | | PEGCX | | N/A | | N/A | | N/A | | JUSEX | | PEGZX | | |
| | CUSIP | | 476296108 | | 476296207 | | 476296306 | | 476296603 | | 476296702 | | 476296504 | | 476296801 | | 476296405 | | |
| | | | | | | | | | | | | | | | | | | | |
MF173E IFS-A139890 Ed. 10/2007

Item 2 – Code of Ethics — See Exhibit (a)
As of the end of the period covered by this report, the Registrant has adopted a code of ethics (the “Section 406 Standards for Investment Companies – Ethical Standards for Principal Executive and Financial Officers”) that applies to the Registrant’s Principal Executive Officer and Principal Financial Officer; the Registrant’s Principal Financial Officer also serves as the Principal Accounting Officer.
The Registrant hereby undertakes to provide any person, without charge, upon request, a copy of the code of ethics. To request a copy of the code of ethics, contact the registrant 800-225-1852, and ask for a copy of the Section 406 Standards for Investment Companies - Ethical Standards for Principal Executive and Financial Officers.
Item 3 – Audit Committee Financial Expert –
The Registrant’s Board has determined that Mr. David E. A. Carson, member of the Board’s Audit Committee is an “audit committee financial expert,” and that he is “independent,” for purposes of this Item.
Item 4 – Principal Accountant Fees and Services –
(a) Audit Fees
For the fiscal period November 1, 2006 through August 31, 2007 and fiscal year ended October 31, 2006, KPMG LLP (“KPMG”), the Registrant’s principal accountant, billed the Registrant $19,859 and $33,700, respectively, for professional services rendered for the audit of the Registrant’s annual financial statements or services that are normally provided in connection with statutory and regulatory filings.
(b) Audit-Related Fees
For the fiscal period November 1, 2006 through August 31, 2007, KPMG, the Registrant’s principal accountant, did not bill the Registrant for assurance and related services that are reasonably related to the performance of the audit of the Registrant’s financial statements. For the fiscal year ended October 31, 2006, KPMG, the Registrant’s principal accountant, did not bill the Registrant for assurance and related services that are reasonably related to the performance of the audit of the Registrant’s financial statements.
(c) Tax Fees
None.
(d) All Other Fees
None.
(e) (1) Audit Committee Pre-Approval Policies and Procedures
THE PRUDENTIAL MUTUAL FUNDS
AUDIT COMMITTEE POLICY
on
Pre-Approval of Services Provided by the Independent Accountants
The Audit Committee of each Prudential Mutual Fund is charged with the responsibility to monitor the independence of the Fund’s independent accountants. As part of this responsibility, the Audit Committee must pre-approve any independent accounting firm’s engagement to render audit and/or permissible non-audit services, as required by law. In evaluating a proposed engagement of the independent accountants, the Audit Committee will assess the effect that the engagement might reasonably be expected to have on the accountant’s independence. The Committee’s evaluation will be based on:
| | • | | a review of the nature of the professional services expected to be provided, |
| | • | | a review of the safeguards put into place by the accounting firm to safeguard independence, and |
| | • | | periodic meetings with the accounting firm. |
Policy for Audit and Non-Audit Services Provided to the Funds
On an annual basis, the scope of audits for each Fund, audit fees and expenses, and audit-related and non-audit services (and fees proposed in respect thereof) proposed to be performed by the Fund’s independent accountants will be presented by the Treasurer and the independent accountants to the Audit Committee for review and, as appropriate, approval prior to the initiation of such services. Such presentation shall be accompanied by confirmation by both the Treasurer and the independent accountants that the proposed services will not adversely affect the independence of the independent accountants. Proposed services shall be described in sufficient detail to enable the Audit Committee to assess the appropriateness of such services and fees, and the compatibility of the provision of such services with the auditor’s independence. The Committee shall receive periodic reports on the progress of the audit and other services which are approved by the Committee or by the Committee Chair pursuant to authority delegated in this Policy.
The categories of services enumerated under “Audit Services”, “Audit-related Services”, and “Tax Services” are intended to provide guidance to the Treasurer and the independent accountants as to those categories of services which the Committee believes are generally consistent with the independence of the independent accountants and which the Committee (or the Committee Chair) would expect upon the presentation of specific proposals to pre-approve. The enumerated categories are not intended as an exclusive list of audit, audit-related or tax services, which the Committee (or the Committee Chair) would consider for pre-approval.
Audit Services
The following categories of audit services are considered to be consistent with the role of the Fund’s independent accountants:
| | • | | Annual Fund financial statement audits |
| | • | | Seed audits (related to new product filings, as required) |
| | • | | SEC and regulatory filings and consents |
Audit-related Services
The following categories of audit-related services are considered to be consistent with the role of the Fund’s independent accountants:
| | • | | Accounting consultations |
| | • | | Fund merger support services |
| | • | | Agreed Upon Procedure Reports |
| | • | | Other Internal Control Reports |
Individual audit-related services that fall within one of these categories and are not presented to the Audit Committee as part of the annual pre-approval process will be subject to pre-approval by the Committee Chair (or any other Committee member on whom this responsibility has been delegated) so long as the estimated fee for those services does not exceed $50,000.
Tax Services
The following categories of tax services are considered to be consistent with the role of the Fund’s independent accountants:
| | • | | Tax compliance services related to the filing or amendment of the following: |
| | • | | Federal, state and local income tax compliance; and, |
| | • | | Sales and use tax compliance |
| | • | | Timely RIC qualification reviews |
| | • | | Tax distribution analysis and planning |
| | • | | Tax authority examination services |
| | • | | Tax appeals support services |
| | • | | Accounting methods studies |
| | • | | Fund merger support services |
| | • | | Tax consulting services and related projects |
Individual tax services that fall within one of these categories and are not presented to the Audit Committee as part of the annual pre-approval process will be subject to pre-approval by the Committee Chair (or any other Committee member on whom this responsibility has been delegated) so long as the estimated fee for those services does not exceed $50,000.
Other Non-audit Services
Certain non-audit services that the independent accountants are legally permitted to render will be subject to pre-approval by the Committee or by one or more Committee members to whom the Committee has delegated this authority and who will report to the full Committee any pre-approval decisions made pursuant to this Policy. Non-audit services presented for pre-approval pursuant to this paragraph will be accompanied by a confirmation from both the Treasurer and the independent accountants that the proposed services will not adversely affect the independence of the independent accountants.
Proscribed Services
The Fund’s independent accountants will not render services in the following categories of non-audit services:
| | • | | Bookkeeping or other services related to the accounting records or financial statements of the Fund |
| | • | | Financial information systems design and implementation |
| | • | | Appraisal or valuation services, fairness opinions, or contribution-in-kind reports |
| | • | | Internal audit outsourcing services |
| | • | | Management functions or human resources |
| | • | | Broker or dealer, investment adviser, or investment banking services |
| | • | | Legal services and expert services unrelated to the audit |
| | • | | Any other service that the Public Company Accounting Oversight Board determines, by regulation, is impermissible. |
Pre-approval of Non-Audit Services Provided to Other Entities Within the Prudential Fund Complex
Certain non-audit services provided to Prudential Investments LLC or any of its affiliates that also provide ongoing services to the Prudential Mutual Funds will be subject to pre-approval by the Audit Committee. The only non-audit services provided to these entities that will require pre-approval are those related directly to the operations and financial reporting of the Funds. Individual projects that are not presented to the Audit Committee as part of the annual pre-approval process will be subject to pre-approval by the Committee Chair (or any other Committee member on whom this responsibility has been delegated) so long as the estimated fee for those services does not exceed $50,000. Services presented for pre-approval pursuant to this paragraph will be accompanied by a confirmation from both the Treasurer and the independent accountants that the proposed services will not adversely affect the independence of the independent accountants.
Although the Audit Committee will not pre-approve all services provided to Prudential Investments LLC and its affiliates, the Committee will receive an annual report from the Fund’s independent accounting firm showing the aggregate fees for all services provided to Prudential Investments and its affiliates.
(e) (2) Percentage of services referred to in 4(b)- (4)(d) that were approved by the audit committee –
Not applicable.
(f) Percentage of hours expended attributable to work performed by other than full time employees of principal accountant if greater than 50%.
Not applicable.
(g) Non-Audit Fees
Not applicable to Registrant for the fiscal period November 1, 2006 through August 31, 2007 and fiscal year 2006. The aggregate non-audit fees billed by KPMG for services rendered to the registrant’s investment adviser and any entity controlling, controlled by, or under common control with the investment adviser that provides ongoing services to the registrant for the fiscal period November 1, 2006 through August 31, 2007 and fiscal year 2006 was $340,700 and $317,300, respectively.
(h) Principal Accountant’s Independence
Not applicable as KPMG has not provided non-audit services to the Registrant’s investment adviser and any entity controlling, controlled by, or under common control with the investment adviser that provides ongoing services to the registrant that were not pre-approved pursuant to Rule 2-01(c)(7)(ii) of Regulation S-X.
Item 5 – Audit Committee of Listed Registrants – Not applicable.
Item 6 – Schedule of Investments – The schedule is included as part of the report to shareholders filed under Item 1 of this Form.
Item 7 – Disclosure of Proxy Voting Policies and Procedures for Closed-End Management Investment Companies – Not applicable.
Item 8 – Portfolio Managers of Closed-End Management Investment Companies – Not applicable.
Item 9 – Purchases of Equity Securities by Closed-End Management Investment Company and Affiliated Purchasers – Not applicable.
Item 10 – Submission of Matters to a Vote of Security Holders – Not applicable.
Item 11 – Controls and Procedures
| | (a) | It is the conclusion of the Registrant’s principal executive officer and principal financial officer that the effectiveness of the Registrant’s current disclosure controls and procedures (such disclosure controls and procedures having been evaluated within 90 days of the date of this filing) provide reasonable assurance that the information required to be disclosed by the Registrant has been recorded, processed, summarized and reported within the time period specified in the Commission’s rules and forms and that the information required to be disclosed by the Registrant has been accumulated and communicated to the Registrant’s principal executive officer and principal financial officer in order to allow timely decisions regarding required disclosure. |
| | (b) | There has been no significant change in the Registrant’s internal control over financial reporting that occurred during the registrant’s most recent fiscal quarter of the period covered by this report that has materially affected, or is likely to materially affect, the Registrant’s internal control over financial reporting. |
Item 12 – Exhibits
| | |
| (a) | | (1) Code of Ethics – Attached hereto as Exhibit EX-99.CODE-ETH |
| |
| | (2) Certifications pursuant to Section 302 of the Sarbanes-Oxley Act – Attached hereto as Exhibit EX-99.CERT. |
| |
| | (3) Any written solicitation to purchase securities under Rule 23c-1. – Not applicable. |
| |
| (b) | | Certifications pursuant to Section 906 of the Sarbanes-Oxley Act – Attached hereto as Exhibit EX-99.906CERT. |
SIGNATURES
Pursuant to the requirements of the Securities Exchange Act of 1934 and the Investment Company Act of 1940, the registrant has duly caused this report to be signed on its behalf by the undersigned, thereunto duly authorized.
(Registrant) Jennison Mid-Cap Growth Fund, Inc.
| | | | |
| By (Signature and Title)* | | /s/ Deborah A. Docs | | |
| | Deborah A. Docs | | |
| | Secretary | | |
Date October 24, 2007
Pursuant to the requirements of the Securities Exchange Act of 1934 and the Investment Company Act of 1940, this report has been signed below by the following persons on behalf of the registrant and in the capacities and on the dates indicated.
| | | | |
| By (Signature and Title)* | | /s/ Judy A. Rice | | |
| | Judy A. Rice President and Principal Executive Officer | | |
Date October 24, 2007
| | | | | | |
| By (Signature and Title)* | | /s/ Grace C. Torres | | | | |
| | Grace C. Torres | | | | |
| | Treasurer and Principal Financial Officer | | | | |
Date October 24, 2007
| * | Print the name and title of each signing officer under his or her signature. |