UNITED STATES
SECURITIES AND EXCHANGE COMMISSION
Washington, D.C. 20549
FORM N-CSR
CERTIFIED SHAREHOLDER REPORT OF REGISTERED
MANAGEMENT INVESTMENT COMPANIES
| | |
Investment Company Act file number: | | 811-07811 |
Jennison Mid-Cap Growth Fund, Inc.
Exact name of registrant as specified in charter:
Gateway Center 3,
100 Mulberry Street,
Newark, New Jersey 07102
Address of principal executive offices:
Deborah A. Docs
Gateway Center 3,
100 Mulberry Street,
Newark, New Jersey 07102
Name and address of agent for service:
| | | | |
Registrant’s telephone number, including area code: | | 800-225-1852 | | |
| | | | |
Date of fiscal year end: | | 8/31/2009 | | |
| | | | |
Date of reporting period: | | 8/31/2009 | | |
Item 1 – Reports to Stockholders


| | |
| AUGUST 31, 2009 | | ANNUAL REPORT |
Jennison Mid-Cap Growth Fund, Inc.
FUND TYPE
Mid-cap stock
OBJECTIVE
Long-term capital appreciation
This report is not authorized for distribution to prospective investors unless preceded or accompanied by a current prospectus.
The views expressed in this report and information about the Fund’s portfolio holdings are for the period covered by this report and are subject to change thereafter.
JennisonDryden, Jennison, Prudential Financial and the Rock Prudential logo are registered service marks of The Prudential Insurance Company of America, Newark, NJ, and its affiliates.

October 15, 2009
Dear Shareholder:
We hope you find the annual report for the Jennison Mid-Cap Growth Fund informative and useful. Because of ongoing market volatility, we understand that this is a difficult time to be an investor. While it is impossible to predict what the future holds, we continue to believe a prudent response to uncertainty is to maintain a diversified portfolio, including stock and bond mutual funds consistent with your tolerance for risk, time horizon, and financial goals.
A diversified asset allocation offers two potential advantages: it limits your exposure to any particular asset class, plus it provides a better opportunity to invest some of your assets in the right place at the right time. Your financial professional can help you create a diversified investment plan that may include mutual funds covering all the basic asset classes and that reflects your personal investor profile and risk tolerance. Keep in mind that diversification and asset allocation strategies do not assure a profit or protect against loss in declining markets.
JennisonDryden Mutual Funds give you a wide range of choices that can help you make progress toward your financial goals. Our funds offer the experience, resources, and professional discipline of four leading asset managers. JennisonDryden equity funds are advised by Jennison Associates LLC, Quantitative Management Associates LLC (QMA), or Prudential Real Estate Investors. Prudential Investment Management, Inc. (PIM) advises the JennisonDryden fixed income and money market funds through its unit Prudential Fixed Income Management. Jennison Associates, QMA, and PIM are registered investment advisers and Prudential Financial companies. Prudential Real Estate Investors is a unit of PIM.
Thank you for choosing JennisonDryden Mutual Funds.
Sincerely,

Judy A. Rice, President
Jennison Mid-Cap Growth Fund, Inc.
| | |
| Jennison Mid-Cap Growth Fund, Inc. | | 1 |
Your Fund’s Performance
Fund objective
The investment objective of the Jennison Mid-Cap Growth Fund, Inc. is long-term capital appreciation. There can be no assurance that the Fund will achieve its investment objective.
Performance data quoted represent past performance. Past performance does not guarantee future results. The investment return and principal value of an investment will fluctuate, so that an investor’s shares, when redeemed, may be worth more or less than their original cost. Current performance may be lower or higher than the past performance data quoted. An investor may obtain performance data as of the most recent month-end by visiting our website at www.jennisondryden.com or by calling (800) 225-1852. Class A and Class L shares have a maximum initial sales charge of 5.50% and 5.75%, respectively. Gross operating expenses: Class A, 1.21%; Class B, 1.91%; Class C, 1.91%; Class L, 1.41%; Class M, 1.91%; Class R, 1.66%; Class X, 1.91%; Class Z, 0.91%. Net operating expenses apply to: Class A, 1.21%; Class B, 1.91%; Class C, 1.91%; Class L, 1.41%; Class M, 1.91%; Class R, 1.41%; Class X, 1.91%; Class Z, 0.91%, after contractual reduction through 12/31/2010.
| | | | | | | | | | | |
| Cumulative Total Returns as of 8/31/09 |
| | | One Year | | | Five Years | | | Ten Years | | | Since Inception1 |
Class A | | –15.63 | % | | 46.45 | % | | 46.57 | % | | — |
Class B | | –16.21 | | | 41.14 | | | 35.97 | | | — |
Class C | | –16.16 | | | 41.22 | | | 36.04 | | | — |
Class L | | –15.76 | | | N/A | | | N/A | | | –0.64% (6/12/06) |
Class M | | –16.21 | | | N/A | | | N/A | | | –2.30 (6/12/06) |
Class R | | –15.73 | | | N/A | | | N/A | | | 17.67 (6/3/05) |
Class X | | –16.12 | | | N/A | | | N/A | | | –1.93 (6/12/06) |
Class Z | | –15.33 | | | 48.41 | | | 50.45 | | | — |
Russell Midcap Growth Index2 | | –20.21 | | | 17.93 | | | 16.33 | | | ** |
Russell Midcap Index3 | | –19.92 | | | 18.22 | | | 64.28 | | | *** |
S&P MidCap 400 Index4 | | –18.17 | | | 21.54 | | | 88.54 | | | **** |
Lipper Mid-Cap Growth Funds Avg.5 | | –21.46 | | | 15.42 | | | 28.87 | | | ***** |
| | |
| 2 | | Visit our website at www.jennisondryden.com |
| | | | | | | | | | | |
| Average Annual Total Returns6 as of 9/30/09 | | | |
| | | One Year | | | Five Years | | | Ten Years | | | Since Inception1 |
Class A | | –3.76 | % | | 6.94 | % | | 3.78 | % | | — |
Class B | | –3.91 | | | 7.20 | | | 3.60 | | | — |
Class C | | 0.15 | | | 7.36 | | | 3.60 | | | — |
Class L | | –4.23 | | | N/A | | | N/A | | | –0.13% (6/12/06) |
Class M | | –4.91 | | | N/A | | | N/A | | | 0.26 (6/12/06) |
Class R | | 1.62 | | | N/A | | | N/A | | | 5.30 (6/3/05) |
Class X | | –4.80 | | | N/A | | | N/A | | | 0.07 (6/12/06) |
Class Z | | 2.11 | | | 8.41 | | | 4.63 | | | — |
Russell Midcap Growth Index2 | | –0.40 | | | 3.75 | | | 2.18 | | | ** |
Russell Midcap Index3 | | –3.55 | | | 3.89 | | | 6.05 | | | *** |
S&P MidCap 400 Index4 | | –3.11 | | | 4.53 | | | 7.48 | | | **** |
Lipper Mid-Cap Growth Funds Avg.5 | | –2.74 | | | 3.16 | | | 2.68 | | | ***** |
The cumulative total returns do not reflect the deduction of applicable sales charges. If reflected, the applicable sales charges would reduce the cumulative total returns performance quoted. The average annual total returns assume the payment of the maximum applicable sales charge. Class A and Class L shares are subject to a maximum front-end sales charge of 5.50% and 5.75%, respectively. Under certain circumstances, Class A shares may be subject to a contingent deferred sales charge (CDSC) of 1%. Class B, Class C, Class L, Class M, and Class X shares are subject to a maximum CDSC of 5%, 1%, 1%, 6%, and 6%, respectively. Class R and Class Z shares are not subject to a sales charge. Class L shares are closed to most new purchases (with the exception of exchanges from the same class of shares offered by certain other JennisonDryden Funds).
Source: Prudential Investments LLC and Lipper Inc. Performance figures may reflect fee waivers and/or expense reimbursements. In the absence of such fee waivers and/or expense reimbursements, total returns would be lower.
1Inception returns are provided for any share class with less than 10 years of returns. The Since Inception returns for the Russell Midcap Growth Index, Russell Midcap Index, S&P MidCap 400 Index, and the Lipper Mid-Cap Growth Funds Average (Lipper Average) are measured from the closest month-end to inception date, and not from the Fund’s actual inception date.
2The Russell Midcap Growth Index is a market value-weighted index that measures the performance of those Russell Midcap companies with higher price-to-book ratios and higher forecasted growth values.
3The Russell Midcap Index measures the performance of the 800 smallest companies in the Russell 1000 Index, which represent approximately 25% of the total market capitalization of the Russell 1000 Index.
4The S&P MidCap 400 Index is an unmanaged index of 400 domestic stocks chosen for market size, liquidity, and industry group representation. It gives a broad look at how U.S. mid-cap stock prices have performed.
5The Lipper Average represents returns based on an average return of all funds in the Lipper Mid-Cap Growth Funds category for the periods noted. Funds in the Lipper Average invest at least 75% of their equity assets in companies with market capitalizations (on a three-year weighted basis) less than 300% of the dollar-weighted
| | |
| Jennison Mid-Cap Growth Fund, Inc. | | 3 |
Your Fund’s Performance (continued)
median market capitalization of the middle 1,000 securities of the S&P SuperComposite 1500 Index. Mid-cap growth funds typically have an above-average price-to-earnings ratio, price-to-book ratio, and three-year sales-per-share growth value compared with the S&P MidCap 400 Index.
6The average annual total returns take into account applicable sales charges. Class A, Class B, Class C, Class L, Class M, Class R, and Class X shares are subject to an annual distribution and service (12b-1) fee of up to 0.30%, 1.00%, 1.00%, 0.50%, 1.00%, 0.75%, and 1.00%, respectively. Approximately seven years after purchase, Class B shares will automatically convert to Class A shares on a quarterly basis. Class Z shares are not subject to a 12b-1 fee. The returns in the tables do not reflect the deduction of taxes that a shareholder would pay on Fund distributions or following the redemption of Fund shares.
**Russell Midcap Growth Index Closest Month-End to Inception cumulative total returns as of 8/31/09 are –13.56% for Class L, Class M, and Class X; and –0.07% for Class R. Russell Midcap Growth Index Closest Month-End to Inception average annual total returns as of 9/30/09 are –2.66% for Class L, Class M, and Class X; and 1.28% for Class R.
***Russell Midcap Index Closest Month-End to Inception cumulative total returns as of 8/31/09 are –14.60% for Class L, Class M, and Class X; and –0.45% for Class R. Russell Midcap Index Closest Month-End to Inception average annual total returns as of 9/30/09 are –3.03% for Class L, Class M, and Class X; and 1.18% for Class R.
****S&P MidCap 400 Index Closest Month-End to Inception cumulative total returns as of 8/31/09 are –10.28% for Class L, Class M, and Class X; and 3.70% for Class R. S&P MidCap 400 Index Closest Month-End to Inception average annual total returns as of 9/30/09 are –1.57% for Class L, Class M, and Class X; and 2.14% for Class R.
*****Lipper Average Closest Month-End to Inception cumulative total returns as of 8/31/09 are –14.29% for Class L, Class M, and Class X; and 0.84% for Class R. Lipper Average Closest Month-End to Inception average annual total returns as of 9/30/09 are –2.89% for Class L, Class M, and Class X; and 1.09% for Class R.
Investors cannot invest directly in an index. The Russell Midcap Growth Index, Russell Midcap Index, and S&P MidCap 400 Index do not bear sales charges, operating expenses of a mutual fund, or deductions for taxes. Returns for these indexes would be lower if they were subject to these deductions. Returns for the Lipper Average reflect the deduction of mutual fund operating expenses, but not sales charges or taxes.
| | | |
| Five Largest Holdings expressed as a percentage of net assets as of 8/31/09 | |
Annaly Capital Management, Inc., Real Estate Investment Trust | | 3.9 | % |
NII Holdings, Inc., Wireless Telecommunication Services | | 3.7 | |
Southwestern Energy Co., Oil, Gas & Consumable Fuels | | 2.4 | |
Crown Castle International Corp., Wireless Telecommunications Services | | 2.3 | |
Thermo Fisher Scientific, Inc., Life Sciences Tools & Services | | 2.2 | |
Holdings reflect only long-term investments and are subject to change.
| | | |
| Five Largest Industries expressed as a percentage of net assets as of 8/31/09 | |
Health Care Providers & Services | | 10.4 | % |
Wireless Telecommunication Services | | 8.0 | |
Oil, Gas & Consumable Fuels | | 6.0 | |
Software | | 4.5 | |
Specialty Retail | | 4.5 | |
Industry weightings reflect only long-term investments and are subject to change.
| | |
| 4 | | Visit our website at www.jennisondryden.com |
Strategy and Performance Overview
How did the Fund perform?
The Jennison Mid Cap Growth Fund Class A shares declined 15.63% for the 12 months ended August 31, 2009, but outperformed the 20.21% decline of its benchmark the Russell Midcap® Growth Index (the Index). The Fund also outperformed the 21.46% decline of the Lipper Mid Cap Growth Funds Average.
Strong stock selection in the energy, financials, and industrials sectors helped the Fund’s performance relative to the Index. Weak stock selection in the telecommunications services sector, in addition to an underweight position in the consumer discretionary sector, hurt performance. All sectors in the Fund and in the Index experienced negative returns for the 12-month reporting period.
What was the investment environment like during the reporting period?
The reporting period was marked by economic and market turmoil. The severe credit crisis that began in 2007 escalated in September 2008, with an extraordinary and alarming series of events: the U.S. government’s takeover of Fannie Mae, Freddie Mac, and AIG; the failure of Lehman Brothers; the distressed sales of the commercial banking franchises of Washington Mutual and Wachovia; Bank of America’s acquisition of Merrill Lynch; and the conversion of investment banks Goldman Sachs and Morgan Stanley to commercial banks.
The credit crisis prompted unprecedented coordination between the U.S. Department of the Treasury and the U.S. Federal Reserve Bank in efforts to resuscitate credit markets and stabilize the financial system. Inflation concerns abated, as slumping demand in the U.S. and the weakening global economy hit commodities prices. The ongoing housing correction, debt deflation, rising unemployment, and stalled production and consumption all contributed to the most severe recession in recent history. Corporations across the globe announced workforce reductions and capital expenditure cuts.
Efforts to revive the economy which were initiated by the Bush administration were subsequently expanded and modified by the Obama administration. The Treasury Department introduced broad new credit stimulus programs concurrent with initiatives to peel away layers of distressed bank loans while laying the groundwork for regulatory overhaul of the financial system. Further capital was injected into major banks as part of a move to stabilize institutions considered too big to fail, and a large fiscal stimulus package was enacted. U.S. equity markets rebounded sharply on signs of economic stabilization in the final months of the period. A combination of falling housing prices, caused primarily by rising foreclosures, low interest rates, and increased availability of mortgage credit stimulated housing activity. Conditions in
| | |
| Jennison Mid-Cap Growth Fund, Inc. | | 5 |
Strategy and Performance Overview (continued)
financial markets have improved and household spending has continued to show signs of stabilizing, although it remains constrained by ongoing job losses, sluggish income growth, lower household wealth, and tight credit. The decline in sales of stores that have been open for a year or more moderated, reflecting the less competitive environment created by several closures and bankruptcies and a reduction in markdown activity. Businesses continued to rein in labor costs, contributing to higher monthly job losses and a U.S. unemployment rate that reached 9.4% at the end of July 2009. Corporations bolstered profits by cutting costs and reducing inventories. As some indicators suggested a stabilizing economy, investors began to readjust their risk exposure. Nevertheless, the severity of the recession continued to cast uncertainty for the coming quarters.
Which holdings made the largest positive contribution to the Fund’s return?
The top individual contributor to positive performance was Annaly Capital Management, a real estate investment trust (REIT) which owns, manages, and finances a portfolio of mortgage-backed securities (MBS) guaranteed by the Federal National Mortgage Association and the Federal Home Loan Mortgage Corporation. Despite the volatile environment, the company announced solid financial results and kept its debt at low levels. Jennison believes that the Fund will continue to benefit from Annaly’s management expertise.
Positions in the information technology sector contributed most significantly to the Fund’s performance. The most notable companies were McAfee, Check Point Software Technologies, and Broadcom. McAfee produces security software that protects computer systems and networks. Jennison believes the company is well positioned, due to its prominence in the software market and a robust pipeline of new products. Its strong revenue stream will most likely continue because of its subscription-based business model.
Check Point Software Technologies benefited from extending its service contracts and turning toward a subscription-based model. In Jennison’s opinion, Check Point has a healthy balance sheet and should continue to deliver strong financial results despite the challenging business environment. The company’s acquisition of Nokia Security Appliance may also benefit earnings growth in the near future.
Jennison favors Broadcom, a manufacturer of semiconductors for wired and wireless communications, especially for the sales potential of bundled, or “triple-play,” technology providers, along with its integrated Bluetooth/Wifi/FM applications. Broadcom should experience an improved earnings outlook.
| | |
| 6 | | Visit our website at www.jennisondryden.com |
In the healthcare sector, Beckman Coulter also performed well. The company manufactures biomedical testing instruments that are used to automate and simplify laboratory processes. A combination of new products, a strong product pipeline, and a high percentage of recurring revenue derived from an operating lease model have created a favorable outlook for the company. Jennison considers Beckman Coulter to be a market leader in clinical diagnostics.
Which holdings detracted most from the Fund’s return?
The top detractor from performance for the fiscal year was digital wireless communications provider NII Holdings. This was partially due to its weighting, as it was the second-largest holding in the Fund. Despite strong revenue growth and a record number of new subscribers, shares fell significantly in late 2008 and early 2009 due to the impact of a rapid deterioration in the exchange rate for the Brazilian real and Mexican peso on its financial results. During the first half of 2009, the company gained from subscriber growth, which helped to offset currency weakness and the economic slowdown in Latin America. Jennison favors NII for its solid fundamentals and believes it should benefit from expanding wireless demand in emerging Latin American markets. In Jennison’s opinion, NII has a strong balance sheet and should continue to grow at a faster rate than other wireless companies.
Construction and engineering services provider Chicago Bridge & Iron also hurt performance due to project delays and a decrease in the company’s scheduled projects, which caused the company’s management to reduce its earnings outlook for 2009. Jennison grew cautious of the near-term effect that these delays could have on generating free cash flow, which is operating cash flow minus capital expenditures, and decided to eliminate this company from the portfolio.
Another holding that detracted from the Fund’s performance was White Mountains Insurance Group, a provider of property and casualty insurance and reinsurance. While Jennison likes the company’s business model, the Fund sold shares due to liquidity concerns resulting from losses in White Mountains’ investment portfolios.
Industrials sector holding Ametek, which also hurt performance, manufactures electronic instruments and electromechanical devices. Ametek’s management lowered its earnings outlook for the second half of 2009, citing expected weakness in the analytical instruments business. The company’s primary customers are oil and gas and chemical companies, which have significantly reduced capital spending due to lower commodity prices and economic weakness. Jennison believes management has taken appropriate steps to address economic hurdles through its continued focus on efficiency and that the company’s long-term fundamentals remain strong.
| | |
| Jennison Mid-Cap Growth Fund, Inc. | | 7 |
Strategy and Performance Overview (continued)
Were there significant changes to the portfolio?
During the reporting period there were no significant changes to the portfolio. Rather, Jennison added or exited individual positions based on company fundamentals and a stock’s potential regarding its risk versus reward.
The Fund is heavily weighted in relatively high quality, sustainable growth companies which are generating solid returns on capital and strong free cash flow. Many of these companies benefit from recurring revenue business models, which are not particularly sensitive to the overall level of economic activity. Jennison is increasingly focused on the overall free-cash flow yield, and the willingness of companies to return cash to shareholders in the form of dividends.
| | |
| 8 | | Visit our website at www.jennisondryden.com |
Comments on Five Largest Holdings
| 3.9% | Annaly Capital Management, Inc., Real Estate Investment Trust (REIT) |
Please see section containing comments on the Fund’s largest contributors for the reporting period.
| 3.7% | NII Holdings, Inc., Wireless Telecommunication Services |
Please see section containing comments on the Fund’s largest detractor for the reporting period.
| 2.4% | Southwestern Energy Co., Oil, Gas & Consumable Fuels |
Southwestern Energy is primarily a producer of natural gas in the Midwest, South, and Southwest regions of the U.S. The company’s strong, low-cost growth, in Jennison’s opinion, will continue over the next several years as it more efficiently drills the Fayetteville Shale field in Arkansas. Jennison believes the ultimate potential of this mining operation is yet to be fully appreciated, and should become more apparent as Southwestern moves out of exploration and into development over the next several years.
| 2.3% | Crown Castle International Corp., Wireless Telecommunication Services |
Crown Castle operates and leases wireless towers and other communications structures. Jennison likes the company for its strong cash flow and earnings. Jennison believes that the wireless tower industry represents a strong business model with both solid growth and stable characteristics. Crown Castle should benefit from increasing mobile phone users and continued growth in data usage on wireless networks.
| 2.2% | Thermo Fisher Scientific, Inc., Life Sciences Tools & Services |
Thermo Fisher Scientific is an integrated life science tools company that provides analytical instruments, equipment, testing chemicals, and software. The company also provides services for research, manufacturing, analysis, discovery and diagnostics. Jennison likes the company for its strong market position, high-quality management team, and longer-term growth potential. Given the company’s growth potential, Jennison believes the stock is attractively valued relative to its peers.
| | |
| Jennison Mid-Cap Growth Fund, Inc. | | 9 |
Fees and Expenses (Unaudited)
As a shareholder of the Fund, you incur two types of costs: (1) transaction costs, including sales charges (loads) on purchase payments and redemptions, as applicable, and (2) ongoing costs, including management fees, distribution and/or service (12b-1) fees, and other Fund expenses, as applicable. This example is intended to help you understand your ongoing costs (in dollars) of investing in the Fund and to compare these costs with the ongoing costs of investing in other mutual funds.
The example is based on an investment of $1,000 invested on March 1, 2009, at the beginning of the period, and held through the six-month period ended August 31, 2009. The example is for illustrative purposes only; you should consult the Prospectus for information on initial and subsequent minimum investment requirements.
The Fund’s transfer agent may charge additional fees to holders of certain accounts that are not included in the expenses shown in the table on the following page. These fees apply to individual retirement accounts (IRAs) and Section 403(b) accounts. As of the close of the six-month period covered by the table, IRA fees included an annual maintenance fee of $15 per account (subject to a maximum annual maintenance fee of $25 for all accounts held by the same shareholder). Section 403(b) accounts are charged an annual $25 fiduciary maintenance fee. Some of the fees may vary in amount, or may be waived, based on your total account balance or the number of JennisonDryden funds, including the Fund, that you own. You should consider the additional fees that were charged to your Fund account over the six-month period when you estimate the total ongoing expenses paid over the period and the impact of these fees on your ending account value, as these additional expenses are not reflected in the information provided in the expense table. Additional fees have the effect of reducing investment returns.
Actual Expenses
The first line for each share class in the table on the following page provides information about actual account values and actual expenses. You may use the information on this line, together with the amount you invested, to estimate the expenses that you paid over the period. Simply divide your account value by $1,000 (for example, an $8,600 account value ÷ $1,000 = 8.6), then multiply the result by the number on the first line under the heading “Expenses Paid During the Six-Month Period” to estimate the expenses you paid on your account during this period.
Hypothetical Example for Comparison Purposes
The second line for each share class in the table on the following page provides information about hypothetical account values and hypothetical expenses based on the Fund’s actual expense ratio and an assumed rate of return of 5% per year before expenses,
| | |
| 10 | | Visit our website at www.jennisondryden.com |
which is not the Fund’s actual return. The hypothetical account values and expenses may not be used to estimate the actual ending account balance or expenses you paid for the period. You may use this information to compare the ongoing costs of investing in the Fund and other funds. To do so, compare this 5% hypothetical example with the 5% hypothetical examples that appear in the shareholder reports of the other funds.
Please note that the expenses shown in the table are meant to highlight your ongoing costs only and do not reflect any transactional costs such as sales charges (loads). Therefore, the second line for each share class in the table is useful in comparing ongoing costs only and will not help you determine the relative total costs of owning different funds. In addition, if these transactional costs were included, your costs would have been higher.
| | | | | | | | | | | | | | |
Jennison Mid-Cap
Growth Fund | | Beginning Account
Value
March 1, 2009 | | Ending Account
Value
August 31, 2009 | | Annualized
Expense Ratio | | | Expenses Paid
During the
Six-Month Period* |
| | | | | | | | | | | | | | |
| Class A | | Actual | | $ | 1,000.00 | | $ | 1,363.90 | | 1.18 | % | | $ | 7.03 |
| | | Hypothetical | | $ | 1,000.00 | | $ | 1,019.26 | | 1.18 | % | | $ | 6.01 |
| | | | | | | | | | | | | | |
| Class B | | Actual | | $ | 1,000.00 | | $ | 1,358.90 | | 1.88 | % | | $ | 11.18 |
| | | Hypothetical | | $ | 1,000.00 | | $ | 1,015.73 | | 1.88 | % | | $ | 9.55 |
| | | | | | | | | | | | | | |
| Class C | | Actual | | $ | 1,000.00 | | $ | 1,358.60 | | 1.88 | % | | $ | 11.18 |
| | | Hypothetical | | $ | 1,000.00 | | $ | 1,015.73 | | 1.88 | % | | $ | 9.55 |
| | | | | | | | | | | | | | |
| Class L | | Actual | | $ | 1,000.00 | | $ | 1,361.80 | | 1.38 | % | | $ | 8.22 |
| | | Hypothetical | | $ | 1,000.00 | | $ | 1,018.25 | | 1.38 | % | | $ | 7.02 |
| | | | | | | | | | | | | | |
| Class M | | Actual | | $ | 1,000.00 | | $ | 1,359.20 | | 1.88 | % | | $ | 11.18 |
| | | Hypothetical | | $ | 1,000.00 | | $ | 1,015.73 | | 1.88 | % | | $ | 9.55 |
| | | | | | | | | | | | | | |
| Class R | | Actual | | $ | 1,000.00 | | $ | 1,362.30 | | 1.38 | % | | $ | 8.22 |
| | | Hypothetical | | $ | 1,000.00 | | $ | 1,018.25 | | 1.38 | % | | $ | 7.02 |
| | | | | | | | | | | | | | |
| Class X | | Actual | | $ | 1,000.00 | | $ | 1,359.30 | | 1.88 | % | | $ | 11.18 |
| | | Hypothetical | | $ | 1,000.00 | | $ | 1,015.73 | | 1.88 | % | | $ | 9.55 |
| | | | | | | | | | | | | | |
| Class Z | | Actual | | $ | 1,000.00 | | $ | 1,365.90 | | 0.88 | % | | $ | 5.25 |
| | | Hypothetical | | $ | 1,000.00 | | $ | 1,020.77 | | 0.88 | % | | $ | 4.48 |
* Fund expenses (net of fee waivers or subsidies, if any) for each share class are equal to the annualized expense ratio for each share class (provided in the table), multiplied by the average account value over the period, multiplied by the 184 days in the six-month period ended August 31, 2009, and divided by 365 days. Expenses presented in the table include the expenses of any underlying portfolios in which the Fund may invest.
| | |
| Jennison Mid-Cap Growth Fund, Inc. | | 11 |
Portfolio of Investments
as of August 31, 2009
| | | | | |
| Shares | | Description | | Value (Note 1) |
| | | | | |
LONG-TERM INVESTMENTS 96.6% |
COMMON STOCKS | | | |
| |
Aerospace & Defense 1.8% | | | |
| 469,500 | | ITT Corp. | | $ | 23,512,560 |
| |
Air Freight & Logistics 1.3% | | | |
| 135,300 | | C.H. Robinson Worldwide, Inc.(b) | | | 7,611,978 |
| 281,600 | | Expeditors International of Washington, Inc. | | | 9,197,056 |
| | | | | |
| | | | | 16,809,034 |
| |
Biotechnology 1.1% | | | |
| 106,900 | | Cephalon, Inc.(a)(b) | | | 6,085,817 |
| 225,900 | | Vertex Pharmaceuticals, Inc.(a)(b) | | | 8,450,919 |
| | | | | |
| | | | | 14,536,736 |
| |
Capital Markets 3.1% | | | |
| 779,450 | | Eaton Vance Corp.(b) | | | 22,268,887 |
| 979,400 | | TD Ameritrade Holding Corp.(a) | | | 18,843,656 |
| | | | | |
| | | | | 41,112,543 |
| |
Chemicals 2.6% | | | |
| 644,200 | | Ecolab, Inc. | | | 27,243,218 |
| 128,500 | | FMC Corp.(b) | | | 6,129,450 |
| | | | | |
| | | | | 33,372,668 |
| |
Commercial Services & Supplies 1.5% | | | |
| 691,305 | | Iron Mountain, Inc.(a)(b) | | | 20,248,323 |
| |
Communications Equipment 0.2% | | | |
| 195,753 | | Ciena Corp.(a)(b) | | | 2,623,090 |
| |
Computers & Peripherals 0.9% | | | |
| 517,700 | | NetApp, Inc.(a)(b) | | | 11,777,675 |
| |
Construction & Engineering 0.8% | | | |
| 188,000 | | Fluor Corp.(b) | | | 9,945,200 |
| |
Electrical Equipment 2.5% | | | |
| 495,350 | | Ametek, Inc.(b) | | | 15,593,618 |
| 348,200 | | Roper Industries, Inc. | | | 16,497,716 |
| | | | | |
| | | | | 32,091,334 |
See Notes to Financial Statements.
| | |
| Jennison Mid-Cap Growth Fund, Inc. | | 13 |
Portfolio of Investments
as of August 31, 2009 continued
| | | | | |
| Shares | | Description | | Value (Note 1) |
| | | | | |
COMMON STOCKS (Continued) | | | |
| |
Electronic Equipment & Instruments 3.9% | | | |
| 559,200 | | Amphenol Corp. (Class A)(b) | | $ | 19,549,632 |
| 555,000 | | Anixter International, Inc.(a)(b) | | | 19,469,400 |
| 470,800 | | Avnet, Inc.(a) | | | 12,546,820 |
| | | | | |
| | | | | 51,565,852 |
| |
Energy Equipment & Services 1.9% | | | |
| 528,800 | | Cameron International Corp.(a)(b) | | | 18,883,448 |
| 135,400 | | FMC Technologies, Inc.(a) | | | 6,458,580 |
| | | | | |
| | | | | 25,342,028 |
| |
Food Products 3.2% | | | |
| 741,300 | | ConAgra Foods, Inc. | | | 15,218,889 |
| 658,100 | | Dean Foods Co.(a) | | | 11,937,934 |
| 243,700 | | Ralcorp Holdings, Inc.(a) | | | 15,287,301 |
| | | | | |
| | | | | 42,444,124 |
| |
Health Care Equipment & Supplies 3.2% | | | |
| 319,500 | | Beckman Coulter, Inc. | | | 21,636,540 |
| 62,700 | | C.R. Bard, Inc. | | | 5,052,366 |
| 317,500 | | ResMed, Inc.(a) | | | 14,576,425 |
| | | | | |
| | | | | 41,265,331 |
| |
Health Care Providers & Services 10.4% | | | |
| 652,200 | | Community Health Systems, Inc.(a)(b) | | | 20,068,194 |
| 507,000 | | DaVita, Inc.(a) | | | 26,216,970 |
| 307,100 | | Express Scripts, Inc.(a) | | | 22,178,762 |
| 273,300 | | Henry Schein, Inc.(a)(b) | | | 14,479,434 |
| 186,200 | | Laboratory Corp. of America Holdings(a)(b) | | | 12,994,898 |
| 654,400 | | Patterson Cos., Inc.(a)(b) | | | 17,819,312 |
| 402,800 | | Quest Diagnostics, Inc.(b) | | | 21,735,088 |
| | | | | |
| | | | | 135,492,658 |
| |
Hotels, Restaurants & Leisure 3.7% | | | |
| 275,600 | | Darden Restaurants, Inc. | | | 9,075,508 |
| 607,300 | | Tim Hortons, Inc. | | | 17,156,225 |
| 636,200 | | Yum! Brands, Inc.(b) | | | 21,789,850 |
| | | | | |
| | | | | 48,021,583 |
| |
Household Products 1.4% | | | |
| 328,400 | | Church & Dwight Co., Inc. | | | 18,761,492 |
See Notes to Financial Statements.
| | |
| 14 | | Visit our website at www.jennisondryden.com |
| | | | | |
| Shares | | Description | | Value (Note 1) |
| | | | | |
COMMON STOCKS (Continued) | | | |
| |
Independent Power Producers & Energy Traders 1.4% | | | |
| 1,344,300 | | AES Corp. (The)(a) | | $ | 18,376,581 |
| |
Insurance 1.1% | | | |
| 539,900 | | W.R. Berkley Corp. | | | 13,794,445 |
| |
Internet Software & Services 2.0% | | | |
| 1,228,200 | | VeriSign, Inc.(a)(b) | | | 26,025,558 |
| |
IT Services 3.5% | | | |
| 204,775 | | Alliance Data Systems Corp.(a)(b) | | | 11,377,299 |
| 747,900 | | Amdocs Ltd.(a) | | | 18,188,928 |
| 467,100 | | Cognizant Technology Solutions Corp.(a) | | | 16,292,448 |
| | | | | |
| | | | | 45,858,675 |
| |
Life Sciences Tools & Services 3.2% | | | |
| 387,000 | | Charles River Laboratories International, Inc.(a)(b) | | | 13,347,630 |
| 637,000 | | Thermo Fisher Scientific, Inc.(a)(b) | | | 28,798,770 |
| | | | | |
| | | | | 42,146,400 |
| |
Machinery 2.2% | | | |
| 255,400 | | Danaher Corp.(b) | | | 15,505,334 |
| 488,560 | | IDEX Corp.(b) | | | 12,917,526 |
| | | | | |
| | | | | 28,422,860 |
| |
Media 1.2% | | | |
| 1,280,899 | | Regal Entertainment Group (Class A) | | | 16,203,372 |
| |
Metals & Mining 1.9% | | | |
| 337,000 | | Cliffs Natural Resources, Inc. | | | 8,529,470 |
| 456,900 | | Goldcorp, Inc. | | | 16,658,574 |
| | | | | |
| | | | | 25,188,044 |
| |
Oil, Gas & Consumable Fuels 6.0% | | | |
| 480,200 | | Denbury Resources, Inc.(a)(b) | | | 7,308,644 |
| 345,900 | | Newfield Exploration Co.(a) | | | 13,382,871 |
| 214,300 | | Range Resources Corp.(b) | | | 10,365,691 |
| 848,500 | | Southwestern Energy Co.(a) | | | 31,275,710 |
| 418,600 | | XTO Energy, Inc. | | | 16,157,960 |
| | | | | |
| | | | | 78,490,876 |
See Notes to Financial Statements.
| | |
| Jennison Mid-Cap Growth Fund, Inc. | | 15 |
Portfolio of Investments
as of August 31, 2009 continued
| | | | | |
| Shares | | Description | | Value (Note 1) |
| | | | | |
COMMON STOCKS (Continued) | | | |
| |
Personal Products 1.4% | | | |
| 573,300 | | Avon Products, Inc.(b) | | $ | 18,271,071 |
| |
Pharmaceuticals 1.0% | | | |
| 894,500 | | Mylan, Inc.(a)(b) | | | 13,122,315 |
| |
Professional Services 1.7% | | | |
| 139,500 | | FTI Consulting, Inc.(a) | | | 6,073,830 |
| 600,300 | | Robert Half International, Inc. | | | 15,781,887 |
| | | | | |
| | | | | 21,855,717 |
| |
Real Estate Investment Trust 3.9% | | | |
| 2,968,200 | | Annaly Capital Management, Inc.(b) | | | 51,468,589 |
| |
Semiconductors & Semiconductor Equipment 4.2% | | | |
| 679,395 | | Broadcom Corp. (Class A)(a)(b) | | | 19,328,788 |
| 671,800 | | Marvell Technology Group Ltd.(a) | | | 10,244,950 |
| 865,800 | | Maxim Integrated Products, Inc.(b) | | | 16,259,724 |
| 422,800 | | Xilinx, Inc.(b) | | | 9,403,072 |
| | | | | |
| | | | | 55,236,534 |
| |
Software 4.5% | | | |
| 936,100 | | Check Point Software Technologies(a) | | | 26,089,107 |
| 367,300 | | McAfee, Inc.(a) | | | 14,611,194 |
| 751,400 | | Nuance Communications, Inc.(a)(b) | | | 9,264,762 |
| 125,300 | | Salesforce.com, Inc.(a)(b) | | | 6,499,311 |
| 49,618 | | Sybase, Inc.(a) | | | 1,729,187 |
| | | | | |
| | | | | 58,193,561 |
| |
Specialty Retail 4.5% | | | |
| 298,700 | | Guess?, Inc. | | | 10,466,448 |
| 181,100 | | O’Reilly Automotive, Inc.(a)(b) | | | 6,932,508 |
| 470,135 | | Ross Stores, Inc.(b) | | | 21,927,096 |
| 555,200 | | TJX Cos., Inc. | | | 19,959,440 |
| | | | | |
| | | | | 59,285,492 |
| |
Textiles, Apparel & Luxury Goods 1.4% | | | |
| 469,700 | | Phillips-Van Heusen Corp. | | | 17,745,266 |
| |
Wireless Telecommunication Services 8.0% | | | |
| 792,200 | | American Tower Corp. (Class A)(a) | | | 25,073,130 |
See Notes to Financial Statements.
| | |
| 16 | | Visit our website at www.jennisondryden.com |
| | | | | | |
| Shares | | Description | | Value (Note 1) | |
| | | | | | |
COMMON STOCKS (Continued) | | | | |
| |
Wireless Telecommunication Services (cont’d.) | | | | |
| 1,133,650 | | Crown Castle International Corp.(a)(b) | | $ | 30,449,839 | |
| 2,046,990 | | NII Holdings, Inc.(a) | | | 48,534,133 | |
| | | | | | |
| | | | | 104,057,102 | |
| | | | | | |
| | TOTAL LONG-TERM INVESTMENTS
(cost $1,084,383,734) | | | 1,262,664,689 | |
| | | | | | |
SHORT-TERM INVESTMENT 28.7% | |
| |
Affiliated Money Market Mutual Fund | | | | |
| 375,360,190 | | Dryden Core Investment Fund - Taxable Money Market Series
(cost $375,360,190; includes $334,883,887 of cash collateral received for securities on loan)(c)(d) | | | 375,360,190 | |
| | | | | | |
| | TOTAL INVESTMENTS 125.3%
(cost $1,459,743,924; Note 5) | | | 1,638,024,879 | |
| | Liabilities in excess of other assets (25.3)% | | | (330,956,494 | ) |
| | | | | | |
| | NET ASSETS 100.0% | | $ | 1,307,068,385 | |
| | | | | | |
| (a) | Non-income producing security. |
| (b) | All or a portion of security is on loan. The aggregate market value of such securities is $320,755,565; cash collateral of $334,883,887 (included in liabilities) was received with which the Fund purchased highly liquid short-term investments. |
| (c) | Represents security, or portion thereof, purchased with cash collateral received for securities on loan. |
| (d) | Prudential Investments LLC, the manager of the Fund, also serves as manager of the Dryden Core Investment Fund—Taxable Money Market Series. |
Various inputs are used in determining the value of the Fund’s investments. These inputs are summarized in the three broad levels listed below.
Level 1—quoted prices in active markets for identical securities
Level 2—other significant observable inputs (including quoted prices for similar securities, interest rates, prepayment speeds, credit risk, etc.)
Level 3—significant unobservable inputs (including the Fund’s own assumptions in determining the fair value of investments)
See Notes to Financial Statements.
| | |
| Jennison Mid-Cap Growth Fund, Inc. | | 17 |
Portfolio of Investments
as of August 31, 2009 continued
The following is a summary of the inputs used as of August 31, 2009 in valuing the Fund’s assets carried at fair value:
| | | | | | | | | |
| | | Level 1 | | Level 2 | | Level 3 |
Investments in Securities | | | | | | | | | |
Common Stocks | | $ | 1,262,664,689 | | $ | — | | $ | — |
Affiliated Money Market Mutual Fund | | | 375,360,190 | | | — | | | — |
| | | | | | | | | |
| | | 1,638,024,879 | | | — | | | — |
Other Financial Instruments* | | | — | | | — | | | — |
| | | | | | | | | |
Total | | $ | 1,638,024,879 | | $ | — | | $ | — |
| | | | | | | | | |
| * | Other financial instruments are derivative instruments not reflected in the Portfolio of Investments, such as futures, forwards and swap contracts, which are valued at the unrealized appreciation/depreciation on the instrument. |
As of August 31, 2008 and August 31, 2009, the Fund did not use any significant unobservable inputs (Level 3) in determining the value of investments.
The industry classification of portfolio holdings and liabilities in excess of other assets shown as a percentage of net assets as of August 31, 2009 were as follows:
| | | |
Affiliated Money Market Mutual Fund (including 25.6% of collateral received for securities on loan) | | 28.7 | % |
Health Care Providers & Services | | 10.4 | |
Wireless Telecommunication Services | | 8.0 | |
Oil, Gas & Consumable Fuels | | 6.0 | |
Software | | 4.5 | |
Specialty Retail | | 4.5 | |
Semiconductors & Semiconductor Equipment | | 4.2 | |
Electronic Equipment & Instruments | | 3.9 | |
Real Estate Investment Trust | | 3.9 | |
Hotels, Restaurants & Leisure | | 3.7 | |
IT Services | | 3.5 | |
Food Products | | 3.2 | |
Health Care Equipment & Supplies | | 3.2 | |
Life Sciences Tools & Services | | 3.2 | |
Capital Markets | | 3.1 | |
Chemicals | | 2.6 | |
Electrical Equipment | | 2.5 | |
Machinery | | 2.2 | |
Internet Software & Services | | 2.0 | |
Energy Equipment & Services | | 1.9 | |
Metals & Mining | | 1.9 | |
Aerospace & Defense | | 1.8 | |
Professional Services | | 1.7 | |
See Notes to Financial Statements.
| | |
| 18 | | Visit our website at www.jennisondryden.com |
| | | |
Industry (cont’d.) | | | |
Commercial Services & Supplies | | 1.5 | % |
Household Products | | 1.4 | |
Independent Power Producers & Energy Traders | | 1.4 | |
Personal Products | | 1.4 | |
Textiles, Apparel & Luxury Goods | | 1.4 | |
Air Freight & Logistics | | 1.3 | |
Media | | 1.2 | |
Biotechnology | | 1.1 | |
Insurance | | 1.1 | |
Pharmaceuticals | | 1.0 | |
Computer & Peripherals | | 0.9 | |
Construction & Engineering | | 0.8 | |
Communications Equipment | | 0.2 | |
| | | |
| | 125.3 | |
Liabilities in excess of other assets | | (25.3 | ) |
| | | |
| | 100.0 | % |
| | | |
See Notes to Financial Statements.
| | |
| Jennison Mid-Cap Growth Fund, Inc. | | 19 |
Statement of Assets and Liabilities
as of August 31, 2009
| | | | |
Assets | | | | |
Investments at value, including securities on loan of $320,755,565: | | | | |
Unaffiliated Investments (cost $1,084,383,734) | | $ | 1,262,664,689 | |
Affiliated Investments (cost $375,360,190) | | | 375,360,190 | |
Cash | | | 190,184 | |
Receivable for investments sold | | | 7,136,555 | |
Receivable for Fund shares sold | | | 4,288,958 | |
Dividends receivable | | | 851,645 | |
Prepaid expenses | | | 41,172 | |
| | | | |
Total assets | | | 1,650,533,393 | |
| | | | |
| |
Liabilities | | | | |
Payable to broker for collateral for securities on loan | | | 334,883,887 | |
Payable for investments purchased | | | 4,479,148 | |
Payable for Fund shares reacquired | | | 2,482,783 | |
Management fee payable | | | 658,362 | |
Accrued expenses | | | 312,356 | |
Distribution fee payable | | | 326,546 | |
Affiliated transfer agent fee payable | | | 292,799 | |
Deferred directors’ fees | | | 29,127 | |
| | | | |
Total liabilities | | | 343,465,008 | |
| | | | |
| |
Net Assets | | $ | 1,307,068,385 | |
| | | | |
| | | | | |
Net assets were comprised of: | | | | |
Common stock, at par | | $ | 64,734 | |
Paid-in capital in excess of par | | | 1,369,784,903 | |
| | | | |
| | | 1,369,849,637 | |
Undistributed net investment income | | | 2,291,159 | |
Accumulated net realized loss on investments | | | (243,353,366 | ) |
Net unrealized appreciation on investments | | | 178,280,955 | |
| | | | |
Net assets, August 31, 2009 | | $ | 1,307,068,385 | |
| | | | |
See Notes to Financial Statements.
| | |
| 20 | | Visit our website at www.jennisondryden.com |
| | | |
Class A | | | |
Net asset value and redemption price per share | | | |
($764,081,502 ÷ 37,748,377 shares of common stock issued and outstanding) | | $ | 20.24 |
Maximum sales charge (5.50% of offering price) | | | 1.18 |
| | | |
Maximum offering price to public | | $ | 21.42 |
| | | |
Class B | | | |
Net asset value, offering price and redemption price per share | | | |
($44,341,025 ÷ 2,428,962 shares of common stock issued and outstanding) | | $ | 18.26 |
| | | |
Class C | | | |
Net asset value, offering price and redemption price per share | | | |
($81,161,500 ÷ 4,444,834 shares of common stock issued and outstanding) | | $ | 18.26 |
| | | |
Class L | | | |
Net asset value, offering price and redemption price per share | | | |
($10,099,226 ÷ 502,354 shares of common stock issued and outstanding) | | $ | 20.10 |
| | | |
Class M | | | |
Net asset value, offering price and redemption price per share | | | |
($8,912,154 ÷ 488,563 shares of common stock issued and outstanding) | | $ | 18.24 |
| | | |
Class R | | | |
Net asset value, offering price and redemption price per share | | | |
($28,761,061 ÷ 1,435,473 shares of common stock issued and outstanding) | | $ | 20.04 |
| | | |
Class X | | | |
Net asset value, offering price and redemption price per share | | | |
($4,388,334 ÷ 239,708 shares of common stock issued and outstanding) | | $ | 18.31 |
| | | |
Class Z | | | |
Net asset value, offering price and redemption price per share | | | |
($365,323,583 ÷17,445,742 shares of common stock issued and outstanding) | | $ | 20.94 |
| | | |
See Notes to Financial Statements.
| | |
| Jennison Mid-Cap Growth Fund, Inc. | | 21 |
Statement of Operations
Year Ended August 31, 2009
| | | | |
Net Investment Income | | | | |
Income | | | | |
Unaffiliated dividend income (net of foreign withholding taxes of $12,690) | | $ | 11,701,827 | |
Affiliated income from securities loaned, net | | | 1,340,593 | |
Affiliated dividend income | | | 353,678 | |
Unaffiliated interest income | | | 147 | |
| | | | |
Total income | | | 13,396,245 | |
| | | | |
| |
Expenses | | | | |
Management fee | | | 5,375,466 | |
Distribution fee—Class A | | | 1,601,390 | |
Distribution fee—Class B | | | 411,281 | |
Distribution fee—Class C | | | 629,083 | |
Distribution fee—Class L | | | 49,369 | |
Distribution fee—Class M | | | 119,293 | |
Distribution fee—Class R | | | 60,634 | |
Distribution fee—Class X | | | 45,672 | |
Transfer agent’s fees and expenses (including affiliated expenses of $1,076,500) (Note 3) | | | 2,232,000 | |
Reports to shareholders | | | 193,000 | |
Registration fees | | | 125,000 | |
Custodian’s fees and expenses | | | 120,000 | |
Directors’ fees | | | 54,000 | |
Legal fees and expenses | | | 29,000 | |
Audit fee | | | 21,000 | |
Insurance expenses | | | 16,000 | |
Miscellaneous | | | 9,489 | |
| | | | |
Total expenses | | | 11,091,677 | |
Less: Expense subsidy (Note 2) | | | (1,596 | ) |
| | | | |
Net expenses | | | 11,090,081 | |
| | | | |
Net investment income | | | 2,306,164 | |
| | | | |
| |
Realized And Unrealized Gain (Loss) On Investments | | | | |
Net realized loss on investment transactions | | | (183,828,758 | ) |
Net change in unrealized appreciation on investments | | | 97,121,354 | |
| | | | |
Net loss on investments | | | (86,707,404 | ) |
| | | | |
Net Decrease In Net Assets Resulting From Operations | | $ | (84,401,240 | ) |
| | | | |
See Notes to Financial Statements.
| | |
| 22 | | Visit our website at www.jennisondryden.com |
Statement of Changes in Net Assets
| | | | | | | | |
| | | Year Ended August 31, | |
| | | 2009 | | | 2008 | |
Increase (Decrease) In Net Assets | | | | | | | | |
Operations | | | | | | | | |
Net investment income (loss) | | $ | 2,306,164 | | | $ | (3,277,860 | ) |
Net realized gain (loss) on investments and foreign currency transactions | | | (183,828,758 | ) | | | 92,809,870 | |
Net change in unrealized appreciation (depreciation) on investments | | | 97,121,354 | | | | (115,841,600 | ) |
| | | | | | | | |
Net decrease in net assets resulting from operations | | | (84,401,240 | ) | | | (26,309,590 | ) |
| | | | | | | | |
| | |
Fund share transactions (Net of share conversions) (Note 6) | | | | | | | | |
Net proceeds from shares sold | | | 638,099,424 | | | | 268,611,623 | |
Net asset value of shares issued in connection with merger (Note 7) | | | 59,187,693 | | | | 122,757,479 | |
Cost of shares reacquired | | | (285,586,252 | ) | | | (249,041,935 | ) |
| | | | | | | | |
Net increase in net assets from Fund share transactions | | | 411,700,865 | | | | 142,327,167 | |
| | | | | | | | |
Total increase | | | 327,299,625 | | | | 116,017,577 | |
| | |
Net Assets | | | | | | | | |
Beginning of year | | | 979,768,760 | | | | 863,751,183 | |
| | | | | | | | |
End of year | | $ | 1,307,068,385 | | | $ | 979,768,760 | |
| | | | | | | | |
(a) Includes undistributed net investment income of | | $ | 2,291,159 | | | | — | |
| | | | | | | | |
See Notes to Financial Statements.
| | |
| Jennison Mid-Cap Growth Fund, Inc. | | 23 |
Notes to Financial Statements
Jennison Mid-Cap Growth Fund, Inc. (the “Fund”) (formerly known as Jennison U.S. Emerging Growth Fund, Inc.) is registered under the Investment Company Act of 1940 as a diversified, open-end, management investment company. The Fund was incorporated in Maryland on August 23, 1996. The Fund issued 2,500 shares each of Class A, Class B, Class C and Class Z common stock for $100,000 on October 21, 1996 to Prudential Investments, LLC, (“PI” or “Manager”). Investment operations commenced on December 31, 1996. The Fund issued 250 shares each of Class L, Class M and Class X common stock for $7,500 on June 12, 2006 to PI.
The Fund’s investment objective is to achieve long-term capital appreciation. It invests primarily in equity securities of small and medium-sized U.S. companies, which will generally have a market capitalization less than the largest capitalization of the Standard & Poor’s Mid-Cap 400 Stock Index, with the potential for above average growth.
The Fund’s fiscal year has changed from an annual reporting period that ends October 31 to one that ends August 31, effective August 31, 2007. This change should have no impact on the way the Fund is managed. Shareholders will receive future annual and semiannual reports on the new fiscal year-end schedule.
Note 1. Accounting Policies
The following is a summary of significant accounting policies followed by the Fund in the preparation of its financial statements.
Securities Valuation: Securities listed on a securities exchange (other than options on securities and indices) are valued at the last sale price on such exchange on the day of valuation or, if there was no sale on such day, at the mean between the last reported bid and ask prices, or at the last bid price on such day in the absence of an asked price. Securities traded via Nasdaq are valued at the Nasdaq official closing price (“NOCP”) on the day of valuation, or if there was no NOCP, at the last sale price. Securities that are actively traded in the over-the-counter market, including listed securities for which the primary market is believed by Prudential Investments LLC (“PI” or “Manager”), in consultation with the subadvisers; to be over-the-counter, are valued at market value using prices provided by an independent pricing agent or principal market maker. Options on securities and indices traded on an exchange are valued at the last sale price as of the close of trading on the applicable exchange or, if
| | |
| 24 | | Visit our website at www.jennisondryden.com |
there was no sale, at the mean between the most recently quoted bid and asked prices on such exchange. Futures contracts and options thereon traded on a commodities exchange or board of trade are valued at the last sale price at the close of trading on such exchange or board of trade or, if there was no sale on the applicable commodities exchange or board of trade on such day, at the mean between the most recently quoted bid and asked prices on such exchange or board of trade or at the last bid price in the absence of an asked price. Prices may be obtained from independent pricing services which use information provided by market makers or estimates of market values obtained from yield data relating to investments or securities with similar characteristics. Securities for which reliable market quotations are not readily available, or whose values have been affected by events occurring after the close of the security’s foreign market and before the Funds’ normal pricing time, are valued at fair value in accordance with the Board of Directors’ approved fair valuation procedures. When determining the fair valuation of securities some of the factors influencing the valuation include, the nature of any restrictions on disposition of the securities; assessment of the general liquidity of the securities; the issuer’s financial condition and the markets in which it does business; the cost of the investment; the size of the holding and the capitalization of issuer; the prices of any recent transactions or bids/offers for such securities or any comparable securities; any available analyst media or other reports or information deemed reliable by the investment adviser regarding the issuer or the markets or industry in which it operates. Using fair value to price securities may result in a value that is different from a security’s most recent closing price and from the price used by other mutual funds to calculate their net asset values.
Investments in mutual funds are valued at their net asset value as of the close of the New York Stock Exchange on the date of valuation.
Short-term debt securities which mature in 60 days or less are valued at amortized cost, which approximates market value. The amortized cost method involves valuing a security at its cost on the date of purchase and thereafter assuming a constant amortization to maturity of the difference between the principal amount due at maturity and cost. Short-term debt securities which mature in more than 60 days are valued at current market quotations.
Foreign Currency Translation: The books and records of the Fund are maintained in U.S. dollars. Foreign currency amounts are translated into U.S. dollars on the following basis:
(i) market value of investment securities, other assets and liabilities-at the current daily rate of exchange.
| | |
| Jennison Mid-Cap Growth Fund, Inc. | | 25 |
Notes to Financial Statements
continued
(ii) purchases and sales of investment securities, income and expenses-at the rates of exchange prevailing on the respective dates of such transactions.
The Fund does not isolate that portion of the results of operations arising as a result of changes in the foreign exchange rates from the fluctuations arising from changes in the market prices of long-term securities held at the end of the period. Similarly, the Fund does not isolate the effect of changes in foreign exchange rates from the fluctuations arising from changes in the market prices of portfolio securities sold during the period. Accordingly, realized foreign currency gains or losses are included in the reported net realized gains or losses on investment transactions.
Net realized gains or losses on foreign currency transactions represent net foreign exchange gains or losses from the holdings of foreign currencies, currency gains or losses realized between the trade and settlement dates on security transactions, and the difference between the amounts of dividends, interest and foreign taxes recorded on the Fund’s books and the U.S. dollar equivalent amounts actually received or paid. Net unrealized currency gains or losses from valuing foreign currency denominated assets and liabilities (other than investments) at period end exchange rates are reflected as a component of net unrealized appreciation (depreciation) on investments and foreign currencies.
Foreign security and currency transactions may involve certain considerations and risks not typically associated with those of domestic origin as a result of, among other factors, the possibility of political and economic instability or the level of governmental supervision and regulation of foreign securities markets.
Securities Lending: The Fund may lend its portfolio securities to broker-dealers. The loans are secured by collateral at least equal, at all times, to the market value of the securities loaned. Loans are subject to termination at the option of the borrower or the Fund. Upon termination of the loan, the borrower will return to the lender securities identical to the loaned securities. Should the borrower of the securities fail financially, the Fund has the right to repurchase the securities using the collateral in the open market. The Fund recognizes income, net of any rebate and securities lending agent fees, for lending its securities in the form of fees or interest on the investment of any cash received as collateral. The Fund also continues to receive interest and dividends or amounts equivalent thereto, on the securities loaned and recognizes any unrealized gain or loss in the market price of the securities loaned that may occur during the term of the loan.
| | |
| 26 | | Visit our website at www.jennisondryden.com |
Securities Transactions and Net Investment Income: Securities transactions are recorded on the trade date. Realized and unrealized gains and losses on sales of portfolio securities are calculated on the identified cost basis. Dividend income is recorded on the ex-dividend date. Interest income, including amortization of premium and accretion of discounts on debt securities, as required, is recorded on the accrual basis. Expenses are recorded on the accrual basis.
Net investment income or loss, (other than distribution fees which are charged directly to the respective class) and unrealized and realized gains or losses are allocated daily to each class of shares based upon the relative proportion of net assets of each class at the beginning of the day.
Dividends and Distributions: The Fund expects to pay dividends of net investment income and distributions of net realized capital and currency gains, if any, annually. Dividends and distributions to shareholders, which are determined in accordance with federal income tax regulations and which may differ from generally accepted accounting principles, are recorded on the ex-dividend date. Permanent book/tax differences relating to income and gains are reclassified amongst undistributed net investment income, accumulated net realized gain or loss and paid-in capital in excess of par, as appropriate.
Taxes: It is the Fund’s policy to continue to meet the requirements of the Internal Revenue Code applicable to regulated investment companies and to distribute all of its taxable net investment income and capital gains, if any, to its shareholders. Therefore, no federal income tax provision is required.
Withholding taxes on foreign dividends are recorded, net of reclaimable amounts, at the time the related income is earned.
Estimates: The preparation of the financial statements requires management to make estimates and assumptions that affect the reported amounts and disclosures in the financial statements. Actual results could differ from those estimates.
Note 2. Agreements
The Fund has a management agreement with PI. Pursuant to this agreement, PI has responsibility for all investment advisory services and supervises the subadvisor’s performance of such services. PI has entered into a subadvisory agreement with Jennison Associates LLC (“Jennison”). The subadvisory agreement provides that Jennison furnishes investment advisory services in connection with the management
| | |
| Jennison Mid-Cap Growth Fund, Inc. | | 27 |
Notes to Financial Statements
continued
of the Fund. In connection therewith, Jennison is obligated to keep certain books and records of the Fund. PI pays for the services of Jennison, the cost of compensation of officers and employees of the Fund, occupancy and certain clerical and bookkeeping costs of the Fund. The Fund bears all other costs and expenses.
The management fee paid to PI is computed daily and payable monthly, at an annual rate of .60 of 1% of the Fund’s average daily net assets up to $1 billion and ..55 of 1% of the average daily net assets in excess of $1 billion. The effective management fee rate was .60 of 1% for the year ended August 31, 2009. For the period June 16, 2006 to June 17, 2007, the Manager has contractually agreed to waive up to .08% of the Fund’s management fee so that the Fund’s operating expenses during such period, exclusive of taxes, interest, brokerage, distribution fees and non-routine expenses do not exceed .83% of the Fund’s average daily net assets. Effective March 2, 2007 through September 30, 2008, such waiver has been amended to up to .06% for such adjusted operating expenses in excess of .89%.
The Fund has a distribution agreement with Prudential Investment Management Services LLC (“PIMS”), which acts as the distributor of the Class A, Class B, Class C, Class L, Class M, Class R, Class X and Class Z shares of the Fund. The Fund compensates PIMS for distributing and servicing the Fund’s Class A, Class B, Class C, Class L, Class M, Class R, Class X and Class Z shares, pursuant to plans of distribution (the “Class A, B, C, L, M, R, X and Z Plans”), regardless of expenses actually incurred by PIMS. The distribution fees are accrued daily and payable monthly. No distribution or service fees are paid to PIMS as distributor of the Class Z shares of the Fund.
Pursuant to the Class A, B, C, L, M, R, X and Z Plans, the Fund compensates PIMS for distribution related activities at an annual rate of up to .30 of 1%, 1%, 1%, .50 of 1%, 1%, .75 of 1% and 1% of the average daily net assets of the Class A, B, C, L, M, R and X shares, respectively. PIMS contractually agreed to limit such fees to .50 of 1% of the average daily net assets of Class R shares through December 31, 2010.
PIMS has advised the Fund that it received approximately $404,300 in front-end sales charges resulting from sales of Class A shares during the year ended August 31, 2009. From these fees, PIMS paid such sales charges to affiliated broker-dealers, which in turn paid commissions to salespersons and incurred other distribution costs. PIMS has advised the Fund that for the year ended August 31, 2009, it received approximately $800, $95,000, $12,500, $17,000 and $4,600 in contingent deferred sales charges
| | |
| 28 | | Visit our website at www.jennisondryden.com |
imposed upon redemptions by certain Class A, Class B, Class C, Class M and Class X shareholders, respectively.
PI, PIMS and Jennison are indirect, wholly-owned subsidiaries of Prudential Financial, Inc. (“Prudential”).
The Fund, along with other affiliated registered investment companies (the “Funds”), is a party to a Syndicated Credit Agreement (“SCA”) with two banks. The SCA provides for a commitment of $500 million. Interest on any borrowings under the SCA is incurred at contracted market rates and a commitment fee for the unused amount is accrued daily and paid quarterly. Effective October 22, 2009, the Funds renewed the SCA with the banks. The commitment under the renewed SCA continues to be $500 million. The Funds pay a commitment fee of .15 of 1% of the unused portion of the renewed SCA. The expiration date of the renewed SCA will be October 20, 2010. For the period from October 24, 2008 through October 21, 2009, the Funds paid a commitment fee of .13 of 1% of the unused portion of the agreement. The purpose of the SCA is to provide an alternative source of temporary funding for capital share redemptions.
The Fund did not utilize the line of credit during the year ended August 31, 2009.
Note 3. Other Transactions with Affiliates
Prudential Mutual Fund Services LLC (“PMFS”), an affiliate of PI and an indirect, wholly-owned subsidiary of Prudential, serves as the Fund’s transfer agent. Transfer agent’s fees and expenses in the Statement of Operations include certain out-of-pocket expenses paid to non-affiliates, where applicable.
The Fund pays networking fees to affiliated and unaffiliated broker/dealers including fees relating to the services of Wells Fargo Advisors, LLC (“Wells Fargo”) and First Clearing, LLC (“First Clearing”), affiliates of PI. These networking fees are payments made to broker/dealers that clear mutual fund transactions through a national clearing system. For the year ended August 31, 2009, the Fund incurred approximately $850,000 in total networking fees, of which $228,100 and $18,000, respectively was paid to First Clearing and Wells Fargo. These amounts are included in transfer agent’s fees and expenses in the Statement of Operations.
Prudential Investment Management, Inc., (“PIM”), an indirect, wholly-owned subsidiary of Prudential, is the Fund’s security lending agent. For the year ended August 31, 2009, PIM has been compensated approximately $566,500 for these services.
| | |
| Jennison Mid-Cap Growth Fund, Inc. | | 29 |
Notes to Financial Statements
continued
The Fund invests in the Taxable Money Market Series (the “Series”), a portfolio of Dryden Core Investment Fund. The Series is a money market mutual fund registered under the Investment Company Act of 1940, as amended, and managed by PI. Earnings from the Series are disclosed on the Statement of Operations as affiliated dividends.
Note 4. Portfolio Securities
Purchases and sales of investment securities, other than short-term investments, for the year ended August 31, 2009 were $902,488,859 and $529,400,053, respectively.
Note 5. Distributions and Tax Information
Distributions to shareholders, which are determined in accordance with federal income tax regulations and which may differ from generally accepted accounting principles, are recorded on the ex-date. In order to present undistributed net investment income, accumulated net realized loss on investments and paid-in capital in excess of par on the Statement of Assets and Liabilities that more closely represent their tax character, certain adjustments have been made to paid-in-capital in excess of par and accumulated net realized loss on investments. For the fiscal year ended August 31, 2009, the adjustments were to increase accumulated net realized loss on investments and to increase paid-in-capital in excess of par by $15,898,275 due to reclassification of capital loss carryforward from reorganization, reclassification of disallowed losses from wash sales due to reorganization and write-off of capital loss carryforward due to expiration and loss limitations. Net investment income, net realized losses and net assets were not affected by this change.
As of August 31, 2009, the Fund had a capital loss carryforward for tax purposes of approximately $89,209,000 of which $29,927,000 expires in 2010, $1,789,000 expires in 2011, $567,000 expires in 2012, $1,057,000 expires in 2013, $5,016,000 expires in 2015, $17,993,000 expires in 2016 and $32,860,000 expires in 2017. Certain portions of the capital loss carryforwards were assumed by the Fund as a result of acquisitions. Utilization of these capital loss carryforwards may be limited in accordance with income tax regulations. As of August 31, 2009, approximately $84,485,000 of its capital loss carryovers were written-off due to expiration and loss limitations. No capital gains distributions are expected to be paid to shareholders
| | |
| 30 | | Visit our website at www.jennisondryden.com |
until net gains have been realized in excess of such carryforward. It is uncertain whether the Fund will be able to realize the full benefit prior to the expiration dates.
The Fund elected to treat post-October capital losses of approximately $115,433,000 incurred in the ten months ended August 31, 2009 as having incurred in the next fiscal year (August 31, 2010).
As of August 31, 2009, the accumulated undistributed earnings on a tax basis was $2,320,235 of ordinary income. This amount differs from undistributed investment income on the Statement of Assets and Liabilities primarily due to timing differences.
The United States federal income tax basis of the Fund’s investments and the net unrealized appreciation as of August 31, 2009 were as follows:
| | | | | | |
Tax Basis of
Investments | | Appreciation | | Depreciation | | Net
Unrealized
Appreciation |
| $1,498,454,996 | | $165,728,068 | | $(26,158,185) | | $139,569,883 |
The difference between book basis and tax basis was primarily attributable to deferred losses on wash sales.
Management has analyzed the Funds’ tax positions taken on federal income tax returns for all open tax years and has concluded that as of August 31, 2009, no provision for income tax would be required in the Funds’ financial statements. The Fund’s federal and state income and federal excise tax returns for tax years for which the applicable statutes of limitations have not expired are subject to examination by the Internal Revenue Service and state departments of revenue.
Note 6. Capital
The Fund offers Class A, Class B, Class C, Class L, Class M , Class R, Class X and Class Z shares. Class A and Class L shares are sold with a front-end sales charge of up to 5.5% and 5.75%, respectively. All investors who purchase Class A or Class L shares in an amount of $1 million or more and sell these shares within 12 months of purchase are subject to a contingent deferred sales charge (CDSC) of 1%, including investors who purchase their shares through broker-dealers affiliated with Prudential Financial, Inc. Class B shares are sold with a CDSC which declines from 5% to zero depending on the period of time the shares are held. Class M and Class X shares are sold with a CDSC which declines from 6% to zero depending on the period of time
| | |
| Jennison Mid-Cap Growth Fund, Inc. | | 31 |
Notes to Financial Statements
continued
the shares are held. Class C shares are sold with a CDSC of 1% during the first 12 months. Class B shares will automatically convert to Class A shares on a quarterly basis approximately seven years after purchase. A special exchange privilege is also available for shareholders who qualified to purchase Class A shares at net asset value. Class M shares will automatically convert to Class A shares approximately eight years after purchase. Class L shares are closed to most new purchases (with the exception of reinvested dividends). Class L and Class M shares are only exchangeable with Class L and Class M shares, respectively, offered by certain other Strategic Partners Funds. Class X shares are closed to new purchases. Class R and Class Z shares are not subject to any sales or redemption charge and are offered exclusively for sale to a limited group of investors.
There are 2 billion shares of $.001 par value common stock authorized divided into eight classes, designated Class A, Class B, Class C, Class L, Class M, Class R, Class X and Class Z, which consists of 800 million, 400 million, 300 million, 100 million, 100 million, 100 million, 100 million and 100 million authorized shares, respectively.
Transactions in shares of common stock were as follows:
| | | | | | | |
Class A | | Shares | | | Amount | |
Year ended August 31, 2009: | | | | | | | |
Shares sold | | 19,722,612 | | | $ | 342,262,795 | |
Shares issued in connection with the merger | | 2,961,111 | | | | 51,641,778 | |
Shares reacquired | | (10,176,648 | ) | | | (180,013,801 | ) |
| | | | | | | |
Net increase (decrease) in shares outstanding before conversion | | 12,507,075 | | | | 213,890,772 | |
Shares issued upon conversion from Class B, Class M and Class X | | 1,192,470 | | | | 21,130,779 | |
| | | | | | | |
Net increase (decrease) in shares outstanding | | 13,699,545 | | | $ | 235,021,551 | |
| | | | | | | |
Year ended August 31, 2008: | | | | | | | |
Shares sold | | 6,834,281 | | | $ | 167,329,475 | |
Shares issued in connection with the merger | | 2,829,916 | | | | 72,188,891 | |
Shares reacquired | | (5,318,412 | ) | | | (130,601,226 | ) |
| | | | | | | |
Net increase (decrease) in shares outstanding before conversion | | 4,345,785 | | | | 108,917,140 | |
Shares issued upon conversion from Class B, Class M and Class X | | 2,147,383 | | | | 52,634,414 | |
| | | | | | | |
Net increase (decrease) in shares outstanding | | 6,493,168 | | | $ | 161,551,554 | |
| | | | | | | |
| | |
| 32 | | Visit our website at www.jennisondryden.com |
| | | | | | | |
Class B | | Shares | | | Amount | |
Year ended August 31, 2009: | | | | | | | |
Shares sold | | 414,803 | | | $ | 6,617,021 | |
Shares issued in connection with the merger | | 291,890 | | | | 4,603,107 | |
Shares reacquired | | (519,973 | ) | | | (8,136,624 | ) |
| | | | | | | |
Net increase (decrease) in shares outstanding before conversion | | 186,720 | | | | 3,083,504 | |
Shares reacquired upon conversion into Class A | | (840,948 | ) | | | (13,621,279 | ) |
| | | | | | | |
Net increase (decrease) in shares outstanding | | (654,228 | ) | | $ | (10,537,775 | ) |
| | | | | | | |
Year ended August 31, 2008: | | | | | | | |
Shares sold | | 286,850 | | | $ | 6,438,230 | |
Shares issued in connection with the merger | | 1,139,766 | | | | 26,579,354 | |
Shares reacquired | | (775,680 | ) | | | (17,389,588 | ) |
| | | | | | | |
Net increase (decrease) in shares outstanding before conversion | | 650,936 | | | | 15,627,996 | |
Shares reacquired upon conversion into Class A | | (1,802,650 | ) | | | (40,489,216 | ) |
| | | | | | | |
Net increase (decrease) in shares outstanding | | (1,151,714 | ) | | $ | (24,861,220 | ) |
| | | | | | | |
Class C | | | | | | |
Year ended August 31, 2009: | | | | | | | |
Shares sold | | 1,532,247 | | | $ | 24,232,375 | |
Shares issued in connection with the merger | | 84,090 | | | | 1,326,104 | |
Shares reacquired | | (877,505 | ) | | | (13,704,445 | ) |
| | | | | | | |
Net increase (decrease) in shares outstanding | | 738,832 | | | $ | 11,854,034 | |
| | | | | | | |
Year ended August 31, 2008: | | | | | | | |
Shares sold | | 461,651 | | | $ | 10,377,828 | |
Shares issued in connection with the merger | | 792,008 | | | | 18,469,609 | |
Shares reacquired | | (849,200 | ) | | | (18,989,478 | ) |
| | | | | | | |
Net increase (decrease) in shares outstanding | | 404,459 | | | $ | 9,857,959 | |
| | | | | | | |
Class L | | | | | | |
Year ended August 31, 2009: | | | | | | | |
Shares sold | | 3,780 | | | $ | 66,175 | |
Shares reacquired | | (147,361 | ) | | | (2,547,122 | ) |
| | | | | | | |
Net increase (decrease) in shares outstanding | | (143,581 | ) | | $ | (2,480,947 | ) |
| | | | | | | |
Year ended August 31, 2008: | | | | | | | |
Shares sold | | 10,932 | | | $ | 275,045 | |
Shares reacquired | | (165,861 | ) | | | (4,063,185 | ) |
| | | | | | | |
Net increase (decrease) in shares outstanding | | (154,929 | ) | | $ | (3,788,140 | ) |
| | | | | | | |
| | |
| Jennison Mid-Cap Growth Fund, Inc. | | 33 |
Notes to Financial Statements
continued
| | | | | | | |
Class M | | Shares | | | Amount | |
Year ended August 31, 2009: | | | | | | | |
Shares sold | | 5,735 | | | $ | 89,206 | |
Shares reacquired | | (190,102 | ) | | | (2,985,583 | ) |
| | | | | | | |
Net increase (decrease) in shares outstanding before conversion | | (184,367 | ) | | | (2,896,377 | ) |
Shares reacquired upon conversion into Class A | | (430,470 | ) | | | (6,785,849 | ) |
| | | | | | | |
Net increase (decrease) in shares outstanding | | (614,837 | ) | | $ | (9,682,226 | ) |
| | | | | | | |
Year ended August 31, 2008: | | | | | | | |
Shares sold | | 23,711 | | | $ | 539,135 | |
Shares reacquired | | (456,144 | ) | | | (10,174,924 | ) |
| | | | | | | |
Net increase (decrease) in shares outstanding before conversion | | (432,433 | ) | | | (9,635,789 | ) |
Shares reacquired upon conversion into Class A | | (550,956 | ) | | | (12,101,469 | ) |
| | | | | | | |
Net increase (decrease) in shares outstanding | | (983,389 | ) | | $ | (21,737,258 | ) |
| | | | | | | |
Class R | | | | | | |
Year ended August 31, 2009: | | | | | | | |
Shares sold | | 1,456,827 | | | $ | 25,490,532 | |
Shares reacquired | | (261,915 | ) | | | (4,555,189 | ) |
| | | | | | | |
Net increase (decrease) in shares outstanding | | 1,194,912 | | | $ | 20,935,343 | |
| | | | | | | |
Year ended August 31, 2008: | | | | | | | |
Shares sold | | 240,980 | | | $ | 5,773,403 | |
Shares reacquired | | (50,406 | ) | | | (1,189,259 | ) |
| | | | | | | |
Net increase (decrease) in shares outstanding | | 190,574 | | | $ | 4,584,144 | |
| | | | | | | |
Class X | | | | | | |
Year ended August 31, 2009: | | | | | | | |
Shares sold | | 9,845 | | | $ | 142,437 | |
Shares reacquired | | (67,096 | ) | | | (1,046,730 | ) |
| | | | | | | |
Net increase (decrease) in shares outstanding before conversion | | (57,251 | ) | | | (904,293 | ) |
Shares reacquired upon conversion into Class A | | (45,595 | ) | | | (723,651 | ) |
| | | | | | | |
Net increase (decrease) in shares outstanding | | (102,846 | ) | | $ | (1,627,944 | ) |
| | | | | | | |
Year ended August 31, 2008: | | | | | | | |
Shares sold | | 10,440 | | | $ | 239,502 | |
Shares reacquired | | (87,689 | ) | | | (1,962,363 | ) |
| | | | | | | |
Net increase (decrease) in shares outstanding before conversion | | (77,249 | ) | | | (1,722,861 | ) |
Shares reacquired upon conversion into Class A | | (1,984 | ) | | | (43,729 | ) |
| | | | | | | |
Net increase (decrease) in shares outstanding | | (79,233 | ) | | $ | (1,766,590 | ) |
| | | | | | | |
| | |
| 34 | | Visit our website at www.jennisondryden.com |
| | | | | | | |
Class Z | | Shares | | | Amount | |
Year ended August 31, 2009: | | | | | | | |
Shares sold | | 13,228,492 | | | $ | 239,198,883 | |
Shares issued in connection with the merger | | 89,717 | | | | 1,616,704 | |
Shares reacquired | | (4,056,596 | ) | | | (72,596,758 | ) |
| | | | | | | |
Net increase (decrease) in shares outstanding | | 9,261,613 | | | $ | 168,218,829 | |
| | | | | | | |
Year ended August 31, 2008: | | | | | | | |
Shares sold | | 3,062,101 | | | $ | 77,639,005 | |
Shares issued in connection with the merger | | 210,432 | | | | 5,519,625 | |
Shares reacquired | | (2,551,188 | ) | | | (64,671,912 | ) |
| | | | | | | |
Net increase (decrease) in shares outstanding | | 721,345 | | | $ | 18,486,718 | |
| | | | | | | |
Note 7. Reorganizations
On September 21, 2007, the Fund acquired all of the net assets of Jennison Technology Fund (“the Merged Fund”) pursuant to a plan of reorganization approved by the Jennison Technology Fund shareholders on August 9, 2007. The acquisition was accomplished by a tax-free issue of Class A, Class B, Class C and Class Z shares for the corresponding classes of Jennison Technology Fund.
On April 17, 2009, the Fund acquired all of the net assets of the Nicholas-Applegate Growth Equity Fund (“the Merged Fund”) pursuant to a plan of reorganization approved by the Nicholas- Applegate Growth Equity Fund shareholders on April 14, 2009. The acquisition was accomplished by a tax-free issue of Class A, Class B, Class C and Class Z shares for the corresponding classes of Nicholas-Applegate Growth Equity Fund.
| | | | | | | | | |
| Jennison Technology Fund | | Jennison Mid-Cap Growth Fund |
Class | | Shares | | Class | | Shares | | Value |
| A | | 7,535,612 | | A | | 2,829,916 | | $ | 72,188,891 |
| B | | 2,953,261 | | B | | 1,139,766 | | | 26,579,354 |
| C | | 2,052,178 | | C | | 792,008 | | | 18,469,609 |
| Z | | 564,379 | | Z | | 210,432 | | | 5,519,625 |
| |
Nicholas-Applegate Growth
Equity Fund | | Jennison Mid-Cap Growth Fund |
Class | | Shares | | Class | | Shares | | Value |
| A | | 6,506,056 | | A | | 2,961,111 | | $ | 51,641,778 |
| B | | 741,077 | | B | | 291,890 | | | 4,603,107 |
| C | | 213,200 | | C | | 84,090 | | | 1,326,104 |
| Z | | 195,727 | | Z | | 89,717 | | | 1,616,704 |
| | |
| Jennison Mid-Cap Growth Fund, Inc. | | 35 |
Notes to Financial Statements
continued
The net assets of Jennison Mid-Cap Growth Fund immediately before the acquisitions were $893,360,092 and $901,857,657.
The net assets and net unrealized appreciation of the Merged funds immediately before the acquisition were:
| | | | | | | |
| | | Net Assets | | Net Unrealized
Appreciation
(Depreciation) | |
Jennison Technology Fund | | $ | 122,757,479 | | $ | 28,949,377 | |
Nicholas-Applegate Growth Equity | | | 59,187,693 | | | (6,980,040 | ) |
The Fund acquired capital loss carryforward from the reorganization with Nicholas-Applegate Growth Equity of approximately $100,291,000 of which approximately $77,282,000 was written off due to expiration and loss limitations (amount included in Note 5). The future utilization of the acquired capital loss carryforwards may be limited under certain conditions defined in the Internal Revenue Code of 1986, as amended.
Note 8. Subsequent Events
Management has evaluated the impact of all subsequent events on the Fund through October 26, 2009, the date the financial statements were issued, and has determined that there were no subsequent events requiring recognition or disclosure in the financial statements.
Note 9. New Accounting Pronouncements
In June 2009, FASB released Statement of Financial Accounting Standard No. 166, Accounting for Transfers of Financial Assets (FAS 166) and Statement of Financial Accounting Standard 167, Amendments to FASB Interpretation No. 46(R) (FAS 167), which change the ways entities account for securitizations and special purpose entities. FAS 166 will require more information about transfers of financial assets, including securitization transactions, and where entities have continuing exposure to the risks related to transferred financial assets. It eliminates the concept of a “qualifying special-purpose entity,” changes the requirements for derecognizing financial assets, and requires additional disclosures. FAS 167 changes how a company determines when an entity that is insufficiently capitalized or is not
| | |
| 36 | | Visit our website at www.jennisondryden.com |
controlled through voting (or similar rights) should be consolidated. The application of FAS 166 and FAS 167 is required for fiscal years beginning after November 15, 2009 and interim periods within those fiscal years. At this time, management is evaluating the implications of FAS 166 and FAS 167 and their impact on the financial statements has not been determined.
| | |
| Jennison Mid-Cap Growth Fund, Inc. | | 37 |
Financial Highlights
| | | | | | | | |
| | | Class A | |
| | | Year Ended August 31, | |
| | | 2009(a) | | | 2008(a) | |
Per Share Operating Performance: | | | | | | | | |
Net Asset Value, Beginning Of Year | | $ | 23.98 | | | $ | 24.49 | |
| | | | | | | | |
Income (loss) from investment operations: | | | | | | | | |
Net investment income (loss) | | | .05 | | | | (.06 | ) |
Net realized and unrealized gain (loss) on investment transactions | | | (3.79 | ) | | | (.45 | ) |
| | | | | | | | |
Total from investment operations | | | (3.74 | ) | | | (.51 | ) |
| | | | | | | | |
Net asset value, end of year | | $ | 20.24 | | | $ | 23.98 | |
| | | | | | | | |
Total Return(c): | | | (15.60 | )% | | | (2.08 | )% |
Ratios/Supplemental Data: | | | | | | | | |
Net assets, end of year (000) | | $ | 764,082 | | | $ | 576,767 | |
Average net assets (000) | | $ | 533,585 | | | $ | 521,772 | |
Ratios to average net assets(h): | | | | | | | | |
Expenses, including distribution and service (12b-1) fees | | | 1.21 | %(g) | | | 1.19 | %(d)(g) |
Expenses, excluding distribution and service (12b-1) fees | | | .91 | %(g) | | | .91 | %(g) |
Net investment income (loss) | | | .28 | %(g) | | | (.23 | )%(g) |
Portfolio turnover rate | | | 59 | % | | | 76 | % |
| (a) | Calculated based upon average shares outstanding during the year. |
| (b) | For the period ended August 31, 2007. The Fund changed its fiscal year end from October 31 to August 31, effective August 31, 2007. |
| (c) | Total return does not consider the effects of sales loads. Total return is calculated assuming a purchase of a share on the first day and a sale on the last day of each year reported, and includes reinvestment of dividends and distributions. Total returns may reflect adjustments to conform to generally accepted accounting principles. Total returns for periods less than a full year are not annualized. |
| (d) | The distributor of the Fund has contractually agreed to limit its distribution and service (12b-1) fees to .25 of 1% of the average daily net assets of the Class A shares through February 29, 2008. |
| (g) | Net of expense subsidy. If the investment manager had not subsidized expenses, the expense ratios including distribution and service (12b-1) fees would have been 1.21% for the year ended August 31, 2009, and 1.19% for the year ended August 31, 2008. The net investment income (loss) ratios would have been .28% for the year ended August 31, 2009, and (.23%) for the year ended August 31, 2008. |
| (h) | Does not include expenses of the underlying portfolios in which the Fund invests. |
See Notes to Financial Statements.
| | |
| 38 | | Visit our website at www.jennisondryden.com |
| | | | | | | | | | | | | | |
| Class A | |
| Ten Months Ended | | | Year Ended October 31, | |
| August 31, 2007(a)(b) | | | 2006(a) | | | 2005(a) | | | 2004(a) | |
| | | | | | | | | | | | | | |
| $ | 21.33 | | | $ | 18.52 | | | $ | 15.29 | | | $ | 14.10 | |
| | | | | | | | | | | | | | | |
| | | | | | | | | | | | | | |
| | (.04 | ) | | | (.04 | ) | | | (.14 | ) | | | (.14 | ) |
| | 3.20 | | | | 2.85 | | | | 3.37 | | | | 1.33 | |
| | | | | | | | | | | | | | | |
| | 3.16 | | | | 2.81 | | | | 3.23 | | | | 1.19 | |
| | | | | | | | | | | | | | | |
| $ | 24.49 | | | $ | 21.33 | | | $ | 18.52 | | | $ | 15.29 | |
| | | | | | | | | | | | | | | |
| | 14.81 | % | | | 15.17 | % | | | 21.12 | % | | | 8.44 | % |
| | | | | | | | | | | | | | |
| $ | 429,993 | | | $ | 352,670 | | | $ | 288,885 | | | $ | 253,031 | |
| $ | 395,762 | | | $ | 336,747 | | | $ | 269,109 | | | $ | 234,527 | |
| | | | | | | | | | | | | | |
| | 1.08 | %(e)(d) | | | 1.16 | %(d) | | | 1.21 | %(d) | | | 1.20 | %(d) |
| | .83 | %(e) | | | .91 | % | | | .96 | % | | | .95 | % |
| | (.21 | )%(e) | | | (.18 | )% | | | (.79 | )% | | | (.97 | )% |
| | 62 | %(f) | | | 86 | % | | | 136 | % | | | 178 | % |
See Notes to Financial Statements.
| | |
| Jennison Mid-Cap Growth Fund, Inc. | | 39 |
Financial Highlights
continued
| | | | | | | | |
| | | Class B | |
| | | Year Ended August 31, | |
| | | 2009(a) | | | 2008(a) | |
Per Share Operating Performance: | | | | | | | | |
Net Asset Value, Beginning Of Year | | $ | 21.78 | | | $ | 22.40 | |
| | | | | | | | |
Income (loss) from investment operations: | | | | | | | | |
Net investment loss | | | (.06 | ) | | | (.21 | ) |
Net realized and unrealized gain (loss) on investment transactions | | | (3.46 | ) | | | (.41 | ) |
| | | | | | | | |
Total from investment operations | | | (3.52 | ) | | | (.62 | ) |
| | | | | | | | |
Net asset value, end of year | | $ | 18.26 | | | $ | 21.78 | |
| | | | | | | | |
Total Return(c): | | | (16.16 | )% | | | (2.77 | )% |
Ratios/Supplemental Data: | | | | | | | | |
Net assets, end of year (000) | | $ | 44,341 | | | $ | 67,165 | |
Average net assets (000) | | $ | 41,105 | | | $ | 87,720 | |
Ratios to average net assets(f): | | | | | | | | |
Expenses, including distribution and service (12b-1) fees | | | 1.91 | %(e) | | | 1.91 | %(e) |
Expenses, excluding distribution and service (12b-1) fees | | | .91 | %(e) | | | .91 | %(e) |
Net investment loss | | | (.37 | )%(e) | | | (.95 | )%(e) |
| (a) | Calculated based upon average shares outstanding during the year. |
| (b) | For the period ended August 31, 2007. The Fund changed its fiscal year end from October 31 to August 31, effective August 31, 2007. |
| (c) | Total return does not consider the effects of sales loads. Total return is calculated assuming a purchase of a share on the first day and a sale on the last day of each year reported, and includes reinvestment of dividends and distributions. Total returns may reflect adjustments to conform to generally accepted accounting principles. Total returns for periods less than a full year are not annualized. |
| (e) | Net of expense subsidy. If the investment manager had not subsidized expenses, the expense ratios including distribution and service (12b-1) fees would have been 1.91% for the year ended August 31, 2009, and 1.91% for the year ended August 31, 2008. The net investment loss ratios would have been (.38%) for the year ended August 31, 2009, and (.96%) for the year ended August 31, 2008. |
| (f) | Does not include expenses of the underlying portfolios in which the Fund invests. |
See Notes to Financial Statements.
| | |
| 40 | | Visit our website at www.jennisondryden.com |
| | | | | | | | | | | | | | |
| Class B | |
| Ten Months Ended | | | Year Ended October 31, | |
| August 31, 2007(a)(b) | | | 2006(a) | | | 2005(a) | | | 2004(a) | |
| | | | | | | | | | | | | | |
| $ | 19.63 | | | $ | 17.17 | | | $ | 14.28 | | | $ | 13.27 | |
| | | | | | | | | | | | | | | |
| | | | | | | | | | | | | | |
| | (.17 | ) | | | (.18 | ) | | | (.24 | ) | | | (.24 | ) |
| | 2.94 | | | | 2.64 | | | | 3.13 | | | | 1.25 | |
| | | | | | | | | | | | | | | |
| | 2.77 | | | | 2.46 | | | | 2.89 | | | | 1.01 | |
| | | | | | | | | | | | | | | |
| $ | 22.40 | | | $ | 19.63 | | | $ | 17.17 | | | $ | 14.28 | |
| | | | | | | | | | | | | | | |
| | 14.11 | % | | | 14.33 | % | | | 20.24 | % | | | 7.61 | % |
| | | | | | | | | | | | | | |
| $ | 94,869 | | | $ | 88,552 | | | $ | 103,285 | | | $ | 121,525 | |
| $ | 94,680 | | | $ | 102,115 | | | $ | 114,179 | | | $ | 140,185 | |
| | | | | | | | | | | | | | |
| | 1.83 | %(d) | | | 1.91 | % | | | 1.96 | % | | | 1.95 | % |
| | .83 | %(d) | | | .91 | % | | | .96 | % | | | .95 | % |
| | (.95 | )%(d) | | | (.91 | )% | | | (1.54 | )% | | | (1.72 | )% |
See Notes to Financial Statements.
| | |
| Jennison Mid-Cap Growth Fund, Inc. | | 41 |
Financial Highlights
continued
| | | | | | | | |
| | | Class C | |
| | | Year Ended August 31, | |
| | | 2009(a) | | | 2008(a) | |
Per Share Operating Performance: | | | | | | | | |
Net Asset Value, Beginning Of Year | | $ | 21.79 | | | $ | 22.41 | |
| | | | | | | | |
Income (loss) from investment operations: | | | | | | | | |
Net investment loss | | | (.06 | ) | | | (.21 | ) |
Net realized and unrealized gain (loss) on investment transactions | | | (3.47 | ) | | | (.41 | ) |
| | | | | | | | |
Total from investment operations | | | (3.53 | ) | | | (.62 | ) |
| | | | | | | | |
Net asset value, end of year | | $ | 18.26 | | | $ | 21.79 | |
| | | | | | | | |
Total Return(c): | | | (16.20 | )% | | | (2.77 | )% |
Ratios/Supplemental Data: | | | | | | | | |
Net assets, end of year (000) | | $ | 81,162 | | | $ | 80,749 | |
Average net assets (000) | | $ | 62,905 | | | $ | 85,016 | |
Ratios to average net assets(f): | | | | | | | | |
Expenses, including distribution and service (12b-1) fees | | | 1.91 | %(e) | | | 1.91 | %(e) |
Expenses, excluding distribution and service (12b-1) fees | | | .91 | %(e) | | | .91 | %(e) |
Net investment loss | | | (.39 | )%(e) | | | (.96 | )%(e) |
| (a) | Calculated based upon average shares outstanding during the year. |
| (b) | For the period ended August 31, 2007. The Fund changed its fiscal year end from October 31 to August 31, effective August 31, 2007. |
| (c) | Total return does not consider the effects of sales loads. Total return is calculated assuming a purchase of a share on the first day and a sale on the last day of each year reported, and includes reinvestment of dividends and distributions. Total returns may reflect adjustments to conform to generally accepted accounting principles. Total returns for periods less than a full year are not annualized. |
| (e) | Net of expense subsidy. If the investment manager had not subsidized expenses, the expense ratios including distribution and service (12b-1) fees would have been 1.91% for the year ended August 31, 2009, and 1.91% for the year ended August 31, 2008. The net investment loss ratios would have been (.39%) for the year ended August 31, 2009, and (.96%) for the year ended August 31, 2008. |
| (f) | Does not include expenses of the underlying portfolios in which the Fund invests. |
See Notes to Financial Statements.
| | |
| 42 | | Visit our website at www.jennisondryden.com |
| | | | | | | | | | | | | | |
| Class C | |
| Ten Months Ended | | | Year Ended October 31, | |
| August 31, 2007(a)(b) | | | 2006(a) | | | 2005(a) | | | 2004(a) | |
| | | | | | | | | | | | | | |
| $ | 19.63 | | | $ | 17.17 | | | $ | 14.28 | | | $ | 13.27 | |
| | | | | | | | | | | | | | | |
| | | | | | | | | | | | | | |
| | (.17 | ) | | | (.18 | ) | | | (.24 | ) | | | (.24 | ) |
| | 2.95 | | | | 2.64 | | | | 3.13 | | | | 1.25 | |
| | | | | | | | | | | | | | | |
| | 2.78 | | | | 2.46 | | | | 2.89 | | | | 1.01 | |
| | | | | | | | | | | | | | | |
| $ | 22.41 | | | $ | 19.63 | | | $ | 17.17 | | | $ | 14.28 | |
| | | | | | | | | | | | | | | |
| | 14.11 | % | | | 14.33 | % | | | 20.24 | % | | | 7.61 | % |
| | | | | | | | | | | | | | |
| $ | 73,977 | | | $ | 41,185 | | | $ | 31,114 | | | $ | 32,054 | |
| $ | 61,516 | | | $ | 36,947 | | | $ | 32,206 | | | $ | 34,207 | |
| | | | | | | | | | | | | | |
| | 1.83 | %(d) | | | 1.91 | % | | | 1.96 | % | | | 1.95 | % |
| | .83 | %(d) | | | .91 | % | | | .96 | % | | | .95 | % |
| | (.93 | )%(d) | | | (.95 | )% | | | (1.54 | )% | | | (1.72 | )% |
See Notes to Financial Statements.
| | |
| Jennison Mid-Cap Growth Fund, Inc. | | 43 |
Financial Highlights
continued
| | | | | | | | |
| | | Class L | |
| | | Year Ended August 31, | |
| | | 2009(b) | | | 2008(b) | |
Per Share Operating Performance: | | | | | | | | |
Net Asset Value, Beginning Of Year | | $ | 23.87 | | | $ | 24.42 | |
| | | | | | | | |
Income (loss) from investment operations: | | | | | | | | |
Net investment income (loss) | | | .02 | | | | (.11 | ) |
Net realized and unrealized gain (loss) on investment transactions | | | (3.79 | ) | | | (.44 | ) |
| | | | | | | | |
Total from investment operations | | | (3.77 | ) | | | (.55 | ) |
| | | | | | | | |
Net asset value, end of year | | $ | 20.10 | | | $ | 23.87 | |
| | | | | | | | |
Total Return(d): | | | (15.79 | )% | | | (2.25 | )% |
Ratios/Supplemental Data: | | | | | | | | |
Net assets, end of year (000) | | $ | 10,099 | | | $ | 15,418 | |
Average net assets (000) | | $ | 9,874 | | | $ | 17,445 | |
Ratios to average net assets(h): | | | | | | | | |
Expenses, including distribution and service (12b-1) fees | | | 1.41 | %(f) | | | 1.41 | %(f) |
Expenses, excluding distribution and service (12b-1) fees | | | .91 | %(f) | | | .91 | %(f) |
Net investment income (loss) | | | .14 | %(f) | | | (.46 | )%(f) |
| (a) | Inception date of Class L shares. |
| (b) | Calculated based upon average shares outstanding during the year. |
| (c) | For the period ended August 31, 2007. The Fund changed its fiscal year end from October 31 to August 31, effective August 31, 2007. |
| (d) | Total return does not consider the effects of sales loads. Total return is calculated assuming a purchase of a share on the first day and a sale on the last day of each year reported, and includes reinvestment of dividends and distributions. Total returns may reflect adjustments to conform to generally accepted accounting principles. Total returns for periods less than a full year are not annualized. |
| (f) | Net of expense subsidy. If the investment manager had not subsidized expenses, the expense ratios including distribution and service (12b-1) fees would have been 1.41% for the year ended August 31,, 2009, and 1.41% for the year ended August 31, 2008. The net investment income (loss) ratios would have been .14% for the year ended August 31, 2009, and (.46%) for the year ended August 31, 2008. |
| (h) | Does not include expenses of the underlying portfolios in which the Fund invests. |
See Notes to Financial Statements.
| | |
| 44 | | Visit our website at www.jennisondryden.com |
| | | | | | |
| Class L | |
| Ten Months Ended | | | June 12, 2006(a) through | |
| August 31, 2007(b)(c) | | | October 31, 2006(b) | |
| | | | | | |
| $ | 21.31 | | | $ | 20.23 | |
| | | | | | | |
| | | | | | |
| | (.08 | ) | | | (.05 | ) |
| | 3.19 | | | | 1.13 | |
| | | | | | | |
| | 3.11 | | | | 1.08 | |
| | | | | | | |
| $ | 24.42 | | | $ | 21.31 | |
| | | | | | | |
| | 14.59 | % | | | 5.34 | % |
| | | | | | |
| $ | 19,558 | | | $ | 5,025 | |
| $ | 14,140 | | | $ | 4,900 | |
| | | | | | |
| | 1.33 | %(e) | | | 1.41 | %(e) |
| | .83 | %(e) | | | .91 | %(e) |
| | (.38 | )%(e) | | | (.71 | )%(e) |
See Notes to Financial Statements.
| | |
| Jennison Mid-Cap Growth Fund, Inc. | | 45 |
Financial Highlights
continued
| | | | | | | | |
| | | Class M | |
| | | Year Ended August 31, | |
| | | 2009(b) | | | 2008(b) | |
Per Share Operating Performance: | | | | | | | | |
Net Asset Value, Beginning Of Year | | $ | 21.77 | | | $ | 22.39 | |
| | | | | | | | |
Income (loss) from investment operations: | | | | | | | | |
Net investment loss | | | (.05 | ) | | | (.21 | ) |
Net realized and unrealized gain (loss) on investment transactions | | | (3.48 | ) | | | (.41 | ) |
| | | | | | | | |
Total from investment operations | | | (3.53 | ) | | | (.62 | ) |
| | | | | | | | |
Net asset value, end of year | | $ | 18.24 | | | $ | 21.77 | |
| | | | | | | | |
Total Return(d): | | | (16.21 | )% | | | (2.77 | )% |
Ratios/Supplemental Data: | | | | | | | | |
Net assets, end of year (000) | | $ | 8,912 | | | $ | 24,023 | |
Average net assets (000) | | $ | 11,930 | | | $ | 36,103 | |
Ratios to average net assets(h): | | | | | | | | |
Expenses, including distribution and service (12b-1) fees | | | 1.91 | %(f) | | | 1.91 | %(f) |
Expenses, excluding distribution and service (12b-1) fees | | | .91 | %(f) | | | .91 | %(f) |
Net investment loss | | | (.33 | )%(f) | | | (.95 | )%(f) |
| (a) | Inception date of Class M shares. |
| (b) | Calculated based upon average shares outstanding during the year. |
| (c) | For the period ended August 31, 2007. The Fund changed its fiscal year end from October 31 to August 31, effective August 31, 2007. |
| (d) | Total return does not consider the effects of sales loads. Total return is calculated assuming a purchase of a share on the first day and a sale on the last day of each year reported, and includes reinvestment of dividends and distributions. Total returns may reflect adjustments to conform to generally accepted accounting principles. Total returns for periods less than a full year are not annualized. |
| (f) | Net of expense subsidy. If the investment manager had not subsidized expenses, the expense ratios including distribution and service (12b-1) fees would have been 1.91% for the year ended August 31, 2009, and 1.91% for the year ended August 31, 2008. The net investment loss ratios would have been (.33%)% for the year ended August 31, 2009, and (.96%) for the year ended August 31, 2008. |
| (h) | Does not include expenses of the underlying portfolios in which the Fund invests. |
See Notes to Financial Statements.
| | |
| 46 | | Visit our website at www.jennisondryden.com |
| | | | | | |
| Class M | |
| Ten Months Ended | | | June 12, 2006(a)
through | |
| August 31, 2007(b)(c) | | | October 31, 2006(b) | |
| | | | | | |
| $ | 19.61 | | | $ | 18.67 | |
| | | | | | | |
| | | | | | |
| | (.17 | ) | | | (.08 | ) |
| | 2.95 | | | | 1.02 | |
| | | | | | | |
| | 2.78 | | | | .94 | |
| | | | | | | |
| $ | 22.39 | | | $ | 19.61 | |
| | | | | | | |
| | 14.13 | % | | | 5.03 | % |
| | | | | | |
| $ | 46,713 | | | $ | 11,836 | |
| $ | 34,765 | | | $ | 11,540 | |
| | | | | | |
| | 1.83 | %(e) | | | 1.91 | %(e) |
| | .83 | %(e) | | | .91 | %(e) |
| | (.88 | )%(e) | | | (1.20 | )%(e) |
See Notes to Financial Statements.
| | |
| Jennison Mid-Cap Growth Fund, Inc. | | 47 |
Financial Highlights
continued
| | | | | | | | |
| | | Class R | |
| | | Year Ended August 31, | |
| | | 2009(b) | | | 2008(b) | |
Per Share Operating Performance: | | | | | | | | |
Net Asset Value, Beginning Of Year | | $ | 23.79 | | | $ | 24.35 | |
| | | | | | | | |
Income (loss) from investment operations: | | | | | | | | |
Net investment loss | | | — | (i) | | | (.11 | ) |
Net realized and unrealized gain (loss) on investment transactions | | | (3.75 | ) | | | (.45 | ) |
| | | | | | | | |
Total from investment operations | | | (3.75 | ) | | | (.56 | ) |
| | | | | | | | |
Net asset value, end of year | | $ | 20.04 | | | $ | 23.79 | |
| | | | | | | | |
Total Return(d): | | | (15.76 | )% | | | (2.30 | )% |
Ratios/Supplemental Data: | | | | | | | | |
Net assets, end of year (000) | | $ | 28,761 | | | $ | 5,722 | |
Average net assets (000) | | $ | 12,128 | | | $ | 3,157 | |
Ratios to average net assets(h): | | | | | | | | |
Expenses, including distribution and service (12b-1) fees(e) | | | 1.41 | %(g) | | | 1.41 | %(g) |
Expenses, excluding distribution and service (12b-1) fees | | | .91 | %(g) | | | .91 | %(g) |
Net investment loss | | | (.02 | )%(g) | | | (.45 | )%(g) |
| (a) | Inception date of Class R shares. |
| (b) | Calculated based upon average shares outstanding during the year. |
| (c) | For the period ended August 31, 2007. The Fund changed its fiscal year end from October 31 to August 31, effective August 31, 2007. |
| (d) | Total return is calculated assuming a purchase of a share on the first day and a sale on the last day of each year reported, and includes reinvestment of dividends and distributions. Total returns may reflect adjustments to conform to generally accepted accounting principles. Total returns for periods less than a full year are not annualized. |
| (e) | The distributor of the Fund has contractually agreed to limit its distribution and service (12b-1) fees to .50 of 1% of the average daily net assets of the Class R shares. |
| (g) | Net of expense subsidy. If the investment manager had not subsidized expenses, the expense ratios including distribution and service (12b-1) fees would have been 1.41% for the year ended August 31, 2009, and 1.41% for the year ended August 31, 2008. The net investment loss ratios would have been (.02%) for the year ended August 31, 2009, and (.46%) for the year ended August 31, 2008. |
| (h) | Does not include expenses of the underlying portfolios in which the Fund invests. |
See Notes to Financial Statements.
| | |
| 48 | | Visit our website at www.jennisondryden.com |
| | | | | | | | | | |
| Class R | |
| Ten Months Ended | | | Year Ended | | | June 3, 2005(a)
through | |
| August 31, 2007(b)(c) | | | October 31, 2006(b) | | | October 31, 2005(b) | |
| | | | | | | | | | |
| $ | 21.24 | | | $ | 18.49 | | | $ | 17.03 | |
| | | | | | | | | | | |
| | | | | | | | | | |
| | (.09 | ) | | | (.07 | ) | | | (.07 | ) |
| | 3.20 | | | | 2.82 | | | | 1.53 | |
| | | | | | | | | | | |
| | 3.11 | | | | 2.75 | | | | 1.46 | |
| | | | | | | | | | | |
| $ | 24.35 | | | $ | 21.24 | | | $ | 18.49 | |
| | | | | | | | | | | |
| | 14.64 | % | | | 14.87 | % | | | 8.57 | % |
| | | | | | | | | | |
| $ | 1,217 | | | $ | 22 | | | $ | 3 | |
| $ | 648 | | | $ | 4 | | | $ | 3 | |
| | | | | | | | | | |
| | 1.33 | %(f) | | | 1.41 | % | | | 1.46 | %(f) |
| | .83 | %(f) | | | .91 | % | | | .96 | %(f) |
| | (.45 | )%(f) | | | (.45 | )% | | | (.96 | )%(f) |
See Notes to Financial Statements.
| | |
| Jennison Mid-Cap Growth Fund, Inc. | | 49 |
Financial Highlights
continued
| | | | | | | | |
| | | Class X | |
| | | Year Ended August 31, | |
| | | 2009(b) | | | 2008(b) | |
Per Share Operating Performance: | | | | | | | | |
Net Asset Value, Beginning Of Year | | $ | 21.84 | | | $ | 22.40 | |
| | | | | | | | |
Income (loss) from investment operations: | | | | | | | | |
Net investment loss | | | (.06 | ) | | | (.17 | ) |
Net realized and unrealized gain (loss) on investment transactions | | | (3.47 | ) | | | (.39 | ) |
| | | | | | | | |
Total from investment operations | | | (3.53 | ) | | | (.56 | ) |
| | | | | | | | |
Net asset value, end of year | | $ | 18.31 | | | $ | 21.84 | |
| | | | | | | | |
Total Return(d): | | | (16.16 | )% | | | (2.50 | )% |
Ratios/Supplemental Data: | | | | | | | | |
Net assets, end of year (000) | | $ | 4,388 | | | $ | 7,481 | |
Average net assets (000) | | $ | 4,567 | | | $ | 8,598 | |
Ratios to average net assets(g): | | | | | | | | |
Expenses, including distribution and service (12b-1) fees | | | 1.91 | %(f) | | | 1.69 | %(f) |
Expenses, excluding distribution and service (12b-1) fees | | | .91 | %(f) | | | .91 | %(f) |
Net investment loss | | | (.36 | )%(f) | | | (.74 | )%(f) |
| (a) | Inception date of Class X shares. |
| (b) | Calculated based upon average shares outstanding during the year. |
| (c) | For the period ended August 31, 2007. The Fund changed its fiscal year end from October 31 to August 31, effective August 31, 2007. |
| (d) | Total return does not consider the effects of sales loads. Total return is calculated assuming a purchase of a share on the first day and a sale on the last day of each year reported, and includes reinvestment of dividends and distributions. Total returns may reflect adjustments to conform to generally accepted accounting principles. Total returns for periods less than a full year are not annualized. |
| (f) | Net of expense subsidy. If the investment manager had not subsidized expenses, the expense ratios including distribution and service (12b-1) fees would have been 1.91% for the year ended August 31, 2009, and 1.69% for the year ended August 31, 2008. The net investment loss ratios would have been (.36%) for the year ended August 31, 2009, and (.74%) for the year ended August 31, 2008. |
| (g) | Does not include expenses of the underlying portfolios in which the Fund invests. |
See Notes to Financial Statements.
| | |
| 50 | | Visit our website at www.jennisondryden.com |
| | | | | | |
| Class X | |
| Ten Months Ended | | | June 12, 2006(a)
through | |
| August 31, 2007(b)(c) | | | October 31, 2006(b) | |
| | | | | | |
| $ | 19.63 | | | $ | 18.67 | |
| | | | | | | |
| | | | | | |
| | (.17 | ) | | | (.09 | ) |
| | 2.94 | | | | 1.05 | |
| | | | | | | |
| | 2.77 | | | | .96 | |
| | | | | | | |
| $ | 22.40 | | | $ | 19.63 | |
| | | | | | | |
| | 14.11 | % | | | 5.14 | % |
| | | | | | |
| $ | 9,450 | �� | | $ | 1,458 | |
| $ | 6,373 | | | $ | 1,448 | |
| | | | | | |
| | 1.83 | %(e) | | | 1.91 | %(e) |
| | .83 | %(e) | | | .91 | %(e) |
| | (.87 | )%(e) | | | (1.20 | )%(e) |
See Notes to Financial Statements.
| | |
| Jennison Mid-Cap Growth Fund, Inc. | | 51 |
Financial Highlights
continued
| | | | | | | | |
| | | Class Z | |
| | | Year Ended August 31, | |
| | | 2009(a) | | | 2008(a) | |
Per Share Operating Performance: | | | | | | | | |
Net Asset Value, Beginning Of Year | | $ | 24.74 | | | $ | 25.19 | |
| | | | | | | | |
Income (loss) from investment operations: | | | | | | | | |
Net investment income (loss) | | | .10 | | | | .01 | |
Net realized and unrealized gain (loss) on investment transactions | | | (3.90 | ) | | | (.46 | ) |
| | | | | | | | |
Total from investment operations | | | (3.80 | ) | | | (.45 | ) |
| | | | | | | | |
Net asset value, end of year | | $ | 20.94 | | | $ | 24.74 | |
| | | | | | | | |
Total Return(c): | | | (15.36 | )% | | | (1.79 | )% |
Ratios/Supplemental Data: | | | | | | | | |
Net assets, end of year (000) | | $ | 365,324 | | | $ | 202,444 | |
Average net assets (000) | | $ | 219,585 | | | $ | 196,477 | |
Ratios to average net assets(f): | | | | | | | | |
Expenses, including distribution and service (12b-1) fees | | | .91 | %(e) | | | .91 | %(e) |
Expenses, excluding distribution and service (12b-1) fees | | | .91 | %(e) | | | .91 | %(e) |
Net investment income (loss) | | | .57 | %(e) | | | .04 | %(e) |
| (a) | Calculated based upon average shares outstanding during the year. |
| (b) | For the period ended August 31, 2007. The Fund changed its fiscal year end from October 31 to August 31, effective August 31, 2007. |
| (c) | Total return is calculated assuming a purchase of a share on the first day and a sale on the last day of each year reported, and includes reinvestment of dividends and distributions. Total returns may reflect adjustments to conform to generally accepted accounting principles. Total returns for periods less than a full year are not annualized. |
| (e) | Net of expense subsidy. If the investment manager had not subsidized expenses, the expense ratios including distribution and service (12b-1) fees would have been .91% for the year ended August 31, 2009, and .91% for the year ended August 31, 2008. The net investment income ratios would have been .57% for the year ended August 31, 2009, and .04% for the year ended August 31, 2008. |
| (f) | Does not include expenses of the underlying portfolios in which the Fund invests. |
See Notes to Financial Statements.
| | |
| 52 | | Visit our website at www.jennisondryden.com |
| | | | | | | | | | | | | | |
| Class Z | |
| Ten Months Ended | | | Year Ended October 31, | |
| August 31, 2007(a)(b) | | | 2006(a) | | | 2005(a) | | | 2004(a) | |
| | | | | | | | | | | | | | |
| $ | 21.88 | | | $ | 18.95 | | | $ | 15.62 | | | $ | 14.37 | |
| | | | | | | | | | | | | | | |
| | | | | | | | | | | | | | |
| | .01 | | | | .02 | | | | (.09 | ) | | | (.11 | ) |
| | 3.30 | | | | 2.91 | | | | 3.42 | | | | 1.36 | |
| | | | | | | | | | | | | | | |
| | 3.31 | | | | 2.93 | | | | 3.33 | | | | 1.25 | |
| | | | | | | | | | | | | | | |
| $ | 25.19 | | | $ | 21.88 | | | $ | 18.95 | | | $ | 15.62 | |
| | | | | | | | | | | | | | | |
| | 15.13 | % | | | 15.46 | % | | | 21.32 | % | | | 8.70 | % |
| | | | | | | | | | | | | | |
| $ | 187,974 | | | $ | 159,855 | | | $ | 133,674 | | | $ | 125,732 | |
| $ | 177,560 | | | $ | 160,261 | | | $ | 126,649 | | | $ | 119,263 | |
| | | | | | | | | | | | | | |
| | .83 | %(d) | | | .91 | % | | | .96 | % | | | .95 | % |
| | .83 | %(d) | | | .91 | % | | | .96 | % | | | .95 | % |
| | .03 | %(d) | | | .07 | % | | | (.54 | )% | | | (.72 | )% |
See Notes to Financial Statements.
| | |
| Jennison Mid-Cap Growth Fund, Inc. | | 53 |
Report of Independent Registered Public
Accounting Firm
The Board of Directors and Shareholders
Jennison Mid-Cap Growth Fund, Inc.:
We have audited the accompanying statement of assets and liabilities of Jennison Mid-Cap Growth Fund, Inc. (hereafter referred to as the “Fund”), including the portfolio of investments, as of August 31, 2009, and the related statement of operations for the year then ended, the statement of changes in net assets for each of the years in the two-year period then ended and the financial highlights for each of the years in the two-year period ended August 31, 2009, for the ten-month period ended August 31, 2007 and each of the years in the three-year period ended October 31, 2006. These financial statements and financial highlights are the responsibility of the Fund’s management. Our responsibility is to express an opinion on these financial statements and financial highlights based on our audits.
We conducted our audits in accordance with the standards of the Public Company Accounting Oversight Board (United States). Those standards require that we plan and perform the audit to obtain reasonable assurance about whether the financial statements and financial highlights are free of material misstatement. An audit includes examining, on a test basis, evidence supporting the amounts and disclosures in the financial statements. Our procedures included confirmation of securities owned as of August 31, 2009, by correspondence with the custodian, transfer agent and brokers or by other appropriate auditing procedures where replies from brokers were not received. An audit also includes assessing the accounting principles used and significant estimates made by management, as well as evaluating the overall financial statement presentation. We believe that our audits provide a reasonable basis for our opinion.
In our opinion, the financial statements and financial highlights referred to above present fairly, in all material respects, the financial position of the Fund as of August 31, 2009, and the results of its operations for the year then ended and the changes in its net assets for each of the years in the two-year period then ended and the financial highlights for each of the years in the two-year period ended August 31, 2009, for the ten-month period ended August 31, 2007 and each of the years in the three-year period ended October 31, 2006, in conformity with U.S. generally accepted accounting principles.

New York, New York
October 26, 2009
| | |
| 54 | | Visit our website at www.jennisondryden.com |
MANAGEMENT OF THE FUND
(Unaudited)
Information about Fund Directors/Trustees (referred to herein as “Board Members”) and Fund Officers is set forth below. Board Members who are not deemed to be “interested persons,” as defined in the 1940 Act, are referred to as “Independent Board Members.” Board Members who are deemed to be “interested persons” are referred to as “Interested Board Members.” The Board Members are responsible for the overall supervision of the operations of the Fund and perform the various duties imposed on the directors or trustees of investment companies by the 1940 Act.
| | | | |
Independent Board Members (1) | | | | |
Name, Address, Age Position(s) Portfolios Overseen | | Principal Occupation(s) During Past Five Years | | Other Directorships Held |
Kevin J. Bannon (57) Board Member Portfolios Overseen: 57 | | Managing Director (since April 2008) of Highmount Capital LLC (registered investment adviser); formerly Executive Vice President and Chief Investment Officer (April 1993-August 2007) of Bank of New York Company; President (May 2003-May 2007) of BNY Hamilton Family of Mutual Funds. | | Director of Urstadt Biddle Properties (since September 2008). |
Linda W. Bynoe (57) Board Member Portfolios Overseen: 57 | | President and Chief Executive Officer (since March 1995) of Telemat Ltd. (management consulting); formerly Vice President at Morgan Stanley & Co (broker-dealer). | | Director of Simon Property Group, Inc. (real estate investment trust) (since May 2003); Anixter International (communication products distributor) (since January 2006); Director of Northern Trust Corporation (banking) (since April 2006). |
David E.A. Carson (75) Board Member Portfolios Overseen: 57 | | Director (since May 2008) of Liberty Bank; Director (since October 2007) of ICI Mutual Insurance Company; formerly President, Chairman and Chief Executive Officer of People’s Bank (1987 – 2000). | | None. |
Michael S. Hyland, CFA (64) Board Member Portfolios Overseen: 57 | | Independent Consultant (since February 2005); formerly Senior Managing Director (July 2001-February 2005) of Bear Stearns & Co, Inc.; Global Partner, INVESCO (1999-2001); Managing Director and President Salomon Brothers Asset Management (1989-1999). | | None. |
Robert E. La Blanc (75) Board Member Portfolios Overseen: 57 | | President (since 1981) of Robert E. La Blanc Associates, Inc. (telecommunications). | | Director of CA, Inc. (since 2002) (software company); FiberNet Telecom Group, Inc. (since 2003) (telecom company). |
Jennison Mid-Cap Growth Fund, Inc.
| | | | |
Douglas H. McCorkindale (70) Board Member Portfolios Overseen: 57 | | Formerly Chairman (February 2001-June 2006), Chief Executive Officer (June 2000-July 2005), President (September 1997-July 2005) and Vice Chairman (March 1984-May 2000) of Gannett Co. Inc. (publishing and media). | | Director of Continental Airlines, Inc. (since May 1993); Director of Lockheed Martin Corp. (aerospace and defense) (since May 2001). |
Stephen P. Munn (67) Board Member Portfolios Overseen: 57 | | Lead Director (since 2007) and formerly Chairman (1993-2007) of Carlisle Companies Incorporated (manufacturer of industrial products). | | None. |
Richard A. Redeker (66) Board Member Portfolios Overseen: 57 | | Retired Mutual Fund Executive (36 years); Management Consultant; Director of Penn Tank Lines, Inc. (since 1999). | | None. |
Robin B. Smith (70) Board Member & Independent Chair Portfolios Overseen: 57 | | Chairman of the Board (since January 2003) of Publishers Clearing House (direct marketing); formerly Chairman and Chief Executive Officer (August 1996-January 2003) of Publishers Clearing House. | | Formerly Director of BellSouth Corporation (telecommunications) (1992-2006). |
Stephen G. Stoneburn (66) Board Member Portfolios Overseen: 57 | | President and Chief Executive Officer (since June 1996) of Quadrant Media Corp. (publishing company); formerly President (June 1995-June 1996) of Argus Integrated Media, Inc.; Senior Vice President and Managing Director (January 1993-1995) of Cowles Business Media; Senior Vice President of Fairchild Publications, Inc (1975-1989). | | None. |
| | | | |
Interested Board Member (1) | | | | |
Judy A. Rice (61) Board Member & President Portfolios Overseen: 57 | | President, Chief Executive Officer, Chief Operating Officer and Officer-In-Charge (since February 2003) of Prudential Investments LLC; President, Chief Executive Officer and Officer-In-Charge (since April 2003) of Prudential Mutual Fund Services LLC; Executive Vice President (since December 2008) of Prudential Investment Management Services LLC; formerly Vice President (February 1999-April 2006) of Prudential Investment Management Services LLC; formerly President, Chief Executive Officer, Chief Operating Officer and Officer-In-Charge (May 2003-June 2005) and Director (May 2003-March 2006) and Executive Vice President (June 2005- March 2006) of AST Investment Services, Inc.; Member of Board of Governors of the Investment Company Institute. | | None. |
Visit our website at www.jennisondryden.com
| 1 | The year that each Board Member joined the Funds’ Board is as follows: |
Kevin J. Bannon, 2008; Linda W. Bynoe, 2005; David E.A. Carson, 2003; Michael S. Hyland, 2008; Robert E. La Blanc, 2003; Douglas H. McCorkindale, 1996; Stephen P. Munn, 2008; Richard A. Redeker, 1996; Robin B. Smith, 1996; Stephen G. Stoneburn, 2003; Judy A. Rice, Board Member since 2000 and President since 2003.
| | |
| Fund Officers(a)(1) | | |
Name, Address and Age Position with Fund | | Principal Occupation(s) During Past Five Years |
Scott E. Benjamin (36) Vice President | | Executive Vice President (since June 2009) of Prudential Investments LLC and Prudential Investment Management Services LLC; Senior Vice President Product Development and Marketing, Prudential Investments (since February 2006); Vice President Product Development and Product Management, Prudential Investments (2003-2006). |
Kathryn L. Quirk (56) Chief Legal Officer | | Vice President and Corporate Counsel (since September 2004) of Prudential; Executive Vice President, Chief Legal Officer and Secretary (since July 2005) of PI and Prudential Mutual Fund Services LLC; Vice President and Corporate Counsel (since June 2005) and Secretary (since February 2006) of AST Investment Services, Inc.; formerly Senior Vice President and Assistant Secretary (November 2004-August 2005) of PI; formerly Assistant Secretary (June 2005-February 2006) of AST Investment Services, Inc.; formerly Managing Director, General Counsel, Chief Compliance Officer, Chief Risk Officer and Corporate Secretary (1997-2002) of Zurich Scudder Investments, Inc. |
Deborah A. Docs (51) Secretary | | Vice President and Corporate Counsel (since January 2001) of Prudential; Vice President (since December 1996) and Assistant Secretary (since March 1999) of PI; formerly Vice President and Assistant Secretary (May 2003-June 2005) of AST Investment Services, Inc. |
Jonathan D. Shain (51) Assistant Secretary | | Vice President and Corporate Counsel (since August 1998) of Prudential; Vice President and Assistant Secretary (since May 2001) of PI; Vice President and Assistant Secretary (since February 2001) of PMFS; formerly Vice President and Assistant Secretary (May 2003-June 2005) of AST Investment Services, Inc. |
Claudia DiGiacomo (35) Assistant Secretary | | Vice President and Corporate Counsel (since January 2005) of Prudential; Vice President and Assistant Secretary of PI (since December 2005); Associate at Sidley Austin Brown & Wood LLP (1999-2004). |
John P. Schwartz (38) Assistant Secretary | | Vice President and Corporate Counsel (since April 2005) of Prudential; Vice President and Assistant Secretary of PI (since December 2005); Associate at Sidley Austin Brown & Wood LLP (1997-2005). |
Andrew R. French (46) Assistant Secretary | | Director and Corporate Counsel (since May 2006) of Prudential; Vice President and Assistant Secretary (since January 2007) of PI; Vice President and Assistant Secretary (since January 2007) of PMFS; formerly Senior Legal Analyst of Prudential Mutual Fund Law Department (1997-2006). |
Timothy J. Knierim (50) Chief Compliance Officer | | Chief Compliance Officer of Prudential Investment Management, Inc. (since July 2007); formerly Chief Risk Officer of PIM and PI (2002-2007) and formerly Chief Ethics Officer of PIM and PI (2006-2007). |
Valerie M. Simpson (51) Deputy Chief Compliance Officer | | Chief Compliance Officer (since April 2007) of PI and AST Investment Services, Inc.; formerly Vice President-Financial Reporting (June 1999-March 2006) for Prudential Life and Annuities Finance. |
Jennison Mid-Cap Growth Fund, Inc.
| | |
Theresa C. Thompson (47) Deputy Chief Compliance Officer | | Vice President, Compliance, PI (since April 2004); and Director, Compliance, PI (2001-2004). |
Noreen M. Fierro (45) Anti-Money Laundering Compliance Officer | | Vice President, Corporate Compliance (since May 2006) of Prudential; formerly Corporate Vice President, Associate General Counsel (April 2002-May 2005) of UBS Financial Services, Inc., in their Money Laundering Prevention Group; Senior Manager (May 2005-May 2006) of Deloitte Financial Advisory Services, LLP, in their Forensic and Dispute Services, Anti-Money Laundering Group. |
Grace C. Torres (50) Treasurer and Principal Financial and Accounting Officer | | Assistant Treasurer (since March 1999) and Senior Vice President (since September 1999) of PI; Assistant Treasurer (since May 2003) and Vice President (since June 2005) of AST Investment Services, Inc.; Senior Vice President and Assistant Treasurer (since May 2003) of Prudential Annuities Advisory Services, Inc.; formerly Senior Vice President (May 2003-June 2005) of AST Investment Services, Inc. |
M. Sadiq Peshimam (45) Assistant Treasurer | | Vice President (since 2005) and Director (2000-2005) within Prudential Mutual Fund Administration. |
Peter Parrella (51) Assistant Treasurer | | Vice President (since 2007) and Director (2004-2007) within Prudential Mutual Fund Administration; formerly Tax Manager at SSB Citi Fund Management LLC (1997-2004). |
| (a) | Excludes interested Board Members who also serve as President or Vice President. |
| 1 | The year that each individual became an Officer of the Funds is as follows: |
Scott E. Benjamin, 2009; Kathryn L. Quirk, 2005; Deborah A. Docs, 2005; Jonathan D. Shain, 2005; Claudia DiGiacomo, 2005; John P. Schwartz, 2006; Andrew R. French, 2006; Timothy J. Knierim, 2007; Valerie M. Simpson, 2007; Theresa Thompson, 2008; Noreen M. Fierro, 2006; Grace C. Torres, 1996; M. Sadiq Peshimam, 2006; Peter Parrella, 2007.
Explanatory Notes
| | • | | Board Members are deemed to be “Interested,” as defined in the 1940 Act, by reason of their affiliation with Prudential Investments LLC and/or an affiliate of Prudential Investments LLC. |
| | • | | Unless otherwise noted, the address of all Board Members and Officers is c/o Prudential Investments LLC, Gateway Center Three, 100 Mulberry Street, Newark, New Jersey 07102. |
| | • | | There is no set term of office for Board Members or Officers. The Board Members have adopted a retirement policy, which calls for the retirement of Board Members on December 31st of the year in which they reach the age of 75. |
| | • | | “Other Directorships Held” includes only directorships of companies required to register or file reports with the SEC under the Securities Exchange Act of 1934 (that is, “public companies”) or other investment companies registered under the 1940 Act. |
| | • | | “Portfolios Overseen” includes all investment companies managed by Prudential Investments LLC. The investment companies for which PI serves as manager include the JennisonDryden Funds, Strategic Partners Funds, The Prudential Variable Contract Accounts, The Target Portfolio Trust, The Prudential Series Fund, Prudential’s Gibraltar Fund, Inc. and the Advanced Series Trust. |
Visit our website at www.jennisondryden.com
Approval of Advisory Agreements
The Fund’s Board of Directors
The Board of Directors (the “Board”) of Jennison Mid-Cap Growth Fund, Inc. (the “Fund”) consists of 11 individuals, 10 of whom are not “interested persons” of the Fund, as defined in the Investment Company Act of 1940, as amended (the “1940 Act”) (the “Independent Directors”). The Board is responsible for the oversight of the Fund and its operations, and performs the various duties imposed on the directors of investment companies by the 1940 Act. The Independent Directors have retained independent legal counsel to assist them in connection with their duties. The Chair of the Board is an Independent Director. The Board has established three standing committees: the Audit Committee, the Nominating and Governance Committee, and the JennisonDryden Investment Committee. Each committee is chaired by, and composed of, Independent Directors.
Annual Approval of the Fund’s Advisory Agreements
As required under the 1940 Act, the Board determines annually whether to renew the Fund’s management agreement with Prudential Investments LLC (“PI”) and the Fund’s subadvisory agreement with Jennison Associates LLC (“Jennison”). In considering the renewal of the agreements, the Board, including all of the Independent Directors, met on June 2-4, 2009 and approved the renewal of the agreements through July 31, 2010, after concluding that renewal of the agreements was in the best interests of the Fund and its shareholders.
In advance of the meetings, the Board requested and received materials relating to the agreements, and had the opportunity to ask questions and request further information in connection with its consideration. Among other things, the Board considered comparisons with other mutual funds in relevant Peer Universes and Peer Groups. The mutual funds included in each Peer Universe or Peer Group were objectively determined by Lipper Inc., an independent provider of mutual fund data. The comparisons placed the Fund in various quartiles over the one-, three, five-, and ten-year periods ending December 31, 2008, with the first quartile being the best 25% of the mutual funds (for performance, the best performing mutual funds and, for expenses, the lowest cost mutual funds).
In approving the agreements, the Board, including the Independent Directors advised by independent legal counsel, considered the factors it deemed relevant, including the nature, quality and extent of services provided by PI and the subadviser, the performance of the Fund, the profitability of PI and its affiliates, expenses and fees, and the potential for economies of scale that may be shared with the Fund and its shareholders. In their deliberations, the Directors did not identify any single factor which alone was responsible for the Board’s decision to approve the agreements with
| | |
| Jennison Mid-Cap Growth Fund, Inc. | | |
Approval of Advisory Agreements (continued)
respect to the Fund. In connection with its deliberations, the Board considered information provided by PI throughout the year at regular Board meetings, presentations from portfolio managers and other information, as well as information furnished at or in advance of the meetings on June 2-4, 2009.
The Directors determined that the overall arrangements between the Fund and PI, which serves as the Fund’s investment manager pursuant to a management agreement, and between PI and Jennison, which serves as the Fund’s subadviser pursuant to the terms of a subadvisory agreement with PI, are fair and reasonable in light of the services performed, fees charged and such other matters as the Directors considered relevant in the exercise of their business judgment.
The material factors and conclusions that formed the basis for the Directors’ reaching their determinations to approve the continuance of the agreements are separately discussed below.
Nature, Quality, and Extent of Services
The Board received and considered information regarding the nature, quality and extent of services provided to the Fund by PI and Jennison. The Board considered the services provided by PI, including but not limited to the oversight of the subadviser for the Fund, as well as the provision of fund recordkeeping, compliance, and other services to the Fund. With respect to PI’s oversight of the subadviser, the Board noted that PI’s Strategic Investment Research Group (“SIRG”), which is a business unit of PI, is responsible for monitoring and reporting to PI’s senior management on the performance and operations of the subadviser. The Board also considered that PI pays the salaries of all of the officers and non-independent Directors of the Fund. The Board also considered the investment subadvisory services provided by Jennison, as well as adherence to the Fund’s investment restrictions and compliance with applicable Fund policies and procedures. The Board considered PI’s evaluation of the subadviser, as well as PI’s recommendation, based on its review of the subadviser, to renew the subadvisory agreement.
The Board reviewed the qualifications, backgrounds and responsibilities of PI’s senior management responsible for the oversight of the Fund and Jennison, and also reviewed the qualifications, backgrounds and responsibilities of Jennison’s portfolio managers who are responsible for the day-to-day management of the Fund’s portfolio. The Board was provided with information pertaining to PI’s and Jennison’s organizational structure, senior management, investment operations, and other relevant information pertaining to both PI and Jennison. The Board also noted that it received favorable compliance reports from the Fund’s Chief Compliance Officer
| | |
| | Visit our website at www.jennisondryden.com |
(“CCO”) as to both PI and Jennison. The Board noted that Jennison is affiliated with PI.
The Board concluded that it was satisfied with the nature, extent and quality of the investment management services provided by PI and the subadvisory services provided to the Fund by Jennison, and that there was a reasonable basis on which to conclude that the Fund benefits from the services provided by PI and Jennison under the management and subadvisory agreements.
Performance of the Fund
The Board received and considered information about the Fund’s historical performance. The Board considered that the Fund’s gross performance in relation to its Peer Universe (the Lipper Retail and Institutional Mid-Cap Growth Funds Performance Universe) was in the first quartile for all periods. The Board also noted that the Fund outperformed its benchmark index during all periods. The Board concluded that, in light of the Fund’s competitive performance, it would be in the interest of the Fund and its shareholders for the Fund to renew the agreements.
Fees and Expenses
The Board considered that the Fund’s actual management fee (which reflects any subsidies, expense caps or waivers) and total expenses both ranked in the Expense Group’s first quartile. The Board concluded that the management fees and total expenses were reasonable in light of the services provided.
Costs of Services and Profits Realized by PI
The Board was provided with information on the profitability of PI and its affiliates in serving as the Fund’s investment manager. The Board discussed with PI the methodology utilized in assembling the information regarding profitability and considered its reasonableness. The Board recognized that it is difficult to make comparisons of profitability from fund management contracts because comparative information is not generally publicly available and is affected by numerous factors, including the structure of the particular adviser, the types of funds it manages, its business mix, numerous assumptions regarding allocations and the adviser’s capital structure and cost of capital. The Board did not separately consider the profitability of the subadviser, an affiliate of PI, as its profitability was reflected in the profitability report for PI. Taking these factors into account, the Board concluded that the profitability of PI and its affiliates in relation to the services rendered was not unreasonable.
| | |
| Jennison Mid-Cap Growth Fund, Inc. | | |
Approval of Advisory Agreements (continued)
Economies of Scale
The Board noted that the management fee schedule for the Fund includes breakpoints, which have the effect of decreasing the fee rate as assets increase, but at the current level of assets the Fund does not realize the effect of those rate reductions. The Board received and discussed information concerning whether PI realizes economies of scale as the Fund’s assets grow beyond current levels. The Board took note that the Fund’s fee structure would result in benefits to Fund shareholders when (and if) assets reach the levels at which the fee rate is reduced. These benefits will accrue whether or not PI is then realizing any economies of scale.
Other Benefits to PI and Jennison
The Board considered potential ancillary benefits that might be received by PI and Jennison and their affiliates as a result of their relationship with the Fund. The Board concluded that potential benefits to be derived by PI included brokerage commissions received by affiliates of PI, transfer agency fees received by the Fund’s transfer agent (which is affiliated with PI), as well as benefits to the reputation or other intangible benefits resulting from PI’s association with the Fund. The Board concluded that the potential benefits to be derived by Jennison included its ability to use soft dollar credits, brokerage commissions received by affiliates of Jennison, as well as the potential benefits consistent with those generally resulting from an increase in assets under management, specifically, potential access to additional research resources and benefits to the reputation. The Board concluded that the benefits derived by PI and Jennison were consistent with the types of benefits generally derived by investment managers and subadvisers to mutual funds.
After full consideration of these factors, the Board concluded that the approval of the agreements was in the best interest of the Fund and its shareholders.
| | |
| | Visit our website at www.jennisondryden.com |
Growth of a $10,000 Investment
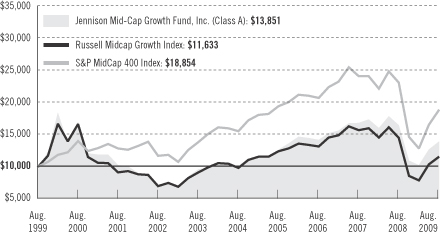
| | | | | | | | | | | |
| Average Annual Total Returns (With Sales Charges) as of 8/31/09 |
| | | One Year | | | Five Years | | | Ten Years | | | Since Inception |
Class A | | –20.27 | % | | 6.72 | % | | 3.31 | % | | — |
Class B | | –20.40 | | | 6.98 | | | 3.12 | | | — |
Class C | | –17.00 | | | 7.15 | | | 3.13 | | | — |
Class L | | –20.60 | | | N/A | | | N/A | | | –2.02% (6/12/06) |
Class M | | –21.24 | | | N/A | | | N/A | | | –1.65 (6/12/06) |
Class R | | –15.73 | | | N/A | | | N/A | | | 3.91 (6/3/05) |
Class X | | –21.16 | | | N/A | | | N/A | | | –1.85 (6/12/06) |
Class Z | | –15.33 | | | 8.22 | | | 4.17 | | | — |
| | | | | | | | | | | |
| Average Annual Total Returns (Without Sales Charges) as of 8/31/09 |
| | | One Year | | | Five Years | | | Ten Years | | | Since Inception |
Class A | | –15.63 | % | | 7.93 | % | | 3.90 | % | | — |
Class B | | –16.21 | | | 7.14 | | | 3.12 | | | — |
Class C | | –16.16 | | | 7.15 | | | 3.13 | | | — |
Class L | | –15.76 | | | N/A | | | N/A | | | –0.20% (6/12/06) |
Class M | | –16.21 | | | N/A | | | N/A | | | –0.72 (6/12/06) |
Class R | | –15.73 | | | N/A | | | N/A | | | 3.91 (6/3/05) |
Class X | | –16.12 | | | N/A | | | N/A | | | –0.60 (6/12/06) |
Class Z | | –15.33 | | | 8.22 | | | 4.17 | | | — |
Performance data quoted represent past performance. Past performance does not guarantee future results. The investment return and principal value of an investment
| | |
| | Visit our website at www.jennisondryden.com |
will fluctuate, so that an investor’s shares, when redeemed, may be worth more or less than their original cost. Current performance may be lower or higher than the past performance data quoted. An investor may obtain performance data as of the most recent month-end by visiting our website at www.jennisondryden.com or by calling (800) 225-1852. Class A and Class L shares have a maximum initial sales charge of 5.50% and 5.75%, respectively. Gross operating expenses: Class A, 1.21%; Class B, 1.91%; Class C, 1.91%; Class L, 1.41%; Class M, 1.91%; Class R, 1.66%; Class X, 1.91%; Class Z, 0.91%. Net operating expenses apply to: Class A, 1.21%; Class B, 1.91%; Class C, 1.91%; Class L, 1.41%; Class M, 1.91%; Class R, 1.41%; Class X, 1.91%; Class Z, 0.91%, after contractual reduction through 12/31/2010.
The returns in the graph and the tables do not reflect the deduction of taxes that a shareholder would pay on Fund distributions or following the redemption of Fund shares.
Source: Prudential Investments LLC and Lipper Inc.
Inception returns are provided for any share class with less than 10 years of returns.
The graph compares a $10,000 investment in the Jennison Mid-Cap Growth Fund, Inc. (Class A shares) with a similar investment in the Russell Midcap Growth Index and the S&P MidCap 400 Index by portraying the initial account values at the beginning of the 10-year period for Class A shares (August 31, 1999) and the account values at the end of the current fiscal year (August 31, 2009) as measured on a quarterly basis. For purposes of the graph, and unless otherwise indicated, it has been assumed that (a) the maximum applicable front-end sales charge was deducted from the initial $10,000 investment in Class A shares; (b) all recurring fees (including management fees) were deducted; and (c) all dividends and distributions were reinvested. The line graph provides information for Class A shares only. As indicated in the tables provided earlier, performance for Class B, Class C, Class L, Class M, Class R, Class X, and Class Z shares will vary due to the differing charges and expenses applicable to each share class (as indicated in the following paragraphs).
The Russell Midcap Growth Index is a market value-weighted index that measures the performance of those Russell Midcap companies with higher price-to-book ratios and higher forecasted growth values. The S&P MidCap 400 Index is an unmanaged index of 400 domestic stocks chosen for market size, liquidity, and industry group representation. It gives a broad look at how U.S. mid-cap stock prices have performed. The Indexes’ total returns include the reinvestment of all dividends, but do not include the effects of sales charges, operating expenses of a mutual fund, or taxes. The returns for the Indexes would be lower if they included the effects of sales charges, operating expenses, or taxes. The securities that comprise these indexes may differ substantially from the securities in the Fund. These are not the only indexes that may be used to characterize performance of small- to mid-capitalization stock funds. Other indexes may portray different comparative performance. Investors cannot invest directly in an index.
Class A and Class L shares are subject to a maximum front-end sales charge of 5.50% and 5.75%, respectively, and an annual 12b-1 fee of up to 0.30% and 0.50%, respectively. Investors who purchase Class A and Class L shares in an amount of $1 million or more and sell these shares within 12 months of purchase are subject to a contingent deferred sales charge (CDSC) of 1%, in certain circumstances. Class B shares are subject to a declining CDSC of 5%, 4%, 3%, 2%, 1%, and 1%, respectively, for the first six years after purchase and a
| | |
| Jennison Mid-Cap Growth Fund, Inc. | | |
Growth of a $10,000 Investment (continued)
12b-1 fee of 1% annually. Approximately seven years after purchase, Class B shares will automatically convert to Class A shares on a quarterly basis. Class C shares purchased are not subject to a front-end sales charge, but are subject to a CDSC of 1% for shares sold within 12 months from the date of purchase, and an annual 12b-1 fee of 1%. Class M and Class X shares are not subject to a front-end sales charge, but are subject to a CDSC of 6% and a 12b-1 fee of 1%. The CDSC for Class M shares decreases by 1% annually to 2% in the fifth and sixth years after purchase, 1% in the seventh year and 0% in the eighth year after purchase. The CDSC for Class X shares decreases by 1% annually to 4% in the third and fourth years after purchase, 3% in the fifth year after purchase, 2% in the sixth and seventh years after purchase, 1% in the eighth year and 0% in the ninth and tenth years after purchase. Class M and Class X shares convert to Class A shares approximately eight years after purchase. Class R and Z shares are not subject to a sales charge or 12b-1 fees. The returns in the graph and tables reflect the share class expense structure in effect at the close of the fiscal period.
| | |
| | Visit our website at www.jennisondryden.com |
| | | | |
| n MAIL | | n TELEPHONE | | n WEBSITE |
Gateway Center Three 100 Mulberry Street Newark, NJ 07102 | | (800) 225-1852 | | www.jennisondryden.com |
|
| PROXY VOTING |
| The Board of Directors of the Fund has delegated to the Fund’s investment subadviser the responsibility for voting any proxies and maintaining proxy recordkeeping with respect to the Fund. A description of these proxy voting policies and procedures is available without charge, upon request, by calling (800) 225-1852 or by visiting the Securities and Exchange Commission’s website at www.sec.gov. Information regarding how the Fund voted proxies relating to portfolio securities during the most recent 12-month period ended June 30 is available on the Fund’s website and on the Commission’s website. |
|
| DIRECTORS |
| Kevin J. Bannon • Linda W. Bynoe • David E.A. Carson • Michael S. Hyland • Robert E. La Blanc • Douglas H. McCorkindale • Stephen P. Munn • Richard A. Redeker • Judy A. Rice • Robin B. Smith • Stephen G. Stoneburn |
|
| OFFICERS |
| Judy A. Rice, President • Scott E. Benjamin, Vice President • Grace C. Torres, Treasurer and Principal Financial and Accounting Officer • Kathryn L. Quirk, Chief Legal Officer • Deborah A. Docs, Secretary • Timothy J. Knierim, Chief Compliance Officer • Valerie M. Simpson, Deputy Chief Compliance Officer • Theresa C. Thompson, Deputy Chief Compliance Officer • Noreen M. Fierro, Anti-Money Laundering Compliance Officer • Jonathan Shain, Assistant Secretary • Claudia DiGiacomo, Assistant Secretary • John P. Schwartz, Assistant Secretary • Andrew R. French, Assistant Secretary • M. Sadiq Peshimam, Assistant Treasurer • Peter Parrella, Assistant Treasurer |
| | | | |
| MANAGER | | Prudential Investments LLC | | Gateway Center Three
100 Mulberry Street
Newark, NJ 07102 |
|
| INVESTMENT SUBADVISER | | Jennison Associates LLC | | 466 Lexington Avenue
New York, NY 10017 |
|
| DISTRIBUTOR | | Prudential Investment
Management Services LLC | | Gateway Center Three
100 Mulberry Street
Newark, NJ 07102 |
|
| CUSTODIAN | | The Bank of New York Mellon | | One Wall Street
New York, NY 10286 |
|
| TRANSFER AGENT | | Prudential Mutual Fund
Services LLC | | PO Box 9658
Providence, RI 02940 |
|
| INDEPENDENT REGISTERED PUBLIC ACCOUNTING FIRM | | KPMG LLP | | 345 Park Avenue
New York, NY 10154 |
|
| FUND COUNSEL | | Willkie Farr & Gallagher LLP | | 787 Seventh Avenue
New York, NY 10019 |
|
| An investor should consider the investment objectives, risks, charges, and expenses of the Fund carefully before investing. The prospectus for the Fund contains this and other information about the Fund. An investor may obtain a prospectus by visiting our website at www.jennisondryden.com or by calling (800) 225-1852. The prospectus should be read carefully before investing. |
|
| E-DELIVERY |
| To receive your mutual fund documents online, go to www.prudential.com/edelivery/mutualfunds and enroll. Instead of receiving printed documents by mail, you will receive notification via e-mail when new materials are available. You can cancel your enrollment or change your e-mail address at any time by visiting the website address above. |
|
| SHAREHOLDER COMMUNICATIONS WITH DIRECTORS |
| Shareholders can communicate directly with the Board of Directors by writing to the Chair of the Board, Jennison Mid-Cap Growth Fund, Inc., Prudential Investments, Attn: Board of Directors, 100 Mulberry Street, Gateway Center Three, Newark, NJ 07102. Shareholders can communicate directly with an individual Director by writing to the same address. Communications are not screened before being delivered to the addressee. |
|
| AVAILABILITY OF PORTFOLIO SCHEDULE |
| The Fund files its complete schedule of portfolio holdings with the Securities and Exchange Commission for the first and third quarters of each fiscal year on Form N-Q. The Fund’s Forms N-Q are available on the Commission’s website at www.sec.gov. The Fund’s Forms N-Q may also be reviewed and copied at the Commission’s Public Reference Room in Washington, D.C. Information on the operation and location of the Public Reference Room may be obtained by calling (202) 551-8090. The Fund’s schedule of portfolio holdings is also available on the Fund’s website as of the end of each fiscal quarter. |
|
| The Fund’s Statement of Additional Information contains additional information about the Fund’s Directors and is available without charge, upon request, by calling (800) 225-1852. |
Mutual Funds:
| | | | |
| ARE NOT INSURED BY THE FDIC OR ANY FEDERAL GOVERNMENT AGENCY | | MAY LOSE VALUE | | ARE NOT A DEPOSIT OF OR GUARANTEED BY ANY BANK OR ANY BANK AFFILIATE |

| | | | | | | | | | | | | | | | | | | | |
| Jennison Mid-Cap Growth Fund, Inc. | | | | | | | | | | | | |
| | | Share Class | | A | | B | | C | | L | | M | | R | | X | | Z | | |
| | NASDAQ | | PEEAX | | PEEBX | | PEGCX | | N/A | | N/A | | JDERX | | N/A | | PEGZX | | |
| | CUSIP | | 476296108 | | 476296207 | | 476296306 | | 476296603 | | 476296702 | | 476296504 | | 476296801 | | 476296405 | | |
| | | | | | | | | | | | | | | | | | | | |
MF173E 0163420-00001-00

Item 2 – Code of Ethics—See Exhibit (a)
As of the end of the period covered by this report, the registrant has adopted a code of ethics (the “Section 406 Standards for Investment Companies – Ethical Standards for Principal Executive and Financial Officers”) that applies to the registrant’s Principal Executive Officer and Principal Financial Officer; the registrant’s Principal Financial Officer also serves as the Principal Accounting Officer.
The registrant hereby undertakes to provide any person, without charge, upon request, a copy of the code of ethics. To request a copy of the code of ethics, contact the registrant 800-225-1852, and ask for a copy of the Section 406 Standards for Investment Companies – Ethical Standards for Principal Executive and Financial Officers.
Item 3 – Audit Committee Financial Expert –
The registrant’s Board has determined that Mr. David E. A. Carson, member of the Board’s Audit Committee is an “audit committee financial expert,” and that he is “independent,” for purposes of this Item.
Item 4 – Principal Accountant Fees and Services –
(a) Audit Fees
For the fiscal years ended August 31, 2009 and August 31, 2008, KPMG LLP (“KPMG”), the Registrant’s principal accountant, billed the Registrant $20,869 and $20,869, respectively, for professional services rendered for the audit of the Registrant’s annual financial statements or services that are normally provided in connection with statutory and regulatory filings.
(b) Audit-Related Fees
During the fiscal year ended August 31, 2009, KPMG, the Registrant’s principal accountant, billed the Registrant $1,558 for professional services rendered in connection with agreed upon procedures performed related to a custody conversion. Not applicable for the fiscal year ended August 31, 2008.
(c) Tax Fees
None.
(d) All Other Fees
None.
(e) (1) Audit Committee Pre-Approval Policies and Procedures
THE PRUDENTIAL MUTUAL FUNDS
AUDIT COMMITTEE POLICY
on
Pre-Approval of Services Provided by the Independent Accountants
The Audit Committee of each Prudential Mutual Fund is charged with the responsibility to monitor the independence of the Fund’s independent accountants. As part of this responsibility, the Audit Committee must pre-approve any independent accounting firm’s engagement to render audit and/or permissible non-audit services, as required by law. In evaluating a proposed engagement of the independent accountants, the Audit Committee will assess the effect that the engagement might reasonably be expected to have on the accountant’s independence. The Committee’s evaluation will be based on:
| | • | | a review of the nature of the professional services expected to be provided, |
| | • | | a review of the safeguards put into place by the accounting firm to safeguard independence, and |
| | • | | periodic meetings with the accounting firm. |
Policy for Audit and Non-Audit Services Provided to the Funds
On an annual basis, the scope of audits for each Fund, audit fees and expenses, and audit-related and non-audit services (and fees proposed in respect thereof) proposed to be performed by the Fund’s independent accountants will be presented by the Treasurer and the independent accountants to the Audit Committee for review and, as appropriate, approval prior to the initiation of such services. Such presentation shall be accompanied by confirmation by both the Treasurer and the independent accountants that the proposed services will not adversely affect the independence of the independent accountants. Proposed services shall be described in sufficient detail to enable the Audit Committee to assess the appropriateness of such services and fees, and the compatibility of the provision of such services with the auditor’s independence. The Committee shall receive periodic reports on the progress of the audit and other services which are approved by the Committee or by the Committee Chair pursuant to authority delegated in this Policy.
The categories of services enumerated under “Audit Services”, “Audit-related Services”, and “Tax Services” are intended to provide guidance to the Treasurer and the independent accountants as to those categories of services which the Committee believes are generally consistent with the independence of the independent accountants and which the Committee (or the Committee Chair) would expect upon the presentation of specific proposals to pre-approve. The enumerated categories are not intended as an exclusive list of audit, audit-related or tax services, which the Committee (or the Committee Chair) would consider for pre-approval.
Audit Services
The following categories of audit services are considered to be consistent with the role of the Fund’s independent accountants:
| | • | | Annual Fund financial statement audits |
| | • | | Seed audits (related to new product filings, as required) |
| | • | | SEC and regulatory filings and consents |
Audit-related Services
The following categories of audit-related services are considered to be consistent with the role of the Fund’s independent accountants:
| | • | | Accounting consultations |
| | • | | Fund merger support services |
| | • | | Agreed Upon Procedure Reports |
| | • | | Other Internal Control Reports |
Individual audit-related services that fall within one of these categories and are not presented to the Audit Committee as part of the annual pre-approval process will be subject to pre-approval by the Committee Chair (or any other Committee member on whom this responsibility has been delegated) so long as the estimated fee for those services does not exceed $50,000.
Tax Services
The following categories of tax services are considered to be consistent with the role of the Fund’s independent accountants:
| | • | | Tax compliance services related to the filing or amendment of the following: |
| | • | | Federal, state and local income tax compliance; and, |
| | • | | Sales and use tax compliance |
| | • | | Timely RIC qualification reviews |
| | • | | Tax distribution analysis and planning |
| | • | | Tax authority examination services |
| | • | | Tax appeals support services |
| | • | | Accounting methods studies |
| | • | | Fund merger support services |
| | • | | Tax consulting services and related projects |
Individual tax services that fall within one of these categories and are not presented to the Audit Committee as part of the annual pre-approval process will be subject to pre-approval by the Committee Chair (or any other Committee member on whom this responsibility has been delegated) so long as the estimated fee for those services does not exceed $50,000.
Other Non-audit Services
Certain non-audit services that the independent accountants are legally permitted to render will be subject to pre-approval by the Committee or by one or more Committee members to whom the Committee has delegated this authority and who will report to the full Committee any pre-approval
decisions made pursuant to this Policy. Non-audit services presented for pre-approval pursuant to this paragraph will be accompanied by a confirmation from both the Treasurer and the independent accountants that the proposed services will not adversely affect the independence of the independent accountants.
Proscribed Services
The Fund’s independent accountants will not render services in the following categories of non-audit services:
| | • | | Bookkeeping or other services related to the accounting records or financial statements of the Fund |
| | • | | Financial information systems design and implementation |
| | • | | Appraisal or valuation services, fairness opinions, or contribution-in-kind reports |
| | • | | Internal audit outsourcing services |
| | • | | Management functions or human resources |
| | • | | Broker or dealer, investment adviser, or investment banking services |
| | • | | Legal services and expert services unrelated to the audit |
| | • | | Any other service that the Public Company Accounting Oversight Board determines, by regulation, is impermissible. |
Pre-approval of Non-Audit Services Provided to Other Entities Within the Prudential Fund Complex
Certain non-audit services provided to Prudential Investments LLC or any of its affiliates that also provide ongoing services to the Prudential Mutual Funds will be subject to pre-approval by the Audit Committee. The only non-audit services provided to these entities that will require pre-approval are those related directly to the operations and financial reporting of the Funds. Individual projects that are not presented to the Audit Committee as part of the annual pre-approval process will be subject to pre-approval by the Committee Chair (or any other Committee member on whom this responsibility has been delegated) so long as the estimated fee for those services does not exceed $50,000. Services presented for pre-approval pursuant to this paragraph will be accompanied by a confirmation from both the Treasurer and the independent accountants that the proposed services will not adversely affect the independence of the independent accountants.
Although the Audit Committee will not pre-approve all services provided to Prudential Investments LLC and its affiliates, the Committee will receive an annual report from the Fund’s independent accounting firm showing the aggregate fees for all services provided to Prudential Investments and its affiliates.
(e) (2) Percentage of services referred to in 4(b) – 4(d) that were approved by the audit committee –
One hundred percent of the services described in Item 4(b) was approved by the audit committee.
| (f) | Percentage of hours expended attributable to work performed by other than full time employees of principal accountant if greater than 50%. |
The percentage of hours expended on the principal accountant’s engagement to audit the registrant’s financial statements for the most recent fiscal year that were attributed to work performed by persons other than the principal accountant’s full-time, permanent employees was 0%.
(g) Non-Audit Fees
Not applicable to Registrant for the fiscal years 2009 and 2008. The aggregate non-audit fees billed by KPMG for services rendered to the registrant’s investment adviser and any entity controlling, controlled by, or under common control with the investment adviser that provides ongoing services to the registrant for the fiscal years 2009 and 2008 was $0 and $0, respectively.
(h) Principal Accountant’s Independence
Not applicable as KPMG has not provided non-audit services to the registrant’s investment adviser and any entity controlling, controlled by, or under common control with the investment adviser that provides ongoing services to the registrant that were not pre-approved pursuant to Rule 2-01(c)(7)(ii) of Regulation S-X.
Item 5 – Audit Committee of Listed Registrants – Not applicable.
Item 6 – Schedule of Investments – The schedule is included as part of the report to shareholders filed under Item 1 of this Form.
Item 7 – Disclosure of Proxy Voting Policies and Procedures for Closed-End Management Investment Companies – Not applicable.
Item 8 – Portfolio Managers of Closed-End Management Investment Companies – Not applicable.
Item 9 – Purchases of Equity Securities by Closed-End Management Investment Company and Affiliated Purchasers – Not applicable.
Item 10 – Submission of Matters to a Vote of Security Holders – Not applicable.
Item 11 – Controls and Procedures
| | (a) | It is the conclusion of the registrant’s principal executive officer and principal financial officer that the effectiveness of the registrant’s current disclosure controls and procedures (such disclosure controls and procedures having been evaluated within 90 days of the date of this filing) provide reasonable assurance that the information required to be disclosed by the registrant has been recorded, processed, summarized and reported within the time period specified in the Commission’s rules and forms and that the information required to be disclosed by the registrant has been accumulated and communicated to the registrant’s principal executive officer and principal financial officer in order to allow timely decisions regarding required disclosure. |
| | (b) | There has been no significant change in the registrant’s internal control over financial reporting that occurred during the registrant’s most recent fiscal quarter of the period covered by this report that has materially affected, or is likely to materially affect, the registrant’s internal control over financial reporting. |
Item 12 – Exhibits
| | | | |
| (a) | | (1) | | Code of Ethics – Attached hereto as Exhibit EX-99.CODE-ETH |
| | |
| | (2) | | Certifications pursuant to Section 302 of the Sarbanes-Oxley Act – Attached hereto as Exhibit EX-99.CERT. |
| | |
| | (3) | | Any written solicitation to purchase securities under Rule 23c-1. – Not applicable. |
| |
| (b) | | Certifications pursuant to Section 906 of the Sarbanes-Oxley Act – Attached hereto as Exhibit EX-99.906CERT. |
SIGNATURES
Pursuant to the requirements of the Securities Exchange Act of 1934 and the Investment Company Act of 1940, the registrant has duly caused this report to be signed on its behalf by the undersigned, thereunto duly authorized.
| | |
| (Registrant) | | Jennison Mid-Cap Growth Fund, Inc. |
| | |
| |
| By (Signature and Title)* | | /s/ Deborah A. Docs |
| | Deborah A. Docs |
| | Secretary |
Pursuant to the requirements of the Securities Exchange Act of 1934 and the Investment Company Act of 1940, this report has been signed below by the following persons on behalf of the registrant and in the capacities and on the dates indicated.
| | |
| By (Signature and Title)* | | /s/ Judy A. Rice |
| | Judy A. Rice |
| | President and Principal Executive Officer |
| | |
| By (Signature and Title)* | | /s/ Grace C. Torres |
| | Grace C. Torres |
| | Treasurer and Principal Financial Officer |
| * | Print the name and title of each signing officer under his or her signature. |