UNITED STATES
SECURITIES AND EXCHANGE COMMISSION
Washington, D.C. 20549
FORM N-CSR
CERTIFIED SHAREHOLDER REPORT OF REGISTERED
MANAGEMENT INVESTMENT COMPANIES
| | |
| Investment Company Act file number: | | 811-07811 |
| |
| Exact name of registrant as specified in charter: | | Prudential Jennison Mid-Cap Growth Fund, Inc. |
| |
| Address of principal executive offices: | | Gateway Center 3, |
| | 100 Mulberry Street, |
| | Newark, New Jersey 07102 |
| |
| Name and address of agent for service: | | Deborah A. Docs Gateway Center 3, 100 Mulberry Street, Newark, New Jersey 07102 |
| |
| Registrant’s telephone number, including area code: | | 800-225-1852 |
| |
| Date of fiscal year end: | | 8/31/2012 |
| |
| Date of reporting period: | | 8/31/2012 |
Item 1 – Reports to Stockholders

PRUDENTIAL INVESTMENTS»MUTUAL FUNDS
PRUDENTIAL JENNISON
MID-CAP GROWTH FUND, INC.
ANNUAL REPORT · AUGUST 31, 2012
Fund Type
Mid-Cap Stock
Objective
Long-term capital appreciation
This report is not authorized for distribution to prospective investors unless preceded or accompanied by a current prospectus.
The views expressed in this report and information about the Fund’s portfolio holdings are for the period covered by this report and are subject to change thereafter.
Prudential Investments, Prudential, Jennison, the Prudential logo, the Rock symbol, and Bring Your Challenges are service marks of Prudential Financial, Inc. and its related entities, registered in many jurisdictions worldwide.

October 15, 2012
Dear Shareholder:
We hope you find the annual report for the Prudential Jennison Mid-Cap Growth Fund, Inc. informative and useful. The report covers performance for the 12-month period that ended August 31, 2012.
We recognize that ongoing market volatility may make it a difficult time to be an investor. We continue to believe a prudent response to uncertainty is to maintain a diversified portfolio of funds consistent with your tolerance for risk, time horizon, and financial goals.
Your financial advisor can help you create a diversified investment plan that may include funds covering all the basic asset classes and that reflects your personal investor profile and risk tolerance. Keep in mind, however, that diversification and asset allocation strategies do not assure a profit or protect against loss in declining markets.
Prudential Investments® is dedicated to helping you solve your toughest investment challenges—whether it’s capital growth, reliable income, or protection from market volatility and other risks. We offer the expertise of Prudential Financial’s affiliated asset managers* that strive to be leaders in a broad range of funds to help you stay on course to the future you envision. They also manage money for major corporations and pension funds around the world, which means you benefit from the same expertise, innovation, and attention to risk demanded by today’s most sophisticated investors.
Thank you for choosing the Prudential Investments family of funds.
Sincerely,

Stuart S. Parker, President
Prudential Jennison Mid-Cap Growth Fund, Inc.
*Most of Prudential Investments’ equity funds are advised by Jennison Associates LLC, Quantitative Management Associates LLC (QMA), or Prudential Real Estate Investors. Prudential Investments’ fixed income and money market funds are advised by Prudential Investment Management, Inc. (PIM) through its Prudential Fixed Income unit. Jennison Associates, QMA, and PIM are registered investment advisers and Prudential Financial companies. Prudential Real Estate Investors is a unit of PIM.
| | | | |
| Prudential Jennison Mid-Cap Growth Fund, Inc. | | | 1 | |
Your Fund’s Performance
Performance data quoted represent past performance. Past performance does not guarantee future results. The investment return and principal value of an investment will fluctuate, so that an investor’s shares, when redeemed, may be worth more or less than their original cost. Current performance may be lower or higher than the past performance data quoted. An investor may obtain performance data as of the most recent month-end by visiting our website at www.prudentialfunds.com or by calling (800) 225-1852. Class A shares have a maximum initial sales charge of 5.50%. Gross operating expenses: Class A, 1.06%; Class B, 1.76%; Class C, 1.76%; Class Q, 0.60%; Class R, 1.51%; Class X, 1.76%; Class Z, 0.76%. Net operating expenses: Class A, 1.06%; Class B, 1.76%; Class C, 1.76%; Class Q, 0.60%; Class R, 1.26; Class X, 1.76%; Class Z, 0.76%, after contractual reduction for Class R through 12/31/2013.
| | | | | | | | | | | | | | |
Cumulative Total Returns (Without Sales Charges) as of 8/31/12 |
| | | One Year | | | Five Years | | | Ten Years | | | Since Inception |
Class A | | | 15.78 | % | | | 30.02 | % | | | 213.71 | % | | — |
Class B | | | 14.95 | | | | 25.53 | | | | 191.68 | | | — |
Class C | | | 15.00 | | | | 25.57 | | | | 191.78 | | | — |
Class Q | | | 16.31 | | | | N/A | | | | N/A | | | 14.58% (1/18/11) |
Class R | | | 15.53 | | | | 28.64 | | | | N/A | | | 83.93 (6/3/05) |
Class X | | | 14.95 | | | | 25.88 | | | | N/A | | | 51.03 (6/12/06) |
Class Z | | | 16.15 | | | | 31.94 | | | | 222.04 | | | — |
Russell Midcap Growth Index | | | 11.72 | | | | 15.47 | | | | 158.73 | | | — |
Russell Midcap Index | | | 13.30 | | | | 12.98 | | | | 156.48 | | | — |
Lipper Mid-Cap Growth Funds Average | | | 9.69 | | | | 10.85 | | | | 125.87 | | | — |
Lipper Multi-Cap Growth Funds Average | | | 12.43 | | | | 8.59 | | | | 107.70 | | | — |
| | |
| 2 | | Visit our website at www.prudentialfunds.com |
| | | | | | | | | | | | | | |
Average Annual Total Returns (With Sales Charges) as of 9/30/12 | | | |
| | | One Year | | | Five Years | | | Ten Years | | | Since Inception |
Class A | | | 21.11 | % | | | 3.42 | % | | | 12.85 | % | | — |
Class B | | | 22.29 | | | | 3.71 | | | | 12.68 | | | — |
Class C | | | 26.24 | | | | 3.87 | | | | 12.68 | | | — |
Class Q | | | 28.74 | | | | N/A | | | | N/A | | | 9.53% (1/18/11) |
Class R | | | 27.86 | | | | 4.39 | | | | N/A | | | 8.95 (6/3/05) |
Class X | | | 21.31 | | | | 3.42 | | | | N/A | | | 6.85 (6/12/06) |
Class Z | | | 28.54 | | | | 4.91 | | | | 13.80 | | | — |
Russell Midcap Growth Index | | | 26.69 | | | | 2.54 | | | | 11.11 | | | — |
Russell Midcap Index | | | 28.03 | | | | 2.24 | | | | 11.18 | | | — |
Lipper Mid-Cap Growth Funds Average | | | 24.15 | | | | 1.27 | | | | 9.33 | | | — |
Lipper Multi-Cap Growth Funds Average | | | 26.13 | | | | 0.92 | | | | 8.62 | | | — |
| | | | | | | | | | | | | | |
Average Annual Total Returns (With Sales Charges) as of 8/31/12 |
| | | One Year | | | Five Years | | | Ten Years | | | Since Inception |
Class A | | | 9.41 | % | | | 4.20 | % | | | 11.48 | % | | — |
Class B | | | 9.95 | | | | 4.48 | | | | 11.30 | | | — |
Class C | | | 14.00 | | | | 4.66 | | | | 11.30 | | | — |
Class Q | | | 16.31 | | | | N/A | | | | N/A | | | 8.76% (1/18/11) |
Class R | | | 15.53 | | | | 5.17 | | | | N/A | | | 8.77 (6/3/05) |
Class X | | | 8.95 | | | | 4.21 | | | | N/A | | | 6.62 (6/12/06) |
Class Z | | | 16.15 | | | | 5.70 | | | | 12.41 | | | — |
| | | | | | | | | | | | | | |
Average Annual Total Returns (Without Sales Charges) as of 8/31/12 |
| | | One Year | | | Five Years | | | Ten Years | | | Since Inception |
Class A | | | 15.78 | % | | | 5.39 | % | | | 12.11 | % | | — |
Class B | | | 14.95 | | | | 4.65 | | | | 11.30 | | | — |
Class C | | | 15.00 | | | | 4.66 | | | | 11.30 | | | — |
Class Q | | | 16.31 | | | | N/A | | | | N/A | | | 8.76% (1/18/11) |
Class R | | | 15.53 | | | | 5.17 | | | | N/A | | | 8.77 (6/3/05) |
Class X | | | 14.95 | | | | 4.71 | | | | N/A | | | 6.85 (6/12/06) |
Class Z | | | 16.15 | | | | 5.70 | | | | 12.41 | | | — |
| | | | |
| Prudential Jennison Mid-Cap Growth Fund, Inc. | | | 3 | |
Your Fund’s Performance (continued)
Growth of a $10,000 Investment
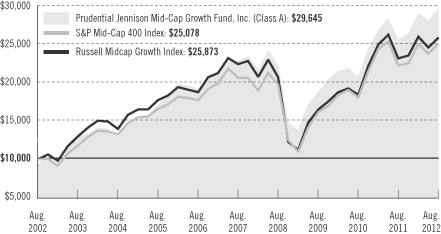
The graph compares a $10,000 investment in the Fund’s Class A shares with a similar investment in the Russell Midcap Growth Index and the S&P Mid-Cap 400 Index by portraying the initial account values at the beginning of the 10-year period for Class A shares (August 31, 2002) and the account values at the end of the current fiscal year (August 31, 2012) as measured on a quarterly basis. For purposes of the graph, and unless otherwise indicated, it has been assumed that (a) the maximum applicable front-end sales charge was deducted from the initial $10,000 investment in Class A shares; (b) all recurring fees (including management fees) were deducted; and (c) all dividends and distributions were reinvested. The line graph provides information for Class A shares only. As indicated in the tables provided earlier, performance for Class B, Class C, Class Q, Class R, Class X, and Class Z shares will vary due to the differing charges and expenses applicable to each share class (as indicated in the following paragraphs).
Source: Prudential Investments LLC and Lipper Inc.
Total returns and the ending account values in the graphs include changes in share price and reinvestment of dividends and capital gains distributions in a hypothetical investment for the periods shown. The Fund’s total returns do not reflect the deduction of income taxes on an individual’s investment. Taxes may reduce your actual investment returns on income or gains paid by the Fund or any gains you may realize if you sell your shares.
Inception returns are provided for any share class with less than 10 years of returns.
The average annual total returns take into account applicable sales charges. Class A shares are subject to a maximum front-end sales charge of 5.50% and an annual 12b-1 fee of 0.30%. Investors who purchase Class A shares in an amount of $1 million or more and sell these shares within 12 months of purchase are subject to a contingent deferred sales charge (CDSC) of 1%. The CDSC is waived for purchases by certain retirement and/or
| | |
| 4 | | Visit our website at www.prudentialfunds.com |
benefit plans. Under certain circumstances, an exchange may be made from specified share classes of the Fund to one or more other share classes of the Fund. Class B shares are subject to a declining CDSC of 5%, 4%, 3%, 2%, 1%, and 1%, respectively, for the first six years after purchase and a 12b-1 fee of 1% annually. Approximately seven years after purchase, Class B shares will automatically convert to Class A shares on a quarterly basis. Class C shares purchased are not subject to a front-end sales charge, but are subject to a CDSC of 1% for shares sold within 12 months from the date of purchase, and an annual 12b-1 fee of 1%. Class X shares are not subject to a front-end sales charge, but Class X shares are subject to a declining CDSC of 6%, 5%, 4%, 4%, 3%, 2%, 2%, 1% and 0% respectively, for the first nine years after purchase and a 12b-1 fee of 1%. Approximately 10 years after purchase, Class X shares will automatically convert to Class A shares. Class R shares are not subject to a front-end sales charge but are subject to a 12b-1 fee of up to 0.75%. Class Q and Class Z shares are not subject to a sales charge or 12b-1 fees. Class X shares are closed to new investors and are available only by exchange from the same share class of another Prudential Investments fund. The returns in the tables and graph do not reflect the deduction of taxes that a shareholder would pay on Fund distributions or following the redemption of Fund shares.
Benchmark Definitions
Russell Midcap Growth Index
The Russell Midcap Growth Index is an unmanaged, market value-weighted index that measures the performance of those Russell Midcap companies with higher price-to-book ratios and higher forecasted growth values. Russell Midcap Growth Index Closest Month-End to Inception cumulative total returns as of 8/31/12 are 7.66% for Class Q; 56.47% for Class R and 35.34% for Class X. Russell Midcap Growth Index Closest Month-End to Inception average annual total returns as of 9/30/12 are 9.81% for Class Q; 59.60% for Class R and 38.05% for Class X.
Russell Midcap Index
The Russell Midcap Index is an unmanaged index which measures the performance of the 800 smallest companies in the Russell 1000 Index, which represent approximately 25% of the total market capitalization of the Russell 1000 Index. Russell Midcap Index Closest Month-End to Inception cumulative total returns as of 8/31/12 are 7.61% for Class Q; 53.66% for Class R and 31.81% for Class X. Russell Midcap Index Closest Month-End to Inception average annual total returns as of 9/30/12 are 9.90% for Class Q; 56.92% for Class R and 34.60% for Class X.
Lipper Mid-Cap Growth Funds Average
The Lipper Mid-Cap Growth Funds Average (Lipper Mid-Cap Average) represents returns based on an average return of all funds in the Lipper Mid-Cap Growth Funds category for the periods noted. Funds in the Lipper Mid-Cap Average invest at least 75% of their equity assets in companies with market capitalizations (on a three-year weighted basis) less than 300% of the dollar-weighted median market capitalization of the middle 1,000 securities of the S&P SuperComposite 1500 Index. Mid-cap growth funds typically have an above-average price-to-earnings ratio, price-to-book ratio, and three-year sales-per-share growth value compared with the S&P MidCap 400 Index. Although Lipper classifies the Fund in the Lipper Multi-Cap Growth Funds category, the returns for the Lipper Mid-Cap Growth Funds Average are also shown because the Fund’s investment manager believes that the Lipper Mid-Cap Growth Funds Average is more consistent with the management of the Fund. Lipper Mid-Cap Average Closest Month-End to Inception cumulative total returns as of 8/31/12 are 4.68% for Class Q; 51.17% for Class R and 30.67% for Class X. Lipper Mid-Cap Average Closest Month-End to Inception average annual total returns as of 9/30/12 are 6.51% for Class Q; 53.92% for Class R and 33.10% for Class X.
| | | | |
| Prudential Jennison Mid-Cap Growth Fund, Inc. | | | 5 | |
Your Fund’s Performance (continued)
Lipper Multi-Cap Growth Funds Average
The Lipper Multi-Cap Growth Funds Average (Lipper Multi-Cap Average) represents returns based on an average of all Funds in the Lipper Multi-Cap Growth Funds category for the periods shown. The Funds in the Lipper Multi-Cap Growth Funds Average are funds that, by portfolio practice, invest in a variety of market capitalization ranges without concentrating 75% of their equity assets in any one market capitalization range over an extended period of time. Multi-cap growth funds typically have an above-average price-to-earnings ratio, price-to-book ratio, and three-year sales-per-share growth value, compared to the S&P SuperComposite 1500 Index. Lipper Multi-Cap Average Closest Month-End to Inception cumulative total returns as of 8/31/12 are 7.83% for Class Q; 45.36% for Class R and 29.48% for Class X. Lipper Multi-Cap Average Closest Month-End to Inception average annual total returns as of 9/30/12 are 10.29% for Class Q; 49.13% for Class R and 32.77% for Class X.
Investors cannot invest directly in an index or average. The Indexes do not include sales charges, operating expenses of a mutual fund, or deductions for taxes. Returns for these indexes would be lower if they were subject to these deductions. Returns for the Lipper Averages reflect the deduction of mutual fund operating expenses, but not sales charges or taxes.
| | | | |
Five Largest Holdings expressed as a percentage of net assets as of 8/31/12 | |
Crown Castle International Corp., Wireless Telecommunication Services | | | 3.0 | % |
VeriSign, Inc., Internet Software & Services | | | 2.4 | |
Ross Stores, Inc., Specialty Retail | | | 2.2 | |
DaVita, Inc., Healthcare Providers & Services | | | 1.8 | |
AMETEK, Inc., Electrical Equipment | | | 1.8 | |
Holdings reflect only long-term investments and are subject to change.
| | | | |
Five Largest Industries expressed as a percentage of net assets as of 8/31/12 | |
Specialty Retail | | | 8.5 | % |
Healthcare Providers & Services | | | 6.6 | |
Chemicals | | | 5.3 | |
Software | | | 5.2 | |
Oil, Gas & Consumable Fuels | | | 5.0 | |
Industry weightings reflect only long-term investments and are subject to change.
| | |
| 6 | | Visit our website at www.prudentialfunds.com |
Strategy and Performance Overview
How did the Fund perform?
The Prudential Jennison Mid-Cap Growth Fund’s Class A shares rose 15.78% in the 12 months ended August 31, 2012, outperforming the 11.72% gain of the Russell Midcap Growth Index (the Index) and the 9.69% gain of the Lipper Mid-Cap Growth Funds Average.
| | • | | Most sectors in the Index advanced; only energy and utilities declined. The largest gains were in healthcare, financials, and consumer discretionary. Most sectors in the Fund rose as well, with the exception of telecommunication services. There were no holdings in utilities. Returns were exceptional in consumer discretionary, industrials, information technology, and healthcare. |
| | • | | The Fund’s outperformance relative to the Index was largely due to stock selection in consumer discretionary, information technology, energy, and industrials. Underweight positions in energy and consumer staples also benefitted performance relative to the Index. |
| | • | | Stock selection in telecommunication services had a negative impact on the Fund’s return. |
What was the investment environment like for U.S. stocks?
The period was marked by volatility, interrupted by a stock market rally in early 2012, which subsided into continued volatility in the second quarter of 2012.
| | • | | Fears in the first half of the period of a double-dip recession were allayed in early 2012. However, a pickup in job growth, housing, and consumer confidence in the first quarter, leading to hopes of a robust recovery, were disappointed as the economy decelerated into the second quarter. Although concerns that Greece might default and withdraw from the Euro zone lessened somewhat, broader uncertainty about the strength of other European economies constrained economic activity and kept markets on edge. |
| | • | | Commodity prices enjoyed a resurgence during the first half as investors viewed commodities as a bulwark against expectations of renewed inflation; prices then retreated as the first quarter rally abated and signs pointed to a sustained period of slow economic growth. Oil prices see-sawed, rising on concerns about Iran’s nuclear ambitions and falling because of unseasonably warm winter weather across most of the U.S. Natural gas prices were particularly hard hit by the warm weather. Accompanying Europe’s woes were signs of continued deterioration in growth prospects for the Chinese economy. Policy makers responded with various interest-rate and reserve-requirement changes to spur credit growth. |
| | | | |
| Prudential Jennison Mid-Cap Growth Fund, Inc. | | | 7 | |
Strategy and Performance Overview (continued)
| | • | | As U.S. employment gains diminished into the second quarter of 2012, broadly eroding consumer and business confidence, analysts trimmed their forecasts for U.S. gross domestic product (GDP) and corporate profits growth. Private sector commentary across a broad range of industries turned cautious into quarter-end. This reinforced fears of a soft patch, leading to further equity market weakness and additional U.S. government bond gains in a flight to safety. |
Which holdings made the largest positive contributions to the Fund’s return?
| | • | | Ross Stores, a discount retailer, reported a succession of strong quarters during the period, and was the largest individual contributor to positive performance. The company continues to do what Jennison considers a great job of offering relevant fashions at attractive prices, thus maintaining healthy market share gains, and it appears to be benefitting from shifts in JCPenney’s strategy. Jennison likes Ross’s planned square footage expansion and movement into new markets and believes Ross has significant future long term growth potential. |
| | • | | Crown Castle International, in the information technology sector, operates and leases towers and other infrastructure for wireless communications in the U.S. and Australia. It and other tower companies benefitted from the upgrading to 4G networks by the four major wireless carriers. The company reported a strong second quarter, with revenues exceeding expectations. Shares also rose on news that the company had extended its leasing agreements for 7,300 towers from T-Mobile. Earlier in the year, Crown Castle completed, ahead of schedule, the acquisition of NextG Networks, a provider of outdoor distributed antenna systems. |
| | • | | VeriSign, also in the information technology sector, is a provider of Internet infrastructure services. During the period, news of a sharp increase in applications for generic Top Level Domains sent shares higher. As the operator of the central registry for the .com and .net domain names, VeriSign stands to win a large share of business generated by successful new applications. It also appears that VeriSign’s contract with the Internet Corporation for Assigned Names and Numbers, which coordinates the Internet’s domain registrations, is likely to be renewed. |
| | • | | Alexion Pharmaceuticals, in the healthcare sector, is a pharmaceutical company focused on developing treatments for rare disorders. Its principal product, Soliris, has been approved in the U.S. and Europe for various uses, including the treatment of blood diseases. In Jennison’s view, Alexion has executed well on the worldwide commercialization of Soliris and continues to aggressively pursue expansion opportunities in other autoimmune and |
| | |
| 8 | | Visit our website at www.prudentialfunds.com |
| | inflammatory diseases. Alexion has also advanced several additional drugs that should help drive growth beyond 2015. |
| | • | | Dollar Tree, in the consumer discretionary sector, is an operator of discount stores in the U.S. and Canada. Supply-chain improvements and robust sales momentum, driven by customers searching for ways to stretch their dollars, have helped drive Dollar Tree’s results for much of the period. Jennison expects continued store growth and positive fundamentals will enable the company to outperform, particularly in a choppy economic environment. |
Which holdings detracted most from the Fund’s return?
NII Holdings, in telecommunication services, was a key detractor from performance.
| | • | | NII Holdings, a Latin American telecommunications service provider, is in a transition period. It is experiencing lower average revenue per customer and slower subscriber growth as it focuses on introducing its 3G services on a new network in Chile, Mexico, and Brazil. It is also enhancing its Push-to-Talk (PTT) services. NII Holding’s shares have been weighed down since the company reported 1st quarter earnings and revenues that were below expectations. These were due to intense competition in the Brazilian market and depreciation of the Brazilian real and Mexican peso relative to the U.S. dollar. |
| | • | | Southwestern Energy, a natural gas and oil exploration company, has been hurt by low gas prices that have weakened profitability and led to a reduced production growth outlook. The Fund exited its position in Southwestern in August in the belief that there are other companies in the exploration and production business that are currently better values. |
| | • | | Juniper Networks, in information technology, makes Internet protocol routers for private and public access networks. Juniper has faced headwinds from a slower-than-expected resumption of carrier expenditures and economic concerns, but Jennison believes the company’s performance may have bottomed as its second quarter earnings and revenues exceeded expectations. In Jennison’s view, the company is driven by its innovation, which can benefit the top line but also impair profitability depending on spending cycles. New product releases should improve results in the remainder of 2012. |
| | • | | Silver Wheaton, in the materials sector, is a silver mining company. The Fund exited its position in the stock because production at Penasquito, one of Silver Wheaton’s principal sources of the precious metal, has grown more slowly than expected. |
| | • | | Deckers Outdoor, in consumer discretionary, makes outdoor footwear, including the UGG boots and Teva brands. The company reported a steep |
| | | | |
| Prudential Jennison Mid-Cap Growth Fund, Inc. | | | 9 | |
Strategy and Performance Overview (continued)
| | decline in profit margins and elevated inventory levels in December, and projected flat earnings for 2012, well below analysts’ expectations. The Fund exited its position in the stock. |
Were there significant changes to the portfolio?
Over the 12-month period, Jennison reduced exposure to financials and energy and increased exposure to industrials. Significant new positions were established in Herbalife, Rackspace Hosting, SBA Communications, and Vertex Pharmaceuticals. Positions in other securities, such as American Tower, YUM Brands, and TJX, were eliminated.
| | |
| 10 | | Visit our website at www.prudentialfunds.com |
Comments on Largest Holdings
| 3.0% | Crown Castle International Corp., Wireless Telecommunication Services |
See Strategy and Performance Overview section for Crown Castle International.
| 2.4% | VeriSign, Inc., Internet Software & Services |
See Strategy and Performance Overview section for VeriSign.
| 2.2% | Ross Stores, Inc., Specialty Retail |
See Strategy and Performance Overview section for Ross Stores.
| 1.8% | DaVita, Inc., Healthcare Providers & Services |
DaVita (DVA), a leading provider of dialysis services and drugs, operates more than 1,500 treatment centers in 43 states. In June, DaVita announced that it would buy HealthCare Partners, a medical group operator. The acquisition could facilitate DaVita’s assuming full care for kidney patients—integrated care—and contribute to further growth, in Jennison’s view.
| 1.8% | AMETEK, Inc., Electrical Equipment |
AMETEK (AME) provides monitoring, testing, calibration, and other devices to the aerospace, industrial, power, and medical industries. The company has made two successful acquisitions this year and future acquisitions should provide further growth prospects.
| | | | |
| Prudential Jennison Mid-Cap Growth Fund, Inc. | | | 11 | |
Fees and Expenses (Unaudited)
As a shareholder of the Fund, you incur two types of costs: (1) transaction costs, including sales charges (loads) on purchase payments and redemptions, as applicable, and (2) ongoing costs, including management fees, distribution and/or service (12b-1) fees, and other Fund expenses, as applicable. This example is intended to help you understand your ongoing costs (in dollars) of investing in the Fund and to compare these costs with the ongoing costs of investing in other mutual funds.
The example is based on an investment of $1,000 invested on March 1, 2012, at the beginning of the period, and held through the six-month period ended August 31, 2012. The example is for illustrative purposes only; you should consult the Prospectus for information on initial and subsequent minimum investment requirements.
The Fund’s transfer agent may charge additional fees to holders of certain accounts that are not included in the expenses shown in the table on the following page. These fees apply to individual retirement accounts (IRAs) and Section 403(b) accounts. As of the close of the six-month period covered by the table, IRA fees included an annual maintenance fee of $15 per account (subject to a maximum annual maintenance fee of $25 for all accounts held by the same shareholder). Section 403(b) accounts are charged an annual $25 fiduciary maintenance fee. Some of the fees may vary in amount, or may be waived, based on your total account balance or the number of Prudential Investments funds, including the Fund, that you own. You should consider the additional fees that were charged to your Fund account over the six-month period when you estimate the total ongoing expenses paid over the period and the impact of these fees on your ending account value, as these additional expenses are not reflected in the information provided in the expense table. Additional fees have the effect of reducing investment returns.
Actual Expenses
The first line for each share class in the table on the following page provides information about actual account values and actual expenses. You may use the information on this line, together with the amount you invested, to estimate the expenses that you paid over the period. Simply divide your account value by $1,000 (for example, an $8,600 account value ÷ $1,000 = 8.6), then multiply the result by the number on the first line under the heading “Expenses Paid During the Six-Month Period” to estimate the expenses you paid on your account during this period.
Hypothetical Example for Comparison Purposes
The second line for each share class in the table on the following page provides information about hypothetical account values and hypothetical expenses based on the Fund’s actual expense ratio and an assumed rate of return of 5% per year before
| | |
| 12 | | Visit our website at www.prudentialfunds.com |
expenses, which is not the Fund’s actual return. The hypothetical account values and expenses may not be used to estimate the actual ending account balance or expenses you paid for the period. You may use this information to compare the ongoing costs of investing in the Fund and other funds. To do so, compare this 5% hypothetical example with the 5% hypothetical examples that appear in the shareholder reports of the other funds.
Please note that the expenses shown in the table are meant to highlight your ongoing costs only and do not reflect any transactional costs such as sales charges (loads). Therefore, the second line for each share class in the table is useful in comparing ongoing costs only and will not help you determine the relative total costs of owning different funds. In addition, if these transactional costs were included, your costs would have been higher.
| | | | | | | | | | | | | | | | | | |
Prudential
Jennison Mid-Cap
Growth Fund, Inc. | | Beginning Account
Value
March 1, 2012 | | | Ending Account
Value
August 31, 2012 | | | Annualized
Expense Ratio | | | Expenses Paid
During the
Six-Month Period* | |
| | | | | | | | | | | | | | | | | | |
| Class A | | Actual | | $ | 1,000.00 | | | $ | 1,020.00 | | | | 1.08 | % | | $ | 5.48 | |
| | | Hypothetical | | $ | 1,000.00 | | | $ | 1,019.71 | | | | 1.08 | % | | $ | 5.48 | |
| | | | | | | | | | | | | | | | | | |
| Class B | | Actual | | $ | 1,000.00 | | | $ | 1,016.40 | | | | 1.78 | % | | $ | 9.02 | |
| | | Hypothetical | | $ | 1,000.00 | | | $ | 1,016.19 | | | | 1.78 | % | | $ | 9.02 | |
| | | | | | | | | | | | | | | | | | |
| Class C | | Actual | | $ | 1,000.00 | | | $ | 1,016.40 | | | | 1.78 | % | | $ | 9.02 | |
| | | Hypothetical | | $ | 1,000.00 | | | $ | 1,016.19 | | | | 1.78 | % | | $ | 9.02 | |
| | | | | | | | | | | | | | | | | | |
| Class Q | | Actual | | $ | 1,000.00 | | | $ | 1,022.40 | | | | 0.60 | % | | $ | 3.05 | |
| | | Hypothetical | | $ | 1,000.00 | | | $ | 1,022.12 | | | | 0.60 | % | | $ | 3.05 | |
| | | | | | | | | | | | | | | | | | |
| Class R | | Actual | | $ | 1,000.00 | | | $ | 1,019.00 | | | | 1.28 | % | | $ | 6.50 | |
| | | Hypothetical | | $ | 1,000.00 | | | $ | 1,018.70 | | | | 1.28 | % | | $ | 6.50 | |
| | | | | | | | | | | | | | | | | | |
| Class X | | Actual | | $ | 1,000.00 | | | $ | 1,016.30 | | | | 1.78 | % | | $ | 9.02 | |
| | | Hypothetical | | $ | 1,000.00 | | | $ | 1,016.19 | | | | 1.78 | % | | $ | 9.02 | |
| | | | | | | | | | | | | | | | | | |
| Class Z | | Actual | | $ | 1,000.00 | | | $ | 1,021.50 | | | | 0.78 | % | | $ | 3.96 | |
| | | Hypothetical | | $ | 1,000.00 | | | $ | 1,021.22 | | | | 0.78 | % | | $ | 3.96 | |
* Fund expenses (net of fee waivers or subsidies, if any) for each share class are equal to the annualized expense ratio for each share class (provided in the table), multiplied by the average account value over the period, multiplied by the 184 days in the six-month period ended August 31, 2012, and divided by 366 days. Expenses presented in the table include the expenses of any underlying funds in which the Fund may invest.
| | | | |
| Prudential Jennison Mid-Cap Growth Fund, Inc. | | | 13 | |
Portfolio of Investments
as of August 31, 2012
| | | | | | |
| Shares | | Description | | Value (Note 1) | |
| | | | | | |
LONG-TERM INVESTMENTS 97.5% | |
COMMON STOCKS | |
| |
Aerospace & Defense 0.7% | | | | |
| 270,524 | | TransDigm Group, Inc.* | | $ | 37,500,037 | |
| |
Air Freight & Logistics 0.6% | | | | |
| 990,996 | | Expeditors International of Washington, Inc. | | | 36,280,364 | |
| |
Beverages 0.7% | | | | |
| 697,006 | | Monster Beverage Corp.* | | | 41,074,564 | |
| |
Biotechnology 3.4% | | | | |
| 551,934 | | Alexion Pharmaceuticals, Inc.*(a) | | | 59,172,844 | |
| 1,510,607 | | BioMarin Pharmaceutical, Inc.*(a) | | | 56,406,065 | |
| 1,454,609 | | Vertex Pharmaceuticals, Inc.* | | | 77,574,298 | |
| | | | | | |
| | | | | 193,153,207 | |
| |
Capital Markets 0.9% | | | | |
| 1,908,178 | | Eaton Vance Corp.(a) | | | 51,692,542 | |
| |
Chemicals 5.3% | | | | |
| 731,865 | | Airgas, Inc. | | | 60,796,026 | |
| 1,417,777 | | Albemarle Corp. | | | 77,594,935 | |
| 1,412,856 | | Ecolab, Inc.(a) | | | 90,465,170 | |
| 1,290,801 | | FMC Corp.(a) | | | 70,116,310 | |
| | | | | | |
| | | | | 298,972,441 | |
| |
Commercial Banks 0.9% | | | | |
| 1,489,076 | | First Republic Bank | | | 48,677,894 | |
| |
Commercial Services & Supplies 1.2% | | | | |
| 1,093,141 | | Iron Mountain, Inc. | | | 35,855,025 | |
| 332,255 | | Stericycle, Inc.*(a) | | | 30,407,977 | |
| | | | | | |
| | | | | 66,263,002 | |
| |
Communications Equipment 2.1% | | | | |
| 399,940 | | F5 Networks, Inc.* | | | 38,990,151 | |
| 2,186,892 | | Finisar Corp.*(a) | | | 30,047,896 | |
| 2,899,421 | | Juniper Networks, Inc.* | | | 50,565,902 | |
| | | | | | |
| | | | | 119,603,949 | |
See Notes to Financial Statements.
| | | | |
| Prudential Jennison Mid-Cap Growth Fund, Inc. | | | 15 | |
Portfolio of Investments
as of August 31, 2012 continued
| | | | | | |
| Shares | | Description | | Value (Note 1) | |
| | | | | | |
COMMON STOCKS (Continued) | |
| |
Computers & Peripherals 0.6% | | | | |
| 1,055,837 | | NetApp, Inc.*(a) | | $ | 36,447,493 | |
| |
Construction & Engineering 0.5% | | | | |
| 775,513 | | Chicago Bridge & Iron Co. NV | | | 28,554,389 | |
| |
Electrical Equipment 3.6% | | | | |
| 3,016,300 | | AMETEK, Inc. | | | 103,489,253 | |
| 992,111 | | Roper Industries, Inc. | | | 101,979,090 | |
| | | | | | |
| | | | | 205,468,343 | |
| |
Electronic Equipment & Instruments 1.3% | | | | |
| 1,198,523 | | Amphenol Corp. (Class A Stock) | | | 72,954,095 | |
| |
Energy Equipment & Services 1.7% | | | | |
| 1,395,242 | | Cameron International Corp.* | | | 76,333,690 | |
| 180,272 | | Core Laboratories NV | | | 22,027,436 | |
| | | | | | |
| | | | | 98,361,126 | |
| |
Food & Staples Retailing 1.0% | | | | |
| 202,431 | | Fresh Market, Inc. (The)*(a) | | | 11,684,317 | |
| 483,497 | | Whole Foods Market, Inc. | | | 46,778,335 | |
| | | | | | |
| | | | | 58,462,652 | |
| |
Food Products 1.8% | | | | |
| 344,825 | | JM Smucker Co. (The) | | | 29,299,780 | |
| 989,033 | | Mead Johnson Nutrition Co. | | | 72,525,790 | |
| | | | | | |
| | | | | 101,825,570 | |
| |
Healthcare Equipment & Supplies 1.4% | | | | |
| 3,273,646 | | Hologic, Inc.*(a) | | | 64,261,671 | |
| 400,369 | | Neogen Corp.*(a) | | | 15,630,406 | |
| | | | | | |
| | | | | 79,892,077 | |
| |
Healthcare Providers & Services 6.6% | | | | |
| 693,849 | | Catamaran Corp. (Canada)* | | | 60,468,940 | |
| 1,073,202 | | DaVita, Inc.* | | | 104,390,359 | |
| 1,246,152 | | Henry Schein, Inc.* | | | 95,716,935 | |
| 501,990 | | Laboratory Corp. of America Holdings*(a) | | | 44,150,020 | |
| 1,769,081 | | Universal Health Services, Inc. (Class B Stock) | | | 70,674,786 | |
| | | | | | |
| | | | | 375,401,040 | |
See Notes to Financial Statements.
| | |
| 16 | | Visit our website at www.prudentialfunds.com |
| | | | | | |
| Shares | | Description | | Value (Note 1) | |
| | | | | | |
COMMON STOCKS (Continued) | |
| |
Hotels, Restaurants & Leisure 4.0% | | | | |
| 543,258 | | Darden Restaurants, Inc.(a) | | $ | 28,222,253 | |
| 408,535 | | Panera Bread Co. (Class A Stock)* | | | 63,282,072 | |
| 873,747 | | Starwood Hotels & Resorts Worldwide, Inc. | | | 48,169,672 | |
| 1,764,255 | | Tim Hortons, Inc. | | | 89,183,090 | |
| | | | | | |
| | | | | 228,857,087 | |
| |
Household Products 1.4% | | | | |
| 1,476,270 | | Church & Dwight Co., Inc. | | | 80,811,020 | |
| |
Insurance 0.8% | | | | |
| 1,168,061 | | WR Berkley Corp.(a) | | | 43,662,120 | |
| |
Internet Software & Services 4.0% | | | | |
| 1,525,865 | | Rackspace Hosting, Inc.*(a) | | | 91,521,383 | |
| 2,829,960 | | VeriSign, Inc.*(a) | | | 134,932,493 | |
| | | | | | |
| | | | | 226,453,876 | |
| |
IT Services 2.6% | | | | |
| 289,806 | | Alliance Data Systems Corp.*(a) | | | 39,891,796 | |
| 1,224,858 | | Gartner, Inc.* | | | 60,495,736 | |
| 635,323 | | Teradata Corp.* | | | 48,525,971 | |
| | | | | | |
| | | | | 148,913,503 | |
| |
Life Sciences Tools & Services 1.7% | | | | |
| 1,580,114 | | Agilent Technologies, Inc. | | | 58,717,036 | |
| 434,304 | | Waters Corp.* | | | 34,826,838 | |
| | | | | | |
| | | | | 93,543,874 | |
| |
Machinery 4.4% | | | | |
| 1,976,940 | | Colfax Corp.*(a) | | | 65,021,557 | |
| 2,050,501 | | IDEX Corp. | | | 81,732,970 | |
| 892,697 | | Pall Corp. | | | 49,553,610 | |
| 2,198,314 | | Xylem, Inc. | | | 53,397,047 | |
| | | | | | |
| | | | | 249,705,184 | |
| |
Metals & Mining 1.6% | | | | |
| 2,572,701 | | Eldorado Gold Corp. | | | 34,165,469 | |
| 1,147,879 | | Reliance Steel & Aluminum Co. | | | 59,035,417 | |
| | | | | | |
| | | | | 93,200,886 | |
See Notes to Financial Statements.
| | | | |
| Prudential Jennison Mid-Cap Growth Fund, Inc. | | | 17 | |
Portfolio of Investments
as of August 31, 2012 continued
| | | | | | |
| Shares | | Description | | Value (Note 1) | |
| | | | | | |
COMMON STOCKS (Continued) | |
| |
Multiline Retail 3.1% | | | | |
| 1,996,290 | | Dollar Tree, Inc.* | | $ | 96,161,289 | |
| 1,368,617 | | Nordstrom, Inc. | | | 79,147,121 | |
| | | | | | |
| | | | | 175,308,410 | |
| |
Oil, Gas & Consumable Fuels 5.0% | | | | |
| 1,221,111 | | Cobalt International Energy, Inc.* | | | 27,731,431 | |
| 716,324 | | Concho Resources, Inc.* | | | 64,282,916 | |
| 3,823,021 | | Denbury Resources, Inc.* | | | 59,218,595 | |
| 1,907,522 | | HollyFrontier Corp. | | | 76,854,061 | |
| 636,238 | | Noble Energy, Inc. | | | 55,925,320 | |
| | | | | | |
| | | | | 284,012,323 | |
| |
Personal Products 1.3% | | | | |
| 1,536,185 | | Herbalife Ltd.(a) | | | 74,335,992 | |
| |
Pharmaceuticals 2.9% | | | | |
| 787,470 | | Perrigo Co. | | | 86,598,076 | |
| 1,574,552 | | Valeant Pharmaceuticals International, Inc.* | | | 80,727,281 | |
| | | | | | |
| | | | | 167,325,357 | |
| |
Professional Services 2.1% | | | | |
| 740,908 | | IHS, Inc. (Class A Stock)*(a) | | | 84,493,148 | |
| 1,401,240 | | Robert Half International, Inc. | | | 36,852,612 | |
| | | | | | |
| | | | | 121,345,760 | |
| |
Real Estate Investment Trusts 1.7% | | | | |
| 5,637,193 | | Annaly Capital Management, Inc.(a) | | | 97,579,811 | |
| |
Road & Rail 1.4% | | | | |
| 620,726 | | JB Hunt Transport Services, Inc. | | | 32,550,871 | |
| 567,887 | | Kansas City Southern | | | 43,914,702 | |
| | | | | | |
| | | | | 76,465,573 | |
| |
Semiconductors & Semiconductor Equipment 4.5% | | | | |
| 1,251,970 | | Altera Corp. | | | 46,736,040 | |
| 1,882,806 | | Broadcom Corp. (Class A Stock) | | | 66,896,097 | |
| 1,035,625 | | Maxim Integrated Products, Inc. | | | 28,106,863 | |
| 1,363,930 | | Skyworks Solutions, Inc.* | | | 41,545,308 | |
| 2,057,334 | | Xilinx, Inc. | | | 69,764,196 | |
| | | | | | |
| | | | | 253,048,504 | |
See Notes to Financial Statements.
| | |
| 18 | | Visit our website at www.prudentialfunds.com |
| | | | | | |
| Shares | | Description | | Value (Note 1) | |
| | | | | | |
COMMON STOCKS (Continued) | |
| |
Software 5.2% | | | | |
| 4,700,648 | | Activision Blizzard, Inc.(a) | | $ | 55,279,620 | |
| 1,408,713 | | Adobe Systems, Inc.* | | | 44,050,456 | |
| 1,159,512 | | Check Point Software Technologies Ltd.*(a) | | | 53,441,908 | |
| 1,296,126 | | Intuit, Inc. | | | 75,875,216 | |
| 1,199,281 | | Red Hat, Inc.*(a) | | | 67,207,707 | |
| | | | | | |
| | | | | 295,854,907 | |
| |
Specialty Retail 8.5% | | | | |
| 1,022,377 | | Bed Bath & Beyond, Inc.* | | | 68,673,063 | |
| 938,997 | | Dick’s Sporting Goods, Inc. | | | 46,724,491 | |
| 1,443,342 | | Limited Brands, Inc.(a) | | | 70,146,421 | |
| 590,870 | | O’Reilly Automotive, Inc.* | | | 50,194,407 | |
| 498,033 | | PetSmart, Inc.(a) | | | 35,320,500 | |
| 1,835,809 | | Ross Stores, Inc. | | | 127,019,625 | |
| 486,440 | | Ulta Salon Cosmetics & Fragrance, Inc. | | | 45,725,360 | |
| 1,103,263 | | Urban Outfitters, Inc.*(a) | | | 41,416,493 | |
| | | | | | |
| | | | | 485,220,360 | |
| |
Textiles, Apparel & Luxury Goods 2.3% | | | | |
| 466,939 | | Lululemon Athletica, Inc.*(a) | | | 30,439,753 | |
| 1,038,770 | | PVH Corp. | | | 97,540,503 | |
| | | | | | |
| | | | | 127,980,256 | |
| |
Wireless Telecommunication Services 4.7% | | | | |
| 2,666,890 | | Crown Castle International Corp.* | | | 169,240,840 | |
| 4,077,214 | | NII Holdings, Inc.*(a) | | | 25,441,815 | |
| 1,194,786 | | SBA Communications Corp. (Class A Stock)*(a) | | | 71,424,307 | |
| | | | | | |
| | | | | 266,106,962 | |
| | | | | | |
| | Total long-term investments
(cost $4,538,000,743) | | | 5,540,316,550 | |
| | | | | | |
SHORT-TERM INVESTMENT 17.3% | | | | |
| |
Affiliated Money Market Mutual Fund | | | | |
| 984,577,724 | | Prudential Investment Portfolios 2 - Prudential Core Taxable Money Market Fund
(cost $984,577,724; includes $803,171,610 of cash collateral received for securities on loan) (Note 3)(b)(c) | | | 984,577,724 | |
| | | | | | |
See Notes to Financial Statements.
| | | | |
| Prudential Jennison Mid-Cap Growth Fund, Inc. | | | 19 | |
Portfolio of Investments
as of August 31, 2012 continued
| | | | | | | | | | | | |
| Description | | | | | | | | | | Value (Note 1) | |
| | | | | | | | | | | | |
Total Investments 114.8%
(cost $5,522,578,467; Note 5) | | | | | | | | | | $ | 6,524,894,274 | |
Liabilities in excess of other assets (14.8%) | | | | | | | | | | | (840,679,976 | ) |
| | | | | | | | | | | | |
Net Assets 100.0% | | | | | | | | | | $ | 5,684,214,298 | |
| | | | | | | | | | | | |
| * | Non-income producing security. |
| (a) | All or a portion of security is on loan. The aggregate market value of such securities, including those sold and pending settlement, is $788,620,136; cash collateral of $803,171,610 (included in liabilities) was received with which the Fund purchased highly liquid short-term investments. |
| (b) | Prudential Investments LLC, the manager of the Fund, also serves as manager of the Prudential Investment Portfolios 2 - Prudential Core Taxable Money Market Fund. |
| (c) | Represents security, or a portion thereof, purchased with cash collateral received for securities on loan. |
Various inputs are used in determining the value of the Fund’s investments. These inputs are summarized in the three broad levels listed below.
Level 1—quoted prices generally in active markets for identical securities.
Level 2—other significant observable inputs including, but not limited to, quoted prices for similar securities, interest rates and yield curve, prepayment speeds, foreign currency exchange rates, and amortized cost.
Level 3—significant unobservable inputs for securities valued in accordance with Board approved fair valuation procedures.
The following is a summary of the inputs used as of August 31, 2012 in valuing such portfolio securities:
| | | | | | | | | | | | |
| | | Level 1 | | | Level 2 | | | Level 3 | |
Investments in Securities | | | | | | | | | | | | |
Common Stocks | | $ | 5,540,316,550 | | | $ | — | | | $ | — | |
Affiliated Money Market Mutual Fund | | | 984,577,724 | | | | — | | | | — | |
| | | | | | | | | | | | |
Total | | $ | 6,524,894,274 | | | $ | — | | | $ | — | |
| | | | | | | | | | | | |
See Notes to Financial Statements.
| | |
| 20 | | Visit our website at www.prudentialfunds.com |
The industry classification of portfolio holdings and liabilities in excess of other assets shown as a percentage of net assets as of August 31, 2012 were as follows:
| | | | |
Affiliated Money Market Mutual Fund (including 14.1% of collateral received for securities on loan) | | | 17.3 | % |
Specialty Retail | | | 8.5 | |
Healthcare Providers & Services | | | 6.6 | |
Chemicals | | | 5.3 | |
Software | | | 5.2 | |
Oil, Gas & Consumable Fuels | | | 5.0 | |
Wireless Telecommunication Services | | | 4.7 | |
Semiconductors & Semiconductor Equipment | | | 4.5 | |
Machinery | | | 4.4 | |
Hotels, Restaurants & Leisure | | | 4.0 | |
Internet Software & Services | | | 4.0 | |
Electrical Equipment | | | 3.6 | |
Biotechnology | | | 3.4 | |
Multiline Retail | | | 3.1 | |
Pharmaceuticals | | | 2.9 | |
IT Services | | | 2.6 | |
Textiles, Apparel & Luxury Goods | | | 2.3 | |
Communications Equipment | | | 2.1 | |
Professional Services | | | 2.1 | |
Food Products | | | 1.8 | |
Energy Equipment & Services | | | 1.7 | |
Life Sciences Tools & Services | | | 1.7 | % |
Real Estate Investment Trusts | | | 1.7 | |
Metals & Mining | | | 1.6 | |
Healthcare Equipment & Supplies | | | 1.4 | |
Household Products | | | 1.4 | |
Road & Rail | | | 1.4 | |
Electronic Equipment & Instruments | | | 1.3 | |
Personal Products | | | 1.3 | |
Commercial Services & Supplies | | | 1.2 | |
Food & Staples Retailing | | | 1.0 | |
Capital Markets | | | 0.9 | |
Commercial Banks | | | 0.9 | |
Insurance | | | 0.8 | |
Aerospace & Defense | | | 0.7 | |
Beverages | | | 0.7 | |
Air Freight & Logistics | | | 0.6 | |
Computers & Peripherals | | | 0.6 | |
Construction & Engineering | | | 0.5 | |
| | | | |
| | | 114.8 | |
Liabilities in excess of other assets | | | (14.8 | ) |
| | | | |
| | | 100.0 | % |
| | | | |
See Notes to Financial Statements.
| | | | |
| Prudential Jennison Mid-Cap Growth Fund, Inc. | | | 21 | |
Statement of Assets and Liabilities
as of August 31, 2012
| | | | |
Assets | | | | |
Investments at value, including securities on loan of $788,620,136: | | | | |
Unaffiliated Investments (cost $4,538,000,743) | | $ | 5,540,316,550 | |
Affiliated Investments (cost $984,577,724) | | | 984,577,724 | |
Cash | | | 197,320 | |
Receivable for Fund shares sold | | | 20,910,392 | |
Dividends and interest receivable | | | 5,712,251 | |
Receivable for investments sold | | | 188,281 | |
Prepaid expenses | | | 100,261 | |
| | | | |
Total assets | | | 6,552,002,779 | |
| | | | |
| |
Liabilities | | | | |
Payable to broker for collateral for securities on loan | | | 803,171,610 | |
Payable for Fund shares reacquired | | | 39,734,063 | |
Payable for investments purchased | | | 19,597,216 | |
Management fee payable | | | 2,639,681 | |
Accrued expenses | | | 1,530,199 | |
Distribution fee payable | | | 860,017 | |
Affiliated transfer agent fee payable | | | 253,266 | |
Deferred trustees’ fees | | | 2,429 | |
| | | | |
Total liabilities | | | 867,788,481 | |
| | | | |
| |
Net Assets | | $ | 5,684,214,298 | |
| | | | |
| | | | | |
Net assets were comprised of: | | | | |
Common stock, at par | | $ | 177,517 | |
Paid-in capital in excess of par | | | 4,556,224,686 | |
| | | | |
| | | 4,556,402,203 | |
Undistributed net investment income | | | 5,430,100 | |
Accumulated net realized gain on investments | | | 120,066,188 | |
Net unrealized appreciation on investments | | | 1,002,315,807 | |
| | | | |
Net assets, August 31, 2012 | | $ | 5,684,214,298 | |
| | | | |
See Notes to Financial Statements.
| | |
| 22 | | Visit our website at www.prudentialfunds.com |
| | | | |
Class A | | | | |
Net asset value and redemption price per share
($2,317,443,267 ÷ 73,380,929 shares of common stock issued and outstanding) | | $ | 31.58 | |
Maximum sales charge (5.50% of offering price) | | | 1.84 | |
| | | | |
Maximum offering price to public | | $ | 33.42 | |
| | | | |
| |
Class B | | | | |
Net asset value, offering price and redemption price per share
($38,235,707 ÷ 1,367,744 shares of common stock issued and outstanding) | | $ | 27.96 | |
| | | | |
| |
Class C | | | | |
Net asset value, offering price and redemption price per share
($157,256,718 ÷ 5,624,370 shares of common stock issued and outstanding) | | $ | 27.96 | |
| | | | |
| |
Class Q | | | | |
Net asset value, offering price and redemption price per share
($301,496,761 ÷ 9,184,270 shares of common stock issued and outstanding) | | $ | 32.83 | |
| | | | |
| |
Class R | | | | |
Net asset value, offering price and redemption price per share
($283,157,551 ÷ 9,090,838 shares of common stock issued and outstanding) | | $ | 31.15 | |
| | | | |
| |
Class X | | | | |
Net asset value, offering price and redemption price per share
($1,089,553 ÷ 38,867 shares of common stock issued and outstanding) | | $ | 28.03 | |
| | | | |
| |
Class Z | | | | |
Net asset value, offering price and redemption price per share
($2,585,534,741 ÷ 78,830,576 shares of common stock issued and outstanding) | | $ | 32.80 | |
| | | | |
See Notes to Financial Statements.
| | | | |
| Prudential Jennison Mid-Cap Growth Fund, Inc. | | | 23 | |
Statement of Operations
Year Ended August 31, 2012
| | | | |
Net Investment Income | | | | |
Income | | | | |
Unaffiliated dividend income (net of foreign withholding taxes of $253,610) | | $ | 41,926,679 | |
Affiliated income from securities loaned, net | | | 1,464,084 | |
Affiliated dividend income | | | 346,129 | |
| | | | |
Total income | | | 43,736,892 | |
| | | | |
| |
Expenses | | | | |
Management fee | | | 24,107,784 | |
Distribution fee—Class A | | | 5,844,229 | |
Distribution fee—Class B | | | 371,963 | |
Distribution fee—Class C | | | 1,358,638 | |
Distribution fee—Class L | | | 47,890 | |
Distribution fee—Class M | | | 4,177 | |
Distribution fee—Class R | | | 1,105,722 | |
Distribution fee—Class X | | | 14,745 | |
Transfer agent’s fees and expenses (including affiliated expense of $1,228,000) (Note 3) | | | 6,902,000 | |
Registration fees | | | 494,000 | |
Custodian’s fees and expenses | | | 474,000 | |
Reports to shareholders | | | 281,000 | |
Trustees’ fees | | | 96,000 | |
Insurance expense | | | 72,000 | |
Legal fees and expenses | | | 49,000 | |
Audit fee | | | 22,000 | |
Miscellaneous | | | 39,269 | |
| | | | |
Total expenses | | | 41,284,417 | |
| | | | |
Net investment income | | | 2,452,475 | |
| | | | |
| |
Realized And Unrealized Gain On Investments | | | | |
Net realized gain on investment transactions | | | 166,898,752 | |
Net change in unrealized appreciation (depreciation) on investments | | | 452,054,655 | |
| | | | |
Net gain on investments | | | 618,953,407 | |
| | | | |
Net Increase In Net Assets Resulting From Operations | | $ | 621,405,882 | |
| | | | |
See Notes to Financial Statements.
| | |
| 24 | | Visit our website at www.prudentialfunds.com |
Statement of Changes in Net Assets
| | | | | | | | |
| | | Year Ended August 31, | |
| | | 2012 | | | 2011 | |
Increase (Decrease) In Net Assets | | | | | | | | |
Operations | | | | | | | | |
Net investment income | | $ | 2,452,475 | | | $ | 7,412,904 | |
Net realized gain on investments | | | 166,898,752 | | | | 117,596,796 | |
Net change in unrealized appreciation (depreciation) on investments | | | 452,054,655 | | | | 325,122,672 | |
| | | | | | | | |
Net increase in net assets resulting from operations | | | 621,405,882 | | | | 450,132,372 | |
| | | | | | | | |
| | |
Dividends and Distributions (Note 1) | | | | | | | | |
Dividends from net investment income: | | | | | | | | |
Class A | | | (1,154,079 | ) | | | — | |
Class Q | | | (863,741 | ) | | | — | |
Class Z | | | (4,322,765 | ) | | | — | |
| | | | | | | | |
| | | (6,340,585 | ) | | | — | |
| | | | | | | | |
| | |
Distributions from net realized gains: | | | | | | | | |
Class A | | | (9,387,983 | ) | | | — | |
Class B | | | (223,519 | ) | | | — | |
Class C | | | (751,184 | ) | | | — | |
Class L | | | (52,488 | ) | | | — | |
Class M | | | (5,223 | ) | | | — | |
Class Q | | | (857,587 | ) | | | — | |
Class R | | | (987,612 | ) | | | — | |
Class X | | | (9,991 | ) | | | — | |
Class Z | | | (6,641,380 | ) | | | — | |
| | | | | | | | |
| | | (18,916,967 | ) | | | — | |
| | | | | | | | |
| | |
Fund share transactions (Net of share conversions) (Note 6) | | | | | | | | |
Net proceeds from shares sold | | | 2,827,174,156 | | | | 1,696,383,826 | |
Net asset value of shares issued in reinvestment of dividends and distributions | | | 21,596,543 | | | | — | |
Cost of shares reacquired | | | (1,110,595,763 | ) | | | (796,054,183 | ) |
| | | | | | | | |
Net increase in net assets from Fund share transactions | | | 1,738,174,936 | | | | 900,329,643 | |
| | | | | | | | |
| | |
Capital Contributions (Note 6) | | | | | | | | |
Proceeds from regulatory settlement | | | — | | | | 28,766 | |
| | | | | | | | |
Total increase | | | 2,334,323,266 | | | | 1,350,490,781 | |
| | |
Net Assets: | | | | | | | | |
Beginning of year | | | 3,349,891,032 | | | | 1,999,400,251 | |
| | | | | | | | |
End of year(a) | | $ | 5,684,214,298 | | | $ | 3,349,891,032 | |
| | | | | | | | |
(a) Includes undistributed net investment income of: | | $ | 5,430,100 | | | $ | 7,757,562 | |
| | | | | | | | |
See Notes to Financial Statements.
| | | | |
| Prudential Jennison Mid-Cap Growth Fund, Inc. | | | 25 | |
Notes to Financial Statements
Prudential Jennison Mid-Cap Growth Fund, Inc. (the “Fund”) is a diversified, open-end management investment company, registered under the Investment Company Act of 1940, as amended (“1940 Act”). The Fund’s investment objective is to achieve long-term capital appreciation.
Note 1. Accounting Policies
The following is a summary of significant accounting policies followed by the Fund in the preparation of the financial statements.
Securities Valuation: The Fund holds portfolio securities and other assets that are fair valued at the close of each day the New York Stock Exchange (“NYSE”) is open for trading. Fair value is the price that would be received to sell an asset or paid to transfer a liability in an orderly transaction between market participants on the measurement date. The Board of Trustees has delegated fair valuation responsibilities to Prudential Investments LLC (“PI” or “Manager”) through the adoption of Valuation Procedures for valuation of the Fund’s securities. Under the current Valuation Procedures, a Valuation Committee is established and responsible for supervising the valuation of portfolio securities and other assets. The Valuation Procedures allow the Fund to utilize independent pricing vendor services, quotations from market makers and other valuation methods in events when market quotations are not readily available. A record of the Valuation Committee’s actions is subject to review, approval and ratification by the Board at its next regularly scheduled quarterly meeting.
Various inputs are used in determining the value of the Fund’s investments, which are summarized in the three broad level hierarchies based on any observable inputs used as described in the table following the Portfolio of Investments. The valuation methodologies and significant inputs used in determining the fair value of securities and other assets classified as Level 1, Level 2 and Level 3 of the hierarchy are as follows:
Common stocks, exchange-traded funds and financial derivative instruments (including futures contracts and certain options contracts on securities), that are traded on a national securities exchange are valued at the last sale price as of the close of trading on the applicable exchange. Securities traded via NASDAQ are
| | |
| 26 | | Visit our website at www.prudentialfunds.com |
valued at the NASDAQ official closing price. To the extent these securities are valued at the last sale price or NASDAQ official closing price, they are classified as Level 1 of the fair value hierarchy.
In the event there is no sale or official closing price on such day, these securities are valued at the mean between the last reported bid and asked prices, or at the last bid price in absence of an asked price. These securities are classified as Level 2 of the fair value hierarchy as these inputs are considered as significant other observable inputs to the valuation.
For common stocks traded on foreign securities exchanges, certain valuation adjustments will be applied when events occur after the close of the security’s foreign market and before the Fund’s normal pricing time. These securities are valued using pricing vendor services that provide adjustment factors based on information such as local closing price, relevant general and sector indices, currency fluctuations, depositary receipts, and futures, as applicable. Securities valued using such adjustment factors are classified as Level 2 of the fair value hierarchy.
Investments in open-end, non-exchange-traded mutual funds are valued at their net asset value as of the close of the NYSE on the date of valuation. These securities are classified as Level 1 as these securities have the ability to be purchased or sold at their net asset value on the date of valuation.
Fixed income securities traded in the over-the-counter market, such as corporate bonds, municipal bonds, U.S. Government agencies, U.S. Treasury obligations, and sovereign issues are usually valued at prices provided by approved independent pricing vendors. The pricing vendors provide these prices usually after evaluating observable inputs including yield curves, credit rating, yield spreads, default rates, cash flows as well as broker/dealer quotations and reported trades. Securities valued using such vendor prices are classified as Level 2 of the fair value hierarchy.
Asset-backed and mortgage-related securities are usually valued by approved independent pricing vendors. The pricing vendors provide the prices using their internal pricing model with input from deal term, tranche level attributes, yield curve, prepayment speeds, and broker/dealer quotes. Securities valued using such vendor prices are classified as Level 2 of the fair value hierarchy.
Short-term debt securities of sufficient credit quality which mature in 60 days or less are valued at amortized cost which approximates fair value. The amortized cost method involves valuing a security at its cost on the date of purchase and thereafter assuming a constant amortization to maturity of the difference between the principal amount due at maturity and cost. These securities are categorized as Level 2 of the fair value hierarchy.
| | | | |
| Prudential Jennison Mid-Cap Growth Fund, Inc. | | | 27 | |
Notes to Financial Statements
continued
Over-the-counter financial derivative instruments, such as option contracts, foreign currency contracts and swaps agreements, are usually valued using pricing vendor services, which derive the valuation based on underlying asset prices, indices, spreads, interest rates, exchange rates and other inputs. These instruments are categorized as Level 2 of the fair value hierarchy.
Securities and other assets that cannot be priced using the methods described above are valued with pricing methodologies approved by the Valuation Committee. In the event there are unobservable inputs used when determining such valuations, the securities will be classified as Level 3 of the fair value hierarchy.
When determining the fair value of securities, some of the factors influencing the valuation include: the nature of any restrictions on disposition of the securities; assessment of the general liquidity of the securities; the issuer’s financial condition and the markets in which it does business; the cost of the investment; the size of the holding and the capitalization of the issuer; the prices of any recent transactions or bids/offers for such securities or any comparable securities; any available analyst media or other reports or information deemed reliable by the investment adviser regarding the issuer or the markets or industry in which it operates. Using fair value to price securities may result in a value that is different from a security’s most recent closing price and from the price used by other mutual funds to calculate their net asset values.
The Fund invests in the Prudential Core Taxable Money Market Fund, a portfolio of the Prudential Investment Portfolios 2, registered under the Investment Company Act of 1940, as amended, and managed by PI.
The Fund may hold up to 15% of its net assets in illiquid securities, including those that are restricted as to disposition under securities law (“restricted securities”). Restricted securities, sometimes referred to as private placements, are valued pursuant to the valuation procedures noted above.
Foreign Currency Translation: The books and records of the Fund are maintained in U.S. dollars. Foreign currency amounts are translated into U.S. dollars on the following basis:
(i) market value of investment securities, other assets and liabilities at the current rates of exchange;
| | |
| 28 | | Visit our website at www.prudentialfunds.com |
(ii) purchases and sales of investment securities, income and expenses at the rates of exchange prevailing on the respective dates of such transactions.
Although the net assets of the Fund are presented at the foreign exchange rates and market values at the close of the fiscal year, the Fund does not isolate that portion of the results of operations arising as a result of changes in the foreign exchange rates from the fluctuations arising from changes in the market prices of securities held at the end of the fiscal year. Similarly, the Fund does not isolate the effect of changes in foreign exchange rates from the fluctuations arising from changes in the market prices of portfolio securities sold during the period. Accordingly, realized foreign currency gains or losses are included in the reported net realized gains or losses on investment transactions.
Net realized gains or losses on foreign currency transactions represent net foreign exchange gains or losses from holdings of foreign currencies, currency gains or losses realized between the trade and settlement dates on security transactions, and the difference between the amounts of dividends, interest and foreign withholding taxes recorded on the Fund’s books and the U.S. dollar equivalent amounts actually received or paid. Net unrealized currency gains or losses from valuing foreign currency denominated assets and liabilities (other than investments) at year end exchange rates are reflected as a component of net unrealized appreciation (depreciation) on foreign currencies. Foreign security and currency transactions may involve certain considerations and risks not typically associated with those of domestic origin as a result of, among other factors, the possibility of political and economic instability, or the level of governmental supervision and regulation of foreign securities markets.
Securities Lending: The Fund may lend its portfolio securities to banks and broker-dealers. The loans are secured by collateral at least equal to the market value of the securities loaned. Collateral pledged by each borrower is marked to market daily, based on the previous day’s market value, such that the value of the collateral exceeds the value of the loaned securities. Loans are subject to termination at the option of the borrower or the Fund. Upon termination of the loan, the borrower will return to the Fund securities identical to the loaned securities. Should the borrower of the securities fail financially, the Fund has the right to repurchase the securities using the collateral in the open market. The Fund recognizes income, net of any rebate and securities lending agent fees, for lending its securities in the form of fees or interest on the investment of any cash received as collateral. The Fund also continues to receive interest and dividends or amounts equivalent thereto, on the securities loaned and recognizes any unrealized gain or loss in the market price of the securities loaned that may occur during the term of the loan.
| | | | |
| Prudential Jennison Mid-Cap Growth Fund, Inc. | | | 29 | |
Notes to Financial Statements
continued
Securities Transactions and Net Investment Income: Securities transactions are recorded on the trade date. Realized gains or losses from investment and currency transactions are calculated on the identified cost basis. Dividend income is recorded on the ex-dividend date. Interest income, including amortization of premium and accretion of discount on debt securities, as required, is recorded on the accrual basis. Expenses are recorded on the accrual basis which may require the use of certain estimates by management.
Net investment income or loss (other than distribution fees which are charged directly to the respective class) and unrealized and realized gains or losses are allocated daily to each class of shares based upon the relative proportion of adjusted net assets of each class at the beginning of the day.
Dividends and Distributions: The Fund expects to pay dividends from net investment income and distributions from net realized capital gains, if any, at least annually. Dividends and distributions to shareholders, which are determined in accordance with federal income tax regulations and which may differ from generally accepted accounting principles, are recorded on the ex-dividend date. Permanent book/tax differences relating to income and gains are reclassified amongst undistributed net investment income, accumulated net realized gain or loss and paid-in capital in excess of par, as appropriate.
Taxes: It is the Fund’s policy to continue to meet the requirements of the Internal Revenue Code applicable to regulated investment companies and to distribute all of its taxable net investment income and capital gains, if any, to its shareholders. Therefore, no federal income tax provision is required.
Withholding taxes on foreign dividends are recorded, net of reclaimable amounts, at the time the related income is earned.
Estimates: The preparation of the financial statements requires management to make estimates and assumptions that affect the reported amounts and disclosures in the financial statements. Actual results could differ from those estimates.
Note 2. Agreements
The Fund has a management agreement with PI. Pursuant to this agreement, PI has responsibility for all investment advisory services and supervises the subadvisor’s
| | |
| 30 | | Visit our website at www.prudentialfunds.com |
performance of such services. PI has entered into a subadvisory agreement with Jennison Associates LLC (“Jennison”). The subadvisory agreement provides that Jennison furnishes investment advisory services in connection with the management of the Fund. In connection therewith, Jennison is obligated to keep certain books and records of the Fund. PI pays for the services of Jennison, the cost of compensation of officers of the Fund, occupancy and certain clerical and bookkeeping costs of the Fund. The Fund bears all other costs and expenses.
The management fee paid to PI is computed daily and payable monthly, at an annual rate of .60% of the Fund’s average daily net assets up to $1 billion and .55% of the average daily net assets in excess of $1 billion. The effective management fee rate was .56% for the year ended August 31, 2012.
The Fund has a distribution agreements with Prudential Investment Management Services LLC (“PIMS”) and Prudential Annuities Distributors, Inc (“PAD”). PIMS and PAD are both affiliates of PI and indirect, wholly-owned subsidiaries of Prudential. PIMS serves as the distributor of the Fund’s Class A, Class B, Class C, Class R and Class Z shares. PIMS, together with PAD, serves as co-distributor of the Fund’s Class L, Class M and Class X shares. The Fund has adopted a separate Distribution and Service plan (each a “Plan” and collectively the “Plans”) for Class A, B, C, L, M, Q, R, X and Z shares of the Fund in accordance with Rule 12b-1 of the 1940 Act, as amended. No distribution or service fees are paid to PIMS as distributor of the Class Q and Class Z shares of the Fund.
Under the Plans, the Fund compensates PIMS and PAD a distribution and service fees at an annual rate of up to .30%, 1%, 1%, .50%, 1%, .75% and 1% of the average daily net assets of the Class A, B, C, L, M, R and X shares, respectively. PIMS contractually agreed to limit such fees to .50% of the average daily net assets of Class R shares through December 31, 2013.
PIMS has advised the Fund that it received $596,609 in front-end sales charges resulting from sales of Class A shares during the year ended August 31, 2012. From these fees, PIMS paid such sales charges to broker-dealers, which in turn paid commissions to salespersons and incurred other distribution costs. PIMS has advised the Fund that for the year ended August 31, 2012, it received $338 , $60,791, $14,778 and $123 in contingent deferred sales charges imposed upon redemptions by certain Class A, Class B, Class C and Class X shareholders, respectively.
PI, PIMS and Jennison are indirect, wholly-owned subsidiaries of Prudential Financial, Inc. (“Prudential”).
| | | | |
| Prudential Jennison Mid-Cap Growth Fund, Inc. | | | 31 | |
Notes to Financial Statements
continued
Note 3. Other Transactions with Affiliates
Prudential Mutual Fund Services LLC (“PMFS”), an affiliate of PI and an indirect, wholly-owned subsidiary of Prudential, serves as the Fund’s transfer agent. Transfer agent’s fees and expenses in the Statement of Operations include certain out-of-pocket expenses paid to non-affiliates, where applicable.
Prudential Investment Management, Inc., (“PIM”), an indirect, wholly-owned subsidiary of Prudential, is the Fund’s security lending agent. For the year ended August 31, 2012, PIM has been compensated approximately $437,324 for these services.
The Fund invests in the Prudential Core Taxable Money Market Fund (the “Core Fund”), a portfolio of Prudential Investment Portfolios 2, registered under 1940 Act, as amended, and managed by PI. Earnings from the Core Fund are disclosed on the Statement of Operations as affiliated dividend income.
Note 4. Portfolio Securities
Purchases and sales of investment securities, other than short-term investments, for the year ended August 31, 2012 were $3,678,053,927 and $2,046,800,495, respectively.
Note 5. Distributions and Tax Information
Distributions to shareholders, which are determined in accordance with federal income tax regulations and which may differ from generally accepted accounting principles, are recorded on the ex-dividend date. In order to present undistributed net investment income, accumulated net realized gain on investments and paid-in capital in excess of par on the Statement of Assets and Liabilities that more closely represent their tax character, certain adjustments have been made to undistributed net investment income and accumulated net realized gain on investments. For the year ended August 31, 2012, the adjustments were to increase undistributed net investment income and decrease accumulated net realized gain on investments by $1,560,648 due to reclassification of distributions and other book to tax differences. Net investment income, net realized gain on investment transactions and net assets were not affected by this change.
| | |
| 32 | | Visit our website at www.prudentialfunds.com |
For the year ended August 31, 2012, the tax character of dividends paid as reflected in the Statement of Changes in Net Assets were $6,340,585 of ordinary income and 18,916,967 of long-term capital gains. For the year ended August 31, 2011, there were no distributions paid by the Fund.
As of August 31, 2012, the accumulated undistributed earnings on a tax basis were $9,613,127 of ordinary income and $167,916,396 of long-term capital gains. This differs from the amount shown on the Statement of Assets and Liabilities primarily due to cumulative timing differences between financial and tax reporting.
The United States federal income tax basis of the Fund’s investments and the net unrealized appreciation as of August 31, 2012 were as follows:
| | | | | | |
Tax Basis | | Appreciation | | Depreciation | | Net
Unrealized
Appreciation |
| $5,562,125,818 | | $1,097,862,963 | | $(135,094,507) | | $962,768,456 |
The difference between book basis and tax basis was primarily attributable to deferred losses on wash sales and other tax adjustments.
Under the Regulated Investment Company Modernization Act of 2010 (“the Act”), the Fund is permitted to carryforward capital losses incurred in the fiscal year ended August 31, 2012 (“post-enactment losses”) for an unlimited period. Post-enactment losses are required to be utilized before the utilization of losses incurred prior to the effective date of the Act. As a result of this ordering rule, capital loss carryforwards related to taxable years ending before August 31, 2012 (“pre-enactment losses”) may have an increased likelihood to expire unused. The Fund utilized approximately $3,121,000 of its pre-enactment losses to offset net taxable gains realized in the fiscal year ended August 31, 2012. As of August 31, 2012, the pre and post-enactment losses were approximately:
| | | | |
Post-Enactment Losses: | | $ | 0 | |
| | | | |
Pre-Enactment Losses: | | | | |
Expiring 2016 | | $ | 12,484,000 | |
| | | | |
A portion of the capital loss carryforward was assumed by the Fund as a result of an acquisition. Realization of such loss is limited in accordance with federal tax regulations.
Management has analyzed the Fund’s tax positions taken on federal income tax returns for all open tax years and has concluded that no provision for income tax is
| | | | |
| Prudential Jennison Mid-Cap Growth Fund, Inc. | | | 33 | |
Notes to Financial Statements
continued
required in the Fund’s financial statements for the current reporting period. The Fund’s federal and state income and federal excise tax returns for tax years for which the applicable statutes of limitations have not expired are subject to examination by the Internal Revenue Service and state departments of revenue.
Note 6. Capital
The Fund offers Class A, Class B, Class C, Class Q, Class R, Class X and Class Z shares. Class A shares are sold with a front-end sales charge of up to 5.50%. All investors who purchase Class A shares in an amount of $1 million or more and sell these shares within 12 months of purchase are subject to a contingent deferred sales charge (“CDSC”) of 1%. Class B shares are sold with a CDSC which declines from 5% to zero depending on the period of time the shares are held. Class B shares will automatically convert to Class A shares on a quarterly basis approximately seven years after purchase. Class C shares are sold with a CDSC of 1% on shares redeemed within the first 12 months of purchase. Class X shares are sold with a CDSC which declines from 6% to zero depending on the period of time the shares are held. Class X shares will automatically convert to Class A shares approximately ten years after purchase. The last conversion of Class M and Class L shares to Class A shares was completed as of April 13, 2012 and August 24, 2012, respectively. There are no Class M and Class L shares outstanding and Class M and Class L shares are no longer being offered for sale. Class X shares are closed to new purchases. Class Q, Class R and Class Z shares are not subject to any sales or redemption charge and are offered exclusively for sale to a limited group of investors.
Under certain circumstances, an exchange may be made from specified share classes of the Fund to one or more other share classes of the Fund as presented in the table of transactions in shares of common stock.
There are 2 billion shares of $.001 par value common stock authorized divided into eight classes, designated Class A, Class B, Class C, Class M, Class Q, Class R, Class X and Class Z, which consists of 825 million, 300 million, 300 million, 25 million, 200 million, 100 million, 25 million and 225 million authorized shares, respectively.
During the fiscal years ended August 21, 2011 and 2010, the Fund received $28,766 and $2,724,527, respectively, related to settlements of regulatory proceedings involving allegations of improper trading in Fund shares. The amounts relating to an
| | |
| 34 | | Visit our website at www.prudentialfunds.com |
unaffiliated-third party and to a former affiliate were $28,766 and $2,724,527, respectively. The per share effect of these amounts is disclosed in the financial highlights for each of the share classes that is affected.
Transaction in shares of common stock were as follows:
| | | | | | | | |
Class A | | Shares | | | Amount | |
Year ended August 31, 2012: | | | | | | | | |
Shares sold | | | 29,500,429 | | | $ | 876,608,089 | |
Shares issued in reinvestment of dividends and distributions | | | 311,704 | | | | 8,771,428 | |
Shares reacquired | | | (17,959,314 | ) | | | (525,874,033 | ) |
| | | | | | | | |
Net increase (decrease) in shares outstanding before conversion | | | 11,852,819 | | | | 359,505,484 | |
Shares issued upon conversion from Class B, Class M, Class X and Class Z | | | 369,984 | | | | 10,720,273 | |
Shares reacquired upon conversion into Class Z | | | (566,767 | ) | | | (16,111,483 | ) |
| | | | | | | | |
Net increase (decrease) in shares outstanding | | | 11,656,036 | | | $ | 354,114,274 | |
| | | | | | | | |
Year ended August 31, 2011: | | | | | | | | |
Shares sold | | | 24,026,182 | | | $ | 661,071,289 | |
Shares reacquired | | | (15,691,091 | ) | | | (433,566,301 | ) |
| | | | | | | | |
Net increase (decrease) in shares outstanding before conversion | | | 8,335,091 | | | | 227,504,988 | |
Shares issued upon conversion from Class B, Class M, Class X and Class Z | | | 502,715 | | | | 13,723,742 | |
Shares reacquired upon conversion into Class Z | | | (1,179,662 | ) | | | (34,331,062 | ) |
| | | | | | | | |
Net increase (decrease) in shares outstanding | | | 7,658,144 | | | $ | 206,897,668 | |
| | | | | | | | |
Class B | | | | | | |
Year ended August 31, 2012: | | | | | | | | |
Shares sold | | | 267,842 | | | $ | 7,093,102 | |
Shares issued in reinvestment of distributions | | | 8,405 | | | | 210,442 | |
Shares reacquired | | | (195,210 | ) | | | (5,099,809 | ) |
| | | | | | | | |
Net increase (decrease) in shares outstanding before conversion | | | 81,037 | | | | 2,203,735 | |
Shares reacquired upon conversion into Class A | | | (277,922 | ) | | | (7,152,093 | ) |
| | | | | | | | |
Net increase (decrease) in shares outstanding | | | (196,885 | ) | | $ | (4,948,358 | ) |
| | | | | | | | |
Year ended August 31, 2011: | | | | | | | | |
Shares sold | | | 246,419 | | | $ | 6,102,970 | |
Shares reacquired | | | (252,416 | ) | | | (6,229,784 | ) |
| | | | | | | | |
Net increase (decrease) in shares outstanding before conversion | | | (5,997 | ) | | | (126,814 | ) |
Shares reacquired upon conversion into Class A | | | (385,366 | ) | | | (9,361,993 | ) |
| | | | | | | | |
Net increase (decrease) in shares outstanding | | | (391,363 | ) | | $ | (9,488,807 | ) |
| | | | | | | | |
| | | | |
| Prudential Jennison Mid-Cap Growth Fund, Inc. | | | 35 | |
Notes to Financial Statements
continued
| | | | | | | | |
Class C | | Shares | | | Amount | |
Year ended August 31, 2012: | | | | | | | | |
Shares sold | | | 1,498,371 | | | $ | 39,859,678 | |
Shares issued in reinvestment of distributions | | | 19,574 | | | | 490,127 | |
Shares reacquired | | | (863,779 | ) | | | (22,720,728 | ) |
| | | | | | | | |
Net increase (decrease) in shares outstanding before conversion | | | 654,166 | | | | 17,629,077 | |
Shares reacquired upon conversion into Class Z | | | (13,243 | ) | | | (359,287 | ) |
| | | | | | | | |
Net increase (decrease) in shares outstanding | | | 640,923 | | | $ | 17,269,790 | |
| | | | | | | | |
Year ended August 31, 2011: | | | | | | | | |
Shares sold | | | 993,293 | | | $ | 24,621,854 | |
Shares reacquired | | | (978,862 | ) | | | (24,200,183 | ) |
| | | | | | | | |
Net increase (decrease) in shares outstanding before conversion | | | 14,431 | | | | 421,671 | |
Shares reacquired upon conversion into Class Z | | | (4,995 | ) | | | (118,313 | ) |
| | | | | | | | |
Net increase (decrease) in shares outstanding | | | 9,436 | | | $ | 303,358 | |
| | | | | | | | |
Class L | | | | | | |
Period ended August 24, 2012*: | | | | | | | | |
Shares sold | | | 967 | | | $ | 29,014 | |
Shares issued in reinvestment of distributions | | | 1,818 | | | | 50,697 | |
Shares reacquired | | | (363,770 | ) | | | (11,282,413 | ) |
| | | | | | | | |
Net increase (decrease) in shares outstanding | | | (360,985 | ) | | $ | (11,202,702 | ) |
| | | | | | | | |
Year ended August 31, 2011: | | | | | | | | |
Shares sold | | | 912 | | | $ | 31,477 | |
Shares reacquired | | | (62,590 | ) | | | (1,728,236 | ) |
| | | | | | | | |
Net increase (decrease) in shares outstanding | | | (61,678 | ) | | $ | (1,696,759 | ) |
| | | | | | | | |
Class M | | | | | | |
Period ended April 13, 2012**: | | | | | | | | |
Shares sold | | | 75 | | | $ | 1,754 | |
Shares issued in reinvestment of distributions | | | 187 | | | | 4,667 | |
Shares reacquired | | | (4,556 | ) | | | (111,413 | ) |
| | | | | | | | |
Net increase (decrease) in shares outstanding before conversion | | | (4,294 | ) | | | (104,992 | ) |
Shares reacquired upon conversion into Class A | | | (56,278 | ) | | | (1,427,839 | ) |
| | | | | | | | |
Net increase (decrease) in shares outstanding | | | (60,572 | ) | | $ | (1,532,831 | ) |
| | | | | | | | |
Year ended August 31, 2011: | | | | | | | | |
Shares sold | | | 1,142 | | | $ | 27,718 | |
Shares reacquired | | | (24,712 | ) | | | (607,373 | ) |
| | | | | | | | |
Net increase (decrease) in shares outstanding before conversion | | | (23,570 | ) | | | (579,655 | ) |
Shares reacquired upon conversion into Class A | | | (120,193 | ) | | | (2,987,143 | ) |
| | | | | | | | |
Net increase (decrease) in shares outstanding | | | (143,763 | ) | | $ | (3,566,798 | ) |
| | | | | | | | |
| | |
| 36 | | Visit our website at www.prudentialfunds.com |
| | | | | | | | |
Class Q | | Shares | | | Amount | |
Year ended August 31, 2012: | | | | | | | | |
Shares sold | | | 5,099,546 | | | $ | 156,662,046 | |
Shares issued in reinvestment of dividends and distributions | | | 58,992 | | | | 1,719,612 | |
Shares reacquired | | | (1,603,747 | ) | | | (49,513,083 | ) |
| | | | | | | | |
Net increase (decrease) in shares outstanding | | | 3,554,791 | | | $ | 108,868,575 | |
| | | | | | | | |
Period ended August 31, 2011***: | | | | | | | | |
Shares sold | | | 864,047 | | | $ | 25,711,637 | |
Shares reacquired | | | (882,589 | ) | | | (25,609,794 | ) |
| | | | | | | | |
Net increase (decrease) in shares outstanding before conversion | | | (18,542 | ) | | | 101,843 | |
Shares issued upon conversion from Class Z | | | 5,648,021 | | | | 176,341,386 | |
| | | | | | | | |
Net increase (decrease) in shares outstanding | | | 5,629,479 | | | $ | 176,443,229 | |
| | | | | | | | |
Class R | | | | | | |
Year ended August 31, 2012: | | | | | | | | |
Shares sold | | | 4,623,462 | | | $ | 136,723,767 | |
Shares issued in reinvestment of distributions | | | 32,414 | | | | 900,727 | |
Shares reacquired | | | (1,906,356 | ) | | | (55,524,905 | ) |
| | | | | | | | |
Net increase (decrease) in shares outstanding | | | 2,749,520 | | | $ | 82,099,589 | |
| | | | | | | | |
Year ended August 31, 2011: | | | | | | | | |
Shares sold | | | 3,808,720 | | | $ | 103,881,907 | |
Shares reacquired | | | (1,801,574 | ) | | | (49,666,053 | ) |
| | | | | | | | |
Net increase (decrease) in shares outstanding | | | 2,007,146 | | | $ | 54,215,854 | |
| | | | | | | | |
Class X | | | | | | |
Year ended August 31, 2012: | | | | | | | | |
Shares sold | | | 153 | | | $ | 4,058 | |
Shares issued in reinvestment of distributions | | | 397 | | | | 9,972 | |
Shares reacquired | | | (8,938 | ) | | | (234,378 | ) |
| | | | | | | | |
Net increase (decrease) in shares outstanding before conversion | | | (8,388 | ) | | | (220,348 | ) |
Shares reacquired upon conversion into Class A | | | (28,632 | ) | | | (757,436 | ) |
| | | | | | | | |
Net increase (decrease) in shares outstanding | | | (37,020 | ) | | $ | (977,784 | ) |
| | | | | | | | |
Year ended August 31, 2011: | | | | | | | | |
Shares sold | | | 442 | | | $ | 10,980 | |
Shares reacquired | | | (18,219 | ) | | | (448,843 | ) |
| | | | | | | | |
Net increase (decrease) in shares outstanding before conversion | | | (17,777 | ) | | | (437,863 | ) |
Shares reacquired upon conversion into Class A | | | (54,548 | ) | | | (1,334,579 | ) |
| | | | | | | | |
Net increase (decrease) in shares outstanding | | | (72,325 | ) | | $ | (1,772,442 | ) |
| | | | | | | | |
| | | | |
| Prudential Jennison Mid-Cap Growth Fund, Inc. | | | 37 | |
Notes to Financial Statements
continued
| | | | | | | | |
Class Z | | Shares | | | Amount | |
Year ended August 31, 2012: | | | | | | | | |
Shares sold | | | 51,949,493 | | | $ | 1,610,192,648 | |
Shares issued in reinvestment of dividends and distributions | | | 323,711 | | | | 9,438,871 | |
Shares reacquired | | | (14,349,207 | ) | | | (440,235,001 | ) |
| | | | | | | | |
Net increase (decrease) in shares outstanding before conversion | | | 37,923,997 | | | | 1,179,396,518 | |
Shares issued upon conversion from Class A and Class C | | | 557,655 | | | | 16,470,770 | |
Shares reacquired upon conversion into Class A | | | (44,121 | ) | | | (1,382,905 | ) |
| | | | | | | | |
Net increase (decrease) in shares outstanding | | | 38,437,531 | | | $ | 1,194,484,383 | |
| | | | | | | | |
Year ended August 31, 2011: | | | | | | | | |
Shares sold | | | 30,249,478 | | | $ | 874,923,994 | |
Shares reacquired | | | (8,822,852 | ) | | | (253,997,616 | ) |
| | | | | | | | |
Net increase (decrease) in shares outstanding before conversion | | | 21,426,626 | | | | 620,926,378 | |
Shares issued upon conversion from Class A and Class C | | | 1,141,939 | | | | 34,449,375 | |
Shares reacquired upon conversion into Class A and Class Q | | | (5,651,034 | ) | | | (176,381,413 | ) |
| | | | | | | | |
Net increase (decrease) in shares outstanding | | | 16,917,531 | | | $ | 478,994,340 | |
| | | | | | | | |
| * | As of August 24, 2012, the last conversion of Class L shares to Class A shares was completed. There are no Class L shares outstanding and Class L shares are no longer being offered for sale. |
| ** | As of April 13, 2012, the last conversion of Class M shares to Class A shares was completed. There are no Class M shares outstanding and Class M shares are no longer being offered for sale. |
| *** | Commencement of offering was January 18, 2011. |
Note 7. Borrowings
The Fund, along with other affiliated registered investment companies (the “Funds”), is a party to a Syndicated Credit Agreement (“SCA”) with a group of banks. The purpose of the SCA is to provide an alternative source of temporary funding for capital share redemptions. The SCA provides for a commitment of $900 million for the period December 16, 2011 through December 14, 2012. The Funds pay an annualized commitment fee of 0.08% of the unused portion of the SCA. Prior to December 16, 2011, the Funds had another Syndicated Credit Agreement of a $750 million commitment with an annualized commitment fee of 0.10% of the unused portion. Interest on any borrowings under the SCA is paid at contracted market rates. The commitment fee for the unused amount is accrued daily and paid quarterly.
The Fund did not utilize the SCA during the year ended August 31, 2012.
| | |
| 38 | | Visit our website at www.prudentialfunds.com |
Note 8. New Accounting Pronouncements
In December 2011, the Financial Accounting Standards Board (“FASB”) issued Accounting Standards Update (“ASU”) No. 2011-11 regarding “Disclosures about Offsetting Assets and Liabilities”. The amendments, which will be effective for annual reporting periods beginning on or after January 1, 2013 and interim periods within those annual periods, require an entity to disclose information about offsetting and related arrangements for assets and liabilities, financial instruments and derivatives that are either currently offset in accordance with current requirements or are subject to enforceable master netting arrangements or similar agreements. At this time, management is evaluating the implications of ASU No. 2011-11 and its impact on the financial statements has not been determined.
| | | | |
| Prudential Jennison Mid-Cap Growth Fund, Inc. | | | 39 | |
Financial Highlights
| | | | | | | | | | | | | | | | | | | | |
| Class A Shares | | | | | | | | | | | | | | | |
| | | Year Ended August 31, | |
| | | 2012 | | | 2011 | | | 2010 | | | 2009 | | | 2008 | |
| Per Share Operating Performance(a): | | | | | | | | | | | | | | | | | | | | |
| Net Asset Value, Beginning Of Year | | | $27.44 | | | | $22.31 | | | | $20.24 | | | | $23.98 | | | | $24.49 | |
| Income (loss) from investment operations: | | | | | | | | | | | | | | | | | | | | |
| Net investment income (loss) | | | (.01 | ) | | | .06 | | | | - | (b) | | | .05 | | | | (.06 | ) |
| Net realized and unrealized gain (loss) on investment transactions | | | 4.32 | | | | 5.07 | | | | 2.08 | | | | (3.79 | ) | | | (.45 | ) |
| Total from investment operations | | | 4.31 | | | | 5.13 | | | | 2.08 | | | | (3.74 | ) | | | (.51 | ) |
| Less Dividends and Distributions: | | | | | | | | | | | | | | | | | | | | |
| Dividends from net investment income | | | (.02 | ) | | | - | | | | (.03 | ) | | | - | | | | - | |
| Distributions from net realized gains | | | (.15 | ) | | | - | | | | - | | | | - | | | | - | |
| Distributions in excess of net investment income | | | - | | | | - | | | | (.02 | ) | | | - | | | | - | |
| Total dividends and distributions | | | (.17 | ) | | | - | | | | (.05 | ) | | | - | | | | - | |
| Capital Contributions (Note 6) | | | - | | | | - | (b) | | | .04 | | | | - | | | | - | |
| Net asset value, end of year | | | $31.58 | | | | $27.44 | | | | $22.31 | | | | $20.24 | | | | $23.98 | |
| Total Return(c): | | | 15.78% | | | | 22.99% | | | | 10.48% | | | | (15.60)% | | | | (2.08)% | |
| |
| Ratios/Supplemental Data: | | | | | | | | | | | | | | | |
| Net assets, end of year (000) | | | $2,317,443 | | | | $1,693,618 | | | | $1,206,308 | | | | $764,082 | | | | $576,767 | |
| Average net assets (000) | | | $1,948,077 | | | | $1,651,332 | | | | $1,050,256 | | | | $533,585 | | | | $521,772 | |
| Ratios to average net assets(d): | | | | | | | | | | | | | | | | | | | | |
| Expenses, including distribution and service (12b-1) fees | | | 1.06% | | | | 1.09% | (g) | | | 1.12% | | | | 1.21% | (e) | | | 1.19% | (e)(f) |
| Expenses, excluding distribution and service (12b-1) fees | | | .76% | | | | .79% | (g) | | | .82% | | | | .91% | (e) | | | .91% | (e) |
| Net investment income (loss) | | | (.05)% | | | | .22% | | | | .01% | | | | .28% | (e) | | | (.23)% | (e) |
| Portfolio turnover rate | | | 49% | | | | 45% | | | | 49% | | | | 59% | | | | 76% | |
(a) Calculated based on average shares outstanding during the year.
(b) Less than $.005 per share.
(c) Total return does not consider the effects of sales loads. Total return is calculated assuming a purchase of a share on the first day and a sale on the last day of each year reported, and includes reinvestment of dividends and distributions. Total returns may reflect adjustments to conform to generally accepted accounting principles.
(d) Does not include expenses of the underlying portfolios in which the Fund invests.
(e) Net of expense subsidy. If the investment manager had not subsidized expenses, the expense ratios including distribution and service (12b-1) fees would have been 1.21% for the year ended August 31, 2009 and 1.19% for the year ended August 31, 2008. The net investment income (loss) ratios would have been .28% for the year ended August 31, 2009, and (.23%) for the year ended August 31, 2008.
(f) The distributor of the Fund contractually agreed to limit its distribution and service (12b-1) fees to .25% of the average daily net assets of the Class A shares through February 29, 2008.
(g) Includes tax expense of ..01%.
See Notes to Financial Statements.
| | |
| 40 | | Visit our website at www.prudentialfunds.com |
| | | | | | | | | | | | | | | | | | | | |
| Class B Shares | |
| | | Year Ended August 31, | |
| | | 2012 | | | 2011 | | | 2010 | | | 2009 | | | 2008 | |
| Per Share Operating Performance(a): | | | | | | | | | | | | | | | | | | | | |
| Net Asset Value, Beginning Of Year | | | $24.46 | | | | $20.03 | | | | $18.26 | | | | $21.78 | | | | $22.40 | |
| Income (loss) from investment operations: | | | | | | | | | | | | | | | | | | | | |
| Net investment loss | | | (.20 | ) | | | (.11 | ) | | | (.14 | ) | | | (.06 | ) | | | (.21 | ) |
| Net realized and unrealized gain (loss) on investment transactions | | | 3.85 | | | | 4.54 | | | | 1.88 | | | | (3.46 | ) | | | (.41 | ) |
| Total from investment operations | | | 3.65 | | | | 4.43 | | | | 1.74 | | | | (3.52 | ) | | | (.62 | ) |
| Less Distributions: | | | | | | | | | | | | | | | | | | | | |
| Distributions from net realized gains | | | (.15 | ) | | | - | | | | - | | | | - | | | | - | |
| Capital Contributions (Note 6) | | | - | | | | - | (b) | | | .03 | | | | - | | | | - | |
| Net asset value, end of year | | | $27.96 | | | | $24.46 | | | | $20.03 | | | | $18.26 | | | | $21.78 | |
| Total Return(c): | | | 15.00% | | | | 22.12% | | | | 9.69% | | | | (16.16)% | | | | (2.77)% | |
| |
| Ratios/Supplemental Data: | | | | | | | | | | | | | | | |
| Net assets, end of year (000) | | | $38,236 | | | | $38,268 | | | | $39,174 | | | | $44,341 | | | | $67,165 | |
| Average net assets (000) | | | $37,196 | | | | $43,011 | | | | $44,611 | | | | $41,105 | | | | $87,720 | |
| Ratios to average net assets(d): | | | | | | | | | | | | | | | | | | | | |
| Expenses, including distribution and service (12b-1) fees | | | 1.76% | | | | 1.79% | (f) | | | 1.82% | | | | 1.91% | (e) | | | 1.91% | (e) |
| Expenses, excluding distribution and service (12b-1) fees | | | .76% | | | | .79% | (f) | | | .82% | | | | .91% | (e) | | | .91% | (e) |
| Net investment loss | | | (.75)% | | | | (.46)% | | | | (.67)% | | | | (.37)% | (e) | | | (.95)% | (e) |
| Portfolio turnover rate | | | 49% | | | | 45% | | | | 49% | | | | 59% | | | | 76% | |
(a) Calculated based on average shares outstanding during the year.
(b) Less than $.005 per share.
(c) Total return does not consider the effects of sales loads. Total return is calculated assuming a purchase of a share on the first day and a sale on the last day of each year reported, and includes reinvestment of dividends and distributions. Total returns may reflect adjustments to conform to generally accepted accounting principles.
(d) Does not include expenses of the underlying portfolios in which the Fund invests.
(e) Net of expense subsidy. If the investment manager had not subsidized expenses, the expense ratios including distribution and service (12b-1) fees would have been 1.91% for the year ended August 31, 2009 and 1.91% for the year ended August 31, 2008. The net investment loss ratios would have been (.38%) for the year ended August 31, 2009, and (.96%) for the year ended August 31, 2008.
(f) Includes tax expense of .01%.
See Notes to Financial Statements.
| | | | |
| Prudential Jennison Mid-Cap Growth Fund, Inc. | | | 41 | |
Financial Highlights
continued
| | | | | | | | | | | | | | | | | | | | |
| Class C Shares | |
| | | Year Ended August 31, | |
| | | 2012 | | | 2011 | | | 2010 | | | 2009 | | | 2008 | |
| Per Share Operating Performance(a): | | | | | | | | | | | | | | | | | | | | |
| Net Asset Value, Beginning Of Year | | | $24.46 | | | | $20.03 | | | | $18.26 | | | | $21.79 | | | | $22.41 | |
| Income (loss) from investment operations: | | | | | | | | | | | | | | | | | | | | |
| Net investment loss | | | (.20 | ) | | | (.12 | ) | | | (.14 | ) | | | (.06 | ) | | | (.21 | ) |
| Net realized and unrealized gain (loss) on investment transactions | | | 3.85 | | | | 4.55 | | | | 1.88 | | | | (3.47 | ) | | | (.41 | ) |
| Total from investment operations | | | 3.65 | | | | 4.43 | | | | 1.74 | | | | (3.53 | ) | | | (.62 | ) |
| Less Distributions: | | | | | | | | | | | | | | | | | | | | |
| Distributions from net realized gains | | | (.15 | ) | | | - | | | | - | | | | - | | | | - | |
| Capital Contributions (Note 6) | | | - | | | | - | (b) | | | .03 | | | | - | | | | - | |
| Net asset value, end of year | | | $27.96 | | | | $24.46 | | | | $20.03 | | | | $18.26 | | | | $21.79 | |
| Total Return(c): | | | 15.00% | | | | 22.12% | | | | 9.69% | | | | (16.20)% | | | | (2.77)% | |
| |
| Ratios/Supplemental Data: | |
| Net assets, end of year (000) | | | $157,257 | | | | $121,908 | | | | $99,639 | | | | $81,162 | | | | $80,749 | |
| Average net assets (000) | | | $135,864 | | | | $124,914 | | | | $98,990 | | | | $62,905 | | | | $85,016 | |
| Ratios to average net assets(d): | | | | | | | | | | | | | | | | | | | | |
| Expenses, including distribution and service (12b-1) fees | | | 1.76% | | | | 1.79% | (f) | | | 1.82% | | | | 1.91% | (e) | | | 1.91% | (e) |
| Expenses, excluding distribution and service (12b-1) fees | | | .76% | | | | .79% | (f) | | | .82% | | | | .91% | (e) | | | .91% | (e) |
| Net investment loss | | | (.75)% | | | | (.47)% | | | | (.67)% | | | | (.39)% | (e) | | | (.96)% | (e) |
| Portfolio turnover rate | | | 49% | | | | 45% | | | | 49% | | | | 59% | | | | 76% | |
(a) Calculated based on average shares outstanding during the year.
(b) Less than $.005 per share.
(c) Total return does not consider the effects of sales loads. Total return is calculated assuming a purchase of a share on the first day and a sale on the last day of each year reported, and includes reinvestment of dividends and distributions. Total returns may reflect adjustments to conform to generally accepted accounting principles.
(d) Does not include expenses of the underlying portfolios in which the Fund invests.
(e) Net of expense subsidy. If the investment manager had not subsidized expenses, the expense ratios including distribution and service (12b-1) fees would have been 1.91% for the year ended August 31, 2009 and 1.91% for the year ended August 31, 2008. The net investment loss ratios would have been (.39%) for the year ended August 31, 2009, and (.96%) for the year ended August 31, 2008.
(f) Includes tax expense of .01%.
See Notes to Financial Statements.
| | |
| 42 | | Visit our website at www.prudentialfunds.com |
| | | | | | | | | | | | | | | | | | | | | | |
| Class L Shares | |
| | | Period
Ended August 24, | | | | | Year Ended August 31, | |
| | | 2012(j) | | | | | 2011 | | | 2010 | | | 2009 | | | 2008 | |
| Per Share Operating Performance(a): | | | | | | | | | | | | | | | | | | | | | | |
| Net Asset Value, Beginning Of Period | | | $27.19 | | | | | | $22.15 | | | | $20.10 | | | | $23.87 | | | | $24.42 | |
| Income (loss) from investment operations: | | | | | | | | | | | | | | | | | | | | | | |
| Net investment income (loss) | | | (.07 | ) | | | | | .01 | | | | (.04 | ) | | | .02 | | | | (.11 | ) |
| Net realized and unrealized gain (loss) on investment transactions | | | 4.36 | | | | | | 5.03 | | | | 2.07 | | | | (3.79 | ) | | | (.44 | ) |
| Total from investment operations | | | 4.29 | | | | | | 5.04 | | | | 2.03 | | | | (3.77 | ) | | | (.55 | ) |
| Less Dividends and Distributions: | | | | | | | | | | | | | | | | | | | | | | |
| Dividends from net investment income | | | - | | | | | | - | | | | (.01 | ) | | | - | | | | - | |
| Distributions from net realized gains | | | (.15 | ) | | | | | - | | | | - | | | | - | | | | - | |
| Distributions in excess of net investment income | | | - | | | | | | - | | | | - | (b) | | | - | | | | - | |
| Total dividends and distributions | | | (.15 | ) | | | | | - | | | | (.01 | ) | | | - | | | | - | |
| Capital Contributions (Note 6) | | | - | | | | | | - | (b) | | | .03 | | | | - | | | | - | |
| Net asset value, end of period | | | $31.33 | | | | | | $27.19 | | | | $22.15 | | | | $20.10 | | | | $23.87 | |
| Total Return(c): | | | 15.85% | | | | | | 22.75% | | | | 10.25% | | | | (15.79)% | | | | (2.25)% | |
| |
| Ratios/Supplemental Data: | |
| Net assets, end of period (000) | | | $9,701 | | | | | | $9,816 | | | | $9,364 | | | | $10,099 | | | | $15,418 | |
| Average net assets (000) | | | $9,764 | | | | | | $10,712 | | | | $10,509 | | | | $9,874 | | | | $17,445 | |
| Ratios to average net assets(d): | | | | | | | | | | | | | | | | | | | | | | |
| Expenses, including distribution and service (12b-1) fees | | | 1.26% | (g) | | | | | 1.29% | (f) | | | 1.32% | | | | 1.41% | (e) | | | 1.41% | (e) |
| Expenses, excluding distribution and service (12b-1) fees | | | .76% | (g) | | | | | .79% | (f) | | | .82% | | | | .91% | (e) | | | .91% | (e) |
| Net investment income (loss) | | | (.25)% | (g) | | | | | .04% | | | | (.16)% | | | | .14% | (e) | | | (.46)% | (e) |
| Portfolio turnover rate | | | 49% | (h)(i) | | | | | 45% | | | | 49% | | | | 59% | | | | 76% | |
(a) Calculated based on average shares outstanding during the year.
(b) Less than $.005 per share.
(c) Total return does not consider the effects of sales loads. Total return is calculated assuming a purchase of a share on the first day and a sale on the last day of each year reported, and includes reinvestment of dividends and distributions. Total returns may reflect adjustments to conform to generally accepted accounting principles. Total returns for periods of less than one full year are not annualized.
(d) Does not include expenses of the underlying portfolios in which the Fund invests.
(e) Net of expense subsidy. If the investment manager had not subsidized expenses, the expense ratios including distribution and service (12b-1) fees would have been 1.41% for the year ended August 31, 2009 and 1.41% for the year ended August 31, 2008. The net investment income (loss) ratios would have been .14% for the year ended August 31, 2009, and (.46%) for the year ended August 31, 2008.
(f) Includes tax expense of .01%.
(g) Annualized.
(h) Not annualized.
(i) Calculated as of August 31, 2012.
(j) As of August 24, 2012, the last conversion of Class L shares to Class A shares was completed. There are no Class L shares outstanding and Class L shares are no longer being offered for sale.
See Notes to Financial Statements.
| | | | |
| Prudential Jennison Mid-Cap Growth Fund, Inc. | | | 43 | |
Financial Highlights
continued
| | | | | | | | | | | | | | | | | | | | | | |
| Class M Shares | |
| | | Period
Ended April 13, | | | | | Year Ended August 31, | |
| | | 2012(j) | | | | | 2011 | | | 2010 | | | 2009 | | | 2008 | |
| Per Share Operating Performance(a): | | | | | | | | | | | | | | | | | | | | | | |
| Net Asset Value, Beginning Of Period | | | $24.44 | | | | | | $20.01 | | | | $18.24 | | | | $21.77 | | | | $22.39 | |
| Income (loss) from investment operations: | | | | | | | | | | | | | | | | | | | | | | |
| Net investment loss | | | (.11 | ) | | | | | (.09 | ) | | | (.13 | ) | | | (.05 | ) | | | (.21 | ) |
| Net realized and unrealized gain (loss) on investment transactions | | | 3.56 | | | | | | 4.52 | | | | 1.88 | | | | (3.48 | ) | | | (.41 | ) |
| Total from investment operations | | | 3.45 | | | | | | 4.43 | | | | 1.75 | | | | (3.53 | ) | | | (.62 | ) |
| Less Distributions: | | | | | | | | | | | | | | | | | | | | | | |
| Distributions from net realized gains | | | (.15 | ) | | | | | - | | | | - | | | | - | | | | - | |
| Capital Contributions (Note 6) | | | - | | | | | | - | (b) | | | .02 | | | | - | | | | - | |
| Net asset value, end of period | | | $27.74 | | | | | | $24.44 | | | | $20.01 | | | | $18.24 | | | | $21.77 | |
| Total Return(c): | | | 14.19% | | | | | | 22.14% | | | | 9.70% | | | | (16.21)% | | | | (2.77)% | |
| |
| Ratios/Supplemental Data: | |
| Net assets, end of period (000) | | | $49 | | | | | | $1,480 | | | | $4,089 | | | | $8,912 | | | | $24,023 | |
| Average net assets (000) | | | $671 | | | | | | $3,077 | | | | $6,774 | | | | $11,930 | | | | $36,103 | |
| Ratios to average net assets(d): | | | | | | | | | | | | | | | | | | | | | | |
| Expenses, including distribution and service (12b-1) fees | | | 1.75% | (g) | | | | | 1.79% | (f) | | | 1.82% | | | | 1.91% | (e) | | | 1.91% | (e) |
| Expenses, excluding distribution and service (12b-1) fees | | | .76% | (g) | | | | | .79% | (f) | | | .82% | | | | .91% | (e) | | | .91% | (e) |
| Net investment loss | | | (.78)% | (g) | | | | | (.37)% | | | | (.64)% | | | | (.33)% | (e) | | | (.95)% | (e) |
| Portfolio turnover rate | | | 49% | (h)(i) | | | | | 45% | | | | 49% | | | | 59% | | | | 76% | |
(a) Calculated based on average shares outstanding during the year.
(b) Less than $.005 per share.
(c) Total return does not consider the effects of sales loads. Total return is calculated assuming a purchase of a share on the first day and a sale on the last day of each year reported, and includes reinvestment of dividends and distributions. Total returns may reflect adjustments to conform to generally accepted accounting principles. Total returns for periods of less than one full year are not annualized.
(d) Does not include expenses of the underlying portfolios in which the Fund invests.
(e) Net of expense subsidy. If the investment manager had not subsidized expenses, the expense ratios including distribution and service (12b-1) fees would have been 1.91% for the year ended August 31, 2009 and 1.91% for the year ended August 31, 2008. The net investment loss ratios would have been (.33%) for the year ended August 31, 2009, and (.96%) for the year ended August 31, 2008.
(f) Includes tax expense of .01%.
(g) Annualized.
(h) Not annualized.
(i) Calculated as of August 31, 2012.
(j) As of April 13, 2012, the last conversion of Class M shares to Class A shares was completed. There are no Class M shares outstanding and Class M shares are no longer being offered for sale.
See Notes to Financial Statements.
| | |
| 44 | | Visit our website at www.prudentialfunds.com |
| | | | | | | | | | |
| Class Q Shares | |
| | | Year Ended
August 31,
2012 | | | | | January 18,
2011(a)
through
August 31,
2011 | |
| Per Share Operating Performance(b): | | | | | | | | | | |
| Net Asset Value, Beginning Of Period | | | $28.51 | | | | | | $28.95 | |
| Income (loss) from investment operations: | | | | | | | | | | |
| Net investment income | | | .13 | | | | | | .12 | |
| Net realized and unrealized gain (loss) on investment transactions | | | 4.49 | | | | | | (.56 | ) |
| Total from investment operations | | | 4.62 | | | | | | (.44 | ) |
| Less Dividends and Distributions: | | | | | | | | | | |
| Dividends from net investment income | | | (.15 | ) | | | | | - | |
| Distributions from net realized gains | | | (.15 | ) | | | | | - | |
| Total dividends and distributions | | | (.30 | ) | | | | | - | |
| Capital Contributions (Note 6) | | | - | | | | | | - | (c) |
| Net asset value, end of period | | | $32.83 | | | | | | $28.51 | |
| Total Return(d): | | | 16.35% | | | | | | (1.52)% | |
| |
| Ratios/Supplemental Data: | |
| Net assets, end of period (000) | | | $301,497 | | | | | | $160,511 | |
| Average net assets (000) | | | $220,693 | | | | | | $97,743 | |
| Ratios to average net assets(e): | | | | | | | | | | |
| Expenses, including distribution and service (12b-1) fees | | | .60% | | | | | | .61% | (f)(g) |
| Expenses, excluding distribution and service (12b-1) fees | | | .60% | | | | | | .61% | (f)(g) |
| Net investment income | | | .42% | | | | | | .60% | (f) |
| Portfolio turnover rate | | | 49% | | | | | | 45% | |
(a) Inception date of Class Q shares.
(b) Calculated based on average shares outstanding during the period.
(c) Less than $.005 per share.
(d) Total return is calculated assuming a purchase of a share on the first day and a sale on the last day of each period reported, and includes reinvestment of dividends and distributions. Total returns may reflect adjustments to conform to generally accepted accounting principles. Total returns for periods of less than one full year are not annualized.
(e) Does not include expenses of the underlying portfolios in which the Fund invests.
(f) Annualized.
(g) Includes tax expense of .01%.
See Notes to Financial Statements.
| | | | |
| Prudential Jennison Mid-Cap Growth Fund, Inc. | | | 45 | |
Financial Highlights
continued
| | | | | | | | | | | | | | | | | | | | |
| Class R Shares | |
| | | Year Ended August 31, | |
| | | 2012 | | | 2011 | | | 2010 | | | 2009 | | | 2008 | |
| Per Share Operating Performance(a): | | | | | | | | | | | | | | | | | | | | |
| Net Asset Value, Beginning Of Year | | | $27.10 | | | | $22.08 | | | | $20.04 | | | | $23.79 | | | | $24.35 | |
| Income (loss) from investment operations: | | | | | | | | | | | | | | | | | | | | |
| Net investment loss | | | (.07 | ) | | | - | (b) | | | (.05 | ) | | | - | (b) | | | (.11 | ) |
| Net realized and unrealized gain (loss) on investment transactions | | | 4.27 | | | | 5.02 | | | | 2.06 | | | | (3.75 | ) | | | (.45 | ) |
| Total from investment operations | | | 4.20 | | | | 5.02 | | | | 2.01 | | | | (3.75 | ) | | | (.56 | ) |
| Less Dividends and Distributions: | | | | | | | | | | | | | | | | | | | | |
| Dividends from net investment income | | | - | | | | - | | | | (.01 | ) | | | - | | | | - | |
| Distributions from net realized gains | | | (.15 | ) | | | - | | | | - | | | | - | | | | - | |
| Distributions in excess of net investment income | | | - | | | | - | | | | - | (b) | | | - | | | | - | |
| Total dividends and distributions | | | (.15 | ) | | | - | | | | (.01 | ) | | | - | | | | - | |
| Capital Contributions (Note 6) | | | - | | | | - | (b) | | | .04 | | | | - | | | | - | |
| Net asset value, end of year | | | $31.15 | | | | $27.10 | | | | $22.08 | | | | $20.04 | | | | $23.79 | |
| Total Return(c): | | | 15.57% | | | | 22.74% | | | | 10.23% | | | | (15.76)% | | | | (2.30)% | |
| |
| Ratios/Supplemental Data: | |
| Net assets, end of year (000) | | | $283,158 | | | | $171,848 | | | | $95,701 | | | | $28,761 | | | | $5,722 | |
| Average net assets (000) | | | $221,144 | | | | $154,320 | | | | $69,420 | | | | $12,128 | | | | $3,157 | |
| Ratios to average net assets(d): | | | | | | | | | | | | | | | | | | | | |
| Expenses, including distribution and service (12b-1) fees(e) | | | 1.26% | | | | 1.29% | (g) | | | 1.32% | | | | 1.41% | (f) | | | 1.41% | (f) |
| Expenses, excluding distribution and service (12b-1) fees | | | .76% | | | | .79% | (g) | | | .82% | | | | .91% | (f) | | | .91% | (f) |
| Net investment income (loss) | | | (.25)% | | | | .01% | | | | (.21)% | | | | (.02)% | (f) | | | (.45)% | (f) |
| Portfolio turnover rate | | | 49% | | | | 45% | | | | 49% | | | | 59% | | | | 76% | |
(a) Calculated based on average shares outstanding during the year.
(b) Less than $.005 per share.
(c) Total return is calculated assuming a purchase of a share on the first day and a sale on the last day of each year reported, and includes reinvestment of dividends and distributions. Total returns may reflect adjustments to conform to generally accepted accounting principles.
(d) Does not include expenses of the underlying portfolios in which the Fund invests.
(e) The distributor of the Fund has contractually agreed to limit its distribution and service (12b-1) fees to .50% of the average daily net assets of the Class R shares.
(f) Net of expense subsidy. If the investment manager had not subsidized expenses, the expense ratios including distribution and service (12b-1) fees would have been 1.41% for the year ended August 31, 2009 and 1.41% for the year ended August 31, 2008. The net investment loss ratios would have been (.02%) for the year ended August 31, 2009, and (.46%) for the year ended August 31, 2008.
(g) Includes tax expense of .01%.
See Notes to Financial Statements.
| | |
| 46 | | Visit our website at www.prudentialfunds.com |
| | | | | | | | | | | | | | | | | | | | |
| Class X Shares | |
| | | Year Ended August 31, | |
| | | 2012 | | | 2011 | | | 2010 | | | 2009 | | | 2008 | |
| Per Share Operating Performance(a): | | | | | | | | | | | | | | | | | | | | |
| Net Asset Value, Beginning Of Year | | | $24.53 | | | | $20.08 | | | | $18.31 | | | | $21.84 | | | | $22.40 | |
| Income (loss) from investment operations: | | | | | | | | | | | | | | | | | | | | |
| Net investment loss | | | (.20 | ) | | | (.10 | ) | | | (.13 | ) | | | (.06 | ) | | | (.17 | ) |
| Net realized and unrealized gain (loss) on investment transactions | | | 3.85 | | | | 4.55 | | | | 1.87 | | | | (3.47 | ) | | | (.39 | ) |
| Total from investment operations | | | 3.65 | | | | 4.45 | | | | 1.74 | | | | (3.53 | ) | | | (.56 | ) |
| Less Distributions: | | | | | | | | | | | | | | | | | | | | |
| Distributions from net realized gains | | | (.15 | ) | | | - | | | | - | | | | - | | | | - | |
| Capital Contributions (Note 6) | | | - | | | | - | (b) | | | .03 | | | | - | | | | - | |
| Net asset value, end of year | | | $28.03 | | | | $24.53 | | | | $20.08 | | | | $18.31 | | | | $21.84 | |
| Total Return(c): | | | 14.95% | | | | 22.16% | | | | 9.67% | | | | (16.16)% | | | | (2.50)% | |
| |
| Ratios/Supplemental Data: | |
| Net assets, end of year (000) | | | $1,090 | | | | $1,861 | | | | $2,976 | | | | $4,388 | | | | $7,481 | |
| Average net assets (000) | | | $1,475 | | | | $2,606 | | | | $4,024 | | | | $4,567 | | | | $8,598 | |
| Ratios to average net assets(d): | | | | | | | | | | | | | | | | | | | | |
| Expenses, including distribution and service (12b-1) fees | | | 1.76% | | | | 1.79% | (f) | | | 1.82% | | | | 1.91% | (e) | | | 1.69% | (e) |
| Expenses, excluding distribution and service (12b-1) fees | | | .76% | | | | .79% | (f) | | | .82% | | | | .91% | (e) | | | .91% | (e) |
| Net investment loss | | | (.76)% | | | | (.42)% | | | | (.65)% | | | | (.36)% | (e) | | | (.74)% | (e) |
| Portfolio turnover rate | | | 49% | | | | 45% | | | | 49% | | | | 59% | | | | 76% | |
(a) Calculated based on average shares outstanding during the year.
(b) Less than $.005 per share.
(c) Total return does not consider the effects of sales loads. Total return is calculated assuming a purchase of a share on the first day and a sale on the last day of each year reported, and includes reinvestment of dividends and distributions. Total returns may reflect adjustments to conform to generally accepted accounting principles.
(d) Does not include expenses of the underlying portfolios in which the Fund invests.
(e) Net of expense subsidy. If the investment manager had not subsidized expenses, the expense ratios including distribution and service (12b-1) fees would have been 1.91% for the year ended August 31, 2009 and 1.69% for the year ended August 31, 2008. The net investment loss ratios would have been (.36%) for the year ended August 31, 2009, and (.74%) for the year ended August 31, 2008.
(f) Includes tax expense of .01%.
See Notes to Financial Statements.
| | | | |
| Prudential Jennison Mid-Cap Growth Fund, Inc. | | | 47 | |
Financial Highlights
continued
| | | | | | | | | | | | | | | | | | | | |
| Class Z Shares | |
| | | Year Ended August 31, | |
| | | 2012 | | | 2011 | | | 2010 | | | 2009 | | | 2008 | |
| Per Share Operating Performance(a): | | | | | | | | | | | | | | | | | | | | |
| Net Asset Value, Beginning Of Year | | | $28.48 | | | | $23.09 | | | | $20.94 | | | | $24.74 | | | | $25.19 | |
| Income (loss) from investment operations: | | | | | | | | | | | | | | | | | | | | |
| Net investment income | | | .08 | | | | .14 | | | | .07 | | | | .10 | | | | .01 | |
| Net realized and unrealized gain (loss) on investment transactions | | | 4.49 | | | | 5.25 | | | | 2.16 | | | | (3.90 | ) | | | (.46 | ) |
| Total from investment operations | | | 4.57 | | | | 5.39 | | | | 2.23 | | | | (3.80 | ) | | | (.45 | ) |
| Less Dividends and Distributions: | | | | | | | | | | | | | | | | | | | | |
| Dividends from net investment income | | | (.10 | ) | | | - | | | | (.07 | ) | | | - | | | | - | |
| Distributions from net realized gains | | | (.15 | ) | | | - | | | | - | | | | - | | | | - | |
| Distributions in excess of net investment income | | | - | | | | - | | | | (.04 | ) | | | - | | | | - | |
| Total dividends and distributions | | | (.25 | ) | | | - | | | | (.11 | ) | | | - | | | | - | |
| Capital Contributions (Note 6) | | | - | | | | - | (b) | | | .03 | | | | - | | | | - | |
| Net asset value, end of year | | | $32.80 | | | | $28.48 | | | | $23.09 | | | | $20.94 | | | | $24.74 | |
| Total Return(c): | | | 16.15% | | | | 23.34% | | | | 10.79% | | | | (15.36)% | | | | (1.79)% | |
| |
| Ratios/Supplemental Data: | |
| Net assets, end of year (000) | | | $2,585,535 | | | | $1,150,581 | | | | $542,149 | | | | $365,324 | | | | $202,444 | |
| Average net assets (000) | | | $1,717,792 | | | | $896,253 | | | | $484,618 | | | | $219,585 | | | | $196,477 | |
| Ratios to average net assets(d): | | | | | | | | | | | | | | | | | | | | |
| Expenses, including distribution and service (12b-1) fees | | | .76% | | | | .79% | (f) | | | .82% | | | | .91% | (e) | | | .91% | (e) |
| Expenses, excluding distribution and service (12b-1) fees | | | .76% | | | | .79% | (f) | | | .82% | | | | .91% | (e) | | | .91% | (e) |
| Net investment income | | | .25% | | | | .47% | | | | .31% | | | | .57% | (e) | | | .04% | (e) |
| Portfolio turnover rate | | | 49% | | | | 45% | | | | 49% | | | | 59% | | | | 76% | |
(a) Calculated based on average shares outstanding during the year.
(b) Less than $.005 per share.
(c) Total return is calculated assuming a purchase of a share on the first day and a sale on the last day of each year reported, and includes reinvestment of dividends and distributions. Total returns may reflect adjustments to conform to generally accepted accounting principles.
(d) Does not include expenses of the underlying portfolios in which the Fund invests.
(e) Net of expense subsidy. If the investment manager had not subsidized expenses, the expense ratios including distribution and service (12b-1) fees would have been .91% for the year ended August 31, 2009 and .91% for the year ended August 31, 2008. The net investment income ratios would have been .57% for the year ended August 31, 2009, and .04% for the year ended August 31, 2008.
(f) Includes tax expense of .01%.
See Notes to Financial Statements.
| | |
| 48 | | Visit our website at www.prudentialfunds.com |
Report of Independent Registered Public
Accounting Firm
The Board of Directors and Shareholders
Prudential Jennison Mid-Cap Growth Fund, Inc.:
We have audited the accompanying statement of assets and liabilities of the Prudential Jennison Mid-Cap Growth Fund, Inc. (hereafter referred to as the “Fund”), including the portfolio of investments, as of August 31, 2012, and the related statement of operations for the year then ended, the statement of changes in net assets for each of the years in the two-year period then ended and the financial highlights for each of the years in the five-year period ended. These financial statements and financial highlights are the responsibility of the Fund’s management. Our responsibility is to express an opinion on these financial statements and financial highlights based on our audits.
We conducted our audits in accordance with the standards of the Public Company Accounting Oversight Board (United States). Those standards require that we plan and perform the audit to obtain reasonable assurance about whether the financial statements and financial highlights are free of material misstatement. An audit includes examining, on a test basis, evidence supporting the amounts and disclosures in the financial statements. Our procedures included confirmation of securities owned as of August 31, 2012, by correspondence with the custodian, transfer agent and brokers or by other appropriate auditing procedures when replies from brokers were not received. An audit also includes assessing the accounting principles used and significant estimates made by management, as well as evaluating the overall financial statement presentation. We believe that our audits provide a reasonable basis for our opinion.
In our opinion, the financial statements and financial highlights referred to above present fairly, in all material respects, the financial position of the Fund as of August 31, 2012, and the results of its operations for the year then ended, the changes in its net assets for each of the years in the two-year period then ended and the financial highlights for each of the years in the five-year period ended, in conformity with U.S. generally accepted accounting principles.

New York, New York
October 23, 2012
| | | | |
| Prudential Jennison Mid-Cap Growth Fund, Inc. | | | 49 | |
Tax Information
(Unaudited)
We are advising you that during the fiscal year ended August 31, 2012, the Fund reported the maximum amount allowed per share, but not less than $0.15 per share for classes A, B, C, L, M, Q, R, X and Z shares as a capital gain distribution in accordance with Section 852(B)(3)(C) of the Internal Revenue Code.
For the year ended August 31, 2012, the Fund reports, in accordance with Section 854 of the Internal Revenue Code, the following percentages of the ordinary income distributions paid as 1) qualified dividend income (QDI); and 2) eligible for corporate dividends received deduction (DRD).
| | | | | | | | |
| | | QDI | | | DRD | |
| | |
Prudential Jennison Mid-Cap Growth Fund, Inc. | | | 100% | | | | 100% | |
In January 2013, you will be advised on IRS Form 1099-DIV or substitute 1099-DIV, as to the federal tax status of distributions received by you in calendar year 2012.
| | |
| 50 | | Visit our website at www.prudentialfunds.com |
INFORMATION ABOUT BOARD MEMBERS AND OFFICERS
(Unaudited)
Information about Board Members and Officers of the Fund is set forth below. Board Members who are not deemed to be “interested persons” of the Fund, as defined in the 1940 Act, are referred to as “Independent Board Members.” Board Members who are deemed to be “interested persons” of the Fund are referred to as “Interested Board Members.” The Board Members are responsible for the overall supervision of the operations of the Fund and perform the various duties imposed on the directors of investment companies by the 1940 Act. The Board in turn elects the Officers, who are responsible for administering the day-to-day operations of the Fund.
| | | | |
Independent Board Members(1) | | | | |
Name, Address, Age Position(s) Portfolios Overseen | | Principal Occupation(s) During Past Five Years | | Other Directorships Held |
Kevin J. Bannon (60) Board Member Portfolios Overseen: 61 | | Managing Director (since April 2008) and Chief Investment Officer (since October 2008) of Highmount Capital LLC (registered investment adviser); formerly Executive Vice President and Chief Investment Officer (April 1993-August 2007) of Bank of New York Company; President (May 2003-May 2007) of BNY Hamilton Family of Mutual Funds. | | Director of Urstadt Biddle Properties (since September 2008). |
Linda W. Bynoe (60) Board Member Portfolios Overseen: 61 | | President and Chief Executive Officer (since March 1995) and formerly Chief Operating Officer (December 1989-February 1995) of Telemat Ltd. (management consulting); formerly Vice President (January 1985-June 1989) at Morgan Stanley & Co (broker-dealer). | | Director of Simon Property Group, Inc. (retail real estate) (May 2003-May 2012); Director of Anixter International, Inc. (communication products distributor) (since January 2006); Director of Northern Trust Corporation (financial services) (since April 2006); Trustee of Equity Residential (residential real estate) (since December 2009). |
Michael S. Hyland, CFA (67) Board Member Portfolios Overseen: 61 | | Independent Consultant (since February 2005); formerly Senior Managing Director (July 2001-February 2005) of Bear Stearns & Co, Inc.; Global Partner, INVESCO (1999-2001); Managing Director and President of Salomon Brothers Asset Management (1989-1999). | | None. |
Douglas H. McCorkindale (73) Board Member Portfolios Overseen: 61 | | Formerly Chairman (February 2001-June 2006), Chief Executive Officer (June 2000-July 2005), President (September 1997-July 2005) and Vice Chairman (March 1984-May 2000) of Gannett Co. Inc. (publishing and media). | | Director of Lockheed Martin Corp. (aerospace and defense) (since May 2001). |
Visit our website at www.prudentialfunds.com
| | | | |
Independent Board Members(1) | | |
Name, Address, Age Position(s) Portfolios Overseen | | Principal Occupation(s) During Past Five Years | | Other Directorships Held |
Stephen P. Munn (70) Board Member Portfolios Overseen: 61 | | Lead Director (since 2007) and formerly Chairman (1993-2007) of Carlisle Companies Incorporated (manufacturer of industrial products). | | Lead Director (since 2007) of Carlisle Companies Incorporated (manufacturer of industrial products). |
Richard A. Redeker (69) Board Member & Independent Chair Portfolios Overseen: 61 | | Retired Mutual Fund Senior Executive (44 years); Management Consultant; Independent Directors Council (organization of 2,800 Independent Mutual Fund Directors)-Executive Committee, Chair of Policy Steering Committee, Governing Council. | | None. |
Robin B. Smith (73) Board Member Portfolios Overseen: 61 | | Chairman of the Board (since January 2003) of Publishers Clearing House (direct marketing); Member of the Board of Directors of ADLPartner (marketing) (since December 2010); formerly Chairman and Chief Executive Officer (August 1996-January 2003) of Publishers Clearing House. | | Formerly Director of BellSouth Corporation (telecommunications) (1992-2006). |
Stephen G. Stoneburn (69) Board Member Portfolios Overseen: 61 | | Chairman, (since July 2011), President and Chief Executive Officer (since June 1996) of Quadrant Media Corp. (publishing company); formerly President (June 1995-June 1996) of Argus Integrated Media, Inc.; Senior Vice President and Managing Director (January 1993-1995) of Cowles Business Media; Senior Vice President of Fairchild Publications, Inc. (1975-1989). | | None. |
| | |
| | | | |
Interested Board Members(1) | | |
Name, Address, Age Position(s) Portfolios Overseen | | Principal Occupation(s) During Past Five Years | | Other Directorships Held |
Stuart S. Parker (50) Board Member & President Portfolios Overseen: 61 | | President of Prudential Investments LLC (since January 2012); Executive Vice President of Jennison Associates LLC and Head of Retail Distribution of Prudential Investments LLC (June 2005 - December 2011). | | None. |
Prudential Jennison Mid-Cap Growth Fund, Inc.
| | | | |
Interested Board Members(1) | | |
Name, Address, Age Position(s) Portfolios Overseen | | Principal Occupation(s) During Past Five Years | | Other Directorships Held |
Scott E. Benjamin (39) Board Member & Vice President Portfolios Overseen: 61 | | Executive Vice President (since June 2009) of Prudential Investments LLC and Prudential Investment Management Services LLC; Executive Vice President (since September 2009) of AST Investment Services, Inc.; Senior Vice President of Product Development and Marketing, Prudential Investments (since February 2006); Vice President of Product Development and Product Management, Prudential Investments (2003-2006). | | None. |
| (1) | The year in which each individual joined the Fund’s Board is as follows: |
Linda W. Bynoe, 2005; Douglas H. McCorkindale, 1996; Richard A. Redeker, 1996; Robin B. Smith, 1996; Stephen G. Stoneburn, 2003; Kevin J. Bannon, 2008; Michael S. Hyland, 2008; Stephen P. Munn, 2008; Stuart S. Parker, Board Member and President since 2012; Scott B. Benjamin, Board Member since 2010 and Vice President since 2009.
| | |
Fund Officers(a)(1) | | |
Name, Address and Age Position with Fund | | Principal Occupation(s) During Past Five Years |
Judy A. Rice (64) Vice President | | President, Chief Executive Officer (May 2011-Present) and Executive Vice President (December 2008-May 2011) of Prudential Investment Management Services LLC; Formerly President, Chief Executive Officer, Chief Operating Officer and Officer-In-Charge (February 2003-December 2011) of Prudential Investments LLC; formerly President, Chief Executive Officer and Officer-In-Charge (April 2003-December 2011) of Prudential Mutual Fund Services LLC (PMFS); formerly Member of the Board of Directors of Jennison Associates LLC (November 2010-December 2011); formerly Vice President (February 1999-April 2006) of Prudential Investment Management Services LLC; formerly President, COO, CEO and Manager of PIFM Holdco, LLC (April 2006-December 2011); formerly President, Chief Executive Officer, Chief Operating Officer and Officer-In-Charge (May 2003-June 2005) and Director (May 2003-March 2006) and Executive Vice President (June 2005-March 2006) of AST Investment Services, Inc.; Member of Board of Governors of the Investment Company Institute. |
Visit our website at www.prudentialfunds.com
| | |
Fund Officers(a)(1) | | |
Name, Address and Age Position with Fund | | Principal Occupation(s) During Past Five Years |
Raymond A. O’Hara (56) Chief Legal Officer | | Vice President and Corporate Counsel (since July 2010) of Prudential Insurance Company of America (Prudential); Vice President (March 2011-Present) of Pruco Life Insurance Company and Pruco Life Insurance Company of New Jersey; Vice President and Corporate Counsel (March 2011-Present) of Prudential Annuities Life Assurance Corporation; Chief Legal Officer of Prudential Investments LLC (since June 2012); Chief Legal Officer of PMFS (since June 2012) and Corporate Counsel of AST Investment Services, Inc. (since June 2012); formerly Vice President and Corporate Counsel (September 2008-July 2010) of The Hartford Financial Services Group, Inc.; formerly Associate (September 1980-December 1987) and Partner (January 1988–August 2008) of Blazzard & Hasenauer, P.C. (formerly, Blazzard, Grodd & Hasenauer, P.C.). |
Deborah A. Docs (54) Secretary | | Vice President and Corporate Counsel (since January 2001) of Prudential; Vice President (since December 1996) and Assistant Secretary (since March 1999) of Prudential Investments LLC; formerly Vice President and Assistant Secretary (May 2003-June 2005) of AST Investment Services, Inc. |
Jonathan D. Shain (54) Assistant Secretary | | Vice President and Corporate Counsel (since August 1998) of Prudential; Vice President and Assistant Secretary (since May 2001) of Prudential Investments LLC; Vice President and Assistant Secretary (since February 2001) of PMFS; formerly Vice President and Assistant Secretary (May 2003-June 2005) of AST Investment Services, Inc. |
Claudia DiGiacomo (38) Assistant Secretary | | Vice President and Corporate Counsel (since January 2005) of Prudential; Vice President and Assistant Secretary of Prudential Investments LLC (since December 2005); Associate at Sidley Austin Brown & Wood LLP (1999-2004). |
Andrew R. French (49) Assistant Secretary | | Vice President and Corporate Counsel (since February 2010) of Prudential; formerly Director and Corporate Counsel (2006-2010) of Prudential; Vice President and Assistant Secretary (since January 2007) of Prudential Investments LLC; Vice President and Assistant Secretary (since January 2007) of PMFS. |
Amanda S. Ryan (34) Assistant Secretary | | Director and Corporate Counsel (since March 2012) of Prudential; Director and Assistant Secretary (since June 2012) of Prudential Investments LLC; Associate at Ropes & Gray (2008-2012). |
Timothy J. Knierim (53) Chief Compliance Officer | | Chief Compliance Officer of Prudential Investment Management, Inc. (since July 2007); formerly Chief Risk Officer of Prudential Investment Management, Inc. and Prudential Investments LLC (2002-2007) and formerly Chief Ethics Officer of Prudential Investment Management, Inc. and Prudential Investments LLC (2006-2007). |
Valerie M. Simpson (54) Deputy Chief Compliance Officer | | Chief Compliance Officer (since April 2007) of Prudential Investments LLC and AST Investment Services, Inc.; formerly Vice President-Financial Reporting (June 1999-March 2006) for Prudential Life and Annuities Finance. |
Prudential Jennison Mid-Cap Growth Fund, Inc.
| | |
Fund Officers(a)(1) | | |
Name, Address and Age Position with Fund | | Principal Occupation(s) During Past Five Years |
Theresa C. Thompson (50) Deputy Chief Compliance Officer | | Vice President, Compliance, Prudential Investments LLC (since April 2004); and Director, Compliance, Prudential Investments LLC (2001-2004). |
Richard W. Kinville (44) Anti-Money Laundering Compliance Officer | | Vice President, Corporate Compliance, Anti-Money Laundering Unit (since January 2005) of Prudential; committee member of the American Council of Life Insurers Anti-Money Laundering and Critical Infrastructure Committee (since January 2007); formerly Investigator and Supervisor in the Special Investigations Unit for the New York Central Mutual Fire Insurance Company (August 1994-January 1999); Investigator in AXA Financial’s Internal Audit Department and Manager in AXA’s Anti-Money Laundering Office (January 1999-January 2005); first chair of the American Council of Life Insurers Anti-Money Laundering and Critical Infrastructure Committee (June 2007-December 2009). |
Grace C. Torres (53) Treasurer and Principal Financial and Accounting Officer | | Assistant Treasurer (since March 1999) and Senior Vice President (since September 1999) of Prudential Investments LLC; Assistant Treasurer (since May 2003) and Vice President (since June 2005) of AST Investment Services, Inc.; Senior Vice President and Assistant Treasurer (since May 2003) of Prudential Annuities Advisory Services, Inc.; formerly Senior Vice President (May 2003-June 2005) of AST Investment Services, Inc. |
M. Sadiq Peshimam (48) Assistant Treasurer | | Vice President (since 2005) of Prudential Investments LLC. |
Peter Parrella (54) Assistant Treasurer | | Vice President (since 2007) and Director (2004-2007) within Prudential Mutual Fund Administration; formerly Tax Manager at SSB Citi Fund Management LLC (1997-2004). |
| (a) | Excludes Mr. Parker and Mr. Benjamin, interested Board Members who also serve as President and Vice President, respectively. |
| (1) | The year in which each individual became an Officer of the Fund is as follows: |
Judy A. Rice, 2012; Raymond A. O’Hara, 2012; Deborah A. Docs, 2005; Jonathan D. Shain, 2005; Claudia DiGiacomo, 2005; Andrew R. French, 2006; Amanda S. Ryan, 2012; Timothy J. Knierim, 2007; Valerie M. Simpson, 2007; Theresa C. Thompson, 2008; Richard W. Kinville, 2011; Grace C. Torres, 1996; Peter Parrella, 2007; M. Sadiq Peshimam, 2006.
Explanatory Notes to Tables:
| • | | Board Members are deemed to be “Interested,” as defined in the 1940 Act, by reason of their affiliation with Prudential Investments LLC and/or an affiliate of Prudential Investments LLC. |
| • | | Unless otherwise noted, the address of all Board Members and Officers is c/o Prudential Investments LLC, Gateway Center Three, 100 Mulberry Street, Newark, New Jersey 07102-4077. |
| • | | There is no set term of office for Board Members or Officers. The Board Members have adopted a retirement policy, which calls for the retirement of Board Members on December 31 of the year in which they reach the age of 75. |
| • | | “Other Directorships Held” includes only directorships of companies required to register or file reports with the SEC under the 1934 Act (that is, “public companies”) or other investment companies registered under the 1940 Act. |
| • | | “Portfolios Overseen” includes all investment companies managed by Prudential Investments LLC. The investment companies for which PI serves as manager include the Prudential Investments Mutual Funds, The Prudential Variable Contract Accounts, Target Mutual Funds, Prudential Short Duration High Yield Fund, Inc., The Prudential Series Fund, Prudential’s Gibraltar Fund, Inc. and the Advanced Series Trust. |
Visit our website at www.prudentialfunds.com
Approval of Advisory Agreements
The Fund’s Board of Directors
The Board of Directors (the “Board”) of Prudential Jennison Mid-Cap Growth Fund, Inc. (the “Fund”) consists of ten individuals, eight of whom are not “interested persons” of the Fund, as defined in the Investment Company Act of 1940, as amended (the “1940 Act”) (the “Independent Directors”). The Board is responsible for the oversight of the Fund and its operations, and performs the various duties imposed on the directors of investment companies by the 1940 Act. The Independent Directors have retained independent legal counsel to assist them in connection with their duties. The Chair of the Board is an Independent Director. The Board has established three standing committees: the Audit Committee, the Nominating and Governance Committee, and the Investment Committee. Each committee is chaired by, and composed of, Independent Directors.
Annual Approval of the Fund’s Advisory Agreements
As required under the 1940 Act, the Board determines annually whether to renew the Fund’s management agreement with Prudential Investments LLC (“PI”) and the Fund’s subadvisory agreement with Jennison Associates LLC (“Jennison”). In considering the renewal of the agreements, the Board, including all of the Independent Directors, met on June 5-7, 2012 and approved the renewal of the agreements through July 31, 2013, after concluding that the renewal of the agreements was in the best interests of the Fund and its shareholders.
In advance of the meetings, the Board requested and received materials relating to the agreements, and had the opportunity to ask questions and request further information in connection with its consideration. Among other things, the Board considered comparative fee information from PI and Jennison. Also, the Board considered comparisons with other mutual funds in relevant Peer Universes and Peer Groups, as is further discussed below.
In approving the agreements, the Board, including the Independent Directors advised by independent legal counsel, considered the factors it deemed relevant, including the nature, quality and extent of services provided by PI and the subadviser, the performance of the Fund, the profitability of PI and its affiliates, expenses and fees, and the potential for economies of scale that may be shared with the Fund and its shareholders as the Fund’s assets grow. In their deliberations, the Directors did not identify any single factor which alone was responsible for the Board’s decision to approve the agreements with respect to the Fund. In connection with its deliberations, the Board considered information provided by PI throughout the year at regular Board meetings, presentations from portfolio managers and other information, as well as information furnished at or in advance of the meetings on June 5-7, 2012.
Prudential Jennison Mid-Cap Growth Fund, Inc.
Approval of Advisory Agreements (continued)
The Directors determined that the overall arrangements between the Fund and PI, which serves as the Fund’s investment manager pursuant to a management agreement, and between PI and Jennison, which serves as the Fund’s subadviser pursuant to the terms of a subadvisory agreement with PI, are in the best interests of the Fund and its shareholders in light of the services performed, fees charged and such other matters as the Directors considered relevant in the exercise of their business judgment.
The material factors and conclusions that formed the basis for the Directors’ reaching their determinations to approve the continuance of the agreements are separately discussed below.
Nature, Quality and Extent of Services
The Board received and considered information regarding the nature, quality and extent of services provided to the Fund by PI and Jennison. The Board considered the services provided by PI, including but not limited to the oversight of the subadviser for the Fund, as well as the provision of fund recordkeeping, compliance, and other services to the Fund. With respect to PI’s oversight of the subadviser, the Board noted that PI’s Strategic Investment Research Group (“SIRG”), which is a business unit of PI, is responsible for monitoring and reporting to PI’s senior management on the performance and operations of the subadviser. The Board also considered that PI pays the salaries of all of the officers and non-independent Directors of the Fund. The Board also considered the investment subadvisory services provided by Jennison, as well as adherence to the Fund’s investment restrictions and compliance with applicable Fund policies and procedures. The Board considered PI’s evaluation of the subadviser, as well as PI’s recommendation, based on its review of the subadviser, to renew the subadvisory agreement.
The Board reviewed the qualifications, backgrounds and responsibilities of PI’s senior management responsible for the oversight of the Fund and Jennison, and also reviewed the qualifications, backgrounds and responsibilities of Jennison’s portfolio managers who are responsible for the day-to-day management of the Fund’s portfolio. The Board was provided with information pertaining to PI’s and Jennison’s organizational structure, senior management, investment operations, and other relevant information pertaining to both PI and Jennison. The Board also noted that it received favorable compliance reports from the Fund’s Chief Compliance Officer (“CCO”) as to both PI and Jennison. The Board noted that Jennison is affiliated with PI.
The Board concluded that it was satisfied with the nature, extent and quality of the investment management services provided by PI and the subadvisory services
Visit our website at www.prudentialfunds.com
provided to the Fund by Jennison, and that there was a reasonable basis on which to conclude that the Fund benefits from the services provided by PI and Jennison under the management and subadvisory agreements.
Costs of Services and Profits Realized by PI
The Board was provided with information on the profitability of PI and its affiliates in serving as the Fund’s investment manager. The Board discussed with PI the methodology utilized in assembling the information regarding profitability and considered its reasonableness. The Board recognized that it is difficult to make comparisons of profitability from fund management contracts because comparative information is not generally publicly available and is affected by numerous factors, including the structure of the particular adviser, the types of funds it manages, its business mix, numerous assumptions regarding allocations and the adviser’s capital structure and cost of capital. The Board did not separately consider the profitability of the subadviser, an affiliate of PI, as its profitability was reflected in the profitability report for PI. Taking these factors into account, the Board concluded that the profitability of PI and its affiliates in relation to the services rendered was not unreasonable.
Economies of Scale
The Board noted that the management fee schedule for the Fund includes breakpoints, which have the effect of decreasing the fee rate as assets increase, and that at its current level of assets the Fund’s effective fee rate reflected some of those rate reductions. The Board received and discussed information concerning whether PI realizes economies of scale as the Fund’s assets grow beyond current levels. The Board took note that the Fund’s fee structure currently results in benefits to Fund shareholders whether or not PI realizes any economies of scale. The Board recognized the inherent limitations of any analysis of economies of scale, stemming largely from the Board’s understanding that most of PI’s costs are not specific to individual funds, but rather are incurred across a variety of products and services.
Other Benefits to PI and Jennison
The Board considered potential ancillary benefits that might be received by PI and Jennison and their affiliates as a result of their relationship with the Fund. The Board concluded that potential benefits to be derived by PI included fees received by affiliates of PI for serving as the Fund’s securities lending agent, transfer agency fees received by the Fund’s transfer agent (which is affiliated with PI), as well as benefits to its reputation or other intangible benefits resulting from PI’s association with the Fund. The Board concluded that the potential benefits to be derived by Jennison included its ability to use soft dollar credits, as well as the potential benefits consistent with those
Prudential Jennison Mid-Cap Growth Fund, Inc.
Approval of Advisory Agreements (continued)
generally resulting from an increase in assets under management, specifically, potential access to additional research resources and benefits to its reputation. The Board concluded that the benefits derived by PI and Jennison were consistent with the types of benefits generally derived by investment managers and subadvisers to mutual funds.
Performance of the Fund / Fees and Expenses
The Board considered certain additional specific factors and made related conclusions relating to the historical performance of the Fund for the one-, three-, five- and ten-year periods ended December 31, 2011.
The Board also considered the Fund’s actual management fee, as well as the Fund’s net total expense ratio, for the fiscal year ended August 31, 2011. The Board considered the management fee for the Fund as compared to the management fee charged by PI to other funds and the fee charged by other advisers to comparable mutual funds in a Peer Group. The actual management fee represents the fee rate actually paid by Fund shareholders and includes any fee waivers or reimbursements. The net total expense ratio for the Fund represents the actual expense ratio incurred by Fund shareholders.
The mutual funds included in the Peer Universe (the Lipper Mid-Cap Growth Funds Performance Universe)1 and the Peer Group were objectively determined by Lipper Inc. (“Lipper”), an independent provider of mutual fund data. To the extent that PI deemed appropriate, and for reasons addressed in detail with the Board, PI may have provided supplemental data compiled by Lipper for the Board’s consideration. The comparisons placed the Fund in various quartiles, with the first quartile being the best 25% of the mutual funds (for performance, the best performing mutual funds and, for expenses, the lowest cost mutual funds).
| 1 | The Fund was compared to the Lipper Mid-Cap Growth Funds Performance Universe, although Lipper classifies the Fund in the Multi-Cap Growth Funds Performance Universe. The Fund was compared to the Lipper Mid-Cap Growth Funds Performance Universe because PI believes that the funds included in this Universe provide a more appropriate basis for Fund performance comparisons. |
Visit our website at www.prudentialfunds.com
The section below summarizes key factors considered by the Board and the Board’s conclusions regarding the Fund’s performance, fees and overall expenses. The table sets forth gross performance comparisons (which do not reflect the impact on performance of fund expenses, or any subsidies, expense caps or waivers that may be applicable) with the Peer Universe, actual management fees with the Peer Group (which reflect the impact of any subsidies or fee waivers), and net total expenses with the Peer Group, each of which were key factors considered by the Board.
| | | | | | | | |
| Performance | | 1 Year | | 3 Years | | 5 Years | | 10 Years |
| | | 1st Quartile | | 2nd Quartile | | 1st Quartile | | 1st Quartile |
Actual Management Fees: 1st Quartile |
Net Total Expenses: 1st Quartile |
| • | | The Board noted that the Fund outperformed its benchmark index over the one-, five- and ten-year periods, although it underperformed over the three-year period. |
| • | | The Board concluded that, in light of the Fund’s strong performance, it would be in the best interests of the Fund and its shareholders to renew the agreements. |
| • | | The Board concluded that the management fees (including subadvisory fees) and total expenses were reasonable in light of the services provided. |
* * *
After full consideration of these factors, the Board concluded that the approval of the agreements was in the best interests of the Fund and its shareholders.
Prudential Jennison Mid-Cap Growth Fund, Inc.
| | | | |
| n MAIL | | n TELEPHONE | | n WEBSITE |
Gateway Center Three 100 Mulberry Street Newark, NJ 07102 | | (800) 225-1852 | | www.prudentialfunds.com |
|
| PROXY VOTING |
| The Board of Directors of the Fund has delegated to the Fund’s investment subadviser the responsibility for voting any proxies and maintaining proxy recordkeeping with respect to the Fund. A description of these proxy voting policies and procedures is available without charge, upon request, by calling (800) 225-1852. Information regarding how the Fund voted proxies relating to portfolio securities during the most recent 12-month period ended June 30 is available on the Fund’s website and on the Securities and Exchange Commission’s website. |
|
| DIRECTORS |
| Kevin J. Bannon • Scott E. Benjamin • Linda W. Bynoe • Michael S. Hyland • Douglas H. McCorkindale • Stephen P. Munn • Stuart S. Parker • Richard A. Redeker • Robin B. Smith • Stephen G. Stoneburn |
|
| OFFICERS |
| Stuart S. Parker, President • Judy A. Rice, Vice President • Scott E. Benjamin, Vice President • Grace C. Torres, Treasurer and Principal Financial and Accounting Officer • Raymond A. O’Hara, Chief Legal Officer • Deborah A. Docs, Secretary • Timothy J. Knierim, Chief Compliance Officer • Valerie M. Simpson, Deputy Chief Compliance Officer • Theresa C. Thompson, Deputy Chief Compliance Officer • Richard W. Kinville, Anti-Money Laundering Compliance Officer • Jonathan Shain, Assistant Secretary • Claudia DiGiacomo, Assistant Secretary • Amanda S. Ryan, Assistant Secretary • Andrew R. French, Assistant Secretary • M. Sadiq Peshimam, Assistant Treasurer • Peter Parrella, Assistant Treasurer |
| | | | |
| MANAGER | | Prudential Investments LLC | | Gateway Center Three
100 Mulberry Street
Newark, NJ 07102 |
|
| INVESTMENT SUBADVISER | | Jennison Associates LLC | | 466 Lexington Avenue
New York, NY 10017 |
|
| DISTRIBUTOR | | Prudential Investment
Management Services LLC | | Gateway Center Three
100 Mulberry Street
Newark, NJ 07102 |
|
| CUSTODIAN | | The Bank of New York Mellon | | One Wall Street
New York, NY 10286 |
|
| TRANSFER AGENT | | Prudential Mutual Fund
Services LLC | | PO Box 9658
Providence, RI 02940 |
|
| INDEPENDENT REGISTERED PUBLIC ACCOUNTING FIRM | | KPMG LLP | | 345 Park Avenue
New York, NY 10154 |
|
| FUND COUNSEL | | Willkie Farr & Gallagher LLP | | 787 Seventh Avenue
New York, NY 10019 |
|
| An investor should consider the investment objectives, risks, charges, and expenses of the Fund carefully before investing. The prospectus and summary prospectus contain this and other information about the Fund. An investor may obtain a prospectus and summary prospectus by visiting our website at www.prudentialfunds.com or by calling (800) 225-1852. The prospectus and summary prospectus should be read carefully before investing. |
|
| E-DELIVERY |
| To receive your mutual fund documents online, go to www.prudentialfunds.com/edelivery and enroll. Instead of receiving printed documents by mail, you will receive notification via email when new materials are available. You can cancel your enrollment or change your email address at any time by visiting the website address above. |
|
| SHAREHOLDER COMMUNICATIONS WITH DIRECTORS |
| Shareholders can communicate directly with the Board of Directors by writing to the Chair of the Board, Prudential Jennison Mid-Cap Growth Fund, Inc., Prudential Investments, Attn: Board of Directors, 100 Mulberry Street, Gateway Center Three, Newark, NJ 07102. Shareholders can communicate directly with an individual Director by writing to the same address. Communications are not screened before being delivered to the addressee. |
|
| AVAILABILITY OF PORTFOLIO SCHEDULE |
| The Fund files its complete schedule of portfolio holdings with the Securities and Exchange Commission for the first and third quarters of each fiscal year on Form N-Q. The Fund’s Forms N-Q are available on the Commission’s website at www.sec.gov. The Fund’s Forms N-Q may also be reviewed and copied at the Commission’s Public Reference Room in Washington, D.C. Information on the operation and location of the Public Reference Room may be obtained by calling (202) 551-8090. The Fund’s schedule of portfolio holdings is also available on the Fund’s website as of the end of each month. |
|
| The Fund’s Statement of Additional Information contains additional information about the Fund’s Directors and is available without charge, upon request, by calling (800) 225-1852. |
Mutual Funds:
| | | | |
| ARE NOT INSURED BY THE FDIC OR ANY FEDERAL GOVERNMENT AGENCY | | MAY LOSE VALUE | | ARE NOT A DEPOSIT OF OR GUARANTEED BY ANY BANK OR ANY BANK AFFILIATE |

PRUDENTIAL JENNISON MID-CAP GROWTH FUND, INC.
| | | | | | | | | | | | | | | | |
| | | SHARE CLASS | | A | | B | | C | | Q | | R | | X | | Z |
| | NASDAQ | | PEEAX | | PEEBX | | PEGCX | | PJGQX | | JDERX | | N/A | | PEGZX |
| | CUSIP | | 74441C105 | | 74441C204 | | 74441C303 | | 74441C881 | | 74441C600 | | 74441C709 | | 74441C808 |
MF173E 0232882-00001-00
Item 2 – Code of Ethics — See Exhibit (a)
As of the end of the period covered by this report, the registrant has adopted a code of ethics (the “Section 406 Standards for Investment Companies – Ethical Standards for Principal Executive and Financial Officers”) that applies to the registrant’s Principal Executive Officer and Principal Financial Officer; the registrant’s Principal Financial Officer also serves as the Principal Accounting Officer.
The registrant hereby undertakes to provide any person, without charge, upon request, a copy of the code of ethics. To request a copy of the code of ethics, contact the registrant 800-225-1852, and ask for a copy of the Section 406 Standards for Investment Companies - Ethical Standards for Principal Executive and Financial Officers.
Item 3 – Audit Committee Financial Expert –
The registrant’s Board has determined that Mr. Stephen P. Munn, member of the Board’s Audit Committee is an “audit committee financial expert,” and that he is “independent,” for purposes of this Item.
Item 4 – Principal Accountant Fees and Services –
(a) Audit Fees
For the fiscal years ended August 31, 2012 and August 31, 2011, KPMG LLP (“KPMG”), the Registrant’s principal accountant, billed the Registrant $22,000 and $26,500, respectively, for professional services rendered for the audit of the Registrant’s annual financial statements or services that are normally provided in connection with statutory and regulatory filings.
(b) Audit-Related Fees
None.
(c) Tax Fees
During the fiscal year ended August 31, 2012, KPMG billed the Registrant $179 for professional services rendered in connection with agreed upon procedures performed related to the receipt of payments pursuant to certain fair fund settlement orders. Not applicable for the fiscal year ended August 31, 2011.
(d) All Other Fees
None.
(e) (1) Audit Committee Pre-Approval Policies and Procedures
THE PRUDENTIAL MUTUAL FUNDS
AUDIT COMMITTEE POLICY
on
Pre-Approval of Services Provided by the Independent Accountants
The Audit Committee of each Prudential Mutual Fund is charged with the responsibility to monitor the independence of the Fund’s independent accountants. As part of this responsibility, the Audit Committee must pre-approve any independent accounting firm’s engagement to render audit and/or permissible non-audit services, as required by law. In evaluating a proposed engagement of the independent accountants, the Audit Committee will assess the effect that the engagement might reasonably be expected to have on the accountant’s independence. The Committee’s evaluation will be based on:
| | • | | a review of the nature of the professional services expected to be provided, |
| | • | | a review of the safeguards put into place by the accounting firm to safeguard independence, and |
| | • | | periodic meetings with the accounting firm. |
Policy for Audit and Non-Audit Services Provided to the Funds
On an annual basis, the scope of audits for each Fund, audit fees and expenses, and audit-related and non-audit services (and fees proposed in respect thereof) proposed to be performed by the Fund’s independent accountants will be presented by the Treasurer and the independent accountants to the Audit Committee for review and, as appropriate, approval prior to the initiation of such services. Such presentation shall be accompanied by confirmation by both the Treasurer and the independent accountants that the proposed services will not adversely affect the independence of the independent accountants. Proposed services shall be described in sufficient detail to enable the Audit Committee to assess the appropriateness of such services and fees, and the compatibility of the provision of such services with the auditor’s independence. The Committee shall receive periodic reports on the progress of the audit and other services which are approved by the Committee or by the Committee Chair pursuant to authority delegated in this Policy.
The categories of services enumerated under “Audit Services”, “Audit-related Services”, and “Tax Services” are intended to provide guidance to the Treasurer and the independent accountants as to those categories of services which the Committee believes are generally consistent with the independence of the independent accountants and which the Committee (or the Committee Chair) would expect upon the presentation of specific proposals to pre-approve. The enumerated categories are not intended as an exclusive list of audit, audit-related or tax services, which the Committee (or the Committee Chair) would consider for pre-approval.
Audit Services
The following categories of audit services are considered to be consistent with the role of the Fund’s independent accountants:
| | • | | Annual Fund financial statement audits |
| | • | | Seed audits (related to new product filings, as required) |
| | • | | SEC and regulatory filings and consents |
Audit-related Services
The following categories of audit-related services are considered to be consistent with the role of the Fund’s independent accountants:
| | • | | Accounting consultations |
| | • | | Fund merger support services |
| | • | | Agreed Upon Procedure Reports |
| | • | | Other Internal Control Reports |
Individual audit-related services that fall within one of these categories and are not presented to the Audit Committee as part of the annual pre-approval process will be subject to pre-approval by the Committee Chair (or any other Committee member on whom this responsibility has been delegated) so long as the estimated fee for those services does not exceed $50,000.
Tax Services
The following categories of tax services are considered to be consistent with the role of the Fund’s independent accountants:
| | • | | Tax compliance services related to the filing or amendment of the following: |
| | • | | Federal, state and local income tax compliance; and, |
| | • | | Sales and use tax compliance |
| | • | | Timely RIC qualification reviews |
| | • | | Tax distribution analysis and planning |
| | • | | Tax authority examination services |
| | • | | Tax appeals support services |
| | • | | Accounting methods studies |
| | • | | Fund merger support services |
| | • | | Tax consulting services and related projects |
Individual tax services that fall within one of these categories and are not presented to the Audit Committee as part of the annual pre-approval process will be subject to pre-approval by the Committee Chair (or any other Committee member on whom this responsibility has been delegated) so long as the estimated fee for those services does not exceed $50,000.
Other Non-audit Services
Certain non-audit services that the independent accountants are legally permitted to render will be subject to pre-approval by the Committee or by one or more Committee members to whom the Committee has delegated this authority and who will report to the full Committee any pre-approval
decisions made pursuant to this Policy. Non-audit services presented for pre-approval pursuant to this paragraph will be accompanied by a confirmation from both the Treasurer and the independent accountants that the proposed services will not adversely affect the independence of the independent accountants.
Proscribed Services
The Fund’s independent accountants will not render services in the following categories of non-audit services:
| | • | | Bookkeeping or other services related to the accounting records or financial statements of the Fund |
| | • | | Financial information systems design and implementation |
| | • | | Appraisal or valuation services, fairness opinions, or contribution-in-kind reports |
| | • | | Internal audit outsourcing services |
| | • | | Management functions or human resources |
| | • | | Broker or dealer, investment adviser, or investment banking services |
| | • | | Legal services and expert services unrelated to the audit |
| | • | | Any other service that the Public Company Accounting Oversight Board determines, by regulation, is impermissible. |
Pre-approval of Non-Audit Services Provided to Other Entities Within the Prudential Fund Complex
Certain non-audit services provided to Prudential Investments LLC or any of its affiliates that also provide ongoing services to the Prudential Mutual Funds will be subject to pre-approval by the Audit Committee. The only non-audit services provided to these entities that will require pre-approval are those related directly to the operations and financial reporting of the Funds. Individual projects that are not presented to the Audit Committee as part of the annual pre-approval process will be subject to pre-approval by the Committee Chair (or any other Committee member on whom this responsibility has been delegated) so long as the estimated fee for those services does not exceed $50,000. Services presented for pre-approval pursuant to this paragraph will be accompanied by a confirmation from both the Treasurer and the independent accountants that the proposed services will not adversely affect the independence of the independent accountants.
Although the Audit Committee will not pre-approve all services provided to Prudential Investments LLC and its affiliates, the Committee will receive an annual report from the Fund’s independent accounting firm showing the aggregate fees for all services provided to Prudential Investments and its affiliates.
(e) (2) Percentage of services referred to in 4(b) – 4(d) that were approved by the audit committee –
One hundred percent of the services described in Item 4(c) was approved by the audit committee.
(f) Percentage of hours expended attributable to work performed by other than full time employees of principal accountant if greater than 50%.
The percentage of hours expended on the principal accountant’s engagement to audit the registrant’s financial statements for the most recent fiscal year that were attributed to work performed by persons other than the principal accountant’s full-time, permanent employees was 0%.
(g) Non-Audit Fees
Not applicable to Registrant for the fiscal years 2012 and 2011. The aggregate non-audit fees billed by KPMG for services rendered to the registrant’s investment adviser and any entity controlling, controlled by, or under common control with the investment adviser that provides ongoing services to the registrant for the fiscal years 2012 and 2011 was $0 and $0, respectively.
(h) Principal Accountant’s Independence
Not applicable as KPMG has not provided non-audit services to the registrant’s investment adviser and any entity controlling, controlled by, or under common control with the investment adviser that provides ongoing services to the registrant that were not pre-approved pursuant to Rule 2-01(c)(7)(ii) of Regulation S-X.
Item 5 – Audit Committee of Listed Registrants – Not applicable.
Item 6 – Schedule of Investments – The schedule is included as part of the report to shareholders filed under Item 1 of this Form.
Item 7 – Disclosure of Proxy Voting Policies and Procedures for Closed-End Management Investment Companies – Not applicable.
Item 8 – Portfolio Managers of Closed-End Management Investment Companies – Not applicable.
Item 9 – Purchases of Equity Securities by Closed-End Management Investment Company and Affiliated Purchasers –
Not applicable.
Item 10 – Submission of Matters to a Vote of Security Holders – Not applicable.
Item 11 – Controls and Procedures
| | (a) | It is the conclusion of the registrant’s principal executive officer and principal financial officer that the effectiveness of the registrant’s current disclosure controls and procedures (such disclosure controls and procedures having been evaluated within 90 days of the date of this filing) provide reasonable assurance that the information required to be disclosed by the registrant has been recorded, processed, summarized and reported within the time period specified in the Commission’s rules and forms and that the information required to be disclosed by the registrant has been accumulated and communicated to the registrant’s principal executive officer and principal financial officer in order to allow timely decisions regarding required disclosure. |
| | (b) | There has been no significant change in the registrant’s internal control over financial reporting that occurred during the registrant’s most recent fiscal quarter of the period covered by this report that has materially affected, or is likely to materially affect, the registrant’s internal control over financial reporting. |
Item 12 – Exhibits
| | | | | | |
| (a) | | (1) Code of Ethics – Attached hereto as Exhibit EX-99.CODE-ETH | | |
| | | |
| | (2) | | Certifications pursuant to Section 302 of the Sarbanes-Oxley Act – Attached hereto as Exhibit EX-99.CERT. | | |
| | | |
| | (3) | | Any written solicitation to purchase securities under Rule 23c-1. – Not applicable. | | |
| | |
| (b) | | Certifications pursuant to Section 906 of the Sarbanes-Oxley Act – Attached hereto as Exhibit EX-99.906CERT. | | |
SIGNATURES
Pursuant to the requirements of the Securities Exchange Act of 1934 and the Investment Company Act of 1940, the registrant has duly caused this report to be signed on its behalf by the undersigned, thereunto duly authorized.
| | |
| Registrant: | | Prudential Jennison Mid-Cap Growth Fund, Inc. |
| |
| By: | | /s/ Deborah A. Docs |
| | Deborah A. Docs |
| | Secretary |
| |
| Date: | | October 22, 2012 |
Pursuant to the requirements of the Securities Exchange Act of 1934 and the Investment Company Act of 1940, this report has been signed below by the following persons on behalf of the registrant and in the capacities and on the dates indicated.
| | |
| By: | | /s/ Stuart S. Parker |
| | Stuart S. Parker |
| | President and Principal Executive Officer |
| |
| Date: | | October 22, 2012 |
| |
| By: | | /s/ Grace C. Torres |
| | Grace C. Torres |
| | Treasurer and Principal Financial Officer |
| |
| Date: | | October 22, 2012 |