UNITED STATES
SECURITIES AND EXCHANGE COMMISSION
Washington, D.C. 20549
FORM N-CSR
CERTIFIED SHAREHOLDER REPORT OF REGISTERED
MANAGEMENT INVESTMENT COMPANIES
Investment Company Act file number 811-07807
Fidelity Revere Street Trust
(Exact name of registrant as specified in charter)
245 Summer St., Boston, Massachusetts 02210
(Address of principal executive offices) (Zip code)
Cynthia Lo Bessette, Secretary
245 Summer St.
Boston, Massachusetts 02210
(Name and address of agent for service)
Registrant's telephone number, including area code:
617-563-7000
| |
Date of fiscal year end: | May 31 |
|
|
Date of reporting period: | May 31, 2022 |
Item 1.
Reports to Stockholders
Fidelity® Tax-Free Cash Central Fund
Annual Report
May 31, 2022
Contents
To view a fund's proxy voting guidelines and proxy voting record for the 12-month period ended June 30, visit http://www.fidelity.com/proxyvotingresults or visit the Securities and Exchange Commission's (SEC) web site at http://www.sec.gov.
You may also call 1-800-544-8544 to request a free copy of the proxy voting guidelines.
Standard & Poor's, S&P and S&P 500 are registered service marks of The McGraw-Hill Companies, Inc. and have been licensed for use by Fidelity Distributors Corporation.
Other third-party marks appearing herein are the property of their respective owners.
All other marks appearing herein are registered or unregistered trademarks or service marks of FMR LLC or an affiliated company. © 2022 FMR LLC. All rights reserved.
A fund files its complete schedule of portfolio holdings with the SEC for the first and third quarters of each fiscal year on Form N-PORT. Forms N-PORT are available on the SEC's web site at http://www.sec.gov. A fund's Forms N-PORT may be reviewed and copied at the SEC's Public Reference Room in Washington, DC. Information regarding the operation of the SEC's Public Reference Room may be obtained by calling 1-800-SEC-0330.
Early in 2020, the outbreak and spread of COVID-19 emerged as a public health emergency that had a major influence on financial markets, primarily based on its impact on the global economy and corporate earnings. On March 11, 2020, the World Health Organization declared the COVID-19 outbreak a pandemic, citing sustained risk of further global spread. The pandemic prompted a number of measures to limit the spread of COVID-19, including travel and border restrictions, quarantines, and restrictions on large gatherings. In turn, these resulted in lower consumer activity, diminished demand for a wide range of products and services, disruption in manufacturing and supply chains, and - given the wide variability in outcomes regarding the outbreak - significant market uncertainty and volatility. To help stem the turmoil, the U.S. government took unprecedented action - in concert with the U.S. Federal Reserve and central banks around the world - to help support consumers, businesses, and the broader economy, and to limit disruption to the financial system.
In general, the overall impact of the pandemic lessened in 2021, amid a resilient economy and widespread distribution of three COVID-19 vaccines granted emergency use authorization from the U.S. Food and Drug Administration (FDA) early in the year. Still, the situation remains dynamic, and the extent and duration of its influence on financial markets and the economy is highly uncertain, due in part to a recent spike in cases based on highly contagious variants of the coronavirus.
Extreme events such as the COVID-19 crisis are exogenous shocks that can have significant adverse effects on mutual funds and their investments. Although multiple asset classes may be affected by market disruption, the duration and impact may not be the same for all types of assets. Fidelity is committed to helping you stay informed amid news about COVID-19 and during increased market volatility, and we continue to take extra steps to be responsive to customer needs. We encourage you to visit us online, where we offer ongoing updates, commentary, and analysis on the markets and our funds.
| Effective Maturity Diversification (% of Fund's Investments) |
| Days |
| 1 - 7 | 99.7 | |
| 31 - 60 | 0.3 | |
| |
Effective maturity is determined in accordance with the requirements of Rule 2a-7 under the Investment Company Act of 1940.
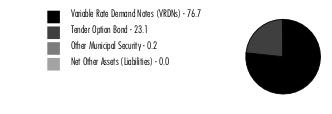
Asset Allocation (% of Fund's net assets) |
|
Percentages shown as 0.0% may reflect amounts less than 0.05%. |
|
Showing Percentage of Net Assets
| Variable Rate Demand Note - 71.2% |
| | | Principal Amount (a) | Value ($) |
| Alabama - 5.3% | | | |
| Columbia Indl. Dev. Board Poll. Cont. Rev. (Alabama Pwr. Co. Proj.): | | | |
| Series 2014 A, 0.65% 6/1/22, VRDN (b) | | 20,185,000 | 20,185,000 |
| Series 2014 B, 0.65% 6/1/22, VRDN (b) | | 9,850,000 | 9,850,000 |
| Eutaw Indl. Dev. Board Poll. Cont. Rev. (Alabama Pwr. Co. Proj.) Series 1998, 0.65% 6/1/22, VRDN (b) | | 2,500,000 | 2,500,000 |
| Mobile Downtown Redev. Auth. Gulf Opportunity Zone: | | | |
| Series 2011 A, 0.81% 6/7/22, LOC Bank of America NA, VRDN (b)(c) | | 17,860,000 | 17,860,000 |
| Series 2011 B, 0.81% 6/7/22, LOC Bank of America NA, VRDN (b)(c) | | 12,000,000 | 12,000,000 |
| Mobile Indl. Dev. Board Dock & Wharf Rev. (Holnam, Inc. Proj.) Series 1999 A, 0.88% 6/7/22, LOC Bayerische Landesbank, VRDN (b) | | 16,200,000 | 16,200,000 |
| Mobile Indl. Dev. Board Poll. Cont. Rev. (Alabama Pwr. Co. Barry Plant Proj.) Series 2009, 0.65% 6/1/22, VRDN (b) | | 11,900,000 | 11,900,000 |
| Mobile Indl. Dev. Board Solid Waste Disp. Rev. (Alabama Pwr. Co. Barry Plant Proj.) Second Series 2009, 0.68% 6/1/22, VRDN (b) | | 8,700,000 | 8,700,000 |
| West Jefferson Indl. Dev. Series 2008, 0.91% 6/7/22, VRDN (b) | | 1,600,000 | 1,600,000 |
| Wilsonville Indl. Dev. Board Poll. Cont. Rev. (Alabama Pwr. Co. Proj.) Series D, 0.67% 6/1/22, VRDN (b) | | 7,030,000 | 7,030,000 |
TOTAL ALABAMA | | | 107,825,000 |
| Alaska - 1.6% | | | |
| Valdez Marine Term. Rev.: | | | |
| (Exxon Pipeline Co. Proj.): | | | |
Series 1993 A, 0.6% 6/1/22 (Exxon Mobil Corp. Guaranteed), VRDN (b) | | 22,200,000 | 22,200,000 |
Series 1993 B, 0.6% 6/1/22 (Exxon Mobil Corp. Guaranteed), VRDN (b) | | 1,100,000 | 1,100,000 |
Series 1993 C, 0.6% 6/1/22 (Exxon Mobil Corp. Guaranteed), VRDN (b) | | 1,080,000 | 1,080,000 |
| (Phillips Trans. Alaska, Inc. Proj.): | | | |
Series 1994 B, 0.81% 6/7/22 (ConocoPhillips Co. Guaranteed), VRDN (b) | | 4,000,000 | 4,000,000 |
Series 1994 C, 0.77% 6/7/22 (ConocoPhillips Co. Guaranteed), VRDN (b) | | 3,300,000 | 3,300,000 |
TOTAL ALASKA | | | 31,680,000 |
| Arizona - 0.3% | | | |
| Arizona Health Facilities Auth. Rev. Series 2015 C, 0.62% 6/1/22, LOC Bank of America NA, VRDN (b) | | 2,705,000 | 2,705,000 |
| Arizona Indl. Dev. Auth. Hosp. Rev. Series 2019 A, 0.62% 6/1/22, LOC JPMorgan Chase Bank, VRDN (b) | | 2,675,000 | 2,675,000 |
TOTAL ARIZONA | | | 5,380,000 |
| California - 0.2% | | | |
| Los Angeles Dept. of Wtr. & Pwr. Wtrwks. Rev. Series 2001 B2, 0.52% 6/1/22 (Liquidity Facility UBS AG), VRDN (b) | | 4,700,000 | 4,700,000 |
| Colorado - 0.6% | | | |
| Colorado Health Facilities Auth. Series 2020 A, 0.62% 6/1/22, LOC The Toronto-Dominion Bank, VRDN (b) | | 12,900,000 | 12,900,000 |
| Connecticut - 1.8% | | | |
| Connecticut Health & Edl. Facilities Auth. Rev.: | | | |
| (Greenwich Hosp. Proj.) Series C, 0.78% 6/7/22, VRDN (b) | | 11,940,000 | 11,940,000 |
| (Wesleyan Univ. Proj.) Series H, 0.77% 6/7/22, VRDN (b) | | 4,050,000 | 4,050,000 |
| Series 2014 C, 0.8% 6/7/22, VRDN (b) | | 11,185,000 | 11,185,000 |
| Connecticut Hsg. Fin. Auth.: | | | |
| (Hsg. Mtg. Fin. Prog.) Series 2018 C, 0.78% 6/7/22 (Liquidity Facility TD Banknorth, NA), VRDN (b) | | 2,500,000 | 2,500,000 |
| Series 2016 B, 0.79% 6/7/22 (Liquidity Facility Wells Fargo Bank NA), VRDN (b) | | 4,240,000 | 4,240,000 |
| Series 2016 F, 0.79% 6/7/22 (Liquidity Facility U.S. Bank NA, Cincinnati), VRDN (b) | | 1,100,000 | 1,100,000 |
| Series F, 0.8% 6/7/22 (Liquidity Facility Barclays Bank PLC), VRDN (b) | | 1,450,000 | 1,450,000 |
TOTAL CONNECTICUT | | | 36,465,000 |
| District Of Columbia - 1.0% | | | |
| District of Columbia Rev.: | | | |
| (Medlantic/Helix Proj.) Series 1998 A Tranche I, 0.62% 6/1/22, LOC TD Banknorth, NA, VRDN (b) | | 19,400,000 | 19,400,000 |
| (The AARP Foundation Proj.) Series 2004, 0.83% 6/7/22, LOC Bank of America NA, VRDN (b) | | 1,035,000 | 1,035,000 |
TOTAL DISTRICT OF COLUMBIA | | | 20,435,000 |
| Florida - 3.2% | | | |
| Escambia County Poll. Cont. Rev. (Gulf Pwr. Co. Proj.) Series 1997, 0.71% 6/1/22, VRDN (b) | | 19,500,000 | 19,500,000 |
| Escambia County Solid Waste Disp. Rev. (Gulf Pwr. Co. Proj.) Series 2009, 0.71% 6/1/22, VRDN (b) | | 16,500,000 | 16,500,000 |
| Jacksonville Poll. Cont. Rev. (Florida Pwr. & Lt. Co. Proj.) Series 1995, 0.68% 6/1/22, VRDN (b) | | 12,600,000 | 12,600,000 |
| Martin County Poll. Cont. Rev. (Florida Pwr. & Lt. Co. Proj.) Series 2000, 0.7% 6/1/22, VRDN (b) | | 16,400,000 | 16,400,000 |
TOTAL FLORIDA | | | 65,000,000 |
| Georgia - 2.9% | | | |
| Athens-Clarke County Unified Govt. Dev. Auth. Rev. (Univ. of Georgia Athletic Assoc. Proj.) Series 2005 B, 0.6% 6/1/22, LOC Wells Fargo Bank NA, VRDN (b) | | 8,845,000 | 8,845,000 |
| Burke County Indl. Dev. Auth. Poll. Cont. Rev. (Georgia Pwr. Co. Plant Vogtle Proj.): | | | |
| First Series 2009, 0.78% 6/1/22, VRDN (b) | | 6,300,000 | 6,300,000 |
| Series 2018, 0.7% 6/1/22, VRDN (b) | | 10,150,000 | 10,150,000 |
| Coweta County Dev. Auth. Poll. Cont. Rev. (Georgia Pwr. Co. Plant Yates Proj.) Series 2006, 0.77% 6/1/22, VRDN (b) | | 1,000,000 | 1,000,000 |
| Floyd County Dev. Auth. Poll. Cont. Rev. (Georgia Pwr. Co. Plant Hammond Proj.) Series 2010, 0.78% 6/1/22, VRDN (b) | | 10,000,000 | 10,000,000 |
| Monroe County Dev. Auth. Poll. Cont. Rev.: | | | |
| (Georgia Pwr. Co. Plant Scherer Proj.): | | | |
Series 1997, 0.77% 6/1/22, VRDN (b) | | 3,200,000 | 3,200,000 |
Series 2008, 0.77% 6/1/22, VRDN (b) | | 6,200,000 | 6,200,000 |
| (Gulf Pwr. Co. Plant Scherer Proj.) Series 2010, 0.71% 6/1/22, VRDN (b) | | 6,475,000 | 6,475,000 |
| Series 2002 V1, 0.71% 6/1/22, VRDN (b) | | 7,000,000 | 7,000,000 |
TOTAL GEORGIA | | | 59,170,000 |
| Illinois - 3.7% | | | |
| Illinois Fin. Auth.: | | | |
| Series 2021 B, 0.63% 6/1/22 (Liquidity Facility Royal Bank of Canada), VRDN (b) | | 485,000 | 485,000 |
| Series 2021 E, 0.78% 6/7/22, VRDN (b) | | 4,200,000 | 4,200,000 |
| Illinois Fin. Auth. Rev.: | | | |
| (Chicago Symphony Orchestra Proj.) Series 2008, 0.8% 6/7/22, LOC PNC Bank NA, VRDN (b) | | 6,475,000 | 6,475,000 |
| (Little Co. of Mary Hosp. Proj.) Series 2008 B, 0.82% 6/7/22, LOC Barclays Bank PLC, VRDN (b) | | 7,955,000 | 7,955,000 |
| (The Univ. of Chicago Med. Ctr. Proj.): | | | |
Series 2009 D2, 0.63% 6/1/22, LOC PNC Bank NA, VRDN (b) | | 2,800,000 | 2,800,000 |
Series 2010 B, 0.6% 6/1/22, LOC Wells Fargo Bank NA, VRDN (b) | | 7,100,000 | 7,100,000 |
| Series 2009 D1, 0.63% 6/1/22, LOC PNC Bank NA, VRDN (b) | | 3,965,000 | 3,965,000 |
| Series 2011 A, 0.57% 6/1/22, LOC Bank of America NA, VRDN (b) | | 10,900,000 | 10,900,000 |
| Series 2018, 0.63% 6/1/22, LOC PNC Bank NA, VRDN (b) | | 27,805,000 | 27,805,000 |
| FHLMC Lake County Multi-family Hsg. Rev. (Whispering Oaks Apts. Proj.) Series 2008, 0.81% 6/7/22, LOC Freddie Mac, VRDN (b) | | 2,750,000 | 2,750,000 |
TOTAL ILLINOIS | | | 74,435,000 |
| Indiana - 1.2% | | | |
| Indiana Dev. Fin. Auth. Envir. Rev. (Duke Energy Indiana, Inc. Proj.): | | | |
| Series 2009 A4, 0.68% 6/1/22, LOC Sumitomo Mitsui Banking Corp., VRDN (b) | | 17,605,000 | 17,605,000 |
| Series 2009 A5, 0.6% 6/1/22, LOC Sumitomo Mitsui Banking Corp., VRDN (b) | | 4,685,000 | 4,685,000 |
| Indiana Fin. Auth. Health Sys. Rev. (Sisters of Saint Francis Health Svcs., Inc. Obligated Group Proj.) Series 2008 I, 0.65% 6/1/22, LOC Barclays Bank PLC, VRDN (b) | | 2,175,000 | 2,175,000 |
TOTAL INDIANA | | | 24,465,000 |
| Iowa - 1.2% | | | |
| Iowa Fin. Auth. Health Facilities Rev.: | | | |
| Series 2013 B1, 0.61% 6/1/22, LOC TD Banknorth, NA, VRDN (b) | | 12,345,000 | 12,345,000 |
| Series 2013 B2, 0.61% 6/1/22, LOC TD Banknorth, NA, VRDN (b) | | 12,460,000 | 12,460,000 |
TOTAL IOWA | | | 24,805,000 |
| Kansas - 1.8% | | | |
| Burlington Envir. Impt. Rev. (Kansas City Pwr. and Lt. Co. Proj.): | | | |
| Series 2007 A, 1.02% 6/7/22, VRDN (b) | | 2,000,000 | 2,000,000 |
| Series 2007 B, 1.02% 6/7/22, VRDN (b) | | 900,000 | 900,000 |
| Kansas Dev. Fin. Auth. Health Facilities Rev. (KU Health Sys. Proj.) Series 2011 J, 0.62% 6/1/22, LOC U.S. Bank NA, Cincinnati, VRDN (b) | | 11,610,000 | 11,610,000 |
| St. Mary's Kansas Poll. Cont. Rev.: | | | |
| (Kansas Gas and Elec. Co. Proj.) Series 1994, 0.96% 6/7/22, VRDN (b) | | 700,000 | 700,000 |
| Series 1994, 0.96% 6/7/22, VRDN (b) | | 5,300,000 | 5,300,000 |
| Univ. of Kansas Hosp. Auth. Health Facilities Rev. (KU Health Sys. Proj.) Series 2004, 0.62% 6/1/22, LOC U.S. Bank NA, Cincinnati, VRDN (b) | | 12,160,000 | 12,160,000 |
| Wamego Kansas Poll. Cont. Rfdg. Rev.: | | | |
| (Kansas Gas & Elec. Co. Proj.) Series 1994, 0.96% 6/7/22, VRDN (b) | | 1,600,000 | 1,600,000 |
| (Western Resources, Inc. Proj.) Series 1994, 0.96% 6/7/22, VRDN (b) | | 2,900,000 | 2,900,000 |
TOTAL KANSAS | | | 37,170,000 |
| Kentucky - 1.0% | | | |
| Louisville & Jefferson County Series 2011 B, 0.62% 6/1/22, LOC PNC Bank NA, VRDN (b) | | 19,310,000 | 19,310,000 |
| Louisiana - 2.0% | | | |
| East Baton Rouge Parish Indl. Dev. Board Rev. (ExxonMobil Proj.) Series 2010 A, 0.58% 6/1/22 (Exxon Mobil Corp. Guaranteed), VRDN (b) | | 26,060,000 | 26,060,000 |
| Louisiana Pub. Facilities Auth. Rev. (Air Products & Chemicals, Inc. Proj.): | | | |
| Series 2007, 0.6% 6/1/22, VRDN (b) | | 8,000,000 | 8,000,000 |
| Series 2008 B, 0.6% 6/1/22, VRDN (b) | | 3,900,000 | 3,900,000 |
| Saint James Parish Gen. Oblig. (Nucor Steel Louisiana LLC Proj.): | | | |
| Series 2010 A1, 0.99% 6/7/22, VRDN (b) | | 300,000 | 300,000 |
| Series 2010 B1, 0.97% 6/7/22, VRDN (b) | | 1,700,000 | 1,700,000 |
TOTAL LOUISIANA | | | 39,960,000 |
| Massachusetts - 0.1% | | | |
| Massachusetts Dev. Fin. Agcy. Rev. (Boston Univ. Proj.) Series U-6C, 0.6% 6/1/22, LOC TD Banknorth, NA, VRDN (b) | | 1,630,000 | 1,630,000 |
| Michigan - 0.2% | | | |
| Michigan Strategic Fund Ltd. Oblig. Rev. (Henry Ford Museum & Greenfield Village Proj.) Series 2002, 0.67% 6/1/22, LOC Comerica Bank, VRDN (b) | | 3,100,000 | 3,100,000 |
| Minnesota - 0.9% | | | |
| Minneapolis Health Care Sys. Rev. (Fairview Health Svcs.) Series 2018 C, 0.58% 6/1/22, LOC Wells Fargo Bank NA, VRDN (b) | | 17,920,000 | 17,920,000 |
| Mississippi - 4.3% | | | |
| Jackson County Poll. Cont. Rev. (Chevron U.S.A., Inc. Proj.) Series 1993 0.6% 6/1/22, VRDN (b) | | 16,800,000 | 16,800,000 |
| Mississippi Bus. Fin. Corp.: | | | |
| (Chevron U.S.A., Inc. Proj.): | | | |
Series 2007 A, 0.58% 6/1/22 (Chevron Corp. Guaranteed), VRDN (b) | | 4,500,000 | 4,500,000 |
Series 2007 C: | | | |
0.6% 6/1/22 (Chevron Corp. Guaranteed), VRDN (b) | | 4,300,000 | 4,300,000 |
0.6% 6/1/22 (Chevron Corp. Guaranteed), VRDN (b) | | 19,820,000 | 19,820,000 |
Series 2007 D, 0.58% 6/1/22 (Chevron Corp. Guaranteed), VRDN (b) | | 6,100,000 | 6,100,000 |
Series 2011 A, 0.6% 6/1/22, VRDN (b) | | 3,300,000 | 3,300,000 |
Series 2011 C, 0.6% 6/1/22, VRDN (b) | | 16,330,000 | 16,330,000 |
Series 2011 E, 0.58% 6/1/22, VRDN (b) | | 4,700,000 | 4,700,000 |
| Series 2011 B, 0.6% 6/1/22, VRDN (b) | | 5,040,000 | 5,040,000 |
| Series 2011 G, 0.6% 6/1/22, VRDN (b) | | 6,300,000 | 6,300,000 |
TOTAL MISSISSIPPI | | | 87,190,000 |
| Missouri - 0.6% | | | |
| Missouri Health & Edl. Facilities Auth. Rev. (Ascension Health Cr. Group Proj.) Series 2003 C3, 0.83% 6/7/22, VRDN (b) | | 11,500,000 | 11,500,000 |
| New York - 18.6% | | | |
| New York City Gen. Oblig.: | | | |
| Series 2006 E2, 0.57% 6/1/22, LOC Bank of America NA, VRDN (b) | | 2,000,000 | 2,000,000 |
| Series 2006 I4, 0.6% 6/1/22 (Liquidity Facility TD Banknorth, NA), VRDN (b) | | 4,780,000 | 4,780,000 |
| Series 2013 F3, 0.57% 6/1/22 (Liquidity Facility Bank of America NA), VRDN (b) | | 30,400,000 | 30,400,000 |
| Series 2014 D4, 0.6% 6/1/22, LOC TD Banknorth, NA, VRDN (b) | | 3,100,000 | 3,100,000 |
| Series 2015 F6, 0.62% 6/1/22 (Liquidity Facility JPMorgan Chase Bank), VRDN (b) | | 8,300,000 | 8,300,000 |
| Series 2022, 0.62% 6/1/22 (Liquidity Facility State Street Bank & Trust Co., Boston), VRDN (b) | | 35,000,000 | 35,000,000 |
| Series 2104 1, 0.62% 6/1/22 (Liquidity Facility JPMorgan Chase Bank), VRDN (b) | | 2,200,000 | 2,200,000 |
| New York City Muni. Wtr. Fin. Auth. Wtr. & Swr. Sys. Rev.: | | | |
| Series 2009 BB1, 0.62% 6/1/22 (Liquidity Facility UBS AG), VRDN (b) | | 12,705,000 | 12,705,000 |
| Series 2009 BB2, 0.62% 6/1/22 (Liquidity Facility UBS AG), VRDN (b) | | 9,790,000 | 9,790,000 |
| Series 2011 DD, 0.62% 6/1/22 (Liquidity Facility JPMorgan Chase Bank), VRDN (b) | | 2,100,000 | 2,100,000 |
| Series 2011 DD-3B, 0.67% 6/1/22 (Liquidity Facility State Street Bank & Trust Co., Boston), VRDN (b) | | 2,200,000 | 2,200,000 |
| Series 2014 AA: | | | |
0.6% 6/1/22 (Liquidity Facility TD Banknorth, NA), VRDN (b) | | 4,200,000 | 4,200,000 |
0.62% 6/1/22 (Liquidity Facility JPMorgan Chase Bank), VRDN (b) | | 10,700,000 | 10,700,000 |
0.62% 6/1/22 (Liquidity Facility JPMorgan Chase Bank), VRDN (b) | | 5,700,000 | 5,700,000 |
0.62% 6/1/22 (Liquidity Facility Mizuho Corporate Bank Ltd.), VRDN (b) | | 3,100,000 | 3,100,000 |
| Series 2015 BB, 0.64% 6/1/22 (Liquidity Facility Mizuho Corporate Bank Ltd.), VRDN (b) | | 6,800,000 | 6,800,000 |
| Series 2015 BB4, 0.65% 6/1/22 (Liquidity Facility Barclays Bank PLC), VRDN (b) | | 3,300,000 | 3,300,000 |
| Series 2016 BB2, 0.6% 6/1/22 (Liquidity Facility State Street Bank & Trust Co., Boston), VRDN (b) | | 2,000,000 | 2,000,000 |
| Series 2017 BB, 0.58% 6/1/22 (Liquidity Facility State Street Bank & Trust Co., Boston), VRDN (b) | | 22,300,000 | 22,300,000 |
| Series 2021 EE1, 0.67% 6/1/22 (Liquidity Facility U.S. Bank NA, Cincinnati), VRDN (b) | | 2,500,000 | 2,500,000 |
| Series 2021 EE2, 0.67% 6/1/22 (Liquidity Facility State Street Bank & Trust Co., Boston), VRDN (b) | | 5,500,000 | 5,500,000 |
| New York City Transitional Fin. Auth. Rev.: | | | |
| Series 2014, 0.62% 6/1/22 (Liquidity Facility Mizuho Corporate Bank Ltd.), VRDN (b) | | 35,065,000 | 35,065,000 |
| Series 2015 A3, 0.63% 6/1/22 (Liquidity Facility Mizuho Corporate Bank Ltd.), VRDN (b) | | 1,100,000 | 1,100,000 |
| Series 2015 A4, 0.62% 6/1/22 (Liquidity Facility Mizuho Corporate Bank Ltd.), VRDN (b) | | 6,550,000 | 6,550,000 |
| Series 2015 E4, 0.62% 6/1/22 (Liquidity Facility JPMorgan Chase Bank), VRDN (b) | | 6,400,000 | 6,400,000 |
| Series 2016 A4, 0.57% 6/1/22 (Liquidity Facility Bank of America NA), VRDN (b) | | 22,800,000 | 22,800,000 |
| Series 2016 E4, 0.62% 6/1/22 (Liquidity Facility JPMorgan Chase Bank), VRDN (b) | | 3,650,000 | 3,650,000 |
| Series 2018 A4, 0.62% 6/1/22 (Liquidity Facility JPMorgan Chase Bank), VRDN (b) | | 12,390,000 | 12,390,000 |
| Series 2019 B4, 0.62% 6/1/22 (Liquidity Facility JPMorgan Chase Bank), VRDN (b) | | 1,700,000 | 1,700,000 |
| Series 2019 C4, 0.65% 6/1/22 (Liquidity Facility Barclays Bank PLC), VRDN (b) | | 1,440,000 | 1,440,000 |
| Series B5, 0.67% 6/1/22 (Liquidity Facility U.S. Bank NA, Cincinnati), VRDN (b) | | 7,300,000 | 7,300,000 |
| New York Hsg. Fin. Agcy. Rev.: | | | |
| Series 2013 A, 0.62% 6/1/22, LOC Landesbank Hessen-Thuringen, VRDN (b) | | 28,900,000 | 28,900,000 |
| Series 2014 A, 0.62% 6/1/22, LOC Landesbank Hessen-Thuringen, VRDN (b) | | 18,490,000 | 18,490,000 |
| New York Metropolitan Trans. Auth. Dedicated Tax Fund Rev. Series A, 0.6% 6/1/22, LOC TD Banknorth, NA, VRDN (b) | | 7,635,000 | 7,635,000 |
| New York Metropolitan Trans. Auth. Rev.: | | | |
| Series 2015 E1, 0.65% 6/1/22, LOC Barclays Bank PLC, VRDN (b) | | 6,000,000 | 6,000,000 |
| Series E3, 0.57% 6/1/22, LOC Bank of America NA, VRDN (b) | | 36,900,000 | 36,900,000 |
TOTAL NEW YORK | | | 374,995,000 |
| North Carolina - 0.3% | | | |
| Charlotte-Mecklenburg Hosp. Auth. Health Care Sys. Rev. Series 2007 E, 0.61% 6/1/22, LOC TD Banknorth, NA, VRDN (b) | | 6,575,000 | 6,575,000 |
| Ohio - 2.6% | | | |
| Allen County Hosp. Facilities Rev. (Catholic Healthcare Partners Proj.) Series 2010 C, 0.67% 6/1/22, LOC Bank of Montreal, VRDN (b) | | 15,000,000 | 15,000,000 |
| Cuyahoga County Health Care Facilities Rev. (The A.M. McGregor Home Proj.) Series 2014, 0.84% 6/7/22, LOC Northern Trust Co., VRDN (b) | | 1,365,000 | 1,365,000 |
| Franklin County Hosp. Facilities Rev.: | | | |
| Series 2009 A, 0.8% 6/7/22 (Liquidity Facility Barclays Bank PLC), VRDN (b) | | 2,150,000 | 2,150,000 |
| Series 2009 B, 0.8% 6/7/22 (Liquidity Facility Barclays Bank PLC), VRDN (b) | | 4,500,000 | 4,500,000 |
| Series 2013 A, 0.72% 6/7/22 (Liquidity Facility JPMorgan Chase Bank), VRDN (b) | | 4,200,000 | 4,200,000 |
| Series 2022, 0.62% 6/1/22 (Liquidity Facility JPMorgan Chase Bank), VRDN (b) | | 8,900,000 | 8,900,000 |
| Montgomery County Hosp. Rev. Series 2019 C, 0.65% 6/1/22, LOC PNC Bank NA, VRDN (b) | | 11,000,000 | 11,000,000 |
| Ohio Higher Edl. Facility Commission Rev. (Cleveland Clinic Foundation Proj.) Series 2008 B4, 0.63% 6/1/22 (Liquidity Facility Barclays Bank PLC), VRDN (b) | | 1,150,000 | 1,150,000 |
| Ohio Hosp. Facilities Rev. Series 2019 D1, 0.78% 6/7/22, VRDN (b) | | 3,170,000 | 3,170,000 |
TOTAL OHIO | | | 51,435,000 |
| Oregon - 0.3% | | | |
| Oregon Facilities Auth. Rev.: | | | |
| Series 2018 A, 0.67% 6/1/22, LOC U.S. Bank NA, Cincinnati, VRDN (b) | | 1,100,000 | 1,100,000 |
| Series 2018 B, 0.6% 6/1/22, LOC TD Banknorth, NA, VRDN (b) | | 4,925,000 | 4,925,000 |
TOTAL OREGON | | | 6,025,000 |
| Pennsylvania - 0.5% | | | |
| Beaver County Indl. Dev. Auth. Series 2018 A, 0.87% 6/7/22, LOC Truist Bank, VRDN (b) | | 200,000 | 200,000 |
| Delaware County Indl. Dev. Auth. Arpt. Facilities Rev. (United Parcel Svc. Proj.) Series 2015, 0.7% 6/1/22, VRDN (b) | | 8,460,000 | 8,460,000 |
| Lancaster County Hosp. Auth. Health Ctr. Rev. (Masonic Homes Proj.) Series 2008 D, 0.6% 6/1/22, LOC JPMorgan Chase Bank, VRDN (b) | | 1,240,000 | 1,240,000 |
TOTAL PENNSYLVANIA | | | 9,900,000 |
| Rhode Island - 0.3% | | | |
| Rhode Island Health and Edl. Bldg. Corp. Higher Ed. Facility Rev. (Bryant Univ. Proj.) Series 2008, 0.81% 6/7/22, LOC TD Banknorth, NA, VRDN (b) | | 6,135,000 | 6,135,000 |
| Tennessee - 1.2% | | | |
| Clarksville Pub. Bldg. Auth. Rev. (Tennessee Muni. Bond Fund Proj.): | | | |
| Series 2001, 0.6% 6/1/22, LOC Bank of America NA, VRDN (b) | | 6,110,000 | 6,110,000 |
| Series 2003, 0.6% 6/1/22, LOC Bank of America NA, VRDN (b) | | 7,700,000 | 7,700,000 |
| Series 2005, 0.6% 6/1/22, LOC Bank of America NA, VRDN (b) | | 6,475,000 | 6,475,000 |
| Sevier County Pub. Bldg. Auth. Rev. Series V1 K1, 0.67% 6/1/22 (Liquidity Facility U.S. Bank NA, Cincinnati), VRDN (b) | | 3,600,000 | 3,600,000 |
TOTAL TENNESSEE | | | 23,885,000 |
| Texas - 9.5% | | | |
| Gulf Coast Indl. Dev. Auth. TX Rev. (ExxonMobil Proj.) Series 2012, 0.6% 6/1/22 (Exxon Mobil Corp. Guaranteed), VRDN (b) | | 5,140,000 | 5,140,000 |
| Harris County Cultural Ed. Facilities Fin. Corp. Rev.: | | | |
| Series 2019 F, 0.83% 6/7/22, VRDN (b) | | 17,255,000 | 17,255,000 |
| Series 2020 B, 0.62% 6/1/22, VRDN (b) | | 46,100,000 | 46,100,000 |
| Series 2021 C, 0.62% 6/1/22 (Liquidity Facility Bank of America NA), VRDN (b) | | 3,875,000 | 3,875,000 |
| Harris County Health Facilities Dev. Corp. Rev. (Methodist Hosp. Proj.): | | | |
| Series 2008 A2, 0.62% 6/1/22, VRDN (b) | | 1,450,000 | 1,450,000 |
| Series A1, 0.62% 6/1/22, VRDN (b) | | 22,275,000 | 22,275,000 |
| Lower Neches Valley Auth. Indl. Dev. Corp. Exempt Facilities Rev.: | | | |
| (ExxonMobil Proj.) Series 2001 A, 0.6% 6/1/22 (Exxon Mobil Corp. Guaranteed), VRDN (b) | | 3,100,000 | 3,100,000 |
| Series A2, 0.6% 6/1/22 (Exxon Mobil Corp. Guaranteed), VRDN (b) | | 5,350,000 | 5,350,000 |
| Lower Neches Valley Auth. Indl. Dev. Corp. Rev. (ExxonMobil Proj.) Series 2010, 0.59% 6/1/22 (Exxon Mobil Corp. Guaranteed), VRDN (b) | | 13,345,000 | 13,345,000 |
| Port Arthur Navigation District Indl. Dev. Corp. Exempt Facilities Rev. (Air Products Proj.): | | | |
| Series 2005, 0.55% 6/1/22 (Air Products & Chemicals, Inc. Guaranteed), VRDN (b) | | 1,200,000 | 1,200,000 |
| Series 2010 A, 0.86% 6/7/22 (TotalEnergies SE Guaranteed), VRDN (b) | | 17,765,000 | 17,765,000 |
| Port Arthur Navigation District Poll. Cont. Rev. (Texaco, Inc. Proj.) Series 1994, 0.58% 6/1/22, VRDN (b) | | 9,800,000 | 9,800,000 |
| Tarrant County Cultural Ed. Facilities Fin. Corp. Hosp. Rev.: | | | |
| (Baylor Health Care Sys. Proj.) Series 2011 C, 0.61% 6/1/22, LOC TD Banknorth, NA, VRDN (b) | | 20,650,000 | 20,650,000 |
| (Methodist Hospitals of Dallas Proj.) Series 2008, 0.61% 6/1/22, LOC TD Banknorth, NA, VRDN (b) | | 14,050,000 | 14,050,000 |
| Texas Gen. Oblig. Series 2019, 0.75% 6/7/22 (Liquidity Facility JPMorgan Chase Bank), VRDN (b) | | 10,400,000 | 10,400,000 |
TOTAL TEXAS | | | 191,755,000 |
| Washington - 0.2% | | | |
| Snohomish County Hsg. Auth. Hsg. Rev. (Ebey Arms Centerhouse Proj.) Series 2003, 0.82% 6/7/22, LOC Bank of America NA, VRDN (b) | | 3,540,000 | 3,540,000 |
| West Virginia - 0.0% | | | |
| West Virginia Hosp. Fin. Auth. Hosp. Rev. Series A, 0.91% 6/7/22, LOC Truist Bank, VRDN (b) | | 240,000 | 240,000 |
| Wisconsin - 3.3% | | | |
| Univ. of Wisconsin Hosp. & Clinics Auth.: | | | |
| Series 2018 C, 0.63% 6/1/22 (Liquidity Facility BMO Harris Bank NA), VRDN (b) | | 2,875,000 | 2,875,000 |
| Series B, 0.62% 6/1/22 (Liquidity Facility JPMorgan Chase Bank), VRDN (b) | | 47,070,000 | 47,070,000 |
| Wisconsin Gen. Oblig. Series 2019 A, 0.92% 6/7/22, VRDN (b) | | 16,000,000 | 16,000,000 |
TOTAL WISCONSIN | | | 65,945,000 |
| Wyoming - 0.5% | | | |
| Sweetwater County Poll. Cont. Rev. (PacifiCorp Proj.) Series 1994, 0.81% 6/7/22, VRDN (b) | | 9,900,000 | 9,900,000 |
| TOTAL VARIABLE RATE DEMAND NOTE (Cost $1,435,370,000) | | | 1,435,370,000 |
| | | | |
| Tender Option Bond - 28.7% |
| | | Principal Amount (a) | Value ($) |
| Alabama - 0.2% | | | |
| Infirmary Health Systems Spl. Care Facilities Fing. Auth. Rev. Participating VRDN Series 50 44, 0.65% 6/1/22 (Liquidity Facility JPMorgan Chase Bank) (b)(d)(e) | | 3,800,000 | 3,800,000 |
| California - 0.6% | | | |
| California Health Facilities Fing. Auth. Rev. Participating VRDN Series 17 04, 0.91% 7/12/22 (Liquidity Facility Barclays Bank PLC) (b)(d)(e) | | 800,000 | 800,000 |
| California Muni. Fin. Auth. Participating VRDN Series XF 28 63, 0.82% 6/7/22 (Liquidity Facility Morgan Stanley Bank, West Valley City Utah) (b)(d)(e) | | 9,400,000 | 9,400,000 |
| Sacramento City Fing. Auth. Rev. Participating VRDN Series Floaters XG 01 00, 0.85% 6/7/22 (Liquidity Facility Deutsche Bank AG New York Branch) (b)(d)(e) | | 900,000 | 900,000 |
| Univ. of California Revs. Participating VRDN Series Floaters ZF 26 70, 0.82% 6/7/22 (Liquidity Facility Morgan Stanley Bank, West Valley City Utah) (b)(d)(e) | | 1,200,000 | 1,200,000 |
TOTAL CALIFORNIA | | | 12,300,000 |
| Colorado - 0.5% | | | |
| Children's Hosp. Assoc., Co. Participating VRDN Series 5008, 0.65% 6/1/22 (Liquidity Facility JPMorgan Chase Bank) (b)(d)(e) | | 9,820,000 | 9,820,000 |
| Connecticut - 0.4% | | | |
| Connecticut Gen. Oblig. Participating VRDN: | | | |
| Series 2017, 0.83% 6/7/22 (Liquidity Facility Barclays Bank PLC) (b)(d)(e) | | 1,900,000 | 1,900,000 |
| Series Floaters 014, 0.91% 7/12/22 (Liquidity Facility Barclays Bank PLC) (b)(d)(e) | | 1,040,000 | 1,040,000 |
| Series Floaters G66, 0.82% 6/7/22 (Liquidity Facility Royal Bank of Canada) (b)(d)(e) | | 3,055,000 | 3,055,000 |
| Connecticut Spl. Tax Oblig. Trans. Infrastructure Rev. Participating VRDN: | | | |
| Series ROC II R 14073, 0.85% 6/7/22 (Liquidity Facility Citibank NA) (b)(d)(e) | | 700,000 | 700,000 |
| Series YX 11 37, 0.83% 6/7/22 (Liquidity Facility Barclays Bank PLC) (b)(d)(e) | | 1,880,000 | 1,880,000 |
TOTAL CONNECTICUT | | | 8,575,000 |
| District Of Columbia - 1.4% | | | |
| District of Columbia Gen. Oblig. Participating VRDN: | | | |
| Series Floaters YX 10 39, 0.82% 6/7/22 (Liquidity Facility Barclays Bank PLC) (b)(d)(e) | | 1,410,000 | 1,410,000 |
| Series MS 4301, 0.82% 6/7/22 (Liquidity Facility Morgan Stanley Bank, West Valley City Utah) (b)(d)(e) | | 14,750,000 | 14,750,000 |
| Metropolitan Washington Arpts. Auth. Dulles Toll Road Rev. Participating VRDN Series XF 09 76, 0.82% 6/7/22 (Liquidity Facility JPMorgan Chase Bank) (b)(d)(e) | | 12,840,000 | 12,840,000 |
TOTAL DISTRICT OF COLUMBIA | | | 29,000,000 |
| Florida - 2.7% | | | |
| Alachua County Health Facilities Auth. Health Facilities Rev. Participating VRDN Series XF 11 39, 0.87% 6/7/22 (Liquidity Facility Deutsche Bank AG New York Branch) (b)(d)(e) | | 700,000 | 700,000 |
| Central Florida Expressway Auth. Sr. Lien Rev. Participating VRDN Series XX 11 36, 0.83% 6/7/22 (Liquidity Facility Barclays Bank PLC) (b)(d)(e) | | 2,375,000 | 2,375,000 |
| Miami-Dade County Expressway Auth. Participating VRDN Series XG 00 99, 0.85% 6/7/22 (Liquidity Facility Deutsche Bank AG New York Branch) (b)(d)(e) | | 4,940,000 | 4,940,000 |
| Miami-Dade County Transit Sales Surtax Rev. Participating VRDN Series YX 11 28, 0.83% 6/7/22 (Liquidity Facility Barclays Bank PLC) (b)(d)(e) | | 370,000 | 370,000 |
| Miami-Dade County Wtr. & Swr. Rev. Participating VRDN Series XF 12 95, 0.82% 6/7/22 (Liquidity Facility Royal Bank of Canada) (b)(d)(e) | | 3,750,000 | 3,750,000 |
| Palm Beach County Health Facilities Auth. Hosp. Rev. Participating VRDN Series XM 07 82, 0.86% 6/7/22 (Liquidity Facility Barclays Bank PLC) (b)(d)(e) | | 200,000 | 200,000 |
| South Broward Hosp. District Rev. Participating VRDN Series XG 03 45, 0.82% 6/7/22 (Liquidity Facility Wells Fargo Bank NA) (b)(d)(e) | | 2,000,000 | 2,000,000 |
| South Miami Health Facilities Auth. Hosp. Rev. Participating VRDN Series XF 25 23, 0.86% 6/7/22 (Liquidity Facility Barclays Bank PLC) (b)(d)(e) | | 400,000 | 400,000 |
| Volusia County Fla Hosp. Rev. Participating VRDN Series 50 32, 0.65% 6/1/22 (Liquidity Facility JPMorgan Chase Bank) (b)(d)(e) | | 39,235,000 | 39,235,000 |
TOTAL FLORIDA | | | 53,970,000 |
| Georgia - 0.6% | | | |
| Private Colleges & Univs. Auth. Rev. Participating VRDN Series 50 34, 0.65% 6/1/22 (Liquidity Facility JPMorgan Chase Bank) (b)(d)(e) | | 12,190,000 | 12,190,000 |
| Hawaii - 0.9% | | | |
| Honolulu City & County Gen. Oblig. Participating VRDN Series 2016, 0.7% 6/1/22 (Liquidity Facility U.S. Bank NA, Cincinnati) (b)(d)(e) | | 10,575,000 | 10,575,000 |
| Honolulu City and County Wastewtr. Sys. Participating VRDN Series 15 XM0080, 0.82% 6/7/22 (Liquidity Facility Citibank NA) (b)(d)(e) | | 7,960,000 | 7,960,000 |
TOTAL HAWAII | | | 18,535,000 |
| Illinois - 1.7% | | | |
| Chicago Gen. Oblig. Participating VRDN Series XM 10 05, 0.94% 6/7/22 (Liquidity Facility Deutsche Bank AG New York Branch) (b)(d)(e) | | 600,000 | 600,000 |
| Chicago Transit Auth. Participating VRDN Series XL 01 45, 0.83% 6/7/22 (Liquidity Facility Barclays Bank PLC) (b)(d)(e) | | 10,275,000 | 10,275,000 |
| Illinois Fin. Auth. Rev. Participating VRDN: | | | |
| Series Floaters 017, 0.91% 7/12/22 (Liquidity Facility Barclays Bank PLC) (b)(d)(e) | | 1,780,000 | 1,780,000 |
| Series MS 3332, 0.82% 6/7/22 (Liquidity Facility Morgan Stanley Bank, West Valley City Utah) (b)(d)(e) | | 4,000,000 | 4,000,000 |
| Illinois Gen. Oblig. Participating VRDN: | | | |
| Series Floaters XF 10 43, 0.83% 6/7/22 (Liquidity Facility Barclays Bank PLC) (b)(d)(e) | | 1,500,000 | 1,500,000 |
| Series XM 07 59, 0.84% 6/7/22 (Liquidity Facility Bank of America NA) (b)(d)(e) | | 1,750,000 | 1,750,000 |
| Series XX 11 41, 0.83% 6/7/22 (Liquidity Facility Barclays Bank PLC) (b)(d)(e) | | 500,000 | 500,000 |
| Series YX 11 50, 0.83% 6/7/22 (Liquidity Facility Barclays Bank PLC) (b)(d)(e) | | 2,500,000 | 2,500,000 |
| Illinois Toll Hwy. Auth. Toll Hwy. Rev. Participating VRDN Series XM 04 75, 0.82% 6/7/22 (Liquidity Facility Morgan Stanley Bank, West Valley City Utah) (b)(d)(e) | | 9,375,000 | 9,375,000 |
| Metropolitan Pier & Exposition Participating VRDN Series XL 01 37, 0.83% 6/7/22 (Liquidity Facility Barclays Bank PLC) (b)(d)(e) | | 1,540,000 | 1,540,000 |
| Portofino Landings Cmnty. Dev. D Participating VRDN Series XM 09 38, 0.84% 6/7/22 (Liquidity Facility Bank of America NA) (b)(d)(e) | | 200,000 | 200,000 |
TOTAL ILLINOIS | | | 34,020,000 |
| Iowa - 0.0% | | | |
| Iowa Fin. Auth. Health Facilities Rev. Participating VRDN Series ZF 26 27, 0.83% 6/7/22 (Liquidity Facility Morgan Stanley Bank, West Valley City Utah) (b)(d)(e) | | 600,000 | 600,000 |
| Kentucky - 0.2% | | | |
| CommonSpirit Health Participating VRDN Series MIZ 90 21, 0.91% 6/7/22 (Liquidity Facility Mizuho Cap. Markets LLC) (b)(d)(e) | | 900,000 | 900,000 |
| Kentucky Econ. Dev. Fin. Auth. Participating VRDN Series Floaters XF 24 85, 0.84% 6/7/22 (Liquidity Facility Barclays Bank PLC) (b)(d)(e) | | 2,900,000 | 2,900,000 |
TOTAL KENTUCKY | | | 3,800,000 |
| Maryland - 0.7% | | | |
| Maryland Health & Higher Edl. Participating VRDN Series XG 03 35, 0.82% 6/7/22 (Liquidity Facility Bank of America NA) (b)(d)(e) | | 1,900,000 | 1,900,000 |
| Maryland Health & Higher Edl. Facilities Auth. Rev. Participating VRDN Series XF 10 21, 0.85% 6/7/22 (Liquidity Facility Deutsche Bank AG New York Branch) (b)(d)(e) | | 11,800,000 | 11,800,000 |
TOTAL MARYLAND | | | 13,700,000 |
| Massachusetts - 0.2% | | | |
| Massachusetts School Bldg. Auth. Dedicated Sales Tax Rev. Participating VRDN Series Solar 17 13, 0.72% 6/1/22 (Liquidity Facility U.S. Bank NA, Cincinnati) (b)(d)(e) | | 3,875,000 | 3,875,000 |
| Michigan - 0.7% | | | |
| Grand Traverse County Hosp. Fin. Auth. Participating VRDN Series 2021 XG 03 19, 0.87% 6/7/22 (Liquidity Facility Barclays Bank PLC) (b)(d)(e) | | 200,000 | 200,000 |
| Michigan Fin. Auth. Rev. Participating VRDN: | | | |
| Series Floaters XF 26 48, 0.82% 6/7/22 (Liquidity Facility Bank of America NA) (b)(d)(e) | | 1,660,000 | 1,660,000 |
| Series Floaters ZF 28 25, 0.87% 6/7/22 (Liquidity Facility Barclays Bank PLC) (b)(d)(e) | | 200,000 | 200,000 |
| Series XG 02 69, 0.82% 6/7/22 (Liquidity Facility Barclays Bank PLC) (b)(d)(e) | | 4,000,000 | 4,000,000 |
| Series XM 02 23, 0.83% 6/7/22 (Liquidity Facility Toronto-Dominion Bank) (b)(d)(e) | | 800,000 | 800,000 |
| Michigan Hsg. Dev. Auth. Single Family Mtg. Rev. Participating VRDN Series YZ 11 94, 0.82% 6/7/22 (Liquidity Facility Barclays Bank PLC) (b)(d)(e) | | 2,425,000 | 2,425,000 |
| Monroe Mich Pub. Schools Participating VRDN Series XL 01 46, 0.91% 6/7/22 (Liquidity Facility JPMorgan Chase Bank) (b)(d)(e) | | 600,000 | 600,000 |
| Univ. of Michigan Rev. Participating VRDN Series Floaters XF 25 48, 0.84% 6/7/22 (Liquidity Facility Toronto-Dominion Bank) (b)(d)(e) | | 3,500,000 | 3,500,000 |
TOTAL MICHIGAN | | | 13,385,000 |
| Minnesota - 0.3% | | | |
| Minnesota Hsg. Fin. Agcy. Participating VRDN Series XF 28 79, 0.82% 6/7/22 (Liquidity Facility Morgan Stanley Bank, West Valley City Utah) (b)(d)(e) | | 5,930,000 | 5,930,000 |
| Missouri - 2.4% | | | |
| Kansas City Spl. Oblig. Participating VRDN Series YX 11 93, 0.83% 6/7/22 (Liquidity Facility Barclays Bank PLC) (b)(d)(e) | | 1,100,000 | 1,100,000 |
| Missouri Health & Edl. Facilities Auth. Edl. Facilities Rev. Participating VRDN Series Floaters XG 01 57, 0.83% 6/7/22 (Liquidity Facility Barclays Bank PLC) (b)(d)(e) | | 7,900,000 | 7,900,000 |
| Missouri Health & Edl. Facilities Auth. Rev. Participating VRDN Series Floaters C16, 0.84% 6/7/22 (Liquidity Facility Royal Bank of Canada) (b)(d)(e) | | 6,300,000 | 6,300,000 |
| Missouri Health & Edl. Facilities Rev. Participating VRDN: | | | |
| Series Floaters 14, 0.83% 6/7/22 (Liquidity Facility Barclays Bank PLC) (b)(d)(e) | | 30,800,000 | 30,800,000 |
| Series Floaters C17, 0.83% 6/7/22 (Liquidity Facility Royal Bank of Canada) (b)(d)(e) | | 2,200,000 | 2,200,000 |
| Series XG 03 00, 0.83% 6/7/22 (Liquidity Facility Bank of America NA) (b)(d)(e) | | 550,000 | 550,000 |
TOTAL MISSOURI | | | 48,850,000 |
| Nebraska - 0.4% | | | |
| Central Plains Energy Proj. Rev. Participating VRDN Series XM 09 92, 0.83% 6/7/22 (Liquidity Facility Royal Bank of Canada) (b)(d)(e) | | 5,330,000 | 5,330,000 |
| Omaha Pub. Pwr. District Elec. Rev. Participating VRDN Series 16 XF1053, 0.85% 6/7/22 (Liquidity Facility Deutsche Bank AG New York Branch) (b)(d)(e) | | 2,200,000 | 2,200,000 |
TOTAL NEBRASKA | | | 7,530,000 |
| Nevada - 1.3% | | | |
| Clark County Fuel Tax Participating VRDN: | | | |
| Series Floaters XF 25 80, 0.82% 6/7/22 (Liquidity Facility Morgan Stanley Bank, West Valley City Utah) (b)(d)(e) | | 9,800,000 | 9,800,000 |
| Series XM 06 38, 0.82% 6/7/22 (Liquidity Facility Wells Fargo Bank NA) (b)(d)(e) | | 2,900,000 | 2,900,000 |
| Las Vegas Convention & Visitors Auth. Participating VRDN Series XF 28 06, 0.83% 6/7/22 (Liquidity Facility Barclays Bank PLC) (b)(d)(e) | | 4,700,000 | 4,700,000 |
| Las Vegas Valley Wtr. District Wtr. Impt. Gen. Oblig. Participating VRDN Series 16 ZF0382, 0.84% 6/7/22 (Liquidity Facility Toronto-Dominion Bank) (b)(d)(e) | | 9,375,000 | 9,375,000 |
TOTAL NEVADA | | | 26,775,000 |
| New Jersey - 1.0% | | | |
| New Jersey Econ. Dev. Auth. Participating VRDN Series XL 01 63, 0.83% 6/7/22 (Liquidity Facility Barclays Bank PLC) (b)(d)(e) | | 5,885,000 | 5,885,000 |
| New Jersey Econ. Dev. Auth. Lease Rev. Participating VRDN Series Floaters XF 25 25, 0.83% 6/7/22 (Liquidity Facility Barclays Bank PLC) (b)(d)(e) | | 8,200,000 | 8,200,000 |
| New Jersey Econ. Dev. Auth. Rev. Participating VRDN Series Floaters XF 25 38, 0.83% 6/7/22 (Liquidity Facility Barclays Bank PLC) (b)(d)(e) | | 2,810,000 | 2,810,000 |
| Union County Impt. Auth. Participating VRDN Series XF 10 19, 0.82% 6/7/22 (Liquidity Facility Barclays Bank PLC) (b)(d)(e) | | 1,640,000 | 1,640,000 |
| Union County Util. Auth. Solid Waste Facilities Lease Rev. Participating VRDN Series Floaters ZF 24 78, 0.82% 6/7/22 (Liquidity Facility Citibank NA) (b)(d)(e) | | 1,500,000 | 1,500,000 |
TOTAL NEW JERSEY | | | 20,035,000 |
| New Mexico - 0.1% | | | |
| New Mexico Mtg. Fin. Auth. Participating VRDN Series YX 11 89, 0.84% 6/7/22 (Liquidity Facility Barclays Bank PLC) (b)(d)(e) | | 1,100,000 | 1,100,000 |
| New York - 1.3% | | | |
| New York City Gen. Oblig. Participating VRDN: | | | |
| Series 2020 XF 29 15, 0.82% 6/7/22 (Liquidity Facility Barclays Bank PLC) (b)(d)(e) | | 1,715,000 | 1,715,000 |
| Series Floaters E 118, 0.67% 6/1/22 (Liquidity Facility Royal Bank of Canada) (b)(d)(e) | | 12,250,000 | 12,250,000 |
| New York City Muni. Wtr. Fin. Auth. Wtr. & Swr. Sys. Rev. Participating VRDN: | | | |
| Series Floaters 2018 E124, 0.67% 6/1/22 (Liquidity Facility Royal Bank of Canada) (b)(d)(e) | | 4,200,000 | 4,200,000 |
| Series ZL 02 09, 0.82% 6/7/22 (Liquidity Facility Barclays Bank PLC) (b)(d)(e) | | 2,465,000 | 2,465,000 |
| New York Metropolitan Trans. Auth. Rev. Participating VRDN: | | | |
| Series 2020 XF 29 09, 0.83% 6/7/22 (Liquidity Facility Barclays Bank PLC) (b)(d)(e) | | 4,000,000 | 4,000,000 |
| Series RBC E 126, 0.84% 6/7/22 (Liquidity Facility Royal Bank of Canada) (b)(d)(e) | | 1,200,000 | 1,200,000 |
| Triborough Bridge & Tunnel Auth. Revs. Participating VRDN Series 2022 XF 12 80, 0.82% 6/7/22 (Liquidity Facility JPMorgan Chase Bank) (b)(d)(e) | | 1,080,000 | 1,080,000 |
TOTAL NEW YORK | | | 26,910,000 |
| New York And New Jersey - 0.1% | | | |
| Port Auth. of New York & New Jersey Participating VRDN Series Floaters XF 05 65, 0.82% 6/7/22 (Liquidity Facility Toronto-Dominion Bank) (b)(d)(e) | | 1,300,000 | 1,300,000 |
| Non-State Specific - 0.2% | | | |
| Monroeville Fin. Auth. UPMC Rev. Participating VRDN Series YX 11 85, 0.83% 6/7/22 (Liquidity Facility Barclays Bank PLC) (b)(d)(e) | | 3,300,000 | 3,300,000 |
| North Dakota - 0.0% | | | |
| Grand Forks Health Care Sys. Rev. Participating VRDN Series XL 02 45, 0.85% 6/7/22 (Liquidity Facility Deutsche Bank AG New York Branch) (b)(d)(e) | | 800,000 | 800,000 |
| Ohio - 0.4% | | | |
| Cuyahoga County Ctfs. of Prtn. Participating VRDN Series Floaters XG 02 06, 0.89% 6/7/22 (Liquidity Facility Bank of America NA) (b)(d)(e) | | 200,000 | 200,000 |
| Franklin County Rev. Participating VRDN Series Floaters XF 25 90, 0.82% 6/7/22 (Liquidity Facility Citibank NA) (b)(d)(e) | | 4,000,000 | 4,000,000 |
| Middletown Hosp. Facilities Rev. Participating VRDN Series Floaters 003, 0.91% 7/12/22 (Liquidity Facility Barclays Bank PLC) (b)(d)(e) | | 495,000 | 495,000 |
| Ohio Gen. Oblig. Participating VRDN Series Floaters XF 25 91, 0.82% 6/7/22 (Liquidity Facility Citibank NA) (b)(d)(e) | | 2,000,000 | 2,000,000 |
| Ohio Hosp. Rev. Participating VRDN Series 002, 0.91% 7/12/22 (Liquidity Facility Barclays Bank PLC) (b)(d)(e) | | 1,000,000 | 1,000,000 |
TOTAL OHIO | | | 7,695,000 |
| Oklahoma - 0.7% | | | |
| Edmond Pub. Works Auth. Sales Tax & Util. Sys. Rev. Participating VRDN Series Floaters XM 05 59, 0.82% 6/7/22 (Liquidity Facility Morgan Stanley Bank, West Valley City Utah) (b)(d)(e) | | 14,865,000 | 14,865,000 |
| Pennsylvania - 5.3% | | | |
| Allegheny County Hosp. Dev. Auth. Rev. Participating VRDN Series Floaters XX 10 94, 0.83% 6/7/22 (Liquidity Facility Barclays Bank PLC) (b)(d)(e) | | 5,260,000 | 5,260,000 |
| Commonwealth Fing. Auth. Tobacco Participating VRDN Series XX 10 80, 0.83% 6/7/22 (Liquidity Facility Barclays Bank PLC) (b)(d)(e) | | 1,800,000 | 1,800,000 |
| Geisinger Auth. Health Sys. Rev. Participating VRDN Series ZF 28 11, 0.87% 6/7/22 (Liquidity Facility Barclays Bank PLC) (b)(d)(e) | | 3,120,000 | 3,120,000 |
| Pennsylvania Econ. Dev. Participating VRDN Series XM 0048, 0.85% 6/7/22 (Liquidity Facility Deutsche Bank AG New York Branch) (b)(d)(e) | | 9,205,000 | 9,205,000 |
| Pennsylvania Tpk. Commission Registration Fee Rev. Participating VRDN: | | | |
| Series Putters 5024, 0.65% 6/1/22 (Liquidity Facility JPMorgan Chase Bank) (b)(d)(e) | | 28,495,000 | 28,495,000 |
| Series Putters 5025, 0.65% 6/1/22 (Liquidity Facility JPMorgan Chase Bank) (b)(d)(e) | | 20,890,000 | 20,890,000 |
| Series Putters 5026, 0.65% 6/1/22 (Liquidity Facility JPMorgan Chase Bank) (b)(d)(e) | | 20,235,000 | 20,235,000 |
| Pennsylvania Tpk. Commission Tpk. Rev. Participating VRDN Series XX 11 34, 0.83% 6/7/22 (Liquidity Facility Barclays Bank PLC) (b)(d)(e) | | 7,600,000 | 7,600,000 |
| Philadelphia Arpt. Rev. Participating VRDN Series YX 11 44, 0.83% 6/7/22 (Liquidity Facility Barclays Bank PLC) (b)(d)(e) | | 11,290,000 | 11,290,000 |
TOTAL PENNSYLVANIA | | | 107,895,000 |
| South Carolina - 0.0% | | | |
| South Carolina Jobs-Econ. Dev. Auth. Hosp. Impt. Rev. Participating VRDN Series XF 09 30, 0.94% 6/7/22 (Liquidity Facility JPMorgan Chase Bank) (b)(d)(e) | | 600,000 | 600,000 |
| Tennessee - 0.5% | | | |
| Nashville and Davidson County Metropolitan Govt. Gen. Oblig. Participating VRDN Series Solar 17 11, 0.7% 6/1/22 (Liquidity Facility U.S. Bank NA, Cincinnati) (b)(d)(e) | | 10,400,000 | 10,400,000 |
| Texas - 1.9% | | | |
| Austin Elec. Util. Sys. Rev. Participating VRDN Series Solar 17 08, 0.72% 6/1/22 (Liquidity Facility U.S. Bank NA, Cincinnati) (b)(d)(e) | | 2,175,000 | 2,175,000 |
| Dallas Fort Worth Int'l. Arpt. Rev. Participating VRDN Series YX 11 32, 0.83% 6/7/22 (Liquidity Facility Barclays Bank PLC) (b)(d)(e) | | 1,200,000 | 1,200,000 |
| Harris County Cultural Ed. Facilities Fin. Corp. Rev. Participating VRDN Series Putters 50 43, 0.65% 6/1/22 (Liquidity Facility JPMorgan Chase Bank) (b)(d)(e) | | 16,000,000 | 16,000,000 |
| North Ft. Bend Wtr. Auth. Participating VRDN Series XF 08 16, 0.89% 6/7/22 (Liquidity Facility JPMorgan Chase Bank) (b)(d)(e) | | 800,000 | 800,000 |
| Tarrant County Cultural Ed. Facilities Fin. Corp. Hosp. Rev. Participating VRDN: | | | |
| Series E 141, 0.82% 6/7/22 (Liquidity Facility Royal Bank of Canada) (b)(d)(e) | | 10,000,000 | 10,000,000 |
| Series XG 02 78, 0.83% 6/7/22 (Liquidity Facility Bank of America NA) (b)(d)(e) | | 2,100,000 | 2,100,000 |
| Tarrant County Cultural Ed. Facilities Fin. Corp. Rev. Participating VRDN Series 2021 E1 50, 0.82% 6/7/22 (Liquidity Facility Royal Bank of Canada) (b)(d)(e) | | 5,000,000 | 5,000,000 |
TOTAL TEXAS | | | 37,275,000 |
| Utah - 0.1% | | | |
| Intermountain Pwr. Agcy. Pwr. Supply Rev. Participating VRDN Series E152, 0.82% 6/7/22 (Liquidity Facility Royal Bank of Canada) (b)(d)(e) | | 2,275,000 | 2,275,000 |
| Vermont - 0.1% | | | |
| Vermont Edl. and Health Buildings Fing. Agcy. Participating VRDN Series XF 23 61, 0.83% 6/7/22 (Liquidity Facility Barclays Bank PLC) (b)(d)(e) | | 2,550,000 | 2,550,000 |
| Virginia - 0.5% | | | |
| Hampton Roads Trans. Accountability Commission Participating VRDN Series ZF 09 98, 0.82% 6/7/22 (Liquidity Facility Bank of America NA) (b)(d)(e) | | 1,750,000 | 1,750,000 |
| Lynchburg Econ. Dev. Participating VRDN Series Floaters XG 01 47, 0.83% 6/7/22 (Liquidity Facility Barclays Bank PLC) (b)(d)(e) | | 2,520,000 | 2,520,000 |
| Suffolk Econ. Dev. Auth. Hosp. Facilities Rev. Participating VRDN Series MIZ 90 25, 0.88% 6/7/22 (Liquidity Facility Mizuho Cap. Markets LLC) (b)(d)(e) | | 5,335,000 | 5,335,000 |
| Virginia Small Bus. Fing. Auth. Health Care Facilities Rev. Participating VRDN: | | | |
| Series XF 09 26, 0.94% 6/7/22 (Liquidity Facility JPMorgan Chase Bank) (b)(d)(e) | | 300,000 | 300,000 |
| Series ZF 09 28, 0.94% 6/7/22 (Liquidity Facility JPMorgan Chase Bank) (b)(d)(e) | | 320,000 | 320,000 |
TOTAL VIRGINIA | | | 10,225,000 |
| Washington - 1.3% | | | |
| Port of Seattle Gen. Oblig. Participating VRDN Series 2017 ZF 2411, 0.82% 6/7/22 (Liquidity Facility Citibank NA) (b)(d)(e) | | 7,500,000 | 7,500,000 |
| Seattle Muni. Lt. & Pwr. Rev. Participating VRDN Series Solar 0055, 0.7% 6/1/22 (Liquidity Facility U.S. Bank NA, Cincinnati) (b)(d)(e) | | 3,000,000 | 3,000,000 |
| Washington Convention Ctr. Pub. Facilities Participating VRDN: | | | |
| Series Floaters XM 06 80, 0.83% 6/7/22 (Liquidity Facility Barclays Bank PLC) (b)(d)(e) | | 9,400,000 | 9,400,000 |
| Series XG 02 96, 0.83% 6/7/22 (Liquidity Facility Barclays Bank PLC) (b)(d)(e) | | 4,700,000 | 4,700,000 |
| Washington Health Care Facilities Auth. Rev. Participating VRDN Series YX 12 10, 0.89% 6/7/22 (Liquidity Facility Barclays Bank PLC) (b)(d)(e) | | 600,000 | 600,000 |
TOTAL WASHINGTON | | | 25,200,000 |
| TOTAL TENDER OPTION BOND (Cost $579,080,000) | | | 579,080,000 |
| | | | |
| Other Municipal Security - 0.1% |
| | | Principal Amount (a) | Value ($) |
| Massachusetts - 0.1% | | | |
Massachusetts Indl. Fin. Agcy. Poll. Cont. Rev. Bonds Series 2022, 0.9% tender 6/7/22, CP mode (Cost $2,600,000) | | 2,600,000 | 2,600,000 |
| | | | |
| TOTAL INVESTMENT IN SECURITIES - 100.0% (Cost $2,017,050,000) | 2,017,050,000 |
NET OTHER ASSETS (LIABILITIES) - 0.0% | 880,562 |
| NET ASSETS - 100.0% | 2,017,930,562 |
| | |
Security Type Abbreviations
| CP | - | COMMERCIAL PAPER |
| VRDN | - | VARIABLE RATE DEMAND NOTE (A debt instrument that is payable upon demand, either daily, weekly or monthly) |
The date shown for securities represents the date when principal payments must be paid, taking into account any call options exercised by the issuer and any permissible maturity shortening features other than interest rate resets
Legend
| (a) | Amount is stated in United States dollars unless otherwise noted. |
| (b) | Coupon rates for floating and adjustable rate securities reflect the rates in effect at period end. |
| (c) | Security exempt from registration under Rule 144A of the Securities Act of 1933. These securities may be resold in transactions exempt from registration, normally to qualified institutional buyers. At the end of the period, the value of these securities amounted to $29,860,000 or 1.5% of net assets. |
| (d) | Provides evidence of ownership in one or more underlying municipal bonds. |
| (e) | Coupon rates are determined by re-marketing agents based on current market conditions. |
Investment Valuation
The following is a summary of the inputs used, as of May 31, 2022, involving the Fund's assets and liabilities carried at fair value. The inputs or methodology used for valuing securities may not be an indication of the risk associated with investing in those securities. For more information on valuation inputs, and their aggregation into the levels used below, please refer to the Investment Valuation section in the accompanying Notes to Financial Statements.
| Valuation Inputs at Reporting Date: |
| Description | Total ($) | Level 1 ($) | Level 2 ($) | Level 3 ($) |
Investments in Securities: | | | | |
|
| Variable Rate Demand Note | 1,435,370,000 | - | 1,435,370,000 | - |
|
| Tender Option Bond | 579,080,000 | - | 579,080,000 | - |
|
| Other Municipal Security | 2,600,000 | - | 2,600,000 | - |
| Total Investments in Securities: | 2,017,050,000 | - | 2,017,050,000 | - |
| Statement of Assets and Liabilities |
| | | | May 31, 2022 |
| | | | | |
| Assets | | | | |
Investment in securities, at value - See accompanying schedule Unaffiliated issuers (cost $2,017,050,000): | | | $ | 2,017,050,000 |
| Cash | | | | 474,019 |
| Interest receivable | | | | 1,419,150 |
Total assets | | | | 2,018,943,169 |
| Liabilities | | | | |
| Distributions payable | | $1,008,466 | | |
| Other payables and accrued expenses | | 4,141 | | |
| Total Liabilities | | | | 1,012,607 |
| Net Assets | | | $ | 2,017,930,562 |
| Net Assets consist of: | | | | |
| Paid in capital | | | $ | 2,017,915,570 |
| Total accumulated earnings (loss) | | | | 14,992 |
| Net Assets | | | $ | 2,017,930,562 |
Net Asset Value , offering price and redemption price per share ($2,017,930,562 ÷ 2,017,292,809 shares) | | | $ | 1.0003 |
| | | | | |
| Statement of Operations |
| | | | Year ended May 31, 2022 |
| Investment Income | | | | |
| Interest | | | $ | 2,264,656 |
| Expenses | | | | |
| Custodian fees and expenses | | 15,639 | | |
| Independent trustees' fees and expenses | | 3,704 | | |
| Total expenses before reductions | | 19,343 | | |
| Expense reductions | | (544) | | |
| Total expenses after reductions | | | | 18,799 |
| Net Investment income (loss) | | | | 2,245,857 |
| Realized and Unrealized Gain (Loss) | | | | |
| Net realized gain (loss) on: | | | | |
| Investment Securities: | | | | |
| Unaffiliated issuers | | 75,943 | | |
| Total net realized gain (loss) | | | | 75,943 |
| Net increase in net assets resulting from operations | | | $ | 2,321,800 |
| Statement of Changes in Net Assets |
| |
| | Year ended May 31, 2022 | | Year ended May 31, 2021 |
| Increase (Decrease) in Net Assets | | | | |
| Operations | | | | |
| Net investment income (loss) | $ | 2,245,857 | $ | 1,442,898 |
| Net realized gain (loss) | | 75,943 | | 97,262 |
| Change in net unrealized appreciation (depreciation) | | - | | (7) |
Net increase in net assets resulting from operations | | 2,321,800 | | 1,540,153 |
| Distributions to shareholders | | (2,269,569) | | (1,458,676) |
| Affiliated share transactions | | | | |
| Proceeds from sales of shares | | 7,610,783,400 | | 7,940,790,000 |
| Cost of shares redeemed | | (6,738,133,200) | | (8,567,382,400) |
Net increase (decrease) in net assets and shares resulting from share transactions | | 872,650,200 | | (626,592,400) |
| Total increase (decrease) in net assets | | 872,702,431 | | (626,510,923) |
| | | | | |
| Net Assets | | | | |
| Beginning of period | | 1,145,228,131 | | 1,771,739,054 |
| End of period | $ | 2,017,930,562 | $ | 1,145,228,131 |
| | | | | |
| Other Information | | | | |
| Shares | | | | |
| Sold | | 7,608,577,795 | | 7,939,100,335 |
| Redeemed | | (6,736,224,856) | | (8,565,556,421) |
| Net increase (decrease) | | 872,352,939 | | (626,456,086) |
| | | | | |
| Fidelity® Tax-Free Cash Central Fund |
| |
| Years ended May 31, | | 2022 | | 2021 | | 2020 | | 2019 | | 2018 |
Selected Per-Share Data | | | | | | | | | | |
| Net asset value, beginning of period | $ | 1.0003 | $ | 1.0002 | $ | 1.0001 | $ | 1.0001 | $ | 1.0001 |
| Income from Investment Operations | | | | | | | | | | |
Net investment income (loss) A | | .0016 | | .0009 | | .0126 | | .0151 | | .0108 |
| Net realized and unrealized gain (loss) | | - B | | .0002 | | .0001 | | - B | | .0001 |
| Total from investment operations | | .0016 | | .0011 | | .0127 | | .0151 | | .0109 |
| Distributions from net investment income | | (.0016) | | (.0009) | | (.0126) | | (.0151) | | (.0108) |
| Distributions from net realized gain | | - B | | - B | | - B | | - | | - B |
| Total distributions | | (.0016) | | (.0010) C | | (.0126) | | (.0151) | | (.0109) C |
| Net asset value, end of period | $ | 1.0003 | $ | 1.0003 | $ | 1.0002 | $ | 1.0001 | $ | 1.0001 |
Total Return D | | .16% | | .10% | | 1.28% | | 1.52% | | 1.09% |
Ratios to Average Net Assets A,E,F | | | | | | | | | | |
Expenses before reductions G | | -% | | -% | | -% | | -% | | -% |
Expenses net of fee waivers, if any G | | -% | | -% | | -% | | -% | | -% |
Expenses net of all reductions G | | -% | | -% | | -% | | -% | | -% |
| Net investment income (loss) | | .18% | | .10% | | 1.17% | | 1.52% | | 1.11% |
| Supplemental Data | | | | | | | | | | |
| Net assets, end of period (000 omitted) | $ | 2,017,931 | $ | 1,145,228 | $ | 1,771,739 | $ | 1,032,627 | $ | 1,173,470 |
A Net investment income (loss) is affected by the timing of the declaration of dividends by any underlying mutual funds or exchange-traded funds (ETFs). Net investment income (loss) of any such underlying funds is not included in the Fund's net investment income (loss) ratio.
B Amount represents less than $.00005 per share.
C Total distributions per share do not sum due to rounding.
D Total returns would have been lower if certain expenses had not been reduced during the applicable periods shown.
E Fees and expenses of any underlying mutual funds or exchange-traded funds (ETFs) are not included in the Fund's expense ratio. The Fund indirectly bears its proportionate share of these expenses.
F Expense ratios reflect operating expenses of the class. Expenses before reductions do not reflect amounts reimbursed, waived, or reduced through arrangements with the investment adviser, brokerage services, or other offset arrangements, if applicable, and do not represent the amount paid by the class during periods when reimbursements, waivers or reductions occur.
G Amount represents less than .005%.
For the period ended May 31, 2022
1. Organization.
Fidelity Tax-Free Cash Central Fund (the Fund) is a fund of Fidelity Revere Street Trust (the Trust) and is authorized to issue an unlimited number of shares. The Trust is registered under the Investment Company Act of 1940, as amended (the 1940 Act), as an open-end management investment company organized as a Delaware statutory trust. Shares of the Fund are only offered to other investment companies and accounts (the Investing Funds) managed by Fidelity Management & Research Company LLC (FMR), or its affiliates.The Fund has been designated an institutional money market fund, and the value of the Fund's shares are calculated to four decimal places that fluctuates based upon changes in the value of the Fund's investments.
2. Significant Accounting Policies.
The Fund is an investment company and applies the accounting and reporting guidance of the Financial Accounting Standards Board (FASB) Accounting Standards Codification Topic 946 Financial Services - Investment Companies. The financial statements have been prepared in conformity with accounting principles generally accepted in the United States of America (GAAP), which require management to make certain estimates and assumptions at the date of the financial statements. Actual results could differ from those estimates. Subsequent events, if any, through the date that the financial statements were issued have been evaluated in the preparation of the financial statements. The Fund's Schedule of Investments lists any underlying mutual funds or exchange-traded funds (ETFs) but does not include the underlying holdings of these funds. The following summarizes the significant accounting policies of the Fund:
Investment Valuation. Investments are valued as of 4:00 p.m. Eastern time on the last calendar day of the period. The Board of Trustees (the Board) has delegated the day to day responsibility for the valuation of the Fund's investments to the Fair Value Committee (the Committee) established by the Fund's investment adviser. In accordance with valuation policies and procedures approved by the Board, the Fund attempts to obtain prices from one or more third party pricing vendors or brokers to value its investments. When current market prices, quotations or currency exchange rates are not readily available or reliable, investments will be fair valued in good faith by the Committee, in accordance with procedures adopted by the Board. Factors used in determining fair value vary by investment type and may include market or investment specific events, changes in interest rates and credit quality. The frequency with which these procedures are used cannot be predicted and they may be utilized to a significant extent. The Committee oversees the Fund's valuation policies and procedures and reports to the Board on the Committee's activities and fair value determinations. The Board monitors the appropriateness of the procedures used in valuing the Fund's investments and ratifies the fair value determinations of the Committee.
The Fund categorizes the inputs to valuation techniques used to value its investments into a disclosure hierarchy consisting of three levels as shown below:
Level 1 - unadjusted quoted prices in active markets for identical investments
Level 2 - other significant observable inputs (including quoted prices for similar investments, interest rates, prepayment speeds, etc.)
Level 3 - unobservable inputs (including the Fund's own assumptions based on the best information available)
Valuation techniques used to value the Fund's investments by major category are as follows:
Debt securities, including restricted securities, are valued based on evaluated prices received from third party pricing vendors or from brokers who make markets in such securities. Municipal securities and other short-term securities are valued by pricing vendors who utilize matrix pricing which considers yield or price of bonds of comparable quality, coupon, maturity and type or by broker-supplied prices. When independent prices are unavailable or unreliable, debt securities may be valued utilizing pricing methodologies which consider similar factors that would be used by third party pricing vendors. Debt securities are generally categorized as Level 2 in the hierarchy but may be Level 3 depending on the circumstances.
Securities held by a money market fund are generally high quality and liquid; however, they are reflected as Level 2 because the inputs used to determine fair value are not quoted prices in an active market.
The aggregate value of investments by input level as of May 31, 2022 is included at the end of the Fund's Schedule of Investments.
Investment Transactions and Income. Security transactions are accounted for as of trade date. Gains and losses on securities sold are determined on the basis of identified cost. Interest income is accrued as earned and includes coupon interest and amortization of premium and accretion of discount on debt securities as applicable.
Expenses. Expenses directly attributable to a fund are charged to that fund. Expenses attributable to more than one fund are allocated among the respective funds on the basis of relative net assets or other appropriate methods. Expenses included in the accompanying financial statements reflect the expenses of that fund and do not include any expenses associated with any underlying mutual funds or exchange-traded funds. Although not included in a fund's expenses, a fund indirectly bears its proportionate share of these expenses through the net asset value of each underlying mutual fund or exchange-traded fund. Expense estimates are accrued in the period to which they relate and adjustments are made when actual amounts are known.
Income Tax Information and Distributions to Shareholders. Each year, the Fund intends to qualify as a regulated investment company under Subchapter M of the Internal Revenue Code, including distributing substantially all of its taxable income and realized gains. As a result, no provision for U.S. Federal income taxes is required. As of May 31, 2022, the Fund did not have any unrecognized tax benefits in the financial statements; nor is the Fund aware of any tax positions for which it is reasonably possible that the total amounts of unrecognized tax benefits will significantly change in the next twelve months. The Fund files a U.S. federal tax return, in addition to state and local tax returns as required. The Fund's federal income tax returns are subject to examination by the Internal Revenue Service (IRS) for a period of three fiscal years after they are filed. State and local tax returns may be subject to examination for an additional fiscal year depending on the jurisdiction.
Distributions are declared and recorded daily and paid monthly from net investment income. Distributions from realized gains, if any, are declared and recorded on the ex-dividend date. Income and capital gain distributions are determined in accordance with income tax regulations, which may differ from GAAP. In addition, the Fund claimed a portion of the payment made to redeeming shareholders as a distribution for income tax purposes.
Capital accounts within the financial statements are adjusted for permanent book-tax differences. These adjustments have no impact on net assets or the results of operations. Capital accounts are not adjusted for temporary book-tax differences which will reverse in a subsequent period.
The Fund purchases municipal securities whose interest, in the opinion of the issuer, is free from federal income tax. There is no assurance that the Internal Revenue Service (IRS) will agree with this opinion. In the event the IRS determines that the issuer does not comply with relevant tax requirements, interest payments from a security could become federally taxable, possibly retroactively to the date the security was issued.
As of period end, the cost and unrealized appreciation (depreciation) in securities for federal income tax purposes were as follows:
| Gross unrealized appreciation | $- |
| Gross unrealized depreciation | - |
| Net unrealized appreciation (depreciation) | $- |
| Tax Cost | $2,017,050,000 |
The tax-based components of distributable earnings as of period end were as follows:
| Undistributed tax-exempt income | $360 |
| Undistributed long-term capital gain | $14,632 |
The tax character of distributions paid was as follows:
| | May 31, 2022 | May 31, 2021 |
| Tax-exempt Income | $2,245,840 | $1,442,463 |
| Ordinary Income | - | 16,213 |
| Long-term Capital Gains | 23,729 | - |
| Total | $2,269,569 | $ 1,458,676 |
Restricted Securities (including Private Placements). Funds may invest in securities that are subject to legal or contractual restrictions on resale. These securities generally may be resold in transactions exempt from registration or to the public if the securities are registered. Disposal of these securities may involve time-consuming negotiations and expense, and prompt sale at an acceptable price may be difficult. Information regarding restricted securities held at period end is included at the end of the Schedule of Investments, if applicable.
3. Fees and Other Transactions with Affiliates.
Management Fee and Expense Contract. Fidelity Management & Research Company LLC (the investment adviser) provides the Fund with investment management services. The Fund does not pay any fees for these services. Pursuant to the Fund's management contract, the investment adviser receives a monthly management fee that represents a portion of the management fees it receives from the Investing Funds. In addition, under an expense contract, the investment adviser also pays all other expenses of the Fund, excluding custody fees, the compensation of the independent Trustees, and certain miscellaneous expenses such as proxy and shareholder meeting expenses.
Interfund Trades. Funds may purchase from or sell securities to other Fidelity Funds under procedures adopted by the Board. The procedures have been designed to ensure these interfund trades are executed in accordance with Rule 17a-7 of the 1940 Act. Interfund trades during the period are noted in the table below.
| | Purchases ($) | Sales ($) | Realized Gain (Loss) ($) |
| Fidelity Tax-Free Cash Central Fund | 414,542,812 | 344,595,000 | - |
4. Expense Reductions.
Through arrangements with the Fund's custodian, credits realized as a result of certain uninvested cash balances were used to reduce the Fund's expenses by $544.
5. Other.
A fund's organizational documents provide former and current trustees and officers with a limited indemnification against liabilities arising in connection with the performance of their duties to the fund. In the normal course of business, a fund may also enter into contracts that provide general indemnifications. A fund's maximum exposure under these arrangements is unknown as this would be dependent on future claims that may be made against a fund. The risk of material loss from such claims is considered remote.
At the end of the period, mutual funds and accounts managed by the investment adviser or its affiliates were the owners of record of all of the outstanding shares of the Fund.
6. Coronavirus (COVID-19) Pandemic.
An outbreak of COVID-19 first detected in China during December 2019 has since spread globally and was declared a pandemic by the World Health Organization during March 2020. Developments that disrupt global economies and financial markets, such as the COVID-19 pandemic, may magnify factors that affect the Fund's performance.
To the Board of Trustees of Fidelity Revere Street Trust and Shareholders of Fidelity Tax-Free Cash Central Fund
Opinion on the Financial Statements and Financial Highlights
We have audited the accompanying statement of assets and liabilities of Fidelity Tax-Free Cash Central Fund (the "Fund"), a fund of Fidelity Revere Street Trust, including the schedule of investments, as of May 31, 2022, the related statement of operations for the year then ended, the statement of changes in net assets for each of the two years in the period then ended, the financial highlights for each of the five years in the period then ended, and the related notes. In our opinion, the financial statements and financial highlights present fairly, in all material respects, the financial position of the Fund as of May 31, 2022, and the results of its operations for the year then ended, the changes in its net assets for each of the two years in the period then ended, and the financial highlights for each of the five years in the period then ended in conformity with accounting principles generally accepted in the United States of America.
Basis for Opinion
These financial statements and financial highlights are the responsibility of the Fund's management. Our responsibility is to express an opinion on the Fund's financial statements and financial highlights based on our audits. We are a public accounting firm registered with the Public Company Accounting Oversight Board (United States) (PCAOB) and are required to be independent with respect to the Fund in accordance with the U.S. federal securities laws and the applicable rules and regulations of the Securities and Exchange Commission and the PCAOB.
We conducted our audits in accordance with the standards of the PCAOB. Those standards require that we plan and perform the audit to obtain reasonable assurance about whether the financial statements and financial highlights are free of material misstatement, whether due to error or fraud. The Fund is not required to have, nor were we engaged to perform, an audit of its internal control over financial reporting. As part of our audits we are required to obtain an understanding of internal control over financial reporting but not for the purpose of expressing an opinion on the effectiveness of the Fund's internal control over financial reporting. Accordingly, we express no such opinion.
Our audits included performing procedures to assess the risks of material misstatement of the financial statements and financial highlights, whether due to error or fraud, and performing procedures that respond to those risks. Such procedures included examining, on a test basis, evidence regarding the amounts and disclosures in the financial statements and financial highlights. Our audits also included evaluating the accounting principles used and significant estimates made by management, as well as evaluating the overall presentation of the financial statements and financial highlights. Our procedures included confirmation of securities owned as of May 31, 2022, by correspondence with the custodian and brokers; when replies were not received from brokers, we performed other auditing procedures. We believe that our audits provide a reasonable basis for our opinion.
/s/ Deloitte & Touche LLP
Boston, Massachusetts
July 14, 2022
We have served as the auditor of one or more of the Fidelity investment companies since 1999.
The Trustees, Members of the Advisory Board (if any), and officers of the trust and fund, as applicable, are listed below. The Board of Trustees governs the fund and is responsible for protecting the interests of shareholders. The Trustees are experienced executives who meet periodically throughout the year to oversee the fund's activities, review contractual arrangements with companies that provide services to the fund, oversee management of the risks associated with such activities and contractual arrangements, and review the fund's performance. Each of the Trustees oversees 299 funds.
The Trustees hold office without limit in time except that (a) any Trustee may resign; (b) any Trustee may be removed by written instrument, signed by at least two-thirds of the number of Trustees prior to such removal; (c) any Trustee who requests to be retired or who has become incapacitated by illness or injury may be retired by written instrument signed by a majority of the other Trustees; and (d) any Trustee may be removed at any special meeting of shareholders by a two-thirds vote of the outstanding voting securities of the trust. Each Trustee who is not an interested person (as defined in the 1940 Act) of the trust and the fund is referred to herein as an Independent Trustee. Each Independent Trustee shall retire not later than the last day of the calendar year in which his or her 75th birthday occurs. The Independent Trustees may waive this mandatory retirement age policy with respect to individual Trustees. Officers and Advisory Board Members hold office without limit in time, except that any officer or Advisory Board Member may resign or may be removed by a vote of a majority of the Trustees at any regular meeting or any special meeting of the Trustees. Except as indicated, each individual has held the office shown or other offices in the same company for the past five years.
The fund's Statement of Additional Information (SAI) includes more information about the Trustees. To request a free copy, call Fidelity at 1-800-544-8544.
Experience, Skills, Attributes, and Qualifications of the Trustees. The Governance and Nominating Committee has adopted a statement of policy that describes the experience, qualifications, attributes, and skills that are necessary and desirable for potential Independent Trustee candidates (Statement of Policy). The Board believes that each Trustee satisfied at the time he or she was initially elected or appointed a Trustee, and continues to satisfy, the standards contemplated by the Statement of Policy. The Governance and Nominating Committee also engages professional search firms to help identify potential Independent Trustee candidates who have the experience, qualifications, attributes, and skills consistent with the Statement of Policy. From time to time, additional criteria based on the composition and skills of the current Independent Trustees, as well as experience or skills that may be appropriate in light of future changes to board composition, business conditions, and regulatory or other developments, have also been considered by the professional search firms and the Governance and Nominating Committee. In addition, the Board takes into account the Trustees' commitment and participation in Board and committee meetings, as well as their leadership of standing and ad hoc committees throughout their tenure.
In determining that a particular Trustee was and continues to be qualified to serve as a Trustee, the Board has considered a variety of criteria, none of which, in isolation, was controlling. The Board believes that, collectively, the Trustees have balanced and diverse experience, qualifications, attributes, and skills, which allow the Board to operate effectively in governing the fund and protecting the interests of shareholders. Information about the specific experience, skills, attributes, and qualifications of each Trustee, which in each case led to the Board's conclusion that the Trustee should serve (or continue to serve) as a trustee of the fund, is provided below.
Board Structure and Oversight Function. Abigail P. Johnson is an interested person and currently serves as Chairman. The Trustees have determined that an interested Chairman is appropriate and benefits shareholders because an interested Chairman has a personal and professional stake in the quality and continuity of services provided to the fund. Independent Trustees exercise their informed business judgment to appoint an individual of their choosing to serve as Chairman, regardless of whether the Trustee happens to be independent or a member of management. The Independent Trustees have determined that they can act independently and effectively without having an Independent Trustee serve as Chairman and that a key structural component for assuring that they are in a position to do so is for the Independent Trustees to constitute a substantial majority for the Board. The Independent Trustees also regularly meet in executive session. Michael E. Kenneally serves as Chairman of the Independent Trustees and as such (i) acts as a liaison between the Independent Trustees and management with respect to matters important to the Independent Trustees and (ii) with management prepares agendas for Board meetings.
Fidelity ® funds are overseen by different Boards of Trustees. The fund's Board oversees Fidelity's investment-grade bond, money market, asset allocation and certain equity funds, and other Boards oversee Fidelity's high income and other equity funds. The asset allocation funds may invest in Fidelity ® funds that are overseen by such other Boards. The use of separate Boards, each with its own committee structure, allows the Trustees of each group of Fidelity ® funds to focus on the unique issues of the funds they oversee, including common research, investment, and operational issues. On occasion, the separate Boards establish joint committees to address issues of overlapping consequences for the Fidelity ® funds overseen by each Board.
The Trustees operate using a system of committees to facilitate the timely and efficient consideration of all matters of importance to the Trustees, the fund, and fund shareholders and to facilitate compliance with legal and regulatory requirements and oversight of the fund's activities and associated risks. The Board, acting through its committees, has charged FMR and its affiliates with (i) identifying events or circumstances the occurrence of which could have demonstrably adverse effects on the fund's business and/or reputation; (ii) implementing processes and controls to lessen the possibility that such events or circumstances occur or to mitigate the effects of such events or circumstances if they do occur; and (iii) creating and maintaining a system designed to evaluate continuously business and market conditions in order to facilitate the identification and implementation processes described in (i) and (ii) above. Because the day-to-day operations and activities of the fund are carried out by or through FMR, its affiliates, and other service providers, the fund's exposure to risks is mitigated but not eliminated by the processes overseen by the Trustees. While each of the Board's committees has responsibility for overseeing different aspects of the fund's activities, oversight is exercised primarily through the Operations and Audit Committees. In addition, an ad hoc Board committee of Independent Trustees has worked with FMR to enhance the Board's oversight of investment and financial risks, legal and regulatory risks, technology risks, and operational risks, including the development of additional risk reporting to the Board. The Operations Committee also worked and continues to work with FMR to enhance the stress tests required under SEC regulations for money market funds. Appropriate personnel, including but not limited to the fund's Chief Compliance Officer (CCO), FMR's internal auditor, the independent accountants, the fund's Treasurer and portfolio management personnel, make periodic reports to the Board's committees, as appropriate, including an annual review of Fidelity's risk management program for the Fidelity ® funds. The responsibilities of each standing committee, including their oversight responsibilities, are described further under "Standing Committees of the Trustees."
Interested Trustees*:
Correspondence intended for a Trustee who is an interested person may be sent to Fidelity Investments, 245 Summer Street, Boston, Massachusetts 02210.
Name, Year of Birth; Principal Occupations and Other Relevant Experience+
Abigail P. Johnson (1961)
Year of Election or Appointment: 2009
Trustee
Chairman of the Board of Trustees
Ms. Johnson also serves as Trustee of other Fidelity ® funds. Ms. Johnson serves as Chairman (2016-present), Chief Executive Officer (2014-present), and Director (2007-present) of FMR LLC (diversified financial services company), President of Fidelity Financial Services (2012-present) and President of Personal, Workplace and Institutional Services (2005-present). Ms. Johnson is Chairman and Director of Fidelity Management & Research Company LLC (investment adviser firm, 2011-present). Previously, Ms. Johnson served as Chairman and Director of FMR Co., Inc. (investment adviser firm, 2011-2019), Vice Chairman (2007-2016) and President (2013-2016) of FMR LLC, President and a Director of Fidelity Management & Research Company (2001-2005), a Trustee of other investment companies advised by Fidelity Management & Research Company, Fidelity Investments Money Management, Inc. (investment adviser firm), and FMR Co., Inc. (2001-2005), Senior Vice President of the Fidelity ® funds (2001-2005), and managed a number of Fidelity ® funds. Ms. Abigail P. Johnson and Mr. Arthur E. Johnson are not related.
Jennifer Toolin McAuliffe (1959)
Year of Election or Appointment: 2016
Trustee
Ms. McAuliffe also serves as Trustee of other Fidelity ® funds and as Trustee of Fidelity Charitable (2020-present). Previously, Ms. McAuliffe served as Co-Head of Fixed Income of Fidelity Investments Limited (now known as FIL Limited (FIL)) (diversified financial services company), Director of Research for FIL's credit and quantitative teams in London, Hong Kong and Tokyo and Director of Research for taxable and municipal bonds at Fidelity Investments Money Management, Inc. Ms. McAuliffe previously served as a member of the Advisory Board of certain Fidelity ® funds (2016). Ms. McAuliffe was previously a lawyer at Ropes & Gray LLP and currently serves as director or trustee of several not-for-profit entities.
* Determined to be an "Interested Trustee" by virtue of, among other things, his or her affiliation with the trust or various entities under common control with FMR.
+ The information includes the Trustee's principal occupation during the last five years and other information relating to the experience, attributes, and skills relevant to the Trustee's qualifications to serve as a Trustee, which led to the conclusion that the Trustee should serve as a Trustee for the fund.
Independent Trustees:
Correspondence intended for an Independent Trustee may be sent to Fidelity Investments, P.O. Box 55235, Boston, Massachusetts 02205-5235.
Name, Year of Birth; Principal Occupations and Other Relevant Experience+
Elizabeth S. Acton (1951)
Year of Election or Appointment: 2013
Trustee
Ms. Acton also serves as Trustee of other Fidelity ® funds. Prior to her retirement, Ms. Acton served as Executive Vice President, Finance (2011-2012), Executive Vice President, Chief Financial Officer (2002-2011) and Treasurer (2004-2005) of Comerica Incorporated (financial services). Prior to joining Comerica, Ms. Acton held a variety of positions at Ford Motor Company (1983-2002), including Vice President and Treasurer (2000-2002) and Executive Vice President and Chief Financial Officer of Ford Motor Credit Company (1998-2000). Ms. Acton currently serves as a member of the Board and Audit and Finance Committees of Beazer Homes USA, Inc. (homebuilding, 2012-present). Ms. Acton previously served as a member of the Advisory Board of certain Fidelity ® funds (2013-2016).
Ann E. Dunwoody (1953)
Year of Election or Appointment: 2018
Trustee
General Dunwoody also serves as Trustee of other Fidelity ® funds. General Dunwoody (United States Army, Retired) was the first woman in U.S. military history to achieve the rank of four-star general and prior to her retirement in 2012 held a variety of positions within the U.S. Army, including Commanding General, U.S. Army Material Command (2008-2012). General Dunwoody currently serves as President of First to Four LLC (leadership and mentoring services, 2012-present), a member of the Board and Nomination and Corporate Governance Committees of Kforce Inc. (professional staffing services, 2016-present) and a member of the Board of Automattic Inc. (software engineering, 2018-present). Previously, General Dunwoody served as a member of the Advisory Board and Nominating and Corporate Governance Committee of L3 Technologies, Inc. (communication, electronic, sensor and aerospace systems, 2013-2019) and a member of the Board and Audit and Sustainability and Corporate Responsibility Committees of Republic Services, Inc. (waste collection, disposal and recycling, 2013-2016). Ms. Dunwoody also serves on several boards for non-profit organizations, including as a member of the Board, Chair of the Nomination and Governance Committee and a member of the Audit Committee of Logistics Management Institute (consulting non-profit, 2012-present), a member of the Council of Trustees for the Association of the United States Army (advocacy non-profit, 2013-present), a member of the Board of Florida Institute of Technology (2015-present) and a member of the Board of ThanksUSA (military family education non-profit, 2014-present). General Dunwoody previously served as a member of the Advisory Board of certain Fidelity ® funds (2018).
John Engler (1948)
Year of Election or Appointment: 2014
Trustee
Mr. Engler also serves as Trustee of other Fidelity ® funds. Previously, Mr. Engler served as Governor of Michigan (1991-2003), President of the Business Roundtable (2011-2017) and interim President of Michigan State University (2018-2019). Mr. Engler currently serves as a member of the Board of Stride, Inc. (formerly K12 Inc.) (technology-based education company, 2012-present). Previously, Mr. Engler served as a member of the Board of Universal Forest Products (manufacturer and distributor of wood and wood-alternative products, 2003-2019) and Trustee of The Munder Funds (2003-2014). Mr. Engler previously served as a member of the Advisory Board of certain Fidelity ® funds (2014-2016).
Robert F. Gartland (1951)
Year of Election or Appointment: 2010
Trustee
Mr. Gartland also serves as Trustee of other Fidelity ® funds. Prior to his retirement, Mr. Gartland held a variety of positions at Morgan Stanley (financial services, 1979-2007), including Managing Director (1987-2007) and Chase Manhattan Bank (1975-1978). Mr. Gartland previously served as Chairman and an investor in Gartland & Mellina Group Corp. (consulting, 2009-2019), as a member of the Board of National Securities Clearing Corporation (1993-1996) and as Chairman of TradeWeb (2003-2004).
Arthur E. Johnson (1947)
Year of Election or Appointment: 2008
Trustee
Mr. Johnson also serves as Trustee of other Fidelity ® funds. Prior to his retirement, Mr. Johnson served as Senior Vice President of Corporate Strategic Development of Lockheed Martin Corporation (defense contractor, 1999-2009). Mr. Johnson currently serves as a member of the Board of Booz Allen Hamilton (management consulting, 2011-present). Mr. Johnson previously served as a member of the Board of Eaton Corporation plc (diversified power management, 2009-2019) and a member of the Board of AGL Resources, Inc. (holding company, 2002-2016). Mr. Johnson previously served as Chairman (2018-2021) and Vice Chairman (2015-2018) of the Independent Trustees of certain Fidelity® funds. Mr. Arthur E. Johnson is not related to Ms. Abigail P. Johnson.
Michael E. Kenneally (1954)
Year of Election or Appointment: 2009
Trustee
Chairman of the Independent Trustees
Mr. Kenneally also serves as Trustee of other Fidelity ® funds and was Vice Chairman (2018-2021) of the Independent Trustees of certain Fidelity ® funds. Prior to retirement in 2005, he was Chairman and Global Chief Executive Officer of Credit Suisse Asset Management, the worldwide fund management and institutional investment business of Credit Suisse Group. Previously, Mr. Kenneally was an Executive Vice President and the Chief Investment Officer for Bank of America. In this role, he was responsible for the investment management, strategy and products delivered to the bank's institutional, high-net-worth and retail clients. Earlier, Mr. Kenneally directed the organization's equity and quantitative research groups. He began his career as a research analyst and then spent more than a dozen years as a portfolio manager for endowments, pension plans and mutual funds. He earned the Chartered Financial Analyst (CFA) designation in 1991.
Marie L. Knowles (1946)
Year of Election or Appointment: 2001
Trustee
Ms. Knowles also serves as Trustee of other Fidelity ® funds. Prior to her retirement, Ms. Knowles held several positions at Atlantic Richfield Company (diversified energy), including Executive Vice President and Chief Financial Officer (1996-2000), Senior Vice President (1993-1996) and President of ARCO Transportation Company (pipeline and tanker operations, 1993-1996). Ms. Knowles currently serves as a member of the Board of the Santa Catalina Island Company (real estate, 2009-present), a member of the Investment Company Institute Board of Governors and a member of the Governing Council of the Independent Directors Council (2014-present). Ms. Knowles also serves as a member of the Advisory Board for the School of Engineering of the University of Southern California. Ms. Knowles previously served as a member of the Board of McKesson Corporation (healthcare service, 2002-2021). In addition, Ms. Knowles previously served as Chairman (2015-2018) and Vice Chairman (2012-2015) of the Independent Trustees of certain Fidelity ® funds.
Mark A. Murray (1954)
Year of Election or Appointment: 2016
Trustee
Mr. Murray also serves as Trustee of other Fidelity ® funds. Previously, Mr. Murray served as Co-Chief Executive Officer (2013-2016), President (2006-2013) and Vice Chairman (2013-2020) of Meijer, Inc. Mr. Murray serves as a member of the Board (2009-present) and Public Policy and Responsibility Committee (2009-present) and Chair of the Nuclear Review Committee (2019-present) of DTE Energy Company (diversified energy company). Mr. Murray previously served as a member of the Board of Spectrum Health (not-for-profit health system, 2015-2019) and as a member of the Board and Audit Committee and Chairman of the Nominating and Corporate Governance Committee of Universal Forest Products, Inc. (manufacturer and distributor of wood and wood-alternative products, 2004-2016). Mr. Murray also serves as a member of the Board of many community and professional organizations. Mr. Murray previously served as a member of the Advisory Board of certain Fidelity ® funds (2016).
+ The information includes the Trustee's principal occupation during the last five years and other information relating to the experience, attributes, and skills relevant to the Trustee's qualifications to serve as a Trustee, which led to the conclusion that the Trustee should serve as a Trustee for the fund.
Advisory Board Members and Officers:
Correspondence intended for an officer may be sent to Fidelity Investments, 245 Summer Street, Boston, Massachusetts 02210. Officers appear below in alphabetical order.
Name, Year of Birth; Principal Occupation
Robert W. Helm (1957)
Year of Election or Appointment: 2021
Member of the Advisory Board
Mr. Helm also serves as a Member of the Advisory Board of other Fidelity® funds. Mr. Helm was formerly Deputy Chairman (2003-2020), partner (1991-2020) and an associate (1984-1991) of Dechert LLP (formerly Dechert Price & Rhoads). Mr. Helm currently serves on boards and committees of several not-for-profit organizations.
Craig S. Brown (1977)
Year of Election or Appointment: 2019
Assistant Treasurer
Mr. Brown also serves as an officer of other funds. Mr. Brown serves as Assistant Treasurer of FIMM, LLC (2021-present) and is an employee of Fidelity Investments (2013-present).
John J. Burke III (1964)
Year of Election or Appointment: 2018
Chief Financial Officer
Mr. Burke also serves as Chief Financial Officer of other funds. Mr. Burke serves as Head of Investment Operations for Fidelity Fund and Investment Operations (2018-present) and is an employee of Fidelity Investments (1998-present). Previously Mr. Burke served as head of Asset Management Investment Operations (2012-2018).
David J. Carter (1973)
Year of Election or Appointment: 2020
Assistant Secretary
Mr. Carter also serves as Assistant Secretary of other funds. Mr. Carter serves as Senior Vice President, Deputy General Counsel (2022-present) and is an employee of Fidelity Investments (2005-present).
Jonathan Davis (1968)
Year of Election or Appointment: 2010
Assistant Treasurer
Mr. Davis also serves as an officer of other funds. Mr. Davis serves as Assistant Treasurer of FIMM, LLC (2021-present), FMR Capital, Inc. (2017-present), FD Funds GP LLC (2021-present), FD Funds Holding LLC (2021-present), and FD Funds Management LLC (2021-present); and is an employee of Fidelity Investments. Previously, Mr. Davis served as Vice President and Associate General Counsel of FMR LLC (diversified financial services company, 2003-2010).
Laura M. Del Prato (1964)
Year of Election or Appointment: 2018
President and Treasurer
Ms. Del Prato also serves as an officer of other funds. Ms. Del Prato serves as Assistant Treasurer of FIMM, LLC (2021-present) and is an employee of Fidelity Investments (2017-present). Previously, Ms. Del Prato served as President and Treasurer of The North Carolina Capital Management Trust: Cash Portfolio and Term Portfolio (2018-2020). Prior to joining Fidelity Investments, Ms. Del Prato served as a Managing Director and Treasurer of the JPMorgan Mutual Funds (2014-2017). Prior to JPMorgan, Ms. Del Prato served as a partner at Cohen Fund Audit Services (accounting firm, 2012-2013) and KPMG LLP (accounting firm, 2004-2012).
Colm A. Hogan (1973)
Year of Election or Appointment: 2016
Assistant Treasurer
Mr. Hogan also serves as an officer of other funds. Mr. Hogan serves as Assistant Treasurer of FIMM, LLC (2021-present) and FMR Capital, Inc. (2017-present) and is an employee of Fidelity Investments (2005-present). Previously, Mr. Hogan served as Deputy Treasurer of certain Fidelity ® funds (2016-2020) and Assistant Treasurer of certain Fidelity ® funds (2016-2018).
Cynthia Lo Bessette (1969)
Year of Election or Appointment: 2019
Secretary and Chief Legal Officer (CLO)
Ms. Lo Bessette also serves as an officer of other funds. Ms. Lo Bessette serves as CLO, Secretary, and Senior Vice President of Fidelity Management & Research Company LLC (investment adviser firm, 2019-present); CLO of Fidelity Management & Research (Hong Kong) Limited, FMR Investment Management (UK) Limited, and Fidelity Management & Research (Japan) Limited (investment adviser firms, 2019-present); Secretary of FD Funds GP LLC (2021-present), FD Funds Holding LLC (2021-present), and FD Funds Management LLC (2021-present); and Assistant Secretary of FIMM, LLC (2019-present). She is a Senior Vice President and Deputy General Counsel of FMR LLC (diversified financial services company, 2019-present), and is an employee of Fidelity Investments. Previously, Ms. Lo Bessette served as CLO, Secretary, and Senior Vice President of FMR Co., Inc. (investment adviser firm, 2019); Secretary of Fidelity SelectCo, LLC and Fidelity Investments Money Management, Inc. (investment adviser firms, 2019). Prior to joining Fidelity Investments, Ms. Lo Bessette was Executive Vice President, General Counsel (2016-2019) and Senior Vice President, Deputy General Counsel (2015-2016) of OppenheimerFunds (investment management company) and Deputy Chief Legal Officer (2013-2015) of Jennison Associates LLC (investment adviser firm).
Chris Maher (1972)
Year of Election or Appointment: 2013
Assistant Treasurer
Mr. Maher also serves as an officer of other funds. Mr. Maher serves as Assistant Treasurer of FIMM, LLC (2021-present) and FMR Capital, Inc. (2017-present), and is an employee of Fidelity Investments (2008-present). Previously, Mr. Maher served as Assistant Treasurer of certain funds (2013-2020); Vice President of Asset Management Compliance (2013), Vice President of the Program Management Group of FMR (investment adviser firm, 2010-2013), and Vice President of Valuation Oversight (2008-2010).
Jamie Pagliocco (1964)
Year of Election or Appointment: 2020
Vice President
Mr. Pagliocco also serves as Vice President of other funds. Mr. Pagliocco serves as President of Fixed Income (2020-present), and is an employee of Fidelity Investments (2001-present). Previously, Mr. Pagliocco served as Co-Chief Investment Officer - Bond (2017-2020), Global Head of Bond Trading (2016-2019), and as a portfolio manager.
Kenneth B. Robins (1969)
Year of Election or Appointment: 2020
Chief Compliance Officer
Mr. Robins also serves as an officer of other funds. Mr. Robins serves as Compliance Officer of Fidelity Management & Research Company LLC (investment adviser firm, 2016-present) and is an employee of Fidelity Investments (2004-present). Previously, Mr. Robins served as Compliance Officer of FMR Co., Inc. (investment adviser firm, 2016-2019), as Executive Vice President of Fidelity Investments Money Management, Inc. (investment adviser firm, 2013-2016) and served in other fund officer roles.
Brett Segaloff (1972)
Year of Election or Appointment: 2021
Anti-Money Laundering (AML) Officer
Mr. Segaloff also serves as an AML Officer of other funds and other related entities. He is Director, Anti-Money Laundering (2007-present) of FMR LLC (diversified financial services company) and is an employee of Fidelity Investments (1996-present).
Stacie M. Smith (1974)
Year of Election or Appointment: 2013
Assistant Treasurer
Ms. Smith also serves as an officer of other funds. Ms. Smith serves as Assistant Treasurer of FIMM, LLC (2021-present) and FMR Capital, Inc. (2017-present), is an employee of Fidelity Investments (2009-present), and has served in other fund officer roles. Prior to joining Fidelity Investments, Ms. Smith served as Senior Audit Manager of Ernst & Young LLP (accounting firm, 1996-2009). Previously, Ms. Smith served as Assistant Treasurer (2013-2019) and Deputy Treasurer (2013-2016) of certain Fidelity ® funds.
Jim Wegmann (1979)
Year of Election or Appointment: 2021
Deputy Treasurer
Mr. Wegmann also serves as an officer of other funds. Mr. Wegmann serves as Assistant Treasurer of FIMM, LLC (2021-present) and is an employee of Fidelity Investments (2011-present). Previously, Mr. Wegmann served as Assistant Treasurer of certain Fidelity ® funds (2019-2021).
As a shareholder, you incur two types of costs: (1) transaction costs, which may include sales charges (loads) on purchase payments or redemption proceeds, as applicable and (2) ongoing costs, which generally include management fees, distribution and/or service (12b-1) fees and other Fund expenses. This Example is intended to help you understand your ongoing costs (in dollars) of investing in a fund and to compare these costs with the ongoing costs of investing in other mutual funds.
| The Example is based on an investment of $1,000 invested at the beginning of the period and held for the entire period (December 1, 2021 to May 31, 2022). |
Actual Expenses
The first line of the accompanying table provides information about actual account values and actual expenses. You may use the information in this line, together with the amount you invested, to estimate the expenses that you paid over the period. Simply divide your account value by $1,000.00 (for example, an $8,600 account value divided by $1,000.00 = 8.6), then multiply the result by the number in the first line for a class/Fund under the heading entitled "Expenses Paid During Period" to estimate the expenses you paid on your account during this period. If any fund is a shareholder of any underlying mutual funds or exchange-traded funds (ETFs) (the Underlying Funds), such fund indirectly bears its proportional share of the expenses of the Underlying Funds in addition to the direct expenses incurred presented in the table. These fees and expenses are not included in the annualized expense ratio used to calculate the expense estimate in the table below.
Hypothetical Example for Comparison Purposes
The second line of the accompanying table provides information about hypothetical account values and hypothetical expenses based on the actual expense ratio and an assumed rate of return of 5% per year before expenses, which is not the actual return. The hypothetical account values and expenses may not be used to estimate the actual ending account balance or expenses you paid for the period. You may use this information to compare the ongoing costs of investing in the Fund and other funds. To do so, compare this 5% hypothetical example with the 5% hypothetical examples that appear in the shareholder reports of the other funds. If any fund is a shareholder of any Underlying Funds, such fund indirectly bears its proportional share of the expenses of the Underlying Funds in addition to the direct expenses as presented in the table. These fees and expenses are not included in the annualized expense ratio used to calculate the expense estimate in the table below.
Please note that the expenses shown in the table are meant to highlight your ongoing costs only and do not reflect any transaction costs. Therefore, the second line of the table is useful in comparing ongoing costs only, and will not help you determine the relative total costs of owning different funds. In addition, if these transactional costs were included, your costs would have been higher.
| | | | | Annualized Expense Ratio- A | | Beginning Account Value December 1, 2021 | | Ending Account Value May 31, 2022 | | Expenses Paid During Period- C December 1, 2021 to May 31, 2022 |
| | | | | | | | | | |
| Fidelity® Tax-Free Cash Central Fund | | | | 0.002% | | | | | | |
| Actual | | | | | | $ 1,000 | | $ 1,001.40 | | $ .01 |
Hypothetical- B | | | | | | $ 1,000 | | $ 1,024.92 | | $ .01 |
| |
A Annualized expense ratio reflects expenses net of applicable fee waivers.
B 5% return per year before expenses
C Expenses are equal to the annualized expense ratio, multiplied by the average account value over the period, multiplied by 182/ 365 (to reflect the one-half year period). The fees and expenses of any Underlying Funds are not included in each annualized expense ratio.
The dividend and capital gains distributions for the fund(s) are available on Fidelity.com or Institutional.Fidelity.com.
The fund hereby designates as a capital gain dividend with respect to the taxable year ended May 31, 2022, $68,853, or, if subsequently determined to be different, the net capital gain of such year.
During fiscal year ended 2022, 100% of the fund's income dividends was free from federal income tax, and 0.00% of the fund's income dividends was subject to the federal alternative minimum tax.
The fund will notify shareholders in January 2023 of amounts for use in preparing 2022 income tax returns.
1.795174.118
TFC-ANN-0722
Fidelity® Securities Lending Cash Central Fund
Annual Report
May 31, 2022


Contents
To view a fund's proxy voting guidelines and proxy voting record for the 12-month period ended June 30, visit http://www.fidelity.com/proxyvotingresults or visit the Securities and Exchange Commission's (SEC) web site at http://www.sec.gov.
You may also call 1-800-544-8544 to request a free copy of the proxy voting guidelines.
Standard & Poor's, S&P and S&P 500 are registered service marks of The McGraw-Hill Companies, Inc. and have been licensed for use by Fidelity Distributors Corporation.
Other third-party marks appearing herein are the property of their respective owners.
All other marks appearing herein are registered or unregistered trademarks or service marks of FMR LLC or an affiliated company. © 2022 FMR LLC. All rights reserved.
A fund files its complete schedule of portfolio holdings with the SEC for the first and third quarters of each fiscal year on Form N-PORT. Forms N-PORT are available on the SEC’s web site at http://www.sec.gov. A fund's Forms N-PORT may be reviewed and copied at the SEC’s Public Reference Room in Washington, DC. Information regarding the operation of the SEC's Public Reference Room may be obtained by calling 1-800-SEC-0330.
Note to Shareholders:
Early in 2020, the outbreak and spread of COVID-19 emerged as a public health emergency that had a major influence on financial markets, primarily based on its impact on the global economy and corporate earnings. On March 11, 2020, the World Health Organization declared the COVID-19 outbreak a pandemic, citing sustained risk of further global spread. The pandemic prompted a number of measures to limit the spread of COVID-19, including travel and border restrictions, quarantines, and restrictions on large gatherings. In turn, these resulted in lower consumer activity, diminished demand for a wide range of products and services, disruption in manufacturing and supply chains, and – given the wide variability in outcomes regarding the outbreak – significant market uncertainty and volatility. To help stem the turmoil, the U.S. government took unprecedented action – in concert with the U.S. Federal Reserve and central banks around the world – to help support consumers, businesses, and the broader economy, and to limit disruption to the financial system.
In general, the overall impact of the pandemic lessened in 2021, amid a resilient economy and widespread distribution of three COVID-19 vaccines granted emergency use authorization from the U.S. Food and Drug Administration (FDA) early in the year. Still, the situation remains dynamic, and the extent and duration of its influence on financial markets and the economy is highly uncertain, due in part to a recent spike in cases based on highly contagious variants of the coronavirus.
Extreme events such as the COVID-19 crisis are exogenous shocks that can have significant adverse effects on mutual funds and their investments. Although multiple asset classes may be affected by market disruption, the duration and impact may not be the same for all types of assets. Fidelity is committed to helping you stay informed amid news about COVID-19 and during increased market volatility, and we continue to take extra steps to be responsive to customer needs. We encourage you to visit us online, where we offer ongoing updates, commentary, and analysis on the markets and our funds.
Investment Summary (Unaudited)
Effective Maturity Diversification as of May 31, 2022
| Days | % of fund's investments |
| 1 - 7 | 99.1 |
| 31 - 60 | 0.9 |
Effective maturity is determined in accordance with the requirements of Rule 2a-7 under the Investment Company Act of 1940.
Asset Allocation (% of fund's net assets)
| As of May 31, 2022 |
| | Non-Negotiable Time Deposit | 9.3% |
| | Repurchase Agreements | 87.8% |
| | Net Other Assets (Liabilities) | 2.9% |

Schedule of Investments May 31, 2022
Showing Percentage of Net Assets
| Non-Negotiable Time Deposit - 9.3% | | | | |
| | | Yield(a) | Principal Amount | Value |
| Time Deposits - 9.3% | | | | |
| Barclays Bank PLC | | | | |
| 6/1/22 | | 0.89% | $1,760,500,000 | $1,760,500,000 |
| Credit Agricole CIB | | | | |
| 6/1/22 | | 0.80 | 605,400,000 | 605,400,000 |
| Mizuho Bank Ltd. Canada Branch | | | | |
| 6/1/22 | | 0.83 | 1,089,000,000 | 1,089,000,000 |
| Skandinaviska Enskilda Banken AB | | | | |
| 6/1/22 | | 0.82 | 41,000,000 | 41,000,000 |
| TOTAL NON-NEGOTIABLE TIME DEPOSIT | | | | |
| (Cost $3,495,900,000) | | | | 3,495,900,000 |
| U.S. Government Agency Repurchase Agreement - 1.6% | | | |
| | | Maturity Amount | Value |
| In a joint trading account at 0.8%, dated 5/31/22 due 6/1/22 (Collateralized by U.S. Government Obligations) # | | | |
| (Cost $587,047,000) | | $587,060,045 | $587,047,000 |
|
| U.S. Treasury Repurchase Agreement - 85.3% | | | |
| With: | | | |
| Federal Reserve Bank of New York at 0.8%, dated 5/31/22 due 6/1/22 (Collateralized by U.S. Treasury Obligations valued at $31,470,699,423, 0.13% - 1.63%, 3/31/23 - 5/15/31) | | 31,470,699,333 | 31,470,000,000 |
| SMBC Nikko Securities America, Inc. at 0.8%, dated 5/31/22 due 6/1/22 (Collateralized by U.S. Treasury Obligations valued at $613,538,874, 2.50% - 2.88%, 11/30/23 - 8/15/47) | | 600,013,333 | 600,000,000 |
| TOTAL U.S. TREASURY REPURCHASE AGREEMENT | | | |
| (Cost $32,070,000,000) | | | 32,070,000,000 |
|
| Other Repurchase Agreement - 0.9% | | | |
| Other Repurchase Agreement - 0.9% | | | |
| With: | | | |
| J.P. Morgan Securities, LLC at 1.22%, dated 5/31/22 due 7/5/22: | | | |
| (Collateralized by Corporate Obligations valued at $120,754,257, 0.50% - 7.75%, 9/21/23 - 09/24/80)(b)(c)(d) | | 115,241,628 | 115,000,000 |
| (Collateralized by Equity Securities valued at $219,247,430)(b)(c)(d) | | 203,426,526 | 203,000,000 |
| Wells Fargo Securities, LLC at 1.07%, dated 3/2/22 due 6/1/22 (Collateralized by Commercial Paper valued at $13,426,217, 6/1/22 - 9/13/22) | | 13,035,161 | 13,000,000 |
| TOTAL OTHER REPURCHASE AGREEMENT | | | |
| (Cost $331,000,000) | | | 331,000,000 |
| TOTAL INVESTMENT IN SECURITIES - 97.1% | | | |
| (Cost $36,483,947,000) | | | 36,483,947,000 |
| NET OTHER ASSETS (LIABILITIES) - 2.9% | | | 1,088,078,254 |
| NET ASSETS - 100% | | | $37,572,025,254 |
The date shown for securities represents the date when principal payments must be paid, taking into account any call options exercised by the issuer and any permissible maturity shortening features other than interest rate resets.
Legend
(a) Yield represents either the annualized yield at the date of purchase, or the stated coupon rate, or, for floating and adjustable rate securities, the rate at period end.
(b) Coupon rates for floating and adjustable rate securities reflect the rates in effect at period end.
(c) The maturity amount is based on the rate at period end.
(d) Coupon is indexed to a floating interest rate which may be multiplied by a specified factor and/or subject to caps or floors.
Investment Valuation
The following is a summary of the inputs used, as of May 31, 2022, involving the Fund's assets and liabilities carried at fair value. The inputs or methodology used for valuing securities may not be an indication of the risk associated with investing in those securities. For more information on valuation inputs, and their aggregation into the levels used below, please refer to the Investment Valuation section in the accompanying Notes to Financial Statements.
| | Valuation Inputs at Reporting Date: |
| Description | Total | Level 1 | Level 2 | Level 3 |
| Investments in Securities: | | | | |
| Non-Negotiable Time Deposit | $3,495,900,000 | $-- | $3,495,900,000 | $-- |
| U.S. Government Agency Repurchase Agreement | 587,047,000 | -- | 587,047,000 | -- |
| U.S. Treasury Repurchase Agreement | 32,070,000,000 | -- | 32,070,000,000 | -- |
| Other Repurchase Agreement | 331,000,000 | -- | 331,000,000 | -- |
| Total Investments in Securities: | $36,483,947,000 | $-- | $36,483,947,000 | $-- |
Other Information
# Additional information on each counterparty to the repurchase agreement is as follows:
| Repurchase Agreement / Counterparty | Value |
| $587,047,000 due 6/01/22 at 0.80% | |
| BofA Securities, Inc. | $30,455,000 |
| JP Morgan Securities LLC | 121,941,000 |
| Nomura Securities International | 19,808,000 |
| RBC Dominion Securities, Inc. | 414,843,000 |
| | $587,047,000 |
See accompanying notes which are an integral part of the financial statements.
Financial Statements
Statement of Assets and Liabilities
| | | May 31, 2022 |
| Assets | | |
Investment in securities, at value (including repurchase agreements of $32,988,047,000) — See accompanying schedule:
Unaffiliated issuers (cost $36,483,947,000) | | $36,483,947,000 |
| Cash | | 1,110,146,269 |
| Interest receivable | | 872,018 |
| Other receivables | | 99,238 |
| Total assets | | 37,595,064,525 |
| Liabilities | | |
| Distributions payable | $23,010,728 | |
| Other payables and accrued expenses | 28,543 | |
| Total liabilities | | 23,039,271 |
| Net Assets | | $37,572,025,254 |
| Net Assets consist of: | | |
| Paid in capital | | $37,571,987,251 |
| Total accumulated earnings (loss) | | 38,003 |
| Net Assets | | $37,572,025,254 |
| Net Asset Value, offering price and redemption price per share ($37,572,025,254 ÷ 37,568,430,182 shares) | | $1.0001 |
See accompanying notes which are an integral part of the financial statements.
Statement of Operations
| | | Year ended May 31, 2022 |
| Investment Income | | |
| Interest | | $56,591,072 |
| Expenses | | |
| Custodian fees and expenses | $132,870 | |
| Independent trustees' fees and expenses | 106,592 | |
| Total expenses before reductions | 239,462 | |
| Expense reductions | (12,023) | |
| Total expenses after reductions | | 227,439 |
| Net investment income (loss) | | 56,363,633 |
| Realized and Unrealized Gain (Loss) | | |
| Net realized gain (loss) on: | | |
| Investment securities: | | |
| Unaffiliated issuers | | 70,879 |
| Total net realized gain (loss) | | 70,879 |
| Change in net unrealized appreciation (depreciation) on investment securities | | (201,212) |
| Net increase in net assets resulting from operations | | $56,233,300 |
See accompanying notes which are an integral part of the financial statements.
Statement of Changes in Net Assets
| | Year ended May 31, 2022 | Year ended May 31, 2021 |
| Increase (Decrease) in Net Assets | | |
| Operations | | |
| Net investment income (loss) | $56,363,633 | $24,178,731 |
| Net realized gain (loss) | 70,879 | 21,320 |
| Change in net unrealized appreciation (depreciation) | (201,212) | 433,127 |
| Net increase in net assets resulting from operations | 56,233,300 | 24,633,178 |
| Distributions to shareholders | (56,363,661) | (24,166,775) |
| Affiliated share transactions | | |
| Proceeds from sales of shares | 310,889,056,981 | 264,639,666,567 |
| Cost of shares redeemed | (309,561,809,964) | (249,618,255,858) |
| Net increase (decrease) in net assets and shares resulting from share transactions | 1,327,247,017 | 15,021,410,709 |
| Total increase (decrease) in net assets | 1,327,116,656 | 15,021,877,112 |
| Net Assets | | |
| Beginning of period | 36,244,908,598 | 21,223,031,486 |
| End of period | $37,572,025,254 | $36,244,908,598 |
| Other Information | | |
| Shares | | |
| Sold | 310,857,971,184 | 264,613,205,246 |
| Redeemed | (309,530,856,879) | (249,593,296,528) |
| Net increase (decrease) | 1,327,114,305 | 15,019,908,718 |
See accompanying notes which are an integral part of the financial statements.
Financial Highlights
Fidelity Securities Lending Cash Central Fund
| | | | | | |
| Years ended May 31, | 2022 | 2021 | 2020 | 2019 | 2018 |
| Selected Per–Share Data | | | | | |
| Net asset value, beginning of period | $1.0001 | $1.0001 | $1.0002 | $1.0001 | $1.0001 |
| Income from Investment Operations | | | | | |
| Net investment income (loss)A | .0016 | .0009 | .0155 | .0223 | .0131 |
| Net realized and unrealized gain (loss) | –B | –B | (.0001) | .0001 | –B |
| Total from investment operations | .0016 | .0009 | .0154 | .0224 | .0131 |
| Distributions from net investment income | (.0016) | (.0009) | (.0155) | (.0223) | (.0131) |
| Total distributions | (.0016) | (.0009) | (.0155) | (.0223) | (.0131) |
| Net asset value, end of period | $1.0001 | $1.0001 | $1.0001 | $1.0002 | $1.0001 |
| Total ReturnC | .15% | .09% | 1.56% | 2.26% | 1.32% |
| Ratios to Average Net AssetsA,D,E | | | | | |
| Expenses before reductions | - %F | - %F | .01% | .01% | - %F |
| Expenses net of fee waivers, if any | - %F | - %F | .01% | .01% | - %F |
| Expenses net of all reductions | - %F | - %F | .01% | .01% | - %F |
| Net investment income (loss) | .16% | .09% | 1.57% | 2.22% | 1.31% |
| Supplemental Data | | | | | |
| Net assets, end of period (000 omitted) | $37,572,025 | $36,244,909 | $21,223,031 | $18,063,947 | $22,829,071 |
A Net investment income (loss) is affected by the timing of the declaration of dividends by any underlying mutual funds or exchange-traded funds (ETFs). Net investment income (loss) of any such underlying funds is not included in the Fund's net investment income (loss) ratio.
B Amount represents less than $.00005 per share.
C Total returns would have been lower if certain expenses had not been reduced during the applicable periods shown.
D Fees and expenses of any underlying mutual funds or exchange-traded funds (ETFs) are not included in the Fund's expense ratio. The Fund indirectly bears its proportionate share of these expenses.
E Expense ratios reflect operating expenses of the class. Expenses before reductions do not reflect amounts reimbursed, waived, or reduced through arrangements with the investment adviser, brokerage services, or other offset arrangements, if applicable, and do not represent the amount paid by the class during periods when reimbursements, waivers or reductions occur.
F Amount represents less than .005%.
See accompanying notes which are an integral part of the financial statements.
Notes to Financial Statements
For the period ended May 31, 2022
1. Organization.
Fidelity Securities Lending Cash Central Fund (the Fund) is a fund of Fidelity Revere Street Trust (the Trust) and is authorized to issue an unlimited number of shares. The Trust is registered under the Investment Company Act of 1940, as amended (the 1940 Act), as an open-end management investment company organized as a Delaware statutory trust. Shares of the Fund are only offered to other investment companies and accounts (the Investing Funds) managed by Fidelity Management & Research Company LLC (FMR), or its affiliates. The Fund has been designated an institutional money market fund, and the value of the Fund's shares are calculated to four decimal places that fluctuates based upon changes in the value of the Fund's investments.
2. Significant Accounting Policies.
The Fund is an investment company and applies the accounting and reporting guidance of the Financial Accounting Standards Board (FASB) Accounting Standards Codification Topic 946 Financial Services - Investment Companies. The financial statements have been prepared in conformity with accounting principles generally accepted in the United States of America (GAAP), which require management to make certain estimates and assumptions at the date of the financial statements. Actual results could differ from those estimates. Subsequent events, if any, through the date that the financial statements were issued have been evaluated in the preparation of the financial statements. The Fund's Schedule of Investments lists any underlying mutual funds or exchange-traded funds (ETFs) but does not include the underlying holdings of these funds. The following summarizes the significant accounting policies of the Fund:
Investment Valuation. Investments are valued as of 4:00 p.m. Eastern time on the last calendar day of the period. The Board of Trustees (the Board) has delegated the day to day responsibility for the valuation of the Fund's investments to the Fair Value Committee (the Committee) established by the Fund's investment adviser. In accordance with valuation policies and procedures approved by the Board, the Fund attempts to obtain prices from one or more third party pricing vendors or brokers to value its investments. When current market prices, quotations or currency exchange rates are not readily available or reliable, investments will be fair valued in good faith by the Committee, in accordance with procedures adopted by the Board. Factors used in determining fair value vary by investment type and may include market or investment specific events, changes in interest rates and credit quality. The frequency with which these procedures are used cannot be predicted and they may be utilized to a significant extent. The Committee oversees the Fund's valuation policies and procedures and reports to the Board on the Committee's activities and fair value determinations. The Board monitors the appropriateness of the procedures used in valuing the Fund's investments and ratifies the fair value determinations of the Committee.
The Fund categorizes the inputs to valuation techniques used to value its investments into a disclosure hierarchy consisting of three levels as shown below:
Level 1 – unadjusted quoted prices in active markets for identical investments
Level 2 – other significant observable inputs (including quoted prices for similar investments, interest rates, prepayment speeds, etc.)
Level 3 – unobservable inputs (including the Fund's own assumptions based on the best information available)
Valuation techniques used to value the Fund's investments by major category are as follows:
Debt securities, including restricted securities, are valued based on evaluated prices received from third party pricing vendors or from brokers who make markets in such securities. U.S. government and government agency obligations, certificates of deposit and other short-term securities are valued by pricing vendors who utilize matrix pricing which considers yield or price of bonds of comparable quality, coupon, maturity and type or by broker-supplied prices. When independent prices are unavailable or unreliable, debt securities may be valued utilizing pricing methodologies which consider similar factors that would be used by third party pricing vendors. Debt securities are generally categorized as Level 2 in the hierarchy but may be Level 3 depending on the circumstances.
Short-term securities with remaining maturities of sixty days or less may be valued at amortized cost, which approximates fair value, and are categorized as Level 2 in the hierarchy.
Securities held by a money market fund are generally high quality and liquid; however, they are reflected as Level 2 because the inputs used to determine fair value are not quoted prices in an active market.
The aggregate value of investments by input level as of May 31, 2022 is included at the end of the Fund's Schedule of Investments.
Investment Transactions and Income. Security transactions are accounted for as of trade date. Gains and losses on securities sold are determined on the basis of identified cost and include proceeds received from litigation. Interest income is accrued as earned and includes coupon interest and amortization of premium and accretion of discount on debt securities as applicable.
Expenses. Expenses directly attributable to a fund are charged to that fund. Expenses attributable to more than one fund are allocated among the respective funds on the basis of relative net assets or other appropriate methods. Expenses included in the accompanying financial statements reflect the expenses of that fund and do not include any expenses associated with any underlying mutual funds or exchange-traded funds. Although not included in a fund's expenses, a fund indirectly bears its proportionate share of these expenses through the net asset value of each underlying mutual fund or exchange-traded fund. Expense estimates are accrued in the period to which they relate and adjustments are made when actual amounts are known.
Income Tax Information and Distributions to Shareholders. Each year, the Fund intends to qualify as a regulated investment company under Subchapter M of the Internal Revenue Code, including distributing substantially all of its taxable income and realized gains. As a result, no provision for U.S. Federal income taxes is required. As of May 31, 2022, the Fund did not have any unrecognized tax benefits in the financial statements; nor is the Fund aware of any tax positions for which it is reasonably possible that the total amounts of unrecognized tax benefits will significantly change in the next twelve months. The Fund files a U.S. federal tax return, in addition to state and local tax returns as required. The Fund's federal income tax returns are subject to examination by the Internal Revenue Service (IRS) for a period of three fiscal years after they are filed. State and local tax returns may be subject to examination for an additional fiscal year depending on the jurisdiction.
Distributions are declared and recorded daily and paid monthly from net investment income. Distributions from realized gains, if any, are declared and recorded on the ex-dividend date. Income and capital gain distributions are determined in accordance with income tax regulations, which may differ from GAAP. In addition, the Fund claimed a portion of the payment made to redeeming shareholders as a distribution for income tax purposes.
Capital accounts within the financial statements are adjusted for permanent book-tax differences. These adjustments have no impact on net assets or the results of operations. Capital accounts are not adjusted for temporary book-tax differences which will reverse in a subsequent period.
As of period end, the cost and unrealized appreciation (depreciation) in securities for federal income tax purposes were as follows:
| Gross unrealized appreciation | $– |
| Gross unrealized depreciation | – |
| Net unrealized appreciation (depreciation) | $– |
| Tax Cost | $36,483,947,000 |
The tax-based components of distributable earnings as of period end were as follows:
| Undistributed ordinary income | $38,003 |
The tax character of distributions paid was as follows:
| | May 31, 2022 | May 31, 2021 |
| Ordinary Income | $56,363,661 | $ 24,166,775 |
Repurchase Agreements. Pursuant to an Exemptive Order issued by the Securities and Exchange Commission, funds and other registered investment companies having management contracts with Fidelity Management and Research Company LLC, or its affiliates are permitted to transfer uninvested cash balances into joint trading accounts which are then invested in repurchase agreements. Funds may also invest directly with institutions in repurchase agreements. Repurchase agreements may be collateralized by government or non-government securities. Upon settlement date, collateral is held in segregated accounts with custodian banks and may be obtained in the event of a default of the counterparty. The collateral balance is monitored on a daily basis to ensure it is at least equal to the principal amount of the repurchase agreement (including accrued interest). In the event of a default by the counterparty, realization of the collateral proceeds could be delayed, during which time the value of the collateral may decline.
3. Fees and Other Transactions with Affiliates.
Management Fee and Expense Contract. Fidelity Management & Research Company LLC (the investment adviser) provides the Fund with investment management services. The Fund does not pay any fees for these services. Pursuant to the Fund's management contract, the investment adviser receives a monthly management fee that represents a portion of the management fees it receives from the Investing Funds. In addition, under an expense contract, the investment adviser also pays all other expenses of the Fund, excluding custody fees, the compensation of the independent Trustees, and certain miscellaneous expenses such as proxy and shareholder meeting expenses.
Interfund Trades. Funds may purchase from or sell securities to other Fidelity Funds under procedures adopted by the Board. The procedures have been designed to ensure these interfund trades are executed in accordance with Rule 17a-7 of the 1940 Act. During the period there were no interfund trades.
4. Expense Reductions.
Through arrangements with the Fund's custodian, credits realized as a result of certain uninvested cash balances were used to reduce the Fund's expenses by $12,023.
5. Other.
A fund's organizational documents provide former and current trustees and officers with a limited indemnification against liabilities arising in connection with the performance of their duties to the fund. In the normal course of business, a fund may also enter into contracts that provide general indemnifications. A fund's maximum exposure under these arrangements is unknown as this would be dependent on future claims that may be made against a fund. The risk of material loss from such claims is considered remote.
At the end of the period, mutual funds and accounts managed by the investment adviser or its affiliates were the owners of record of all of the outstanding shares of the Fund.
6. Coronavirus (COVID-19) Pandemic.
An outbreak of COVID-19 first detected in China during December 2019 has since spread globally and was declared a pandemic by the World Health Organization during March 2020. Developments that disrupt global economies and financial markets, such as the COVID-19 pandemic, may magnify factors that affect the Fund's performance.
Report of Independent Registered Public Accounting Firm
To the Board of Trustees of Fidelity Revere Street Trust and Shareholders of Fidelity Securities Lending Cash Central Fund
Opinion on the Financial Statements
We have audited the accompanying statement of assets and liabilities, including the schedule of investments, of Fidelity Securities Lending Cash Central Fund (one of the funds constituting Fidelity Revere Street Trust, referred to hereafter as the “Fund”) as of May 31, 2022, the related statement of operations for the year ended May 31, 2022, the statement of changes in net assets for each of the two years in the period ended May 31, 2022, including the related notes, and the financial highlights for each of the five years in the period ended May 31, 2022 (collectively referred to as the “financial statements”). In our opinion, the financial statements present fairly, in all material respects, the financial position of the Fund as of May 31, 2022, the results of its operations for the year then ended, the changes in its net assets for each of the two years in the period ended May 31, 2022 and the financial highlights for each of the five years in the period ended May 31, 2022 in conformity with accounting principles generally accepted in the United States of America.
Basis for Opinion
These financial statements are the responsibility of the Fund’s management. Our responsibility is to express an opinion on the Fund’s financial statements based on our audits. We are a public accounting firm registered with the Public Company Accounting Oversight Board (United States) (PCAOB) and are required to be independent with respect to the Fund in accordance with the U.S. federal securities laws and the applicable rules and regulations of the Securities and Exchange Commission and the PCAOB.
We conducted our audits of these financial statements in accordance with the standards of the PCAOB. Those standards require that we plan and perform the audit to obtain reasonable assurance about whether the financial statements are free of material misstatement, whether due to error or fraud.
Our audits included performing procedures to assess the risks of material misstatement of the financial statements, whether due to error or fraud, and performing procedures that respond to those risks. Such procedures included examining, on a test basis, evidence regarding the amounts and disclosures in the financial statements. Our audits also included evaluating the accounting principles used and significant estimates made by management, as well as evaluating the overall presentation of the financial statements. Our procedures included confirmation of securities owned as of May 31, 2022 by correspondence with the custodian and brokers. We believe that our audits provide a reasonable basis for our opinion.
/s/ PricewaterhouseCoopers LLP
Boston, Massachusetts
July 14, 2022
We have served as the auditor of one or more investment companies in the Fidelity group of funds since 1932.
Trustees and Officers
The Trustees, Members of the Advisory Board (if any), and officers of the trust and fund, as applicable, are listed below. The Board of Trustees governs the fund and is responsible for protecting the interests of shareholders. The Trustees are experienced executives who meet periodically throughout the year to oversee the fund's activities, review contractual arrangements with companies that provide services to the fund, oversee management of the risks associated with such activities and contractual arrangements, and review the fund's performance. Each of the Trustees oversees 299 funds.
The Trustees hold office without limit in time except that (a) any Trustee may resign; (b) any Trustee may be removed by written instrument, signed by at least two-thirds of the number of Trustees prior to such removal; (c) any Trustee who requests to be retired or who has become incapacitated by illness or injury may be retired by written instrument signed by a majority of the other Trustees; and (d) any Trustee may be removed at any special meeting of shareholders by a two-thirds vote of the outstanding voting securities of the trust. Each Trustee who is not an interested person (as defined in the 1940 Act) of the trust and the fund is referred to herein as an Independent Trustee. Each Independent Trustee shall retire not later than the last day of the calendar year in which his or her 75th birthday occurs. The Independent Trustees may waive this mandatory retirement age policy with respect to individual Trustees. Officers and Advisory Board Members hold office without limit in time, except that any officer or Advisory Board Member may resign or may be removed by a vote of a majority of the Trustees at any regular meeting or any special meeting of the Trustees. Except as indicated, each individual has held the office shown or other offices in the same company for the past five years.
The fund’s Statement of Additional Information (SAI) includes more information about the Trustees. To request a free copy, call Fidelity at 1-800-544-8544.
Experience, Skills, Attributes, and Qualifications of the Trustees. The Governance and Nominating Committee has adopted a statement of policy that describes the experience, qualifications, attributes, and skills that are necessary and desirable for potential Independent Trustee candidates (Statement of Policy). The Board believes that each Trustee satisfied at the time he or she was initially elected or appointed a Trustee, and continues to satisfy, the standards contemplated by the Statement of Policy. The Governance and Nominating Committee also engages professional search firms to help identify potential Independent Trustee candidates who have the experience, qualifications, attributes, and skills consistent with the Statement of Policy. From time to time, additional criteria based on the composition and skills of the current Independent Trustees, as well as experience or skills that may be appropriate in light of future changes to board composition, business conditions, and regulatory or other developments, have also been considered by the professional search firms and the Governance and Nominating Committee. In addition, the Board takes into account the Trustees' commitment and participation in Board and committee meetings, as well as their leadership of standing and ad hoc committees throughout their tenure.
In determining that a particular Trustee was and continues to be qualified to serve as a Trustee, the Board has considered a variety of criteria, none of which, in isolation, was controlling. The Board believes that, collectively, the Trustees have balanced and diverse experience, qualifications, attributes, and skills, which allow the Board to operate effectively in governing the fund and protecting the interests of shareholders. Information about the specific experience, skills, attributes, and qualifications of each Trustee, which in each case led to the Board's conclusion that the Trustee should serve (or continue to serve) as a trustee of the fund, is provided below.
Board Structure and Oversight Function. Abigail P. Johnson is an interested person and currently serves as Chairman. The Trustees have determined that an interested Chairman is appropriate and benefits shareholders because an interested Chairman has a personal and professional stake in the quality and continuity of services provided to the fund. Independent Trustees exercise their informed business judgment to appoint an individual of their choosing to serve as Chairman, regardless of whether the Trustee happens to be independent or a member of management. The Independent Trustees have determined that they can act independently and effectively without having an Independent Trustee serve as Chairman and that a key structural component for assuring that they are in a position to do so is for the Independent Trustees to constitute a substantial majority for the Board. The Independent Trustees also regularly meet in executive session. Michael E. Kenneally serves as Chairman of the Independent Trustees and as such (i) acts as a liaison between the Independent Trustees and management with respect to matters important to the Independent Trustees and (ii) with management prepares agendas for Board meetings.
Fidelity® funds are overseen by different Boards of Trustees. The fund's Board oversees Fidelity's investment-grade bond, money market, asset allocation and certain equity funds, and other Boards oversee Fidelity's high income and other equity funds. The asset allocation funds may invest in Fidelity® funds that are overseen by such other Boards. The use of separate Boards, each with its own committee structure, allows the Trustees of each group of Fidelity® funds to focus on the unique issues of the funds they oversee, including common research, investment, and operational issues. On occasion, the separate Boards establish joint committees to address issues of overlapping consequences for the Fidelity® funds overseen by each Board.
The Trustees operate using a system of committees to facilitate the timely and efficient consideration of all matters of importance to the Trustees, the fund, and fund shareholders and to facilitate compliance with legal and regulatory requirements and oversight of the fund's activities and associated risks. The Board, acting through its committees, has charged FMR and its affiliates with (i) identifying events or circumstances the occurrence of which could have demonstrably adverse effects on the fund's business and/or reputation; (ii) implementing processes and controls to lessen the possibility that such events or circumstances occur or to mitigate the effects of such events or circumstances if they do occur; and (iii) creating and maintaining a system designed to evaluate continuously business and market conditions in order to facilitate the identification and implementation processes described in (i) and (ii) above. Because the day-to-day operations and activities of the fund are carried out by or through FMR, its affiliates, and other service providers, the fund's exposure to risks is mitigated but not eliminated by the processes overseen by the Trustees. While each of the Board's committees has responsibility for overseeing different aspects of the fund's activities, oversight is exercised primarily through the Operations and Audit Committees. In addition, an ad hoc Board committee of Independent Trustees has worked with FMR to enhance the Board's oversight of investment and financial risks, legal and regulatory risks, technology risks, and operational risks, including the development of additional risk reporting to the Board. The Operations Committee also worked and continues to work with FMR to enhance the stress tests required under SEC regulations for money market funds. Appropriate personnel, including but not limited to the fund's Chief Compliance Officer (CCO), FMR's internal auditor, the independent accountants, the fund's Treasurer and portfolio management personnel, make periodic reports to the Board's committees, as appropriate, including an annual review of Fidelity's risk management program for the Fidelity® funds. The responsibilities of each standing committee, including their oversight responsibilities, are described further under "Standing Committees of the Trustees."
Interested Trustees*:
Correspondence intended for a Trustee who is an interested person may be sent to Fidelity Investments, 245 Summer Street, Boston, Massachusetts 02210.
Name, Year of Birth; Principal Occupations and Other Relevant Experience+
Abigail P. Johnson (1961)
Year of Election or Appointment: 2009
Trustee
Chairman of the Board of Trustees
Ms. Johnson also serves as Trustee of other Fidelity® funds. Ms. Johnson serves as Chairman (2016-present), Chief Executive Officer (2014-present), and Director (2007-present) of FMR LLC (diversified financial services company), President of Fidelity Financial Services (2012-present) and President of Personal, Workplace and Institutional Services (2005-present). Ms. Johnson is Chairman and Director of Fidelity Management & Research Company LLC (investment adviser firm, 2011-present). Previously, Ms. Johnson served as Chairman and Director of FMR Co., Inc. (investment adviser firm, 2011-2019), Vice Chairman (2007-2016) and President (2013-2016) of FMR LLC, President and a Director of Fidelity Management & Research Company (2001-2005), a Trustee of other investment companies advised by Fidelity Management & Research Company, Fidelity Investments Money Management, Inc. (investment adviser firm), and FMR Co., Inc. (2001-2005), Senior Vice President of the Fidelity® funds (2001-2005), and managed a number of Fidelity® funds. Ms. Abigail P. Johnson and Mr. Arthur E. Johnson are not related.
Jennifer Toolin McAuliffe (1959)
Year of Election or Appointment: 2016
Trustee
Ms. McAuliffe also serves as Trustee of other Fidelity® funds and as Trustee of Fidelity Charitable (2020-present). Previously, Ms. McAuliffe served as Co-Head of Fixed Income of Fidelity Investments Limited (now known as FIL Limited (FIL)) (diversified financial services company), Director of Research for FIL’s credit and quantitative teams in London, Hong Kong and Tokyo and Director of Research for taxable and municipal bonds at Fidelity Investments Money Management, Inc. Ms. McAuliffe previously served as a member of the Advisory Board of certain Fidelity® funds (2016). Ms. McAuliffe was previously a lawyer at Ropes & Gray LLP and currently serves as director or trustee of several not-for-profit entities.
* Determined to be an “Interested Trustee” by virtue of, among other things, his or her affiliation with the trust or various entities under common control with FMR.
+ The information includes the Trustee's principal occupation during the last five years and other information relating to the experience, attributes, and skills relevant to the Trustee's qualifications to serve as a Trustee, which led to the conclusion that the Trustee should serve as a Trustee for the fund.
Independent Trustees:
Correspondence intended for an Independent Trustee may be sent to Fidelity Investments, P.O. Box 55235, Boston, Massachusetts 02205-5235.
Name, Year of Birth; Principal Occupations and Other Relevant Experience+
Elizabeth S. Acton (1951)
Year of Election or Appointment: 2013
Trustee
Ms. Acton also serves as Trustee of other Fidelity® funds. Prior to her retirement, Ms. Acton served as Executive Vice President, Finance (2011-2012), Executive Vice President, Chief Financial Officer (2002-2011) and Treasurer (2004-2005) of Comerica Incorporated (financial services). Prior to joining Comerica, Ms. Acton held a variety of positions at Ford Motor Company (1983-2002), including Vice President and Treasurer (2000-2002) and Executive Vice President and Chief Financial Officer of Ford Motor Credit Company (1998-2000). Ms. Acton currently serves as a member of the Board and Audit and Finance Committees of Beazer Homes USA, Inc. (homebuilding, 2012-present). Ms. Acton previously served as a member of the Advisory Board of certain Fidelity® funds (2013-2016).
Ann E. Dunwoody (1953)
Year of Election or Appointment: 2018
Trustee
General Dunwoody also serves as Trustee of other Fidelity® funds. General Dunwoody (United States Army, Retired) was the first woman in U.S. military history to achieve the rank of four-star general and prior to her retirement in 2012 held a variety of positions within the U.S. Army, including Commanding General, U.S. Army Material Command (2008-2012). General Dunwoody currently serves as President of First to Four LLC (leadership and mentoring services, 2012-present), a member of the Board and Nomination and Corporate Governance Committees of Kforce Inc. (professional staffing services, 2016-present) and a member of the Board of Automattic Inc. (software engineering, 2018-present). Previously, General Dunwoody served as a member of the Advisory Board and Nominating and Corporate Governance Committee of L3 Technologies, Inc. (communication, electronic, sensor and aerospace systems, 2013-2019) and a member of the Board and Audit and Sustainability and Corporate Responsibility Committees of Republic Services, Inc. (waste collection, disposal and recycling, 2013-2016). Ms. Dunwoody also serves on several boards for non-profit organizations, including as a member of the Board, Chair of the Nomination and Governance Committee and a member of the Audit Committee of Logistics Management Institute (consulting non-profit, 2012-present), a member of the Council of Trustees for the Association of the United States Army (advocacy non-profit, 2013-present), a member of the Board of Florida Institute of Technology (2015-present) and a member of the Board of ThanksUSA (military family education non-profit, 2014-present). General Dunwoody previously served as a member of the Advisory Board of certain Fidelity® funds (2018).
John Engler (1948)
Year of Election or Appointment: 2014
Trustee
Mr. Engler also serves as Trustee of other Fidelity® funds. Previously, Mr. Engler served as Governor of Michigan (1991-2003), President of the Business Roundtable (2011-2017) and interim President of Michigan State University (2018-2019). Mr. Engler currently serves as a member of the Board of Stride, Inc. (formerly K12 Inc.) (technology-based education company, 2012-present). Previously, Mr. Engler served as a member of the Board of Universal Forest Products (manufacturer and distributor of wood and wood-alternative products, 2003-2019) and Trustee of The Munder Funds (2003-2014). Mr. Engler previously served as a member of the Advisory Board of certain Fidelity® funds (2014-2016).
Robert F. Gartland (1951)
Year of Election or Appointment: 2010
Trustee
Mr. Gartland also serves as Trustee of other Fidelity® funds. Prior to his retirement, Mr. Gartland held a variety of positions at Morgan Stanley (financial services, 1979-2007), including Managing Director (1987-2007) and Chase Manhattan Bank (1975-1978). Mr. Gartland previously served as Chairman and an investor in Gartland & Mellina Group Corp. (consulting, 2009-2019), as a member of the Board of National Securities Clearing Corporation (1993-1996) and as Chairman of TradeWeb (2003-2004).
Arthur E. Johnson (1947)
Year of Election or Appointment: 2008
Trustee
Mr. Johnson also serves as Trustee of other Fidelity® funds. Prior to his retirement, Mr. Johnson served as Senior Vice President of Corporate Strategic Development of Lockheed Martin Corporation (defense contractor, 1999-2009). Mr. Johnson currently serves as a member of the Board of Booz Allen Hamilton (management consulting, 2011-present). Mr. Johnson previously served as a member of the Board of Eaton Corporation plc (diversified power management, 2009-2019) and a member of the Board of AGL Resources, Inc. (holding company, 2002-2016). Mr. Johnson previously served as Chairman (2018-2021) and Vice Chairman (2015-2018) of the Independent Trustees of certain Fidelity® funds. Mr. Arthur E. Johnson is not related to Ms. Abigail P. Johnson.
Michael E. Kenneally (1954)
Year of Election or Appointment: 2009
Trustee
Chairman of the Independent Trustees
Mr. Kenneally also serves as Trustee of other Fidelity® funds and was Vice Chairman (2018-2021) of the Independent Trustees of certain Fidelity® funds. Prior to retirement in 2005, he was Chairman and Global Chief Executive Officer of Credit Suisse Asset Management, the worldwide fund management and institutional investment business of Credit Suisse Group. Previously, Mr. Kenneally was an Executive Vice President and the Chief Investment Officer for Bank of America. In this role, he was responsible for the investment management, strategy and products delivered to the bank’s institutional, high-net-worth and retail clients. Earlier, Mr. Kenneally directed the organization’s equity and quantitative research groups. He began his career as a research analyst and then spent more than a dozen years as a portfolio manager for endowments, pension plans and mutual funds. He earned the Chartered Financial Analyst (CFA) designation in 1991.
Marie L. Knowles (1946)
Year of Election or Appointment: 2001
Trustee
Ms. Knowles also serves as Trustee of other Fidelity® funds. Prior to her retirement, Ms. Knowles held several positions at Atlantic Richfield Company (diversified energy), including Executive Vice President and Chief Financial Officer (1996-2000), Senior Vice President (1993-1996) and President of ARCO Transportation Company (pipeline and tanker operations, 1993-1996). Ms. Knowles currently serves as a member of the Board of the Santa Catalina Island Company (real estate, 2009-present), a member of the Investment Company Institute Board of Governors and a member of the Governing Council of the Independent Directors Council (2014-present). Ms. Knowles also serves as a member of the Advisory Board for the School of Engineering of the University of Southern California. Ms. Knowles previously served as a member of the Board of McKesson Corporation (healthcare service, 2002-2021). In addition, Ms. Knowles previously served as Chairman (2015-2018) and Vice Chairman (2012-2015) of the Independent Trustees of certain Fidelity® funds.
Mark A. Murray (1954)
Year of Election or Appointment: 2016
Trustee
Mr. Murray also serves as Trustee of other Fidelity® funds. Previously, Mr. Murray served as Co-Chief Executive Officer (2013-2016), President (2006-2013) and Vice Chairman (2013-2020) of Meijer, Inc. Mr. Murray serves as a member of the Board (2009-present) and Public Policy and Responsibility Committee (2009-present) and Chair of the Nuclear Review Committee (2019-present) of DTE Energy Company (diversified energy company). Mr. Murray previously served as a member of the Board of Spectrum Health (not-for-profit health system, 2015-2019) and as a member of the Board and Audit Committee and Chairman of the Nominating and Corporate Governance Committee of Universal Forest Products, Inc. (manufacturer and distributor of wood and wood-alternative products, 2004-2016). Mr. Murray also serves as a member of the Board of many community and professional organizations. Mr. Murray previously served as a member of the Advisory Board of certain Fidelity® funds (2016).
+ The information includes the Trustee's principal occupation during the last five years and other information relating to the experience, attributes, and skills relevant to the Trustee's qualifications to serve as a Trustee, which led to the conclusion that the Trustee should serve as a Trustee for the fund.
Advisory Board Members and Officers:
Correspondence intended for an officer may be sent to Fidelity Investments, 245 Summer Street, Boston, Massachusetts 02210. Officers appear below in alphabetical order.
Name, Year of Birth; Principal Occupation
Robert W. Helm (1957)
Year of Election or Appointment: 2021
Member of the Advisory Board
Mr. Helm also serves as a Member of the Advisory Board of other Fidelity® funds. Mr. Helm was formerly Deputy Chairman (2003-2020), partner (1991-2020) and an associate (1984-1991) of Dechert LLP (formerly Dechert Price & Rhoads). Mr. Helm currently serves on boards and committees of several not-for-profit organizations.
Craig S. Brown (1977)
Year of Election or Appointment: 2019
Assistant Treasurer
Mr. Brown also serves as an officer of other funds. Mr. Brown serves as Assistant Treasurer of FIMM, LLC (2021-present) and is an employee of Fidelity Investments (2013-present).
John J. Burke III (1964)
Year of Election or Appointment: 2018
Chief Financial Officer
Mr. Burke also serves as Chief Financial Officer of other funds. Mr. Burke serves as Head of Investment Operations for Fidelity Fund and Investment Operations (2018-present) and is an employee of Fidelity Investments (1998-present). Previously Mr. Burke served as head of Asset Management Investment Operations (2012-2018).
David J. Carter (1973)
Year of Election or Appointment: 2020
Assistant Secretary
Mr. Carter also serves as Assistant Secretary of other funds. Mr. Carter serves as Senior Vice President, Deputy General Counsel (2022-present) and is an employee of Fidelity Investments (2005-present).
Jonathan Davis (1968)
Year of Election or Appointment: 2010
Assistant Treasurer
Mr. Davis also serves as an officer of other funds. Mr. Davis serves as Assistant Treasurer of FIMM, LLC (2021-present), FMR Capital, Inc. (2017-present), FD Funds GP LLC (2021-present), FD Funds Holding LLC (2021-present), and FD Funds Management LLC (2021-present); and is an employee of Fidelity Investments. Previously, Mr. Davis served as Vice President and Associate General Counsel of FMR LLC (diversified financial services company, 2003-2010).
Laura M. Del Prato (1964)
Year of Election or Appointment: 2018
President and Treasurer
Ms. Del Prato also serves as an officer of other funds. Ms. Del Prato serves as Assistant Treasurer of FIMM, LLC (2021-present) and is an employee of Fidelity Investments (2017-present). Previously, Ms. Del Prato served as President and Treasurer of The North Carolina Capital Management Trust: Cash Portfolio and Term Portfolio (2018-2020). Prior to joining Fidelity Investments, Ms. Del Prato served as a Managing Director and Treasurer of the JPMorgan Mutual Funds (2014-2017). Prior to JPMorgan, Ms. Del Prato served as a partner at Cohen Fund Audit Services (accounting firm, 2012-2013) and KPMG LLP (accounting firm, 2004-2012).
Colm A. Hogan (1973)
Year of Election or Appointment: 2016
Assistant Treasurer
Mr. Hogan also serves as an officer of other funds. Mr. Hogan serves as Assistant Treasurer of FIMM, LLC (2021-present) and FMR Capital, Inc. (2017-present) and is an employee of Fidelity Investments (2005-present). Previously, Mr. Hogan served as Deputy Treasurer of certain Fidelity® funds (2016-2020) and Assistant Treasurer of certain Fidelity® funds (2016-2018).
Cynthia Lo Bessette (1969)
Year of Election or Appointment: 2019
Secretary and Chief Legal Officer (CLO)
Ms. Lo Bessette also serves as an officer of other funds. Ms. Lo Bessette serves as CLO, Secretary, and Senior Vice President of Fidelity Management & Research Company LLC (investment adviser firm, 2019-present); CLO of Fidelity Management & Research (Hong Kong) Limited, FMR Investment Management (UK) Limited, and Fidelity Management & Research (Japan) Limited (investment adviser firms, 2019-present); Secretary of FD Funds GP LLC (2021-present), FD Funds Holding LLC (2021-present), and FD Funds Management LLC (2021-present); and Assistant Secretary of FIMM, LLC (2019-present). She is a Senior Vice President and Deputy General Counsel of FMR LLC (diversified financial services company, 2019-present), and is an employee of Fidelity Investments. Previously, Ms. Lo Bessette served as CLO, Secretary, and Senior Vice President of FMR Co., Inc. (investment adviser firm, 2019); Secretary of Fidelity SelectCo, LLC and Fidelity Investments Money Management, Inc. (investment adviser firms, 2019). Prior to joining Fidelity Investments, Ms. Lo Bessette was Executive Vice President, General Counsel (2016-2019) and Senior Vice President, Deputy General Counsel (2015-2016) of OppenheimerFunds (investment management company) and Deputy Chief Legal Officer (2013-2015) of Jennison Associates LLC (investment adviser firm).
Chris Maher (1972)
Year of Election or Appointment: 2013
Assistant Treasurer
Mr. Maher also serves as an officer of other funds. Mr. Maher serves as Assistant Treasurer of FIMM, LLC (2021-present) and FMR Capital, Inc. (2017-present), and is an employee of Fidelity Investments (2008-present). Previously, Mr. Maher served as Assistant Treasurer of certain funds (2013-2020); Vice President of Asset Management Compliance (2013), Vice President of the Program Management Group of FMR (investment adviser firm, 2010-2013), and Vice President of Valuation Oversight (2008-2010).
Jamie Pagliocco (1964)
Year of Election or Appointment: 2020
Vice President
Mr. Pagliocco also serves as Vice President of other funds. Mr. Pagliocco serves as President of Fixed Income (2020-present), and is an employee of Fidelity Investments (2001-present). Previously, Mr. Pagliocco served as Co-Chief Investment Officer – Bond (2017-2020), Global Head of Bond Trading (2016-2019), and as a portfolio manager.
Kenneth B. Robins (1969)
Year of Election or Appointment: 2020
Chief Compliance Officer
Mr. Robins also serves as an officer of other funds. Mr. Robins serves as Compliance Officer of Fidelity Management & Research Company LLC (investment adviser firm, 2016-present) and is an employee of Fidelity Investments (2004-present). Previously, Mr. Robins served as Compliance Officer of FMR Co., Inc. (investment adviser firm, 2016-2019), as Executive Vice President of Fidelity Investments Money Management, Inc. (investment adviser firm, 2013-2016) and served in other fund officer roles.
Brett Segaloff (1972)
Year of Election or Appointment: 2021
Anti-Money Laundering (AML) Officer
Mr. Segaloff also serves as an AML Officer of other funds and other related entities. He is Director, Anti-Money Laundering (2007-present) of FMR LLC (diversified financial services company) and is an employee of Fidelity Investments (1996-present).
Stacie M. Smith (1974)
Year of Election or Appointment: 2013
Assistant Treasurer
Ms. Smith also serves as an officer of other funds. Ms. Smith serves as Assistant Treasurer of FIMM, LLC (2021-present) and FMR Capital, Inc. (2017-present), is an employee of Fidelity Investments (2009-present), and has served in other fund officer roles. Prior to joining Fidelity Investments, Ms. Smith served as Senior Audit Manager of Ernst & Young LLP (accounting firm, 1996-2009). Previously, Ms. Smith served as Assistant Treasurer (2013-2019) and Deputy Treasurer (2013-2016) of certain Fidelity® funds.
Jim Wegmann (1979)
Year of Election or Appointment: 2021
Deputy Treasurer
Mr. Wegmann also serves as an officer of other funds. Mr. Wegmann serves as Assistant Treasurer of FIMM, LLC (2021-present) and is an employee of Fidelity Investments (2011-present). Previously, Mr. Wegmann served as Assistant Treasurer of certain Fidelity® funds (2019-2021).
Shareholder Expense Example
As a shareholder, you incur two types of costs: (1) transaction costs, which may include sales charges (loads) on purchase payments or redemption proceeds, as applicable and (2) ongoing costs, which generally include management fees, distribution and/or service (12b-1) fees and other Fund expenses. This Example is intended to help you understand your ongoing costs (in dollars) of investing in a fund and to compare these costs with the ongoing costs of investing in other mutual funds.
The Example is based on an investment of $1,000 invested at the beginning of the period and held for the entire period (December 1, 2021 to May 31, 2022).
Actual Expenses
The first line of the accompanying table provides information about actual account values and actual expenses. You may use the information in this line, together with the amount you invested, to estimate the expenses that you paid over the period. Simply divide your account value by $1,000.00 (for example, an $8,600 account value divided by $1,000.00 = 8.6), then multiply the result by the number in the first line for a class/Fund under the heading entitled "Expenses Paid During Period" to estimate the expenses you paid on your account during this period. If any fund is a shareholder of any underlying mutual funds or exchange-traded funds (ETFs) (the Underlying Funds), such fund indirectly bears its proportional share of the expenses of the Underlying Funds in addition to the direct expenses incurred presented in the table. These fees and expenses are not included in the annualized expense ratio used to calculate the expense estimate in the table below.
Hypothetical Example for Comparison Purposes
The second line of the accompanying table provides information about hypothetical account values and hypothetical expenses based on the actual expense ratio and an assumed rate of return of 5% per year before expenses, which is not the actual return. The hypothetical account values and expenses may not be used to estimate the actual ending account balance or expenses you paid for the period. You may use this information to compare the ongoing costs of investing in the Fund and other funds. To do so, compare this 5% hypothetical example with the 5% hypothetical examples that appear in the shareholder reports of the other funds. If any fund is a shareholder of any Underlying Funds, such fund indirectly bears its proportional share of the expenses of the Underlying Funds in addition to the direct expenses as presented in the table. These fees and expenses are not included in the annualized expense ratio used to calculate the expense estimate in the table below.
Please note that the expenses shown in the table are meant to highlight your ongoing costs only and do not reflect any transaction costs. Therefore, the second line of the table is useful in comparing ongoing costs only, and will not help you determine the relative total costs of owning different funds. In addition, if these transactional costs were included, your costs would have been higher.
| | Annualized Expense Ratio-A | Beginning
Account Value
December 1, 2021 | Ending
Account Value
May 31, 2022 | Expenses Paid
During Period-B
December 1, 2021
to May 31, 2022 |
| Fidelity Securities Lending Cash Central Fund | .0006% | | | |
| Actual | | $1,000.00 | $1,001.20 | $--C |
| Hypothetical-D | | $1,000.00 | $1,024.93 | $--C |
A Annualized expense ratio reflects expenses net of applicable fee waivers.
B Expenses are equal to the annualized expense ratio, multiplied by the average account value over the period, multiplied by 182/ 365 (to reflect the one-half year period). The fees and expenses of any Underlying Funds are not included in each annualized expense ratio.
C Amount represents less than $.005.
D 5% return per year before expenses
Distributions (Unaudited)
The dividend and capital gains distributions for the fund(s) are available on Fidelity.com or Institutional.Fidelity.com.
A total of 3.61% of the dividends distributed during the fiscal year was derived from interest on U.S. Government securities which is generally exempt from state income tax.
The fund designates $19,442,955 of distributions paid in the calendar year 2021 as qualifying to be taxed as interest-related dividends for nonresident alien shareholders.
The fund designates $19,946,073 of distributions paid in the calendar year 2021 as qualifying to be taxed as section 163(j) interest dividends.
The fund will notify shareholders in January 2023 of amounts for use in preparing 2022 income tax returns.

CCC-ANN-0722
1.734009.123
Fidelity® Municipal Cash Central Fund
Annual Report
May 31, 2022
Contents
To view a fund's proxy voting guidelines and proxy voting record for the 12-month period ended June 30, visit http://www.fidelity.com/proxyvotingresults or visit the Securities and Exchange Commission's (SEC) web site at http://www.sec.gov.
You may also call 1-800-544-8544 to request a free copy of the proxy voting guidelines.
Standard & Poor's, S&P and S&P 500 are registered service marks of The McGraw-Hill Companies, Inc. and have been licensed for use by Fidelity Distributors Corporation.
Other third-party marks appearing herein are the property of their respective owners.
All other marks appearing herein are registered or unregistered trademarks or service marks of FMR LLC or an affiliated company. © 2022 FMR LLC. All rights reserved.
A fund files its complete schedule of portfolio holdings with the SEC for the first and third quarters of each fiscal year on Form N-PORT. Forms N-PORT are available on the SEC's web site at http://www.sec.gov. A fund's Forms N-PORT may be reviewed and copied at the SEC's Public Reference Room in Washington, DC. Information regarding the operation of the SEC's Public Reference Room may be obtained by calling 1-800-SEC-0330.
Early in 2020, the outbreak and spread of COVID-19 emerged as a public health emergency that had a major influence on financial markets, primarily based on its impact on the global economy and corporate earnings. On March 11, 2020, the World Health Organization declared the COVID-19 outbreak a pandemic, citing sustained risk of further global spread. The pandemic prompted a number of measures to limit the spread of COVID-19, including travel and border restrictions, quarantines, and restrictions on large gatherings. In turn, these resulted in lower consumer activity, diminished demand for a wide range of products and services, disruption in manufacturing and supply chains, and - given the wide variability in outcomes regarding the outbreak - significant market uncertainty and volatility. To help stem the turmoil, the U.S. government took unprecedented action - in concert with the U.S. Federal Reserve and central banks around the world - to help support consumers, businesses, and the broader economy, and to limit disruption to the financial system.
In general, the overall impact of the pandemic lessened in 2021, amid a resilient economy and widespread distribution of three COVID-19 vaccines granted emergency use authorization from the U.S. Food and Drug Administration (FDA) early in the year. Still, the situation remains dynamic, and the extent and duration of its influence on financial markets and the economy is highly uncertain, due in part to a recent spike in cases based on highly contagious variants of the coronavirus.
Extreme events such as the COVID-19 crisis are exogenous shocks that can have significant adverse effects on mutual funds and their investments. Although multiple asset classes may be affected by market disruption, the duration and impact may not be the same for all types of assets. Fidelity is committed to helping you stay informed amid news about COVID-19 and during increased market volatility, and we continue to take extra steps to be responsive to customer needs. We encourage you to visit us online, where we offer ongoing updates, commentary, and analysis on the markets and our funds.
| Effective Maturity Diversification (% of Fund's Investments) |
| Days |
| 1 - 7 | 99.7 | |
| 31 - 60 | 0.3 | |
| |
Effective maturity is determined in accordance with the requirements of Rule 2a-7 under the Investment Company Act of 1940.
Asset Allocation (% of Fund's net assets) |
|
Percentages shown as 0.0% may reflect amounts less than 0.05%. |
|
Showing Percentage of Net Assets
| Variable Rate Demand Note - 76.7% |
| | | Principal Amount (a) | Value ($) |
| Alabama - 3.1% | | | |
| Columbia Indl. Dev. Board Poll. Cont. Rev. (Alabama Pwr. Co. Proj.) Series 2014 A, 0.65% 6/1/22, VRDN (b) | | 10,710,000 | 10,710,000 |
| Mobile Indl. Dev. Board Rev.: | | | |
| (Alabama Pwr. Co. Proj.) Series 2001 B, 0.72% 6/1/22, VRDN (b)(c) | | 1,400,000 | 1,400,000 |
| (Alabama Pwr. Theodore Plant Proj.) Series A, 0.72% 6/1/22, VRDN (b)(c) | | 9,725,000 | 9,725,000 |
| Mobile Indl. Dev. Board Solid Waste Disp. Rev. (Alabama Pwr. Co. Barry Plant Proj.) Second Series 2009, 0.68% 6/1/22, VRDN (b) | | 3,600,000 | 3,600,000 |
| Walker County Econ. & Indl. Dev. Auth. Solid Waste Disp. Rev. (Alabama Pwr. Co. Plant Gorgas Proj.) Series 2007, 0.72% 6/1/22, VRDN (b)(c) | | 1,400,000 | 1,400,000 |
| West Jefferson Indl. Dev. Board Solid Waste Disp. Rev. (Alabama Pwr. Co. Miller Plant Proj.) Series 2008, 0.72% 6/1/22, VRDN (b)(c) | | 21,785,000 | 21,785,000 |
| Wilsonville Indl. Dev. Board Poll. Cont. Rev.: | | | |
| (Alabama Pwr. Co. Gaston Plant Proj.) Series 2008, 0.72% 6/1/22, VRDN (b)(c) | | 6,750,000 | 6,750,000 |
| (Alabama Pwr. Co. Proj.) Series D, 0.67% 6/1/22, VRDN (b) | | 2,200,000 | 2,200,000 |
TOTAL ALABAMA | | | 57,570,000 |
| Alaska - 0.3% | | | |
| Valdez Marine Term. Rev. (Phillips Trans. Alaska, Inc. Proj.) Series 1994 B, 0.81% 6/7/22 (ConocoPhillips Co. Guaranteed), VRDN (b) | | 5,400,000 | 5,400,000 |
| Arizona - 0.2% | | | |
| Arizona Health Facilities Auth. Rev. Series 2015 C, 0.62% 6/1/22, LOC Bank of America NA, VRDN (b) | | 1,855,000 | 1,855,000 |
| Maricopa County Poll. Cont. Rev. (Arizona Pub. Svc. Co. Palo Verde Proj.) Series 2009 A, 0.94% 6/7/22, VRDN (b) | | 1,100,000 | 1,100,000 |
TOTAL ARIZONA | | | 2,955,000 |
| California - 0.6% | | | |
| California Poll. Cont. Fing. Auth. Solid Waste Disp. Rev. (Recology, Inc. Proj.) Series 2018 A, 0.82% 6/7/22, LOC Wells Fargo Bank NA, VRDN (b)(c)(d) | | 4,390,000 | 4,390,000 |
| Los Angeles Dept. of Wtr. & Pwr. Wtrwks. Rev. Series 2001 B2, 0.52% 6/1/22 (Liquidity Facility UBS AG), VRDN (b) | | 6,800,000 | 6,800,000 |
TOTAL CALIFORNIA | | | 11,190,000 |
| Delaware - 1.0% | | | |
| Delaware Econ. Dev. Auth. Rev. (Delmarva Pwr. & Lt. Co. Proj.): | | | |
| Series 1994, 0.69% 6/1/22, VRDN (b)(c) | | 16,200,000 | 16,200,000 |
| Series 1999 B, 0.82% 6/7/22, VRDN (b)(c) | | 2,400,000 | 2,400,000 |
TOTAL DELAWARE | | | 18,600,000 |
| District Of Columbia - 0.3% | | | |
| Metropolitan Washington DC Arpts. Auth. Sys. Rev. Series 2011 A, 0.82% 6/7/22, LOC Sumitomo Mitsui Banking Corp., VRDN (b)(c) | | 5,000,000 | 5,000,000 |
| Florida - 4.9% | | | |
| Brevard County Hsg. Fin. Auth. (Manatee Cove Apts. Proj.) Series 2005, 0.86% 6/7/22, LOC Citibank NA, VRDN (b)(c) | | 5,565,000 | 5,565,000 |
| Broward County Indl. Dev. Rev. (Florida Pwr. & Lt. Co. Proj.): | | | |
| Series 2015, 0.74% 6/1/22, VRDN (b)(c) | | 28,935,000 | 28,935,000 |
| Series 2018 B, 0.74% 6/1/22, VRDN (b)(c) | | 19,440,000 | 19,440,000 |
| Collier County Hsg. Fin. Auth. Multi-family Rev. (Summer Lakes Phase II Apts. Proj.) Series 2005, 0.86% 6/7/22, LOC Citibank NA, VRDN (b)(c) | | 5,330,000 | 5,330,000 |
| Escambia County Poll. Cont. Rev. (Gulf Pwr. Co. Proj.) Series 1997, 0.71% 6/1/22, VRDN (b) | | 6,500,000 | 6,500,000 |
| Escambia County Solid Waste Disp. Rev. (Gulf Pwr. Co. Proj.) Series 2009, 0.71% 6/1/22, VRDN (b) | | 1,800,000 | 1,800,000 |
| Hillsborough County Hsg. Fin. Auth. Multi-family Rev. (Claymore Crossings Apt. Proj.) Series 2005, 0.86% 6/7/22, LOC Citibank NA, VRDN (b)(c) | | 9,635,000 | 9,635,000 |
| Lee County Indl. Dev. Auth. Rev. (Florida Pwr. & Lt. Co. Proj.) Series 2016 A, 0.74% 6/1/22, VRDN (b)(c) | | 3,100,000 | 3,100,000 |
| Miami-Dade County Indl. Dev. Auth. Rev. (Florida Pwr. & Lt. Co. Proj.) Series 2021, 0.71% 6/1/22, VRDN (b)(c) | | 10,900,000 | 10,900,000 |
TOTAL FLORIDA | | | 91,205,000 |
| Georgia - 3.4% | | | |
| Burke County Indl. Dev. Auth. Poll. Cont. Rev. (Georgia Pwr. Co. Plant Vogtle Proj.): | | | |
| Series 2012, 0.79% 6/1/22, VRDN (b)(c) | | 6,350,000 | 6,350,000 |
| Series 2018, 0.7% 6/1/22, VRDN (b) | | 3,750,000 | 3,750,000 |
| Floyd County Dev. Auth. Poll. Cont. Rev. (Georgia Pwr. Co. Plant Hammond Proj.) Series 2010, 0.78% 6/1/22, VRDN (b) | | 5,400,000 | 5,400,000 |
| Heard County Dev. Auth. Poll. Cont. Rev. Series 2007, 0.76% 6/1/22, VRDN (b)(c) | | 14,900,000 | 14,900,000 |
| Monroe County Dev. Auth. Poll. Cont. Rev. (Georgia Pwr. Co. Plant Scherer Proj.) Series 2008, 0.77% 6/1/22, VRDN (b) | | 6,900,000 | 6,900,000 |
| Monroe County Dev. Auth. Rev. (Florida Pwr. & Lt. Co. Proj.): | | | |
| Series 2017, 0.74% 6/1/22, VRDN (b)(c) | | 19,550,000 | 19,550,000 |
| Series 2019, 0.74% 6/1/22, VRDN (b)(c) | | 5,700,000 | 5,700,000 |
TOTAL GEORGIA | | | 62,550,000 |
| Illinois - 2.0% | | | |
| Chicago Midway Arpt. Rev. Series 2014 C, 0.82% 6/7/22, LOC Barclays Bank PLC, VRDN (b)(c) | | 4,300,000 | 4,300,000 |
| Chicago O'Hare Int'l. Arpt. Spl. Facilities Rev. (Lufthansa German Airlines Proj.) Series 2001, 0.93% 6/7/22, LOC Bayerische Landesbank, VRDN (b)(c) | | 6,000,000 | 6,000,000 |
| Illinois Fin. Auth. Rev. Series 2011 A, 0.57% 6/1/22, LOC Bank of America NA, VRDN (b) | | 5,500,000 | 5,500,000 |
| Will County Exempt Facilities Rev. (ExxonMobil Corp. Proj.) Series 2001, 0.62% 6/1/22 (Exxon Mobil Corp. Guaranteed), VRDN (b)(c) | | 20,600,000 | 20,600,000 |
TOTAL ILLINOIS | | | 36,400,000 |
| Indiana - 2.6% | | | |
| Hammond Swr. & Solid Waste Disp. Rev. (Cargill, Inc. Proj.) Series 2005, 0.86% 6/7/22, VRDN (b)(c) | | 39,000,000 | 39,000,000 |
| Indiana Dev. Fin. Auth. Envir. Rev. (Duke Energy Indiana, Inc. Proj.): | | | |
| Series 2009 A4, 0.68% 6/1/22, LOC Sumitomo Mitsui Banking Corp., VRDN (b) | | 5,700,000 | 5,700,000 |
| Series 2009 A5, 0.6% 6/1/22, LOC Sumitomo Mitsui Banking Corp., VRDN (b) | | 1,700,000 | 1,700,000 |
| Indiana Muni. Pwr. Agcy. Pwr. Supply Sys. Rev. Series B, 0.67% 6/1/22, LOC U.S. Bank NA, Cincinnati, VRDN (b) | | 2,000,000 | 2,000,000 |
TOTAL INDIANA | | | 48,400,000 |
| Iowa - 3.7% | | | |
| Iowa Fin. Auth. Econ. Dev. Rev.: | | | |
| Series 2009 A, 0.83% 6/7/22, VRDN (b) | | 4,000,000 | 4,000,000 |
| Series 2011 A, 0.83% 6/7/22, VRDN (b) | | 15,800,000 | 15,800,000 |
| Iowa Fin. Auth. Health Facilities Rev.: | | | |
| Series 2013 B1, 0.61% 6/1/22, LOC TD Banknorth, NA, VRDN (b) | | 8,485,000 | 8,485,000 |
| Series 2013 B2, 0.61% 6/1/22, LOC TD Banknorth, NA, VRDN (b) | | 2,285,000 | 2,285,000 |
| Iowa Fin. Auth. Solid Waste Facilities (MidAmerican Energy Co. Proj.) Series 2017, 0.91% 6/7/22, VRDN (b)(c) | | 35,330,000 | 35,330,000 |
| Iowa Higher Ed. Ln. Auth. Rev. (Loras College Proj.) Series 2000, 0.62% 6/1/22, LOC Bank of America NA, VRDN (b) | | 3,700,000 | 3,700,000 |
TOTAL IOWA | | | 69,600,000 |
| Kansas - 0.6% | | | |
| Burlington Envir. Impt. Rev. (Kansas City Pwr. and Lt. Co. Proj.): | | | |
| Series 2007 A, 1.02% 6/7/22, VRDN (b) | | 1,000,000 | 1,000,000 |
| Series 2007 B, 1.02% 6/7/22, VRDN (b) | | 600,000 | 600,000 |
| Kansas Dev. Fin. Auth. Health Facilities Rev. (KU Health Sys. Proj.) Series 2011 J, 0.62% 6/1/22, LOC U.S. Bank NA, Cincinnati, VRDN (b) | | 7,460,000 | 7,460,000 |
| St. Mary's Kansas Poll. Cont. Rev. (Kansas Gas and Elec. Co. Proj.) Series 1994, 0.96% 6/7/22, VRDN (b) | | 2,100,000 | 2,100,000 |
| Wamego Kansas Poll. Cont. Rfdg. Rev.: | | | |
| (Kansas Gas & Elec. Co. Proj.) Series 1994, 0.96% 6/7/22, VRDN (b) | | 200,000 | 200,000 |
| (Western Resources, Inc. Proj.) Series 1994, 0.96% 6/7/22, VRDN (b) | | 600,000 | 600,000 |
TOTAL KANSAS | | | 11,960,000 |
| Kentucky - 2.2% | | | |
| Daviess County Solid Waste Disp. Facilities Rev. (Scott Paper Co. Proj.) Series 1993 B, 0.92% 6/7/22 (Kimberly-Clark Corp. Guaranteed), VRDN (b)(c) | | 5,100,000 | 5,100,000 |
| Louisville Reg'l. Arpt. Auth. Series 2006 A, 0.67% 6/1/22, VRDN (b)(c) | | 23,200,000 | 23,200,000 |
| Meade County Indl. Bldg. Rev. (Nucor Steel Brandenburg Proj.): | | | |
| Series 2020 A1, 0.88% 6/1/22, VRDN (b)(c) | | 9,800,000 | 9,800,000 |
| Series 2020 B1, 0.88% 6/1/22, VRDN (b)(c) | | 3,500,000 | 3,500,000 |
TOTAL KENTUCKY | | | 41,600,000 |
| Louisiana - 3.8% | | | |
| East Baton Rouge Parish Indl. Dev. Board Rev. (ExxonMobil Proj.) Series 2010 A, 0.58% 6/1/22 (Exxon Mobil Corp. Guaranteed), VRDN (b) | | 2,700,000 | 2,700,000 |
| East Baton Rouge Parish Solid Waste Series 1998, 0.62% 6/1/22 (Exxon Mobil Corp. Guaranteed), VRDN (b)(c) | | 9,000,000 | 9,000,000 |
| Saint Charles Parish Poll. Cont. Rev.: | | | |
| (Shell Oil Co. Proj.) Series 1992 B, 0.65% 6/1/22, VRDN (b) | | 2,000,000 | 2,000,000 |
| (Shell Oil Co.-Norco Proj.) Series 1993, 0.68% 6/1/22, VRDN (b)(c) | | 14,100,000 | 14,100,000 |
| Series 1992 A, 0.68% 6/1/22, VRDN (b)(c) | | 25,400,000 | 25,400,000 |
| Saint James Parish Gen. Oblig. (Nucor Steel Louisiana LLC Proj.) Series 2010 B1, 0.97% 6/7/22, VRDN (b) | | 2,400,000 | 2,400,000 |
| St. Bernard Parish Exempt FAC Series 1996, 0.62% 6/1/22, VRDN (b)(c) | | 15,500,000 | 15,500,000 |
TOTAL LOUISIANA | | | 71,100,000 |
| Michigan - 0.9% | | | |
| Michigan Hsg. Dev. Auth. Rental Hsg. Rev.: | | | |
| Series 2000 A, 0.85% 6/7/22, LOC Barclays Bank PLC, VRDN (b)(c) | | 4,890,000 | 4,890,000 |
| Series 2002 A, 0.86% 6/7/22, LOC Bank of America NA, VRDN (b)(c) | | 3,200,000 | 3,200,000 |
| Series 2008 A, 0.85% 6/7/22, LOC Barclays Bank PLC, VRDN (b)(c) | | 2,400,000 | 2,400,000 |
| Michigan Strategic Fund Ltd. Oblig. Rev. (Henry Ford Museum & Greenfield Village Proj.) Series 2002, 0.67% 6/1/22, LOC Comerica Bank, VRDN (b) | | 6,890,000 | 6,890,000 |
TOTAL MICHIGAN | | | 17,380,000 |
| Minnesota - 0.7% | | | |
| Minneapolis Health Care Sys. Rev. (Fairview Health Svcs.) Series 2018 C, 0.58% 6/1/22, LOC Wells Fargo Bank NA, VRDN (b) | | 12,670,000 | 12,670,000 |
| Mississippi - 5.0% | | | |
| Jackson County Indl. Sewage Facilities Rev. (Chevron U.S.A., Inc. Proj.) Series 1994, 0.62% 6/1/22, VRDN (b)(c) | | 17,300,000 | 17,300,000 |
| Jackson County Poll. Cont. Rev. (Chevron U.S.A., Inc. Proj.) Series 1993 0.6% 6/1/22, VRDN (b) | | 2,780,000 | 2,780,000 |
| Jackson County Port Facilities Rev. (Chevron U.S.A., Inc. Proj.) Series 1993, 0.6% 6/1/22, VRDN (b) | | 9,005,000 | 9,005,000 |
| Mississippi Bus. Fin. Corp.: | | | |
| (Chevron U.S.A., Inc. Proj.): | | | |
Series 2007 A, 0.58% 6/1/22 (Chevron Corp. Guaranteed), VRDN (b) | | 18,500,000 | 18,500,000 |
Series 2007 C, 0.6% 6/1/22 (Chevron Corp. Guaranteed), VRDN (b) | | 11,800,000 | 11,800,000 |
Series 2007 D, 0.58% 6/1/22 (Chevron Corp. Guaranteed), VRDN (b) | | 22,320,000 | 22,320,000 |
Series 2011 E, 0.58% 6/1/22, VRDN (b) | | 3,300,000 | 3,300,000 |
| Series 2011 B, 0.6% 6/1/22, VRDN (b) | | 7,640,000 | 7,640,000 |
TOTAL MISSISSIPPI | | | 92,645,000 |
| Nevada - 1.9% | | | |
| Clark County Arpt. Rev.: | | | |
| Series 2008 C3, 0.85% 6/7/22, LOC Sumitomo Mitsui Banking Corp., VRDN (b)(c) | | 20,645,000 | 20,645,000 |
| Series 2008 D 2B, 0.8% 6/7/22, LOC Barclays Bank PLC, VRDN (b) | | 13,950,000 | 13,950,000 |
TOTAL NEVADA | | | 34,595,000 |
| New York - 15.8% | | | |
| New York City Gen. Oblig.: | | | |
| Series 2006 I4, 0.6% 6/1/22 (Liquidity Facility TD Banknorth, NA), VRDN (b) | | 1,900,000 | 1,900,000 |
| Series 2008 L4, 0.67% 6/1/22 (Liquidity Facility U.S. Bank NA, Cincinnati), VRDN (b) | | 8,735,000 | 8,735,000 |
| Series 2013 A2, 0.63% 6/1/22 (Liquidity Facility Mizuho Corporate Bank Ltd.), VRDN (b) | | 2,000,000 | 2,000,000 |
| Series 2013 F3, 0.57% 6/1/22 (Liquidity Facility Bank of America NA), VRDN (b) | | 13,600,000 | 13,600,000 |
| Series 2014 D4, 0.6% 6/1/22, LOC TD Banknorth, NA, VRDN (b) | | 18,865,000 | 18,865,000 |
| Series 2017 A-7, 0.64% 6/1/22 (Liquidity Facility Bank of The West San Francisco), VRDN (b) | | 15,590,000 | 15,590,000 |
| Series 2017 B-4 & B-5, 0.65% 6/1/22 (Liquidity Facility Barclays Bank PLC), VRDN (b) | | 4,000,000 | 4,000,000 |
| Series 2018 B, 0.65% 6/1/22 (Liquidity Facility Barclays Bank PLC), VRDN (b) | | 1,730,000 | 1,730,000 |
| Series 2018 E, 0.6% 6/1/22 (Liquidity Facility TD Banknorth, NA), VRDN (b) | | 4,775,000 | 4,775,000 |
| Series 2104 1, 0.62% 6/1/22 (Liquidity Facility JPMorgan Chase Bank), VRDN (b) | | 2,200,000 | 2,200,000 |
| New York City Muni. Wtr. Fin. Auth. Wtr. & Swr. Sys. Rev.: | | | |
| Series 2011 DD-1, 0.6% 6/1/22 (Liquidity Facility TD Banknorth, NA), VRDN (b) | | 5,660,000 | 5,660,000 |
| Series 2011 DD-3B, 0.67% 6/1/22 (Liquidity Facility State Street Bank & Trust Co., Boston), VRDN (b) | | 2,100,000 | 2,100,000 |
| Series 2014 AA: | | | |
0.6% 6/1/22 (Liquidity Facility TD Banknorth, NA), VRDN (b) | | 7,785,000 | 7,785,000 |
0.61% 6/1/22 (Liquidity Facility Mizuho Corporate Bank Ltd.), VRDN (b) | | 22,855,000 | 22,855,000 |
0.62% 6/1/22 (Liquidity Facility Mizuho Corporate Bank Ltd.), VRDN (b) | | 4,120,000 | 4,120,000 |
| Series 2015 BB, 0.64% 6/1/22 (Liquidity Facility Mizuho Corporate Bank Ltd.), VRDN (b) | | 5,600,000 | 5,600,000 |
| Series 2015 BB4, 0.65% 6/1/22 (Liquidity Facility Barclays Bank PLC), VRDN (b) | | 2,450,000 | 2,450,000 |
| Series 2017 BB: | | | |
0.58% 6/1/22 (Liquidity Facility State Street Bank & Trust Co., Boston), VRDN (b) | | 1,355,000 | 1,355,000 |
0.58% 6/1/22 (Liquidity Facility State Street Bank & Trust Co., Boston), VRDN (b) | | 8,610,000 | 8,610,000 |
| Series 2021 EE1, 0.67% 6/1/22 (Liquidity Facility U.S. Bank NA, Cincinnati), VRDN (b) | | 11,100,000 | 11,100,000 |
| New York City Transitional Fin. Auth. Rev.: | | | |
| Series 2003 A4, 0.6% 6/1/22 (Liquidity Facility TD Banknorth, NA), VRDN (b) | | 14,400,000 | 14,400,000 |
| Series 2015 A3, 0.63% 6/1/22 (Liquidity Facility Mizuho Corporate Bank Ltd.), VRDN (b) | | 10,280,000 | 10,280,000 |
| Series 2015 A4, 0.62% 6/1/22 (Liquidity Facility Mizuho Corporate Bank Ltd.), VRDN (b) | | 6,900,000 | 6,900,000 |
| Series B5, 0.67% 6/1/22 (Liquidity Facility U.S. Bank NA, Cincinnati), VRDN (b) | | 5,015,000 | 5,015,000 |
| New York Hsg. Fin. Agcy. Rev.: | | | |
| (350 West 43rd Street Hsg. Proj.): | | | |
Series 2001 A, 0.64% 6/1/22, LOC Landesbank Hessen-Thuringen, VRDN (b)(c) | | 13,285,000 | 13,285,000 |
Series 2002 A, 0.64% 6/1/22, LOC Landesbank Hessen-Thuringen, VRDN (b)(c) | | 49,650,000 | 49,650,000 |
| Series 2013 A, 0.62% 6/1/22, LOC Landesbank Hessen-Thuringen, VRDN (b) | | 5,000,000 | 5,000,000 |
| New York Metropolitan Trans. Auth. Dedicated Tax Fund Rev. Series A, 0.6% 6/1/22, LOC TD Banknorth, NA, VRDN (b) | | 17,440,000 | 17,440,000 |
| New York Metropolitan Trans. Auth. Rev.: | | | |
| Series 2005 D2, 0.67% 6/1/22, LOC Landesbank Hessen-Thuringen, VRDN (b) | | 21,000,000 | 21,000,000 |
| Series 2015 E1, 0.65% 6/1/22, LOC Barclays Bank PLC, VRDN (b) | | 2,750,000 | 2,750,000 |
| Series E3, 0.57% 6/1/22, LOC Bank of America NA, VRDN (b) | | 2,300,000 | 2,300,000 |
TOTAL NEW YORK | | | 293,050,000 |
| North Carolina - 1.4% | | | |
| Charlotte-Mecklenburg Hosp. Auth. Health Care Sys. Rev. Series 2007 E, 0.61% 6/1/22, LOC TD Banknorth, NA, VRDN (b) | | 23,760,000 | 23,760,000 |
| Hertford County Indl. Facilities Poll. Cont. Fing. Auth. (Nucor Corp. Proj.) Series 2000 A, 0.98% 6/7/22, VRDN (b)(c) | | 1,500,000 | 1,500,000 |
TOTAL NORTH CAROLINA | | | 25,260,000 |
| Ohio - 2.3% | | | |
| Allen County Hosp. Facilities Rev. (Catholic Healthcare Partners Proj.) Series 2010 C, 0.67% 6/1/22, LOC Bank of Montreal, VRDN (b) | | 24,435,000 | 24,435,000 |
| Ohio Higher Edl. Facility Commission Rev. (Cleveland Clinic Foundation Proj.) Series 2008 B4, 0.63% 6/1/22 (Liquidity Facility Barclays Bank PLC), VRDN (b) | | 18,575,000 | 18,575,000 |
TOTAL OHIO | | | 43,010,000 |
| Oregon - 1.0% | | | |
| Oregon Facilities Auth. Rev.: | | | |
| Series 2018 A, 0.67% 6/1/22, LOC U.S. Bank NA, Cincinnati, VRDN (b) | | 7,500,000 | 7,500,000 |
| Series 2018 B, 0.6% 6/1/22, LOC TD Banknorth, NA, VRDN (b) | | 9,490,000 | 9,490,000 |
| FHLMC Portland Multi-family Hsg. Rev. (The Village at Lovejoy Fountain Proj.) Series 2009, 0.88% 6/7/22, LOC Freddie Mac, VRDN (b)(c) | | 1,700,000 | 1,700,000 |
TOTAL OREGON | | | 18,690,000 |
| Pennsylvania - 1.3% | | | |
| Beaver County Indl. Dev. Auth. Series 2018 A, 0.87% 6/7/22, LOC Truist Bank, VRDN (b) | | 200,000 | 200,000 |
| Delaware County Indl. Dev. Auth. Arpt. Facilities Rev. (United Parcel Svc. Proj.) Series 2015, 0.7% 6/1/22, VRDN (b) | | 8,000,000 | 8,000,000 |
| Lancaster County Hosp. Auth. Health Ctr. Rev. (Masonic Homes Proj.) Series 2008 D, 0.6% 6/1/22, LOC JPMorgan Chase Bank, VRDN (b) | | 6,500,000 | 6,500,000 |
| Montgomery County Indl. Dev. Auth. Rev. (Foulkeways at Gwynedd Proj.) Series 2006 B, 0.88% 6/7/22, LOC Citizens Bank NA, VRDN (b) | | 9,330,000 | 9,330,000 |
TOTAL PENNSYLVANIA | | | 24,030,000 |
| South Carolina - 0.4% | | | |
| Berkeley County Indl. Dev. Rev. (Nucor Corp. Proj.): | | | |
| Series 1995, 1.03% 6/7/22, VRDN (b)(c) | | 100,000 | 100,000 |
| Series 1997, 1.03% 6/7/22, VRDN (b)(c) | | 2,700,000 | 2,700,000 |
| South Carolina Jobs-Econ. Dev. Auth. Indl. Rev. (South Carolina Generating Co., Inc. Proj.) Series 2008, 0.83% 6/7/22, LOC TD Banknorth, NA, VRDN (b)(c) | | 5,000,000 | 5,000,000 |
TOTAL SOUTH CAROLINA | | | 7,800,000 |
| Tennessee - 1.8% | | | |
| Blount County Pub. Bldg. Auth. Series D3A, 0.67% 6/1/22 (Liquidity Facility Bank of America NA), VRDN (b) | | 19,500,000 | 19,500,000 |
| Henderson TN IDB Rev. (Arvin Sango, Inc. Proj.) Series 2012, 0.82% 6/7/22, LOC Bank of Tokyo-Mitsubishi UFJ Ltd., VRDN (b)(c) | | 10,000,000 | 10,000,000 |
| Sevier County Pub. Bldg. Auth. Rev. Series V1 K1, 0.67% 6/1/22 (Liquidity Facility U.S. Bank NA, Cincinnati), VRDN (b) | | 4,400,000 | 4,400,000 |
TOTAL TENNESSEE | | | 33,900,000 |
| Texas - 10.1% | | | |
| Calhoun County Navigation District Envir. Facilities Rev. (Formosa Plastics Corp. Proj.) Series 2004, 0.82% 6/7/22, LOC Citibank NA, VRDN (b)(c) | | 8,600,000 | 8,600,000 |
| Calhoun County Solid Waste Disp. Rev. (Formosa Plastics Corp. Proj.): | | | |
| Series 2000, 0.77% 6/7/22, LOC JPMorgan Chase Bank, VRDN (b)(c) | | 10,600,000 | 10,600,000 |
| Series 2001, 0.77% 6/7/22, LOC JPMorgan Chase Bank, VRDN (b)(c) | | 25,000,000 | 25,000,000 |
| Calhoun Port Auth. Envir. Facilities Rev.: | | | |
| Series 2007 A, 0.84% 6/7/22, LOC PNC Bank NA, VRDN (b)(c) | | 10,930,000 | 10,930,000 |
| Series 2008, 0.84% 6/7/22, LOC Bank of America NA, VRDN (b)(c) | | 4,400,000 | 4,400,000 |
| Dallas/Fort Worth Int'l. Arpt. Facility Impt. Corp. Rev. (United Parcel Svc., Inc. Proj.) Series 2002, 0.75% 6/1/22, VRDN (b)(c) | | 13,000,000 | 13,000,000 |
| Gulf Coast Waste Disp. Auth. Envir. Facilities Rev.: | | | |
| (Exxon Mobil Proj.) Series 2002, 0.61% 6/1/22 (Exxon Mobil Corp. Guaranteed), VRDN (b)(c) | | 5,400,000 | 5,400,000 |
| Series 2001 A, 0.62% 6/1/22 (Exxon Mobil Corp. Guaranteed), VRDN (b)(c) | | 9,460,000 | 9,460,000 |
| Harris County Cultural Ed. Facilities Fin. Corp. Rev. Series 2020 B, 0.62% 6/1/22, VRDN (b) | | 6,050,000 | 6,050,000 |
| Harris County Health Facilities Dev. Corp. Rev. (Methodist Hosp. Proj.): | | | |
| Series 2008 A2, 0.62% 6/1/22, VRDN (b) | | 3,465,000 | 3,465,000 |
| Series A1, 0.62% 6/1/22, VRDN (b) | | 3,250,000 | 3,250,000 |
| Harris County Indl. Dev. Corp. Poll. Cont. Rev. (Exxon Proj.) Series 1987, 0.62% 6/1/22 (Exxon Mobil Corp. Guaranteed), VRDN (b)(c) | | 9,550,000 | 9,550,000 |
| Jewett Econ. Dev. Corp. Indl. Dev. Rev. (Nucor Corp. Proj.) Series 2003, 1.03% 6/7/22, VRDN (b)(c) | | 4,950,000 | 4,950,000 |
| Lower Neches Valley Auth. Indl. Dev. Corp. Exempt Facilities Rev.: | | | |
| (ExxonMobil Proj.): | | | |
Series 2001 B2, 0.62% 6/1/22 (Exxon Mobil Corp. Guaranteed), VRDN (b)(c) | | 13,625,000 | 13,625,000 |
Series 2008 B4, 0.62% 6/1/22 (Exxon Mobil Corp. Guaranteed), VRDN (b)(c) | | 2,985,000 | 2,985,000 |
| (Mobil Oil Corp. Proj.) Series 1999, 0.61% 6/1/22, VRDN (b)(c) | | 5,000,000 | 5,000,000 |
| (Onyx Envir. Svcs. Proj.) Series 2003, 0.86% 6/7/22, LOC Bank of America NA, VRDN (b)(c) | | 10,250,000 | 10,250,000 |
| Tarrant County Cultural Ed. Facilities Fin. Corp. Hosp. Rev. (Methodist Hospitals of Dallas Proj.) Series 2008, 0.61% 6/1/22, LOC TD Banknorth, NA, VRDN (b) | | 24,970,000 | 24,970,000 |
| Texas Gen. Oblig.: | | | |
| Series 2001 A2, 0.93% 6/7/22 (Liquidity Facility State Street Bank & Trust Co., Boston), VRDN (b)(c) | | 12,450,000 | 12,450,000 |
| Series 2006 D, 0.93% 6/7/22 (Liquidity Facility State Street Bank & Trust Co., Boston), VRDN (b)(c) | | 4,215,000 | 4,215,000 |
| Series 2007 B, 0.93% 6/7/22 (Liquidity Facility State Street Bank & Trust Co., Boston), VRDN (b)(c) | | 295,000 | 295,000 |
TOTAL TEXAS | | | 188,445,000 |
| Washington - 1.2% | | | |
| Port of Seattle Rev. Series 2008, 0.81% 6/7/22, LOC MUFG Bank Ltd., VRDN (b)(c) | | 22,600,000 | 22,600,000 |
| West Virginia - 0.6% | | | |
| West Virginia Econ. Dev. Auth. Solid Waste Disp. Facilities Rev.: | | | |
| (Appalachian Pwr. Co. Amos Proj.) Series 2008 B, 0.92% 6/7/22, VRDN (b)(c) | | 2,400,000 | 2,400,000 |
| (Appalachian Pwr. Co.- Mountaineer Proj.) Series 2008 A, 0.87% 6/7/22, VRDN (b)(c) | | 8,000,000 | 8,000,000 |
TOTAL WEST VIRGINIA | | | 10,400,000 |
| Wisconsin - 1.7% | | | |
| Green Bay Redev. Auth. (Green Bay Packaging, Inc. Proj.) Series 2019, 0.88% 6/7/22, LOC Wells Fargo Bank NA, VRDN (b)(c)(d) | | 18,500,000 | 18,500,000 |
| Wisconsin Health & Edl. Facilities Series 2018 A, 0.65% 6/1/22, LOC Barclays Bank PLC, VRDN (b) | | 12,850,000 | 12,850,000 |
TOTAL WISCONSIN | | | 31,350,000 |
| Wyoming - 1.9% | | | |
| Laramie County Indl. Dev. Rev. (Cheyenne Lt., Fuel & Pwr. Co. Proj.) Series 2009 A, 0.86% 6/7/22, LOC Wells Fargo Bank NA, VRDN (b)(c) | | 2,000,000 | 2,000,000 |
| Lincoln County Envir. (PacifiCorp Proj.) Series 1995, 0.83% 6/7/22, VRDN (b)(c) | | 9,000,000 | 9,000,000 |
| Lincoln County Poll. Cont. Rev. (PacifiCorp Proj.) Series 1994, 0.81% 6/7/22, VRDN (b) | | 3,130,000 | 3,130,000 |
| Sweetwater County Env Imp Rev. (Pacificorp Proj.) Series 1995, 0.74% 6/1/22, VRDN (b)(c) | | 20,300,000 | 20,300,000 |
TOTAL WYOMING | | | 34,430,000 |
| TOTAL VARIABLE RATE DEMAND NOTE (Cost $1,423,785,000) | | | 1,423,785,000 |
| | | | |
| Tender Option Bond - 23.1% |
| | | Principal Amount (a) | Value ($) |
| Alabama - 0.3% | | | |
| Infirmary Health Systems Spl. Care Facilities Fing. Auth. Rev. Participating VRDN Series 50 44, 0.65% 6/1/22 (Liquidity Facility JPMorgan Chase Bank) (b)(e)(f) | | 5,650,000 | 5,650,000 |
| Arizona - 0.2% | | | |
| Maricopa County Rev. Participating VRDN Series 2021 XG 03 12, 0.82% 6/7/22 (Liquidity Facility Royal Bank of Canada) (b)(e)(f) | | 1,280,000 | 1,280,000 |
| Phoenix Civic Impt. Board Arpt. Rev. Participating VRDN Series Floaters ZF 27 58, 0.89% 6/7/22 (Liquidity Facility Barclays Bank PLC) (b)(c)(e)(f) | | 1,725,000 | 1,725,000 |
TOTAL ARIZONA | | | 3,005,000 |
| California - 2.0% | | | |
| California Health Facilities Fing. Auth. Rev. Participating VRDN Series 17 04, 0.91% 7/12/22 (Liquidity Facility Barclays Bank PLC) (b)(e)(f) | | 100,000 | 100,000 |
| California State Univ. Rev. Participating VRDN Series Floaters XF 24 41, 0.82% 6/7/22 (Liquidity Facility JPMorgan Chase Bank) (b)(e)(f) | | 7,645,000 | 7,645,000 |
| Los Angeles Dept. Arpt. Rev. Participating VRDN: | | | |
| Series Floaters XF 27 24, 0.84% 6/7/22 (Liquidity Facility Morgan Stanley Bank, West Valley City Utah) (b)(c)(e)(f) | | 4,200,000 | 4,200,000 |
| Series Floaters XG 02 32, 0.83% 6/7/22 (Liquidity Facility Morgan Stanley Bank, West Valley City Utah) (b)(c)(e)(f) | | 4,025,000 | 4,025,000 |
| Series XL 01 61, 0.83% 6/7/22 (Liquidity Facility Morgan Stanley Bank, West Valley City Utah) (b)(c)(e)(f) | | 2,100,000 | 2,100,000 |
| Sacramento City Fing. Auth. Rev. Participating VRDN Series Floaters XG 01 00, 0.85% 6/7/22 (Liquidity Facility Deutsche Bank AG New York Branch) (b)(e)(f) | | 600,000 | 600,000 |
| San Diego County Reg'l. Arpt. Auth. Arpt. Rev. Participating VRDN Series XF 28 50, 0.83% (b)(c)(e)(f) | | 1,100,000 | 1,100,000 |
| San Francisco City & County Arpts. Commission Int'l. Arpt. Rev. Participating VRDN: | | | |
| Series XF 28 76, 0.83% 6/7/22 (Liquidity Facility Barclays Bank PLC) (b)(c)(e)(f) | | 7,695,000 | 7,695,000 |
| Series YX 11 31, 0.83% 6/7/22 (Liquidity Facility Barclays Bank PLC) (b)(c)(e)(f) | | 10,135,000 | 10,135,000 |
TOTAL CALIFORNIA | | | 37,600,000 |
| Colorado - 1.5% | | | |
| Children's Hosp. Assoc., Co. Participating VRDN Series 5008, 0.65% 6/1/22 (Liquidity Facility JPMorgan Chase Bank) (b)(e)(f) | | 7,750,000 | 7,750,000 |
| CommonSpirit Health Participating VRDN Series Floaters XF 10 01, 0.83% 6/7/22 (Liquidity Facility Barclays Bank PLC) (b)(e)(f) | | 3,800,000 | 3,800,000 |
| Denver City & County Arpt. Rev. Participating VRDN: | | | |
| Series Floaters XF 10 36, 0.85% 6/7/22 (Liquidity Facility Deutsche Bank AG New York Branch) (b)(e)(f) | | 7,400,000 | 7,400,000 |
| Series XG 03 73, 0.84% 6/7/22 (Liquidity Facility Barclays Bank PLC) (b)(c)(e)(f) | | 7,915,000 | 7,915,000 |
TOTAL COLORADO | | | 26,865,000 |
| Connecticut - 1.5% | | | |
| Connecticut Gen. Oblig. Participating VRDN: | | | |
| Series 2017, 0.83% 6/7/22 (Liquidity Facility Barclays Bank PLC) (b)(e)(f) | | 5,560,000 | 5,560,000 |
| Series Floaters 014, 0.91% 7/12/22 (Liquidity Facility Barclays Bank PLC) (b)(e)(f) | | 2,455,000 | 2,455,000 |
| Series Floaters XL 00 66, 0.83% 6/7/22 (Liquidity Facility Barclays Bank PLC) (b)(e)(f) | | 2,905,000 | 2,905,000 |
| Series YX 11 07, 0.83% 6/7/22 (Liquidity Facility Barclays Bank PLC) (b)(e)(f) | | 6,750,000 | 6,750,000 |
| Connecticut Spl. Tax Oblig. Trans. Infrastructure Rev. Participating VRDN Series Floaters YX 10 77, 0.83% 6/7/22 (Liquidity Facility Barclays Bank PLC) (b)(e)(f) | | 10,750,000 | 10,750,000 |
TOTAL CONNECTICUT | | | 28,420,000 |
| District Of Columbia - 0.5% | | | |
| District of Columbia Income Tax Rev. Participating VRDN Series XF 23 41, 0.83% 6/7/22 (Liquidity Facility Barclays Bank PLC) (b)(e)(f) | | 4,385,000 | 4,385,000 |
| Metropolitan Washington Arpts. Auth. Dulles Toll Road Rev. Participating VRDN Series XG 02 98, 0.83% 6/7/22 (Liquidity Facility Barclays Bank PLC) (b)(e)(f) | | 3,125,000 | 3,125,000 |
| Metropolitan Washington DC Arpts. Auth. Sys. Rev. Participating VRDN Series Floaters XF 06 94, 0.91% 6/7/22 (Liquidity Facility Bank of America NA) (b)(c)(e)(f) | | 1,065,000 | 1,065,000 |
TOTAL DISTRICT OF COLUMBIA | | | 8,575,000 |
| Florida - 3.6% | | | |
| Alachua County Health Facilities Auth. Health Facilities Rev. Participating VRDN Series XF 11 39, 0.87% 6/7/22 (Liquidity Facility Deutsche Bank AG New York Branch) (b)(e)(f) | | 800,000 | 800,000 |
| Broward County Arpt. Sys. Rev. Participating VRDN Series Floaters XL 00 88, 0.84% 6/7/22 (Liquidity Facility Barclays Bank PLC) (b)(c)(e)(f) | | 3,780,000 | 3,780,000 |
| Broward County Port Facilities Rev. Participating VRDN Series XF 09 52, 0.85% 6/7/22 (Liquidity Facility Toronto-Dominion Bank) (b)(c)(e)(f) | | 2,230,000 | 2,230,000 |
| Escambia County Health Facilities Auth. Health Facilities Rev. Participating VRDN Series XF 28 82, 0.83% 6/7/22 (Liquidity Facility Barclays Bank PLC) (b)(e)(f) | | 2,800,000 | 2,800,000 |
| Florida Higher Edl. Facilities Fing. Auth. Participating VRDN Series XF 29 22, 0.83% 6/7/22 (Liquidity Facility Barclays Bank PLC) (b)(e)(f) | | 3,230,000 | 3,230,000 |
| Fort Myers Util. Sys. Rev. Participating VRDN Series XF 08 13, 0.91% 6/7/22 (Liquidity Facility JPMorgan Chase Bank) (b)(e)(f) | | 400,000 | 400,000 |
| Gainesville Utils. Sys. Rev. Participating VRDN Series Solar 0061, 0.72% 6/1/22 (Liquidity Facility U.S. Bank NA, Cincinnati) (b)(e)(f) | | 12,400,000 | 12,400,000 |
| Greater Orlando Aviation Auth. Arpt. Facilities Rev. Participating VRDN: | | | |
| Series Floaters ZF 25 03, 0.83% 6/7/22 (Liquidity Facility Citibank NA) (b)(c)(e)(f) | | 3,750,000 | 3,750,000 |
| Series XF 28 77, 0.83% 6/7/22 (Liquidity Facility Barclays Bank PLC) (b)(c)(e)(f) | | 2,075,000 | 2,075,000 |
| Series XL 01 66, 0.84% 6/7/22 (Liquidity Facility JPMorgan Chase Bank) (b)(c)(e)(f) | | 1,500,000 | 1,500,000 |
| Series XM 08 90, 0.84% 6/7/22 (Liquidity Facility JPMorgan Chase Bank) (b)(c)(e)(f) | | 2,665,000 | 2,665,000 |
| Series XM 08 96, 0.84% 6/7/22 (Liquidity Facility JPMorgan Chase Bank) (b)(c)(e)(f) | | 1,000,000 | 1,000,000 |
| Lee County Arpt. Rev. Participating VRDN Series XF 11 26, 0.86% 6/7/22 (Liquidity Facility Deutsche Bank AG New York Branch) (b)(c)(e)(f) | | 600,000 | 600,000 |
| Miami-Dade County Participating VRDN Series XF 29 46, 0.87% 6/7/22 (Liquidity Facility Barclays Bank PLC) (b)(c)(e)(f) | | 800,000 | 800,000 |
| Miami-Dade County Expressway Auth. Participating VRDN Series XG 00 99, 0.85% 6/7/22 (Liquidity Facility Deutsche Bank AG New York Branch) (b)(e)(f) | | 100,000 | 100,000 |
| Miami-Dade County Wtr. & Swr. Rev. Participating VRDN Series 2021 XF 11 01, 0.85% 6/7/22 (Liquidity Facility Deutsche Bank AG New York Branch) (b)(e)(f) | | 3,360,000 | 3,360,000 |
| Palm Beach County Health Facilities Auth. Hosp. Rev. Participating VRDN Series XM 07 82, 0.86% 6/7/22 (Liquidity Facility Barclays Bank PLC) (b)(e)(f) | | 700,000 | 700,000 |
| South Miami Health Facilities Auth. Hosp. Rev. Participating VRDN Series XF 25 23, 0.86% 6/7/22 (Liquidity Facility Barclays Bank PLC) (b)(e)(f) | | 3,000,000 | 3,000,000 |
| Volusia County Fla Hosp. Rev. Participating VRDN Series 50 32, 0.65% 6/1/22 (Liquidity Facility JPMorgan Chase Bank) (b)(e)(f) | | 21,315,000 | 21,315,000 |
TOTAL FLORIDA | | | 66,505,000 |
| Hawaii - 0.2% | | | |
| Hawaii Arpts. Sys. Rev. Participating VRDN Series XX 12 17, 0.85% 6/7/22 (Liquidity Facility Barclays Bank PLC) (b)(c)(e)(f) | | 3,400,000 | 3,400,000 |
| Illinois - 1.2% | | | |
| Chicago Gen. Oblig. Participating VRDN: | | | |
| Series E 151, 0.83% 6/7/22 (Liquidity Facility Royal Bank of Canada) (b)(e)(f) | | 4,425,000 | 4,425,000 |
| Series XM 10 05, 0.94% 6/7/22 (Liquidity Facility Deutsche Bank AG New York Branch) (b)(e)(f) | | 600,000 | 600,000 |
| Cook County Ill Sales Tax Rev. Participating VRDN Series Floaters XF 25 01, 0.85% 6/7/22 (Liquidity Facility Deutsche Bank AG New York Branch) (b)(e)(f) | | 4,800,000 | 4,800,000 |
| Illinois Fin. Auth. Rev. Participating VRDN Series Floaters 017, 0.91% 7/12/22 (Liquidity Facility Barclays Bank PLC) (b)(e)(f) | | 1,870,000 | 1,870,000 |
| Illinois Gen. Oblig. Participating VRDN: | | | |
| Series Floaters XX 10 81, 0.83% 6/7/22 (Liquidity Facility Barclays Bank PLC) (b)(e)(f) | | 600,000 | 600,000 |
| Series XF 10 10, 0.83% 6/7/22 (Liquidity Facility Barclays Bank PLC) (b)(e)(f) | | 900,000 | 900,000 |
| Series XM 07 59, 0.84% 6/7/22 (Liquidity Facility Bank of America NA) (b)(e)(f) | | 775,000 | 775,000 |
| Series XX 11 41, 0.83% 6/7/22 (Liquidity Facility Barclays Bank PLC) (b)(e)(f) | | 300,000 | 300,000 |
| Series YX 11 50, 0.83% 6/7/22 (Liquidity Facility Barclays Bank PLC) (b)(e)(f) | | 2,300,000 | 2,300,000 |
| Illinois Toll Hwy. Auth. Toll Hwy. Rev. Participating VRDN Series 2022 XF 12 88, 0.85% 6/7/22 (Liquidity Facility JPMorgan Chase Bank) (b)(e)(f) | | 3,600,000 | 3,600,000 |
| Portofino Landings Cmnty. Dev. D Participating VRDN Series XM 09 38, 0.84% 6/7/22 (Liquidity Facility Bank of America NA) (b)(e)(f) | | 1,700,000 | 1,700,000 |
TOTAL ILLINOIS | | | 21,870,000 |
| Indiana - 0.3% | | | |
| Hamilton County Healthcare Facilities Rev. Participating VRDN Series XF 10 26, 0.85% 6/7/22 (Liquidity Facility Deutsche Bank AG New York Branch) (b)(e)(f) | | 5,950,000 | 5,950,000 |
| Iowa - 0.0% | | | |
| Iowa Fin. Auth. Health Facilities Rev. Participating VRDN Series ZF 26 26, 0.83% 6/7/22 (Liquidity Facility Morgan Stanley Bank, West Valley City Utah) (b)(e)(f) | | 600,000 | 600,000 |
| Kentucky - 0.2% | | | |
| CommonSpirit Health Participating VRDN Series MIZ 90 21, 0.91% 6/7/22 (Liquidity Facility Mizuho Cap. Markets LLC) (b)(e)(f) | | 900,000 | 900,000 |
| Kentucky Econ. Dev. Fin. Auth. Participating VRDN Series Floaters XF 24 85, 0.84% 6/7/22 (Liquidity Facility Barclays Bank PLC) (b)(e)(f) | | 2,400,000 | 2,400,000 |
TOTAL KENTUCKY | | | 3,300,000 |
| Louisiana - 0.1% | | | |
| New Orleans Aviation Board Rev. Participating VRDN Series Floaters XL 00 46, 0.84% 6/7/22 (Liquidity Facility Barclays Bank PLC) (b)(c)(e)(f) | | 1,800,000 | 1,800,000 |
| Maryland - 0.4% | | | |
| Baltimore Proj. Rev. Participating VRDN Series ZF 09 41, 0.82% 6/7/22 (Liquidity Facility JPMorgan Chase Bank) (b)(e)(f) | | 2,935,000 | 2,935,000 |
| Maryland Health & Higher Edl. Facilities Auth. Rev. Participating VRDN Series XF 10 21, 0.85% 6/7/22 (Liquidity Facility Deutsche Bank AG New York Branch) (b)(e)(f) | | 4,070,000 | 4,070,000 |
TOTAL MARYLAND | | | 7,005,000 |
| Michigan - 1.1% | | | |
| Eastern Michigan Univ. Revs. Participating VRDN Series Floaters 009, 0.83% 6/7/22 (Liquidity Facility Barclays Bank PLC) (b)(e)(f) | | 19,600,000 | 19,600,000 |
| Grand Traverse County Hosp. Fin. Auth. Participating VRDN Series 2021 XG 03 19, 0.87% 6/7/22 (Liquidity Facility Barclays Bank PLC) (b)(e)(f) | | 305,000 | 305,000 |
| Michigan Fin. Auth. Rev. Participating VRDN: | | | |
| Series Floaters ZF 07 96, 0.89% 6/7/22 (Liquidity Facility JPMorgan Chase Bank) (b)(e)(f) | | 595,000 | 595,000 |
| Series Floaters ZF 28 25, 0.87% 6/7/22 (Liquidity Facility Barclays Bank PLC) (b)(e)(f) | | 195,000 | 195,000 |
| Monroe Mich Pub. Schools Participating VRDN Series XL 01 46, 0.91% 6/7/22 (Liquidity Facility JPMorgan Chase Bank) (b)(e)(f) | | 565,000 | 565,000 |
TOTAL MICHIGAN | | | 21,260,000 |
| Missouri - 1.4% | | | |
| Kansas City Indl. Dev. Auth. Participating VRDN Series YX 11 59, 0.84% 6/7/22 (Liquidity Facility Barclays Bank PLC) (b)(c)(e)(f) | | 800,000 | 800,000 |
| Kansas City Spl. Oblig. Participating VRDN Series YX 11 93, 0.83% 6/7/22 (Liquidity Facility Barclays Bank PLC) (b)(e)(f) | | 1,200,000 | 1,200,000 |
| Missouri Health & Edl. Facilities Rev. Participating VRDN Series Floaters 14, 0.83% 6/7/22 (Liquidity Facility Barclays Bank PLC) (b)(e)(f) | | 24,000,000 | 24,000,000 |
TOTAL MISSOURI | | | 26,000,000 |
| Nebraska - 0.1% | | | |
| Omaha Pub. Pwr. District Elec. Rev. Participating VRDN Series 16 XF1053, 0.85% 6/7/22 (Liquidity Facility Deutsche Bank AG New York Branch) (b)(e)(f) | | 2,200,000 | 2,200,000 |
| Nevada - 0.1% | | | |
| Las Vegas Convention & Visitors Auth. Participating VRDN: | | | |
| Series XF 28 06, 0.83% 6/7/22 (Liquidity Facility Barclays Bank PLC) (b)(e)(f) | | 700,000 | 700,000 |
| Series XG 03 56, 0.82% 6/7/22 (Liquidity Facility Royal Bank of Canada) (b)(e)(f) | | 1,600,000 | 1,600,000 |
TOTAL NEVADA | | | 2,300,000 |
| New Jersey - 0.1% | | | |
| New Jersey Trans. Trust Fund Auth. Participating VRDN Series Floaters XG 02 24, 0.82% 6/7/22 (Liquidity Facility Bank of America NA) (b)(e)(f) | | 2,500,000 | 2,500,000 |
| New Mexico - 0.1% | | | |
| New Mexico Mtg. Fin. Auth. Participating VRDN Series YX 11 89, 0.84% 6/7/22 (Liquidity Facility Barclays Bank PLC) (b)(e)(f) | | 1,000,000 | 1,000,000 |
| New York - 0.6% | | | |
| New York City Muni. Wtr. Fin. Auth. Wtr. & Swr. Sys. Rev. Participating VRDN: | | | |
| Series Floaters 2018 E124, 0.67% 6/1/22 (Liquidity Facility Royal Bank of Canada) (b)(e)(f) | | 3,000,000 | 3,000,000 |
| Series Floaters 2018 E125, 0.67% 6/1/22 (Liquidity Facility Royal Bank of Canada) (b)(e)(f) | | 1,325,000 | 1,325,000 |
| New York Metropolitan Trans. Auth. Rev. Participating VRDN: | | | |
| Series RBC E 126, 0.84% 6/7/22 (Liquidity Facility Royal Bank of Canada) (b)(e)(f) | | 1,100,000 | 1,100,000 |
| Series XF 28 68, 0.83% 6/7/22 (Liquidity Facility Barclays Bank PLC) (b)(e)(f) | | 4,805,000 | 4,805,000 |
| Triborough Bridge & Tunnel Auth. Revs. Participating VRDN Series 2022 XF 12 80, 0.82% 6/7/22 (Liquidity Facility JPMorgan Chase Bank) (b)(e)(f) | | 1,340,000 | 1,340,000 |
TOTAL NEW YORK | | | 11,570,000 |
| New York And New Jersey - 0.5% | | | |
| Port Auth. of New York & New Jersey Participating VRDN: | | | |
| Series Floaters XM 06 16, 0.87% 6/7/22 (Liquidity Facility Barclays Bank PLC) (b)(c)(e)(f) | | 2,000,000 | 2,000,000 |
| Series ROC 14086, 0.84% 6/7/22 (Liquidity Facility Citibank NA) (b)(c)(e)(f) | | 2,050,000 | 2,050,000 |
| Series XF 09 38, 0.86% 6/7/22 (Liquidity Facility JPMorgan Chase Bank) (b)(c)(e)(f)(g) | | 4,945,000 | 4,945,000 |
| Series ZL 02 55, 0.89% 6/7/22 (Liquidity Facility Bank of America NA) (b)(c)(e)(f) | | 470,000 | 470,000 |
TOTAL NEW YORK AND NEW JERSEY | | | 9,465,000 |
| Non-State Specific - 0.2% | | | |
| Monroeville Fin. Auth. UPMC Rev. Participating VRDN Series YX 11 85, 0.83% 6/7/22 (Liquidity Facility Barclays Bank PLC) (b)(e)(f) | | 3,500,000 | 3,500,000 |
| North Carolina - 0.1% | | | |
| Charlotte Int'l. Arpt. Rev. Participating VRDN Series 2021 XF 29 38, 0.84% 6/7/22 (Liquidity Facility Barclays Bank PLC) (b)(c)(e)(f) | | 1,800,000 | 1,800,000 |
| North Dakota - 0.1% | | | |
| Grand Forks Health Care Sys. Rev. Participating VRDN Series XL 02 45, 0.85% 6/7/22 (Liquidity Facility Deutsche Bank AG New York Branch) (b)(e)(f) | | 800,000 | 800,000 |
| Univ. of North Dakota Participating VRDN Series XG 03 36, 0.83% 6/7/22 (Liquidity Facility Toronto-Dominion Bank) (b)(e)(f) | | 1,280,000 | 1,280,000 |
TOTAL NORTH DAKOTA | | | 2,080,000 |
| Ohio - 0.7% | | | |
| Cuyahoga County Ctfs. of Prtn. Participating VRDN Series Floaters XG 02 06, 0.89% 6/7/22 (Liquidity Facility Bank of America NA) (b)(e)(f) | | 100,000 | 100,000 |
| Middletown Hosp. Facilities Rev. Participating VRDN Series Floaters 003, 0.91% 7/12/22 (Liquidity Facility Barclays Bank PLC) (b)(e)(f) | | 985,000 | 985,000 |
| Montgomery County Hosp. Rev. Participating VRDN: | | | |
| Series Floaters E 132, 0.82% 6/7/22 (Liquidity Facility Royal Bank of Canada) (b)(e)(f) | | 7,885,000 | 7,885,000 |
| Series XX 11 33, 0.83% 6/7/22 (Liquidity Facility Barclays Bank PLC) (b)(e)(f) | | 2,700,000 | 2,700,000 |
| Ohio Hosp. Rev. Participating VRDN Series 002, 0.91% 7/12/22 (Liquidity Facility Barclays Bank PLC) (b)(e)(f) | | 700,000 | 700,000 |
TOTAL OHIO | | | 12,370,000 |
| Oregon - 0.2% | | | |
| Port of Portland Arpt. Rev. Participating VRDN Series XM 09 73, 0.86% 6/7/22 (Liquidity Facility Royal Bank of Canada) (b)(c)(e)(f) | | 2,360,000 | 2,360,000 |
| Salem Hosp. Facility Auth. Rev. Participating VRDN Series ZF 09 42, 0.94% 6/7/22 (Liquidity Facility JPMorgan Chase Bank) (b)(e)(f) | | 1,600,000 | 1,600,000 |
TOTAL OREGON | | | 3,960,000 |
| Pennsylvania - 1.8% | | | |
| Commonwealth Fing. Auth. Tobacco Participating VRDN Series XX 10 80, 0.83% 6/7/22 (Liquidity Facility Barclays Bank PLC) (b)(e)(f) | | 4,530,000 | 4,530,000 |
| Pennsylvania Tpk. Commission Registration Fee Rev. Participating VRDN: | | | |
| Series Putters 5024, 0.65% 6/1/22 (Liquidity Facility JPMorgan Chase Bank) (b)(e)(f) | | 10,295,000 | 10,295,000 |
| Series Putters 5025, 0.65% 6/1/22 (Liquidity Facility JPMorgan Chase Bank) (b)(e)(f) | | 18,900,000 | 18,900,000 |
TOTAL PENNSYLVANIA | | | 33,725,000 |
| South Carolina - 0.3% | | | |
| South Carolina Jobs-Econ. Dev. Auth. Hosp. Impt. Rev. Participating VRDN Series XF 09 30, 0.94% 6/7/22 (Liquidity Facility JPMorgan Chase Bank) (b)(e)(f) | | 600,000 | 600,000 |
| South Carolina Pub. Svc. Auth. Rev. Participating VRDN Series Floaters XG 02 09, 0.83% 6/7/22 (Liquidity Facility Toronto-Dominion Bank) (b)(e)(f) | | 5,625,000 | 5,625,000 |
TOTAL SOUTH CAROLINA | | | 6,225,000 |
| Tennessee - 0.1% | | | |
| Metropolitan Nashville Arpt. Auth. Rev. Participating VRDN: | | | |
| Series 2021 XL 01 89, 0.86% 6/7/22 (Liquidity Facility Deutsche Bank AG New York Branch) (b)(c)(e)(f) | | 570,000 | 570,000 |
| Series YX 11 39, 0.84% 6/7/22 (Liquidity Facility Barclays Bank PLC) (b)(c)(e)(f) | | 695,000 | 695,000 |
TOTAL TENNESSEE | | | 1,265,000 |
| Texas - 1.8% | | | |
| Austin Arpt. Sys. Rev. Participating VRDN Series YX 11 99, 0.84% 6/7/22 (Liquidity Facility Barclays Bank PLC) (b)(c)(e)(f) | | 2,400,000 | 2,400,000 |
| Harris County Cultural Ed. Facilities Fin. Corp. Rev. Participating VRDN Series Putters 50 43, 0.65% 6/1/22 (Liquidity Facility JPMorgan Chase Bank) (b)(e)(f) | | 24,000,000 | 24,000,000 |
| North Ft. Bend Wtr. Auth. Participating VRDN Series XF 08 16, 0.89% 6/7/22 (Liquidity Facility JPMorgan Chase Bank) (b)(e)(f) | | 2,000,000 | 2,000,000 |
| Parker County Participating VRDN Series Floaters G 38, 0.82% 6/7/22 (Liquidity Facility Royal Bank of Canada) (b)(e)(f) | | 4,000,000 | 4,000,000 |
| Tarrant County Cultural Ed. Facilities Fin. Corp. Hosp. Rev. Participating VRDN Series XG 02 78, 0.83% 6/7/22 (Liquidity Facility Bank of America NA) (b)(e)(f) | | 800,000 | 800,000 |
TOTAL TEXAS | | | 33,200,000 |
| Utah - 0.3% | | | |
| Intermountain Pwr. Agcy. Pwr. Supply Rev. Participating VRDN Series E152, 0.82% 6/7/22 (Liquidity Facility Royal Bank of Canada) (b)(e)(f) | | 2,275,000 | 2,275,000 |
| Utah County Hosp. Rev. Participating VRDN Series XM 10 03, 0.82% 6/7/22 (Liquidity Facility JPMorgan Chase Bank) (b)(e)(f) | | 2,435,000 | 2,435,000 |
TOTAL UTAH | | | 4,710,000 |
| Virginia - 0.2% | | | |
| Roanoke Econ. Dev. Authority. Participating VRDN Series 20 XG 02 97, 0.82% 6/7/22 (Liquidity Facility Royal Bank of Canada) (b)(e)(f) | | 525,000 | 525,000 |
| Suffolk Econ. Dev. Auth. Hosp. Facilities Rev. Participating VRDN Series MIZ 90 25, 0.88% 6/7/22 (Liquidity Facility Mizuho Cap. Markets LLC) (b)(e)(f) | | 3,305,000 | 3,305,000 |
| Virginia Small Bus. Fing. Auth. Health Care Facilities Rev. Participating VRDN: | | | |
| Series XF 09 26, 0.94% 6/7/22 (Liquidity Facility JPMorgan Chase Bank) (b)(e)(f) | | 300,000 | 300,000 |
| Series ZF 09 28, 0.94% 6/7/22 (Liquidity Facility JPMorgan Chase Bank) (b)(e)(f) | | 320,000 | 320,000 |
TOTAL VIRGINIA | | | 4,450,000 |
| Washington - 1.1% | | | |
| CommonSpirit Health Participating VRDN Series XF 1017, 0.83% 6/7/22 (Liquidity Facility Barclays Bank PLC) (b)(e)(f) | | 8,000,000 | 8,000,000 |
| Port of Seattle Rev. Participating VRDN: | | | |
| Series Floaters XM 06 65, 0.89% 6/7/22 (Liquidity Facility JPMorgan Chase Bank) (b)(c)(e)(f) | | 800,000 | 800,000 |
| Series XF 28 28, 0.88% 6/7/22 (Liquidity Facility Deutsche Bank AG New York Branch) (b)(c)(e)(f) | | 900,000 | 900,000 |
| Series XM 08 75, 0.89% 6/7/22 (Liquidity Facility JPMorgan Chase Bank) (b)(c)(e)(f) | | 700,000 | 700,000 |
| Series XM 09 59, 0.89% 6/7/22 (Liquidity Facility JPMorgan Chase Bank) (b)(c)(e)(f) | | 2,100,000 | 2,100,000 |
| Washington Convention Ctr. Pub. Facilities Participating VRDN: | | | |
| Series Floaters XM 06 80, 0.83% 6/7/22 (Liquidity Facility Barclays Bank PLC) (b)(e)(f) | | 3,400,000 | 3,400,000 |
| Series XG 02 87, 0.83% 6/7/22 (Liquidity Facility Barclays Bank PLC) (b)(e)(f) | | 4,185,000 | 4,185,000 |
| Washington Health Care Facilities Auth. Rev. Participating VRDN Series YX 12 10, 0.89% 6/7/22 (Liquidity Facility Barclays Bank PLC) (b)(e)(f) | | 700,000 | 700,000 |
TOTAL WASHINGTON | | | 20,785,000 |
| Wisconsin - 0.2% | | | |
| Wisconsin Health & Edl. Facilities Participating VRDN Series Floaters XG 00 72, 0.85% 6/7/22 (Liquidity Facility Deutsche Bank AG New York Branch) (b)(e)(f) | | 4,200,000 | 4,200,000 |
| TOTAL TENDER OPTION BOND (Cost $429,110,000) | | | 429,110,000 |
| | | | |
| Other Municipal Security - 0.2% |
| | | Principal Amount (a) | Value ($) |
| Massachusetts - 0.2% | | | |
| Massachusetts Dev. Fin. Agcy. Elec. Util. Rev. Bonds Series 2022, 0.95% tender 6/2/22 (Massachusetts Elec. Co. Guaranteed), CP mode (c) | | 800,000 | 800,000 |
| Massachusetts Indl. Fin. Agcy. Poll. Cont. Rev. Bonds Series 2022, 0.9% tender 6/7/22, CP mode | | 2,500,000 | 2,500,000 |
| | | | |
| TOTAL OTHER MUNICIPAL SECURITY (Cost $3,300,000) | | | 3,300,000 |
| | | | |
| TOTAL INVESTMENT IN SECURITIES - 100.0% (Cost $1,856,195,000) | 1,856,195,000 |
NET OTHER ASSETS (LIABILITIES) - 0.0% | 13,994 |
| NET ASSETS - 100.0% | 1,856,208,994 |
| | |
Security Type Abbreviations
| CP | - | COMMERCIAL PAPER |
| VRDN | - | VARIABLE RATE DEMAND NOTE (A debt instrument that is payable upon demand, either daily, weekly or monthly) |
The date shown for securities represents the date when principal payments must be paid, taking into account any call options exercised by the issuer and any permissible maturity shortening features other than interest rate resets
Legend
| (a) | Amount is stated in United States dollars unless otherwise noted. |
| (b) | Coupon rates for floating and adjustable rate securities reflect the rates in effect at period end. |
| (c) | Private activity obligations whose interest is subject to the federal alternative minimum tax for individuals. |
| (d) | Security exempt from registration under Rule 144A of the Securities Act of 1933. These securities may be resold in transactions exempt from registration, normally to qualified institutional buyers. At the end of the period, the value of these securities amounted to $22,890,000 or 1.2% of net assets. |
| (e) | Provides evidence of ownership in one or more underlying municipal bonds. |
| (f) | Coupon rates are determined by re-marketing agents based on current market conditions. |
| (g) | Security or a portion of the security purchased on a delayed delivery or when-issued basis. |
Investment Valuation
The following is a summary of the inputs used, as of May 31, 2022, involving the Fund's assets and liabilities carried at fair value. The inputs or methodology used for valuing securities may not be an indication of the risk associated with investing in those securities. For more information on valuation inputs, and their aggregation into the levels used below, please refer to the Investment Valuation section in the accompanying Notes to Financial Statements.
| Valuation Inputs at Reporting Date: |
| Description | Total ($) | Level 1 ($) | Level 2 ($) | Level 3 ($) |
Investments in Securities: | | | | |
|
| Variable Rate Demand Note | 1,423,785,000 | - | 1,423,785,000 | - |
|
| Tender Option Bond | 429,110,000 | - | 429,110,000 | - |
|
| Other Municipal Security | 3,300,000 | - | 3,300,000 | - |
| Total Investments in Securities: | 1,856,195,000 | - | 1,856,195,000 | - |
| Statement of Assets and Liabilities |
| | | | May 31, 2022 |
| | | | | |
| Assets | | | | |
Investment in securities, at value - See accompanying schedule Unaffiliated issuers (cost $1,856,195,000): | | | $ | 1,856,195,000 |
| Receivable for securities sold on a delayed delivery basis | | | | 3,300,000 |
| Interest receivable | | | | 1,306,970 |
| Other receivables | | | | 1,727 |
Total assets | | | | 1,860,803,697 |
| Liabilities | | | | |
| Payable to custodian bank | | $28,522 | | |
| Payable for investments purchased on a delayed delivery basis | | 3,500,000 | | |
| Distributions payable | | 1,060,842 | | |
| Other payables and accrued expenses | | 5,339 | | |
| Total Liabilities | | | | 4,594,703 |
| Net Assets | | | $ | 1,856,208,994 |
| Net Assets consist of: | | | | |
| Paid in capital | | | $ | 1,856,207,948 |
| Total accumulated earnings (loss) | | | | 1,046 |
| Net Assets | | | $ | 1,856,208,994 |
Net Asset Value , offering price and redemption price per share ($1,856,208,994 ÷ 1,855,821,155 shares) | | | $ | 1.0002 |
| | | | | |
| Statement of Operations |
| | | | Year ended May 31, 2022 |
| Investment Income | | | | |
| Interest | | | $ | 2,879,939 |
| Expenses | | | | |
| Custodian fees and expenses | | 21,146 | | |
| Independent trustees' fees and expenses | | 5,165 | | |
| Total expenses before reductions | | 26,311 | | |
| Expense reductions | | (1,602) | | |
| Total expenses after reductions | | | | 24,709 |
| Net Investment income (loss) | | | | 2,855,230 |
| Realized and Unrealized Gain (Loss) | | | | |
| Net realized gain (loss) on: | | | | |
| Investment Securities: | | | | |
| Unaffiliated issuers | | 113,681 | | |
| Total net realized gain (loss) | | | | 113,681 |
| Net increase in net assets resulting from operations | | | $ | 2,968,911 |
| Statement of Changes in Net Assets |
| |
| | Year ended May 31, 2022 | | Year ended May 31, 2021 |
| Increase (Decrease) in Net Assets | | | | |
| Operations | | | | |
| Net investment income (loss) | $ | 2,855,230 | $ | 1,552,899 |
| Net realized gain (loss) | | 113,681 | | 136,804 |
| Change in net unrealized appreciation (depreciation) | | - | | (25) |
Net increase in net assets resulting from operations | | 2,968,911 | | 1,689,678 |
| Distributions to shareholders | | (2,889,399) | | (1,571,322) |
| Affiliated share transactions | | | | |
| Proceeds from sales of shares | | 11,760,356,800 | | 10,324,916,000 |
| Cost of shares redeemed | | (11,247,136,125) | | (10,232,077,008) |
Net increase (decrease) in net assets and shares resulting from share transactions | | 513,220,675 | | 92,838,992 |
| Total increase (decrease) in net assets | | 513,300,187 | | 92,957,348 |
| | | | | |
| Net Assets | | | | |
| Beginning of period | | 1,342,908,807 | | 1,249,951,459 |
| End of period | $ | 1,856,208,994 | $ | 1,342,908,807 |
| | | | | |
| Other Information | | | | |
| Shares | | | | |
| Sold | | 11,758,005,199 | | 10,323,661,090 |
| Redeemed | | (11,244,887,147) | | (10,230,789,988) |
| Net increase (decrease) | | 513,118,052 | | 92,871,102 |
| | | | | |
| Fidelity® Municipal Cash Central Fund |
| |
| Years ended May 31, | | 2022 | | 2021 | | 2020 | | 2019 | | 2018 |
Selected Per-Share Data | | | | | | | | | | |
| Net asset value, beginning of period | $ | 1.0002 | $ | 1.0001 | $ | 1.0001 | $ | 1.0001 | $ | 1.0001 |
| Income from Investment Operations | | | | | | | | | | |
Net investment income (loss) A | | .0016 | | .0011 | | .0130 | | .0155 | | .0113 |
| Net realized and unrealized gain (loss) | | .0001 | | .0001 | | - B | | - B | | - B |
| Total from investment operations | | .0017 | | .0012 | | .0130 | | .0155 | | .0113 |
| Distributions from net investment income | | (.0016) | | (.0011) | | (.0130) | | (.0155) | | (.0113) |
| Distributions from net realized gain | | - B | | - B | | - B | | - B | | (.0001) |
| Total distributions | | (.0017) C | | (.0011) | | (.0130) | | (.0155) | | (.0113) C |
| Net asset value, end of period | $ | 1.0002 | $ | 1.0002 | $ | 1.0001 | $ | 1.0001 | $ | 1.0001 |
Total Return D | | .17% | | .12% | | 1.31% | | 1.56% | | 1.14% |
Ratios to Average Net Assets A,E,F | | | | | | | | | | |
Expenses before reductions G | | -% | | -% | | -% | | -% | | -% |
Expenses net of fee waivers, if any G | | -% | | -% | | -% | | -% | | -% |
Expenses net of all reductions G | | -% | | -% | | -% | | -% | | -% |
| Net investment income (loss) | | .17% | | .10% | | 1.18% | | 1.54% | | 1.06% |
| Supplemental Data | | | | | | | | | | |
| Net assets, end of period (000 omitted) | $ | 1,856,209 | $ | 1,342,909 | $ | 1,249,951 | $ | 728,715 | $ | 822,008 |
A Net investment income (loss) is affected by the timing of the declaration of dividends by any underlying mutual funds or exchange-traded funds (ETFs). Net investment income (loss) of any such underlying funds is not included in the Fund's net investment income (loss) ratio.
B Amount represents less than $.00005 per share.
C Total distributions per share do not sum due to rounding.
D Total returns would have been lower if certain expenses had not been reduced during the applicable periods shown.
E Fees and expenses of any underlying mutual funds or exchange-traded funds (ETFs) are not included in the Fund's expense ratio. The Fund indirectly bears its proportionate share of these expenses.
F Expense ratios reflect operating expenses of the class. Expenses before reductions do not reflect amounts reimbursed, waived, or reduced through arrangements with the investment adviser, brokerage services, or other offset arrangements, if applicable, and do not represent the amount paid by the class during periods when reimbursements, waivers or reductions occur.
G Amount represents less than .005%.
For the period ended May 31, 2022
1. Organization.
Fidelity Municipal Cash Central Fund (the Fund) is a fund of Fidelity Revere Street Trust (the Trust) and is authorized to issue an unlimited number of shares. The Trust is registered under the Investment Company Act of 1940, as amended (the 1940 Act), as an open-end management investment company organized as a Delaware statutory trust. Shares of the Fund are only offered to other investment companies and accounts (the Investing Funds) managed by Fidelity Management & Research Company LLC (FMR), or its affiliates.The Fund has been designated an institutional money market fund, and the value of the Fund's shares are calculated to four decimal places that fluctuates based upon changes in the value of the Fund's investments.
2. Significant Accounting Policies.
The Fund is an investment company and applies the accounting and reporting guidance of the Financial Accounting Standards Board (FASB) Accounting Standards Codification Topic 946 Financial Services - Investment Companies. The financial statements have been prepared in conformity with accounting principles generally accepted in the United States of America (GAAP), which require management to make certain estimates and assumptions at the date of the financial statements. Actual results could differ from those estimates. Subsequent events, if any, through the date that the financial statements were issued have been evaluated in the preparation of the financial statements. The Fund's Schedule of Investments lists any underlying mutual funds or exchange-traded funds (ETFs) but does not include the underlying holdings of these funds. The following summarizes the significant accounting policies of the Fund:
Investment Valuation. Investments are valued as of 4:00 p.m. Eastern time on the last calendar day of the period. The Board of Trustees (the Board) has delegated the day to day responsibility for the valuation of the Fund's investments to the Fair Value Committee (the Committee) established by the Fund's investment adviser. In accordance with valuation policies and procedures approved by the Board, the Fund attempts to obtain prices from one or more third party pricing vendors or brokers to value its investments. When current market prices, quotations or currency exchange rates are not readily available or reliable, investments will be fair valued in good faith by the Committee, in accordance with procedures adopted by the Board. Factors used in determining fair value vary by investment type and may include market or investment specific events, changes in interest rates and credit quality. The frequency with which these procedures are used cannot be predicted and they may be utilized to a significant extent. The Committee oversees the Fund's valuation policies and procedures and reports to the Board on the Committee's activities and fair value determinations. The Board monitors the appropriateness of the procedures used in valuing the Fund's investments and ratifies the fair value determinations of the Committee.
The Fund categorizes the inputs to valuation techniques used to value its investments into a disclosure hierarchy consisting of three levels as shown below:
Level 1 - unadjusted quoted prices in active markets for identical investments
Level 2 - other significant observable inputs (including quoted prices for similar investments, interest rates, prepayment speeds, etc.)
Level 3 - unobservable inputs (including the Fund's own assumptions based on the best information available)
Valuation techniques used to value the Fund's investments by major category are as follows:
Debt securities, including restricted securities, are valued based on evaluated prices received from third party pricing vendors or from brokers who make markets in such securities. Municipal securities and other short-term securities are valued by pricing vendors who utilize matrix pricing which considers yield or price of bonds of comparable quality, coupon, maturity and type or by broker-supplied prices. When independent prices are unavailable or unreliable, debt securities may be valued utilizing pricing methodologies which consider similar factors that would be used by third party pricing vendors. Debt securities are generally categorized as Level 2 in the hierarchy but may be Level 3 depending on the circumstances.
Securities held by a money market fund are generally high quality and liquid; however, they are reflected as Level 2 because the inputs used to determine fair value are not quoted prices in an active market.
The aggregate value of investments by input level as of May 31, 2022 is included at the end of the Fund's Schedule of Investments.
Investment Transactions and Income. Security transactions are accounted for as of trade date. Gains and losses on securities sold are determined on the basis of identified cost.Interest income is accrued as earned and includes coupon interest and amortization of premium and accretion of discount on debt securities as applicable.
Expenses. Expenses directly attributable to a fund are charged to that fund. Expenses attributable to more than one fund are allocated among the respective funds on the basis of relative net assets or other appropriate methods. Expenses included in the accompanying financial statements reflect the expenses of that fund and do not include any expenses associated with any underlying mutual funds or exchange-traded funds. Although not included in a fund's expenses, a fund indirectly bears its proportionate share of these expenses through the net asset value of each underlying mutual fund or exchange-traded fund. Expense estimates are accrued in the period to which they relate and adjustments are made when actual amounts are known.
Income Tax Information and Distributions to Shareholders. Each year, the Fund intends to qualify as a regulated investment company under Subchapter M of the Internal Revenue Code, including distributing substantially all of its taxable income and realized gains. As a result, no provision for U.S. Federal income taxes is required. As of May 31, 2022, the Fund did not have any unrecognized tax benefits in the financial statements; nor is the Fund aware of any tax positions for which it is reasonably possible that the total amounts of unrecognized tax benefits will significantly change in the next twelve months. The Fund files a U.S. federal tax return, in addition to state and local tax returns as required. The Fund's federal income tax returns are subject to examination by the Internal Revenue Service (IRS) for a period of three fiscal years after they are filed. State and local tax returns may be subject to examination for an additional fiscal year depending on the jurisdiction.
Distributions are declared and recorded daily and paid monthly from net investment income. Distributions from realized gains, if any, are declared and recorded on the ex-dividend date. Income and capital gain distributions are determined in accordance with income tax regulations, which may differ from GAAP. In addition, the Fund claimed a portion of the payment made to redeeming shareholders as a distribution for income tax purposes.
Capital accounts within the financial statements are adjusted for permanent book-tax differences. These adjustments have no impact on net assets or the results of operations. Capital accounts are not adjusted for temporary book-tax differences which will reverse in a subsequent period.
The Fund purchases municipal securities whose interest, in the opinion of the issuer, is free from federal income tax. There is no assurance that the IRS will agree with this opinion. In the event the IRS determines that the issuer does not comply with relevant tax requirements, interest payments from a security could become federally taxable, possibly retroactively to the date the security was issued.
As of period end, the cost and unrealized appreciation (depreciation) in securities for federal income tax purposes were as follows:
| Gross unrealized appreciation | $- |
| Gross unrealized depreciation | - |
| Net unrealized appreciation (depreciation) | $- |
| Tax Cost | $1,856,195,000 |
The tax-based components of distributable earnings as of period end were as follows:
| Undistributed long-term capital gain | $1,303 |
| Net unrealized appreciation (depreciation) on securities and other investments | $- |
The tax character of distributions paid was as follows:
| | May 31, 2022 | May 31, 2021 |
| Tax-exempt Income | $ 2,854,808 | $ 1,552,970 |
| Long-term Capital Gains | 34,591 | 18,352 |
| Total | $2,889,399 | $ 1,571,322 |
Delayed Delivery Transactions and When-Issued Securities. During the period, certain Funds transacted in securities on a delayed delivery or when-issued basis. Payment and delivery may take place after the customary settlement period for that security. The price of the underlying securities and the date when the securities will be delivered and paid for are fixed at the time the transaction is negotiated. Securities purchased on a delayed delivery or when-issued basis are identified as such in the Schedule of Investments. Compensation for interest forgone in the purchase of a delayed delivery or when-issued debt security may be received. With respect to purchase commitments, each applicable Fund identifies securities as segregated in its records with a value at least equal to the amount of the commitment. Payables and receivables associated with the purchases and sales of delayed delivery securities having the same coupon, settlement date and broker are offset. Delayed delivery or when-issued securities that have been purchased from and sold to different brokers are reflected as both payables and receivables in the Statement of Assets and Liabilities under the caption "Delayed delivery", as applicable. Losses may arise due to changes in the value of the underlying securities or if the counterparty does not perform under the contract's terms, or if the issuer does not issue the securities due to political, economic, or other factors.
Restricted Securities (including Private Placements). Funds may invest in securities that are subject to legal or contractual restrictions on resale. These securities generally may be resold in transactions exempt from registration or to the public if the securities are registered. Disposal of these securities may involve time-consuming negotiations and expense, and prompt sale at an acceptable price may be difficult. Information regarding restricted securities held at period end is included at the end of the Schedule of Investments, if applicable.
3. Fees and Other Transactions with Affiliates.
Management Fee and Expense Contract. Fidelity Management & Research Company LLC (the investment adviser) provides the Fund with investment management services. The Fund does not pay any fees for these services. Pursuant to the Fund's management contract, the investment adviser receives a monthly management fee that represents a portion of the management fees it receives from the Investing Funds. In addition, under an expense contract, the investment adviser also pays all other expenses of the Fund, excluding custody fees, the compensation of the independent Trustees, and certain miscellaneous expenses such as proxy and shareholder meeting expenses.
Interfund Trades. Funds may purchase from or sell securities to other Fidelity Funds under procedures adopted by the Board. The procedures have been designed to ensure these interfund trades are executed in accordance with Rule 17a-7 of the 1940 Act. Interfund trades during the period are noted in the table below.
| | Purchases ($) | Sales ($) | Realized Gain (Loss) ($) |
| Fidelity Municipal Cash Central Fund | 468,835,000 | 506,815,000 | - |
4. Expense Reductions.
Through arrangements with the Fund's custodian, credits realized as a result of certain uninvested cash balances were used to reduce the Fund's expenses by $1,602.
5. Other.
A fund's organizational documents provide former and current trustees and officers with a limited indemnification against liabilities arising in connection with the performance of their duties to the fund. In the normal course of business, a fund may also enter into contracts that provide general indemnifications. A fund's maximum exposure under these arrangements is unknown as this would be dependent on future claims that may be made against a fund. The risk of material loss from such claims is considered remote.
At the end of the period, mutual funds managed by the investment adviser or its affiliates were the owners of record of all of the outstanding shares of the Fund.
6. Coronavirus (COVID-19) Pandemic.
An outbreak of COVID-19 first detected in China during December 2019 has since spread globally and was declared a pandemic by the World Health Organization during March 2020. Developments that disrupt global economies and financial markets, such as the COVID-19 pandemic, may magnify factors that affect the Fund's performance.
To the Board of Trustees of Fidelity Revere Street Trust and Shareholders of Fidelity Municipal Cash Central Fund
Opinion on the Financial Statements
We have audited the accompanying statement of assets and liabilities, including the schedule of investments, of Fidelity Municipal Cash Central Fund (one of the funds constituting Fidelity Revere Street Trust, referred to hereafter as the "Fund") as of May 31, 2022, the related statement of operations for the year ended May 31, 2022, the statement of changes in net assets for each of the two years in the period ended May 31, 2022, including the related notes, and the financial highlights for each of the five years in the period ended May 31, 2022 (collectively referred to as the "financial statements"). In our opinion, the financial statements present fairly, in all material respects, the financial position of the Fund as of May 31, 2022, the results of its operations for the year then ended, the changes in its net assets for each of the two years in the period ended May 31, 2022 and the financial highlights for each of the five years in the period ended May 31, 2022 in conformity with accounting principles generally accepted in the United States of America.
Basis for Opinion
These financial statements are the responsibility of the Fund's management. Our responsibility is to express an opinion on the Fund's financial statements based on our audits. We are a public accounting firm registered with the Public Company Accounting Oversight Board (United States) (PCAOB) and are required to be independent with respect to the Fund in accordance with the U.S. federal securities laws and the applicable rules and regulations of the Securities and Exchange Commission and the PCAOB.
We conducted our audits of these financial statements in accordance with the standards of the PCAOB. Those standards require that we plan and perform the audit to obtain reasonable assurance about whether the financial statements are free of material misstatement, whether due to error or fraud.
Our audits included performing procedures to assess the risks of material misstatement of the financial statements, whether due to error or fraud, and performing procedures that respond to those risks. Such procedures included examining, on a test basis, evidence regarding the amounts and disclosures in the financial statements. Our audits also included evaluating the accounting principles used and significant estimates made by management, as well as evaluating the overall presentation of the financial statements. Our procedures included confirmation of securities owned as of May 31, 2022 by correspondence with the custodian and brokers; when replies were not received from brokers, we performed other auditing procedures. We believe that our audits provide a reasonable basis for our opinion.
/s/ PricewaterhouseCoopers LLP
Boston, Massachusetts
July 14, 2022
We have served as the auditor of one or more investment companies in the Fidelity group of funds since 1932.
The Trustees, Members of the Advisory Board (if any), and officers of the trust and fund, as applicable, are listed below. The Board of Trustees governs the fund and is responsible for protecting the interests of shareholders. The Trustees are experienced executives who meet periodically throughout the year to oversee the fund's activities, review contractual arrangements with companies that provide services to the fund, oversee management of the risks associated with such activities and contractual arrangements, and review the fund's performance. Each of the Trustees oversees 299 funds.
The Trustees hold office without limit in time except that (a) any Trustee may resign; (b) any Trustee may be removed by written instrument, signed by at least two-thirds of the number of Trustees prior to such removal; (c) any Trustee who requests to be retired or who has become incapacitated by illness or injury may be retired by written instrument signed by a majority of the other Trustees; and (d) any Trustee may be removed at any special meeting of shareholders by a two-thirds vote of the outstanding voting securities of the trust. Each Trustee who is not an interested person (as defined in the 1940 Act) of the trust and the fund is referred to herein as an Independent Trustee. Each Independent Trustee shall retire not later than the last day of the calendar year in which his or her 75th birthday occurs. The Independent Trustees may waive this mandatory retirement age policy with respect to individual Trustees. Officers and Advisory Board Members hold office without limit in time, except that any officer or Advisory Board Member may resign or may be removed by a vote of a majority of the Trustees at any regular meeting or any special meeting of the Trustees. Except as indicated, each individual has held the office shown or other offices in the same company for the past five years.
The fund's Statement of Additional Information (SAI) includes more information about the Trustees. To request a free copy, call Fidelity at 1-800-544-8544.
Experience, Skills, Attributes, and Qualifications of the Trustees. The Governance and Nominating Committee has adopted a statement of policy that describes the experience, qualifications, attributes, and skills that are necessary and desirable for potential Independent Trustee candidates (Statement of Policy). The Board believes that each Trustee satisfied at the time he or she was initially elected or appointed a Trustee, and continues to satisfy, the standards contemplated by the Statement of Policy. The Governance and Nominating Committee also engages professional search firms to help identify potential Independent Trustee candidates who have the experience, qualifications, attributes, and skills consistent with the Statement of Policy. From time to time, additional criteria based on the composition and skills of the current Independent Trustees, as well as experience or skills that may be appropriate in light of future changes to board composition, business conditions, and regulatory or other developments, have also been considered by the professional search firms and the Governance and Nominating Committee. In addition, the Board takes into account the Trustees' commitment and participation in Board and committee meetings, as well as their leadership of standing and ad hoc committees throughout their tenure.
In determining that a particular Trustee was and continues to be qualified to serve as a Trustee, the Board has considered a variety of criteria, none of which, in isolation, was controlling. The Board believes that, collectively, the Trustees have balanced and diverse experience, qualifications, attributes, and skills, which allow the Board to operate effectively in governing the fund and protecting the interests of shareholders. Information about the specific experience, skills, attributes, and qualifications of each Trustee, which in each case led to the Board's conclusion that the Trustee should serve (or continue to serve) as a trustee of the fund, is provided below.
Board Structure and Oversight Function. Abigail P. Johnson is an interested person and currently serves as Chairman. The Trustees have determined that an interested Chairman is appropriate and benefits shareholders because an interested Chairman has a personal and professional stake in the quality and continuity of services provided to the fund. Independent Trustees exercise their informed business judgment to appoint an individual of their choosing to serve as Chairman, regardless of whether the Trustee happens to be independent or a member of management. The Independent Trustees have determined that they can act independently and effectively without having an Independent Trustee serve as Chairman and that a key structural component for assuring that they are in a position to do so is for the Independent Trustees to constitute a substantial majority for the Board. The Independent Trustees also regularly meet in executive session. Michael E. Kenneally serves as Chairman of the Independent Trustees and as such (i) acts as a liaison between the Independent Trustees and management with respect to matters important to the Independent Trustees and (ii) with management prepares agendas for Board meetings.
Fidelity ® funds are overseen by different Boards of Trustees. The fund's Board oversees Fidelity's investment-grade bond, money market, asset allocation and certain equity funds, and other Boards oversee Fidelity's high income and other equity funds. The asset allocation funds may invest in Fidelity ® funds that are overseen by such other Boards. The use of separate Boards, each with its own committee structure, allows the Trustees of each group of Fidelity ® funds to focus on the unique issues of the funds they oversee, including common research, investment, and operational issues. On occasion, the separate Boards establish joint committees to address issues of overlapping consequences for the Fidelity ® funds overseen by each Board.
The Trustees operate using a system of committees to facilitate the timely and efficient consideration of all matters of importance to the Trustees, the fund, and fund shareholders and to facilitate compliance with legal and regulatory requirements and oversight of the fund's activities and associated risks. The Board, acting through its committees, has charged FMR and its affiliates with (i) identifying events or circumstances the occurrence of which could have demonstrably adverse effects on the fund's business and/or reputation; (ii) implementing processes and controls to lessen the possibility that such events or circumstances occur or to mitigate the effects of such events or circumstances if they do occur; and (iii) creating and maintaining a system designed to evaluate continuously business and market conditions in order to facilitate the identification and implementation processes described in (i) and (ii) above. Because the day-to-day operations and activities of the fund are carried out by or through FMR, its affiliates, and other service providers, the fund's exposure to risks is mitigated but not eliminated by the processes overseen by the Trustees. While each of the Board's committees has responsibility for overseeing different aspects of the fund's activities, oversight is exercised primarily through the Operations and Audit Committees. In addition, an ad hoc Board committee of Independent Trustees has worked with FMR to enhance the Board's oversight of investment and financial risks, legal and regulatory risks, technology risks, and operational risks, including the development of additional risk reporting to the Board. The Operations Committee also worked and continues to work with FMR to enhance the stress tests required under SEC regulations for money market funds. Appropriate personnel, including but not limited to the fund's Chief Compliance Officer (CCO), FMR's internal auditor, the independent accountants, the fund's Treasurer and portfolio management personnel, make periodic reports to the Board's committees, as appropriate, including an annual review of Fidelity's risk management program for the Fidelity ® funds. The responsibilities of each standing committee, including their oversight responsibilities, are described further under "Standing Committees of the Trustees."
Interested Trustees*:
Correspondence intended for a Trustee who is an interested person may be sent to Fidelity Investments, 245 Summer Street, Boston, Massachusetts 02210.
Name, Year of Birth; Principal Occupations and Other Relevant Experience+
Abigail P. Johnson (1961)
Year of Election or Appointment: 2009
Trustee
Chairman of the Board of Trustees
Ms. Johnson also serves as Trustee of other Fidelity ® funds. Ms. Johnson serves as Chairman (2016-present), Chief Executive Officer (2014-present), and Director (2007-present) of FMR LLC (diversified financial services company), President of Fidelity Financial Services (2012-present) and President of Personal, Workplace and Institutional Services (2005-present). Ms. Johnson is Chairman and Director of Fidelity Management & Research Company LLC (investment adviser firm, 2011-present). Previously, Ms. Johnson served as Chairman and Director of FMR Co., Inc. (investment adviser firm, 2011-2019), Vice Chairman (2007-2016) and President (2013-2016) of FMR LLC, President and a Director of Fidelity Management & Research Company (2001-2005), a Trustee of other investment companies advised by Fidelity Management & Research Company, Fidelity Investments Money Management, Inc. (investment adviser firm), and FMR Co., Inc. (2001-2005), Senior Vice President of the Fidelity ® funds (2001-2005), and managed a number of Fidelity ® funds. Ms. Abigail P. Johnson and Mr. Arthur E. Johnson are not related.
Jennifer Toolin McAuliffe (1959)
Year of Election or Appointment: 2016
Trustee
Ms. McAuliffe also serves as Trustee of other Fidelity ® funds and as Trustee of Fidelity Charitable (2020-present). Previously, Ms. McAuliffe served as Co-Head of Fixed Income of Fidelity Investments Limited (now known as FIL Limited (FIL)) (diversified financial services company), Director of Research for FIL's credit and quantitative teams in London, Hong Kong and Tokyo and Director of Research for taxable and municipal bonds at Fidelity Investments Money Management, Inc. Ms. McAuliffe previously served as a member of the Advisory Board of certain Fidelity ® funds (2016). Ms. McAuliffe was previously a lawyer at Ropes & Gray LLP and currently serves as director or trustee of several not-for-profit entities.
* Determined to be an "Interested Trustee" by virtue of, among other things, his or her affiliation with the trust or various entities under common control with FMR.
+ The information includes the Trustee's principal occupation during the last five years and other information relating to the experience, attributes, and skills relevant to the Trustee's qualifications to serve as a Trustee, which led to the conclusion that the Trustee should serve as a Trustee for the fund.
Independent Trustees:
Correspondence intended for an Independent Trustee may be sent to Fidelity Investments, P.O. Box 55235, Boston, Massachusetts 02205-5235.
Name, Year of Birth; Principal Occupations and Other Relevant Experience+
Elizabeth S. Acton (1951)
Year of Election or Appointment: 2013
Trustee
Ms. Acton also serves as Trustee of other Fidelity ® funds. Prior to her retirement, Ms. Acton served as Executive Vice President, Finance (2011-2012), Executive Vice President, Chief Financial Officer (2002-2011) and Treasurer (2004-2005) of Comerica Incorporated (financial services). Prior to joining Comerica, Ms. Acton held a variety of positions at Ford Motor Company (1983-2002), including Vice President and Treasurer (2000-2002) and Executive Vice President and Chief Financial Officer of Ford Motor Credit Company (1998-2000). Ms. Acton currently serves as a member of the Board and Audit and Finance Committees of Beazer Homes USA, Inc. (homebuilding, 2012-present). Ms. Acton previously served as a member of the Advisory Board of certain Fidelity ® funds (2013-2016).
Ann E. Dunwoody (1953)
Year of Election or Appointment: 2018
Trustee
General Dunwoody also serves as Trustee of other Fidelity ® funds. General Dunwoody (United States Army, Retired) was the first woman in U.S. military history to achieve the rank of four-star general and prior to her retirement in 2012 held a variety of positions within the U.S. Army, including Commanding General, U.S. Army Material Command (2008-2012). General Dunwoody currently serves as President of First to Four LLC (leadership and mentoring services, 2012-present), a member of the Board and Nomination and Corporate Governance Committees of Kforce Inc. (professional staffing services, 2016-present) and a member of the Board of Automattic Inc. (software engineering, 2018-present). Previously, General Dunwoody served as a member of the Advisory Board and Nominating and Corporate Governance Committee of L3 Technologies, Inc. (communication, electronic, sensor and aerospace systems, 2013-2019) and a member of the Board and Audit and Sustainability and Corporate Responsibility Committees of Republic Services, Inc. (waste collection, disposal and recycling, 2013-2016). Ms. Dunwoody also serves on several boards for non-profit organizations, including as a member of the Board, Chair of the Nomination and Governance Committee and a member of the Audit Committee of Logistics Management Institute (consulting non-profit, 2012-present), a member of the Council of Trustees for the Association of the United States Army (advocacy non-profit, 2013-present), a member of the Board of Florida Institute of Technology (2015-present) and a member of the Board of ThanksUSA (military family education non-profit, 2014-present). General Dunwoody previously served as a member of the Advisory Board of certain Fidelity ® funds (2018).
John Engler (1948)
Year of Election or Appointment: 2014
Trustee
Mr. Engler also serves as Trustee of other Fidelity ® funds. Previously, Mr. Engler served as Governor of Michigan (1991-2003), President of the Business Roundtable (2011-2017) and interim President of Michigan State University (2018-2019). Mr. Engler currently serves as a member of the Board of Stride, Inc. (formerly K12 Inc.) (technology-based education company, 2012-present). Previously, Mr. Engler served as a member of the Board of Universal Forest Products (manufacturer and distributor of wood and wood-alternative products, 2003-2019) and Trustee of The Munder Funds (2003-2014). Mr. Engler previously served as a member of the Advisory Board of certain Fidelity ® funds (2014-2016).
Robert F. Gartland (1951)
Year of Election or Appointment: 2010
Trustee
Mr. Gartland also serves as Trustee of other Fidelity ® funds. Prior to his retirement, Mr. Gartland held a variety of positions at Morgan Stanley (financial services, 1979-2007), including Managing Director (1987-2007) and Chase Manhattan Bank (1975-1978). Mr. Gartland previously served as Chairman and an investor in Gartland & Mellina Group Corp. (consulting, 2009-2019), as a member of the Board of National Securities Clearing Corporation (1993-1996) and as Chairman of TradeWeb (2003-2004).
Arthur E. Johnson (1947)
Year of Election or Appointment: 2008
Trustee
Mr. Johnson also serves as Trustee of other Fidelity ® funds. Prior to his retirement, Mr. Johnson served as Senior Vice President of Corporate Strategic Development of Lockheed Martin Corporation (defense contractor, 1999-2009). Mr. Johnson currently serves as a member of the Board of Booz Allen Hamilton (management consulting, 2011-present). Mr. Johnson previously served as a member of the Board of Eaton Corporation plc (diversified power management, 2009-2019) and a member of the Board of AGL Resources, Inc. (holding company, 2002-2016). Mr. Johnson previously served as Chairman (2018-2021) and Vice Chairman (2015-2018) of the Independent Trustees of certain Fidelity® funds. Mr. Arthur E. Johnson is not related to Ms. Abigail P. Johnson.
Michael E. Kenneally (1954)
Year of Election or Appointment: 2009
Trustee
Chairman of the Independent Trustees
Mr. Kenneally also serves as Trustee of other Fidelity ® funds and was Vice Chairman (2018-2021) of the Independent Trustees of certain Fidelity ® funds. Prior to retirement in 2005, he was Chairman and Global Chief Executive Officer of Credit Suisse Asset Management, the worldwide fund management and institutional investment business of Credit Suisse Group. Previously, Mr. Kenneally was an Executive Vice President and the Chief Investment Officer for Bank of America. In this role, he was responsible for the investment management, strategy and products delivered to the bank's institutional, high-net-worth and retail clients. Earlier, Mr. Kenneally directed the organization's equity and quantitative research groups. He began his career as a research analyst and then spent more than a dozen years as a portfolio manager for endowments, pension plans and mutual funds. He earned the Chartered Financial Analyst (CFA) designation in 1991.
Marie L. Knowles (1946)
Year of Election or Appointment: 2001
Trustee
Ms. Knowles also serves as Trustee of other Fidelity ® funds. Prior to her retirement, Ms. Knowles held several positions at Atlantic Richfield Company (diversified energy), including Executive Vice President and Chief Financial Officer (1996-2000), Senior Vice President (1993-1996) and President of ARCO Transportation Company (pipeline and tanker operations, 1993-1996). Ms. Knowles currently serves as a member of the Board of the Santa Catalina Island Company (real estate, 2009-present), a member of the Investment Company Institute Board of Governors and a member of the Governing Council of the Independent Directors Council (2014-present). Ms. Knowles also serves as a member of the Advisory Board for the School of Engineering of the University of Southern California. Ms. Knowles previously served as a member of the Board of McKesson Corporation (healthcare service, 2002-2021). In addition, Ms. Knowles previously served as Chairman (2015-2018) and Vice Chairman (2012-2015) of the Independent Trustees of certain Fidelity ® funds.
Mark A. Murray (1954)
Year of Election or Appointment: 2016
Trustee
Mr. Murray also serves as Trustee of other Fidelity ® funds. Previously, Mr. Murray served as Co-Chief Executive Officer (2013-2016), President (2006-2013) and Vice Chairman (2013-2020) of Meijer, Inc. Mr. Murray serves as a member of the Board (2009-present) and Public Policy and Responsibility Committee (2009-present) and Chair of the Nuclear Review Committee (2019-present) of DTE Energy Company (diversified energy company). Mr. Murray previously served as a member of the Board of Spectrum Health (not-for-profit health system, 2015-2019) and as a member of the Board and Audit Committee and Chairman of the Nominating and Corporate Governance Committee of Universal Forest Products, Inc. (manufacturer and distributor of wood and wood-alternative products, 2004-2016). Mr. Murray also serves as a member of the Board of many community and professional organizations. Mr. Murray previously served as a member of the Advisory Board of certain Fidelity ® funds (2016).
+ The information includes the Trustee's principal occupation during the last five years and other information relating to the experience, attributes, and skills relevant to the Trustee's qualifications to serve as a Trustee, which led to the conclusion that the Trustee should serve as a Trustee for the fund.
Advisory Board Members and Officers:
Correspondence intended for an officer may be sent to Fidelity Investments, 245 Summer Street, Boston, Massachusetts 02210. Officers appear below in alphabetical order.
Name, Year of Birth; Principal Occupation
Robert W. Helm (1957)
Year of Election or Appointment: 2021
Member of the Advisory Board
Mr. Helm also serves as a Member of the Advisory Board of other Fidelity® funds. Mr. Helm was formerly Deputy Chairman (2003-2020), partner (1991-2020) and an associate (1984-1991) of Dechert LLP (formerly Dechert Price & Rhoads). Mr. Helm currently serves on boards and committees of several not-for-profit organizations.
Craig S. Brown (1977)
Year of Election or Appointment: 2019
Assistant Treasurer
Mr. Brown also serves as an officer of other funds. Mr. Brown serves as Assistant Treasurer of FIMM, LLC (2021-present) and is an employee of Fidelity Investments (2013-present).
John J. Burke III (1964)
Year of Election or Appointment: 2018
Chief Financial Officer
Mr. Burke also serves as Chief Financial Officer of other funds. Mr. Burke serves as Head of Investment Operations for Fidelity Fund and Investment Operations (2018-present) and is an employee of Fidelity Investments (1998-present). Previously Mr. Burke served as head of Asset Management Investment Operations (2012-2018).
David J. Carter (1973)
Year of Election or Appointment: 2020
Assistant Secretary
Mr. Carter also serves as Assistant Secretary of other funds. Mr. Carter serves as Senior Vice President, Deputy General Counsel (2022-present) and is an employee of Fidelity Investments (2005-present).
Jonathan Davis (1968)
Year of Election or Appointment: 2010
Assistant Treasurer
Mr. Davis also serves as an officer of other funds. Mr. Davis serves as Assistant Treasurer of FIMM, LLC (2021-present), FMR Capital, Inc. (2017-present), FD Funds GP LLC (2021-present), FD Funds Holding LLC (2021-present), and FD Funds Management LLC (2021-present); and is an employee of Fidelity Investments. Previously, Mr. Davis served as Vice President and Associate General Counsel of FMR LLC (diversified financial services company, 2003-2010).
Laura M. Del Prato (1964)
Year of Election or Appointment: 2018
President and Treasurer
Ms. Del Prato also serves as an officer of other funds. Ms. Del Prato serves as Assistant Treasurer of FIMM, LLC (2021-present) and is an employee of Fidelity Investments (2017-present). Previously, Ms. Del Prato served as President and Treasurer of The North Carolina Capital Management Trust: Cash Portfolio and Term Portfolio (2018-2020). Prior to joining Fidelity Investments, Ms. Del Prato served as a Managing Director and Treasurer of the JPMorgan Mutual Funds (2014-2017). Prior to JPMorgan, Ms. Del Prato served as a partner at Cohen Fund Audit Services (accounting firm, 2012-2013) and KPMG LLP (accounting firm, 2004-2012).
Colm A. Hogan (1973)
Year of Election or Appointment: 2016
Assistant Treasurer
Mr. Hogan also serves as an officer of other funds. Mr. Hogan serves as Assistant Treasurer of FIMM, LLC (2021-present) and FMR Capital, Inc. (2017-present) and is an employee of Fidelity Investments (2005-present). Previously, Mr. Hogan served as Deputy Treasurer of certain Fidelity ® funds (2016-2020) and Assistant Treasurer of certain Fidelity ® funds (2016-2018).
Cynthia Lo Bessette (1969)
Year of Election or Appointment: 2019
Secretary and Chief Legal Officer (CLO)
Ms. Lo Bessette also serves as an officer of other funds. Ms. Lo Bessette serves as CLO, Secretary, and Senior Vice President of Fidelity Management & Research Company LLC (investment adviser firm, 2019-present); CLO of Fidelity Management & Research (Hong Kong) Limited, FMR Investment Management (UK) Limited, and Fidelity Management & Research (Japan) Limited (investment adviser firms, 2019-present); Secretary of FD Funds GP LLC (2021-present), FD Funds Holding LLC (2021-present), and FD Funds Management LLC (2021-present); and Assistant Secretary of FIMM, LLC (2019-present). She is a Senior Vice President and Deputy General Counsel of FMR LLC (diversified financial services company, 2019-present), and is an employee of Fidelity Investments. Previously, Ms. Lo Bessette served as CLO, Secretary, and Senior Vice President of FMR Co., Inc. (investment adviser firm, 2019); Secretary of Fidelity SelectCo, LLC and Fidelity Investments Money Management, Inc. (investment adviser firms, 2019). Prior to joining Fidelity Investments, Ms. Lo Bessette was Executive Vice President, General Counsel (2016-2019) and Senior Vice President, Deputy General Counsel (2015-2016) of OppenheimerFunds (investment management company) and Deputy Chief Legal Officer (2013-2015) of Jennison Associates LLC (investment adviser firm).
Chris Maher (1972)
Year of Election or Appointment: 2013
Assistant Treasurer
Mr. Maher also serves as an officer of other funds. Mr. Maher serves as Assistant Treasurer of FIMM, LLC (2021-present) and FMR Capital, Inc. (2017-present), and is an employee of Fidelity Investments (2008-present). Previously, Mr. Maher served as Assistant Treasurer of certain funds (2013-2020); Vice President of Asset Management Compliance (2013), Vice President of the Program Management Group of FMR (investment adviser firm, 2010-2013), and Vice President of Valuation Oversight (2008-2010).
Jamie Pagliocco (1964)
Year of Election or Appointment: 2020
Vice President
Mr. Pagliocco also serves as Vice President of other funds. Mr. Pagliocco serves as President of Fixed Income (2020-present), and is an employee of Fidelity Investments (2001-present). Previously, Mr. Pagliocco served as Co-Chief Investment Officer - Bond (2017-2020), Global Head of Bond Trading (2016-2019), and as a portfolio manager.
Kenneth B. Robins (1969)
Year of Election or Appointment: 2020
Chief Compliance Officer
Mr. Robins also serves as an officer of other funds. Mr. Robins serves as Compliance Officer of Fidelity Management & Research Company LLC (investment adviser firm, 2016-present) and is an employee of Fidelity Investments (2004-present). Previously, Mr. Robins served as Compliance Officer of FMR Co., Inc. (investment adviser firm, 2016-2019), as Executive Vice President of Fidelity Investments Money Management, Inc. (investment adviser firm, 2013-2016) and served in other fund officer roles.
Brett Segaloff (1972)
Year of Election or Appointment: 2021
Anti-Money Laundering (AML) Officer
Mr. Segaloff also serves as an AML Officer of other funds and other related entities. He is Director, Anti-Money Laundering (2007-present) of FMR LLC (diversified financial services company) and is an employee of Fidelity Investments (1996-present).
Stacie M. Smith (1974)
Year of Election or Appointment: 2013
Assistant Treasurer
Ms. Smith also serves as an officer of other funds. Ms. Smith serves as Assistant Treasurer of FIMM, LLC (2021-present) and FMR Capital, Inc. (2017-present), is an employee of Fidelity Investments (2009-present), and has served in other fund officer roles. Prior to joining Fidelity Investments, Ms. Smith served as Senior Audit Manager of Ernst & Young LLP (accounting firm, 1996-2009). Previously, Ms. Smith served as Assistant Treasurer (2013-2019) and Deputy Treasurer (2013-2016) of certain Fidelity ® funds.
Jim Wegmann (1979)
Year of Election or Appointment: 2021
Deputy Treasurer
Mr. Wegmann also serves as an officer of other funds. Mr. Wegmann serves as Assistant Treasurer of FIMM, LLC (2021-present) and is an employee of Fidelity Investments (2011-present). Previously, Mr. Wegmann served as Assistant Treasurer of certain Fidelity ® funds (2019-2021).
As a shareholder, you incur two types of costs: (1) transaction costs, which may include sales charges (loads) on purchase payments or redemption proceeds, as applicable and (2) ongoing costs, which generally include management fees, distribution and/or service (12b-1) fees and other Fund expenses. This Example is intended to help you understand your ongoing costs (in dollars) of investing in a fund and to compare these costs with the ongoing costs of investing in other mutual funds.
| The Example is based on an investment of $1,000 invested at the beginning of the period and held for the entire period (December 1, 2021 to May 31, 2022). |
Actual Expenses
The first line of the accompanying table provides information about actual account values and actual expenses. You may use the information in this line, together with the amount you invested, to estimate the expenses that you paid over the period. Simply divide your account value by $1,000.00 (for example, an $8,600 account value divided by $1,000.00 = 8.6), then multiply the result by the number in the first line for a class/Fund under the heading entitled "Expenses Paid During Period" to estimate the expenses you paid on your account during this period. If any fund is a shareholder of any underlying mutual funds or exchange-traded funds (ETFs) (the Underlying Funds), such fund indirectly bears its proportional share of the expenses of the Underlying Funds in addition to the direct expenses incurred presented in the table. These fees and expenses are not included in the annualized expense ratio used to calculate the expense estimate in the table below.
Hypothetical Example for Comparison Purposes
The second line of the accompanying table provides information about hypothetical account values and hypothetical expenses based on the actual expense ratio and an assumed rate of return of 5% per year before expenses, which is not the actual return. The hypothetical account values and expenses may not be used to estimate the actual ending account balance or expenses you paid for the period. You may use this information to compare the ongoing costs of investing in the Fund and other funds. To do so, compare this 5% hypothetical example with the 5% hypothetical examples that appear in the shareholder reports of the other funds. If any fund is a shareholder of any Underlying Funds, such fund indirectly bears its proportional share of the expenses of the Underlying Funds in addition to the direct expenses as presented in the table. These fees and expenses are not included in the annualized expense ratio used to calculate the expense estimate in the table below.
Please note that the expenses shown in the table are meant to highlight your ongoing costs only and do not reflect any transaction costs. Therefore, the second line of the table is useful in comparing ongoing costs only, and will not help you determine the relative total costs of owning different funds. In addition, if these transactional costs were included, your costs would have been higher.
| | | | | Annualized Expense Ratio- A | | Beginning Account Value December 1, 2021 | | Ending Account Value May 31, 2022 | | Expenses Paid During Period- C December 1, 2021 to May 31, 2022 |
| | | | | | | | | | |
| Fidelity® Municipal Cash Central Fund | | | | 0.002% | | | | | | |
| Actual | | | | | | $ 1,000 | | $ 1,001.40 | | $ .01 |
Hypothetical- B | | | | | | $ 1,000 | | $ 1,024.92 | | $ .01 |
| |
A Annualized expense ratio reflects expenses net of applicable fee waivers.
B 5% return per year before expenses
C Expenses are equal to the annualized expense ratio, multiplied by the average account value over the period, multiplied by 182/ 365 (to reflect the one-half year period). The fees and expenses of any Underlying Funds are not included in each annualized expense ratio.
The dividend and capital gains distributions for the fund(s) are available on Fidelity.com or Institutional.Fidelity.com .
The fund hereby designates as a capital gain dividend with respect to the taxable year ended May 31, 2022, $107,419, or, if subsequently determined to be different, the net capital gain of such year.
During fiscal year ended 2022, 100% of the fund's income dividends was free from federal income tax, and 51.16% of the fund's income dividends was subject to the federal alternative minimum tax.
The fund will notify shareholders in January 2023 of amounts for use in preparing 2022 income tax returns.
1.743117.122
MCC-ANN-0722
Fidelity® Cash Central Fund
Annual Report
May 31, 2022
Contents
To view a fund's proxy voting guidelines and proxy voting record for the 12-month period ended June 30, visit http://www.fidelity.com/proxyvotingresults or visit the Securities and Exchange Commission's (SEC) web site at http://www.sec.gov.
You may also call 1-800-544-8544 to request a free copy of the proxy voting guidelines.
Standard & Poor's, S&P and S&P 500 are registered service marks of The McGraw-Hill Companies, Inc. and have been licensed for use by Fidelity Distributors Corporation.
Other third-party marks appearing herein are the property of their respective owners.
All other marks appearing herein are registered or unregistered trademarks or service marks of FMR LLC or an affiliated company. © 2022 FMR LLC. All rights reserved.
A fund files its complete schedule of portfolio holdings with the SEC for the first and third quarters of each fiscal year on Form N-PORT. Forms N-PORT are available on the SEC’s web site at http://www.sec.gov. A fund's Forms N-PORT may be reviewed and copied at the SEC’s Public Reference Room in Washington, DC. Information regarding the operation of the SEC's Public Reference Room may be obtained by calling 1-800-SEC-0330.
Note to Shareholders:
Early in 2020, the outbreak and spread of COVID-19 emerged as a public health emergency that had a major influence on financial markets, primarily based on its impact on the global economy and corporate earnings. On March 11, 2020, the World Health Organization declared the COVID-19 outbreak a pandemic, citing sustained risk of further global spread. The pandemic prompted a number of measures to limit the spread of COVID-19, including travel and border restrictions, quarantines, and restrictions on large gatherings. In turn, these resulted in lower consumer activity, diminished demand for a wide range of products and services, disruption in manufacturing and supply chains, and – given the wide variability in outcomes regarding the outbreak – significant market uncertainty and volatility. To help stem the turmoil, the U.S. government took unprecedented action – in concert with the U.S. Federal Reserve and central banks around the world – to help support consumers, businesses, and the broader economy, and to limit disruption to the financial system.
In general, the overall impact of the pandemic lessened in 2021, amid a resilient economy and widespread distribution of three COVID-19 vaccines granted emergency use authorization from the U.S. Food and Drug Administration (FDA) early in the year. Still, the situation remains dynamic, and the extent and duration of its influence on financial markets and the economy is highly uncertain, due in part to a recent spike in cases based on highly contagious variants of the coronavirus.
Extreme events such as the COVID-19 crisis are exogenous shocks that can have significant adverse effects on mutual funds and their investments. Although multiple asset classes may be affected by market disruption, the duration and impact may not be the same for all types of assets. Fidelity is committed to helping you stay informed amid news about COVID-19 and during increased market volatility, and we continue to take extra steps to be responsive to customer needs. We encourage you to visit us online, where we offer ongoing updates, commentary, and analysis on the markets and our funds.
Investment Summary (Unaudited)
Effective Maturity Diversification as of May 31, 2022
| Days | % of fund's investments 5/31/22 |
| 1 - 7 | 99.1 |
| 31 - 60 | 0.9 |
Effective maturity is determined in accordance with the requirements of Rule 2a-7 under the Investment Company Act of 1940.
Asset Allocation (% of fund's net assets)
| As of May 31, 2022 |
| | Non-Negotiable Time Deposit | 9.7% |
| | Repurchase Agreements | 88.9% |
| | Net Other Assets (Liabilities) | 1.4% |

Schedule of Investments May 31, 2022
Showing Percentage of Net Assets
| Non-Negotiable Time Deposit - 9.7% | | | | |
| | | Yield(a) | Principal Amount | Value |
| Time Deposits - 9.7% | | | | |
| Barclays Bank PLC | | | | |
| 6/1/22 | | 0.89% | $2,575,000,000 | $2,575,000,000 |
| Credit Agricole CIB | | | | |
| 6/1/22 | | 0.80 | 886,000,000 | 886,000,000 |
| Mizuho Bank Ltd. Canada Branch | | | | |
| 6/1/22 | | 0.83 | 1,593,000,000 | 1,593,000,000 |
| Skandinaviska Enskilda Banken AB | | | | |
| 6/1/22 | | 0.82 | 60,000,000 | 60,000,000 |
| TOTAL NON-NEGOTIABLE TIME DEPOSIT | | | | |
| (Cost $5,114,000,000) | | | | 5,114,000,000 |
| | | | | |
|
| Interfund Loans - 0.0% | | | | |
| With: | | | | |
| Fidelity Flex 500 Index Fund at 1.06% due 06/01/2022(b) | | | 14,445,000 | 14,445,000 |
| Fidelity SAI U.S. Large Cap Index Fund at 1.06% due 06/01/2022(b) | | | 6,086,000 | 6,086,000 |
| TOTAL INTERFUND LOANS | | | | |
| (Cost $20,531,000) | | | | 20,531,000 |
| U.S. Government Agency Repurchase Agreement - 1.6% | | | |
| | | Maturity Amount | Value |
| In a joint trading account at | | | |
| 0.8% dated 5/31/22 due 6/1/22 (Collateralized by (U.S. Government Obligations) # | | | |
| (Cost $858,650,000) | | $858,669,081 | 858,650,000 |
|
| U.S. Treasury Repurchase Agreement - 86.4% | | | |
| With: | | | |
| Federal Reserve Bank of New York at 0.8%, dated 5/31/22 due 6/1/22 (Collateralized by U.S. Treasury Obligations valued at $44,980,999,560, 0.13% - 2.88%, 3/31/23 - 5/15/31) | | 44,980,999,556 | 44,980,000,000 |
| SMBC Nikko Securities America, Inc. at 0.8%, dated 5/31/22 due 6/1/22 (Collateralized by U.S. Treasury Obligations valued at $713,835,591, 2.50% - 2.75%, 2/15/24 - 5/15/24) | | 700,015,556 | 700,000,000 |
| TOTAL U.S. TREASURY REPURCHASE AGREEMENT | | | |
| (Cost $45,680,000,000) | | | 45,680,000,000 |
|
| Other Repurchase Agreement - 0.9% | | | |
| Other Repurchase Agreement - 0.9% | | | |
| With: | | | |
| J.P. Morgan Securities, LLC at 1.22%, dated 5/31/22 due 7/5/22 | | | |
| (Collateralized by Corporate Obligations valued at $175,355,951, 0.51% - 7.20%, 6/1/24 - 2/15/98)(c)(d)(e) | | 167,350,886 | 167,000,000 |
| (Collateralized by Equity Securities valued at $320,770,871)(c)(d)(e) | | 297,624,030 | 297,000,000 |
| Wells Fargo Securities, LLC at 1.07%, dated 3/2/22 due 6/1/22 (Collateralized by Commercial Paper valued at $19,622,932, 6/1/22 - 6/13/22) | | 19,051,390 | 19,000,000 |
| TOTAL OTHER REPURCHASE AGREEMENT | | | |
| (Cost $483,000,000) | | | 483,000,000 |
| TOTAL INVESTMENT IN SECURITIES - 98.6% | | | |
| (Cost $52,156,181,000) | | | 52,156,181,000 |
| NET OTHER ASSETS (LIABILITIES) - 1.4% | | | 734,077,881 |
| NET ASSETS - 100% | | | $52,890,258,881 |
The date shown for securities represents the date when principal payments must be paid, taking into account any call options exercised by the issuer and any permissible maturity shortening features other than interest rate resets.
Legend
(a) Yield represents either the annualized yield at the date of purchase, or the stated coupon rate, or, for floating and adjustable rate securities, the rate at period end.
(b) Loan is with an affiliated fund.
(c) Coupon rates for floating and adjustable rate securities reflect the rates in effect at period end.
(d) The maturity amount is based on the rate at period end.
(e) Coupon is indexed to a floating interest rate which may be multiplied by a specified factor and/or subject to caps or floors.
Investment Valuation
The following is a summary of the inputs used, as of May 31, 2022, involving the Fund's assets and liabilities carried at fair value. The inputs or methodology used for valuing securities may not be an indication of the risk associated with investing in those securities. For more information on valuation inputs, and their aggregation into the levels used below, please refer to the Investment Valuation section in the accompanying Notes to Financial Statements.
| | Valuation Inputs at Reporting Date: |
| Description | Total | Level 1 | Level 2 | Level 3 |
| Investments in Securities: | | | | |
| Non-Negotiable Time Deposit | $5,114,000,000 | $-- | $5,114,000,000 | $-- |
| U.S. Government Agency Repurchase Agreement | 858,650,000 | -- | 858,650,000 | -- |
| U.S. Treasury Repurchase Agreement | 45,680,000,000 | -- | 45,680,000,000 | -- |
| Other Repurchase Agreement | 483,000,000 | -- | 483,000,000 | -- |
| Interfund Loans | 20,531,000 | -- | 20,531,000 | -- |
| Total Investments in Securities: | $52,156,181,000 | $-- | $52,156,181,000 | $-- |
Other Information
# Additional information on each counterparty to the repurchase agreement is as follows:
| Repurchase Agreement / Counterparty | Value |
| $858,650,000 due 6/01/22 at 0.80% | |
| BofA Securities, Inc. | $44,545,000 |
| JP Morgan Securities, LLC | 178,359,000 |
| Nomura Securities International | 28,972,000 |
| RBC Dominion Securities, Inc. | 606,774,000 |
| | $858,650,000 |
See accompanying notes which are an integral part of the financial statements.
Financial Statements
Statement of Assets and Liabilities
| | | May 31, 2022 |
| Assets | | |
Investment in securities, at value (including repurchase agreements of $47,021,650,000) — See accompanying schedule:
Unaffiliated issuers (cost $52,135,650,000) | $52,135,650,000 | |
| Affiliated issuers (cost $20,531,000) | 20,531,000 | |
| Total Investment in Securities (cost $52,156,181,000) | | $52,156,181,000 |
| Cash | | 765,445,451 |
| Interest receivable | | 1,235,913 |
| Other affiliated receivables | | 2,952 |
| Total assets | | 52,922,865,316 |
| Liabilities | | |
| Distributions payable | 32,469,252 | |
| Other payables and accrued expenses | 137,183 | |
| Total liabilities | | 32,606,435 |
| Net Assets | | $52,890,258,881 |
| Net Assets consist of: | | |
| Paid in capital | | $52,890,239,012 |
| Total accumulated earnings (loss) | | 19,869 |
| Net Assets | | $52,890,258,881 |
| Net Asset Value, offering price and redemption price per share ($52,890,258,881 ÷ 52,879,842,047 shares) | | $1.0002 |
See accompanying notes which are an integral part of the financial statements.
Statement of Operations
| | | Year ended May 31, 2022 |
| Investment Income | | |
| Interest (including $444,321 from affiliated interfund lending) | | $82,454,752 |
| Expenses | | |
| Custodian fees and expenses | $190,272 | |
| Independent trustees' fees and expenses | 177,960 | |
| Total expenses before reductions | 368,232 | |
| Expense reductions | (11,271) | |
| Total expenses after reductions | | 356,961 |
| Net investment income (loss) | | 82,097,791 |
| Realized and Unrealized Gain (Loss) | | |
| Net realized gain (loss) on: | | |
| Investment securities: | | |
| Unaffiliated issuers | 69,356 | |
| Total net realized gain (loss) | | 69,356 |
| Change in net unrealized appreciation (depreciation) on investment securities | | (399,235) |
| Net increase in net assets resulting from operations | | $81,767,912 |
See accompanying notes which are an integral part of the financial statements.
Statement of Changes in Net Assets
| | Year ended May 31, 2022 | Year ended May 31, 2021 |
| Increase (Decrease) in Net Assets | | |
| Operations | | |
| Net investment income (loss) | $82,097,791 | $41,841,305 |
| Net realized gain (loss) | 69,356 | (3,156) |
| Change in net unrealized appreciation (depreciation) | (399,235) | 783,144 |
| Net increase in net assets resulting from operations | 81,767,912 | 42,621,293 |
| Distributions to shareholders | (82,097,806) | (41,834,911) |
| Affiliated share transactions | | |
| Proceeds from sales of shares | 596,087,231,699 | 573,269,453,183 |
| Reinvestment of distributions | 1,788 | – |
| Cost of shares redeemed | (601,492,138,278) | (559,941,848,084) |
| Net increase (decrease) in net assets and shares resulting from share transactions | (5,404,904,791) | 13,327,605,099 |
| Total increase (decrease) in net assets | (5,405,234,685) | 13,328,391,481 |
| Net Assets | | |
| Beginning of period | 58,295,493,566 | 44,967,102,085 |
| End of period | $52,890,258,881 | $58,295,493,566 |
| Other Information | | |
| Shares | | |
| Sold | 595,968,034,803 | 573,152,061,767 |
| Issued in reinvestment of distributions | 1,788 | – |
| Redeemed | (601,371,863,905) | (559,826,914,344) |
| Net increase (decrease) | (5,403,827,314) | 13,325,147,423 |
See accompanying notes which are an integral part of the financial statements.
Financial Highlights
Fidelity Cash Central Fund
| | | | | | |
| Years ended May 31, | 2022 | 2021 | 2020 | 2019 | 2018 |
| Selected Per–Share Data | | | | | |
| Net asset value, beginning of period | $1.0002 | $1.0002 | $1.0002 | $1.0002 | $1.0002 |
| Income from Investment Operations | | | | | |
| Net investment income (loss)A | .0016 | .0010 | .0155 | .0223 | .0131 |
| Net realized and unrealized gain (loss) | –B | –B | –B | –B | –B |
| Total from investment operations | .0016 | .0010 | .0155 | .0223 | .0131 |
| Distributions from net investment income | (.0016) | (.0010) | (.0155) | (.0223) | (.0131) |
| Total distributions | (.0016) | (.0010) | (.0155) | (.0223) | (.0131) |
| Net asset value, end of period | $1.0002 | $1.0002 | $1.0002 | $1.0002 | $1.0002 |
| Total ReturnC | .15% | .10% | 1.56% | 2.26% | 1.31% |
| Ratios to Average Net AssetsA,D,E | | | | | |
| Expenses before reductions | - %F | - %F | .01% | .01% | - %F |
| Expenses net of fee waivers, if any | - %F | - %F | .01% | .01% | - %F |
| Expenses net of all reductions | - %F | - %F | .01% | .01% | - %F |
| Net investment income (loss) | .14% | .09% | 1.55% | 2.24% | 1.31% |
| Supplemental Data | | | | | |
| Net assets, end of period (000 omitted) | $52,890,259 | $58,295,494 | $44,967,102 | $44,503,265 | $43,495,230 |
A Net investment income (loss) is affected by the timing of the declaration of dividends by any underlying mutual funds or exchange-traded funds (ETFs). Net investment income (loss) of any such underlying funds is not included in the Fund's net investment income (loss) ratio.
B Amount represents less than $.00005 per share.
C Total returns would have been lower if certain expenses had not been reduced during the applicable periods shown.
D Fees and expenses of any underlying mutual funds or exchange-traded funds (ETFs) are not included in the Fund's expense ratio. The Fund indirectly bears its proportionate share of these expenses.
E Expense ratios reflect operating expenses of the class. Expenses before reductions do not reflect amounts reimbursed, waived, or reduced through arrangements with the investment adviser, brokerage services, or other offset arrangements, if applicable, and do not represent the amount paid by the class during periods when reimbursements, waivers or reductions occur.
F Amount represents less than .005%.
See accompanying notes which are an integral part of the financial statements.
Notes to Financial Statements
For the period ended May 31, 2022
1. Organization.
Fidelity Cash Central Fund (the Fund) is a fund of Fidelity Revere Street Trust (the Trust) and is authorized to issue an unlimited number of shares. The Trust is registered under the Investment Company Act of 1940, as amended (the 1940 Act), as an open-end management investment company organized as a Delaware statutory trust. Shares of the Fund are only offered to other investment companies and accounts (the Investing Funds) managed by Fidelity Management & Research Company LLC (FMR), or its affiliates. The Fund has been designated an institutional money market fund, and the value of the Fund's shares are calculated to four decimal places that fluctuates based upon changes in the value of the Fund's investments.
2. Significant Accounting Policies.
The Fund is an investment company and applies the accounting and reporting guidance of the Financial Accounting Standards Board (FASB) Accounting Standards Codification Topic 946 Financial Services - Investment Companies. The financial statements have been prepared in conformity with accounting principles generally accepted in the United States of America (GAAP), which require management to make certain estimates and assumptions at the date of the financial statements. Actual results could differ from those estimates. Subsequent events, if any, through the date that the financial statements were issued have been evaluated in the preparation of the financial statements. The Fund's Schedule of Investments lists any underlying mutual funds or exchange-traded funds (ETFs) but does not include the underlying holdings of these funds. The following summarizes the significant accounting policies of the Fund:
Investment Valuation. Investments are valued as of 4:00 p.m. Eastern time on the last calendar day of the period. The Board of Trustees (the Board) has delegated the day to day responsibility for the valuation of the Fund's investments to the Fair Value Committee (the Committee) established by the Fund's investment adviser. In accordance with valuation policies and procedures approved by the Board, the Fund attempts to obtain prices from one or more third party pricing vendors or brokers to value its investments. When current market prices, quotations or currency exchange rates are not readily available or reliable, investments will be fair valued in good faith by the Committee, in accordance with procedures adopted by the Board. Factors used in determining fair value vary by investment type and may include market or investment specific events, changes in interest rates and credit quality. The frequency with which these procedures are used cannot be predicted and they may be utilized to a significant extent. The Committee oversees the Fund's valuation policies and procedures and reports to the Board on the Committee's activities and fair value determinations. The Board monitors the appropriateness of the procedures used in valuing the Fund's investments and ratifies the fair value determinations of the Committee.
The Fund categorizes the inputs to valuation techniques used to value its investments into a disclosure hierarchy consisting of three levels as shown below:
Level 1 – unadjusted quoted prices in active markets for identical investments
Level 2 – other significant observable inputs (including quoted prices for similar investments, interest rates, prepayment speeds, etc.)
Level 3 – unobservable inputs (including the Fund's own assumptions based on the best information available)
Valuation techniques used to value the Fund's investments by major category are as follows:
Debt securities, including restricted securities, are valued based on evaluated prices received from third party pricing vendors or from brokers who make markets in such securities. U.S. government and government agency obligations and other short-term securities are valued by pricing vendors who utilize matrix pricing which considers yield or price of bonds of comparable quality, coupon, maturity and type or by broker-supplied prices. When independent prices are unavailable or unreliable, debt securities may be valued utilizing pricing methodologies which consider similar factors that would be used by third party pricing vendors. Debt securities are generally categorized as Level 2 in the hierarchy but may be Level 3 depending on the circumstances.
Short-term securities with remaining maturities of sixty days or less may be valued at amortized cost, which approximates fair value, and are categorized as Level 2 in the hierarchy.
Securities held by a money market fund are generally high quality and liquid; however, they are reflected as Level 2 because the inputs used to determine fair value are not quoted prices in an active market.
The aggregate value of investments by input level as of May 31, 2022 is included at the end of the Fund's Schedule of Investments.
Investment Transactions and Income. Security transactions are accounted for as of trade date. Gains and losses on securities sold are determined on the basis of identified cost and include proceeds received from litigation. Interest income is accrued as earned and includes coupon interest and amortization of premium and accretion of discount on debt securities as applicable.
Expenses. Expenses directly attributable to a fund are charged to that fund. Expenses attributable to more than one fund are allocated among the respective funds on the basis of relative net assets or other appropriate methods. Expenses included in the accompanying financial statements reflect the expenses of that fund and do not include any expenses associated with any underlying mutual funds or exchange-traded funds. Although not included in a fund's expenses, a fund indirectly bears its proportionate share of these expenses through the net asset value of each underlying mutual fund or exchange-traded fund. Expense estimates are accrued in the period to which they relate and adjustments are made when actual amounts are known.
Income Tax Information and Distributions to Shareholders. Each year, the Fund intends to qualify as a regulated investment company under Subchapter M of the Internal Revenue Code, including distributing substantially all of its taxable income and realized gains. As a result, no provision for U.S. Federal income taxes is required. As of May 31, 2022, the Fund did not have any unrecognized tax benefits in the financial statements; nor is the Fund aware of any tax positions for which it is reasonably possible that the total amounts of unrecognized tax benefits will significantly change in the next twelve months. The Fund files a U.S. federal tax return, in addition to state and local tax returns as required. The Fund's federal income tax returns are subject to examination by the Internal Revenue Service (IRS) for a period of three fiscal years after they are filed. State and local tax returns may be subject to examination for an additional fiscal year depending on the jurisdiction.
Distributions are declared and recorded daily and paid monthly from net investment income. Distributions from realized gains, if any, are declared and recorded on the ex-dividend date. Income and capital gain distributions are determined in accordance with income tax regulations, which may differ from GAAP. In addition, the Fund claimed a portion of the payment made to redeeming shareholders as a distribution for income tax purposes.
Capital accounts within the financial statements are adjusted for permanent book-tax differences. These adjustments have no impact on net assets or the results of operations. Capital accounts are not adjusted for temporary book-tax differences which will reverse in a subsequent period.
Book-tax differences are primarily due to capital loss carryforwards.
As of period end, the cost and unrealized appreciation (depreciation) in securities for federal income tax purposes were as follows:
| Gross unrealized appreciation | $– |
| Gross unrealized depreciation | – |
| Net unrealized appreciation (depreciation) | $– |
| Tax Cost | $52,156,181,000 |
The tax-based components of distributable earnings as of period end were as follows:
| Undistributed ordinary income | $19,870 |
The tax character of distributions paid was as follows:
| | May 31, 2022 | May 31, 2021 |
| Ordinary Income | $82,097,806 | $ 41,834,911 |
Repurchase Agreements. Pursuant to an Exemptive Order issued by the Securities and Exchange Commission, funds and other registered investment companies having management contracts with Fidelity Management and Research Company LLC, or its affiliates are permitted to transfer uninvested cash balances into joint trading accounts which are then invested in repurchase agreements. Funds may also invest directly with institutions in repurchase agreements. Upon settlement date, collateral is held in segregated accounts with custodian banks and may be obtained in the event of a default of the counterparty. The collateral balance is monitored on a daily basis to ensure it is at least equal to the principal amount of the repurchase agreement (including accrued interest). In the event of a default by the counterparty, realization of the collateral proceeds could be delayed, during which time the value of the collateral may decline.
3. Fees and Other Transactions with Affiliates.
Management Fee and Expense Contract. Fidelity Management & Research Company LLC (the investment adviser) provides the Fund with investment management services. The Fund does not pay any fees for these services. Pursuant to the Fund's management contract, the investment adviser receives a monthly management fee that represents a portion of the management fees it receives from the Investing Funds. In addition, under an expense contract, the investment adviser also pays all other expenses of the Fund, excluding custody fees, the compensation of the independent Trustees, and certain miscellaneous expenses such as proxy and shareholder meeting expenses.
Interfund Lending Program. Pursuant to an Exemptive Order issued by the Securities and Exchange Commission (the SEC), the Fund, along with other registered investment companies having management contracts with FMR, or other affiliated entities of FMR, may participate in an interfund lending program. This program provides an alternative credit facility allowing the Fund to borrow from, or lend money to, other participating affiliated funds. Any open loans at period end are presented under the caption "Interfund Loans" in the Schedule of Investments with accrued interest included in Other affiliated receivables on the Statement of Assets and Liabilities. Activity in this program during the period for which loans were outstanding was as follows:
| | | Average Loan Balance | Weighted Average Interest Rate |
| Fidelity Cash Central Fund | Lender | 19,716,040 | .41% |
Interfund Trades. Funds may purchase from or sell securities to other Fidelity Funds under procedures adopted by the Board. The procedures have been designed to ensure these interfund trades are executed in accordance with Rule 17a-7 of the 1940 Act. During the period there were no interfund trades.
Other. During the period, the investment adviser reimbursed the Fund for certain losses as follows:
| | Amount ($) |
| Fidelity Cash Central Fund | 6,163 |
4. Expense Reductions.
Through arrangements with the Fund's custodian, credits realized as a result of certain uninvested cash balances were used to reduce the Fund's expenses by $11,271.
5. Other.
A fund's organizational documents provide former and current trustees and officers with a limited indemnification against liabilities arising in connection with the performance of their duties to the fund. In the normal course of business, a fund may also enter into contracts that provide general indemnifications. A fund's maximum exposure under these arrangements is unknown as this would be dependent on future claims that may be made against a fund. The risk of material loss from such claims is considered remote.
At the end of the period, mutual funds managed by the investment adviser or its affiliates were the owners of record of all of the outstanding shares of the Fund.
6. Coronavirus (COVID-19) Pandemic.
An outbreak of COVID-19 first detected in China during December 2019 has since spread globally and was declared a pandemic by the World Health Organization during March 2020. Developments that disrupt global economies and financial markets, such as the COVID-19 pandemic, may magnify factors that affect the Fund's performance.
Report of Independent Registered Public Accounting Firm
To the Board of Trustees of Fidelity Revere Street Trust and Shareholders of Fidelity Cash Central Fund
Opinion on the Financial Statements
We have audited the accompanying statement of assets and liabilities, including the schedule of investments, of Fidelity Cash Central Fund (one of the funds constituting Fidelity Revere Street Trust, referred to hereafter as the “Fund”) as of May 31, 2022, the related statement of operations for the year ended May 31, 2022, the statement of changes in net assets for each of the two years in the period ended May 31, 2022, including the related notes, and the financial highlights for each of the five years in the period ended May 31, 2022 (collectively referred to as the “financial statements”). In our opinion, the financial statements present fairly, in all material respects, the financial position of the Fund as of May 31, 2022, the results of its operations for the year then ended, the changes in its net assets for each of the two years in the period ended May 31, 2022 and the financial highlights for each of the five years in the period ended May 31, 2022 in conformity with accounting principles generally accepted in the United States of America.
Basis for Opinion
These financial statements are the responsibility of the Fund’s management. Our responsibility is to express an opinion on the Fund’s financial statements based on our audits. We are a public accounting firm registered with the Public Company Accounting Oversight Board (United States) (PCAOB) and are required to be independent with respect to the Fund in accordance with the U.S. federal securities laws and the applicable rules and regulations of the Securities and Exchange Commission and the PCAOB.
We conducted our audits of these financial statements in accordance with the standards of the PCAOB. Those standards require that we plan and perform the audit to obtain reasonable assurance about whether the financial statements are free of material misstatement, whether due to error or fraud.
Our audits included performing procedures to assess the risks of material misstatement of the financial statements, whether due to error or fraud, and performing procedures that respond to those risks. Such procedures included examining, on a test basis, evidence regarding the amounts and disclosures in the financial statements. Our audits also included evaluating the accounting principles used and significant estimates made by management, as well as evaluating the overall presentation of the financial statements. Our procedures included confirmation of securities owned as of May 31, 2022 by correspondence with the custodians and brokers. We believe that our audits provide a reasonable basis for our opinion.
/s/ PricewaterhouseCoopers LLP
Boston, Massachusetts
July 14, 2022
We have served as the auditor of one or more investment companies in the Fidelity group of funds since 1932.
Trustees and Officers
The Trustees, Members of the Advisory Board (if any), and officers of the trust and fund, as applicable, are listed below. The Board of Trustees governs the fund and is responsible for protecting the interests of shareholders. The Trustees are experienced executives who meet periodically throughout the year to oversee the fund's activities, review contractual arrangements with companies that provide services to the fund, oversee management of the risks associated with such activities and contractual arrangements, and review the fund's performance. Each of the Trustees oversees 299 funds.
The Trustees hold office without limit in time except that (a) any Trustee may resign; (b) any Trustee may be removed by written instrument, signed by at least two-thirds of the number of Trustees prior to such removal; (c) any Trustee who requests to be retired or who has become incapacitated by illness or injury may be retired by written instrument signed by a majority of the other Trustees; and (d) any Trustee may be removed at any special meeting of shareholders by a two-thirds vote of the outstanding voting securities of the trust. Each Trustee who is not an interested person (as defined in the 1940 Act) of the trust and the fund is referred to herein as an Independent Trustee. Each Independent Trustee shall retire not later than the last day of the calendar year in which his or her 75th birthday occurs. The Independent Trustees may waive this mandatory retirement age policy with respect to individual Trustees. Officers and Advisory Board Members hold office without limit in time, except that any officer or Advisory Board Member may resign or may be removed by a vote of a majority of the Trustees at any regular meeting or any special meeting of the Trustees. Except as indicated, each individual has held the office shown or other offices in the same company for the past five years.
The fund’s Statement of Additional Information (SAI) includes more information about the Trustees. To request a free copy, call Fidelity at 1-800-544-8544.
Experience, Skills, Attributes, and Qualifications of the Trustees. The Governance and Nominating Committee has adopted a statement of policy that describes the experience, qualifications, attributes, and skills that are necessary and desirable for potential Independent Trustee candidates (Statement of Policy). The Board believes that each Trustee satisfied at the time he or she was initially elected or appointed a Trustee, and continues to satisfy, the standards contemplated by the Statement of Policy. The Governance and Nominating Committee also engages professional search firms to help identify potential Independent Trustee candidates who have the experience, qualifications, attributes, and skills consistent with the Statement of Policy. From time to time, additional criteria based on the composition and skills of the current Independent Trustees, as well as experience or skills that may be appropriate in light of future changes to board composition, business conditions, and regulatory or other developments, have also been considered by the professional search firms and the Governance and Nominating Committee. In addition, the Board takes into account the Trustees' commitment and participation in Board and committee meetings, as well as their leadership of standing and ad hoc committees throughout their tenure.
In determining that a particular Trustee was and continues to be qualified to serve as a Trustee, the Board has considered a variety of criteria, none of which, in isolation, was controlling. The Board believes that, collectively, the Trustees have balanced and diverse experience, qualifications, attributes, and skills, which allow the Board to operate effectively in governing the fund and protecting the interests of shareholders. Information about the specific experience, skills, attributes, and qualifications of each Trustee, which in each case led to the Board's conclusion that the Trustee should serve (or continue to serve) as a trustee of the fund, is provided below.
Board Structure and Oversight Function. Abigail P. Johnson is an interested person and currently serves as Chairman. The Trustees have determined that an interested Chairman is appropriate and benefits shareholders because an interested Chairman has a personal and professional stake in the quality and continuity of services provided to the fund. Independent Trustees exercise their informed business judgment to appoint an individual of their choosing to serve as Chairman, regardless of whether the Trustee happens to be independent or a member of management. The Independent Trustees have determined that they can act independently and effectively without having an Independent Trustee serve as Chairman and that a key structural component for assuring that they are in a position to do so is for the Independent Trustees to constitute a substantial majority for the Board. The Independent Trustees also regularly meet in executive session. Michael E. Kenneally serves as Chairman of the Independent Trustees and as such (i) acts as a liaison between the Independent Trustees and management with respect to matters important to the Independent Trustees and (ii) with management prepares agendas for Board meetings.
Fidelity® funds are overseen by different Boards of Trustees. The fund's Board oversees Fidelity's investment-grade bond, money market, asset allocation and certain equity funds, and other Boards oversee Fidelity's high income and other equity funds. The asset allocation funds may invest in Fidelity® funds that are overseen by such other Boards. The use of separate Boards, each with its own committee structure, allows the Trustees of each group of Fidelity® funds to focus on the unique issues of the funds they oversee, including common research, investment, and operational issues. On occasion, the separate Boards establish joint committees to address issues of overlapping consequences for the Fidelity® funds overseen by each Board.
The Trustees operate using a system of committees to facilitate the timely and efficient consideration of all matters of importance to the Trustees, the fund, and fund shareholders and to facilitate compliance with legal and regulatory requirements and oversight of the fund's activities and associated risks. The Board, acting through its committees, has charged FMR and its affiliates with (i) identifying events or circumstances the occurrence of which could have demonstrably adverse effects on the fund's business and/or reputation; (ii) implementing processes and controls to lessen the possibility that such events or circumstances occur or to mitigate the effects of such events or circumstances if they do occur; and (iii) creating and maintaining a system designed to evaluate continuously business and market conditions in order to facilitate the identification and implementation processes described in (i) and (ii) above. Because the day-to-day operations and activities of the fund are carried out by or through FMR, its affiliates, and other service providers, the fund's exposure to risks is mitigated but not eliminated by the processes overseen by the Trustees. While each of the Board's committees has responsibility for overseeing different aspects of the fund's activities, oversight is exercised primarily through the Operations and Audit Committees. In addition, an ad hoc Board committee of Independent Trustees has worked with FMR to enhance the Board's oversight of investment and financial risks, legal and regulatory risks, technology risks, and operational risks, including the development of additional risk reporting to the Board. The Operations Committee also worked and continues to work with FMR to enhance the stress tests required under SEC regulations for money market funds. Appropriate personnel, including but not limited to the fund's Chief Compliance Officer (CCO), FMR's internal auditor, the independent accountants, the fund's Treasurer and portfolio management personnel, make periodic reports to the Board's committees, as appropriate, including an annual review of Fidelity's risk management program for the Fidelity® funds. The responsibilities of each standing committee, including their oversight responsibilities, are described further under "Standing Committees of the Trustees."
Interested Trustees*:
Correspondence intended for a Trustee who is an interested person may be sent to Fidelity Investments, 245 Summer Street, Boston, Massachusetts 02210.
Name, Year of Birth; Principal Occupations and Other Relevant Experience+
Abigail P. Johnson (1961)
Year of Election or Appointment: 2009
Trustee
Chairman of the Board of Trustees
Ms. Johnson also serves as Trustee of other Fidelity® funds. Ms. Johnson serves as Chairman (2016-present), Chief Executive Officer (2014-present), and Director (2007-present) of FMR LLC (diversified financial services company), President of Fidelity Financial Services (2012-present) and President of Personal, Workplace and Institutional Services (2005-present). Ms. Johnson is Chairman and Director of Fidelity Management & Research Company LLC (investment adviser firm, 2011-present). Previously, Ms. Johnson served as Chairman and Director of FMR Co., Inc. (investment adviser firm, 2011-2019), Vice Chairman (2007-2016) and President (2013-2016) of FMR LLC, President and a Director of Fidelity Management & Research Company (2001-2005), a Trustee of other investment companies advised by Fidelity Management & Research Company, Fidelity Investments Money Management, Inc. (investment adviser firm), and FMR Co., Inc. (2001-2005), Senior Vice President of the Fidelity® funds (2001-2005), and managed a number of Fidelity® funds. Ms. Abigail P. Johnson and Mr. Arthur E. Johnson are not related.
Jennifer Toolin McAuliffe (1959)
Year of Election or Appointment: 2016
Trustee
Ms. McAuliffe also serves as Trustee of other Fidelity® funds and as Trustee of Fidelity Charitable (2020-present). Previously, Ms. McAuliffe served as Co-Head of Fixed Income of Fidelity Investments Limited (now known as FIL Limited (FIL)) (diversified financial services company), Director of Research for FIL’s credit and quantitative teams in London, Hong Kong and Tokyo and Director of Research for taxable and municipal bonds at Fidelity Investments Money Management, Inc. Ms. McAuliffe previously served as a member of the Advisory Board of certain Fidelity® funds (2016). Ms. McAuliffe was previously a lawyer at Ropes & Gray LLP and currently serves as director or trustee of several not-for-profit entities.
* Determined to be an “Interested Trustee” by virtue of, among other things, his or her affiliation with the trust or various entities under common control with FMR.
+ The information includes the Trustee's principal occupation during the last five years and other information relating to the experience, attributes, and skills relevant to the Trustee's qualifications to serve as a Trustee, which led to the conclusion that the Trustee should serve as a Trustee for the fund.
Independent Trustees:
Correspondence intended for an Independent Trustee may be sent to Fidelity Investments, P.O. Box 55235, Boston, Massachusetts 02205-5235.
Name, Year of Birth; Principal Occupations and Other Relevant Experience+
Elizabeth S. Acton (1951)
Year of Election or Appointment: 2013
Trustee
Ms. Acton also serves as Trustee of other Fidelity® funds. Prior to her retirement, Ms. Acton served as Executive Vice President, Finance (2011-2012), Executive Vice President, Chief Financial Officer (2002-2011) and Treasurer (2004-2005) of Comerica Incorporated (financial services). Prior to joining Comerica, Ms. Acton held a variety of positions at Ford Motor Company (1983-2002), including Vice President and Treasurer (2000-2002) and Executive Vice President and Chief Financial Officer of Ford Motor Credit Company (1998-2000). Ms. Acton currently serves as a member of the Board and Audit and Finance Committees of Beazer Homes USA, Inc. (homebuilding, 2012-present). Ms. Acton previously served as a member of the Advisory Board of certain Fidelity® funds (2013-2016).
Ann E. Dunwoody (1953)
Year of Election or Appointment: 2018
Trustee
General Dunwoody also serves as Trustee of other Fidelity® funds. General Dunwoody (United States Army, Retired) was the first woman in U.S. military history to achieve the rank of four-star general and prior to her retirement in 2012 held a variety of positions within the U.S. Army, including Commanding General, U.S. Army Material Command (2008-2012). General Dunwoody currently serves as President of First to Four LLC (leadership and mentoring services, 2012-present), a member of the Board and Nomination and Corporate Governance Committees of Kforce Inc. (professional staffing services, 2016-present) and a member of the Board of Automattic Inc. (software engineering, 2018-present). Previously, General Dunwoody served as a member of the Advisory Board and Nominating and Corporate Governance Committee of L3 Technologies, Inc. (communication, electronic, sensor and aerospace systems, 2013-2019) and a member of the Board and Audit and Sustainability and Corporate Responsibility Committees of Republic Services, Inc. (waste collection, disposal and recycling, 2013-2016). Ms. Dunwoody also serves on several boards for non-profit organizations, including as a member of the Board, Chair of the Nomination and Governance Committee and a member of the Audit Committee of Logistics Management Institute (consulting non-profit, 2012-present), a member of the Council of Trustees for the Association of the United States Army (advocacy non-profit, 2013-present), a member of the Board of Florida Institute of Technology (2015-present) and a member of the Board of ThanksUSA (military family education non-profit, 2014-present). General Dunwoody previously served as a member of the Advisory Board of certain Fidelity® funds (2018).
John Engler (1948)
Year of Election or Appointment: 2014
Trustee
Mr. Engler also serves as Trustee of other Fidelity® funds. Previously, Mr. Engler served as Governor of Michigan (1991-2003), President of the Business Roundtable (2011-2017) and interim President of Michigan State University (2018-2019). Mr. Engler currently serves as a member of the Board of Stride, Inc. (formerly K12 Inc.) (technology-based education company, 2012-present). Previously, Mr. Engler served as a member of the Board of Universal Forest Products (manufacturer and distributor of wood and wood-alternative products, 2003-2019) and Trustee of The Munder Funds (2003-2014). Mr. Engler previously served as a member of the Advisory Board of certain Fidelity® funds (2014-2016).
Robert F. Gartland (1951)
Year of Election or Appointment: 2010
Trustee
Mr. Gartland also serves as Trustee of other Fidelity® funds. Prior to his retirement, Mr. Gartland held a variety of positions at Morgan Stanley (financial services, 1979-2007), including Managing Director (1987-2007) and Chase Manhattan Bank (1975-1978). Mr. Gartland previously served as Chairman and an investor in Gartland & Mellina Group Corp. (consulting, 2009-2019), as a member of the Board of National Securities Clearing Corporation (1993-1996) and as Chairman of TradeWeb (2003-2004).
Arthur E. Johnson (1947)
Year of Election or Appointment: 2008
Trustee
Mr. Johnson also serves as Trustee of other Fidelity® funds. Prior to his retirement, Mr. Johnson served as Senior Vice President of Corporate Strategic Development of Lockheed Martin Corporation (defense contractor, 1999-2009). Mr. Johnson currently serves as a member of the Board of Booz Allen Hamilton (management consulting, 2011-present). Mr. Johnson previously served as a member of the Board of Eaton Corporation plc (diversified power management, 2009-2019) and a member of the Board of AGL Resources, Inc. (holding company, 2002-2016). Mr. Johnson previously served as Chairman (2018-2021) and Vice Chairman (2015-2018) of the Independent Trustees of certain Fidelity® funds. Mr. Arthur E. Johnson is not related to Ms. Abigail P. Johnson.
Michael E. Kenneally (1954)
Year of Election or Appointment: 2009
Trustee
Chairman of the Independent Trustees
Mr. Kenneally also serves as Trustee of other Fidelity® funds and was Vice Chairman (2018-2021) of the Independent Trustees of certain Fidelity® funds. Prior to retirement in 2005, he was Chairman and Global Chief Executive Officer of Credit Suisse Asset Management, the worldwide fund management and institutional investment business of Credit Suisse Group. Previously, Mr. Kenneally was an Executive Vice President and the Chief Investment Officer for Bank of America. In this role, he was responsible for the investment management, strategy and products delivered to the bank’s institutional, high-net-worth and retail clients. Earlier, Mr. Kenneally directed the organization’s equity and quantitative research groups. He began his career as a research analyst and then spent more than a dozen years as a portfolio manager for endowments, pension plans and mutual funds. He earned the Chartered Financial Analyst (CFA) designation in 1991.
Marie L. Knowles (1946)
Year of Election or Appointment: 2001
Trustee
Ms. Knowles also serves as Trustee of other Fidelity® funds. Prior to her retirement, Ms. Knowles held several positions at Atlantic Richfield Company (diversified energy), including Executive Vice President and Chief Financial Officer (1996-2000), Senior Vice President (1993-1996) and President of ARCO Transportation Company (pipeline and tanker operations, 1993-1996). Ms. Knowles currently serves as a member of the Board of the Santa Catalina Island Company (real estate, 2009-present), a member of the Investment Company Institute Board of Governors and a member of the Governing Council of the Independent Directors Council (2014-present). Ms. Knowles also serves as a member of the Advisory Board for the School of Engineering of the University of Southern California. Ms. Knowles previously served as a member of the Board of McKesson Corporation (healthcare service, 2002-2021). In addition, Ms. Knowles previously served as Chairman (2015-2018) and Vice Chairman (2012-2015) of the Independent Trustees of certain Fidelity® funds.
Mark A. Murray (1954)
Year of Election or Appointment: 2016
Trustee
Mr. Murray also serves as Trustee of other Fidelity® funds. Previously, Mr. Murray served as Co-Chief Executive Officer (2013-2016), President (2006-2013) and Vice Chairman (2013-2020) of Meijer, Inc. Mr. Murray serves as a member of the Board (2009-present) and Public Policy and Responsibility Committee (2009-present) and Chair of the Nuclear Review Committee (2019-present) of DTE Energy Company (diversified energy company). Mr. Murray previously served as a member of the Board of Spectrum Health (not-for-profit health system, 2015-2019) and as a member of the Board and Audit Committee and Chairman of the Nominating and Corporate Governance Committee of Universal Forest Products, Inc. (manufacturer and distributor of wood and wood-alternative products, 2004-2016). Mr. Murray also serves as a member of the Board of many community and professional organizations. Mr. Murray previously served as a member of the Advisory Board of certain Fidelity® funds (2016).
+ The information includes the Trustee's principal occupation during the last five years and other information relating to the experience, attributes, and skills relevant to the Trustee's qualifications to serve as a Trustee, which led to the conclusion that the Trustee should serve as a Trustee for the fund.
Advisory Board Members and Officers:
Correspondence intended for an officer may be sent to Fidelity Investments, 245 Summer Street, Boston, Massachusetts 02210. Officers appear below in alphabetical order.
Name, Year of Birth; Principal Occupation
Robert W. Helm (1957)
Year of Election or Appointment: 2021
Member of the Advisory Board
Mr. Helm also serves as a Member of the Advisory Board of other Fidelity® funds. Mr. Helm was formerly Deputy Chairman (2003-2020), partner (1991-2020) and an associate (1984-1991) of Dechert LLP (formerly Dechert Price & Rhoads). Mr. Helm currently serves on boards and committees of several not-for-profit organizations.
Craig S. Brown (1977)
Year of Election or Appointment: 2019
Assistant Treasurer
Mr. Brown also serves as an officer of other funds. Mr. Brown serves as Assistant Treasurer of FIMM, LLC (2021-present) and is an employee of Fidelity Investments (2013-present).
John J. Burke III (1964)
Year of Election or Appointment: 2018
Chief Financial Officer
Mr. Burke also serves as Chief Financial Officer of other funds. Mr. Burke serves as Head of Investment Operations for Fidelity Fund and Investment Operations (2018-present) and is an employee of Fidelity Investments (1998-present). Previously Mr. Burke served as head of Asset Management Investment Operations (2012-2018).
David J. Carter (1973)
Year of Election or Appointment: 2020
Assistant Secretary
Mr. Carter also serves as Assistant Secretary of other funds. Mr. Carter serves as Senior Vice President, Deputy General Counsel (2022-present) and is an employee of Fidelity Investments (2005-present).
Jonathan Davis (1968)
Year of Election or Appointment: 2010
Assistant Treasurer
Mr. Davis also serves as an officer of other funds. Mr. Davis serves as Assistant Treasurer of FIMM, LLC (2021-present), FMR Capital, Inc. (2017-present), FD Funds GP LLC (2021-present), FD Funds Holding LLC (2021-present), and FD Funds Management LLC (2021-present); and is an employee of Fidelity Investments. Previously, Mr. Davis served as Vice President and Associate General Counsel of FMR LLC (diversified financial services company, 2003-2010).
Laura M. Del Prato (1964)
Year of Election or Appointment: 2018
President and Treasurer
Ms. Del Prato also serves as an officer of other funds. Ms. Del Prato serves as Assistant Treasurer of FIMM, LLC (2021-present) and is an employee of Fidelity Investments (2017-present). Previously, Ms. Del Prato served as President and Treasurer of The North Carolina Capital Management Trust: Cash Portfolio and Term Portfolio (2018-2020). Prior to joining Fidelity Investments, Ms. Del Prato served as a Managing Director and Treasurer of the JPMorgan Mutual Funds (2014-2017). Prior to JPMorgan, Ms. Del Prato served as a partner at Cohen Fund Audit Services (accounting firm, 2012-2013) and KPMG LLP (accounting firm, 2004-2012).
Colm A. Hogan (1973)
Year of Election or Appointment: 2016
Assistant Treasurer
Mr. Hogan also serves as an officer of other funds. Mr. Hogan serves as Assistant Treasurer of FIMM, LLC (2021-present) and FMR Capital, Inc. (2017-present) and is an employee of Fidelity Investments (2005-present). Previously, Mr. Hogan served as Deputy Treasurer of certain Fidelity® funds (2016-2020) and Assistant Treasurer of certain Fidelity® funds (2016-2018).
Cynthia Lo Bessette (1969)
Year of Election or Appointment: 2019
Secretary and Chief Legal Officer (CLO)
Ms. Lo Bessette also serves as an officer of other funds. Ms. Lo Bessette serves as CLO, Secretary, and Senior Vice President of Fidelity Management & Research Company LLC (investment adviser firm, 2019-present); CLO of Fidelity Management & Research (Hong Kong) Limited, FMR Investment Management (UK) Limited, and Fidelity Management & Research (Japan) Limited (investment adviser firms, 2019-present); Secretary of FD Funds GP LLC (2021-present), FD Funds Holding LLC (2021-present), and FD Funds Management LLC (2021-present); and Assistant Secretary of FIMM, LLC (2019-present). She is a Senior Vice President and Deputy General Counsel of FMR LLC (diversified financial services company, 2019-present), and is an employee of Fidelity Investments. Previously, Ms. Lo Bessette served as CLO, Secretary, and Senior Vice President of FMR Co., Inc. (investment adviser firm, 2019); Secretary of Fidelity SelectCo, LLC and Fidelity Investments Money Management, Inc. (investment adviser firms, 2019). Prior to joining Fidelity Investments, Ms. Lo Bessette was Executive Vice President, General Counsel (2016-2019) and Senior Vice President, Deputy General Counsel (2015-2016) of OppenheimerFunds (investment management company) and Deputy Chief Legal Officer (2013-2015) of Jennison Associates LLC (investment adviser firm).
Chris Maher (1972)
Year of Election or Appointment: 2013
Assistant Treasurer
Mr. Maher also serves as an officer of other funds. Mr. Maher serves as Assistant Treasurer of FIMM, LLC (2021-present) and FMR Capital, Inc. (2017-present), and is an employee of Fidelity Investments (2008-present). Previously, Mr. Maher served as Assistant Treasurer of certain funds (2013-2020); Vice President of Asset Management Compliance (2013), Vice President of the Program Management Group of FMR (investment adviser firm, 2010-2013), and Vice President of Valuation Oversight (2008-2010).
Jamie Pagliocco (1964)
Year of Election or Appointment: 2020
Vice President
Mr. Pagliocco also serves as Vice President of other funds. Mr. Pagliocco serves as President of Fixed Income (2020-present), and is an employee of Fidelity Investments (2001-present). Previously, Mr. Pagliocco served as Co-Chief Investment Officer – Bond (2017-2020), Global Head of Bond Trading (2016-2019), and as a portfolio manager.
Kenneth B. Robins (1969)
Year of Election or Appointment: 2020
Chief Compliance Officer
Mr. Robins also serves as an officer of other funds. Mr. Robins serves as Compliance Officer of Fidelity Management & Research Company LLC (investment adviser firm, 2016-present) and is an employee of Fidelity Investments (2004-present). Previously, Mr. Robins served as Compliance Officer of FMR Co., Inc. (investment adviser firm, 2016-2019), as Executive Vice President of Fidelity Investments Money Management, Inc. (investment adviser firm, 2013-2016) and served in other fund officer roles.
Brett Segaloff (1972)
Year of Election or Appointment: 2021
Anti-Money Laundering (AML) Officer
Mr. Segaloff also serves as an AML Officer of other funds and other related entities. He is Director, Anti-Money Laundering (2007-present) of FMR LLC (diversified financial services company) and is an employee of Fidelity Investments (1996-present).
Stacie M. Smith (1974)
Year of Election or Appointment: 2013
Assistant Treasurer
Ms. Smith also serves as an officer of other funds. Ms. Smith serves as Assistant Treasurer of FIMM, LLC (2021-present) and FMR Capital, Inc. (2017-present), is an employee of Fidelity Investments (2009-present), and has served in other fund officer roles. Prior to joining Fidelity Investments, Ms. Smith served as Senior Audit Manager of Ernst & Young LLP (accounting firm, 1996-2009). Previously, Ms. Smith served as Assistant Treasurer (2013-2019) and Deputy Treasurer (2013-2016) of certain Fidelity® funds.
Jim Wegmann (1979)
Year of Election or Appointment: 2021
Deputy Treasurer
Mr. Wegmann also serves as an officer of other funds. Mr. Wegmann serves as Assistant Treasurer of FIMM, LLC (2021-present) and is an employee of Fidelity Investments (2011-present). Previously, Mr. Wegmann served as Assistant Treasurer of certain Fidelity® funds (2019-2021).
Shareholder Expense Example
As a shareholder, you incur two types of costs: (1) transaction costs, which may include sales charges (loads) on purchase payments or redemption proceeds, as applicable and (2) ongoing costs, which generally include management fees, distribution and/or service (12b-1) fees and other Fund expenses. This Example is intended to help you understand your ongoing costs (in dollars) of investing in a fund and to compare these costs with the ongoing costs of investing in other mutual funds.
The Example is based on an investment of $1,000 invested at the beginning of the period and held for the entire period (December 1, 2021 to May 31, 2022).
Actual Expenses
The first line of the accompanying table provides information about actual account values and actual expenses. You may use the information in this line, together with the amount you invested, to estimate the expenses that you paid over the period. Simply divide your account value by $1,000.00 (for example, an $8,600 account value divided by $1,000.00 = 8.6), then multiply the result by the number in the first line for a class/Fund under the heading entitled "Expenses Paid During Period" to estimate the expenses you paid on your account during this period. If any fund is a shareholder of any underlying mutual funds or exchange-traded funds (ETFs) (the Underlying Funds), such fund indirectly bears its proportional share of the expenses of the Underlying Funds in addition to the direct expenses incurred presented in the table. These fees and expenses are not included in the annualized expense ratio used to calculate the expense estimate in the table below.
Hypothetical Example for Comparison Purposes
The second line of the accompanying table provides information about hypothetical account values and hypothetical expenses based on the actual expense ratio and an assumed rate of return of 5% per year before expenses, which is not the actual return. The hypothetical account values and expenses may not be used to estimate the actual ending account balance or expenses you paid for the period. You may use this information to compare the ongoing costs of investing in the Fund and other funds. To do so, compare this 5% hypothetical example with the 5% hypothetical examples that appear in the shareholder reports of the other funds. If any fund is a shareholder of any Underlying Funds, such fund indirectly bears its proportional share of the expenses of the Underlying Funds in addition to the direct expenses as presented in the table. These fees and expenses are not included in the annualized expense ratio used to calculate the expense estimate in the table below.
Please note that the expenses shown in the table are meant to highlight your ongoing costs only and do not reflect any transaction costs. Therefore, the second line of the table is useful in comparing ongoing costs only, and will not help you determine the relative total costs of owning different funds. In addition, if these transactional costs were included, your costs would have been higher.
| | Annualized Expense Ratio-A | Beginning
Account Value
December 1, 2021 | Ending
Account Value
May 31, 2022 | Expenses Paid
During Period-B
December 1, 2021
to May 31, 2022 |
| Fidelity Cash Central Fund | .0007% | | | |
| Actual | | $1,000.00 | $1,001.30 | $--C |
| Hypothetical-D | | $1,000.00 | $1,024.93 | $--C |
A Annualized expense ratio reflects expenses net of applicable fee waivers.
B Expenses are equal to the annualized expense ratio, multiplied by the average account value over the period, multiplied by 182/ 365 (to reflect the one-half year period). The fees and expenses of any Underlying Funds are not included in each annualized expense ratio.
C Amount represents less than $.00005.
D 5% return per year before expenses
Distributions (Unaudited)
The dividend and capital gains distributions for the fund(s) are available on Fidelity.com or Institutional.Fidelity.com.
A total of 4.43% of the dividends distributed during the fiscal year was derived from interest on U.S. Government securities which is generally exempt from state income tax.
The fund designates $34,324,935 of distributions paid in the calendar year 2021 as qualifying to be taxed as interest-related dividends for nonresident alien shareholders.
The fund designates $35,222,320 of distributions paid in the calendar year 2021 as qualifying to be taxed as section 163(j) interest dividends.
The fund will notify shareholders in January 2023 of amounts for use in preparing 2022 income tax returns.
TCC-ANN-0722
1.743118.122
Item 2.
Code of Ethics
As of the end of the period, May 31, 2022, Fidelity Revere Street Trust (the trust) has adopted a code of ethics, as defined in Item 2 of Form N-CSR, that applies to its President and Treasurer and its Chief Financial Officer. A copy of the code of ethics is filed as an exhibit to this Form N-CSR.
Item 3.
Audit Committee Financial Expert
The Board of Trustees of the trust has determined that Elizabeth S. Acton is an audit committee financial expert, as defined in Item 3 of Form N-CSR. Ms. Acton is independent for purposes of Item 3 of Form N-CSR.
Item 4.
Principal Accountant Fees and Services
Fees and Services
The following table presents fees billed by Deloitte & Touche LLP, the member firms of Deloitte Touche Tohmatsu, and their respective affiliates (collectively, “Deloitte Entities”) in each of the last two fiscal years for services rendered to Fidelity Tax-Free Cash Central Fund (the “Fund”):
Services Billed by Deloitte Entities
May 31, 2022 FeesA
| | | | |
| Audit Fees | Audit-Related Fees | Tax Fees | All Other Fees |
Fidelity Tax-Free Cash Central Fund | $29,900 | $- | $5,300 | $700 |
| | | | |
| Audit Fees | Audit-Related Fees | Tax Fees | All Other Fees |
Fidelity Tax-Free Cash Central Fund | $29,100 | $- | $5,100 | $700 |
A Amounts may reflect rounding.
The following table presents fees billed by PricewaterhouseCoopers LLP (“PwC”) in each of the last two fiscal years for services rendered to Fidelity Cash Central Fund,
Fidelity Municipal Cash Central Fund, and Fidelity Securities Lending Cash Central Fund (the “Funds”):
Services Billed by PwC
May 31, 2022 FeesA
| | | | |
| Audit Fees | Audit-Related Fees | Tax Fees | All Other Fees |
Fidelity Cash Central Fund | $36,300 | $2,900 | $2,000 | $1,300 |
Fidelity Municipal Cash Central Fund | $29,800 | $2,400 | $2,000 | $1,000 |
Fidelity Securities Lending Cash Central Fund | $36,300 | $2,900 | $2,000 | $1,300 |
| | | | |
| Audit Fees | Audit-Related Fees | Tax Fees | All Other Fees |
Fidelity Cash Central Fund | $35,300 | $2,900 | $1,900 | $1,400 |
Fidelity Municipal Cash Central Fund | $28,900 | $2,400 | $1,900 | $1,200 |
Fidelity Securities Lending Cash Central Fund | $35,300 | $2,900 | $1,900 | $1,400 |
A Amounts may reflect rounding.
The following table(s) present(s) fees billed by Deloitte Entities and PwC that were required to be approved by the Audit Committee for services that relate directly to the operations and financial reporting of the Fund(s) and that are rendered on behalf of Fidelity Management & Research Company LLC ("FMR") and entities controlling, controlled by, or under common control with FMR (not including any sub-adviser whose role is primarily portfolio management and is subcontracted with or overseen by another investment adviser) that provide ongoing services to the Fund(s) (“Fund Service Providers”):
Services Billed by Deloitte Entities
| | |
| May 31, 2022A | May 31, 2021A |
Audit-Related Fees | $- | $- |
Tax Fees | $- | $- |
All Other Fees | $- | $- |
A Amounts may reflect rounding.
Services Billed by PwC
| | |
| May 31, 2022A | May 31, 2021A |
Audit-Related Fees | $7,914,600 | $9,015,700 |
Tax Fees | $353,200 | $14,300 |
All Other Fees | $- | $- |
A Amounts may reflect rounding.
“Audit-Related Fees” represent fees billed for assurance and related services that are reasonably related to the performance of the fund audit or the review of the fund's financial statements and that are not reported under Audit Fees.
“Tax Fees” represent fees billed for tax compliance, tax advice or tax planning that relate directly to the operations and financial reporting of the fund.
“All Other Fees” represent fees billed for services provided to the fund or Fund Service Provider, a significant portion of which are assurance related, that relate directly to the operations and financial reporting of the fund, excluding those services that are reported under Audit Fees, Audit-Related Fees or Tax Fees.
Assurance services must be performed by an independent public accountant.
* * *
The aggregate non-audit fees billed by Deloitte Entities and PwC for services rendered to the Fund(s), FMR (not including any sub-adviser whose role is primarily portfolio management and is subcontracted with or overseen by another investment adviser), and any Fund Service Provider for each of the last two fiscal years of the Fund(s) are as follows:
| | |
Billed By | May 31, 2022A | May 31, 2021A |
Deloitte Entities | $463,600 | $527,400 |
PwC | $13,303,000 | $14,300,600 |
A Amounts may reflect rounding.
The trust's Audit Committee has considered non-audit services that were not pre-approved that were provided by Deloitte Entities and PwC to Fund Service Providers to be compatible with maintaining the independence of Deloitte Entities and PwC in its(their) audit of the Fund(s), taking into account representations from Deloitte Entities and PwC, in accordance with Public Company Accounting Oversight Board rules, regarding its independence from the Fund(s) and its(their) related entities and FMR’s review of the appropriateness and permissibility under applicable law of such non-audit services prior to their provision to the Fund(s) Service Providers.
Audit Committee Pre-Approval Policies and Procedures
The trust’s Audit Committee must pre-approve all audit and non-audit services provided by a fund’s independent registered public accounting firm relating to the operations or financial reporting of the fund. Prior to the commencement of any audit or non-audit services to a fund, the Audit Committee reviews the services to determine whether they are appropriate and permissible under applicable law.
The Audit Committee has adopted policies and procedures to, among other purposes, provide a framework for the Committee’s consideration of non-audit services by the audit firms that audit the Fidelity funds. The policies and procedures require that any non-audit service provided by a fund audit firm to a Fidelity fund and any non-audit service provided by a fund auditor to a Fund Service Provider that relates directly to the operations and financial reporting of a Fidelity fund (“Covered Service”) are subject to approval by the Audit Committee before such service is provided.
All Covered Services must be approved in advance of provision of the service either: (i) by formal resolution of the Audit Committee, or (ii) by oral or written approval of the service by the Chair of the Audit Committee (or if the Chair is unavailable, such other member of the Audit Committee as may be designated by the Chair to act in the Chair’s absence). The approval contemplated by (ii) above is permitted where the Treasurer determines that action on such an engagement is necessary before the next meeting of the Audit Committee.
Non-audit services provided by a fund audit firm to a Fund Service Provider that do not relate directly to the operations and financial reporting of a Fidelity fund are reported to the Audit Committee periodically.
Non-Audit Services Approved Pursuant to Rule 2-01(c)(7)(i)(C) and (ii) of Regulation S-X (“De Minimis Exception”)
There were no non-audit services approved or required to be approved by the Audit Committee pursuant to the De Minimis Exception during the Fund’s(s’) last two fiscal years relating to services provided to (i) the Fund(s) or (ii) any Fund Service Provider that relate directly to the operations and financial reporting of the Fund(s).
Item 5.
Audit Committee of Listed Registrants
Not applicable.
Item 6.
Investments
(a)
Not applicable.
(b)
Not applicable.
Item 7.
Disclosure of Proxy Voting Policies and Procedures for Closed-End Management Investment Companies
Not applicable.
Item 8.
Portfolio Managers of Closed-End Management Investment Companies
Not applicable.
Item 9.
Purchase of Equity Securities by Closed-End Management Investment Company and Affiliated Purchasers
Not applicable.
Item 10.
Submission of Matters to a Vote of Security Holders
There were no material changes to the procedures by which shareholders may recommend nominees to the trust’s Board of Trustees.
Item 11.
Controls and Procedures
(a)(i) The President and Treasurer and the Chief Financial Officer have concluded that the trust’s disclosure controls and procedures (as defined in Rule 30a-3(c) under the Investment Company Act) provide reasonable assurances that material information relating to the trust is made known to them by the appropriate persons, based on their evaluation of these controls and procedures as of a date within 90 days of the filing date of this report.
(a)(ii) There was no change in the trust’s internal control over financial reporting (as defined in Rule 30a-3(d) under the Investment Company Act) that occurred during the period covered by this report that has materially affected, or is reasonably likely to materially affect, the trust’s internal control over financial reporting.
Item 12.
Disclosure of Securities Lending Activities for Closed-End Management
Investment Companies
Not applicable.
Item 13.
Exhibits
SIGNATURES
Pursuant to the requirements of the Securities Exchange Act of 1934 and the Investment Company Act of 1940, the registrant has duly caused this report to be signed on its behalf by the undersigned, thereunto duly authorized.
Fidelity Revere Street Trust
| |
By: | /s/Laura M. Del Prato |
| Laura M. Del Prato |
| President and Treasurer |
|
|
Date: | July 21, 2022 |
Pursuant to the requirements of the Securities Exchange Act of 1934 and the Investment Company Act of 1940, this report has been signed below by the following persons on behalf of the registrant and in the capacities and on the dates indicated.
| |
By: | /s/Laura M. Del Prato |
| Laura M. Del Prato |
| President and Treasurer |
|
|
Date: | July 21, 2022 |
| |
By: | /s/John J. Burke III |
| John J. Burke III |
| Chief Financial Officer |
|
|
Date: | July 21, 2022 |