UNITED STATES
SECURITIES AND EXCHANGE COMMISSION
Washington, D.C. 20549
FORM N-CSR
CERTIFIED SHAREHOLDER REPORT OF REGISTERED
MANAGEMENT INVESTMENT COMPANIES
Investment Company Act file number 811-07807
Fidelity Revere Street Trust
(Exact name of registrant as specified in charter)
245 Summer St., Boston, Massachusetts 02210
(Address of principal executive offices) (Zip code)
Margaret Carey, Secretary
245 Summer St.
Boston, Massachusetts 02210
(Name and address of agent for service)
Registrant's telephone number, including area code:
617-563-7000
| |
Date of fiscal year end: | May 31 |
|
|
Date of reporting period: | May 31, 2024 |
Item 1.
Reports to Stockholders
| |
| | ANNUAL SHAREHOLDER REPORT | AS OF MAY 31, 2024 | |
| | Fidelity® Tax-Free Cash Central Fund Fidelity® Tax-Free Cash Central Fund true |
| | | |
This annual shareholder report contains information about Fidelity® Tax-Free Cash Central Fund for the period June 1, 2023 to May 31, 2024. You can find additional information about the Fund at fundresearch.fidelity.com/
prospectus/sec. You can also request this information by contacting us at 1-800-544-8544.
What were your Fund costs for the last year?(based on hypothetical $10,000 investment)
FUND COST (PREVIOUS YEAR)
| | Costs of a $10,000 investment | Costs paid as a percentage of a $10,000 investment | |
| Fidelity® Tax-Free Cash Central Fund | $ 0 A | 0.00%B | |
A Amount represents less than $.50
B Amount represents less than 0.005%
Key Fund Statistics (as of May 31, 2024)
KEY FACTS | | |
| Fund Size | $1,451,419,094 | |
| Number of Holdings | 226 | |
| Total Advisory Fee | $0 | |
What did the Fund invest in?
(as of May 31, 2024)
EFFECTIVE MATURITY DIVERSIFICATION (% of Fund's net assets) |
| Days |
| 1-7 | 99.9 | |
| |
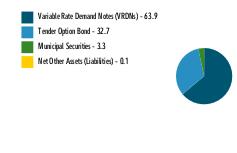
| Variable Rate Demand Notes (VRDNs) | 63.9 |
| Tender Option Bond | 32.7 |
| Municipal Securities | 3.3 |
| Net Other Assets (Liabilities) | 0.1 |
ASSET ALLOCATION (% of Fund's net assets) |
|
|
| Fidelity, the Fidelity Investments Logo and all other Fidelity trademarks or service marks used herein are trademarks or service marks of FMR LLC. Any third-party marks that are used herein are trademarks or service marks of their respective owners. © 2024 FMR LLC. All rights reserved. |
1.9913317.100 1335-TSRA-0724 | | For additional information about the Fund; including its prospectus, financial information, holdings and proxy information, scan the QR code or visit fundresearch.fidelity.com/prospectus/sec |
| |
| | ANNUAL SHAREHOLDER REPORT | AS OF MAY 31, 2024 | |
| | Fidelity® Cash Central Fund Fidelity® Cash Central Fund true |
| | | |
This annual shareholder report contains information about Fidelity® Cash Central Fund for the period June 1, 2023 to May 31, 2024. You can find additional information about the Fund at fundresearch.fidelity.com/
prospectus/sec. You can also request this information by contacting us at 1-800-544-8544.
What were your Fund costs for the last year?(based on hypothetical $10,000 investment)
FUND COST (PREVIOUS YEAR)
| | Costs of a $10,000 investment | Costs paid as a percentage of a $10,000 investment | |
| Fidelity® Cash Central Fund | $ 0 A | 0.00%B | |
A Amount represents less than $.50
B Amount represents less than 0.005%
Key Fund Statistics (as of May 31, 2024)
KEY FACTS | | |
| Fund Size | $48,411,595,900 | |
| Number of Holdings | 26 | |
| Total Advisory Fee | $0 | |
What did the Fund invest in?
(as of May 31, 2024)
EFFECTIVE MATURITY DIVERSIFICATION (% of Fund's net assets) |
| Days |
| 1-7 | 72.5 | |
| 8-30 | 12.1 | |
| 31-60 | 13.8 | |
| 61-90 | 1.7 | |
| 91-180 | 0.1 | |
| |
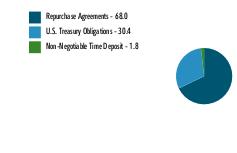
| Repurchase Agreements | 68.0 |
| U.S. Treasury Obligations | 30.4 |
| Non-Negotiable Time Deposit | 1.8 |
ASSET ALLOCATION (% of Fund's net assets) |
|
| Net Other Assets (Liabilities) - (0.2)% |
|
| Fidelity, the Fidelity Investments Logo and all other Fidelity trademarks or service marks used herein are trademarks or service marks of FMR LLC. Any third-party marks that are used herein are trademarks or service marks of their respective owners. © 2024 FMR LLC. All rights reserved. |
1.9913314.100 693-TSRA-0724 | | For additional information about the Fund; including its prospectus, financial information, holdings and proxy information, scan the QR code or visit fundresearch.fidelity.com/prospectus/sec |
| |
| | ANNUAL SHAREHOLDER REPORT | AS OF MAY 31, 2024 | |
| | Fidelity® Municipal Cash Central Fund Fidelity® Municipal Cash Central Fund true |
| | | |
This annual shareholder report contains information about Fidelity® Municipal Cash Central Fund for the period June 1, 2023 to May 31, 2024. You can find additional information about the Fund at fundresearch.fidelity.com/
prospectus/sec. You can also request this information by contacting us at 1-800-544-8544.
What were your Fund costs for the last year?(based on hypothetical $10,000 investment)
FUND COST (PREVIOUS YEAR)
| | Costs of a $10,000 investment | Costs paid as a percentage of a $10,000 investment | |
| Fidelity® Municipal Cash Central Fund | $ 0 A | 0.00%B | |
A Amount represents less than $.50
B Amount represents less than 0.005%
Key Fund Statistics (as of May 31, 2024)
KEY FACTS | | |
| Fund Size | $1,991,760,698 | |
| Number of Holdings | 269 | |
| Total Advisory Fee | $0 | |
What did the Fund invest in?
(as of May 31, 2024)
EFFECTIVE MATURITY DIVERSIFICATION (% of Fund's net assets) |
| Days |
| 1-7 | 98.3 | |
| |
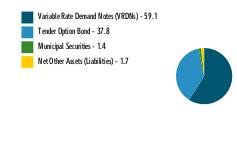
| Variable Rate Demand Notes (VRDNs) | 59.1 |
| Tender Option Bond | 37.8 |
| Municipal Securities | 1.4 |
| Net Other Assets (Liabilities) | 1.7 |
ASSET ALLOCATION (% of Fund's net assets) |
|
|
| Fidelity, the Fidelity Investments Logo and all other Fidelity trademarks or service marks used herein are trademarks or service marks of FMR LLC. Any third-party marks that are used herein are trademarks or service marks of their respective owners. © 2024 FMR LLC. All rights reserved. |
1.9913315.100 698-TSRA-0724 | | For additional information about the Fund; including its prospectus, financial information, holdings and proxy information, scan the QR code or visit fundresearch.fidelity.com/prospectus/sec |
| |
| | ANNUAL SHAREHOLDER REPORT | AS OF MAY 31, 2024 | |
| | Fidelity® Securities Lending Cash Central Fund Fidelity® Securities Lending Cash Central Fund true |
| | | |
This annual shareholder report contains information about Fidelity® Securities Lending Cash Central Fund for the period June 1, 2023 to May 31, 2024. You can find additional information about the Fund at fundresearch.fidelity.com/
prospectus/sec. You can also request this information by contacting us at 1-800-544-8544.
What were your Fund costs for the last year?(based on hypothetical $10,000 investment)
FUND COST (PREVIOUS YEAR)
| | Costs of a $10,000 investment | Costs paid as a percentage of a $10,000 investment | |
| Fidelity® Securities Lending Cash Central Fund | $ 0 A | 0.00%B | |
A Amount represents less than $.50
B Amount represents less than 0.005%
Key Fund Statistics (as of May 31, 2024)
KEY FACTS | | |
| Fund Size | $24,897,834,231 | |
| Number of Holdings | 26 | |
| Total Advisory Fee | $0 | |
What did the Fund invest in?
(as of May 31, 2024)
EFFECTIVE MATURITY DIVERSIFICATION (% of Fund's net assets) |
| Days |
| 1-7 | 70.0 | |
| 8-30 | 12.3 | |
| 31-60 | 15.2 | |
| 61-90 | 1.8 | |
| 91-180 | 0.1 | |
| |
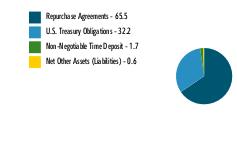
| Repurchase Agreements | 65.5 |
| U.S. Treasury Obligations | 32.2 |
| Non-Negotiable Time Deposit | 1.7 |
| Net Other Assets (Liabilities) | 0.6 |
ASSET ALLOCATION (% of Fund's net assets) |
|
|
| Fidelity, the Fidelity Investments Logo and all other Fidelity trademarks or service marks used herein are trademarks or service marks of FMR LLC. Any third-party marks that are used herein are trademarks or service marks of their respective owners. © 2024 FMR LLC. All rights reserved. |
1.9913316.100 761-TSRA-0724 | | For additional information about the Fund; including its prospectus, financial information, holdings and proxy information, scan the QR code or visit fundresearch.fidelity.com/prospectus/sec |
Item 2.
Code of Ethics
As of the end of the period, May 31, 2024, Fidelity Revere Street Trust (the trust) has adopted a code of ethics, as defined in Item 2 of Form N-CSR, that applies to its President and Treasurer and its Chief Financial Officer. A copy of the code of ethics is filed as an exhibit to this Form N-CSR.
Item 3.
Audit Committee Financial Expert
The Board of Trustees of the trust has determined that Elizabeth S. Acton is an audit committee financial expert, as defined in Item 3 of Form N-CSR. Ms. Acton is independent for purposes of Item 3 of Form N-CSR.
Item 4.
Principal Accountant Fees and Services
Fees and Services
The following table presents fees billed by Deloitte & Touche LLP, the member firms of Deloitte Touche Tohmatsu, and their respective affiliates (collectively, “Deloitte Entities”) in each of the last two fiscal years for services rendered to Fidelity Tax-Free Cash Central Fund (the “Fund”):
Services Billed by Deloitte Entities
May 31, 2024 FeesA
| | | | |
| Audit Fees | Audit-Related Fees | Tax Fees | All Other Fees |
Fidelity Tax-Free Cash Central Fund | $30,300 | $- | $5,600 | $700 |
| | | | |
| Audit Fees | Audit-Related Fees | Tax Fees | All Other Fees |
Fidelity Tax-Free Cash Central Fund | $30,400 | $- | $5,600 | $700 |
A Amounts may reflect rounding.
The following table presents fees billed by PricewaterhouseCoopers LLP (“PwC”) in each of the last two fiscal years for services rendered to Fidelity Cash Central Fund,
Fidelity Municipal Cash Central Fund, and Fidelity Securities Lending Cash Central Fund (the “Funds”):
Services Billed by PwC
May 31, 2024 FeesA
| | | | |
| Audit Fees | Audit-Related Fees | Tax Fees | All Other Fees |
Fidelity Cash Central Fund | $39,700 | $2,900 | $2,100 | $1,200 |
Fidelity Municipal Cash Central Fund | $31,100 | $2,400 | $2,100 | $1,000 |
Fidelity Securities Lending Cash Central Fund | $39,000 | $2,900 | $2,100 | $1,200 |
| | | | |
| Audit Fees | Audit-Related Fees | Tax Fees | All Other Fees |
Fidelity Cash Central Fund | $38,800 | $2,900 | $2,100 | $1,300 |
Fidelity Municipal Cash Central Fund | $31,100 | $2,400 | $2,100 | $1,000 |
Fidelity Securities Lending Cash Central Fund | $38,600 | $2,900 | $2,100 | $1,300 |
A Amounts may reflect rounding.
The following table(s) present(s) fees billed by Deloitte Entities and PwC that were required to be approved by the Audit Committee for services that relate directly to the operations and financial reporting of the Fund(s) and that are rendered on behalf of Fidelity Management & Research Company LLC ("FMR") and entities controlling, controlled by, or under common control with FMR (not including any sub-adviser whose role is primarily portfolio management and is subcontracted with or overseen by another investment adviser) that provide ongoing services to the Fund(s) (“Fund Service Providers”):
Services Billed by Deloitte Entities
| | |
| May 31, 2024A | May 31, 2023A |
Audit-Related Fees | $200,000 | $80,000 |
Tax Fees | $- | $- |
All Other Fees | $935,000 | $- |
A Amounts may reflect rounding.
Services Billed by PwC
| | |
| May 31, 2024A | May 31, 2023A |
Audit-Related Fees | $9,367,800 | $8,604,200 |
Tax Fees | $61,000 | $1,000 |
All Other Fees | $- | $- |
A Amounts may reflect rounding.
“Audit-Related Fees” represent fees billed for assurance and related services that are reasonably related to the performance of the fund audit or the review of the fund's financial statements and that are not reported under Audit Fees.
“Tax Fees” represent fees billed for tax compliance, tax advice or tax planning that relate directly to the operations and financial reporting of the fund.
“All Other Fees” represent fees billed for services provided to the fund or Fund Service Provider, a significant portion of which are assurance related, that relate directly to the operations and financial reporting of the fund, excluding those services that are reported under Audit Fees, Audit-Related Fees or Tax Fees.
Assurance services must be performed by an independent public accountant.
* * *
The aggregate non-audit fees billed by Deloitte Entities and PwC for services rendered to the Fund(s), FMR (not including any sub-adviser whose role is primarily portfolio management and is subcontracted with or overseen by another investment adviser), and any Fund Service Provider for each of the last two fiscal years of the Fund(s) are as follows:
| | |
Billed By | May 31, 2024A | May 31, 2023A |
Deloitte Entities | $5,165,800 | $2,054,300 |
PwC | $14,881,300 | $14,076,100 |
A Amounts may reflect rounding.
The trust's Audit Committee has considered non-audit services that were not pre-approved that were provided by Deloitte Entities and PwC to Fund Service Providers to be compatible with maintaining the independence of Deloitte Entities and PwC in its(their) audit of the Fund(s), taking into account representations from Deloitte Entities and PwC, in accordance with Public Company Accounting Oversight Board rules, regarding its independence from the Fund(s) and its(their) related entities and FMR’s review of the appropriateness and permissibility under applicable law of such non-audit services prior to their provision to the Fund(s) Service Providers.
Audit Committee Pre-Approval Policies and Procedures
The trust’s Audit Committee must pre-approve all audit and non-audit services provided by a fund’s independent registered public accounting firm relating to the operations or financial reporting of the fund. Prior to the commencement of any audit or non-audit services to a fund, the Audit Committee reviews the services to determine whether they are appropriate and permissible under applicable law.
The Audit Committee has adopted policies and procedures to, among other purposes, provide a framework for the Committee’s consideration of non-audit services by the audit firms that audit the Fidelity funds. The policies and procedures require that any non-audit service provided by a fund audit firm to a Fidelity fund and any non-audit service provided by a fund auditor to a Fund Service Provider that relates directly to the operations and financial reporting of a Fidelity fund (“Covered Service”) are subject to approval by the Audit Committee before such service is provided.
All Covered Services must be approved in advance of provision of the service either: (i) by formal resolution of the Audit Committee, or (ii) by oral or written approval of the service by the Chair of the Audit Committee (or if the Chair is unavailable, such other member of the Audit Committee as may be designated by the Chair to act in the Chair’s absence). The approval contemplated by (ii) above is permitted where the Treasurer determines that action on such an engagement is necessary before the next meeting of the Audit Committee.
Non-audit services provided by a fund audit firm to a Fund Service Provider that do not relate directly to the operations and financial reporting of a Fidelity fund are reported to the Audit Committee periodically.
Non-Audit Services Approved Pursuant to Rule 2-01(c)(7)(i)(C) and (ii) of Regulation S-X (“De Minimis Exception”)
There were no non-audit services approved or required to be approved by the Audit Committee pursuant to the De Minimis Exception during the Fund’s(s’) last two fiscal years relating to services provided to (i) the Fund(s) or (ii) any Fund Service Provider that relate directly to the operations and financial reporting of the Fund(s).
Item 5.
Audit Committee of Listed Registrants
Not applicable.
Item 6.
Investments
(a)
Not applicable.
(b)
Not applicable.
Item 7.
Financial Statements and Financial Highlights for Open-End Management Investment Companies
Fidelity® Tax-Free Cash Central Fund
Annual Report
May 31, 2024
Contents
To view a fund's proxy voting guidelines and proxy voting record for the 12-month period ended June 30, visit http://www.fidelity.com/proxyvotingresults or visit the Securities and Exchange Commission's (SEC) web site at http://www.sec.gov.
You may also call 1-800-544-8544 to request a free copy of the proxy voting guidelines.
Standard & Poor's, S&P and S&P 500 are registered service marks of The McGraw-Hill Companies, Inc. and have been licensed for use by Fidelity Distributors Corporation.
Other third-party marks appearing herein are the property of their respective owners.
All other marks appearing herein are registered or unregistered trademarks or service marks of FMR LLC or an affiliated company. © 2024 FMR LLC. All rights reserved.
A fund files its complete schedule of portfolio holdings with the SEC for the first and third quarters of each fiscal year on Form N-PORT. Forms N-PORT are available on the SEC's web site at http://www.sec.gov. A fund's Forms N-PORT may be reviewed and copied at the SEC's Public Reference Room in Washington, DC. Information regarding the operation of the SEC's Public Reference Room may be obtained by calling 1-800-SEC-0330.
Item 7: Financial Statements and Financial Highlights for Open-End Management Investment Companies (Annual Report)
Fidelity® Tax-Free Cash Central Fund
Schedule of Investments May 31, 2024
Showing Percentage of Net Assets
| Variable Rate Demand Note - 63.9% |
| | | Principal Amount (a) | Value ($) |
| Alabama - 3.5% | | | |
| Columbia Indl. Dev. Board Poll. Cont. Rev. (Alabama Pwr. Co. Proj.): | | | |
| Series 2014 A, 3.85% 6/3/24, VRDN (b) | | 9,755,000 | 9,755,000 |
| Series 2014 B, 3.85% 6/3/24, VRDN (b) | | 14,335,000 | 14,335,000 |
| Mobile Downtown Redev. Auth. Gulf Opportunity Zone Series 2011 A, 3.35% 6/7/24, LOC Bank of America NA, VRDN (b)(c) | | 21,810,000 | 21,810,000 |
| Mobile Indl. Dev. Board Solid Waste Disp. Rev. (Alabama Pwr. Co. Barry Plant Proj.) Second Series 2009, 3.8% 6/3/24, VRDN (b) | | 4,700,000 | 4,700,000 |
TOTAL ALABAMA | | | 50,600,000 |
| Arizona - 1.2% | | | |
| Arizona Indl. Dev. Auth. Hosp. Rev.: | | | |
| Series 2019 A, 3.7% 6/3/24, LOC TD Banknorth, NA, VRDN (b) | | 8,000,000 | 8,000,000 |
| Series 2019 B, 3.7% 6/3/24, LOC TD Banknorth, NA, VRDN (b) | | 3,000,000 | 3,000,000 |
| Maricopa County Poll. Cont. Rev.: | | | |
| Series 2009 B, 3.62% 6/7/24, VRDN (b) | | 200,000 | 200,000 |
| Series 2009 C, 3.6% 6/7/24, VRDN (b) | | 5,900,000 | 5,900,000 |
TOTAL ARIZONA | | | 17,100,000 |
| Connecticut - 3.5% | | | |
| Connecticut Gen. Oblig. Series 2016 C, 3.41% 6/7/24 (Liquidity Facility Bank of America NA), VRDN (b) | | 15,985,000 | 15,985,000 |
| Connecticut Health & Edl. Facilities Auth. Rev. Series 2013 O, 3.55% 6/7/24, VRDN (b) | | 31,600,000 | 31,600,000 |
| Connecticut Hsg. Fin. Auth. Series 2012 C2, 3.36% 6/7/24 (Liquidity Facility Sumitomo Mitsui Banking Corp.), VRDN (b) | | 2,395,000 | 2,395,000 |
TOTAL CONNECTICUT | | | 49,980,000 |
| Delaware - 0.0% | | | |
| Delaware Econ. Dev. Auth. Rev. (Delmarva Pwr. & Lt. Co. Proj.) Series 1993 C, 3.48% 6/7/24, VRDN (b) | | 500,000 | 500,000 |
| District Of Columbia - 0.1% | | | |
| FHLMC District of Columbia Hsg. Fin. Agcy. Multi-family Hsg. Rev. (Park 7 at Minnesota Benning Proj.) Series 2012, 3.39% 6/7/24, LOC Freddie Mac, VRDN (b) | | 1,895,000 | 1,895,000 |
| Florida - 0.6% | | | |
| Escambia County Solid Waste Disp. Rev. (Gulf Pwr. Co. Proj.) Series 2009, 3.5% 6/7/24, VRDN (b) | | 1,200,000 | 1,200,000 |
| Jacksonville Poll. Cont. Rev. (Florida Pwr. & Lt. Co. Proj.) Series 1995, 3.55% 6/7/24, VRDN (b) | | 2,500,000 | 2,500,000 |
| Palm Beach County Rev. (Raymond F. Kravis Ctr. Proj.) Series 2002, 3.38% 6/7/24, LOC Northern Trust Co., VRDN (b) | | 2,750,000 | 2,750,000 |
| FNMA Florida Hsg. Fin. Corp. Multi-family Mtg. Rev. (Mariner's Cay Apts. Proj.) Series 2008 M, 3.41% 6/7/24, LOC Fannie Mae, VRDN (b) | | 2,850,000 | 2,850,000 |
TOTAL FLORIDA | | | 9,300,000 |
| Georgia - 2.4% | | | |
| Burke County Indl. Dev. Auth. Poll. Cont. Rev. (Georgia Pwr. Co. Plant Vogtle Proj.): | | | |
| First Series 2009, 4% 6/3/24, VRDN (b) | | 1,100,000 | 1,100,000 |
| Series 2018, 4.05% 6/3/24, VRDN (b) | | 7,600,000 | 7,600,000 |
| Heard County Dev. Auth. Poll. Cont. Rev. (Georgia Pwr. Co. Plant Wansley Proj.) First Series 1997, 3.92% 6/3/24, VRDN (b) | | 15,800,000 | 15,800,000 |
| Monroe County Dev. Auth. Poll. Cont. Rev.: | | | |
| (Georgia Pwr. Co. Plant Scherer Proj.) Series 2008, 4% 6/3/24, VRDN (b) | | 7,900,000 | 7,900,000 |
| (Gulf Pwr. Co. Plant Scherer Proj.) Series 2010, 3.45% 6/7/24, VRDN (b) | | 500,000 | 500,000 |
| Series 2002 V1, 3.45% 6/7/24, VRDN (b) | | 1,900,000 | 1,900,000 |
TOTAL GEORGIA | | | 34,800,000 |
| Illinois - 1.0% | | | |
| Illinois Dev. Fin. Auth. Rev. (Glenwood School for Boys Proj.) Series 1998, 3.48% 6/7/24, LOC Northern Trust Co., VRDN (b) | | 700,000 | 700,000 |
| Illinois Fin. Auth. Series 2021 B, 3.65% 6/3/24 (Liquidity Facility Royal Bank of Canada), VRDN (b) | | 12,395,000 | 12,395,000 |
| Illinois Fin. Auth. Rev. Series 2018, 3.6% 6/3/24, LOC PNC Bank NA, VRDN (b) | | 1,635,000 | 1,635,000 |
TOTAL ILLINOIS | | | 14,730,000 |
| Indiana - 2.7% | | | |
| Indiana Fin. Auth. Health Sys. Rev. (Sisters of Saint Francis Health Svcs., Inc. Obligated Group Proj.): | | | |
| Series 2008 I, 3.7% 6/3/24, LOC Barclays Bank PLC, VRDN (b) | | 6,000,000 | 6,000,000 |
| Series 2008 J, 3.7% 6/3/24, LOC Barclays Bank PLC, VRDN (b) | | 16,215,000 | 16,215,000 |
| Indiana Fin. Auth. Hosp. Rev. (Parkview Health Sys. Oblig. Group Proj.) Series 2009 D, 3.7% 6/3/24, LOC TD Banknorth, NA, VRDN (b) | | 11,700,000 | 11,700,000 |
| Indiana Fin. Auth. Rev. (Ascension Health Proj.) Series 2008 E4, 3.25% 6/7/24, VRDN (b) | | 1,300,000 | 1,300,000 |
| Indiana Muni. Pwr. Agcy. Pwr. Supply Sys. Rev. Series B, 3.7% 6/3/24, LOC U.S. Bank NA, Cincinnati, VRDN (b) | | 4,100,000 | 4,100,000 |
TOTAL INDIANA | | | 39,315,000 |
| Iowa - 1.1% | | | |
| Iowa Fin. Auth. Health Facilities Rev. Series 2013 B1, 3.7% 6/3/24, LOC TD Banknorth, NA, VRDN (b) | | 3,400,000 | 3,400,000 |
| Iowa Fin. Auth. Midwestern Disaster Area Rev. (ADM Proj.) Series 2011, 3.4% 6/7/24, VRDN (b) | | 3,100,000 | 3,100,000 |
| Iowa Fin. Auth. Poll. Cont. Facility Rev. (Midamerican Energy Proj.) Series 2016 A, 3.44% 6/7/24, VRDN (b) | | 6,800,000 | 6,800,000 |
| Iowa Fin. Auth. Rev. (Trinity Health Sys. Proj.) Series 2000 D, 3.26% 6/7/24, VRDN (b) | | 3,230,000 | 3,230,000 |
TOTAL IOWA | | | 16,530,000 |
| Kansas - 3.8% | | | |
| Cygne Poll. Cont. Rev. (Kansas Gas and Elec. Co. Proj.) Series 1994 B, 3.55% 6/7/24, VRDN (b) | | 3,040,000 | 3,040,000 |
| Burlington Envir. Impt. Rev. (Kansas City Pwr. and Lt. Co. Proj.): | | | |
| Series 2007 A, 3.52% 6/7/24, VRDN (b) | | 4,200,000 | 4,200,000 |
| Series 2007 B, 3.52% 6/7/24, VRDN (b) | | 2,650,000 | 2,650,000 |
| Kansas Dev. Fin. Auth. Health Facilities Rev. (KU Health Sys. Proj.) Series 2011 J, 3.7% 6/3/24, LOC U.S. Bank NA, Cincinnati, VRDN (b) | | 18,530,000 | 18,530,000 |
| St. Mary's Kansas Poll. Cont. Rev.: | | | |
| (Kansas Gas and Elec. Co. Proj.) Series 1994, 3.55% 6/7/24, VRDN (b) | | 900,000 | 900,000 |
| Series 1994, 3.55% 6/7/24, VRDN (b) | | 11,600,000 | 11,600,000 |
| Univ. of Kansas Hosp. Auth. Health Facilities Rev. (KU Health Sys. Proj.) Series 2004, 3.7% 6/3/24, LOC U.S. Bank NA, Cincinnati, VRDN (b) | | 9,110,000 | 9,110,000 |
| Wamego Kansas Poll. Cont. Rfdg. Rev.: | | | |
| (Kansas Gas & Elec. Co. Proj.) Series 1994, 3.55% 6/7/24, VRDN (b) | | 1,600,000 | 1,600,000 |
| (Western Resources, Inc. Proj.) Series 1994, 3.55% 6/7/24, VRDN (b) | | 4,100,000 | 4,100,000 |
TOTAL KANSAS | | | 55,730,000 |
| Louisiana - 6.8% | | | |
| East Baton Rouge Parish Indl. Dev. Board Rev. (ExxonMobil Proj.) Series 2010 A, 3.67% 6/3/24 (Exxon Mobil Corp. Guaranteed), VRDN (b) | | 42,460,000 | 42,460,000 |
| Louisiana Gas & Fuel Tax Rev.: | | | |
| Series 2023 A1, 4% 6/3/24, LOC Toronto-Dominion Bank, VRDN (b) | | 5,560,000 | 5,560,000 |
| Series 2023 A2, 3.7% 6/3/24, LOC Toronto-Dominion Bank, VRDN (b) | | 13,300,000 | 13,300,000 |
| Louisiana Pub. Facilities Auth. Rev.: | | | |
| (Air Products & Chemicals, Inc. Proj.): | | | |
Series 2007, 3.6% 6/3/24, VRDN (b) | | 2,000,000 | 2,000,000 |
Series 2008 A, 3.7% 6/3/24, VRDN (b) | | 20,380,000 | 20,380,000 |
| (Christus Health Proj.) Series 2008 B, 3.4% 6/7/24, VRDN (b) | | 10,200,000 | 10,200,000 |
| Saint James Parish Gen. Oblig. (Nucor Steel Louisiana LLC Proj.): | | | |
| Series 2010 A1, 3.58% 6/7/24, VRDN (b) | | 950,000 | 950,000 |
| Series 2010 B1, 3.65% 6/7/24, VRDN (b) | | 3,100,000 | 3,100,000 |
TOTAL LOUISIANA | | | 97,950,000 |
| Maryland - 0.1% | | | |
| Montgomery County Hsg. Opportunities Commission Multi-family Hsg. Rev. Series 2011 A, 3.36% 6/7/24, LOC TD Banknorth, NA, VRDN (b) | | 1,365,000 | 1,365,000 |
| Massachusetts - 0.6% | | | |
| Massachusetts Dev. Fin. Agcy. Rev. Series 2024 U1, 3.7% 6/3/24, LOC TD Banknorth, NA, VRDN (b) | | 8,870,000 | 8,870,000 |
| Michigan - 3.5% | | | |
| Kent Hosp. Fin. Auth. Hosp. Facilities Rev. (Spectrum Health Sys. Proj.) Series 2008 B3, 3.3% 6/7/24 (Liquidity Facility Wells Fargo Bank NA), VRDN (b) | | 17,700,000 | 17,700,000 |
| Michigan Strategic Fund Ltd. Oblig. Rev.: | | | |
| (Air Products and Chemicals, Inc. Proj.) Series 2007 V1, 3.7% 6/3/24, VRDN (b) | | 31,810,000 | 31,810,000 |
| (The Kroger Co. Recovery Zone Facilities Bond Proj.) Series 2010, 3.4% 6/7/24, LOC Bank of Nova Scotia, VRDN (b) | | 700,000 | 700,000 |
| FHLMC Livonia Econ. Dev. Corp. (Madonna Univ. Proj.) Series 2009, 3.38% 6/7/24, LOC Fed. Home Ln. Bank Chicago, VRDN (b) | | 995,000 | 995,000 |
TOTAL MICHIGAN | | | 51,205,000 |
| Minnesota - 0.5% | | | |
| Minneapolis Health Care Sys. Rev. (Fairview Health Svcs.) Series 2018 C, 3.57% 6/3/24, LOC Wells Fargo Bank NA, VRDN (b) | | 6,815,000 | 6,815,000 |
| Mississippi - 2.5% | | | |
| Mississippi Bus. Fin. Corp.: | | | |
| (Chevron U.S.A., Inc. Proj.) Series 2007 C: | | | |
3.67% 6/3/24 (Chevron Corp. Guaranteed), VRDN (b) | | 4,405,000 | 4,405,000 |
3.67% 6/3/24 (Chevron Corp. Guaranteed), VRDN (b) | | 16,195,000 | 16,195,000 |
| Series 2011 G, 3.67% 6/3/24, VRDN (b) | | 16,315,000 | 16,315,000 |
TOTAL MISSISSIPPI | | | 36,915,000 |
| Missouri - 0.5% | | | |
| Missouri Health & Edl. Facilities Auth. Rev. Series 2008 C5, 3.45% 6/7/24, VRDN (b) | | 7,450,000 | 7,450,000 |
| New Hampshire - 0.2% | | | |
| Nat'l. Fin. Auth. N H Health C Series 2024 C, 3.47% 6/7/24, LOC Truist Bank, VRDN (b) | | 2,600,000 | 2,600,000 |
| New York - 12.7% | | | |
| New York City Gen. Oblig.: | | | |
| Series 2013 A2, 3.7% 6/3/24 (Liquidity Facility Mizuho Corporate Bank Ltd.), VRDN (b) | | 2,365,000 | 2,365,000 |
| Series 2014 D4, 3.7% 6/3/24, LOC TD Banknorth, NA, VRDN (b) | | 1,700,000 | 1,700,000 |
| Series 2017 B-4 & B-5, 3.7% 6/3/24 (Liquidity Facility Barclays Bank PLC), VRDN (b) | | 16,235,000 | 16,235,000 |
| Series 2019 D, 3.7% 6/3/24 (Liquidity Facility State Street Bank & Trust Co., Boston), VRDN (b) | | 11,800,000 | 11,800,000 |
| Series 2022 A4, 3.7% 6/3/24 (Liquidity Facility The Toronto-Dominion Bank), VRDN (b) | | 4,185,000 | 4,185,000 |
| Series 2023 A, 3.7% 6/3/24 (Liquidity Facility Bank of Montreal), VRDN (b) | | 28,020,000 | 28,020,000 |
| New York City Muni. Wtr. Fin. Auth. Wtr. & Swr. Sys. Rev.: | | | |
| Series 2009 BB2, 3.67% 6/3/24 (Liquidity Facility UBS AG), VRDN (b) | | 2,400,000 | 2,400,000 |
| Series 2011 DD-3B, 3.8% 6/3/24 (Liquidity Facility State Street Bank & Trust Co., Boston), VRDN (b) | | 4,600,000 | 4,600,000 |
| Series 2014 AA: | | | |
3.55% 6/3/24 (Liquidity Facility Mizuho Corporate Bank Ltd.), VRDN (b) | | 10,560,000 | 10,560,000 |
3.7% 6/3/24 (Liquidity Facility Mizuho Corporate Bank Ltd.), VRDN (b) | | 4,100,000 | 4,100,000 |
3.7% 6/3/24 (Liquidity Facility TD Banknorth, NA), VRDN (b) | | 2,405,000 | 2,405,000 |
| Series 2015 BB4, 3.7% 6/3/24 (Liquidity Facility Barclays Bank PLC), VRDN (b) | | 3,235,000 | 3,235,000 |
| Series 2016 BB2, 3.67% 6/3/24 (Liquidity Facility State Street Bank & Trust Co., Boston), VRDN (b) | | 1,490,000 | 1,490,000 |
| Series 2017 BB, 3.8% 6/3/24 (Liquidity Facility State Street Bank & Trust Co., Boston), VRDN (b) | | 8,900,000 | 8,900,000 |
| Series 2021 EE2, 3.8% 6/3/24 (Liquidity Facility State Street Bank & Trust Co., Boston), VRDN (b) | | 10,200,000 | 10,200,000 |
| Series 2023 CC, 3.7% 6/3/24 (Liquidity Facility Barclays Bank PLC), VRDN (b) | | 3,070,000 | 3,070,000 |
| New York City Transitional Fin. Auth. Rev.: | | | |
| Series 2011 A4 3.7% 6/3/24 (Liquidity Facility Barclays Bank PLC), VRDN (b) | | 1,750,000 | 1,750,000 |
| Series 2015 A3, 3.73% 6/3/24 (Liquidity Facility Mizuho Corporate Bank Ltd.), VRDN (b) | | 9,350,000 | 9,350,000 |
| Series 2015 A4, 3.67% 6/3/24 (Liquidity Facility Mizuho Corporate Bank Ltd.), VRDN (b) | | 3,315,000 | 3,315,000 |
| Series 2019 C4, 3.7% 6/3/24 (Liquidity Facility Barclays Bank PLC), VRDN (b) | | 12,935,000 | 12,935,000 |
| Series B5, 3.8% 6/3/24 (Liquidity Facility U.S. Bank NA, Cincinnati), VRDN (b) | | 19,800,000 | 19,800,000 |
| New York Dorm. Auth. Rev. Series 2019 B, 3.8% 6/3/24 (Liquidity Facility U.S. Bank NA, Cincinnati), VRDN (b) | | 10,400,000 | 10,400,000 |
| New York Metropolitan Trans. Auth. Rev. Series 2015 E1, 3.7% 6/3/24, LOC Barclays Bank PLC, VRDN (b) | | 6,900,000 | 6,900,000 |
| Triborough Bridge & Tunnel Auth. Revs. Series 2005 B, 3.8% 6/3/24, LOC U.S. Bank NA, Cincinnati, VRDN (b) | | 4,600,000 | 4,600,000 |
TOTAL NEW YORK | | | 184,315,000 |
| North Carolina - 0.6% | | | |
| Charlotte-Mecklenburg Hosp. Auth. Health Care Sys. Rev. Series 2007 E, 3.7% 6/3/24, LOC TD Banknorth, NA, VRDN (b) | | 8,205,000 | 8,205,000 |
| Ohio - 4.1% | | | |
| Allen County Hosp. Facilities Rev. (Catholic Healthcare Partners Proj.) Series 2010 C, 3.65% 6/3/24, LOC Bank of Montreal, VRDN (b) | | 100,000 | 100,000 |
| Cuyahoga County Health Care Facilities Rev. (The A.M. McGregor Home Proj.) Series 2014, 3.4% 6/7/24, LOC Northern Trust Co., VRDN (b) | | 2,065,000 | 2,065,000 |
| Ohio Hosp. Facilities Rev. Series 2019 D2, 3.55% 6/7/24, VRDN (b) | | 57,690,000 | 57,690,000 |
TOTAL OHIO | | | 59,855,000 |
| Oregon - 1.8% | | | |
| Oregon Facilities Auth. Rev. Series 2018 B, 3.7% 6/3/24, LOC TD Banknorth, NA, VRDN (b) | | 26,170,000 | 26,170,000 |
| Pennsylvania - 1.1% | | | |
| Delaware County Indl. Dev. Auth. Arpt. Facilities Rev. (United Parcel Svc. Proj.) Series 2015, 3.75% 6/3/24, VRDN (b) | | 9,800,000 | 9,800,000 |
| Lancaster County Hosp. Auth. Health Ctr. Rev. (Masonic Homes Proj.) Series 2008 D, 3.67% 6/3/24, LOC JPMorgan Chase Bank, VRDN (b) | | 3,080,000 | 3,080,000 |
| Lancaster Indl. Dev. Auth. Rev. (Willow Valley Retirement Proj.) Series 2009 B, 3.4% 6/7/24, LOC PNC Bank NA, VRDN (b) | | 1,500,000 | 1,500,000 |
| Philadelphia Auth. for Indl. Dev. Rev. (The Franklin Institute Proj.) Series 2006, 3.45% 6/7/24, LOC Bank of America NA, VRDN (b) | | 1,240,000 | 1,240,000 |
| FNMA Montgomery County Redev. Auth. Multi-family Hsg. Rev. (Kingswood Apts. Proj.) Series 2001 A, 3.39% 6/7/24, LOC Fannie Mae, VRDN (b) | | 700,000 | 700,000 |
TOTAL PENNSYLVANIA | | | 16,320,000 |
| Rhode Island - 0.5% | | | |
| Rhode Island Indl. Facilities Corp. Marine Term. Rev. (Exxon Mobil Corp. Proj.) Series 2001, 3.67% 6/3/24 (Exxon Mobil Corp. Guaranteed), VRDN (b) | | 7,000,000 | 7,000,000 |
| South Carolina - 0.3% | | | |
| South Carolina Jobs-Econ. Dev. Auth. Series B, 3.7% 6/3/24, LOC TD Banknorth, NA, VRDN (b) | | 4,500,000 | 4,500,000 |
| Tennessee - 0.6% | | | |
| Blount County Pub. Bldg. Auth. Series D3A, 3.75% (b) | | 100,000 | 100,000 |
| Clarksville Pub. Bldg. Auth. Rev. (Tennessee Muni. Bond Fund Proj.): | | | |
| Series 2003, 3.8% 6/3/24, LOC Bank of America NA, VRDN (b) | | 5,380,000 | 5,380,000 |
| Series 2008, 3.8% 6/3/24, LOC Bank of America NA, VRDN (b) | | 2,670,000 | 2,670,000 |
TOTAL TENNESSEE | | | 8,150,000 |
| Texas - 5.2% | | | |
| Harris County Hosp. District Rev. Series 2010, 3.39% 6/7/24, LOC JPMorgan Chase Bank, VRDN (b) | | 2,900,000 | 2,900,000 |
| Houston Util. Sys. Rev.: | | | |
| Series 2004 B4, 3.36% 6/7/24 (Liquidity Facility JPMorgan Chase Bank), VRDN (b) | | 3,100,000 | 3,100,000 |
| Series 2004 B5, 3.36% 6/7/24 (Liquidity Facility UBS AG), VRDN (b) | | 11,000,000 | 11,000,000 |
| Series 2004 B6, 3.36% 6/7/24, LOC Sumitomo Mitsui Banking Corp., VRDN (b) | | 2,900,000 | 2,900,000 |
| Lower Neches Valley Auth. Indl. Dev. Corp. Rev. (ExxonMobil Proj.): | | | |
| Series 2010, 3.7% 6/3/24 (Exxon Mobil Corp. Guaranteed), VRDN (b) | | 9,310,000 | 9,310,000 |
| Series 2011, 3.69% 6/3/24 (Exxon Mobil Corp. Guaranteed), VRDN (b) | | 1,180,000 | 1,180,000 |
| Series 2012, 3.69% 6/3/24 (Exxon Mobil Corp. Guaranteed), VRDN (b) | | 2,930,000 | 2,930,000 |
| Port Arthur Navigation District Indl. Dev. Corp. Exempt Facilities Rev. (Air Products Proj.): | | | |
| Series 2005, 3.7% 6/3/24 (Air Products & Chemicals, Inc. Guaranteed), VRDN (b) | | 5,800,000 | 5,800,000 |
| Series 2012, 3.7% 6/7/24 (TotalEnergies SE Guaranteed), VRDN (b) | | 4,300,000 | 4,300,000 |
| Tarrant County Cultural Ed. Facilities Fin. Corp. Hosp. Rev.: | | | |
| (Baylor Health Care Sys. Proj.) Series 2011 C, 3.7% 6/3/24, LOC TD Banknorth, NA, VRDN (b) | | 20,820,000 | 20,820,000 |
| (Methodist Hospitals of Dallas Proj.) Series 2008, 3.7% 6/3/24, LOC TD Banknorth, NA, VRDN (b) | | 3,775,000 | 3,775,000 |
| Texas Gen. Oblig.: | | | |
| Series 2013 A, 3.45% 6/7/24 (Liquidity Facility State Street Bank & Trust Co., Boston), VRDN (b) | | 2,300,000 | 2,300,000 |
| Series 2014 A, 3.45% 6/7/24 (Liquidity Facility State Street Bank & Trust Co., Boston), VRDN (b) | | 2,925,000 | 2,925,000 |
| Series 2015 A, 3.45% 6/7/24 (Liquidity Facility State Street Bank & Trust Co., Boston), VRDN (b) | | 1,500,000 | 1,500,000 |
TOTAL TEXAS | | | 74,740,000 |
| Utah - 0.6% | | | |
| Emery County Poll. Cont. Rev. (PacifiCorp Proj.) Series 1994, 3.85% 6/7/24, VRDN (b) | | 8,200,000 | 8,200,000 |
| Virginia - 0.1% | | | |
| Harrisonburg Econ. Dev. A Series 2023, 3.25% 6/7/24, LOC U.S. Bank NA, Cincinnati, VRDN (b) | | 1,000,000 | 1,000,000 |
| Washington - 0.0% | | | |
| FHLMC Washington Hsg. Fin. Commission Multi-family Hsg. Rev. (Interurban Sr. Living Apts. Proj.) Series 2012, 3.45% 6/7/24, LOC Freddie Mac, VRDN (b) | | 300,000 | 300,000 |
| West Virginia - 0.1% | | | |
| West Virginia Hosp. Fin. Auth. Hosp. Rev. Series A, 3.46% 6/7/24, LOC Truist Bank, VRDN (b) | | 1,990,000 | 1,990,000 |
| Wisconsin - 1.6% | | | |
| Wisconsin Health & Edl. Facilities Series 2021 B, 3.75% 6/3/24 (Liquidity Facility U.S. Bank NA, Cincinnati), VRDN (b) | | 22,840,000 | 22,840,000 |
| TOTAL VARIABLE RATE DEMAND NOTE (Cost $927,235,000) | | | 927,235,000 |
| | | | |
| Tender Option Bond - 32.6% |
| | | Principal Amount (a) | Value ($) |
| Alabama - 0.9% | | | |
| Black Belt Energy Gas District Participating VRDN Series XM 11 27, 3.75% 6/3/24 (Liquidity Facility JPMorgan Chase Bank) (b)(d)(e) | | 2,800,000 | 2,800,000 |
| Huntsville Hosp. Participating VRDN Series XG 03 84, 3.4% 6/7/24 (Liquidity Facility Bank of America NA) (b)(d)(e) | | 1,910,000 | 1,910,000 |
| Infirmary Health Systems Spl. Care Facilities Fing. Auth. Rev. Participating VRDN Series 50 44, 3.7% 6/3/24 (Liquidity Facility JPMorgan Chase Bank) (b)(d)(e) | | 6,225,000 | 6,225,000 |
| Southeast Energy Auth. Rev. Participating VRDN Series ZL 05 21, 3.41% 6/7/24 (Liquidity Facility Royal Bank of Canada) (b)(d)(e) | | 2,500,000 | 2,500,000 |
TOTAL ALABAMA | | | 13,435,000 |
| Arizona - 0.4% | | | |
| Arizona Indl. Dev. Auth. Hosp. Rev. Participating VRDN Series XM 10 13, 3.48% 6/7/24 (Liquidity Facility JPMorgan Chase Bank) (b)(d)(e) | | 375,000 | 375,000 |
| Jefferson County Ala Board Ed. Pubs Participating VRDN Series YX 13 19, 3.4% 6/7/24 (Liquidity Facility Barclays Bank PLC) (b)(d)(e) | | 2,025,000 | 2,025,000 |
| Mesa Util. Sys. Rev. Participating VRDN Series Solar 17 0026, 3.41% 6/7/24 (Liquidity Facility U.S. Bank NA, Cincinnati) (b)(d)(e) | | 3,505,000 | 3,505,000 |
TOTAL ARIZONA | | | 5,905,000 |
| Colorado - 0.1% | | | |
| Colorado Health Facilities Auth. Rev. Bonds Participating VRDN Series XG 04 91, 3.39% 6/7/24 (Liquidity Facility Royal Bank of Canada) (b)(d)(e) | | 1,730,000 | 1,730,000 |
| Connecticut - 0.7% | | | |
| Connecticut Gen. Oblig. Participating VRDN: | | | |
| Series Floaters 014, 3.4% 6/7/24 (Liquidity Facility Barclays Bank PLC) (b)(d)(e) | | 4,840,000 | 4,840,000 |
| Series Floaters 016, 3.4% 6/7/24 (Liquidity Facility Barclays Bank PLC) (b)(d)(e) | | 5,400,000 | 5,400,000 |
TOTAL CONNECTICUT | | | 10,240,000 |
| District Of Columbia - 0.1% | | | |
| Metropolitan Washington Arpts. Auth. Dulles Toll Road Rev. Participating VRDN: | | | |
| Series XF 08 53, 3.4% 6/7/24 (Liquidity Facility Toronto-Dominion Bank) (b)(d)(e) | | 835,000 | 835,000 |
| Series XG 02 67, 3.41% 6/7/24 (Liquidity Facility Bank of America NA) (b)(d)(e) | | 25,000 | 25,000 |
TOTAL DISTRICT OF COLUMBIA | | | 860,000 |
| Florida - 1.7% | | | |
| Broward County Convention Ctr. Participating VRDN Series XF 16 41, 3.46% 6/7/24 (Liquidity Facility JPMorgan Chase Bank) (b)(d)(e) | | 2,300,000 | 2,300,000 |
| County of Broward Tourist Dev. Tax Rev. Participating VRDN Series XL 04 29, 3.47% 6/7/24 (Liquidity Facility Wells Fargo Bank NA) (b)(d)(e) | | 300,000 | 300,000 |
| Florida Dev. Fin. Corp. Healthcare Facility Rev. Participating VRDN Series XG 05 49, 3.7% 6/3/24 (Liquidity Facility JPMorgan Chase Bank) (b)(d)(e) | | 3,100,000 | 3,100,000 |
| Miami-Dade County Expressway Auth. Participating VRDN Series Floaters XG 02 52, 3.41% 6/7/24 (Liquidity Facility Bank of America NA) (b)(d)(e) | | 1,300,000 | 1,300,000 |
| Miami-Dade County Wtr. & Swr. Rev. Participating VRDN Series XF 31 22, 3.39% 6/7/24 (Liquidity Facility Barclays Bank PLC) (b)(d)(e) | | 4,280,000 | 4,280,000 |
| Pittsburg WTSW Participating VRDN Series 2022, 3.7% 6/3/24 (Liquidity Facility JPMorgan Chase Bank) (b)(d)(e) | | 4,770,000 | 4,770,000 |
| South Miami Health Facilities Auth. Hosp. Rev. Participating VRDN Series YX 12 86, 3.43% 6/7/24 (Liquidity Facility Barclays Bank PLC) (b)(d)(e) | | 2,400,000 | 2,400,000 |
| Volusia County Fla Hosp. Rev. Participating VRDN Series 50 32, 3.7% 6/3/24 (Liquidity Facility JPMorgan Chase Bank) (b)(d)(e) | | 6,100,000 | 6,100,000 |
TOTAL FLORIDA | | | 24,550,000 |
| Georgia - 1.4% | | | |
| Brookhaven Dev. Auth. Rev. Participating VRDN Series XF 15 03, 4.15% 6/3/24 (Liquidity Facility JPMorgan Chase Bank) (b)(d)(e) | | 11,430,000 | 11,430,000 |
| Burke County Indl. Dev. Auth. Poll. Cont. Rev. Participating VRDN Series E 155, 3.4% 6/7/24 (Liquidity Facility Royal Bank of Canada) (b)(d)(e) | | 1,000,000 | 1,000,000 |
| Fulton County Dev. Auth. Rev. Participating VRDN Series XL 02 68, 3.46% 6/7/24 (Liquidity Facility Bank of America NA) (b)(d)(e) | | 630,000 | 630,000 |
| Georgia Muni. Elec. Auth. Pwr. Rev. Participating VRDN: | | | |
| Series XF 15 54, 3.4% 6/7/24 (Liquidity Facility Toronto-Dominion Bank) (b)(d)(e) | | 300,000 | 300,000 |
| Series XG 04 70, 3.41% 6/7/24 (Liquidity Facility Bank of America NA) (b)(d)(e) | | 500,000 | 500,000 |
| Series XG 04 72, 3.4% 6/7/24 (Liquidity Facility Toronto-Dominion Bank) (b)(d)(e) | | 2,500,000 | 2,500,000 |
| Main Street Natural Gas, Inc. Participating VRDN: | | | |
| Series XF 16 01, 3.39% 6/7/24 (Liquidity Facility Royal Bank of Canada) (b)(d)(e) | | 1,000,000 | 1,000,000 |
| Series XG 04 89, 3.39% 6/7/24 (Liquidity Facility Royal Bank of Canada) (b)(d)(e) | | 2,710,000 | 2,710,000 |
| Muni. Elec. Auth. of Georgia Participating VRDN Series XG 02 54, 3.41% 6/7/24 (Liquidity Facility Bank of America NA) (b)(d)(e) | | 250,000 | 250,000 |
TOTAL GEORGIA | | | 20,320,000 |
| Illinois - 3.9% | | | |
| Chicago Gen. Oblig. Participating VRDN: | | | |
| Series 2022 XF 30 45, 3.4% 6/7/24 (Liquidity Facility Barclays Bank PLC) (b)(d)(e) | | 1,900,000 | 1,900,000 |
| Series Floaters XL 01 05, 3.4% 6/7/24 (Liquidity Facility Barclays Bank PLC) (b)(d)(e) | | 600,000 | 600,000 |
| Series XX 12 64, 3.4% 6/7/24 (Liquidity Facility Barclays Bank PLC) (b)(d)(e) | | 4,300,000 | 4,300,000 |
| Chicago Transit Auth. Participating VRDN Series XG 04 87, 3.39% 6/7/24 (Liquidity Facility Royal Bank of Canada) (b)(d)(e) | | 3,660,000 | 3,660,000 |
| Illinois Fin. Auth. Participating VRDN: | | | |
| Series BAML 50 45, 3.44% 6/7/24 (Liquidity Facility Bank of America NA) (b)(d)(e) | | 9,000,000 | 9,000,000 |
| Series BAML 50 47, 3.44% 6/7/24 (Liquidity Facility Bank of America NA) (b)(d)(e) | | 13,435,000 | 13,435,000 |
| Series XG 04 31, 3.4% 6/7/24 (Liquidity Facility Barclays Bank PLC) (b)(d)(e) | | 1,500,000 | 1,500,000 |
| Illinois Gen. Oblig. Participating VRDN: | | | |
| Series XL 02 60, 3.4% 6/7/24 (Liquidity Facility Barclays Bank PLC) (b)(d)(e) | | 1,200,000 | 1,200,000 |
| Series XM 07 59, 3.41% 6/7/24 (Liquidity Facility Bank of America NA) (b)(d)(e) | | 390,000 | 390,000 |
| Series XM 10 48, 3.41% 6/7/24 (Liquidity Facility Bank of America NA) (b)(d)(e) | | 1,800,000 | 1,800,000 |
| Series XM 10 49, 3.41% 6/7/24 (Liquidity Facility Bank of America NA) (b)(d)(e) | | 250,000 | 250,000 |
| Metropolitan Pier & Exposition Participating VRDN Series Floaters XF 10 45, 3.48% 6/7/24 (Liquidity Facility Barclays Bank PLC) (b)(d)(e) | | 400,000 | 400,000 |
| Pittsburg WTSW Participating VRDN Series 2023, 3.73% 6/3/24 (Liquidity Facility JPMorgan Chase Bank) (b)(d)(e) | | 7,900,000 | 7,900,000 |
| RBC Muni. Products, Inc. Trust Participating VRDN Series 2023, 3.41% 6/7/24 (Liquidity Facility Royal Bank of Canada) (b)(d)(e) | | 9,900,000 | 9,900,000 |
TOTAL ILLINOIS | | | 56,235,000 |
| Kansas - 0.1% | | | |
| Wyandotte County/Kansas City Unified Govt. Util. Sys. Rev. Participating VRDN Series YX 12 23, 3.4% 6/7/24 (Liquidity Facility Barclays Bank PLC) (b)(d)(e) | | 2,040,000 | 2,040,000 |
| Kentucky - 0.4% | | | |
| CommonSpirit Health Participating VRDN Series MIZ 90 21, 3.46% 6/7/24 (Liquidity Facility Mizuho Cap. Markets LLC) (b)(d)(e) | | 700,000 | 700,000 |
| Kentucky State Property & Buildings Commission Rev. Participating VRDN Series XG 0113, 3.4% 6/7/24 (Liquidity Facility Barclays Bank PLC) (b)(d)(e) | | 5,600,000 | 5,600,000 |
TOTAL KENTUCKY | | | 6,300,000 |
| Louisiana - 1.0% | | | |
| Louisiana Pub. Facilities Auth. Rev. Participating VRDN Series Floater BAML 5041 D1, 3.89% 6/3/24 (Liquidity Facility Bank of America NA) (b)(d)(e) | | 15,200,000 | 15,200,000 |
| Maryland - 0.3% | | | |
| Maryland Stadium Auth. Rev. Participating VRDN Series 2023, 3.39% 6/7/24 (Liquidity Facility Royal Bank of Canada) (b)(d)(e) | | 3,800,000 | 3,800,000 |
| Michigan - 6.4% | | | |
| Eastern Michigan Univ. Revs. Participating VRDN Series Floater 046, 3.75% 6/3/24 (Liquidity Facility Barclays Bank PLC) (b)(d)(e) | | 37,250,000 | 37,250,000 |
| Mclaren Health Care Corp. Participating VRDN Series XL 02 71, 3.46% 6/7/24 (Liquidity Facility Bank of America NA) (b)(d)(e) | | 365,000 | 365,000 |
| Michigan Fin. Auth. Rev. Participating VRDN: | | | |
| Series XF 07 82, 3.39% 6/7/24 (Liquidity Facility JPMorgan Chase Bank) (b)(d)(e) | | 935,000 | 935,000 |
| Series XF 16 67, 3.39% 6/7/24 (Liquidity Facility Royal Bank of Canada) (b)(d)(e) | | 2,250,000 | 2,250,000 |
| Pittsburg WTSW Participating VRDN Series 50 49, 4.18% 6/3/24 (Liquidity Facility JPMorgan Chase Bank) (b)(d)(e) | | 52,000,000 | 52,000,000 |
TOTAL MICHIGAN | | | 92,800,000 |
| Minnesota - 0.3% | | | |
| Duluth Econ. Dev. Auth. Health Care Facilities Rev. Participating VRDN Series XG 05 23, 3.4% 6/7/24 (Liquidity Facility Barclays Bank PLC) (b)(d)(e) | | 4,685,000 | 4,685,000 |
| Missouri - 3.7% | | | |
| Missouri Health & Edl. Facilities Auth. Edl. Facilities Rev. Participating VRDN Series XF 16 80, 3.39% 6/7/24 (Liquidity Facility Royal Bank of Canada) (b)(d)(e) | | 1,875,000 | 1,875,000 |
| Missouri Health & Edl. Facilities Auth. Rev. Participating VRDN Series Floaters C16, 3.41% 6/7/24 (Liquidity Facility Royal Bank of Canada) (b)(d)(e) | | 6,300,000 | 6,300,000 |
| Missouri Health & Edl. Facilities Rev. Participating VRDN: | | | |
| Series Floaters 14, 3.4% 6/7/24 (Liquidity Facility Barclays Bank PLC) (b)(d)(e) | | 39,000,000 | 39,000,000 |
| Series Floaters C17, 3.4% 6/7/24 (Liquidity Facility Royal Bank of Canada) (b)(d)(e) | | 2,200,000 | 2,200,000 |
| Series XF 16 11, 3.4% 6/7/24 (Liquidity Facility Toronto-Dominion Bank) (b)(d)(e) | | 3,750,000 | 3,750,000 |
TOTAL MISSOURI | | | 53,125,000 |
| Nebraska - 0.1% | | | |
| Central Plains Energy Proj. Rev. Participating VRDN Series 2022 ZL 03 01, 3.41% 6/7/24 (Liquidity Facility Royal Bank of Canada) (b)(d)(e) | | 145,000 | 145,000 |
| Nebraska Invt. Fin. Auth. Single Family Hsg. Rev. Participating VRDN Series YX 13 35, 3.39% 6/7/24 (Liquidity Facility Barclays Bank PLC) (b)(d)(e) | | 1,910,000 | 1,910,000 |
TOTAL NEBRASKA | | | 2,055,000 |
| Nevada - 0.7% | | | |
| Clark County Wtr. Reclamation District Participating VRDN Series XM 11 57, 4.15% 6/3/24 (Liquidity Facility JPMorgan Chase Bank) (b)(d)(e) | | 9,880,000 | 9,880,000 |
| New Jersey - 0.5% | | | |
| New Jersey Econ. Dev. Auth. Rev. Participating VRDN Series Floaters XF 25 38, 3.4% 6/7/24 (Liquidity Facility Barclays Bank PLC) (b)(d)(e) | | 2,810,000 | 2,810,000 |
| New Jersey Tpk. Auth. Tpk. Rev. Participating VRDN Series XM 10 96, 3.41% 6/7/24 (Liquidity Facility Royal Bank of Canada) (b)(d)(e) | | 1,200,000 | 1,200,000 |
| New Jersey Trans. Trust Fund Auth. Participating VRDN: | | | |
| Series XF 15 57, 3.39% 6/7/24 (Liquidity Facility Toronto-Dominion Bank) (b)(d)(e) | | 2,000,000 | 2,000,000 |
| Series YX 12 68, 3.4% 6/7/24 (Liquidity Facility Barclays Bank PLC) (b)(d)(e) | | 1,100,000 | 1,100,000 |
TOTAL NEW JERSEY | | | 7,110,000 |
| New York - 0.1% | | | |
| New York City Muni. Wtr. Fin. Auth. Wtr. & Swr. Sys. Rev. Participating VRDN Series XF 16 31, 3.7% 6/3/24 (Liquidity Facility JPMorgan Chase Bank) (b)(d)(e) | | 2,200,000 | 2,200,000 |
| Ohio - 0.7% | | | |
| Cuyahoga County Ctfs. of Prtn. Participating VRDN Series Floaters XG 02 06, 3.46% 6/7/24 (Liquidity Facility Bank of America NA) (b)(d)(e) | | 200,000 | 200,000 |
| Middletown Hosp. Facilities Rev. Participating VRDN 4.21% 6/3/24 (Liquidity Facility Bank of America NA) (b)(d)(e) | | 2,300,000 | 2,300,000 |
| Montgomery County Hosp. Rev. Participating VRDN Series XX 12 48, 3.4% 6/7/24 (Liquidity Facility Barclays Bank PLC) (b)(d)(e) | | 800,000 | 800,000 |
| Ohio Hosp. Facilities Rev. Participating VRDN Series Floater BAML 50 40, 3.89% 6/3/24 (Liquidity Facility Bank of America NA) (b)(d)(e) | | 3,000,000 | 3,000,000 |
| Ohio Hosp. Rev. Participating VRDN Series C18, 3.4% 6/7/24 (Liquidity Facility Royal Bank of Canada) (b)(d)(e) | | 300,000 | 300,000 |
| Ohio Hsg. Fin. Agcy. Residential Mtg. Rev. Participating VRDN Series XL 05 40, 3.39% 6/7/24 (Liquidity Facility JPMorgan Chase Bank) (b)(d)(e) | | 3,520,000 | 3,520,000 |
TOTAL OHIO | | | 10,120,000 |
| Oregon - 0.3% | | | |
| Clackamas County School District #62C, Oregon City Participating VRDN Series XG 05 33, 3.4% 6/7/24 (Liquidity Facility Toronto-Dominion Bank) (b)(d)(e) | | 3,905,000 | 3,905,000 |
| Pennsylvania - 1.3% | | | |
| Allegheny County Arpt. Auth. Rev. Participating VRDN Series XF 16 85, 3.39% 6/7/24 (Liquidity Facility Royal Bank of Canada) (b)(d)(e) | | 6,015,000 | 6,015,000 |
| Allegheny County Hosp. Dev. Auth. Rev. Participating VRDN Series Floaters XX 10 94, 3.4% 6/7/24 (Liquidity Facility Barclays Bank PLC) (b)(d)(e) | | 2,260,000 | 2,260,000 |
| Montgomery County Higher Ed. & Health Auth. Rev. Participating VRDN Series XG 05 28, 3.4% 6/7/24 (Liquidity Facility Toronto-Dominion Bank) (b)(d)(e) | | 1,875,000 | 1,875,000 |
| Pennsylvania Higher Edl. Facilities Auth. Rev. Participating VRDN Series XG 02 63, 3.39% 6/7/24 (Liquidity Facility Bank of America NA) (b)(d)(e) | | 185,000 | 185,000 |
| Philadelphia Auth. for Indl. Dev. Participating VRDN: | | | |
| Series 2022 044, 3.75% 6/3/24 (Liquidity Facility Barclays Bank PLC) (b)(d)(e) | | 2,180,000 | 2,180,000 |
| Series XM 00 05, 3.7% 6/3/24 (Liquidity Facility JPMorgan Chase Bank) (b)(d)(e) | | 3,700,000 | 3,700,000 |
| Philadelphia School District Participating VRDN Series XG 05 36, 3.39% 6/7/24 (Liquidity Facility Royal Bank of Canada) (b)(d)(e) | | 2,500,000 | 2,500,000 |
TOTAL PENNSYLVANIA | | | 18,715,000 |
| South Carolina - 0.5% | | | |
| Patriots Energy Group Fing. Agcy. Participating VRDN Series XG 05 39, 3.39% 6/7/24 (Liquidity Facility Royal Bank of Canada) (b)(d)(e) | | 3,750,000 | 3,750,000 |
| South Carolina Pub. Svc. Auth. Rev. Participating VRDN Series XF 15 48, 3.39% 6/7/24 (Liquidity Facility Royal Bank of Canada) (b)(d)(e) | | 3,000,000 | 3,000,000 |
TOTAL SOUTH CAROLINA | | | 6,750,000 |
| Tennessee - 0.7% | | | |
| Sullivan County Health, Ed. and Hsg. Board Participating VRDN Series BAML 50 24, 3.89% 6/3/24 (Liquidity Facility Bank of America NA) (b)(d)(e) | | 10,300,000 | 10,300,000 |
| Texas - 1.7% | | | |
| Harris County Cultural Ed. Facilities Fin. Corp. Rev. Participating VRDN Series XF 32 03, 3.51% 6/7/24 (Liquidity Facility Wells Fargo Bank NA) (b)(d)(e) | | 1,000,000 | 1,000,000 |
| Harris County Gen. Oblig. Participating VRDN Series XG 05 16, 3.39% 6/7/24 (Liquidity Facility Wells Fargo Bank NA) (b)(d)(e) | | 2,160,000 | 2,160,000 |
| Lamar Consolidated Independent School District Participating VRDN Series XM 11 03, 3.7% 6/3/24 (Liquidity Facility JPMorgan Chase Bank) (b)(d)(e) | | 2,500,000 | 2,500,000 |
| Princeton Independent School District Participating VRDN Series XF 31 92, 3.38% 6/7/24 (Liquidity Facility Morgan Stanley Bank, West Valley City Utah) (b)(d)(e) | | 3,125,000 | 3,125,000 |
| Royse City Independent School District Participating VRDN Series XF 15 94, 3.39% 6/7/24 (Liquidity Facility Bank of America NA) (b)(d)(e) | | 3,470,000 | 3,470,000 |
| Tarrant County Cultural Ed. Facilities Fin. Corp. Hosp. Rev. Participating VRDN Series XG 04 21, 3.41% 6/7/24 (Liquidity Facility Bank of America NA) (b)(d)(e) | | 755,000 | 755,000 |
| Tarrant County Cultural Ed. Facilities Fin. Corp. Rev. Participating VRDN Series XG 03 99, 3.39% 6/7/24 (Liquidity Facility Royal Bank of Canada) (b)(d)(e) | | 3,750,000 | 3,750,000 |
| Texas Wtr. Dev. Board Rev. Participating VRDN: | | | |
| Series XF 15 28, 3.4% 6/7/24 (Liquidity Facility Toronto-Dominion Bank) (b)(d)(e) | | 2,855,000 | 2,855,000 |
| Series XF 31 54, 3.39% 6/7/24 (Liquidity Facility Wells Fargo Bank NA) (b)(d)(e) | | 2,000,000 | 2,000,000 |
| Series ZF 16 78, 3.39% 6/7/24 (Liquidity Facility JPMorgan Chase Bank) (b)(d)(e) | | 2,565,000 | 2,565,000 |
TOTAL TEXAS | | | 24,180,000 |
| Virginia - 2.0% | | | |
| Norfolk Econ. Dev. Health Care Facilities Participating VRDN Series 2022 C20, 3.4% 6/7/24 (Liquidity Facility Royal Bank of Canada) (b)(d)(e) | | 3,000,000 | 3,000,000 |
| Suffolk Econ. Dev. Auth. Hosp. Facilities Rev. Participating VRDN Series MIZ 90 25, 3.46% 6/7/24 (Liquidity Facility Mizuho Cap. Markets LLC) (b)(d)(e) | | 8,700,000 | 8,700,000 |
| Univ. of Virginia Gen. Rev. Participating VRDN Series Solar 17 17, 3.39% 6/7/24 (Liquidity Facility U.S. Bank NA, Cincinnati) (b)(d)(e) | | 13,500,000 | 13,500,000 |
| Virginia Small Bus. Fing. Auth. Health Care Facilities Rev. Participating VRDN Series XL 04 37, 4.2% 6/3/24 (Liquidity Facility JPMorgan Chase Bank) (b)(d)(e) | | 3,500,000 | 3,500,000 |
TOTAL VIRGINIA | | | 28,700,000 |
| Washington - 0.8% | | | |
| Multicare Health Sys. Participating VRDN Series E 153, 3.39% 6/7/24 (Liquidity Facility Royal Bank of Canada) (b)(d)(e) | | 3,600,000 | 3,600,000 |
| Seattle Muni. Lt. & Pwr. Rev. Participating VRDN Series XL 04 82, 4.15% 6/3/24 (Liquidity Facility JPMorgan Chase Bank) (b)(d)(e) | | 6,670,000 | 6,670,000 |
| Washington Health Care Facilities Auth. Rev. Participating VRDN Series XF 15 14, 3.4% 6/7/24 (Liquidity Facility Toronto-Dominion Bank) (b)(d)(e) | | 2,025,000 | 2,025,000 |
TOTAL WASHINGTON | | | 12,295,000 |
| West Virginia - 0.4% | | | |
| West Virginia Hosp. Fin. Auth. Hosp. Rev. Participating VRDN Series XF 15 37, 3.4% 6/7/24 (Liquidity Facility Toronto-Dominion Bank) (b)(d)(e) | | 5,520,000 | 5,520,000 |
| Wisconsin - 1.4% | | | |
| Wisconsin Health & Edl. Facilities Auth. Rev. Participating VRDN Series BAML 50 35, 3.97% 6/3/24 (Liquidity Facility Bank of America NA) (b)(d)(e) | | 21,100,000 | 21,100,000 |
| TOTAL TENDER OPTION BOND (Cost $474,055,000) | | | 474,055,000 |
| | | | |
| Other Municipal Security - 3.4% |
| | | Principal Amount (a) | Value ($) |
| Texas - 3.4% | | | |
Harris County Cultural Ed. Facilities Fin. Corp. Rev. Bonds Series 2024 C1, 4.05% tender 6/3/24, CP mode (Cost $49,000,000) | | 49,000,000 | 49,000,000 |
| | | | |
| TOTAL INVESTMENT IN SECURITIES - 99.9% (Cost $1,450,290,000) | 1,450,290,000 |
NET OTHER ASSETS (LIABILITIES) - 0.1% | 1,129,094 |
| NET ASSETS - 100.0% | 1,451,419,094 |
| | |
Security Type Abbreviations
| CP | - | COMMERCIAL PAPER |
| VRDN | - | VARIABLE RATE DEMAND NOTE (A debt instrument that is payable upon demand, either daily, weekly or monthly) |
The date shown for securities represents the date when principal payments must be paid, taking into account any call options exercised by the issuer and any permissible maturity shortening features other than interest rate resets.
Legend
| (a) | Amount is stated in United States dollars unless otherwise noted. |
| (b) | Coupon rates for floating and adjustable rate securities reflect the rates in effect at period end. |
| (c) | Security exempt from registration under Rule 144A of the Securities Act of 1933. These securities may be resold in transactions exempt from registration, normally to qualified institutional buyers. At the end of the period, the value of these securities amounted to $21,810,000 or 1.5% of net assets. |
| (d) | Provides evidence of ownership in one or more underlying municipal bonds. |
| (e) | Coupon rates are determined by re-marketing agents based on current market conditions. |
Investment Valuation
The following is a summary of the inputs used, as of May 31, 2024, involving the Fund's assets and liabilities carried at fair value. The inputs or methodology used for valuing securities may not be an indication of the risk associated with investing in those securities. For more information on valuation inputs, and their aggregation into the levels used below, please refer to the Investment Valuation section in the accompanying Notes to Financial Statements.
| Valuation Inputs at Reporting Date: |
| Description | Total ($) | Level 1 ($) | Level 2 ($) | Level 3 ($) |
Investments in Securities: | | | | |
|
| Variable Rate Demand Note | 927,235,000 | - | 927,235,000 | - |
|
| Tender Option Bond | 474,055,000 | - | 474,055,000 | - |
|
| Other Municipal Security | 49,000,000 | - | 49,000,000 | - |
| Total Investments in Securities: | 1,450,290,000 | - | 1,450,290,000 | - |
Financial Statements
| Statement of Assets and Liabilities |
| | | | May 31, 2024 |
| | | | | |
| Assets | | | | |
Investment in securities, at value - See accompanying schedule Unaffiliated issuers (cost $1,450,290,000): | | | $ | 1,450,290,000 |
| Cash | | | | 2,675,959 |
| Receivable for investments sold | | | | 200,000 |
| Interest receivable | | | | 6,976,716 |
| Other receivables | | | | 17,106 |
Total assets | | | | 1,460,159,781 |
| Liabilities | | | | |
| Payable for investments purchased | $ | 4,512,221 | | |
| Distributions payable | | 4,211,363 | | |
| Other payables and accrued expenses | | 17,103 | | |
| Total liabilities | | | | 8,740,687 |
| Net Assets | | | $ | 1,451,419,094 |
| Net Assets consist of: | | | | |
| Paid in capital | | | $ | 1,451,417,021 |
| Total accumulated earnings (loss) | | | | 2,073 |
| Net Assets | | | $ | 1,451,419,094 |
Net Asset Value, offering price and redemption price per share ($1,451,419,094 ÷ 1,450,856,835 shares) | | | $ | 1.0004 |
| Statement of Operations |
| | | | Year ended May 31, 2024 |
| Investment Income | | | | |
| Interest | | | $ | 51,431,054 |
| Expenses | | | | |
| Custodian fees and expenses | $ | 23,243 | | |
| Independent trustees' fees and expenses | | 4,411 | | |
| Miscellaneous | | 4 | | |
| Total expenses before reductions | | 27,658 | | |
| Expense reductions | | (22,364) | | |
| Total expenses after reductions | | | | 5,294 |
| Net Investment income (loss) | | | | 51,425,760 |
| Realized and Unrealized Gain (Loss) | | | | |
| Net realized gain (loss) on: | | | | |
| Investment Securities: | | | | |
| Unaffiliated issuers | | 28,914 | | |
| Total net realized gain (loss) | | | | 28,914 |
| Change in net unrealized appreciation (depreciation) on investment securities | | | | (240) |
| Net gain (loss) | | | | 28,674 |
| Net increase in net assets resulting from operations | | | $ | 51,454,434 |
| Statement of Changes in Net Assets |
| |
| | Year ended May 31, 2024 | | Year ended May 31, 2023 |
| Increase (Decrease) in Net Assets | | | | |
| Operations | | | | |
| Net investment income (loss) | $ | 51,425,760 | $ | 26,881,804 |
| Net realized gain (loss) | | 28,914 | | 82,607 |
| Change in net unrealized appreciation (depreciation) | | (240) | | 240 |
Net increase in net assets resulting from operations | | 51,454,434 | | 26,964,651 |
| Distributions to shareholders | | (51,451,691) | | (26,917,527) |
| | | | | |
| Affiliated share transactions | | | | |
| Proceeds from sales of shares | | 8,059,064,133 | | 6,643,788,000 |
| Cost of shares redeemed | | (7,671,895,201) | | (7,597,518,267) |
| | | | | |
Net increase (decrease) in net assets and shares resulting from share transactions | | 387,168,932 | | (953,730,267) |
| Total increase (decrease) in net assets | | 387,171,675 | | (953,683,143) |
| | | | | |
| Net Assets | | | | |
| Beginning of period | | 1,064,247,419 | | 2,017,930,562 |
| End of period | $ | 1,451,419,094 | $ | 1,064,247,419 |
| | | | | |
| Other Information | | | | |
| Shares | | | | |
| Sold | | 8,055,841,796 | | 6,641,628,988 |
| Redeemed | | (7,668,827,670) | | (7,595,079,088) |
| Net increase (decrease) | | 387,014,126 | | (953,450,100) |
| | | | | |
Financial Highlights
Fidelity® Tax-Free Cash Central Fund |
| |
| Years ended May 31, | | 2024 | | 2023 | | 2022 | | 2021 | | 2020 |
Selected Per-Share Data | | | | | | | | | | |
| Net asset value, beginning of period | $ | 1.0004 | $ | 1.0003 | $ | 1.0003 | $ | 1.0002 | $ | 1.0001 |
| Income from Investment Operations | | | | | | | | | | |
Net investment income (loss) A | | .0343 | | .0214 | | .0016 | | .0009 | | .0126 |
| Net realized and unrealized gain (loss) | | - B | | .0001 | | - B | | .0002 | | .0001 |
| Total from investment operations | | .0343 | | .0215 | | .0016 | | .0011 | | .0127 |
| Distributions from net investment income | | (.0343) | | (.0214) | | (.0016) | | (.0009) | | (.0126) |
| Distributions from net realized gain | | - B | | - B | | - B | | - B | | - B |
| Total distributions | | (.0343) | | (.0214) | | (.0016) | | (.0010) C | | (.0126) |
| Net asset value, end of period | $ | 1.0004 | $ | 1.0004 | $ | 1.0003 | $ | 1.0003 | $ | 1.0002 |
Total Return D | | | | 2.17% | | .16% | | .10% | | 1.28% |
Ratios to Average Net Assets A,E,F | | | | | | | | | | |
Expenses before reductions G | | -% | | -% | | -% | | -% | | -% |
Expenses net of fee waivers, if any G | | | | -% | | -% | | -% | | -% |
Expenses net of all reductions G | | -% | | -% | | -% | | -% | | -% |
| Net investment income (loss) | | 3.40% | | 1.78% | | .18% | | .10% | | 1.17% |
| Supplemental Data | | | | | | | | | | |
| Net assets, end of period (000 omitted) | $ | 1,451,419 | $ | 1,064,247 | $ | 2,017,931 | $ | 1,145,228 | $ | 1,771,739 |
ANet investment income (loss) is affected by the timing of the declaration of dividends by any underlying mutual funds or exchange-traded funds (ETFs). Net investment income (loss) of any mutual funds or ETFs is not included in the Fund's net investment income (loss) ratio.
BAmount represents less than $.00005 per share.
CTotal distributions per share do not sum due to rounding.
DTotal returns would have been lower if certain expenses had not been reduced during the applicable periods shown.
EFees and expenses of any underlying mutual funds or exchange-traded funds (ETFs) are not included in the Fund's expense ratio. The Fund indirectly bears its proportionate share of these expenses.
FExpense ratios reflect operating expenses of the class. Expenses before reductions do not reflect amounts reimbursed, waived, or reduced through arrangements with the investment adviser, brokerage services, or other offset arrangements, if applicable, and do not represent the amount paid by the class during periods when reimbursements, waivers or reductions occur.
GAmount represents less than .005%.
Notes to Financial Statements
For the period ended May 31, 2024
1. Organization.
Fidelity Tax-Free Cash Central Fund (the Fund) is a fund of Fidelity Revere Street Trust (the Trust) and is authorized to issue an unlimited number of shares. The Trust is registered under the Investment Company Act of 1940, as amended (the 1940 Act), as an open-end management investment company organized as a Delaware statutory trust. Shares of the Fund are only offered to other investment companies and accounts (the Investing Funds) managed by Fidelity Management & Research Company LLC (FMR), or its affiliates. The Fund has been designated an institutional money market fund, and the value of the Fund's shares are calculated to four decimal places that fluctuates based upon changes in the value of the Fund's investments.
2. Significant Accounting Policies.
The Fund is an investment company and applies the accounting and reporting guidance of the Financial Accounting Standards Board (FASB) Accounting Standards Codification Topic 946 Financial Services - Investment Companies. The financial statements have been prepared in conformity with accounting principles generally accepted in the United States of America (GAAP), which require management to make certain estimates and assumptions at the date of the financial statements. Actual results could differ from those estimates. Subsequent events, if any, through the date that the financial statements were issued have been evaluated in the preparation of the financial statements. The Fund's Schedule of Investments lists any underlying mutual funds or exchange-traded funds (ETFs) but does not include the underlying holdings of these funds. The following summarizes the significant accounting policies of the Fund:
Investment Valuation. Investments are valued as of 4:00 p.m. Eastern time on the last calendar day of the period. The Board of Trustees (the Board) has designated the Fund's investment adviser as the valuation designee responsible for the fair valuation function and performing fair value determinations as needed. The investment adviser has established a Fair Value Committee (the Committee) to carry out the day-to-day fair valuation responsibilities and has adopted policies and procedures to govern the fair valuation process and the activities of the Committee. In accordance with these fair valuation policies and procedures, which have been approved by the Board, the Fund attempts to obtain prices from one or more third party pricing services or brokers to value its investments. When current market prices, quotations or currency exchange rates are not readily available or reliable, investments will be fair valued in good faith by the Committee, in accordance with the policies and procedures. Factors used in determining fair value vary by investment type and may include market or investment specific events, transaction data, estimated cash flows, and market observations of comparable investments. The frequency that the fair valuation procedures are used cannot be predicted and they may be utilized to a significant extent. The Committee manages the Fund's fair valuation practices and maintains the fair valuation policies and procedures. The Fund's investment adviser reports to the Board information regarding the fair valuation process and related material matters.
The Fund categorizes the inputs to valuation techniques used to value its investments into a disclosure hierarchy consisting of three levels as shown below:
Level 1 - unadjusted quoted prices in active markets for identical investments
Level 2 - other significant observable inputs (including quoted prices for similar investments, interest rates, prepayment speeds, etc.)
Level 3 - unobservable inputs (including the Fund's own assumptions based on the best information available)
Valuation techniques used to value the Fund's investments by major category are as follows:
Debt securities, including restricted securities, are valued based on evaluated prices received from third party pricing services or from brokers who make markets in such securities. Municipal securities and other short-term securities are valued by pricing services who utilize matrix pricing which considers yield or price of bonds of comparable quality, coupon, maturity and type or by broker-supplied prices. When independent prices are unavailable or unreliable, debt securities may be valued utilizing pricing methodologies which consider similar factors that would be used by third party pricing services. Debt securities are generally categorized as Level 2 in the hierarchy but may be Level 3 depending on the circumstances.
Securities held by a money market fund are generally high quality and liquid; however, they are reflected as Level 2 because the inputs used to determine fair value are not quoted prices in an active market.
The aggregate value of investments by input level as of May 31, 2024 is included at the end of the Fund's Schedule of Investments.
Investment Transactions and Income. Security transactions are accounted for as of trade date. Gains and losses on securities sold are determined on the basis of identified cost. Interest income is accrued as earned and includes coupon interest and amortization of premium and accretion of discount on debt securities as applicable.
Expenses. Expenses directly attributable to a fund are charged to that fund. Expenses attributable to more than one fund are allocated among the respective funds on the basis of relative net assets or other appropriate methods. Expenses included in the accompanying financial statements reflect the expenses of that fund and do not include any expenses associated with any underlying mutual funds or exchange-traded funds. Although not included in a fund's expenses, a fund indirectly bears its proportionate share of these expenses through the net asset value of each underlying mutual fund or exchange-traded fund. Expense estimates are accrued in the period to which they relate and adjustments are made when actual amounts are known.
Income Tax Information and Distributions to Shareholders. Each year, the Fund intends to qualify as a regulated investment company under Subchapter M of the Internal Revenue Code, including distributing substantially all of its taxable income and realized gains. As a result, no provision for U.S. Federal income taxes is required. As of May 31, 2024, the Fund did not have any unrecognized tax benefits in the financial statements; nor is the Fund aware of any tax positions for which it is reasonably possible that the total amounts of unrecognized tax benefits will significantly change in the next twelve months. The Fund files a U.S. federal tax return, in addition to state and local tax returns as required. The Fund's federal income tax returns are subject to examination by the Internal Revenue Service (IRS) for a period of three fiscal years after they are filed. State and local tax returns may be subject to examination for an additional fiscal year depending on the jurisdiction.
Distributions are declared and recorded daily and paid monthly from net investment income. Distributions from realized gains, if any, are declared and recorded on the ex-dividend date. Income and capital gain distributions are determined in accordance with income tax regulations, which may differ from GAAP. In addition, the Fund claimed a portion of the payment made to redeeming shareholders as a distribution for income tax purposes.
Capital accounts within the financial statements are adjusted for permanent book-tax differences. These adjustments have no impact on net assets or the results of operations. Capital accounts are not adjusted for temporary book-tax differences which will reverse in a subsequent period.
The Fund purchases municipal securities whose interest, in the opinion of the issuer, is free from federal income tax. There is no assurance that the IRS will agree with this opinion. In the event the IRS determines that the issuer does not comply with relevant tax requirements, interest payments from a security could become federally taxable, possibly retroactively to the date the security was issued.
As of period end, the cost and unrealized appreciation (depreciation) in securities for federal income tax purposes were as follows:
| Gross unrealized appreciation | $- |
| Gross unrealized depreciation | - |
| Net unrealized appreciation (depreciation) | $- |
| Tax Cost | $1,450,290,000 |
The tax-based components of distributable earnings as of period end were as follows:
| Undistributed ordinary income | $2,162 |
The tax character of distributions paid was as follows:
| | May 31, 2024 | May 31, 2023 |
| Tax-exempt Income | 51,426,191 | 26,881,822 |
| Long-term Capital Gains | 25,500 | 35,705 |
| Total | $51,451,691 | $ 26,917,527 |
Restricted Securities (including Private Placements). Funds may invest in securities that are subject to legal or contractual restrictions on resale. These securities generally may be resold in transactions exempt from registration or to the public if the securities are registered. Disposal of these securities may involve time-consuming negotiations and expense, and prompt sale at an acceptable price may be difficult. Information regarding restricted securities held at period end is included at the end of the Schedule of Investments, if applicable.
New Rule Issuance. In July 2023, the Securities and Exchange Commission issued a Final Rule relative to Money Market Reform. Among other things, the Final Rule includes amendments for: (1) Removal of redemption gates except for liquidations; (2) Required liquidity fees for institutional prime and institutional tax-exempt money market funds; (3) Discretionary liquidity fees for non-government money market funds; (4) Higher liquidity requirements; and (5) Changes to reporting requirements for Form N-MFP and Form N-CR. The Final Rule imposes different implementation dates for the amendments through October 2, 2024. Management has evaluated the amendments and does not expect them to have a material impact to the Fund's financial statements and related disclosures.
3. Fees and Other Transactions with Affiliates.
Management Fee and Expense Contract. Fidelity Management & Research Company LLC (the investment adviser) provides the Fund with investment management services. The Fund does not pay any fees for these services. Pursuant to the Fund's expense contract, the investment adviser also pays all other expenses of the Fund, excluding custody fees, the compensation of the independent Trustees, and certain miscellaneous expenses such as proxy and shareholder meeting expenses.
Interfund Trades. Funds may purchase from or sell securities to other Fidelity Funds under procedures adopted by the Board. The procedures have been designed to ensure these interfund trades are executed in accordance with Rule 17a-7 of the 1940 Act. Interfund trades during the period are noted in the table below.
| | Purchases ($) | Sales ($) | Realized Gain (Loss)($) |
| Fidelity Tax-Free Cash Central Fund | 699,660,000 | 642,140,000 | - |
Sub-Advisory Arrangements. Effective March 1, 2024, the Fund's sub-advisory agreements with FMR Investment Management (UK) Limited, Fidelity Management & Research (Hong Kong) Limited, and Fidelity Management & Research (Japan) Limited were amended to provide that the investment adviser pays each sub-adviser monthly fees equal to 110% of the sub-adviser's costs for providing sub-advisory services.
4. Expense Reductions.
Through arrangements with the Fund's custodian, credits realized as a result of certain uninvested cash balances were used to reduce the Fund's expenses by $22,364.
5. Other.
A fund's organizational documents provide former and current trustees and officers with a limited indemnification against liabilities arising in connection with the performance of their duties to the fund. In the normal course of business, a fund may also enter into contracts that provide general indemnifications. A fund's maximum exposure under these arrangements is unknown as this would be dependent on future claims that may be made against a fund. The risk of material loss from such claims is considered remote.
At the end of the period, mutual funds and accounts managed by the investment adviser or its affiliates were the owners of record of all of the outstanding shares of the Fund.
6. Risk and Uncertainties.
Many factors affect a fund's performance. Developments that disrupt global economies and financial markets, such as pandemics, epidemics, outbreaks of infectious diseases, war, terrorism, and environmental disasters, may significantly affect a fund's investment performance. The effects of these developments to a fund will be impacted by the types of securities in which a fund invests, the financial condition, industry, economic sector, and geographic location of an issuer, and a fund's level of investment in the securities of that issuer. Significant concentrations in security types, issuers, industries, sectors, and geographic locations may magnify the factors that affect a fund's performance.
Report of Independent Registered Public Accounting Firm
To the Board of Trustees of Fidelity Revere Street Trust and the Shareholders of Fidelity Tax-Free Cash Central Fund:
Opinion on the Financial Statements and Financial Highlights
We have audited the accompanying statement of assets and liabilities of Fidelity Tax-Free Cash Central Fund (the "Fund"), a fund of Fidelity Revere Street Trust, including the schedule of investments, as of May 31, 2024, the related statement of operations for the year then ended, the statement of changes in net assets for each of the two years in the period then ended, the financial highlights for each of the five years in the period then ended, and the related notes. In our opinion, the financial statements and financial highlights present fairly, in all material respects, the financial position of the Fund as of May 31, 2024, and the results of its operations for the year then ended, the changes in its net assets for each of the two years in the period then ended, and the financial highlights for each of the five years in the period then ended in conformity with accounting principles generally accepted in the United States of America.
Basis for Opinion
These financial statements and financial highlights are the responsibility of the Fund's management. Our responsibility is to express an opinion on the Fund's financial statements and financial highlights based on our audits. We are a public accounting firm registered with the Public Company Accounting Oversight Board (United States) (PCAOB) and are required to be independent with respect to the Fund in accordance with the U.S. federal securities laws and the applicable rules and regulations of the Securities and Exchange Commission and the PCAOB.
We conducted our audits in accordance with the standards of the PCAOB. Those standards require that we plan and perform the audit to obtain reasonable assurance about whether the financial statements and financial highlights are free of material misstatement, whether due to error or fraud. The Fund is not required to have, nor were we engaged to perform, an audit of its internal control over financial reporting. As part of our audits, we are required to obtain an understanding of internal control over financial reporting but not for the purpose of expressing an opinion on the effectiveness of the Fund's internal control over financial reporting. Accordingly, we express no such opinion.
Our audits included performing procedures to assess the risks of material misstatement of the financial statements and financial highlights, whether due to error or fraud, and performing procedures that respond to those risks. Such procedures included examining, on a test basis, evidence regarding the amounts and disclosures in the financial statements and financial highlights. Our audits also included evaluating the accounting principles used and significant estimates made by management, as well as evaluating the overall presentation of the financial statements and financial highlights. Our procedures included confirmation of securities owned as of May 31, 2024, by correspondence with the custodian and brokers; when replies were not received from brokers, we performed other auditing procedures. We believe that our audits provide a reasonable basis for our opinion.
/s/ Deloitte & Touche LLP
Boston, Massachusetts
July 12, 2024
We have served as the auditor of one or more of the Fidelity investment companies since 1999.
Distributions
(Unaudited)
The dividend and capital gains distributions for the fund(s) are available on Fidelity.com or Institutional.Fidelity.com.
The fund hereby designates as a capital gain dividend with respect to the taxable year ended May 31, 2024, $6,785, or, if subsequently determined to be different, the net capital gain of such year.
During fiscal year ended 2024, 100% of the fund's income dividends was free from federal income tax, and 0.00% of the fund's income dividends was subject to the federal alternative minimum tax.
The fund will notify shareholders in January 2025 of amounts for use in preparing 2024 income tax returns.
Item 8: Changes in and Disagreements with Accountants for Open-End Management Investment Companies
Note: This is not applicable for any fund included in this document.
Item 9: Proxy Disclosures for Open-End Management Investment Companies
| A special meeting of shareholders was held on October 18, 2023. The results of votes taken among shareholders on the proposal before them are reported below. Each vote reported represents one dollar of net asset value held on the record date for the meeting. |
| Proposal 1 |
| To elect a Board of Trustees. |
| | # of Votes | % of Votes |
| Abigail P. Johnson |
| Affirmative | 52,175,225,933.96 | 100.00 |
| TOTAL | 52,175,225,933.96 | 100.00 |
| Jennifer Toolin McAuliffe |
| Affirmative | 52,175,225,933.96 | 100.00 |
| TOTAL | 52,175,225,933.96 | 100.00 |
| Christine J. Thompson |
| Affirmative | 52,175,225,933.96 | 100.00 |
| TOTAL | 52,175,225,933.96 | 100.00 |
| Elizabeth S. Acton |
| Affirmative | 52,175,225,933.96 | 100.00 |
| TOTAL | 52,175,225,933.96 | 100.00 |
| Laura M. Bishop |
| Affirmative | 52,175,225,933.96 | 100.00 |
| TOTAL | 52,175,225,933.96 | 100.00 |
| Ann E. Dunwoody |
| Affirmative | 52,175,225,933.96 | 100.00 |
| TOTAL | 52,175,225,933.96 | 100.00 |
| John Engler |
| Affirmative | 52,175,225,933.96 | 100.00 |
| TOTAL | 52,175,225,933.96 | 100.00 |
| Robert F. Gartland |
| Affirmative | 52,175,225,933.96 | 100.00 |
| TOTAL | 52,175,225,933.96 | 100.00 |
| Robert W. Helm |
| Affirmative | 52,175,225,933.96 | 100.00 |
| TOTAL | 52,175,225,933.96 | 100.00 |
| Arthur E. Johnson |
| Affirmative | 52,175,225,933.96 | 100.00 |
| TOTAL | 52,175,225,933.96 | 100.00 |
| Michael E. Kenneally |
| Affirmative | 52,175,225,933.96 | 100.00 |
| TOTAL | 52,175,225,933.96 | 100.00 |
| Mark A. Murray |
| Affirmative | 52,175,225,933.96 | 100.00 |
| TOTAL | 52,175,225,933.96 | 100.00 |
| Carol J. Zierhoffer |
| Affirmative | 52,175,225,933.96 | 100.00 |
| TOTAL | 52,175,225,933.96 | 100.00 |
| | | |
| Proposal 1 reflects trust-wide proposal and voting results. |
Item 10: Renumeration Paid to Directors, Officers, and others of Open-End Management Investment Companies
Note: This information is disclosed as part of the financial statements for each Fund as part of Item 7: Financial Statements and Financial Highlights for Open-End Management Investment companies.
Item 11: Statement Regarding Basis for Approval of Investment Advisory Contract
Board Approval of Investment Advisory Contracts
Fidelity Tax-Free Cash Central Fund
At its January 2024 meeting, the Board of Trustees, including the Independent Trustees (together, the Board), approved an amended and restated management contract with Fidelity Management & Research Company LLC (FMR) (the Management Contract), and amended and restated sub-advisory agreements (the Sub-Advisory Contracts, and together with the Management Contract, the Advisory Contracts) for the fund, including the fund's sub-advisory agreements with FMR Investment Management (UK) Limited (FMR UK), Fidelity Management & Research (Hong Kong) Limited (FMR H.K.), and Fidelity Management & Research (Japan) Limited (FMR Japan). The Advisory Contracts will be effective March 1, 2024. The Board will consider the annual renewal of the fund's Advisory Contracts in September 2024, following its review of additional materials provided by FMR.
Management Contract. The Board approved the Management Contract, which eliminates the fee that FMR previously received from each investing fund's investment adviser. The Board noted the fund will continue to pay no management fee to FMR for services provided under the Management Contract.
Sub-Advisory Contracts. In connection with the Management Contract changes, the Board considered the Sub-Advisory Contracts, which changed the arrangements for fees paid by FMR to the sub-advisers under the agreements. The Board noted that the agreements with FMR UK, FMR H.K., and FMR Japan were amended to provide that FMR will compensate each sub-adviser at a fee equal to 110% of the sub-adviser's costs incurred in providing services under the agreement. The Board considered that, under the Sub-Advisory Contracts, FMR, and not the fund, will continue to pay the sub-advisory fees to each applicable sub-adviser.
The Board considered that the approval of the fund's Advisory Contracts will not result in any changes in the investment process or strategies employed in the management of the fund's assets or the day-to-day management of the fund or the persons primarily responsible for such management. Further, the Board considered that the Management Contract would not change the obligations and services of FMR and its affiliates on behalf of the fund, and, in particular, there would be no change in the nature and level of advisory, management, administration, transfer agent, and pricing and bookkeeping services provided to the fund by FMR and its affiliates.
In connection with its consideration of future renewals of the fund's Advisory Contracts, the Board will consider: (i) the nature, extent and quality of services provided to the funds, including shareholder and administrative services and investment performance; (ii) the competitiveness of the management fee and total expenses for the fund; (iii) the costs of the services and profitability, including the revenues earned and the expenses incurred in conducting the business of developing, marketing, distributing, managing, administering, and servicing the fund and its shareholders, to the extent applicable; and (iv) whether there have been economies of scale in respect of the Fidelity funds, whether the Fidelity funds (including the fund) have appropriately benefited from any such economies of scale, and whether there is the potential for realization of any further economies.
Based on its evaluation of all of the conclusions noted above, and after considering all factors it believed relevant, the Board concluded that the fund's management fee structure is fair and reasonable, and that the fund's Advisory Contracts should be approved.
1.795174.120
TFC-ANN-0724
Fidelity® Securities Lending Cash Central Fund
Annual Report
May 31, 2024
Contents
To view a fund's proxy voting guidelines and proxy voting record for the 12-month period ended June 30, visit http://www.fidelity.com/proxyvotingresults or visit the Securities and Exchange Commission's (SEC) web site at http://www.sec.gov.
You may also call 1-800-544-8544 to request a free copy of the proxy voting guidelines.
Standard & Poor's, S&P and S&P 500 are registered service marks of The McGraw-Hill Companies, Inc. and have been licensed for use by Fidelity Distributors Corporation.
Other third-party marks appearing herein are the property of their respective owners.
All other marks appearing herein are registered or unregistered trademarks or service marks of FMR LLC or an affiliated company. © 2024 FMR LLC. All rights reserved.
A fund files its complete schedule of portfolio holdings with the SEC for the first and third quarters of each fiscal year on Form N-PORT. Forms N-PORT are available on the SEC's web site at http://www.sec.gov. A fund's Forms N-PORT may be reviewed and copied at the SEC's Public Reference Room in Washington, DC. Information regarding the operation of the SEC's Public Reference Room may be obtained by calling 1-800-SEC-0330.
Item 7: Financial Statements and Financial Highlights for Open-End Management Investment Companies (Annual Report)
Fidelity® Securities Lending Cash Central Fund
Schedule of Investments May 31, 2024
Showing Percentage of Net Assets
| U.S. Treasury Debt - 32.2% |
| | | Yield (%)(a) | Principal Amount (b) | Value ($) |
| U.S. Treasury Obligations - 32.2% | | | | |
| U.S. Treasury Bills | | | | |
| 6/4/24 to 9/19/24 | | 5.27 to 5.34 | 8,048,498,400 | 8,010,948,103 |
| | | | | |
| TOTAL U.S. TREASURY DEBT (Cost $8,008,899,413) | | | | 8,010,948,103 |
| | | | | |
| Non-Negotiable Time Deposit - 1.8% |
| | | Yield (%)(a) | Principal Amount (b) | Value ($) |
| Time Deposits - 1.8% | | | | |
| Canadian Imperial Bank of Commerce | | | | |
| 6/3/24 | | 5.31 | 118,000,000 | 118,000,000 |
| Credit Agricole CIB | | | | |
| 6/3/24 | | 5.33 | 79,000,000 | 79,000,000 |
| Mizuho Bank Ltd. | | | | |
| 6/3/24 | | 5.33 | 160,900,000 | 160,900,000 |
| Royal Bank of Canada | | | | |
| 6/3/24 | | 5.32 | 84,000,000 | 84,000,000 |
| | | | | |
| TOTAL NON-NEGOTIABLE TIME DEPOSIT (Cost $441,900,000) | | | | 441,900,000 |
| | | | | |
| U.S. Government Agency Repurchase Agreement - 0.5% |
| | | Maturity Amount ($) | Value ($) |
In a joint trading account at 5.32% dated 5/31/24 due 6/3/24 (Collateralized by U.S. Government Obligations) # (Cost $132,080,000) | | 132,138,555 | 132,080,000 |
| | | | |
| U.S. Treasury Repurchase Agreement - 64.9% |
| | | Maturity Amount ($) | Value ($) |
With Federal Reserve Bank of New York at 5.3%, dated 5/31/24 due 6/3/24 (Collateralized by U.S. Treasury Obligations valued at $16,171,139,105, 0.63% - 4.75%, 8/15/29 - 5/15/42) (Cost $16,164,000,000) | | 16,171,139,100 | 16,164,000,000 |
| | | | |
| TOTAL INVESTMENT IN SECURITIES - 99.4% (Cost $24,746,879,413) | 24,748,928,103 |
NET OTHER ASSETS (LIABILITIES) - 0.6% | 148,906,128 |
| NET ASSETS - 100.0% | 24,897,834,231 |
| | |
The date shown for securities represents the date when principal payments must be paid, taking into account any call options exercised by the issuer and any permissible maturity shortening features other than interest rate resets.
Legend
| (a) | Yield represents either the annualized yield at the date of purchase, or the stated coupon rate, or, for floating and adjustable rate securities, the rate at period end. |
| (b) | Amount is stated in United States dollars unless otherwise noted. |
Investment Valuation
The following is a summary of the inputs used, as of May 31, 2024, involving the Fund's assets and liabilities carried at fair value. The inputs or methodology used for valuing securities may not be an indication of the risk associated with investing in those securities. For more information on valuation inputs, and their aggregation into the levels used below, please refer to the Investment Valuation section in the accompanying Notes to Financial Statements.
| Valuation Inputs at Reporting Date: |
| Description | Total ($) | Level 1 ($) | Level 2 ($) | Level 3 ($) |
Investments in Securities: | | | | |
|
| U.S. Treasury Debt | 8,010,948,103 | - | 8,010,948,103 | - |
|
| Non-Negotiable Time Deposit | 441,900,000 | - | 441,900,000 | - |
|
| U.S. Government Agency Repurchase Agreement | 132,080,000 | - | 132,080,000 | - |
|
| U.S. Treasury Repurchase Agreement | 16,164,000,000 | - | 16,164,000,000 | - |
| Total Investments in Securities: | 24,748,928,103 | - | 24,748,928,103 | - |
| Other Information |
| # Additional information on each counterparty to the repurchase agreement is as follows: |
| Repurchase Agreement / Counterparty | Value ($) | |
| $132,080,000 due 6/03/24 at 5.32% | | |
| Citigroup Global Markets, Inc. | 73,203,000 | |
| Societe Generale | 58,877,000 | |
| | 132,080,000 | |
Financial Statements
| Statement of Assets and Liabilities |
| | | | May 31, 2024 |
| | | | | |
| Assets | | | | |
Investment in securities, at value (including repurchase agreements of $16,296,080,000) - See accompanying schedule Unaffiliated issuers (cost $24,746,879,413): | | | $ | 24,748,928,103 |
| Cash | | | | 464,410,318 |
| Interest receivable | | | | 3,971,490 |
Total assets | | | | 25,217,309,911 |
| Liabilities | | | | |
| Payable for investments purchased | $ | 202,623,760 | | |
| Distributions payable | | 116,812,032 | | |
| Other payables and accrued expenses | | 39,888 | | |
| Total liabilities | | | | 319,475,680 |
| Net Assets | | | $ | 24,897,834,231 |
| Net Assets consist of: | | | | |
| Paid in capital | | | $ | 24,895,729,293 |
| Total accumulated earnings (loss) | | | | 2,104,938 |
| Net Assets | | | $ | 24,897,834,231 |
Net Asset Value, offering price and redemption price per share ($24,897,834,231 ÷ 24,893,437,684 shares) | | | $ | 1.0002 |
| Statement of Operations |
| | | | Year ended May 31, 2024 |
| Investment Income | | | | |
| Interest | | | $ | 1,486,112,420 |
| Expenses | | | | |
| Custodian fees and expenses | $ | 55,793 | | |
| Independent trustees' fees and expenses | | 88,669 | | |
| Miscellaneous | | 303 | | |
| Total expenses | | | | 144,765 |
| Net Investment income (loss) | | | | 1,485,967,655 |
| Change in net unrealized appreciation (depreciation) on investment securities | | | | 2,048,690 |
| Net gain (loss) | | | | 2,048,690 |
| Net increase in net assets resulting from operations | | | $ | 1,488,016,345 |
| Statement of Changes in Net Assets |
| |
| | Year ended May 31, 2024 | | Year ended May 31, 2023 |
| Increase (Decrease) in Net Assets | | | | |
| Operations | | | | |
| Net investment income (loss) | $ | 1,485,967,655 | $ | 1,186,195,543 |
| Net realized gain (loss) | | - | | 29 |
| Change in net unrealized appreciation (depreciation) | | 2,048,690 | | - |
Net increase in net assets resulting from operations | | 1,488,016,345 | | 1,186,195,572 |
| Distributions to shareholders | | (1,485,969,269) | | (1,186,173,673) |
| | | | | |
| Affiliated share transactions | | | | |
| Proceeds from sales of shares | | 251,956,608,298 | | 291,914,416,340 |
| Cost of shares redeemed | | (255,921,026,410) | | (300,626,258,226) |
| | | | | |
Net increase (decrease) in net assets and shares resulting from share transactions | | (3,964,418,112) | | (8,711,841,886) |
| Total increase (decrease) in net assets | | (3,962,371,036) | | (8,711,819,987) |
| | | | | |
| Net Assets | | | | |
| Beginning of period | | 28,860,205,267 | | 37,572,025,254 |
| End of period | $ | 24,897,834,231 | $ | 28,860,205,267 |
| | | | | |
| Other Information | | | | |
| Shares | | | | |
| Sold | | 251,931,415,157 | | 291,885,227,818 |
| Redeemed | | (255,895,436,867) | | (300,596,198,606) |
| Net increase (decrease) | | (3,964,021,710) | | (8,710,970,788) |
| | | | | |
Financial Highlights
Fidelity® Securities Lending Cash Central Fund |
| |
| Years ended May 31, | | 2024 | | 2023 | | 2022 | | 2021 | | 2020 |
Selected Per-Share Data | | | | | | | | | | |
| Net asset value, beginning of period | $ | 1.0001 | $ | 1.0001 | $ | 1.0001 | $ | 1.0001 | $ | 1.0002 |
| Income from Investment Operations | | | | | | | | | | |
Net investment income (loss) A | | .0536 | | .0354 | | .0016 | | .0009 | | .0155 |
| Net realized and unrealized gain (loss) | | .0001 | | - B | | - B | | - B | | (.0001) |
| Total from investment operations | | .0537 | | .0354 | | .0016 | | .0009 | | .0154 |
| Distributions from net investment income | | (.0536) | | (.0354) | | (.0016) | | (.0009) | | (.0155) |
| Total distributions | | (.0536) | | (.0354) | | (.0016) | | (.0009) | | (.0155) |
| Net asset value, end of period | $ | 1.0002 | $ | 1.0001 | $ | 1.0001 | $ | 1.0001 | $ | 1.0001 |
Total Return C | | | | 3.59% | | .15% | | .09% | | 1.56% |
Ratios to Average Net Assets A,D,E | | | | | | | | | | |
| Expenses before reductions | | -% F | | -% F | | -% F | | -% F | | .01% |
| Expenses net of fee waivers, if any | | | | -% F | | -% F | | -% F | | .01% |
| Expenses net of all reductions | | -% F | | -% F | | -% F | | -% F | | .01% |
| Net investment income (loss) | | 5.36% | | 3.46% | | .16% | | .09% | | 1.57% |
| Supplemental Data | | | | | | | | | | |
| Net assets, end of period (000 omitted) | $ | 24,897,834 | $ | 28,860,205 | $ | 37,572,025 | $ | 36,244,909 | $ | 21,223,031 |
ANet investment income (loss) is affected by the timing of the declaration of dividends by any underlying mutual funds or exchange-traded funds (ETFs). Net investment income (loss) of any mutual funds or ETFs is not included in the Fund's net investment income (loss) ratio.
BAmount represents less than $.00005 per share.
CTotal returns would have been lower if certain expenses had not been reduced during the applicable periods shown.
DFees and expenses of any underlying mutual funds or exchange-traded funds (ETFs) are not included in the Fund's expense ratio. The Fund indirectly bears its proportionate share of these expenses.
EExpense ratios reflect operating expenses of the class. Expenses before reductions do not reflect amounts reimbursed, waived, or reduced through arrangements with the investment adviser, brokerage services, or other offset arrangements, if applicable, and do not represent the amount paid by the class during periods when reimbursements, waivers or reductions occur.
FAmount represents less than .005%.
Notes to Financial Statements
For the period ended May 31, 2024
1. Organization.
Fidelity Securities Lending Cash Central Fund (the Fund) is a fund of Fidelity Revere Street Trust (the Trust) and is authorized to issue an unlimited number of shares. The Trust is registered under the Investment Company Act of 1940, as amended (the 1940 Act), as an open-end management investment company organized as a Delaware statutory trust. Shares of the Fund are only offered to other investment companies and accounts (the Investing Funds) managed by Fidelity Management & Research Company LLC (FMR), or its affiliates. The Fund has been designated an institutional money market fund, and the value of the Fund's shares are calculated to four decimal places that fluctuates based upon changes in the value of the Fund's investments.
2. Significant Accounting Policies.
The Fund is an investment company and applies the accounting and reporting guidance of the Financial Accounting Standards Board (FASB) Accounting Standards Codification Topic 946 Financial Services - Investment Companies. The financial statements have been prepared in conformity with accounting principles generally accepted in the United States of America (GAAP), which require management to make certain estimates and assumptions at the date of the financial statements. Actual results could differ from those estimates. Subsequent events, if any, through the date that the financial statements were issued have been evaluated in the preparation of the financial statements. The Fund's Schedule of Investments lists any underlying mutual funds or exchange-traded funds (ETFs) but does not include the underlying holdings of these funds. The following summarizes the significant accounting policies of the Fund:
Investment Valuation. Investments are valued as of 4:00 p.m. Eastern time on the last calendar day of the period. The Board of Trustees (the Board) has designated the Fund's investment adviser as the valuation designee responsible for the fair valuation function and performing fair value determinations as needed. The investment adviser has established a Fair Value Committee (the Committee) to carry out the day-to-day fair valuation responsibilities and has adopted policies and procedures to govern the fair valuation process and the activities of the Committee. In accordance with these fair valuation policies and procedures, which have been approved by the Board, the Fund attempts to obtain prices from one or more third party pricing services or brokers to value its investments. When current market prices, quotations or currency exchange rates are not readily available or reliable, investments will be fair valued in good faith by the Committee, in accordance with the policies and procedures. Factors used in determining fair value vary by investment type and may include market or investment specific events, transaction data, estimated cash flows, and market observations of comparable investments. The frequency that the fair valuation procedures are used cannot be predicted and they may be utilized to a significant extent. The Committee manages the Fund's fair valuation practices and maintains the fair valuation policies and procedures. The Fund's investment adviser reports to the Board information regarding the fair valuation process and related material matters.
The Fund categorizes the inputs to valuation techniques used to value its investments into a disclosure hierarchy consisting of three levels as shown below:
Level 1 - unadjusted quoted prices in active markets for identical investments
Level 2 - other significant observable inputs (including quoted prices for similar investments, interest rates, prepayment speeds, etc.)
Level 3 - unobservable inputs (including the Fund's own assumptions based on the best information available)
Valuation techniques used to value the Fund's investments by major category are as follows:
Debt securities, including restricted securities, are valued based on evaluated prices received from third party pricing services or from brokers who make markets in such securities. U.S. government and government agency obligations, certificates of deposit and other short-term securities are valued by pricing services who utilize matrix pricing which considers yield or price of bonds of comparable quality, coupon, maturity and type or by broker-supplied prices. When independent prices are unavailable or unreliable, debt securities may be valued utilizing pricing methodologies which consider similar factors that would be used by third party pricing services. Debt securities are generally categorized as Level 2 in the hierarchy but may be Level 3 depending on the circumstances.
Short-term securities with remaining maturities of sixty days or less may be valued at amortized cost, which approximates fair value, and are categorized as Level 2 in the hierarchy.
Securities held by a money market fund are generally high quality and liquid; however, they are reflected as Level 2 because the inputs used to determine fair value are not quoted prices in an active market.
The aggregate value of investments by input level as of May 31, 2024 is included at the end of the Fund's Schedule of Investments.
Investment Transactions and Income. Security transactions are accounted for as of trade date. Gains and losses on securities sold are determined on the basis of identified cost. Interest income is accrued as earned and includes coupon interest and amortization of premium and accretion of discount on debt securities as applicable.
Expenses. Expenses directly attributable to a fund are charged to that fund. Expenses attributable to more than one fund are allocated among the respective funds on the basis of relative net assets or other appropriate methods. Expenses included in the accompanying financial statements reflect the expenses of that fund and do not include any expenses associated with any underlying mutual funds or exchange-traded funds. Although not included in a fund's expenses, a fund indirectly bears its proportionate share of these expenses through the net asset value of each underlying mutual fund or exchange-traded fund. Expense estimates are accrued in the period to which they relate and adjustments are made when actual amounts are known.
Income Tax Information and Distributions to Shareholders. Each year, the Fund intends to qualify as a regulated investment company under Subchapter M of the Internal Revenue Code, including distributing substantially all of its taxable income and realized gains. As a result, no provision for U.S. Federal income taxes is required. As of May 31, 2024, the Fund did not have any unrecognized tax benefits in the financial statements; nor is the Fund aware of any tax positions for which it is reasonably possible that the total amounts of unrecognized tax benefits will significantly change in the next twelve months. The Fund files a U.S. federal tax return, in addition to state and local tax returns as required. The Fund's federal income tax returns are subject to examination by the Internal Revenue Service (IRS) for a period of three fiscal years after they are filed. State and local tax returns may be subject to examination for an additional fiscal year depending on the jurisdiction.
Distributions are declared and recorded daily and paid monthly from net investment income. Distributions from realized gains, if any, are declared and recorded on the ex-dividend date. Income and capital gain distributions are determined in accordance with income tax regulations, which may differ from GAAP. There were no significant book-to-tax differences during the period.
As of period end, the cost and unrealized appreciation (depreciation) in securities for federal income tax purposes were as follows:
| Gross unrealized appreciation | $2,076,908 |
| Gross unrealized depreciation | (28,218) |
| Net unrealized appreciation (depreciation) | $2,048,690 |
| Tax Cost | $24,746,879,413 |
The tax-based components of distributable earnings as of period end were as follows:
| Undistributed ordinary income | $56,248 |
| Net unrealized appreciation (depreciation) on securities and other investments | $2,048,690 |
The tax character of distributions paid was as follows:
| | May 31, 2024 | May 31, 2023 |
| | | |
Ordinary Income | $1,485,969,269 | $ 1,186,173,673 |
| | | |
Repurchase Agreements. Pursuant to an Exemptive Order issued by the Securities and Exchange Commission, funds and other registered investment companies having management contracts with Fidelity Management and Research Company LLC, or its affiliates are permitted to transfer uninvested cash balances into joint trading accounts which are then invested in repurchase agreements. Funds may also invest directly with institutions in repurchase agreements. Upon settlement date, collateral is held in segregated accounts with custodian banks and may be obtained in the event of a default of the counterparty. The collateral balance is monitored on a daily basis to ensure it is at least equal to the principal amount of the repurchase agreement (including accrued interest). In the event of a default by the counterparty, realization of the collateral proceeds could be delayed, during which time the value of the collateral may decline.
New Rule Issuance. In July 2023, the Securities and Exchange Commission issued a Final Rule relative to Money Market Reform. Among other things, the Final Rule includes amendments for: (1) Removal of redemption gates except for liquidations; (2) Required liquidity fees for institutional prime and institutional tax-exempt money market funds; (3) Discretionary liquidity fees for non-government money market funds; (4) Higher liquidity requirements; and (5) Changes to reporting requirements for Form N-MFP and Form N-CR. The Final Rule imposes different implementation dates for the amendments through October 2, 2024. Management has evaluated the amendments and does not expect them to have a material impact to the Fund's financial statements and related disclosures.
3. Fees and Other Transactions with Affiliates.
Management Fee and Expense Contract. Fidelity Management & Research Company LLC (the investment adviser) provides the Fund with investment management services. The Fund does not pay any fees for these services. Pursuant to the Fund's expense contract, the investment adviser also pays all other expenses of the Fund, excluding custody fees, the compensation of the independent Trustees, and certain miscellaneous expenses such as proxy and shareholder meeting expenses.
Interfund Trades. Funds may purchase from or sell securities to other Fidelity Funds under procedures adopted by the Board. The procedures have been designed to ensure these interfund trades are executed in accordance with Rule 17a-7 of the 1940 Act. During the period, there were no interfund trades.
Sub-Advisory Arrangements. Effective March 1, 2024, the Fund's sub-advisory agreements with FMR Investment Management (UK) Limited, Fidelity Management & Research (Hong Kong) Limited, and Fidelity Management & Research (Japan) Limited were amended to provide that the investment adviser pays each sub-adviser monthly fees equal to 110% of the sub-adviser's costs for providing sub-advisory services.
4. Other.
A fund's organizational documents provide former and current trustees and officers with a limited indemnification against liabilities arising in connection with the performance of their duties to the fund. In the normal course of business, a fund may also enter into contracts that provide general indemnifications. A fund's maximum exposure under these arrangements is unknown as this would be dependent on future claims that may be made against a fund. The risk of material loss from such claims is considered remote.
At the end of the period, mutual funds managed by the investment adviser or its affiliates were the owners of record of all of the outstanding shares of the Fund.
5. Risk and Uncertainties.
Many factors affect a fund's performance. Developments that disrupt global economies and financial markets, such as pandemics, epidemics, outbreaks of infectious diseases, war, terrorism, and environmental disasters, may significantly affect a fund's investment performance. The effects of these developments to a fund will be impacted by the types of securities in which a fund invests, the financial condition, industry, economic sector, and geographic location of an issuer, and a fund's level of investment in the securities of that issuer. Significant concentrations in security types, issuers, industries, sectors, and geographic locations may magnify the factors that affect a fund's performance.
Report of Independent Registered Public Accounting Firm
To the Board of Trustees of Fidelity Revere Street Trust and Shareholders of Fidelity Securities Lending Cash Central Fund
Opinion on the Financial Statements
We have audited the accompanying statement of assets and liabilities, including the schedule of investments, of Fidelity Securities Lending Cash Central Fund (one of the funds constituting Fidelity Revere Street Trust, referred to hereafter as the "Fund") as of May 31, 2024, the related statement of operations for the year ended May 31, 2024, the statement of changes in net assets for each of the two years in the period ended May 31, 2024, including the related notes, and the financial highlights for each of the five years in the period ended May 31, 2024 (collectively referred to as the "financial statements"). In our opinion, the financial statements present fairly, in all material respects, the financial position of the Fund as of May 31, 2024, the results of its operations for the year then ended, the changes in its net assets for each of the two years in the period ended May 31, 2024 and the financial highlights for each of the five years in the period ended May 31, 2024 in conformity with accounting principles generally accepted in the United States of America.
Basis for Opinion
These financial statements are the responsibility of the Fund's management. Our responsibility is to express an opinion on the Fund's financial statements based on our audits. We are a public accounting firm registered with the Public Company Accounting Oversight Board (United States) (PCAOB) and are required to be independent with respect to the Fund in accordance with the U.S. federal securities laws and the applicable rules and regulations of the Securities and Exchange Commission and the PCAOB.
We conducted our audits of these financial statements in accordance with the standards of the PCAOB. Those standards require that we plan and perform the audit to obtain reasonable assurance about whether the financial statements are free of material misstatement, whether due to error or fraud.
Our audits included performing procedures to assess the risks of material misstatement of the financial statements, whether due to error or fraud, and performing procedures that respond to those risks. Such procedures included examining, on a test basis, evidence regarding the amounts and disclosures in the financial statements. Our audits also included evaluating the accounting principles used and significant estimates made by management, as well as evaluating the overall presentation of the financial statements. Our procedures included confirmation of securities owned as of May 31, 2024 by correspondence with the custodian and brokers; when replies were not received from brokers, we performed other auditing procedures. We believe that our audits provide a reasonable basis for our opinion.
/s/ PricewaterhouseCoopers LLP
Boston, Massachusetts
July 12, 2024
We have served as the auditor of one or more investment companies in the Fidelity group of funds since 1932.
Distributions
(Unaudited)
The dividend and capital gains distributions for the fund(s) are available on Fidelity.com or Institutional.Fidelity.com.
A total of 16.55% of the dividends distributed during the fiscal year was derived from interest on U.S. Government securities which is generally exempt from state income tax.
The fund designates $1,501,470,331 of distributions paid in the calendar year 2023 as qualifying to be taxed as interest-related dividends for nonresident alien shareholders.
The fund will notify shareholders in January 2025 of amounts for use in preparing 2024 income tax returns.
Item 8: Changes in and Disagreements with Accountants for Open-End Management Investment Companies
Note: This is not applicable for any fund included in this document.
Item 9: Proxy Disclosures for Open-End Management Investment Companies
| A special meeting of shareholders was held on October 18, 2023. The results of votes taken among shareholders on the proposal before them are reported below. Each vote reported represents one dollar of net asset value held on the record date for the meeting. |
| Proposal 1 |
| To elect a Board of Trustees. |
| | # of Votes | % of Votes |
| Abigail P. Johnson |
| Affirmative | 52,175,225,933.96 | 100.00 |
| TOTAL | 52,175,225,933.96 | 100.00 |
| Jennifer Toolin McAuliffe |
| Affirmative | 52,175,225,933.96 | 100.00 |
| TOTAL | 52,175,225,933.96 | 100.00 |
| Christine J. Thompson |
| Affirmative | 52,175,225,933.96 | 100.00 |
| TOTAL | 52,175,225,933.96 | 100.00 |
| Elizabeth S. Acton |
| Affirmative | 52,175,225,933.96 | 100.00 |
| TOTAL | 52,175,225,933.96 | 100.00 |
| Laura M. Bishop |
| Affirmative | 52,175,225,933.96 | 100.00 |
| TOTAL | 52,175,225,933.96 | 100.00 |
| Ann E. Dunwoody |
| Affirmative | 52,175,225,933.96 | 100.00 |
| TOTAL | 52,175,225,933.96 | 100.00 |
| John Engler |
| Affirmative | 52,175,225,933.96 | 100.00 |
| TOTAL | 52,175,225,933.96 | 100.00 |
| Robert F. Gartland |
| Affirmative | 52,175,225,933.96 | 100.00 |
| TOTAL | 52,175,225,933.96 | 100.00 |
| Robert W. Helm |
| Affirmative | 52,175,225,933.96 | 100.00 |
| TOTAL | 52,175,225,933.96 | 100.00 |
| Arthur E. Johnson |
| Affirmative | 52,175,225,933.96 | 100.00 |
| TOTAL | 52,175,225,933.96 | 100.00 |
| Michael E. Kenneally |
| Affirmative | 52,175,225,933.96 | 100.00 |
| TOTAL | 52,175,225,933.96 | 100.00 |
| Mark A. Murray |
| Affirmative | 52,175,225,933.96 | 100.00 |
| TOTAL | 52,175,225,933.96 | 100.00 |
| Carol J. Zierhoffer |
| Affirmative | 52,175,225,933.96 | 100.00 |
| TOTAL | 52,175,225,933.96 | 100.00 |
| | | |
| Proposal 1 reflects trust-wide proposal and voting results. |
Item 10: Renumeration Paid to Directors, Officers, and others of Open-End Management Investment Companies
Note: This information is disclosed as part of the financial statements for each Fund as part of Item 7: Financial Statements and Financial Highlights for Open-End Management Investment companies.
Item 11: Statement Regarding Basis for Approval of Investment Advisory Contract
Board Approval of Investment Advisory Contracts
Fidelity Securities Lending Cash Central Fund
At its January 2024 meeting, the Board of Trustees, including the Independent Trustees (together, the Board), approved an amended and restated management contract with Fidelity Management & Research Company LLC (FMR) (the Management Contract), and amended and restated sub-advisory agreements (the Sub-Advisory Contracts, and together with the Management Contract, the Advisory Contracts) for the fund, including the fund's sub-advisory agreements with FMR Investment Management (UK) Limited (FMR UK), Fidelity Management & Research (Hong Kong) Limited (FMR H.K.), and Fidelity Management & Research (Japan) Limited (FMR Japan). The Advisory Contracts will be effective March 1, 2024. The Board will consider the annual renewal of the fund's Advisory Contracts in September 2024, following its review of additional materials provided by FMR.
Management Contract. The Board approved the Management Contract, which eliminates the fee that FMR previously received from each investing fund's investment adviser. The Board noted the fund will continue to pay no management fee to FMR for services provided under the Management Contract.
Sub-Advisory Contracts. In connection with the Management Contract changes, the Board considered the Sub-Advisory Contracts, which changed the arrangements for fees paid by FMR to the sub-advisers under the agreements. The Board noted that the agreements with FMR UK, FMR H.K., and FMR Japan were amended to provide that FMR will compensate each sub-adviser at a fee equal to 110% of the sub-adviser's costs incurred in providing services under the agreement. The Board considered that, under the Sub-Advisory Contracts, FMR, and not the fund, will continue to pay the sub-advisory fees to each applicable sub-adviser.
The Board considered that the approval of the fund's Advisory Contracts will not result in any changes in the investment process or strategies employed in the management of the fund's assets or the day-to-day management of the fund or the persons primarily responsible for such management. Further, the Board considered that the Management Contract would not change the obligations and services of FMR and its affiliates on behalf of the fund, and, in particular, there would be no change in the nature and level of advisory, management, administration, transfer agent, and pricing and bookkeeping services provided to the fund by FMR and its affiliates.
In connection with its consideration of future renewals of the fund's Advisory Contracts, the Board will consider: (i) the nature, extent and quality of services provided to the funds, including shareholder and administrative services and investment performance; (ii) the competitiveness of the management fee and total expenses for the fund; (iii) the costs of the services and profitability, including the revenues earned and the expenses incurred in conducting the business of developing, marketing, distributing, managing, administering, and servicing the fund and its shareholders, to the extent applicable; and (iv) whether there have been economies of scale in respect of the Fidelity funds, whether the Fidelity funds (including the fund) have appropriately benefited from any such economies of scale, and whether there is the potential for realization of any further economies.
Based on its evaluation of all of the conclusions noted above, and after considering all factors it believed relevant, the Board concluded that the fund's management fee structure is fair and reasonable, and that the fund's Advisory Contracts should be approved.
1.734009.125
CCC-ANN-0724
Fidelity® Municipal Cash Central Fund
Annual Report
May 31, 2024
Contents
To view a fund's proxy voting guidelines and proxy voting record for the 12-month period ended June 30, visit http://www.fidelity.com/proxyvotingresults or visit the Securities and Exchange Commission's (SEC) web site at http://www.sec.gov.
You may also call 1-800-544-8544 to request a free copy of the proxy voting guidelines.
Standard & Poor's, S&P and S&P 500 are registered service marks of The McGraw-Hill Companies, Inc. and have been licensed for use by Fidelity Distributors Corporation.
Other third-party marks appearing herein are the property of their respective owners.
All other marks appearing herein are registered or unregistered trademarks or service marks of FMR LLC or an affiliated company. © 2024 FMR LLC. All rights reserved.
A fund files its complete schedule of portfolio holdings with the SEC for the first and third quarters of each fiscal year on Form N-PORT. Forms N-PORT are available on the SEC's web site at http://www.sec.gov. A fund's Forms N-PORT may be reviewed and copied at the SEC's Public Reference Room in Washington, DC. Information regarding the operation of the SEC's Public Reference Room may be obtained by calling 1-800-SEC-0330.
Item 7: Financial Statements and Financial Highlights for Open-End Management Investment Companies (Annual Report)
Fidelity® Municipal Cash Central Fund
Schedule of Investments May 31, 2024
Showing Percentage of Net Assets
| Variable Rate Demand Note - 59.1% |
| | | Principal Amount (a) | Value ($) |
| Alabama - 4.2% | | | |
| Decatur Indl. Dev. Board Exempt Facilities Rev. (Nucor Steel Decatur LLC Proj.) Series 2003 A, 3.72% 6/7/24, VRDN (b)(c) | | 1,900,000 | 1,900,000 |
| Walker County Econ. & Indl. Dev. Auth. Solid Waste Disp. Rev. (Alabama Pwr. Co. Plant Gorgas Proj.) Series 2023: | | | |
| 3.9% 6/3/24, VRDN (b)(c) | | 16,700,000 | 16,700,000 |
| 4.05% 6/3/24, VRDN (b)(c) | | 37,990,000 | 37,990,000 |
| West Jefferson Indl. Dev. Board Solid Waste Disp. Rev.: | | | |
| (Alabama Pwr. Co. Miller Plant Proj.) Series 2008, 3.9% 6/3/24, VRDN (b)(c) | | 18,600,000 | 18,600,000 |
| (Alabama Pwr. Co. Plant Miller Proj.) Series 2023, 3.9% 6/7/24, VRDN (b)(c) | | 8,900,000 | 8,900,000 |
TOTAL ALABAMA | | | 84,090,000 |
| Arizona - 0.9% | | | |
| Arizona Indl. Dev. Auth. Hosp. Rev. Series 2019 B, 3.7% 6/3/24, LOC TD Banknorth, NA, VRDN (b) | | 8,810,000 | 8,810,000 |
| Maricopa County Indl. Dev. Auth. Rev. (Clayton Homes, Inc. Proj.) Series 1998, 3.48% 6/7/24, LOC U.S. Bank NA, Cincinnati, VRDN (b)(c) | | 1,900,000 | 1,900,000 |
| Maricopa County Poll. Cont. Rev.: | | | |
| (Arizona Pub. Svc. Co. Palo Verde Proj.) Series 2009 A, 3.62% 6/7/24, VRDN (b) | | 2,300,000 | 2,300,000 |
| Series 2009 C, 3.6% 6/7/24, VRDN (b) | | 4,400,000 | 4,400,000 |
TOTAL ARIZONA | | | 17,410,000 |
| Arkansas - 0.1% | | | |
| Blytheville Indl. Dev. Rev. (Nucor Corp. Proj.): | | | |
| Series 1998, 3.72% 6/7/24, VRDN (b)(c) | | 200,000 | 200,000 |
| Series 2002, 3.7% 6/7/24, VRDN (b)(c) | | 1,000,000 | 1,000,000 |
TOTAL ARKANSAS | | | 1,200,000 |
| Delaware - 1.5% | | | |
| Delaware Econ. Dev. Auth. Rev. (Delmarva Pwr. & Lt. Co. Proj.): | | | |
| Series 1994, 4.04% 6/3/24, VRDN (b)(c) | | 28,200,000 | 28,200,000 |
| Series 1999 B, 3.7% 6/7/24, VRDN (b)(c) | | 2,400,000 | 2,400,000 |
TOTAL DELAWARE | | | 30,600,000 |
| Florida - 4.6% | | | |
| Bay County Indl. Rev. Dev. (Gulf Pwr. Co. Proj.) Series 2020, 3.55% 6/7/24, VRDN (b)(c) | | 22,300,000 | 22,300,000 |
| Broward County Indl. Dev. Rev.: | | | |
| (Florida Pwr. & Lt. Co. Proj.) Series 2018 B, 3.55% 6/7/24, VRDN (b)(c) | | 3,100,000 | 3,100,000 |
| Series 2018, 3.55% 6/7/24, VRDN (b)(c) | | 2,800,000 | 2,800,000 |
| Escambia County Solid Waste Disp. Rev. (Gulf Pwr. Co. Proj.) Series 2009, 3.5% 6/7/24, VRDN (b) | | 5,000,000 | 5,000,000 |
| Hillsborough County Hsg. Fin. Auth. Multi-family Rev. (Claymore Crossings Apt. Proj.) Series 2005, 3.38% 6/7/24, LOC Citibank NA, VRDN (b)(c) | | 8,805,000 | 8,805,000 |
| Jacksonville Poll. Cont. Rev. (Florida Pwr. & Lt. Co. Proj.) Series 1995, 3.55% 6/7/24, VRDN (b) | | 5,600,000 | 5,600,000 |
| Lee County Indl. Dev. Auth. Rev. (Florida Pwr. & Lt. Co. Proj.) Series 2016 A: | | | |
| 3.45% 6/7/24, VRDN (b)(c) | | 5,100,000 | 5,100,000 |
| 3.6% 6/7/24, VRDN (b)(c) | | 3,400,000 | 3,400,000 |
| Miami-Dade County Indl. Dev. Auth. Rev.: | | | |
| (Florida Pwr. & Lt. Co. Proj.) Series 2021, 3.45% 6/7/24, VRDN (b)(c) | | 3,800,000 | 3,800,000 |
| Series 2024 A, 3.65% 6/7/24, VRDN (b)(c) | | 13,700,000 | 13,700,000 |
| Series 2024 B, 3.7% 6/7/24, VRDN (b)(c) | | 14,800,000 | 14,800,000 |
| Mississippi Bus. Fin. Corp. Poll. Cont. Rev. (Gulf Pwr. Co. Proj.) Series 2014, 3.55% 6/7/24, VRDN (b) | | 2,100,000 | 2,100,000 |
| FNMA Hillsborough County Hsg. Fin. Auth. Multi-family Rev. (Grande Oaks Apts. Proj.) Series A, 3.41% 6/7/24, LOC Fannie Mae, VRDN (b)(c) | | 1,030,000 | 1,030,000 |
TOTAL FLORIDA | | | 91,535,000 |
| Georgia - 2.2% | | | |
| Bartow County Dev. Auth. (Georgia Pwr. Co. Plant Bowen Proj.) Series 2022, 4.25% 6/3/24, VRDN (b)(c) | | 15,850,000 | 15,850,000 |
| Burke County Indl. Dev. Auth. Poll. Cont. Rev. (Georgia Pwr. Co. Plant Vogtle Proj.) Series 2012, 4.05% 6/3/24, VRDN (b)(c) | | 10,105,000 | 10,105,000 |
| Monroe County Dev. Auth. Poll. Cont. Rev. (Gulf Pwr. Co. Plant Scherer Proj.) Series 2010, 3.45% 6/7/24, VRDN (b) | | 1,300,000 | 1,300,000 |
| Monroe County Dev. Auth. Rev. (Florida Pwr. & Lt. Co. Proj.): | | | |
| Series 2017, 3.5% 6/7/24, VRDN (b)(c) | | 4,600,000 | 4,600,000 |
| Series 2019, 3.6% 6/7/24, VRDN (b)(c) | | 13,040,000 | 13,040,000 |
TOTAL GEORGIA | | | 44,895,000 |
| Illinois - 2.0% | | | |
| Chicago Midway Arpt. Rev. Series 2014 C, 3.4% 6/7/24, LOC PNC Bank NA, VRDN (b)(c) | | 4,300,000 | 4,300,000 |
| Chicago O'Hare Int'l. Arpt. Spl. Facilities Rev. (Lufthansa German Airlines Proj.) Series 2001, 3.41% 6/7/24, LOC Bayerische Landesbank, VRDN (b)(c) | | 6,000,000 | 6,000,000 |
| Illinois Dev. Fin. Auth. Rev. (Glenwood School for Boys Proj.) Series 1998, 3.48% 6/7/24, LOC Northern Trust Co., VRDN (b) | | 1,900,000 | 1,900,000 |
| Will County Exempt Facilities Rev. (ExxonMobil Corp. Proj.) Series 2001, 3.75% 6/3/24 (Exxon Mobil Corp. Guaranteed), VRDN (b)(c) | | 26,815,000 | 26,815,000 |
TOTAL ILLINOIS | | | 39,015,000 |
| Indiana - 0.9% | | | |
| Indiana Dev. Fin. Auth. Envir. Rev. (PSI Energy Proj.) Series 2003 B, 3.44% 6/7/24, VRDN (b)(c) | | 1,050,000 | 1,050,000 |
| Indiana Fin. Auth. Hosp. Rev. (Parkview Health Sys. Oblig. Group Proj.) Series 2009 D, 3.7% 6/3/24, LOC TD Banknorth, NA, VRDN (b) | | 12,170,000 | 12,170,000 |
| Indiana Muni. Pwr. Agcy. Pwr. Supply Sys. Rev. Series B, 3.7% 6/3/24, LOC U.S. Bank NA, Cincinnati, VRDN (b) | | 5,745,000 | 5,745,000 |
TOTAL INDIANA | | | 18,965,000 |
| Iowa - 2.9% | | | |
| Iowa Fin. Auth. Health Facilities Rev.: | | | |
| Series 2013 B1, 3.7% 6/3/24, LOC TD Banknorth, NA, VRDN (b) | | 16,295,000 | 16,295,000 |
| Series 2013 B2, 3.7% 6/3/24, LOC TD Banknorth, NA, VRDN (b) | | 1,100,000 | 1,100,000 |
| Iowa Fin. Auth. Midwestern Disaster Area Rev. (ADM Proj.) Series 2011, 3.4% 6/7/24, VRDN (b) | | 3,200,000 | 3,200,000 |
| Iowa Fin. Auth. Solid Waste Facilities (MidAmerican Energy Co. Proj.) Series 2017, 3.95% 6/7/24, VRDN (b)(c) | | 36,830,000 | 36,830,000 |
TOTAL IOWA | | | 57,425,000 |
| Kansas - 0.5% | | | |
| Cygne Poll. Cont. Rev. (Kansas Gas and Elec. Co. Proj.) Series 1994 B, 3.55% 6/7/24, VRDN (b) | | 400,000 | 400,000 |
| Burlington Envir. Impt. Rev. (Kansas City Pwr. and Lt. Co. Proj.): | | | |
| Series 2007 A, 3.52% 6/7/24, VRDN (b) | | 3,300,000 | 3,300,000 |
| Series 2007 B, 3.52% 6/7/24, VRDN (b) | | 1,000,000 | 1,000,000 |
| St. Mary's Kansas Poll. Cont. Rev. (Kansas Gas and Elec. Co. Proj.) Series 1994, 3.55% 6/7/24, VRDN (b) | | 4,100,000 | 4,100,000 |
| Wamego Kansas Poll. Cont. Rfdg. Rev.: | | | |
| (Kansas Gas & Elec. Co. Proj.) Series 1994, 3.55% 6/7/24, VRDN (b) | | 200,000 | 200,000 |
| (Western Resources, Inc. Proj.) Series 1994, 3.55% 6/7/24, VRDN (b) | | 600,000 | 600,000 |
TOTAL KANSAS | | | 9,600,000 |
| Kentucky - 2.8% | | | |
| Louisville Reg'l. Arpt. Auth. Series 2006 A, 4% 6/3/24, VRDN (b)(c) | | 42,600,000 | 42,600,000 |
| Meade County Indl. Bldg. Rev. (Nucor Steel Brandenburg Proj.): | | | |
| Series 2020 A1, 4.3% 6/3/24, VRDN (b)(c) | | 9,800,000 | 9,800,000 |
| Series 2020 B1, 4.3% 6/3/24, VRDN (b)(c) | | 3,500,000 | 3,500,000 |
| Series 2021 A1, 4.62% 6/3/24, VRDN (b)(c) | | 400,000 | 400,000 |
TOTAL KENTUCKY | | | 56,300,000 |
| Louisiana - 2.9% | | | |
| Louisiana Gas & Fuel Tax Rev.: | | | |
| Series 2023 A1, 4% 6/3/24, LOC Toronto-Dominion Bank, VRDN (b) | | 9,920,000 | 9,920,000 |
| Series 2023 A2, 3.7% 6/3/24, LOC Toronto-Dominion Bank, VRDN (b) | | 13,040,000 | 13,040,000 |
| Louisiana Pub. Facilities Auth. Recycl Series 2024, 3.7% 6/3/24 (Chevron Corp. Guaranteed), VRDN (b)(c) | | 4,585,000 | 4,585,000 |
| Louisiana Pub. Facilities Auth. Rev. (Air Products & Chemicals, Inc. Proj.): | | | |
| Series 2007, 3.6% 6/3/24, VRDN (b) | | 475,000 | 475,000 |
| Series 2008 B, 3.6% 6/3/24, VRDN (b) | | 10,700,000 | 10,700,000 |
| Saint James Parish Gen. Oblig. (Nucor Steel Louisiana LLC Proj.): | | | |
| Series 2010 A1, 3.58% 6/7/24, VRDN (b) | | 400,000 | 400,000 |
| Series 2010 B1, 3.65% 6/7/24, VRDN (b) | | 3,075,000 | 3,075,000 |
| St. Bernard Parish Exempt FAC Series 1996, 3.75% 6/3/24, VRDN (b)(c) | | 15,500,000 | 15,500,000 |
TOTAL LOUISIANA | | | 57,695,000 |
| Massachusetts - 0.1% | | | |
| Massachusetts Health & Edl. Facilities Auth. Rev. (Baystate Health Sys. Proj.) Series 2009 J2, 3.7% 6/3/24, LOC TD Banknorth, NA, VRDN (b) | | 1,300,000 | 1,300,000 |
| Michigan - 0.1% | | | |
| Michigan Strategic Fund Ltd. Oblig. Rev. (The Kroger Co. Recovery Zone Facilities Bond Proj.) Series 2010, 3.4% 6/7/24, LOC Bank of Nova Scotia, VRDN (b) | | 2,100,000 | 2,100,000 |
| Mississippi - 2.4% | | | |
| Jackson County Indl. Sewage Facilities Rev. (Chevron U.S.A., Inc. Proj.) Series 1994, 3.72% 6/3/24, VRDN (b)(c) | | 10,635,000 | 10,635,000 |
| Mississippi Bus. Fin. Corp.: | | | |
| (Chevron U.S.A., Inc. Proj.) Series 2007 C: | | | |
3.67% 6/3/24 (Chevron Corp. Guaranteed), VRDN (b) | | 2,230,000 | 2,230,000 |
3.67% 6/3/24 (Chevron Corp. Guaranteed), VRDN (b) | | 1,410,000 | 1,410,000 |
| Mississippi Pwr. Co. Proj.) Series 2022, 4.4% 6/3/24, VRDN (b)(c) | | 6,500,000 | 6,500,000 |
| Series 2011 G, 3.67% 6/3/24, VRDN (b) | | 3,160,000 | 3,160,000 |
| Mississippi Bus. Fin. Corp. Rev. (Gulf Pwr. Co. Proj.) Series 2019, 3.6% 6/7/24, VRDN (b)(c) | | 14,000,000 | 14,000,000 |
| Mississippi Bus. Fin. Corp. Solid Waste Disp. Rev. (Waste Mgmt., Inc. Proj.) Series 2003, 3.7% 6/7/24, LOC Bank of America NA, VRDN (b)(c) | | 10,000,000 | 10,000,000 |
TOTAL MISSISSIPPI | | | 47,935,000 |
| Nebraska - 2.7% | | | |
| Nebraska Invt. Fin. Auth. Single Family Hsg. Rev.: | | | |
| Series 2015 B, 3.6% 6/7/24 (Liquidity Facility Fed. Home Ln. Bank Topeka), VRDN (b)(c) | | 14,580,000 | 14,580,000 |
| Series 2016 D, 3.65% 6/7/24 (Liquidity Facility Fed. Home Ln. Bank Topeka), VRDN (b)(c) | | 7,930,000 | 7,930,000 |
| Series 2021 B, 3.65% 6/7/24 (Liquidity Facility Fed. Home Ln. Bank Topeka), VRDN (b)(c) | | 20,000,000 | 20,000,000 |
| Series B, 3.65% 6/7/24 (Liquidity Facility Fed. Home Ln. Bank Topeka), VRDN (b)(c) | | 10,900,000 | 10,900,000 |
| Stanton County Indl. Dev. Rev.: | | | |
| (Nucor Corp. Proj.) Series 1996, 3.72% 6/7/24, VRDN (b)(c) | | 1,200,000 | 1,200,000 |
| Series 1998, 3.72% 6/7/24, VRDN (b)(c) | | 100,000 | 100,000 |
TOTAL NEBRASKA | | | 54,710,000 |
| Nevada - 0.7% | | | |
| Clark County Indl. Dev. Rev. Series 2008 A, 3.4% 6/7/24, LOC MUFG Bank Ltd., VRDN (b)(c) | | 15,000,000 | 15,000,000 |
| New Hampshire - 0.2% | | | |
| Nat'l. Fin. Auth. N H Health C Series 2024 C, 3.47% 6/7/24, LOC Truist Bank, VRDN (b) | | 4,200,000 | 4,200,000 |
| New York - 9.7% | | | |
| New York City Gen. Oblig.: | | | |
| Series 2014 D4, 3.7% 6/3/24, LOC TD Banknorth, NA, VRDN (b) | | 1,630,000 | 1,630,000 |
| Series 2018 E, 3.7% 6/3/24 (Liquidity Facility TD Banknorth, NA), VRDN (b) | | 3,620,000 | 3,620,000 |
| Series 2023 A, 3.7% 6/3/24 (Liquidity Facility Bank of Montreal), VRDN (b) | | 61,765,000 | 61,765,000 |
| New York City Muni. Wtr. Fin. Auth. Wtr. & Swr. Sys. Rev.: | | | |
| Series 2011 DD-1, 3.7% 6/3/24 (Liquidity Facility TD Banknorth, NA), VRDN (b) | | 9,250,000 | 9,250,000 |
| Series 2011 DD-3B, 3.8% 6/3/24 (Liquidity Facility State Street Bank & Trust Co., Boston), VRDN (b) | | 6,360,000 | 6,360,000 |
| Series 2014 AA: | | | |
3.7% 6/3/24 (Liquidity Facility Mizuho Corporate Bank Ltd.), VRDN (b) | | 15,630,000 | 15,630,000 |
3.7% 6/3/24 (Liquidity Facility TD Banknorth, NA), VRDN (b) | | 8,060,000 | 8,060,000 |
| Series 2016 BB2, 3.67% 6/3/24 (Liquidity Facility State Street Bank & Trust Co., Boston), VRDN (b) | | 2,055,000 | 2,055,000 |
| Series 2017 BB, 3.8% 6/3/24 (Liquidity Facility State Street Bank & Trust Co., Boston), VRDN (b) | | 12,380,000 | 12,380,000 |
| Series 2021 EE1, 3.8% 6/3/24 (Liquidity Facility U.S. Bank NA, Cincinnati), VRDN (b) | | 5,400,000 | 5,400,000 |
| Series 2021 EE2, 3.8% 6/3/24 (Liquidity Facility State Street Bank & Trust Co., Boston), VRDN (b) | | 14,200,000 | 14,200,000 |
| New York City Transitional Fin. Auth. Rev.: | | | |
| Series 2015 A4, 3.67% 6/3/24 (Liquidity Facility Mizuho Corporate Bank Ltd.), VRDN (b) | | 295,000 | 295,000 |
| Series B5, 3.8% 6/3/24 (Liquidity Facility U.S. Bank NA, Cincinnati), VRDN (b) | | 31,515,000 | 31,515,000 |
| New York Dorm. Auth. Rev. Series 2019 B, 3.8% 6/3/24 (Liquidity Facility U.S. Bank NA, Cincinnati), VRDN (b) | | 8,120,000 | 8,120,000 |
| New York Hsg. Fin. Agcy. Rev. (350 West 43rd Street Hsg. Proj.) Series 2002 A, 3.75% 6/3/24, LOC Landesbank Hessen-Thuringen, VRDN (b)(c) | | 100,000 | 100,000 |
| Triborough Bridge & Tunnel Auth. Revs.: | | | |
| Series 2005 B, 3.8% 6/3/24, LOC U.S. Bank NA, Cincinnati, VRDN (b) | | 6,315,000 | 6,315,000 |
| Series 2023 B4A, 3.7% 6/3/24, LOC TD Banknorth, NA, VRDN (b) | | 5,780,000 | 5,780,000 |
TOTAL NEW YORK | | | 192,475,000 |
| North Carolina - 0.8% | | | |
| Charlotte-Mecklenburg Hosp. Auth. Health Care Sys. Rev. Series 2007 E, 3.7% 6/3/24, LOC TD Banknorth, NA, VRDN (b) | | 12,355,000 | 12,355,000 |
| Cumberland County Indl. Facilities & Poll. Cont. Fing. Auth. (Cargill, Inc. Proj.) Series 2022, 3.4% 6/7/24, VRDN (b)(c) | | 2,900,000 | 2,900,000 |
TOTAL NORTH CAROLINA | | | 15,255,000 |
| Ohio - 0.7% | | | |
| Cuyahoga County Health Care Facilities Rev. (The A.M. McGregor Home Proj.) Series 2014, 3.4% 6/7/24, LOC Northern Trust Co., VRDN (b) | | 2,000,000 | 2,000,000 |
| Ohio Hsg. Fin. Agcy. Residential Mtg. Rev. Series 2016 G, 3.4% 6/7/24 (Liquidity Facility TD Banknorth, NA), VRDN (b)(c) | | 11,460,000 | 11,460,000 |
TOTAL OHIO | | | 13,460,000 |
| Oregon - 1.0% | | | |
| Oregon Facilities Auth. Rev. Series 2018 B, 3.7% 6/3/24, LOC TD Banknorth, NA, VRDN (b) | | 20,590,000 | 20,590,000 |
| Pennsylvania - 0.1% | | | |
| Lancaster County Hosp. Auth. Health Ctr. Rev. (Masonic Homes Proj.) Series 2008 D, 3.67% 6/3/24, LOC JPMorgan Chase Bank, VRDN (b) | | 1,135,000 | 1,135,000 |
| South Carolina - 1.2% | | | |
| Berkeley County Indl. Dev. Rev.: | | | |
| (Nucor Corp. Proj.): | | | |
Series 1995, 3.72% 6/7/24, VRDN (b)(c) | | 200,000 | 200,000 |
Series 1997, 3.72% 6/7/24, VRDN (b)(c) | | 2,700,000 | 2,700,000 |
| Series A, 3.75% 6/7/24, VRDN (b)(c) | | 1,925,000 | 1,925,000 |
| Darlington County Indl. Dev. Rev. (Nucor Corp. Proj.) Series 2003 A, 3.75% 6/7/24, VRDN (b)(c) | | 900,000 | 900,000 |
| South Carolina Jobs-Econ. Dev. Auth. Series B, 3.7% 6/3/24, LOC TD Banknorth, NA, VRDN (b) | | 5,400,000 | 5,400,000 |
| South Carolina Jobs-Econ. Dev. Auth. Econ. Dev. Rev. (Waste Mgmt. of South Carolina, Inc. Proj.) Series 2003 A, 3.41% 6/7/24, LOC Wells Fargo Bank NA, VRDN (b)(c) | | 13,200,000 | 13,200,000 |
TOTAL SOUTH CAROLINA | | | 24,325,000 |
| Tennessee - 1.5% | | | |
| Clarksville Pub. Bldg. Auth. Rev. (Tennessee Muni. Bond Fund Proj.): | | | |
| Series 2004, 3.8% 6/3/24, LOC Bank of America NA, VRDN (b) | | 1,200,000 | 1,200,000 |
| Series 2005, 3.8% 6/3/24, LOC Bank of America NA, VRDN (b) | | 12,525,000 | 12,525,000 |
| Series 2008, 3.8% 6/3/24, LOC Bank of America NA, VRDN (b) | | 7,725,000 | 7,725,000 |
| Indl. Dev. Board of Blount County and Cities of Alcoa and Maryville (Maryville Civic Arts Ctr. Proj.) Series 2009 B, 3.46% 6/7/24, LOC Truist Bank, VRDN (b) | | 2,150,000 | 2,150,000 |
| Loudon County Indl. Dev. Board Exempt Facilities Rev. (Kimberly-Clark Corp. Proj.) Series 1999, 3.55% 6/7/24, VRDN (b)(c) | | 1,000,000 | 1,000,000 |
| Montgomery County Pub. Bldg. Auth. Pooled Fing. Rev.: | | | |
| (Tennessee County Ln. Pool Prog.) Series 2006, 3.78% 6/3/24, LOC Bank of America NA, VRDN (b) | | 900,000 | 900,000 |
| (Tennessee County Ln. Pool Proj.) Series 2004, 3.84% 6/3/24, LOC Bank of America NA, VRDN (b) | | 4,295,000 | 4,295,000 |
TOTAL TENNESSEE | | | 29,795,000 |
| Texas - 6.8% | | | |
| Calhoun County Navigation District Envir. Facilities Rev. (Formosa Plastics Corp. Proj.) Series 2004, 3.5% 6/7/24, LOC Citibank NA, VRDN (b)(c) | | 5,000,000 | 5,000,000 |
| Calhoun County Navigation District Poll. Cont. Rev. (Formosa Plastics Corp., Texas Proj.) Series 2002, 3.5% 6/7/24, LOC Citibank NA, VRDN (b)(c) | | 10,000,000 | 10,000,000 |
| Calhoun Port Auth. Envir. Facilities Rev.: | | | |
| Series 2007 A, 3.44% 6/7/24, LOC PNC Bank NA, VRDN (b)(c) | | 10,930,000 | 10,930,000 |
| Series 2008, 3.44% 6/7/24, LOC Bank of America NA, VRDN (b)(c) | | 4,400,000 | 4,400,000 |
| Dallas/Fort Worth Int'l. Arpt. Facility Impt. Corp. Rev. (United Parcel Svc., Inc. Proj.) Series 2002, 3.7% 6/3/24, VRDN (b)(c) | | 29,050,000 | 29,050,000 |
| Gulf Coast Waste Disp. Auth. Envir. Facilities Rev. Series 2003, 3.75% 6/3/24 (Exxon Mobil Corp. Guaranteed), VRDN (b)(c) | | 1,400,000 | 1,400,000 |
| Harris County Indl. Dev. Corp. Poll. Cont. Rev. (Exxon Proj.) Series 1987, 3.67% 6/3/24 (Exxon Mobil Corp. Guaranteed), VRDN (b)(c) | | 9,005,000 | 9,005,000 |
| Jewett Econ. Dev. Corp. Indl. Dev. Rev. (Nucor Corp. Proj.) Series 2003, 3.72% 6/7/24, VRDN (b)(c) | | 4,950,000 | 4,950,000 |
| Lower Neches Valley Auth. Indl. Dev. Corp. Exempt Facilities Rev.: | | | |
| (ExxonMobil Proj.): | | | |
Series 2006 B3, 3.74% 6/3/24, VRDN (b)(c) | | 5,835,000 | 5,835,000 |
Series 2008 B4, 3.74% 6/3/24 (Exxon Mobil Corp. Guaranteed), VRDN (b)(c) | | 2,505,000 | 2,505,000 |
| (Onyx Envir. Svcs. Proj.) Series 2003, 3.48% 6/7/24, LOC Bank of America NA, VRDN (b)(c) | | 10,250,000 | 10,250,000 |
| Port Arthur Navigation District Indl. Dev. Corp. Exempt Facilities Rev. (Air Products Proj.): | | | |
| Series 2000, 3.54% 6/7/24, VRDN (b)(c) | | 12,500,000 | 12,500,000 |
| Series 2001, 3.54% 6/7/24, VRDN (b)(c) | | 10,100,000 | 10,100,000 |
| Tarrant County Cultural Ed. Facilities Fin. Corp. Hosp. Rev. (Baylor Health Care Sys. Proj.) Series 2011 C, 3.7% 6/3/24, LOC TD Banknorth, NA, VRDN (b) | | 4,065,000 | 4,065,000 |
| Texas Gen. Oblig.: | | | |
| Series 2012 B, 3.45% 6/7/24 (Liquidity Facility State Street Bank & Trust Co., Boston), VRDN (b) | | 500,000 | 500,000 |
| Series 2013 A, 3.45% 6/7/24 (Liquidity Facility State Street Bank & Trust Co., Boston), VRDN (b) | | 420,000 | 420,000 |
| FNMA: | | | |
| Harris County Hsg. Fin. Corp. Multi-family Hsg. Rev. (Louetta Village Apts. Proj.) Series 2005, 3.61% 6/7/24, LOC Fannie Mae, VRDN (b)(c) | | 4,780,000 | 4,780,000 |
| Houston Hsg. Fin. Corp. Multi-family Hsg. Rev. (Little Nell Apts. Proj.) Series 2003, 3.61% 6/7/24, LOC Fannie Mae, VRDN (b)(c) | | 8,900,000 | 8,900,000 |
TOTAL TEXAS | | | 134,590,000 |
| Utah - 0.4% | | | |
| Emery County Poll. Cont. Rev. (PacifiCorp Proj.) Series 1994, 3.85% 6/7/24, VRDN (b) | | 8,800,000 | 8,800,000 |
| Washington - 1.5% | | | |
| FHLMC Washington Hsg. Fin. Commission Multi-family Hsg. Rev. (Fairwinds Redmond Proj.) Series A, 3.45% 6/7/24, LOC Fed. Home Ln. Bank, San Francisco, VRDN (b)(c) | | 19,250,000 | 19,250,000 |
| FNMA Washington Hsg. Fin. Commission Multi-family Hsg. Rev. (Pinehurst Apts. Proj.) Series A, 3.61% 6/7/24, LOC Fannie Mae, VRDN (b)(c) | | 11,000,000 | 11,000,000 |
TOTAL WASHINGTON | | | 30,250,000 |
| West Virginia - 2.3% | | | |
| West Virginia Econ. Dev. Auth. Solid Waste Disp. Facilities Rev.: | | | |
| (Appalachian Pwr. Co. Amos Proj.) Series 2008 B, 3.46% 6/7/24, VRDN (b)(c) | | 11,600,000 | 11,600,000 |
| (Appalachian Pwr. Co.- Mountaineer Proj.) Series 2008 A, 3.37% 6/7/24, VRDN (b)(c) | | 34,200,000 | 34,200,000 |
TOTAL WEST VIRGINIA | | | 45,800,000 |
| Wisconsin - 1.1% | | | |
| Green Bay Redev. Auth. (Green Bay Packaging, Inc. Proj.) Series 2019, 3.4% 6/7/24, LOC Wells Fargo Bank NA, VRDN (b)(c)(d) | | 21,500,000 | 21,500,000 |
| Wyoming - 0.3% | | | |
| Converse County Envir. Impt. Rev. Series 1995, 3.85% 6/7/24, VRDN (b)(c) | | 1,300,000 | 1,300,000 |
| Sweetwater County Env Imp Rev. (Pacificorp Proj.) Series 1995, 4.1% 6/3/24, VRDN (b)(c) | | 4,400,000 | 4,400,000 |
TOTAL WYOMING | | | 5,700,000 |
| TOTAL VARIABLE RATE DEMAND NOTE (Cost $1,177,648,802) | | | 1,177,650,000 |
| | | | |
| Tender Option Bond - 37.8% |
| | | Principal Amount (a) | Value ($) |
| Alabama - 1.5% | | | |
| Black Belt Energy Gas District Participating VRDN: | | | |
| Series XM 11 26, 3.75% 6/3/24 (Liquidity Facility JPMorgan Chase Bank) (b)(e)(f) | | 6,670,000 | 6,670,000 |
| Series XM 11 27, 3.75% 6/3/24 (Liquidity Facility JPMorgan Chase Bank) (b)(e)(f) | | 3,870,000 | 3,870,000 |
| Series XM 11 44, 3.41% 6/7/24 (Liquidity Facility Royal Bank of Canada) (b)(e)(f) | | 6,250,000 | 6,250,000 |
| Infirmary Health Systems Spl. Care Facilities Fing. Auth. Rev. Participating VRDN Series 50 44, 3.7% 6/3/24 (Liquidity Facility JPMorgan Chase Bank) (b)(e)(f) | | 8,700,000 | 8,700,000 |
| Southeast Alabama Gas Supply District Participating VRDN Series XF 16 87, 3.41% 6/7/24 (Liquidity Facility Royal Bank of Canada) (b)(e)(f) | | 5,315,000 | 5,315,000 |
TOTAL ALABAMA | | | 30,805,000 |
| Arizona - 0.3% | | | |
| Arizona Health Facilities Auth. Rev. Participating VRDN Series MIZ 91 01, 3.56% 6/7/24 (Liquidity Facility Mizuho Cap. Markets LLC) (b)(e)(f) | | 2,050,000 | 2,050,000 |
| Arizona Indl. Dev. Auth. Hosp. Rev. Participating VRDN Series XM 10 13, 3.48% 6/7/24 (Liquidity Facility JPMorgan Chase Bank) (b)(e)(f) | | 825,000 | 825,000 |
| Phoenix Civic Impt. Board Arpt. Rev. Participating VRDN Series YX 12 72, 3.41% 6/7/24 (Liquidity Facility Barclays Bank PLC) (b)(c)(e)(f) | | 2,750,000 | 2,750,000 |
TOTAL ARIZONA | | | 5,625,000 |
| California - 0.0% | | | |
| Los Angeles Dept. Arpt. Rev. Participating VRDN Series XF 13 73, 3.41% 6/7/24 (Liquidity Facility JPMorgan Chase Bank) (b)(c)(e)(f) | | 800,000 | 800,000 |
| Colorado - 1.3% | | | |
| Colorado Health Facilities Auth. Rev. Bonds Participating VRDN Series 2022 YX 12 54, 3.4% 6/7/24 (Liquidity Facility Barclays Bank PLC) (b)(e)(f) | | 3,905,000 | 3,905,000 |
| Denver City & County Arpt. Rev. Participating VRDN: | | | |
| Series 2022 XX 12 60, 3.41% 6/7/24 (Liquidity Facility Barclays Bank PLC) (b)(c)(e)(f) | | 7,075,000 | 7,075,000 |
| Series Floaters XG 01 96, 3.44% 6/7/24 (Liquidity Facility Toronto-Dominion Bank) (b)(c)(e)(f) | | 10,680,000 | 10,680,000 |
| Series XF 15 13, 3.44% 6/7/24 (Liquidity Facility Toronto-Dominion Bank) (b)(c)(e)(f) | | 2,200,000 | 2,200,000 |
| Series ZF 32 04, 3.41% 6/7/24 (Liquidity Facility Morgan Stanley Bank, West Valley City Utah) (b)(c)(e)(f) | | 2,120,000 | 2,120,000 |
TOTAL COLORADO | | | 25,980,000 |
| Connecticut - 0.7% | | | |
| Connecticut Gen. Oblig. Participating VRDN: | | | |
| Series Floaters 014, 3.4% 6/7/24 (Liquidity Facility Barclays Bank PLC) (b)(e)(f) | | 9,955,000 | 9,955,000 |
| Series Floaters 016, 3.4% 6/7/24 (Liquidity Facility Barclays Bank PLC) (b)(e)(f) | | 3,300,000 | 3,300,000 |
TOTAL CONNECTICUT | | | 13,255,000 |
| Florida - 8.7% | | | |
| Broward County Convention Ctr. Participating VRDN Series XF 16 41, 3.46% 6/7/24 (Liquidity Facility JPMorgan Chase Bank) (b)(e)(f) | | 2,100,000 | 2,100,000 |
| County of Broward Tourist Dev. Tax Rev. Participating VRDN Series XL 04 29, 3.47% 6/7/24 (Liquidity Facility Wells Fargo Bank NA) (b)(e)(f) | | 500,000 | 500,000 |
| Escambia County Health Facilities Auth. Health Facilities Rev. Participating VRDN Series 50 28, 3.89% 6/3/24 (Liquidity Facility Bank of America NA) (b)(e)(f) | | 68,015,000 | 68,015,000 |
| Florida Dev. Fin. Corp. Healthcare Facility Rev. Participating VRDN: | | | |
| Series BAML 80 87, 3.89% 6/3/24 (Liquidity Facility Bank of America NA) (b)(e)(f) | | 30,815,000 | 30,815,000 |
| Series XG 05 49, 3.7% 6/3/24 (Liquidity Facility JPMorgan Chase Bank) (b)(e)(f) | | 4,400,000 | 4,400,000 |
| Florida Dev. Fin. Corp. Rev. Participating VRDN: | | | |
| Series XF 17 04, 3.41% 6/7/24 (Liquidity Facility Royal Bank of Canada) (b)(c)(e)(f) | | 7,400,000 | 7,400,000 |
| Series XG 05 77, 3.41% 6/7/24 (Liquidity Facility Barclays Bank PLC) (b)(c)(e)(f) | | 3,400,000 | 3,400,000 |
| Greater Orlando Aviation Auth. Arpt. Facilities Rev. Participating VRDN: | | | |
| Series XF 14 63, 3.46% 6/7/24 (Liquidity Facility Toronto-Dominion Bank) (b)(c)(e)(f) | | 930,000 | 930,000 |
| Series XF 15 19, 3.44% 6/7/24 (Liquidity Facility Toronto-Dominion Bank) (b)(c)(e)(f) | | 1,875,000 | 1,875,000 |
| Series XG 05 45, 3.42% 6/7/24 (Liquidity Facility Royal Bank of Canada) (b)(c)(e)(f) | | 1,875,000 | 1,875,000 |
| Series XM 08 96, 3.41% 6/7/24 (Liquidity Facility JPMorgan Chase Bank) (b)(c)(e)(f) | | 750,000 | 750,000 |
| Hillsborough County Aviation Auth. Rev. Participating VRDN Series XF 16 37, 3.42% 6/7/24 (Liquidity Facility Royal Bank of Canada) (b)(c)(e)(f) | | 3,400,000 | 3,400,000 |
| Lee County Arpt. Rev. Participating VRDN: | | | |
| Series XF 11 26, 3.44% 6/7/24 (Liquidity Facility Toronto-Dominion Bank) (b)(c)(e)(f) | | 3,195,000 | 3,195,000 |
| Series XF 15 23, 3.42% 6/7/24 (Liquidity Facility Royal Bank of Canada) (b)(c)(e)(f) | | 2,440,000 | 2,440,000 |
| Miami-Dade County Participating VRDN Series XF 15 12, 3.44% 6/7/24 (Liquidity Facility Toronto-Dominion Bank) (b)(c)(e)(f) | | 2,815,000 | 2,815,000 |
| Miami-Dade County Edl. Facilities Rev. Participating VRDN Series Floaters XG 01 92, 3.4% 6/7/24 (Liquidity Facility Royal Bank of Canada) (b)(e)(f) | | 3,770,000 | 3,770,000 |
| North Broward Hosp. District Rev. Participating VRDN Series BAML 50 48, 3.89% 6/3/24 (Liquidity Facility Bank of America NA) (b)(e)(f) | | 11,340,000 | 11,340,000 |
| Pittsburg WTSW Participating VRDN Series 2022, 3.7% 6/3/24 (Liquidity Facility JPMorgan Chase Bank) (b)(e)(f) | | 8,900,000 | 8,900,000 |
| South Miami Health Facilities Auth. Hosp. Rev. Participating VRDN Series YX 12 86, 3.43% 6/7/24 (Liquidity Facility Barclays Bank PLC) (b)(e)(f) | | 2,000,000 | 2,000,000 |
| Volusia County Fla Hosp. Rev. Participating VRDN Series 50 32, 3.7% 6/3/24 (Liquidity Facility JPMorgan Chase Bank) (b)(e)(f) | | 12,650,000 | 12,650,000 |
TOTAL FLORIDA | | | 172,570,000 |
| Georgia - 0.8% | | | |
| Brookhaven Dev. Auth. Rev. Participating VRDN Series XF 15 03, 4.15% 6/3/24 (Liquidity Facility JPMorgan Chase Bank) (b)(e)(f) | | 5,100,000 | 5,100,000 |
| Burke County Indl. Dev. Auth. Poll. Cont. Rev. Participating VRDN Series Floaters E 107, 3.41% 6/7/24 (Liquidity Facility Royal Bank of Canada) (b)(e)(f) | | 4,000,000 | 4,000,000 |
| Columbia County Hosp. Auth. Rev. Participating VRDN Series XF 16 40, 3.4% 6/7/24 (Liquidity Facility Toronto-Dominion Bank) (b)(e)(f) | | 3,650,000 | 3,650,000 |
| Fulton County Dev. Auth. Rev. Participating VRDN Series XL 02 68, 3.46% 6/7/24 (Liquidity Facility Bank of America NA) (b)(e)(f) | | 360,000 | 360,000 |
| Georgia Muni. Elec. Auth. Pwr. Rev. Participating VRDN Series XF 15 54, 3.4% 6/7/24 (Liquidity Facility Toronto-Dominion Bank) (b)(e)(f) | | 2,080,000 | 2,080,000 |
TOTAL GEORGIA | | | 15,190,000 |
| Hawaii - 0.4% | | | |
| Hawaii Arpts. Sys. Rev. Participating VRDN Series XX 12 17, 3.41% 6/7/24 (Liquidity Facility Barclays Bank PLC) (b)(c)(e)(f) | | 7,700,000 | 7,700,000 |
| Illinois - 4.0% | | | |
| Chicago Board of Ed. Participating VRDN Series XG 04 69, 3.42% 6/7/24 (Liquidity Facility Bank of America NA) (b)(e)(f) | | 3,255,000 | 3,255,000 |
| Chicago Gen. Oblig. Participating VRDN: | | | |
| Series 2022 XF 30 42, 3.4% 6/7/24 (Liquidity Facility Barclays Bank PLC) (b)(e)(f) | | 4,450,000 | 4,450,000 |
| Series 2022 XF 30 45, 3.4% 6/7/24 (Liquidity Facility Barclays Bank PLC) (b)(e)(f) | | 6,050,000 | 6,050,000 |
| Series XX 12 64, 3.4% 6/7/24 (Liquidity Facility Barclays Bank PLC) (b)(e)(f) | | 8,600,000 | 8,600,000 |
| Chicago O'Hare Int'l. Arpt. Rev. Participating VRDN: | | | |
| Series Floaters XF 07 23, 3.4% 6/7/24 (Liquidity Facility JPMorgan Chase Bank) (b)(c)(e)(f) | | 7,735,000 | 7,735,000 |
| Series XF 14 30, 3.43% 6/7/24 (Liquidity Facility Royal Bank of Canada) (b)(c)(e)(f) | | 2,810,000 | 2,810,000 |
| Series XG 05 38, 3.42% 6/7/24 (Liquidity Facility Royal Bank of Canada) (b)(c)(e)(f) | | 2,810,000 | 2,810,000 |
| Chicago Transit Auth. Participating VRDN Series XL 01 45, 3.4% 6/7/24 (Liquidity Facility Barclays Bank PLC) (b)(e)(f) | | 1,830,000 | 1,830,000 |
| Illinois Fin. Auth. Participating VRDN: | | | |
| Series BAML 50 45, 3.44% 6/7/24 (Liquidity Facility Bank of America NA) (b)(e)(f) | | 10,600,000 | 10,600,000 |
| Series XG 04 31, 3.4% 6/7/24 (Liquidity Facility Barclays Bank PLC) (b)(e)(f) | | 3,435,000 | 3,435,000 |
| Illinois Fin. Auth. Rev. Participating VRDN Series YX 13 26, 3.4% 6/7/24 (Liquidity Facility Barclays Bank PLC) (b)(e)(f) | | 1,175,000 | 1,175,000 |
| Illinois Gen. Oblig. Participating VRDN: | | | |
| Series XF 10 10, 3.4% 6/7/24 (Liquidity Facility Barclays Bank PLC) (b)(e)(f) | | 700,000 | 700,000 |
| Series XF 31 11, 3.4% 6/7/24 (Liquidity Facility Barclays Bank PLC) (b)(e)(f) | | 5,700,000 | 5,700,000 |
| Series XL 02 60, 3.4% 6/7/24 (Liquidity Facility Barclays Bank PLC) (b)(e)(f) | | 1,100,000 | 1,100,000 |
| Metropolitan Pier & Exposition Participating VRDN Series Floaters XF 10 45, 3.48% 6/7/24 (Liquidity Facility Barclays Bank PLC) (b)(e)(f) | | 800,000 | 800,000 |
| Pittsburg WTSW Participating VRDN Series 2023, 3.73% 6/3/24 (Liquidity Facility JPMorgan Chase Bank) (b)(e)(f) | | 7,100,000 | 7,100,000 |
| RBC Muni. Products, Inc. Trust Participating VRDN Series 2023, 3.41% 6/7/24 (Liquidity Facility Royal Bank of Canada) (b)(e)(f) | | 12,600,000 | 12,600,000 |
TOTAL ILLINOIS | | | 80,750,000 |
| Kentucky - 0.0% | | | |
| CommonSpirit Health Participating VRDN Series MIZ 90 21, 3.46% 6/7/24 (Liquidity Facility Mizuho Cap. Markets LLC) (b)(e)(f) | | 800,000 | 800,000 |
| Louisiana - 1.2% | | | |
| Louisiana Pub. Facilities Auth. Hosp. Rev. Participating VRDN Series BAML 80 06, 3.89% 6/3/24 (Liquidity Facility Bank of America NA) (b)(e)(f) | | 8,500,000 | 8,500,000 |
| Louisiana Pub. Facilities Auth. Rev. Participating VRDN Series Floater BAML 5041 D1, 3.89% 6/3/24 (Liquidity Facility Bank of America NA) (b)(e)(f) | | 11,625,000 | 11,625,000 |
| New Orleans Aviation Board Rev. Participating VRDN Series XF 31 48, 3.41% 6/7/24 (Liquidity Facility Barclays Bank PLC) (b)(c)(e)(f) | | 3,000,000 | 3,000,000 |
TOTAL LOUISIANA | | | 23,125,000 |
| Michigan - 1.1% | | | |
| Eastern Michigan Univ. Revs. Participating VRDN Series Floater 046, 3.75% 6/3/24 (Liquidity Facility Barclays Bank PLC) (b)(e)(f) | | 16,100,000 | 16,100,000 |
| Mclaren Health Care Corp. Participating VRDN Series XL 02 71, 3.46% 6/7/24 (Liquidity Facility Bank of America NA) (b)(e)(f) | | 595,000 | 595,000 |
| Michigan Fin. Auth. Act 38 Facss Participating VRDN Series XF 17 05, 3.39% 6/7/24 (Liquidity Facility JPMorgan Chase Bank) (b)(e)(f) | | 4,400,000 | 4,400,000 |
TOTAL MICHIGAN | | | 21,095,000 |
| Minnesota - 0.1% | | | |
| Duluth Econ. Dev. Auth. Health Care Facilities Rev. Participating VRDN Series XG 05 23, 3.4% 6/7/24 (Liquidity Facility Barclays Bank PLC) (b)(e)(f) | | 3,060,000 | 3,060,000 |
| Mississippi - 0.4% | | | |
| Mississippi Hosp. Equip. & Facilities Auth. Participating VRDN Series 50 26, 3.89% 6/3/24 (Liquidity Facility Bank of America NA) (b)(e)(f) | | 8,565,000 | 8,565,000 |
| Missouri - 0.4% | | | |
| Kansas City Indl. Dev. Auth. Participating VRDN Series XG 03 96, 3.44% 6/7/24 (Liquidity Facility Toronto-Dominion Bank) (b)(c)(e)(f) | | 6,055,000 | 6,055,000 |
| Kansas City Spl. Oblig. Participating VRDN Series YX 11 93, 3.4% 6/7/24 (Liquidity Facility Barclays Bank PLC) (b)(e)(f) | | 1,200,000 | 1,200,000 |
TOTAL MISSOURI | | | 7,255,000 |
| Nebraska - 0.0% | | | |
| Central Plains Energy Proj. Rev. Participating VRDN Series 2022 ZL 03 01, 3.41% 6/7/24 (Liquidity Facility Royal Bank of Canada) (b)(e)(f) | | 140,000 | 140,000 |
| Nevada - 0.8% | | | |
| Clark County School District Participating VRDN Series XF 14 73, 3.48% 6/7/24 (Liquidity Facility JPMorgan Chase Bank) (b)(e)(f) | | 1,490,000 | 1,490,000 |
| Clark County Wtr. Reclamation District Participating VRDN Series XM 11 57, 4.15% 6/3/24 (Liquidity Facility JPMorgan Chase Bank) (b)(e)(f) | | 13,700,000 | 13,700,000 |
TOTAL NEVADA | | | 15,190,000 |
| New Jersey - 0.7% | | | |
| New Jersey Tpk. Auth. Tpk. Rev. Participating VRDN Series XM 10 96, 3.41% 6/7/24 (Liquidity Facility Royal Bank of Canada) (b)(e)(f) | | 8,800,000 | 8,800,000 |
| New Jersey Trans. Trust Fund Auth. Participating VRDN: | | | |
| Series XF 16 75, 3.4% 6/7/24 (Liquidity Facility Toronto-Dominion Bank) (b)(e)(f) | | 3,170,000 | 3,170,000 |
| Series YX 12 68, 3.4% 6/7/24 (Liquidity Facility Barclays Bank PLC) (b)(e)(f) | | 2,300,000 | 2,300,000 |
TOTAL NEW JERSEY | | | 14,270,000 |
| New York - 2.6% | | | |
| New York City Gen. Oblig. Participating VRDN Series Floaters E 118, 3.75% 6/3/24 (Liquidity Facility Royal Bank of Canada) (b)(e)(f) | | 9,850,000 | 9,850,000 |
| New York City Muni. Wtr. Fin. Auth. Wtr. & Swr. Sys. Rev. Participating VRDN Series Floaters 2018 E125, 3.75% 6/3/24 (Liquidity Facility Royal Bank of Canada) (b)(e)(f) | | 8,600,000 | 8,600,000 |
| New York Trans. Dev. Corp. Participating VRDN Series 2022 E 154, 3.46% 6/7/24 (Liquidity Facility Royal Bank of Canada) (b)(c)(e)(f) | | 33,050,000 | 33,050,000 |
TOTAL NEW YORK | | | 51,500,000 |
| North Carolina - 0.2% | | | |
| Charlotte Int'l. Arpt. Rev. Participating VRDN: | | | |
| Series XG 04 51, 3.44% 6/7/24 (Liquidity Facility Wells Fargo Bank NA) (b)(c)(e)(f) | | 2,000,000 | 2,000,000 |
| Series XG 05 27, 3.45% 6/7/24 (Liquidity Facility Bank of America NA) (b)(c)(e)(f) | | 130,000 | 130,000 |
| Greater Asheville Reg'l. Arpt. Auth. Participating VRDN Series XM 10 11, 3.43% 6/7/24 (Liquidity Facility Royal Bank of Canada) (b)(c)(e)(f) | | 1,100,000 | 1,100,000 |
TOTAL NORTH CAROLINA | | | 3,230,000 |
| North Dakota - 0.4% | | | |
| Grand Forks Health Care Sys. Rev. Participating VRDN Series XF 16 02, 3.4% 6/7/24 (Liquidity Facility Toronto-Dominion Bank) (b)(e)(f) | | 4,565,000 | 4,565,000 |
| Monroeville Fin. Auth. UPMC Rev. Participating VRDN Series YX 11 85, 3.4% 6/7/24 (Liquidity Facility Barclays Bank PLC) (b)(e)(f) | | 3,500,000 | 3,500,000 |
TOTAL NORTH DAKOTA | | | 8,065,000 |
| Ohio - 0.9% | | | |
| CommonSpirit Health Participating VRDN Series MIZ 90 20, 3.46% 6/7/24 (Liquidity Facility Mizuho Cap. Markets LLC) (b)(e)(f) | | 1,900,000 | 1,900,000 |
| Cuyahoga County Ctfs. of Prtn. Participating VRDN Series Floaters XG 02 06, 3.46% 6/7/24 (Liquidity Facility Bank of America NA) (b)(e)(f) | | 500,000 | 500,000 |
| Middletown Hosp. Facilities Rev. Participating VRDN 4.21% 6/3/24 (Liquidity Facility Bank of America NA) (b)(e)(f) | | 3,270,000 | 3,270,000 |
| Montgomery County Hosp. Rev. Participating VRDN Series XX 12 48, 3.4% 6/7/24 (Liquidity Facility Barclays Bank PLC) (b)(e)(f) | | 1,300,000 | 1,300,000 |
| Ohio Hosp. Facilities Rev. Participating VRDN Series Floater BAML 50 40, 3.89% 6/3/24 (Liquidity Facility Bank of America NA) (b)(e)(f) | | 9,400,000 | 9,400,000 |
| Ohio Hosp. Rev. Participating VRDN Series C18, 3.4% 6/7/24 (Liquidity Facility Royal Bank of Canada) (b)(e)(f) | | 1,800,000 | 1,800,000 |
TOTAL OHIO | | | 18,170,000 |
| Pennsylvania - 1.5% | | | |
| Allegheny County Arpt. Auth. Rev. Participating VRDN Series XG 05 41, 3.42% 6/7/24 (Liquidity Facility Royal Bank of Canada) (b)(c)(e)(f) | | 5,400,000 | 5,400,000 |
| Commonwealth Fing. Auth. Tobacco Participating VRDN Series XX 10 80, 3.4% 6/7/24 (Liquidity Facility Barclays Bank PLC) (b)(e)(f) | | 4,530,000 | 4,530,000 |
| Pennsylvania Econ. Dev. Fing. Auth. Participating VRDN: | | | |
| Series XG 04 37, 3.41% 6/7/24 (Liquidity Facility Barclays Bank PLC) (b)(c)(e)(f) | | 4,400,000 | 4,400,000 |
| Series XM 10 83, 3.44% 6/7/24 (Liquidity Facility Royal Bank of Canada) (b)(c)(e)(f) | | 3,900,000 | 3,900,000 |
| Series YX 11 86, 3.4% 6/7/24 (Liquidity Facility Barclays Bank PLC) (b)(e)(f) | | 8,000,000 | 8,000,000 |
| Philadelphia Arpt. Rev. Participating VRDN: | | | |
| Series XG 05 51, 3.42% 6/7/24 (Liquidity Facility Royal Bank of Canada) (b)(c)(e)(f) | | 1,850,000 | 1,850,000 |
| Series YX 12 11, 3.41% 6/7/24 (Liquidity Facility Barclays Bank PLC) (b)(c)(e)(f) | | 1,600,000 | 1,600,000 |
TOTAL PENNSYLVANIA | | | 29,680,000 |
| South Carolina - 0.5% | | | |
| South Carolina Pub. Svc. Auth. Rev. Participating VRDN: | | | |
| Series Floaters XG 02 09, 3.4% 6/7/24 (Liquidity Facility Toronto-Dominion Bank) (b)(e)(f) | | 5,625,000 | 5,625,000 |
| Series YX 12 69, 3.4% 6/7/24 (Liquidity Facility Barclays Bank PLC) (b)(e)(f) | | 4,165,000 | 4,165,000 |
TOTAL SOUTH CAROLINA | | | 9,790,000 |
| Tennessee - 1.8% | | | |
| Metropolitan Nashville Arpt. Auth. Rev. Participating VRDN: | | | |
| Series XL 03 82, 3.43% 6/7/24 (Liquidity Facility Royal Bank of Canada) (b)(c)(e)(f) | | 1,965,000 | 1,965,000 |
| Series YX 12 89, 3.41% 6/7/24 (Liquidity Facility Barclays Bank PLC) (b)(c)(e)(f) | | 1,910,000 | 1,910,000 |
| Sullivan County Health, Ed. and Hsg. Board Participating VRDN Series BAML 50 24, 3.89% 6/3/24 (Liquidity Facility Bank of America NA) (b)(e)(f) | | 31,630,000 | 31,630,000 |
TOTAL TENNESSEE | | | 35,505,000 |
| Texas - 1.4% | | | |
| Austin Arpt. Sys. Rev. Participating VRDN Series YX 11 99, 3.41% 6/7/24 (Liquidity Facility Barclays Bank PLC) (b)(c)(e)(f) | | 2,400,000 | 2,400,000 |
| Houston Arpt. Sys. Rev. Participating VRDN Series XF 31 26, 3.41% 6/7/24 (Liquidity Facility Barclays Bank PLC) (b)(c)(e)(f) | | 10,900,000 | 10,900,000 |
| Lamar Consolidated Independent School District Participating VRDN Series XM 11 03, 3.7% 6/3/24 (Liquidity Facility JPMorgan Chase Bank) (b)(e)(f) | | 4,700,000 | 4,700,000 |
| Texas Muni. Gas Acquisition & Supply Corp. Participating VRDN Series XM 11 54, 3.41% 6/7/24 (Liquidity Facility Royal Bank of Canada) (b)(e)(f) | | 2,175,000 | 2,175,000 |
| Texas Private Activity Bond Surface Trans. Corp. Participating VRDN Series XM 11 23, 3.43% 6/7/24 (Liquidity Facility Royal Bank of Canada) (b)(c)(e)(f) | | 3,300,000 | 3,300,000 |
| Wylie Tex Independent School District Colli Participating VRDN Series XM 11 61, 3.7% 6/3/24 (Liquidity Facility JPMorgan Chase Bank) (b)(e)(f) | | 4,025,000 | 4,025,000 |
TOTAL TEXAS | | | 27,500,000 |
| Utah - 0.9% | | | |
| Salt Lake City Arpt. Rev. Participating VRDN: | | | |
| Series XF 15 50, 3.44% 6/7/24 (Liquidity Facility Toronto-Dominion Bank) (b)(c)(e)(f) | | 2,055,000 | 2,055,000 |
| Series XL 04 57, 3.41% 6/7/24 (Liquidity Facility Barclays Bank PLC) (b)(c)(e)(f) | | 2,615,000 | 2,615,000 |
| Series XL 04 59, 3.41% 6/7/24 (Liquidity Facility Barclays Bank PLC) (b)(c)(e)(f) | | 9,490,000 | 9,490,000 |
| Series XM 11 46, 3.41% 6/7/24 (Liquidity Facility UBS AG) (b)(c)(e)(f) | | 2,500,000 | 2,500,000 |
| Series XX 12 49, 3.41% 6/7/24 (Liquidity Facility Barclays Bank PLC) (b)(c)(e)(f) | | 1,000,000 | 1,000,000 |
TOTAL UTAH | | | 17,660,000 |
| Virginia - 2.6% | | | |
| Chesapeake Bay Bridge and Tunnel District Gen. Resolution Rev. Participating VRDN Series XF 30 64, 3.4% 6/7/24 (Liquidity Facility Barclays Bank PLC) (b)(e)(f) | | 3,500,000 | 3,500,000 |
| Norfolk Econ. Dev. Health Care Facilities Participating VRDN Series 2022 C20, 3.4% 6/7/24 (Liquidity Facility Royal Bank of Canada) (b)(e)(f) | | 3,000,000 | 3,000,000 |
| Suffolk Econ. Dev. Auth. Hosp. Facilities Rev. Participating VRDN Series MIZ 90 25, 3.46% 6/7/24 (Liquidity Facility Mizuho Cap. Markets LLC) (b)(e)(f) | | 37,290,000 | 37,290,000 |
| Virginia Small Bus. Fing. Auth. Participating VRDN Series XF 32 17, 3.41% 6/7/24 (Liquidity Facility Barclays Bank PLC) (b)(c)(e)(f) | | 5,225,000 | 5,225,000 |
| Virginia Small Bus. Fing. Auth. Health Care Facilities Rev. Participating VRDN Series XL 04 37, 4.2% 6/3/24 (Liquidity Facility JPMorgan Chase Bank) (b)(e)(f) | | 3,700,000 | 3,700,000 |
TOTAL VIRGINIA | | | 52,715,000 |
| Washington - 1.1% | | | |
| Barclays Bank PLC Participating VRDN Series YX 12 41, 3.43% 6/7/24 (Liquidity Facility Barclays Bank PLC) (b)(c)(e)(f) | | 1,430,000 | 1,430,000 |
| CommonSpirit Health Participating VRDN Series XF 1017, 3.4% 6/7/24 (Liquidity Facility Barclays Bank PLC) (b)(e)(f) | | 4,000,000 | 4,000,000 |
| Port of Seattle Rev. Participating VRDN: | | | |
| Series 2022 ZF 30 68, 3.41% 6/7/24 (Liquidity Facility Morgan Stanley Bank, West Valley City Utah) (b)(c)(e)(f) | | 2,635,000 | 2,635,000 |
| Series XF 13 71, 3.5% 6/7/24 (Liquidity Facility JPMorgan Chase Bank) (b)(c)(e)(f) | | 2,025,000 | 2,025,000 |
| Series XF 15 99, 3.43% 6/7/24 (Liquidity Facility Royal Bank of Canada) (b)(c)(e)(f) | | 1,360,000 | 1,360,000 |
| Series XM 08 75, 3.46% 6/7/24 (Liquidity Facility JPMorgan Chase Bank) (b)(c)(e)(f) | | 470,000 | 470,000 |
| Series XM 10 27, 3.5% 6/7/24 (Liquidity Facility JPMorgan Chase Bank) (b)(c)(e)(f) | | 2,000,000 | 2,000,000 |
| Series ZF 13 97, 3.5% 6/7/24 (Liquidity Facility JPMorgan Chase Bank) (b)(c)(e)(f) | | 2,585,000 | 2,585,000 |
| Washington Convention Ctr. Pub. Facilities Participating VRDN: | | | |
| Series 2022 XX 12 38, 3.4% 6/7/24 (Liquidity Facility Barclays Bank PLC) (b)(e)(f) | | 1,500,000 | 1,500,000 |
| Series XG 02 87, 3.4% 6/7/24 (Liquidity Facility Barclays Bank PLC) (b)(e)(f) | | 4,185,000 | 4,185,000 |
TOTAL WASHINGTON | | | 22,190,000 |
| Wisconsin - 1.5% | | | |
| Wisconsin Health & Edl. Facilities Auth. Rev. Participating VRDN Series BAML 50 35, 3.97% 6/3/24 (Liquidity Facility Bank of America NA) (b)(e)(f) | | 30,675,000 | 30,675,000 |
| TOTAL TENDER OPTION BOND (Cost $752,855,000) | | | 752,855,000 |
| | | | |
| Other Municipal Security - 1.4% |
| | | Principal Amount (a) | Value ($) |
| Texas - 1.4% | | | |
Harris County Cultural Ed. Facilities Fin. Corp. Rev. Bonds Series 2024 C1, 4.05% tender 6/3/24, CP mode (Cost $28,000,000) | | 28,000,000 | 28,000,000 |
| | | | |
| TOTAL INVESTMENT IN SECURITIES - 98.3% (Cost $1,958,503,802) | 1,958,505,000 |
NET OTHER ASSETS (LIABILITIES) - 1.7% | 33,255,698 |
| NET ASSETS - 100.0% | 1,991,760,698 |
| | |
Security Type Abbreviations
| CP | - | COMMERCIAL PAPER |
| VRDN | - | VARIABLE RATE DEMAND NOTE (A debt instrument that is payable upon demand, either daily, weekly or monthly) |
The date shown for securities represents the date when principal payments must be paid, taking into account any call options exercised by the issuer and any permissible maturity shortening features other than interest rate resets.
Legend
| (a) | Amount is stated in United States dollars unless otherwise noted. |
| (b) | Coupon rates for floating and adjustable rate securities reflect the rates in effect at period end. |
| (c) | Private activity obligations whose interest is subject to the federal alternative minimum tax for individuals. |
| (d) | Security exempt from registration under Rule 144A of the Securities Act of 1933. These securities may be resold in transactions exempt from registration, normally to qualified institutional buyers. At the end of the period, the value of these securities amounted to $21,500,000 or 1.1% of net assets. |
| (e) | Provides evidence of ownership in one or more underlying municipal bonds. |
| (f) | Coupon rates are determined by re-marketing agents based on current market conditions. |
Investment Valuation
The following is a summary of the inputs used, as of May 31, 2024, involving the Fund's assets and liabilities carried at fair value. The inputs or methodology used for valuing securities may not be an indication of the risk associated with investing in those securities. For more information on valuation inputs, and their aggregation into the levels used below, please refer to the Investment Valuation section in the accompanying Notes to Financial Statements.
| Valuation Inputs at Reporting Date: |
| Description | Total ($) | Level 1 ($) | Level 2 ($) | Level 3 ($) |
Investments in Securities: | | | | |
|
| Variable Rate Demand Note | 1,177,650,000 | - | 1,177,650,000 | - |
|
| Tender Option Bond | 752,855,000 | - | 752,855,000 | - |
|
| Other Municipal Security | 28,000,000 | - | 28,000,000 | - |
| Total Investments in Securities: | 1,958,505,000 | - | 1,958,505,000 | - |
Financial Statements
| Statement of Assets and Liabilities |
| | | | May 31, 2024 |
| | | | | |
| Assets | | | | |
Investment in securities, at value - See accompanying schedule Unaffiliated issuers (cost $1,958,503,802): | | | $ | 1,958,505,000 |
| Cash | | | | 5,356 |
| Receivable for investments sold | | | | 33,155,814 |
| Interest receivable | | | | 10,862,938 |
| Other receivables | | | | 21,248 |
Total assets | | | | 2,002,550,356 |
| Liabilities | | | | |
| Payable for investments purchased | $ | 4,130,000 | | |
| Distributions payable | | 6,638,411 | | |
| Other payables and accrued expenses | | 21,247 | | |
| Total liabilities | | | | 10,789,658 |
| Net Assets | | | $ | 1,991,760,698 |
| Net Assets consist of: | | | | |
| Paid in capital | | | $ | 1,991,759,472 |
| Total accumulated earnings (loss) | | | | 1,226 |
| Net Assets | | | $ | 1,991,760,698 |
Net Asset Value, offering price and redemption price per share ($1,991,760,698 ÷ 1,991,305,624 shares) | | | $ | 1.0002 |
| Statement of Operations |
| | | | Year ended May 31, 2024 |
| Investment Income | | | | |
| Interest | | | $ | 85,517,526 |
| Expenses | | | | |
| Custodian fees and expenses | $ | 32,482 | | |
| Independent trustees' fees and expenses | | 7,630 | | |
| Tax expense | | 2,350 | | |
| Miscellaneous | | 25 | | |
| Total expenses before reductions | | 42,487 | | |
| Expense reductions | | (32,482) | | |
| Total expenses after reductions | | | | 10,005 |
| Net Investment income (loss) | | | | 85,507,521 |
| Realized and Unrealized Gain (Loss) | | | | |
| Net realized gain (loss) on: | | | | |
| Investment Securities: | | | | |
| Unaffiliated issuers | | 36,209 | | |
| Total net realized gain (loss) | | | | 36,209 |
| Change in net unrealized appreciation (depreciation) on investment securities | | | | 1,198 |
| Net gain (loss) | | | | 37,407 |
| Net increase in net assets resulting from operations | | | $ | 85,544,928 |
| Statement of Changes in Net Assets |
| |
| | Year ended May 31, 2024 | | Year ended May 31, 2023 |
| Increase (Decrease) in Net Assets | | | | |
| Operations | | | | |
| Net investment income (loss) | $ | 85,507,521 | $ | 45,185,547 |
| Net realized gain (loss) | | 36,209 | | 53,974 |
| Change in net unrealized appreciation (depreciation) | | 1,198 | | - |
Net increase in net assets resulting from operations | | 85,544,928 | | 45,239,521 |
| Distributions to shareholders | | (85,507,794) | | (45,210,801) |
| | | | | |
| Affiliated share transactions | | | | |
| Proceeds from sales of shares | | 14,061,391,161 | | 11,472,270,999 |
| Cost of shares redeemed | | (14,066,332,327) | | (11,331,843,983) |
| | | | | |
Net increase (decrease) in net assets and shares resulting from share transactions | | (4,941,166) | | 140,427,016 |
| Total increase (decrease) in net assets | | (4,904,032) | | 140,455,736 |
| | | | | |
| Net Assets | | | | |
| Beginning of period | | 1,996,664,730 | | 1,856,208,994 |
| End of period | $ | 1,991,760,698 | $ | 1,996,664,730 |
| | | | | |
| Other Information | | | | |
| Shares | | | | |
| Sold | | 14,086,164,542 | | 11,469,977,004 |
| Redeemed | | (14,091,079,010) | | (11,329,578,067) |
| Net increase (decrease) | | (4,914,468) | | 140,398,937 |
| | | | | |
Financial Highlights
Fidelity® Municipal Cash Central Fund |
| |
| Years ended May 31, | | 2024 | | 2023 | | 2022 | | 2021 | | 2020 |
Selected Per-Share Data | | | | | | | | | | |
| Net asset value, beginning of period | $ | 1.0002 | $ | 1.0002 | $ | 1.0002 | $ | 1.0001 | $ | 1.0001 |
| Income from Investment Operations | | | | | | | | | | |
Net investment income (loss) A | | .0349 | | .0220 | | .0016 | | .0011 | | .0130 |
| Net realized and unrealized gain (loss) | | - B | | - B | | .0001 | | .0001 | | - B |
| Total from investment operations | | .0349 | | .0220 | | .0017 | | .0012 | | .0130 |
| Distributions from net investment income | | (.0349) | | (.0220) | | (.0016) | | (.0011) | | (.0130) |
| Distributions from net realized gain | | - | | - B | | - B | | - B | | - B |
| Total distributions | | (.0349) | | (.0220) | | (.0017) C | | (.0011) | | (.0130) |
| Net asset value, end of period | $ | 1.0002 | $ | 1.0002 | $ | 1.0002 | $ | 1.0002 | $ | 1.0001 |
Total Return D | | | | 2.22% | | .17% | | .12% | | 1.31% |
Ratios to Average Net Assets A,E,F | | | | | | | | | | |
Expenses before reductions G | | -% | | -% | | -% | | -% | | -% |
Expenses net of fee waivers, if any G | | | | -% | | -% | | -% | | -% |
Expenses net of all reductions G | | -% | | -% | | -% | | -% | | -% |
| Net investment income (loss) | | 3.46% | | 2.25% | | .17% | | .10% | | 1.18% |
| Supplemental Data | | | | | | | | | | |
| Net assets, end of period (000 omitted) | $ | 1,991,761 | $ | 1,996,665 | $ | 1,856,209 | $ | 1,342,909 | $ | 1,249,951 |
ANet investment income (loss) is affected by the timing of the declaration of dividends by any underlying mutual funds or exchange-traded funds (ETFs). Net investment income (loss) of any mutual funds or ETFs is not included in the Fund's net investment income (loss) ratio.
BAmount represents less than $.00005 per share.
CTotal distributions per share do not sum due to rounding.
DTotal returns would have been lower if certain expenses had not been reduced during the applicable periods shown.
EFees and expenses of any underlying mutual funds or exchange-traded funds (ETFs) are not included in the Fund's expense ratio. The Fund indirectly bears its proportionate share of these expenses.
FExpense ratios reflect operating expenses of the class. Expenses before reductions do not reflect amounts reimbursed, waived, or reduced through arrangements with the investment adviser, brokerage services, or other offset arrangements, if applicable, and do not represent the amount paid by the class during periods when reimbursements, waivers or reductions occur.
GAmount represents less than .005%.
Notes to Financial Statements
For the period ended May 31, 2024
1. Organization.
Fidelity Municipal Cash Central Fund (the Fund) is a fund of Fidelity Revere Street Trust (the Trust) and is authorized to issue an unlimited number of shares. The Trust is registered under the Investment Company Act of 1940, as amended (the 1940 Act), as an open-end management investment company organized as a Delaware statutory trust. Shares of the Fund are only offered to other investment companies and accounts (the Investing Funds) managed by Fidelity Management & Research Company LLC (FMR), or its affiliates. The Fund has been designated an institutional money market fund, and the value of the Fund's shares are calculated to four decimal places that fluctuates based upon changes in the value of the Fund's investments.
2. Significant Accounting Policies.
The Fund is an investment company and applies the accounting and reporting guidance of the Financial Accounting Standards Board (FASB) Accounting Standards Codification Topic 946 Financial Services - Investment Companies. The financial statements have been prepared in conformity with accounting principles generally accepted in the United States of America (GAAP), which require management to make certain estimates and assumptions at the date of the financial statements. Actual results could differ from those estimates. Subsequent events, if any, through the date that the financial statements were issued have been evaluated in the preparation of the financial statements. The Fund's Schedule of Investments lists any underlying mutual funds or exchange-traded funds (ETFs) but does not include the underlying holdings of these funds. The following summarizes the significant accounting policies of the Fund:
Investment Valuation. Investments are valued as of 4:00 p.m. Eastern time on the last calendar day of the period. The Board of Trustees (the Board) has designated the Fund's investment adviser as the valuation designee responsible for the fair valuation function and performing fair value determinations as needed. The investment adviser has established a Fair Value Committee (the Committee) to carry out the day-to-day fair valuation responsibilities and has adopted policies and procedures to govern the fair valuation process and the activities of the Committee. In accordance with these fair valuation policies and procedures, which have been approved by the Board, the Fund attempts to obtain prices from one or more third party pricing services or brokers to value its investments. When current market prices, quotations or currency exchange rates are not readily available or reliable, investments will be fair valued in good faith by the Committee, in accordance with the policies and procedures. Factors used in determining fair value vary by investment type and may include market or investment specific events, transaction data, estimated cash flows, and market observations of comparable investments. The frequency that the fair valuation procedures are used cannot be predicted and they may be utilized to a significant extent. The Committee manages the Fund's fair valuation practices and maintains the fair valuation policies and procedures. The Fund's investment adviser reports to the Board information regarding the fair valuation process and related material matters.
The Fund categorizes the inputs to valuation techniques used to value its investments into a disclosure hierarchy consisting of three levels as shown below:
Level 1 - unadjusted quoted prices in active markets for identical investments
Level 2 - other significant observable inputs (including quoted prices for similar investments, interest rates, prepayment speeds, etc.)
Level 3 - unobservable inputs (including the Fund's own assumptions based on the best information available)
Valuation techniques used to value the Fund's investments by major category are as follows:
Debt securities, including restricted securities, are valued based on evaluated prices received from third party pricing services or from brokers who make markets in such securities. Municipal securities and other short-term securities are valued by pricing services who utilize matrix pricing which considers yield or price of bonds of comparable quality, coupon, maturity and type or by broker-supplied prices. When independent prices are unavailable or unreliable, debt securities may be valued utilizing pricing methodologies which consider similar factors that would be used by third party pricing services. Debt securities are generally categorized as Level 2 in the hierarchy but may be Level 3 depending on the circumstances.
Securities held by a money market fund are generally high quality and liquid; however, they are reflected as Level 2 because the inputs used to determine fair value are not quoted prices in an active market.
The aggregate value of investments by input level as of May 31, 2024 is included at the end of the Fund's Schedule of Investments.
Investment Transactions and Income. Security transactions are accounted for as of trade date. Gains and losses on securities sold are determined on the basis of identified cost. Interest income is accrued as earned and includes coupon interest and amortization of premium and accretion of discount on debt securities as applicable.
Expenses. Expenses directly attributable to a fund are charged to that fund. Expenses attributable to more than one fund are allocated among the respective funds on the basis of relative net assets or other appropriate methods. Expenses included in the accompanying financial statements reflect the expenses of that fund and do not include any expenses associated with any underlying mutual funds or exchange-traded funds. Although not included in a fund's expenses, a fund indirectly bears its proportionate share of these expenses through the net asset value of each underlying mutual fund or exchange-traded fund. Expense estimates are accrued in the period to which they relate and adjustments are made when actual amounts are known.
Income Tax Information and Distributions to Shareholders. Each year, the Fund intends to qualify as a regulated investment company under Subchapter M of the Internal Revenue Code, including distributing substantially all of its taxable income and realized gains. As a result, no provision for U.S. Federal income taxes is required. During the period, the Fund incurred a corporate tax liability on undistributed short-term capital gain which is included in Tax expense on the Statement of Operations. As of May 31, 2024, the Fund did not have any unrecognized tax benefits in the financial statements; nor is the Fund aware of any tax positions for which it is reasonably possible that the total amounts of unrecognized tax benefits will significantly change in the next twelve months. The Fund files a U.S. federal tax return, in addition to state and local tax returns as required. The Fund's federal income tax returns are subject to examination by the Internal Revenue Service (IRS) for a period of three fiscal years after they are filed. State and local tax returns may be subject to examination for an additional fiscal year depending on the jurisdiction.
Distributions are declared and recorded daily and paid monthly from net investment income. Distributions from realized gains, if any, are declared and recorded on the ex-dividend date. Income and capital gain distributions are determined in accordance with income tax regulations, which may differ from GAAP. In addition, the Fund claimed a portion of the payment made to redeeming shareholders as a distribution for income tax purposes.
Capital accounts within the financial statements are adjusted for permanent book-tax differences. These adjustments have no impact on net assets or the results of operations. Capital accounts are not adjusted for temporary book-tax differences which will reverse in a subsequent period.
The Fund purchases municipal securities whose interest, in the opinion of the issuer, is free from federal income tax. There is no assurance that the IRS will agree with this opinion. In the event the IRS determines that the issuer does not comply with relevant tax requirements, interest payments from a security could become federally taxable, possibly retroactively to the date the security was issued.
As of period end, the cost and unrealized appreciation (depreciation) in securities for federal income tax purposes were as follows:
| Gross unrealized appreciation | $1,198 |
| Gross unrealized depreciation | - |
| Net unrealized appreciation (depreciation) | $1,198 |
| Tax Cost | $1,958,503,802 |
The tax-based components of distributable earnings as of period end were as follows:
| Net unrealized appreciation (depreciation) on securities and other investments | $1,198 |
The tax character of distributions paid was as follows:
| | May 31, 2024 | May 31, 2023 |
| Tax-exempt Income | $85,507,794 | $45,185,499 |
| Long-term Capital Gains | - | 25,302 |
| Total | $85,507,794 | $ 45,210,801 |
Restricted Securities (including Private Placements). Funds may invest in securities that are subject to legal or contractual restrictions on resale. These securities generally may be resold in transactions exempt from registration or to the public if the securities are registered. Disposal of these securities may involve time-consuming negotiations and expense, and prompt sale at an acceptable price may be difficult. Information regarding restricted securities held at period end is included at the end of the Schedule of Investments, if applicable.
New Rule Issuance. In July 2023, the Securities and Exchange Commission issued a Final Rule relative to Money Market Reform. Among other things, the Final Rule includes amendments for: (1) Removal of redemption gates except for liquidations; (2) Required liquidity fees for institutional prime and institutional tax-exempt money market funds; (3) Discretionary liquidity fees for non-government money market funds; (4) Higher liquidity requirements; and (5) Changes to reporting requirements for Form N-MFP and Form N-CR. The Final Rule imposes different implementation dates for the amendments through October 2, 2024. Management has evaluated the amendments and does not expect them to have a material impact to the Fund's financial statements and related disclosures.
3. Fees and Other Transactions with Affiliates.
Management Fee and Expense Contract. Fidelity Management & Research Company LLC (the investment adviser) provides the Fund with investment management services. The Fund does not pay any fees for these services. Pursuant to the Fund's expense contract, the investment adviser also pays all other expenses of the Fund, excluding custody fees, the compensation of the independent Trustees, and certain miscellaneous expenses such as proxy and shareholder meeting expenses.
Interfund Trades. Funds may purchase from or sell securities to other Fidelity Funds under procedures adopted by the Board. The procedures have been designed to ensure these interfund trades are executed in accordance with Rule 17a-7 of the 1940 Act. Interfund trades during the period are noted in the table below.
| | Purchases ($) | Sales ($) | Realized Gain (Loss)($) |
| Fidelity Municipal Cash Central Fund | 1,031,868,773 | 717,502,000 | - |
Sub-Advisory Arrangements. Effective March 1, 2024, the Fund's sub-advisory agreements with FMR Investment Management (UK) Limited, Fidelity Management & Research (Hong Kong) Limited, and Fidelity Management & Research (Japan) Limited were amended to provide that the investment adviser pays each sub-adviser monthly fees equal to 110% of the sub-adviser's costs for providing sub-advisory services.
4. Expense Reductions.
Through arrangements with the Fund's custodian, credits realized as a result of certain uninvested cash balances were used to reduce the Fund's expenses by $32,482.
5. Other.
A fund's organizational documents provide former and current trustees and officers with a limited indemnification against liabilities arising in connection with the performance of their duties to the fund. In the normal course of business, a fund may also enter into contracts that provide general indemnifications. A fund's maximum exposure under these arrangements is unknown as this would be dependent on future claims that may be made against a fund. The risk of material loss from such claims is considered remote.
At the end of the period, mutual funds managed by the investment adviser or its affiliates were the owners of record of all of the outstanding shares of the Fund.
6. Risk and Uncertainties.
Many factors affect a fund's performance. Developments that disrupt global economies and financial markets, such as pandemics, epidemics, outbreaks of infectious diseases, war, terrorism, and environmental disasters, may significantly affect a fund's investment performance. The effects of these developments to a fund will be impacted by the types of securities in which a fund invests, the financial condition, industry, economic sector, and geographic location of an issuer, and a fund's level of investment in the securities of that issuer. Significant concentrations in security types, issuers, industries, sectors, and geographic locations may magnify the factors that affect a fund's performance.
Report of Independent Registered Public Accounting Firm
To the Board of Trustees of Fidelity Revere Street Trust and Shareholders of Fidelity Municipal Cash Central Fund
Opinion on the Financial Statements
We have audited the accompanying statement of assets and liabilities, including the schedule of investments, of Fidelity Municipal Cash Central Fund (one of the funds constituting Fidelity Revere Street Trust, referred to hereafter as the "Fund") as of May 31, 2024, the related statement of operations for the year ended May 31, 2024, the statement of changes in net assets for each of the two years in the period ended May 31, 2024, including the related notes, and the financial highlights for each of the five years in the period ended May 31, 2024 (collectively referred to as the "financial statements"). In our opinion, the financial statements present fairly, in all material respects, the financial position of the Fund as of May 31, 2024, the results of its operations for the year then ended, the changes in its net assets for each of the two years in the period ended May 31, 2024 and the financial highlights for each of the five years in the period ended May 31, 2024 in conformity with accounting principles generally accepted in the United States of America.
Basis for Opinion
These financial statements are the responsibility of the Fund's management. Our responsibility is to express an opinion on the Fund's financial statements based on our audits. We are a public accounting firm registered with the Public Company Accounting Oversight Board (United States) (PCAOB) and are required to be independent with respect to the Fund in accordance with the U.S. federal securities laws and the applicable rules and regulations of the Securities and Exchange Commission and the PCAOB.
We conducted our audits of these financial statements in accordance with the standards of the PCAOB. Those standards require that we plan and perform the audit to obtain reasonable assurance about whether the financial statements are free of material misstatement, whether due to error or fraud.
Our audits included performing procedures to assess the risks of material misstatement of the financial statements, whether due to error or fraud, and performing procedures that respond to those risks. Such procedures included examining, on a test basis, evidence regarding the amounts and disclosures in the financial statements. Our audits also included evaluating the accounting principles used and significant estimates made by management, as well as evaluating the overall presentation of the financial statements. Our procedures included confirmation of securities owned as of May 31, 2024 by correspondence with the custodian and brokers; when replies were not received from brokers, we performed other auditing procedures. We believe that our audits provide a reasonable basis for our opinion.
/s/ PricewaterhouseCoopers LLP
Boston, Massachusetts
July 12, 2024
We have served as the auditor of one or more investment companies in the Fidelity group of funds since 1932.
Distributions
(Unaudited)
The dividend and capital gains distributions for the fund(s) are available on Fidelity.com or Institutional.Fidelity.com.
The fund hereby designates as a capital gain dividend with respect to the taxable year ended May 31, 2024, $772, or, if subsequently determined to be different, the net capital gain of such year.
During fiscal year ended 2024, 100% of the fund's income dividends was free from federal income tax, and 41.76% of the fund's income dividends was subject to the federal alternative minimum tax.
The fund will notify shareholders in January 2025 of amounts for use in preparing 2024 income tax returns.
Item 8: Changes in and Disagreements with Accountants for Open-End Management Investment Companies
Note: This is not applicable for any fund included in this document.
Item 9: Proxy Disclosures for Open-End Management Investment Companies
| A special meeting of shareholders was held on October 18, 2023. The results of votes taken among shareholders on the proposal before them are reported below. Each vote reported represents one dollar of net asset value held on the record date for the meeting. |
| Proposal 1 |
| To elect a Board of Trustees. |
| | # of Votes | % of Votes |
| Abigail P. Johnson |
| Affirmative | 52,175,225,933.96 | 100.00 |
| TOTAL | 52,175,225,933.96 | 100.00 |
| Jennifer Toolin McAuliffe |
| Affirmative | 52,175,225,933.96 | 100.00 |
| TOTAL | 52,175,225,933.96 | 100.00 |
| Christine J. Thompson |
| Affirmative | 52,175,225,933.96 | 100.00 |
| TOTAL | 52,175,225,933.96 | 100.00 |
| Elizabeth S. Acton |
| Affirmative | 52,175,225,933.96 | 100.00 |
| TOTAL | 52,175,225,933.96 | 100.00 |
| Laura M. Bishop |
| Affirmative | 52,175,225,933.96 | 100.00 |
| TOTAL | 52,175,225,933.96 | 100.00 |
| Ann E. Dunwoody |
| Affirmative | 52,175,225,933.96 | 100.00 |
| TOTAL | 52,175,225,933.96 | 100.00 |
| John Engler |
| Affirmative | 52,175,225,933.96 | 100.00 |
| TOTAL | 52,175,225,933.96 | 100.00 |
| Robert F. Gartland |
| Affirmative | 52,175,225,933.96 | 100.00 |
| TOTAL | 52,175,225,933.96 | 100.00 |
| Robert W. Helm |
| Affirmative | 52,175,225,933.96 | 100.00 |
| TOTAL | 52,175,225,933.96 | 100.00 |
| Arthur E. Johnson |
| Affirmative | 52,175,225,933.96 | 100.00 |
| TOTAL | 52,175,225,933.96 | 100.00 |
| Michael E. Kenneally |
| Affirmative | 52,175,225,933.96 | 100.00 |
| TOTAL | 52,175,225,933.96 | 100.00 |
| Mark A. Murray |
| Affirmative | 52,175,225,933.96 | 100.00 |
| TOTAL | 52,175,225,933.96 | 100.00 |
| Carol J. Zierhoffer |
| Affirmative | 52,175,225,933.96 | 100.00 |
| TOTAL | 52,175,225,933.96 | 100.00 |
| | | |
| Proposal 1 reflects trust-wide proposal and voting results. |
Item 10: Renumeration Paid to Directors, Officers, and others of Open-End Management Investment Companies
Note: This information is disclosed as part of the financial statements for each Fund as part of Item 7: Financial Statements and Financial Highlights for Open-End Management Investment companies.
Item 11: Statement Regarding Basis for Approval of Investment Advisory Contract
Board Approval of Investment Advisory Contracts
Fidelity Municipal Cash Central Fund
At its January 2024 meeting, the Board of Trustees, including the Independent Trustees (together, the Board), approved an amended and restated management contract with Fidelity Management & Research Company LLC (FMR) (the Management Contract), and amended and restated sub-advisory agreements (the Sub-Advisory Contracts, and together with the Management Contract, the Advisory Contracts) for the fund, including the fund's sub-advisory agreements with FMR Investment Management (UK) Limited (FMR UK), Fidelity Management & Research (Hong Kong) Limited (FMR H.K.), and Fidelity Management & Research (Japan) Limited (FMR Japan). The Advisory Contracts will be effective March 1, 2024. The Board will consider the annual renewal of the fund's Advisory Contracts in September 2024, following its review of additional materials provided by FMR.
Management Contract. The Board approved the Management Contract, which eliminates the fee that FMR previously received from each investing fund's investment adviser. The Board noted the fund will continue to pay no management fee to FMR for services provided under the Management Contract.
Sub-Advisory Contracts. In connection with the Management Contract changes, the Board considered the Sub-Advisory Contracts, which changed the arrangements for fees paid by FMR to the sub-advisers under the agreements. The Board noted that the agreements with FMR UK, FMR H.K., and FMR Japan were amended to provide that FMR will compensate each sub-adviser at a fee equal to 110% of the sub-adviser's costs incurred in providing services under the agreement. The Board considered that, under the Sub-Advisory Contracts, FMR, and not the fund, will continue to pay the sub-advisory fees to each applicable sub-adviser.
The Board considered that the approval of the fund's Advisory Contracts will not result in any changes in the investment process or strategies employed in the management of the fund's assets or the day-to-day management of the fund or the persons primarily responsible for such management. Further, the Board considered that the Management Contract would not change the obligations and services of FMR and its affiliates on behalf of the fund, and, in particular, there would be no change in the nature and level of advisory, management, administration, transfer agent, and pricing and bookkeeping services provided to the fund by FMR and its affiliates.
In connection with its consideration of future renewals of the fund's Advisory Contracts, the Board will consider: (i) the nature, extent and quality of services provided to the funds, including shareholder and administrative services and investment performance; (ii) the competitiveness of the management fee and total expenses for the fund; (iii) the costs of the services and profitability, including the revenues earned and the expenses incurred in conducting the business of developing, marketing, distributing, managing, administering, and servicing the fund and its shareholders, to the extent applicable; and (iv) whether there have been economies of scale in respect of the Fidelity funds, whether the Fidelity funds (including the fund) have appropriately benefited from any such economies of scale, and whether there is the potential for realization of any further economies.
Based on its evaluation of all of the conclusions noted above, and after considering all factors it believed relevant, the Board concluded that the fund's management fee structure is fair and reasonable, and that the fund's Advisory Contracts should be approved.
1.743117.124
MCC-ANN-0724
Fidelity® Cash Central Fund
Annual Report
May 31, 2024
Contents
To view a fund's proxy voting guidelines and proxy voting record for the 12-month period ended June 30, visit http://www.fidelity.com/proxyvotingresults or visit the Securities and Exchange Commission's (SEC) web site at http://www.sec.gov.
You may also call 1-800-544-8544 to request a free copy of the proxy voting guidelines.
Standard & Poor's, S&P and S&P 500 are registered service marks of The McGraw-Hill Companies, Inc. and have been licensed for use by Fidelity Distributors Corporation.
Other third-party marks appearing herein are the property of their respective owners.
All other marks appearing herein are registered or unregistered trademarks or service marks of FMR LLC or an affiliated company. © 2024 FMR LLC. All rights reserved.
A fund files its complete schedule of portfolio holdings with the SEC for the first and third quarters of each fiscal year on Form N-PORT. Forms N-PORT are available on the SEC's web site at http://www.sec.gov. A fund's Forms N-PORT may be reviewed and copied at the SEC's Public Reference Room in Washington, DC. Information regarding the operation of the SEC's Public Reference Room may be obtained by calling 1-800-SEC-0330.
Item 7: Financial Statements and Financial Highlights for Open-End Management Investment Companies (Annual Report)
Fidelity® Cash Central Fund
Schedule of Investments May 31, 2024
Showing Percentage of Net Assets
| U.S. Treasury Debt - 30.4% |
| | | Yield (%)(a) | Principal Amount (b) | Value ($) |
| U.S. Treasury Obligations - 30.4% | | | | |
| U.S. Treasury Bills | | | | |
| 6/4/24 to 9/19/24 | | 5.27 to 5.34 | 14,790,300,000 | 14,721,911,111 |
| | | | | |
| TOTAL U.S. TREASURY DEBT (Cost $14,718,139,106) | | | | 14,721,911,111 |
| | | | | |
| Non-Negotiable Time Deposit - 1.8% |
| | | Yield (%)(a) | Principal Amount (b) | Value ($) |
| Time Deposits - 1.8% | | | | |
| Canadian Imperial Bank of Commerce | | | | |
| 6/3/24 | | 5.31 | 232,000,000 | 232,000,000 |
| Credit Agricole CIB | | | | |
| 6/3/24 | | 5.33 | 155,277,000 | 155,277,000 |
| Mizuho Bank Ltd. | | | | |
| 6/3/24 | | 5.33 | 317,000,000 | 317,000,000 |
| Royal Bank of Canada | | | | |
| 6/3/24 | | 5.32 | 166,000,000 | 166,000,000 |
| | | | | |
| TOTAL NON-NEGOTIABLE TIME DEPOSIT (Cost $870,277,000) | | | | 870,277,000 |
| | | | | |
| U.S. Government Agency Repurchase Agreement - 1.5% |
| | | Maturity Amount ($) | Value ($) |
In a joint trading account at 5.32% dated 5/31/24 due 6/3/24 (Collateralized by U.S. Government Obligations) # (Cost $706,370,000) | | 706,683,157 | 706,370,000 |
| | | | |
| U.S. Treasury Repurchase Agreement - 66.5% |
| | | Maturity Amount ($) | Value ($) |
With Federal Reserve Bank of New York at 5.3%, dated 5/31/24 due 6/3/24 (Collateralized by U.S. Treasury Obligations valued at $32,202,216,378, 0.38% - 4.75%, 8/15/24 - 11/15/41) (Cost $32,188,000,000) | | 32,202,216,367 | 32,188,000,000 |
| | | | |
| TOTAL INVESTMENT IN SECURITIES - 100.2% (Cost $48,482,786,106) | 48,486,558,111 |
NET OTHER ASSETS (LIABILITIES) - (0.2)% | (74,962,211) |
| NET ASSETS - 100.0% | 48,411,595,900 |
| | |
The date shown for securities represents the date when principal payments must be paid, taking into account any call options exercised by the issuer and any permissible maturity shortening features other than interest rate resets.
Legend
| (a) | Yield represents either the annualized yield at the date of purchase, or the stated coupon rate, or, for floating and adjustable rate securities, the rate at period end. |
| (b) | Amount is stated in United States dollars unless otherwise noted. |
Investment Valuation
The following is a summary of the inputs used, as of May 31, 2024, involving the Fund's assets and liabilities carried at fair value. The inputs or methodology used for valuing securities may not be an indication of the risk associated with investing in those securities. For more information on valuation inputs, and their aggregation into the levels used below, please refer to the Investment Valuation section in the accompanying Notes to Financial Statements.
| Valuation Inputs at Reporting Date: |
| Description | Total ($) | Level 1 ($) | Level 2 ($) | Level 3 ($) |
Investments in Securities: | | | | |
|
| U.S. Treasury Debt | 14,721,911,111 | - | 14,721,911,111 | - |
|
| Non-Negotiable Time Deposit | 870,277,000 | - | 870,277,000 | - |
|
| U.S. Government Agency Repurchase Agreement | 706,370,000 | - | 706,370,000 | - |
|
| U.S. Treasury Repurchase Agreement | 32,188,000,000 | - | 32,188,000,000 | - |
| Total Investments in Securities: | 48,486,558,111 | - | 48,486,558,111 | - |
| Other Information |
| # Additional information on each counterparty to the repurchase agreement is as follows: |
| Repurchase Agreement / Counterparty | Value ($) | |
| $706,370,000 due 6/03/24 at 5.32% | | |
| Citigroup Global Markets, Inc. | 144,370,000 | |
| Societe Generale | 562,000,000 | |
| | 706,370,000 | |
Financial Statements
| Statement of Assets and Liabilities |
| | | | May 31, 2024 |
| | | | | |
| Assets | | | | |
Investment in securities, at value (including repurchase agreements of $32,894,370,000) - See accompanying schedule Unaffiliated issuers (cost $48,482,786,106): | | | $ | 48,486,558,111 |
| Cash | | | | 499,427,861 |
| Interest receivable | | | | 6,585,403 |
| Receivable for interfund loans | | | | 8,517,000 |
| Other affiliated receivables | | | | 2,640 |
Total assets | | | | 49,001,091,015 |
| Liabilities | | | | |
| Payable for investments purchased | $ | 374,204,333 | | |
| Distributions payable | | 215,221,754 | | |
| Other payables and accrued expenses | | 69,028 | | |
| Total liabilities | | | | 589,495,115 |
| Net Assets | | | $ | 48,411,595,900 |
| Net Assets consist of: | | | | |
| Paid in capital | | | $ | 48,407,820,203 |
| Total accumulated earnings (loss) | | | | 3,775,697 |
| Net Assets | | | $ | 48,411,595,900 |
Net Asset Value, offering price and redemption price per share ($48,411,595,900 ÷ 48,398,360,896 shares) | | | $ | 1.0003 |
| Statement of Operations |
| | | | Year ended May 31, 2024 |
| Investment Income | | | | |
| Interest (including $4,398,757 from affiliated interfund lending) | | | $ | 2,435,566,548 |
| Expenses | | | | |
| Custodian fees and expenses | $ | 86,535 | | |
| Independent trustees' fees and expenses | | 136,807 | | |
| Miscellaneous | | 526 | | |
| Total expenses | | | | 223,868 |
| Net Investment income (loss) | | | | 2,435,342,680 |
| Realized and Unrealized Gain (Loss) | | | | |
| Net realized gain (loss) on: | | | | |
| Investment Securities: | | | | |
| Unaffiliated issuers | | 11 | | |
| Total net realized gain (loss) | | | | 11 |
| Change in net unrealized appreciation (depreciation) on investment securities | | | | 3,772,005 |
| Net gain (loss) | | | | 3,772,016 |
| Net increase in net assets resulting from operations | | | $ | 2,439,114,696 |
| Statement of Changes in Net Assets |
| |
| | Year ended May 31, 2024 | | Year ended May 31, 2023 |
| Increase (Decrease) in Net Assets | | | | |
| Operations | | | | |
| Net investment income (loss) | $ | 2,435,342,680 | $ | 1,600,426,332 |
| Net realized gain (loss) | | 11 | | 35 |
| Change in net unrealized appreciation (depreciation) | | 3,772,005 | | - |
Net increase in net assets resulting from operations | | 2,439,114,696 | | 1,600,426,367 |
| Distributions to shareholders | | (2,435,345,654) | | (1,600,390,943) |
| | | | | |
| Affiliated share transactions | | | | |
| Proceeds from sales of shares | | 515,597,423,520 | | 486,470,014,725 |
| Reinvestment of distributions | | 77,024 | | 48,615 |
| Cost of shares redeemed | | (508,253,475,743) | | (498,296,555,588) |
| | | | | |
Net increase (decrease) in net assets and shares resulting from share transactions | | 7,344,024,801 | | (11,826,492,248) |
| Total increase (decrease) in net assets | | 7,347,793,843 | | (11,826,456,824) |
| | | | | |
| Net Assets | | | | |
| Beginning of period | | 41,063,802,057 | | 52,890,258,881 |
| End of period | $ | 48,411,595,900 | $ | 41,063,802,057 |
| | | | | |
| Other Information | | | | |
| Shares | | | | |
| Sold | | 515,494,098,703 | | 486,372,740,177 |
| Issued in reinvestment of distributions | | 77,009 | | 48,605 |
| Redeemed | | (508,151,529,440) | | (498,196,916,205) |
| Net increase (decrease) | | 7,342,646,272 | | (11,824,127,423) |
| | | | | |
Financial Highlights
Fidelity® Cash Central Fund |
| |
| Years ended May 31, | | 2024 | | 2023 | | 2022 | | 2021 | | 2020 |
Selected Per-Share Data | | | | | | | | | | |
| Net asset value, beginning of period | $ | 1.0002 | $ | 1.0002 | $ | 1.0002 | $ | 1.0002 | $ | 1.0002 |
| Income from Investment Operations | | | | | | | | | | |
Net investment income (loss) A | | .0536 | | .0354 | | .0016 | | .0010 | | .0155 |
| Net realized and unrealized gain (loss) | | .0001 | | - B | | - B | | - B | | - B |
| Total from investment operations | | .0537 | | .0354 | | .0016 | | .0010 | | .0155 |
| Distributions from net investment income | | (.0536) | | (.0354) | | (.0016) | | (.0010) | | (.0155) |
| Total distributions | | (.0536) | | (.0354) | | (.0016) | | (.0010) | | (.0155) |
| Net asset value, end of period | $ | 1.0003 | $ | 1.0002 | $ | 1.0002 | $ | 1.0002 | $ | 1.0002 |
Total Return C | | | | 3.59% | | .15% | | .10% | | 1.56% |
Ratios to Average Net Assets A,D,E | | | | | | | | | | |
| Expenses before reductions | | -% F | | -% F | | -% F | | -% F | | .01% |
| Expenses net of fee waivers, if any | | | | -% F | | -% F | | -% F | | .01% |
| Expenses net of all reductions | | -% F | | -% F | | -% F | | -% F | | .01% |
| Net investment income (loss) | | 5.37% | | 3.42% | | .14% | | .09% | | 1.55% |
| Supplemental Data | | | | | | | | | | |
| Net assets, end of period (000 omitted) | $ | 48,411,596 | $ | 41,063,802 | $ | 52,890,259 | $ | 58,295,494 | $ | 44,967,102 |
ANet investment income (loss) is affected by the timing of the declaration of dividends by any underlying mutual funds or exchange-traded funds (ETFs). Net investment income (loss) of any mutual funds or ETFs is not included in the Fund's net investment income (loss) ratio.
BAmount represents less than $.00005 per share.
CTotal returns would have been lower if certain expenses had not been reduced during the applicable periods shown.
DFees and expenses of any underlying mutual funds or exchange-traded funds (ETFs) are not included in the Fund's expense ratio. The Fund indirectly bears its proportionate share of these expenses.
EExpense ratios reflect operating expenses of the class. Expenses before reductions do not reflect amounts reimbursed, waived, or reduced through arrangements with the investment adviser, brokerage services, or other offset arrangements, if applicable, and do not represent the amount paid by the class during periods when reimbursements, waivers or reductions occur.
FAmount represents less than .005%.
Notes to Financial Statements
For the period ended May 31, 2024
1. Organization.
Fidelity Cash Central Fund (the Fund) is a fund of Fidelity Revere Street Trust (the Trust) and is authorized to issue an unlimited number of shares. The Trust is registered under the Investment Company Act of 1940, as amended (the 1940 Act), as an open-end management investment company organized as a Delaware statutory trust. Shares of the Fund are only offered to other investment companies and accounts (the Investing Funds) managed by Fidelity Management & Research Company LLC (FMR), or its affiliates. The Fund has been designated an institutional money market fund, and the value of the Fund's shares are calculated to four decimal places that fluctuates based upon changes in the value of the Fund's investments.
2. Significant Accounting Policies.
The Fund is an investment company and applies the accounting and reporting guidance of the Financial Accounting Standards Board (FASB) Accounting Standards Codification Topic 946 Financial Services - Investment Companies. The financial statements have been prepared in conformity with accounting principles generally accepted in the United States of America (GAAP), which require management to make certain estimates and assumptions at the date of the financial statements. Actual results could differ from those estimates. Subsequent events, if any, through the date that the financial statements were issued have been evaluated in the preparation of the financial statements. The Fund's Schedule of Investments lists any underlying mutual funds or exchange-traded funds (ETFs) but does not include the underlying holdings of these funds. The following summarizes the significant accounting policies of the Fund:
Investment Valuation. Investments are valued as of 4:00 p.m. Eastern time on the last calendar day of the period. The Board of Trustees (the Board) has designated the Fund's investment adviser as the valuation designee responsible for the fair valuation function and performing fair value determinations as needed. The investment adviser has established a Fair Value Committee (the Committee) to carry out the day-to-day fair valuation responsibilities and has adopted policies and procedures to govern the fair valuation process and the activities of the Committee. In accordance with these fair valuation policies and procedures, which have been approved by the Board, the Fund attempts to obtain prices from one or more third party pricing services or brokers to value its investments. When current market prices, quotations or currency exchange rates are not readily available or reliable, investments will be fair valued in good faith by the Committee, in accordance with the policies and procedures. Factors used in determining fair value vary by investment type and may include market or investment specific events, transaction data, estimated cash flows, and market observations of comparable investments. The frequency that the fair valuation procedures are used cannot be predicted and they may be utilized to a significant extent. The Committee manages the Fund's fair valuation practices and maintains the fair valuation policies and procedures. The Fund's investment adviser reports to the Board information regarding the fair valuation process and related material matters.
The Fund categorizes the inputs to valuation techniques used to value its investments into a disclosure hierarchy consisting of three levels as shown below:
Level 1 - unadjusted quoted prices in active markets for identical investments
Level 2 - other significant observable inputs (including quoted prices for similar investments, interest rates, prepayment speeds, etc.)
Level 3 - unobservable inputs (including the Fund's own assumptions based on the best information available)
Valuation techniques used to value the Fund's investments by major category are as follows:
Debt securities, including restricted securities, are valued based on evaluated prices received from third party pricing services or from brokers who make markets in such securities. U.S. government and government agency obligations and other short-term securities are valued by pricing services who utilize matrix pricing which considers yield or price of bonds of comparable quality, coupon, maturity and type or by broker-supplied prices. When independent prices are unavailable or unreliable, debt securities may be valued utilizing pricing methodologies which consider similar factors that would be used by third party pricing services. Debt securities are generally categorized as Level 2 in the hierarchy but may be Level 3 depending on the circumstances.
Short-term securities with remaining maturities of sixty days or less may be valued at amortized cost, which approximates fair value, and are categorized as Level 2 in the hierarchy.
Securities held by a money market fund are generally high quality and liquid; however, they are reflected as Level 2 because the inputs used to determine fair value are not quoted prices in an active market.
The aggregate value of investments by input level as of May 31, 2024 is included at the end of the Fund's Schedule of Investments.
Investment Transactions and Income. Security transactions are accounted for as of trade date. Gains and losses on securities sold are determined on the basis of identified cost. Interest income is accrued as earned and includes coupon interest and amortization of premium and accretion of discount on debt securities as applicable.
Expenses. Expenses directly attributable to a fund are charged to that fund. Expenses attributable to more than one fund are allocated among the respective funds on the basis of relative net assets or other appropriate methods. Expenses included in the accompanying financial statements reflect the expenses of that fund and do not include any expenses associated with any underlying mutual funds or exchange-traded funds. Although not included in a fund's expenses, a fund indirectly bears its proportionate share of these expenses through the net asset value of each underlying mutual fund or exchange-traded fund. Expense estimates are accrued in the period to which they relate and adjustments are made when actual amounts are known.
Income Tax Information and Distributions to Shareholders. Each year, the Fund intends to qualify as a regulated investment company under Subchapter M of the Internal Revenue Code, including distributing substantially all of its taxable income and realized gains. As a result, no provision for U.S. Federal income taxes is required. As of May 31, 2024, the Fund did not have any unrecognized tax benefits in the financial statements; nor is the Fund aware of any tax positions for which it is reasonably possible that the total amounts of unrecognized tax benefits will significantly change in the next twelve months. The Fund files a U.S. federal tax return, in addition to state and local tax returns as required. The Fund's federal income tax returns are subject to examination by the Internal Revenue Service (IRS) for a period of three fiscal years after they are filed. State and local tax returns may be subject to examination for an additional fiscal year depending on the jurisdiction.
Distributions are declared and recorded daily and paid monthly from net investment income. Distributions from realized gains, if any, are declared and recorded on the ex-dividend date. Income and capital gain distributions are determined in accordance with income tax regulations, which may differ from GAAP. In addition, the Fund claimed a portion of the payment made to redeeming shareholders as a distribution for income tax purposes.
Capital accounts within the financial statements are adjusted for permanent book-tax differences. These adjustments have no impact on net assets or the results of operations. Capital accounts are not adjusted for temporary book-tax differences which will reverse in a subsequent period.
As of period end, the cost and unrealized appreciation (depreciation) in securities for federal income tax purposes were as follows:
| Gross unrealized appreciation | $3,824,141 |
| Gross unrealized depreciation | (52,136) |
| Net unrealized appreciation (depreciation) | $3,772,005 |
| Tax Cost | $48,482,786,106 |
The tax-based components of distributable earnings as of period end were as follows:
| Undistributed ordinary income | $3,693 |
| Net unrealized appreciation (depreciation) on securities and other investments | $3,772,005 |
The tax character of distributions paid was as follows:
| | May 31, 2024 | May 31, 2023 |
| Ordinary Income | $2,435,345,654 | $1,600,390,943 |
Repurchase Agreements. Pursuant to an Exemptive Order issued by the Securities and Exchange Commission, funds and other registered investment companies having management contracts with Fidelity Management and Research Company LLC, or its affiliates are permitted to transfer uninvested cash balances into joint trading accounts which are then invested in repurchase agreements. Funds may also invest directly with institutions in repurchase agreements. Upon settlement date, collateral is held in segregated accounts with custodian banks and may be obtained in the event of a default of the counterparty. The collateral balance is monitored on a daily basis to ensure it is at least equal to the principal amount of the repurchase agreement (including accrued interest). In the event of a default by the counterparty, realization of the collateral proceeds could be delayed, during which time the value of the collateral may decline.
New Rule Issuance. In July 2023, the Securities and Exchange Commission issued a Final Rule relative to Money Market Reform. Among other things, the Final Rule includes amendments for: (1) Removal of redemption gates except for liquidations; (2) Required liquidity fees for institutional prime and institutional tax-exempt money market funds; (3) Discretionary liquidity fees for non-government money market funds; (4) Higher liquidity requirements; and (5) Changes to reporting requirements for Form N-MFP and Form N-CR. The Final Rule imposes different implementation dates for the amendments through October 2, 2024. Management has evaluated the amendments and does not expect them to have a material impact to the Fund's financial statements and related disclosures.
3. Fees and Other Transactions with Affiliates.
Management Fee and Expense Contract. Fidelity Management & Research Company LLC (the investment adviser) provides the Fund with investment management services. The Fund does not pay any fees for these services. Pursuant to the Fund's expense contract, the investment adviser also pays all other expenses of the Fund, excluding custody fees, the compensation of the independent Trustees, and certain miscellaneous expenses such as proxy and shareholder meeting expenses.
Interfund Lending Program. Pursuant to an Exemptive Order issued by the Securities and Exchange Commission (the SEC), the Fund, along with other registered investment companies having management contracts with FMR, or other affiliated entities of FMR, may participate in an interfund lending program. This program provides an alternative credit facility allowing the Fund to borrow from, or lend money to, other participating affiliated funds. Any open loans at period end are presented as Receivable for interfund loans in the Statement of Assets and Liabilities, and any accrued interest is included in Other affiliated receivables. Activity in this program during the period for which loans were outstanding was as follows:
| | | Average Loan Balance ($) | Weighted Average Interest Rate |
| Fidelity Cash Central Fund | Lender | 23,921,582 | 5.52% |
Interfund Trades. Funds may purchase from or sell securities to other Fidelity Funds under procedures adopted by the Board. The procedures have been designed to ensure these interfund trades are executed in accordance with Rule 17a-7 of the 1940 Act. During the period, there were no interfund trades.
Sub-Advisory Arrangements. Effective March 1, 2024, the Fund's sub-advisory agreements with FMR Investment Management (UK) Limited, Fidelity Management & Research (Hong Kong) Limited, and Fidelity Management & Research (Japan) Limited were amended to provide that the investment adviser pays each sub-adviser monthly fees equal to 110% of the sub-adviser's costs for providing sub-advisory services.
4. Other.
A fund's organizational documents provide former and current trustees and officers with a limited indemnification against liabilities arising in connection with the performance of their duties to the fund. In the normal course of business, a fund may also enter into contracts that provide general indemnifications. A fund's maximum exposure under these arrangements is unknown as this would be dependent on future claims that may be made against a fund. The risk of material loss from such claims is considered remote.
At the end of the period, mutual funds managed by the investment adviser or its affiliates were the owners of record of all of the outstanding shares of the Fund.
5. Risk and Uncertainties.
Many factors affect a fund's performance. Developments that disrupt global economies and financial markets, such as pandemics, epidemics, outbreaks of infectious diseases, war, terrorism, and environmental disasters, may significantly affect a fund's investment performance. The effects of these developments to a fund will be impacted by the types of securities in which a fund invests, the financial condition, industry, economic sector, and geographic location of an issuer, and a fund's level of investment in the securities of that issuer. Significant concentrations in security types, issuers, industries, sectors, and geographic locations may magnify the factors that affect a fund's performance.
Report of Independent Registered Public Accounting Firm
To the Board of Trustees of Fidelity Revere Street Trust and Shareholders of Fidelity Cash Central Fund
Opinion on the Financial Statements
We have audited the accompanying statement of assets and liabilities, including the schedule of investments, of Fidelity Cash Central Fund (one of the funds constituting Fidelity Revere Street Trust, referred to hereafter as the "Fund") as of May 31, 2024, the related statement of operations for the year ended May 31, 2024, the statement of changes in net assets for each of the two years in the period ended May 31, 2024, including the related notes, and the financial highlights for each of the five years in the period ended May 31, 2024 (collectively referred to as the "financial statements"). In our opinion, the financial statements present fairly, in all material respects, the financial position of the Fund as of May 31, 2024, the results of its operations for the year then ended, the changes in its net assets for each of the two years in the period ended May 31, 2024 and the financial highlights for each of the five years in the period ended May 31, 2024 in conformity with accounting principles generally accepted in the United States of America.
Basis for Opinion
These financial statements are the responsibility of the Fund's management. Our responsibility is to express an opinion on the Fund's financial statements based on our audits. We are a public accounting firm registered with the Public Company Accounting Oversight Board (United States) (PCAOB) and are required to be independent with respect to the Fund in accordance with the U.S. federal securities laws and the applicable rules and regulations of the Securities and Exchange Commission and the PCAOB.
We conducted our audits of these financial statements in accordance with the standards of the PCAOB. Those standards require that we plan and perform the audit to obtain reasonable assurance about whether the financial statements are free of material misstatement, whether due to error or fraud.
Our audits included performing procedures to assess the risks of material misstatement of the financial statements, whether due to error or fraud, and performing procedures that respond to those risks. Such procedures included examining, on a test basis, evidence regarding the amounts and disclosures in the financial statements. Our audits also included evaluating the accounting principles used and significant estimates made by management, as well as evaluating the overall presentation of the financial statements. Our procedures included confirmation of securities owned as of May 31, 2024 by correspondence with the custodian and brokers; when replies were not received from brokers, we performed other auditing procedures. We believe that our audits provide a reasonable basis for our opinion.
/s/ PricewaterhouseCoopers LLP
Boston, Massachusetts
July 12, 2024
We have served as the auditor of one or more investment companies in the Fidelity group of funds since 1932.
Distributions
(Unaudited)
The dividend and capital gains distributions for the fund(s) are available on Fidelity.com or Institutional.Fidelity.com.
A total of 17.24% of the dividends distributed during the fiscal year was derived from interest on U.S. Government securities which is generally exempt from state income tax.
The fund designates $2,141,282,051 of distributions paid in the calendar year 2023 as qualifying to be taxed as interest-related dividends for nonresident alien shareholders.
The fund designates $2,435,345,654 of distributions paid during the fiscal year ended 2024 as qualifying to be taxed as section 163(j) interest dividends.
The fund will notify shareholders in January 2025 of amounts for use in preparing 2024 income tax returns.
Item 8: Changes in and Disagreements with Accountants for Open-End Management Investment Companies
Note: This is not applicable for any fund included in this document.
Item 9: Proxy Disclosures for Open-End Management Investment Companies
| A special meeting of shareholders was held on October 18, 2023. The results of votes taken among shareholders on the proposal before them are reported below. Each vote reported represents one dollar of net asset value held on the record date for the meeting. |
| Proposal 1 |
| To elect a Board of Trustees. |
| | # of Votes | % of Votes |
| Abigail P. Johnson |
| Affirmative | 52,175,225,933.96 | 100.00 |
| TOTAL | 52,175,225,933.96 | 100.00 |
| Jennifer Toolin McAuliffe |
| Affirmative | 52,175,225,933.96 | 100.00 |
| TOTAL | 52,175,225,933.96 | 100.00 |
| Christine J. Thompson |
| Affirmative | 52,175,225,933.96 | 100.00 |
| TOTAL | 52,175,225,933.96 | 100.00 |
| Elizabeth S. Acton |
| Affirmative | 52,175,225,933.96 | 100.00 |
| TOTAL | 52,175,225,933.96 | 100.00 |
| Laura M. Bishop |
| Affirmative | 52,175,225,933.96 | 100.00 |
| TOTAL | 52,175,225,933.96 | 100.00 |
| Ann E. Dunwoody |
| Affirmative | 52,175,225,933.96 | 100.00 |
| TOTAL | 52,175,225,933.96 | 100.00 |
| John Engler |
| Affirmative | 52,175,225,933.96 | 100.00 |
| TOTAL | 52,175,225,933.96 | 100.00 |
| Robert F. Gartland |
| Affirmative | 52,175,225,933.96 | 100.00 |
| TOTAL | 52,175,225,933.96 | 100.00 |
| Robert W. Helm |
| Affirmative | 52,175,225,933.96 | 100.00 |
| TOTAL | 52,175,225,933.96 | 100.00 |
| Arthur E. Johnson |
| Affirmative | 52,175,225,933.96 | 100.00 |
| TOTAL | 52,175,225,933.96 | 100.00 |
| Michael E. Kenneally |
| Affirmative | 52,175,225,933.96 | 100.00 |
| TOTAL | 52,175,225,933.96 | 100.00 |
| Mark A. Murray |
| Affirmative | 52,175,225,933.96 | 100.00 |
| TOTAL | 52,175,225,933.96 | 100.00 |
| Carol J. Zierhoffer |
| Affirmative | 52,175,225,933.96 | 100.00 |
| TOTAL | 52,175,225,933.96 | 100.00 |
| | | |
| Proposal 1 reflects trust-wide proposal and voting results. |
Item 10: Renumeration Paid to Directors, Officers, and others of Open-End Management Investment Companies
Note: This information is disclosed as part of the financial statements for each Fund as part of Item 7: Financial Statements and Financial Highlights for Open-End Management Investment companies.
Item 11: Statement Regarding Basis for Approval of Investment Advisory Contract
Board Approval of Investment Advisory Contracts
Fidelity Cash Central Fund
At its January 2024 meeting, the Board of Trustees, including the Independent Trustees (together, the Board), approved an amended and restated management contract with Fidelity Management & Research Company LLC (FMR) (the Management Contract), and amended and restated sub-advisory agreements (the Sub-Advisory Contracts, and together with the Management Contract, the Advisory Contracts) for the fund, including the fund's sub-advisory agreements with FMR Investment Management (UK) Limited (FMR UK), Fidelity Management & Research (Hong Kong) Limited (FMR H.K.), and Fidelity Management & Research (Japan) Limited (FMR Japan). The Advisory Contracts will be effective March 1, 2024. The Board will consider the annual renewal of the fund's Advisory Contracts in September 2024, following its review of additional materials provided by FMR.
Management Contract. The Board approved the Management Contract, which eliminates the fee that FMR previously received from each investing fund's investment adviser. The Board noted the fund will continue to pay no management fee to FMR for services provided under the Management Contract.
Sub-Advisory Contracts. In connection with the Management Contract changes, the Board considered the Sub-Advisory Contracts, which changed the arrangements for fees paid by FMR to the sub-advisers under the agreements. The Board noted that the agreements with FMR UK, FMR H.K., and FMR Japan were amended to provide that FMR will compensate each sub-adviser at a fee equal to 110% of the sub-adviser's costs incurred in providing services under the agreement. The Board considered that, under the Sub-Advisory Contracts, FMR, and not the fund, will continue to pay the sub-advisory fees to each applicable sub-adviser.
The Board considered that the approval of the fund's Advisory Contracts will not result in any changes in the investment process or strategies employed in the management of the fund's assets or the day-to-day management of the fund or the persons primarily responsible for such management. Further, the Board considered that the Management Contract would not change the obligations and services of FMR and its affiliates on behalf of the fund, and, in particular, there would be no change in the nature and level of advisory, management, administration, transfer agent, and pricing and bookkeeping services provided to the fund by FMR and its affiliates.
In connection with its consideration of future renewals of the fund's Advisory Contracts, the Board will consider: (i) the nature, extent and quality of services provided to the funds, including shareholder and administrative services and investment performance; (ii) the competitiveness of the management fee and total expenses for the fund; (iii) the costs of the services and profitability, including the revenues earned and the expenses incurred in conducting the business of developing, marketing, distributing, managing, administering, and servicing the fund and its shareholders, to the extent applicable; and (iv) whether there have been economies of scale in respect of the Fidelity funds, whether the Fidelity funds (including the fund) have appropriately benefited from any such economies of scale, and whether there is the potential for realization of any further economies.
Based on its evaluation of all of the conclusions noted above, and after considering all factors it believed relevant, the Board concluded that the fund's management fee structure is fair and reasonable, and that the fund's Advisory Contracts should be approved.
1.743118.124
TCC-ANN-0724
Item 8.
Changes in and Disagreements with Accountants for Open-End Management Investment Companies
See Item 7.
Item 9.
Proxy Disclosures for Open-End Management Investment Companies
See Item 7.
Item 10.
Remuneration Paid to Directors, Officers, and Others of Open-End Management Investment Companies
See Item 7.
Item 11.
Statement Regarding Basis for Approval of Investment Advisory Contract
See Item 7.
Item 12.
Disclosure of Proxy Voting Policies and Procedures for Closed-End Management Investment Companies
Not applicable.
Item 13.
Portfolio Managers of Closed-End Management Investment Companies
Not applicable.
Item 14.
Purchase of Equity Securities by Closed-End Management Investment Company and Affiliated Purchasers
Not applicable.
Item 15.
Submission of Matters to a Vote of Security Holders
There were no material changes to the procedures by which shareholders may recommend nominees to the trust’s Board of Trustees.
Item 16.
Controls and Procedures
(a)(i) The President and Treasurer and the Chief Financial Officer have concluded that the trust’s disclosure controls and procedures (as defined in Rule 30a-3(c) under the Investment Company Act) provide reasonable assurances that material information relating to the trust is made known to them by the appropriate persons, based on their evaluation of these controls and procedures as of a date within 90 days of the filing date of this report.
(a)(ii) There was no change in the trust’s internal control over financial reporting (as defined in Rule 30a-3(d) under the Investment Company Act) that occurred during the period covered by this report that has materially affected, or is reasonably likely to materially affect, the trust’s internal control over financial reporting.
Item 17.
Disclosure of Securities Lending Activities for Closed-End Management Investment Companies
Not applicable.
Item 18.
Recovery of Erroneously Awarded Compensation
(a)
Not applicable.
(b)
Not applicable.
Item 19.
Exhibits
SIGNATURES
Pursuant to the requirements of the Securities Exchange Act of 1934 and the Investment Company Act of 1940, the registrant has duly caused this report to be signed on its behalf by the undersigned, thereunto duly authorized.
Fidelity Revere Street Trust
|
By: | /s/Laura M. Del Prato |
| Laura M. Del Prato |
| President and Treasurer (Principal Executive Officer) |
|
|
Date: | July 23, 2024 |
Pursuant to the requirements of the Securities Exchange Act of 1934 and the Investment Company Act of 1940, this report has been signed below by the following persons on behalf of the registrant and in the capacities and on the dates indicated.
|
By: | /s/Laura M. Del Prato |
| Laura M. Del Prato |
| President and Treasurer (Principal Executive Officer) |
|
|
Date: | July 23, 2024 |
|
By: | /s/John J. Burke III |
| John J. Burke III |
| Chief Financial Officer (Principal Financial Officer) |
|
|
Date: | July 23, 2024 |