UNITED STATES
SECURITIES AND EXCHANGE COMMISSION
Washington, DC 20549
FORM N-CSRS
CERTIFIED SHAREHOLDER REPORT OF REGISTERED MANAGEMENT INVESTMENT COMPANIES
Investment Company Act file number 811-07851
Franklin Fund Allocator Series
(Exact name of registrant as specified in charter)
One Franklin Parkway, San Mateo, CA 94403-1906
(Address of principal executive offices) (Zip code)
Craig S. Tyle, One Franklin Parkway, San Mateo, CA 94403-1906
(Name and address of agent for service)
Registrant's telephone number, including area code: (650) 312-2000
Date of fiscal year end: 5/31
Date of reporting period: 11/30/15
Item 1. Reports to Stockholders.
Visit franklintempleton.com for fund updates, to access your account, or to find helpful financial planning tools.
franklintempleton.com
Semiannual Report
Franklin Multi-Asset Real Return Fund
This semiannual report for Franklin Multi-Asset Real Return Fund covers the period ended November 30, 2015.
Your Fund’s Goal and Main Investments
The Fund seeks real return, which is total return that exceeds U.S. inflation over a full inflation cycle, typically five years. The Fund is structured as a limited “fund-of-funds,” meaning that it seeks to achieve its investment goal by investing its assets primarily in other mutual funds, predominantly other Franklin Templeton mutual funds (underlying funds). The Fund also invests a portion of its assets in inflation-indexed securities, predominantly Treasury Inflation-Protected Securities (TIPS).

*The asset allocation is based on the Statement of Investments (SOI), which
classifies each underlying fund and other fund investments into a broad asset class
based on their predominant investments under normal market conditions.
Performance Overview
The Fund’s Class A shares had a -6.70% cumulative total return for the six months under review. In comparison, the Fund’s primary benchmark, the Barclays U.S. 1-10 Year TIPS Index, which tracks performance of inflation-protected notes issued by the U.S. Treasury that have at least one year and less than 10 years to final maturity, had a -1.51% total return.1 The Fund’s secondary benchmark, the Consumer Price Index for Urban Consumers (All Items) NSA (non-seasonally adjusted), a measure of the average change in prices of all goods and services purchased for consumption by urban householders, had a -0.20% total return for the same period.2 The Fund’s equity benchmark, the Standard & Poor’s® 500 Index (S&P 500®), a broad measure of U.S. stock performance, had a -0.21% total return, and its fixed income benchmark, the Barclays U.S. Aggregate Bond Index, which tracks U.S. investment-grade bonds, posted a -0.12% total return.1 You can find other performance data in the Performance Summary beginning on page 6.
Performance data represent past performance, which does not guarantee future results. Investment return and principal value will fluctuate, and you may have a gain or loss when you sell your shares. Current performance may differ from figures shown. For most recent month-end performance, go to franklintempleton.com or call (800) 342-5236.
Economic and Market Overview
The global economy expanded moderately during the six months under review despite slowing growth in some countries. As measured by the MSCI World Index, stocks in global developed markets declined overall during the period. Weighing on global stocks were worries about China’s slowing economy and tumbling stock market, declining commodity prices, geopolitical tensions in Russia and Turkey, and ongoing uncertainty over the U.S. Federal Reserve’s (Fed’s) timing for raising interest rates. Conversely, stocks gained as economic data in the U.S. and certain eurozone countries improved, Greece reached an agreement with its creditors, certain global
1. Source: Morningstar.
The indexes are unmanaged and include reinvestment of any income or distributions. One cannot invest directly in an index, and an index is not representative of the Fund’s
portfolio.
2. Source: Bureau of Labor Statistics, bls.gov/cpi.
See www.franklintempletondatasources.com for additional data provider information.
The dollar value, number of shares or principal amount, and names of all portfolio holdings are listed in the Fund’s SOI, which begins on page 15.
franklintempleton.com Semiannual Report 3
FRANKLIN MULTI-ASSET REAL RETURN FUND
central banks sought to boost their respective economies and the Fed kept the federal funds target rate unchanged. For the reporting period, oil prices declined sharply largely due to strong global supply, and gold and other commodity prices also fell. The U.S. dollar appreciated against most currencies during the period, which reduced returns of many foreign assets in U.S. dollar terms.
Amid healthy consumer spending, U.S. economic growth strengthened in the second quarter. The third quarter was less robust as businesses cut back on inventories, exports slowed, and state and local governments reduced their spending. Although global financial markets anticipated a Fed interest rate increase, the Fed kept interest rates unchanged. It said it expected moderate economic expansion but would monitor developments domestically and abroad. The Fed’s October meeting minutes indicated most members acknowledged the possibility of an interest rate increase at their next meeting.
Outside the U.S., the U.K. economy’s growth slowed in the third quarter following slight second-quarter growth spurred by the service sector. Weak construction and manufacturing results along with slower-than-expected expansion of national income hampered third-quarter expansion. In the eurozone, despite investor concerns about China’s moderating economy and geopolitical tensions between Russia and Turkey, the region generally benefited during the period from lower oil prices, a weaker euro that supported exports, the European Central Bank’s (ECB’s) accommodative policy, an improved 2015 eurozone growth forecast and expectations of further ECB stimulus.
After a decline in the second quarter of 2015, Japan’s economy expanded in the third quarter as capital expenditures improved. The Bank of Japan took several actions during the reporting period, including maintaining its monetary policy, lowering its economic growth and inflation forecasts and increasing its purchases of longer term debt.
In emerging markets, economic growth generally moderated. At the beginning of the reporting period, Greece’s economic and financial woes weighed on investor sentiment although the country and its creditors reached an agreement for a third bailout package in July. In China, the government’s intervention to cool domestic stock market speculation and its effective currency devaluation led to a severe slump in emerging market stocks from June through August. In October, emerging market equities gained after China expanded its monetary and fiscal stimulus to support its economy, though they retreated in November amid other concerns. Central bank actions varied across emerging markets during the six months under review, as some banks raised interest rates in response to rising inflation and weakening currencies, while others lowered interest rates to promote economic growth. In the recent global environment, emerging market stocks, as measured by the MSCI Emerging Markets Index, fell for the six-month period.
Investment Strategy
Under normal market conditions, we allocate the Fund’s assets among the broad asset classes representing exposure to global equities, global fixed income and commodities markets by investing primarily in a combination of underlying funds, based on each underlying fund’s predominant asset class. These underlying funds, in turn, invest in a variety of U.S. and foreign equity, fixed income and money market securities, and commodity-linked instruments. We will vary the underlying funds’ allocation percentages based on the current inflationary and economic environment and our tactical views. When selecting equity funds, we consider the underlying funds’ foreign and domestic exposure, market capitalization ranges and investment style (growth vs. value). When selecting fixed income funds, we focus primarily on maximizing income. We invest in commodities funds, TIPS and other inflation-indexed securities, floating rate notes and inflation-sensitive equity funds in an effort to improve the portfolio’s inflation hedging properties.
With respect to the portion of the Fund’s portfolio invested in inflation-indexed securities, the investment manager has engaged Franklin Templeton Institutional, LLC, to manage the Fund’s assets invested in inflation-indexed securities, predominantly TIPS. Such securities are structured to provide protection against inflation. In periods shorter than a full inflation cycle, the Fund’s returns may be volatile compared with the Consumer Price Index or lag behind inflation.
Manager’s Discussion
During the six months under review, near-term inflation risks remained subdued, with import prices, an improved labor market, employment costs, producer prices and other indicators pointing toward tame inflation. We continued to monitor the threat of inflation driven by monetary policy, which in our opinion can be a potentially long-term concern. The inflation data led us to construct a portfolio that favored domestic fixed income and core fixed income at period-end. We continued to be watchful of the potential global impact of the economic developments in Europe along with recent developments surrounding the Fed’s potential decision to increase interest rates.
4 Semiannual Report
franklintempleton.com
FRANKLIN MULTI-ASSET REAL RETURN FUND
| | |
| Top 10 Fund Holdings | | |
| 11/30/15 | | |
| | % of Total | |
| | Net Assets | |
| Franklin Pelagos Commodities Strategy Fund – | | |
| Class R6 | 14.0 | % |
| Franklin K2 Alternative Strategies Fund – Class R6 | 11.0 | % |
| Franklin U.S. Government Securities Fund – | | |
| Class R6 | 8.8 | % |
| Templeton Global Total Return Fund – Class R6 | 7.9 | % |
| Franklin Mutual European Fund – Class R6 | 4.8 | % |
| Franklin High Income Fund – Class R6 | 3.7 | % |
| Franklin Strategic Income Fund – Class R6 | 3.7 | % |
| iShares MSCI Eurozone ETF | 3.4 | % |
| Franklin Natural Resources Fund – Class R6 | 3.3 | % |
| Franklin Mutual International Fund – Class R6 | 2.5 | % |
Detractors from absolute Fund performance included the Fund’s holdings in alternative strategies, domestic equity, domestic fixed income, foreign equity and foreign fixed income. Some of the largest detractors among the Fund’s holdings included Franklin Natural Resources Fund – Class R6, Franklin Pelagos Commodities Strategies Fund – Class R6, Franklin High Income Fund – Class R6 and Franklin Mutual International Fund – Class R6. Franklin U.S. Government Securities Fund – Class R6 had a small positive effect on returns.
The Fund ended the period with 25.7% of total net assets in equity (9.9% domestic funds and 15.8% foreign funds), 48.0% in fixed income (18.3% domestic funds, 7.9% foreign funds and 21.8% inflation-indexed securities), 25.0% in alternative strategies (commodity and alternative equity funds), and 1.3% in short-term investments (cash) and other net assets. With respect to inflation positioning, the Fund’s portfolio ended the period with 18.5% of total net assets in core equity funds (having a relatively high correlation to the S&P 500), 26.2% in core fixed income funds (having a relatively high correlation to the Barclays U.S. Aggregate Bond Index), 42.9% in inflation-sensitive strategies, 11.0% in alternative equity strategies and 1.3% in cash and other net assets. Inflation-sensitive strategies consisted of 14.0% of total net assets in commodities, 7.2% in inflation-sensitive equity funds, 21.7% in inflation-sensitive fixed income securities, with no exposure to floating rate loans.
Thank you for your participation in Franklin Multi-Asset Real Return Fund.

The foregoing information reflects our analysis, opinions and portfolio holdings as of November 30, 2015, the end of the reporting period. The way we implement our main investment strategies and the resulting portfolio holdings may change depending on factors such as market and economic conditions. These opinions may not be relied upon as investment advice or an offer for a particular security. The information is not a complete analysis of every aspect of any market, country, industry, security or the Fund. Statements of fact are from sources considered reliable, but the investment manager makes no representation or warranty as to their completeness or accuracy. Although historical performance is no guarantee of future results, these insights may help you understand our investment management philosophy.
CFA® is a trademark owned by CFA Institute.
franklintempleton.com
Semiannual Report 5
FRANKLIN MULTI-ASSET REAL RETURN FUND
Performance Summary as of November 30, 2015
Your dividend income will vary depending on dividends or interest paid by securities in the Fund’s portfolio, adjusted for operating expenses of each class. Capital gain distributions are net profits realized from the sale of portfolio securities. The performance table does not reflect any taxes that a shareholder would pay on Fund dividends, capital gain distributions, if any, or any realized gains on the sale of Fund shares. Total return reflects reinvestment of the Fund’s dividends and capital gain distributions, if any, and any unrealized gains or losses.
| | | | | | |
| Net Asset Value | | | | | | |
| Share Class (Symbol) | | 11/30/15 | | 5/31/15 | | Change |
| A (FTMAX) | $ | 9.33 | $ | 10.00 | -$ | 0.67 |
| C (N/A) | $ | 9.18 | $ | 9.88 | -$ | 0.70 |
| R (N/A) | $ | 9.30 | $ | 9.98 | -$ | 0.68 |
| Advisor (N/A) | $ | 9.35 | $ | 10.01 | -$ | 0.66 |
6 Semiannual Report
franklintempleton.com
FRANKLIN MULTI-ASSET REAL RETURN FUND
PERFORMANCE SUMMARY
Performance as of 11/30/151
Cumulative total return excludes sales charges. Average annual total returns and value of $10,000 investment include maximum sales charges. Class A: 5.75% maximum initial sales charge; Class C: 1% contingent deferred sales charge in first year only;
Class R/Advisor Class: no sales charges.
| | | | | | | | | | | | |
| | | | | | | Value of | Average Annual | | | | | |
| | Cumulative | | Average Annual | | $ | 10,000 | Total Return | | Total Annual Operating Expenses6 | |
| Share Class | Total Return2 | | Total Return3 | | | Investment4 | (12/31/15 | )5 | (with waiver) | | (without waiver) | |
| A | | | | | | | | | 1.44 | % | 2.04 | % |
| 6-Month | -6.70 | % | -12.06 | % | $ | 8,794 | | | | | | |
| 1-Year | -6.95 | % | -12.34 | % | $ | 8,766 | -11.91 | % | | | | |
| 3-Year | -3.47 | % | -3.11 | % | $ | 9,095 | -3.93 | % | | | | |
| Since Inception (12/19/11) | +1.03 | % | -1.23 | % | $ | 9,522 | -1.68 | % | | | | |
| C | | | | | | | | | 2.19 | % | 2.79 | % |
| 6-Month | -7.09 | % | -8.01 | % | $ | 9,199 | | | | | | |
| 1-Year | -7.57 | % | -8.47 | % | $ | 9,153 | -8.09 | % | | | | |
| 3-Year | -5.60 | % | -1.90 | % | $ | 9,440 | -2.72 | % | | | | |
| Since Inception (12/19/11) | -2.06 | % | -0.52 | % | $ | 9,794 | -0.99 | % | | | | |
| R | | | | | | | | | 1.69 | % | 2.29 | % |
| 6-Month | -6.81 | % | -6.81 | % | $ | 9,319 | | | | | | |
| 1-Year | -7.15 | % | -7.15 | % | $ | 9,285 | -6.63 | % | | | | |
| 3-Year | -4.07 | % | -1.37 | % | $ | 9,593 | -2.17 | % | | | | |
| Since Inception (12/19/11) | +0.02 | % | 0.00 | % | $ | 10,002 | -0.45 | % | | | | |
| Advisor | | | | | | | | | 1.19 | % | 1.79 | % |
| 6-Month | -6.59 | % | -6.59 | % | $ | 9,341 | | | | | | |
| 1-Year | -6.63 | % | -6.63 | % | $ | 9,337 | -6.25 | % | | | | |
| 3-Year | -2.78 | % | -0.93 | % | $ | 9,722 | -1.74 | % | | | | |
| Since Inception (12/19/11) | +1.85 | % | +0.46 | % | $ | 10,185 | 0.00 | % | | | | |
Performance data represent past performance, which does not guarantee future results. Investment return and principal value will fluctuate, and you may have a gain or loss when you sell your shares. Current performance may differ from figures shown. For most recent month-end performance, go to franklintempleton.com or call (800) 342-5236.
See page 8 for Performance Summary footnotes.
franklintempleton.com
Semiannual Report 7
FRANKLIN MULTI-ASSET REAL RETURN FUND
PERFORMANCE SUMMARY
All investments involve risks, including possible loss of principal. Generally, investors should be comfortable with fluctuation in the value of their investments, especially over the short term. Stock prices fluctuate, sometimes rapidly and dramatically, due to factors affecting individual companies, particular industries or sectors, or general market conditions. Bond prices generally move in the opposite direction of interest rates. Thus, as the prices of bonds in the Fund adjust to a rise in interest rates, the Fund’s share price may decline. Foreign investing carries additional risks such as currency and market volatility and political or social instability, risks that are heightened in developing countries. Because the Fund has a significant investment in Treasury Inflation-Protected Securities (TIPS), it is highly influenced by the TIPS market and the monthly inflation adjustments on these securities. Commodity-linked investments can have heightened risks, including price volatility and less liquidity, and their value may be affected by the performance of broader commodities baskets and markets, as well as supply and demand, weather, tax and other regulatory policies. Because the Fund allocates assets to a variety of investment strategies involving certain risks, the Fund may be subject to those same risks. These risks and others are described more fully in the Fund’s prospectus. The Fund is actively managed but there is no guarantee that the manager’s investment decisions will produce the desired results.
| |
| Class C: | These shares have higher annual fees and expenses than Class A shares. |
| Class R: | Shares are available to certain eligible investors as described in the prospectus. These shares have higher annual fees and expenses than Class A shares. |
| Advisor Class: | Shares are available to certain eligible investors as described in the prospectus. |
1. The Fund has an expense reduction contractually guaranteed through at least 9/30/16 and a fee waiver associated with any investment in a Franklin Templeton money fund,
contractually guaranteed through at least its current fiscal year-end. Fund investment results reflect the expense reduction and fee waiver, to the extent applicable; without
these reductions, the results would have been lower.
2. Cumulative total return represents the change in value of an investment over the periods indicated.
3. Average annual total return represents the average annual change in value of an investment over the periods indicated. Return for less than one year, if any, has not been
annualized.
4. These figures represent the value of a hypothetical $10,000 investment in the Fund over the periods indicated.
5. In accordance with SEC rules, we provide standardized average annual total return information through the latest calendar quarter.
6. Figures are as stated in the Fund’s current prospectus and include the effect of acquired fund fees and expenses. In periods of market volatility, assets may decline signifi-
cantly, causing total annual Fund operating expenses to become higher than the figures shown.
8 Semiannual Report
franklintempleton.com
FRANKLIN MULTI-ASSET REAL RETURN FUND
Your Fund’s Expenses
As a Fund shareholder, you can incur two types of costs:
- Transaction costs, including sales charges (loads) on Fund purchases; and
- Ongoing Fund costs, including management fees, distribution and service (12b-1) fees, and other Fund expenses. All mutual funds have ongoing costs, sometimes referred to as operating expenses.
The following table shows ongoing costs of investing in the Fund and can help you understand these costs and compare them with those of other mutual funds. The table assumes a $1,000 investment held for the six months indicated.
Actual Fund Expenses
The first line (Actual) for each share class listed in the table provides actual account values and expenses. The “Ending Account Value” is derived from the Fund’s actual return, which includes the effect of Fund expenses.
You can estimate the expenses you paid during the period by following these steps. Of course, your account value and expenses will differ from those in this illustration:
| 1. | Divide your account value by $1,000. |
| | If an account had an $8,600 value, then $8,600 ÷ $1,000 = 8.6. |
| 2. | Multiply the result by the number under the heading “Expenses Paid During Period.” |
| | If Expenses Paid During Period were $7.50, then 8.6 x $7.50 = $64.50. |
In this illustration, the estimated expenses paid this period are $64.50.
Hypothetical Example for Comparison with Other Funds
Information in the second line (Hypothetical) for each class in the table can help you compare ongoing costs of investing in the Fund with those of other mutual funds. This information may not be used to estimate the actual ending account balance or expenses you paid during the period. The hypothetical “Ending Account Value” is based on the actual expense ratio for each class and an assumed 5% annual rate of return before expenses, which does not represent the Fund’s actual return. The figure under the heading “Expenses Paid During Period” shows the hypothetical expenses your account would have incurred under this scenario. You can compare this figure with the 5% hypothetical examples that appear in shareholder reports of other funds.
Please note that expenses shown in the table are meant to highlight ongoing costs and do not reflect any transaction costs, such as sales charges. Therefore, the second line for each class is useful in comparing ongoing costs only, and will not help you compare total costs of owning different funds. In addition, if transaction costs were included, your total costs would have been higher. Please refer to the Fund prospectus for additional information on operating expenses.
franklintempleton.com
Semiannual Report 9
| | | | | | | | |
| FRANKLIN MULTI-ASSET REAL RETURN FUND | | | | | | |
| YOUR FUND’S EXPENSES | | | | | | | | |
| |
| |
| |
| | | Beginning | | Ending | | Expenses Paid | | Expenses Paid |
| | | Account | | Account | | During Period* | | During Period** |
| Share Class | | Value 6/1/15 | | Value 11/30/15 | | 6/1/15–11/30/15 | | 6/1/15–11/30/15 |
| A | | | | | | | | |
| Actual | $ | 1,000 | $ | 933.00 | $ | 3.48 | $ | 6.96 |
| Hypothetical (5% return before expenses) | $ | 1,000 | $ | 1,021.35 | $ | 3.64 | $ | 7.26 |
| C | | | | | | | | |
| Actual | $ | 1,000 | $ | 929.10 | $ | 6.99 | $ | 10.47 |
| Hypothetical (5% return before expenses) | $ | 1,000 | $ | 1,017.75 | $ | 7.31 | $ | 10.93 |
| R | | | | | | | | |
| Actual | $ | 1,000 | $ | 931.90 | $ | 4.59 | $ | 8.07 |
| Hypothetical (5% return before expenses) | $ | 1,000 | $ | 1,020.25 | $ | 4.80 | $ | 8.42 |
| Advisor | | | | | | | | |
| Actual | $ | 1,000 | $ | 934.10 | $ | 2.18 | $ | 5.66 |
| Hypothetical (5% return before expenses) | $ | 1,000 | $ | 1,022.70 | $ | 2.28 | $ | 5.91 |
*Expenses are calculated using the most recent six-month expense ratio, excluding expenses of the underlying funds, net of expense waivers, annualized for each class
(A: 0.72%; C: 1.45%; R: 0.95%; and Advisor: 0.45%), multiplied by the average account value over the period, multiplied by 183/366 to reflect the one-half year period.
**Expenses are calculated using the most recent six-month expense ratio including expenses of the underlying funds, net of expense waivers, annualized for each class
(A: 1.44%; C: 2.17%; R: 1.67%; and Advisor: 1.17%), multiplied by the average account value over the period, multiplied by 183/366 to reflect the one-half year period.
10 Semiannual Report
franklintempleton.com
FRANKLIN FUND ALLOCATOR SERIES
| | | | | | | | | | | | | | | |
| Financial Highlights | | | | | | | | | | | | | | | |
| Franklin Multi-Asset Real Return Fund | | | | | | | | | | | | | | | |
| | | Six Months Ended | | | | | | | | | | | | | |
| | | November 30, 2015 | | | | | | Year Ended May 31, | | | | |
| | | (unaudited) | | | 2015 | | | 2014 | | | 2013 | | | 2012 | a |
| Class A | | | | | | | | | | | | | | | |
| Per share operating performance | | | | | | | | | | | | | | | |
| (for a share outstanding throughout the period) | | | | | | | | | | | | | | | |
| Net asset value, beginning of period | $ | 10.00 | | $ | 10.83 | | $ | 10.39 | | $ | 9.94 | | $ | 10.00 | |
| Income from investment operationsb: | | | | | | | | | | | | | | | |
| Net investment incomec,d | | 0.04 | | | 0.19 | | | 0.14 | | | 0.16 | | | 0.07 | |
| Net realized and unrealized gains (losses) | | (0.71 | ) | | (0.64 | ) | | 0.47 | | | 0.53 | | | (0.11 | ) |
| Total from investment operations | | (0.67 | ) | | (0.45 | ) | | 0.61 | | | 0.69 | | | (0.04 | ) |
| Less distributions from: | | | | | | | | | | | | | | | |
| Net investment income and short term gains received from | | | | | | | | | | | | | | | |
| Underlying Funds and exchange traded funds | | — | | | (0.26 | ) | | (0.15 | ) | | (0.24 | ) | | (0.02 | ) |
| Net realized gains. | | — | | | (0.12 | ) | | (0.02 | ) | | (—)e | | | — | |
| Total distributions | | — | | | (0.38 | ) | | (0.17 | ) | | (0.24 | ) | | (0.02 | ) |
| Net asset value, end of period | $ | 9.33 | | $ | 10.00 | | $ | 10.83 | | $ | 10.39 | | $ | 9.94 | |
| |
| Total returnf | | (6.70 | )% | | (4.14 | )% | | 5.82 | % | | 7.03 | % | | (0.35 | )% |
| |
| Ratios to average net assetsg | | | | | | | | | | | | | | | |
| Expenses before waiver and payments by affiliatesh | | 1.59 | % | | 1.38 | % | | 1.26 | % | | 2.71 | % | | 5.85 | % |
| Expenses net of waiver and payments by affiliatesh | | 0.72 | % | | 0.78 | % | | 0.71 | % | | 0.59 | % | | 0.49 | % |
| Net investment incomed | | 0.90 | % | | 1.79 | % | | 1.32 | % | | 1.54 | % | | 1.53 | % |
| |
| Supplemental data | | | | | | | | | | | | | | | |
| Net assets, end of period (000’s) | $ | 5,599 | | $ | 7,420 | | $ | 13,962 | | $ | 10,241 | | $ | 5,382 | |
| Portfolio turnover rate | | 13.57 | % | | 55.73 | % | | 39.70 | % | | 46.45 | % | | 27.24 | % |
aFor the period December 19, 2011 (commencement of operations) to May 31, 2012.
bThe amount shown for a share outstanding throughout the period may not correlate with the Statement of Operations for the period due to the timing of sales and
repurchases of the Fund’s shares in relation to income earned and/or fluctuating fair value of the investments of the Fund.
cBased on average daily shares outstanding.
dRecognition of net investment income by the Fund is affected by the timing of declaration of dividends by the Underlying Funds and exchange traded funds in which the
Fund invests.
eAmount rounds to less than $0.01 per share.
fTotal return does not reflect sales commissions or contingent deferred sales charges, if applicable, and is not annualized for periods less than one year.
gRatios are annualized for periods less than one year.
hDoes not include expenses of the Underlying Funds and exchange traded funds in which the Fund invests. The weighted average indirect expenses of the Underlying Funds
and exchange traded funds was 0.72% for the period ended November 30, 2015.
franklintempleton.com The accompanying notes are an integral part of these financial statements. | Semiannual Report 11
| | | | | | | | | | | | | | | |
| FRANKLIN FUND ALLOCATOR SERIES | | | | | | | | | | | | | | | |
| FINANCIAL HIGHLIGHTS | | | | | | | | | | | | | | | |
| |
| |
| Franklin Multi-Asset Real Return Fund (continued) | | | | | | | | | | | | | |
| | | Six Months Ended | | | | | | | | | | | | | |
| | | November 30, 2015 | | | | | | Year Ended May 31, | | | | |
| | | (unaudited) | | | 2015 | | | 2014 | | | 2013 | | | 2012 | a |
| Class C | | | | | | | | | | | | | | | |
| Per share operating performance | | | | | | | | | | | | | | | |
| (for a share outstanding throughout the period) | | | | | | | | | | | | | | | |
| Net asset value, beginning of period | $ | 9.88 | | $ | 10.69 | | $ | 10.29 | | $ | 9.90 | | $ | 10.00 | |
| Income from investment operationsb: | | | | | | | | | | | | | | | |
| Net investment incomec,d | | 0.01 | | | 0.11 | | | 0.06 | | | 0.06 | | | 0.04 | |
| Net realized and unrealized gains (losses) | | (0.71 | ) | | (0.62 | ) | | 0.46 | | | 0.54 | | | (0.12 | ) |
| Total from investment operations | | (0.70 | ) | | (0.51 | ) | | 0.52 | | | 0.60 | | | (0.08 | ) |
| Less distributions from: | | | | | | | | | | | | | | | |
| Net investment income and short term gains received from | | | | | | | | | | | | | | | |
| Underlying Funds and exchange traded funds | | — | | | (0.18 | ) | | (0.10 | ) | | (0.21 | ) | | (0.02 | ) |
| Net realized gains. | | — | | | (0.12 | ) | | (0.02 | ) | | (—)e | | | — | |
| Total distributions | | — | | | (0.30 | ) | | (0.12 | ) | | (0.21 | ) | | (0.02 | ) |
| Netasset value, end of period | $ | 9.18 | | $ | 9.88 | | $ | 10.69 | | $ | 10.29 | | $ | 9.90 | |
| |
| Total returnf | | (7.09 | )% | | (4.71 | )% | | 5.07 | % | | 6.08 | % | | (0.75 | )% |
| |
| Ratios to average net assetsg | | | | | | | | | | | | | | �� | |
| Expenses before waiver and payments by affiliatesh | | 2.32 | % | | 2.05 | % | | 2.00 | % | | 3.57 | % | | 6.81 | % |
| Expenses net of waiver and payments by affiliatesh | | 1.45 | % | | 1.45 | % | | 1.45 | % | | 1.45 | % | | 1.45 | % |
| Net investment incomed | | 0.17 | % | | 1.12 | % | | 0.58 | % | | 0.68 | % | | 0.57 | % |
| |
| Supplemental data | | | | | | | | | | | | | | | |
| Net assets,end of period (000’s) | $ | 3,181 | | $ | 4,361 | | $ | 5,830 | | $ | 3,568 | | $ | 579 | |
| Portfolio turnover rate | | 13.57 | % | | 55.73 | % | | 39.70 | % | | 46.45 | % | | 27.24 | % |
aFor the period December 19, 2011 (commencement of operations) to May 31, 2012.
bThe amount shown for a share outstanding throughout the period may not correlate with the Statement of Operations for the period due to the timing of sales and
repurchases of the Fund’s shares in relation to income earned and/or fluctuating fair value of the investments of the Fund.
cBased on average daily shares outstanding.
dRecognition of net investment income by the Fund is affected by the timing of declaration of dividends by the Underlying Funds and exchange traded funds in which the
Fund invests.
eAmount rounds to less than $0.01 per share.
fTotal return does not reflect sales commissions or contingent deferred sales charges, if applicable, and is not annualized for periods less than one year.
gRatios are annualized for periods less than one year.
hDoes not include expenses of the Underlying Funds and exchange traded funds in which the Fund invests. The weighted average indirect expenses of the Underlying Funds
and exchange traded funds was 0.72% for the period ended November 30, 2015.
12 Semiannual Report | The accompanying notes are an integral part of these financial statements. franklintempleton.com
| | | | | | | | | | | | | | | |
| | | | | | FRANKLIN FUND ALLOCATOR SERIES | |
| | | | | | | | | FINANCIAL HIGHLIGHTS | |
| |
| |
| Franklin Multi-Asset Real Return Fund (continued) | | | | | | | | | | | | | |
| | | Six Months Ended | | | | | | | | | | | | | |
| | | November 30, 2015 | | | | | | Year Ended May 31, | | | | |
| | | (unaudited) | | | 2015 | | | 2014 | | | 2013 | | | 2012 | a |
| Class R | | | | | | | | | | | | | | | |
| Per share operating performance | | | | | | | | | | | | | | | |
| (for a share outstanding throughout the period) | | | | | | | | | | | | | | | |
| Net asset value, beginning of period | $ | 9.98 | | $ | 10.79 | | $ | 10.36 | | $ | 9.92 | | $ | 10.00 | |
| Income from investment operationsb: | | | | | | | | | | | | | | | |
| Net investment incomec,d | | 0.03 | | | 0.15 | | | 0.14 | | | 0.10 | | | 0.05 | |
| Net realized and unrealized gains (losses) | | (0.71 | ) | | (0.61 | ) | | 0.45 | | | 0.55 | | | (0.11 | ) |
| Total from investment operations | | (0.68 | ) | | (0.46 | ) | | 0.59 | | | 0.65 | | | (0.06 | ) |
| Less distributions from: | | | | | | | | | | | | | | | |
| Net investment income and short term gains received from | | | | | | | | | | | | | | | |
| Underlying Funds and exchange traded funds | | — | | | (0.23 | ) | | (0.14 | ) | | (0.21 | ) | | (0.02 | ) |
| Net realized gains. | | — | | | (0.12 | ) | | (0.02 | ) | | (—)e | | | — | |
| Totaldistributions | | — | | | (0.35 | ) | | (0.16 | ) | | (0.21 | ) | | (0.02 | ) |
| Netassetvalue,endofperiod | $ | 9.30 | | $ | 9.98 | | $ | 10.79 | | $ | 10.36 | | $ | 9.92 | |
| |
| Total returnf | | (6.81 | )% | | (4.24 | )% | | 5.72 | % | | 6.61 | % | | (0.55 | )% |
| |
| Ratios to average net assetsg | | | | | | | | | | | | | | | |
| Expenses before waiver and payments by affiliatesh | | 1.82 | % | | 1.55 | % | | 1.50 | % | | 3.07 | % | | 6.31 | % |
| Expenses net of waiver and payments by affiliatesh | | 0.95 | % | | 0.95 | % | | 0.95 | % | | 0.95 | % | | 0.95 | % |
| Net investment incomed | | 0.67 | % | | 1.62 | % | | 1.08 | % | | 1.18 | % | | 1.07 | % |
| |
| Supplemental data | | | | | | | | | | | | | | | |
| Net assets, end of period (000’s) | $ | 21 | | $ | 22 | | $ | 23 | | $ | 68 | | $ | 10 | |
| Portfolio turnover rate | | 13.57 | % | | 55.73 | % | | 39.70 | % | | 46.45 | % | | 27.24 | % |
aFor the period December 19, 2011 (commencement of operations) to May 31, 2012.
bThe amount shown for a share outstanding throughout the period may not correlate with the Statement of Operations for the period due to the timing of sales and
repurchases of the Fund’s shares in relation to income earned and/or fluctuating fair value of the investments of the Fund.
cBased on average daily shares outstanding.
dRecognition of net investment income by the Fund is affected by the timing of declaration of dividends by the Underlying Funds and exchange traded funds in which the
Fund invests.
eAmount rounds to less than $0.01 per share.
fTotal return is not annualized for periods less than one year.
gRatios are annualized for periods less than one year.
hDoes not include expenses of the Underlying Funds and exchange traded funds in which the Fund invests. The weighted average indirect expenses of the Underlying Funds
and exchange traded funds was 0.72% for the period ended November 30, 2015.
franklintempleton.com The accompanying notes are an integral part of these financial statements. | Semiannual Report 13
| | | | | | | | | | | | | | | |
| FRANKLIN FUND ALLOCATOR SERIES | | | | | | | | | | | | | | | |
| FINANCIAL HIGHLIGHTS | | | | | | | | | | | | | | | |
| |
| |
| Franklin Multi-Asset Real Return Fund (continued) | | | | | | | | | | | | | |
| | | Six Months Ended | | | | | | | | | | | | | |
| | | November 30, 2015 | | | | | | Year Ended May 31, | | | | |
| | | (unaudited) | | | 2015 | | | 2014 | | | 2013 | | | 2012 | a |
| Advisor Class | | | | | | | | | | | | | | | |
| Per share operating performance | | | | | | | | | | | | | | | |
| (for a share outstanding throughout the period) | | | | | | | | | | | | | | | |
| Net asset value, beginning of period | $ | 10.01 | | $ | 10.84 | | $ | 10.40 | | $ | 9.94 | | $ | 10.00 | |
| Income from investment operationsb: | | | | | | | | | | | | | | | |
| Net investment incomec,d | | 0.06 | | | 0.21 | | | 0.16 | | | 0.18 | | | 0.07 | |
| Net realized and unrealized gains (losses) | | (0.72 | ) | | (0.63 | ) | | 0.47 | | | 0.53 | | | (0.11 | ) |
| Total from investment operations | | (0.66 | ) | | (0.42 | ) | | 0.63 | | | 0.71 | | | (0.04 | ) |
| Less distributions from: | | | | | | | | | | | | | | | |
| Net investment income and short term gains received from | | | | | | | | | | | | | | | |
| Underlying Funds and exchange traded funds | | — | | | (0.29 | ) | | (0.17 | ) | | (0.25 | ) | | (0.02 | ) |
| Net realized gains. | | — | | | (0.12 | ) | | (0.02 | ) | | (—)e | | | — | |
| Totaldistributions | | — | | | (0.41 | ) | | (0.19 | ) | | (0.25 | ) | | (0.02 | ) |
| Net asset value, end of period | $ | 9.35 | | $ | 10.01 | | $ | 10.84 | | $ | 10.40 | | $ | 9.94 | |
| |
| Total returnf | | (6.59 | )% | | (3.82 | )% | | 6.13 | % | | 7.21 | % | | (0.35 | )% |
| |
| Ratios to average net assetsg | | | | | | | | | | | | | | | |
| Expenses before waiver and payments by affiliatesh | | 1.32 | % | | 1.05 | % | | 1.00 | % | | 2.57 | % | | 5.81 | % |
| Expenses net of waiver and payments by affiliatesh | | 0.45 | % | | 0.45 | % | | 0.45 | % | | 0.45 | % | | 0.45 | % |
| Net investment incomed | | 1.17 | % | | 2.12 | % | | 1.58 | % | | 1.68 | % | | 1.57 | % |
| |
| Supplemental data | | | | | | | | | | | | | | | |
| Net assets,end of period (000’s) | $ | 1,983 | | $ | 2,593 | | $ | 2,485 | | $ | 2,948 | | $ | 1,627 | |
| Portfolio turnover rate | | 13.57 | % | | 55.73 | % | | 39.70 | % | | 46.45 | % | | 27.24 | % |
aFor the period December 19, 2011 (commencement of operations) to May 31, 2012.
bThe amount shown for a share outstanding throughout the period may not correlate with the Statement of Operations for the period due to the timing of sales and
repurchases of the Fund’s shares in relation to income earned and/or fluctuating fair value of the investments of the Fund.
cBased on average daily shares outstanding.
dRecognition of net investment income by the Fund is affected by the timing of declaration of dividends by the Underlying Funds and exchange traded funds in which the
Fund invests.
eAmount rounds to less than $0.01 per share.
fTotal return is not annualized for periods less than one year.
gRatios are annualized for periods less than one year.
hDoes not include expenses of the Underlying Funds and exchange traded funds in which the Fund invests. The weighted average indirect expenses of the Underlying Funds
and exchange traded funds was 0.72% for the period ended November 30, 2015.
14 Semiannual Report | The accompanying notes are an integral part of these financial statements. franklintempleton.com
FRANKLIN FUND ALLOCATOR SERIES
| | | | | |
| Statement of Investments, November 30, 2015 (unaudited) | | | | | |
| |
| Franklin Multi-Asset Real Return Fund | | | | | |
| | Shares | | | | Value |
| |
| Investments in Underlying Funds and Exchange Traded Funds 76.9% | | | | | |
| Alternative Strategies 25.0% | | | | | |
| aFranklin K2 Alternative Strategies Fund, Class R6 | 108,367 | | | $ | 1,186,617 |
| a,bFranklin Pelagos Commodities Strategy Fund, Class R6 | 255,399 | | | | 1,514,519 |
| | | | | | 2,701,136 |
| Domestic Equity 9.9% | | | | | |
| aFranklin Focused Core Equity Fund, Class R6 | 14,882 | | | | 219,654 |
| aFranklin Gold and Precious Metals Fund, Class R6 | 9,557 | | | | 111,630 |
| aFranklin Growth Fund, Class R6 | 1,877 | | | | 146,608 |
| a,bFranklin Growth Opportunities Fund, Class R6 | 3,112 | | | | 110,976 |
| aFranklin Natural Resources Fund, Class R6 | 14,153 | | | | 352,126 |
| aFranklin Utilities Fund, Class R6 | 7,654 | | | | 123,227 |
| | | | | | 1,064,221 |
| Domestic Fixed Income 18.3% | | | | | |
| aFranklin High Income Fund, Class R6 | 228,518 | | | | 397,621 |
| aFranklin Low Duration Total Return Fund, Class R6 | 23,649 | | | | 234,361 |
| aFranklin Strategic Income Fund, Class R6 | 42,388 | | | | 396,325 |
| aFranklin U.S. Government Securities Fund, Class R6 | 148,584 | | | | 949,453 |
| | | | | | 1,977,760 |
| Foreign Equity 15.8% | | | | | |
| aFranklin Global Real Estate Fund, Class R6 | 20,855 | | | | 182,690 |
| aFranklin India Growth Fund, Class R6 | 15,312 | | | | 186,192 |
| aFranklin Mutual European Fund, Class R6 | 24,294 | | | | 515,753 |
| aFranklin Mutual International Fund, Class R6 | 17,995 | | | | 262,734 |
| iShares MSCI Eurozone ETF | 10,000 | | | | 365,600 |
| iShares MSCI Japan ETF (Japan) | 15,000 | | | | 185,850 |
| | | | | | 1,698,819 |
| Foreign Fixed Income 7.9% | | | | | |
| aTempleton Global Total Return Fund, Class R6 | 71,948 | | | | 853,301 |
| Total Investments in Underlying Funds and Exchange Traded Funds | | | | | |
| (Cost $9,347,266) | | | | | 8,295,237 |
| |
| |
| | Principal | | | | |
| | Amount* | | | | |
| |
| Foreign Government and Agency Securities (Cost $93,754) 0.7% | | | | | |
| cMexican Udibonos, Index Linked, 5.00%, 6/16/16 | 11,793 | d | MXN | | 72,727 |
| U.S. Government and Agency Securities 21.1% | | | | | |
| cU.S. Treasury Bond, | | | | | |
| Index Linked, 2.125%, 2/15/41 | 108,661 | | | | 131,463 |
| Index Linked, 0.75%, 2/15/42 | 52,655 | | | | 47,376 |
| cU.S. Treasury Note, | | | | | |
| Index Linked, 0.125%, 4/15/16 | 362,224 | | | | 360,557 |
| Index Linked, 2.50%, 7/15/16 | 117,829 | | | | 119,957 |
| Index Linked, 2.375%, 1/15/17 | 147,496 | | | | 151,316 |
| Index Linked, 0.125%, 4/15/17 | 304,871 | | | | 304,581 |
| Index Linked, 0.125%, 4/15/18 | 298,527 | | | | 298,634 |
| Index Linked, 0.125%, 4/15/19 | 101,552 | | | | 101,309 |
| Index Linked, 0.125%, 4/15/20 | 101,613 | | | | 100,851 |
| Index Linked, 1.125%, 1/15/21 | 108,779 | | | | 113,055 |
| Index Linked, 0.625%, 7/15/21 | 211,157 | | | | 214,465 |
franklintempleton.com
Semiannual Report 15
FRANKLIN FUND ALLOCATOR SERIES
STATEMENT OF INVESTMENTS (UNAUDITED)
| | | | |
| Franklin Multi-Asset Real Return Fund (continued) | | | | |
| | Principal | | | |
| | Amount* | | Value | |
| U.S. Government and Agency Securities (continued) | | | | |
| cU.S. Treasury Note, (continued) | | | | |
| Index Linked, 0.125%, 1/15/22 | 52,568 | $ | 51,398 | |
| Index Linked, 0.375%, 7/15/23 | 178,940 | | 176,645 | |
| Index Linked, 0.25%, 1/15/25 | 100,466 | | 96,948 | |
| Total U.S. Government and Agency Securities (Cost $2,321,458) | | | 2,268,555 | |
| Total Investments before Short Term Investments (Cost $11,762,478) | | | 10,636,519 | |
| |
| |
| | Shares | | | |
| Short Term Investments (Cost $218,585) 2.0% | | | | |
| Money Market Funds 2.0% | | | | |
| a,bInstitutional Fiduciary Trust Money Market Portfolio | 218,585 | | 218,585 | |
| Total Investments (Cost $11,981,063) 100.7% | | | 10,855,104 | |
| Other Assets, less Liabilities (0.7)%. | | | (71,165 | ) |
| Net Assets 100.0%. | | $ | 10,783,939 | |
See Abbreviations on page 28.
*The principal amount is stated in U.S. dollars unless otherwise indicated.
aSee Note 3(f) regarding investments in Underlying Funds.
bNon-income producing.
cPrincipal amount of security is adjusted for inflation. See Note 1(d).
dPrincipal amount is stated in 100 Unidad de Inversion Units.
16 Semiannual Report | The accompanying notes are an integral part of these financial statements. franklintempleton.com
FRANKLIN FUND ALLOCATOR SERIES
Financial Statements
Statement of Assets and Liabilities
November 30, 2015 (unaudited)
| | | |
| Franklin Multi-Asset Real Return Fund | | | |
| |
| Assets: | | | |
| Investments in securities: | | | |
| Cost - Unaffiliated issuers | $ | 2,415,212 | |
| Cost - Underlying Funds (Note 3f) | | 9,014,624 | |
| Cost - Exchange traded funds | | 551,227 | |
| Total cost of investments | $ | 11,981,063 | |
| Value - Unaffiliated issuers | $ | 2,341,282 | |
| Value - Underlying Funds (Note 3f) | | 7,962,372 | |
| Value - Exchange traded funds | | 551,450 | |
| Total value of investments | | 10,855,104 | |
| Receivables: | | | |
| Capitalsharessold | | 120 | |
| Interest | | 6,340 | |
| Affiliates | | 19,416 | |
| Total assets | | 10,880,980 | |
| Liabilities: | | | |
| Payables: | | | |
| Capital shares redeemed | | 66,216 | |
| Distribution fees | | 3,863 | |
| Transferagentfees | | 2,384 | |
| Reports to shareholders | | 7,898 | |
| Professional fees. | | 11,752 | |
| Accrued expenses and other liabilities | | 4,928 | |
| Total liabilities | | 97,041 | |
| Net assets, at value. | $ | 10,783,939 | |
| Net assets consist of: | | | |
| Paid-incapital. | $ | 12,399,421 | |
| Distributions in excess of net investment income. | | (24,682 | ) |
| Net unrealized appreciation (depreciation) | | (1,125,978 | ) |
| Accumulated net realized gain (loss) | | (464,822 | ) |
| Net assets, at value. | $ | 10,783,939 | |
franklintempleton.com The accompanying notes are an integral part of these financial statements. | Semiannual Report 17
FRANKLIN FUND ALLOCATOR SERIES
FINANCIAL STATEMENTS
Statement of Assets and Liabilities (continued)
November 30, 2015 (unaudited)
| | |
| Franklin Multi-Asset Real Return Fund | | |
| |
| Class A: | | |
| Netassets,atvalue. | $ | 5,598,938 |
| Shares outstanding | | 599,997 |
| Net asset value per sharea | $ | 9.33 |
| Maximum offering price per share (net asset value per share ÷ 94.25%) | $ | 9.90 |
| Class C: | | |
| Netassets,atvalue. | $ | 3,180,807 |
| Shares outstanding | | 346,327 |
| Net asset value and maximum offering price per sharea | $ | 9.18 |
| Class R: | | |
| Netassets,atvalue. | $ | 20,813 |
| Shares outstanding | | 2,237 |
| Net asset value and maximum offering price per share | $ | 9.30 |
| Advisor Class: | | |
| Netassets,atvalue. | $ | 1,983,381 |
| Shares outstanding | | 212,015 |
| Net asset value and maximum offering price per share | $ | 9.35 |
aRedemption price is equal to net asset value less contingent deferred sales charges, if applicable.
18 Semiannual Report | The accompanying notes are an integral part of these financial statements. franklintempleton.com
FRANKLIN FUND ALLOCATOR SERIES
FINANCIAL STATEMENTS
Statement of Operations
for the six months ended November 30, 2015 (unaudited)
| | | |
| Franklin Multi-Asset Real Return Fund | | | |
| |
| Investment income: | | | |
| Dividends: | | | |
| Underlying Funds (Note 3f) | $ | 78,263 | |
| Exchange traded funds | | 9,250 | |
| Interest and inflation principal adjustments | | 14,019 | |
| Total investment income | | 101,532 | |
| Expenses: | | | |
| Management fees (Note 3a) | | 22,011 | |
| Distribution fees: (Note 3c) | | | |
| Class A | | 8,803 | |
| Class C | | 18,353 | |
| Class R | | 52 | |
| Transfer agent fees: (Note 3e) | | | |
| Class A | | 4,969 | |
| Class C | | 2,799 | |
| Class R | | 19 | |
| Advisor Class | | 1,733 | |
| Custodian fees (Note 4) | | 33 | |
| Reports to shareholders | | 4,776 | |
| Registration and filing fees | | 27,222 | |
| Professional fees | | 12,479 | |
| Other | | 6,824 | |
| Total expenses | | 110,073 | |
| Expenses waived/paid by affiliates (Note 3f and 3g) | | (54,605 | ) |
| Net expenses | | 55,468 | |
| Net investment income | | 46,064 | |
| Realized and unrealized gains (losses): | | | |
| Net realized gain (loss) from: | | | |
| Sale of investments: | | | |
| Underlying Funds (Note 3f) | | (117,794 | ) |
| Exchange traded funds | | (4,786 | ) |
| Foreign currency transactions | | (30 | ) |
| Realized gain distributions from Underlying Funds (Note 3f) | | 14,855 | |
| Net realized gain(loss) | | (107,755 | ) |
| Net change in unrealized appreciation (depreciation) on: | | | |
| Investments | | (861,800 | ) |
| Translation of other assets and liabilities denominated in foreign | | | |
| currencies | | 14 | |
| Net change in unrealized appreciation (depreciation) | | (861,786 | ) |
| Net realized and unrealized gain(loss) | | (969,541 | ) |
| Net increase (decrease) in net assets resulting from operations | $ | (923,477 | ) |
franklintempleton.com The accompanying notes are an integral part of these financial statements. | Semiannual Report 19
| | | | | | |
| FRANKLIN FUND ALLOCATOR SERIES | | | | | | |
| FINANCIAL STATEMENTS | | | | | | |
| |
| |
| Statements of Changes in Net Assets | | | | | | |
| |
| Franklin Multi-Asset Real Return Fund | | | | | | |
| |
| | | Six Months Ended | | | | |
| | | November 30, 2015 | | | Year Ended | |
| | | (unaudited) | | | May 31, 2015 | |
| Increase (decrease) in net assets: | | | | | | |
| Operations: | | | | | | |
| Net investment income | $ | 46,064 | | $ | 314,312 | |
| Netrealizedgain(loss) | | (107,755 | ) | | (150,466 | ) |
| Net change in unrealized appreciation (depreciation) | | (861,786 | ) | | (1,243,224 | ) |
| Net increase (decrease) in net assets resulting from operations. | | (923,477 | ) | | (1,079,378 | ) |
| Distributions to shareholders from: | | | | | | |
| Net investment income and short term gains received from Underlying Funds and exchange | | | | | | |
| traded funds: | | | | | | |
| Class A | | — | | | (305,575 | ) |
| Class C | | — | | | (98,516 | ) |
| Class R | | — | | | (492 | ) |
| Advisor Class | | — | | | (69,227 | ) |
| Net realized gains: | | | | | | |
| Class A | | — | | | (141,910 | ) |
| Class C | | — | | | (64,183 | ) |
| Class R | | — | | | (257 | ) |
| Advisor Class | | — | | | (28,521 | ) |
| Total distributions to shareholders | | — | | | (708,681 | ) |
| Capital share transactions: (Note 2) | | | | | | |
| Class A | | (1,344,827 | ) | | (5,424,567 | ) |
| Class C | | (898,315 | ) | | (998,095 | ) |
| Class R | | — | | | 749 | |
| Advisor Class | | (446,318 | ) | | 306,733 | |
| Total capital share transactions | | (2,689,460 | ) | | (6,115,180 | ) |
| Net increase (decrease) in net assets | | (3,612,937 | ) | | (7,903,239 | ) |
| Net assets: | | | | | | |
| Beginning of period | | 14,396,876 | | | 22,300,115 | |
| Endof period | $ | 10,783,939 | | $ | 14,396,876 | |
| Distributions in excess of net investment income included in net assets: | | | | | | |
| End of period | $ | (24,682 | ) | $ | (70,746 | ) |
20 Semiannual Report | The accompanying notes are an integral part of these financial statements. franklintempleton.com
FRANKLIN FUND ALLOCATOR SERIES
Notes to Financial Statements (unaudited)
Franklin Multi-Asset Real Return Fund
1. Organization and Significant Accounting Policies
Franklin Fund Allocator Series (Trust) is registered under the Investment Company Act of 1940 (1940 Act) as an open-end management investment company, consisting of twenty separate funds. Franklin Multi-Asset Real Return Fund (Fund) is included in this report and applies the specialized accounting and reporting guidance in U.S. Generally Accepted Accounting Principles (U.S. GAAP). The financial statements of the remaining funds in the Trust are presented separately. The Fund invests primarily in Franklin Templeton mutual funds (Underlying Funds). The Fund offers four classes of shares: Class A, Class C, Class R, and Advisor Class. Each class of shares differs by its initial sales load, contingent deferred sales charges, voting rights on matters affecting a single class, its exchange privilege and fees primarily due to differing arrangements for distribution and transfer agent fees. The Fund was closed to new investors with limited exceptions effective at the close of market December 10, 2015. The Fund will not accept any additional purchases after the close of market on or about February 23, 2016.
The accounting policies of the Underlying Funds are outlined in their respective shareholder reports. A copy of the Underlying Funds’ shareholder reports is available on the U.S. Securities and Exchange Commission (SEC) website at sec.gov or at the SEC’s Public Reference Room in Washington, D.C. The Underlying Funds’ shareholder reports are not covered by this report.
The following summarizes the Fund’s significant accounting policies.
a. Financial Instrument Valuation
The Fund’s investments in financial instruments are carried at fair value daily. Fair value is the price that would be received to sell an asset or paid to transfer a liability in an orderly transaction between market participants on the measurement date. The Fund calculates the net asset value (NAV) per share as of 4 p.m. Eastern time each day the New York Stock Exchange (NYSE) is open for trading. Under compliance policies and procedures approved by the Trust’s Board of Trustees (the Board), the Fund’s administrator has responsibility for oversight of valuation, including leading the cross-functional Valuation and Liquidity Oversight Committee (VLOC). The VLOC provides administration and oversight of the Fund’s valuation policies and procedures, which are approved annually by the Board. Among other things, these procedures allow the Fund to utilize independent pricing services, quotations from securities and financial instrument dealers, and other market sources to determine fair value.
Investments in the Underlying Funds are valued at their closing NAV each trading day. Exchange traded funds (ETFs) listed on an exchange or on the NASDAQ National Market System are valued at the last quoted sale price or the official closing price of the day, respectively.
Debt securities generally trade in the over-the-counter market rather than on a securities exchange. The Fund’s pricing services use multiple valuation techniques to determine fair value. In instances where sufficient market activity exists, the pricing services may utilize a market-based approach through which quotes from market makers are used to determine fair value. In instances where sufficient market activity may not exist or is limited, the pricing services also utilize proprietary valuation models which may consider market characteristics such as benchmark yield curves, credit spreads, estimated default rates, anticipated market interest rate volatility, coupon rates, anticipated timing of principal repayments, underlying collateral, and other unique security features in order to estimate the relevant cash flows, which are then discounted to calculate the fair value. Securities denominated in a foreign currency are converted into their U.S. dollar equivalent at the foreign exchange rate in effect at the NYSE close on the date that the values of the foreign debt securities are determined.
The Fund has procedures to determine the fair value of financial instruments for which market prices are not reliable or readily available. Under these procedures, the VLOC convenes on a regular basis to review such financial instruments and considers a number of factors, including significant unobservable valuation inputs, when arriving at fair value. The VLOC primarily employs a market-based approach which may use related or comparable assets or liabilities, recent transactions, market multiples, book values, and other relevant information for the investment to determine the fair value of the investment. An income-based valuation approach may also be used in which the anticipated future cash flows of the investment are discounted to calculate fair value. Discounts may also be applied due to the nature or duration of any restrictions on the disposition of the investments. Due to the inherent uncertainty of valuations of such investments, the fair values may differ significantly from the values that would have been used had an active market existed. The VLOC employs various methods for calibrating
franklintempleton.com
Semiannual Report 21
FRANKLIN FUND ALLOCATOR SERIES
NOTES TO FINANCIAL STATEMENTS (UNAUDITED)
Franklin Multi-Asset Real Return Fund (continued)
1. Organization and Significant Accounting
Policies (continued)
a. Financial Instrument Valuation (continued)
these valuation approaches including a regular review of key inputs and assumptions, transactional back-testing or disposition analysis, and reviews of any related market activity.
b. Foreign Currency Translation
Portfolio securities and other assets and liabilities denominated in foreign currencies are translated into U.S. dollars based on the exchange rate of such currencies against U.S. dollars on the date of valuation. The Fund may enter into foreign currency exchange contracts to facilitate transactions denominated in a foreign currency. Purchases and sales of securities, income and expense items denominated in foreign currencies are translated into U.S. dollars at the exchange rate in effect on the transaction date. Portfolio securities and assets and liabilities denominated in foreign currencies contain risks that those currencies will decline in value relative to the U.S. dollar. Occasionally, events may impact the availability or reliability of foreign exchange rates used to convert the U.S. dollar equivalent value. If such an event occurs, the foreign exchange rate will be valued at fair value using procedures established and approved by the Board.
The Fund does not separately report the effect of changes in foreign exchange rates from changes in market prices on securities held. Such changes are included in net realized and unrealized gain or loss from investments in the Statement of Operations.
Realized foreign exchange gains or losses arise from sales of foreign currencies, currency gains or losses realized between the trade and settlement dates on securities transactions and the difference between the recorded amounts of dividends, interest, and foreign withholding taxes and the U.S. dollar equivalent of the amounts actually received or paid. Net unrealized foreign exchange gains and losses arise from changes in foreign exchange rates on foreign denominated assets and liabilities other than investments in securities held at the end of the reporting period.
c. Income and Deferred Taxes
It is the Fund’s policy to qualify as a regulated investment company under the Internal Revenue Code. The Fund intends to distribute to shareholders substantially all of its taxable income and net realized gains to relieve it from federal income and excise taxes. As a result, no provision for U.S. federal income taxes is required.
The Fund may be subject to foreign taxation related to income received, capital gains on the sale of securities and certain foreign currency transactions in the foreign jurisdictions in which it invests. Foreign taxes, if any, are recorded based on the tax regulations and rates that exist in the foreign markets in which the Fund invests. When a capital gain tax is determined to apply, the Fund records an estimated deferred tax liability in an amount that would be payable if the securities were disposed of on the valuation date.
The Fund recognizes the tax benefits of uncertain tax positions only when the position is “more likely than not” to be sustained upon examination by the tax authorities based on the technical merits of the tax position. As of November 30, 2015, and for all open tax years, the Fund has determined that no liability for unrecognized tax benefits is required in the Fund’s financial statements related to uncertain tax positions taken on a tax return (or expected to be taken on future tax returns). Open tax years are those that remain subject to examination and are based on each tax jurisdiction’s statute of limitation.
d. Security Transactions, Investment Income, Expenses and Distributions
Security transactions are accounted for on trade date. Realized gains and losses on security transactions are determined on a specific identification basis. Interest income and estimated expenses are accrued daily. Amortization of premium and accretion of discount on debt securities are included in interest income. Dividend income and realized gain distributions by Underlying Funds and ETFs are recorded on the ex-dividend date. Distributions to shareholders are recorded on the ex-dividend date and are determined according to income tax regulations (tax basis). Distributable earnings determined on a tax basis may differ from earnings recorded in accordance with U.S. GAAP. These differences may be permanent or temporary. Permanent differences are reclassified among capital accounts to reflect their tax character. These reclassifications have no impact on net assets or the results of operations. Temporary differences are not reclassified, as they may reverse in subsequent periods.
22 Semiannual Report
franklintempleton.com
FRANKLIN FUND ALLOCATOR SERIES
NOTES TO FINANCIAL STATEMENTS (UNAUDITED)
Franklin Multi-Asset Real Return Fund (continued)
Common expenses incurred by the Trust are allocated among the Funds based on the ratio of net assets of each fund to the combined net assets of the Trust. Fund specific expenses are charged directly to the fund that incurred the expense.
The Fund indirectly bears its proportionate share of expenses from the Underlying Funds and ETFs. Since the Underlying Funds and ETFs have varied expense levels and the Fund may own different proportions of the Underlying Funds and ETFs at different times, the amount of expenses incurred indirectly by the Fund will vary.
Realized and unrealized gains and losses and net investment income, not including class specific expenses, are allocated daily to each class of shares based upon the relative proportion of net assets of each class. Differences in per share distributions, by class, are generally due to differences in class specific expenses.
Inflation-indexed bonds are adjusted for inflation through periodic increases or decreases in the security’s interest accruals, face amount, or principal redemption value, by amounts corresponding to the rate of inflation as measured by an index. Any increase or decrease in the face amount or principal redemption value will be included as inflation principal adjustments in the Statement of Operations.
e. Accounting Estimates
The preparation of financial statements in accordance with U.S. GAAP requires management to make estimates and assumptions that affect the reported amounts of assets and liabilities at the date of the financial statements and the amounts of income and expenses during the reporting period. Actual results could differ from those estimates.
f. Guarantees and Indemnifications
Under the Trust’s organizational documents, its officers and trustees are indemnified by the Trust against certain liabilities arising out of the performance of their duties to the Trust. Additionally, in the normal course of business, the Trust, on behalf of the Fund, enters into contracts with service providers that contain general indemnification clauses. The Trust’s maximum exposure under these arrangements is unknown as this would involve future claims that may be made against the Trust that have not yet occurred. Currently, the Trust expects the risk of loss to be remote.
2. Shares of Beneficial Interest
At November 30, 2015, there were an unlimited number of shares authorized (without par value). Transactions in the Fund’s shares were as follows:
| | | | | | | | | | |
| | Six Months Ended | | Year Ended | |
| | November 30, 2015a | | May 31, 2015 | |
| | Shares | | | Amount | | Shares | | | Amount | |
| Class A Shares: | | | | | | | | | | |
| Shares sold | 51,794 | | $ | 498,279 | | 261,496 | | $ | 2,749,582 | |
| Shares issued in reinvestment of distributions | — | | | — | | 45,027 | | | 442,164 | |
| Shares redeemed | (193,830 | ) | | (1,843,106 | ) | (854,289 | ) | | (8,616,313 | ) |
| Netincrease(decrease) | (142,036 | ) | $ | (1,344,827 | ) | (547,766 | ) | $ | (5,424,567 | ) |
| Class C Shares: | | | | | | | | | | |
| Shares sold | 20,042 | | $ | 189,513 | | 85,542 | | $ | 875,179 | |
| Shares issued in reinvestment of distributions | — | | | — | | 16,521 | | | 160,752 | |
| Shares redeemed | (115,275 | ) | | (1,087,828 | ) | (205,755 | ) | | (2,034,026 | ) |
| Netincrease(decrease) | (95,233 | ) | $ | (898,315 | ) | (103,692 | ) | $ | (998,095 | ) |
| Class R Shares: | | | | | | | | | | |
| Shares issued in reinvestment of distributions | — | | $ | — | | 76 | | $ | 749 | |
franklintempleton.com
Semiannual Report 23
FRANKLIN FUND ALLOCATOR SERIES
NOTES TO FINANCIAL STATEMENTS (UNAUDITED)
| | | | | | | | | | |
| Franklin Multi-Asset Real Return Fund (continued) | | | | | | | | | | |
| |
| 2. Shares of Beneficial Interest (continued) | | | | | | | | | | |
| |
| | Six Months Ended | | Year Ended | |
| | November 30, 2015a | | May 31, 2015 | |
| | Shares | | | Amount | | Shares | | | Amount | |
| Advisor Class Shares: | | | | | | | | | | |
| Shares sold | 5,879 | | $ | 57,352 | | 39,236 | | $ | 405,829 | |
| Shares issued in reinvestment of distributions | — | | | — | | 6,585 | | | 64,667 | |
| Shares redeemed | (52,953 | ) | | (503,670 | ) | (16,059 | ) | | (163,763 | ) |
| Netincrease(decrease) | (47,074 | ) | $ | (446,318 | ) | 29,762 | | $ | 306,733 | |
| |
| a During the period, Class R did not report any share transactions. | | | | | | | | | | |
3. Transactions with Affiliates
Franklin Resources, Inc. is the holding company for various subsidiaries that together are referred to as Franklin Templeton Investments. Certain officers and trustees of the Trust are also officers and/or directors/trustees of certain of the Underlying Funds and of the following subsidiaries:
| |
| Subsidiary | Affiliation |
| Franklin Advisers, Inc. (Advisers) | Investment manager |
| Franklin Templeton Institutional, LLC (FT Institutional) | Investment manager |
| Franklin Templeton Services, LLC (FT Services) | Administrative manager |
| Franklin Templeton Distributors, Inc. (Distributors) | Principal underwriter |
| Franklin Templeton Investor Services, LLC (Investor Services) | Transfer agent |
a. Management Fees
The Fund pays an investment management fee to Advisers of 0.35% per year of the average daily net assets of the Fund.
Under a subadvisory agreement, FT Institutional, an affiliate of Advisers, provides subadvisory services to the Fund. The subad-visory fee is paid by Advisers based on the Fund’s average daily net assets, and is not an additional expense of the Fund.
b. Administrative Fees
Under an agreement with Advisers, FT Services provides administrative services to the Fund. The fee is paid by Advisers based on the Fund’s average daily net assets, and is not an additional expense of the Fund.
c. Distribution Fees
The Board has adopted distribution plans for each share class, with the exception of Advisor Class shares, pursuant to Rule 12b-1 under the 1940 Act. Under the Fund’s Class A reimbursement distribution plan, the Fund reimburses Distributors for costs incurred in connection with the servicing, sale and distribution of the Fund’s shares up to the maximum annual plan rate. Under the Class A reimbursement distribution plan, costs exceeding the maximum for the current plan year cannot be reimbursed in subsequent periods. In addition, under the Fund’s Class C and R compensation distribution plans, the Fund pays Distributors for costs incurred in connection with the servicing, sale and distribution of the Fund’s shares up to the maximum annual plan rate for each class. The plan year, for purposes of monitoring compliance with the maximum annual plan rates, is February 1 through January 31.
24 Semiannual Report
franklintempleton.com
FRANKLIN FUND ALLOCATOR SERIES
NOTES TO FINANCIAL STATEMENTS (UNAUDITED)
Franklin Multi-Asset Real Return Fund (continued)
The maximum annual plan rates, based on the average daily net assets, for each class, are as follows:
| | |
| ClassA | 0.30 | % |
| ClassC | 1.00 | % |
| ClassR | 0.50 | % |
Effective August 1, 2015, the Board has set the current rate at 0.25% per year for Class A shares until further notice and approval by the Board.
d. Sales Charges/Underwriting Agreements
Front-end sales charges and contingent deferred sales charges (CDSC) do not represent expenses of the Fund. These charges are deducted from the proceeds of sales of Fund shares prior to investment or from redemption proceeds prior to remittance, as applicable. Distributors has advised the Fund of the following commission transactions related to the sales and redemptions of the Fund’s shares for the period:
| | |
| Sales charges retained net of comissions paid to unaffiliated | | |
| brokers/dealers | $ | 990 |
| CDSC retained | $ | 861 |
e. Transfer Agent Fees
Each class of shares pays transfer agent fees to Investor Services for its performance of shareholder servicing obligations and reimburses Investor Services for out of pocket expenses incurred, including shareholding servicing fees paid to third parties. These fees are allocated daily based upon their relative proportion of such classes’ aggregate net assets.
For the period ended November 30, 2015, the Fund paid transfer agent fees of $9,263, of which $5,552 was retained by Investor Services.
f. Investments in Underlying Funds
The Fund invests primarily in the Underlying Funds which are managed by Advisers or an affiliate of Advisers. The Fund does not invest in the Underlying Funds for the purpose of exercising a controlling influence over the management or policies. Management fees paid by the Fund are waived on assets invested in Institutional Fiduciary Trust Money Market Portfolio (Sweep Money Fund), as noted in the Statement of Operations, in an amount not to exceed the management and administrative fees paid directly or indirectly by the Sweep Money Fund. Prior to June 1, 2013, the waiver was accounted for as a reduction to management fees.
Investments in Underlying Funds for the period ended November 30, 2015, were as follows:
| | | | | | | | | | | | | | |
| | | | | | | | | | | | | | % of | |
| | | | | | | | | | | | | | Underlying | |
| | Number of | | | | Number of | | | | | | | | Fund Shares | |
| | Shares Held | | | | Shares | | Value | | | | | | Outstanding | |
| | at Beginning | Gross | Gross | | Held at End | | at End | | Investment | | Realized | | Held at End | |
| Underlying Funds | of Period | Additions | Reductions | | of Period | | of Period | | Income | | Gain (Loss) | | of Period | |
| Franklin Emerging Market Debt Opportunities | | | | | | | | | | | | | | |
| Fund | 6,975 | — | (6,975 | ) | — | $ | —a | $ | — | $ | (477 | ) | — | |
| Franklin Focused Core Equity Fund, Class R6 | 30,576 | — | (15,694 | ) | 14,882 | | 219,654 | | — | | (1,786 | ) | 0.10 | % |
| Franklin Global Real Estate Fund, Class R6 | 37,757 | 106 | (17,008 | ) | 20,855 | | 182,690 | | 880 | | 17,874 | | 0.11 | % |
| Franklin Gold and Precious Metals Fund, | | | | | | | | | | | | | | |
| ClassR6 | 9,929 | 1,280 | (1,652 | ) | 9,557 | | 111,630 | | — | | (17,374 | ) | 0.02 | % |
| Franklin Growth Fund, Class R6 | 7,242 | — | (5,365 | ) | 1,877 | | 146,608 | | — | | 28,758 | | 0.00 | %c |
| Franklin Growth Opportunities Fund, Class R6 | 3,112 | — | — | | 3,112 | | 110,976 | | — | | — | | 0.01 | % |
| Franklin High Income Fund, Class R6 | 179,606 | 145,118 | (96,206 | ) | 228,518 | | 397,621 | | 10,713 | | (19,723 | ) | 0.01 | % |
| Franklin India Growth Fund, Class R6 | 28,519 | — | (13,207 | ) | 15,312 | | 186,192 | | — | | (15,064 | ) | 0.15 | % |
franklintempleton.com
Semiannual Report 25
FRANKLIN FUND ALLOCATOR SERIES
NOTES TO FINANCIAL STATEMENTS (UNAUDITED)
Franklin Multi-Asset Real Return Fund (continued)
| 3. | Transactions with Affiliates (continued) |
| f. | Investments in Underlying Funds (continued) |
| | | | | | | | | | | | | | |
| | | | | | | | | | | | | | % of | |
| | | | | | | | | | | | | | Underlying | |
| | Number of | | | | Number of | | | | | | | | Fund Shares | |
| | Shares Held | | | | Shares | | Value | | | | | | Outstanding | |
| | at Beginning | Gross | Gross | | Held at End | | at End | | Investment | | Realized | | Held at End | |
| Underlying Funds | of Period | Additions | Reductions | | of Period | | of Period | | Income | | Gain (Loss) | | of Period | |
| Franklin K2 Alternative Strategies Fund, | | | | | | | | | | | | | | |
| ClassR6 | 108,367 | — | — | | 108,367 | $ | 1,186,617 | $ | — | $ | — | | 0.10 | % |
| Franklin Low Duration Total Return Fund, | | | | | | | | | | | | | | |
| ClassR6 | 53,418 | 382 | (30,151 | ) | 23,649 | | 234,361 | | 3,803 | | (6,209 | ) | 0.01 | % |
| Franklin Mutual European Fund, Class R6. | 22,354 | 1,940 | — | | 24,294 | | 515,753 | | 976 | | 11,261 | b | 0.02 | % |
| Franklin Mutual International Fund, Class R6 | 12,952 | 5,043 | — | | 17,995 | | 262,734 | | — | | 3,594 | b | 0.14 | % |
| Franklin Natural Resources Fund, Class R6 | 12,317 | 1,836 | — | | 14,153 | | 352,126 | | — | | — | | 0.06 | % |
| Franklin Pelagos Commodities Strategy Fund, | | | | | | | | | | | | | | |
| ClassR6 | 228,663 | 30,303 | (3,567 | ) | 255,399 | | 1,514,519 | | — | | (9,807 | ) | 1.27 | % |
| Franklin Strategic Income Fund, Class R6 | 103,820 | 9,560 | (70,992 | ) | 42,388 | | 396,325 | | 19,107 | | (72,453 | ) | 0.00 | %c |
| Franklin U.S. Government Securities Fund, | | | | | | | | | | | | | | |
| ClassR6 | 184,461 | 7,092 | (42,969 | ) | 148,584 | | 949,453 | | 20,643 | | (15,817 | ) | 0.02 | % |
| Franklin Utilities Fund, Class R6 | 13,345 | 168 | (5,859 | ) | 7,654 | | 123,227 | | 2,739 | | 17,808 | | 0.00 | %c |
| Institutional Fiduciary Trust Money Market | | | | | | | | | | | | | | |
| Portfolio | 686,375 | 2,550,667 | (3,018,457 | ) | 218,585 | | 218,585 | | — | | — | | 0.00 | %c |
| Templeton China World Fund, Class R6 | 3,222 | — | (3,222 | ) | — | | —a | | — | | 2,018 | | — | |
| Templeton Foreign Fund, Class R6 | 20,847 | — | (20,847 | ) | — | | —a | | — | | 14,278 | | — | |
| Templeton Global Total Return Fund, Class R6 | 93,758 | 1,631 | (23,441 | ) | 71,948 | | 853,301 | | 19,402 | | (39,820 | ) | 0.01 | % |
| Total | | | | | | $ | 7,962,372 | $ | 78,263 | $ | (102,939 | ) | | |
aAs of November 30, 2015, no longer held by the fund.
bIncludes realized gain distributions received.
cRounds to less than 0.01%.
g. Waiver and Expense Reimbursements
Advisers has contractually agreed in advance to waive or limit its fees and to assume as its own expense certain expenses otherwise payable by the Fund so that the expenses (excluding distribution fees, and acquired fund fees and expenses) for each class of the Fund do not exceed 0.45%, based on the average net assets of each class (other than certain non-routine expenses or costs, including those relating to litigation, indemnification, reorganizations, and liquidations) until September 30, 2016.
4. Expense Offset Arrangement
The Fund has entered into an arrangement with its custodian whereby credits realized as a result of uninvested cash balances are used to reduce a portion of the Fund’s custodian expenses. During the period ended November 30, 2015, there were no credits earned.
5. Income Taxes
For tax purposes, the Fund may elect to defer any portion of a post-October capital loss to the first day of the following fiscal year.
At May 31, 2015, the Fund deferred post-October capital losses of $261,100.
26 Semiannual Report
franklintempleton.com
FRANKLIN FUND ALLOCATOR SERIES
NOTES TO FINANCIAL STATEMENTS (UNAUDITED)
Franklin Multi-Asset Real Return Fund (continued)
At November 30, 2015, the cost of investments and net unrealized appreciation (depreciation) for income tax purposes were as follows:
| | | |
| Cost of investments | $ | 12,141,922 | |
| |
| Unrealizedappreciation | $ | 179,813 | |
| Unrealized depreciation | | (1,466,631 | ) |
| Net unrealized appreciation (depreciation) | $ | (1,286,818 | ) |
Differences between income and/or capital gains as determined on a book basis and a tax basis are primarily due to differing treatments of short term capital gains distributions from Underlying Funds and ETFs and wash sales.
6. Investment Transactions
Purchases and sales of investments (excluding short term securities) for the period ended November 30, 2015, aggregated $1,679,066 and $3,766,548, respectively.
7. Upcoming Liquidation
On September 17, 2015, the Board approved a proposal to liquidate the Fund. The Fund is scheduled to liquidate on or about March 1, 2016.
8. Credit Facility
The Fund, together with other U.S. registered and foreign investment funds (collectively, Borrowers), managed by Franklin Templeton Investments, are borrowers in a joint syndicated senior unsecured credit facility totaling $2 billion (Global Credit Facility) which matures on February 12, 2016. This Global Credit Facility provides a source of funds to the Borrowers for temporary and emergency purposes, including the ability to meet future unanticipated or unusually large redemption requests.
Under the terms of the Global Credit Facility, the Fund shall, in addition to interest charged on any borrowings made by the Fund and other costs incurred by the Fund, pay its share of fees and expenses incurred in connection with the implementation and maintenance of the Global Credit Facility, based upon its relative share of the aggregate net assets of all of the Borrowers, including an annual commitment fee of 0.07% based upon the unused portion of the Global Credit Facility. These fees are reflected in other expenses in the Statement of Operations. During the period ended November 30, 2015, the Fund did not use the Global Credit Facility.
9. Fair Value Measurements
The Fund follows a fair value hierarchy that distinguishes between market data obtained from independent sources (observable inputs) and the Fund’s own market assumptions (unobservable inputs). These inputs are used in determining the value of the Fund’s financial instruments and are summarized in the following fair value hierarchy:
- Level 1 – quoted prices in active markets for identical financial instruments
- Level 2 – other significant observable inputs (including quoted prices for similar financial instruments, interest rates, pre- payment speed, credit risk, etc.)
franklintempleton.com
Semiannual Report 27
FRANKLIN FUND ALLOCATOR SERIES
NOTES TO FINANCIAL STATEMENTS (UNAUDITED)
Franklin Multi-Asset Real Return Fund (continued)
| 9. | Fair Value Measurements (continued) |
| | | Level 3 – significant unobservable inputs (including the Fund’s own assumptions in determining the fair value of financial instruments) |
The input levels are not necessarily an indication of the risk or liquidity associated with financial instruments at that level.
For movements between the levels within the fair value hierarchy, the Fund has adopted a policy of recognizing the transfers as of the date of the underlying event which caused the movement.
A summary of inputs used as of November 30, 2015, in valuing the Fund’s assets carried at fair value, is as follows:
| | | | | | | | |
| | | Level 1 | | Level 2 | | Level 3 | | Total |
| Assets: | | | | | | | | |
| Investments in Securities: | | | | | | | | |
| Investments in Underlying Funds and Exchange | | | | | | | | |
| Traded Fundsa | $ | 8,295,237 | $ | — | $ | — | $ | 8,295,237 |
| Foreign Government and Agency Securities | | — | | 72,727 | | — | | 72,727 |
| U.S. Government and Agency Securities. | | — | | 2,268,555 | | — | | 2,268,555 |
| Short Term Investments | | 218,585 | | — | | — | | 218,585 |
| Total Investments in Securities | $ | 8,513,822 | $ | 2,341,282 | $ | — | $ | 10,855,104 |
| |
| a For detailed Underlying Fund and ETF categories, see the accompanying Statement of Investments. | | | | | | |
10. Subsequent Events
The Fund has evaluated subsequent events through the issuance of the financial statements and determined that no events have occurred that require disclosure other than those already disclosed in the financial statements.
| |
| Abbreviations | |
| Currency | Selected Portfolio |
| MXN Mexican Peso | ETF Exchange-Traded Fund |
28 Semiannual Report
franklintempleton.com
FRANKLIN FUND ALLOCATOR SERIES
FRANKLIN MULTI-ASSET REAL RETURN FUND
Shareholder Information
Proxy Voting Policies and Procedures
The Fund’s investment manager has established Proxy Voting Policies and Procedures (Policies) that the Fund uses to determine how to vote proxies relating to portfolio securities. Shareholders may view the Fund’s complete Policies online at franklintempleton.com. Alternatively, shareholders may request copies of the Policies free of charge by calling the Proxy Group collect at (954) 527-7678 or by sending a written request to: Franklin Templeton Companies, LLC, 300 S.E. 2nd Street, Fort Lauderdale, FL 33301, Attention: Proxy Group. Copies of the Fund’s proxy voting records are also made available online at franklintempleton.com and posted on the U.S. Securities and Exchange Commission’s website at sec.gov and reflect the most recent 12-month period ended June 30.
Quarterly Statement of Investments
The Fund files a complete statement of investments with the U.S. Securities and Exchange Commission for the first and third quarters for each fiscal year on Form N-Q. Shareholders may view the filed Form N-Q by visiting the Commission’s website at sec.gov. The filed form may also be viewed and copied at the Commission’s Public Reference Room in Wash-ington, DC. Information regarding the operations of the Public Reference Room may be obtained by calling (800) SEC-0330.
franklintempleton.com
Semiannual Report 29
This page intentionally left blank.
This page intentionally left blank.
This page intentionally left blank.
Franklin Templeton Investments
| |
| Contents | |
| Semiannual Report | |
| Economic and Market Overview | 2 |
| Franklin Payout 2017 Fund | 3 |
| Franklin Payout 2018 Fund | 8 |
| Franklin Payout 2019 Fund | 13 |
| Franklin Payout 2020 Fund | 18 |
| Franklin Payout 2021 Fund | 23 |
| Financial Highlights and Statements of Investments | 28 |
| Financial Statements | 49 |
| Notes to Financial Statements | 55 |
| Shareholder Information | 63 |
Semiannual Report
Economic and Market Overview
U.S. economic growth improved during the six months under review amid healthy consumer spending. The economy strengthened in the second quarter of 2015 but moderated in the third quarter as businesses cut back on inventories, exports slowed, and state and local governments reduced their spending. Manufacturing activities expanded for most of the period but contracted toward period-end. Non-manufacturing activities, however, increased throughout the six-month period, contributing to new jobs and helping drive down the unemployment rate to 5.0% at period-end, the lowest level in more than seven years.1 Home prices rose as new and existing home sales slowed and mortgage rates remained low. Retail sales grew modestly, driven by automobile and auto component sales. Inflation remained subdued, but after two consecutive declines, monthly inflation, as measured by the Consumer Price Index, rose modestly in October and held steady through November.
During the six-month period, the Federal Reserve (Fed) kept its target interest rate at 0%–0.25% while considering when an increase might be appropriate. Although global financial markets anticipated an increase, the Fed kept interest rates unchanged and said it expected moderate economic expansion, but it would monitor developments domestically and abroad. The Fed’s October meeting minutes indicated that most members acknowledged the possibility of an interest rate increase at their next meeting.
The 10-year Treasury yield, which moves inversely to price, shifted throughout the period. It began at 2.12% in May and rose to a period high of 2.50% in June based partly on upbeat domestic and eurozone economic data as well as Greece’s agreement with its international creditors. However, the yield declined to a period low of 1.99% in early October and ended the period higher at 2.21% as investors sought less risky assets due to the Fed’s possible interest rate increase at its December policy meeting as well as weak Chinese data.
The foregoing information reflects our analysis and opinions as of November 30, 2015. The information is not a complete analysis of every aspect of any market, country, industry, security or fund. Statements of fact are from sources considered reliable.
1. Source: Bureau of Labor Statistics.
|
2 Semiannual Report
Franklin Payout 2017 Fund
We are pleased to bring you this inaugural semiannual report for Franklin Payout 2017 Fund for the period since the Fund’s inception on June 1, 2015, through November 30, 2015.
Your Fund’s Goal and Main Investments
The Fund seeks capital preservation and income with a predetermined maturity date. Under normal market conditions, the Fund invests predominantly in U.S. investment-grade debt securities and investments, including government and corporate debt securities and asset-backed securities and municipal securities.
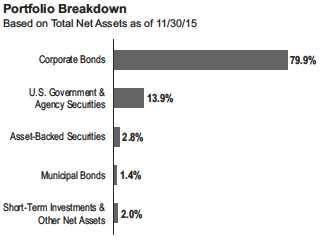
Performance Overview
The Fund’s Advisor Class shares delivered a +0.20% cumulative total return for the period ended November 30, 2015. In comparison, the Fund’s benchmark, the Barclays U.S. Government/Credit 2017 Maturity Index, returned +0.02%.1 The index includes investment-grade, U.S. dollar-denominated, fixed-rate Treasuries, government-related and corporate securities and foreign debt maturing in 2017. You can find more of the Fund’s performance data in the Performance Summary beginning on page 5.
Performance data represent past performance, which does not guarantee future results. Investment return and principal value will fluctuate, and you may have a gain or loss when you sell your shares. Current performance may differ from figures shown. Please call (800) 321-8563 for most recent month-end performance.
Investment Strategy
We focus on investment-grade securities and investments or on unrated securities and investments we determine are of comparable quality. Our focus on the portfolio’s credit quality is intended to reduce credit risk and help to preserve capital. We may invest a portion of the Fund’s assets in U.S. dollar-denominated foreign securities, including debt issued by supranational entities. In choosing investments, we select securities in various market sectors based on our assessment of changing economic, market, industry and issuer conditions. We use a top-down analysis of broad economic trends, combined with a bottom-up fundamental analysis of market sectors, industries and issuers, to try to take advantage of varying sector reactions to economic events.
Although the Fund may invest in individual securities of any maturity, the Fund is a term fund and is managed to mature in 2017. Over time, the Fund’s duration and weighted average maturity will decline as 2017 approaches. In the later months of operation, when the debt securities held by the Fund mature, the proceeds from such securities will be held in cash, cash equivalents and money market instruments, including affiliated money market funds, or invested in short-term bonds. In early December 2017, the Fund is expected to consist almost entirely of cash, cash equivalents and money market instruments. The Fund is designed for investors who seek an investment with a payout schedule to help meet their retirement spending needs, particularly those who are nearing retirement or are in retirement. There is no guarantee the Fund will meet an investor’s retirement spending needs.
What is duration?
Duration is a measure of a bond’s price sensitivity to interest rate changes. In general, a portfolio of securities with a lower duration can be expected to be less sensitive to interest rate changes than a portfolio with a higher duration.
| | |
| Maturity | | |
| 11/30/15 | | |
| | % of Total Net Assets | |
| 0 to 1 Year | 1.1 | % |
| 1 to 2 Years | 45.0 | % |
| 2 to 3 Years | 51.1 | % |
| 3 to 5 Years | 2.8 | % |
1. Source: FactSet, Barclays.
The index is unmanaged and includes reinvestment of any income or distributions. One cannot invest directly in an index, and an index is not representative of the
Fund’s portfolio.
See www.franklintempletondatasources.com for additional data provider information.
The dollar value, number of shares or principal amount, and names of all portfolio holdings are listed in the Fund’s Statement of Investments (SOI).
The SOI begins on page 30.
|
Semiannual Report 3
| | |
| FRANKLIN PAYOUT 2017 FUND | | |
| |
| |
| Top 10 Holdings* | | |
| 11/30/15 | | |
| | % of Total | |
| Issue/Issuer | Net Assets | |
| Federal Home Loan Bank (FHLB) | 8.9 | % |
| Federal National Mortgage Association (FNMA) | 5.0 | % |
| The Bear Stearns Cos. LLC | 3.1 | % |
| Morgan Stanley | 3.1 | % |
| Wells Fargo & Co. | 3.1 | % |
| Bank of America Corp. | 3.1 | % |
| The Goldman Sachs Group Inc. | 3.1 | % |
| General Electric Co. | 3.1 | % |
| Citigroup Inc. | 3.1 | % |
| Pacific Gas & Electric Co. | 3.1 | % |
*Securities are listed by issuer, which may appear by another name in the SOI.
Manager’s Discussion
From a perspective of excess returns over U.S. Treasuries, many investment-grade corporate bonds underperformed for the reporting period. However, shorter duration and higher quality investment-grade sectors performed relatively well. U.S. agency securities generally produced positive excess returns over U.S. Treasuries, while asset-backed securities slightly underperformed. Over the period, yields on shorter maturity bonds rose.
During the period under review, security selection and an overweighting in the investment-grade corporate credit sector contributed to the Fund’s performance relative to the Barclays U.S. Government/Credit 2017 Maturity Index. The positive contribution of the Fund’s overweighted position in U.S. agency securities was offset by the negative effect of security selection within the sector. Relatively small allocations to taxable municipal bonds and to non-U.S. issuers helped performance. Over the period, the Fund’s modestly longer duration compared with the benchmark, resulting from slight maturity differences, detracted from performance as interest rates for shorter maturity bonds moved higher.
At period-end, we maintained an overweighting in the investment-grade corporate credit sector compared with the benchmark. We favored the sector based on our belief that its overall valuations will remain relatively attractive over the Fund’s expected life and that the sector offered relatively higher income potential. We also maintained an overweighted position in the agency sector due to our view of its incremental income advantage over U.S. Treasuries during the Fund’s expected life. Conversely, we remained underweighted in the U.S. Treasury sector due to the sector’s less attractive income opportunities.
Thank you for your participation in Franklin Payout 2017 Fund. We look forward to serving your future investment needs.

The foregoing information reflects our analysis, opinions and portfolio holdings as of November 30, 2015, the end of the reporting period. The way we implement our main investment strategies and the resulting portfolio holdings may change depending on factors such as market and economic conditions. These opinions may not be relied upon as investment advice or an offer for a particular security. The information is not a complete analysis of every aspect of any market, country, industry, security or the Fund. Statements of fact are from sources considered reliable, but the investment manager makes no representation or warranty as to their completeness or accuracy. Although historical performance is no guarantee of future results, these insights may help you understand our investment management philosophy.
CFA® is a trademark owned by CFA Institute.
FRANKLIN PAYOUT 2017 FUND
Performance Summary as of November 30, 2015
Your dividend income will vary depending on dividends or interest paid by securities in the Fund’s portfolio, adjusted for operating expenses of each class. Capital gain distributions are net profits realized from the sale of portfolio securities. The performance table does not reflect any taxes that a shareholder would pay on Fund dividends, capital gain distributions, if any, or any realized gains on the sale of Fund shares. Total return reflects reinvestment of the Fund’s dividends and capital gain distributions, if any, and any unrealized gains or losses.
| | | | | |
| Net Asset Value | | | | | |
| Share Class (Symbol) | | 11/30/15 | | 6/1/15 | Change |
| R6 (FPOKX) | $ | 10.02 | $ | 10.00 | +$0.02 |
| Advisor (FPOBX) | $ | 10.02 | $ | 10.00 | +$0.02 |
Performance1
Cumulative total return excludes sales charges. Average annual total returns include maximum sales charges.
Class R6/Advisor Class: no sales charges.
| | | | | | | | | | |
| | | | | | | | | | | |
| | | | | | Average Annual | | | |
| | Cumulative | | Average Annual | | Total Return | | Total Annual Operating Expenses5 | |
| Share Class | Total Return2 | | Total Return3 | | (12/31/15 | )4 | (with waiver) | | (without waiver) | |
| R6 | | | | | | | 0.30 | % | 1.11 | % |
| Since Inception (6/1/15) | +0.20 | % | +0.20 | % | -0.01 | % | | | | |
| Advisor | | | | | | | 0.44 | % | 1.25 | % |
| Since Inception (6/1/15) | +0.20 | % | +0.20 | % | -0.01 | % | | | | |
Performance data represent past performance, which does not guarantee future results. Investment return and principal value will fluctuate, and you may have a gain or loss when you sell your shares. Current performance may differ from figures shown. For most recent month-end performance, call a Franklin Templeton Institutional Services representative at (800) 321-8563.
See page 6 for Performance Summary footnotes.
|
Semiannual Report 5
|
| FRANKLIN PAYOUT 2017 FUND |
| PERFORMANCE SUMMARY |
All investments involve risks, including possible loss of principal. Changes in the financial strength of a bond issuer or in a bond’s credit rating may affect its value. Interest rate movements will affect the Fund’s share price and yield. Bond prices generally move in the opposite direction of interest rates. As the prices of bonds in the Fund adjust to a rise in interest rates, the Fund’s share price may decline. Because the Fund can only distribute what it earns, the Fund’s distributions to shareholders may decline when prevailing interest rates fall or when the Fund experiences defaults on debt securities it holds. Interest earned on floating rate loans varies with changes in prevailing interest rates. Therefore, while floating rate loans offer higher interest income when interest rates rise, they will also generate less income when interest rates decline. The Fund is actively managed but there is no guarantee that the manager’s investment decisions will achieve the desired results. The Fund’s prospectus also includes a description of the main investment risks.
| |
| Class R6: | Shares are available to certain eligible investors as described in the prospectus. |
| Advisor Class: | Shares are available to certain eligible investors as described in the prospectus. |
1. The Fund has an expense reduction contractually guaranteed through at least 9/30/16 and a fee waiver associated with any investment in a Franklin Templeton money
fund, contractually guaranteed through at least its current fiscal year-end. The transfer agent has contractually agreed to cap transfer agency fees for Class R6 shares of
the Fund so that transfer agency fees for that class do not exceed 0.01% until 9/30/16. Fund investment results reflect the expense reduction, fee waiver and fee cap,
to the extent applicable; without these reductions, the results would have been lower.
2. Cumulative total return represents the change in value of an investment over the period indicated.
3. Average annual total return represents the change in value of an investment over the period indicated. Return for less than one year, if any, has not been annualized.
4. In accordance with SEC rules, we provide standardized total return information through the latest calendar quarter. Return for less than one year, if any, has not been
annualized.
5. Figures are as stated in the Fund’s current prospectus. In periods of market volatility, assets may decline significantly, causing total annual Fund operating expenses to
become higher than the figures shown.
FRANKLIN PAYOUT 2017 FUND
Your Fund’s Expenses
As a Fund shareholder, you can incur two types of costs:
- Transaction costs, including sales charges (loads), if applicable, on Fund purchases; and
- Ongoing Fund costs, including management fees, distri- bution and service (12b-1) fees, and other Fund expenses.
All mutual funds have ongoing costs, sometimes referred to as operating expenses.
The following table shows ongoing costs of investing in the Fund and can help you understand these costs and compare them with those of other mutual funds. The table assumes a $1,000 investment held for the six months indicated.
Actual Fund Expenses
The first line (Actual) for each share class listed in the table provides actual account values and expenses. The “Ending Account Value” is derived from the Fund’s actual return, which includes the effect of Fund expenses.
You can estimate the expenses you paid during the period by following these steps. Of course, your account value and expenses will differ from those in this illustration:
| 1. | Divide your account value by $1,000. |
| | If an account had an $8,600 value, then $8,600 ÷ $1,000 = 8.6. |
| 2. | Multiply the result by the number under the heading “Expenses Paid During Period.” |
| | If Expenses Paid During Period were $7.50, then 8.6 x $7.50 = $64.50. |
In this illustration, the estimated expenses paid this period are $64.50.
Hypothetical Example for Comparison with Other Funds
Information in the second line (Hypothetical) for each class in the table can help you compare ongoing costs of investing in the Fund with those of other mutual funds. This information may not be used to estimate the actual ending account balance or expenses you paid during the period. The hypothetical “Ending Account Value” is based on the actual expense ratio for each class and an assumed 5% annual rate of return before expenses, which does not represent the Fund’s actual return. The figure under the heading “Expenses Paid During Period” shows the hypothetical expenses your account would have incurred under this scenario. You can compare this figure with the 5% hypothetical examples that appear in shareholder reports of other funds.
Please note that expenses shown in the table are meant to highlight ongoing costs and do not reflect any transaction costs, such as sales charges. Therefore, the second line for each class is useful in comparing ongoing costs only, and will not help you compare total costs of owning different funds. In addition, if transaction costs were included, your total costs would have been higher. Please refer to the Fund prospectus for additional information on operating expenses.
| | | | | | |
| | | Beginning Account | | Ending Account | | Expenses Paid During |
| Share Class | | Value 6/1/15 | | Value 11/30/15 | | Period* 6/1/15–11/30/15 |
| R6 | | | | | | |
| Actual | $ | 1,000 | $ | 1,002.00 | $ | 1.45 |
| Hypothetical (5% return before expenses) | $ | 1,000 | $ | 1,023.55 | $ | 1.47 |
| Advisor | | | | | | |
| Actual | $ | 1,000 | $ | 1,002.00 | $ | 1.45 |
| Hypothetical (5% return before expenses) | $ | 1,000 | $ | 1,023.55 | $ | 1.47 |
*Expenses are calculated using the most recent six-month expense ratio, net of expense waivers, annualized for each class (R6: 0.29% and
Advisor: 0.29%), multiplied by the average account value over the period, multiplied by 183/366 to reflect the one-half year period.
|
Semiannual Report 7
Franklin Payout 2018 Fund
We are pleased to bring you this inaugural semiannual report for Franklin Payout 2018 Fund for the period since the Fund’s inception on June 1, 2015, through November 30, 2015.
Your Fund’s Goal and Main Investments
The Fund seeks capital preservation and income with a predetermined maturity date. Under normal market conditions, the Fund invests predominantly in U.S. investment-grade debt securities and investments, including government and corporate debt securities and asset-backed securities and municipal securities.
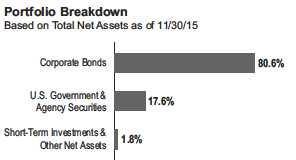
Performance Overview
The Fund’s Advisor Class shares delivered a +0.40% cumulative total return for the period ended November 30, 2015. In comparison, the Fund’s benchmark, the Barclays U.S. Government/Credit 2018 Maturity Index, returned +0.12%.1 The index includes investment-grade, U.S. dollar-denominated, fixed-rate Treasuries, government-related and corporate securities and foreign debt maturing in 2018. You can find more of the Fund’s performance data in the Performance Summary beginning on page 10.
Performance data represent past performance, which does not guarantee future results. Investment return and principal value will fluctuate, and you may have a gain or loss when you sell your shares. Current performance may differ from figures shown. Please call (800) 321-8563 for most recent month-end performance.
Investment Strategy
We focus on investment-grade securities and investments or on unrated securities and investments we determine are of comparable quality. Our focus on the portfolio’s credit quality is intended to reduce credit risk and help to preserve capital. We may invest a portion of the Fund’s assets in U.S. dollar-denominated foreign securities, including debt issued by supranational entities. In choosing investments, we select securities in various market sectors based on our assessment of changing economic, market, industry and issuer conditions. We use a top-down analysis of broad economic trends, combined with a bottom-up fundamental analysis of market sectors, industries and issuers, to try to take advantage of varying sector reactions to economic events.
Although the Fund may invest in individual securities of any maturity, the Fund is a term fund and is managed to mature in 2018. Over time, the Fund’s duration and weighted average maturity will decline as 2018 approaches. In the later months of operation, when the debt securities held by the Fund mature, the proceeds from such securities will be held in cash, cash equivalents and money market instruments, including affiliated money market funds, or invested in short-term bonds. In early December 2018, the Fund is expected to consist almost entirely of cash, cash equivalents and money market instruments. The Fund is designed for investors who seek an investment with a payout schedule to help meet their retirement spending needs, particularly those who are nearing retirement or are in retirement. There is no guarantee the Fund will meet an investor’s retirement spending needs.
What is duration?
Duration is a measure of a bond’s price sensitivity to interest rate changes. In general, a portfolio of securities with a lower duration can be expected to be less sensitive to interest rate changes than a portfolio with a higher duration.
| | |
| Maturity | | |
| 11/30/15 | | |
| | % of Total Net Assets | |
| 0 to 1 Year | 1.1 | % |
| 2 to 3 Years | 60.4 | % |
| 3 to 5 Years | 38.5 | % |
1. Source: FactSet, Barclays.
The index is unmanaged and includes reinvestment of any income or distributions. One cannot invest directly in an index, and an index is not representative of the Fund’s
portfolio.
See www.franklintempletondatasources.com for additional data provider information.
The dollar value, number of shares or principal amount, and names of all portfolio holdings are listed in the Fund’s Statement of Investments (SOI).
The SOI begins on page 34.
|
8 Semiannual Report
FRANKLIN PAYOUT 2018 FUND
| | |
| Top 10 Holdings* | | |
| 11/30/15 | | |
| | % of Total | |
| Issue/Issuer | Net Assets | |
| U.S. Treasury Note | 8.7 | % |
| Federal National Mortgage Association (FNMA) | 5.0 | % |
| Federal Home Loan Bank (FHLB) | 3.8 | % |
| Caterpillar Inc. | 3.3 | % |
| PepsiCo Inc. | 3.3 | % |
| Pacific Gas & Electric Co. | 3.3 | % |
| Duke Energy Carolinas LLC | 3.3 | % |
| Raytheon Co. | 3.2 | % |
| Bank of America Corp. | 3.2 | % |
| HSBC USA Inc. | 2.9 | % |
*Securities are listed by issuer, which may appear by another name in the SOI.
Manager’s Discussion
From a perspective of excess returns over U.S. Treasuries, many investment-grade corporate bonds underperformed for the reporting period. However, shorter duration and higher quality investment-grade sectors performed relatively well. U.S. agency securities generally produced positive excess returns over U.S. Treasuries, while asset-backed securities slightly underperformed. Over the period, yields on shorter maturity bonds rose.
During the period under review, security selection and an overweighting in the investment-grade corporate credit sector contributed to the Fund’s performance relative to the Barclays U.S. Government/Credit 2018 Maturity Index. The positive contribution of the Fund’s overweighted position in U.S. agency securities was offset by the negative effect of security selection within the sector. A relatively small allocation to non-U.S. issuers helped performance. Over the period, the Fund’s modestly longer duration compared with the benchmark, resulting from slight maturity differences, detracted from performance as interest rates for shorter maturity bonds moved higher.
At period-end, we maintained an overweighting in the investment-grade corporate credit sector compared with the benchmark. We favored the sector based on our belief that its overall valuations will remain relatively attractive over the Fund’s expected life and that the sector offered relatively higher income potential. We also maintained an overweighted position in the agency sector due to our view of its incremental income advantage over U.S. Treasuries during the Fund’s expected life. Conversely, we remained underweighted in the U.S. Treasury sector due to the sector’s less attractive income opportunities.
Thank you for your participation in Franklin Payout 2018 Fund. We look forward to serving your future investment needs.

The foregoing information reflects our analysis, opinions and portfolio holdings as of November 30, 2015, the end of the reporting period. The way we implement our main investment strategies and the resulting portfolio holdings may change depending on factors such as market and economic conditions. These opinions may not be relied upon as investment advice or an offer for a particular security. The information is not a complete analysis of every aspect of any market, country, industry, security or the Fund. Statements of fact are from sources considered reliable, but the investment manager makes no representation or warranty as to their completeness or accuracy. Although historical performance is no guarantee of future results, these insights may help you understand our investment management philosophy.
|
Semiannual Report 9
FRANKLIN PAYOUT 2018 FUND
Performance Summary as of November 30, 2015
Your dividend income will vary depending on dividends or interest paid by securities in the Fund’s portfolio, adjusted for operating expenses of each class. Capital gain distributions are net profits realized from the sale of portfolio securities. The performance table does not reflect any taxes that a shareholder would pay on Fund dividends, capital gain distributions, if any, or any realized gains on the sale of Fund shares. Total return reflects reinvestment of the Fund’s dividends and capital gain distributions, if any, and any unrealized gains or losses.
| | | | | |
| Net Asset Value | | | | | |
| Share Class (Symbol) | | 11/30/15 | | 6/1/15 | Change |
| R6 (FPOLX) | $ | 10.04 | $ | 10.00 | +$0.04 |
| Advisor (FPODX) | $ | 10.04 | $ | 10.00 | +$0.04 |
Performance1
Cumulative total return excludes sales charges. Average annual total returns include maximum sales charges.
Class R6/Advisor Class: no sales charges.
| | | | | | | | | | |
| | | | | | | | | | | |
| | | | | | Average Annual | | | |
| | Cumulative | | Average Annual | | Total Return | | Total Annual Operating Expenses5 | |
| Share Class | Total Return2 | | Total Return3 | | (12/31/15 | )4 | (with waiver) | | (without waiver) | |
| R6 | | | | | | | 0.30 | % | 1.11 | % |
| Since Inception (6/1/15) | +0.40 | % | +0.40 | % | +0.06 | % | | | | |
| Advisor | | | | | | | 0.44 | % | 1.25 | % |
| Since Inception (6/1/15) | +0.40 | % | +0.40 | % | +0.06 | % | | | | |
Performance data represent past performance, which does not guarantee future results. Investment return and principal value will fluctuate, and you may have a gain or loss when you sell your shares. Current performance may differ from figures shown. For most recent month-end performance, call a Franklin Templeton Institutional Services representative at (800) 321-8563.
See page 11 for Performance Summary footnotes.
|
10 Semiannual Report
|
| FRANKLIN PAYOUT 2018 FUND |
| PERFORMANCE SUMMARY |
All investments involve risks, including possible loss of principal. Changes in the financial strength of a bond issuer or in a bond’s credit rating may affect its value. Interest rate movements will affect the Fund’s share price and yield. Bond prices generally move in the opposite direction of interest rates. As the prices of bonds in the Fund adjust to a rise in interest rates, the Fund’s share price may decline. Because the Fund can only distribute what it earns, the Fund’s distributions to shareholders may decline when prevailing interest rates fall or when the Fund experiences defaults on debt securities it holds. Interest earned on floating rate loans varies with changes in prevailing interest rates. Therefore, while floating rate loans offer higher interest income when interest rates rise, they will also generate less income when interest rates decline. The Fund is actively managed but there is no guarantee that the manager’s investment decisions will achieve the desired results. The Fund’s prospectus also includes a description of the main investment risks.
| |
| Class R6: | Shares are available to certain eligible investors as described in the prospectus. |
| Advisor Class: | Shares are available to certain eligible investors as described in the prospectus. |
1. The Fund has an expense reduction contractually guaranteed through at least 9/30/16 and a fee waiver associated with any investment in a Franklin Templeton money
fund, contractually guaranteed through at least its current fiscal year-end. The transfer agent has contractually agreed to cap transfer agency fees for Class R6 shares of
the Fund so that transfer agency fees for that class do not exceed 0.01% until 9/30/16. Fund investment results reflect the expense reduction, fee waiver and fee cap, to
the extent applicable; without these reductions, the results would have been lower.
2. Cumulative total return represents the change in value of an investment over the period indicated.
3. Average annual total return represents the change in value of an investment over the period indicated. Return for less than one year, if any, has not been annualized.
4. In accordance with SEC rules, we provide standardized total return information through the latest calendar quarter. Return for less than one year, if any, has not been
annualized.
5. Figures are as stated in the Fund’s current prospectus. In periods of market volatility, assets may decline significantly, causing total annual Fund operating expenses to
become higher than the figures shown.
|
Semiannual Report 11
FRANKLIN PAYOUT 2018 FUND
Your Fund’s Expenses
As a Fund shareholder, you can incur two types of costs:
- Transaction costs, including sales charges (loads), if applicable, on Fund purchases; and
- Ongoing Fund costs, including management fees, distri- bution and service (12b-1) fees, and other Fund expenses.
All mutual funds have ongoing costs, sometimes referred to as operating expenses.
The following table shows ongoing costs of investing in the Fund and can help you understand these costs and compare them with those of other mutual funds. The table assumes a $1,000 investment held for the six months indicated.
Actual Fund Expenses
The first line (Actual) for each share class listed in the table provides actual account values and expenses. The “Ending Account Value” is derived from the Fund’s actual return, which includes the effect of Fund expenses.
You can estimate the expenses you paid during the period by following these steps. Of course, your account value and expenses will differ from those in this illustration:
| 1. | Divide your account value by $1,000. |
| | If an account had an $8,600 value, then $8,600 ÷ $1,000 = 8.6. |
| 2. | Multiply the result by the number under the heading “Expenses Paid During Period.” |
| | If Expenses Paid During Period were $7.50, then 8.6 x $7.50 = $64.50. |
In this illustration, the estimated expenses paid this period are $64.50.
Hypothetical Example for Comparison with Other Funds
Information in the second line (Hypothetical) for each class in the table can help you compare ongoing costs of investing in the Fund with those of other mutual funds. This information may not be used to estimate the actual ending account balance or expenses you paid during the period. The hypothetical “Ending Account Value” is based on the actual expense ratio for each class and an assumed 5% annual rate of return before expenses, which does not represent the Fund’s actual return. The figure under the heading “Expenses Paid During Period” shows the hypothetical expenses your account would have incurred under this scenario. You can compare this figure with the 5% hypothetical examples that appear in shareholder reports of other funds.
Please note that expenses shown in the table are meant to highlight ongoing costs and do not reflect any transaction costs, such as sales charges. Therefore, the second line for each class is useful in comparing ongoing costs only, and will not help you compare total costs of owning different funds. In addition, if transaction costs were included, your total costs would have been higher. Please refer to the Fund prospectus for additional information on operating expenses.
| | | | | | |
| | | Beginning Account | | Ending Account | | Expenses Paid During |
| Share Class | | Value 6/1/15 | | Value 11/30/15 | | Period* 6/1/15–11/30/15 |
| R6 | | | | | | |
| Actual | $ | 1,000 | $ | 1,004.00 | $ | 1.45 |
| Hypothetical (5% return before expenses) | $ | 1,000 | $ | 1,023.55 | $ | 1.47 |
| Advisor | | | | | | |
| Actual | $ | 1,000 | $ | 1,004.00 | $ | 1.45 |
| Hypothetical (5% return before expenses) | $ | 1,000 | $ | 1,023.55 | $ | 1.47 |
*Expenses are calculated using the most recent six-month expense ratio, net of expense waivers, annualized for each class (R6: 0.29% and
Advisor: 0.29%), multiplied by the average account value over the period, multiplied by 183/366 to reflect the one-half year period.
|
12 Semiannual Report
Franklin Payout 2019 Fund
We are pleased to bring you this inaugural semiannual report for Franklin Payout 2019 Fund for the period since the Fund’s inception on June 1, 2015, through November 30, 2015.
Your Fund’s Goal and Main Investments
The Fund seeks capital preservation and income with a predetermined maturity date. Under normal market conditions, the Fund invests predominantly in U.S. investment-grade debt securities and investments, including government and corporate debt securities and asset-backed securities and municipal securities.
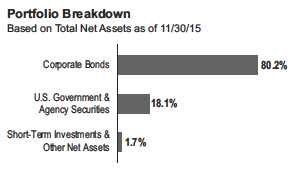
Performance Overview
The Fund’s Advisor Class shares delivered a +0.60% cumulative total return for the period ended November 30, 2015. In comparison, the Fund’s benchmark, the Barclays U.S. Government/Credit 2019 Maturity Index, returned +0.19%.1 The index includes investment-grade, U.S. dollar-denominated, fixed-rate Treasuries, government-related and corporate securities and foreign debt maturing in 2019. You can find more of the Fund’s performance data in the Performance Summary beginning on page 15.
Performance data represent past performance, which does not guarantee future results. Investment return and principal value will fluctuate, and you may have a gain or loss when you sell your shares. Current performance may differ from figures shown. Please call (800) 321-8563 for most recent month-end performance.
Investment Strategy
We focus on investment-grade securities and investments or on unrated securities and investments we determine are of comparable quality. Our focus on the portfolio’s credit quality is intended to reduce credit risk and help to preserve capital. We may invest a portion of the Fund’s assets in U.S. dollar-denominated foreign securities, including debt issued by supranational entities. In choosing investments, we select securities in various market sectors based on our assessment of changing economic, market, industry and issuer conditions. We use a top-down analysis of broad economic trends, combined with a bottom-up fundamental analysis of market sectors, industries and issuers, to try to take advantage of varying sector reactions to economic events.
Although the Fund may invest in individual securities of any maturity, the Fund is a term fund and is managed to mature in 2019. Over time, the Fund’s duration and weighted average maturity will decline as 2019 approaches. In the later months of operation, when the debt securities held by the Fund mature, the proceeds from such securities will be held in cash, cash equivalents and money market instruments, including affiliated money market funds, or invested in short-term bonds. In early December 2019, the Fund is expected to consist almost entirely of cash, cash equivalents and money market instruments. The Fund is designed for investors who seek an investment with a payout schedule to help meet their retirement spending needs, particularly those who are nearing retirement or are in retirement. There is no guarantee the Fund will meet an investor’s retirement spending needs.
What is duration?
Duration is a measure of a bond’s price sensitivity to interest rate changes. In general, a portfolio of securities with a lower duration can be expected to be less sensitive to interest rate changes than a portfolio with a higher duration.
| | |
| Maturity | | |
| 11/30/15 | | |
| | % of Total Net Assets | |
| 0 to 1 Year | 1.0 | % |
| 3 to 5 Years | 99.0 | % |
1. Source: FactSet, Barclays.
The index is unmanaged and includes reinvestment of any income or distributions. One cannot invest directly in an index, and an index is not representative of the Fund’s
portfolio.
The dollar value, number of shares or principal amount, and names of all portfolio holdings are listed in the Fund’s Statement of Investments (SOI).
The SOI begins on page 38.
|
Semiannual Report 13
| | |
| FRANKLIN PAYOUT 2019 FUND | | |
| |
| |
| Top 10 Holdings* | | |
| 11/30/15 | | |
| | % of Total | |
| Issue/Issuer | Net Assets | |
| Federal Home Loan Bank (FHLB) | 9.3 | % |
| Federal National Mortgage Association (FNMA) | 5.0 | % |
| Federal Farm Credit Bank (FFCB) | 3.8 | % |
| Anheuser-Busch InBev Worldwide Inc. | 2.9 | % |
| Morgan Stanley | 2.8 | % |
| Boeing Capital Corp. | 2.7 | % |
| Emerson Electric Co. | 2.7 | % |
| Westpac Banking Corp. | 2.7 | % |
| Deere & Co. | 2.7 | % |
| Georgia Power Co. | 2.7 | % |
*Securities are listed by issuer, which may appear by another name in the SOI.
Manager’s Discussion
From a perspective of excess returns over U.S. Treasuries, many investment-grade corporate bonds underperformed for the reporting period. However, shorter duration and higher quality investment-grade sectors performed relatively well. U.S. agency securities generally produced positive excess returns over U.S. Treasuries, while asset-backed securities slightly underperformed. Over the period, yields on shorter maturity bonds rose.
During the period under review, an overweighting in the investment-grade corporate credit sector contributed to the Fund’s performance relative to the Barclays U.S. Government/Credit 2019 Maturity Index, but security selection within the sector hurt performance. The positive contribution of the Fund’s overweighted position in U.S. agency securities was offset by the negative effect of security selection within the sector. A relatively small allocation to non-U.S. issuers helped performance, while exposure to covered bonds hindered performance.2 Over the period, the Fund’s modestly longer duration compared with the benchmark, resulting from slight maturity differences, detracted from performance as interest rates for shorter maturity bonds moved higher.
At period-end, we maintained an overweighting in the investment-grade corporate credit sector compared with the benchmark. We favored the sector based on our belief that its overall valuations will remain relatively attractive over the
Fund’s expected life and that the sector offered relatively higher income potential. We also maintained an overweighted position in the agency sector due to our view of its incremental income advantage over U.S. Treasuries during the Fund’s expected life. Conversely, we remained underweighted in the U.S. Treasury sector due to the sector’s less attractive income opportunities.
Thank you for your participation in Franklin Payout 2019 Fund. We look forward to serving your future investment needs.

The foregoing information reflects our analysis, opinions and portfolio holdings as of November 30, 2015, the end of the reporting period. The way we implement our main investment strategies and the resulting portfolio holdings may change depending on factors such as market and economic conditions. These opinions may not be relied upon as investment advice or an offer for a particular security. The information is not a complete analysis of every aspect of any market, country, industry, security or the Fund. Statements of fact are from sources considered reliable, but the investment manager makes no representation or warranty as to their completeness or accuracy. Although historical performance is no guarantee of future results, these insights may help you understand our investment management philosophy.
2. “Covered bonds” are debt securities created from public sector or mortgage loans and are backed by a guarantee from the issuing entity and secured by a separate pool
of assets on that entity’s balance sheet.
See www.franklintempletondatasources.com for additional data provider information.
|
14 Semiannual Report
FRANKLIN PAYOUT 2019 FUND
Performance Summary as of November 30, 2015
Your dividend income will vary depending on dividends or interest paid by securities in the Fund’s portfolio, adjusted for operating expenses of each class. Capital gain distributions are net profits realized from the sale of portfolio securities. The performance table does not reflect any taxes that a shareholder would pay on Fund dividends, capital gain distributions, if any, or any realized gains on the sale of Fund shares. Total return reflects reinvestment of the Fund’s dividends and capital gain distributions, if any, and any unrealized gains or losses.
| | | | | |
| Net Asset Value | | | | | |
| Share Class (Symbol) | | 11/30/15 | | 6/1/15 | Change |
| R6 (FPOEX) | $ | 10.06 | $ | 10.00 | +$0.06 |
| Advisor (FPOFX) | $ | 10.06 | $ | 10.00 | +$0.06 |
Performance1
Cumulative total return excludes sales charges. Average annual total returns include maximum sales charges.
Class R6/Advisor Class: no sales charges.
| | | | | | | | | | |
| | | | | | | | | | | |
| | | | | | Average Annual | | | |
| | Cumulative | | Average Annual | | Total Return | | Total Annual Operating Expenses5 | |
| Share Class | Total Return2 | | Total Return3 | | (12/31/15 | )4 | (with waiver) | | (without waiver) | |
| R6 | | | | | | | 0.30 | % | 1.11 | % |
| Since Inception (6/1/15) | +0.60 | % | +0.60 | % | +0.22 | % | | | | |
| Advisor | | | | | | | 0.44 | % | 1.25 | % |
| Since Inception (6/1/15) | +0.60 | % | +0.60 | % | +0.22 | % | | | | |
Performance data represent past performance, which does not guarantee future results. Investment return and principal value will fluctuate, and you may have a gain or loss when you sell your shares. Current performance may differ from figures shown. For most recent month-end performance, call a Franklin Templeton Institutional Services representative at (800) 321-8563.
See page 16 for Performance Summary footnotes.
|
Semiannual Report 15
|
| FRANKLIN PAYOUT 2019 FUND |
| PERFORMANCE SUMMARY |
All investments involve risks, including possible loss of principal. Changes in the financial strength of a bond issuer or in a bond’s credit rating may affect its value. Interest rate movements will affect the Fund’s share price and yield. Bond prices generally move in the opposite direction of interest rates. As the prices of bonds in the Fund adjust to a rise in interest rates, the Fund’s share price may decline. Because the Fund can only distribute what it earns, the Fund’s distributions to shareholders may decline when prevailing interest rates fall or when the Fund experiences defaults on debt securities it holds. Interest earned on floating rate loans varies with changes in prevailing interest rates. Therefore, while floating rate loans offer higher interest income when interest rates rise, they will also generate less income when interest rates decline. The Fund is actively managed but there is no guarantee that the manager’s investment decisions will achieve the desired results. The Fund’s prospectus also includes a description of the main investment risks.
| |
| Class R6: | Shares are available to certain eligible investors as described in the prospectus. |
| Advisor Class: | Shares are available to certain eligible investors as described in the prospectus. |
1. The Fund has an expense reduction contractually guaranteed through at least 9/30/16 and a fee waiver associated with any investment in a Franklin Templeton money
fund, contractually guaranteed through at least its current fiscal year-end. The transfer agent has contractually agreed to cap transfer agency fees for Class R6 shares of
the Fund so that transfer agency fees for that class do not exceed 0.01% until 9/30/16. Fund investment results reflect the expense reduction, fee waiver and fee cap, to
the extent applicable; without these reductions, the results would have been lower.
2. Cumulative total return represents the change in value of an investment over the period indicated.
3. Average annual total return represents the change in value of an investment over the period indicated. Return for less than one year, if any, has not been annualized.
4. In accordance with SEC rules, we provide standardized total return information through the latest calendar quarter. Return for less than one year, if any, has not been
annualized.
5. Figures are as stated in the Fund’s current prospectus. In periods of market volatility, assets may decline significantly, causing total annual Fund operating expenses to
become higher than the figures shown.
|
16 Semiannual Report
FRANKLIN PAYOUT 2019 FUND
Your Fund’s Expenses
As a Fund shareholder, you can incur two types of costs:
- Transaction costs, including sales charges (loads), if applicable, on Fund purchases; and
- Ongoing Fund costs, including management fees, distri- bution and service (12b-1) fees, and other Fund expenses.
All mutual funds have ongoing costs, sometimes referred to as operating expenses.
The following table shows ongoing costs of investing in the Fund and can help you understand these costs and compare them with those of other mutual funds. The table assumes a $1,000 investment held for the six months indicated.
Actual Fund Expenses
The first line (Actual) for each share class listed in the table provides actual account values and expenses. The “Ending Account Value” is derived from the Fund’s actual return, which includes the effect of Fund expenses.
You can estimate the expenses you paid during the period by following these steps. Of course, your account value and expenses will differ from those in this illustration:
| 1. | Divide your account value by $1,000. |
| | If an account had an $8,600 value, then $8,600 ÷ $1,000 = 8.6. |
| 2. | Multiply the result by the number under the heading “Expenses Paid During Period.” |
| | If Expenses Paid During Period were $7.50, then 8.6 x $7.50 = $64.50. |
In this illustration, the estimated expenses paid this period are $64.50.
Hypothetical Example for Comparison with Other Funds
Information in the second line (Hypothetical) for each class in the table can help you compare ongoing costs of investing in the Fund with those of other mutual funds. This information may not be used to estimate the actual ending account balance or expenses you paid during the period. The hypothetical “Ending Account Value” is based on the actual expense ratio for each class and an assumed 5% annual rate of return before expenses, which does not represent the Fund’s actual return. The figure under the heading “Expenses Paid During Period” shows the hypothetical expenses your account would have incurred under this scenario. You can compare this figure with the 5% hypothetical examples that appear in shareholder reports of other funds.
Please note that expenses shown in the table are meant to highlight ongoing costs and do not reflect any transaction costs, such as sales charges. Therefore, the second line for each class is useful in comparing ongoing costs only, and will not help you compare total costs of owning different funds. In addition, if transaction costs were included, your total costs would have been higher. Please refer to the Fund prospectus for additional information on operating expenses.
| | | | | | |
| | | Beginning Account | | Ending Account | | Expenses Paid During |
| Share Class | | Value 6/1/15 | | Value 11/30/15 | | Period* 6/1/15–11/30/15 |
| R6 | | | | | | |
| Actual | $ | 1,000 | $ | 1,006.00 | $ | 1.45 |
| Hypothetical (5% return before expenses) | $ | 1,000 | $ | 1,023.55 | $ | 1.47 |
| Advisor | | | | | | |
| Actual | $ | 1,000 | $ | 1,006.00 | $ | 1.45 |
| Hypothetical (5% return before expenses) | $ | 1,000 | $ | 1,023.55 | $ | 1.47 |
*Expenses are calculated using the most recent six-month expense ratio, net of expense waivers, annualized for each class (R6: 0.29% and
Advisor: 0.29%), multiplied by the average account value over the period, multiplied by 183/366 to reflect the one-half year period.
|
Semiannual Report 17
Franklin Payout 2020 Fund
We are pleased to bring you this inaugural semiannual report for Franklin Payout 2020 Fund for the period since the Fund’s inception on June 1, 2015, through November 30, 2015.
Your Fund’s Goal and Main Investments
The Fund seeks capital preservation and income with a predetermined maturity date. Under normal market conditions, the Fund invests predominantly in U.S. investment-grade debt securities and investments, including government and corporate debt securities and asset-backed securities and municipal securities.
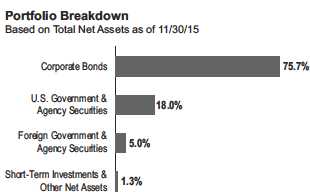
Performance Overview
The Fund’s Advisor Class shares delivered a +0.40% cumulative total return for the period ended November 30, 2015. In comparison, the Fund’s benchmark, the Barclays U.S. Government/Credit 2020 Maturity Index, returned +0.12%.1 The index includes investment-grade, U.S. dollar-denominated, fixed-rate Treasuries, government-related and corporate securities and foreign debt maturing in 2020. You can find more of the Fund’s performance data in the Performance Summary beginning on page 20.
Performance data represent past performance, which does not guarantee future results. Investment return and principal value will fluctuate, and you may have a gain or loss when you sell your shares. Current performance may differ from figures shown. Please call (800) 321-8563 for most recent month-end performance.
Investment Strategy
We focus on investment-grade securities and investments or on unrated securities and investments we determine are of comparable quality. Our focus on the portfolio’s credit quality is intended to reduce credit risk and help to preserve capital. We may invest a portion of the Fund’s assets in U.S. dollar-denominated foreign securities, including debt issued by supranational entities. In choosing investments, we select securities in various market sectors based on our assessment of changing economic, market, industry and issuer conditions. We use a top-down analysis of broad economic trends, combined with a bottom-up fundamental analysis of market sectors, industries and issuers, to try to take advantage of varying sector reactions to economic events.
Although the Fund may invest in individual securities of any maturity, the Fund is a term fund and is managed to mature in 2020. Over time, the Fund’s duration and weighted average maturity will decline as 2020 approaches. In the later months of operation, when the debt securities held by the Fund mature, the proceeds from such securities will be held in cash, cash equivalents and money market instruments, including affiliated money market funds, or invested in short-term bonds. In early December 2020, the Fund is expected to consist almost entirely of cash, cash equivalents and money market instruments. The Fund is designed for investors who seek an investment with a payout schedule to help meet their retirement spending needs, particularly those who are nearing retirement or are in retirement. There is no guarantee the Fund will meet an investor’s retirement spending needs.
What is duration?
Duration is a measure of a bond’s price sensitivity to interest rate changes. In general, a portfolio of securities with a lower duration can be expected to be less sensitive to interest rate changes than a portfolio with a higher duration.
| | |
| Maturity | | |
| 11/30/15 | | |
| | % of Total Net Assets | |
| 0 to 1 Year | 0.6 | % |
| 3 to 5 Years | 76.4 | % |
| 5 to 7 Years | 23.0 | % |
1. Source: FactSet, Barclays.
The index is unmanaged and includes reinvestment of any income or distributions. One cannot invest directly in an index, and an index is not representative of the Fund’s
portfolio.
See www.franklintempletondatasources.com for additional data provider information.
The dollar value, number of shares or principal amount, and names of all portfolio holdings are listed in the Fund’s Statement of Investments (SOI).
The SOI begins on page 42.
|
18 Semiannual Report
FRANKLIN PAYOUT 2020 FUND
| | |
| Top 10 Holdings* | | |
| 11/30/15 | | |
| | % of Total | |
| Issue/Issuer | Net Assets | |
| U.S. Treasury Note | 12.7 | % |
| Federal Home Loan Bank (FHLB) | 5.3 | % |
| AEGON Funding Co. LLC | 2.9 | % |
| Morgan Stanley | 2.8 | % |
| Hershey Co. | 2.7 | % |
| Emerson Electric Co. | 2.7 | % |
| JPMorgan Chase & Co. | 2.7 | % |
| Travelers Cos. Inc. | 2.7 | % |
| UnitedHealth Group Inc. | 2.7 | % |
| Aetna Inc. | 2.6 | % |
*Securities are listed by issuer, which may appear by another name in the SOI.
Manager’s Discussion
From a perspective of excess returns over U.S. Treasuries, many investment-grade corporate bonds underperformed for the reporting period. However, shorter duration and higher quality investment-grade sectors performed relatively well. U.S. agency securities generally produced positive excess returns over U.S. Treasuries, while asset-backed securities slightly underperformed. Over the period, yields on shorter maturity bonds rose.
During the period under review, security selection and an overweighting in the investment-grade corporate credit sector contributed to the Fund’s performance relative to the Barclays U.S. Government/Credit 2020 Maturity Index. The positive contribution of the Fund’s overweighted position in U.S. agency securities was offset by the negative effect of security selection within the sector. A relatively small allocation to non-U.S. issuers helped performance. Over the period, the Fund’s modestly longer duration compared with the benchmark, resulting from slight maturity differences, detracted from performance as interest rates for shorter maturity bonds moved higher.
At period-end, we maintained an overweighting in the investment-grade corporate credit sector compared with the benchmark. We favored the sector based on our belief that its overall valuations will remain relatively attractive over the Fund’s expected life and that the sector offered relatively higher income potential. We also maintained an overweighted position in the agency sector due to our view of its incremental income advantage over U.S. Treasuries during the Fund’s expected life. Conversely, we remained underweighted in the U.S. Treasury sector due to the sector’s less attractive income opportunities.
Thank you for your participation in Franklin Payout 2020 Fund. We look forward to serving your future investment needs.

The foregoing information reflects our analysis, opinions and portfolio holdings as of November 30, 2015, the end of the reporting period. The way we implement our main investment strategies and the resulting portfolio holdings may change depending on factors such as market and economic conditions. These opinions may not be relied upon as investment advice or an offer for a particular security. The information is not a complete analysis of every aspect of any market, country, industry, security or the Fund. Statements of fact are from sources considered reliable, but the investment manager makes no representation or warranty as to their completeness or accuracy. Although historical performance is no guarantee of future results, these insights may help you understand our investment management philosophy.
|
Semiannual Report 19
FRANKLIN PAYOUT 2020 FUND
Performance Summary as of November 30, 2015
Your dividend income will vary depending on dividends or interest paid by securities in the Fund’s portfolio, adjusted for operating expenses of each class. Capital gain distributions are net profits realized from the sale of portfolio securities. The performance table does not reflect any taxes that a shareholder would pay on Fund dividends, capital gain distributions, if any, or any realized gains on the sale of Fund shares. Total return reflects reinvestment of the Fund’s dividends and capital gain distributions, if any, and any unrealized gains or losses.
| | | | | |
| Net Asset Value | | | | | |
| Share Class (Symbol) | | 11/30/15 | | 6/1/15 | Change |
| R6 (FPOGX) | $ | 10.04 | $ | 10.00 | +$0.04 |
| Advisor (FPOHX) | $ | 10.04 | $ | 10.00 | +$0.04 |
Performance1
Cumulative total return excludes sales charges. Average annual total returns include maximum sales charges.
Class R6/Advisor Class: no sales charges.
| | | | | | | | | | |
| | | | | | | | | | | |
| | | | | | Average Annual | | | |
| | Cumulative | | Average Annual | | Total Return | | Total Annual Operating Expenses5 | |
| Share Class | Total Return2 | | Total Return3 | | (12/31/15 | )4 | (with waiver) | | (without waiver) | |
| R6 | | | | | | | 0.30 | % | 1.11 | % |
| Since Inception (6/1/15) | +0.40 | % | +0.40 | % | -0.14 | % | | | | |
| Advisor | | | | | | | 0.44 | % | 1.25 | % |
| Since Inception (6/1/15) | +0.40 | % | +0.40 | % | -0.14 | % | | | | |
Performance data represent past performance, which does not guarantee future results. Investment return and principal value will fluctuate, and you may have a gain or loss when you sell your shares. Current performance may differ from figures shown. For most recent month-end performance, call a Franklin Templeton Institutional Services representative at (800) 321-8563.
See page 21 for Performance Summary footnotes.
|
20 Semiannual Report
|
| FRANKLIN PAYOUT 2020 FUND |
| PERFORMANCE SUMMARY |
All investments involve risks, including possible loss of principal. Changes in the financial strength of a bond issuer or in a bond’s credit rating may affect its value. Interest rate movements will affect the Fund’s share price and yield. Bond prices generally move in the opposite direction of interest rates. As the prices of bonds in the Fund adjust to a rise in interest rates, the Fund’s share price may decline. Because the Fund can only distribute what it earns, the Fund’s distributions to shareholders may decline when prevailing interest rates fall or when the Fund experiences defaults on debt securities it holds. Interest earned on floating rate loans varies with changes in prevailing interest rates. Therefore, while floating rate loans offer higher interest income when interest rates rise, they will also generate less income when interest rates decline. The Fund is actively managed but there is no guarantee that the manager’s investment decisions will achieve the desired results. The Fund’s prospectus also includes a description of the main investment risks.
| |
| Class R6: | Shares are available to certain eligible investors as described in the prospectus. |
| Advisor Class: | Shares are available to certain eligible investors as described in the prospectus. |
1. The Fund has an expense reduction contractually guaranteed through at least 9/30/16 and a fee waiver associated with any investment in a Franklin Templeton money
fund, contractually guaranteed through at least its current fiscal year-end. The transfer agent has contractually agreed to cap transfer agency fees for Class R6 shares of
the Fund so that transfer agency fees for that class do not exceed 0.01% until 9/30/16. Fund investment results reflect the expense reduction, fee waiver and fee cap, to
the extent applicable; without these reductions, the results would have been lower.
2. Cumulative total return represents the change in value of an investment over the period indicated.
3. Average annual total return represents the change in value of an investment over the period indicated. Return for less than one year, if any, has not been annualized.
4. In accordance with SEC rules, we provide standardized total return information through the latest calendar quarter. Return for less than one year, if any, has not been
annualized.
5. Figures are as stated in the Fund’s current prospectus. In periods of market volatility, assets may decline significantly, causing total annual Fund operating expenses to
become higher than the figures shown.
|
Semiannual Report 21
FRANKLIN PAYOUT 2020 FUND
Your Fund’s Expenses
As a Fund shareholder, you can incur two types of costs:
- Transaction costs, including sales charges (loads), if applicable, on Fund purchases; and
- Ongoing Fund costs, including management fees, distri- bution and service (12b-1) fees, and other Fund expenses.
All mutual funds have ongoing costs, sometimes referred to as operating expenses.
The following table shows ongoing costs of investing in the Fund and can help you understand these costs and compare them with those of other mutual funds. The table assumes a $1,000 investment held for the six months indicated.
Actual Fund Expenses
The first line (Actual) for each share class listed in the table provides actual account values and expenses. The “Ending Account Value” is derived from the Fund’s actual return, which includes the effect of Fund expenses.
You can estimate the expenses you paid during the period by following these steps. Of course, your account value and expenses will differ from those in this illustration:
| 1. | Divide your account value by $1,000. |
| | If an account had an $8,600 value, then $8,600 ÷ $1,000 = 8.6. |
| 2. | Multiply the result by the number under the heading “Expenses Paid During Period.” |
| | If Expenses Paid During Period were $7.50, then 8.6 x $7.50 = $64.50. |
In this illustration, the estimated expenses paid this period are $64.50.
Hypothetical Example for Comparison with Other Funds
Information in the second line (Hypothetical) for each class in the table can help you compare ongoing costs of investing in the Fund with those of other mutual funds. This information may not be used to estimate the actual ending account balance or expenses you paid during the period. The hypothetical “Ending Account Value” is based on the actual expense ratio for each class and an assumed 5% annual rate of return before expenses, which does not represent the Fund’s actual return. The figure under the heading “Expenses Paid During Period” shows the hypothetical expenses your account would have incurred under this scenario. You can compare this figure with the 5% hypothetical examples that appear in shareholder reports of other funds.
Please note that expenses shown in the table are meant to highlight ongoing costs and do not reflect any transaction costs, such as sales charges. Therefore, the second line for each class is useful in comparing ongoing costs only, and will not help you compare total costs of owning different funds. In addition, if transaction costs were included, your total costs would have been higher. Please refer to the Fund prospectus for additional information on operating expenses.
| | | | | | |
| | | Beginning Account | | Ending Account | | Expenses Paid During |
| Share Class | | Value 6/1/15 | | Value 11/30/15 | | Period* 6/1/15–11/30/15 |
| R6 | | | | | | |
| Actual | $ | 1,000 | $ | 1,004.00 | $ | 1.45 |
| Hypothetical (5% return before expenses) | $ | 1,000 | $ | 1,023.55 | $ | 1.47 |
| Advisor | | | | | | |
| Actual | $ | 1,000 | $ | 1,004.00 | $ | 1.45 |
| Hypothetical (5% return before expenses) | $ | 1,000 | $ | 1,023.55 | $ | 1.47 |
*Expenses are calculated using the most recent six-month expense ratio, net of expense waivers, annualized for each class (R6: 0.29% and
Advisor: 0.29%), multiplied by the average account value over the period, multiplied by 183/366 to reflect the one-half year period.
|
22 Semiannual Report
Franklin Payout 2021 Fund
We are pleased to bring you this inaugural semiannual report for Franklin Payout 2021 Fund for the period since the Fund’s inception on June 1, 2015, through November 30, 2015.
Your Fund’s Goal and Main Investments
The Fund seeks capital preservation and income with a predetermined maturity date. Under normal market conditions, the Fund invests predominantly in U.S. investment-grade debt securities and investments, including government and corporate debt securities and asset-backed securities and municipal securities.

Performance Overview
The Fund’s Advisor Class shares delivered a +0.90% cumulative total return for the period ended November 30, 2015. In comparison, the Fund’s benchmark, the Barclays U.S. Government/Credit 2021 Maturity Index, returned +0.06%.1 The index includes investment-grade, U.S. dollar-denominated, fixed-rate Treasuries, government-related and corporate securities and foreign debt maturing in 2021.You can find more of the Fund’s performance data in the Performance Summary beginning on page 25.
Performance data represent past performance, which does not guarantee future results. Investment return and principal value will fluctuate, and you may have a gain or loss when you sell your shares. Current performance may differ from figures shown. Please call (800) 321-8563 for most recent month-end performance.
Investment Strategy
We focus on investment-grade securities and investments or on unrated securities and investments we determine are of comparable quality. Our focus on the portfolio’s credit quality is intended to reduce credit risk and help to preserve capital. We may invest a portion of the Fund’s assets in U.S. dollar-denominated foreign securities, including debt issued by supranational entities. In choosing investments, we select securities in various market sectors based on our assessment of changing economic, market, industry and issuer conditions. We use a top-down analysis of broad economic trends, combined with a bottom-up fundamental analysis of market sectors, industries and issuers, to try to take advantage of varying sector reactions to economic events.
Although the Fund may invest in individual securities of any maturity, the Fund is a term fund and is managed to mature in 2021. Over time, the Fund’s duration and weighted average maturity will decline as 2021 approaches. In the later months of operation, when the debt securities held by the Fund mature, the proceeds from such securities will be held in cash, cash equivalents and money market instruments, including affiliated money market funds, or invested in short-term bonds. In early December 2021, the Fund is expected to consist almost entirely of cash, cash equivalents and money market instruments. The Fund is designed for investors who seek an investment with a payout schedule to help meet their retirement spending needs, particularly those who are nearing retirement or are in retirement. There is no guarantee the Fund will meet an investor’s retirement spending needs.
What is duration?
Duration is a measure of a bond’s price sensitivity to interest rate changes. In general, a portfolio of securities with a lower duration can be expected to be less sensitive to interest rate changes than a portfolio with a higher duration.
| | |
| Maturity | | |
| 11/30/15 | | |
| | % of Total Net Assets | |
| 0 to 1 Year | 1.1 | % |
| 5 to 7 Years | 98.9 | % |
1. Source: FactSet, Barclays.
The index is unmanaged and includes reinvestment of any income or distributions. One cannot invest directly in an index, and an index is not representative of the Fund’s
portfolio.
See www.franklintempletondatasources.com for additional data provider information.
The dollar value, number of shares or principal amount, and names of all portfolio holdings are listed in the Fund’s Statement of Investments (SOI).
The SOI begins on page 46.
|
Semiannual Report 23
FRANKLIN PAYOUT 2021 FUND
| | |
| Top 10 Holdings* | | |
| 11/30/15 | | |
| | % of Total | |
| Issue/Issuer | Net Assets | |
| U.S. Treasury Note | 8.0 | % |
| Federal Home Loan Bank (FHLB) | 5.1 | % |
| Federal Farm Credit Bank (FFCB) | 4.9 | % |
| California State General Obligation (GO) | 2.9 | % |
| Thomas & Betts Corp. | 2.8 | % |
| General Electric Capital Corp. | 2.8 | % |
| Telstra Corp. Ltd. | 2.7 | % |
| Gilead Sciences Inc. | 2.7 | % |
| Total Capital SA | 2.7 | % |
| Berkshire Hathaway Inc. | 2.7 | % |
*Securities are listed by issuer, which may appear by another name in the SOI.
Manager’s Discussion
From a perspective of excess returns over U.S. Treasuries, many investment-grade corporate bonds underperformed for the reporting period. However, shorter duration and higher quality investment-grade sectors performed relatively well. U.S. agency securities generally produced positive excess returns over U.S. Treasuries, while asset-backed securities slightly underperformed. Over the period, yields on shorter maturity bonds rose.
During the period under review, security selection and an overweighting in the investment-grade corporate credit sector contributed to the Fund’s performance relative to the Barclays U.S. Government/Credit 2021 Maturity Index. The positive contribution of the Fund’s overweighted position in U.S. agency securities was offset by the negative effect of security selection within the sector. A relatively small allocation to taxable municipal bonds hindered results, while exposure to non-U.S. issuers helped performance. Over the period, the Fund’s modestly longer duration compared with the benchmark, resulting from slight maturity differences, detracted from performance as interest rates for shorter maturity bonds moved higher.
At period-end, we maintained an overweighting in the investment-grade corporate credit sector compared with the benchmark. We favored the sector based on our belief that its overall valuations will remain relatively attractive over the Fund’s expected life and that the sector offered relatively higher income potential. We also maintained an overweighted position in the agency sector due to our view of its incremental income advantage over U.S. Treasuries during the Fund’s expected life. Conversely, we remained underweighted in the U.S. Treasury sector due to the sector’s less attractive income opportunities.
Thank you for your participation in Franklin Payout 2021 Fund. We look forward to serving your future investment needs.

The foregoing information reflects our analysis, opinions and portfolio holdings as of November 30, 2015, the end of the reporting period. The way we implement our main investment strategies and the resulting portfolio holdings may change depending on factors such as market and economic conditions. These opinions may not be relied upon as investment advice or an offer for a particular security. The information is not a complete analysis of every aspect of any market, country, industry, security or the Fund. Statements of fact are from sources considered reliable, but the investment manager makes no representation or warranty as to their completeness or accuracy. Although historical performance is no guarantee of future results, these insights may help you understand our investment management philosophy.
|
24 Semiannual Report
FRANKLIN PAYOUT 2021 FUND
Performance Summary as of November 30, 2015
Your dividend income will vary depending on dividends or interest paid by securities in the Fund’s portfolio, adjusted for operating expenses of each class. Capital gain distributions are net profits realized from the sale of portfolio securities. The performance table does not reflect any taxes that a shareholder would pay on Fund dividends, capital gain distributions, if any, or any realized gains on the sale of Fund shares. Total return reflects reinvestment of the Fund’s dividends and capital gain distributions, if any, and any unrealized gains or losses.
| | | | | |
| Net Asset Value | | | | | |
| Share Class (Symbol) | | 11/30/15 | | 6/1/15 | Change |
| R6 (FPOMX) | $ | 10.09 | $ | 10.00 | +$0.09 |
| Advisor (FPOJX) | $ | 10.09 | $ | 10.00 | +$0.09 |
Performance1
Cumulative total return excludes sales charges. Average annual total returns include maximum sales charges.
Class R6/Advisor Class: no sales charges.
| | | | | | | | | | |
| | | | | | | | | | | |
| | | | | | Average Annual | | | |
| | Cumulative | | Average Annual | | Total Return | | Total Annual Operating Expenses5 | |
| Share Class | Total Return2 | | Total Return3 | | (12/31/15 | )4 | (with waiver) | | (without waiver) | |
| R6 | | | | | | | 0.30 | % | 1.11 | % |
| Since Inception (6/1/15) | +0.90 | % | +0.90 | % | +0.38 | % | | | | |
| Advisor | | | | | | | 0.44 | % | 1.25 | % |
| Since Inception (6/1/15) | +0.90 | % | +0.90 | % | +0.38 | % | | | | |
Performance data represent past performance, which does not guarantee future results. Investment return and principal value will fluctuate, and you may have a gain or loss when you sell your shares. Current performance may differ from figures shown. For most recent month-end performance, call a Franklin Templeton Institutional Services representative at (800) 321-8563.
See page 26 for Performance Summary footnotes.
|
Semiannual Report 25
|
| FRANKLIN PAYOUT 2021 FUND |
| PERFORMANCE SUMMARY |
All investments involve risks, including possible loss of principal. Changes in the financial strength of a bond issuer or in a bond’s credit rating may affect its value. Interest rate movements will affect the Fund’s share price and yield. Bond prices generally move in the opposite direction of interest rates. As the prices of bonds in the Fund adjust to a rise in interest rates, the Fund’s share price may decline. Because the Fund can only distribute what it earns, the Fund’s distributions to shareholders may decline when prevailing interest rates fall or when the Fund experiences defaults on debt securities it holds. Interest earned on floating rate loans varies with changes in prevailing interest rates. Therefore, while floating rate loans offer higher interest income when interest rates rise, they will also generate less income when interest rates decline. The Fund is actively managed but there is no guarantee that the manager’s investment decisions will achieve the desired results. The Fund’s prospectus also includes a description of the main investment risks.
| |
| Class R6: | Shares are available to certain eligible investors as described in the prospectus. |
| Advisor Class: | Shares are available to certain eligible investors as described in the prospectus. |
1. The Fund has an expense reduction contractually guaranteed through at least 9/30/16 and a fee waiver associated with any investment in a Franklin Templeton money
fund, contractually guaranteed through at least its current fiscal year-end. The transfer agent has contractually agreed to cap transfer agency fees for Class R6 shares of
the Fund so that transfer agency fees for that class do not exceed 0.01% until 9/30/16. Fund investment results reflect the expense reduction, fee waiver and fee cap, to
the extent applicable; without these reductions, the results would have been lower.
2. Cumulative total return represents the change in value of an investment over the period indicated.
3. Average annual total return represents the change in value of an investment over the period indicated. Return for less than one year, if any, has not been annualized.
4. In accordance with SEC rules, we provide standardized total return information through the latest calendar quarter. Return for less than one year, if any, has not been
annualized.
5. Figures are as stated in the Fund’s current prospectus. In periods of market volatility, assets may decline significantly, causing total annual Fund operating expenses to
become higher than the figures shown.
|
26 Semiannual Report
FRANKLIN PAYOUT 2021 FUND
Your Fund’s Expenses
As a Fund shareholder, you can incur two types of costs:
- Transaction costs, including sales charges (loads), if applicable, on Fund purchases; and
- Ongoing Fund costs, including management fees, distri- bution and service (12b-1) fees, and other Fund expenses.
All mutual funds have ongoing costs, sometimes referred to as operating expenses.
The following table shows ongoing costs of investing in the Fund and can help you understand these costs and compare them with those of other mutual funds. The table assumes a $1,000 investment held for the six months indicated.
Actual Fund Expenses
The first line (Actual) for each share class listed in the table provides actual account values and expenses. The “Ending Account Value” is derived from the Fund’s actual return, which includes the effect of Fund expenses.
You can estimate the expenses you paid during the period by following these steps. Of course, your account value and expenses will differ from those in this illustration:
| 1. | Divide your account value by $1,000. |
| | If an account had an $8,600 value, then $8,600 ÷ $1,000 = 8.6. |
| 2. | Multiply the result by the number under the heading “Expenses Paid During Period.” |
| | If Expenses Paid During Period were $7.50, then 8.6 x $7.50 = $64.50. |
In this illustration, the estimated expenses paid this period are $64.50.
Hypothetical Example for Comparison with Other Funds
Information in the second line (Hypothetical) for each class in the table can help you compare ongoing costs of investing in the Fund with those of other mutual funds. This information may not be used to estimate the actual ending account balance or expenses you paid during the period. The hypothetical “Ending Account Value” is based on the actual expense ratio for each class and an assumed 5% annual rate of return before expenses, which does not represent the Fund’s actual return. The figure under the heading “Expenses Paid During Period” shows the hypothetical expenses your account would have incurred under this scenario. You can compare this figure with the 5% hypothetical examples that appear in shareholder reports of other funds.
Please note that expenses shown in the table are meant to highlight ongoing costs and do not reflect any transaction costs, such as sales charges. Therefore, the second line for each class is useful in comparing ongoing costs only, and will not help you compare total costs of owning different funds. In addition, if transaction costs were included, your total costs would have been higher. Please refer to the Fund prospectus for additional information on operating expenses.
| | | | | | |
| | | Beginning Account | | Ending Account | | Expenses Paid During |
| Share Class | | Value 6/1/15 | | Value 11/30/15 | | Period* 6/1/15–11/30/15 |
| R6 | | | | | | |
| Actual | $ | 1,000 | $ | 1,009.00 | $ | 1.46 |
| Hypothetical (5% return before expenses) | $ | 1,000 | $ | 1,023.55 | $ | 1.47 |
| Advisor | | | | | | |
| Actual | $ | 1,000 | $ | 1,009.00 | $ | 1.46 |
| Hypothetical (5% return before expenses) | $ | 1,000 | $ | 1,023.55 | $ | 1.47 |
*Expenses are calculated using the most recent six-month expense ratio, net of expense waivers, annualized for each class (R6: 0.29% and
Advisor: 0.29%), multiplied by the average account value over the period, multiplied by 183/366 to reflect the one-half year period.
|
Semiannual Report 27
| | | |
| FRANKLIN FUND ALLOCATOR SERIES | | | |
| |
| |
| Financial Highlights | | | |
| Franklin Payout 2017 Fund | | | |
| | | Period Ended | |
| | | November 30, 2015a | |
| | | (unaudited) | |
| Class R6 | | | |
| Per share operating performance | | | |
| (for a share outstanding throughout the period) | | | |
| Net asset value, beginning of period | $ | 10.00 | |
| Income from investment operationsb: | | | |
| Net investment incomec | | 0.05 | |
| Net realized and unrealized gains (losses) | | (0.03 | ) |
| Total from investment operations | | 0.02 | |
| Net asset value, end of period | $ | 10.02 | |
| |
| Total returnd | | 0.20 | % |
| |
| Ratios to average net assetse | | | |
| Expenses before waiver and payments by affiliates | | 3.13 | % |
| Expenses net of waiver and payments by affiliates | | 0.29 | % |
| Net investment income | | 1.09 | % |
| |
| Supplemental data | | | |
| Net assets, end of period (000’s) | $ | 1,754 | |
| Portfolio turnover rate | | —% | |
aFor the period June 1, 2015 (commencement of operations) to November 30, 2015.
bThe amount shown for a share outstanding throughout the period may not correlate with the Statement of Operations for the period due to the timing of sales and
repurchases of the Fund’s shares in relation to income earned and/or fluctuating fair value of the investments of the Fund.
cBased on average daily shares outstanding.
dTotal return is not annualized for periods less than one year.
eRatios are annualized for periods less than one year.
| 28 | | Semiannual Report | The accompanying notes are an integral part of these financial statements. |
FRANKLIN FUND ALLOCATOR SERIES
FINANCIAL HIGHLIGHTS
| | | |
| Franklin Payout 2017 Fund (continued) | | | |
| | | Period Ended | |
| | | November 30, 2015a | |
| | | (unaudited) | |
| Advisor Class | | | |
| Per share operating performance | | | |
| (for a share outstanding throughout the period) | | | |
| Net asset value, beginning of period | $ | 10.00 | |
| Income from investment operationsb: | | | |
| Net investment incomec | | 0.05 | |
| Net realized and unrealized gains (losses) | | (0.03 | ) |
| Total from investment operations | | 0.02 | |
| Net asset value, end of period | $ | 10.02 | |
| |
| Total returnd | | 0.20 | % |
| |
| Ratios to average net assetse | | | |
| Expenses before waiver and payments by affiliates | | 3.13 | % |
| Expenses net of waiver and payments by affiliates | | 0.29 | % |
| Net investment income | | 1.09 | % |
| |
| Supplemental data | | | |
| Net assets, end of period (000’s) | $ | 1,754 | |
| Portfolio turnover rate | | —% | |
aFor the period June 1, 2015 (commencement of operations) to November 30, 2015.
bThe amount shown for a share outstanding throughout the period may not correlate with the Statement of Operations for the period due to the timing of sales and
repurchases of the Fund’s shares in relation to income earned and/or fluctuating fair value of the investments of the Fund.
cBased on average daily shares outstanding.
dTotal return is not annualized for periods less than one year.
eRatios are annualized for periods less than one year.
|
The accompanying notes are an integral part of these financial statements. | Semiannual Report 29
| | | | |
| FRANKLIN FUND ALLOCATOR SERIES | | | | |
| |
| |
| |
| |
| Statement of Investments, November 30, 2015 (unaudited) | | | | |
| |
| Franklin Payout 2017 Fund | | | | |
| | | Principal | | |
| | Country | Amount* | | Value |
| Corporate Bonds 79.9% | | | | |
| Automobiles & Components 1.4% | | | | |
| aHyundai Capital America, senior note, 144A, 2.125%, 10/02/17 | South Korea | 50,000 | $ | 49,910 |
| Banks 17.8% | | | | |
| Bank of America Corp., senior note, 6.40%, 8/28/17 | United States | 100,000 | | 108,052 |
| Bank of Nova Scotia, senior note, 1.375%, 12/18/17 | Canada | 100,000 | | 99,441 |
| Citigroup Inc., senior note, 6.00%, 8/15/17 | United States | 100,000 | | 107,607 |
| HSBC USA Inc., senior note, 1.50%, 11/13/17 | United States | 100,000 | | 99,698 |
| Royal Bank of Canada, secured note, 1.20%, 9/19/17 | Canada | 100,000 | | 99,527 |
| Wells Fargo & Co., senior note, 5.625%, 12/11/17 | United States | 100,000 | | 108,117 |
| | | | | 622,442 |
| Capital Goods 3.1% | | | | |
| General Electric Co., senior note, 5.25%, 12/06/17 | United States | 100,000 | | 107,870 |
| Consumer Services 1.4% | | | | |
| Carnival Corp., senior note, 1.875%, 12/15/17 | United States | 50,000 | | 50,065 |
| Diversified Financials 9.3% | | | | |
| The Bear Stearns Cos. LLC, senior note, 6.40%, 10/02/17 | United States | 100,000 | | 108,488 |
| The Goldman Sachs Group Inc., senior note, 6.25%, 9/01/17 | United States | 100,000 | | 108,020 |
| Morgan Stanley, senior note, 5.95%, 12/28/17 | United States | 100,000 | | 108,408 |
| | | | | 324,916 |
| Energy 11.7% | | | | |
| Anadarko Petroleum Corp., senior note, 6.375%, 9/15/17 | United States | 50,000 | | 53,526 |
| EOG Resources Inc., senior note, 5.875%, 9/15/17 | United States | 100,000 | | 107,389 |
| Kinder Morgan Inc., senior note, 7.00%, 6/15/17 | United States | 50,000 | | 52,144 |
| National Oilwell Varco Inc., senior note, 1.35%, 12/01/17 | United States | 100,000 | | 98,956 |
| Statoil ASA, senior note, 1.25%, 11/09/17 | Norway | 100,000 | | 99,614 |
| | | | | 411,629 |
| Food & Staples Retailing 1.4% | | | | |
| Walgreens Boots Alliance Inc., senior note, 1.75%, 11/17/17 | United States | 50,000 | | 49,857 |
| Food, Beverage & Tobacco 1.5% | | | | |
| Bunge Ltd. Finance Corp., senior note, 3.20%, 6/15/17 | United States | 50,000 | | 50,549 |
| Health Care Equipment & Services 4.3% | | | | |
| Aetna Inc., senior note, 1.50%, 11/15/17 | United States | 100,000 | | 99,874 |
| Becton Dickinson and Co., senior note, 1.80%, 12/15/17 | United States | 50,000 | | 50,136 |
| | | | | 150,010 |
| Insurance 4.4% | | | | |
| Metlife Inc., senior note, 1.903%, 12/15/17 | United States | 100,000 | | 100,651 |
| Prudential Financial Inc., senior note, 6.00%, 12/01/17 | United States | 50,000 | | 54,129 |
| | | | | 154,780 |
| Materials 5.8% | | | | |
| Ecolab Inc., senior note, 1.45%, 12/08/17 | United States | 50,000 | | 49,731 |
| Potash Corp. of Saskatchewan Inc., senior note, 3.25%, 12/01/17 | Canada | 100,000 | | 101,539 |
| Rohm & Haas Co., senior bond, 6.00%, 9/15/17 | United States | 50,000 | | 53,494 |
| | | | | 204,764 |
| Media 3.1% | | | | |
| Time Warner Cos. Inc., senior bond, 7.25%, 10/15/17 | United States | 50,000 | | 55,024 |
| Viacom Inc., senior note, 6.125%, 10/05/17 | United States | 50,000 | | 53,540 |
| | | | | 108,564 |
|
30 Semiannual Report
FRANKLIN FUND ALLOCATOR SERIES
STATEMENT OF INVESTMENTS (UNAUDITED)
| | | | |
| Franklin Payout 2017 Fund (continued) | | | | |
| | | Principal | | |
| | Country | Amount* | | Value |
| Corporate Bonds continued) | | | | |
| Pharmaceuticals, Biotechnology & Life Sciences 1.4% | | | | |
| AbbVie Inc., senior note, 1.75%, 11/06/17 | United States | 50,000 | $ | 50,200 |
| Semiconductors & Semiconductor Equipment 2.9% | | | | |
| Intel Corp., senior note, 1.35%, 12/15/17 | United States | 100,000 | | 100,356 |
| Software & Services 1.4% | | | | |
| Autodesk Inc., senior note, 1.95%, 12/15/17 | United States | 50,000 | | 49,917 |
| Telecommunication Services 1.4% | | | | |
| AT&T Inc., senior note, 1.40%, 12/01/17 | United States | 50,000 | | 49,948 |
| Utilities 7.6% | | | | |
| American Electric Power Co. Inc., senior note, 1.65%, 12/15/17 | United States | 50,000 | | 49,659 |
| CenterPoint Energy Resources Corp., senior note, 6.125%, 11/01/17 | United States | 50,000 | | 53,957 |
| Pacific Gas & Electric Co., senior note, 5.625%, 11/30/17 | United States | 100,000 | | 107,442 |
| TECO Finance Inc., senior note, 6.572%, 11/01/17 | United States | 50,000 | | 54,229 |
| | | | | 265,287 |
| Total Corporate Bonds (Cost $2,811,542) | | | | 2,801,064 |
| U.S. Government and Agency Securities 13.9% | | | | |
| FHLB, | | | | |
| 1.125%, 12/08/17 | United States | 150,000 | | 150,286 |
| 3.125%, 12/08/17 | United States | 155,000 | | 161,416 |
| FNMA, 0.875%, 12/20/17 | United States | 175,000 | | 174,374 |
| Total U.S. Government and Agency Securities | | | | |
| (Cost $487,227) | | | | 486,076 |
| Asset-Backed Securities (Cost $100,320) 2.8% | | | | |
| Diversified Financials 2.8% | | | | |
| Discover Card Execution Note Trust, 2014-A5, A, 1.39%, 4/15/20 | United States | 100,000 | | 100,135 |
| Municipal Bonds (Cost $50,000) 1.4% | | | | |
| Jersey City GO, Qualified Public Improvement, Refunding, Series A, 1.829%, | | | | |
| 9/01/17 | United States | 50,000 | | 50,015 |
| Total Investments before Short Term Investments | | | | |
| (Cost $3,449,089) | | | | 3,437,290 |
| |
| | | Shares | | |
| Short Term Investments (Cost $41,773) 1.2% | | | | |
| Money Market Funds 1.2% | | | | |
| b,cInstitutional Fiduciary Trust Money Market Portfolio | United States | 41,773 | | 41,773 |
| Total Investments (Cost $3,490,862) 99.2% | | | | 3,479,063 |
| Other Assets, less Liabilities 0.8% | | | | 28,074 |
| Net Assets 100.0% | | | $ | 3,507,137 |
See Abbreviations on page 62.
*The principal amount is stated in U.S. dollars unless otherwise indicated.
aSecurity was purchased pursuant to Rule 144A under the Securities Act of 1933 and may be sold in transactions exempt from registration only to qualified institutional
buyers or in a public offering registered under the Securities Act of 1933. This security has been deemed liquid under guidelines approved by the Fund’s Board of Trustees.
bNon-income producing.
cSee Note 3(d) regarding investments in affiliated management investment companies.
|
The accompanying notes are an integral part of these financial statements. | Semiannual Report 31
| | | |
| FRANKLIN FUND ALLOCATOR SERIES | | | |
| |
| |
| Financial Highlights | | | |
| Franklin Payout 2018 Fund | | | |
| | | Period Ended | |
| | | November 30, 2015a | |
| | | (unaudited) | |
| Class R6 | | | |
| Per share operating performance | | | |
| (for a share outstanding throughout the period) | | | |
| Net asset value, beginning of period | $ | 10.00 | |
| Income from investment operationsb: | | | |
| Net investment incomec | | 0.07 | |
| Net realized and unrealized gains (losses) | | (0.03 | ) |
| Total from investment operations | | 0.04 | |
| Net asset value, end of period | $ | 10.04 | |
| |
| Total returnd | | 0.40 | % |
| |
| Ratios to average net assetse | | | |
| Expenses before waiver and payments by affiliates | | 3.09 | % |
| Expenses net of waiver and payments by affiliates | | 0.29 | % |
| Net investment income | | 1.34 | % |
| |
| Supplemental data | | | |
| Net assets, end of period (000’s) | $ | 1,756 | |
| Portfolio turnover rate | | 3.00 | % |
aFor the period June 1, 2015 (commencement of operations) to November 30, 2015.
bThe amount shown for a share outstanding throughout the period may not correlate with the Statement of Operations for the period due to the timing of sales and
repurchases of the Fund’s shares in relation to income earned and/or fluctuating fair value of the investments of the Fund.
cBased on average daily shares outstanding.
dTotal return is not annualized for periods less than one year.
eRatios are annualized for periods less than one year.
|
32 Semiannual Report | The accompanying notes are an integral part of these financial statements.
FRANKLIN FUND ALLOCATOR SERIES
FINANCIAL HIGHLIGHTS
| | | |
| Franklin Payout 2018 Fund (continued) | | | |
| | | Period Ended | |
| | | November 30, 2015a | |
| | | (unaudited) | |
| Advisor Class | | | |
| Per share operating performance | | | |
| (for a share outstanding throughout the period) | | | |
| Net asset value, beginning of period | $ | 10.00 | |
| Income from investment operationsb: | | | |
| Net investment incomec | | 0.07 | |
| Net realized and unrealized gains (losses) | | (0.03 | ) |
| Total from investment operations | | 0.04 | |
| Net asset value, end of period | $ | 10.04 | |
| |
| Total returnd | | 0.40 | % |
| |
| Ratios to average net assetse | | | |
| Expenses before waiver and payments by affiliates | | 3.09 | % |
| Expenses net of waiver and payments by affiliates | | 0.29 | % |
| Net investment income | | 1.34 | % |
| |
| Supplemental data | | | |
| Net assets, end of period (000’s) | $ | 1,756 | |
| Portfolio turnover rate | | 3.00 | % |
aFor the period June 1, 2015 (commencement of operations) to November 30, 2015.
bThe amount shown for a share outstanding throughout the period may not correlate with the Statement of Operations for the period due to the timing of sales and
repurchases of the Fund’s shares in relation to income earned and/or fluctuating fair value of the investments of the Fund.
cBased on average daily shares outstanding.
dTotal return is not annualized for periods less than one year.
eRatios are annualized for periods less than one year.
|
The accompanying notes are an integral part of these financial statements. | Semiannual Report 33
| | | | |
| FRANKLIN FUND ALLOCATOR SERIES | | | | |
| |
| |
| |
| |
| Statement of Investments, November 30, 2015 (unaudited) | | | | |
| |
| Franklin Payout 2018 Fund | | | | |
| | | Principal | | |
| | Country | Amount* | | Value |
| Corporate Bonds 80.6% | | | | |
| Banks 23.3% | | | | |
| Bank of America Corp., senior note, 6.875%, 11/15/18 | United States | 100,000 | $ | 113,173 |
| Bank of Nova Scotia, senior note, 2.05%, 10/30/18 | Canada | 100,000 | | 100,124 |
| BNP Paribas SA, senior note, 2.40%, 12/12/18 | France | 100,000 | | 101,153 |
| Citigroup Inc., senior note, 2.50%, 9/26/18 | United States | 100,000 | | 101,522 |
| HSBC USA Inc., senior note, 2.625%, 9/24/18 | United States | 100,000 | | 101,992 |
| KeyCorp., senior note, 2.30%, 12/13/18 | United States | 50,000 | | 49,933 |
| Royal Bank of Canada, secured note, 2.00%, 10/01/18 | Canada | 100,000 | | 100,312 |
| Suntrust Banks Inc., senior note, 2.35%, 11/01/18 | United States | 50,000 | | 50,366 |
| Toyota Motor Credit Corp., senior note, 2.00%, 10/24/18 | United States | 100,000 | | 101,102 |
| | | | | 819,677 |
| Capital Goods 6.6% | | | | |
| Caterpillar Inc., senior note, 7.90%, 12/15/18 | United States | 100,000 | | 117,552 |
| Raytheon Co., senior bond, 6.40%, 12/15/18 | United States | 100,000 | | 113,526 |
| | | | | 231,078 |
| Consumer Services 2.9% | | | | |
| Starbucks Corp., senior note, 2.00%, 12/05/18 | United States | 100,000 | | 101,075 |
| Diversified Financials 8.6% | | | | |
| John Deere Capital Corp., senior note, 1.95%, 12/13/18 | United States | 100,000 | | 100,805 |
| Morgan Stanley, senior note, 2.20%, 12/07/18 | United States | 100,000 | | 100,738 |
| Shell International Finance BV, senior note, 2.00%, 11/15/18 | Netherlands | 100,000 | | 100,787 |
| | | | | 302,330 |
| Energy 8.7% | | | | |
| Apache Corp., senior note, 6.90%, 9/15/18 | United States | 50,000 | | 56,258 |
| Devon Energy Corp., senior note, 2.25%, 12/15/18 | United States | 50,000 | | 49,729 |
| Oneok Partners LP, senior note, 3.20%, 9/15/18 | United States | 50,000 | | 49,409 |
| Spectra Energy Partners LP, senior note, 2.95%, 9/25/18 | United States | 50,000 | | 50,072 |
| Statoil ASA, senior note, 1.95%, 11/08/18 | Norway | 100,000 | | 100,416 |
| | | | | 305,884 |
| Food & Staples Retailing 3.1% | | | | |
| CVS Health Corp., senior note, 2.25%, 12/05/18 | United States | 50,000 | | 50,587 |
| Kroger Co., senior bond, 6.80%, 12/15/18 | United States | 50,000 | | 56,501 |
| | | | | 107,088 |
| Food, Beverage & Tobacco 8.0% | | | | |
| Altria Group Inc., senior note, 9.70%, 11/10/18 | United States | 50,000 | | 60,611 |
| The Coca-Cola Co., senior note, 1.65%, 11/01/18 | United States | 100,000 | | 101,063 |
| PepsiCo Inc., senior bond, 7.90%, 11/01/18 | United States | 100,000 | | 117,513 |
| | | | | 279,187 |
| Health Care Equipment & Services 2.9% | | | | |
| Boston Scientific Corp., senior note, 2.65%, 10/01/18 | United States | 50,000 | | 50,429 |
| Laboratory Corp. of America Holdings, senior note, 2.50%, 11/01/18 | United States | 50,000 | | 50,086 |
| | | | | 100,515 |
| Materials 1.4% | | | | |
| Monsanto Co., senior note, 1.85%, 11/15/18 | United States | 50,000 | | 49,617 |
| Pharmaceuticals, Biotechnology & Life Sciences 1.4% | | | | |
| Abbvie Inc., senior note, 2.00%, 11/06/18 | United States | 50,000 | | 50,178 |
|
34 Semiannual Report
FRANKLIN FUND ALLOCATOR SERIES
STATEMENT OF INVESTMENTS (UNAUDITED)
| | | | |
| Franklin Payout 2018 Fund (continued) | | | | |
| | | Principal | | |
| | Country | Amount* | | Value |
| Corporate Bonds (continued) | | | | |
| Real Estate 1.5% | | | | |
| Boston Properties LP, senior note, 3.70%, 11/15/18 | United States | 50,000 | $ | 52,004 |
| Semiconductors & Semiconductor Equipment 1.4% | | | | |
| Maxim Integrated Products Inc., senior note, 2.50%, 11/15/18 | United States | 50,000 | | 50,111 |
| Technology Hardware & Equipment 1.4% | | | | |
| Tyco Electronics Group SA, senior note, 2.375%, 12/17/18 | Switzerland | 50,000 | | 50,277 |
| Telecommunication Services 1.4% | | | | |
| AT&T Inc., senior note, 2.375%, 11/27/18 | United States | 50,000 | | 50,697 |
| Utilities 8.0% | | | | |
| Berkshire Hathaway Energy Co., senior note, 2.00%, 11/15/18 | United States | 50,000 | | 49,911 |
| Duke Energy Carolinas LLC, secured note, 7.00%, 11/15/18 | United States | 100,000 | | 114,843 |
| Pacific Gas & Electric Co., senior note, 8.25%, 10/15/18 | United States | 100,000 | | 116,811 |
| | | | | 281,565 |
| Total Corporate Bonds (Cost $2,841,282) | | | | 2,831,283 |
| U.S. Government and Agency Securities 17.6% | | | | |
| FHLB, 3.75%, 12/14/18 | United States | 125,000 | | 133,797 |
| FNMA, 1.625%, 11/27/18 | United States | 175,000 | | 176,748 |
| U.S. Treasury Note, | | | | |
| 1.375%, 12/31/18 | United States | 130,000 | | 130,473 |
| 1.50%, 12/31/18 | United States | 175,000 | | 176,268 |
| Total U.S. Government and Agency Securities | | | | |
| (Cost $617,919) | | | | 617,286 |
| Total Investments before Short Term Investments | | | | |
| (Cost $3,459,201) | | | | 3,448,569 |
| |
| | | Shares | | |
| Short Term Investments (Cost $43,642) 1.2% | | | | |
| Money Market Funds 1.2% | | | | |
| a,bInstitutional Fiduciary Trust Money Market Portfolio | United States | 43,642 | | 43,642 |
| Total Investments (Cost $3,502,843) 99.4% | | | | 3,492,211 |
| Other Assets, less Liabilities 0.6% | | | | 20,379 |
| Net Assets 100.0% | | | $ | 3,512,590 |
See Abbreviations on page 62.
*The principal amount is stated in U.S. dollars unless otherwise indicated.
aNon-income producing.
bSee Note 3(d) regarding investments in affiliated management investment companies.
|
The accompanying notes are an integral part of these financial statements. | Semiannual Report 35
| | | |
| FRANKLIN FUND ALLOCATOR SERIES | | | |
| |
| |
| Financial Highlights | | | |
| Franklin Payout 2019 Fund | | | |
| | | Period Ended | |
| | | November 30, 2015a | |
| | | (unaudited) | |
| Class R6 | | | |
| Per share operating performance | | | |
| (for a share outstanding throughout the period) | | | |
| Net asset value, beginning of period | $ | 10.00 | |
| Income from investment operationsb: | | | |
| Net investment incomec | | 0.09 | |
| Net realized and unrealized gains (losses) | | (0.03 | ) |
| Total from investment operations | | 0.06 | |
| Net asset value, end of period | $ | 10.06 | |
| |
| Total returnd | | 0.60 | % |
| |
| Ratios to average net assetse | | | |
| Expenses before waiver and payments by affiliates | | 2.73 | % |
| Expenses net of waiver and payments by affiliates | | 0.29 | % |
| Net investment income | | 1.74 | % |
| |
| Supplemental data | | | |
| Net assets, end of period (000’s) | $ | 2,013 | |
| Portfolio turnover rate | | —% | |
aFor the period June 1, 2015 (commencement of operations) to November 30, 2015.
bThe amount shown for a share outstanding throughout the period may not correlate with the Statement of Operations for the period due to the timing of sales and
repurchases of the Fund’s shares in relation to income earned and/or fluctuating fair value of the investments of the Fund.
cBased on average daily shares outstanding.
dTotal return is not annualized for periods less than one year.
eRatios are annualized for periods less than one year.
|
36 Semiannual Report | The accompanying notes are an integral part of these financial statements.
FRANKLIN FUND ALLOCATOR SERIES
FINANCIAL HIGHLIGHTS
| | | |
| Franklin Payout 2019 Fund (continued) | | | |
| | | Period Ended | |
| | | November 30, 2015a | |
| | | (unaudited) | |
| Advisor Class | | | |
| Per share operating performance | | | |
| (for a share outstanding throughout the period) | | | |
| Net asset value, beginning of period | $ | 10.00 | |
| Income from investment operationsb: | | | |
| Net investment incomec | | 0.09 | |
| Net realized and unrealized gains (losses) | | (0.03 | ) |
| Total from investment operations | | 0.06 | |
| Net asset value, end of period | $ | 10.06 | |
| |
| Total returnd | | 0.60 | % |
| |
| Ratios to average net assetse | | | |
| Expenses before waiver and payments by affiliates | | 2.73 | % |
| Expenses net of waiver and payments by affiliates | | 0.29 | % |
| Net investment income | | 1.74 | % |
| |
| Supplemental data | | | |
| Net assets, end of period (000’s) | $ | 2,013 | |
| Portfolio turnover rate | | —% | |
aFor the period June 1, 2015 (commencement of operations) to November 30, 2015.
bThe amount shown for a share outstanding throughout the period may not correlate with the Statement of Operations for the period due to the timing of sales and
repurchases of the Fund’s shares in relation to income earned and/or fluctuating fair value of the investments of the Fund.
cBased on average daily shares outstanding.
dTotal return is not annualized for periods less than one year.
eRatios are annualized for periods less than one year.
|
The accompanying notes are an integral part of these financial statements. | Semiannual Report 37
| | | | |
| FRANKLIN FUND ALLOCATOR SERIES | | | | |
| |
| |
| |
| |
| Statement of Investments, November 30, 2015 (unaudited) | | | | |
| |
| Franklin Payout 2019 Fund | | | | |
| | | Principal | | |
| | Country | Amount* | | Value |
| Corporate Bonds 80.2% | | | | |
| Banks 15.2% | | | | |
| Bank of Nova Scotia, secured note, 2.125%, 9/11/19 | Canada | 100,000 | $ | 100,358 |
| HSBC USA Inc., senior note, 2.375%, 11/13/19 | United States | 100,000 | | 100,147 |
| JPMorgan Chase & Co., senior note, 2.20%, 10/22/19 | United States | 100,000 | | 100,191 |
| Royal Bank of Canada, secured note, 2.20%, 9/23/19 | Canada | 100,000 | | 100,742 |
| The Toronto-Dominion Bank, senior note, 2.25%, 11/05/19 | Canada | 100,000 | | 100,556 |
| Westpac Banking Corp., senior note, 4.875%, 11/19/19 | Australia | 100,000 | | 109,773 |
| | | | | 611,767 |
| Capital Goods 8.1% | | | | |
| Deere & Co., senior note, 4.375%, 10/16/19 | United States | 100,000 | | 108,531 |
| Emerson Electric Co., senior bond, 4.875%, 10/15/19 | United States | 100,000 | | 110,460 |
| Lockheed Martin Corp., senior note, 4.25%, 11/15/19 | United States | 100,000 | | 107,686 |
| | | | | 326,677 |
| Commercial & Professional Services 1.4% | | | | |
| Republic Services Inc., senior note, 5.50%, 9/15/19 | United States | 50,000 | | 55,338 |
| Diversified Financials 13.0% | | | | |
| Boeing Capital Corp., senior note, 4.70%, 10/27/19 | United States | 100,000 | | 110,605 |
| Caterpillar Financial Services Corp., senior note, 2.25%, 12/01/19 | United States | 100,000 | | 100,515 |
| General Electric Capital Corp., senior secured note, first lien, 2.10%, 12/11/19 . | United States | 100,000 | | 100,148 |
| Goldman Sachs Group Inc., senior note, 2.55%, 10/23/19 | United States | 100,000 | | 101,032 |
| Morgan Stanley, senior note, 5.625%, 9/23/19 | United States | 100,000 | | 111,377 |
| | | | | 523,677 |
| Energy 9.8% | | | | |
| Chevron Corp., senior note, 2.193%, 11/15/19 | United States | 100,000 | | 100,876 |
| Enterprise Products Operating LLC, senior note, 2.55%, 10/15/19 | United States | 50,000 | | 49,455 |
| Kinder Morgan Inc., senior note, 3.05%, 12/01/19 | United States | 50,000 | | 45,864 |
| Plains All American Pipeline LP/PAA Finance Corp., senior note, 2.60%, | | | | |
| 12/15/19 | United States | 50,000 | | 47,813 |
| Pride International Inc., senior bond, 8.50%, 6/15/19 | United States | 50,000 | | 51,384 |
| Statoil ASA, senior note, 2.25%, 11/08/19 | Norway | 100,000 | | 100,749 |
| | | | | 396,141 |
| Food & Staples Retailing 3.7% | | | | |
| Costco Wholesale Corp., senior note, 1.70%, 12/15/19 | United States | 100,000 | | 99,678 |
| Walgreens Boots Alliance Inc., senior note, 2.70%, 11/18/19 | United States | 50,000 | | 50,140 |
| | | | | 149,818 |
| Food, Beverage & Tobacco 4.2% | | | | |
| Anheuser-Busch InBev Worldwide Inc., senior note, 6.875%, 11/15/19 | Belgium | 100,000 | | 116,435 |
| Mead Johnson Nutrition Co., senior note, 4.90%, 11/01/19 | United States | 50,000 | | 54,129 |
| | | | | 170,564 |
| Health Care Equipment & Services 5.1% | | | | |
| Becton Dickinson and Co., senior note, 2.675%, 12/15/19 | United States | 50,000 | | 50,642 |
| UnitedHealth Group Inc., senior note, 2.30%, 12/15/19 | United States | 100,000 | | 101,193 |
| Zimmer Holdings Inc., senior bond, 4.625%, 11/30/19 | United States | 50,000 | | 53,713 |
| | | | | 205,548 |
| Insurance 1.5% | | | | |
| CNA Financial Corp., senior bond, 7.35%, 11/15/19 | United States | 50,000 | | 58,241 |
|
38 Semiannual Report
FRANKLIN FUND ALLOCATOR SERIES
STATEMENT OF INVESTMENTS (UNAUDITED)
| | | | |
| Franklin Payout 2019 Fund (continued) | | | | |
| | | Principal | | |
| | Country | Amount* | | Value |
| Corporate Bonds (continued) | | | | |
| Materials 3.8% | | | | |
| Eastman Chemical Co., senior bond, 5.50%, 11/15/19 | United States | 50,000 | $ | 54,757 |
| PPG Industries Inc., senior note, 2.30%, 11/15/19 | United States | 100,000 | | 99,405 |
| | | | | 154,162 |
| Media 3.9% | | | | |
| DIRECTV Holdings LLC/DIRECTV Financing Co. Inc., senior note, 5.875%, | | | | |
| 10/01/19 | United States | 50,000 | | 56,355 |
| Scripps Networks Interactive Inc., senior note, 2.75%, 11/15/19 | United States | 50,000 | | 49,350 |
| Viacom Inc., senior note, 2.75%, 12/15/19 | United States | 50,000 | | 49,662 |
| | | | | 155,367 |
| Pharmaceuticals, Biotechnology & Life Sciences 2.5% | | | | |
| Johnson & Johnson, senior note, 1.875%, 12/05/19 | United States | 100,000 | | 101,194 |
| Real Estate 1.5% | | | | |
| Weyerhaeuser Co., senior note, 7.375%, 10/01/19 | United States | 50,000 | | 58,100 |
| Utilities 6.5% | | | | |
| Dominion Resources Inc., senior note, 2.50%, 12/01/19 | United States | 50,000 | | 50,035 |
| DTE Energy Co., senior note, 2.40%, 12/01/19 | United States | 50,000 | | 49,862 |
| Georgia Power Co., senior note, 4.25%, 12/01/19 | United States | 100,000 | | 108,224 |
| Progress Energy Inc., senior bond, 4.875%, 12/01/19 | United States | 50,000 | | 54,173 |
| | | | | 262,294 |
| Total Corporate Bonds (Cost $3,240,907) | | | | 3,228,888 |
| U.S. Government and Agency Securities 18.1% | | | | |
| FFCB, 1.95%, 12/17/19 | United States | 150,000 | | 152,620 |
| FHLB, | | | | |
| 1.25%, 12/13/19 | United States | 160,000 | | 157,897 |
| 2.375%, 12/13/19 | United States | 210,000 | | 216,608 |
| FNMA, 1.75%, 11/26/19 | United States | 200,000 | | 201,112 |
| Total U.S. Government and Agency Securities | | | | |
| (Cost $725,981) | | | | 728,237 |
| Total Investments before Short Term Investments | | | | |
| (Cost $3,966,888) | | | | 3,957,125 |
| |
| | | Shares | | |
| Short Term Investments (Cost $46,996) 1.2% | | | | |
| Money Market Funds 1.2% | | | | |
| a,bInstitutional Fiduciary Trust Money Market Portfolio | United States | 46,996 | | 46,996 |
| Total Investments (Cost $4,013,884) 99.5% | | | | 4,004,121 |
| Other Assets, less Liabilities 0.5% | | | | 20,934 |
| Net Assets 100.0% | | | $ | 4,025,055 |
See Abbreviations on page 62.
*The principal amount is stated in U.S. dollars unless otherwise indicated.
aNon-income producing.
bSee Note 3(d) regarding investments in affiliated management investment companies.
|
The accompanying notes are an integral part of these financial statements. | Semiannual Report 39
| | | |
| FRANKLIN FUND ALLOCATOR SERIES | | | |
| |
| |
| Financial Highlights | | | |
| Franklin Payout 2020 Fund | | | |
| | | Period Ended | |
| | | November 30, 2015a | |
| | | (unaudited) | |
| Class R6 | | | |
| Per share operating performance | | | |
| (for a share outstanding throughout the period) | | | |
| Net asset value, beginning of period | $ | 10.00 | |
| Income from investment operationsb: | | | |
| Net investment incomec | | 0.10 | |
| Net realized and unrealized gains (losses) | | (0.06 | ) |
| Total from investment operations | | 0.04 | |
| Net asset value, end of period | $ | 10.04 | |
| |
| Total returnd | | 0.40 | % |
| |
| Ratios to average net assetse | | | |
| Expenses before waiver and payments by affiliates | | 2.74 | % |
| Expenses net of waiver and payments by affiliates | | 0.29 | % |
| Net investment income | | 1.95 | % |
| |
| Supplemental data | | | |
| Net assets, end of period (000’s) | $ | 2,009 | |
| Portfolio turnover rate | | 4.27 | % |
aFor the period June 1, 2015 (commencement of operations) to November 30, 2015.
bThe amount shown for a share outstanding throughout the period may not correlate with the Statement of Operations for the period due to the timing of sales and
repurchases of the Fund’s shares in relation to income earned and/or fluctuating fair value of the investments of the Fund.
cBased on average daily shares outstanding.
dTotal return is not annualized for periods less than one year.
eRatios are annualized for periods less than one year.
|
40 Semiannual Report | The accompanying notes are an integral part of these financial statements.
FRANKLIN FUND ALLOCATOR SERIES
FINANCIAL HIGHLIGHTS
| | | |
| Franklin Payout 2020 Fund (continued) | | | |
| | | Period Ended | |
| | | November 30, 2015a | |
| | | (unaudited) | |
| Advisor Class | | | |
| Per share operating performance | | | |
| (for a share outstanding throughout the period) | | | |
| Net asset value, beginning of period | $ | 10.00 | |
| Income from investment operationsb: | | | |
| Net investment incomec | | 0.10 | |
| Net realized and unrealized gains (losses) | | (0.06 | ) |
| Total from investment operations | | 0.04 | |
| Net asset value, end of period | $ | 10.04 | |
| |
| Total returnd | | 0.40 | % |
| |
| Ratios to average net assetse | | | |
| Expenses before waiver and payments by affiliates | | 2.74 | % |
| Expenses net of waiver and payments by affiliates | | 0.29 | % |
| Net investment income | | 1.95 | % |
| |
| Supplemental data | | | |
| Net assets, end of period (000’s) | $ | 2,009 | |
| Portfolio turnover rate | | 4.27 | % |
aFor the period June 1, 2015 (commencement of operations) to November 30, 2015.
bThe amount shown for a share outstanding throughout the period may not correlate with the Statement of Operations for the period due to the timing of sales and
repurchases of the Fund’s shares in relation to income earned and/or fluctuating fair value of the investments of the Fund.
cBased on average daily shares outstanding.
dTotal return is not annualized for periods less than one year.
eRatios are annualized for periods less than one year.
|
The accompanying notes are an integral part of these financial statements. | Semiannual Report 41
| | | | |
| FRANKLIN FUND ALLOCATOR SERIES | | | | |
| |
| |
| |
| |
| Statement of Investments, November 30, 2015 (unaudited) | | | | |
| |
| Franklin Payout 2020 Fund | | | | |
| | Country/ | Principal | | |
| | Organization | Amount* | | Value |
| Corporate Bonds 75.7% | | | | |
| Banks 5.2% | | | | |
| Bank of America Corp., senior note, 2.625%, 10/19/20 | United States | 100,000 | $ | 99,665 |
| JPMorgan Chase & Co., senior note, 4.25%, 10/15/20 | United States | 100,000 | | 106,986 |
| | | | | 206,651 |
| Capital Goods 7.8% | | | | |
| Boeing Co., senior note, 1.65%, 10/30/20 | United States | 100,000 | | 98,260 |
| Emerson Electric Co., senior bond, 4.25%, 11/15/20 | United States | 100,000 | | 108,384 |
| Raytheon Co., senior note, 3.125%, 10/15/20 | United States | 100,000 | | 104,275 |
| | | | | 310,919 |
| Consumer Services 2.5% | | | | |
| Carnival Corp., senior note, 3.95%, 10/15/20 | United States | 50,000 | | 52,807 |
| Yum! Brands Inc., senior bond, 3.875%, 11/01/20 | United States | 50,000 | | 48,540 |
| | | | | 101,347 |
| Diversified Financials 5.4% | | | | |
| Morgan Stanley, senior note, 5.50%, 7/24/20 | United States | 100,000 | | 112,498 |
| Northern Trust Corp., senior note, 3.45%, 11/04/20 | United States | 100,000 | | 105,155 |
| | | | | 217,653 |
| Energy 11.4% | | | | |
| Energy Transfer Partners LP, senior note, 4.15%, 10/01/20 | United States | 50,000 | | 48,570 |
| Enterprise Products Operating LLC, senior note, 5.20%, 9/01/20 | United States | 50,000 | | 54,523 |
| Kinder Morgan Energy Partners LP, senior bond, 5.30%, 9/15/20 | United States | 50,000 | | 49,373 |
| Pride International Inc., senior bond, 6.875%, 8/15/20 | United States | 50,000 | | 49,208 |
| Statoil ASA, senior note, 2.90%, 11/08/20 | Norway | 100,000 | | 102,622 |
| Transcanada Pipelines Ltd., senior bond, 3.80%, 10/01/20 | Canada | 100,000 | | 105,520 |
| Williams Partners LP, senior note, 4.125%, 11/15/20 | United States | 50,000 | | 48,260 |
| | | | | 458,076 |
| Food, Beverage & Tobacco 7.9% | | | | |
| Coca Cola Co., senior note, 3.15%, 11/15/20 | United States | 100,000 | | 105,349 |
| Hershey Co., senior note, 4.125%, 12/01/20 | United States | 100,000 | | 108,449 |
| PepsiCo Inc., senior bond, 3.125%, 11/01/20 | United States | 100,000 | | 104,379 |
| | | | | 318,177 |
| Health Care Equipment & Services 9.2% | | | | |
| Aetna Inc., senior bond, 3.95%, 9/01/20 | United States | 100,000 | | 105,894 |
| Becton Dickinson and Co., senior note, 3.25%, 11/12/20 | United States | 50,000 | | 51,086 |
| Cigna Corp., senior bond, 4.375%, 12/15/20 | United States | 50,000 | | 53,611 |
| Laboratory Corp. of America Holdings, senior note, 4.625%, 11/15/20 | United States | 50,000 | | 52,995 |
| UnitedHealth Group Inc., senior note, 3.875%, 10/15/20 | United States | 100,000 | | 106,648 |
| | | | | 370,234 |
| Household & Personal Products 2.6% | | | | |
| Colgate-Palmolive Co., senior note, 2.95%, 11/01/20 | United States | 100,000 | | 103,979 |
| Insurance 9.5% | | | | |
| AEGON Funding Co. LLC, senior bond, 5.75%, 12/15/20 | United States | 100,000 | | 114,628 |
| Berkshire Hathaway Finance Corp., senior note, 2.90%, 10/15/20 | United States | 100,000 | | 103,984 |
| Prudential Financial Inc., senior note, 4.50%, 11/15/20 | United States | 50,000 | | 54,107 |
| Travelers Cos. Inc., senior note, 3.90%, 11/01/20 | United States | 100,000 | | 106,986 |
| | | | | 379,705 |
| Materials 2.2% | | | | |
| The Dow Chemical Co., senior bond, 4.25%, 11/15/20 | United States | 31,000 | | 32,936 |
| aGeorgia-Pacific LLC, senior note, 144A, 5.40%, 11/01/20 | United States | 50,000 | | 55,425 |
| | | | | 88,361 |
|
42 Semiannual Report
FRANKLIN FUND ALLOCATOR SERIES
STATEMENT OF INVESTMENTS (UNAUDITED)
| | | | |
| Franklin Payout 2020 Fund (continued) | | | | |
| | Country/ | Principal | | |
| | Organization | Amount* | | Value |
| Corporate Bonds (continued) | | | | |
| Media 1.4% | | | | |
| 21st Century Fox America Inc., senior bond, 5.65%, 8/15/20 | United States | 50,000 | $ | 56,485 |
| Pharmaceuticals, Biotechnology & Life Sciences 2.6% | | | | |
| Amgen Inc., senior note, 3.45%, 10/01/20 | United States | 50,000 | | 52,196 |
| Celgene Corp., senior bond, 3.95%, 10/15/20 | United States | 50,000 | | 52,639 |
| | | | | 104,835 |
| Technology Hardware & Equipment 0.2% | | | | |
| Hewlett-Packard Co., senior note, 3.75%, 12/01/20 | United States | 9,000 | | 9,019 |
| Utilities 7.8% | | | | |
| Alabama Power Co., senior note, 3.375%, 10/01/20 | United States | 100,000 | | 103,408 |
| Constellation Energy Group, senior note, 5.15%, 12/01/20 | United States | 50,000 | | 54,591 |
| Exelon Generation Co. LLC, senior bond, 4.00%, 10/01/20 | United States | 50,000 | | 51,777 |
| Pacific Gas & Electric Co., senior note, 3.50%, 10/01/20 | United States | 100,000 | | 104,601 |
| | | | | 314,377 |
| Total Corporate Bonds (Cost $3,062,122) | | | | 3,039,818 |
| Foreign Government and Agency Securities 5.0% | | | | |
| Inter-American Development Bank, senior note, 2.125%, 11/09/20 | Supranationalb | 100,000 | | 101,445 |
| International Bank for Reconstruction and Development, senior note, 2.125%, | | | | |
| 11/01/20 | Supranationalb | 100,000 | | 101,590 |
| Total Foreign Government and Agency Securities | | | | |
| (Cost $202,267) | | | | 203,035 |
| U.S. Government and Agency Securities 18.0% | | | | |
| FHLB, 3.125%, 12/11/20 | United States | 200,000 | | 213,629 |
| U.S. Treasury Note, | | | | |
| 2.00%, 11/30/20 | United States | 145,000 | | 147,118 |
| 2.375%, 12/31/20 | United States | 205,000 | | 211,703 |
| 2.625%, 11/15/20 | United States | 145,000 | | 151,358 |
| Total U.S. Government and Agency Securities | | | | |
| (Cost $720,397) | | | | 723,808 |
| Total Investments before Short Term Investments | | | | |
| (Cost $3,984,786) | | | | 3,966,661 |
| | | Shares | | |
| Short Term Investments (Cost $30,199) 0.8% | | | | |
| Money Market Funds 0.8% | | | | |
| c,dInstitutional Fiduciary Trust Money Market Portfolio | United States | 30,199 | | 30,199 |
| Total Investments (Cost $4,014,985) 99.5% | | | | 3,996,860 |
| Other Assets, less Liabilities 0.5% | | | | 21,054 |
| Net Assets 100.0% | | | $ | 4,017,914 |
See Abbreviations on page 62.
*The principal amount is stated in U.S. dollars unless otherwise indicated.
aSecurity was purchased pursuant to Rule 144A under the Securities Act of 1933 and may be sold in transactions exempt from registration only to qualified institutional
buyers or in a public offering registered under the Securities Act of 1933. This security has been deemed liquid under guidelines approved by the Trust’s Board of
Trustees. At November 30, 2015, the value of this security was $55,425, representing 1.38% of net assets.
bA supranational organization is an entity formed by two or more central governments through international treaties.
cNon-income producing.
dSee Note 3(d) regarding investments in affiliated management investment companies.
|
The accompanying notes are an integral part of these financial statements. | Semiannual Report 43
| | | |
| FRANKLIN FUND ALLOCATOR SERIES | | | |
| |
| |
| Financial Highlights | | | |
| Franklin Payout 2021 Fund | | | |
| | | Period Ended | |
| | | November 30, 2015a | |
| | | (unaudited) | |
| Class R6 | | | |
| Per share operating performance | | | |
| (for a share outstanding throughout the period) | | | |
| Net asset value, beginning of period | $ | 10.00 | |
| Income from investment operationsb: | | | |
| Net investment incomec | | 0.11 | |
| Net realized and unrealized gains (losses) | | (0.02 | ) |
| Total from investment operations | | 0.09 | |
| Net asset value, end of period | $ | 10.09 | |
| |
| Total returnd | | 0.90 | % |
| |
| Ratios to average net assetse | | | |
| Expenses before waiver and payments by affiliates | | 2.74 | % |
| Expenses net of waiver and payments by affiliates | | 0.29 | % |
| Net investment income | | 2.15 | % |
| |
| Supplemental data | | | |
| Net assets, end of period (000’s) | $ | 2,018 | |
| Portfolio turnover rate | | —% | |
aFor the period June 1, 2015 (commencement of operations) to November 30, 2015.
bThe amount shown for a share outstanding throughout the period may not correlate with the Statement of Operations for the period due to the timing of sales and
repurchases of the Fund’s shares in relation to income earned and/or fluctuating fair value of the investments of the Fund.
cBased on average daily shares outstanding.
dTotal return is not annualized for periods less than one year.
eRatios are annualized for periods less than one year.
|
44 Semiannual Report | The accompanying notes are an integral part of these financial statements.
FRANKLIN FUND ALLOCATOR SERIES
FINANCIAL HIGHLIGHTS
| | | |
| Franklin Payout 2021 Fund (continued) | | | |
| | | Period Ended | |
| | | November 30, 2015a | |
| | | (unaudited) | |
| Advisor Class | | | |
| Per share operating performance | | | |
| (for a share outstanding throughout the period) | | | |
| Net asset value, beginning of period | $ | 10.00 | |
| Income from investment operationsb: | | | |
| Net investment incomec | | 0.11 | |
| Net realized and unrealized gains (losses) | | (0.02 | ) |
| Total from investment operations | | 0.09 | |
| Net asset value, end of period | $ | 10.09 | |
| |
| Total returnd | | 0.90 | % |
| |
| Ratios to average net assetse | | | |
| Expenses before waiver and payments by affiliates | | 2.74 | % |
| Expenses net of waiver and payments by affiliates | | 0.29 | % |
| Net investment income | | 2.15 | % |
| |
| Supplemental data | | | |
| Net assets, end of period (000’s) | $ | 2,018 | |
| Portfolio turnover rate | | —% | |
aFor the period June 1, 2015 (commencement of operations) to November 30, 2015.
bThe amount shown for a share outstanding throughout the period may not correlate with the Statement of Operations for the period due to the timing of sales and
repurchases of the Fund’s shares in relation to income earned and/or fluctuating fair value of the investments of the Fund.
cBased on average daily shares outstanding.
dTotal return is not annualized for periods less than one year.
eRatios are annualized for periods less than one year.
|
The accompanying notes are an integral part of these financial statements. | Semiannual Report 45
| | | | |
| FRANKLIN FUND ALLOCATOR SERIES | | | | |
| |
| |
| |
| |
| Statement of Investments, November 30, 2015 (unaudited) | | | | |
| |
| Franklin Payout 2021 Fund | | | | |
| | Country/ | Principal | | |
| | Organization | Amount* | | Value |
| Corporate Bonds 74.8% | | | | |
| Capital Goods 5.0% | | | | |
| The Boeing Co., senior note, 2.35%, 10/30/21 | United States | 100,000 | $ | 100,109 |
| Emerson Electric Co., senior note, 2.625%, 12/01/21 | United States | 100,000 | | 99,579 |
| | | | | 199,688 |
| Consumer Services 1.2% | | | | |
| Yum! Brands Inc., senior bond, 3.75%, 11/01/21 | United States | 50,000 | | 46,952 |
| Diversified Financials 10.6% | | | | |
| Bank of New York Mellon Corp., senior note, 3.55%, 9/23/21 | United States | 100,000 | | 105,401 |
| Berkshire Hathaway Inc., senior note, 3.75%, 8/15/21 | United States | 100,000 | | 107,710 |
| General Electric Capital Corp., senior note, 4.65%, 10/17/21 | United States | 100,000 | | 111,576 |
| John Deere Capital Corp., senior bond, 3.15%, 10/15/21 | United States | 100,000 | | 102,506 |
| | | | | 427,193 |
| Energy 13.9% | | | | |
| BP Capital Markets PLC, senior note, 3.561%, 11/01/21 | United Kingdom | 100,000 | | 104,074 |
| ConocoPhillips Co., senior note, 2.875%, 11/15/21 | United States | 100,000 | | 99,729 |
| Halliburton Co., senior bond, 3.25%, 11/15/21 | United States | 100,000 | | 101,669 |
| Statoil ASA, senior note, 2.75%, 11/10/21 | Norway | 100,000 | | 99,942 |
| Total Capital SA, senior bond, 4.25%, 12/15/21 | France | 100,000 | | 108,217 |
| Williams Partners LP, senior note, 4.00%, 11/15/21 | United States | 50,000 | | 46,079 |
| | | | | 559,710 |
| Food & Staples Retailing 2.5% | | | | |
| The Kroger Co., senior note, 2.95%, 11/01/21 | United States | 50,000 | | 49,689 |
| Walgreens Boots Alliance Inc., senior note, 3.30%, 11/18/21 | United States | 50,000 | | 49,906 |
| | | | | 99,595 |
| Food, Beverage & Tobacco 3.8% | | | | |
| General Mills Inc., senior bond, 3.15%, 12/15/21 | United States | 50,000 | | 50,480 |
| Philip Morris International Inc., senior note, 2.90%, 11/15/21 | United States | 100,000 | | 101,397 |
| | | | | 151,877 |
| Health Care Equipment & Services 3.9% | | | | |
| Express Scripts Holding Co., senior note, 4.75%, 11/15/21 | United States | 50,000 | | 54,344 |
| UnitedHealth Group Inc., senior note, 3.375%, 11/15/21 | United States | 100,000 | | 103,731 |
| | | | | 158,075 |
| Insurance 1.4% | | | | |
| Prudential Financial Inc., senior note, 4.50%, 11/16/21 | United States | 50,000 | | 54,395 |
| Materials 5.1% | | | | |
| Air Products and Chemicals Inc., senior note, 3.00%, 11/03/21 | United States | 100,000 | | 101,098 |
| The Dow Chemical Co., senior bond, 4.125%, 11/15/21 | United States | 50,000 | | 52,680 |
| Ecolab Inc., senior note, 4.35%, 12/08/21 | United States | 50,000 | | 53,840 |
| | | | | 207,618 |
| Pharmaceuticals, Biotechnology & Life Sciences 6.5% | | | | |
| Gilead Sciences Inc., senior note, 4.40%, 12/01/21 | United States | 100,000 | | 108,977 |
| Johnson & Johnson, senior note, 2.45%, 12/05/21 | United States | 100,000 | | 101,853 |
| PerkinElmer Inc., senior note, 5.00%, 11/15/21 | United States | 50,000 | | 53,034 |
| | | | | 263,864 |
|
46 Semiannual Report
FRANKLIN FUND ALLOCATOR SERIES
STATEMENT OF INVESTMENTS (UNAUDITED)
| | | | |
| Franklin Payout 2021 Fund (continued) | | | | |
| | Country/ | Principal | | |
| | Organization | Amount* | | Value |
| Corporate Bonds (continued) | | | | |
| Real Estate 4.0% | | | | |
| American Tower Corp., senior note, 5.90%, 11/01/21 | United States | 50,000 | $ | 55,903 |
| Simon Property Group LP, senior bond, 4.125%, 12/01/21 | United States | 100,000 | | 107,380 |
| | | | | 163,283 |
| Semiconductors & Semiconductor Equipment 2.6% | | | | |
| Intel Corp., senior note, 3.30%, 10/01/21 | United States | 100,000 | | 104,801 |
| Software & Services 2.5% | | | | |
| International Business Machines Corp., senior note, 2.90%, 11/01/21 | United States | 100,000 | | 101,959 |
| Technology Hardware & Equipment 2.8% | | | | |
| Thomas & Betts Corp., senior bond, 5.625%, 11/15/21 | United States | 100,000 | | 114,407 |
| Telecommunication Services 4.0% | | | | |
| aTelstra Corp. Ltd., senior note, 144A, 4.80%, 10/12/21 | Australia | 100,000 | | 110,189 |
| Verizon Communications Inc., senior note, 3.00%, 11/01/21 | United States | 50,000 | | 50,150 |
| | | | | 160,339 |
| Transportation 1.2% | | | | |
| Norfolk Southern Corp., senior bond, 3.25%, 12/01/21 | United States | 50,000 | | 50,037 |
| Utilities 3.8% | | | | |
| Baltimore Gas & Electric Co., senior note, 3.50%, 11/15/21 | United States | 50,000 | | 52,160 |
| Pacific Gas & Electric Co., senior note, 3.25%, 9/15/21 | United States | 100,000 | | 102,965 |
| | | | | 155,125 |
| Total Corporate Bonds (Cost $3,031,086) | | | | 3,018,918 |
| Foreign Government and Agency Securities | | | | |
| (Cost $100,169) 2.5% | | | | |
| European Investment Bank, senior note, 2.125%, 10/15/21 | Supranationalb | 100,000 | | 100,571 |
| U.S. Government and Agency Securities 18.0% | | | | |
| FFCB, 2.00%, 12/01/21 | United States | 200,000 | | 199,035 |
| FHLB, 2.625%, 12/10/21 | United States | 200,000 | | 207,128 |
| U.S. Treasury Note, | | | | |
| 1.875%, 11/30/21 | United States | 160,000 | | 160,037 |
| 2.125%, 12/31/21 | United States | 160,000 | | 162,213 |
| Total U.S. Government and Agency Securities | | | | |
| (Cost $723,902) | | | | 728,413 |
| Municipal Bonds (Cost $116,538) 2.9% | | | | |
| California State GO, Various Purpose, 5.70%, 11/01/21 | United States | 100,000 | | 116,739 |
| Total Investments before Short Term Investments | | | | |
| (Cost $3,971,695) | | | | 3,964,641 |
|
Semiannual Report 47
| | | | |
| FRANKLIN FUND ALLOCATOR SERIES | | | | |
| STATEMENT OF INVESTMENTS (UNAUDITED) | | | | |
| |
| |
| |
| |
| Franklin Payout 2021 Fund (continued) | | | | |
| | Country/ | | | |
| | Organization | Shares | | Value |
| Short Term Investments (Cost $51,063) 1.3% | | | | |
| Money Market Funds 1.3% | | | | |
| c,dInstitutional Fiduciary Trust Money Market Portfolio | United States | 51,063 | $ | 51,063 |
| Total Investments (Cost $4,022,758) 99.5% | | | | 4,015,704 |
| Other Assets, less Liabilities 0.5% | | | | 20,355 |
| Net Assets 100.0% | | | $ | 4,036,059 |
See Abbreviations on page 62.
*The principal amount is stated in U.S. dollars unless otherwise indicated.
aSecurity was purchased pursuant to Rule 144A under the Securities Act of 1933 and may be sold in transactions exempt from registration only to qualified institutional
buyers or in a public offering registered under the Securities Act of 1933. This security has been deemed liquid under guidelines approved by the Trust’s Board of Trustees.
At November 30, 2015, the value of this security was $110,189, representing 2.73% of net assets.
bA supranational organization is an entity formed by two or more central governments through international treaties.
cNon-income producing.
dSee Note 3(d) regarding investments in affiliated management investment companies.
|
48 Semiannual Report | The accompanying notes are an integral part of these financial statements.
| | | | | | | | | |
| | | FRANKLIN FUND ALLOCATOR SERIES | |
| |
| |
| |
| |
| Financial Statements | | | | | | | | | |
| |
| Statements of Assets and Liabilities | | | | | | | | | |
| November 30, 2015 (unaudited) | | | | | | | | | |
| |
| | | Franklin | | | Franklin | | | Franklin | |
| | | Payout 2017 | | | Payout 2018 | | | Payout 2019 | |
| | | Fund | | | Fund | | | Fund | |
| Assets: | | | | | | | | | |
| Investments in securities: | | | | | | | | | |
| Cost - Unaffiliated issuers | $ | 3,449,089 | | $ | 3,459,201 | | $ | 3,966,888 | |
| Cost - Non-controlled affiliates (Note 3d) | | 41,773 | | | 43,642 | | | 46,996 | |
| Total cost of investments | $ | 3,490,862 | | $ | 3,502,843 | | $ | 4,013,884 | |
| Value - Unaffiliated issuers | $ | 3,437,290 | | $ | 3,448,569 | | $ | 3,957,125 | |
| Value - Non-controlled affiliates (Note 3d) | | 41,773 | | | 43,642 | | | 46,996 | |
| Total value of investments | | 3,479,063 | | | 3,492,211 | | | 4,004,121 | |
| Receivables from interest | | 32,499 | | | 24,806 | | | 26,126 | |
| Offering costs | | 25,078 | | | 25,142 | | | 25,104 | |
| Other assets | | 1,329 | | | 1,329 | | | 1,329 | |
| Total assets | | 3,537,969 | | | 3,543,488 | | | 4,056,680 | |
| Liabilities: | | | | | | | | | |
| Payables: | | | | | | | | | |
| Transfer agent fees | | 7 | | | 7 | | | 7 | |
| Reports to shareholders | | 1,820 | | | 1,820 | | | 1,820 | |
| Professional fees | | 16,487 | | | 16,487 | | | 16,487 | |
| Affiliates | | 11,800 | | | 11,840 | | | 12,552 | |
| Accrued expenses and other liabilities | | 718 | | | 744 | | | 759 | |
| Total liabilities | | 30,832 | | | 30,898 | | | 31,625 | |
| Net assets, at value | $ | 3,507,137 | | $ | 3,512,590 | | $ | 4,025,055 | |
| |
| Net assets consist of: | | | | | | | | | |
| Paid-in capital | $ | 3,500,000 | | $ | 3,500,000 | | $ | 4,000,000 | |
| Undistributed net investment income | | 18,936 | | | 23,445 | | | 34,818 | |
| Net unrealized appreciation (depreciation) | | (11,799 | ) | | (10,632 | ) | | (9,763 | ) |
| Accumulated net realized gain (loss) | | — | | | (223 | ) | | — | |
| Net assets, at value | $ | 3,507,137 | | $ | 3,512,590 | | $ | 4,025,055 | |
| |
| Class R6: | | | | | | | | | |
| Net assets, at value | $ | 1,753,562 | | $ | 1,756,290 | | $ | 2,012,522 | |
| Shares outstanding | | 175,000 | | | 175,000 | | | 200,000 | |
| Net asset value and maximum offering price per share | $ | 10.02 | | $ | 10.04 | | $ | 10.06 | |
| Advisor Class: | | | | | | | | | |
| Net assets, at value | $ | 1,753,575 | | $ | 1,756,300 | | $ | 2,012,533 | |
| Shares outstanding | | 175,000 | | | 175,000 | | | 200,000 | |
| Net asset value and maximum offering price per share | $ | 10.02 | | $ | 10.04 | | $ | 10.06 | |
The accompanying notes are an integral part of these financial statements. | Semiannual Report 49
| | | | | | |
| FRANKLIN FUND ALLOCATOR SERIES | | | | | | |
| FINANCIAL STATEMENTS | | | | | | |
| |
| |
| Statements of Assets and Liabilities (continued) | | | | | | |
| November 30, 2015 (unaudited) | | | | | | |
| |
| | | Franklin | | | Franklin | |
| | | Payout 2020 | | | Payout 2021 | |
| | | Fund | | | Fund | |
| Assets: | | | | | | |
| Investments in securities: | | | | | | |
| Cost - Unaffiliated issuers | $ | 3,984,786 | | $ | 3,971,695 | |
| Cost - Non-controlled affiliates (Note 3d) | | 30,199 | | | 51,063 | |
| Total cost of investments | $ | 4,014,985 | | $ | 4,022,758 | |
| Value - Unaffiliated issuers | $ | 3,966,661 | | $ | 3,964,641 | |
| Value - Non-controlled affiliates (Note 3d) | | 30,199 | | | 51,063 | |
| Total value of investments | | 3,996,860 | | | 4,015,704 | |
| Receivables from interest | | 26,198 | | | 25,554 | |
| Offering costs | | 25,116 | | | 25,072 | |
| Other assets | | 1,329 | | | 1,329 | |
| Total assets | | 4,049,503 | | | 4,067,659 | |
| Liabilities: | | | | | | |
| Payables: | | | | | | |
| Transfer agent fees | | 7 | | | 7 | |
| Reports to shareholders | | 1,820 | | | 1,820 | |
| Professional fees | | 16,487 | | | 16,487 | |
| Affiliates | | 12,513 | | | 12,499 | |
| Accrued expenses and other liabilities | | 762 | | | 787 | |
| Total liabilities | | 31,589 | | | 31,600 | |
| Net assets, at value | $ | 4,017,914 | | $ | 4,036,059 | |
| Net assets consist of: | | | | | | |
| Paid-in capital | $ | 4,000,000 | | $ | 4,000,000 | |
| Undistributed net investment income | | 39,038 | | | 43,113 | |
| Net unrealized appreciation (depreciation) | | (18,125 | ) | | (7,054 | ) |
| Accumulated net realized gain (loss) | | (2,999 | ) | | — | |
| Net assets, at value | $ | 4,017,914 | | $ | 4,036,059 | |
| |
| Class R6: | | | | | | |
| Net assets, at value | $ | 2,008,950 | | $ | 2,018,023 | |
| Shares outstanding | | 200,000 | | | 200,000 | |
| Net asset value and maximum offering price per share | $ | 10.04 | | $ | 10.09 | |
| Advisor Class: | | | | | | |
| Net assets, at value | $ | 2,008,964 | | $ | 2,018,036 | |
| Shares outstanding | | 200,000 | | | 200,000 | |
| Net asset value and maximum offering price per share | $ | 10.04 | | $ | 10.09 | |
| 50 | | Semiannual Report | The accompanying notes are an integral part of these financial statements. |
| | | | | | | | | |
| | | FRANKLIN FUND ALLOCATOR SERIES | |
| | | | | | FINANCIAL STATEMENTS | |
| |
| |
| Statements of Operations | | | | | | | | | |
| for the period ended November 30, 2015 (unaudited)* | | | | | | | | | |
| |
| | | Franklin | | | Franklin | | | Franklin | |
| | | Payout 2017 | | | Payout 2018 | | | Payout 2019 | |
| | | Fund | | | Fund | | | Fund | |
| Investment income: | | | | | | | | | |
| Interest | $ | 24,029 | | $ | 28,544 | | $ | 40,623 | |
| Expenses: | | | | | | | | | |
| Management fees (Note 3a) | | 5,224 | | | 5,231 | | | 5,992 | |
| Transfer agent fees: (Note 3c) | | | | | | | | | |
| Class R6 | | 28 | | | 28 | | | 28 | |
| Advisor Class | | 14 | | | 14 | | | 14 | |
| Custodian fees (Note 4) | | 59 | | | 63 | | | 27 | |
| Reports to shareholders | | 1,977 | | | 1,977 | | | 1,977 | |
| Registration and filing fees | | 125 | | | 125 | | | 125 | |
| Professional fees | | 16,487 | | | 16,487 | | | 16,487 | |
| Amortization of offering costs | | 29,223 | | | 28,665 | | | 28,623 | |
| Other | | 1,509 | | | 1,509 | | | 1,509 | |
| Total expenses | | 54,646 | | | 54,099 | | | 54,782 | |
| Expenses waived/paid by affiliates (Notes 3d and 3e) | | (49,553 | ) | | (49,000 | ) | | (48,977 | ) |
| Net expenses | | 5,093 | | | 5,099 | | | 5,805 | |
| Net investment income | | 18,936 | | | 23,445 | | | 34,818 | |
| Realized and unrealized gains (losses): | | | | | | | | | |
| Net realized gain (loss) from investments | | — | | | (223 | ) | | — | |
| Net change in unrealized appreciation (depreciation) on investments | | (11,799 | ) | | (10,632 | ) | | (9,763 | ) |
| Net realized and unrealized gain (loss) | | (11,799 | ) | | (10,855 | ) | | (9,763 | ) |
| Net increase (decrease) in net assets resulting from operations | $ | 7,137 | | $ | 12,590 | | $ | 25,055 | |
*For the period June 1, 2015 (commencement of operations) to November 30, 2015.
|
The accompanying notes are an integral part of these financial statements. | Semiannual Report 51
| | | | | | |
| FRANKLIN FUND ALLOCATOR SERIES | | | | | | |
| FINANCIAL STATEMENTS | | | | | | |
| |
| |
| Statements of Operations (continued) | | | | | | |
| for the period ended November 30, 2015 (unaudited)* | | | | | | |
| |
| | | Franklin | | | Franklin | |
| | | Payout 2020 | | | Payout 2021 | |
| | | Fund | | | Fund | |
| Investment income: | | | | | | |
| Interest | $ | 44,865 | | $ | 48,947 | |
| Expenses: | | | | | | |
| Management fees (Note 3a) | | 5,984 | | | 5,992 | |
| Transfer agent fees: (Note 3c) | | | | | | |
| Class R6 | | 28 | | | 28 | |
| Advisor Class | | 14 | | | 14 | |
| Custodian fees (Note 4) | | 55 | | | 106 | |
| Reports to shareholders | | 1,977 | | | 1,977 | |
| Registration and filing fees | | 125 | | | 125 | |
| Professional fees | | 16,487 | | | 16,487 | |
| Amortization of offering costs | | 28,607 | | | 28,534 | |
| Other | | 1,611 | | | 1,509 | |
| Total expenses | | 54,888 | | | 54,772 | |
| Expenses waived/paid by affiliates (Notes 3d and 3e) | | (49,061 | ) | | (48,938 | ) |
| Net expenses | | 5,827 | | | 5,834 | |
| Net investment income | | 39,038 | | | 43,113 | |
| Realized and unrealized gains (losses): | | | | | | |
| Net realized gain (loss) from investments | | (2,999 | ) | | — | |
| Net change in unrealized appreciation (depreciation) on investments | | (18,125 | ) | | (7,054 | ) |
| Net realized and unrealized gain (loss) | | (21,124 | ) | | (7,054 | ) |
| Net increase (decrease) in net assets resulting from operations | $ | 17,914 | | $ | 36,059 | |
*For the period June 1, 2015 (commencement of operations) to November 30, 2015.
| 52 | | Semiannual Report | The accompanying notes are an integral part of these financial statements. |
| | | | | | |
| | | FRANKLIN FUND ALLOCATOR SERIES | |
| | | | | | FINANCIAL STATEMENTS | |
| |
| |
| Statements of Changes in Net Assets | | | | | | |
| |
| | | Franklin Payout 2017 Fund | | | Franklin Payout 2018 Fund | |
| | | Period Ended | | | Period Ended | |
| | | November 30, 2015 | | | November 30, 2015 | |
| | | (unaudited)* | | | (unaudited)* | |
| Increase (decrease) in net assets: | | | | | | |
| Operations: | | | | | | |
| Net investment income | $ | 18,936 | | $ | 23,445 | |
| Net realized gain (loss) | | — | | | (223 | ) |
| Net change in unrealized appreciation (depreciation) | | (11,799 | ) | | (10,632 | ) |
| Net increase (decrease) in net assets resulting from | | | | | | |
| operations | | 7,137 | | | 12,590 | |
| Capital share transactions: (Note 2) | | | | | | |
| Class R6 | | 1,750,000 | | | 1,750,000 | |
| Advisor Class | | 1,750,000 | | | 1,750,000 | |
| Total capital share transactions | | 3,500,000 | | | 3,500,000 | |
| Net increase (decrease) in net assets | | 3,507,137 | | | 3,512,590 | |
| Net assets: | | | | | | |
| End of period | $ | 3,507,137 | | $ | 3,512,590 | |
| Undistributed net investment income included in net assets: | | | | | | |
| End of period | $ | 18,936 | | $ | 23,445 | |
| |
| | | Franklin Payout 2019 Fund | | | Franklin Payout 2020 Fund | |
| | | Period Ended | | | Period Ended | |
| | | November 30, 2015 | | | November 30, 2015 | |
| | | (unaudited)* | | | (unaudited)* | |
| Increase (decrease) in net assets: | | | | | | |
| Operations: | | | | | | |
| Net investment income | $ | 34,818 | | $ | 39,038 | |
| Net realized gain (loss) | | — | | | (2,999 | ) |
| Net change in unrealized appreciation (depreciation) | | (9,763 | ) | | (18,125 | ) |
| Net increase (decrease) in net assets resulting from | | | | | | |
| operations | | 25,055 | | | 17,914 | |
| Capital share transactions: (Note 2) | | | | | | |
| Class R6 | | 2,000,000 | | | 2,000,000 | |
| Advisor Class | | 2,000,000 | | | 2,000,000 | |
| Total capital share transactions | | 4,000,000 | | | 4,000,000 | |
| Net increase (decrease) in net assets | | 4,025,055 | | | 4,017,914 | |
| Net assets: | | | | | | |
| End of period | $ | 4,025,055 | | $ | 4,017,914 | |
| Undistributed net investment income included in net assets: | | | | | | |
| End of period | $ | 34,818 | | $ | 39,038 | |
*For the period June 1, 2015 (commencement of operations) to November 30, 2015.
|
The accompanying notes are an integral part of these financial statements. | Semiannual Report 53
| | | |
| FRANKLIN FUND ALLOCATOR SERIES | | | |
| FINANCIAL STATEMENTS | | | |
| |
| |
| Statements of Changes in Net Assets (continued) | | | |
| |
| | | Franklin Payout 2021 Fund | |
| | | Period Ended | |
| | | November 30, 2015 | |
| | | (unaudited)* | |
| Increase (decrease) in net assets: | | | |
| Operations: | | | |
| Net investment income | $ | 43,113 | |
| Net change in unrealized appreciation (depreciation) | | (7,054 | ) |
| Net increase (decrease) in net assets resulting from operations | | 36,059 | |
| Capital share transactions: (Note 2) | | | |
| Class R6 | | 2,000,000 | |
| Advisor Class | | 2,000,000 | |
| Total capital share transactions | | 4,000,000 | |
| Net increase (decrease) in net assets | | 4,036,059 | |
| Net assets: | | | |
| End of period | $ | 4,036,059 | |
| Undistributed net investment income included in net assets: | | | |
| End of period | $ | 43,113 | |
*For the period June 1, 2015 (commencement of operations) to November 30, 2015.
| 54 | | Semiannual Report | The accompanying notes are an integral part of these financial statements. |
FRANKLIN FUND ALLOCATOR SERIES
Notes to Financial Statements (unaudited)
1. Organization and Significant Accounting Policies
Franklin Fund Allocator Series (Trust) is registered under the Investment Company Act of 1940 (1940 Act) as an open-end management investment company, consisting of twenty separate funds, five of which are included in this report (Funds) and applies the specialized accounting and reporting guidance in U.S. Generally Accepted Accounting Principles (U.S. GAAP). The financial statements of the remaining funds in the Trust are presented separately. Effective June 1, 2015, the Funds commenced operations offering two classes of shares: Class R6 and Advisor Class. Each class of shares differs by its voting rights on matters affecting a single class and fees primarily due to differing arrangements for transfer agent fees.
The following summarizes the Funds’ significant accounting policies.
a. Financial Instrument Valuation
The Funds’ investments in financial instruments are carried at fair value daily. Fair value is the price that would be received to sell an asset or paid to transfer a liability in an orderly transaction between market participants on the measurement date. The Funds calculate the net asset value (NAV) per share as of 4 p.m. Eastern time each day the New York Stock Exchange (NYSE) is open for trading. Under compliance policies and procedures approved by the Trust’s Board of Trustees (the Board), the Funds’ administrator has responsibility for oversight of valuation, including leading the cross-functional Valuation and Liquidity Oversight Committee (VLOC). The VLOC provides administration and oversight of the Funds’ valuation policies and procedures, which are approved annually by the Board. Among other things, these procedures allow the Funds to utilize independent pricing services, quotations from securities and financial instrument dealers, and other market sources to determine fair value.
Debt securities generally trade in the over-the-counter market rather than on a securities exchange. The Funds’ pricing services use multiple valuation techniques to determine fair value. In instances where sufficient market activity exists, the pricing services may utilize a market-based approach through which quotes from market makers are used to determine fair value. In instances where sufficient market activity may not exist or is limited, the pricing services also utilize proprietary valuation models which may consider market characteristics such as benchmark yield curves, credit spreads, estimated default rates, anticipated market interest rate volatility, coupon rates, anticipated timing of principal repayments, underlying collateral, and other unique security features in order to estimate the relevant cash flows, which are then discounted to calculate the fair value.
Investments in open-end mutual funds are valued at the closing NAV.
The Funds have procedures to determine the fair value of financial instruments for which market prices are not reliable or readily available. Under these procedures, the VLOC convenes on a regular basis to review such financial instruments and considers a number of factors, including significant unobservable valuation inputs, when arriving at fair value. The VLOC primarily employs a market-based approach which may use related or comparable assets or liabilities, recent transactions, market multiples, book values, and other relevant information for the investment to determine the fair value of the investment. An income-based valuation approach may also be used in which the anticipated future cash flows of the investment are discounted to calculate fair value. Discounts may also be applied due to the nature or duration of any restrictions on the disposition of the investments. Due to the inherent uncertainty of valuations of such investments, the fair values may differ significantly from the values that would have been used had an active market existed. The VLOC employs various methods for calibrating these valuation approaches including a regular review of key inputs and assumptions, transactional back-testing or disposition analysis, and reviews of any related market activity.
|
Semiannual Report 55
FRANKLIN FUND ALLOCATOR SERIES
NOTES TO FINANCIAL STATEMENTS (UNAUDITED)
1. Organization and Significant Accounting
Policies (continued)
b. Income and Deferred Taxes
It is each Fund’s policy to qualify as a regulated investment company under the Internal Revenue Code. Each Fund intends to distribute to shareholders substantially all of its taxable income and net realized gains to relieve it from federal income and excise taxes. As a result, no provision for U.S. federal income taxes is required.
The Funds may be subject to foreign taxation related to income received, capital gains on the sale of securities and certain foreign currency transactions in the foreign jurisdictions in which the Funds invest. Foreign taxes, if any, are recorded based on the tax regulations and rates that exist in the foreign markets in which the Funds invest. When a capital gain tax is determined to apply, certain or all Funds record an estimated deferred tax liability in an amount that would be payable if the securities were disposed of on the valuation date.
Each Fund recognizes the tax benefits of uncertain tax positions only when the position is “more likely than not” to be sustained upon examination by the tax authorities based on the technical merits of the tax position. As of November 30, 2015, each Fund has determined that no liability for unrecognized tax benefits is required in each Fund’s financial statements related to uncertain tax positions taken on a tax return (or expected to be taken on future tax returns).
c. Security Transactions, Investment Income, Expenses and Distributions
Security transactions are accounted for on trade date. Realized gains and losses on security transactions are determined on a specific identification basis. Interest income and estimated expenses are accrued daily. Amortization of premium and accretion of discount on debt securities are included in interest income. Distributions to shareholders are recorded on the ex-dividend date and are determined according to income tax regulations (tax basis). Distributable earnings determined on a tax basis may differ from earnings recorded in accordance with U.S. GAAP. These differences may be permanent or temporary.
Permanent differences are reclassified among capital accounts to reflect their tax character. These reclassifications have no impact on net assets or the results of operations. Temporary differences are not reclassified, as they may reverse in subsequent periods.
Common expenses incurred by the Trust are allocated among the Funds based on the ratio of net assets of each Fund to the combined net assets of the Trust. Fund specific expenses are charged directly to the fund that incurred the expense.
Realized and unrealized gains and losses and net investment income, not including class specific expenses, are allocated daily to each class of shares based upon the relative proportion of net assets of each class. Differences in per share distributions, by class, are generally due to differences in class specific expenses.
d. Offering Costs
Offering costs are amortized on a straight line basis over twelve months.
e. Accounting Estimates
The preparation of financial statements in accordance with U.S. GAAP requires management to make estimates and assumptions that affect the reported amounts of assets and liabilities at the date of the financial statements and the amounts of income and expenses during the reporting period. Actual results could differ from those estimates.
f. Guarantees and Indemnifications
Under the Trust’s organizational documents, its officers and trustees are indemnified by the Trust against certain liabilities arising out of the performance of their duties to the Trust. Additionally, in the normal course of business, the Trust, on behalf of the Funds, enters into contracts with service providers that contain general indemnification clauses. The Trust’s maximum exposure under these arrangements is unknown as this would involve future claims that may be made against the Trust that have not yet occurred. Currently, the Trust expects the risk of loss to be remote.
|
56 Semiannual Report
FRANKLIN FUND ALLOCATOR SERIES
NOTES TO FINANCIAL STATEMENTS (UNAUDITED)
2. Shares of Beneficial Interest
At November 30, 2015, there were an unlimited number of shares authorized (without par value). Transactions in the Funds’ shares were as follows:
| | | | | | |
| | Franklin Payout | Franklin Payout |
| | 2017 Fund* | 2018 Fund* |
| | Shares | | Amount | Shares | | Amount |
| |
| Class R6 Shares: | | | | | | |
| Period ended November 30, 2015 | | | | | | |
| Shares sold | 175,000 | $ | 1,750,000 | 175,000 | $ | 1,750,000 |
| Advisor Class Shares: | | | | | | |
| Period ended November 30, 2015 | | | | | | |
| Shares sold | 175,000 | $ | 1,750,000 | 175,000 | $ | 1,750,000 |
| |
| | Franklin Payout | Franklin Payout |
| | 2019 Fund* | 2020 Fund* |
| | Shares | | Amount | Shares | | Amount |
| |
| Class R6 Shares: | | | | | | |
| Period ended November 30, 2015 | | | | | | |
| Shares sold | 200,000 | $ | 2,000,000 | 200,000 | $ | 2,000,000 |
| Advisor Class Shares: | | | | | | |
| Period ended November 30, 2015 | | | | | | |
| Shares sold | 200,000 | $ | 2,000,000 | 200,000 | $ | 2,000,000 |
| |
| | Franklin Payout | | | |
| | 2021 Fund* | | | |
| | Shares | | Amount | | | |
| |
| Class R6 Shares: | | | | | | |
| Period ended November 30, 2015 | | | | | | |
| Shares sold | 200,000 | $ | 2,000,000 | | | |
| Advisor Class Shares: | | | | | | |
| Period ended November 30, 2015 | | | | | | |
| Shares sold | 200,000 | $ | 2,000,000 | | | |
| |
| |
| *For the period June 1, 2015 (commencement of operations) to November 30, 2015. | | | | | | |
|
Semiannual Report 57
FRANKLIN FUND ALLOCATOR SERIES
NOTES TO FINANCIAL STATEMENTS (UNAUDITED)
3. Transactions with Affiliates
Franklin Resources, Inc. is the holding company for various subsidiaries that together are referred to as Franklin Templeton Investments. Certain officers and trustees of the Funds are also officers and/or directors of the following subsidiaries:
| |
| Subsidiary | Affiliation |
| Franklin Advisers, Inc. (Advisers) | Investment manager |
| Franklin Templeton Services, LLC (FT Services) | Administrative manager |
| Franklin Templeton Distributors, Inc. (Distributors) | Principal underwriter |
| Franklin Templeton Investor Services, LLC (Investor Services) | Transfer agent |
a. Management Fees
The Funds pay an investment management fee to Advisers of 0.30% per year of the average daily net assets of each of the Funds.
b. Administrative Fees
Under an agreement with Advisers, FT Services provides administrative services to the Funds. The fee is paid by Advisers based on each of the Funds’ average daily net assets, and is not an additional expense of the Funds.
c. Transfer Agent Fees
Advisor Class pays transfer agent fees to Investor Services for its performance of shareholder servicing obligations and reimburses Investor Services for out of pocket expenses incurred, including shareholding servicing fees paid to third parties. Class R6 pays Investor Services transfer agent fees specific to that class.
For the period ended November 30, 2015, the Funds paid transfer agent fees as noted in the Statements of Operations of which the following amounts were retained by Investor Services:
| | | | | | | | | |
| | Franklin | | Franklin | | Franklin | | Franklin | | Franklin |
| | Payout 2017 | | Payout 2018 | | Payout 2019 | | Payout 2020 | | Payout 2021 |
| | Fund | | Fund | | Fund | | Fund | | Fund |
| |
| Transfer agent fees | $42 | | $42 | | $42 | | $42 | | $42 |
|
58 Semiannual Report
FRANKLIN FUND ALLOCATOR SERIES
NOTES TO FINANCIAL STATEMENTS (UNAUDITED)
d. Investments in Affiliated Management Investment Companies
The Funds invest in an affiliated management investment company for purposes other than exercising a controlling influence over the management or policies. Management fees paid by the Funds are waived on assets invested in the affiliated management investment company, as noted in the Statements of Operations, in an amount not to exceed the management and administrative fees paid directly or indirectly by the affiliate.
| | | | | | | | | | |
| | | | | | | | | | | % of |
| | | | | | | | | | | Affiliated |
| | Number of | | | | Number of | | | | | Fund Shares |
| | Shares Held | | | | Shares | | Value | | | Outstanding |
| | at Beginning | Gross | Gross | | Held at End | | at End | Investment | Realized | Held at End |
| | of Period | Additions | Reductions | | of Period | | of Period | Income | Gain (Loss) | of Period |
| Franklin Payout 2017 Fund | | | | | | | | | | |
| Non-Controlled Affiliates | | | | | | | | | | |
| Institutional Fiduciary Trust Money Market | | | | | | | | | | |
| Portfolio | — | 3,218,490 | (3,176,717 | ) | 41,773 | $ | 41,773 | $ — | $ — | —a |
| Franklin Payout 2018 Fund | | | | | | | | | | |
| Non-Controlled Affiliates | | | | | | | | | | |
| Institutional Fiduciary Trust Money Market | | | | | | | | | | |
| Portfolio | — | 3,294,861 | (3,251,219 | ) | 43,642 | $ | 43,642 | $ — | $ — | —a |
| Franklin Payout 2019 Fund | | | | | | | | | | |
| Non-Controlled Affiliates | | | | | | | | | | |
| Institutional Fiduciary Trust Money Market | | | | | | | | | | |
| Portfolio | — | 3,627,653 | (3,580,657 | ) | 46,996 | $ | 46,996 | $ — | $ — | —a |
| Franklin Payout 2020 Fund | | | | | | | | | | |
| Non-Controlled Affiliates | | | | | | | | | | |
| Institutional Fiduciary Trust Money Market | | | | | | | | | | |
| Portfolio | — | 3,707,561 | (3,677,362 | ) | 30,199 | $ | 30,199 | $ — | $ — | —a |
| Franklin Payout 2021 Fund | | | | | | | | | | |
| Non-Controlled Affiliates | | | | | | | | | | |
| Institutional Fiduciary Trust Money Market | | | | | | | | | | |
| Portfolio | — | 3,647,094 | (3,596,031 | ) | 51,063 | $ | 51,063 | $ — | $ — | —a |
| |
| aRounds to less than 0.01%. | | | | | | | | | | |
e. Waiver and Expense Reimbursements
Advisers and Investor Services have contractually agreed in advance to waive or limit their respective fees and to assume as their own expense certain expenses otherwise payable by the Funds so that the expenses (excluding acquired fund fees and expenses) for Advisor Class does not exceed 0.44% and Class R6 does not exceed 0.30%, based on the average net assets of each class (other than certain non-routine expenses or costs, including those relating to litigation, indemnification, reorganizations, and liquidations) until September 30, 2016.
f. Other Affiliated Transactions
At November 30, 2015, Advisers owned 100% of the Funds’ outstanding shares. Investment activities of this shareholder could have a material impact on the Fund.
|
Semiannual Report 59
FRANKLIN FUND ALLOCATOR SERIES
NOTES TO FINANCIAL STATEMENTS (UNAUDITED)
4. Expense Offset Arrangement
The Funds have entered into an arrangement with their custodian whereby credits realized as a result of uninvested cash balances are used to reduce a portion of the Funds’ custodian expenses. During the period ended November 30, 2015, there were no credits earned.
5. Income Taxes
At November 30, 2015, the cost of investments and net unrealized appreciation (depreciation) for income tax purposes were as follows:
| | | | | | | | | | | | | | | |
| | | Franklin | | | Franklin | | | Franklin | | | Franklin | | | Franklin | |
| | | Payout 2017 | | | Payout 2018 | | | Payout 2019 | | | Payout 2020 | | | Payout 2021 | |
| | | Fund | | | Fund | | | Fund | | | Fund | | | Fund | |
| Cost of investments | $ | 3,490,699 | | $ | 3,502,827 | | $ | 4,013,816 | | $ | 4,014,985 | | $ | 4,022,499 | |
| |
| Unrealized appreciation | $ | 1,846 | | $ | 2,080 | | $ | 10,415 | | $ | 12,804 | | $ | 13,449 | |
| Unrealized depreciation | | (13,482 | ) | | (12,696 | ) | | (20,110 | ) | | (30,929 | ) | | (20,244 | ) |
| Net unrealized appreciation | | | | | | | | | | | | | | | |
| (depreciation) | $ | (11,636 | ) | $ | (10,616 | ) | $ | (9,695 | ) | $ | (18,125 | ) | $ | (6,795 | ) |
Differences between income and/or capital gains as determined on a book basis and a tax basis are primarily due to differing treatments of offering costs.
6. Investment Transactions
Purchases and sales of investments (excluding short term securities) for the period ended November 30, 2015, were as follows:
| | | | | | | | | | |
| | | Franklin | | Franklin | | Franklin | | Franklin | | Franklin |
| | | Payout 2017 | | Payout 2018 | | Payout 2019 | | Payout 2020 | | Payout 2021 |
| | | Fund | | Fund | | Fund | | Fund | | Fund |
| |
| Purchases | $ | 3,478,022 | $ | 3,585,711 | $ | 3,983,654 | $ | 4,173,167 | $ | 3,982,955 |
| Sales | $ | — | $ | 102,724 | $ | — | $ | 166,500 | $ | — |
7. Fair Value Measurements
The Funds follow a fair value hierarchy that distinguishes between market data obtained from independent sources (observable inputs) and the Funds’ own market assumptions (unobservable inputs). These inputs are used in determining the value of the Funds’ financial instruments and are summarized in the following fair value hierarchy:
- Level 1 – quoted prices in active markets for identical financial instruments
- Level 2 – other significant observable inputs (including quoted prices for similar financial instruments, interest rates, prepayment speed, credit risk, etc.)
- Level 3 – significant unobservable inputs (including the Funds’ own assumptions in determining the fair value of financial instruments)
|
60 Semiannual Report
FRANKLIN FUND ALLOCATOR SERIES
NOTES TO FINANCIAL STATEMENTS (UNAUDITED)
The input levels are not necessarily an indication of the risk or liquidity associated with financial instruments at that level.
For movements between the levels within the fair value hierarchy, the Funds have adopted a policy of recognizing the transfers as of the date of the underlying event which caused the movement.
A summary of inputs used as of November 30, 2015, in valuing the Funds’ assets carried at fair value, is as follows:
| | | | | | | | |
| | | Level 1 | | Level 2 | | Level 3 | | Total |
| Franklin Payout 2017 Fund | | | | | | | | |
| Assets: | | | | | | | | |
| Investments in Securities: | | | | | | | | |
| Corporate Bonds | $ | — | $ | 2,801,064 | $ | — | $ | 2,801,064 |
| U.S. Government and Agency Securities | | — | | 486,076 | | — | | 486,076 |
| Asset-Backed Securities | | — | | 100,135 | | — | | 100,135 |
| Municipal Bonds | | — | | 50,015 | | — | | 50,015 |
| Short Term Investments | | 41,773 | | — | | — | | 41,773 |
| Total Investments in Securities | $ | 41,773 | $ | 3,437,290 | $ | — | $ | 3,479,063 |
| Franklin Payout 2018 Fund | | | | | | | | |
| Assets: | | | | | | | | |
| Investments in Securities: | | | | | | | | |
| Corporate Bonds | $ | — | $ | 2,831,283 | $ | — | $ | 2,831,283 |
| U.S. Government and Agency Securities | | — | | 617,286 | | — | | 617,286 |
| Short Term Investments | | 43,642 | | — | | — | | 43,642 |
| Total Investments in Securities | $ | 43,642 | $ | 3,448,569 | $ | — | $ | 3,492,211 |
| Franklin Payout 2019 Fund | | | | | | | | |
| Assets: | | | | | | | | |
| Investments in Securities: | | | | | | | | |
| Corporate Bonds | $ | — | $ | 3,228,888 | $ | — | $ | 3,228,888 |
| U.S. Government and Agency Securities | | — | | 728,237 | | — | | 728,237 |
| Short Term Investments | | 46,996 | | — | | — | | 46,996 |
| Total Investments in Securities | $ | 46,996 | $ | 3,957,125 | $ | — | $ | 4,004,121 |
| Franklin Payout 2020 Fund | | | | | | | | |
| Assets: | | | | | | | | |
| Investments in Securities: | | | | | | | | |
| Corporate Bonds | $ | — | $ | 3,039,818 | $ | — | $ | 3,039,818 |
| Foreign Government and Agency Securities | | — | | 203,035 | | — | | 203,035 |
| U.S. Government and Agency Securities | | — | | 723,808 | | — | | 723,808 |
| Short Term Investments | | 30,199 | | — | | — | | 30,199 |
| Total Investments in Securities | $ | 30,199 | $ | 3,966,661 | $ | — | $ | 3,996,860 |
| Franklin Payout 2021 Fund | | | | | | | | |
| Assets: | | | | | | | | |
| Investments in Securities: | | | | | | | | |
| Corporate Bonds | $ | — | $ | 3,018,918 | $ | — | $ | 3,018,918 |
| Foreign Government and Agency Securities | | — | | 100,571 | | — | | 100,571 |
| U.S. Government and Agency Securities | | — | | 728,413 | | — | | 728,413 |
| Municipal Bonds | | — | | 116,739 | | — | | 116,739 |
| Short Term Investments | | 51,063 | | — | | — | | 51,063 |
| Total Investments in Securities | $ | 51,063 | $ | 3,964,641 | $ | — | $ | 4,015,704 |
|
Semiannual Report 61
FRANKLIN FUND ALLOCATOR SERIES
NOTES TO FINANCIAL STATEMENTS (UNAUDITED)
8. Subsequent Events
The Funds have evaluated subsequent events through the issuance of the financial statements and determined that no events have occurred that require disclosure.
| |
| Abbreviations |
| Selected Portfolio |
| FHLB | Federal Home Loan Bank |
| FNMA | Federal National Mortgage Association |
| FFCB | Federal Farm Credit Bank |
| GO | General Obligation |
|
62 Semiannual Report
FRANKLIN FUND ALLOCATOR SERIES
Shareholder Information
Board Approval of Investment Management Agreement
At a meeting held February 24, 2015, the Board of Trustees (Board), including a majority of non-interested or independent trustees, approved the investment management agreement for Franklin Payout 2017 Fund, Franklin Payout 2018 Fund, Franklin Payout 2019 Fund, Franklin Payout 2020 Fund and Franklin Payout 2021 Fund (collectively, the Funds), all of which are newly created series of Franklin Fund Allocator Series, with Franklin Advisers, Inc. (FAV) as the investment manager (Manager). In reaching its decision to approve the agreement with FAV (FAV Agreement) on behalf of each fund, the Board took into account that the terms of the FAVAgreement were explained, noting that the form of the FAV Agreement was substantially the same as the standard forms of investment management agreement for other funds in the Franklin Templeton group of funds that include fund administration services. The Board considered the qualifications of the personnel of the Manager who would be responsible for managing and advising the Funds and the specific terms and fees of the FAV Agreement and management’s voluntary agreement to cap fees for a period of time.
The Board considered various materials relating to the FAV Agreement, including: (1) a copy of the proposed form of agreement; (2) the biographies of the portfolio managers; and (3) information describing the fee payments and allocations under the new agreement. The Board was also provided with data from Lipper, Inc. (Lipper), an independent third party, comparing each Fund’s proposed fees with the fees of other funds in each Fund’s Lipper selected peer group. The Board reviewed this information and its usefulness in the approval process with respect to matters such as comparative fees and expense ratios.
In determining that the terms of the proposed agreement were fair and reasonable, the Board took into account several factors including, but not limited to, the following: (1) the nature and quality of the services to be provided by the Manager to the Funds under the proposed FAV Agreement; (2) the Manager’s strength and reputation within the industry; (3) the fairness of the compensation under the proposed FAV Agreement; (4) the pricing structure (including the estimated expense ratio to be borne by shareholders) of the Funds; (5) the personnel, operations, and investment management capabilities, methodologies and resources of the Manager, including the management team’s expertise in the management of other mutual funds; (6) profitability matters; and (7) the Manager’s compliance capabilities, as demonstrated by its policies and procedures designed to prevent violations of the federal securities laws, which had previously been approved by the Board in connection with its oversight of other funds in the Franklin Templeton Investments complex (FTI complex).
The Board approved the Code of Ethics and Compliance Policies and Procedures of the Manager, which are identical to those of other Franklin Templeton investment managers. In considering such materials, the independent Trustees received assistance and advice from and met separately with independent counsel.
The following sets forth some of the preliminary information and factors relevant to the Board’s decision to approve the agreement. This discussion of the information and factors considered by the Board (including the information and factors discussed above) is not intended to be exhaustive, but rather summarizes certain factors considered by the Board. In view of the wide variety of factors considered, the Board did not, unless otherwise noted, find it practicable to quantify or otherwise assign relative weights to the foregoing and following factors. In addition, individual Trustees may have assigned different weights to various factors.
NATURE, EXTENT AND QUALITY OF SERVICE. The Board reviewed the nature, extent and quality of the services to be provided by the Manager. In this regard, they reviewed the Funds’ investment goal and the Manager’s ability to implement the Funds’ investment strategy, including, but not limited to, the Manager’s trading practices and investment decision processes.
The Board reviewed the Funds’ portfolio managers, including their backgrounds and skills as well as their expertise in managing other similar fixed income funds within the FTI complex. They also considered that the nature, extent and quality of the services to be provided under the other service agreements with affiliates of the Manager would not be altered by the FAV Agreement. The Board noted that it was satisfied with the nature and quality of the overall services provided by the Manager to the Funds.
INVESTMENT PERFORMANCE. The Board noted that, as the Funds had not yet commenced investment operations, there was no investment performance for the Funds. The Board considered the performance benchmarks for the Funds and how such benchmarks would be utilized to measure performance of the Manager.
|
Semiannual Report 63
FRANKLIN FUND ALLOCATOR SERIES
SHAREHOLDER INFORMATION
Board Approval of Investment Management
Agreement (continued)
COMPARATIVE EXPENSES. The Board considered the cost of the services to be provided by the Manager (and its affiliates) from their respective relationships with the Funds. The Board noted that the Manager (and its affiliates) could not report any financial results from their relationships with the Funds because the Funds had not yet commenced investment operations, and thus, the Board could not evaluate the Manager’s or its affiliates’ profitability with respect to the Funds. The Board considered that the Manager will provide general investment management and administrative services to the Funds for a fee equal to an annual rate of 0.30% of the average daily net assets of each Fund without breakpoints. Additionally, the Board noted that the Manager has agreed to waive or assume certain fees and expenses so that each Fund’s total expenses do not exceed 0.44% for a period of at least one year from the date of the initial prospectus. It is not anticipated that the Funds will generate significant, if any, profit for the Manager and/or its affiliates for some time.
In considering the appropriateness of the investment management fee to be charged to the Funds, the Board reviewed and considered the nature, extent and quality of the overall investment management services expected to be provided by the Manager, as more fully discussed above, as well as the fairness of the proposed compensation. The Board further considered the extent to which the Manager may derive ancillary benefits from operations of the Funds. Consideration was also given to the information provided by Lipper on other funds in the Lipper data (Comparable Funds) and that the Manager’s total expense ratio for each Fund, including waivers, was below the average and median of the total expense ratio of Comparable Funds, including waivers.
Based upon its consideration of all these factors, the Board determined that the investment management fee structure was fair and reasonable.
ECONOMIES OF SCALE. The Board considered economies of scale that may be realized by the Manager and its affiliates as the Funds grow larger and the extent to which they are shared with shareholders. The Board concluded that the favorable management fee rate of 0.30% of the value of average daily net assets will benefit shareholders.
Proxy Voting Policies and Procedures
The Trust’s investment manager has established Proxy Voting Policies and Procedures (Policies) that the Trust uses to determine how to vote proxies relating to portfolio securities. Shareholders may view the Trust’s complete Policies online at franklintempleton.com. Alternatively, shareholders may request copies of the Policies free of charge by calling the Proxy Group collect at (954) 527-7678 or by sending a written request to: Franklin Templeton Companies, LLC, 300 S.E. 2nd Street, Fort Lauderdale, FL 33301, Attention: Proxy Group. Copies of the Trust’s proxy voting records are also made available online at franklintempleton.com and posted on the U.S. Securities and Exchange Commission’s website at sec.gov and reflect the most recent 12-month period ended June 30.
Quarterly Statement of Investments
The Trust files a complete statement of investments with the U.S. Securities and Exchange Commission for the first and third quarters for each fiscal year on Form N-Q. Shareholders may view the filed Form N-Q by visiting the Commission’s website at sec.gov. The filed form may also be viewed and copied at the Commission’s Public Reference Room in Washington, DC. Information regarding the operations of the Public Reference Room may be obtained by calling (800) SEC-0330.
|
64 Semiannual Report
Item 2. Code of Ethics.
(a) The Registrant has adopted a code of ethics that applies to its principal executive officers and principal financial and accounting officer.
(c) N/A
(d) N/A
(f) Pursuant to Item 12(a)(1), the Registrant is attaching as an exhibit a copy of its code of ethics that applies to its principal executive officers and principal financial and accounting officer.
Item 3. Audit Committee Financial Expert.
(a)(1) The Registrant has an audit committee financial expert serving on its audit committee.
(2) The audit committee financial expert is John B. Wilson, and he is "independent" as defined under the relevant Securities and Exchange Commission Rules and Releases.
Item 4. Principal Accountant Fees and Services. N/A
Item 5. Audit Committee of Listed Registrants. N/A
Item 6. Schedule of Investments. N/A
Item 7. Disclosure of Proxy Voting Policies and Procedures for Closed-End Management Investment Companies. N/A
Item 8. Portfolio Managers of Closed-End Management Investment Companies. N/A
Item 9. Purchases of Equity Securities by Closed-End Management Investment Company and Affiliated Purchasers. N/A
Item 10. Submission of Matters to a Vote of Security Holders.
There have been no changes to the procedures by which shareholders may recommend nominees to the Registrant's Board of Trustees that would require disclosure herein.
Item 11. Controls and Procedures.
(a) Evaluation of Disclosure Controls and Procedures. The Registrant maintains disclosure controls and procedures that are designed to ensure that information required to be disclosed in the Registrant’s filings under the Securities Exchange Act of 1934 and the Investment Company Act of 1940 is recorded, processed, summarized and reported within the periods specified in the rules and forms of the Securities and Exchange Commission. Such information is accumulated and communicated to the Registrant’s management, including its principal executive officer and principal financial officer, as appropriate, to allow timely decisions regarding required disclosure. The Registrant’s management, including the principal executive officer and the principal financial officer, recognizes that any set of controls and procedures, no matter how well designed and operated, can provide only reasonable assurance of achieving the desired control objectives.
Within 90 days prior to the filing date of this Shareholder Report on Form N-CSR, the Registrant had carried out an evaluation, under the supervision and with the participation of the Registrant’s management, including the Registrant’s principal executive officer and the Registrant’s principal financial officer, of the effectiveness of the design and operation of the Registrant’s disclosure controls and procedures. Based on such evaluation, the Registrant’s principal executive officer and principal financial officer concluded that the Registrant’s disclosure controls and procedures are effective.
(b) Changes in Internal Controls. There have been no changes in the Registrant’s internal controls or in other factors that could materially affect the internal controls over financial reporting subsequent to the date of their evaluation in connection with the preparation of this Shareholder Report on Form N-CSR.
Item 12. Exhibits.
(a)(1) Code of Ethics
(a)(2) Certifications pursuant to Section 302 of the Sarbanes-Oxley Act of 2002 of Laura F. Fergerson, Chief Executive Officer - Finance and Administration, and Gaston Gardey, Chief Financial Officer and Chief Accounting Officer
(b) Certifications pursuant to Section 906 of the Sarbanes-Oxley Act of 2002 of Laura F. Fergerson, Chief Executive Officer - Finance and Administration, and Gaston Gardey, Chief Financial Officer and Chief Accounting Officer
SIGNATURES
Pursuant to the requirements of the Securities Exchange Act of 1934 and the Investment Company Act of 1940, the registrant has duly caused this report to be signed on its behalf by the undersigned, thereunto duly authorized.
FRANKLIN FUND ALLOCATOR SERIES
By /s/Laura F. Fergerson
Laura F. Fergerson
Chief Executive Officer - Finance and Administration
Date January 26, 2016
Pursuant to the requirements of the Securities Exchange Act of 1934 and the Investment Company Act of 1940, this report has been signed below by the following persons on behalf of the registrant and in the capacities and on the dates indicated.
By /s/Laura F. Fergerson
Laura F. Fergerson
Chief Executive Officer - Finance and Administration
Date January 26, 2016
By /s/Gaston Gardey
Gaston Gardey
Chief Financial Officer and Chief Accounting Officer
Date January 26, 2016