UNITED STATES
SECURITIES AND EXCHANGE COMMISSION
Washington, DC 20549
FORM N-CSR
CERTIFIED SHAREHOLDER REPORT OF REGISTERED MANAGEMENT INVESTMENT COMPANIES
Investment Company Act file number_811-07851
_Franklin Fund Allocator Series
(Exact name of registrant as specified in charter)
_One Franklin Parkway, San Mateo, CA 94403-1906
(Address of principal executive offices) (Zip code)
_Craig S. Tyle, One Franklin Parkway, San Mateo, CA 94403-1906
(Name and address of agent for service)
Registrant's telephone number, including area code: (650) 312-2000
Date of fiscal year end: 5/31
Date of reporting period: 5/31/16
Item 1. Reports to Stockholders.
| |
| Contents | |
| Annual Report | |
| Economic and Market Overview | 2 |
| Franklin NextStep Conservative Fund | 3 |
| Franklin NextStep Moderate Fund | 9 |
| Franklin NextStep Growth Fund | 15 |
| Financial Highlights and Statement of Investments | 21 |
| Financial Statements | 30 |
| Notes to Financial Statements | 35 |
| Report of Independent Registered | |
| Public Accounting Firm | 43 |
| Board Members and Officers | 44 |
| Shareholder Information | 49 |
1
Annual Report
Economic and Market Overview
The global economy expanded moderately during the period under review. Despite investor concerns about global economic growth, geopolitical tensions in several regions and the U.K.’s potential exit from the European Union (commonly known as Brexit), equity markets overall strengthened as the U.S. Federal Reserve (Fed) left its federal funds target rate unchanged after raising it for the first time in nine years in December. Further helping global stocks were the Bank of Japan’s (BOJ’s) continued accommodative monetary policy and the European Central Bank’s (ECB’s) interest rate cut and quantitative easing expansion. An improvement in the prices of crude oil and many precious and industrial metals also helped investor sentiment. The U.S. dollar generally declined against most currencies during the period, enhancing returns of many foreign assets in U.S. dollar terms. In this environment, global developed market stocks, as measured by the MSCI World Index, and global bonds, as measured by the Barclays Multiverse Index, rose during the period.
The U.S. economy grew modestly in 2016’s first quarter, as strength in consumer spending, residential investment, and state and local government spending was partially offset by lower business investment, private inventory investment and federal government spending. After raising its target range for the federal funds rate to 0.25%–0.50% at its December meeting, the Fed kept interest rates unchanged through period-end. At its April meeting, the Fed indicated that its monetary policy remained accommodative, thus supporting further labor market improvement and progress toward its 2.0% inflation objective.
In Europe, U.K. economic growth moderated in 2016’s first quarter, compared with the previous quarter, as household spending growth was countered by lower exports and a second quarterly decline in business investment amid uncertainties surrounding the upcoming Brexit referendum. Conversely, the eurozone’s economy grew at the fastest quarterly rate in the past year during 2016’s first quarter, driven largely by household spending and private investment. European stocks, as measured by the MSCI Europe Index, rose for the period amid continued accommodative monetary policies by the Bank of England and the ECB.
Japan’s economy grew in 2016’s first quarter as government spending, private consumption and exports rose. The BOJ left its monetary policy unchanged at its March and April meetings after setting a negative interest rate on excess reserves kept by financial institutions with the central bank in an effort to boost lending and support inflation.
In emerging markets, economic growth generally moderated amid contraction in some countries. India’s economy expanded in 2016’s first quarter at the fastest annual rate in one and a half years, driven by private spending. China’s economy grew in 2016’s first quarter at an annual rate that was largely in line with the government’s target. Russia’s economy contracted in 2016’s first quarter amid declines in manufacturing, construction and wholesale and retail trade, while Brazil’s economy shrank amid weakness in investment and domestic consumption. The People’s Bank of China cut the cash reserve requirement ratio for the country’s banks in February and lowered its currency valuation in May to the lowest level since March 2011. The Reserve Bank of India slashed interest rates to the lowest in five years and took steps to increase monetary liquidity. In the recent global environment, emerging market stocks, as measured by the MSCI Emerging Markets Index, rose during the period.
The foregoing information reflects our analysis and opinions as of May 31, 2016. The information is not a complete analysis of every aspect of any market, country, industry, security or fund. Statements of fact are from sources considered reliable.
2 Annual Report
nextstepfunds.com
Franklin NextStep Conservative Fund
We are pleased to bring you Franklin NextStep Conservative Fund’s inaugural annual report for the period since the Fund’s inception on February 5, 2016, through May 31, 2016.
Your Fund’s Goal and Main Investments
The Fund seeks the highest level of long-term total return consistent with a conservative level of risk.1 As a “fund of funds,” it seeks to achieve its investment goal by investing its assets in underlying funds (i.e., other mutual funds and exchange-traded funds (ETFs)) managed by Franklin Templeton as well as those managed by unaffiliated investment managers. Under normal market conditions, we allocate the Fund’s assets among the broad asset classes of equity and debt investments by investing primarily in a distinctly weighted combination of underlying funds, based on each underlying fund’s predominant asset class. These underlying funds, in turn, invest in a variety of U.S. and foreign equity, debt and derivative investments.
Performance Overview
The Fund’s Class A shares delivered a +4.26% cumulative total return for the period since the Fund’s inception on February 5, 2016, through May 31, 2016. In comparison, the Fund’s blended benchmark, which is 60% Barclays U.S. Aggregate Bond Index, 15% Barclays Multiverse ex USD Index (Hedged to U.S. Dollar), 15% Standard & Poor’s 500® Index (S&P 500®) and 10% MSCI All Country World Index (ACWI) ex USA, generated a +4.23% total return.2 You can find more of the Fund’s performance data in the Performance Summary beginning on page 6.
Performance data represent past performance, which does not guarantee future results. Investment return and principal value will fluctuate, and you may have a gain or loss when you sell your shares. Current performance may differ from figures shown. For most recent month-end performance, go to nextstepfunds.com or call (800) 342-5236.
Investment Strategy
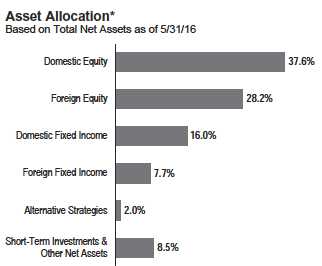
The Fund seeks to maintain a target exposure, principally through investment in underlying funds, of 25% to equities and equity-related securities and 75% to debt securities. The Fund’s asset allocation may change from time to time and deviate from its target exposure based on market conditions and our strategic
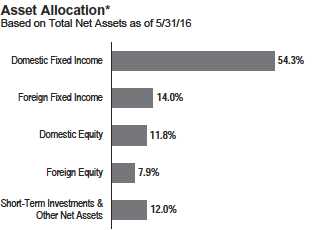
*The asset allocation is based on the Statement of Investments (SOI), which classi-
fies each underlying fund and other fund investments into a broad asset class based
on its predominant investments under normal market conditions.
and tactical asset allocation views. However, the Fund’s equity and debt investments will typically be in the 10%–30% and 70%–90% range, respectively. The risk profile of underlying funds will be considered when determining allocations. The Fund may also invest directly in securities of each asset class and may use currency forwards for hedging purposes.
What is a currency forward?
A currency forward is an agreement between the Fund and a counterparty to buy or sell a foreign currency in exchange for another currency at a specific exchange rate on a future date.
Risk control will be an integral part of the Fund’s investment process. Among other things, we will analyze portfolio volatility, portfolio concentration, expected extreme events and expected instability in returns among various asset classes and types of investments. When selecting equity funds, we consider the underlying funds’ foreign and domestic exposure, market capitalization ranges and investment style (growth vs. value). When selecting debt funds, we focus primarily on maximizing income appropriate to the Fund’s risk profile and consider the overall credit quality, duration and maturity of the underlying funds’ portfolios.
1. The risk/reward potential is based on the Fund’s goal and level of risk. It is not indicative of the Fund’s actual or implied performance or portfolio composition, which may
change on a continuous basis.
2. Source: Morningstar.
The indexes are unmanaged and include reinvestment of any income or distributions. They do not reflect any fees, expenses or sale charges. One cannot invest directly in an
index, and an index is not representative of the Fund’s portfolio.
See www.franklintempletondatasources.com for additional data provider information.
The dollar value, number of shares or principal amount, and names of all portfolio holdings are listed in the Fund’s SOI, which begins on page 23.
nextstepfunds.com
Annual Report 3
FRANKLIN NEXTSTEP CONSERVATIVE FUND
| | |
| Top 10 Fund Holdings | | |
| 5/31/16 | | |
| | % of Total | |
| | Net Assets | |
| Franklin Total Return Fund – Class R6 | 17.9 | % |
| Delaware Corporate Bond Fund – Class I | 13.6 | % |
| iShares Core U.S. Aggregate Bond ETF | 9.2 | % |
| iShares 7-10 Year Treasury Bond ETF | 8.2 | % |
| Vanguard Total International Bond ETF | 7.0 | % |
| Templeton Global Total Return Fund – Class R6 | 7.0 | % |
| Delaware Value Fund – Class I | 5.9 | % |
| iShares TIPS Bond ETF | 5.4 | % |
| Franklin Focused Core Equity Fund – Class R6 | 3.5 | % |
| Columbia European Equity Fund – Class Z | 2.6 | % |
Manager’s Discussion
The Fund’s performance can be attributed to our allocation among equities and fixed income securities and to the performance of the underlying funds we selected for investment.
On May 31, 2016, the portfolio was diversified across capitalization sizes, regions and investment styles for both our equity and fixed income allocations. At period-end, Franklin NextStep Conservative Fund allocated 68.3% of total net assets to fixed income and 19.7% to equity. Domestic fixed income exposure was 79.5% of the total fixed income weighting, with the balance represented by foreign fixed income. Franklin Total Return Fund – Class R6, at 17.9% of the Fund’s total net assets, was our largest fixed income weighting at period-end. On the equity side, domestic exposure was 59.9% of the Fund’s total equity weighting, with the balance represented by foreign equity. Delaware Value Fund – Class I, was our largest equity weighting at period-end with 5.9% of the Fund’s total net assets.
During the reporting period, our largest domestic fixed income fund holding, Franklin Total Return Fund – Class R6, outperformed the Barclays U.S. Aggregate Bond Index, while our largest foreign fixed income fund holding, Vanguard Total International Bond ETF, underperformed the Barclays Multiverse ex USD Index (Hedged to U.S. Dollar). On the equity side, our largest domestic equity fund holding, Delaware Value Fund –Class I, outperformed the S&P 500, while our largest foreign equity fund holding, Columbia European Equity Fund – Class Z, underperformed the MSCI ACWI ex USA.
Thank you for your participation in Franklin NextStep Conservative Fund. We look forward to serving your future investment needs.

The foregoing information reflects our analysis, opinions and portfolio holdings as of May 31, 2016, the end of the reporting period. The way we implement our main investment strategies and the resulting portfolio holdings may change depending on factors such as market and economic conditions. These opinions may not be relied upon as investment advice or an offer for a particular security. The information is not a complete analysis of every aspect of any market, country, industry, security or the Fund. Statements of fact are from sources considered reliable, but the investment manager makes no representation or warranty as to their completeness or accuracy. Although historical performance is no guarantee of future results, these insights may help you understand our investment management philosophy.
CFA® is a trademark owned by CFA Institute.
4 Annual Report
nextstepfunds.com
FRANKLIN NEXTSTEP CONSERVATIVE FUND
Thomas A. Nelson is a senior vice president and director of investment solutions for Franklin Templeton Solutions (FT Solutions). In this role he oversees FT Solutions’ traditional asset portfolio management team as well as its systematic modeling and asset class research teams. He also co-chairs the FT Solutions Global Investment Committee and is a portfolio manager of a number of funds offered for sale in various jurisdictions. Mr. Nelson joined Franklin Templeton Investments in 2007 and co-founded the firm’s quantitative research services group upon joining the company. He moved to FT Solutions in 2009. Prior to working at Franklin Templeton, Mr. Nelson worked for Bloomberg LP from 1991 to 2007, where he was most recently manager of the Americas market specialist teams.
Stephen R. Lingard is a senior vice president and portfolio manager for FT Solutions and a member of the FT Solutions Global Investment Committee, and he serves as co-head of equity strategy. He has portfolio management responsibilities for all Canadian-based multi-asset products, in addition to managing retail and institutional accounts for global clients. He has previously served as director of research for the FT Solutions manager and asset research team. Mr. Lingard joined Franklin Templeton Investments in 2007 and has 22 years of industry experience. Before joining Franklin Templeton, he held various roles as investment manager, fund analyst and bond dealer for companies such as Fidelity, Societe Generale (Asia) and Freedom International Bond Brokers.
John G. Levy is a portfolio manager and director of manager research for FT Solutions. He leads the long-only manager research team, which is responsible for research and analysis of proprietary and third-party mutual funds and mandates for use in U.S., Canadian and globally registered multi-asset strategies. Mr. Levy began working for Franklin Templeton Investments in 2005. He later joined the company’s Futures Program and took a position with FT Solutions in 2008.
Brooks Ritchey is a senior managing director and head of portfolio construction for K2 Advisors. He is also a senior vice president and director of investment solutions for FT Solutions. In this capacity he co-chairs the FT Solutions Global Investment Committee and heads the portfolio review and investment solution management team. In these roles, he works with various teams to analyze market and macroeconomic conditions, determine tactical asset allocation tilts, and manage absolute return and risk overlay portfolios. Mr. Ritchey joined K2 Advisors in 2005, and he joined FT Solutions in 2013. Mr. Ritchey began his investment career in 1982 as a proprietary trader for the NYSE specialist firm of Conklin, Cahill & Co. Since 1987, Mr. Ritchey has successfully managed multi-asset mutual fund and hedge fund portfolios while located in New York and Paris during his employment with organizations including Steinhardt Partners, Citibank, Finch Asset Management, Paribas, AIG and ING.
nextstepfunds.com
Annual Report 5
FRANKLIN NEXTSTEP CONSERVATIVE FUND
Performance Summary as of May 31, 2016
Your dividend income will vary depending on dividends or interest paid by securities in the Fund’s portfolio, adjusted for operating expenses of each class. Capital gain distributions are net profits realized from the sale of portfolio securities. The performance table does not reflect any taxes that a shareholder would pay on Fund dividends, capital gain distributions, if any, or any realized gains on the sale of Fund shares. Total return reflects reinvestment of the Fund’s dividends and capital gain distributions, if any, and any unrealized gains or losses.
| | | | | |
| Net Asset Value | | | | | |
| |
| Share Class (Symbol) | | 5/31/16 | | 2/5/16 | Change |
| A (FNCAX) | $ | 10.42 | $ | 10.00 | +$0.42 |
| C (FNCDX) | $ | 10.39 | $ | 10.00 | +$0.39 |
| | |
| Distributions1 (2/5/16–5/31/16) | | |
| |
| | | Dividend |
| Share Class | | Income |
| A | $ | 0.0057 |
| C | $ | 0.0057 |
Performance2
Cumulative total return excludes sales charges. Average annual total returns and value of $10,000 investment include maximum sales charges. Class A: 5.75% maximum initial sales charge; Class C: 1% contingent deferred sales charge in first year only.
| | | | | | | | | | | | |
| | | | | | | Value of | | | | | | |
| | Cumulative | | Average Annual | | $ | 10,000 | Average Annual | | Total Annual Operating Expenses7 | |
| Share Class | Total Return3 | | Total Return4 | | | Investment5 | Total Return (6/30/16)6 | | (With Waiver) | | (Without Waiver) | |
| |
| A | | | | | | | | | 1.10 | % | 31.47 | % |
| Since Inception (2/5/16) | +4.26 | % | -1.74 | % | $ | 9,826 | -0.93 | % | | | | |
| |
| C | | | | | | | | | 1.85 | % | 32.22 | % |
| Since Inception (2/5/16) | +3.96 | % | +2.96 | % | $ | 10,296 | +3.77 | % | | | | |
Performance data represent past performance, which does not guarantee future results. Investment return and principal value will fluctuate, and you may have a gain or loss when you sell your shares. Current performance may differ from figures shown. For most recent month-end performance, go to nextstepfunds.com or call (800) 342-5236.
See page 7 for Performance Summary footnotes.
6 Annual Report
nextstepfunds.com
FRANKLIN NEXTSTEP CONSERVATIVE FUND
PERFORMANCE SUMMARY
While an asset allocation plan can be a valuable tool to help reduce overall volatility, all investments involve risks, including possible loss of principal. Because the Fund invests in underlying funds, which may engage in a variety of investment strategies involving certain risks, the Fund is subject to those same risks. In addition, the Fund’s shareholders will indirectly bear the fees and expenses of the underlying funds. The risks described herein are the principal risks of the Fund and the underlying funds. Typically, the more aggressive the investment, or the greater the potential return, the more risk involved. Generally, investors should be comfortable with some fluctuation in the value of their investments, especially over the short term. Stock prices fluctuate, sometimes rapidly and dramatically, due to factors affecting individual companies, particular industries or sectors, or general market conditions. Bond prices generally move in the opposite direction of interest rates. Thus, as prices of bonds in a fund adjust to a rise in interest rates, that fund’s share price may decline. Foreign investing carries additional risks such as currency and market volatility and political or social instability, risks which are heightened in developing countries. Investments in derivatives involve costs and create economic leverage, which may result in significant volatility and cause the funds to participate in losses (as well as gains) that significantly exceed the funds’ initial investment. These risks are described in the Fund’s prospectus. Investors should consult their financial advisor for help selecting the appropriate fund of funds, or fund combination, based on an evaluation of their investment objectives and risk tolerance. The Fund is actively managed but there is no guarantee that the manager’s investment decisions will produce the desired results.
Class C: These shares have higher annual fees and expenses than Class A shares.
1. The distribution amount is the sum of the dividend payments to shareholders for the period shown and includes only estimated tax-basis net investment income.
2. The Fund has an expense reduction contractually guaranteed through at least 9/30/17 and a fee waiver associated with any investment in a Franklin Templeton money fund
and/or other Franklin Templeton fund, as applicable, contractually guaranteed through at least the Fund’s current fiscal year-end. Fund investment results reflect the expense
reduction and fee waiver, to the extent applicable; without these reductions, the results would have been lower.
3. Cumulative total return represents the change in value of an investment over the period indicated.
4. Average annual total return represents the average annual change in value of an investment over the period indicated. Return for less than one year, if any, has not
been annualized.
5. These figures represent the value of a hypothetical $10,000 investment in the Fund over the period indicated.
6. In accordance with SEC rules, we provide standardized average annual total return for the latest calendar quarter.
7. Figures are as stated in the Fund’s current prospectus and may differ from the expense ratios disclosed in the Financial Highlights in this report. In periods of market vola-
tility, assets may decline significantly, causing total annual Fund operating expenses to become higher than the figures shown.
nextstepfunds.com
Annual Report 7
FRANKLIN NEXTSTEP CONSERVATIVE FUND
Your Fund’s Expenses
As a Fund shareholder, you can incur two types of costs:
- Transaction costs, including sales charges (loads) on Fund purchases; and
- Ongoing Fund costs, including management fees, distribution and service (12b-1) fees, and other Fund expenses. All mutual funds have ongoing costs, sometimes referred to as operating expenses.
The following table shows ongoing costs of investing in the Fund and can help you understand these costs and compare them with those of other mutual funds. The table assumes a $1,000 investment held for the six months indicated.
Actual Fund Expenses
The first line (Actual) for each share class listed in the table provides actual account values and expenses. The “Ending Account Value” is derived from the Fund’s actual return, which includes the effect of Fund expenses.
You can estimate the expenses you paid during the period by following these steps. Of course, your account value and expenses will differ from those in this illustration:
1. Divide your account value by $1,000.
If an account had an $8,600 value, then $8,600 ÷ $1,000 = 8.6.
2. Multiply the result by the number under the heading “Expenses Paid During Period.”
If Expenses Paid During Period were $7.50, then 8.6 × $7.50 = $64.50.
In this illustration, the estimated expenses paid this period are $64.50.
Hypothetical Example for Comparison with Other Funds
Information in the second line (Hypothetical) for each class in the table can help you compare ongoing costs of investing in the Fund with those of other mutual funds. This information may not be used to estimate the actual ending account balance or expenses you paid during the period. The hypothetical “Ending Account Value” is based on the actual expense ratio for each class and an assumed 5% annual rate of return before expenses, which does not represent the Fund’s actual return. The figure under the heading “Expenses Paid During Period” shows the hypothetical expenses your account would have incurred under this scenario. You can compare this figure with the 5% hypothetical examples that appear in shareholder reports of other funds.
Please note that expenses shown in the table are meant to highlight ongoing costs and do not reflect any transaction costs, such as sales charges. Therefore, the second line for each class is useful in comparing ongoing costs only, and will not help you compare total costs of owning different funds. In addition, if transaction costs were included, your total costs would have been higher. Please refer to the Fund prospectus for additional information on operating expenses.
| | | | | | | | |
| | | | | | | Expenses Paid | | Expenses Paid |
| | | Beginning Account | | | | During Period* | | During Period** |
| | | Actual 2/5/16 | | | | Actual 2/5/16–5/31/16 | | Actual 2/5/16–5/31/16 |
| | | Hypothetical | | Ending Account | | Hypothetical | | Hypothetical |
| Share Class | | 12/1/15 | | Value 5/31/16 | | 12/1/15–5/31/16 | | 12/1/15–5/31/16 |
| |
| A | | | | | | | | |
| Actual | $ | 1,000 | $ | 1,042.60 | $ | 1.94 | $ | 3.43 |
| Hypothetical (5% return before expenses) | $ | 1,000 | $ | 1,022.00 | $ | 3.03 | $ | 5.35 |
| |
| C | | | | | | | | |
| Actual | $ | 1,000 | $ | 1,039.60 | $ | 4.36 | $ | 5.85 |
| Hypothetical (5% return before expenses) | $ | 1,000 | $ | 1,018.25 | $ | 6.81 | $ | 9.12 |
*Expenses are calculated using the most recent six-month expense ratio excluding expenses of the underlying funds, net of expense waivers, annualized for each
class (A: 0.60%; C: 1.35%), multiplied by the average account value over the period, multiplied by 183/366 to reflect the one-half year period for Hypothetical expenses. For
Actual expenses, the multiplier is 116/366 to reflect the number of days since inception.
**Expenses are calculated using the most recent six-month expense ratio including expenses of the underlying funds, net of expense waivers, annualized for each
class (A: 1.06%; C: 1.81%), multiplied by the average account value over the period, multiplied by 183/366 to reflect the one-half year period for Hypothetical expenses. For
Actual expenses, the multiplier is 116/366 to reflect the number of days since inception.
8 Annual Report
nextstepfunds.com
Franklin NextStep Moderate Fund
We are pleased to bring you Franklin NextStep Moderate Fund’s inaugural annual report for the period since the Fund’s inception on February 5, 2016, through May 31, 2016.
Your Fund’s Goal and Main Investments
The Fund seeks the highest level of long-term total return consistent with a moderate level of risk.1 As a “fund of funds,” it seeks to achieve its investment goal by investing its assets in underlying funds (i.e., other mutual funds and exchange-traded funds (ETFs)) managed by Franklin Templeton as well as those managed by unaffiliated investment managers. Under normal market conditions, we allocate the Fund’s assets among the broad asset classes of equity, debt and alternative investments by investing primarily in a distinctly weighted combination of underlying funds, based on each underlying fund’s predominant asset class. These underlying funds, in turn, invest in a variety of U.S. and foreign equity, debt and derivative investments.
Performance Overview
The Fund’s Class A shares delivered a cumulative total return of +8.02% for the period since the Fund’s inception on February 5, 2016, through May 31, 2016. In comparison, the Fund’s blended benchmark, which is 35% Standard & Poor’s 500 Index (S&P 500), 25% MSCI All Country World Index (ACWI) ex USA, 25% Barclays U.S. Aggregate Bond Index and 15% Barclays Multiverse ex USD Index (Hedged to U.S. Dollar), generated a +7.49% total return.2 You can find more of the Fund’s performance data in the Performance Summary beginning on page 12.
Performance data represent past performance, which does not guarantee future results. Investment return and principal value will fluctuate, and you may have a gain or loss when you sell your shares. Current performance may differ from figures shown. For most recent month-end performance, go to nextstepfunds.com or call (800) 342-5236.
Investment Strategy
The Fund seeks to maintain a target exposure, principally through investment in underlying funds, of 60% to equities and equity-related securities and 40% to debt securities. The Fund may also invest up to 5% in alternative investment funds. The Fund’s asset allocation may change from time to time and deviate from its target exposure based on market conditions and
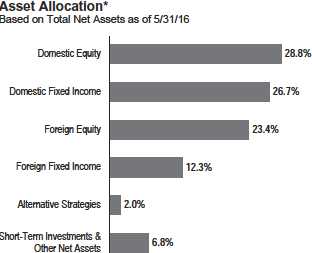
*The asset allocation is based on the Statement of Investments (SOI), which classi-
fies each underlying fund and other fund investments into a broad asset class based
on its predominant investments under normal market conditions.
our strategic and tactical asset allocation views. However, the Fund’s equity, debt and alternative investments will typically be in the 45%–65%, 35%–55% and 0%–5% range, respectively. The risk profile of underlying funds will be considered when determining allocations. The Fund may also invest directly in securities of each asset class and may use currency forwards for hedging purposes.
What is a currency forward?
A currency forward is an agreement between the Fund and a counterparty to buy or sell a foreign currency in exchange for another currency at a specific exchange rate on a future date.
Risk control will be an integral part of the Fund’s investment process. Among other things, we will analyze portfolio volatility, portfolio concentration, expected extreme events and expected instability in returns among various asset classes and types of investments. When selecting equity funds, we consider the underlying funds’ foreign and domestic exposure, market capitalization ranges and investment style (growth vs. value). When selecting debt funds, we focus primarily on maximizing income appropriate to the Fund’s risk profile and consider the overall credit quality, duration and maturity of the underlying funds’ portfolios. When selecting alternative investment funds,
1. The risk/reward potential is based on the Fund’s goal and level of risk. It is not indicative of the Fund’s actual or implied performance or portfolio composition, which may
change on a continuous basis.
2. Source: Morningstar.
The indexes are unmanaged and include reinvestment of any income or distributions. They do not reflect any fees, expenses or sale charges. One cannot invest directly in an
index, and an index is not representative of the Fund’s portfolio.
See www.franklintempletondatasources.com for additional data provider information.
The dollar value, number of shares or principal amount, and names of all portfolio holdings are listed in the Fund’s SOI, which begins on page 26.
nextstepfunds.com
Annual Report 9
FRANKLIN NEXTSTEP MODERATE FUND
| | |
| Top 10 Fund Holdings | | |
| 5/31/16 | | |
| | % of Total | |
| | Net Assets | |
| Delaware Value Fund – Class I | 10.1 | % |
| iShares Core S&P 500 ETF | 8.6 | % |
| iShares 7-10 Year Treasury Bond ETF | 6.7 | % |
| Vanguard Total International Bond ETF | 6.2 | % |
| Templeton Global Total Return Fund – Class R6 | 6.2 | % |
| iShares Core U.S. Aggregate Bond ETF | 6.1 | % |
| Franklin Total Return Fund – Class R6 | 5.9 | % |
| Columbia European Equity Fund – Class Z | 5.8 | % |
| Franklin Focused Core Equity Fund – Class R6 | 5.8 | % |
| Delaware Corporate Bond Fund – Class I | 5.3 | % |
we focus primarily on the specific alternative strategy employed by the fund; how the fund generates alpha (a measurement of how well the fund performed compared to a benchmark index); how the fund is expected to correlate to different markets; the strategies, methods and techniques the underlying fund uses to hedge certain markets or investments; and how a fund’s net asset value typically reduces when the market falls (the lower correlation between these two factors, the better).
Manager’s Discussion
The Fund’s performance can be attributed mainly to our allocation among equities and fixed income securities and to the performance of the underlying funds we selected for investment.
On May 31, 2016, the portfolio was diversified across capitalization sizes, regions and investment styles for both the equity and fixed income allocations. At period-end, Franklin NextStep Moderate Fund allocated 52.2% of total net assets to equity, 39.0% to fixed income and 2.0% to alternative strategies. Domestic equity exposure was 55.2% of the total equity weighting, with the balance represented by foreign equity. Delaware Value Fund – Class I, at 10.1% of the Fund’s total net assets, was our largest equity weighting at period-end. On the fixed income side, domestic exposure was 68.5% of the Fund’s total fixed income weighting, with the balance represented by foreign fixed income. iShares 7-10 Year Treasury Bond ETF, at 6.7% of the Fund’s total net assets, was our largest fixed income weighting at period-end.
During the reporting period, our largest domestic equity fund holding, Delaware Value Fund – Class I, outperformed the S&P 500, while our largest foreign equity fund holding, Columbia European Equity Fund – Class Z, underperformed the MSCI ACWI ex USA. On the fixed income side, our largest domestic fixed income fund holding, iShares 7-10 Year Treasury Bond ETF, underperformed the Barclays U.S. Aggregate Bond Index, and our largest foreign fixed income fund holding, Vanguard Total International Bond ETF, underperformed the Barclays Multiverse ex USD (Hedged to U.S. Dollar).
Thank you for your participation in Franklin NextStep Moderate Fund. We look forward to serving your future investment needs.

The foregoing information reflects our analysis, opinions and portfolio holdings as of May 31, 2016, the end of the reporting period. The way we implement our main investment strategies and the resulting portfolio holdings may change depending on factors such as market and economic conditions. These opinions may not be relied upon as investment advice or an offer for a particular security. The information is not a complete analysis of every aspect of any market, country, industry, security or the Fund. Statements of fact are from sources considered reliable, but the investment manager makes no representation or warranty as to their completeness or accuracy. Although historical performance is no guarantee of future results, these insights may help you understand our investment management philosophy.
10 Annual Report
nextstepfunds.com
FRANKLIN NEXTSTEP MODERATE FUND
Thomas A. Nelson is a senior vice president and director of investment solutions for Franklin Templeton Solutions (FT Solutions). In this role he oversees FT Solutions’ traditional asset portfolio management team as well as its systematic modeling and asset class research teams. He also co-chairs the FT Solutions Global Investment Committee and is a portfolio manager of a number of funds offered for sale in various jurisdictions. Mr. Nelson joined Franklin Templeton Investments in 2007 and co-founded the firm’s quantitative research services group upon joining the company. He moved to FT Solutions in 2009. Prior to working at Franklin Templeton, Mr. Nelson worked for Bloomberg LP from 1991 to 2007, where he was most recently manager of the Americas market specialist teams.
Stephen R. Lingard is a senior vice president and portfolio manager for FT Solutions and a member of the FT Solutions Global Investment Committee, and he serves as co-head of equity strategy. He has portfolio management responsibilities for all Canadian-based multi-asset products, in addition to managing retail and institutional accounts for global clients. He has previously served as director of research for the FT Solutions manager and asset research team. Mr. Lingard joined Franklin Templeton Investments in 2007 and has 22 years of industry experience. Before joining Franklin Templeton, he held various roles as investment manager, fund analyst and bond dealer for companies such as Fidelity, Societe Generale (Asia) and Freedom International Bond Brokers.
John G. Levy is a portfolio manager and director of manager research for FT Solutions. He leads the long-only manager research team, which is responsible for research and analysis of proprietary and third-party mutual funds and mandates for use in U.S., Canadian and globally registered multi-asset strategies. Mr. Levy began working for Franklin Templeton Investments in 2005. He later joined the company’s Futures Program and took a position with FT Solutions in 2008.
Brooks Ritchey is a senior managing director and head of portfolio construction for K2 Advisors. He is also a senior vice president and director of investment solutions for FT Solutions. In this capacity he co-chairs the FT Solutions Global Investment Committee and heads the portfolio review and investment solution management team. In these roles, he works with various teams to analyze market and macroeconomic conditions, determine tactical asset allocation tilts, and manage absolute return and risk overlay portfolios. Mr. Ritchey joined K2 Advisors in 2005, and he joined FT Solutions in 2013. Mr. Ritchey began his investment career in 1982 as a proprietary trader for the NYSE specialist firm of Conklin, Cahill & Co. Since 1987, Mr. Ritchey has successfully managed multi-asset mutual fund and hedge fund portfolios while located in New York and Paris during his employment with organizations including Steinhardt Partners, Citibank, Finch Asset Management, Paribas, AIG and ING.
nextstepfunds.com
Annual Report
11
FRANKLIN NEXTSTEP MODERATE FUND
Performance Summary as of May 31, 2016
Your dividend income will vary depending on dividends or interest paid by securities in the Fund’s portfolio, adjusted for operating expenses of each class. Capital gain distributions are net profits realized from the sale of portfolio securities. The performance table does not reflect any taxes that a shareholder would pay on Fund dividends, capital gain distributions, if any, or any realized gains on the sale of Fund shares. Total return reflects reinvestment of the Fund’s dividends and capital gain distributions, if any, and any unrealized gains or losses.
| | | | | |
| Net Asset Value | | | | | |
| |
| Share Class (Symbol) | | 5/31/16 | | 2/5/16 | Change |
| A (FNMDX) | $ | 10.80 | $ | 10.00 | +$0.80 |
| C (FNMFX) | $ | 10.78 | $ | 10.00 | +$0.78 |
| | |
| Distributions1 (2/5/16–5/31/16) | | |
| |
| | | Dividend |
| Share Class | | Income |
| A | $ | 0.0017 |
| C | $ | 0.0017 |
Performance2
Cumulative total return excludes sales charges. Average annual total returns and value of $10,000 investment include maximum sales charges. Class A: 5.75% maximum initial sales charge; Class C: 1% contingent deferred sales charge in first year only.
| | | | | | | | | | | | |
| | | | | | | Value of | | | | | | |
| | Cumulative | | Average Annual | | $ | 10,000 | Average Annual | | Total Annual Operating Expenses7 | |
| Share Class | Total Return3 | | Total Return4 | | | Investment5 | Total Return (6/30/16)6 | | (With Waiver) | | (Without Waiver) | |
| A | | | | | | | | | 1.15 | % | 12.85 | % |
| Since Inception (2/5/16) | +8.02 | % | +1.81 | % | $ | 10,181 | +1.86 | % | | | | |
| |
| C | | | | | | | | | 1.90 | % | 13.60 | % |
| Since Inception (2/5/16) | +7.82 | % | +6.82 | % | $ | 10,682 | +6.74 | % | | | | |
Performance data represent past performance, which does not guarantee future results. Investment return and principal value will fluctuate, and you may have a gain or loss when you sell your shares. Current performance may differ from figures shown. For most recent month-end performance, go to nextstepfunds.com or call (800) 342-5236.
See page 13 for Performance Summary footnotes.
12 Annual Report
nextstepfunds.com
FRANKLIN NEXTSTEP MODERATE FUND
PERFORMANCE SUMMARY
While an asset allocation plan can be a valuable tool to help reduce overall volatility, all investments involve risks, including possible loss of principal. Because the Fund invests in underlying funds, which may engage in a variety of investment strategies involving certain risks, the Fund is subject to those same risks. In addition, the Fund’s shareholders will indirectly bear the fees and expenses of the underlying funds. The risks described herein are the principal risks of the Fund and the underlying funds. Typically, the more aggressive the investment, or the greater the potential return, the more risk involved. Generally, investors should be comfortable with some fluctuation in the value of their investments, especially over the short term. Stock prices fluctuate, sometimes rapidly and dramatically, due to factors affecting individual companies, particular industries or sectors, or general market conditions. Bond prices generally move in the opposite direction of interest rates. Thus, as prices of bonds in a fund adjust to a rise in interest rates, that fund’s share price may decline. Foreign investing carries additional risks such as currency and market volatility and political or social instability, risks which are heightened in developing countries. Investments in derivatives involve costs and create economic leverage, which may result in significant volatility and cause the funds to participate in losses (as well as gains) that significantly exceed the funds’ initial investment. These risks are described in the Fund’s prospectus. Investors should consult their financial advisor for help selecting the appropriate fund of funds, or fund combination, based on an evaluation of their investment objectives and risk tolerance. The Fund is actively managed but there is no guarantee that the manager’s investment decisions will produce the desired results.
Class C: These shares have higher annual fees and expenses than Class A shares.
1. The distribution amount is the sum of the dividend payments to shareholders for the period shown and includes only estimated tax-basis net investment income.
2. The Fund has an expense reduction contractually guaranteed through at least 9/30/17 and a fee waiver associated with any investment in a Franklin Templeton money fund
and/or other Franklin Templeton fund, as applicable, contractually guaranteed through at least the Fund’s current fiscal year-end. Fund investment results reflect the expense
reduction and fee waiver, to the extent applicable; without these reductions, the results would have been lower.
3. Cumulative total return represents the change in value of an investment over the period indicated.
4. Average annual total return represents the average annual change in value of an investment over the period indicated. Return for less than one year, if any, has not
been annualized.
5. These figures represent the value of a hypothetical $10,000 investment in the Fund over the period indicated.
6. In accordance with SEC rules, we provide standardized average annual total return information through the latest calendar quarter.
7. Figures are as stated in the Fund’s current prospectus and may differ from the expense ratios disclosed in the Financial Highlights in this report. In periods of market vola-
tility, assets may decline significantly, causing total annual Fund operating expenses to become higher than the figures shown.
nextstepfunds.com
Annual Report
13
FRANKLIN NEXTSTEP MODERATE FUND
Your Fund’s Expenses
As a Fund shareholder, you can incur two types of costs:
- Transaction costs, including sales charges (loads) on Fund purchases; and
- Ongoing Fund costs, including management fees, distribution and service (12b-1) fees, and other Fund expenses. All mutual funds have ongoing costs, sometimes referred to as operating expenses.
The following table shows ongoing costs of investing in the Fund and can help you understand these costs and compare them with those of other mutual funds. The table assumes a $1,000 investment held for the six months indicated.
Actual Fund Expenses
The first line (Actual) for each share class listed in the table provides actual account values and expenses. The “Ending Account Value” is derived from the Fund’s actual return, which includes the effect of Fund expenses.
You can estimate the expenses you paid during the period by following these steps. Of course, your account value and expenses will differ from those in this illustration:
1. Divide your account value by $1,000.
If an account had an $8,600 value, then $8,600 ÷ $1,000 = 8.6.
2. Multiply the result by the number under the heading “Expenses Paid During Period.”
If Expenses Paid During Period were $7.50, then 8.6 × $7.50 = $64.50.
In this illustration, the estimated expenses paid this period are $64.50.
Hypothetical Example for Comparison with Other Funds
Information in the second line (Hypothetical) for each class in the table can help you compare ongoing costs of investing in the Fund with those of other mutual funds. This information may not be used to estimate the actual ending account balance or expenses you paid during the period. The hypothetical “Ending Account Value” is based on the actual expense ratio for each class and an assumed 5% annual rate of return before expenses, which does not represent the Fund’s actual return. The figure under the heading “Expenses Paid During Period” shows the hypothetical expenses your account would have incurred under this scenario. You can compare this figure with the 5% hypothetical examples that appear in shareholder reports of other funds.
Please note that expenses shown in the table are meant to highlight ongoing costs and do not reflect any transaction costs, such as sales charges. Therefore, the second line for each class is useful in comparing ongoing costs only, and will not help you compare total costs of owning different funds. In addition, if transaction costs were included, your total costs would have been higher. Please refer to the Fund prospectus for additional information on operating expenses.
| | | | | | | | |
| | | | | | | Expenses Paid | | Expenses Paid |
| | | Beginning Account | | | | During Period* | | During Period** |
| | | Actual 2/5/16 | | | | Actual 2/5/16–5/31/16 | | Actual 2/5/16–5/31/16 |
| | | Hypothetical | | Ending Account | | Hypothetical | | Hypothetical |
| Share Class | | 12/1/15 | | Value 5/31/16 | | 12/1/15–5/31/16 | | 12/1/15–5/31/16 |
| |
| A | | | | | | | | |
| Actual | $ | 1,000 | $ | 1,080.20 | $ | 1.98 | $ | 3.79 |
| Hypothetical (5% return before expenses) | $ | 1,000 | $ | 1,022.00 | $ | 3.03 | $ | 5.81 |
| |
| C | | | | | | | | |
| Actual | $ | 1,000 | $ | 1,078.20 | $ | 4.45 | $ | 6.26 |
| Hypothetical (5% return before expenses) | $ | 1,000 | $ | 1,018.25 | $ | 6.81 | $ | 9.57 |
*Expenses are calculated using the most recent six-month expense ratio excluding expenses of the underlying funds, net of expense waivers, annualized for each
class (A: 0.60%; C: 1.35%), multiplied by the average account value over the period, multiplied by 183/366 to reflect the one-half year period for Hypothetical expenses. For
Actual expenses, the multiplier is 116/366 to reflect the number of days since inception.
**Expenses are calculated using the most recent six-month expense ratio including expenses of the underlying funds, net of expense waivers, annualized for each
class (A: 1.15%; C: 1.90%), multiplied by the average account value over the period, multiplied by 183/366 to reflect the one-half year period for Hypothetical expenses. For
Actual expenses, the multiplier is 116/366 to reflect the number of days since inception.
14 Annual Report
nextstepfunds.com
Franklin NextStep Growth Fund
This inaugural annual report for Franklin NextStep Growth Fund covers the period since the Fund’s inception on February 5, 2016, through May 31, 2016.
Your Fund’s Goal and Main Investments
The Fund seeks the highest level of long-term total return consistent with a growth-oriented level of risk.1 As a “fund of funds,” it seeks to achieve its investment goal by investing its assets in underlying funds (i.e., other mutual funds and exchange-traded funds (ETFs)) managed by Franklin Templeton as well as those managed by unaffiliated investment managers. Under normal market conditions, we allocate the Fund’s assets among the broad asset classes of equity, debt and alternative investments by investing primarily in a distinctly weighted combination of underlying funds, based on each underlying fund’s predominant asset class. These underlying funds, in turn, invest in a variety of U.S. and foreign equity, debt and derivative investments.
Performance Overview
The Fund’s Class A shares delivered a cumulative total return of +8.81% for the period since the Fund’s inception on February 5, 2016, through May 31, 2016. In comparison, the Fund’s blended benchmark, which is 45% Standard & Poor’s 500 Index (S&P 500), 30% MSCI All Country World Index (ACWI) ex USA, 15% Barclays U.S. Aggregate Bond Index and 10% Barclays Multiverse ex USD Index (Hedged to U.S. Dollar), generated a total return of +8.91%.2 You can find more of the Fund’s performance data in the Performance Summary beginning on page 18.
Performance data represent past performance, which does not guarantee future results. Investment return and principal value will fluctuate, and you may have a gain or loss when you sell your shares. Current performance may differ from figures shown. For most recent month-end performance, go to nextstepfunds.com or call (800) 342-5236.
Investment Strategy
The Fund seeks to maintain a target exposure, principally through investment in underlying funds, of 75% to equities and equity-related securities and 25% to debt securities. The Fund may also invest up to 10% in alternative investment funds. The
*The asset allocation is based on the Statement of Investments (SOI), which classi-
fies each underlying fund and other fund investments into a broad asset class based
on its predominant investments under normal market conditions.
Fund’s asset allocation may change from time to time and deviate from its target exposure based on market conditions and our strategic and tactical asset allocation views. However, the Fund’s equity, debt and alternative investments will typically be in the 60%–80%, 20%–40% and 0%–10% range, respectively. The risk profile of underlying funds will be considered when determining allocations. The Fund may also invest directly in securities of each asset class and may use currency forwards for hedging purposes.
What is a currency forward?
A currency forward is an agreement between the Fund and a counterparty to buy or sell a foreign currency in exchange for another currency at a specific exchange rate on a future date.
Risk control will be an integral part of the Fund’s investment process. Among other things, we will analyze portfolio volatility, portfolio concentration, expected extreme events and expected instability in returns among various asset classes and types of investments. When selecting equity funds, we consider the underlying funds’ foreign and domestic exposure, market capitalization ranges and investment style (growth vs. value). When selecting debt funds, we focus primarily on maximizing income appropriate to the Fund’s risk profile and consider the overall credit quality, duration and maturity of the underlying funds’ portfolios. When selecting alternative investment funds,
1. The risk/reward potential is based on the Fund’s goal and level of risk. It is not indicative of the Fund’s actual or implied performance or portfolio composition, which may
change on a continuous basis.
2. Source: Morningstar.
The indexes are unmanaged and include reinvestment of any income or distributions. They do not reflect any fees, expenses or sale charges. One cannot invest directly in an
index, and an index is not representative of the Fund’s portfolio.
See www.franklintempletondatasources.com for additional data provider information.
The dollar value, number of shares or principal amount, and names of all portfolio holdings are listed in the Fund’s SOI, which begins on page 29.
nextstepfunds.com
Annual Report
15
FRANKLIN NEXTSTEP GROWTH FUND
| | |
| Top 10 Fund Holdings | | |
| 5/31/16 | | |
| | % of Total | |
| | Net Assets | |
| Delaware Value Fund – Class I | 13.1 | % |
| iShares Core S&P 500 ETF | 9.4 | % |
| iShares 7-10 Year Treasury Bond ETF | 8.0 | % |
| Franklin Focused Core Equity Fund – Class R6 | 7.5 | % |
| Columbia European Equity Fund – Class Z | 7.1 | % |
| Franklin Mutual European Fund – Class R6 | 6.4 | % |
| Franklin Growth Opportunities Fund – Class R6 | 5.6 | % |
| Van Eck Emerging Markets Fund – Class I | 5.0 | % |
| iShares MSCI Japan ETF | 4.3 | % |
| Vanguard Total International Bond ETF | 4.3 | % |
we focus primarily on the specific alternative strategy employed by the fund; how the fund generates alpha (a measurement of how well the fund performed compared to a benchmark index); how the fund is expected to correlate to different markets; the strategies, methods and techniques the underlying fund uses to hedge certain markets or investments; and how a fund’s net asset value typically reduces when the market falls (the lower correlation between these two factors, the better).
Manager’s Discussion
The Fund’s performance can be attributed mainly to our allocation among equities and fixed income securities and to the performance of the underlying funds we selected for investment.
On May 31, 2016, the portfolio was diversified across capitalization sizes, regions and investment styles for both the equity and fixed income allocations. At period-end, Franklin NextStep Growth Fund allocated 65.8% of total net assets to equity, 23.7% to fixed income and 2.0% to alternative strategies. Domestic equity exposure was 57.1% of the total equity weighting, with the balance represented by foreign equity. Delaware Value Fund – Class I was our largest equity weighting at period-end with 13.1% of total net assets. On the fixed income side, domestic exposure was 67.5% of the Fund’s total fixed income weighting, with the balance represented by foreign fixed income. iShares 7-10 Year Treasury Bond ETF, at 8.0% of the Fund’s total net assets, was our largest fixed income weighting at period-end.
During the reporting period, our largest domestic equity fund holding, Delaware Value Fund – Class I, outperformed the
S&P 500, while our largest foreign equity fund holding, Colum-bia European Equity Fund – Class Z, underperformed the MSCI ACWI ex USA. On the fixed income side, our largest domestic fixed income fund holding, iShares 7-10 Year Treasury Bond ETF, underperformed the Barclays U.S. Aggregate Bond Index, and our largest global fixed income fund holding, Vanguard Total International Bond ETF, underperformed the Barclays Multiverse ex USD Index (Hedged to U.S. Dollar).
Thank you for your participation in Franklin NextStep Growth Fund. We look forward to serving your future investment needs.

The foregoing information reflects our analysis, opinions and portfolio holdings as of May 31, 2016, the end of the reporting period. The way we implement our main investment strategies and the resulting portfolio holdings may change depending on factors such as market and economic conditions. These opinions may not be relied upon as investment advice or an offer for a particular security. The information is not a complete analysis of every aspect of any market, country, industry, security or the Fund. Statements of fact are from sources considered reliable, but the investment manager makes no representation or warranty as to their completeness or accuracy. Although historical performance is no guarantee of future results, these insights may help you understand our investment management philosophy.
16 Annual Report
nextstepfunds.com
FRANKLIN NEXTSTEP GROWTH FUND
Thomas A. Nelson is a senior vice president and director of investment solutions for Franklin Templeton Solutions (FT Solutions). In this role he oversees FT Solutions’ traditional asset portfolio management team as well as its systematic modeling and asset class research teams. He also co-chairs the FT Solutions Global Investment Committee and is a portfolio manager of a number of funds offered for sale in various jurisdictions. Mr. Nelson joined Franklin Templeton Investments in 2007 and co-founded the firm’s quantitative research services group upon joining the company. He moved to FT Solutions in 2009. Prior to working at Franklin Templeton, Mr. Nelson worked for Bloomberg LP from 1991 to 2007, where he was most recently manager of the Americas market specialist teams.
Stephen R. Lingard is a senior vice president and portfolio manager for FT Solutions and a member of the FT Solutions Global Investment Committee, and he serves as co-head of equity strategy. He has portfolio management responsibilities for all Canadian-based multi-asset products, in addition to managing retail and institutional accounts for global clients. He has previously served as director of research for the FT Solutions manager and asset research team. Mr. Lingard joined Franklin Templeton Investments in 2007 and has 22 years of industry experience. Before joining Franklin Templeton, he held various roles as investment manager, fund analyst and bond dealer for companies such as Fidelity, Societe Generale (Asia) and Freedom International Bond Brokers.
John G. Levy is a portfolio manager and director of manager research for FT Solutions. He leads the long-only manager research team, which is responsible for research and analysis of proprietary and third-party mutual funds and mandates for use in U.S., Canadian and globally registered multi-asset strategies. Mr. Levy began working for Franklin Templeton Investments in 2005. He later joined the company’s Futures Program and took a position with FT Solutions in 2008.
Brooks Ritchey is a senior managing director and head of portfolio construction for K2 Advisors. He is also a senior vice president and director of investment solutions for FT Solutions. In this capacity he co-chairs the FT Solutions Global Investment Committee and heads the portfolio review and investment solution management team. In these roles, he works with various teams to analyze market and macroeconomic conditions, determine tactical asset allocation tilts, and manage absolute return and risk overlay portfolios. Mr. Ritchey joined K2 Advisors in 2005, and he joined FT Solutions in 2013. Mr. Ritchey began his investment career in 1982 as a proprietary trader for the NYSE specialist firm of Conklin, Cahill & Co. Since 1987, Mr. Ritchey has successfully managed multi-asset mutual fund and hedge fund portfolios while located in New York and Paris during his employment with organizations including Steinhardt Partners, Citibank, Finch Asset Management, Paribas, AIG and ING.
nextstepfunds.com
Annual Report
17
FRANKLIN NEXTSTEP GROWTH FUND
Performance Summary as of May 31, 2016
Your dividend income will vary depending on dividends or interest paid by securities in the Fund’s portfolio, adjusted for operating expenses of each class. Capital gain distributions are net profits realized from the sale of portfolio securities. The performance table does not reflect any taxes that a shareholder would pay on Fund dividends, capital gain distributions, if any, or any realized gains on the sale of Fund shares. Total return reflects reinvestment of the Fund’s dividends and capital gain distributions, if any, and any unrealized gains or losses.
| | | | | |
| Net Asset Value | | | | | |
| Share Class (Symbol) | | 5/31/16 | | 2/5/16 | Change |
| A (FNGBX) | $ | 10.88 | $ | 10.00 | +$0.88 |
| C (FNGCX) | $ | 10.86 | $ | 10.00 | +$0.86 |
| | |
| Distributions1 (2/5/16–5/31/16) | | |
| |
| | | Dividend |
| Share Class | | Income |
| A | $ | 0.0012 |
| C | $ | 0.0012 |
Performance2
Cumulative total return excludes sales charges. Average annual total returns and value of $10,000 investment include maximum sales charges. Class A: 5.75% maximum initial sales charge; Class C: 1% contingent deferred sales charge in first year only.
| | | | | | | | | | | | |
| | | | | | | Value of | | | | | | |
| | Cumulative | | Average Annual | | $ | 10,000 | Average Annual | | Total Annual Operating Expenses7 | |
| Share Class | Total Return3 | | Total Return4 | | | Investment5 | Total Return (6/30/16)6 | | (With Waiver) | | (Without Waiver) | |
| |
| A | | | | | | | | | 1.20 | % | 30.56 | % |
| Since Inception (2/5/16) | +8.81 | % | +2.56 | % | $ | 10,256 | +2.08 | % | | | | |
| |
| C | | | | | | | | | 1.95 | % | 31.31 | % |
| Since Inception (2/5/16) | +8.61 | % | +7.61 | % | $ | 10,761 | +7.01 | % | | | | |
Performance data represent past performance, which does not guarantee future results. Investment return and principal value will fluctuate, and you may have a gain or loss when you sell your shares. Current performance may differ from figures shown. For most recent month-end performance, go to nextstepfunds.com or call (800) 342-5236.
See page 19 for Performance Summary footnotes.
18 Annual Report
nextstepfunds.com
FRANKLIN NEXTSTEP GROWTH FUND
PERFORMANCE SUMMARY
While an asset allocation plan can be a valuable tool to help reduce overall volatility, all investments involve risks, including possible loss of principal. Because the Fund invests in underlying funds, which may engage in a variety of investment strategies involving certain risks, the Fund is subject to those same risks. In addition, the Fund’s shareholders will indirectly bear the fees and expenses of the underlying funds. The risks described herein are the principal risks of the Fund and the underlying funds. Typically, the more aggressive the investment, or the greater the potential return, the more risk involved. Generally, investors should be comfortable with some fluctuation in the value of their investments, especially over the short term. Stock prices fluctuate, sometimes rapidly and dramatically, due to factors affecting individual companies, particular industries or sectors, or general market conditions. Bond prices generally move in the opposite direction of interest rates. Thus, as prices of bonds in a fund adjust to a rise in interest rates, that fund’s share price may decline. Foreign investing carries additional risks such as currency and market volatility and political or social instability, risks which are heightened in developing countries. Investments in derivatives involve costs and create economic leverage, which may result in significant volatility and cause the funds to participate in losses (as well as gains) that significantly exceed the funds’ initial investment. These risks are described in the Fund’s prospectus. Investors should consult their financial advisor for help selecting the appropriate fund of funds, or fund combination, based on an evaluation of their investment objectives and risk tolerance. The Fund is actively managed but there is no guarantee that the manager’s investment decisions will produce the desired results.
Class C: These shares have higher annual fees and expenses than Class A shares.
1. The distribution amount is the sum of the dividend payments to shareholders for the period shown and includes only estimated tax-basis net investment income.
2. The Fund has an expense reduction contractually guaranteed through at least 9/30/17 and a fee waiver associated with any investment in a Franklin Templeton money fund
and/or other Franklin Templeton fund, as applicable, contractually guaranteed through at least the Fund’s current fiscal year-end. Fund investment results reflect the expense
reduction and fee waiver, to the extent applicable; without these reductions, the results would have been lower.
3. Cumulative total return represents the change in value of an investment over the period indicated.
4. Average annual total return represents the average annual change in value of an investment over the period indicated. Return for less than one year, if any, has not
been annualized.
5. These figures represent the value of a hypothetical $10,000 investment in the Fund over the period indicated.
6. In accordance with SEC rules, we provide standardized average annual total return information through the latest calendar quarter.
7. Figures are as stated in the Fund’s current prospectus and may differ from the expense ratios disclosed in the Financial Highlights in this report. In periods of market vola-
tility, assets may decline significantly, causing total annual Fund operating expenses to become higher than the figures shown.
nextstepfunds.com
Annual Report
19
FRANKLIN NEXTSTEP GROWTH FUND
Your Fund’s Expenses
As a Fund shareholder, you can incur two types of costs:
- Transaction costs, including sales charges (loads) on Fund purchases; and
- Ongoing Fund costs, including management fees, distribution and service (12b-1) fees, and other Fund expenses. All mutual funds have ongoing costs, sometimes referred to as operating expenses.
The following table shows ongoing costs of investing in the Fund and can help you understand these costs and compare them with those of other mutual funds. The table assumes a $1,000 investment held for the six months indicated.
Actual Fund Expenses
The first line (Actual) for each share class listed in the table provides actual account values and expenses. The “Ending Account Value” is derived from the Fund’s actual return, which includes the effect of Fund expenses.
You can estimate the expenses you paid during the period by following these steps. Of course, your account value and expenses will differ from those in this illustration:
1. Divide your account value by $1,000.
If an account had an $8,600 value, then $8,600 ÷ $1,000 = 8.6.
2. Multiply the result by the number under the heading “Expenses Paid During Period.”
If Expenses Paid During Period were $7.50, then 8.6 × $7.50 = $64.50.
In this illustration, the estimated expenses paid this period are $64.50.
Hypothetical Example for Comparison with Other Funds
Information in the second line (Hypothetical) for each class in the table can help you compare ongoing costs of investing in the Fund with those of other mutual funds. This information may not be used to estimate the actual ending account balance or expenses you paid during the period. The hypothetical “Ending Account Value” is based on the actual expense ratio for each class and an assumed 5% annual rate of return before expenses, which does not represent the Fund’s actual return. The figure under the heading “Expenses Paid During Period” shows the hypothetical expenses your account would have incurred under this scenario. You can compare this figure with the 5% hypothetical examples that appear in shareholder reports of other funds.
Please note that expenses shown in the table are meant to highlight ongoing costs and do not reflect any transaction costs, such as sales charges. Therefore, the second line for each class is useful in comparing ongoing costs only, and will not help you compare total costs of owning different funds. In addition, if transaction costs were included, your total costs would have been higher. Please refer to the Fund prospectus for additional information on operating expenses.
| | | | | | | | |
| | | | | | | Expenses Paid | | Expenses Paid |
| | | Beginning Account | | | | During Period* | | During Period** |
| | | Actual 2/5/16 | | | | Actual 2/5/16–5/31/16 | | Actual 2/5/16–5/31/16 |
| | | Hypothetical | | Ending Account | | Hypothetical | | Hypothetical |
| Share Class | | 12/1/15 | | Value 5/31/16 | | 12/1/15–5/31/16 | | 12/1/15–5/31/16 |
| |
| A | | | | | | | | |
| Actual | $ | 1,000 | $ | 1,088.10 | $ | 1.99 | $ | 3.97 |
| Hypothetical (5% return before expenses) | $ | 1,000 | $ | 1,022.00 | $ | 3.03 | $ | 6.06 |
| |
| C | | | | | | | | |
| Actual | $ | 1,000 | $ | 1,086.10 | $ | 4.46 | $ | 6.45 |
| Hypothetical (5% return before expenses) | $ | 1,000 | $ | 1,018.25 | $ | 6.81 | $ | 9.82 |
*Expenses are calculated using the most recent six-month expense ratio excluding expenses of the underlying funds, net of expense waivers, annualized for each class
(A: 0.60%; C: 1.35%), multiplied by the average account value over the period, multiplied by 183/366 to reflect the one-half year period for Hypothetical expenses. For Actual
expenses, the multiplier is 116/366 to reflect the number of days since inception.
**Expenses are calculated using the most recent six-month expense ratio including expenses of the underlying funds, net of expense waivers, annualized for each class
(A: 1.20%; C: 1.95%), multiplied by the average account value over the period, multiplied by 183/366 to reflect the one-half year period for Hypothetical expenses. For Actual
expenses, the multiplier is 116/366 to reflect the number of days since inception.
20 Annual Report
nextstepfunds.com
FRANKLIN FUND ALLOCATOR SERIES
| | | |
| Financial Highlights | | | |
| Franklin NextStep Conservative Fund | | | |
| | | Period Ended | |
| | | May 31, 2016a | |
| Class A | | | |
| Per share operating performance | | | |
| (for a share outstanding throughout the period) | | | |
| Net asset value, beginning of period | $ | 10.00 | |
| Income from investment operationsb: | | | |
| Net investment incomec,d | | 0.03 | |
| Net realized and unrealized gains (losses) | | 0.40 | |
| Total from investment operations | | 0.43 | |
| Less distributions from net investment income | | (0.01 | ) |
| Net asset value, end of period | $ | 10.42 | |
| |
| Total returne | | 4.26 | % |
| |
| Ratios to average net assetsf | | | |
| Expenses before waiver and payments by affiliatesg,h | | 23.36 | % |
| Expenses net of waiver and payments by affiliatesg | | 0.60 | % |
| Net investment incomed | | 0.84 | % |
| |
| Supplemental data | | | |
| Net assets, end of period (000’s) | $ | 549 | |
| Portfolio turnover rate | | 23.45 | % |
aFor the period February 5, 2016 (commencement of operations) to May 31, 2016.
bThe amount shown for a share outstanding throughout the period may not correlate with the Statement of Operations for the period due to the timing of sales and repurchases
of the Fund’s shares in relation to income earned and/or fluctuating fair value of the investments of the Fund.
cBased on average daily shares outstanding.
dRecognition of net investment income by the Fund is affected by the timing of declaration of dividends by the Underlying Funds and exchange traded funds in which the
Fund invests.
eTotal return does not reflect sales commissions or contingent deferred sales charges, if applicable, and is not annualized for periods less than one year.
fRatios are annualized for periods less than one year.
gDoes not include expenses of the Underlying Funds and exchange traded funds in which the Fund invests. The weighted average indirect expenses of the Underlying Funds
and exchange traded funds was 0.46% for the period ended May 31, 2016.
hRatios are adjusted to exclude the effects of annualization for non-recurring expenses.
nextstepfunds.com
The accompanying notes are an integral part of these financial statements. | Annual Report 21
FRANKLIN FUND ALLOCATOR SERIES
FINANCIAL H IGHLIGHTS
| | | |
| Franklin NextStep Conservative Fund (continued) | | | |
| | | Period Ended | |
| | | May 31, 2016a | |
| Class C | | | |
| Per share operating performance | | | |
| (for a share outstanding throughout the period) | | | |
| Net asset value, beginning of period | $ | 10.00 | |
| Income from investment operationsb: | | | |
| Net investment incomec,d | | —e | |
| Net realized and unrealized gains (losses) | | 0.40 | |
| Total from investment operations | | 0.40 | |
| Less distributions from net investment income | | (0.01 | ) |
| Net asset value, end of period | $ | 10.39 | |
| |
| Total returnf | | 3.96 | % |
| |
| Ratios to average net assetsg | | | |
| Expenses before waiver and payments by affiliatesh,i | | 24.11 | % |
| Expenses net of waiver and payments by affiliatesh | | 1.35 | % |
| Net investment incomed | | 0.09 | % |
| |
| Supplemental data | | | |
| Net assets, end of period (000’s) | $ | 373 | |
| Portfolio turnover rate | | 23.45 | % |
aFor the period February 5, 2016 (commencement of operations) to May 31, 2016.
bThe amount shown for a share outstanding throughout the period may not correlate with the Statement of Operations for the period due to the timing of sales and repurchases
of the Fund’s shares in relation to income earned and/or fluctuating fair value of the investments of the Fund.
cBased on average daily shares outstanding.
dRecognition of net investment income by the Fund is affected by the timing of declaration of dividends by the Underlying Funds and exchange traded funds in which the
Fund invests.
eAmount rounds to less than $0.01 per share.
fTotal return does not reflect sales commissions or contingent deferred sales charges, if applicable, and is not annualized for periods less than one year.
gRatios are annualized for periods less than one year.
hDoes not include expenses of the Underlying Funds and exchange traded funds in which the Fund invests. The weighted average indirect expenses of the Underlying Funds
and exchange traded funds was 0.46% for the period ended May 31, 2016.
iRatios are adjusted to exclude the effects of annualization for non-recurring expenses.
22 Annual Report | The accompanying notes are an integral part of these financial statements.
nextstepfunds.com
FRANKLIN FUND ALLOCATOR SERIES
| | | |
| Statement of Investments, May 31, 2016 | | | |
| Franklin NextStep Conservative Fund | | | |
| | Shares | | Value |
| Investments in Underlying Funds and Exchange Traded Funds 88.0% | | | |
| Domestic Equity 11.8% | | | |
| Delaware Value Fund, Class I | 2,871 | $ | 54,261 |
| a Franklin Focused Core Equity Fund, Class R6 | 2,409 | | 32,715 |
| a,b Franklin Growth Opportunities Fund, Class R6 | 328 | | 10,877 |
| iShares Core S&P 500 ETF | 51 | | 10,762 |
| | | | 108,615 |
| Domestic Fixed Income 54.3% | | | |
| Delaware Corporate Bond Fund, Class I | 21,771 | | 125,182 |
| a Franklin Total Return Fund, Class R6 | 16,884 | | 165,633 |
| iShares 7-10 Year Treasury Bond ETF | 686 | | 75,275 |
| iShares Core U.S. Aggregate Bond ETF | 770 | | 85,239 |
| iShares TIPS Bond ETF | 438 | | 49,993 |
| | | | 501,322 |
| Foreign Equity 7.9% | | | |
| Columbia European Equity Fund, Class Z | 3,812 | | 24,095 |
| a Franklin Mutual European Fund, Class R6 | 1,038 | | 19,735 |
| iShares MSCI Japan ETF (Japan) | 953 | | 11,226 |
| Van Eck Emerging Markets Fund, Class I | 1,357 | | 17,491 |
| | | | 72,547 |
| Foreign Fixed Income 14.0% | | | |
| a Templeton Global Total Return Fund, Class R6 | 5,695 | | 64,586 |
| Vanguard Total International Bond ETF | 1,183 | | 64,698 |
| | | | 129,284 |
| Total Investments in Underlying Funds and Exchange Traded Funds before | | | |
| Short Term Investments (Cost $794,849) | | | 811,768 |
| Short Term Investments (Cost $58,273) 6.3% | | | |
| Money Market Funds 6.3% | | | |
| a,b Institutional Fiduciary Trust Money Market Portfolio | 58,273 | | 58,273 |
| Total Investments (Cost $853,122) 94.3% | | | 870,041 |
| Other Assets, less Liabilities 5.7% | | | 52,325 |
| Net Assets 100.0% | | $ | 922,366 |
See Abbreviations on page 42.
aSee Note 3(f) regarding investments in FT Underlying Funds.
bNon-income producing.
nextstepfunds.com
The accompanying notes are an integral part of these financial statements. | Annual Report 23
FRANKLIN FUND ALLOCATOR SERIES
| | | |
| Financial Highlights | | | |
| Franklin NextStep Moderate Fund | | | |
| | | Period Ended | |
| | | May 31, 2016a | |
| Class A | | | |
| Per share operating performance | | | |
| (for a share outstanding throughout the period) | | | |
| Net asset value, beginning of period | $ | 10.00 | |
| Income from investment operationsb: | | | |
| Net investment incomec,d | | 0.01 | |
| Net realized and unrealized gains (losses) | | 0.79 | |
| Total from investment operations | | 0.80 | |
| Less distributions from net investment income | | (—)e | |
| Net asset value, end of period | $ | 10.80 | |
| |
| Total returnf | | 8.02 | % |
| |
| Ratios to average net assetsg | | | |
| Expenses before waiver and payments by affiliatesh,i | | 6.08 | % |
| Expenses net of waiver and payments by affiliatesh | | 0.60 | % |
| Net investment incomed | | 0.34 | % |
| |
| Supplemental data | | | |
| Net assets, end of period (000’s) | $ | 3,280 | |
| Portfolio turnover rate | | 13.45 | % |
aFor the period February 5, 2016 (commencement of operations) to May 31, 2016.
bThe amount shown for a share outstanding throughout the period may not correlate with the Statement of Operations for the period due to the timing of sales and repurchases
of the Fund’s shares in relation to income earned and/or fluctuating fair value of the investments of the Fund.
cBased on average daily shares outstanding.
dRecognition of net investment income by the Fund is affected by the timing of declaration of dividends by the Underlying Funds and exchange traded funds in which the
Fund invests.
eAmount rounds to less than $0.01 per share.
fTotal return does not reflect sales commissions or contingent deferred sales charges, if applicable, and is not annualized for periods less than one year.
gRatios are annualized for periods less than one year.
hDoes not include expenses of the Underlying Funds and exchange traded funds in which the Fund invests. The weighted average indirect expenses of the Underlying Funds
and exchange traded funds was 0.55% for the period ended May 31, 2016.
iRatios are adjusted to exclude the effects of annualization for non-recurring expenses.
24 Annual Report | The accompanying notes are an integral part of these financial statements.
nextstepfunds.com
FRANKLIN FUND ALLOCATOR SERIES
FINANCIAL H IGHLIGHTS
| | | |
| Franklin NextStep Moderate Fund (continued) | | | |
| | | Period Ended | |
| | | May 31, 2016a | |
| Class C | | | |
| Per share operating performance | | | |
| (for a share outstanding throughout the period) | | | |
| Net asset value, beginning of period | $ | 10.00 | |
| Income from investment operationsb: | | | |
| Net investment income (loss)c,d | | (0.02 | ) |
| Net realized and unrealized gains (losses) | | 0.80 | |
| Total from investment operations | | 0.78 | |
| Less distributions from net investment income | | (—)e | |
| Net asset value, end of period | $ | 10.78 | |
| |
| Total returnf | | 7.82 | % |
| |
| Ratios to average net assetsg | | | |
| Expenses before waiver and payments by affiliatesh,i | | 6.83 | % |
| Expenses net of waiver and payments by affiliatesh | | 1.35 | % |
| Net investment income (loss)d | | (0.41 | )% |
| |
| Supplemental data | | | |
| Net assets, end of period (000’s) | $ | 1,369 | |
| Portfolio turnover rate | | 13.45 | % |
aFor the period February 5, 2016 (commencement of operations) to May 31, 2016.
bThe amount shown for a share outstanding throughout the period may not correlate with the Statement of Operations for the period due to the timing of sales and repurchases
of the Fund’s shares in relation to income earned and/or fluctuating fair value of the investments of the Fund.
cBased on average daily shares outstanding.
dRecognition of net investment income by the Fund is affected by the timing of declaration of dividends by the Underlying Funds and exchange traded funds in which the
Fund invests.
eAmount rounds to less than $0.01 per share.
fTotal return does not reflect sales commissions or contingent deferred sales charges, if applicable, and is not annualized for periods less than one year.
gRatios are annualized for periods less than one year.
hDoes not include expenses of the Underlying Funds and exchange traded funds in which the Fund invests. The weighted average indirect expenses of the Underlying Funds
and exchange traded funds was 0.55% for the period ended May 31, 2016.
iRatios are adjusted to exclude the effects of annualization for non-recurring expenses.
nextstepfunds.com
The accompanying notes are an integral part of these financial statements. | Annual Report 25
FRANKLIN FUND ALLOCATOR SERIES
| | | |
| Statement of Investments, May 31, 2016 | | | |
| Franklin NextStep Moderate Fund | | | |
| | Shares | | Value |
| Investments in Underlying Funds and Exchange Traded Funds 93.2% | | | |
| Alternative Strategies 2.0% | | | |
| a Franklin K2 Alternative Strategies Fund, Class R6 | 8,672 | $ | 91,835 |
| Domestic Equity 28.8% | | | |
| Delaware Value Fund, Class I | 24,755 | | 467,862 |
| a Franklin Focused Core Equity Fund, Class R6 | 19,714 | | 267,713 |
| a,b Franklin Growth Opportunities Fund, Class R6 | 6,052 | | 200,872 |
| iShares Core S&P 500 ETF | 1,902 | | 401,360 |
| | | | 1,337,807 |
| Domestic Fixed Income 26.7% | | | |
| Delaware Corporate Bond Fund, Class I | 43,082 | | 247,724 |
| a Franklin Total Return Fund, Class R6 | 27,827 | | 272,987 |
| iShares 7-10 Year Treasury Bond ETF | 2,825 | | 309,987 |
| iShares Core U.S. Aggregate Bond ETF | 2,575 | | 285,052 |
| iShares TIPS Bond ETF | 1,084 | | 123,728 |
| | | | 1,239,478 |
| Foreign Equity 23.4% | | | |
| Brookfield Global Listed Real Estate Fund, Class I | 7,052 | | 91,749 |
| Columbia European Equity Fund, Class Z | 42,591 | | 269,175 |
| a Franklin Mutual European Fund, Class R6 | 12,632 | | 240,260 |
| iShares Core MSCI Emerging Markets ETF | 1,736 | | 70,256 |
| iShares MSCI Eurozone ETF | 2,571 | | 87,388 |
| iShares MSCI Japan ETF (Japan) | 14,127 | | 166,416 |
| Van Eck Emerging Markets Fund, Class I | 12,735 | | 164,153 |
| | | | 1,089,397 |
| Foreign Fixed Income 12.3% | | | |
| a Templeton Global Total Return Fund, Class R6 | 25,218 | | 285,968 |
| Vanguard Total International Bond ETF | 5,237 | | 286,412 |
| | | | 572,380 |
| Total Investments in Underlying Funds and Exchange Traded Funds before | | | |
| Short Term Investments (Cost $4,227,207) | | | 4,330,897 |
| Short Term Investments (Cost $273,535) 5.9% | | | |
| Money Market Funds 5.9% | | | |
| a,b Institutional Fiduciary Trust Money Market Portfolio | 273,535 | | 273,535 |
| Total Investments (Cost $4,500,742) 99.1% | | | 4,604,432 |
| Other Assets, less Liabilities 0.9% | | | 44,092 |
| Net Assets 100.0% | | $ | 4,648,524 |
See Abbreviations on page 42.
aSee Note 3(f) regarding investments in FT Underlying Funds.
bNon-income producing.
26 Annual Report | The accompanying notes are an integral part of these financial statements.
nextstepfunds.com
FRANKLIN FUND ALLOCATOR SERIES
| | | |
| Financial Highlights | | | |
| Franklin NextStep Growth Fund | | | |
| | | Period Ended | |
| | | May 31, 2016a | |
| Class A | | | |
| Per share operating performance | | | |
| (for a share outstanding throughout the period) | | | |
| Net asset value, beginning of period | $ | 10.00 | |
| Income from investment operationsb: | | | |
| Net investment incomec,d | | —e | |
| Net realized and unrealized gains (losses) | | 0.88 | |
| Total from investment operations | | 0.88 | |
| Less distributions from net investment income | | (—)e | |
| Net asset value, end of period | $ | 10.88 | |
| |
| Total returnf | | 8.81 | % |
| |
| Ratios to average net assetsg | | | |
| Expenses before waiver and payments by affiliatesh,i | | 17.15 | % |
| Expenses net of waiver and payments by affiliatesh | | 0.60 | % |
| Net investment incomed | | 0.07 | % |
| |
| Supplemental data | | | |
| Net assets, end of period (000’s) | $ | 1,129 | |
| Portfolio turnover rate | | 24.56 | % |
aFor the period February 5, 2016 (commencement of operations) to May 31, 2016.
bThe amount shown for a share outstanding throughout the period may not correlate with the Statement of Operations for the period due to the timing of sales and repurchases
of the Fund’s shares in relation to income earned and/or fluctuating fair value of the investments of the Fund.
cBased on average daily shares outstanding.
dRecognition of net investment income by the Fund is affected by the timing of declaration of dividends by the Underlying Funds and exchange traded funds in which the
Fund invests.
eAmount rounds to less than $0.01 per share.
fTotal return does not reflect sales commissions or contingent deferred sales charges, if applicable, and is not annualized for periods less than one year.
gRatios are annualized for periods less than one year.
hDoes not include expenses of the Underlying Funds and exchange traded funds in which the Fund invests. The weighted average indirect expenses of the Underlying Funds
and exchange traded funds was 0.60% for the period ended May 31, 2016.
iRatios are adjusted to exclude the effects of annualization for non-recurring expenses.
nextstepfunds.com
The accompanying notes are an integral part of these financial statements. | Annual Report 27
FRANKLIN FUND ALLOCATOR SERIES
FINANCIAL H IGHLIGHTS
| | | |
| Franklin NextStep Growth Fund (continued) | | | |
| | | Period Ended | |
| | | May 31, 2016a | |
| Class C | | | |
| Per share operating performance | | | |
| (for a share outstanding throughout the period) | | | |
| Net asset value, beginning of period | $ | 10.00 | |
| Income from investment operationsb: | | | |
| Net investment income (loss)c,d | | (0.02 | ) |
| Net realized and unrealized gains (losses) | | 0.88 | |
| Total from investment operations | | 0.86 | |
| Less distributions from net investment income | | (—)e | |
| Net asset value, end of period | $ | 10.86 | |
| |
| Total returnf | | 8.61 | % |
| |
| Ratios to average net assetsg | | | |
| Expenses before waiver and payments by affiliatesh,i | | 17.90 | % |
| Expenses net of waiver and payments by affiliatesh | | 1.35 | % |
| Net investment income (loss)d | | (0.68 | )% |
| |
| Supplemental data | | | |
| Net assets, end of period (000’s) | $ | 661 | |
| Portfolio turnover rate | | 24.56 | % |
aFor the period February 5, 2016 (commencement of operations) to May 31, 2016.
bThe amount shown for a share outstanding throughout the period may not correlate with the Statement of Operations for the period due to the timing of sales and repurchases
of the Fund’s shares in relation to income earned and/or fluctuating fair value of the investments of the Fund.
cBased on average daily shares outstanding.
dRecognition of net investment income by the Fund is affected by the timing of declaration of dividends by the Underlying Funds and exchange traded funds in which the
Fund invests.
eAmount rounds to less than $0.01 per share.
fTotal return does not reflect sales commissions or contingent deferred sales charges, if applicable, and is not annualized for periods less than one year.
gRatios are annualized for periods less than one year.
hDoes not include expenses of the Underlying Funds and exchange traded funds in which the Fund invests. The weighted average indirect expenses of the Underlying Funds
and exchange traded funds was 0.60% for the period ended May 31, 2016.
iRatios are adjusted to exclude the effects of annualization for non-recurring expenses.
28 Annual Report | The accompanying notes are an integral part of these financial statements.
nextstepfunds.com
FRANKLIN FUND ALLOCATOR SERIES
| | | |
| Statement of Investments, May 31, 2016 | | | |
| Franklin NextStep Growth Fund | | | |
| | Shares | | Value |
| Investments in Underlying Funds and Exchange Traded Funds 91.5% | | | |
| Alternative Strategies 2.0% | | | |
| a Franklin K2 Alternative Strategies Fund, Class R6 | 3,278 | $ | 34,718 |
| Domestic Equity 37.6% | | | |
| Delaware Value Fund, Class I | 12,436 | | 235,046 |
| a Franklin Focused Core Equity Fund, Class R6 | 9,903 | | 134,489 |
| a,b Franklin Growth Opportunities Fund, Class R6 | 3,040 | | 100,909 |
| a,b Franklin Small Cap Growth Fund, Class R6 | 1,902 | | 33,848 |
| iShares Core S&P 500 ETF | 796 | | 167,972 |
| | | | 672,264 |
| Domestic Fixed Income 16.0% | | | |
| Delaware Corporate Bond Fund, Class I | 12,442 | | 71,541 |
| iShares 7-10 Year Treasury Bond ETF | 1,305 | | 143,198 |
| iShares Core U.S. Aggregate Bond ETF | 647 | | 71,623 |
| | | | 286,362 |
| Foreign Equity 28.2% | | | |
| Brookfield Global Listed Real Estate Fund, Class I | 2,666 | | 34,687 |
| Columbia European Equity Fund, Class Z | 20,160 | | 127,413 |
| a Franklin Mutual European Fund, Class R6 | 5,979 | | 113,715 |
| iShares Core MSCI Emerging Markets ETF | 549 | | 22,218 |
| iShares MSCI Eurozone ETF | 1,217 | | 41,366 |
| iShares MSCI Japan ETF (Japan) | 6,528 | | 76,900 |
| Van Eck Emerging Markets Fund, Class I | 6,905 | | 88,999 |
| | | | 505,298 |
| Foreign Fixed Income 7.7% | | | |
| a Templeton Global Total Return Fund, Class R6 | 5,492 | | 62,278 |
| Vanguard Total International Bond ETF | 1,394 | | 76,238 |
| | | | 138,516 |
| Total Investments in Underlying Funds and Exchange Traded Funds before | | | |
| Short Term Investments (Cost $1,591,911) | | | 1,637,158 |
| Short Term Investments (Cost $119,757) 6.7% | | | |
| Money Market Funds 6.7% | | | |
| a,b Institutional Fiduciary Trust Money Market Portfolio | 119,757 | | 119,757 |
| Total Investments (Cost $1,711,668) 98.2% | | | 1,756,915 |
| Other Assets, less Liabilities 1.8% | | | 33,008 |
| Net Assets 100.0% | | $ | 1,789,923 |
See Abbreviations on page 42.
aSee Note 3(f) regarding investments in FT Underlying Funds.
bNon-income producing.
nextstepfunds.com
The accompanying notes are an integral part of these financial statements. | Annual Report 29
FRANKLIN FUND ALLOCATOR SERIES
| | | | | | | | |
| Financial Statements | | | | | | | | |
| |
| Statements of Assets and Liabilities | | | | | | | | |
| May 31, 2016 | | | | | | | | |
| |
| | | Franklin | | Franklin | | | Franklin | |
| | | NextStep | | NextStep | | | NextStep | |
| | | Conservative | | Moderate | | | Growth | |
| | | Fund | | Fund | | | Fund | |
| Assets: | | | | | | | | |
| Cost - Unaffiliated issuers | $ | 213,169 | $ | 1,196,844 | | $ | 538,399 | |
| Cost - Non-controlled affiliates (Note 3f) | | 344,911 | | 1,599,567 | | | 582,909 | |
| Cost - Exchange traded funds | | 295,042 | | 1,704,331 | | | 590,360 | |
| Total cost of investments | $ | 853,122 | $ | 4,500,742 | | $ | 1,711,668 | |
| Value - Unaffiliated issuers | $ | 221,029 | $ | 1,240,663 | | $ | 557,686 | |
| Value - Non-controlled affiliates (Note 3f) | | 351,819 | | 1,633,170 | | | 599,714 | |
| Value - Exchange traded funds | | 297,193 | | 1,730,599 | | | 599,515 | |
| Total value of investments | | 870,041 | | 4,604,432 | | | 1,756,915 | |
| Receivables: | | | | | | | | |
| Capital shares sold | | — | | 71,803 | | | 68,266 | |
| Affiliates | | 61,547 | | 60,062 | | | 61,345 | |
| Offering costs | | 19,764 | | 19,292 | | | 19,013 | |
| Total assets | | 951,352 | | 4,755,589 | | | 1,905,539 | |
| Liabilities: | | | | | | | | |
| Payables: | | | | | | | | |
| Investment securities purchased | | 6,387 | | 82,943 | | | 92,660 | |
| Distribution fees | | 401 | | 1,562 | | | 621 | |
| Transfer agent fees | | 82 | | 352 | | | 175 | |
| Reports to shareholders | | 1,698 | | 1,691 | | | 1,692 | |
| Professional fees | | 20,313 | | 20,313 | | | 20,313 | |
| Accrued expenses and other liabilities | | 105 | | 204 | | | 155 | |
| Total liabilities | | 28,986 | | 107,065 | | | 115,616 | |
| Net assets, at value | $ | 922,366 | $ | 4,648,524 | | $ | 1,789,923 | |
| Net assets consist of: | | | | | | | | |
| Paid-in capital | $ | 903,761 | $ | 4,543,509 | | $ | 1,746,191 | |
| Undistributed net investment income (loss) | | 1,460 | | 3,529 | | | 470 | |
| Net unrealized appreciation (depreciation) | | 16,919 | | 103,690 | | | 45,247 | |
| Accumulated net realized gain (loss) | | 226 | | (2,204 | ) | | (1,985 | ) |
| Net assets, at value | $ | 922,366 | $ | 4,648,524 | | $ | 1,789,923 | |
30 Annual Report | The accompanying notes are an integral part of these financial statements.
nextstepfunds.com
FRANKLIN FUND ALLOCATOR SERIES
FINANCIAL STATEMENTS
| | | | | | |
| Statements of Assets and Liabilities (continued) | | | | | | |
| May 31, 2016 | | | | | | |
| |
| | | Franklin | | Franklin | | Franklin |
| | | NextStep | | NextStep | | NextStep |
| | | Conservative | | Moderate | | Growth |
| | | Fund | | Fund | | Fund |
| Class A: | | | | | | |
| Net assets, at value | $ | 549,078 | $ | 3,279,770 | $ | 1,128,799 |
| Shares outstanding | | 52,688 | | 303,632 | | 103,760 |
| Net asset value per sharea | $ | 10.42 | $ | 10.80 | $ | 10.88 |
| Maximum offering price per share (net asset value per share ÷ 94.25%) | $ | 11.06 | $ | 11.46 | $ | 11.54 |
| Class C: | | | | | | |
| Net assets, at value | $ | 373,288 | $ | 1,368,754 | $ | 661,124 |
| Shares outstanding | | 35,921 | | 127,007 | | 60,885 |
| Net asset value and maximum offering price per sharea | $ | 10.39 | $ | 10.78 | $ | 10.86 |
aRedemption price is equal to net asset value less contingent deferred sales charges, if applicable.
nextstepfunds.com
The accompanying notes are an integral part of these financial statements. | Annual Report 31
FRANKLIN FUND ALLOCATOR SERIES
FINANCIAL STATEMENTS
| | | | | | | | | |
| Statements of Operations | | | | | | | | | |
| for the period ended May 31, 2016a | | | | | | | | | |
| |
| | | Franklin | | | Franklin | | | Franklin | |
| | | NextStep | | | NextStep | | | NextStep | |
| | | Conservative | | | Moderate | | | Growth | |
| | | Fund | | | Fund | | | Fund | |
| Investment income: | | | | | | | | | |
| Dividends: | | | | | | | | | |
| Unaffiliated issuers | $ | 894 | | $ | 1,820 | | $ | 535 | |
| Non-controlled affiliates (Note 3f) | | 771 | | | 1,892 | | | 279 | |
| Exchange traded funds | | 721 | | | 2,734 | | | 711 | |
| Total investment income | | 2,386 | | | 6,446 | | | 1,525 | |
| Expenses: | | | | | | | | | |
| Management fees (Note 3a) | | 413 | | | 1,703 | | | 567 | |
| Distribution fees: (Note 3c) | | | | | | | | | |
| Class A | | 227 | | | 1,321 | | | 373 | |
| Class C | | 789 | | | 1,697 | | | 852 | |
| Transfer agent fees: (Note 3e) | | | | | | | | | |
| Class A | | 64 | | | 364 | | | 140 | |
| Class C | | 56 | | | 116 | | | 79 | |
| Custodian fees (Note 4) | | 5 | | | 5 | | | 5 | |
| Reports to shareholders | | 2,190 | | | 2,182 | | | 2,182 | |
| Registration and filing fees | | 3,581 | | | 3,437 | | | 3,436 | |
| Professional fees | | 20,450 | | | 20,450 | | | 20,450 | |
| Amortization of offering costs | | 35,702 | | | 35,702 | | | 35,702 | |
| Other | | 100 | | | 200 | | | 150 | |
| Total expenses | | 63,577 | | | 67,177 | | | 63,936 | |
| Expenses waived/paid by affiliates (Notes 3f and 3g) | | (61,976 | ) | | (61,765 | ) | | (61,912 | ) |
| Net expenses | | 1,601 | | | 5,412 | | | 2,024 | |
| Net investment income (loss) | | 785 | | | 1,034 | | | (499 | ) |
| Realized and unrealized gains (losses): | | | | | | | | | |
| Net realized gain (loss) from: | | | | | | | | | |
| Sale of investments: | | | | | | | | | |
| Unaffiliated issuers | | (57 | ) | | (308 | ) | | (681 | ) |
| Non-controlled affiliates (Note 3f) | | 3 | | | (602 | ) | | (73 | ) |
| Exchange traded funds | | 280 | | | (1,294 | ) | | (1,231 | ) |
| Net realized gain (loss) | | 226 | | | (2,204 | ) | | (1,985 | ) |
| Net change in unrealized appreciation (depreciation) on investments | | 16,919 | | | 103,690 | | | 45,247 | |
| Net realized and unrealized gain (loss) | | 17,145 | | | 101,486 | | | 43,262 | |
| Net increase (decrease) in net assets resulting from operations | $ | 17,930 | | $ | 102,520 | | $ | 42,763 | |
aFor the period February 5, 2016 (commencement of operations) to May 31, 2016.
32 Annual Report | The accompanying notes are an integral part of these financial statements.
nextstepfunds.com
FRANKLIN FUND ALLOCATOR SERIES
FINANCIAL STATEMENTS
| | | | | | |
| Statements of Changes in Net Assets | | | | | | |
| |
| | | Franklin NextStep | | | Franklin NextStep | |
| | | Conservative Fund | | | Moderate Fund | |
| | | Period Ended | | | Period Ended | |
| | | May 31, 2016a | | | May 31, 2016a | |
| Increase (decrease) in net assets: | | | | | | |
| Operations: | | | | | | |
| Net investment income | $ | 785 | | $ | 1,034 | |
| Net realized gain (loss) | | 226 | | | (2,204 | ) |
| Net change in unrealized appreciation (depreciation) | | 16,919 | | | 103,690 | |
| Net increase (decrease) in net assets resulting from operations | | 17,930 | | | 102,520 | |
| Distributions to shareholders from: | | | | | | |
| Net investment income: | | | | | | |
| Class A | | (132 | ) | | (220 | ) |
| Class C | | (139 | ) | | (56 | ) |
| Total distributions to shareholders | | (271 | ) | | (276 | ) |
| Capital share transactions: (Note 2) | | | | | | |
| Class A | | 539,137 | | | 3,204,582 | |
| Class C | | 365,570 | | | 1,341,698 | |
| Total capital share transactions | | 904,707 | | | 4,546,280 | |
| Net increase (decrease) in net assets | | 922,366 | | | 4,648,524 | |
| Net assets: | | | | | | |
| End of period | $ | 922,366 | | $ | 4,648,524 | |
| Undistributed net investment income included in net assets: | | | | | | |
| End of period | $ | 1,460 | | $ | 3,529 | |
aFor the period February 5, 2016 (commencement of operations) to May 31, 2016.
nextstepfunds.com
The accompanying notes are an integral part of these financial statements. | Annual Report 33
FRANKLIN FUND ALLOCATOR SERIES
FINANCIAL STATEMENTS
| | | |
| Statements of Changes in Net Assets (continued) | | | |
| |
| | | Franklin NextStep | |
| | | Growth Fund | |
| | | Period Ended | |
| | | May 31, 2016a | |
| Increase (decrease) in net assets: | | | |
| Operations: | | | |
| Net investment income (loss) | $ | (499 | ) |
| Net realized gain (loss) | | (1,985 | ) |
| Net change in unrealized appreciation (depreciation) | | 45,247 | |
| Net increase (decrease) in net assets resulting from operations | | 42,763 | |
| Distributions to shareholders from: | | | |
| Net investment income: | | | |
| Class A | | (29 | ) |
| Class C | | (19 | ) |
| Total distributions to shareholders | | (48 | ) |
| Capital share transactions: (Note 2) | | | |
| Class A | | 1,103,558 | |
| Class C | | 643,650 | |
| Total capital share transactions | | 1,747,208 | |
| Net increase (decrease) in net assets | | 1,789,923 | |
| Net assets: | | | |
| End of period | $ | 1,789,923 | |
| Undistributed net investment income included in net assets: | | | |
| End of period | $ | 470 | |
aFor the period February 5, 2016 (commencement of operations) to May 31, 2016.
34 Annual Report | The accompanying notes are an integral part of these financial statements.
nextstepfunds.com
FRANKLIN FUND ALLOCATOR SERIES
Notes to Financial Statements
1. Organization and Significant Accounting Policies
Franklin Fund Allocator Series (Trust) is registered under the Investment Company Act of 1940 (1940 Act) as an open-end management investment company, consisting of twenty-two separate funds, three of which are included in this report (Funds) and applies the specialized accounting and reporting guidance in U.S. Generally Accepted Accounting Principles (U.S. GAAP). The financial statements of the remaining funds in the Trust are presented separately. The Funds invest in mutual funds (Underlying Funds) and exchange traded funds (ETFs), including affiliated funds managed by Franklin Templeton (FT Underlying Funds). Effective February 5, 2016, the Funds commenced operations offering two classes of shares: Class A and Class C. Effective June 15, 2016, the Funds began offering a new class of shares, Advisor Class. Each class of shares differs by its initial sales load, contingent deferred sales charges, voting rights on matters affecting a single class, its exchange privilege and fees primarily due to differing arrangements for distribution fees.
The accounting policies of the Underlying Funds are outlined in their respective shareholder reports. A copy of the Underlying Funds’ shareholder reports, in which each Fund invests, is available on the U.S. Securities and Exchange Commission (SEC) website at sec.gov or at the SEC’s Public Reference Room in Washington, D.C. The Underlying Funds’ shareholder reports are not covered by this report.
The following summarizes the Funds’ significant accounting policies.
a. Financial Instrument Valuation
The Funds’ investments in financial instruments are carried at fair value daily. Fair value is the price that would be received to sell an asset or paid to transfer a liability in an orderly transaction between market participants on the measurement date. The Funds calculate the net asset value (NAV) per share as of 4 p.m. Eastern time each day the New York Stock Exchange (NYSE) is open for trading. Under compliance policies and procedures approved by the Trust’s Board of Trustees (the Board), the Funds’ administrator has responsibility for oversight of valuation, including leading the cross-functional Valuation Committee (VC). The VC provides administration and oversight of the Funds’ valuation policies and procedures, which are approved annually by the Board. Among other things, these procedures allow the Funds to utilize independent pricing services, quotations from securities and financial instrument dealers, and other market sources to determine fair value.
Investments in the Underlying Funds are valued at their closing NAV each trading day. ETFs listed on an exchange or on the NASDAQ National Market System are valued at the last quoted sale price or the official closing price of the day, respectively.
The Funds have procedures to determine the fair value of financial instruments for which market prices are not reliable or readily available. Under these procedures, the VC convenes on a regular basis to review such financial instruments and considers a number of factors, including significant unobservable valuation inputs, when arriving at fair value. The VC primarily employs a market-based approach which may use related or comparable assets or liabilities, recent transactions, market multiples, book values, and other relevant information for the investment to determine the fair value of the investment. An income-based valuation approach may also be used in which the anticipated future cash flows of the investment are discounted to calculate fair value. Discounts may also be applied due to the nature or duration of any restrictions on the disposition of the investments. Due to the inherent uncertainty of valuations of such investments, the fair values may differ significantly from the values that would have been used had an active market existed. The VC employs various methods for calibrating these valuation approaches including a regular review of key inputs and assumptions, transactional back-testing or disposition analysis, and reviews of any related market activity.
b. Income Taxes
It is each Fund’s policy to qualify as a regulated investment company under the Internal Revenue Code. Each Fund intends to distribute to shareholders substantially all of its taxable income and net realized gains to relieve it from federal income and excise taxes. As a result, no provision for U.S. federal income taxes is required.
Each Fund may recognize an income tax liability related to its uncertain tax positions under U.S. GAAP when the uncertain tax position has a less than 50% probability that it will be sustained upon examination by the tax authorities based on its technical merits. As of May 31, 2016, each Fund has determined that no tax liability is required in its financial statements related to uncertain tax positions for any open tax years (or expected to be taken in future tax years). Open tax years are those that remain subject to examination and are based on each tax jurisdiction’s statute of limitation.
c. Security Transactions, Investment Income, Expenses and Distributions
Security transactions are accounted for on trade date. Realized gains and losses on security transactions are determined on a
nextstepfunds.com
Annual Report
35
FRANKLIN FUND ALLOCATOR SERIES
NOTES TO FINANCIAL STATEMENTS
1. Organization and Significant Accounting
Policies (continued)
specific identification basis. Estimated expenses are accrued daily. Dividend income is recorded on the ex-dividend date. Distributions to shareholders are recorded on the ex-dividend date and are determined according to income tax regulations (tax basis). Distributable earnings determined on a tax basis may differ from earnings recorded in accordance with U.S. GAAP. These differences may be permanent or temporary. Permanent differences are reclassified among capital accounts to reflect their tax character. These reclassifications have no impact on net assets or the results of operations. Temporary differences are not reclassified, as they may reverse in subsequent periods.
Common expenses incurred by the Trust are allocated among the Funds based on the ratio of net assets of each Fund to the combined net assets of the Trust. Fund specific expenses are charged directly to the fund that incurred the expense.
The Funds indirectly bear their proportionate share of expenses from the Underlying Funds and ETFs. Since the Underlying Funds and ETFs have varied expense levels and the Funds may own different proportions of the Underlying Funds and ETFs at different times, the amount of expenses incurred indirectly by the Funds will vary.
Realized and unrealized gains and losses and net investment income, not including class specific expenses, are allocated daily to each class of shares based upon the relative proportion of net assets of each class. Differences in per share distributions, by class, are generally due to differences in class specific expenses.
d. Offering Costs
Offering costs are amortized on a straight line basis over twelve months.
e. Accounting Estimates
The preparation of financial statements in accordance with U.S. GAAP requires management to make estimates and assumptions that affect the reported amounts of assets and liabilities at the date of the financial statements and the amounts of income and expenses during the reporting period. Actual results could differ from those estimates.
f. Guarantees and Indemnifications
Under the Trust’s organizational documents, its officers and trustees are indemnified by the Trust against certain liabilities arising out of the performance of their duties to the Trust. Additionally, in the normal course of business, the Trust, on behalf of the Funds, enters into contracts with service providers that contain general indemnification clauses. The Trust’s maximum exposure under these arrangements is unknown as this would involve future claims that may be made against the Trust that have not yet occurred. Currently, the Trust expects the risk of loss to be remote.
2. Shares of Beneficial Interest
At May 31, 2016, there were an unlimited number of shares authorized (without par value). Transactions in the Funds’ shares were as follows:
| | | | | | | | |
| | Franklin NextStep | Franklin NextStep | |
| | Conservative Fund* | Moderate Fund* | |
| | Shares | | Amount | Shares | | | Amount | |
| |
| Class A Shares: | | | | | | | | |
| Period ended May 31, 2016 | | | | | | | | |
| Shares sold | 52,683 | $ | 539,090 | 326,243 | | $ | 3,446,444 | |
| Shares issued in reinvestment of distributions | 5 | | 47 | 18 | | | 195 | |
| Shares redeemed | — | | — | (22,629 | ) | | (242,057 | ) |
| Net increase (decrease) | 52,688 | $ | 539,137 | 303,632 | | $ | 3,204,582 | |
| Class C Shares: | | | | | | | | |
| Period ended May 31, 2016 | | | | | | | | |
| Shares sold | 35,916 | $ | 365,516 | 127,004 | | $ | 1,341,668 | |
| Shares issued in reinvestment of distributions | 5 | | 54 | 3 | | | 30 | |
| Net increase (decrease) | 35,921 | $ | 365,570 | 127,007 | | $ | 1,341,698 | |
36 Annual Report
nextstepfunds.com
FRANKLIN FUND ALLOCATOR SERIES
NOTES TO FINANCIAL STATEMENTS
| | | | | |
| | Franklin NextStep | |
| | Growth Fund* | |
| | Shares | | | Amount | |
| |
| Class A Shares: | | | | | |
| Period ended May 31, 2016 | | | | | |
| Shares sold | 105,009 | | $ | 1,116,905 | |
| Shares issued in reinvestment of distributions | 1 | | | 11 | |
| Shares redeemed | (1,250 | ) | | (13,358 | ) |
| Net increase (decrease) | 103,760 | | $ | 1,103,558 | |
| Class C Shares: | | | | | |
| Period ended May 31, 2016 | | | | | |
| Shares sold | 85,011 | | $ | 901,364 | |
| Shares redeemed | (24,126 | ) | | (257,714 | ) |
| Net increase (decrease) | 60,885 | | $ | 643,650 | |
| |
| *For the period February 5, 2016 (commencement of operations) to May 31, 2016. | | | | | |
3. Transactions with Affiliates
Franklin Resources, Inc. is the holding company for various subsidiaries that together are referred to as Franklin Templeton Investments. Certain officers and trustees of the Funds are also officers and/or directors of certain of the FT Underlying Funds and of the following subsidiaries:
| |
Subsidiary Franklin Advisers, Inc. (Advisers) Franklin Templeton Investments Corp. (FTIC) K2/D&S Management Co., LLC (K2 Advisors) Franklin Templeton Services, LLC (FT Services) Franklin Templeton Distributors, Inc. (Distributors) Franklin Templeton Investor Services, LLC (Investor Services) | Affiliation Investment manager Investment manager Investment manager Administrative manager Principal underwriter Transfer agent |
a. Management Fees
The Funds pay an investment management fee to Advisers of 0.25% per year of the average daily net assets of each of the Funds for investment advisory services, consisting principally of determining the allocation of assets of the Funds among the Underlying Funds and ETFs.
Under a subadvisory agreement, FTIC and K2 Advisors, affiliates of Advisers, provide subadvisory services to the Funds. The subadvisory fee is paid by Advisers based on each Fund’s average daily net assets, and is not an additional expense of the Funds.
b. Administrative Fees
Under an agreement with Advisers, FT Services provides administrative services to the Funds. The fee is paid by Advisers based on each of the Funds’ average net assets, and is not an additional expense of the Funds.
c. Distribution Fees
The Board has adopted distribution plans for each share class, pursuant to Rule 12b-1 under the 1940 Act. Under the Funds’ Class A reimbursement distribution plans, the Funds reimburse Distributors for costs incurred in connection with the servicing, sale and distribution of each Fund’s shares up to the maximum annual plan rate for each class. Under the Funds’ Class A reimbursement
nextstepfunds.com
Annual Report
37
FRANKLIN FUND ALLOCATOR SERIES
NOTES TO FINANCIAL STATEMENTS
3. Transactions with Affiliates (continued)
c. Distribution Fees (continued)
distribution plans, costs exceeding the maximum for the current plan year cannot be reimbursed in subsequent periods. In addition, under the Funds’ Class C compensation distribution plans, the Funds pay Distributors for costs incurred in connection with the servicing, sale and distribution of each Fund’s shares up to the maximum annual plan rate. The plan year, for purposes of monitoring compliance with the maximum annual plan rates, is February 1 through January 31 for each Fund.
The maximum annual plan rates, based on the average daily net assets, for each class, are as follows:
d. Sales Charges/Underwriting Agreements
Front-end sales charges and contingent deferred sales charges (CDSC) do not represent expenses of the Funds. These charges are deducted from the proceeds of sales of Fund shares prior to investment or from redemption proceeds prior to remittance, as applicable. Distributors has advised the Funds of the following commission transactions related to the sales and redemptions of the Funds’ shares for the period:
| | | | | | |
| | | Franklin | | Franklin | | Franklin |
| | | NextStep | | NextStep | | NextStep |
| | | Conservative | | Moderate | | Growth |
| | | Fund | | Fund | | Fund |
| |
| Sales charges retained net of commissions paid to unaffiliated broker/dealers | $ | 1,433 | $ | 19,577 | $ | 5,938 |
| CDSC retained | $ | — | $ | 1,172 | $ | — |
e. Transfer Agent Fees
Each class of shares pays transfer agent fees to Investor Services for its performance of shareholder servicing obligations and reimburses Investor Services for out of pocket expenses incurred, including shareholder servicing fees paid to third parties. These fees are allocated daily based upon their relative proportion of such classes’ aggregate net assets.
For the period ended May 31, 2016, the Funds paid transfer agent fees as noted in the Statements of Operations of which the following amounts were retained by Investor Services:
| | | | | | |
| | | Franklin | | Franklin | | Franklin |
| | | NextStep | | NextStep | | NextStep |
| | | Conservative | | Moderate | | Growth |
| | | Fund | | Fund | | Fund |
| |
| Transfer agent fees | $ | 28 | $ | 72 | $ | 33 |
f. Investments in FT Underlying Funds
The Funds invest in FT Underlying Funds which are managed by Advisers or by an affiliate of Advisers. The Funds do not invest in FT Underlying Funds for the purpose of exercising a controlling influence over the management or policies. Investment management fees paid by the Funds are waived on assets invested in Institutional Fiduciary Trust Money Market Portfolio (Sweep Money Fund), as noted in the Statements of Operations, in an amount not to exceed the management and administrative fees paid directly or indirectly by the Sweep Money Fund.
38 Annual Report
nextstepfunds.com
FRANKLIN FUND ALLOCATOR SERIES
NOTES TO FINANCIAL STATEMENTS
| | | | | | | | | | | | | | | | |
| Investments in FT Underlying Funds for the period ended May 31, 2016, were as follows: | | | | | | | | |
| |
| | | | | | | | | | | | | | | | % of FT | |
| | Number | | | | | | | | | | | | | | Underlying | |
| | of Shares | | | | | Number of | | | | | | | | | Fund Shares | |
| | Held at | | | | | Shares Held | | Value | | | | | Realized | | Outstanding | |
| | Beginning | Gross | Gross | | | at End | | at End Investment | | | Gain | | Held at End | |
| FT Underlying Funds | of Period | Additions | Reductions | | | of Period | | of Period | Income | | | (Loss) | | of Period | |
| Franklin NextStep Conservative Fund | | | | | | | | | | | | | | | |
| Non-Controlled Affiliates | | | | | | | | | | | | | | | | |
| Franklin Focused Core Equity | | | | | | | | | | | | | | | | |
| Fund, Class R6 | — | 3,133 | (724 | ) | | 2,409 | $ | 32,715 | $ | — | | $ | (18 | ) | 0.02 | % |
| Franklin Growth Opportunities | | | | | | | | | | | | | | | | |
| Fund, Class R6 | — | 374 | (46 | ) | | 328 | | 10,877 | | — | | | (15 | ) | —a | |
| Franklin Mutual European Fund, | | | | | | | | | | | | | | | | |
| Class R6 | — | 1,216 | (178 | ) | | 1,038 | | 19,735 | | — | | | (29 | ) | —a | |
| Franklin Total Return Fund, | | | | | | | | | | | | | | | | |
| Class R6 | — | 17,756 | (872 | ) | | 16,884 | | 165,633 | | 317 | | | 8 | | —a | |
| Institutional Fiduciary Trust Money | | | | | | | | | | | | | | | | |
| Market Portfolio | — | 510,412 | (452,139 | ) | | 58,273 | | 58,273 | | — | | | — | | —a | |
| Templeton Global Total Return | | | | | | | | | | | | | | | | |
| Fund, Class R6 | — | 7,279 | (1,584 | ) | | 5,695 | | 64,586 | | 454 | | | 57 | | —a | |
| Total Non-Controlled Affiliates | | | | | | $ | | 351,819 | $ | 771 | | $ | 3 | | | |
| |
| Franklin NextStep Moderate Fund | | | | | | | | | | | | | | | | |
| Non-Controlled Affiliates | | | | | | | | | | | | | | | | |
| Franklin Focused Core Equity | | | | | | | | | | | | | | | | |
| Fund, Class R6 | — | 20,847 | (1,133 | ) | | 19,714 | $ | 267,713 | $ | — | | $ | (291 | ) | 0.16 | % |
| Franklin Growth Opportunities | | | | | | | | | | | | | | | | |
| Fund, Class R6 | — | 6,378 | (326 | ) | | 6,052 | | 200,872 | | — | | | (166 | ) | 0.02 | % |
| Franklin K2 Alternative Strategies | | | | | | | | | | | | | | | | |
| Fund, Class R6 | — | 8,788 | (116 | ) | | 8,672 | | 91,835 | | — | | | (1 | ) | 0.01 | % |
| Franklin Mutual European Fund, | | | | | | | | | | | | | | | | |
| Class R6 | — | 13,138 | (506 | ) | | 12,632 | | 240,260 | | — | | | (181 | ) | 0.01 | % |
| Franklin Total Return Fund, | | | | | | | | | | | | | | | | |
| Class R6 | — | 28,181 | (354 | ) | | 27,827 | | 272,987 | | 409 | | | 3 | | 0.01 | % |
| Institutional Fiduciary Trust Money | | | | | | | | | | | | | | | | |
| Market Portfolio | — | 2,264,227 | (1,990,692 | ) | | 273,535 | | 273,535 | | — | | | — | | —a | |
| Templeton Global Total Return | | | | | | | | | | | | | | | | |
| Fund, Class R6 | — | 27,289 | (2,071 | ) | | 25,218 | | 285,968 | | 1,483 | | | 34 | | —a | |
| Total Non-Controlled Affiliates | | | | | $ | 1,633,170 | $1,892 | $ | (602 | ) | | |
| |
| Franklin NextStep Growth Fund | | | | | | | | | | | | | | | | |
| Non-Controlled Affiliates | | | | | | | | | | | | | | | | |
| Franklin Focused Core Equity | | | | | | | | | | | | | | | | |
| Fund, Class R6 | — | 10,748 | (845 | ) | | 9,903 | $ | 134,489 | $ | — | | $ | (238 | ) | 0.08 | % |
| Franklin Growth Opportunities | | | | | | | | | | | | | | | | |
| Fund, Class R6 | — | 3,361 | (321 | ) | | 3,040 | | 100,909 | | — | | | (167 | ) | 0.01 | % |
| Franklin K2 Alternative Strategies | | | | | | | | | | | | | | | | |
| Fund, Class R6 | — | 3,458 | (180 | ) | | 3,278 | | 34,718 | | — | | | (7 | ) | —a | |
| Franklin Mutual European Fund, | | | | | | | | | | | | | | | | |
| Class R6 | — | 6,500 | (521 | ) | | 5,979 | | 113,715 | | — | | | (163 | ) | —a | |
| Franklin Small Cap Growth Fund, | | | | | | | | | | | | | | | | |
| Class R6 | — | 3,201 | (1,299 | ) | | 1,902 | | 33,848 | | — | | | 568 | | —a | |
nextstepfunds.com
Annual Report
39
FRANKLIN FUND ALLOCATOR SERIES
NOTES TO FINANCIAL STATEMENTS
| | | | | | | | | | | | | |
| 3. Transactions with Affiliates (continued) | | | | | | | | | | | | |
| |
| f. Investments in FT Underlying Funds (continued) | | | | | | | | | | | |
| |
| | | | | | | | | | | | | | % of FT |
| | Number | | | | | | | | | | | | Underlying |
| | of Shares | | | | Number of | | | | | | | | Fund Shares |
| | Held at | | | | Shares Held | | Value | | | | Realized | | Outstanding |
| | Beginning | Gross | Gross | | at End | | at End Investment | | Gain | | Held at End |
| FT Underlying Funds | of Period | Additions | Reductions | | of Period | | of Period | | Income | | (Loss) | | of Period |
| Institutional Fiduciary Trust Money | | | | | | | | | | | | | |
| Market Portfolio | — | 718,282 | (598,525 | ) | 119,757 | $ | 119,757 | $ | — | $ | — | | —a |
| Templeton Global Total Return | | | | | | | | | | | | | |
| Fund, Class R6 | — | 5,952 | (460 | ) | 5,492 | | 62,278 | | 279 | | (66 | ) | —a |
| Total Non-Controlled Affiliates | | | | | | $ | 599,714 | $ | 279 | $ | (73 | ) | |
| |
| aRounds to less than 0.01%. | | | | | | | | | | | | | |
g. Waiver and Expense Reimbursements
Advisers has contractually agreed in advance to waive or limit its fees and to assume as its own expense certain expenses otherwise payable by the Funds so that the expenses (excluding distribution fees and acquired fund fees and expenses) for each class of the Funds do not exceed 0.35% based on the average net assets of each class (other than certain non-routine expenses or costs, including those relating to litigation, indemnification, reorganizations, and liquidations) until September 30, 2017. Total expenses waived or paid are not subject to recapture subsequent to the Funds’ fiscal year end.
h. Other Affiliated Transactions
At May 31, 2016, Franklin Resources, Inc. owned a percentage of the Funds’ outstanding shares as follows:
| | | | | |
| Franklin | | Franklin | | Franklin | |
| NextStep | | NextStep | | NextStep | |
| Conservative | | Moderate | | Growth | |
| Fund | | Fund | | Fund | |
| 33.71 | % | 6.87 | % | 17.97 | % |
4. Expense Offset Arrangement
The Funds have entered into an arrangement with their custodian whereby credits realized as a result of uninvested cash balances are used to reduce a portion of the Funds’ custodian expenses. During the period ended May 31, 2016, there were no credits earned.
| | | | | | |
| 5. Income Taxes | | | | | | |
| |
| The tax character of distributions paid during the period ended May 31, 2016, was as follows: | | | | |
| |
| | | Franklin | | Franklin | | Franklin |
| | | NextStep | | NextStep | | NextStep |
| | | Conservative | | Moderate | | Growth |
| | | Fund | | Fund | | Fund |
| |
| Distributions paid from ordinary income | $ | 271 | $ | 276 | $ | 48 |
40 Annual Report
nextstepfunds.com
FRANKLIN FUND ALLOCATOR SERIES
NOTES TO FINANCIAL STATEMENTS
At May 31, 2016, the cost of investments, net unrealized appreciation (depreciation) and undistributed ordinary income for income tax purposes were as follows:
| | | | | | | | | |
| | | Franklin | | | Franklin | | | Franklin | |
| | | NextStep | | | NextStep | | | NextStep | |
| | | Conservative | | | Moderate | | | Growth | |
| | | Fund | | | Fund | | | Fund | |
| Cost of investments | $ | 853,609 | | $ | 4,503,577 | | $ | 1,714,371 | |
| Unrealized appreciation | $ | 16,935 | | $ | 103,843 | | $ | 45,507 | |
| Unrealized depreciation | | (503 | ) | | (2,988 | ) | | (2,963 | ) |
| Net unrealized appreciation (depreciation) | $ | 16,432 | | $ | 100,855 | | $ | 42,544 | |
| Distributable earnings - undistributed ordinary income | $ | 2,173 | | $ | 4,161 | | $ | 1,188 | |
Differences between income and/or capital gains as determined on a book basis and a tax basis are primarily due to differing treatments of offering costs and wash sales.
6. Investment Transactions
Purchases and sales of Underlying Funds and ETFs (excluding short term securities) for the period ended May 31, 2016, were as follows:
| | | | | | |
| | | Franklin | | Franklin | | Franklin |
| | | NextStep | | NextStep | | NextStep |
| | | Conservative | | Moderate | | Growth |
| | | Fund | | Fund | | Fund |
| |
| Purchases | $ | 918,007 | $ | 4,545,376 | $ | 1,783,692 |
| Sales | $ | 124,154 | $ | 318,233 | $ | 190,195 |
7. Fair Value Measurements
The Funds follow a fair value hierarchy that distinguishes between market data obtained from independent sources (observable inputs) and the Funds’ own market assumptions (unobservable inputs). These inputs are used in determining the value of the Funds’ financial instruments and are summarized in the following fair value hierarchy:
- Level 1 – quoted prices in active markets for identical financial instruments
- Level 2 – other significant observable inputs (including quoted prices for similar financial instruments, interest rates, prepayment speed, credit risk, etc.)
- Level 3 – significant unobservable inputs (including the Funds’ own assumptions in determining the fair value of financial instruments)
The input levels are not necessarily an indication of the risk or liquidity associated with financial instruments at that level.
For movements between the levels within the fair value hierarchy, the Funds have adopted a policy of recognizing the transfers as of the date of the underlying event which caused the movement.
At May 31, 2016, all of the Funds’ investments in financial instruments carried at fair value were valued using Level 1 inputs. For detailed categories, see the accompanying Statements of Investments.
nextstepfunds.com
Annual Report
41
FRANKLIN FUND ALLOCATOR SERIES
NOTES TO FINANCIAL STATEMENTS
8. Subsequent Events
The Funds have evaluated subsequent events through the issuance of the financial statements and determined that no events have occurred that require disclosure other than those already disclosed in the financial statements.
Abbreviations
Selected Portfolio
ETF Exchange Traded Fund
42 Annual Report
nextstepfunds.com
FRANKLIN FUND ALLOCATOR SERIES
Report of Independent Registered Public Accounting Firm
To the Board of Trustees and Shareholders of Franklin Fund Allocator Series
In our opinion, the accompanying statements of assets and liabilities, including the statements of investments, and the related statements of operations and of changes in net assets and the financial highlights present fairly, in all material respects, the financial position of Franklin NextStep Conservative Fund, Franklin NextStep Moderate Fund and Franklin NextStep Growth Fund (separate portfolios Franklin Fund Allocator Series, hereafter referred to as the “Funds”) at May 31, 2016, and the results of each of their operations, the changes in each of their net assets and the financial highlights for the period February 5, 2016 (commencement of operations) through May 31, 2016, in conformity with accounting principles generally accepted in the United States of America. These financial statements and financial highlights (hereafter referred to as “financial statements”) are the responsibility of the Funds’ management. Our responsibility is to express an opinion on these financial statements based on our audits. We conducted our audits of these financial statements in accordance with the standards of the Public Company Accounting Oversight Board (United States). Those standards require that we plan and perform the audit to obtain reasonable assurance about whether the financial statements are free of material misstatement. An audit includes examining, on a test basis, evidence supporting the amounts and disclosures in the financial statements, assessing the accounting principles used and significant estimates made by management, and evaluating the overall financial statement presentation. We believe that our audits, which included confirmation of securities at May 31, 2016 by correspondence with the custodian, transfer agent, and brokers, provide a reasonable basis for our opinion.
PricewaterhouseCoopers LLP
San Francisco, California
July 15, 2016
nextstepfunds.com
Annual Report
43
FRANKLIN FUND ALLOCATOR SERIES
Board Members and Officers
The name, year of birth and address of the officers and board members, as well as their affiliations, positions held with the Trust, principal occupations during at least the past five years and number of U.S. registered portfolios overseen in the Franklin Templeton Investments fund complex, are shown below. Generally, each board member serves until that person’s successor is elected and qualified.
| | | | |
| Independent Board Members | | | |
| |
| | | | Number of Portfolios in | |
| Name, Year of Birth | | Length of | Fund Complex Overseen | Other Directorships Held During |
| and Address | Position | Time Served | by Board Member* | at Least the Past 5 Years |
| |
| Harris J. Ashton (1932) | Trustee | Since 1995 | 145 | Bar-S Foods (meat packing company) |
| One Franklin Parkway | | | | (1981-2010). |
| San Mateo, CA 94403-1906 | | | | |
| Principal Occupation During at Least the Past 5 Years: | | |
| Director of various companies; and formerly, Director, RBC Holdings, Inc. (bank holding company) (until 2002); and President, Chief |
| Executive Officer and Chairman of the Board, General Host Corporation (nursery and craft centers) (until 1998). |
| |
| Mary C. Choksi (1950) | Trustee | Since 2014 | 121 | Avis Budget Group Inc. (car rental) |
| One Franklin Parkway | | | | (2007-present), Omnicom Group Inc. |
| San Mateo, CA 94403-1906 | | | | (advertising and marketing |
| | | | | communications services) (2011- |
| | | | | present) and H.J. Heinz Company |
| | | | | (processed foods and allied products) |
| | | | | (1998-2006). |
| Principal Occupation During at Least the Past 5 Years: | | |
| Senior Advisor, Strategic Investment Group (investment management group) (2015-present); director of various companies; and formerly, |
| Founding Partner and Senior Managing Director, Strategic Investment Group (1987-2015); Founding Partner and Managing Director, |
| Emerging Markets Management LLC (investment management firm) (1987-2011); and Loan Officer/Senior Loan Officer/Senior Pension |
| Investment Officer, World Bank Group (international financial institution) (1977-1987). | |
| |
| Edith E. Holiday (1952) | Trustee | Since 1998 | 145 | Hess Corporation (exploration and |
| One Franklin Parkway | | | | refining of oil and gas) (1993-present), |
| San Mateo, CA 94403-1906 | | | | Canadian National Railway (railroad) |
| | | | | (2001-present), White Mountains |
| | | | | Insurance Group, Ltd. (holding |
| | | | | company) (2004-present), RTI |
| | | | | International Metals, Inc. (manufacture |
| | | | | and distribution of titanium) (1999- |
| | | | | 2015) and H.J. Heinz Company |
| | | | | (processed foods and allied products) |
| | | | | (1994-2013). |
| Principal Occupation During at Least the Past 5 Years: | | |
| Director or Trustee of various companies and trusts; and formerly, Assistant to the President of the United States and Secretary of the |
| Cabinet (1990-1993); General Counsel to the United States Treasury Department (1989-1990); and Counselor to the Secretary and Assistant |
| Secretary for Public Affairs and Public Liaison – United States Treasury Department (1988-1989). | |
| |
| J. Michael Luttig (1954) | Trustee | Since 2009 | 145 | Boeing Capital Corporation (aircraft |
| One Franklin Parkway | | | | financing) (2006-2013). |
| San Mateo, CA 94403-1906 | | | | |
| Principal Occupation During at Least the Past 5 Years: | | |
| Executive Vice President, General Counsel and member of the Executive Council, The Boeing Company (aerospace company) (2006- |
| present); and formerly, Federal Appeals Court Judge, U.S. Court of Appeals for the Fourth Circuit (1991-2006). |
44 Annual Report
nextstepfunds.com
FRANKLIN FUND ALLOCATOR SERIES
| | | | |
| Independent Board Members (continued) | | |
| |
| | | | Number of Portfolios in | |
| Name, Year of Birth | | Length of | Fund Complex Overseen | Other Directorships Held During |
| and Address | Position | Time Served | by Board Member* | at Least the Past 5 Years |
| |
| Frank A. Olson (1932) | Trustee | Since 2007 | 145 | Hess Corporation (exploration and |
| One Franklin Parkway | | | | refining of oil and gas) (1998-2013). |
| San Mateo, CA 94403-1906 | | | | |
| Principal Occupation During at Least the Past 5 Years: | | |
| Director of various companies; and formerly, Chairman of the Board, The Hertz Corporation (car rental) (1980-2000) and Chief Executive |
| Officer (1977-1999); and Chairman of the Board, President and Chief Executive Officer, UAL Corporation (airlines) (June-December 1987). |
| |
| Larry D. Thompson (1945) | Trustee | Since 2007 | 145 | The Southern Company (energy |
| One Franklin Parkway | | | | company) (2014-present; previously |
| San Mateo, CA 94403-1906 | | | | 2010-2012), Graham Holdings |
| | | | | Company (education and media |
| | | | | organization) (2011-present) and |
| | | | | Cbeyond, Inc. (business |
| | | | | communications provider) (2010-2012). |
| Principal Occupation During at Least the Past 5 Years: | | |
| Director of various companies; John A. Sibley Professor of Corporate and Business Law, University of Georgia School of Law (2015-present; |
| previously 2011-2012); and formerly, Executive Vice President – Government Affairs, General Counsel and Corporate Secretary, PepsiCo, |
| Inc. (consumer products) (2012-2014); Senior Vice President – Government Affairs, General Counsel and Secretary, PepsiCo, Inc. (2004- |
| 2011); Senior Fellow of The Brookings Institution (2003-2004); Visiting Professor, University of Georgia School of Law (2004); and Deputy |
| Attorney General, U.S. Department of Justice (2001-2003). | | |
| |
| John B. Wilson (1959) | Lead | Trustee since | 121 | None |
| One Franklin Parkway | Independent | 2006 and Lead | | |
| San Mateo, CA 94403-1906 | Trustee | Independent | | |
| | | Trustee since | | |
| | | 2008 | | |
| Principal Occupation During at Least the Past 5 Years: | | |
| President, Staples Europe (office supplies) (2012-present); President and Founder, Hyannis Port Capital, Inc. (real estate and private equity |
| investing); serves on private and non-profit boards; and formerly, Chief Operating Officer and Executive Vice President, Gap, Inc. (retail) (1996- |
| 2000); Chief Financial Officer and Executive Vice President – Finance and Strategy, Staples, Inc. (1992-1996); Senior Vice President – Corporate |
| Planning, Northwest Airlines, Inc. (airlines) (1990-1992); and Vice President and Partner, Bain & Company (consulting firm) (1986-1990). |
| |
| |
| |
| Interested Board Members and Officers | | |
| |
| | | | Number of Portfolios in | |
| Name, Year of Birth | | Length of | Fund Complex Overseen | Other Directorships Held During |
| and Address | Position | Time Served | by Board Member* | at Least the Past 5 Years |
| |
| **Gregory E. Johnson (1961) | Trustee | Since 2007 | 160 | None |
| One Franklin Parkway | | | | |
| San Mateo, CA 94403-1906 | | | | |
| Principal Occupation During at Least the Past 5 Years: | | |
| Chairman of the Board, Member – Office of the Chairman, Director and Chief Executive Officer, Franklin Resources, Inc.; officer and/or director |
| or trustee, as the case may be, of some of the other subsidiaries of Franklin Resources, Inc. and of 44 of the investment companies in Franklin |
| Templeton Investments; Vice Chairman, Investment Company Institute; and formerly, President, Franklin Resources, Inc. (1994-2015). |
| |
| **Rupert H. Johnson, Jr. (1940) | Chairman of | Chairman of | 145 | None |
| One Franklin Parkway | the Board and | the Board and | | |
| San Mateo, CA 94403-1906 | Trustee | Trustee since | | |
| | | 2013 | | |
| Principal Occupation During at Least the Past 5 Years: | | |
| Vice Chairman, Member – Office of the Chairman and Director, Franklin Resources, Inc.; Director, Franklin Advisers, Inc.; Senior Vice |
| President, Franklin Advisory Services, LLC; and officer and/or director or trustee, as the case may be, of some of the other subsidiaries of |
| Franklin Resources, Inc. and of 42 of the investment companies in Franklin Templeton Investments. | |
nextstepfunds.com
Annual Report
45
FRANKLIN FUND ALLOCATOR SERIES
| | | | |
| Interested Board Members and Officers (continued) | |
| |
| | | | Number of Portfolios in | |
| Name, Year of Birth | | Length of | Fund Complex Overseen | Other Directorships Held During |
| and Address | Position | Time Served | by Board Member* | at Least the Past 5 Years |
| |
| Alison E. Baur (1964) | Vice | Since 2012 | Not Applicable | Not Applicable |
| One Franklin Parkway | President | | | |
| San Mateo, CA 94403-1906 | | | | |
| Principal Occupation During at Least the Past 5 Years: | | |
| Deputy General Counsel, Franklin Templeton Investments; and officer of some of the other subsidiaries of Franklin Resources, Inc. and of 45 |
| of the investment companies in Franklin Templeton Investments. | | |
| |
| Laura F. Fergerson (1962) | Chief | Since 2009 | Not Applicable | Not Applicable |
| One Franklin Parkway | Executive | | | |
| San Mateo, CA 94403-1906 | Officer – | | | |
| | Finance and | | | |
| | Administration | | | |
| Principal Occupation During at Least the Past 5 Years: | | |
| Senior Vice President, Franklin Templeton Services, LLC; Vice President, Franklin Advisers, Inc. and Franklin Templeton Institutional, LLC; |
| and officer of 45 of the investment companies in Franklin Templeton Investments. | |
| |
| Gaston Gardey (1967) | Treasurer, | Since 2009 | Not Applicable | Not Applicable |
| One Franklin Parkway | Chief | | | |
| San Mateo, CA 94403-1906 | Financial | | | |
| | Officer and | | | |
| | Chief | | | |
| | Accounting | | | |
| | Officer | | | |
| Principal Occupation During at Least the Past 5 Years: | | |
| Treasurer, U.S. Fund Administration & Reporting, Franklin Templeton Investments; and officer of 28 of the investment companies in Franklin |
| Templeton Investments. | | | | |
| |
| Aliya S. Gordon (1973) | Vice | Since 2009 | Not Applicable | Not Applicable |
| One Franklin Parkway | President | | | |
| San Mateo, CA 94403-1906 | | | | |
| Principal Occupation During at Least the Past 5 Years: | | |
| Senior Associate General Counsel, Franklin Templeton Investments; and officer of 45 of the investment companies in Franklin Templeton Investments. |
| |
| Steven J. Gray (1955) | Vice | Since 2009 | Not Applicable | Not Applicable |
| One Franklin Parkway | President | | | |
| San Mateo, CA 94403-1906 | | | | |
| Principal Occupation During at Least the Past 5 Years: | | |
| Senior Associate General Counsel, Franklin Templeton Investments; Vice President, Franklin Templeton Distributors, Inc. and Franklin |
| Alternative Strategies Advisers, LLC; and officer of 45 of the investment companies in Franklin Templeton Investments. |
| |
| Edward B. Jamieson (1948) | President | Since 2010 | Not Applicable | Not Applicable |
| One Franklin Parkway | and Chief | | | |
| San Mateo, CA 94403-1906 | Executive | | | |
| | Officer – | | | |
| | Investment | | | |
| | Management | | | |
| Principal Occupation During at Least the Past 5 Years: | | |
| President, Chief Investment Officer and Director, Franklin Advisers, Inc.; Executive Vice President, Franklin Templeton Institutional, LLC; and |
| officer and/or trustee, as the case may be, of some of the other subsidiaries of Franklin Resources, Inc. and of 10 of the investment companies |
| in Franklin Templeton Investments. | | | | |
46 Annual Report
nextstepfunds.com
FRANKLIN FUND ALLOCATOR SERIES
| | | | |
| Interested Board Members and Officers (continued) | |
| |
| | | | Number of Portfolios in | |
| Name, Year of Birth | | Length of | Fund Complex Overseen | Other Directorships Held During |
| and Address | Position | Time Served | by Board Member* | at Least the Past 5 Years |
| |
| Robert Lim (1948) | Vice | Since May 2016 | Not Applicable | Not Applicable |
| One Franklin Parkway | President – | | | |
| San Mateo, CA 94403-1906 | AML | | | |
| | Compliance | | | |
| Principal Occupation During at Least the Past 5 Years: | | |
| Vice President, Franklin Templeton Companies, LLC; Chief Compliance Officer, Franklin Templeton Distributors, Inc. and Franklin Templeton |
| Investor Services, LLC; and officer of 45 of the investment companies in Franklin Templeton Investments. |
| |
| Kimberly H. Novotny (1972) | Vice | Since 2013 | Not Applicable | Not Applicable |
| 300 S.E. 2nd Street | President | | | |
| Fort Lauderdale, FL 33301-1923 | | | | |
| Principal Occupation During at Least the Past 5 Years: | | |
| Associate General Counsel, Franklin Templeton Investments; Vice President and Corporate Secretary, Fiduciary Trust International of the |
| South; Vice President, Templeton Investment Counsel, LLC; Assistant Secretary, Franklin Resources, Inc.; and officer of 45 of the investment |
| companies in Franklin Templeton Investments. | | | |
| |
| Robert C. Rosselot (1960) | Chief | Since 2013 | Not Applicable | Not Applicable |
| 300 S.E. 2nd Street | Compliance | | | |
| Fort Lauderdale, FL 33301-1923 | Officer | | | |
| Principal Occupation During at Least the Past 5 Years: | | |
| Director, Global Compliance, Franklin Templeton Investments; Vice President, Franklin Templeton Companies, LLC; officer of 45 of the |
| investment companies in Franklin Templeton Investments; and formerly, Senior Associate General Counsel, Franklin Templeton Investments |
| (2007-2013); and Secretary and Vice President, Templeton Group of Funds (2004-2013). | |
| |
| Karen L. Skidmore (1952) | Vice | Since 2006 | Not Applicable | Not Applicable |
| One Franklin Parkway | President and | | | |
| San Mateo, CA 94403-1906 | Secretary | | | |
| Principal Occupation During at Least the Past 5 Years: | | |
| Senior Associate General Counsel, Franklin Templeton Investments; and officer of 45 of the investment companies in Franklin Templeton Investments. |
| |
| Navid Tofigh (1972) | Vice | Since | Not Applicable | Not Applicable |
| One Franklin Parkway | President | November 2015 | | |
| San Mateo, CA 94403-1906 | | | | |
| Principal Occupation During at Least the Past 5 Years: | | |
| Associate General Counsel, Franklin Templeton Investments; and officer of 45 of the investment companies in Franklin Templeton Investments. |
| |
| Craig S. Tyle (1960) | Vice | Since 2005 | Not Applicable | Not Applicable |
| One Franklin Parkway | President | | | |
| San Mateo, CA 94403-1906 | | | | |
| Principal Occupation During at Least the Past 5 Years: | | |
| General Counsel and Executive Vice President, Franklin Resources, Inc.; and officer of some of the other subsidiaries of Franklin Resources, |
| Inc. and of 45 of the investment companies in Franklin Templeton Investments. | |
| |
| Lori A. Weber (1964) | Vice | Since 2011 | Not Applicable | Not Applicable |
| 300 S.E. 2nd Street | President | | | |
| Fort Lauderdale, FL 33301-1923 | | | | |
| Principal Occupation During at Least the Past 5 Years: | | |
| Senior Associate General Counsel, Franklin Templeton Investments; Assistant Secretary, Franklin Resources, Inc.; Vice President and |
| Secretary, Templeton Investment Counsel, LLC; and officer of 45 of the investment companies in Franklin Templeton Investments. |
nextstepfunds.com
Annual Report
47
FRANKLIN FUND ALLOCATOR SERIES
Interested Board Members and Officers (continued)
*We base the number of portfolios on each separate series of the U.S. registered investment companies within the Franklin Templeton Investments fund complex. These
portfolios have a common investment manager or affiliated investment managers.
**Gregory E. Johnson is considered to be an interested person of the Fund under the federal securities laws due to his position as an officer and director of Franklin
Resources, Inc. (Resources), which is the parent company of the Fund’s investment manager and distributor. Rupert H. Johnson, Jr. is considered to be an interested person
of the Fund under the federal securities laws due to his position as officer and director and major shareholder of Resources.
Note 1: Rupert H. Johnson, Jr. is the uncle of Gregory E. Johnson.
Note 2: Officer information is current as of the date of this report. It is possible that after this date, information about officers may change.
The Sarbanes-Oxley Act of 2002 and Rules adopted by the Securities and Exchange Commission require the Fund to disclose whether the Fund’s Audit
Committee includes at least one member who is an audit committee financial expert within the meaning of such Act and Rules. The Fund’s Board has determined
that there is at least one such financial expert on the Audit Committee and has designated John B. Wilson as its audit committee financial expert. The Board
believes that Mr. Wilson qualifies as such an expert in view of his extensive business background and experience, including service as chief financial officer of
Staples, Inc. from 1992 to 1996. Mr. Wilson has been a Member and Chairman of the Fund’s Audit Committee since 2006. As a result of such background and
experience, the Board believes that Mr. Wilson has acquired an understanding of generally accepted accounting principles and financial statements, the general
application of such principles in connection with the accounting estimates, accruals and reserves, and analyzing and evaluating financial statements that present
a breadth and level of complexity of accounting issues generally comparable to those of the Fund, as well as an understanding of internal controls and
procedures for financial reporting and an understanding of audit committee functions. Mr. Wilson is an independent Board member as that term is defined under
the relevant Securities and Exchange Commission Rules and Releases.
The Statement of Additional Information (SAI) includes additional information about the board members and is available, without charge, upon request.
Shareholders may call (800) DIAL BEN/342-5236 to request the SAI.
48 Annual Report
nextstepfunds.com
FRANKLIN FUND ALLOCATOR SERIES
Shareholder Information
Board Approval of Investment Management Agreement and Sub-Advisory Agreements
At a meeting held December 3, 2015, the Board of Trustees (Board), including a majority of non-interested or independent Trustees, approved, for the Franklin NextStep Conservative Fund (Conservative Fund), Franklin NextStep Moderate Fund (Moderate Fund), and Franklin NextStep Growth Fund (Growth Fund, and collectively with the Conservative Fund and the Moderate Fund, Funds), each a series of Franklin Fund Allocator Series (FFAS), the investment management agreement with Franklin Advisers, Inc. (FAV) as investment manager (FAV Agreement), as well as the sub-advisory agreements between FAV and Franklin Templeton Investments Corp. (FTIC) (FTIC Agreement) and K2/D&S Management Co., L.L.C. (K2, and collectively with FAV and FTIC, Managers) (K2 Agreement, and collectively with the FAV Agreement and FTIC Agreement, agreements), as sub-advisors to the Funds. The Board noted that the forms of such agreements are substantially the same as the standard forms of investment management and sub-advisory agreements for other funds in the Franklin Templeton group of funds (F-T Funds) that include fund administration services. The Board considered the qualifications of the personnel of the Managers who would be responsible for managing and advising the Funds and the specific terms and fees of the agreements and management’s voluntary agreement to cap fees for a period of time.
In reaching its decision to approve the agreements, the Board took into account that the Funds are somewhat similar to current series of FFAS that invest predominantly in other F-T Funds. However, the Funds are designed to align with varying levels of client risk tolerance and are expected to invest substantially in underlying funds managed by third-party asset managers, as well as other F-T Funds. The Board considered various materials related to the agreements, including: (1) copies of the proposed forms of the agreements; (2) biographies of the portfolio managers; and (3) information describing the fee payments under the agreements. The Board also was provided with information relating to proposed expenses for the Funds, including comparative data provided by Broadridge Financial Solutions, Inc. (formerly Lipper, Inc.) (Broadridge), an independent organization, which compared the expenses to those of other mutual funds deemed comparable to the Funds as selected by Broadridge.
In determining that the terms of the proposed agreements were fair and reasonable, the Board took into account several factors including, but not limited to, the following: (1) the nature and quality of the services to be provided by the Managers to the Funds under the proposed agreements; (2) the Managers’ experience as managers of similar funds and accounts, including those within FFAS; (3) the Managers’ strength and reputation within the industry; (4) the fairness of the compensation under the proposed agreements; (5) the comparative pricing structure (including the estimated expense ratio to be borne by shareholders) of the Funds; (6) the personnel, operations and investment management capabilities, methodologies, and resources of the Managers; (7) profitability matters; and (8) the Managers’ compliance capabilities, as demonstrated by, among other things, their policies and procedures designed to prevent violations of the federal securities laws, which had previously been approved by the Board in connection with its oversight of other F-T Funds.
The Board approved the Code of Ethics and Compliance Policies and Procedures of the Managers, which are identical to those of other Franklin Templeton investment managers. In considering such materials, the independent Trustees received assistance and advice from and met separately with independent counsel.
The following sets forth some of the primary information and factors relevant to the Board’s decision to approve the agreements. This discussion of the information and factors considered by the Board (including the information and factors discussed above) is not intended to be exhaustive, but rather summarizes certain factors considered by the Board. In view of the wide variety of factors considered, the Board did not, unless otherwise noted, find it practicable to quantify or otherwise assign relative weights to the foregoing factors. In addition, individual Trustees may have assigned different weights to various factors.
NATURE, EXTENT AND QUALITY OF SERVICES. The Trustees reviewed the nature, extent and quality of the services to be provided by the Managers. In this regard, they reviewed the Funds’ proposed investment goals and the Managers’ proposed investment strategies and ability to implement such investment strategies, including, but not limited to, the Managers’ trading practices and investment decision processes. The Trustees reviewed the Funds’ portfolio managers, including their background, skills as well as their expertise in managing other F-T Funds, including those within FFAS.
Based on their review, the Trustees were satisfied with the nature and quality of the overall services to be provided by the Managers (and their affiliates) to the Funds and their shareholders and were
nextstepfunds.com
Annual Report
49
FRANKLIN FUND ALLOCATOR SERIES
SHAREHOLDER INFORMATION
confident in the abilities of the Managers to implement their proposed investment strategies and to provide quality services to the Funds and their shareholders.
INVESTMENT PERFORMANCE. The Board noted that, as the Funds had not yet commenced investment operations, there was no investment performance for the Funds. The Board also considered the proposed performance benchmarks for the Funds and how such benchmarks were selected by the Managers and would be utilized to measure performance of the Funds.
COMPARATIVE EXPENSES. The Board considered the cost of the services to be provided and the profits to be realized by the Managers (and their affiliates) from their respective relationships with the Funds. The Board noted that the Managers (and their affiliates) could not report any financial results from their relationships with the Funds because the Funds had not yet commenced investment operations, and thus, the Board could not evaluate the Managers’ (or their affiliates’) profitability with respect to the Funds. The Board considered that FAV will provide general investment management services to the Funds for a monthly fee equal to an annual rate of 0.25% of the average daily net assets of the Funds. FAV will then pay FTIC and K2 a sub-advisory fee out of this monthly fee. Further, the Board noted that FAV will waive or assume certain fees and expenses so that the total expenses of each Fund will not exceed 0.35% (excluding certain fees and expenses). It is not anticipated that the Funds will generate significant, if any, profit for the Managers and/or their affiliates for some time.
In considering the appropriateness of the investment management fee to be charged to the Funds, the Board reviewed and considered the nature, extent and quality of the overall investment management services expected to be provided by the Managers, as more fully discussed above, as well as the fairness of the proposed compensation. The Board found that the investment management fees charged under the agreements are based on services provided that are in addition to, rather than duplicative of, services provided pursuant to the investment management contract for an underlying fund in which the Funds may invest.
Consideration was also given to the information provided by Broadridge on other funds in the Broadridge data (Comparable Funds) and that the Managers’ contractual management fee for the Conservative Fund and the Growth Fund is above the average and median charged by their respective Comparable Funds. However, the contractual management fee for the Moderate Fund is below the average and median charged by its Comparable Funds.
Although the total expense ratios for all Funds (without a waiver) are above the average and median of their respective Comparable Funds (without a waiver), after a waiver, the total expense ratios for all Funds are below the average and median of their respective Comparable Funds (without a waiver).
Based upon its consideration of all these factors, the Board determined that the investment management fee structure under the agreements was fair and reasonable.
ECONOMIES OF SCALE. The Board considered economies of scale that may be realized by the Managers and their affiliates as the Funds grow larger and the extent to which they are shared with shareholders of the Funds. The Board noted that, although the investment management agreement fee schedule does not include breakpoints, the overall schedule of fees (including sub-administrative fees) allows for sharing of such economies as the Funds grow.
Proxy Voting Policies and Procedures
The Trust’s investment manager has established Proxy Voting Policies and Procedures (Policies) that the Trust uses to determine how to vote proxies relating to portfolio securities. Shareholders may view the Trust’s complete Policies online at nextstepfunds.com. Alternatively, shareholders may request copies of the Policies free of charge by calling the Proxy Group collect at (954) 527-7678 or by sending a written request to: Franklin Templeton Companies, LLC, 300 S.E. 2nd Street, Fort Lauderdale, FL 33301, Attention: Proxy Group. Copies of the Trust’s proxy voting records are also made available online at nextstepfunds.com and posted on the U.S. Securities and Exchange Commission’s website at sec.gov and reflect the most recent 12-month period ended June 30.
Quarterly Statement of Investments
The Trust files a complete statement of investments with the U.S. Securities and Exchange Commission for the first and third quarters for each fiscal year on Form N-Q. Shareholders may view the filed Form N-Q by visiting the Commission’s website at sec.gov. The filed form may also be viewed and copied at the Commission’s Public Reference Room in Washington, DC. Information regarding the operations of the Public Reference Room may be obtained by calling (800) SEC-0330.
50 Annual Report
nextstepfunds.com
FRANKLIN FUND ALLOCATOR SERIES
SHAREHOLDER INFORMATION
Householding of Reports and Prospectuses
You will receive each Fund’s financial reports every six months
as well as an annual updated summary prospectus (prospectus
available upon request). To reduce Fund expenses, we try to
identify related shareholders in a household and send only one
copy of the financial reports and summary prospectus. This
process, called “householding,” will continue indefinitely
unless you instruct us otherwise. If you prefer not to have these
documents householded, please call us at (800) 632-2301. At
any time you may view current prospectuses/summary pro-
spectuses and financial reports on our website. If you choose,
you may receive these documents through electronic delivery.
nextstepfunds.com
Annual Report
51
This page intentionally left blank
| |
| Contents | |
| Annual Report | |
| Economic and Market Overview | 2 |
| Franklin Payout 2017 Fund | 3 |
| Franklin Payout 2018 Fund | 9 |
| Franklin Payout 2019 Fund | 15 |
| Franklin Payout 2020 Fund | 21 |
| Franklin Payout 2021 Fund | 27 |
| Financial Highlights and Statements of Investments | 33 |
| Financial Statements | 55 |
| Notes to Financial Statements | 62 |
| Report of Independent Registered | |
| Public Accounting Firm | 69 |
| Board Members and Officers | 70 |
| Shareholder Information | 75 |
1
Annual Report
Economic and Market Overview
The U.S. economy moderated during the 12 months under review. After strengthening in 2015’s second quarter, the economy moderated in the third and fourth quarters. Growth slowed further in 2016’s first quarter as non-residential investments, private inventory investments and federal government spending declined. The manufacturing sector expanded in May for the third consecutive month, while the services sector expanded throughout the 12-month period. Growth in services contributed to new jobs and helped the unemployment rate decrease from 5.5% in May 2015 to 4.7% at period-end.1 Home sales and prices rose amid relatively low mortgage rates. Monthly retail sales grew during most of the review period and rose to the highest level in April in more than a year, due to a broad-based increase across most retail categories, particularly in motor vehicle sales and non-store retail. Inflation, as measured by the Consumer Price Index, remained subdued due to low energy prices but recorded its strongest monthly reading in three years in April, mainly led by a rebound in energy prices and a higher cost of rent.
After maintaining a near-zero interest rate for seven years to support the U.S. economy’s recovery, the U.S. Federal Reserve (Fed) raised its target range for the federal funds rate to 0.25%–0.50% at its December meeting, maintaining the rate through period-end. At its April meeting, the Fed indicated that its monetary policy remained accommodative, thus supporting further labor market improvement and progress toward its 2.0% inflation objective.
The 10-year Treasury yield, which moves inversely to price, shifted throughout the period. It rose from 2.19% on June 1, 2015, to a period high of 2.50% in June 2015, and remained relatively high through the rest of 2015, based partly on upbeat domestic and eurozone economic data as well as the Fed’s interest rate increase. However, the Treasury yield declined in 2016 and ended the period at 1.84% as investors sought the perceived safe haven of sovereign bonds due to weak Chinese economic data, lackluster domestic April jobs data, a broad decline in commodity prices, bargain hunting and strong overseas investor demand during the 10-year notes auction.
The foregoing information reflects our analysis and opinions as of May 31, 2016. The information is not a complete analysis of every aspect of any market, country, industry, security or fund. Statements of fact are from sources considered reliable.
1. Source: Bureau of Labor Statistics.
2 Annual Report
Franklin Payout 2017 Fund
We are pleased to bring you this inaugural annual report for Franklin Payout 2017 Fund for the period since the Fund’s inception on June 1, 2015, through May 31, 2016.
Your Fund’s Goal and Main Investments
The Fund seeks capital preservation and income with a predetermined maturity date. Under normal market conditions, the Fund invests predominantly in U.S. investment-grade debt securities and investments, including government and corporate debt securities and asset-backed securities and municipal securities.
Performance Overview
The Fund’s Advisor Class shares delivered a +1.10% cumulative total return for the period ended May 31, 2016. In comparison, the Fund’s benchmark, the Barclays U.S. Government/Credit 2017 Maturity Index, generated a +0.65% total return.1 The index includes investment-grade, U.S. dollar-denominated, fixed-rate Treasuries, government-related and corporate securities and foreign debt maturing in 2017. You can find more of the Fund’s performance data in the Performance Summary beginning on page 5.
Performance data represent past performance, which does not guarantee future results. Investment return and principal value will fluctuate, and you may have a gain or loss when you sell your shares. Current performance may differ from figures shown. For most recent month-end performance, call a Franklin Templeton Institutional Services representative at (800) 321-8563.
Investment Strategy
We focus on investment-grade securities and investments or on unrated securities and investments we determine are of comparable quality. Our focus on the portfolio’s credit quality is intended to reduce credit risk and help to preserve capital. We may invest a portion of the Fund’s assets in U.S. dollar-denominated foreign securities, including debt issued by supranational entities. In choosing investments, we select securities in various market sectors based on our assessment of changing economic, market, industry and issuer conditions. We use a top-down analysis of broad economic trends, combined with a bottom-up fundamental analysis of market sectors, industries and issuers, to try to take advantage of varying sector reactions to economic events.
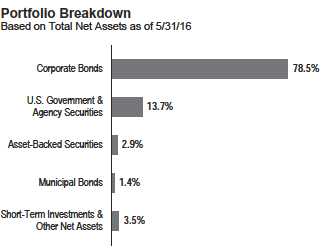
Although the Fund may invest in individual securities of any maturity, the Fund is a term fund and is managed to mature in 2017. Over time, the Fund’s duration and weighted average maturity will decline as 2017 approaches. In the later months of operation, when the debt securities held by the Fund mature, the proceeds from such securities will be held in cash, cash equivalents and money market instruments, including affiliated money market funds, or invested in short-term bonds. In early December 2017, the Fund is expected to consist almost entirely of cash, cash equivalents and money market instruments. The Fund is designed for investors who seek an investment with a payout schedule to help meet their retirement spending needs, particularly those who are nearing retirement or are in retirement. There is no guarantee the Fund will meet an investor’s retirement spending needs.
What is duration?
Duration is a measure of a bond’s price sensitivity to interest rate changes. In general, a portfolio of securities with a lower duration can be expected to be less sensitive to interest rate changes than a portfolio with a higher duration.
| | |
| Maturity | | |
| 5/31/16 | | |
| | % of | |
| | Market Value | |
| 0 to 1 Year | 2.6 | % |
| 1 to 2 Years | 94.6 | % |
| 3 to 4 Years | 2.8 | % |
1. Source: Morningstar.
The index is unmanaged and includes reinvestment of any income or distributions. It does not reflect any fees, expenses or sales charges. One cannot invest directly in an
index, and an index is not representative of the Fund’s portfolio.
See www.franklintempletondatasources.com for additional data provider information.
The dollar value, number of shares or principal amount, and names of all portfolio holdings are listed in the Fund’s Statement of Investments (SOI). The SOI begins on page 35.
Annual Report
3
FRANKLIN PAYOUT 2017 FUND
| | |
| Top 10 Holdings* | | |
| 5/31/16 | | |
| | % of Total | |
| Issue/Issuer | Net Assets | |
| Federal Home Loan Bank (FHLB) | 8.8 | % |
| Federal National Mortgage Association (FNMA) | 4.9 | % |
| Morgan Stanley | 3.0 | % |
| The Bear Stearns Cos. LLC | 3.0 | % |
| Wells Fargo & Co. | 3.0 | % |
| General Electric Co. | 3.0 | % |
| Pacific Gas & Electric Co. | 3.0 | % |
| Bank of America Corp. | 3.0 | % |
| The Goldman Sachs Group Inc. | 3.0 | % |
| EOG Resources Inc. | 3.0 | % |
*Securities are listed by issuer, which may appear by another name in the SOI.
Manager’s Discussion
From a perspective of excess returns over U.S. Treasuries, many investment-grade corporate bonds underperformed for the reporting period. However, shorter duration and higher quality investment-grade sectors performed relatively well. U.S. agency securities generally produced positive excess returns over U.S. Treasuries, and asset-backed securities also outperformed. Over the period, yields on shorter maturity bonds rose, while yields on intermediate and longer maturity bonds declined.
During the period under review, the Fund’s modestly longer duration relative to the Barclays U.S. Government/Credit 2017 Maturity Index, resulting from slight maturity differences, contributed significantly to relative performance. The Fund’s overweighted allocation and security selection in the investment-grade corporate credit sector also contributed to relative performance. Additionally, the Fund’s exposure to asset-backed securities contributed to performance. Relatively small allocations to non-U.S. issuers and taxable municipal bonds helped performance, although the positive effect was partially offset by the small negative effect of security selection within the municipal bond sector.
At period-end, we maintained an overweighting in the investment-grade corporate credit sector compared with the benchmark. We favored the sector based on our belief that its overall valuations will remain relatively attractive over the Fund’s expected life and that the sector offered relatively higher income potential. We also maintained an overweighted position in the agency sector due to our view of its incremental income advantage over U.S. Treasuries during the Fund’s expected life. Conversely, we remained underweighted in the U.S. Treasury sector due to the sector’s less attractive income opportunities. Finally, we maintained a modestly longer duration compared with the benchmark, driven largely by our focus on bonds with final maturity dates closer to the Fund’s predetermined maturity date.
Thank you for your participation in Franklin Payout 2017 Fund.
We look forward to serving your future investment needs.
The foregoing information reflects our analysis, opinions and portfolio holdings as of May 31, 2016, the end of the reporting period. The way we implement our main investment strategies and the resulting portfolio holdings may change depending on factors such as market and economic conditions. These opinions may not be relied upon as investment advice or an offer for a particular security. The information is not a complete analysis of every aspect of any market, country, industry, security or the Fund. Statements of fact are from sources considered reliable, but the investment manager makes no representation or warranty as to their completeness or accuracy. Although historical performance is no guarantee of future results, these insights may help you understand our investment management philosophy.
CFA® is a trademark owned by CFA Institute.
4 Annual Report
FRANKLIN PAYOUT 2017 FUND
Performance Summary as of May 31, 2016
Your dividend income will vary depending on dividends or interest paid by securities in the Fund’s portfolio, adjusted for operating expenses of each class. Capital gain distributions are net profits realized from the sale of portfolio securities. The performance table and graphs do not reflect any taxes that a shareholder would pay on Fund dividends, capital gain distributions, if any, or any realized gains on the sale of Fund shares. Total return reflects reinvestment of the Fund’s dividends and capital gain distributions, if any, and any unrealized gains or losses.
| | | | | |
| Net Asset Value | | | | | |
| |
| Share Class (Symbol) | | 5/31/16 | | 6/1/15 | Change |
| R6 (FPOKX) | $ | 10.03 | $ | 10.00 | +$0.03 |
| Advisor (FPOBX) | $ | 10.03 | $ | 10.00 | +$0.03 |
| | |
| Distributions1 (6/1/15–5/31/16) | | |
| |
| | | Dividend |
| Share Class | | Income |
| R6 | $ | 0.0794 |
| Advisor | $ | 0.0794 |
Performance2
Cumulative total return excludes sales charges. Average annual total returns include maximum sales charges. Class R6/Advisor Class: no sales charges.
| | | | | | | | | | |
| | | | | | Average Annual | | | | | |
| | Cumulative | | Average Annual | | Total Return | | Total Annual Operating Expenses6 | |
| Share Class | Total Return3 | | Total Return4 | | (6/30/16 | )5 | (with waiver) | | (without waiver) | |
| |
| R6 | | | | | | | 0.30 | % | 1.11 | % |
| 1-Year | — | | — | | +1.61 | % | | | | |
| Since Inception (6/1/15) | +1.10 | % | +1.10 | % | +1.39 | % | | | | |
| |
| Advisor | | | | | | | 0.44 | % | 1.25 | % |
| 1-Year | — | | — | | +1.61 | % | | | | |
| Since Inception (6/1/15) | +1.10 | % | +1.10 | % | +1.39 | % | | | | |
Performance data represent past performance, which does not guarantee future results. Investment return and principal value will fluctuate, and you may have a gain or loss when you sell your shares. Current performance may differ from figures shown. For most recent month-end performance, call a Franklin Templeton Institutional Services representative at (800) 321-8563.
See page 7 for Performance Summary footnotes.
Annual Report 5
FRANKLIN PAYOUT 2017 FUND
PERFORMANCE SUMMARY
Total Return Index Comparison for a Hypothetical $10,000 Investment2
Total return represents the change in value of an investment over the period shown. It includes any applicable maximum sales charge, Fund expenses, account fees and reinvested distributions. The unmanaged index includes reinvestment of any income or distributions. It differs from the Fund in composition and does not pay management fees or expenses. One cannot invest directly in an index.
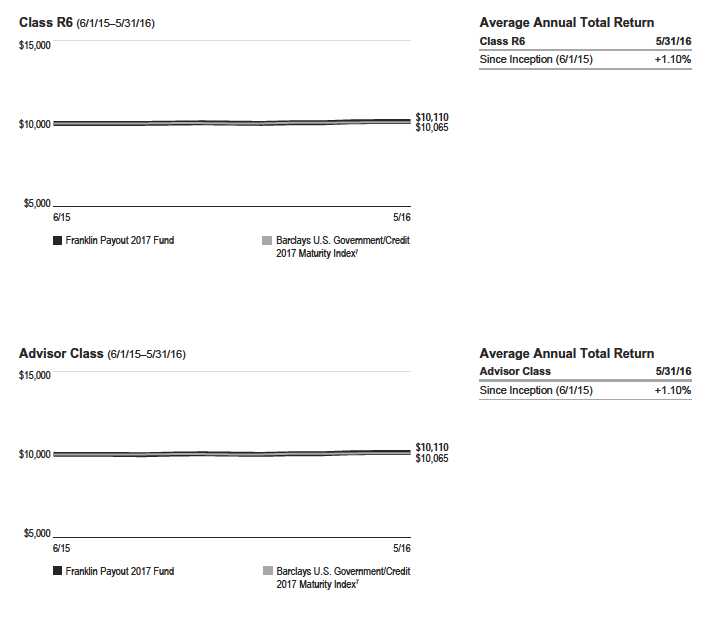
See page 7 for Performance Summary footnotes.
FRANKLIN PAYOUT 2017 FUND
PERFORMANCE SUMMARY
All investments involve risks, including possible loss of principal. Changes in the financial strength of a bond issuer or in a bond’s credit rating may affect its value. Interest rate movements will affect the Fund’s share price and yield. Bond prices generally move in the opposite direction of interest rates. As the prices of bonds in the Fund adjust to a rise in interest rates, the Fund’s share price may decline. Because the Fund can only distribute what it earns, the Fund’s distributions to shareholders may decline when prevailing interest rates fall or when the Fund experiences defaults on debt securities it holds. Interest earned on floating rate loans varies with changes in prevailing interest rates. Therefore, while floating rate loans offer higher interest income when interest rates rise, they will also generate less income when interest rates decline. The Fund is actively managed but there is no guarantee that the manager’s investment decisions will achieve the desired results. The Fund’s prospectus also includes a description of the main investment risks.
| |
| Class R6: | Shares are available to certain eligible investors as described in the prospectus. |
| Advisor Class: | Shares are available to certain eligible investors as described in the prospectus. |
1. The distribution amount is the sum of the dividend payments to shareholders for the period shown and includes only estimated tax-basis net investment income.
2. The Fund has an expense reduction contractually guaranteed through at least 9/30/16 and a fee waiver associated with any investment in a Franklin Templeton money fund
and/or other Franklin Templeton fund, as applicable, contractually guaranteed through at least the Fund’s current fiscal year-end. The transfer agent has contractually agreed
to cap transfer agency fees for Class R6 shares of the Fund so that transfer agency fees for that class do not exceed 0.01% until 9/30/16. Fund investment results reflect the
expense reduction, fee waiver and fee cap, to the extent applicable; without these reductions, the results would have been lower.
3. Cumulative total return represents the change in value of an investment over the period indicated.
4. Average annual total return represents the average annual change in value of an investment over the periods indicated. Return for less than one year, if any, has not
been annualized.
5. In accordance with SEC rules, we provide standardized average annual total return information through the latest calendar quarter.
6. Figures are as stated in the Fund’s current prospectus and may differ from the expense ratios disclosed in the Financial Highlights in this report. In periods of market vola-
tility, assets may decline significantly, causing total annual Fund operating expenses to become higher than the figures shown.
7. Source: Morningstar. The Barclays U.S. Government/Credit 2017 Maturity Index includes investment-grade, U.S. dollar-denominated, fixed-rate Treasuries, government-
related and corporate securities and foreign debt maturing in 2017.
See www.franklintempletondatasources.com for additional data provider information.
Annual Report 7
FRANKLIN PAYOUT 2017 FUND
Your Fund’s Expenses
As a Fund shareholder, you can incur two types of costs:
- Transaction costs, including sales charges (loads) on Fund purchases, if applicable; and
- Ongoing Fund costs, including management fees, distribution and service (12b-1) fees, and other Fund expenses. All mutual funds have ongoing costs, sometimes referred to as operating expenses.
The following table shows ongoing costs of investing in the Fund and can help you understand these costs and compare them with those of other mutual funds. The table assumes a $1,000 investment held for the six months indicated.
Actual Fund Expenses
The first line (Actual) for each share class listed in the table provides actual account values and expenses. The “Ending Account Value” is derived from the Fund’s actual return, which includes the effect of Fund expenses.
You can estimate the expenses you paid during the period by following these steps. Of course, your account value and expenses will differ from those in this illustration:
1. Divide your account value by $1,000.
If an account had an $8,600 value, then $8,600 ÷ $1,000 = 8.6.
2. Multiply the result by the number under the heading “Expenses Paid During Period.”
If Expenses Paid During Period were $7.50, then 8.6 × $7.50 = $64.50.
In this illustration, the estimated expenses paid this period are $64.50.
Hypothetical Example for Comparison with Other Funds
Information in the second line (Hypothetical) for each class in the table can help you compare ongoing costs of investing in the Fund with those of other mutual funds. This information may not be used to estimate the actual ending account balance or expenses you paid during the period. The hypothetical “Ending Account Value” is based on the actual expense ratio for each class and an assumed 5% annual rate of return before expenses, which does not represent the Fund’s actual return. The figure under the heading “Expenses Paid During Period” shows the hypothetical expenses your account would have incurred under this scenario. You can compare this figure with the 5% hypothetical examples that appear in shareholder reports of other funds.
Please note that expenses shown in the table are meant to highlight ongoing costs and do not reflect any transaction costs, such as sales charges. Therefore, the second line for each class is useful in comparing ongoing costs only, and will not help you compare total costs of owning different funds. In addition, if transaction costs were included, your total costs would have been higher. Please refer to the Fund prospectus for additional information on operating expenses.
| | | | | | |
| | | Beginning Account | | Ending Account | | Expenses Paid During |
| Share Class | | Value 12/1/15 | | Value 5/31/16 | | Period* 12/1/15–5/31/16 |
| R6 | | | | | | |
| Actual | $ | 1,000 | $ | 1,009.00 | $ | 1.46 |
| Hypothetical (5% return before expenses) | $ | 1,000 | $ | 1,023.55 | $ | 1.47 |
| Advisor | | | | | | |
| Actual | $ | 1,000 | $ | 1,009.00 | $ | 1.46 |
| Hypothetical (5% return before expenses) | $ | 1,000 | $ | 1,023.55 | $ | 1.47 |
*Expenses are calculated using the most recent six-month expense ratio, net of expense waivers, annualized for each class (R6: 0.29% and
Advisor: 0.29%), multiplied by the average account value over the period, multiplied by 183/366 to reflect the one-half year period.
Franklin Payout 2018 Fund
We are pleased to bring you this inaugural annual report for Franklin Payout 2018 Fund for the period since the Fund’s inception on June 1, 2015, through May 31, 2016.
Your Fund’s Goal and Main Investments
The Fund seeks capital preservation and income with a predetermined maturity date. Under normal market conditions, the Fund invests predominantly in U.S. investment-grade debt securities and investments, including government and corporate debt securities and asset-backed securities and municipal securities.
Performance Overview
The Fund’s Advisor Class shares delivered a +1.78% cumulative total return for the period ended May 31, 2016. In comparison, the Fund’s benchmark, the Barclays U.S. Government/Credit 2018 Maturity Index, generated a +1.28% total return.1 The index includes investment-grade, U.S. dollar-denominated, fixed-rate Treasuries, government-related and corporate securities and foreign debt maturing in 2018. You can find more of the Fund’s performance data in the Performance Summary beginning on page 11.
Performance data represent past performance, which does not guarantee future results. Investment return and principal value will fluctuate, and you may have a gain or loss when you sell your shares. Current performance may differ from figures shown. For most recent month-end performance, call a Franklin Templeton Institutional Services representative at (800) 321-8563.
Investment Strategy
We focus on investment-grade securities and investments or on unrated securities and investments we determine are of comparable quality. Our focus on the portfolio’s credit quality is intended to reduce credit risk and help to preserve capital. We may invest a portion of the Fund’s assets in U.S. dollar-denominated foreign securities, including debt issued by supranational entities. In choosing investments, we select securities in various market sectors based on our assessment of changing economic, market, industry and issuer conditions. We use a top-down analysis of broad economic trends, combined with a bottom-up fundamental analysis of market sectors, industries and issuers, to try to take advantage of varying sector reactions to economic events.

Although the Fund may invest in individual securities of any maturity, the Fund is a term fund and is managed to mature in 2018. Over time, the Fund’s duration and weighted average maturity will decline as 2018 approaches. In the later months of operation, when the debt securities held by the Fund mature, the proceeds from such securities will be held in cash, cash equivalents and money market instruments, including affiliated money market funds, or invested in short-term bonds. In early December 2018, the Fund is expected to consist almost entirely of cash, cash equivalents and money market instruments. The Fund is designed for investors who seek an investment with a payout schedule to help meet their retirement spending needs, particularly those who are nearing retirement or are in retirement. There is no guarantee the Fund will meet an investor’s retirement spending needs.
What is duration?
Duration is a measure of a bond’s price sensitivity to interest rate changes. In general, a portfolio of securities with a lower duration can be expected to be less sensitive to interest rate changes than a portfolio with a higher duration.
| | |
| Maturity | | |
| 5/31/16 | | |
| | % of | |
| | Market Value | |
| 0 to 1 Year | 1.1 | % |
| 2 to 3 Years | 98.9 | % |
Manager’s Discussion
From a perspective of excess returns over U.S. Treasuries, many investment-grade corporate bonds underperformed for the reporting period. However, shorter duration and higher quality investment-grade sectors performed relatively well. U.S. agency
1. Source: Morningstar.
The index is unmanaged and includes reinvestment of any income or distributions. It does not reflect any fees, expenses or sales charges. One cannot invest directly in an
index, and an index is not representative of the Fund’s portfolio.
See www.franklintempletondatasources.com for additional data provider information.
The dollar value, number of shares or principal amount, and names of all portfolio holdings are listed in the Fund’s Statement of Investments (SOI). The SOI begins on page 39.
Annual Report
9
FRANKLIN PAYOUT 2018 FUND
| | |
| Top 10 Holdings* | | |
| 5/31/16 | | |
| | % of Total | |
| Issue/Issuer | Net Assets | |
| U.S. Treasury Note | 8.7 | % |
| Federal National Mortgage Association (FNMA) | 5.0 | % |
| Federal Home Loan Bank (FHLB) | 3.7 | % |
| Caterpillar Inc. | 3.2 | % |
| PepsiCo Inc. | 3.2 | % |
| Pacific Gas & Electric Co. | 3.2 | % |
| Duke Energy Carolinas LLC | 3.2 | % |
| Raytheon Co. | 3.2 | % |
| Bank of America Corp. | 3.1 | % |
| Starbucks Corp. | 2.9 | % |
*Securities are listed by issuer, which may appear by another name in the SOI.
securities generally produced positive excess returns over U.S. Treasuries, and asset-backed securities also outperformed. Over the period, yields on shorter maturity bonds rose, while yields on intermediate and longer maturity bonds declined.
During the period under review, the Fund’s modestly longer duration relative to the Barclays U.S. Government/Credit 2018 Maturity Index, resulting from slight maturity differences, contributed significantly to relative performance. The Fund’s allocation to the investment-grade corporate credit sector also contributed to relative performance and more than offset the negative effect of security selection within the sector. Additionally, the Fund’s exposure to the high yield corporate credit sector contributed slightly to performance. A relatively small allocation to non-U.S. issuers also helped performance. The negative effect of security selection in U.S. agency securities was partially offset by the positive effect of sector allocation.
At period-end, we maintained an overweighting in the investment-grade corporate credit sector compared with the benchmark. We favored the sector based on our belief that its overall valuations will remain relatively attractive over the Fund’s expected life and that the sector offered relatively higher income potential. We also favored the agency sector due to our view of its incremental income advantage over U.S. Treasuries during the Fund’s expected life.
Conversely, we remained underweighted in the U.S. Treasury sector due to the sector’s less attractive income opportunities. Finally, we maintained a modestly longer duration compared with the benchmark, driven largely by our focus on bonds with final maturity dates closer to the Fund’s predetermined maturity date.
Thank you for your participation in Franklin Payout 2018 Fund.
We look forward to serving your future investment needs.

The foregoing information reflects our analysis, opinions and portfolio holdings as of May 31, 2016, the end of the reporting period. The way we implement our main investment strategies and the resulting portfolio holdings may change depending on factors such as market and economic conditions. These opinions may not be relied upon as investment advice or an offer for a particular security. The information is not a complete analysis of every aspect of any market, country, industry, security or the Fund. Statements of fact are from sources considered reliable, but the investment manager makes no representation or warranty as to their completeness or accuracy. Although historical performance is no guarantee of future results, these insights may help you understand our investment management philosophy.
FRANKLIN PAYOUT 2018 FUND
Performance Summary as of May 31, 2016
Your dividend income will vary depending on dividends or interest paid by securities in the Fund’s portfolio, adjusted for operating expenses of each class. Capital gain distributions are net profits realized from the sale of portfolio securities. The performance table and graphs do not reflect any taxes that a shareholder would pay on Fund dividends, capital gain distributions, if any, or any realized gains on the sale of Fund shares. Total return reflects reinvestment of the Fund’s dividends and capital gain distributions, if any, and any unrealized gains or losses.
| | | | | |
| Net Asset Value | | | | | |
| |
| Share Class (Symbol) | | 5/31/16 | | 6/1/15 | Change |
| R6 (FPOLX) | $ | 10.08 | $ | 10.00 | +$0.08 |
| Advisor (FPODX) | $ | 10.08 | $ | 10.00 | +$0.08 |
| | |
| Distributions1 (6/1/15–5/31/16) | | |
| |
| | | Dividend |
| Share Class | | Income |
| R6 | $ | 0.0966 |
| Advisor | $ | 0.0966 |
Performance2
Cumulative total return excludes sales charges. Average annual total returns include maximum sales charges. Class R6/Advisor Class: no sales charges.
| | | | | | | | | | |
| | | | | | Average Annual | | | | | |
| | Cumulative | | Average Annual | | Total Return | | Total Annual Operating Expenses6 | |
| Share Class | Total Return3 | | Total Return4 | | (6/30/16 | )5 | (with waiver) | | (without waiver) | |
| |
| R6 | | | | | | | 0.30 | % | 1.11 | % |
| 1-Year | — | | — | | +2.49 | % | | | | |
| Since Inception (6/1/15) | +1.78 | % | +1.78 | % | +2.30 | % | | | | |
| |
| Advisor | | | | | | | 0.44 | % | 1.25 | % |
| 1-Year | — | | — | | +2.49 | % | | | | |
| Since Inception (6/1/15) | +1.78 | % | +1.78 | % | +2.30 | % | | | | |
Performance data represent past performance, which does not guarantee future results. Investment return and principal value will fluctuate, and you may have a gain or loss when you sell your shares. Current performance may differ from figures shown. For most recent month-end performance, call a Franklin Templeton Institutional Services representative at (800) 321-8563.
See page 13 for Performance Summary footnotes.
Annual Report
11
FRANKLIN PAYOUT 2018 FUND
PERFORMANCE SUMMARY
Total Return Index Comparison for a Hypothetical $10,000 Investment2
Total return represents the change in value of an investment over the period shown. It includes any applicable maximum sales charge, Fund expenses, account fees and reinvested distributions. The unmanaged index includes reinvestment of any income or distributions. It differs from the Fund in composition and does not pay management fees or expenses. One cannot invest directly in an index.
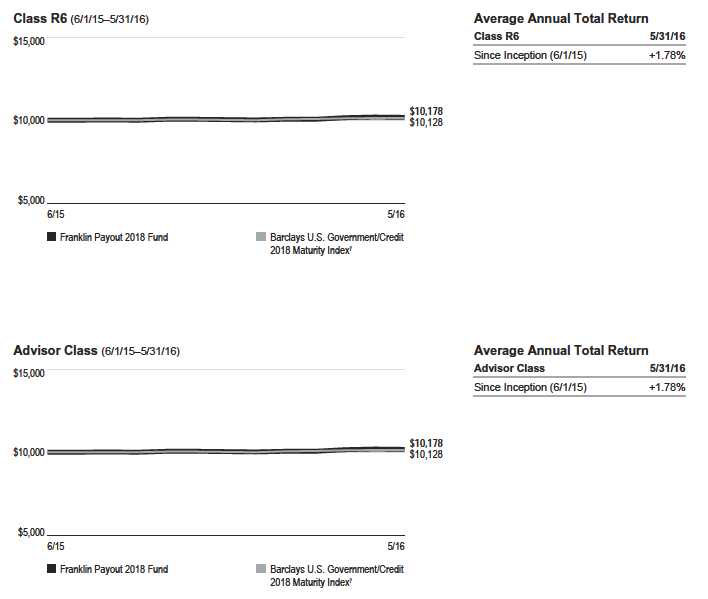
See page 13 for Performance Summary footnotes.
FRANKLIN PAYOUT 2018 FUND
PERFORMANCE SUMMARY
All investments involve risks, including possible loss of principal. Changes in the financial strength of a bond issuer or in a bond’s credit rating may affect its value. Interest rate movements will affect the Fund’s share price and yield. Bond prices generally move in the opposite direction of interest rates. As the prices of bonds in the Fund adjust to a rise in interest rates, the Fund’s share price may decline. Because the Fund can only distribute what it earns, the Fund’s distributions to shareholders may decline when prevailing interest rates fall or when the Fund experiences defaults on debt securities it holds. Interest earned on floating rate loans varies with changes in prevailing interest rates. Therefore, while floating rate loans offer higher interest income when interest rates rise, they will also generate less income when interest rates decline. The Fund is actively managed but there is no guarantee that the manager’s investment decisions will achieve the desired results. The Fund’s prospectus also includes a description of the main investment risks.
| |
| Class R6: | Shares are available to certain eligible investors as described in the prospectus. |
| Advisor Class: | Shares are available to certain eligible investors as described in the prospectus. |
1. The distribution amount is the sum of the dividend payments to shareholders for the period shown and includes only estimated tax-basis net investment income.
2. The Fund has an expense reduction contractually guaranteed through at least 9/30/16 and a fee waiver associated with any investment in a Franklin Templeton money fund
and/or other Franklin Templeton fund, as applicable, contractually guaranteed through at least the Fund’s current fiscal year-end. The transfer agent has contractually agreed
to cap transfer agency fees for Class R6 shares of the Fund so that transfer agency fees for that class do not exceed 0.01% until 9/30/16. Fund investment results reflect the
expense reduction, fee waiver and fee cap, to the extent applicable; without these reductions, the results would have been lower.
3. Cumulative total return represents the change in value of an investment over the period indicated.
4. Average annual total return represents the average annual change in value of an investment over the periods indicated. Return for less than one year, if any, has not
been annualized.
5. In accordance with SEC rules, we provide standardized average annual total return information through the latest calendar quarter.
6. Figures are as stated in the Fund’s current prospectus and may differ from the expense ratios disclosed in the Financial Highlights in this report. In periods of market vola-
tility, assets may decline significantly, causing total annual Fund operating expenses to become higher than the figures shown.
7. Source: Morningstar. The Barclays U.S. Government/Credit 2018 Maturity Index includes investment-grade, U.S. dollar-denominated, fixed-rate Treasuries, government-
related and corporate securities and foreign debt maturing in 2018.
See www.franklintempletondatasources.com for additional data provider information.
Annual Report
13
FRANKLIN PAYOUT 2018 FUND
Your Fund’s Expenses
As a Fund shareholder, you can incur two types of costs:
- Transaction costs, including sales charges (loads) on Fund purchases, if applicable; and
- Ongoing Fund costs, including management fees, distribution and service (12b-1) fees, and other Fund expenses. All mutual funds have ongoing costs, sometimes referred to as operating expenses.
The following table shows ongoing costs of investing in the Fund and can help you understand these costs and compare them with those of other mutual funds. The table assumes a $1,000 investment held for the six months indicated.
Actual Fund Expenses
The first line (Actual) for each share class listed in the table provides actual account values and expenses. The “Ending Account Value” is derived from the Fund’s actual return, which includes the effect of Fund expenses.
You can estimate the expenses you paid during the period by following these steps. Of course, your account value and expenses will differ from those in this illustration:
1. Divide your account value by $1,000.
If an account had an $8,600 value, then $8,600 ÷ $1,000 = 8.6.
2. Multiply the result by the number under the heading “Expenses Paid During Period.”
If Expenses Paid During Period were $7.50, then 8.6 × $7.50 = $64.50.
In this illustration, the estimated expenses paid this period are $64.50.
Hypothetical Example for Comparison with Other Funds
Information in the second line (Hypothetical) for each class in the table can help you compare ongoing costs of investing in the Fund with those of other mutual funds. This information may not be used to estimate the actual ending account balance or expenses you paid during the period. The hypothetical “Ending Account Value” is based on the actual expense ratio for each class and an assumed 5% annual rate of return before expenses, which does not represent the Fund’s actual return. The figure under the heading “Expenses Paid During Period” shows the hypothetical expenses your account would have incurred under this scenario. You can compare this figure with the 5% hypothetical examples that appear in shareholder reports of other funds.
Please note that expenses shown in the table are meant to highlight ongoing costs and do not reflect any transaction costs, such as sales charges. Therefore, the second line for each class is useful in comparing ongoing costs only, and will not help you compare total costs of owning different funds. In addition, if transaction costs were included, your total costs would have been higher. Please refer to the Fund prospectus for additional information on operating expenses.
| | | | | | |
| | | Beginning Account | | Ending Account | | Expenses Paid During |
| Share Class | | Value 12/1/15 | | Value 5/31/16 | | Period* 12/1/15–5/31/16 |
| R6 | | | | | | |
| Actual | $ | 1,000 | $ | 1,013.70 | $ | 1.46 |
| Hypothetical (5% return before expenses) | $ | 1,000 | $ | 1,023.55 | $ | 1.47 |
| Advisor | | | | | | |
| Actual | $ | 1,000 | $ | 1,013.70 | $ | 1.46 |
| Hypothetical (5% return before expenses) | $ | 1,000 | $ | 1,023.55 | $ | 1.47 |
*Expenses are calculated using the most recent six-month expense ratio, net of expense waivers, annualized for each class (R6: 0.29% and
Advisor: 0.29%), multiplied by the average account value over the period, multiplied by 183/366 to reflect the one-half year period.
Franklin Payout 2019 Fund
We are pleased to bring you this inaugural annual report for Franklin Payout 2019 Fund for the period since the Fund’s inception on June 1, 2015, through May 31, 2016.
Your Fund’s Goal and Main Investments
The Fund seeks capital preservation and income with a predetermined maturity date. Under normal market conditions, the Fund invests predominantly in U.S. investment-grade debt securities and investments, including government and corporate debt securities and asset-backed securities and municipal securities.
Performance Overview
The Fund’s Advisor Class shares delivered a +2.85% cumulative total return for the period ended May 31, 2016. In comparison, the Fund’s benchmark, the Barclays U.S. Government/Credit 2019 Maturity Index, generated a +1.95% total return.1 The index includes investment-grade, U.S. dollar-denominated, fixed-rate Treasuries, government-related and corporate securities and foreign debt maturing in 2019. You can find more of the Fund’s performance data in the Performance Summary beginning on page 17.
Performance data represent past performance, which does not guarantee future results. Investment return and principal value will fluctuate, and you may have a gain or loss when you sell your shares. Current performance may differ from figures shown. For most recent month-end performance, call a Franklin Templeton Institutional Services representative at (800) 321-8563.
Investment Strategy
We focus on investment-grade securities and investments or on unrated securities and investments we determine are of comparable quality. Our focus on the portfolio’s credit quality is intended to reduce credit risk and help to preserve capital. We may invest a portion of the Fund’s assets in U.S. dollar-denominated foreign securities, including debt issued by supranational entities. In choosing investments, we select securities in various market sectors based on our assessment of changing economic, market, industry and issuer conditions. We use a top-down analysis of broad economic trends, combined with a bottom-up fundamental analysis of market sectors, industries and issuers, to try to take advantage of varying sector reactions to economic events.
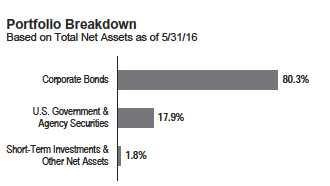
Although the Fund may invest in individual securities of any maturity, the Fund is a term fund and is managed to mature in 2019. Over time, the Fund’s duration and weighted average maturity will decline as 2019 approaches. In the later months of operation, when the debt securities held by the Fund mature, the proceeds from such securities will be held in cash, cash equivalents and money market instruments, including affiliated money market funds, or invested in short-term bonds. In early December 2019, the Fund is expected to consist almost entirely of cash, cash equivalents and money market instruments. The Fund is designed for investors who seek an investment with a payout schedule to help meet their retirement spending needs, particularly those who are nearing retirement or are in retirement. There is no guarantee the Fund will meet an investor’s retirement spending needs.
What is duration?
Duration is a measure of a bond’s price sensitivity to interest rate changes. In general, a portfolio of securities with a lower duration can be expected to be less sensitive to interest rate changes than a portfolio with a higher duration.
| | |
| Maturity | | |
| 5/31/16 | | |
| | % of | |
| | Market Value | |
| 0 to 1 Year | 1.2 | % |
| 3 to 4 Years | 98.8 | % |
Manager’s Discussion
From a perspective of excess returns over U.S. Treasuries, many investment-grade corporate bonds underperformed for the reporting period. However, shorter duration and higher quality investment-grade sectors performed relatively well. U.S. agency
1. Source: Morningstar.
The index is unmanaged and includes reinvestment of any income or distributions. It does not reflect any fees, expenses or sales charges. One cannot invest directly in an
index, and an index is not representative of the Fund’s portfolio.
See www.franklintempletondatasources.com for additional data provider information.
The dollar value, number of shares or principal amount, and names of all portfolio holdings are listed in the Fund’s Statement of Investments (SOI). The SOI begins on page 43.
Annual Report
15
FRANKLIN PAYOUT 2019 FUND
| | |
| Top 10 Holdings* | | |
| 5/31/16 | | |
| | % of Total | |
| Issue/Issuer | Net Assets | |
| Federal Home Loan Bank (FHLB) | 9.2 | % |
| Federal National Mortgage Association (FNMA) | 5.0 | % |
| Federal Farm Credit Bank (FFCB) | 3.7 | % |
| Anheuser-Busch InBev Worldwide Inc. | 2.9 | % |
| Morgan Stanley | 2.7 | % |
| Emerson Electric Co. | 2.7 | % |
| Boeing Capital Corp. | 2.7 | % |
| Deere & Co. | 2.7 | % |
| Westpac Banking Corp. | 2.7 | % |
| Lockheed Martin Corp. | 2.6 | % |
*Securities are listed by issuer, which may appear by another name in the SOI.
securities generally produced positive excess returns over U.S. Treasuries, and asset-backed securities also outperformed. Over the period, yields on shorter maturity bonds rose, while yields on intermediate and longer maturity bonds declined.
During the period under review, the Fund’s modestly longer duration relative to the Barclays U.S. Government/Credit 2019 Maturity Index, resulting from slight maturity differences, contributed significantly to relative performance. The Fund’s allocation and security selection in the high yield corporate credit sector also contributed to relative performance. An overweighted exposure to the investment-grade corporate credit sector contributed to relative performance and more than offset the negative effect of security selection within the sector. A relatively small allocation to non-U.S. issuers also helped performance over the period, while our exposure to taxable municipal bonds detracted slightly from relative performance. The positive effect of the Fund’s overweighted position in U.S. agency securities was offset by the negative effect of security selection within the sector.
At period-end, we maintained an overweighting in the investment-grade corporate credit sector compared with the benchmark. We favored the sector based on our belief that its overall valuations will remain relatively attractive over the Fund’s expected life and that the sector offered relatively higher income potential. We also maintained an overweighted position in the agency sector due to our view of its incremental income advantage over U.S. Treasuries during the Fund’s expected life. Conversely, we remained underweighted in the U.S. Treasury sector due to the sector’s less attractive income opportunities. Finally, we maintained a modestly longer duration compared with the benchmark, driven largely by our focus on bonds with final maturity dates closer to the Fund’s predetermined maturity date.
Thank you for your participation in Franklin Payout 2019 Fund.
We look forward to serving your future investment needs.
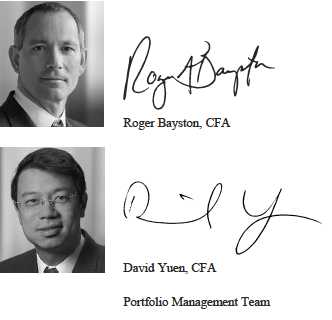
The foregoing information reflects our analysis, opinions and portfolio holdings as of May 31, 2016, the end of the reporting period. The way we implement our main investment strategies and the resulting portfolio holdings may change depending on factors such as market and economic conditions. These opinions may not be relied upon as investment advice or an offer for a particular security. The information is not a complete analysis of every aspect of any market, country, industry, security or the Fund. Statements of fact are from sources considered reliable, but the investment manager makes no representation or warranty as to their completeness or accuracy. Although historical performance is no guarantee of future results, these insights may help you understand our investment management philosophy.
FRANKLIN PAYOUT 2019 FUND
Performance Summary as of May 31, 2016
Your dividend income will vary depending on dividends or interest paid by securities in the Fund’s portfolio, adjusted for operating expenses of each class. Capital gain distributions are net profits realized from the sale of portfolio securities. The performance table and graphs do not reflect any taxes that a shareholder would pay on Fund dividends, capital gain distributions, if any, or any realized gains on the sale of Fund shares. Total return reflects reinvestment of the Fund’s dividends and capital gain distributions, if any, and any unrealized gains or losses.
| | | | | |
| Net Asset Value | | | | | |
| |
| Share Class (Symbol) | | 5/31/16 | | 6/1/15 | Change |
| R6 (FPOEX) | $ | 10.16 | $ | 10.00 | +$0.16 |
| Advisor (FPOFX) | $ | 10.16 | $ | 10.00 | +$0.16 |
| | |
| Distributions1 (6/1/15–5/31/16) | | |
| |
| | | Dividend |
| Share Class | | Income |
| R6 | $ | 0.1225 |
| Advisor | $ | 0.1225 |
Performance2
Cumulative total return excludes sales charges. Average annual total returns include maximum sales charges. Class R6/Advisor Class: no sales charges.
| | | | | | | | | | |
| | | | | | Average Annual | | | | | |
| | Cumulative | | Average Annual | | Total Return | | Total Annual Operating Expenses6 | |
| Share Class | Total Return3 | | Total Return4 | | (6/30/16 | )5 | (with waiver) | | (without waiver) | |
| |
| R6 | | | | | | | 0.30 | % | 1.11 | % |
| 1-Year | — | | — | | +3.97 | % | | | | |
| Since Inception (6/1/15) | +2.85 | % | +2.85 | % | +3.67 | % | | | | |
| |
| Advisor | | | | | | | 0.44 | % | 1.25 | % |
| 1-Year | — | | — | | +3.97 | % | | | | |
| Since Inception (6/1/15) | +2.85 | % | +2.85 | % | +3.67 | % | | | | |
Performance data represent past performance, which does not guarantee future results. Investment return and principal value will fluctuate, and you may have a gain or loss when you sell your shares. Current performance may differ from figures shown. For most recent month-end performance, call a Franklin Templeton Institutional Services representative at (800) 321-8563.
See page 19 for Performance Summary footnotes.
Annual Report
17
FRANKLIN PAYOUT 2019 FUND
PERFORMANCE SUMMARY
Total Return Index Comparison for a Hypothetical $10,000 Investment2
Total return represents the change in value of an investment over the period shown. It includes any applicable maximum sales charge, Fund expenses, account fees and reinvested distributions. The unmanaged index includes reinvestment of any income or distributions. It differs from the Fund in composition and does not pay management fees or expenses. One cannot invest directly in an index.

See page 19 for Performance Summary footnotes.
FRANKLIN PAYOUT 2019 FUND
PERFORMANCE SUMMARY
All investments involve risks, including possible loss of principal. Changes in the financial strength of a bond issuer or in a bond’s credit rating may affect its value. Interest rate movements will affect the Fund’s share price and yield. Bond prices generally move in the opposite direction of interest rates. As the prices of bonds in the Fund adjust to a rise in interest rates, the Fund’s share price may decline. Because the Fund can only distribute what it earns, the Fund’s distributions to shareholders may decline when prevailing interest rates fall or when the Fund experiences defaults on debt securities it holds. Interest earned on floating rate loans varies with changes in prevailing interest rates. Therefore, while floating rate loans offer higher interest income when interest rates rise, they will also generate less income when interest rates decline. The Fund is actively managed but there is no guarantee that the manager’s investment decisions will achieve the desired results. The Fund’s prospectus also includes a description of the main investment risks.
| |
| Class R6: | Shares are available to certain eligible investors as described in the prospectus. |
| Advisor Class: | Shares are available to certain eligible investors as described in the prospectus. |
1. The distribution amount is the sum of the dividend payments to shareholders for the period shown and includes only estimated tax-basis net investment income.
2. The Fund has an expense reduction contractually guaranteed through at least 9/30/16 and a fee waiver associated with any investment in a Franklin Templeton money fund
and/or other Franklin Templeton fund, as applicable, contractually guaranteed through at least the Fund’s current fiscal year-end. The transfer agent has contractually agreed
to cap transfer agency fees for Class R6 shares of the Fund so that transfer agency fees for that class do not exceed 0.01% until 9/30/16. Fund investment results reflect the
expense reduction, fee waiver and fee cap, to the extent applicable; without these reductions, the results would have been lower.
3. Cumulative total return represents the change in value of an investment over the period indicated.
4. Average annual total return represents the average annual change in value of an investment over the periods indicated. Return for less than one year, if any, has not
been annualized.
5. In accordance with SEC rules, we provide standardized average annual total return information through the latest calendar quarter.
6. Figures are as stated in the Fund’s current prospectus and may differ from the expense ratios disclosed in the Financial Highlights in this report. In periods of market vola-
tility, assets may decline significantly, causing total annual Fund operating expenses to become higher than the figures shown.
7. Source: Morningstar. The Barclays U.S. Government/Credit 2019 Maturity Index includes investment-grade, U.S. dollar-denominated, fixed-rate Treasuries, government-
related and corporate securities and foreign debt maturing in 2019.
See www.franklintempletondatasources.com for additional data provider information.
Annual Report
19
FRANKLIN PAYOUT 2019 FUND
Your Fund’s Expenses
As a Fund shareholder, you can incur two types of costs:
- Transaction costs, including sales charges (loads) on Fund purchases, if applicable; and
- Ongoing Fund costs, including management fees, distribution and service (12b-1) fees, and other Fund expenses. All mutual funds have ongoing costs, sometimes referred to as operating expenses.
The following table shows ongoing costs of investing in the Fund and can help you understand these costs and compare them with those of other mutual funds. The table assumes a $1,000 investment held for the six months indicated.
Actual Fund Expenses
The first line (Actual) for each share class listed in the table provides actual account values and expenses. The “Ending Account Value” is derived from the Fund’s actual return, which includes the effect of Fund expenses.
You can estimate the expenses you paid during the period by following these steps. Of course, your account value and expenses will differ from those in this illustration:
1. Divide your account value by $1,000.
If an account had an $8,600 value, then $8,600 ÷ $1,000 = 8.6.
2. Multiply the result by the number under the heading “Expenses Paid During Period.”
If Expenses Paid During Period were $7.50, then 8.6 × $7.50 = $64.50.
In this illustration, the estimated expenses paid this period are $64.50.
Hypothetical Example for Comparison with Other Funds
Information in the second line (Hypothetical) for each class in the table can help you compare ongoing costs of investing in the Fund with those of other mutual funds. This information may not be used to estimate the actual ending account balance or expenses you paid during the period. The hypothetical “Ending Account Value” is based on the actual expense ratio for each class and an assumed 5% annual rate of return before expenses, which does not represent the Fund’s actual return. The figure under the heading “Expenses Paid During Period” shows the hypothetical expenses your account would have incurred under this scenario. You can compare this figure with the 5% hypothetical examples that appear in shareholder reports of other funds.
Please note that expenses shown in the table are meant to highlight ongoing costs and do not reflect any transaction costs, such as sales charges. Therefore, the second line for each class is useful in comparing ongoing costs only, and will not help you compare total costs of owning different funds. In addition, if transaction costs were included, your total costs would have been higher. Please refer to the Fund prospectus for additional information on operating expenses.
| | | | | | |
| | | Beginning Account | | Ending Account | | Expenses Paid During |
| Share Class | | Value 12/1/15 | | Value 5/31/16 | | Period* 12/1/15–5/31/16 |
| R6 | | | | | | |
| Actual | $ | 1,000 | $ | 1,022.40 | $ | 1.47 |
| Hypothetical (5% return before expenses) | $ | 1,000 | $ | 1,023.55 | $ | 1.47 |
| Advisor | | | | | | |
| Actual | $ | 1,000 | $ | 1,022.40 | $ | 1.47 |
| Hypothetical (5% return before expenses) | $ | 1,000 | $ | 1,023.55 | $ | 1.47 |
*Expenses are calculated using the most recent six-month expense ratio, net of expense waivers, annualized for each class (R6: 0.29% and
Advisor: 0.29%), multiplied by the average account value over the period, multiplied by 183/366 to reflect the one-half year period.
Franklin Payout 2020 Fund
We are pleased to bring you this inaugural annual report for Franklin Payout 2020 Fund for the period since the Fund’s inception on June 1, 2015, through May 31, 2016.
Your Fund’s Goal and Main Investments
The Fund seeks capital preservation and income with a predetermined maturity date. Under normal market conditions, the Fund invests predominantly in U.S. investment-grade debt securities and investments, including government and corporate debt securities and asset-backed securities and municipal securities.
Performance Overview
The Fund’s Advisor Class shares delivered a +3.10% cumulative total return for the period ended May 31, 2016. In comparison, the Fund’s benchmark, the Barclays U.S. Government/Credit 2020 Maturity Index, generated a +2.42% total return.1 The index includes investment-grade, U.S. dollar-denominated, fixed-rate Treasuries, government-related and corporate securities, and foreign debt maturing in 2020. You can find more of the Fund’s performance data in the Performance Summary beginning on page 23.
Performance data represent past performance, which does not guarantee future results. Investment return and principal value will fluctuate, and you may have a gain or loss when you sell your shares. Current performance may differ from figures shown. For most recent month-end performance, call a Franklin Templeton Institutional Services representative at (800) 321-8563.
Investment Strategy
We focus on investment-grade securities and investments or on unrated securities and investments we determine are of comparable quality. Our focus on the portfolio’s credit quality is intended to reduce credit risk and help to preserve capital. We may invest a portion of the Fund’s assets in U.S. dollar-denominated foreign securities, including debt issued by supranational entities. In choosing investments, we select securities in various market sectors based on our assessment of changing economic, market, industry and issuer conditions. We use a top-down analysis of broad economic trends, combined with a bottom-up fundamental analysis of market sectors, industries and issuers, to try to take advantage of varying sector reactions to economic events.
| | | | |
| Portfolio Breakdown | | | |
| Based on Total Net Assets as of 5/31/16 | | | |
| |
| |
| |
| Corporate Bonds | | | 74.6 | % |
| |
| |
| U.S. Government & | 17.7 | % | | |
| Agency Securities | | | | |
| |
| |
| Foreign Government & | 5.0 | % | | |
| Agency Securities | | | | |
| |
| |
| Short-Term Investments & | 2.7 | % | | |
| Other Net Assets | | | | |
Although the Fund may invest in individual securities of any maturity, the Fund is a term fund and is managed to mature in 2020. Over time, the Fund’s duration and weighted average maturity will decline as 2020 approaches. In the later months of operation, when the debt securities held by the Fund mature, the proceeds from such securities will be held in cash, cash equivalents and money market instruments, including affiliated money market funds, or invested in short-term bonds. In early December 2020, the Fund is expected to consist almost entirely of cash, cash equivalents and money market instruments. The Fund is designed for investors who seek an investment with a payout schedule to help meet their retirement spending needs, particularly those who are nearing retirement or are in retirement. There is no guarantee the Fund will meet an investor’s retirement spending needs.
What is duration?
Duration is a measure of a bond’s price sensitivity to interest rate changes. In general, a portfolio of securities with a lower duration can be expected to be less sensitive to interest rate changes than a portfolio with a higher duration.
Maturity
5/31/16
| | |
| | % of | |
| | Market Value | |
| 0 to 1 Year | 2.1 | % |
| 4 to 5 Years | 97.9 | % |
1. Source: Morningstar.
The index is unmanaged and includes reinvestment of any income or distributions. It does not reflect any fees, expenses or sales charges. One cannot invest directly in an index, and an index is not representative of the Fund’s portfolio.
See www.franklintempletondatasources.com for additional data provider information.
The dollar value, number of shares or principal amount, and names of all portfolio holdings are listed in the Fund’s Statement of Investments (SOI). The SOI begins on page 47.
Annual Report
21
FRANKLIN PAYOUT 2020 FUND
| | |
| Top 10 Holdings* | | |
| 5/31/16 | | |
| | % of Total | |
| Issue/Issuer | Net Assets | |
| U.S. Treasury Note | 12.5 | % |
| Federal Home Loan Bank (FHLB) | 5.2 | % |
| AEGON Funding Co. LLC | 2.7 | % |
| Morgan Stanley | 2.7 | % |
| Hershey Co. | 2.7 | % |
| Emerson Electric Co. | 2.7 | % |
| Travelers Cos. Inc. | 2.6 | % |
| JPMorgan Chase & Co. | 2.6 | % |
| UnitedHealth Group Inc. | 2.6 | % |
| Pacific Gas & Electric Co. | 2.6 | % |
*Securities are listed by issuer, which may appear by another name in the SOI.
Manager’s Discussion
From a perspective of excess returns over U.S. Treasuries, many investment-grade corporate bonds underperformed for the reporting period. However, shorter duration and higher quality investment-grade sectors performed relatively well. U.S. agency securities generally produced positive excess returns over U.S. Treasuries, and asset-backed securities also outperformed. Over the period, yields on shorter maturity bonds rose, while yields on intermediate and longer maturity bonds declined.
During the period under review, the Fund’s modestly longer duration relative to the Barclays U.S. Government/Credit 2020 Maturity Index, resulting from slight maturity differences, contributed significantly to relative performance. The Fund’s allocation and security selection in the high yield corporate credit sector also contributed to relative performance. Relatively small allocations to non-U.S. issuers also helped performance. The Fund’s security selection within the investment-grade corporate credit sector detracted from relative performance, although the negative effect was partially offset by the positive effect of sector allocation. Security selection in U.S. agency securities detracted from performance, although the negative effect was partially offset by the positive effect of our overweighted sector position.
At period-end, we maintained an overweighting in the investment-grade corporate credit sector compared with the benchmark. We favored the sector based on our belief that its overall valuations will remain relatively attractive over the Fund’s expected life and that the sector offered relatively higher income potential. We also maintained an overweighted position in the agency sector due to our view of its incremental income advantage over U.S. Treasuries during the Fund’s expected life. Conversely, we remained underweighted in the U.S. Treasury sector due to the sector’s less attractive income opportunities. Finally, we maintained a modestly longer duration compared with the benchmark, driven largely by our focus on bonds with final maturity dates closer to the Fund’s predetermined maturity date.
Thank you for your participation in Franklin Payout 2020 Fund.
We look forward to serving your future investment needs.
The foregoing information reflects our analysis, opinions and portfolio holdings as of May 31, 2016, the end of the reporting period. The way we implement our main investment strategies and the resulting portfolio holdings may change depending on factors such as market and economic conditions. These opinions may not be relied upon as investment advice or an offer for a particular security. The information is not a complete analysis of every aspect of any market, country, industry, security or the Fund. Statements of fact are from sources considered reliable, but the investment manager makes no representation or warranty as to their completeness or accuracy. Although historical performance is no guarantee of future results, these insights may help you understand our investment management philosophy.
FRANKLIN PAYOUT 2020 FUND
Performance Summary as of May 31, 2016
Your dividend income will vary depending on dividends or interest paid by securities in the Fund’s portfolio, adjusted for operating expenses of each class. Capital gain distributions are net profits realized from the sale of portfolio securities. The performance table and graphs do not reflect any taxes that a shareholder would pay on Fund dividends, capital gain distributions, if any, or any realized gains on the sale of Fund shares. Total return reflects reinvestment of the Fund’s dividends and capital gain distributions, if any, and any unrealized gains or losses.
| | | | | |
| Net Asset Value | | | | | |
| |
| Share Class (Symbol) | | 5/31/16 | | 6/1/15 | Change |
| R6 (FPOGX) | $ | 10.17 | $ | 10.00 | +$0.17 |
| Advisor (FPOHX) | $ | 10.17 | $ | 10.00 | +$0.17 |
| | |
| Distributions1 (6/1/15–5/31/16) | | |
| |
| | | Dividend |
| Share Class | | Income |
| R6 | $ | 0.1369 |
| Advisor | $ | 0.1369 |
Performance2
Cumulative total return excludes sales charges. Average annual total returns include maximum sales charges. Class R6/Advisor Class: no sales charges.
| | | | | | | | | | |
| | | | | | Average Annual | | | | | |
| | Cumulative | | Average Annual | | Total Return | | Total Annual Operating Expenses6 | |
| Share Class | Total Return3 | | Total Return4 | | (6/30/16 | )5 | (with waiver) | | (without waiver) | |
| |
| R6 | | | | | | | 0.30 | % | 1.11 | % |
| 1-Year | — | | — | | +4.83 | % | | | | |
| Since Inception (6/1/15) | +3.10 | % | +3.10 | % | +4.37 | % | | | | |
| |
| Advisor | | | | | | | 0.44 | % | 1.25 | % |
| 1-Year | — | | — | | +4.83 | % | | | | |
| Since Inception (6/1/15) | +3.10 | % | +3.10 | % | +4.37 | % | | | | |
Performance data represent past performance, which does not guarantee future results. Investment return and principal value will fluctuate, and you may have a gain or loss when you sell your shares. Current performance may differ from figures shown. For most recent month-end performance, call a Franklin Templeton Institutional Services representative at (800) 321-8563.
See page 25 for Performance Summary footnotes.
Annual Report
23
FRANKLIN PAYOUT 2020 FUND
PERFORMANCE SUMMARY
Total Return Index Comparison for a Hypothetical $10,000 Investment2
Total return represents the change in value of an investment over the period shown. It includes any applicable maximum sales charge, Fund expenses, account fees and reinvested distributions. The unmanaged index includes reinvestment of any income or distributions. It differs from the Fund in composition and does not pay management fees or expenses. One cannot invest directly in an index.
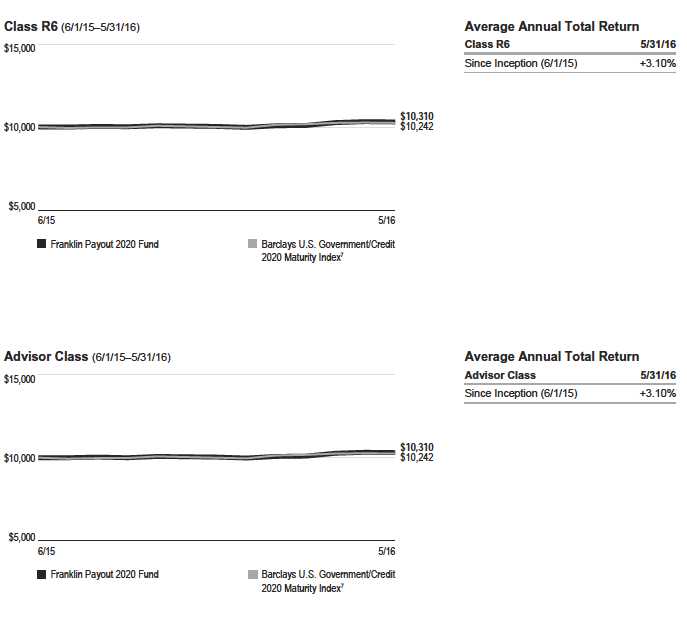
See page 25 for Performance Summary footnotes.
24 Annual Report
FRANKLIN PAYOUT 2020 FUND
PERFORMANCE SUMMARY
All investments involve risks, including possible loss of principal. Changes in the financial strength of a bond issuer or in a bond’s credit rating may affect its value. Interest rate movements will affect the Fund’s share price and yield. Bond prices generally move in the opposite direction of interest rates. As the prices of bonds in the Fund adjust to a rise in interest rates, the Fund’s share price may decline. Because the Fund can only distribute what it earns, the Fund’s distributions to shareholders may decline when prevailing interest rates fall or when the Fund experiences defaults on debt securities it holds. Interest earned on floating rate loans varies with changes in prevailing interest rates. Therefore, while floating rate loans offer higher interest income when interest rates rise, they will also generate less income when interest rates decline. The Fund is actively managed but there is no guarantee that the manager’s investment decisions will achieve the desired results. The Fund’s prospectus also includes a description of the main investment risks.
| |
| Class R6: | Shares are available to certain eligible investors as described in the prospectus. |
| Advisor Class: | Shares are available to certain eligible investors as described in the prospectus. |
1. The distribution amount is the sum of the dividend payments to shareholders for the period shown and includes only estimated tax-basis net investment income.
2. The Fund has an expense reduction contractually guaranteed through at least 9/30/16 and a fee waiver associated with any investment in a Franklin Templeton money fund
and/or other Franklin Templeton fund, as applicable, contractually guaranteed through at least the Fund’s current fiscal year-end. The transfer agent has contractually agreed
to cap transfer agency fees for Class R6 shares of the Fund so that transfer agency fees for that class do not exceed 0.01% until 9/30/16. Fund investment results reflect the
expense reduction, fee waiver and fee cap, to the extent applicable; without these reductions, the results would have been lower.
3. Cumulative total return represents the change in value of an investment over the period indicated.
4. Average annual total return represents the average annual change in value of an investment over the periods indicated. Return for less than one year, if any, has not
been annualized.
5. In accordance with SEC rules, we provide standardized average annual total return information through the latest calendar quarter.
6. Figures are as stated in the Fund’s current prospectus and may differ from the expense ratios disclosed in the Financial Highlights in this report. In periods of market
volatility, assets may decline significantly, causing total annual Fund operating expenses to become higher than the figures shown.
7. Source: Morningstar. The Barclays U.S. Government/Credit 2020 Maturity Index includes investment-grade, U.S. dollar-denominated, fixed-rate Treasuries, government-
related and corporate securities and foreign debt maturing in 2020.
See www.franklintempletondatasources.com for additional data provider information.
Annual Report
25
FRANKLIN PAYOUT 2020 FUND
Your Fund’s Expenses
As a Fund shareholder, you can incur two types of costs:
- Transaction costs, including sales charges (loads) on Fund purchases, if applicable; and
- Ongoing Fund costs, including management fees, distribution and service (12b-1) fees, and other Fund expenses. All mutual funds have ongoing costs, sometimes referred to as operating expenses.
The following table shows ongoing costs of investing in the Fund and can help you understand these costs and compare them with those of other mutual funds. The table assumes a $1,000 investment held for the six months indicated.
Actual Fund Expenses
The first line (Actual) for each share class listed in the table provides actual account values and expenses. The “Ending Account Value” is derived from the Fund’s actual return, which includes the effect of Fund expenses.
You can estimate the expenses you paid during the period by following these steps. Of course, your account value and expenses will differ from those in this illustration:
1. Divide your account value by $1,000.
If an account had an $8,600 value, then $8,600 ÷ $1,000 = 8.6.
2. Multiply the result by the number under the heading “Expenses Paid During Period.”
If Expenses Paid During Period were $7.50, then 8.6 × $7.50 = $64.50.
In this illustration, the estimated expenses paid this period are $64.50.
Hypothetical Example for Comparison with Other Funds
Information in the second line (Hypothetical) for each class in the table can help you compare ongoing costs of investing in the Fund with those of other mutual funds. This information may not be used to estimate the actual ending account balance or expenses you paid during the period. The hypothetical “Ending Account Value” is based on the actual expense ratio for each class and an assumed 5% annual rate of return before expenses, which does not represent the Fund’s actual return. The figure under the heading “Expenses Paid During Period” shows the hypothetical expenses your account would have incurred under this scenario. You can compare this figure with the 5% hypothetical examples that appear in shareholder reports of other funds.
Please note that expenses shown in the table are meant to highlight ongoing costs and do not reflect any transaction costs, such as sales charges. Therefore, the second line for each class is useful in comparing ongoing costs only, and will not help you compare total costs of owning different funds. In addition, if transaction costs were included, your total costs would have been higher. Please refer to the Fund prospectus for additional information on operating expenses.
| | | | | | |
| | | Beginning Account | | Ending Account | | Expenses Paid During |
| Share Class | | Value 12/1/15 | | Value 5/31/16 | | Period* 12/1/15–5/31/16 |
| R6 | | | | | | |
| Actual | $ | 1,000 | $ | 1,026.90 | $ | 1.47 |
| Hypothetical (5% return before expenses) | $ | 1,000 | $ | 1,023.55 | $ | 1.47 |
| Advisor | | | | | | |
| Actual | $ | 1,000 | $ | 1,026.90 | $ | 1.47 |
| Hypothetical (5% return before expenses) | $ | 1,000 | $ | 1,023.55 | $ | 1.47 |
*Expenses are calculated using the most recent six-month expense ratio, net of expense waivers, annualized for each class (R6: 0.29% and
Advisor: 0.29%), multiplied by the average account value over the period, multiplied by 183/366 to reflect the one-half year period.
Franklin Payout 2021 Fund
We are pleased to bring you this inaugural annual report for Franklin Payout 2021 Fund for the period since the Fund’s inception on June 1, 2015, through May 31, 2016.
Your Fund’s Goal and Main Investments
The Fund seeks capital preservation and income with a predetermined maturity date. Under normal market conditions, the Fund invests predominantly in U.S. investment-grade debt securities and investments, including government and corporate debt securities and asset-backed securities and municipal securities.
Performance Overview
The Fund’s Advisor Class shares delivered a +4.55% cumulative total return for the period ended May 31, 2016. In comparison, the Fund’s benchmark, the Barclays U.S. Government/Credit 2021 Maturity Index, generated a +3.34% total return.1 The index includes investment-grade, U.S. dollar-denominated, fixed-rate Treasuries, government-related and corporate securities and foreign debt maturing in 2021. You can find more of the Fund’s performance data in the Performance Summary beginning on page 29.
Performance data represent past performance, which does not guarantee future results. Investment return and principal value will fluctuate, and you may have a gain or loss when you sell your shares. Current performance may differ from figures shown. For most recent month-end performance, call a Franklin Templeton Institutional Services representative at (800) 321-8563.
Investment Strategy
We focus on investment-grade securities and investments or on unrated securities and investments we determine are of comparable quality. Our focus on the portfolio’s credit quality is intended to reduce credit risk and help to preserve capital. We may invest a portion of the Fund’s assets in U.S. dollar-denominated foreign securities, including debt issued by supranational entities. In choosing investments, we select securities in various market sectors based on our assessment of changing economic, market, industry and issuer conditions. We use a top-down analysis of broad economic trends, combined with a bottom-up fundamental analysis of market sectors, industries and issuers, to try to take advantage of varying sector reactions to economic events.
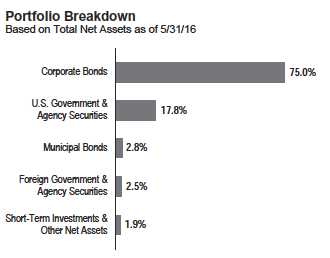
Although the Fund may invest in individual securities of any maturity, the Fund is a term fund and is managed to mature in 2021. Over time, the Fund’s duration and weighted average maturity will decline as 2021 approaches. In the later months of operation, when the debt securities held by the Fund mature, the proceeds from such securities will be held in cash, cash equivalents and money market instruments, including affiliated money market funds, or invested in short-term bonds. In early December 2021, the Fund is expected to consist almost entirely of cash, cash equivalents and money market instruments. The Fund is designed for investors who seek an investment with a payout schedule to help meet their retirement spending needs, particularly those who are nearing retirement or are in retirement. There is no guarantee the Fund will meet an investor’s retirement spending needs.
What is duration?
Duration is a measure of a bond’s price sensitivity to interest rate changes. In general, a portfolio of securities with a lower duration can be expected to be less sensitive to interest rate changes than a portfolio with a higher duration.
| | |
| Maturity | | |
| 5/31/16 | | |
| | % of | |
| | Market Value | |
| 0 to 1 Year | 1.3 | % |
| 5 to 6 Years | 98.7 | % |
1. Source: Morningstar.
The index is unmanaged and includes reinvestment of any income or distributions. It does not reflect any fees, expenses or sales charges. One cannot invest directly in an
index, and an index is not representative of the Fund’s portfolio.
See www.franklintempletondatasources.com for additional data provider information.
The dollar value, number of shares or principal amount, and names of all portfolio holdings are listed in the Fund’s Statement of Investments (SOI). The SOI begins on page 52.
Annual Report
27
FRANKLIN PAYOUT 2021 FUND
| | |
| Top 10 Holdings* | | |
| 5/31/16 | | |
| | % of Total | |
| Issue/Issuer | Net Assets | |
| U.S. Treasury Note | 7.9 | % |
| Federal Home Loan Bank (FHLB) | 5.1 | % |
| Federal Farm Credit Bank (FFCB) | 4.9 | % |
| California State General Obligation (GO) | 2.8 | % |
| Thomas & Betts Corp. | 2.7 | % |
| General Electric Co. | 2.7 | % |
| Telstra Corp. Ltd. | 2.7 | % |
| Gilead Sciences Inc. | 2.7 | % |
| Total Capital SA | 2.6 | % |
| Simon Property Group LP | 2.6 | % |
*Securities are listed by issuer, which may appear by another name in the SOI.
Manager’s Discussion
From a perspective of excess returns over U.S. Treasuries, many investment-grade corporate bonds underperformed for the reporting period. However, shorter duration and higher quality investment-grade sectors performed relatively well. U.S. agency securities generally produced positive excess returns over U.S. Treasuries, and asset-backed securities also outperformed. Over the period, yields on shorter maturity bonds rose, while yields on intermediate and longer maturity bonds declined.
During the period under review, the Fund’s modestly longer duration relative to the Barclays U.S. Government/Credit 2021 Maturity Index, resulting from slight maturity differences, contributed significantly to relative performance. Security selection in the investment-grade corporate credit sector also contributed to relative performance and more than offset the negative effect of an overweighted position in the sector. Additionally, the positive result of the Fund’s overweighted position in U.S. agency securities more than offset the negative effect of security selection within the sector. Relatively small allocations to taxable municipal bonds and non-U.S. issuers helped relative performance. The Fund’s exposure to the high yield corporate credit sector detracted from relative performance, although the negative effect was partially offset by the positive effect of security selection within the sector.
At period-end, we maintained an overweighting in the investment-grade corporate credit sector compared with the benchmark. We favored the sector based on our belief that its overall valuations will remain relatively attractive over the Fund’s expected life and that the sector offered relatively higher income potential. We also maintained an overweighted position in the agency sector due to our view of its incremental income advantage over U.S. Treasuries during the Fund’s expected life. Conversely, we remained underweighted in the U.S. Treasury sector due to the sector’s less attractive income opportunities. Finally, we maintained a modestly longer duration compared with the benchmark, driven largely by our focus on bonds with final maturity dates closer to the Fund’s predetermined maturity date.
Thank you for your participation in Franklin Payout 2021 Fund.
We look forward to serving your future investment needs.

The foregoing information reflects our analysis, opinions and portfolio holdings as of May 31, 2016, the end of the reporting period. The way we implement our main investment strategies and the resulting portfolio holdings may change depending on factors such as market and economic conditions. These opinions may not be relied upon as investment advice or an offer for a particular security. The information is not a complete analysis of every aspect of any market, country, industry, security or the Fund. Statements of fact are from sources considered reliable, but the investment manager makes no representation or warranty as to their completeness or accuracy. Although historical performance is no guarantee of future results, these insights may help you understand our investment management philosophy.
FRANKLIN PAYOUT 2021 FUND
Performance Summary as of May 31, 2016
Your dividend income will vary depending on dividends or interest paid by securities in the Fund’s portfolio, adjusted for operating expenses of each class. Capital gain distributions are net profits realized from the sale of portfolio securities. The performance table and graphs do not reflect any taxes that a shareholder would pay on Fund dividends, capital gain distributions, if any, or any realized gains on the sale of Fund shares. Total return reflects reinvestment of the Fund’s dividends and capital gain distributions, if any, and any unrealized gains or losses.
| | | | | |
| Net Asset Value | | | | | |
| |
| Share Class (Symbol) | | 5/31/16 | | 6/1/15 | Change |
| R6 (FPOMX) | $ | 10.30 | $ | 10.00 | +$0.30 |
| Advisor (FPOJX) | $ | 10.30 | $ | 10.00 | +$0.30 |
| | |
| Distributions1 (6/1/15–5/31/16) | | |
| |
| | | Dividend |
| Share Class | | Income |
| R6 | $ | 0.1493 |
| Advisor | $ | 0.1493 |
Performance2
Cumulative total return excludes sales charges. Average annual total returns include maximum sales charges. Class R6/Advisor Class: no sales charges.
| | | | | | | | | | |
| | | | | | Average Annual | | | | | |
| | Cumulative | | Average Annual | | Total Return | | Total Annual Operating Expenses6 | |
| Share Class | Total Return3 | | Total Return4 | | (6/30/16 | )5 | (with waiver) | | (without waiver) | |
| |
| R6 | | | | | | | 0.30 | % | 1.11 | % |
| 1-Year | — | | — | | +6.69 | % | | | | |
| Since Inception (6/1/15) | +4.55 | % | +4.55 | % | +5.98 | % | | | | |
| |
| Advisor | | | | | | | 0.44 | % | 1.25 | % |
| 1-Year | — | | — | | +6.69 | % | | | | |
| Since Inception (6/1/15) | +4.55 | % | +4.55 | % | +5.98 | % | | | | |
Performance data represent past performance, which does not guarantee future results. Investment return and principal value will fluctuate, and you may have a gain or loss when you sell your shares. Current performance may differ from figures shown. For most recent month-end performance, call a Franklin Templeton Institutional Services representative at (800) 321-8563.
See page 31 for Performance Summary footnotes.
Annual Report
29
FRANKLIN PAYOUT 2021 FUND
PERFORMANCE SUMMARY
Total Return Index Comparison for a Hypothetical $10,000 Investment2
Total return represents the change in value of an investment over the period shown. It includes any applicable maximum sales charge, Fund expenses, account fees and reinvested distributions. The unmanaged index includes reinvestment of any income or distributions. It differs from the Fund in composition and does not pay management fees or expenses. One cannot invest directly in an index.
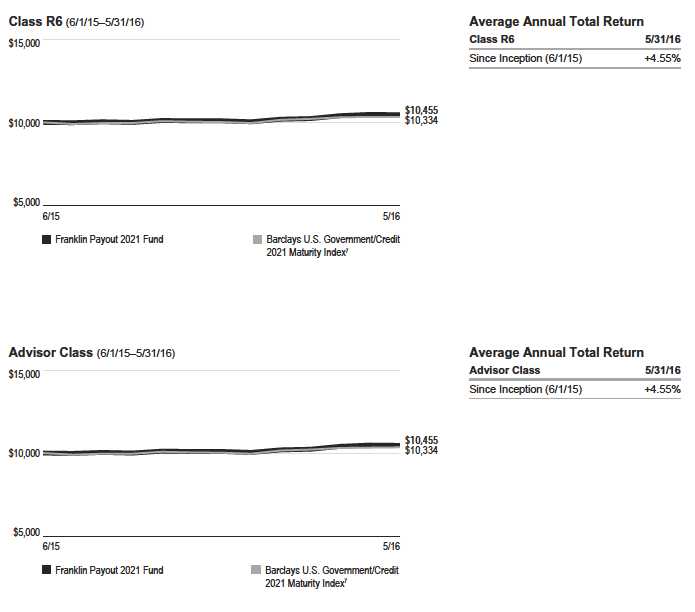
See page 31 for Performance Summary footnotes.
FRANKLIN PAYOUT 2021 FUND
PERFORMANCE SUMMARY
All investments involve risks, including possible loss of principal. Changes in the financial strength of a bond issuer or in a bond’s credit rating may affect its value. Interest rate movements will affect the Fund’s share price and yield. Bond prices generally move in the opposite direction of interest rates. As the prices of bonds in the Fund adjust to a rise in interest rates, the Fund’s share price may decline. Because the Fund can only distribute what it earns, the Fund’s distributions to shareholders may decline when prevailing interest rates fall or when the Fund experiences defaults on debt securities it holds. Interest earned on floating rate loans varies with changes in prevailing interest rates. Therefore, while floating rate loans offer higher interest income when interest rates rise, they will also generate less income when interest rates decline. The Fund is actively managed but there is no guarantee that the manager’s investment decisions will achieve the desired results. The Fund’s prospectus also includes a description of the main investment risks.
| |
| Class R6: | Shares are available to certain eligible investors as described in the prospectus. |
| Advisor Class: | Shares are available to certain eligible investors as described in the prospectus. |
1. The distribution amount is the sum of the dividend payments to shareholders for the period shown and includes only estimated tax-basis net investment income.
2. The Fund has an expense reduction contractually guaranteed through at least 9/30/16 and a fee waiver associated with any investment in a Franklin Templeton money fund
and/or other Franklin Templeton fund, as applicable, contractually guaranteed through at least the Fund’s current fiscal year-end. The transfer agent has contractually agreed
to cap transfer agency fees for Class R6 shares of the Fund so that transfer agency fees for that class do not exceed 0.01% until 9/30/16. Fund investment results reflect the
expense reduction, fee waiver and fee cap, to the extent applicable; without these reductions, the results would have been lower.
3. Cumulative total return represents the change in value of an investment over the periods indicated.
4. Average annual total return represents the average annual change in value of an investment over the periods indicated. Return for less than one year, if any, has not
been annualized.
5. In accordance with SEC rules, we provide standardized average annual total return information through the latest calendar quarter.
6. Figures are as stated in the Fund’s current prospectus and may differ from the expense ratios disclosed in the Financial Highlights in this report. In periods of market vola-
tility, assets may decline significantly, causing total annual Fund operating expenses to become higher than the figures shown.
7. Source: Morningstar. The Barclays U.S. Government/Credit 2021 Maturity Index includes investment-grade, U.S. dollar-denominated, fixed-rate Treasuries, government-
related and corporate securities and foreign debt maturing in 2021.
See www.franklintempletondatasources.com for additional data provider information.
Annual Report
31
FRANKLIN PAYOUT 2021 FUND
Your Fund’s Expenses
As a Fund shareholder, you can incur two types of costs:
- Transaction costs, including sales charges (loads) on Fund purchases, if applicable; and
- Ongoing Fund costs, including management fees, distribution and service (12b-1) fees, and other Fund expenses. All mutual funds have ongoing costs, sometimes referred to as operating expenses.
The following table shows ongoing costs of investing in the Fund and can help you understand these costs and compare them with those of other mutual funds. The table assumes a $1,000 investment held for the six months indicated.
Actual Fund Expenses
The first line (Actual) for each share class listed in the table provides actual account values and expenses. The “Ending Account Value” is derived from the Fund’s actual return, which includes the effect of Fund expenses.
You can estimate the expenses you paid during the period by following these steps. Of course, your account value and expenses will differ from those in this illustration:
1. Divide your account value by $1,000.
If an account had an $8,600 value, then $8,600 ÷ $1,000 = 8.6.
2. Multiply the result by the number under the heading “Expenses Paid During Period.”
If Expenses Paid During Period were $7.50, then 8.6 × $7.50 = $64.50.
In this illustration, the estimated expenses paid this period are $64.50.
Hypothetical Example for Comparison with Other Funds
Information in the second line (Hypothetical) for each class in the table can help you compare ongoing costs of investing in the Fund with those of other mutual funds. This information may not be used to estimate the actual ending account balance or expenses you paid during the period. The hypothetical “Ending Account Value” is based on the actual expense ratio for each class and an assumed 5% annual rate of return before expenses, which does not represent the Fund’s actual return. The figure under the heading “Expenses Paid During Period” shows the hypothetical expenses your account would have incurred under this scenario. You can compare this figure with the 5% hypothetical examples that appear in shareholder reports of other funds.
Please note that expenses shown in the table are meant to highlight ongoing costs and do not reflect any transaction costs, such as sales charges. Therefore, the second line for each class is useful in comparing ongoing costs only, and will not help you compare total costs of owning different funds. In addition, if transaction costs were included, your total costs would have been higher. Please refer to the Fund prospectus for additional information on operating expenses.
| | | | | | |
| | | Beginning Account | | Ending Account | | Expenses Paid During |
| Share Class | | Value 12/1/15 | | Value 5/31/16 | | Period* 12/1/15–5/31/16 |
| R6 | | | | | | |
| Actual | $ | 1,000 | $ | 1,036.10 | $ | 1.48 |
| Hypothetical (5% return before expenses) | $ | 1,000 | $ | 1,023.55 | $ | 1.47 |
| Advisor | | | | | | |
| Actual | $ | 1,000 | $ | 1,036.10 | $ | 1.48 |
| Hypothetical (5% return before expenses) | $ | 1,000 | $ | 1,023.55 | $ | 1.47 |
*Expenses are calculated using the most recent six-month expense ratio, net of expense waivers, annualized for each class (R6: 0.29% and
Advisor: 0.29%), multiplied by the average account value over the period, multiplied by 183/366 to reflect the one-half year period.
FRANKLIN FUND ALLOCATOR SERIES
| | | |
| Financial Highlights | | | |
| Franklin Payout 2017 Fund | | | |
| | | Year Ended | |
| | | May 31, 2016a | |
| Class R6 | | | |
| Per share operating performance | | | |
| (for a share outstanding throughout the year) | | | |
| Net asset value, beginning of year | $ | 10.00 | |
| Income from investment operationsb: | | | |
| Net investment incomec | | 0.11 | |
| Net realized and unrealized gains (losses) | | —d | |
| Total from investment operations | | 0.11 | |
| Less distributions from net investment income | | (0.08 | ) |
| Net asset value, end of year | $ | 10.03 | |
| |
| Total return | | 1.10 | % |
| |
| Ratios to average net assets | | | |
| Expenses before waiver and payments by affiliates | | 4.11 | % |
| Expenses net of waiver and payments by affiliates | | 0.29 | % |
| Net investment income | | 1.12 | % |
| |
| Supplemental data | | | |
| Net assets, end of year (000’s) | $ | 1,770 | |
| Portfolio turnover rate | | 4.47 | % |
aFor the year June 1, 2015 (commencement of operations) to May 31, 2016.
bThe amount shown for a share outstanding throughout the period may not correlate with the Statement of Operations for the period due to the timing of sales and repurchases
of the Fund’s shares in relation to income earned and/or fluctuating fair value of the investments of the Fund.
cBased on average daily shares outstanding.
dAmount rounds to less than $0.01 per share.
The accompanying notes are an integral part of these financial statements. | Annual Report 33
FRANKLIN FUND ALLOCATOR SERIES
FINANCIAL H IGHLIGHTS
| | | |
| Franklin Payout 2017 Fund (continued) | | | |
| | | Year Ended | |
| | | May 31, 2016a | |
| Advisor Class | | | |
| Per share operating performance | | | |
| (for a share outstanding throughout the year) | | | |
| Net asset value, beginning of year | $ | 10.00 | |
| Income from investment operationsb: | | | |
| Net investment incomec | | 0.11 | |
| Net realized and unrealized gains (losses) | | —d | |
| Total from investment operations | | 0.11 | |
| Less distributions from net investment income | | (0.08 | ) |
| Net asset value, end of year | $ | 10.03 | |
| |
| Total return | | 1.10 | % |
| |
| Ratios to average net assets | | | |
| Expenses before waiver and payments by affiliates | | 4.11 | % |
| Expenses net of waiver and payments by affiliates | | 0.29 | % |
| Net investment income | | 1.12 | % |
| |
| Supplemental data | | | |
| Net assets, end of year (000’s) | $ | 1,770 | |
| Portfolio turnover rate | | 4.47 | % |
aFor the year June 1, 2015 (commencement of operations) to May 31, 2016.
bThe amount shown for a share outstanding throughout the period may not correlate with the Statement of Operations for the period due to the timing of sales and repurchases
of the Fund’s shares in relation to income earned and/or fluctuating fair value of the investments of the Fund.
cBased on average daily shares outstanding.
dAmount rounds to less than $0.01 per share.
34 Annual Report | The accompanying notes are an integral part of these financial statements.
FRANKLIN FUND ALLOCATOR SERIES
| | | | |
| Statement of Investments, May 31, 2016 | | | | |
| Franklin Payout 2017 Fund | | | | |
| | | Principal | | |
| | Country | Amount* | | Value |
| Corporate Bonds 78.5% | | | | |
| Automobiles & Components 1.4% | | | | |
| a Hyundai Capital America, senior note, 144A, 2.125%, 10/02/17 | United States | 50,000 | $ | 50,259 |
| Banks 14.5% | | | | |
| Bank of America Corp., senior note, 6.40%, 8/28/17 | United States | 100,000 | | 105,890 |
| Bank of Nova Scotia, senior note, 1.375%, 12/18/17 | Canada | 100,000 | | 100,079 |
| HSBC USA Inc., senior note, 1.50%, 11/13/17 | United States | 100,000 | | 99,940 |
| Royal Bank of Canada, secured note, 1.20%, 9/19/17 | Canada | 100,000 | | 99,884 |
| Wells Fargo & Co., senior note, 5.625%, 12/11/17 | United States | 100,000 | | 106,314 |
| | | | | 512,107 |
| Capital Goods 4.4% | | | | |
| General Dynamics Corp., senior note, 1.00%, 11/15/17 | United States | 50,000 | | 49,995 |
| General Electric Co., senior note, 5.25%, 12/06/17 | United States | 100,000 | | 106,294 |
| | | | | 156,289 |
| Consumer Services 1.4% | | | | |
| Carnival Corp., senior note, 1.875%, 12/15/17 | United States | 50,000 | | 50,328 |
| Diversified Financials 9.0% | | | | |
| The Bear Stearns Cos. LLC, senior note, 6.40%, 10/02/17 | United States | 100,000 | | 106,372 |
| The Goldman Sachs Group Inc., senior note, 6.25%, 9/01/17 | United States | 100,000 | | 105,599 |
| Morgan Stanley, senior note, 5.95%, 12/28/17 | United States | 100,000 | | 106,418 |
| | | | | 318,389 |
| Energy 10.3% | | | | |
| Anadarko Petroleum Corp., senior note, 6.375%, 9/15/17 | United States | 7,000 | | 7,368 |
| EOG Resources Inc., senior note, 5.875%, 9/15/17 | United States | 100,000 | | 105,454 |
| Kinder Morgan Inc., senior note, 7.00%, 6/15/17 | United States | 50,000 | | 52,202 |
| National Oilwell Varco Inc., senior note, 1.35%, 12/01/17 | United States | 100,000 | | 98,865 |
| Statoil ASA, senior note, 1.25%, 11/09/17 | Norway | 100,000 | | 99,975 |
| | | | | 363,864 |
| Food & Staples Retailing 1.4% | | | | |
| Walgreens Boots Alliance Inc., senior note, 1.75%, 11/17/17 | United States | 50,000 | | 50,235 |
| Food, Beverage & Tobacco 1.4% | | | | |
| Bunge Ltd. Finance Corp., senior note, 3.20%, 6/15/17 | United States | 50,000 | | 50,670 |
| Health Care Equipment & Services 4.3% | | | | |
| Aetna Inc., senior note, 1.50%, 11/15/17 | United States | 100,000 | | 100,026 |
| Becton Dickinson and Co., senior note, 1.80%, 12/15/17 | United States | 50,000 | | 50,225 |
| | | | | 150,251 |
| Insurance 4.4% | | | | |
| Metlife Inc., senior note, 1.903%, 12/15/17 | United States | 100,000 | | 100,774 |
| Prudential Financial Inc., senior note, 6.00%, 12/01/17 | United States | 50,000 | | 53,078 |
| | | | | 153,852 |
| Materials 5.8% | | | | |
| Ecolab Inc., senior note, 1.45%, 12/08/17 | United States | 50,000 | | 50,031 |
| Potash Corp. of Saskatchewan Inc., senior note, 3.25%, 12/01/17 | Canada | 100,000 | | 102,490 |
| Rohm & Haas Co., senior bond, 6.00%, 9/15/17 | United States | 50,000 | | 52,760 |
| | | | | 205,281 |
| Media 3.0% | | | | |
| Time Warner Cos. Inc., senior bond, 7.25%, 10/15/17 | United States | 50,000 | | 53,764 |
Annual Report
35
FRANKLIN FUND ALLOCATOR SERIES
STATEMENT O F INVESTMENTS
| | | | |
| Franklin Payout 2017 Fund (continued) | | | | |
| |
| | | Principal | | |
| | Country | Amount* | | Value |
| Corporate Bonds (continued) | | | | |
| Media (continued) | | | | |
| Viacom Inc., senior note, 6.125%, 10/05/17 | United States | 50,000 | $ | 52,645 |
| | | | | 106,409 |
| Pharmaceuticals, Biotechnology & Life Sciences 1.4% | | | | |
| AbbVie Inc., senior note, 1.75%, 11/06/17 | United States | 50,000 | | 50,124 |
| Semiconductors & Semiconductor Equipment 2.8% | | | | |
| Intel Corp., senior note, 1.35%, 12/15/17 | United States | 100,000 | | 100,297 |
| Software & Services 1.4% | | | | |
| Autodesk Inc., senior note, 1.95%, 12/15/17 | United States | 50,000 | | 50,026 |
| Telecommunication Services 4.2% | | | | |
| AT&T Inc., senior note, 1.40%, 12/01/17 | United States | 50,000 | | 50,001 |
| Verizon Communications Inc., senior note, 1.10%, 11/01/17 | United States | 100,000 | | 99,753 |
| | | | | 149,754 |
| Utilities 7.4% | | | | |
| American Electric Power Co. Inc., senior note, 1.65%, 12/15/17 | United States | 50,000 | | 50,004 |
| CenterPoint Energy Resources Corp., senior note, 6.125%, 11/01/17 | United States | 50,000 | | 52,664 |
| Pacific Gas & Electric Co., senior note, 5.625%, 11/30/17 | United States | 100,000 | | 106,189 |
| TECO Finance Inc., senior note, 6.572%, 11/01/17 | United States | 50,000 | | 53,046 |
| | | | | 261,903 |
| Total Corporate Bonds (Cost $2,780,355) | | | | 2,780,038 |
| U.S. Government and Agency Securities 13.7% | | | | |
| FHLB, | | | | |
| 1.125%, 12/08/17 | United States | 150,000 | | 150,596 |
| 3.125%, 12/08/17 | United States | 155,000 | | 160,135 |
| FNMA, 0.875%, 12/20/17 | United States | 175,000 | | 174,992 |
| Total U.S. Government and Agency Securities (Cost $485,452) | | | | 485,723 |
| Asset-Backed Securities (Cost $100,320) 2.9% | | | | |
| Diversified Financials 2.9% | | | | |
| Discover Card Execution Note Trust, 2014-A5, A, 1.39%, 4/15/20 | United States | 100,000 | | 100,432 |
| Municipal Bonds (Cost $50,000) 1.4% | | | | |
| Jersey City GO, Hudson County, Qualified Public Improvement, Refunding, Series A, | | | | |
| 1.829%, 9/01/17 | United States | 50,000 | | 50,152 |
| Total Investments before Short Term Investments | | | | |
| (Cost $3,416,127) | | | | 3,416,345 |
| |
| | | Shares | | |
| Short Term Investments (Cost $91,374) 2.6% | | | | |
| Money Market Funds 2.6% | | | | |
| b,c Institutional Fiduciary Trust Money Market Portfolio | United States | 91,374 | | 91,374 |
| Total Investments (Cost $3,507,501) 99.1% | | | | 3,507,719 |
| Other Assets, less Liabilities 0.9% | | | | 32,318 |
| Net Assets 100.0% | | | $ | 3,540,037 |
See Abbreviations on page 68.
*The principal amount is stated in U.S. dollars unless otherwise indicated.
aSecurity was purchased pursuant to Rule 144A under the Securities Act of 1933 and may be sold in transactions exempt from registration only to qualified institutional buyers
or in a public offering registered under the Securities Act of 1933. This security has been deemed liquid under guidelines approved by the Trust’s Board of Trustees.
bNon-income producing.
cSee Note 3(d) regarding investments in affiliated management investment companies.
36 Annual Report | The accompanying notes are an integral part of these financial statements.
FRANKLIN FUND ALLOCATOR SERIES
| | | |
| Financial Highlights | | | |
| Franklin Payout 2018 Fund | | | |
| | | Year Ended | |
| | | May 31, 2016a | |
| Class R6 | | | |
| Per share operating performance | | | |
| (for a share outstanding throughout the year) | | | |
| Net asset value, beginning of year | $ | 10.00 | |
| Income from investment operationsb: | | | |
| Net investment incomec | | 0.14 | |
| Net realized and unrealized gains (losses) | | 0.04 | |
| Total from investment operations | | 0.18 | |
| Less distributions from net investment income | | (0.10 | ) |
| Net asset value, end of year | $ | 10.08 | |
| |
| Total return | | 1.78 | % |
| |
| Ratios to average net assets | | | |
| Expenses before waiver and payments by affiliates | | 4.03 | % |
| Expenses net of waiver and payments by affiliates | | 0.29 | % |
| Net investment income | | 1.39 | % |
| |
| Supplemental data | | | |
| Net assets, end of year (000’s) | $ | 1,781 | |
| Portfolio turnover rate | | 2.97 | % |
aFor the year June 1, 2015 (commencement of operations) to May 31, 2016.
bThe amount shown for a share outstanding throughout the period may not correlate with the Statement of Operations for the period due to the timing of sales and repurchases
of the Fund’s shares in relation to income earned and/or fluctuating fair value of the investments of the Fund.
cBased on average daily shares outstanding.
The accompanying notes are an integral part of these financial statements. | Annual Report 37
FRANKLIN FUND ALLOCATOR SERIES
FINANCIAL H IGHLIGHTS
| | | |
| Franklin Payout 2018 Fund (continued) | | | |
| | | Year Ended | |
| | | May 31, 2016a | |
| Advisor Class | | | |
| Per share operating performance | | | |
| (for a share outstanding throughout the year) | | | |
| Net asset value, beginning of year | $ | 10.00 | |
| Income from investment operationsb: | | | |
| Net investment incomec | | 0.14 | |
| Net realized and unrealized gains (losses) | | 0.04 | |
| Total from investment operations | | 0.18 | |
| Less distributions from net investment income | | (0.10 | ) |
| Net asset value, end of year | $ | 10.08 | |
| |
| Total return | | 1.78 | % |
| |
| Ratios to average net assets | | | |
| Expenses before waiver and payments by affiliates | | 4.03 | % |
| Expenses net of waiver and payments by affiliates | | 0.29 | % |
| Net investment income | | 1.39 | % |
| |
| Supplemental data | | | |
| Net assets, end of year (000’s) | $ | 1,781 | |
| Portfolio turnover rate | | 2.97 | % |
aFor the year June 1, 2015 (commencement of operations) to May 31, 2016.
bThe amount shown for a share outstanding throughout the period may not correlate with the Statement of Operations for the period due to the timing of sales and repurchases
of the Fund’s shares in relation to income earned and/or fluctuating fair value of the investments of the Fund.
cBased on average daily shares outstanding.
38 Annual Report | The accompanying notes are an integral part of these financial statements.
FRANKLIN FUND ALLOCATOR SERIES
| | | | |
| Statement of Investments, May 31, 2016 | | | | |
| Franklin Payout 2018 Fund | | | | |
| | | Principal | | |
| | Country | Amount* | | Value |
| Corporate Bonds 80.8% | | | | |
| Automobiles & Components 2.8% | | | | |
| Toyota Motor Credit Corp., senior note, 2.00%, 10/24/18 | United States | 100,000 | $ | 101,430 |
| Banks 20.3% | | | | |
| Bank of America Corp., senior note, 6.875%, 11/15/18 | United States | 100,000 | | 111,583 |
| Bank of Nova Scotia, senior note, 2.05%, 10/30/18 | Canada | 100,000 | | 101,408 |
| BNP Paribas SA, senior note, 2.40%, 12/12/18 | France | 100,000 | | 101,621 |
| Citigroup Inc., senior note, 2.50%, 9/26/18 | United States | 100,000 | | 101,569 |
| HSBC USA Inc., senior note, 2.625%, 9/24/18 | United States | 100,000 | | 101,776 |
| KeyCorp., senior note, 2.30%, 12/13/18 | United States | 50,000 | | 50,480 |
| Royal Bank of Canada, secured note, 2.00%, 10/01/18 | Canada | 100,000 | | 100,740 |
| Suntrust Banks Inc., senior note, 2.35%, 11/01/18 | United States | 50,000 | | 50,608 |
| | | | | 719,785 |
| Capital Goods 9.2% | | | | |
| Caterpillar Inc., senior note, 7.90%, 12/15/18 | United States | 100,000 | | 115,752 |
| John Deere Capital Corp., senior note, 1.95%, 12/13/18 | United States | 100,000 | | 101,438 |
| Raytheon Co., senior bond, 6.40%, 12/15/18 | United States | 100,000 | | 112,280 |
| | | | | 329,470 |
| Consumer Services 2.9% | | | | |
| Starbucks Corp., senior note, 2.00%, 12/05/18 | United States | 100,000 | | 101,849 |
| Diversified Financials 2.8% | | | | |
| Morgan Stanley, senior note, 2.20%, 12/07/18 | United States | 100,000 | | 100,889 |
| Energy 11.4% | | | | |
| Apache Corp., senior note, 6.90%, 9/15/18 | United States | 50,000 | | 54,331 |
| Devon Energy Corp., senior note, 2.25%, 12/15/18 | United States | 50,000 | | 48,022 |
| Oneok Partners LP, senior note, 3.20%, 9/15/18 | United States | 50,000 | | 50,188 |
| Shell International Finance BV, senior note, 2.00%, 11/15/18 | Netherlands | 100,000 | | 101,128 |
| Spectra Energy Partners LP, senior note, 2.95%, 9/25/18 | United States | 50,000 | | 50,679 |
| Statoil ASA, senior note, 1.95%, 11/08/18 | Norway | 100,000 | | 100,722 |
| | | | | 405,070 |
| Food & Staples Retailing 3.0% | | | | |
| CVS Health Corp., senior note, 2.25%, 12/05/18 | United States | 50,000 | | 50,841 |
| Kroger Co., senior bond, 6.80%, 12/15/18 | United States | 50,000 | | 56,205 |
| | | | | 107,046 |
| Food, Beverage & Tobacco 7.8% | | | | |
| Altria Group Inc., senior note, 9.70%, 11/10/18 | United States | 50,000 | | 59,482 |
| The Coca-Cola Co., senior note, 1.65%, 11/01/18 | United States | 100,000 | | 101,276 |
| PepsiCo Inc., senior bond, 7.90%, 11/01/18 | United States | 100,000 | | 115,606 |
| | | | | 276,364 |
| Health Care Equipment & Services 2.9% | | | | |
| Boston Scientific Corp., senior note, 2.65%, 10/01/18 | United States | 50,000 | | 50,921 |
| Laboratory Corp. of America Holdings, senior note, 2.50%, 11/01/18 | United States | 50,000 | | 50,514 |
| | | | | 101,435 |
| Materials 2.8% | | | | |
| Monsanto Co., senior note, 1.85%, 11/15/18 | United States | 50,000 | | 50,126 |
| Praxair Inc., senior note, 1.25%, 11/07/18 | United States | 50,000 | | 49,953 |
| | | | | 100,079 |
Annual Report
39
FRANKLIN FUND ALLOCATOR SERIES
STATEMENT O F INVESTMENTS
| | | | |
| Franklin Payout 2018 Fund (continued) | | | | |
| | | Principal | | |
| | Country | Amount* | | Value |
| Corporate Bonds (continued) | | | | |
| Pharmaceuticals, Biotechnology & Life Sciences 1.4% | | | | |
| Abbvie Inc., senior note, 2.00%, 11/06/18 | United States | 50,000 | $ | 50,149 |
| Real Estate 1.5% | | | | |
| Boston Properties LP, senior note, 3.70%, 11/15/18 | United States | 50,000 | | 52,237 |
| Semiconductors & Semiconductor Equipment 1.4% | | | | |
| Maxim Integrated Products Inc., senior note, 2.50%, 11/15/18 | United States | 50,000 | | 50,494 |
| Technology Hardware & Equipment 1.4% | | | | |
| Tyco Electronics Group SA, senior note, 2.375%, 12/17/18 | Switzerland | 50,000 | | 50,450 |
| Telecommunication Services 1.4% | | | | |
| AT&T Inc., senior note, 2.375%, 11/27/18 | United States | 50,000 | | 50,814 |
| Utilities 7.8% | | | | |
| Berkshire Hathaway Energy Co., senior note, 2.00%, 11/15/18 | United States | 50,000 | | 50,592 |
| Duke Energy Carolinas LLC, secured note, 7.00%, 11/15/18 | United States | 100,000 | | 113,326 |
| Pacific Gas & Electric Co., senior note, 8.25%, 10/15/18 | United States | 100,000 | | 115,279 |
| | | | | 279,197 |
| Total Corporate Bonds (Cost $2,867,390) | | | | 2,876,758 |
| U.S. Government and Agency Securities 17.4% | | | | |
| FHLB, 3.75%, 12/14/18 | United States | 125,000 | | 133,501 |
| FNMA, 1.625%, 11/27/18 | United States | 175,000 | | 177,659 |
| U.S. Treasury Note, | | | | |
| 1.375%, 12/31/18 | United States | 130,000 | | 131,326 |
| 1.50%, 12/31/18 | United States | 175,000 | | 177,365 |
| Total U.S. Government and Agency Securities (Cost $615,823) | | | | 619,851 |
| Total Investments before Short Term Investments | | | | |
| (Cost $3,483,213) | | | | 3,496,609 |
| |
| | | Shares | | |
| Short Term Investments (Cost $39,351) 1.1% | | | | |
| Money Market Funds 1.1% | | | | |
| a,b Institutional Fiduciary Trust Money Market Portfolio | United States | 39,351 | | 39,351 |
| Total Investments (Cost $3,522,564) 99.3% | | | | 3,535,960 |
| Other Assets, less Liabilities 0.7% | | | | 26,122 |
| Net Assets 100.0% | | | $ | 3,562,082 |
See Abbreviations on page 68.
*The principal amount is stated in U.S. dollars unless otherwise indicated.
aNon-income producing.
bSee Note 3(d) regarding investments in affiliated management investment companies.
40 Annual Report | The accompanying notes are an integral part of these financial statements.
FRANKLIN FUND ALLOCATOR SERIES
| | | |
| Financial Highlights | | | |
| Franklin Payout 2019 Fund | | | |
| | | Year Ended | |
| | | May 31, 2016a | |
| Class R6 | | | |
| Per share operating performance | | | |
| (for a share outstanding throughout the year) | | | |
| Net asset value, beginning of year | $ | 10.00 | |
| Income from investment operationsb: | | | |
| Net investment incomec | | 0.18 | |
| Net realized and unrealized gains (losses) | | 0.10 | |
| Total from investment operations | | 0.28 | |
| Less distributions from net investment income | | (0.12 | ) |
| Net asset value, end of year | $ | 10.16 | |
| |
| Total return | | 2.85 | % |
| |
| Ratios to average net assets | | | |
| Expenses before waiver and payments by affiliates | | 3.57 | % |
| Expenses net of waiver and payments by affiliates | | 0.29 | % |
| Net investment income | | 1.80 | % |
| |
| Supplemental data | | | |
| Net assets, end of year (000’s) | $ | 2,057 | |
| Portfolio turnover rate | | —%d | |
aFor the year June 1, 2015 (commencement of operations) to May 31, 2016.
bThe amount shown for a share outstanding throughout the period may not correlate with the Statement of Operations for the period due to the timing of sales and repurchases
of the Fund’s shares in relation to income earned and/or fluctuating fair value of the investments of the Fund.
cBased on average daily shares outstanding.
dRounds to less than 0.01%
The accompanying notes are an integral part of these financial statements. | Annual Report 41
FRANKLIN FUND ALLOCATOR SERIES
FINANCIAL H IGHLIGHTS
| | | |
| Franklin Payout 2019 Fund (continued) | | | |
| | | Year Ended | |
| | | May 31, 2016a | |
| Advisor Class | | | |
| Per share operating performance | | | |
| (for a share outstanding throughout the year) | | | |
| Net asset value, beginning of year | $ | 10.00 | |
| Income from investment operationsb: | | | |
| Net investment incomec | | 0.18 | |
| Net realized and unrealized gains (losses) | | 0.10 | |
| Total from investment operations | | 0.28 | |
| Less distributions from net investment income | | (0.12 | ) |
| Net asset value, end of year | $ | 10.16 | |
| |
| Total return | | 2.85 | % |
| |
| Ratios to average net assets | | | |
| Expenses before waiver and payments by affiliates | | 3.57 | % |
| Expenses net of waiver and payments by affiliates | | 0.29 | % |
| Net investment income | | 1.80 | % |
| |
| Supplemental data | | | |
| Net assets, end of year (000’s) | $ | 2,057 | |
| Portfolio turnover rate | | —%d | |
aFor the year June 1, 2015 (commencement of operations) to May 31, 2016.
bThe amount shown for a share outstanding throughout the period may not correlate with the Statement of Operations for the period due to the timing of sales and repurchases
of the Fund’s shares in relation to income earned and/or fluctuating fair value of the investments of the Fund.
cBased on average daily shares outstanding.
dRounds to less than 0.01%
42 Annual Report | The accompanying notes are an integral part of these financial statements.
FRANKLIN FUND ALLOCATOR SERIES
| | | | |
| Statement of Investments, May 31, 2016 | | | | |
| Franklin Payout 2019 Fund | | | | |
| | | Principal | | |
| | Country | Amount* | | Value |
| Corporate Bonds 80.3% | | | | |
| Banks 15.0% | | | | |
| Bank of Nova Scotia, secured note, 2.125%, 9/11/19 | Canada | 100,000 | $ | 101,269 |
| HSBC USA Inc., senior note, 2.375%, 11/13/19 | United States | 100,000 | | 100,716 |
| JPMorgan Chase & Co., senior note, 2.20%, 10/22/19 | United States | 100,000 | | 100,692 |
| Royal Bank of Canada, secured note, 2.20%, 9/23/19 | Canada | 100,000 | | 101,820 |
| The Toronto-Dominion Bank, senior note, 2.25%, 11/05/19 | Canada | 100,000 | | 101,713 |
| Westpac Banking Corp., senior note, 4.875%, 11/19/19 | Australia | 100,000 | | 109,756 |
| | | | | 615,966 |
| Capital Goods 15.7% | | | | |
| Boeing Capital Corp., senior note, 4.70%, 10/27/19 | United States | 100,000 | | 110,562 |
| Caterpillar Financial Services Corp., senior note, 2.25%, 12/01/19 | United States | 100,000 | | 102,017 |
| Deere & Co., senior note, 4.375%, 10/16/19 | United States | 100,000 | | 109,947 |
| Emerson Electric Co., senior bond, 4.875%, 10/15/19 | United States | 100,000 | | 110,706 |
| General Electric Co., senior secured note, first lien, 2.10%, 12/11/19 | United States | 100,000 | | 102,270 |
| Lockheed Martin Corp., senior note, 4.25%, 11/15/19 | United States | 100,000 | | 108,998 |
| | | | | 644,500 |
| Commercial & Professional Services 1.3% | | | | |
| Republic Services Inc., senior note, 5.50%, 9/15/19 | United States | 50,000 | | 55,347 |
| Diversified Financials 5.1% | | | | |
| Goldman Sachs Group Inc., senior note, 2.55%, 10/23/19 | United States | 100,000 | | 101,454 |
| Morgan Stanley, senior note, 5.625%, 9/23/19 | United States | 100,000 | | 110,817 |
| | | | | 212,271 |
| Energy 9.7% | | | | |
| Chevron Corp., senior note, 2.193%, 11/15/19 | United States | 100,000 | | 101,572 |
| Enterprise Products Operating LLC, senior note, 2.55%, 10/15/19 | United States | 50,000 | | 50,770 |
| Kinder Morgan Inc., senior note, 3.05%, 12/01/19 | United States | 50,000 | | 49,867 |
| Plains All American Pipeline LP/PAA Finance Corp., senior note, 2.60%, 12/15/19 | United States | 50,000 | | 47,478 |
| Pride International Inc., senior bond, 8.50%, 6/15/19 | United States | 50,000 | | 49,387 |
| Statoil ASA, senior note, 2.25%, 11/08/19 | Norway | 100,000 | | 101,846 |
| | | | | 400,920 |
| Food & Staples Retailing 3.7% | | | | |
| Costco Wholesale Corp., senior note, 1.70%, 12/15/19 | United States | 100,000 | | 101,382 |
| Walgreens Boots Alliance Inc., senior note, 2.70%, 11/18/19 | United States | 50,000 | | 51,120 |
| | | | | 152,502 |
| Food, Beverage & Tobacco 4.2% | | | | |
| Anheuser-Busch InBev Worldwide Inc., senior note, 6.875%, 11/15/19 | Belgium | 100,000 | | 117,029 |
| Mead Johnson Nutrition Co., senior note, 4.90%, 11/01/19 | United States | 50,000 | | 54,582 |
| | | | | 171,611 |
| Health Care Equipment & Services 5.0% | | | | |
| Becton Dickinson and Co., senior note, 2.675%, 12/15/19 | United States | 50,000 | | 51,067 |
| UnitedHealth Group Inc., senior note, 2.30%, 12/15/19 | United States | 100,000 | | 102,273 |
| Zimmer Holdings Inc., senior bond, 4.625%, 11/30/19 | United States | 50,000 | | 54,190 |
| | | | | 207,530 |
| Insurance 1.4% | | | | |
| CNA Financial Corp., senior bond, 7.35%, 11/15/19 | United States | 50,000 | | 57,465 |
Annual Report
43
FRANKLIN FUND ALLOCATOR SERIES
STATEMENT O F INVESTMENTS
| | | | |
| Franklin Payout 2019 Fund (continued) | | | | |
| | | Principal | | |
| | Country | Amount* | | Value |
| Corporate Bonds (continued) | | | | |
| Materials 3.8% | | | | |
| Eastman Chemical Co., senior bond, 5.50%, 11/15/19 | United States | 50,000 | $ | 55,003 |
| PPG Industries Inc., senior note, 2.30%, 11/15/19 | United States | 100,000 | | 100,092 |
| | | | | 155,095 |
| Media 2.5% | | | | |
| Scripps Networks Interactive Inc., senior note, 2.75%, 11/15/19 | United States | 50,000 | | 50,577 |
| Viacom Inc., senior note, 2.75%, 12/15/19 | United States | 50,000 | | 50,492 |
| | | | | 101,069 |
| Pharmaceuticals, Biotechnology & Life Sciences 2.5% | | | | |
| Johnson & Johnson, senior note, 1.875%, 12/05/19 | United States | 100,000 | | 101,966 |
| Real Estate 1.4% | | | | |
| Weyerhaeuser Co., senior note, 7.375%, 10/01/19 | United States | 50,000 | | 57,284 |
| Telecommunication Services 1.4% | | | | |
| AT&T Inc., senior note, 5.875%, 10/01/19 | United States | 50,000 | | 56,314 |
| Utilities 7.6% | | | | |
| Dominion Resources Inc., senior note, 2.50%, 12/01/19 | United States | 50,000 | | 50,707 |
| DTE Energy Co., senior note, 2.40%, 12/01/19 | United States | 50,000 | | 50,633 |
| Georgia Power Co., senior note, 4.25%, 12/01/19 | United States | 100,000 | | 108,305 |
| Progress Energy Inc., senior bond, 4.875%, 12/01/19 | United States | 50,000 | | 54,560 |
| Public Service Electric and Gas Co., secured note, 2.00%, 8/15/19 | United States | 50,000 | | 50,758 |
| | | | | 314,963 |
| Total Corporate Bonds (Cost $3,274,871) | | | | 3,304,803 |
| U.S. Government and Agency Securities 17.9% | | | | |
| FFCB, 1.95%, 12/17/19 | United States | 150,000 | | 153,497 |
| FHLB, | | | | |
| 1.25%, 12/13/19 | United States | 160,000 | | 160,110 |
| 2.375%, 12/13/19 | United States | 210,000 | | 217,472 |
| FNMA, 1.75%, 11/26/19 | United States | 200,000 | | 203,812 |
| Total U.S. Government and Agency Securities (Cost $725,258) | | | | 734,891 |
| Total Investments before Short Term Investments | | | | |
| (Cost $4,000,129) | | | | 4,039,694 |
| |
| | | Shares | | |
| Short Term Investments (Cost $51,192) 1.2% | | | | |
| Money Market Funds 1.2% | | | | |
| a,b Institutional Fiduciary Trust Money Market Portfolio | United States | 51,192 | | 51,192 |
| Total Investments (Cost $4,051,321) 99.4% | | | | 4,090,886 |
| Other Assets, less Liabilities 0.6% | | | | 22,703 |
| Net Assets 100.0% | | | $ | 4,113,589 |
See Abbreviations on page 68.
*The principal amount is stated in U.S. dollars unless otherwise indicated.
aNon-income producing.
bSee Note 3(d) regarding investments in affiliated management investment companies.
44 Annual Report | The accompanying notes are an integral part of these financial statements.
FRANKLIN FUND ALLOCATOR SERIES
| | | |
| Financial Highlights | | | |
| Franklin Payout 2020 Fund | | | |
| | | Year Ended | |
| | | May 31, 2016a | |
| Class R6 | | | |
| Per share operating performance | | | |
| (for a share outstanding throughout the year) | | | |
| Net asset value, beginning of year | $ | 10.00 | |
| Income from investment operationsb: | | | |
| Net investment incomec | | 0.20 | |
| Net realized and unrealized gains (losses) | | 0.11 | |
| Total from investment operations | | 0.31 | |
| Less distributions from net investment income | | (0.14 | ) |
| Net asset value, end of year | $ | 10.17 | |
| |
| Total return | | 3.10 | % |
| |
| Ratios to average net assets | | | |
| Expenses before waiver and payments by affiliates | | 3.59 | % |
| Expenses net of waiver and payments by affiliates | | 0.29 | % |
| Net investment income | | 2.01 | % |
| |
| Supplemental data | | | |
| Net assets, end of year (000’s) | $ | 2,061 | |
| Portfolio turnover rate | | 4.23 | % |
aFor the year June 1, 2015 (commencement of operations) to May 31, 2016.
bThe amount shown for a share outstanding throughout the period may not correlate with the Statement of Operations for the period due to the timing of sales and repurchases
of the Fund’s shares in relation to income earned and/or fluctuating fair value of the investments of the Fund.
cBased on average daily shares outstanding.
The accompanying notes are an integral part of these financial statements. | Annual Report 45
FRANKLIN FUND ALLOCATOR SERIES
FINANCIAL H IGHLIGHTS
| | | |
| Franklin Payout 2020 Fund (continued) | | | |
| | | Year Ended | |
| | | May 31, 2016a | |
| Advisor Class | | | |
| Per share operating performance | | | |
| (for a share outstanding throughout the year) | | | |
| Net asset value, beginning of year | $ | 10.00 | |
| Income from investment operationsb: | | | |
| Net investment incomec | | 0.20 | |
| Net realized and unrealized gains (losses) | | 0.11 | |
| Total from investment operations | | 0.31 | |
| Less distributions from net investment income | | (0.14 | ) |
| Net asset value, end of year | $ | 10.17 | |
| |
| Total return | | 3.10 | % |
| |
| Ratios to average net assets | | | |
| Expenses before waiver and payments by affiliates | | 3.59 | % |
| Expenses net of waiver and payments by affiliates | | 0.29 | % |
| Net investment income | | 2.01 | % |
| |
| Supplemental data | | | |
| Net assets, end of year (000’s) | $ | 2,061 | |
| Portfolio turnover rate | | 4.23 | % |
aFor the year June 1, 2015 (commencement of operations) to May 31, 2016.
bThe amount shown for a share outstanding throughout the period may not correlate with the Statement of Operations for the period due to the timing of sales and repurchases
of the Fund’s shares in relation to income earned and/or fluctuating fair value of the investments of the Fund.
cBased on average daily shares outstanding.
46 Annual Report | The accompanying notes are an integral part of these financial statements.
FRANKLIN FUND ALLOCATOR SERIES
| | | | |
| Statement of Investments, May 31, 2016 | | | | |
| Franklin Payout 2020 Fund | | | | |
| | Country/ | Principal | | |
| | Organization | Amount* | | Value |
| Corporate Bonds 74.6% | | | | |
| Banks 5.1% | | | | |
| Bank of America Corp., senior note, 2.625%, 10/19/20 | United States | 100,000 | $ | 100,654 |
| JPMorgan Chase & Co., senior note, 4.25%, 10/15/20 | United States | 100,000 | | 107,885 |
| | | | | 208,539 |
| Capital Goods 7.6% | | | | |
| Boeing Co., senior note, 1.65%, 10/30/20 | United States | 100,000 | | 99,807 |
| Emerson Electric Co., senior bond, 4.25%, 11/15/20 | United States | 100,000 | | 109,773 |
| Raytheon Co., senior note, 3.125%, 10/15/20 | United States | 100,000 | | 105,894 |
| | | | | 315,474 |
| Consumer Services 2.5% | | | | |
| Carnival Corp., senior note, 3.95%, 10/15/20 | United States | 50,000 | | 53,338 |
| Yum! Brands Inc., senior bond, 3.875%, 11/01/20 | United States | 50,000 | | 50,250 |
| | | | | 103,588 |
| Diversified Financials 5.3% | | | | |
| Morgan Stanley, senior note, 5.50%, 7/24/20 | United States | 100,000 | | 111,783 |
| Northern Trust Corp., senior note, 3.45%, 11/04/20 | United States | 100,000 | | 106,606 |
| | | | | 218,389 |
| Energy 11.1% | | | | |
| Energy Transfer Partners LP, senior note, 4.15%, 10/01/20 | United States | 50,000 | | 49,351 |
| Enterprise Products Operating LLC, senior note, 5.20%, 9/01/20 | United States | 50,000 | | 55,428 |
| Kinder Morgan Energy Partners LP, senior bond, 5.30%, 9/15/20 | United States | 50,000 | | 52,486 |
| Pride International Inc., senior bond, 6.875%, 8/15/20 | United States | 50,000 | | 44,500 |
| Statoil ASA, senior note, 2.90%, 11/08/20 | Norway | 100,000 | | 103,162 |
| Transcanada Pipelines Ltd., senior bond, 3.80%, 10/01/20 | Canada | 100,000 | | 106,553 |
| Williams Partners LP, senior note, 4.125%, 11/15/20 | United States | 50,000 | | 46,919 |
| | | | | 458,399 |
| Food, Beverage & Tobacco 7.8% | | | | |
| Coca Cola Co., senior note, 3.15%, 11/15/20 | United States | 100,000 | | 106,458 |
| Hershey Co., senior note, 4.125%, 12/01/20 | United States | 100,000 | | 110,947 |
| PepsiCo Inc., senior bond, 3.125%, 11/01/20 | United States | 100,000 | | 105,890 |
| | | | | 323,295 |
| Health Care Equipment & Services 9.1% | | | | |
| Aetna Inc., senior bond, 3.95%, 9/01/20 | United States | 100,000 | | 106,399 |
| Becton Dickinson and Co., senior note, 3.25%, 11/12/20 | United States | 50,000 | | 51,932 |
| Cigna Corp., senior bond, 4.375%, 12/15/20 | United States | 50,000 | | 53,783 |
| Laboratory Corp. of America Holdings, senior note, 4.625%, 11/15/20 | United States | 50,000 | | 53,939 |
| UnitedHealth Group Inc., senior note, 3.875%, 10/15/20 | United States | 100,000 | | 107,867 |
| | | | | 373,920 |
| Household & Personal Products 2.6% | | | | |
| Colgate-Palmolive Co., senior note, 2.95%, 11/01/20 | United States | 100,000 | | 106,015 |
| Insurance 9.3% | | | | |
| AEGON Funding Co. LLC, senior bond, 5.75%, 12/15/20 | United States | 100,000 | | 113,206 |
| Berkshire Hathaway Finance Corp., senior note, 2.90%, 10/15/20 | United States | 100,000 | | 105,065 |
| Prudential Financial Inc., senior note, 4.50%, 11/15/20 | United States | 50,000 | | 54,611 |
| Travelers Cos. Inc., senior note, 3.90%, 11/01/20 | United States | 100,000 | | 108,713 |
| | | | | 381,595 |
Annual Report
47
FRANKLIN FUND ALLOCATOR SERIES
STATEMENT O F INVESTMENTS
| | | | |
| Franklin Payout 2020 Fund (continued) | | | | |
| | Country/ | Principal | | |
| | Organization | Amount* | | Value |
| Corporate Bonds (continued) | | | | |
| Materials 2.2% | | | | |
| The Dow Chemical Co., senior bond, 4.25%, 11/15/20 | United States | 31,000 | $ | 33,663 |
| a Georgia-Pacific LLC, senior note, 144A, 5.40%, 11/01/20 | United States | 50,000 | | 55,805 |
| | | | | 89,468 |
| Media 1.4% | | | | |
| 21st Century Fox America Inc., senior bond, 5.65%, 8/15/20 | United States | 50,000 | | 56,984 |
| Pharmaceuticals, Biotechnology & Life Sciences 2.6% | | | | |
| Amgen Inc., senior note, 3.45%, 10/01/20 | United States | 50,000 | | 52,953 |
| Celgene Corp., senior bond, 3.95%, 10/15/20 | United States | 50,000 | | 53,346 |
| | | | | 106,299 |
| Technology Hardware & Equipment 0.2% | | | | |
| Hewlett-Packard Co., senior note, 3.75%, 12/01/20 | United States | 9,000 | | 9,446 |
| Utilities 7.8% | | | | |
| Alabama Power Co., senior note, 3.375%, 10/01/20 | United States | 100,000 | | 105,987 |
| Constellation Energy Group, senior note, 5.15%, 12/01/20 | United States | 50,000 | | 55,457 |
| Exelon Generation Co. LLC, senior bond, 4.00%, 10/01/20 | United States | 50,000 | | 52,760 |
| Pacific Gas & Electric Co., senior note, 3.50%, 10/01/20 | United States | 100,000 | | 107,398 |
| | | | | 321,602 |
| Total Corporate Bonds (Cost $3,045,266) | | | | 3,073,013 |
| Foreign Government and Agency Securities 5.0% | | | | |
| Inter-American Development Bank, senior note, 2.125%, 11/09/20 | Supranationalb | 100,000 | | 102,725 |
| International Bank for Reconstruction and Development, senior note, | | | | |
| 2.125%, 11/01/20 | Supranationalb | 100,000 | | 102,861 |
| Total Foreign Government and Agency Securities | | | | |
| (Cost $202,045) | | | | 205,586 |
| U.S. Government and Agency Securities 17.7% | | | | |
| FHLB, 3.125%, 12/11/20 | United States | 200,000 | | 214,712 |
| U.S. Treasury Note, | | | | |
| 2.00%, 11/30/20 | United States | 145,000 | | 149,160 |
| 2.375%, 12/31/20 | United States | 205,000 | | 214,325 |
| 2.625%, 11/15/20 | United States | 145,000 | | 153,057 |
| Total U.S. Government and Agency Securities (Cost $717,965) | | | | 731,254 |
| Total Investments before Short Term Investments | | | | |
| (Cost $3,965,276) | | | | 4,009,853 |
| |
| | | Shares | | |
| Short Term Investments (Cost $86,725) 2.1% | | | | |
| Money Market Funds 2.1% | | | | |
| c,d Institutional Fiduciary Trust Money Market Portfolio | United States | 86,725 | | 86,725 |
| Total Investments (Cost $4,052,001) 99.4% | | | | 4,096,578 |
| Other Assets, less Liabilities 0.6% | | | | 26,011 |
| Net Assets 100.0% | | | $ | 4,122,589 |
48 Annual Report
FRANKLIN FUND ALLOCATOR SERIES
STATEMENT O F INVESTMENTS
Franklin Payout 2020 Fund (continued)
See Abbreviations on page 68.
*The principal amount is stated in U.S. dollars unless otherwise indicated.
aSecurity was purchased pursuant to Rule 144A under the Securities Act of 1933 and may be sold in transactions exempt from registration only to qualified institutional buyers
or in a public offering registered under the Securities Act of 1933. This security has been deemed liquid under guidelines approved by the Trust’s Board of Trustees. At
May 31, 2016, the value of this security was $55,805, representing 1.35% of net assets.
bA supranational organization is an entity formed by two or more central governments through international treaties.
cNon-income producing.
dSee Note 3(d) regarding investments in affiliated management investment companies.
The accompanying notes are an integral part of these financial statements. | Annual Report 49
FRANKLIN FUND ALLOCATOR SERIES
| | | |
| Financial Highlights | | | |
| Franklin Payout 2021 Fund | | | |
| | | Year Ended | |
| | | May 31, 2016a | |
| Class R6 | | | |
| Per share operating performance | | | |
| (for a share outstanding throughout the year) | | | |
| Net asset value, beginning of year | $ | 10.00 | |
| Income from investment operationsb: | | | |
| Net investment incomec | | 0.22 | |
| Net realized and unrealized gains (losses) | | 0.23 | |
| Total from investment operations | | 0.45 | |
| Less distributions from net investment income | | (0.15 | ) |
| Net asset value, end of year | $ | 10.30 | |
| |
| Total return | | 4.55 | % |
| |
| Ratios to average net assets | | | |
| Expenses before waiver and payments by affiliates | | 3.56 | % |
| Expenses net of waiver and payments by affiliates | | 0.29 | % |
| Net investment income | | 2.21 | % |
| |
| Supplemental data | | | |
| Net assets, end of year (000’s) | $ | 2,090 | |
| Portfolio turnover rate | | —% | |
aFor the year June 1, 2015 (commencement of operations) to May 31, 2016.
bThe amount shown for a share outstanding throughout the period may not correlate with the Statement of Operations for the period due to the timing of sales and repurchases
of the Fund’s shares in relation to income earned and/or fluctuating fair value of the investments of the Fund.
cBased on average daily shares outstanding.
50 Annual Report | The accompanying notes are an integral part of these financial statements.
FRANKLIN FUND ALLOCATOR SERIES
FINANCIAL H IGHLIGHTS
| | | |
| Franklin Payout 2021 Fund (continued) | | | |
| | | Year Ended | |
| | | May 31, 2016a | |
| Advisor Class | | | |
| Per share operating performance | | | |
| (for a share outstanding throughout the year) | | | |
| Net asset value, beginning of year | $ | 10.00 | |
| Income from investment operationsb: | | | |
| Net investment incomec | | 0.22 | |
| Net realized and unrealized gains (losses) | | 0.23 | |
| Total from investment operations | | 0.45 | |
| Less distributions from net investment income | | (0.15 | ) |
| Net asset value, end of year | $ | 10.30 | |
| |
| Total return | | 4.55 | % |
| |
| Ratios to average net assets | | | |
| Expenses before waiver and payments by affiliates | | 3.56 | % |
| Expenses net of waiver and payments by affiliates | | 0.29 | % |
| Net investment income | | 2.21 | % |
| |
| Supplemental data | | | |
| Net assets, end of year (000’s) | $ | 2,090 | |
| Portfolio turnover rate | | —% | |
aFor the year June 1, 2015 (commencement of operations) to May 31, 2016.
bThe amount shown for a share outstanding throughout the period may not correlate with the Statement of Operations for the period due to the timing of sales and repurchases
of the Fund’s shares in relation to income earned and/or fluctuating fair value of the investments of the Fund.
cBased on average daily shares outstanding.
The accompanying notes are an integral part of these financial statements. | Annual Report 51
FRANKLIN FUND ALLOCATOR SERIES
| | | | |
| Statement of Investments, May 31, 2016 | | | | |
| Franklin Payout 2021 Fund | | | | |
| | Country/ | Principal | | |
| | Organization | Amount* | | Value |
| Corporate Bonds 75.0% | | | | |
| Capital Goods 10.1% | | | | |
| The Boeing Co., senior note, 2.35%, 10/30/21 | United States | 100,000 | $ | 102,533 |
| Emerson Electric Co., senior note, 2.625%, 12/01/21 | United States | 100,000 | | 103,536 |
| General Electric Co., senior note, 4.65%, 10/17/21 | United States | 100,000 | | 113,172 |
| John Deere Capital Corp., senior bond, 3.15%, 10/15/21 | United States | 100,000 | | 105,050 |
| | | | | 424,291 |
| Consumer Services 2.4% | | | | |
| Marriott International Inc., senior note, N, 3.125%, 10/15/21 | United States | 50,000 | | 51,232 |
| Yum! Brands Inc., senior bond, 3.75%, 11/01/21 | United States | 50,000 | | 48,437 |
| | | | | 99,669 |
| Diversified Financials 5.2% | | | | |
| Bank of New York Mellon Corp., senior note, 3.55%, 9/23/21 | United States | 100,000 | | 106,751 |
| Berkshire Hathaway Inc., senior note, 3.75%, 8/15/21 | United States | 100,000 | | 109,431 |
| | | | | 216,182 |
| Energy 13.6% | | | | |
| BP Capital Markets PLC, senior note, 3.561%, 11/01/21 | United Kingdom | 100,000 | | 105,602 |
| ConocoPhillips Co., senior note, 2.875%, 11/15/21 | United States | 100,000 | | 100,559 |
| Halliburton Co., senior bond, 3.25%, 11/15/21 | United States | 100,000 | | 102,615 |
| Statoil ASA, senior note, 2.75%, 11/10/21 | Norway | 100,000 | | 102,255 |
| Total Capital SA, senior bond, 4.25%, 12/15/21 | France | 100,000 | | 110,274 |
| Williams Partners LP, senior note, 4.00%, 11/15/21 | United States | 50,000 | | 46,312 |
| | | | | 567,617 |
| Food & Staples Retailing 2.5% | | | | |
| The Kroger Co., senior note, 2.95%, 11/01/21 | United States | 50,000 | | 51,735 |
| Walgreens Boots Alliance Inc., senior note, 3.30%, 11/18/21 | United States | 50,000 | | 51,731 |
| | | | | 103,466 |
| Food, Beverage & Tobacco 3.7% | | | | |
| General Mills Inc., senior bond, 3.15%, 12/15/21 | United States | 50,000 | | 52,554 |
| Philip Morris International Inc., senior note, 2.90%, 11/15/21 | United States | 100,000 | | 103,840 |
| | | | | 156,394 |
| Health Care Equipment & Services 3.9% | | | | |
| Express Scripts Holding Co., senior note, 4.75%, 11/15/21 | United States | 50,000 | | 55,164 |
| UnitedHealth Group Inc., senior note, 3.375%, 11/15/21 | United States | 100,000 | | 105,884 |
| | | | | 161,048 |
| Insurance 1.3% | | | | |
| Prudential Financial Inc., senior note, 4.50%, 11/16/21 | United States | 50,000 | | 55,044 |
| Materials 5.1% | | | | |
| Air Products and Chemicals Inc., senior note, 3.00%, 11/03/21 | United States | 100,000 | | 104,490 |
| The Dow Chemical Co., senior bond, 4.125%, 11/15/21 | United States | 50,000 | | 54,370 |
| Ecolab Inc., senior note, 4.35%, 12/08/21 | United States | 50,000 | | 55,538 |
| | | | | 214,398 |
| Pharmaceuticals, Biotechnology & Life Sciences 6.5% | | | | |
| Gilead Sciences Inc., senior note, 4.40%, 12/01/21 | United States | 100,000 | | 110,824 |
| Johnson & Johnson, senior note, 2.45%, 12/05/21 | United States | 100,000 | | 104,529 |
| PerkinElmer Inc., senior note, 5.00%, 11/15/21 | United States | 50,000 | | 55,177 |
| | | | | 270,530 |
FRANKLIN FUND ALLOCATOR SERIES
STATEMENT O F INVESTMENTS
| | | | |
| Franklin Payout 2021 Fund (continued) | | | | |
| | Country/ | Principal | | |
| | Organization | Amount* | | Value |
| Corporate Bonds (continued) | | | | |
| Real Estate 4.0% | | | | |
| American Tower Corp., senior note, 5.90%, 11/01/21 | United States | 50,000 | $ | 57,093 |
| Simon Property Group LP, senior bond, 4.125%, 12/01/21 | United States | 100,000 | | 109,453 |
| | | | | 166,546 |
| Semiconductors & Semiconductor Equipment 2.6% | | | | |
| Intel Corp., senior note, 3.30%, 10/01/21 | United States | 100,000 | | 106,916 |
| Software & Services 2.5% | | | | |
| International Business Machines Corp., senior note, 2.90%, 11/01/21 | United States | 100,000 | | 104,662 |
| Technology Hardware & Equipment 2.7% | | | | |
| Thomas & Betts Corp., senior bond, 5.625%, 11/15/21 | United States | 100,000 | | 114,111 |
| Telecommunication Services 3.9% | | | | |
| a Telstra Corp. Ltd., senior note, 144A, 4.80%, 10/12/21 | Australia | 100,000 | | 112,668 |
| Verizon Communications Inc., senior note, 3.00%, 11/01/21 | United States | 50,000 | | 51,517 |
| | | | | 164,185 |
| Transportation 1.2% | | | | |
| Norfolk Southern Corp., senior bond, 3.25%, 12/01/21 | United States | 50,000 | | 52,097 |
| Utilities 3.8% | | | | |
| Baltimore Gas & Electric Co., senior note, 3.50%, 11/15/21 | United States | 50,000 | | 53,077 |
| Pacific Gas & Electric Co., senior note, 3.25%, 9/15/21 | United States | 100,000 | | 104,973 |
| | | | | 158,050 |
| Total Corporate Bonds (Cost $3,071,065) | | | | 3,135,206 |
| Foreign Government and Agency Securities (Cost $100,155) 2.5% | | | | |
| European Investment Bank, senior note, 2.125%, 10/15/21 | Supranationalb | 100,000 | | 102,378 |
| U.S. Government and Agency Securities 17.8% | | | | |
| FFCB, 2.00%, 12/01/21 | United States | 200,000 | | 203,753 |
| FHLB, 2.625%, 12/10/21 | United States | 200,000 | | 211,820 |
| U.S. Treasury Note, | | | | |
| 1.875%, 11/30/21 | United States | 160,000 | | 163,353 |
| 2.125%, 12/31/21 | United States | 160,000 | | 165,397 |
| Total U.S. Government and Agency Securities (Cost $723,599) | | | | 744,323 |
| Municipal Bonds (Cost $115,239) 2.8% | | | | |
| California State GO, Various Purpose, 5.70%, 11/01/21 | United States | 100,000 | | 118,884 |
| Total Investments before Short Term Investments | | | | |
| (Cost $4,010,058) | | | | 4,100,791 |
| |
| | | Shares | | |
| Short Term Investments (Cost $48,291) 1.2% | | | | |
| Money Market Funds 1.2% | | | | |
| c,d Institutional Fiduciary Trust Money Market Portfolio | United States | 48,291 | | 48,291 |
| Total Investments (Cost $4,058,349) 99.3% | | | | 4,149,082 |
| Other Assets, less Liabilities 0.7% | | | | 31,335 |
| Net Assets 100.0% | | | $ | 4,180,417 |
Annual Report
53
FRANKLIN FUND ALLOCATOR SERIES
STATEMENT O F INVESTMENTS
Franklin Payout 2021 Fund (continued)
See Abbreviations on page 68.
*The principal amount is stated in U.S. dollars unless otherwise indicated.
aSecurity was purchased pursuant to Rule 144A under the Securities Act of 1933 and may be sold in transactions exempt from registration only to qualified institutional buyers
or in a public offering registered under the Securities Act of 1933. This security has been deemed liquid under guidelines approved by the Trust’s Board of Trustees. At
May 31, 2016, the value of this security was $112,668, representing 2.70% of net assets.
bA supranational organization is an entity formed by two or more central governments through international treaties.
cNon-income producing.
dSee Note 3(d) regarding investments in affiliated management investment companies.
54 Annual Report | The accompanying notes are an integral part of these financial statements.
FRANKLIN FUND ALLOCATOR SERIES
| | | | | | | |
| Financial Statements | | | | | | | |
| |
| Statements of Assets and Liabilities | | | | | | | |
| May 31, 2016 | | | | | | | |
| |
| | | Franklin | | Franklin | | | Franklin |
| | | Payout 2017 | | Payout 2018 | | | Payout 2019 |
| | | Fund | | Fund | | | Fund |
| Assets: | | | | | | | |
| Investments in securities: | | | | | | | |
| Cost - Unaffiliated issuers | $ | 3,416,127 | $ | 3,483,213 | | $ | 4,000,129 |
| Cost - Non-controlled affiliates (Note 3d) | | 91,374 | | 39,351 | | | 51,192 |
| Total cost of investments | $ | 3,507,501 | $ | 3,522,564 | | $ | 4,051,321 |
| Value - Unaffiliated issuers | $ | 3,416,345 | $ | 3,496,609 | | $ | 4,039,694 |
| Value - Non-controlled affiliates (Note 3d) | | 91,374 | | 39,351 | | | 51,192 |
| Total value of investments | | 3,507,719 | | 3,535,960 | | | 4,090,886 |
| Receivables: | | | | | | | |
| Interest | | 30,287 | | 24,860 | | | 26,417 |
| Affiliates | | 67,360 | | 65,539 | | | 64,959 |
| Other assets | | 2 | | 2 | | | 2 |
| Total assets | | 3,605,368 | | 3,626,361 | | | 4,182,264 |
| Liabilities: | | | | | | | |
| Payables: | | | | | | | |
| Transfer agent fees | | 37 | | 7 | | | 8 |
| Reports to shareholders | | 5,526 | | 5,531 | | | 5,910 |
| Professional fees | | 40,345 | | 40,065 | | | 40,169 |
| Registration and filing fees | | 17,207 | | 17,207 | | | 17,209 |
| Funds advanced by custodian | | — | | — | | | 3,500 |
| Accrued expenses and other liabilities | | 2,216 | | 1,469 | | | 1,879 |
| Total liabilities | | 65,331 | | 64,279 | | | 68,675 |
| Net assets, at value | $ | 3,540,037 | $ | 3,562,082 | | $ | 4,113,589 |
| Net assets consist of: | | | | | | | |
| Paid-in capital | $ | 3,523,308 | $ | 3,529,322 | | $ | 4,043,899 |
| Undistributed net investment income | | 15,918 | | 19,587 | | | 28,690 |
| Net unrealized appreciation (depreciation) | | 218 | | 13,396 | | | 39,565 |
| Accumulated net realized gain (loss) | | 593 | | (223 | ) | | 1,435 |
| Net assets, at value | $ | 3,540,037 | $ | 3,562,082 | | $ | 4,113,589 |
| |
| Class R6: | | | | | | | |
| Net assets, at value | $ | 1,770,022 | $ | 1,781,030 | | $ | 2,056,780 |
| Shares outstanding | | 176,398 | | 176,701 | | | 202,465 |
| Net asset value and maximum offering price per share | $ | 10.03 | $ | 10.08 | | $ | 10.16 |
| |
| Advisor Class: | | | | | | | |
| Net assets, at value | $ | 1,770,015 | $ | 1,781,052 | | $ | 2,056,809 |
| Shares outstanding | | 176,398 | | 176,701 | | | 202,465 |
| Net asset value and maximum offering price per share | $ | 10.03 | $ | 10.08 | | $ | 10.16 |
The accompanying notes are an integral part of these financial statements. | Annual Report 55
FRANKLIN FUND ALLOCATOR SERIES
FINANCIAL STATEMENTS
| | | | | |
| Statements of Assets and Liabilities (continued) | | | | | |
| May 31, 2016 | | | | | |
| |
| | | Franklin | | | Franklin |
| | | Payout 2020 | | | Payout 2021 |
| | | Fund | | | Fund |
| Assets: | | | | | |
| Investments in securities: | | | | | |
| Cost - Unaffiliated issuers | $ | 3,965,276 | | $ | 4,010,058 |
| Cost - Non-controlled affiliates (Note 3d) | | 86,725 | | | 48,291 |
| Total cost of investments | $ | 4,052,001 | | $ | 4,058,349 |
| Value - Unaffiliated issuers | $ | 4,009,853 | | $ | 4,100,791 |
| Value - Non-controlled affiliates (Note 3d) | | 86,725 | | | 48,291 |
| Total value of investments | | 4,096,578 | | | 4,149,082 |
| Receivables: | | | | | |
| Interest | | 26,211 | | | 25,683 |
| Affiliates | | 65,451 | | | 71,231 |
| Other assets | | 2 | | | 2 |
| Total assets | | 4,188,242 | | | 4,245,998 |
| Liabilities: | | | | | |
| Payables: | | | | | |
| Transfer agent fees | | 13 | | | 8 |
| Reports to shareholders | | 5,905 | | | 5,904 |
| Professional fees | | 40,169 | | | 40,050 |
| Registration and filing fees | | 17,209 | | | 17,209 |
| Accrued expenses and other liabilities | | 2,357 | | | 2,410 |
| Total liabilities | | 65,653 | | | 65,581 |
| Net assets, at value | $ | 4,122,589 | | $ | 4,180,417 |
| Net assets consist of: | | | | | |
| Paid-in capital | $ | 4,049,677 | | $ | 4,054,606 |
| Undistributed net investment income | | 31,334 | | | 35,078 |
| Net unrealized appreciation (depreciation) | | 44,577 | | | 90,733 |
| Accumulated net realized gain (loss) | | (2,999 | ) | | — |
| Net assets, at value | $ | 4,122,589 | | $ | 4,180,417 |
| |
| Class R6: | | | | | |
| Net assets, at value | $ | 2,061,278 | | $ | 2,090,199 |
| Shares outstanding | | 202,763 | | | 203,001 |
| Net asset value and maximum offering price per share | $ | 10.17 | | $ | 10.30 |
| |
| Advisor Class: | | | | | |
| Net assets, at value | $ | 2,061,311 | | $ | 2,090,218 |
| Shares outstanding | | 202,763 | | | 203,001 |
| Net asset value and maximum offering price per share | $ | 10.17 | | $ | 10.30 |
56 Annual Report | The accompanying notes are an integral part of these financial statements.
FRANKLIN FUND ALLOCATOR SERIES
FINANCIAL STATEMENTS
| | | | | | | | | |
| Statements of Operations | | | | | | | | | |
| for the year ended May 31, 2016* | | | | | | | | | |
| |
| | | Franklin | | | Franklin | | | Franklin | |
| | | Payout 2017 | | | Payout 2018 | | | Payout 2019 | |
| | | Fund | | | Fund | | | Fund | |
| Investment income: | | | | | | | | | |
| Interest | $ | 49,491 | | $ | 59,169 | | $ | 84,327 | |
| Expenses: | | | | | | | | | |
| Management fees (Note 3a) | | 10,501 | | | 10,527 | | | 12,081 | |
| Transfer agent fees: (Note 3c) | | | | | | | | | |
| Class R6 | | 54 | | | 57 | | | 57 | |
| Advisor Class | | 61 | | | 28 | | | 29 | |
| Custodian fees (Note 4) | | 76 | | | 86 | | | 55 | |
| Reports to shareholders | | 6,507 | | | 6,511 | | | 6,890 | |
| Registration and filing fees | | 19,354 | | | 19,209 | | | 19,212 | |
| Professional fees | | 45,226 | | | 44,945 | | | 45,051 | |
| Amortization of offering costs | | 58,605 | | | 57,486 | | | 57,409 | |
| Other | | 3,872 | | | 3,086 | | | 3,531 | |
| Total expenses | | 144,256 | | | 141,935 | | | 144,315 | |
| Expenses waived/paid by affiliates (Notes 3d and 3e) | | (133,991 | ) | | (131,675 | ) | | (132,577 | ) |
| Net expenses | | 10,265 | | | 10,260 | | | 11,738 | |
| Net investment income | | 39,226 | | | 48,909 | | | 72,589 | |
| Realized and unrealized gains (losses): | | | | | | | | | |
| Net realized gain (loss) from investments | | 593 | | | (223 | ) | | 1,435 | |
| Net change in unrealized appreciation (depreciation) on investments | | 218 | | | 13,396 | | | 39,565 | |
| Net realized and unrealized gain (loss) | | 811 | | | 13,173 | | | 41,000 | |
| Net increase (decrease) in net assets resulting from operations | $ | 40,037 | | $ | 62,082 | | $ | 113,589 | |
*For the year June 1, 2015 (commencement of operations) to May 31, 2016.
The accompanying notes are an integral part of these financial statements. | Annual Report 57
FRANKLIN FUND ALLOCATOR SERIES
FINANCIAL STATEMENTS
| | | | | | |
| Statements of Operations (continued) | | | | | | |
| for the year ended May 31, 2016* | | | | | | |
| |
| | | Franklin | | | Franklin | |
| | | Payout 2020 | | | Payout 2021 | |
| | | Fund | | | Fund | |
| Investment income: | | | | | | |
| Interest | $ | 92,770 | | $ | 101,512 | |
| Expenses: | | | | | | |
| Management fees (Note 3a) | | 12,068 | | | 12,145 | |
| Transfer agent fees: (Note 3c) | | | | | | |
| Class R6 | | 63 | | | 57 | |
| Advisor Class | | 29 | | | 30 | |
| Custodian fees (Note 4) | | 84 | | | 135 | |
| Reports to shareholders | | 6,885 | | | 6,885 | |
| Registration and filing fees | | 19,212 | | | 19,212 | |
| Professional fees | | 45,051 | | | 44,902 | |
| Amortization of offering costs | | 57,370 | | | 57,223 | |
| Other | | 4,106 | | | 4,038 | |
| Total expenses | | 144,868 | | | 144,627 | |
| Expenses waived/paid by affiliates (Notes 3d and 3e) | | (133,109 | ) | | (132,799 | ) |
| Net expenses | | 11,759 | | | 11,828 | |
| Net investment income | | 81,011 | | | 89,684 | |
| Realized and unrealized gains (losses): | | | | | | |
| Net realized gain (loss) from investments | | (2,999 | ) | | — | |
| Net change in unrealized appreciation (depreciation) on investments | | 44,577 | | | 90,733 | |
| Net realized and unrealized gain (loss) | | 41,578 | | | 90,733 | |
| Net increase (decrease) in net assets resulting from operations | $ | 122,589 | | $ | 180,417 | |
*For the year June 1, 2015 (commencement of operations) to May 31, 2016.
58 Annual Report | The accompanying notes are an integral part of these financial statements.
FRANKLIN FUND ALLOCATOR SERIES
FINANCIAL STATEMENTS
| | | | | | |
| Statements of Changes in Net Assets | | | | | | |
| |
| | | Franklin | | | Franklin | |
| | | Payout 2017 Fund | | | Payout 2018 Fund | |
| | | Year Ended | | | Year Ended | |
| | | May 31, 2016* | | | May 31, 2016* | |
| Increase (decrease) in net assets: | | | | | | |
| Operations: | | | | | | |
| Net investment income | $ | 39,226 | | $ | 48,909 | |
| Net realized gain (loss) | | 593 | | | (223 | ) |
| Net change in unrealized appreciation (depreciation) | | 218 | | | 13,396 | |
| Net increase (decrease) in net assets resulting from operations | | 40,037 | | | 62,082 | |
| Distributions to shareholders from: | | | | | | |
| Net investment income: | | | | | | |
| Class R6 | | (13,895 | ) | | (16,905 | ) |
| Advisor Class | | (13,895 | ) | | (16,905 | ) |
| Total distributions to shareholders | | (27,790 | ) | | (33,810 | ) |
| Capital share transactions: (Note 2) | | | | | | |
| Class R6 | | 1,763,895 | | | 1,766,905 | |
| Advisor Class | | 1,763,895 | | | 1,766,905 | |
| Total capital share transactions | | 3,527,790 | | | 3,533,810 | |
| Net increase (decrease) in net assets | | 3,540,037 | | | 3,562,082 | |
| Net assets: | | | | | | |
| End of year | $ | 3,540,037 | | $ | 3,562,082 | |
| Undistributed net investment income included in net assets: | | | | | | |
| End of year | $ | 15,918 | | $ | 19,587 | |
*For the year June 1, 2015 (commencement of operations) to May 31, 2016.
The accompanying notes are an integral part of these financial statements. | Annual Report 59
FRANKLIN FUND ALLOCATOR SERIES
FINANCIAL STATEMENTS
| | | | | | |
| Statements of Changes in Net Assets (continued) | | | | | | |
| |
| | | Franklin | | | Franklin | |
| | | Payout 2019 Fund | | | Payout 2020 Fund | |
| | | Year Ended | | | Year Ended | |
| | | May 31, 2016* | | | May 31, 2016* | |
| Increase (decrease) in net assets: | | | | | | |
| Operations: | | | | | | |
| Net investment income | $ | 72,589 | | $ | 81,011 | |
| Net realized gain (loss) | | 1,435 | | | (2,999 | ) |
| Net change in unrealized appreciation (depreciation) | | 39,565 | | | 44,577 | |
| Net increase (decrease) in net assets resulting from operations | | 113,589 | | | 122,589 | |
| Distributions to shareholders from: | | | | | | |
| Net investment income: | | | | | | |
| Class R6 | | (24,500 | ) | | (27,380 | ) |
| Advisor Class | | (24,500 | ) | | (27,380 | ) |
| Total distributions to shareholders | | (49,000 | ) | | (54,760 | ) |
| Capital share transactions: (Note 2) | | | | | | |
| Class R6 | | 2,024,500 | | | 2,027,380 | |
| Advisor Class | | 2,024,500 | | | 2,027,380 | |
| Total capital share transactions | | 4,049,000 | | | 4,054,760 | |
| Net increase (decrease) in net assets | | 4,113,589 | | | 4,122,589 | |
| Net assets: | | | | | | |
| End of year | $ | 4,113,589 | | $ | 4,122,589 | |
| Undistributed net investment income included in net assets: | | | | | | |
| End of year | $ | 28,690 | | $ | 31,334 | |
*For the year June 1, 2015 (commencement of operations) to May 31, 2016.
60 Annual Report | The accompanying notes are an integral part of these financial statements.
FRANKLIN FUND ALLOCATOR SERIES
FINANCIAL STATEMENTS
| | | |
| Statements of Changes in Net Assets (continued) | | | |
| |
| | | Franklin | |
| | | Payout 2021 Fund | |
| | | Year Ended | |
| | | May 31, 2016* | |
| Increase (decrease) in net assets: | | | |
| Operations: | | | |
| Net investment income | $ | 89,684 | |
| Net change in unrealized appreciation (depreciation) | | 90,733 | |
| Net increase (decrease) in net assets resulting from operations | | 180,417 | |
| Distributions to shareholders from: | | | |
| Net investment income: | | | |
| Class R6 | | (29,860 | ) |
| Advisor Class | | (29,860 | ) |
| Total distributions to shareholders | | (59,720 | ) |
| Capital share transactions: (Note 2) | | | |
| Class R6 | | 2,029,860 | |
| Advisor Class | | 2,029,860 | |
| Total capital share transactions | | 4,059,720 | |
| Net increase (decrease) in net assets | | 4,180,417 | |
| Net assets: | | | |
| End of year | $ | 4,180,417 | |
| Undistributed net investment income included in net assets: | | | |
| End of year | $ | 35,078 | |
*For the year June 1, 2015 (commencement of operations) to May 31, 2016.
The accompanying notes are an integral part of these financial statements. | Annual Report 61
FRANKLIN FUND ALLOCATOR SERIES
Notes to Financial Statements
1. Organization and Significant Accounting Policies
Franklin Fund Allocator Series (Trust) is registered under the Investment Company Act of 1940 (1940 Act) as an open-end management investment company, consisting of twenty-two separate funds, five of which are included in this report (Funds) and applies the specialized accounting and reporting guidance in U.S. Generally Accepted Accounting Principles (U.S. GAAP). The financial statements of the remaining funds in the Trust are presented separately. Effective June 1 2015, the Funds commenced operations offering two classes of shares: Class R6 and Advisor Class. Each class of shares differs by its voting rights on matters affecting a single class and fees primarily due to differing arrangements for transfer agent fees.
The following summarizes the Funds’ significant accounting policies.
a. Financial Instrument Valuation
The Funds’ investments in financial instruments are carried at fair value daily. Fair value is the price that would be received to sell an asset or paid to transfer a liability in an orderly transaction between market participants on the measurement date. The Funds calculate the net asset value (NAV) per share as of 4 p.m. Eastern time each day the New York Stock Exchange (NYSE) is open for trading. Under compliance policies and procedures approved by the Trust’s Board of Trustees (the Board), the Funds’ administrator has responsibility for oversight of valuation, including leading the cross-functional Valuation Committee (VC). The VC provides administration and oversight of the Funds’ valuation policies and procedures, which are approved annually by the Board. Among other things, these procedures allow the Funds to utilize independent pricing services, quotations from securities and financial instrument dealers, and other market sources to determine fair value.
Debt securities generally trade in the over-the-counter market rather than on a securities exchange. The Funds’ pricing services use multiple valuation techniques to determine fair value. In instances where sufficient market activity exists, the pricing services may utilize a market-based approach through which quotes from market makers are used to determine fair value. In instances where sufficient market activity may not exist or is limited, the pricing services also utilize proprietary valuation models which may consider market characteristics such as benchmark yield curves, credit spreads, estimated default rates, anticipated market interest rate volatility, coupon rates, anticipated timing of principal repayments, underlying collateral, and other unique security features in order to estimate the relevant cash flows, which are then discounted to calculate the fair value.
Investments in open-end mutual funds are valued at the closing NAV.
The Funds have procedures to determine the fair value of financial instruments for which market prices are not reliable or readily available. Under these procedures, the VC convenes on a regular basis to review such financial instruments and considers a number of factors, including significant unobservable valuation inputs, when arriving at fair value. The VC primarily employs a market-based approach which may use related or comparable assets or liabilities, recent transactions, market multiples, book values, and other relevant information for the investment to determine the fair value of the investment. An income-based valuation approach may also be used in which the anticipated future cash flows of the investment are discounted to calculate fair value. Discounts may also be applied due to the nature or duration of any restrictions on the disposition of the investments. Due to the inherent uncertainty of valuations of such investments, the fair values may differ significantly from the values that would have been used had an active market existed. The VC employs various methods for calibrating these valuation approaches including a regular review of key inputs and assumptions, transactional back-testing or disposition analysis, and reviews of any related market activity.
b. Income and Deferred Taxes
It is each Fund’s policy to qualify as a regulated investment company under the Internal Revenue Code. Each Fund intends to distribute to shareholders substantially all of its taxable income and net realized gains to relieve it from federal income and excise taxes. As a result, no provision for U.S. federal income taxes is required.
The Funds may be subject to foreign taxation related to income received, capital gains on the sale of securities and certain foreign currency transactions in the foreign jurisdictions in which the Funds invest. Foreign taxes, if any, are recorded based on the tax regulations and rates that exist in the foreign markets in which the Funds invest. When a capital gain tax is determined to apply, certain or all Funds record an estimated deferred tax liability in an amount that would be payable if the securities were disposed of on the valuation date.
Each Fund may recognize an income tax liability related to its uncertain tax positions under U.S. GAAP when the uncertain tax position has a less than 50% probability that it will be sustained
FRANKLIN FUND ALLOCATOR SERIES
NOTES TO FINANCIAL STATEMENTS
upon examination by the tax authorities based on its technical merits. As of May 31, 2016, each Fund has determined that no tax liability is required in its financial statements related to uncertain tax positions for any open tax years (or expected to be taken in future tax years). Open tax years are those that remain subject to examination and are based on each jurisdiction’s statute of limitation.
c. Security Transactions, Investment Income, Expenses and Distributions
Security transactions are accounted for on trade date. Realized gains and losses on security transactions are determined on a specific identification basis. Interest income and estimated expenses are accrued daily. Amortization of premium and accretion of discount on debt securities are included in interest income. Distributions to shareholders are recorded on the ex-dividend date and are determined according to income tax regulations (tax basis). Distributable earnings determined on a tax basis may differ from earnings recorded in accordance with U.S. GAAP. These differences may be permanent or temporary. Permanent differences are reclassified among capital accounts to reflect their tax character. These reclassifications have no impact on net assets or the results of operations. Temporary differences are not reclassified, as they may reverse in subsequent periods.
Common expenses incurred by the Trust are allocated among the Funds based on the ratio of net assets of each Fund to the combined net assets of the Trust. Fund specific expenses are charged directly to the fund that incurred the expense.
Realized and unrealized gains and losses and net investment income, not including class specific expenses, are allocated daily to each class of shares based upon the relative proportion of net assets of each class. Differences in per share distributions, by class, are generally due to differences in class specific expenses.
d. Offering Costs
Offering costs are amortized on a straight line basis over twelve months.
e. Accounting Estimates
The preparation of financial statements in accordance with U.S. GAAP requires management to make estimates and assumptions that affect the reported amounts of assets and liabilities at the date of the financial statements and the amounts of income and expenses during the reporting period. Actual results could differ from those estimates.
f. Guarantees and Indemnifications
Under the Trust’s organizational documents, its officers and trustees are indemnified by the Trust against certain liabilities arising out of the performance of their duties to the Trust. Additionally, in the normal course of business, the Trust, on behalf of the Funds, enters into contracts with service providers that contain general indemnification clauses. The Trust’s maximum exposure under these arrangements is unknown as this would involve future claims that may be made against the Trust that have not yet occurred. Currently, the Trust expects the risk of loss to be remote.
2. Shares of Beneficial Interest
At May 31, 2016, there were an unlimited number of shares authorized (without par value). Transactions in the Funds’ shares were as follows:
| | | | | | |
| | Franklin Payout 2017 Fund* | Franklin Payout 2018 Fund* |
| | Shares | | Amount | Shares | | Amount |
| |
| Class R6 Shares: | | | | | | |
| Year ended May 31, 2016 | | | | | | |
| Shares sold | 175,000 | $ | 1,750,000 | 175,000 | $ | 1,750,000 |
| Shares issued in reinvestment of distributions | 1,398 | | 13,895 | 1,701 | | 16,905 |
| Net increase (decrease) | 176,398 | $ | 1,763,895 | 176,701 | $ | 1,766,905 |
| Advisor Class Shares: | | | | | | |
| Year ended May 31, 2016 | | | | | | |
| Shares sold | 175,000 | $ | 1,750,000 | 175,000 | $ | 1,750,000 |
| Shares issued in reinvestment of distributions | 1,398 | | 13,895 | 1,701 | | 16,905 |
| Net increase (decrease) | 176,398 | $ | 1,763,895 | 176,701 | $ | 1,766,905 |
Annual Report
63
FRANKLIN FUND ALLOCATOR SERIES
NOTES TO FINANCIAL STATEMENTS
| | | | | | |
| 2. Shares of Beneficial Interest (continued) | | | | | | |
| | Franklin Payout 2019 Fund* | Franklin Payout 2020 Fund* |
| | Shares | | Amount | Shares | | Amount |
| Class R6 Shares: | | | | | | |
| Year ended May 31, 2016 | | | | | | |
| Shares sold | 200,000 | $ | 2,000,000 | 200,000 | $ | 2,000,000 |
| Shares issued in reinvestment of distributions | 2,465 | | 24,500 | 2,763 | | 27,380 |
| Net increase (decrease) | 202,465 | $ | 2,024,500 | 202,763 | $ | 2,027,380 |
| Advisor Class Shares: | | | | | | |
| Year ended May 31, 2016 | | | | | | |
| Shares sold | 200,000 | $ | 2,000,000 | 200,000 | $ | 2,000,000 |
| Shares issued in reinvestment of distributions | 2,465 | | 24,500 | 2,763 | | 27,380 |
| Net increase (decrease) | 202,465 | $ | 2,024,500 | 202,763 | $ | 2,027,380 |
| |
| | | | | Franklin Payout 2021 Fund* |
| | | | | Shares | | Amount |
| Class R6 Shares: | | | | | | |
| Year ended May 31, 2016 | | | | | | |
| Shares sold | | | | 200,000 | $ | 2,000,000 |
| Shares issued in reinvestment of distributions | | | | 3,001 | | 29,860 |
| Net increase (decrease) | | | | 203,001 | $ | 2,029,860 |
| Advisor Class Shares: | | | | | | |
| Year ended May 31, 2016 | | | | | | |
| Shares sold | | | | 200,000 | $ | 2,000,000 |
| Shares issued in reinvestment of distributions | | | | 3,001 | | 29,860 |
| Net increase (decrease) | | | | 203,001 | $ | 2,029,860 |
| *For the year June 1, 2015 (commencement of operations) to May 31, 2016. | | | | | | |
3. Transactions with Affiliates
Franklin Resources, Inc. is the holding company for various subsidiaries that together are referred to as Franklin Templeton Investments. Certain officers and trustees of the Funds are also officers and/or directors of the following subsidiaries:
| |
Subsidiary Franklin Advisers, Inc. (Advisers) Franklin Templeton Services, LLC (FT Services) Franklin Templeton Distributors, Inc. (Distributors) Franklin Templeton Investor Services, LLC (Investor Services) | Affiliation Investment manager Administrative manager Principal underwriter Transfer agent |
a. Management Fees
The Funds pay an investment management fee to Advisers of 0.30% per year of the average daily net assets of each of the Funds.
b. Administrative Fees
Under an agreement with Advisers, FT Services provides administrative services to the Funds. The fee is paid by Advisers based on each of the Funds’ average daily net assets, and is not an additional expense of the Funds.
FRANKLIN FUND ALLOCATOR SERIES
NOTES TO FINANCIAL STATEMENTS
c. Transfer Agent Fees
Advisor Class pays transfer agent fees to Investor Services for its performance of shareholder servicing obligations and reimburses Investor Services for out of pocket expenses incurred, including shareholder servicing fees paid to third parties. Class R6 pays Investor Services transfer agent fees specific to that class.
For the year ended May 31, 2016, the Funds paid transfer agent fees as noted in the Statements of Operations of which the following amounts were retained by Investor Services:
| | | | | | | | | | |
| | | Franklin | | Franklin | | Franklin | | Franklin | | Franklin |
| | | Payout 2017 | | Payout 2018 | | Payout 2019 | | Payout 2020 | | Payout 2021 |
| | | Fund | | Fund | | Fund | | Fund | | Fund |
| |
| Transfer agent fees | $ | 84 | $ | 84 | $ | 84 | $ | 84 | $ | 84 |
d. Investments in Affiliated Management Investment Companies
Certain or all Funds invest in one or more affiliated management investment companies for purposes other than exercising a controlling influence over the management or policies. Management fees paid by the Funds are waived on assets invested in the affiliated management investment companies, as noted in the Statements of Operations, in an amount not to exceed the management and administrative fees paid directly or indirectly by each affiliate.
| | | | | | | | | | |
| | Number | | | | | | | | | % of Affiliated |
| | of Shares | | | | Number of | | | | | Fund Shares |
| | Held at | | | | Shares Held | | Value | | Realized | Outstanding |
| | Beginning | Gross | Gross | | at End | | at End Investment | Gain | Held at End |
| | of Year | Additions | Reductions | | of Year | | of Year | Income | (Loss) | of Year |
| Franklin Payout 2017 Fund | | | | | | | | | | |
| Non-Controlled Affiliates | | | | | | | | | | |
| Institutional Fiduciary Trust | | | | | | | | | | |
| Money Market Portfolio | — | 3,429,509 | (3,338,135 | ) | 91,374 | $ | 91,374 | $ — | $ — | —a |
| Franklin Payout 2018 Fund | | | | | | | | | | |
| Non-Controlled Affiliates | | | | | | | | | | |
| Institutional Fiduciary Trust | | | | | | | | | | |
| Money Market Portfolio | — | 3,352,439 | (3,313,088 | ) | 39,351 | $ | 39,351 | $ — | $ — | —a |
| Franklin Payout 2019 Fund | | | | | | | | | | |
| Non-Controlled Affiliates | | | | | | | | | | |
| Institutional Fiduciary Trust | | | | | | | | | | |
| Money Market Portfolio | — | 3,693,254 | (3,642,062 | ) | 51,192 | $ | 51,192 | $ — | $ — | —a |
| Franklin Payout 2020 Fund | | | | | | | | | | |
| Non-Controlled Affiliates | | | | | | | | | | |
| Institutional Fiduciary Trust | | | | | | | | | | |
| Money Market Portfolio | — | 3,774,962 | (3,688,237 | ) | 86,725 | $ | 86,725 | $ — | $ — | —a |
| Franklin Payout 2021 Fund | | | | | | | | | | |
| Non-Controlled Affiliates | | | | | | | | | | |
| Institutional Fiduciary Trust | | | | | | | | | | |
| Money Market Portfolio | — | 3,712,004 | (3,663,713 | ) | 48,291 | $ | 48,291 | $ — | $ — | —a |
| aRounds to less than 0.01%. | | | | | | | | | | |
e. Waiver and Expense Reimbursements
Advisers has contractually agreed in advance to waive or limit its respective fees and to assume as its own expense certain expenses otherwise payable by the Funds so that the expenses (excluding acquired fund fees and expenses) for Advisor Class does not exceed 0.44%, and Class R6 does not exceed 0.30% based on the average net assets of each class (other than certain non-routine expenses or costs, including those relating to litigation, indemnification, reorganizations, and liquidations) until September 30, 2016. Total expenses waived or paid are not subject to recapture subsequent to the Funds’ fiscal year end.
Annual Report
65
FRANKLIN FUND ALLOCATOR SERIES
NOTES TO FINANCIAL STATEMENTS
3. Transactions with Affiliates (continued)
f. Other Affiliated Transactions
At May 31, 2016, Advisers owned 100% of the Funds’ outstanding shares. Investment activities of this shareholder could have a material impact on the Funds.
4. Expense Offset Arrangement
The Funds have entered into an arrangement with their custodian whereby credits realized as a result of uninvested cash balances are used to reduce a portion of the Funds’ custodian expenses. During the year ended May 31, 2016, there were no credits earned.
5. Income Taxes
For tax purposes, capital losses may be carried over to offset future capital gains. At May 31, 2016, the capital loss carryforwards were as follows:
| | | | | | | | | | | | | | | | | | | | | | | | | |
| | | | | | | | | | | | | | | | | | | | Franklin | | | | | Franklin | |
| | | | | | | | | | | | | | | | | | Payout 2018 | | | Payout 2020 | |
| | | | | | | | | | | | | | | | | | | | Fund | | | | | Fund | |
| Capital loss carryforwards: | | | | | | | | | | | | | | | | | | | | | | | | | |
| Short term | | | | | | | | | | | | | | | | | | $ | 223 | | | | $ | 2,999 | |
| |
| The tax character of distributions paid during the year ended May 31, 2016 was as follows: | | | | | | | | | | | |
| | | | | Franklin | | | | | Franklin | | | | | Franklin | | | | | Franklin | | | | | Franklin | |
| | | Payout 2017 | | | Payout 2018 | | | Payout 2019 | | | Payout 2020 | | | Payout 2021 | |
| | | | | Fund | | | | | Fund | | | | | Fund | | | | | Fund | | | | | Fund | |
| Distributions paid from ordinary income | | | $ | 27,790 | | | | $ | 33,810 | | | | $ | 49,000 | | | | $ | 54,760 | | | | $ | 59,720 | |
| |
| At May 31, 2016, the cost of investments, net unrealized appreciation (depreciation) and undistributed ordinary income for income | |
| tax purposes were as follows: | | | | | | | | | | | | | | | | | | | | | | | | | |
| | | | | Franklin | | | | | Franklin | | | | | Franklin | | | | | Franklin | | | | | Franklin | |
| | | Payout 2017 | | | Payout 2018 | | | Payout 2019 | | | Payout 2020 | | | Payout 2021 | |
| | | | | Fund | | | | | Fund | | | | | Fund | | | | | Fund | | | | | Fund | |
| Cost of investments | $ | 3,507,148 | | $ | 3,522,531 | | $ | 4,051,180 | | $ | 4,052,001 | | $ | 4,057,797 | |
| Unrealized appreciation | | $ | | 4,235 | | | $ | | 17,734 | | | $ | | 50,435 | | | $ | | 66,520 | | | $ | | 98,598 | |
| Unrealized depreciation | | | | (3,664 | ) | | | | (4,305 | ) | | | | (10,729 | ) | | | | (21,943 | ) | | | | (7,313 | ) |
| Net unrealized appreciation (depreciation) | | $ | | 571 | | | $ | | 13,429 | | | $ | | 39,706 | | | $ | | 44,577 | | | $ | | 91,285 | |
| Distributable earnings - | | | | | | | | | | | | | | | | | | | | | | | | | |
| undistributed ordinary income | | $ | | 16,160 | | | $ | | 19,554 | | | $ | | 29,983 | | | $ | | 31,334 | | | $ | | 34,525 | |
| |
| Differences between income and/or capital gains as determined on a book basis and a tax basis are primarily due to differing treat- | |
| ment of bond discount and premiums. | | | | | | | | | | | | | | | | | | | | | | | | | |
| |
| 6. Investment Transactions | | | | | | | | | | | | | | | | | | | | | | | | | |
| Purchases and sales of investments (excluding short term securities) for the year ended May 31, 2016, were as follows: | | | |
| | | | | Franklin | | | | | Franklin | | | | | Franklin | | | | | Franklin | | | | | Franklin | |
| | | Payout 2017 | | | Payout 2018 | | | Payout 2019 | | | Payout 2020 | | | Payout 2021 | |
| | | | | Fund | | | | | Fund | | | | | Fund | | | | | Fund | | | | | Fund | |
| Purchases | $ | 3,626,964 | | $ | 3,635,292 | | $ | 4,033,739 | | $ | 4,173,167 | | $ | 4,033,385 | |
| Sales | | $ | | 153,583 | | | $ | | 102,724 | | | $ | | 50 | | | $ | | 166,500 | | | $ | | — | |
FRANKLIN FUND ALLOCATOR SERIES
NOTES TO FINANCIAL STATEMENTS
7. Credit Facility
Certain or all Funds, together with other U.S. registered and foreign investment funds (collectively, Borrowers), managed by Franklin Templeton Investments, are borrowers in a joint syndicated senior unsecured credit facility totaling $2 billion (Global Credit Facility) which matures on February 10, 2017. This Global Credit Facility provides a source of funds to the Borrowers for temporary and emergency purposes, including the ability to meet future unanticipated or unusually large redemption requests. The Funds began participating in the Global Credit Facility on February 12, 2016.
Under the terms of the Global Credit Facility, the Funds shall, in addition to interest charged on any borrowings made by the Funds and other costs incurred by the Funds, pay their share of fees and expenses incurred in connection with the implementation and maintenance of the Global Credit Facility, based upon their relative share of the aggregate net assets of all of the Borrowers, including an annual commitment fee of 0.15% based upon the unused portion of the Global Credit Facility. These fees are reflected in other expenses in the Statements of Operations. During the year ended May 31, 2016, the Funds did not use the Global Credit Facility.
8. Fair Value Measurements
The Funds follow a fair value hierarchy that distinguishes between market data obtained from independent sources (observable inputs) and the Funds’ own market assumptions (unobservable inputs). These inputs are used in determining the value of the Funds’ financial instruments and are summarized in the following fair value hierarchy:
- Level 1 – quoted prices in active markets for identical financial instruments
- Level 2 – other significant observable inputs (including quoted prices for similar financial instruments, interest rates, prepay- ment speed, credit risk, etc.)
- Level 3 – significant unobservable inputs (including the Funds’ own assumptions in determining the fair value of financial instruments)
The input levels are not necessarily an indication of the risk or liquidity associated with financial instruments at that level.
For movements between the levels within the fair value hierarchy, the Funds have adopted a policy of recognizing the transfers as of the date of the underlying event which caused the movement.
A summary of inputs used as of May 31, 2016, in valuing the Funds’ assets carried at fair value, is as follows:
| | | | | | | | |
| | | Level 1 | | Level 2 | | Level 3 | | Total |
| |
| Franklin Payout 2017 Fund | | | | | | | | |
| Assets: | | | | | | | | |
| Investments in Securities: | | | | | | | | |
| Corporate Bonds | $ | — | $ | 2,780,038 | $ | — | $ | 2,780,038 |
| U.S. Government and Agency Securities | | — | | 485,723 | | — | | 485,723 |
| Asset-Backed Securities | | — | | 100,432 | | — | | 100,432 |
| Municipal Bonds | | — | | 50,152 | | — | | 50,152 |
| Short Term Investments | | 91,374 | | — | | — | | 91,374 |
| Total Investments in Securities | $ | 91,374 | $ | 3,416,345 | $ | — | $ | 3,507,719 |
| |
| Franklin Payout 2018 Fund | | | | | | | | |
| Assets: | | | | | | | | |
| Investments in Securities: | | | | | | | | |
| Corporate Bonds | $ | — | $ | 2,876,758 | $ | — | $ | 2,876,758 |
| U.S. Government and Agency Securities | | — | | 619,851 | | — | | 619,851 |
| Short Term Investments | | 39,351 | | — | | — | | 39,351 |
| Total Investments in Securities | $ | 39,351 | $ | 3,496,609 | $ | — | $ | 3,535,960 |
Annual Report
67
FRANKLIN FUND ALLOCATOR SERIES
NOTES TO FINANCIAL STATEMENTS
| | | | | | | | |
| 8. Fair Value Measurements (continued) | | | | | | | | |
| |
| | | Level 1 | | Level 2 | | Level 3 | | Total |
| |
| Franklin Payout 2019 Fund | | | | | | | | |
| Assets: | | | | | | | | |
| Investments in Securities: | | | | | | | | |
| Corporate Bonds | $ | — | $ | 3,304,803 | $ | — | $ | 3,304,803 |
| U.S. Government and Agency Securities | | — | | 734,891 | | — | | 734,891 |
| Short Term Investments | | 51,192 | | — | | — | | 51,192 |
| Total Investments in Securities | $ | 51,192 | $ | 4,039,694 | $ | — | $ | 4,090,886 |
| |
| Franklin Payout 2020 Fund | | | | | | | | |
| Assets: | | | | | | | | |
| Investments in Securities: | | | | | | | | |
| Corporate Bonds | $ | — | $ | 3,073,013 | $ | — | $ | 3,073,013 |
| Foreign Government and Agency Securities | | — | | 205,586 | | — | | 205,586 |
| U.S. Government and Agency Securities | | — | | 731,254 | | — | | 731,254 |
| Short Term Investments | | 86,725 | | — | | — | | 86,725 |
| Total Investments in Securities | $ | 86,725 | $ | 4,009,853 | $ | — | $ | 4,096,578 |
| |
| Franklin Payout 2021 Fund | | | | | | | | |
| Assets: | | | | | | | | |
| Investments in Securities: | | | | | | | | |
| Corporate Bonds | $ | — | $ | 3,135,206 | $ | — | $ | 3,135,206 |
| Foreign Government and Agency Securities | | — | | 102,378 | | — | | 102,378 |
| U.S. Government and Agency Securities | | — | | 744,323 | | — | | 744,323 |
| Municipal Bonds | | — | | 118,884 | | — | | 118,884 |
| Short Term Investments | | 48,291 | | — | | — | | 48,291 |
| Total Investments in Securities | $ | 48,291 | $ | 4,100,791 | $ | — | $ | 4,149,082 |
9. Subsequent Events
The Funds have evaluated subsequent events through the issuance of the financial statements and determined that no events have occurred that require disclosure.
| |
| Abbreviations |
| Selected Portfolio |
| FFCB | Federal Farm Credit Bank |
| FHLB | Federal Home Loan Bank |
| FNMA | Federal National Mortgage Association |
| GO | General Obligation |
FRANKLIN FUND ALLOCATOR SERIES
Report of Independent Registered Public Accounting Firm
To the Board of Trustees and Shareholders of Franklin Fund Allocator Series
In our opinion, the accompanying statements of assets and liabilities, including the statements of investments, and the related statements of operations and of changes in net assets and the financial highlights present fairly, in all material respects, the financial position of Franklin Payout 2017 Fund, Franklin Payout 2018 Fund, Franklin Payout 2019 Fund, Franklin Payout 2020 Fund and Franklin Payout 2021 Fund (separate portfolios of Franklin Fund Allocator Series, hereafter referred to as the “Funds”) at May 31, 2016, the results of each of their operations, the changes in each of their net assets and the financial highlights for the year, in conformity with accounting principles generally accepted in the United States of America. These financial statements and financial highlights (hereafter referred to as “financial statements”) are the responsibility of the Funds’ management. Our responsibility is to express an opinion on these financial statements based on our audits. We conducted our audits of these financial statements in accordance with the standards of the Public Company Accounting Oversight Board (United States). Those standards require that we plan and perform the audit to obtain reasonable assurance about whether the financial statements are free of material misstatement. An audit includes examining, on a test basis, evidence supporting the amounts and disclosures in the financial statements, assessing the accounting principles used and significant estimates made by management, and evaluating the overall financial statement presentation. We believe that our audits, which included confirmation of securities at May 31, 2016 by correspondence with the transfer agent and custodian, provide a reasonable basis for our opinion.
PricewaterhouseCoopers LLP
San Francisco, California
July 15, 2016
Annual Report
69
FRANKLIN FUND ALLOCATOR SERIES
Board Members and Officers
The name, year of birth and address of the officers and board members, as well as their affiliations, positions held with the Trust, principal occupations during at least the past five years and number of U.S. registered portfolios overseen in the Franklin Templeton Investments fund complex, are shown below. Generally, each board member serves until that person’s successor is elected and qualified.
| | | | |
| Independent Board Members | | | |
| |
| | | | Number of Portfolios in | |
| Name, Year of Birth | | Length of | Fund Complex Overseen | Other Directorships Held During |
| and Address | Position | Time Served | by Board Member* | at Least the Past 5 Years |
| |
| Harris J. Ashton (1932) | Trustee | Since 1995 | 145 | Bar-S Foods (meat packing company) |
| One Franklin Parkway | | | | (1981-2010). |
| San Mateo, CA 94403-1906 | | | | |
| Principal Occupation During at Least the Past 5 Years: | | |
| Director of various companies; and formerly, Director, RBC Holdings, Inc. (bank holding company) (until 2002); and President, Chief |
| Executive Officer and Chairman of the Board, General Host Corporation (nursery and craft centers) (until 1998). |
| |
| Mary C. Choksi (1950) | Trustee | Since 2014 | 121 | Avis Budget Group Inc. (car rental) |
| One Franklin Parkway | | | | (2007-present), Omnicom Group Inc. |
| San Mateo, CA 94403-1906 | | | | (advertising and marketing |
| | | | | communications services) (2011- |
| | | | | present) and H.J. Heinz Company |
| | | | | (processed foods and allied products) |
| | | | | (1998-2006). |
| Principal Occupation During at Least the Past 5 Years: | | |
| Senior Advisor, Strategic Investment Group (investment management group) (2015-present); director of various companies; and formerly, |
| Founding Partner and Senior Managing Director, Strategic Investment Group (1987-2015); Founding Partner and Managing Director, |
| Emerging Markets Management LLC (investment management firm) (1987-2011); and Loan Officer/Senior Loan Officer/Senior Pension |
| Investment Officer, World Bank Group (international financial institution) (1977-1987). | |
| |
| Edith E. Holiday (1952) | Trustee | Since 1998 | 145 | Hess Corporation (exploration and |
| One Franklin Parkway | | | | refining of oil and gas) (1993-present), |
| San Mateo, CA 94403-1906 | | | | Canadian National Railway (railroad) |
| | | | | (2001-present), White Mountains |
| | | | | Insurance Group, Ltd. (holding |
| | | | | company) (2004-present), RTI |
| | | | | International Metals, Inc. (manufacture |
| | | | | and distribution of titanium) (1999- |
| | | | | 2015) and H.J. Heinz Company |
| | | | | (processed foods and allied products) |
| | | | | (1994-2013). |
| Principal Occupation During at Least the Past 5 Years: | | |
| Director or Trustee of various companies and trusts; and formerly, Assistant to the President of the United States and Secretary of the |
| Cabinet (1990-1993); General Counsel to the United States Treasury Department (1989-1990); and Counselor to the Secretary and Assistant |
| Secretary for Public Affairs and Public Liaison – United States Treasury Department (1988-1989). | |
| |
| J. Michael Luttig (1954) | Trustee | Since 2009 | 145 | Boeing Capital Corporation (aircraft |
| One Franklin Parkway | | | | financing) (2006-2013). |
| San Mateo, CA 94403-1906 | | | | |
| Principal Occupation During at Least the Past 5 Years: | | |
| Executive Vice President, General Counsel and member of the Executive Council, The Boeing Company (aerospace company) (2006- |
| present); and formerly, Federal Appeals Court Judge, U.S. Court of Appeals for the Fourth Circuit (1991-2006). |
FRANKLIN FUND ALLOCATOR SERIES
| | | | |
| Independent Board Members (continued) | | |
| |
| | | | Number of Portfolios in | |
| Name, Year of Birth | | Length of | Fund Complex Overseen | Other Directorships Held During |
| and Address | Position | Time Served | by Board Member* | at Least the Past 5 Years |
| |
| Frank A. Olson (1932) | Trustee | Since 2007 | 145 | Hess Corporation (exploration and |
| One Franklin Parkway | | | | refining of oil and gas) (1998-2013). |
| San Mateo, CA 94403-1906 | | | | |
| Principal Occupation During at Least the Past 5 Years: | | |
| Director of various companies; and formerly, Chairman of the Board, The Hertz Corporation (car rental) (1980-2000) and Chief Executive |
| Officer (1977-1999); and Chairman of the Board, President and Chief Executive Officer, UAL Corporation (airlines) (June-December 1987). |
| |
| Larry D. Thompson (1945) | Trustee | Since 2007 | 145 | The Southern Company (energy |
| One Franklin Parkway | | | | company) (2014-present; previously |
| San Mateo, CA 94403-1906 | | | | 2010-2012), Graham Holdings |
| | | | | Company (education and media |
| | | | | organization) (2011-present) and |
| | | | | Cbeyond, Inc. (business |
| | | | | communications provider) (2010-2012). |
| Principal Occupation During at Least the Past 5 Years: | | |
| Director of various companies; John A. Sibley Professor of Corporate and Business Law, University of Georgia School of Law (2015-present; |
| previously 2011-2012); and formerly, Executive Vice President – Government Affairs, General Counsel and Corporate Secretary, PepsiCo, |
| Inc. (consumer products) (2012-2014); Senior Vice President – Government Affairs, General Counsel and Secretary, PepsiCo, Inc. (2004- |
| 2011); Senior Fellow of The Brookings Institution (2003-2004); Visiting Professor, University of Georgia School of Law (2004); and Deputy |
| Attorney General, U.S. Department of Justice (2001-2003). | | |
| |
| John B. Wilson (1959) | Lead | Trustee since | 121 | None |
| One Franklin Parkway | Independent | 2006 and Lead | | |
| San Mateo, CA 94403-1906 | Trustee | Independent | | |
| | | Trustee since | | |
| | | 2008 | | |
| Principal Occupation During at Least the Past 5 Years: | | |
| President, Staples Europe (office supplies) (2012-present); President and Founder, Hyannis Port Capital, Inc. (real estate and private equity |
| investing); serves on private and non-profit boards; and formerly, Chief Operating Officer and Executive Vice President, Gap, Inc. (retail) (1996- |
| 2000); Chief Financial Officer and Executive Vice President – Finance and Strategy, Staples, Inc. (1992-1996); Senior Vice President – Corporate |
| Planning, Northwest Airlines, Inc. (airlines) (1990-1992); and Vice President and Partner, Bain & Company (consulting firm) (1986-1990). |
| |
| |
| |
| Interested Board Members and Officers | | |
| |
| | | | Number of Portfolios in | |
| Name, Year of Birth | | Length of | Fund Complex Overseen | Other Directorships Held During |
| and Address | Position | Time Served | by Board Member* | at Least the Past 5 Years |
| |
| **Gregory E. Johnson (1961) | Trustee | Since 2007 | 160 | None |
| One Franklin Parkway | | | | |
| San Mateo, CA 94403-1906 | | | | |
| Principal Occupation During at Least the Past 5 Years: | | |
| Chairman of the Board, Member – Office of the Chairman, Director and Chief Executive Officer, Franklin Resources, Inc.; officer and/or director |
| or trustee, as the case may be, of some of the other subsidiaries of Franklin Resources, Inc. and of 44 of the investment companies in Franklin |
| Templeton Investments; Vice Chairman, Investment Company Institute; and formerly, President, Franklin Resources, Inc. (1994-2015). |
| |
| **Rupert H. Johnson, Jr. (1940) | Chairman of | Chairman of | 145 | None |
| One Franklin Parkway | the Board and | the Board and | | |
| San Mateo, CA 94403-1906 | Trustee | Trustee since | | |
| | | 2013 | | |
| Principal Occupation During at Least the Past 5 Years: | | |
| Vice Chairman, Member – Office of the Chairman and Director, Franklin Resources, Inc.; Director, Franklin Advisers, Inc.; Senior Vice |
| President, Franklin Advisory Services, LLC; and officer and/or director or trustee, as the case may be, of some of the other subsidiaries of |
| Franklin Resources, Inc. and of 42 of the investment companies in Franklin Templeton Investments. | |
Annual Report
71
FRANKLIN FUND ALLOCATOR SERIES
| | | | |
| Interested Board Members and Officers (continued) | |
| |
| | | | Number of Portfolios in | |
| Name, Year of Birth | | Length of | Fund Complex Overseen | Other Directorships Held During |
| and Address | Position | Time Served | by Board Member* | at Least the Past 5 Years |
| |
| Alison E. Baur (1964) | Vice | Since 2012 | Not Applicable | Not Applicable |
| One Franklin Parkway | President | | | |
| San Mateo, CA 94403-1906 | | | | |
| Principal Occupation During at Least the Past 5 Years: | | |
| Deputy General Counsel, Franklin Templeton Investments; and officer of some of the other subsidiaries of Franklin Resources, Inc. and of 45 |
| of the investment companies in Franklin Templeton Investments. | | |
| |
| Laura F. Fergerson (1962) | Chief | Since 2009 | Not Applicable | Not Applicable |
| One Franklin Parkway | Executive | | | |
| San Mateo, CA 94403-1906 | Officer – | | | |
| | Finance and | | | |
| | Administration | | | |
| Principal Occupation During at Least the Past 5 Years: | | |
| Senior Vice President, Franklin Templeton Services, LLC; Vice President, Franklin Advisers, Inc. and Franklin Templeton Institutional, LLC; |
| and officer of 45 of the investment companies in Franklin Templeton Investments. | |
| |
| Gaston Gardey (1967) | Treasurer, | Since 2009 | Not Applicable | Not Applicable |
| One Franklin Parkway | Chief | | | |
| San Mateo, CA 94403-1906 | Financial | | | |
| | Officer and | | | |
| | Chief | | | |
| | Accounting | | | |
| | Officer | | | |
| Principal Occupation During at Least the Past 5 Years: | | |
| Treasurer, U.S. Fund Administration & Reporting, Franklin Templeton Investments; and officer of 28 of the investment companies in Franklin |
| Templeton Investments. | | | | |
| |
| Aliya S. Gordon (1973) | Vice | Since 2009 | Not Applicable | Not Applicable |
| One Franklin Parkway | President | | | |
| San Mateo, CA 94403-1906 | | | | |
| Principal Occupation During at Least the Past 5 Years: | | |
| Senior Associate General Counsel, Franklin Templeton Investments; and officer of 45 of the investment companies in Franklin Templeton Investments. |
| |
| Steven J. Gray (1955) | Vice | Since 2009 | Not Applicable | Not Applicable |
| One Franklin Parkway | President | | | |
| San Mateo, CA 94403-1906 | | | | |
| Principal Occupation During at Least the Past 5 Years: | | |
| Senior Associate General Counsel, Franklin Templeton Investments; Vice President, Franklin Templeton Distributors, Inc. and Franklin |
| Alternative Strategies Advisers, LLC; and officer of 45 of the investment companies in Franklin Templeton Investments. |
| |
| Edward B. Jamieson (1948) | President | Since 2010 | Not Applicable | Not Applicable |
| One Franklin Parkway | and Chief | | | |
| San Mateo, CA 94403-1906 | Executive | | | |
| | Officer – | | | |
| | Investment | | | |
| | Management | | | |
| Principal Occupation During at Least the Past 5 Years: | | |
| President, Chief Investment Officer and Director, Franklin Advisers, Inc.; Executive Vice President, Franklin Templeton Institutional, LLC; and |
| officer and/or trustee, as the case may be, of some of the other subsidiaries of Franklin Resources, Inc. and of 10 of the investment companies |
| in Franklin Templeton Investments. | | | | |
FRANKLIN FUND ALLOCATOR SERIES
| | | | |
| Interested Board Members and Officers (continued) | |
| |
| | | | Number of Portfolios in | |
| Name, Year of Birth | | Length of | Fund Complex Overseen | Other Directorships Held During |
| and Address | Position | Time Served | by Board Member* | at Least the Past 5 Years |
| |
| Robert Lim (1948) | Vice | Since May 2016 | Not Applicable | Not Applicable |
| One Franklin Parkway | President – | | | |
| San Mateo, CA 94403-1906 | AML | | | |
| | Compliance | | | |
| Principal Occupation During at Least the Past 5 Years: | | |
| Vice President, Franklin Templeton Companies, LLC; Chief Compliance Officer, Franklin Templeton Distributors, Inc. and Franklin Templeton |
| Investor Services, LLC; and officer of 45 of the investment companies in Franklin Templeton Investments. |
| |
| Kimberly H. Novotny (1972) | Vice | Since 2013 | Not Applicable | Not Applicable |
| 300 S.E. 2nd Street | President | | | |
| Fort Lauderdale, FL 33301-1923 | | | | |
| Principal Occupation During at Least the Past 5 Years: | | |
| Associate General Counsel, Franklin Templeton Investments; Vice President and Corporate Secretary, Fiduciary Trust International of the |
| South; Vice President, Templeton Investment Counsel, LLC; Assistant Secretary, Franklin Resources, Inc.; and officer of 45 of the investment |
| companies in Franklin Templeton Investments. | | | |
| |
| Robert C. Rosselot (1960) | Chief | Since 2013 | Not Applicable | Not Applicable |
| 300 S.E. 2nd Street | Compliance | | | |
| Fort Lauderdale, FL 33301-1923 | Officer | | | |
| Principal Occupation During at Least the Past 5 Years: | | |
| Director, Global Compliance, Franklin Templeton Investments; Vice President, Franklin Templeton Companies, LLC; officer of 45 of the |
| investment companies in Franklin Templeton Investments; and formerly, Senior Associate General Counsel, Franklin Templeton Investments |
| (2007-2013); and Secretary and Vice President, Templeton Group of Funds (2004-2013). | |
| |
| Karen L. Skidmore (1952) | Vice | Since 2006 | Not Applicable | Not Applicable |
| One Franklin Parkway | President and | | | |
| San Mateo, CA 94403-1906 | Secretary | | | |
| Principal Occupation During at Least the Past 5 Years: | | |
| Senior Associate General Counsel, Franklin Templeton Investments; and officer of 45 of the investment companies in Franklin Templeton Investments. |
| |
| Navid Tofigh (1972) | Vice | Since | Not Applicable | Not Applicable |
| One Franklin Parkway | President | November 2015 | | |
| San Mateo, CA 94403-1906 | | | | |
| Principal Occupation During at Least the Past 5 Years: | | |
| Associate General Counsel, Franklin Templeton Investments; and officer of 45 of the investment companies in Franklin Templeton Investments. |
| |
| Craig S. Tyle (1960) | Vice | Since 2005 | Not Applicable | Not Applicable |
| One Franklin Parkway | President | | | |
| San Mateo, CA 94403-1906 | | | | |
| Principal Occupation During at Least the Past 5 Years: | | |
| General Counsel and Executive Vice President, Franklin Resources, Inc.; and officer of some of the other subsidiaries of Franklin Resources, |
| Inc. and of 45 of the investment companies in Franklin Templeton Investments. | |
| |
| Lori A. Weber (1964) | Vice | Since 2011 | Not Applicable | Not Applicable |
| 300 S.E. 2nd Street | President | | | |
| Fort Lauderdale, FL 33301-1923 | | | | |
| Principal Occupation During at Least the Past 5 Years: | | |
| Senior Associate General Counsel, Franklin Templeton Investments; Assistant Secretary, Franklin Resources, Inc.; Vice President and |
| Secretary, Templeton Investment Counsel, LLC; and officer of 45 of the investment companies in Franklin Templeton Investments. |
Annual Report
73
FRANKLIN FUND ALLOCATOR SERIES
Interested Board Members and Officers (continued)
*We base the number of portfolios on each separate series of the U.S. registered investment companies within the Franklin Templeton Investments fund complex. These
portfolios have a common investment manager or affiliated investment managers.
**Gregory E. Johnson is considered to be an interested person of the Fund under the federal securities laws due to his position as an officer and director of Franklin
Resources, Inc. (Resources), which is the parent company of the Fund’s investment manager and distributor. Rupert H. Johnson, Jr. is considered to be an interested person
of the Fund under the federal securities laws due to his position as officer and director and major shareholder of Resources.
Note 1: Rupert H. Johnson, Jr. is the uncle of Gregory E. Johnson.
Note 2: Officer information is current as of the date of this report. It is possible that after this date, information about officers may change.
The Sarbanes-Oxley Act of 2002 and Rules adopted by the Securities and Exchange Commission require the Fund to disclose whether the Fund’s Audit
Committee includes at least one member who is an audit committee financial expert within the meaning of such Act and Rules. The Fund’s Board has determined
that there is at least one such financial expert on the Audit Committee and has designated John B. Wilson as its audit committee financial expert. The Board
believes that Mr. Wilson qualifies as such an expert in view of his extensive business background and experience, including service as chief financial officer of
Staples, Inc. from 1992 to 1996. Mr. Wilson has been a Member and Chairman of the Fund’s Audit Committee since 2006. As a result of such background and
experience, the Board believes that Mr. Wilson has acquired an understanding of generally accepted accounting principles and financial statements, the general
application of such principles in connection with the accounting estimates, accruals and reserves, and analyzing and evaluating financial statements that present
a breadth and level of complexity of accounting issues generally comparable to those of the Fund, as well as an understanding of internal controls and
procedures for financial reporting and an understanding of audit committee functions. Mr. Wilson is an independent Board member as that term is defined under
the relevant Securities and Exchange Commission Rules and Releases.
The Statement of Additional Information (SAI) includes additional information about the board members and is available, without charge, upon request.
Shareholders may call (800) DIAL BEN/342-5236 to request the SAI.
FRANKLIN FUND ALLOCATOR SERIES
Shareholder Information
Proxy Voting Policies and Procedures
The Trust’s investment manager has established Proxy Voting Policies and Procedures (Policies) that the Trust uses to determine how to vote proxies relating to portfolio securities. Shareholders may view the Trust’s complete Policies online at franklintempleton.com. Alternatively, shareholders may request copies of the Policies free of charge by calling the Proxy Group collect at (954) 527-7678 or by sending a written request to: Franklin Templeton Companies, LLC, 300 S.E. 2nd Street, Fort Lauderdale, FL 33301, Attention: Proxy Group. Copies of the Trust’s proxy voting records are also made available online at franklintempleton.com and posted on the U.S. Securities and Exchange Commission’s website at sec.gov and reflect the most recent 12-month period ended June 30.
Quarterly Statement of Investments
The Trust files a complete statement of investments with the U.S. Securities and Exchange Commission for the first and third quarters for each fiscal year on Form N-Q. Shareholders may view the filed Form N-Q by visiting the Commission’s website at sec.gov. The filed form may also be viewed and copied at the Commission’s Public Reference Room in Washington, DC. Information regarding the operations of the Public Reference Room may be obtained by calling (800) SEC-0330.
Householding of Reports and Prospectuses
You will receive each Fund’s financial reports every six months as well as an annual updated summary prospectus (prospectus available upon request). To reduce Fund expenses, we try to identify related shareholders in a household and send only one copy of the financial reports and summary prospectus. This process, called “householding,” will continue indefinitely unless you instruct us otherwise. If you prefer not to have these documents householded, please call us at (800) 632-2301. At any time you may view current prospectuses/summary prospectuses and financial reports on our website. If you choose, you may receive these documents through electronic delivery.
Annual Report
75
This page intentionally left blank
This page intentionally left blank
Item 2. Code of Ethics.
(a) The Registrant has adopted a code of ethics that applies to its principal executive officers and principal financial and accounting officer.
(c) N/A
(d) N/A
(f) Pursuant to Item 12(a)(1), the Registrant is attaching as an exhibit a copy of its code of ethics that applies to its principal executive officers and principal financial and accounting officer.
Item 3. Audit Committee Financial Expert.
(a)(1) The Registrant has an audit committee financial expert serving on its audit committee.
(2) The audit committee financial expert is John B. Wilson, and he is "independent" as defined under the relevant Securities and Exchange Commission Rules and Releases.
Item 4. Principal Accountant Fees and Services.
(a) Audit Fees
The aggregate fees paid to the principal accountant for professional services rendered by the principal accountant for the audit of the registrant’s annual financial statements or for services that are normally provided by the principal accountant in connection with statutory and regulatory filings or engagements were $252,217 for the fiscal year ended May 31, 2016.
(b) Audit-Related Fees
There were no fees paid to the principal accountant for assurance and related services rendered by the principal accountant to the registrant that are reasonably related to the performance of the audit of the registrant's financial statements and are not reported under paragraph (a) of Item 4.
There were no fees paid to the principal accountant for assurance and related services rendered by the principal accountant to the registrant's investment adviser and any entity controlling, controlled by or under common control with the investment adviser that provides ongoing services to the registrant that are reasonably related to the performance of the audit of their financial statements.
(c) Tax Fees
There were no fees paid to the principal accountant for professional services rendered by the principal accountant to the registrant for tax compliance, tax advice and tax planning.
There were no fees paid to the principal accountant for professional services rendered by the principal accountant to the registrant’s investment adviser and any entity controlling, controlled by or under common control with the investment adviser that provides ongoing services to the registrant for tax compliance, tax advice and tax planning.
(d) All Other Fees
The aggregate fees paid to the principal accountant for products and services rendered by the principal accountant to the registrant not reported in paragraphs (a)-(c) of Item 4 were $8 for the fiscal year ended May 31, 2016. The services for which these fees were paid included review of materials provided to the fund Board in connection with the investment management contract renewal process.
The aggregate fees paid to the principal accountant for products and services rendered by the principal accountant to the registrant’s investment adviser and any entity controlling, controlled by or under common control with the investment adviser that provides ongoing services to the registrant not reported in paragraphs (a)-(c) of Item 4 were $663,151 for the fiscal year ended May 31, 2016. The services for which these fees were paid included preparation and review of materials provided to the fund Board in connection with the investment management contract renewal process and derivatives assessment, and review of system processes related to fixed income securities.
(e) (1) The registrant’s audit committee is directly responsible for approving the services to be provided by the auditors, including:
(i) pre-approval of all audit and audit related services;
(ii) pre-approval of all non-audit related services to be provided to the Fund by the auditors;
(iii) pre-approval of all non-audit related services to be provided to the registrant by the auditors to the registrant’s investment adviser or to any entity that controls, is controlled by or is under common control with the registrant’s investment adviser and that provides ongoing services to the registrant where the non-audit services relate directly to the operations or financial reporting of the registrant; and
(iv) establishment by the audit committee, if deemed necessary or appropriate, as an alternative to committee pre-approval of services to be provided by the auditors, as required by paragraphs (ii) and (iii) above, of policies and procedures to permit such services to be pre-approved by other means, such as through establishment of guidelines or by action of a designated member or members of the committee; provided the policies and procedures are detailed as to the particular service and the committee is informed of each service and such policies and procedures do not include delegation of audit committee responsibilities, as contemplated under the Securities Exchange Act of 1934, to management; subject, in the case of (ii) through (iv), to any waivers, exceptions or exemptions that may be available under applicable law or rules.
(e) (2) None of the services provided to the registrant described in paragraphs (b)-(d) of Item 4 were approved by the audit committee pursuant to paragraph (c)(7)(i)(C) of Rule 2-01 of regulation S-X.
(f) No disclosures are required by this Item 4(f).
(g) The aggregate non-audit fees paid to the principal accountant for services rendered by the principal accountant to the registrant and the registrant’s investment adviser and any entity controlling, controlled by or under common control with the investment adviser that provides ongoing services to the registrant were $663,159 for the fiscal year ended May 31, 2016.
(h) The registrant’s audit committee of the board has considered whether the provision of non-audit services that were rendered to the registrant’s investment adviser (not including any sub-adviser whose role is primarily portfolio management and is subcontracted with or overseen by another investment adviser), and any entity controlling, controlled by, or under common control with the investment adviser that provides ongoing services to the registrant that were not pre-approved pursuant to paragraph (c)(7)(ii) of Rule 2-01 of Regulation S-X is compatible with maintaining the principal accountant’s independence.
Item 5. Audit Committee of Listed Registrants. N/A
Item 6. Schedule of Investments. N/A
Item 7. Disclosure of Proxy Voting Policies and Procedures for Closed-End Management Investment Companies. N/A
Item 8. Portfolio Managers of Closed-End Management Investment Companies. N/A
Item 9. Purchases of Equity Securities by Closed-End Management Investment Company and Affiliated Purchasers. N/A
Item 10. Submission of Matters to a Vote of Security Holders.
There have been no changes to the procedures by which shareholders may recommend nominees to the Registrant's Board of Trustees that would require disclosure herein.
Item 11. Controls and Procedures.
(a) Evaluation of Disclosure Controls and Procedures. The Registrant maintains disclosure controls and procedures that are designed to ensure that information required to be disclosed in the Registrant’s filings under the Securities Exchange Act of 1934 and the Investment Company Act of 1940 is recorded, processed, summarized and reported within the periods specified in the rules and forms of the Securities and Exchange Commission. Such information is accumulated and communicated to the Registrant’s management, including its principal executive officer and principal financial officer, as appropriate, to allow timely decisions regarding required disclosure. The Registrant’s management, including the principal executive officer and the principal financial officer, recognizes that any set of controls and procedures, no matter how well designed and operated, can provide only reasonable assurance of achieving the desired control objectives.
Within 90 days prior to the filing date of this Shareholder Report on Form N-CSR, the Registrant had carried out an evaluation, under the supervision and with the participation of the Registrant’s management, including the Registrant’s principal executive officer and the Registrant’s principal financial officer, of the effectiveness of the design and operation of the Registrant’s disclosure controls and procedures. Based on such evaluation, the Registrant’s principal executive officer and principal financial officer concluded that the Registrant’s disclosure controls and procedures are effective.
(b) Changes in Internal Controls. There have been no changes in the Registrant’s internal controls or in other factors that could materially affect the internal controls over financial reporting subsequent to the date of their evaluation in connection with the preparation of this Shareholder Report on Form N-CSR.
Item 12. Exhibits.
(a)(1) Code of Ethics
(a)(2) Certifications pursuant to Section 302 of the Sarbanes-Oxley Act of 2002 of Laura F. Fergerson, Chief Executive Officer - Finance and Administration, and Gaston Gardey, Chief Financial Officer and Chief Accounting Officer
(b) Certifications pursuant to Section 906 of the Sarbanes-Oxley Act of 2002 of Laura F. Fergerson, Chief Executive Officer - Finance and Administration, and Gaston Gardey, Chief Financial Officer and Chief Accounting Officer
SIGNATURES
Pursuant to the requirements of the Securities Exchange Act of 1934 and the Investment Company Act of 1940, the registrant has duly caused this report to be signed on its behalf by the undersigned, thereunto duly authorized.
FRANKLIN FUND ALLOCATOR SERIES
By /s/Laura F. Fergerson
Laura F. Fergerson
Chief Executive Officer - Finance and Administration
Date July 27, 2016
Pursuant to the requirements of the Securities Exchange Act of 1934 and the Investment Company Act of 1940, this report has been signed below by the following persons on behalf of the registrant and in the capacities and on the dates indicated.
By /s/Laura F. Fergerson
Laura F. Fergerson
Chief Executive Officer - Finance and Administration
Date July 27, 2016
By /s/Gaston Gardey
Gaston Gardey
Chief Financial Officer and Chief Accounting Officer
Date July 27, 2016