UNITED STATES
SECURITIES AND EXCHANGE COMMISSION
Washington, DC 20549
FORM N-CSR
CERTIFIED SHAREHOLDER REPORT OF REGISTERED MANAGEMENT INVESTMENT COMPANIES
Investment Company Act file number_811-07851
Franklin Fund Allocator Series
(Exact name of registrant as specified in charter)
One Franklin Parkway, San Mateo, CA 94403-1906
(Address of principal executive offices) (Zip code)
Craig S. Tyle, One Franklin Parkway, San Mateo, CA 94403-1906
(Name and address of agent for service)
Registrant's telephone number, including area code: (650) 312-2000
Date of fiscal year end: 5/31
Date of reporting period: 5/31/15
Item 1. Reports to Stockholders.
Franklin Templeton Investments
Gain From Our Perspective®
At Franklin Templeton Investments, we’re dedicated to one goal: delivering exceptional asset management for our clients. By bringing together multiple, world-class investment teams in a single firm, we’re able to offer specialized expertise across styles and asset classes, all supported by the strength and resources of one of the world’s largest asset managers. This has helped us to become a trusted partner to individual and institutional investors across the globe.
Focus on Investment Excellence
At the core of our firm, you’ll find multiple independent investment teams—each with a focused area of expertise—from traditional to alternative strategies and multi-asset solutions. And because our portfolio groups operate autonomously, their strategies can be combined to deliver true style and asset class diversification.
All of our investment teams share a common commitment to excellence grounded in rigorous, fundamental research and robust, disciplined risk management. Decade after decade, our consistent, research-driven processes have helped Franklin Templeton earn an impressive record of strong, long-term results.
Global Perspective Shaped by Local Expertise
In today’s complex and interconnected world, smart investing demands a global perspective. Franklin Templeton pioneered international investing over 60 years ago, and our expertise in emerging markets spans more than a quarter of a century. Today, our investment professionals are on the ground across the globe, spotting investment ideas and potential risks firsthand. These locally based teams bring in-depth understanding of local companies, economies and cultural nuances, and share their best thinking across our global research network.
Strength and Experience
Franklin Templeton is a global leader in asset management serving clients in over 150 countries.1 We run our business with the same prudence we apply to asset management, staying focused on delivering relevant investment solutions, strong long-term results and reliable, personal service. This approach, focused on putting clients first, has helped us to become one of the most trusted names in financial services.
1. As of 12/31/14. Clients are represented by the total number of shareholder accounts.
Not FDIC Insured | May Lose Value | No Bank Guarantee
| Contents | |
| Annual Report | |
| Franklin Multi-Asset | |
| Real Return Fund | 3 |
| Performance Summary | 7 |
| Your Fund’s Expenses | 12 |
| Financial Highlights and | |
| Statement of Investments | 14 |
| Financial Statements | 20 |
| Notes to Financial Statements | 24 |
| Report of Independent Registered | |
| Public Accounting Firm | 33 |
| Tax Information | 34 |
| Board Members and Officers | 36 |
| Shareholder Information | 41 |
franklintempleton.com
1
Annual Report
Franklin Multi-Asset Real Return Fund
(formerly, Franklin Templeton Multi-Asset Real Return Fund)
This annual report for Franklin Multi-Asset Real Return Fund covers the period ended May 31, 2015.
Your Fund’s Goal and Main Investments
The Fund seeks real return, which is total return that exceeds U.S. inflation over a full inflation cycle, typically five years. The Fund is structured as a limited “fund-of-funds,” meaning that it seeks to achieve its investment goal by investing its assets primarily in other mutual funds, predominantly other Franklin Templeton mutual funds (underlying funds). The Fund also invests a portion of its assets in inflation-indexed securities, predominantly Treasury Inflation-Protected Securities (TIPS).
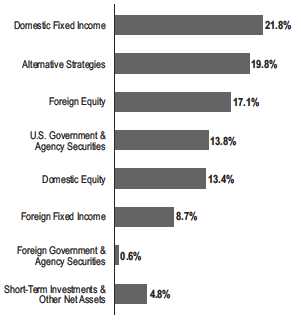
Asset Allocation*
Based on Total Net Assets as of 5/31/15
*The asset allocation is based on the Statement of Investments (SOI), which
classifies each underlying fund and other fund investments into a broad asset
class based on their predominant investments under normal market conditions.
Performance Overview
The Fund’s Class A shares had a -4.14% cumulative total return for the 12 months under review. In comparison, the Fund’s primary benchmark, the Barclays U.S. 1-10 Year TIPS Index, which tracks performance of inflation-protected notes issued by the U.S. Treasury that have at least one year and less than 10 years to final maturity, had a -1.13% total return.1 The Fund’s secondary benchmark, the Consumer Price Index (CPI) for Urban Consumers (All Items) NSA (non-seasonally adjusted), a measure of the average change in prices of all goods and services purchased for consumption by urban householders, declined 0.04% for the same period.2 The Fund’s equity benchmark, the Standard & Poor’s® 500 Index (S&P 500®), a broad measure of U.S. stock performance, generated a total return of +11.81%, and its fixed income benchmark, the Barclays U.S. Aggregate Bond Index, which tracks U.S. investment-grade bonds, posted a +3.03% total return.1 You can find other performance data in the Performance Summary beginning on page 7.
Performance data represent past performance, which does not guarantee future results. Investment return and principal value will fluctuate, and you may have a gain or loss when you sell your shares. Current performance may differ from figures shown. Please visit franklintempleton.com or call (800) 342-5236 for most recent month-end performance.
Economic and Market Overview
The global economy expanded moderately during the 12 months under review despite slowing growth in some countries. As measured by the MSCI World Index, stocks in global developed markets advanced overall during the 12-month period amid a generally accommodative monetary policy environment and signs of economic improvement in Europe and Japan. Prices of oil and other commodities declined sharply during the 12-month period owing largely to strong global supply.
1. Source: Morningstar.
The indexes are unmanaged and include reinvestment of any income or distributions. One cannot invest directly in an index, and an index is not representative of the
Fund’s portfolio.
2. Source: Bureau of Labor Statistics, bls.gov/cpi.
See www.franklintempletondatasources.com for additional data provider information.
The dollar value, number of shares or principal amount, and names of all portfolio holdings are listed in the Fund’s SOI, which begins on page 18.
franklintempleton.com
Annual Report
| 3
FRANKLIN MULTI-ASSET REAL RETURN FUND
U.S. economic growth moderated, especially in the second half of the period. In 2015’s first quarter, low energy prices, U.S. dollar strength and a labor dispute at West Coast ports led exports to decline. Lower business investment and state and local government spending also weighed on the economy, while increases in consumer spending and private inventory investment offered some support. The U.S. Federal Reserve Board (Fed) ended its bond buying program in October 2014 and kept its target interest rate at 0%–0.25% while considering when it might be appropriate to raise it. In its April meeting, the Fed attributed the economy’s first-quarter slowdown to transitory factors. The Fed reiterated that it would raise interest rates when it saw further improvement in the labor market and was reasonably confident that inflation would move back to its 2% objective over the medium term.
Outside the U.S., the U.K. economy grew relatively well through 2014, aided by the services and manufacturing sectors but moderated in 2015’s first quarter as the construction, mining and agriculture sectors contracted. Near period-end, the Conservative Party’s unexpected victory in the U.K. general elections supported investor sentiment. In the eurozone, economic growth improved during the 12-month period. Spain expanded at a solid pace, and France and Italy returned to growth in 2015’s first quarter. However, Germany, the region’s largest economy, slowed during the first quarter amid sluggish exports. In June and September 2014, the European Central Bank (ECB) reduced interest rates. The ECB also expanded asset purchases to boost inflation and the economy. Despite deflationary pressures and the crisis in Ukraine, the region benefited from lower oil prices, a weaker euro that helped exports, the ECB’s accommodative policy and an improved 2015 eurozone growth forecast.
The Bank of Japan (BOJ) broadened its stimulus measures amid weak domestic demand and lower inflation. In December, Japan’s ruling coalition was reelected and announced a new stimulus package to revive economic growth. The country exited recession in the fourth quarter, supported largely by exports. The Japanese economy continued to grow in 2015’s first quarter, driven by an increase in private demand as business investment and private consumption rose. Near period-end, the BOJ lowered its economic growth and inflation forecasts and maintained its monetary policy.
In emerging markets, economic growth generally moderated. Brazil continued to face headwinds such as high inflation, lower commodity prices and a severe drought. To reduce a widening fiscal deficit and regain investors’ confidence after a first-quarter decline in growth, Brazil’s government approved austerity measures that curbed social security and labor benefits. Central bank actions varied across emerging markets, as some banks raised interest rates in response to rising inflation and weakening currencies, while others lowered interest rates to promote economic growth. In the recent global environment, emerging market stocks, as measured by the MSCI Emerging Markets Index, were fairly flat for the 12-month period.
Investment Strategy
Under normal market conditions, we allocate the Fund’s assets among the broad asset classes representing exposure to global equities, global fixed income and commodities markets by investing primarily in a combination of underlying funds, based on each underlying fund’s predominant asset class. These underlying funds, in turn, invest in a variety of U.S. and foreign equity, fixed income and money market securities, and commodity-linked instruments. We will vary the underlying funds’ allocation percentages based on the current inflationary and economic environment and our tactical views. When selecting equity funds, we consider the underlying funds’ foreign and domestic exposure, market capitalization ranges and investment style (growth vs. value). When selecting fixed income funds, we focus primarily on maximizing income. We invest in commodities funds, TIPS and other inflation-indexed securities, floating rate notes and inflation-sensitive equity funds in an effort to improve the portfolio’s inflation hedging properties.
With respect to the portion of the Fund’s portfolio invested in inflation-indexed securities, the investment manager has engaged Franklin Templeton Institutional, LLC, to manage the Fund’s assets invested in inflation-indexed securities, predominantly TIPS. Such securities are structured to provide protection against inflation. In periods shorter than a full inflation cycle, the Fund’s returns may be volatile compared with the CPI or lag behind inflation.
4 | Annual Report
franklintempleton.com
FRANKLIN MULTI-ASSET REAL RETURN FUND
| Top 10 Fund Holdings | ||
| 5/31/15 | ||
| % of Total | ||
| Net Assets | ||
| Franklin Pelagos Commodities Strategy Fund – Class R6 | 11.4 | % |
| Franklin K2 Alternative Strategies Fund – Class R6 | 8.4 | % |
| Franklin U.S. Government Securities Fund – Class R6 | 8.3 | % |
| Templeton Global Total Return Fund – Class R6 | 8.1 | % |
| Franklin Strategic Income Fund – Class R6 | 7.2 | % |
| Franklin Growth Fund – Class R6 | 3.9 | % |
| Franklin Low Duration Total Return Fund – Class R6 | 3.7 | % |
| Franklin Mutual European Fund – Class R6 | 3.6 | % |
| WisdomTree Europe Hedged Equity Fund, ETF | 3.4 | % |
| Franklin Focused Core Equity Fund – Class R6 | 3.3 | % |
Manager’s Discussion
During the 12 months under review, near-term inflation risks remained subdued amid low energy and commodity prices. We continued to monitor the threat of inflation driven by commodity prices and monetary policy, with the latter being a potentially longer term threat, in our opinion. The inflation data led us to construct a portfolio that favored core fixed income and equity at period-end. We continued to be watchful of the potential global impact of the economic developments in Europe and the termination of the U.S. Fed’s bond purchasing program, which kept us somewhat cautious during the period.
The Fund’s alternative strategies holdings had mixed results. The Fund’s investment in Franklin K2 Alternative Strategies Fund – Class R6 contributed to absolute performance, but the Fund’s investment in Franklin Pelagos Commodities Strategy Fund – Class R6 was a significant detractor as commodity prices generally fell during the period. Domestic equity holdings with substantial sensitivity to commodity prices, such as Franklin Natural Resources Fund – Class R6 and Franklin Gold and Precious Metals Fund – Class R6, also weighed on performance. In contrast, core domestic equity holdings, such as Franklin Growth Opportunities Fund – Class R6 and
Franklin Flex Cap Growth Fund – Class R6, added to returns. Within foreign equity, performance was mixed; top performers included WisdomTree Japan Hedged Equity Fund, an ETF, and Franklin India Growth Fund – Class R6, while Templeton Foreign Fund – Class R6 detracted from performance. Domestic fixed income also had mixed results with Franklin High Income Fund – Class R6 as a detractor, while Franklin U.S. Government Securities Fund – Class R6 and Franklin Low Duration Total Return Fund – Class R6 supported performance. Within foreign fixed income, Franklin Emerging Market Debt Opportunities Fund and Templeton Global Total Return Fund – Class R6 declined.
The Fund ended the period with 30.5% of total net assets in equity (13.4% domestic funds and 17.1% foreign funds), 44.9% in fixed income (21.8% domestic funds, 8.7% foreign funds and 14.4% inflation-indexed securities), 19.8% in alternative strategies (commodity and alternative equity funds), and 4.8% in short-term investments (cash) and other net assets. With respect to inflation positioning, the Fund’s portfolio ended the period with 22.9% of total net assets in core equity funds (having a relatively high correlation to the S&P 500), 30.5% in core fixed income funds (having a relatively high correlation to the Barclays U.S. Aggregate Bond Index), 33.5% in inflation-sensitive strategies, 8.4% in alternative equity strategies, and 4.8% in cash and other net assets. Inflation-sensitive strategies consisted of 11.4% of total net assets in commodities, 7.7% in inflation-sensitive equity funds and 14.4% in inflation-sensitive fixed income securities, with no exposure to floating rate loans.
franklintempleton.com
Annual Report
| 5
FRANKLIN MULTI-ASSET REAL RETURN FUND
Thank you for your participation in Franklin Multi-Asset Real Return Fund. We look forward to serving your future investment needs.

The foregoing information reflects our analysis, opinions and portfolio holdings as of May 31, 2015, the end of the reporting period. The way we implement our main investment strategies and the resulting portfolio holdings may change depending on factors such as market and economic conditions. These opinions may not be relied upon as investment advice or an offer for a particular security. The information is not a complete analysis of every aspect of any market, country, industry, security or the Fund. Statements of fact are from sources considered reliable, but the investment manager makes no representation or warranty as to their completeness or accuracy. Although historical performance is no guarantee of future results, these insights may help you understand our investment management philosophy.
CFA® is a trademark owned by CFA Institute.
6 | Annual Report
franklintempleton.com
FRANKLIN MULTI-ASSET REAL RETURN FUND
Performance Summary as of May 31, 2015
Your dividend income will vary depending on dividends or interest paid by securities in the Fund’s portfolio, adjusted for operating expenses of each class. Capital gain distributions are net profits realized from the sale of portfolio securities. The performance table and graphs do not reflect any taxes that a shareholder would pay on Fund dividends, capital gain distributions, if any, or any realized gains on the sale of Fund shares. Total return reflects reinvestment of the Fund’s dividends and capital gain distributions, if any, and any unrealized gains or losses.
| Net Asset Value | ||||||||
| Share Class (Symbol) | 5/31/15 | 5/31/14 | Change | |||||
| A (FTMAX) | $ | 10.00 | $ | 10.83 | -$ | 0.83 | ||
| C (N/A) | $ | 9.88 | $ | 10.69 | -$ | 0.81 | ||
| R (N/A) | $ | 9.98 | $ | 10.79 | -$ | 0.81 | ||
| Advisor (N/A) | $ | 10.01 | $ | 10.84 | -$ | 0.83 | ||
| Distributions (6/1/14–5/31/15) | ||||||||
| Dividend | Short-Term | Long-Term | ||||||
| Share Class | Income | Capital Gain | Capital Gain | Total | ||||
| A | $ | 0.2559 | $ | 0.0143 | $ | 0.1046 | $ | 0.3748 |
| C | $ | 0.1825 | $ | 0.0143 | $ | 0.1046 | $ | 0.3014 |
| R | $ | 0.2279 | $ | 0.0143 | $ | 0.1046 | $ | 0.3468 |
| Advisor | $ | 0.2886 | $ | 0.0143 | $ | 0.1046 | $ | 0.4075 |
franklintempleton.com
Annual Report
| 7
FRANKLIN MULTI-ASSET REAL RETURN FUND
PERFORMANCE SUMMARY
Performance as of 5/31/151
Cumulative total return excludes sales charges. Average annual total returns and value of $10,000 investment include maximum sales charges. Class A: 5.75% maximum initial sales charge; Class C: 1% contingent deferred sales charge in first year only;
Class R/Advisor Class: no sales charges.
| Value of | Average Annual | |||||||||||
| Cumulative | Average Annual | $ | 10,000 | Total Return | Total Annual Operating Expenses6 | |||||||
| Share Class | Total Return2 | Total Return3 | Investment4 | (6/30/15 | )5 | (with waiver) | (without waiver) | |||||
| A | 1.41 | % | 1.96 | % | ||||||||
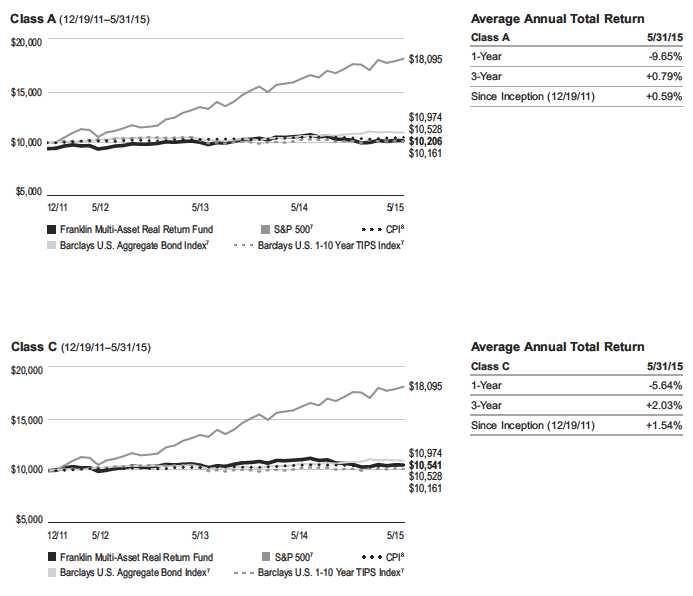
| 1-Year | -4.14 | % | -9.65 | % | $ | 9,035 | -12.00 | % | ||||
| 3-Year | +8.67 | % | +0.79 | % | $ | 10,238 | -0.10 | % | ||||
| Since Inception (12/19/11) | +8.28 | % | +0.59 | % | $ | 10,206 | +0.15 | % | ||||
| C | 2.15 | % | 2.70 | % | ||||||||
| 1-Year | -4.71 | % | -5.64 | % | $ | 9,436 | -8.10 | % | ||||
| 3-Year | +6.21 | % | +2.03 | % | $ | 10,621 | +1.14 | % | ||||
| Since Inception (12/19/11) | +5.41 | % | +1.54 | % | $ | 10,541 | +1.06 | % | ||||
| R | 1.65 | % | 2.20 | % | ||||||||
| 1-Year | -4.24 | % | -4.24 | % | $ | 9,576 | -6.71 | % | ||||
| 3-Year | +7.93 | % | +2.58 | % | $ | 10,793 | +1.68 | % | ||||
| Since Inception (12/19/11) | +7.33 | % | +2.07 | % | $ | 10,733 | +1.59 | % | ||||
| Advisor | 1.15 | % | 1.70 | % | ||||||||
| 1-Year | -3.82 | % | -3.82 | % | 9,618 | -6.21 | % | |||||
| 3-Year | +9.43 | % | +3.05 | % | $ | 10,943 | +2.16 | % | ||||
| Since Inception (12/19/11) | +9.04 | % | +2.54 | % | $ | 10,904 | +2.07 | % | ||||
Performance data represent past performance, which does not guarantee future results. Investment return and principal value will fluctuate, and you may have a gain or loss when you sell your shares. Current performance may differ from figures shown. For most recent month-end performance, go to franklintempleton.com or call (800) 342-5236.
8 | Annual Report
franklintempleton.com
FRANKLIN MULTI-ASSET REAL RETURN FUND
PERFORMANCE SUMMARY
Total Return Index Comparison for a Hypothetical $10,000 Investment1
Total return represents the change in value of an investment over the periods shown. It includes any applicable maximum sales charge, Fund expenses, account fees and reinvested distributions. The unmanaged indexes include reinvestment of any income or distributions. They differ from the Fund in composition and do not pay management fees or expenses. One cannot invest directly in an index.
franklintempleton.com
Annual Report
| 9
FRANKLIN MULTI-ASSET REAL RETURN FUND
PERFORMANCE SUMMARY
Total Return Index Comparison for a Hypothetical $10,000 Investment1 (continued)
10 | Annual Report
franklintempleton.com
FRANKLIN MULTI-ASSET REAL RETURN FUND
PERFORMANCE SUMMARY
All investments involve risks, including possible loss of principal. Generally, investors should be comfortable with fluctuation in the value of their investments, especially over the short term. Stock prices fluctuate, sometimes rapidly and dramatically, due to factors affecting individual companies, particular industries or sectors, or general market conditions. Bond prices generally move in the opposite direction of interest rates. Thus, as the prices of bonds in the Fund adjust to a rise in interest rates, the Fund’s share price may decline. Foreign investing carries additional risks such as currency and market volatility and political or social instability, risks that are heightened in developing countries. Because the Fund has a significant investment in Treasury Inflation-Protected Securities (TIPS), it is highly influenced by the TIPS market and the monthly inflation adjustments on these securities. Commodity-linked investments can have heightened risks, including price volatility and less liquidity, and their value may be affected by the performance of broader commodities baskets and markets, as well as supply and demand, weather, tax and other regulatory policies. Because the Fund allocates assets to a variety of investment strategies involving certain risks, the Fund may be subject to those same risks. These risks and others are described more fully in the Fund’s prospectus. The Fund is actively managed but there is no guarantee that the manager’s investment decisions will produce the desired results.
| Class C: | These shares have higher annual fees and expenses than Class A shares. |
| Class R: | Shares are available to certain eligible investors as described in the prospectus. These shares have higher annual fees and expenses than Class A shares. |
| Advisor Class: | Shares are available to certain eligible investors as described in the prospectus. |
1. The Fund has an expense reduction contractually guaranteed through at least 9/30/15 and a fee waiver associated with any investments in a Franklin Templeton money
fund, contractually guaranteed through at least its current fiscal year-end. Fund investment results reflect the expense reduction and fee waiver, to the extent applicable;
without these reductions, the results would have been lower.
2. Cumulative total return represents the change in value of an investment over the periods indicated.
3. Average annual total return represents the average annual change in value of an investment over the periods indicated.
4. These figures represent the value of a hypothetical $10,000 investment in the Fund over the periods indicated.
5. In accordance with SEC rules, we provide standardized average annual total return information through the latest calendar quarter.
6. Figures are as stated in the Fund’s current prospectus and include the effect of acquired fund fees and expenses. In periods of market volatility, assets may decline
significantly, causing total annual Fund operating expenses to become higher than the figures shown.
7. Source: Morningstar. The Barclays U.S. 1-10 Year TIPS Index is the 1-10 year component of the Barclays U.S. TIPS Index and includes inflation-protected notes issued
by the U.S. Treasury with a maturity of at least 1 year and less than 10 years. The S&P 500 is a market capitalization-weighted index of 500 stocks designed to measure
total U.S. equity market performance. The Barclays U.S. Aggregate Bond Index is a market capitalization-weighted index representing the U.S. investment grade fixed rate
taxable bond market with index components for government and corporate, mortgage pass-through, and asset-backed securities. All issues included are SEC-registered,
taxable, dollar denominated, non-convertible, must have at least one year to final maturity, and must be rated investment grade (Baa3/BBB-/BBB- or above) using the
middle rating of Moody’s, S&P and Fitch, respectively.
8. Source: Bureau of Labor Statistics, bls.gov/cpi. The CPI is a commonly used measure of the inflation rate.
See www.franklintempletondatasources.com for additional data provider information.
franklintempleton.com
Annual Report
| 11
FRANKLIN MULTI-ASSET REAL RETURN FUND
Your Fund’s Expenses
As a Fund shareholder, you can incur two types of costs:
- Transaction costs, including sales charges (loads) on Fund purchases; and
- Ongoing Fund costs, including management fees, distribu- tion and service (12b-1) fees, and other Fund expenses. All mutual funds have ongoing costs, sometimes referred to as operating expenses.
The following table shows ongoing costs of investing in the Fund and can help you understand these costs and compare them with those of other mutual funds. The table assumes a $1,000 investment held for the six months indicated.
Actual Fund Expenses
The first line (Actual) for each share class listed in the table provides actual account values and expenses. The “Ending Account Value” is derived from the Fund’s actual return, which includes the effect of Fund expenses.
You can estimate the expenses you paid during the period by following these steps. Of course, your account value and expenses will differ from those in this illustration:
| 1. | Divide your account value by $1,000. |
| If an account had an $8,600 value, then $8,600 ÷ $1,000 = 8.6. | |
| 2. | Multiply the result by the number under the heading “Expenses Paid During Period.” |
| If Expenses Paid During Period were $7.50, then 8.6 x $7.50 = $64.50. |
In this illustration, the estimated expenses paid this period are $64.50.
Hypothetical Example for Comparison with Other Funds
Information in the second line (Hypothetical) for each class in the table can help you compare ongoing costs of investing in the Fund with those of other mutual funds. This information may not be used to estimate the actual ending account balance or expenses you paid during the period. The hypothetical “Ending Account Value” is based on the actual expense ratio for each class and an assumed 5% annual rate of return before expenses, which does not represent the Fund’s actual return. The figure under the heading “Expenses Paid During Period” shows the hypothetical expenses your account would have incurred under this scenario. You can compare this figure with the 5% hypothetical examples that appear in shareholder reports of other funds.
Please note that expenses shown in the table are meant to highlight ongoing costs and do not reflect any transaction costs, such as sales charges. Therefore, the second line for each class is useful in comparing ongoing costs only, and will not help you compare total costs of owning different funds. In addition, if transaction costs were included, your total costs would have been higher. Please refer to the Fund prospectus for additional information on operating expenses.
12 | Annual Report
franklintempleton.com
FRANKLIN MULTI-ASSET REAL RETURN FUND
YOUR FUND’S EXPENSES
| Beginning | Ending | Expenses Paid | Expenses Paid | |||||
| Account | Account | During Period* During Period** | ||||||
| Share Class | Value 12/1/14 | Value 5/31/15 | 12/1/14–5/31/15 | 12/1/14–5/31/15 | ||||
| A | ||||||||
| Actual | $ | 1,000 | $ | 997.30 | $ | 3.73 | $ | 7.42 |
| Hypothetical (5% return before expenses) | $ | 1,000 | $ | 1,021.19 | $ | 3.78 | $ | 7.49 |
| C | ||||||||
| Actual | $ | 1,000 | $ | 994.70 | $ | 7.21 | $ | 10.89 |
| Hypothetical (5% return before expenses) | $ | 1,000 | $ | 1,017.70 | $ | 7.29 | $ | 11.00 |
| R | ||||||||
| Actual | $ | 1,000 | $ | 996.40 | $ | 4.73 | $ | 8.41 |
| Hypothetical (5% return before expenses) | $ | 1,000 | $ | 1,020.19 | $ | 4.78 | $ | 8.50 |
| Advisor | ||||||||
| Actual | $ | 1,000 | $ | 999.60 | $ | 2.24 | $ | 5.93 |
| Hypothetical (5% return before expenses) | $ | 1,000 | $ | 1,022.69 | $ | 2.27 | $ | 5.99 |
*Expenses are calculated using the most recent six-month expense ratio excluding expenses of the underlying funds, net of expense waivers,
annualized for each class (A: 0.75%; C: 1.45%; R: 0.95%; and Advisor: 0.45%), multiplied by the average account value over the period,
multiplied by 182/365 to reflect the one-half year period.
**Expenses are calculated using the most recent six-month expense ratio including expenses of the underlying funds, net of expense waivers,
annualized for each class (A: 1.49%; C: 2.19%; R: 1.69%; and Advisor: 1.19%), multiplied by the average account value over the period,
multiplied by 182/365 to reflect the one-half year period.
franklintempleton.com
Annual Report
| 13
| FRANKLIN FUND ALLOCATOR SERIES | ||||||||||||
| Financial Highlights | ||||||||||||
| Franklin Multi-Asset Real Return Fund | ||||||||||||
| Year Ended May 31, | ||||||||||||
| 2015 | 2014 | 2013 | 2012 | a | ||||||||
| Class A | ||||||||||||
| Per share operating performance | ||||||||||||
| (for a share outstanding throughout the year) | ||||||||||||
| Net asset value, beginning of year | $ | 10.83 | $ | 10.39 | $ | 9.94 | $ | 10.00 | ||||
| Income from investment operationsb: | ||||||||||||
| Net investment incomec,d | 0.19 | 0.14 | 0.16 | 0.07 | ||||||||
| Net realized and unrealized gains (losses) | (0.64 | ) | 0.47 | 0.53 | (0.11 | ) | ||||||
| Total from investment operations | (0.45 | ) | 0.61 | 0.69 | (0.04 | ) | ||||||
| Less distributions from: | ||||||||||||
| Net investment income and short term gains received from Underlying Funds | ||||||||||||
| and exchange traded funds | (0.26 | ) | (0.15 | ) | (0.24 | ) | (0.02 | ) | ||||
| Net realized gains | (0.12 | ) | (0.02 | ) | (—)e | — | ||||||
| Total distributions | (0.38 | ) | (0.17 | ) | (0.24 | ) | (0.02 | ) | ||||
| Net asset value, end of year | $ | 10.00 | $ | 10.83 | $ | 10.39 | $ | 9.94 | ||||
| Total returnf | (4.14 | )% | 5.82 | % | 7.03 | % | (0.35 | )% | ||||
| Ratios to average net assetsg | ||||||||||||
| Expenses before waiver and payments by affiliatesh | 1.38 | % | 1.26 | % | 2.71 | % | 5.85 | % | ||||
| Expenses net of waiver and payments by affiliatesh | 0.78 | % | 0.71 | % | 0.59 | % | 0.49 | % | ||||
| Net investment incomed | 1.79 | % | 1.32 | % | 1.54 | % | 1.53 | % | ||||
| Supplemental data | ||||||||||||
| Net assets, end of year (000’s) | $ | 7,420 | $ | 13,962 | $ | 10,241 | $ | 5,382 | ||||
| Portfolio turnover rate | 55.73 | % | 39.70 | % | 46.45 | % | 27.24 | % | ||||
aFor the period December 19, 2011 (commencement of operations) to May 31, 2012.
bThe amount shown for a share outstanding throughout the period may not correlate with the Statement of Operations for the period due to the timing of sales and
repurchases of the Fund’s shares in relation to income earned and/or fluctuating fair value of the investments of the Fund.
cBased on average daily shares outstanding.
dRecognition of net investment income by the Fund is affected by the timing of declaration of dividends by the Underlying Funds and exchange traded funds in which the
Fund invests.
eAmount rounds to less than $0.01 per share.
fTotal return does not reflect sales commissions or contingent deferred sales charges, if applicable, and is not annualized for periods less than one year.
gRatios are annualized for periods less than one year.
hDoes not include expenses of the Underlying Funds and exchange traded funds in which the Fund invests. The weighted average indirect expenses of the Underlying
Funds and exchange traded funds was 0.74% for the year ended May 31, 2015.
14 | Annual Report | The accompanying notes are an integral part of these financial statements.
franklintempleton.com
| FRANKLIN FUND ALLOCATOR SERIES | ||||||||||||
| FINANCIAL HIGHLIGHTS | ||||||||||||
| Franklin Multi-Asset Real Return Fund (continued) | ||||||||||||
| Year Ended May 31, | ||||||||||||
| 2015 | 2014 | 2013 | 2012 | a | ||||||||
| Class C | ||||||||||||
| Per share operating performance | ||||||||||||
| (for a share outstanding throughout the year) | ||||||||||||
| Net asset value, beginning of year | $ | 10.69 | $ | 10.29 | $ | 9.90 | $ | 10.00 | ||||
| Income from investment operationsb: | ||||||||||||
| Net investment incomec,d | 0.11 | 0.06 | 0.06 | 0.04 | ||||||||
| Net realized and unrealized gains (losses) | (0.62 | ) | 0.46 | 0.54 | (0.12 | ) | ||||||
| Total from investment operations | (0.51 | ) | 0.52 | 0.60 | (0.08 | ) | ||||||
| Less distributions from: | ||||||||||||
| Net investment income and short term gains received from Underlying Funds | ||||||||||||
| and exchange traded funds | (0.18 | ) | (0.10 | ) | (0.21 | ) | (0.02 | ) | ||||
| Net realized gains | (0.12 | ) | (0.02 | ) | (—)e | — | ||||||
| Total distributions | (0.30 | ) | (0.12 | ) | (0.21 | ) | (0.02 | ) | ||||
| Net asset value, end of year | $ | 9.88 | $ | 10.69 | $ | 10.29 | $ | 9.90 | ||||
| Total returnf | (4.71 | )% | 5.07 | % | 6.08 | % | (0.75 | )% | ||||
| Ratios to average net assetsg | ||||||||||||
| Expenses before waiver and payments by affiliatesh | 2.05 | % | 2.00 | % | 3.57 | % | 6.81 | % | ||||
| Expenses net of waiver and payments by affiliatesh | 1.45 | % | 1.45 | % | 1.45 | % | 1.45 | % | ||||
| Net investment incomed | 1.12 | % | 0.58 | % | 0.68 | % | 0.57 | % | ||||
| Supplemental data | ||||||||||||
| Net assets, end of year (000’s) | $ | 4,361 | $ | 5,830 | $ | 3,568 | $ | 579 | ||||
| Portfolio turnover rate | 55.73 | % | 39.70 | % | 46.45 | % | 27.24 | % | ||||
aFor the period December 19, 2011 (commencement of operations) to May 31, 2012.
bThe amount shown for a share outstanding throughout the period may not correlate with the Statement of Operations for the period due to the timing of sales and
repurchases of the Fund’s shares in relation to income earned and/or fluctuating fair value of the investments of the Fund.
cBased on average daily shares outstanding.
dRecognition of net investment income by the Fund is affected by the timing of declaration of dividends by the Underlying Funds and exchange traded funds in which the
Fund invests.
eAmount rounds to less than $0.01 per share.
fTotal return does not reflect sales commissions or contingent deferred sales charges, if applicable, and is not annualized for periods less than one year.
gRatios are annualized for periods less than one year.
hDoes not include expenses of the Underlying Funds and exchange traded funds in which the Fund invests. The weighted average indirect expenses of the Underlying
Funds and exchange traded funds was 0.74% for the year ended May 31, 2015.
franklintempleton.com
The accompanying notes are an integral part of these financial statements. | Annual Report | 15
| FRANKLIN FUND ALLOCATOR SERIES | ||||||||||||
| FINANCIAL HIGHLIGHTS | ||||||||||||
| Franklin Multi-Asset Real Return Fund (continued) | ||||||||||||
| Year Ended May 31, | ||||||||||||
| 2015 | 2014 | 2013 | 2012 | a | ||||||||
| Class R | ||||||||||||
| Per share operating performance | ||||||||||||
| (for a share outstanding throughout the year) | ||||||||||||
| Net asset value, beginning of year | $ | 10.79 | $ | 10.36 | $ | 9.92 | $ | 10.00 | ||||
| Income from investment operationsb: | ||||||||||||
| Net investment incomec,d | 0.15 | 0.14 | 0.10 | 0.05 | ||||||||
| Net realized and unrealized gains (losses) | (0.61 | ) | 0.45 | 0.55 | (0.11 | ) | ||||||
| Total from investment operations | (0.46 | ) | 0.59 | 0.65 | (0.06 | ) | ||||||
| Less distributions from: | ||||||||||||
| Net investment income and short term gains received from Underlying Funds | ||||||||||||
| and exchange traded funds | (0.23 | ) | (0.14 | ) | (0.21 | ) | (0.02 | ) | ||||
| Net realized gains | (0.12 | ) | (0.02 | ) | (—)e | — | ||||||
| Total distributions | (0.35 | ) | (0.16 | ) | (0.21 | ) | (0.02 | ) | ||||
| Net asset value, end of year | $ | 9.98 | $ | 10.79 | $ | 10.36 | $ | 9.92 | ||||
| Total returnf | (4.24 | )% | 5.72 | % | 6.61 | % | (0.55 | )% | ||||
| Ratios to average net assetsg | ||||||||||||
| Expenses before waiver and payments by affiliatesh | 1.55 | % | 1.50 | % | 3.07 | % | 6.31 | % | ||||
| Expenses net of waiver and payments by affiliatesh | 0.95 | % | 0.95 | % | 0.95 | % | 0.95 | % | ||||
| Net investment incomed | 1.62 | % | 1.08 | % | 1.18 | % | 1.07 | % | ||||
| Supplemental data | ||||||||||||
| Net assets, end of year (000’s) | $ | 22 | $ | 23 | $ | 68 | $ | 10 | ||||
| Portfolio turnover rate | 55.73 | % | 39.70 | % | 46.45 | % | 27.24 | % | ||||
aFor the period December 19, 2011 (commencement of operations) to May 31, 2012.
bThe amount shown for a share outstanding throughout the period may not correlate with the Statement of Operations for the period due to the timing of sales and
repurchases of the Fund’s shares in relation to income earned and/or fluctuating fair value of the investments of the Fund.
cBased on average daily shares outstanding.
dRecognition of net investment income by the Fund is affected by the timing of declaration of dividends by the Underlying Funds and exchange traded funds in which the
Fund invests.
eAmount rounds to less than $0.01 per share.
fTotal return is not annualized for periods less than one year.
gRatios are annualized for periods less than one year.
hDoes not include expenses of the Underlying Funds and exchange traded funds in which the Fund invests. The weighted average indirect expenses of the Underlying
Funds and exchange traded funds was 0.74% for the year ended May 31, 2015.
16 | Annual Report | The accompanying notes are an integral part of these financial statements.
franklintempleton.com
| FRANKLIN FUND ALLOCATOR SERIES | ||||||||||||
| FINANCIAL HIGHLIGHTS | ||||||||||||
| Franklin Multi-Asset Real Return Fund (continued) | ||||||||||||
| Year Ended May 31, | ||||||||||||
| 2015 | 2014 | 2013 | 2012 | a | ||||||||
| Advisor Class | ||||||||||||
| Per share operating performance | ||||||||||||
| (for a share outstanding throughout the year) | ||||||||||||
| Net asset value, beginning of year | $ | 10.84 | $ | 10.40 | $ | 9.94 | $ | 10.00 | ||||
| Income from investment operationsb: | ||||||||||||
| Net investment incomec,d | 0.21 | 0.16 | 0.18 | 0.07 | ||||||||
| Net realized and unrealized gains (losses) | (0.63 | ) | 0.47 | 0.53 | (0.11 | ) | ||||||
| Total from investment operations | (0.42 | ) | 0.63 | 0.71 | (0.04 | ) | ||||||
| Less distributions from: | ||||||||||||
| Net investment income and short term gains received from Underlying Funds | ||||||||||||
| and exchange traded funds | (0.29 | ) | (0.17 | ) | (0.25 | ) | (0.02 | ) | ||||
| Net realized gains | (0.12 | ) | (0.02 | ) | (—)e | — | ||||||
| Total distributions | (0.41 | ) | (0.19 | ) | (0.25 | ) | (0.02 | ) | ||||
| Net asset value, end of year | $ | 10.01 | $ | 10.84 | $ | 10.40 | $ | 9.94 | ||||
| Total returnf | (3.82 | )% | 6.13 | % | 7.21 | % | (0.35 | )% | ||||
| Ratios to average net assetsg | ||||||||||||
| Expenses before waiver and payments by affiliatesh | 1.05 | % | 1.00 | % | 2.57 | % | 5.81 | % | ||||
| Expenses net of waiver and payments by affiliatesh | 0.45 | % | 0.45 | % | 0.45 | % | 0.45 | % | ||||
| Net investment incomed | 2.12 | % | 1.58 | % | 1.68 | % | 1.57 | % | ||||
| Supplemental data | ||||||||||||
| Net assets, end of year (000’s) | $ | 2,593 | $ | 2,485 | $ | 2,948 | $ | 1,627 | ||||
| Portfolio turnover rate | 55.73 | % | 39.70 | % | 46.45 | % | 27.24 | % | ||||
aFor the period December 19, 2011 (commencement of operations) to May 31, 2012.
bThe amount shown for a share outstanding throughout the period may not correlate with the Statement of Operations for the period due to the timing of sales and
repurchases of the Fund’s shares in relation to income earned and/or fluctuating fair value of the investments of the Fund.
cBased on average daily shares outstanding.
dRecognition of net investment income by the Fund is affected by the timing of declaration of dividends by the Underlying Funds and exchange traded funds in which the
Fund invests.
eAmount rounds to less than $0.01 per share.
fTotal return is not annualized for periods less than one year.
gRatios are annualized for periods less than one year.
hDoes not include expenses of the Underlying Funds and exchange traded funds in which the Fund invests. The weighted average indirect expenses of the Underlying
Funds and exchange traded funds was 0.74% for the year ended May 31, 2015.
franklintempleton.com
The accompanying notes are an integral part of these financial statements. | Annual Report | 17
| FRANKLIN FUND ALLOCATOR SERIES | |||
| Statement of Investments, May 31, 2015 | |||
| Franklin Multi-Asset Real Return Fund | |||
| Shares/ | |||
| Units | Value | ||
| Investments in Underlying Funds and Exchange Traded Funds 80.8% | |||
| Alternative Strategies 19.8% | |||
| aFranklin K2 Alternative Strategies Fund, Class R6 | 108,367 | $ | 1,211,541 |
| a,bFranklin Pelagos Commodities Strategy Fund, Class R6 | 228,663 | 1,637,225 | |
| 2,848,766 | |||
| Domestic Equity 13.4% | |||
| aFranklin Focused Core Equity Fund, Class R6 | 30,576 | 480,659 | |
| aFranklin Gold and Precious Metals Fund, Class R6 | 9,929 | 157,080 | |
| aFranklin Growth Fund, Class R6 | 7,242 | 566,950 | |
| a,bFranklin Growth Opportunities Fund, Class R6 | 3,112 | 111,816 | |
| aFranklin Natural Resources Fund, Class R6 | 12,317 | 388,985 | |
| aFranklin Utilities Fund, Class R6 | 13,345 | 227,674 | |
| 1,933,164 | |||
| Domestic Fixed Income 21.8% | |||
| aFranklin High Income Fund, Class R6 | 179,606 | 361,008 | |
| aFranklin Low Duration Total Return Fund, Class R6 | 53,418 | 537,920 | |
| aFranklin Strategic Income Fund, Class R6 | 103,820 | 1,040,276 | |
| aFranklin U.S. Government Securities Fund, Class R6 | 184,461 | 1,198,998 | |
| 3,138,202 | |||
| Foreign Equity 17.1% | |||
| aFranklin Global Real Estate Fund, Class R6 | 37,757 | 337,549 | |
| aFranklin India Growth Fund, Class R6 | 28,519 | 379,015 | |
| aFranklin Mutual European Fund, Class R6 | 22,354 | 511,470 | |
| aFranklin Mutual International Fund, Class R6 | 12,952 | 209,044 | |
| aTempleton China World Fund, Class R6 | 3,222 | 111,627 | |
| aTempleton Foreign Fund, Class R6 | 20,847 | 155,725 | |
| WisdomTree Europe Hedged Equity Fund ETF (Euro Community) | 7,550 | 491,580 | |
| WisdomTree Japan Hedged Equity Fund ETF (Japan) | 4,500 | 269,010 | |
| 2,465,020 | |||
| Foreign Fixed Income 8.7% | |||
| aFranklin Emerging Market Debt Opportunities Fund | 6,975 | 75,953 | |
| aTempleton Global Total Return Fund, Class R6 | 93,758 | 1,171,977 | |
| 1,247,930 | |||
| Total Investments in Underlying Funds and Exchange Traded Funds | |||
| (Cost $11,867,121) | 11,633,082 | ||
18 | Annual Report
franklintempleton.com
FRANKLIN FUND ALLOCATOR SERIES
STATEMENT OF INVESTMENTS
| Franklin Multi-Asset Real Return Fund (continued) | ||||
| Principal | ||||
| Amount* | Value | |||
| Foreign Government and Agency Securities (Cost $94,162) 0.6% | ||||
| cMexican Udibonos, Index Linked, 5.00%, 6/16/16 | 11,637 | d MXN | $ | 79,185 |
| U.S. Government and Agency Securities 13.8% | ||||
| cU.S. Treasury Bond, Index Linked, | ||||
| 0.125%, 1/15/22 | 52,152 | 52,088 | ||
| 0.375%, 7/15/23 | 177,524 | 179,867 | ||
| 0.25%, 1/15/25 | 99,671 | 99,258 | ||
| 2.125%, 2/15/41 | 107,801 | 138,061 | ||
| 0.75%, 2/15/42 | 52,238 | 49,826 | ||
| cU.S. Treasury Note, Index Linked, | ||||
| 0.125%, 4/15/16 | 305,881 | 307,769 | ||
| 2.50%, 7/15/16 | 116,896 | 121,700 | ||
| 2.375%, 1/15/17 | 146,328 | 154,022 | ||
| 0.125%, 4/15/17 | 250,489 | 254,442 | ||
| 0.125%, 4/15/18 | 296,165 | 301,417 | ||
| 1.125%, 1/15/21 | 107,918 | 114,823 | ||
| 0.625%, 7/15/21 | 209,486 | 217,735 | ||
| Total U.S. Government and Agency Securities (Cost $2,006,151) | 1,991,008 | |||
| Total Investments before Short Term Investments (Cost $13,967,434) | 13,703,275 | |||
| Shares | ||||
| Short Term Investments (Cost $686,375) 4.8% | ||||
| Money Market Funds 4.8% | ||||
| a,bInstitutional Fiduciary Trust Money Market Portfolio | 686,375 | 686,375 | ||
| Total Investments (Cost $14,653,809) 100.0% | 14,389,650 | |||
| Other Assets, less Liabilities 0.0%† | 7,226 | |||
| Net Assets 100.0% | $ | 14,396,876 |
See Abbreviations on page 32.
*The principal amount is stated in U.S. dollars unless otherwise indicated.
†Rounds to less than 0.1% of net assets.
aSee Note 3(f) regarding investments in Underlying Funds.
bNon-income producing.
cPrincipal amount of security is adjusted for inflation. See Note 1(d).
dPrincipal amount is stated in 100 Unidad de Inversion Units.
franklintempleton.com
The accompanying notes are an integral part of these financial statements. | Annual Report | 19
FRANKLIN FUND ALLOCATOR SERIES
| Financial Statements | |||
| Statement of Assets and Liabilities | |||
| May 31, 2015 | |||
| Franklin Multi-Asset Real Return Fund | |||
| Assets: | |||
| Investments in securities: | |||
| Cost - Unaffiliated issuers | $ | 2,100,313 | |
| Cost - Underlying Funds (Note 3f) | 11,882,835 | ||
| Cost - Exchange traded funds | 670,661 | ||
| Total cost of investments | $ | 14,653,809 | |
| Value - Unaffiliated issuers | $ | 2,070,193 | |
| Value - Underlying Funds (Note 3f) | 11,558,867 | ||
| Value - Exchange traded funds | 760,590 | ||
| Total value of investments | 14,389,650 | ||
| Cash | 19,200 | ||
| Receivables: | |||
| Capital shares sold | 15,712 | ||
| Interest | 6,360 | ||
| Affiliates | 7,113 | ||
| Other assets | 7 | ||
| Total assets | 14,438,042 | ||
| Liabilities: | |||
| Payables: | |||
| Distribution fees | 5,614 | ||
| Transfer agent fees | 2,174 | ||
| Reports to shareholders | 9,712 | ||
| Professional fees | 21,662 | ||
| Accrued expenses and other liabilities | 2,004 | ||
| Total liabilities | 41,166 | ||
| Net assets, at value | $ | 14,396,876 | |
| Net assets consist of: | |||
| Paid-in capital | $ | 15,088,881 | |
| Distributions in excess of net investment income | (70,746 | ) | |
| Net unrealized appreciation (depreciation) | (264,192 | ) | |
| Accumulated net realized gain (loss) | (357,067 | ) | |
| Net assets, at value | $ | 14,396,876 | |
20 | Annual Report | The accompanying notes are an integral part of these financial statements.
franklintempleton.com
| FRANKLIN FUND ALLOCATOR SERIES | ||
| FINANCIAL STATEMENTS | ||
| Statement of Assets and Liabilities (continued) | ||
| May 31, 2015 | ||
| Class A: | ||
| Net assets, at value | $ | 7,419,893 |
| Shares outstanding | 742,033 | |
| Net asset value per sharea | $ | 10.00 |
| Maximum offering price per share (net asset value per share ÷ 94.25%) | $ | 10.61 |
| Class C: | ||
| Net assets, at value | $ | 4,361,317 |
| Shares outstanding | 441,560 | |
| Net asset value and maximum offering price per sharea | $ | 9.88 |
| Class R: | ||
| Net assets, at value | $ | 22,326 |
| Shares outstanding | 2,237 | |
| Net asset value and maximum offering price per share | $ | 9.98 |
| Advisor Class: | ||
| Net assets, at value | $ | 2,593,340 |
| Shares outstanding | 259,089 | |
| Net asset value and maximum offering price per share | $ | 10.01 |
aRedemption price is equal to net asset value less contingent deferred sales charges, if applicable.
franklintempleton.com The accompanying notes are an integral part of these financial statements. | Annual Report | 21
| FRANKLIN FUND ALLOCATOR SERIES | |||
| FINANCIAL STATEMENTS | |||
| Statement of Operations | |||
| for the year ended May 31, 2015 | |||
| Franklin Multi-Asset Real Return Fund | |||
| Investment income: | |||
| Dividends: | |||
| Underlying Funds (Note 3f) | $ | 477,477 | |
| Exchange traded funds | 18,399 | ||
| Interest and inflation principal adjustments | (7,232 | ) | |
| Total investment income | 488,644 | ||
| Expenses: | |||
| Management fees (Note 3a) | 66,539 | ||
| Distribution fees: (Note 3c) | |||
| Class A | 36,694 | ||
| Class C | 52,194 | ||
| Class R | 113 | ||
| Transfer agent fees: (Note 3e) | |||
| Class A | 12,131 | ||
| Class C | 5,617 | ||
| Class R | 24 | ||
| Advisor Class | 2,665 | ||
| Custodian fees (Note 4) | 73 | ||
| Reports to shareholders | 22,796 | ||
| Registration and filing fees | 54,446 | ||
| Professional fees | 22,342 | ||
| Other | 13,150 | ||
| Total expenses | 288,784 | ||
| Expenses waived/paid by affiliates (Notes 3f and 3g) | (114,452 | ) | |
| Net expenses | 174,332 | ||
| Net investment income | 314,312 | ||
| Realized and unrealized gains (losses): | |||
| Net realized gain (loss) from: | |||
| Sale of Investments: | |||
| Underlying Funds (Note 3f) | (412,358 | ) | |
| Exchange traded funds | 18,174 | ||
| Unaffiliated issuers | 28 | ||
| Foreign currency transactions | (164 | ) | |
| Realized gain distributions: | |||
| Underlying Funds (Note 3f) | 165,500 | ||
| Exchange traded funds | 78,354 | ||
| Net realized gain (loss) | (150,466 | ) | |
| Net change in unrealized appreciation (depreciation) on: | |||
| Investments | (1,243,146 | ) | |
| Translation of other assets and liabilities denominated in foreign currencies | (78 | ) | |
| Net change in unrealized appreciation (depreciation) | (1,243,224 | ) | |
| Net realized and unrealized gain (loss) | (1,393,690 | ) | |
| Net increase (decrease) in net assets resulting from operations | $ | (1,079,378 | ) |
22 | Annual Report | The accompanying notes are an integral part of these financial statements.
franklintempleton.com
FRANKLIN FUND ALLOCATOR SERIES
FINANCIAL STATEMENTS
| Statements of Changes in Net Assets | ||||||
| Franklin Multi-Asset Real Return Fund | ||||||
| Year Ended May 31, | ||||||
| 2015 | 2014 | |||||
| Increase (decrease) in net assets: | ||||||
| Operations: | ||||||
| Net investment income | $ | 314,312 | $ | 227,603 | ||
| Net realized gain (loss) | (150,466 | ) | 178,699 | |||
| Net change in unrealized appreciation (depreciation) | (1,243,224 | ) | 734,157 | |||
| Net increase (decrease) in net assets resulting from operations | (1,079,378 | ) | 1,140,459 | |||
| Distributions to shareholders from: | ||||||
| Net investment income and short term gains received from Underlying Funds and exchange | ||||||
| traded funds: | ||||||
| Class A | (305,575 | ) | (172,889 | ) | ||
| Class C | (98,516 | ) | (50,739 | ) | ||
| Class R | (492 | ) | (1,167 | ) | ||
| Advisor Class | (69,227 | ) | (35,219 | ) | ||
| Net realized gains: | ||||||
| Class A | (141,910 | ) | (24,901 | ) | ||
| Class C | (64,183 | ) | (11,040 | ) | ||
| Class R | (257 | ) | (182 | ) | ||
| Advisor Class | (28,521 | ) | (4,405 | ) | ||
| Total distributions to shareholders | (708,681 | ) | (300,542 | ) | ||
| Capital share transactions: (Note 2) | ||||||
| Class A | (5,424,567 | ) | 3,199,877 | |||
| Class C | (998,095 | ) | 2,051,442 | |||
| Class R | 749 | (46,621 | ) | |||
| Advisor Class | 306,733 | (569,406 | ) | |||
| Total capital share transactions | (6,115,180 | ) | 4,635,292 | |||
| Net increase (decrease) in net assets | (7,903,239 | ) | 5,475,209 | |||
| Net assets: | ||||||
| Beginning of year | 22,300,115 | 16,824,906 | ||||
| End of year | $ | 14,396,876 | $ | 22,300,115 | ||
| Undistributed net investment income (distributions in excess of net investment income) included in | ||||||
| net assets: | ||||||
| End of year | $ | (70,746 | ) | $ | 22,169 | |
franklintempleton.com
The accompanying notes are an integral part of these financial statements. | Annual Report | 23
FRANKLIN FUND ALLOCATOR SERIES
Notes to Financial Statements
Franklin Multi-Asset Real Return Fund
1. Organization and Significant Accounting Policies
Franklin Fund Allocator Series (Trust) is registered under the Investment Company Act of 1940 (1940 Act) as an open-end management investment company, consisting of fifteen separate funds. Franklin Multi-Asset Real Return Fund (Fund) is included in this report and applies the specialized accounting and reporting guidance in U.S. Generally Accepted Accounting Principles (U.S. GAAP). The financial statements of the remaining funds in the Trust are presented separately. The Fund invests primarily in Franklin Templeton mutual funds (Underlying Funds). The Fund offers four classes of shares: Class A, Class C, Class R, and Advisor Class. Each class of shares differs by its initial sales load, contingent deferred sales charges, voting rights on matters affecting a single class, its exchange privilege and fees primarily due to differing arrangements for distribution and transfer agent fees.
The accounting policies of the Underlying Funds are outlined in their respective shareholder reports. A copy of the Underlying Funds’ shareholder reports is available on the U.S. Securities and Exchange Commission (SEC) website at sec.gov or at the SEC’s Public Reference Room in Washington, D.C. The Underlying Funds’ shareholder reports are not covered by this report.
Effective June 30, 2014, Franklin Templeton Fund Allocator Series and Franklin Templeton Multi-Asset Real Return Fund were renamed Franklin Fund Allocator Series and Franklin Multi-Asset Real Return Fund, respectively.
The following summarizes the Fund’s significant accounting policies.
a. Financial Instrument Valuation
The Fund’s investments in financial instruments are carried at fair value daily. Fair value is the price that would be received to sell an asset or paid to transfer a liability in an orderly transaction between market participants on the measurement date. The Fund calculates the net asset value (NAV) per share at the close of the New York Stock Exchange (NYSE), generally at 4 p.m. Eastern time (NYSE close) on each day the NYSE is open for trading. Under compliance policies and procedures approved by the Trust’s Board of Trustees (the Board), the Fund’s administrator has responsibility for oversight of valuation, including leading the cross-functional Valuation and Liquidity Oversight Committee (VLOC). The VLOC provides administration and oversight of the Fund’s valuation policies and procedures, which are approved annually by the Board. Among other things, these procedures allow the Fund to utilize independent pricing services, quotations from securities and financial instrument dealers, and other market sources to determine fair value. Investments in the Underlying Funds are valued at their closing NAV each trading day. Exchange traded funds (ETFs) listed on an exchange or on the NASDAQ National Market System are valued at the last quoted sale price or the official closing price of the day, respectively.
Debt securities generally trade in the over-the-counter market rather than on a securities exchange. The Fund’s pricing services use multiple valuation techniques to determine fair value. In instances where sufficient market activity exists, the pricing services may utilize a market-based approach through which quotes from market makers are used to determine fair value. In instances where sufficient market activity may not exist or is limited, the pricing services also utilize proprietary valuation models which may consider market characteristics such as benchmark yield curves, credit spreads, estimated default rates, anticipated market interest rate volatility, coupon rates, anticipated timing of principal repayments, underlying collateral, and other unique security features in order to estimate the relevant cash flows, which are then discounted to calculate the fair value. Securities denominated in a foreign currency are converted into their U.S. dollar equivalent at the foreign exchange rate in effect at the NYSE close on the date that the values of the foreign debt securities are determined.
The Fund has procedures to determine the fair value of financial instruments for which market prices are not reliable or readily available. Under these procedures, the VLOC convenes on a regular basis to review such financial instruments and considers a number of factors, including significant unobservable valuation inputs, when arriving at fair value. The VLOC primarily employs a market-based approach which may use related or comparable assets or liabilities, recent transactions, market multiples, book values, and other relevant information for the investment to determine the fair value of the investment. An income-based valuation approach may also be used in which the anticipated future cash flows of the investment are discounted to calculate fair value. Discounts may also be applied due to the nature or duration of any restrictions on the disposition of the investments. Due to the inherent uncertainty of valuations of such investments, the fair values may differ significantly from
24 | Annual Report
franklintempleton.com
FRANKLIN FUND ALLOCATOR SERIES
NOTES TO FINANCIAL STATEMENTS
Franklin Multi-Asset Real Return Fund (continued)
the values that would have been used had an active market existed. The VLOC employs various methods for calibrating these valuation approaches including a regular review of key inputs and assumptions, transactional back-testing or disposition analysis, and reviews of any related market activity.
b. Foreign Currency Translation
Portfolio securities and other assets and liabilities denominated in foreign currencies are translated into U.S. dollars based on the exchange rate of such currencies against U.S. dollars on the date of valuation. The Fund may enter into foreign currency exchange contracts to facilitate transactions denominated in a foreign currency. Purchases and sales of securities, income and expense items denominated in foreign currencies are translated into U.S. dollars at the exchange rate in effect on the transaction date. Portfolio securities and assets and liabilities denominated in foreign currencies contain risks that those currencies will decline in value relative to the U.S. dollar. Occasionally, events may impact the availability or reliability of foreign exchange rates used to convert the U.S. dollar equivalent value. If such an event occurs, the foreign exchange rate will be valued at fair value using procedures established and approved by the Board.
The Fund does not separately report the effect of changes in foreign exchange rates from changes in market prices on securities held. Such changes are included in net realized and unrealized gain or loss from investments in the Statement of Operations.
Realized foreign exchange gains or losses arise from sales of foreign currencies, currency gains or losses realized between the trade and settlement dates on securities transactions and the difference between the recorded amounts of dividends, interest, and foreign withholding taxes and the U.S. dollar equivalent of the amounts actually received or paid. Net unrealized foreign exchange gains and losses arise from changes in foreign exchange rates on foreign denominated assets and liabilities other than investments in securities held at the end of the reporting period.
c. Income and Deferred Taxes
It is the Fund’s policy to qualify as a regulated investment company under the Internal Revenue Code. The Fund intends to distribute to shareholders substantially all of its taxable income and net realized gains to relieve it from federal income and excise taxes. As a result, no provision for U.S. federal income taxes is required.
The Fund may be subject to foreign taxation related to income received, capital gains on the sale of securities and certain foreign currency transactions in the foreign jurisdictions in which it invests. Foreign taxes, if any, are recorded based on the tax regulations and rates that exist in the foreign markets in which the Fund invests. When a capital gain tax is determined to apply, the Fund records an estimated deferred tax liability in an amount that would be payable if the securities were disposed of on the valuation date.
The Fund recognizes the tax benefits of uncertain tax positions only when the position is “more likely than not” to be sustained upon examination by the tax authorities based on the technical merits of the tax position. As of May 31, 2015, and for all open tax years, the Fund has determined that no liability for unrecognized tax benefits is required in the Fund’s financial statements related to uncertain tax positions taken on a tax return (or expected to be taken on future tax returns). Open tax years are those that remain subject to examination and are based on each tax jurisdiction statute of limitation.
d. Security Transactions, Investment Income, Expenses and Distributions
Security transactions are accounted for on trade date. Realized gains and losses on security transactions are determined on a specific identification basis. Interest income and estimated expenses are accrued daily. Amortization of premium and accretion of discount on debt securities are included in interest income. Dividend income and realized gain distributions by Underlying Funds and ETFs are recorded on the ex-dividend date. Distributions to shareholders are recorded on the ex-dividend date and are determined according to income tax regulations (tax basis). Distributable earnings determined on a tax basis may differ from earnings recorded in accordance with U.S. GAAP. These differences may be permanent or temporary. Permanent differences are reclassified among capital accounts to reflect their tax character. These reclassifications have no impact on net assets or the results of operations. Temporary differences are not reclassified, as they may reverse in subsequent periods.
Common expenses incurred by the Trust are allocated among the funds based on the ratio of net assets of each fund to the combined net assets of the Trust. Fund specific expenses are charged directly to the fund that incurred the expense.
franklintempleton.com
Annual Report
| 25
FRANKLIN FUND ALLOCATOR SERIES
NOTES TO FINANCIAL STATEMENTS
Franklin Multi-Asset Real Return Fund (continued)
1. Organization and Significant Accounting
Policies (continued)
d. Security Transactions, Investment Income, Expenses and Distributions (continued)
The Fund indirectly bears its proportionate share of expenses from the Underlying Funds and ETFs. Since the Underlying Funds and ETFs have varied expense levels and the Fund may own different proportions of the Underlying Funds and ETFs at different times, the amount of expenses incurred indirectly by the Fund will vary.
Realized and unrealized gains and losses and net investment income, not including class specific expenses, are allocated daily to each class of shares based upon the relative proportion of net assets of each class. Differences in per share distributions, by class, are generally due to differences in class specific expenses.
Inflation-indexed bonds are adjusted for inflation through periodic increases or decreases in the security’s interest accruals, face amount, or principal redemption value, by amounts corresponding to the rate of inflation as measured by an index. Any increase or decrease in the face amount or principal redemption value will be included as inflation principal adjustments in the Statement of Operations.
e. Accounting Estimates
The preparation of financial statements in accordance with U.S. GAAP requires management to make estimates and assumptions that affect the reported amounts of assets and liabilities at the date of the financial statements and the amounts of income and expenses during the reporting period. Actual results could differ from those estimates.
f. Guarantees and Indemnifications
Under the Trust’s organizational documents, its officers and trustees are indemnified by the Trust against certain liabilities arising out of the performance of their duties to the Trust. Additionally, in the normal course of business, the Trust, on behalf of the Fund, enters into contracts with service providers that contain general indemnification clauses. The Trust’s maximum exposure under these arrangements is unknown as this would involve future claims that may be made against the Trust that have not yet occurred. Currently, the Trust expects the risk of loss to be remote.
2. Shares of Beneficial Interest
At May 31, 2015, there were an unlimited number of shares authorized (without par value). Transactions in the Fund’s shares were as follows:
| Year Ended May 31, | ||||||||||
| 2015 | 2014 | |||||||||
| Shares | Amount | Shares | Amount | |||||||
| Class A Shares: | ||||||||||
| Shares sold | 261,496 | $ | 2,749,582 | 480,346 | $ | 5,073,475 | ||||
| Shares issued in reinvestment of distributions | 45,027 | 442,164 | 18,545 | 196,759 | ||||||
| Shares redeemed | (854,289 | ) | (8,616,313 | ) | (194,671 | ) | (2,070,357 | ) | ||
| Net increase (decrease) | (547,766 | ) | $ | (5,424,567 | ) | 304,220 | $ | 3,199,877 | ||
| Class C Shares: | ||||||||||
| Shares sold | 85,542 | $ | 875,179 | 252,062 | $ | 2,607,526 | ||||
| Shares issued in reinvestment of distributions | 16,521 | 160,752 | 5,761 | 60,550 | ||||||
| Shares redeemed | (205,755 | ) | (2,034,026 | ) | (59,237 | ) | (616,634 | ) | ||
| Net increase (decrease) | (103,692 | ) | $ | (998,095 | ) | 198,586 | $ | 2,051,442 | ||
26 | Annual Report
franklintempleton.com
| FRANKLIN FUND ALLOCATOR SERIES | ||||||||||
| NOTES TO FINANCIAL STATEMENTS | ||||||||||
| Franklin Multi-Asset Real Return Fund (continued) | ||||||||||
| Year Ended May 31, | ||||||||||
| 2015 | 2014 | |||||||||
| Shares | Amount | Shares | Amount | |||||||
| Class R Shares: | ||||||||||
| Shares sold | — | $ | — | 2,429 | $ | 25,763 | ||||
| Shares issued in reinvestment of distributions | 76 | 749 | 127 | 1,349 | ||||||
| Shares redeemed | — | — | (6,976 | ) | (73,733 | ) | ||||
| Net increase (decrease) | 76 | $ | 749 | (4,420 | ) | $ | (46,621 | ) | ||
| Advisor Class Shares: | ||||||||||
| Shares sold | 39,236 | $ | 405,829 | 40,294 | $ | 425,113 | ||||
| Shares issued in reinvestment of distributions | 6,585 | 64,667 | 2,033 | 21,565 | ||||||
| Shares redeemed | (16,059 | ) | (163,763 | ) | (96,498 | ) | (1,016,084 | ) | ||
| Net increase (decrease) | 29,762 | $ | 306,733 | (54,171 | ) | $ | (569,406 | ) | ||
3. Transactions with Affiliates
Franklin Resources, Inc. is the holding company for various subsidiaries that together are referred to as Franklin Templeton Investments. Certain officers and trustees of the Trust are also officers and/or directors/trustees of certain of the Underlying Funds and of the following subsidiaries:
| Subsidiary | Affiliation |
| Franklin Advisers, Inc. (Advisers) | Investment manager |
| Franklin Templeton Institutional, LLC (FT Institutional) | Investment manager |
| Franklin Templeton Services, LLC (FT Services) | Administrative manager |
| Franklin Templeton Distributors, Inc. (Distributors) | Principal underwriter |
| Franklin Templeton Investor Services, LLC (Investor Services) | Transfer agent |
a. Management Fees
The Fund pays an investment management fee to Advisers of 0.35% per year of the average daily net assets of the Fund.
Under a subadvisory agreement, FT Institutional, an affiliate of Advisers, provides subadvisory services to the Fund. The subadvisory fee is paid by Advisers based on the Fund’s average daily net assets, and is not an additional expense of the Fund.
b. Administrative Fees
Under an agreement with Advisers, FT Services provides administrative services to the Fund. The fee is paid by Advisers based on the Fund’s average daily net assets, and is not an additional expense of the Fund.
c. Distribution Fees
The Board has adopted distribution plans for each share class, with the exception of Advisor Class shares, pursuant to Rule 12b-1 under the 1940 Act. Distribution fees are not charged on shares held by affiliates. Under the Fund’s Class A reimbursement distribution plan, the Fund reimburses Distributors for costs incurred in connection with the servicing, sale and distribution of the Fund’s shares up to the maximum annual plan rate. Under the Class A reimbursement distribution plan, costs exceeding the maximum for the current plan year cannot be reimbursed in subsequent periods. In addition, under the Fund’s Class C and R compensation distribution plans, the Fund pays Distributors for costs incurred in connection with the servicing, sale and distribution of the Fund’s shares up to the maximum annual plan rate for each class. The plan year, for purposes of monitoring compliance with the maximum annual plan rates, is February 1 through January 31.
franklintempleton.com
Annual Report
| 27
FRANKLIN FUND ALLOCATOR SERIES
NOTES TO FINANCIAL STATEMENTS
Franklin Multi-Asset Real Return Fund (continued)
3. Transactions with Affiliates (continued)
c. Distribution Fees (continued)
The maximum annual plan rates, based on the average daily net assets, for each class, are as follows:
| Class A | 0.30 | % |
| Class C | 1.00 | % |
| Class R | 0.50 | % |
On July 15, 2015, the Board approved to set the current rate at 0.25% per year for Class A shares, effective August 1, 2015, until further notice and approval by the Board.
d. Sales Charges/Underwriting Agreements
Front-end sales charges and contingent deferred sales charges (CDSC) do not represent expenses of the Fund. These charges are deducted from the proceeds of sales of Fund shares prior to investment or from redemption proceeds prior to remittance, as applicable. Distributors has advised the Fund of the following commission transactions related to the sales and redemptions of the Fund’s shares for the year:
| Sales charges retained net of commissions paid to unaffiliated | ||
| broker/dealers | $ | 8,050 |
| CDSC retained | $ | 5,286 |
e. Transfer Agent Fees
Each class of shares pays transfer agent fees to Investor Services for its performance of shareholder servicing obligations and reimburses Investor Services for out of pocket expenses incurred, including shareholding servicing fees paid to third parties. These fees are allocated daily based upon their relative proportion of such classes’ aggregate net assets.
For the year ended May 31, 2015, the Fund paid transfer agent fees of $20,437, of which $11,897 was retained by Investor Services.
f. Investments in Underlying Funds
The Fund invests primarily in the Underlying Funds which are managed by Advisers or an affiliate of Advisers. The Fund does not invest in the Underlying Funds for the purpose of exercising a controlling influence over the management or policies. Management fees paid by the Fund are waived on assets invested in Institutional Fiduciary Trust Money Market Portfolio (Sweep Money Fund), as noted in the Statement of Operations, in an amount not to exceed the management and administrative fees paid directly or indirectly by the Sweep Money Fund.
| Investments in Underlying Funds for the year ended May 31, 2015, were as follows: | |||||||||||||
| % of | |||||||||||||
| Underlying | |||||||||||||
| Number of | Number of | Fund Shares | |||||||||||
| Shares Held | Shares | Value | Outstanding | ||||||||||
| at Beginning | Gross | Gross | Held at End | at End | Investment | Realized | Held at End | ||||||
| Underlying Funds | of Year | Additions | Reductions | of Year | of Year | Income | Gain (Loss) | of Year | |||||
| Franklin Adjustable U.S. Government | |||||||||||||
| Securities Fund, Class R6 | 38,184 | 102 | (38,286 | ) | — $ | —a | $ | 896 | $ | (4,341 | ) | — | |
| Franklin Emerging Market Debt | |||||||||||||
| Opportunities Fundb | 39,200 | 25,163 | (57,388 | ) | 6,975 | 75,953 | 32,660 | (52,869 | )c | 0.01 | % | ||
28 | Annual Report
franklintempleton.com
FRANKLIN FUND ALLOCATOR SERIES
NOTES TO FINANCIAL STATEMENTS
| Franklin Multi-Asset Real Return Fund (continued) | ||||||||||||||
| % of | ||||||||||||||
| Underlying | ||||||||||||||
| Number of | Number of | Fund Shares | ||||||||||||
| Shares Held | Shares | Value | Outstanding | |||||||||||
| at Beginning | Gross | Gross | Held at End | at End | Investment | Realized | Held at End | |||||||
| Underlying Funds | of Year | Additions | Reductions | of Year | of Year | Income | Gain (Loss) | of Year | ||||||
| Franklin Floating Rate Daily Access | ||||||||||||||
| Fund, Class R6 | 72,167 | 1,358 | (73,525 | ) | — | $ | —a | $ | 12,326 | $ | (4,799 | ) | — | |
| Franklin Focused Core Equity Fund, | ||||||||||||||
| Class R6 | — | 55,024 | (24,448 | ) | 30,576 | 480,659 | 1,395 | 28,026 | c | 0.30 | % | |||
| Franklin Global Real Estate Fund, | ||||||||||||||
| Class R6 | 86,785 | 37,740 | (86,768 | ) | 37,757 | 337,549 | 15,245 | 61,398 | 0.19 | % | ||||
| Franklin Gold and Precious Metals | ||||||||||||||
| Fund, Class R6 | — | 9,929 | — | 9,929 | 157,080 | 2,487 | — | 0.02 | % | |||||
| Franklin Growth Fund, Class R6 | 5,823 | 6,216 | (4,797 | ) | 7,242 | 566,950 | 5,008 | 22,180 | 0.00 | %d | ||||
| Franklin Growth Opportunities Fund, | ||||||||||||||
| Class R6 | 9,665 | 98 | (6,651 | ) | 3,112 | 111,816 | — | 39,394 | c | 0.01 | % | |||
| Franklin High Income Fund, Class R6 | 579,120 | 138,572 | (538,086 | ) | 179,606 | 361,008 | 33,043 | (16,125 | ) | 0.01 | % | |||
| Franklin India Growth Fund, Class R6 | — | 28,519 | — | 28,519 | 379,015 | 2,554 | — | 0.27 | % | |||||
| Franklin International Small Cap Growth | ||||||||||||||
| Fund, Class R6 | 52,191 | 2,458 | (54,649 | ) | — | —a | 7,298 | 180,209 | c | — | ||||
| Franklin K2 Alternative Strategies Fund, | ||||||||||||||
| Class R6 | 114,014 | 17,339 | (22,986 | ) | 108,367 | 1,211,541 | 12,185 | 4,642 | 0.16 | % | ||||
| Franklin Low Duration Total Return | ||||||||||||||
| Fund, Class R6 | 89,153 | 41,303 | (77,038 | ) | 53,418 | 537,920 | 17,918 | (12,140 | ) | 0.02 | % | |||
| Franklin MicroCap Value Fund, | ||||||||||||||
| Class R6 | 12,489 | — | (12,489 | ) | — | —a | — | 56,298 | — | |||||
| Franklin Mutual European Fund, | ||||||||||||||
| Class R6 | — | 22,354 | — | 22,354 | 511,470 | — | — | 0.02 | % | |||||
| Franklin Mutual International Fund, | ||||||||||||||
| Class R6 | — | 19,437 | (6,485 | ) | 12,952 | 209,044 | — | 3,243 | 0.12 | % | ||||
| Franklin Mutual Shares Fund, | ||||||||||||||
| Class R6e | 8,143 | 189 | (8,332 | ) | — | —a | 5,668 | 71,504 | — | |||||
| Franklin Natural Resources Fund, | ||||||||||||||
| Class R6 | 21,914 | 1,435 | (11,032 | ) | 12,317 | 388,985 | 8,649 | (112,923 | ) | 0.05 | % | |||
| Franklin Pelagos Commodities Strategy | ||||||||||||||
| Fund, Class R6 | 350,073 | 23,876 | (145,286 | ) | 228,663 | 1,637,225 | — | (357,117 | ) | 2.93 | % | |||
| Franklin Small Cap Growth Fund, | ||||||||||||||
| Class R6 | 14,623 | 837 | (15,460 | ) | — | —a | — | 30,349 | c | — | ||||
| Franklin Strategic Income Fund, | ||||||||||||||
| Class R6 | 149,291 | 50,003 | (95,474 | ) | 103,820 | 1,040,276 | 69,863 | (37,255 | )c | 0.01 | % | |||
| Franklin Total Return Fund, Class R6 | — | 125,969 | (125,969 | ) | — | —a | 27,096 | (4,018 | ) | — | ||||
| Franklin U.S. Government Securities | ||||||||||||||
| Fund, Class R6 | 66,748 | 134,585 | (16,872 | ) | 184,461 | 1,198,998 | 27,482 | (4,540 | ) | 0.02 | % | |||
| Franklin Utilities Fund, Class R6 | 24,707 | 4,858 | (16,220 | ) | 13,345 | 227,674 | 10,639 | 20,604 | c | 0.00 | %d | |||
| Institutional Fiduciary Trust Money | ||||||||||||||
| Market Portfolio | 697,824 | 9,517,539 | (9,528,988 | ) | 686,375 | 686,375 | — | — | 0.00 | %d | ||||
| Templeton China World Fund, | ||||||||||||||
| Class R6 | — | 12,576 | (9,354 | ) | 3,222 | 111,627 | 6,283 | (11,378 | )c | 0.02 | % | |||
| Templeton Developing Markets Trust, | ||||||||||||||
| Class R6 | 8,989 | 8,683 | (17,672 | ) | — | —a | 211 | (17,273 | )c | — | ||||
| Templeton Foreign Fund, Class R6 | 79,788 | 51,580 | (110,521 | ) | 20,847 | 155,725 | 20,200 | (46,496 | )c | 0.00 | %d | |||
franklintempleton.com
Annual Report
| 29
FRANKLIN FUND ALLOCATOR SERIES
NOTES TO FINANCIAL STATEMENTS
| Franklin Multi-Asset Real Return Fund (continued) | ||||||||||||||
| 3. Transactions with Affiliates (continued) | ||||||||||||||
| f. Investments in Underlying Funds (continued) | ||||||||||||||
| % of | ||||||||||||||
| Underlying | ||||||||||||||
| Number of | Number of | Fund Shares | ||||||||||||
| Shares Held | Shares | Value | Outstanding | |||||||||||
| at Beginning | Gross | Gross | Held at End | at End | Investment | Realized | Held at End | |||||||
| Underlying Funds | of Year | Additions | Reductions | of Year | of Year | Income | Gain (Loss) | of Year | ||||||
| Templeton Frontier Markets Fund, | ||||||||||||||
| Class R6 | 54,373 | 8,088 | (62,461 | ) | — | $ | —a | $ | 11,942 | $ | 2,730 | c | — | |
| Templeton Global Total Return Fund, | ||||||||||||||
| Class R6 | 117,258 | 60,258 | (83,758 | ) | 93,758 | 1,171,977 | 146,429 | (86,161 | )c | 0.01 | % | |||
| Total | $ | 11,558,867 | $ | 477,477 | $ | (246,858 | ) | |||||||
aAs of May 31, 2015, no longer held by the fund.
bEffective June 30, 2014, Franklin Templeton Emerging Market Debt Opportunities Fund was renamed Franklin Emerging Market Debt Opportunities Fund.
cIncludes realized gain distributions received.
dRounds to less than 0.01%.
eEffective June 30, 2014, Mutual Shares Fund was renamed Franklin Mutual Shares Fund.
g. Waiver and Expense Reimbursements
Advisers has contractually agreed in advance to waive or limit its fees and to assume as its own expense certain expenses otherwise payable by the Fund so that the expenses (excluding distribution fees, and acquired fund fees and expenses) for each class of the Fund do not exceed 0.45%, based on the average net assets of each class (other than certain non-routine expenses or costs, including those relating to litigation, indemnification, reorganizations, and liquidations) until September 30, 2015.
4. Expense Offset Arrangement
The Fund has entered into an arrangement with its custodian whereby credits realized as a result of uninvested cash balances are used to reduce a portion of the Fund’s custodian expenses. During the year ended May 31, 2015, there were no credits earned.
5. Income Taxes
For tax purposes, the Fund may elect to defer any portion of a post-October capital loss to the first day of the following fiscal year. At May 31, 2015, the Fund deferred post-October capital losses of $261,100.
The tax character of distributions paid during the years ended May 31, 2015 and 2014, was as follows:
| 2015 | 2014 | |||
| Distributions paid from: | ||||
| Ordinary income | $ | 502,113 | $ | 260,014 |
| Long term capital gain | 206,568 | 40,528 | ||
| $ | 708,681 | $ | 300,542 |
At May 31, 2015, the cost of investments and net unrealized appreciation (depreciation) for income tax purposes were as follows:
| Cost of investments | $ | 14,820,520 | ||
| Unrealized appreciation | $ | 485,382 | ||
| Unrealized depreciation | (916,252 | ) | ||
| Net unrealized appreciation (depreciation) | $ | (430,870 | ) | |
| 30 | Annual Report | franklintempleton.com | |||
FRANKLIN FUND ALLOCATOR SERIES
NOTES TO FINANCIAL STATEMENTS
Franklin Multi-Asset Real Return Fund (continued)
Differences between income and/or capital gains as determined on a book basis and a tax basis are primarily due to differing treatments of short term capital gains distributions from Underlying Funds and ETFs and wash sales.
6. Investment Transactions
Purchases and sales of investments (excluding short term securities) for the year ended May 31, 2015, aggregated $10,261,163 and $16,456,668, respectively.
7. Credit Facility
The Fund, together with other U.S. registered and foreign investment funds (collectively, Borrowers), managed by Franklin Templeton Investments, are borrowers in a joint syndicated senior unsecured credit facility totaling $2 billion (Global Credit Facility) which matures on February 12, 2016. This Global Credit Facility provides a source of funds to the Borrowers for temporary and emergency purposes, including the ability to meet future unanticipated or unusually large redemption requests.
Under the terms of the Global Credit Facility, the Fund shall, in addition to interest charged on any borrowings made by the Fund and other costs incurred by the Fund, pay its share of fees and expenses incurred in connection with the implementation and maintenance of the Global Credit Facility, based upon its relative share of the aggregate net assets of all of the Borrowers, including an annual commitment fee of 0.07% based upon the unused portion of the Global Credit Facility. These fees are reflected in other expenses in the Statement of Operations. During the year ended May 31, 2015, the Fund did not use the Global Credit Facility.
8. Fair Value Measurements
The Fund follows a fair value hierarchy that distinguishes between market data obtained from independent sources (observable inputs) and the Fund’s own market assumptions (unobservable inputs). These inputs are used in determining the value of the Fund’s financial instruments and are summarized in the following fair value hierarchy:
- Level 1 – quoted prices in active markets for identical financial instruments
- Level 2 – other significant observable inputs (including quoted prices for similar financial instruments, interest rates, prepayment speed, credit risk, etc.)
- Level 3 – significant unobservable inputs (including the Fund’s own assumptions in determining the fair value of financial instruments)
The input levels are not necessarily an indication of the risk or liquidity associated with financial instruments at that level.
For movements between the levels within the fair value hierarchy, the Fund has adopted a policy of recognizing the transfers as of the date of the underlying event which caused the movement.
A summary of inputs used as of May 31, 2015, in valuing the Fund’s assets carried at fair value, is as follows:
| Level 1 | Level 2 | Level 3 | Total | |||||
| Assets: | ||||||||
| Investments in Securities: | ||||||||
| Investments in Underlying Funds and Exchange Traded Fundsa | $ | 11,633,082 | $ | — | $ | — | $ | 11,633,082 |
| Foreign Government and Agency Securities | — | 79,185 | — | 79,185 | ||||
| U.S. Government and Agency Securities | — | 1,991,008 | — | 1,991,008 | ||||
| Short Term Investments | 686,375 | — | — | 686,375 | ||||
| Total Investments in Securities | $ | 12,319,457 | $ | 2,070,193 | $ | — | $ | 14,389,650 |
aFor detailed Underlying Fund and ETF categories, see the accompanying Statement of Investments.
franklintempleton.com Annual Report | 31
FRANKLIN FUND ALLOCATOR SERIES
NOTES TO FINANCIAL STATEMENTS
Franklin Multi-Asset Real Return Fund (continued)
9. Subsequent Events
The Fund has evaluated subsequent events through the issuance of the financial statements and determined that no events have occurred that require disclosure other than those already disclosed in the financial statements.
| Abbreviations | |
| Currency | Selected Portfolio |
| MXN Mexican Peso | ETF Exchange Traded Fund |
32 | Annual Report
franklintempleton.com
FRANKLIN FUND ALLOCATOR SERIES
Report of Independent Registered Public Accounting Firm
To the Board of Trustees and Shareholders of Franklin Multi-Asset Real Return Fund
In our opinion, the accompanying statement of assets and liabilities, including the statement of investments, and the related statements of operations and of changes in net assets and the financial highlights present fairly, in all material respects, the financial position of Franklin Multi-Asset Real Return Fund (the “Fund”) at May 31, 2015, the results of its operations for the year then ended, the changes in its net assets for each of the two years in the period then ended and the financial highlights for the periods presented, in conformity with accounting principles generally accepted in the United States of America. These financial statements and financial highlights (hereafter referred to as “financial statements”) are the responsibility of the Fund’s management. Our responsibility is to express an opinion on these financial statements based on our audits. We conducted our audits of these financial statements in accordance with the standards of the Public Company Accounting Oversight Board (United States). Those standards require that we plan and perform the audit to obtain reasonable assurance about whether the financial statements are free of material misstatement. An audit includes examining, on a test basis, evidence supporting the amounts and disclosures in the financial statements, assessing the accounting principles used and significant estimates made by management, and evaluating the overall financial statement presentation. We believe that our audits, which included confirmation of securities at May 31, 2015 by correspondence with the custodian, transfer agent and brokers, provide a reasonable basis for our opinion.
PricewaterhouseCoopers LLP
San Francisco, California
July 16, 2015
franklintempleton.com
Annual Report
| 33
FRANKLIN FUND ALLOCATOR SERIES
Tax Information (unaudited)
Franklin Multi-Asset Real Return Fund
Under Section 852(b)(3)(C) of the Internal Revenue Code (Code), the Fund hereby reports the maximum amount allowable but no less than $206,568 as a long term capital gain dividend for the fiscal year ended May 31, 2015.
Under Section 871(k)(2)(C) of the Code, the Fund hereby reports the maximum amount allowable but no less than $28,165 as a short term capital gain dividend for purposes of the tax imposed under Section 871(a)(1)(A) of the Code for the fiscal year ended May 31, 2015.
Under Section 854(b)(1)(A) of the Code, the Fund hereby reports 6.78% of the ordinary income dividends as income qualifying for the dividends received deduction for the fiscal year ended May 31, 2015.
Under Section 854(b)(1)(B) of the Code, the Fund hereby reports the maximum amount allowable but no less than $114,659 as qualified dividends for purposes of the maximum rate under Section 1(h)(11) of the Code for the fiscal year ended May 31, 2015. Distributions, including qualified dividend income, paid during calendar year 2015 will be reported to shareholders on Form 1099-DIV by mid-February 2016. Shareholders are advised to check with their tax advisors for information on the treatment of these amounts on their individual income tax returns.
During the fiscal year ended May 31, 2015, the Fund, a qualified fund of funds under Section 852(g)(2) of Code, received an allocation of foreign taxes paid from one or more of its underlying funds. As shown in the table below, the Fund hereby reports to shareholders the foreign source income and foreign taxes paid by underlying funds, pursuant to Section 853 of the Code. This written statement will allow shareholders of record on December 29, 2014, to treat their proportionate share of foreign taxes paid by the underlying funds as having been paid directly by them. The shareholder shall consider these amounts as foreign taxes paid in the tax year in which they receive the Fund distribution.
The following table provides a detailed analysis of foreign tax paid, foreign source income, and foreign source qualified dividends as reported by the Fund, to Class A, Class C, Class R, and Advisor Class shareholders of record.
| Foreign Tax Paid | Foreign Source | Foreign Source Qualified | ||||
| Class | Per Share | Income Per Share | Dividends Per Share | |||
| Class A | $ | 0.0024 | $ | 0.0646 | $ | 0.0131 |
| Class C | $ | 0.0024 | $ | 0.0646 | $ | 0.0131 |
| Class R | $ | 0.0024 | $ | 0.0646 | $ | 0.0131 |
| Advisor Class | $ | 0.0024 | $ | 0.0646 | $ | 0.0131 |
Foreign Tax Paid Per Share (Column 1) is the amount per share available to you, as a tax credit (assuming you held your shares in the Fund for a minimum of 16 days during the 31-day period beginning 15 days before the ex-dividend date of the Fund’s distribution to which the foreign taxes relate), or, as a tax deduction.
Foreign Source Income Per Share (Column 2) is the amount per share of income dividends attributable to foreign securities held by the underlying funds, plus any foreign taxes withheld on these dividends. The amounts reported include foreign source qualified dividends that have not been adjusted for the rate differential applicable to such dividend income.1
Foreign Source Qualified Dividends Per Share (Column 3) is the amount per share of foreign source qualified dividends, plus any foreign taxes withheld on these dividends. These amounts represent the portion of the Foreign Source Income reported to you in column 2 that were derived from qualified foreign securities held by the underlying funds.1
34 | Annual Report
franklintempleton.com
FRANKLIN FUND ALLOCATOR SERIES
FRANKLIN MULTI-ASSET REAL RETURN FUND
TAX INFORMATION (UNAUDITED)
In February 2015, shareholders received Form 1099-DIV which included their share of taxes paid and foreign source income distributed during the calendar year 2014. The Foreign Source Income reported on Form 1099-DIV was not adjusted for the rate differential on foreign source qualified dividend income. Shareholders are advised to check with their tax advisors for information on the treatment of these amounts on their 2014 individual income tax returns.
1Qualified dividends are taxed at reduced long term capital gains tax rates. In determining the amount of foreign tax credit that may be applied against the U.S. tax liability
of individuals receiving foreign source qualified dividends, adjustments may be required to the foreign tax credit limitation calculation to reflect the rate differential applicable
to such dividend income. The rules however permit certain individuals to elect not to apply the rate differential adjustments for capital gains and/or dividends for any taxable
year. Please consult your tax advisor and the instructions to Form 1116 for more information.
franklintempleton.com
Annual Report
| 35
FRANKLIN FUND ALLOCATOR SERIES
Board Members and Officers
The name, year of birth and address of the officers and board members, as well as their affiliations, positions held with the Trust, principal occupations during at least the past five years and number of portfolios overseen in the Franklin Templeton Investments fund complex are shown below. Generally, each board member serves until that person’s successor is elected and qualified.
| Independent Board Members | ||||
| Number of Portfolios in | ||||
| Name, Year of Birth | Length of | Fund Complex Overseen | Other Directorships Held | |
| and Address | Position | Time Served | by Board Member* | During at Least the Past 5 Years |
| Harris J. Ashton (1932) | Trustee | Since 1995 | 145 | Bar-S Foods (meat packing company) |
| One Franklin Parkway | (1981-2010). | |||
| San Mateo, CA 94403-1906 | ||||
| Principal Occupation During at Least the Past 5 Years: | ||||
| Director of various companies; and formerly, Director, RBC Holdings, Inc. (bank holding company) (until 2002); and President, Chief | ||||
| Executive Officer and Chairman of the Board, General Host Corporation (nursery and craft centers) (until 1998). | ||||
| Mary C. Choksi (1950) | Trustee | Since | 119 | Avis Budget Group Inc. (car rental) |
| One Franklin Parkway | October 2014 | (2007-present), Omnicom Group Inc. | ||
| San Mateo, CA 94403-1906 | (advertising and marketing communi- | |||
| cations services) (2011-present) and | ||||
| H.J. Heinz Company (processed foods | ||||
| and allied products) (1998-2006). | ||||
| Principal Occupation During at Least the Past 5 Years: | ||||
| Founding Partner and Senior Managing Director, Strategic Investment Group (investment management group) (1987-present); director of | ||||
| various companies; and formerly, Founding Partner and Managing Director, Emerging Markets Management LLC (investment management | ||||
| firm) (1987-2011); and Loan Officer/Senior Loan Officer/Senior Pension Investment Officer, World Bank Group (international financial | ||||
| institution) (1977-1987). | ||||
| Edith E. Holiday (1952) | Trustee | Since 1998 | 145 | Hess Corporation (exploration and |
| One Franklin Parkway | refining of oil and gas) (1993-present), | |||
| San Mateo, CA 94403-1906 | RTI International Metals, Inc. (manu- | |||
| facture and distribution of titanium) | ||||
| (1999-present), Canadian National | ||||
| Railway (railroad) (2001-present), | ||||
| White Mountains Insurance Group, | ||||
| Ltd. (holding company) (2004-present) | ||||
| and H.J. Heinz Company (processed | ||||
| foods and allied products) (1994-2013). | ||||
| Principal Occupation During at Least the Past 5 Years: | ||||
| Director or Trustee of various companies and trusts; and formerly, Assistant to the President of the United States and Secretary of the | ||||
| Cabinet (1990-1993); General Counsel to the United States Treasury Department (1989-1990); and Counselor to the Secretary and Assistant | ||||
| Secretary for Public Affairs and Public Liaison – United States Treasury Department (1988-1989). | ||||
| J. Michael Luttig (1954) | Trustee | Since 2009 | 145 | Boeing Capital Corporation |
| One Franklin Parkway | (aircraft financing) (2006-2013). | |||
| San Mateo, CA 94403-1906 | ||||
| Principal Occupation During at Least the Past 5 Years: | ||||
| Executive Vice President, General Counsel and member of the Executive Council, The Boeing Company (aerospace company); and | ||||
| formerly, Federal Appeals Court Judge, U.S. Court of Appeals for the Fourth Circuit (1991-2006). | ||||
36 | Annual Report
franklintempleton.com
FRANKLIN FUND ALLOCATOR SERIES
| Independent Board Members (continued) | |||||
| Number of Portfolios in | |||||
| Name, Year of Birth | Length of | Fund Complex Overseen | Other Directorships Held | ||
| and Address | Position | Time Served | by Board Member* | During at Least the Past 5 Years | |
| Frank A. Olson (1932) | Trustee | Since 2007 | 145 | Hess Corporation (exploration and | |
| One Franklin Parkway | refining of oil and gas) (1998-2013). | ||||
| San Mateo, CA 94403-1906 | |||||
| Principal Occupation During at Least the Past 5 Years: | |||||
| Director of various companies; and formerly, Chairman of the Board, The Hertz Corporation (car rental) (1980-2000) and Chief Executive | |||||
| Officer (1977-1999); and Chairman of the Board, President and Chief Executive Officer, UAL Corporation (airlines) (June-December 1987). | |||||
| Larry D. Thompson (1945) | Trustee | Since 2007 | 145 | Cbeyond, Inc. (business commu- | |
| One Franklin Parkway | nications provider) (2010-2012), | ||||
| San Mateo, CA 94403-1906 | The Southern Company (energy | ||||
| company) (December 2014; | |||||
| previously 2010-2012) and Graham | |||||
| Holdings Company (education and | |||||
| media organization) (2011-present). | |||||
| Principal Occupation During at Least the Past 5 Years: | |||||
| Director of various companies; John A. Sibley Professor of Corporate and Business Law, University of Georgia School of Law (January | |||||
| 2015; previously 2011-2012); and formerly, Executive Vice President – Government Affairs, General Counsel and Corporate Secretary, | |||||
| PepsiCo, Inc. (consumer products) (2012-2014); Senior Vice President – Government Affairs, General Counsel and Secretary, PepsiCo, Inc. | |||||
| (2004-2011); Senior Fellow of The Brookings Institution (2003-2004); Visiting Professor, University of Georgia School of Law (2004); and | |||||
| Deputy Attorney General, U.S. Department of Justice (2001-2003). | |||||
| John B. Wilson (1959) | Lead | Trustee since | 119 | None | |
| One Franklin Parkway | Independent | 2006 and Lead | |||
| San Mateo, CA 94403-1906 | Trustee | Independent | |||
| Trustee since 2008 | |||||
| Principal Occupation During at Least the Past 5 Years: | |||||
| President, Staples Europe (office supplies) (2012-present); President and Founder, Hyannis Port Capital, Inc. (real estate and private | |||||
| equity investing); serves on private and non-profit boards; and formerly, Chief Operating Officer and Executive Vice President, Gap, | |||||
| Inc. (retail) (1996-2000); Chief Financial Officer and Executive Vice President – Finance and Strategy, Staples, Inc. (1992-1996); Senior | |||||
| Vice President – Corporate Planning, Northwest Airlines, Inc. (airlines) (1990-1992); and Vice President and Partner, Bain & Company | |||||
| (consulting firm) (1986-1990). | |||||
| Interested Board Members and Officers | |||||
| Number of Portfolios in | |||||
| Name, Year of Birth | Length of | Fund Complex Overseen | Other Directorships Held | ||
| and Address | Position | Time Served | by Board Member* | During at Least the Past 5 Years | |
| **Gregory E. Johnson (1961) | Trustee | Since 2007 | 162 | None | |
| One Franklin Parkway | |||||
| San Mateo, CA 94403-1906 | |||||
| Principal Occupation During at Least the Past 5 Years: | |||||
| Chairman of the Board, Member – Office of the Chairman, Director, President and Chief Executive Officer, Franklin Resources, Inc.; officer | |||||
| and/or director or trustee, as the case may be, of some of the other subsidiaries of Franklin Resources, Inc. and of 46 of the investment | |||||
| companies in Franklin Templeton Investments; and Vice Chairman, Investment Company Institute. | |||||
franklintempleton.com
Annual Report
| 37
| FRANKLIN FUND ALLOCATOR SERIES | ||||
| Interested Board Members and Officers (continued) | ||||
| Number of Portfolios in | ||||
| Name, Year of Birth | Length of | Fund Complex Overseen | Other Directorships Held | |
| and Address | Position | Time Served | by Board Member* | During at Least the Past 5 Years |
| **Rupert H. Johnson, Jr. (1940) Chairman of | Chairman of the | 145 | None | |
| One Franklin Parkway | the Board and | Board and Trustee | ||
| San Mateo, CA 94403-1906 | Trustee | since 2013 | ||
| Principal Occupation During at Least the Past 5 Years: | ||||
| Vice Chairman, Member – Office of the Chairman and Director, Franklin Resources, Inc.; Director, Franklin Advisers, Inc.; Senior Vice | ||||
| President, Franklin Advisory Services, LLC; and officer and/or director or trustee, as the case may be, of some of the other subsidiaries of | ||||
| Franklin Resources, Inc. and of 43 of the investment companies in Franklin Templeton Investments. | ||||
| Alison E. Baur (1964) | Vice President | Since 2012 | Not Applicable | Not Applicable |
| One Franklin Parkway | ||||
| San Mateo, CA 94403-1906 | ||||
| Principal Occupation During at Least the Past 5 Years: | ||||
| Deputy General Counsel, Franklin Templeton Investments; and officer of some of the other subsidiaries of Franklin Resources, Inc. and of 46 | ||||
| of the investment companies in Franklin Templeton Investments. | ||||
| Laura F. Fergerson (1962) | Chief | Since 2009 | Not Applicable | Not Applicable |
| One Franklin Parkway | Executive | |||
| San Mateo, CA 94403-1906 | Officer – | |||
| Finance and | ||||
| Administration | ||||
| Principal Occupation During at Least the Past 5 Years: | ||||
| Senior Vice President, Franklin Templeton Services, LLC; Vice President, Franklin Advisers, Inc. and Franklin Templeton Institutional, LLC; | ||||
| and officer of 46 of the investment companies in Franklin Templeton Investments. | ||||
| Gaston Gardey (1967) | Treasurer, | Since 2009 | Not Applicable | Not Applicable |
| One Franklin Parkway | Chief Financial | |||
| San Mateo, CA 94403-1906 | Officer and | |||
| Chief | ||||
| Accounting | ||||
| Officer | ||||
| Principal Occupation During at Least the Past 5 Years: | ||||
| Treasurer, U.S. Fund Administration & Reporting, Franklin Templeton Investments; and officer of 27 of the investment companies in Franklin | ||||
| Templeton Investments. | ||||
| Aliya S. Gordon (1973) | Vice President | Since 2009 | Not Applicable | Not Applicable |
| One Franklin Parkway | ||||
| San Mateo, CA 94403-1906 | ||||
| Principal Occupation During at Least the Past 5 Years: | ||||
| Senior Associate General Counsel, Franklin Templeton Investments; officer of 46 of the investment companies in Franklin Templeton | ||||
| Investments; and formerly, Litigation Associate, Steefel, Levitt & Weiss, LLP (2000-2004). | ||||
| Steven J. Gray (1955) | Vice President | Since 2009 | Not Applicable | Not Applicable |
| One Franklin Parkway | ||||
| San Mateo, CA 94403-1906 | ||||
| Principal Occupation During at Least the Past 5 Years: | ||||
| Senior Associate General Counsel, Franklin Templeton Investments; Vice President, Franklin Templeton Distributors, Inc. and Franklin | ||||
| Alternative Strategies Advisers, LLC; and officer of 46 of the investment companies in Franklin Templeton Investments. | ||||
38 | Annual Report
franklintempleton.com
FRANKLIN FUND ALLOCATOR SERIES
| Interested Board Members and Officers (continued) | ||||
| Number of Portfolios in | ||||
| Name, Year of Birth | Length of | Fund Complex Overseen | Other Directorships Held | |
| and Address | Position | Time Served | by Board Member* | During at Least the Past 5 Years |
| Selena L. Holmes (1965) | Vice President | Since 2012 | Not Applicable | Not Applicable |
| 100 Fountain Parkway | – AML | |||
| St. Petersburg, FL 33716-1205 | Compliance | |||
| Principal Occupation During at Least the Past 5 Years: | ||||
| Director, Global Compliance Monitoring; Chief Compliance Officer, Franklin Alternative Strategies Advisers, LLC; Vice President, Franklin | ||||
| Templeton Companies, LLC; and officer of 46 of the investment companies in Franklin Templeton Investments. | ||||
| Edward B. Jamieson (1948) | President and | Since 2010 | Not Applicable | Not Applicable |
| One Franklin Parkway | Chief Executive | |||
| San Mateo, CA 94403-1906 | Officer – | |||
| Investment | ||||
| Management | ||||
| Principal Occupation During at Least the Past 5 Years: | ||||
| President, Chief Investment Officer and Director, Franklin Advisers, Inc.; Executive Vice President, Franklin Templeton Institutional, LLC; | ||||
| and officer and/or trustee, as the case may be, of some of the other subsidiaries of Franklin Resources, Inc. and of 10 of the investment | ||||
| companies in Franklin Templeton Investments. | ||||
| Kimberly H. Novotny (1972) | Vice President | Since 2013 | Not Applicable | Not Applicable |
| 300 S.E. 2nd Street | ||||
| Fort Lauderdale, FL 33301-1923 | ||||
| Principal Occupation During at Least the Past 5 Years: | ||||
| Associate General Counsel, Franklin Templeton Investments; Vice President and Secretary, Fiduciary Trust International of the South; Vice | ||||
| President, Templeton Investment Counsel, LLC; Assistant Secretary, Franklin Resources, Inc.; and officer of 46 of the investment companies | ||||
| in Franklin Templeton Investments. | ||||
| Robert C. Rosselot (1960) | Chief | Since 2013 | Not Applicable | Not Applicable |
| 300 S.E. 2nd Street | Compliance | |||
| Fort Lauderdale, FL 33301-1923 | Officer | |||
| Principal Occupation During at Least the Past 5 Years: | ||||
| Director, Global Compliance, Franklin Templeton Investments; Vice President, Franklin Templeton Companies, LLC; officer of 46 of the | ||||
| investment companies in Franklin Templeton Investments; and formerly, Senior Associate General Counsel, Franklin Templeton Investments | ||||
| (2007-2013); and Secretary and Vice President, Templeton Group of Funds (2004-2013). | ||||
| Karen L. Skidmore (1952) | Vice President | Since 2006 | Not Applicable | Not Applicable |
| One Franklin Parkway | and Secretary | |||
| San Mateo, CA 94403-1906 | ||||
| Principal Occupation During at Least the Past 5 Years: | ||||
| Senior Associate General Counsel, Franklin Templeton Investments; and officer of 46 of the investment companies in Franklin Templeton | ||||
| Investments. | ||||
| Craig S. Tyle (1960) | Vice President | Since 2005 | Not Applicable | Not Applicable |
| One Franklin Parkway | ||||
| San Mateo, CA 94403-1906 | ||||
| Principal Occupation During at Least the Past 5 Years: | ||||
| General Counsel and Executive Vice President, Franklin Resources, Inc.; and officer of some of the other subsidiaries of Franklin Resources, | ||||
| Inc. and of 46 of the investment companies in Franklin Templeton Investments. | ||||
franklintempleton.com
Annual Report
| 39
FRANKLIN FUND ALLOCATOR SERIES
| Interested Board Members and Officers (continued) | ||||
| Number of Portfolios in | ||||
| Name, Year of Birth | Length of | Fund Complex Overseen | Other Directorships Held | |
| and Address | Position | Time Served | by Board Member* | During at Least the Past 5 Years |
| Lori A. Weber (1964) | Vice President | Since 2011 | Not Applicable | Not Applicable |
| 300 S.E. 2nd Street | ||||
| Fort Lauderdale, FL 33301-1923 | ||||
| Principal Occupation During at Least the Past 5 Years: | ||||
| Senior Associate General Counsel, Franklin Templeton Investments; Assistant Secretary, Franklin Resources, Inc.; Vice President and | ||||
| Secretary, Templeton Investment Counsel, LLC; Vice President, Fiduciary Trust International of the South; and officer of 46 of the investment | ||||
| companies in Franklin Templeton Investments. | ||||
*We base the number of portfolios on each separate series of the U.S. registered investment companies within the Franklin Templeton Investments fund complex.
These portfolios have a common investment manager or affiliated investment managers.
**Gregory E. Johnson is considered to be an interested person of the Fund under the federal securities laws due to his position as an officer and director of Franklin
Resources, Inc. (Resources), which is the parent company of the Fund’s investment manager and distributor. Rupert H. Johnson, Jr. is considered to be an interested
person of the Fund under the federal securities laws due to his position as officer and director and major shareholder of Resources.
Note 1: Rupert H. Johnson, Jr. is the uncle of Gregory E. Johnson.
Note 2: Officer information is current as of the date of this report. It is possible that after this date, information about officers may change.
Note 3: Effective April 30, 2015, Sam Ginn ceased to be a trustee of the Fund.
The Sarbanes-Oxley Act of 2002 and Rules adopted by the Securities and Exchange Commission require the Fund to disclose whether the Fund’s Audit Committee
includes at least one member who is an audit committee financial expert within the meaning of such Act and Rules. The Fund’s Board has determined that there
is at least one such financial expert on the Audit Committee and has designated John B. Wilson as its audit committee financial expert. The Board believes that
Mr. Wilson qualifies as such an expert in view of his extensive business background and experience, including service as chief financial officer of Staples, Inc.
from 1992 to 1996. Mr. Wilson has been a Member and Chairman of the Fund’s Audit Committee since 2006. As a result of such background and experience, the
Board believes that Mr. Wilson has acquired an understanding of generally accepted accounting principles and financial statements, the general application of
such principles in connection with the accounting estimates, accruals and reserves, and analyzing and evaluating financial statements that present a breadth
and level of complexity of accounting issues generally comparable to those of the Fund, as well as an understanding of internal controls and procedures for
financial reporting and an understanding of audit committee functions. Mr. Wilson is an independent Board member as that term is defined under the relevant
Securities and Exchange Commission Rules and Releases.
The Statement of Additional Information (SAI) includes additional information about the board members and is available, without charge, upon request.
Shareholders may call (800) DIAL BEN/342-5236 to request the SAI.
40 | Annual Report
franklintempleton.com
FRANKLIN FUND ALLOCATOR SERIES
FRANKLIN MULTI-ASSET REAL RETURN FUND
Shareholder Information
Board Review of Investment Management Agreement
At a meeting held February 24, 2015, the Board of Trustees, including a majority of non-interested or independent Trustees, approved renewal of the investment management agreement for each of the separate funds comprising Franklin Fund Allocator Series, including Franklin Multi-Asset Real Return Fund (Fund(s)). In reaching its decision to approve renewal of the investment management agreements, the Board took into account information furnished throughout the year at regular Board meetings, as well as information prepared specifically in connection with the annual renewal review process. Information furnished and discussed throughout the year included investment performance reports and related financial information for each Fund, along with periodic reports on expenses, shareholder services, legal and compliance matters, pricing, brokerage commissions and execution and other services provided by the Investment Manager (Manager) and its affiliates, as well as marketing support payments made to financial intermediaries. Information furnished specifically in connection with the renewal process included a report for each Fund prepared by Lipper, Inc. (Lipper), an independent organization, as well as additional material, including a Fund profitability analysis prepared by management. The Lipper reports compared each Fund’s investment performance and expenses with those of other mutual funds deemed comparable to the Fund as selected by Lipper. The Fund profitability analysis discussed the profitability to Franklin Templeton Investments (FTI) from its overall U.S. fund operations, as well as on an individual fund-by-fund basis. Additional material accompanying such profitability analysis included information on a fund-by-fund basis listing portfolio managers and other accounts they manage, as well as information on management fees charged by the Manager and its affiliates to U.S. mutual funds and other accounts, including management’s explanation of differences where relevant. Such material also included a memorandum prepared by management describing project initiatives and capital investments relating to the services provided to the Funds by the FTI organization, as well as a memorandum relating to economies of scale and an analysis concerning transfer agent fees charged by an affiliate of the Manager. The Board also noted that at the February meetings each year, it receives an annual report on all marketing support payments made by FTI to financial intermediaries.
In considering such materials, the independent Trustees received assistance and advice from and met separately with independent counsel. While the investment management agreements for all Funds were considered at the same Board meeting, the Board dealt with each Fund separately. In approving continuance of the investment management agreement for each Fund, the Board, including a majority of independent Trustees, determined that the existing management fee structure was fair and reasonable and that continuance of the investment management agreement was in the best interests of each Fund and its shareholders. While attention was given to all information furnished, the following discusses some primary factors relevant to the Board’s decision.
NATURE, EXTENT AND QUALITY OF SERVICE. The Board was generally satisfied with the nature and quality of the overall services provided by the Manager and its affiliates to the Fund and its shareholders. In addition to investment performance and expenses discussed later, the Board’s opinion was based, in part, upon periodic reports furnished it showing that the investment policies and restrictions for the Fund were consistently complied with as well as other reports periodically furnished the Board covering matters such as the compliance of portfolio managers and other management personnel with the code of ethics adopted throughout the Franklin Templeton fund complex, the adherence to fair value pricing procedures established by the Board, and the accuracy of net asset value calculations. The Board also noted the extent of benefits provided Fund shareholders from being part of the Franklin Templeton family of funds, including the right to exchange investments between the same class of shares of different funds without a sales charge, the ability to reinvest Fund dividends into other funds and the right to combine holdings in other funds to obtain a reduced sales charge. Favorable consideration was given to management’s continual efforts and expenditures in establishing effective business continuity plans and developing strategies to address cybersecurity threats. Among other factors taken into account by the Board were the Managers’ best execution trading policies, including a favorable report by an independent portfolio trading analytical firm that also covered FOREX transactions. Consideration was also given to the experience of the Fund’s portfolio management team, the number of accounts managed and general method of compensation. In this latter respect, the Board noted that a primary factor in management’s determination of a portfolio manager’s bonus
franklintempleton.com
Annual Report
| 41
FRANKLIN FUND ALLOCATOR SERIES FRANKLIN MULTI-ASSET REAL RETURN FUND SHAREHOLDER INFORMATION
Board Review of Investment Management
Agreement (continued) compensation was the relative investment performance of the funds he or she managed and that a portion of such bonus was required to be invested in a predesignated list of funds within such person’s fund management area so as to be aligned with the interests of shareholders. The Board also took into account the quality of transfer agent and shareholder services provided Fund shareholders by an affiliate of the Manager noting the changes taking place in the nature of transfer agency services throughout the industry and regulatory initiatives in this area, and the continual enhancements to the Franklin Templeton website. Particular attention was given to management’s conservative approach and diligent risk management procedures, including continual monitoring of counterparty credit risk and attention given to derivatives and other complex instruments including expanded collateralization requirements. The Board also took into account, among other things, management’s efforts in establishing a global credit facility for the benefit of the Fund and other accounts managed by FTI to provide a source of cash for temporary and emergency purposes or to meet unusual redemption requests as well as the strong financial position of the Manager’s parent company and its commitment to the mutual fund business as evidenced by its continued subsidization of money market funds.
INVESTMENT PERFORMANCE. The Board placed significant emphasis on the investment performance of the Fund in view of its importance to shareholders. While consideration was given to performance reports and discussions with portfolio managers at Board meetings throughout the year, particular attention in assessing performance was given to the Lipper reports furnished for the agreement renewal. The Lipper reports prepared for the Fund showed the investment performance of its Class A shares, in comparison to a performance universe selected by Lipper. Comparative performance for the Fund was shown for the one-year period ended December 31, 2014, and for additional periods ended that date depending on when the Fund commenced operations. The Board observed that the performance of the Fund was impacted by its allocations to global markets and currencies, as well as U.S. fixed income. These allocations, while consistent with the Fund’s longer term perspectives, were detrimental to short-term returns and comparisons to peers. The performance universe for the Fund consisted of the Fund and all retail and institutional global macro funds. The Fund has been in existence for only three full years and the Lipper report showed its 2014 total return to be in the lowest performing quintile of such universe. The Lipper report also showed the Fund’s total return on an annualized basis to be in the second-lowest performing quintile of such universe during the previous three-year period. The Board did not consider such performance to be particularly meaningful in view of the Fund’s short period of operations. The Board also noted management’s observation that the performance universe was broad and included funds with a much higher equity exposure than that of the Fund whose objective is to seek total return that exceeds U.S. inflation.
COMPARATIVE EXPENSES. Consideration was given to the management fee and total expense ratio of the Fund compared with those of a group of retail front-end load fund of funds selected by Lipper as its appropriate Lipper expense group. Lipper expense data is based upon information taken from each fund’s most recent annual report, which reflects historical asset levels that may be quite different from those currently existing, particularly in a period of market volatility. While recognizing such inherent limitation and the fact that expense ratios generally increase as assets decline and decrease as assets grow, the Board believed the independent analysis conducted by Lipper to be an appropriate measure of comparative expenses. In reviewing comparative costs, Lipper provides information on the Fund’s contractual investment management fee in comparison with the contractual investment management fee that would have been charged by other funds within its Lipper expense group assuming they were similar in size to the Fund, as well as the actual total expense ratios of the Fund, including expenses of the underlying funds they invest in. The Lipper contractual investment management fee analysis includes the administrative fee and asset allocation advisory fee directly charged to the Fund as being part of the contractual investment management fee, with the investment management fees charged underlying funds being included within actual total expenses. Contractual investment management fees and total expenses for comparative consistency are shown by Lipper for Fund Class A shares. The Board noted that the Fund pays an asset allocation advisory fee. The Lipper report for the Fund showed its contractual management fee rate was 12 basis points higher than its expense group median, and its actual total expense ratio was 14 basis points below the median of such expense group. The Board found the comparative expenses of the Fund as shown in the Lipper report to be acceptable, noting that in each case such expenses were being subsidized by fee waivers.
42 | Annual Report
franklintempleton.com
FRANKLIN FUND ALLOCATOR SERIES
FRANKLIN MULTI-ASSET REAL RETURN FUND
SHAREHOLDER INFORMATION
MANAGEMENT PROFITABILITY. The Board also considered the level of profits realized by the Manager and its affiliates in connection with the operation of the Fund. In this respect, the Board reviewed the Fund profitability analysis that addresses the overall profitability of Franklin Templeton’s U.S. fund business, as well as its profits in providing management and other services to each of the individual funds during the 12-month period ended September 30, 2014, being the most recent fiscal year-end for Franklin Resources, Inc., the Manager’s parent. In reviewing the analysis, the Board recognized that allocation methodologies are inherently subjective and various allocation methodologies may be reasonable while producing different results. In this respect, the Board noted that while management continually makes refinements to its methodologies in response to organizational and product related changes, the overall approach as defined by the primary drivers and activity measurements has remained consistent with that used in the Fund’s profitability report presentations from prior years. Additionally, the Fund’s independent registered public accounting firm had been engaged by the Manager to periodically review the reasonableness of the allocation methodologies to be used solely by the Fund’s Board in reference to the profitability analysis. In reviewing and discussing such analysis, management discussed with the Board its belief that costs incurred in establishing the infrastructure necessary for the type of mutual fund operations conducted by the Manager and its affiliates may not be fully reflected in the expenses allocated to the Fund in determining its profitability, as well as the fact that the level of profits, to a certain extent, reflected operational cost savings and efficiencies initiated by management. The Board also took into account management’s expenditures in improving shareholder services provided the Fund, as well as the need to implement systems and meet additional regulatory and compliance requirements resulting from statutes such as the Sarbanes-Oxley and Dodd-Frank Acts and recent SEC and other regulatory requirements. In addition, the Board considered a third-party study comparing the profitability of the Manager’s parent on an overall basis to other publicly held managers broken down to show profitability from management operations exclusive of distribution expenses, as well as profitability including distribution expenses. The Board also considered the extent to which the Manager and its affiliates might derive ancillary benefits from fund operations, including revenues generated from transfer agent services and potential benefits resulting from personnel and systems enhancements necessitated by Fund growth, as well as increased leverage with the service providers and counterparties. Based upon its consideration of all these factors, and taking into account the fact that Fund expenses were being subsidized through fee waivers, the Board determined that the level of profits realized by the Manager and its affiliates from providing services to the Fund was not excessive in view of the nature, quality and extent of services provided.
ECONOMIES OF SCALE. The Board also considered whether economies of scale are realized by the Managers as the Fund grows larger and the extent to which this is reflected in the level of management fees charged. While recognizing that any precise determination is inherently subjective, the Board noted that based upon the Fund profitability analysis, it appears that as some funds get larger, at some point economies of scale do result in the Managers realizing a larger profit margin on management services provided such a fund. The Board also noted that economies of scale are shared with a fund and its shareholders through management fee breakpoints so that as a fund grows in size, its effective management fee rate declines. The management fees charged by all or substantially all the underlying funds in which the Fund invests provide for such management fee breakpoints. Consequently, to the extent economies of scale may be realized by the investment managers of these funds, the benefits are shared with the Fund and its shareholders through a reduction in actual total expense ratios.
Proxy Voting Policies and Procedures
The Trust’s investment manager has established Proxy Voting Policies and Procedures (Policies) that the Trust uses to determine how to vote proxies relating to portfolio securities. Shareholders may view the Trust’s complete Policies online at franklintempleton.com. Alternatively, shareholders may request copies of the Policies free of charge by calling the Proxy Group collect at (954) 527-7678 or by sending a written request to: Franklin Templeton Companies, LLC, 300 S.E. 2nd Street, Fort Lauderdale, FL 33301, Attention: Proxy Group. Copies of the Trust’s proxy voting records are also made available online at franklintempleton.com and posted on the U.S. Securities and Exchange Commission’s website at sec.gov and reflect the most recent 12-month period ended June 30.
franklintempleton.com
Annual Report
| 43
FRANKLIN FUND ALLOCATOR SERIES FRANKLIN MULTI-ASSET REAL RETURN FUND SHAREHOLDER INFORMATION
Quarterly Statement of Investments
The Trust files a complete statement of investments with the U.S. Securities and Exchange Commission for the first and third quarters for each fiscal year on Form N-Q. Shareholders may view the filed Form N-Q by visiting the Commission’s website at sec.gov. The filed form may also be viewed and copied at the Commission’s Public Reference Room in Washington, DC. Information regarding the operations of the Public Reference Room may be obtained by calling (800) SEC-0330.
Householding of Reports and Prospectuses
You will receive the Fund’s financial reports every six months as well as an annual updated summary prospectus (prospectus available upon request). To reduce Fund expenses, we try to identify related shareholders in a household and send only one copy of the financial reports and summary prospectus. This process, called “householding,” will continue indefinitely unless you instruct us otherwise. If you prefer not to have these documents householded, please call us at (800) 632-2301. At any time you may view current prospectuses/summary prospectuses and financial reports on our website. If you choose, you may receive these documents through electronic delivery.
44 | Annual Report
franklintempleton.com
Item 2. Code of Ethics.
(a) The Registrant has adopted a code of ethics that applies to its principal executive officers and principal financial and accounting officer.
(c) N/A
(d) N/A
(f) Pursuant to Item 12(a)(1), the Registrant is attaching as an exhibit a copy of its code of ethics that applies to its principal executive officers and principal financial and accounting officer.
Item 3. Audit Committee Financial Expert.
(a)(1) The Registrant has an audit committee financial expert serving on its audit committee.
(2) The audit committee financial expert is John B. Wilson, and he is "independent" as defined under the relevant Securities and Exchange Commission Rules and Releases.
Item 4. Principal Accountant Fees and Services.
(a) Audit Fees
The aggregate fees paid to the principal accountant for professional services rendered by the principal accountant for the audit of the registrant’s annual financial statements or for services that are normally provided by the principal accountant in connection with statutory and regulatory filings or engagements were $20,002 for the fiscal year ended May 31, 2015 and $19,610 for the fiscal year ended May 31, 2014.
(b) Audit-Related Fees
There were no fees paid to the principal accountant for assurance and related services rendered by the principal accountant to the registrant that are reasonably related to the performance of the audit of the registrant's financial statements and are not reported under paragraph (a) of Item 4.
There were no fees paid to the principal accountant for assurance and related services rendered by the principal accountant to the registrant's investment adviser and any entity controlling, controlled by or under common control with the investment adviser that provides ongoing services to the registrant that are reasonably related to the performance of the audit of their financial statements.
(c) Tax Fees
There were no fees paid to the principal accountant for professional services rendered by the principal accountant to the registrant for tax compliance, tax advice and tax planning.
The aggregate fees paid to the principal accountant for professional services rendered by the principal accountant to the registrant’s investment adviser and any entity controlling, controlled by or under common control with the investment adviser that provides ongoing services to the registrant for tax compliance, tax advice and tax planning were $0 for the fiscal year ended May 31, 2015 and $6,930 for the fiscal year ended May 31, 2014. The services for which these fees were paid included technical tax consultation for capital gain tax and withholding tax reporting for foreign governments and requirements on local country’s self-certification forms.
(d) All Other Fees
The aggregate fees paid to the principal accountant for products and services rendered by the principal accountant to the registrant not reported in paragraphs (a)-(c) of Item 4 were $0 for the fiscal year ended May 31, 2015 and $6 for the fiscal year ended May 31, 2014. The services for which these fees were paid included review of materials provided to the fund Board in connection with the investment management contract renewal process.
The aggregate fees paid to the principal accountant for products and services rendered by the principal accountant to the registrant’s investment adviser and any entity controlling, controlled by or under common control with the investment adviser that provides ongoing services to the registrant other than services reported in paragraphs (a)-(c) of Item 4 were $22,079 for the fiscal year ended May 31, 2015 and $182,230 for the fiscal year ended May 31, 2014. The services for which these fees were paid included preparation and review of materials provided to the fund Board in connection with the investment management contract renewal process. Other services include compliance examination for Investment Advisor Act rule 206-4(2) and assets under management certification review.
(e) (1) The registrant’s audit committee is directly responsible for approving the services to be provided by the auditors, including:
(i) pre-approval of all audit and audit related services;
(ii) pre-approval of all non-audit related services to be provided to the Fund by the auditors;
(iii) pre-approval of all non-audit related services to be provided to the registrant by the auditors to the registrant’s investment adviser or to any entity that controls, is controlled by or is under common control with the registrant’s investment adviser and that provides ongoing services to the registrant where the non-audit services relate directly to the operations or financial reporting of the registrant; and
(iv) establishment by the audit committee, if deemed necessary or appropriate, as an alternative to committee pre-approval of services to be provided by the auditors, as required by paragraphs (ii) and (iii) above, of policies and procedures to permit such services to be pre-approved by other means, such as through establishment of guidelines or by action of a designated member or members of the committee; provided the policies and procedures are detailed as to the particular service and the committee is informed of each service and such policies and procedures do not include delegation of audit committee responsibilities, as contemplated under the Securities Exchange Act of 1934, to management; subject, in the case of (ii) through (iv), to any waivers, exceptions or exemptions that may be available under applicable law or rules.
(e) (2) None of the services provided to the registrant described in paragraphs (b)-(d) of Item 4 were approved by the audit committee pursuant to paragraph (c)(7)(i)(C) of Rule 2-01 of regulation S-X.
(f) No disclosures are required by this Item 4(f).
(g) The aggregate non-audit fees paid to the principal accountant for services rendered by the principal accountant to the registrant and the registrant’s investment adviser and any entity controlling, controlled by or under common control with the investment adviser that provides ongoing services to the registrant were $22,079 for the fiscal year ended May 31, 2015 and $189,166 for the fiscal year ended May 31, 2014.
(h) The registrant’s audit committee of the board has considered whether the provision of non-audit services that were rendered to the registrant’s investment adviser (not including any sub-adviser whose role is primarily portfolio management and is subcontracted with or overseen by another investment adviser), and any entity controlling, controlled by, or under common control with the investment adviser that provides ongoing services to the registrant that were not pre-approved pursuant to paragraph (c)(7)(ii) of Rule 2-01 of Regulation S-X is compatible with maintaining the principal accountant’s independence.
Item 5. Audit Committee of Listed Registrants. N/A
Item 6. Schedule of Investments. N/A
Item 7. Disclosure of Proxy Voting Policies and Procedures for Closed-End Management Investment Companies. N/A
Item 8. Portfolio Managers of Closed-End Management Investment Companies. N/A
Item 9. Purchases of Equity Securities by Closed-End Management Investment Company and Affiliated Purchasers. N/A
Item 10. Submission of Matters to a Vote of Security Holders.
There have been no changes to the procedures by which shareholders may recommend nominees to the Registrant's Board of Trustees that would require disclosure herein.
Item 11. Controls and Procedures.
(a) Evaluation of Disclosure Controls and Procedures. The Registrant maintains disclosure controls and procedures that are designed to ensure that information required to be disclosed in the Registrant’s filings under the Securities Exchange Act of 1934 and the Investment Company Act of 1940 is recorded, processed, summarized and reported within the periods specified in the rules and forms of the Securities and Exchange Commission. Such information is accumulated and communicated to the Registrant’s management, including its principal executive officer and principal financial officer, as appropriate, to allow timely decisions regarding required disclosure. The Registrant’s management, including the principal executive officer and the principal financial officer, recognizes that any set of controls and procedures, no matter how well designed and operated, can provide only reasonable assurance of achieving the desired control objectives.
Within 90 days prior to the filing date of this Shareholder Report on Form N-CSR, the Registrant had carried out an evaluation, under the supervision and with the participation of the Registrant’s management, including the Registrant’s principal executive officer and the Registrant’s principal financial officer, of the effectiveness of the design and operation of the Registrant’s disclosure controls and procedures. Based on such evaluation, the Registrant’s principal executive officer and principal financial officer concluded that the Registrant’s disclosure controls and procedures are effective.
(b) Changes in Internal Controls. There have been no changes in the Registrant’s internal controls or in other factors that could materially affect the internal controls over financial reporting subsequent to the date of their evaluation in connection with the preparation of this Shareholder Report on Form N-CSR.
Item 12. Exhibits.
(a)(1) Code of Ethics
(a)(2) Certifications pursuant to Section 302 of the Sarbanes-Oxley Act of 2002 of Laura F. Fergerson, Chief Executive Officer - Finance and Administration, and Gaston Gardey, Chief Financial Officer and Chief Accounting Officer
(b) Certifications pursuant to Section 906 of the Sarbanes-Oxley Act of 2002 of Laura F. Fergerson, Chief Executive Officer - Finance and Administration, and Gaston Gardey, Chief Financial Officer and Chief Accounting Officer
SIGNATURES
Pursuant to the requirements of the Securities Exchange Act of 1934 and the Investment Company Act of 1940, the registrant has duly caused this report to be signed on its behalf by the undersigned, thereunto duly authorized.
FRANKLIN FUND ALLOCATOR SERIES
By /s/Laura F. Fergerson
Laura F. Fergerson
Chief Executive Officer - Finance and Administration
Date July 27, 2015
Pursuant to the requirements of the Securities Exchange Act of 1934 and the Investment Company Act of 1940, this report has been signed below by the following persons on behalf of the registrant and in the capacities and on the dates indicated.
By /s/Laura F. Fergerson
Laura F. Fergerson
Chief Executive Officer - Finance and Administration
Date July 27, 2015
By /s/Gaston Gardey
Gaston Gardey
Chief Financial Officer and Chief Accounting Officer
Date July 27, 2015