0001022804 tsr:benchmarkBM2557_2570Member 2019-12-31 0001022804 tsr:benchmarkBM7197_2611Member 2021-12-31 0001022804 tsr:C000034934Member tsr:bench202501285161_2603Member 2024-12-31 0001022804 tsr:bench202502255237_2593Member 2017-12-31 0001022804 tsr:C000154870Member 2024-01-01 2024-12-31
UNITED STATES
SECURITIES AND EXCHANGE COMMISSION
Washington, D.C. 20549
FORM N-CSR
CERTIFIED SHAREHOLDER REPORT OF REGISTERED
MANAGEMENT INVESTMENT COMPANIES
Investment Company Act file number 811-07851
FRANKLIN FUND ALLOCATOR SERIES
(Exact name of registrant as specified in charter)
One Franklin Parkway, San Mateo, CA 94403-1906
(Address of principal executive offices) (Zip code)
Alison Baur
Franklin Templeton
One Franklin Parkway
San Mateo, CA 94403-1906
(Name and address of agent for service)
Registrant’s telephone number, including area code: 650 312-2000
Date of fiscal year end: December 31
Date of reporting period: December 31, 2024
| ITEM 1. | REPORT TO STOCKHOLDERS. |
(a) The Report to Shareholders is filed herewith
| | |
Franklin Conservative Allocation Fund | |
| Class A [FTCIX] |
| Annual Shareholder Report | December 31, 2024 |
|
This annual shareholder report contains important information about Franklin Conservative Allocation Fund for the period January 1, 2024, to December 31, 2024.
You can find additional information about the Fund at https://www.franklintempleton.com/regulatory-fund-documents. You can also request this information by contacting us at (800) DIAL BEN/342-5236.
This report describes changes to the Fund that occurred during the reporting period.
WHAT WERE THE FUND COSTS FOR THE LAST YEAR? (based on a hypothetical $10,000 investment)
| | |
Class Name | Costs of a $10,000 investment | Costs paid as a percentage of a $10,000 investment* |
| Class A | $63 | 0.61% |
| * | Reflects fee waivers and/or expense reimbursements, without which expenses would have been higher. |
HOW DID THE FUND PERFORM LAST YEAR AND WHAT AFFECTED ITS PERFORMANCE?
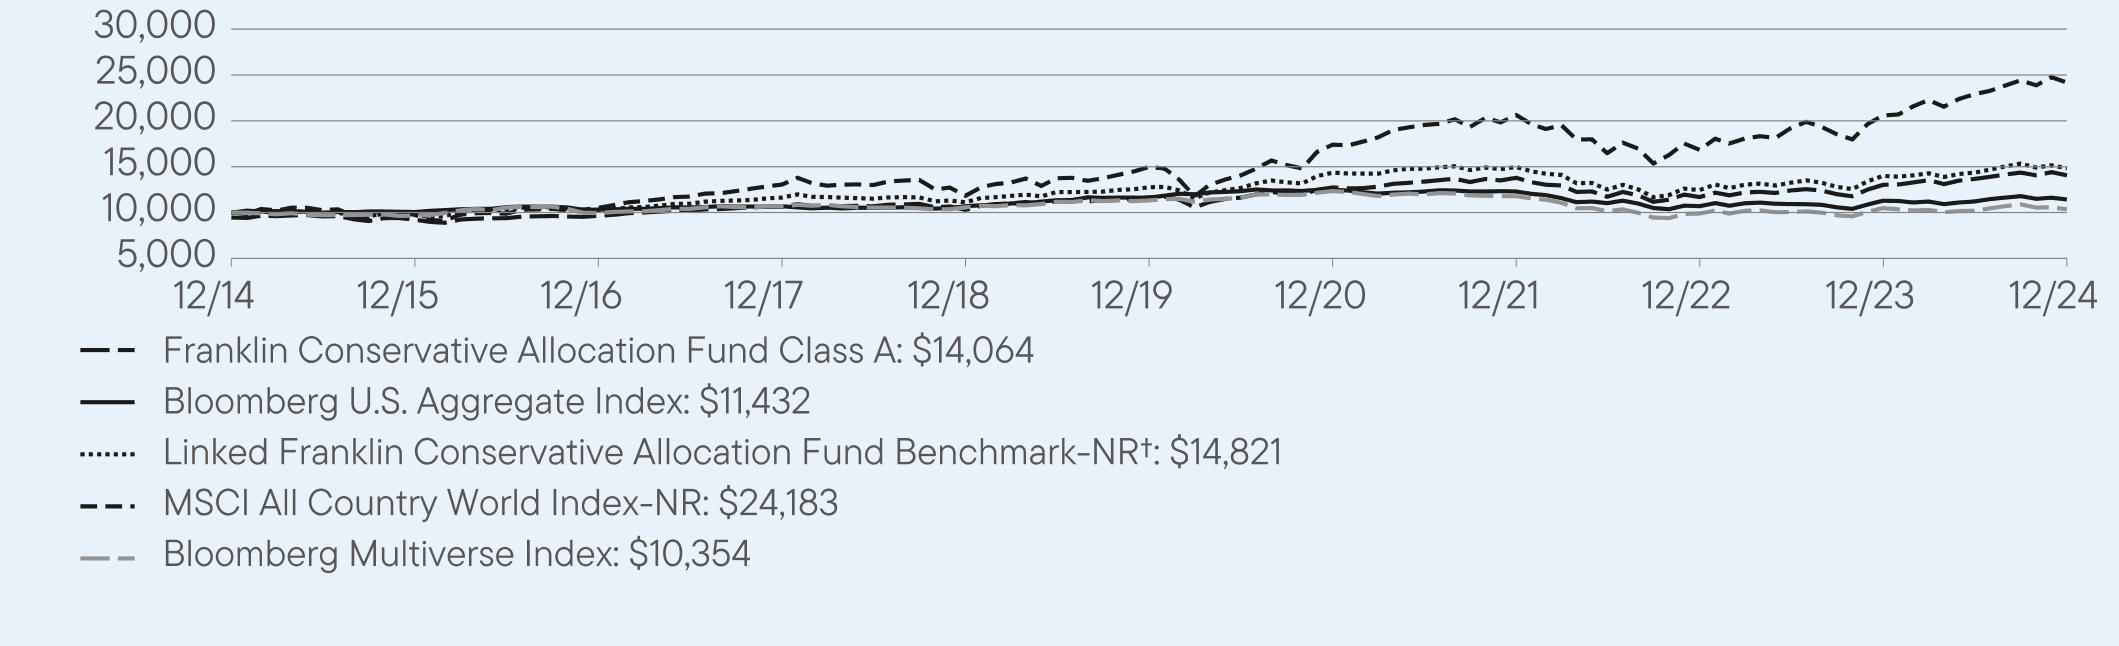
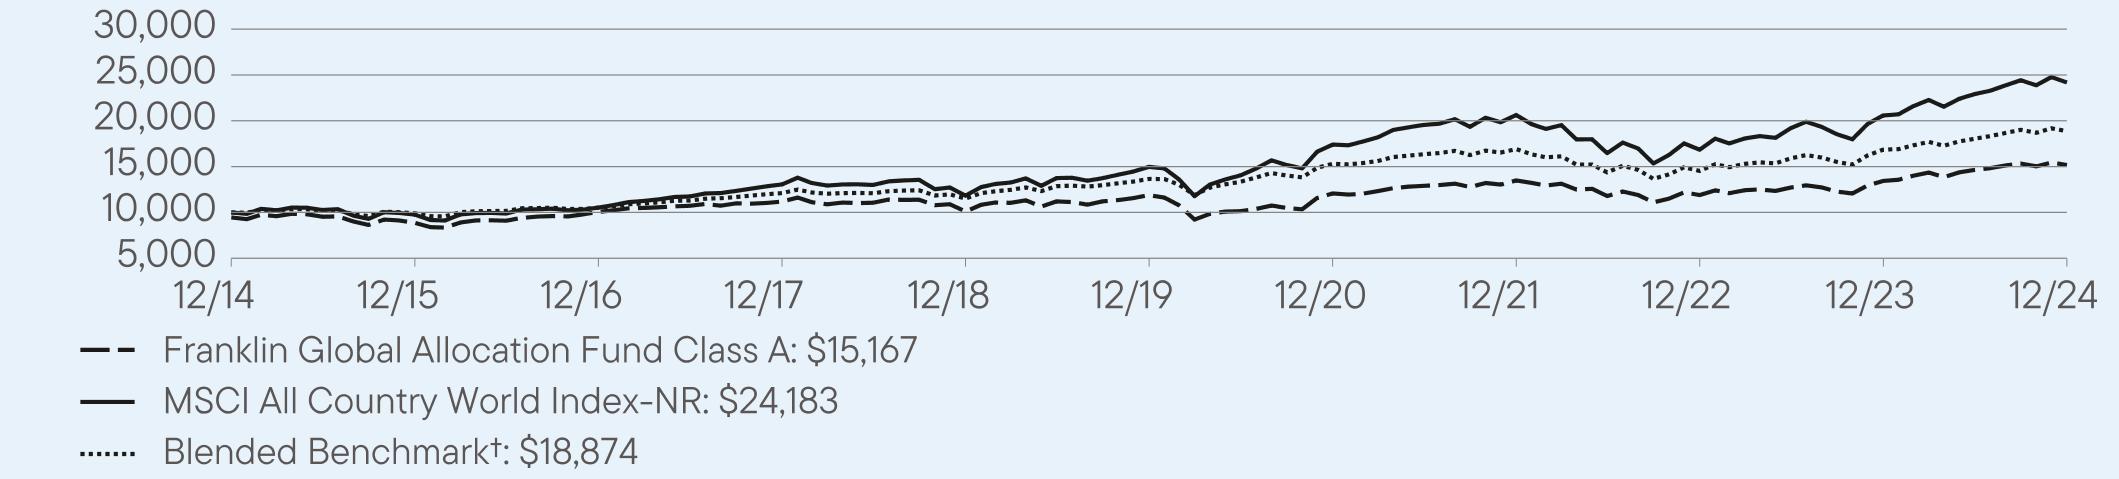
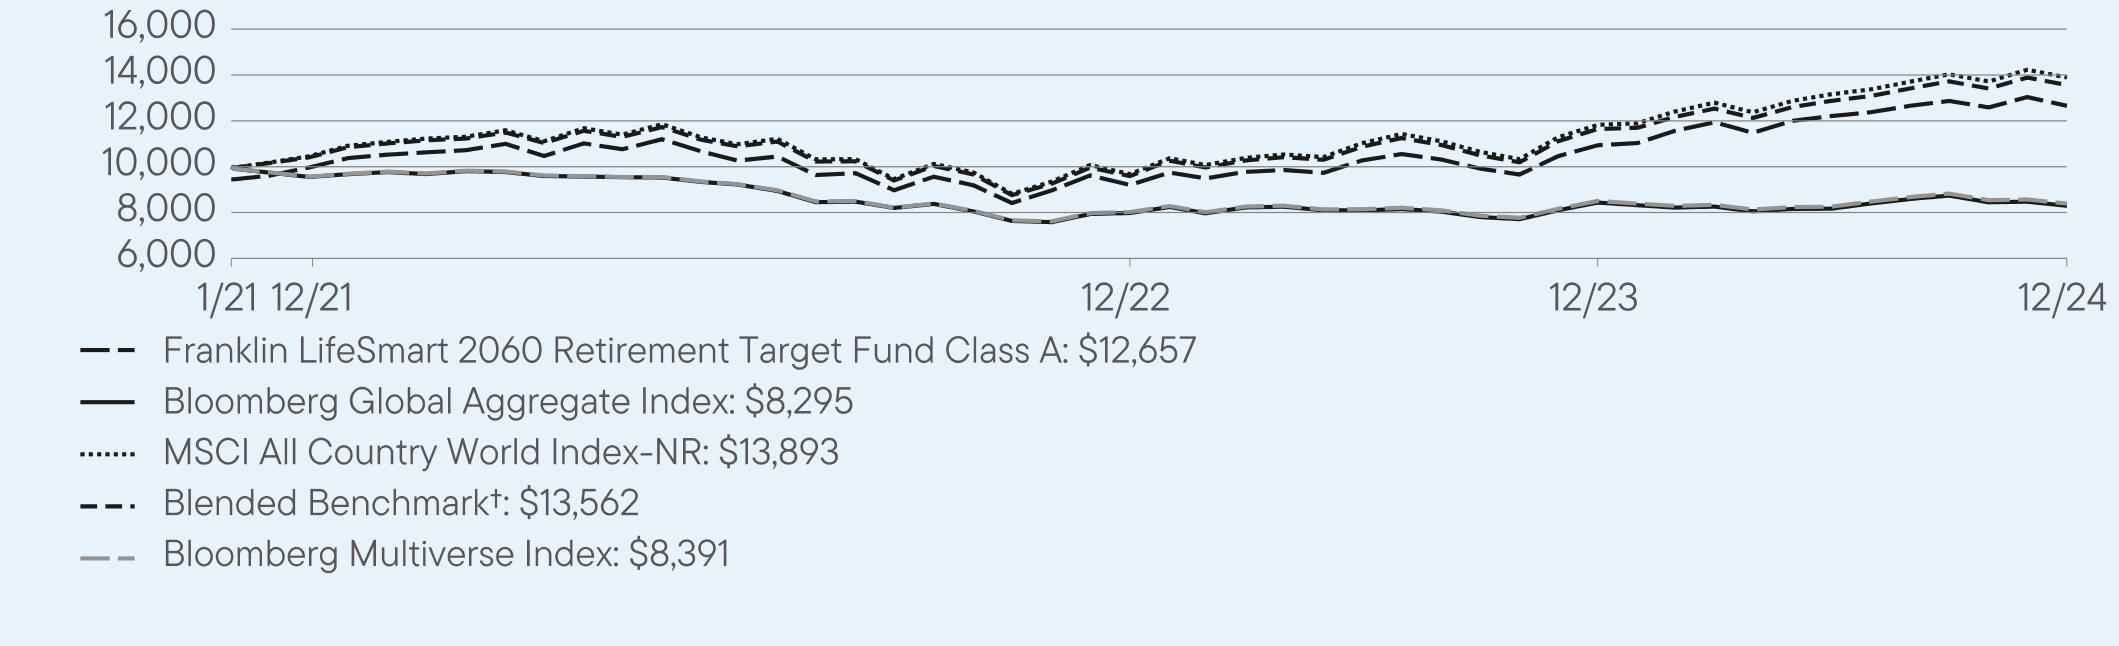
For the twelve months ended December 31, 2024, Class A shares of Franklin Conservative Allocation Fund returned 8.06%. The Fund compares its performance to the Linked Franklin Conservative Allocation Fund Benchmark-NR†, the MSCI All Country World Index-NR and the Bloomberg Multiverse Index, which returned 5.91%, 17.49% and -1.34%, respectively, for the same period.
| |
Top contributors to performance: |
| ↑ | Fixed income underweight, reflecting our cross asset tactical preference. |
| ↑ | Within fixed income, a regional overweight to the U.S. and an underweight to international positions. |
| ↑ | Within equities, a regional overweight to the U.S. and an underweight to international holdings. |
| |
Top detractors from performance: |
| ↓ | Fund selection in international fixed income. |
| ↓ | Fund selection in U.S. equity, as value stock exposure and one growth fund detracted. |
| ↓ | Fund selection in international equity. |
| Franklin Conservative Allocation Fund | PAGE 1 | 484-ATSR-0225 |
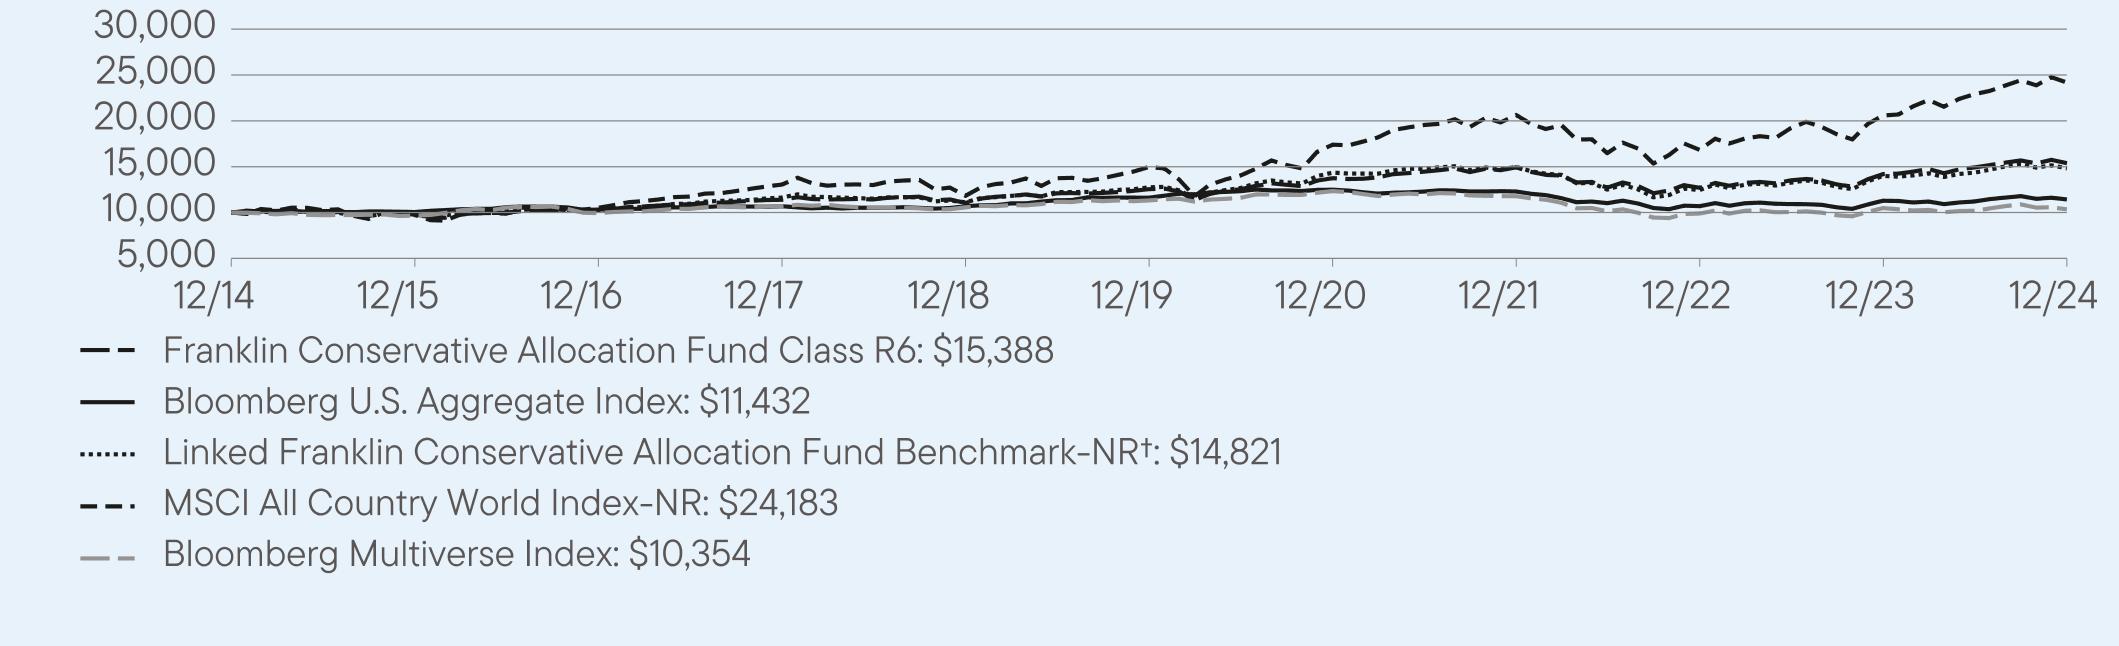
HOW DID THE FUND PERFORM OVER THE LAST 10 YEARS?
The Fund’s past performance is not necessarily an indication of how the Fund will perform in the future. The graph and table do not reflect the deduction of taxes that a shareholder would pay on Fund distributions or redemption of Fund shares.
VALUE OF A $10,000 INVESTMENT ($9,450 AFTER MAXIMUM APPLICABLE SALES CHARGE) –
Class A 12/31/2014 — 12/31/2024
AVERAGE ANNUAL TOTAL RETURNS (%) Period Ended December 31, 2024
| | | |
| | 1 Year | 5 Year | 10 Year |
Class A | 8.06 | 3.83 | 4.06 |
Class A (with sales charge) | 2.11 | 2.66 | 3.47 |
Bloomberg U.S. Aggregate Index | 1.25 | -0.33 | 1.35 |
Linked Franklin Conservative Allocation Fund Benchmark-NR† | 5.91 | 3.03 | 4.01 |
MSCI All Country World Index-NR | 17.49 | 10.06 | 9.23 |
Bloomberg Multiverse Index | -1.34 | -1.76 | 0.35 |
| † | The Linked Franklin Conservative Allocation Fund Benchmark-NR is comprised of 28% S&P 500 Index, 12% MSCI EAFE Index-NR, 40% Bloomberg U.S. Aggregate Index and 20% Payden & Rygel 90 Day U.S. T-Bill Index from 1/1/2001 to 12/31/2012; 28% S&P 500 Index, 12% MSCI EAFE Index-NR and 60% Bloomberg U.S. Aggregate Index from 1/1/2013 to 12/31/14; and 40% MSCI ACWI-NR and 60% Bloomberg Multiverse Index thereafter. |
Fund performance figures may reflect fee waivers and/or expense reimbursements, without which the performance would have been lower.
Performance for periods prior to September 10, 2018, has been restated to reflect the current maximum sales charge, which is lower than the maximum sales charge prior to that date.
For current month-end performance, please call Franklin Templeton at (800) DIAL BEN/342-5236 or visit https://www.franklintempleton.com/investments/options/mutual-funds.
Important data provider notices and terms available at www.franklintempletondatasources.com.
KEY FUND STATISTICS (as of December 31, 2024)
| |
Total Net Assets | $855,733,091 |
Total Number of Portfolio Holdings* | 21 |
Total Management Fee Paid | $2,193,955 |
Portfolio Turnover Rate | 40.01% |
| * | Does not include derivatives, except purchased options, if any. |
| Franklin Conservative Allocation Fund | PAGE 2 | 484-ATSR-0225 |
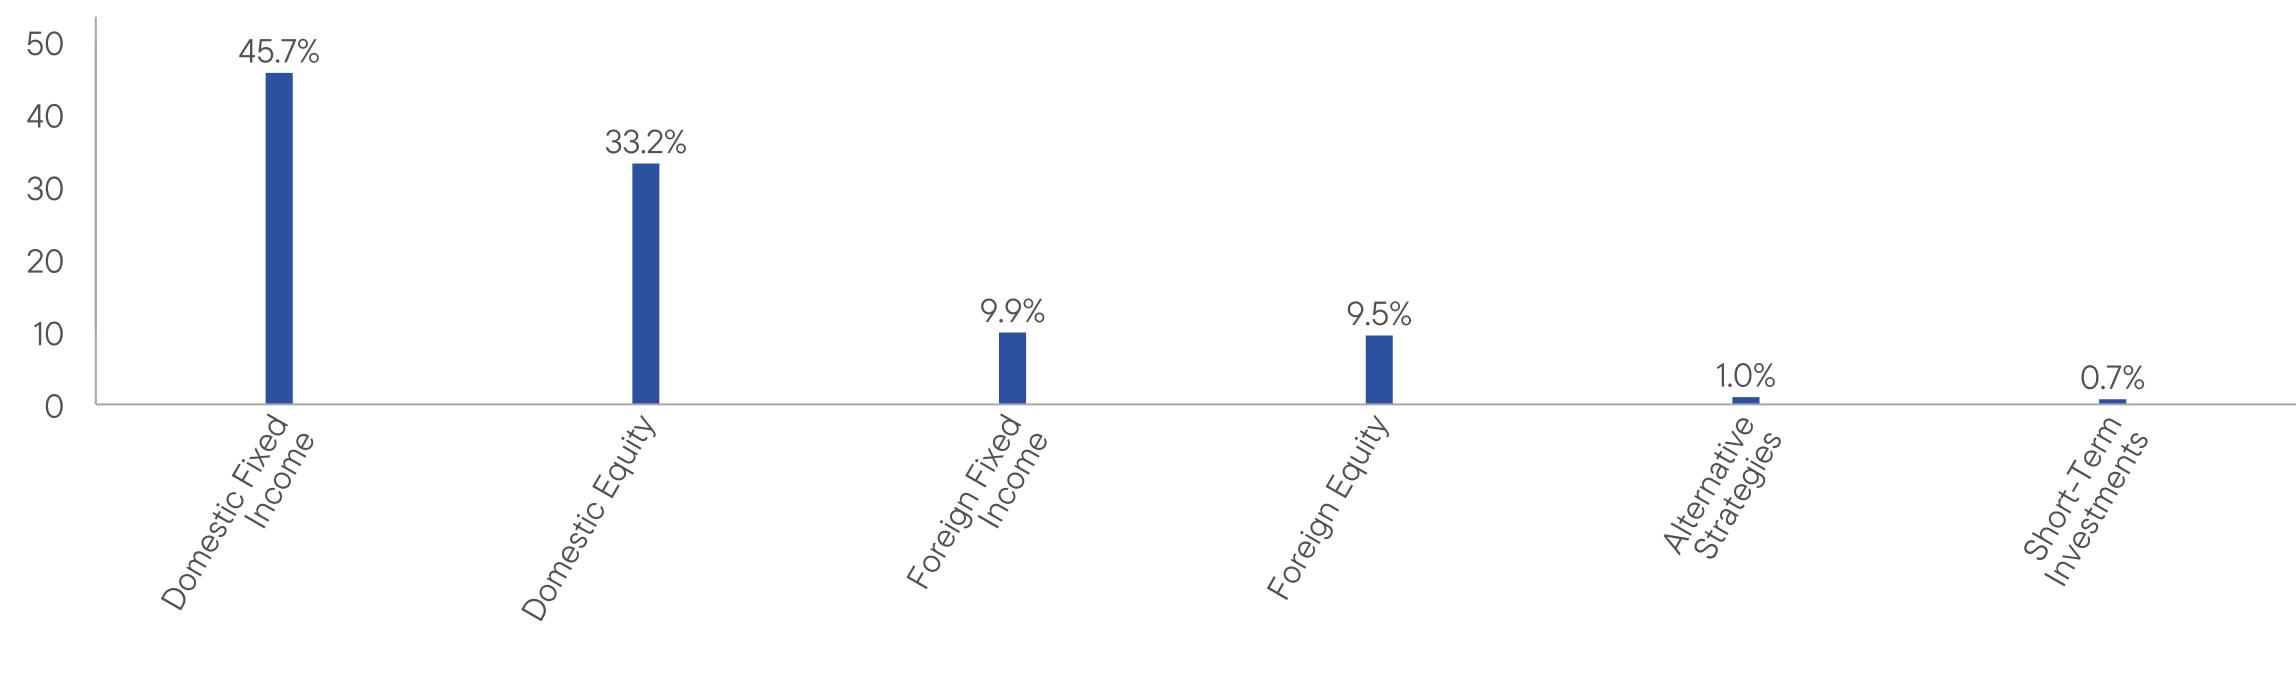
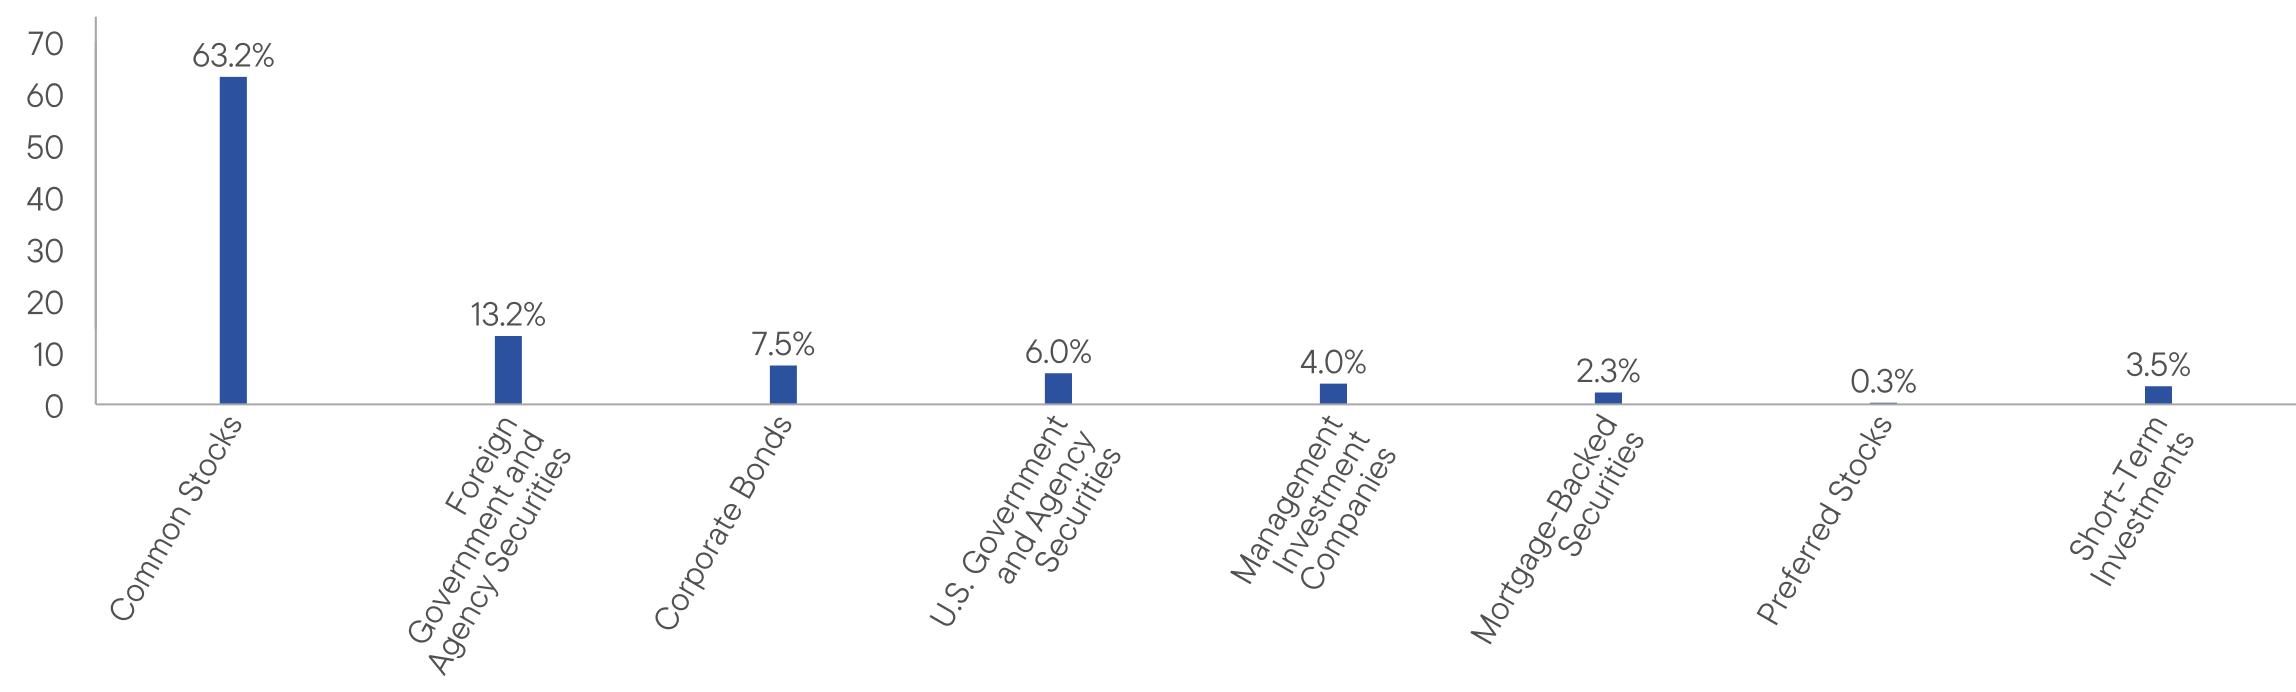
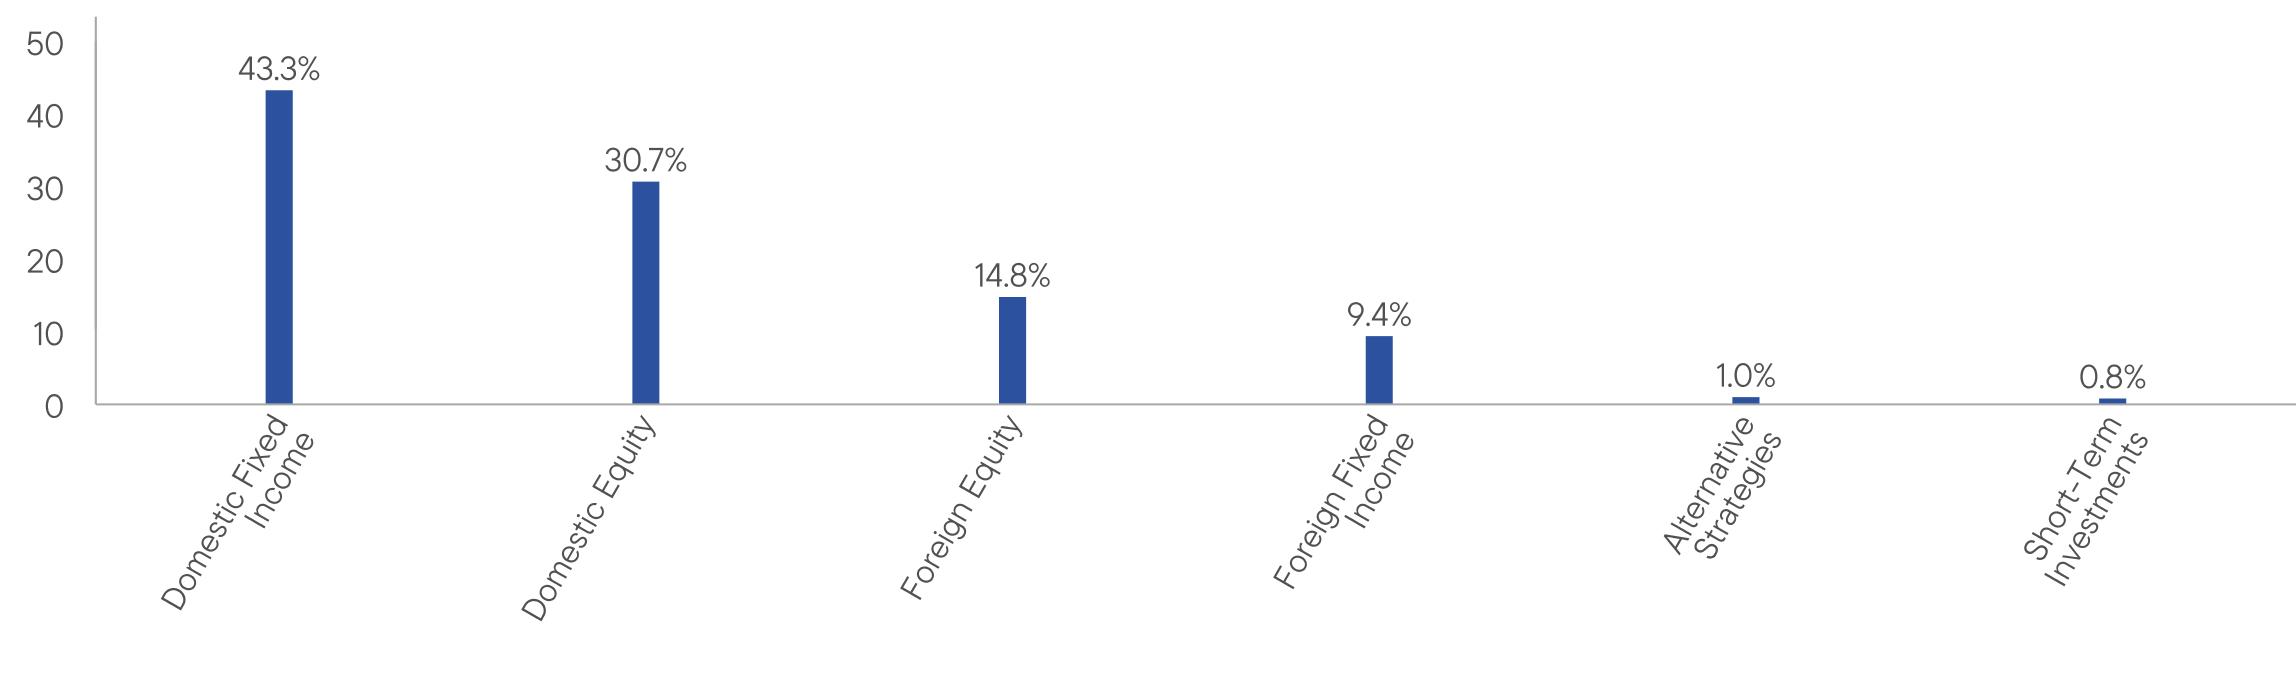
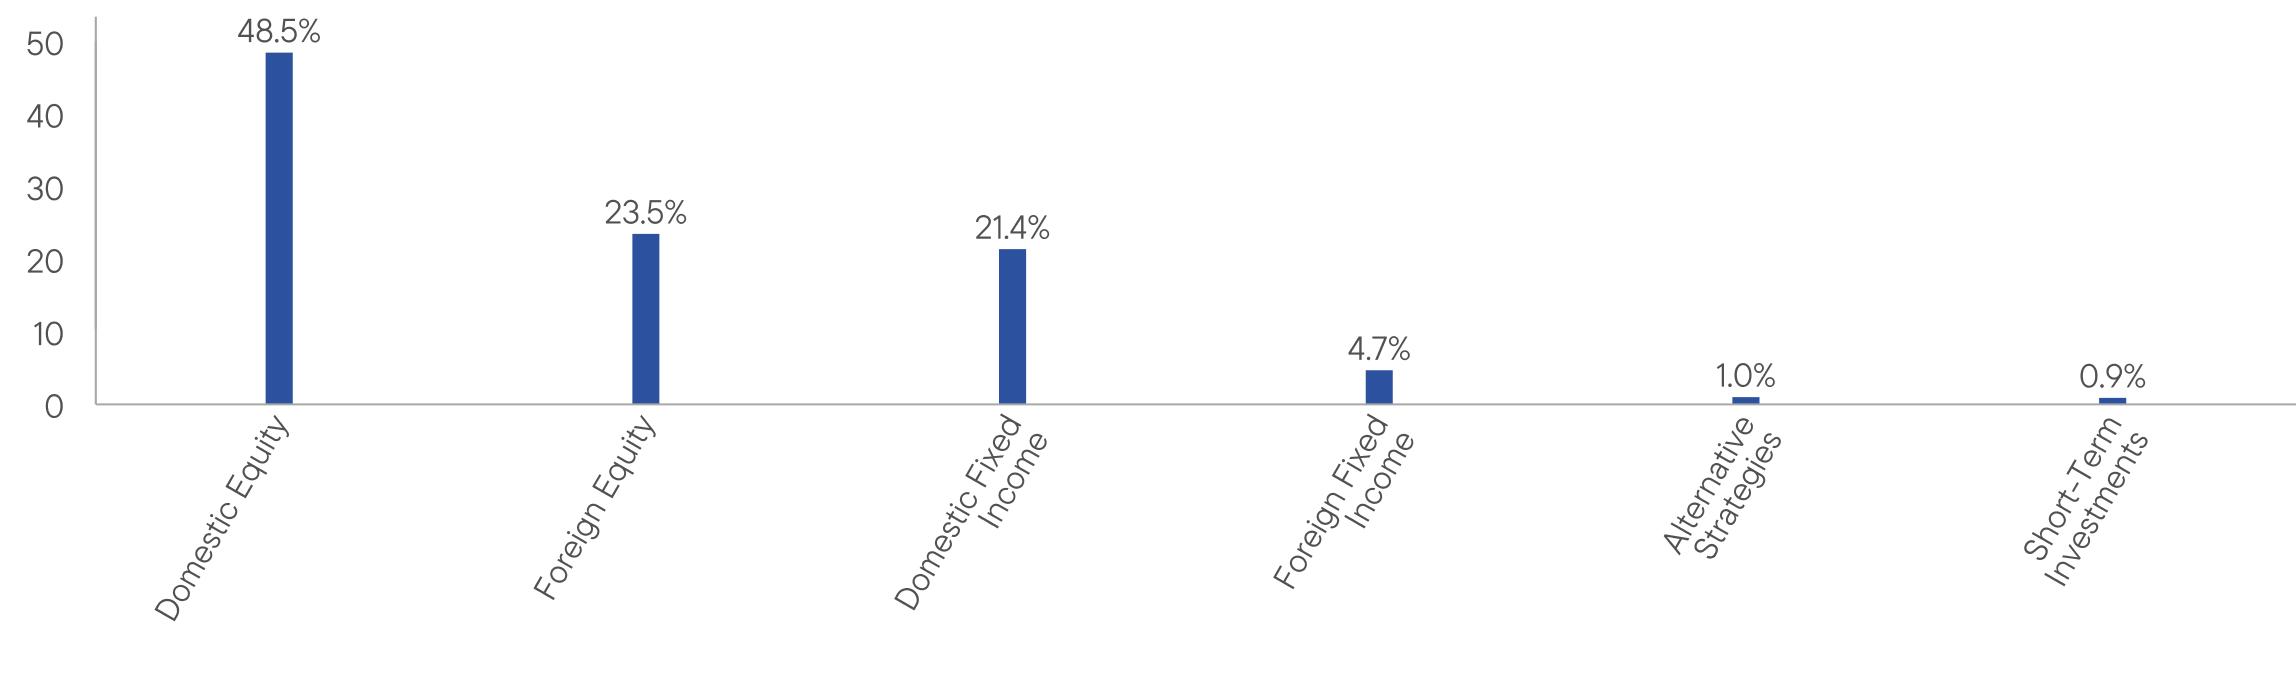
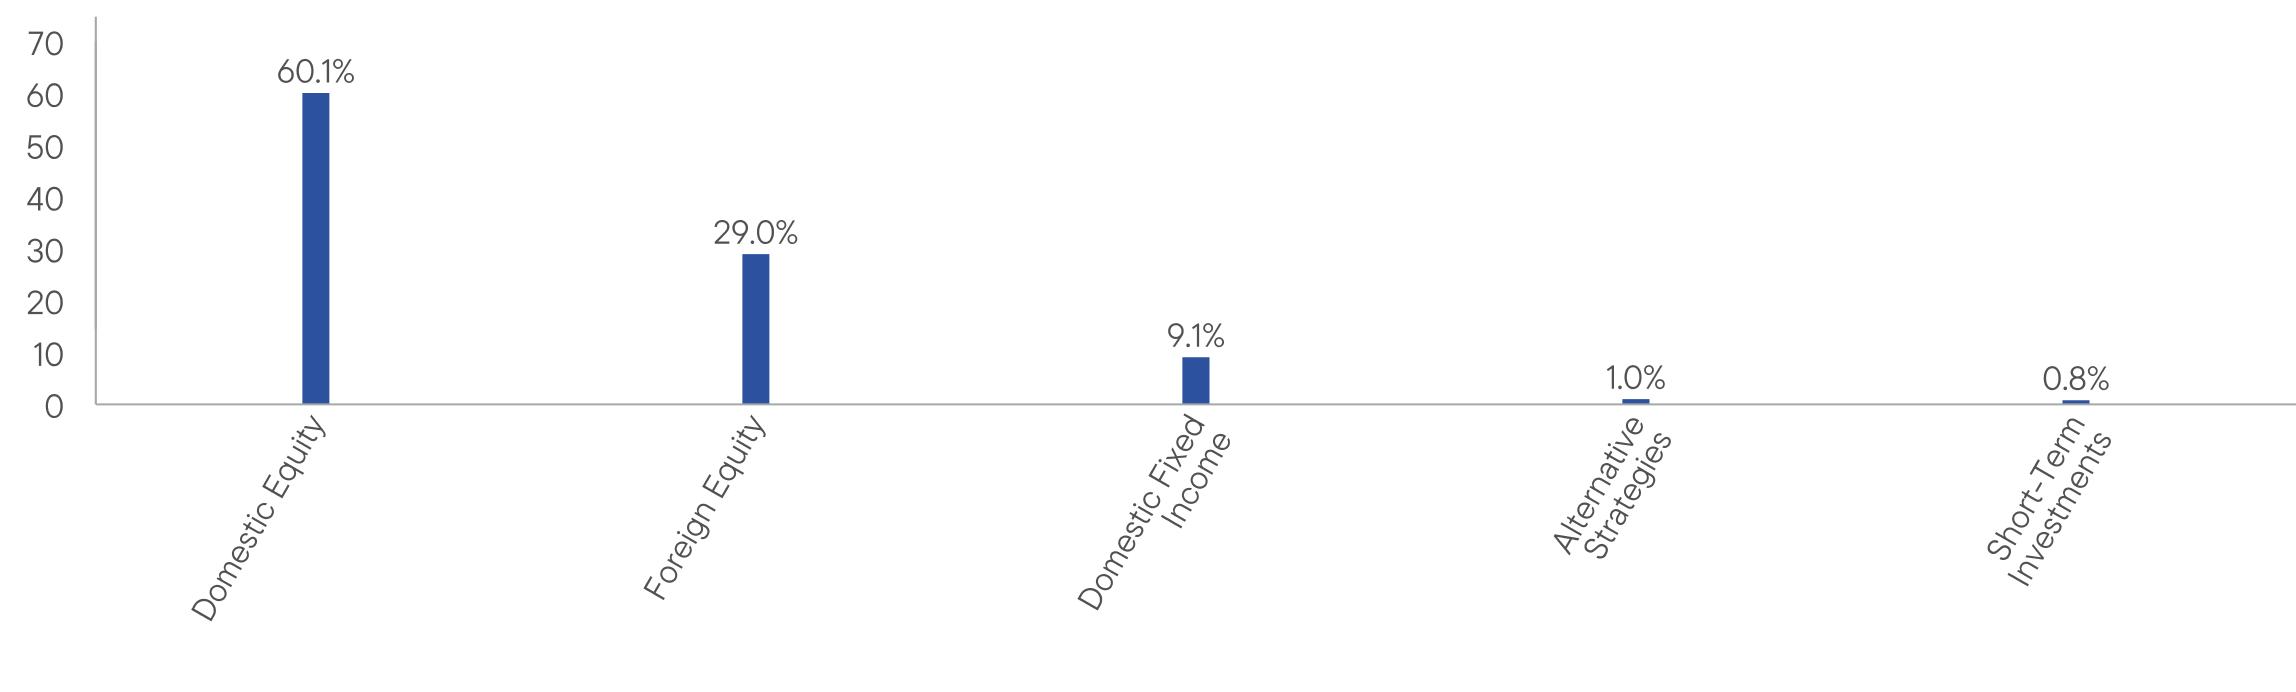
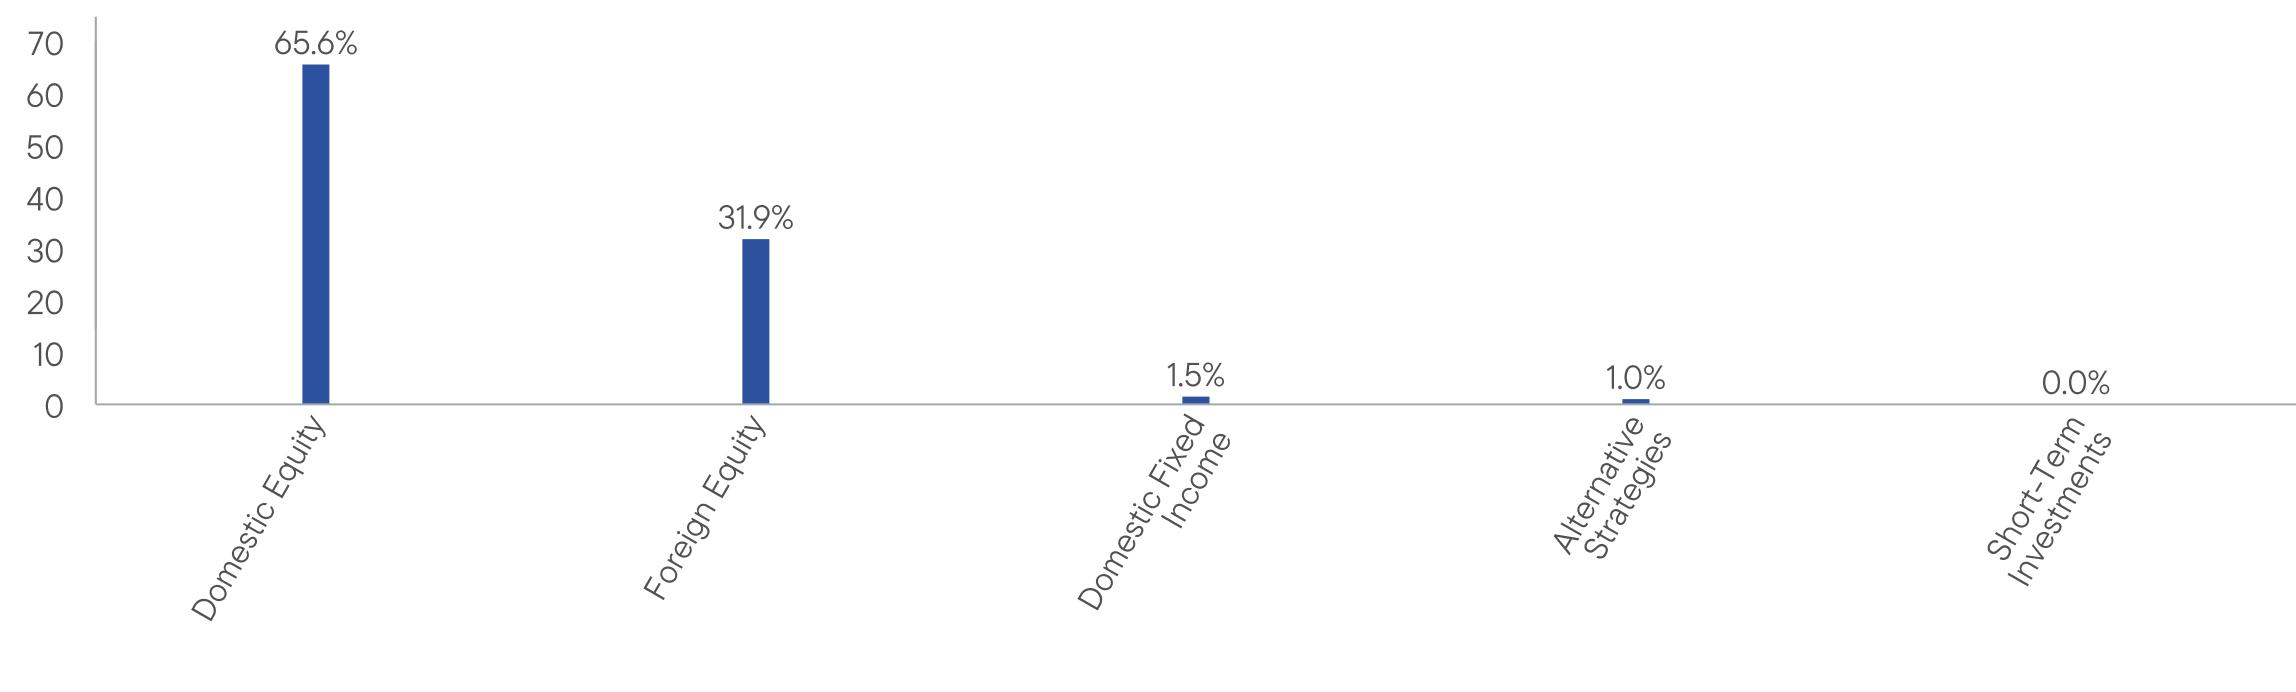
WHAT DID THE FUND INVEST IN? (as of December 31, 2024)
Portfolio Composition* (% of Total Investments)
| * | Does not include derivatives, except purchased options, if any. |
HOW HAS THE FUND CHANGED?
Effective July 1, 2024, investments of $250,000 or more in Class A shares will not be charged a sales charge, but will be subject to a 1% contingent deferred sales charge, if sold within 18 months of purchase.
This is a summary of a change to the Fund since January 1, 2024. For more complete information, you may review the Fund’s current prospectus and any applicable supplements and the Fund’s next prospectus, which we expect to be available by May 1, 2025, at https://www.franklintempleton.com/regulatory-fund-documents or upon request at (800) DIAL BEN/342-5236 or
prospectus@franklintempleton.com.
| |
| WHERE CAN I FIND ADDITIONAL INFORMATION ABOUT THE FUND? |
Additional information is available on https://www.franklintempleton.com/regulatory-fund-documents, including its: |
| • prospectus • proxy voting information • financial information • holdings • tax information |
HOUSEHOLDING
You will receive the Fund’s shareholder reports every six months. In addition, you will receive an annual updated summary prospectus (detail prospectus available upon request). To reduce Fund expenses, we try to identify related shareholders in a household and send only one copy of the shareholder reports and summary prospectus. This process, called “householding,” will continue indefinitely unless you instruct us otherwise. If you prefer not to have these documents householded, please call us at (800) DIAL BEN/342-5236. At any time, you may view current prospectuses/summary prospectuses and shareholder reports on our website. If you choose, you may receive these documents through electronic delivery.
| Franklin Conservative Allocation Fund | PAGE 3 | 484-ATSR-0225 |
94509236964210662102951165912744137921169313023140641000010055103211068710688116201249212299106991129111432100009728102131163911121127641435814969124581399414821100009764105311305611827149731740620633168442058424183100009671994610710105651131812339117839896104941035445.733.29.99.51.00.7
| | |
Franklin Conservative Allocation Fund | |
| Class C [FTCCX] |
| Annual Shareholder Report | December 31, 2024 |
|
This annual shareholder report contains important information about Franklin Conservative Allocation Fund for the period January 1, 2024, to December 31, 2024.
You can find additional information about the Fund at https://www.franklintempleton.com/regulatory-fund-documents. You can also request this information by contacting us at (800) DIAL BEN/342-5236.
WHAT WERE THE FUND COSTS FOR THE LAST YEAR? (based on a hypothetical $10,000 investment)
| | |
Class Name | Costs of a $10,000 investment | Costs paid as a percentage of a $10,000 investment* |
| Class C | $141 | 1.36% |
| * | Reflects fee waivers and/or expense reimbursements, without which expenses would have been higher. |
HOW DID THE FUND PERFORM LAST YEAR AND WHAT AFFECTED ITS PERFORMANCE?
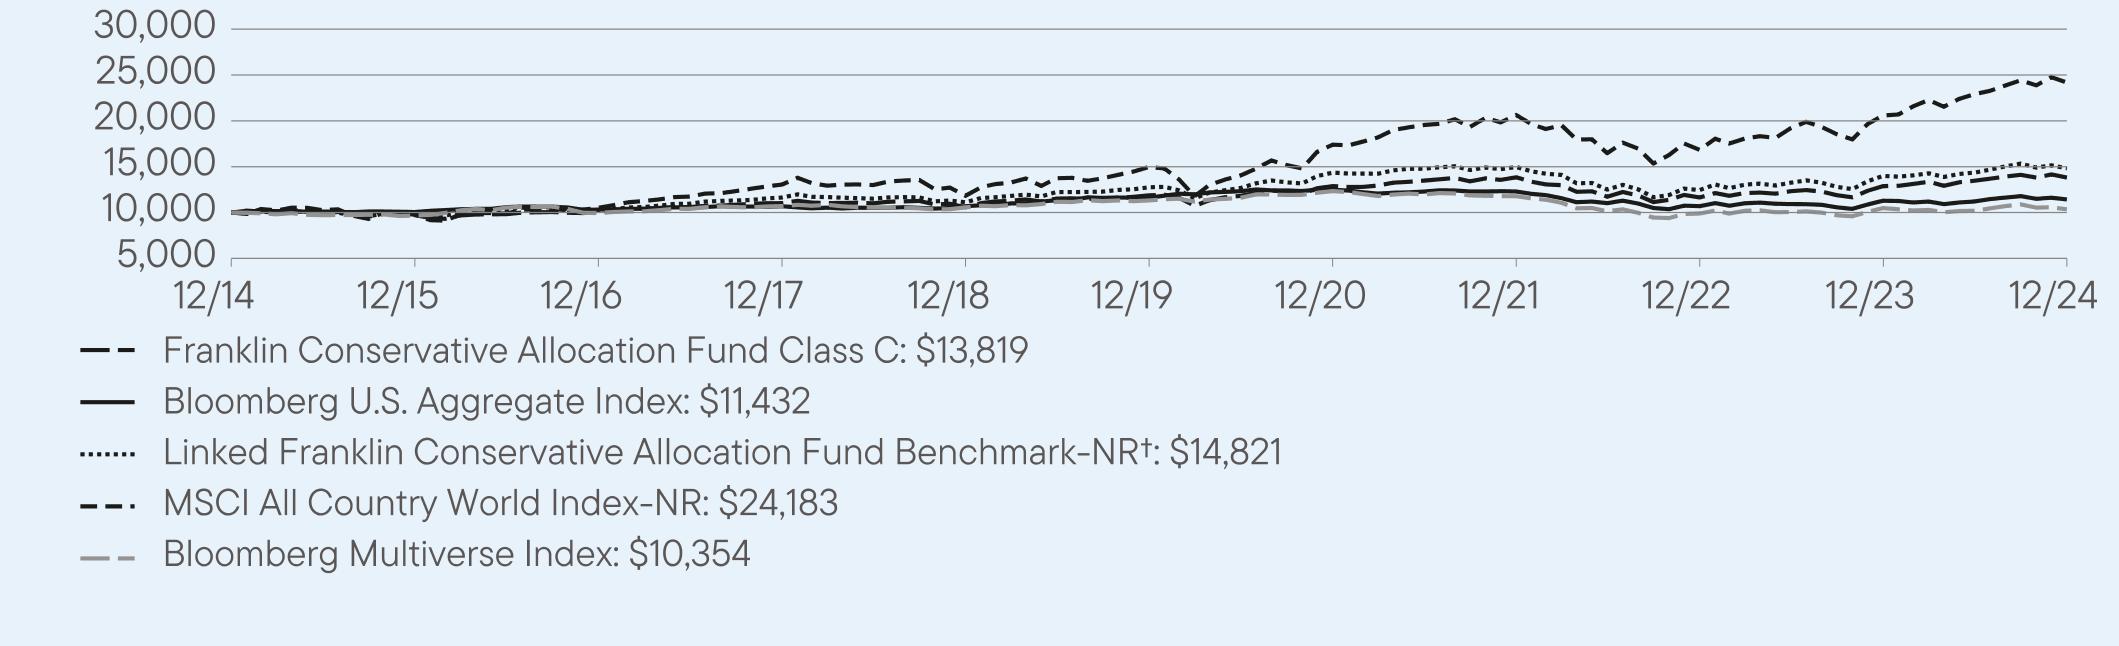
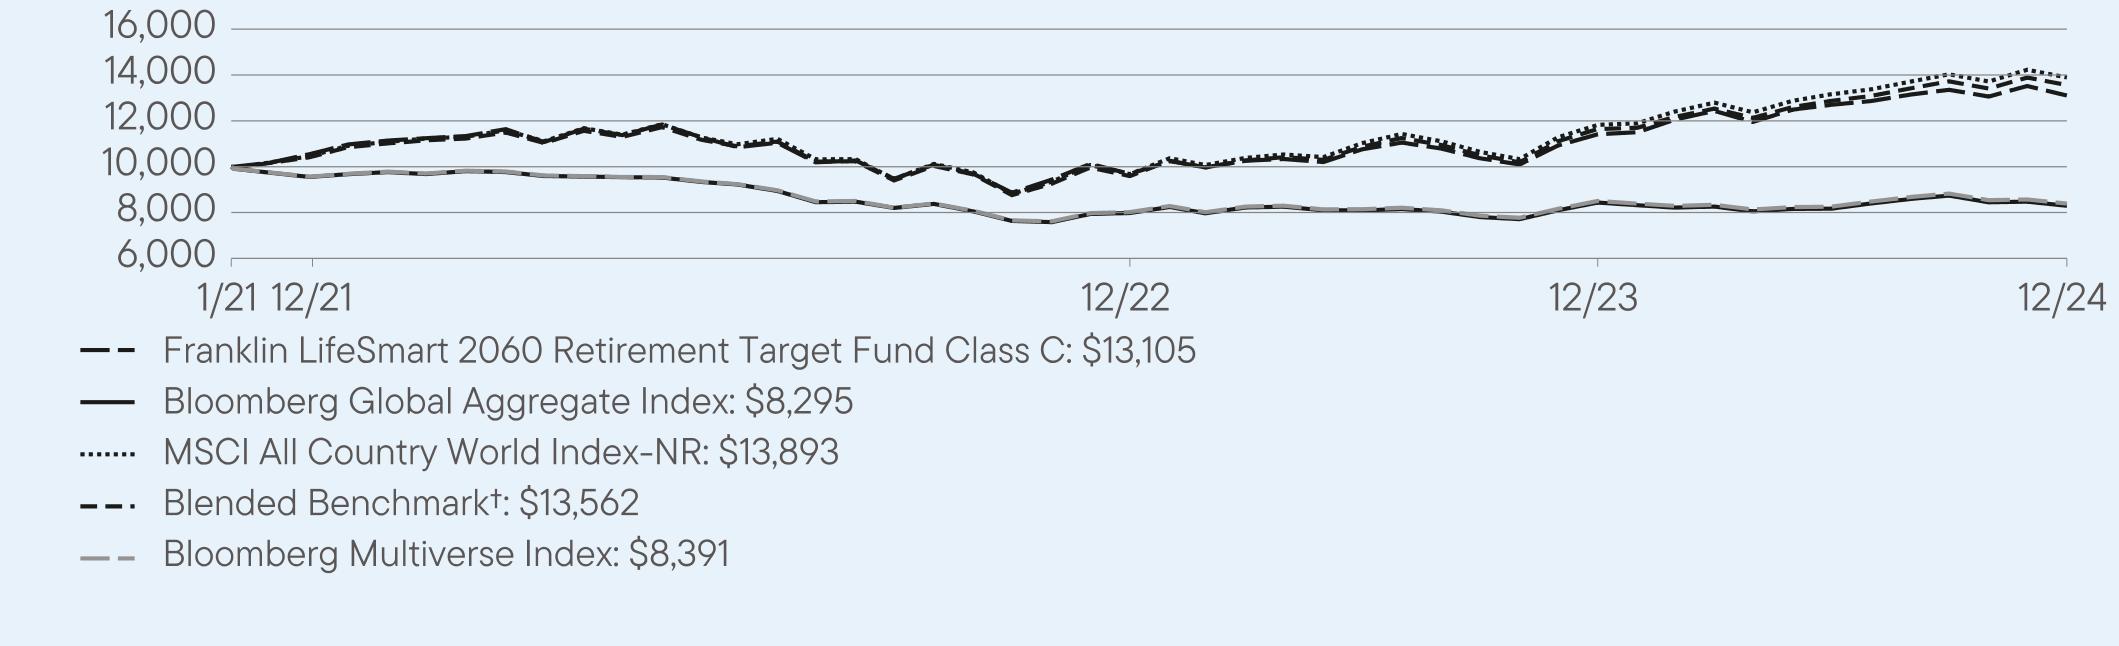
For the twelve months ended December 31, 2024, Class C shares of Franklin Conservative Allocation Fund returned 7.28%. The Fund compares its performance to the Linked Franklin Conservative Allocation Fund Benchmark-NR†, the MSCI All Country World Index-NR and the Bloomberg Multiverse Index, which returned 5.91%, 17.49% and -1.34%, respectively, for the same period.
| |
Top contributors to performance: |
| ↑ | Fixed income underweight, reflecting our cross asset tactical preference. |
| ↑ | Within fixed income, a regional overweight to the U.S. and an underweight to international positions. |
| ↑ | Within equities, a regional overweight to the U.S. and an underweight to international holdings. |
| |
Top detractors from performance: |
| ↓ | Fund selection in international fixed income. |
| ↓ | Fund selection in U.S. equity, as value stock exposure and one growth fund detracted. |
| ↓ | Fund selection in international equity. |
| Franklin Conservative Allocation Fund | PAGE 1 | 584-ATSR-0225 |
HOW DID THE FUND PERFORM OVER THE LAST 10 YEARS?
The Fund’s past performance is not necessarily an indication of how the Fund will perform in the future. The graph and table do not reflect the deduction of taxes that a shareholder would pay on Fund distributions or redemption of Fund shares.
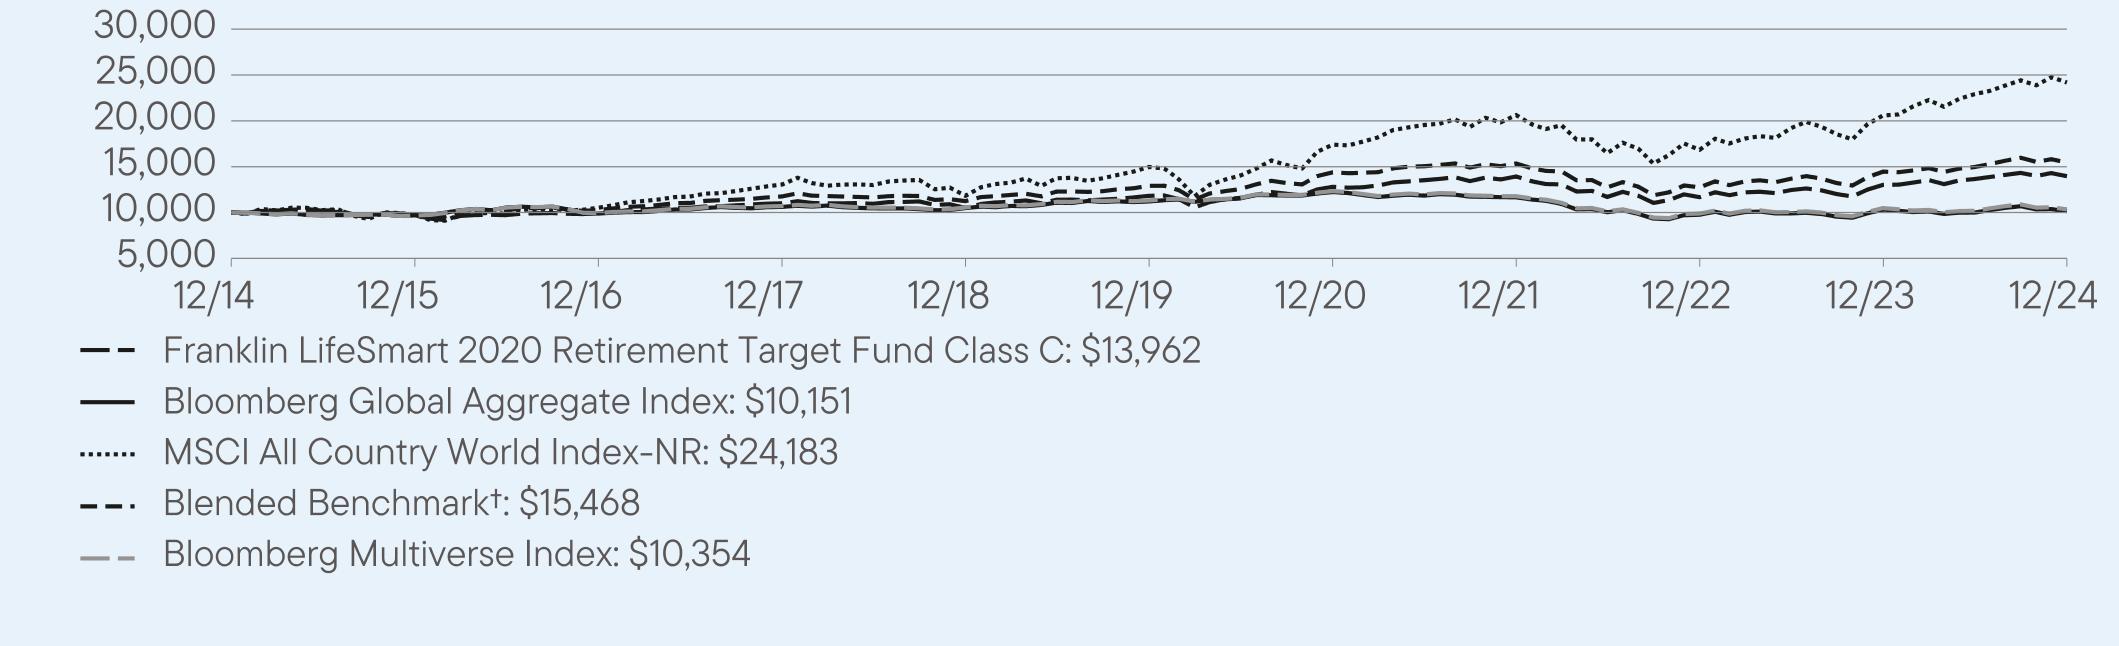
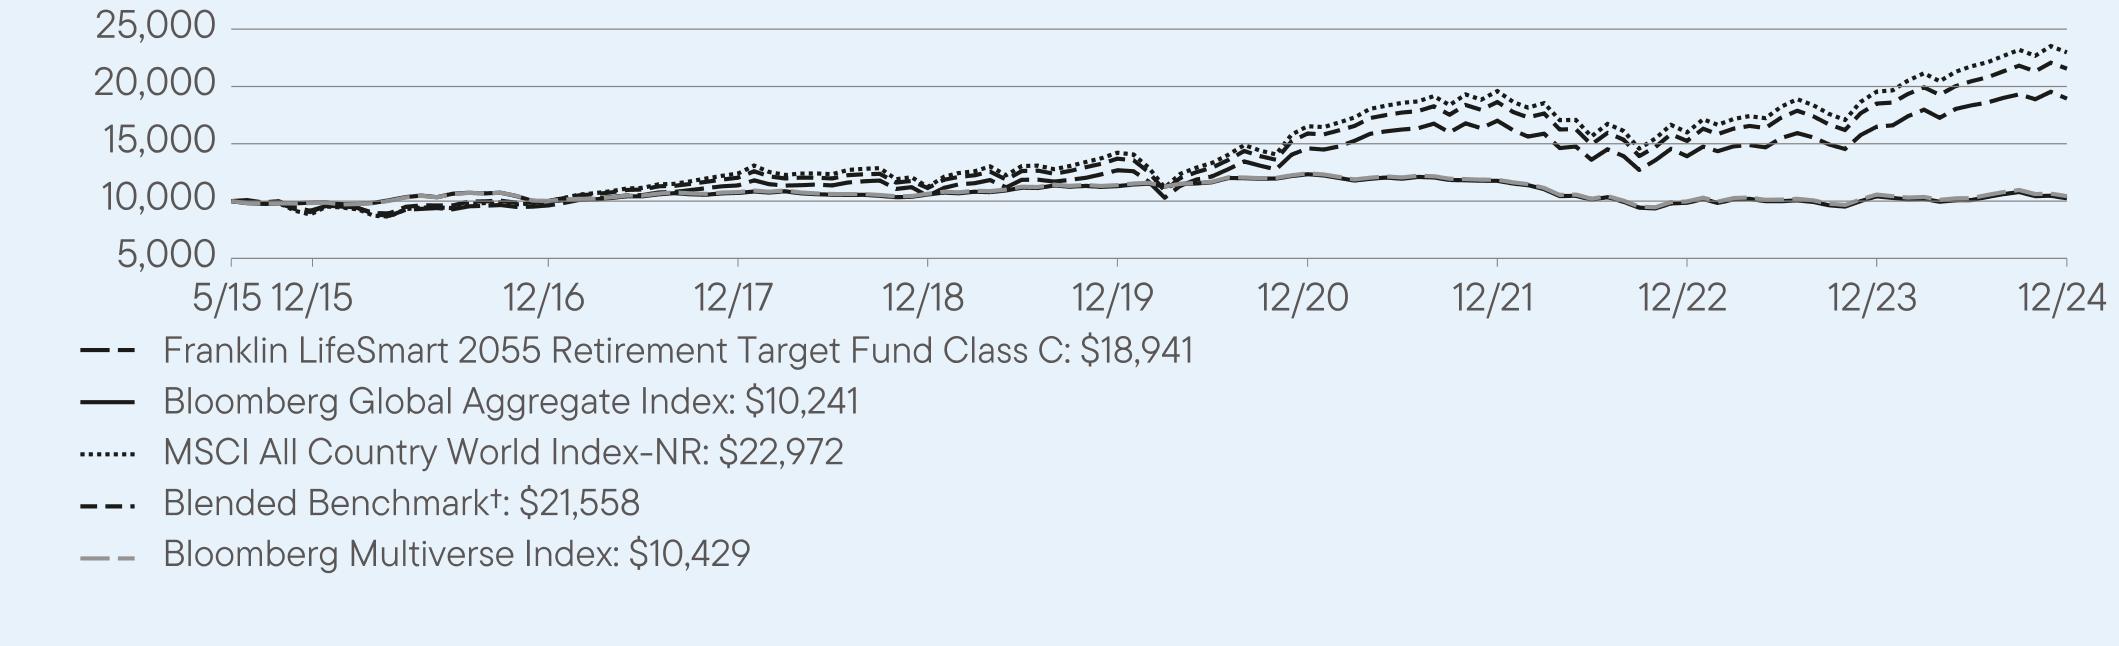
VALUE OF A $10,000 INVESTMENT – Class C 12/31/2014 — 12/31/2024
AVERAGE ANNUAL TOTAL RETURNS (%) Period Ended December 31, 2024
| | | |
| | 1 Year | 5 Year | 10 Year |
Class C | 7.28 | 3.07 | 3.29 |
Class C (with sales charge) | 6.28 | 3.07 | 3.29 |
Bloomberg U.S. Aggregate Index | 1.25 | -0.33 | 1.35 |
Linked Franklin Conservative Allocation Fund Benchmark-NR† | 5.91 | 3.03 | 4.01 |
MSCI All Country World Index-NR | 17.49 | 10.06 | 9.23 |
Bloomberg Multiverse Index | -1.34 | -1.76 | 0.35 |
| † | The Linked Franklin Conservative Allocation Fund Benchmark-NR is comprised of 28% S&P 500 Index, 12% MSCI EAFE Index-NR, 40% Bloomberg U.S. Aggregate Index and 20% Payden & Rygel 90 Day U.S. T-Bill Index from 1/1/2001 to 12/31/2012; 28% S&P 500 Index, 12% MSCI EAFE Index-NR and 60% Bloomberg U.S. Aggregate Index from 1/1/2013 to 12/31/14; and 40% MSCI ACWI-NR and 60% Bloomberg Multiverse Index thereafter. |
Fund performance figures may reflect fee waivers and/or expense reimbursements, without which the performance would have been lower.
For current month-end performance, please call Franklin Templeton at (800) DIAL BEN/342-5236 or visit https://www.franklintempleton.com/investments/options/mutual-funds.
Important data provider notices and terms available at www.franklintempletondatasources.com.
KEY FUND STATISTICS (as of December 31, 2024)
| |
Total Net Assets | $855,733,091 |
Total Number of Portfolio Holdings* | 21 |
Total Management Fee Paid | $2,193,955 |
Portfolio Turnover Rate | 40.01% |
| * | Does not include derivatives, except purchased options, if any. |
| Franklin Conservative Allocation Fund | PAGE 2 | 584-ATSR-0225 |
WHAT DID THE FUND INVEST IN? (as of December 31, 2024)
Portfolio Composition* (% of Total Investments)
| * | Does not include derivatives, except purchased options, if any. |
| |
| WHERE CAN I FIND ADDITIONAL INFORMATION ABOUT THE FUND? |
Additional information is available on https://www.franklintempleton.com/regulatory-fund-documents, including its: |
| • prospectus • proxy voting information • financial information • holdings • tax information |
HOUSEHOLDING
You will receive the Fund’s shareholder reports every six months. In addition, you will receive an annual updated summary prospectus (detail prospectus available upon request). To reduce Fund expenses, we try to identify related shareholders in a household and send only one copy of the shareholder reports and summary prospectus. This process, called “householding,” will continue indefinitely unless you instruct us otherwise. If you prefer not to have these documents householded, please call us at (800) DIAL BEN/342-5236. At any time, you may view current prospectuses/summary prospectuses and shareholder reports on our website. If you choose, you may receive these documents through electronic delivery.
| Franklin Conservative Allocation Fund | PAGE 3 | 584-ATSR-0225 |
1000097041004811033105761188212893138471164512882138191000010055103211068710688116201249212299106991129111432100009728102131163911121127641435814969124581399414821100009764105311305611827149731740620633168442058424183100009671994610710105651131812339117839896104941035445.733.29.99.51.00.7
| | |
Franklin Conservative Allocation Fund | |
| Class R [FTCRX] |
| Annual Shareholder Report | December 31, 2024 |
|
This annual shareholder report contains important information about Franklin Conservative Allocation Fund for the period January 1, 2024, to December 31, 2024.
You can find additional information about the Fund at https://www.franklintempleton.com/regulatory-fund-documents. You can also request this information by contacting us at (800) DIAL BEN/342-5236.
WHAT WERE THE FUND COSTS FOR THE LAST YEAR? (based on a hypothetical $10,000 investment)
| | |
Class Name | Costs of a $10,000 investment | Costs paid as a percentage of a $10,000 investment* |
| Class R | $89 | 0.86% |
| * | Reflects fee waivers and/or expense reimbursements, without which expenses would have been higher. |
HOW DID THE FUND PERFORM LAST YEAR AND WHAT AFFECTED ITS PERFORMANCE?
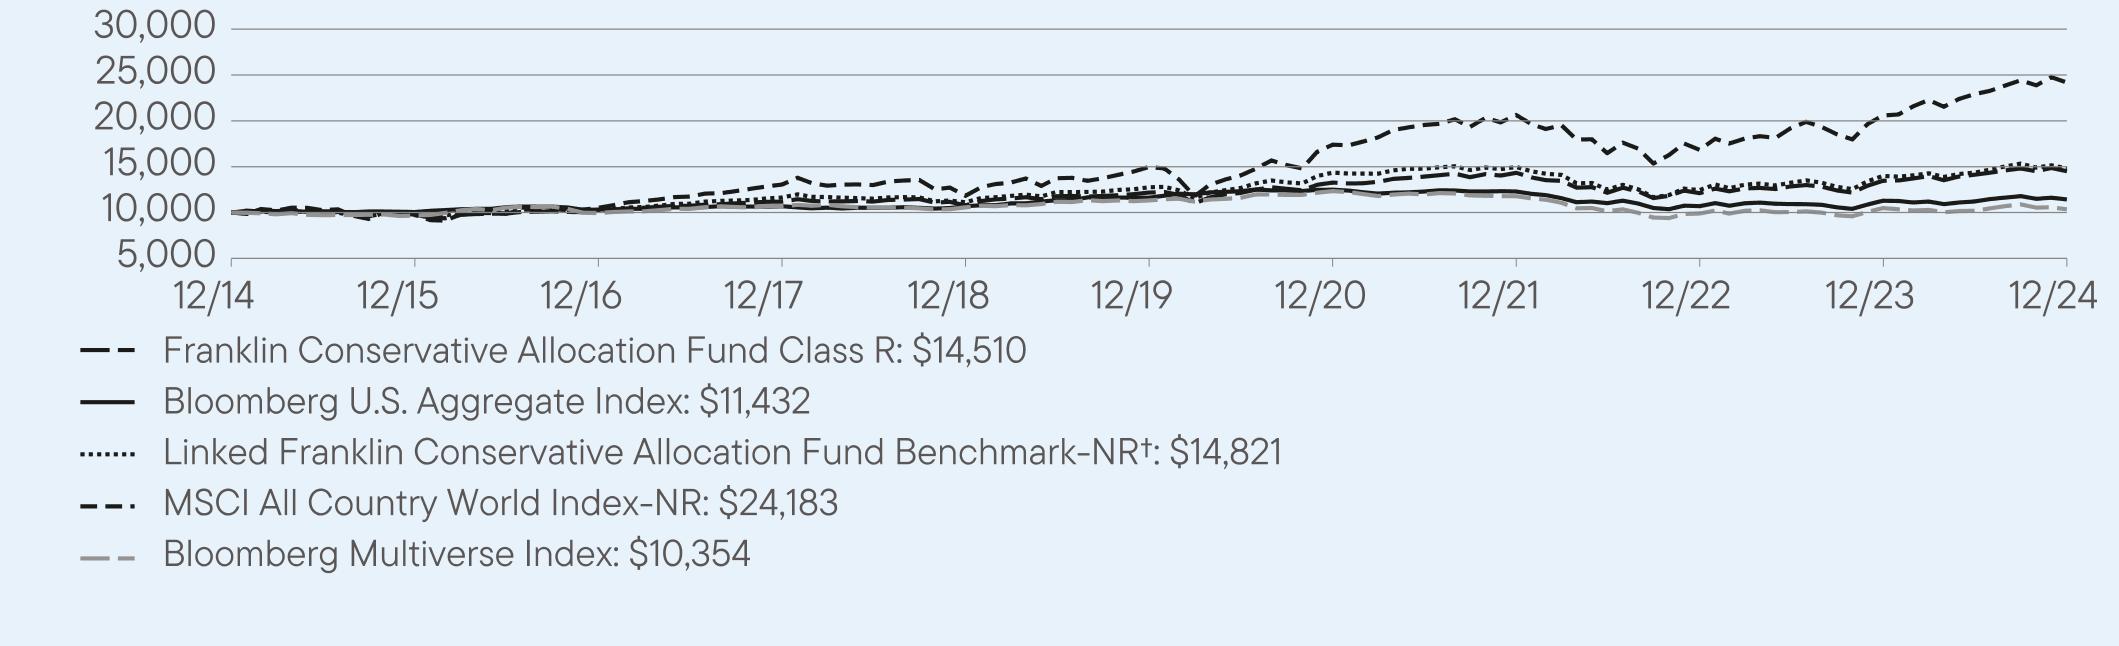
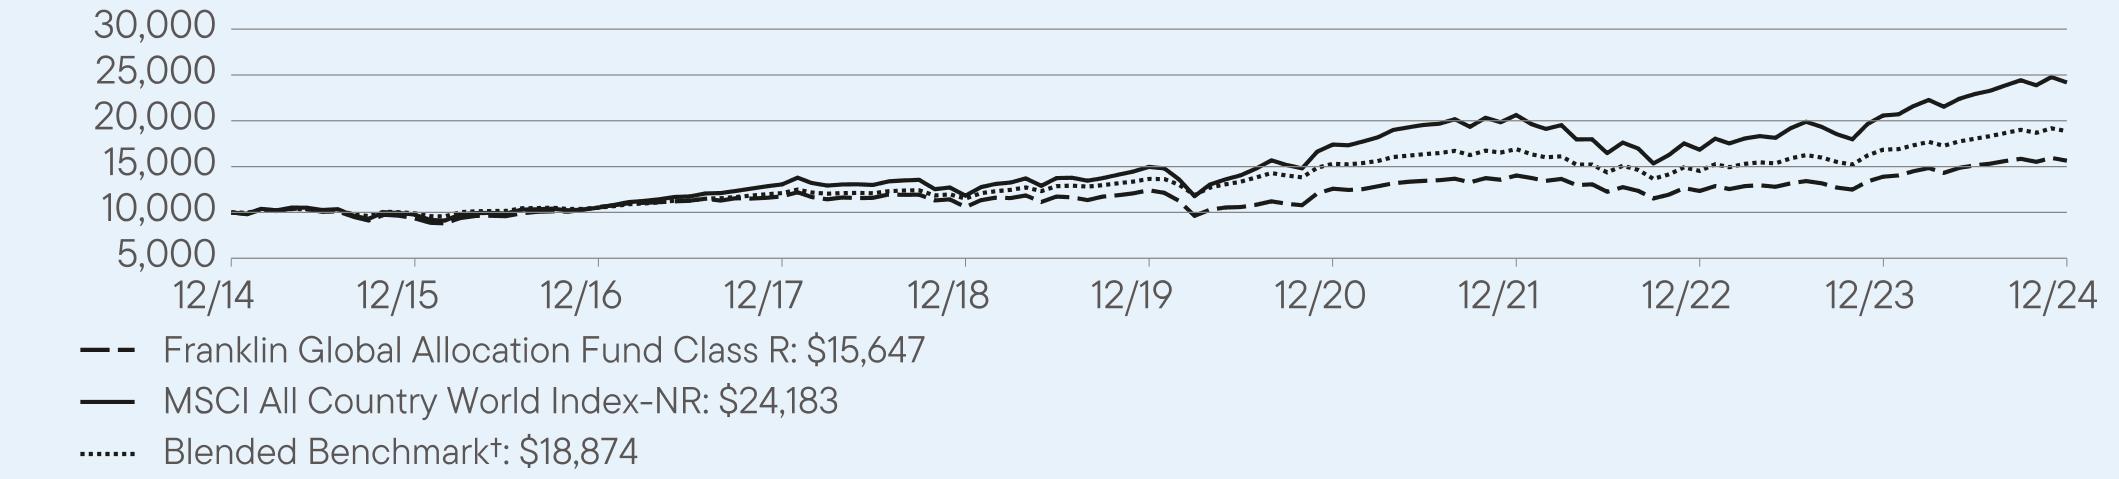
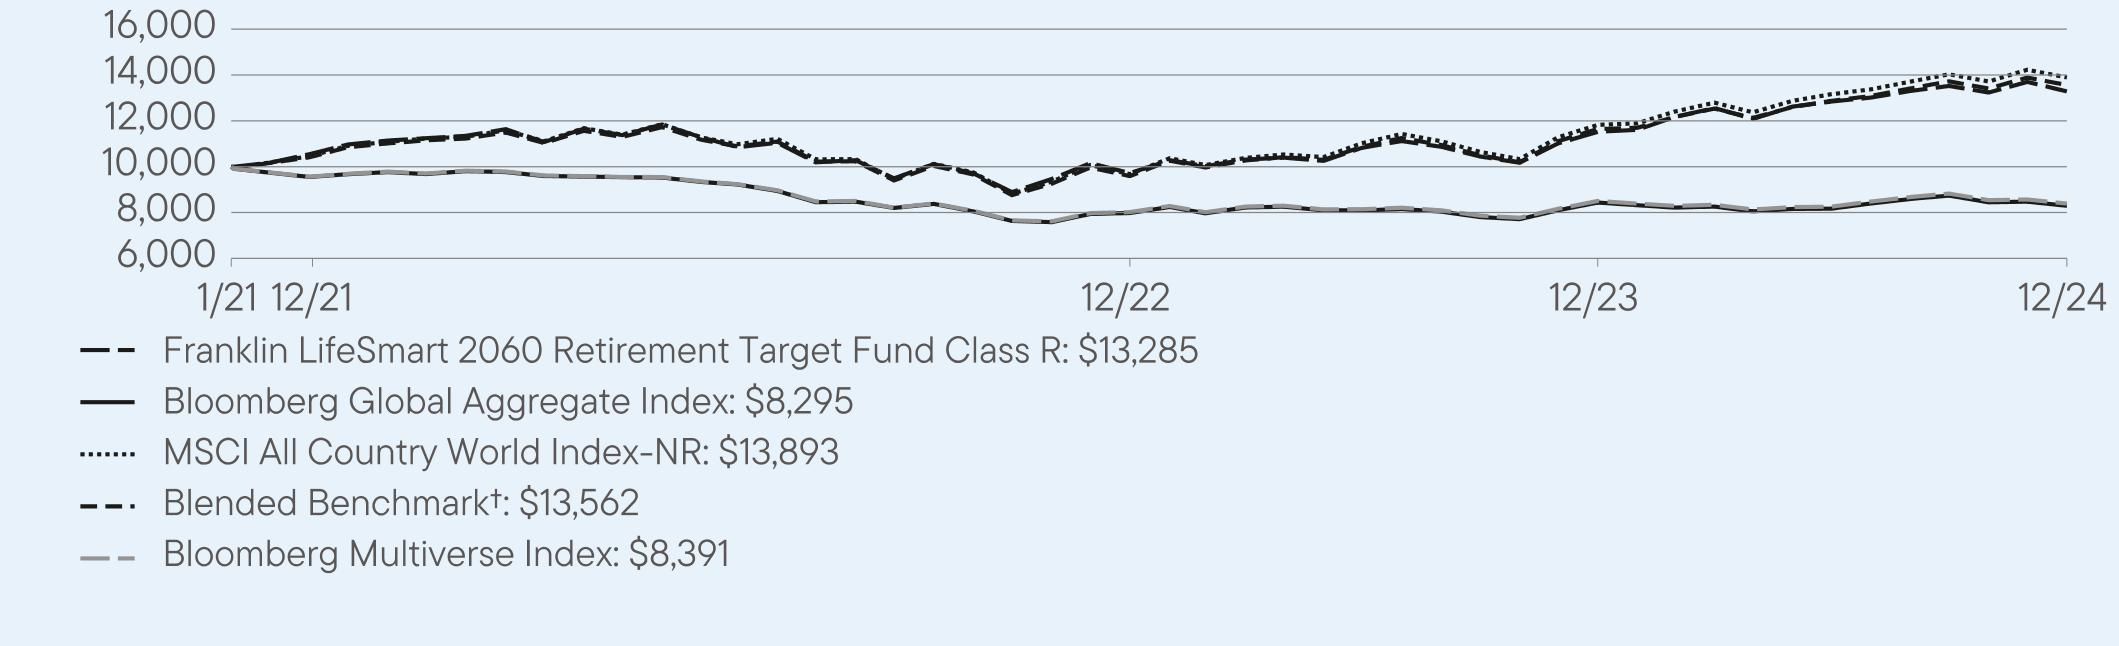
For the twelve months ended December 31, 2024, Class R shares of Franklin Conservative Allocation Fund returned 7.75%. The Fund compares its performance to the Linked Franklin Conservative Allocation Fund Benchmark-NR†, the MSCI All Country World Index-NR and the Bloomberg Multiverse Index, which returned 5.91%, 17.49% and -1.34%, respectively, for the same period.
| |
Top contributors to performance: |
| ↑ | Fixed income underweight, reflecting our cross asset tactical preference. |
| ↑ | Within fixed income, a regional overweight to the U.S. and an underweight to international positions. |
| ↑ | Within equities, a regional overweight to the U.S. and an underweight to international holdings. |
| |
Top detractors from performance: |
| ↓ | Fund selection in international fixed income. |
| ↓ | Fund selection in U.S. equity, as value stock exposure and one growth fund detracted. |
| ↓ | Fund selection in international equity. |
| Franklin Conservative Allocation Fund | PAGE 1 | 884-ATSR-0225 |
HOW DID THE FUND PERFORM OVER THE LAST 10 YEARS?
The Fund’s past performance is not necessarily an indication of how the Fund will perform in the future. The graph and table do not reflect the deduction of taxes that a shareholder would pay on Fund distributions or redemption of Fund shares.
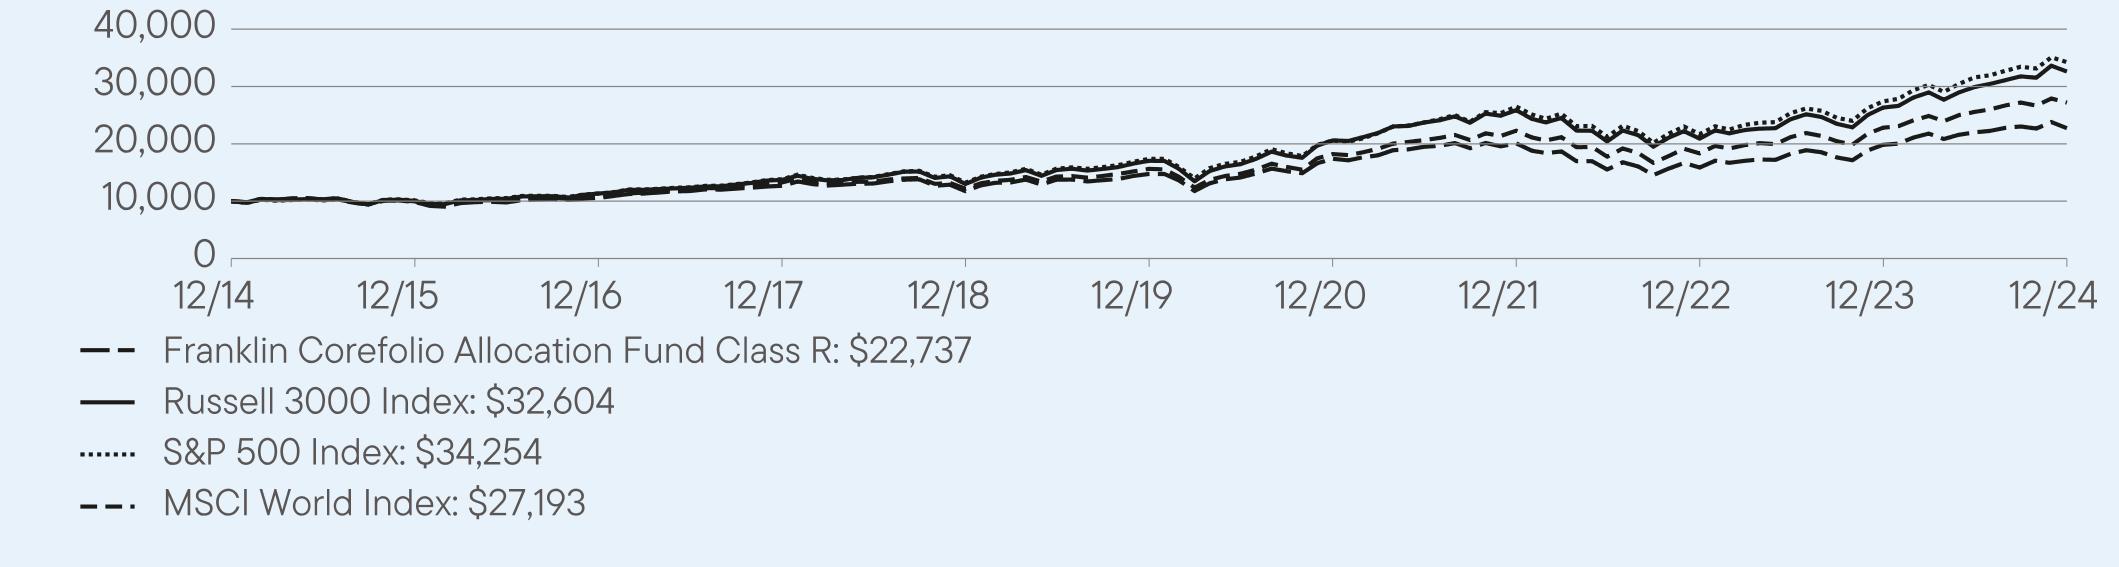
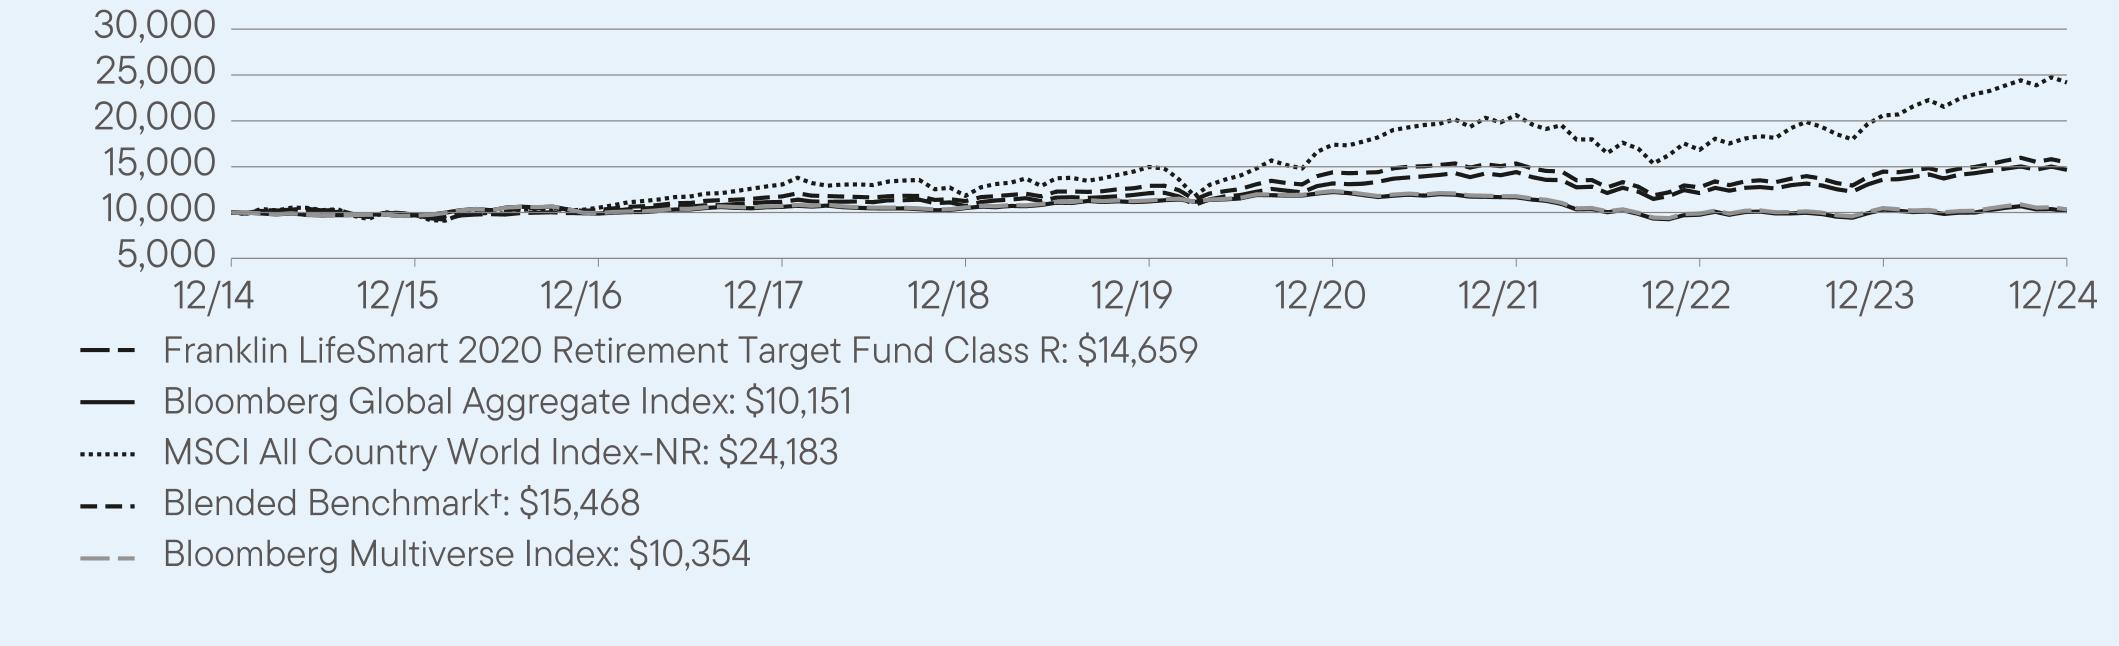
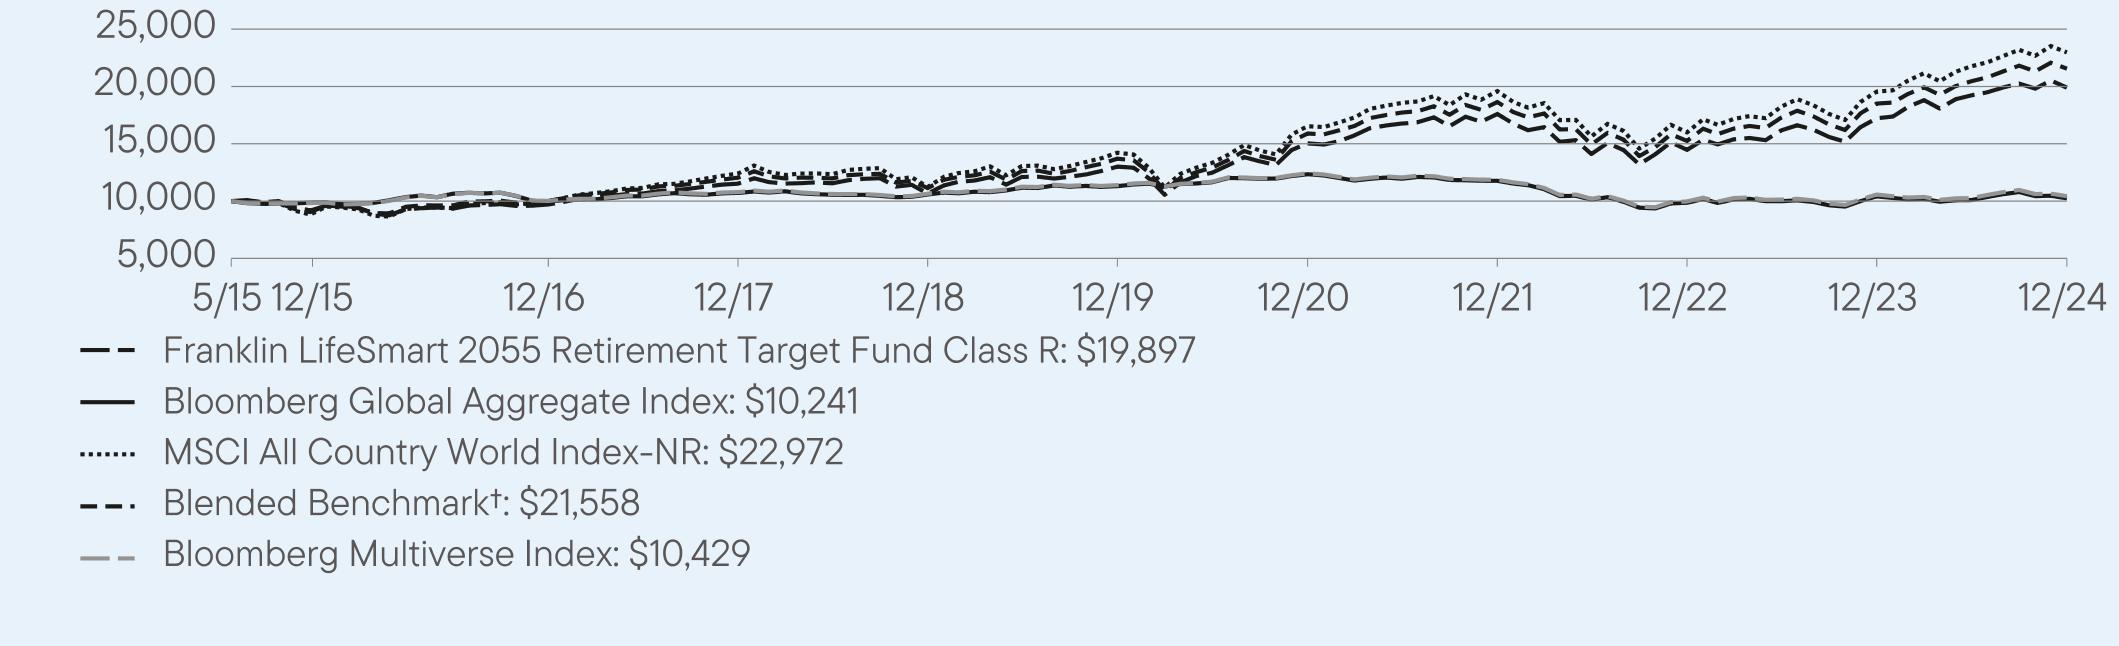
VALUE OF A $10,000 INVESTMENT – Class R 12/31/2014 — 12/31/2024
AVERAGE ANNUAL TOTAL RETURNS (%) Period Ended December 31, 2024
| | | |
| | 1 Year | 5 Year | 10 Year |
Class R | 7.75 | 3.56 | 3.79 |
Bloomberg U.S. Aggregate Index | 1.25 | -0.33 | 1.35 |
Linked Franklin Conservative Allocation Fund Benchmark-NR† | 5.91 | 3.03 | 4.01 |
MSCI All Country World Index-NR | 17.49 | 10.06 | 9.23 |
Bloomberg Multiverse Index | -1.34 | -1.76 | 0.35 |
| † | The Linked Franklin Conservative Allocation Fund Benchmark-NR is comprised of 28% S&P 500 Index, 12% MSCI EAFE Index-NR, 40% Bloomberg U.S. Aggregate Index and 20% Payden & Rygel 90 Day U.S. T-Bill Index from 1/1/2001 to 12/31/2012; 28% S&P 500 Index, 12% MSCI EAFE Index-NR and 60% Bloomberg U.S. Aggregate Index from 1/1/2013 to 12/31/14; and 40% MSCI ACWI-NR and 60% Bloomberg Multiverse Index thereafter. |
Fund performance figures may reflect fee waivers and/or expense reimbursements, without which the performance would have been lower.
For current month-end performance, please call Franklin Templeton at (800) DIAL BEN/342-5236 or visit https://www.franklintempleton.com/investments/options/mutual-funds.
Important data provider notices and terms available at www.franklintempletondatasources.com.
KEY FUND STATISTICS (as of December 31, 2024)
| |
Total Net Assets | $855,733,091 |
Total Number of Portfolio Holdings* | 21 |
Total Management Fee Paid | $2,193,955 |
Portfolio Turnover Rate | 40.01% |
| * | Does not include derivatives, except purchased options, if any. |
| Franklin Conservative Allocation Fund | PAGE 2 | 884-ATSR-0225 |
WHAT DID THE FUND INVEST IN? (as of December 31, 2024)
Portfolio Composition* (% of Total Investments)
| * | Does not include derivatives, except purchased options, if any. |
| |
| WHERE CAN I FIND ADDITIONAL INFORMATION ABOUT THE FUND? |
Additional information is available on https://www.franklintempleton.com/regulatory-fund-documents, including its: |
| • prospectus • proxy voting information • financial information • holdings • tax information |
HOUSEHOLDING
You will receive the Fund’s shareholder reports every six months. In addition, you will receive an annual updated summary prospectus (detail prospectus available upon request). To reduce Fund expenses, we try to identify related shareholders in a household and send only one copy of the shareholder reports and summary prospectus. This process, called “householding,” will continue indefinitely unless you instruct us otherwise. If you prefer not to have these documents householded, please call us at (800) DIAL BEN/342-5236. At any time, you may view current prospectuses/summary prospectuses and shareholder reports on our website. If you choose, you may receive these documents through electronic delivery.
| Franklin Conservative Allocation Fund | PAGE 3 | 884-ATSR-0225 |
1000097481015211193107851218013274143341211613467145101000010055103211068710688116201249212299106991129111432100009728102131163911121127641435814969124581399414821100009764105311305611827149731740620633168442058424183100009671994610710105651131812339117839896104941035445.733.29.99.51.00.7
| | |
Franklin Conservative Allocation Fund | |
| Class R6 [FTCMX] |
| Annual Shareholder Report | December 31, 2024 |
|
This annual shareholder report contains important information about Franklin Conservative Allocation Fund for the period January 1, 2024, to December 31, 2024.
You can find additional information about the Fund at https://www.franklintempleton.com/regulatory-fund-documents. You can also request this information by contacting us at (800) DIAL BEN/342-5236.
WHAT WERE THE FUND COSTS FOR THE LAST YEAR? (based on a hypothetical $10,000 investment)
| | |
Class Name | Costs of a $10,000 investment | Costs paid as a percentage of a $10,000 investment* |
| Class R6 | $32 | 0.31% |
| * | Reflects fee waivers and/or expense reimbursements, without which expenses would have been higher. |
HOW DID THE FUND PERFORM LAST YEAR AND WHAT AFFECTED ITS PERFORMANCE?
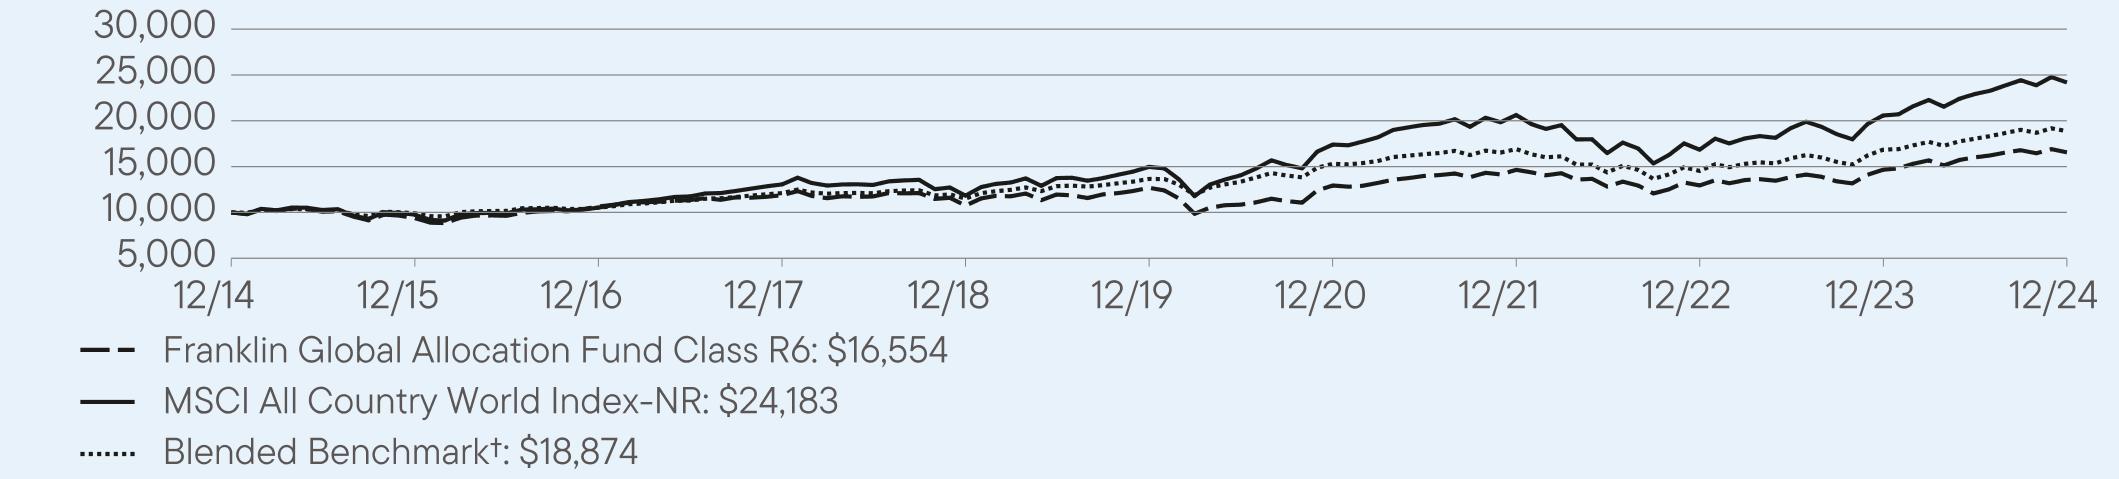
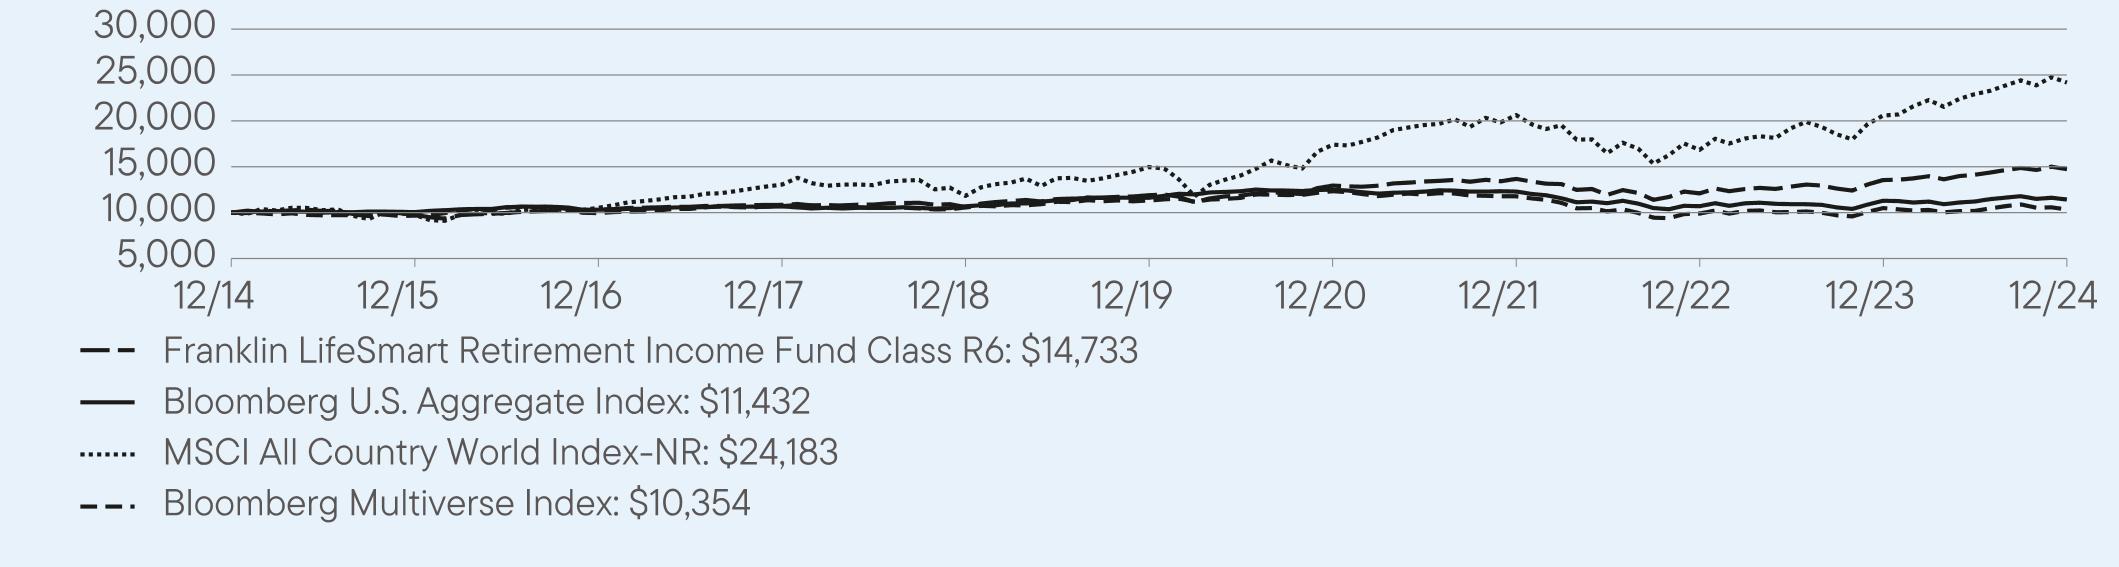
For the twelve months ended December 31, 2024, Class R6 shares of Franklin Conservative Allocation Fund returned 8.40%. The Fund compares its performance to the Linked Franklin Conservative Allocation Fund Benchmark-NR†, the MSCI All Country World Index-NR and the Bloomberg Multiverse Index, which returned 5.91%, 17.49% and -1.34%, respectively, for the same period.
| |
Top contributors to performance: |
| ↑ | Fixed income underweight, reflecting our cross asset tactical preference. |
| ↑ | Within fixed income, a regional overweight to the U.S. and an underweight to international positions. |
| ↑ | Within equities, a regional overweight to the U.S. and an underweight to international holdings. |
| |
Top detractors from performance: |
| ↓ | Fund selection in international fixed income. |
| ↓ | Fund selection in U.S. equity, as value stock exposure and one growth fund detracted. |
| ↓ | Fund selection in international equity. |
| Franklin Conservative Allocation Fund | PAGE 1 | 384-ATSR-0225 |
HOW DID THE FUND PERFORM OVER THE LAST 10 YEARS?
The Fund’s past performance is not necessarily an indication of how the Fund will perform in the future. The graph and table do not reflect the deduction of taxes that a shareholder would pay on Fund distributions or redemption of Fund shares.
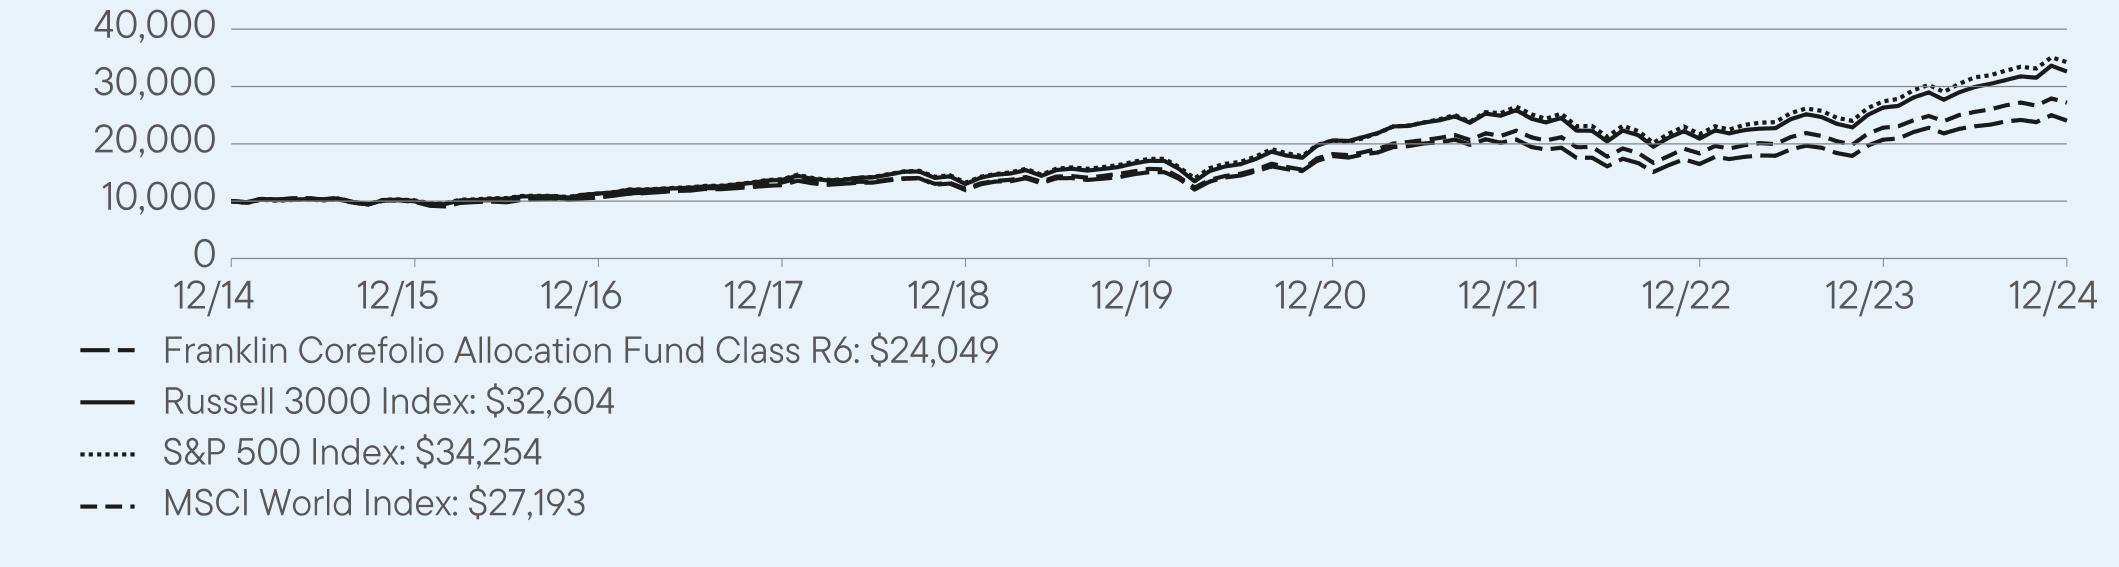
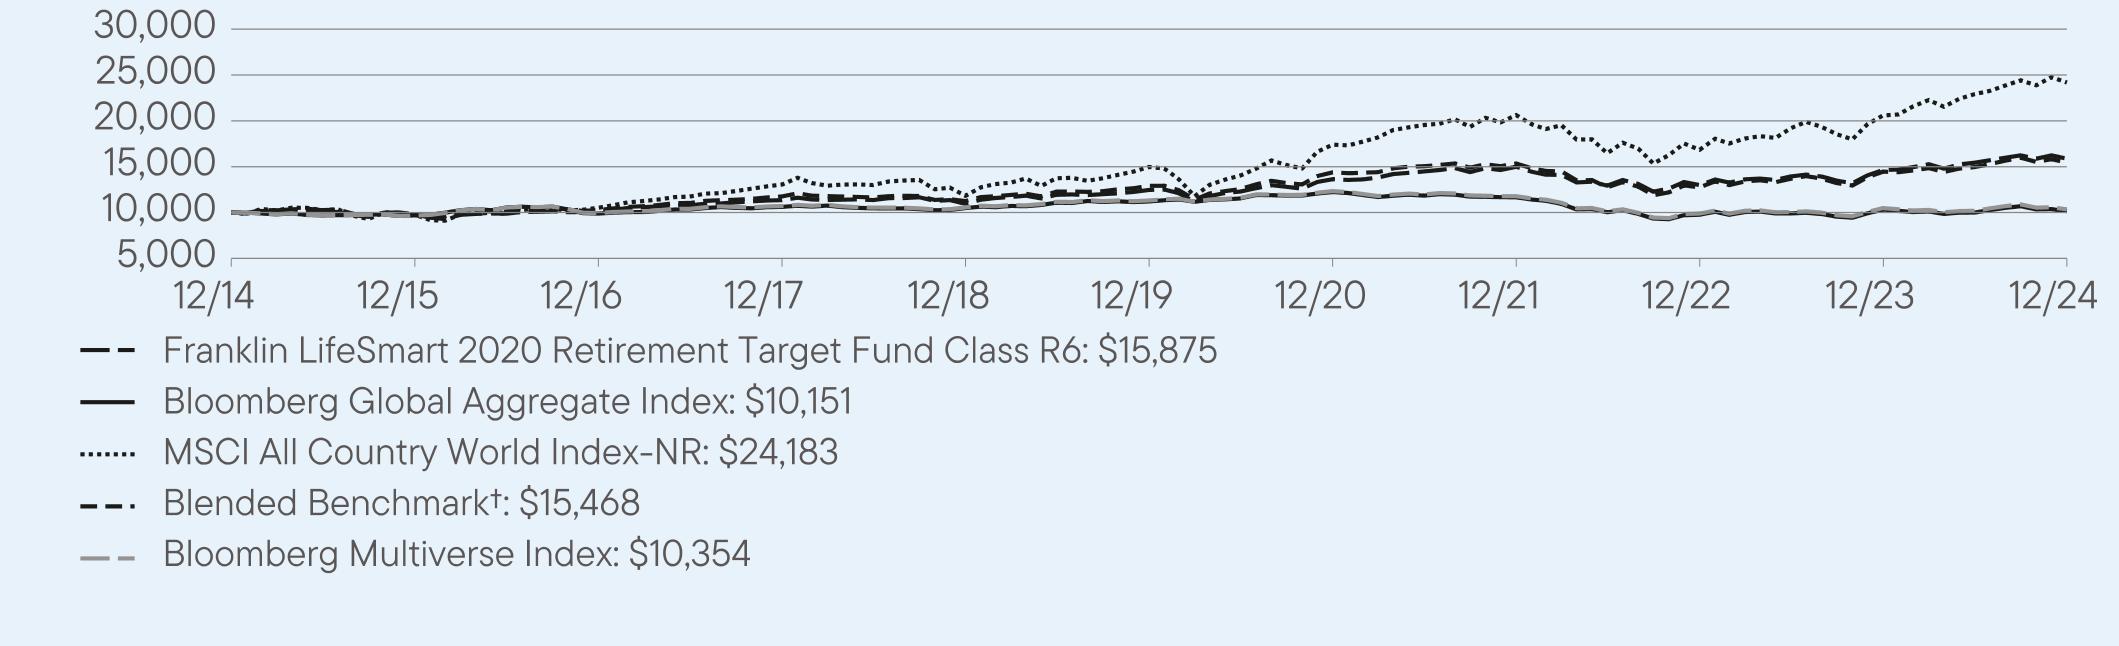
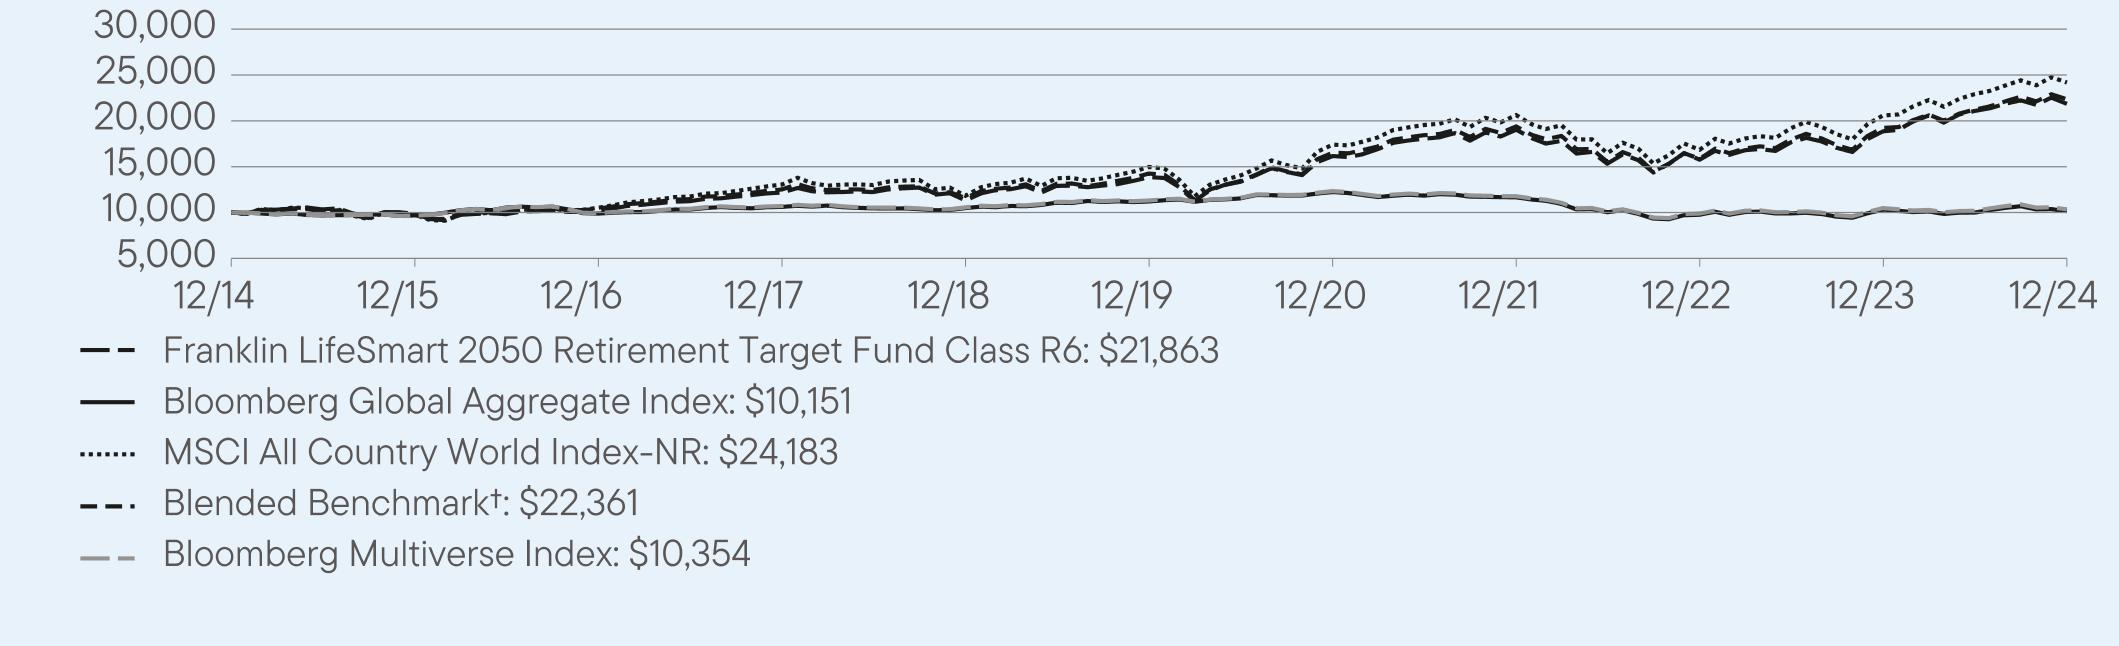
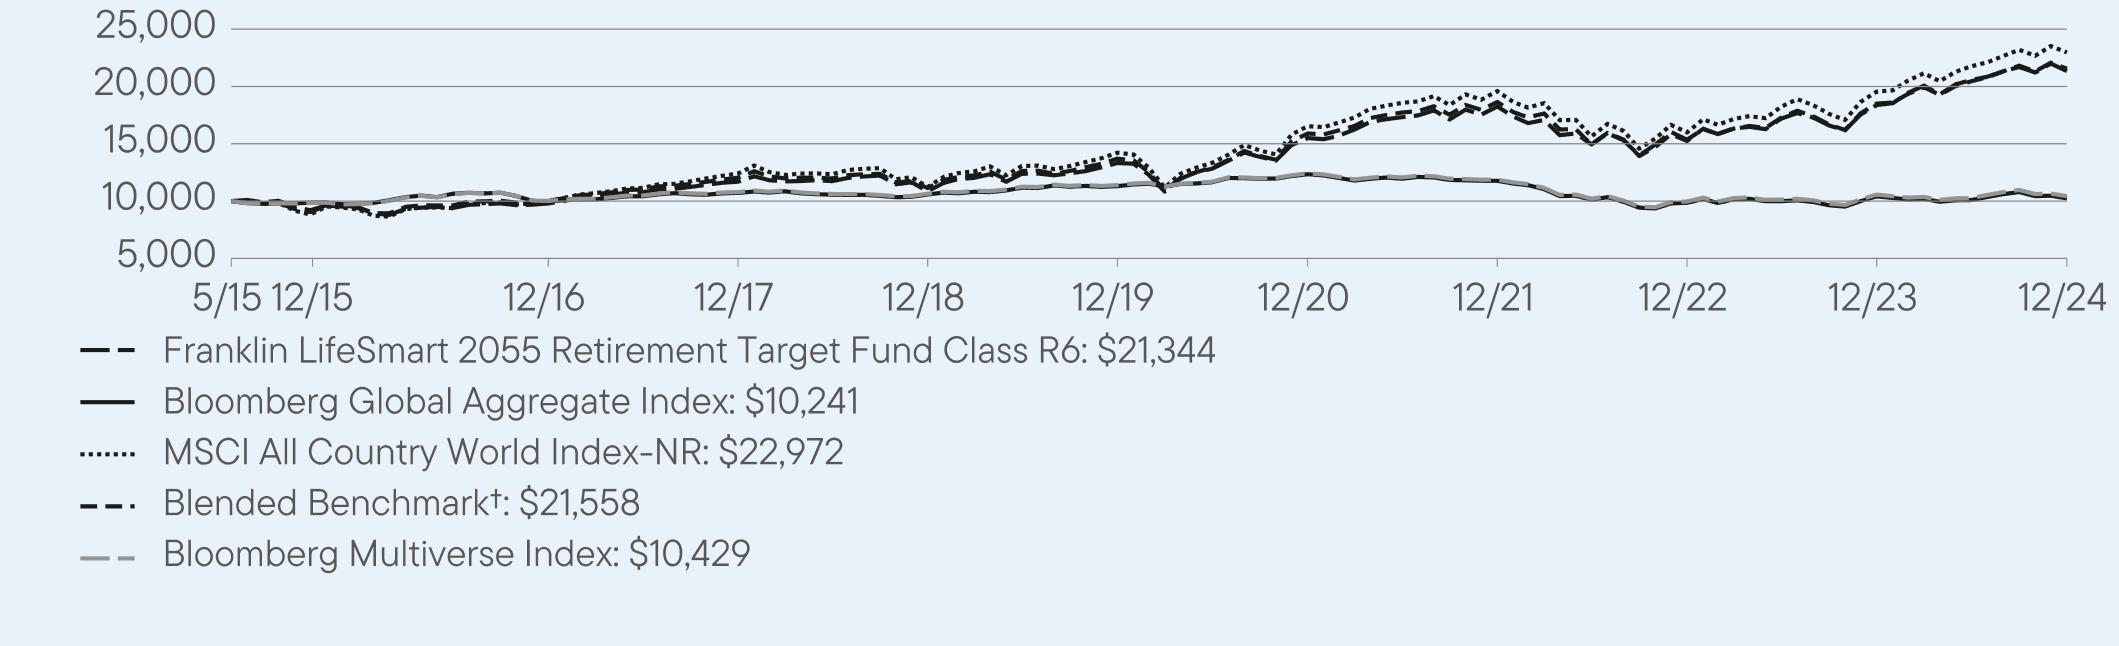
VALUE OF A $10,000 INVESTMENT – Class R6 12/31/2014 — 12/31/2024
AVERAGE ANNUAL TOTAL RETURNS (%) Period Ended December 31, 2024
| | | |
| | 1 Year | 5 Year | 10 Year |
Class R6 | 8.40 | 4.17 | 4.40 |
Bloomberg U.S. Aggregate Index | 1.25 | -0.33 | 1.35 |
Linked Franklin Conservative Allocation Fund Benchmark-NR† | 5.91 | 3.03 | 4.01 |
MSCI All Country World Index-NR | 17.49 | 10.06 | 9.23 |
Bloomberg Multiverse Index | -1.34 | -1.76 | 0.35 |
| † | The Linked Franklin Conservative Allocation Fund Benchmark-NR is comprised of 28% S&P 500 Index, 12% MSCI EAFE Index-NR, 40% Bloomberg U.S. Aggregate Index and 20% Payden & Rygel 90 Day U.S. T-Bill Index from 1/1/2001 to 12/31/2012; 28% S&P 500 Index, 12% MSCI EAFE Index-NR and 60% Bloomberg U.S. Aggregate Index from 1/1/2013 to 12/31/14; and 40% MSCI ACWI-NR and 60% Bloomberg Multiverse Index thereafter. |
Fund performance figures may reflect fee waivers and/or expense reimbursements, without which the performance would have been lower.
For current month-end performance, please call Franklin Templeton at (800) DIAL BEN/342-5236 or visit https://www.franklintempleton.com/investments/options/mutual-funds.
Important data provider notices and terms available at www.franklintempletondatasources.com.
KEY FUND STATISTICS (as of December 31, 2024)
| |
Total Net Assets | $855,733,091 |
Total Number of Portfolio Holdings* | 21 |
Total Management Fee Paid | $2,193,955 |
Portfolio Turnover Rate | 40.01% |
| * | Does not include derivatives, except purchased options, if any. |
| Franklin Conservative Allocation Fund | PAGE 2 | 384-ATSR-0225 |
WHAT DID THE FUND INVEST IN? (as of December 31, 2024)
Portfolio Composition* (% of Total Investments)
| * | Does not include derivatives, except purchased options, if any. |
| |
| WHERE CAN I FIND ADDITIONAL INFORMATION ABOUT THE FUND? |
Additional information is available on https://www.franklintempleton.com/regulatory-fund-documents, including its: |
| • prospectus • proxy voting information • financial information • holdings • tax information |
HOUSEHOLDING
You will receive the Fund’s shareholder reports every six months. In addition, you will receive an annual updated summary prospectus (detail prospectus available upon request). To reduce Fund expenses, we try to identify related shareholders in a household and send only one copy of the shareholder reports and summary prospectus. This process, called “householding,” will continue indefinitely unless you instruct us otherwise. If you prefer not to have these documents householded, please call us at (800) DIAL BEN/342-5236. At any time, you may view current prospectuses/summary prospectuses and shareholder reports on our website. If you choose, you may receive these documents through electronic delivery.
| Franklin Conservative Allocation Fund | PAGE 3 | 384-ATSR-0225 |
1000098071026711395110411254613752149351269314195153881000010055103211068710688116201249212299106991129111432100009728102131163911121127641435814969124581399414821100009764105311305611827149731740620633168442058424183100009671994610710105651131812339117839896104941035445.733.29.99.51.00.7
| | |
Franklin Conservative Allocation Fund | |
| Advisor Class [FTCZX] |
| Annual Shareholder Report | December 31, 2024 |
|
This annual shareholder report contains important information about Franklin Conservative Allocation Fund for the period January 1, 2024, to December 31, 2024.
You can find additional information about the Fund at https://www.franklintempleton.com/regulatory-fund-documents. You can also request this information by contacting us at (800) DIAL BEN/342-5236.
WHAT WERE THE FUND COSTS FOR THE LAST YEAR? (based on a hypothetical $10,000 investment)
| | |
Class Name | Costs of a $10,000 investment | Costs paid as a percentage of a $10,000 investment* |
| Advisor Class | $37 | 0.36% |
| * | Reflects fee waivers and/or expense reimbursements, without which expenses would have been higher. |
HOW DID THE FUND PERFORM LAST YEAR AND WHAT AFFECTED ITS PERFORMANCE?
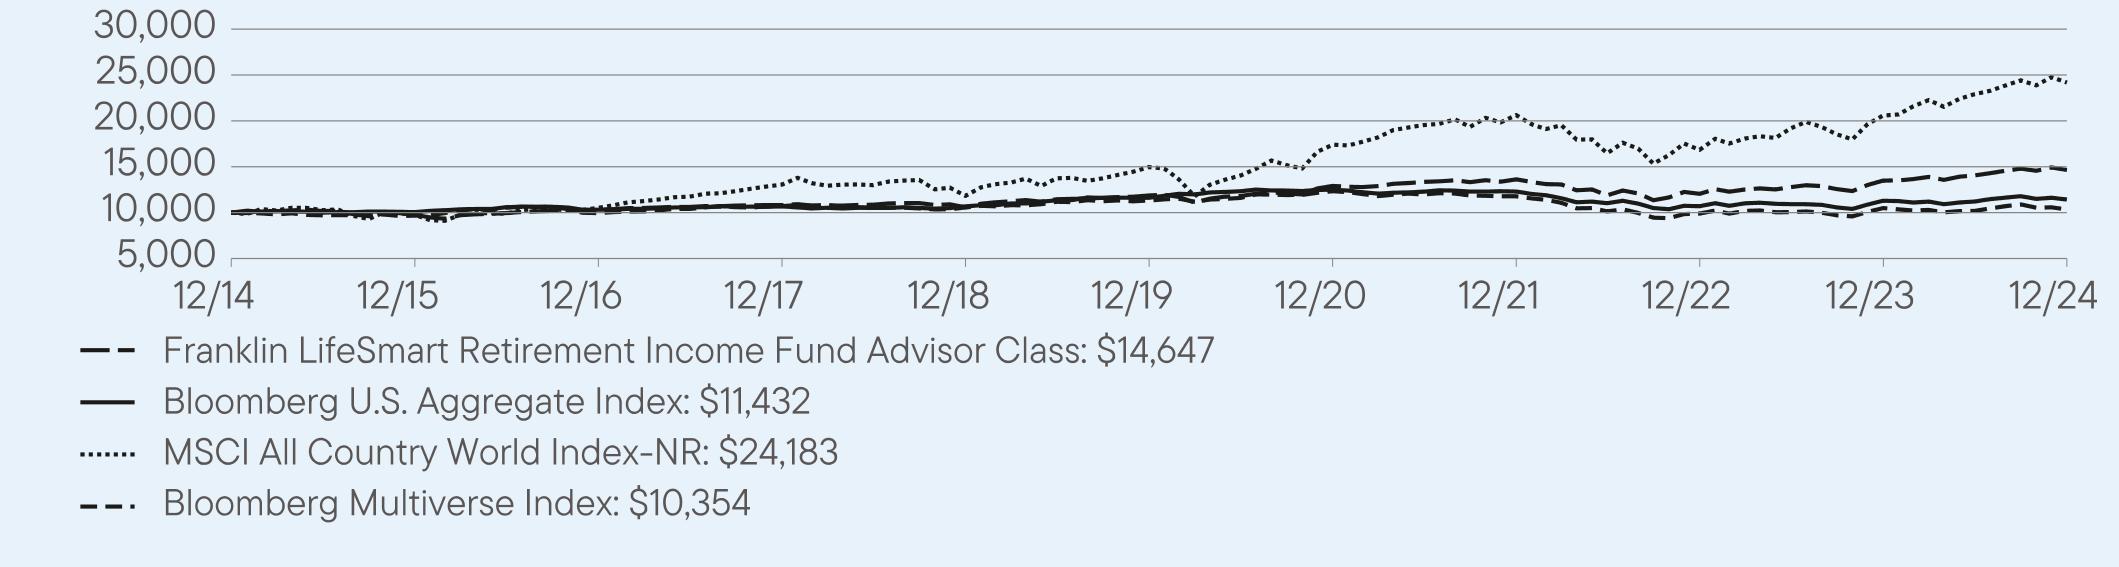
For the twelve months ended December 31, 2024, Advisor Class shares of Franklin Conservative Allocation Fund returned 8.33%. The Fund compares its performance to the Linked Franklin Conservative Allocation Fund Benchmark-NR†, the MSCI All Country World Index-NR and the Bloomberg Multiverse Index, which returned 5.91%, 17.49% and -1.34%, respectively, for the same period.
| |
Top contributors to performance: |
| ↑ | Fixed income underweight, reflecting our cross asset tactical preference. |
| ↑ | Within fixed income, a regional overweight to the U.S. and an underweight to international positions. |
| ↑ | Within equities, a regional overweight to the U.S. and an underweight to international holdings. |
| |
Top detractors from performance: |
| ↓ | Fund selection in international fixed income. |
| ↓ | Fund selection in U.S. equity, as value stock exposure and one growth fund detracted. |
| ↓ | Fund selection in international equity. |
| Franklin Conservative Allocation Fund | PAGE 1 | 641-ATSR-0225 |
HOW DID THE FUND PERFORM OVER THE LAST 10 YEARS?
The Fund’s past performance is not necessarily an indication of how the Fund will perform in the future. The graph and table do not reflect the deduction of taxes that a shareholder would pay on Fund distributions or redemption of Fund shares.
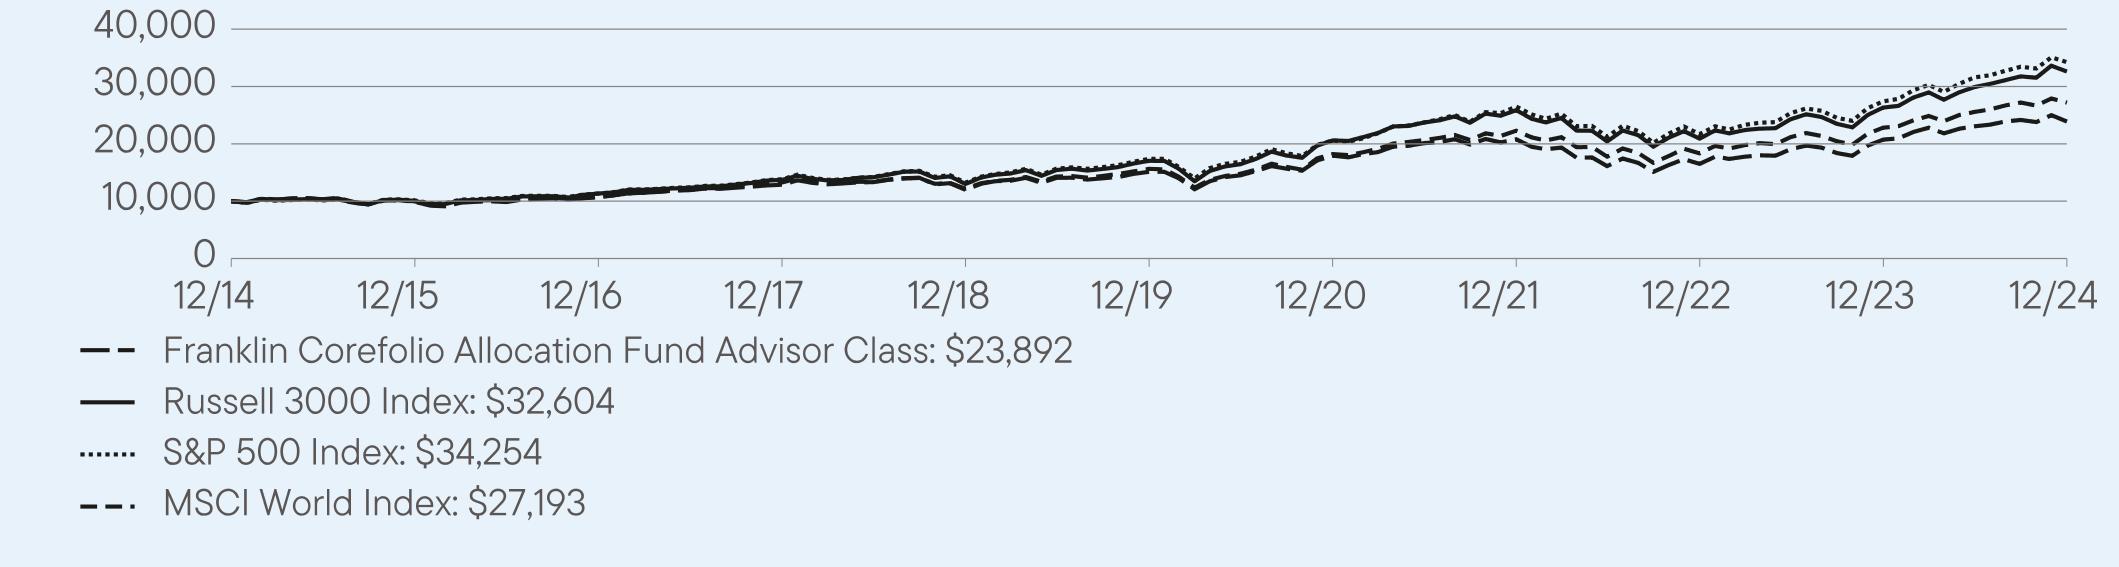
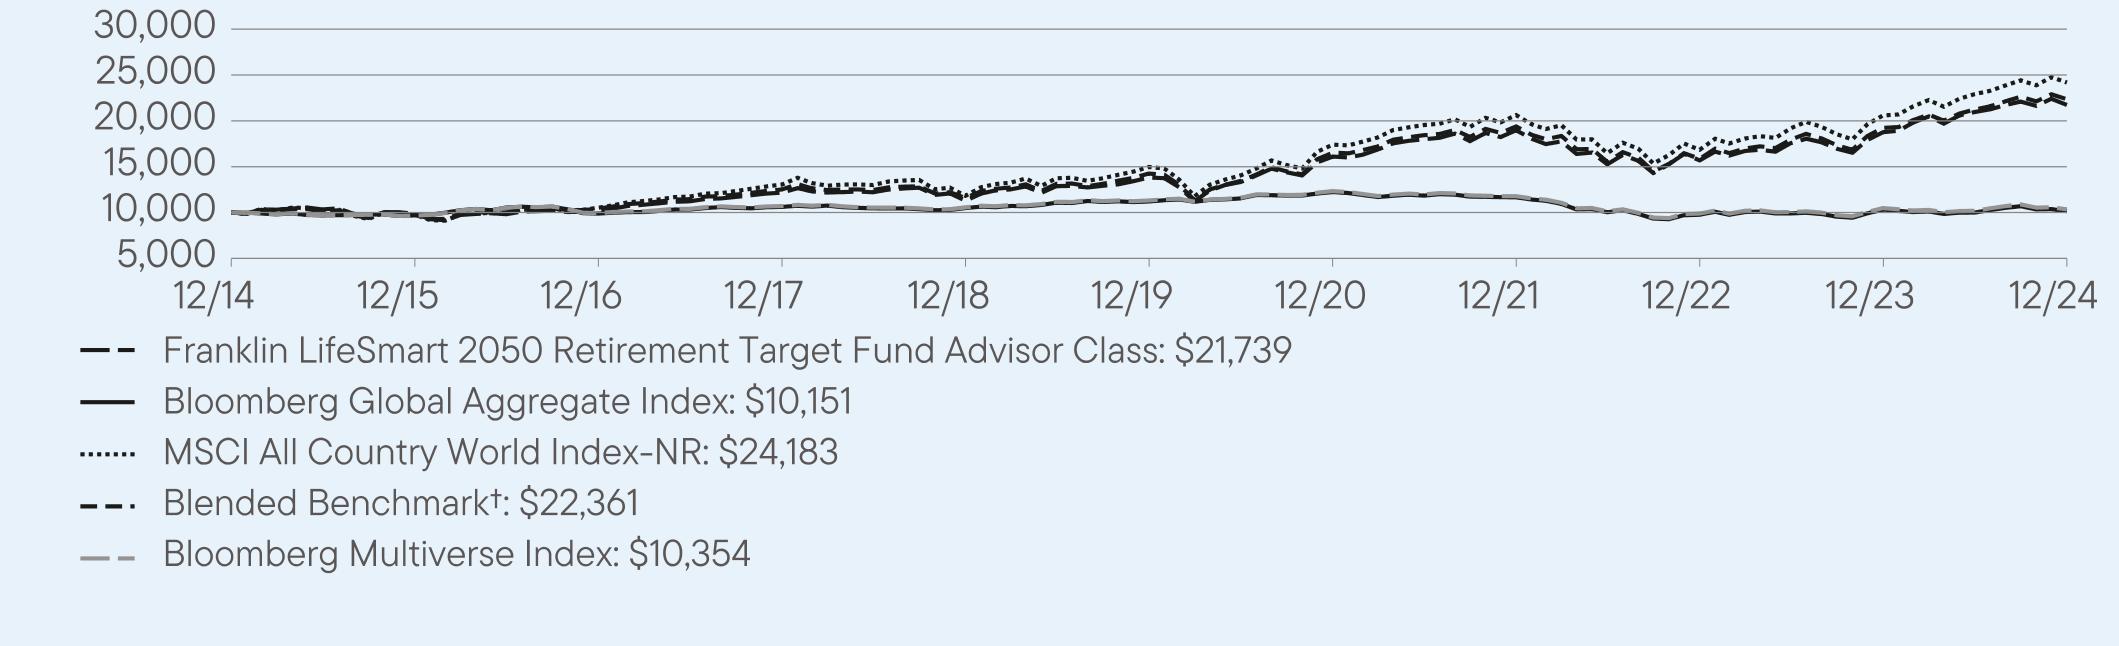
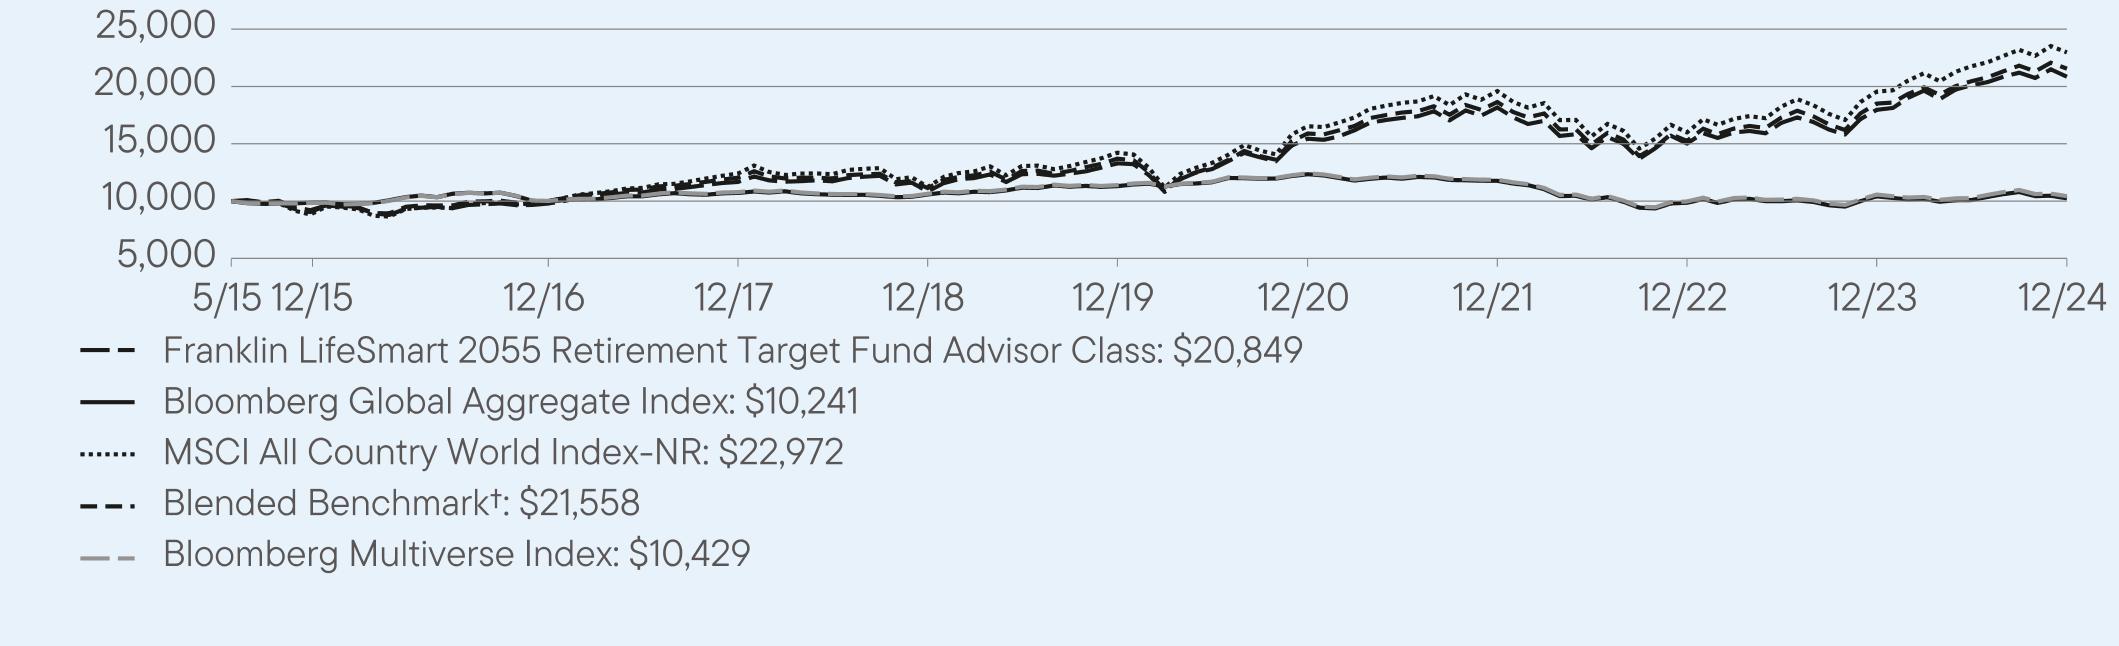
VALUE OF A $10,000 INVESTMENT – Advisor Class 12/31/2014 — 12/31/2024
AVERAGE ANNUAL TOTAL RETURNS (%) Period Ended December 31, 2024
| | | |
| | 1 Year | 5 Year | 10 Year |
Advisor Class | 8.33 | 4.09 | 4.33 |
Bloomberg U.S. Aggregate Index | 1.25 | -0.33 | 1.35 |
Linked Franklin Conservative Allocation Fund Benchmark-NR† | 5.91 | 3.03 | 4.01 |
MSCI All Country World Index-NR | 17.49 | 10.06 | 9.23 |
Bloomberg Multiverse Index | -1.34 | -1.76 | 0.35 |
| † | The Linked Franklin Conservative Allocation Fund Benchmark-NR is comprised of 28% S&P 500 Index, 12% MSCI EAFE Index-NR, 40% Bloomberg U.S. Aggregate Index and 20% Payden & Rygel 90 Day U.S. T-Bill Index from 1/1/2001 to 12/31/2012; 28% S&P 500 Index, 12% MSCI EAFE Index-NR and 60% Bloomberg U.S. Aggregate Index from 1/1/2013 to 12/31/14; and 40% MSCI ACWI-NR and 60% Bloomberg Multiverse Index thereafter. |
Fund performance figures may reflect fee waivers and/or expense reimbursements, without which the performance would have been lower.
For current month-end performance, please call Franklin Templeton at (800) DIAL BEN/342-5236 or visit https://www.franklintempleton.com/investments/options/mutual-funds.
Important data provider notices and terms available at www.franklintempletondatasources.com.
KEY FUND STATISTICS (as of December 31, 2024)
| |
Total Net Assets | $855,733,091 |
Total Number of Portfolio Holdings* | 21 |
Total Management Fee Paid | $2,193,955 |
Portfolio Turnover Rate | 40.01% |
| * | Does not include derivatives, except purchased options, if any. |
| Franklin Conservative Allocation Fund | PAGE 2 | 641-ATSR-0225 |
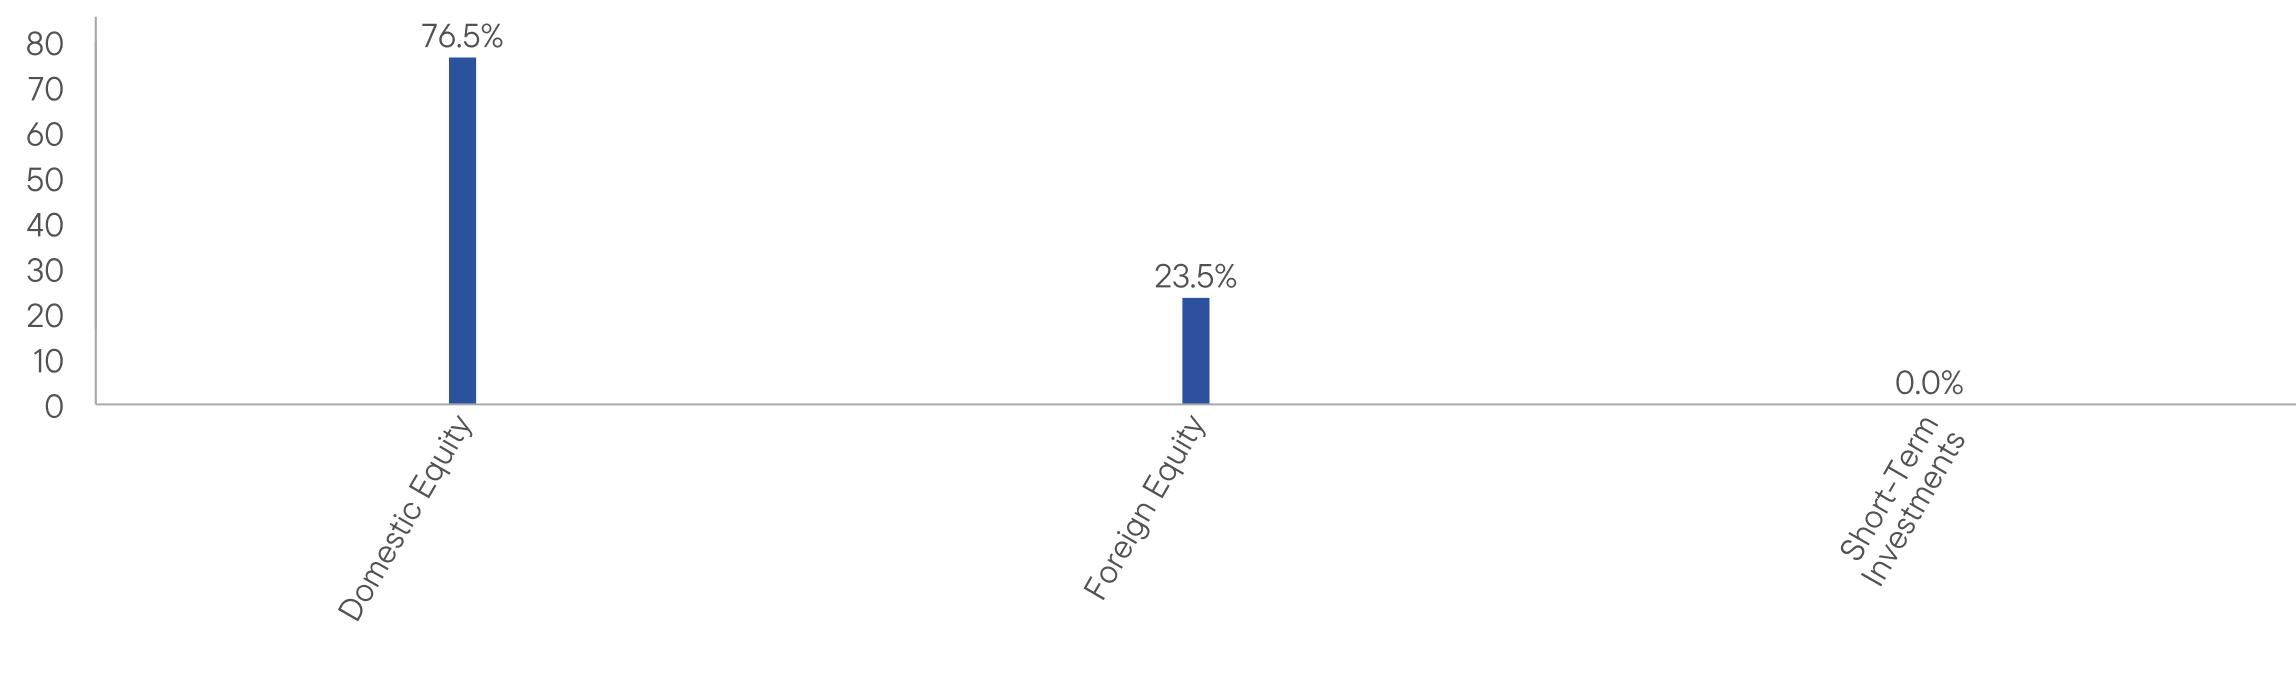
WHAT DID THE FUND INVEST IN? (as of December 31, 2024)
Portfolio Composition* (% of Total Investments)
| * | Does not include derivatives, except purchased options, if any. |
| |
| WHERE CAN I FIND ADDITIONAL INFORMATION ABOUT THE FUND? |
Additional information is available on https://www.franklintempleton.com/regulatory-fund-documents, including its: |
| • prospectus • proxy voting information • financial information • holdings • tax information |
HOUSEHOLDING
You will receive the Fund’s shareholder reports every six months. In addition, you will receive an annual updated summary prospectus (detail prospectus available upon request). To reduce Fund expenses, we try to identify related shareholders in a household and send only one copy of the shareholder reports and summary prospectus. This process, called “householding,” will continue indefinitely unless you instruct us otherwise. If you prefer not to have these documents householded, please call us at (800) DIAL BEN/342-5236. At any time, you may view current prospectuses/summary prospectuses and shareholder reports on our website. If you choose, you may receive these documents through electronic delivery.
| Franklin Conservative Allocation Fund | PAGE 3 | 641-ATSR-0225 |
1000097981025811374110111250113698148561261714099152731000010055103211068710688116201249212299106991129111432100009728102131163911121127641435814969124581399414821100009764105311305611827149731740620633168442058424183100009671994610710105651131812339117839896104941035445.733.29.99.51.00.7
| | |
Franklin Moderate Allocation Fund | |
| Class A [FMTIX] |
| Annual Shareholder Report | December 31, 2024 |
|
This annual shareholder report contains important information about Franklin Moderate Allocation Fund for the period January 1, 2024, to December 31, 2024.
You can find additional information about the Fund at https://www.franklintempleton.com/regulatory-fund-documents. You can also request this information by contacting us at (800) DIAL BEN/342-5236.
This report describes changes to the Fund that occurred during the reporting period.
WHAT WERE THE FUND COSTS FOR THE LAST YEAR? (based on a hypothetical $10,000 investment)
| | |
Class Name | Costs of a $10,000 investment | Costs paid as a percentage of a $10,000 investment* |
| Class A | $65 | 0.61% |
| * | Reflects fee waivers and/or expense reimbursements, without which expenses would have been higher. |
HOW DID THE FUND PERFORM LAST YEAR AND WHAT AFFECTED ITS PERFORMANCE?
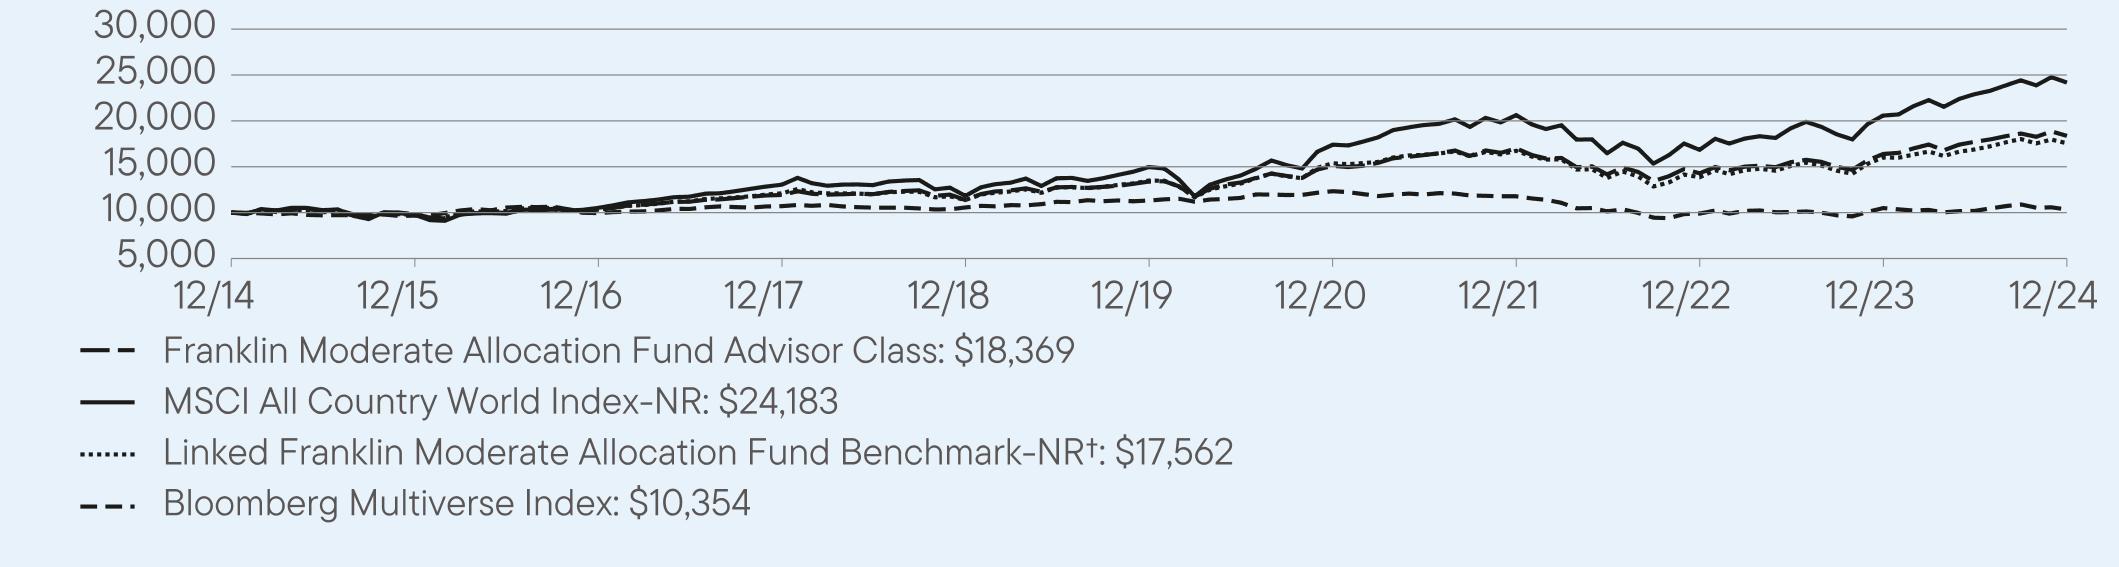
For the twelve months ended December 31, 2024, Class A shares of Franklin Moderate Allocation Fund returned 11.80%. The Fund compares its performance to the MSCI All Country World Index-NR, the Linked Franklin Moderate Allocation Fund Benchmark-NR† and the Bloomberg Multiverse Index, which returned 17.49%, 9.67% and -1.34%, respectively, for the same period.
| |
Top contributors to performance: |
| ↑ | Fixed income underweight, reflecting our cross asset tactical preference. |
| ↑ | Within equities, a regional overweight to the U.S. and an underweight to international holdings. |
| ↑ | Within fixed income, a regional overweight to the U.S. and an underweight to international positions. |
| |
Top detractors from performance: |
| ↓ | Fund selection in U.S. equity, as value stock exposure and one growth fund detracted. |
| ↓ | Fund selection in international fixed income. |
| ↓ | Fund selection in international equity. |
| Franklin Moderate Allocation Fund | PAGE 1 | 485-ATSR-0225 |
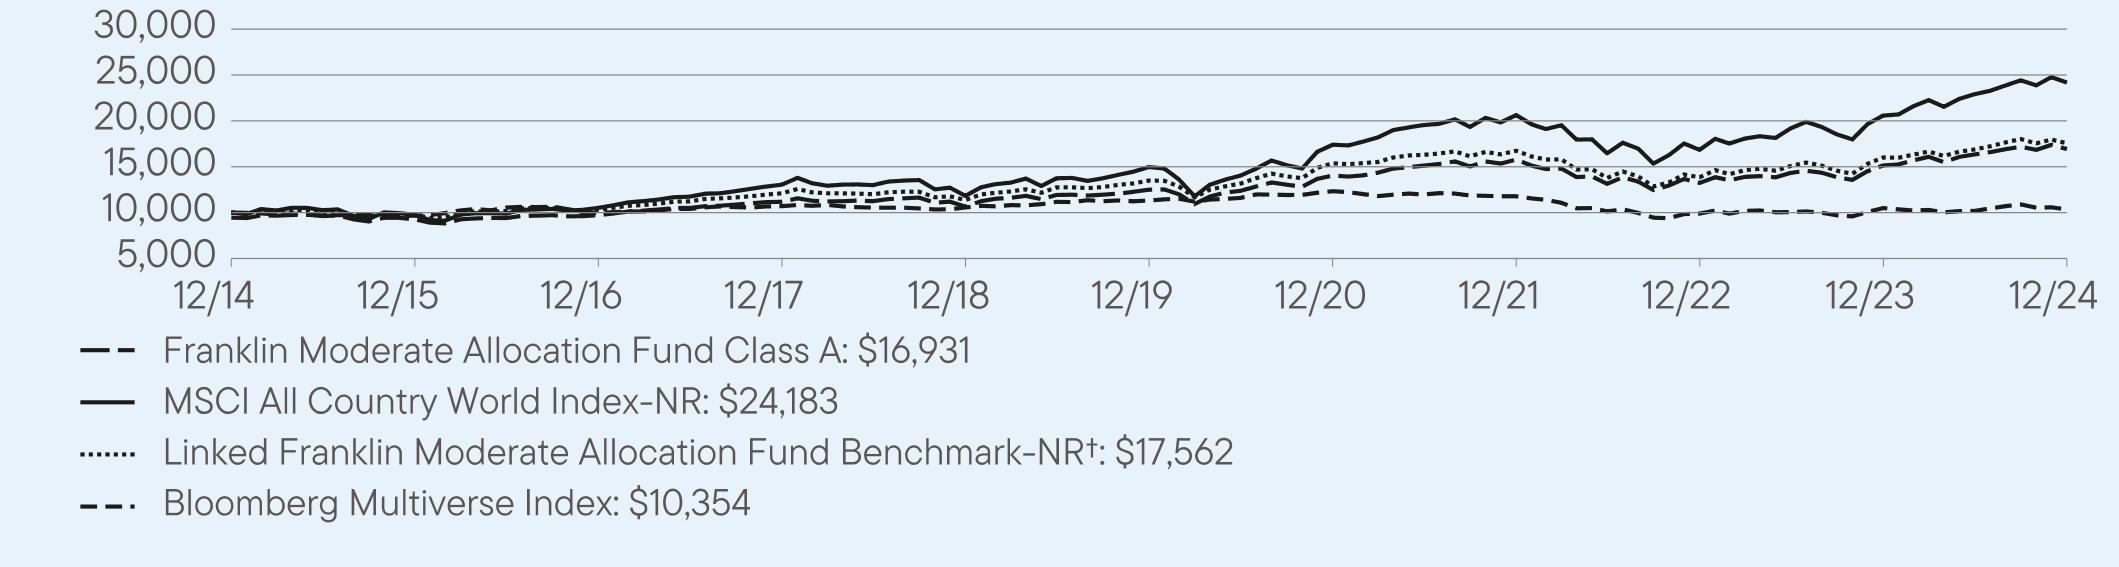
HOW DID THE FUND PERFORM OVER THE LAST 10 YEARS?
The Fund’s past performance is not necessarily an indication of how the Fund will perform in the future. The graph and table do not reflect the deduction of taxes that a shareholder would pay on Fund distributions or redemption of Fund shares.
VALUE OF A $10,000 INVESTMENT ($9,450 AFTER MAXIMUM APPLICABLE SALES CHARGE) –
Class A 12/31/2014 — 12/31/2024
AVERAGE ANNUAL TOTAL RETURNS (%) Period Ended December 31, 2024
| | | |
| | 1 Year | 5 Year | 10 Year |
Class A | 11.80 | 6.25 | 6.00 |
Class A (with sales charge) | 5.64 | 5.05 | 5.41 |
MSCI All Country World Index-NR | 17.49 | 10.06 | 9.23 |
Linked Franklin Moderate Allocation Fund Benchmark-NR† | 9.67 | 5.40 | 5.79 |
Bloomberg Multiverse Index | -1.34 | -1.76 | 0.35 |
| † | The Linked Franklin Moderate Allocation Fund Benchmark-NR reflects the performance of 38.5% S&P 500 Index, 16.5% MSCI EAFE Index-NR, 35% Bloomberg U.S. Aggregate Index and 10% Payden & Rygel 90 Day U.S. T-Bill Index from 1/1/2001 to 12/31/2012; 38.5% S&P 500 Index, 16.5% MSCI EAFE Index-NR and 45% Bloomberg U.S. Aggregate Index from 1/1/2013 to 12/31/14; and 60% MSCI ACWI-NR and 40% Bloomberg Multiverse Index thereafter. |
Fund performance figures may reflect fee waivers and/or expense reimbursements, without which the performance would have been lower.
Performance for periods prior to September 10, 2018, has been restated to reflect the current maximum sales charge, which is lower than the maximum sales charge prior to that date.
For current month-end performance, please call Franklin Templeton at (800) DIAL BEN/342-5236 or visit https://www.franklintempleton.com/investments/options/mutual-funds.
Important data provider notices and terms available at www.franklintempletondatasources.com.
KEY FUND STATISTICS (as of December 31, 2024)
| |
Total Net Assets | $1,647,146,434 |
Total Number of Portfolio Holdings* | 21 |
Total Management Fee Paid | $4,118,785 |
Portfolio Turnover Rate | 37.85% |
| * | Does not include derivatives, except purchased options, if any. |
| Franklin Moderate Allocation Fund | PAGE 2 | 485-ATSR-0225 |
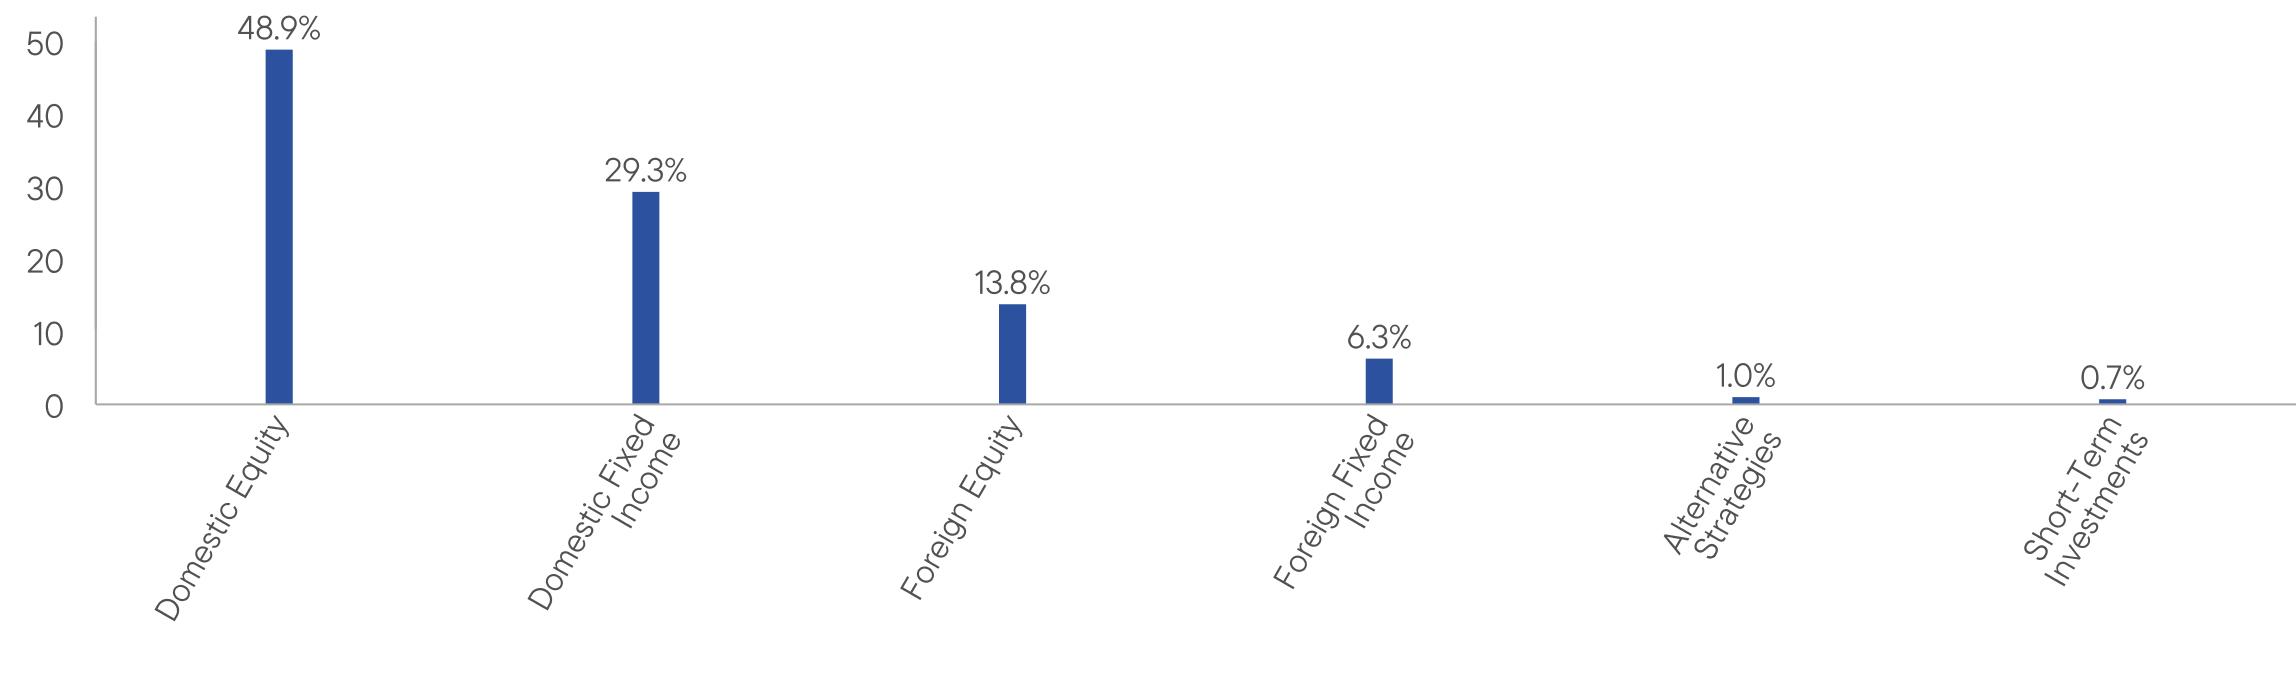
WHAT DID THE FUND INVEST IN? (as of December 31, 2024)
Portfolio Composition* (% of Total Investments)
| * | Does not include derivatives, except purchased options, if any. |
HOW HAS THE FUND CHANGED?
Effective July 1, 2024, investments of $250,000 or more in Class A shares will not be charged a sales charge, but will be subject to a 1% contingent deferred sales charge, if sold within 18 months of purchase.
This is a summary of a change to the Fund since January 1, 2024. For more complete information, you may review the Fund’s current prospectus and any applicable supplements and the Fund’s next prospectus, which we expect to be available by May 1, 2025, at https://www.franklintempleton.com/regulatory-fund-documents or upon request at (800) DIAL BEN/342-5236 or
prospectus@franklintempleton.com.
| |
| WHERE CAN I FIND ADDITIONAL INFORMATION ABOUT THE FUND? |
Additional information is available on https://www.franklintempleton.com/regulatory-fund-documents, including its: |
| • prospectus • proxy voting information • financial information • holdings • tax information |
HOUSEHOLDING
You will receive the Fund’s shareholder reports every six months. In addition, you will receive an annual updated summary prospectus (detail prospectus available upon request). To reduce Fund expenses, we try to identify related shareholders in a household and send only one copy of the shareholder reports and summary prospectus. This process, called “householding,” will continue indefinitely unless you instruct us otherwise. If you prefer not to have these documents householded, please call us at (800) DIAL BEN/342-5236. At any time, you may view current prospectuses/summary prospectuses and shareholder reports on our website. If you choose, you may receive these documents through electronic delivery.
| Franklin Moderate Allocation Fund | PAGE 3 | 485-ATSR-0225 |
9450927197291118710648125011404815786132381514016931100009764105311305611827149731740620633168442058424183100009747103311210911375134991538116744138561601317562100009671994610710105651131812339117839896104941035448.929.313.86.31.00.7
| | |
Franklin Moderate Allocation Fund | |
| Class C [FTMTX] |
| Annual Shareholder Report | December 31, 2024 |
|
This annual shareholder report contains important information about Franklin Moderate Allocation Fund for the period January 1, 2024, to December 31, 2024.
You can find additional information about the Fund at https://www.franklintempleton.com/regulatory-fund-documents. You can also request this information by contacting us at (800) DIAL BEN/342-5236.
WHAT WERE THE FUND COSTS FOR THE LAST YEAR? (based on a hypothetical $10,000 investment)
| | |
Class Name | Costs of a $10,000 investment | Costs paid as a percentage of a $10,000 investment* |
| Class C | $143 | 1.36% |
| * | Reflects fee waivers and/or expense reimbursements, without which expenses would have been higher. |
HOW DID THE FUND PERFORM LAST YEAR AND WHAT AFFECTED ITS PERFORMANCE?
For the twelve months ended December 31, 2024, Class C shares of Franklin Moderate Allocation Fund returned 10.96%. The Fund compares its performance to the MSCI All Country World Index-NR, the Linked Franklin Moderate Allocation Fund Benchmark-NR† and the Bloomberg Multiverse Index, which returned 17.49%, 9.67% and -1.34%, respectively, for the same period.
| |
Top contributors to performance: |
| ↑ | Fixed income underweight, reflecting our cross asset tactical preference. |
| ↑ | Within equities, a regional overweight to the U.S. and an underweight to international holdings. |
| ↑ | Within fixed income, a regional overweight to the U.S. and an underweight to international positions. |
| |
Top detractors from performance: |
| ↓ | Fund selection in U.S. equity, as value stock exposure and one growth fund detracted. |
| ↓ | Fund selection in international fixed income. |
| ↓ | Fund selection in international equity. |
| Franklin Moderate Allocation Fund | PAGE 1 | 585-ATSR-0225 |
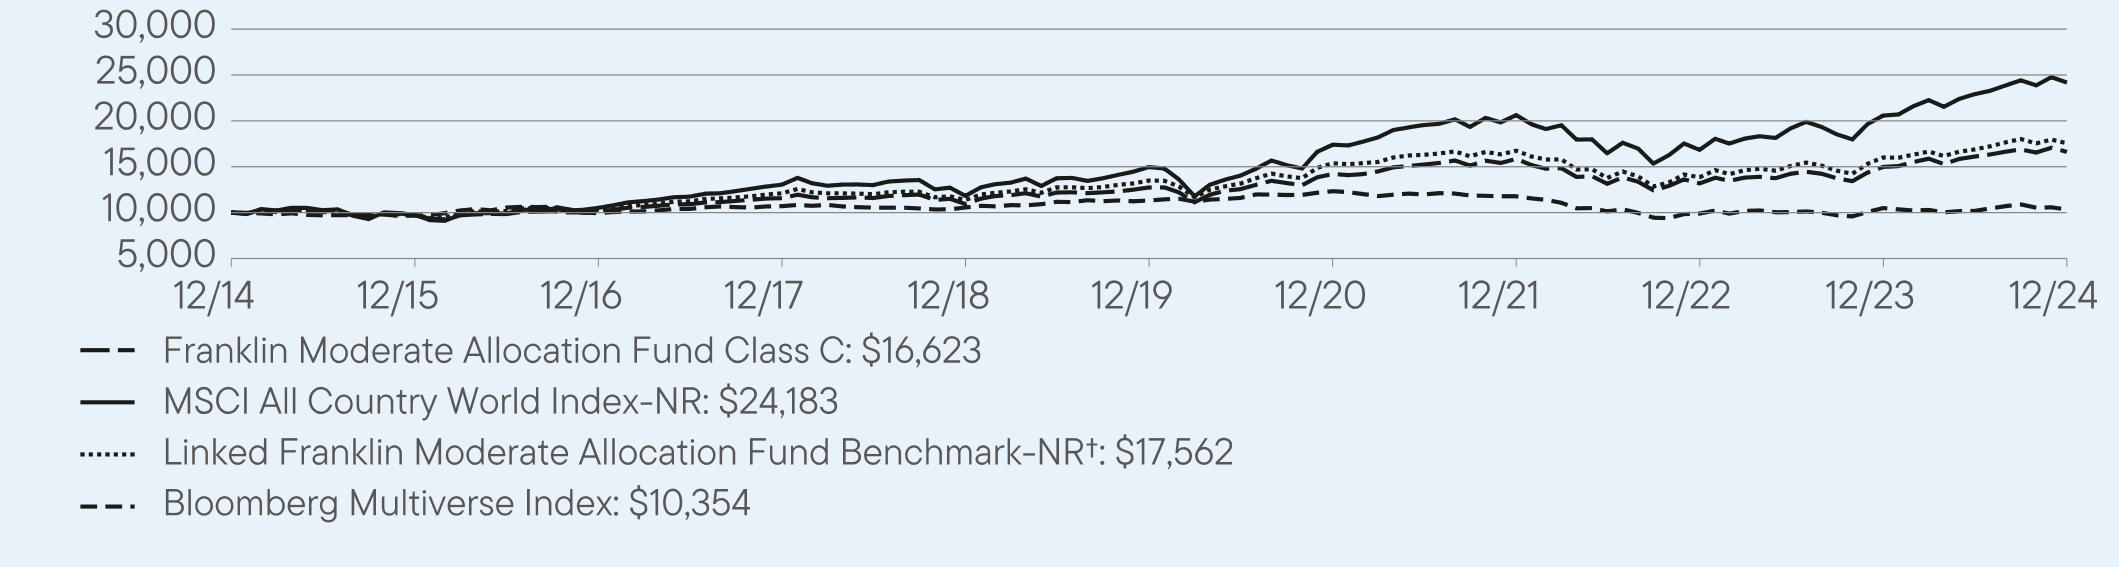
HOW DID THE FUND PERFORM OVER THE LAST 10 YEARS?
The Fund’s past performance is not necessarily an indication of how the Fund will perform in the future. The graph and table do not reflect the deduction of taxes that a shareholder would pay on Fund distributions or redemption of Fund shares.
VALUE OF A $10,000 INVESTMENT – Class C 12/31/2014 — 12/31/2024
AVERAGE ANNUAL TOTAL RETURNS (%) Period Ended December 31, 2024
| | | |
| | 1 Year | 5 Year | 10 Year |
Class C | 10.96 | 5.46 | 5.21 |
Class C (with sales charge) | 9.96 | 5.46 | 5.21 |
MSCI All Country World Index-NR | 17.49 | 10.06 | 9.23 |
Linked Franklin Moderate Allocation Fund Benchmark-NR† | 9.67 | 5.40 | 5.79 |
Bloomberg Multiverse Index | -1.34 | -1.76 | 0.35 |
| † | The Linked Franklin Moderate Allocation Fund Benchmark-NR reflects the performance of 38.5% S&P 500 Index, 16.5% MSCI EAFE Index-NR, 35% Bloomberg U.S. Aggregate Index and 10% Payden & Rygel 90 Day U.S. T-Bill Index from 1/1/2001 to 12/31/2012; 38.5% S&P 500 Index, 16.5% MSCI EAFE Index-NR and 45% Bloomberg U.S. Aggregate Index from 1/1/2013 to 12/31/14; and 60% MSCI ACWI-NR and 40% Bloomberg Multiverse Index thereafter. |
Fund performance figures may reflect fee waivers and/or expense reimbursements, without which the performance would have been lower.
For current month-end performance, please call Franklin Templeton at (800) DIAL BEN/342-5236 or visit https://www.franklintempleton.com/investments/options/mutual-funds.
Important data provider notices and terms available at www.franklintempletondatasources.com.
KEY FUND STATISTICS (as of December 31, 2024)
| |
Total Net Assets | $1,647,146,434 |
Total Number of Portfolio Holdings* | 21 |
Total Management Fee Paid | $4,118,785 |
Portfolio Turnover Rate | 37.85% |
| * | Does not include derivatives, except purchased options, if any. |
| Franklin Moderate Allocation Fund | PAGE 2 | 585-ATSR-0225 |
WHAT DID THE FUND INVEST IN? (as of December 31, 2024)
Portfolio Composition* (% of Total Investments)
| * | Does not include derivatives, except purchased options, if any. |
| |
| WHERE CAN I FIND ADDITIONAL INFORMATION ABOUT THE FUND? |
Additional information is available on https://www.franklintempleton.com/regulatory-fund-documents, including its: |
| • prospectus • proxy voting information • financial information • holdings • tax information |
HOUSEHOLDING
You will receive the Fund’s shareholder reports every six months. In addition, you will receive an annual updated summary prospectus (detail prospectus available upon request). To reduce Fund expenses, we try to identify related shareholders in a household and send only one copy of the shareholder reports and summary prospectus. This process, called “householding,” will continue indefinitely unless you instruct us otherwise. If you prefer not to have these documents householded, please call us at (800) DIAL BEN/342-5236. At any time, you may view current prospectuses/summary prospectuses and shareholder reports on our website. If you choose, you may receive these documents through electronic delivery.
| Franklin Moderate Allocation Fund | PAGE 3 | 585-ATSR-0225 |
100009732101451157610935127411421415857131851498116623100009764105311305611827149731740620633168442058424183100009747103311210911375134991538116744138561601317562100009671994610710105651131812339117839896104941035448.929.313.86.31.00.7
| | |
Franklin Moderate Allocation Fund | |
| Class R [FTMRX] |
| Annual Shareholder Report | December 31, 2024 |
|
This annual shareholder report contains important information about Franklin Moderate Allocation Fund for the period January 1, 2024, to December 31, 2024.
You can find additional information about the Fund at https://www.franklintempleton.com/regulatory-fund-documents. You can also request this information by contacting us at (800) DIAL BEN/342-5236.
WHAT WERE THE FUND COSTS FOR THE LAST YEAR? (based on a hypothetical $10,000 investment)
| | |
Class Name | Costs of a $10,000 investment | Costs paid as a percentage of a $10,000 investment* |
| Class R | $91 | 0.86% |
| * | Reflects fee waivers and/or expense reimbursements, without which expenses would have been higher. |
HOW DID THE FUND PERFORM LAST YEAR AND WHAT AFFECTED ITS PERFORMANCE?
For the twelve months ended December 31, 2024, Class R shares of Franklin Moderate Allocation Fund returned 11.55%. The Fund compares its performance to the MSCI All Country World Index-NR, the Linked Franklin Moderate Allocation Fund Benchmark-NR† and the Bloomberg Multiverse Index, which returned 17.49%, 9.67% and -1.34%, respectively, for the same period.
| |
Top contributors to performance: |
| ↑ | Fixed income underweight, reflecting our cross asset tactical preference. |
| ↑ | Within equities, a regional overweight to the U.S. and an underweight to international holdings. |
| ↑ | Within fixed income, a regional overweight to the U.S. and an underweight to international positions. |
| |
Top detractors from performance: |
| ↓ | Fund selection in U.S. equity, as value stock exposure and one growth fund detracted. |
| ↓ | Fund selection in international fixed income. |
| ↓ | Fund selection in international equity. |
| Franklin Moderate Allocation Fund | PAGE 1 | 885-ATSR-0225 |
HOW DID THE FUND PERFORM OVER THE LAST 10 YEARS?
The Fund’s past performance is not necessarily an indication of how the Fund will perform in the future. The graph and table do not reflect the deduction of taxes that a shareholder would pay on Fund distributions or redemption of Fund shares.
VALUE OF A $10,000 INVESTMENT – Class R 12/31/2014 — 12/31/2024
AVERAGE ANNUAL TOTAL RETURNS (%) Period Ended December 31, 2024
| | | |
| | 1 Year | 5 Year | 10 Year |
Class R | 11.55 | 6.00 | 5.74 |
MSCI All Country World Index-NR | 17.49 | 10.06 | 9.23 |
Linked Franklin Moderate Allocation Fund Benchmark-NR† | 9.67 | 5.40 | 5.79 |
Bloomberg Multiverse Index | -1.34 | -1.76 | 0.35 |
| † | The Linked Franklin Moderate Allocation Fund Benchmark-NR reflects the performance of 38.5% S&P 500 Index, 16.5% MSCI EAFE Index-NR, 35% Bloomberg U.S. Aggregate Index and 10% Payden & Rygel 90 Day U.S. T-Bill Index from 1/1/2001 to 12/31/2012; 38.5% S&P 500 Index, 16.5% MSCI EAFE Index-NR and 45% Bloomberg U.S. Aggregate Index from 1/1/2013 to 12/31/14; and 60% MSCI ACWI-NR and 40% Bloomberg Multiverse Index thereafter. |
Fund performance figures may reflect fee waivers and/or expense reimbursements, without which the performance would have been lower.
For current month-end performance, please call Franklin Templeton at (800) DIAL BEN/342-5236 or visit https://www.franklintempleton.com/investments/options/mutual-funds.
Important data provider notices and terms available at www.franklintempletondatasources.com.
KEY FUND STATISTICS (as of December 31, 2024)
| |
Total Net Assets | $1,647,146,434 |
Total Number of Portfolio Holdings* | 21 |
Total Management Fee Paid | $4,118,785 |
Portfolio Turnover Rate | 37.85% |
| * | Does not include derivatives, except purchased options, if any. |
| Franklin Moderate Allocation Fund | PAGE 2 | 885-ATSR-0225 |
WHAT DID THE FUND INVEST IN? (as of December 31, 2024)
Portfolio Composition* (% of Total Investments)
| * | Does not include derivatives, except purchased options, if any. |
| |
| WHERE CAN I FIND ADDITIONAL INFORMATION ABOUT THE FUND? |
Additional information is available on https://www.franklintempleton.com/regulatory-fund-documents, including its: |
| • prospectus • proxy voting information • financial information • holdings • tax information |
HOUSEHOLDING
You will receive the Fund’s shareholder reports every six months. In addition, you will receive an annual updated summary prospectus (detail prospectus available upon request). To reduce Fund expenses, we try to identify related shareholders in a household and send only one copy of the shareholder reports and summary prospectus. This process, called “householding,” will continue indefinitely unless you instruct us otherwise. If you prefer not to have these documents householded, please call us at (800) DIAL BEN/342-5236. At any time, you may view current prospectuses/summary prospectuses and shareholder reports on our website. If you choose, you may receive these documents through electronic delivery.
| Franklin Moderate Allocation Fund | PAGE 3 | 885-ATSR-0225 |
100009782102431174711155130571464616294136271555117471100009764105311305611827149731740620633168442058424183100009747103311210911375134991538116744138561601317562100009671994610710105651131812339117839896104941035448.929.313.86.31.00.7
| | |
Franklin Moderate Allocation Fund | |
| Class R6 [FTMLX] |
| Annual Shareholder Report | December 31, 2024 |
|
This annual shareholder report contains important information about Franklin Moderate Allocation Fund for the period January 1, 2024, to December 31, 2024.
You can find additional information about the Fund at https://www.franklintempleton.com/regulatory-fund-documents. You can also request this information by contacting us at (800) DIAL BEN/342-5236.
WHAT WERE THE FUND COSTS FOR THE LAST YEAR? (based on a hypothetical $10,000 investment)
| | |
Class Name | Costs of a $10,000 investment | Costs paid as a percentage of a $10,000 investment* |
| Class R6 | $31 | 0.29% |
| * | Reflects fee waivers and/or expense reimbursements, without which expenses would have been higher. |
HOW DID THE FUND PERFORM LAST YEAR AND WHAT AFFECTED ITS PERFORMANCE?
For the twelve months ended December 31, 2024, Class R6 shares of Franklin Moderate Allocation Fund returned 12.15%. The Fund compares its performance to the MSCI All Country World Index-NR, the Linked Franklin Moderate Allocation Fund Benchmark-NR† and the Bloomberg Multiverse Index, which returned 17.49%, 9.67% and -1.34%, respectively, for the same period.
| |
Top contributors to performance: |
| ↑ | Fixed income underweight, reflecting our cross asset tactical preference. |
| ↑ | Within equities, a regional overweight to the U.S. and an underweight to international holdings. |
| ↑ | Within fixed income, a regional overweight to the U.S. and an underweight to international positions. |
| |
Top detractors from performance: |
| ↓ | Fund selection in U.S. equity, as value stock exposure and one growth fund detracted. |
| ↓ | Fund selection in international fixed income. |
| ↓ | Fund selection in international equity. |
| Franklin Moderate Allocation Fund | PAGE 1 | 385-ATSR-0225 |
HOW DID THE FUND PERFORM OVER THE LAST 10 YEARS?
The Fund’s past performance is not necessarily an indication of how the Fund will perform in the future. The graph and table do not reflect the deduction of taxes that a shareholder would pay on Fund distributions or redemption of Fund shares.
VALUE OF A $10,000 INVESTMENT – Class R6 12/31/2014 — 12/31/2024
AVERAGE ANNUAL TOTAL RETURNS (%) Period Ended December 31, 2024
| | | |
| | 1 Year | 5 Year | 10 Year |
Class R6 | 12.15 | 6.60 | 6.36 |
MSCI All Country World Index-NR | 17.49 | 10.06 | 9.23 |
Linked Franklin Moderate Allocation Fund Benchmark-NR† | 9.67 | 5.40 | 5.79 |
Bloomberg Multiverse Index | -1.34 | -1.76 | 0.35 |
| † | The Linked Franklin Moderate Allocation Fund Benchmark-NR reflects the performance of 38.5% S&P 500 Index, 16.5% MSCI EAFE Index-NR, 35% Bloomberg U.S. Aggregate Index and 10% Payden & Rygel 90 Day U.S. T-Bill Index from 1/1/2001 to 12/31/2012; 38.5% S&P 500 Index, 16.5% MSCI EAFE Index-NR and 45% Bloomberg U.S. Aggregate Index from 1/1/2013 to 12/31/14; and 60% MSCI ACWI-NR and 40% Bloomberg Multiverse Index thereafter. |
Fund performance figures may reflect fee waivers and/or expense reimbursements, without which the performance would have been lower.
For current month-end performance, please call Franklin Templeton at (800) DIAL BEN/342-5236 or visit https://www.franklintempleton.com/investments/options/mutual-funds.
Important data provider notices and terms available at www.franklintempletondatasources.com.
KEY FUND STATISTICS (as of December 31, 2024)
| |
Total Net Assets | $1,647,146,434 |
Total Number of Portfolio Holdings* | 21 |
Total Management Fee Paid | $4,118,785 |
Portfolio Turnover Rate | 37.85% |
| * | Does not include derivatives, except purchased options, if any. |
| Franklin Moderate Allocation Fund | PAGE 2 | 385-ATSR-0225 |
WHAT DID THE FUND INVEST IN? (as of December 31, 2024)
Portfolio Composition* (% of Total Investments)
| * | Does not include derivatives, except purchased options, if any. |
| |
| WHERE CAN I FIND ADDITIONAL INFORMATION ABOUT THE FUND? |
Additional information is available on https://www.franklintempleton.com/regulatory-fund-documents, including its: |
| • prospectus • proxy voting information • financial information • holdings • tax information |
HOUSEHOLDING
You will receive the Fund’s shareholder reports every six months. In addition, you will receive an annual updated summary prospectus (detail prospectus available upon request). To reduce Fund expenses, we try to identify related shareholders in a household and send only one copy of the shareholder reports and summary prospectus. This process, called “householding,” will continue indefinitely unless you instruct us otherwise. If you prefer not to have these documents householded, please call us at (800) DIAL BEN/342-5236. At any time, you may view current prospectuses/summary prospectuses and shareholder reports on our website. If you choose, you may receive these documents through electronic delivery.
| Franklin Moderate Allocation Fund | PAGE 3 | 385-ATSR-0225 |
100009841103661196211425134601517717111143891652218529100009764105311305611827149731740620633168442058424183100009747103311210911375134991538116744138561601317562100009671994610710105651131812339117839896104941035448.929.313.86.31.00.7
| | |
Franklin Moderate Allocation Fund | |
| Advisor Class [FMTZX] |
| Annual Shareholder Report | December 31, 2024 |
|
This annual shareholder report contains important information about Franklin Moderate Allocation Fund for the period January 1, 2024, to December 31, 2024.
You can find additional information about the Fund at https://www.franklintempleton.com/regulatory-fund-documents. You can also request this information by contacting us at (800) DIAL BEN/342-5236.
WHAT WERE THE FUND COSTS FOR THE LAST YEAR? (based on a hypothetical $10,000 investment)
| | |
Class Name | Costs of a $10,000 investment | Costs paid as a percentage of a $10,000 investment* |
| Advisor Class | $38 | 0.36% |
| * | Reflects fee waivers and/or expense reimbursements, without which expenses would have been higher. |
HOW DID THE FUND PERFORM LAST YEAR AND WHAT AFFECTED ITS PERFORMANCE?
For the twelve months ended December 31, 2024, Advisor Class shares of Franklin Moderate Allocation Fund returned 12.07%. The Fund compares its performance to the MSCI All Country World Index-NR, the Linked Franklin Moderate Allocation Fund Benchmark-NR† and the Bloomberg Multiverse Index, which returned 17.49%, 9.67% and -1.34%, respectively, for the same period.
| |
Top contributors to performance: |
| ↑ | Fixed income underweight, reflecting our cross asset tactical preference. |
| ↑ | Within equities, a regional overweight to the U.S. and an underweight to international holdings. |
| ↑ | Within fixed income, a regional overweight to the U.S. and an underweight to international positions. |
| |
Top detractors from performance: |
| ↓ | Fund selection in U.S. equity, as value stock exposure and one growth fund detracted. |
| ↓ | Fund selection in international fixed income. |
| ↓ | Fund selection in international equity. |
| Franklin Moderate Allocation Fund | PAGE 1 | 642-ATSR-0225 |
HOW DID THE FUND PERFORM OVER THE LAST 10 YEARS?
The Fund’s past performance is not necessarily an indication of how the Fund will perform in the future. The graph and table do not reflect the deduction of taxes that a shareholder would pay on Fund distributions or redemption of Fund shares.
VALUE OF A $10,000 INVESTMENT – Advisor Class 12/31/2014 — 12/31/2024
AVERAGE ANNUAL TOTAL RETURNS (%) Period Ended December 31, 2024
| | | |
| | 1 Year | 5 Year | 10 Year |
Advisor Class | 12.07 | 6.52 | 6.27 |
MSCI All Country World Index-NR | 17.49 | 10.06 | 9.23 |
Linked Franklin Moderate Allocation Fund Benchmark-NR† | 9.67 | 5.40 | 5.79 |
Bloomberg Multiverse Index | -1.34 | -1.76 | 0.35 |
| † | The Linked Franklin Moderate Allocation Fund Benchmark-NR reflects the performance of 38.5% S&P 500 Index, 16.5% MSCI EAFE Index-NR, 35% Bloomberg U.S. Aggregate Index and 10% Payden & Rygel 90 Day U.S. T-Bill Index from 1/1/2001 to 12/31/2012; 38.5% S&P 500 Index, 16.5% MSCI EAFE Index-NR and 45% Bloomberg U.S. Aggregate Index from 1/1/2013 to 12/31/14; and 60% MSCI ACWI-NR and 40% Bloomberg Multiverse Index thereafter. |
Fund performance figures may reflect fee waivers and/or expense reimbursements, without which the performance would have been lower.
For current month-end performance, please call Franklin Templeton at (800) DIAL BEN/342-5236 or visit https://www.franklintempleton.com/investments/options/mutual-funds.
Important data provider notices and terms available at www.franklintempletondatasources.com.
KEY FUND STATISTICS (as of December 31, 2024)
| |
Total Net Assets | $1,647,146,434 |
Total Number of Portfolio Holdings* | 21 |
Total Management Fee Paid | $4,118,785 |
Portfolio Turnover Rate | 37.85% |
| * | Does not include derivatives, except purchased options, if any. |
| Franklin Moderate Allocation Fund | PAGE 2 | 642-ATSR-0225 |
WHAT DID THE FUND INVEST IN? (as of December 31, 2024)
Portfolio Composition* (% of Total Investments)
| * | Does not include derivatives, except purchased options, if any. |
| |
| WHERE CAN I FIND ADDITIONAL INFORMATION ABOUT THE FUND? |
Additional information is available on https://www.franklintempleton.com/regulatory-fund-documents, including its: |
| • prospectus • proxy voting information • financial information • holdings • tax information |
HOUSEHOLDING
You will receive the Fund’s shareholder reports every six months. In addition, you will receive an annual updated summary prospectus (detail prospectus available upon request). To reduce Fund expenses, we try to identify related shareholders in a household and send only one copy of the shareholder reports and summary prospectus. This process, called “householding,” will continue indefinitely unless you instruct us otherwise. If you prefer not to have these documents householded, please call us at (800) DIAL BEN/342-5236. At any time, you may view current prospectuses/summary prospectuses and shareholder reports on our website. If you choose, you may receive these documents through electronic delivery.
| Franklin Moderate Allocation Fund | PAGE 3 | 642-ATSR-0225 |
100009834103521192511380133921509617004142891639118369100009764105311305611827149731740620633168442058424183100009747103311210911375134991538116744138561601317562100009671994610710105651131812339117839896104941035448.929.313.86.31.00.7
| | |
Franklin Growth Allocation Fund | |
| Class A [FGTIX] |
| Annual Shareholder Report | December 31, 2024 |
|
This annual shareholder report contains important information about Franklin Growth Allocation Fund for the period January 1, 2024, to December 31, 2024.
You can find additional information about the Fund at https://www.franklintempleton.com/regulatory-fund-documents. You can also request this information by contacting us at (800) DIAL BEN/342-5236.
WHAT WERE THE FUND COSTS FOR THE LAST YEAR? (based on a hypothetical $10,000 investment)
| | |
Class Name | Costs of a $10,000 investment | Costs paid as a percentage of a $10,000 investment* |
| Class A | $68 | 0.63% |
| * | Reflects fee waivers and/or expense reimbursements, without which expenses would have been higher. |
HOW DID THE FUND PERFORM LAST YEAR AND WHAT AFFECTED ITS PERFORMANCE?
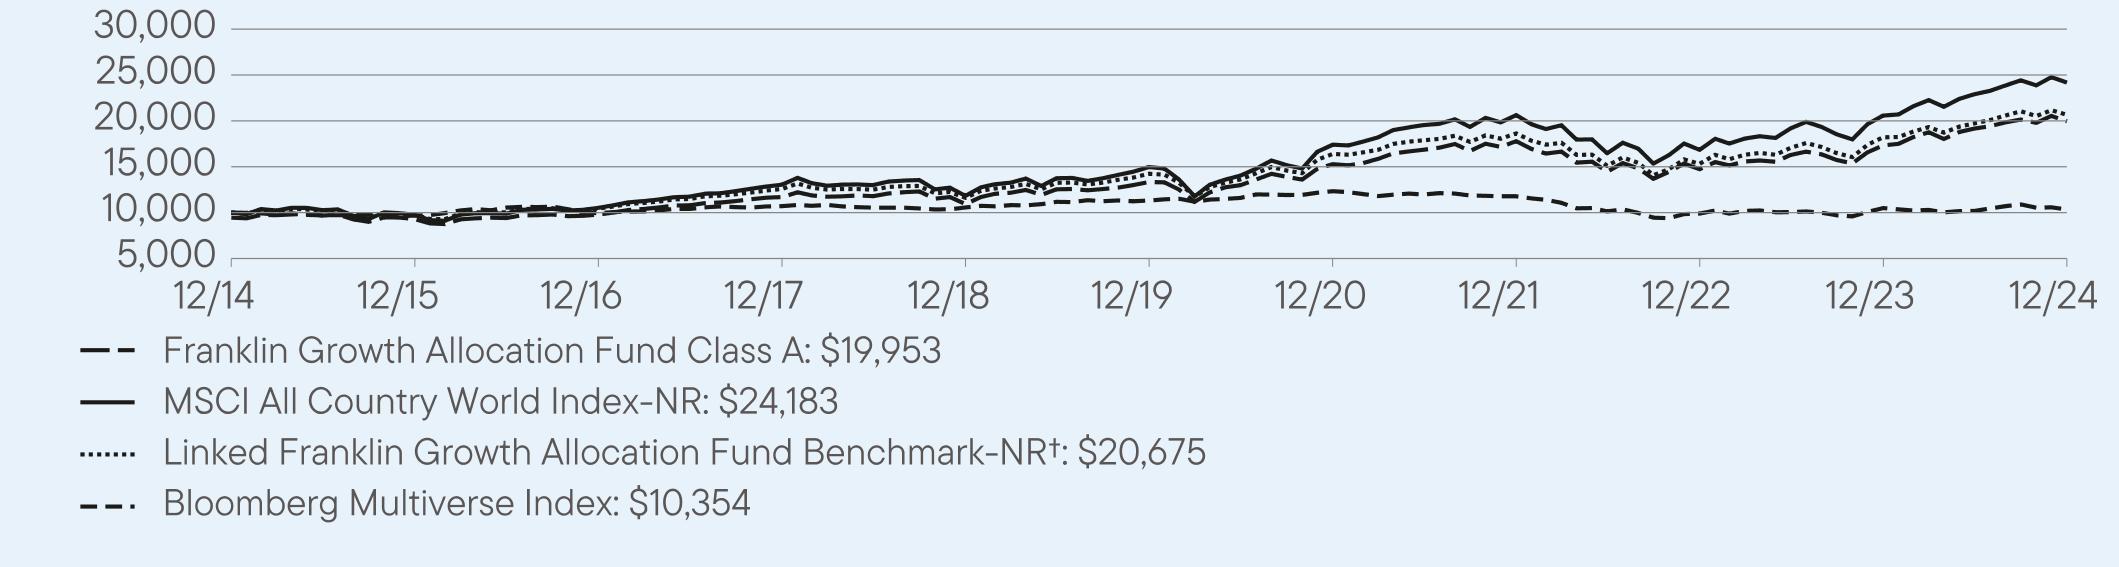
For the twelve months ended December 31, 2024, Class A shares of Franklin Growth Allocation Fund returned 15.14%. The Fund compares its performance to the MSCI All Country World Index-NR, the Linked Franklin Growth Allocation Fund Benchmark-NR† and the Bloomberg Multiverse Index, which returned 17.49%, 13.53% and -1.34%, respectively, for the same period.
| |
Top contributors to performance: |
| ↑ | Fixed income underweight, reflecting our cross asset tactical preference. |
| ↑ | Within equities, a regional overweight to the U.S. and an underweight to international holdings. |
| ↑ | Within fixed income, a regional overweight to the U.S. and an underweight to international positions. |
| |
Top detractors from performance: |
| ↓ | Fund selection in U.S. equity, as value stock exposure and one growth fund detracted. |
| ↓ | Fund selection in international equity. |
| ↓ | Fund selection in international fixed income. |
| Franklin Growth Allocation Fund | PAGE 1 | 486-ATSR-0225 |
HOW DID THE FUND PERFORM OVER THE LAST 10 YEARS?
The Fund’s past performance is not necessarily an indication of how the Fund will perform in the future. The graph and table do not reflect the deduction of taxes that a shareholder would pay on Fund distributions or redemption of Fund shares.
VALUE OF A $10,000 INVESTMENT ($9,450 AFTER MAXIMUM APPLICABLE SALES CHARGE) –
Class A 12/31/2014 — 12/31/2024
AVERAGE ANNUAL TOTAL RETURNS (%) Period Ended December 31, 2024
| | | |
| | 1 Year | 5 Year | 10 Year |
Class A | 15.14 | 8.39 | 7.76 |
Class A (with sales charge) | 8.82 | 7.16 | 7.15 |
MSCI All Country World Index-NR | 17.49 | 10.06 | 9.23 |
Linked Franklin Growth Allocation Fund Benchmark-NR† | 13.53 | 7.74 | 7.53 |
Bloomberg Multiverse Index | -1.34 | -1.76 | 0.35 |
| † | The Linked Franklin Growth Allocation Fund Benchmark-NR is comprised of 56% S&P 500 Index, 24% MSCI EAFE Index-NR, 15% Bloomberg U.S. Aggregate Index and 5% Payden & Rygel 90 Day U.S. T-Bill Index from 1/1/2001 to 12/31/2012; 56% S&P 500 Index, 24% MSCI EAFE Index-NR and 20% Bloomberg U.S. Aggregate Index from 1/1/2013 to 12/31/14; and 80% MSCI ACWI-NR and 20% Bloomberg Multiverse Index thereafter. |
Fund performance figures may reflect fee waivers and/or expense reimbursements, without which the performance would have been lower.
Performance for periods prior to September 10, 2018, has been restated to reflect the current maximum sales charge, which is lower than the maximum sales charge prior to that date.
For current month-end performance, please call Franklin Templeton at (800) DIAL BEN/342-5236 or visit https://www.franklintempleton.com/investments/options/mutual-funds.
Important data provider notices and terms available at www.franklintempletondatasources.com.
KEY FUND STATISTICS (as of December 31, 2024)
| |
Total Net Assets | $1,363,823,356 |
Total Number of Portfolio Holdings* | 21 |
Total Management Fee Paid | $3,322,435 |
Portfolio Turnover Rate | 33.45% |
| * | Does not include derivatives, except purchased options, if any. |
| Franklin Growth Allocation Fund | PAGE 2 | 486-ATSR-0225 |
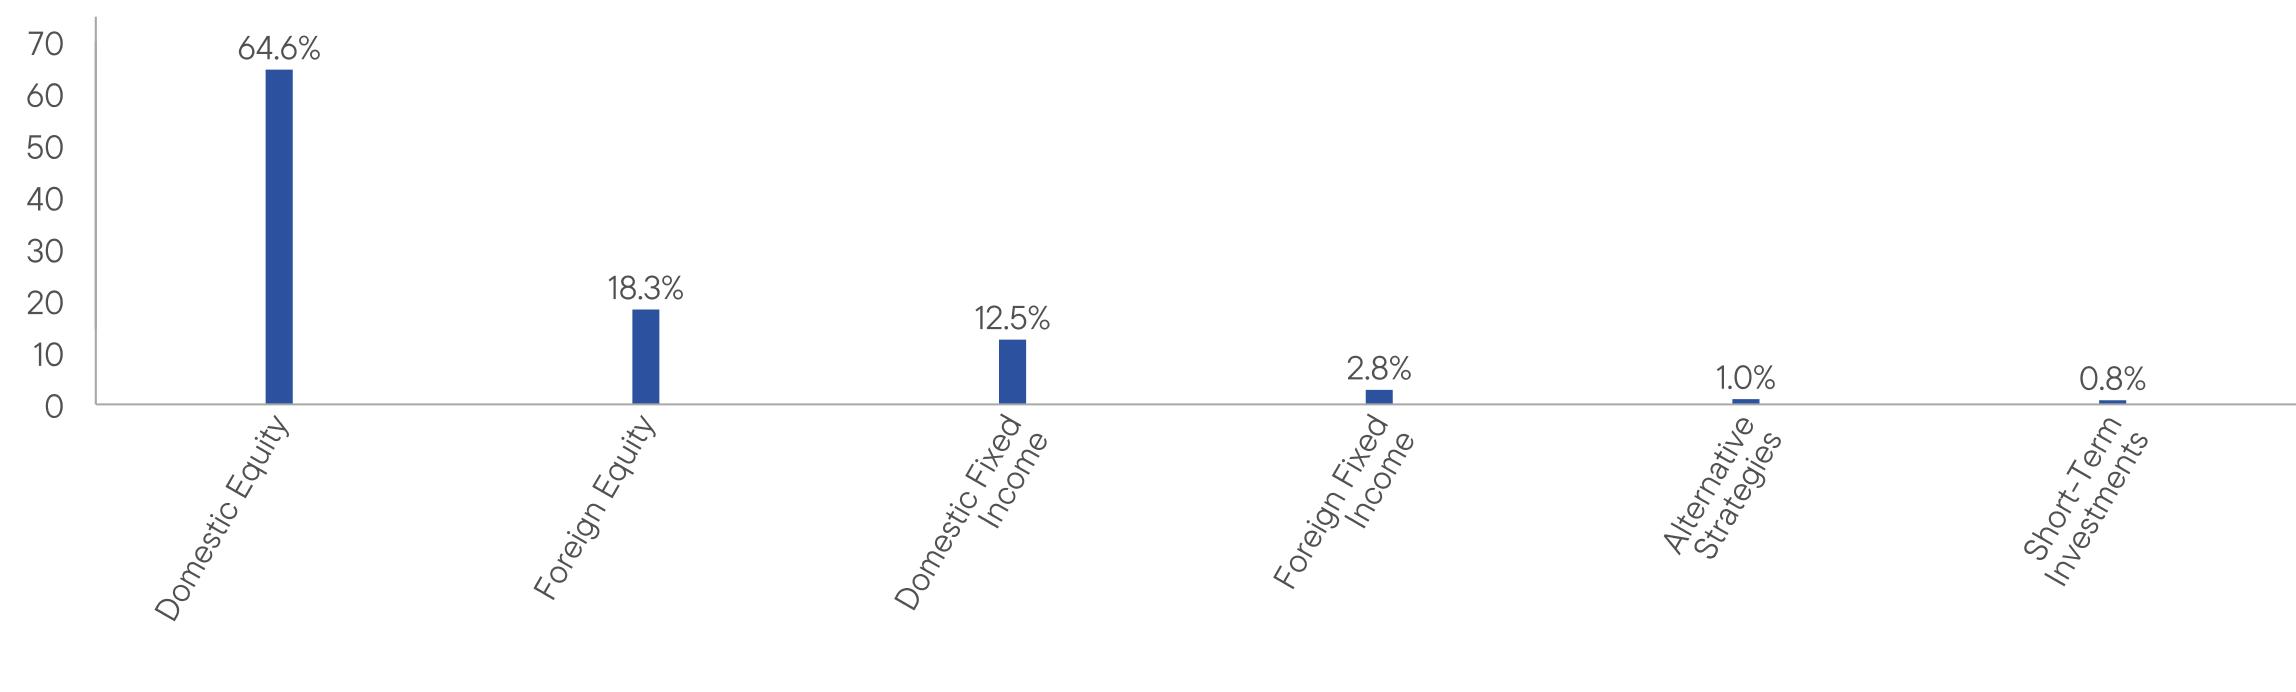
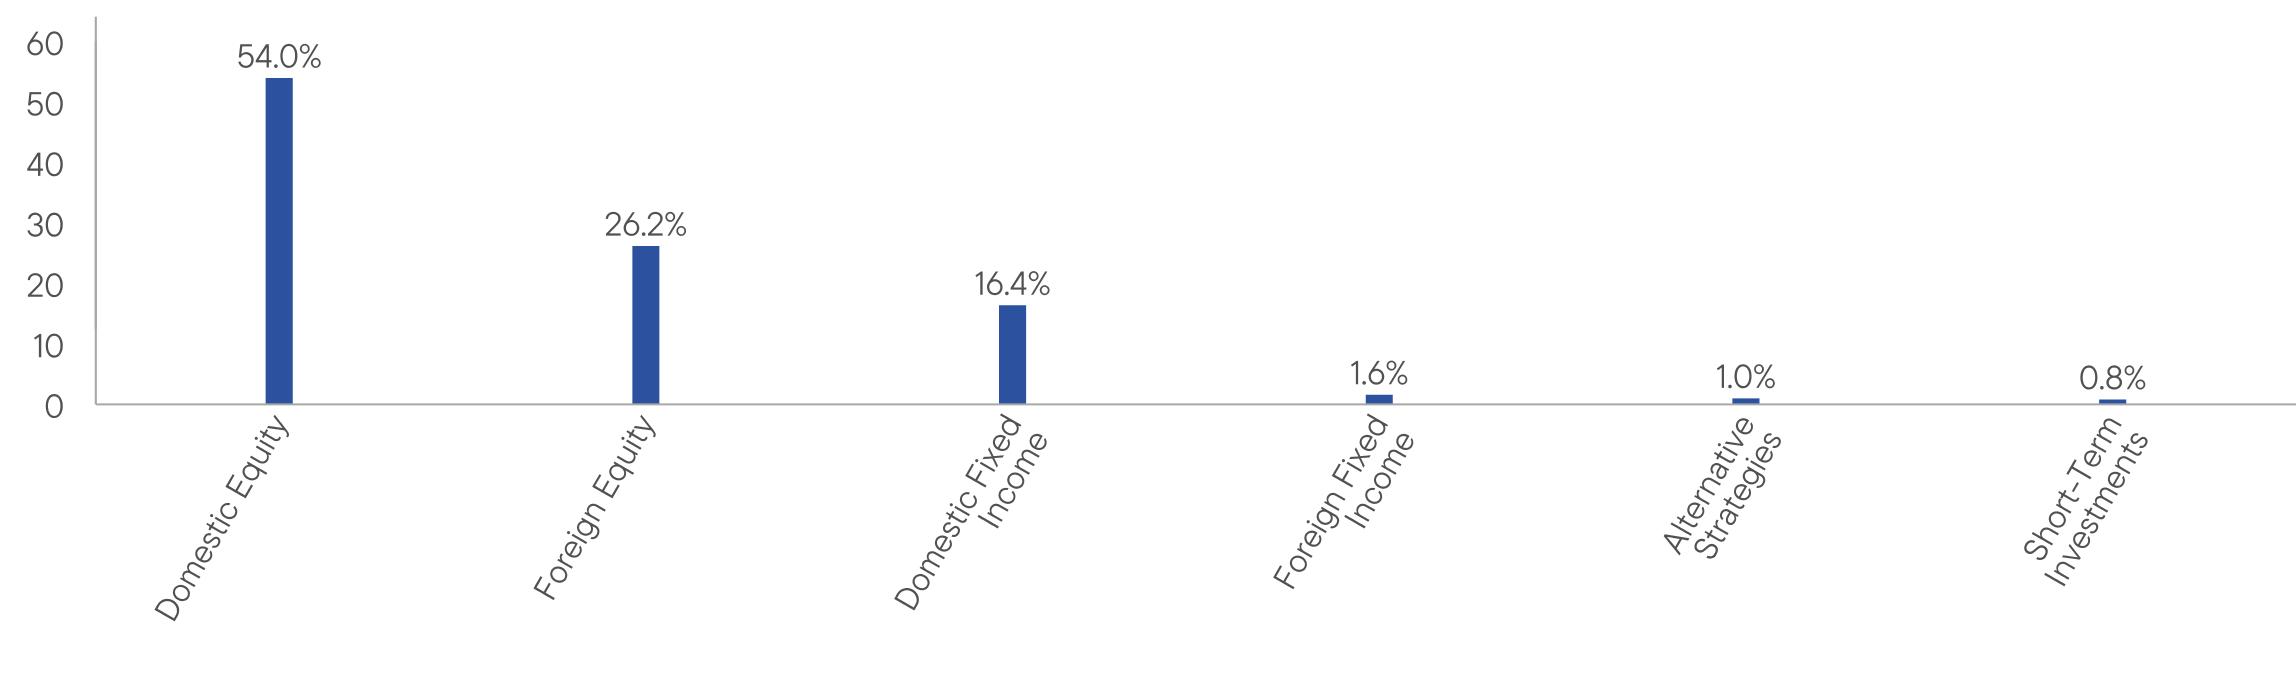
WHAT DID THE FUND INVEST IN? (as of December 31, 2024)
Portfolio Composition* (% of Total Investments)
| * | Does not include derivatives, except purchased options, if any. |
| |
| WHERE CAN I FIND ADDITIONAL INFORMATION ABOUT THE FUND? |
Additional information is available on https://www.franklintempleton.com/regulatory-fund-documents, including its: |
| • prospectus • proxy voting information • financial information • holdings • tax information |
HOUSEHOLDING
You will receive the Fund’s shareholder reports every six months. In addition, you will receive an annual updated summary prospectus (detail prospectus available upon request). To reduce Fund expenses, we try to identify related shareholders in a household and send only one copy of the shareholder reports and summary prospectus. This process, called “householding,” will continue indefinitely unless you instruct us otherwise. If you prefer not to have these documents householded, please call us at (800) DIAL BEN/342-5236. At any time, you may view current prospectuses/summary prospectuses and shareholder reports on our website. If you choose, you may receive these documents through electronic delivery.
| Franklin Growth Allocation Fund | PAGE 3 | 486-ATSR-0225 |
9450929397921169610941133381528217790147371732919953100009764105311305611827149731740620633168442058424183100009758104371258211611142371640118635153221821120675100009671994610710105651131812339117839896104941035464.618.312.52.81.00.8
| | |
Franklin Growth Allocation Fund | |
| Class C [FTGTX] |
| Annual Shareholder Report | December 31, 2024 |
|
This annual shareholder report contains important information about Franklin Growth Allocation Fund for the period January 1, 2024, to December 31, 2024.
You can find additional information about the Fund at https://www.franklintempleton.com/regulatory-fund-documents. You can also request this information by contacting us at (800) DIAL BEN/342-5236.
WHAT WERE THE FUND COSTS FOR THE LAST YEAR? (based on a hypothetical $10,000 investment)
| | |
Class Name | Costs of a $10,000 investment | Costs paid as a percentage of a $10,000 investment* |
| Class C | $148 | 1.38% |
| * | Reflects fee waivers and/or expense reimbursements, without which expenses would have been higher. |
HOW DID THE FUND PERFORM LAST YEAR AND WHAT AFFECTED ITS PERFORMANCE?
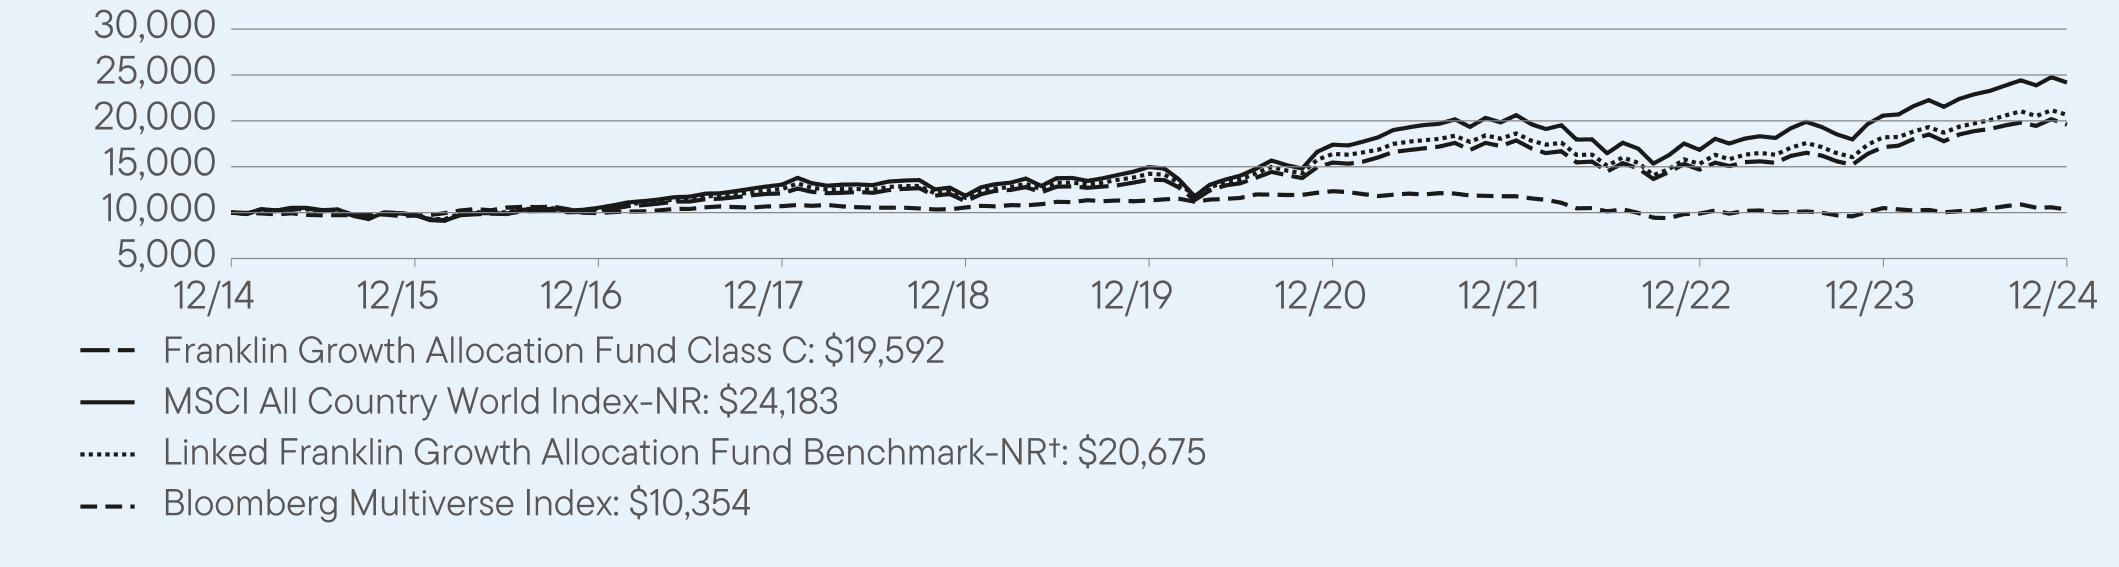
For the twelve months ended December 31, 2024, Class C shares of Franklin Growth Allocation Fund returned 14.35%. The Fund compares its performance to the MSCI All Country World Index-NR, the Linked Franklin Growth Allocation Fund Benchmark-NR† and the Bloomberg Multiverse Index, which returned 17.49%, 13.53% and -1.34%, respectively, for the same period.
| |
Top contributors to performance: |
| ↑ | Fixed income underweight, reflecting our cross asset tactical preference. |
| ↑ | Within equities, a regional overweight to the U.S. and an underweight to international holdings. |
| ↑ | Within fixed income, a regional overweight to the U.S. and an underweight to international positions. |
| |
Top detractors from performance: |
| ↓ | Fund selection in U.S. equity, as value stock exposure and one growth fund detracted. |
| ↓ | Fund selection in international equity. |
| ↓ | Fund selection in international fixed income. |
| Franklin Growth Allocation Fund | PAGE 1 | 586-ATSR-0225 |
HOW DID THE FUND PERFORM OVER THE LAST 10 YEARS?
The Fund’s past performance is not necessarily an indication of how the Fund will perform in the future. The graph and table do not reflect the deduction of taxes that a shareholder would pay on Fund distributions or redemption of Fund shares.
VALUE OF A $10,000 INVESTMENT – Class C 12/31/2014 — 12/31/2024
AVERAGE ANNUAL TOTAL RETURNS (%) Period Ended December 31, 2024
| | | |
| | 1 Year | 5 Year | 10 Year |
Class C | 14.35 | 7.58 | 6.96 |
Class C (with sales charge) | 13.35 | 7.58 | 6.96 |
MSCI All Country World Index-NR | 17.49 | 10.06 | 9.23 |
Linked Franklin Growth Allocation Fund Benchmark-NR† | 13.53 | 7.74 | 7.53 |
Bloomberg Multiverse Index | -1.34 | -1.76 | 0.35 |
| † | The Linked Franklin Growth Allocation Fund Benchmark-NR is comprised of 56% S&P 500 Index, 24% MSCI EAFE Index-NR, 15% Bloomberg U.S. Aggregate Index and 5% Payden & Rygel 90 Day U.S. T-Bill Index from 1/1/2001 to 12/31/2012; 56% S&P 500 Index, 24% MSCI EAFE Index-NR and 20% Bloomberg U.S. Aggregate Index from 1/1/2013 to 12/31/14; and 80% MSCI ACWI-NR and 20% Bloomberg Multiverse Index thereafter. |
Fund performance figures may reflect fee waivers and/or expense reimbursements, without which the performance would have been lower.
For current month-end performance, please call Franklin Templeton at (800) DIAL BEN/342-5236 or visit https://www.franklintempleton.com/investments/options/mutual-funds.
Important data provider notices and terms available at www.franklintempletondatasources.com.
KEY FUND STATISTICS (as of December 31, 2024)
| |
Total Net Assets | $1,363,823,356 |
Total Number of Portfolio Holdings* | 21 |
Total Management Fee Paid | $3,322,435 |
Portfolio Turnover Rate | 33.45% |
| * | Does not include derivatives, except purchased options, if any. |
| Franklin Growth Allocation Fund | PAGE 2 | 586-ATSR-0225 |
WHAT DID THE FUND INVEST IN? (as of December 31, 2024)
Portfolio Composition* (% of Total Investments)
| * | Does not include derivatives, except purchased options, if any. |
| |
| WHERE CAN I FIND ADDITIONAL INFORMATION ABOUT THE FUND? |
Additional information is available on https://www.franklintempleton.com/regulatory-fund-documents, including its: |
| • prospectus • proxy voting information • financial information • holdings • tax information |
HOUSEHOLDING
You will receive the Fund’s shareholder reports every six months. In addition, you will receive an annual updated summary prospectus (detail prospectus available upon request). To reduce Fund expenses, we try to identify related shareholders in a household and send only one copy of the shareholder reports and summary prospectus. This process, called “householding,” will continue indefinitely unless you instruct us otherwise. If you prefer not to have these documents householded, please call us at (800) DIAL BEN/342-5236. At any time, you may view current prospectuses/summary prospectuses and shareholder reports on our website. If you choose, you may receive these documents through electronic delivery.
| Franklin Growth Allocation Fund | PAGE 3 | 586-ATSR-0225 |
100009759102071210111238135931546117872146871713319592100009764105311305611827149731740620633168442058424183100009758104371258211611142371640118635153221821120675100009671994610710105651131812339117839896104941035464.618.312.52.81.00.8
| | |
Franklin Growth Allocation Fund | |
| Class R [FGTRX] |
| Annual Shareholder Report | December 31, 2024 |
|
This annual shareholder report contains important information about Franklin Growth Allocation Fund for the period January 1, 2024, to December 31, 2024.
You can find additional information about the Fund at https://www.franklintempleton.com/regulatory-fund-documents. You can also request this information by contacting us at (800) DIAL BEN/342-5236.
WHAT WERE THE FUND COSTS FOR THE LAST YEAR? (based on a hypothetical $10,000 investment)
| | |
Class Name | Costs of a $10,000 investment | Costs paid as a percentage of a $10,000 investment* |
| Class R | $95 | 0.88% |
| * | Reflects fee waivers and/or expense reimbursements, without which expenses would have been higher. |
HOW DID THE FUND PERFORM LAST YEAR AND WHAT AFFECTED ITS PERFORMANCE?
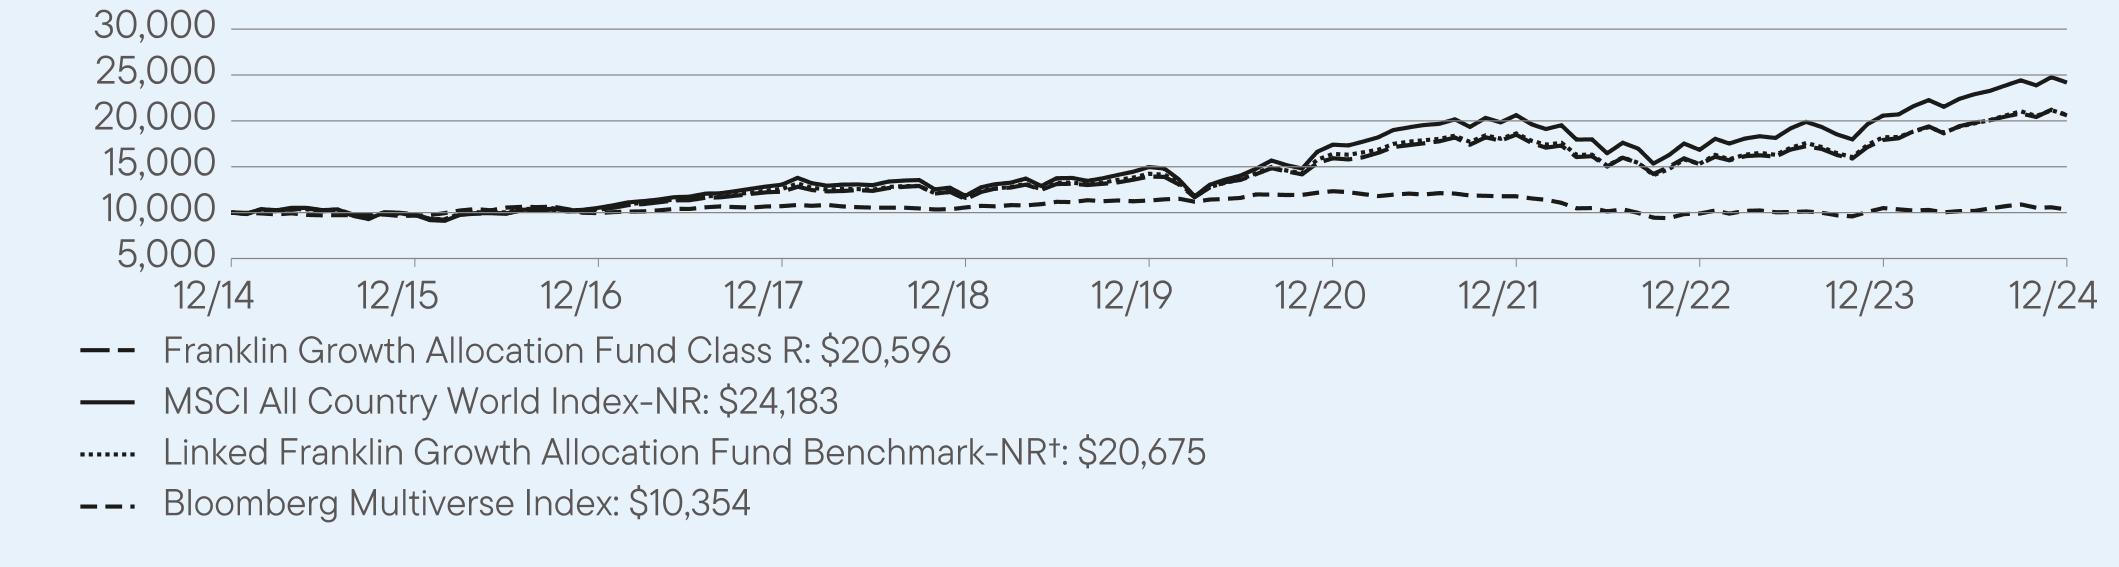
For the twelve months ended December 31, 2024, Class R shares of Franklin Growth Allocation Fund returned 14.90%. The Fund compares its performance to the MSCI All Country World Index-NR, the Linked Franklin Growth Allocation Fund Benchmark-NR† and the Bloomberg Multiverse Index, which returned 17.49%, 13.53% and -1.34%, respectively, for the same period.
| |
Top contributors to performance: |
| ↑ | Fixed income underweight, reflecting our cross asset tactical preference. |
| ↑ | Within equities, a regional overweight to the U.S. and an underweight to international holdings. |
| ↑ | Within fixed income, a regional overweight to the U.S. and an underweight to international positions. |
| |
Top detractors from performance: |
| ↓ | Fund selection in U.S. equity, as value stock exposure and one growth fund detracted. |
| ↓ | Fund selection in international equity. |
| ↓ | Fund selection in international fixed income. |
| Franklin Growth Allocation Fund | PAGE 1 | 886-ATSR-0225 |
HOW DID THE FUND PERFORM OVER THE LAST 10 YEARS?
The Fund’s past performance is not necessarily an indication of how the Fund will perform in the future. The graph and table do not reflect the deduction of taxes that a shareholder would pay on Fund distributions or redemption of Fund shares.
VALUE OF A $10,000 INVESTMENT – Class R 12/31/2014 — 12/31/2024
AVERAGE ANNUAL TOTAL RETURNS (%) Period Ended December 31, 2024
| | | |
| | 1 Year | 5 Year | 10 Year |
Class R | 14.90 | 8.13 | 7.49 |
MSCI All Country World Index-NR | 17.49 | 10.06 | 9.23 |
Linked Franklin Growth Allocation Fund Benchmark-NR† | 13.53 | 7.74 | 7.53 |
Bloomberg Multiverse Index | -1.34 | -1.76 | 0.35 |
| † | The Linked Franklin Growth Allocation Fund Benchmark-NR is comprised of 56% S&P 500 Index, 24% MSCI EAFE Index-NR, 15% Bloomberg U.S. Aggregate Index and 5% Payden & Rygel 90 Day U.S. T-Bill Index from 1/1/2001 to 12/31/2012; 56% S&P 500 Index, 24% MSCI EAFE Index-NR and 20% Bloomberg U.S. Aggregate Index from 1/1/2013 to 12/31/14; and 80% MSCI ACWI-NR and 20% Bloomberg Multiverse Index thereafter. |
Fund performance figures may reflect fee waivers and/or expense reimbursements, without which the performance would have been lower.
For current month-end performance, please call Franklin Templeton at (800) DIAL BEN/342-5236 or visit https://www.franklintempleton.com/investments/options/mutual-funds.
Important data provider notices and terms available at www.franklintempletondatasources.com.
KEY FUND STATISTICS (as of December 31, 2024)
| |
Total Net Assets | $1,363,823,356 |
Total Number of Portfolio Holdings* | 21 |
Total Management Fee Paid | $3,322,435 |
Portfolio Turnover Rate | 33.45% |
| * | Does not include derivatives, except purchased options, if any. |
| Franklin Growth Allocation Fund | PAGE 2 | 886-ATSR-0225 |
WHAT DID THE FUND INVEST IN? (as of December 31, 2024)
Portfolio Composition* (% of Total Investments)
| * | Does not include derivatives, except purchased options, if any. |
| |
| WHERE CAN I FIND ADDITIONAL INFORMATION ABOUT THE FUND? |
Additional information is available on https://www.franklintempleton.com/regulatory-fund-documents, including its: |
| • prospectus • proxy voting information • financial information • holdings • tax information |
HOUSEHOLDING
You will receive the Fund’s shareholder reports every six months. In addition, you will receive an annual updated summary prospectus (detail prospectus available upon request). To reduce Fund expenses, we try to identify related shareholders in a household and send only one copy of the shareholder reports and summary prospectus. This process, called “householding,” will continue indefinitely unless you instruct us otherwise. If you prefer not to have these documents householded, please call us at (800) DIAL BEN/342-5236. At any time, you may view current prospectuses/summary prospectuses and shareholder reports on our website. If you choose, you may receive these documents through electronic delivery.
| Franklin Growth Allocation Fund | PAGE 3 | 886-ATSR-0225 |
100009807103091228511464139361593018501152811792420596100009764105311305611827149731740620633168442058424183100009758104371258211611142371640118635153221821120675100009671994610710105651131812339117839896104941035464.618.312.52.81.00.8
| | |
Franklin Growth Allocation Fund | |
| Class R6 [FTGMX] |
| Annual Shareholder Report | December 31, 2024 |
|
This annual shareholder report contains important information about Franklin Growth Allocation Fund for the period January 1, 2024, to December 31, 2024.
You can find additional information about the Fund at https://www.franklintempleton.com/regulatory-fund-documents. You can also request this information by contacting us at (800) DIAL BEN/342-5236.
WHAT WERE THE FUND COSTS FOR THE LAST YEAR? (based on a hypothetical $10,000 investment)
| | |
Class Name | Costs of a $10,000 investment | Costs paid as a percentage of a $10,000 investment* |
| Class R6 | $32 | 0.30% |
| * | Reflects fee waivers and/or expense reimbursements, without which expenses would have been higher. |
HOW DID THE FUND PERFORM LAST YEAR AND WHAT AFFECTED ITS PERFORMANCE?
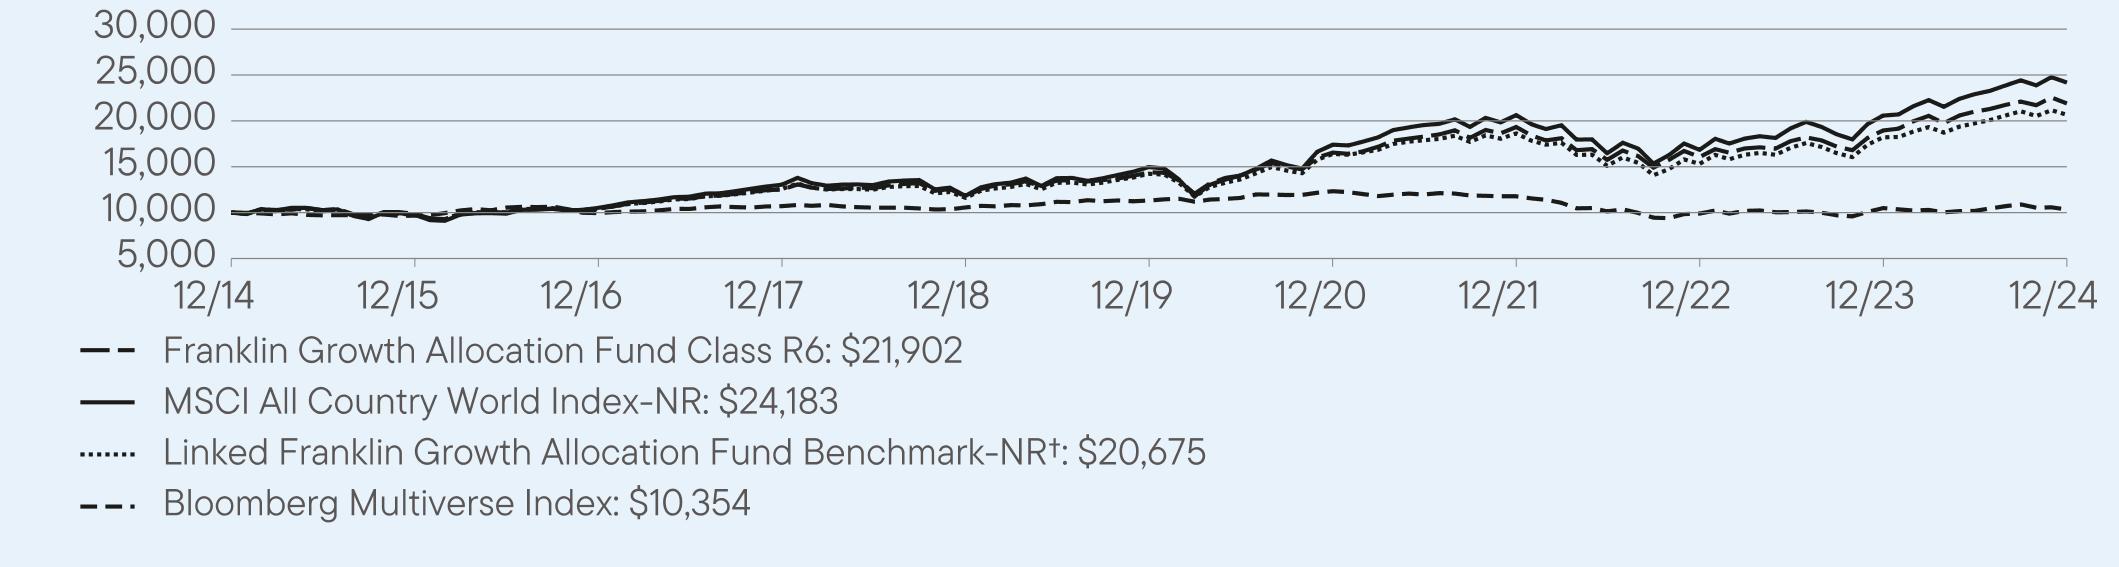
For the twelve months ended December 31, 2024, Class R6 shares of Franklin Growth Allocation Fund returned 15.52%. The Fund compares its performance to the MSCI All Country World Index-NR, the Linked Franklin Growth Allocation Fund Benchmark-NR† and the Bloomberg Multiverse Index, which returned 17.49%, 13.53% and -1.34%, respectively, for the same period.
| |
Top contributors to performance: |
| ↑ | Fixed income underweight, reflecting our cross asset tactical preference. |
| ↑ | Within equities, a regional overweight to the U.S. and an underweight to international holdings. |
| ↑ | Within fixed income, a regional overweight to the U.S. and an underweight to international positions. |
| |
Top detractors from performance: |
| ↓ | Fund selection in U.S. equity, as value stock exposure and one growth fund detracted. |
| ↓ | Fund selection in international equity. |
| ↓ | Fund selection in international fixed income. |
| Franklin Growth Allocation Fund | PAGE 1 | 386-ATSR-0225 |
HOW DID THE FUND PERFORM OVER THE LAST 10 YEARS?
The Fund’s past performance is not necessarily an indication of how the Fund will perform in the future. The graph and table do not reflect the deduction of taxes that a shareholder would pay on Fund distributions or redemption of Fund shares.
VALUE OF A $10,000 INVESTMENT – Class R6 12/31/2014 — 12/31/2024
AVERAGE ANNUAL TOTAL RETURNS (%) Period Ended December 31, 2024
| | | |
| | 1 Year | 5 Year | 10 Year |
Class R6 | 15.52 | 8.77 | 8.16 |
MSCI All Country World Index-NR | 17.49 | 10.06 | 9.23 |
Linked Franklin Growth Allocation Fund Benchmark-NR† | 13.53 | 7.74 | 7.53 |
Bloomberg Multiverse Index | -1.34 | -1.76 | 0.35 |
| † | The Linked Franklin Growth Allocation Fund Benchmark-NR is comprised of 56% S&P 500 Index, 24% MSCI EAFE Index-NR, 15% Bloomberg U.S. Aggregate Index and 5% Payden & Rygel 90 Day U.S. T-Bill Index from 1/1/2001 to 12/31/2012; 56% S&P 500 Index, 24% MSCI EAFE Index-NR and 20% Bloomberg U.S. Aggregate Index from 1/1/2013 to 12/31/14; and 80% MSCI ACWI-NR and 20% Bloomberg Multiverse Index thereafter. |
Fund performance figures may reflect fee waivers and/or expense reimbursements, without which the performance would have been lower.
For current month-end performance, please call Franklin Templeton at (800) DIAL BEN/342-5236 or visit https://www.franklintempleton.com/investments/options/mutual-funds.
Important data provider notices and terms available at www.franklintempletondatasources.com.
KEY FUND STATISTICS (as of December 31, 2024)
| |
Total Net Assets | $1,363,823,356 |
Total Number of Portfolio Holdings* | 21 |
Total Management Fee Paid | $3,322,435 |
Portfolio Turnover Rate | 33.45% |
| * | Does not include derivatives, except purchased options, if any. |
| Franklin Growth Allocation Fund | PAGE 2 | 386-ATSR-0225 |
WHAT DID THE FUND INVEST IN? (as of December 31, 2024)
Portfolio Composition* (% of Total Investments)
| * | Does not include derivatives, except purchased options, if any. |
| |
| WHERE CAN I FIND ADDITIONAL INFORMATION ABOUT THE FUND? |
Additional information is available on https://www.franklintempleton.com/regulatory-fund-documents, including its: |
| • prospectus • proxy voting information • financial information • holdings • tax information |
HOUSEHOLDING
You will receive the Fund’s shareholder reports every six months. In addition, you will receive an annual updated summary prospectus (detail prospectus available upon request). To reduce Fund expenses, we try to identify related shareholders in a household and send only one copy of the shareholder reports and summary prospectus. This process, called “householding,” will continue indefinitely unless you instruct us otherwise. If you prefer not to have these documents householded, please call us at (800) DIAL BEN/342-5236. At any time, you may view current prospectuses/summary prospectuses and shareholder reports on our website. If you choose, you may receive these documents through electronic delivery.
| Franklin Growth Allocation Fund | PAGE 3 | 386-ATSR-0225 |
100009873104431252111761143841655019339160661895921902100009764105311305611827149731740620633168442058424183100009758104371258211611142371640118635153221821120675100009671994610710105651131812339117839896104941035464.618.312.52.81.00.8
| | |
Franklin Growth Allocation Fund | |
| Advisor Class [FGTZX] |
| Annual Shareholder Report | December 31, 2024 |
|
This annual shareholder report contains important information about Franklin Growth Allocation Fund for the period January 1, 2024, to December 31, 2024.
You can find additional information about the Fund at https://www.franklintempleton.com/regulatory-fund-documents. You can also request this information by contacting us at (800) DIAL BEN/342-5236.
WHAT WERE THE FUND COSTS FOR THE LAST YEAR? (based on a hypothetical $10,000 investment)
| | |
Class Name | Costs of a $10,000 investment | Costs paid as a percentage of a $10,000 investment* |
| Advisor Class | $41 | 0.38% |
| * | Reflects fee waivers and/or expense reimbursements, without which expenses would have been higher. |
HOW DID THE FUND PERFORM LAST YEAR AND WHAT AFFECTED ITS PERFORMANCE?
For the twelve months ended December 31, 2024, Advisor Class shares of Franklin Growth Allocation Fund returned 15.42%. The Fund compares its performance to the MSCI All Country World Index-NR, the Linked Franklin Growth Allocation Fund Benchmark-NR† and the Bloomberg Multiverse Index, which returned 17.49%, 13.53% and -1.34%, respectively, for the same period.
| |
Top contributors to performance: |
| ↑ | Fixed income underweight, reflecting our cross asset tactical preference. |
| ↑ | Within equities, a regional overweight to the U.S. and an underweight to international holdings. |
| ↑ | Within fixed income, a regional overweight to the U.S. and an underweight to international positions. |
| |
Top detractors from performance: |
| ↓ | Fund selection in U.S. equity, as value stock exposure and one growth fund detracted. |
| ↓ | Fund selection in international equity. |
| ↓ | Fund selection in international fixed income. |
| Franklin Growth Allocation Fund | PAGE 1 | 643-ATSR-0225 |
HOW DID THE FUND PERFORM OVER THE LAST 10 YEARS?
The Fund’s past performance is not necessarily an indication of how the Fund will perform in the future. The graph and table do not reflect the deduction of taxes that a shareholder would pay on Fund distributions or redemption of Fund shares.
VALUE OF A $10,000 INVESTMENT – Advisor Class 12/31/2014 — 12/31/2024
AVERAGE ANNUAL TOTAL RETURNS (%) Period Ended December 31, 2024
| | | |
| | 1 Year | 5 Year | 10 Year |
Advisor Class | 15.42 | 8.66 | 8.03 |
MSCI All Country World Index-NR | 17.49 | 10.06 | 9.23 |
Linked Franklin Growth Allocation Fund Benchmark-NR† | 13.53 | 7.74 | 7.53 |
Bloomberg Multiverse Index | -1.34 | -1.76 | 0.35 |
| † | The Linked Franklin Growth Allocation Fund Benchmark-NR is comprised of 56% S&P 500 Index, 24% MSCI EAFE Index-NR, 15% Bloomberg U.S. Aggregate Index and 5% Payden & Rygel 90 Day U.S. T-Bill Index from 1/1/2001 to 12/31/2012; 56% S&P 500 Index, 24% MSCI EAFE Index-NR and 20% Bloomberg U.S. Aggregate Index from 1/1/2013 to 12/31/14; and 80% MSCI ACWI-NR and 20% Bloomberg Multiverse Index thereafter. |
Fund performance figures may reflect fee waivers and/or expense reimbursements, without which the performance would have been lower.
For current month-end performance, please call Franklin Templeton at (800) DIAL BEN/342-5236 or visit https://www.franklintempleton.com/investments/options/mutual-funds.
Important data provider notices and terms available at www.franklintempletondatasources.com.
KEY FUND STATISTICS (as of December 31, 2024)
| |
Total Net Assets | $1,363,823,356 |
Total Number of Portfolio Holdings* | 21 |
Total Management Fee Paid | $3,322,435 |
Portfolio Turnover Rate | 33.45% |
| * | Does not include derivatives, except purchased options, if any. |
| Franklin Growth Allocation Fund | PAGE 2 | 643-ATSR-0225 |
WHAT DID THE FUND INVEST IN? (as of December 31, 2024)
Portfolio Composition* (% of Total Investments)
| * | Does not include derivatives, except purchased options, if any. |
| |
| WHERE CAN I FIND ADDITIONAL INFORMATION ABOUT THE FUND? |
Additional information is available on https://www.franklintempleton.com/regulatory-fund-documents, including its: |
| • prospectus • proxy voting information • financial information • holdings • tax information |
HOUSEHOLDING
You will receive the Fund’s shareholder reports every six months. In addition, you will receive an annual updated summary prospectus (detail prospectus available upon request). To reduce Fund expenses, we try to identify related shareholders in a household and send only one copy of the shareholder reports and summary prospectus. This process, called “householding,” will continue indefinitely unless you instruct us otherwise. If you prefer not to have these documents householded, please call us at (800) DIAL BEN/342-5236. At any time, you may view current prospectuses/summary prospectuses and shareholder reports on our website. If you choose, you may receive these documents through electronic delivery.
| Franklin Growth Allocation Fund | PAGE 3 | 643-ATSR-0225 |
100009860104121247011693142911642019163159081875221644100009764105311305611827149731740620633168442058424183100009758104371258211611142371640118635153221821120675100009671994610710105651131812339117839896104941035464.618.312.52.81.00.8
| | |
Franklin Corefolio Allocation Fund | |
| Class A [FTCOX] |
| Annual Shareholder Report | December 31, 2024 |
|
This annual shareholder report contains important information about Franklin Corefolio Allocation Fund for the period January 1, 2024, to December 31, 2024.
You can find additional information about the Fund at https://www.franklintempleton.com/regulatory-fund-documents. You can also request this information by contacting us at (800) DIAL BEN/342-5236.
WHAT WERE THE FUND COSTS FOR THE LAST YEAR? (based on a hypothetical $10,000 investment)
| | |
Class Name | Costs of a $10,000 investment | Costs paid as a percentage of a $10,000 investment* |
| Class A | $42 | 0.39% |
| * | Reflects fee waivers and/or expense reimbursements, without which expenses would have been higher. |
HOW DID THE FUND PERFORM LAST YEAR AND WHAT AFFECTED ITS PERFORMANCE?
For the twelve months ended December 31, 2024, Class A shares of Franklin Corefolio Allocation Fund returned 14.88%. The Fund compares its performance to the S&P 500 Index and the MSCI World Index which returned 25.02% and 19.19%, respectively, for the same period.
| |
Top contributors to performance: |
| ↑ | Franklin Growth Opportunities Fund: growth and technology focus aided relative performance, as did stock selection in the industrials sector including Axon Enterprises. |
| ↑ | Franklin Growth Fund: lack of exposure to energy and limited exposure to real estate. |
| ↑ | Franklin Mutual Shares Fund: allocation and selection in the information technology (IT) and real estate sectors. |
| ↑ | Templeton Growth Fund: selection in the industrials sector including Rolls Royce Holdings. |
| |
Top detractors from performance: |
| ↓ | Templeton Growth Fund: value focus held back returns, as did allocation and selection in the IT sector. |
| ↓ | Franklin Mutual Shares Fund: value focus held back returns, as did selection in the health care sector. |
| ↓ | Franklin Growth Fund: diversification strategy held back returns due to limited exposure to Magnifcent Seven, as did selection in the IT sector. |
| ↓ | Franklin Growth Opportunities Fund: diversification strategy held back returns due to limited exposure to Magnificent Seven, as did allocation and selection in the consumer discretionary sector. |
| Franklin Corefolio Allocation Fund | PAGE 1 | 470-ATSR-0225 |
HOW DID THE FUND PERFORM OVER THE LAST 10 YEARS?
The Fund’s past performance is not necessarily an indication of how the Fund will perform in the future. The graph and table do not reflect the deduction of taxes that a shareholder would pay on Fund distributions or redemption of Fund shares.
VALUE OF A $10,000 INVESTMENT ($9,450 AFTER MAXIMUM APPLICABLE SALES CHARGE) –
Class A 12/31/2014 — 12/31/2024
AVERAGE ANNUAL TOTAL RETURNS (%) Period Ended December 31, 2024
| | | |
| | 1 Year | 5 Year | 10 Year |
Class A | 14.88 | 9.31 | 8.82 |
Class A (with sales charge) | 8.54 | 8.08 | 8.21 |
Russell 3000 Index | 23.81 | 13.86 | 12.54 |
S&P 500 Index | 25.02 | 14.52 | 13.10 |
MSCI World Index | 19.19 | 11.69 | 10.52 |
Fund performance figures may reflect fee waivers and/or expense reimbursements, without which the performance would have been lower.
Performance for periods prior to September 10, 2018, has been restated to reflect the current maximum sales charge, which is lower than the maximum sales charge prior to that date.
For current month-end performance, please call Franklin Templeton at (800) DIAL BEN/342-5236 or visit https://www.franklintempleton.com/investments/options/mutual-funds.
Important data provider notices and terms available at www.franklintempletondatasources.com.
KEY FUND STATISTICS (as of December 31, 2024)
| |
Total Net Assets | $984,374,131 |
Total Number of Portfolio Holdings* | 5 |
Total Administrative Fee Paid | $294,270 |
Portfolio Turnover Rate | 10.38% |
| * | Does not include derivatives, except purchased options, if any. |
| Franklin Corefolio Allocation Fund | PAGE 2 | 470-ATSR-0225 |
WHAT DID THE FUND INVEST IN? (as of December 31, 2024)
Portfolio Composition*,† (% of Total Investments)
| * | Does not include derivatives, except purchased options, if any. |
| † | Certain categories may represent less than 0.1%. |
| |
| WHERE CAN I FIND ADDITIONAL INFORMATION ABOUT THE FUND? |
Additional information is available on https://www.franklintempleton.com/regulatory-fund-documents, including its: |
| • prospectus • proxy voting information • financial information • holdings • tax information |
HOUSEHOLDING
You will receive the Fund’s shareholder reports every six months. In addition, you will receive an annual updated summary prospectus (detail prospectus available upon request). To reduce Fund expenses, we try to identify related shareholders in a household and send only one copy of the shareholder reports and summary prospectus. This process, called “householding,” will continue indefinitely unless you instruct us otherwise. If you prefer not to have these documents householded, please call us at (800) DIAL BEN/342-5236. At any time, you may view current prospectuses/summary prospectuses and shareholder reports on our website. If you choose, you may receive these documents through electronic delivery.
| Franklin Corefolio Allocation Fund | PAGE 3 | 470-ATSR-0225 |
945093371005112067112101410216679193081528419159220081000010048113271372113002170352059325877209072633432604100001013811351138291322317386205852649421696273993425410000996810781132681217915639182182229018337228142719376.523.50.0
| | |
Franklin Corefolio Allocation Fund | |
| Class C [FTCLX] |
| Annual Shareholder Report | December 31, 2024 |
|
This annual shareholder report contains important information about Franklin Corefolio Allocation Fund for the period January 1, 2024, to December 31, 2024.
You can find additional information about the Fund at https://www.franklintempleton.com/regulatory-fund-documents. You can also request this information by contacting us at (800) DIAL BEN/342-5236.
WHAT WERE THE FUND COSTS FOR THE LAST YEAR? (based on a hypothetical $10,000 investment)
| | |
Class Name | Costs of a $10,000 investment | Costs paid as a percentage of a $10,000 investment* |
| Class C | $122 | 1.14% |
| * | Reflects fee waivers and/or expense reimbursements, without which expenses would have been higher. |
HOW DID THE FUND PERFORM LAST YEAR AND WHAT AFFECTED ITS PERFORMANCE?
For the twelve months ended December 31, 2024, Class C shares of Franklin Corefolio Allocation Fund returned 14.08%. The Fund compares its performance to the S&P 500 Index and the MSCI World Index which returned 25.02% and 19.19%, respectively, for the same period.
| |
Top contributors to performance: |
| ↑ | Franklin Growth Opportunities Fund: growth and technology focus aided relative performance, as did stock selection in the industrials sector including Axon Enterprises. |
| ↑ | Franklin Growth Fund: lack of exposure to energy and limited exposure to real estate. |
| ↑ | Franklin Mutual Shares Fund: allocation and selection in the information technology (IT) and real estate sectors. |
| ↑ | Templeton Growth Fund: selection in the industrials sector including Rolls Royce Holdings. |
| |
Top detractors from performance: |
| ↓ | Templeton Growth Fund: value focus held back returns, as did allocation and selection in the IT sector. |
| ↓ | Franklin Mutual Shares Fund: value focus held back returns, as did selection in the health care sector. |
| ↓ | Franklin Growth Fund: diversification strategy held back returns due to limited exposure to Magnifcent Seven, as did selection in the IT sector. |
| ↓ | Franklin Growth Opportunities Fund: diversification strategy held back returns due to limited exposure to Magnificent Seven, as did allocation and selection in the consumer discretionary sector. |
| Franklin Corefolio Allocation Fund | PAGE 1 | 570-ATSR-0225 |
HOW DID THE FUND PERFORM OVER THE LAST 10 YEARS?
The Fund’s past performance is not necessarily an indication of how the Fund will perform in the future. The graph and table do not reflect the deduction of taxes that a shareholder would pay on Fund distributions or redemption of Fund shares.
VALUE OF A $10,000 INVESTMENT – Class C 12/31/2014 — 12/31/2024
AVERAGE ANNUAL TOTAL RETURNS (%) Period Ended December 31, 2024
| | | |
| | 1 Year | 5 Year | 10 Year |
Class C | 14.08 | 8.50 | 8.01 |
Class C (with sales charge) | 13.08 | 8.50 | 8.01 |
Russell 3000 Index | 23.81 | 13.86 | 12.54 |
S&P 500 Index | 25.02 | 14.52 | 13.10 |
MSCI World Index | 19.19 | 11.69 | 10.52 |
Fund performance figures may reflect fee waivers and/or expense reimbursements, without which the performance would have been lower.
For current month-end performance, please call Franklin Templeton at (800) DIAL BEN/342-5236 or visit https://www.franklintempleton.com/investments/options/mutual-funds.
Important data provider notices and terms available at www.franklintempletondatasources.com.
KEY FUND STATISTICS (as of December 31, 2024)
| |
Total Net Assets | $984,374,131 |
Total Number of Portfolio Holdings* | 5 |
Total Administrative Fee Paid | $294,270 |
Portfolio Turnover Rate | 10.38% |
| * | Does not include derivatives, except purchased options, if any. |
| Franklin Corefolio Allocation Fund | PAGE 2 | 570-ATSR-0225 |
WHAT DID THE FUND INVEST IN? (as of December 31, 2024)
Portfolio Composition*,† (% of Total Investments)
| * | Does not include derivatives, except purchased options, if any. |
| † | Certain categories may represent less than 0.1%. |
| |
| WHERE CAN I FIND ADDITIONAL INFORMATION ABOUT THE FUND? |
Additional information is available on https://www.franklintempleton.com/regulatory-fund-documents, including its: |
| • prospectus • proxy voting information • financial information • holdings • tax information |
HOUSEHOLDING
You will receive the Fund’s shareholder reports every six months. In addition, you will receive an annual updated summary prospectus (detail prospectus available upon request). To reduce Fund expenses, we try to identify related shareholders in a household and send only one copy of the shareholder reports and summary prospectus. This process, called “householding,” will continue indefinitely unless you instruct us otherwise. If you prefer not to have these documents householded, please call us at (800) DIAL BEN/342-5236. At any time, you may view current prospectuses/summary prospectuses and shareholder reports on our website. If you choose, you may receive these documents through electronic delivery.
| Franklin Corefolio Allocation Fund | PAGE 3 | 570-ATSR-0225 |
1000098081047712488115191437916882193951523718951216191000010048113271372113002170352059325877209072633432604100001013811351138291322317386205852649421696273993425410000996810781132681217915639182182229018337228142719376.523.50.0
| | |
Franklin Corefolio Allocation Fund | |
| Class R [FFAYX] |
| Annual Shareholder Report | December 31, 2024 |
|
This annual shareholder report contains important information about Franklin Corefolio Allocation Fund for the period January 1, 2024, to December 31, 2024.
You can find additional information about the Fund at https://www.franklintempleton.com/regulatory-fund-documents. You can also request this information by contacting us at (800) DIAL BEN/342-5236.
WHAT WERE THE FUND COSTS FOR THE LAST YEAR? (based on a hypothetical $10,000 investment)
| | |
Class Name | Costs of a $10,000 investment | Costs paid as a percentage of a $10,000 investment* |
| Class R | $69 | 0.64% |
| * | Reflects fee waivers and/or expense reimbursements, without which expenses would have been higher. |
HOW DID THE FUND PERFORM LAST YEAR AND WHAT AFFECTED ITS PERFORMANCE?
For the twelve months ended December 31, 2024, Class R shares of Franklin Corefolio Allocation Fund returned 14.64%. The Fund compares its performance to the S&P 500 Index and the MSCI World Index which returned 25.02% and 19.19%, respectively, for the same period.
| |
Top contributors to performance: |
| ↑ | Franklin Growth Opportunities Fund: growth and technology focus aided relative performance, as did stock selection in the industrials sector including Axon Enterprises. |
| ↑ | Franklin Growth Fund: lack of exposure to energy and limited exposure to real estate. |
| ↑ | Franklin Mutual Shares Fund: allocation and selection in the information technology (IT) and real estate sectors. |
| ↑ | Templeton Growth Fund: selection in the industrials sector including Rolls Royce Holdings. |
| |
Top detractors from performance: |
| ↓ | Templeton Growth Fund: value focus held back returns, as did allocation and selection in the IT sector. |
| ↓ | Franklin Mutual Shares Fund: value focus held back returns, as did selection in the health care sector. |
| ↓ | Franklin Growth Fund: diversification strategy held back returns due to limited exposure to Magnifcent Seven, as did selection in the IT sector. |
| ↓ | Franklin Growth Opportunities Fund: diversification strategy held back returns due to limited exposure to Magnificent Seven, as did allocation and selection in the consumer discretionary sector. |
| Franklin Corefolio Allocation Fund | PAGE 1 | 870-ATSR-0225 |
HOW DID THE FUND PERFORM OVER THE LAST 10 YEARS?
The Fund’s past performance is not necessarily an indication of how the Fund will perform in the future. The graph and table do not reflect the deduction of taxes that a shareholder would pay on Fund distributions or redemption of Fund shares.
VALUE OF A $10,000 INVESTMENT – Class R 12/31/2014 — 12/31/2024
AVERAGE ANNUAL TOTAL RETURNS (%) Period Ended December 31, 2024
| | | |
| | 1 Year | 5 Year | 10 Year |
Class R | 14.64 | 9.05 | 8.56 |
Russell 3000 Index | 23.81 | 13.86 | 12.54 |
S&P 500 Index | 25.02 | 14.52 | 13.10 |
MSCI World Index | 19.19 | 11.69 | 10.52 |
Fund performance figures may reflect fee waivers and/or expense reimbursements, without which the performance would have been lower.
For current month-end performance, please call Franklin Templeton at (800) DIAL BEN/342-5236 or visit https://www.franklintempleton.com/investments/options/mutual-funds.
Important data provider notices and terms available at www.franklintempletondatasources.com.
KEY FUND STATISTICS (as of December 31, 2024)
| |
Total Net Assets | $984,374,131 |
Total Number of Portfolio Holdings* | 5 |
Total Administrative Fee Paid | $294,270 |
Portfolio Turnover Rate | 10.38% |
| * | Does not include derivatives, except purchased options, if any. |
| Franklin Corefolio Allocation Fund | PAGE 2 | 870-ATSR-0225 |
WHAT DID THE FUND INVEST IN? (as of December 31, 2024)
Portfolio Composition*,† (% of Total Investments)
| * | Does not include derivatives, except purchased options, if any. |
| † | Certain categories may represent less than 0.1%. |
| |
| WHERE CAN I FIND ADDITIONAL INFORMATION ABOUT THE FUND? |
Additional information is available on https://www.franklintempleton.com/regulatory-fund-documents, including its: |
| • prospectus • proxy voting information • financial information • holdings • tax information |
HOUSEHOLDING
You will receive the Fund’s shareholder reports every six months. In addition, you will receive an annual updated summary prospectus (detail prospectus available upon request). To reduce Fund expenses, we try to identify related shareholders in a household and send only one copy of the shareholder reports and summary prospectus. This process, called “householding,” will continue indefinitely unless you instruct us otherwise. If you prefer not to have these documents householded, please call us at (800) DIAL BEN/342-5236. At any time, you may view current prospectuses/summary prospectuses and shareholder reports on our website. If you choose, you may receive these documents through electronic delivery.
| Franklin Corefolio Allocation Fund | PAGE 3 | 870-ATSR-0225 |
1000098571057912672117481474517399200891586119834227371000010048113271372113002170352059325877209072633432604100001013811351138291322317386205852649421696273993425410000996810781132681217915639182182229018337228142719376.523.50.0
| | |
Franklin Corefolio Allocation Fund | |
| Class R6 [FTLQX] |
| Annual Shareholder Report | December 31, 2024 |
|
This annual shareholder report contains important information about Franklin Corefolio Allocation Fund for the period January 1, 2024, to December 31, 2024.
You can find additional information about the Fund at https://www.franklintempleton.com/regulatory-fund-documents. You can also request this information by contacting us at (800) DIAL BEN/342-5236.
WHAT WERE THE FUND COSTS FOR THE LAST YEAR? (based on a hypothetical $10,000 investment)
| | |
Class Name | Costs of a $10,000 investment | Costs paid as a percentage of a $10,000 investment* |
| Class R6 | $9 | 0.08% |
| * | Reflects fee waivers and/or expense reimbursements, without which expenses would have been higher. |
HOW DID THE FUND PERFORM LAST YEAR AND WHAT AFFECTED ITS PERFORMANCE?
For the twelve months ended December 31, 2024, Class R6 shares of Franklin Corefolio Allocation Fund returned 15.28%. The Fund compares its performance to the S&P 500 Index and the MSCI World Index which returned 25.02% and 19.19%, respectively, for the same period.
| |
Top contributors to performance: |
| ↑ | Franklin Growth Opportunities Fund: growth and technology focus aided relative performance, as did stock selection in the industrials sector including Axon Enterprises. |
| ↑ | Franklin Growth Fund: lack of exposure to energy and limited exposure to real estate. |
| ↑ | Franklin Mutual Shares Fund: allocation and selection in the information technology (IT) and real estate sectors. |
| ↑ | Templeton Growth Fund: selection in the industrials sector including Rolls Royce Holdings. |
| |
Top detractors from performance: |
| ↓ | Templeton Growth Fund: value focus held back returns, as did allocation and selection in the IT sector. |
| ↓ | Franklin Mutual Shares Fund: value focus held back returns, as did selection in the health care sector. |
| ↓ | Franklin Growth Fund: diversification strategy held back returns due to limited exposure to Magnifcent Seven, as did selection in the IT sector. |
| ↓ | Franklin Growth Opportunities Fund: diversification strategy held back returns due to limited exposure to Magnificent Seven, as did allocation and selection in the consumer discretionary sector. |
| Franklin Corefolio Allocation Fund | PAGE 1 | 8470-ATSR-0225 |
HOW DID THE FUND PERFORM OVER THE LAST 10 YEARS?
The Fund’s past performance is not necessarily an indication of how the Fund will perform in the future. The graph and table do not reflect the deduction of taxes that a shareholder would pay on Fund distributions or redemption of Fund shares.
VALUE OF A $10,000 INVESTMENT – Class R6 12/31/2014 — 12/31/2024
AVERAGE ANNUAL TOTAL RETURNS (%) Period Ended December 31, 2024
| | | |
| | 1 Year | 5 Year | 10 Year |
Class R6 | 15.28 | 9.68 | 9.17 |
Russell 3000 Index | 23.81 | 13.86 | 12.54 |
S&P 500 Index | 25.02 | 14.52 | 13.10 |
MSCI World Index | 19.19 | 11.69 | 10.52 |
Fund performance figures may reflect fee waivers and/or expense reimbursements, without which the performance would have been lower.
The Fund began offering Class R6 shares on 8/1/2017. Returns for periods before 8/1/2017, are based on the Fund’s Advisor Class performance, which has been adjusted to take into account differences in class-specific operating expenses and maximum sales charges. For periods after the share class offering, performance for the specific share class is used, reflecting the applicable expenses and maximum sales charges.
For current month-end performance, please call Franklin Templeton at (800) DIAL BEN/342-5236 or visit https://www.franklintempleton.com/investments/options/mutual-funds.
Important data provider notices and terms available at www.franklintempletondatasources.com.
KEY FUND STATISTICS (as of December 31, 2024)
| |
Total Net Assets | $984,374,131 |
Total Number of Portfolio Holdings* | 5 |
Total Administrative Fee Paid | $294,270 |
Portfolio Turnover Rate | 10.38% |
| * | Does not include derivatives, except purchased options, if any. |
| Franklin Corefolio Allocation Fund | PAGE 2 | 8470-ATSR-0225 |
WHAT DID THE FUND INVEST IN? (as of December 31, 2024)
Portfolio Composition*,† (% of Total Investments)
| * | Does not include derivatives, except purchased options, if any. |
| † | Certain categories may represent less than 0.1%. |
| |
| WHERE CAN I FIND ADDITIONAL INFORMATION ABOUT THE FUND? |
Additional information is available on https://www.franklintempleton.com/regulatory-fund-documents, including its: |
| • prospectus • proxy voting information • financial information • holdings • tax information |
HOUSEHOLDING
You will receive the Fund’s shareholder reports every six months. In addition, you will receive an annual updated summary prospectus (detail prospectus available upon request). To reduce Fund expenses, we try to identify related shareholders in a household and send only one copy of the shareholder reports and summary prospectus. This process, called “householding,” will continue indefinitely unless you instruct us otherwise. If you prefer not to have these documents householded, please call us at (800) DIAL BEN/342-5236. At any time, you may view current prospectuses/summary prospectuses and shareholder reports on our website. If you choose, you may receive these documents through electronic delivery.
| Franklin Corefolio Allocation Fund | PAGE 3 | 8470-ATSR-0225 |
1000098801063612791119241505317867207541647920720240491000010048113271372113002170352059325877209072633432604100001013811351138291322317386205852649421696273993425410000996810781132681217915639182182229018337228142719376.523.50.0
| | |
Franklin Corefolio Allocation Fund | |
| Advisor Class [FCAZX] |
| Annual Shareholder Report | December 31, 2024 |
|
This annual shareholder report contains important information about Franklin Corefolio Allocation Fund for the period January 1, 2024, to December 31, 2024.
You can find additional information about the Fund at https://www.franklintempleton.com/regulatory-fund-documents. You can also request this information by contacting us at (800) DIAL BEN/342-5236.
WHAT WERE THE FUND COSTS FOR THE LAST YEAR? (based on a hypothetical $10,000 investment)
| | |
Class Name | Costs of a $10,000 investment | Costs paid as a percentage of a $10,000 investment* |
| Advisor Class | $15 | 0.14% |
| * | Reflects fee waivers and/or expense reimbursements, without which expenses would have been higher. |
HOW DID THE FUND PERFORM LAST YEAR AND WHAT AFFECTED ITS PERFORMANCE?
For the twelve months ended December 31, 2024, Advisor Class shares of Franklin Corefolio Allocation Fund returned 15.24%. The Fund compares its performance to the S&P 500 Index and the MSCI World Index which returned 25.02% and 19.19%, respectively, for the same period.
| |
Top contributors to performance: |
| ↑ | Franklin Growth Opportunities Fund: growth and technology focus aided relative performance, as did stock selection in the industrials sector including Axon Enterprises. |
| ↑ | Franklin Growth Fund: lack of exposure to energy and limited exposure to real estate. |
| ↑ | Franklin Mutual Shares Fund: allocation and selection in the information technology (IT) and real estate sectors. |
| ↑ | Templeton Growth Fund: selection in the industrials sector including Rolls Royce Holdings. |
| |
Top detractors from performance: |
| ↓ | Templeton Growth Fund: value focus held back returns, as did allocation and selection in the IT sector. |
| ↓ | Franklin Mutual Shares Fund: value focus held back returns, as did selection in the health care sector. |
| ↓ | Franklin Growth Fund: diversification strategy held back returns due to limited exposure to Magnifcent Seven, as did selection in the IT sector. |
| ↓ | Franklin Growth Opportunities Fund: diversification strategy held back returns due to limited exposure to Magnificent Seven, as did allocation and selection in the consumer discretionary sector. |
| Franklin Corefolio Allocation Fund | PAGE 1 | 670-ATSR-0225 |
HOW DID THE FUND PERFORM OVER THE LAST 10 YEARS?
The Fund’s past performance is not necessarily an indication of how the Fund will perform in the future. The graph and table do not reflect the deduction of taxes that a shareholder would pay on Fund distributions or redemption of Fund shares.
VALUE OF A $10,000 INVESTMENT – Advisor Class 12/31/2014 — 12/31/2024
AVERAGE ANNUAL TOTAL RETURNS (%) Period Ended December 31, 2024
| | | |
| | 1 Year | 5 Year | 10 Year |
Advisor Class | 15.24 | 9.59 | 9.10 |
Russell 3000 Index | 23.81 | 13.86 | 12.54 |
S&P 500 Index | 25.02 | 14.52 | 13.10 |
MSCI World Index | 19.19 | 11.69 | 10.52 |
Fund performance figures may reflect fee waivers and/or expense reimbursements, without which the performance would have been lower.
For current month-end performance, please call Franklin Templeton at (800) DIAL BEN/342-5236 or visit https://www.franklintempleton.com/investments/options/mutual-funds.
Important data provider notices and terms available at www.franklintempletondatasources.com.
KEY FUND STATISTICS (as of December 31, 2024)
| |
Total Net Assets | $984,374,131 |
Total Number of Portfolio Holdings* | 5 |
Total Administrative Fee Paid | $294,270 |
Portfolio Turnover Rate | 10.38% |
| * | Does not include derivatives, except purchased options, if any. |
| Franklin Corefolio Allocation Fund | PAGE 2 | 670-ATSR-0225 |
WHAT DID THE FUND INVEST IN? (as of December 31, 2024)
Portfolio Composition*,† (% of Total Investments)
| * | Does not include derivatives, except purchased options, if any. |
| † | Certain categories may represent less than 0.1%. |
| |
| WHERE CAN I FIND ADDITIONAL INFORMATION ABOUT THE FUND? |
Additional information is available on https://www.franklintempleton.com/regulatory-fund-documents, including its: |
| • prospectus • proxy voting information • financial information • holdings • tax information |
HOUSEHOLDING
You will receive the Fund’s shareholder reports every six months. In addition, you will receive an annual updated summary prospectus (detail prospectus available upon request). To reduce Fund expenses, we try to identify related shareholders in a household and send only one copy of the shareholder reports and summary prospectus. This process, called “householding,” will continue indefinitely unless you instruct us otherwise. If you prefer not to have these documents householded, please call us at (800) DIAL BEN/342-5236. At any time, you may view current prospectuses/summary prospectuses and shareholder reports on our website. If you choose, you may receive these documents through electronic delivery.
| Franklin Corefolio Allocation Fund | PAGE 3 | 670-ATSR-0225 |
1000099041068712867119861511417924208011650920733238921000010048113271372113002170352059325877209072633432604100001013811351138291322317386205852649421696273993425410000996810781132681217915639182182229018337228142719376.523.50.0
| | |
Franklin Global Allocation Fund | |
| Class A [FFALX] |
| Annual Shareholder Report | December 31, 2024 |
|
This annual shareholder report contains important information about Franklin Global Allocation Fund for the period January 1, 2024, to December 31, 2024.
You can find additional information about the Fund at https://www.franklintempleton.com/regulatory-fund-documents. You can also request this information by contacting us at (800) DIAL BEN/342-5236.
This report describes changes to the Fund that occurred during the reporting period.
WHAT WERE THE FUND COSTS FOR THE LAST YEAR? (based on a hypothetical $10,000 investment)
| | |
Class Name | Costs of a $10,000 investment | Costs paid as a percentage of a $10,000 investment* |
| Class A | $99 | 0.93% |
| * | Reflects fee waivers and/or expense reimbursements, without which expenses would have been higher. |
HOW DID THE FUND PERFORM LAST YEAR AND WHAT AFFECTED ITS PERFORMANCE?
For the twelve months ended December 31, 2024, Class A shares of Franklin Global Allocation Fund returned 12.87%. The Fund compares its performance to the MSCI All Country World Index-NR and the Blended Benchmark†, which returned 17.49% and 12.00%, respectively, for the same period.
| |
Top contributors to performance: |
| ↑ | Security selection. Within equities, information technology (IT), industrials and health care sectors. Within fixed income, corporate investment-grade and sovereign developed securities. |
| ↑ | Regional security selection. Key contributors were: North America, Arista Networks and Nvidia; Asia, Taiwan Semiconductor and MediaTek; Europe, Unicredit and 3i Group. |
| ↑ | Equity allocation. Overweight positions in Asia and IT and energy sectors; underweight positions in Australia/New Zealand and materials and real estate sectors. |
| |
Top detractors from performance: |
| ↓ | Overweight equity allocation to Latin America and the Caribbean. Key detractors included Quimica y Minera de Chile and Vibra Energia. |
| ↓ | Underweight equity allocation and selection in the financials sector. Key detractors included Ing Groep and Itausa. |
| ↓ | Underweight fixed income allocation to emerging market debt as well as selection within Latin America issues. |
Use of derivatives and the impact on performance:
The Fund utilized foreign currency contracts for hedging foreign currency exposure, which contributed to performance.
| Franklin Global Allocation Fund | PAGE 1 | 481-ATSR-0225 |
HOW DID THE FUND PERFORM OVER THE LAST 10 YEARS?
The Fund’s past performance is not necessarily an indication of how the Fund will perform in the future. The graph and table do not reflect the deduction of taxes that a shareholder would pay on Fund distributions or redemption of Fund shares.
VALUE OF A $10,000 INVESTMENT ($9,450 AFTER MAXIMUM APPLICABLE SALES CHARGE) –
Class A 12/31/2014 — 12/31/2024
AVERAGE ANNUAL TOTAL RETURNS (%) Period Ended December 31, 2024
| | | |
| | 1 Year | 5 Year | 10 Year |
Class A | 12.87 | 4.98 | 4.84 |
Class A (with sales charge) | 6.63 | 3.80 | 4.25 |
MSCI All Country World Index-NR | 17.49 | 10.06 | 9.23 |
Blended Benchmark† | 12.00 | 6.69 | 6.56 |
| † | The Fund’s Blended Benchmark is comprised of 60% MSCI All Country World Index-NR, 30% Bloomberg Multiverse (100% hedged to USD) Index and 10% cash and cash equivalents (as represented by the ICE BofA US 3-Month Treasury Bill Index). |
Fund performance figures may reflect fee waivers and/or expense reimbursements, without which the performance would have been lower.
Performance for periods prior to September 10, 2018, has been restated to reflect the current maximum sales charge, which is lower than the maximum sales charge prior to that date.
Effective February 1, 2021, the Fund adopted its current investment strategy.
For current month-end performance, please call Franklin Templeton at (800) DIAL BEN/342-5236 or visit https://www.franklintempleton.com/investments/options/mutual-funds.
Important data provider notices and terms available at www.franklintempletondatasources.com.
KEY FUND STATISTICS (as of December 31, 2024)
| |
Total Net Assets | $2,710,550,737 |
Total Number of Portfolio Holdings* | 242 |
Total Management Fee Paid | $15,406,326 |
Portfolio Turnover Rate | 59.82% |
| * | Does not include derivatives, except purchased options, if any. |
| Franklin Global Allocation Fund | PAGE 2 | 481-ATSR-0225 |
WHAT DID THE FUND INVEST IN? (as of December 31, 2024)
Portfolio Composition* (% of Total Investments)
| * | Does not include derivatives, except purchased options, if any. |
HOW HAS THE FUND CHANGED?
Effective June 3, 2024, Franklin Templeton Investments Corp. was appointed as sub-adviser to the Fund.
In addition, effective February 29, 2024, Jacqueline Kenney was added as a portfolio manager of the Fund and Kimberly Strand stepped down as a portfolio manager of the Fund. Effective June 3, 2024, Michael Greenberg was added as a portfolio manager of the Fund and Richard Hsu stepped down as a portfolio manager of the Fund.
Effective July 1, 2024, investments of $250,000 or more in Class A shares will not be charged a sales charge, but will be subject to a 1% contingent deferred sales charge, if sold within 18 months of purchase.
Effective May 1, 2024, the Fund’s operating expense limit was reduced from 0.73% to 0.70% and removed acquired fund fees and expenses from the operating expense limit.
This is a summary of certain changes to the Fund since January 1, 2024. For more complete information, you may review the Fund’s current prospectus and any applicable supplements and the Fund’s next prospectus, which we expect to be available by May 1, 2025, at https://www.franklintempleton.com/regulatory-fund-documents or upon request at (800) DIAL BEN/342-5236 or
prospectus@franklintempleton.com.
| |
| WHERE CAN I FIND ADDITIONAL INFORMATION ABOUT THE FUND? |
Additional information is available on https://www.franklintempleton.com/regulatory-fund-documents, including its: |
| • prospectus • proxy voting information • financial information • holdings • tax information |
HOUSEHOLDING
You will receive the Fund’s shareholder reports every six months. In addition, you will receive an annual updated summary prospectus (detail prospectus available upon request). To reduce Fund expenses, we try to identify related shareholders in a household and send only one copy of the shareholder reports and summary prospectus. This process, called “householding,” will continue indefinitely unless you instruct us otherwise. If you prefer not to have these documents householded, please call us at (800) DIAL BEN/342-5236. At any time, you may view current prospectuses/summary prospectuses and shareholder reports on our website. If you choose, you may receive these documents through electronic delivery.
| Franklin Global Allocation Fund | PAGE 3 | 481-ATSR-0225 |
9450886610065111921009311890120741349211896134331516710000976410531130561182714973174062063316844205842418310000990610524121091151413654153101691514528168511887463.213.27.56.04.02.30.33.5
| | |
Franklin Global Allocation Fund | |
| Class C [FFACX] |
| Annual Shareholder Report | December 31, 2024 |
|
This annual shareholder report contains important information about Franklin Global Allocation Fund for the period January 1, 2024, to December 31, 2024.
You can find additional information about the Fund at https://www.franklintempleton.com/regulatory-fund-documents. You can also request this information by contacting us at (800) DIAL BEN/342-5236.
This report describes changes to the Fund that occurred during the reporting period.
WHAT WERE THE FUND COSTS FOR THE LAST YEAR? (based on a hypothetical $10,000 investment)
| | |
Class Name | Costs of a $10,000 investment | Costs paid as a percentage of a $10,000 investment* |
| Class C | $178 | 1.68% |
| * | Reflects fee waivers and/or expense reimbursements, without which expenses would have been higher. |
HOW DID THE FUND PERFORM LAST YEAR AND WHAT AFFECTED ITS PERFORMANCE?
For the twelve months ended December 31, 2024, Class C shares of Franklin Global Allocation Fund returned 12.06%. The Fund compares its performance to the MSCI All Country World Index-NR and the Blended Benchmark†, which returned 17.49% and 12.00%, respectively, for the same period.
| |
Top contributors to performance: |
| ↑ | Security selection. Within equities, information technology (IT), industrials and health care sectors. Within fixed income, corporate investment-grade and sovereign developed securities. |
| ↑ | Regional security selection. Key contributors were: North America, Arista Networks and Nvidia; Asia, Taiwan Semiconductor and MediaTek; Europe, Unicredit and 3i Group. |
| ↑ | Equity allocation. Overweight positions in Asia and IT and energy sectors; underweight positions in Australia/New Zealand and materials and real estate sectors. |
| |
Top detractors from performance: |
| ↓ | Overweight equity allocation to Latin America and the Caribbean. Key detractors included Quimica y Minera de Chile and Vibra Energia. |
| ↓ | Underweight equity allocation and selection in the financials sector. Key detractors included Ing Groep and Itausa. |
| ↓ | Underweight fixed income allocation to emerging market debt as well as selection within Latin America issues. |
Use of derivatives and the impact on performance:
The Fund utilized foreign currency contracts for hedging foreign currency exposure, which contributed to performance.
| Franklin Global Allocation Fund | PAGE 1 | 282-ATSR-0225 |
HOW DID THE FUND PERFORM OVER THE LAST 10 YEARS?
The Fund’s past performance is not necessarily an indication of how the Fund will perform in the future. The graph and table do not reflect the deduction of taxes that a shareholder would pay on Fund distributions or redemption of Fund shares.
VALUE OF A $10,000 INVESTMENT – Class C 12/31/2014 — 12/31/2024
AVERAGE ANNUAL TOTAL RETURNS (%) Period Ended December 31, 2024
| | | |
| | 1 Year | 5 Year | 10 Year |
Class C | 12.06 | 4.19 | 4.06 |
Class C (with sales charge) | 11.06 | 4.19 | 4.06 |
MSCI All Country World Index-NR | 17.49 | 10.06 | 9.23 |
Blended Benchmark† | 12.00 | 6.69 | 6.56 |
| † | The Fund’s Blended Benchmark is comprised of 60% MSCI All Country World Index-NR, 30% Bloomberg Multiverse (100% hedged to USD) Index and 10% cash and cash equivalents (as represented by the ICE BofA US 3-Month Treasury Bill Index). |
Fund performance figures may reflect fee waivers and/or expense reimbursements, without which the performance would have been lower.
Effective February 1, 2021, the Fund adopted its current investment strategy.
For current month-end performance, please call Franklin Templeton at (800) DIAL BEN/342-5236 or visit https://www.franklintempleton.com/investments/options/mutual-funds.
Important data provider notices and terms available at www.franklintempletondatasources.com.
KEY FUND STATISTICS (as of December 31, 2024)
| |
Total Net Assets | $2,710,550,737 |
Total Number of Portfolio Holdings* | 242 |
Total Management Fee Paid | $15,406,326 |
Portfolio Turnover Rate | 59.82% |
| * | Does not include derivatives, except purchased options, if any. |
| Franklin Global Allocation Fund | PAGE 2 | 282-ATSR-0225 |
WHAT DID THE FUND INVEST IN? (as of December 31, 2024)
Portfolio Composition* (% of Total Investments)
| * | Does not include derivatives, except purchased options, if any. |
HOW HAS THE FUND CHANGED?
Effective June 3, 2024, Franklin Templeton Investments Corp. was appointed as sub-adviser to the Fund.
In addition, effective February 29, 2024, Jacqueline Kenney was added as a portfolio manager of the Fund and Kimberly Strand stepped down as a portfolio manager of the Fund. Effective June 3, 2024, Michael Greenberg was added as a portfolio manager of the Fund and Richard Hsu stepped down as a portfolio manager of the Fund.
Effective May 1, 2024, the Fund’s operating expense limit was reduced from 0.73% to 0.70% and removed acquired fund fees and expenses from the operating expense limit.
This is a summary of certain changes to the Fund since January 1, 2024. For more complete information, you may review the Fund’s current prospectus and any applicable supplements and the Fund’s next prospectus, which we expect to be available by May 1, 2025, at https://www.franklintempleton.com/regulatory-fund-documents or upon request at (800) DIAL BEN/342-5236 or
prospectus@franklintempleton.com.
| |
| WHERE CAN I FIND ADDITIONAL INFORMATION ABOUT THE FUND? |
Additional information is available on https://www.franklintempleton.com/regulatory-fund-documents, including its: |
| • prospectus • proxy voting information • financial information • holdings • tax information |
HOUSEHOLDING
You will receive the Fund’s shareholder reports every six months. In addition, you will receive an annual updated summary prospectus (detail prospectus available upon request). To reduce Fund expenses, we try to identify related shareholders in a household and send only one copy of the shareholder reports and summary prospectus. This process, called “householding,” will continue indefinitely unless you instruct us otherwise. If you prefer not to have these documents householded, please call us at (800) DIAL BEN/342-5236. At any time, you may view current prospectuses/summary prospectuses and shareholder reports on our website. If you choose, you may receive these documents through electronic delivery.
| Franklin Global Allocation Fund | PAGE 3 | 282-ATSR-0225 |
10000931510499115941037212126122221355311865132881489010000976410531130561182714973174062063316844205842418310000990610524121091151413654153101691514528168511887463.213.27.56.04.02.30.33.5
| | |
Franklin Global Allocation Fund | |
| Class R [FFARX] |
| Annual Shareholder Report | December 31, 2024 |
|
This annual shareholder report contains important information about Franklin Global Allocation Fund for the period January 1, 2024, to December 31, 2024.
You can find additional information about the Fund at https://www.franklintempleton.com/regulatory-fund-documents. You can also request this information by contacting us at (800) DIAL BEN/342-5236.
This report describes changes to the Fund that occurred during the reporting period.
WHAT WERE THE FUND COSTS FOR THE LAST YEAR? (based on a hypothetical $10,000 investment)
| | |
Class Name | Costs of a $10,000 investment | Costs paid as a percentage of a $10,000 investment* |
| Class R | $125 | 1.18% |
| * | Reflects fee waivers and/or expense reimbursements, without which expenses would have been higher. |
HOW DID THE FUND PERFORM LAST YEAR AND WHAT AFFECTED ITS PERFORMANCE?
For the twelve months ended December 31, 2024, Class R shares of Franklin Global Allocation Fund returned 12.57%. The Fund compares its performance to the MSCI All Country World Index-NR and the Blended Benchmark†, which returned 17.49% and 12.00%, respectively, for the same period.
| |
Top contributors to performance: |
| ↑ | Security selection. Within equities, information technology (IT), industrials and health care sectors. Within fixed income, corporate investment-grade and sovereign developed securities. |
| ↑ | Regional security selection. Key contributors were: North America, Arista Networks and Nvidia; Asia, Taiwan Semiconductor and MediaTek; Europe, Unicredit and 3i Group. |
| ↑ | Equity allocation. Overweight positions in Asia and IT and energy sectors; underweight positions in Australia/New Zealand and materials and real estate sectors. |
| |
Top detractors from performance: |
| ↓ | Overweight equity allocation to Latin America and the Caribbean. Key detractors included Quimica y Minera de Chile and Vibra Energia. |
| ↓ | Underweight equity allocation and selection in the financials sector. Key detractors included Ing Groep and Itausa. |
| ↓ | Underweight fixed income allocation to emerging market debt as well as selection within Latin America issues. |
Use of derivatives and the impact on performance:
The Fund utilized foreign currency contracts for hedging foreign currency exposure, which contributed to performance.
| Franklin Global Allocation Fund | PAGE 1 | 871-ATSR-0225 |
HOW DID THE FUND PERFORM OVER THE LAST 10 YEARS?
The Fund’s past performance is not necessarily an indication of how the Fund will perform in the future. The graph and table do not reflect the deduction of taxes that a shareholder would pay on Fund distributions or redemption of Fund shares.
VALUE OF A $10,000 INVESTMENT – Class R 12/31/2014 — 12/31/2024
AVERAGE ANNUAL TOTAL RETURNS (%) Period Ended December 31, 2024
| | | |
| | 1 Year | 5 Year | 10 Year |
Class R | 12.57 | 4.72 | 4.58 |
MSCI All Country World Index-NR | 17.49 | 10.06 | 9.23 |
Blended Benchmark† | 12.00 | 6.69 | 6.56 |
| † | The Fund’s Blended Benchmark is comprised of 60% MSCI All Country World Index-NR, 30% Bloomberg Multiverse (100% hedged to USD) Index and 10% cash and cash equivalents (as represented by the ICE BofA US 3-Month Treasury Bill Index). |
Fund performance figures may reflect fee waivers and/or expense reimbursements, without which the performance would have been lower.
Effective February 1, 2021, the Fund adopted its current investment strategy.
For current month-end performance, please call Franklin Templeton at (800) DIAL BEN/342-5236 or visit https://www.franklintempleton.com/investments/options/mutual-funds.
Important data provider notices and terms available at www.franklintempletondatasources.com.
KEY FUND STATISTICS (as of December 31, 2024)
| |
Total Net Assets | $2,710,550,737 |
Total Number of Portfolio Holdings* | 242 |
Total Management Fee Paid | $15,406,326 |
Portfolio Turnover Rate | 59.82% |
| * | Does not include derivatives, except purchased options, if any. |
| Franklin Global Allocation Fund | PAGE 2 | 871-ATSR-0225 |
WHAT DID THE FUND INVEST IN? (as of December 31, 2024)
Portfolio Composition* (% of Total Investments)
| * | Does not include derivatives, except purchased options, if any. |
HOW HAS THE FUND CHANGED?
Effective June 3, 2024, Franklin Templeton Investments Corp. was appointed as sub-adviser to the Fund.
In addition, effective February 29, 2024, Jacqueline Kenney was added as a portfolio manager of the Fund and Kimberly Strand stepped down as a portfolio manager of the Fund. Effective June 3, 2024, Michael Greenberg was added as a portfolio manager of the Fund and Richard Hsu stepped down as a portfolio manager of the Fund.
Effective May 1, 2024, the Fund’s operating expense limit was reduced from 0.73% to 0.70% and removed acquired fund fees and expenses from the operating expense limit.
This is a summary of certain changes to the Fund since January 1, 2024. For more complete information, you may review the Fund’s current prospectus and any applicable supplements and the Fund’s next prospectus, which we expect to be available by May 1, 2025, at https://www.franklintempleton.com/regulatory-fund-documents or upon request at (800) DIAL BEN/342-5236 or
prospectus@franklintempleton.com.
| |
| WHERE CAN I FIND ADDITIONAL INFORMATION ABOUT THE FUND? |
Additional information is available on https://www.franklintempleton.com/regulatory-fund-documents, including its: |
| • prospectus • proxy voting information • financial information • holdings • tax information |
HOUSEHOLDING
You will receive the Fund’s shareholder reports every six months. In addition, you will receive an annual updated summary prospectus (detail prospectus available upon request). To reduce Fund expenses, we try to identify related shareholders in a household and send only one copy of the shareholder reports and summary prospectus. This process, called “householding,” will continue indefinitely unless you instruct us otherwise. If you prefer not to have these documents householded, please call us at (800) DIAL BEN/342-5236. At any time, you may view current prospectuses/summary prospectuses and shareholder reports on our website. If you choose, you may receive these documents through electronic delivery.
| Franklin Global Allocation Fund | PAGE 3 | 871-ATSR-0225 |
10000936010597117591058212427125861403412342139001564710000976410531130561182714973174062063316844205842418310000990610524121091151413654153101691514528168511887463.213.27.56.04.02.30.33.5
| | |
Franklin Global Allocation Fund | |
| Class R6 [FFAQX] |
| Annual Shareholder Report | December 31, 2024 |
|
This annual shareholder report contains important information about Franklin Global Allocation Fund for the period January 1, 2024, to December 31, 2024.
You can find additional information about the Fund at https://www.franklintempleton.com/regulatory-fund-documents. You can also request this information by contacting us at (800) DIAL BEN/342-5236.
This report describes changes to the Fund that occurred during the reporting period.
WHAT WERE THE FUND COSTS FOR THE LAST YEAR? (based on a hypothetical $10,000 investment)
| | |
Class Name | Costs of a $10,000 investment | Costs paid as a percentage of a $10,000 investment* |
| Class R6 | $66 | 0.62% |
| * | Reflects fee waivers and/or expense reimbursements, without which expenses would have been higher. |
HOW DID THE FUND PERFORM LAST YEAR AND WHAT AFFECTED ITS PERFORMANCE?
For the twelve months ended December 31, 2024, Class R6 shares of Franklin Global Allocation Fund returned 13.28%. The Fund compares its performance to the MSCI All Country World Index-NR and the Blended Benchmark†, which returned 17.49% and 12.00%, respectively, for the same period.
| |
Top contributors to performance: |
| ↑ | Security selection. Within equities, information technology (IT), industrials and health care sectors. Within fixed income, corporate investment-grade and sovereign developed securities. |
| ↑ | Regional security selection. Key contributors were: North America, Arista Networks and Nvidia; Asia, Taiwan Semiconductor and MediaTek; Europe, Unicredit and 3i Group. |
| ↑ | Equity allocation. Overweight positions in Asia and IT and energy sectors; underweight positions in Australia/New Zealand and materials and real estate sectors. |
| |
Top detractors from performance: |
| ↓ | Overweight equity allocation to Latin America and the Caribbean. Key detractors included Quimica y Minera de Chile and Vibra Energia. |
| ↓ | Underweight equity allocation and selection in the financials sector. Key detractors included Ing Groep and Itausa. |
| ↓ | Underweight fixed income allocation to emerging market debt as well as selection within Latin America issues. |
Use of derivatives and the impact on performance:
The Fund utilized foreign currency contracts for hedging foreign currency exposure, which contributed to performance.
| Franklin Global Allocation Fund | PAGE 1 | 8481-ATSR-0225 |
HOW DID THE FUND PERFORM OVER THE LAST 10 YEARS?
The Fund’s past performance is not necessarily an indication of how the Fund will perform in the future. The graph and table do not reflect the deduction of taxes that a shareholder would pay on Fund distributions or redemption of Fund shares.
VALUE OF A $10,000 INVESTMENT – Class R6 12/31/2014 — 12/31/2024
AVERAGE ANNUAL TOTAL RETURNS (%) Period Ended December 31, 2024
| | | |
| | 1 Year | 5 Year | 10 Year |
Class R6 | 13.28 | 5.33 | 5.17 |
MSCI All Country World Index-NR | 17.49 | 10.06 | 9.23 |
Blended Benchmark† | 12.00 | 6.69 | 6.56 |
| † | The Fund’s Blended Benchmark is comprised of 60% MSCI All Country World Index-NR, 30% Bloomberg Multiverse (100% hedged to USD) Index and 10% cash and cash equivalents (as represented by the ICE BofA US 3-Month Treasury Bill Index). |
Fund performance figures may reflect fee waivers and/or expense reimbursements, without which the performance would have been lower.
The Fund began offering Class R6 shares on 8/1/2017. Returns for periods before 8/1/2017, are based on the Fund’s Advisor Class performance, which has been adjusted to take into account differences in class-specific operating expenses and maximum sales charges. For periods after the share class offering, performance for the specific share class is used, reflecting the applicable expenses and maximum sales charges.
Effective February 1, 2021, the Fund adopted its current investment strategy.
For current month-end performance, please call Franklin Templeton at (800) DIAL BEN/342-5236 or visit https://www.franklintempleton.com/investments/options/mutual-funds.
Important data provider notices and terms available at www.franklintempletondatasources.com.
KEY FUND STATISTICS (as of December 31, 2024)
| |
Total Net Assets | $2,710,550,737 |
Total Number of Portfolio Holdings* | 242 |
Total Management Fee Paid | $15,406,326 |
Portfolio Turnover Rate | 59.82% |
| * | Does not include derivatives, except purchased options, if any. |
| Franklin Global Allocation Fund | PAGE 2 | 8481-ATSR-0225 |
WHAT DID THE FUND INVEST IN? (as of December 31, 2024)
Portfolio Composition* (% of Total Investments)
| * | Does not include derivatives, except purchased options, if any. |
HOW HAS THE FUND CHANGED?
Effective June 3, 2024, Franklin Templeton Investments Corp. was appointed as sub-adviser to the Fund.
In addition, effective February 29, 2024, Jacqueline Kenney was added as a portfolio manager of the Fund and Kimberly Strand stepped down as a portfolio manager of the Fund. Effective June 3, 2024, Michael Greenberg was added as a portfolio manager of the Fund and Richard Hsu stepped down as a portfolio manager of the Fund.
Effective May 1, 2024, the Fund’s operating expense limit was reduced from 0.73% to 0.70% and removed acquired fund fees and expenses from the operating expense limit.
This is a summary of certain changes to the Fund since January 1, 2024. For more complete information, you may review the Fund’s current prospectus and any applicable supplements and the Fund’s next prospectus, which we expect to be available by May 1, 2025, at https://www.franklintempleton.com/regulatory-fund-documents or upon request at (800) DIAL BEN/342-5236 or
prospectus@franklintempleton.com.
| |
| WHERE CAN I FIND ADDITIONAL INFORMATION ABOUT THE FUND? |
Additional information is available on https://www.franklintempleton.com/regulatory-fund-documents, including its: |
| • prospectus • proxy voting information • financial information • holdings • tax information |
HOUSEHOLDING
You will receive the Fund’s shareholder reports every six months. In addition, you will receive an annual updated summary prospectus (detail prospectus available upon request). To reduce Fund expenses, we try to identify related shareholders in a household and send only one copy of the shareholder reports and summary prospectus. This process, called “householding,” will continue indefinitely unless you instruct us otherwise. If you prefer not to have these documents householded, please call us at (800) DIAL BEN/342-5236. At any time, you may view current prospectuses/summary prospectuses and shareholder reports on our website. If you choose, you may receive these documents through electronic delivery.
| Franklin Global Allocation Fund | PAGE 3 | 8481-ATSR-0225 |
10000938210651118761074012692129381464612944146601655410000976410531130561182714973174062063316844205842418310000990610524121091151413654153101691514528168511887463.213.27.56.04.02.30.33.5
| | |
Franklin Global Allocation Fund | |
| Advisor Class [FFAAX] |
| Annual Shareholder Report | December 31, 2024 |
|
This annual shareholder report contains important information about Franklin Global Allocation Fund for the period January 1, 2024, to December 31, 2024.
You can find additional information about the Fund at https://www.franklintempleton.com/regulatory-fund-documents. You can also request this information by contacting us at (800) DIAL BEN/342-5236.
This report describes changes to the Fund that occurred during the reporting period.
WHAT WERE THE FUND COSTS FOR THE LAST YEAR? (based on a hypothetical $10,000 investment)
| | |
Class Name | Costs of a $10,000 investment | Costs paid as a percentage of a $10,000 investment* |
| Advisor Class | $72 | 0.68% |
| * | Reflects fee waivers and/or expense reimbursements, without which expenses would have been higher. |
HOW DID THE FUND PERFORM LAST YEAR AND WHAT AFFECTED ITS PERFORMANCE?
For the twelve months ended December 31, 2024, Advisor Class shares of Franklin Global Allocation Fund returned 13.11%. The Fund compares its performance to the MSCI All Country World Index-NR and the Blended Benchmark†, which returned 17.49% and 12.00%, respectively, for the same period.
| |
Top contributors to performance: |
| ↑ | Security selection. Within equities, information technology (IT), industrials and health care sectors. Within fixed income, corporate investment-grade and sovereign developed securities. |
| ↑ | Regional security selection. Key contributors were: North America, Arista Networks and Nvidia; Asia, Taiwan Semiconductor and MediaTek; Europe, Unicredit and 3i Group. |
| ↑ | Equity allocation. Overweight positions in Asia and IT and energy sectors; underweight positions in Australia/New Zealand and materials and real estate sectors. |
| |
Top detractors from performance: |
| ↓ | Overweight equity allocation to Latin America and the Caribbean. Key detractors included Quimica y Minera de Chile and Vibra Energia. |
| ↓ | Underweight equity allocation and selection in the financials sector. Key detractors included Ing Groep and Itausa. |
| ↓ | Underweight fixed income allocation to emerging market debt as well as selection within Latin America issues. |
Use of derivatives and the impact on performance:
The Fund utilized foreign currency contracts for hedging foreign currency exposure, which contributed to performance.
| Franklin Global Allocation Fund | PAGE 1 | 671-ATSR-0225 |
HOW DID THE FUND PERFORM OVER THE LAST 10 YEARS?
The Fund’s past performance is not necessarily an indication of how the Fund will perform in the future. The graph and table do not reflect the deduction of taxes that a shareholder would pay on Fund distributions or redemption of Fund shares.
VALUE OF A $10,000 INVESTMENT – Advisor Class 12/31/2014 — 12/31/2024
AVERAGE ANNUAL TOTAL RETURNS (%) Period Ended December 31, 2024
| | | |
| | 1 Year | 5 Year | 10 Year |
Advisor Class | 13.11 | 5.23 | 5.10 |
MSCI All Country World Index-NR | 17.49 | 10.06 | 9.23 |
Blended Benchmark† | 12.00 | 6.69 | 6.56 |
| † | The Fund’s Blended Benchmark is comprised of 60% MSCI All Country World Index-NR, 30% Bloomberg Multiverse (100% hedged to USD) Index and 10% cash and cash equivalents (as represented by the ICE BofA US 3-Month Treasury Bill Index). |
Fund performance figures may reflect fee waivers and/or expense reimbursements, without which the performance would have been lower.
Effective February 1, 2021, the Fund adopted its current investment strategy.
For current month-end performance, please call Franklin Templeton at (800) DIAL BEN/342-5236 or visit https://www.franklintempleton.com/investments/options/mutual-funds.
Important data provider notices and terms available at www.franklintempletondatasources.com.
KEY FUND STATISTICS (as of December 31, 2024)
| |
Total Net Assets | $2,710,550,737 |
Total Number of Portfolio Holdings* | 242 |
Total Management Fee Paid | $15,406,326 |
Portfolio Turnover Rate | 59.82% |
| * | Does not include derivatives, except purchased options, if any. |
| Franklin Global Allocation Fund | PAGE 2 | 671-ATSR-0225 |
WHAT DID THE FUND INVEST IN? (as of December 31, 2024)
Portfolio Composition* (% of Total Investments)
| * | Does not include derivatives, except purchased options, if any. |
HOW HAS THE FUND CHANGED?
Effective June 3, 2024, Franklin Templeton Investments Corp. was appointed as sub-adviser to the Fund.
In addition, effective February 29, 2024, Jacqueline Kenney was added as a portfolio manager of the Fund and Kimberly Strand stepped down as a portfolio manager of the Fund. Effective June 3, 2024, Michael Greenberg was added as a portfolio manager of the Fund and Richard Hsu stepped down as a portfolio manager of the Fund.
Effective May 1, 2024, the Fund’s operating expense limit was reduced from 0.73% to 0.70% and removed acquired fund fees and expenses from the operating expense limit.
This is a summary of certain changes to the Fund since January 1, 2024. For more complete information, you may review the Fund’s current prospectus and any applicable supplements and the Fund’s next prospectus, which we expect to be available by May 1, 2025, at https://www.franklintempleton.com/regulatory-fund-documents or upon request at (800) DIAL BEN/342-5236 or
prospectus@franklintempleton.com.
| |
| WHERE CAN I FIND ADDITIONAL INFORMATION ABOUT THE FUND? |
Additional information is available on https://www.franklintempleton.com/regulatory-fund-documents, including its: |
| • prospectus • proxy voting information • financial information • holdings • tax information |
HOUSEHOLDING
You will receive the Fund’s shareholder reports every six months. In addition, you will receive an annual updated summary prospectus (detail prospectus available upon request). To reduce Fund expenses, we try to identify related shareholders in a household and send only one copy of the shareholder reports and summary prospectus. This process, called “householding,” will continue indefinitely unless you instruct us otherwise. If you prefer not to have these documents householded, please call us at (800) DIAL BEN/342-5236. At any time, you may view current prospectuses/summary prospectuses and shareholder reports on our website. If you choose, you may receive these documents through electronic delivery.
| Franklin Global Allocation Fund | PAGE 3 | 671-ATSR-0225 |
10000940210701119401079312743129711452912838145391644610000976410531130561182714973174062063316844205842418310000990610524121091151413654153101691514528168511887463.213.27.56.04.02.30.33.5
| | |
Franklin LifeSmart Retirement Income Fund | |
| Class A [FTRAX] |
| Annual Shareholder Report | December 31, 2024 |
|
This annual shareholder report contains important information about Franklin LifeSmart Retirement Income Fund for the period January 1, 2024, to December 31, 2024.
You can find additional information about the Fund at https://www.franklintempleton.com/regulatory-fund-documents. You can also request this information by contacting us at (800) DIAL BEN/342-5236.
WHAT WERE THE FUND COSTS FOR THE LAST YEAR? (based on a hypothetical $10,000 investment)
| | |
Class Name | Costs of a $10,000 investment | Costs paid as a percentage of a $10,000 investment* |
Class A1 | $31 | 0.30% |
| * | Reflects waiver of fees and/or reimbursement of expenses (including acquired fund fees and expenses), without which expenses would be higher. |
| 1 | Excludes fees and expenses of the underlying funds in which the Fund invests. |
HOW DID THE FUND PERFORM LAST YEAR AND WHAT AFFECTED ITS PERFORMANCE?
For the twelve months ended December 31, 2024, Class A shares of Franklin LifeSmart Retirement Income Fund returned 8.32%. The Fund compares its performance to the MSCI All Country World Index-NR and the Bloomberg Multiverse Index, which returned 17.49% and -1.34%, respectively, for the same period.
| |
Top contributors to performance: |
| ↑ | Fund selection in fixed income. |
| ↑ | Fund selection in U.S. fixed income, reflecting a preference for short duration at points in 2024. |
| ↑ | Underweight in international equity, reflecting a preference for U.S. equities. |
| |
Top detractors from performance: |
| ↓ | Fund selection in equity, reflecting a focus on high dividend funds and ETFs. |
| ↓ | Fund selection in U.S. equity. |
| ↓ | Equity underweight, reflecting prioritization of both income generation and portfolio downside protection. |
| Franklin LifeSmart Retirement Income Fund | PAGE 1 | 427-ATSR-0225 |
HOW DID THE FUND PERFORM OVER THE LAST 10 YEARS?
The Fund’s past performance is not necessarily an indication of how the Fund will perform in the future. The graph and table do not reflect the deduction of taxes that a shareholder would pay on Fund distributions or redemption of Fund shares.
VALUE OF A $10,000 INVESTMENT ($9,450 AFTER MAXIMUM APPLICABLE SALES CHARGE) –
Class A 12/31/2014 — 12/31/2024
AVERAGE ANNUAL TOTAL RETURNS (%) Period Ended December 31, 2024
| | | |
| | 1 Year | 5 Year | 10 Year |
Class A | 8.32 | 4.02 | 3.63 |
Class A (with sales charge) | 2.37 | 2.85 | 3.05 |
Bloomberg U.S. Aggregate Index | 1.25 | -0.33 | 1.35 |
MSCI All Country World Index-NR | 17.49 | 10.06 | 9.23 |
Bloomberg Multiverse Index | -1.34 | -1.76 | 0.35 |
Reflects waiver of fees and/or reimbursement of expenses (including acquired fund fees and expenses), without which expenses would be higher.
Performance for periods prior to September 10, 2018, has been restated to reflect the current maximum sales charge, which is lower than the maximum sales charge prior to that date.
The Fund was able to successfully meet its monthly distributions under its managed distribution policy without the return of capital.
For current month-end performance, please call Franklin Templeton at (800) DIAL BEN/342-5236 or visit https://www.franklintempleton.com/investments/options/mutual-funds.
Important data provider notices and terms available at www.franklintempletondatasources.com.
KEY FUND STATISTICS (as of December 31, 2024)
| |
Total Net Assets | $44,850,105 |
Total Number of Portfolio Holdings* | 15 |
Total Management Fee Paid | $0 |
Portfolio Turnover Rate | 38.32% |
| * | Does not include derivatives, except purchased options, if any. |
| Franklin LifeSmart Retirement Income Fund | PAGE 2 | 427-ATSR-0225 |
WHAT DID THE FUND INVEST IN? (as of December 31, 2024)
Portfolio Composition* (% of Total Investments)
| * | Does not include derivatives, except purchased options, if any. |
| |
| WHERE CAN I FIND ADDITIONAL INFORMATION ABOUT THE FUND? |
Additional information is available on https://www.franklintempleton.com/regulatory-fund-documents, including its: |
| • prospectus • proxy voting information • financial information • holdings • tax information |
HOUSEHOLDING
You will receive the Fund’s shareholder reports every six months. In addition, you will receive an annual updated summary prospectus (detail prospectus available upon request). To reduce Fund expenses, we try to identify related shareholders in a household and send only one copy of the shareholder reports and summary prospectus. This process, called “householding,” will continue indefinitely unless you instruct us otherwise. If you prefer not to have these documents householded, please call us at (800) DIAL BEN/342-5236. At any time, you may view current prospectuses/summary prospectuses and shareholder reports on our website. If you choose, you may receive these documents through electronic delivery.
| Franklin LifeSmart Retirement Income Fund | PAGE 3 | 427-ATSR-0225 |
9450920596881015799051108612017126671116812465135011000010055103211068710688116201249212299106991129111432100009764105311305611827149731740620633168442058424183100009671994610710105651131812339117839896104941035430.628.827.65.45.22.4
| | |
Franklin LifeSmart Retirement Income Fund | |
| Class C [FRTCX] |
| Annual Shareholder Report | December 31, 2024 |
|
This annual shareholder report contains important information about Franklin LifeSmart Retirement Income Fund for the period January 1, 2024, to December 31, 2024.
You can find additional information about the Fund at https://www.franklintempleton.com/regulatory-fund-documents. You can also request this information by contacting us at (800) DIAL BEN/342-5236.
WHAT WERE THE FUND COSTS FOR THE LAST YEAR? (based on a hypothetical $10,000 investment)
| | |
Class Name | Costs of a $10,000 investment | Costs paid as a percentage of a $10,000 investment* |
Class C1 | $109 | 1.05% |
| * | Reflects waiver of fees and/or reimbursement of expenses (including acquired fund fees and expenses), without which expenses would be higher. |
| 1 | Excludes fees and expenses of the underlying funds in which the Fund invests. |
HOW DID THE FUND PERFORM LAST YEAR AND WHAT AFFECTED ITS PERFORMANCE?
For the twelve months ended December 31, 2024, Class C shares of Franklin LifeSmart Retirement Income Fund returned 7.48%. The Fund compares its performance to the MSCI All Country World Index-NR and the Bloomberg Multiverse Index, which returned 17.49% and -1.34%, respectively, for the same period.
| |
Top contributors to performance: |
| ↑ | Fund selection in fixed income. |
| ↑ | Fund selection in U.S. fixed income, reflecting a preference for short duration at points in 2024. |
| ↑ | Underweight in international equity, reflecting a preference for U.S. equities. |
| |
Top detractors from performance: |
| ↓ | Fund selection in equity, reflecting a focus on high dividend funds and ETFs. |
| ↓ | Fund selection in U.S. equity. |
| ↓ | Equity underweight, reflecting prioritization of both income generation and portfolio downside protection. |
| Franklin LifeSmart Retirement Income Fund | PAGE 1 | 527-ATSR-0225 |
HOW DID THE FUND PERFORM OVER THE LAST 10 YEARS?
The Fund’s past performance is not necessarily an indication of how the Fund will perform in the future. The graph and table do not reflect the deduction of taxes that a shareholder would pay on Fund distributions or redemption of Fund shares.
VALUE OF A $10,000 INVESTMENT – Class C 12/31/2014 — 12/31/2024
AVERAGE ANNUAL TOTAL RETURNS (%) Period Ended December 31, 2024
| | | |
| | 1 Year | 5 Year | 10 Year |
Class C | 7.48 | 3.24 | 2.86 |
Class C (with sales charge) | 6.48 | 3.24 | 2.86 |
Bloomberg U.S. Aggregate Index | 1.25 | -0.33 | 1.35 |
MSCI All Country World Index-NR | 17.49 | 10.06 | 9.23 |
Bloomberg Multiverse Index | -1.34 | -1.76 | 0.35 |
Reflects waiver of fees and/or reimbursement of expenses (including acquired fund fees and expenses), without which expenses would be higher.
The Fund was able to successfully meet its monthly distributions under its managed distribution policy without the return of capital.
For current month-end performance, please call Franklin Templeton at (800) DIAL BEN/342-5236 or visit https://www.franklintempleton.com/investments/options/mutual-funds.
Important data provider notices and terms available at www.franklintempletondatasources.com.
KEY FUND STATISTICS (as of December 31, 2024)
| |
Total Net Assets | $44,850,105 |
Total Number of Portfolio Holdings* | 15 |
Total Management Fee Paid | $0 |
Portfolio Turnover Rate | 38.32% |
| * | Does not include derivatives, except purchased options, if any. |
| Franklin LifeSmart Retirement Income Fund | PAGE 2 | 527-ATSR-0225 |
WHAT DID THE FUND INVEST IN? (as of December 31, 2024)
Portfolio Composition* (% of Total Investments)
| * | Does not include derivatives, except purchased options, if any. |
| |
| WHERE CAN I FIND ADDITIONAL INFORMATION ABOUT THE FUND? |
Additional information is available on https://www.franklintempleton.com/regulatory-fund-documents, including its: |
| • prospectus • proxy voting information • financial information • holdings • tax information |
HOUSEHOLDING
You will receive the Fund’s shareholder reports every six months. In addition, you will receive an annual updated summary prospectus (detail prospectus available upon request). To reduce Fund expenses, we try to identify related shareholders in a household and send only one copy of the shareholder reports and summary prospectus. This process, called “householding,” will continue indefinitely unless you instruct us otherwise. If you prefer not to have these documents householded, please call us at (800) DIAL BEN/342-5236. At any time, you may view current prospectuses/summary prospectuses and shareholder reports on our website. If you choose, you may receive these documents through electronic delivery.
| Franklin LifeSmart Retirement Income Fund | PAGE 3 | 527-ATSR-0225 |
1000096681010310514101681130112162127171112412334132561000010055103211068710688116201249212299106991129111432100009764105311305611827149731740620633168442058424183100009671994610710105651131812339117839896104941035430.628.827.65.45.22.4
| | |
Franklin LifeSmart Retirement Income Fund | |
| Class R [FBRLX] |
| Annual Shareholder Report | December 31, 2024 |
|
This annual shareholder report contains important information about Franklin LifeSmart Retirement Income Fund for the period January 1, 2024, to December 31, 2024.
You can find additional information about the Fund at https://www.franklintempleton.com/regulatory-fund-documents. You can also request this information by contacting us at (800) DIAL BEN/342-5236.
WHAT WERE THE FUND COSTS FOR THE LAST YEAR? (based on a hypothetical $10,000 investment)
| | |
Class Name | Costs of a $10,000 investment | Costs paid as a percentage of a $10,000 investment* |
Class R1 | $57 | 0.55% |
| * | Reflects waiver of fees and/or reimbursement of expenses (including acquired fund fees and expenses), without which expenses would be higher. |
| 1 | Excludes fees and expenses of the underlying funds in which the Fund invests. |
HOW DID THE FUND PERFORM LAST YEAR AND WHAT AFFECTED ITS PERFORMANCE?
For the twelve months ended December 31, 2024, Class R shares of Franklin LifeSmart Retirement Income Fund returned 7.97%. The Fund compares its performance to the MSCI All Country World Index-NR and the Bloomberg Multiverse Index, which returned 17.49% and -1.34%, respectively, for the same period.
| |
Top contributors to performance: |
| ↑ | Fund selection in fixed income. |
| ↑ | Fund selection in U.S. fixed income, reflecting a preference for short duration at points in 2024. |
| ↑ | Underweight in international equity, reflecting a preference for U.S. equities. |
| |
Top detractors from performance: |
| ↓ | Fund selection in equity, reflecting a focus on high dividend funds and ETFs. |
| ↓ | Fund selection in U.S. equity. |
| ↓ | Equity underweight, reflecting prioritization of both income generation and portfolio downside protection. |
| Franklin LifeSmart Retirement Income Fund | PAGE 1 | 827-ATSR-0225 |
HOW DID THE FUND PERFORM OVER THE LAST 10 YEARS?
The Fund’s past performance is not necessarily an indication of how the Fund will perform in the future. The graph and table do not reflect the deduction of taxes that a shareholder would pay on Fund distributions or redemption of Fund shares.
VALUE OF A $10,000 INVESTMENT – Class R 12/31/2014 — 12/31/2024
AVERAGE ANNUAL TOTAL RETURNS (%) Period Ended December 31, 2024
| | | |
| | 1 Year | 5 Year | 10 Year |
Class R | 7.97 | 3.78 | 3.38 |
Bloomberg U.S. Aggregate Index | 1.25 | -0.33 | 1.35 |
MSCI All Country World Index-NR | 17.49 | 10.06 | 9.23 |
Bloomberg Multiverse Index | -1.34 | -1.76 | 0.35 |
Reflects waiver of fees and/or reimbursement of expenses (including acquired fund fees and expenses), without which expenses would be higher.
The Fund was able to successfully meet its monthly distributions under its managed distribution policy without the return of capital.
For current month-end performance, please call Franklin Templeton at (800) DIAL BEN/342-5236 or visit https://www.franklintempleton.com/investments/options/mutual-funds.
Important data provider notices and terms available at www.franklintempletondatasources.com.
KEY FUND STATISTICS (as of December 31, 2024)
| |
Total Net Assets | $44,850,105 |
Total Number of Portfolio Holdings* | 15 |
Total Management Fee Paid | $0 |
Portfolio Turnover Rate | 38.32% |
| * | Does not include derivatives, except purchased options, if any. |
| Franklin LifeSmart Retirement Income Fund | PAGE 2 | 827-ATSR-0225 |
WHAT DID THE FUND INVEST IN? (as of December 31, 2024)
Portfolio Composition* (% of Total Investments)
| * | Does not include derivatives, except purchased options, if any. |
| |
| WHERE CAN I FIND ADDITIONAL INFORMATION ABOUT THE FUND? |
Additional information is available on https://www.franklintempleton.com/regulatory-fund-documents, including its: |
| • prospectus • proxy voting information • financial information • holdings • tax information |
HOUSEHOLDING
You will receive the Fund’s shareholder reports every six months. In addition, you will receive an annual updated summary prospectus (detail prospectus available upon request). To reduce Fund expenses, we try to identify related shareholders in a household and send only one copy of the shareholder reports and summary prospectus. This process, called “householding,” will continue indefinitely unless you instruct us otherwise. If you prefer not to have these documents householded, please call us at (800) DIAL BEN/342-5236. At any time, you may view current prospectuses/summary prospectuses and shareholder reports on our website. If you choose, you may receive these documents through electronic delivery.
| Franklin LifeSmart Retirement Income Fund | PAGE 3 | 827-ATSR-0225 |
1000097131019410660103751158812541131871160012917139471000010055103211068710688116201249212299106991129111432100009764105311305611827149731740620633168442058424183100009671994610710105651131812339117839896104941035430.628.827.65.45.22.4
| | |
Franklin LifeSmart Retirement Income Fund | |
| Class R6 [FLMTX] |
| Annual Shareholder Report | December 31, 2024 |
|
This annual shareholder report contains important information about Franklin LifeSmart Retirement Income Fund for the period January 1, 2024, to December 31, 2024.
You can find additional information about the Fund at https://www.franklintempleton.com/regulatory-fund-documents. You can also request this information by contacting us at (800) DIAL BEN/342-5236.
WHAT WERE THE FUND COSTS FOR THE LAST YEAR? (based on a hypothetical $10,000 investment)
| | |
Class Name | Costs of a $10,000 investment | Costs paid as a percentage of a $10,000 investment* |
Class R61 | $0 | 0.00% |
| * | Reflects waiver of fees and/or reimbursement of expenses (including acquired fund fees and expenses), without which expenses would be higher. |
| 1 | Excludes fees and expenses of the underlying funds in which the Fund invests. |
HOW DID THE FUND PERFORM LAST YEAR AND WHAT AFFECTED ITS PERFORMANCE?
For the twelve months ended December 31, 2024, Class R6 shares of Franklin LifeSmart Retirement Income Fund returned 8.73%. The Fund compares its performance to the MSCI All Country World Index-NR and the Bloomberg Multiverse Index, which returned 17.49% and -1.34%, respectively, for the same period.
| |
Top contributors to performance: |
| ↑ | Fund selection in fixed income. |
| ↑ | Fund selection in U.S. fixed income, reflecting a preference for short duration at points in 2024. |
| ↑ | Underweight in international equity, reflecting a preference for U.S. equities. |
| |
Top detractors from performance: |
| ↓ | Fund selection in equity, reflecting a focus on high dividend funds and ETFs. |
| ↓ | Fund selection in U.S. equity. |
| ↓ | Equity underweight, reflecting prioritization of both income generation and portfolio downside protection. |
| Franklin LifeSmart Retirement Income Fund | PAGE 1 | 327-ATSR-0225 |
HOW DID THE FUND PERFORM OVER THE LAST 10 YEARS?
The Fund’s past performance is not necessarily an indication of how the Fund will perform in the future. The graph and table do not reflect the deduction of taxes that a shareholder would pay on Fund distributions or redemption of Fund shares.
VALUE OF A $10,000 INVESTMENT – Class R6 12/31/2014 — 12/31/2024
AVERAGE ANNUAL TOTAL RETURNS (%) Period Ended December 31, 2024
| | | |
| | 1 Year | 5 Year | 10 Year |
Class R6 | 8.73 | 4.36 | 3.95 |
Bloomberg U.S. Aggregate Index | 1.25 | -0.33 | 1.35 |
MSCI All Country World Index-NR | 17.49 | 10.06 | 9.23 |
Bloomberg Multiverse Index | -1.34 | -1.76 | 0.35 |
Reflects waiver of fees and/or reimbursement of expenses (including acquired fund fees and expenses), without which expenses would be higher.
The Fund was able to successfully meet its monthly distributions under its managed distribution policy without the return of capital.
For current month-end performance, please call Franklin Templeton at (800) DIAL BEN/342-5236 or visit https://www.franklintempleton.com/investments/options/mutual-funds.
Important data provider notices and terms available at www.franklintempletondatasources.com.
KEY FUND STATISTICS (as of December 31, 2024)
| |
Total Net Assets | $44,850,105 |
Total Number of Portfolio Holdings* | 15 |
Total Management Fee Paid | $0 |
Portfolio Turnover Rate | 38.32% |
| * | Does not include derivatives, except purchased options, if any. |
| Franklin LifeSmart Retirement Income Fund | PAGE 2 | 327-ATSR-0225 |
WHAT DID THE FUND INVEST IN? (as of December 31, 2024)
Portfolio Composition* (% of Total Investments)
| * | Does not include derivatives, except purchased options, if any. |
| |
| WHERE CAN I FIND ADDITIONAL INFORMATION ABOUT THE FUND? |
Additional information is available on https://www.franklintempleton.com/regulatory-fund-documents, including its: |
| • prospectus • proxy voting information • financial information • holdings • tax information |
HOUSEHOLDING
You will receive the Fund’s shareholder reports every six months. In addition, you will receive an annual updated summary prospectus (detail prospectus available upon request). To reduce Fund expenses, we try to identify related shareholders in a household and send only one copy of the shareholder reports and summary prospectus. This process, called “householding,” will continue indefinitely unless you instruct us otherwise. If you prefer not to have these documents householded, please call us at (800) DIAL BEN/342-5236. At any time, you may view current prospectuses/summary prospectuses and shareholder reports on our website. If you choose, you may receive these documents through electronic delivery.
| Franklin LifeSmart Retirement Income Fund | PAGE 3 | 327-ATSR-0225 |
1000097661031310843106091190312951136791209813550147331000010055103211068710688116201249212299106991129111432100009764105311305611827149731740620633168442058424183100009671994610710105651131812339117839896104941035430.628.827.65.45.22.4
| | |
Franklin LifeSmart Retirement Income Fund | |
| Advisor Class [FLRDX] |
| Annual Shareholder Report | December 31, 2024 |
|
This annual shareholder report contains important information about Franklin LifeSmart Retirement Income Fund for the period January 1, 2024, to December 31, 2024.
You can find additional information about the Fund at https://www.franklintempleton.com/regulatory-fund-documents. You can also request this information by contacting us at (800) DIAL BEN/342-5236.
WHAT WERE THE FUND COSTS FOR THE LAST YEAR? (based on a hypothetical $10,000 investment)
| | |
Class Name | Costs of a $10,000 investment | Costs paid as a percentage of a $10,000 investment* |
Advisor Class1 | $5 | 0.05% |
| * | Reflects waiver of fees and/or reimbursement of expenses (including acquired fund fees and expenses), without which expenses would be higher. |
| 1 | Excludes fees and expenses of the underlying funds in which the Fund invests. |
HOW DID THE FUND PERFORM LAST YEAR AND WHAT AFFECTED ITS PERFORMANCE?
For the twelve months ended December 31, 2024, Advisor Class shares of Franklin LifeSmart Retirement Income Fund returned 8.57%. The Fund compares its performance to the MSCI All Country World Index-NR and the Bloomberg Multiverse Index, which returned 17.49% and -1.34%, respectively, for the same period.
| |
Top contributors to performance: |
| ↑ | Fund selection in fixed income. |
| ↑ | Fund selection in U.S. fixed income, reflecting a preference for short duration at points in 2024. |
| ↑ | Underweight in international equity, reflecting a preference for U.S. equities. |
| |
Top detractors from performance: |
| ↓ | Fund selection in equity, reflecting a focus on high dividend funds and ETFs. |
| ↓ | Fund selection in U.S. equity. |
| ↓ | Equity underweight, reflecting prioritization of both income generation and portfolio downside protection. |
| Franklin LifeSmart Retirement Income Fund | PAGE 1 | 627-ATSR-0225 |
HOW DID THE FUND PERFORM OVER THE LAST 10 YEARS?
The Fund’s past performance is not necessarily an indication of how the Fund will perform in the future. The graph and table do not reflect the deduction of taxes that a shareholder would pay on Fund distributions or redemption of Fund shares.
VALUE OF A $10,000 INVESTMENT – Advisor Class 12/31/2014 — 12/31/2024
AVERAGE ANNUAL TOTAL RETURNS (%) Period Ended December 31, 2024
| | | |
| | 1 Year | 5 Year | 10 Year |
Advisor Class | 8.57 | 4.29 | 3.89 |
Bloomberg U.S. Aggregate Index | 1.25 | -0.33 | 1.35 |
MSCI All Country World Index-NR | 17.49 | 10.06 | 9.23 |
Bloomberg Multiverse Index | -1.34 | -1.76 | 0.35 |
Reflects waiver of fees and/or reimbursement of expenses (including acquired fund fees and expenses), without which expenses would be higher.
The Fund was able to successfully meet its monthly distributions under its managed distribution policy without the return of capital.
For current month-end performance, please call Franklin Templeton at (800) DIAL BEN/342-5236 or visit https://www.franklintempleton.com/investments/options/mutual-funds.
Important data provider notices and terms available at www.franklintempletondatasources.com.
KEY FUND STATISTICS (as of December 31, 2024)
| |
Total Net Assets | $44,850,105 |
Total Number of Portfolio Holdings* | 15 |
Total Management Fee Paid | $0 |
Portfolio Turnover Rate | 38.32% |
| * | Does not include derivatives, except purchased options, if any. |
| Franklin LifeSmart Retirement Income Fund | PAGE 2 | 627-ATSR-0225 |
WHAT DID THE FUND INVEST IN? (as of December 31, 2024)
Portfolio Composition* (% of Total Investments)
| * | Does not include derivatives, except purchased options, if any. |
| |
| WHERE CAN I FIND ADDITIONAL INFORMATION ABOUT THE FUND? |
Additional information is available on https://www.franklintempleton.com/regulatory-fund-documents, including its: |
| • prospectus • proxy voting information • financial information • holdings • tax information |
HOUSEHOLDING
You will receive the Fund’s shareholder reports every six months. In addition, you will receive an annual updated summary prospectus (detail prospectus available upon request). To reduce Fund expenses, we try to identify related shareholders in a household and send only one copy of the shareholder reports and summary prospectus. This process, called “householding,” will continue indefinitely unless you instruct us otherwise. If you prefer not to have these documents householded, please call us at (800) DIAL BEN/342-5236. At any time, you may view current prospectuses/summary prospectuses and shareholder reports on our website. If you choose, you may receive these documents through electronic delivery.
| Franklin LifeSmart Retirement Income Fund | PAGE 3 | 627-ATSR-0225 |
1000097601030210826105861187312913136331204913490146471000010055103211068710688116201249212299106991129111432100009764105311305611827149731740620633168442058424183100009671994610710105651131812339117839896104941035430.628.827.65.45.22.4
| | |
Franklin LifeSmart 2020 Retirement Target Fund | |
| Class A [FLRMX] |
| Annual Shareholder Report | December 31, 2024 |
|
This annual shareholder report contains important information about Franklin LifeSmart 2020 Retirement Target Fund for the period January 1, 2024, to December 31, 2024.
You can find additional information about the Fund at https://www.franklintempleton.com/regulatory-fund-documents. You can also request this information by contacting us at (800) DIAL BEN/342-5236.
WHAT WERE THE FUND COSTS FOR THE LAST YEAR? (based on a hypothetical $10,000 investment)
| | |
Class Name | Costs of a $10,000 investment | Costs paid as a percentage of a $10,000 investment* |
Class A1 | $51 | 0.49% |
| * | Reflects waiver of fees and/or reimbursement of expenses (including acquired fund fees and expenses), without which expenses would be higher. |
| 1 | Excludes fees and expenses of the underlying funds in which the Fund invests. |
HOW DID THE FUND PERFORM LAST YEAR AND WHAT AFFECTED ITS PERFORMANCE?
For the twelve months ended December 31, 2024, Class A shares of Franklin LifeSmart 2020 Retirement Target Fund returned 8.00%. The Fund compares its performance to the MSCI All Country World Index-NR, the Blended Benchmark† and the Bloomberg Multiverse Index, which returned 17.49%, 6.94% and -1.34% respectively, for the same period.
| |
Top contributors to performance: |
| ↑ | Overweight U.S. bonds relative to international bonds. |
| ↑ | Underweight fixed income relative to equity, reflecting preference for equities. |
| ↑ | Fund selection in U.S. fixed income, including overweight in high yield bonds. |
| |
Top detractors from performance: |
| ↓ | Fund selection in equity, reflecting meaningful exposure to value stocks. |
| ↓ | Fund selection in international fixed income. |
| ↓ | Fund selection in U.S. equity. |
| Franklin LifeSmart 2020 Retirement Target Fund | PAGE 1 | 52-ATSR-0225 |
HOW DID THE FUND PERFORM OVER THE LAST 10 YEARS?
The Fund’s past performance is not necessarily an indication of how the Fund will perform in the future. The graph and table do not reflect the deduction of taxes that a shareholder would pay on Fund distributions or redemption of Fund shares.
VALUE OF A $10,000 INVESTMENT ($9,450 AFTER MAXIMUM APPLICABLE SALES CHARGE) –
Class A 12/31/2014 — 12/31/2024
AVERAGE ANNUAL TOTAL RETURNS (%) Period Ended December 31, 2024
| | | |
| | 1 Year | 5 Year | 10 Year |
Class A | 8.00 | 4.16 | 4.17 |
Class A (with sales charge) | 2.10 | 2.99 | 3.58 |
Bloomberg Global Aggregate Index | -1.69 | -1.96 | 0.15 |
MSCI All Country World Index-NR | 17.49 | 10.06 | 9.23 |
Blended Benchmark† | 6.94 | 3.67 | 4.46 |
Bloomberg Multiverse Index | -1.34 | -1.76 | 0.35 |
| † | The Fund’s Blended Benchmark consists of 51% MSCI AC World Index-NR and 49% Bloomberg Multiverse Index. Allocations for the Fund’s Blended Benchmark reflect the Fund’s current target asset class allocations and may not be representative of the Fund’s historical asset class allocations. Performance for the Blended Benchmark is based on an asset class allocation that matches the glide path of the Franklin LifeSmart Funds over time. Prior to May 1, 2019, the Blended Benchmark had an allocation to FTSE 3 Month U.S. T-Bill Index. |
Reflects waiver of fees and/or reimbursement of expenses (including acquired fund fees and expenses), without which expenses would be higher.
Performance for periods prior to September 10, 2018, has been restated to reflect the current maximum sales charge, which is lower than the maximum sales charge prior to that date.
For current month-end performance, please call Franklin Templeton at (800) DIAL BEN/342-5236 or visit https://www.franklintempleton.com/investments/options/mutual-funds.
Important data provider notices and terms available at www.franklintempletondatasources.com.
KEY FUND STATISTICS (as of December 31, 2024)
| |
Total Net Assets | $25,431,016 |
Total Number of Portfolio Holdings* | 21 |
Total Management Fee Paid | $0 |
Portfolio Turnover Rate | 38.80% |
| * | Does not include derivatives, except purchased options, if any. |
| Franklin LifeSmart 2020 Retirement Target Fund | PAGE 2 | 52-ATSR-0225 |
WHAT DID THE FUND INVEST IN? (as of December 31, 2024)
Portfolio Composition* (% of Total Investments)
| * | Does not include derivatives, except purchased options, if any. |
| |
| WHERE CAN I FIND ADDITIONAL INFORMATION ABOUT THE FUND? |
Additional information is available on https://www.franklintempleton.com/regulatory-fund-documents, including its: |
| • prospectus • proxy voting information • financial information • holdings • tax information |
HOUSEHOLDING
You will receive the Fund’s shareholder reports every six months. In addition, you will receive an annual updated summary prospectus (detail prospectus available upon request). To reduce Fund expenses, we try to identify related shareholders in a household and send only one copy of the shareholder reports and summary prospectus. This process, called “householding,” will continue indefinitely unless you instruct us otherwise. If you prefer not to have these documents householded, please call us at (800) DIAL BEN/342-5236. At any time, you may view current prospectuses/summary prospectuses and shareholder reports on our website. If you choose, you may receive these documents through electronic delivery.
| Franklin LifeSmart 2020 Retirement Target Fund | PAGE 3 | 52-ATSR-0225 |
94509244952510623102221159412645138621170313162142131000096859887106181049011208122381166297671032610151100009764105311305611827149731740620633168442058424183100009757102761175911246129171439115353127481446615468100009671994610710105651131812339117839896104941035443.330.714.89.41.00.8
| | |
Franklin LifeSmart 2020 Retirement Target Fund | |
| Class C [FLRQX] |
| Annual Shareholder Report | December 31, 2024 |
|
This annual shareholder report contains important information about Franklin LifeSmart 2020 Retirement Target Fund for the period January 1, 2024, to December 31, 2024.
You can find additional information about the Fund at https://www.franklintempleton.com/regulatory-fund-documents. You can also request this information by contacting us at (800) DIAL BEN/342-5236.
WHAT WERE THE FUND COSTS FOR THE LAST YEAR? (based on a hypothetical $10,000 investment)
| | |
Class Name | Costs of a $10,000 investment | Costs paid as a percentage of a $10,000 investment* |
Class C1 | $128 | 1.24% |
| * | Reflects waiver of fees and/or reimbursement of expenses (including acquired fund fees and expenses), without which expenses would be higher. |
| 1 | Excludes fees and expenses of the underlying funds in which the Fund invests. |
HOW DID THE FUND PERFORM LAST YEAR AND WHAT AFFECTED ITS PERFORMANCE?
For the twelve months ended December 31, 2024, Class C shares of Franklin LifeSmart 2020 Retirement Target Fund returned 7.22%. The Fund compares its performance to the MSCI All Country World Index-NR, the Blended Benchmark† and the Bloomberg Multiverse Index, which returned 17.49%, 6.94% and -1.34% respectively, for the same period.
| |
Top contributors to performance: |
| ↑ | Overweight U.S. bonds relative to international bonds. |
| ↑ | Underweight fixed income relative to equity, reflecting preference for equities. |
| ↑ | Fund selection in U.S. fixed income, including overweight in high yield bonds. |
| |
Top detractors from performance: |
| ↓ | Fund selection in equity, reflecting meaningful exposure to value stocks. |
| ↓ | Fund selection in international fixed income. |
| ↓ | Fund selection in U.S. equity. |
| Franklin LifeSmart 2020 Retirement Target Fund | PAGE 1 | 552-ATSR-0225 |
HOW DID THE FUND PERFORM OVER THE LAST 10 YEARS?
The Fund’s past performance is not necessarily an indication of how the Fund will perform in the future. The graph and table do not reflect the deduction of taxes that a shareholder would pay on Fund distributions or redemption of Fund shares.
VALUE OF A $10,000 INVESTMENT – Class C 12/31/2014 — 12/31/2024
AVERAGE ANNUAL TOTAL RETURNS (%) Period Ended December 31, 2024
| | | |
| | 1 Year | 5 Year | 10 Year |
Class C | 7.22 | 3.38 | 3.39 |
Class C (with sales charge) | 6.22 | 3.38 | 3.39 |
Bloomberg Global Aggregate Index | -1.69 | -1.96 | 0.15 |
MSCI All Country World Index-NR | 17.49 | 10.06 | 9.23 |
Blended Benchmark† | 6.94 | 3.67 | 4.46 |
Bloomberg Multiverse Index | -1.34 | -1.76 | 0.35 |
| † | The Fund’s Blended Benchmark consists of 51% MSCI AC World Index-NR and 49% Bloomberg Multiverse Index. Allocations for the Fund’s Blended Benchmark reflect the Fund’s current target asset class allocations and may not be representative of the Fund’s historical asset class allocations. Performance for the Blended Benchmark is based on an asset class allocation that matches the glide path of the Franklin LifeSmart Funds over time. Prior to May 1, 2019, the Blended Benchmark had an allocation to FTSE 3 Month U.S. T-Bill Index. |
Reflects waiver of fees and/or reimbursement of expenses (including acquired fund fees and expenses), without which expenses would be higher.
For current month-end performance, please call Franklin Templeton at (800) DIAL BEN/342-5236 or visit https://www.franklintempleton.com/investments/options/mutual-funds.
Important data provider notices and terms available at www.franklintempletondatasources.com.
KEY FUND STATISTICS (as of December 31, 2024)
| |
Total Net Assets | $25,431,016 |
Total Number of Portfolio Holdings* | 21 |
Total Management Fee Paid | $0 |
Portfolio Turnover Rate | 38.80% |
| * | Does not include derivatives, except purchased options, if any. |
| Franklin LifeSmart 2020 Retirement Target Fund | PAGE 2 | 552-ATSR-0225 |
WHAT DID THE FUND INVEST IN? (as of December 31, 2024)
Portfolio Composition* (% of Total Investments)
| * | Does not include derivatives, except purchased options, if any. |
| |
| WHERE CAN I FIND ADDITIONAL INFORMATION ABOUT THE FUND? |
Additional information is available on https://www.franklintempleton.com/regulatory-fund-documents, including its: |
| • prospectus • proxy voting information • financial information • holdings • tax information |
HOUSEHOLDING
You will receive the Fund’s shareholder reports every six months. In addition, you will receive an annual updated summary prospectus (detail prospectus available upon request). To reduce Fund expenses, we try to identify related shareholders in a household and send only one copy of the shareholder reports and summary prospectus. This process, called “householding,” will continue indefinitely unless you instruct us otherwise. If you prefer not to have these documents householded, please call us at (800) DIAL BEN/342-5236. At any time, you may view current prospectuses/summary prospectuses and shareholder reports on our website. If you choose, you may receive these documents through electronic delivery.
| Franklin LifeSmart 2020 Retirement Target Fund | PAGE 3 | 552-ATSR-0225 |
100009716993811001105031182512805139381167613021139621000096859887106181049011208122381166297671032610151100009764105311305611827149731740620633168442058424183100009757102761175911246129171439115353127481446615468100009671994610710105651131812339117839896104941035443.330.714.89.41.00.8
| | |
Franklin LifeSmart 2020 Retirement Target Fund | |
| Class R [FLRVX] |
| Annual Shareholder Report | December 31, 2024 |
|
This annual shareholder report contains important information about Franklin LifeSmart 2020 Retirement Target Fund for the period January 1, 2024, to December 31, 2024.
You can find additional information about the Fund at https://www.franklintempleton.com/regulatory-fund-documents. You can also request this information by contacting us at (800) DIAL BEN/342-5236.
WHAT WERE THE FUND COSTS FOR THE LAST YEAR? (based on a hypothetical $10,000 investment)
| | |
Class Name | Costs of a $10,000 investment | Costs paid as a percentage of a $10,000 investment* |
Class R1 | $77 | 0.74% |
| * | Reflects waiver of fees and/or reimbursement of expenses (including acquired fund fees and expenses), without which expenses would be higher. |
| 1 | Excludes fees and expenses of the underlying funds in which the Fund invests. |
HOW DID THE FUND PERFORM LAST YEAR AND WHAT AFFECTED ITS PERFORMANCE?
For the twelve months ended December 31, 2024, Class R shares of Franklin LifeSmart 2020 Retirement Target Fund returned 7.74%. The Fund compares its performance to the MSCI All Country World Index-NR, the Blended Benchmark† and the Bloomberg Multiverse Index, which returned 17.49%, 6.94% and -1.34% respectively, for the same period.
| |
Top contributors to performance: |
| ↑ | Overweight U.S. bonds relative to international bonds. |
| ↑ | Underweight fixed income relative to equity, reflecting preference for equities. |
| ↑ | Fund selection in U.S. fixed income, including overweight in high yield bonds. |
| |
Top detractors from performance: |
| ↓ | Fund selection in equity, reflecting meaningful exposure to value stocks. |
| ↓ | Fund selection in international fixed income. |
| ↓ | Fund selection in U.S. equity. |
| Franklin LifeSmart 2020 Retirement Target Fund | PAGE 1 | 852-ATSR-0225 |
HOW DID THE FUND PERFORM OVER THE LAST 10 YEARS?
The Fund’s past performance is not necessarily an indication of how the Fund will perform in the future. The graph and table do not reflect the deduction of taxes that a shareholder would pay on Fund distributions or redemption of Fund shares.
VALUE OF A $10,000 INVESTMENT – Class R 12/31/2014 — 12/31/2024
AVERAGE ANNUAL TOTAL RETURNS (%) Period Ended December 31, 2024
| | | |
| | 1 Year | 5 Year | 10 Year |
Class R | 7.74 | 3.88 | 3.90 |
Bloomberg Global Aggregate Index | -1.69 | -1.96 | 0.15 |
MSCI All Country World Index-NR | 17.49 | 10.06 | 9.23 |
Blended Benchmark† | 6.94 | 3.67 | 4.46 |
Bloomberg Multiverse Index | -1.34 | -1.76 | 0.35 |
| † | The Fund’s Blended Benchmark consists of 51% MSCI AC World Index-NR and 49% Bloomberg Multiverse Index. Allocations for the Fund’s Blended Benchmark reflect the Fund’s current target asset class allocations and may not be representative of the Fund’s historical asset class allocations. Performance for the Blended Benchmark is based on an asset class allocation that matches the glide path of the Franklin LifeSmart Funds over time. Prior to May 1, 2019, the Blended Benchmark had an allocation to FTSE 3 Month U.S. T-Bill Index. |
Reflects waiver of fees and/or reimbursement of expenses (including acquired fund fees and expenses), without which expenses would be higher.
For current month-end performance, please call Franklin Templeton at (800) DIAL BEN/342-5236 or visit https://www.franklintempleton.com/investments/options/mutual-funds.
Important data provider notices and terms available at www.franklintempletondatasources.com.
KEY FUND STATISTICS (as of December 31, 2024)
| |
Total Net Assets | $25,431,016 |
Total Number of Portfolio Holdings* | 21 |
Total Management Fee Paid | $0 |
Portfolio Turnover Rate | 38.80% |
| * | Does not include derivatives, except purchased options, if any. |
| Franklin LifeSmart 2020 Retirement Target Fund | PAGE 2 | 852-ATSR-0225 |
WHAT DID THE FUND INVEST IN? (as of December 31, 2024)
Portfolio Composition* (% of Total Investments)
| * | Does not include derivatives, except purchased options, if any. |
| |
| WHERE CAN I FIND ADDITIONAL INFORMATION ABOUT THE FUND? |
Additional information is available on https://www.franklintempleton.com/regulatory-fund-documents, including its: |
| • prospectus • proxy voting information • financial information • holdings • tax information |
HOUSEHOLDING
You will receive the Fund’s shareholder reports every six months. In addition, you will receive an annual updated summary prospectus (detail prospectus available upon request). To reduce Fund expenses, we try to identify related shareholders in a household and send only one copy of the shareholder reports and summary prospectus. This process, called “householding,” will continue indefinitely unless you instruct us otherwise. If you prefer not to have these documents householded, please call us at (800) DIAL BEN/342-5236. At any time, you may view current prospectuses/summary prospectuses and shareholder reports on our website. If you choose, you may receive these documents through electronic delivery.
| Franklin LifeSmart 2020 Retirement Target Fund | PAGE 3 | 852-ATSR-0225 |
1000097651003311163107001211813183144181213113606146591000096859887106181049011208122381166297671032610151100009764105311305611827149731740620633168442058424183100009757102761175911246129171439115353127481446615468100009671994610710105651131812339117839896104941035443.330.714.89.41.00.8
| | |
Franklin LifeSmart 2020 Retirement Target Fund | |
| Class R6 [FRTSX] |
| Annual Shareholder Report | December 31, 2024 |
|
This annual shareholder report contains important information about Franklin LifeSmart 2020 Retirement Target Fund for the period January 1, 2024, to December 31, 2024.
You can find additional information about the Fund at https://www.franklintempleton.com/regulatory-fund-documents. You can also request this information by contacting us at (800) DIAL BEN/342-5236.
WHAT WERE THE FUND COSTS FOR THE LAST YEAR? (based on a hypothetical $10,000 investment)
| | |
Class Name | Costs of a $10,000 investment | Costs paid as a percentage of a $10,000 investment* |
Class R61 | $20 | 0.19% |
| * | Reflects waiver of fees and/or reimbursement of expenses (including acquired fund fees and expenses), without which expenses would be higher. |
| 1 | Excludes fees and expenses of the underlying funds in which the Fund invests. |
HOW DID THE FUND PERFORM LAST YEAR AND WHAT AFFECTED ITS PERFORMANCE?
For the twelve months ended December 31, 2024, Class R6 shares of Franklin LifeSmart 2020 Retirement Target Fund returned 8.37%. The Fund compares its performance to the MSCI All Country World Index-NR, the Blended Benchmark† and the Bloomberg Multiverse Index, which returned 17.49%, 6.94% and -1.34% respectively, for the same period.
| |
Top contributors to performance: |
| ↑ | Overweight U.S. bonds relative to international bonds. |
| ↑ | Underweight fixed income relative to equity, reflecting preference for equities. |
| ↑ | Fund selection in U.S. fixed income, including overweight in high yield bonds. |
| |
Top detractors from performance: |
| ↓ | Fund selection in equity, reflecting meaningful exposure to value stocks. |
| ↓ | Fund selection in international fixed income. |
| ↓ | Fund selection in U.S. equity. |
| Franklin LifeSmart 2020 Retirement Target Fund | PAGE 1 | 892-ATSR-0225 |
HOW DID THE FUND PERFORM OVER THE LAST 10 YEARS?
The Fund’s past performance is not necessarily an indication of how the Fund will perform in the future. The graph and table do not reflect the deduction of taxes that a shareholder would pay on Fund distributions or redemption of Fund shares.
VALUE OF A $10,000 INVESTMENT – Class R6 12/31/2014 — 12/31/2024
AVERAGE ANNUAL TOTAL RETURNS (%) Period Ended December 31, 2024
| | | |
| | 1 Year | 5 Year | 10 Year |
Class R6 | 8.37 | 4.95 | 4.73 |
Bloomberg Global Aggregate Index | -1.69 | -1.96 | 0.15 |
MSCI All Country World Index-NR | 17.49 | 10.06 | 9.23 |
Blended Benchmark† | 6.94 | 3.67 | 4.46 |
Bloomberg Multiverse Index | -1.34 | -1.76 | 0.35 |
| † | The Fund’s Blended Benchmark consists of 51% MSCI AC World Index-NR and 49% Bloomberg Multiverse Index. Allocations for the Fund’s Blended Benchmark reflect the Fund’s current target asset class allocations and may not be representative of the Fund’s historical asset class allocations. Performance for the Blended Benchmark is based on an asset class allocation that matches the glide path of the Franklin LifeSmart Funds over time. Prior to May 1, 2019, the Blended Benchmark had an allocation to FTSE 3 Month U.S. T-Bill Index. |
Reflects waiver of fees and/or reimbursement of expenses (including acquired fund fees and expenses), without which expenses would be higher.
For current month-end performance, please call Franklin Templeton at (800) DIAL BEN/342-5236 or visit https://www.franklintempleton.com/investments/options/mutual-funds.
Important data provider notices and terms available at www.franklintempletondatasources.com.
KEY FUND STATISTICS (as of December 31, 2024)
| |
Total Net Assets | $25,431,016 |
Total Number of Portfolio Holdings* | 21 |
Total Management Fee Paid | $0 |
Portfolio Turnover Rate | 38.80% |
| * | Does not include derivatives, except purchased options, if any. |
| Franklin LifeSmart 2020 Retirement Target Fund | PAGE 2 | 892-ATSR-0225 |
WHAT DID THE FUND INVEST IN? (as of December 31, 2024)
Portfolio Composition* (% of Total Investments)
| * | Does not include derivatives, except purchased options, if any. |
| |
| WHERE CAN I FIND ADDITIONAL INFORMATION ABOUT THE FUND? |
Additional information is available on https://www.franklintempleton.com/regulatory-fund-documents, including its: |
| • prospectus • proxy voting information • financial information • holdings • tax information |
HOUSEHOLDING
You will receive the Fund’s shareholder reports every six months. In addition, you will receive an annual updated summary prospectus (detail prospectus available upon request). To reduce Fund expenses, we try to identify related shareholders in a household and send only one copy of the shareholder reports and summary prospectus. This process, called “householding,” will continue indefinitely unless you instruct us otherwise. If you prefer not to have these documents householded, please call us at (800) DIAL BEN/342-5236. At any time, you may view current prospectuses/summary prospectuses and shareholder reports on our website. If you choose, you may receive these documents through electronic delivery.
| Franklin LifeSmart 2020 Retirement Target Fund | PAGE 3 | 892-ATSR-0225 |
1000098201014711357109521246713644150001299314649158751000096859887106181049011208122381166297671032610151100009764105311305611827149731740620633168442058424183100009757102761175911246129171439115353127481446615468100009671994610710105651131812339117839896104941035443.330.714.89.41.00.8
| | |
Franklin LifeSmart 2020 Retirement Target Fund | |
| Advisor Class [FLROX] |
| Annual Shareholder Report | December 31, 2024 |
|
This annual shareholder report contains important information about Franklin LifeSmart 2020 Retirement Target Fund for the period January 1, 2024, to December 31, 2024.
You can find additional information about the Fund at https://www.franklintempleton.com/regulatory-fund-documents. You can also request this information by contacting us at (800) DIAL BEN/342-5236.
WHAT WERE THE FUND COSTS FOR THE LAST YEAR? (based on a hypothetical $10,000 investment)
| | |
Class Name | Costs of a $10,000 investment | Costs paid as a percentage of a $10,000 investment* |
Advisor Class1 | $25 | 0.24% |
| * | Reflects waiver of fees and/or reimbursement of expenses (including acquired fund fees and expenses), without which expenses would be higher. |
| 1 | Excludes fees and expenses of the underlying funds in which the Fund invests. |
HOW DID THE FUND PERFORM LAST YEAR AND WHAT AFFECTED ITS PERFORMANCE?
For the twelve months ended December 31, 2024, Advisor Class shares of Franklin LifeSmart 2020 Retirement Target Fund returned 8.25%. The Fund compares its performance to the MSCI All Country World Index-NR, the Blended Benchmark† and the Bloomberg Multiverse Index, which returned 17.49%, 6.94% and -1.34% respectively, for the same period.
| |
Top contributors to performance: |
| ↑ | Overweight U.S. bonds relative to international bonds. |
| ↑ | Underweight fixed income relative to equity, reflecting preference for equities. |
| ↑ | Fund selection in U.S. fixed income, including overweight in high yield bonds. |
| |
Top detractors from performance: |
| ↓ | Fund selection in equity, reflecting meaningful exposure to value stocks. |
| ↓ | Fund selection in international fixed income. |
| ↓ | Fund selection in U.S. equity. |
| Franklin LifeSmart 2020 Retirement Target Fund | PAGE 1 | 82-ATSR-0225 |
HOW DID THE FUND PERFORM OVER THE LAST 10 YEARS?
The Fund’s past performance is not necessarily an indication of how the Fund will perform in the future. The graph and table do not reflect the deduction of taxes that a shareholder would pay on Fund distributions or redemption of Fund shares.
VALUE OF A $10,000 INVESTMENT – Advisor Class 12/31/2014 — 12/31/2024
AVERAGE ANNUAL TOTAL RETURNS (%) Period Ended December 31, 2024
| | | |
| | 1 Year | 5 Year | 10 Year |
Advisor Class | 8.25 | 4.42 | 4.44 |
Bloomberg Global Aggregate Index | -1.69 | -1.96 | 0.15 |
MSCI All Country World Index-NR | 17.49 | 10.06 | 9.23 |
Blended Benchmark† | 6.94 | 3.67 | 4.46 |
Bloomberg Multiverse Index | -1.34 | -1.76 | 0.35 |
| † | The Fund’s Blended Benchmark consists of 51% MSCI AC World Index-NR and 49% Bloomberg Multiverse Index. Allocations for the Fund’s Blended Benchmark reflect the Fund’s current target asset class allocations and may not be representative of the Fund’s historical asset class allocations. Performance for the Blended Benchmark is based on an asset class allocation that matches the glide path of the Franklin LifeSmart Funds over time. Prior to May 1, 2019, the Blended Benchmark had an allocation to FTSE 3 Month U.S. T-Bill Index. |
Reflects waiver of fees and/or reimbursement of expenses (including acquired fund fees and expenses), without which expenses would be higher.
For current month-end performance, please call Franklin Templeton at (800) DIAL BEN/342-5236 or visit https://www.franklintempleton.com/investments/options/mutual-funds.
Important data provider notices and terms available at www.franklintempletondatasources.com.
KEY FUND STATISTICS (as of December 31, 2024)
| |
Total Net Assets | $25,431,016 |
Total Number of Portfolio Holdings* | 21 |
Total Management Fee Paid | $0 |
Portfolio Turnover Rate | 38.80% |
| * | Does not include derivatives, except purchased options, if any. |
| Franklin LifeSmart 2020 Retirement Target Fund | PAGE 2 | 82-ATSR-0225 |
WHAT DID THE FUND INVEST IN? (as of December 31, 2024)
Portfolio Composition* (% of Total Investments)
| * | Does not include derivatives, except purchased options, if any. |
| |
| WHERE CAN I FIND ADDITIONAL INFORMATION ABOUT THE FUND? |
Additional information is available on https://www.franklintempleton.com/regulatory-fund-documents, including its: |
| • prospectus • proxy voting information • financial information • holdings • tax information |
HOUSEHOLDING
You will receive the Fund’s shareholder reports every six months. In addition, you will receive an annual updated summary prospectus (detail prospectus available upon request). To reduce Fund expenses, we try to identify related shareholders in a household and send only one copy of the shareholder reports and summary prospectus. This process, called “householding,” will continue indefinitely unless you instruct us otherwise. If you prefer not to have these documents householded, please call us at (800) DIAL BEN/342-5236. At any time, you may view current prospectuses/summary prospectuses and shareholder reports on our website. If you choose, you may receive these documents through electronic delivery.
| Franklin LifeSmart 2020 Retirement Target Fund | PAGE 3 | 82-ATSR-0225 |
1000098151013711341109301243613603149561265714264154411000096859887106181049011208122381166297671032610151100009764105311305611827149731740620633168442058424183100009757102761175911246129171439115353127481446615468100009671994610710105651131812339117839896104941035443.330.714.89.41.00.8
| | |
Franklin LifeSmart 2025 Retirement Target Fund | |
| Class A [FTRTX] |
| Annual Shareholder Report | December 31, 2024 |
|
This annual shareholder report contains important information about Franklin LifeSmart 2025 Retirement Target Fund for the period January 1, 2024, to December 31, 2024.
You can find additional information about the Fund at https://www.franklintempleton.com/regulatory-fund-documents. You can also request this information by contacting us at (800) DIAL BEN/342-5236.
WHAT WERE THE FUND COSTS FOR THE LAST YEAR? (based on a hypothetical $10,000 investment)
| | |
Class Name | Costs of a $10,000 investment | Costs paid as a percentage of a $10,000 investment* |
Class A1 | $52 | 0.50% |
| * | Reflects waiver of fees and/or reimbursement of expenses (including acquired fund fees and expenses), without which expenses would be higher. |
| 1 | Excludes fees and expenses of the underlying funds in which the Fund invests. |
HOW DID THE FUND PERFORM LAST YEAR AND WHAT AFFECTED ITS PERFORMANCE?
For the twelve months ended December 31, 2024, Class A shares of Franklin LifeSmart 2025 Retirement Target Fund returned 9.41%. The Fund compares its performance to the MSCI All Country World Index-NR, the Blended Benchmark† and the Bloomberg Multiverse Index, which returned 17.49%, 8.59% and -1.34%, respectively, for the same period.
| |
Top contributors to performance: |
| ↑ | Within fixed income, an overweight to U.S. holdings can provide downside protection for investors close to retirement. |
| ↑ | Within fixed income, an underweight to international fixed income. |
| ↑ | Fixed income underweight, reflecting our preference for equities over fixed income. |
| |
Top detractors from performance: |
| ↓ | Fund selection in equity, reflecting meaningful exposure to value stocks. |
| ↓ | Fund selection in U.S. equity. |
| ↓ | Fund selection in international fixed income. |
| Franklin LifeSmart 2025 Retirement Target Fund | PAGE 1 | 445-ATSR-0225 |
HOW DID THE FUND PERFORM OVER THE LAST 10 YEARS?
The Fund’s past performance is not necessarily an indication of how the Fund will perform in the future. The graph and table do not reflect the deduction of taxes that a shareholder would pay on Fund distributions or redemption of Fund shares.
VALUE OF A $10,000 INVESTMENT ($9,450 AFTER MAXIMUM APPLICABLE SALES CHARGE) –
Class A 12/31/2014 — 12/31/2024
AVERAGE ANNUAL TOTAL RETURNS (%) Period Ended December 31, 2024
| | | |
| | 1 Year | 5 Year | 10 Year |
Class A | 9.41 | 5.07 | 5.07 |
Class A (with sales charge) | 3.40 | 3.88 | 4.47 |
Bloomberg Global Aggregate Index | -1.69 | -1.96 | 0.15 |
MSCI All Country World Index-NR | 17.49 | 10.06 | 9.23 |
Blended Benchmark† | 8.59 | 4.72 | 5.43 |
Bloomberg Multiverse Index | -1.34 | -1.76 | 0.35 |
| † | The Fund’s Blended Benchmark consists of 60% MSCI AC World Index-NR and 40% Bloomberg Multiverse Index. Allocations for the Fund’s Blended Benchmark reflect the Fund’s current target asset class allocations and may not be representative of the Fund’s historical asset class allocations. Performance for the Blended Benchmark is based on an asset class allocation that matches the glide path of the Franklin LifeSmart Funds over time. Prior to May 1, 2019, the Blended Benchmark had an allocation to FTSE 3 Month U.S. T-Bill Index. |
Reflects waiver of fees and/or reimbursement of expenses (including acquired fund fees and expenses), without which expenses would be higher.
Performance for periods prior to September 10, 2018, has been restated to reflect the current maximum sales charge, which is lower than the maximum sales charge prior to that date.
For current month-end performance, please call Franklin Templeton at (800) DIAL BEN/342-5236 or visit https://www.franklintempleton.com/investments/options/mutual-funds.
Important data provider notices and terms available at www.franklintempletondatasources.com.
KEY FUND STATISTICS (as of December 31, 2024)
| |
Total Net Assets | $108,490,594 |
Total Number of Portfolio Holdings* | 22 |
Total Management Fee Paid | $0 |
Portfolio Turnover Rate | 37.51% |
| * | Does not include derivatives, except purchased options, if any. |
| Franklin LifeSmart 2025 Retirement Target Fund | PAGE 2 | 445-ATSR-0225 |
WHAT DID THE FUND INVEST IN? (as of December 31, 2024)
Portfolio Composition* (% of Total Investments)
| * | Does not include derivatives, except purchased options, if any. |
| |
| WHERE CAN I FIND ADDITIONAL INFORMATION ABOUT THE FUND? |
Additional information is available on https://www.franklintempleton.com/regulatory-fund-documents, including its: |
| • prospectus • proxy voting information • financial information • holdings • tax information |
HOUSEHOLDING
You will receive the Fund’s shareholder reports every six months. In addition, you will receive an annual updated summary prospectus (detail prospectus available upon request). To reduce Fund expenses, we try to identify related shareholders in a household and send only one copy of the shareholder reports and summary prospectus. This process, called “householding,” will continue indefinitely unless you instruct us otherwise. If you prefer not to have these documents householded, please call us at (800) DIAL BEN/342-5236. At any time, you may view current prospectuses/summary prospectuses and shareholder reports on our website. If you choose, you may receive these documents through electronic delivery.
| Franklin LifeSmart 2025 Retirement Target Fund | PAGE 3 | 445-ATSR-0225 |
94509254952810952103541209913340148351245314159154911000096859887106181049011208122381166297671032610151100009764105311305611827149731740620633168442058424183100009801104261223311562137011541116753138741594117309100009671994610710105651131812339117839896104941035436.436.017.77.81.01.1
| | |
Franklin LifeSmart 2025 Retirement Target Fund | |
| Class C [FTTCX] |
| Annual Shareholder Report | December 31, 2024 |
|
This annual shareholder report contains important information about Franklin LifeSmart 2025 Retirement Target Fund for the period January 1, 2024, to December 31, 2024.
You can find additional information about the Fund at https://www.franklintempleton.com/regulatory-fund-documents. You can also request this information by contacting us at (800) DIAL BEN/342-5236.
WHAT WERE THE FUND COSTS FOR THE LAST YEAR? (based on a hypothetical $10,000 investment)
| | |
Class Name | Costs of a $10,000 investment | Costs paid as a percentage of a $10,000 investment* |
Class C1 | $130 | 1.25% |
| * | Reflects waiver of fees and/or reimbursement of expenses (including acquired fund fees and expenses), without which expenses would be higher. |
| 1 | Excludes fees and expenses of the underlying funds in which the Fund invests. |
HOW DID THE FUND PERFORM LAST YEAR AND WHAT AFFECTED ITS PERFORMANCE?
For the twelve months ended December 31, 2024, Class C shares of Franklin LifeSmart 2025 Retirement Target Fund returned 8.64%. The Fund compares its performance to the MSCI All Country World Index-NR, the Blended Benchmark† and the Bloomberg Multiverse Index, which returned 17.49%, 8.59% and -1.34%, respectively, for the same period.
| |
Top contributors to performance: |
| ↑ | Within fixed income, an overweight to U.S. holdings can provide downside protection for investors close to retirement. |
| ↑ | Within fixed income, an underweight to international fixed income. |
| ↑ | Fixed income underweight, reflecting our preference for equities over fixed income. |
| |
Top detractors from performance: |
| ↓ | Fund selection in equity, reflecting meaningful exposure to value stocks. |
| ↓ | Fund selection in U.S. equity. |
| ↓ | Fund selection in international fixed income. |
| Franklin LifeSmart 2025 Retirement Target Fund | PAGE 1 | 545-ATSR-0225 |
HOW DID THE FUND PERFORM OVER THE LAST 10 YEARS?
The Fund’s past performance is not necessarily an indication of how the Fund will perform in the future. The graph and table do not reflect the deduction of taxes that a shareholder would pay on Fund distributions or redemption of Fund shares.
VALUE OF A $10,000 INVESTMENT – Class C 12/31/2014 — 12/31/2024
AVERAGE ANNUAL TOTAL RETURNS (%) Period Ended December 31, 2024
| | | |
| | 1 Year | 5 Year | 10 Year |
Class C | 8.64 | 4.29 | 4.29 |
Class C (with sales charge) | 7.64 | 4.29 | 4.29 |
Bloomberg Global Aggregate Index | -1.69 | -1.96 | 0.15 |
MSCI All Country World Index-NR | 17.49 | 10.06 | 9.23 |
Blended Benchmark† | 8.59 | 4.72 | 5.43 |
Bloomberg Multiverse Index | -1.34 | -1.76 | 0.35 |
| † | The Fund’s Blended Benchmark consists of 60% MSCI AC World Index-NR and 40% Bloomberg Multiverse Index. Allocations for the Fund’s Blended Benchmark reflect the Fund’s current target asset class allocations and may not be representative of the Fund’s historical asset class allocations. Performance for the Blended Benchmark is based on an asset class allocation that matches the glide path of the Franklin LifeSmart Funds over time. Prior to May 1, 2019, the Blended Benchmark had an allocation to FTSE 3 Month U.S. T-Bill Index. |
Reflects waiver of fees and/or reimbursement of expenses (including acquired fund fees and expenses), without which expenses would be higher.
For current month-end performance, please call Franklin Templeton at (800) DIAL BEN/342-5236 or visit https://www.franklintempleton.com/investments/options/mutual-funds.
Important data provider notices and terms available at www.franklintempletondatasources.com.
KEY FUND STATISTICS (as of December 31, 2024)
| |
Total Net Assets | $108,490,594 |
Total Number of Portfolio Holdings* | 22 |
Total Management Fee Paid | $0 |
Portfolio Turnover Rate | 37.51% |
| * | Does not include derivatives, except purchased options, if any. |
| Franklin LifeSmart 2025 Retirement Target Fund | PAGE 2 | 545-ATSR-0225 |
WHAT DID THE FUND INVEST IN? (as of December 31, 2024)
Portfolio Composition* (% of Total Investments)
| * | Does not include derivatives, except purchased options, if any. |
| |
| WHERE CAN I FIND ADDITIONAL INFORMATION ABOUT THE FUND? |
Additional information is available on https://www.franklintempleton.com/regulatory-fund-documents, including its: |
| • prospectus • proxy voting information • financial information • holdings • tax information |
HOUSEHOLDING
You will receive the Fund’s shareholder reports every six months. In addition, you will receive an annual updated summary prospectus (detail prospectus available upon request). To reduce Fund expenses, we try to identify related shareholders in a household and send only one copy of the shareholder reports and summary prospectus. This process, called “householding,” will continue indefinitely unless you instruct us otherwise. If you prefer not to have these documents householded, please call us at (800) DIAL BEN/342-5236. At any time, you may view current prospectuses/summary prospectuses and shareholder reports on our website. If you choose, you may receive these documents through electronic delivery.
| Franklin LifeSmart 2025 Retirement Target Fund | PAGE 3 | 545-ATSR-0225 |
100009726994111339106451233813503149061242414012152231000096859887106181049011208122381166297671032610151100009764105311305611827149731740620633168442058424183100009801104261223311562137011541116753138741594117309100009671994610710105651131812339117839896104941035436.436.017.77.81.01.1
| | |
Franklin LifeSmart 2025 Retirement Target Fund | |
| Class R [FRELX] |
| Annual Shareholder Report | December 31, 2024 |
|
This annual shareholder report contains important information about Franklin LifeSmart 2025 Retirement Target Fund for the period January 1, 2024, to December 31, 2024.
You can find additional information about the Fund at https://www.franklintempleton.com/regulatory-fund-documents. You can also request this information by contacting us at (800) DIAL BEN/342-5236.
WHAT WERE THE FUND COSTS FOR THE LAST YEAR? (based on a hypothetical $10,000 investment)
| | |
Class Name | Costs of a $10,000 investment | Costs paid as a percentage of a $10,000 investment* |
Class R1 | $78 | 0.75% |
| * | Reflects waiver of fees and/or reimbursement of expenses (including acquired fund fees and expenses), without which expenses would be higher. |
| 1 | Excludes fees and expenses of the underlying funds in which the Fund invests. |
HOW DID THE FUND PERFORM LAST YEAR AND WHAT AFFECTED ITS PERFORMANCE?
For the twelve months ended December 31, 2024, Class R shares of Franklin LifeSmart 2025 Retirement Target Fund returned 9.19%. The Fund compares its performance to the MSCI All Country World Index-NR, the Blended Benchmark† and the Bloomberg Multiverse Index, which returned 17.49%, 8.59% and -1.34%, respectively, for the same period.
| |
Top contributors to performance: |
| ↑ | Within fixed income, an overweight to U.S. holdings can provide downside protection for investors close to retirement. |
| ↑ | Within fixed income, an underweight to international fixed income. |
| ↑ | Fixed income underweight, reflecting our preference for equities over fixed income. |
| |
Top detractors from performance: |
| ↓ | Fund selection in equity, reflecting meaningful exposure to value stocks. |
| ↓ | Fund selection in U.S. equity. |
| ↓ | Fund selection in international fixed income. |
| Franklin LifeSmart 2025 Retirement Target Fund | PAGE 1 | 845-ATSR-0225 |
HOW DID THE FUND PERFORM OVER THE LAST 10 YEARS?
The Fund’s past performance is not necessarily an indication of how the Fund will perform in the future. The graph and table do not reflect the deduction of taxes that a shareholder would pay on Fund distributions or redemption of Fund shares.
VALUE OF A $10,000 INVESTMENT – Class R 12/31/2014 — 12/31/2024
AVERAGE ANNUAL TOTAL RETURNS (%) Period Ended December 31, 2024
| | | |
| | 1 Year | 5 Year | 10 Year |
Class R | 9.19 | 4.82 | 4.82 |
Bloomberg Global Aggregate Index | -1.69 | -1.96 | 0.15 |
MSCI All Country World Index-NR | 17.49 | 10.06 | 9.23 |
Blended Benchmark† | 8.59 | 4.72 | 5.43 |
Bloomberg Multiverse Index | -1.34 | -1.76 | 0.35 |
| † | The Fund’s Blended Benchmark consists of 60% MSCI AC World Index-NR and 40% Bloomberg Multiverse Index. Allocations for the Fund’s Blended Benchmark reflect the Fund’s current target asset class allocations and may not be representative of the Fund’s historical asset class allocations. Performance for the Blended Benchmark is based on an asset class allocation that matches the glide path of the Franklin LifeSmart Funds over time. Prior to May 1, 2019, the Blended Benchmark had an allocation to FTSE 3 Month U.S. T-Bill Index. |
Reflects waiver of fees and/or reimbursement of expenses (including acquired fund fees and expenses), without which expenses would be higher.
For current month-end performance, please call Franklin Templeton at (800) DIAL BEN/342-5236 or visit https://www.franklintempleton.com/investments/options/mutual-funds.
Important data provider notices and terms available at www.franklintempletondatasources.com.
KEY FUND STATISTICS (as of December 31, 2024)
| |
Total Net Assets | $108,490,594 |
Total Number of Portfolio Holdings* | 22 |
Total Management Fee Paid | $0 |
Portfolio Turnover Rate | 37.51% |
| * | Does not include derivatives, except purchased options, if any. |
| Franklin LifeSmart 2025 Retirement Target Fund | PAGE 2 | 845-ATSR-0225 |
WHAT DID THE FUND INVEST IN? (as of December 31, 2024)
Portfolio Composition* (% of Total Investments)
| * | Does not include derivatives, except purchased options, if any. |
| |
| WHERE CAN I FIND ADDITIONAL INFORMATION ABOUT THE FUND? |
Additional information is available on https://www.franklintempleton.com/regulatory-fund-documents, including its: |
| • prospectus • proxy voting information • financial information • holdings • tax information |
HOUSEHOLDING
You will receive the Fund’s shareholder reports every six months. In addition, you will receive an annual updated summary prospectus (detail prospectus available upon request). To reduce Fund expenses, we try to identify related shareholders in a household and send only one copy of the shareholder reports and summary prospectus. This process, called “householding,” will continue indefinitely unless you instruct us otherwise. If you prefer not to have these documents householded, please call us at (800) DIAL BEN/342-5236. At any time, you may view current prospectuses/summary prospectuses and shareholder reports on our website. If you choose, you may receive these documents through electronic delivery.
| Franklin LifeSmart 2025 Retirement Target Fund | PAGE 3 | 845-ATSR-0225 |
1000097801003911518108591265213917154321293114660160071000096859887106181049011208122381166297671032610151100009764105311305611827149731740620633168442058424183100009801104261223311562137011541116753138741594117309100009671994610710105651131812339117839896104941035436.436.017.77.81.01.1
| | |
Franklin LifeSmart 2025 Retirement Target Fund | |
| Class R6 [FTLMX] |
| Annual Shareholder Report | December 31, 2024 |
|
This annual shareholder report contains important information about Franklin LifeSmart 2025 Retirement Target Fund for the period January 1, 2024, to December 31, 2024.
You can find additional information about the Fund at https://www.franklintempleton.com/regulatory-fund-documents. You can also request this information by contacting us at (800) DIAL BEN/342-5236.
WHAT WERE THE FUND COSTS FOR THE LAST YEAR? (based on a hypothetical $10,000 investment)
| | |
Class Name | Costs of a $10,000 investment | Costs paid as a percentage of a $10,000 investment* |
Class R61 | $20 | 0.19% |
| * | Reflects waiver of fees and/or reimbursement of expenses (including acquired fund fees and expenses), without which expenses would be higher. |
| 1 | Excludes fees and expenses of the underlying funds in which the Fund invests. |
HOW DID THE FUND PERFORM LAST YEAR AND WHAT AFFECTED ITS PERFORMANCE?
For the twelve months ended December 31, 2024, Class R6 shares of Franklin LifeSmart 2025 Retirement Target Fund returned 9.79%. The Fund compares its performance to the MSCI All Country World Index-NR, the Blended Benchmark† and the Bloomberg Multiverse Index, which returned 17.49%, 8.59% and -1.34%, respectively, for the same period.
| |
Top contributors to performance: |
| ↑ | Within fixed income, an overweight to U.S. holdings can provide downside protection for investors close to retirement. |
| ↑ | Within fixed income, an underweight to international fixed income. |
| ↑ | Fixed income underweight, reflecting our preference for equities over fixed income. |
| |
Top detractors from performance: |
| ↓ | Fund selection in equity, reflecting meaningful exposure to value stocks. |
| ↓ | Fund selection in U.S. equity. |
| ↓ | Fund selection in international fixed income. |
| Franklin LifeSmart 2025 Retirement Target Fund | PAGE 1 | 345-ATSR-0225 |
HOW DID THE FUND PERFORM OVER THE LAST 10 YEARS?
The Fund’s past performance is not necessarily an indication of how the Fund will perform in the future. The graph and table do not reflect the deduction of taxes that a shareholder would pay on Fund distributions or redemption of Fund shares.
VALUE OF A $10,000 INVESTMENT – Class R6 12/31/2014 — 12/31/2024
AVERAGE ANNUAL TOTAL RETURNS (%) Period Ended December 31, 2024
| | | |
| | 1 Year | 5 Year | 10 Year |
Class R6 | 9.79 | 5.41 | 5.40 |
Bloomberg Global Aggregate Index | -1.69 | -1.96 | 0.15 |
MSCI All Country World Index-NR | 17.49 | 10.06 | 9.23 |
Blended Benchmark† | 8.59 | 4.72 | 5.43 |
Bloomberg Multiverse Index | -1.34 | -1.76 | 0.35 |
| † | The Fund’s Blended Benchmark consists of 60% MSCI AC World Index-NR and 40% Bloomberg Multiverse Index. Allocations for the Fund’s Blended Benchmark reflect the Fund’s current target asset class allocations and may not be representative of the Fund’s historical asset class allocations. Performance for the Blended Benchmark is based on an asset class allocation that matches the glide path of the Franklin LifeSmart Funds over time. Prior to May 1, 2019, the Blended Benchmark had an allocation to FTSE 3 Month U.S. T-Bill Index. |
Reflects waiver of fees and/or reimbursement of expenses (including acquired fund fees and expenses), without which expenses would be higher.
For current month-end performance, please call Franklin Templeton at (800) DIAL BEN/342-5236 or visit https://www.franklintempleton.com/investments/options/mutual-funds.
Important data provider notices and terms available at www.franklintempletondatasources.com.
KEY FUND STATISTICS (as of December 31, 2024)
| |
Total Net Assets | $108,490,594 |
Total Number of Portfolio Holdings* | 22 |
Total Management Fee Paid | $0 |
Portfolio Turnover Rate | 37.51% |
| * | Does not include derivatives, except purchased options, if any. |
| Franklin LifeSmart 2025 Retirement Target Fund | PAGE 2 | 345-ATSR-0225 |
WHAT DID THE FUND INVEST IN? (as of December 31, 2024)
Portfolio Composition* (% of Total Investments)
| * | Does not include derivatives, except purchased options, if any. |
| |
| WHERE CAN I FIND ADDITIONAL INFORMATION ABOUT THE FUND? |
Additional information is available on https://www.franklintempleton.com/regulatory-fund-documents, including its: |
| • prospectus • proxy voting information • financial information • holdings • tax information |
HOUSEHOLDING
You will receive the Fund’s shareholder reports every six months. In addition, you will receive an annual updated summary prospectus (detail prospectus available upon request). To reduce Fund expenses, we try to identify related shareholders in a household and send only one copy of the shareholder reports and summary prospectus. This process, called “householding,” will continue indefinitely unless you instruct us otherwise. If you prefer not to have these documents householded, please call us at (800) DIAL BEN/342-5236. At any time, you may view current prospectuses/summary prospectuses and shareholder reports on our website. If you choose, you may receive these documents through electronic delivery.
| Franklin LifeSmart 2025 Retirement Target Fund | PAGE 3 | 345-ATSR-0225 |
1000098261014511701110981300114384160371351815408169161000096859887106181049011208122381166297671032610151100009764105311305611827149731740620633168442058424183100009801104261223311562137011541116753138741594117309100009671994610710105651131812339117839896104941035436.436.017.77.81.01.1
| | |
Franklin LifeSmart 2025 Retirement Target Fund | |
| Advisor Class [FLRFX] |
| Annual Shareholder Report | December 31, 2024 |
|
This annual shareholder report contains important information about Franklin LifeSmart 2025 Retirement Target Fund for the period January 1, 2024, to December 31, 2024.
You can find additional information about the Fund at https://www.franklintempleton.com/regulatory-fund-documents. You can also request this information by contacting us at (800) DIAL BEN/342-5236.
WHAT WERE THE FUND COSTS FOR THE LAST YEAR? (based on a hypothetical $10,000 investment)
| | |
Class Name | Costs of a $10,000 investment | Costs paid as a percentage of a $10,000 investment* |
Advisor Class1 | $26 | 0.25% |
| * | Reflects waiver of fees and/or reimbursement of expenses (including acquired fund fees and expenses), without which expenses would be higher. |
| 1 | Excludes fees and expenses of the underlying funds in which the Fund invests. |
HOW DID THE FUND PERFORM LAST YEAR AND WHAT AFFECTED ITS PERFORMANCE?
For the twelve months ended December 31, 2024, Advisor Class shares of Franklin LifeSmart 2025 Retirement Target Fund returned 9.65%. The Fund compares its performance to the MSCI All Country World Index-NR, the Blended Benchmark† and the Bloomberg Multiverse Index, which returned 17.49%, 8.59% and -1.34%, respectively, for the same period.
| |
Top contributors to performance: |
| ↑ | Within fixed income, an overweight to U.S. holdings can provide downside protection for investors close to retirement. |
| ↑ | Within fixed income, an underweight to international fixed income. |
| ↑ | Fixed income underweight, reflecting our preference for equities over fixed income. |
| |
Top detractors from performance: |
| ↓ | Fund selection in equity, reflecting meaningful exposure to value stocks. |
| ↓ | Fund selection in U.S. equity. |
| ↓ | Fund selection in international fixed income. |
| Franklin LifeSmart 2025 Retirement Target Fund | PAGE 1 | 645-ATSR-0225 |
HOW DID THE FUND PERFORM OVER THE LAST 10 YEARS?
The Fund’s past performance is not necessarily an indication of how the Fund will perform in the future. The graph and table do not reflect the deduction of taxes that a shareholder would pay on Fund distributions or redemption of Fund shares.
VALUE OF A $10,000 INVESTMENT – Advisor Class 12/31/2014 — 12/31/2024
AVERAGE ANNUAL TOTAL RETURNS (%) Period Ended December 31, 2024
| | | |
| | 1 Year | 5 Year | 10 Year |
Advisor Class | 9.65 | 5.33 | 5.34 |
Bloomberg Global Aggregate Index | -1.69 | -1.96 | 0.15 |
MSCI All Country World Index-NR | 17.49 | 10.06 | 9.23 |
Blended Benchmark† | 8.59 | 4.72 | 5.43 |
Bloomberg Multiverse Index | -1.34 | -1.76 | 0.35 |
| † | The Fund’s Blended Benchmark consists of 60% MSCI AC World Index-NR and 40% Bloomberg Multiverse Index. Allocations for the Fund’s Blended Benchmark reflect the Fund’s current target asset class allocations and may not be representative of the Fund’s historical asset class allocations. Performance for the Blended Benchmark is based on an asset class allocation that matches the glide path of the Franklin LifeSmart Funds over time. Prior to May 1, 2019, the Blended Benchmark had an allocation to FTSE 3 Month U.S. T-Bill Index. |
Reflects waiver of fees and/or reimbursement of expenses (including acquired fund fees and expenses), without which expenses would be higher.
For current month-end performance, please call Franklin Templeton at (800) DIAL BEN/342-5236 or visit https://www.franklintempleton.com/investments/options/mutual-funds.
Important data provider notices and terms available at www.franklintempletondatasources.com.
KEY FUND STATISTICS (as of December 31, 2024)
| |
Total Net Assets | $108,490,594 |
Total Number of Portfolio Holdings* | 22 |
Total Management Fee Paid | $0 |
Portfolio Turnover Rate | 37.51% |
| * | Does not include derivatives, except purchased options, if any. |
| Franklin LifeSmart 2025 Retirement Target Fund | PAGE 2 | 645-ATSR-0225 |
WHAT DID THE FUND INVEST IN? (as of December 31, 2024)
Portfolio Composition* (% of Total Investments)
| * | Does not include derivatives, except purchased options, if any. |
| |
| WHERE CAN I FIND ADDITIONAL INFORMATION ABOUT THE FUND? |
Additional information is available on https://www.franklintempleton.com/regulatory-fund-documents, including its: |
| • prospectus • proxy voting information • financial information • holdings • tax information |
HOUSEHOLDING
You will receive the Fund’s shareholder reports every six months. In addition, you will receive an annual updated summary prospectus (detail prospectus available upon request). To reduce Fund expenses, we try to identify related shareholders in a household and send only one copy of the shareholder reports and summary prospectus. This process, called “householding,” will continue indefinitely unless you instruct us otherwise. If you prefer not to have these documents householded, please call us at (800) DIAL BEN/342-5236. At any time, you may view current prospectuses/summary prospectuses and shareholder reports on our website. If you choose, you may receive these documents through electronic delivery.
| Franklin LifeSmart 2025 Retirement Target Fund | PAGE 3 | 645-ATSR-0225 |
1000098201013511685110771297014334159871346215338168181000096859887106181049011208122381166297671032610151100009764105311305611827149731740620633168442058424183100009801104261223311562137011541116753138741594117309100009671994610710105651131812339117839896104941035436.436.017.77.81.01.1
| | |
Franklin LifeSmart 2030 Retirement Target Fund | |
| Class A [FLRSX] |
| Annual Shareholder Report | December 31, 2024 |
|
This annual shareholder report contains important information about Franklin LifeSmart 2030 Retirement Target Fund for the period January 1, 2024, to December 31, 2024.
You can find additional information about the Fund at https://www.franklintempleton.com/regulatory-fund-documents. You can also request this information by contacting us at (800) DIAL BEN/342-5236.
WHAT WERE THE FUND COSTS FOR THE LAST YEAR? (based on a hypothetical $10,000 investment)
| | |
Class Name | Costs of a $10,000 investment | Costs paid as a percentage of a $10,000 investment* |
Class A1 | $53 | 0.50% |
| * | Reflects waiver of fees and/or reimbursement of expenses (including acquired fund fees and expenses), without which expenses would be higher. |
| 1 | Excludes fees and expenses of the underlying funds in which the Fund invests. |
HOW DID THE FUND PERFORM LAST YEAR AND WHAT AFFECTED ITS PERFORMANCE?
For the twelve months ended December 31, 2024, Class A shares of Franklin LifeSmart 2030 Retirement Target Fund returned 10.88%. The Fund compares its performance to the MSCI All Country World Index-NR, the Blended Benchmark† and the Bloomberg Multiverse Index, which returned 17.49%, 10.27% and -1.34%, respectively, for the same period.
| |
Top contributors to performance: |
| ↑ | Fixed income underweight, reflecting our preference for equities over fixed income. |
| ↑ | Within fixed income, an overweight to U.S. fixed income. |
| ↑ | Within fixed income, an underweight to international fixed income. |
| |
Top detractors from performance: |
| ↓ | Fund selection in equity, reflecting meaningful exposure to value stocks. |
| ↓ | Fund selection in U.S. equity. |
| ↓ | Fund selection in international equity. |
| Franklin LifeSmart 2030 Retirement Target Fund | PAGE 1 | 47-ATSR-0225 |
HOW DID THE FUND PERFORM OVER THE LAST 10 YEARS?
The Fund’s past performance is not necessarily an indication of how the Fund will perform in the future. The graph and table do not reflect the deduction of taxes that a shareholder would pay on Fund distributions or redemption of Fund shares.
VALUE OF A $10,000 INVESTMENT ($9,450 AFTER MAXIMUM APPLICABLE SALES CHARGE) –
Class A 12/31/2014 — 12/31/2024
AVERAGE ANNUAL TOTAL RETURNS (%) Period Ended December 31, 2024
| | | |
| | 1 Year | 5 Year | 10 Year |
Class A | 10.88 | 6.01 | 5.81 |
Class A (with sales charge) | 4.77 | 4.82 | 5.21 |
Bloomberg Global Aggregate Index | -1.69 | -1.96 | 0.15 |
MSCI All Country World Index-NR | 17.49 | 10.06 | 9.23 |
Blended Benchmark† | 10.27 | 5.79 | 6.23 |
Bloomberg Multiverse Index | -1.34 | -1.76 | 0.35 |
| † | The Fund’s Blended Benchmark consists of 69% MSCI AC World Index-NR and 31% Bloomberg Multiverse Index. Allocations for the Fund’s Blended Benchmark reflect the Fund’s current target asset class allocations and may not be representative of the Fund’s historical asset class allocations. Performance for the Blended Benchmark is based on an asset class allocation that matches the glide path of the Franklin LifeSmart Funds over time. Prior to May 1, 2019, the Blended Benchmark had an allocation to FTSE 3 Month U.S. T-Bill Index. |
Reflects waiver of fees and/or reimbursement of expenses (including acquired fund fees and expenses), without which expenses would be higher.
Performance for periods prior to September 10, 2018, has been restated to reflect the current maximum sales charge, which is lower than the maximum sales charge prior to that date.
For current month-end performance, please call Franklin Templeton at (800) DIAL BEN/342-5236 or visit https://www.franklintempleton.com/investments/options/mutual-funds.
Important data provider notices and terms available at www.franklintempletondatasources.com.
KEY FUND STATISTICS (as of December 31, 2024)
| |
Total Net Assets | $72,277,059 |
Total Number of Portfolio Holdings* | 21 |
Total Management Fee Paid | $0 |
Portfolio Turnover Rate | 37.55% |
| * | Does not include derivatives, except purchased options, if any. |
| Franklin LifeSmart 2030 Retirement Target Fund | PAGE 2 | 47-ATSR-0225 |
WHAT DID THE FUND INVEST IN? (as of December 31, 2024)
Portfolio Composition* (% of Total Investments)
| * | Does not include derivatives, except purchased options, if any. |
| |
| WHERE CAN I FIND ADDITIONAL INFORMATION ABOUT THE FUND? |
Additional information is available on https://www.franklintempleton.com/regulatory-fund-documents, including its: |
| • prospectus • proxy voting information • financial information • holdings • tax information |
HOUSEHOLDING
You will receive the Fund’s shareholder reports every six months. In addition, you will receive an annual updated summary prospectus (detail prospectus available upon request). To reduce Fund expenses, we try to identify related shareholders in a household and send only one copy of the shareholder reports and summary prospectus. This process, called “householding,” will continue indefinitely unless you instruct us otherwise. If you prefer not to have these documents householded, please call us at (800) DIAL BEN/342-5236. At any time, you may view current prospectuses/summary prospectuses and shareholder reports on our website. If you choose, you may receive these documents through electronic delivery.
| Franklin LifeSmart 2030 Retirement Target Fund | PAGE 3 | 47-ATSR-0225 |
94509285955711156104511241613846156331304214994166211000096859887106181049011208122381166297671032610151100009764105311305611827149731740620633168442058424183100009771103931230111494138071558117273142661659618299100009671994610710105651131812339117839896104941035442.728.720.66.21.00.8
| | |
Franklin LifeSmart 2030 Retirement Target Fund | |
| Class C [FLRTX] |
| Annual Shareholder Report | December 31, 2024 |
|
This annual shareholder report contains important information about Franklin LifeSmart 2030 Retirement Target Fund for the period January 1, 2024, to December 31, 2024.
You can find additional information about the Fund at https://www.franklintempleton.com/regulatory-fund-documents. You can also request this information by contacting us at (800) DIAL BEN/342-5236.
WHAT WERE THE FUND COSTS FOR THE LAST YEAR? (based on a hypothetical $10,000 investment)
| | |
Class Name | Costs of a $10,000 investment | Costs paid as a percentage of a $10,000 investment* |
Class C1 | $131 | 1.25% |
| * | Reflects waiver of fees and/or reimbursement of expenses (including acquired fund fees and expenses), without which expenses would be higher. |
| 1 | Excludes fees and expenses of the underlying funds in which the Fund invests. |
HOW DID THE FUND PERFORM LAST YEAR AND WHAT AFFECTED ITS PERFORMANCE?
For the twelve months ended December 31, 2024, Class C shares of Franklin LifeSmart 2030 Retirement Target Fund returned 10.01%. The Fund compares its performance to the MSCI All Country World Index-NR, the Blended Benchmark† and the Bloomberg Multiverse Index, which returned 17.49%, 10.27% and -1.34%, respectively, for the same period.
| |
Top contributors to performance: |
| ↑ | Fixed income underweight, reflecting our preference for equities over fixed income. |
| ↑ | Within fixed income, an overweight to U.S. fixed income. |
| ↑ | Within fixed income, an underweight to international fixed income. |
| |
Top detractors from performance: |
| ↓ | Fund selection in equity, reflecting meaningful exposure to value stocks. |
| ↓ | Fund selection in U.S. equity. |
| ↓ | Fund selection in international equity. |
| Franklin LifeSmart 2030 Retirement Target Fund | PAGE 1 | 553-ATSR-0225 |
HOW DID THE FUND PERFORM OVER THE LAST 10 YEARS?
The Fund’s past performance is not necessarily an indication of how the Fund will perform in the future. The graph and table do not reflect the deduction of taxes that a shareholder would pay on Fund distributions or redemption of Fund shares.
VALUE OF A $10,000 INVESTMENT – Class C 12/31/2014 — 12/31/2024
AVERAGE ANNUAL TOTAL RETURNS (%) Period Ended December 31, 2024
| | | |
| | 1 Year | 5 Year | 10 Year |
Class C | 10.01 | 5.22 | 5.02 |
Class C (with sales charge) | 9.01 | 5.22 | 5.02 |
Bloomberg Global Aggregate Index | -1.69 | -1.96 | 0.15 |
MSCI All Country World Index-NR | 17.49 | 10.06 | 9.23 |
Blended Benchmark† | 10.27 | 5.79 | 6.23 |
Bloomberg Multiverse Index | -1.34 | -1.76 | 0.35 |
| † | The Fund’s Blended Benchmark consists of 69% MSCI AC World Index-NR and 31% Bloomberg Multiverse Index. Allocations for the Fund’s Blended Benchmark reflect the Fund’s current target asset class allocations and may not be representative of the Fund’s historical asset class allocations. Performance for the Blended Benchmark is based on an asset class allocation that matches the glide path of the Franklin LifeSmart Funds over time. Prior to May 1, 2019, the Blended Benchmark had an allocation to FTSE 3 Month U.S. T-Bill Index. |
Reflects waiver of fees and/or reimbursement of expenses (including acquired fund fees and expenses), without which expenses would be higher.
For current month-end performance, please call Franklin Templeton at (800) DIAL BEN/342-5236 or visit https://www.franklintempleton.com/investments/options/mutual-funds.
Important data provider notices and terms available at www.franklintempletondatasources.com.
KEY FUND STATISTICS (as of December 31, 2024)
| |
Total Net Assets | $72,277,059 |
Total Number of Portfolio Holdings* | 21 |
Total Management Fee Paid | $0 |
Portfolio Turnover Rate | 37.55% |
| * | Does not include derivatives, except purchased options, if any. |
| Franklin LifeSmart 2030 Retirement Target Fund | PAGE 2 | 553-ATSR-0225 |
WHAT DID THE FUND INVEST IN? (as of December 31, 2024)
Portfolio Composition* (% of Total Investments)
| * | Does not include derivatives, except purchased options, if any. |
| |
| WHERE CAN I FIND ADDITIONAL INFORMATION ABOUT THE FUND? |
Additional information is available on https://www.franklintempleton.com/regulatory-fund-documents, including its: |
| • prospectus • proxy voting information • financial information • holdings • tax information |
HOUSEHOLDING
You will receive the Fund’s shareholder reports every six months. In addition, you will receive an annual updated summary prospectus (detail prospectus available upon request). To reduce Fund expenses, we try to identify related shareholders in a household and send only one copy of the shareholder reports and summary prospectus. This process, called “householding,” will continue indefinitely unless you instruct us otherwise. If you prefer not to have these documents householded, please call us at (800) DIAL BEN/342-5236. At any time, you may view current prospectuses/summary prospectuses and shareholder reports on our website. If you choose, you may receive these documents through electronic delivery.
| Franklin LifeSmart 2030 Retirement Target Fund | PAGE 3 | 553-ATSR-0225 |
100009757995911542107321266114003157021300514840163261000096859887106181049011208122381166297671032610151100009764105311305611827149731740620633168442058424183100009771103931230111494138071558117273142661659618299100009671994610710105651131812339117839896104941035442.728.720.66.21.00.8
| | |
Franklin LifeSmart 2030 Retirement Target Fund | |
| Class R [FLRWX] |
| Annual Shareholder Report | December 31, 2024 |
|
This annual shareholder report contains important information about Franklin LifeSmart 2030 Retirement Target Fund for the period January 1, 2024, to December 31, 2024.
You can find additional information about the Fund at https://www.franklintempleton.com/regulatory-fund-documents. You can also request this information by contacting us at (800) DIAL BEN/342-5236.
WHAT WERE THE FUND COSTS FOR THE LAST YEAR? (based on a hypothetical $10,000 investment)
| | |
Class Name | Costs of a $10,000 investment | Costs paid as a percentage of a $10,000 investment* |
Class R1 | $79 | 0.75% |
| * | Reflects waiver of fees and/or reimbursement of expenses (including acquired fund fees and expenses), without which expenses would be higher. |
| 1 | Excludes fees and expenses of the underlying funds in which the Fund invests. |
HOW DID THE FUND PERFORM LAST YEAR AND WHAT AFFECTED ITS PERFORMANCE?
For the twelve months ended December 31, 2024, Class R shares of Franklin LifeSmart 2030 Retirement Target Fund returned 10.58%. The Fund compares its performance to the MSCI All Country World Index-NR, the Blended Benchmark† and the Bloomberg Multiverse Index, which returned 17.49%, 10.27% and -1.34%, respectively, for the same period.
| |
Top contributors to performance: |
| ↑ | Fixed income underweight, reflecting our preference for equities over fixed income. |
| ↑ | Within fixed income, an overweight to U.S. fixed income. |
| ↑ | Within fixed income, an underweight to international fixed income. |
| |
Top detractors from performance: |
| ↓ | Fund selection in equity, reflecting meaningful exposure to value stocks. |
| ↓ | Fund selection in U.S. equity. |
| ↓ | Fund selection in international equity. |
| Franklin LifeSmart 2030 Retirement Target Fund | PAGE 1 | 853-ATSR-0225 |
HOW DID THE FUND PERFORM OVER THE LAST 10 YEARS?
The Fund’s past performance is not necessarily an indication of how the Fund will perform in the future. The graph and table do not reflect the deduction of taxes that a shareholder would pay on Fund distributions or redemption of Fund shares.
VALUE OF A $10,000 INVESTMENT – Class R 12/31/2014 — 12/31/2024
AVERAGE ANNUAL TOTAL RETURNS (%) Period Ended December 31, 2024
| | | |
| | 1 Year | 5 Year | 10 Year |
Class R | 10.58 | 5.73 | 5.55 |
Bloomberg Global Aggregate Index | -1.69 | -1.96 | 0.15 |
MSCI All Country World Index-NR | 17.49 | 10.06 | 9.23 |
Blended Benchmark† | 10.27 | 5.79 | 6.23 |
Bloomberg Multiverse Index | -1.34 | -1.76 | 0.35 |
| † | The Fund’s Blended Benchmark consists of 69% MSCI AC World Index-NR and 31% Bloomberg Multiverse Index. Allocations for the Fund’s Blended Benchmark reflect the Fund’s current target asset class allocations and may not be representative of the Fund’s historical asset class allocations. Performance for the Blended Benchmark is based on an asset class allocation that matches the glide path of the Franklin LifeSmart Funds over time. Prior to May 1, 2019, the Blended Benchmark had an allocation to FTSE 3 Month U.S. T-Bill Index. |
Reflects waiver of fees and/or reimbursement of expenses (including acquired fund fees and expenses), without which expenses would be higher.
For current month-end performance, please call Franklin Templeton at (800) DIAL BEN/342-5236 or visit https://www.franklintempleton.com/investments/options/mutual-funds.
Important data provider notices and terms available at www.franklintempletondatasources.com.
KEY FUND STATISTICS (as of December 31, 2024)
| |
Total Net Assets | $72,277,059 |
Total Number of Portfolio Holdings* | 21 |
Total Management Fee Paid | $0 |
Portfolio Turnover Rate | 37.55% |
| * | Does not include derivatives, except purchased options, if any. |
| Franklin LifeSmart 2030 Retirement Target Fund | PAGE 2 | 853-ATSR-0225 |
WHAT DID THE FUND INVEST IN? (as of December 31, 2024)
Portfolio Composition* (% of Total Investments)
| * | Does not include derivatives, except purchased options, if any. |
| |
| WHERE CAN I FIND ADDITIONAL INFORMATION ABOUT THE FUND? |
Additional information is available on https://www.franklintempleton.com/regulatory-fund-documents, including its: |
| • prospectus • proxy voting information • financial information • holdings • tax information |
HOUSEHOLDING
You will receive the Fund’s shareholder reports every six months. In addition, you will receive an annual updated summary prospectus (detail prospectus available upon request). To reduce Fund expenses, we try to identify related shareholders in a household and send only one copy of the shareholder reports and summary prospectus. This process, called “householding,” will continue indefinitely unless you instruct us otherwise. If you prefer not to have these documents householded, please call us at (800) DIAL BEN/342-5236. At any time, you may view current prospectuses/summary prospectuses and shareholder reports on our website. If you choose, you may receive these documents through electronic delivery.
| Franklin LifeSmart 2030 Retirement Target Fund | PAGE 3 | 853-ATSR-0225 |
1000098111006711716109451298514435162621352315516171561000096859887106181049011208122381166297671032610151100009764105311305611827149731740620633168442058424183100009771103931230111494138071558117273142661659618299100009671994610710105651131812339117839896104941035442.728.720.66.21.00.8
| | |
Franklin LifeSmart 2030 Retirement Target Fund | |
| Class R6 [FLERX] |
| Annual Shareholder Report | December 31, 2024 |
|
This annual shareholder report contains important information about Franklin LifeSmart 2030 Retirement Target Fund for the period January 1, 2024, to December 31, 2024.
You can find additional information about the Fund at https://www.franklintempleton.com/regulatory-fund-documents. You can also request this information by contacting us at (800) DIAL BEN/342-5236.
WHAT WERE THE FUND COSTS FOR THE LAST YEAR? (based on a hypothetical $10,000 investment)
| | |
Class Name | Costs of a $10,000 investment | Costs paid as a percentage of a $10,000 investment* |
Class R61 | $21 | 0.20% |
| * | Reflects waiver of fees and/or reimbursement of expenses (including acquired fund fees and expenses), without which expenses would be higher. |
| 1 | Excludes fees and expenses of the underlying funds in which the Fund invests. |
HOW DID THE FUND PERFORM LAST YEAR AND WHAT AFFECTED ITS PERFORMANCE?
For the twelve months ended December 31, 2024, Class R6 shares of Franklin LifeSmart 2030 Retirement Target Fund returned 11.21%. The Fund compares its performance to the MSCI All Country World Index-NR, the Blended Benchmark† and the Bloomberg Multiverse Index, which returned 17.49%, 10.27% and -1.34%, respectively, for the same period.
| |
Top contributors to performance: |
| ↑ | Fixed income underweight, reflecting our preference for equities over fixed income. |
| ↑ | Within fixed income, an overweight to U.S. fixed income. |
| ↑ | Within fixed income, an underweight to international fixed income. |
| |
Top detractors from performance: |
| ↓ | Fund selection in equity, reflecting meaningful exposure to value stocks. |
| ↓ | Fund selection in U.S. equity. |
| ↓ | Fund selection in international equity. |
| Franklin LifeSmart 2030 Retirement Target Fund | PAGE 1 | 833-ATSR-0225 |
HOW DID THE FUND PERFORM OVER THE LAST 10 YEARS?
The Fund’s past performance is not necessarily an indication of how the Fund will perform in the future. The graph and table do not reflect the deduction of taxes that a shareholder would pay on Fund distributions or redemption of Fund shares.
VALUE OF A $10,000 INVESTMENT – Class R6 12/31/2014 — 12/31/2024
AVERAGE ANNUAL TOTAL RETURNS (%) Period Ended December 31, 2024
| | | |
| | 1 Year | 5 Year | 10 Year |
Class R6 | 11.21 | 6.49 | 6.22 |
Bloomberg Global Aggregate Index | -1.69 | -1.96 | 0.15 |
MSCI All Country World Index-NR | 17.49 | 10.06 | 9.23 |
Blended Benchmark† | 10.27 | 5.79 | 6.23 |
Bloomberg Multiverse Index | -1.34 | -1.76 | 0.35 |
| † | The Fund’s Blended Benchmark consists of 69% MSCI AC World Index-NR and 31% Bloomberg Multiverse Index. Allocations for the Fund’s Blended Benchmark reflect the Fund’s current target asset class allocations and may not be representative of the Fund’s historical asset class allocations. Performance for the Blended Benchmark is based on an asset class allocation that matches the glide path of the Franklin LifeSmart Funds over time. Prior to May 1, 2019, the Blended Benchmark had an allocation to FTSE 3 Month U.S. T-Bill Index. |
Reflects waiver of fees and/or reimbursement of expenses (including acquired fund fees and expenses), without which expenses would be higher.
For current month-end performance, please call Franklin Templeton at (800) DIAL BEN/342-5236 or visit https://www.franklintempleton.com/investments/options/mutual-funds.
Important data provider notices and terms available at www.franklintempletondatasources.com.
KEY FUND STATISTICS (as of December 31, 2024)
| |
Total Net Assets | $72,277,059 |
Total Number of Portfolio Holdings* | 21 |
Total Management Fee Paid | $0 |
Portfolio Turnover Rate | 37.55% |
| * | Does not include derivatives, except purchased options, if any. |
| Franklin LifeSmart 2030 Retirement Target Fund | PAGE 2 | 833-ATSR-0225 |
WHAT DID THE FUND INVEST IN? (as of December 31, 2024)
Portfolio Composition* (% of Total Investments)
| * | Does not include derivatives, except purchased options, if any. |
| |
| WHERE CAN I FIND ADDITIONAL INFORMATION ABOUT THE FUND? |
Additional information is available on https://www.franklintempleton.com/regulatory-fund-documents, including its: |
| • prospectus • proxy voting information • financial information • holdings • tax information |
HOUSEHOLDING
You will receive the Fund’s shareholder reports every six months. In addition, you will receive an annual updated summary prospectus (detail prospectus available upon request). To reduce Fund expenses, we try to identify related shareholders in a household and send only one copy of the shareholder reports and summary prospectus. This process, called “householding,” will continue indefinitely unless you instruct us otherwise. If you prefer not to have these documents householded, please call us at (800) DIAL BEN/342-5236. At any time, you may view current prospectuses/summary prospectuses and shareholder reports on our website. If you choose, you may receive these documents through electronic delivery.
| Franklin LifeSmart 2030 Retirement Target Fund | PAGE 3 | 833-ATSR-0225 |
1000098661018111913111961335114926169031425316443182861000096859887106181049011208122381166297671032610151100009764105311305611827149731740620633168442058424183100009771103931230111494138071558117273142661659618299100009671994610710105651131812339117839896104941035442.728.720.66.21.00.8
| | |
Franklin LifeSmart 2030 Retirement Target Fund | |
| Advisor Class [FLRZX] |
| Annual Shareholder Report | December 31, 2024 |
|
This annual shareholder report contains important information about Franklin LifeSmart 2030 Retirement Target Fund for the period January 1, 2024, to December 31, 2024.
You can find additional information about the Fund at https://www.franklintempleton.com/regulatory-fund-documents. You can also request this information by contacting us at (800) DIAL BEN/342-5236.
WHAT WERE THE FUND COSTS FOR THE LAST YEAR? (based on a hypothetical $10,000 investment)
| | |
Class Name | Costs of a $10,000 investment | Costs paid as a percentage of a $10,000 investment* |
Advisor Class1 | $26 | 0.25% |
| * | Reflects waiver of fees and/or reimbursement of expenses (including acquired fund fees and expenses), without which expenses would be higher. |
| 1 | Excludes fees and expenses of the underlying funds in which the Fund invests. |
HOW DID THE FUND PERFORM LAST YEAR AND WHAT AFFECTED ITS PERFORMANCE?
For the twelve months ended December 31, 2024, Advisor Class shares of Franklin LifeSmart 2030 Retirement Target Fund returned 11.09%. The Fund compares its performance to the MSCI All Country World Index-NR, the Blended Benchmark† and the Bloomberg Multiverse Index, which returned 17.49%, 10.27% and -1.34%, respectively, for the same period.
| |
Top contributors to performance: |
| ↑ | Fixed income underweight, reflecting our preference for equities over fixed income. |
| ↑ | Within fixed income, an overweight to U.S. fixed income. |
| ↑ | Within fixed income, an underweight to international fixed income. |
| |
Top detractors from performance: |
| ↓ | Fund selection in equity, reflecting meaningful exposure to value stocks. |
| ↓ | Fund selection in U.S. equity. |
| ↓ | Fund selection in international equity. |
| Franklin LifeSmart 2030 Retirement Target Fund | PAGE 1 | 83-ATSR-0225 |
HOW DID THE FUND PERFORM OVER THE LAST 10 YEARS?
The Fund’s past performance is not necessarily an indication of how the Fund will perform in the future. The graph and table do not reflect the deduction of taxes that a shareholder would pay on Fund distributions or redemption of Fund shares.
VALUE OF A $10,000 INVESTMENT – Advisor Class 12/31/2014 — 12/31/2024
AVERAGE ANNUAL TOTAL RETURNS (%) Period Ended December 31, 2024
| | | |
| | 1 Year | 5 Year | 10 Year |
Advisor Class | 11.09 | 6.27 | 6.08 |
Bloomberg Global Aggregate Index | -1.69 | -1.96 | 0.15 |
MSCI All Country World Index-NR | 17.49 | 10.06 | 9.23 |
Blended Benchmark† | 10.27 | 5.79 | 6.23 |
Bloomberg Multiverse Index | -1.34 | -1.76 | 0.35 |
| † | The Fund’s Blended Benchmark consists of 69% MSCI AC World Index-NR and 31% Bloomberg Multiverse Index. Allocations for the Fund’s Blended Benchmark reflect the Fund’s current target asset class allocations and may not be representative of the Fund’s historical asset class allocations. Performance for the Blended Benchmark is based on an asset class allocation that matches the glide path of the Franklin LifeSmart Funds over time. Prior to May 1, 2019, the Blended Benchmark had an allocation to FTSE 3 Month U.S. T-Bill Index. |
Reflects waiver of fees and/or reimbursement of expenses (including acquired fund fees and expenses), without which expenses would be higher.
For current month-end performance, please call Franklin Templeton at (800) DIAL BEN/342-5236 or visit https://www.franklintempleton.com/investments/options/mutual-funds.
Important data provider notices and terms available at www.franklintempletondatasources.com.
KEY FUND STATISTICS (as of December 31, 2024)
| |
Total Net Assets | $72,277,059 |
Total Number of Portfolio Holdings* | 21 |
Total Management Fee Paid | $0 |
Portfolio Turnover Rate | 37.55% |
| * | Does not include derivatives, except purchased options, if any. |
| Franklin LifeSmart 2030 Retirement Target Fund | PAGE 2 | 83-ATSR-0225 |
WHAT DID THE FUND INVEST IN? (as of December 31, 2024)
Portfolio Composition* (% of Total Investments)
| * | Does not include derivatives, except purchased options, if any. |
| |
| WHERE CAN I FIND ADDITIONAL INFORMATION ABOUT THE FUND? |
Additional information is available on https://www.franklintempleton.com/regulatory-fund-documents, including its: |
| • prospectus • proxy voting information • financial information • holdings • tax information |
HOUSEHOLDING
You will receive the Fund’s shareholder reports every six months. In addition, you will receive an annual updated summary prospectus (detail prospectus available upon request). To reduce Fund expenses, we try to identify related shareholders in a household and send only one copy of the shareholder reports and summary prospectus. This process, called “householding,” will continue indefinitely unless you instruct us otherwise. If you prefer not to have these documents householded, please call us at (800) DIAL BEN/342-5236. At any time, you may view current prospectuses/summary prospectuses and shareholder reports on our website. If you choose, you may receive these documents through electronic delivery.
| Franklin LifeSmart 2030 Retirement Target Fund | PAGE 3 | 83-ATSR-0225 |
1000098541016511891111681331414869168431409216241180431000096859887106181049011208122381166297671032610151100009764105311305611827149731740620633168442058424183100009771103931230111494138071558117273142661659618299100009671994610710105651131812339117839896104941035442.728.720.66.21.00.8
| | |
Franklin LifeSmart 2035 Retirement Target Fund | |
| Class A [FRTAX] |
| Annual Shareholder Report | December 31, 2024 |
|
This annual shareholder report contains important information about Franklin LifeSmart 2035 Retirement Target Fund for the period January 1, 2024, to December 31, 2024.
You can find additional information about the Fund at https://www.franklintempleton.com/regulatory-fund-documents. You can also request this information by contacting us at (800) DIAL BEN/342-5236.
WHAT WERE THE FUND COSTS FOR THE LAST YEAR? (based on a hypothetical $10,000 investment)
| | |
Class Name | Costs of a $10,000 investment | Costs paid as a percentage of a $10,000 investment* |
Class A1 | $55 | 0.52% |
| * | Reflects waiver of fees and/or reimbursement of expenses (including acquired fund fees and expenses), without which expenses would be higher. |
| 1 | Excludes fees and expenses of the underlying funds in which the Fund invests. |
HOW DID THE FUND PERFORM LAST YEAR AND WHAT AFFECTED ITS PERFORMANCE?
For the twelve months ended December 31, 2024, Class A shares of Franklin LifeSmart 2035 Retirement Target Fund returned 12.27%. The Fund compares its performance to the MSCI All Country World Index-NR, the Blended Benchmark† and the Bloomberg Multiverse Index, which returned 17.49%, 11.94% and -1.34%, respectively, for the same period.
| |
Top contributors to performance: |
| ↑ | Fixed income underweight, reflecting our preference for equities over fixed income. |
| ↑ | Within fixed income, an overweight to U.S. fixed income. |
| ↑ | Within fixed income, an underweight to international fixed income. |
| |
Top detractors from performance: |
| ↓ | Fund selection in equity, reflecting meaningful exposure to value stocks. |
| ↓ | Fund selection in U.S. equity. |
| ↓ | Fund selection in international equity. |
| Franklin LifeSmart 2035 Retirement Target Fund | PAGE 1 | 446-ATSR-0225 |
HOW DID THE FUND PERFORM OVER THE LAST 10 YEARS?
The Fund’s past performance is not necessarily an indication of how the Fund will perform in the future. The graph and table do not reflect the deduction of taxes that a shareholder would pay on Fund distributions or redemption of Fund shares.
VALUE OF A $10,000 INVESTMENT ($9,450 AFTER MAXIMUM APPLICABLE SALES CHARGE) –
Class A 12/31/2014 — 12/31/2024
AVERAGE ANNUAL TOTAL RETURNS (%) Period Ended December 31, 2024
| | | |
| | 1 Year | 5 Year | 10 Year |
Class A | 12.27 | 7.08 | 6.52 |
Class A (with sales charge) | 6.11 | 5.87 | 5.91 |
Bloomberg Global Aggregate Index | -1.69 | -1.96 | 0.15 |
MSCI All Country World Index-NR | 17.49 | 10.06 | 9.23 |
Blended Benchmark† | 11.94 | 6.94 | 6.96 |
Bloomberg Multiverse Index | -1.34 | -1.76 | 0.35 |
| † | The Fund’s Blended Benchmark consists of 77% MSCI AC World Index-NR and 23% Bloomberg Multiverse Index. Allocations for the Fund’s Blended Benchmark reflect the Fund’s current target asset class allocations and may not be representative of the Fund’s historical asset class allocations. Performance for the Blended Benchmark is based on an asset class allocation that matches the glide path of the Franklin LifeSmart Funds over time. Prior to May 1, 2019, the Blended Benchmark had an allocation to FTSE 3 Month U.S. T-Bill Index. |
Reflects waiver of fees and/or reimbursement of expenses (including acquired fund fees and expenses), without which expenses would be higher.
Performance for periods prior to September 10, 2018, has been restated to reflect the current maximum sales charge, which is lower than the maximum sales charge prior to that date.
For current month-end performance, please call Franklin Templeton at (800) DIAL BEN/342-5236 or visit https://www.franklintempleton.com/investments/options/mutual-funds.
Important data provider notices and terms available at www.franklintempletondatasources.com.
KEY FUND STATISTICS (as of December 31, 2024)
| |
Total Net Assets | $139,277,375 |
Total Number of Portfolio Holdings* | 21 |
Total Management Fee Paid | $0 |
Portfolio Turnover Rate | 33.89% |
| * | Does not include derivatives, except purchased options, if any. |
| Franklin LifeSmart 2035 Retirement Target Fund | PAGE 2 | 446-ATSR-0225 |
WHAT DID THE FUND INVEST IN? (as of December 31, 2024)
Portfolio Composition* (% of Total Investments)
| * | Does not include derivatives, except purchased options, if any. |
| |
| WHERE CAN I FIND ADDITIONAL INFORMATION ABOUT THE FUND? |
Additional information is available on https://www.franklintempleton.com/regulatory-fund-documents, including its: |
| • prospectus • proxy voting information • financial information • holdings • tax information |
HOUSEHOLDING
You will receive the Fund’s shareholder reports every six months. In addition, you will receive an annual updated summary prospectus (detail prospectus available upon request). To reduce Fund expenses, we try to identify related shareholders in a household and send only one copy of the shareholder reports and summary prospectus. This process, called “householding,” will continue indefinitely unless you instruct us otherwise. If you prefer not to have these documents householded, please call us at (800) DIAL BEN/342-5236. At any time, you may view current prospectuses/summary prospectuses and shareholder reports on our website. If you choose, you may receive these documents through electronic delivery.
| Franklin LifeSmart 2035 Retirement Target Fund | PAGE 3 | 446-ATSR-0225 |
94509261955011262104881262314320163541362415827177651000096859887106181049011208122381166297671032610151100009764105311305611827149731740620633168442058424183100009773104141240911540140091600718052148701750719594100009671994610710105651131812339117839896104941035448.523.521.44.71.00.9
| | |
Franklin LifeSmart 2035 Retirement Target Fund | |
| Class C [FTRCX] |
| Annual Shareholder Report | December 31, 2024 |
|
This annual shareholder report contains important information about Franklin LifeSmart 2035 Retirement Target Fund for the period January 1, 2024, to December 31, 2024.
You can find additional information about the Fund at https://www.franklintempleton.com/regulatory-fund-documents. You can also request this information by contacting us at (800) DIAL BEN/342-5236.
WHAT WERE THE FUND COSTS FOR THE LAST YEAR? (based on a hypothetical $10,000 investment)
| | |
Class Name | Costs of a $10,000 investment | Costs paid as a percentage of a $10,000 investment* |
Class C1 | $134 | 1.27% |
| * | Reflects waiver of fees and/or reimbursement of expenses (including acquired fund fees and expenses), without which expenses would be higher. |
| 1 | Excludes fees and expenses of the underlying funds in which the Fund invests. |
HOW DID THE FUND PERFORM LAST YEAR AND WHAT AFFECTED ITS PERFORMANCE?
For the twelve months ended December 31, 2024, Class C shares of Franklin LifeSmart 2035 Retirement Target Fund returned 11.48%. The Fund compares its performance to the MSCI All Country World Index-NR, the Blended Benchmark† and the Bloomberg Multiverse Index, which returned 17.49%, 11.94% and -1.34%, respectively, for the same period.
| |
Top contributors to performance: |
| ↑ | Fixed income underweight, reflecting our preference for equities over fixed income. |
| ↑ | Within fixed income, an overweight to U.S. fixed income. |
| ↑ | Within fixed income, an underweight to international fixed income. |
| |
Top detractors from performance: |
| ↓ | Fund selection in equity, reflecting meaningful exposure to value stocks. |
| ↓ | Fund selection in U.S. equity. |
| ↓ | Fund selection in international equity. |
| Franklin LifeSmart 2035 Retirement Target Fund | PAGE 1 | 546-ATSR-0225 |
HOW DID THE FUND PERFORM OVER THE LAST 10 YEARS?
The Fund’s past performance is not necessarily an indication of how the Fund will perform in the future. The graph and table do not reflect the deduction of taxes that a shareholder would pay on Fund distributions or redemption of Fund shares.
VALUE OF A $10,000 INVESTMENT – Class C 12/31/2014 — 12/31/2024
AVERAGE ANNUAL TOTAL RETURNS (%) Period Ended December 31, 2024
| | | |
| | 1 Year | 5 Year | 10 Year |
Class C | 11.48 | 6.29 | 5.73 |
Class C (with sales charge) | 10.48 | 6.29 | 5.73 |
Bloomberg Global Aggregate Index | -1.69 | -1.96 | 0.15 |
MSCI All Country World Index-NR | 17.49 | 10.06 | 9.23 |
Blended Benchmark† | 11.94 | 6.94 | 6.96 |
Bloomberg Multiverse Index | -1.34 | -1.76 | 0.35 |
| † | The Fund’s Blended Benchmark consists of 77% MSCI AC World Index-NR and 23% Bloomberg Multiverse Index. Allocations for the Fund’s Blended Benchmark reflect the Fund’s current target asset class allocations and may not be representative of the Fund’s historical asset class allocations. Performance for the Blended Benchmark is based on an asset class allocation that matches the glide path of the Franklin LifeSmart Funds over time. Prior to May 1, 2019, the Blended Benchmark had an allocation to FTSE 3 Month U.S. T-Bill Index. |
Reflects waiver of fees and/or reimbursement of expenses (including acquired fund fees and expenses), without which expenses would be higher.
For current month-end performance, please call Franklin Templeton at (800) DIAL BEN/342-5236 or visit https://www.franklintempleton.com/investments/options/mutual-funds.
Important data provider notices and terms available at www.franklintempletondatasources.com.
KEY FUND STATISTICS (as of December 31, 2024)
| |
Total Net Assets | $139,277,375 |
Total Number of Portfolio Holdings* | 21 |
Total Management Fee Paid | $0 |
Portfolio Turnover Rate | 33.89% |
| * | Does not include derivatives, except purchased options, if any. |
| Franklin LifeSmart 2035 Retirement Target Fund | PAGE 2 | 546-ATSR-0225 |
WHAT DID THE FUND INVEST IN? (as of December 31, 2024)
Portfolio Composition* (% of Total Investments)
| * | Does not include derivatives, except purchased options, if any. |
| |
| WHERE CAN I FIND ADDITIONAL INFORMATION ABOUT THE FUND? |
Additional information is available on https://www.franklintempleton.com/regulatory-fund-documents, including its: |
| • prospectus • proxy voting information • financial information • holdings • tax information |
HOUSEHOLDING
You will receive the Fund’s shareholder reports every six months. In addition, you will receive an annual updated summary prospectus (detail prospectus available upon request). To reduce Fund expenses, we try to identify related shareholders in a household and send only one copy of the shareholder reports and summary prospectus. This process, called “householding,” will continue indefinitely unless you instruct us otherwise. If you prefer not to have these documents householded, please call us at (800) DIAL BEN/342-5236. At any time, you may view current prospectuses/summary prospectuses and shareholder reports on our website. If you choose, you may receive these documents through electronic delivery.
| Franklin LifeSmart 2035 Retirement Target Fund | PAGE 3 | 546-ATSR-0225 |
100009724995211653107691286514489164241357315658174551000096859887106181049011208122381166297671032610151100009764105311305611827149731740620633168442058424183100009773104141240911540140091600718052148701750719594100009671994610710105651131812339117839896104941035448.523.521.44.71.00.9
| | |
Franklin LifeSmart 2035 Retirement Target Fund | |
| Class R [FLRGX] |
| Annual Shareholder Report | December 31, 2024 |
|
This annual shareholder report contains important information about Franklin LifeSmart 2035 Retirement Target Fund for the period January 1, 2024, to December 31, 2024.
You can find additional information about the Fund at https://www.franklintempleton.com/regulatory-fund-documents. You can also request this information by contacting us at (800) DIAL BEN/342-5236.
WHAT WERE THE FUND COSTS FOR THE LAST YEAR? (based on a hypothetical $10,000 investment)
| | |
Class Name | Costs of a $10,000 investment | Costs paid as a percentage of a $10,000 investment* |
Class R1 | $82 | 0.77% |
| * | Reflects waiver of fees and/or reimbursement of expenses (including acquired fund fees and expenses), without which expenses would be higher. |
| 1 | Excludes fees and expenses of the underlying funds in which the Fund invests. |
HOW DID THE FUND PERFORM LAST YEAR AND WHAT AFFECTED ITS PERFORMANCE?
For the twelve months ended December 31, 2024, Class R shares of Franklin LifeSmart 2035 Retirement Target Fund returned 12.03%. The Fund compares its performance to the MSCI All Country World Index-NR, the Blended Benchmark† and the Bloomberg Multiverse Index, which returned 17.49%, 11.94% and -1.34%, respectively, for the same period.
| |
Top contributors to performance: |
| ↑ | Fixed income underweight, reflecting our preference for equities over fixed income. |
| ↑ | Within fixed income, an overweight to U.S. fixed income. |
| ↑ | Within fixed income, an underweight to international fixed income. |
| |
Top detractors from performance: |
| ↓ | Fund selection in equity, reflecting meaningful exposure to value stocks. |
| ↓ | Fund selection in U.S. equity. |
| ↓ | Fund selection in international equity. |
| Franklin LifeSmart 2035 Retirement Target Fund | PAGE 1 | 846-ATSR-0225 |
HOW DID THE FUND PERFORM OVER THE LAST 10 YEARS?
The Fund’s past performance is not necessarily an indication of how the Fund will perform in the future. The graph and table do not reflect the deduction of taxes that a shareholder would pay on Fund distributions or redemption of Fund shares.
VALUE OF A $10,000 INVESTMENT – Class R 12/31/2014 — 12/31/2024
AVERAGE ANNUAL TOTAL RETURNS (%) Period Ended December 31, 2024
| | | |
| | 1 Year | 5 Year | 10 Year |
Class R | 12.03 | 6.82 | 6.26 |
Bloomberg Global Aggregate Index | -1.69 | -1.96 | 0.15 |
MSCI All Country World Index-NR | 17.49 | 10.06 | 9.23 |
Blended Benchmark† | 11.94 | 6.94 | 6.96 |
Bloomberg Multiverse Index | -1.34 | -1.76 | 0.35 |
| † | The Fund’s Blended Benchmark consists of 77% MSCI AC World Index-NR and 23% Bloomberg Multiverse Index. Allocations for the Fund’s Blended Benchmark reflect the Fund’s current target asset class allocations and may not be representative of the Fund’s historical asset class allocations. Performance for the Blended Benchmark is based on an asset class allocation that matches the glide path of the Franklin LifeSmart Funds over time. Prior to May 1, 2019, the Blended Benchmark had an allocation to FTSE 3 Month U.S. T-Bill Index. |
Reflects waiver of fees and/or reimbursement of expenses (including acquired fund fees and expenses), without which expenses would be higher.
For current month-end performance, please call Franklin Templeton at (800) DIAL BEN/342-5236 or visit https://www.franklintempleton.com/investments/options/mutual-funds.
Important data provider notices and terms available at www.franklintempletondatasources.com.
KEY FUND STATISTICS (as of December 31, 2024)
| |
Total Net Assets | $139,277,375 |
Total Number of Portfolio Holdings* | 21 |
Total Management Fee Paid | $0 |
Portfolio Turnover Rate | 33.89% |
| * | Does not include derivatives, except purchased options, if any. |
| Franklin LifeSmart 2035 Retirement Target Fund | PAGE 2 | 846-ATSR-0225 |
WHAT DID THE FUND INVEST IN? (as of December 31, 2024)
Portfolio Composition* (% of Total Investments)
| * | Does not include derivatives, except purchased options, if any. |
| |
| WHERE CAN I FIND ADDITIONAL INFORMATION ABOUT THE FUND? |
Additional information is available on https://www.franklintempleton.com/regulatory-fund-documents, including its: |
| • prospectus • proxy voting information • financial information • holdings • tax information |
HOUSEHOLDING
You will receive the Fund’s shareholder reports every six months. In addition, you will receive an annual updated summary prospectus (detail prospectus available upon request). To reduce Fund expenses, we try to identify related shareholders in a household and send only one copy of the shareholder reports and summary prospectus. This process, called “householding,” will continue indefinitely unless you instruct us otherwise. If you prefer not to have these documents householded, please call us at (800) DIAL BEN/342-5236. At any time, you may view current prospectuses/summary prospectuses and shareholder reports on our website. If you choose, you may receive these documents through electronic delivery.
| Franklin LifeSmart 2035 Retirement Target Fund | PAGE 3 | 846-ATSR-0225 |
1000097751005511836109861319314939170111413116378183481000096859887106181049011208122381166297671032610151100009764105311305611827149731740620633168442058424183100009773104141240911540140091600718052148701750719594100009671994610710105651131812339117839896104941035448.523.521.44.71.00.9
| | |
Franklin LifeSmart 2035 Retirement Target Fund | |
| Class R6 [FMTLX] |
| Annual Shareholder Report | December 31, 2024 |
|
This annual shareholder report contains important information about Franklin LifeSmart 2035 Retirement Target Fund for the period January 1, 2024, to December 31, 2024.
You can find additional information about the Fund at https://www.franklintempleton.com/regulatory-fund-documents. You can also request this information by contacting us at (800) DIAL BEN/342-5236.
WHAT WERE THE FUND COSTS FOR THE LAST YEAR? (based on a hypothetical $10,000 investment)
| | |
Class Name | Costs of a $10,000 investment | Costs paid as a percentage of a $10,000 investment* |
Class R61 | $19 | 0.18% |
| * | Reflects waiver of fees and/or reimbursement of expenses (including acquired fund fees and expenses), without which expenses would be higher. |
| 1 | Excludes fees and expenses of the underlying funds in which the Fund invests. |
HOW DID THE FUND PERFORM LAST YEAR AND WHAT AFFECTED ITS PERFORMANCE?
For the twelve months ended December 31, 2024, Class R6 shares of Franklin LifeSmart 2035 Retirement Target Fund returned 12.71%. The Fund compares its performance to the MSCI All Country World Index-NR, the Blended Benchmark† and the Bloomberg Multiverse Index, which returned 17.49%, 11.94% and -1.34%, respectively, for the same period.
| |
Top contributors to performance: |
| ↑ | Fixed income underweight, reflecting our preference for equities over fixed income. |
| ↑ | Within fixed income, an overweight to U.S. fixed income. |
| ↑ | Within fixed income, an underweight to international fixed income. |
| |
Top detractors from performance: |
| ↓ | Fund selection in equity, reflecting meaningful exposure to value stocks. |
| ↓ | Fund selection in U.S. equity. |
| ↓ | Fund selection in international equity. |
| Franklin LifeSmart 2035 Retirement Target Fund | PAGE 1 | 346-ATSR-0225 |
HOW DID THE FUND PERFORM OVER THE LAST 10 YEARS?
The Fund’s past performance is not necessarily an indication of how the Fund will perform in the future. The graph and table do not reflect the deduction of taxes that a shareholder would pay on Fund distributions or redemption of Fund shares.
VALUE OF A $10,000 INVESTMENT – Class R6 12/31/2014 — 12/31/2024
AVERAGE ANNUAL TOTAL RETURNS (%) Period Ended December 31, 2024
| | | |
| | 1 Year | 5 Year | 10 Year |
Class R6 | 12.71 | 7.42 | 6.85 |
Bloomberg Global Aggregate Index | -1.69 | -1.96 | 0.15 |
MSCI All Country World Index-NR | 17.49 | 10.06 | 9.23 |
Blended Benchmark† | 11.94 | 6.94 | 6.96 |
Bloomberg Multiverse Index | -1.34 | -1.76 | 0.35 |
| † | The Fund’s Blended Benchmark consists of 77% MSCI AC World Index-NR and 23% Bloomberg Multiverse Index. Allocations for the Fund’s Blended Benchmark reflect the Fund’s current target asset class allocations and may not be representative of the Fund’s historical asset class allocations. Performance for the Blended Benchmark is based on an asset class allocation that matches the glide path of the Franklin LifeSmart Funds over time. Prior to May 1, 2019, the Blended Benchmark had an allocation to FTSE 3 Month U.S. T-Bill Index. |
Reflects waiver of fees and/or reimbursement of expenses (including acquired fund fees and expenses), without which expenses would be higher.
For current month-end performance, please call Franklin Templeton at (800) DIAL BEN/342-5236 or visit https://www.franklintempleton.com/investments/options/mutual-funds.
Important data provider notices and terms available at www.franklintempletondatasources.com.
KEY FUND STATISTICS (as of December 31, 2024)
| |
Total Net Assets | $139,277,375 |
Total Number of Portfolio Holdings* | 21 |
Total Management Fee Paid | $0 |
Portfolio Turnover Rate | 33.89% |
| * | Does not include derivatives, except purchased options, if any. |
| Franklin LifeSmart 2035 Retirement Target Fund | PAGE 2 | 346-ATSR-0225 |
WHAT DID THE FUND INVEST IN? (as of December 31, 2024)
Portfolio Composition* (% of Total Investments)
| * | Does not include derivatives, except purchased options, if any. |
| |
| WHERE CAN I FIND ADDITIONAL INFORMATION ABOUT THE FUND? |
Additional information is available on https://www.franklintempleton.com/regulatory-fund-documents, including its: |
| • prospectus • proxy voting information • financial information • holdings • tax information |
HOUSEHOLDING
You will receive the Fund’s shareholder reports every six months. In addition, you will receive an annual updated summary prospectus (detail prospectus available upon request). To reduce Fund expenses, we try to identify related shareholders in a household and send only one copy of the shareholder reports and summary prospectus. This process, called “householding,” will continue indefinitely unless you instruct us otherwise. If you prefer not to have these documents householded, please call us at (800) DIAL BEN/342-5236. At any time, you may view current prospectuses/summary prospectuses and shareholder reports on our website. If you choose, you may receive these documents through electronic delivery.
| Franklin LifeSmart 2035 Retirement Target Fund | PAGE 3 | 346-ATSR-0225 |
1000098251016712028112311355915433176651477217209193961000096859887106181049011208122381166297671032610151100009764105311305611827149731740620633168442058424183100009773104141240911540140091600718052148701750719594100009671994610710105651131812339117839896104941035448.523.521.44.71.00.9
| | |
Franklin LifeSmart 2035 Retirement Target Fund | |
| Advisor Class [FLRHX] |
| Annual Shareholder Report | December 31, 2024 |
|
This annual shareholder report contains important information about Franklin LifeSmart 2035 Retirement Target Fund for the period January 1, 2024, to December 31, 2024.
You can find additional information about the Fund at https://www.franklintempleton.com/regulatory-fund-documents. You can also request this information by contacting us at (800) DIAL BEN/342-5236.
WHAT WERE THE FUND COSTS FOR THE LAST YEAR? (based on a hypothetical $10,000 investment)
| | |
Class Name | Costs of a $10,000 investment | Costs paid as a percentage of a $10,000 investment* |
Advisor Class1 | $29 | 0.27% |
| * | Reflects waiver of fees and/or reimbursement of expenses (including acquired fund fees and expenses), without which expenses would be higher. |
| 1 | Excludes fees and expenses of the underlying funds in which the Fund invests. |
HOW DID THE FUND PERFORM LAST YEAR AND WHAT AFFECTED ITS PERFORMANCE?
For the twelve months ended December 31, 2024, Advisor Class shares of Franklin LifeSmart 2035 Retirement Target Fund returned 12.53%. The Fund compares its performance to the MSCI All Country World Index-NR, the Blended Benchmark† and the Bloomberg Multiverse Index, which returned 17.49%, 11.94% and -1.34%, respectively, for the same period.
| |
Top contributors to performance: |
| ↑ | Fixed income underweight, reflecting our preference for equities over fixed income. |
| ↑ | Within fixed income, an overweight to U.S. fixed income. |
| ↑ | Within fixed income, an underweight to international fixed income. |
| |
Top detractors from performance: |
| ↓ | Fund selection in equity, reflecting meaningful exposure to value stocks. |
| ↓ | Fund selection in U.S. equity. |
| ↓ | Fund selection in international equity. |
| Franklin LifeSmart 2035 Retirement Target Fund | PAGE 1 | 646-ATSR-0225 |
HOW DID THE FUND PERFORM OVER THE LAST 10 YEARS?
The Fund’s past performance is not necessarily an indication of how the Fund will perform in the future. The graph and table do not reflect the deduction of taxes that a shareholder would pay on Fund distributions or redemption of Fund shares.
VALUE OF A $10,000 INVESTMENT – Advisor Class 12/31/2014 — 12/31/2024
AVERAGE ANNUAL TOTAL RETURNS (%) Period Ended December 31, 2024
| | | |
| | 1 Year | 5 Year | 10 Year |
Advisor Class | 12.53 | 7.34 | 6.79 |
Bloomberg Global Aggregate Index | -1.69 | -1.96 | 0.15 |
MSCI All Country World Index-NR | 17.49 | 10.06 | 9.23 |
Blended Benchmark† | 11.94 | 6.94 | 6.96 |
Bloomberg Multiverse Index | -1.34 | -1.76 | 0.35 |
| † | The Fund’s Blended Benchmark consists of 77% MSCI AC World Index-NR and 23% Bloomberg Multiverse Index. Allocations for the Fund’s Blended Benchmark reflect the Fund’s current target asset class allocations and may not be representative of the Fund’s historical asset class allocations. Performance for the Blended Benchmark is based on an asset class allocation that matches the glide path of the Franklin LifeSmart Funds over time. Prior to May 1, 2019, the Blended Benchmark had an allocation to FTSE 3 Month U.S. T-Bill Index. |
Reflects waiver of fees and/or reimbursement of expenses (including acquired fund fees and expenses), without which expenses would be higher.
For current month-end performance, please call Franklin Templeton at (800) DIAL BEN/342-5236 or visit https://www.franklintempleton.com/investments/options/mutual-funds.
Important data provider notices and terms available at www.franklintempletondatasources.com.
KEY FUND STATISTICS (as of December 31, 2024)
| |
Total Net Assets | $139,277,375 |
Total Number of Portfolio Holdings* | 21 |
Total Management Fee Paid | $0 |
Portfolio Turnover Rate | 33.89% |
| * | Does not include derivatives, except purchased options, if any. |
| Franklin LifeSmart 2035 Retirement Target Fund | PAGE 2 | 646-ATSR-0225 |
WHAT DID THE FUND INVEST IN? (as of December 31, 2024)
Portfolio Composition* (% of Total Investments)
| * | Does not include derivatives, except purchased options, if any. |
| |
| WHERE CAN I FIND ADDITIONAL INFORMATION ABOUT THE FUND? |
Additional information is available on https://www.franklintempleton.com/regulatory-fund-documents, including its: |
| • prospectus • proxy voting information • financial information • holdings • tax information |
HOUSEHOLDING
You will receive the Fund’s shareholder reports every six months. In addition, you will receive an annual updated summary prospectus (detail prospectus available upon request). To reduce Fund expenses, we try to identify related shareholders in a household and send only one copy of the shareholder reports and summary prospectus. This process, called “householding,” will continue indefinitely unless you instruct us otherwise. If you prefer not to have these documents householded, please call us at (800) DIAL BEN/342-5236. At any time, you may view current prospectuses/summary prospectuses and shareholder reports on our website. If you choose, you may receive these documents through electronic delivery.
| Franklin LifeSmart 2035 Retirement Target Fund | PAGE 3 | 646-ATSR-0225 |
1000098241016012013112131353715398176251471017139192871000096859887106181049011208122381166297671032610151100009764105311305611827149731740620633168442058424183100009773104141240911540140091600718052148701750719594100009671994610710105651131812339117839896104941035448.523.521.44.71.00.9
| | |
Franklin LifeSmart 2040 Retirement Target Fund | |
| Class A [FLADX] |
| Annual Shareholder Report | December 31, 2024 |
|
This annual shareholder report contains important information about Franklin LifeSmart 2040 Retirement Target Fund for the period January 1, 2024, to December 31, 2024.
You can find additional information about the Fund at https://www.franklintempleton.com/regulatory-fund-documents. You can also request this information by contacting us at (800) DIAL BEN/342-5236.
WHAT WERE THE FUND COSTS FOR THE LAST YEAR? (based on a hypothetical $10,000 investment)
| | |
Class Name | Costs of a $10,000 investment | Costs paid as a percentage of a $10,000 investment* |
Class A1 | $56 | 0.52% |
| * | Reflects waiver of fees and/or reimbursement of expenses (including acquired fund fees and expenses), without which expenses would be higher. |
| 1 | Excludes fees and expenses of the underlying funds in which the Fund invests. |
HOW DID THE FUND PERFORM LAST YEAR AND WHAT AFFECTED ITS PERFORMANCE?
For the twelve months ended December 31, 2024, Class A shares of Franklin LifeSmart 2040 Retirement Target Fund returned 13.58%. The Fund compares its performance to the MSCI All Country World Index-NR, the Blended Benchmark† and the Bloomberg Multiverse Index, which returned 17.49%, 13.54% and -1.34%, respectively, for the same period.
| |
Top contributors to performance: |
| ↑ | Fixed income underweight, reflecting our preference for equities over fixed income. |
| ↑ | Within fixed income, an overweight to U.S. fixed income. |
| ↑ | Within fixed income, an underweight to international fixed income. |
| |
Top detractors from performance: |
| ↓ | Fund selection in equity, reflecting meaningful exposure to value stocks. |
| ↓ | Fund selection in U.S. equity. |
| ↓ | Fund selection in international equity. |
| Franklin LifeSmart 2040 Retirement Target Fund | PAGE 1 | 49-ATSR-0225 |
HOW DID THE FUND PERFORM OVER THE LAST 10 YEARS?
The Fund’s past performance is not necessarily an indication of how the Fund will perform in the future. The graph and table do not reflect the deduction of taxes that a shareholder would pay on Fund distributions or redemption of Fund shares.
VALUE OF A $10,000 INVESTMENT ($9,450 AFTER MAXIMUM APPLICABLE SALES CHARGE) –
Class A 12/31/2014 — 12/31/2024
AVERAGE ANNUAL TOTAL RETURNS (%) Period Ended December 31, 2024
| | | |
| | 1 Year | 5 Year | 10 Year |
Class A | 13.58 | 8.08 | 7.14 |
Class A (with sales charge) | 7.29 | 6.86 | 6.54 |
Bloomberg Global Aggregate Index | -1.69 | -1.96 | 0.15 |
MSCI All Country World Index-NR | 17.49 | 10.06 | 9.23 |
Blended Benchmark† | 13.54 | 8.03 | 7.60 |
Bloomberg Multiverse Index | -1.34 | -1.76 | 0.35 |
| † | The Fund’s Blended Benchmark consists of 86% MSCI AC World Index-NR and 14% Bloomberg Multiverse Index. Allocations for the Fund’s Blended Benchmark reflect the Fund’s current target asset class allocations and may not be representative of the Fund’s historical asset class allocations. Performance for the Blended Benchmark is based on an asset class allocation that matches the glide path of the Franklin LifeSmart Funds over time. Prior to May 1, 2019, the Blended Benchmark had an allocation to FTSE 3 Month U.S. T-Bill Index. |
Reflects waiver of fees and/or reimbursement of expenses (including acquired fund fees and expenses), without which expenses would be higher.
Performance for periods prior to September 10, 2018, has been restated to reflect the current maximum sales charge, which is lower than the maximum sales charge prior to that date.
For current month-end performance, please call Franklin Templeton at (800) DIAL BEN/342-5236 or visit https://www.franklintempleton.com/investments/options/mutual-funds.
Important data provider notices and terms available at www.franklintempletondatasources.com.
KEY FUND STATISTICS (as of December 31, 2024)
| |
Total Net Assets | $62,183,326 |
Total Number of Portfolio Holdings* | 19 |
Total Management Fee Paid | $0 |
Portfolio Turnover Rate | 31.39% |
| * | Does not include derivatives, except purchased options, if any. |
| Franklin LifeSmart 2040 Retirement Target Fund | PAGE 2 | 49-ATSR-0225 |
WHAT DID THE FUND INVEST IN? (as of December 31, 2024)
Portfolio Composition* (% of Total Investments)
| * | Does not include derivatives, except purchased options, if any. |
| |
| WHERE CAN I FIND ADDITIONAL INFORMATION ABOUT THE FUND? |
Additional information is available on https://www.franklintempleton.com/regulatory-fund-documents, including its: |
| • prospectus • proxy voting information • financial information • holdings • tax information |
HOUSEHOLDING
You will receive the Fund’s shareholder reports every six months. In addition, you will receive an annual updated summary prospectus (detail prospectus available upon request). To reduce Fund expenses, we try to identify related shareholders in a household and send only one copy of the shareholder reports and summary prospectus. This process, called “householding,” will continue indefinitely unless you instruct us otherwise. If you prefer not to have these documents householded, please call us at (800) DIAL BEN/342-5236. At any time, you may view current prospectuses/summary prospectuses and shareholder reports on our website. If you choose, you may receive these documents through electronic delivery.
| Franklin LifeSmart 2040 Retirement Target Fund | PAGE 3 | 49-ATSR-0225 |
94509266953611300105091276814688170371413116578188351000096859887106181049011208122381166297671032610151100009764105311305611827149731740620633168442058424183100009774104261246811564141401629918737153871833020809100009671994610710105651131812339117839896104941035454.026.216.41.61.00.8
| | |
Franklin LifeSmart 2040 Retirement Target Fund | |
| Class C [FLOLX] |
| Annual Shareholder Report | December 31, 2024 |
|
This annual shareholder report contains important information about Franklin LifeSmart 2040 Retirement Target Fund for the period January 1, 2024, to December 31, 2024.
You can find additional information about the Fund at https://www.franklintempleton.com/regulatory-fund-documents. You can also request this information by contacting us at (800) DIAL BEN/342-5236.
WHAT WERE THE FUND COSTS FOR THE LAST YEAR? (based on a hypothetical $10,000 investment)
| | |
Class Name | Costs of a $10,000 investment | Costs paid as a percentage of a $10,000 investment* |
Class C1 | $135 | 1.27% |
| * | Reflects waiver of fees and/or reimbursement of expenses (including acquired fund fees and expenses), without which expenses would be higher. |
| 1 | Excludes fees and expenses of the underlying funds in which the Fund invests. |
HOW DID THE FUND PERFORM LAST YEAR AND WHAT AFFECTED ITS PERFORMANCE?
For the twelve months ended December 31, 2024, Class C shares of Franklin LifeSmart 2040 Retirement Target Fund returned 12.69%. The Fund compares its performance to the MSCI All Country World Index-NR, the Blended Benchmark† and the Bloomberg Multiverse Index, which returned 17.49%, 13.54% and -1.34%, respectively, for the same period.
| |
Top contributors to performance: |
| ↑ | Fixed income underweight, reflecting our preference for equities over fixed income. |
| ↑ | Within fixed income, an overweight to U.S. fixed income. |
| ↑ | Within fixed income, an underweight to international fixed income. |
| |
Top detractors from performance: |
| ↓ | Fund selection in equity, reflecting meaningful exposure to value stocks. |
| ↓ | Fund selection in U.S. equity. |
| ↓ | Fund selection in international equity. |
| Franklin LifeSmart 2040 Retirement Target Fund | PAGE 1 | 255-ATSR-0225 |
HOW DID THE FUND PERFORM OVER THE LAST 10 YEARS?
The Fund’s past performance is not necessarily an indication of how the Fund will perform in the future. The graph and table do not reflect the deduction of taxes that a shareholder would pay on Fund distributions or redemption of Fund shares.
VALUE OF A $10,000 INVESTMENT – Class C 12/31/2014 — 12/31/2024
AVERAGE ANNUAL TOTAL RETURNS (%) Period Ended December 31, 2024
| | | |
| | 1 Year | 5 Year | 10 Year |
Class C | 12.69 | 7.27 | 6.34 |
Class C (with sales charge) | 11.69 | 7.27 | 6.34 |
Bloomberg Global Aggregate Index | -1.69 | -1.96 | 0.15 |
MSCI All Country World Index-NR | 17.49 | 10.06 | 9.23 |
Blended Benchmark† | 13.54 | 8.03 | 7.60 |
Bloomberg Multiverse Index | -1.34 | -1.76 | 0.35 |
| † | The Fund’s Blended Benchmark consists of 86% MSCI AC World Index-NR and 14% Bloomberg Multiverse Index. Allocations for the Fund’s Blended Benchmark reflect the Fund’s current target asset class allocations and may not be representative of the Fund’s historical asset class allocations. Performance for the Blended Benchmark is based on an asset class allocation that matches the glide path of the Franklin LifeSmart Funds over time. Prior to May 1, 2019, the Blended Benchmark had an allocation to FTSE 3 Month U.S. T-Bill Index. |
Reflects waiver of fees and/or reimbursement of expenses (including acquired fund fees and expenses), without which expenses would be higher.
For current month-end performance, please call Franklin Templeton at (800) DIAL BEN/342-5236 or visit https://www.franklintempleton.com/investments/options/mutual-funds.
Important data provider notices and terms available at www.franklintempletondatasources.com.
KEY FUND STATISTICS (as of December 31, 2024)
| |
Total Net Assets | $62,183,326 |
Total Number of Portfolio Holdings* | 19 |
Total Management Fee Paid | $0 |
Portfolio Turnover Rate | 31.39% |
| * | Does not include derivatives, except purchased options, if any. |
| Franklin LifeSmart 2040 Retirement Target Fund | PAGE 2 | 255-ATSR-0225 |
WHAT DID THE FUND INVEST IN? (as of December 31, 2024)
Portfolio Composition* (% of Total Investments)
| * | Does not include derivatives, except purchased options, if any. |
| |
| WHERE CAN I FIND ADDITIONAL INFORMATION ABOUT THE FUND? |
Additional information is available on https://www.franklintempleton.com/regulatory-fund-documents, including its: |
| • prospectus • proxy voting information • financial information • holdings • tax information |
HOUSEHOLDING
You will receive the Fund’s shareholder reports every six months. In addition, you will receive an annual updated summary prospectus (detail prospectus available upon request). To reduce Fund expenses, we try to identify related shareholders in a household and send only one copy of the shareholder reports and summary prospectus. This process, called “householding,” will continue indefinitely unless you instruct us otherwise. If you prefer not to have these documents householded, please call us at (800) DIAL BEN/342-5236. At any time, you may view current prospectuses/summary prospectuses and shareholder reports on our website. If you choose, you may receive these documents through electronic delivery.
| Franklin LifeSmart 2040 Retirement Target Fund | PAGE 3 | 255-ATSR-0225 |
100009734994511698107961301614859171251409316410184921000096859887106181049011208122381166297671032610151100009764105311305611827149731740620633168442058424183100009774104261246811564141401629918737153871833020809100009671994610710105651131812339117839896104941035454.026.216.41.61.00.8
| | |
Franklin LifeSmart 2040 Retirement Target Fund | |
| Class R [FLSGX] |
| Annual Shareholder Report | December 31, 2024 |
|
This annual shareholder report contains important information about Franklin LifeSmart 2040 Retirement Target Fund for the period January 1, 2024, to December 31, 2024.
You can find additional information about the Fund at https://www.franklintempleton.com/regulatory-fund-documents. You can also request this information by contacting us at (800) DIAL BEN/342-5236.
WHAT WERE THE FUND COSTS FOR THE LAST YEAR? (based on a hypothetical $10,000 investment)
| | |
Class Name | Costs of a $10,000 investment | Costs paid as a percentage of a $10,000 investment* |
Class R1 | $82 | 0.77% |
| * | Reflects waiver of fees and/or reimbursement of expenses (including acquired fund fees and expenses), without which expenses would be higher. |
| 1 | Excludes fees and expenses of the underlying funds in which the Fund invests. |
HOW DID THE FUND PERFORM LAST YEAR AND WHAT AFFECTED ITS PERFORMANCE?
For the twelve months ended December 31, 2024, Class R shares of Franklin LifeSmart 2040 Retirement Target Fund returned 13.22%. The Fund compares its performance to the MSCI All Country World Index-NR, the Blended Benchmark† and the Bloomberg Multiverse Index, which returned 17.49%, 13.54% and -1.34%, respectively, for the same period.
| |
Top contributors to performance: |
| ↑ | Fixed income underweight, reflecting our preference for equities over fixed income. |
| ↑ | Within fixed income, an overweight to U.S. fixed income. |
| ↑ | Within fixed income, an underweight to international fixed income. |
| |
Top detractors from performance: |
| ↓ | Fund selection in equity, reflecting meaningful exposure to value stocks. |
| ↓ | Fund selection in U.S. equity. |
| ↓ | Fund selection in international equity. |
| Franklin LifeSmart 2040 Retirement Target Fund | PAGE 1 | 855-ATSR-0225 |
HOW DID THE FUND PERFORM OVER THE LAST 10 YEARS?
The Fund’s past performance is not necessarily an indication of how the Fund will perform in the future. The graph and table do not reflect the deduction of taxes that a shareholder would pay on Fund distributions or redemption of Fund shares.
VALUE OF A $10,000 INVESTMENT – Class R 12/31/2014 — 12/31/2024
AVERAGE ANNUAL TOTAL RETURNS (%) Period Ended December 31, 2024
| | | |
| | 1 Year | 5 Year | 10 Year |
Class R | 13.22 | 7.80 | 6.87 |
Bloomberg Global Aggregate Index | -1.69 | -1.96 | 0.15 |
MSCI All Country World Index-NR | 17.49 | 10.06 | 9.23 |
Blended Benchmark† | 13.54 | 8.03 | 7.60 |
Bloomberg Multiverse Index | -1.34 | -1.76 | 0.35 |
| † | The Fund’s Blended Benchmark consists of 86% MSCI AC World Index-NR and 14% Bloomberg Multiverse Index. Allocations for the Fund’s Blended Benchmark reflect the Fund’s current target asset class allocations and may not be representative of the Fund’s historical asset class allocations. Performance for the Blended Benchmark is based on an asset class allocation that matches the glide path of the Franklin LifeSmart Funds over time. Prior to May 1, 2019, the Blended Benchmark had an allocation to FTSE 3 Month U.S. T-Bill Index. |
Reflects waiver of fees and/or reimbursement of expenses (including acquired fund fees and expenses), without which expenses would be higher.
For current month-end performance, please call Franklin Templeton at (800) DIAL BEN/342-5236 or visit https://www.franklintempleton.com/investments/options/mutual-funds.
Important data provider notices and terms available at www.franklintempletondatasources.com.
KEY FUND STATISTICS (as of December 31, 2024)
| |
Total Net Assets | $62,183,326 |
Total Number of Portfolio Holdings* | 19 |
Total Management Fee Paid | $0 |
Portfolio Turnover Rate | 31.39% |
| * | Does not include derivatives, except purchased options, if any. |
| Franklin LifeSmart 2040 Retirement Target Fund | PAGE 2 | 855-ATSR-0225 |
WHAT DID THE FUND INVEST IN? (as of December 31, 2024)
Portfolio Composition* (% of Total Investments)
| * | Does not include derivatives, except purchased options, if any. |
| |
| WHERE CAN I FIND ADDITIONAL INFORMATION ABOUT THE FUND? |
Additional information is available on https://www.franklintempleton.com/regulatory-fund-documents, including its: |
| • prospectus • proxy voting information • financial information • holdings • tax information |
HOUSEHOLDING
You will receive the Fund’s shareholder reports every six months. In addition, you will receive an annual updated summary prospectus (detail prospectus available upon request). To reduce Fund expenses, we try to identify related shareholders in a household and send only one copy of the shareholder reports and summary prospectus. This process, called “householding,” will continue indefinitely unless you instruct us otherwise. If you prefer not to have these documents householded, please call us at (800) DIAL BEN/342-5236. At any time, you may view current prospectuses/summary prospectuses and shareholder reports on our website. If you choose, you may receive these documents through electronic delivery.
| Franklin LifeSmart 2040 Retirement Target Fund | PAGE 3 | 855-ATSR-0225 |
1000097861004611886110221335115319177371466917163194331000096859887106181049011208122381166297671032610151100009764105311305611827149731740620633168442058424183100009774104261246811564141401629918737153871833020809100009671994610710105651131812339117839896104941035454.026.216.41.61.00.8
| | |
Franklin LifeSmart 2040 Retirement Target Fund | |
| Class R6 [FLREX] |
| Annual Shareholder Report | December 31, 2024 |
|
This annual shareholder report contains important information about Franklin LifeSmart 2040 Retirement Target Fund for the period January 1, 2024, to December 31, 2024.
You can find additional information about the Fund at https://www.franklintempleton.com/regulatory-fund-documents. You can also request this information by contacting us at (800) DIAL BEN/342-5236.
WHAT WERE THE FUND COSTS FOR THE LAST YEAR? (based on a hypothetical $10,000 investment)
| | |
Class Name | Costs of a $10,000 investment | Costs paid as a percentage of a $10,000 investment* |
Class R61 | $24 | 0.22% |
| * | Reflects waiver of fees and/or reimbursement of expenses (including acquired fund fees and expenses), without which expenses would be higher. |
| 1 | Excludes fees and expenses of the underlying funds in which the Fund invests. |
HOW DID THE FUND PERFORM LAST YEAR AND WHAT AFFECTED ITS PERFORMANCE?
For the twelve months ended December 31, 2024, Class R6 shares of Franklin LifeSmart 2040 Retirement Target Fund returned 13.85%. The Fund compares its performance to the MSCI All Country World Index-NR, the Blended Benchmark† and the Bloomberg Multiverse Index, which returned 17.49%, 13.54% and -1.34%, respectively, for the same period.
| |
Top contributors to performance: |
| ↑ | Fixed income underweight, reflecting our preference for equities over fixed income. |
| ↑ | Within fixed income, an overweight to U.S. fixed income. |
| ↑ | Within fixed income, an underweight to international fixed income. |
| |
Top detractors from performance: |
| ↓ | Fund selection in equity, reflecting meaningful exposure to value stocks. |
| ↓ | Fund selection in U.S. equity. |
| ↓ | Fund selection in international equity. |
| Franklin LifeSmart 2040 Retirement Target Fund | PAGE 1 | 895-ATSR-0225 |
HOW DID THE FUND PERFORM OVER THE LAST 10 YEARS?
The Fund’s past performance is not necessarily an indication of how the Fund will perform in the future. The graph and table do not reflect the deduction of taxes that a shareholder would pay on Fund distributions or redemption of Fund shares.
VALUE OF A $10,000 INVESTMENT – Class R6 12/31/2014 — 12/31/2024
AVERAGE ANNUAL TOTAL RETURNS (%) Period Ended December 31, 2024
| | | |
| | 1 Year | 5 Year | 10 Year |
Class R6 | 13.85 | 8.40 | 7.46 |
Bloomberg Global Aggregate Index | -1.69 | -1.96 | 0.15 |
MSCI All Country World Index-NR | 17.49 | 10.06 | 9.23 |
Blended Benchmark† | 13.54 | 8.03 | 7.60 |
Bloomberg Multiverse Index | -1.34 | -1.76 | 0.35 |
| † | The Fund’s Blended Benchmark consists of 86% MSCI AC World Index-NR and 14% Bloomberg Multiverse Index. Allocations for the Fund’s Blended Benchmark reflect the Fund’s current target asset class allocations and may not be representative of the Fund’s historical asset class allocations. Performance for the Blended Benchmark is based on an asset class allocation that matches the glide path of the Franklin LifeSmart Funds over time. Prior to May 1, 2019, the Blended Benchmark had an allocation to FTSE 3 Month U.S. T-Bill Index. |
Reflects waiver of fees and/or reimbursement of expenses (including acquired fund fees and expenses), without which expenses would be higher.
For current month-end performance, please call Franklin Templeton at (800) DIAL BEN/342-5236 or visit https://www.franklintempleton.com/investments/options/mutual-funds.
Important data provider notices and terms available at www.franklintempletondatasources.com.
KEY FUND STATISTICS (as of December 31, 2024)
| |
Total Net Assets | $62,183,326 |
Total Number of Portfolio Holdings* | 19 |
Total Management Fee Paid | $0 |
Portfolio Turnover Rate | 31.39% |
| * | Does not include derivatives, except purchased options, if any. |
| Franklin LifeSmart 2040 Retirement Target Fund | PAGE 2 | 895-ATSR-0225 |
WHAT DID THE FUND INVEST IN? (as of December 31, 2024)
Portfolio Composition* (% of Total Investments)
| * | Does not include derivatives, except purchased options, if any. |
| |
| WHERE CAN I FIND ADDITIONAL INFORMATION ABOUT THE FUND? |
Additional information is available on https://www.franklintempleton.com/regulatory-fund-documents, including its: |
| • prospectus • proxy voting information • financial information • holdings • tax information |
HOUSEHOLDING
You will receive the Fund’s shareholder reports every six months. In addition, you will receive an annual updated summary prospectus (detail prospectus available upon request). To reduce Fund expenses, we try to identify related shareholders in a household and send only one copy of the shareholder reports and summary prospectus. This process, called “householding,” will continue indefinitely unless you instruct us otherwise. If you prefer not to have these documents householded, please call us at (800) DIAL BEN/342-5236. At any time, you may view current prospectuses/summary prospectuses and shareholder reports on our website. If you choose, you may receive these documents through electronic delivery.
| Franklin LifeSmart 2040 Retirement Target Fund | PAGE 3 | 895-ATSR-0225 |
1000098381014912069112511371415819184171531218031205281000096859887106181049011208122381166297671032610151100009764105311305611827149731740620633168442058424183100009774104261246811564141401629918737153871833020809100009671994610710105651131812339117839896104941035454.026.216.41.61.00.8
| | |
Franklin LifeSmart 2040 Retirement Target Fund | |
| Advisor Class [FLSHX] |
| Annual Shareholder Report | December 31, 2024 |
|
This annual shareholder report contains important information about Franklin LifeSmart 2040 Retirement Target Fund for the period January 1, 2024, to December 31, 2024.
You can find additional information about the Fund at https://www.franklintempleton.com/regulatory-fund-documents. You can also request this information by contacting us at (800) DIAL BEN/342-5236.
WHAT WERE THE FUND COSTS FOR THE LAST YEAR? (based on a hypothetical $10,000 investment)
| | |
Class Name | Costs of a $10,000 investment | Costs paid as a percentage of a $10,000 investment* |
Advisor Class1 | $29 | 0.27% |
| * | Reflects waiver of fees and/or reimbursement of expenses (including acquired fund fees and expenses), without which expenses would be higher. |
| 1 | Excludes fees and expenses of the underlying funds in which the Fund invests. |
HOW DID THE FUND PERFORM LAST YEAR AND WHAT AFFECTED ITS PERFORMANCE?
For the twelve months ended December 31, 2024, Advisor Class shares of Franklin LifeSmart 2040 Retirement Target Fund returned 13.75%. The Fund compares its performance to the MSCI All Country World Index-NR, the Blended Benchmark† and the Bloomberg Multiverse Index, which returned 17.49%, 13.54% and -1.34%, respectively, for the same period.
| |
Top contributors to performance: |
| ↑ | Fixed income underweight, reflecting our preference for equities over fixed income. |
| ↑ | Within fixed income, an overweight to U.S. fixed income. |
| ↑ | Within fixed income, an underweight to international fixed income. |
| |
Top detractors from performance: |
| ↓ | Fund selection in equity, reflecting meaningful exposure to value stocks. |
| ↓ | Fund selection in U.S. equity. |
| ↓ | Fund selection in international equity. |
| Franklin LifeSmart 2040 Retirement Target Fund | PAGE 1 | 81-ATSR-0225 |
HOW DID THE FUND PERFORM OVER THE LAST 10 YEARS?
The Fund’s past performance is not necessarily an indication of how the Fund will perform in the future. The graph and table do not reflect the deduction of taxes that a shareholder would pay on Fund distributions or redemption of Fund shares.
VALUE OF A $10,000 INVESTMENT – Advisor Class 12/31/2014 — 12/31/2024
AVERAGE ANNUAL TOTAL RETURNS (%) Period Ended December 31, 2024
| | | |
| | 1 Year | 5 Year | 10 Year |
Advisor Class | 13.75 | 8.35 | 7.39 |
Bloomberg Global Aggregate Index | -1.69 | -1.96 | 0.15 |
MSCI All Country World Index-NR | 17.49 | 10.06 | 9.23 |
Blended Benchmark† | 13.54 | 8.03 | 7.60 |
Bloomberg Multiverse Index | -1.34 | -1.76 | 0.35 |
| † | The Fund’s Blended Benchmark consists of 86% MSCI AC World Index-NR and 14% Bloomberg Multiverse Index. Allocations for the Fund’s Blended Benchmark reflect the Fund’s current target asset class allocations and may not be representative of the Fund’s historical asset class allocations. Performance for the Blended Benchmark is based on an asset class allocation that matches the glide path of the Franklin LifeSmart Funds over time. Prior to May 1, 2019, the Blended Benchmark had an allocation to FTSE 3 Month U.S. T-Bill Index. |
Reflects waiver of fees and/or reimbursement of expenses (including acquired fund fees and expenses), without which expenses would be higher.
For current month-end performance, please call Franklin Templeton at (800) DIAL BEN/342-5236 or visit https://www.franklintempleton.com/investments/options/mutual-funds.
Important data provider notices and terms available at www.franklintempletondatasources.com.
KEY FUND STATISTICS (as of December 31, 2024)
| |
Total Net Assets | $62,183,326 |
Total Number of Portfolio Holdings* | 19 |
Total Management Fee Paid | $0 |
Portfolio Turnover Rate | 31.39% |
| * | Does not include derivatives, except purchased options, if any. |
| Franklin LifeSmart 2040 Retirement Target Fund | PAGE 2 | 81-ATSR-0225 |
WHAT DID THE FUND INVEST IN? (as of December 31, 2024)
Portfolio Composition* (% of Total Investments)
| * | Does not include derivatives, except purchased options, if any. |
| |
| WHERE CAN I FIND ADDITIONAL INFORMATION ABOUT THE FUND? |
Additional information is available on https://www.franklintempleton.com/regulatory-fund-documents, including its: |
| • prospectus • proxy voting information • financial information • holdings • tax information |
HOUSEHOLDING
You will receive the Fund’s shareholder reports every six months. In addition, you will receive an annual updated summary prospectus (detail prospectus available upon request). To reduce Fund expenses, we try to identify related shareholders in a household and send only one copy of the shareholder reports and summary prospectus. This process, called “householding,” will continue indefinitely unless you instruct us otherwise. If you prefer not to have these documents householded, please call us at (800) DIAL BEN/342-5236. At any time, you may view current prospectuses/summary prospectuses and shareholder reports on our website. If you choose, you may receive these documents through electronic delivery.
| Franklin LifeSmart 2040 Retirement Target Fund | PAGE 3 | 81-ATSR-0225 |
1000098281013712051112291366315758183421524917940204061000096859887106181049011208122381166297671032610151100009764105311305611827149731740620633168442058424183100009774104261246811564141401629918737153871833020809100009671994610710105651131812339117839896104941035454.026.216.41.61.00.8
| | |
Franklin LifeSmart 2045 Retirement Target Fund | |
| Class A [FTTAX] |
| Annual Shareholder Report | December 31, 2024 |
|
This annual shareholder report contains important information about Franklin LifeSmart 2045 Retirement Target Fund for the period January 1, 2024, to December 31, 2024.
You can find additional information about the Fund at https://www.franklintempleton.com/regulatory-fund-documents. You can also request this information by contacting us at (800) DIAL BEN/342-5236.
WHAT WERE THE FUND COSTS FOR THE LAST YEAR? (based on a hypothetical $10,000 investment)
| | |
Class Name | Costs of a $10,000 investment | Costs paid as a percentage of a $10,000 investment* |
Class A1 | $56 | 0.52% |
| * | Reflects waiver of fees and/or reimbursement of expenses (including acquired fund fees and expenses), without which expenses would be higher. |
| 1 | Excludes fees and expenses of the underlying funds in which the Fund invests. |
HOW DID THE FUND PERFORM LAST YEAR AND WHAT AFFECTED ITS PERFORMANCE?
For the twelve months ended December 31, 2024, Class A shares of Franklin LifeSmart 2045 Retirement Target Fund returned 14.69%. The Fund compares its performance to the MSCI All Country World Index-NR, the Blended Benchmark† and the Bloomberg Multiverse Index, which returned 17.49%, 15.18% and -1.34%, respectively, for the same period.
| |
Top contributors to performance: |
| ↑ | Fixed income underweight, reflecting our preference for equities over fixed income. |
| ↑ | Within fixed income, an overweight to U.S. fixed income. |
| ↑ | Within fixed income, an underweight to international fixed income. |
| |
Top detractors from performance: |
| ↓ | Fund selection in equity, reflecting meaningful exposure to value stocks. |
| ↓ | Fund selection in U.S. equity. |
| ↓ | Fund selection in international equity. |
| Franklin LifeSmart 2045 Retirement Target Fund | PAGE 1 | 451-ATSR-0225 |
HOW DID THE FUND PERFORM OVER THE LAST 10 YEARS?
The Fund’s past performance is not necessarily an indication of how the Fund will perform in the future. The graph and table do not reflect the deduction of taxes that a shareholder would pay on Fund distributions or redemption of Fund shares.
VALUE OF A $10,000 INVESTMENT ($9,450 AFTER MAXIMUM APPLICABLE SALES CHARGE) –
Class A 12/31/2014 — 12/31/2024
AVERAGE ANNUAL TOTAL RETURNS (%) Period Ended December 31, 2024
| | | |
| | 1 Year | 5 Year | 10 Year |
Class A | 14.69 | 8.71 | 7.51 |
Class A (with sales charge) | 8.37 | 7.49 | 6.90 |
Bloomberg Global Aggregate Index | -1.69 | -1.96 | 0.15 |
MSCI All Country World Index-NR | 17.49 | 10.06 | 9.23 |
Blended Benchmark† | 15.18 | 8.93 | 8.11 |
Bloomberg Multiverse Index | -1.34 | -1.76 | 0.35 |
| † | The Fund’s Blended Benchmark consists of 93% MSCI AC World Index-NR and 7% Bloomberg Multiverse Index. Allocations for the Fund’s Blended Benchmark reflect the Fund’s current target asset class allocations and may not be representative of the Fund’s historical asset class allocations. Performance for the Blended Benchmark is based on an asset class allocation that matches the glide path of the Franklin LifeSmart Funds over time. Prior to May 1, 2019, the Blended Benchmark had an allocation to FTSE 3 Month U.S. T-Bill Index. |
Reflects waiver of fees and/or reimbursement of expenses (including acquired fund fees and expenses), without which expenses would be higher.
Performance for periods prior to September 10, 2018, has been restated to reflect the current maximum sales charge, which is lower than the maximum sales charge prior to that date.
For current month-end performance, please call Franklin Templeton at (800) DIAL BEN/342-5236 or visit https://www.franklintempleton.com/investments/options/mutual-funds.
Important data provider notices and terms available at www.franklintempletondatasources.com.
KEY FUND STATISTICS (as of December 31, 2024)
| |
Total Net Assets | $103,572,261 |
Total Number of Portfolio Holdings* | 16 |
Total Management Fee Paid | $0 |
Portfolio Turnover Rate | 30.84% |
| * | Does not include derivatives, except purchased options, if any. |
| Franklin LifeSmart 2045 Retirement Target Fund | PAGE 2 | 451-ATSR-0225 |
WHAT DID THE FUND INVEST IN? (as of December 31, 2024)
Portfolio Composition* (% of Total Investments)
| * | Does not include derivatives, except purchased options, if any. |
| |
| WHERE CAN I FIND ADDITIONAL INFORMATION ABOUT THE FUND? |
Additional information is available on https://www.franklintempleton.com/regulatory-fund-documents, including its: |
| • prospectus • proxy voting information • financial information • holdings • tax information |
HOUSEHOLDING
You will receive the Fund’s shareholder reports every six months. In addition, you will receive an annual updated summary prospectus (detail prospectus available upon request). To reduce Fund expenses, we try to identify related shareholders in a household and send only one copy of the shareholder reports and summary prospectus. This process, called “householding,” will continue indefinitely unless you instruct us otherwise. If you prefer not to have these documents householded, please call us at (800) DIAL BEN/342-5236. At any time, you may view current prospectuses/summary prospectuses and shareholder reports on our website. If you choose, you may receive these documents through electronic delivery.
| Franklin LifeSmart 2045 Retirement Target Fund | PAGE 3 | 451-ATSR-0225 |
94509245954911337104961284014864174001432516997194921000096859887106181049011208122381166297671032610151100009764105311305611827149731740620633168442058424183100009775104331250111578142231645919202157311894321819100009671994610710105651131812339117839896104941035460.129.09.11.00.8
| | |
Franklin LifeSmart 2045 Retirement Target Fund | |
| Class C [FLRIX] |
| Annual Shareholder Report | December 31, 2024 |
|
This annual shareholder report contains important information about Franklin LifeSmart 2045 Retirement Target Fund for the period January 1, 2024, to December 31, 2024.
You can find additional information about the Fund at https://www.franklintempleton.com/regulatory-fund-documents. You can also request this information by contacting us at (800) DIAL BEN/342-5236.
WHAT WERE THE FUND COSTS FOR THE LAST YEAR? (based on a hypothetical $10,000 investment)
| | |
Class Name | Costs of a $10,000 investment | Costs paid as a percentage of a $10,000 investment* |
Class C1 | $137 | 1.28% |
| * | Reflects waiver of fees and/or reimbursement of expenses (including acquired fund fees and expenses), without which expenses would be higher. |
| 1 | Excludes fees and expenses of the underlying funds in which the Fund invests. |
HOW DID THE FUND PERFORM LAST YEAR AND WHAT AFFECTED ITS PERFORMANCE?
For the twelve months ended December 31, 2024, Class C shares of Franklin LifeSmart 2045 Retirement Target Fund returned 13.89%. The Fund compares its performance to the MSCI All Country World Index-NR, the Blended Benchmark† and the Bloomberg Multiverse Index, which returned 17.49%, 15.18% and -1.34%, respectively, for the same period.
| |
Top contributors to performance: |
| ↑ | Fixed income underweight, reflecting our preference for equities over fixed income. |
| ↑ | Within fixed income, an overweight to U.S. fixed income. |
| ↑ | Within fixed income, an underweight to international fixed income. |
| |
Top detractors from performance: |
| ↓ | Fund selection in equity, reflecting meaningful exposure to value stocks. |
| ↓ | Fund selection in U.S. equity. |
| ↓ | Fund selection in international equity. |
| Franklin LifeSmart 2045 Retirement Target Fund | PAGE 1 | 551-ATSR-0225 |
HOW DID THE FUND PERFORM OVER THE LAST 10 YEARS?
The Fund’s past performance is not necessarily an indication of how the Fund will perform in the future. The graph and table do not reflect the deduction of taxes that a shareholder would pay on Fund distributions or redemption of Fund shares.
VALUE OF A $10,000 INVESTMENT – Class C 12/31/2014 — 12/31/2024
AVERAGE ANNUAL TOTAL RETURNS (%) Period Ended December 31, 2024
| | | |
| | 1 Year | 5 Year | 10 Year |
Class C | 13.89 | 7.91 | 6.72 |
Class C (with sales charge) | 12.89 | 7.91 | 6.72 |
Bloomberg Global Aggregate Index | -1.69 | -1.96 | 0.15 |
MSCI All Country World Index-NR | 17.49 | 10.06 | 9.23 |
Blended Benchmark† | 15.18 | 8.93 | 8.11 |
Bloomberg Multiverse Index | -1.34 | -1.76 | 0.35 |
| † | The Fund’s Blended Benchmark consists of 93% MSCI AC World Index-NR and 7% Bloomberg Multiverse Index. Allocations for the Fund’s Blended Benchmark reflect the Fund’s current target asset class allocations and may not be representative of the Fund’s historical asset class allocations. Performance for the Blended Benchmark is based on an asset class allocation that matches the glide path of the Franklin LifeSmart Funds over time. Prior to May 1, 2019, the Blended Benchmark had an allocation to FTSE 3 Month U.S. T-Bill Index. |
Reflects waiver of fees and/or reimbursement of expenses (including acquired fund fees and expenses), without which expenses would be higher.
For current month-end performance, please call Franklin Templeton at (800) DIAL BEN/342-5236 or visit https://www.franklintempleton.com/investments/options/mutual-funds.
Important data provider notices and terms available at www.franklintempletondatasources.com.
KEY FUND STATISTICS (as of December 31, 2024)
| |
Total Net Assets | $103,572,261 |
Total Number of Portfolio Holdings* | 16 |
Total Management Fee Paid | $0 |
Portfolio Turnover Rate | 30.84% |
| * | Does not include derivatives, except purchased options, if any. |
| Franklin LifeSmart 2045 Retirement Target Fund | PAGE 2 | 551-ATSR-0225 |
WHAT DID THE FUND INVEST IN? (as of December 31, 2024)
Portfolio Composition* (% of Total Investments)
| * | Does not include derivatives, except purchased options, if any. |
| |
| WHERE CAN I FIND ADDITIONAL INFORMATION ABOUT THE FUND? |
Additional information is available on https://www.franklintempleton.com/regulatory-fund-documents, including its: |
| • prospectus • proxy voting information • financial information • holdings • tax information |
HOUSEHOLDING
You will receive the Fund’s shareholder reports every six months. In addition, you will receive an annual updated summary prospectus (detail prospectus available upon request). To reduce Fund expenses, we try to identify related shareholders in a household and send only one copy of the shareholder reports and summary prospectus. This process, called “householding,” will continue indefinitely unless you instruct us otherwise. If you prefer not to have these documents householded, please call us at (800) DIAL BEN/342-5236. At any time, you may view current prospectuses/summary prospectuses and shareholder reports on our website. If you choose, you may receive these documents through electronic delivery.
| Franklin LifeSmart 2045 Retirement Target Fund | PAGE 3 | 551-ATSR-0225 |
100009718995511739107911309515060174851429516827191641000096859887106181049011208122381166297671032610151100009764105311305611827149731740620633168442058424183100009775104331250111578142231645919202157311894321819100009671994610710105651131812339117839896104941035460.129.09.11.00.8
| | |
Franklin LifeSmart 2045 Retirement Target Fund | |
| Class R [FLRJX] |
| Annual Shareholder Report | December 31, 2024 |
|
This annual shareholder report contains important information about Franklin LifeSmart 2045 Retirement Target Fund for the period January 1, 2024, to December 31, 2024.
You can find additional information about the Fund at https://www.franklintempleton.com/regulatory-fund-documents. You can also request this information by contacting us at (800) DIAL BEN/342-5236.
WHAT WERE THE FUND COSTS FOR THE LAST YEAR? (based on a hypothetical $10,000 investment)
| | |
Class Name | Costs of a $10,000 investment | Costs paid as a percentage of a $10,000 investment* |
Class R1 | $83 | 0.77% |
| * | Reflects waiver of fees and/or reimbursement of expenses (including acquired fund fees and expenses), without which expenses would be higher. |
| 1 | Excludes fees and expenses of the underlying funds in which the Fund invests. |
HOW DID THE FUND PERFORM LAST YEAR AND WHAT AFFECTED ITS PERFORMANCE?
For the twelve months ended December 31, 2024, Class R shares of Franklin LifeSmart 2045 Retirement Target Fund returned 14.35%. The Fund compares its performance to the MSCI All Country World Index-NR, the Blended Benchmark† and the Bloomberg Multiverse Index, which returned 17.49%, 15.18% and -1.34%, respectively, for the same period.
| |
Top contributors to performance: |
| ↑ | Fixed income underweight, reflecting our preference for equities over fixed income. |
| ↑ | Within fixed income, an overweight to U.S. fixed income. |
| ↑ | Within fixed income, an underweight to international fixed income. |
| |
Top detractors from performance: |
| ↓ | Fund selection in equity, reflecting meaningful exposure to value stocks. |
| ↓ | Fund selection in U.S. equity. |
| ↓ | Fund selection in international equity. |
| Franklin LifeSmart 2045 Retirement Target Fund | PAGE 1 | 851-ATSR-0225 |
HOW DID THE FUND PERFORM OVER THE LAST 10 YEARS?
The Fund’s past performance is not necessarily an indication of how the Fund will perform in the future. The graph and table do not reflect the deduction of taxes that a shareholder would pay on Fund distributions or redemption of Fund shares.
VALUE OF A $10,000 INVESTMENT – Class R 12/31/2014 — 12/31/2024
AVERAGE ANNUAL TOTAL RETURNS (%) Period Ended December 31, 2024
| | | |
| | 1 Year | 5 Year | 10 Year |
Class R | 14.35 | 8.44 | 7.24 |
Bloomberg Global Aggregate Index | -1.69 | -1.96 | 0.15 |
MSCI All Country World Index-NR | 17.49 | 10.06 | 9.23 |
Blended Benchmark† | 15.18 | 8.93 | 8.11 |
Bloomberg Multiverse Index | -1.34 | -1.76 | 0.35 |
| † | The Fund’s Blended Benchmark consists of 93% MSCI AC World Index-NR and 7% Bloomberg Multiverse Index. Allocations for the Fund’s Blended Benchmark reflect the Fund’s current target asset class allocations and may not be representative of the Fund’s historical asset class allocations. Performance for the Blended Benchmark is based on an asset class allocation that matches the glide path of the Franklin LifeSmart Funds over time. Prior to May 1, 2019, the Blended Benchmark had an allocation to FTSE 3 Month U.S. T-Bill Index. |
Reflects waiver of fees and/or reimbursement of expenses (including acquired fund fees and expenses), without which expenses would be higher.
For current month-end performance, please call Franklin Templeton at (800) DIAL BEN/342-5236 or visit https://www.franklintempleton.com/investments/options/mutual-funds.
Important data provider notices and terms available at www.franklintempletondatasources.com.
KEY FUND STATISTICS (as of December 31, 2024)
| |
Total Net Assets | $103,572,261 |
Total Number of Portfolio Holdings* | 16 |
Total Management Fee Paid | $0 |
Portfolio Turnover Rate | 30.84% |
| * | Does not include derivatives, except purchased options, if any. |
| Franklin LifeSmart 2045 Retirement Target Fund | PAGE 2 | 851-ATSR-0225 |
WHAT DID THE FUND INVEST IN? (as of December 31, 2024)
Portfolio Composition* (% of Total Investments)
| * | Does not include derivatives, except purchased options, if any. |
| |
| WHERE CAN I FIND ADDITIONAL INFORMATION ABOUT THE FUND? |
Additional information is available on https://www.franklintempleton.com/regulatory-fund-documents, including its: |
| • prospectus • proxy voting information • financial information • holdings • tax information |
HOUSEHOLDING
You will receive the Fund’s shareholder reports every six months. In addition, you will receive an annual updated summary prospectus (detail prospectus available upon request). To reduce Fund expenses, we try to identify related shareholders in a household and send only one copy of the shareholder reports and summary prospectus. This process, called “householding,” will continue indefinitely unless you instruct us otherwise. If you prefer not to have these documents householded, please call us at (800) DIAL BEN/342-5236. At any time, you may view current prospectuses/summary prospectuses and shareholder reports on our website. If you choose, you may receive these documents through electronic delivery.
| Franklin LifeSmart 2045 Retirement Target Fund | PAGE 3 | 851-ATSR-0225 |
1000097651005711911110051342115508181031486717601201261000096859887106181049011208122381166297671032610151100009764105311305611827149731740620633168442058424183100009775104331250111578142231645919202157311894321819100009671994610710105651131812339117839896104941035460.129.09.11.00.8
| | |
Franklin LifeSmart 2045 Retirement Target Fund | |
| Class R6 [FMLTX] |
| Annual Shareholder Report | December 31, 2024 |
|
This annual shareholder report contains important information about Franklin LifeSmart 2045 Retirement Target Fund for the period January 1, 2024, to December 31, 2024.
You can find additional information about the Fund at https://www.franklintempleton.com/regulatory-fund-documents. You can also request this information by contacting us at (800) DIAL BEN/342-5236.
WHAT WERE THE FUND COSTS FOR THE LAST YEAR? (based on a hypothetical $10,000 investment)
| | |
Class Name | Costs of a $10,000 investment | Costs paid as a percentage of a $10,000 investment* |
Class R61 | $25 | 0.23% |
| * | Reflects waiver of fees and/or reimbursement of expenses (including acquired fund fees and expenses), without which expenses would be higher. |
| 1 | Excludes fees and expenses of the underlying funds in which the Fund invests. |
HOW DID THE FUND PERFORM LAST YEAR AND WHAT AFFECTED ITS PERFORMANCE?
For the twelve months ended December 31, 2024, Class R6 shares of Franklin LifeSmart 2045 Retirement Target Fund returned 15.05%. The Fund compares its performance to the MSCI All Country World Index-NR, the Blended Benchmark† and the Bloomberg Multiverse Index, which returned 17.49%, 15.18% and -1.34%, respectively, for the same period.
| |
Top contributors to performance: |
| ↑ | Fixed income underweight, reflecting our preference for equities over fixed income. |
| ↑ | Within fixed income, an overweight to U.S. fixed income. |
| ↑ | Within fixed income, an underweight to international fixed income. |
| |
Top detractors from performance: |
| ↓ | Fund selection in equity, reflecting meaningful exposure to value stocks. |
| ↓ | Fund selection in U.S. equity. |
| ↓ | Fund selection in international equity. |
| Franklin LifeSmart 2045 Retirement Target Fund | PAGE 1 | 351-ATSR-0225 |
HOW DID THE FUND PERFORM OVER THE LAST 10 YEARS?
The Fund’s past performance is not necessarily an indication of how the Fund will perform in the future. The graph and table do not reflect the deduction of taxes that a shareholder would pay on Fund distributions or redemption of Fund shares.
VALUE OF A $10,000 INVESTMENT – Class R6 12/31/2014 — 12/31/2024
AVERAGE ANNUAL TOTAL RETURNS (%) Period Ended December 31, 2024
| | | |
| | 1 Year | 5 Year | 10 Year |
Class R6 | 15.05 | 9.74 | 8.19 |
Bloomberg Global Aggregate Index | -1.69 | -1.96 | 0.15 |
MSCI All Country World Index-NR | 17.49 | 10.06 | 9.23 |
Blended Benchmark† | 15.18 | 8.93 | 8.11 |
Bloomberg Multiverse Index | -1.34 | -1.76 | 0.35 |
| † | The Fund’s Blended Benchmark consists of 93% MSCI AC World Index-NR and 7% Bloomberg Multiverse Index. Allocations for the Fund’s Blended Benchmark reflect the Fund’s current target asset class allocations and may not be representative of the Fund’s historical asset class allocations. Performance for the Blended Benchmark is based on an asset class allocation that matches the glide path of the Franklin LifeSmart Funds over time. Prior to May 1, 2019, the Blended Benchmark had an allocation to FTSE 3 Month U.S. T-Bill Index. |
Reflects waiver of fees and/or reimbursement of expenses (including acquired fund fees and expenses), without which expenses would be higher.
For current month-end performance, please call Franklin Templeton at (800) DIAL BEN/342-5236 or visit https://www.franklintempleton.com/investments/options/mutual-funds.
Important data provider notices and terms available at www.franklintempletondatasources.com.
KEY FUND STATISTICS (as of December 31, 2024)
| |
Total Net Assets | $103,572,261 |
Total Number of Portfolio Holdings* | 16 |
Total Management Fee Paid | $0 |
Portfolio Turnover Rate | 30.84% |
| * | Does not include derivatives, except purchased options, if any. |
| Franklin LifeSmart 2045 Retirement Target Fund | PAGE 2 | 351-ATSR-0225 |
WHAT DID THE FUND INVEST IN? (as of December 31, 2024)
Portfolio Composition* (% of Total Investments)
| * | Does not include derivatives, except purchased options, if any. |
| |
| WHERE CAN I FIND ADDITIONAL INFORMATION ABOUT THE FUND? |
Additional information is available on https://www.franklintempleton.com/regulatory-fund-documents, including its: |
| • prospectus • proxy voting information • financial information • holdings • tax information |
HOUSEHOLDING
You will receive the Fund’s shareholder reports every six months. In addition, you will receive an annual updated summary prospectus (detail prospectus available upon request). To reduce Fund expenses, we try to identify related shareholders in a household and send only one copy of the shareholder reports and summary prospectus. This process, called “householding,” will continue indefinitely unless you instruct us otherwise. If you prefer not to have these documents householded, please call us at (800) DIAL BEN/342-5236. At any time, you may view current prospectuses/summary prospectuses and shareholder reports on our website. If you choose, you may receive these documents through electronic delivery.
| Franklin LifeSmart 2045 Retirement Target Fund | PAGE 3 | 351-ATSR-0225 |
1000098231017212115112471379916022188051605919091219641000096859887106181049011208122381166297671032610151100009764105311305611827149731740620633168442058424183100009775104331250111578142231645919202157311894321819100009671994610710105651131812339117839896104941035460.129.09.11.00.8
| | |
Franklin LifeSmart 2045 Retirement Target Fund | |
| Advisor Class [FLRLX] |
| Annual Shareholder Report | December 31, 2024 |
|
This annual shareholder report contains important information about Franklin LifeSmart 2045 Retirement Target Fund for the period January 1, 2024, to December 31, 2024.
You can find additional information about the Fund at https://www.franklintempleton.com/regulatory-fund-documents. You can also request this information by contacting us at (800) DIAL BEN/342-5236.
WHAT WERE THE FUND COSTS FOR THE LAST YEAR? (based on a hypothetical $10,000 investment)
| | |
Class Name | Costs of a $10,000 investment | Costs paid as a percentage of a $10,000 investment* |
Advisor Class1 | $29 | 0.27% |
| * | Reflects waiver of fees and/or reimbursement of expenses (including acquired fund fees and expenses), without which expenses would be higher. |
| 1 | Excludes fees and expenses of the underlying funds in which the Fund invests. |
HOW DID THE FUND PERFORM LAST YEAR AND WHAT AFFECTED ITS PERFORMANCE?
For the twelve months ended December 31, 2024, Advisor Class shares of Franklin LifeSmart 2045 Retirement Target Fund returned 15.01%. The Fund compares its performance to the MSCI All Country World Index-NR, the Blended Benchmark† and the Bloomberg Multiverse Index, which returned 17.49%, 15.18% and -1.34%, respectively, for the same period.
| |
Top contributors to performance: |
| ↑ | Fixed income underweight, reflecting our preference for equities over fixed income. |
| ↑ | Within fixed income, an overweight to U.S. fixed income. |
| ↑ | Within fixed income, an underweight to international fixed income. |
| |
Top detractors from performance: |
| ↓ | Fund selection in equity, reflecting meaningful exposure to value stocks. |
| ↓ | Fund selection in U.S. equity. |
| ↓ | Fund selection in international equity. |
| Franklin LifeSmart 2045 Retirement Target Fund | PAGE 1 | 651-ATSR-0225 |
HOW DID THE FUND PERFORM OVER THE LAST 10 YEARS?
The Fund’s past performance is not necessarily an indication of how the Fund will perform in the future. The graph and table do not reflect the deduction of taxes that a shareholder would pay on Fund distributions or redemption of Fund shares.
VALUE OF A $10,000 INVESTMENT – Advisor Class 12/31/2014 — 12/31/2024
AVERAGE ANNUAL TOTAL RETURNS (%) Period Ended December 31, 2024
| | | |
| | 1 Year | 5 Year | 10 Year |
Advisor Class | 15.01 | 8.99 | 7.78 |
Bloomberg Global Aggregate Index | -1.69 | -1.96 | 0.15 |
MSCI All Country World Index-NR | 17.49 | 10.06 | 9.23 |
Blended Benchmark† | 15.18 | 8.93 | 8.11 |
Bloomberg Multiverse Index | -1.34 | -1.76 | 0.35 |
| † | The Fund’s Blended Benchmark consists of 93% MSCI AC World Index-NR and 7% Bloomberg Multiverse Index. Allocations for the Fund’s Blended Benchmark reflect the Fund’s current target asset class allocations and may not be representative of the Fund’s historical asset class allocations. Performance for the Blended Benchmark is based on an asset class allocation that matches the glide path of the Franklin LifeSmart Funds over time. Prior to May 1, 2019, the Blended Benchmark had an allocation to FTSE 3 Month U.S. T-Bill Index. |
Reflects waiver of fees and/or reimbursement of expenses (including acquired fund fees and expenses), without which expenses would be higher.
For current month-end performance, please call Franklin Templeton at (800) DIAL BEN/342-5236 or visit https://www.franklintempleton.com/investments/options/mutual-funds.
Important data provider notices and terms available at www.franklintempletondatasources.com.
KEY FUND STATISTICS (as of December 31, 2024)
| |
Total Net Assets | $103,572,261 |
Total Number of Portfolio Holdings* | 16 |
Total Management Fee Paid | $0 |
Portfolio Turnover Rate | 30.84% |
| * | Does not include derivatives, except purchased options, if any. |
| Franklin LifeSmart 2045 Retirement Target Fund | PAGE 2 | 651-ATSR-0225 |
WHAT DID THE FUND INVEST IN? (as of December 31, 2024)
Portfolio Composition* (% of Total Investments)
| * | Does not include derivatives, except purchased options, if any. |
| |
| WHERE CAN I FIND ADDITIONAL INFORMATION ABOUT THE FUND? |
Additional information is available on https://www.franklintempleton.com/regulatory-fund-documents, including its: |
| • prospectus • proxy voting information • financial information • holdings • tax information |
HOUSEHOLDING
You will receive the Fund’s shareholder reports every six months. In addition, you will receive an annual updated summary prospectus (detail prospectus available upon request). To reduce Fund expenses, we try to identify related shareholders in a household and send only one copy of the shareholder reports and summary prospectus. This process, called “householding,” will continue indefinitely unless you instruct us otherwise. If you prefer not to have these documents householded, please call us at (800) DIAL BEN/342-5236. At any time, you may view current prospectuses/summary prospectuses and shareholder reports on our website. If you choose, you may receive these documents through electronic delivery.
| Franklin LifeSmart 2045 Retirement Target Fund | PAGE 3 | 651-ATSR-0225 |
1000098181016012095112321376215972187381547818400211621000096859887106181049011208122381166297671032610151100009764105311305611827149731740620633168442058424183100009775104331250111578142231645919202157311894321819100009671994610710105651131812339117839896104941035460.129.09.11.00.8
| | |
Franklin LifeSmart 2050 Retirement Target Fund | |
| Class A [FLSJX] |
| Annual Shareholder Report | December 31, 2024 |
|
This annual shareholder report contains important information about Franklin LifeSmart 2050 Retirement Target Fund for the period January 1, 2024, to December 31, 2024.
You can find additional information about the Fund at https://www.franklintempleton.com/regulatory-fund-documents. You can also request this information by contacting us at (800) DIAL BEN/342-5236.
WHAT WERE THE FUND COSTS FOR THE LAST YEAR? (based on a hypothetical $10,000 investment)
| | |
Class Name | Costs of a $10,000 investment | Costs paid as a percentage of a $10,000 investment* |
Class A1 | $56 | 0.52% |
| * | Reflects waiver of fees and/or reimbursement of expenses (including acquired fund fees and expenses), without which expenses would be higher. |
| 1 | Excludes fees and expenses of the underlying funds in which the Fund invests. |
HOW DID THE FUND PERFORM LAST YEAR AND WHAT AFFECTED ITS PERFORMANCE?
For the twelve months ended December 31, 2024, Class A shares of Franklin LifeSmart 2050 Retirement Target Fund returned 15.53%. The Fund compares its performance to the MSCI All Country World Index-NR, the Blended Benchmark† and the Bloomberg Multiverse Index, which returned 17.49%, 16.27% and -1.34%, respectively, for the same period.
| |
Top contributors to performance: |
| ↑ | Fixed income underweight, reflecting our preference for equities over fixed income. |
| ↑ | Underweight and fund selection in emerging markets equity. |
| ↑ | Overweight to U.S. equity, reflecting a regional preference. |
| |
Top detractors from performance: |
| ↓ | Fund selection in equity, reflecting meaningful exposure to value stocks. |
| ↓ | Fund selection in U.S. equity. |
| ↓ | Fund selection in international equity. |
| Franklin LifeSmart 2050 Retirement Target Fund | PAGE 1 | 59-ATSR-0225 |
HOW DID THE FUND PERFORM OVER THE LAST 10 YEARS?
The Fund’s past performance is not necessarily an indication of how the Fund will perform in the future. The graph and table do not reflect the deduction of taxes that a shareholder would pay on Fund distributions or redemption of Fund shares.
VALUE OF A $10,000 INVESTMENT ($9,450 AFTER MAXIMUM APPLICABLE SALES CHARGE) –
Class A 12/31/2014 — 12/31/2024
AVERAGE ANNUAL TOTAL RETURNS (%) Period Ended December 31, 2024
| | | |
| | 1 Year | 5 Year | 10 Year |
Class A | 15.53 | 9.21 | 7.80 |
Class A (with sales charge) | 9.15 | 7.97 | 7.19 |
Bloomberg Global Aggregate Index | -1.69 | -1.96 | 0.15 |
MSCI All Country World Index-NR | 17.49 | 10.06 | 9.23 |
Blended Benchmark† | 16.27 | 9.42 | 8.38 |
Bloomberg Multiverse Index | -1.34 | -1.76 | 0.35 |
| † | The Fund’s Blended Benchmark consists of 95% MSCI AC World Index-NR and 5% Bloomberg Multiverse Index. Allocations for the Fund’s Blended Benchmark reflect the Fund’s current target asset class allocations and may not be representative of the Fund’s historical asset class allocations. Performance for the Blended Benchmark is based on an asset class allocation that matches the glide path of the Franklin LifeSmart Funds over time. Prior to May 1, 2019, the Blended Benchmark had an allocation to FTSE 3 Month U.S. T-Bill Index. |
Reflects waiver of fees and/or reimbursement of expenses (including acquired fund fees and expenses), without which expenses would be higher.
Performance for periods prior to September 10, 2018, has been restated to reflect the current maximum sales charge, which is lower than the maximum sales charge prior to that date.
For current month-end performance, please call Franklin Templeton at (800) DIAL BEN/342-5236 or visit https://www.franklintempleton.com/investments/options/mutual-funds.
Important data provider notices and terms available at www.franklintempletondatasources.com.
KEY FUND STATISTICS (as of December 31, 2024)
| |
Total Net Assets | $56,219,296 |
Total Number of Portfolio Holdings* | 16 |
Total Management Fee Paid | $0 |
Portfolio Turnover Rate | 25.21% |
| * | Does not include derivatives, except purchased options, if any. |
| Franklin LifeSmart 2050 Retirement Target Fund | PAGE 2 | 59-ATSR-0225 |
WHAT DID THE FUND INVEST IN? (as of December 31, 2024)
Portfolio Composition* (% of Total Investments)
| * | Does not include derivatives, except purchased options, if any. |
| |
| WHERE CAN I FIND ADDITIONAL INFORMATION ABOUT THE FUND? |
Additional information is available on https://www.franklintempleton.com/regulatory-fund-documents, including its: |
| • prospectus • proxy voting information • financial information • holdings • tax information |
HOUSEHOLDING
You will receive the Fund’s shareholder reports every six months. In addition, you will receive an annual updated summary prospectus (detail prospectus available upon request). To reduce Fund expenses, we try to identify related shareholders in a household and send only one copy of the shareholder reports and summary prospectus. This process, called “householding,” will continue indefinitely unless you instruct us otherwise. If you prefer not to have these documents householded, please call us at (800) DIAL BEN/342-5236. At any time, you may view current prospectuses/summary prospectuses and shareholder reports on our website. If you choose, you may receive these documents through electronic delivery.
| Franklin LifeSmart 2050 Retirement Target Fund | PAGE 3 | 59-ATSR-0225 |
94509284959211410105661289214983176161453017331200171000096859887106181049011208122381166297671032610151100009764105311305611827149731740620633168442058424183100009775104361252011585142541653619395158651923122361100009671994610710105651131812339117839896104941035464.131.13.11.00.7
| | |
Franklin LifeSmart 2050 Retirement Target Fund | |
| Class C [FLSKX] |
| Annual Shareholder Report | December 31, 2024 |
|
This annual shareholder report contains important information about Franklin LifeSmart 2050 Retirement Target Fund for the period January 1, 2024, to December 31, 2024.
You can find additional information about the Fund at https://www.franklintempleton.com/regulatory-fund-documents. You can also request this information by contacting us at (800) DIAL BEN/342-5236.
WHAT WERE THE FUND COSTS FOR THE LAST YEAR? (based on a hypothetical $10,000 investment)
| | |
Class Name | Costs of a $10,000 investment | Costs paid as a percentage of a $10,000 investment* |
Class C1 | $136 | 1.27% |
| * | Reflects waiver of fees and/or reimbursement of expenses (including acquired fund fees and expenses), without which expenses would be higher. |
| 1 | Excludes fees and expenses of the underlying funds in which the Fund invests. |
HOW DID THE FUND PERFORM LAST YEAR AND WHAT AFFECTED ITS PERFORMANCE?
For the twelve months ended December 31, 2024, Class C shares of Franklin LifeSmart 2050 Retirement Target Fund returned 14.70%. The Fund compares its performance to the MSCI All Country World Index-NR, the Blended Benchmark† and the Bloomberg Multiverse Index, which returned 17.49%, 16.27% and -1.34%, respectively, for the same period.
| |
Top contributors to performance: |
| ↑ | Fixed income underweight, reflecting our preference for equities over fixed income. |
| ↑ | Underweight and fund selection in emerging markets equity. |
| ↑ | Overweight to U.S. equity, reflecting a regional preference. |
| |
Top detractors from performance: |
| ↓ | Fund selection in equity, reflecting meaningful exposure to value stocks. |
| ↓ | Fund selection in U.S. equity. |
| ↓ | Fund selection in international equity. |
| Franklin LifeSmart 2050 Retirement Target Fund | PAGE 1 | 259-ATSR-0225 |
HOW DID THE FUND PERFORM OVER THE LAST 10 YEARS?
The Fund’s past performance is not necessarily an indication of how the Fund will perform in the future. The graph and table do not reflect the deduction of taxes that a shareholder would pay on Fund distributions or redemption of Fund shares.
VALUE OF A $10,000 INVESTMENT – Class C 12/31/2014 — 12/31/2024
AVERAGE ANNUAL TOTAL RETURNS (%) Period Ended December 31, 2024
| | | |
| | 1 Year | 5 Year | 10 Year |
Class C | 14.70 | 8.39 | 7.00 |
Class C (with sales charge) | 13.70 | 8.39 | 7.00 |
Bloomberg Global Aggregate Index | -1.69 | -1.96 | 0.15 |
MSCI All Country World Index-NR | 17.49 | 10.06 | 9.23 |
Blended Benchmark† | 16.27 | 9.42 | 8.38 |
Bloomberg Multiverse Index | -1.34 | -1.76 | 0.35 |
| † | The Fund’s Blended Benchmark consists of 95% MSCI AC World Index-NR and 5% Bloomberg Multiverse Index. Allocations for the Fund’s Blended Benchmark reflect the Fund’s current target asset class allocations and may not be representative of the Fund’s historical asset class allocations. Performance for the Blended Benchmark is based on an asset class allocation that matches the glide path of the Franklin LifeSmart Funds over time. Prior to May 1, 2019, the Blended Benchmark had an allocation to FTSE 3 Month U.S. T-Bill Index. |
Reflects waiver of fees and/or reimbursement of expenses (including acquired fund fees and expenses), without which expenses would be higher.
For current month-end performance, please call Franklin Templeton at (800) DIAL BEN/342-5236 or visit https://www.franklintempleton.com/investments/options/mutual-funds.
Important data provider notices and terms available at www.franklintempletondatasources.com.
KEY FUND STATISTICS (as of December 31, 2024)
| |
Total Net Assets | $56,219,296 |
Total Number of Portfolio Holdings* | 16 |
Total Management Fee Paid | $0 |
Portfolio Turnover Rate | 25.21% |
| * | Does not include derivatives, except purchased options, if any. |
| Franklin LifeSmart 2050 Retirement Target Fund | PAGE 2 | 259-ATSR-0225 |
WHAT DID THE FUND INVEST IN? (as of December 31, 2024)
Portfolio Composition* (% of Total Investments)
| * | Does not include derivatives, except purchased options, if any. |
| |
| WHERE CAN I FIND ADDITIONAL INFORMATION ABOUT THE FUND? |
Additional information is available on https://www.franklintempleton.com/regulatory-fund-documents, including its: |
| • prospectus • proxy voting information • financial information • holdings • tax information |
HOUSEHOLDING
You will receive the Fund’s shareholder reports every six months. In addition, you will receive an annual updated summary prospectus (detail prospectus available upon request). To reduce Fund expenses, we try to identify related shareholders in a household and send only one copy of the shareholder reports and summary prospectus. This process, called “householding,” will continue indefinitely unless you instruct us otherwise. If you prefer not to have these documents householded, please call us at (800) DIAL BEN/342-5236. At any time, you may view current prospectuses/summary prospectuses and shareholder reports on our website. If you choose, you may receive these documents through electronic delivery.
| Franklin LifeSmart 2050 Retirement Target Fund | PAGE 3 | 259-ATSR-0225 |
1000097601001011815108561314915168176951448617148196691000096859887106181049011208122381166297671032610151100009764105311305611827149731740620633168442058424183100009775104361252011585142541653619395158651923122361100009671994610710105651131812339117839896104941035464.131.13.11.00.7
| | |
Franklin LifeSmart 2050 Retirement Target Fund | |
| Class R [FLSNX] |
| Annual Shareholder Report | December 31, 2024 |
|
This annual shareholder report contains important information about Franklin LifeSmart 2050 Retirement Target Fund for the period January 1, 2024, to December 31, 2024.
You can find additional information about the Fund at https://www.franklintempleton.com/regulatory-fund-documents. You can also request this information by contacting us at (800) DIAL BEN/342-5236.
WHAT WERE THE FUND COSTS FOR THE LAST YEAR? (based on a hypothetical $10,000 investment)
| | |
Class Name | Costs of a $10,000 investment | Costs paid as a percentage of a $10,000 investment* |
Class R1 | $83 | 0.77% |
| * | Reflects waiver of fees and/or reimbursement of expenses (including acquired fund fees and expenses), without which expenses would be higher. |
| 1 | Excludes fees and expenses of the underlying funds in which the Fund invests. |
HOW DID THE FUND PERFORM LAST YEAR AND WHAT AFFECTED ITS PERFORMANCE?
For the twelve months ended December 31, 2024, Class R shares of Franklin LifeSmart 2050 Retirement Target Fund returned 15.29%. The Fund compares its performance to the MSCI All Country World Index-NR, the Blended Benchmark† and the Bloomberg Multiverse Index, which returned 17.49%, 16.27% and -1.34%, respectively, for the same period.
| |
Top contributors to performance: |
| ↑ | Fixed income underweight, reflecting our preference for equities over fixed income. |
| ↑ | Underweight and fund selection in emerging markets equity. |
| ↑ | Overweight to U.S. equity, reflecting a regional preference. |
| |
Top detractors from performance: |
| ↓ | Fund selection in equity, reflecting meaningful exposure to value stocks. |
| ↓ | Fund selection in U.S. equity. |
| ↓ | Fund selection in international equity. |
| Franklin LifeSmart 2050 Retirement Target Fund | PAGE 1 | 859-ATSR-0225 |
HOW DID THE FUND PERFORM OVER THE LAST 10 YEARS?
The Fund’s past performance is not necessarily an indication of how the Fund will perform in the future. The graph and table do not reflect the deduction of taxes that a shareholder would pay on Fund distributions or redemption of Fund shares.
VALUE OF A $10,000 INVESTMENT – Class R 12/31/2014 — 12/31/2024
AVERAGE ANNUAL TOTAL RETURNS (%) Period Ended December 31, 2024
| | | |
| | 1 Year | 5 Year | 10 Year |
Class R | 15.29 | 8.95 | 7.54 |
Bloomberg Global Aggregate Index | -1.69 | -1.96 | 0.15 |
MSCI All Country World Index-NR | 17.49 | 10.06 | 9.23 |
Blended Benchmark† | 16.27 | 9.42 | 8.38 |
Bloomberg Multiverse Index | -1.34 | -1.76 | 0.35 |
| † | The Fund’s Blended Benchmark consists of 95% MSCI AC World Index-NR and 5% Bloomberg Multiverse Index. Allocations for the Fund’s Blended Benchmark reflect the Fund’s current target asset class allocations and may not be representative of the Fund’s historical asset class allocations. Performance for the Blended Benchmark is based on an asset class allocation that matches the glide path of the Franklin LifeSmart Funds over time. Prior to May 1, 2019, the Blended Benchmark had an allocation to FTSE 3 Month U.S. T-Bill Index. |
Reflects waiver of fees and/or reimbursement of expenses (including acquired fund fees and expenses), without which expenses would be higher.
For current month-end performance, please call Franklin Templeton at (800) DIAL BEN/342-5236 or visit https://www.franklintempleton.com/investments/options/mutual-funds.
Important data provider notices and terms available at www.franklintempletondatasources.com.
KEY FUND STATISTICS (as of December 31, 2024)
| |
Total Net Assets | $56,219,296 |
Total Number of Portfolio Holdings* | 16 |
Total Management Fee Paid | $0 |
Portfolio Turnover Rate | 25.21% |
| * | Does not include derivatives, except purchased options, if any. |
| Franklin LifeSmart 2050 Retirement Target Fund | PAGE 2 | 859-ATSR-0225 |
WHAT DID THE FUND INVEST IN? (as of December 31, 2024)
Portfolio Composition* (% of Total Investments)
| * | Does not include derivatives, except purchased options, if any. |
| |
| WHERE CAN I FIND ADDITIONAL INFORMATION ABOUT THE FUND? |
Additional information is available on https://www.franklintempleton.com/regulatory-fund-documents, including its: |
| • prospectus • proxy voting information • financial information • holdings • tax information |
HOUSEHOLDING
You will receive the Fund’s shareholder reports every six months. In addition, you will receive an annual updated summary prospectus (detail prospectus available upon request). To reduce Fund expenses, we try to identify related shareholders in a household and send only one copy of the shareholder reports and summary prospectus. This process, called “householding,” will continue indefinitely unless you instruct us otherwise. If you prefer not to have these documents householded, please call us at (800) DIAL BEN/342-5236. At any time, you may view current prospectuses/summary prospectuses and shareholder reports on our website. If you choose, you may receive these documents through electronic delivery.
| Franklin LifeSmart 2050 Retirement Target Fund | PAGE 3 | 859-ATSR-0225 |
1000098031009811983110701347415619183111508117940206831000096859887106181049011208122381166297671032610151100009764105311305611827149731740620633168442058424183100009775104361252011585142541653619395158651923122361100009671994610710105651131812339117839896104941035464.131.13.11.00.7
| | |
Franklin LifeSmart 2050 Retirement Target Fund | |
| Class R6 [FRLEX] |
| Annual Shareholder Report | December 31, 2024 |
|
This annual shareholder report contains important information about Franklin LifeSmart 2050 Retirement Target Fund for the period January 1, 2024, to December 31, 2024.
You can find additional information about the Fund at https://www.franklintempleton.com/regulatory-fund-documents. You can also request this information by contacting us at (800) DIAL BEN/342-5236.
WHAT WERE THE FUND COSTS FOR THE LAST YEAR? (based on a hypothetical $10,000 investment)
| | |
Class Name | Costs of a $10,000 investment | Costs paid as a percentage of a $10,000 investment* |
Class R61 | $23 | 0.21% |
| * | Reflects waiver of fees and/or reimbursement of expenses (including acquired fund fees and expenses), without which expenses would be higher. |
| 1 | Excludes fees and expenses of the underlying funds in which the Fund invests. |
HOW DID THE FUND PERFORM LAST YEAR AND WHAT AFFECTED ITS PERFORMANCE?
For the twelve months ended December 31, 2024, Class R6 shares of Franklin LifeSmart 2050 Retirement Target Fund returned 15.92%. The Fund compares its performance to the MSCI All Country World Index-NR, the Blended Benchmark† and the Bloomberg Multiverse Index, which returned 17.49%, 16.27% and -1.34%, respectively, for the same period.
| |
Top contributors to performance: |
| ↑ | Fixed income underweight, reflecting our preference for equities over fixed income. |
| ↑ | Underweight and fund selection in emerging markets equity. |
| ↑ | Overweight to U.S. equity, reflecting a regional preference. |
| |
Top detractors from performance: |
| ↓ | Fund selection in equity, reflecting meaningful exposure to value stocks. |
| ↓ | Fund selection in U.S. equity. |
| ↓ | Fund selection in international equity. |
| Franklin LifeSmart 2050 Retirement Target Fund | PAGE 1 | 899-ATSR-0225 |
HOW DID THE FUND PERFORM OVER THE LAST 10 YEARS?
The Fund’s past performance is not necessarily an indication of how the Fund will perform in the future. The graph and table do not reflect the deduction of taxes that a shareholder would pay on Fund distributions or redemption of Fund shares.
VALUE OF A $10,000 INVESTMENT – Class R6 12/31/2014 — 12/31/2024
AVERAGE ANNUAL TOTAL RETURNS (%) Period Ended December 31, 2024
| | | |
| | 1 Year | 5 Year | 10 Year |
Class R6 | 15.92 | 9.55 | 8.14 |
Bloomberg Global Aggregate Index | -1.69 | -1.96 | 0.15 |
MSCI All Country World Index-NR | 17.49 | 10.06 | 9.23 |
Blended Benchmark† | 16.27 | 9.42 | 8.38 |
Bloomberg Multiverse Index | -1.34 | -1.76 | 0.35 |
| † | The Fund’s Blended Benchmark consists of 95% MSCI AC World Index-NR and 5% Bloomberg Multiverse Index. Allocations for the Fund’s Blended Benchmark reflect the Fund’s current target asset class allocations and may not be representative of the Fund’s historical asset class allocations. Performance for the Blended Benchmark is based on an asset class allocation that matches the glide path of the Franklin LifeSmart Funds over time. Prior to May 1, 2019, the Blended Benchmark had an allocation to FTSE 3 Month U.S. T-Bill Index. |
Reflects waiver of fees and/or reimbursement of expenses (including acquired fund fees and expenses), without which expenses would be higher.
For current month-end performance, please call Franklin Templeton at (800) DIAL BEN/342-5236 or visit https://www.franklintempleton.com/investments/options/mutual-funds.
Important data provider notices and terms available at www.franklintempletondatasources.com.
KEY FUND STATISTICS (as of December 31, 2024)
| |
Total Net Assets | $56,219,296 |
Total Number of Portfolio Holdings* | 16 |
Total Management Fee Paid | $0 |
Portfolio Turnover Rate | 25.21% |
| * | Does not include derivatives, except purchased options, if any. |
| Franklin LifeSmart 2050 Retirement Target Fund | PAGE 2 | 899-ATSR-0225 |
WHAT DID THE FUND INVEST IN? (as of December 31, 2024)
Portfolio Composition* (% of Total Investments)
| * | Does not include derivatives, except purchased options, if any. |
| |
| WHERE CAN I FIND ADDITIONAL INFORMATION ABOUT THE FUND? |
Additional information is available on https://www.franklintempleton.com/regulatory-fund-documents, including its: |
| • prospectus • proxy voting information • financial information • holdings • tax information |
HOUSEHOLDING
You will receive the Fund’s shareholder reports every six months. In addition, you will receive an annual updated summary prospectus (detail prospectus available upon request). To reduce Fund expenses, we try to identify related shareholders in a household and send only one copy of the shareholder reports and summary prospectus. This process, called “householding,” will continue indefinitely unless you instruct us otherwise. If you prefer not to have these documents householded, please call us at (800) DIAL BEN/342-5236. At any time, you may view current prospectuses/summary prospectuses and shareholder reports on our website. If you choose, you may receive these documents through electronic delivery.
| Franklin LifeSmart 2050 Retirement Target Fund | PAGE 3 | 899-ATSR-0225 |
1000098611021112188113131385816158190401577018861218631000096859887106181049011208122381166297671032610151100009764105311305611827149731740620633168442058424183100009775104361252011585142541653619395158651923122361100009671994610710105651131812339117839896104941035464.131.13.11.00.7
| | |
Franklin LifeSmart 2050 Retirement Target Fund | |
| Advisor Class [FLSOX] |
| Annual Shareholder Report | December 31, 2024 |
|
This annual shareholder report contains important information about Franklin LifeSmart 2050 Retirement Target Fund for the period January 1, 2024, to December 31, 2024.
You can find additional information about the Fund at https://www.franklintempleton.com/regulatory-fund-documents. You can also request this information by contacting us at (800) DIAL BEN/342-5236.
WHAT WERE THE FUND COSTS FOR THE LAST YEAR? (based on a hypothetical $10,000 investment)
| | |
Class Name | Costs of a $10,000 investment | Costs paid as a percentage of a $10,000 investment* |
Advisor Class1 | $29 | 0.27% |
| * | Reflects waiver of fees and/or reimbursement of expenses (including acquired fund fees and expenses), without which expenses would be higher. |
| 1 | Excludes fees and expenses of the underlying funds in which the Fund invests. |
HOW DID THE FUND PERFORM LAST YEAR AND WHAT AFFECTED ITS PERFORMANCE?
For the twelve months ended December 31, 2024, Advisor Class shares of Franklin LifeSmart 2050 Retirement Target Fund returned 15.87%. The Fund compares its performance to the MSCI All Country World Index-NR, the Blended Benchmark† and the Bloomberg Multiverse Index, which returned 17.49%, 16.27% and -1.34%, respectively, for the same period.
| |
Top contributors to performance: |
| ↑ | Fixed income underweight, reflecting our preference for equities over fixed income. |
| ↑ | Underweight and fund selection in emerging markets equity. |
| ↑ | Overweight to U.S. equity, reflecting a regional preference. |
| |
Top detractors from performance: |
| ↓ | Fund selection in equity, reflecting meaningful exposure to value stocks. |
| ↓ | Fund selection in U.S. equity. |
| ↓ | Fund selection in international equity. |
| Franklin LifeSmart 2050 Retirement Target Fund | PAGE 1 | 98-ATSR-0225 |
HOW DID THE FUND PERFORM OVER THE LAST 10 YEARS?
The Fund’s past performance is not necessarily an indication of how the Fund will perform in the future. The graph and table do not reflect the deduction of taxes that a shareholder would pay on Fund distributions or redemption of Fund shares.
VALUE OF A $10,000 INVESTMENT – Advisor Class 12/31/2014 — 12/31/2024
AVERAGE ANNUAL TOTAL RETURNS (%) Period Ended December 31, 2024
| | | |
| | 1 Year | 5 Year | 10 Year |
Advisor Class | 15.87 | 9.48 | 8.07 |
Bloomberg Global Aggregate Index | -1.69 | -1.96 | 0.15 |
MSCI All Country World Index-NR | 17.49 | 10.06 | 9.23 |
Blended Benchmark† | 16.27 | 9.42 | 8.38 |
Bloomberg Multiverse Index | -1.34 | -1.76 | 0.35 |
| † | The Fund’s Blended Benchmark consists of 95% MSCI AC World Index-NR and 5% Bloomberg Multiverse Index. Allocations for the Fund’s Blended Benchmark reflect the Fund’s current target asset class allocations and may not be representative of the Fund’s historical asset class allocations. Performance for the Blended Benchmark is based on an asset class allocation that matches the glide path of the Franklin LifeSmart Funds over time. Prior to May 1, 2019, the Blended Benchmark had an allocation to FTSE 3 Month U.S. T-Bill Index. |
Reflects waiver of fees and/or reimbursement of expenses (including acquired fund fees and expenses), without which expenses would be higher.
For current month-end performance, please call Franklin Templeton at (800) DIAL BEN/342-5236 or visit https://www.franklintempleton.com/investments/options/mutual-funds.
Important data provider notices and terms available at www.franklintempletondatasources.com.
KEY FUND STATISTICS (as of December 31, 2024)
| |
Total Net Assets | $56,219,296 |
Total Number of Portfolio Holdings* | 16 |
Total Management Fee Paid | $0 |
Portfolio Turnover Rate | 25.21% |
| * | Does not include derivatives, except purchased options, if any. |
| Franklin LifeSmart 2050 Retirement Target Fund | PAGE 2 | 98-ATSR-0225 |
WHAT DID THE FUND INVEST IN? (as of December 31, 2024)
Portfolio Composition* (% of Total Investments)
| * | Does not include derivatives, except purchased options, if any. |
| |
| WHERE CAN I FIND ADDITIONAL INFORMATION ABOUT THE FUND? |
Additional information is available on https://www.franklintempleton.com/regulatory-fund-documents, including its: |
| • prospectus • proxy voting information • financial information • holdings • tax information |
HOUSEHOLDING
You will receive the Fund’s shareholder reports every six months. In addition, you will receive an annual updated summary prospectus (detail prospectus available upon request). To reduce Fund expenses, we try to identify related shareholders in a household and send only one copy of the shareholder reports and summary prospectus. This process, called “householding,” will continue indefinitely unless you instruct us otherwise. If you prefer not to have these documents householded, please call us at (800) DIAL BEN/342-5236. At any time, you may view current prospectuses/summary prospectuses and shareholder reports on our website. If you choose, you may receive these documents through electronic delivery.
| Franklin LifeSmart 2050 Retirement Target Fund | PAGE 3 | 98-ATSR-0225 |
1000098571021012170112911382516111189741569118761217391000096859887106181049011208122381166297671032610151100009764105311305611827149731740620633168442058424183100009775104361252011585142541653619395158651923122361100009671994610710105651131812339117839896104941035464.131.13.11.00.7
| | |
Franklin LifeSmart 2055 Retirement Target Fund | |
| Class A [FLTFX] |
| Annual Shareholder Report | December 31, 2024 |
|
This annual shareholder report contains important information about Franklin LifeSmart 2055 Retirement Target Fund for the period January 1, 2024, to December 31, 2024.
You can find additional information about the Fund at https://www.franklintempleton.com/regulatory-fund-documents. You can also request this information by contacting us at (800) DIAL BEN/342-5236.
WHAT WERE THE FUND COSTS FOR THE LAST YEAR? (based on a hypothetical $10,000 investment)
| | |
Class Name | Costs of a $10,000 investment | Costs paid as a percentage of a $10,000 investment* |
Class A1 | $56 | 0.52% |
| * | Reflects waiver of fees and/or reimbursement of expenses (including acquired fund fees and expenses), without which expenses would be higher. |
| 1 | Excludes fees and expenses of the underlying funds in which the Fund invests. |
HOW DID THE FUND PERFORM LAST YEAR AND WHAT AFFECTED ITS PERFORMANCE?
For the twelve months ended December 31, 2024, Class A shares of Franklin LifeSmart 2055 Retirement Target Fund returned 15.73%. The Fund compares its performance to the MSCI All Country World Index-NR, the Blended Benchmark† and the Bloomberg Multiverse Index, which returned 17.49%, 16.49% and -1.34%, respectively, for the same period.
| |
Top contributors to performance: |
| ↑ | Fixed income underweight, reflecting our preference for equities over fixed income. |
| ↑ | Underweight and fund selection in emerging markets equity. |
| ↑ | Overweight to U.S. equity, reflecting a regional preference. |
| |
Top detractors from performance: |
| ↓ | Fund selection in equity, reflecting meaningful exposure to value stocks. |
| ↓ | Fund selection in U.S. equity. |
| ↓ | Fund selection in international equity. |
| Franklin LifeSmart 2055 Retirement Target Fund | PAGE 1 | 959-ATSR-0225 |
HOW DID THE FUND PERFORM OVER THE LAST 10 YEARS?
The Fund’s past performance is not necessarily an indication of how the Fund will perform in the future. The graph and table do not reflect the deduction of taxes that a shareholder would pay on Fund distributions or redemption of Fund shares.
VALUE OF A $10,000 INVESTMENT ($9,450 AFTER MAXIMUM APPLICABLE SALES CHARGE) –
Class A 5/1/2015 — 12/31/2024
AVERAGE ANNUAL TOTAL RETURNS (%) Period Ended December 31, 2024
| | | |
| | 1 Year | 5 Year | Since Inception
(5/1/2015) |
Class A | 15.73 | 9.15 | 7.65 |
Class A (with sales charge) | 9.38 | 7.92 | 7.03 |
Bloomberg Global Aggregate Index | -1.69 | -1.96 | 0.28 |
MSCI All Country World Index-NR | 17.49 | 10.06 | 8.93 |
Blended Benchmark† | 16.49 | 9.48 | 8.23 |
Bloomberg Multiverse Index | -1.34 | -1.76 | 0.47 |
| † | The Fund’s Blended Benchmark consists of 95% MSCI AC World Index-NR and 5% Bloomberg Multiverse Index. Allocations for the Fund’s Blended Benchmark reflect the Fund’s current target asset class allocations and may not be representative of the Fund’s historical asset class allocations. Performance for the Blended Benchmark is based on an asset class allocation that matches the glide path of the Franklin LifeSmart Funds over time. Prior to May 1, 2019, the Blended Benchmark had an allocation to FTSE 3 Month U.S. T-Bill Index. |
Reflects waiver of fees and/or reimbursement of expenses (including acquired fund fees and expenses), without which expenses would be higher.
Performance for periods prior to September 10, 2018, has been restated to reflect the current maximum sales charge, which is lower than the maximum sales charge prior to that date.
For current month-end performance, please call Franklin Templeton at (800) DIAL BEN/342-5236 or visit https://www.franklintempleton.com/investments/options/mutual-funds.
Important data provider notices and terms available at www.franklintempletondatasources.com.
KEY FUND STATISTICS (as of December 31, 2024)
| |
Total Net Assets | $40,819,395 |
Total Number of Portfolio Holdings* | 15 |
Total Management Fee Paid | $0 |
Portfolio Turnover Rate | 27.08% |
| * | Does not include derivatives, except purchased options, if any. |
| Franklin LifeSmart 2055 Retirement Target Fund | PAGE 2 | 959-ATSR-0225 |
WHAT DID THE FUND INVEST IN? (as of December 31, 2024)
Portfolio Composition*,† (% of Total Investments)
| * | Does not include derivatives, except purchased options, if any. |
| † | Certain categories may represent less than 0.1%. |
| |
| WHERE CAN I FIND ADDITIONAL INFORMATION ABOUT THE FUND? |
Additional information is available on https://www.franklintempleton.com/regulatory-fund-documents, including its: |
| • prospectus • proxy voting information • financial information • holdings • tax information |
HOUSEHOLDING
You will receive the Fund’s shareholder reports every six months. In addition, you will receive an annual updated summary prospectus (detail prospectus available upon request). To reduce Fund expenses, we try to identify related shareholders in a household and send only one copy of the shareholder reports and summary prospectus. This process, called “householding,” will continue indefinitely unless you instruct us otherwise. If you prefer not to have these documents householded, please call us at (800) DIAL BEN/342-5236. At any time, you may view current prospectuses/summary prospectuses and shareholder reports on our website. If you choose, you may receive these documents through electronic delivery.
| Franklin LifeSmart 2055 Retirement Target Fund | PAGE 3 | 959-ATSR-0225 |
945089409220109771016812444144291693113961166581928310000977099741071210583113071234711766985410417102411000092741000412402112341422216534195991600019552229721000093891002812042111361370215896186451524918507215581000097411001910789106421140112429118699968105711042965.731.81.51.00.0
| | |
Franklin LifeSmart 2055 Retirement Target Fund | |
| Class C [FLTNX] |
| Annual Shareholder Report | December 31, 2024 |
|
This annual shareholder report contains important information about Franklin LifeSmart 2055 Retirement Target Fund for the period January 1, 2024, to December 31, 2024.
You can find additional information about the Fund at https://www.franklintempleton.com/regulatory-fund-documents. You can also request this information by contacting us at (800) DIAL BEN/342-5236.
WHAT WERE THE FUND COSTS FOR THE LAST YEAR? (based on a hypothetical $10,000 investment)
| | |
Class Name | Costs of a $10,000 investment | Costs paid as a percentage of a $10,000 investment* |
Class C1 | $136 | 1.27% |
| * | Reflects waiver of fees and/or reimbursement of expenses (including acquired fund fees and expenses), without which expenses would be higher. |
| 1 | Excludes fees and expenses of the underlying funds in which the Fund invests. |
HOW DID THE FUND PERFORM LAST YEAR AND WHAT AFFECTED ITS PERFORMANCE?
For the twelve months ended December 31, 2024, Class C shares of Franklin LifeSmart 2055 Retirement Target Fund returned 14.86%. The Fund compares its performance to the MSCI All Country World Index-NR, the Blended Benchmark† and the Bloomberg Multiverse Index, which returned 17.49%, 16.49% and -1.34%, respectively, for the same period.
| |
Top contributors to performance: |
| ↑ | Fixed income underweight, reflecting our preference for equities over fixed income. |
| ↑ | Underweight and fund selection in emerging markets equity. |
| ↑ | Overweight to U.S. equity, reflecting a regional preference. |
| |
Top detractors from performance: |
| ↓ | Fund selection in equity, reflecting meaningful exposure to value stocks. |
| ↓ | Fund selection in U.S. equity. |
| ↓ | Fund selection in international equity. |
| Franklin LifeSmart 2055 Retirement Target Fund | PAGE 1 | 289-ATSR-0225 |
HOW DID THE FUND PERFORM OVER THE LAST 10 YEARS?
The Fund’s past performance is not necessarily an indication of how the Fund will perform in the future. The graph and table do not reflect the deduction of taxes that a shareholder would pay on Fund distributions or redemption of Fund shares.
VALUE OF A $10,000 INVESTMENT – Class C 5/1/2015 — 12/31/2024
AVERAGE ANNUAL TOTAL RETURNS (%) Period Ended December 31, 2024
| | | |
| | 1 Year | 5 Year | Since Inception
(5/1/2015) |
Class C | 14.86 | 8.34 | 6.83 |
Class C (with sales charge) | 13.86 | 8.34 | 6.83 |
Bloomberg Global Aggregate Index | -1.69 | -1.96 | 0.28 |
MSCI All Country World Index-NR | 17.49 | 10.06 | 8.93 |
Blended Benchmark† | 16.49 | 9.48 | 8.23 |
Bloomberg Multiverse Index | -1.34 | -1.76 | 0.47 |
| † | The Fund’s Blended Benchmark consists of 95% MSCI AC World Index-NR and 5% Bloomberg Multiverse Index. Allocations for the Fund’s Blended Benchmark reflect the Fund’s current target asset class allocations and may not be representative of the Fund’s historical asset class allocations. Performance for the Blended Benchmark is based on an asset class allocation that matches the glide path of the Franklin LifeSmart Funds over time. Prior to May 1, 2019, the Blended Benchmark had an allocation to FTSE 3 Month U.S. T-Bill Index. |
Reflects waiver of fees and/or reimbursement of expenses (including acquired fund fees and expenses), without which expenses would be higher.
For current month-end performance, please call Franklin Templeton at (800) DIAL BEN/342-5236 or visit https://www.franklintempleton.com/investments/options/mutual-funds.
Important data provider notices and terms available at www.franklintempletondatasources.com.
KEY FUND STATISTICS (as of December 31, 2024)
| |
Total Net Assets | $40,819,395 |
Total Number of Portfolio Holdings* | 15 |
Total Management Fee Paid | $0 |
Portfolio Turnover Rate | 27.08% |
| * | Does not include derivatives, except purchased options, if any. |
| Franklin LifeSmart 2055 Retirement Target Fund | PAGE 2 | 289-ATSR-0225 |
WHAT DID THE FUND INVEST IN? (as of December 31, 2024)
Portfolio Composition*,† (% of Total Investments)
| * | Does not include derivatives, except purchased options, if any. |
| † | Certain categories may represent less than 0.1%. |
| |
| WHERE CAN I FIND ADDITIONAL INFORMATION ABOUT THE FUND? |
Additional information is available on https://www.franklintempleton.com/regulatory-fund-documents, including its: |
| • prospectus • proxy voting information • financial information • holdings • tax information |
HOUSEHOLDING
You will receive the Fund’s shareholder reports every six months. In addition, you will receive an annual updated summary prospectus (detail prospectus available upon request). To reduce Fund expenses, we try to identify related shareholders in a household and send only one copy of the shareholder reports and summary prospectus. This process, called “householding,” will continue indefinitely unless you instruct us otherwise. If you prefer not to have these documents householded, please call us at (800) DIAL BEN/342-5236. At any time, you may view current prospectuses/summary prospectuses and shareholder reports on our website. If you choose, you may receive these documents through electronic delivery.
| Franklin LifeSmart 2055 Retirement Target Fund | PAGE 3 | 289-ATSR-0225 |
1000094019623113651045112692146051701413918164911894110000977099741071210583113071234711766985410417102411000092741000412402112341422216534195991600019552229721000093891002812042111361370215896186451524918507215581000097411001910789106421140112429118699968105711042965.731.81.51.00.0
| | |
Franklin LifeSmart 2055 Retirement Target Fund | |
| Class R [FLSBX] |
| Annual Shareholder Report | December 31, 2024 |
|
This annual shareholder report contains important information about Franklin LifeSmart 2055 Retirement Target Fund for the period January 1, 2024, to December 31, 2024.
You can find additional information about the Fund at https://www.franklintempleton.com/regulatory-fund-documents. You can also request this information by contacting us at (800) DIAL BEN/342-5236.
WHAT WERE THE FUND COSTS FOR THE LAST YEAR? (based on a hypothetical $10,000 investment)
| | |
Class Name | Costs of a $10,000 investment | Costs paid as a percentage of a $10,000 investment* |
Class R1 | $83 | 0.77% |
| * | Reflects waiver of fees and/or reimbursement of expenses (including acquired fund fees and expenses), without which expenses would be higher. |
| 1 | Excludes fees and expenses of the underlying funds in which the Fund invests. |
HOW DID THE FUND PERFORM LAST YEAR AND WHAT AFFECTED ITS PERFORMANCE?
For the twelve months ended December 31, 2024, Class R shares of Franklin LifeSmart 2055 Retirement Target Fund returned 15.47%. The Fund compares its performance to the MSCI All Country World Index-NR, the Blended Benchmark† and the Bloomberg Multiverse Index, which returned 17.49%, 16.49% and -1.34%, respectively, for the same period.
| |
Top contributors to performance: |
| ↑ | Fixed income underweight, reflecting our preference for equities over fixed income. |
| ↑ | Underweight and fund selection in emerging markets equity. |
| ↑ | Overweight to U.S. equity, reflecting a regional preference. |
| |
Top detractors from performance: |
| ↓ | Fund selection in equity, reflecting meaningful exposure to value stocks. |
| ↓ | Fund selection in U.S. equity. |
| ↓ | Fund selection in international equity. |
| Franklin LifeSmart 2055 Retirement Target Fund | PAGE 1 | 869-ATSR-0225 |
HOW DID THE FUND PERFORM OVER THE LAST 10 YEARS?
The Fund’s past performance is not necessarily an indication of how the Fund will perform in the future. The graph and table do not reflect the deduction of taxes that a shareholder would pay on Fund distributions or redemption of Fund shares.
VALUE OF A $10,000 INVESTMENT – Class R 5/1/2015 — 12/31/2024
AVERAGE ANNUAL TOTAL RETURNS (%) Period Ended December 31, 2024
| | | |
| | 1 Year | 5 Year | Since Inception
(5/1/2015) |
Class R | 15.47 | 8.88 | 7.38 |
Bloomberg Global Aggregate Index | -1.69 | -1.96 | 0.28 |
MSCI All Country World Index-NR | 17.49 | 10.06 | 8.93 |
Blended Benchmark† | 16.49 | 9.48 | 8.23 |
Bloomberg Multiverse Index | -1.34 | -1.76 | 0.47 |
| † | The Fund’s Blended Benchmark consists of 95% MSCI AC World Index-NR and 5% Bloomberg Multiverse Index. Allocations for the Fund’s Blended Benchmark reflect the Fund’s current target asset class allocations and may not be representative of the Fund’s historical asset class allocations. Performance for the Blended Benchmark is based on an asset class allocation that matches the glide path of the Franklin LifeSmart Funds over time. Prior to May 1, 2019, the Blended Benchmark had an allocation to FTSE 3 Month U.S. T-Bill Index. |
Reflects waiver of fees and/or reimbursement of expenses (including acquired fund fees and expenses), without which expenses would be higher.
For current month-end performance, please call Franklin Templeton at (800) DIAL BEN/342-5236 or visit https://www.franklintempleton.com/investments/options/mutual-funds.
Important data provider notices and terms available at www.franklintempletondatasources.com.
KEY FUND STATISTICS (as of December 31, 2024)
| |
Total Net Assets | $40,819,395 |
Total Number of Portfolio Holdings* | 15 |
Total Management Fee Paid | $0 |
Portfolio Turnover Rate | 27.08% |
| * | Does not include derivatives, except purchased options, if any. |
| Franklin LifeSmart 2055 Retirement Target Fund | PAGE 2 | 869-ATSR-0225 |
WHAT DID THE FUND INVEST IN? (as of December 31, 2024)
Portfolio Composition*,† (% of Total Investments)
| * | Does not include derivatives, except purchased options, if any. |
| † | Certain categories may represent less than 0.1%. |
| |
| WHERE CAN I FIND ADDITIONAL INFORMATION ABOUT THE FUND? |
Additional information is available on https://www.franklintempleton.com/regulatory-fund-documents, including its: |
| • prospectus • proxy voting information • financial information • holdings • tax information |
HOUSEHOLDING
You will receive the Fund’s shareholder reports every six months. In addition, you will receive an annual updated summary prospectus (detail prospectus available upon request). To reduce Fund expenses, we try to identify related shareholders in a household and send only one copy of the shareholder reports and summary prospectus. This process, called “householding,” will continue indefinitely unless you instruct us otherwise. If you prefer not to have these documents householded, please call us at (800) DIAL BEN/342-5236. At any time, you may view current prospectuses/summary prospectuses and shareholder reports on our website. If you choose, you may receive these documents through electronic delivery.
| Franklin LifeSmart 2055 Retirement Target Fund | PAGE 3 | 869-ATSR-0225 |
1000094399707115211065313006150361760314472172321989710000977099741071210583113071234711766985410417102411000092741000412402112341422216534195991600019552229721000093891002812042111361370215896186451524918507215581000097411001910789106421140112429118699968105711042965.731.81.51.00.0
| | |
Franklin LifeSmart 2055 Retirement Target Fund | |
| Class R6 [FLSZX] |
| Annual Shareholder Report | December 31, 2024 |
|
This annual shareholder report contains important information about Franklin LifeSmart 2055 Retirement Target Fund for the period January 1, 2024, to December 31, 2024.
You can find additional information about the Fund at https://www.franklintempleton.com/regulatory-fund-documents. You can also request this information by contacting us at (800) DIAL BEN/342-5236.
WHAT WERE THE FUND COSTS FOR THE LAST YEAR? (based on a hypothetical $10,000 investment)
| | |
Class Name | Costs of a $10,000 investment | Costs paid as a percentage of a $10,000 investment* |
Class R61 | $24 | 0.22% |
| * | Reflects waiver of fees and/or reimbursement of expenses (including acquired fund fees and expenses), without which expenses would be higher. |
| 1 | Excludes fees and expenses of the underlying funds in which the Fund invests. |
HOW DID THE FUND PERFORM LAST YEAR AND WHAT AFFECTED ITS PERFORMANCE?
For the twelve months ended December 31, 2024, Class R6 shares of Franklin LifeSmart 2055 Retirement Target Fund returned 16.13%. The Fund compares its performance to the MSCI All Country World Index-NR, the Blended Benchmark† and the Bloomberg Multiverse Index, which returned 17.49%, 16.49% and -1.34%, respectively, for the same period.
| |
Top contributors to performance: |
| ↑ | Fixed income underweight, reflecting our preference for equities over fixed income. |
| ↑ | Underweight and fund selection in emerging markets equity. |
| ↑ | Overweight to U.S. equity, reflecting a regional preference. |
| |
Top detractors from performance: |
| ↓ | Fund selection in equity, reflecting meaningful exposure to value stocks. |
| ↓ | Fund selection in U.S. equity. |
| ↓ | Fund selection in international equity. |
| Franklin LifeSmart 2055 Retirement Target Fund | PAGE 1 | 879-ATSR-0225 |
HOW DID THE FUND PERFORM OVER THE LAST 10 YEARS?
The Fund’s past performance is not necessarily an indication of how the Fund will perform in the future. The graph and table do not reflect the deduction of taxes that a shareholder would pay on Fund distributions or redemption of Fund shares.
VALUE OF A $10,000 INVESTMENT – Class R6 5/1/2015 — 12/31/2024
AVERAGE ANNUAL TOTAL RETURNS (%) Period Ended December 31, 2024
| | | |
| | 1 Year | 5 Year | Since Inception
(5/1/2015) |
Class R6 | 16.13 | 9.88 | 8.16 |
Bloomberg Global Aggregate Index | -1.69 | -1.96 | 0.28 |
MSCI All Country World Index-NR | 17.49 | 10.06 | 8.93 |
Blended Benchmark† | 16.49 | 9.48 | 8.23 |
Bloomberg Multiverse Index | -1.34 | -1.76 | 0.47 |
| † | The Fund’s Blended Benchmark consists of 95% MSCI AC World Index-NR and 5% Bloomberg Multiverse Index. Allocations for the Fund’s Blended Benchmark reflect the Fund’s current target asset class allocations and may not be representative of the Fund’s historical asset class allocations. Performance for the Blended Benchmark is based on an asset class allocation that matches the glide path of the Franklin LifeSmart Funds over time. Prior to May 1, 2019, the Blended Benchmark had an allocation to FTSE 3 Month U.S. T-Bill Index. |
Reflects waiver of fees and/or reimbursement of expenses (including acquired fund fees and expenses), without which expenses would be higher.
For current month-end performance, please call Franklin Templeton at (800) DIAL BEN/342-5236 or visit https://www.franklintempleton.com/investments/options/mutual-funds.
Important data provider notices and terms available at www.franklintempletondatasources.com.
KEY FUND STATISTICS (as of December 31, 2024)
| |
Total Net Assets | $40,819,395 |
Total Number of Portfolio Holdings* | 15 |
Total Management Fee Paid | $0 |
Portfolio Turnover Rate | 27.08% |
| * | Does not include derivatives, except purchased options, if any. |
| Franklin LifeSmart 2055 Retirement Target Fund | PAGE 2 | 879-ATSR-0225 |
WHAT DID THE FUND INVEST IN? (as of December 31, 2024)
Portfolio Composition*,† (% of Total Investments)
| * | Does not include derivatives, except purchased options, if any. |
| † | Certain categories may represent less than 0.1%. |
| |
| WHERE CAN I FIND ADDITIONAL INFORMATION ABOUT THE FUND? |
Additional information is available on https://www.franklintempleton.com/regulatory-fund-documents, including its: |
| • prospectus • proxy voting information • financial information • holdings • tax information |
HOUSEHOLDING
You will receive the Fund’s shareholder reports every six months. In addition, you will receive an annual updated summary prospectus (detail prospectus available upon request). To reduce Fund expenses, we try to identify related shareholders in a household and send only one copy of the shareholder reports and summary prospectus. This process, called “householding,” will continue indefinitely unless you instruct us otherwise. If you prefer not to have these documents householded, please call us at (800) DIAL BEN/342-5236. At any time, you may view current prospectuses/summary prospectuses and shareholder reports on our website. If you choose, you may receive these documents through electronic delivery.
| Franklin LifeSmart 2055 Retirement Target Fund | PAGE 3 | 879-ATSR-0225 |
1000094679798116911085813325155031825115350183802134410000977099741071210583113071234711766985410417102411000092741000412402112341422216534195991600019552229721000093891002812042111361370215896186451524918507215581000097411001910789106421140112429118699968105711042965.731.81.51.00.0
| | |
Franklin LifeSmart 2055 Retirement Target Fund | |
| Advisor Class [FLTKX] |
| Annual Shareholder Report | December 31, 2024 |
|
This annual shareholder report contains important information about Franklin LifeSmart 2055 Retirement Target Fund for the period January 1, 2024, to December 31, 2024.
You can find additional information about the Fund at https://www.franklintempleton.com/regulatory-fund-documents. You can also request this information by contacting us at (800) DIAL BEN/342-5236.
WHAT WERE THE FUND COSTS FOR THE LAST YEAR? (based on a hypothetical $10,000 investment)
| | |
Class Name | Costs of a $10,000 investment | Costs paid as a percentage of a $10,000 investment* |
Advisor Class1 | $29 | 0.27% |
| * | Reflects waiver of fees and/or reimbursement of expenses (including acquired fund fees and expenses), without which expenses would be higher. |
| 1 | Excludes fees and expenses of the underlying funds in which the Fund invests. |
HOW DID THE FUND PERFORM LAST YEAR AND WHAT AFFECTED ITS PERFORMANCE?
For the twelve months ended December 31, 2024, Advisor Class shares of Franklin LifeSmart 2055 Retirement Target Fund returned 16.07%. The Fund compares its performance to the MSCI All Country World Index-NR, the Blended Benchmark† and the Bloomberg Multiverse Index, which returned 17.49%, 16.49% and -1.34%, respectively, for the same period.
| |
Top contributors to performance: |
| ↑ | Fixed income underweight, reflecting our preference for equities over fixed income. |
| ↑ | Underweight and fund selection in emerging markets equity. |
| ↑ | Overweight to U.S. equity, reflecting a regional preference. |
| |
Top detractors from performance: |
| ↓ | Fund selection in equity, reflecting meaningful exposure to value stocks. |
| ↓ | Fund selection in U.S. equity. |
| ↓ | Fund selection in international equity. |
| Franklin LifeSmart 2055 Retirement Target Fund | PAGE 1 | 999-ATSR-0225 |
HOW DID THE FUND PERFORM OVER THE LAST 10 YEARS?
The Fund’s past performance is not necessarily an indication of how the Fund will perform in the future. The graph and table do not reflect the deduction of taxes that a shareholder would pay on Fund distributions or redemption of Fund shares.
VALUE OF A $10,000 INVESTMENT – Advisor Class 5/1/2015 — 12/31/2024
AVERAGE ANNUAL TOTAL RETURNS (%) Period Ended December 31, 2024
| | | |
| | 1 Year | 5 Year | Since Inception
(5/1/2015) |
Advisor Class | 16.07 | 9.41 | 7.90 |
Bloomberg Global Aggregate Index | -1.69 | -1.96 | 0.28 |
MSCI All Country World Index-NR | 17.49 | 10.06 | 8.93 |
Blended Benchmark† | 16.49 | 9.48 | 8.23 |
Bloomberg Multiverse Index | -1.34 | -1.76 | 0.47 |
| † | The Fund’s Blended Benchmark consists of 95% MSCI AC World Index-NR and 5% Bloomberg Multiverse Index. Allocations for the Fund’s Blended Benchmark reflect the Fund’s current target asset class allocations and may not be representative of the Fund’s historical asset class allocations. Performance for the Blended Benchmark is based on an asset class allocation that matches the glide path of the Franklin LifeSmart Funds over time. Prior to May 1, 2019, the Blended Benchmark had an allocation to FTSE 3 Month U.S. T-Bill Index. |
Reflects waiver of fees and/or reimbursement of expenses (including acquired fund fees and expenses), without which expenses would be higher.
For current month-end performance, please call Franklin Templeton at (800) DIAL BEN/342-5236 or visit https://www.franklintempleton.com/investments/options/mutual-funds.
Important data provider notices and terms available at www.franklintempletondatasources.com.
KEY FUND STATISTICS (as of December 31, 2024)
| |
Total Net Assets | $40,819,395 |
Total Number of Portfolio Holdings* | 15 |
Total Management Fee Paid | $0 |
Portfolio Turnover Rate | 27.08% |
| * | Does not include derivatives, except purchased options, if any. |
| Franklin LifeSmart 2055 Retirement Target Fund | PAGE 2 | 999-ATSR-0225 |
WHAT DID THE FUND INVEST IN? (as of December 31, 2024)
Portfolio Composition*,† (% of Total Investments)
| * | Does not include derivatives, except purchased options, if any. |
| † | Certain categories may represent less than 0.1%. |
| |
| WHERE CAN I FIND ADDITIONAL INFORMATION ABOUT THE FUND? |
Additional information is available on https://www.franklintempleton.com/regulatory-fund-documents, including its: |
| • prospectus • proxy voting information • financial information • holdings • tax information |
HOUSEHOLDING
You will receive the Fund’s shareholder reports every six months. In addition, you will receive an annual updated summary prospectus (detail prospectus available upon request). To reduce Fund expenses, we try to identify related shareholders in a household and send only one copy of the shareholder reports and summary prospectus. This process, called “householding,” will continue indefinitely unless you instruct us otherwise. If you prefer not to have these documents householded, please call us at (800) DIAL BEN/342-5236. At any time, you may view current prospectuses/summary prospectuses and shareholder reports on our website. If you choose, you may receive these documents through electronic delivery.
| Franklin LifeSmart 2055 Retirement Target Fund | PAGE 3 | 999-ATSR-0225 |
1000094639789116751083913297154491816815025179642084910000977099741071210583113071234711766985410417102411000092741000412402112341422216534195991600019552229721000093891002812042111361370215896186451524918507215581000097411001910789106421140112429118699968105711042965.731.81.51.00.0
| | |
Franklin LifeSmart 2060 Retirement Target Fund | |
| Class A [FLASX] |
| Annual Shareholder Report | December 31, 2024 |
|
This annual shareholder report contains important information about Franklin LifeSmart 2060 Retirement Target Fund for the period January 1, 2024, to December 31, 2024.
You can find additional information about the Fund at https://www.franklintempleton.com/regulatory-fund-documents. You can also request this information by contacting us at (800) DIAL BEN/342-5236.
WHAT WERE THE FUND COSTS FOR THE LAST YEAR? (based on a hypothetical $10,000 investment)
| | |
Class Name | Costs of a $10,000 investment | Costs paid as a percentage of a $10,000 investment* |
Class A1 | $56 | 0.52% |
| * | Reflects waiver of fees and/or reimbursement of expenses (including acquired fund fees and expenses), without which expenses would be higher. |
| 1 | Excludes fees and expenses of the underlying funds in which the Fund invests. |
HOW DID THE FUND PERFORM LAST YEAR AND WHAT AFFECTED ITS PERFORMANCE?
For the twelve months ended December 31, 2024, Class A shares of Franklin LifeSmart 2060 Retirement Target Fund returned 15.71%. The Fund compares its performance to the MSCI All Country World Index-NR, the Blended Benchmark† and the Bloomberg Multiverse Index, which returned 17.49%, 16.49% and -1.34%, respectively, for the same period.
| |
Top contributors to performance: |
| ↑ | Fixed income underweight, reflecting our preference for equities over fixed income. |
| ↑ | Underweight and fund selection in emerging markets equity. |
| ↑ | Overweight to U.S. equity, reflecting a regional preference. |
| |
Top detractors from performance: |
| ↓ | Fund selection in equity, reflecting meaningful exposure to value stocks. |
| ↓ | Fund selection in U.S. equity. |
| ↓ | Fund selection in international equity. |
| Franklin LifeSmart 2060 Retirement Target Fund | PAGE 1 | 1899-ATSR-0225 |
HOW DID THE FUND PERFORM OVER THE LAST 10 YEARS?
The Fund’s past performance is not necessarily an indication of how the Fund will perform in the future. The graph and table do not reflect the deduction of taxes that a shareholder would pay on Fund distributions or redemption of Fund shares.
VALUE OF A $10,000 INVESTMENT ($9,450 AFTER MAXIMUM APPLICABLE SALES CHARGE) –
Class A 1/29/2021 — 12/31/2024
AVERAGE ANNUAL TOTAL RETURNS (%) Period Ended December 31, 2024
| | |
| | 1 Year | Since Inception
(1/29/2021) |
Class A | 15.71 | 7.73 |
Class A (with sales charge) | 9.34 | 6.19 |
Bloomberg Global Aggregate Index | -1.69 | -4.44 |
MSCI All Country World Index-NR | 17.49 | 8.88 |
Blended Benchmark† | 16.49 | 7.84 |
Bloomberg Multiverse Index | -1.34 | -4.12 |
| † | The Blended Benchmark is an allocation of 95% MSCI All Country World Index-NR and 5% Bloomberg Multiverse Index. |
Reflects waiver of fees and/or reimbursement of expenses (including acquired fund fees and expenses), without which expenses would be higher.
For current month-end performance, please call Franklin Templeton at (800) DIAL BEN/342-5236 or visit https://www.franklintempleton.com/investments/options/mutual-funds.
Important data provider notices and terms available at www.franklintempletondatasources.com.
KEY FUND STATISTICS (as of December 31, 2024)
| |
Total Net Assets | $8,071,534 |
Total Number of Portfolio Holdings* | 16 |
Total Management Fee Paid | $0 |
Portfolio Turnover Rate | 27.48% |
| * | Does not include derivatives, except purchased options, if any. |
| Franklin LifeSmart 2060 Retirement Target Fund | PAGE 2 | 1899-ATSR-0225 |
WHAT DID THE FUND INVEST IN? (as of December 31, 2024)
Portfolio Composition*,† (% of Total Investments)
| * | Does not include derivatives, except purchased options, if any. |
| † | Certain categories may represent less than 0.1%. |
| |
| WHERE CAN I FIND ADDITIONAL INFORMATION ABOUT THE FUND? |
Additional information is available on https://www.franklintempleton.com/regulatory-fund-documents, including its: |
| • prospectus • proxy voting information • financial information • holdings • tax information |
HOUSEHOLDING
You will receive the Fund’s shareholder reports every six months. In addition, you will receive an annual updated summary prospectus (detail prospectus available upon request). To reduce Fund expenses, we try to identify related shareholders in a household and send only one copy of the shareholder reports and summary prospectus. This process, called “householding,” will continue indefinitely unless you instruct us otherwise. If you prefer not to have these documents householded, please call us at (800) DIAL BEN/342-5236. At any time, you may view current prospectuses/summary prospectuses and shareholder reports on our website. If you choose, you may receive these documents through electronic delivery.
| Franklin LifeSmart 2060 Retirement Target Fund | PAGE 3 | 1899-ATSR-0225 |
9450112009206109371265710000952979818437829510000118549677118251389310000117299593116431356210000954980208505839165.631.91.51.00.0
| | |
Franklin LifeSmart 2060 Retirement Target Fund | |
| Class C [FLBSX] |
| Annual Shareholder Report | December 31, 2024 |
|
This annual shareholder report contains important information about Franklin LifeSmart 2060 Retirement Target Fund for the period January 1, 2024, to December 31, 2024.
You can find additional information about the Fund at https://www.franklintempleton.com/regulatory-fund-documents. You can also request this information by contacting us at (800) DIAL BEN/342-5236.
WHAT WERE THE FUND COSTS FOR THE LAST YEAR? (based on a hypothetical $10,000 investment)
| | |
Class Name | Costs of a $10,000 investment | Costs paid as a percentage of a $10,000 investment* |
Class C1 | $136 | 1.27% |
| * | Reflects waiver of fees and/or reimbursement of expenses (including acquired fund fees and expenses), without which expenses would be higher. |
| 1 | Excludes fees and expenses of the underlying funds in which the Fund invests. |
HOW DID THE FUND PERFORM LAST YEAR AND WHAT AFFECTED ITS PERFORMANCE?
For the twelve months ended December 31, 2024, Class C shares of Franklin LifeSmart 2060 Retirement Target Fund returned 14.79%. The Fund compares its performance to the MSCI All Country World Index-NR, the Blended Benchmark† and the Bloomberg Multiverse Index, which returned 17.49%, 16.49% and -1.34%, respectively, for the same period.
| |
Top contributors to performance: |
| ↑ | Fixed income underweight, reflecting our preference for equities over fixed income. |
| ↑ | Underweight and fund selection in emerging markets equity. |
| ↑ | Overweight to U.S. equity, reflecting a regional preference. |
| |
Top detractors from performance: |
| ↓ | Fund selection in equity, reflecting meaningful exposure to value stocks. |
| ↓ | Fund selection in U.S. equity. |
| ↓ | Fund selection in international equity. |
| Franklin LifeSmart 2060 Retirement Target Fund | PAGE 1 | 2899-ATSR-0225 |
HOW DID THE FUND PERFORM OVER THE LAST 10 YEARS?
The Fund’s past performance is not necessarily an indication of how the Fund will perform in the future. The graph and table do not reflect the deduction of taxes that a shareholder would pay on Fund distributions or redemption of Fund shares.
VALUE OF A $10,000 INVESTMENT – Class C 1/29/2021 — 12/31/2024
AVERAGE ANNUAL TOTAL RETURNS (%) Period Ended December 31, 2024
| | |
| | 1 Year | Since Inception
(1/29/2021) |
Class C | 14.79 | 7.14 |
Class C (with sales charge) | 13.79 | 7.14 |
Bloomberg Global Aggregate Index | -1.69 | -4.44 |
MSCI All Country World Index-NR | 17.49 | 8.88 |
Blended Benchmark† | 16.49 | 8.21 |
Bloomberg Multiverse Index | -1.34 | -4.16 |
| † | The Blended Benchmark is an allocation of 95% MSCI All Country World Index-NR and 5% Bloomberg Multiverse Index. |
Reflects waiver of fees and/or reimbursement of expenses (including acquired fund fees and expenses), without which expenses would be higher.
For current month-end performance, please call Franklin Templeton at (800) DIAL BEN/342-5236 or visit https://www.franklintempleton.com/investments/options/mutual-funds.
Important data provider notices and terms available at www.franklintempletondatasources.com.
KEY FUND STATISTICS (as of December 31, 2024)
| |
Total Net Assets | $8,071,534 |
Total Number of Portfolio Holdings* | 16 |
Total Management Fee Paid | $0 |
Portfolio Turnover Rate | 27.48% |
| * | Does not include derivatives, except purchased options, if any. |
| Franklin LifeSmart 2060 Retirement Target Fund | PAGE 2 | 2899-ATSR-0225 |
WHAT DID THE FUND INVEST IN? (as of December 31, 2024)
Portfolio Composition*,† (% of Total Investments)
| * | Does not include derivatives, except purchased options, if any. |
| † | Certain categories may represent less than 0.1%. |
| |
| WHERE CAN I FIND ADDITIONAL INFORMATION ABOUT THE FUND? |
Additional information is available on https://www.franklintempleton.com/regulatory-fund-documents, including its: |
| • prospectus • proxy voting information • financial information • holdings • tax information |
HOUSEHOLDING
You will receive the Fund’s shareholder reports every six months. In addition, you will receive an annual updated summary prospectus (detail prospectus available upon request). To reduce Fund expenses, we try to identify related shareholders in a household and send only one copy of the shareholder reports and summary prospectus. This process, called “householding,” will continue indefinitely unless you instruct us otherwise. If you prefer not to have these documents householded, please call us at (800) DIAL BEN/342-5236. At any time, you may view current prospectuses/summary prospectuses and shareholder reports on our website. If you choose, you may receive these documents through electronic delivery.
| Franklin LifeSmart 2060 Retirement Target Fund | PAGE 3 | 2899-ATSR-0225 |
10000118439684114171310510000952979818437829510000118549677118251389310000117299593116431356210000954980208505839165.631.91.51.00.0
| | |
Franklin LifeSmart 2060 Retirement Target Fund | |
| Class R [FLESX] |
| Annual Shareholder Report | December 31, 2024 |
|
This annual shareholder report contains important information about Franklin LifeSmart 2060 Retirement Target Fund for the period January 1, 2024, to December 31, 2024.
You can find additional information about the Fund at https://www.franklintempleton.com/regulatory-fund-documents. You can also request this information by contacting us at (800) DIAL BEN/342-5236.
WHAT WERE THE FUND COSTS FOR THE LAST YEAR? (based on a hypothetical $10,000 investment)
| | |
Class Name | Costs of a $10,000 investment | Costs paid as a percentage of a $10,000 investment* |
Class R1 | $83 | 0.77% |
| * | Reflects waiver of fees and/or reimbursement of expenses (including acquired fund fees and expenses), without which expenses would be higher. |
| 1 | Excludes fees and expenses of the underlying funds in which the Fund invests. |
HOW DID THE FUND PERFORM LAST YEAR AND WHAT AFFECTED ITS PERFORMANCE?
For the twelve months ended December 31, 2024, Class R shares of Franklin LifeSmart 2060 Retirement Target Fund returned 15.29%. The Fund compares its performance to the MSCI All Country World Index-NR, the Blended Benchmark† and the Bloomberg Multiverse Index, which returned 17.49%, 16.49% and -1.34%, respectively, for the same period.
| |
Top contributors to performance: |
| ↑ | Fixed income underweight, reflecting our preference for equities over fixed income. |
| ↑ | Underweight and fund selection in emerging markets equity. |
| ↑ | Overweight to U.S. equity, reflecting a regional preference. |
| |
Top detractors from performance: |
| ↓ | Fund selection in equity, reflecting meaningful exposure to value stocks. |
| ↓ | Fund selection in U.S. equity. |
| ↓ | Fund selection in international equity. |
| Franklin LifeSmart 2060 Retirement Target Fund | PAGE 1 | 8899-ATSR-0225 |
HOW DID THE FUND PERFORM OVER THE LAST 10 YEARS?
The Fund’s past performance is not necessarily an indication of how the Fund will perform in the future. The graph and table do not reflect the deduction of taxes that a shareholder would pay on Fund distributions or redemption of Fund shares.
VALUE OF A $10,000 INVESTMENT – Class R 1/29/2021 — 12/31/2024
AVERAGE ANNUAL TOTAL RETURNS (%) Period Ended December 31, 2024
| | |
| | 1 Year | Since Inception
(1/29/2021) |
Class R | 15.29 | 7.51 |
Bloomberg Global Aggregate Index | -1.69 | -4.44 |
MSCI All Country World Index-NR | 17.49 | 8.88 |
Blended Benchmark† | 16.49 | 8.21 |
Bloomberg Multiverse Index | -1.34 | -4.16 |
| † | The Blended Benchmark is an allocation of 95% MSCI All Country World Index-NR and 5% Bloomberg Multiverse Index. |
Reflects waiver of fees and/or reimbursement of expenses (including acquired fund fees and expenses), without which expenses would be higher.
For current month-end performance, please call Franklin Templeton at (800) DIAL BEN/342-5236 or visit https://www.franklintempleton.com/investments/options/mutual-funds.
Important data provider notices and terms available at www.franklintempletondatasources.com.
KEY FUND STATISTICS (as of December 31, 2024)
| |
Total Net Assets | $8,071,534 |
Total Number of Portfolio Holdings* | 16 |
Total Management Fee Paid | $0 |
Portfolio Turnover Rate | 27.48% |
| * | Does not include derivatives, except purchased options, if any. |
| Franklin LifeSmart 2060 Retirement Target Fund | PAGE 2 | 8899-ATSR-0225 |
WHAT DID THE FUND INVEST IN? (as of December 31, 2024)
Portfolio Composition*,† (% of Total Investments)
| * | Does not include derivatives, except purchased options, if any. |
| † | Certain categories may represent less than 0.1%. |
| |
| WHERE CAN I FIND ADDITIONAL INFORMATION ABOUT THE FUND? |
Additional information is available on https://www.franklintempleton.com/regulatory-fund-documents, including its: |
| • prospectus • proxy voting information • financial information • holdings • tax information |
HOUSEHOLDING
You will receive the Fund’s shareholder reports every six months. In addition, you will receive an annual updated summary prospectus (detail prospectus available upon request). To reduce Fund expenses, we try to identify related shareholders in a household and send only one copy of the shareholder reports and summary prospectus. This process, called “householding,” will continue indefinitely unless you instruct us otherwise. If you prefer not to have these documents householded, please call us at (800) DIAL BEN/342-5236. At any time, you may view current prospectuses/summary prospectuses and shareholder reports on our website. If you choose, you may receive these documents through electronic delivery.
| Franklin LifeSmart 2060 Retirement Target Fund | PAGE 3 | 8899-ATSR-0225 |
10000118429721115231328510000952979818437829510000118549677118251389310000117299593116431356210000954980208505839165.631.91.51.00.0
| | |
Franklin LifeSmart 2060 Retirement Target Fund | |
| Class R6 [FLFSX] |
| Annual Shareholder Report | December 31, 2024 |
|
This annual shareholder report contains important information about Franklin LifeSmart 2060 Retirement Target Fund for the period January 1, 2024, to December 31, 2024.
You can find additional information about the Fund at https://www.franklintempleton.com/regulatory-fund-documents. You can also request this information by contacting us at (800) DIAL BEN/342-5236.
WHAT WERE THE FUND COSTS FOR THE LAST YEAR? (based on a hypothetical $10,000 investment)
| | |
Class Name | Costs of a $10,000 investment | Costs paid as a percentage of a $10,000 investment* |
Class R61 | $24 | 0.22% |
| * | Reflects waiver of fees and/or reimbursement of expenses (including acquired fund fees and expenses), without which expenses would be higher. |
| 1 | Excludes fees and expenses of the underlying funds in which the Fund invests. |
HOW DID THE FUND PERFORM LAST YEAR AND WHAT AFFECTED ITS PERFORMANCE?
For the twelve months ended December 31, 2024, Class R6 shares of Franklin LifeSmart 2060 Retirement Target Fund returned 16.08%. The Fund compares its performance to the MSCI All Country World Index-NR, the Blended Benchmark† and the Bloomberg Multiverse Index, which returned 17.49%, 16.49% and -1.34%, respectively, for the same period.
| |
Top contributors to performance: |
| ↑ | Fixed income underweight, reflecting our preference for equities over fixed income. |
| ↑ | Underweight and fund selection in emerging markets equity. |
| ↑ | Overweight to U.S. equity, reflecting a regional preference. |
| |
Top detractors from performance: |
| ↓ | Fund selection in equity, reflecting meaningful exposure to value stocks. |
| ↓ | Fund selection in U.S. equity. |
| ↓ | Fund selection in international equity. |
| Franklin LifeSmart 2060 Retirement Target Fund | PAGE 1 | 3899-ATSR-0225 |
HOW DID THE FUND PERFORM OVER THE LAST 10 YEARS?
The Fund’s past performance is not necessarily an indication of how the Fund will perform in the future. The graph and table do not reflect the deduction of taxes that a shareholder would pay on Fund distributions or redemption of Fund shares.
VALUE OF A $10,000 INVESTMENT – Class R6 1/29/2021 — 12/31/2024
AVERAGE ANNUAL TOTAL RETURNS (%) Period Ended December 31, 2024
| | |
| | 1 Year | Since Inception
(1/29/2021) |
Class R6 | 16.08 | 8.01 |
Bloomberg Global Aggregate Index | -1.69 | -4.44 |
MSCI All Country World Index-NR | 17.49 | 8.88 |
Blended Benchmark† | 16.49 | 8.21 |
Bloomberg Multiverse Index | -1.34 | -4.16 |
| † | The Blended Benchmark is an allocation of 95% MSCI All Country World Index-NR and 5% Bloomberg Multiverse Index. |
Reflects waiver of fees and/or reimbursement of expenses (including acquired fund fees and expenses), without which expenses would be higher.
For current month-end performance, please call Franklin Templeton at (800) DIAL BEN/342-5236 or visit https://www.franklintempleton.com/investments/options/mutual-funds.
Important data provider notices and terms available at www.franklintempletondatasources.com.
KEY FUND STATISTICS (as of December 31, 2024)
| |
Total Net Assets | $8,071,534 |
Total Number of Portfolio Holdings* | 16 |
Total Management Fee Paid | $0 |
Portfolio Turnover Rate | 27.48% |
| * | Does not include derivatives, except purchased options, if any. |
| Franklin LifeSmart 2060 Retirement Target Fund | PAGE 2 | 3899-ATSR-0225 |
WHAT DID THE FUND INVEST IN? (as of December 31, 2024)
Portfolio Composition*,† (% of Total Investments)
| * | Does not include derivatives, except purchased options, if any. |
| † | Certain categories may represent less than 0.1%. |
| |
| WHERE CAN I FIND ADDITIONAL INFORMATION ABOUT THE FUND? |
Additional information is available on https://www.franklintempleton.com/regulatory-fund-documents, including its: |
| • prospectus • proxy voting information • financial information • holdings • tax information |
HOUSEHOLDING
You will receive the Fund’s shareholder reports every six months. In addition, you will receive an annual updated summary prospectus (detail prospectus available upon request). To reduce Fund expenses, we try to identify related shareholders in a household and send only one copy of the shareholder reports and summary prospectus. This process, called “householding,” will continue indefinitely unless you instruct us otherwise. If you prefer not to have these documents householded, please call us at (800) DIAL BEN/342-5236. At any time, you may view current prospectuses/summary prospectuses and shareholder reports on our website. If you choose, you may receive these documents through electronic delivery.
| Franklin LifeSmart 2060 Retirement Target Fund | PAGE 3 | 3899-ATSR-0225 |
10000118569788116551352910000952979818437829510000118549677118251389310000117299593116431356210000954980208505839165.631.91.51.00.0
| | |
Franklin LifeSmart 2060 Retirement Target Fund | |
| Advisor Class [FLJSX] |
| Annual Shareholder Report | December 31, 2024 |
|
This annual shareholder report contains important information about Franklin LifeSmart 2060 Retirement Target Fund for the period January 1, 2024, to December 31, 2024.
You can find additional information about the Fund at https://www.franklintempleton.com/regulatory-fund-documents. You can also request this information by contacting us at (800) DIAL BEN/342-5236.
WHAT WERE THE FUND COSTS FOR THE LAST YEAR? (based on a hypothetical $10,000 investment)
| | |
Class Name | Costs of a $10,000 investment | Costs paid as a percentage of a $10,000 investment* |
Advisor Class1 | $29 | 0.27% |
| * | Reflects waiver of fees and/or reimbursement of expenses (including acquired fund fees and expenses), without which expenses would be higher. |
| 1 | Excludes fees and expenses of the underlying funds in which the Fund invests. |
HOW DID THE FUND PERFORM LAST YEAR AND WHAT AFFECTED ITS PERFORMANCE?
For the twelve months ended December 31, 2024, Advisor Class shares of Franklin LifeSmart 2060 Retirement Target Fund returned 15.96%. The Fund compares its performance to the MSCI All Country World Index-NR, the Blended Benchmark† and the Bloomberg Multiverse Index, which returned 17.49%, 16.49% and -1.34%, respectively, for the same period.
| |
Top contributors to performance: |
| ↑ | Fixed income underweight, reflecting our preference for equities over fixed income. |
| ↑ | Underweight and fund selection in emerging markets equity. |
| ↑ | Overweight to U.S. equity, reflecting a regional preference. |
| |
Top detractors from performance: |
| ↓ | Fund selection in equity, reflecting meaningful exposure to value stocks. |
| ↓ | Fund selection in U.S. equity. |
| ↓ | Fund selection in international equity. |
| Franklin LifeSmart 2060 Retirement Target Fund | PAGE 1 | 6899-ATSR-0225 |
HOW DID THE FUND PERFORM OVER THE LAST 10 YEARS?
The Fund’s past performance is not necessarily an indication of how the Fund will perform in the future. The graph and table do not reflect the deduction of taxes that a shareholder would pay on Fund distributions or redemption of Fund shares.
VALUE OF A $10,000 INVESTMENT – Advisor Class 1/29/2021 — 12/31/2024
AVERAGE ANNUAL TOTAL RETURNS (%) Period Ended December 31, 2024
| | |
| | 1 Year | Since Inception
(1/29/2021) |
Advisor Class | 15.96 | 7.90 |
Bloomberg Global Aggregate Index | -1.69 | -4.44 |
MSCI All Country World Index-NR | 17.49 | 8.88 |
Blended Benchmark† | 16.49 | 8.21 |
Bloomberg Multiverse Index | -1.34 | -4.16 |
| † | The Blended Benchmark is an allocation of 95% MSCI All Country World Index-NR and 5% Bloomberg Multiverse Index. |
Reflects waiver of fees and/or reimbursement of expenses (including acquired fund fees and expenses), without which expenses would be higher.
For current month-end performance, please call Franklin Templeton at (800) DIAL BEN/342-5236 or visit https://www.franklintempleton.com/investments/options/mutual-funds.
Important data provider notices and terms available at www.franklintempletondatasources.com.
KEY FUND STATISTICS (as of December 31, 2024)
| |
Total Net Assets | $8,071,534 |
Total Number of Portfolio Holdings* | 16 |
Total Management Fee Paid | $0 |
Portfolio Turnover Rate | 27.48% |
| * | Does not include derivatives, except purchased options, if any. |
| Franklin LifeSmart 2060 Retirement Target Fund | PAGE 2 | 6899-ATSR-0225 |
WHAT DID THE FUND INVEST IN? (as of December 31, 2024)
Portfolio Composition*,† (% of Total Investments)
| * | Does not include derivatives, except purchased options, if any. |
| † | Certain categories may represent less than 0.1%. |
| |
| WHERE CAN I FIND ADDITIONAL INFORMATION ABOUT THE FUND? |
Additional information is available on https://www.franklintempleton.com/regulatory-fund-documents, including its: |
| • prospectus • proxy voting information • financial information • holdings • tax information |
HOUSEHOLDING
You will receive the Fund’s shareholder reports every six months. In addition, you will receive an annual updated summary prospectus (detail prospectus available upon request). To reduce Fund expenses, we try to identify related shareholders in a household and send only one copy of the shareholder reports and summary prospectus. This process, called “householding,” will continue indefinitely unless you instruct us otherwise. If you prefer not to have these documents householded, please call us at (800) DIAL BEN/342-5236. At any time, you may view current prospectuses/summary prospectuses and shareholder reports on our website. If you choose, you may receive these documents through electronic delivery.
| Franklin LifeSmart 2060 Retirement Target Fund | PAGE 3 | 6899-ATSR-0225 |
10000118419758116191347310000952979818437829510000118549677118251389310000117299593116431356210000954980208505839165.631.91.51.00.0
(b) Not applicable
(a) The Registrant has adopted a code of ethics that applies to its principal executive officers and principal financial and accounting officer.
(c) N/A
(d) N/A
(f) Pursuant to Item 19(a) (1), the Registrant is attaching as an exhibit a copy of its code of ethics that applies to its principal executive officers and principal financial and accounting officer.
| ITEM 3. | AUDIT COMMITTEE FINANCIAL EXPERT. |
| | |
| | The Board of Trustees of the Registrant has determined that Mary C. Choksi possesses the technical attributes identified in Instruction 2(b) of Item 3 to Form N-CSR to qualify as an “audit committee financial expert,” and has designated Mary C. Choksi as the Audit Committee’s financial expert. Mary C. Choksi is an “independent” Trustee pursuant to paragraph (a) (2) of Item 3 to Form N-CSR. |
| ITEM 4. | PRINCIPAL ACCOUNTANT FEES AND SERVICES. |
(a) Audit Fees. The aggregate fees billed in the last two fiscal years ending December 31, 2023 and December 31, 2024 (the “Reporting Periods”) for professional services rendered by the Registrant’s principal accountant (the “Auditor”) for the audit of the Registrant’s annual financial statements, or services that are normally provided by the Auditor in connection with the statutory and regulatory filings or engagements for the Reporting Periods, were $290,999 in December 31, 2023 and $301,793 in December 31, 2024.
(b) Audit-Related Fees. The aggregate fees billed in the Reporting Periods for assurance and related services by the Auditor that are reasonably related to the performance of the Registrant’s financial statements were $0 in December 31, 2023 and $0 in December 31, 2024.
(c) Tax Fees. The aggregate fees billed in the Reporting Periods for professional services rendered by the Auditor for tax compliance, tax advice and tax planning (“Tax Services”) were $0 in December 31, 2023 and $146,250 in December 31, 2024. These services consisted of (i) review or preparation of U.S. federal, state, local and excise tax returns; (ii) U.S. federal, state and local tax planning, advice and assistance regarding statutory, regulatory or administrative developments, and (iii) tax advice regarding tax qualification matters and/or treatment of various financial instruments held or proposed to be acquired or held.
There were no fees billed for tax services by the Auditor to the Registrant’s investment adviser and any entity controlling, controlled by, or under common control with the investment adviser that provides ongoing services to the Registrant (“Service Affiliates”) during the Reporting Periods that required pre-approval by the Audit Committee.
(d) All Other Fees. The aggregate fees billed in the Reporting Periods for products and services provided by the Auditor to the Registrant, other than the services reported in paragraphs (a) through (c) of this item, were $0 in December 31, 2023 and $0 in December 31, 2024.
There were no other non-audit services rendered by the Auditor to the Service Affiliates requiring pre-approval by the Audit Committee in the Reporting Periods.
(e) Audit Committee’s pre-approval policies and procedures described in paragraph (c) (7) of Rule 2-01 of Regulation S-X.
(1) The Registrant’s Audit Committee is directly responsible for approving the services to be provided by the Auditors, including:
(i) pre-approval of all audit and audit related services;
(ii) pre-approval of all non-audit related services to be provided to the Registrant by the Auditors;
(iii) pre-approval of all non-audit related services to be provided by the Auditors to the Registrant and the Service Affiliates where the non-audit services relate directly to the operations or financial reporting of the Registrant; and
(iv) establishment by the Audit Committee, if deemed necessary or appropriate, as an alternative to committee pre-approval of services to be provided by the Auditors, as required by paragraphs (ii) and (iii) above, of policies and procedures to permit such services to be pre-approved by other means, such as through establishment of guidelines or by action of a designated member or members of the committee; provided the policies and procedures are detailed as to the particular service and the committee is informed of each service and such policies and procedures do not include delegation of Audit Committee responsibilities, as contemplated under the Securities Exchange Act of 1934, to management; subject, in the case of (ii) through (iv), to any waivers, exceptions or exemptions that may be available under applicable law or rules.
(2) None of the services described in paragraphs (b) through (d) of this Item were performed in reliance on paragraph (c)(7)(i)(C) of Rule 2-01 of Regulation S-X.
(f) Not applicable.
(g) Non-audit fees billed by the Auditor for services rendered to the Registrant and the Service Affiliates during the Reporting Periods were $233,926 in December 31, 2023 and $489,326 in December 31, 2024.
(h) Yes. The Registrant’s audit committee has considered whether the provision of non-audit services that were rendered to Service Affiliates, which were not pre-approved (not requiring pre-approval), is compatible with maintaining the Auditor’s independence. All services provided by the Auditor to the Registrant or to the Service Affiliates, which were required to be pre-approved, were pre-approved as required.
(i) Not applicable.
(j) Not applicable.
| ITEM 5. | AUDIT COMMITTEE OF LISTED REGISTRANTS. |
| ITEM 6. | SCHEDULE OF INVESTMENTS. |
| (a) | Please see schedule of investments contained in the Financial Statements and Financial Highlights included under Item 7 of this Form N-CSR. |
| ITEM 7. | FINANCIAL STATEMENTS AND FINANCIAL HIGLIGHTS FOR OPEN-END MANAGEMENT INVESTMENT COMPANIES. |
Franklin
Fund
Allocator
Series
Financial
Statements
and
Other
Important
Information
Annual
|December
31,
2024
Franklin
Conservative
Allocation
Fund
Franklin
Moderate
Allocation
Fund
Franklin
Growth
Allocation
Fund
Financial
Statements
and
Other
Important
Information—Annual
Financial
Highlights
and
Schedules
of
Investments
2
Financial
Statements
23
Notes
to
Financial
Statements
28
Report
of
Independent
Registered
Public
Accounting
Firm
42
Tax
Information
43
Changes
In
and
Disagreements
with
Accountants
44
Results
of
Meeting(s)
of
Shareholders
44
Remuneration
Paid
to
Directors,
Officers
and
Others
44
Board
Approval
of
Management
and
Subadvisory
Agreements
44
Franklin
Fund
Allocator
Series
Financial
Highlights
Franklin
Conservative
Allocation
Fund
Annual
Report
The
accompanying
notes
are
an
integral
part
of
these
financial
statements.
a
Year
Ended
December
31,
2024
2023
2022
2021
2020
Class
A
Per
share
operating
performance
(for
a
share
outstanding
throughout
the
year)
Net
asset
value,
beginning
of
year
...................
$13.22
$12.17
$14.89
$14.95
$14.08
Income
from
investment
operations
a
:
Net
investment
income
b,c
........................
0.33
0.29
0.27
0.23
0.22
Net
realized
and
unrealized
gains
(losses)
...........
0.73
1.08
(2.53)
0.99
1.05
Total
from
investment
operations
....................
1.06
1.37
(2.26)
1.22
1.27
Less
distributions
from:
Net
investment
income
..........................
(0.35)
(0.32)
(0.22)
(0.35)
(0.23)
Net
realized
gains
.............................
—
—
(0.24)
(0.93)
(0.17)
Total
distributions
...............................
(0.35)
(0.32)
(0.46)
(1.28)
(0.40)
Net
asset
value,
end
of
year
.......................
$13.93
$13.22
$12.17
$14.89
$14.95
Total
return
d
...................................
8.06%
11.37%
(15.22)%
8.18%
9.30%
Ratios
to
average
net
assets
Expenses
e
,f
....................................
0.61%
0.61%
g
0.63%
g
0.62%
0.63%
g
Net
investment
income
c
...........................
2.39%
2.27%
2.08%
1.47%
1.54%
Supplemental
data
Net
assets,
end
of
year
(000’s)
.....................
$731,888
$768,040
$796,888
$1,081,071
$941,777
Portfolio
turnover
rate
............................
40.01%
19.49%
37.16%
61.92%
48.36%
a
The
amount
shown
for
a
share
outstanding
throughout
the
period
may
not
correlate
with
the
Statement
of
Operations
for
the
period
due
to
the
timing
of
sales
and
repurchases
of
the
Fund’s
shares
in
relation
to
income
earned
and/or
fluctuating
fair
value
of
the
investments
of
the
Fund.
b
Based
on
average
daily
shares
outstanding.
c
Recognition
of
net
investment
income
by
the
Fund
is
affected
by
the
timing
of
declaration
of
dividends
by
the
Underlying
Funds
and
exchange
traded
funds
in
which
the
Fund
invests.
d
Total
return
does
not
reflect
sales
commissions
or
contingent
deferred
sales
charges,
if
applicable.
e
Benefit
of
waiver
and
payments
by
affiliates
rounds
to
less
than
0.01%.
f
Does
not
include
expenses
of
the
Underlying
Funds
and
exchange
traded
funds
in
which
the
Fund
invests.
The
weighted
average
indirect
expenses
of
the
Underlying
Funds
and
exchange
traded
funds
was
0.22%
for
the
year
ended
December
31,
2024.
g
Benefit
of
expense
reduction
rounds
to
less
than
0.01%.
Franklin
Fund
Allocator
Series
Financial
Highlights
Franklin
Conservative
Allocation
Fund
(continued)
The
accompanying
notes
are
an
integral
part
of
these
financial
statements.
Annual
Report
a
Year
Ended
December
31,
2024
2023
2022
2021
2020
Class
C
Per
share
operating
performance
(for
a
share
outstanding
throughout
the
year)
Net
asset
value,
beginning
of
year
...................
$12.90
$11.87
$14.54
$14.62
$13.77
Income
from
investment
operations
a
:
Net
investment
income
b,c
........................
0.21
0.18
0.16
0.09
0.10
Net
realized
and
unrealized
gains
(losses)
...........
0.73
1.07
(2.47)
0.99
1.05
Total
from
investment
operations
....................
0.94
1.25
(2.31)
1.08
1.15
Less
distributions
from:
Net
investment
income
..........................
(0.25)
(0.22)
(0.12)
(0.23)
(0.13)
Net
realized
gains
.............................
—
—
(0.24)
(0.93)
(0.17)
Total
distributions
...............................
(0.25)
(0.22)
(0.36)
(1.16)
(0.30)
Net
asset
value,
end
of
year
.......................
$13.59
$12.90
$11.87
$14.54
$14.62
Total
return
d
...................................
7.28%
10.62%
(15.90)%
7.40%
8.51%
Ratios
to
average
net
assets
Expenses
before
waiver
and
payments
by
affiliates
f
......
1.37%
1.37%
1.38%
1.37%
1.38%
Expenses
net
of
waiver
and
payments
by
affiliates
f
......
1.36%
1.36%
g
1.38%
e,g
1.37%
e
1.38%
e
Net
investment
income
c
...........................
1.60%
1.45%
1.24%
0.61%
0.76%
Supplemental
data
Net
assets,
end
of
year
(000’s)
.....................
$51,585
$63,436
$89,012
$152,244
$212,656
Portfolio
turnover
rate
............................
40.01%
19.49%
37.16%
61.92%
48.36%
a
The
amount
shown
for
a
share
outstanding
throughout
the
period
may
not
correlate
with
the
Statement
of
Operations
for
the
period
due
to
the
timing
of
sales
and
repurchases
of
the
Fund’s
shares
in
relation
to
income
earned
and/or
fluctuating
fair
value
of
the
investments
of
the
Fund.
b
Based
on
average
daily
shares
outstanding.
c
Recognition
of
net
investment
income
by
the
Fund
is
affected
by
the
timing
of
declaration
of
dividends
by
the
Underlying
Funds
and
exchange
traded
funds
in
which
the
Fund
invests.
d
Total
return
does
not
reflect
sales
commissions
or
contingent
deferred
sales
charges,
if
applicable.
e
Benefit
of
waiver
and
payments
by
affiliates
rounds
to
less
than
0.01%.
f
Does
not
include
expenses
of
the
Underlying
Funds
and
exchange
traded
funds
in
which
the
Fund
invests.
The
weighted
average
indirect
expenses
of
the
Underlying
Funds
and
exchange
traded
funds
was
0.22%
for
the
year
ended
December
31,
2024.
g
Benefit
of
expense
reduction
rounds
to
less
than
0.01%.
Franklin
Fund
Allocator
Series
Financial
Highlights
Franklin
Conservative
Allocation
Fund
(continued)
Annual
Report
The
accompanying
notes
are
an
integral
part
of
these
financial
statements.
a
Year
Ended
December
31,
2024
2023
2022
2021
2020
Class
R
Per
share
operating
performance
(for
a
share
outstanding
throughout
the
year)
Net
asset
value,
beginning
of
year
...................
$13.16
$12.11
$14.83
$14.88
$14.02
Income
from
investment
operations
a
:
Net
investment
income
b,c
........................
0.29
0.25
0.24
0.18
0.18
Net
realized
and
unrealized
gains
(losses)
...........
0.73
1.09
(2.53)
1.01
1.05
Total
from
investment
operations
....................
1.02
1.34
(2.29)
1.19
1.23
Less
distributions
from:
Net
investment
income
..........................
(0.32)
(0.29)
(0.19)
(0.31)
(0.20)
Net
realized
gains
.............................
—
—
(0.24)
(0.93)
(0.17)
Total
distributions
...............................
(0.32)
(0.29)
(0.43)
(1.24)
(0.37)
Net
asset
value,
end
of
year
.......................
$13.86
$13.16
$12.11
$14.83
$14.88
Total
return
....................................
7.75%
11.15%
(15.48)%
7.99%
8.98%
Ratios
to
average
net
assets
Expenses
d,e
....................................
0.86%
0.86%
f
0.88%
f
0.87%
0.88%
Net
investment
income
c
...........................
2.14%
2.01%
1.87%
1.14%
1.28%
Supplemental
data
Net
assets,
end
of
year
(000’s)
.....................
$39,818
$41,582
$45,036
$55,629
$66,208
Portfolio
turnover
rate
............................
40.01%
19.49%
37.16%
61.92%
48.36%
a
The
amount
shown
for
a
share
outstanding
throughout
the
period
may
not
correlate
with
the
Statement
of
Operations
for
the
period
due
to
the
timing
of
sales
and
repurchases
of
the
Fund’s
shares
in
relation
to
income
earned
and/or
fluctuating
fair
value
of
the
investments
of
the
Fund.
b
Based
on
average
daily
shares
outstanding.
c
Recognition
of
net
investment
income
by
the
Fund
is
affected
by
the
timing
of
declaration
of
dividends
by
the
Underlying
Funds
and
exchange
traded
funds
in
which
the
Fund
invests.
d
Benefit
of
waiver
and
payments
by
affiliates
rounds
to
less
than
0.01%.
e
Does
not
include
expenses
of
the
Underlying
Funds
and
exchange
traded
funds
in
which
the
Fund
invests.
The
weighted
average
indirect
expenses
of
the
Underlying
Funds
and
exchange
traded
funds
was
0.22%
for
the
year
ended
December
31,
2024.
f
Benefit
of
expense
reduction
rounds
to
less
than
0.01%.
Franklin
Fund
Allocator
Series
Financial
Highlights
Franklin
Conservative
Allocation
Fund
(continued)
The
accompanying
notes
are
an
integral
part
of
these
financial
statements.
Annual
Report
0
a
Year
Ended
December
31,
2024
2023
2022
2021
2020
Class
R6
Per
share
operating
performance
(for
a
share
outstanding
throughout
the
year)
Net
asset
value,
beginning
of
year
...................
$13.20
$12.14
$14.87
$14.92
$14.06
Income
from
investment
operations
a
:
Net
investment
income
b,c
........................
0.38
0.35
0.32
0.28
0.26
Net
realized
and
unrealized
gains
(losses)
...........
0.72
1.07
(2.55)
1.00
1.05
Total
from
investment
operations
....................
1.10
1.42
(2.23)
1.28
1.31
Less
distributions
from:
Net
investment
income
..........................
(0.39)
(0.36)
(0.26)
(0.40)
(0.28)
Net
realized
gains
.............................
—
—
(0.24)
(0.93)
(0.17)
Total
distributions
...............................
(0.39)
(0.36)
(0.50)
(1.33)
(0.45)
Net
asset
value,
end
of
year
.......................
$13.91
$13.20
$12.14
$14.87
$14.92
Total
return
....................................
8.40%
11.83%
(15.01)%
8.60%
9.61%
Ratios
to
average
net
assets
Expenses
before
waiver
and
payments
by
affiliates
d
.....
0.36%
0.38%
0.40%
0.39%
0.40%
Expenses
net
of
waiver
and
payments
by
affiliates
d
......
0.31%
0.30%
e
0.29%
e
0.30%
0.30%
Net
investment
income
c
...........................
2.76%
2.78%
2.45%
1.78%
1.86%
Supplemental
data
Net
assets,
end
of
year
(000’s)
.....................
$6,688
$5,147
$2,274
$2,852
$2,537
Portfolio
turnover
rate
............................
40.01%
19.49%
37.16%
61.92%
48.36%
a
The
amount
shown
for
a
share
outstanding
throughout
the
period
may
not
correlate
with
the
Statement
of
Operations
for
the
period
due
to
the
timing
of
sales
and
repurchases
of
the
Fund’s
shares
in
relation
to
income
earned
and/or
fluctuating
fair
value
of
the
investments
of
the
Fund.
b
Based
on
average
daily
shares
outstanding.
c
Recognition
of
net
investment
income
by
the
Fund
is
affected
by
the
timing
of
declaration
of
dividends
by
the
Underlying
Funds
and
exchange
traded
funds
in
which
the
Fund
invests.
d
Does
not
include
expenses
of
the
Underlying
Funds
and
exchange
traded
funds
in
which
the
Fund
invests.
The
weighted
average
indirect
expenses
of
the
Underlying
Funds
and
exchange
traded
funds
was
0.22%
for
the
year
ended
December
31,
2024.
e
Benefit
of
expense
reduction
rounds
to
less
than
0.01%.
Franklin
Fund
Allocator
Series
Financial
Highlights
Franklin
Conservative
Allocation
Fund
(continued)
Annual
Report
The
accompanying
notes
are
an
integral
part
of
these
financial
statements.
a
Year
Ended
December
31,
2024
2023
2022
2021
2020
Advisor
Class
Per
share
operating
performance
(for
a
share
outstanding
throughout
the
year)
Net
asset
value,
beginning
of
year
...................
$13.22
$12.16
$14.89
$14.95
$14.08
Income
from
investment
operations
a
:
Net
investment
income
b,c
........................
0.36
0.32
0.29
0.27
0.25
Net
realized
and
unrealized
gains
(losses)
...........
0.74
1.09
(2.53)
0.99
1.06
Total
from
investment
operations
....................
1.10
1.41
(2.24)
1.26
1.31
Less
distributions
from:
Net
investment
income
..........................
(0.39)
(0.35)
(0.25)
(0.39)
(0.27)
Net
realized
gains
.............................
—
—
(0.24)
(0.93)
(0.17)
Total
distributions
...............................
(0.39)
(0.35)
(0.49)
(1.32)
(0.44)
Net
asset
value,
end
of
year
.......................
$13.93
$13.22
$12.16
$14.89
$14.95
Total
return
....................................
8.33%
11.75%
(15.07)%
8.45%
9.58%
Ratios
to
average
net
assets
Expenses
d,e
....................................
0.36%
0.36%
f
0.38%
f
0.37%
0.38%
Net
investment
income
c
...........................
2.63%
2.51%
2.20%
1.72%
1.79%
Supplemental
data
Net
assets,
end
of
year
(000’s)
.....................
$25,754
$27,713
$30,231
$54,537
$48,041
Portfolio
turnover
rate
............................
40.01%
19.49%
37.16%
61.92%
48.36%
a
The
amount
shown
for
a
share
outstanding
throughout
the
period
may
not
correlate
with
the
Statement
of
Operations
for
the
period
due
to
the
timing
of
sales
and
repurchases
of
the
Fund’s
shares
in
relation
to
income
earned
and/or
fluctuating
fair
value
of
the
investments
of
the
Fund.
b
Based
on
average
daily
shares
outstanding.
c
Recognition
of
net
investment
income
by
the
Fund
is
affected
by
the
timing
of
declaration
of
dividends
by
the
Underlying
Funds
and
exchange
traded
funds
in
which
the
Fund
invests.
d
Benefit
of
waiver
and
payments
by
affiliates
rounds
to
less
than
0.01%.
e
Does
not
include
expenses
of
the
Underlying
Funds
and
exchange
traded
funds
in
which
the
Fund
invests.
The
weighted
average
indirect
expenses
of
the
Underlying
Funds
and
exchange
traded
funds
was
0.22%
for
the
year
ended
December
31,
2024.
f
Benefit
of
expense
reduction
rounds
to
less
than
0.01%.
Franklin
Fund
Allocator
Series
Schedule
of
Investments,
December
31,
2024
Franklin
Conservative
Allocation
Fund
The
accompanying
notes
are
an
integral
part
of
these
financial
statements.
Annual
Report
a
a
Shares
a
Value
a
Investments
In
Underlying
Funds
and
Exchange
Traded
Funds
99.4%
Alternative
Strategies
1.0%
a
Franklin
Systematic
Style
Premia
ETF
....................................
369,701
$
8,839,551
Domestic
Equity
33.2%
a
Franklin
Growth
Fund
,
Class
R6
........................................
453,225
61,035,865
a
Franklin
U.S.
Core
Equity
(IU)
Fund
.....................................
7,981,168
137,754,964
a
Franklin
U.S.
Equity
Index
ETF
.........................................
272,473
13,989,990
a
Franklin
U.S.
Large
Cap
Multifactor
Index
ETF
.............................
546,602
32,052,741
iShares
MSCI
USA
Quality
Factor
ETF
...................................
23,858
4,248,633
a
Putnam
Large
Cap
Value
Fund
,
Class
R6
.................................
1,026,177
35,392,831
284,475,024
Domestic
Fixed
Income
45.8%
a
Franklin
Investment
Grade
Corporate
ETF
.................................
4,483,074
94,539,513
a
Franklin
U.S.
Core
Bond
ETF
..........................................
9,379,493
197,813,507
a
Franklin
U.S.
Treasury
Bond
ETF
.......................................
4,934,948
99,291,154
391,644,174
Foreign
Equity
9.5%
a
ClearBridge
International
Growth
Fund
,
Class
IS
............................
90,816
5,870,363
a
Franklin
Emerging
Market
Core
Equity
(IU)
Fund
............................
1,281,325
12,979,823
a
Franklin
International
Core
Equity
(IU)
Fund
...............................
3,317,288
38,812,275
iShares
Core
MSCI
EAFE
ETF
.........................................
81,904
5,756,213
a
Templeton
Developing
Markets
Trust
,
Class
R6
.............................
451,590
8,390,538
a
Templeton
Foreign
Fund
,
Class
R6
......................................
1,197,320
8,943,982
80,753,194
Foreign
Fixed
Income
9.9%
a
BrandywineGLOBAL
-
Global
Opportunities
Bond
Fund
,
Class
IS
...............
3,979,625
32,632,925
a
Franklin
High
Yield
Corporate
ETF
......................................
1,584,481
37,821,562
a
Franklin
International
Aggregate
Bond
ETF
................................
698,446
14,164,485
84,618,972
Total
Investments
In
Underlying
Funds
and
Exchange
Traded
Funds
(Cost
$
761,677,670
)
...............................................................
850,330,915
a
a
a
a
Short
Term
Investments
0.7%
a
Money
Market
Funds
0.0%
†
a,b
Institutional
Fiduciary
Trust
-
Money
Market
Portfolio
,
4.183
%
..................
73,842
73,842
Total
Money
Market
Funds
(Cost
$
73,842
)
......................................
73,842
Franklin
Fund
Allocator
Series
Schedule
of
Investments
Franklin
Conservative
Allocation
Fund
(continued)
Annual
Report
The
accompanying
notes
are
an
integral
part
of
these
financial
statements.
s
Short
Term
Investments
(continued)
a
a
Principal
Amount
a
Value
Repurchase
Agreements
0.7%
c
Joint
Repurchase
Agreement
,
4.41
%
,
1/02/25
(Maturity
Value
$
6,234,375
)
BNP
Paribas
Securities
Corp.
(Maturity
Value
$3,037,200)
Deutsche
Bank
Securities,
Inc.
(Maturity
Value
$1,982,282)
HSBC
Securities
(USA),
Inc.
(Maturity
Value
$1,214,893)
Collateralized
by
U.S.
Government
Agency
Securities,
1.78%
-
6%,
6/18/35
-
10/20/54;
U.S.
Government
Agency
Strips,
11/15/53;
U.S.
Treasury
Notes,
3.75%,
12/31/28;
and
U.S.
Treasury
Notes,
Index
Linked,
0.38%,
7/15/25
(valued
at
$
6,358,062
)
......................................................
$
6,232,848
$
6,232,848
Total
Repurchase
Agreements
(Cost
$
6,232,848
)
................................
6,232,848
Total
Short
Term
Investments
(Cost
$
6,306,690
)
.................................
6,306,690
a
Total
Investments
(Cost
$
767,984,360
)
100.1
%
..................................
$856,637,605
Other
Assets,
less
Liabilities
(
0.1
)
%
...........................................
(904,514)
Net
Assets
100.0%
...........................................................
$855,733,091
See
Abbreviations
on
page
41
.
†
Rounds
to
less
than
0.1%
of
net
assets.
a
See
Note
3(f)
regarding
investments
in
FT
Underlying
Funds.
b
The
rate
shown
is
the
annualized
seven-day
effective
yield
at
period
end.
c
See
Note
1(b)
regarding
joint
repurchase
agreement.
Franklin
Fund
Allocator
Series
Financial
Highlights
Franklin
Moderate
Allocation
Fund
The
accompanying
notes
are
an
integral
part
of
these
financial
statements.
Annual
Report
a
Year
Ended
December
31,
2024
2023
2022
2021
2020
Class
A
Per
share
operating
performance
(for
a
share
outstanding
throughout
the
year)
Net
asset
value,
beginning
of
year
...................
$14.39
$12.93
$16.08
$16.17
$15.08
Income
from
investment
operations
a
:
Net
investment
income
b
,c
........................
0.29
0.27
0.22
0.22
0.19
Net
realized
and
unrealized
gains
(losses)
...........
1.40
1.56
(2.82)
1.77
1.60
Total
from
investment
operations
....................
1.69
1.83
(2.60)
1.99
1.79
Less
distributions
from:
Net
investment
income
..........................
(0.35)
(0.28)
(0.17)
(0.41)
(0.22)
Net
realized
gains
.............................
—
(0.09)
(0.38)
(1.67)
(0.48)
Total
distributions
...............................
(0.35)
(0.37)
(0.55)
(2.08)
(0.70)
Net
asset
value,
end
of
year
.......................
$15.73
$14.39
$12.93
$16.08
$16.17
Total
return
d
...................................
11.80%
14.37%
(16.14)%
12.38%
12.37%
Ratios
to
average
net
assets
Expenses
before
waiver
and
payments
by
affiliates
e
.....
0.61%
0.62%
0.63%
0.63%
0.64%
Expenses
net
of
waiver
and
payments
by
affiliates
e
......
0.61%
f
0.62%
f
0.63%
f,g
0.62%
0.64%
f,g
Net
investment
income
c
...........................
1.90%
2.02%
1.59%
1.29%
1.29%
Supplemental
data
Net
assets,
end
of
year
(000’s)
.....................
$1,434,337
$1,398,350
$1,349,466
$1,794,149
$1,573,566
Portfolio
turnover
rate
............................
37.85%
22.15%
33.29%
56.07%
44.49%
a
The
amount
shown
for
a
share
outstanding
throughout
the
period
may
not
correlate
with
the
Statement
of
Operations
for
the
period
due
to
the
timing
of
sales
and
repurchases
of
the
Fund’s
shares
in
relation
to
income
earned
and/or
fluctuating
fair
value
of
the
investments
of
the
Fund.
b
Based
on
average
daily
shares
outstanding.
c
Recognition
of
net
investment
income
by
the
Fund
is
affected
by
the
timing
of
declaration
of
dividends
by
the
Underlying
Funds
and
exchange
traded
funds
in
which
the
Fund
invests.
d
Total
return
does
not
reflect
sales
commissions
or
contingent
deferred
sales
charges,
if
applicable.
e
Does
not
include
expenses
of
the
Underlying
Funds
and
exchange
traded
funds
in
which
the
Fund
invests.
The
weighted
average
indirect
expenses
of
the
Underlying
Funds
and
exchange
traded
funds
was
0.21%
for
the
year
ended
December
31,
2024.
f
Benefit
of
waiver
and
payments
by
affiliates
rounds
to
less
than
0.01%.
g
Benefit
of
expense
reduction
rounds
to
less
than
0.01%.
Franklin
Fund
Allocator
Series
Financial
Highlights
Franklin
Moderate
Allocation
Fund
(continued)
Annual
Report
The
accompanying
notes
are
an
integral
part
of
these
financial
statements.
a
Year
Ended
December
31,
2024
2023
2022
2021
2020
Class
C
Per
share
operating
performance
(for
a
share
outstanding
throughout
the
year)
Net
asset
value,
beginning
of
year
...................
$13.81
$12.41
$15.49
$15.64
$14.60
Income
from
investment
operations
a
:
Net
investment
income
b
,c
........................
0.17
0.16
0.11
0.07
0.07
Net
realized
and
unrealized
gains
(losses)
...........
1.34
1.51
(2.72)
1.73
1.56
Total
from
investment
operations
....................
1.51
1.67
(2.61)
1.80
1.63
Less
distributions
from:
Net
investment
income
..........................
(0.24)
(0.18)
(0.09)
(0.28)
(0.11)
Net
realized
gains
.............................
—
(0.09)
(0.38)
(1.67)
(0.48)
Total
distributions
...............................
(0.24)
(0.27)
(0.47)
(1.95)
(0.59)
Net
asset
value,
end
of
year
.......................
$15.08
$13.81
$12.41
$15.49
$15.64
Total
return
d
...................................
10.96%
13.62%
(16.85)%
11.55%
11.57%
Ratios
to
average
net
assets
Expenses
before
waiver
and
payments
by
affiliates
e
.....
1.36%
1.37%
1.38%
1.37%
1.39%
Expenses
net
of
waiver
and
payments
by
affiliates
e
......
1.36%
f
1.36%
1.38%
f,g
1.37%
f,g
1.39%
f,g
Net
investment
income
c
...........................
1.12%
1.22%
0.79%
0.43%
0.50%
Supplemental
data
Net
assets,
end
of
year
(000’s)
.....................
$99,039
$111,516
$130,268
$205,894
$289,283
Portfolio
turnover
rate
............................
37.85%
22.15%
33.29%
56.07%
44.49%
a
The
amount
shown
for
a
share
outstanding
throughout
the
period
may
not
correlate
with
the
Statement
of
Operations
for
the
period
due
to
the
timing
of
sales
and
repurchases
of
the
Fund’s
shares
in
relation
to
income
earned
and/or
fluctuating
fair
value
of
the
investments
of
the
Fund.
b
Based
on
average
daily
shares
outstanding.
c
Recognition
of
net
investment
income
by
the
Fund
is
affected
by
the
timing
of
declaration
of
dividends
by
the
Underlying
Funds
and
exchange
traded
funds
in
which
the
Fund
invests.
d
Total
return
does
not
reflect
sales
commissions
or
contingent
deferred
sales
charges,
if
applicable.
e
Does
not
include
expenses
of
the
Underlying
Funds
and
exchange
traded
funds
in
which
the
Fund
invests.
The
weighted
average
indirect
expenses
of
the
Underlying
Funds
and
exchange
traded
funds
was
0.21%
for
the
year
ended
December
31,
2024.
f
Benefit
of
waiver
and
payments
by
affiliates
rounds
to
less
than
0.01%.
g
Benefit
of
expense
reduction
rounds
to
less
than
0.01%.
Franklin
Fund
Allocator
Series
Financial
Highlights
Franklin
Moderate
Allocation
Fund
(continued)
The
accompanying
notes
are
an
integral
part
of
these
financial
statements.
Annual
Report
a
Year
Ended
December
31,
2024
2023
2022
2021
2020
Class
R
Per
share
operating
performance
(for
a
share
outstanding
throughout
the
year)
Net
asset
value,
beginning
of
year
...................
$14.36
$12.90
$16.05
$16.15
$15.05
Income
from
investment
operations
a
:
Net
investment
income
b,c
........................
0.25
0.24
0.19
0.17
0.15
Net
realized
and
unrealized
gains
(losses)
...........
1.40
1.56
(2.82)
1.77
1.61
Total
from
investment
operations
....................
1.65
1.80
(2.63)
1.94
1.76
Less
distributions
from:
Net
investment
income
..........................
(0.31)
(0.25)
(0.14)
(0.37)
(0.18)
Net
realized
gains
.............................
—
(0.09)
(0.38)
(1.67)
(0.48)
Total
distributions
...............................
(0.31)
(0.34)
(0.52)
(2.04)
(0.66)
Net
asset
value,
end
of
year
.......................
$15.70
$14.36
$12.90
$16.05
$16.15
Total
return
....................................
11.55%
14.12%
(16.37)%
12.05%
12.17%
Ratios
to
average
net
assets
Expenses
d,e
....................................
0.86%
0.87%
0.88%
f
0.87%
0.89%
f
Net
investment
income
c
...........................
1.64%
1.77%
1.34%
1.01%
1.01%
Supplemental
data
Net
assets,
end
of
year
(000’s)
.....................
$52,744
$52,883
$52,069
$69,211
$68,789
Portfolio
turnover
rate
............................
37.85%
22.15%
33.29%
56.07%
44.49%
a
The
amount
shown
for
a
share
outstanding
throughout
the
period
may
not
correlate
with
the
Statement
of
Operations
for
the
period
due
to
the
timing
of
sales
and
repurchases
of
the
Fund’s
shares
in
relation
to
income
earned
and/or
fluctuating
fair
value
of
the
investments
of
the
Fund.
b
Based
on
average
daily
shares
outstanding.
c
Recognition
of
net
investment
income
by
the
Fund
is
affected
by
the
timing
of
declaration
of
dividends
by
the
Underlying
Funds
and
exchange
traded
funds
in
which
the
Fund
invests.
d
Does
not
include
expenses
of
the
Underlying
Funds
and
exchange
traded
funds
in
which
the
Fund
invests.
The
weighted
average
indirect
expenses
of
the
Underlying
Funds
and
exchange
traded
funds
was
0.21%
for
the
year
ended
December
31,
2024.
e
Benefit
of
waiver
and
payments
by
affiliates
rounds
to
less
than
0.01%.
f
Benefit
of
expense
reduction
rounds
to
less
than
0.01%.
Franklin
Fund
Allocator
Series
Financial
Highlights
Franklin
Moderate
Allocation
Fund
(continued)
Annual
Report
The
accompanying
notes
are
an
integral
part
of
these
financial
statements.
a
Year
Ended
December
31,
2024
2023
2022
2021
2020
Class
R6
Per
share
operating
performance
(for
a
share
outstanding
throughout
the
year)
Net
asset
value,
beginning
of
year
...................
$14.39
$12.92
$16.08
$16.17
$15.08
Income
from
investment
operations
a
:
Net
investment
income
b,c
........................
0.34
0.34
0.27
0.27
0.24
Net
realized
and
unrealized
gains
(losses)
...........
1.40
1.55
(2.83)
1.78
1.60
Total
from
investment
operations
....................
1.74
1.89
(2.56)
2.05
1.84
Less
distributions
from:
Net
investment
income
..........................
(0.40)
(0.33)
(0.22)
(0.47)
(0.27)
Net
realized
gains
.............................
—
(0.09)
(0.38)
(1.67)
(0.48)
Total
distributions
...............................
(0.40)
(0.42)
(0.60)
(2.14)
(0.75)
Net
asset
value,
end
of
year
.......................
$15.73
$14.39
$12.92
$16.08
$16.17
Total
return
....................................
12.15%
14.82%
(15.91)%
12.74%
12.76%
Ratios
to
average
net
assets
Expenses
before
waiver
and
payments
by
affiliates
d
.....
0.31%
0.32%
0.33%
0.33%
0.33%
Expenses
net
of
waiver
and
payments
by
affiliates
d
......
0.29%
0.30%
0.28%
e
0.30%
0.30%
e
Net
investment
income
c
...........................
2.23%
2.48%
1.97%
1.60%
1.61%
Supplemental
data
Net
assets,
end
of
year
(000’s)
.....................
$13,412
$12,031
$6,065
$7,261
$6,767
Portfolio
turnover
rate
............................
37.85%
22.15%
33.29%
56.07%
44.49%
a
The
amount
shown
for
a
share
outstanding
throughout
the
period
may
not
correlate
with
the
Statement
of
Operations
for
the
period
due
to
the
timing
of
sales
and
repurchases
of
the
Fund’s
shares
in
relation
to
income
earned
and/or
fluctuating
fair
value
of
the
investments
of
the
Fund.
b
Based
on
average
daily
shares
outstanding.
c
Recognition
of
net
investment
income
by
the
Fund
is
affected
by
the
timing
of
declaration
of
dividends
by
the
Underlying
Funds
and
exchange
traded
funds
in
which
the
Fund
invests.
d
Does
not
include
expenses
of
the
Underlying
Funds
and
exchange
traded
funds
in
which
the
Fund
invests.
The
weighted
average
indirect
expenses
of
the
Underlying
Funds
and
exchange
traded
funds
was
0.21%
for
the
year
ended
December
31,
2024.
e
Benefit
of
expense
reduction
rounds
to
less
than
0.01%.
Franklin
Fund
Allocator
Series
Financial
Highlights
Franklin
Moderate
Allocation
Fund
(continued)
The
accompanying
notes
are
an
integral
part
of
these
financial
statements.
Annual
Report
a
Year
Ended
December
31,
2024
2023
2022
2021
2020
Advisor
Class
Per
share
operating
performance
(for
a
share
outstanding
throughout
the
year)
Net
asset
value,
beginning
of
year
...................
$14.41
$12.94
$16.10
$16.19
$15.09
Income
from
investment
operations
a
:
Net
investment
income
b,c
........................
0.33
0.30
0.25
0.27
0.23
Net
realized
and
unrealized
gains
(losses)
...........
1.40
1.58
(2.83)
1.76
1.61
Total
from
investment
operations
....................
1.73
1.88
(2.58)
2.03
1.84
Less
distributions
from:
Net
investment
income
..........................
(0.39)
(0.32)
(0.20)
(0.45)
(0.26)
Net
realized
gains
.............................
—
(0.09)
(0.38)
(1.67)
(0.48)
Total
distributions
...............................
(0.39)
(0.41)
(0.58)
(2.12)
(0.74)
Net
asset
value,
end
of
year
.......................
$15.75
$14.41
$12.94
$16.10
$16.19
Total
return
....................................
12.07%
14.71%
(15.97)%
12.64%
12.72%
Ratios
to
average
net
assets
Expenses
before
waiver
and
payments
by
affiliates
d
.....
0.36%
0.37%
0.38%
0.38%
0.39%
Expenses
net
of
waiver
and
payments
by
affiliates
d
......
0.36%
e
0.36%
0.38%
e,f
0.37%
0.39%
e,f
Net
investment
income
c
...........................
2.17%
2.24%
1.78%
1.55%
1.53%
Supplemental
data
Net
assets,
end
of
year
(000’s)
.....................
$47,615
$42,895
$48,288
$78,346
$66,421
Portfolio
turnover
rate
............................
37.85%
22.15%
33.29%
56.07%
44.49%
a
The
amount
shown
for
a
share
outstanding
throughout
the
period
may
not
correlate
with
the
Statement
of
Operations
for
the
period
due
to
the
timing
of
sales
and
repurchases
of
the
Fund’s
shares
in
relation
to
income
earned
and/or
fluctuating
fair
value
of
the
investments
of
the
Fund.
b
Based
on
average
daily
shares
outstanding.
c
Recognition
of
net
investment
income
by
the
Fund
is
affected
by
the
timing
of
declaration
of
dividends
by
the
Underlying
Funds
and
exchange
traded
funds
in
which
the
Fund
invests.
d
Does
not
include
expenses
of
the
Underlying
Funds
and
exchange
traded
funds
in
which
the
Fund
invests.
The
weighted
average
indirect
expenses
of
the
Underlying
Funds
and
exchange
traded
funds
was
0.21%
for
the
year
ended
December
31,
2024.
e
Benefit
of
waiver
and
payments
by
affiliates
rounds
to
less
than
0.01%.
f
Benefit
of
expense
reduction
rounds
to
less
than
0.01%.
Franklin
Fund
Allocator
Series
Schedule
of
Investments,
December
31,
2024
Franklin
Moderate
Allocation
Fund
Annual
Report
The
accompanying
notes
are
an
integral
part
of
these
financial
statements.
a
a
Shares
a
Value
a
Investments
In
Underlying
Funds
and
Exchange
Traded
Funds
99.3%
Alternative
Strategies
1.0%
a
Franklin
Systematic
Style
Premia
ETF
....................................
713,548
$
17,060,933
Domestic
Equity
48.9%
a
Franklin
Growth
Fund
,
Class
R6
........................................
1,282,702
172,741,512
a
Franklin
U.S.
Core
Equity
(IU)
Fund
.....................................
22,588,873
389,883,942
a
Franklin
U.S.
Equity
Index
ETF
.........................................
771,225
39,598,162
a
Franklin
U.S.
Large
Cap
Multifactor
Index
ETF
.............................
1,547,117
90,722,941
iShares
MSCI
USA
Quality
Factor
ETF
...................................
67,550
12,029,304
a
Putnam
Large
Cap
Value
Fund
,
Class
R6
.................................
2,904,291
100,168,991
805,144,852
Domestic
Fixed
Income
29.3%
a
Franklin
Investment
Grade
Corporate
ETF
.................................
5,511,073
116,218,058
a
Franklin
U.S.
Core
Bond
ETF
..........................................
11,530,266
243,173,310
a
Franklin
U.S.
Treasury
Bond
ETF
.......................................
6,066,597
122,059,932
481,451,300
Foreign
Equity
13.8%
a
ClearBridge
International
Growth
Fund
,
Class
IS
............................
257,005
16,612,800
a
Franklin
Emerging
Market
Core
Equity
(IU)
Fund
............................
3,627,643
36,748,019
a
Franklin
International
Core
Equity
(IU)
Fund
...............................
9,387,816
109,837,445
iShares
Core
MSCI
EAFE
ETF
.........................................
231,772
16,288,936
a
Templeton
Developing
Markets
Trust
,
Class
R6
.............................
1,278,514
23,754,799
a
Templeton
Foreign
Fund
,
Class
R6
......................................
3,388,349
25,310,968
228,552,967
Foreign
Fixed
Income
6.3%
a
BrandywineGLOBAL
-
Global
Opportunities
Bond
Fund
,
Class
IS
...............
4,892,185
40,115,920
a
Franklin
High
Yield
Corporate
ETF
......................................
1,947,820
46,494,463
a
Franklin
International
Aggregate
Bond
ETF
................................
858,638
17,413,179
104,023,562
Total
Investments
In
Underlying
Funds
and
Exchange
Traded
Funds
(Cost
$
1,328,731,479
)
..............................................................
1,636,233,614
a
a
a
a
Short
Term
Investments
0.7%
a
Money
Market
Funds
0.0%
†
a,b
Institutional
Fiduciary
Trust
-
Money
Market
Portfolio
,
4.183
%
..................
43,970
43,970
Total
Money
Market
Funds
(Cost
$
43,970
)
......................................
43,970
Franklin
Fund
Allocator
Series
Schedule
of
Investments
Franklin
Moderate
Allocation
Fund
(continued)
The
accompanying
notes
are
an
integral
part
of
these
financial
statements.
Annual
Report
Short
Term
Investments
(continued)
a
a
Principal
Amount
a
Value
Repurchase
Agreements
0.7%
c
Joint
Repurchase
Agreement
,
4.41
%
,
1/02/25
(Maturity
Value
$
12,223,502
)
BNP
Paribas
Securities
Corp.
(Maturity
Value
$5,954,923)
Deutsche
Bank
Securities,
Inc.
(Maturity
Value
$3,886,585)
HSBC
Securities
(USA),
Inc.
(Maturity
Value
$2,381,994)
Collateralized
by
U.S.
Government
Agency
Securities,
1.78%
-
6%,
6/18/35
-
10/20/54;
U.S.
Government
Agency
Strips,
11/15/53;
U.S.
Treasury
Notes,
3.75%,
12/31/28;
and
U.S.
Treasury
Notes,
Index
Linked,
0.38%,
7/15/25
(valued
at
$
12,466,009
)
.....................................................
$
12,220,508
$
12,220,508
Total
Repurchase
Agreements
(Cost
$
12,220,508
)
...............................
12,220,508
Total
Short
Term
Investments
(Cost
$
12,264,478
)
................................
12,264,478
a
Total
Investments
(Cost
$
1,340,995,957
)
100.0
%
................................
$1,648,498,092
Other
Assets,
less
Liabilities
(0.0)
%
†
...........................................
(1,351,658)
Net
Assets
100.0%
...........................................................
$1,647,146,434
See
Abbreviations
on
page
41
.
†
Rounds
to
less
than
0.1%
of
net
assets.
a
See
Note
3(f)
regarding
investments
in
FT
Underlying
Funds.
b
The
rate
shown
is
the
annualized
seven-day
effective
yield
at
period
end.
c
See
Note
1(b)
regarding
joint
repurchase
agreement.
Franklin
Fund
Allocator
Series
Financial
Highlights
Franklin
Growth
Allocation
Fund
Annual
Report
The
accompanying
notes
are
an
integral
part
of
these
financial
statements.
4
a
Year
Ended
December
31,
2024
2023
2022
2021
2020
Class
A
Per
share
operating
performance
(for
a
share
outstanding
throughout
the
year)
Net
asset
value,
beginning
of
year
...................
$17.92
$15.77
$19.99
$19.64
$18.13
Income
from
investment
operations
a
:
Net
investment
income
b,c
........................
0.27
0.28
0.20
0.23
0.19
Net
realized
and
unrealized
gains
(losses)
...........
2.43
2.45
(3.65)
2.97
2.32
Total
from
investment
operations
....................
2.70
2.73
(3.45)
3.20
2.51
Less
distributions
from:
Net
investment
income
..........................
(0.39)
(0.22)
(0.18)
(0.48)
(0.22)
Net
realized
gains
.............................
(0.06)
(0.36)
(0.59)
(2.37)
(0.78)
Total
distributions
...............................
(0.45)
(0.58)
(0.77)
(2.85)
(1.00)
Net
asset
value,
end
of
year
.......................
$20.17
$17.92
$15.77
$19.99
$19.64
Total
return
d
...................................
15.14%
17.59%
(17.16)%
16.41%
14.58%
Ratios
to
average
net
assets
Expenses
before
waiver
and
payments
by
affiliates
e
.....
0.63%
0.64%
0.67%
0.66%
0.68%
Expenses
net
of
waiver
and
payments
by
affiliates
e
......
0.63%
f
0.64%
f
0.66%
g
0.66%
f
0.67%
g
Net
investment
income
c
...........................
1.38%
1.65%
1.15%
1.07%
1.07%
Supplemental
data
Net
assets,
end
of
year
(000’s)
.....................
$1,170,322
$1,077,785
$977,212
$1,258,769
$1,074,822
Portfolio
turnover
rate
............................
33.45%
28.72%
29.59%
59.90%
39.22%
a
The
amount
shown
for
a
share
outstanding
throughout
the
period
may
not
correlate
with
the
Statement
of
Operations
for
the
period
due
to
the
timing
of
sales
and
repurchases
of
the
Fund’s
shares
in
relation
to
income
earned
and/or
fluctuating
fair
value
of
the
investments
of
the
Fund.
b
Based
on
average
daily
shares
outstanding.
c
Recognition
of
net
investment
income
by
the
Fund
is
affected
by
the
timing
of
declaration
of
dividends
by
the
Underlying
Funds
and
exchange
traded
funds
in
which
the
Fund
invests.
d
Total
return
does
not
reflect
sales
commissions
or
contingent
deferred
sales
charges,
if
applicable.
e
Does
not
include
expenses
of
the
Underlying
Funds
and
exchange
traded
funds
in
which
the
Fund
invests.
The
weighted
average
indirect
expenses
of
the
Underlying
Funds
and
exchange
traded
funds
was
0.20%
for
the
year
ended
December
31,
2024.
f
Benefit
of
waiver
and
payments
by
affiliates
rounds
to
less
than
0.01%.
g
Benefit
of
expense
reduction
rounds
to
less
than
0.01%.
Franklin
Fund
Allocator
Series
Financial
Highlights
Franklin
Growth
Allocation
Fund
(continued)
The
accompanying
notes
are
an
integral
part
of
these
financial
statements.
Annual
Report
a
Year
Ended
December
31,
2024
2023
2022
2021
2020
Class
C
Per
share
operating
performance
(for
a
share
outstanding
throughout
the
year)
Net
asset
value,
beginning
of
year
...................
$17.13
$15.12
$19.24
$19.03
$17.62
Income
from
investment
operations
a
:
Net
investment
income
b,c
........................
0.11
0.14
0.06
0.04
0.05
Net
realized
and
unrealized
gains
(losses)
...........
2.34
2.35
(3.50)
2.91
2.25
Total
from
investment
operations
....................
2.45
2.49
(3.44)
2.95
2.30
Less
distributions
from:
Net
investment
income
..........................
(0.25)
(0.12)
(0.09)
(0.37)
(0.11)
Net
realized
gains
.............................
(0.06)
(0.36)
(0.59)
(2.37)
(0.78)
Total
distributions
...............................
(0.31)
(0.48)
(0.68)
(2.74)
(0.89)
Net
asset
value,
end
of
year
.......................
$19.27
$17.13
$15.12
$19.24
$19.03
Total
return
d
...................................
14.35%
16.66%
(17.82)%
15.59%
13.74%
Ratios
to
average
net
assets
Expenses
before
waiver
and
payments
by
affiliates
e
.....
1.38%
1.39%
1.42%
1.41%
1.42%
Expenses
net
of
waiver
and
payments
by
affiliates
e
......
1.38%
f
1.39%
f
1.41%
g
1.41%
f
1.42%
f,g
Net
investment
income
c
...........................
0.60%
0.87%
0.36%
0.20%
0.28%
Supplemental
data
Net
assets,
end
of
year
(000’s)
.....................
$90,351
$92,540
$95,210
$141,604
$186,526
Portfolio
turnover
rate
............................
33.45%
28.72%
29.59%
59.90%
39.22%
a
The
amount
shown
for
a
share
outstanding
throughout
the
period
may
not
correlate
with
the
Statement
of
Operations
for
the
period
due
to
the
timing
of
sales
and
repurchases
of
the
Fund’s
shares
in
relation
to
income
earned
and/or
fluctuating
fair
value
of
the
investments
of
the
Fund.
b
Based
on
average
daily
shares
outstanding.
c
Recognition
of
net
investment
income
by
the
Fund
is
affected
by
the
timing
of
declaration
of
dividends
by
the
Underlying
Funds
and
exchange
traded
funds
in
which
the
Fund
invests.
d
Total
return
does
not
reflect
sales
commissions
or
contingent
deferred
sales
charges,
if
applicable.
e
Does
not
include
expenses
of
the
Underlying
Funds
and
exchange
traded
funds
in
which
the
Fund
invests.
The
weighted
average
indirect
expenses
of
the
Underlying
Funds
and
exchange
traded
funds
was
0.20%
for
the
year
ended
December
31,
2024.
f
Benefit
of
waiver
and
payments
by
affiliates
rounds
to
less
than
0.01%.
g
Benefit
of
expense
reduction
rounds
to
less
than
0.01%.
Franklin
Fund
Allocator
Series
Financial
Highlights
Franklin
Growth
Allocation
Fund
(continued)
Annual
Report
The
accompanying
notes
are
an
integral
part
of
these
financial
statements.
a
Year
Ended
December
31,
2024
2023
2022
2021
2020
Class
R
Per
share
operating
performance
(for
a
share
outstanding
throughout
the
year)
Net
asset
value,
beginning
of
year
...................
$17.60
$15.50
$19.68
$19.38
$17.89
Income
from
investment
operations
a
:
Net
investment
income
b,c
........................
0.21
0.23
0.15
0.16
0.14
Net
realized
and
unrealized
gains
(losses)
...........
2.40
2.41
(3.59)
2.93
2.30
Total
from
investment
operations
....................
2.61
2.64
(3.44)
3.09
2.44
Less
distributions
from:
Net
investment
income
..........................
(0.34)
(0.18)
(0.15)
(0.42)
(0.17)
Net
realized
gains
.............................
(0.06)
(0.36)
(0.59)
(2.37)
(0.78)
Total
distributions
...............................
(0.40)
(0.54)
(0.74)
(2.79)
(0.95)
Net
asset
value,
end
of
year
.......................
$19.81
$17.60
$15.50
$19.68
$19.38
Total
return
....................................
14.90%
17.30%
(17.40)%
16.14%
14.30%
Ratios
to
average
net
assets
Expenses
before
waiver
and
payments
by
affiliates
d
.....
0.88%
0.89%
0.92%
0.91%
0.92%
Expenses
net
of
waiver
and
payments
by
affiliates
d
......
0.88%
e
0.89%
e
0.91%
f
0.91%
e
0.92%
e,f
Net
investment
income
c
...........................
1.10%
1.39%
0.88%
0.77%
0.77%
Supplemental
data
Net
assets,
end
of
year
(000’s)
.....................
$39,771
$39,993
$37,341
$54,097
$54,297
Portfolio
turnover
rate
............................
33.45%
28.72%
29.59%
59.90%
39.22%
a
The
amount
shown
for
a
share
outstanding
throughout
the
period
may
not
correlate
with
the
Statement
of
Operations
for
the
period
due
to
the
timing
of
sales
and
repurchases
of
the
Fund’s
shares
in
relation
to
income
earned
and/or
fluctuating
fair
value
of
the
investments
of
the
Fund.
b
Based
on
average
daily
shares
outstanding.
c
Recognition
of
net
investment
income
by
the
Fund
is
affected
by
the
timing
of
declaration
of
dividends
by
the
Underlying
Funds
and
exchange
traded
funds
in
which
the
Fund
invests.
d
Does
not
include
expenses
of
the
Underlying
Funds
and
exchange
traded
funds
in
which
the
Fund
invests.
The
weighted
average
indirect
expenses
of
the
Underlying
Funds
and
exchange
traded
funds
was
0.20%
for
the
year
ended
December
31,
2024.
e
Benefit
of
waiver
and
payments
by
affiliates
rounds
to
less
than
0.01%.
f
Benefit
of
expense
reduction
rounds
to
less
than
0.01%.
Franklin
Fund
Allocator
Series
Financial
Highlights
Franklin
Growth
Allocation
Fund
(continued)
The
accompanying
notes
are
an
integral
part
of
these
financial
statements.
Annual
Report
a
Year
Ended
December
31,
2024
2023
2022
2021
2020
Class
R6
Per
share
operating
performance
(for
a
share
outstanding
throughout
the
year)
Net
asset
value,
beginning
of
year
...................
$18.03
$15.86
$20.10
$19.73
$18.20
Income
from
investment
operations
a
:
Net
investment
income
b,c
........................
0.35
0.36
0.26
0.29
0.26
Net
realized
and
unrealized
gains
(losses)
...........
2.44
2.45
(3.68)
3.01
2.34
Total
from
investment
operations
....................
2.79
2.81
(3.42)
3.30
2.60
Less
distributions
from:
Net
investment
income
..........................
(0.46)
(0.28)
(0.23)
(0.56)
(0.29)
Net
realized
gains
.............................
(0.06)
(0.36)
(0.59)
(2.37)
(0.78)
Total
distributions
...............................
(0.52)
(0.64)
(0.82)
(2.93)
(1.07)
Net
asset
value,
end
of
year
.......................
$20.30
$18.03
$15.86
$20.10
$19.73
Total
return
....................................
15.52%
18.01%
(16.92)%
16.85%
15.06%
Ratios
to
average
net
assets
Expenses
before
waiver
and
payments
by
affiliates
d
.....
0.33%
0.33%
0.34%
0.34%
0.35%
Expenses
net
of
waiver
and
payments
by
affiliates
d
......
0.30%
0.30%
0.29%
e
0.30%
0.30%
e
Net
investment
income
c
...........................
1.76%
2.12%
1.51%
1.37%
1.44%
Supplemental
data
Net
assets,
end
of
year
(000’s)
.....................
$10,924
$7,793
$4,071
$5,434
$5,592
Portfolio
turnover
rate
............................
33.45%
28.72%
29.59%
59.90%
39.22%
a
The
amount
shown
for
a
share
outstanding
throughout
the
period
may
not
correlate
with
the
Statement
of
Operations
for
the
period
due
to
the
timing
of
sales
and
repurchases
of
the
Fund���s
shares
in
relation
to
income
earned
and/or
fluctuating
fair
value
of
the
investments
of
the
Fund.
b
Based
on
average
daily
shares
outstanding.
c
Recognition
of
net
investment
income
by
the
Fund
is
affected
by
the
timing
of
declaration
of
dividends
by
the
Underlying
Funds
and
exchange
traded
funds
in
which
the
Fund
invests.
d
Does
not
include
expenses
of
the
Underlying
Funds
and
exchange
traded
funds
in
which
the
Fund
invests.
The
weighted
average
indirect
expenses
of
the
Underlying
Funds
and
exchange
traded
funds
was
0.20%
for
the
year
ended
December
31,
2024.
e
Benefit
of
expense
reduction
rounds
to
less
than
0.01%.
Franklin
Fund
Allocator
Series
Financial
Highlights
Franklin
Growth
Allocation
Fund
(continued)
Annual
Report
The
accompanying
notes
are
an
integral
part
of
these
financial
statements.
a
Year
Ended
December
31,
2024
2023
2022
2021
2020
Advisor
Class
Per
share
operating
performance
(for
a
share
outstanding
throughout
the
year)
Net
asset
value,
beginning
of
year
...................
$18.05
$15.88
$20.12
$19.76
$18.22
Income
from
investment
operations
a
:
Net
investment
income
b,c
........................
0.32
0.32
0.24
0.28
0.24
Net
realized
and
unrealized
gains
(losses)
...........
2.45
2.48
(3.68)
2.98
2.34
Total
from
investment
operations
....................
2.77
2.80
(3.44)
3.26
2.58
Less
distributions
from:
Net
investment
income
..........................
(0.44)
(0.27)
(0.21)
(0.53)
(0.26)
Net
realized
gains
.............................
(0.06)
(0.36)
(0.59)
(2.37)
(0.78)
Total
distributions
...............................
(0.50)
(0.63)
(0.80)
(2.90)
(1.04)
Net
asset
value,
end
of
year
.......................
$20.32
$18.05
$15.88
$20.12
$19.76
Total
return
....................................
15.42%
17.88%
(16.99)%
16.71%
14.90%
Ratios
to
average
net
assets
Expenses
before
waiver
and
payments
by
affiliates
d
.....
0.38%
0.39%
0.42%
0.41%
0.43%
Expenses
net
of
waiver
and
payments
by
affiliates
d
......
0.38%
e
0.39%
e
0.41%
f
0.41%
e
0.42%
f
Net
investment
income
c
...........................
1.64%
1.89%
1.39%
1.32%
1.32%
Supplemental
data
Net
assets,
end
of
year
(000’s)
.....................
$52,456
$47,511
$43,957
$60,851
$51,693
Portfolio
turnover
rate
............................
33.45%
28.72%
29.59%
59.90%
39.22%
a
The
amount
shown
for
a
share
outstanding
throughout
the
period
may
not
correlate
with
the
Statement
of
Operations
for
the
period
due
to
the
timing
of
sales
and
repurchases
of
the
Fund’s
shares
in
relation
to
income
earned
and/or
fluctuating
fair
value
of
the
investments
of
the
Fund.
b
Based
on
average
daily
shares
outstanding.
c
Recognition
of
net
investment
income
by
the
Fund
is
affected
by
the
timing
of
declaration
of
dividends
by
the
Underlying
Funds
and
exchange
traded
funds
in
which
the
Fund
invests.
d
Does
not
include
expenses
of
the
Underlying
Funds
and
exchange
traded
funds
in
which
the
Fund
invests.
The
weighted
average
indirect
expenses
of
the
Underlying
Funds
and
exchange
traded
funds
was
0.20%
for
the
year
ended
December
31,
2024.
e
Benefit
of
waiver
and
payments
by
affiliates
rounds
to
less
than
0.01%.
f
Benefit
of
expense
reduction
rounds
to
less
than
0.01%.
Franklin
Fund
Allocator
Series
Schedule
of
Investments,
December
31,
2024
Franklin
Growth
Allocation
Fund
The
accompanying
notes
are
an
integral
part
of
these
financial
statements.
Annual
Report
a
a
Shares
a
Value
a
Investments
In
Underlying
Funds
and
Exchange
Traded
Funds
99.3%
Alternative
Strategies
1.0%
a
Franklin
Systematic
Style
Premia
ETF
....................................
592,757
$
14,172,820
Domestic
Equity
64.7%
a
Franklin
Growth
Fund
,
Class
R6
........................................
1,404,800
189,184,355
a
Franklin
U.S.
Core
Equity
(IU)
Fund
.....................................
19,086,522
329,433,361
a
Franklin
U.S.
Equity
Index
ETF
.........................................
2,740,800
140,725,006
a
Franklin
U.S.
Large
Cap
Multifactor
Index
ETF
.............................
1,694,301
99,353,811
iShares
MSCI
USA
Quality
Factor
ETF
...................................
73,925
13,164,564
a
Putnam
Large
Cap
Value
Fund
,
Class
R6
.................................
3,180,652
109,700,695
881,561,792
Domestic
Fixed
Income
12.6%
a
Franklin
Investment
Grade
Corporate
ETF
.................................
1,963,297
41,402,203
a
Franklin
U.S.
Core
Bond
ETF
..........................................
4,107,638
86,630,085
a
Franklin
U.S.
Treasury
Bond
ETF
.......................................
2,161,193
43,483,203
171,515,491
Foreign
Equity
18.3%
a
ClearBridge
International
Growth
Fund
,
Class
IS
............................
281,438
18,192,123
a
Franklin
Emerging
Market
Core
Equity
(IU)
Fund
............................
3,973,400
40,250,539
a
Franklin
International
Core
Equity
(IU)
Fund
...............................
10,280,179
120,278,099
iShares
Core
MSCI
EAFE
ETF
.........................................
253,822
17,838,610
a
Templeton
Developing
Markets
Trust
,
Class
R6
.............................
1,400,358
26,018,653
a
Templeton
Foreign
Fund
,
Class
R6
......................................
3,710,489
27,717,356
250,295,380
Foreign
Fixed
Income
2.7%
a
BrandywineGLOBAL
-
Global
Opportunities
Bond
Fund
,
Class
IS
...............
1,742,883
14,291,640
a
Franklin
High
Yield
Corporate
ETF
......................................
693,881
16,562,939
a
Franklin
International
Aggregate
Bond
ETF
................................
305,874
6,203,125
37,057,704
Total
Investments
In
Underlying
Funds
and
Exchange
Traded
Funds
(Cost
$
1,000,862,132
)
..............................................................
1,354,603,187
a
a
a
a
Short
Term
Investments
0.8%
a
Money
Market
Funds
0.0%
†
a,b
Institutional
Fiduciary
Trust
-
Money
Market
Portfolio
,
4.183
%
..................
35,400
35,400
Total
Money
Market
Funds
(Cost
$
35,400
)
......................................
35,400
Franklin
Fund
Allocator
Series
Schedule
of
Investments
Franklin
Growth
Allocation
Fund
(continued)
Annual
Report
The
accompanying
notes
are
an
integral
part
of
these
financial
statements.
s
Short
Term
Investments
(continued)
a
a
Principal
Amount
a
Value
Repurchase
Agreements
0.8%
c
Joint
Repurchase
Agreement
,
4.41
%
,
1/02/25
(Maturity
Value
$
10,411,634
)
BNP
Paribas
Securities
Corp.
(Maturity
Value
$5,072,236)
Deutsche
Bank
Securities,
Inc.
(Maturity
Value
$3,310,483)
HSBC
Securities
(USA),
Inc.
(Maturity
Value
$2,028,915)
Collateralized
by
U.S.
Government
Agency
Securities,
1.78%
-
6%,
6/18/35
-
10/20/54;
U.S.
Government
Agency
Strips,
11/15/53;
U.S.
Treasury
Notes,
3.75%,
12/31/28;
and
U.S.
Treasury
Notes,
Index
Linked,
0.38%,
7/15/25
(valued
at
$
10,618,194
)
.....................................................
$
10,409,083
$
10,409,083
Total
Repurchase
Agreements
(Cost
$
10,409,083
)
...............................
10,409,083
Total
Short
Term
Investments
(Cost
$
10,444,483
)
................................
10,444,483
a
Total
Investments
(Cost
$
1,011,306,615
)
100.1
%
.................................
$1,365,047,670
Other
Assets,
less
Liabilities
(
0.1
)
%
...........................................
(1,224,314)
Net
Assets
100.0%
...........................................................
$1,363,823,356
See
Abbreviations
on
page
41
.
†
Rounds
to
less
than
0.1%
of
net
assets.
a
See
Note
3(f)
regarding
investments
in
FT
Underlying
Funds.
b
The
rate
shown
is
the
annualized
seven-day
effective
yield
at
period
end.
c
See
Note
1(b)
regarding
joint
repurchase
agreement.
Franklin
Fund
Allocator
Series
Financial
Statements
Statements
of
Assets
and
Liabilities
December
31,
2024
The
accompanying
notes
are
an
integral
part
of
these
financial
statements.
Annual
Report
Franklin
Conservative
Allocation
Fund
Franklin
Moderate
Allocation
Fund
Franklin
Growth
Allocation
Fund
Assets:
Investments
in
securities:
Cost
-
Unaffiliated
issuers
.................................
$7,436,208
$23,061,669
$25,828,212
Cost
-
Controlled
affiliates
(Note
3
f
)
..........................
—
370,290,658
343,661,658
Cost
-
Non-controlled
affiliates
(Note
3
f
)
......................
754,315,304
935,423,122
631,407,662
Cost
-
Unaffiliated
repurchase
agreements
....................
6,232,848
12,220,508
10,409,083
Value
-
Unaffiliated
issuers
................................
$10,004,846
$28,318,240
$31,003,174
Value
-
Controlled
affiliates
(Note
3
f
)
.........................
—
536,469,406
489,961,999
Value
-
Non-controlled
affiliates
(Note
3
f
)
......................
840,399,911
1,071,489,938
833,673,414
Value
-
Unaffiliated
repurchase
agreements
....................
6,232,848
12,220,508
10,409,083
Cash
..................................................
1,946
1,390
2,412
Receivables:
Capital
shares
sold
......................................
249,444
861,293
398,901
Interest
...............................................
764
1,497
1,275
Total
assets
........................................
856,889,759
1,649,362,272
1,365,450,258
Liabilities:
Payables:
Capital
shares
redeemed
.................................
448,474
889,081
460,330
Asset
allocation
fees
.....................................
182,850
352,722
292,825
Distribution
fees
........................................
219,807
419,892
349,710
Transfer
agent
fees
......................................
192,576
404,072
376,240
Trustees'
fees
and
expenses
...............................
377
533
323
Accrued
expenses
and
other
liabilities
.........................
112,584
149,538
147,474
Total
liabilities
.......................................
1,156,668
2,215,838
1,626,902
Net
assets,
at
value
...............................
$855,733,091
$1,647,146,434
$1,363,823,356
Net
assets
consist
of:
Paid-in
capital
...........................................
$785,639,576
$1,311,879,874
$962,463,357
Total
distributable
earnings
(losses)
...........................
70,093,515
335,266,560
401,359,999
Net
assets,
at
value
...............................
$855,733,091
$1,647,146,434
$1,363,823,356
Franklin
Fund
Allocator
Series
Financial
Statements
Statements
of
Assets
and
Liabilities
(continued)
December
31,
2024
Annual
Report
The
accompanying
notes
are
an
integral
part
of
these
financial
statements.
Franklin
Conservative
Allocation
Fund
Franklin
Moderate
Allocation
Fund
Franklin
Growth
Allocation
Fund
Class
A:
Net
assets,
at
value
.....................................
$731,888,200
$1,434,336,753
$1,170,321,511
Shares
outstanding
......................................
52,532,289
91,160,385
58,017,128
Net
asset
value
per
share
a
,b
................................
$13.93
$15.73
$20.17
Maximum
offering
price
per
share
(net
asset
value
per
share
÷
94
.50
%
)
b
..............................................
$14.74
$16.65
$21.34
Class
C:
Net
assets,
at
value
.....................................
$51,584,925
$99,038,789
$90,351,281
Shares
outstanding
......................................
3,796,897
6,568,416
4,689,175
Net
asset
value
and
maximum
offering
price
per
share
a
,b
..........
$13.59
$15.08
$19.27
Class
R:
Net
assets,
at
value
.....................................
$39,817,597
$52,743,755
$39,770,662
Shares
outstanding
......................................
2,872,154
3,360,184
2,007,982
Net
asset
value
and
maximum
offering
price
per
share
b
...........
$13.86
$15.70
$19.81
Class
R6:
Net
assets,
at
value
.....................................
$6,688,167
$13,412,114
$10,923,948
Shares
outstanding
......................................
480,897
852,677
537,996
Net
asset
value
and
maximum
offering
price
per
share
b
...........
$13.91
$15.73
$20.30
Advisor
Class:
Net
assets,
at
value
.....................................
$25,754,202
$47,615,023
$52,455,954
Shares
outstanding
......................................
1,848,774
3,022,764
2,580,903
Net
asset
value
and
maximum
offering
price
per
share
b
...........
$13.93
$15.75
$20.32
a
Redemption
price
is
equal
to
net
asset
value
less
contingent
deferred
sales
charges,
if
applicable.
b
Net
asset
value
per
share
may
not
recalculate
due
to
rounding.
Franklin
Fund
Allocator
Series
Financial
Statements
Statements
of
Operations
for
the
year
ended
December
31,
2024
The
accompanying
notes
are
an
integral
part
of
these
financial
statements.
Annual
Report
Franklin
Conservative
Allocation
Fund
Franklin
Moderate
Allocation
Fund
Franklin
Growth
Allocation
Fund
Investment
income:
Dividends:
Unaffiliated
issuers
......................................
$501,649
$1,453,624
$1,380,991
Controlled
affiliates
(Note
3
f
)
...............................
—
10,105,460
9,719,975
Non-controlled
affiliates
(Note
3
f
)
...........................
26,024,951
30,150,201
15,792,295
Interest:
Unaffiliated
issuers
......................................
40,832
76,454
63,371
Total
investment
income
.................................
26,567,432
41,785,739
26,956,632
Expenses:
Asset
allocation
fees
(Note
3
a
)
...............................
2,215,348
4,160,174
3,356,795
Distribution
fees:
(Note
3c
)
Class
A
..............................................
1,889,608
3,607,937
2,871,904
Class
C
..............................................
565,377
1,066,357
928,860
Class
R
..............................................
201,279
271,786
200,014
Transfer
agent
fees:
(Note
3e
)
Class
A
..............................................
660,382
1,394,437
1,283,192
Class
C
..............................................
49,636
103,213
103,957
Class
R
..............................................
35,146
52,540
44,810
Class
R6
.............................................
5,027
5,415
5,132
Advisor
Class
..........................................
23,775
45,128
57,820
Custodian
fees
..........................................
3,001
3,675
2,905
Reports
to
shareholders
fees
................................
59,906
78,823
69,459
Registration
and
filing
fees
..................................
100,055
100,005
107,199
Professional
fees
.........................................
59,596
60,659
67,751
Trustees'
fees
and
expenses
................................
9,264
17,231
13,969
Other
..................................................
16,111
27,824
24,840
Total
expenses
.......................................
5,893,511
10,995,204
9,138,607
Expenses
waived/paid
by
affiliates
(Note
3
f
and
3
g
)
............
(24,529)
(42,856)
(36,709)
Net
expenses
.......................................
5,868,982
10,952,348
9,101,898
Net
investment
income
..............................
20,698,450
30,833,391
17,854,734
Realized
and
unrealized
gains
(losses):
Net
realized
gain
(loss)
from:
Investments:
Unaffiliated
issuers
....................................
(1,775,880)
(33,346)
2,337,616
Controlled
affiliates
(Note
3
f
)
.............................
—
18,094,403
8,186,517
Non-controlled
affiliates
(Note
3
f
)
..........................
4,265,453
4,088,719
16,917,202
Capital
gain
distributions
from
Underlying
Funds:
Controlled
affiliates
(Note
3
f
)
.............................
—
29,472,729
25,493,465
Non-controlled
affiliates
(Note
3
f
)
..........................
17,093,122
18,728,753
20,506,829
Net
realized
gain
(loss)
................................
19,582,695
70,351,258
73,441,629
Net
change
in
unrealized
appreciation
(depreciation)
on:
Investments:
Unaffiliated
issuers
....................................
4,115,149
4,805,501
2,053,309
Controlled
affiliates
(Note
3
f
)
.............................
—
58,718,227
55,012,506
Non-controlled
affiliates
(Note
3
f
)
..........................
24,241,678
19,483,138
38,084,125
Net
change
in
unrealized
appreciation
(depreciation)
..........
28,356,827
83,006,866
95,149,940
Net
realized
and
unrealized
gain
(loss)
..........................
47,939,522
153,358,124
168,591,569
Net
increase
(decrease)
in
net
assets
resulting
from
operations
........
$68,637,972
$184,191,515
$186,446,303
Franklin
Fund
Allocator
Series
Financial
Statements
Statements
of
Changes
in
Net
Assets
Annual
Report
The
accompanying
notes
are
an
integral
part
of
these
financial
statements.
Franklin
Conservative
Allocation
Fund
Franklin
Moderate
Allocation
Fund
Year
Ended
December
31,
2024
Year
Ended
December
31,
2023
Year
Ended
December
31,
2024
Year
Ended
December
31,
2023
Increase
(decrease)
in
net
assets:
Operations:
Net
investment
income
............
$20,698,450
$20,390,572
$30,833,391
$31,253,073
Net
realized
gain
(loss)
............
19,582,695
(21,420,110)
70,351,258
(18,238,351)
Net
change
in
unrealized
appreciation
(depreciation)
.................
28,356,827
99,860,109
83,006,866
200,711,846
Net
increase
(decrease)
in
net
assets
resulting
from
operations
.
68,637,972
98,830,571
184,191,515
213,726,568
Distributions
to
shareholders:
Class
A
........................
(18,959,519)
(19,352,191)
(32,629,335)
(37,543,461)
Class
C
........................
(1,010,101)
(1,315,832)
(1,675,254)
(2,506,233)
Class
R
........................
(914,805)
(983,534)
(1,083,731)
(1,277,855)
Class
R6
.......................
(183,761)
(79,254)
(342,147)
(223,289)
Advisor
Class
...................
(748,695)
(813,466)
(1,188,020)
(1,409,376)
Total
distributions
to
shareholders
.....
(21,816,881)
(22,544,277)
(36,918,487)
(42,960,214)
Capital
share
transactions:
(Note
2
)
Class
A
........................
(76,049,013)
(92,949,308)
(91,615,486)
(97,867,821)
Class
C
........................
(14,906,242)
(31,553,063)
(22,086,342)
(31,428,339)
Class
R
........................
(3,871,903)
(6,991,350)
(4,997,345)
(4,807,516)
Class
R6
.......................
1,224,664
2,509,676
234,902
4,928,088
Advisor
Class
...................
(3,403,335)
(4,825,102)
662,962
(10,072,426)
Total
capital
share
transactions
.......
(97,005,829)
(133,809,147)
(117,801,309)
(139,248,014)
Net
increase
(decrease)
in
net
assets
.....................
(50,184,738)
(57,522,853)
29,471,719
31,518,340
Net
assets:
Beginning
of
year
..................
905,917,829
963,440,682
1,617,674,715
1,586,156,375
End
of
year
......................
$855,733,091
$905,917,829
$1,647,146,434
$1,617,674,715
Franklin
Fund
Allocator
Series
Financial
Statements
Statements
of
Changes
in
Net
Assets
(continued)
The
accompanying
notes
are
an
integral
part
of
these
financial
statements.
Annual
Report
Franklin
Growth
Allocation
Fund
Year
Ended
December
31,
2024
Year
Ended
December
31,
2023
Increase
(decrease)
in
net
assets:
Operations:
Net
investment
income
.................................................
$17,854,734
$19,187,688
Net
realized
gain
(loss)
.................................................
73,441,629
(7,253,316)
Net
change
in
unrealized
appreciation
(depreciation)
...........................
95,149,940
183,096,287
Net
increase
(decrease)
in
net
assets
resulting
from
operations
................
186,446,303
195,030,659
Distributions
to
shareholders:
Class
A
.............................................................
(26,422,324)
(35,611,823)
Class
C
.............................................................
(1,498,663)
(2,717,860)
Class
R
.............................................................
(820,250)
(1,267,002)
Class
R6
............................................................
(258,231)
(206,512)
Advisor
Class
........................................................
(1,309,949)
(1,730,319)
Total
distributions
to
shareholders
..........................................
(30,309,417)
(41,533,516)
Capital
share
transactions:
(Note
2
)
Class
A
.............................................................
(40,883,835)
(29,853,584)
Class
C
.............................................................
(13,157,285)
(14,238,915)
Class
R
.............................................................
(4,966,805)
(2,224,448)
Class
R6
............................................................
2,138,737
2,937,710
Advisor
Class
........................................................
(1,066,416)
(2,286,383)
Total
capital
share
transactions
............................................
(57,935,604)
(45,665,620)
Net
increase
(decrease)
in
net
assets
...................................
98,201,282
107,831,523
Net
assets:
Beginning
of
year
.......................................................
1,265,622,074
1,157,790,551
End
of
year
...........................................................
$1,363,823,356
$1,265,622,074
Franklin
Fund
Allocator
Series
Notes
to
Financial
Statements
1.
Organization
and
Significant
Accounting
Policies
Franklin
Fund
Allocator
Series (Trust)
is
registered
under
the
Investment
Company
Act
of
1940
(1940
Act)
as
an
open-end
management
investment
company,
consisting
of eighteen separate
funds, three
of
which
are
included
in
this
report
(Funds).
The
Funds
follow
the
accounting
and
reporting
guidance
in
Financial
Accounting
Standards
Board
(FASB)
Accounting
Standards
Codification
Topic
946,
Financial
Services
–
Investment
Companies
(ASC
946)
and
apply
the
specialized
accounting
and
reporting
guidance
in
U.S.
Generally
Accepted
Accounting
Principles
(U.S.
GAAP),
including,
but
not
limited
to,
ASC
946.
Certain
or
all
Funds
invest
primarily
in
mutual
funds
(Underlying
Funds)
and
exchange
traded
funds
(ETFs),
including
affiliated
funds
managed
by
Franklin
Templeton
(FT
Underlying
Funds).
The
Funds
offer five classes
of
shares:
Class
A,
Class
C,
Class
R,
Class
R6
and
Advisor
Class. Class
C
shares
automatically
convert
to
Class
A
shares
on
a
monthly
basis,
after
they
have
been
held
for
8
years.
Each
class
of
shares
may
differ
by
its
initial
sales
load,
contingent
deferred
sales
charges,
voting
rights
on
matters
affecting
a
single
class,
its
exchange
privilege
and
fees
due
to
differing
arrangements
for
distribution
and
transfer
agent
fees.
The
accounting
policies
of
the
Underlying
Funds
are
outlined
in
their
respective
shareholder
reports.
A
copy
of
the
Underlying
Funds’
shareholder
reports
is
available
on
the
U.S.
Securities
and
Exchange
Commission
(SEC)
website
at
sec.gov.
The
Underlying
Funds’
shareholder
reports
are
not
covered
by
this
report.
The
following
summarizes
the Funds'
significant
accounting
policies.
a.
Financial
Instrument
Valuation
The Funds'
investments
in
financial
instruments
are
carried
at
fair
value
daily.
Fair
value
is
the
price
that
would
be
received
to
sell
an
asset
or
paid
to
transfer
a
liability
in
an
orderly
transaction
between
market
participants
on
the
measurement
date.
The Funds calculate the
net
asset
value
(NAV)
per
share
each
business
day
as
of
4
p.m.
Eastern
time
or
the
regularly
scheduled
close
of
the
New
York
Stock
Exchange
(NYSE),
whichever
is
earlier. Under
compliance
policies
and
procedures
approved
by
the
Trust’s
Board
of
Trustees
(the
Board),
the
Board
has
designated
the
Funds’
investment
manager
as
the
valuation
designee
and
has
responsibility
for
oversight
of
valuation.
The
investment
manager
is
assisted
by
the
Funds'
administrator
in
performing
this
responsibility,
including
leading
the
cross-
functional
Valuation
Committee
(VC).
The
Funds
may
utilize
independent
pricing
services,
quotations
from
securities
and
financial
instrument
dealers,
and
other
market
sources
to
determine
fair
value.
Investments
in
the
Underlying
Funds
are
valued
at
their
closing
NAV
each
trading
day. ETFs
listed
on
an
exchange
or
on
the
NASDAQ
National
Market
System
are
valued
at
the
last
quoted
sale
price
or
the
official
closing
price
of
the
day,
respectively.
Investments
in
repurchase
agreements are
valued
at
cost,
which
approximates
fair
value.
b.
Joint
Repurchase
Agreement
Certain
or
all
Funds
enter
into
a
joint
repurchase
agreement
whereby
their
uninvested
cash
balance
is
deposited
into
a
joint
cash
account
with
other
funds
managed
by
the
investment
manager
or
an
affiliate
of
the
investment
manager
and
is
used
to
invest
in
one
or
more
repurchase
agreements.
The
value
and
face
amount
of
the
joint
repurchase
agreement
are
allocated
to
the
funds
based
on
their
pro-rata
interest.
A
repurchase
agreement
is
accounted
for
as
a
loan
by
the
Fund
to
the
seller,
collateralized
by
securities
which
are
delivered
to
the
Funds'
custodian.
The
fair
value,
including
accrued
interest,
of
the
initial
collateralization
is
required
to
be
at
least
102%
of
the
dollar
amount
invested
by
the
funds,
with
the
value
of
the
underlying
securities
marked
to
market
daily
to
maintain
coverage
of
at
least
100%.
Repurchase
agreements
are
subject
to
the
terms
of
Master
Repurchase
Agreements
(MRAs)
with
approved
counterparties
(sellers).
The
MRAs
contain
various
provisions,
including
but
not
limited
to
events
of
default
and
maintenance
of
collateral
for
repurchase
agreements.
In
the
event
of
default
by
either
the
seller
or
the
Funds,
certain
MRAs
may
permit
the
non-defaulting
party
to
net
and
close-out
all
transactions,
if
any,
traded
under
such
agreements.
The
Funds
may
sell
securities
it
holds
as
collateral
and
apply
the
proceeds
towards
the
repurchase
price
and
any
other
amounts
owed
by
the
seller
to
the
Funds
in
the
event
of
default
by
the
seller.
This
could
involve
costs
or
delays
in
addition
to
a
loss
on
the
securities
if
their
value
falls
below
the
repurchase
price
owed
by
the
seller.
The
joint
repurchase
agreement
held
by
the
Funds
at
year
end,
as
indicated
in
the
Schedules
of
Investments,
had
been
entered
into
on December
31,
2024.
Franklin
Fund
Allocator
Series
Notes
to
Financial
Statements
c.
Income
Taxes
It
is each
Fund's
policy
to
qualify
as
a
regulated
investment
company
under
the
Internal
Revenue
Code. Each
Fund
intends
to
distribute
to
shareholders
substantially
all
of
its
taxable
income
and
net
realized
gains
to
relieve
it
from
federal
income
and excise
taxes.
As
a
result,
no
provision
for
U.S.
federal
income
taxes
is
required.
Each
Fund
may
recognize
an
income
tax
liability
related
to
its
uncertain
tax
positions
under
U.S.
GAAP
when
the
uncertain
tax
position
has
a
less
than
50%
probability
that
it
will
be
sustained
upon
examination
by
the
tax
authorities
based
on
its
technical
merits.
As
of
December
31,
2024, each
Fund
has
determined
that
no
tax
liability
is
required
in
its
financial
statements
related
to
uncertain
tax
positions
for
any
open
tax
years
(or
expected
to
be
taken
in
future
tax
years).
Open
tax
years
are
those
that
remain
subject
to
examination
and
are
based
on
the
statute
of
limitations
in
each
jurisdiction
in
which
the
Fund
invests.
d.
Security
Transactions,
Investment
Income,
Expenses
and
Distributions
Security
transactions
are
accounted
for
on
trade
date.
Realized
gains
and
losses
on
security
transactions
are
determined
on
a
specific
identification
basis.
Interest
income (including
interest
income
from
payment-in-kind
securities,
if
any)
and
estimated
expenses
are
accrued
daily.
Dividend
income
and
realized capital
gain
distributions
by
Underlying
Funds
and
ETF's
are
recorded
on
the
ex-
dividend
date.
Distributions
to
shareholders
are
recorded
on
the
ex-dividend
date.
Distributable
earnings
are
determined
according
to
income
tax
regulations
(tax
basis)
and
may
differ
from
earnings
recorded
in
accordance
with
U.S.
GAAP.
These
differences
may
be
permanent
or
temporary.
Permanent
differences
are
reclassified
among
capital
accounts
to
reflect
their
tax
character.
These
reclassifications
have
no
impact
on
net
assets
or
the
results
of
operations.
Temporary
differences
are
not
reclassified,
as
they
may
reverse
in
subsequent
periods.
Common
expenses
incurred
by
the
Trust
are
allocated
among
the
Funds
based
on
the
ratio
of
net
assets
of
each
Fund
to
the
combined
net
assets
of
the
Trust
or
based
on
the
ratio
of
number
of
shareholders
of
each
Fund
to
the
combined
number
of
shareholders
of
the
Trust.
Fund
specific
expenses
are
charged
directly
to
the
Fund
that
incurred
the
expense.
The
Funds
indirectly
bear
their
proportionate
share
of
expenses
from
the
Underlying
Funds
and
ETFs.
Since
the
Underlying
Funds
and
ETFs
have
varied
expense
levels
and
the
Funds
may
own
different
proportions
of
the
Underlying
Funds
and
ETFs
at
different
times,
the
amount
of
expenses
incurred
indirectly
by
the
Funds
will
vary.
Realized
and
unrealized
gains
and
losses
and
net
investment
income,
excluding
class
specific
expenses,
are
allocated
daily
to
each
class
of
shares
based
upon
the
relative
proportion
of
net
assets
of
each
class.
Differences
in
per
share
distributions
by
class
are
generally
due
to
differences
in
class
specific
expenses.
e.
Accounting
Estimates
The
preparation
of
financial
statements
in
accordance
with
U.S.
GAAP
requires
management
to
make
estimates
and
assumptions
that
affect
the
reported
amounts
of
assets
and
liabilities
at
the
date
of
the
financial
statements
and
the
amounts
of
income
and
expenses
during
the
reporting
period.
Actual
results
could
differ
from
those
estimates.
f.
Guarantees
and
Indemnifications
Under
the Trust's
organizational
documents,
its
officers
and trustees
are
indemnified
by
the Trust against
certain
liabilities
arising
out
of
the
performance
of
their
duties
to
the
Trust.
Additionally,
in
the
normal
course
of
business,
the Trust,
on
behalf
of
the
Funds, enters
into
contracts
with
service
providers
that
contain
general
indemnification
clauses.
The Trust's
maximum
exposure
under
these
arrangements
is
unknown
as
this
would
involve
future
claims
that
may
be
made
against
the Trust
that
have
not
yet
occurred.
Currently,
the Trust
expects
the
risk
of
loss
to
be
remote.
1.
Organization
and
Significant
Accounting
Policies
(continued)
Franklin
Fund
Allocator
Series
Notes
to
Financial
Statements
2.
Shares
of
Beneficial
Interest
At
December
31,
2024,
there
were
an
unlimited
number
of
shares
authorized
(without
par value).
Transactions
in
the
Funds'
shares
were
as
follows:
Franklin
Conservative
Allocation
Fund
Franklin
Moderate
Allocation
Fund
Shares
Amount
Shares
Amount
Class
A
Class
A
Shares:
Year
ended
December
31,
2024
Shares
sold
a
...................................
4,392,631
$60,171,639
7,422,491
$114,170,384
Shares
issued
in
reinvestment
of
distributions
..........
1,336,871
18,544,114
2,062,801
32,186,918
Shares
redeemed
...............................
(11,289,882)
(154,764,766)
(15,468,865)
(237,972,788)
Net
increase
(decrease)
..........................
(5,560,380)
$(76,049,013)
(5,983,573)
$(91,615,486)
Year
ended
December
31,
2023
Shares
sold
a
...................................
6,240,619
$78,434,577
11,923,837
$160,912,999
Shares
issued
in
reinvestment
of
distributions
..........
1,495,788
18,928,417
2,699,272
37,017,805
Shares
redeemed
...............................
(15,144,493)
(190,312,302)
(21,876,349)
(295,798,625)
Net
increase
(decrease)
..........................
(7,408,086)
$(92,949,308)
(7,253,240)
$(97,867,821)
Class
C
Class
C
Shares:
Year
ended
December
31,
2024
Shares
sold
...................................
452,480
$6,080,993
907,942
$13,353,030
Shares
issued
in
reinvestment
of
distributions
..........
74,000
999,491
111,389
1,663,125
Shares
redeemed
a
..............................
(1,647,439)
(21,986,726)
(2,527,211)
(37,102,497)
Net
increase
(decrease)
..........................
(1,120,959)
$(14,906,242)
(1,507,880)
$(22,086,342)
Year
ended
December
31,
2023
Shares
sold
...................................
752,214
$9,185,011
2,295,944
$29,625,102
Shares
issued
in
reinvestment
of
distributions
..........
105,751
1,302,591
189,440
2,489,614
Shares
redeemed
a
..............................
(3,437,427)
(42,040,665)
(4,904,075)
(63,543,055)
Net
increase
(decrease)
..........................
(2,579,462)
$(31,553,063)
(2,418,691)
$(31,428,339)
Class
R
Class
R
Shares:
Year
ended
December
31,
2024
Shares
sold
...................................
519,446
$7,137,798
637,889
$9,710,308
Shares
issued
in
reinvestment
of
distributions
..........
66,017
910,941
69,498
1,081,128
Shares
redeemed
...............................
(873,765)
(11,920,642)
(1,029,642)
(15,788,781)
Net
increase
(decrease)
..........................
(288,302)
$(3,871,903)
(322,255)
$(4,997,345)
Year
ended
December
31,
2023
Shares
sold
...................................
638,808
$7,994,361
719,603
$9,736,119
Shares
issued
in
reinvestment
of
distributions
..........
77,947
981,213
93,213
1,275,277
Shares
redeemed
...............................
(1,275,613)
(15,966,924)
(1,167,715)
(15,818,912)
Net
increase
(decrease)
..........................
(558,858)
$(6,991,350)
(354,899)
$(4,807,516)
Class
R6
Franklin
Fund
Allocator
Series
Notes
to
Financial
Statements
Franklin
Conservative
Allocation
Fund
Franklin
Moderate
Allocation
Fund
Shares
Amount
Shares
Amount
Class
R6
Shares:
Year
ended
December
31,
2024
Shares
sold
...................................
172,575
$2,343,659
152,775
$2,345,233
Shares
issued
in
reinvestment
of
distributions
..........
13,249
183,665
21,913
342,147
Shares
redeemed
...............................
(94,915)
(1,302,660)
(158,090)
(2,452,478)
Net
increase
(decrease)
..........................
90,909
$1,224,664
16,598
$234,902
Year
ended
December
31,
2023
Shares
sold
...................................
238,482
$2,954,035
430,991
$5,789,858
Shares
issued
in
reinvestment
of
distributions
..........
6,221
79,254
16,187
223,289
Shares
redeemed
...............................
(41,924)
(523,613)
(80,474)
(1,085,059)
Net
increase
(decrease)
..........................
202,779
$2,509,676
366,704
$4,928,088
Advisor
Class
Advisor
Class
Shares:
Year
ended
December
31,
2024
Shares
sold
...................................
381,402
$5,271,282
873,798
$13,443,124
Shares
issued
in
reinvestment
of
distributions
..........
48,548
673,470
69,885
1,092,290
Shares
redeemed
...............................
(677,571)
(9,348,087)
(897,647)
(13,872,452)
Net
increase
(decrease)
..........................
(247,621)
$(3,403,335)
46,036
$662,962
Year
ended
December
31,
2023
Shares
sold
...................................
601,753
$7,577,365
987,687
$13,389,966
Shares
issued
in
reinvestment
of
distributions
..........
57,867
731,996
94,808
1,300,608
Shares
redeemed
...............................
(1,048,281)
(13,134,463)
(1,837,860)
(24,763,000)
Net
increase
(decrease)
..........................
(388,661)
$(4,825,102)
(755,365)
$(10,072,426)
Franklin
Growth
Allocation
Fund
Shares
Amount
Class
A
Class
A
Shares:
Year
ended
December
31,
2024
Shares
sold
a
...................................
5,274,570
$103,337,576
Shares
issued
in
reinvestment
of
distributions
..........
1,303,861
26,133,891
Shares
redeemed
...............................
(8,718,738)
(170,355,302)
Net
increase
(decrease)
..........................
(2,140,307)
$(40,883,835)
Year
ended
December
31,
2023
Shares
sold
a
...................................
8,137,077
$135,503,916
Shares
issued
in
reinvestment
of
distributions
..........
2,068,298
35,219,331
Shares
redeemed
...............................
(12,018,807)
(200,576,831)
Net
increase
(decrease)
..........................
(1,813,432)
$(29,853,584)
Class
C
2.
Shares
of
Beneficial
Interest
(continued)
Franklin
Fund
Allocator
Series
Notes
to
Financial
Statements
Franklin
Growth
Allocation
Fund
Shares
Amount
Class
C
Shares:
Year
ended
December
31,
2024
Shares
sold
...................................
753,997
$14,018,250
Shares
issued
in
reinvestment
of
distributions
..........
77,986
1,491,106
Shares
redeemed
a
..............................
(1,544,079)
(28,666,641)
Net
increase
(decrease)
..........................
(712,096)
$(13,157,285)
Year
ended
December
31,
2023
Shares
sold
...................................
1,560,622
$24,885,973
Shares
issued
in
reinvestment
of
distributions
..........
166,293
2,704,755
Shares
redeemed
a
..............................
(2,623,484)
(41,829,643)
Net
increase
(decrease)
..........................
(896,569)
$(14,238,915)
Class
R
Class
R
Shares:
Year
ended
December
31,
2024
Shares
sold
...................................
236,712
$4,580,211
Shares
issued
in
reinvestment
of
distributions
..........
41,585
818,211
Shares
redeemed
...............................
(542,759)
(10,365,227)
Net
increase
(decrease)
..........................
(264,462)
$(4,966,805)
Year
ended
December
31,
2023
Shares
sold
...................................
284,849
$4,665,871
Shares
issued
in
reinvestment
of
distributions
..........
75,592
1,264,429
Shares
redeemed
...............................
(496,853)
(8,154,748)
Net
increase
(decrease)
..........................
(136,412)
$(2,224,448)
Class
R6
Class
R6
Shares:
Year
ended
December
31,
2024
Shares
sold
...................................
182,613
$3,615,392
Shares
issued
in
reinvestment
of
distributions
..........
12,781
258,231
Shares
redeemed
...............................
(89,632)
(1,734,886)
Net
increase
(decrease)
..........................
105,762
$2,138,737
Year
ended
December
31,
2023
Shares
sold
...................................
209,376
$3,504,274
Shares
issued
in
reinvestment
of
distributions
..........
12,018
206,512
Shares
redeemed
...............................
(45,760)
(773,076)
Net
increase
(decrease)
..........................
175,634
$2,937,710
Advisor
Class
2.
Shares
of
Beneficial
Interest
(continued)
Franklin
Fund
Allocator
Series
Notes
to
Financial
Statements
)
3.
Transactions
with
Affiliates
Franklin
Resources,
Inc.
is
the
holding
company
for
various
subsidiaries
that
together
are
referred
to
as
Franklin
Templeton.
Certain
officers
and
trustees
of
the Funds are
also
officers,
directors, and/or trustees
of
certain
of
the
FT
Underlying
Funds
and
of
the
following
subsidiaries:
a.
Asset
Allocation
Fees
The
Funds
pay
an asset
allocation
fee
to
Advisers of
0.25%
per
year
of
the
average
daily
net
assets
of
each
of
the
Funds
for
investment
advisory
services,
consisting
principally
of
determining
the
allocation
of
assets
of
the
Funds
among
the
Underlying
Funds
and
ETFs.
b.
Administrative
Fees
Under
an
agreement
with
Advisers,
FT
Services
provides
administrative
services
to
the
Funds
and
is
not
paid
by
the
Funds
for
the services.
c.
Distribution
Fees
The
Board
has
adopted
distribution
plans
for
each
share
class,
with
the
exception
of
Class
R6
and
Advisor
Class
shares,
pursuant
to
Rule
12b-1
under
the
1940
Act.
Under
the
Funds'
Class
A
reimbursement
distribution
plans,
the
Funds
reimburse
Distributors
for
costs
incurred
in
connection
with
the
servicing,
sale
and
distribution
of each
Fund's
shares
up
to
the
maximum
annual
plan
rate.
Under
the
Class
A
reimbursement
distribution
plans,
costs
exceeding
the
maximum
for
the
current
plan
year
cannot
be
reimbursed
in
subsequent
periods.
In
addition,
under
the
Funds'
Class
C
and
R compensation
distribution
plans,
Franklin
Growth
Allocation
Fund
Shares
Amount
Advisor
Class
Shares:
Year
ended
December
31,
2024
Shares
sold
...................................
468,165
$9,238,644
Shares
issued
in
reinvestment
of
distributions
..........
57,408
1,159,997
Shares
redeemed
...............................
(577,237)
(11,465,057)
Net
increase
(decrease)
..........................
(51,664)
$(1,066,416)
Year
ended
December
31,
2023
Shares
sold
...................................
671,356
$11,279,238
Shares
issued
in
reinvestment
of
distributions
..........
89,851
1,540,943
Shares
redeemed
...............................
(896,822)
(15,106,564)
Net
increase
(decrease)
..........................
(135,615)
$(2,286,383)
a
May
include
a
portion
of
Class
C
shares
that
were
automatically
converted
to
Class
A.
Subsidiary
Affiliation
Franklin
Advisers,
Inc.
(Advisers)
Investment
manager
Franklin
Templeton
Services,
LLC
(FT
Services)
Administrative
manager
Franklin
Distributors,
LLC
(
Distributors)
Principal
underwriter
Franklin
Templeton
Investor
Services,
LLC
(Investor
Services)
Transfer
agent
2.
Shares
of
Beneficial
Interest
(continued)
Franklin
Fund
Allocator
Series
Notes
to
Financial
Statements
the
Funds
pay
Distributors
for
costs
incurred
in
connection
with
the
servicing,
sale
and
distribution
of each
Fund's
shares
up
to
the
maximum
annual
plan
rate
for
each
class.
The
plan
year,
for
purposes
of
monitoring
compliance
with
the
maximum
annual
plan
rates,
is
February
1
through
January
31
for
each
Fund.
The
maximum
annual
plan
rates,
based
on
the
average
daily
net
assets,
for
each
class,
are
as
follows:
d.
Sales
Charges/Underwriting
Agreements
Front-end
sales
charges
and
contingent
deferred
sales
charges
(CDSC)
do
not
represent
expenses
of
the
Funds.
These
charges
are
deducted
from
the
proceeds
of
sales
of
fund
shares
prior
to
investment
or
from
redemption
proceeds
prior
to
remittance,
as
applicable.
Distributors
has
advised
the
Funds
of
the
following
commission
transactions
related
to
the
sales
and
redemptions
of
the
Funds'
shares
for
the
year:
e.
Transfer
Agent
Fees
Each
class
of
shares
pays
transfer
agent
fees,
calculated
monthly
and
paid
monthly, to
Investor
Services
for
its
performance
of
shareholder
servicing
obligations. The
fees
are based
on
a
fixed
margin
earned
by
Investor
Services
and
are allocated
to
the Funds
based
upon
relative
assets
and
relative
transactions. In
addition,
each
class reimburses
Investor
Services
for
out
of
pocket
expenses
incurred
and,
except
for
Class
R6, reimburses
shareholder
servicing
fees
paid
to
third
parties.
These
fees
paid
to
third
parties
are
accrued
and
allocated
daily
based
upon
their
relative
proportion
of
such
classes'
aggregate
net
assets.
Class
R6
pays
Investor
Services
transfer
agent
fees
allocated
specifically
to
that
class
based
upon
its
relative
assets
and
relative
transactions.
For
the
year
ended
December
31,
2024,
the Funds
paid
transfer
agent
fees
as
noted
in
the
Statements of
Operations
of
which
the
following
amounts
were
retained
by
Investor
Services:
Franklin
Conservative
Allocation
Fund
Franklin
Moderate
Allocation
Fund
Franklin
Growth
Allocation
Fund
Class
A
...............................
0.25%
0.25%
0.25%
Class
C
...............................
1.00%
1.00%
1.00%
Class
R
...............................
0.50%
0.50%
0.50%
Franklin
Conservative
Allocation
Fund
Franklin
Moderate
Allocation
Fund
Franklin
Growth
Allocation
Fund
Sales
charges
retained
net
of
commissions
paid
to
unaffiliated
brokers/dealers
..................
$39,635
$122,025
$151,132
CDSC
retained
...........................
$4,155
$6,943
$10,285
Franklin
Conservative
Allocation
Fund
Franklin
Moderate
Allocation
Fund
Franklin
Growth
Allocation
Fund
Transfer
agent
fees
........................
$294,206
$587,804
$594,833
3.
Transactions
with
Affiliates
(continued)
c.
Distribution
Fees
(continued)
Franklin
Fund
Allocator
Series
Notes
to
Financial
Statements
f.
Investments
in
FT
Underlying
Funds
The
Funds
invest
in
FT
Underlying
Funds
which
are
managed
by
Advisers
(or
an
affiliate
of
Advisers).
As
defined
in
the
1940
Act,
an
investment
is
deemed
to
be
a
“Controlled
Affiliate”
of
a
fund
when
a
fund
owns,
either
directly
or
indirectly,
25%
or
more
of
the
Underlying
Fund’s
outstanding
shares
or
has
the
power
to
exercise
control
over
management
or
policies
of
such
Underlying
Fund.
The
Funds
do
not
invest
in
FT
Underlying
Funds
for
the
purpose
of
exercising
a
controlling
influence
over
the
management
or
policies. Asset
allocation
fees
paid
by
the
Funds
are
waived
on
assets
invested
in
Institutional
Fiduciary
Trust
Money
Market
Portfolio
(Sweep
Money
Fund),
as
noted
in
the
Statements
of
Operations,
in
an
amount
not
to
exceed
the
asset
allocation
fees
paid
directly
or
indirectly
by
the
Sweep
Money
Fund.
Investments
in
FT
Underlying
Funds
for
the
year
ended
December
31,
2024,
were
as
follows:
aa
Value
at
Beginning
of
Year
Purchases
Sales
Realized
Gain
(Loss)
Net
Change
in
Unrealized
Appreciation
(Depreciation)
Value
at
End
of
Year
Number
of
Shares
Held
at
End
of
Year
Dividend
Income
a
a
a
a
a
a
a
a
a
Franklin
Conservative
Allocation
Fund
Non-Controlled
Affiliates
BrandywineGLOBAL
-
Global
Opportunities
Bond
Fund,
Class
IS
$
35,532,536
$
6,485,420
$
(4,922,008)
$
(1,338,751)
$
(3,124,272)
$
32,632,925
3,979,625
$
1,224,648
ClearBridge
International
Growth
Fund,
Class
IS
............
6,472,793
819,289
(1,842,230)
144,290
276,221
5,870,363
90,816
86,666
ClearBridge
Large
Cap
Value
Fund,
Class
IS
.................
26,439,391
1,948,912
(30,548,854)
6,192,344
(4,031,793)
—
—
287,319
a
Franklin
Emerging
Market
Core
Equity
(IU)
Fund
...........
13,340,652
2,354,362
(3,534,293)
(110,994)
930,096
12,979,823
1,281,325
529,699
Franklin
Growth
Fund,
Class
R6
.
63,091,507
8,968,038
(16,664,997)
5,395,084
246,233
61,035,865
453,225
4,848,070
a
Franklin
High
Yield
Corporate
ETF
18,243,540
24,518,949
(4,937,744)
(418,809)
415,626
37,821,562
1,584,481
1,616,417
Franklin
International
Aggregate
Bond
ETF
................
15,322,392
1,639,153
(2,728,336)
(672,123)
603,399
14,164,485
698,446
420,716
Franklin
International
Core
Equity
(IU)
Fund
................
42,320,816
6,259,842
(10,403,917)
1,085,763
(450,229)
38,812,275
3,317,288
1,674,758
a
Franklin
Investment
Grade
Corporate
ETF
............
22,880,435
79,163,375
(4,121,902)
(428,743)
(2,953,652)
94,539,513
4,483,074
2,051,277
Franklin
Systematic
Style
Premia
ETF
....................
8,696,285
551,783
(1,291,912)
55,577
827,818
8,839,551
369,701
104,639
Franklin
U.S.
Core
Bond
ETF
...
179,960,360
49,645,787
(26,248,861)
(4,629,963)
(913,816)
197,813,507
9,379,493
7,588,223
Franklin
U.S.
Core
Equity
(IU)
Fund
140,498,475
26,077,958
(55,933,617)
12,628,630
14,483,518
137,754,964
7,981,168
11,881,566
a
Franklin
U.S.
Equity
Index
ETF
.
14,968,633
4,433,907
(8,277,126)
803,536
2,061,040
13,989,990
272,473
185,317
Franklin
U.S.
Large
Cap
Multifactor
Index
ETF
...............
33,011,646
1,739,408
(9,396,657)
2,096,456
4,601,888
32,052,741
546,602
379,731
Franklin
U.S.
Treasury
Bond
ETF
59,583,178
56,571,774
(13,356,413)
(2,972,671)
(534,714)
99,291,154
4,934,948
3,725,560
Institutional
Fiduciary
Trust
-
Money
Market
Portfolio,
4.183%
......
2,128,612
101,005,119
(103,059,889)
—
—
73,842
73,842
292,480
Putnam
Large
Cap
Value
Fund,
Class
R6
................
—
38,338,242
(297,054)
1,312
(2,649,669)
35,392,831
1,026,177
2,032,753
a
Templeton
Developing
Markets
Trust,
Class
R6
............
9,751,940
2,675,863
(4,558,346)
(48,639)
569,720
8,390,538
451,590
240,699
a
Templeton
Foreign
Fund,
Class
R6
9,717,617
2,403,797
(2,803,278)
457,128
(831,282)
8,943,982
1,197,320
246,500
3.
Transactions
with
Affiliates
(continued)
Franklin
Fund
Allocator
Series
Notes
to
Financial
Statements
aa
Value
at
Beginning
of
Year
Purchases
Sales
Realized
Gain
(Loss)
Net
Change
in
Unrealized
Appreciation
(Depreciation)
Value
at
End
of
Year
Number
of
Shares
Held
at
End
of
Year
Dividend
Income
a
a
a
a
a
a
a
a
a
Franklin
Conservative
Allocation
Fund
(continued)
Non-Controlled
Affiliates
(continued)
Western
Asset
Core
Plus
Bond
Fund,
Class
IS
............
$
100,478,405
$
10,744,333
$
(111,649,108)
$
(13,804,488)
$
14,230,858
$
—
—
$
3,077,739
Western
Asset
Short-Term
Bond
Fund,
Class
IS
............
22,616,221
2,569,131
(25,500,554)
(169,486)
484,688
—
—
623,296
Total
Non-Controlled
Affiliates
$825,055,434
$428,914,442
$(442,077,096)
$4,265,453
$24,241,678
$840,399,911
$43,118,073
Total
Affiliated
Securities
....
$825,055,434
$428,914,442
$(442,077,096)
$4,265,453
$24,241,678
$840,399,911
$43,118,073
Franklin
Moderate
Allocation
Fund
Controlled
Affiliates
Franklin
Emerging
Market
Core
Equity
(IU)
Fund
...........
35,295,411
6,212,306
(6,981,549)
(243,121)
2,464,972
36,748,019
3,627,643
1,492,650
Franklin
International
Core
Equity
(IU)
Fund
................
111,579,997
17,316,821
(20,347,832)
1,455,392
(166,933)
109,837,445
9,387,816
4,709,757
a
Franklin
U.S.
Core
Equity
(IU)
Fund
370,356,559
63,359,684
(117,134,621)
16,882,132
56,420,188
389,883,942
22,588,873
33,375,782
a
Total
Controlled
Affiliates
....
$517,231,967
$86,888,811
$(144,464,002)
$18,094,403
$58,718,227
$536,469,406
$39,578,189
Non-Controlled
Affiliates
BrandywineGLOBAL
-
Global
Opportunities
Bond
Fund,
Class
IS
40,799,789
10,276,467
(5,673,166)
(1,522,247)
(3,764,923)
40,115,920
4,892,185
1,490,714
ClearBridge
International
Growth
Fund,
Class
IS
............
17,065,760
2,014,187
(3,580,454)
289,201
824,106
16,612,800
257,005
245,165
ClearBridge
Large
Cap
Value
Fund,
Class
IS
.................
71,152,721
4,398,207
(81,487,000)
16,466,669
(10,530,597)
—
—
797,377
a
Franklin
Growth
Fund,
Class
R6
.
166,310,770
21,658,418
(30,002,423)
6,796,529
7,978,218
172,741,512
1,282,702
13,717,011
a
Franklin
High
Yield
Corporate
ETF
20,948,797
31,980,682
(6,415,220)
(466,909)
447,113
46,494,463
1,947,820
1,967,467
Franklin
International
Aggregate
Bond
ETF
................
17,594,286
3,114,766
(3,231,127)
(780,421)
715,675
17,413,179
858,638
516,999
Franklin
Investment
Grade
Corporate
ETF
............
26,273,427
98,502,849
(4,424,679)
(429,833)
(3,703,706)
116,218,058
5,511,073
2,502,504
Franklin
Systematic
Style
Premia
ETF
....................
15,518,135
1,594,367
(1,647,973)
40,238
1,556,166
17,060,933
713,548
201,960
Franklin
U.S.
Core
Bond
ETF
...
206,644,306
73,467,826
(30,466,015)
(5,258,046)
(1,214,761)
243,173,310
11,530,266
9,207,937
Franklin
U.S.
Equity
Index
ETF
.
39,457,841
12,904,319
(20,646,757)
1,586,342
6,296,417
39,598,162
771,225
518,035
Franklin
U.S.
Large
Cap
Multifactor
Index
ETF
...............
87,019,424
3,619,760
(18,213,238)
3,660,622
14,636,373
90,722,941
1,547,117
1,061,742
Franklin
U.S.
Treasury
Bond
ETF
68,417,872
73,743,845
(15,953,483)
(3,638,045)
(510,257)
122,059,932
6,066,597
4,530,464
Institutional
Fiduciary
Trust
-
Money
Market
Portfolio,
4.183%
......
6,534,089
168,488,628
(174,978,747)
—
—
43,970
43,970
568,696
Putnam
Large
Cap
Value
Fund,
Class
R6
................
—
108,168,292
(488,235)
2,110
(7,513,176)
100,168,991
2,904,291
5,748,080
a
3.
Transactions
with
Affiliates
(continued)
f.
Investments
in
FT
Underlying
Funds
(continued)
Franklin
Fund
Allocator
Series
Notes
to
Financial
Statements
aa
Value
at
Beginning
of
Year
Purchases
Sales
Realized
Gain
(Loss)
Net
Change
in
Unrealized
Appreciation
(Depreciation)
Value
at
End
of
Year
Number
of
Shares
Held
at
End
of
Year
Dividend
Income
a
a
a
a
a
a
a
a
a
Franklin
Moderate
Allocation
Fund
(continued)
Non-Controlled
Affiliates
(continued)
Templeton
Developing
Markets
Trust,
Class
R6
............
$
25,614,321
$
7,267,422
$
(10,537,911)
$
(350,598)
$
1,761,565
$
23,754,799
1,278,514
$
681,485
a
Templeton
Foreign
Fund,
Class
R6
25,621,000
6,642,128
(5,871,116)
509,742
(1,590,786)
25,310,968
3,388,349
697,349
Western
Asset
Core
Plus
Bond
Fund,
Class
IS
............
115,377,631
18,998,407
(135,252,352)
(12,819,107)
13,695,421
—
—
3,681,184
Western
Asset
Short-Term
Bond
Fund,
Class
IS
............
25,970,221
4,554,914
(30,927,897)
2,472
400,290
—
—
744,785
Total
Non-Controlled
Affiliates
$976,320,390
$651,395,484
$(579,797,793)
$4,088,719
$19,483,138
$1,071,489,938
$48,878,954
Total
Affiliated
Securities
....
$1,493,552,357
$738,284,295
$(724,261,795)
$22,183,122
$78,201,365
$1,607,959,344
$88,457,143
Franklin
Growth
Allocation
Fund
Controlled
Affiliates
Franklin
Emerging
Market
Core
Equity
(IU)
Fund
...........
36,237,958
6,985,088
(5,282,690)
(241,349)
2,551,532
40,250,539
3,973,400
1,613,274
Franklin
International
Core
Equity
(IU)
Fund
................
115,442,847
20,336,516
(16,418,873)
565,595
352,014
120,278,099
10,280,179
5,075,731
a
Franklin
U.S.
Core
Equity
(IU)
Fund
305,126,935
36,248,225
(71,913,030)
7,862,271
52,108,960
329,433,361
19,086,522
28,524,435
a
Total
Controlled
Affiliates
....
$456,807,740
$63,569,829
$(93,614,593)
$8,186,517
$55,012,506
$489,961,999
$35,213,440
Non-Controlled
Affiliates
BrandywineGLOBAL
-
Global
Opportunities
Bond
Fund,
Class
IS
14,223,395
5,248,608
(3,343,064)
(916,760)
(920,539)
14,291,640
1,742,883
539,536
ClearBridge
International
Growth
Fund,
Class
IS
............
17,656,450
2,199,474
(2,795,367)
208,443
923,123
18,192,123
281,438
268,302
ClearBridge
Large
Cap
Value
Fund,
Class
IS
.................
72,098,193
6,268,099
(84,647,081)
16,605,968
(10,325,179)
—
—
848,103
a
Franklin
Growth
Fund,
Class
R6
.
174,044,468
21,588,687
(21,317,378)
2,427,597
12,440,981
189,184,355
1,404,800
15,022,467
a
Franklin
High
Yield
Corporate
ETF
7,304,631
12,998,962
(3,729,083)
(62,633)
51,062
16,562,939
693,881
711,563
Franklin
International
Aggregate
Bond
ETF
................
6,135,331
1,961,838
(1,884,490)
(427,021)
417,467
6,203,125
305,874
184,065
Franklin
Investment
Grade
Corporate
ETF
............
9,161,624
35,550,851
(1,813,670)
(103,780)
(1,392,822)
41,402,203
1,963,297
904,500
Franklin
Systematic
Style
Premia
ETF
....................
12,133,894
1,868,867
(1,082,878)
13,161
1,239,776
14,172,820
592,757
167,772
Franklin
U.S.
Core
Bond
ETF
...
72,059,201
35,781,290
(19,019,882)
(3,193,420)
1,002,896
86,630,085
4,107,638
3,322,669
Franklin
U.S.
Equity
Index
ETF
.
116,704,561
26,829,855
(29,309,423)
2,640,650
23,859,363
140,725,006
2,740,800
1,704,291
Franklin
U.S.
Large
Cap
Multifactor
Index
ETF
...............
90,020,249
4,589,718
(14,579,137)
2,600,685
16,722,296
99,353,811
1,694,301
1,141,602
Franklin
U.S.
Treasury
Bond
ETF
23,858,015
30,409,644
(9,351,786)
(1,123,801)
(308,869)
43,483,203
2,161,193
1,639,556
Institutional
Fiduciary
Trust
-
Money
Market
Portfolio,
4.183%
......
6,207,441
120,130,795
(126,302,836)
—
—
35,400
35,400
474,874
3.
Transactions
with
Affiliates
(continued)
f.
Investments
in
FT
Underlying
Funds
(continued)
Franklin
Fund
Allocator
Series
Notes
to
Financial
Statements
g.
Waiver
and
Expense
Reimbursements
Advisers
has contractually
agreed
in
advance
to
waive
or
limit
its fees
and
to
assume
as
its
own
expense
certain
expenses
otherwise
payable
by
the
Funds
so
that
the
operating expenses
(excluding
interest
expense,
distribution
fees,
acquired
fund
fees
and
expenses and
certain
non-routine
expenses
or
costs,
including
those
relating
to
litigation,
indemnification,
reorganizations,
and
liquidations)
for
each
class
of
the
Funds
do
not
exceed 0.45%
based
on
the
average
net
assets
of
each
class
until April
30,
2025.
Total
expenses
waived
or
paid
are
not
subject
to
recapture
subsequent
to
the
Funds'
fiscal
year
end.
Transfer
agent
fees
on
Class
R6
shares
of
the
Funds have
been
capped
so
that
transfer
agent
fees
for
that
class
do
not
exceed
0.03%
based
on
the
average
net
assets
of
the
class
until
April
30,
2025.
4.
Income
Taxes
For
tax
purposes,
capital
losses
may
be
carried
over
to
offset
future
capital
gains.
During
the
year
ended December
31,
2024,
the
utilized
capital
loss
carryforwards
were
as
follows:
The
tax
character
of
distributions
paid
during
the
years
ended
December
31,
2024
and
2023,
was
as
follows:
aa
Value
at
Beginning
of
Year
Purchases
Sales
Realized
Gain
(Loss)
Net
Change
in
Unrealized
Appreciation
(Depreciation)
Value
at
End
of
Year
Number
of
Shares
Held
at
End
of
Year
Dividend
Income
a
a
a
a
a
a
a
a
a
Franklin
Growth
Allocation
Fund
(continued)
Non-Controlled
Affiliates
(continued)
Putnam
Large
Cap
Value
Fund,
Class
R6
................
$
—
$
118,209,184
$
(264,427)
$
4,703
$
(8,248,765)
$
109,700,695
3,180,652
$
6,291,004
a
Templeton
Developing
Markets
Trust,
Class
R6
............
26,787,077
7,276,213
(9,458,382)
(317,705)
1,731,450
26,018,653
1,400,358
744,840
a
Templeton
Foreign
Fund,
Class
R6
26,507,551
7,363,943
(4,912,098)
218,949
(1,460,989)
27,717,356
3,710,489
763,650
Western
Asset
Core
Plus
Bond
Fund,
Class
IS
............
40,233,942
11,787,566
(52,555,641)
(1,819,497)
2,353,630
—
—
1,306,663
Western
Asset
Short-Term
Bond
Fund,
Class
IS
............
9,057,382
2,862,685
(12,080,974)
161,663
(756)
—
—
263,667
Total
Non-Controlled
Affiliates
$724,193,405
$452,926,279
$(398,447,597)
$16,917,202
$38,084,125
$833,673,414
$36,299,124
Total
Affiliated
Securities
....
$1,181,001,145
$516,496,108
$(492,062,190)
$25,103,719
$93,096,631
$1,323,635,413
$71,512,564
a
Dividend
income
includes
capital
gain
distributions
received,
if
any,
from
underlying
funds,
and
are
presented
in
corresponding
line
item
in
the
Statements
of
Operations.
Franklin
Conservative
Allocation
Fund
Franklin
Moderate
Allocation
Fund
Franklin
Growth
Allocation
Fund
Capital
loss
utilized
carryforwards
....
$10,225,334
$3,416,039
$3,202,232
3.
Transactions
with
Affiliates
(continued)
f.
Investments
in
FT
Underlying
Funds
(continued)
Franklin
Fund
Allocator
Series
Notes
to
Financial
Statements
At
December
31,
2024,
the
cost
of
investments,
net
unrealized
appreciation
(depreciation),
undistributed
ordinary
income
and
undistributed
long
term
capital
gains for
income
tax
purposes
were
as
follows:
Differences
between
income
and/or
capital
gains
as
determined
on
a
book
basis
and
a
tax
basis
are
primarily
due
to
differing
treatments
of
wash
sales
and
regulated
investment
companies.
5.
Investment
Transactions
Purchases
and
sales
of Underlying
Funds and
ETFs
(excluding
short
term
securities)
for
the
year
ended
December
31,
2024,
were
as
follows:
Franklin
Conservative
Allocation
Fund
Franklin
Moderate
Allocation
Fund
2024
2023
2024
2023
Distributions
paid
from:
Ordinary
income
........................
$21,816,881
$22,544,277
$36,918,487
$32,013,158
Long
term
capital
gain
....................
—
—
—
10,947,056
$21,816,881
$22,544,277
$36,918,487
$42,960,214
Franklin
Growth
Allocation
Fund
2024
2023
Distributions
paid
from:
Ordinary
income
........................
$30,309,417
$15,514,251
Long
term
capital
gain
....................
—
26,019,265
$30,309,417
$41,533,516
Franklin
Conservative
Allocation
Fund
Franklin
Moderate
Allocation
Fund
Franklin
Growth
Allocation
Fund
a
a
a
a
Cost
of
investments
.......................
$793,846,946
$1,370,716,470
$1,022,052,587
Unrealized
appreciation
.....................
$128,444,923
$353,284,527
$369,847,374
Unrealized
depreciation
.....................
(65,654,264)
(75,502,905)
(26,852,291)
Net
unrealized
appreciation
(depreciation)
.......
$62,790,659
$277,781,622
$342,995,083
Distributable
earnings:
Undistributed
ordinary
income
................
$7,825,941
$19,538,071
$6,988,978
Undistributed
long
term
capital
gains
...........
—
37,946,868
51,375,938
Total
distributable
earnings
..................
$7,825,941
$57,484,939
$58,364,916
Franklin
Conservative
Allocation
Fund
Franklin
Moderate
Allocation
Fund
Franklin
Growth
Allocation
Fund
Purchases
..............................
$351,705,619
$623,774,630
$444,754,950
Sales
..................................
$430,750,521
$698,565,583
$467,767,048
Franklin
Fund
Allocator
Series
Notes
to
Financial
Statements
6.
Credit
Facility
The
Funds,
together
with
other
U.S.
registered
and
foreign
investment
funds
(collectively,
Borrowers),
managed
by
Franklin
Templeton,
are
borrowers
in
a
joint
syndicated
senior
unsecured
credit
facility
totaling
$2.675
billion
(Global
Credit
Facility)
which
matured
on
January
31,
2025.
This
Global
Credit
Facility
provides
a
source
of
funds
to
the
Borrowers
for
temporary
and
emergency
purposes,
including
the
ability
to
meet
future
unanticipated
or
unusually
large
redemption
requests.
Effective
January
31,
2025,
the
Borrowers
renewed
the
Global
Credit
Facility
for
a
one-year
term,
maturing
January
30,
2026,
for
a
total
of
$2.995
billion.
Under
the
terms
of
the
Global
Credit
Facility,
the
Funds
may,
in
addition
to
interest
charged
on
any
borrowings
made
by
the
Funds
and
other
costs
incurred
by
the
Funds,
pay
their
share
of
fees
and
expenses
incurred
in
connection
with
the
implementation
and
maintenance
of
the
Global
Credit
Facility,
based
upon
their
relative
share
of
the
aggregate
net
assets
of
all
of
the
Borrowers,
including
an
annual
commitment
fee
of
0.15%
based
upon
the
unused
portion
of
the
Global
Credit
Facility.
These
fees
are
reflected
in
other
expenses
in
the
Statements
of
Operations.
During
the
year ended
December
31,
2024,
the
Funds
did
not
use
the
Global
Credit
Facility.
7.
Fair
Value
Measurements
The Funds
follow
a
fair
value
hierarchy
that
distinguishes
between
market
data
obtained
from
independent
sources
(observable
inputs)
and
the Funds'
own
market
assumptions
(unobservable
inputs).
These
inputs
are
used
in
determining
the
value
of
the Funds' financial
instruments
and
are
summarized
in
the
following
fair
value
hierarchy:
Level
1
–
quoted
prices
in
active
markets
for
identical
financial
instruments
Level
2
–
other
significant
observable
inputs
(including
quoted
prices
for
similar
financial
instruments,
interest
rates,
prepayment
speed,
credit
risk,
etc.)
Level
3
–
significant
unobservable
inputs
(including
the Funds'
own
assumptions
in
determining
the
fair
value
of
financial
instruments)
The
input
levels
are
not
necessarily
an
indication
of
the
risk
or
liquidity
associated
with
financial
instruments
at
that
level.
A
summary
of
inputs
used
as
of
December
31,
2024,
in
valuing
the
Funds'
assets carried
at
fair
value,
is
as
follows:
Level
1
Level
2
Level
3
Total
Franklin
Conservative
Allocation
Fund
Assets:
Investments
in
Securities:
a
Investments
in
Underlying
Funds
and
Exchange
Traded
Funds
..........................
$
850,330,915
$
—
$
—
$
850,330,915
Short
Term
Investments
...................
73,842
6,232,848
—
6,306,690
Total
Investments
in
Securities
...........
$850,404,757
$6,232,848
$—
$856,637,605
Franklin
Moderate
Allocation
Fund
Assets:
Investments
in
Securities:
a
Investments
in
Underlying
Funds
and
Exchange
Traded
Funds
..........................
1,636,233,614
—
—
1,636,233,614
Short
Term
Investments
...................
43,970
12,220,508
—
12,264,478
Total
Investments
in
Securities
...........
$1,636,277,584
$12,220,508
$—
$1,648,498,092
Franklin
Fund
Allocator
Series
Notes
to
Financial
Statements
8.
Operating
Segments
The Funds
have
adopted
the
FASB
Accounting
Standards
Update
(ASU)
2023-07,
Segment
Reporting
(Topic
280)
-
Improvements
to
Reportable
Segment
Disclosures.
The
update
is
limited
to
disclosure
requirements
and
does
not
impact
the Funds'
financial
position
or
results
of
operations.
Each
Fund
operates
as
a
single
operating
segment,
which
is
an
investment
portfolio.
The
Funds'
Investment
manager
serves
as
the
Chief
Operating
Decision
Maker
(CODM),
evaluating
fund-wide
results
and
performance
under
a
unified
investment
strategy.
The
CODM
uses
these
measures
to
assess
fund
performance
and
allocate
resources
effectively.
Internal
reporting
provided
to
the
CODM
aligns
with
the
accounting
policies
and
measurement
principles
used
in
the
financial
statements.
For
information
regarding
segment
assets,
segment
profit
or
loss,
and
significant
expenses,
refer
to
the
Statements
of
Assets
and
Liabilities
and
the
Statements
of
Operations,
along
with
the
related
notes
to
the
financial
statements.
The
Schedules
of
Investments
provides
details
of
the
Funds'
investments
that
generate
returns
such
as
interest,
dividends,
and
realized
and
unrealized
gains
or
losses.
Performance
metrics,
including
portfolio
turnover
and
expense
ratios,
are
disclosed
in
the
Financial
Highlights.
9.
Subsequent
Events
The
Funds
have
evaluated
subsequent
events
through
the
issuance
of
the financial
statements
and
determined
that
no
events
have
occurred
that
require
disclosure
other
than
those
already
disclosed
in
the
financial
statements.
Abbreviations
Level
1
Level
2
Level
3
Total
Franklin
Growth
Allocation
Fund
Assets:
Investments
in
Securities:
a
Investments
in
Underlying
Funds
and
Exchange
Traded
Funds
..........................
$
1,354,603,187
$
—
$
—
$
1,354,603,187
Short
Term
Investments
...................
35,400
10,409,083
—
10,444,483
Total
Investments
in
Securities
...........
$1,354,638,587
$10,409,083
$—
$1,365,047,670
a
For
detailed
categories,
see
the
accompanying
Schedules
of
Investments.
Selected
Portfolio
ETF
Exchange-Traded
Fund
7.
Fair
Value
Measurements
(continued)
Franklin
Fund
Allocator
Series
Report
of
Independent
Registered
Public
Accounting
Firm
To
the
Board
of
Trustees
of
Franklin
Fund
Allocator
Series
and
Shareholders
of
Franklin
Conservative
Allocation
Fund,
Franklin
Moderate
Allocation
Fund
and
Franklin
Growth
Allocation
Fund
Opinions
on
the
Financial
Statements
We
have
audited
the
accompanying
statements
of
assets
and
liabilities,
including
the
schedules
of
investments,
of
Franklin
Conservative
Allocation
Fund,
Franklin
Moderate
Allocation
Fund
and
Franklin
Growth
Allocation
Fund
(three
of
the
funds
constituting
Franklin
Fund
Allocator
Series,
hereafter
collectively
referred
to
as
the
"Funds")
as
of
December
31,
2024,
the
related
statements
of
operations
for
the
year
ended
December
31,
2024,
the
statements
of
changes
in
net
assets
for
each
of
the
two
years
in
the
period
ended
December
31,
2024,
including
the
related
notes,
and
the
financial
highlights
for
each
of
the
five
years
in
the
period
ended
December
31,
2024
(collectively
referred
to
as
the
“financial
statements”).
In
our
opinion,
the
financial
statements
present
fairly,
in
all
material
respects,
the
financial
position
of
each
of
the
Funds
as
of
December
31,
2024,
the
results
of
each
of
their
operations
for
the
year
then
ended,
the
changes
in
each
of
their
net
assets
for
each
of
the
two
years
in
the
period
ended
December
31,
2024
and
each
of
the
financial
highlights
for
each
of
the
five
years
in
the
period
ended
December
31,
2024
in
conformity
with
accounting
principles
generally
accepted
in
the
United
States
of
America.
Basis
for
Opinions
These
financial
statements
are
the
responsibility
of
the
Funds’
management.
Our
responsibility
is
to
express
an
opinion
on
the
Funds’
financial
statements
based
on
our
audits.
We
are
a
public
accounting
firm
registered
with
the
Public
Company
Accounting
Oversight
Board
(United
States)
(PCAOB)
and
are
required
to
be
independent
with
respect
to
the
Funds
in
accordance
with
the
U.S.
federal
securities
laws
and
the
applicable
rules
and
regulations
of
the
Securities
and
Exchange
Commission
and
the
PCAOB.
We
conducted
our
audits
of
these
financial
statements
in
accordance
with
the
standards
of
the
PCAOB.
Those
standards
require
that
we
plan
and
perform
the
audit
to
obtain
reasonable
assurance
about
whether
the
financial
statements
are
free
of
material
misstatement,
whether
due
to
error
or
fraud.
Our
audits
included
performing
procedures
to
assess
the
risks
of
material
misstatement
of
the
financial
statements,
whether
due
to
error
or
fraud,
and
performing
procedures
that
respond
to
those
risks.
Such
procedures
included
examining,
on
a
test
basis,
evidence
regarding
the
amounts
and
disclosures
in
the
financial
statements.
Our
audits
also
included
evaluating
the
accounting
principles
used
and
significant
estimates
made
by
management,
as
well
as
evaluating
the
overall
presentation
of
the
financial
statements.
Our
procedures
included
confirmation
of
securities
owned
as
of
December
31,
2024
by
correspondence
with
the
custodian,
transfer
agents
and
brokers.
We
believe
that
our
audits
provide
a
reasonable
basis
for
our
opinions.
/s/PricewaterhouseCoopers
LLP
San
Francisco,
California
February
20,
2025
We
have
served
as
the
auditor
of
one
or
more
investment
companies
in
the
Franklin
Templeton
Group
of
Funds
since
1948.
Franklin
Fund
Allocator
Series
Tax
Information
(unaudited)
By
mid-February,
tax
information
related
to
a
shareholder's
proportionate
share
of
distributions
paid
during
the
preceding
calendar
year
will
be
received,
if
applicable.
Please
also
refer
to
www.franklintempleton.com
for
per
share
tax
information
related
to
any
distributions
paid
during
the
preceding
calendar
year.
Shareholders
are
advised
to
consult
with
their
tax
advisors
for
further
information
on
the
treatment
of
these
amounts
on
their
tax
returns.
The
following
tax
information
for
the
Funds
is
required
to
be
furnished
to
shareholders
with
respect
to
income
earned
and
distributions
paid
during their
fiscal
year.
The
Funds
hereby
report
the
following
amounts,
or
if
subsequently
determined
to
be
different,
the
maximum
allowable
amounts,
for
the
fiscal
year
ended
December
31,
2024:
Under
Section
853
of
the
Internal
Revenue
Code,
the
Funds
below intend
to
elect
to
pass
through
to
their
shareholders
the
following
amounts,
or
amounts
as
finally
determined,
of
foreign
taxes
paid
and
foreign
source
income
earned
by
the
Funds
during
the
fiscal
year
ended
December
31,
2024
:
Pursuant
to:
Franklin
Conservative
Allocation
Fund
Franklin
Moderate
Allocation
Fund
Franklin
Growth
Allocation
Fund
Long-Term
Capital
Gain
Dividends
Distributed
§852(b)(3)(C)
$—
$1,467,550
$1,341,395
Income
Eligible
for
Dividends
Received
Deduction
(DRD)
§854(b)(1)(A)
$2,107,586
$5,857,485
$6,760,867
Qualified
Dividend
Income
Earned
(QDI)
§854(b)(1)(B)
$3,808,863
$10,607,515
$11,910,588
Short-Term
Capital
Gain
Dividends
Distributed
§871(k)(2)(C)
$—
$—
$4,493,111
Franklin
Conservative
Allocation
Fund
Franklin
Moderate
Allocation
Fund
Franklin
Growth
Allocation
Fund
Foreign
Taxes
Paid
$119,388
$337,861
$370,030
Foreign
Source
Income
Earned
$2,023,860
$5,372,964
$5,623,169
Franklin
Fund
Allocator
Series
Changes
In
and
Disagreements
with
Accountants
For
the
period
covered
by
this
report
Not
applicable.
Results
of
Meeting(s)
of
Shareholders
For
the
period
covered
by
this
report
Not
applicable.
Remuneration
Paid
to
Directors,
Officers
and
Others
For
the
period
covered
by
this
report
Refer
to
the
financial
statements
included
herein.
Board
Approval
of
Management
and
Subadvisory
Agreements
For
the
period
covered
by
this
report
Not
applicable.
©
2025
Franklin
Templeton.
All
rights
reserved.
Franklin
Corefolio
Allocation
Fund
Financial
Statements
and
Other
Important
Information
Annual
|
December
31,
2024
Financial
Statements
and
Other
Important
Information—Annual
Financial
Highlights
and
Schedule
of
Investments
2
Financial
Statements
8
Notes
to
Financial
Statements
12
Report
of
Independent
Registered
Public
Accounting
Firm
19
Tax
Information
20
Changes
In
and
Disagreements
with
Accountants
21
Results
of
Meeting(s)
of
Shareholders
21
Remuneration
Paid
to
Directors,
Officers
and
Others
21
Board
Approval
of
Management
and
Subadvisory
Agreements
21
Franklin
Fund
Allocator
Series
Financial
Highlights
Franklin
Corefolio
Allocation
Fund
Annual
Report
The
accompanying
notes
are
an
integral
part
of
these
financial
statements.
a
Year
Ended
December
31,
2024
2023
2022
2021
2020
Class
A
Per
share
operating
performance
(for
a
share
outstanding
throughout
the
year)
Net
asset
value,
beginning
of
year
...................
$21.40
$17.85
$24.42
$21.92
$20.04
Income
from
investment
operations
a
:
Net
investment
income
b,c
........................
0.10
0.11
0.05
0.22
0.12
Net
realized
and
unrealized
gains
(losses)
...........
3.05
4.35
(5.16)
3.21
3.32
Total
from
investment
operations
....................
3.15
4.46
(5.11)
3.43
3.44
Less
distributions
from:
Net
investment
income
..........................
(0.19)
(0.12)
(0.01)
(0.22)
(0.18)
Net
realized
gains
.............................
(1.23)
(0.79)
(1.45)
(0.71)
(1.38)
Total
distributions
...............................
(1.42)
(0.91)
(1.46)
(0.93)
(1.56)
Net
asset
value,
end
of
year
.......................
$23.13
$21.40
$17.85
$24.42
$21.92
Total
return
d
...................................
14.88%
25.36%
(20.84)%
15.76%
18.28%
Ratios
to
average
net
assets
Expenses
e
,f
....................................
0.39%
0.40%
0.41%
0.42%
0.43%
Net
investment
income
c
...........................
0.45%
0.55%
0.26%
0.91%
0.64%
Supplemental
data
Net
assets,
end
of
year
(000’s)
.....................
$869,673
$805,511
$690,297
$931,489
$812,250
Portfolio
turnover
rate
............................
10.38%
6.51%
9.00%
3.58%
9.29%
a
The
amount
shown
for
a
share
outstanding
throughout
the
period
may
not
correlate
with
the
Statement
of
Operations
for
the
period
due
to
the
timing
of
sales
and
repurchases
of
the
Fund’s
shares
in
relation
to
income
earned
and/or
fluctuating
fair
value
of
the
investments
of
the
Fund.
b
Based
on
average
daily
shares
outstanding.
c
Recognition
of
net
investment
income
by
the
Fund
is
affected
by
the
timing
of
declaration
of
dividends
by
the
Underlying
Funds
in
which
the
Fund
invests.
d
Total
return
does
not
reflect
sales
commissions
or
contingent
deferred
sales
charges,
if
applicable.
e
Benefit
of
waiver
and
payments
by
affiliates
rounds
to
less
than
0.01%.
f
Does
not
include
expenses
of
the
Underlying
Funds
in
which
the
Fund
invests.
The
weighted
average
indirect
expenses
of
the
Underlying
Funds
was
0.62%
for
the
year
ended
December
31,
2024.
Franklin
Fund
Allocator
Series
Financial
Highlights
Franklin
Corefolio
Allocation
Fund
(continued)
The
accompanying
notes
are
an
integral
part
of
these
financial
statements.
Annual
Report
a
Year
Ended
December
31,
2024
2023
2022
2021
2020
Class
C
Per
share
operating
performance
(for
a
share
outstanding
throughout
the
year)
Net
asset
value,
beginning
of
year
...................
$20.68
$17.34
$23.94
$21.57
$19.76
Income
from
investment
operations
a
:
Net
investment
(loss)
b,c
..........................
(0.07)
(0.05)
(0.10)
(0.01)
(0.03)
Net
realized
and
unrealized
gains
(losses)
...........
2.95
4.21
(5.05)
3.20
3.25
Total
from
investment
operations
....................
2.88
4.16
(5.15)
3.19
3.22
Less
distributions
from:
Net
investment
income
..........................
(0.02)
(0.03)
(—)
d
(0.11)
(0.03)
Net
realized
gains
.............................
(1.23)
(0.79)
(1.45)
(0.71)
(1.38)
Total
distributions
...............................
(1.25)
(0.82)
(1.45)
(0.82)
(1.41)
Net
asset
value,
end
of
year
.......................
$22.31
$20.68
$17.34
$23.94
$21.57
Total
return
e
...................................
14.08%
24.38%
(21.44)%
14.88%
17.41%
Ratios
to
average
net
assets
Expenses
f
,g
....................................
1.14%
1.15%
1.16%
1.17%
1.18%
Net
investment
(loss)
c
............................
(0.33)%
(0.26)%
(0.53)%
(0.05)%
(0.18)%
Supplemental
data
Net
assets,
end
of
year
(000’s)
.....................
$40,821
$41,410
$39,781
$61,517
$73,513
Portfolio
turnover
rate
............................
10.38%
6.51%
9.00%
3.58%
9.29%
a
The
amount
shown
for
a
share
outstanding
throughout
the
period
may
not
correlate
with
the
Statement
of
Operations
for
the
period
due
to
the
timing
of
sales
and
repurchases
of
the
Fund’s
shares
in
relation
to
income
earned
and/or
fluctuating
fair
value
of
the
investments
of
the
Fund.
b
Based
on
average
daily
shares
outstanding.
c
Recognition
of
net
investment
income
by
the
Fund
is
affected
by
the
timing
of
declaration
of
dividends
by
the
Underlying
Funds
in
which
the
Fund
invests.
d
Amount
rounds
to
less
than
$0.01
per
share.
e
Total
return
does
not
reflect
sales
commissions
or
contingent
deferred
sales
charges,
if
applicable.
f
Benefit
of
waiver
and
payments
by
affiliates
rounds
to
less
than
0.01%.
g
Does
not
include
expenses
of
the
Underlying
Funds
in
which
the
Fund
invests.
The
weighted
average
indirect
expenses
of
the
Underlying
Funds
was
0.62%
for
the
year
ended
December
31,
2024.
Franklin
Fund
Allocator
Series
Financial
Highlights
Franklin
Corefolio
Allocation
Fund
(continued)
Annual
Report
The
accompanying
notes
are
an
integral
part
of
these
financial
statements.
a
Year
Ended
December
31,
2024
2023
2022
2021
2020
Class
R
Per
share
operating
performance
(for
a
share
outstanding
throughout
the
year)
Net
asset
value,
beginning
of
year
...................
$21.34
$17.81
$24.42
$21.95
$20.07
Income
from
investment
operations
a
:
Net
investment
income
b,c
........................
0.06
0.07
0.01
0.16
0.07
Net
realized
and
unrealized
gains
(losses)
...........
3.03
4.32
(5.17)
3.21
3.32
Total
from
investment
operations
....................
3.09
4.39
(5.16)
3.37
3.39
Less
distributions
from:
Net
investment
income
..........................
(0.14)
(0.07)
(—)
d
(0.19)
(0.13)
Net
realized
gains
.............................
(1.23)
(0.79)
(1.45)
(0.71)
(1.38)
Total
distributions
...............................
(1.37)
(0.86)
(1.45)
(0.90)
(1.51)
Net
asset
value,
end
of
year
.......................
$23.06
$21.34
$17.81
$24.42
$21.95
Total
return
....................................
14.64%
25.05%
(21.04)%
15.46%
18.00%
Ratios
to
average
net
assets
Expenses
e
,f
....................................
0.64%
0.65%
0.66%
0.66%
0.67%
Net
investment
income
c
...........................
0.25%
0.35%
0.04%
0.68%
0.38%
Supplemental
data
Net
assets,
end
of
year
(000’s)
.....................
$2,257
$1,935
$1,488
$1,764
$1,498
Portfolio
turnover
rate
............................
10.38%
6.51%
9.00%
3.58%
9.29%
a
The
amount
shown
for
a
share
outstanding
throughout
the
period
may
not
correlate
with
the
Statement
of
Operations
for
the
period
due
to
the
timing
of
sales
and
repurchases
of
the
Fund’s
shares
in
relation
to
income
earned
and/or
fluctuating
fair
value
of
the
investments
of
the
Fund.
b
Based
on
average
daily
shares
outstanding.
c
Recognition
of
net
investment
income
by
the
Fund
is
affected
by
the
timing
of
declaration
of
dividends
by
the
Underlying
Funds
in
which
the
Fund
invests.
d
Amount
rounds
to
less
than
$0.01
per
share.
e
Benefit
of
waiver
and
payments
by
affiliates
rounds
to
less
than
0.01%.
f
Does
not
include
expenses
of
the
Underlying
Funds
in
which
the
Fund
invests.
The
weighted
average
indirect
expenses
of
the
Underlying
Funds
was
0.62%
for
the
year
ended
December
31,
2024.
Franklin
Fund
Allocator
Series
Financial
Highlights
Franklin
Corefolio
Allocation
Fund
(continued)
The
accompanying
notes
are
an
integral
part
of
these
financial
statements.
Annual
Report
A
Year
Ended
December
31,
2024
2023
2022
2021
2020
Class
R6
Per
share
operating
performance
(for
a
share
outstanding
throughout
the
year)
Net
asset
value,
beginning
of
year
...................
$21.49
$17.92
$24.52
$21.97
$20.07
Income
from
investment
operations
a
:
Net
investment
income
b,c
........................
0.13
0.18
0.12
0.30
0.21
Net
realized
and
unrealized
gains
(losses)
...........
3.12
4.36
(5.19)
3.23
3.31
Total
from
investment
operations
....................
3.25
4.54
(5.07)
3.53
3.52
Less
distributions
from:
Net
investment
income
..........................
(0.26)
(0.18)
(0.08)
(0.27)
(0.24)
Net
realized
gains
.............................
(1.23)
(0.79)
(1.45)
(0.71)
(1.38)
Total
distributions
...............................
(1.49)
(0.97)
(1.53)
(0.98)
(1.62)
Net
asset
value,
end
of
year
.......................
$23.25
$21.49
$17.92
$24.52
$21.97
Total
return
....................................
15.28%
25.74%
(20.60)%
16.16%
18.69%
Ratios
to
average
net
assets
Expenses
before
waiver
and
payments
by
affiliates
d
.....
0.14%
0.11%
0.13%
0.13%
0.13%
Expenses
net
of
waiver
and
payments
by
affiliates
d
......
0.08%
0.09%
0.08%
0.09%
0.09%
Net
investment
income
c
...........................
0.55%
0.92%
0.62%
1.26%
1.05%
Supplemental
data
Net
assets,
end
of
year
(000’s)
.....................
$3,826
$4,966
$4,379
$5,349
$4,393
Portfolio
turnover
rate
............................
10.38%
6.51%
9.00%
3.58%
9.29%
a
The
amount
shown
for
a
share
outstanding
throughout
the
period
may
not
correlate
with
the
Statement
of
Operations
for
the
period
due
to
the
timing
of
sales
and
repurchases
of
the
Fund’s
shares
in
relation
to
income
earned
and/or
fluctuating
fair
value
of
the
investments
of
the
Fund.
b
Based
on
average
daily
shares
outstanding.
c
Recognition
of
net
investment
income
by
the
Fund
is
affected
by
the
timing
of
declaration
of
dividends
by
the
Underlying
Funds
in
which
the
Fund
invests.
d
Does
not
include
expenses
of
the
Underlying
Funds
in
which
the
Fund
invests.
The
weighted
average
indirect
expenses
of
the
Underlying
Funds
was
0.62%
for
the
year
ended
December
31,
2024.
Franklin
Fund
Allocator
Series
Financial
Highlights
Franklin
Corefolio
Allocation
Fund
(continued)
Annual
Report
The
accompanying
notes
are
an
integral
part
of
these
financial
statements.
a
Year
Ended
December
31,
2024
2023
2022
2021
2020
Advisor
Class
Per
share
operating
performance
(for
a
share
outstanding
throughout
the
year)
Net
asset
value,
beginning
of
year
...................
$21.49
$17.93
$24.52
$21.98
$20.08
Income
from
investment
operations
a
:
Net
investment
income
b,c
........................
0.17
0.16
0.09
0.28
0.17
Net
realized
and
unrealized
gains
(losses)
...........
3.07
4.36
(5.17)
3.22
3.34
Total
from
investment
operations
....................
3.24
4.52
(5.08)
3.50
3.51
Less
distributions
from:
Net
investment
income
..........................
(0.25)
(0.17)
(0.06)
(0.25)
(0.23)
Net
realized
gains
.............................
(1.23)
(0.79)
(1.45)
(0.71)
(1.38)
Total
distributions
...............................
(1.48)
(0.96)
(1.51)
(0.96)
(1.61)
Net
asset
value,
end
of
year
.......................
$23.25
$21.49
$17.93
$24.52
$21.98
Total
return
....................................
15.24%
25.58%
(20.63)%
16.05%
18.59%
Ratios
to
average
net
assets
Expenses
d,e
....................................
0.14%
0.15%
0.16%
0.17%
0.18%
Net
investment
income
c
...........................
0.71%
0.83%
0.48%
1.16%
0.90%
Supplemental
data
Net
assets,
end
of
year
(000’s)
.....................
$67,797
$59,702
$48,963
$69,322
$61,166
Portfolio
turnover
rate
............................
10.38%
6.51%
9.00%
3.58%
9.29%
a
The
amount
shown
for
a
share
outstanding
throughout
the
period
may
not
correlate
with
the
Statement
of
Operations
for
the
period
due
to
the
timing
of
sales
and
repurchases
of
the
Fund’s
shares
in
relation
to
income
earned
and/or
fluctuating
fair
value
of
the
investments
of
the
Fund.
b
Based
on
average
daily
shares
outstanding.
c
Recognition
of
net
investment
income
by
the
Fund
is
affected
by
the
timing
of
declaration
of
dividends
by
the
Underlying
Funds
in
which
the
Fund
invests.
d
Benefit
of
waiver
and
payments
by
affiliates
rounds
to
less
than
0.01%.
e
Does
not
include
expenses
of
the
Underlying
Funds
in
which
the
Fund
invests.
The
weighted
average
indirect
expenses
of
the
Underlying
Funds
was
0.62%
for
the
year
ended
December
31,
2024.
Franklin
Fund
Allocator
Series
Schedule
of
Investments,
December
31,
2024
Franklin
Corefolio
Allocation
Fund
The
accompanying
notes
are
an
integral
part
of
these
financial
statements.
Annual
Report
a
a
Shares
a
Value
a
Investments
In
Underlying
Funds
99.9%
Domestic
Equity
76.4%
a
Franklin
Growth
Fund
,
Class
R6
........................................
1,850,854
$
249,254,536
a,b
Franklin
Growth
Opportunities
Fund
,
Class
R6
.............................
4,542,945
262,809,393
a
Franklin
Mutual
Shares
Fund
,
Class
R6
...................................
9,648,696
240,349,025
752,412,954
Foreign
Equity
23.5%
a
Templeton
Growth
Fund,
Inc.
,
Class
R6
...................................
8,790,958
231,465,919
Total
Investments
In
Underlying
Funds
(Cost
$
625,117,497
)
......................
983,878,873
a
a
a
a
Short
Term
Investments
0.0%
†
a
Money
Market
Funds
0.0%
†
a,c
Institutional
Fiduciary
Trust
-
Money
Market
Portfolio
,
4.183
%
..................
1,104
1,104
Total
Money
Market
Funds
(Cost
$
1,104
)
.......................................
1,104
Total
Short
Term
Investments
(Cost
$
1,104
)
....................................
1,104
a
Total
Investments
(Cost
$
625,118,601
)
99.9
%
...................................
$983,879,977
Other
Assets,
less
Liabilities
0.1
%
.............................................
494,154
Net
Assets
100.0%
...........................................................
$984,374,131
†
Rounds
to
less
than
0.1%
of
net
assets.
a
See
Note
3(e)
regarding
investments
in
FT
Underlying
Funds.
b
Non-income
producing.
c
The
rate
shown
is
the
annualized
seven-day
effective
yield
at
period
end.
Franklin
Fund
Allocator
Series
Financial
Statements
Statement
of
Assets
and
Liabilities
December
31,
2024
Annual
Report
The
accompanying
notes
are
an
integral
part
of
these
financial
statements.
Franklin
Corefolio
Allocation
Fund
Assets:
Investments
in
securities:
Cost
-
Non-controlled
affiliates
(Note
3
e
)
........................................................
$625,118,601
Value
-
Non-controlled
affiliates
(Note
3
e
)
.......................................................
983,879,977
Receivables:
Investment
securities
sold
...................................................................
1,533,249
Capital
shares
sold
........................................................................
120,481
Dividends
...............................................................................
1,104
Affiliates
................................................................................
84
Total
assets
..........................................................................
985,534,895
Liabilities:
Payables:
Capital
shares
redeemed
...................................................................
280,287
Administrative
fees
........................................................................
25,866
Distribution
fees
..........................................................................
227,072
Transfer
agent
fees
........................................................................
210,200
Trustees'
fees
and
expenses
.................................................................
207
Funds
advanced
by
custodian
.................................................................
335,373
Accrued
expenses
and
other
liabilities
...........................................................
81,759
Total
liabilities
.........................................................................
1,160,764
Net
assets,
at
value
.................................................................
$984,374,131
Net
assets
consist
of:
Paid-in
capital
.............................................................................
$572,665,725
Total
distributable
earnings
(losses)
.............................................................
411,708,406
Net
assets,
at
value
.................................................................
$984,374,131
Franklin
Fund
Allocator
Series
Financial
Statements
Statement
of
Assets
and
Liabilities
(continued)
December
31,
2024
The
accompanying
notes
are
an
integral
part
of
these
financial
statements.
Annual
Report
Franklin
Corefolio
Allocation
Fund
Class
A:
Net
assets,
at
value
.......................................................................
$869,673,423
Shares
outstanding
........................................................................
37,594,107
Net
asset
value
per
share
a
,b
..................................................................
$23.13
Maximum
offering
price
per
share
(net
asset
value
per
share
÷
94
.50
%
)
b
................................
$24.48
Class
C:
Net
assets,
at
value
.......................................................................
$40,821,139
Shares
outstanding
........................................................................
1,829,608
Net
asset
value
and
maximum
offering
price
per
share
a
,b
............................................
$22.31
Class
R:
Net
assets,
at
value
.......................................................................
$2,256,878
Shares
outstanding
........................................................................
97,880
Net
asset
value
and
maximum
offering
price
per
share
b
.............................................
$23.06
Class
R6:
Net
assets,
at
value
.......................................................................
$3,825,762
Shares
outstanding
........................................................................
164,529
Net
asset
value
and
maximum
offering
price
per
share
b
.............................................
$23.25
Advisor
Class:
Net
assets,
at
value
.......................................................................
$67,796,929
Shares
outstanding
........................................................................
2,916,096
Net
asset
value
and
maximum
offering
price
per
share
b
.............................................
$23.25
a
Redemption
price
is
equal
to
net
asset
value
less
contingent
deferred
sales
charges,
if
applicable.
b
Net
asset
value
per
share
may
not
recalculate
due
to
rounding.
Franklin
Fund
Allocator
Series
Financial
Statements
Statement
of
Operations
for
the
year
ended
December
31,
2024
Annual
Report
The
accompanying
notes
are
an
integral
part
of
these
financial
statements.
Franklin
Corefolio
Allocation
Fund
Investment
income:
Dividends:
Non-controlled
affiliates
(Note
3
e
)
.............................................................
$8,301,210
Expenses:
Administrative
fees
(Note
3
a
)
..................................................................
294,881
Distribution
fees:
(Note
3b
)
Class
A
................................................................................
2,164,900
Class
C
................................................................................
424,314
Class
R
................................................................................
10,604
Transfer
agent
fees:
(Note
3d
)
Class
A
................................................................................
784,553
Class
C
................................................................................
38,450
Class
R
................................................................................
1,920
Class
R6
...............................................................................
4,604
Advisor
Class
............................................................................
60,958
Reports
to
shareholders
fees
..................................................................
57,887
Registration
and
filing
fees
....................................................................
98,776
Professional
fees
...........................................................................
59,122
Trustees'
fees
and
expenses
..................................................................
10,365
Other
....................................................................................
1,344
Total
expenses
.........................................................................
4,012,678
Expenses
waived/paid
by
affiliates
(Note
3
e
and
3
f
)
..............................................
(3,682)
Net
expenses
.........................................................................
4,008,996
Net
investment
income
................................................................
4,292,214
Realized
and
unrealized
gains
(losses):
Net
realized
gain
(loss)
from:
Investments:
Non-controlled
affiliates
(Note
3
e
)
...........................................................
11,709,010
Capital
gain
distributions
from
Underlying
Funds:
Non-controlled
affiliates
(Note
3
e
)
...........................................................
61,867,817
Net
realized
gain
(loss)
..................................................................
73,576,827
Net
change
in
unrealized
appreciation
(depreciation)
on:
Investments:
Non-controlled
affiliates
(Note
3
e
)
...........................................................
56,516,323
Net
realized
and
unrealized
gain
(loss)
............................................................
130,093,150
Net
increase
(decrease)
in
net
assets
resulting
from
operations
..........................................
$134,385,364
Franklin
Fund
Allocator
Series
Financial
Statements
Statements
of
Changes
in
Net
Assets
The
accompanying
notes
are
an
integral
part
of
these
financial
statements.
Annual
Report
Franklin
Corefolio
Allocation
Fund
Year
Ended
December
31,
2024
Year
Ended
December
31,
2023
Increase
(decrease)
in
net
assets:
Operations:
Net
investment
income
.................................................
$4,292,214
$4,451,007
Net
realized
gain
(loss)
.................................................
73,576,827
45,150,803
Net
change
in
unrealized
appreciation
(depreciation)
...........................
56,516,323
141,234,240
Net
increase
(decrease)
in
net
assets
resulting
from
operations
................
134,385,364
190,836,050
Distributions
to
shareholders:
Class
A
.............................................................
(52,408,857)
(33,786,898)
Class
C
.............................................................
(2,330,249)
(1,730,998)
Class
R
.............................................................
(125,253)
(74,092)
Class
R6
............................................................
(323,118)
(223,016)
Advisor
Class
........................................................
(4,210,566)
(2,551,557)
Total
distributions
to
shareholders
..........................................
(59,398,043)
(38,366,561)
Capital
share
transactions:
(Note
2
)
Class
A
.............................................................
(1,803,386)
(19,272,974)
Class
C
.............................................................
(3,881,717)
(5,443,378)
Class
R
.............................................................
170,023
135,836
Class
R6
............................................................
(1,614,653)
(263,934)
Advisor
Class
........................................................
2,993,306
989,827
Total
capital
share
transactions
............................................
(4,136,427)
(23,854,623)
Net
increase
(decrease)
in
net
assets
...................................
70,850,894
128,614,866
Net
assets:
Beginning
of
year
.......................................................
913,523,237
784,908,371
End
of
year
...........................................................
$984,374,131
$913,523,237
Franklin
Fund
Allocator
Series
Notes
to
Financial
Statements
Franklin
Corefolio
Allocation
Fund
1.
Organization
and
Significant
Accounting
Policies
Franklin
Fund
Allocator
Series (Trust)
is
registered
under
the
Investment
Company
Act
of
1940
(1940
Act)
as
an
open-end
management
investment
company,
consisting
of eighteen
separate
funds.
The
Trust
follows
the
accounting
and
reporting
guidance
in
Financial
Accounting
Standards
Board
(FASB)
Accounting
Standards
Codification
Topic
946,
Financial
Services
–
Investment
Companies
(ASC
946)
and applies
the
specialized
accounting
and
reporting
guidance
in
U.S.
Generally
Accepted
Accounting
Principles
(U.S.
GAAP),
including,
but
not
limited
to,
ASC
946.
Franklin
Corefolio
Allocation
Fund
(Fund)
is
included
in
this
report.
The
Fund
invests
in
affiliated
mutual
funds
managed
by
Franklin
Templeton
(Underlying
Funds).
The
Fund
offers five
classes
of
shares:
Class
A,
Class
C,
Class
R,
Class
R6
and
Advisor
Class. Class
C
shares
automatically
convert
to
Class
A
shares
on
a
monthly
basis,
after
they
have
been
held
for
8
years.
Each
class
of
shares
may
differ
by
its
initial
sales
load,
contingent
deferred
sales
charges,
voting
rights
on
matters
affecting
a
single
class,
its
exchange
privilege
and
fees
due
to
differing
arrangements
for
distribution
and
transfer
agent
fees.
The
accounting
policies
of
the
Underlying
Funds
are
outlined
in
their
respective
shareholder
reports.
A
copy
of
the
Underlying
Funds’
shareholder
reports
is
available
on
the
U.S.
Securities
and
Exchange
Commission
(SEC)
website
at
sec.gov.
The
Underlying
Funds’
shareholder
reports
are
not
covered
by
this
report.
The
following
summarizes
the Fund's
significant
accounting
policies.
a.
Financial
Instrument
Valuation
The
Fund's
investments
in
financial
instruments
are
carried
at
fair
value
daily.
Fair
value
is
the
price
that
would
be
received
to
sell
an
asset
or
paid
to
transfer
a
liability
in
an
orderly
transaction
between
market
participants
on
the
measurement
date.
The
Fund
calculates
the
net
asset
value
(NAV)
per
share
each business
day as
of
4
p.m.
Eastern
time
or
the
regularly
scheduled
close
of
the
New
York
Stock
Exchange
(NYSE),
whichever
is
earlier.
Under
compliance
policies
and
procedures
approved
by
the Trust's
Board
of
Trustees
(the
Board),
the
Board
has
designated
the
Fund’s
investment
manager
as
the
valuation
designee
and
has
responsibility
for
oversight
of
valuation.
The
investment
manager
is
assisted
by
the
Fund’s
administrator
in
performing
this
responsibility,
including
leading
the
cross-
functional
Valuation
Committee
(VC).
The
Fund
may
utilize
independent
pricing
services,
quotations
from
securities
and
financial
instrument
dealers,
and
other
market
sources
to
determine
fair
value.
Investments
in open-end mutual
funds
are
valued
at
the
closing
NAV.
The
Fund
has
procedures
to
determine
the
fair
value
of
financial
instruments
for
which
market
prices
are
not
reliable
or
readily
available.
Under
these
procedures,
the Fund
primarily
employs
a
market-based
approach
which
may
use
related
or
comparable
assets
or
liabilities,
recent
transactions,
market
multiples,
and
other
relevant
information
for
the
investment
to
determine
the
fair
value
of
the
investment.
An
income-based
valuation
approach
may
also
be
used
in
which
the
anticipated
future
cash
flows
of
the
investment
are
discounted
to
calculate
fair
value.
Discounts
may
also
be
applied
due
to
the
nature
or
duration
of
any
restrictions
on
the
disposition
of
the
investments.
Due
to
the
inherent
uncertainty
of
valuations
of
such
investments,
the
fair
values
may
differ
significantly
from
the
values
that
would
have
been
used
had
an
active
market
existed.
b.
Income
Taxes
It
is the Fund's
policy
to
qualify
as
a
regulated
investment
company
under
the
Internal
Revenue
Code. The Fund
intends
to
distribute
to
shareholders
substantially
all
of
its
taxable
income
and
net
realized
gains
to
relieve
it
from
federal
income
and
excise
taxes.
As
a
result,
no
provision
for
U.S.
federal
income
taxes
is
required.
The Fund
may
recognize
an
income
tax
liability
related
to
its
uncertain
tax
positions
under
U.S.
GAAP
when
the
uncertain
tax
position
has
a
less
than
50%
probability
that
it
will
be
sustained
upon
examination
by
the
tax
authorities
based
on
its
technical
merits.
As
of
December
31,
2024, the Fund
has
determined
that
no
tax
liability
is
required
in
its
financial
statements
related
to
uncertain
tax
positions
for
any
open
tax
years
(or
expected
to
be
taken
in
future
tax
years).
Open
tax
years
are
those
that
remain
subject
to
examination
and
are
based
on
the
statute
of
limitations
in
each
jurisdiction
in
which
the Fund
invests.
c.
Security
Transactions,
Investment
Income,
Expenses
and
Distributions
Security
transactions
are
accounted
for
on
trade
date.
Realized
gains
and
losses
on
security
transactions
are
determined
on
a
specific
identification
basis. Estimated
Franklin
Fund
Allocator
Series
Notes
to
Financial
Statements
Franklin
Corefolio
Allocation
Fund
(continued)
expenses
are
accrued
daily.
Dividend
income
and
capital
gain
distributions
by
Underlying
Funds
are
recorded
on
the
ex-dividend
date.
Distributions
to
shareholders
are recorded
on
the
ex-dividend
date.
Distributable
earnings
are
determined
according
to
income
tax
regulations
(tax
basis)
and
may
differ
from
earnings
recorded
in
accordance
with
U.S.
GAAP.
These
differences
may
be
permanent
or
temporary.
Permanent
differences
are
reclassified
among
capital
accounts
to
reflect
their
tax
character.
These
reclassifications
have
no
impact
on
net
assets
or
the
results
of
operations.
Temporary
differences
are
not
reclassified,
as
they
may
reverse
in
subsequent
periods.
Common
expenses
incurred
by
the
Trust
are
allocated
among
the
Funds
based
on
the
ratio
of
net
assets
of
each
Fund
to
the
combined
net
assets
of
the
Trust
or
based
on
the
ratio
of
number
of
shareholders
of
each
Fund
to
the
combined
number
of
shareholders
of
the
Trust.
Fund
specific
expenses
are
charged
directly
to
the
Fund
that
incurred
the
expense.
The
Fund
indirectly
bears
its
proportionate
share
of
expenses
from
the
Underlying
Funds.
Since
the
Underlying
Funds
have
varied
expense
levels
and
the
Fund may
own
different
proportions
of
the
Underlying
Funds
at
different
times,
the
amount
of
expenses
incurred
indirectly
by
the Fund
will
vary.
Realized
and
unrealized
gains
and
losses
and
net
investment
income,
excluding
class
specific
expenses,
are
allocated
daily
to
each
class
of
shares
based
upon
the
relative
proportion
of
net
assets
of
each
class.
Differences
in
per
share
distributions
by
class
are
generally
due
to
differences
in
class
specific
expenses.
d.
Accounting
Estimates
The
preparation
of
financial
statements
in
accordance
with
U.S.
GAAP
requires
management
to
make
estimates
and
assumptions
that
affect
the
reported
amounts
of
assets
and
liabilities
at
the
date
of
the
financial
statements
and
the
amounts
of
income
and
expenses
during
the
reporting
period.
Actual
results
could
differ
from
those
estimates.
e.
Guarantees
and
Indemnifications
Under
the Trust's
organizational
documents,
its
officers
and trustees
are
indemnified
by
the Trust against
certain
liabilities
arising
out
of
the
performance
of
their
duties
to
the
Trust.
Additionally,
in
the
normal
course
of
business,
the Trust,
on
behalf
of
the
Fund, enters
into
contracts
with
service
providers
that
contain
general
indemnification
clauses.
The Trust's
maximum
exposure
under
these
arrangements
is
unknown
as
this
would
involve
future
claims
that
may
be
made
against
the Trust
that
have
not
yet
occurred.
Currently,
the Trust
expects
the
risk
of
loss
to
be
remote.
2.
Shares
of
Beneficial
Interest
At
December
31,
2024,
there
were
an
unlimited
number
of
shares
authorized
(without
par
value).
Transactions
in
the
Fund's
shares
were
as
follows:
Year
Ended
December
31,
2024
Year
Ended
December
31,
2023
Shares
Amount
Shares
Amount
Class
A
Shares:
Shares
sold
a
...................................
2,702,482
$62,501,396
3,830,947
$74,525,445
Shares
issued
in
reinvestment
of
distributions
..........
2,247,575
51,472,241
1,666,077
33,143,401
Shares
redeemed
...............................
(5,005,189)
(115,777,023)
(6,518,373)
(126,941,820)
Net
increase
(decrease)
..........................
(55,132)
$(1,803,386)
(1,021,349)
$(19,272,974)
1.
Organization
and
Significant
Accounting
Policies
(continued)
c.
Security
Transactions,
Investment
Income,
Expenses
and
Distributions
(continued)
Franklin
Fund
Allocator
Series
Notes
to
Financial
Statements
Franklin
Corefolio
Allocation
Fund
(continued)
3.
Transactions
with
Affiliates
Franklin
Resources,
Inc.
is
the
holding
company
for
various
subsidiaries
that
together
are
referred
to
as
Franklin
Templeton.
Certain
officers
and
trustees
of
the
Fund are
also
officers,
directors, and/or trustees
of
certain
of
the
Underlying
Funds
and
of
the
following
subsidiaries:
a.
Administrative
Fees
The
Fund
pays
an
administrative
fee
to
FT
Services
of
0.03%
per
year
of
the
average
daily
net
assets of
the
Fund for
administrative
services
including
monitoring
and
rebalancing
the
percentage
of the
Fund's
investment
in
the
Underlying
Funds.
Year
Ended
December
31,
2024
Year
Ended
December
31,
2023
Shares
Amount
Shares
Amount
Class
C
Shares:
Shares
sold
...................................
243,389
$5,393,113
506,642
$9,501,220
Shares
issued
in
reinvestment
of
distributions
..........
105,273
2,315,710
90,386
1,724,635
Shares
redeemed
a
..............................
(521,261)
(11,590,540)
(888,929)
(16,669,233)
Net
increase
(decrease)
..........................
(172,599)
$(3,881,717)
(291,901)
$(5,443,378)
Class
R
Shares:
Shares
sold
...................................
6,916
$159,339
47,557
$928,639
Shares
issued
in
reinvestment
of
distributions
..........
5,491
125,253
3,751
74,092
Shares
redeemed
...............................
(5,210)
(114,569)
(44,144)
(866,895)
Net
increase
(decrease)
..........................
7,197
$170,023
7,164
$135,836
Class
R6
Shares:
Shares
sold
...................................
29,445
$692,133
73,257
$1,441,873
Shares
issued
in
reinvestment
of
distributions
..........
13,992
322,070
11,056
222,203
Shares
redeemed
...............................
(109,964)
(2,628,856)
(97,597)
(1,928,010)
Net
increase
(decrease)
..........................
(66,527)
$(1,614,653)
(13,284)
$(263,934)
Advisor
Class
Shares:
Shares
sold
...................................
533,407
$12,237,907
489,426
$9,622,126
Shares
issued
in
reinvestment
of
distributions
..........
166,182
3,830,162
114,135
2,292,689
Shares
redeemed
...............................
(561,105)
(13,074,763)
(557,442)
(10,924,988)
Net
increase
(decrease)
..........................
138,484
$2,993,306
46,119
$989,827
a
May
include
a
portion
of
Class
C
shares
that
were
automatically
converted
to
Class
A.
Subsidiary
Affiliation
Franklin
Advisers,
Inc.
(Advisers)
Investment
manager
Franklin
Templeton
Services,
LLC
(FT
Services)
Administrative
manager
Franklin
Distributors,
LLC
(Distributors)
Principal
underwriter
Franklin
Templeton
Investor
Services,
LLC
(Investor
Services)
Transfer
agent
2.
Shares
of
Beneficial
Interest
(continued)
Franklin
Fund
Allocator
Series
Notes
to
Financial
Statements
Franklin
Corefolio
Allocation
Fund
(continued)
b.
Distribution
Fees
The
Board
has
adopted
distribution
plans
for
each
share
class,
with
the
exception
of
Class
R6
and
Advisor
Class
shares,
pursuant
to
Rule
12b-1
under
the
1940
Act.
Under
the
Fund's
Class
A
reimbursement
distribution
plan,
the
Fund
reimburses
Distributors
for
costs
incurred
in
connection
with
the
servicing,
sale
and
distribution
of the
Fund's
shares
up
to
the
maximum
annual
plan
rate.
Under
the
Class
A
reimbursement
distribution
plan,
costs
exceeding
the
maximum
for
the
current
plan
year
cannot
be
reimbursed
in
subsequent
periods.
In
addition,
under
the
Fund's
Class
C
and
R compensation
distribution
plans,
the
Fund
pays
Distributors
for
costs
incurred
in
connection
with
the
servicing,
sale
and
distribution
of
the
Fund's
shares
up
to
the
maximum
annual
plan
rate
for
each
class.
The
plan
year,
for
purposes
of
monitoring
compliance
with
the
maximum
annual
plan
rates,
is
February
1
through
January
31.
The
maximum
annual
plan
rates,
based
on
the
average
daily
net
assets,
for
each
class,
are
as
follows:
The
Board
has
set
the
current
rate
at
0.25%
per
year
for
Class
A
shares
until
further
notice
and
approval
by
the
Board.
c.
Sales
Charges/Underwriting
Agreements
Front-end
sales
charges
and
contingent
deferred
sales
charges
(CDSC)
do
not
represent
expenses
of
the
Fund.
These
charges
are
deducted
from
the
proceeds
of
sales
of
fund
shares
prior
to
investment
or
from
redemption
proceeds
prior
to
remittance,
as
applicable.
Distributors
has
advised
the
Fund
of
the
following
commission
transactions
related
to
the
sales
and
redemptions
of
the
Fund's
shares
for
the
year:
d.
Transfer
Agent
Fees
Each
class
of
shares
pays
transfer
agent
fees,
calculated
monthly
and
paid
monthly, to
Investor
Services
for
its
performance
of
shareholder
servicing
obligations. The
fees
are based
on
a
fixed
margin
earned
by
Investor
Services
and
are allocated
to
the Fund
based
upon
relative
assets
and
relative
transactions. In
addition,
each
class reimburses
Investor
Services
for
out
of
pocket
expenses
incurred
and,
except
for
Class
R6, reimburses
shareholder
servicing
fees
paid
to
third
parties.
These
fees
paid
to
third
parties
are
accrued
and
allocated
daily
based
upon
their
relative
proportion
of
such
classes'
aggregate
net
assets.
Class
R6
pays
Investor
Services
transfer
agent
fees
allocated
specifically
to
that
class
based
upon
its
relative
assets
and
relative
transactions.
For
the
year
ended
December
31,
2024,
the Fund
paid
transfer
agent
fees
as
noted
in
the
Statement of
Operations,
of
which
$378,654
was
retained
by
Investor
Services.
e.
Investments
in
FT
Underlying
Funds
The Fund
invests in
Underlying
Funds
which
are
managed
by
Advisers,
an
affiliate
of
FT
Services
or by
an
affiliate
of
Advisers.
As
defined
in
the
1940
Act,
an
investment
is
deemed
to
be
a
“Controlled
Affiliate”
of
a
fund
when
a
fund
owns,
either
directly
or
indirectly,
25%
or
more
of
the
Underlying
Fund’s
outstanding
shares
or
has
the
power
to
exercise
control
over
management
or
policies
of
such
Underlying
Fund.
The
Fund
does
not
invest
in
Underlying
Funds
for
the
purpose
of
exercising
a
controlling
influence
over
the
management
or
policies.
Administrative
fees
paid
by
the Fund
are
waived
on
assets
invested
in
the
Underlying
Funds,
as
noted
in
the
Statement of
Operations,
in
an
amount
not
to
exceed
the
management
and
administrative
fees
paid
directly
or
indirectly by
the
Underlying
Funds.
Class
A
....................................................................................
0.35%
Class
C
....................................................................................
1.00%
Class
R
....................................................................................
0.50%
Sales
charges
retained
net
of
commissions
paid
to
unaffiliated
brokers/dealers
..............................
$99,418
CDSC
retained
..............................................................................
$3,125
3.
Transactions
with
Affiliates
(continued)
Franklin
Fund
Allocator
Series
Notes
to
Financial
Statements
Franklin
Corefolio
Allocation
Fund
(continued)
Investments
in
Underlying
Funds
for
the
year
ended
December
31,
2024,
were
as
follows:
f.
Waiver
and
Expense
Reimbursements
Transfer
agent
fees
on
Class
R6
shares
of
the
Fund have
been
capped
so
that
transfer
agent
fees
for
that
class
do
not
exceed
0.03%
based
on
the
average
net
assets
of
the
class
until
April
30,
2025.
4.
Income
Taxes
The
tax
character
of
distributions
paid
during
the
years
ended
December
31,
2024
and
2023,
was
as
follows:
At
December
31,
2024,
the
cost
of
investments,
net
unrealized
appreciation
(depreciation),
undistributed
ordinary
income
and
undistributed
long
term
capital
gains for
income
tax
purposes
were
as
follows:
aa
Value
at
Beginning
of
Year
Purchases
Sales
Realized
Gain
(Loss)
Net
Change
in
Unrealized
Appreciation
(Depreciation)
Value
at
End
of
Year
Number
of
Shares
Held
at
End
of
Year
Dividend
Income
a
a
a
a
a
a
a
a
a
Franklin
Corefolio
Allocation
Fund
Non-Controlled
Affiliates
Franklin
Growth
Fund,
Class
R6
.
$
230,947,089
$
19,860,951
$
(22,334,626)
$
3,147,754
$
17,633,368
$
249,254,536
1,850,854
$
19,860,954
a
Franklin
Growth
Opportunities
Fund,
Class
R6
............
251,269,180
21,816,187
(46,162,291)
6,170,382
29,715,935
262,809,393
4,542,945
21,816,187
a
Franklin
Mutual
Shares
Fund,
Class
R6
.....................
209,518,825
42,715,645
(16,608,584)
1,136,183
3,586,956
240,349,025
9,648,696
21,566,060
a
Institutional
Fiduciary
Trust
-
Money
Market
Portfolio,
4.183%
......
1,179
22,725,414
(22,725,489)
—
—
1,104
1,104
8,605
Templeton
Growth
Fund,
Inc.,
Class
R6
.....................
222,226,088
18,946,742
(16,541,666)
1,254,691
5,580,064
231,465,919
8,790,958
6,917,221
a
Total
Non-Controlled
Affiliates
$913,962,361
$126,064,939
$(124,372,656)
$11,709,010
$56,516,323
$983,879,977
$70,169,027
a
Total
Affiliated
Securities
....
$913,962,361
$126,064,939
$(124,372,656)
$11,709,010
$56,516,323
$983,879,977
$70,169,027
a
Dividend
income
includes
capital
gain
distributions
received,
if
any,
from
underlying
funds,
and
are
presented
in
corresponding
line
item
in
the
Statement
of
Operations.
2024
2023
Distributions
paid
from:
Ordinary
income
..........................................................
$12,836,918
$4,980,979
Long
term
capital
gain
......................................................
46,561,125
33,385,582
$59,398,043
$38,366,561
Cost
of
investments
..........................................................................
$632,674,744
Unrealized
appreciation
........................................................................
$358,761,376
Unrealized
depreciation
........................................................................
(7,556,143)
Net
unrealized
appreciation
(depreciation)
..........................................................
$351,205,233
3.
Transactions
with
Affiliates
(continued)
e.
Investments
in
FT
Underlying
Funds
(continued)
Franklin
Fund
Allocator
Series
Notes
to
Financial
Statements
Franklin
Corefolio
Allocation
Fund
(continued)
Differences
between
income
and/or
capital
gains
as
determined
on
a
book
basis
and
a
tax
basis
are
primarily
due
to
differing
treatments
of
wash
sales
and
regulated
investment
companies.
The
Fund
utilized
a
tax
accounting
practice
to
treat
a
portion
of
the
proceeds
from
capital
shares
redeemed
as
a
distribution
from
realized
capital
gains.
5.
Investment
Transactions
Purchases
and
sales
of
investments (excluding
short
term
securities) for
the
year
ended
December
31,
2024,
aggregated
$103,339,526 and
$101,647,167,
respectively.
6.
Credit
Facility
The
Fund,
together
with
other
U.S.
registered
and
foreign
investment
funds
(collectively,
Borrowers),
managed
by
Franklin
Templeton,
are
borrowers
in
a
joint
syndicated
senior
unsecured
credit
facility
totaling
$2.675
billion
(Global
Credit
Facility)
which
matured
on
January
31,
2025.
This
Global
Credit
Facility
provides
a
source
of
funds
to
the
Borrowers
for
temporary
and
emergency
purposes,
including
the
ability
to
meet
future
unanticipated
or
unusually
large
redemption
requests.
Effective
January
31,
2025,
the
Borrowers
renewed
the
Global
Credit
Facility
for
a
one-year
term,
maturing
January
30,
2026,
for
a
total
of
$2.995
billion.
Under
the
terms
of
the
Global
Credit
Facility,
the
Fund
may,
in
addition
to
interest
charged
on
any
borrowings
made
by
the
Fund
and
other
costs
incurred
by
the
Fund,
pay
its
share
of
fees
and
expenses
incurred
in
connection
with
the
implementation
and
maintenance
of
the
Global
Credit
Facility,
based
upon
its
relative
share
of
the
aggregate
net
assets
of
all
of
the
Borrowers,
including
an
annual
commitment
fee
of
0.15%
based
upon
the
unused
portion
of
the
Global
Credit
Facility.
These
fees
are
reflected
in
other
expenses
in
the
Statement
of
Operations.
During
the
year
ended
December
31,
2024,
the Fund
did
not
use
the
Global
Credit
Facility.
7.
Fair
Value
Measurements
The
Fund
follows
a
fair
value
hierarchy
that
distinguishes
between
market
data
obtained
from
independent
sources
(observable
inputs)
and
the Fund's
own
market
assumptions
(unobservable
inputs).
These
inputs
are
used
in
determining
the
value
of
the
Fund's financial
instruments
and
are
summarized
in
the
following
fair
value
hierarchy:
Level
1
–
quoted
prices
in
active
markets
for
identical
financial
instruments
Level
2
–
other
significant
observable
inputs
(including
quoted
prices
for
similar
financial
instruments,
interest
rates,
prepayment
speed,
credit
risk,
etc.)
Level
3
–
significant
unobservable
inputs
(including
the
Fund's
own
assumptions
in
determining
the
fair
value
of
financial
instruments)
Distributable
earnings:
Undistributed
ordinary
income
...................................................................
$629,541
Undistributed
long
term
capital
gains
..............................................................
59,873,632
Total
distributable
earnings
.....................................................................
$60,503,173
Franklin
Fund
Allocator
Series
Notes
to
Financial
Statements
Franklin
Corefolio
Allocation
Fund
(continued)
The
input
levels
are
not
necessarily
an
indication
of
the
risk
or
liquidity
associated
with
financial
instruments
at
that
level.
At
December
31,
2024,
all
of
the Fund's
investments
in
financial
instruments
carried
at
fair
value
were
valued
using
Level 1
inputs.
8.
Operating
Segments
The Fund
has adopted
the
FASB
Accounting
Standards
Update
(ASU)
2023-07,
Segment
Reporting
(Topic
280)
-
Improvements
to
Reportable
Segment
Disclosures.
The
update
is
limited
to
disclosure
requirements
and
does
not
impact
the
Fund’s
financial
position
or
results
of
operations.
The
Fund
operates
as
a
single
operating
segment,
which
is
an
investment
portfolio.
The
Fund's
Investment
manager
serves
as
the
Chief
Operating
Decision
Maker
(CODM),
evaluating
fund-wide
results
and
performance
under
a
unified
investment
strategy.
The
CODM
uses
these
measures
to
assess
fund
performance
and
allocate
resources
effectively.
Internal
reporting
provided
to
the
CODM
aligns
with
the
accounting
policies
and
measurement
principles
used
in
the financial
statements.
For
information
regarding
segment
assets,
segment
profit
or
loss,
and
significant
expenses,
refer
to
the Statement
of
Assets
and
Liabilities
and
the Statement
of
Operations,
along
with
the
related
notes
to
the financial
statements.
The Schedule
of
Investments
provides
details
of
the
Fund's
investments
that
generate
returns
such
as
interest,
dividends,
and
realized
and
unrealized
gains
or
losses.
Performance
metrics,
including
portfolio
turnover
and
expense
ratios,
are
disclosed
in
the Financial
Highlights.
9.
Subsequent
Events
The Fund
has
evaluated
subsequent
events
through
the
issuance
of
the
financial
statements
and
determined
that
no
events
have
occurred
that
require
disclosure
other
than
those
already
disclosed
in
the
financial
statements.
7.
Fair
Value
Measurements
(continued)
Franklin
Fund
Allocator
Series
Report
of
Independent
Registered
Public
Accounting
Firm
To
the
Board
of
Trustees
of
Franklin
Fund
Allocator
Series
and
Shareholders
of
Franklin
Corefolio
Allocation
Fund
Opinion
on
the
Financial
Statements
We
have
audited
the
accompanying
statement
of
assets
and
liabilities,
including
the
schedule
of
investments,
of
Franklin
Corefolio
Allocation
Fund
(one
of
the
funds
constituting
Franklin
Fund
Allocator
Series,
referred
to
hereafter
as
the
"Fund")
as
of
December
31,
2024,
the
related
statement
of
operations
for
the
year
ended
December
31,
2024,
the
statements
of
changes
in
net
assets
for
each
of
the
two
years
in
the
period
ended
December
31,
2024,
including
the
related
notes,
and
the
financial
highlights
for
each
of
the
five
years
in
the
period
ended
December
31,
2024
(collectively
referred
to
as
the
“financial
statements”).
In
our
opinion,
the
financial
statements
present
fairly,
in
all
material
respects,
the
financial
position
of
the
Fund
as
of
December
31,
2024,
the
results
of
its
operations
for
the
year
then
ended,
the
changes
in
its
net
assets
for
each
of
the
two
years
in
the
period
ended
December
31,
2024
and
the
financial
highlights
for
each
of
the
five
years
in
the
period
ended
December
31,
2024
in
conformity
with
accounting
principles
generally
accepted
in
the
United
States
of
America.
Basis
for
Opinion
These
financial
statements
are
the
responsibility
of
the
Fund’s
management.
Our
responsibility
is
to
express
an
opinion
on
the
Fund’s
financial
statements
based
on
our
audits.
We
are
a
public
accounting
firm
registered
with
the
Public
Company
Accounting
Oversight
Board
(United
States)
(PCAOB)
and
are
required
to
be
independent
with
respect
to
the
Fund
in
accordance
with
the
U.S.
federal
securities
laws
and
the
applicable
rules
and
regulations
of
the
Securities
and
Exchange
Commission
and
the
PCAOB.
We
conducted
our
audits
of
these
financial
statements
in
accordance
with
the
standards
of
the
PCAOB.
Those
standards
require
that
we
plan
and
perform
the
audit
to
obtain
reasonable
assurance
about
whether
the
financial
statements
are
free
of
material
misstatement,
whether
due
to
error
or
fraud.
Our
audits
included
performing
procedures
to
assess
the
risks
of
material
misstatement
of
the
financial
statements,
whether
due
to
error
or
fraud,
and
performing
procedures
that
respond
to
those
risks.
Such
procedures
included
examining,
on
a
test
basis,
evidence
regarding
the
amounts
and
disclosures
in
the
financial
statements.
Our
audits
also
included
evaluating
the
accounting
principles
used
and
significant
estimates
made
by
management,
as
well
as
evaluating
the
overall
presentation
of
the
financial
statements.
Our
procedures
included
confirmation
of
securities
owned
as
of
December
31,
2024
by
correspondence
with
the
custodian
and
transfer
agent.
We
believe
that
our
audits
provide
a
reasonable
basis
for
our
opinion.
/s/PricewaterhouseCoopers
LLP
San
Francisco,
California
February
20,
2025
We
have
served
as
the
auditor
of
one
or
more
investment
companies
in
the
Franklin
Templeton
Group
of
Funds
since
1948.
Franklin
Fund
Allocator
Series
Tax
Information
(unaudited)
Franklin
Corefolio
Allocation
Fund
By
mid-February,
tax
information
related
to
a
shareholder's
proportionate
share
of
distributions
paid
during
the
preceding
calendar
year
will
be
received,
if
applicable.
Please
also
refer
to
www.franklintempleton.com
for
per
share
tax
information
related
to
any
distributions
paid
during
the
preceding
calendar
year.
Shareholders
are
advised
to
consult
with
their
tax
advisors
for
further
information
on
the
treatment
of
these
amounts
on
their
tax
returns.
The
following
tax
information
for
the
Fund
is
required
to
be
furnished
to
shareholders
with
respect
to
income
earned
and
distributions
paid
during
its
fiscal
year.
The
Fund
hereby
reports
the
following
amounts,
or
if
subsequently
determined
to
be
different,
the
maximum
allowable
amounts,
for
the
fiscal
year
ended
December
31,
2024:
Under
Section
853
of
the
Internal
Revenue
Code,
the
Fund
intends
to
elect
to
pass
through
to
its
shareholders
the
following
amounts,
or
amounts
as
finally
determined,
of
foreign
taxes
paid
and
foreign
source
income
earned
by
the
Fund
during
the
fiscal
year
ended
December
31,
2024:
Pursuant
to:
Amount
Reported
Long-Term
Capital
Gain
Dividends
Distributed
§852(b)(3)(C)
$47,206,096
Income
Eligible
for
Dividends
Received
Deduction
(DRD)
§854(b)(1)(A)
$4,914,421
Qualified
Dividend
Income
Earned
(QDI)
§854(b)(1)(B)
$6,985,859
Short-Term
Capital
Gain
Dividends
Distributed
§871(k)(2)(C)
$4,785,218
Amount
Reported
Foreign
Taxes
Paid
$142,499
Foreign
Source
Income
Earned
$1,397,220
Franklin
Fund
Allocator
Series
Changes
In
and
Disagreements
with
Accountants
For
the
period
covered
by
this
report
Not
applicable.
Results
of
Meeting(s)
of
Shareholders
For
the
period
covered
by
this
report
Not
applicable.
Remuneration
Paid
to
Directors,
Officers
and
Others
For
the
period
covered
by
this
report
Refer
to
the
financial
statements
included
herein.
Board
Approval
of
Management
and
Subadvisory
Agreements
For
the
period
covered
by
this
report
Not
applicable.
©
2025
Franklin
Templeton.
All
rights
reserved.
Franklin
Global
Allocation
Fund
Financial
Statements
and
Other
Important
Information
Annual
|
December
31,
2024
Financial
Statements
and
Other
Important
Information—Annual
Financial
Highlights
and
Schedule
of
Investments
2
Financial
Statements
17
Notes
to
Financial
Statements
21
Report
of
Independent
Registered
Public
Accounting
Firm
34
Tax
Information
35
Changes
In
and
Disagreements
with
Accountants
36
Results
of
Meeting(s)
of
Shareholders
36
Remuneration
Paid
to
Directors,
Officers
and
Others
36
Board
Approval
of
Management
and
Subadvisory
Agreements
36
Franklin
Fund
Allocator
Series
Financial
Highlights
Franklin
Global
Allocation
Fund
Annual
Report
The
accompanying
notes
are
an
integral
part
of
these
financial
statements.
a
Year
Ended
December
31,
2024
2023
2022
2021
2020
Class
A
Per
share
operating
performance
(for
a
share
outstanding
throughout
the
year)
Net
asset
value,
beginning
of
year
...................
$14.01
$12.62
$14.95
$13.49
$14.43
Income
from
investment
operations
a
:
Net
investment
income
b
.........................
0.23
0.23
0.18
0.19
c
0.34
c
Net
realized
and
unrealized
gains
(losses)
...........
1.57
1.39
(1.95)
1.39
(0.27)
Total
from
investment
operations
....................
1.80
1.62
(1.77)
1.58
0.07
Less
distributions
from:
Net
investment
income
..........................
(0.17)
(0.23)
(0.56)
(0.12)
(0.47)
Net
realized
gains
.............................
—
—
—
—
(0.54)
Total
distributions
...............................
(0.17)
(0.23)
(0.56)
(0.12)
(1.01)
Net
asset
value,
end
of
year
.......................
$15.64
$14.01
$12.62
$14.95
$13.49
Total
return
d
...................................
12.87%
12.92%
(11.83)%
11.74%
1.55%
Ratios
to
average
net
assets
Expenses
before
waiver
and
payments
by
affiliates
......
0.95%
0.95%
0.94%
0.94%
e
0.42%
e
Expenses
net
of
waiver
and
payments
by
affiliates
.......
0.93%
0.92%
f
0.91%
f
0.88%
e,f
0.42%
e,g
Net
investment
income
...........................
1.49%
1.75%
1.31%
1.33%
c
2.73%
c
Supplemental
data
Net
assets,
end
of
year
(000’s)
.....................
$2,520,588
$2,479,455
$2,417,274
$3,006,324
$2,952,287
Portfolio
turnover
rate
............................
59.82%
76.65%
15.46%
97.19%
h
4.07%
a
The
amount
shown
for
a
share
outstanding
throughout
the
period
may
not
correlate
with
the
Statement
of
Operations
for
the
period
due
to
the
timing
of
sales
and
repurchases
of
the
Fund’s
shares
in
relation
to
income
earned
and/or
fluctuating
fair
value
of
the
investments
of
the
Fund.
b
Based
on
average
daily
shares
outstanding.
c
Recognition
of
net
investment
income
by
the
Fund
is
affected
by
the
timing
of
declaration
of
dividends
by
the
Underlying
Funds
and
exchange
traded
funds
in
which
the
Fund
invests.
d
Total
return
does
not
reflect
sales
commissions
or
contingent
deferred
sales
charges,
if
applicable.
e
Does
not
include
expenses
of
the
Underlying
Funds
in
which
the
Fund
invests.
f
Benefit
of
expense
reduction
rounds
to
less
than
0.01%.
g
Benefit
of
waiver
and
payments
by
affiliates
rounds
to
less
than
0.01%.
h
Excludes
the
value
of
portfolio
activity
as
a
result
of
in-kind
transactions.
Franklin
Fund
Allocator
Series
Financial
Highlights
Franklin
Global
Allocation
Fund
(continued)
The
accompanying
notes
are
an
integral
part
of
these
financial
statements.
Annual
Report
a
Year
Ended
December
31,
2024
2023
2022
2021
2020
Class
C
Per
share
operating
performance
(for
a
share
outstanding
throughout
the
year)
Net
asset
value,
beginning
of
year
...................
$13.87
$12.50
$14.79
$13.40
$14.33
Income
from
investment
operations
a
:
Net
investment
income
b
.........................
0.11
0.13
0.07
0.08
c
0.23
c
Net
realized
and
unrealized
gains
(losses)
...........
1.56
1.36
(1.91)
1.38
(0.26)
Total
from
investment
operations
....................
1.67
1.49
(1.84)
1.46
(0.03)
Less
distributions
from:
Net
investment
income
..........................
(0.06)
(0.12)
(0.45)
(0.07)
(0.36)
Net
realized
gains
.............................
—
—
—
—
(0.54)
Total
distributions
...............................
(0.06)
(0.12)
(0.45)
(0.07)
(0.90)
Net
asset
value,
end
of
year
.......................
$15.48
$13.87
$12.50
$14.79
$13.40
Total
return
d
...................................
12.06%
12.00%
(12.45)%
10.89%
0.79%
Ratios
to
average
net
assets
Expenses
before
waiver
and
payments
by
affiliates
......
1.70%
1.70%
1.69%
1.68%
e
1.17%
e
Expenses
net
of
waiver
and
payments
by
affiliates
.......
1.68%
1.67%
f
1.66%
f
1.62%
e,f
1.17%
e,g
Net
investment
income
...........................
0.73%
1.00%
0.56%
0.58%
c
1.85%
c
Supplemental
data
Net
assets,
end
of
year
(000’s)
.....................
$62,592
$71,783
$84,086
$131,347
$201,506
Portfolio
turnover
rate
............................
59.82%
76.65%
15.46%
97.19%
h
4.07%
a
The
amount
shown
for
a
share
outstanding
throughout
the
period
may
not
correlate
with
the
Statement
of
Operations
for
the
period
due
to
the
timing
of
sales
and
repurchases
of
the
Fund’s
shares
in
relation
to
income
earned
and/or
fluctuating
fair
value
of
the
investments
of
the
Fund.
b
Based
on
average
daily
shares
outstanding.
c
Recognition
of
net
investment
income
by
the
Fund
is
affected
by
the
timing
of
declaration
of
dividends
by
the
Underlying
Funds
and
exchange
traded
funds
in
which
the
Fund
invests.
d
Total
return
does
not
reflect
sales
commissions
or
contingent
deferred
sales
charges,
if
applicable.
e
Does
not
include
expenses
of
the
Underlying
Funds
in
which
the
Fund
invests.
f
Benefit
of
expense
reduction
rounds
to
less
than
0.01%.
g
Benefit
of
waiver
and
payments
by
affiliates
rounds
to
less
than
0.01%.
h
Excludes
the
value
of
portfolio
activity
as
a
result
of
in-kind
transactions.
Franklin
Fund
Allocator
Series
Financial
Highlights
Franklin
Global
Allocation
Fund
(continued)
Annual
Report
The
accompanying
notes
are
an
integral
part
of
these
financial
statements.
a
Year
Ended
December
31,
2024
2023
2022
2021
2020
Class
R
Per
share
operating
performance
(for
a
share
outstanding
throughout
the
year)
Net
asset
value,
beginning
of
year
...................
$14.05
$12.66
$14.99
$13.54
$14.48
Income
from
investment
operations
a
:
Net
investment
income
b
.........................
0.19
0.20
0.14
0.15
c
0.31
c
Net
realized
and
unrealized
gains
(losses)
...........
1.57
1.39
(1.95)
1.40
(0.28)
Total
from
investment
operations
....................
1.76
1.59
(1.81)
1.55
0.03
Less
distributions
from:
Net
investment
income
..........................
(0.13)
(0.20)
(0.52)
(0.10)
(0.43)
Net
realized
gains
.............................
—
—
—
—
(0.54)
Total
distributions
...............................
(0.13)
(0.20)
(0.52)
(0.10)
(0.97)
Net
asset
value,
end
of
year
.......................
$15.68
$14.05
$12.66
$14.99
$13.54
Total
return
....................................
12.57%
12.63%
(12.06)%
11.50%
1.28%
Ratios
to
average
net
assets
Expenses
before
waiver
and
payments
by
affiliates
......
1.20%
1.20%
1.19%
1.19%
d
0.67%
d
Expenses
net
of
waiver
and
payments
by
affiliates
.......
1.18%
1.17%
e
1.16%
e
1.13%
d,e
0.67%
d,f
Net
investment
income
...........................
1.25%
1.50%
1.06%
1.08%
c
2.47%
c
Supplemental
data
Net
assets,
end
of
year
(000’s)
.....................
$4,671
$4,213
$3,906
$5,229
$4,975
Portfolio
turnover
rate
............................
59.82%
76.65%
15.46%
97.19%
g
4.07%
a
The
amount
shown
for
a
share
outstanding
throughout
the
period
may
not
correlate
with
the
Statement
of
Operations
for
the
period
due
to
the
timing
of
sales
and
repurchases
of
the
Fund’s
shares
in
relation
to
income
earned
and/or
fluctuating
fair
value
of
the
investments
of
the
Fund.
b
Based
on
average
daily
shares
outstanding.
c
Recognition
of
net
investment
income
by
the
Fund
is
affected
by
the
timing
of
declaration
of
dividends
by
the
Underlying
Funds
and
exchange
traded
funds
in
which
the
Fund
invests.
d
Does
not
include
expenses
of
the
Underlying
Funds
in
which
the
Fund
invests.
e
Benefit
of
expense
reduction
rounds
to
less
than
0.01%.
f
Benefit
of
waiver
and
payments
by
affiliates
rounds
to
less
than
0.01%.
g
Excludes
the
value
of
portfolio
activity
as
a
result
of
in-kind
transactions.
Franklin
Fund
Allocator
Series
Financial
Highlights
Franklin
Global
Allocation
Fund
(continued)
The
accompanying
notes
are
an
integral
part
of
these
financial
statements.
Annual
Report
a
Year
Ended
December
31,
2024
2023
2022
2021
2020
Class
R6
Per
share
operating
performance
(for
a
share
outstanding
throughout
the
year)
Net
asset
value,
beginning
of
year
...................
$14.47
$13.03
$15.43
$13.89
$14.81
Income
from
investment
operations
a
:
Net
investment
income
b
.........................
0.28
0.28
0.22
0.25
c
0.96
c
Net
realized
and
unrealized
gains
(losses)
...........
1.64
1.44
(2.02)
1.43
(0.83)
Total
from
investment
operations
....................
1.92
1.72
(1.80)
1.68
0.13
Less
distributions
from:
Net
investment
income
..........................
(0.22)
(0.28)
(0.60)
(0.14)
(0.51)
Net
realized
gains
.............................
—
—
—
—
(0.54)
Total
distributions
...............................
(0.22)
(0.28)
(0.60)
(0.14)
(1.05)
Net
asset
value,
end
of
year
.......................
$16.17
$14.47
$13.03
$15.43
$13.89
Total
return
....................................
13.28%
13.26%
(11.62)%
12.14%
1.94%
Ratios
to
average
net
assets
Expenses
before
waiver
and
payments
by
affiliates
......
0.66%
0.65%
0.66%
0.67%
d
0.21%
d
Expenses
net
of
waiver
and
payments
by
affiliates
.......
0.62%
0.60%
e
0.59%
e
0.54%
d,e
0.07%
d
Net
investment
income
...........................
1.78%
2.06%
1.61%
1.69%
c
7.33%
c
Supplemental
data
Net
assets,
end
of
year
(000’s)
.....................
$5,343
$4,018
$1,087
$573
$631
Portfolio
turnover
rate
............................
59.82%
76.65%
15.46%
97.19%
f
4.07%
a
The
amount
shown
for
a
share
outstanding
throughout
the
period
may
not
correlate
with
the
Statement
of
Operations
for
the
period
due
to
the
timing
of
sales
and
repurchases
of
the
Fund’s
shares
in
relation
to
income
earned
and/or
fluctuating
fair
value
of
the
investments
of
the
Fund.
b
Based
on
average
daily
shares
outstanding.
c
Recognition
of
net
investment
income
by
the
Fund
is
affected
by
the
timing
of
declaration
of
dividends
by
the
Underlying
Funds
and
exchange
traded
funds
in
which
the
Fund
invests.
d
Does
not
include
expenses
of
the
Underlying
Funds
in
which
the
Fund
invests.
e
Benefit
of
expense
reduction
rounds
to
less
than
0.01%.
f
Excludes
the
value
of
portfolio
activity
as
a
result
of
in-kind
transactions.
Franklin
Fund
Allocator
Series
Financial
Highlights
Franklin
Global
Allocation
Fund
(continued)
Annual
Report
The
accompanying
notes
are
an
integral
part
of
these
financial
statements.
a
Year
Ended
December
31,
2024
2023
2022
2021
2020
Advisor
Class
Per
share
operating
performance
(for
a
share
outstanding
throughout
the
year)
Net
asset
value,
beginning
of
year
...................
$14.13
$12.72
$15.07
$13.58
$14.52
Income
from
investment
operations
a
:
Net
investment
income
b
.........................
0.27
0.27
0.21
0.23
c
0.37
c
Net
realized
and
unrealized
gains
(losses)
...........
1.59
1.41
(1.97)
1.40
(0.27)
Total
from
investment
operations
....................
1.86
1.68
(1.76)
1.63
0.10
Less
distributions
from:
Net
investment
income
..........................
(0.21)
(0.27)
(0.59)
(0.14)
(0.50)
Net
realized
gains
.............................
—
—
—
—
(0.54)
Total
distributions
...............................
(0.21)
(0.27)
(0.59)
(0.14)
(1.04)
Net
asset
value,
end
of
year
.......................
$15.78
$14.13
$12.72
$15.07
$13.58
Total
return
....................................
13.11%
13.25%
(11.64)%
12.01%
1.79%
Ratios
to
average
net
assets
Expenses
before
waiver
and
payments
by
affiliates
......
0.70%
0.70%
0.69%
0.69%
d
0.17%
d
Expenses
net
of
waiver
and
payments
by
affiliates
.......
0.68%
0.67%
e
0.66%
e
0.63%
d,e
0.17%
d,f
Net
investment
income
...........................
1.75%
2.00%
1.56%
1.58%
c
2.89%
c
Supplemental
data
Net
assets,
end
of
year
(000’s)
.....................
$117,356
$103,377
$98,974
$122,896
$123,049
Portfolio
turnover
rate
............................
59.82%
76.65%
15.46%
97.19%
g
4.07%
a
The
amount
shown
for
a
share
outstanding
throughout
the
period
may
not
correlate
with
the
Statement
of
Operations
for
the
period
due
to
the
timing
of
sales
and
repurchases
of
the
Fund’s
shares
in
relation
to
income
earned
and/or
fluctuating
fair
value
of
the
investments
of
the
Fund.
b
Based
on
average
daily
shares
outstanding.
c
Recognition
of
net
investment
income
by
the
Fund
is
affected
by
the
timing
of
declaration
of
dividends
by
the
Underlying
Funds
and
exchange
traded
funds
in
which
the
Fund
invests.
d
Does
not
include
expenses
of
the
Underlying
Funds
in
which
the
Fund
invests.
e
Benefit
of
expense
reduction
rounds
to
less
than
0.01%.
f
Benefit
of
waiver
and
payments
by
affiliates
rounds
to
less
than
0.01%.
g
Excludes
the
value
of
portfolio
activity
as
a
result
of
in-kind
transactions.
Franklin
Fund
Allocator
Series
Schedule
of
Investments,
December
31,
2024
Franklin
Global
Allocation
Fund
The
accompanying
notes
are
an
integral
part
of
these
financial
statements.
Annual
Report
a
a
Country
Shares
a
Value
a
a
a
a
a
a
Common
Stocks
62.7%
Aerospace
&
Defense
0.4%
BAE
Systems
plc
...................................
United
Kingdom
221,520
$
3,177,767
L3Harris
Technologies,
Inc.
............................
United
States
14,498
3,048,639
Lockheed
Martin
Corp.
...............................
United
States
9,737
4,731,598
10,958,004
Air
Freight
&
Logistics
0.2%
Expeditors
International
of
Washington,
Inc.
...............
United
States
43,564
4,825,584
Automobiles
1.1%
General
Motors
Co.
..................................
United
States
233,871
12,458,308
a
Tesla,
Inc.
.........................................
United
States
43,655
17,629,635
30,087,943
Banks
3.6%
BNP
Paribas
SA
....................................
France
49,252
3,023,917
Citigroup,
Inc.
......................................
United
States
240,352
16,918,377
ING
Groep
NV
.....................................
Netherlands
2,267,954
35,542,444
Intesa
Sanpaolo
SpA
.................................
Italy
3,611,412
14,484,719
JPMorgan
Chase
&
Co.
...............................
United
States
24,472
5,866,183
NatWest
Group
plc
..................................
United
Kingdom
730,733
3,661,889
UniCredit
SpA
......................................
Italy
471,238
18,872,312
98,369,841
Biotechnology
1.9%
AbbVie,
Inc.
.......................................
United
States
226,914
40,322,618
Amgen,
Inc.
.......................................
United
States
10,147
2,644,714
Gilead
Sciences,
Inc.
................................
United
States
84,607
7,815,149
50,782,481
Broadline
Retail
2.3%
b
Alibaba
Group
Holding
Ltd.
,
ADR
.......................
China
135,724
11,508,038
a
Amazon.com,
Inc.
...................................
United
States
180,878
39,682,825
a
MercadoLibre,
Inc.
..................................
Brazil
5,885
10,007,089
61,197,952
Building
Products
0.2%
Cie
de
Saint-Gobain
SA
..............................
France
50,459
4,483,872
Capital
Markets
1.1%
3i
Group
plc
.......................................
United
Kingdom
266,481
11,861,935
Deutsche
Bank
AG
..................................
Germany
356,564
6,153,189
Lazard,
Inc.
,
A
......................................
United
States
69,769
3,591,708
SEI
Investments
Co.
.................................
United
States
110,528
9,116,350
30,723,182
Chemicals
0.4%
LyondellBasell
Industries
NV
,
A
.........................
United
States
45,856
3,405,725
Nitto
Denko
Corp.
...................................
Japan
252,000
4,213,142
Sherwin-Williams
Co.
(The)
............................
United
States
8,824
2,999,542
10,618,409
Commercial
Services
&
Supplies
0.2%
Cintas
Corp.
.......................................
United
States
35,492
6,484,388
Communications
Equipment
1.1%
a
Arista
Networks,
Inc.
.................................
United
States
93,300
10,312,449
Cisco
Systems,
Inc.
.................................
United
States
318,889
18,878,229
29,190,678
Franklin
Fund
Allocator
Series
Schedule
of
Investments
Franklin
Global
Allocation
Fund
(continued)
Annual
Report
The
accompanying
notes
are
an
integral
part
of
these
financial
statements.
a
a
Country
Shares
a
Value
a
a
a
a
a
a
Common
Stocks
(continued)
Construction
Materials
0.5%
Beijing
Oriental
Yuhong
Waterproof
Technology
Co.
Ltd.
,
A
....
China
5,074,500
$
9,026,276
CRH
plc
..........................................
United
States
55,800
5,162,616
14,188,892
Consumer
Staples
Distribution
&
Retail
1.7%
Carrefour
SA
.......................................
France
426,704
6,073,201
Koninklijke
Ahold
Delhaize
NV
..........................
Netherlands
175,585
5,727,392
Kroger
Co.
(The)
....................................
United
States
198,332
12,128,002
Loblaw
Cos.
Ltd.
....................................
Canada
76,200
10,028,004
Target
Corp.
.......................................
United
States
21,314
2,881,227
Walmart,
Inc.
......................................
United
States
117,219
10,590,737
47,428,563
Diversified
Telecommunication
Services
0.4%
Deutsche
Telekom
AG
................................
Germany
295,996
8,868,957
Telkom
Indonesia
Persero
Tbk.
PT
......................
Indonesia
13,349,900
2,234,587
11,103,544
Electric
Utilities
0.3%
Iberdrola
SA
.......................................
Spain
375,036
5,168,082
NRG
Energy,
Inc.
...................................
United
States
41,651
3,757,753
8,925,835
Electrical
Equipment
0.6%
Eaton
Corp.
plc
.....................................
United
States
53,000
17,589,110
WEG
SA
..........................................
Brazil
90
769
17,589,879
Entertainment
1.3%
b
NetEase,
Inc.
......................................
China
708,800
12,616,519
a
Netflix,
Inc.
........................................
United
States
25,088
22,361,436
34,977,955
Financial
Services
2.4%
a
Berkshire
Hathaway,
Inc.
,
B
............................
United
States
10,066
4,562,716
Equitable
Holdings,
Inc.
...............................
United
States
111,383
5,253,936
Investor
AB
,
B
......................................
Sweden
588,101
15,576,991
Mastercard,
Inc.
,
A
..................................
United
States
26,943
14,187,376
MGIC
Investment
Corp.
...............................
United
States
328,187
7,781,314
a
PayPal
Holdings,
Inc.
................................
United
States
47,470
4,051,564
Visa,
Inc.
,
A
........................................
United
States
45,846
14,489,170
65,903,067
Food
Products
0.1%
Kellanova
.........................................
United
States
43,297
3,505,758
Ground
Transportation
0.5%
Landstar
System,
Inc.
................................
United
States
18,357
3,154,834
Old
Dominion
Freight
Line,
Inc.
.........................
United
States
52,844
9,321,682
12,476,516
Health
Care
Equipment
&
Supplies
2.1%
Abbott
Laboratories
..................................
United
States
154,153
17,436,246
a
IDEXX
Laboratories,
Inc.
..............................
United
States
23,390
9,670,362
a
Insulet
Corp.
.......................................
United
States
62,335
16,273,798
Medtronic
plc
......................................
United
States
138,100
11,031,428
Stryker
Corp.
......................................
United
States
9,937
3,577,817
57,989,651
Franklin
Fund
Allocator
Series
Schedule
of
Investments
Franklin
Global
Allocation
Fund
(continued)
The
accompanying
notes
are
an
integral
part
of
these
financial
statements.
Annual
Report
a
a
Country
Shares
a
Value
a
a
a
a
a
a
Common
Stocks
(continued)
Health
Care
Providers
&
Services
0.3%
Premier,
Inc.
,
A
.....................................
United
States
161,696
$
3,427,955
UnitedHealth
Group,
Inc.
..............................
United
States
7,578
3,833,407
7,261,362
Hotels,
Restaurants
&
Leisure
1.7%
Booking
Holdings,
Inc.
...............................
United
States
9,396
46,683,274
Household
Durables
0.1%
a
NVR,
Inc.
.........................................
United
States
455
3,721,400
Household
Products
0.8%
Colgate-Palmolive
Co.
...............................
United
States
78,603
7,145,799
Kimberly-Clark
Corp.
.................................
United
States
25,935
3,398,522
Procter
&
Gamble
Co.
(The)
...........................
United
States
58,388
9,788,748
20,333,069
Industrial
Conglomerates
0.9%
Hitachi
Ltd.
........................................
Japan
942,400
23,079,432
Insurance
1.3%
Erie
Indemnity
Co.
,
A
.................................
United
States
26,169
10,787,647
iA
Financial
Corp.,
Inc.
...............................
Canada
124,652
11,561,171
Manulife
Financial
Corp.
..............................
Canada
143,636
4,412,651
NN
Group
NV
......................................
Netherlands
84,660
3,691,902
Ping
An
Insurance
Group
Co.
of
China
Ltd.
,
H
..............
China
973,000
5,710,884
36,164,255
Interactive
Media
&
Services
3.3%
Alphabet,
Inc.
,
A
....................................
United
States
261,519
49,505,547
a,b,c
Kuaishou
Technology
,
144A
,
Reg
S
......................
China
1,181,600
6,198,158
Meta
Platforms,
Inc.
,
A
...............................
United
States
50,147
29,361,570
a
Pinterest,
Inc.
,
A
....................................
United
States
181,803
5,272,287
90,337,562
IT
Services
1.3%
Cognizant
Technology
Solutions
Corp.
,
A
..................
United
States
43,493
3,344,612
Infosys
Ltd.
,
ADR
...................................
India
1,265,604
27,742,039
a
Shopify,
Inc.
,
A
.....................................
Canada
36,410
3,875,172
34,961,823
Leisure
Products
0.1%
a
Mattel,
Inc.
........................................
United
States
175,916
3,118,991
Life
Sciences
Tools
&
Services
0.3%
a
Mettler-Toledo
International,
Inc.
........................
United
States
5,962
7,295,580
Machinery
0.9%
Atlas
Copco
AB
,
B
...................................
Sweden
498,831
6,739,710
Caterpillar,
Inc.
.....................................
United
States
39,416
14,298,548
Illinois
Tool
Works,
Inc.
...............................
United
States
13,625
3,454,755
24,493,013
Metals
&
Mining
1.8%
Agnico
Eagle
Mines
Ltd.
..............................
Canada
39,230
3,069,189
Fortescue
Ltd.
......................................
Australia
2,881,861
32,451,377
Reliance,
Inc.
......................................
United
States
19,628
5,285,035
Steel
Dynamics,
Inc.
.................................
United
States
59,001
6,730,244
47,535,845
Franklin
Fund
Allocator
Series
Schedule
of
Investments
Franklin
Global
Allocation
Fund
(continued)
Annual
Report
The
accompanying
notes
are
an
integral
part
of
these
financial
statements.
a
a
Country
Shares
a
Value
a
a
a
a
a
a
Common
Stocks
(continued)
Mortgage
Real
Estate
Investment
Trusts
(REITs)
0.1%
Ladder
Capital
Corp.
,
A
...............................
United
States
360,691
$
4,036,132
Multi-Utilities
0.2%
Atco
Ltd.
,
I
........................................
Canada
126,213
4,177,686
Office
REITs
0.1%
Highwoods
Properties,
Inc.
............................
United
States
115,272
3,525,018
Oil,
Gas
&
Consumable
Fuels
3.3%
Exxon
Mobil
Corp.
...................................
United
States
29,108
3,131,148
Keyera
Corp.
......................................
Canada
113,630
3,475,025
Parex
Resources,
Inc.
................................
Canada
552,062
5,599,544
Pembina
Pipeline
Corp.
...............................
Canada
104,221
3,850,692
Petroleo
Brasileiro
SA
................................
Brazil
2,504,600
16,135,276
Suncor
Energy,
Inc.
..................................
Canada
520,825
18,590,929
Valero
Energy
Corp.
.................................
United
States
35,993
4,412,382
Whitecap
Resources,
Inc.
.............................
Canada
1,945,176
13,802,772
Williams
Cos.,
Inc.
(The)
..............................
United
States
381,335
20,637,850
89,635,618
Personal
Care
Products
0.5%
a
BellRing
Brands,
Inc.
.................................
United
States
58,222
4,386,446
a
Oddity
Tech
Ltd.
,
A
..................................
Israel
73,762
3,099,479
Unilever
plc
........................................
United
Kingdom
88,066
5,003,965
12,489,890
Pharmaceuticals
2.6%
Eli
Lilly
&
Co.
......................................
United
States
8,559
6,607,548
GSK
plc
..........................................
United
States
446,558
7,532,218
Johnson
&
Johnson
.................................
United
States
290,019
41,942,548
Novartis
AG
.......................................
Switzerland
71,866
6,996,680
Novo
Nordisk
A/S
,
B
.................................
Denmark
32,336
2,790,009
Shionogi
&
Co.
Ltd.
..................................
Japan
279,900
3,925,644
69,794,647
Professional
Services
0.8%
Recruit
Holdings
Co.
Ltd.
.............................
Japan
311,500
21,651,716
Retail
REITs
0.3%
Simon
Property
Group,
Inc.
............................
United
States
42,219
7,270,534
Semiconductors
&
Semiconductor
Equipment
6.7%
Applied
Materials,
Inc.
................................
United
States
18,287
2,974,015
Broadcom,
Inc.
.....................................
United
States
59,122
13,706,844
KLA
Corp.
.........................................
United
States
33,633
21,192,826
Lam
Research
Corp.
.................................
United
States
37,190
2,686,234
MediaTek,
Inc.
.....................................
Taiwan
709,000
30,479,723
Novatek
Microelectronics
Corp.
.........................
Taiwan
466,000
7,118,778
NVIDIA
Corp.
......................................
United
States
567,912
76,264,902
QUALCOMM,
Inc.
...................................
United
States
22,324
3,429,413
Taiwan
Semiconductor
Manufacturing
Co.
Ltd.
,
ADR
.........
Taiwan
57,897
11,434,079
Texas
Instruments,
Inc.
...............................
United
States
47,786
8,960,353
Tokyo
Electron
Ltd.
..................................
Japan
19,200
2,886,132
181,133,299
Software
4.2%
a
Adobe,
Inc.
........................................
United
States
15,879
7,061,074
a
Atlassian
Corp.
,
A
...................................
United
States
22,990
5,595,306
a
Cadence
Design
Systems,
Inc.
.........................
United
States
11,322
3,401,808
a
Dropbox,
Inc.
,
A
....................................
United
States
118,904
3,571,876
a
Fair
Isaac
Corp.
....................................
United
States
6,588
13,116,247
Franklin
Fund
Allocator
Series
Schedule
of
Investments
Franklin
Global
Allocation
Fund
(continued)
The
accompanying
notes
are
an
integral
part
of
these
financial
statements.
Annual
Report
a
a
Country
Shares
a
Value
a
a
a
a
a
a
Common
Stocks
(continued)
Software
(continued)
a
HubSpot,
Inc.
......................................
United
States
5,408
$
3,768,132
Microsoft
Corp.
.....................................
United
States
135,616
57,162,144
a
Monday.com
Ltd.
....................................
United
States
17,636
4,152,220
a
ServiceNow,
Inc.
....................................
United
States
7,935
8,412,052
a
Xero
Ltd.
..........................................
New
Zealand
71,627
7,453,723
113,694,582
Specialized
REITs
0.3%
National
Storage
Affiliates
Trust
.........................
United
States
184,796
7,005,616
Specialty
Retail
1.7%
a
AutoZone,
Inc.
.....................................
United
States
5,085
16,282,170
Dick's
Sporting
Goods,
Inc.
............................
United
States
21,020
4,810,217
Home
Depot,
Inc.
(The)
...............................
United
States
8,245
3,207,222
Industria
de
Diseno
Textil
SA
...........................
Spain
67,640
3,464,789
Lowe's
Cos.,
Inc.
....................................
United
States
13,677
3,375,484
Ross
Stores,
Inc.
...................................
United
States
95,893
14,505,734
45,645,616
Technology
Hardware,
Storage
&
Peripherals
3.5%
Apple,
Inc.
........................................
United
States
381,840
95,620,373
Textiles,
Apparel
&
Luxury
Goods
1.2%
a
Deckers
Outdoor
Corp.
...............................
United
States
47,754
9,698,360
a
Lululemon
Athletica,
Inc.
..............................
United
States
34,952
13,365,994
Pandora
A/S
.......................................
Denmark
21,415
3,917,992
Ralph
Lauren
Corp.
,
A
................................
United
States
19,280
4,453,294
31,435,640
Tobacco
1.2%
Altria
Group,
Inc.
....................................
United
States
641,871
33,563,435
Trading
Companies
&
Distributors
0.6%
Fastenal
Co.
.......................................
United
States
48,550
3,491,230
WW
Grainger,
Inc.
...................................
United
States
12,558
13,236,760
16,727,990
Wireless
Telecommunication
Services
0.2%
Vodafone
Group
plc
.................................
United
Kingdom
5,939,151
5,066,569
Total
Common
Stocks
(Cost
$
1,436,748,644
)
..................................
1,699,271,961
Management
Investment
Companies
4.0%
Capital
Markets
4.0%
d
Franklin
BSP
Private
Credit
Fund
,
Class
Advisor
............
United
States
3,076,841
32,922,201
d
Franklin
FTSE
India
ETF
..............................
United
States
165,050
6,255,395
d
Franklin
High
Yield
Corporate
ETF
......................
United
States
205,000
4,893,350
d
Franklin
Systematic
Style
Premia
ETF
....................
United
States
2,225,000
53,199,750
VanEck
J.P.
Morgan
EM
Local
Currency
Bond
ETF
..........
United
States
515,881
11,922,010
109,192,706
Total
Management
Investment
Companies
(Cost
$
111,177,322
)
.................
109,192,706
Franklin
Fund
Allocator
Series
Schedule
of
Investments
Franklin
Global
Allocation
Fund
(continued)
Annual
Report
The
accompanying
notes
are
an
integral
part
of
these
financial
statements.
a
a
Country
Shares
a
Value
a
a
a
a
a
a
Preferred
Stocks
0.3%
Banks
0.3%
e
Itausa
SA
,
3.24
%
...................................
Brazil
5,120,535
$
7,315,093
Total
Preferred
Stocks
(Cost
$
10,289,903
)
....................................
7,315,093
Principal
Amount
*
Corporate
Bonds
7.4%
Automobile
Components
0.1%
c
Dornoch
Debt
Merger
Sub,
Inc.
,
Senior
Note
,
144A,
6.625%,
10/15/29
........................................
United
States
3,250,000
2,636,023
Banks
1.1%
c
Societe
Generale
SA
,
Senior
Non-Preferred
Note
,
144A,
2.625%,
1/22/25
.........................................
France
7,393,000
7,383,048
Sumitomo
Mitsui
Financial
Group,
Inc.
,
Sub.
Bond
,
2.142%,
9/23/30
.........................................
Japan
5,500,000
4,660,891
c
UniCredit
SpA
,
Senior
Preferred
Bond
,
144A,
3.127%
to
6/02/31,
FRN
thereafter
,
6/03/32
.............................
Italy
9,889,000
8,601,509
f
US
Bancorp
,
Junior
Sub.
Bond
,
3.7%
to
1/14/27,
FRN
thereafter
,
Perpetual
........................................
United
States
8,870,000
8,410,955
Westpac
Banking
Corp.
,
Sub.
Bond
,
2.894%
to
2/03/25,
FRN
thereafter
,
2/04/30
.................................
Australia
1,749,000
1,745,262
30,801,665
Beverages
0.2%
Anheuser-Busch
InBev
Worldwide,
Inc.
,
Senior
Bond
,
4%,
4/13/28
.........................................
Belgium
4,654,000
4,570,806
Biotechnology
0.2%
AbbVie,
Inc.
,
Senior
Bond
,
5.4%,
3/15/54
.................
United
States
5,170,000
4,981,164
c
Grifols
SA
,
Senior
Note
,
144A,
4.75%,
10/15/28
............
Spain
1,862,000
1,713,121
6,694,285
Broadline
Retail
0.2%
b
Alibaba
Group
Holding
Ltd.
,
Senior
Bond
,
3.4%,
12/06/27
.....
China
6,300,000
6,080,155
Capital
Markets
0.3%
Deutsche
Bank
AG
,
Senior
Non-Preferred
Bond
,
3.547%
to
9/17/30,
FRN
thereafter
,
9/18/31
.........................................
Germany
5,817,000
5,224,933
Senior
Non-Preferred
Note
,
2.129%
to
11/23/25,
FRN
thereafter
,
11/24/26
................................
Germany
3,491,000
3,402,526
8,627,459
Chemicals
0.3%
Nutrien
Ltd.
,
Senior
Bond
,
2.95%,
5/13/30
.................
Canada
9,075,000
8,170,434
Communications
Equipment
0.2%
c
CommScope
LLC
,
Senior
Secured
Note
,
144A,
4.75%,
9/01/29
.
United
States
4,800,000
4,281,225
Consumer
Finance
0.5%
AerCap
Ireland
Capital
DAC
/
AerCap
Global
Aviation
Trust
,
Senior
Bond
,
3.4%,
10/29/33
.........................
Ireland
3,956,000
3,371,278
Senior
Note
,
2.45%,
10/29/26
........................
Ireland
5,527,000
5,295,036
c
,f
Volkswagen
International
Finance
NV
,
Senior
Bond
,
Reg
S,
3.5%
to
6/16/25,
FRN
thereafter
,
Perpetual
...................
Germany
3,700,000
EUR
3,816,818
12,483,132
Electric
Utilities
0.2%
MidAmerican
Energy
Co.
,
Senior
Bond
,
4.25%,
5/01/46
.......
United
States
6,112,000
5,064,195
Franklin
Fund
Allocator
Series
Schedule
of
Investments
Franklin
Global
Allocation
Fund
(continued)
The
accompanying
notes
are
an
integral
part
of
these
financial
statements.
Annual
Report
a
a
Country
Principal
Amount
*
a
Value
a
a
a
a
a
Corporate
Bonds
(continued)
Financial
Services
0.4%
c
Siemens
Financieringsmaatschappij
NV
,
Senior
Bond
,
144A,
2.35%,
10/15/26
...................................
Germany
6,748,000
$
6,499,178
c
Woodside
Finance
Ltd.
,
Senior
Bond
,
144A,
4.5%,
3/04/29
....
Australia
4,654,000
4,514,394
11,013,572
Food
Products
0.4%
c
,g
Chobani
Holdco
II
LLC
,
Senior
Note
,
144A,
PIK,
8.75%,
10/01/29
United
States
5,090,000
5,300,127
JBS
USA
Holding
Lux
SARL
/
JBS
USA
Food
Co.
/
JBS
Lux
Co.
SARL
,
Senior
Note
,
3.75%,
12/01/31
........................
United
States
4,800,000
4,273,724
Senior
Note
,
3%,
5/15/32
...........................
United
States
1,310,362
1,093,301
10,667,152
Ground
Transportation
0.3%
c
Ashtead
Capital,
Inc.
,
Senior
Bond
,
144A,
5.5%,
8/11/32
......
United
Kingdom
6,981,000
6,905,485
Health
Care
Providers
&
Services
0.3%
c
Fresenius
Medical
Care
US
Finance
III,
Inc.
,
Senior
Bond
,
144A,
2.375%,
2/16/31
...................................
Germany
10,471,000
8,620,917
Machinery
0.2%
c
Terex
Corp.
,
Senior
Note
,
144A,
6.25%,
10/15/32
...........
United
States
5,176,000
5,079,859
Media
0.4%
Comcast
Corp.
,
Senior
Bond
,
3.75%,
4/01/40
..............
United
States
6,272,000
5,049,195
Paramount
Global
,
Senior
Bond
,
4.95%,
1/15/31
............
United
States
5,600,000
5,231,188
10,280,383
Metals
&
Mining
0.5%
ArcelorMittal
SA
,
Senior
Bond
,
4.25%,
7/16/29
.............
Luxembourg
6,981,000
6,764,010
c
Glencore
Funding
LLC
,
Senior
Bond
,
144A,
2.5%,
9/01/30
....
Australia
8,144,000
7,064,100
13,828,110
Oil,
Gas
&
Consumable
Fuels
0.5%
c
Aker
BP
ASA
,
Senior
Bond
,
144A,
3.1%,
7/15/31
............
Norway
9,191,000
7,941,929
Canadian
Natural
Resources
Ltd.
,
Senior
Bond
,
3.85%,
6/01/27
Canada
6,399,000
6,265,180
14,207,109
Pharmaceuticals
0.7%
AstraZeneca
plc
,
Senior
Bond
,
4%,
1/17/29
................
United
Kingdom
4,654,000
4,529,855
c
Bayer
US
Finance
II
LLC
,
Senior
Note
,
144A,
4.25%,
12/15/25
.
Germany
8,144,000
8,093,053
Takeda
Pharmaceutical
Co.
Ltd.
,
Senior
Note
,
5%,
11/26/28
...
Japan
6,500,000
6,518,064
19,140,972
Semiconductors
&
Semiconductor
Equipment
0.3%
c
SK
Hynix,
Inc.
,
Senior
Note
,
144A,
1.5%,
1/19/26
...........
South
Korea
9,308,000
8,978,977
Wireless
Telecommunication
Services
0.1%
Vodafone
Group
plc
,
Senior
Bond
,
6.15%,
2/27/37
...........
United
Kingdom
2,680,000
2,821,525
Total
Corporate
Bonds
(Cost
$
201,015,644
)
...................................
200,953,440
Foreign
Government
and
Agency
Securities
13.1%
Asian
Development
Bank
,
Senior
Note
,
4.875%,
5/21/26
......
Supranational
h
16,478,000
16,589,819
Australia
Government
Bond
,
c
Reg
S,
1%,
11/21/31
...............................
Australia
22,871,000
AUD
11,499,206
Franklin
Fund
Allocator
Series
Schedule
of
Investments
Franklin
Global
Allocation
Fund
(continued)
Annual
Report
The
accompanying
notes
are
an
integral
part
of
these
financial
statements.
a
a
Country
Principal
Amount
*
a
Value
a
a
a
a
a
Foreign
Government
and
Agency
Securities
(continued)
c
Belgium
Government
Bond
,
Senior
Bond
,
144A,
Reg
S,
0.35%,
6/22/32
.........................................
Belgium
4,833,114
EUR
$
4,194,107
i
Brazil
Notas
do
Tesouro
Nacional
,
Index
Linked,
6%,
8/15/26
..
Brazil
35,098,140
BRL
5,539,128
c
Bundesrepublik
Deutschland
,
Reg
S,
8/15/30
....................................
Germany
16,633,000
EUR
15,344,872
Reg
S,
2.3%,
2/15/33
...............................
Germany
64,657,492
EUR
67,135,032
Reg
S,
1%,
5/15/38
................................
Germany
16,545,000
EUR
14,178,016
Canada
Government
Bond
,
3.25%,
9/01/28
...................................
Canada
20,600,000
CAD
14,491,440
2.5%,
12/01/32
...................................
Canada
27,072,000
CAD
17,976,622
2.75%,
6/01/33
...................................
Canada
19,081,000
CAD
12,867,346
China
Government
Bond
,
2.5%,
7/25/27
....................................
China
121,580,000
CNY
17,213,355
2.44%,
10/15/27
...................................
China
47,210,000
CNY
6,690,251
Ecopetrol
SA
,
Senior
Bond
,
4.625%,
11/02/31
..............
Colombia
1,920,000
1,593,754
c
Export-Import
Bank
of
Korea
,
Senior
Note
,
Reg
S,
7.15%,
4/18/25
South
Korea
306,100,000
INR
3,564,541
c
Finland
Government
Bond
,
Senior
Bond
,
144A,
Reg
S,
0.125%,
9/15/31
.............
Finland
2,437,000
EUR
2,148,807
Senior
Bond
,
144A,
Reg
S,
0.5%,
4/15/43
...............
Finland
2,085,000
EUR
1,402,436
c
France
Government
Bond
,
144A,
Reg
S,
2.75%,
2/25/30
.........................
France
4,770,335
EUR
4,950,251
144A,
Reg
S,
1.5%,
5/25/31
..........................
France
4,728,295
EUR
4,526,845
144A,
Reg
S,
11/25/31
..............................
France
5,786,000
EUR
4,934,314
144A,
Reg
S,
2%,
11/25/32
..........................
France
15,124,000
EUR
14,571,862
International
Bank
for
Reconstruction
&
Development
,
Senior
Note
,
6%,
1/16/25
.................................
Supranational
h
275,200,000
INR
3,217,179
Japan
Government
Bond
,
0.5%,
6/20/29
..................
Japan
2,802,000,000
17,639,847
Mexican
Bonos
Desarr
Fixed
Rate
,
M
,
7.5%,
5/26/33
.........
Mexico
143,100,000
MXN
5,805,258
c
Netherlands
Government
Bond
,
144A,
Reg
S,
3.25%,
1/15/44
..
Netherlands
2,432,271
EUR
2,709,154
Petroleos
Mexicanos
,
Senior
Note
,
6.5%,
3/13/27
...........
Mexico
5,236,000
5,066,292
c
Portugal
Obrigacoes
do
Tesouro
,
Senior
Bond
,
144A,
Reg
S,
2.875%,
7/21/26
...................................
Portugal
6,298,945
EUR
6,601,061
Spain
Bonos
Y
Oblig
del
Estado
,
c
Senior
Bond
,
144A,
Reg
S,
2.7%,
10/31/48
..............
Spain
2,008,000
EUR
1,793,959
Senior
Note
,
2.5%,
5/31/27
..........................
Spain
3,087,000
EUR
3,210,075
Senior
Note
,
3.5%,
5/31/29
..........................
Spain
4,964,000
EUR
5,351,954
c
United
Kingdom
Gilt
,
Reg
S,
4.125%,
1/29/27
.............................
United
Kingdom
22,840,000
GBP
28,445,682
Reg
S,
4.625%,
1/31/34
.............................
United
Kingdom
15,140,000
GBP
19,044,782
Reg
S,
4.5%,
12/07/42
..............................
United
Kingdom
13,370,859
GBP
15,752,785
Total
Foreign
Government
and
Agency
Securities
(Cost
$
373,135,765
)
..........
356,050,032
U.S.
Government
and
Agency
Securities
6.0%
U.S.
Treasury
Bonds
,
4.125
%,
8/15/44
...................
United
States
41,075,400
37,184,832
U.S.
Treasury
Notes
,
0.375
%,
4/30/25
...................................
United
States
17,060,000
16,844,790
4
%,
1/31/29
......................................
United
States
47,020,000
46,386,937
3.5
%,
9/30/29
....................................
United
States
11,100,000
10,687,288
2.75
%,
8/15/32
...................................
United
States
35,905,500
31,853,266
3.875
%,
8/15/34
...................................
United
States
19,088,500
18,054,872
Total
U.S.
Government
and
Agency
Securities
(Cost
$
164,838,154
)
..............
161,011,985
Mortgage-Backed
Securities
2.3%
Federal
Home
Loan
Mortgage
Corp.
(FHLMC)
Fixed
Rate
0.9%
FHLMC
Pool,
30
Year
,
5
%,
7/01/53
......................
United
States
5,322,930
5,145,546
FHLMC
Pool,
30
Year
,
5
%,
9/01/53
......................
United
States
18,011,288
17,414,331
Franklin
Fund
Allocator
Series
Schedule
of
Investments
Franklin
Global
Allocation
Fund
(continued)
The
accompanying
notes
are
an
integral
part
of
these
financial
statements.
Annual
Report
a
a
Country
Principal
Amount
*
a
Value
a
a
a
a
a
Mortgage-Backed
Securities
(continued)
Federal
Home
Loan
Mortgage
Corp.
(FHLMC)
Fixed
Rate
(continued)
FHLMC
Pool,
30
Year
,
6
%,
3/01/54
......................
United
States
2,309,377
$
2,321,672
24,881,549
Federal
National
Mortgage
Association
(FNMA)
Fixed
Rate
0.7%
FNMA,
30
Year
,
2
%,
4/01/52
...........................
United
States
3,260,792
2,545,001
FNMA,
30
Year
,
2.5
%,
12/01/51
.........................
United
States
4,673,508
3,822,469
FNMA,
30
Year
,
3
%,
4/01/52
...........................
United
States
4,400,483
3,743,880
FNMA,
30
Year
,
5.5
%,
3/01/54
.........................
United
States
7,441,583
7,348,951
17,460,301
Government
National
Mortgage
Association
(GNMA)
Fixed
Rate
0.7%
GNMA
II,
Single-family,
30
Year
,
5
%,
10/20/54
..............
United
States
19,921,648
19,344,764
Total
Mortgage-Backed
Securities
(Cost
$
62,617,738
)
..........................
61,686,614
Total
Long
Term
Investments
(Cost
$
2,359,823,170
)
...........................
2,595,481,831
a
Short
Term
Investments
3.4%
a
a
Country
Principal
Amount
*
a
Value
a
a
a
a
a
a
Foreign
Government
and
Agency
Securities
2.5%
j
Canada
Treasury
Bills
,
3.06
%,
5/22/25
...................
Canada
98,083,000
CAD
67,419,994
Total
Foreign
Government
and
Agency
Securities
(Cost
$
67,445,843
)
............
67,419,994
Shares
Money
Market
Funds
0.9%
d,k
Institutional
Fiduciary
Trust
-
Money
Market
Portfolio
,
4.183
%
..
United
States
25,651,499
25,651,499
Total
Money
Market
Funds
(Cost
$
25,651,499
)
................................
25,651,499
Total
Short
Term
Investments
(Cost
$
93,097,342
)
..............................
93,071,493
a
Total
Investments
(Cost
$
2,452,920,512
)
99.2
%
................................
$2,688,553,324
Other
Assets,
less
Liabilities
0.8
%
...........................................
21,997,413
Net
Assets
100.0%
.........................................................
$2,710,550,737
a
a
a
Franklin
Fund
Allocator
Series
Schedule
of
Investments
Franklin
Global
Allocation
Fund
(continued)
Annual
Report
The
accompanying
notes
are
an
integral
part
of
these
financial
statements.
OTC
Forward
Exchange
Contracts
Total
Forward
Exchange
Contracts
...................................................
Net
unrealized
appreciation
(depreciation)
............................................
*
In
U.S.
dollars
unless
otherwise
indicated.
a
May
be
comprised
of
multiple
contracts
with
the
same
counterparty,
currency
and
settlement
date.
At
December
31,
2024,
the
Fund
had
the
following
forward
exchange
contracts
outstanding.
See
Note
1(c).
See
Note
7
regarding
other
derivative
information.
*
The
principal
amount
is
stated
in
U.S.
dollars
unless
otherwise
indicated.
a
Non-income
producing.
b
Variable
interest
entity
(VIE).
See
Note
6
regarding
investments
made
through
a
VIE
structure.
At
December
31,
2024,
the
aggregate
value
of
these
securities
was
$36,402,870,
representing
1.3%
of
net
assets.
c
Security
was
purchased
pursuant
to
Rule
144A
or
Regulation
S
under
the
Securities
Act
of
1933.
144A
securities
may
be
sold
in
transactions
exempt
from
registration
only
to
qualified
institutional
buyers
or
in
a
public
offering
registered
under
the
Securities
Act
of
1933.
Regulation
S
securities
cannot
be
sold
in
the
United
States
without
either
an
effective
registration
statement
filed
pursuant
to
the
Securities
Act
of
1933,
or
pursuant
to
an
exemption
from
registration.
At
December
31,
2024,
the
aggregate
value
of
these
securities
was
$326,425,633,
representing
12.0%
of
net
assets.
d
See
Note
3(f)
regarding
investments
in
affiliated
management
investment
companies.
e
Variable
rate
security.
The
rate
shown
represents
the
yield
at
period
end.
f
Perpetual
security
with
no
stated
maturity
date.
g
Income
may
be
received
in
additional
securities
and/or
cash.
h
A
supranational
organization
is
an
entity
formed
by
two
or
more
central
governments
through
international
treaties.
i
Principal
amount
of
security,
redemption
price
at
maturity,
and/or
coupon
payments
are
adjusted
for
inflation.
See
Note
1(e).
j
The
rate
shown
represents
the
yield
at
period
end.
k
The
rate
shown
is
the
annualized
seven-day
effective
yield
at
period
end.
See
Abbreviations
on
page
33
.
Franklin
Fund
Allocator
Series
Financial
Statements
Statement
of
Assets
and
Liabilities
December
31,
2024
The
accompanying
notes
are
an
integral
part
of
these
financial
statements.
Annual
Report
Franklin
Global
Allocation
Fund
Assets:
Investments
in
securities:
Cost
-
Unaffiliated
issuers
...................................................................
$2,333,006,036
Cost
-
Controlled
affiliates
(Note
3
f
)
............................................................
32,000,000
Cost
-
Non-controlled
affiliates
(Note
3
f
)
........................................................
87,914,476
Value
-
Unaffiliated
issuers
..................................................................
$2,565,631,129
Value
-
Controlled
affiliates
(Note
3
f
)
...........................................................
32,922,201
Value
-
Non-controlled
affiliates
(Note
3
f
)
........................................................
89,999,994
Cash
....................................................................................
967,262
Receivables:
Capital
shares
sold
........................................................................
665,553
Dividends
and
interest
.....................................................................
13,294,710
European
Union
tax
reclaims
(Note
1
d
)
.........................................................
484,636
Unrealized
appreciation
on
OTC
forward
exchange
contracts
..........................................
11,063,247
Total
assets
..........................................................................
2,715,028,732
Liabilities:
Payables:
Capital
shares
redeemed
...................................................................
1,357,669
Management
fees
.........................................................................
1,142,929
Distribution
fees
..........................................................................
601,220
Transfer
agent
fees
........................................................................
642,863
Trustees'
fees
and
expenses
.................................................................
866
Distributions
to
shareholders
.................................................................
448,584
Unrealized
depreciation
on
OTC
forward
exchange
contracts
..........................................
10,567
Accrued
expenses
and
other
liabilities
...........................................................
273,297
Total
liabilities
.........................................................................
4,477,995
Net
assets,
at
value
.................................................................
$2,710,550,737
Net
assets
consist
of:
Paid-in
capital
.............................................................................
$2,422,121,627
Total
distributable
earnings
(losses)
.............................................................
288,429,110
Net
assets,
at
value
.................................................................
$2,710,550,737
Franklin
Fund
Allocator
Series
Financial
Statements
Statement
of
Assets
and
Liabilities
(continued)
December
31,
2024
Annual
Report
The
accompanying
notes
are
an
integral
part
of
these
financial
statements.
Franklin
Global
Allocation
Fund
Class
A:
Net
assets,
at
value
.......................................................................
$2,520,588,459
Shares
outstanding
........................................................................
161,177,914
Net
asset
value
per
share
a
,b
..................................................................
$15.64
Maximum
offering
price
per
share
(net
asset
value
per
share
÷
94
.50
%
)
b
................................
$16.55
Class
C:
Net
assets,
at
value
.......................................................................
$62,592,127
Shares
outstanding
........................................................................
4,042,938
Net
asset
value
and
maximum
offering
price
per
share
a
,b
............................................
$15.48
Class
R:
Net
assets,
at
value
.......................................................................
$4,670,761
Shares
outstanding
........................................................................
297,811
Net
asset
value
and
maximum
offering
price
per
share
b
.............................................
$15.68
Class
R6:
Net
assets,
at
value
.......................................................................
$5,342,972
Shares
outstanding
........................................................................
330,476
Net
asset
value
and
maximum
offering
price
per
share
b
.............................................
$16.17
Advisor
Class:
Net
assets,
at
value
.......................................................................
$117,356,418
Shares
outstanding
........................................................................
7,439,363
Net
asset
value
and
maximum
offering
price
per
share
b
.............................................
$15.78
a
Redemption
price
is
equal
to
net
asset
value
less
contingent
deferred
sales
charges,
if
applicable.
b
Net
asset
value
per
share
may
not
recalculate
due
to
rounding.
Franklin
Fund
Allocator
Series
Financial
Statements
Statement
of
Operations
for
the
year
ended
December
31,
2024
The
accompanying
notes
are
an
integral
part
of
these
financial
statements.
Annual
Report
Franklin
Global
Allocation
Fund
Investment
income:
Dividends:
(net
of
foreign
taxes
of
$2,158,353)
Unaffiliated
issuers
........................................................................
$29,155,562
Controlled
affiliates
(Note
3
f
)
.................................................................
1,806,681
Non-controlled
affiliates
(Note
3
f
)
.............................................................
6,274,533
Interest:
Unaffiliated
issuers
........................................................................
28,544,549
Other
income
(Note
1
d
)
......................................................................
496,589
Total
investment
income
...................................................................
66,277,914
Expenses:
Management
fees
(Note
3
a
)
...................................................................
15,917,535
Distribution
fees:
(Note
3c
)
Class
A
................................................................................
6,373,041
Class
C
................................................................................
676,343
Class
R
................................................................................
22,456
Transfer
agent
fees:
(Note
3e
)
Class
A
................................................................................
2,364,841
Class
C
................................................................................
62,863
Class
R
................................................................................
4,160
Class
R6
...............................................................................
2,764
Advisor
Class
............................................................................
105,483
Custodian
fees
............................................................................
41,701
Reports
to
shareholders
fees
..................................................................
204,887
Registration
and
filing
fees
....................................................................
117,013
Professional
fees
...........................................................................
135,164
Trustees'
fees
and
expenses
..................................................................
28,405
Other
....................................................................................
91,634
Total
expenses
.........................................................................
26,148,290
Expenses
waived/paid
by
affiliates
(Note
3
f
and
3
g
)
..............................................
(512,558)
Net
expenses
.........................................................................
25,635,732
Net
investment
income
................................................................
40,642,182
Realized
and
unrealized
gains
(losses):
Net
realized
gain
(loss)
from:
Investments:
Unaffiliated
issuers
......................................................................
75,803,243
Non-controlled
affiliates
(Note
3
f
)
............................................................
73,589
Written
options
...........................................................................
588,310
Foreign
currency
transactions
................................................................
302,628
Forward
exchange
contracts
.................................................................
885,531
Capital
gain
distributions
from
management
investment
companies:
Controlled
affiliates
(Note
3
f
)
...............................................................
462,203
Net
realized
gain
(loss)
..................................................................
78,115,504
Net
change
in
unrealized
appreciation
(depreciation)
on:
Investments:
Unaffiliated
issuers
......................................................................
185,928,366
Controlled
affiliates
(Note
3
f
)
...............................................................
922,201
Non-controlled
affiliates
(Note
3
f
)
............................................................
4,293,524
Translation
of
other
assets
and
liabilities
denominated
in
foreign
currencies
..............................
(390,465)
Forward
exchange
contracts
.................................................................
21,122,132
Net
change
in
unrealized
appreciation
(depreciation)
............................................
211,875,758
Net
realized
and
unrealized
gain
(loss)
............................................................
289,991,262
Net
increase
(decrease)
in
net
assets
resulting
from
operations
..........................................
$330,633,444
Franklin
Fund
Allocator
Series
Financial
Statements
Statements
of
Changes
in
Net
Assets
Annual
Report
The
accompanying
notes
are
an
integral
part
of
these
financial
statements.
Franklin
Global
Allocation
Fund
Year
Ended
December
31,
2024
Year
Ended
December
31,
2023
Increase
(decrease)
in
net
assets:
Operations:
Net
investment
income
.................................................
$40,642,182
$45,397,693
Net
realized
gain
(loss)
.................................................
78,115,504
7,670,157
Net
change
in
unrealized
appreciation
(depreciation)
...........................
211,875,758
264,083,729
Net
increase
(decrease)
in
net
assets
resulting
from
operations
................
330,633,444
317,151,579
Distributions
to
shareholders:
Class
A
.............................................................
(28,202,493)
(41,927,115)
Class
C
.............................................................
(272,883)
(706,351)
Class
R
.............................................................
(39,408)
(60,410)
Class
R6
............................................................
(68,814)
(51,289)
Advisor
Class
........................................................
(1,550,886)
(1,992,170)
Total
distributions
to
shareholders
..........................................
(30,134,484)
(44,737,335)
Capital
share
transactions:
(Note
2
)
Class
A
.............................................................
(238,597,409)
(191,103,192)
Class
C
.............................................................
(16,762,298)
(20,274,572)
Class
R
.............................................................
(25,879)
(100,474)
Class
R6
............................................................
837,322
2,635,578
Advisor
Class
........................................................
1,754,246
(6,052,941)
Total
capital
share
transactions
............................................
(252,794,018)
(214,895,601)
Net
increase
(decrease)
in
net
assets
...................................
47,704,942
57,518,643
Net
assets:
Beginning
of
year
.......................................................
2,662,845,795
2,605,327,152
End
of
year
...........................................................
$2,710,550,737
$2,662,845,795
Franklin
Fund
Allocator
Series
Notes
to
Financial
Statements
Franklin
Global
Allocation
Fund
1.
Organization
and
Significant
Accounting
Policies
Franklin
Fund
Allocator
Series
(Trust)
is
registered
under
the
Investment
Company
Act
of
1940
(1940
Act)
as
an
open-end
management
investment
company,
consisting
of eighteen
separate
funds.
The
Trust
follows
the
accounting
and
reporting
guidance
in
Financial
Accounting
Standards
Board
(FASB)
Accounting
Standards
Codification
Topic
946,
Financial
Services
–
Investment
Companies
(ASC
946)
and applies
the
specialized
accounting
and
reporting
guidance
in
U.S.
Generally
Accepted
Accounting
Principles
(U.S.
GAAP),
including,
but
not
limited
to,
ASC
946.
Franklin
Global
Allocation
Fund
(Fund)
is
included
in
this
report.
The
Fund
offers five
classes
of
shares:
Class
A,
Class
C,
Class
R,
Class
R6
and
Advisor
Class. Class
C
shares
automatically
convert
to
Class
A
shares
on
a
monthly
basis,
after
they
have
been
held
for
8
years.
Each
class
of
shares
may
differ
by
its
initial
sales
load,
contingent
deferred
sales
charges,
voting
rights
on
matters
affecting
a
single
class,
its
exchange
privilege
and
fees
due
to
differing
arrangements
for
distribution
and
transfer
agent
fees.
The
following
summarizes
the Fund's
significant
accounting
policies.
a.
Financial
Instrument
Valuation
The
Fund's
investments
in
financial
instruments
are
carried
at
fair
value
daily.
Fair
value
is
the
price
that
would
be
received
to
sell
an
asset
or
paid
to
transfer
a
liability
in
an
orderly
transaction
between
market
participants
on
the
measurement
date.
The
Fund
calculates
the
net
asset
value
(NAV)
per
share
each business
day as
of
4
p.m.
Eastern
time
or
the
regularly
scheduled
close
of
the
New
York
Stock
Exchange
(NYSE),
whichever
is
earlier.
Under
compliance
policies
and
procedures
approved
by
the Trust's
Board
of
Trustees
(the
Board),
the
Board
has
designated
the
Fund’s
investment
manager
as
the
valuation
designee
and
has
responsibility
for
oversight
of
valuation.
The
investment
manager
is
assisted
by
the
Fund’s
administrator
in
performing
this
responsibility,
including
leading
the
cross-
functional
Valuation
Committee
(VC).
The
Fund
may
utilize
independent
pricing
services,
quotations
from
securities
and
financial
instrument
dealers,
and
other
market
sources
to
determine
fair
value.
Equity
securities,
exchange
traded
funds, and
derivative
financial instruments listed
on
an
exchange
or
on
the
NASDAQ
National
Market
System
are
valued
at
the
last
quoted
sale
price
or
the
official
closing
price of
the
day,
respectively.
Foreign
equity
securities
are
valued
as
of
the
close
of
trading
on
the
foreign
stock
exchange
on
which
the
security
is
primarily
traded,
or
as
of
4
p.m.
Eastern
time.
The
value
is
then
converted
into
its
U.S.
dollar
equivalent
at
the
foreign
exchange
rate
in
effect
at
4
p.m.
Eastern
time
on
the
day
that
the
value
of
the
security
is
determined.
Over-the-
counter
(OTC)
securities
are
valued
within
the
range
of
the
most
recent
quoted
bid
and
ask
prices.
Securities
that
trade
in
multiple
markets
or
on
multiple
exchanges
are
valued
according
to
the
broadest
and
most
representative
market.
Certain
equity
securities
are
valued
based
upon
fundamental
characteristics
or
relationships
to
similar
securities.
Debt
securities
generally
trade
in
the OTC
market
rather
than
on
a
securities
exchange.
The
Fund's
pricing
services
use
multiple
valuation
techniques
to
determine
fair
value.
In
instances
where
sufficient
market
activity
exists,
the
pricing
services
may
utilize
a
market-based
approach
through
which
quotes
from
market
makers
are
used
to
determine
fair
value.
In
instances
where
sufficient
market
activity
may
not
exist
or
is
limited,
the
pricing
services
also
utilize
proprietary
valuation
models
which
may
consider
market
characteristics
such
as
benchmark
yield
curves,
credit
spreads,
estimated
default
rates,
anticipated
market
interest
rate
volatility,
coupon
rates,
anticipated
timing
of
principal
repayments,
underlying
collateral,
and
other
unique
security
features
in
order
to
estimate
the
relevant
cash
flows,
which
are
then
discounted
to
calculate
the
fair
value.
Securities
denominated
in
a
foreign
currency
are
converted
into
their
U.S.
dollar
equivalent
at
the
foreign
exchange
rate
in
effect
at
4
p.m.
Eastern
time
on
the
date
that
the
values
of
the
foreign
debt
securities
are
determined.
Investments
in open-end mutual
funds
are
valued
at
the
closing
NAV.
Certain
derivative
financial
instruments
trade
in
the
OTC
market.
The
Fund's
pricing
services
use
various
techniques
including
industry
standard
option
pricing
models
and
proprietary
discounted
cash
flow
models
to
determine
the
fair
value
of
those
instruments.
The
Fund's
net
benefit
or
obligation
under
the
derivative
contract,
as
measured
by
the
fair
value
of
the
contract,
is
included
in
net
assets.
The
Fund
has
procedures
to
determine
the
fair
value
of
financial
instruments
for
which
market
prices
are
not
reliable
or
readily
available.
Under
these
procedures,
the Fund
primarily
employs
a
market-based
approach
which
may
use
related
or
comparable
assets
or
liabilities,
recent
transactions,
market
multiples,
and
other
relevant
Franklin
Fund
Allocator
Series
Notes
to
Financial
Statements
Franklin
Global
Allocation
Fund
(continued)
information
for
the
investment
to
determine
the
fair
value
of
the
investment.
An
income-based
valuation
approach
may
also
be
used
in
which
the
anticipated
future
cash
flows
of
the
investment
are
discounted
to
calculate
fair
value.
Discounts
may
also
be
applied
due
to
the
nature
or
duration
of
any
restrictions
on
the
disposition
of
the
investments.
Due
to
the
inherent
uncertainty
of
valuations
of
such
investments,
the
fair
values
may
differ
significantly
from
the
values
that
would
have
been
used
had
an
active
market
existed.
Trading
in
securities
on
foreign
securities
stock
exchanges
and
OTC
markets
may
be
completed
before
4
p.m.
Eastern
time.
In
addition,
trading
in
certain
foreign
markets
may
not
take
place
on
every
Fund's
business
day. Events
can occur
between
the
time
at
which
trading
in
a
foreign
security
is
completed
and
4
p.m.
Eastern
time
that
might
call
into
question
the
reliability
of
the
value
of
a
portfolio
security
held
by
the
Fund.
As
a
result,
differences
may
arise
between
the
value
of
the
Fund's
portfolio
securities
as
determined
at
the
foreign
market
close
and
the
latest
indications
of
value
at
4
p.m.
Eastern
time. In
order
to
minimize
the
potential
for
these
differences,
an
independent
pricing
service
may
be
used
to
adjust
the
value
of
the
Fund's
portfolio
securities
to
the
latest
indications
of
fair
value
at
4
p.m.
Eastern
time.
At
December
31,
2024,
certain
securities
may
have
been
fair
valued
using
these
procedures,
in
which
case
the
securities
were
categorized
as
Level
2
within
the
fair
value
hierarchy
(referred
to
as
“market
level
fair
value”).
See
the
Fair
Value
Measurements
note
for
more
information.
When
the
last
day
of
the
reporting
period
is
a
non-business
day,
certain
foreign
markets
may
be
open
on
those
days
that
the
Fund's
NAV
is
not
calculated,
which
could
result
in
differences
between
the
value
of
the
Fund's
portfolio
securities
on
the
last
business
day
and
the
last
calendar
day
of
the
reporting
period.
Any
security
valuation
changes
due
to
an
open
foreign
market
are
adjusted
and
reflected
by
the
Fund
for
financial
reporting
purposes.
b.
Foreign
Currency
Translation
Portfolio
securities
and
other
assets
and
liabilities
denominated
in
foreign
currencies
are
translated
into
U.S.
dollars
based
on
the
exchange
rate
of
such
currencies
against
U.S.
dollars
on
the
date
of
valuation.
The
Fund
may
enter
into
foreign
currency
exchange
contracts
to
facilitate
transactions
denominated
in
a
foreign
currency.
Purchases
and
sales
of
securities,
income
and
expense
items
denominated
in
foreign
currencies
are
translated
into
U.S.
dollars
at
the
exchange
rate
in
effect
on
the
transaction
date.
Portfolio
securities
and
assets
and
liabilities
denominated
in
foreign
currencies
contain
risks
that
those
currencies
will
decline
in
value
relative
to
the
U.S.
dollar.
Occasionally,
events
may
impact
the
availability
or
reliability
of
foreign
exchange
rates
used
to
convert
the
U.S.
dollar
equivalent
value.
If
such
an
event
occurs,
the
foreign
exchange
rate
will
be
valued
at
fair
value
using
procedures
established
and
approved
by
the
Board.
The
Fund
does
not
separately
report
the
effect
of
changes
in
foreign
exchange
rates
from
changes
in
market
prices
on
securities
held.
Such
changes
are
included
in
net
realized
and
unrealized
gain
or
loss
from
investments
in
the
Statement of
Operations.
Realized
foreign
exchange
gains
or
losses
arise
from
sales
of
foreign
currencies,
currency
gains
or
losses
realized
between
the
trade
and
settlement
dates
on
securities
transactions
and
the
difference
between
the
recorded
amounts
of
dividends,
interest,
and
foreign
withholding
taxes
and
the
U.S.
dollar
equivalent
of
the
amounts
actually
received
or
paid.
Net
unrealized
foreign
exchange
gains
and
losses
arise
from
changes
in
foreign
exchange
rates
on
foreign
denominated
assets
and
liabilities
other
than
investments
in
securities
held
at
the
end
of
the
reporting
period.
c.
Derivative
Financial
Instruments
The
Fund invested
in
derivative
financial
instruments
in
order
to
manage
risk
or
gain
exposure
to
various
other
investments
or
markets.
Derivatives
are
financial
contracts
based
on
an
underlying
or
notional
amount,
require
no
initial
investment
or
an
initial
net
investment
that
is
smaller
than
would
normally
be
required
to
have
a
similar
response
to
changes
in
market
factors,
and
require
or
permit
net
settlement.
Derivatives
contain
various
risks
including
the
potential
inability
of
the
counterparty
to
fulfill
their
obligations
under
the
terms
of
the
contract,
the
potential
for
an
illiquid
secondary
market,
and/or
the
potential
for
market
movements
which
expose
the
Fund
to
gains
or
losses
in
excess
of
the
amounts
shown
in
the
Statement
of
Assets
and
Liabilities.
Realized
gain
and
loss
and
unrealized
appreciation
and
depreciation
on
these
contracts
for
the
period
are
included
in
the
Statement
of
Operations.
1.
Organization
and
Significant
Accounting
Policies
(continued)
a.
Financial
Instrument
Valuation
(continued)
Franklin
Fund
Allocator
Series
Notes
to
Financial
Statements
Franklin
Global
Allocation
Fund
(continued)
Derivative
counterparty
credit
risk
is
managed
through
a
formal
evaluation
of
the
creditworthiness
of
all
potential
counterparties.
The
Fund
attempts
to
reduce
its
exposure
to
counterparty
credit
risk
on
OTC
derivatives,
whenever
possible,
by
entering
into
International
Swaps
and
Derivatives
Association
(ISDA)
master
agreements
with
certain
counterparties.
These
agreements
contain
various
provisions,
including
but
not
limited
to
collateral
requirements,
events
of
default,
or
early
termination.
Termination
events
applicable
to
the
counterparty
include
certain
deteriorations
in
the
credit
quality
of
the
counterparty.
Termination
events
applicable
to
the
Fund
include
failure
of
the
Fund
to
maintain
certain
net
asset
levels
and/or
limit
the
decline
in
net
assets
over
various
periods
of
time.
In
the
event
of
default
or
early
termination,
the
ISDA
master
agreement
gives
the
non-defaulting
party
the
right
to
net
and
close-out
all
transactions
traded,
whether
or
not
arising
under
the
ISDA
agreement,
to
one
net
amount
payable
by
one
counterparty
to
the
other.
However,
absent
an
event
of
default
or
early
termination,
OTC
derivative
assets
and
liabilities
are
presented
gross
and
not
offset
in
the
Statement
of
Assets
and
Liabilities.
Early
termination
by
the
counterparty
may
result
in
an
immediate
payment
by
the
Fund
of
any
net
liability
owed
to
that
counterparty
under
the
ISDA
agreement.
At
December
31,
2024,
the
Fund
had
no
OTC
derivatives
in
a
net
liability
position
for
such
contracts.
Collateral
requirements
differ
by
type
of
derivative.
Collateral
terms
are
contract
specific
for
OTC
derivatives.
For
OTC
derivatives
traded
under
an
ISDA
master
agreement,
posting
of
collateral
is
required
by
either
the
Fund
or
the
applicable
counterparty
if
the
total
net
exposure
of
all
OTC
derivatives
with
the
applicable
counterparty
exceeds
the
minimum
transfer
amount,
which
typically
ranges
from
$100,000
to
$250,000,
and
can
vary
depending
on
the
counterparty
and
the
type
of
agreement.
Generally,
collateral
is
determined
at
the
close
of
Fund
business
each
day
and
any
additional
collateral
required
due
to
changes
in
derivative
values
may
be
delivered
by
the
Fund
or
the
counterparty
the
next
business
day,
or
within
a
few
business
days.
Collateral
pledged
and/or
received
by
the
Fund,
if
any,
is
held
in
segregated
accounts
with
the
Fund’s
custodian/counterparty
broker
and
can
be
in
the
form
of
cash
and/or
securities.
Unrestricted
cash
may
be
invested
according
to
the
Fund's
investment
objectives.
To
the
extent
that
the
amounts
due
to
the
Fund
from
its
counterparties
are
not
subject
to
collateralization
or
are
not
fully
collateralized,
the
Fund
bears
the
risk
of
loss
from
counterparty
non-performance.
The
Fund entered
into
OTC
forward
exchange
contracts
primarily
to
manage
and/or
gain exposure
to
certain
foreign
currencies.
A
forward
exchange
contract
is
an
agreement
between
the
Fund
and
a
counterparty
to
buy
or
sell
a
foreign
currency at
a
specific
exchange
rate
on
a
future
date.
Forward
exchange
contracts
outstanding
at
period
end,
if
any,
are
listed
in
the
Fund's
Schedule
of
Investments.
The
Fund
purchased
or
wrote
exchange
traded
option
contracts
primarily
to
manage
and/or
gain
exposure
to
equity
price/equity
volatility
risk.
An
option
is
a
contract
entitling
the
holder
to
purchase
or
sell
a
specific
amount
of
shares
or
units
of
an
asset
or
notional
amount
of
a
swap
(swaption),
at
a
specified
price.
When
an
option
is
purchased
or
written,
an
amount
equal
to
the
premium
paid
or
received
is
recorded
as
an
asset
or
liability,
respectively.
Upon
exercise
of
an
option,
the
acquisition
cost
or
sales
proceeds
of
the
underlying
investment
is
adjusted
by
any
premium
received
or
paid.
Upon
expiration
of
an
option,
any
premium
received
or
paid
is
recorded
as
a
realized
gain
or
loss.
Upon
closing
an
option
other
than
through
expiration
or
exercise,
the
difference
between
the
premium
received
or
paid
and
the
cost
to
close
the
position
is
recorded
as
a
realized
gain
or
loss.
Option
contracts
outstanding
at
period
end,
if
any,
are
listed
in
the
Fund's
Schedule
of
Investments.
See
Note
7 regarding
other
derivative
information.
d.
Income
and
Deferred
Taxes
It
is the Fund's
policy
to
qualify
as
a
regulated
investment
company
under
the
Internal
Revenue
Code. The Fund
intends
to
distribute
to
shareholders
substantially
all
of
its
taxable
income
and
net
realized
gains
to
relieve
it
from
federal
income
and
excise
taxes.
As
a
result,
no
provision
for
U.S.
federal
income
taxes
is
required.
The
Fund
may
be
subject
to
foreign
taxation
related
to
income
received,
capital
gains
on
the
sale
of
securities
and
certain
foreign
currency
transactions
in
the
foreign
jurisdictions
in
which it
invests.
Foreign
taxes,
if
any,
are
recorded
based
on
the
tax
regulations
and
rates
that
exist
in
the
foreign
markets
in
which
the
Fund
invests.
When
a
capital
gain
tax
is
determined
to
apply,
the
Fund
records
an
1.
Organization
and
Significant
Accounting
Policies
(continued)
c.
Derivative
Financial
Instruments
(continued)
Franklin
Fund
Allocator
Series
Notes
to
Financial
Statements
Franklin
Global
Allocation
Fund
(continued)
estimated
deferred
tax
liability
in
an
amount
that
would
be
payable
if
the
securities
were
disposed
of
on
the
valuation
date.
As
a
result
of
several
court
cases,
in
certain
countries
across
the
European
Union, the
Fund
filed
additional
tax
reclaims
for
previously
withheld
taxes
on
dividends
earned
in
those
countries
(EU
reclaims). Income
recognized,
if
any,
for
EU
reclaims
is
reflected
as
other
income
in
the
Statement
of
Operations
and
any
related
receivable,
if
any,
is
reflected
as
European
Union
tax
reclaims
in
the
Statement
of
Assets
and
Liabilities.
Any
fees
associated
with
these
filings
are
reflected
in
other
expenses
in
the
Statement
of
Operations.
When
uncertainty
exists
as
to
the
ultimate
resolution
of
these
proceedings,
the
likelihood
of
receipt
of
these
EU
reclaims,
and
the
potential
timing
of
payment,
no
amounts
are
reflected
in
the
financial
statements.
For
U.S.
income
tax
purposes,
EU
reclaims
received
by
the
Fund,
if
any,
reduce
the
amount
of
foreign
taxes
Fund
shareholders
can
use
as
tax
deductions
or credits
on
their
income
tax
returns.
In
the
event
that
EU
reclaims
received
by
the Fund
during a
fiscal
year
exceed
foreign
withholding
taxes
paid
by
the
Fund,
and
the
Fund previously
passed
through to
its
shareholders
foreign
taxes
incurred
by
the
Fund
to
be
used
as
a
credit
or
deduction
on
a
shareholder’s
income
tax
return,
the Fund
will enter
into
a
closing
agreement
with
the
Internal
Revenue
Service
(IRS)
in
order
to
pay
the
associated
tax
liability
on
behalf
of
the Fund's
shareholders.
The Fund
may
recognize
an
income
tax
liability
related
to
its
uncertain
tax
positions
under
U.S.
GAAP
when
the
uncertain
tax
position
has
a
less
than
50%
probability
that
it
will
be
sustained
upon
examination
by
the
tax
authorities
based
on
its
technical
merits.
As
of
December
31,
2024, the Fund
has
determined
that
no
tax
liability
is
required
in
its
financial
statements
related
to
uncertain
tax
positions
for
any
open
tax
years
(or
expected
to
be
taken
in
future
tax
years).
Open
tax
years
are
those
that
remain
subject
to
examination
and
are
based
on
the
statute
of
limitations
in
each
jurisdiction
in
which
the Fund
invests.
e.
Security
Transactions,
Investment
Income,
Expenses
and
Distributions
Security
transactions
are
accounted
for
on
trade
date.
Realized
gains
and
losses
on
security
transactions
are
determined
on
a
specific
identification
basis.
Interest
income
(including
interest
income
from
payment-in-kind
securities,
if
any)
and
estimated
expenses
are
accrued
daily.
Amortization
of
premium
and
accretion
of
discount
on
debt
securities
are
included
in
interest
income.
Paydown
gains
and
losses
are
recorded
as
an
adjustment
to
interest
income. Dividend
income
and
capital
gain
distributions
are
recorded
on
the
ex-dividend
date
except
for
certain
dividends
from
securities
where
the
dividend
rate
is
not
available.
In
such
cases,
the
dividend
is
recorded
as
soon
as
the
information
is
received
by
the
Fund.
Distributions
to
shareholders
are
recorded
on
the ex-dividend
date.
Distributable
earnings
are
determined
according
to
income
tax
regulations
(tax
basis)
and
may
differ
from
earnings
recorded
in
accordance
with
U.S.
GAAP.
These
differences
may
be
permanent
or
temporary.
Permanent
differences
are
reclassified
among
capital
accounts
to
reflect
their
tax
character.
These
reclassifications
have
no
impact
on
net
assets
or
the
results
of
operations.
Temporary
differences
are
not
reclassified,
as
they
may
reverse
in
subsequent
periods.
Common
expenses
incurred
by
the
Trust
are
allocated
among
the
Funds
based
on
the
ratio
of
net
assets
of
each
Fund
to
the
combined
net
assets
of
the
Trust
or
based
on
the
ratio
of
number
of
shareholders
of
each
Fund
to
the
combined
number
of
shareholders
of
the
Trust.
Fund
specific
expenses
are
charged
directly
to
the
Fund
that
incurred
the
expense.
Realized
and
unrealized
gains
and
losses
and
net
investment
income,
excluding
class
specific
expenses,
are
allocated
daily
to
each
class
of
shares
based
upon
the
relative
proportion
of
net
assets
of
each
class.
Differences
in
per
share
distributions
by
class
are
generally
due
to
differences
in
class
specific
expenses.
Inflation-indexed
bonds
are
adjusted
for
inflation
through
periodic
increases
or
decreases
in
the
security's
interest
accruals,
face
amount,
or
principal
redemption
value,
by
amounts
corresponding
to
the
rate
of
inflation
as
measured
by
an
index.
Any
increase
or
decrease
in
the
face
amount
or
principal
redemption
value
will
be
included
as
interest
income
in
the
Statement
of
Operations.
1.
Organization
and
Significant
Accounting
Policies
(continued)
d.
Income
and
Deferred
Taxes
(continued)
Franklin
Fund
Allocator
Series
Notes
to
Financial
Statements
Franklin
Global
Allocation
Fund
(continued)
f.
Accounting
Estimates
The
preparation
of
financial
statements
in
accordance
with
U.S.
GAAP
requires
management
to
make
estimates
and
assumptions
that
affect
the
reported
amounts
of
assets
and
liabilities
at
the
date
of
the
financial
statements
and
the
amounts
of
income
and
expenses
during
the
reporting
period.
Actual
results
could
differ
from
those
estimates.
g.
Guarantees
and
Indemnifications
Under
the Trust's
organizational
documents,
its
officers
and trustees
are
indemnified
by
the Trust against
certain
liabilities
arising
out
of
the
performance
of
their
duties
to
the
Trust.
Additionally,
in
the
normal
course
of
business,
the Trust,
on
behalf
of
the
Fund, enters
into
contracts
with
service
providers
that
contain
general
indemnification
clauses.
The Trust's
maximum
exposure
under
these
arrangements
is
unknown
as
this
would
involve
future
claims
that
may
be
made
against
the Trust
that
have
not
yet
occurred.
Currently,
the Trust
expects
the
risk
of
loss
to
be
remote.
2.
Shares
of
Beneficial
Interest
At
December
31,
2024,
there
were
an
unlimited
number
of
shares
authorized
(without
par
value).
Transactions
in
the
Fund's
shares
were
as
follows:
Year
Ended
December
31,
2024
Year
Ended
December
31,
2023
Shares
Amount
Shares
Amount
Class
A
Shares:
Shares
sold
a
...................................
5,129,352
$77,516,994
11,612,764
$152,377,805
Shares
issued
in
reinvestment
of
distributions
..........
1,753,339
26,983,547
2,964,468
40,136,085
Shares
redeemed
...............................
(22,724,662)
(343,097,950)
(29,125,920)
(383,617,082)
Net
increase
(decrease)
..........................
(15,841,971)
$(238,597,409)
(14,548,688)
$(191,103,192)
Class
C
Shares:
Shares
sold
...................................
478,418
$7,140,642
1,327,495
$17,205,473
Shares
issued
in
reinvestment
of
distributions
..........
17,960
271,007
52,579
700,891
Shares
redeemed
a
..............................
(1,627,582)
(24,173,947)
(2,935,306)
(38,180,936)
Net
increase
(decrease)
..........................
(1,131,204)
$(16,762,298)
(1,555,232)
$(20,274,572)
Class
R
Shares:
Shares
sold
...................................
7,605
$115,593
62,918
$837,022
Shares
issued
in
reinvestment
of
distributions
..........
2,547
39,261
4,435
60,187
Shares
redeemed
...............................
(12,235)
(180,733)
(75,997)
(997,683)
Net
increase
(decrease)
..........................
(2,083)
$(25,879)
(8,644)
$(100,474)
Class
R6
Shares:
Shares
sold
...................................
148,967
$2,325,107
299,239
$4,056,936
Shares
issued
in
reinvestment
of
distributions
..........
4,165
66,427
3,403
48,083
Shares
redeemed
...............................
(100,306)
(1,554,212)
(108,425)
(1,469,441)
Net
increase
(decrease)
..........................
52,826
$837,322
194,217
$2,635,578
Advisor
Class
Shares:
Shares
sold
...................................
1,642,517
$24,850,693
1,444,396
$19,165,754
Shares
issued
in
reinvestment
of
distributions
..........
92,599
1,440,046
133,802
1,828,113
Shares
redeemed
...............................
(1,613,172)
(24,536,493)
(2,038,831)
(27,046,808)
Net
increase
(decrease)
..........................
121,944
$1,754,246
(460,633)
$(6,052,941)
1.
Organization
and
Significant
Accounting
Policies
(continued)
Franklin
Fund
Allocator
Series
Notes
to
Financial
Statements
Franklin
Global
Allocation
Fund
(continued)
3.
Transactions
with
Affiliates
Franklin
Resources,
Inc.
is
the
holding
company
for
various
subsidiaries
that
together
are
referred
to
as
Franklin
Templeton.
Certain
officers
and
trustees
of
the Fund are
also
officers,
directors, and/or trustees
of
the
following
subsidiaries:
a.
Management
Fees
The
Fund
pays
an
investment
management fee,
calculated daily and
paid
monthly,
to
Advisers based
on the
average
daily net
assets
of
the
Fund
as
follows:
For
the
year
ended
December
31,
2024,
the
gross
effective
investment
management
fee
rate
was 0.581%
of
the
Fund’s
average daily
net
assets.
Effective
June
3,
2024,
under
a
subadvisory
agreement,
FTIC,
an
affiliate
of
Advisers,
provides
subadvisory
services
to
the
Fund.
The
subadvisory
fee
is
paid
by
Advisers
based
on
the
Fund's
average
daily
net
assets,
and
is
not
an
additional
expense
of
the
Fund.
b.
Administrative
Fees
Under
an
agreement
with
Advisers,
FT
Services
provides
administrative
services
to
the
Fund.
The
fee
is
paid
by
Advisers
based
on
the Fund's
average
daily
net
assets,
and
is
not
an
additional
expense
of
the
Fund.
c.
Distribution
Fees
The
Board
has
adopted
distribution
plans
for
each
share
class,
with
the
exception
of
Class
R6
and
Advisor
Class
shares,
pursuant
to
Rule
12b-1
under
the
1940
Act.
Under
the
Fund's
Class
A
reimbursement
distribution
plan,
the
Fund
reimburses
Distributors
for
costs
incurred
in
connection
with
the
servicing,
sale
and
distribution
of the
Fund's
shares
up
to
the
maximum
annual
plan
rate.
Under
the
Class
A
reimbursement
distribution
plan,
costs
exceeding
the
maximum
for
the
current
plan
year
cannot
be
reimbursed
in
subsequent
periods.
In
addition,
under
the
Fund's
Class
C
and
R compensation
distribution
plans,
the
Fund
pays
Distributors
for
costs
incurred
in
connection
with
the
servicing,
sale
and
distribution
of
the
Fund's
shares
up
to
the
maximum
annual
plan
rate
for
each
class.
The
plan
year,
for
purposes
of
monitoring
compliance
with
the
maximum
annual
plan
rates,
is
February
1
through
January
31.
The
maximum
annual
plan
rates,
based
on
the
average
daily
net
assets,
for
each
class,
are
as
follows:
a
May
include
a
portion
of
Class
C
shares
that
were
automatically
converted
to
Class
A.
Subsidiary
Affiliation
Franklin
Advisers,
Inc.
(Advisers)
Investment
manager
Franklin
Templeton
Investment
Corp.
(FTIC)
Investment
manager
Franklin
Templeton
Services,
LLC
(FT
Services)
Administrative
manager
Franklin
Distributors,
LLC
(Distributors)
Principal
underwriter
Franklin
Templeton
Investor
Services,
LLC
(Investor
Services)
Transfer
agent
Annualized
Fee
Rate
Net
Assets
0.600%
Up
to
and
including
$1
billion
0.570%
Over
$1
billion,
up
to
and
including
$5
billion
0.550%
In
excess
of
$5
billion
2.
Shares
of
Beneficial
Interest
(continued)
Franklin
Fund
Allocator
Series
Notes
to
Financial
Statements
Franklin
Global
Allocation
Fund
(continued)
The
Board
has
set
the
current
rate
at
0.25%
per
year
for
Class
A
shares
until
further
notice
and
approval
by
the
Board.
d.
Sales
Charges/Underwriting
Agreements
Front-end
sales
charges
and
contingent
deferred
sales
charges
(CDSC)
do
not
represent
expenses
of
the
Fund.
These
charges
are
deducted
from
the
proceeds
of
sales
of
fund
shares
prior
to
investment
or
from
redemption
proceeds
prior
to
remittance,
as
applicable.
Distributors
has
advised
the
Fund
of
the
following
commission
transactions
related
to
the
sales
and
redemptions
of
the
Fund's
shares
for
the
year:
e.
Transfer
Agent
Fees
Each
class
of
shares pays
transfer
agent
fees,
calculated
monthly
and
paid
monthly, to
Investor
Services
for
its
performance
of
shareholder
servicing
obligations. The
fees
are based
on
a
fixed
margin
earned
by
Investor
Services
and
are allocated
to
the Fund
based
upon
relative
assets
and
relative
transactions. In
addition,
each
class reimburses
Investor
Services
for
out
of
pocket
expenses
incurred
and,
except
for
Class
R6, reimburses
shareholder
servicing
fees
paid
to
third
parties.
These
fees
paid
to
third
parties
are
accrued
and
allocated
daily
based
upon
their
relative
proportion
of
such
classes'
aggregate
net
assets.
Class
R6
pays
Investor
Services
transfer
agent
fees
allocated
specifically
to
that
class
based
upon
its
relative
assets
and
relative
transactions.
For
the
year
ended
December
31,
2024,
the Fund
paid
transfer
agent
fees
as
noted
in
the
Statement of
Operations,
of
which
$800,235
was
retained
by
Investor
Services.
f.
Investments
in
Affiliated
Management
Investment
Companies
The
Fund
invests
in
one
or
more
affiliated
management
investment
companies.
As
defined
in
the
1940
Act,
an
investment
is
deemed
to
be
a
“Controlled
Affiliate”
of
a
fund
when
a
fund
owns,
either
directly
or
indirectly,
25%
or
more
of
the
affiliated
fund’s
outstanding
shares
or
has
the
power
to
exercise
control
over
management
or
policies
of
such
fund.
The
Fund
does
not
invest
for
purposes
of
exercising
a
controlling
influence
over
the
management
or
policies.
Management
fees
paid
by
the
Fund
are
waived
on
assets
invested
in
the
affiliated
management
investment
companies,
as
noted
in
the
Statement
of
Operations,
in
an
amount
not
to
exceed
the
management
and
administrative
fees
paid
directly
or
indirectly
by
each
affiliate.
During
the
year
ended
December
31,
2024,
the
Fund
held
investments
in
affiliated
management
investment
companies
as
follows:
Class
A
....................................................................................
0.35%
Class
C
....................................................................................
1.00%
Class
R
....................................................................................
0.50%
Sales
charges
retained
net
of
commissions
paid
to
unaffiliated
brokers/dealers
..............................
$72,198
CDSC
retained
..............................................................................
$6,452
aa
Value
at
Beginning
of
Year
Purchases
Sales
Realized
Gain
(Loss)
Net
Change
in
Unrealized
Appreciation
(Depreciation)
Value
at
End
of
Year
Number
of
Shares
Held
at
End
of
Year
Investment
Income
a
a
a
a
a
a
a
a
Franklin
Global
Allocation
Fund
Controlled
Affiliates
Dividends
Franklin
BSP
Private
Credit
Fund,
Class
Advisor
........
$
—
$
32,000,000
$
—
$
—
$
922,201
$
32,922,201
3,076,841
$
2,268,884
a
3.
Transactions
with
Affiliates
(continued)
c.
Distribution
Fees
(continued)
Franklin
Fund
Allocator
Series
Notes
to
Financial
Statements
Franklin
Global
Allocation
Fund
(continued)
g.
Waiver
and
Expense
Reimbursements
Effective
May
1,
2024,
Advisers
has
contractually
agreed
in
advance
to
waive
or
limit
its fees
and
to
assume
as
its own
expense
certain
expenses
otherwise
payable
by
the
Fund
so
that
the
operating
expenses
(excluding
interest
expense,
distribution
fees,
acquired
fund
fees
and
expenses,
and certain
non-routine
expenses
or
costs,
including
those
relating
to
litigation,
indemnification,
reorganizations,
and
liquidations)
for
each
class of
the
Fund
do
not
exceed
0.70%
based
on
the
average
net
assets
of
each
class
until
April
30, 2025.
Total
expenses
waived
or
paid
are
not
subject
to
recapture
subsequent
to
the
Fund's
fiscal
year
end.
Prior
to May
1,
2024, expenses
(excluding
certain
fees
and
expenses
as
previously
disclosed)
and
acquired
fund
fees
and
expenses
for
each
class
of
the
Fund were
limited
to
0.73% based
on
the
average
net
assets
of
each class.
Transfer
agent
fees
on
Class
R6
shares
of
the
Fund have
been
capped
so
that
transfer
agent
fees
for
that
class
do
not
exceed
0.03%
based
on
the
average
net
assets
of
the
class
until
April
30,
2025.
4.
Income
Taxes
For
tax
purposes,
capital
losses
may
be
carried
over
to
offset
future
capital
gains.
During
the
year
ended
December
31,
2024,
the
Fund
utilized
$40,982,229
of
capital
loss
carryforwards.
The
tax
character
of
distributions
paid
during
the
years
ended
December
31,
2024
and
2023,
was
as
follows:
aa
Value
at
Beginning
of
Year
Purchases
Sales
Realized
Gain
(Loss)
Net
Change
in
Unrealized
Appreciation
(Depreciation)
Value
at
End
of
Year
Number
of
Shares
Held
at
End
of
Year
Investment
Income
a
a
a
a
a
a
a
a
Franklin
Global
Allocation
Fund
(continued)
Non-Controlled
Affiliates
Dividends
Franklin
FTSE
India
ETF
.....
$
—
$
6,789,332
$
—
$
—
$
(533,937)
$
6,255,395
165,050
$
40,232
Franklin
High
Yield
Corporate
ETF
...................
—
5,010,200
—
—
(116,850)
4,893,350
205,000
107,133
Franklin
Senior
Loan
ETF
....
5,100,900
—
(5,090,300)
73,589
(84,189)
—
280,056
Franklin
Systematic
Style
Premia
ETF
...................
48,171,250
—
—
—
5,028,500
53,199,750
2,225,000
629,757
Institutional
Fiduciary
Trust
-
Money
Market
Portfolio,
4.183%
73,636,327
537,057,104
(585,041,932)
—
—
25,651,499
25,651,499
5,217,355
Total
Non-Controlled
Affiliates
$126,908,477
$
548,856,636
$
(590,132,232)
$
73,589
$
4,293,524
$89,999,994
$
6,274,533
Total
Affiliated
Securities
...
$126,908,477
$580,856,636
$(590,132,232)
$73,589
$5,215,725
$122,922,195
$8,543,417
a
Dividend
income
includes
capital
gain
distributions
received,
if
any,
from
underlying
funds,
and
are
presented
in
corresponding
line
item
in
the
Statement
of
Operations.
2024
2023
Distributions
paid
from:
Ordinary
income
..........................................................
$30,134,484
$44,737,335
3.
Transactions
with
Affiliates
(continued)
f.
Investments
in
Affiliated
Management
Investment
Companies
(continued)
Franklin
Fund
Allocator
Series
Notes
to
Financial
Statements
Franklin
Global
Allocation
Fund
(continued)
At
December
31,
2024,
the
cost
of
investments,
net
unrealized
appreciation
(depreciation)
and
undistributed
ordinary
income for
income
tax
purposes
were
as
follows:
Differences
between
income
and/or
capital
gains
as
determined
on
a
book
basis
and
a
tax
basis
are
primarily
due
to
differing
treatments
of
foreign
currency
transactions,
wash
sales,
passive
foreign
investment
company
shares,
bond
discounts
and
premiums
and
regulated
investment
companies.
5.
Investment
Transactions
Purchases
and
sales
of
investments (excluding
short
term
securities) for
the
year
ended
December
31,
2024,
aggregated
$1,555,434,187 and
$1,827,126,509,
respectively.
6.
Concentration
of
Risk
Certain
investments
in
Chinese
companies
are
made
through
a
special
structure
known
as
a
VIE.
In
a
VIE
structure,
foreign
investors,
such
as
the
Fund,
will
only
own
stock
in
a
shell
company
rather
than
directly
in
the
VIE,
which
must
be
owned
by
Chinese
nationals
(and/or
Chinese
companies)
to
obtain
the
licenses
and/or
assets
required
to
operate
in
a
restricted
or
prohibited
sector
in
China.
The
value
of
the
shell
company
is
derived
from
its
ability
to
consolidate
the
VIE
into
its
financials
pursuant
to
contractual
arrangements
that
allow
the
shell
company
to
exert
a
degree
of
control
over,
and
obtain
economic
benefits
arising
from,
the
VIE
without
formal
legal
ownership.
While
VIEs
are
a
longstanding
industry
practice
and
are
well
known
by
Chinese
officials
and
regulators,
the
structure
historically
has
not
been
formally
recognized
under
Chinese
law
and
it
is
uncertain
whether
Chinese
officials
or
regulators
will
withdraw
their
implicit
acceptance
of
the
structure.
It
is
also
uncertain
whether
the
contractual
arrangements,
which
may
be
subject
to
conflicts
of
interest
between
the
legal
owners
of
the
VIE
and
foreign
investors,
would
be
enforced
by
Chinese
courts
or
arbitration
bodies.
Prohibitions
of
these
structures
by
the
Chinese
government,
or
the
inability
to
enforce
such
contracts,
from
which
the
shell
company
derives
its
value,
would
likely
cause
the
VIE-structured
holding(s)
to
suffer
significant,
detrimental,
and
possibly
permanent
losses,
and
in
turn,
adversely
affect
the
Fund’s
returns
and
net
asset
value.
Cost
of
investments
..........................................................................
$2,472,243,487
Unrealized
appreciation
........................................................................
$334,166,655
Unrealized
depreciation
........................................................................
(106,804,138)
Net
unrealized
appreciation
(depreciation)
..........................................................
$227,362,517
Distributable
earnings:
Undistributed
ordinary
income
...................................................................
$60,482,987
Undistributed
long
term
capital
gains
..............................................................
832,161
Total
distributable
earnings
.....................................................................
$61,315,148
Franklin
Fund
Allocator
Series
Notes
to
Financial
Statements
Franklin
Global
Allocation
Fund
(continued)
7.
Other
Derivative
Information
At
December
31,
2024,
investments
in
derivative
contracts
are
reflected
in
the Statement of
Assets
and
Liabilities
as
follows:
For
the
year
ended
December
31,
2024,
the
effect
of
derivative
contracts
in
the Statement
of
Operations
was
as
follows:
For
the
year
ended
December
31,
2024,
the
average
month
end
notional
amount
of
options represented
$15,200,000. The
average
month
end
contract
value
of
forward
exchange
contracts
was
$293,656,636.
See
Note
1(c) regarding
derivative
financial
instruments.
8.
Credit
Facility
The
Fund,
together
with
other
U.S.
registered
and
foreign
investment
funds
(collectively,
Borrowers),
managed
by
Franklin
Templeton,
are
borrowers
in
a
joint
syndicated
senior
unsecured
credit
facility
totaling
$2.675
billion
(Global
Credit
Facility)
which
matured
on
January
31,
2025.
This
Global
Credit
Facility
provides
a
source
of
funds
to
the
Borrowers
for
temporary
and
emergency
purposes,
including
the
ability
to
meet
future
unanticipated
or
unusually
large
redemption
requests.
Effective
January
31,
2025,
the
Borrowers
renewed
the
Global
Credit
Facility
for
a
one-year
term,
maturing
January
30,
2026,
for
a
total
of
$2.995
billion.
Under
the
terms
of
the
Global
Credit
Facility,
the
Fund
may,
in
addition
to
interest
charged
on
any
borrowings
made
by
the
Fund
and
other
costs
incurred
by
the
Fund,
pay
its
share
of
fees
and
expenses
incurred
in
connection
with
the
implementation
and
maintenance
of
the
Global
Credit
Facility,
based
upon
its
relative
share
of
the
aggregate
net
assets
of
all
of
the
Borrowers,
Asset
Derivatives
Liability
Derivatives
Derivative
Contracts
Not
Accounted
for
as
Hedging
Instruments
Statement
of
Assets
and
Liabilities
Location
Fair
Value
Statement
of
Assets
and
Liabilities
Location
Fair
Value
Franklin
Global
Allocation
Fund
Foreign
exchange
contracts
..
Unrealized
appreciation
on
OTC
forward
exchange
contracts
$
11,063,247
Unrealized
depreciation
on
OTC
forward
exchange
contracts
$
10,567
Total
....................
$11,063,247
$10,567
Derivative
Contracts
Not
Accounted
for
as
Hedging
Instruments
Statement
of
Operations
Location
Net
Realized
Gain
(Loss)
for
the
Year
Statement
of
Operations
Location
Net
Change
in
Unrealized
Appreciation
(Depreciation)
for
the
Year
Franklin
Global
Allocation
Fund
Net
realized
gain
(loss)
from:
Net
change
in
unrealized
appreciation
(depreciation)
on:
Foreign
exchange
contracts
.....
Forward
exchange
contracts
$885,531
Forward
exchange
contracts
$21,122,132
Equity
contracts
..............
Investments
(1,303,216)
a
Investments
—
Written
options
588,310
Written
options
—
Total
.......................
$170,625
$21,122,132
a
Purchased
option
contracts
are
included
in
net
realized
gain
(loss)
from
investments
in
the
Statement
of
Operations.
Franklin
Fund
Allocator
Series
Notes
to
Financial
Statements
Franklin
Global
Allocation
Fund
(continued)
including
an
annual
commitment
fee
of
0.15%
based
upon
the
unused
portion
of
the
Global
Credit
Facility.
These
fees
are
reflected
in
other
expenses
in
the
Statement
of
Operations.
During
the
year
ended
December
31,
2024,
the Fund
did
not
use
the
Global
Credit
Facility.
9.
Fair
Value
Measurements
The
Fund
follows
a
fair
value
hierarchy
that
distinguishes
between
market
data
obtained
from
independent
sources
(observable
inputs)
and
the Fund's
own
market
assumptions
(unobservable
inputs).
These
inputs
are
used
in
determining
the
value
of
the
Fund's financial
instruments
and
are
summarized
in
the
following
fair
value
hierarchy:
Level
1
–
quoted
prices
in
active
markets
for
identical
financial
instruments
Level
2
–
other
significant
observable
inputs
(including
quoted
prices
for
similar
financial
instruments,
interest
rates,
prepayment
speed,
credit
risk,
etc.)
Level
3
–
significant
unobservable
inputs
(including
the
Fund's
own
assumptions
in
determining
the
fair
value
of
financial
instruments)
The
input
levels
are
not
necessarily
an
indication
of
the
risk
or
liquidity
associated
with
financial
instruments
at
that
level.
A
summary
of
inputs
used
as
of
December
31,
2024,
in
valuing
the
Fund's assets
and
liabilities carried
at
fair
value,
is
as
follows:
Level
1
Level
2
Level
3
Total
Franklin
Global
Allocation
Fund
Assets:
Investments
in
Securities:
Common
Stocks
:
Aerospace
&
Defense
...................
$
7,780,237
$
3,177,767
$
—
$
10,958,004
Air
Freight
&
Logistics
...................
4,825,584
—
—
4,825,584
Automobiles
..........................
30,087,943
—
—
30,087,943
Banks
...............................
22,784,560
75,585,281
—
98,369,841
Biotechnology
.........................
50,782,481
—
—
50,782,481
Broadline
Retail
.......................
61,197,952
—
—
61,197,952
Building
Products
......................
—
4,483,872
—
4,483,872
Capital
Markets
........................
12,708,058
18,015,124
—
30,723,182
Chemicals
...........................
6,405,267
4,213,142
—
10,618,409
Commercial
Services
&
Supplies
...........
6,484,388
—
—
6,484,388
Communications
Equipment
..............
29,190,678
—
—
29,190,678
Construction
Materials
..................
5,162,616
9,026,276
—
14,188,892
Consumer
Staples
Distribution
&
Retail
......
41,355,362
6,073,201
—
47,428,563
Diversified
Telecommunication
Services
.....
—
11,103,544
—
11,103,544
Electric
Utilities
........................
3,757,753
5,168,082
—
8,925,835
Electrical
Equipment
....................
17,589,879
—
—
17,589,879
Entertainment
.........................
22,361,436
12,616,519
—
34,977,955
Financial
Services
......................
50,326,076
15,576,991
—
65,903,067
Food
Products
........................
3,505,758
—
—
3,505,758
Ground
Transportation
..................
12,476,516
—
—
12,476,516
Health
Care
Equipment
&
Supplies
.........
57,989,651
—
—
57,989,651
Health
Care
Providers
&
Services
..........
7,261,362
—
—
7,261,362
Hotels,
Restaurants
&
Leisure
.............
46,683,274
—
—
46,683,274
Household
Durables
....................
3,721,400
—
—
3,721,400
Household
Products
....................
20,333,069
—
—
20,333,069
Industrial
Conglomerates
................
—
23,079,432
—
23,079,432
8.
Credit
Facility
(continued)
Franklin
Fund
Allocator
Series
Notes
to
Financial
Statements
Franklin
Global
Allocation
Fund
(continued)
10.
Operating
Segments
The Fund
has adopted
the
FASB
Accounting
Standards
Update
(ASU)
2023-07,
Segment
Reporting
(Topic
280)
-
Improvements
to
Reportable
Segment
Disclosures.
The
update
is
limited
to
disclosure
requirements
and
does
not
impact
the
Fund’s
financial
position
or
results
of
operations.
Level
1
Level
2
Level
3
Total
Franklin
Global
Allocation
Fund
(continued)
Assets:
(continued)
Investments
in
Securities:
(continued)
Common
Stocks:
(continued)
Insurance
............................
$
26,761,469
$
9,402,786
$
—
$
36,164,255
Interactive
Media
&
Services
..............
84,139,404
6,198,158
—
90,337,562
IT
Services
...........................
34,961,823
—
—
34,961,823
Leisure
Products
.......................
3,118,991
—
—
3,118,991
Life
Sciences
Tools
&
Services
............
7,295,580
—
—
7,295,580
Machinery
............................
17,753,303
6,739,710
—
24,493,013
Metals
&
Mining
.......................
15,084,468
32,451,377
—
47,535,845
Mortgage
Real
Estate
Investment
Trusts
(REITs)
............................
4,036,132
—
—
4,036,132
Multi-Utilities
..........................
4,177,686
—
—
4,177,686
Office
REITs
..........................
3,525,018
—
—
3,525,018
Oil,
Gas
&
Consumable
Fuels
.............
73,500,342
16,135,276
—
89,635,618
Personal
Care
Products
.................
7,485,925
5,003,965
—
12,489,890
Pharmaceuticals
.......................
48,550,096
21,244,551
—
69,794,647
Professional
Services
...................
—
21,651,716
—
21,651,716
Retail
REITs
..........................
7,270,534
—
—
7,270,534
Semiconductors
&
Semiconductor
Equipment
.
140,648,666
40,484,633
—
181,133,299
Software
.............................
106,240,859
7,453,723
—
113,694,582
Specialized
REITs
......................
7,005,616
—
—
7,005,616
Specialty
Retail
........................
42,180,827
3,464,789
—
45,645,616
Technology
Hardware,
Storage
&
Peripherals
.
95,620,373
—
—
95,620,373
Textiles,
Apparel
&
Luxury
Goods
..........
27,517,648
3,917,992
—
31,435,640
Tobacco
.............................
33,563,435
—
—
33,563,435
Trading
Companies
&
Distributors
..........
16,727,990
—
—
16,727,990
Wireless
Telecommunication
Services
.......
—
5,066,569
—
5,066,569
Management
Investment
Companies
.........
109,192,706
—
—
109,192,706
Preferred
Stocks
.........................
—
7,315,093
—
7,315,093
Corporate
Bonds
........................
—
200,953,440
—
200,953,440
Foreign
Government
and
Agency
Securities
....
—
356,050,032
—
356,050,032
U.S.
Government
and
Agency
Securities
.......
—
161,011,985
—
161,011,985
Mortgage-Backed
Securities
................
—
61,686,614
—
61,686,614
Short
Term
Investments
...................
25,651,499
67,419,994
—
93,071,493
Total
Investments
in
Securities
...........
$1,466,781,690
$1,221,771,634
a
$—
$2,688,553,324
Other
Financial
Instruments:
Forward
Exchange
Contracts
...............
$—
$11,063,247
$—
$11,063,247
Total
Other
Financial
Instruments
.........
$—
$11,063,247
$—
$11,063,247
Liabilities:
Other
Financial
Instruments:
Forward
Exchange
Contracts
...............
$—
$10,567
$—
$10,567
Total
Other
Financial
Instruments
.........
$—
$10,567
$—
$10,567
a
Includes
foreign
securities
valued
at
$374,649,569,
which
were
categorized
as
Level
2
as
a
result
of
the
application
of
market
level
fair
value
procedures.
See
the
Financial
Instrument
Valuation
note
for
more
information.
9.
Fair
Value
Measurements
(continued)
Franklin
Fund
Allocator
Series
Notes
to
Financial
Statements
Franklin
Global
Allocation
Fund
(continued)
The
Fund
operates
as
a
single
operating
segment,
which
is
an
investment
portfolio.
The
Fund's
Investment
manager
serves
as
the
Chief
Operating
Decision
Maker
(CODM),
evaluating
fund-wide
results
and
performance
under
a
unified
investment
strategy.
The
CODM
uses
these
measures
to
assess
fund
performance
and
allocate
resources
effectively.
Internal
reporting
provided
to
the
CODM
aligns
with
the
accounting
policies
and
measurement
principles
used
in
the financial
statements.
For
information
regarding
segment
assets,
segment
profit
or
loss,
and
significant
expenses,
refer
to
the Statement
of
Assets
and
Liabilities
and
the Statement
of
Operations,
along
with
the
related
notes
to
the financial
statements.
The Schedule
of
Investments
provides
details
of
the
Fund's
investments
that
generate
returns
such
as
interest,
dividends,
and
realized
and
unrealized
gains
or
losses.
Performance
metrics,
including
portfolio
turnover
and
expense
ratios,
are
disclosed
in
the Financial
Highlights.
11.
Subsequent
Events
The Fund
has
evaluated
subsequent
events
through
the
issuance
of
the
financial
statements
and
determined
that
no
events
have
occurred
that
require
disclosure
other
than
those
already
disclosed
in
the
financial
statements.
Abbreviations
Counterparty
BZWS
Barclays
Bank
plc
JPHQ
JPMorgan
Chase
Bank
NA
Cu
r
rency
AUD
Australian
Dollar
BRL
Brazilian
Real
CAD
Canadian
Dollar
CNY
Chinese
Yuan
EUR
Euro
GBP
British
Pound
INR
Indian
Rupee
MXN
Mexican
Peso
Selected
Portfolio
ADR
American
Depositary
Receipt
ETF
Exchange-Traded
Fund
FHLMC
Federal
Home
Loan
Mortgage
Corp.
FNMA
Federal
National
Mortgage
Association
FRN
Floating
Rate
Note
GNMA
Government
National
Mortgage
Association
PIK
Payment-In-Kind
REIT
Real
Estate
Investment
Trust
10.
Operating
Segments
(continued)
Franklin
Fund
Allocator
Series
Report
of
Independent
Registered
Public
Accounting
Firm
To
the
Board
of
Trustees
of
Franklin
Fund
Allocator
Series
and
Shareholders
of
Franklin
Global
Allocation
Fund
Opinion
on
the
Financial
Statements
We
have
audited
the
accompanying
statement
of
assets
and
liabilities,
including
the
schedule
of
investments,
of
Franklin
Global
Allocation
Fund
(one
of
the
funds
constituting
Franklin
Fund
Allocator
Series,
referred
to
hereafter
as
the
"Fund")
as
of
December
31,
2024,
the
related
statement
of
operations
for
the
year
ended
December
31,
2024,
the
statements
of
changes
in
net
assets
for
each
of
the
two
years
in
the
period
ended
December
31,
2024,
including
the
related
notes,
and
the
financial
highlights
for
each
of
the
five
years
in
the
period
ended
December
31,
2024
(collectively
referred
to
as
the
“financial
statements”).
In
our
opinion,
the
financial
statements
present
fairly,
in
all
material
respects,
the
financial
position
of
the
Fund
as
of
December
31,
2024,
the
results
of
its
operations
for
the
year
then
ended,
the
changes
in
its
net
assets
for
each
of
the
two
years
in
the
period
ended
December
31,
2024
and
the
financial
highlights
for
each
of
the
five
years
in
the
period
ended
December
31,
2024
in
conformity
with
accounting
principles
generally
accepted
in
the
United
States
of
America.
Basis
for
Opinion
These
financial
statements
are
the
responsibility
of
the
Fund’s
management.
Our
responsibility
is
to
express
an
opinion
on
the
Fund’s
financial
statements
based
on
our
audits.
We
are
a
public
accounting
firm
registered
with
the
Public
Company
Accounting
Oversight
Board
(United
States)
(PCAOB)
and
are
required
to
be
independent
with
respect
to
the
Fund
in
accordance
with
the
U.S.
federal
securities
laws
and
the
applicable
rules
and
regulations
of
the
Securities
and
Exchange
Commission
and
the
PCAOB.
We
conducted
our
audits
of
these
financial
statements
in
accordance
with
the
standards
of
the
PCAOB.
Those
standards
require
that
we
plan
and
perform
the
audit
to
obtain
reasonable
assurance
about
whether
the
financial
statements
are
free
of
material
misstatement,
whether
due
to
error
or
fraud.
Our
audits
included
performing
procedures
to
assess
the
risks
of
material
misstatement
of
the
financial
statements,
whether
due
to
error
or
fraud,
and
performing
procedures
that
respond
to
those
risks.
Such
procedures
included
examining,
on
a
test
basis,
evidence
regarding
the
amounts
and
disclosures
in
the
financial
statements.
Our
audits
also
included
evaluating
the
accounting
principles
used
and
significant
estimates
made
by
management,
as
well
as
evaluating
the
overall
presentation
of
the
financial
statements.
Our
procedures
included
confirmation
of
securities
owned
as
of
December
31,
2024
by
correspondence
with
the
custodian,
transfer
agents
and
brokers.
We
believe
that
our
audits
provide
a
reasonable
basis
for
our
opinion.
/s/PricewaterhouseCoopers
LLP
San
Francisco,
California
February
20,
2025
We
have
served
as
the
auditor
of
one
or
more
investment
companies
in
the
Franklin
Templeton
Group
of
Funds
since
1948.
Franklin
Fund
Allocator
Series
Tax
Information
(unaudited)
By
mid-February,
tax
information
related
to
a
shareholder's
proportionate
share
of
distributions
paid
during
the
preceding
calendar
year
will
be
received,
if
applicable.
Please
also
refer
to
www.franklintempleton.com
for
per
share
tax
information
related
to
any
distributions
paid
during
the
preceding
calendar
year.
Shareholders
are
advised
to
consult
with
their
tax
advisors
for
further
information
on
the
treatment
of
these
amounts
on
their
tax
returns.
The
following
tax
information
for
the
Fund
is
required
to
be
furnished
to
shareholders
with
respect
to
income
earned
and
distributions
paid
during
its
fiscal
year.
The
Fund
hereby
reports
the
following
amounts,
or
if
subsequently
determined
to
be
different,
the
maximum
allowable
amounts,
for
the
fiscal
year
ended
December
31,
2024:
Note
(1)
-
The
Law
varies
in
each
state
as
to
whether
and
what
percentage
of
dividend
income
attributable
to
Federal
obiligations
is
exempt
from
state
income
tax.
Shareholders
are
advised
to
consult
with
their
tax
advisors
to
determine
if
any
portion
of
the
dividends
received
is
exempt
from
state
income
taxes.
Under
Section
853
of
the
Internal
Revenue
Code,
the
Fund
intends
to
elect
to
pass
through
to
its
shareholders
the
following
amounts,
or
amounts
as
finally
determined,
of
foreign
taxes
paid
and
foreign
source
income
earned
by
the
Fund
during
the
fiscal
year
ended
December
31,
2024:
Pursuant
to:
Amount
Reported
Income
Eligible
for
Dividends
Received
Deduction
(DRD)
§854(b)(1)(A)
$10,480,716
Qualified
Dividend
Income
Earned
(QDI)
§854(b)(1)(B)
$24,094,595
Section
163(j)
Interest
Earned
§163(j)
$19,931,374
Interest
Earned
from
Federal
Obligations
Note
(1)
$9,027,071
Amount
Reported
Foreign
Taxes
Paid
$2,009,833
Foreign
Source
Income
Earned
$16,764,514
Franklin
Fund
Allocator
Series
Changes
In
and
Disagreements
with
Accountants
For
the
period
covered
by
this
report
Not
applicable.
Results
of
Meeting(s)
of
Shareholders
For
the
period
covered
by
this
report
Not
applicable.
Remuneration
Paid
to
Directors,
Officers
and
Others
For
the
period
covered
by
this
report
Refer
to
the
financial
statements
included
herein.
Board
Approval
of
Management
and
Subadvisory
Agreements
For
the
period
covered
by
this
report
Not
applicable.
©
2025
Franklin
Templeton.
All
rights
reserved.
Franklin
Fund
Allocator
Series
Financial
Statements
and
Other
Important
Information
Annual
|
December
31,
2024
Franklin
LifeSmart
TM
Retirement
Income
Fund
Franklin
LifeSmart
TM
2020
Retirement
Target
Fund
Franklin
LifeSmart
TM
2025
Retirement
Target
Fund
Franklin
LifeSmart
TM
2030
Retirement
Target
Fund
Franklin
LifeSmart
TM
2035
Retirement
Target
Fund
Franklin
LifeSmart
TM
2040
Retirement
Target
Fund
Franklin
LifeSmart
TM
2045
Retirement
Target
Fund
Franklin
LifeSmart
TM
2050
Retirement
Target
Fund
Franklin
LifeSmart
TM
2055
Retirement
Target
Fund
Franklin
LifeSmart
TM
2060
Retirement
Target
Fund
Financial
Statements
and
Other
Important
Information—Annual
Financial
Highlights
and
Schedules
of
Investments
2
Financial
Statements
70
Notes
to
Financial
Statements
84
Report
of
Independent
Registered
Public
Accounting
Firm
114
Tax
Information
116
Changes
In
and
Disagreements
with
Accountants
118
Results
of
Meeting(s)
of
Shareholders
118
Remuneration
Paid
to
Directors,
Officers
and
Others
118
Board
Approval
of
Management
and
Subadvisory
Agreements
118
Franklin
Fund
Allocator
Series
Financial
Highlights
Franklin
LifeSmart™
Retirement
Income
Fund
Annual
Report
The
accompanying
notes
are
an
integral
part
of
these
financial
statements.
a
Year
Ended
December
31,
2024
2023
2022
2021
2020
Class
A
Per
share
operating
performance
(for
a
share
outstanding
throughout
the
year)
Net
asset
value,
beginning
of
year
...................
$10.15
$9.59
$11.50
$11.62
$11.15
Income
from
investment
operations
a
:
Net
investment
income
b
,c
........................
0.52
0.52
0.53
0.36
0.39
Net
realized
and
unrealized
gains
(losses)
...........
0.31
0.57
(1.88)
0.25
0.52
Total
from
investment
operations
....................
0.83
1.09
(1.35)
0.61
0.91
Less
distributions
from:
Net
investment
income
..........................
(0.53)
(0.53)
(0.47)
(0.43)
(0.44)
Net
realized
gains
.............................
—
—
(0.09)
(0.30)
—
Total
distributions
...............................
(0.53)
(0.53)
(0.56)
(0.73)
(0.44)
Net
asset
value,
end
of
year
.......................
$10.45
$10.15
$9.59
$11.50
$11.62
Total
return
d
...................................
8.32%
11.61%
(11.83)%
5.41%
8.40%
Ratios
to
average
net
assets
Expenses
before
waiver
and
payments
by
affiliates
e
.....
0.99%
0.94%
0.98%
0.95%
0.94%
Expenses
net
of
waiver
and
payments
by
affiliates
e
......
0.30%
0.30%
f
0.30%
f
0.30%
f
0.30%
f
Net
investment
income
c
...........................
4.97%
5.32%
5.20%
3.05%
3.56%
Supplemental
data
Net
assets,
end
of
year
(000’s)
.....................
$37,045
$38,172
$36,999
$46,058
$40,343
Portfolio
turnover
rate
............................
38.32%
26.44%
35.25%
121.26%
51.13%
a
The
amount
shown
for
a
share
outstanding
throughout
the
period
may
not
correlate
with
the
Statement
of
Operations
for
the
period
due
to
the
timing
of
sales
and
repurchas-
es
of
the
Fund’s
shares
in
relation
to
income
earned
and/or
fluctuating
fair
value
of
the
investments
of
the
Fund.
b
Based
on
average
daily
shares
outstanding.
c
Recognition
of
net
investment
income
by
the
Fund
is
affected
by
the
timing
of
declaration
of
dividends
by
the
Underlying
Funds
and
exchange
traded
funds
in
which
the
Fund
invests.
d
Total
return
does
not
reflect
sales
commissions
or
contingent
deferred
sales
charges,
if
applicable.
e
Does
not
include
expenses
of
the
Underlying
Funds
and
exchange
traded
funds
in
which
the
Fund
invests.
The
weighted
average
indirect
expenses
of
the
Underlying
Funds
and
exchange
traded
funds
was
0.45%
for
the
year
ended
December
31,
2024.
f
Benefit
of
expense
reduction
rounds
to
less
than
0.01%.
Franklin
Fund
Allocator
Series
Financial
Highlights
Franklin
LifeSmart™
Retirement
Income
Fund
(continued)
The
accompanying
notes
are
an
integral
part
of
these
financial
statements.
Annual
Report
a
Year
Ended
December
31,
2024
2023
2022
2021
2020
Class
C
Per
share
operating
performance
(for
a
share
outstanding
throughout
the
year)
Net
asset
value,
beginning
of
year
...................
$10.03
$9.48
$11.36
$11.48
$11.01
Income
from
investment
operations
a
:
Net
investment
income
b
,c
........................
0.43
0.44
0.44
0.25
0.30
Net
realized
and
unrealized
gains
(losses)
...........
0.31
0.56
(1.86)
0.27
0.52
Total
from
investment
operations
....................
0.74
1.00
(1.42)
0.52
0.82
Less
distributions
from:
Net
investment
income
..........................
(0.45)
(0.45)
(0.37)
(0.34)
(0.35)
Net
realized
gains
.............................
—
—
(0.09)
(0.30)
—
Total
distributions
...............................
(0.45)
(0.45)
(0.46)
(0.64)
(0.35)
Net
asset
value,
end
of
year
.......................
$10.32
$10.03
$9.48
$11.36
$11.48
Total
return
d
...................................
7.48%
10.88%
(12.53)%
4.56%
7.62%
Ratios
to
average
net
assets
Expenses
before
waiver
and
payments
by
affiliates
e
.....
1.74%
1.69%
1.73%
1.70%
1.69%
Expenses
net
of
waiver
and
payments
by
affiliates
e
......
1.05%
1.05%
f
1.05%
f
1.05%
f
1.05%
f
Net
investment
income
c
...........................
4.21%
4.52%
4.29%
2.20%
2.80%
Supplemental
data
Net
assets,
end
of
year
(000’s)
.....................
$2,928
$3,415
$4,145
$6,803
$9,355
Portfolio
turnover
rate
............................
38.32%
26.44%
35.25%
121.26%
51.13%
a
The
amount
shown
for
a
share
outstanding
throughout
the
period
may
not
correlate
with
the
Statement
of
Operations
for
the
period
due
to
the
timing
of
sales
and
repurchas-
es
of
the
Fund’s
shares
in
relation
to
income
earned
and/or
fluctuating
fair
value
of
the
investments
of
the
Fund.
b
Based
on
average
daily
shares
outstanding.
c
Recognition
of
net
investment
income
by
the
Fund
is
affected
by
the
timing
of
declaration
of
dividends
by
the
Underlying
Funds
and
exchange
traded
funds
in
which
the
Fund
invests.
d
Total
return
does
not
reflect
sales
commissions
or
contingent
deferred
sales
charges,
if
applicable.
e
Does
not
include
expenses
of
the
Underlying
Funds
and
exchange
traded
funds
in
which
the
Fund
invests.
The
weighted
average
indirect
expenses
of
the
Underlying
Funds
and
exchange
traded
funds
was
0.45%
for
the
year
ended
December
31,
2024.
f
Benefit
of
expense
reduction
rounds
to
less
than
0.01%.
Franklin
Fund
Allocator
Series
Financial
Highlights
Franklin
LifeSmart™
Retirement
Income
Fund
(continued)
Annual
Report
The
accompanying
notes
are
an
integral
part
of
these
financial
statements.
a
Year
Ended
December
31,
2024
2023
2022
2021
2020
Class
R
Per
share
operating
performance
(for
a
share
outstanding
throughout
the
year)
Net
asset
value,
beginning
of
year
...................
$10.12
$9.56
$11.47
$11.59
$11.11
Income
from
investment
operations
a
:
Net
investment
income
b
,c
........................
0.49
0.50
0.50
0.33
0.37
Net
realized
and
unrealized
gains
(losses)
...........
0.32
0.56
(1.88)
0.26
0.52
Total
from
investment
operations
....................
0.81
1.06
(1.38)
0.59
0.89
Less
distributions
from:
Net
investment
income
..........................
(0.51)
(0.50)
(0.44)
(0.41)
(0.41)
Net
realized
gains
.............................
—
—
(0.09)
(0.30)
—
Total
distributions
...............................
(0.51)
(0.50)
(0.53)
(0.71)
(0.41)
Net
asset
value,
end
of
year
.......................
$10.42
$10.12
$9.56
$11.47
$11.59
Total
return
....................................
7.97%
11.36%
(12.03)%
5.15%
8.22%
Ratios
to
average
net
assets
Expenses
before
waiver
and
payments
by
affiliates
d
.....
1.25%
1.19%
1.23%
1.19%
1.11%
Expenses
net
of
waiver
and
payments
by
affiliates
d
......
0.55%
0.55%
e
0.55%
e
0.54%
e
0.47%
e
Net
investment
income
c
...........................
4.69%
5.06%
4.96%
2.80%
3.39%
Supplemental
data
Net
assets,
end
of
year
(000’s)
.....................
$1,444
$1,643
$1,748
$2,197
$2,108
Portfolio
turnover
rate
............................
38.32%
26.44%
35.25%
121.26%
51.13%
a
The
amount
shown
for
a
share
outstanding
throughout
the
period
may
not
correlate
with
the
Statement
of
Operations
for
the
period
due
to
the
timing
of
sales
and
repurchas-
es
of
the
Fund’s
shares
in
relation
to
income
earned
and/or
fluctuating
fair
value
of
the
investments
of
the
Fund.
b
Based
on
average
daily
shares
outstanding.
c
Recognition
of
net
investment
income
by
the
Fund
is
affected
by
the
timing
of
declaration
of
dividends
by
the
Underlying
Funds
and
exchange
traded
funds
in
which
the
Fund
invests.
d
Does
not
include
expenses
of
the
Underlying
Funds
and
exchange
traded
funds
in
which
the
Fund
invests.
The
weighted
average
indirect
expenses
of
the
Underlying
Funds
and
exchange
traded
funds
was
0.45%
for
the
year
ended
December
31,
2024.
e
Benefit
of
expense
reduction
rounds
to
less
than
0.01%.
Franklin
Fund
Allocator
Series
Financial
Highlights
Franklin
LifeSmart™
Retirement
Income
Fund
(continued)
The
accompanying
notes
are
an
integral
part
of
these
financial
statements.
Annual
Report
a
Year
Ended
December
31,
2024
2023
2022
2021
2020
Class
R6
Per
share
operating
performance
(for
a
share
outstanding
throughout
the
year)
Net
asset
value,
beginning
of
year
...................
$10.21
$9.64
$11.55
$11.67
$11.20
Income
from
investment
operations
a
:
Net
investment
income
b
,c
........................
0.55
0.56
0.55
0.34
0.43
Net
realized
and
unrealized
gains
(losses)
...........
0.32
0.57
(1.87)
0.31
0.52
Total
from
investment
operations
....................
0.87
1.13
(1.32)
0.65
0.95
Less
distributions
from:
Net
investment
income
..........................
(0.57)
(0.56)
(0.50)
(0.47)
(0.48)
Net
realized
gains
.............................
—
—
(0.09)
(0.30)
—
Total
distributions
...............................
(0.57)
(0.56)
(0.59)
(0.77)
(0.48)
Net
asset
value,
end
of
year
.......................
$10.51
$10.21
$9.64
$11.55
$11.67
Total
return
....................................
8.73%
12.00%
(11.56)%
5.63%
8.81%
Ratios
to
average
net
assets
Expenses
before
waiver
and
payments
by
affiliates
d
.....
0.82%
0.63%
0.64%
0.57%
0.58%
Expenses
net
of
waiver
and
payments
by
affiliates
d
......
—%
—%
e
—%
e
—%
e
—%
e
Net
investment
income
c
...........................
5.27%
5.65%
5.43%
2.88%
3.84%
Supplemental
data
Net
assets,
end
of
year
(000’s)
.....................
$103
$104
$67
$56
$4,092
Portfolio
turnover
rate
............................
38.32%
26.44%
35.25%
121.26%
51.13%
a
The
amount
shown
for
a
share
outstanding
throughout
the
period
may
not
correlate
with
the
Statement
of
Operations
for
the
period
due
to
the
timing
of
sales
and
repurchas-
es
of
the
Fund’s
shares
in
relation
to
income
earned
and/or
fluctuating
fair
value
of
the
investments
of
the
Fund.
b
Based
on
average
daily
shares
outstanding.
c
Recognition
of
net
investment
income
by
the
Fund
is
affected
by
the
timing
of
declaration
of
dividends
by
the
Underlying
Funds
and
exchange
traded
funds
in
which
the
Fund
invests.
d
Does
not
include
expenses
of
the
Underlying
Funds
and
exchange
traded
funds
in
which
the
Fund
invests.
The
weighted
average
indirect
expenses
of
the
Underlying
Funds
and
exchange
traded
funds
was
0.45%
for
the
year
ended
December
31,
2024.
e
Benefit
of
expense
reduction
rounds
to
less
than
0.01%.
Franklin
Fund
Allocator
Series
Financial
Highlights
Franklin
LifeSmart™
Retirement
Income
Fund
(continued)
Annual
Report
The
accompanying
notes
are
an
integral
part
of
these
financial
statements.
a
Year
Ended
December
31,
2024
2023
2022
2021
2020
Advisor
Class
Per
share
operating
performance
(for
a
share
outstanding
throughout
the
year)
Net
asset
value,
beginning
of
year
...................
$10.19
$9.63
$11.55
$11.66
$11.19
Income
from
investment
operations
a
:
Net
investment
income
b
,c
........................
0.54
0.56
0.56
0.39
0.42
Net
realized
and
unrealized
gains
(losses)
...........
0.33
0.55
(1.89)
0.26
0.52
Total
from
investment
operations
....................
0.87
1.11
(1.33)
0.65
0.94
Less
distributions
from:
Net
investment
income
..........................
(0.56)
(0.55)
(0.50)
(0.46)
(0.47)
Net
realized
gains
.............................
—
—
(0.09)
(0.30)
—
Total
distributions
...............................
(0.56)
(0.55)
(0.59)
(0.76)
(0.47)
Net
asset
value,
end
of
year
.......................
$10.50
$10.19
$9.63
$11.55
$11.66
Total
return
....................................
8.57%
11.96%
(11.62)%
5.58%
8.75%
Ratios
to
average
net
assets
Expenses
before
waiver
and
payments
by
affiliates
d
.....
0.74%
0.67%
0.73%
0.70%
0.69%
Expenses
net
of
waiver
and
payments
by
affiliates
d
......
0.05%
0.05%
e
0.05%
e
0.05%
e
0.05%
e
Net
investment
income
c
...........................
5.20%
5.67%
5.45%
3.34%
3.83%
Supplemental
data
Net
assets,
end
of
year
(000’s)
.....................
$3,331
$3,638
$2,414
$2,837
$2,021
Portfolio
turnover
rate
............................
38.32%
26.44%
35.25%
121.26%
51.13%
a
The
amount
shown
for
a
share
outstanding
throughout
the
period
may
not
correlate
with
the
Statement
of
Operations
for
the
period
due
to
the
timing
of
sales
and
repurchas-
es
of
the
Fund’s
shares
in
relation
to
income
earned
and/or
fluctuating
fair
value
of
the
investments
of
the
Fund.
b
Based
on
average
daily
shares
outstanding.
c
Recognition
of
net
investment
income
by
the
Fund
is
affected
by
the
timing
of
declaration
of
dividends
by
the
Underlying
Funds
and
exchange
traded
funds
in
which
the
Fund
invests.
d
Does
not
include
expenses
of
the
Underlying
Funds
and
exchange
traded
funds
in
which
the
Fund
invests.
The
weighted
average
indirect
expenses
of
the
Underlying
Funds
and
exchange
traded
funds
was
0.45%
for
the
year
ended
December
31,
2024.
e
Benefit
of
expense
reduction
rounds
to
less
than
0.01%.
Franklin
Fund
Allocator
Series
Schedule
of
Investments,
December
31,
2024
Franklin
LifeSmart™
Retirement
Income
Fund
The
accompanying
notes
are
an
integral
part
of
these
financial
statements.
Annual
Report
a
a
Shares
a
Value
a
Investments
In
Underlying
Funds
and
Exchange
Traded
Funds
92.4%
Domestic
Equity
28.8%
a
ClearBridge
Tactical
Dividend
Income
Fund
,
Class
IS
........................
198,314
$
4,967,756
a
Franklin
U.S.
Core
Equity
(IU)
Fund
.....................................
55,535
958,533
JPMorgan
Equity
Premium
Income
ETF
..................................
83,375
4,796,564
JPMorgan
Nasdaq
Equity
Premium
Income
ETF
............................
38,350
2,162,173
12,885,026
Domestic
Fixed
Income
30.6%
a
Franklin
Investment
Grade
Corporate
ETF
.................................
163,854
3,455,370
a
Franklin
U.S.
Core
Bond
ETF
..........................................
299,544
6,317,383
a
Franklin
U.S.
Government
Securities
Fund
,
Class
R6
........................
787,630
3,953,901
13,726,654
Foreign
Equity
5.4%
a
Franklin
International
Core
Dividend
Tilt
Index
ETF
..........................
40,900
1,227,409
a
Templeton
Developing
Markets
Trust
,
Class
R6
.............................
22,500
418,046
a
Templeton
Foreign
Fund
,
Class
R6
......................................
108,565
810,980
2,456,435
Foreign
Fixed
Income
27.6%
a
BrandywineGLOBAL
-
Global
Opportunities
Bond
Fund
,
Class
IS
...............
246,671
2,022,702
a
BrandywineGLOBAL
High
Yield
Fund
,
Class
IS
.............................
811,321
8,372,835
a
Franklin
High
Yield
Corporate
ETF
......................................
82,355
1,965,814
12,361,351
Total
Investments
In
Underlying
Funds
and
Exchange
Traded
Funds
(Cost
$
41,525,578
)
................................................................
41,429,466
Units
a
a
a
a
b
Index-Linked
Notes
5.2%
Capital
Markets
5.2%
c,d
UBS
AG
into
S&P
500
Index
,
Senior
Note
,
5.69
%
,
5/07/27
.....................
1,999
2,335,071
Total
Index-Linked
Notes
(Cost
$
2,099,710
)
.....................................
2,335,071
Total
Long
Term
Investments
(Cost
$
43,625,288
)
................................
43,764,537
a
a
a
a
a
Short
Term
Investments
2.4%
Shares
a
Money
Market
Funds
2.4%
a,e
Institutional
Fiduciary
Trust
-
Money
Market
Portfolio
,
4.183
%
..................
1,066,597
1,066,597
Total
Money
Market
Funds
(Cost
$
1,066,597
)
...................................
1,066,597
Total
Short
Term
Investments
(Cost
$
1,066,597
)
.................................
1,066,597
a
Total
Investments
(Cost
$
44,691,885
)
100.0
%
...................................
$44,831,134
Other
Assets,
less
Liabilities
0.0
%
†
............................................
18,971
Net
Assets
100.0%
...........................................................
$44,850,105
See
Abbreviations
on
page
113
.
Franklin
Fund
Allocator
Series
Schedule
of
Investments
Franklin
LifeSmart™
Retirement
Income
Fund
(continued)
Annual
Report
The
accompanying
notes
are
an
integral
part
of
these
financial
statements.
†
Rounds
to
less
than
0.1%
of
net
assets.
a
See
Note
3(f)
regarding
investments
in
FT
Underlying
Funds.
b
See
Note
1(c)
regarding
index-linked
notes.
c
Fair
valued
using
significant
unobservable
inputs.
See
Note
7
regarding
fair
value
measurements.
d
Security
pays
variable
interest
based
on
the
distributions
of
the
strategy
index
and
proceeds
earned
from
related
equity
derivatives.
The
coupon
rate
shown
represents
the
combined
rate
at
period
end.
Cash
payment
at
maturity
or
upon
early
redemption
is
based
on
the
performance
of
the
strategy
index.
e
The
rate
shown
is
the
annualized
seven-day
effective
yield
at
period
end.
Franklin
Fund
Allocator
Series
Financial
Highlights
Franklin
LifeSmart™
2020
Retirement
Target
Fund
The
accompanying
notes
are
an
integral
part
of
these
financial
statements.
Annual
Report
a
Year
Ended
December
31,
2024
2023
2022
2021
2020
Class
A
Per
share
operating
performance
(for
a
share
outstanding
throughout
the
year)
Net
asset
value,
beginning
of
year
...................
$11.59
$10.58
$13.00
$12.99
$12.17
Income
from
investment
operations
a
:
Net
investment
income
b
,c
........................
0.31
0.27
0.25
0.22
0.19
Net
realized
and
unrealized
gains
(losses)
...........
0.61
1.03
(2.27)
1.02
0.89
Total
from
investment
operations
....................
0.92
1.30
(2.02)
1.24
1.08
Less
distributions
from:
Net
investment
income
..........................
(0.35)
(0.29)
(0.16)
(0.34)
(0.26)
Net
realized
gains
.............................
—
—
(0.24)
(0.89)
—
Total
distributions
...............................
(0.35)
(0.29)
(0.40)
(1.23)
(0.26)
Net
asset
value,
end
of
year
.......................
$12.16
$11.59
$10.58
$13.00
$12.99
Total
return
d
...................................
8.00%
12.47%
(15.58)%
9.62%
9.06%
Ratios
to
average
net
assets
Expenses
before
waiver
and
payments
by
affiliates
e
.....
1.20%
0.99%
0.98%
0.98%
0.98%
Expenses
net
of
waiver
and
payments
by
affiliates
e
......
0.49%
0.48%
0.47%
f
0.46%
0.47%
f
Net
investment
income
c
...........................
2.55%
2.42%
2.19%
1.63%
1.61%
Supplemental
data
Net
assets,
end
of
year
(000’s)
.....................
$22,170
$26,265
$27,491
$36,698
$30,265
Portfolio
turnover
rate
............................
38.80%
17.72%
35.46%
79.95%
68.93%
a
The
amount
shown
for
a
share
outstanding
throughout
the
period
may
not
correlate
with
the
Statement
of
Operations
for
the
period
due
to
the
timing
of
sales
and
repurchas-
es
of
the
Fund’s
shares
in
relation
to
income
earned
and/or
fluctuating
fair
value
of
the
investments
of
the
Fund.
b
Based
on
average
daily
shares
outstanding.
c
Recognition
of
net
investment
income
by
the
Fund
is
affected
by
the
timing
of
declaration
of
dividends
by
the
Underlying
Funds
and
exchange
traded
funds
in
which
the
Fund
invests.
d
Total
return
does
not
reflect
sales
commissions
or
contingent
deferred
sales
charges,
if
applicable.
e
Does
not
include
expenses
of
the
Underlying
Funds
and
exchange
traded
funds
in
which
the
Fund
invests.
The
weighted
average
indirect
expenses
of
the
Underlying
Funds
and
exchange
traded
funds
was
0.22%
for
the
year
ended
December
31,
2024.
The
weighted
average
indirect
expenses
is
calculated
based
on
the
Form
N1-A
method
which
may
not
correlate
to
the
underlying
fund
fee
waiver
on
the
Statement
of
Operations.
f
Benefit
of
expense
reduction
rounds
to
less
than
0.01%.
Franklin
Fund
Allocator
Series
Financial
Highlights
Franklin
LifeSmart™
2020
Retirement
Target
Fund
(continued)
Annual
Report
The
accompanying
notes
are
an
integral
part
of
these
financial
statements.
a
Year
Ended
December
31,
2024
2023
2022
2021
2020
Class
C
Per
share
operating
performance
(for
a
share
outstanding
throughout
the
year)
Net
asset
value,
beginning
of
year
...................
$11.49
$10.50
$12.91
$12.91
$12.09
Income
from
investment
operations
a
:
Net
investment
income
b
,c
........................
0.21
0.13
0.15
0.11
0.10
Net
realized
and
unrealized
gains
(losses)
...........
0.62
1.07
(2.24)
1.02
0.89
Total
from
investment
operations
....................
0.83
1.20
(2.09)
1.13
0.99
Less
distributions
from:
Net
investment
income
..........................
(0.26)
(0.21)
(0.08)
(0.24)
(0.17)
Net
realized
gains
.............................
—
—
(0.24)
(0.89)
—
Total
distributions
...............................
(0.26)
(0.21)
(0.32)
(1.13)
(0.17)
Net
asset
value,
end
of
year
.......................
$12.06
$11.49
$10.50
$12.91
$12.91
Total
return
d
...................................
7.22%
11.52%
(16.23)%
8.85%
8.29%
Ratios
to
average
net
assets
Expenses
before
waiver
and
payments
by
affiliates
e
.....
1.94%
1.74%
1.73%
1.72%
1.73%
Expenses
net
of
waiver
and
payments
by
affiliates
e
......
1.24%
1.23%
1.22%
f
1.21%
1.22%
f
Net
investment
income
c
...........................
1.76%
1.20%
1.36%
0.79%
0.85%
Supplemental
data
Net
assets,
end
of
year
(000’s)
.....................
$2,357
$3,412
$3,796
$6,235
$7,118
Portfolio
turnover
rate
............................
38.80%
17.72%
35.46%
79.95%
68.93%
a
The
amount
shown
for
a
share
outstanding
throughout
the
period
may
not
correlate
with
the
Statement
of
Operations
for
the
period
due
to
the
timing
of
sales
and
repurchas-
es
of
the
Fund’s
shares
in
relation
to
income
earned
and/or
fluctuating
fair
value
of
the
investments
of
the
Fund.
b
Based
on
average
daily
shares
outstanding.
c
Recognition
of
net
investment
income
by
the
Fund
is
affected
by
the
timing
of
declaration
of
dividends
by
the
Underlying
Funds
and
exchange
traded
funds
in
which
the
Fund
invests.
d
Total
return
does
not
reflect
sales
commissions
or
contingent
deferred
sales
charges,
if
applicable.
e
Does
not
include
expenses
of
the
Underlying
Funds
and
exchange
traded
funds
in
which
the
Fund
invests.
The
weighted
average
indirect
expenses
of
the
Underlying
Funds
and
exchange
traded
funds
was
0.22%
for
the
year
ended
December
31,
2024.
The
weighted
average
indirect
expenses
is
calculated
based
on
the
Form
N1-A
method
which
may
not
correlate
to
the
underlying
fund
fee
waiver
on
the
Statement
of
Operations.
f
Benefit
of
expense
reduction
rounds
to
less
than
0.01%.
Franklin
Fund
Allocator
Series
Financial
Highlights
Franklin
LifeSmart™
2020
Retirement
Target
Fund
(continued)
The
accompanying
notes
are
an
integral
part
of
these
financial
statements.
Annual
Report
a
Year
Ended
December
31,
2024
2023
2022
2021
2020
Class
R
Per
share
operating
performance
(for
a
share
outstanding
throughout
the
year)
Net
asset
value,
beginning
of
year
...................
$11.59
$10.57
$13.00
$12.98
$12.16
Income
from
investment
operations
a
:
Net
investment
income
b
,c
........................
0.28
0.19
0.23
0.17
0.16
Net
realized
and
unrealized
gains
(losses)
...........
0.61
1.08
(2.29)
1.03
0.89
Total
from
investment
operations
....................
0.89
1.27
(2.06)
1.20
1.05
Less
distributions
from:
Net
investment
income
..........................
(0.32)
(0.25)
(0.13)
(0.29)
(0.23)
Net
realized
gains
.............................
—
—
(0.24)
(0.89)
—
Total
distributions
...............................
(0.32)
(0.25)
(0.37)
(1.18)
(0.23)
Net
asset
value,
end
of
year
.......................
$12.16
$11.59
$10.57
$13.00
$12.98
Total
return
....................................
7.74%
12.16%
(15.86)%
9.37%
8.79%
Ratios
to
average
net
assets
Expenses
before
waiver
and
payments
by
affiliates
d
.....
1.45%
1.24%
1.23%
1.22%
1.23%
Expenses
net
of
waiver
and
payments
by
affiliates
d
......
0.74%
0.73%
0.72%
e
0.71%
0.72%
e
Net
investment
income
c
...........................
2.32%
1.72%
2.01%
1.23%
1.35%
Supplemental
data
Net
assets,
end
of
year
(000’s)
.....................
$360
$392
$650
$758
$786
Portfolio
turnover
rate
............................
38.80%
17.72%
35.46%
79.95%
68.93%
a
The
amount
shown
for
a
share
outstanding
throughout
the
period
may
not
correlate
with
the
Statement
of
Operations
for
the
period
due
to
the
timing
of
sales
and
repurchas-
es
of
the
Fund’s
shares
in
relation
to
income
earned
and/or
fluctuating
fair
value
of
the
investments
of
the
Fund.
b
Based
on
average
daily
shares
outstanding.
c
Recognition
of
net
investment
income
by
the
Fund
is
affected
by
the
timing
of
declaration
of
dividends
by
the
Underlying
Funds
and
exchange
traded
funds
in
which
the
Fund
invests.
d
Does
not
include
expenses
of
the
Underlying
Funds
and
exchange
traded
funds
in
which
the
Fund
invests.
The
weighted
average
indirect
expenses
of
the
Underlying
Funds
and
exchange
traded
funds
was
0.22%
for
the
year
ended
December
31,
2024.
The
weighted
average
indirect
expenses
is
calculated
based
on
the
Form
N1-A
method
which
may
not
correlate
to
the
underlying
fund
fee
waiver
on
the
Statement
of
Operations.
e
Benefit
of
expense
reduction
rounds
to
less
than
0.01%.
Franklin
Fund
Allocator
Series
Financial
Highlights
Franklin
LifeSmart™
2020
Retirement
Target
Fund
(continued)
Annual
Report
The
accompanying
notes
are
an
integral
part
of
these
financial
statements.
a
Year
Ended
December
31,
2024
2023
2022
2021
2020
Class
R6
Per
share
operating
performance
(for
a
share
outstanding
throughout
the
year)
Net
asset
value,
beginning
of
year
...................
$11.91
$10.86
$13.04
$13.03
$12.20
Income
from
investment
operations
a
:
Net
investment
income
b
,c
........................
0.33
0.16
0.29
0.19
0.22
Net
realized
and
unrealized
gains
(losses)
...........
0.65
1.21
(2.29)
1.09
0.90
Total
from
investment
operations
....................
0.98
1.37
(2.00)
1.28
1.12
Less
distributions
from:
Net
investment
income
..........................
(0.39)
(0.32)
(0.19)
(0.38)
(0.29)
Net
realized
gains
.............................
—
—
(0.24)
(0.89)
—
Total
distributions
...............................
(0.39)
(0.32)
(0.43)
(1.27)
(0.29)
Capital
contributions
.............................
—
—
0.25
—
—
Net
asset
value,
end
of
year
.......................
$12.50
$11.91
$10.86
$13.04
$13.03
Total
return
....................................
8.37%
12.75%
(13.38)%
d
9.93%
9.45%
Ratios
to
average
net
assets
Expenses
before
waiver
and
payments
by
affiliates
e
.....
1.53%
1.24%
1.31%
0.59%
0.62%
Expenses
net
of
waiver
and
payments
by
affiliates
e
......
0.19%
0.18%
0.16%
f
0.16%
0.16%
f
Net
investment
income
c
...........................
2.67%
1.38%
2.54%
1.40%
1.83%
Supplemental
data
Net
assets,
end
of
year
(000’s)
.....................
$9
$18
$4
$5
$4,855
Portfolio
turnover
rate
............................
38.80%
17.72%
35.46%
79.95%
68.93%
a
The
amount
shown
for
a
share
outstanding
throughout
the
period
may
not
correlate
with
the
Statement
of
Operations
for
the
period
due
to
the
timing
of
sales
and
repurchas-
es
of
the
Fund’s
shares
in
relation
to
income
earned
and/or
fluctuating
fair
value
of
the
investments
of
the
Fund.
b
Based
on
average
daily
shares
outstanding.
c
Recognition
of
net
investment
income
by
the
Fund
is
affected
by
the
timing
of
declaration
of
dividends
by
the
Underlying
Funds
and
exchange
traded
funds
in
which
the
Fund
invests.
d
Includes
the
effect
of
a
capital
contribution.
Absent
the
capital
contribution,
the
total
return
would
have
been
(15.38)%.
e
Does
not
include
expenses
of
the
Underlying
Funds
and
exchange
traded
funds
in
which
the
Fund
invests.
The
weighted
average
indirect
expenses
of
the
Underlying
Funds
and
exchange
traded
funds
was
0.22%
for
the
year
ended
December
31,
2024.
The
weighted
average
indirect
expenses
is
calculated
based
on
the
Form
N1-A
method
which
may
not
correlate
to
the
underlying
fund
fee
waiver
on
the
Statement
of
Operations.
f
Benefit
of
expense
reduction
rounds
to
less
than
0.01%.
Franklin
Fund
Allocator
Series
Financial
Highlights
Franklin
LifeSmart™
2020
Retirement
Target
Fund
(continued)
The
accompanying
notes
are
an
integral
part
of
these
financial
statements.
Annual
Report
a
Year
Ended
December
31,
2024
2023
2022
2021
2020
Advisor
Class
Per
share
operating
performance
(for
a
share
outstanding
throughout
the
year)
Net
asset
value,
beginning
of
year
...................
$11.63
$10.62
$13.05
$13.03
$12.20
Income
from
investment
operations
a
:
Net
investment
income
b
,c
........................
0.33
0.30
0.28
0.26
0.22
Net
realized
and
unrealized
gains
(losses)
...........
0.62
1.03
(2.28)
1.02
0.90
Total
from
investment
operations
....................
0.95
1.33
(2.00)
1.28
1.12
Less
distributions
from:
Net
investment
income
..........................
(0.38)
(0.32)
(0.19)
(0.37)
(0.29)
Net
realized
gains
.............................
—
—
(0.24)
(0.89)
—
Total
distributions
...............................
(0.38)
(0.32)
(0.43)
(1.26)
(0.29)
Net
asset
value,
end
of
year
.......................
$12.20
$11.63
$10.62
$13.05
$13.03
Total
return
....................................
8.25%
12.70%
(15.37)%
9.95%
9.39%
Ratios
to
average
net
assets
Expenses
before
waiver
and
payments
by
affiliates
d
.....
0.95%
0.74%
0.73%
0.73%
0.73%
Expenses
net
of
waiver
and
payments
by
affiliates
d
......
0.24%
0.23%
0.22%
e
0.21%
0.21%
e
Net
investment
income
c
...........................
2.76%
2.73%
2.44%
1.88%
1.80%
Supplemental
data
Net
assets,
end
of
year
(000’s)
.....................
$535
$729
$620
$826
$685
Portfolio
turnover
rate
............................
38.80%
17.72%
35.46%
79.95%
68.93%
a
The
amount
shown
for
a
share
outstanding
throughout
the
period
may
not
correlate
with
the
Statement
of
Operations
for
the
period
due
to
the
timing
of
sales
and
repurchas-
es
of
the
Fund’s
shares
in
relation
to
income
earned
and/or
fluctuating
fair
value
of
the
investments
of
the
Fund.
b
Based
on
average
daily
shares
outstanding.
c
Recognition
of
net
investment
income
by
the
Fund
is
affected
by
the
timing
of
declaration
of
dividends
by
the
Underlying
Funds
and
exchange
traded
funds
in
which
the
Fund
invests.
d
Does
not
include
expenses
of
the
Underlying
Funds
and
exchange
traded
funds
in
which
the
Fund
invests.
The
weighted
average
indirect
expenses
of
the
Underlying
Funds
and
exchange
traded
funds
was
0.22%
for
the
year
ended
December
31,
2024.
The
weighted
average
indirect
expenses
is
calculated
based
on
the
Form
N1-A
method
which
may
not
correlate
to
the
underlying
fund
fee
waiver
on
the
Statement
of
Operations.
e
Benefit
of
expense
reduction
rounds
to
less
than
0.01%.
Franklin
Fund
Allocator
Series
Schedule
of
Investments,
December
31,
2024
Franklin
LifeSmart™
2020
Retirement
Target
Fund
Annual
Report
The
accompanying
notes
are
an
integral
part
of
these
financial
statements.
a
a
Shares
a
Value
a
Investments
In
Underlying
Funds
and
Exchange
Traded
Funds
99.4%
Alternative
Strategies
1.0%
a
Franklin
Systematic
Style
Premia
ETF
....................................
11,010
$
263,249
Domestic
Equity
30.8%
a
Franklin
Growth
Fund
,
Class
R6
........................................
12,444
1,675,891
a
Franklin
U.S.
Core
Equity
(IU)
Fund
.....................................
219,132
3,782,224
a
Franklin
U.S.
Equity
Index
ETF
.........................................
7,450
382,516
a
Franklin
U.S.
Large
Cap
Multifactor
Index
ETF
.............................
15,003
879,776
iShares
MSCI
USA
Quality
Factor
ETF
...................................
650
115,752
a
Putnam
Large
Cap
Value
Fund
,
Class
R6
.................................
28,183
972,028
7,808,187
Domestic
Fixed
Income
43.4%
a
Franklin
Investment
Grade
Corporate
ETF
.................................
126,203
2,661,381
a
Franklin
U.S.
Core
Bond
ETF
..........................................
264,063
5,569,089
a
Franklin
U.S.
Treasury
Bond
ETF
.......................................
138,923
2,795,131
11,025,601
Foreign
Equity
14.8%
a
ClearBridge
International
Growth
Fund
,
Class
IS
............................
4,167
269,385
a
Franklin
Emerging
Market
Core
Equity
(IU)
Fund
............................
63,686
645,141
a
Franklin
International
Core
Equity
(IU)
Fund
...............................
152,274
1,781,603
iShares
Core
MSCI
EAFE
ETF
.........................................
3,754
263,831
a
Templeton
Developing
Markets
Trust
,
Class
R6
.............................
22,447
417,074
a
Templeton
Foreign
Fund
,
Class
R6
......................................
54,942
410,420
3,787,454
Foreign
Fixed
Income
9.4%
a
BrandywineGLOBAL
-
Global
Opportunities
Bond
Fund
,
Class
IS
...............
112,050
918,807
a
Franklin
High
Yield
Corporate
ETF
......................................
44,613
1,064,912
a
Franklin
International
Aggregate
Bond
ETF
................................
19,646
398,421
2,382,140
Total
Investments
In
Underlying
Funds
and
Exchange
Traded
Funds
(Cost
$
22,872,639
)
................................................................
25,266,631
a
a
a
a
Short
Term
Investments
0.8%
a
Money
Market
Funds
0.1%
a,b
Institutional
Fiduciary
Trust
-
Money
Market
Portfolio
,
4.183
%
..................
20,292
20,292
Total
Money
Market
Funds
(Cost
$
20,292
)
......................................
20,292
Franklin
Fund
Allocator
Series
Schedule
of
Investments
Franklin
LifeSmart™
2020
Retirement
Target
Fund
(continued)
The
accompanying
notes
are
an
integral
part
of
these
financial
statements.
Annual
Report
Short
Term
Investments
(continued)
a
a
Principal
Amount
a
Value
Repurchase
Agreements
0.7%
c
Joint
Repurchase
Agreement
,
4.41
%
,
1/02/25
(Maturity
Value
$
172,565
)
BNP
Paribas
Securities
Corp.
(Maturity
Value
$84,068)
Deutsche
Bank
Securities,
Inc.
(Maturity
Value
$54,869)
HSBC
Securities
(USA),
Inc.
(Maturity
Value
$33,628)
Collateralized
by
U.S.
Government
Agency
Securities,
1.78%
-
6%,
6/18/35
-
10/20/54;
U.S.
Government
Agency
Strips,
11/15/53;
U.S.
Treasury
Notes,
3.75%,
12/31/28;
and
U.S.
Treasury
Notes,
Index
Linked,
0.38%,
7/15/25
(valued
at
$
175,989
)
.......................................................
$
172,523
$
172,523
Total
Repurchase
Agreements
(Cost
$
172,523
)
..................................
172,523
Total
Short
Term
Investments
(Cost
$
192,815
)
..................................
192,815
a
Total
Investments
(Cost
$
23,065,454
)
100.2
%
...................................
$25,459,446
Other
Assets,
less
Liabilities
(
0.2
)
%
...........................................
(28,430)
Net
Assets
100.0%
...........................................................
$25,431,016
See
Abbreviations
on
page
113
.
a
See
Note
3(f)
regarding
investments
in
FT
Underlying
Funds.
b
The
rate
shown
is
the
annualized
seven-day
effective
yield
at
period
end.
c
See
Note
1(b)
regarding
joint
repurchase
agreement.
Franklin
Fund
Allocator
Series
Financial
Highlights
Franklin
LifeSmart™
2025
Retirement
Target
Fund
Annual
Report
The
accompanying
notes
are
an
integral
part
of
these
financial
statements.
a
Year
Ended
December
31,
2024
2023
2022
2021
2020
Class
A
Per
share
operating
performance
(for
a
share
outstanding
throughout
the
year)
Net
asset
value,
beginning
of
year
...................
$12.21
$11.04
$13.67
$13.80
$12.98
Income
from
investment
operations
a
:
Net
investment
income
b
,c
........................
0.30
0.27
0.23
0.23
0.20
Net
realized
and
unrealized
gains
(losses)
...........
0.85
1.23
(2.43)
1.31
1.08
Total
from
investment
operations
....................
1.15
1.50
(2.20)
1.54
1.28
Less
distributions
from:
Net
investment
income
..........................
(0.38)
(0.32)
(0.14)
(0.37)
(0.21)
Net
realized
gains
.............................
(0.06)
(0.01)
(0.29)
(1.30)
(0.25)
Total
distributions
...............................
(0.44)
(0.33)
(0.43)
(1.67)
(0.46)
Net
asset
value,
end
of
year
.......................
$12.92
$12.21
$11.04
$13.67
$13.80
Total
return
d
...................................
9.41%
13.70%
(16.06)%
11.21%
10.26%
Ratios
to
average
net
assets
Expenses
before
waiver
and
payments
by
affiliates
e
.....
0.78%
0.75%
0.76%
0.76%
0.77%
Expenses
net
of
waiver
and
payments
by
affiliates
e
......
0.50%
0.49%
0.48%
f
0.47%
0.45%
f
Net
investment
income
c
...........................
2.31%
2.32%
1.97%
1.57%
1.53%
Supplemental
data
Net
assets,
end
of
year
(000’s)
.....................
$92,992
$96,649
$97,043
$118,521
$96,973
Portfolio
turnover
rate
............................
37.51%
20.95%
33.70%
69.35%
66.87%
a
The
amount
shown
for
a
share
outstanding
throughout
the
period
may
not
correlate
with
the
Statement
of
Operations
for
the
period
due
to
the
timing
of
sales
and
repurchas-
es
of
the
Fund’s
shares
in
relation
to
income
earned
and/or
fluctuating
fair
value
of
the
investments
of
the
Fund.
b
Based
on
average
daily
shares
outstanding.
c
Recognition
of
net
investment
income
by
the
Fund
is
affected
by
the
timing
of
declaration
of
dividends
by
the
Underlying
Funds
and
exchange
traded
funds
in
which
the
Fund
invests.
d
Total
return
does
not
reflect
sales
commissions
or
contingent
deferred
sales
charges,
if
applicable.
e
Does
not
include
expenses
of
the
Underlying
Funds
and
exchange
traded
funds
in
which
the
Fund
invests.
The
weighted
average
indirect
expenses
of
the
Underlying
Funds
and
exchange
traded
funds
was
0.22%
for
the
year
ended
December
31,
2024.
The
weighted
average
indirect
expenses
is
calculated
based
on
the
Form
N1-A
method
which
may
not
correlate
to
the
underlying
fund
fee
waiver
on
the
Statement
of
Operations.
f
Benefit
of
expense
reduction
rounds
to
less
than
0.01%.
Franklin
Fund
Allocator
Series
Financial
Highlights
Franklin
LifeSmart™
2025
Retirement
Target
Fund
(continued)
The
accompanying
notes
are
an
integral
part
of
these
financial
statements.
Annual
Report
a
Year
Ended
December
31,
2024
2023
2022
2021
2020
Class
C
Per
share
operating
performance
(for
a
share
outstanding
throughout
the
year)
Net
asset
value,
beginning
of
year
...................
$11.94
$10.81
$13.40
$13.56
$12.76
Income
from
investment
operations
a
:
Net
investment
income
b
,c
........................
0.20
0.18
0.13
0.10
0.09
Net
realized
and
unrealized
gains
(losses)
...........
0.83
1.19
(2.36)
1.30
1.08
Total
from
investment
operations
....................
1.03
1.37
(2.23)
1.40
1.17
Less
distributions
from:
Net
investment
income
..........................
(0.28)
(0.23)
(0.07)
(0.26)
(0.12)
Net
realized
gains
.............................
(0.06)
(0.01)
(0.29)
(1.30)
(0.25)
Total
distributions
...............................
(0.34)
(0.24)
(0.36)
(1.56)
(0.37)
Net
asset
value,
end
of
year
.......................
$12.63
$11.94
$10.81
$13.40
$13.56
Total
return
d
...................................
8.64%
12.79%
(16.66)%
10.40%
9.44%
Ratios
to
average
net
assets
Expenses
before
waiver
and
payments
by
affiliates
e
.....
1.53%
1.50%
1.51%
1.50%
1.51%
Expenses
net
of
waiver
and
payments
by
affiliates
e
......
1.25%
1.24%
1.23%
f
1.21%
1.20%
f
Net
investment
income
c
...........................
1.56%
1.56%
1.16%
0.70%
0.76%
Supplemental
data
Net
assets,
end
of
year
(000’s)
.....................
$11,299
$11,928
$12,140
$17,778
$21,991
Portfolio
turnover
rate
............................
37.51%
20.95%
33.70%
69.35%
66.87%
a
The
amount
shown
for
a
share
outstanding
throughout
the
period
may
not
correlate
with
the
Statement
of
Operations
for
the
period
due
to
the
timing
of
sales
and
repurchas-
es
of
the
Fund’s
shares
in
relation
to
income
earned
and/or
fluctuating
fair
value
of
the
investments
of
the
Fund.
b
Based
on
average
daily
shares
outstanding.
c
Recognition
of
net
investment
income
by
the
Fund
is
affected
by
the
timing
of
declaration
of
dividends
by
the
Underlying
Funds
and
exchange
traded
funds
in
which
the
Fund
invests.
d
Total
return
does
not
reflect
sales
commissions
or
contingent
deferred
sales
charges,
if
applicable.
e
Does
not
include
expenses
of
the
Underlying
Funds
and
exchange
traded
funds
in
which
the
Fund
invests.
The
weighted
average
indirect
expenses
of
the
Underlying
Funds
and
exchange
traded
funds
was
0.22%
for
the
year
ended
December
31,
2024.
The
weighted
average
indirect
expenses
is
calculated
based
on
the
Form
N1-A
method
which
may
not
correlate
to
the
underlying
fund
fee
waiver
on
the
Statement
of
Operations.
f
Benefit
of
expense
reduction
rounds
to
less
than
0.01%.
Franklin
Fund
Allocator
Series
Financial
Highlights
Franklin
LifeSmart™
2025
Retirement
Target
Fund
(continued)
Annual
Report
The
accompanying
notes
are
an
integral
part
of
these
financial
statements.
a
Year
Ended
December
31,
2024
2023
2022
2021
2020
Class
R
Per
share
operating
performance
(for
a
share
outstanding
throughout
the
year)
Net
asset
value,
beginning
of
year
...................
$12.16
$11.00
$13.61
$13.75
$12.93
Income
from
investment
operations
a
:
Net
investment
income
b
,c
........................
0.27
0.24
0.19
0.18
0.16
Net
realized
and
unrealized
gains
(losses)
...........
0.85
1.22
(2.40)
1.31
1.09
Total
from
investment
operations
....................
1.12
1.46
(2.21)
1.49
1.25
Less
distributions
from:
Net
investment
income
..........................
(0.35)
(0.29)
(0.11)
(0.33)
(0.18)
Net
realized
gains
.............................
(0.06)
(0.01)
(0.29)
(1.30)
(0.25)
Total
distributions
...............................
(0.41)
(0.30)
(0.40)
(1.63)
(0.43)
Net
asset
value,
end
of
year
.......................
$12.87
$12.16
$11.00
$13.61
$13.75
Total
return
....................................
9.19%
13.37%
(16.21)%
10.89%
10.00%
Ratios
to
average
net
assets
Expenses
before
waiver
and
payments
by
affiliates
d
.....
1.03%
1.00%
1.01%
1.01%
1.02%
Expenses
net
of
waiver
and
payments
by
affiliates
d
......
0.75%
0.74%
0.73%
e
0.72%
0.70%
e
Net
investment
income
c
...........................
2.09%
2.06%
1.61%
1.26%
1.24%
Supplemental
data
Net
assets,
end
of
year
(000’s)
.....................
$1,707
$1,778
$1,954
$3,069
$3,117
Portfolio
turnover
rate
............................
37.51%
20.95%
33.70%
69.35%
66.87%
a
The
amount
shown
for
a
share
outstanding
throughout
the
period
may
not
correlate
with
the
Statement
of
Operations
for
the
period
due
to
the
timing
of
sales
and
repurchas-
es
of
the
Fund’s
shares
in
relation
to
income
earned
and/or
fluctuating
fair
value
of
the
investments
of
the
Fund.
b
Based
on
average
daily
shares
outstanding.
c
Recognition
of
net
investment
income
by
the
Fund
is
affected
by
the
timing
of
declaration
of
dividends
by
the
Underlying
Funds
and
exchange
traded
funds
in
which
the
Fund
invests.
d
Does
not
include
expenses
of
the
Underlying
Funds
and
exchange
traded
funds
in
which
the
Fund
invests.
The
weighted
average
indirect
expenses
of
the
Underlying
Funds
and
exchange
traded
funds
was
0.22%
for
the
year
ended
December
31,
2024.
The
weighted
average
indirect
expenses
is
calculated
based
on
the
Form
N1-A
method
which
may
not
correlate
to
the
underlying
fund
fee
waiver
on
the
Statement
of
Operations.
e
Benefit
of
expense
reduction
rounds
to
less
than
0.01%.
Franklin
Fund
Allocator
Series
Financial
Highlights
Franklin
LifeSmart™
2025
Retirement
Target
Fund
(continued)
The
accompanying
notes
are
an
integral
part
of
these
financial
statements.
Annual
Report
a
Year
Ended
December
31,
2024
2023
2022
2021
2020
Class
R6
Per
share
operating
performance
(for
a
share
outstanding
throughout
the
year)
Net
asset
value,
beginning
of
year
...................
$12.26
$11.09
$13.72
$13.85
$13.02
Income
from
investment
operations
a
:
Net
investment
income
b
,c
........................
0.30
0.30
0.29
0.19
0.23
Net
realized
and
unrealized
gains
(losses)
...........
0.90
1.23
(2.45)
1.39
1.10
Total
from
investment
operations
....................
1.20
1.53
(2.16)
1.58
1.33
Less
distributions
from:
Net
investment
income
..........................
(0.42)
(0.35)
(0.18)
(0.41)
(0.25)
Net
realized
gains
.............................
(0.06)
(0.01)
(0.29)
(1.30)
(0.25)
Total
distributions
...............................
(0.48)
(0.36)
(0.47)
(1.71)
(0.50)
Net
asset
value,
end
of
year
.......................
$12.98
$12.26
$11.09
$13.72
$13.85
Total
return
....................................
9.79%
13.99%
(15.71)%
11.49%
10.64%
Ratios
to
average
net
assets
Expenses
before
waiver
and
payments
by
affiliates
d
.....
0.47%
0.41%
0.38%
0.39%
0.39%
Expenses
net
of
waiver
and
payments
by
affiliates
d
......
0.19%
0.17%
0.14%
e
0.15%
0.15%
e
Net
investment
income
c
...........................
2.39%
2.61%
2.48%
1.34%
1.83%
Supplemental
data
Net
assets,
end
of
year
(000’s)
.....................
$27
$566
$670
$544
$16,094
Portfolio
turnover
rate
............................
37.51%
20.95%
33.70%
69.35%
66.87%
a
The
amount
shown
for
a
share
outstanding
throughout
the
period
may
not
correlate
with
the
Statement
of
Operations
for
the
period
due
to
the
timing
of
sales
and
repurchas-
es
of
the
Fund’s
shares
in
relation
to
income
earned
and/or
fluctuating
fair
value
of
the
investments
of
the
Fund.
b
Based
on
average
daily
shares
outstanding.
c
Recognition
of
net
investment
income
by
the
Fund
is
affected
by
the
timing
of
declaration
of
dividends
by
the
Underlying
Funds
and
exchange
traded
funds
in
which
the
Fund
invests.
d
Does
not
include
expenses
of
the
Underlying
Funds
and
exchange
traded
funds
in
which
the
Fund
invests.
The
weighted
average
indirect
expenses
of
the
Underlying
Funds
and
exchange
traded
funds
was
0.22%
for
the
year
ended
December
31,
2024.
The
weighted
average
indirect
expenses
is
calculated
based
on
the
Form
N1-A
method
which
may
not
correlate
to
the
underlying
fund
fee
waiver
on
the
Statement
of
Operations.
e
Benefit
of
expense
reduction
rounds
to
less
than
0.01%.
Franklin
Fund
Allocator
Series
Financial
Highlights
Franklin
LifeSmart™
2025
Retirement
Target
Fund
(continued)
Annual
Report
The
accompanying
notes
are
an
integral
part
of
these
financial
statements.
a
Year
Ended
December
31,
2024
2023
2022
2021
2020
Advisor
Class
Per
share
operating
performance
(for
a
share
outstanding
throughout
the
year)
Net
asset
value,
beginning
of
year
...................
$12.25
$11.08
$13.71
$13.83
$13.01
Income
from
investment
operations
a
:
Net
investment
income
b
,c
........................
0.33
0.30
0.27
0.26
0.24
Net
realized
and
unrealized
gains
(losses)
...........
0.85
1.23
(2.44)
1.32
1.07
Total
from
investment
operations
....................
1.18
1.53
(2.17)
1.58
1.31
Less
distributions
from:
Net
investment
income
..........................
(0.41)
(0.35)
(0.17)
(0.40)
(0.24)
Net
realized
gains
.............................
(0.06)
(0.01)
(0.29)
(1.30)
(0.25)
Total
distributions
...............................
(0.47)
(0.36)
(0.46)
(1.70)
(0.49)
Net
asset
value,
end
of
year
.......................
$12.96
$12.25
$11.08
$13.71
$13.83
Total
return
....................................
9.65%
13.94%
(15.79)%
11.53%
10.51%
Ratios
to
average
net
assets
Expenses
before
waiver
and
payments
by
affiliates
d
.....
0.53%
0.50%
0.51%
0.51%
0.52%
Expenses
net
of
waiver
and
payments
by
affiliates
d
......
0.25%
0.24%
0.23%
e
0.22%
0.20%
e
Net
investment
income
c
...........................
2.53%
2.61%
2.25%
1.80%
1.90%
Supplemental
data
Net
assets,
end
of
year
(000’s)
.....................
$2,465
$2,910
$2,572
$3,055
$2,872
Portfolio
turnover
rate
............................
37.51%
20.95%
33.70%
69.35%
66.87%
a
The
amount
shown
for
a
share
outstanding
throughout
the
period
may
not
correlate
with
the
Statement
of
Operations
for
the
period
due
to
the
timing
of
sales
and
repurchas-
es
of
the
Fund’s
shares
in
relation
to
income
earned
and/or
fluctuating
fair
value
of
the
investments
of
the
Fund.
b
Based
on
average
daily
shares
outstanding.
c
Recognition
of
net
investment
income
by
the
Fund
is
affected
by
the
timing
of
declaration
of
dividends
by
the
Underlying
Funds
and
exchange
traded
funds
in
which
the
Fund
invests.
d
Does
not
include
expenses
of
the
Underlying
Funds
and
exchange
traded
funds
in
which
the
Fund
invests.
The
weighted
average
indirect
expenses
of
the
Underlying
Funds
and
exchange
traded
funds
was
0.22%
for
the
year
ended
December
31,
2024.
The
weighted
average
indirect
expenses
is
calculated
based
on
the
Form
N1-A
method
which
may
not
correlate
to
the
underlying
fund
fee
waiver
on
the
Statement
of
Operations.
e
Benefit
of
expense
reduction
rounds
to
less
than
0.01%.
Franklin
Fund
Allocator
Series
Schedule
of
Investments,
December
31,
2024
Franklin
LifeSmart™
2025
Retirement
Target
Fund
The
accompanying
notes
are
an
integral
part
of
these
financial
statements.
Annual
Report
a
a
Shares
a
Value
a
Investments
In
Underlying
Funds
and
Exchange
Traded
Funds
99.8%
Alternative
Strategies
1.0%
a
Franklin
Systematic
Style
Premia
ETF
....................................
47,083
$
1,125,755
Domestic
Equity
36.9%
a
Franklin
Growth
Fund,
Class
R6
........................................
63,690
8,577,095
a
Franklin
U.S.
Core
Equity
(IU)
Fund
.....................................
1,121,450
19,356,229
a
Franklin
U.S.
Equity
Index
ETF
.........................................
38,275
1,965,211
a
Franklin
U.S.
Large
Cap
Multifactor
Index
ETF
.............................
76,786
4,502,731
iShares
MSCI
USA
Quality
Factor
ETF
...................................
3,350
596,568
a
Putnam
Large
Cap
Value
Fund,
Class
R6
.................................
144,188
4,973,056
39,970,890
Domestic
Fixed
Income
36.3%
a
Franklin
Investment
Grade
Corporate
ETF
.................................
450,365
9,497,342
a
Franklin
U.S.
Core
Bond
ETF
..........................................
942,283
19,872,748
a
Franklin
U.S.
Treasury
Bond
ETF
.......................................
495,763
9,974,752
39,344,842
Foreign
Equity
17.8%
a
ClearBridge
International
Growth
Fund,
Class
IS
............................
21,307
1,377,313
a
Franklin
Emerging
Market
Core
Equity
(IU)
Fund
............................
325,712
3,299,462
a
Franklin
International
Core
Equity
(IU)
Fund
...............................
778,534
9,108,851
iShares
Core
MSCI
EAFE
ETF
.........................................
19,192
1,348,814
a
Templeton
Developing
Markets
Trust,
Class
R6
.............................
114,800
2,132,981
a
Templeton
Foreign
Fund,
Class
R6
......................................
280,904
2,098,352
19,365,773
Foreign
Fixed
Income
7.8%
a
BrandywineGLOBAL
-
Global
Opportunities
Bond
Fund,
Class
IS
...............
399,803
3,278,382
a
Franklin
High
Yield
Corporate
ETF
......................................
159,178
3,799,579
a
Franklin
International
Aggregate
Bond
ETF
................................
70,158
1,422,804
8,500,765
Total
Investments
In
Underlying
Funds
and
Exchange
Traded
Funds
(Cost
$93,493,385)
................................................................
108,308,025
a
A
a
A
Short
Term
Investments
1.1%
a
Money
Market
Funds
0.0%
†
a,b
Institutional
Fiduciary
Trust
-
Money
Market
Portfolio,
4.183%
..................
3,765
3,765
Total
Money
Market
Funds
(Cost
$3,765)
.......................................
3,765
Franklin
Fund
Allocator
Series
Schedule
of
Investments
Franklin
LifeSmart™
2025
Retirement
Target
Fund
(continued)
Annual
Report
The
accompanying
notes
are
an
integral
part
of
these
financial
statements.
Short
Term
Investments
(continued)
a
a
Principal
Amount
a
Value
Repurchase
Agreements
1.1%
c
Joint
Repurchase
Agreement,
4.41%,
1/02/25
(Maturity
Value
$1,169,726)
BNP
Paribas
Securities
Corp.
(Maturity
Value
$569,855)
Deutsche
Bank
Securities,
Inc.
(Maturity
Value
$371,926)
HSBC
Securities
(USA),
Inc.
(Maturity
Value
$227,945)
Collateralized
by
U.S.
Government
Agency
Securities,
1.78%
-
6%,
6/18/35
-
10/20/54;
U.S.
Government
Agency
Strips,
11/15/53;
U.S.
Treasury
Notes,
3.75%,
12/31/28;
and
U.S.
Treasury
Notes,
Index
Linked,
0.38%,
7/15/25
(valued
at
$1,192,933)
......................................................
$
1,169,440
$
1,169,440
Total
Repurchase
Agreements
(Cost
$1,169,440)
................................
1,169,440
Total
Short
Term
Investments
(Cost
$1,173,205)
.................................
1,173,205
A
Total
Investments
(Cost
$94,666,590)
100.9%
...................................
$109,481,230
Other
Assets,
less
Liabilities
(0.9)%
...........................................
(990,636)
Net
Assets
100.0%
...........................................................
$108,490,594
See
Abbreviations
on
page
113
.
†
Rounds
to
less
than
0.1%
of
net
assets.
a
See
Note
3(f)
regarding
investments
in
FT
Underlying
Funds.
b
The
rate
shown
is
the
annualized
seven-day
effective
yield
at
period
end.
c
See
Note
1(b)
regarding
joint
repurchase
agreement.
Franklin
Fund
Allocator
Series
Financial
Highlights
Franklin
LifeSmart™
2030
Retirement
Target
Fund
The
accompanying
notes
are
an
integral
part
of
these
financial
statements.
Annual
Report
a
Year
Ended
December
31,
2024
2023
2022
2021
2020
Class
A
Per
share
operating
performance
(for
a
share
outstanding
throughout
the
year)
Net
asset
value,
beginning
of
year
...................
$12.85
$11.42
$14.21
$14.40
$13.28
Income
from
investment
operations
a
:
Net
investment
income
b
,c
........................
0.29
0.27
0.22
0.24
0.19
Net
realized
and
unrealized
gains
(losses)
...........
1.10
1.42
(2.58)
1.61
1.29
Total
from
investment
operations
....................
1.39
1.69
(2.36)
1.85
1.48
Less
distributions
from:
Net
investment
income
..........................
(0.34)
(0.26)
(0.13)
(0.41)
(0.22)
Net
realized
gains
.............................
—
—
(0.30)
(1.63)
(0.14)
Total
distributions
...............................
(0.34)
(0.26)
(0.43)
(2.04)
(0.36)
Net
asset
value,
end
of
year
.......................
$13.90
$12.85
$11.42
$14.21
$14.40
Total
return
d
...................................
10.88%
14.97%
(16.57)%
12.91%
11.52%
Ratios
to
average
net
assets
Expenses
before
waiver
and
payments
by
affiliates
e
.....
0.89%
0.87%
0.94%
0.93%
0.95%
Expenses
net
of
waiver
and
payments
by
affiliates
e
......
0.50%
0.50%
0.48%
f
0.46%
0.44%
f
Net
investment
income
c
...........................
2.14%
2.25%
1.78%
1.57%
1.46%
Supplemental
data
Net
assets,
end
of
year
(000’s)
.....................
$56,797
$51,566
$44,099
$49,835
$34,019
Portfolio
turnover
rate
............................
37.55%
22.74%
48.44%
82.69%
67.25%
a
The
amount
shown
for
a
share
outstanding
throughout
the
period
may
not
correlate
with
the
Statement
of
Operations
for
the
period
due
to
the
timing
of
sales
and
repurchases
of
the
Fund’s
shares
in
relation
to
income
earned
and/or
fluctuating
fair
value
of
the
investments
of
the
Fund.
b
Based
on
average
daily
shares
outstanding.
c
Recognition
of
net
investment
income
by
the
Fund
is
affected
by
the
timing
of
declaration
of
dividends
by
the
Underlying
Funds
and
exchange
traded
funds
in
which
the
Fund
invests.
d
Total
return
does
not
reflect
sales
commissions
or
contingent
deferred
sales
charges,
if
applicable.
e
Does
not
include
expenses
of
the
Underlying
Funds
and
exchange
traded
funds
in
which
the
Fund
invests.
The
weighted
average
indirect
expenses
of
the
Underlying
Funds
and
exchange
traded
funds
was
0.22%
for
the
year
ended
December
31,
2024.
The
weighted
average
indirect
expenses
is
calculated
based
on
the
Form
N1-A
method
which
may
not
correlate
to
the
underlying
fund
fee
waiver
on
the
Statement
of
Operations.
f
Benefit
of
expense
reduction
rounds
to
less
than
0.01%.
Franklin
Fund
Allocator
Series
Financial
Highlights
Franklin
LifeSmart™
2030
Retirement
Target
Fund
(continued)
Annual
Report
The
accompanying
notes
are
an
integral
part
of
these
financial
statements.
a
Year
Ended
December
31,
2024
2023
2022
2021
2020
Class
C
Per
share
operating
performance
(for
a
share
outstanding
throughout
the
year)
Net
asset
value,
beginning
of
year
...................
$12.63
$11.23
$14.00
$14.22
$13.13
Income
from
investment
operations
a
:
Net
investment
income
b
,c
........................
0.19
0.17
0.12
0.11
0.09
Net
realized
and
unrealized
gains
(losses)
...........
1.07
1.40
(2.53)
1.61
1.27
Total
from
investment
operations
....................
1.26
1.57
(2.41)
1.72
1.36
Less
distributions
from:
Net
investment
income
..........................
(0.24)
(0.17)
(0.06)
(0.31)
(0.13)
Net
realized
gains
.............................
—
—
(0.30)
(1.63)
(0.14)
Total
distributions
...............................
(0.24)
(0.17)
(0.36)
(1.94)
(0.27)
Net
asset
value,
end
of
year
.......................
$13.65
$12.63
$11.23
$14.00
$14.22
Total
return
d
...................................
10.01%
14.11%
(17.18)%
12.13%
10.60%
Ratios
to
average
net
assets
Expenses
before
waiver
and
payments
by
affiliates
e
.....
1.64%
1.62%
1.69%
1.68%
1.70%
Expenses
net
of
waiver
and
payments
by
affiliates
e
......
1.25%
1.25%
1.23%
f
1.21%
1.19%
f
Net
investment
income
c
...........................
1.40%
1.47%
0.99%
0.74%
0.71%
Supplemental
data
Net
assets,
end
of
year
(000’s)
.....................
$11,084
$10,343
$9,642
$12,281
$10,937
Portfolio
turnover
rate
............................
37.55%
22.74%
48.44%
82.69%
67.25%
a
The
amount
shown
for
a
share
outstanding
throughout
the
period
may
not
correlate
with
the
Statement
of
Operations
for
the
period
due
to
the
timing
of
sales
and
repurchases
of
the
Fund’s
shares
in
relation
to
income
earned
and/or
fluctuating
fair
value
of
the
investments
of
the
Fund.
b
Based
on
average
daily
shares
outstanding.
c
Recognition
of
net
investment
income
by
the
Fund
is
affected
by
the
timing
of
declaration
of
dividends
by
the
Underlying
Funds
and
exchange
traded
funds
in
which
the
Fund
invests.
d
Total
return
does
not
reflect
sales
commissions
or
contingent
deferred
sales
charges,
if
applicable.
e
Does
not
include
expenses
of
the
Underlying
Funds
and
exchange
traded
funds
in
which
the
Fund
invests.
The
weighted
average
indirect
expenses
of
the
Underlying
Funds
and
exchange
traded
funds
was
0.22%
for
the
year
ended
December
31,
2024.
The
weighted
average
indirect
expenses
is
calculated
based
on
the
Form
N1-A
method
which
may
not
correlate
to
the
underlying
fund
fee
waiver
on
the
Statement
of
Operations.
f
Benefit
of
expense
reduction
rounds
to
less
than
0.01%.
Franklin
Fund
Allocator
Series
Financial
Highlights
Franklin
LifeSmart™
2030
Retirement
Target
Fund
(continued)
The
accompanying
notes
are
an
integral
part
of
these
financial
statements.
Annual
Report
a
Year
Ended
December
31,
2024
2023
2022
2021
2020
Class
R
Per
share
operating
performance
(for
a
share
outstanding
throughout
the
year)
Net
asset
value,
beginning
of
year
...................
$12.82
$11.39
$14.19
$14.38
$13.27
Income
from
investment
operations
a
:
Net
investment
income
b
,c
........................
0.27
0.24
0.18
0.20
0.15
Net
realized
and
unrealized
gains
(losses)
...........
1.08
1.42
(2.58)
1.61
1.29
Total
from
investment
operations
....................
1.35
1.66
(2.40)
1.81
1.44
Less
distributions
from:
Net
investment
income
..........................
(0.31)
(0.23)
(0.10)
(0.37)
(0.19)
Net
realized
gains
.............................
—
—
(0.30)
(1.63)
(0.14)
Total
distributions
...............................
(0.31)
(0.23)
(0.40)
(2.00)
(0.33)
Net
asset
value,
end
of
year
.......................
$13.86
$12.82
$11.39
$14.19
$14.38
Total
return
....................................
10.58%
14.73%
(16.84)%
12.65%
11.17%
Ratios
to
average
net
assets
Expenses
before
waiver
and
payments
by
affiliates
d
.....
1.14%
1.11%
1.19%
1.18%
1.20%
Expenses
net
of
waiver
and
payments
by
affiliates
d
......
0.75%
0.75%
0.74%
e
0.71%
0.69%
e
Net
investment
income
c
...........................
1.95%
2.00%
1.51%
1.29%
1.19%
Supplemental
data
Net
assets,
end
of
year
(000’s)
.....................
$2,133
$1,613
$1,295
$1,512
$1,186
Portfolio
turnover
rate
............................
37.55%
22.74%
48.44%
82.69%
67.25%
a
The
amount
shown
for
a
share
outstanding
throughout
the
period
may
not
correlate
with
the
Statement
of
Operations
for
the
period
due
to
the
timing
of
sales
and
repurchases
of
the
Fund’s
shares
in
relation
to
income
earned
and/or
fluctuating
fair
value
of
the
investments
of
the
Fund.
b
Based
on
average
daily
shares
outstanding.
c
Recognition
of
net
investment
income
by
the
Fund
is
affected
by
the
timing
of
declaration
of
dividends
by
the
Underlying
Funds
and
exchange
traded
funds
in
which
the
Fund
invests.
d
Does
not
include
expenses
of
the
Underlying
Funds
and
exchange
traded
funds
in
which
the
Fund
invests.
The
weighted
average
indirect
expenses
of
the
Underlying
Funds
and
exchange
traded
funds
was
0.22%
for
the
year
ended
December
31,
2024.
The
weighted
average
indirect
expenses
is
calculated
based
on
the
Form
N1-A
method
which
may
not
correlate
to
the
underlying
fund
fee
waiver
on
the
Statement
of
Operations.
e
Benefit
of
expense
reduction
rounds
to
less
than
0.01%.
Franklin
Fund
Allocator
Series
Financial
Highlights
Franklin
LifeSmart™
2030
Retirement
Target
Fund
(continued)
Annual
Report
The
accompanying
notes
are
an
integral
part
of
these
financial
statements.
a
Year
Ended
December
31,
2024
2023
2022
2021
2020
Class
R6
Per
share
operating
performance
(for
a
share
outstanding
throughout
the
year)
Net
asset
value,
beginning
of
year
...................
$13.03
$11.57
$14.28
$14.46
$13.34
Income
from
investment
operations
a
:
Net
investment
income
b
,c
........................
0.31
0.38
0.36
0.18
0.23
Net
realized
and
unrealized
gains
(losses)
...........
1.14
1.38
(2.67)
1.72
1.29
Total
from
investment
operations
....................
1.45
1.76
(2.31)
1.90
1.52
Less
distributions
from:
Net
investment
income
..........................
(0.38)
(0.30)
(0.16)
(0.45)
(0.26)
Net
realized
gains
.............................
—
—
(0.30)
(1.63)
(0.14)
Total
distributions
...............................
(0.38)
(0.30)
(0.46)
(2.08)
(0.40)
Capital
contributions
.............................
—
—
0.06
—
—
Net
asset
value,
end
of
year
.......................
$14.10
$13.03
$11.57
$14.28
$14.46
Total
return
....................................
11.21%
15.37%
(15.68)%
d
13.24%
11.80%
Ratios
to
average
net
assets
Expenses
before
waiver
and
payments
by
affiliates
e
.....
0.69%
0.61%
1.18%
0.45%
0.50%
Expenses
net
of
waiver
and
payments
by
affiliates
e
......
0.20%
0.20%
0.15%
f
0.15%
0.15%
f
Net
investment
income
c
...........................
2.29%
3.08%
3.02%
1.20%
1.72%
Supplemental
data
Net
assets,
end
of
year
(000’s)
.....................
$99
$245
$51
$40
$23,717
Portfolio
turnover
rate
............................
37.55%
22.74%
48.44%
82.69%
67.25%
a
The
amount
shown
for
a
share
outstanding
throughout
the
period
may
not
correlate
with
the
Statement
of
Operations
for
the
period
due
to
the
timing
of
sales
and
repurchases
of
the
Fund’s
shares
in
relation
to
income
earned
and/or
fluctuating
fair
value
of
the
investments
of
the
Fund.
b
Based
on
average
daily
shares
outstanding.
c
Recognition
of
net
investment
income
by
the
Fund
is
affected
by
the
timing
of
declaration
of
dividends
by
the
Underlying
Funds
and
exchange
traded
funds
in
which
the
Fund
invests.
d
Includes
the
effect
of
a
capital
contribution.
Absent
the
capital
contribution,
the
total
return
would
have
been
(16.08)%.
e
Does
not
include
expenses
of
the
Underlying
Funds
and
exchange
traded
funds
in
which
the
Fund
invests.
The
weighted
average
indirect
expenses
of
the
Underlying
Funds
and
exchange
traded
funds
was
0.22%
for
the
year
ended
December
31,
2024.
The
weighted
average
indirect
expenses
is
calculated
based
on
the
Form
N1-A
method
which
may
not
correlate
to
the
underlying
fund
fee
waiver
on
the
Statement
of
Operations.
f
Benefit
of
expense
reduction
rounds
to
less
than
0.01%.
Franklin
Fund
Allocator
Series
Financial
Highlights
Franklin
LifeSmart™
2030
Retirement
Target
Fund
(continued)
The
accompanying
notes
are
an
integral
part
of
these
financial
statements.
Annual
Report
a
Year
Ended
December
31,
2024
2023
2022
2021
2020
Advisor
Class
Per
share
operating
performance
(for
a
share
outstanding
throughout
the
year)
Net
asset
value,
beginning
of
year
...................
$12.92
$11.48
$14.27
$14.44
$13.33
Income
from
investment
operations
a
:
Net
investment
income
b
,c
........................
0.33
0.30
0.25
0.28
0.23
Net
realized
and
unrealized
gains
(losses)
...........
1.10
1.43
(2.59)
1.62
1.28
Total
from
investment
operations
....................
1.43
1.73
(2.34)
1.90
1.51
Less
distributions
from:
Net
investment
income
..........................
(0.38)
(0.29)
(0.15)
(0.44)
(0.26)
Net
realized
gains
.............................
—
—
(0.30)
(1.63)
(0.14)
Total
distributions
...............................
(0.38)
(0.29)
(0.45)
(2.07)
(0.40)
Net
asset
value,
end
of
year
.......................
$13.97
$12.92
$11.48
$14.27
$14.44
Total
return
....................................
11.09%
15.26%
(16.34)%
13.28%
11.68%
Ratios
to
average
net
assets
Expenses
before
waiver
and
payments
by
affiliates
d
.....
0.64%
0.61%
0.69%
0.68%
0.70%
Expenses
net
of
waiver
and
payments
by
affiliates
d
......
0.25%
0.25%
0.23%
e
0.21%
0.19%
e
Net
investment
income
c
...........................
2.41%
2.47%
2.05%
1.81%
1.74%
Supplemental
data
Net
assets,
end
of
year
(000’s)
.....................
$2,163
$1,936
$1,770
$1,937
$1,546
Portfolio
turnover
rate
............................
37.55%
22.74%
48.44%
82.69%
67.25%
a
The
amount
shown
for
a
share
outstanding
throughout
the
period
may
not
correlate
with
the
Statement
of
Operations
for
the
period
due
to
the
timing
of
sales
and
repurchases
of
the
Fund’s
shares
in
relation
to
income
earned
and/or
fluctuating
fair
value
of
the
investments
of
the
Fund.
b
Based
on
average
daily
shares
outstanding.
c
Recognition
of
net
investment
income
by
the
Fund
is
affected
by
the
timing
of
declaration
of
dividends
by
the
Underlying
Funds
and
exchange
traded
funds
in
which
the
Fund
invests.
d
Does
not
include
expenses
of
the
Underlying
Funds
and
exchange
traded
funds
in
which
the
Fund
invests.
The
weighted
average
indirect
expenses
of
the
Underlying
Funds
and
exchange
traded
funds
was
0.22%
for
the
year
ended
December
31,
2024.
The
weighted
average
indirect
expenses
is
calculated
based
on
the
Form
N1-A
method
which
may
not
correlate
to
the
underlying
fund
fee
waiver
on
the
Statement
of
Operations.
e
Benefit
of
expense
reduction
rounds
to
less
than
0.01%.
Franklin
Fund
Allocator
Series
Schedule
of
Investments,
December
31,
2024
Franklin
LifeSmart™
2030
Retirement
Target
Fund
Annual
Report
The
accompanying
notes
are
an
integral
part
of
these
financial
statements.
a
a
Shares
a
Value
a
Investments
In
Underlying
Funds
and
Exchange
Traded
Funds
99.1%
Alternative
Strategies
1.0%
a
Franklin
Systematic
Style
Premia
ETF
....................................
31,361
$
749,842
Domestic
Equity
42.6%
a
Franklin
Growth
Fund
,
Class
R6
........................................
49,086
6,610,430
a
Franklin
U.S.
Core
Equity
(IU)
Fund
.....................................
863,849
14,910,025
a
Franklin
U.S.
Equity
Index
ETF
.........................................
29,471
1,513,174
a
Franklin
U.S.
Large
Cap
Multifactor
Index
ETF
.............................
59,145
3,468,263
iShares
MSCI
USA
Quality
Factor
ETF
...................................
2,564
456,597
a
Putnam
Large
Cap
Value
Fund
,
Class
R6
.................................
111,068
3,830,736
30,789,225
Domestic
Fixed
Income
28.7%
a
Franklin
Investment
Grade
Corporate
ETF
.................................
237,079
4,999,546
a
Franklin
U.S.
Core
Bond
ETF
..........................................
496,050
10,461,695
a
Franklin
U.S.
Treasury
Bond
ETF
.......................................
260,993
5,251,179
20,712,420
Foreign
Equity
20.6%
a
ClearBridge
International
Growth
Fund
,
Class
IS
............................
16,426
1,061,794
a
Franklin
Emerging
Market
Core
Equity
(IU)
Fund
............................
250,925
2,541,869
a
Franklin
International
Core
Equity
(IU)
Fund
...............................
600,181
7,022,113
iShares
Core
MSCI
EAFE
ETF
.........................................
14,807
1,040,636
a
Templeton
Developing
Markets
Trust
,
Class
R6
.............................
88,438
1,643,183
a
Templeton
Foreign
Fund
,
Class
R6
......................................
216,557
1,617,683
14,927,278
Foreign
Fixed
Income
6.2%
a
BrandywineGLOBAL
-
Global
Opportunities
Bond
Fund
,
Class
IS
...............
210,479
1,725,932
a
Franklin
High
Yield
Corporate
ETF
......................................
83,789
2,000,043
a
Franklin
International
Aggregate
Bond
ETF
................................
36,933
749,001
4,474,976
Total
Investments
In
Underlying
Funds
and
Exchange
Traded
Funds
(Cost
$
60,774,039
)
................................................................
71,653,741
a
a
a
a
Short
Term
Investments
0.8%
a
Money
Market
Funds
0.0%
†
a,b
Institutional
Fiduciary
Trust
-
Money
Market
Portfolio
,
4.183
%
..................
2,084
2,084
Total
Money
Market
Funds
(Cost
$
2,084
)
.......................................
2,084
Franklin
Fund
Allocator
Series
Schedule
of
Investments
Franklin
LifeSmart™
2030
Retirement
Target
Fund
(continued)
The
accompanying
notes
are
an
integral
part
of
these
financial
statements.
Annual
Report
Short
Term
Investments
(continued)
a
a
Principal
Amount
a
Value
Repurchase
Agreements
0.8%
c
Joint
Repurchase
Agreement
,
4.41
%
,
1/02/25
(Maturity
Value
$
554,241
)
BNP
Paribas
Securities
Corp.
(Maturity
Value
$270,010)
Deutsche
Bank
Securities,
Inc.
(Maturity
Value
$176,226)
HSBC
Securities
(USA),
Inc.
(Maturity
Value
$108,005)
Collateralized
by
U.S.
Government
Agency
Securities,
1.78%
-
6%,
6/18/35
-
10/20/54;
U.S.
Government
Agency
Strips,
11/15/53;
U.S.
Treasury
Notes,
3.75%,
12/31/28;
and
U.S.
Treasury
Notes,
Index
Linked,
0.38%,
7/15/25
(valued
at
$
565,237
)
.......................................................
$
554,105
$
554,105
Total
Repurchase
Agreements
(Cost
$
554,105
)
..................................
554,105
Total
Short
Term
Investments
(Cost
$
556,189
)
..................................
556,189
a
Total
Investments
(Cost
$
61,330,228
)
99.9
%
....................................
$72,209,930
Other
Assets,
less
Liabilities
0.1
%
.............................................
67,129
Net
Assets
100.0%
...........................................................
$72,277,059
See
Abbreviations
on
page
113
.
†
Rounds
to
less
than
0.1%
of
net
assets.
a
See
Note
3(f)
regarding
investments
in
FT
Underlying
Funds.
b
The
rate
shown
is
the
annualized
seven-day
effective
yield
at
period
end.
c
See
Note
1(b)
regarding
joint
repurchase
agreement.
Franklin
Fund
Allocator
Series
Financial
Highlights
Franklin
LifeSmart™
2035
Retirement
Target
Fund
Annual
Report
The
accompanying
notes
are
an
integral
part
of
these
financial
statements.
a
Year
Ended
December
31,
2024
2023
2022
2021
2020
Class
A
Per
share
operating
performance
(for
a
share
outstanding
throughout
the
year)
Net
asset
value,
beginning
of
year
...................
$13.28
$11.75
$14.67
$15.18
$13.94
Income
from
investment
operations
a
:
Net
investment
income
b
,c
........................
0.27
0.26
0.20
0.24
0.19
Net
realized
and
unrealized
gains
(losses)
...........
1.36
1.62
(2.66)
1.90
1.61
Total
from
investment
operations
....................
1.63
1.88
(2.46)
2.14
1.80
Less
distributions
from:
Net
investment
income
..........................
(0.34)
(0.31)
(0.11)
(0.42)
(0.20)
Net
realized
gains
.............................
(0.07)
(0.04)
(0.35)
(2.23)
(0.36)
Total
distributions
...............................
(0.41)
(0.35)
(0.46)
(2.65)
(0.56)
Net
asset
value,
end
of
year
.......................
$14.50
$13.28
$11.75
$14.67
$15.18
Total
return
d
...................................
12.27%
16.17%
(16.69)%
14.20%
13.44%
Ratios
to
average
net
assets
Expenses
before
waiver
and
payments
by
affiliates
e
.....
0.77%
0.79%
0.77%
0.81%
0.81%
Expenses
net
of
waiver
and
payments
by
affiliates
e
......
0.52%
0.50%
0.49%
f
0.47%
0.43%
f
Net
investment
income
c
...........................
1.92%
2.12%
1.60%
1.45%
1.38%
Supplemental
data
Net
assets,
end
of
year
(000’s)
.....................
$112,783
$102,932
$91,064
$104,174
$84,029
Portfolio
turnover
rate
............................
33.89%
23.54%
29.56%
69.46%
47.82%
a
The
amount
shown
for
a
share
outstanding
throughout
the
period
may
not
correlate
with
the
Statement
of
Operations
for
the
period
due
to
the
timing
of
sales
and
repurchases
of
the
Fund’s
shares
in
relation
to
income
earned
and/or
fluctuating
fair
value
of
the
investments
of
the
Fund.
b
Based
on
average
daily
shares
outstanding.
c
Recognition
of
net
investment
income
by
the
Fund
is
affected
by
the
timing
of
declaration
of
dividends
by
the
Underlying
Funds
and
exchange
traded
funds
in
which
the
Fund
invests.
d
Total
return
does
not
reflect
sales
commissions
or
contingent
deferred
sales
charges,
if
applicable.
e
Does
not
include
expenses
of
the
Underlying
Funds
and
exchange
traded
funds
in
which
the
Fund
invests.
The
weighted
average
indirect
expenses
of
the
Underlying
Funds
and
exchange
traded
funds
was
0.21%
for
the
year
ended
December
31,
2024.
The
weighted
average
indirect
expenses
is
calculated
based
on
the
Form
N1-A
method
which
may
not
correlate
to
the
underlying
fund
fee
waiver
on
the
Statement
of
Operations.
f
Benefit
of
expense
reduction
rounds
to
less
than
0.01%.
Franklin
Fund
Allocator
Series
Financial
Highlights
Franklin
LifeSmart™
2035
Retirement
Target
Fund
(continued)
The
accompanying
notes
are
an
integral
part
of
these
financial
statements.
Annual
Report
a
Year
Ended
December
31,
2024
2023
2022
2021
2020
Class
C
Per
share
operating
performance
(for
a
share
outstanding
throughout
the
year)
Net
asset
value,
beginning
of
year
...................
$12.83
$11.36
$14.23
$14.79
$13.60
Income
from
investment
operations
a
:
Net
investment
income
b
,c
........................
0.16
0.16
0.10
0.09
0.08
Net
realized
and
unrealized
gains
(losses)
...........
1.31
1.57
(2.57)
1.88
1.58
Total
from
investment
operations
....................
1.47
1.73
(2.47)
1.97
1.66
Less
distributions
from:
Net
investment
income
..........................
(0.23)
(0.22)
(0.05)
(0.30)
(0.11)
Net
realized
gains
.............................
(0.07)
(0.04)
(0.35)
(2.23)
(0.36)
Total
distributions
...............................
(0.30)
(0.26)
(0.40)
(2.53)
(0.47)
Net
asset
value,
end
of
year
.......................
$14.00
$12.83
$11.36
$14.23
$14.79
Total
return
d
...................................
11.48%
15.36%
(17.36)%
13.36%
12.62%
Ratios
to
average
net
assets
Expenses
before
waiver
and
payments
by
affiliates
e
.....
1.52%
1.54%
1.53%
1.55%
1.56%
Expenses
net
of
waiver
and
payments
by
affiliates
e
......
1.27%
1.25%
1.24%
f
1.21%
1.18%
f
Net
investment
income
c
...........................
1.14%
1.36%
0.81%
0.60%
0.60%
Supplemental
data
Net
assets,
end
of
year
(000’s)
.....................
$15,892
$16,352
$14,549
$18,502
$21,329
Portfolio
turnover
rate
............................
33.89%
23.54%
29.56%
69.46%
47.82%
a
The
amount
shown
for
a
share
outstanding
throughout
the
period
may
not
correlate
with
the
Statement
of
Operations
for
the
period
due
to
the
timing
of
sales
and
repurchases
of
the
Fund’s
shares
in
relation
to
income
earned
and/or
fluctuating
fair
value
of
the
investments
of
the
Fund.
b
Based
on
average
daily
shares
outstanding.
c
Recognition
of
net
investment
income
by
the
Fund
is
affected
by
the
timing
of
declaration
of
dividends
by
the
Underlying
Funds
and
exchange
traded
funds
in
which
the
Fund
invests.
d
Total
return
does
not
reflect
sales
commissions
or
contingent
deferred
sales
charges,
if
applicable.
e
Does
not
include
expenses
of
the
Underlying
Funds
and
exchange
traded
funds
in
which
the
Fund
invests.
The
weighted
average
indirect
expenses
of
the
Underlying
Funds
and
exchange
traded
funds
was
0.21%
for
the
year
ended
December
31,
2024.
The
weighted
average
indirect
expenses
is
calculated
based
on
the
Form
N1-A
method
which
may
not
correlate
to
the
underlying
fund
fee
waiver
on
the
Statement
of
Operations.
f
Benefit
of
expense
reduction
rounds
to
less
than
0.01%.
Franklin
Fund
Allocator
Series
Financial
Highlights
Franklin
LifeSmart™
2035
Retirement
Target
Fund
(continued)
Annual
Report
The
accompanying
notes
are
an
integral
part
of
these
financial
statements.
a
Year
Ended
December
31,
2024
2023
2022
2021
2020
Class
R
Per
share
operating
performance
(for
a
share
outstanding
throughout
the
year)
Net
asset
value,
beginning
of
year
...................
$13.26
$11.73
$14.66
$15.17
$13.92
Income
from
investment
operations
a
:
Net
investment
income
b
,c
........................
0.25
0.23
0.17
0.18
0.15
Net
realized
and
unrealized
gains
(losses)
...........
1.35
1.62
(2.66)
1.91
1.63
Total
from
investment
operations
....................
1.60
1.85
(2.49)
2.09
1.78
Less
distributions
from:
Net
investment
income
..........................
(0.31)
(0.28)
(0.09)
(0.37)
(0.17)
Net
realized
gains
.............................
(0.07)
(0.04)
(0.35)
(2.23)
(0.36)
Total
distributions
...............................
(0.38)
(0.32)
(0.44)
(2.60)
(0.53)
Net
asset
value,
end
of
year
.......................
$14.48
$13.26
$11.73
$14.66
$15.17
Total
return
....................................
12.03%
15.90%
(16.93)%
13.87%
13.23%
Ratios
to
average
net
assets
Expenses
before
waiver
and
payments
by
affiliates
d
.....
1.02%
1.04%
1.02%
1.05%
1.05%
Expenses
net
of
waiver
and
payments
by
affiliates
d
......
0.77%
0.75%
0.74%
e
0.71%
0.68%
e
Net
investment
income
c
...........................
1.72%
1.85%
1.38%
1.08%
1.07%
Supplemental
data
Net
assets,
end
of
year
(000’s)
.....................
$5,604
$4,150
$3,881
$4,113
$4,530
Portfolio
turnover
rate
............................
33.89%
23.54%
29.56%
69.46%
47.82%
a
The
amount
shown
for
a
share
outstanding
throughout
the
period
may
not
correlate
with
the
Statement
of
Operations
for
the
period
due
to
the
timing
of
sales
and
repurchases
of
the
Fund’s
shares
in
relation
to
income
earned
and/or
fluctuating
fair
value
of
the
investments
of
the
Fund.
b
Based
on
average
daily
shares
outstanding.
c
Recognition
of
net
investment
income
by
the
Fund
is
affected
by
the
timing
of
declaration
of
dividends
by
the
Underlying
Funds
and
exchange
traded
funds
in
which
the
Fund
invests.
d
Does
not
include
expenses
of
the
Underlying
Funds
and
exchange
traded
funds
in
which
the
Fund
invests.
The
weighted
average
indirect
expenses
of
the
Underlying
Funds
and
exchange
traded
funds
was
0.21%
for
the
year
ended
December
31,
2024.
The
weighted
average
indirect
expenses
is
calculated
based
on
the
Form
N1-A
method
which
may
not
correlate
to
the
underlying
fund
fee
waiver
on
the
Statement
of
Operations.
e
Benefit
of
expense
reduction
rounds
to
less
than
0.01%.
Franklin
Fund
Allocator
Series
Financial
Highlights
Franklin
LifeSmart™
2035
Retirement
Target
Fund
(continued)
The
accompanying
notes
are
an
integral
part
of
these
financial
statements.
Annual
Report
a
Year
Ended
December
31,
2024
2023
2022
2021
2020
Class
R6
Per
share
operating
performance
(for
a
share
outstanding
throughout
the
year)
Net
asset
value,
beginning
of
year
...................
$13.43
$11.88
$14.81
$15.31
$14.05
Income
from
investment
operations
a
:
Net
investment
income
b
,c
........................
0.34
0.32
0.25
0.18
0.23
Net
realized
and
unrealized
gains
(losses)
...........
1.37
1.62
(2.68)
2.02
1.63
Total
from
investment
operations
....................
1.71
1.94
(2.43)
2.20
1.86
Less
distributions
from:
Net
investment
income
..........................
(0.39)
(0.35)
(0.15)
(0.47)
(0.24)
Net
realized
gains
.............................
(0.07)
(0.04)
(0.35)
(2.23)
(0.36)
Total
distributions
...............................
(0.46)
(0.39)
(0.50)
(2.70)
(0.60)
Net
asset
value,
end
of
year
.......................
$14.68
$13.43
$11.88
$14.81
$15.31
Total
return
....................................
12.71%
16.50%
(16.38)%
14.46%
13.82%
Ratios
to
average
net
assets
Expenses
before
waiver
and
payments
by
affiliates
d
.....
0.68%
0.73%
0.79%
0.38%
0.40%
Expenses
net
of
waiver
and
payments
by
affiliates
d
......
0.18%
0.19%
0.15%
e
0.14%
0.13%
e
Net
investment
income
c
...........................
2.32%
2.54%
1.98%
1.10%
1.66%
Supplemental
data
Net
assets,
end
of
year
(000’s)
.....................
$222
$160
$91
$93
$30,069
Portfolio
turnover
rate
............................
33.89%
23.54%
29.56%
69.46%
47.82%
a
The
amount
shown
for
a
share
outstanding
throughout
the
period
may
not
correlate
with
the
Statement
of
Operations
for
the
period
due
to
the
timing
of
sales
and
repurchases
of
the
Fund’s
shares
in
relation
to
income
earned
and/or
fluctuating
fair
value
of
the
investments
of
the
Fund.
b
Based
on
average
daily
shares
outstanding.
c
Recognition
of
net
investment
income
by
the
Fund
is
affected
by
the
timing
of
declaration
of
dividends
by
the
Underlying
Funds
and
exchange
traded
funds
in
which
the
Fund
invests.
d
Does
not
include
expenses
of
the
Underlying
Funds
and
exchange
traded
funds
in
which
the
Fund
invests.
The
weighted
average
indirect
expenses
of
the
Underlying
Funds
and
exchange
traded
funds
was
0.21%
for
the
year
ended
December
31,
2024.
The
weighted
average
indirect
expenses
is
calculated
based
on
the
Form
N1-A
method
which
may
not
correlate
to
the
underlying
fund
fee
waiver
on
the
Statement
of
Operations.
e
Benefit
of
expense
reduction
rounds
to
less
than
0.01%.
Franklin
Fund
Allocator
Series
Financial
Highlights
Franklin
LifeSmart™
2035
Retirement
Target
Fund
(continued)
Annual
Report
The
accompanying
notes
are
an
integral
part
of
these
financial
statements.
a
Year
Ended
December
31,
2024
2023
2022
2021
2020
Advisor
Class
Per
share
operating
performance
(for
a
share
outstanding
throughout
the
year)
Net
asset
value,
beginning
of
year
...................
$13.45
$11.89
$14.84
$15.33
$14.07
Income
from
investment
operations
a
:
Net
investment
income
b
,c
........................
0.32
0.30
0.23
0.27
0.23
Net
realized
and
unrealized
gains
(losses)
...........
1.36
1.64
(2.69)
1.93
1.63
Total
from
investment
operations
....................
1.68
1.94
(2.46)
2.20
1.86
Less
distributions
from:
Net
investment
income
..........................
(0.37)
(0.34)
(0.14)
(0.46)
(0.24)
Net
realized
gains
.............................
(0.07)
(0.04)
(0.35)
(2.23)
(0.36)
Total
distributions
...............................
(0.44)
(0.38)
(0.49)
(2.69)
(0.60)
Net
asset
value,
end
of
year
.......................
$14.69
$13.45
$11.89
$14.84
$15.33
Total
return
....................................
12.53%
16.51%
(16.54)%
14.46%
13.75%
Ratios
to
average
net
assets
Expenses
before
waiver
and
payments
by
affiliates
d
.....
0.52%
0.54%
0.52%
0.56%
0.56%
Expenses
net
of
waiver
and
payments
by
affiliates
d
......
0.27%
0.25%
0.24%
e
0.21%
0.18%
e
Net
investment
income
c
...........................
2.19%
2.36%
1.85%
1.67%
1.67%
Supplemental
data
Net
assets,
end
of
year
(000’s)
.....................
$4,776
$3,932
$3,496
$3,911
$3,438
Portfolio
turnover
rate
............................
33.89%
23.54%
29.56%
69.46%
47.82%
a
The
amount
shown
for
a
share
outstanding
throughout
the
period
may
not
correlate
with
the
Statement
of
Operations
for
the
period
due
to
the
timing
of
sales
and
repurchases
of
the
Fund’s
shares
in
relation
to
income
earned
and/or
fluctuating
fair
value
of
the
investments
of
the
Fund.
b
Based
on
average
daily
shares
outstanding.
c
Recognition
of
net
investment
income
by
the
Fund
is
affected
by
the
timing
of
declaration
of
dividends
by
the
Underlying
Funds
and
exchange
traded
funds
in
which
the
Fund
invests.
d
Does
not
include
expenses
of
the
Underlying
Funds
and
exchange
traded
funds
in
which
the
Fund
invests.
The
weighted
average
indirect
expenses
of
the
Underlying
Funds
and
exchange
traded
funds
was
0.21%
for
the
year
ended
December
31,
2024.
The
weighted
average
indirect
expenses
is
calculated
based
on
the
Form
N1-A
method
which
may
not
correlate
to
the
underlying
fund
fee
waiver
on
the
Statement
of
Operations.
e
Benefit
of
expense
reduction
rounds
to
less
than
0.01%.
Franklin
Fund
Allocator
Series
Schedule
of
Investments,
December
31,
2024
Franklin
LifeSmart™
2035
Retirement
Target
Fund
The
accompanying
notes
are
an
integral
part
of
these
financial
statements.
Annual
Report
a
a
Shares
a
Value
a
Investments
In
Underlying
Funds
and
Exchange
Traded
Funds
99.4%
Alternative
Strategies
1.0%
a
Franklin
Systematic
Style
Premia
ETF
....................................
60,450
$
1,445,360
Domestic
Equity
48.5%
a
Franklin
Growth
Fund
,
Class
R6
........................................
107,905
14,531,587
a
Franklin
U.S.
Core
Equity
(IU)
Fund
.....................................
1,899,498
32,785,330
a
Franklin
U.S.
Equity
Index
ETF
.........................................
64,812
3,327,740
a
Franklin
U.S.
Large
Cap
Multifactor
Index
ETF
.............................
130,074
7,627,539
iShares
MSCI
USA
Quality
Factor
ETF
...................................
5,664
1,008,645
a
Putnam
Large
Cap
Value
Fund
,
Class
R6
.................................
244,225
8,423,320
67,704,161
Domestic
Fixed
Income
21.6%
a
Franklin
Investment
Grade
Corporate
ETF
.................................
342,621
7,225,226
a
Franklin
U.S.
Core
Bond
ETF
..........................................
716,859
15,118,556
a
Franklin
U.S.
Treasury
Bond
ETF
.......................................
377,168
7,588,620
29,932,402
Foreign
Equity
23.6%
a
ClearBridge
International
Growth
Fund
,
Class
IS
............................
36,110
2,334,167
a
Franklin
Emerging
Market
Core
Equity
(IU)
Fund
............................
552,409
5,595,906
a
Franklin
International
Core
Equity
(IU)
Fund
...............................
1,319,373
15,436,666
iShares
Core
MSCI
EAFE
ETF
.........................................
32,524
2,285,787
a
Templeton
Developing
Markets
Trust
,
Class
R6
.............................
194,697
3,617,465
a
Templeton
Foreign
Fund
,
Class
R6
......................................
476,060
3,556,166
32,826,157
Foreign
Fixed
Income
4.7%
a
BrandywineGLOBAL
-
Global
Opportunities
Bond
Fund
,
Class
IS
...............
304,191
2,494,370
a
Franklin
High
Yield
Corporate
ETF
......................................
121,087
2,890,347
a
Franklin
International
Aggregate
Bond
ETF
................................
53,352
1,081,979
6,466,696
Total
Investments
In
Underlying
Funds
and
Exchange
Traded
Funds
(Cost
$
112,818,079
)
...............................................................
138,374,776
a
a
a
a
Short
Term
Investments
0.9%
a
Money
Market
Funds
0.0%
†
a,b
Institutional
Fiduciary
Trust
-
Money
Market
Portfolio
,
4.183
%
..................
4,644
4,644
Total
Money
Market
Funds
(Cost
$
4,644
)
.......................................
4,644
Franklin
Fund
Allocator
Series
Schedule
of
Investments
Franklin
LifeSmart™
2035
Retirement
Target
Fund
(continued)
Annual
Report
The
accompanying
notes
are
an
integral
part
of
these
financial
statements.
Short
Term
Investments
(continued)
a
a
Principal
Amount
a
Value
Repurchase
Agreements
0.9%
c
Joint
Repurchase
Agreement
,
4.41
%
,
1/02/25
(Maturity
Value
$
1,208,026
)
BNP
Paribas
Securities
Corp.
(Maturity
Value
$588,514)
Deutsche
Bank
Securities,
Inc.
(Maturity
Value
$384,104)
HSBC
Securities
(USA),
Inc.
(Maturity
Value
$235,408)
Collateralized
by
U.S.
Government
Agency
Securities,
1.78%
-
6%,
6/18/35
-
10/20/54;
U.S.
Government
Agency
Strips,
11/15/53;
U.S.
Treasury
Notes,
3.75%,
12/31/28;
and
U.S.
Treasury
Notes,
Index
Linked,
0.38%,
7/15/25
(valued
at
$
1,231,993
)
......................................................
$
1,207,730
$
1,207,730
Total
Repurchase
Agreements
(Cost
$
1,207,730
)
................................
1,207,730
Total
Short
Term
Investments
(Cost
$
1,212,374
)
.................................
1,212,374
a
Total
Investments
(Cost
$
114,030,453
)
100.3
%
..................................
$139,587,150
Other
Assets,
less
Liabilities
(
0.3
)
%
...........................................
(309,775)
Net
Assets
100.0%
...........................................................
$139,277,375
See
Abbreviations
on
page
113
.
†
Rounds
to
less
than
0.1%
of
net
assets.
a
See
Note
3(f)
regarding
investments
in
FT
Underlying
Funds.
b
The
rate
shown
is
the
annualized
seven-day
effective
yield
at
period
end.
c
See
Note
1(b)
regarding
joint
repurchase
agreement.
Franklin
Fund
Allocator
Series
Financial
Highlights
Franklin
LifeSmart™
2040
Retirement
Target
Fund
The
accompanying
notes
are
an
integral
part
of
these
financial
statements.
Annual
Report
a
Year
Ended
December
31,
2024
2023
2022
2021
2020
Class
A
Per
share
operating
performance
(for
a
share
outstanding
throughout
the
year)
Net
asset
value,
beginning
of
year
...................
$13.15
$11.50
$14.42
$15.30
$13.76
Income
from
investment
operations
a
:
Net
investment
income
b
,c
........................
0.25
0.26
0.16
0.24
0.18
Net
realized
and
unrealized
gains
(losses)
...........
1.53
1.71
(2.63)
2.19
1.82
Total
from
investment
operations
....................
1.78
1.97
(2.47)
2.43
2.00
Less
distributions
from:
Net
investment
income
..........................
(0.30)
(0.28)
(0.10)
(0.43)
(0.23)
Net
realized
gains
.............................
(0.14)
(0.04)
(0.35)
(2.88)
(0.23)
Total
distributions
...............................
(0.44)
(0.32)
(0.45)
(3.31)
(0.46)
Net
asset
value,
end
of
year
.......................
$14.49
$13.15
$11.50
$14.42
$15.30
Total
return
d
...................................
13.58%
17.32%
(17.06)%
15.99%
15.04%
Ratios
to
average
net
assets
Expenses
before
waiver
and
payments
by
affiliates
e
.....
0.96%
0.99%
1.10%
1.11%
1.11%
Expenses
net
of
waiver
and
payments
by
affiliates
e
......
0.52%
0.52%
0.50%
f
0.46%
0.43%
f
Net
investment
income
c
...........................
1.76%
2.09%
1.31%
1.43%
1.30%
Supplemental
data
Net
assets,
end
of
year
(000’s)
.....................
$50,894
$43,076
$32,112
$35,193
$24,809
Portfolio
turnover
rate
............................
31.39%
26.09%
30.11%
86.92%
37.54%
a
The
amount
shown
for
a
share
outstanding
throughout
the
period
may
not
correlate
with
the
Statement
of
Operations
for
the
period
due
to
the
timing
of
sales
and
repurchases
of
the
Fund’s
shares
in
relation
to
income
earned
and/or
fluctuating
fair
value
of
the
investments
of
the
Fund.
b
Based
on
average
daily
shares
outstanding.
c
Recognition
of
net
investment
income
by
the
Fund
is
affected
by
the
timing
of
declaration
of
dividends
by
the
Underlying
Funds
and
exchange
traded
funds
in
which
the
Fund
invests.
d
Total
return
does
not
reflect
sales
commissions
or
contingent
deferred
sales
charges,
if
applicable.
e
Does
not
include
expenses
of
the
Underlying
Funds
and
exchange
traded
funds
in
which
the
Fund
invests.
The
weighted
average
indirect
expenses
of
the
Underlying
Funds
and
exchange
traded
funds
was
0.21%
for
the
year
ended
December
31,
2024.
The
weighted
average
indirect
expenses
is
calculated
based
on
the
Form
N1-A
method
which
may
not
correlate
to
the
underlying
fund
fee
waiver
on
the
Statement
of
Operations.
f
Benefit
of
expense
reduction
rounds
to
less
than
0.01%.
Franklin
Fund
Allocator
Series
Financial
Highlights
Franklin
LifeSmart™
2040
Retirement
Target
Fund
(continued)
Annual
Report
The
accompanying
notes
are
an
integral
part
of
these
financial
statements.
a
Year
Ended
December
31,
2024
2023
2022
2021
2020
Class
C
Per
share
operating
performance
(for
a
share
outstanding
throughout
the
year)
Net
asset
value,
beginning
of
year
...................
$12.83
$11.23
$14.10
$15.02
$13.52
Income
from
investment
operations
a
:
Net
investment
income
b
,c
........................
0.14
0.15
0.06
0.10
0.07
Net
realized
and
unrealized
gains
(losses)
...........
1.48
1.68
(2.56)
2.18
1.79
Total
from
investment
operations
....................
1.62
1.83
(2.50)
2.28
1.86
Less
distributions
from:
Net
investment
income
..........................
(0.19)
(0.19)
(0.02)
(0.32)
(0.13)
Net
realized
gains
.............................
(0.14)
(0.04)
(0.35)
(2.88)
(0.23)
Total
distributions
...............................
(0.33)
(0.23)
(0.37)
(3.20)
(0.36)
Net
asset
value,
end
of
year
.......................
$14.12
$12.83
$11.23
$14.10
$15.02
Total
return
d
...................................
12.69%
16.44%
(17.70)%
15.25%
14.15%
Ratios
to
average
net
assets
Expenses
before
waiver
and
payments
by
affiliates
e
.....
1.71%
1.75%
1.85%
1.85%
1.86%
Expenses
net
of
waiver
and
payments
by
affiliates
e
......
1.27%
1.27%
1.25%
f
1.21%
1.18%
f
Net
investment
income
c
...........................
0.98%
1.29%
0.53%
0.62%
0.55%
Supplemental
data
Net
assets,
end
of
year
(000’s)
.....................
$8,041
$7,737
$6,697
$7,989
$6,867
Portfolio
turnover
rate
............................
31.39%
26.09%
30.11%
86.92%
37.54%
a
The
amount
shown
for
a
share
outstanding
throughout
the
period
may
not
correlate
with
the
Statement
of
Operations
for
the
period
due
to
the
timing
of
sales
and
repurchases
of
the
Fund’s
shares
in
relation
to
income
earned
and/or
fluctuating
fair
value
of
the
investments
of
the
Fund.
b
Based
on
average
daily
shares
outstanding.
c
Recognition
of
net
investment
income
by
the
Fund
is
affected
by
the
timing
of
declaration
of
dividends
by
the
Underlying
Funds
and
exchange
traded
funds
in
which
the
Fund
invests.
d
Total
return
does
not
reflect
sales
commissions
or
contingent
deferred
sales
charges,
if
applicable.
e
Does
not
include
expenses
of
the
Underlying
Funds
and
exchange
traded
funds
in
which
the
Fund
invests.
The
weighted
average
indirect
expenses
of
the
Underlying
Funds
and
exchange
traded
funds
was
0.21%
for
the
year
ended
December
31,
2024.
The
weighted
average
indirect
expenses
is
calculated
based
on
the
Form
N1-A
method
which
may
not
correlate
to
the
underlying
fund
fee
waiver
on
the
Statement
of
Operations.
f
Benefit
of
expense
reduction
rounds
to
less
than
0.01%.
Franklin
Fund
Allocator
Series
Financial
Highlights
Franklin
LifeSmart™
2040
Retirement
Target
Fund
(continued)
The
accompanying
notes
are
an
integral
part
of
these
financial
statements.
Annual
Report
a
Year
Ended
December
31,
2024
2023
2022
2021
2020
Class
R
Per
share
operating
performance
(for
a
share
outstanding
throughout
the
year)
Net
asset
value,
beginning
of
year
...................
$13.15
$11.50
$14.41
$15.28
$13.74
Income
from
investment
operations
a
:
Net
investment
income
b
,c
........................
0.22
0.21
0.12
0.18
0.14
Net
realized
and
unrealized
gains
(losses)
...........
1.51
1.73
(2.62)
2.21
1.82
Total
from
investment
operations
....................
1.73
1.94
(2.50)
2.39
1.96
Less
distributions
from:
Net
investment
income
..........................
(0.26)
(0.25)
(0.06)
(0.38)
(0.19)
Net
realized
gains
.............................
(0.14)
(0.04)
(0.35)
(2.88)
(0.23)
Total
distributions
...............................
(0.40)
(0.29)
(0.41)
(3.26)
(0.42)
Net
asset
value,
end
of
year
.......................
$14.48
$13.15
$11.50
$14.41
$15.28
Total
return
....................................
13.22%
17.00%
(17.29)%
15.78%
14.74%
Ratios
to
average
net
assets
Expenses
before
waiver
and
payments
by
affiliates
d
.....
1.21%
1.24%
1.35%
1.35%
1.36%
Expenses
net
of
waiver
and
payments
by
affiliates
d
......
0.77%
0.77%
0.75%
e
0.71%
0.68%
e
Net
investment
income
c
...........................
1.51%
1.75%
0.96%
1.09%
1.02%
Supplemental
data
Net
assets,
end
of
year
(000’s)
.....................
$1,260
$1,121
$1,114
$1,806
$1,540
Portfolio
turnover
rate
............................
31.39%
26.09%
30.11%
86.92%
37.54%
a
The
amount
shown
for
a
share
outstanding
throughout
the
period
may
not
correlate
with
the
Statement
of
Operations
for
the
period
due
to
the
timing
of
sales
and
repurchases
of
the
Fund’s
shares
in
relation
to
income
earned
and/or
fluctuating
fair
value
of
the
investments
of
the
Fund.
b
Based
on
average
daily
shares
outstanding.
c
Recognition
of
net
investment
income
by
the
Fund
is
affected
by
the
timing
of
declaration
of
dividends
by
the
Underlying
Funds
and
exchange
traded
funds
in
which
the
Fund
invests.
d
Does
not
include
expenses
of
the
Underlying
Funds
and
exchange
traded
funds
in
which
the
Fund
invests.
The
weighted
average
indirect
expenses
of
the
Underlying
Funds
and
exchange
traded
funds
was
0.21%
for
the
year
ended
December
31,
2024.
The
weighted
average
indirect
expenses
is
calculated
based
on
the
Form
N1-A
method
which
may
not
correlate
to
the
underlying
fund
fee
waiver
on
the
Statement
of
Operations.
e
Benefit
of
expense
reduction
rounds
to
less
than
0.01%.
Franklin
Fund
Allocator
Series
Financial
Highlights
Franklin
LifeSmart™
2040
Retirement
Target
Fund
(continued)
Annual
Report
The
accompanying
notes
are
an
integral
part
of
these
financial
statements.
a
Year
Ended
December
31,
2024
2023
2022
2021
2020
Class
R6
Per
share
operating
performance
(for
a
share
outstanding
throughout
the
year)
Net
asset
value,
beginning
of
year
...................
$13.28
$11.60
$14.54
$15.40
$13.85
Income
from
investment
operations
a
:
Net
investment
income
b
,c
........................
0.30
0.30
0.19
0.17
0.21
Net
realized
and
unrealized
gains
(losses)
...........
1.53
1.74
(2.64)
2.33
1.84
Total
from
investment
operations
....................
1.83
2.04
(2.45)
2.50
2.05
Less
distributions
from:
Net
investment
income
..........................
(0.34)
(0.32)
(0.14)
(0.48)
(0.27)
Net
realized
gains
.............................
(0.14)
(0.04)
(0.35)
(2.88)
(0.23)
Total
distributions
...............................
(0.48)
(0.36)
(0.49)
(3.36)
(0.50)
Net
asset
value,
end
of
year
.......................
$14.63
$13.28
$11.60
$14.54
$15.40
Total
return
....................................
13.85%
17.76%
(16.86)%
16.42%
15.35%
Ratios
to
average
net
assets
Expenses
before
waiver
and
payments
by
affiliates
d
.....
0.59%
0.59%
0.57%
0.49%
0.55%
Expenses
net
of
waiver
and
payments
by
affiliates
d
......
0.22%
0.22%
0.20%
e
0.14%
0.13%
e
Net
investment
income
c
...........................
2.08%
2.40%
1.54%
1.01%
1.58%
Supplemental
data
Net
assets,
end
of
year
(000’s)
.....................
$339
$272
$213
$310
$25,450
Portfolio
turnover
rate
............................
31.39%
26.09%
30.11%
86.92%
37.54%
a
The
amount
shown
for
a
share
outstanding
throughout
the
period
may
not
correlate
with
the
Statement
of
Operations
for
the
period
due
to
the
timing
of
sales
and
repurchases
of
the
Fund’s
shares
in
relation
to
income
earned
and/or
fluctuating
fair
value
of
the
investments
of
the
Fund.
b
Based
on
average
daily
shares
outstanding.
c
Recognition
of
net
investment
income
by
the
Fund
is
affected
by
the
timing
of
declaration
of
dividends
by
the
Underlying
Funds
and
exchange
traded
funds
in
which
the
Fund
invests.
d
Does
not
include
expenses
of
the
Underlying
Funds
and
exchange
traded
funds
in
which
the
Fund
invests.
The
weighted
average
indirect
expenses
of
the
Underlying
Funds
and
exchange
traded
funds
was
0.21%
for
the
year
ended
December
31,
2024.
The
weighted
average
indirect
expenses
is
calculated
based
on
the
Form
N1-A
method
which
may
not
correlate
to
the
underlying
fund
fee
waiver
on
the
Statement
of
Operations.
e
Benefit
of
expense
reduction
rounds
to
less
than
0.01%.
Franklin
Fund
Allocator
Series
Financial
Highlights
Franklin
LifeSmart™
2040
Retirement
Target
Fund
(continued)
The
accompanying
notes
are
an
integral
part
of
these
financial
statements.
Annual
Report
a
Year
Ended
December
31,
2024
2023
2022
2021
2020
Advisor
Class
Per
share
operating
performance
(for
a
share
outstanding
throughout
the
year)
Net
asset
value,
beginning
of
year
...................
$13.25
$11.58
$14.52
$15.37
$13.82
Income
from
investment
operations
a
:
Net
investment
income
b
,c
........................
0.29
0.29
0.19
0.29
0.22
Net
realized
and
unrealized
gains
(losses)
...........
1.53
1.73
(2.65)
2.21
1.82
Total
from
investment
operations
....................
1.82
2.02
(2.46)
2.50
2.04
Less
distributions
from:
Net
investment
income
..........................
(0.34)
(0.31)
(0.13)
(0.47)
(0.26)
Net
realized
gains
.............................
(0.14)
(0.04)
(0.35)
(2.88)
(0.23)
Total
distributions
...............................
(0.48)
(0.35)
(0.48)
(3.35)
(0.49)
Net
asset
value,
end
of
year
.......................
$14.59
$13.25
$11.58
$14.52
$15.37
Total
return
....................................
13.75%
17.65%
(16.87)%
16.40%
15.33%
Ratios
to
average
net
assets
Expenses
before
waiver
and
payments
by
affiliates
d
.....
0.71%
0.74%
0.85%
0.86%
0.86%
Expenses
net
of
waiver
and
payments
by
affiliates
d
......
0.27%
0.27%
0.25%
e
0.22%
0.18%
e
Net
investment
income
c
...........................
2.02%
2.35%
1.54%
1.75%
1.60%
Supplemental
data
Net
assets,
end
of
year
(000’s)
.....................
$1,649
$1,430
$1,156
$937
$506
Portfolio
turnover
rate
............................
31.39%
26.09%
30.11%
86.92%
37.54%
a
The
amount
shown
for
a
share
outstanding
throughout
the
period
may
not
correlate
with
the
Statement
of
Operations
for
the
period
due
to
the
timing
of
sales
and
repurchases
of
the
Fund’s
shares
in
relation
to
income
earned
and/or
fluctuating
fair
value
of
the
investments
of
the
Fund.
b
Based
on
average
daily
shares
outstanding.
c
Recognition
of
net
investment
income
by
the
Fund
is
affected
by
the
timing
of
declaration
of
dividends
by
the
Underlying
Funds
and
exchange
traded
funds
in
which
the
Fund
invests.
d
Does
not
include
expenses
of
the
Underlying
Funds
and
exchange
traded
funds
in
which
the
Fund
invests.
The
weighted
average
indirect
expenses
of
the
Underlying
Funds
and
exchange
traded
funds
was
0.21%
for
the
year
ended
December
31,
2024.
The
weighted
average
indirect
expenses
is
calculated
based
on
the
Form
N1-A
method
which
may
not
correlate
to
the
underlying
fund
fee
waiver
on
the
Statement
of
Operations.
e
Benefit
of
expense
reduction
rounds
to
less
than
0.01%.
Franklin
Fund
Allocator
Series
Schedule
of
Investments,
December
31,
2024
Franklin
LifeSmart™
2040
Retirement
Target
Fund
Annual
Report
The
accompanying
notes
are
an
integral
part
of
these
financial
statements.
a
a
Shares
a
Value
a
Investments
In
Underlying
Funds
and
Exchange
Traded
Funds
99.3%
Alternative
Strategies
1.0%
a
Franklin
Systematic
Style
Premia
ETF
....................................
27,037
$
646,455
Domestic
Equity
54.0%
a
Franklin
Growth
Fund
,
Class
R6
........................................
53,599
7,218,172
a
Franklin
U.S.
Core
Equity
(IU)
Fund
.....................................
728,121
12,567,362
a
Franklin
U.S.
Equity
Index
ETF
.........................................
104,550
5,368,067
a
Franklin
U.S.
Large
Cap
Multifactor
Index
ETF
.............................
64,617
3,789,141
iShares
MSCI
USA
Quality
Factor
ETF
...................................
2,825
503,076
a
Putnam
Large
Cap
Value
Fund
,
Class
R6
.................................
121,339
4,184,970
33,630,788
Domestic
Fixed
Income
16.5%
a
Franklin
Investment
Grade
Corporate
ETF
.................................
116,453
2,455,772
a
Franklin
U.S.
Core
Bond
ETF
..........................................
243,677
5,139,148
a
Franklin
U.S.
Treasury
Bond
ETF
.......................................
128,196
2,579,304
10,174,224
Foreign
Equity
26.2%
a
ClearBridge
International
Growth
Fund
,
Class
IS
............................
17,937
1,159,418
a
Franklin
Emerging
Market
Core
Equity
(IU)
Fund
............................
274,484
2,780,521
a
Franklin
International
Core
Equity
(IU)
Fund
...............................
655,340
7,667,478
iShares
Core
MSCI
EAFE
ETF
.........................................
16,159
1,135,654
a
Templeton
Developing
Markets
Trust
,
Class
R6
.............................
96,731
1,797,269
a
Templeton
Foreign
Fund
,
Class
R6
......................................
236,462
1,766,373
16,306,713
Foreign
Fixed
Income
1.6%
a
Franklin
High
Yield
Corporate
ETF
......................................
41,148
982,203
Total
Investments
In
Underlying
Funds
and
Exchange
Traded
Funds
(Cost
$
50,151,802
)
................................................................
61,740,383
a
a
a
a
Short
Term
Investments
0.8%
a
Money
Market
Funds
0.0%
†
a,b
Institutional
Fiduciary
Trust
-
Money
Market
Portfolio
,
4.183
%
..................
2,091
2,091
Total
Money
Market
Funds
(Cost
$
2,091
)
.......................................
2,091
Franklin
Fund
Allocator
Series
Schedule
of
Investments
Franklin
LifeSmart™
2040
Retirement
Target
Fund
(continued)
The
accompanying
notes
are
an
integral
part
of
these
financial
statements.
Annual
Report
Short
Term
Investments
(continued)
a
a
Principal
Amount
a
Value
Repurchase
Agreements
0.8%
c
Joint
Repurchase
Agreement
,
4.41
%
,
1/02/25
(Maturity
Value
$
509,633
)
BNP
Paribas
Securities
Corp.
(Maturity
Value
$248,278)
Deutsche
Bank
Securities,
Inc.
(Maturity
Value
$162,043)
HSBC
Securities
(USA),
Inc.
(Maturity
Value
$99,312)
Collateralized
by
U.S.
Government
Agency
Securities,
1.78%
-
6%,
6/18/35
-
10/20/54;
U.S.
Government
Agency
Strips,
11/15/53;
U.S.
Treasury
Notes,
3.75%,
12/31/28;
and
U.S.
Treasury
Notes,
Index
Linked,
0.38%,
7/15/25
(valued
at
$
519,744
)
.......................................................
$
509,508
$
509,508
Total
Repurchase
Agreements
(Cost
$
509,508
)
..................................
509,508
Total
Short
Term
Investments
(Cost
$
511,599
)
..................................
511,599
a
Total
Investments
(Cost
$
50,663,401
)
100.1
%
...................................
$62,251,982
Other
Assets,
less
Liabilities
(
0.1
)
%
...........................................
(68,656)
Net
Assets
100.0%
...........................................................
$62,183,326
See
Abbreviations
on
page
113
.
†
Rounds
to
less
than
0.1%
of
net
assets.
a
See
Note
3(f)
regarding
investments
in
FT
Underlying
Funds.
b
The
rate
shown
is
the
annualized
seven-day
effective
yield
at
period
end.
c
See
Note
1(b)
regarding
joint
repurchase
agreement.
Franklin
Fund
Allocator
Series
Financial
Highlights
Franklin
LifeSmart™
2045
Retirement
Target
Fund
Annual
Report
The
accompanying
notes
are
an
integral
part
of
these
financial
statements.
a
Year
Ended
December
31,
2024
2023
2022
2021
2020
Class
A
Per
share
operating
performance
(for
a
share
outstanding
throughout
the
year)
Net
asset
value,
beginning
of
year
...................
$13.90
$12.00
$15.19
$15.80
$14.27
Income
from
investment
operations
a
:
Net
investment
income
b
,c
........................
0.23
0.25
0.14
0.23
0.17
Net
realized
and
unrealized
gains
(losses)
...........
1.81
1.97
(2.84)
2.45
1.98
Total
from
investment
operations
....................
2.04
2.22
(2.70)
2.68
2.15
Less
distributions
from:
Net
investment
income
..........................
(0.32)
(0.25)
(0.08)
(0.45)
(0.19)
Net
realized
gains
.............................
(0.14)
(0.07)
(0.41)
(2.84)
(0.43)
Total
distributions
...............................
(0.46)
(0.32)
(0.49)
(3.29)
(0.62)
Net
asset
value,
end
of
year
.......................
$15.48
$13.90
$12.00
$15.19
$15.80
Total
return
d
...................................
14.69%
18.65%
(17.67)%
17.06%
15.76%
Ratios
to
average
net
assets
Expenses
before
waiver
and
payments
by
affiliates
e
.....
0.84%
0.89%
0.91%
0.91%
0.94%
Expenses
net
of
waiver
and
payments
by
affiliates
e
......
0.52%
0.51%
0.50%
f
0.46%
0.43%
f
Net
investment
income
c
...........................
1.52%
1.93%
1.13%
1.32%
1.22%
Supplemental
data
Net
assets,
end
of
year
(000’s)
.....................
$87,733
$75,190
$62,061
$72,764
$59,801
Portfolio
turnover
rate
............................
30.84%
28.98%
26.96%
70.40%
36.61%
a
The
amount
shown
for
a
share
outstanding
throughout
the
period
may
not
correlate
with
the
Statement
of
Operations
for
the
period
due
to
the
timing
of
sales
and
repurchas-
es
of
the
Fund’s
shares
in
relation
to
income
earned
and/or
fluctuating
fair
value
of
the
investments
of
the
Fund.
b
Based
on
average
daily
shares
outstanding.
c
Recognition
of
net
investment
income
by
the
Fund
is
affected
by
the
timing
of
declaration
of
dividends
by
the
Underlying
Funds
and
exchange
traded
funds
in
which
the
Fund
invests.
d
Total
return
does
not
reflect
sales
commissions
or
contingent
deferred
sales
charges,
if
applicable.
e
Does
not
include
expenses
of
the
Underlying
Funds
and
exchange
traded
funds
in
which
the
Fund
invests.
The
weighted
average
indirect
expenses
of
the
Underlying
Funds
and
exchange
traded
funds
was
0.21%
for
the
year
ended
December
31,
2024.
The
weighted
average
indirect
expenses
is
calculated
based
on
the
Form
N1-A
method
which
may
not
correlate
to
the
underlying
fund
fee
waiver
on
the
Statement
of
Operations.
f
Benefit
of
expense
reduction
rounds
to
less
than
0.01%.
Franklin
Fund
Allocator
Series
Financial
Highlights
Franklin
LifeSmart™
2045
Retirement
Target
Fund
(continued)
The
accompanying
notes
are
an
integral
part
of
these
financial
statements.
Annual
Report
a
Year
Ended
December
31,
2024
2023
2022
2021
2020
Class
C
Per
share
operating
performance
(for
a
share
outstanding
throughout
the
year)
Net
asset
value,
beginning
of
year
...................
$13.31
$11.51
$14.61
$15.33
$13.88
Income
from
investment
operations
a
:
Net
investment
income
b
,c
........................
0.11
0.14
0.04
0.08
0.06
Net
realized
and
unrealized
gains
(losses)
...........
1.74
1.89
(2.71)
2.38
1.94
Total
from
investment
operations
....................
1.85
2.03
(2.67)
2.46
2.00
Less
distributions
from:
Net
investment
income
..........................
(0.21)
(0.16)
(0.02)
(0.34)
(0.12)
Net
realized
gains
.............................
(0.14)
(0.07)
(0.41)
(2.84)
(0.43)
Total
distributions
...............................
(0.35)
(0.23)
(0.43)
(3.18)
(0.55)
Net
asset
value,
end
of
year
.......................
$14.81
$13.31
$11.51
$14.61
$15.33
Total
return
d
...................................
13.89%
17.71%
(18.25)%
16.10%
15.00%
Ratios
to
average
net
assets
Expenses
before
waiver
and
payments
by
affiliates
e
.....
1.59%
1.64%
1.66%
1.66%
1.68%
Expenses
net
of
waiver
and
payments
by
affiliates
e
......
1.28%
1.26%
1.25%
f
1.21%
1.17%
f
Net
investment
income
c
...........................
0.74%
1.14%
0.36%
0.48%
0.46%
Supplemental
data
Net
assets,
end
of
year
(000’s)
.....................
$11,573
$11,414
$10,537
$13,509
$14,502
Portfolio
turnover
rate
............................
30.84%
28.98%
26.96%
70.40%
36.61%
a
The
amount
shown
for
a
share
outstanding
throughout
the
period
may
not
correlate
with
the
Statement
of
Operations
for
the
period
due
to
the
timing
of
sales
and
repurchas-
es
of
the
Fund’s
shares
in
relation
to
income
earned
and/or
fluctuating
fair
value
of
the
investments
of
the
Fund.
b
Based
on
average
daily
shares
outstanding.
c
Recognition
of
net
investment
income
by
the
Fund
is
affected
by
the
timing
of
declaration
of
dividends
by
the
Underlying
Funds
and
exchange
traded
funds
in
which
the
Fund
invests.
d
Total
return
does
not
reflect
sales
commissions
or
contingent
deferred
sales
charges,
if
applicable.
e
Does
not
include
expenses
of
the
Underlying
Funds
and
exchange
traded
funds
in
which
the
Fund
invests.
The
weighted
average
indirect
expenses
of
the
Underlying
Funds
and
exchange
traded
funds
was
0.21%
for
the
year
ended
December
31,
2024.
The
weighted
average
indirect
expenses
is
calculated
based
on
the
Form
N1-A
method
which
may
not
correlate
to
the
underlying
fund
fee
waiver
on
the
Statement
of
Operations.
f
Benefit
of
expense
reduction
rounds
to
less
than
0.01%.
Franklin
Fund
Allocator
Series
Financial
Highlights
Franklin
LifeSmart™
2045
Retirement
Target
Fund
(continued)
Annual
Report
The
accompanying
notes
are
an
integral
part
of
these
financial
statements.
a
Year
Ended
December
31,
2024
2023
2022
2021
2020
Class
R
Per
share
operating
performance
(for
a
share
outstanding
throughout
the
year)
Net
asset
value,
beginning
of
year
...................
$13.82
$11.93
$15.11
$15.74
$14.20
Income
from
investment
operations
a
:
Net
investment
income
b
,c
........................
0.18
0.21
0.10
0.19
0.11
Net
realized
and
unrealized
gains
(losses)
...........
1.80
1.97
(2.81)
2.43
2.01
Total
from
investment
operations
....................
1.98
2.18
(2.71)
2.62
2.12
Less
distributions
from:
Net
investment
income
..........................
(0.28)
(0.22)
(0.06)
(0.41)
(0.15)
Net
realized
gains
.............................
(0.14)
(0.07)
(0.41)
(2.84)
(0.43)
Total
distributions
...............................
(0.42)
(0.29)
(0.47)
(3.25)
(0.58)
Net
asset
value,
end
of
year
.......................
$15.38
$13.82
$11.93
$15.11
$15.74
Total
return
....................................
14.35%
18.39%
(17.87)%
16.73%
15.55%
Ratios
to
average
net
assets
Expenses
before
waiver
and
payments
by
affiliates
d
.....
1.09%
1.14%
1.16%
1.16%
1.18%
Expenses
net
of
waiver
and
payments
by
affiliates
d
......
0.77%
0.76%
0.75%
e
0.71%
0.67%
e
Net
investment
income
c
...........................
1.20%
1.63%
0.81%
1.08%
0.80%
Supplemental
data
Net
assets,
end
of
year
(000’s)
.....................
$1,574
$2,009
$2,178
$3,348
$2,620
Portfolio
turnover
rate
............................
30.84%
28.98%
26.96%
70.40%
36.61%
a
The
amount
shown
for
a
share
outstanding
throughout
the
period
may
not
correlate
with
the
Statement
of
Operations
for
the
period
due
to
the
timing
of
sales
and
repurchas-
es
of
the
Fund’s
shares
in
relation
to
income
earned
and/or
fluctuating
fair
value
of
the
investments
of
the
Fund.
b
Based
on
average
daily
shares
outstanding.
c
Recognition
of
net
investment
income
by
the
Fund
is
affected
by
the
timing
of
declaration
of
dividends
by
the
Underlying
Funds
and
exchange
traded
funds
in
which
the
Fund
invests.
d
Does
not
include
expenses
of
the
Underlying
Funds
and
exchange
traded
funds
in
which
the
Fund
invests.
The
weighted
average
indirect
expenses
of
the
Underlying
Funds
and
exchange
traded
funds
was
0.21%
for
the
year
ended
December
31,
2024.
The
weighted
average
indirect
expenses
is
calculated
based
on
the
Form
N1-A
method
which
may
not
correlate
to
the
underlying
fund
fee
waiver
on
the
Statement
of
Operations.
e
Benefit
of
expense
reduction
rounds
to
less
than
0.01%.
Franklin
Fund
Allocator
Series
Financial
Highlights
Franklin
LifeSmart™
2045
Retirement
Target
Fund
(continued)
The
accompanying
notes
are
an
integral
part
of
these
financial
statements.
Annual
Report
a
Year
Ended
December
31,
2024
2023
2022
2021
2020
Class
R6
Per
share
operating
performance
(for
a
share
outstanding
throughout
the
year)
Net
asset
value,
beginning
of
year
...................
$14.54
$12.55
$15.34
$15.93
$14.38
Income
from
investment
operations
a
:
Net
investment
income
b
,c
........................
0.31
0.34
0.24
0.15
0.21
Net
realized
and
unrealized
gains
(losses)
...........
1.87
2.01
(2.81)
2.60
2.01
Total
from
investment
operations
....................
2.18
2.35
(2.57)
2.75
2.22
Less
distributions
from:
Net
investment
income
..........................
(0.36)
(0.29)
(0.11)
(0.50)
(0.24)
Net
realized
gains
.............................
(0.14)
(0.07)
(0.41)
(2.84)
(0.43)
Total
distributions
...............................
(0.50)
(0.36)
(0.52)
(3.34)
(0.67)
Capital
contributions
.............................
—
—
0.30
—
—
Net
asset
value,
end
of
year
.......................
$16.22
$14.54
$12.55
$15.34
$15.93
Total
return
....................................
15.05%
18.88%
(14.60)%
d
17.37%
16.11%
Ratios
to
average
net
assets
Expenses
before
waiver
and
payments
by
affiliates
e
.....
0.50%
0.67%
1.25%
0.41%
0.44%
Expenses
net
of
waiver
and
payments
by
affiliates
e
......
0.23%
0.21%
0.19%
0.14%
0.13%
f
Net
investment
income
c
...........................
1.93%
2.50%
1.85%
0.87%
1.52%
Supplemental
data
Net
assets,
end
of
year
(000’s)
.....................
$798
$140
$15
$4
$23,504
Portfolio
turnover
rate
............................
30.84%
28.98%
26.96%
70.40%
36.61%
a
The
amount
shown
for
a
share
outstanding
throughout
the
period
may
not
correlate
with
the
Statement
of
Operations
for
the
period
due
to
the
timing
of
sales
and
repurchas-
es
of
the
Fund’s
shares
in
relation
to
income
earned
and/or
fluctuating
fair
value
of
the
investments
of
the
Fund.
b
Based
on
average
daily
shares
outstanding.
c
Recognition
of
net
investment
income
by
the
Fund
is
affected
by
the
timing
of
declaration
of
dividends
by
the
Underlying
Funds
and
exchange
traded
funds
in
which
the
Fund
invests.
d
Includes
the
effect
of
a
capital
contribution.
Absent
the
capital
contribution,
the
total
return
would
have
been
(16.64)%.
e
Does
not
include
expenses
of
the
Underlying
Funds
and
exchange
traded
funds
in
which
the
Fund
invests.
The
weighted
average
indirect
expenses
of
the
Underlying
Funds
and
exchange
traded
funds
was
0.21%
for
the
year
ended
December
31,
2024.
The
weighted
average
indirect
expenses
is
calculated
based
on
the
Form
N1-A
method
which
may
not
correlate
to
the
underlying
fund
fee
waiver
on
the
Statement
of
Operations.
f
Benefit
of
expense
reduction
rounds
to
less
than
0.01%.
Franklin
Fund
Allocator
Series
Financial
Highlights
Franklin
LifeSmart™
2045
Retirement
Target
Fund
(continued)
Annual
Report
The
accompanying
notes
are
an
integral
part
of
these
financial
statements.
a
Year
Ended
December
31,
2024
2023
2022
2021
2020
Advisor
Class
Per
share
operating
performance
(for
a
share
outstanding
throughout
the
year)
Net
asset
value,
beginning
of
year
...................
$14.06
$12.14
$15.34
$15.93
$14.38
Income
from
investment
operations
a
:
Net
investment
income
b
,c
........................
0.27
0.28
0.18
0.28
0.21
Net
realized
and
unrealized
gains
(losses)
...........
1.84
1.99
(2.86)
2.46
2.00
Total
from
investment
operations
....................
2.11
2.27
(2.68)
2.74
2.21
Less
distributions
from:
Net
investment
income
..........................
(0.36)
(0.28)
(0.11)
(0.49)
(0.23)
Net
realized
gains
.............................
(0.14)
(0.07)
(0.41)
(2.84)
(0.43)
Total
distributions
...............................
(0.50)
(0.35)
(0.52)
(3.33)
(0.66)
Net
asset
value,
end
of
year
.......................
$15.67
$14.06
$12.14
$15.34
$15.93
Total
return
....................................
15.01%
18.88%
(17.40)%
17.32%
16.06%
Ratios
to
average
net
assets
Expenses
before
waiver
and
payments
by
affiliates
d
.....
0.59%
0.64%
0.66%
0.67%
0.69%
Expenses
net
of
waiver
and
payments
by
affiliates
d
......
0.27%
0.26%
0.25%
e
0.22%
0.18%
e
Net
investment
income
c
...........................
1.77%
2.17%
1.37%
1.63%
1.49%
Supplemental
data
Net
assets,
end
of
year
(000’s)
.....................
$1,895
$1,574
$1,279
$1,584
$1,089
Portfolio
turnover
rate
............................
30.84%
28.98%
26.96%
70.40%
36.61%
a
The
amount
shown
for
a
share
outstanding
throughout
the
period
may
not
correlate
with
the
Statement
of
Operations
for
the
period
due
to
the
timing
of
sales
and
repurchas-
es
of
the
Fund’s
shares
in
relation
to
income
earned
and/or
fluctuating
fair
value
of
the
investments
of
the
Fund.
b
Based
on
average
daily
shares
outstanding.
c
Recognition
of
net
investment
income
by
the
Fund
is
affected
by
the
timing
of
declaration
of
dividends
by
the
Underlying
Funds
and
exchange
traded
funds
in
which
the
Fund
invests.
d
Does
not
include
expenses
of
the
Underlying
Funds
and
exchange
traded
funds
in
which
the
Fund
invests.
The
weighted
average
indirect
expenses
of
the
Underlying
Funds
and
exchange
traded
funds
was
0.21%
for
the
year
ended
December
31,
2024.
The
weighted
average
indirect
expenses
is
calculated
based
on
the
Form
N1-A
method
which
may
not
correlate
to
the
underlying
fund
fee
waiver
on
the
Statement
of
Operations.
e
Benefit
of
expense
reduction
rounds
to
less
than
0.01%.
Franklin
Fund
Allocator
Series
Schedule
of
Investments,
December
31,
2024
Franklin
LifeSmart™
2045
Retirement
Target
Fund
The
accompanying
notes
are
an
integral
part
of
these
financial
statements.
Annual
Report
See
Abbreviations
on
page
113
.
a
a
Shares
a
Value
a
Investments
In
Underlying
Funds
and
Exchange
Traded
Funds
99.3%
Alternative
Strategies
1.0%
a
Franklin
Systematic
Style
Premia
ETF
....................................
45,009
$
1,076,165
Domestic
Equity
60.1%
a
Franklin
Growth
Fund
,
Class
R6
........................................
99,150
13,352,489
a
Franklin
U.S.
Core
Equity
(IU)
Fund
.....................................
1,346,909
23,247,645
a
Franklin
U.S.
Equity
Index
ETF
.........................................
193,400
9,930,026
a
Franklin
U.S.
Large
Cap
Multifactor
Index
ETF
.............................
119,542
7,009,943
iShares
MSCI
USA
Quality
Factor
ETF
...................................
5,200
926,016
a
Putnam
Large
Cap
Value
Fund
,
Class
R6
.................................
224,459
7,741,603
62,207,722
Domestic
Fixed
Income
9.1%
a
Franklin
U.S.
Core
Bond
ETF
..........................................
447,186
9,431,153
Foreign
Equity
29.1%
a
ClearBridge
International
Growth
Fund
,
Class
IS
............................
33,191
2,145,437
a
Franklin
Emerging
Market
Core
Equity
(IU)
Fund
............................
507,517
5,141,151
a
Franklin
International
Core
Equity
(IU)
Fund
...............................
1,212,680
14,188,351
iShares
Core
MSCI
EAFE
ETF
.........................................
29,927
2,103,270
a
Templeton
Developing
Markets
Trust
,
Class
R6
.............................
178,874
3,323,480
a
Templeton
Foreign
Fund
,
Class
R6
......................................
437,567
3,268,624
30,170,313
Total
Investments
In
Underlying
Funds
and
Exchange
Traded
Funds
(Cost
$
79,182,170
)
................................................................
102,885,353
a
a
a
a
Short
Term
Investments
0.8%
a
Money
Market
Funds
0.0%
†
a,b
Institutional
Fiduciary
Trust
-
Money
Market
Portfolio
,
4.183
%
..................
3,409
3,409
Total
Money
Market
Funds
(Cost
$
3,409
)
.......................................
3,409
Principal
Amount
Repurchase
Agreements
0.8%
c
Joint
Repurchase
Agreement
,
4.41
%
,
1/02/25
(Maturity
Value
$
830,328
)
BNP
Paribas
Securities
Corp.
(Maturity
Value
$404,511)
Deutsche
Bank
Securities,
Inc.
(Maturity
Value
$264,011)
HSBC
Securities
(USA),
Inc.
(Maturity
Value
$161,806)
Collateralized
by
U.S.
Government
Agency
Securities,
1.78%
-
6%,
6/18/35
-
10/20/54;
U.S.
Government
Agency
Strips,
11/15/53;
U.S.
Treasury
Notes,
3.75%,
12/31/28;
and
U.S.
Treasury
Notes,
Index
Linked,
0.38%,
7/15/25
(valued
at
$
846,801
)
.......................................................
$
830,124
830,124
Total
Repurchase
Agreements
(Cost
$
830,124
)
..................................
830,124
Total
Short
Term
Investments
(Cost
$
833,533
)
..................................
833,533
a
Total
Investments
(Cost
$
80,015,703
)
100.1
%
...................................
$103,718,886
Other
Assets,
less
Liabilities
(
0.1
)
%
...........................................
(146,625)
Net
Assets
100.0%
...........................................................
$103,572,261
Franklin
Fund
Allocator
Series
Schedule
of
Investments
Franklin
LifeSmart™
2045
Retirement
Target
Fund
(continued)
Annual
Report
The
accompanying
notes
are
an
integral
part
of
these
financial
statements.
†
Rounds
to
less
than
0.1%
of
net
assets.
a
See
Note
3(f)
regarding
investments
in
FT
Underlying
Funds.
b
The
rate
shown
is
the
annualized
seven-day
effective
yield
at
period
end.
c
See
Note
1(b)
regarding
joint
repurchase
agreement.
Franklin
Fund
Allocator
Series
Financial
Highlights
Franklin
LifeSmart™
2050
Retirement
Target
Fund
The
accompanying
notes
are
an
integral
part
of
these
financial
statements.
Annual
Report
a
Year
Ended
December
31,
2024
2023
2022
2021
2020
Class
A
Per
share
operating
performance
(for
a
share
outstanding
throughout
the
year)
Net
asset
value,
beginning
of
year
...................
$13.52
$11.55
$14.60
$15.76
$14.01
Income
from
investment
operations
a
:
Net
investment
income
b
,c
........................
0.22
0.23
0.14
0.24
0.17
Net
realized
and
unrealized
gains
(losses)
...........
1.88
1.97
(2.71)
2.51
2.03
Total
from
investment
operations
....................
2.10
2.20
(2.57)
2.75
2.20
Less
distributions
from:
Net
investment
income
..........................
(0.33)
(0.19)
(0.08)
(0.43)
(0.22)
Net
realized
gains
.............................
(0.04)
(0.04)
(0.40)
(3.48)
(0.23)
Total
distributions
...............................
(0.37)
(0.23)
(0.48)
(3.91)
(0.45)
Net
asset
value,
end
of
year
.......................
$15.25
$13.52
$11.55
$14.60
$15.76
Total
return
d
...................................
15.53%
19.28%
(17.52)%
17.58%
16.22%
Ratios
to
average
net
assets
Expenses
before
waiver
and
payments
by
affiliates
e
.....
1.06%
1.16%
1.31%
1.28%
1.28%
Expenses
net
of
waiver
and
payments
by
affiliates
e
......
0.52%
0.50%
0.49%
f
0.45%
0.42%
f
Net
investment
income
c
...........................
1.46%
1.89%
1.11%
1.42%
1.23%
Supplemental
data
Net
assets,
end
of
year
(000’s)
.....................
$43,472
$31,778
$24,594
$30,413
$20,709
Portfolio
turnover
rate
............................
25.21%
27.46%
43.95%
85.61%
35.30%
a
The
amount
shown
for
a
share
outstanding
throughout
the
period
may
not
correlate
with
the
Statement
of
Operations
for
the
period
due
to
the
timing
of
sales
and
repurchases
of
the
Fund’s
shares
in
relation
to
income
earned
and/or
fluctuating
fair
value
of
the
investments
of
the
Fund.
b
Based
on
average
daily
shares
outstanding.
c
Recognition
of
net
investment
income
by
the
Fund
is
affected
by
the
timing
of
declaration
of
dividends
by
the
Underlying
Funds
and
exchange
traded
funds
in
which
the
Fund
invests.
d
Total
return
does
not
reflect
sales
commissions
or
contingent
deferred
sales
charges,
if
applicable.
e
Does
not
include
expenses
of
the
Underlying
Funds
and
exchange
traded
funds
in
which
the
Fund
invests.
The
weighted
average
indirect
expenses
of
the
Underlying
Funds
and
exchange
traded
funds
was
0.20%
for
the
year
ended
December
31,
2024.
The
weighted
average
indirect
expenses
is
calculated
based
on
the
Form
N1-A
method
which
may
not
correlate
to
the
underlying
fund
fee
waiver
on
the
Statement
of
Operations.
f
Benefit
of
expense
reduction
rounds
to
less
than
0.01%.
Franklin
Fund
Allocator
Series
Financial
Highlights
Franklin
LifeSmart™
2050
Retirement
Target
Fund
(continued)
Annual
Report
The
accompanying
notes
are
an
integral
part
of
these
financial
statements.
a
Year
Ended
December
31,
2024
2023
2022
2021
2020
Class
C
Per
share
operating
performance
(for
a
share
outstanding
throughout
the
year)
Net
asset
value,
beginning
of
year
...................
$13.30
$11.37
$14.40
$15.61
$13.91
Income
from
investment
operations
a
:
Net
investment
income
b
,c
........................
0.09
0.13
0.04
0.10
0.07
Net
realized
and
unrealized
gains
(losses)
...........
1.86
1.94
(2.66)
2.49
2.00
Total
from
investment
operations
....................
1.95
2.07
(2.62)
2.59
2.07
Less
distributions
from:
Net
investment
income
..........................
(0.23)
(0.10)
(0.01)
(0.32)
(0.14)
Net
realized
gains
.............................
(0.04)
(0.04)
(0.40)
(3.48)
(0.23)
Total
distributions
...............................
(0.27)
(0.14)
(0.41)
(3.80)
(0.37)
Net
asset
value,
end
of
year
.......................
$14.98
$13.30
$11.37
$14.40
$15.61
Total
return
d
...................................
14.70%
18.38%
(18.13)%
16.66%
15.35%
Ratios
to
average
net
assets
Expenses
before
waiver
and
payments
by
affiliates
e
.....
1.81%
1.91%
2.06%
2.02%
2.03%
Expenses
net
of
waiver
and
payments
by
affiliates
e
......
1.27%
1.25%
1.24%
f
1.20%
1.17%
f
Net
investment
income
c
...........................
0.64%
1.10%
0.36%
0.57%
0.48%
Supplemental
data
Net
assets,
end
of
year
(000’s)
.....................
$8,609
$7,947
$6,564
$8,038
$7,014
Portfolio
turnover
rate
............................
25.21%
27.46%
43.95%
85.61%
35.30%
a
The
amount
shown
for
a
share
outstanding
throughout
the
period
may
not
correlate
with
the
Statement
of
Operations
for
the
period
due
to
the
timing
of
sales
and
repurchases
of
the
Fund’s
shares
in
relation
to
income
earned
and/or
fluctuating
fair
value
of
the
investments
of
the
Fund.
b
Based
on
average
daily
shares
outstanding.
c
Recognition
of
net
investment
income
by
the
Fund
is
affected
by
the
timing
of
declaration
of
dividends
by
the
Underlying
Funds
and
exchange
traded
funds
in
which
the
Fund
invests.
d
Total
return
does
not
reflect
sales
commissions
or
contingent
deferred
sales
charges,
if
applicable.
e
Does
not
include
expenses
of
the
Underlying
Funds
and
exchange
traded
funds
in
which
the
Fund
invests.
The
weighted
average
indirect
expenses
of
the
Underlying
Funds
and
exchange
traded
funds
was
0.20%
for
the
year
ended
December
31,
2024.
The
weighted
average
indirect
expenses
is
calculated
based
on
the
Form
N1-A
method
which
may
not
correlate
to
the
underlying
fund
fee
waiver
on
the
Statement
of
Operations.
f
Benefit
of
expense
reduction
rounds
to
less
than
0.01%.
Franklin
Fund
Allocator
Series
Financial
Highlights
Franklin
LifeSmart™
2050
Retirement
Target
Fund
(continued)
The
accompanying
notes
are
an
integral
part
of
these
financial
statements.
Annual
Report
a
Year
Ended
December
31,
2024
2023
2022
2021
2020
Class
R
Per
share
operating
performance
(for
a
share
outstanding
throughout
the
year)
Net
asset
value,
beginning
of
year
...................
$13.54
$11.57
$14.61
$15.76
$14.01
Income
from
investment
operations
a
:
Net
investment
income
b
,c
........................
0.17
0.20
0.10
0.17
0.13
Net
realized
and
unrealized
gains
(losses)
...........
1.90
1.97
(2.68)
2.54
2.03
Total
from
investment
operations
....................
2.07
2.17
(2.58)
2.71
2.16
Less
distributions
from:
Net
investment
income
..........................
(0.29)
(0.16)
(0.06)
(0.38)
(0.18)
Net
realized
gains
.............................
(0.04)
(0.04)
(0.40)
(3.48)
(0.23)
Total
distributions
...............................
(0.33)
(0.20)
(0.46)
(3.86)
(0.41)
Net
asset
value,
end
of
year
.......................
$15.28
$13.54
$11.57
$14.61
$15.76
Total
return
....................................
15.29%
18.96%
(17.64)%
17.23%
15.92%
Ratios
to
average
net
assets
Expenses
before
waiver
and
payments
by
affiliates
d
.....
1.31%
1.41%
1.56%
1.51%
1.53%
Expenses
net
of
waiver
and
payments
by
affiliates
d
......
0.77%
0.75%
0.74%
e
0.70%
0.67%
e
Net
investment
income
c
...........................
1.17%
1.60%
0.84%
0.97%
0.91%
Supplemental
data
Net
assets,
end
of
year
(000’s)
.....................
$2,261
$1,868
$1,608
$1,857
$2,468
Portfolio
turnover
rate
............................
25.21%
27.46%
43.95%
85.61%
35.30%
a
The
amount
shown
for
a
share
outstanding
throughout
the
period
may
not
correlate
with
the
Statement
of
Operations
for
the
period
due
to
the
timing
of
sales
and
repurchases
of
the
Fund’s
shares
in
relation
to
income
earned
and/or
fluctuating
fair
value
of
the
investments
of
the
Fund.
b
Based
on
average
daily
shares
outstanding.
c
Recognition
of
net
investment
income
by
the
Fund
is
affected
by
the
timing
of
declaration
of
dividends
by
the
Underlying
Funds
and
exchange
traded
funds
in
which
the
Fund
invests.
d
Does
not
include
expenses
of
the
Underlying
Funds
and
exchange
traded
funds
in
which
the
Fund
invests.
The
weighted
average
indirect
expenses
of
the
Underlying
Funds
and
exchange
traded
funds
was
0.20%
for
the
year
ended
December
31,
2024.
The
weighted
average
indirect
expenses
is
calculated
based
on
the
Form
N1-A
method
which
may
not
correlate
to
the
underlying
fund
fee
waiver
on
the
Statement
of
Operations.
e
Benefit
of
expense
reduction
rounds
to
less
than
0.01%.
Franklin
Fund
Allocator
Series
Financial
Highlights
Franklin
LifeSmart™
2050
Retirement
Target
Fund
(continued)
Annual
Report
The
accompanying
notes
are
an
integral
part
of
these
financial
statements.
a
Year
Ended
December
31,
2024
2023
2022
2021
2020
Class
R6
Per
share
operating
performance
(for
a
share
outstanding
throughout
the
year)
Net
asset
value,
beginning
of
year
...................
$13.65
$11.66
$14.72
$15.87
$14.10
Income
from
investment
operations
a
:
Net
investment
income
b
,c
........................
0.31
0.34
0.20
0.14
0.21
Net
realized
and
unrealized
gains
(losses)
...........
1.86
1.92
(2.76)
2.68
2.05
Total
from
investment
operations
....................
2.17
2.26
(2.56)
2.82
2.26
Less
distributions
from:
Net
investment
income
..........................
(0.37)
(0.23)
(0.12)
(0.49)
(0.26)
Net
realized
gains
.............................
(0.04)
(0.04)
(0.40)
(3.48)
(0.23)
Total
distributions
...............................
(0.41)
(0.27)
(0.52)
(3.97)
(0.49)
Capital
contributions
.............................
—
—
0.02
—
—
Net
asset
value,
end
of
year
.......................
$15.41
$13.65
$11.66
$14.72
$15.87
Total
return
....................................
15.92%
19.60%
(17.18)%
d
17.84%
16.59%
Ratios
to
average
net
assets
Expenses
before
waiver
and
payments
by
affiliates
e
.....
0.92%
0.78%
0.43%
0.51%
0.59%
Expenses
net
of
waiver
and
payments
by
affiliates
e
......
0.21%
0.21%
0.19%
f
0.14%
0.12%
f
Net
investment
income
c
...........................
2.05%
2.69%
1.66%
0.85%
1.54%
Supplemental
data
Net
assets,
end
of
year
(000’s)
.....................
$222
$91
$5
$2
$22,839
Portfolio
turnover
rate
............................
25.21%
27.46%
43.95%
85.61%
35.30%
a
The
amount
shown
for
a
share
outstanding
throughout
the
period
may
not
correlate
with
the
Statement
of
Operations
for
the
period
due
to
the
timing
of
sales
and
repurchases
of
the
Fund’s
shares
in
relation
to
income
earned
and/or
fluctuating
fair
value
of
the
investments
of
the
Fund.
b
Based
on
average
daily
shares
outstanding.
c
Recognition
of
net
investment
income
by
the
Fund
is
affected
by
the
timing
of
declaration
of
dividends
by
the
Underlying
Funds
and
exchange
traded
funds
in
which
the
Fund
invests.
d
Includes
the
effect
of
a
capital
contribution.
Absent
the
capital
contribution,
the
total
return
would
have
been
(17.32)%.
e
Does
not
include
expenses
of
the
Underlying
Funds
and
exchange
traded
funds
in
which
the
Fund
invests.
The
weighted
average
indirect
expenses
of
the
Underlying
Funds
and
exchange
traded
funds
was
0.20%
for
the
year
ended
December
31,
2024.
The
weighted
average
indirect
expenses
is
calculated
based
on
the
Form
N1-A
method
which
may
not
correlate
to
the
underlying
fund
fee
waiver
on
the
Statement
of
Operations.
f
Benefit
of
expense
reduction
rounds
to
less
than
0.01%.
Franklin
Fund
Allocator
Series
Financial
Highlights
Franklin
LifeSmart™
2050
Retirement
Target
Fund
(continued)
The
accompanying
notes
are
an
integral
part
of
these
financial
statements.
Annual
Report
a
Year
Ended
December
31,
2024
2023
2022
2021
2020
Advisor
Class
Per
share
operating
performance
(for
a
share
outstanding
throughout
the
year)
Net
asset
value,
beginning
of
year
...................
$13.64
$11.65
$14.72
$15.87
$14.10
Income
from
investment
operations
a
:
Net
investment
income
b
,c
........................
0.25
0.27
0.17
0.28
0.20
Net
realized
and
unrealized
gains
(losses)
...........
1.91
1.98
(2.73)
2.53
2.05
Total
from
investment
operations
....................
2.16
2.25
(2.56)
2.81
2.25
Less
distributions
from:
Net
investment
income
..........................
(0.36)
(0.22)
(0.11)
(0.48)
(0.25)
Net
realized
gains
.............................
(0.04)
(0.04)
(0.40)
(3.48)
(0.23)
Total
distributions
...............................
(0.40)
(0.26)
(0.51)
(3.96)
(0.48)
Net
asset
value,
end
of
year
.......................
$15.40
$13.64
$11.65
$14.72
$15.87
Total
return
....................................
15.87%
19.56%
(17.30)%
17.77%
16.54%
Ratios
to
average
net
assets
Expenses
before
waiver
and
payments
by
affiliates
d
.....
0.81%
0.91%
1.06%
1.03%
1.03%
Expenses
net
of
waiver
and
payments
by
affiliates
d
......
0.27%
0.25%
0.25%
e
0.20%
0.18%
e
Net
investment
income
c
...........................
1.68%
2.16%
1.41%
1.62%
1.45%
Supplemental
data
Net
assets,
end
of
year
(000’s)
.....................
$1,655
$1,330
$978
$942
$720
Portfolio
turnover
rate
............................
25.21%
27.46%
43.95%
85.61%
35.30%
a
The
amount
shown
for
a
share
outstanding
throughout
the
period
may
not
correlate
with
the
Statement
of
Operations
for
the
period
due
to
the
timing
of
sales
and
repurchases
of
the
Fund’s
shares
in
relation
to
income
earned
and/or
fluctuating
fair
value
of
the
investments
of
the
Fund.
b
Based
on
average
daily
shares
outstanding.
c
Recognition
of
net
investment
income
by
the
Fund
is
affected
by
the
timing
of
declaration
of
dividends
by
the
Underlying
Funds
and
exchange
traded
funds
in
which
the
Fund
invests.
d
Does
not
include
expenses
of
the
Underlying
Funds
and
exchange
traded
funds
in
which
the
Fund
invests.
The
weighted
average
indirect
expenses
of
the
Underlying
Funds
and
exchange
traded
funds
was
0.20%
for
the
year
ended
December
31,
2024.
The
weighted
average
indirect
expenses
is
calculated
based
on
the
Form
N1-A
method
which
may
not
correlate
to
the
underlying
fund
fee
waiver
on
the
Statement
of
Operations.
e
Benefit
of
expense
reduction
rounds
to
less
than
0.01%.
Franklin
Fund
Allocator
Series
Schedule
of
Investments,
December
31,
2024
Franklin
LifeSmart™
2050
Retirement
Target
Fund
Annual
Report
The
accompanying
notes
are
an
integral
part
of
these
financial
statements.
a
a
Shares
a
Value
a
Investments
In
Underlying
Funds
and
Exchange
Traded
Funds
99.4%
Alternative
Strategies
1.0%
a
Franklin
Systematic
Style
Premia
ETF
....................................
24,563
$
587,301
Domestic
Equity
64.2%
a
Franklin
Growth
Fund
,
Class
R6
........................................
57,523
7,746,621
a
Franklin
U.S.
Core
Equity
(IU)
Fund
.....................................
781,412
13,487,178
a
Franklin
U.S.
Equity
Index
ETF
.........................................
112,205
5,761,110
a
Franklin
U.S.
Large
Cap
Multifactor
Index
ETF
.............................
69,337
4,065,922
iShares
MSCI
USA
Quality
Factor
ETF
...................................
3,036
540,651
a
Putnam
Large
Cap
Value
Fund
,
Class
R6
.................................
130,246
4,492,188
36,093,670
Domestic
Fixed
Income
3.1%
a
Franklin
U.S.
Core
Bond
ETF
..........................................
82,009
1,729,570
Foreign
Equity
31.1%
a
ClearBridge
International
Growth
Fund
,
Class
IS
............................
19,247
1,244,154
a
Franklin
Emerging
Market
Core
Equity
(IU)
Fund
............................
294,366
2,981,930
a
Franklin
International
Core
Equity
(IU)
Fund
...............................
703,265
8,228,200
iShares
Core
MSCI
EAFE
ETF
.........................................
17,332
1,218,093
a
Templeton
Developing
Markets
Trust
,
Class
R6
.............................
103,747
1,927,623
a
Templeton
Foreign
Fund
,
Class
R6
......................................
253,751
1,895,517
17,495,517
Total
Investments
In
Underlying
Funds
and
Exchange
Traded
Funds
(Cost
$
44,178,135
)
................................................................
55,906,058
a
a
a
a
Short
Term
Investments
0.7%
a
Money
Market
Funds
0.0%
†
a,b
Institutional
Fiduciary
Trust
-
Money
Market
Portfolio
,
4.183
%
..................
1,844
1,844
Total
Money
Market
Funds
(Cost
$
1,844
)
.......................................
1,844
Principal
Amount
Repurchase
Agreements
0.7%
c
Joint
Repurchase
Agreement
,
4.41
%
,
1/02/25
(Maturity
Value
$
395,384
)
BNP
Paribas
Securities
Corp.
(Maturity
Value
$192,620)
Deutsche
Bank
Securities,
Inc.
(Maturity
Value
$125,716)
HSBC
Securities
(USA),
Inc.
(Maturity
Value
$77,048)
Collateralized
by
U.S.
Government
Agency
Securities,
1.78%
-
6%,
6/18/35
-
10/20/54;
U.S.
Government
Agency
Strips,
11/15/53;
U.S.
Treasury
Notes,
3.75%,
12/31/28;
and
U.S.
Treasury
Notes,
Index
Linked,
0.38%,
7/15/25
(valued
at
$
403,228
)
.......................................................
$
395,287
395,287
Total
Repurchase
Agreements
(Cost
$
395,287
)
..................................
395,287
Total
Short
Term
Investments
(Cost
$
397,131
)
..................................
397,131
a
Total
Investments
(Cost
$
44,575,266
)
100.1
%
...................................
$56,303,189
Other
Assets,
less
Liabilities
(
0.1
)
%
...........................................
(83,893)
Net
Assets
100.0%
...........................................................
$56,219,296
Franklin
Fund
Allocator
Series
Schedule
of
Investments
Franklin
LifeSmart™
2050
Retirement
Target
Fund
(continued)
The
accompanying
notes
are
an
integral
part
of
these
financial
statements.
Annual
Report
See
Abbreviations
on
page
113
.
†
Rounds
to
less
than
0.1%
of
net
assets.
a
See
Note
3(f)
regarding
investments
in
FT
Underlying
Funds.
b
The
rate
shown
is
the
annualized
seven-day
effective
yield
at
period
end.
c
See
Note
1(b)
regarding
joint
repurchase
agreement.
Franklin
Fund
Allocator
Series
Financial
Highlights
Franklin
LifeSmart™
2055
Retirement
Target
Fund
Annual
Report
The
accompanying
notes
are
an
integral
part
of
these
financial
statements.
a
Year
Ended
December
31,
2024
2023
2022
2021
2020
Class
A
Per
share
operating
performance
(for
a
share
outstanding
throughout
the
year)
Net
asset
value,
beginning
of
year
...................
$12.23
$10.48
$13.21
$13.41
$11.86
Income
from
investment
operations
a
:
Net
investment
income
b
,c
........................
0.19
0.21
0.13
0.20
0.15
Net
realized
and
unrealized
gains
(losses)
...........
1.73
1.79
(2.46)
2.12
1.69
Total
from
investment
operations
....................
1.92
2.00
(2.33)
2.32
1.84
Less
distributions
from:
Net
investment
income
..........................
(0.29)
(0.17)
(0.07)
(0.40)
(0.19)
Net
realized
gains
.............................
(0.05)
(0.08)
(0.33)
(2.12)
(0.10)
Total
distributions
...............................
(0.34)
(0.25)
(0.40)
(2.52)
(0.29)
Net
asset
value,
end
of
year
.......................
$13.81
$12.23
$10.48
$13.21
$13.41
Total
return
d
...................................
15.73%
19.32%
(17.54)%
17.34%
15.95%
Ratios
to
average
net
assets
Expenses
before
waiver
and
payments
by
affiliates
e
.....
1.23%
1.43%
1.65%
1.79%
2.03%
Expenses
net
of
waiver
and
payments
by
affiliates
e
......
0.52%
0.50%
f
0.49%
f
0.46%
f
0.43%
f
Net
investment
income
c
...........................
1.40%
1.90%
1.16%
1.38%
1.27%
Supplemental
data
Net
assets,
end
of
year
(000’s)
.....................
$30,422
$24,201
$17,210
$17,727
$12,408
Portfolio
turnover
rate
............................
27.08%
29.62%
28.43%
87.74%
32.75%
a
The
amount
shown
for
a
share
outstanding
throughout
the
period
may
not
correlate
with
the
Statement
of
Operations
for
the
period
due
to
the
timing
of
sales
and
repurchases
of
the
Fund’s
shares
in
relation
to
income
earned
and/or
fluctuating
fair
value
of
the
investments
of
the
Fund.
b
Based
on
average
daily
shares
outstanding.
c
Recognition
of
net
investment
income
by
the
Fund
is
affected
by
the
timing
of
declaration
of
dividends
by
the
Underlying
Funds
and
exchange
traded
funds
in
which
the
Fund
invests.
d
Total
return
does
not
reflect
sales
commissions
or
contingent
deferred
sales
charges,
if
applicable.
e
Does
not
include
expenses
of
the
Underlying
Funds
and
exchange
traded
funds
in
which
the
Fund
invests.
The
weighted
average
indirect
expenses
of
the
Underlying
Funds
and
exchange
traded
funds
was
0.20%
for
the
year
ended
December
31,
2024.
The
weighted
average
indirect
expenses
is
calculated
based
on
the
Form
N1-A
method
which
may
not
correlate
to
the
underlying
fund
fee
waiver
on
the
Statement
of
Operations.
f
Benefit
of
expense
reduction
rounds
to
less
than
0.01%.
Franklin
Fund
Allocator
Series
Financial
Highlights
Franklin
LifeSmart™
2055
Retirement
Target
Fund
(continued)
The
accompanying
notes
are
an
integral
part
of
these
financial
statements.
Annual
Report
a
Year
Ended
December
31,
2024
2023
2022
2021
2020
Class
C
Per
share
operating
performance
(for
a
share
outstanding
throughout
the
year)
Net
asset
value,
beginning
of
year
...................
$11.92
$10.22
$12.92
$13.18
$11.69
Income
from
investment
operations
a
:
Net
investment
income
b
,c
........................
0.08
0.12
0.05
0.09
0.06
Net
realized
and
unrealized
gains
(losses)
...........
1.69
1.75
(2.41)
2.08
1.66
Total
from
investment
operations
....................
1.77
1.87
(2.36)
2.17
1.72
Less
distributions
from:
Net
investment
income
..........................
(0.21)
(0.09)
(0.01)
(0.31)
(0.13)
Net
realized
gains
.............................
(0.05)
(0.08)
(0.33)
(2.12)
(0.10)
Total
distributions
...............................
(0.26)
(0.17)
(0.34)
(2.43)
(0.23)
Net
asset
value,
end
of
year
.......................
$13.43
$11.92
$10.22
$12.92
$13.18
Total
return
d
...................................
14.86%
18.48%
(18.19)%
16.49%
15.07%
Ratios
to
average
net
assets
Expenses
before
waiver
and
payments
by
affiliates
e
.....
1.98%
2.19%
2.40%
2.54%
2.78%
Expenses
net
of
waiver
and
payments
by
affiliates
e
......
1.27%
1.25%
f
1.24%
f
1.21%
f
1.18%
f
Net
investment
income
c
...........................
0.62%
1.12%
0.42%
0.60%
0.51%
Supplemental
data
Net
assets,
end
of
year
(000’s)
.....................
$7,828
$7,243
$5,880
$6,236
$5,083
Portfolio
turnover
rate
............................
27.08%
29.62%
28.43%
87.74%
32.75%
a
The
amount
shown
for
a
share
outstanding
throughout
the
period
may
not
correlate
with
the
Statement
of
Operations
for
the
period
due
to
the
timing
of
sales
and
repurchases
of
the
Fund’s
shares
in
relation
to
income
earned
and/or
fluctuating
fair
value
of
the
investments
of
the
Fund.
b
Based
on
average
daily
shares
outstanding.
c
Recognition
of
net
investment
income
by
the
Fund
is
affected
by
the
timing
of
declaration
of
dividends
by
the
Underlying
Funds
and
exchange
traded
funds
in
which
the
Fund
invests.
d
Total
return
does
not
reflect
sales
commissions
or
contingent
deferred
sales
charges,
if
applicable.
e
Does
not
include
expenses
of
the
Underlying
Funds
and
exchange
traded
funds
in
which
the
Fund
invests.
The
weighted
average
indirect
expenses
of
the
Underlying
Funds
and
exchange
traded
funds
was
0.20%
for
the
year
ended
December
31,
2024.
The
weighted
average
indirect
expenses
is
calculated
based
on
the
Form
N1-A
method
which
may
not
correlate
to
the
underlying
fund
fee
waiver
on
the
Statement
of
Operations.
f
Benefit
of
expense
reduction
rounds
to
less
than
0.01%.
Franklin
Fund
Allocator
Series
Financial
Highlights
Franklin
LifeSmart™
2055
Retirement
Target
Fund
(continued)
Annual
Report
The
accompanying
notes
are
an
integral
part
of
these
financial
statements.
a
Year
Ended
December
31,
2024
2023
2022
2021
2020
Class
R
Per
share
operating
performance
(for
a
share
outstanding
throughout
the
year)
Net
asset
value,
beginning
of
year
...................
$12.16
$10.42
$13.15
$13.36
$11.82
Income
from
investment
operations
a
:
Net
investment
income
b
,c
........................
0.16
0.18
0.10
0.17
0.11
Net
realized
and
unrealized
gains
(losses)
...........
1.72
1.79
(2.45)
2.10
1.69
Total
from
investment
operations
....................
1.88
1.97
(2.35)
2.27
1.80
Less
distributions
from:
Net
investment
income
..........................
(0.26)
(0.15)
(0.05)
(0.36)
(0.16)
Net
realized
gains
.............................
(0.05)
(0.08)
(0.33)
(2.12)
(0.10)
Total
distributions
...............................
(0.31)
(0.23)
(0.38)
(2.48)
(0.26)
Net
asset
value,
end
of
year
.......................
$13.73
$12.16
$10.42
$13.15
$13.36
Total
return
....................................
15.47%
19.07%
(17.79)%
17.07%
15.61%
Ratios
to
average
net
assets
Expenses
before
waiver
and
payments
by
affiliates
d
.....
1.47%
1.68%
1.89%
2.04%
2.29%
Expenses
net
of
waiver
and
payments
by
affiliates
d
......
0.77%
0.75%
e
0.74%
e
0.71%
e
0.67%
e
Net
investment
income
c
...........................
1.17%
1.64%
0.94%
1.16%
0.95%
Supplemental
data
Net
assets,
end
of
year
(000’s)
.....................
$1,684
$1,321
$996
$936
$580
Portfolio
turnover
rate
............................
27.08%
29.62%
28.43%
87.74%
32.75%
a
The
amount
shown
for
a
share
outstanding
throughout
the
period
may
not
correlate
with
the
Statement
of
Operations
for
the
period
due
to
the
timing
of
sales
and
repurchases
of
the
Fund’s
shares
in
relation
to
income
earned
and/or
fluctuating
fair
value
of
the
investments
of
the
Fund.
b
Based
on
average
daily
shares
outstanding.
c
Recognition
of
net
investment
income
by
the
Fund
is
affected
by
the
timing
of
declaration
of
dividends
by
the
Underlying
Funds
and
exchange
traded
funds
in
which
the
Fund
invests.
d
Does
not
include
expenses
of
the
Underlying
Funds
and
exchange
traded
funds
in
which
the
Fund
invests.
The
weighted
average
indirect
expenses
of
the
Underlying
Funds
and
exchange
traded
funds
was
0.20%
for
the
year
ended
December
31,
2024.
The
weighted
average
indirect
expenses
is
calculated
based
on
the
Form
N1-A
method
which
may
not
correlate
to
the
underlying
fund
fee
waiver
on
the
Statement
of
Operations.
e
Benefit
of
expense
reduction
rounds
to
less
than
0.01%.
Franklin
Fund
Allocator
Series
Financial
Highlights
Franklin
LifeSmart™
2055
Retirement
Target
Fund
(continued)
The
accompanying
notes
are
an
integral
part
of
these
financial
statements.
Annual
Report
a
Year
Ended
December
31,
2024
2023
2022
2021
2020
Class
R6
Per
share
operating
performance
(for
a
share
outstanding
throughout
the
year)
Net
asset
value,
beginning
of
year
...................
$12.49
$10.69
$13.24
$13.43
$11.87
Income
from
investment
operations
a
:
Net
investment
income
b
,c
........................
0.27
0.31
0.15
0.13
0.18
Net
realized
and
unrealized
gains
(losses)
...........
1.74
1.77
(2.44)
2.24
1.70
Total
from
investment
operations
....................
2.01
2.08
(2.29)
2.37
1.88
Less
distributions
from:
Net
investment
income
..........................
(0.33)
(0.20)
(0.09)
(0.44)
(0.22)
Net
realized
gains
.............................
(0.05)
(0.08)
(0.33)
(2.12)
(0.10)
Total
distributions
...............................
(0.38)
(0.28)
(0.42)
(2.56)
(0.32)
Capital
contributions
.............................
—
—
0.16
—
—
Net
asset
value,
end
of
year
.......................
$14.12
$12.49
$10.69
$13.24
$13.43
Total
return
....................................
16.13%
19.74%
(15.90)%
d
17.72%
16.34%
Ratios
to
average
net
assets
Expenses
before
waiver
and
payments
by
affiliates
e
.....
1.90%
2.37%
0.59%
0.67%
0.87%
Expenses
net
of
waiver
and
payments
by
affiliates
e
......
0.22%
0.20%
f
0.15%
f
0.12%
f
0.13%
f
Net
investment
income
c
...........................
1.96%
2.64%
1.29%
0.87%
1.57%
Supplemental
data
Net
assets,
end
of
year
(000’s)
.....................
$76
$27
$4
$8
$12,017
Portfolio
turnover
rate
............................
27.08%
29.62%
28.43%
87.74%
32.75%
a
The
amount
shown
for
a
share
outstanding
throughout
the
period
may
not
correlate
with
the
Statement
of
Operations
for
the
period
due
to
the
timing
of
sales
and
repurchases
of
the
Fund’s
shares
in
relation
to
income
earned
and/or
fluctuating
fair
value
of
the
investments
of
the
Fund.
b
Based
on
average
daily
shares
outstanding.
c
Recognition
of
net
investment
income
by
the
Fund
is
affected
by
the
timing
of
declaration
of
dividends
by
the
Underlying
Funds
and
exchange
traded
funds
in
which
the
Fund
invests.
d
Includes
the
effect
of
a
capital
contribution.
Absent
the
capital
contribution,
the
total
return
would
have
been
(17.14)%.
e
Does
not
include
expenses
of
the
Underlying
Funds
and
exchange
traded
funds
in
which
the
Fund
invests.
The
weighted
average
indirect
expenses
of
the
Underlying
Funds
and
exchange
traded
funds
was
0.20%
for
the
year
ended
December
31,
2024.
The
weighted
average
indirect
expenses
is
calculated
based
on
the
Form
N1-A
method
which
may
not
correlate
to
the
underlying
fund
fee
waiver
on
the
Statement
of
Operations.
f
Benefit
of
expense
reduction
rounds
to
less
than
0.01%.
Franklin
Fund
Allocator
Series
Financial
Highlights
Franklin
LifeSmart™
2055
Retirement
Target
Fund
(continued)
Annual
Report
The
accompanying
notes
are
an
integral
part
of
these
financial
statements.
a
Year
Ended
December
31,
2024
2023
2022
2021
2020
Advisor
Class
Per
share
operating
performance
(for
a
share
outstanding
throughout
the
year)
Net
asset
value,
beginning
of
year
...................
$12.25
$10.50
$13.22
$13.42
$11.87
Income
from
investment
operations
a
:
Net
investment
income
b
,c
........................
0.23
0.23
0.16
0.24
0.21
Net
realized
and
unrealized
gains
(losses)
...........
1.73
1.80
(2.46)
2.11
1.66
Total
from
investment
operations
....................
1.96
2.03
(2.30)
2.35
1.87
Less
distributions
from:
Net
investment
income
..........................
(0.32)
(0.20)
(0.09)
(0.43)
(0.22)
Net
realized
gains
.............................
(0.05)
(0.08)
(0.33)
(2.12)
(0.10)
Total
distributions
...............................
(0.37)
(0.28)
(0.42)
(2.55)
(0.32)
Net
asset
value,
end
of
year
.......................
$13.84
$12.25
$10.50
$13.22
$13.42
Total
return
....................................
16.07%
19.56%
(17.30)%
17.60%
16.19%
Ratios
to
average
net
assets
Expenses
before
waiver
and
payments
by
affiliates
d
.....
0.98%
1.21%
1.39%
1.54%
1.77%
Expenses
net
of
waiver
and
payments
by
affiliates
d
......
0.27%
0.25%
e
0.24%
e
0.21%
e
0.19%
e
Net
investment
income
c
...........................
1.68%
2.05%
1.43%
1.61%
1.74%
Supplemental
data
Net
assets,
end
of
year
(000’s)
.....................
$809
$579
$519
$505
$378
Portfolio
turnover
rate
............................
27.08%
29.62%
28.43%
87.74%
32.75%
a
The
amount
shown
for
a
share
outstanding
throughout
the
period
may
not
correlate
with
the
Statement
of
Operations
for
the
period
due
to
the
timing
of
sales
and
repurchases
of
the
Fund’s
shares
in
relation
to
income
earned
and/or
fluctuating
fair
value
of
the
investments
of
the
Fund.
b
Based
on
average
daily
shares
outstanding.
c
Recognition
of
net
investment
income
by
the
Fund
is
affected
by
the
timing
of
declaration
of
dividends
by
the
Underlying
Funds
and
exchange
traded
funds
in
which
the
Fund
invests.
d
Does
not
include
expenses
of
the
Underlying
Funds
and
exchange
traded
funds
in
which
the
Fund
invests.
The
weighted
average
indirect
expenses
of
the
Underlying
Funds
and
exchange
traded
funds
was
0.20%
for
the
year
ended
December
31,
2024.
The
weighted
average
indirect
expenses
is
calculated
based
on
the
Form
N1-A
method
which
may
not
correlate
to
the
underlying
fund
fee
waiver
on
the
Statement
of
Operations.
e
Benefit
of
expense
reduction
rounds
to
less
than
0.01%.
Franklin
Fund
Allocator
Series
Schedule
of
Investments,
December
31,
2024
Franklin
LifeSmart™
2055
Retirement
Target
Fund
The
accompanying
notes
are
an
integral
part
of
these
financial
statements.
Annual
Report
a
a
Shares
a
Value
a
Investments
In
Underlying
Funds
and
Exchange
Traded
Funds
99.3%
Alternative
Strategies
1.0%
a
Franklin
Systematic
Style
Premia
ETF
....................................
17,713
$
423,518
Domestic
Equity
65.1%
a
Franklin
Growth
Fund
,
Class
R6
........................................
42,367
5,705,557
a
Franklin
U.S.
Core
Equity
(IU)
Fund
.....................................
575,545
9,933,899
a
Franklin
U.S.
Equity
Index
ETF
.........................................
82,600
4,241,056
a
Franklin
U.S.
Large
Cap
Multifactor
Index
ETF
.............................
51,049
2,993,513
iShares
MSCI
USA
Quality
Factor
ETF
...................................
2,225
396,228
a
Putnam
Large
Cap
Value
Fund
,
Class
R6
.................................
95,921
3,308,306
26,578,559
Domestic
Fixed
Income
1.5%
a
Franklin
U.S.
Core
Bond
ETF
..........................................
29,721
626,816
Foreign
Equity
31.7%
a
ClearBridge
International
Growth
Fund
,
Class
IS
............................
14,175
916,277
a
Franklin
Emerging
Market
Core
Equity
(IU)
Fund
............................
216,986
2,198,072
a
Franklin
International
Core
Equity
(IU)
Fund
...............................
517,934
6,059,827
iShares
Core
MSCI
EAFE
ETF
.........................................
12,780
898,178
a
Templeton
Developing
Markets
Trust
,
Class
R6
.............................
76,483
1,421,049
a
Templeton
Foreign
Fund
,
Class
R6
......................................
186,953
1,396,537
12,889,940
Total
Investments
In
Underlying
Funds
and
Exchange
Traded
Funds
(Cost
$
32,233,792
)
................................................................
40,518,833
a
a
a
a
Short
Term
Investments
0.0%
†
a
Money
Market
Funds
0.0%
†
a,b
Institutional
Fiduciary
Trust
-
Money
Market
Portfolio
,
4.183
%
..................
1,420
1,420
Total
Money
Market
Funds
(Cost
$
1,420
)
.......................................
1,420
Total
Short
Term
Investments
(Cost
$
1,420
)
....................................
1,420
a
Total
Investments
(Cost
$
32,235,212
)
99.3
%
....................................
$40,520,253
Other
Assets,
less
Liabilities
0.7
%
.............................................
299,142
Net
Assets
100.0%
...........................................................
$40,819,395
See
Abbreviations
on
page
113
.
†
Rounds
to
less
than
0.1%
of
net
assets.
a
See
Note
3(f)
regarding
investments
in
FT
Underlying
Funds.
b
The
rate
shown
is
the
annualized
seven-day
effective
yield
at
period
end.
Franklin
Fund
Allocator
Series
Financial
Highlights
Franklin
LifeSmart™
2060
Retirement
Target
Fund
Annual
Report
The
accompanying
notes
are
an
integral
part
of
these
financial
statements.
a
Year
Ended
December
31,
Year
Ended
December
31,
2021
a
2024
2023
2022
Class
A
Per
share
operating
performance
(for
a
share
outstanding
throughout
the
year)
Net
asset
value,
beginning
of
year
................................
$10.48
$9.00
$11.26
$10.00
Income
from
investment
operations
b
:
Net
investment
income
c,d
.....................................
0.17
0.19
0.14
0.27
Net
realized
and
unrealized
gains
(losses)
........................
1.48
1.49
(2.15)
1.58
Total
from
investment
operations
.................................
1.65
1.68
(2.01)
1.85
Less
distributions
from:
Net
investment
income
.......................................
(0.22)
(0.17)
(0.07)
(0.32)
Net
realized
gains
..........................................
(0.03)
(0.03)
(0.18)
(0.27)
Total
distributions
............................................
(0.25)
(0.20)
(0.25)
(0.59)
Net
asset
value,
end
of
year
....................................
$11.88
$10.48
$9.00
$11.26
Total
return
e
................................................
15.71%
18.80%
(17.81)%
18.52%
Ratios
to
average
net
assets
f
Expenses
before
waiver
and
payments
by
affiliates
g
..................
2.63%
4.63%
7.64%
13.83%
Expenses
net
of
waiver
and
payments
by
affiliates
g
...................
0.52%
0.51%
h
0.44%
h
0.21%
Net
investment
income
d
........................................
1.49%
1.93%
1.47%
2.34%
Supplemental
data
Net
assets,
end
of
year
(000’s)
..................................
$5,929
$3,364
$1,631
$325
Portfolio
turnover
rate
.........................................
27.48%
31.87%
34.77%
77.89%
a
For
the
period
January
29,
2021
(commencement
of
operations)
to
December
31,
2021.
b
The
amount
shown
for
a
share
outstanding
throughout
the
period
may
not
correlate
with
the
Statement
of
Operations
for
the
period
due
to
the
timing
of
sales
and
repurchases
of
the
Fund’s
shares
in
relation
to
income
earned
and/or
fluctuating
fair
value
of
the
investments
of
the
Fund.
c
Based
on
average
daily
shares
outstanding.
d
Recognition
of
net
investment
income
by
the
Fund
is
affected
by
the
timing
of
declaration
of
dividends
by
the
Underlying
Funds
and
exchange
traded
funds
in
which
the
Fund
invests.
e
Total
return
does
not
reflect
sales
commissions
or
contingent
deferred
sales
charges,
if
applicable,
and
is
not
annualized
for
periods
less
than
one
year.
f
Ratios
are
annualized
for
periods
less
than
one
year,
except
for
non-recurring
expenses,
if
any.
g
Does
not
include
expenses
of
the
Underlying
Funds
and
exchange
traded
funds
in
which
the
Fund
invests.
The
weighted
average
indirect
expenses
of
the
Underlying
Funds
and
exchange
traded
funds
was
0.20%
for
the
year
ended
December
31,
2024.
The
weighted
average
indirect
expenses
is
calculated
based
on
the
Form
N1-A
method
which
may
not
correlate
to
the
underlying
fund
fee
waiver
on
the
Statement
of
Operations.
h
Benefit
of
expense
reduction
rounds
to
less
than
0.01%.
Franklin
Fund
Allocator
Series
Financial
Highlights
Franklin
LifeSmart™
2060
Retirement
Target
Fund
(continued)
The
accompanying
notes
are
an
integral
part
of
these
financial
statements.
Annual
Report
a
Year
Ended
December
31,
Year
Ended
December
31,
2021
a
2024
2023
2022
Class
C
Per
share
operating
performance
(for
a
share
outstanding
throughout
the
year)
Net
asset
value,
beginning
of
year
................................
$10.45
$8.99
$11.25
$10.00
Income
from
investment
operations
b
:
Net
investment
income
c,d
.....................................
0.08
0.13
0.07
0.28
Net
realized
and
unrealized
gains
(losses)
........................
1.47
1.47
(2.13)
1.56
Total
from
investment
operations
.................................
1.55
1.60
(2.06)
1.84
Less
distributions
from:
Net
investment
income
.......................................
(0.15)
(0.11)
(0.02)
(0.32)
Net
realized
gains
..........................................
(0.03)
(0.03)
(0.18)
(0.27)
Total
distributions
............................................
(0.18)
(0.14)
(0.20)
(0.59)
Net
asset
value,
end
of
year
....................................
$11.82
$10.45
$8.99
$11.25
Total
return
e
................................................
14.79%
17.90%
(18.23)%
18.43%
Ratios
to
average
net
assets
f
Expenses
before
waiver
and
payments
by
affiliates
g
..................
3.39%
5.05%
8.76%
14.00%
Expenses
net
of
waiver
and
payments
by
affiliates
g
...................
1.27%
1.27%
h
1.10%
h
0.21%
Net
investment
income
d
........................................
0.73%
1.32%
0.80%
2.49%
Supplemental
data
Net
assets,
end
of
year
(000’s)
..................................
$767
$475
$176
$68
Portfolio
turnover
rate
.........................................
27.48%
31.87%
34.77%
77.89%
a
For
the
period
January
29,
2021
(commencement
of
operations)
to
December
31,
2021.
b
The
amount
shown
for
a
share
outstanding
throughout
the
period
may
not
correlate
with
the
Statement
of
Operations
for
the
period
due
to
the
timing
of
sales
and
repurchases
of
the
Fund’s
shares
in
relation
to
income
earned
and/or
fluctuating
fair
value
of
the
investments
of
the
Fund.
c
Based
on
average
daily
shares
outstanding.
d
Recognition
of
net
investment
income
by
the
Fund
is
affected
by
the
timing
of
declaration
of
dividends
by
the
Underlying
Funds
and
exchange
traded
funds
in
which
the
Fund
invests.
e
Total
return
does
not
reflect
sales
commissions
or
contingent
deferred
sales
charges,
if
applicable,
and
is
not
annualized
for
periods
less
than
one
year.
f
Ratios
are
annualized
for
periods
less
than
one
year,
except
for
non-recurring
expenses,
if
any.
g
Does
not
include
expenses
of
the
Underlying
Funds
and
exchange
traded
funds
in
which
the
Fund
invests.
The
weighted
average
indirect
expenses
of
the
Underlying
Funds
and
exchange
traded
funds
was
0.20%
for
the
year
ended
December
31,
2024.
The
weighted
average
indirect
expenses
is
calculated
based
on
the
Form
N1-A
method
which
may
not
correlate
to
the
underlying
fund
fee
waiver
on
the
Statement
of
Operations.
h
Benefit
of
expense
reduction
rounds
to
less
than
0.01%.
Franklin
Fund
Allocator
Series
Financial
Highlights
Franklin
LifeSmart™
2060
Retirement
Target
Fund
(continued)
Annual
Report
The
accompanying
notes
are
an
integral
part
of
these
financial
statements.
a
Year
Ended
December
31,
Year
Ended
December
31,
2021
a
2024
2023
2022
Class
R
Per
share
operating
performance
(for
a
share
outstanding
throughout
the
year)
Net
asset
value,
beginning
of
year
................................
$10.48
$9.00
$11.25
$10.00
Income
from
investment
operations
b
:
Net
investment
income
c,d
.....................................
0.17
0.16
0.09
0.23
Net
realized
and
unrealized
gains
(losses)
........................
1.43
1.49
(2.11)
1.61
Total
from
investment
operations
.................................
1.60
1.65
(2.02)
1.84
Less
distributions
from:
Net
investment
income
.......................................
(0.19)
(0.14)
(0.05)
(0.32)
Net
realized
gains
..........................................
(0.03)
(0.03)
(0.18)
(0.27)
Total
distributions
............................................
(0.22)
(0.17)
(0.23)
(0.59)
Net
asset
value,
end
of
year
....................................
$11.86
$10.48
$9.00
$11.25
Total
return
e
................................................
15.29%
18.54%
(17.91)%
18.42%
Ratios
to
average
net
assets
f
Expenses
before
waiver
and
payments
by
affiliates
g
..................
2.67%
4.79%
7.79%
12.86%
Expenses
net
of
waiver
and
payments
by
affiliates
g
...................
0.77%
0.76%
h
0.61%
h
0.21%
Net
investment
income
d
........................................
1.45%
1.68%
1.00%
2.02%
Supplemental
data
Net
assets,
end
of
year
(000’s)
..................................
$121
$54
$32
$37
Portfolio
turnover
rate
.........................................
27.48%
31.87%
34.77%
77.89%
a
For
the
period
January
29,
2021
(commencement
of
operations)
to
December
31,
2021.
b
The
amount
shown
for
a
share
outstanding
throughout
the
period
may
not
correlate
with
the
Statement
of
Operations
for
the
period
due
to
the
timing
of
sales
and
repurchases
of
the
Fund’s
shares
in
relation
to
income
earned
and/or
fluctuating
fair
value
of
the
investments
of
the
Fund.
c
Based
on
average
daily
shares
outstanding.
d
Recognition
of
net
investment
income
by
the
Fund
is
affected
by
the
timing
of
declaration
of
dividends
by
the
Underlying
Funds
and
exchange
traded
funds
in
which
the
Fund
invests.
e
Total
return
is
not
annualized
for
periods
less
than
one
year.
f
Ratios
are
annualized
for
periods
less
than
one
year,
except
for
non-recurring
expenses,
if
any.
g
Does
not
include
expenses
of
the
Underlying
Funds
and
exchange
traded
funds
in
which
the
Fund
invests.
The
weighted
average
indirect
expenses
of
the
Underlying
Funds
and
exchange
traded
funds
was
0.20%
for
the
year
ended
December
31,
2024.
The
weighted
average
indirect
expenses
is
calculated
based
on
the
Form
N1-A
method
which
may
not
correlate
to
the
underlying
fund
fee
waiver
on
the
Statement
of
Operations.
h
Benefit
of
expense
reduction
rounds
to
less
than
0.01%.
Franklin
Fund
Allocator
Series
Financial
Highlights
Franklin
LifeSmart™
2060
Retirement
Target
Fund
(continued)
The
accompanying
notes
are
an
integral
part
of
these
financial
statements.
Annual
Report
a
Year
Ended
December
31,
Year
Ended
December
31,
2021
a
2024
2023
2022
Class
R6
Per
share
operating
performance
(for
a
share
outstanding
throughout
the
year)
Net
asset
value,
beginning
of
year
................................
$10.50
$9.02
$11.26
$10.00
Income
from
investment
operations
b
:
Net
investment
income
c,d
.....................................
0.20
0.20
0.13
0.16
Net
realized
and
unrealized
gains
(losses)
........................
1.49
1.50
(2.13)
1.69
Total
from
investment
operations
.................................
1.69
1.70
(2.00)
1.85
Less
distributions
from:
Net
investment
income
.......................................
(0.25)
(0.19)
(0.08)
(0.32)
Net
realized
gains
..........................................
(0.03)
(0.03)
(0.18)
(0.27)
Total
distributions
............................................
(0.28)
(0.22)
(0.26)
(0.59)
Capital
contributions
..........................................
—
—
0.02
—
Net
asset
value,
end
of
year
....................................
$11.91
$10.50
$9.02
$11.26
Total
return
e
................................................
16.08%
19.08%
(17.45)%
f
18.56%
Ratios
to
average
net
assets
g
Expenses
before
waiver
and
payments
by
affiliates
h
..................
2.52%
4.35%
6.87%
13.90%
Expenses
net
of
waiver
and
payments
by
affiliates
h
...................
0.22%
0.21%
0.20%
i
0.15%
Net
investment
income
d
........................................
1.75%
2.10%
1.39%
1.38%
Supplemental
data
Net
assets,
end
of
year
(000’s)
..................................
$16
$11
$9
$11
Portfolio
turnover
rate
.........................................
27.48%
31.87%
34.77%
77.89%
a
For
the
period
January
29,
2021
(commencement
of
operations)
to
December
31,
2021.
b
The
amount
shown
for
a
share
outstanding
throughout
the
period
may
not
correlate
with
the
Statement
of
Operations
for
the
period
due
to
the
timing
of
sales
and
repurchases
of
the
Fund’s
shares
in
relation
to
income
earned
and/or
fluctuating
fair
value
of
the
investments
of
the
Fund.
c
Based
on
average
daily
shares
outstanding.
d
Recognition
of
net
investment
income
by
the
Fund
is
affected
by
the
timing
of
declaration
of
dividends
by
the
Underlying
Funds
and
exchange
traded
funds
in
which
the
Fund
invests.
e
Total
return
is
not
annualized
for
periods
less
than
one
year.
f
Includes
the
effect
of
a
capital
contribution.
Absent
the
capital
contribution,
the
total
return
would
have
been
(17.62)%.
g
Ratios
are
annualized
for
periods
less
than
one
year,
except
for
non-recurring
expenses,
if
any.
h
Does
not
include
expenses
of
the
Underlying
Funds
and
exchange
traded
funds
in
which
the
Fund
invests.
The
weighted
average
indirect
expenses
of
the
Underlying
Funds
and
exchange
traded
funds
was
0.20%
for
the
year
ended
December
31,
2024.
The
weighted
average
indirect
expenses
is
calculated
based
on
the
Form
N1-A
method
which
may
not
correlate
to
the
underlying
fund
fee
waiver
on
the
Statement
of
Operations.
i
Benefit
of
expense
reduction
rounds
to
less
than
0.01%.
Franklin
Fund
Allocator
Series
Financial
Highlights
Franklin
LifeSmart™
2060
Retirement
Target
Fund
(continued)
Annual
Report
The
accompanying
notes
are
an
integral
part
of
these
financial
statements.
a
Year
Ended
December
31,
Year
Ended
December
31,
2021
a
2024
2023
2022
Advisor
Class
Per
share
operating
performance
(for
a
share
outstanding
throughout
the
year)
Net
asset
value,
beginning
of
year
................................
$10.48
$9.00
$11.25
$10.00
Income
from
investment
operations
b
:
Net
investment
income
c,d
.....................................
0.19
0.20
0.13
0.20
Net
realized
and
unrealized
gains
(losses)
........................
1.48
1.50
(2.12)
1.64
Total
from
investment
operations
.................................
1.67
1.70
(1.99)
1.84
Less
distributions
from:
Net
investment
income
.......................................
(0.24)
(0.19)
(0.08)
(0.32)
Net
realized
gains
..........................................
(0.03)
(0.03)
(0.18)
(0.27)
Total
distributions
............................................
(0.27)
(0.22)
(0.26)
(0.59)
Net
asset
value,
end
of
year
....................................
$11.88
$10.48
$9.00
$11.25
Total
return
e
................................................
15.96%
19.07%
(17.59)%
18.41%
Ratios
to
average
net
assets
f
Expenses
before
waiver
and
payments
by
affiliates
g
..................
2.50%
4.51%
7.40%
14.59%
Expenses
net
of
waiver
and
payments
by
affiliates
g
...................
0.27%
0.25%
h
0.25%
h
0.20%
Net
investment
income
d
........................................
1.63%
2.06%
1.35%
1.75%
Supplemental
data
Net
assets,
end
of
year
(000’s)
..................................
$1,239
$1,054
$888
$1,096
Portfolio
turnover
rate
.........................................
27.48%
31.87%
34.77%
77.89%
a
For
the
period
January
29,
2021
(commencement
of
operations)
to
December
31,
2021.
b
The
amount
shown
for
a
share
outstanding
throughout
the
period
may
not
correlate
with
the
Statement
of
Operations
for
the
period
due
to
the
timing
of
sales
and
repurchases
of
the
Fund’s
shares
in
relation
to
income
earned
and/or
fluctuating
fair
value
of
the
investments
of
the
Fund.
c
Based
on
average
daily
shares
outstanding.
d
Recognition
of
net
investment
income
by
the
Fund
is
affected
by
the
timing
of
declaration
of
dividends
by
the
Underlying
Funds
and
exchange
traded
funds
in
which
the
Fund
invests.
e
Total
return
is
not
annualized
for
periods
less
than
one
year.
f
Ratios
are
annualized
for
periods
less
than
one
year,
except
for
non-recurring
expenses,
if
any.
g
Does
not
include
expenses
of
the
Underlying
Funds
and
exchange
traded
funds
in
which
the
Fund
invests.
The
weighted
average
indirect
expenses
of
the
Underlying
Funds
and
exchange
traded
funds
was
0.20%
for
the
year
ended
December
31,
2024.
The
weighted
average
indirect
expenses
is
calculated
based
on
the
Form
N1-A
method
which
may
not
correlate
to
the
underlying
fund
fee
waiver
on
the
Statement
of
Operations.
h
Benefit
of
expense
reduction
rounds
to
less
than
0.01%.
Franklin
Fund
Allocator
Series
Schedule
of
Investments,
December
31,
2024
Franklin
LifeSmart™
2060
Retirement
Target
Fund
The
accompanying
notes
are
an
integral
part
of
these
financial
statements.
Annual
Report
a
a
Shares
a
Value
a
Investments
In
Underlying
Funds
and
Exchange
Traded
Funds
98.9%
Alternative
Strategies
1.0%
a
Franklin
Systematic
Style
Premia
ETF
....................................
3,419
$
81,748
Domestic
Equity
64.9%
a
Franklin
Growth
Fund
,
Class
R6
........................................
8,359
1,125,755
a
Franklin
U.S.
Core
Equity
(IU)
Fund
.....................................
113,453
1,958,206
a
Franklin
U.S.
Equity
Index
ETF
.........................................
16,250
834,348
a
Franklin
U.S.
Large
Cap
Multifactor
Index
ETF
.............................
10,030
588,159
iShares
MSCI
USA
Quality
Factor
ETF
...................................
425
75,684
a
Putnam
Large
Cap
Value
Fund
,
Class
R6
.................................
18,923
652,646
5,234,798
Domestic
Fixed
Income
1.5%
a
Franklin
U.S.
Core
Bond
ETF
..........................................
5,850
123,377
Foreign
Equity
31.5%
a
ClearBridge
International
Growth
Fund
,
Class
IS
............................
2,792
180,502
a
Franklin
Emerging
Market
Core
Equity
(IU)
Fund
............................
42,865
434,220
a
Franklin
International
Core
Equity
(IU)
Fund
...............................
102,159
1,195,263
iShares
Core
MSCI
EAFE
ETF
.........................................
2,489
174,927
a
Templeton
Developing
Markets
Trust
,
Class
R6
.............................
15,126
281,047
a
Templeton
Foreign
Fund
,
Class
R6
......................................
36,951
276,020
2,541,979
Total
Investments
In
Underlying
Funds
and
Exchange
Traded
Funds
(Cost
$
7,165,682
)
.................................................................
7,981,902
a
a
a
a
Short
Term
Investments
0.0%
†
a
Money
Market
Funds
0.0%
†
a,b
Institutional
Fiduciary
Trust
-
Money
Market
Portfolio
,
4.183
%
..................
345
345
Total
Money
Market
Funds
(Cost
$
345
)
.........................................
345
Total
Short
Term
Investments
(Cost
$
345
)
......................................
345
a
Total
Investments
(Cost
$
7,166,027
)
98.9
%
.....................................
$7,982,247
Other
Assets,
less
Liabilities
1.1
%
.............................................
89,287
Net
Assets
100.0%
...........................................................
$8,071,534
See
Abbreviations
on
page
113
.
†
Rounds
to
less
than
0.1%
of
net
assets.
a
See
Note
3(f)
regarding
investments
in
FT
Underlying
Funds.
b
The
rate
shown
is
the
annualized
seven-day
effective
yield
at
period
end.
Franklin
Fund
Allocator
Series
Financial
Statements
Statements
of
Assets
and
Liabilities
December
31,
2024
Annual
Report
The
accompanying
notes
are
an
integral
part
of
these
financial
statements.
Franklin
LifeSmart™
Retirement
Income
Fund
Franklin
LifeSmart™
2020
Retirement
Target
Fund
Franklin
LifeSmart™
2025
Retirement
Target
Fund
Franklin
LifeSmart™
2030
Retirement
Target
Fund
Assets:
Investments
in
securities:
Cost
-
Unaffiliated
issuers
................
$8,233,953
$320,252
$1,586,619
$1,202,120
Cost
-
Non-controlled
affiliates
(Note
3
f
)
.....
36,457,932
22,572,679
91,910,531
59,574,003
Cost
-
Unaffiliated
repurchase
agreements
...
—
172,523
1,169,440
554,105
Value
-
Unaffiliated
issuers
...............
$9,293,808
$379,583
$1,945,382
$1,497,233
Value
-
Non-controlled
affiliates
(Note
3
f
)
.....
35,537,326
24,907,340
106,366,408
70,158,592
Value
-
Unaffiliated
repurchase
agreements
...
—
172,523
1,169,440
554,105
Cash
.................................
2,387
1,648
2,402
416
Receivables:
Capital
shares
sold
.....................
14,203
2,883
212,134
129,632
Dividends
and
interest
..................
61,771
650
143
2,074
Affiliates
.............................
24,485
20,876
13,523
26,542
Total
assets
.......................
44,933,980
25,485,503
109,709,432
72,368,594
Liabilities:
Payables:
Capital
shares
redeemed
................
13,691
6
1,107,275
574
Distribution
fees
.......................
11,126
7,008
30,715
23,116
Transfer
agent
fees
.....................
14,160
9,805
42,474
29,913
Reports
to
shareholders
fees
.............
8,600
5,502
8,010
6,790
Registration
and
filing
fees
...............
4,742
7,209
4,619
5,940
Professional
fees
......................
30,035
22,733
22,915
22,652
Trustees'
fees
and
expenses
..............
24
25
53
25
Accrued
expenses
and
other
liabilities
........
1,497
2,199
2,777
2,525
Total
liabilities
......................
83,875
54,487
1,218,838
91,535
Net
assets,
at
value
..............
$44,850,105
$25,431,016
$108,490,594
$72,277,059
Net
assets
consist
of:
Paid-in
capital
..........................
$48,898,426
$23,473,410
$93,356,123
$61,216,948
Total
distributable
earnings
(losses)
..........
(4,048,321)
1,957,606
15,134,471
11,060,111
Net
assets,
at
value
..............
$44,850,105
$25,431,016
$108,490,594
$72,277,059
Franklin
Fund
Allocator
Series
Financial
Statements
Statements
of
Assets
and
Liabilities
(continued)
December
31,
2024
The
accompanying
notes
are
an
integral
part
of
these
financial
statements.
Annual
Report
Franklin
LifeSmart™
Retirement
Income
Fund
Franklin
LifeSmart™
2020
Retirement
Target
Fund
Franklin
LifeSmart™
2025
Retirement
Target
Fund
Franklin
LifeSmart™
2030
Retirement
Target
Fund
Class
A:
Net
assets,
at
value
....................
$37,045,050
$22,170,220
$92,991,942
$56,797,175
Shares
outstanding
.....................
3,543,460
1,823,856
7,195,715
4,085,276
Net
asset
value
per
share
a
,b
...............
$10.45
$12.16
$12.92
$13.90
Maximum
offering
price
per
share
(net
asset
value
per
share
÷
94
.50
%
)
b
...............
$11.06
$12.87
$13.67
$14.71
Class
C:
Net
assets,
at
value
....................
$2,927,612
$2,356,719
$11,298,992
$11,084,146
Shares
outstanding
.....................
283,560
195,432
894,470
811,921
Net
asset
value
and
maximum
offering
price
per
share
a
,b
..............................
$10.32
$12.06
$12.63
$13.65
Class
R:
Net
assets,
at
value
....................
$1,443,886
$360,186
$1,707,470
$2,133,492
Shares
outstanding
.....................
138,622
29,619
132,695
153,941
Net
asset
value
and
maximum
offering
price
per
share
b
...............................
$10.42
$12.16
$12.87
$13.86
Class
R6:
Net
assets,
at
value
....................
$102,660
$8,865
$27,093
$99,073
Shares
outstanding
.....................
9,768
709
2,087
7,028
Net
asset
value
and
maximum
offering
price
per
share
b
...............................
$10.51
$12.50
$12.98
$14.10
Advisor
Class:
Net
assets,
at
value
....................
$3,330,897
$535,026
$2,465,097
$2,163,173
Shares
outstanding
.....................
317,379
43,850
190,162
154,792
Net
asset
value
and
maximum
offering
price
per
share
b
...............................
$10.50
$12.20
$12.96
$13.97
a
Redemption
price
is
equal
to
net
asset
value
less
contingent
deferred
sales
charges,
if
applicable.
b
Net
asset
value
per
share
may
not
recalculate
due
to
rounding.
Franklin
Fund
Allocator
Series
Financial
Statements
Statements
of
Assets
and
Liabilities
(continued)
December
31,
2024
Annual
Report
The
accompanying
notes
are
an
integral
part
of
these
financial
statements.
Franklin
LifeSmart™
2035
Retirement
Target
Fund
Franklin
LifeSmart™
2040
Retirement
Target
Fund
Franklin
LifeSmart™
2045
Retirement
Target
Fund
Franklin
LifeSmart™
2050
Retirement
Target
Fund
Assets:
Investments
in
securities:
Cost
-
Unaffiliated
issuers
................
$2,701,766
$1,377,495
$2,574,468
$1,510,334
Cost
-
Non-controlled
affiliates
(Note
3
f
)
.....
110,120,957
48,776,398
76,611,111
42,669,645
Cost
-
Unaffiliated
repurchase
agreements
...
1,207,730
509,508
830,124
395,287
Value
-
Unaffiliated
issuers
...............
$3,294,432
$1,638,730
$3,029,286
$1,758,744
Value
-
Non-controlled
affiliates
(Note
3
f
)
.....
135,084,988
60,103,744
99,859,476
54,149,158
Value
-
Unaffiliated
repurchase
agreements
...
1,207,730
509,508
830,124
395,287
Cash
.................................
2,455
409
2,494
233
Receivables:
Capital
shares
sold
.....................
265,002
26,954
54,195
29,759
Dividends
and
interest
..................
148
2,081
—
1,819
Affiliates
.............................
12,266
29,643
23,658
30,919
Total
assets
.......................
139,867,021
62,311,069
103,799,233
56,365,919
Liabilities:
Payables:
Capital
shares
redeemed
................
450,867
41,972
118,378
65,631
Distribution
fees
.......................
40,969
18,676
30,098
18,024
Transfer
agent
fees
.....................
57,812
28,453
44,800
30,723
Reports
to
shareholders
fees
.............
9,215
6,791
8,744
7,651
Registration
and
filing
fees
...............
5,058
6,782
—
7
Professional
fees
......................
22,942
22,604
22,740
22,667
Trustees'
fees
and
expenses
..............
39
16
23
7
Accrued
expenses
and
other
liabilities
........
2,744
2,449
2,189
1,913
Total
liabilities
......................
589,646
127,743
226,972
146,623
Net
assets,
at
value
..............
$139,277,375
$62,183,326
$103,572,261
$56,219,296
Net
assets
consist
of:
Paid-in
capital
..........................
$110,590,702
$48,947,120
$76,675,233
$42,648,858
Total
distributable
earnings
(losses)
..........
28,686,673
13,236,206
26,897,028
13,570,438
Net
assets,
at
value
..............
$139,277,375
$62,183,326
$103,572,261
$56,219,296
Franklin
Fund
Allocator
Series
Financial
Statements
Statements
of
Assets
and
Liabilities
(continued)
December
31,
2024
The
accompanying
notes
are
an
integral
part
of
these
financial
statements.
Annual
Report
Franklin
LifeSmart™
2035
Retirement
Target
Fund
Franklin
LifeSmart™
2040
Retirement
Target
Fund
Franklin
LifeSmart™
2045
Retirement
Target
Fund
Franklin
LifeSmart™
2050
Retirement
Target
Fund
Class
A:
Net
assets,
at
value
....................
$112,782,865
$50,893,986
$87,733,187
$43,472,139
Shares
outstanding
.....................
7,777,113
3,513,405
5,668,019
2,849,992
Net
asset
value
per
share
a
,b
...............
$14.50
$14.49
$15.48
$15.25
Maximum
offering
price
per
share
(net
asset
value
per
share
÷
94
.50
%
)
b
...............
$15.34
$15.33
$16.38
$16.14
Class
C:
Net
assets,
at
value
....................
$15,892,222
$8,040,623
$11,572,597
$8,609,152
Shares
outstanding
.....................
1,135,537
569,507
781,626
574,541
Net
asset
value
and
maximum
offering
price
per
share
a
,b
..............................
$14.00
$14.12
$14.81
$14.98
Class
R:
Net
assets,
at
value
....................
$5,603,650
$1,259,929
$1,573,989
$2,260,909
Shares
outstanding
.....................
386,979
86,993
102,329
147,939
Net
asset
value
and
maximum
offering
price
per
share
b
...............................
$14.48
$14.48
$15.38
$15.28
Class
R6:
Net
assets,
at
value
....................
$222,292
$339,321
$797,780
$222,436
Shares
outstanding
.....................
15,146
23,200
49,192
14,434
Net
asset
value
and
maximum
offering
price
per
share
b
...............................
$14.68
$14.63
$16.22
$15.41
Advisor
Class:
Net
assets,
at
value
....................
$4,776,346
$1,649,467
$1,894,708
$1,654,660
Shares
outstanding
.....................
325,057
113,032
120,944
107,443
Net
asset
value
and
maximum
offering
price
per
share
b
...............................
$14.69
$14.59
$15.67
$15.40
a
Redemption
price
is
equal
to
net
asset
value
less
contingent
deferred
sales
charges,
if
applicable.
b
Net
asset
value
per
share
may
not
recalculate
due
to
rounding.
Franklin
Fund
Allocator
Series
Financial
Statements
Statements
of
Assets
and
Liabilities
(continued)
December
31,
2024
Annual
Report
The
accompanying
notes
are
an
integral
part
of
these
financial
statements.
Franklin
LifeSmart™
2055
Retirement
Target
Fund
Franklin
LifeSmart™
2060
Retirement
Target
Fund
Assets:
Investments
in
securities:
Cost
-
Unaffiliated
issuers
..................................................
$1,100,286
$225,879
Cost
-
Non-controlled
affiliates
(Note
3
f
)
.......................................
31,134,926
6,940,148
Value
-
Unaffiliated
issuers
.................................................
$1,294,406
$250,611
Value
-
Non-controlled
affiliates
(Note
3
f
)
.......................................
39,225,847
7,731,636
Cash
...................................................................
351,037
86,799
Receivables:
Capital
shares
sold
.......................................................
41,990
22,823
Dividends
and
interest
....................................................
1,379
335
Affiliates
...............................................................
31,211
22,990
Total
assets
.........................................................
40,945,870
8,115,194
Liabilities:
Payables:
Capital
shares
redeemed
..................................................
48,025
—
Distribution
fees
.........................................................
14,201
1,974
Transfer
agent
fees
.......................................................
28,812
11,981
Reports
to
shareholders
fees
...............................................
7,666
5,536
Registration
and
filing
fees
.................................................
2,920
3,000
Professional
fees
........................................................
22,615
19,875
Trustees'
fees
and
expenses
................................................
11
8
Accrued
expenses
and
other
liabilities
..........................................
2,225
1,286
Total
liabilities
........................................................
126,475
43,660
Net
assets,
at
value
................................................
$40,819,395
$8,071,534
Net
assets
consist
of:
Paid-in
capital
............................................................
$31,301,445
$7,092,926
Total
distributable
earnings
(losses)
............................................
9,517,950
978,608
Net
assets,
at
value
................................................
$40,819,395
$8,071,534
Franklin
Fund
Allocator
Series
Financial
Statements
Statements
of
Assets
and
Liabilities
(continued)
December
31,
2024
The
accompanying
notes
are
an
integral
part
of
these
financial
statements.
Annual
Report
Franklin
LifeSmart™
2055
Retirement
Target
Fund
Franklin
LifeSmart™
2060
Retirement
Target
Fund
Class
A:
Net
assets,
at
value
......................................................
$30,421,615
$5,928,523
Shares
outstanding
.......................................................
2,202,243
499,170
Net
asset
value
per
share
a
,b
.................................................
$13.81
$11.88
Maximum
offering
price
per
share
(net
asset
value
per
share
÷
94
.50
%
)
b
...............
$14.61
$12.57
Class
C:
Net
assets,
at
value
......................................................
$7,828,342
$767,139
Shares
outstanding
.......................................................
582,745
64,887
Net
asset
value
and
maximum
offering
price
per
share
a
,b
...........................
$13.43
$11.82
Class
R:
Net
assets,
at
value
......................................................
$1,684,230
$120,691
Shares
outstanding
.......................................................
122,649
10,173
Net
asset
value
and
maximum
offering
price
per
share
b
............................
$13.73
$11.86
Class
R6:
Net
assets,
at
value
......................................................
$75,829
$15,693
Shares
outstanding
.......................................................
5,371
1,318
Net
asset
value
and
maximum
offering
price
per
share
b
............................
$14.12
$11.91
Advisor
Class:
Net
assets,
at
value
......................................................
$809,379
$1,239,488
Shares
outstanding
.......................................................
58,465
104,368
Net
asset
value
and
maximum
offering
price
per
share
b
............................
$13.84
$11.88
a
Redemption
price
is
equal
to
net
asset
value
less
contingent
deferred
sales
charges,
if
applicable.
b
Net
asset
value
per
share
may
not
recalculate
due
to
rounding.
Franklin
Fund
Allocator
Series
Financial
Statements
Statements
of
Operations
for
the
year
ended
December
31,
2024
Annual
Report
The
accompanying
notes
are
an
integral
part
of
these
financial
statements.
Franklin
LifeSmart™
Retirement
Income
Fund
Franklin
LifeSmart™
2020
Retirement
Target
Fund
Franklin
LifeSmart™
2025
Retirement
Target
Fund
Franklin
LifeSmart™
2030
Retirement
Target
Fund
Investment
income:
Dividends:
Unaffiliated
issuers
.....................
$496,491
$35,767
$100,655
$73,324
Non-controlled
affiliates
(Note
3
f
)
..........
1,806,645
799,859
3,071,488
1,801,965
Interest:
Unaffiliated
issuers
.....................
83,411
2,134
6,737
4,230
Total
investment
income
................
2,386,547
837,760
3,178,880
1,879,519
Expenses:
Management
&
Asset
allocation
fees
(Note
3
a
)
..
113,211
68,920
282,923
177,444
Distribution
fees:
(Note
3c
)
Class
A
.............................
94,283
59,827
241,449
138,283
Class
C
.............................
31,094
26,909
116,389
113,131
Class
R
.............................
6,886
1,807
8,481
10,105
Transfer
agent
fees:
(Note
3e
)
Class
A
.............................
49,382
29,943
129,596
87,684
Class
C
.............................
4,081
3,358
15,589
17,931
Class
R
.............................
1,802
450
2,260
3,208
Class
R6
............................
210
66
310
441
Advisor
Class
.........................
3,892
719
3,928
3,413
Custodian
fees
.........................
—
1,228
1,350
1,256
Reports
to
shareholders
fees
...............
11,684
6,681
11,341
9,805
Registration
and
filing
fees
.................
77,524
81,661
78,694
82,082
Professional
fees
........................
56,913
49,127
49,002
48,258
Trustees'
fees
and
expenses
...............
730
554
1,430
991
Other
.................................
17,979
19,304
20,087
19,890
Total
expenses
......................
469,671
350,554
962,829
713,922
Expenses
waived/paid
by
affiliates
(Note
3
f
and
3
g
)
...........................
(314,818)
(195,760)
(313,328)
(273,497)
Net
expenses
......................
154,853
154,794
649,501
440,425
Net
investment
income
.............
2,231,694
682,966
2,529,379
1,439,094
Realized
and
unrealized
gains
(losses):
Net
realized
gain
(loss)
from:
Investments:
Unaffiliated
issuers
...................
434,002
(52,910)
(91,570)
4,217
Non-controlled
affiliates
(Note
3
f
)
.........
(1,023,373)
487,805
2,122,820
719,719
Capital
gain
distributions
from
Underlying
Funds:
Non-controlled
affiliates
(Note
3
f
)
.........
72,412
473,768
2,402,723
1,851,844
Net
realized
gain
(loss)
...............
(516,959)
908,663
4,433,973
2,575,780
Net
change
in
unrealized
appreciation
(depreciation)
on:
Investments:
Unaffiliated
issuers
...................
500,607
103,190
372,597
172,804
Non-controlled
affiliates
(Note
3
f
)
.........
1,369,587
430,225
2,788,134
2,909,470
Net
change
in
unrealized
appreciation
(depreciation)
......................
1,870,194
533,415
3,160,731
3,082,274
Net
realized
and
unrealized
gain
(loss)
.........
1,353,235
1,442,078
7,594,704
5,658,054
Net
increase
(decrease)
in
net
assets
resulting
from
operations
...............................
$3,584,929
$2,125,044
$10,124,083
$7,097,148
Franklin
Fund
Allocator
Series
Financial
Statements
Statements
of
Operations
(continued)
for
the
year
ended
December
31,
2024
The
accompanying
notes
are
an
integral
part
of
these
financial
statements.
Annual
Report
Franklin
LifeSmart™
2035
Retirement
Target
Fund
Franklin
LifeSmart™
2040
Retirement
Target
Fund
Franklin
LifeSmart™
2045
Retirement
Target
Fund
Franklin
LifeSmart™
2050
Retirement
Target
Fund
Investment
income:
Dividends:
Unaffiliated
issuers
.....................
$150,021
$70,386
$87,537
$60,951
Non-controlled
affiliates
(Note
3
f
)
..........
3,182,559
1,268,374
1,936,888
949,430
Interest:
Unaffiliated
issuers
.....................
7,538
3,561
5,662
3,649
Total
investment
income
................
3,340,118
1,342,321
2,030,087
1,014,030
Expenses:
Management
&
Asset
allocation
fees
(Note
3
a
)
..
342,846
147,143
248,991
129,011
Distribution
fees:
(Note
3c
)
Class
A
.............................
277,654
119,240
208,534
98,017
Class
C
.............................
164,843
80,336
121,571
85,696
Class
R
.............................
25,416
6,060
7,870
10,703
Transfer
agent
fees:
(Note
3e
)
Class
A
.............................
174,698
88,052
147,560
92,114
Class
C
.............................
25,896
14,865
21,555
20,408
Class
R
.............................
8,041
2,235
2,780
5,070
Class
R6
............................
604
199
622
394
Advisor
Class
.........................
6,822
2,978
3,070
3,704
Custodian
fees
.........................
1,323
1,235
1,252
1,208
Reports
to
shareholders
fees
...............
13,292
10,891
12,736
11,068
Registration
and
filing
fees
.................
69,309
81,649
77,413
84,223
Professional
fees
........................
49,034
48,532
47,236
48,823
Trustees'
fees
and
expenses
...............
1,675
865
1,279
772
Other
.................................
20,366
19,711
19,444
19,136
Total
expenses
......................
1,181,819
623,991
921,913
610,347
Expenses
waived/paid
by
affiliates
(Note
3
f
and
3
g
)
...........................
(345,331)
(258,444)
(310,436)
(278,129)
Net
expenses
......................
836,488
365,547
611,477
332,218
Net
investment
income
.............
2,503,630
976,774
1,418,610
681,812
Realized
and
unrealized
gains
(losses):
Net
realized
gain
(loss)
from:
Investments:
Unaffiliated
issuers
...................
82,692
75,967
222,127
104,543
Non-controlled
affiliates
(Note
3
f
)
.........
1,977,680
887,729
1,999,553
651,660
Capital
gain
distributions
from
Underlying
Funds:
Non-controlled
affiliates
(Note
3
f
)
.........
4,071,632
1,764,627
3,273,929
1,898,226
Net
realized
gain
(loss)
...............
6,132,004
2,728,323
5,495,609
2,654,429
Net
change
in
unrealized
appreciation
(depreciation)
on:
Investments:
Unaffiliated
issuers
...................
281,715
85,033
84,056
44,332
Non-controlled
affiliates
(Note
3
f
)
.........
6,580,767
3,347,575
6,171,736
3,586,560
Net
change
in
unrealized
appreciation
(depreciation)
......................
6,862,482
3,432,608
6,255,792
3,630,892
Net
realized
and
unrealized
gain
(loss)
.........
12,994,486
6,160,931
11,751,401
6,285,321
Net
increase
(decrease)
in
net
assets
resulting
from
operations
...............................
$15,498,116
$7,137,705
$13,170,011
$6,967,133
Franklin
Fund
Allocator
Series
Financial
Statements
Statements
of
Operations
(continued)
for
the
year
ended
December
31,
2024
Annual
Report
The
accompanying
notes
are
an
integral
part
of
these
financial
statements.
Franklin
LifeSmart™
2055
Retirement
Target
Fund
Franklin
LifeSmart™
2060
Retirement
Target
Fund
Investment
income:
Dividends:
Unaffiliated
issuers
.......................................................
$49,262
$8,437
Non-controlled
affiliates
(Note
3
f
)
............................................
681,936
123,071
Total
investment
income
..................................................
731,198
131,508
Expenses:
Management
&
Asset
allocation
fees
(Note
3
a
)
....................................
95,664
16,537
Distribution
fees:
(Note
3c
)
Class
A
...............................................................
70,600
11,799
Class
C
...............................................................
77,016
6,198
Class
R
...............................................................
7,962
418
Transfer
agent
fees:
(Note
3e
)
Class
A
...............................................................
88,417
34,015
Class
C
...............................................................
24,293
4,470
Class
R
...............................................................
4,969
607
Class
R6
..............................................................
607
106
Advisor
Class
...........................................................
2,142
8,477
Custodian
fees
...........................................................
1,206
6
Reports
to
shareholders
fees
.................................................
11,487
5,355
Registration
and
filing
fees
...................................................
77,196
28,056
Professional
fees
..........................................................
48,866
41,570
Trustees'
fees
and
expenses
.................................................
652
326
Pricing
fees
..............................................................
10,748
11,241
Other
...................................................................
8,274
8,119
Total
expenses
........................................................
530,099
177,300
Expenses
waived/paid
by
affiliates
(Note
3
f
and
3
g
)
.............................
(272,602)
(141,262)
Net
expenses
........................................................
257,497
36,038
Net
investment
income
...............................................
473,701
95,470
Realized
and
unrealized
gains
(losses):
Net
realized
gain
(loss)
from:
Investments:
Unaffiliated
issuers
.....................................................
79,498
12,520
Non-controlled
affiliates
(Note
3
f
)
...........................................
504,982
41,411
Capital
gain
distributions
from
Underlying
Funds:
Non-controlled
affiliates
(Note
3
f
)
...........................................
1,392,848
267,522
Net
realized
gain
(loss)
.................................................
1,977,328
321,453
Net
change
in
unrealized
appreciation
(depreciation)
on:
Investments:
Unaffiliated
issuers
.....................................................
33,800
4,656
Non-controlled
affiliates
(Note
3
f
)
...........................................
2,831,774
440,578
Net
change
in
unrealized
appreciation
(depreciation)
...........................
2,865,574
445,234
Net
realized
and
unrealized
gain
(loss)
...........................................
4,842,902
766,687
Net
increase
(decrease)
in
net
assets
resulting
from
operations
.........................
$5,316,603
$862,157
Franklin
Fund
Allocator
Series
Financial
Statements
Statements
of
Changes
in
Net
Assets
The
accompanying
notes
are
an
integral
part
of
these
financial
statements.
Annual
Report
Franklin
LifeSmart™
Retirement
Income
Fund
Franklin
LifeSmart™
2020
Retirement
Target
Fund
Year
Ended
December
31,
2024
Year
Ended
December
31,
2023
Year
Ended
December
31,
2024
Year
Ended
December
31,
2023
Increase
(decrease)
in
net
assets:
Operations:
Net
investment
income
............
$2,231,694
$2,393,575
$682,966
$725,986
Net
realized
gain
(loss)
............
(516,959)
(1,416,333)
908,663
(530,393)
Net
change
in
unrealized
appreciation
(depreciation)
.................
1,870,194
4,061,374
533,415
3,462,550
Net
increase
(decrease)
in
net
assets
resulting
from
operations
.
3,584,929
5,038,616
2,125,044
3,658,143
Distributions
to
shareholders:
Class
A
........................
(1,905,349)
(1,988,182)
(690,697)
(707,742)
Class
C
........................
(133,213)
(158,840)
(56,591)
(69,368)
Class
R
........................
(66,791)
(82,164)
(9,696)
(14,856)
Class
R6
.......................
(5,531)
(4,787)
(246)
(898)
Advisor
Class
...................
(163,095)
(164,258)
(17,717)
(20,685)
Total
distributions
to
shareholders
.....
(2,273,979)
(2,398,231)
(774,947)
(813,549)
Capital
share
transactions:
(Note
2
)
Class
A
........................
(2,230,836)
(931,858)
(5,265,482)
(3,626,232)
Class
C
........................
(582,119)
(948,086)
(1,190,939)
(704,393)
Class
R
........................
(233,898)
(198,695)
(46,260)
(318,937)
Class
R6
.......................
(4,140)
28,046
(9,805)
12,913
Advisor
Class
...................
(381,854)
1,009,444
(222,270)
46,187
Total
capital
share
transactions
.......
(3,432,847)
(1,041,149)
(6,734,756)
(4,590,462)
Net
increase
(decrease)
in
net
assets
.....................
(2,121,897)
1,599,236
(5,384,659)
(1,745,868)
Net
assets:
Beginning
of
year
..................
46,972,002
45,372,766
30,815,675
32,561,543
End
of
year
......................
$44,850,105
$46,972,002
$25,431,016
$30,815,675
Franklin
Fund
Allocator
Series
Financial
Statements
Statements
of
Changes
in
Net
Assets
(continued)
Annual
Report
The
accompanying
notes
are
an
integral
part
of
these
financial
statements.
Franklin
LifeSmart™
2025
Retirement
Target
Fund
Franklin
LifeSmart™
2030
Retirement
Target
Fund
Year
Ended
December
31,
2024
Year
Ended
December
31,
2023
Year
Ended
December
31,
2024
Year
Ended
December
31,
2023
Increase
(decrease)
in
net
assets:
Operations:
Net
investment
income
............
$2,529,379
$2,562,803
$1,439,094
$1,286,367
Net
realized
gain
(loss)
............
4,433,973
(1,504,490)
2,575,780
(184,615)
Net
change
in
unrealized
appreciation
(depreciation)
.................
3,160,731
13,438,095
3,082,274
7,326,846
Net
increase
(decrease)
in
net
assets
resulting
from
operations
.
10,124,083
14,496,408
7,097,148
8,428,598
Distributions
to
shareholders:
Class
A
........................
(3,186,835)
(2,684,010)
(1,382,415)
(1,026,209)
Class
C
........................
(306,056)
(246,946)
(200,470)
(143,083)
Class
R
........................
(53,349)
(47,499)
(46,815)
(25,059)
Class
R6
.......................
(8,582)
(19,284)
(5,112)
(2,507)
Advisor
Class
...................
(96,504)
(83,704)
(57,714)
(41,720)
Total
distributions
to
shareholders
.....
(3,651,326)
(3,081,443)
(1,692,526)
(1,238,578)
Capital
share
transactions:
(Note
2
)
Class
A
........................
(9,171,472)
(10,100,474)
1,016,986
1,846,679
Class
C
........................
(1,287,961)
(1,388,211)
(130,280)
(465,290)
Class
R
........................
(156,278)
(365,719)
380,496
137,586
Class
R6
.......................
(570,013)
(172,542)
(162,531)
179,091
Advisor
Class
...................
(627,860)
64,371
65,138
(42,837)
Total
capital
share
transactions
.......
(11,813,584)
(11,962,575)
1,169,809
1,655,229
Net
increase
(decrease)
in
net
assets
.....................
(5,340,827)
(547,610)
6,574,431
8,845,249
Net
assets:
Beginning
of
year
..................
113,831,421
114,379,031
65,702,628
56,857,379
End
of
year
......................
$108,490,594
$113,831,421
$72,277,059
$65,702,628
Franklin
Fund
Allocator
Series
Financial
Statements
Statements
of
Changes
in
Net
Assets
(continued)
The
accompanying
notes
are
an
integral
part
of
these
financial
statements.
Annual
Report
Franklin
LifeSmart™
2035
Retirement
Target
Fund
Franklin
LifeSmart™
2040
Retirement
Target
Fund
Year
Ended
December
31,
2024
Year
Ended
December
31,
2023
Year
Ended
December
31,
2024
Year
Ended
December
31,
2023
Increase
(decrease)
in
net
assets:
Operations:
Net
investment
income
............
$2,503,630
$2,444,096
$976,774
$900,463
Net
realized
gain
(loss)
............
6,132,004
(375,415)
2,728,323
184,581
Net
change
in
unrealized
appreciation
(depreciation)
.................
6,862,482
15,824,328
3,432,608
6,436,848
Net
increase
(decrease)
in
net
assets
resulting
from
operations
.
15,498,116
17,893,009
7,137,705
7,521,892
Distributions
to
shareholders:
Class
A
........................
(3,130,673)
(2,737,263)
(1,496,476)
(970,541)
Class
C
........................
(343,708)
(327,711)
(189,699)
(141,391)
Class
R
........................
(138,931)
(100,870)
(34,731)
(22,949)
Class
R6
.......................
(6,304)
(3,575)
(10,637)
(7,338)
Advisor
Class
...................
(136,989)
(112,245)
(53,374)
(35,694)
Total
distributions
to
shareholders
.....
(3,756,605)
(3,281,664)
(1,784,917)
(1,177,913)
Capital
share
transactions:
(Note
2
)
Class
A
........................
325,122
65,682
3,503,497
5,908,266
Class
C
........................
(1,899,153)
(48,205)
(447,766)
88,937
Class
R
........................
1,046,435
(233,093)
28,794
(131,516)
Class
R6
.......................
47,651
52,951
39,736
25,828
Advisor
Class
...................
489,343
(3,770)
69,999
108,972
Total
capital
share
transactions
.......
9,398
(166,435)
3,194,260
6,000,487
Net
increase
(decrease)
in
net
assets
.....................
11,750,909
14,444,910
8,547,048
12,344,466
Net
assets:
Beginning
of
year
..................
127,526,466
113,081,556
53,636,278
41,291,812
End
of
year
......................
$139,277,375
$127,526,466
$62,183,326
$53,636,278
Franklin
Fund
Allocator
Series
Financial
Statements
Statements
of
Changes
in
Net
Assets
(continued)
Annual
Report
The
accompanying
notes
are
an
integral
part
of
these
financial
statements.
Franklin
LifeSmart™
2045
Retirement
Target
Fund
Franklin
LifeSmart™
2050
Retirement
Target
Fund
Year
Ended
December
31,
2024
Year
Ended
December
31,
2023
Year
Ended
December
31,
2024
Year
Ended
December
31,
2023
Increase
(decrease)
in
net
assets:
Operations:
Net
investment
income
............
$1,418,610
$1,507,756
$681,812
$658,693
Net
realized
gain
(loss)
............
5,495,609
(231,759)
2,654,429
54,402
Net
change
in
unrealized
appreciation
(depreciation)
.................
6,255,792
12,807,423
3,630,892
5,996,501
Net
increase
(decrease)
in
net
assets
resulting
from
operations
.
13,170,011
14,083,420
6,967,133
6,709,596
Distributions
to
shareholders:
Class
A
........................
(2,530,504)
(1,690,040)
(986,261)
(535,517)
Class
C
........................
(272,032)
(193,731)
(156,345)
(85,725)
Class
R
........................
(42,933)
(41,916)
(47,290)
(27,380)
Class
R6
.......................
(24,180)
(1,930)
(4,386)
(1,927)
Advisor
Class
...................
(57,444)
(39,398)
(41,947)
(24,644)
Total
distributions
to
shareholders
.....
(2,927,093)
(1,967,015)
(1,236,229)
(675,193)
Capital
share
transactions:
(Note
2
)
Class
A
........................
4,000,159
3,077,971
7,396,617
2,741,585
Class
C
........................
(1,138,997)
(685,727)
(337,740)
247,400
Class
R
........................
(591,754)
(456,233)
147,665
(4,202)
Class
R6
.......................
588,876
118,645
124,093
74,527
Advisor
Class
...................
144,270
86,089
144,102
171,195
Total
capital
share
transactions
.......
3,002,554
2,140,745
7,474,737
3,230,505
Net
increase
(decrease)
in
net
assets
.....................
13,245,472
14,257,150
13,205,641
9,264,908
Net
assets:
Beginning
of
year
..................
90,326,789
76,069,639
43,013,655
33,748,747
End
of
year
......................
$103,572,261
$90,326,789
$56,219,296
$43,013,655
Franklin
Fund
Allocator
Series
Financial
Statements
Statements
of
Changes
in
Net
Assets
(continued)
The
accompanying
notes
are
an
integral
part
of
these
financial
statements.
Annual
Report
Franklin
LifeSmart™
2055
Retirement
Target
Fund
Franklin
LifeSmart™
2060
Retirement
Target
Fund
Year
Ended
December
31,
2024
Year
Ended
December
31,
2023
Year
Ended
December
31,
2024
Year
Ended
December
31,
2023
Increase
(decrease)
in
net
assets:
Operations:
Net
investment
income
............
$473,701
$496,944
$95,470
$75,155
Net
realized
gain
(loss)
............
1,977,328
(110,244)
321,453
(61,061)
Net
change
in
unrealized
appreciation
(depreciation)
.................
2,865,574
4,723,501
445,234
663,878
Net
increase
(decrease)
in
net
assets
resulting
from
operations
.
5,316,603
5,110,201
862,157
677,972
Distributions
to
shareholders:
Class
A
........................
(721,918)
(473,348)
(110,189)
(56,383)
Class
C
........................
(149,574)
(103,640)
(10,383)
(4,549)
Class
R
........................
(36,454)
(21,663)
(1,943)
(764)
Class
R6
.......................
(1,691)
(261)
(330)
(227)
Advisor
Class
...................
(20,004)
(14,390)
(27,802)
(22,018)
Total
distributions
to
shareholders
.....
(929,641)
(613,302)
(150,647)
(83,941)
Capital
share
transactions:
(Note
2
)
Class
A
........................
2,990,907
3,767,353
2,068,674
1,343,244
Class
C
........................
(312,039)
347,507
226,134
251,048
Class
R
........................
181,382
153,371
58,905
15,875
Class
R6
.......................
45,344
19,976
3,820
—
Advisor
Class
...................
156,708
(24,944)
45,013
17,602
Total
capital
share
transactions
.......
3,062,302
4,263,263
2,402,546
1,627,769
Net
increase
(decrease)
in
net
assets
.....................
7,449,264
8,760,162
3,114,056
2,221,800
Net
assets:
Beginning
of
year
..................
33,370,131
24,609,969
4,957,478
2,735,678
End
of
year
......................
$40,819,395
$33,370,131
$8,071,534
$4,957,478
Franklin
Fund
Allocator
Series
Notes
to
Financial
Statements
1.
Organization
and
Significant
Accounting
Policies
Franklin
Fund
Allocator
Series (Trust)
is
registered
under
the
Investment
Company
Act
of
1940
(1940
Act)
as
an
open-end
management
investment
company,
consisting
of eighteen separate
funds, ten
of
which
are
included
in
this
report
(Funds).
The
Funds
follow
the
accounting
and
reporting
guidance
in
Financial
Accounting
Standards
Board
(FASB)
Accounting
Standards
Codification
Topic
946,
Financial
Services
–
Investment
Companies
(ASC
946)
and
apply
the
specialized
accounting
and
reporting
guidance
in
U.S.
Generally
Accepted
Accounting
Principles
(U.S.
GAAP),
including,
but
not
limited
to,
ASC
946.
Certain
or
all
Funds
invest
primarily
in
mutual
funds
(Underlying
Funds)
and
exchange
traded
funds
(ETFs),
including
affiliated
funds
managed
by
Franklin
Templeton
(FT
Underlying
Funds).
The
Funds
offer five classes
of
shares:
Class
A,
Class
C,
Class
R,
Class
R6
and
Advisor
Class. Class
C
shares
automatically
convert
to
Class
A
shares
on
a
monthly
basis,
after
they
have
been
held
for
8
years.
Each
class
of
shares
may
differ
by
its
initial
sales
load,
contingent
deferred
sales
charges,
voting
rights
on
matters
affecting
a
single
class,
its
exchange
privilege
and
fees
due
to
differing
arrangements
for
distribution
and
transfer
agent
fees.
The
accounting
policies
of
the
Underlying
Funds
are
outlined
in
their
respective
shareholder
reports.
A
copy
of
the
Underlying
Funds’
shareholder
reports
is
available
on
the
U.S.
Securities
and
Exchange
Commission
(SEC)
website
at
sec.gov.
The
Underlying
Funds’
shareholder
reports
are
not
covered
by
this
report.
The
following
summarizes
the Funds'
significant
accounting
policies.
a.
Financial
Instrument
Valuation
The Funds'
investments
in
financial
instruments
are
carried
at
fair
value
daily.
Fair
value
is
the
price
that
would
be
received
to
sell
an
asset
or
paid
to
transfer
a
liability
in
an
orderly
transaction
between
market
participants
on
the
measurement
date.
The Funds calculate the
net
asset
value
(NAV)
per
share
each
business
day
as
of
4
p.m.
Eastern
time
or
the
regularly
scheduled
close
of
the
New
York
Stock
Exchange
(NYSE),
whichever
is
earlier. Under
compliance
policies
and
procedures
approved
by
the
Trust’s
Board
of
Trustees
(the
Board),
the
Board
has
designated
the
Funds’
investment
manager
as
the
valuation
designee
and
has
responsibility
for
oversight
of
valuation.
The
investment
manager
is
assisted
by
the
Funds'
administrator
in
performing
this
responsibility,
including
leading
the
cross-
functional
Valuation
Committee
(VC).
The
Funds
may
utilize
independent
pricing
services,
quotations
from
securities
and
financial
instrument
dealers,
and
other
market
sources
to
determine
fair
value.
Investments
in
the
Underlying
Funds
are
valued
at
their
closing
NAV
each
trading
day. ETFs
listed
on
an
exchange
or
on
the
NASDAQ
National
Market
System
are
valued
at
the
last
quoted
sale
price
or
the
official
closing
price
of
the
day,
respectively.
Debt
securities
generally
trade
in
the over-the-counter
(OTC)
market
rather
than
on
a
securities
exchange.
The
Funds'
pricing
services
use
multiple
valuation
techniques
to
determine
fair
value.
In
instances
where
sufficient
market
activity
exists,
the
pricing
services
may
utilize
a
market-based
approach
through
which
quotes
from
market
makers
are
used
to
determine
fair
value.
In
instances
where
sufficient
market
activity
may
not
exist
or
is
limited,
the
pricing
services
also
utilize
proprietary
valuation
models
which
may
consider
market
characteristics
such
as
benchmark
yield
curves,
credit
spreads,
estimated
default
rates,
anticipated
market
interest
rate
volatility,
coupon
rates,
anticipated
timing
of
principal
repayments,
underlying
collateral,
and
other
unique
security
features
in
order
to
estimate
the
relevant
cash
flows,
which
are
then
discounted
to
calculate
the
fair
value.
Investments
in
repurchase
agreements are
valued
at
cost,
which
approximates
fair
value.
The
Funds
have
procedures
to
determine
the
fair
value
of
financial
instruments
for
which
market
prices
are
not
reliable
or
readily
available.
Under
these
procedures,
the
Funds
primarily
employ
a
market-based
approach
which
may
use
related
or
comparable
assets
or
liabilities,
recent
transactions,
market
multiples,
and
other
relevant
information
for
the
investment
to
determine
the
fair
value
of
the
investment.
An
income-based
valuation
approach
may
also
be
used
in
which
the
anticipated
future
cash
flows
of
the
investment
are
discounted
to
calculate
fair
value.
Discounts
may
also
be
applied
due
to
the
nature
or
duration
of
any
restrictions
on
the
disposition
of
the
investments.
Due
to
the
inherent
uncertainty
of
valuations
of
such
investments,
the
fair
values
may
differ
significantly
from
the
values
that
would
have
been
used
had
an
active
market
existed.
Franklin
Fund
Allocator
Series
Notes
to
Financial
Statements
b.
Joint
Repurchase
Agreement
Certain
or
all
Funds
enter
into
a
joint
repurchase
agreement
whereby
their
uninvested
cash
balance
is
deposited
into
a
joint
cash
account
with
other
funds
managed
by
the
investment
manager
or
an
affiliate
of
the
investment
manager
and
is
used
to
invest
in
one
or
more
repurchase
agreements.
The
value
and
face
amount
of
the
joint
repurchase
agreement
are
allocated
to
the
funds
based
on
their
pro-rata
interest.
A
repurchase
agreement
is
accounted
for
as
a
loan
by
the
Fund
to
the
seller,
collateralized
by
securities
which
are
delivered
to
the
Funds'
custodian.
The
fair
value,
including
accrued
interest,
of
the
initial
collateralization
is
required
to
be
at
least
102%
of
the
dollar
amount
invested
by
the
funds,
with
the
value
of
the
underlying
securities
marked
to
market
daily
to
maintain
coverage
of
at
least
100%.
Repurchase
agreements
are
subject
to
the
terms
of
Master
Repurchase
Agreements
(MRAs)
with
approved
counterparties
(sellers).
The
MRAs
contain
various
provisions,
including
but
not
limited
to
events
of
default
and
maintenance
of
collateral
for
repurchase
agreements.
In
the
event
of
default
by
either
the
seller
or
the
Funds,
certain
MRAs
may
permit
the
non-defaulting
party
to
net
and
close-out
all
transactions,
if
any,
traded
under
such
agreements.
The
Funds
may
sell
securities
it
holds
as
collateral
and
apply
the
proceeds
towards
the
repurchase
price
and
any
other
amounts
owed
by
the
seller
to
the
Funds
in
the
event
of
default
by
the
seller.
This
could
involve
costs
or
delays
in
addition
to
a
loss
on
the
securities
if
their
value
falls
below
the
repurchase
price
owed
by
the
seller.
The
joint
repurchase
agreement
held
by
the
Funds
at
year
end,
as
indicated
in
the
Schedules
of
Investments,
had
been
entered
into
on December
31,
2024.
c.
Index-Linked
Notes
Certain
or
all
Funds
invest
in
index-linked
notes.
Index-linked
notes
are
senior,
unsecured,
subordinated
debt
securities
issued
by
a
financial
institution,
and
the
value
is
based
on
the
price
movements
of
the
underlying
index.
Index-linked
notes
are
designed
to
provide
investors
access
to
the
returns
of
various
market
benchmarks
and
intended
to
replicate
the
economic
effects
that
would
apply
had
the
Fund
directly
purchased
the
underlying
referenced
asset
or
basket
of
assets.
The
risks
of
investing
in
index-linked
notes
include
unfavorable
price
movements
in
the
underlying
index
and
the
credit
risk
of
the
issuing
financial
institution.
There
may
be
no
guarantee
of
a
return
of
principal
with
index-linked
notes
and
the
appreciation
potential
may
be
limited.
Index-linked
notes
may
be
more
volatile
and
less
liquid
than
other
investments
held
by
the
Funds.
d.
Income
Taxes
It
is each
Fund's
policy
to
qualify
as
a
regulated
investment
company
under
the
Internal
Revenue
Code. Each
Fund
intends
to
distribute
to
shareholders
substantially
all
of
its
taxable
income
and
net
realized
gains
to
relieve
it
from
federal
income
and excise
taxes.
As
a
result,
no
provision
for
U.S.
federal
income
taxes
is
required.
Each
Fund
may
recognize
an
income
tax
liability
related
to
its
uncertain
tax
positions
under
U.S.
GAAP
when
the
uncertain
tax
position
has
a
less
than
50%
probability
that
it
will
be
sustained
upon
examination
by
the
tax
authorities
based
on
its
technical
merits.
As
of
December
31,
2024, each
Fund
has
determined
that
no
tax
liability
is
required
in
its
financial
statements
related
to
uncertain
tax
positions
for
any
open
tax
years
(or
expected
to
be
taken
in
future
tax
years).
Open
tax
years
are
those
that
remain
subject
to
examination
and
are
based
on
the
statute
of
limitations
in
each
jurisdiction
in
which
the
Fund
invests.
e.
Security
Transactions,
Investment
Income,
Expenses
and
Distributions
Security
transactions
are
accounted
for
on
trade
date.
Realized
gains
and
losses
on
security
transactions
are
determined
on
a
specific
identification
basis.
Interest
income
(including
interest
income
from
payment-in-kind
securities,
if
any)
and
estimated
expenses
are
accrued
daily.
Dividend
income
and
realized
capital
gain
distributions
are
recorded
on
the
ex-dividend
date.
Distributions
to
shareholders
are
recorded
on
the
ex-dividend
date.
The
Franklin
LifeSmart
TM
Retirement
Income
Fund
employs
a
managed
distribution
policy.
Under
this
policy,
the
Fund
will
distribute
level
monthly
distributions
in
any
given
year
regardless
of
the
performance
of
the
Fund;
however,
the
twelfth
monthly
payment
may
be
greater
than
the
initially
anticipated
amount
if
additional
income
or
capital
gains
are
required
to
be
distributed.
These
distributions
may
include
income
and
capital
gains
generated
by
the
Underlying
Funds,
as
well
as
a
possible
return
of
capital
component,
if
necessary,
to
meet
the
annual
distribution
rate.
The
annual
payout
rate
may
be
adjusted
higher
or
lower
from
year
to
year
in
response
to
market
conditions.
Distributable
earnings
are
determined
according
to
income
tax
regulations
(tax
basis)
and
may
differ
from
1.
Organization
and
Significant
Accounting
Policies
(continued)
Franklin
Fund
Allocator
Series
Notes
to
Financial
Statements
earnings
recorded
in
accordance
with
U.S.
GAAP.
These
differences
may
be
permanent
or
temporary.
Permanent
differences
are
reclassified
among
capital
accounts
to
reflect
their
tax
character.
These
reclassifications
have
no
impact
on
net
assets
or
the
results
of
operations.
Temporary
differences
are
not
reclassified,
as
they
may
reverse
in
subsequent
periods.
Common
expenses
incurred
by
the
Trust
are
allocated
among
the
Funds
based
on
the
ratio
of
net
assets
of
each
Fund
to
the
combined
net
assets
of
the
Trust
or
based
on
the
ratio
of
number
of
shareholders
of
each
Fund
to
the
combined
number
of
shareholders
of
the
Trust.
Fund
specific
expenses
are
charged
directly
to
the
Fund
that
incurred
the
expense.
The
Funds
indirectly
bear
their
proportionate
share
of
expenses
from
the
Underlying
Funds
and
ETFs.
Since
the
Underlying
Funds
and
ETFs
have
varied
expense
levels
and
the
Funds
may
own
different
proportions
of
the
Underlying
Funds
and
ETFs
at
different
times,
the
amount
of
expenses
incurred
indirectly
by
the
Funds
will
vary.
Realized
and
unrealized
gains
and
losses
and
net
investment
income,
excluding
class
specific
expenses,
are
allocated
daily
to
each
class
of
shares
based
upon
the
relative
proportion
of
net
assets
of
each
class.
Differences
in
per
share
distributions
by
class
are
generally
due
to
differences
in
class
specific
expenses.
f.
Accounting
Estimates
The
preparation
of
financial
statements
in
accordance
with
U.S.
GAAP
requires
management
to
make
estimates
and
assumptions
that
affect
the
reported
amounts
of
assets
and
liabilities
at
the
date
of
the
financial
statements
and
the
amounts
of
income
and
expenses
during
the
reporting
period.
Actual
results
could
differ
from
those
estimates.
g.
Guarantees
and
Indemnifications
Under
the Trust's
organizational
documents,
its
officers
and trustees
are
indemnified
by
the Trust against
certain
liabilities
arising
out
of
the
performance
of
their
duties
to
the
Trust.
Additionally,
in
the
normal
course
of
business,
the Trust,
on
behalf
of
the
Funds, enters
into
contracts
with
service
providers
that
contain
general
indemnification
clauses.
The Trust's
maximum
exposure
under
these
arrangements
is
unknown
as
this
would
involve
future
claims
that
may
be
made
against
the Trust
that
have
not
yet
occurred.
Currently,
the Trust
expects
the
risk
of
loss
to
be
remote.
2.
Shares
of
Beneficial
Interest
At
December
31,
2024,
there
were
an
unlimited
number
of
shares
authorized
(without
par value).
Transactions
in
the
Funds'
shares
were
as
follows:
Franklin
LifeSmart™
Retirement
Income
Fund
Franklin
LifeSmart™
2020
Retirement
Target
Fund
Shares
Amount
Shares
Amount
Class
A
Class
A
Shares:
Year
ended
December
31,
2024
Shares
sold
a
...................................
331,077
$3,459,146
307,385
$3,687,346
Shares
issued
in
reinvestment
of
distributions
..........
178,817
1,865,598
56,868
689,303
Shares
redeemed
...............................
(726,012)
(7,555,580)
(807,167)
(9,642,131)
Net
increase
(decrease)
..........................
(216,118)
$(2,230,836)
(442,914)
$(5,265,482)
Year
ended
December
31,
2023
Shares
sold
a
...................................
835,256
$8,203,333
339,543
$3,701,430
Shares
issued
in
reinvestment
of
distributions
..........
196,562
1,947,041
63,897
702,720
Shares
redeemed
...............................
(1,129,020)
(11,082,232)
(735,451)
(8,030,382)
Net
increase
(decrease)
..........................
(97,202)
$(931,858)
(332,011)
$(3,626,232)
Class
C
1.
Organization
and
Significant
Accounting
Policies
(continued)
e.
Security
Transactions,
Investment
Income,
Expenses
and
Distributions
(continued)
Franklin
Fund
Allocator
Series
Notes
to
Financial
Statements
Franklin
LifeSmart™
Retirement
Income
Fund
Franklin
LifeSmart™
2020
Retirement
Target
Fund
Shares
Amount
Shares
Amount
Class
C
Shares:
Year
ended
December
31,
2024
Shares
sold
...................................
40,039
$410,612
22,509
$268,364
Shares
issued
in
reinvestment
of
distributions
..........
12,879
132,712
4,713
56,591
Shares
redeemed
a
..............................
(109,857)
(1,125,443)
(128,596)
(1,515,894)
Net
increase
(decrease)
..........................
(56,939)
$(582,119)
(101,374)
$(1,190,939)
Year
ended
December
31,
2023
Shares
sold
...................................
88,261
$855,031
102,146
$1,099,927
Shares
issued
in
reinvestment
of
distributions
..........
16,025
157,043
6,356
69,110
Shares
redeemed
a
..............................
(201,025)
(1,960,160)
(173,286)
(1,873,430)
Net
increase
(decrease)
..........................
(96,739)
$(948,086)
(64,784)
$(704,393)
Class
R
Class
R
Shares:
Year
ended
December
31,
2024
Shares
sold
...................................
27,766
$286,143
13,604
$160,399
Shares
issued
in
reinvestment
of
distributions
..........
6,419
66,791
800
9,696
Shares
redeemed
...............................
(57,887)
(586,832)
(18,592)
(216,355)
Net
increase
(decrease)
..........................
(23,702)
$(233,898)
(4,188)
$(46,260)
Year
ended
December
31,
2023
Shares
sold
...................................
18,280
$178,833
50,086
$543,698
Shares
issued
in
reinvestment
of
distributions
..........
8,287
81,853
1,358
14,856
Shares
redeemed
...............................
(47,060)
(459,381)
(79,085)
(877,491)
Net
increase
(decrease)
..........................
(20,493)
$(198,695)
(27,641)
$(318,937)
Class
R6
Class
R6
Shares:
Year
ended
December
31,
2024
Shares
sold
...................................
—
$—
310
$3,873
Shares
issued
in
reinvestment
of
distributions
..........
526
5,515
20
246
Shares
redeemed
...............................
(931)
(9,655)
(1,158)
(13,924)
Net
increase
(decrease)
..........................
(405)
$(4,140)
(828)
$(9,805)
Year
ended
December
31,
2023
Shares
sold
...................................
9,983
$97,654
3,257
$36,533
Shares
issued
in
reinvestment
of
distributions
..........
188
1,907
69
782
Shares
redeemed
...............................
(6,959)
(71,515)
(2,147)
(24,402)
Net
increase
(decrease)
..........................
3,212
$28,046
1,179
$12,913
Advisor
Class
2.
Shares
of
Beneficial
Interest
(continued)
Franklin
Fund
Allocator
Series
Notes
to
Financial
Statements
Franklin
LifeSmart™
Retirement
Income
Fund
Franklin
LifeSmart™
2020
Retirement
Target
Fund
Shares
Amount
Shares
Amount
Advisor
Class
Shares:
Year
ended
December
31,
2024
Shares
sold
...................................
105,270
$1,125,024
3,537
$41,749
Shares
issued
in
reinvestment
of
distributions
..........
15,075
157,886
1,456
17,717
Shares
redeemed
...............................
(159,943)
(1,664,764)
(23,785)
(281,736)
Net
increase
(decrease)
..........................
(39,598)
$(381,854)
(18,792)
$(222,270)
Year
ended
December
31,
2023
Shares
sold
...................................
184,774
$1,790,123
19,484
$215,206
Shares
issued
in
reinvestment
of
distributions
..........
15,963
158,996
1,872
20,685
Shares
redeemed
...............................
(94,479)
(939,675)
(17,144)
(189,704)
Net
increase
(decrease)
..........................
106,258
$1,009,444
4,212
$46,187
Franklin
LifeSmart™
2025
Retirement
Target
Fund
Franklin
LifeSmart™
2030
Retirement
Target
Fund
Shares
Amount
Shares
Amount
Class
A
Class
A
Shares:
Year
ended
December
31,
2024
Shares
sold
a
...................................
793,798
$10,179,063
663,169
$9,025,455
Shares
issued
in
reinvestment
of
distributions
..........
245,068
3,177,790
100,024
1,381,171
Shares
redeemed
...............................
(1,758,678)
(22,528,325)
(690,146)
(9,389,640)
Net
increase
(decrease)
..........................
(719,812)
$(9,171,472)
73,047
$1,016,986
Year
ended
December
31,
2023
Shares
sold
a
...................................
2,400,842
$27,476,419
1,369,146
$16,363,899
Shares
issued
in
reinvestment
of
distributions
..........
228,586
2,664,079
84,183
1,018,795
Shares
redeemed
...............................
(3,500,664)
(40,240,972)
(1,301,358)
(15,536,015)
Net
increase
(decrease)
..........................
(871,236)
$(10,100,474)
151,971
$1,846,679
Class
C
Class
C
Shares:
Year
ended
December
31,
2024
Shares
sold
...................................
138,478
$1,741,384
153,773
$2,051,583
Shares
issued
in
reinvestment
of
distributions
..........
24,141
305,745
14,813
200,386
Shares
redeemed
a
..............................
(266,797)
(3,335,090)
(175,813)
(2,382,249)
Net
increase
(decrease)
..........................
(104,178)
$(1,287,961)
(7,227)
$(130,280)
Year
ended
December
31,
2023
Shares
sold
...................................
439,839
$4,914,549
329,021
$3,849,922
Shares
issued
in
reinvestment
of
distributions
..........
21,672
246,938
12,102
143,083
Shares
redeemed
a
..............................
(585,722)
(6,549,698)
(380,644)
(4,458,295)
Net
increase
(decrease)
..........................
(124,211)
$(1,388,211)
(39,521)
$(465,290)
Class
R
2.
Shares
of
Beneficial
Interest
(continued)
Franklin
Fund
Allocator
Series
Notes
to
Financial
Statements
Franklin
LifeSmart™
2025
Retirement
Target
Fund
Franklin
LifeSmart™
2030
Retirement
Target
Fund
Shares
Amount
Shares
Amount
Class
R
Shares:
Year
ended
December
31,
2024
Shares
sold
...................................
30,244
$392,755
56,056
$755,329
Shares
issued
in
reinvestment
of
distributions
..........
4,137
53,349
3,403
46,815
Shares
redeemed
...............................
(47,938)
(602,382)
(31,387)
(421,648)
Net
increase
(decrease)
..........................
(13,557)
$(156,278)
28,072
$380,496
Year
ended
December
31,
2023
Shares
sold
...................................
78,928
$898,012
89,893
$1,057,456
Shares
issued
in
reinvestment
of
distributions
..........
4,092
47,499
2,076
25,058
Shares
redeemed
...............................
(114,389)
(1,311,230)
(79,731)
(944,928)
Net
increase
(decrease)
..........................
(31,369)
$(365,719)
12,238
$137,586
Class
R6
Class
R6
Shares:
Year
ended
December
31,
2024
Shares
sold
...................................
310
$7,789
3,570
$50,956
Shares
issued
in
reinvestment
of
distributions
..........
667
8,582
369
5,112
Shares
redeemed
...............................
(45,083)
(586,384)
(15,698)
(218,599)
Net
increase
(decrease)
..........................
(44,106)
$(570,013)
(11,759)
$(162,531)
Year
ended
December
31,
2023
Shares
sold
...................................
2,227
$25,525
14,266
$177,241
Shares
issued
in
reinvestment
of
distributions
..........
1,647
19,284
202
2,507
Shares
redeemed
...............................
(18,151)
(217,351)
(55)
(657)
Net
increase
(decrease)
..........................
(14,277)
$(172,542)
14,413
$179,091
Advisor
Class
Advisor
Class
Shares:
Year
ended
December
31,
2024
Shares
sold
...................................
50,892
$656,810
38,290
$523,974
Shares
issued
in
reinvestment
of
distributions
..........
6,805
88,598
4,133
57,448
Shares
redeemed
...............................
(105,137)
(1,373,268)
(37,513)
(516,284)
Net
increase
(decrease)
..........................
(47,440)
$(627,860)
4,910
$65,138
Year
ended
December
31,
2023
Shares
sold
...................................
79,358
$917,994
33,773
$420,460
Shares
issued
in
reinvestment
of
distributions
..........
6,635
77,568
3,392
41,310
Shares
redeemed
...............................
(80,609)
(931,191)
(41,510)
(504,607)
Net
increase
(decrease)
..........................
5,384
$64,371
(4,345)
$(42,837)
2.
Shares
of
Beneficial
Interest
(continued)
Franklin
Fund
Allocator
Series
Notes
to
Financial
Statements
Franklin
LifeSmart™
2035
Retirement
Target
Fund
Franklin
LifeSmart™
2040
Retirement
Target
Fund
Shares
Amount
Shares
Amount
Class
A
Class
A
Shares:
Year
ended
December
31,
2024
Shares
sold
a
...................................
1,052,543
$15,059,271
596,372
$8,552,544
Shares
issued
in
reinvestment
of
distributions
..........
214,224
3,112,782
103,177
1,496,384
Shares
redeemed
...............................
(1,241,143)
(17,846,931)
(460,826)
(6,545,431)
Net
increase
(decrease)
..........................
25,624
$325,122
238,723
$3,503,497
Year
ended
December
31,
2023
Shares
sold
a
...................................
2,616,276
$32,169,187
1,184,077
$14,408,801
Shares
issued
in
reinvestment
of
distributions
..........
213,559
2,707,534
76,617
964,593
Shares
redeemed
...............................
(2,829,631)
(34,811,039)
(778,828)
(9,465,128)
Net
increase
(decrease)
..........................
204
$65,682
481,866
$5,908,266
Class
C
Class
C
Shares:
Year
ended
December
31,
2024
Shares
sold
...................................
203,586
$2,780,766
77,400
$1,070,589
Shares
issued
in
reinvestment
of
distributions
..........
24,499
343,515
13,423
189,699
Shares
redeemed
a
..............................
(367,193)
(5,023,434)
(124,298)
(1,708,054)
Net
increase
(decrease)
..........................
(139,108)
$(1,899,153)
(33,475)
$(447,766)
Year
ended
December
31,
2023
Shares
sold
...................................
628,803
$7,497,562
310,298
$3,674,205
Shares
issued
in
reinvestment
of
distributions
..........
26,703
327,647
11,488
141,115
Shares
redeemed
a
..............................
(661,114)
(7,873,414)
(315,357)
(3,726,383)
Net
increase
(decrease)
..........................
(5,608)
$(48,205)
6,429
$88,937
Class
R
Class
R
Shares:
Year
ended
December
31,
2024
Shares
sold
...................................
91,912
$1,302,455
20,540
$292,949
Shares
issued
in
reinvestment
of
distributions
..........
9,573
138,931
2,397
34,731
Shares
redeemed
...............................
(27,442)
(394,951)
(21,153)
(298,886)
Net
increase
(decrease)
..........................
74,043
$1,046,435
1,784
$28,794
Year
ended
December
31,
2023
Shares
sold
...................................
96,198
$1,184,524
56,519
$685,734
Shares
issued
in
reinvestment
of
distributions
..........
7,966
100,869
1,821
22,949
Shares
redeemed
...............................
(121,972)
(1,518,486)
(70,003)
(840,199)
Net
increase
(decrease)
..........................
(17,808)
$(233,093)
(11,663)
$(131,516)
Class
R6
2.
Shares
of
Beneficial
Interest
(continued)
Franklin
Fund
Allocator
Series
Notes
to
Financial
Statements
Franklin
LifeSmart™
2035
Retirement
Target
Fund
Franklin
LifeSmart™
2040
Retirement
Target
Fund
Shares
Amount
Shares
Amount
Class
R6
Shares:
Year
ended
December
31,
2024
Shares
sold
...................................
3,025
$44,663
2,080
$30,883
Shares
issued
in
reinvestment
of
distributions
..........
429
6,304
726
10,637
Shares
redeemed
...............................
(224)
(3,316)
(119)
(1,784)
Net
increase
(decrease)
..........................
3,230
$47,651
2,687
$39,736
Year
ended
December
31,
2023
Shares
sold
...................................
5,516
$68,918
2,371
$28,646
Shares
issued
in
reinvestment
of
distributions
..........
277
3,575
579
7,338
Shares
redeemed
...............................
(1,577)
(19,542)
(812)
(10,156)
Net
increase
(decrease)
..........................
4,216
$52,951
2,138
$25,828
Advisor
Class
Advisor
Class
Shares:
Year
ended
December
31,
2024
Shares
sold
...................................
56,540
$829,117
21,702
$310,310
Shares
issued
in
reinvestment
of
distributions
..........
9,071
133,564
3,653
53,374
Shares
redeemed
...............................
(32,880)
(473,338)
(20,271)
(293,685)
Net
increase
(decrease)
..........................
32,731
$489,343
5,084
$69,999
Year
ended
December
31,
2023
Shares
sold
...................................
98,969
$1,244,920
30,118
$375,081
Shares
issued
in
reinvestment
of
distributions
..........
8,502
109,069
2,810
35,598
Shares
redeemed
...............................
(109,109)
(1,357,759)
(24,879)
(301,707)
Net
increase
(decrease)
..........................
(1,638)
$(3,770)
8,049
$108,972
Franklin
LifeSmart™
2045
Retirement
Target
Fund
Franklin
LifeSmart™
2050
Retirement
Target
Fund
Shares
Amount
Shares
Amount
Class
A
Class
A
Shares:
Year
ended
December
31,
2024
Shares
sold
a
...................................
936,906
$14,324,401
918,879
$13,714,472
Shares
issued
in
reinvestment
of
distributions
..........
162,028
2,509,138
65,002
985,848
Shares
redeemed
...............................
(840,118)
(12,833,380)
(484,335)
(7,303,703)
Net
increase
(decrease)
..........................
258,816
$4,000,159
499,546
$7,396,617
Year
ended
December
31,
2023
Shares
sold
a
...................................
1,610,491
$20,528,901
728,260
$8,988,442
Shares
issued
in
reinvestment
of
distributions
..........
126,180
1,663,537
42,196
533,827
Shares
redeemed
...............................
(1,497,714)
(19,114,467)
(549,618)
(6,780,684)
Net
increase
(decrease)
..........................
238,957
$3,077,971
220,838
$2,741,585
Class
C
2.
Shares
of
Beneficial
Interest
(continued)
Franklin
Fund
Allocator
Series
Notes
to
Financial
Statements
Franklin
LifeSmart™
2045
Retirement
Target
Fund
Franklin
LifeSmart™
2050
Retirement
Target
Fund
Shares
Amount
Shares
Amount
Class
C
Shares:
Year
ended
December
31,
2024
Shares
sold
...................................
126,729
$1,826,699
95,059
$1,373,778
Shares
issued
in
reinvestment
of
distributions
..........
18,392
271,953
10,550
156,343
Shares
redeemed
a
..............................
(220,736)
(3,237,649)
(128,432)
(1,867,861)
Net
increase
(decrease)
..........................
(75,615)
$(1,138,997)
(22,823)
$(337,740)
Year
ended
December
31,
2023
Shares
sold
...................................
394,408
$4,817,157
217,561
$2,642,161
Shares
issued
in
reinvestment
of
distributions
..........
15,378
193,580
6,959
85,688
Shares
redeemed
a
..............................
(467,844)
(5,696,464)
(204,403)
(2,480,449)
Net
increase
(decrease)
..........................
(58,058)
$(685,727)
20,117
$247,400
Class
R
Class
R
Shares:
Year
ended
December
31,
2024
Shares
sold
...................................
38,035
$574,744
20,693
$302,044
Shares
issued
in
reinvestment
of
distributions
..........
2,793
42,933
3,119
47,290
Shares
redeemed
...............................
(83,923)
(1,209,431)
(13,821)
(201,669)
Net
increase
(decrease)
..........................
(43,095)
$(591,754)
9,991
$147,665
Year
ended
December
31,
2023
Shares
sold
...................................
41,752
$530,779
51,131
$631,433
Shares
issued
in
reinvestment
of
distributions
..........
3,201
41,916
2,162
27,328
Shares
redeemed
...............................
(82,085)
(1,028,928)
(54,363)
(662,963)
Net
increase
(decrease)
..........................
(37,132)
$(456,233)
(1,070)
$(4,202)
Class
R6
Class
R6
Shares:
Year
ended
December
31,
2024
Shares
sold
...................................
39,406
$585,100
8,229
$130,275
Shares
issued
in
reinvestment
of
distributions
..........
1,490
24,180
285
4,386
Shares
redeemed
...............................
(1,303)
(20,404)
(717)
(10,568)
Net
increase
(decrease)
..........................
39,593
$588,876
7,797
$124,093
Year
ended
December
31,
2023
Shares
sold
...................................
65,518
$878,626
7,107
$85,663
Shares
issued
in
reinvestment
of
distributions
..........
131
1,830
142
1,820
Shares
redeemed
...............................
(57,230)
(761,811)
(1,001)
(12,956)
Net
increase
(decrease)
..........................
8,419
$118,645
6,248
$74,527
Advisor
Class
2.
Shares
of
Beneficial
Interest
(continued)
Franklin
Fund
Allocator
Series
Notes
to
Financial
Statements
Franklin
LifeSmart™
2045
Retirement
Target
Fund
Franklin
LifeSmart™
2050
Retirement
Target
Fund
Shares
Amount
Shares
Amount
Advisor
Class
Shares:
Year
ended
December
31,
2024
Shares
sold
...................................
20,429
$316,149
42,164
$655,452
Shares
issued
in
reinvestment
of
distributions
..........
3,662
57,444
2,734
41,863
Shares
redeemed
...............................
(15,085)
(229,323)
(34,910)
(553,213)
Net
increase
(decrease)
..........................
9,006
$144,270
9,988
$144,102
Year
ended
December
31,
2023
Shares
sold
...................................
21,444
$279,870
13,879
$175,508
Shares
issued
in
reinvestment
of
distributions
..........
2,953
39,398
1,926
24,644
Shares
redeemed
...............................
(17,806)
(233,179)
(2,333)
(28,957)
Net
increase
(decrease)
..........................
6,591
$86,089
13,472
$171,195
Franklin
LifeSmart™
2055
Retirement
Target
Fund
Franklin
LifeSmart™
2060
Retirement
Target
Fund
Shares
Amount
Shares
Amount
Class
A
Class
A
Shares:
Year
ended
December
31,
2024
Shares
sold
a
...................................
558,090
$7,458,291
211,735
$2,449,876
Shares
issued
in
reinvestment
of
distributions
..........
52,557
721,865
9,293
110,189
Shares
redeemed
...............................
(387,248)
(5,189,249)
(42,794)
(491,391)
Net
increase
(decrease)
..........................
223,399
$2,990,907
178,234
$2,068,674
Year
ended
December
31,
2023
Shares
sold
a
...................................
684,806
$7,653,011
174,331
$1,674,861
Shares
issued
in
reinvestment
of
distributions
..........
41,241
473,386
5,649
56,184
Shares
redeemed
...............................
(389,876)
(4,359,044)
(40,237)
(387,801)
Net
increase
(decrease)
..........................
336,171
$3,767,353
139,743
$1,343,244
Class
C
Class
C
Shares:
Year
ended
December
31,
2024
Shares
sold
...................................
111,393
$1,444,771
27,650
$318,959
Shares
issued
in
reinvestment
of
distributions
..........
11,242
149,565
882
10,383
Shares
redeemed
a
..............................
(147,567)
(1,906,375)
(9,111)
(103,208)
Net
increase
(decrease)
..........................
(24,932)
$(312,039)
19,421
$226,134
Year
ended
December
31,
2023
Shares
sold
...................................
191,868
$2,085,563
28,613
$276,288
Shares
issued
in
reinvestment
of
distributions
..........
9,322
103,557
444
4,409
Shares
redeemed
a
..............................
(168,843)
(1,841,613)
(3,124)
(29,649)
Net
increase
(decrease)
..........................
32,347
$347,507
25,933
$251,048
Class
R
2.
Shares
of
Beneficial
Interest
(continued)
Franklin
Fund
Allocator
Series
Notes
to
Financial
Statements
Franklin
LifeSmart™
2055
Retirement
Target
Fund
Franklin
LifeSmart™
2060
Retirement
Target
Fund
Shares
Amount
Shares
Amount
Class
R
Shares:
Year
ended
December
31,
2024
Shares
sold
...................................
41,759
$553,696
7,289
$85,313
Shares
issued
in
reinvestment
of
distributions
..........
2,671
36,453
164
1,943
Shares
redeemed
...............................
(30,399)
(408,767)
(2,451)
(28,351)
Net
increase
(decrease)
..........................
14,031
$181,382
5,002
$58,905
Year
ended
December
31,
2023
Shares
sold
...................................
66,587
$738,504
4,514
$43,167
Shares
issued
in
reinvestment
of
distributions
..........
1,899
21,663
59
587
Shares
redeemed
...............................
(55,471)
(606,796)
(2,945)
(27,879)
Net
increase
(decrease)
..........................
13,015
$153,371
1,628
$15,875
Class
R6
Class
R6
Shares:
Year
ended
December
31,
2024
Shares
sold
...................................
3,695
$51,908
314
$3,764
Shares
issued
in
reinvestment
of
distributions
..........
109
1,538
4
56
Shares
redeemed
...............................
(566)
(8,102)
—
—
Net
increase
(decrease)
..........................
3,238
$45,344
318
$3,820
Year
ended
December
31,
2023
Shares
sold
...................................
1,739
$20,080
—
$—
Shares
issued
in
reinvestment
of
distributions
..........
12
145
—
—
Shares
redeemed
...............................
(22)
(249)
—
—
Net
increase
(decrease)
..........................
1,729
$19,976
—
$—
Advisor
Class
Advisor
Class
Shares:
Year
ended
December
31,
2024
Shares
sold
...................................
17,903
$250,755
3,997
$47,272
Shares
issued
in
reinvestment
of
distributions
..........
1,452
20,004
162
1,920
Shares
redeemed
...............................
(8,161)
(114,051)
(348)
(4,179)
Net
increase
(decrease)
..........................
11,194
$156,708
3,811
$45,013
Year
ended
December
31,
2023
Shares
sold
...................................
16,363
$183,253
1,840
$17,555
Shares
issued
in
reinvestment
of
distributions
..........
1,250
14,390
77
773
Shares
redeemed
...............................
(19,791)
(222,587)
(74)
(726)
Net
increase
(decrease)
..........................
(2,178)
$(24,944)
1,843
$17,602
a
May
include
a
portion
of
Class
C
shares
that
were
automatically
converted
to
Class
A.
2.
Shares
of
Beneficial
Interest
(continued)
Franklin
Fund
Allocator
Series
Notes
to
Financial
Statements
3.
Transactions
with
Affiliates
Franklin
Resources,
Inc.
is
the
holding
company
for
various
subsidiaries
that
together
are
referred
to
as
Franklin
Templeton.
Certain
officers
and
trustees
of
the Funds are
also
officers,
directors, and/or trustees
of
certain
of
the
FT
Underlying
Funds
and
of
the
following
subsidiaries:
a.
Management
and
Asset
Allocation
Fees
The
Funds,
except
Franklin
LifeSmart
TM
Retirement
Income
Fund,
pay
an
asset
allocation
fee,
calculated
daily
and
paid
monthly,
to
Advisers
of
0.25%
per
year
of
the
average
daily
net
assets
of
each
of
the
Funds
for
investment
advisory
services,
consisting
principally
of
determining
the
allocation
of
assets
of
the
Funds
among
the
Underlying
Funds
and
ETFs.
Franklin
LifeSmart
TM
Retirement
Income
Fund
pays
an
investment
management
fee,
calculated
daily
and
paid
monthly,
to
Advisers
of
0.25%
per
year
of
the
average
daily
net
assets
of
the
Fund.
b.
Administrative
Fees
Under
an
agreement
with
Advisers,
FT
Services
provides
administrative
services
to
the
Funds
and
is
not
paid
by
the
Funds
for
the services.
c.
Distribution
Fees
The
Board
has
adopted
distribution
plans
for
each
share
class,
with
the
exception
of
Class
R6
and
Advisor
Class
shares,
pursuant
to
Rule
12b-1
under
the
1940
Act.
Under
the
Funds'
Class
A
reimbursement
distribution
plans,
the
Funds
reimburse
Distributors
for
costs
incurred
in
connection
with
the
servicing,
sale
and
distribution
of each
Fund's
shares
up
to
the
maximum
annual
plan
rate.
Under
the
Class
A
reimbursement
distribution
plans,
costs
exceeding
the
maximum
for
the
current
plan
year
cannot
be
reimbursed
in
subsequent
periods.
In
addition,
under
the
Funds'
Class
C
and
R compensation
distribution
plans,
the
Funds
pay
Distributors
for
costs
incurred
in
connection
with
the
servicing,
sale
and
distribution
of each
Fund's
shares
up
to
the
maximum
annual
plan
rate
for
each
class.
The
plan
year,
for
purposes
of
monitoring
compliance
with
the
maximum
annual
plan
rates,
is
February
1
through
January
31
for
each
Fund.
The
maximum
annual
plan
rates,
based
on
the
average
daily
net
assets,
for
each
class,
are
as
follows:
The
Board
has
set
the
current
rate
at
0.25%
per
year
for
Class
A
shares
until
further
notice
and
approval
by
the
Board.
d.
Sales
Charges/Underwriting
Agreements
Front-end
sales
charges
and
contingent
deferred
sales
charges
(CDSC)
do
not
represent
expenses
of
the
Funds.
These
charges
are
deducted
from
the
proceeds
of
sales
of
fund
shares
prior
to
investment
or
from
redemption
proceeds
prior
to
remittance,
as
applicable.
Distributors
has
advised
the
Funds
of
the
following
commission
transactions
related
to
the
sales
and
redemptions
of
the
Funds'
shares
for
the
year:
Subsidiary
Affiliation
Franklin
Advisers,
Inc.
(Advisers)
Investment
manager
Franklin
Templeton
Services,
LLC
(FT
Services)
Administrative
manager
Franklin
Distributors,
LLC
(Distributors)
Principal
underwriter
Franklin
Templeton
Investor
Services,
LLC
(Investor
Services)
Transfer
agent
Class
A
....................................................................................
0.35%
Class
C
....................................................................................
1.00%
Class
R
....................................................................................
0.50%
Franklin
Fund
Allocator
Series
Notes
to
Financial
Statements
e.
Transfer
Agent
Fees
Each
class
of
shares
pays
transfer
agent
fees,
calculated
monthly
and
paid
monthly, to
Investor
Services
for
its
performance
of
shareholder
servicing
obligations. The
fees
are based
on
a
fixed
margin
earned
by
Investor
Services
and
are allocated
to
the Funds
based
upon
relative
assets
and
relative
transactions. In
addition,
each
class reimburses
Investor
Services
for
out
of
pocket
expenses
incurred
and,
except
for
Class
R6, reimburses
shareholder
servicing
fees
paid
to
third
parties.
These
fees
paid
to
third
parties
are
accrued
and
allocated
daily
based
upon
their
relative
proportion
of
such
classes'
aggregate
net
assets.
Class
R6
pays
Investor
Services
transfer
agent
fees
allocated
specifically
to
that
class
based
upon
its
relative
assets
and
relative
transactions.
For
the
year
ended
December
31,
2024,
the Funds
paid
transfer
agent
fees
as
noted
in
the
Statements of
Operations
of
which
the
following
amounts
were
retained
by
Investor
Services:
Franklin
LifeSmart™
Retirement
Income
Fund
Franklin
LifeSmart™
2020
Retirement
Target
Fund
Franklin
LifeSmart™
2025
Retirement
Target
Fund
Franklin
LifeSmart™
2030
Retirement
Target
Fund
Sales
charges
retained
net
of
commissions
paid
to
unaffiliated
brokers/dealers
..................
$4,573
$811
$7,957
$14,091
CDSC
retained
...........................
$360
$330
$1,038
$3,616
Franklin
LifeSmart™
2035
Retirement
Target
Fund
Franklin
LifeSmart™
2040
Retirement
Target
Fund
Franklin
LifeSmart™
2045
Retirement
Target
Fund
Franklin
LifeSmart™
2050
Retirement
Target
Fund
Sales
charges
retained
net
of
commissions
paid
to
unaffiliated
brokers/dealers
..................
$21,278
$12,817
$25,585
$21,587
CDSC
retained
...........................
$1,772
$663
$2,180
$1,441
Franklin
LifeSmart™
2055
Retirement
Target
Fund
Franklin
LifeSmart™
2060
Retirement
Target
Fund
Sales
charges
retained
net
of
commissions
paid
to
unaffiliated
brokers/dealers
.............
$20,381
$7,623
CDSC
retained
.............................................................
$1,641
$96
Franklin
LifeSmart™
Retirement
Income
Fund
Franklin
LifeSmart™
2020
Retirement
Target
Fund
Franklin
LifeSmart™
2025
Retirement
Target
Fund
Franklin
LifeSmart™
2030
Retirement
Target
Fund
Transfer
agent
fees
........................
$29,857
$17,696
$66,185
$57,414
3.
Transactions
with
Affiliates
(continued)
d.
Sales
Charges/Underwriting
Agreements
(continued)
Franklin
Fund
Allocator
Series
Notes
to
Financial
Statements
f.
Investments
in
FT
Underlying
Funds
The
Funds
invest
in
FT
Underlying
Funds
which
are
managed
by
Advisers
(or
an
affiliate
of
Advisers).
As
defined
in
the
1940
Act,
an
investment
is
deemed
to
be
a
“Controlled
Affiliate”
of
a
fund
when
a
fund
owns,
either
directly
or
indirectly,
25%
or
more
of
the
Underlying
Fund’s
outstanding
shares
or
has
the
power
to
exercise
control
over
management
or
policies
of
such
Underlying
Fund.
The
Funds
do
not
invest
in
FT
Underlying
Funds
for
the
purpose
of
exercising
a
controlling
influence
over
the
management
or
policies.
Management
fees
and
asset
allocation
fees
paid
by
the
Funds
are
waived
on
assets
invested
in
the
Underlying
Funds,
as
noted
in
the
Statements
of
Operations,
in
an
amount
not
to
exceed
the
management
and
administrative
fees
paid
directly
or
indirectly
by
the
Underlying
Funds.
Investments
in
FT
Underlying
Funds
for
the
year
ended
December
31,
2024,
were
as
follows:
Franklin
LifeSmart™
2035
Retirement
Target
Fund
Franklin
LifeSmart™
2040
Retirement
Target
Fund
Franklin
LifeSmart™
2045
Retirement
Target
Fund
Franklin
LifeSmart™
2050
Retirement
Target
Fund
Transfer
agent
fees
........................
$101,726
$66,597
$102,202
$81,696
Franklin
LifeSmart™
2055
Retirement
Target
Fund
Franklin
LifeSmart™
2060
Retirement
Target
Fund
Transfer
agent
fees
..........................................................
$85,052
$34,744
aa
Value
at
Beginning
of
Year
Purchases
Sales
Realized
Gain
(Loss)
Net
Change
in
Unrealized
Appreciation
(Depreciation)
Value
at
End
of
Year
Number
of
Shares
Held
at
End
of
Year
Dividend
Income
a
a
a
a
a
a
a
a
a
Franklin
LifeSmart™
Retirement
Income
Fund
Non-Controlled
Affiliates
BrandywineGLOBAL
-
Global
Opportunities
Bond
Fund,
Class
IS
$
2,313,314
$
242,608
$
(238,360)
$
(60,088)
$
(234,772)
$
2,022,702
246,671
$
73,445
BrandywineGLOBAL
High
Yield
Fund,
Class
IS
............
—
8,529,590
(124,655)
(176)
(31,924)
8,372,835
811,321
163,147
ClearBridge
Tactical
Dividend
Income
Fund,
Class
IS
.......
5,526,588
255,948
(1,635,679)
143,982
676,917
4,967,756
198,314
184,256
Franklin
High
Yield
Corporate
ETF
2,055,805
105,754
(228,492)
(27,574)
60,321
1,965,814
82,355
127,559
Franklin
International
Core
Dividend
Tilt
Index
ETF
.............
1,316,440
96,267
(150,253)
6,483
(41,528)
1,227,409
40,900
52,053
Franklin
Investment
Grade
Corporate
ETF
............
2,661,486
1,226,300
(307,036)
(84,234)
(41,146)
3,455,370
163,854
127,579
Franklin
U.S.
Core
Bond
ETF
...
5,208,669
1,902,326
(586,503)
(109,931)
(97,178)
6,317,383
299,544
215,313
Franklin
U.S.
Core
Equity
(IU)
Fund
1,084,545
98,075
(445,292)
166,609
54,596
958,533
55,535
82,238
a
Franklin
U.S.
Government
Securities
Fund,
Class
R6
.....
3,133,651
1,301,070
(351,643)
(59,954)
(69,223)
3,953,901
787,630
114,785
3.
Transactions
with
Affiliates
(continued)
e.
Transfer
Agent
Fees
(continued)
Franklin
Fund
Allocator
Series
Notes
to
Financial
Statements
aa
Value
at
Beginning
of
Year
Purchases
Sales
Realized
Gain
(Loss)
Net
Change
in
Unrealized
Appreciation
(Depreciation)
Value
at
End
of
Year
Number
of
Shares
Held
at
End
of
Year
Dividend
Income
a
a
a
a
a
a
a
a
a
Franklin
LifeSmart™
Retirement
Income
Fund
(continued)
Non-Controlled
Affiliates
(continued)
Institutional
Fiduciary
Trust
-
Money
Market
Portfolio,
4.183%
......
$
1,101,739
$
6,546,624
$
(6,581,766)
$
—
$
—
$
1,066,597
1,066,597
$
51,639
Templeton
Developing
Markets
Trust,
Class
R6
............
487,991
20,219
(118,029)
(15,627)
43,492
418,046
22,500
12,382
a
Templeton
Foreign
Fund,
Class
R6
1,008,454
35,890
(200,084)
41,649
(74,929)
810,980
108,565
22,336
Western
Asset
Income
Fund,
Class
IS
.....................
6,817,371
404,777
(7,244,009)
(691,395)
713,256
—
—
378,261
Western
Asset
Short
Duration
High
Income
Fund,
Class
I
........
5,025,310
294,196
(5,398,094)
(333,117)
411,705
—
—
274,064
Total
Non-Controlled
Affiliates
$37,741,363
$21,059,644
$(23,609,895)
$(1,023,373)
$1,369,587
$35,537,326
$1,879,057
Total
Affiliated
Securities
....
$37,741,363
$21,059,644
$(23,609,895)
$(1,023,373)
$1,369,587
$35,537,326
$1,879,057
Franklin
LifeSmart™
2020
Retirement
Target
Fund
Non-Controlled
Affiliates
BrandywineGLOBAL
-
Global
Opportunities
Bond
Fund,
Class
IS
1,087,048
258,237
(296,298)
(82,440)
(47,740)
918,807
112,050
34,797
ClearBridge
International
Growth
Fund,
Class
IS
............
381,221
20,558
(156,665)
12,116
12,155
269,385
4,167
3,994
ClearBridge
Large
Cap
Value
Fund,
Class
IS
.................
852,285
58,623
(972,931)
197,809
(135,786)
—
—
8,356
a
Franklin
Emerging
Market
Core
Equity
(IU)
Fund
...........
824,345
77,128
(304,756)
(13,838)
62,262
645,141
63,686
28,151
Franklin
Growth
Fund,
Class
R6
.
2,033,799
252,213
(783,499)
314,800
(141,422)
1,675,891
12,444
133,035
a
Franklin
High
Yield
Corporate
ETF
558,177
678,822
(172,141)
(14,805)
14,859
1,064,912
44,613
45,897
Franklin
International
Aggregate
Bond
ETF
................
468,379
56,663
(123,919)
(29,973)
27,271
398,421
19,646
11,893
Franklin
International
Core
Equity
(IU)
Fund
................
2,492,364
231,460
(986,996)
89,786
(45,011)
1,781,603
152,274
87,260
a
Franklin
Investment
Grade
Corporate
ETF
............
700,604
2,289,580
(233,424)
(28,135)
(67,244)
2,661,381
126,203
58,090
Franklin
Systematic
Style
Premia
ETF
....................
295,198
14,632
(75,495)
3,957
24,957
263,249
11,010
3,116
Franklin
U.S.
Core
Bond
ETF
...
5,511,219
1,639,877
(1,418,516)
(251,835)
88,344
5,569,089
264,063
216,685
Franklin
U.S.
Core
Equity
(IU)
Fund
4,528,984
606,516
(2,155,104)
644,848
156,980
3,782,224
219,132
324,197
a
Franklin
U.S.
Equity
Index
ETF
.
481,751
134,519
(316,228)
47,168
35,306
382,516
7,450
5,256
Franklin
U.S.
Large
Cap
Multifactor
Index
ETF
...............
1,063,106
76,799
(454,960)
145,052
49,779
879,776
15,003
10,789
Franklin
U.S.
Treasury
Bond
ETF
1,824,228
1,740,833
(668,309)
(113,996)
12,375
2,795,131
138,923
106,052
Institutional
Fiduciary
Trust
-
Money
Market
Portfolio,
4.183%
......
164,927
5,647,588
(5,792,223)
—
—
20,292
20,292
9,391
3.
Transactions
with
Affiliates
(continued)
f.
Investments
in
FT
Underlying
Funds
(continued)
Franklin
Fund
Allocator
Series
Notes
to
Financial
Statements
aa
Value
at
Beginning
of
Year
Purchases
Sales
Realized
Gain
(Loss)
Net
Change
in
Unrealized
Appreciation
(Depreciation)
Value
at
End
of
Year
Number
of
Shares
Held
at
End
of
Year
Dividend
Income
a
a
a
a
a
a
a
a
a
Franklin
LifeSmart™
2020
Retirement
Target
Fund
(continued)
Non-Controlled
Affiliates
(continued)
Putnam
Large
Cap
Value
Fund,
Class
R6
................
$
—
$
1,059,845
$
(14,070)
$
(196)
$
(73,551)
$
972,028
28,183
$
56,027
a
Templeton
Developing
Markets
Trust,
Class
R6
............
582,832
155,109
(349,208)
(16,969)
45,310
417,074
22,447
12,126
a
Templeton
Foreign
Fund,
Class
R6
572,338
111,011
(257,231)
35,696
(51,394)
410,420
54,942
11,304
Western
Asset
Core
Plus
Bond
Fund,
Class
IS
............
3,077,238
369,525
(3,449,647)
(435,396)
438,280
—
—
89,120
Western
Asset
Short-Term
Bond
Fund,
Class
IS
............
692,612
79,874
(781,137)
(15,844)
24,495
—
—
18,091
Total
Non-Controlled
Affiliates
$28,192,655
$15,559,412
$(19,762,757)
$487,805
$430,225
$24,907,340
$1,273,627
Total
Affiliated
Securities
....
$28,192,655
$15,559,412
$(19,762,757)
$487,805
$430,225
$24,907,340
$1,273,627
Franklin
LifeSmart™
2025
Retirement
Target
Fund
Non-Controlled
Affiliates
BrandywineGLOBAL
-
Global
Opportunities
Bond
Fund,
Class
IS
3,319,712
929,792
(539,457)
(145,301)
(286,364)
3,278,382
399,803
119,759
ClearBridge
International
Growth
Fund,
Class
IS
............
1,671,512
86,368
(493,391)
45,200
67,624
1,377,313
21,307
20,306
ClearBridge
Large
Cap
Value
Fund,
Class
IS
.................
3,735,880
259,251
(4,296,379)
888,831
(587,583)
—
—
40,732
a
Franklin
Emerging
Market
Core
Equity
(IU)
Fund
...........
3,609,671
436,023
(974,225)
(29,966)
257,959
3,299,462
325,712
141,376
Franklin
Growth
Fund,
Class
R6
.
8,914,864
1,157,333
(2,264,843)
919,886
(150,145)
8,577,095
63,690
680,864
a
Franklin
High
Yield
Corporate
ETF
1,706,502
2,449,038
(353,868)
(26,227)
24,134
3,799,579
159,178
158,961
Franklin
International
Aggregate
Bond
ETF
................
1,431,031
201,795
(203,541)
(49,600)
43,119
1,422,804
70,158
42,201
Franklin
International
Core
Equity
(IU)
Fund
................
10,928,089
1,247,142
(3,231,997)
224,106
(58,489)
9,108,851
778,534
433,074
a
Franklin
Investment
Grade
Corporate
ETF
............
2,140,380
8,220,903
(529,608)
(78,649)
(255,684)
9,497,342
450,365
202,668
Franklin
Systematic
Style
Premia
ETF
....................
1,092,957
85,187
(163,988)
5,270
106,329
1,125,755
47,083
13,326
Franklin
U.S.
Core
Bond
ETF
...
16,834,046
5,984,516
(2,410,595)
(423,507)
(111,712)
19,872,748
942,283
743,474
Franklin
U.S.
Core
Equity
(IU)
Fund
19,852,245
2,672,681
(6,951,229)
1,755,441
2,027,091
19,356,229
1,121,450
1,626,748
a
Franklin
U.S.
Equity
Index
ETF
.
2,114,296
621,022
(1,169,801)
128,906
270,788
1,965,211
38,275
26,168
Franklin
U.S.
Large
Cap
Multifactor
Index
ETF
...............
4,663,962
335,404
(1,425,920)
314,617
614,668
4,502,731
76,786
53,664
Franklin
U.S.
Treasury
Bond
ETF
5,573,561
5,910,701
(1,169,952)
(193,541)
(146,017)
9,974,752
495,763
365,350
Institutional
Fiduciary
Trust
-
Money
Market
Portfolio,
4.183%
......
404,403
19,319,787
(19,720,425)
—
—
3,765
3,765
42,410
3.
Transactions
with
Affiliates
(continued)
f.
Investments
in
FT
Underlying
Funds
(continued)
Franklin
Fund
Allocator
Series
Notes
to
Financial
Statements
aa
Value
at
Beginning
of
Year
Purchases
Sales
Realized
Gain
(Loss)
Net
Change
in
Unrealized
Appreciation
(Depreciation)
Value
at
End
of
Year
Number
of
Shares
Held
at
End
of
Year
Dividend
Income
a
a
a
a
a
a
a
a
a
Franklin
LifeSmart™
2025
Retirement
Target
Fund
(continued)
Non-Controlled
Affiliates
(continued)
Putnam
Large
Cap
Value
Fund,
Class
R6
................
$
—
$
5,427,567
$
(78,517)
$
1,573
$
(377,567)
$
4,973,056
144,188
$
285,098
a
Templeton
Developing
Markets
Trust,
Class
R6
............
2,565,806
704,327
(1,272,906)
(59,712)
195,466
2,132,981
114,800
62,048
a
Templeton
Foreign
Fund,
Class
R6
2,509,499
519,437
(846,247)
100,807
(185,144)
2,098,352
280,904
57,793
Western
Asset
Core
Plus
Bond
Fund,
Class
IS
............
9,399,396
1,320,320
(10,772,996)
(1,224,127)
1,277,407
—
—
297,843
Western
Asset
Short-Term
Bond
Fund,
Class
IS
............
2,115,581
296,585
(2,443,233)
(31,187)
62,254
—
—
60,348
Total
Non-Controlled
Affiliates
$104,583,393
$58,185,179
$(61,313,118)
$2,122,820
$2,788,134
$106,366,408
$5,474,211
Total
Affiliated
Securities
....
$104,583,393
$58,185,179
$(61,313,118)
$2,122,820
$2,788,134
$106,366,408
$5,474,211
Franklin
LifeSmart™
2030
Retirement
Target
Fund
Non-Controlled
Affiliates
BrandywineGLOBAL
-
Global
Opportunities
Bond
Fund,
Class
IS
1,511,702
601,722
(173,825)
(45,711)
(167,956)
1,725,932
210,479
60,887
ClearBridge
International
Growth
Fund,
Class
IS
............
1,111,715
129,596
(255,012)
18,630
56,865
1,061,794
16,426
15,733
ClearBridge
Large
Cap
Value
Fund,
Class
IS
.................
2,486,207
307,957
(3,010,499)
596,037
(379,702)
—
—
29,629
a
Franklin
Emerging
Market
Core
Equity
(IU)
Fund
...........
2,392,445
472,937
(478,551)
11,004
144,034
2,541,869
250,925
105,905
Franklin
Growth
Fund,
Class
R6
.
5,932,774
1,195,872
(1,014,135)
79,913
416,006
6,610,430
49,086
527,113
a
Franklin
High
Yield
Corporate
ETF
774,294
1,353,469
(125,263)
(8,568)
6,111
2,000,043
83,789
80,713
Franklin
International
Aggregate
Bond
ETF
................
651,460
159,629
(59,212)
(13,398)
10,522
749,001
36,933
22,321
Franklin
International
Core
Equity
(IU)
Fund
................
7,268,271
1,230,338
(1,544,912)
31,446
36,970
7,022,113
600,181
321,975
a
Franklin
Investment
Grade
Corporate
ETF
............
971,595
4,370,192
(169,496)
(25,639)
(147,106)
4,999,546
237,079
103,834
Franklin
Systematic
Style
Premia
ETF
....................
628,629
112,141
(56,403)
477
64,998
749,842
31,361
8,876
Franklin
U.S.
Core
Bond
ETF
...
7,642,216
3,759,002
(678,529)
(111,904)
(149,090)
10,461,695
496,050
373,792
Franklin
U.S.
Core
Equity
(IU)
Fund
13,211,611
2,684,952
(3,618,937)
472,689
2,159,710
14,910,025
863,849
1,240,220
a
Franklin
U.S.
Equity
Index
ETF
.
1,406,756
504,701
(686,613)
62,020
226,310
1,513,174
29,471
19,453
Franklin
U.S.
Large
Cap
Multifactor
Index
ETF
...............
3,103,041
383,935
(680,954)
84,927
577,314
3,468,263
59,145
39,960
Franklin
U.S.
Treasury
Bond
ETF
2,529,946
3,216,359
(326,817)
(52,066)
(116,243)
5,251,179
260,993
184,417
Institutional
Fiduciary
Trust
-
Money
Market
Portfolio,
4.183%
......
712,937
11,024,308
(11,735,161)
—
—
2,084
2,084
31,389
3.
Transactions
with
Affiliates
(continued)
f.
Investments
in
FT
Underlying
Funds
(continued)
Franklin
Fund
Allocator
Series
Notes
to
Financial
Statements
aa
Value
at
Beginning
of
Year
Purchases
Sales
Realized
Gain
(Loss)
Net
Change
in
Unrealized
Appreciation
(Depreciation)
Value
at
End
of
Year
Number
of
Shares
Held
at
End
of
Year
Dividend
Income
a
a
a
a
a
a
a
a
a
Franklin
LifeSmart™
2030
Retirement
Target
Fund
(continued)
Non-Controlled
Affiliates
(continued)
Putnam
Large
Cap
Value
Fund,
Class
R6
................
$
—
$
4,143,294
$
(19,201)
$
(2,286)
$
(291,071)
$
3,830,736
111,068
$
220,713
a
Templeton
Developing
Markets
Trust,
Class
R6
............
1,719,622
580,066
(749,022)
31,452
61,065
1,643,183
88,438
47,759
a
Templeton
Foreign
Fund,
Class
R6
1,669,040
478,471
(458,156)
8,404
(80,076)
1,617,683
216,557
44,778
Western
Asset
Core
Plus
Bond
Fund,
Class
IS
............
4,267,097
918,398
(5,232,063)
(421,219)
467,787
—
—
144,994
Western
Asset
Short-Term
Bond
Fund,
Class
IS
............
960,425
222,493
(1,199,451)
3,511
13,022
—
—
29,348
Total
Non-Controlled
Affiliates
$60,951,783
$37,849,832
$(32,272,212)
$719,719
$2,909,470
$70,158,592
$3,653,809
Total
Affiliated
Securities
....
$60,951,783
$37,849,832
$(32,272,212)
$719,719
$2,909,470
$70,158,592
$3,653,809
Franklin
LifeSmart™
2035
Retirement
Target
Fund
Non-Controlled
Affiliates
BrandywineGLOBAL
-
Global
Opportunities
Bond
Fund,
Class
IS
2,160,214
842,347
(201,983)
(52,127)
(254,081)
2,494,370
304,191
87,572
ClearBridge
International
Growth
Fund,
Class
IS
............
2,443,406
205,194
(481,059)
42,559
124,067
2,334,167
36,110
34,469
ClearBridge
Large
Cap
Value
Fund,
Class
IS
.................
5,462,294
533,052
(6,470,529)
1,315,363
(840,180)
—
—
64,926
a
Franklin
Emerging
Market
Core
Equity
(IU)
Fund
...........
5,255,477
845,779
(848,266)
(21,093)
364,009
5,595,906
552,409
231,941
Franklin
Growth
Fund,
Class
R6
.
13,034,561
2,225,532
(1,821,687)
316,053
777,128
14,531,587
107,905
1,155,148
a
Franklin
High
Yield
Corporate
ETF
1,111,525
1,950,225
(167,815)
(11,307)
7,719
2,890,347
121,087
116,444
Franklin
International
Aggregate
Bond
ETF
................
931,048
224,666
(69,930)
(16,353)
12,548
1,081,979
53,352
32,152
Franklin
International
Core
Equity
(IU)
Fund
................
15,974,688
2,239,954
(2,933,549)
75,307
80,266
15,436,666
1,319,373
705,578
a
Franklin
Investment
Grade
Corporate
ETF
............
1,393,954
6,291,912
(211,616)
(34,353)
(214,671)
7,225,226
342,621
149,865
Franklin
Systematic
Style
Premia
ETF
....................
1,220,519
196,362
(98,235)
627
126,087
1,445,360
60,450
17,110
Franklin
U.S.
Core
Bond
ETF
...
10,965,448
5,232,413
(705,807)
(117,200)
(256,298)
15,118,556
716,859
538,715
Franklin
U.S.
Core
Equity
(IU)
Fund
29,026,351
4,817,905
(6,839,959)
813,145
4,967,888
32,785,330
1,899,498
2,729,407
a
Franklin
U.S.
Equity
Index
ETF
.
3,092,366
1,049,244
(1,448,069)
151,248
482,951
3,327,740
64,812
42,632
Franklin
U.S.
Large
Cap
Multifactor
Index
ETF
...............
6,819,236
667,676
(1,316,077)
200,848
1,255,856
7,627,539
130,074
87,569
Franklin
U.S.
Treasury
Bond
ETF
3,630,568
4,537,977
(338,080)
(53,293)
(188,552)
7,588,620
377,168
265,893
Institutional
Fiduciary
Trust
-
Money
Market
Portfolio,
4.183%
......
167,891
16,149,655
(16,312,902)
—
—
4,644
4,644
57,870
3.
Transactions
with
Affiliates
(continued)
f.
Investments
in
FT
Underlying
Funds
(continued)
Franklin
Fund
Allocator
Series
Notes
to
Financial
Statements
aa
Value
at
Beginning
of
Year
Purchases
Sales
Realized
Gain
(Loss)
Net
Change
in
Unrealized
Appreciation
(Depreciation)
Value
at
End
of
Year
Number
of
Shares
Held
at
End
of
Year
Dividend
Income
a
a
a
a
a
a
a
a
a
Franklin
LifeSmart™
2035
Retirement
Target
Fund
(continued)
Non-Controlled
Affiliates
(continued)
Putnam
Large
Cap
Value
Fund,
Class
R6
................
$
—
$
9,134,547
$
(70,562)
$
570
$
(641,235)
$
8,423,320
244,225
$
483,681
a
Templeton
Developing
Markets
Trust,
Class
R6
............
3,784,328
1,145,586
(1,517,352)
(66,882)
271,785
3,617,465
194,697
104,848
a
Templeton
Foreign
Fund,
Class
R6
3,668,343
895,412
(852,353)
23,425
(178,661)
3,556,166
476,060
98,104
Western
Asset
Core
Plus
Bond
Fund,
Class
IS
............
6,122,530
1,350,083
(7,543,841)
(597,260)
668,488
—
—
208,165
Western
Asset
Short-Term
Bond
Fund,
Class
IS
............
1,378,083
313,221
(1,715,360)
8,403
15,653
—
—
42,102
Total
Non-Controlled
Affiliates
$117,642,830
$60,848,742
$(51,965,031)
$1,977,680
$6,580,767
$135,084,988
$7,254,191
Total
Affiliated
Securities
....
$117,642,830
$60,848,742
$(51,965,031)
$1,977,680
$6,580,767
$135,084,988
$7,254,191
Franklin
LifeSmart™
2040
Retirement
Target
Fund
Non-Controlled
Affiliates
ClearBridge
International
Growth
Fund,
Class
IS
............
1,143,148
162,967
(222,694)
12,502
63,495
1,159,418
17,937
17,151
ClearBridge
Large
Cap
Value
Fund,
Class
IS
.................
2,555,586
384,349
(3,164,471)
599,826
(375,290)
—
—
30,691
a
Franklin
Emerging
Market
Core
Equity
(IU)
Fund
...........
2,441,885
564,347
(379,886)
(17,700)
171,875
2,780,521
274,484
112,115
Franklin
Growth
Fund,
Class
R6
.
6,169,181
1,438,974
(871,432)
34,732
446,717
7,218,172
53,599
572,990
a
Franklin
High
Yield
Corporate
ETF
342,177
679,606
(37,673)
(2,278)
371
982,203
41,148
38,225
Franklin
International
Core
Equity
(IU)
Fund
................
7,473,832
1,552,725
(1,410,658)
3,422
48,157
7,667,478
655,340
339,977
a
Franklin
Investment
Grade
Corporate
ETF
............
428,834
2,146,954
(37,223)
(5,977)
(76,816)
2,455,772
116,453
49,627
Franklin
Systematic
Style
Premia
ETF
....................
512,824
105,252
(24,777)
(100)
53,256
646,455
27,037
7,652
Franklin
U.S.
Core
Bond
ETF
...
3,375,466
2,045,371
(162,696)
(27,645)
(91,348)
5,139,148
243,677
175,226
Franklin
U.S.
Core
Equity
(IU)
Fund
10,815,466
1,850,586
(2,216,707)
284,472
1,833,545
12,567,362
728,121
1,051,515
a
Franklin
U.S.
Equity
Index
ETF
.
4,135,988
1,011,745
(723,408)
62,128
881,614
5,368,067
104,550
62,766
Franklin
U.S.
Large
Cap
Multifactor
Index
ETF
...............
3,189,700
491,450
(579,507)
53,996
633,502
3,789,141
64,617
42,100
Franklin
U.S.
Treasury
Bond
ETF
1,117,178
1,619,680
(79,838)
(13,346)
(64,370)
2,579,304
128,196
86,731
Institutional
Fiduciary
Trust
-
Money
Market
Portfolio,
4.183%
......
308,445
8,197,594
(8,503,948)
—
—
2,091
2,091
26,179
Putnam
Large
Cap
Value
Fund,
Class
R6
................
—
4,519,938
(14,231)
(1,373)
(319,364)
4,184,970
121,339
240,719
a
Templeton
Developing
Markets
Trust,
Class
R6
............
1,781,865
621,393
(696,872)
(23,739)
114,622
1,797,269
96,731
51,457
a
3.
Transactions
with
Affiliates
(continued)
f.
Investments
in
FT
Underlying
Funds
(continued)
Franklin
Fund
Allocator
Series
Notes
to
Financial
Statements
aa
Value
at
Beginning
of
Year
Purchases
Sales
Realized
Gain
(Loss)
Net
Change
in
Unrealized
Appreciation
(Depreciation)
Value
at
End
of
Year
Number
of
Shares
Held
at
End
of
Year
Dividend
Income
a
a
a
a
a
a
a
a
a
Franklin
LifeSmart™
2040
Retirement
Target
Fund
(continued)
Non-Controlled
Affiliates
(continued)
Templeton
Foreign
Fund,
Class
R6
$
1,716,215
$
515,328
$
(384,044)
$
7,572
$
(88,698)
$
1,766,373
236,462
$
48,650
Western
Asset
Core
Plus
Bond
Fund,
Class
IS
............
1,884,719
578,380
(2,492,552)
(86,657)
116,110
—
—
65,911
Western
Asset
Short-Term
Bond
Fund,
Class
IS
............
424,242
134,975
(567,308)
7,894
197
—
—
13,319
Total
Non-Controlled
Affiliates
$49,816,751
$28,621,614
$(22,569,925)
$887,729
$3,347,575
$60,103,744
$3,033,001
Total
Affiliated
Securities
....
$49,816,751
$28,621,614
$(22,569,925)
$887,729
$3,347,575
$60,103,744
$3,033,001
Franklin
LifeSmart™
2045
Retirement
Target
Fund
Non-Controlled
Affiliates
ClearBridge
International
Growth
Fund,
Class
IS
............
2,116,749
297,697
(412,320)
26,709
116,602
2,145,437
33,191
31,631
ClearBridge
Large
Cap
Value
Fund,
Class
IS
.................
4,733,010
690,119
(5,843,526)
1,132,009
(711,612)
—
—
57,491
a
Franklin
Emerging
Market
Core
Equity
(IU)
Fund
...........
4,514,017
965,182
(632,172)
(26,080)
320,204
5,141,151
507,517
209,542
Franklin
Growth
Fund,
Class
R6
.
11,425,471
2,461,389
(1,445,301)
54,185
856,745
13,352,489
99,150
1,059,943
a
Franklin
International
Core
Equity
(IU)
Fund
................
13,839,193
2,722,183
(2,475,370)
6,795
95,550
14,188,351
1,212,680
635,651
a
Franklin
Systematic
Style
Premia
ETF
....................
864,571
161,420
(39,846)
(105)
90,125
1,076,165
45,009
12,739
Franklin
U.S.
Core
Bond
ETF
...
3,590,239
7,010,728
(851,592)
(96,802)
(221,420)
9,431,153
447,186
244,555
Franklin
U.S.
Core
Equity
(IU)
Fund
20,030,536
2,923,364
(3,665,465)
758,045
3,201,165
23,247,645
1,346,909
1,958,167
a
Franklin
U.S.
Equity
Index
ETF
.
7,661,202
1,814,177
(1,308,696)
98,981
1,664,362
9,930,026
193,400
117,084
Franklin
U.S.
Large
Cap
Multifactor
Index
ETF
...............
5,908,547
849,963
(1,032,624)
102,227
1,181,830
7,009,943
119,542
78,520
Institutional
Fiduciary
Trust
-
Money
Market
Portfolio,
4.183%
......
349,503
11,028,788
(11,374,882)
—
—
3,409
3,409
42,358
Putnam
Large
Cap
Value
Fund,
Class
R6
................
—
8,357,235
(26,003)
881
(590,510)
7,741,603
224,459
443,814
a
Templeton
Developing
Markets
Trust,
Class
R6
............
3,318,948
1,102,340
(1,271,881)
(60,680)
234,753
3,323,480
178,874
95,565
a
Templeton
Foreign
Fund,
Class
R6
3,177,885
936,694
(699,910)
16,883
(162,928)
3,268,624
437,567
90,025
3.
Transactions
with
Affiliates
(continued)
f.
Investments
in
FT
Underlying
Funds
(continued)
Franklin
Fund
Allocator
Series
Notes
to
Financial
Statements
aa
Value
at
Beginning
of
Year
Purchases
Sales
Realized
Gain
(Loss)
Net
Change
in
Unrealized
Appreciation
(Depreciation)
Value
at
End
of
Year
Number
of
Shares
Held
at
End
of
Year
Dividend
Income
a
a
a
a
a
a
a
a
a
Franklin
LifeSmart™
2045
Retirement
Target
Fund
(continued)
Non-Controlled
Affiliates
(continued)
Western
Asset
Core
Plus
Bond
Fund,
Class
IS
............
$
3,600,983
$
1,636,381
$
(5,320,739)
$
(13,495)
$
96,870
$
—
—
$
133,732
Total
Non-Controlled
Affiliates
$85,130,854
$42,957,660
$(36,400,327)
$1,999,553
$6,171,736
$99,859,476
$5,210,817
Total
Affiliated
Securities
....
$85,130,854
$42,957,660
$(36,400,327)
$1,999,553
$6,171,736
$99,859,476
$5,210,817
Franklin
LifeSmart™
2050
Retirement
Target
Fund
Non-Controlled
Affiliates
ClearBridge
International
Growth
Fund,
Class
IS
............
1,064,121
285,406
(176,800)
5,278
66,149
1,244,154
19,247
18,404
ClearBridge
Large
Cap
Value
Fund,
Class
IS
.................
2,378,783
655,126
(3,264,662)
587,738
(356,985)
—
—
31,822
a
Franklin
Emerging
Market
Core
Equity
(IU)
Fund
...........
2,263,490
782,422
(210,642)
(8,215)
154,875
2,981,930
294,366
119,669
Franklin
Growth
Fund,
Class
R6
.
5,742,365
2,068,163
(491,060)
(208)
427,361
7,746,621
57,523
616,985
a
Franklin
International
Core
Equity
(IU)
Fund
................
6,957,196
2,300,595
(1,021,309)
(24,130)
15,848
8,228,200
703,265
359,076
a
Franklin
Systematic
Style
Premia
ETF
....................
410,549
150,349
(16,948)
(99)
43,450
587,301
24,563
6,952
Franklin
U.S.
Core
Bond
ETF
...
589,686
1,728,585
(527,226)
(17,067)
(44,408)
1,729,570
82,009
46,438
Franklin
U.S.
Core
Equity
(IU)
Fund
10,067,241
2,693,851
(1,345,722)
86,553
1,985,255
13,487,178
781,412
1,123,893
a
Franklin
U.S.
Equity
Index
ETF
.
3,849,850
1,433,063
(474,489)
(590)
953,276
5,761,110
112,205
65,926
Franklin
U.S.
Large
Cap
Multifactor
Index
ETF
...............
2,969,234
812,661
(403,739)
1,459
686,307
4,065,922
69,337
44,251
Institutional
Fiduciary
Trust
-
Money
Market
Portfolio,
4.183%
......
313,460
5,455,018
(5,766,634)
—
—
1,844
1,844
24,036
Putnam
Large
Cap
Value
Fund,
Class
R6
................
—
4,851,011
(14,029)
(1,671)
(343,123)
4,492,188
130,246
258,335
a
Templeton
Developing
Markets
Trust,
Class
R6
............
1,666,680
763,410
(590,674)
(23,889)
112,096
1,927,623
103,747
55,604
a
Templeton
Foreign
Fund,
Class
R6
1,597,562
663,711
(273,183)
1,778
(94,351)
1,895,517
253,751
52,380
Western
Asset
Core
Plus
Bond
Fund,
Class
IS
............
591,854
572,486
(1,189,879)
44,729
(19,190)
—
—
23,885
3.
Transactions
with
Affiliates
(continued)
f.
Investments
in
FT
Underlying
Funds
(continued)
Franklin
Fund
Allocator
Series
Notes
to
Financial
Statements
aa
Value
at
Beginning
of
Year
Purchases
Sales
Realized
Gain
(Loss)
Net
Change
in
Unrealized
Appreciation
(Depreciation)
Value
at
End
of
Year
Number
of
Shares
Held
at
End
of
Year
Dividend
Income
a
a
a
a
a
a
a
a
a
Franklin
LifeSmart™
2050
Retirement
Target
Fund
(continued)
Non-Controlled
Affiliates
(continued)
Western
Asset
Short-Term
Bond
Fund,
Class
IS
............
$
6
$
—
$
—
$
(6)
$
—
$
—
—
$
—
Total
Non-Controlled
Affiliates
$40,462,077
$25,215,857
$(15,766,996)
$651,660
$3,586,560
$54,149,158
$2,847,656
Total
Affiliated
Securities
....
$40,462,077
$25,215,857
$(15,766,996)
$651,660
$3,586,560
$54,149,158
$2,847,656
Franklin
LifeSmart™
2055
Retirement
Target
Fund
Non-Controlled
Affiliates
ClearBridge
International
Growth
Fund,
Class
IS
............
837,457
168,489
(146,102)
5,577
50,856
916,277
14,175
13,485
ClearBridge
Large
Cap
Value
Fund,
Class
IS
.................
1,871,945
376,650
(2,422,328)
435,591
(261,858)
—
—
23,694
a
Franklin
Emerging
Market
Core
Equity
(IU)
Fund
...........
1,783,287
479,715
(181,924)
(13,912)
130,906
2,198,072
216,986
87,522
Franklin
Growth
Fund,
Class
R6
.
4,518,859
1,278,332
(439,690)
5,687
342,369
5,705,557
42,367
453,317
a
Franklin
International
Core
Equity
(IU)
Fund
................
5,475,307
1,466,342
(903,234)
(9,729)
31,141
6,059,827
517,934
264,647
a
Franklin
Systematic
Style
Premia
ETF
....................
319,619
82,147
(11,716)
(95)
33,563
423,518
17,713
5,013
Franklin
U.S.
Core
Bond
ETF
...
292,324
1,003,460
(641,595)
(18,960)
(8,413)
626,816
29,721
21,336
Franklin
U.S.
Core
Equity
(IU)
Fund
7,922,253
1,617,822
(1,205,489)
52,087
1,547,226
9,933,899
575,545
826,805
a
Franklin
U.S.
Equity
Index
ETF
.
3,029,936
900,792
(412,611)
23,715
699,224
4,241,056
82,600
48,918
Franklin
U.S.
Large
Cap
Multifactor
Index
ETF
...............
2,337,039
457,723
(325,655)
13,354
511,052
2,993,513
51,049
32,819
Institutional
Fiduciary
Trust
-
Money
Market
Portfolio,
4.183%
......
236,168
5,478,729
(5,713,477)
—
—
1,420
1,420
16,767
Putnam
Large
Cap
Value
Fund,
Class
R6
................
—
3,572,528
(11,369)
(231)
(252,622)
3,308,306
95,921
189,294
a
Templeton
Developing
Markets
Trust,
Class
R6
............
1,311,487
516,947
(476,629)
(18,211)
87,455
1,421,049
76,483
40,765
a
Templeton
Foreign
Fund,
Class
R6
1,257,276
447,918
(243,969)
3,402
(68,090)
1,396,537
186,953
38,498
3.
Transactions
with
Affiliates
(continued)
f.
Investments
in
FT
Underlying
Funds
(continued)
Franklin
Fund
Allocator
Series
Notes
to
Financial
Statements
aa
Value
at
Beginning
of
Year
Purchases
Sales
Realized
Gain
(Loss)
Net
Change
in
Unrealized
Appreciation
(Depreciation)
Value
at
End
of
Year
Number
of
Shares
Held
at
End
of
Year
Dividend
Income
a
a
a
a
a
a
a
a
a
Franklin
LifeSmart™
2055
Retirement
Target
Fund
(continued)
Non-Controlled
Affiliates
(continued)
Western
Asset
Core
Plus
Bond
Fund,
Class
IS
............
$
293,346
$
357,717
$
(666,735)
$
26,707
$
(11,035)
$
—
—
$
11,904
Total
Non-Controlled
Affiliates
$31,486,303
$18,205,311
$(13,802,523)
$504,982
$2,831,774
$39,225,847
$2,074,784
Total
Affiliated
Securities
....
$31,486,303
$18,205,311
$(13,802,523)
$504,982
$2,831,774
$39,225,847
$2,074,784
Franklin
LifeSmart™
2060
Retirement
Target
Fund
Non-Controlled
Affiliates
ClearBridge
International
Growth
Fund,
Class
IS
............
121,671
78,961
(27,669)
224
7,315
180,502
2,792
2,609
ClearBridge
Large
Cap
Value
Fund,
Class
IS
.................
271,967
149,426
(450,389)
57,461
(28,465)
—
—
4,047
a
Franklin
Emerging
Market
Core
Equity
(IU)
Fund
...........
258,560
190,989
(31,114)
(6,285)
22,070
434,220
42,865
15,968
Franklin
Growth
Fund,
Class
R6
.
656,526
496,647
(67,346)
(1,951)
41,879
1,125,755
8,359
87,870
a
Franklin
International
Core
Equity
(IU)
Fund
................
795,474
577,854
(166,675)
(5,749)
(5,641)
1,195,263
102,159
47,546
a
Franklin
Systematic
Style
Premia
ETF
....................
46,418
30,957
(563)
(3)
4,939
81,748
3,419
968
Franklin
U.S.
Core
Bond
ETF
...
42,159
207,342
(121,013)
(3,485)
(1,626)
123,377
5,850
3,797
Franklin
U.S.
Core
Equity
(IU)
Fund
1,150,996
748,120
(189,637)
(671)
249,398
1,958,206
113,453
155,665
a
Franklin
U.S.
Equity
Index
ETF
.
440,132
332,007
(57,060)
213
119,056
834,348
16,250
8,715
Franklin
U.S.
Large
Cap
Multifactor
Index
ETF
...............
339,051
208,102
(44,321)
239
85,088
588,159
10,030
5,862
Institutional
Fiduciary
Trust
-
Money
Market
Portfolio,
4.183%
......
94,853
1,627,108
(1,721,616)
—
—
345
345
3,763
Putnam
Large
Cap
Value
Fund,
Class
R6
................
—
703,812
(1,658)
—
(49,508)
652,646
18,923
36,514
a
Templeton
Developing
Markets
Trust,
Class
R6
............
191,056
161,687
(80,858)
(2,813)
11,975
281,047
15,126
7,806
a
Templeton
Foreign
Fund,
Class
R6
182,664
158,567
(50,549)
(844)
(13,818)
276,020
36,951
7,470
Western
Asset
Core
Plus
Bond
Fund,
Class
IS
............
42,616
73,231
(118,838)
5,075
(2,084)
—
—
1,993
Total
Non-Controlled
Affiliates
$4,634,143
$5,744,810
$(3,129,306)
$41,411
$440,578
$7,731,636
$390,593
Total
Affiliated
Securities
....
$4,634,143
$5,744,810
$(3,129,306)
$41,411
$440,578
$7,731,636
$390,593
a
Dividend
income
includes
capital
gain
distributions
received,
if
any,
from
underlying
funds,
and
are
presented
in
corresponding
line
item
in
the
Statements
of
Operations.
3.
Transactions
with
Affiliates
(continued)
f.
Investments
in
FT
Underlying
Funds
(continued)
Franklin
Fund
Allocator
Series
Notes
to
Financial
Statements
g.
Waiver
and
Expense
Reimbursements
Advisers
has
contractually
agreed
in
advance
to
waive
or
limit
its
fees
and
to
assume
as
its
own
expense
certain
expenses
otherwise
payable
by
Franklin
LifeSmart
TM
Retirement
Income
Fund
so
that
the
operating
expenses
(excluding
interest
expense,
distribution
fees,
acquired
fund
fees
and
expenses
and
certain
non-routine
expenses
or
costs,
including
those
relating
to
litigation,
indemnification,
reorganizations,
and
liquidations)
for
each
class
of
the
Fund do
not
exceed
0.05%
and
for
Class
R6
do
not
exceed
0.00%
based
on
the
average
net
assets
of
each
class
until
April
30,
2025.
Total
expenses
waived
or
paid
are
not
subject
to
recapture
subsequent
to
the
Fund's
fiscal
year
end.
Advisers
has
contractually
agreed
in
advance
to
waive
or
limit
its
fees
and
to
assume
as
its
own
expense
certain
expenses
otherwise
payable
by
the
Funds,
except
Franklin
LifeSmart
TM
Retirement
Income
Fund
so
that
the
operating
expenses
(excluding
interest
expense,
distribution
fees
and
certain
non-routine
expenses
or
costs,
including
those
relating
to
litigation,
indemnification,
reorganizations,
and
liquidations)
and
acquired
fund
fees
and
expenses
for
each
class
of
the
Funds do
not
exceed
0.45%
and
for
Class
R6
do
not
exceed
0.40%
based
on
the
average
net
assets
of
each
class
until
April
30,
2025.
Total
expenses
waived
or
paid
are
not
subject
to
recapture
subsequent
to
the
Funds'
fiscal
year
end.
Transfer
agent
fees
on
Class
R6
shares
of
the
Funds have
been
capped
so
that
transfer
agent
fees
for
that
class
do
not
exceed
0.00%
based
on
the
average
net
assets
of
the
class
until
April
30,
2025.
h.
Other
Affiliated
Transactions
At
December
31,
2024, Templeton
International
Inc.
owned
14.3%
of
Franklin
LifeSmart
TM
2060
Retirement
Target
Fund’s
outstanding
shares.
4.
Income
Taxes
For
tax
purposes,
capital
losses
may
be
carried
over
to
offset
future
capital
gains.
At
December
31,
2024,
the
capital
loss
carryforwards
were
as
follows:
During
the
year
ended December
31,
2024,
the
utilized
capital
loss
carryforwards
were
as
follows:
Franklin
LifeSmart™
Retirement
Income
Fund
1
1
Capital
loss
carryforwards
not
subject
to
expiration:
Short
term
................................................................................
$
592,753
Long
term
................................................................................
3,302,667
Total
capital
loss
carryforwards
...............................................................
$3,895,420
Franklin
LifeSmart™
Retirement
Income
Fund
Franklin
LifeSmart™
2020
Retirement
Target
Fund
Franklin
LifeSmart™
2025
Retirement
Target
Fund
Franklin
LifeSmart™
2030
Retirement
Target
Fund
Capital
loss
utilized
carryforwards
.............
$50,000
$441,570
$404,093
$1,291,792
3.
Transactions
with
Affiliates
(continued)
Franklin
Fund
Allocator
Series
Notes
to
Financial
Statements
The
tax
character
of
distributions
paid
during
the
years
ended
December
31,
2024
and
2023,
was
as
follows:
Franklin
LifeSmart™
2050
Retirement
Target
Fund
Franklin
LifeSmart™
2055
Retirement
Target
Fund
Capital
loss
utilized
carryforwards
...............................................
$64,022
$25,370
Franklin
LifeSmart™
Retirement
Income
Fund
Franklin
LifeSmart™
2020
Retirement
Target
Fund
2024
2023
2024
2023
Distributions
paid
from:
Ordinary
income
........................
$2,273,979
$2,398,231
$774,947
$813,549
Franklin
LifeSmart™
2025
Retirement
Target
Fund
Franklin
LifeSmart™
2030
Retirement
Target
Fund
2024
2023
2024
2023
Distributions
paid
from:
Ordinary
income
........................
$3,615,421
$3,027,131
$1,692,526
$1,238,578
Long
term
capital
gain
....................
35,905
54,312
—
—
$3,651,326
$3,081,443
$1,692,526
$1,238,578
Franklin
LifeSmart™
2035
Retirement
Target
Fund
Franklin
LifeSmart™
2040
Retirement
Target
Fund
2024
2023
2024
2023
Distributions
paid
from:
Ordinary
income
........................
$3,746,968
$2,917,768
$1,615,293
$1,028,011
Long
term
capital
gain
....................
9,637
363,896
169,624
149,902
$3,756,605
$3,281,664
$1,784,917
$1,177,913
Franklin
LifeSmart™
2045
Retirement
Target
Fund
Franklin
LifeSmart™
2050
Retirement
Target
Fund
2024
2023
2024
2023
Distributions
paid
from:
Ordinary
income
........................
$2,571,496
$1,530,127
$1,201,149
$539,411
Long
term
capital
gain
....................
355,597
436,888
35,080
135,782
$2,927,093
$1,967,015
$1,236,229
$675,193
Franklin
LifeSmart™
2055
Retirement
Target
Fund
Franklin
LifeSmart™
2060
Retirement
Target
Fund
2024
2023
2024
2023
Distributions
paid
from:
Ordinary
income
........................
$929,641
$399,537
$150,028
$70,207
Long
term
capital
gain
....................
—
213,765
619
13,734
$929,641
$613,302
$150,647
$83,941
Franklin
Fund
Allocator
Series
Notes
to
Financial
Statements
At
December
31,
2024,
the
cost
of
investments,
net
unrealized
appreciation
(depreciation),
undistributed
ordinary
income
and
undistributed
long
term
capital
gains for
income
tax
purposes
were
as
follows:
Franklin
LifeSmart™
Retirement
Income
Fund
Franklin
LifeSmart™
2020
Retirement
Target
Fund
Franklin
LifeSmart™
2025
Retirement
Target
Fund
Franklin
LifeSmart™
2030
Retirement
Target
Fund
a
a
a
a
a
Cost
of
investments
.......................
$45,414,367
$24,099,740
$97,604,955
$62,536,177
Unrealized
appreciation
.....................
$2,500,672
$3,384,805
$18,620,893
$12,721,158
Unrealized
depreciation
.....................
(3,083,905)
(2,025,099)
(6,744,618)
(3,047,405)
Net
unrealized
appreciation
(depreciation)
.......
$(583,233)
$1,359,706
$11,876,275
$9,673,753
Distributable
earnings:
Undistributed
ordinary
income
................
$430,330
$160,832
$3,111
$342,168
Undistributed
long
term
capital
gains
...........
—
437,069
3,255,083
1,044,192
Total
distributable
earnings
..................
$430,330
$597,901
$3,258,194
$1,386,360
Franklin
LifeSmart™
2035
Retirement
Target
Fund
Franklin
LifeSmart™
2040
Retirement
Target
Fund
Franklin
LifeSmart™
2045
Retirement
Target
Fund
Franklin
LifeSmart™
2050
Retirement
Target
Fund
a
a
a
a
a
Cost
of
investments
.......................
$115,914,200
$51,201,456
$80,925,708
$45,028,806
Unrealized
appreciation
.....................
$28,613,758
$12,393,211
$24,636,944
$12,106,717
Unrealized
depreciation
.....................
(4,940,808)
(1,342,685)
(1,843,766)
(832,334)
Net
unrealized
appreciation
(depreciation)
.......
$23,672,950
$11,050,526
$22,793,178
$11,274,383
Distributable
earnings:
Undistributed
ordinary
income
................
$163,256
$105,225
$37,955
$19,618
Undistributed
long
term
capital
gains
...........
4,850,467
2,080,454
4,065,895
2,276,439
Total
distributable
earnings
..................
$5,013,723
$2,185,679
$4,103,850
$2,296,057
Franklin
LifeSmart™
2055
Retirement
Target
Fund
Franklin
LifeSmart™
2060
Retirement
Target
Fund
a
a
a
Cost
of
investments
.........................................................
$32,698,768
$7,303,693
Unrealized
appreciation
.......................................................
$8,540,043
$865,961
Unrealized
depreciation
.......................................................
(718,558)
(187,407)
Net
unrealized
appreciation
(depreciation)
.........................................
$7,821,485
$678,554
Distributable
earnings:
Undistributed
ordinary
income
..................................................
$18,754
$7,814
Undistributed
long
term
capital
gains
.............................................
1,677,709
292,240
Total
distributable
earnings
....................................................
$1,696,463
$300,054
Franklin
Fund
Allocator
Series
Notes
to
Financial
Statements
Differences
between
income
and/or
capital
gains
as
determined
on
a
book
basis
and
a
tax
basis
are
primarily
due
to
differing
treatments
of
wash
sales,
regulated
investment
companies
and
equity-linked
securities.
The
Funds,
except
for
Franklin
LifeSmart™
Retirement
Income
Fund
utilized
a
tax
accounting
practice
to
treat
a
portion
of
the
proceeds
from
capital
shares
redeemed
as
a
distribution
from
realized
capital
gains.
5.
Investment
Transactions
Purchases
and
sales
of
investments
(excluding
short
term
securities)
for
the
year
ended
December
31,
2024,
were
as
follows:
6.
Credit
Facility
The
Funds,
together
with
other
U.S.
registered
and
foreign
investment
funds
(collectively,
Borrowers),
managed
by
Franklin
Templeton,
are
borrowers
in
a
joint
syndicated
senior
unsecured
credit
facility
totaling
$2.675
billion
(Global
Credit
Facility)
which
matured
on
January
31,
2025.
This
Global
Credit
Facility
provides
a
source
of
funds
to
the
Borrowers
for
temporary
and
emergency
purposes,
including
the
ability
to
meet
future
unanticipated
or
unusually
large
redemption
requests.
Effective
January
31,
2025,
the
Borrowers
renewed
the
Global
Credit
Facility
for
a
one-year
term,
maturing
January
30,
2026,
for
a
total
of
$2.995
billion.
Under
the
terms
of
the
Global
Credit
Facility,
the
Funds
may,
in
addition
to
interest
charged
on
any
borrowings
made
by
the
Funds
and
other
costs
incurred
by
the
Funds,
pay
their
share
of
fees
and
expenses
incurred
in
connection
with
the
implementation
and
maintenance
of
the
Global
Credit
Facility,
based
upon
their
relative
share
of
the
aggregate
net
assets
of
all
of
the
Borrowers,
including
an
annual
commitment
fee
of
0.15%
based
upon
the
unused
portion
of
the
Global
Credit
Facility.
These
fees
are
reflected
in
other
expenses
in
the
Statements
of
Operations.
During
the
year ended
December
31,
2024,
the
Funds
did
not
use
the
Global
Credit
Facility.
Franklin
LifeSmart™
Retirement
Income
Fund
Franklin
LifeSmart™
2020
Retirement
Target
Fund
Franklin
LifeSmart™
2025
Retirement
Target
Fund
Franklin
LifeSmart™
2030
Retirement
Target
Fund
Purchases
..............................
$16,961,871
$10,627,991
$42,043,903
$29,143,891
Sales
..................................
$20,281,823
$16,889,372
$51,935,729
$26,336,557
Franklin
LifeSmart™
2035
Retirement
Target
Fund
Franklin
LifeSmart™
2040
Retirement
Target
Fund
Franklin
LifeSmart™
2045
Retirement
Target
Fund
Franklin
LifeSmart™
2050
Retirement
Target
Fund
Purchases
..............................
$49,117,789
$22,518,010
$35,286,759
$21,821,037
Sales
..................................
$45,935,375
$18,269,582
$30,388,309
$12,834,419
Franklin
LifeSmart™
2055
Retirement
Target
Fund
Franklin
LifeSmart™
2060
Retirement
Target
Fund
Purchases
................................................................
$14,180,390
$4,456,059
Sales
....................................................................
$10,239,094
$1,783,912
Franklin
Fund
Allocator
Series
Notes
to
Financial
Statements
7.
Fair
Value
Measurements
The Funds
follow
a
fair
value
hierarchy
that
distinguishes
between
market
data
obtained
from
independent
sources
(observable
inputs)
and
the Funds'
own
market
assumptions
(unobservable
inputs).
These
inputs
are
used
in
determining
the
value
of
the Funds' financial
instruments
and
are
summarized
in
the
following
fair
value
hierarchy:
Level
1
–
quoted
prices
in
active
markets
for
identical
financial
instruments
Level
2
–
other
significant
observable
inputs
(including
quoted
prices
for
similar
financial
instruments,
interest
rates,
prepayment
speed,
credit
risk,
etc.)
Level
3
–
significant
unobservable
inputs
(including
the Funds'
own
assumptions
in
determining
the
fair
value
of
financial
instruments)
The
input
levels
are
not
necessarily
an
indication
of
the
risk
or
liquidity
associated
with
financial
instruments
at
that
level.
A
summary
of
inputs
used
as
of
December
31,
2024,
in
valuing
the
Funds'
assets carried
at
fair
value,
is
as
follows:
Level
1
Level
2
Level
3
Total
Franklin
LifeSmart™
Retirement
Income
Fund
Assets:
Investments
in
Securities:
a
Investments
in
Underlying
Funds
and
Exchange
Traded
Funds
...........................
$
41,429,466
$
—
$
—
$
41,429,466
Index-Linked
Notes
:
Capital
Markets
........................
—
—
2,335,071
2,335,071
Short
Term
Investments
...................
1,066,597
—
—
1,066,597
Total
Investments
in
Securities
...........
$42,496,063
$—
$2,335,071
$44,831,134
Franklin
LifeSmart™
2020
Retirement
Target
Fund
Assets:
Investments
in
Securities:
a
Investments
in
Underlying
Funds
and
Exchange
Traded
Funds
...........................
25,266,631
—
—
25,266,631
Short
Term
Investments
...................
20,292
172,523
—
192,815
Total
Investments
in
Securities
...........
$25,286,923
$172,523
$—
$25,459,446
Franklin
LifeSmart™
2025
Retirement
Target
Fund
Assets:
Investments
in
Securities:
a
Investments
in
Underlying
Funds
and
Exchange
Traded
Funds
...........................
108,308,025
—
—
108,308,025
Short
Term
Investments
...................
3,765
1,169,440
—
1,173,205
Total
Investments
in
Securities
...........
$108,311,790
$1,169,440
$—
$109,481,230
Franklin
LifeSmart™
2030
Retirement
Target
Fund
Assets:
Investments
in
Securities:
a
Investments
in
Underlying
Funds
and
Exchange
Traded
Funds
...........................
71,653,741
—
—
71,653,741
Short
Term
Investments
...................
2,084
554,105
—
556,189
Total
Investments
in
Securities
...........
$71,655,825
$554,105
$—
$72,209,930
Franklin
LifeSmart™
2035
Retirement
Target
Fund
Assets:
Investments
in
Securities:
a
Investments
in
Underlying
Funds
and
Exchange
Traded
Funds
...........................
138,374,776
—
—
138,374,776
Short
Term
Investments
...................
4,644
1,207,730
—
1,212,374
Total
Investments
in
Securities
...........
$138,379,420
$1,207,730
$—
$139,587,150
Franklin
Fund
Allocator
Series
Notes
to
Financial
Statements
A
reconciliation
in
which
Level
3
inputs
are
used
in
determining
fair
value
is
presented
when
there
are
significant
Level
3
assets
and/or
liabilities
at
the
beginning
and/or
end
of
the
year.
At
December
31,
2024,
the
reconciliation
is
as
follows:
Level
1
Level
2
Level
3
Total
Franklin
LifeSmart™
2040
Retirement
Target
Fund
Assets:
Investments
in
Securities:
a
Investments
in
Underlying
Funds
and
Exchange
Traded
Funds
...........................
$
61,740,383
$
—
$
—
$
61,740,383
Short
Term
Investments
...................
2,091
509,508
—
511,599
Total
Investments
in
Securities
...........
$61,742,474
$509,508
$—
$62,251,982
Franklin
LifeSmart™
2045
Retirement
Target
Fund
Assets:
Investments
in
Securities:
a
Investments
in
Underlying
Funds
and
Exchange
Traded
Funds
...........................
102,885,353
—
—
102,885,353
Short
Term
Investments
...................
3,409
830,124
—
833,533
Total
Investments
in
Securities
...........
$102,888,762
$830,124
$—
$103,718,886
Franklin
LifeSmart™
2050
Retirement
Target
Fund
Assets:
Investments
in
Securities:
a
Investments
in
Underlying
Funds
and
Exchange
Traded
Funds
...........................
55,906,058
—
—
55,906,058
Short
Term
Investments
...................
1,844
395,287
—
397,131
Total
Investments
in
Securities
...........
$55,907,902
$395,287
$—
$56,303,189
Franklin
LifeSmart™
2055
Retirement
Target
Fund
Assets:
Investments
in
Securities:
a
Investments
in
Underlying
Funds
and
Exchange
Traded
Funds
...........................
40,518,833
—
—
40,518,833
Short
Term
Investments
...................
1,420
—
—
1,420
Total
Investments
in
Securities
...........
$40,520,253
$—
$—
$40,520,253
Franklin
LifeSmart™
2060
Retirement
Target
Fund
Assets:
Investments
in
Securities:
a
Investments
in
Underlying
Funds
and
Exchange
Traded
Funds
...........................
7,981,902
—
—
7,981,902
Short
Term
Investments
...................
345
—
—
345
Total
Investments
in
Securities
...........
$7,982,247
$—
$—
$7,982,247
a
For
detailed
categories,
see
the
accompanying
Schedule
of
Investments.
7.
Fair
Value
Measurements
(continued)
Franklin
Fund
Allocator
Series
Notes
to
Financial
Statements
Level
3
financial
instruments,
for
the
Franklin
LifeSmart
Retirement
Income
Fund,
include
fair
value
of
immaterial
assets
and/
or
liabilities
developed
using
various
valuation
techniques
and
unobservable
inputs.
May
also
include
values
derived
using
recent
transactions,
private
transaction
prices
or
non-public
third-party
pricing
information
which
is
unobservable.
8.
Operating
Segments
The Funds
have
adopted
the
FASB
Accounting
Standards
Update
(ASU)
2023-07,
Segment
Reporting
(Topic
280)
-
Improvements
to
Reportable
Segment
Disclosures.
The
update
is
limited
to
disclosure
requirements
and
does
not
impact
the Funds'
financial
position
or
results
of
operations.
Each
Fund
operates
as
a
single
operating
segment,
which
is
an
investment
portfolio.
The
Funds'
Investment
manager
serves
as
the
Chief
Operating
Decision
Maker
(CODM),
evaluating
fund-wide
results
and
performance
under
a
unified
investment
strategy.
The
CODM
uses
these
measures
to
assess
fund
performance
and
allocate
resources
effectively.
Internal
reporting
provided
to
the
CODM
aligns
with
the
accounting
policies
and
measurement
principles
used
in
the
financial
statements.
For
information
regarding
segment
assets,
segment
profit
or
loss,
and
significant
expenses,
refer
to
the
Statements
of
Assets
and
Liabilities
and
the
Statements
of
Operations,
along
with
the
related
notes
to
the
financial
statements.
The
Schedules
of
Investments
provides
details
of
the
Funds'
investments
that
generate
returns
such
as
interest,
dividends,
and
realized
and
unrealized
gains
or
losses.
Performance
metrics,
including
portfolio
turnover
and
expense
ratios,
are
disclosed
in
the
Financial
Highlights.
9.
Subsequent
Events
The
Funds
have
evaluated
subsequent
events
through
the
issuance
of
the financial
statements
and
determined
that
no
events
have
occurred
that
require
disclosure
other
than
those
already
disclosed
in
the
financial
statements.
Abbreviations
Balance
at
Beginning
of
Year
Purchases
a
Sales
b
Transfer
Into
Level
3
Transfer
Out
of
Level
3
Net
Accretion
(
Amortiza
-
tion
)
Net
Realized
Gain
(Loss)
Net
Unr
ealized
Appreciatio
n
(
Depreciation
)
Balance
at
End
of
Year
Net
Change
in
Unrealized
Appreciation
(Depreciation)
on
Assets
Held
at
Year
End
a
a
a
a
a
a
a
a
a
a
a
Franklin
LifeSmart™
Retirement
Income
Fund
Assets:
Investments
in
Securities:
Index-Linked
Notes
:
Capital
Markets
.....
$
2,270,512
$
2,099,710
$
(2,335,175)
$
—
$
—
$
—
$
235,262
$
64,762
$
2,335,071
$
235,362
Total
Investments
in
Securities
............
$2,270,512
$2,099,710
$(2,335,175)
$—
$—
$—
$235,262
$64,762
$2,335,071
$235,362
a
Purchases
include
all
purchases
of
securities
and
securities
received
in
corporate
actions.
b
Sales
include
all
sales
of
securities,
maturities,
paydowns
and
securities
tendered
in
corporate
actions.
Selected
Portfolio
ETF
Exchange-Traded
Fund
7.
Fair
Value
Measurements
(continued)
Franklin
Fund
Allocator
Series
Report
of
Independent
Registered
Public
Accounting
Firm
To
the
Board
of
Trustees
of
Franklin
Fund
Allocator
Series
and
Shareholders
of
Franklin
LifeSmart™
Retirement
Income
Fund,
Franklin
LifeSmart™
2020
Retirement
Target
Fund,
Franklin
LifeSmart™
2025
Retirement
Target
Fund,
Franklin
LifeSmart™
2030
Retirement
Target
Fund,
Franklin
LifeSmart™
2035
Retirement
Target
Fund,
Franklin
LifeSmart™
2040
Retirement
Target
Fund,
Franklin
LifeSmart™
2045
Retirement
Target
Fund,
Franklin
LifeSmart™
2050
Retirement
Target
Fund,
Franklin
LifeSmart™
2055
Retirement
Target
Fund
and
Franklin
LifeSmart™
2060
Retirement
Target
Fund
Opinions
on
the
Financial
Statements
We
have
audited
the
accompanying
statements
of
assets
and
liabilities,
including
the
schedules
of
investments,
of
each
of
the
funds
listed
in
the
table
below
(ten
of
the
funds
constituting
Franklin
Fund
Allocator
Series,
hereafter
collectively
referred
to
as
the
"Funds")
as
of
December
31,
2024,
the
related
statements
of
operations
for
the
year
ended
December
31,
2024,
the
statements
of
changes
in
net
assets
for
each
of
the
two
years
in
the
period
ended
December
31,
2024,
including
the
related
notes,
and
the
financial
highlights
for
each
of
the
periods
indicated
in
the
table
below
(collectively
referred
to
as
the
“financial
statements”).
In
our
opinion,
the
financial
statements
present
fairly,
in
all
material
respects,
the
financial
position
of
each
of
the
Funds
as
of
December
31,
2024,
the
results
of
each
of
their
operations
for
the
year
then
ended,
the
changes
in
each
of
their
net
assets
for
each
of
the
two
years
in
the
period
ended
December
31,
2024
and
each
of
the
financial
highlights
for
each
of
the
periods
indicated
in
the
table
below
in
conformity
with
accounting
principles
generally
accepted
in
the
United
States
of
America.
(a)
The
financial
highlights
for
each
of
the
five
years
in
the
period
ended
December
31,
2024
(b)
The
financial
highlights
each
of
the
three
years
in
the
period
ended
December
31,
2024,
and
for
the
period
January
29,
2021
(commencement
of
operations)
through
December
31,
2021
Basis
for
Opinions
These
financial
statements
are
the
responsibility
of
the
Funds’
management.
Our
responsibility
is
to
express
an
opinion
on
the
Funds’
financial
statements
based
on
our
audits.
We
are
a
public
accounting
firm
registered
with
the
Public
Company
Accounting
Oversight
Board
(United
States)
(PCAOB)
and
are
required
to
be
independent
with
respect
to
the
Funds
in
accordance
with
the
U.S.
federal
securities
laws
and
the
applicable
rules
and
regulations
of
the
Securities
and
Exchange
Commission
and
the
PCAOB.
We
conducted
our
audits
of
these
financial
statements
in
accordance
with
the
standards
of
the
PCAOB.
Those
standards
require
that
we
plan
and
perform
the
audit
to
obtain
reasonable
assurance
about
whether
the
financial
statements
are
free
of
material
misstatement,
whether
due
to
error
or
fraud.
Franklin
LifeSmart™
Retirement
Income
Fund
(a)
Franklin
LifeSmart™
2020
Retirement
Target
Fund
(a)
Franklin
LifeSmart™
2025
Retirement
Target
Fund
(a)
Franklin
LifeSmart™
2030
Retirement
Target
Fund
(a)
Franklin
LifeSmart™
2035
Retirement
Target
Fund
(a)
Franklin
LifeSmart™
2040
Retirement
Target
Fund
(a)
Franklin
LifeSmart™
2045
Retirement
Target
Fund
(a)
Franklin
LifeSmart™
2050
Retirement
Target
Fund
(a)
Franklin
LifeSmart™
2055
Retirement
Target
Fund
(a)
Franklin
LifeSmart™
2060
Retirement
Target
Fund
(b)
Franklin
Fund
Allocator
Series
Report
of
Independent
Registered
Public
Accounting
Firm
Our
audits
included
performing
procedures
to
assess
the
risks
of
material
misstatement
of
the
financial
statements,
whether
due
to
error
or
fraud,
and
performing
procedures
that
respond
to
those
risks.
Such
procedures
included
examining,
on
a
test
basis,
evidence
regarding
the
amounts
and
disclosures
in
the
financial
statements.
Our
audits
also
included
evaluating
the
accounting
principles
used
and
significant
estimates
made
by
management,
as
well
as
evaluating
the
overall
presentation
of
the
financial
statements.
Our
procedures
included
confirmation
of
securities
owned
as
of
December
31,
2024
by
correspondence
with
the
custodian,
transfer
agents
and
brokers.
We
believe
that
our
audits
provide
a
reasonable
basis
for
our
opinions.
/s/PricewaterhouseCoopers
LLP
San
Francisco,
California
February
20,
2025
We
have
served
as
the
auditor
of
one
or
more
investment
companies
in
the
Franklin
Templeton
Group
of
Funds
since
1948.
Franklin
Fund
Allocator
Series
Tax
Information
(unaudited)
By
mid-February,
tax
information
related
to
a
shareholder's
proportionate
share
of
distributions
paid
during
the
preceding
calendar
year
will
be
received,
if
applicable.
Please
also
refer
to
www.franklintempleton.com
for
per
share
tax
information
related
to
any
distributions
paid
during
the
preceding
calendar
year.
Shareholders
are
advised
to
consult
with
their
tax
advisors
for
further
information
on
the
treatment
of
these
amounts
on
their
tax
returns.
The
following
tax
information
for
the
Funds
is
required
to
be
furnished
to
shareholders
with
respect
to
income
earned
and
distributions
paid
during
their
fiscal
year.
The
Funds
below
hereby
report
the
following
amounts,
or
if
subsequently
determined
to
be
different,
the
maximum
allowable
amounts,
for
the
fiscal
year
ended
December
31,
2024:
Pursuant
to:
Franklin
LifeSmart™
Retirement
Income
Fund
Franklin
LifeSmart™
2020
Retirement
Target
Fund
Franklin
LifeSmart™
2025
Retirement
Target
Fund
Long-Term
Capital
Gain
Dividends
Distributed
§852(b)(3)(C)
—
$42,293
$236,056
Income
Eligible
for
Dividends
Received
Deduction
(DRD)
§854(b)(1)(A)
$193,773
$60,467
$297,044
Qualified
Dividend
Income
Earned
(QDI)
§854(b)(1)(B)
$269,810
$146,052
$722,331
Short-Term
Capital
Gain
Dividends
Distributed
§871(k)(2)(C)
—
—
$450,385
Section
163(j)
Interest
Dividends
Earned
§163(j)
$48,350
—
—
Pursuant
to:
Franklin
LifeSmart™
2030
Retirement
Target
Fund
Franklin
LifeSmart™
2035
Retirement
Target
Fund
Franklin
LifeSmart™
2040
Retirement
Target
Fund
Long-Term
Capital
Gain
Dividends
Distributed
§852(b)(3)(C)
$27,023
$201,423
$238,203
Income
Eligible
for
Dividends
Received
Deduction
(DRD)
§854(b)(1)(A)
$217,937
$477,319
$246,310
Qualified
Dividend
Income
Earned
(QDI)
§854(b)(1)(B)
$534,403
$1,173,149
$582,671
Short-Term
Capital
Gain
Dividends
Distributed
§871(k)(2)(C)
—
$650,114
$424,752
Pursuant
to:
Franklin
LifeSmart™
2045
Retirement
Target
Fund
Franklin
LifeSmart™
2050
Retirement
Target
Fund
Franklin
LifeSmart™
2055
Retirement
Target
Fund
Long-Term
Capital
Gain
Dividends
Distributed
§852(b)(3)(C)
$514,572
$92,914
$41,308
Income
Eligible
for
Dividends
Received
Deduction
(DRD)
§854(b)(1)(A)
$459,671
$256,231
$190,961
Qualified
Dividend
Income
Earned
(QDI)
§854(b)(1)(B)
$1,088,949
$612,736
$454,080
Short-Term
Capital
Gain
Dividends
Distributed
§871(k)(2)(C)
$574,212
$104,875
$143,315
Pursuant
to:
Franklin
LifeSmart™
2060
Retirement
Target
Fund
Long-Term
Capital
Gain
Dividends
Distributed
§852(b)(3)(C)
$4,493
Income
Eligible
for
Dividends
Received
Deduction
(DRD)
§854(b)(1)(A)
$33,533
Qualified
Dividend
Income
Earned
(QDI)
§854(b)(1)(B)
$80,561
Short-Term
Capital
Gain
Dividends
Distributed
§871(k)(2)(C)
$17,486
Section
163(j)
Interest
Dividends
Earned
§163(j)
$3,049
Franklin
Fund
Allocator
Series
Tax
Information
(unaudited)
Under
Section
853
of
the
Internal
Revenue
Code,
the
Funds
below
intend
to
elect
to
pass
through
to
their
shareholders
the
following
amounts,
or
amounts
as
finally
determined,
of
foreign
taxes
paid
and
foreign
source
income
earned
by
the
Funds
during
the
fiscal
year
ended
December
31,
2024:
Franklin
LifeSmart™
Retirement
Income
Fund
Franklin
LifeSmart™
2020
Retirement
Target
Fund
Franklin
LifeSmart™
2025
Retirement
Target
Fund
Franklin
LifeSmart™
2030
Retirement
Target
Fund
Franklin
LifeSmart™
2035
Retirement
Target
Fund
Foreign
Taxes
Paid
$5,190
$5,849
$29,902
$23,154
$50,789
Foreign
Source
Income
Earned
$53,556
$99,507
$488,814
$361,037
$782,377
Franklin
LifeSmart™
2040
Retirement
Target
Fund
Franklin
LifeSmart™
2045
Retirement
Target
Fund
Franklin
LifeSmart™
2050
Retirement
Target
Fund
Franklin
LifeSmart™
2055
Retirement
Target
Fund
Franklin
LifeSmart™
2060
Retirement
Target
Fund
Foreign
Taxes
Paid
$25,198
$46,589
$27,111
$19,931
$3,867
Foreign
Source
Income
Earned
$370,858
$692,311
$393,485
$289,389
$52,612
Franklin
Fund
Allocator
Series
Changes
In
and
Disagreements
with
Accountants
For
the
period
covered
by
this
report
Not
applicable.
Results
of
Meeting(s)
of
Shareholders
For
the
period
covered
by
this
report
Not
applicable.
Remuneration
Paid
to
Directors,
Officers
and
Others
For
the
period
covered
by
this
report
Refer
to
the
financial
statements
included
herein.
Board
Approval
of
Management
and
Subadvisory
Agreements
For
the
period
covered
by
this
report
Not
applicable.
©
2025
Franklin
Templeton.
All
rights
reserved.
| ITEM 8. | CHANGES IN AND DISAGREEMENTS WITH ACCOUNTANTS FOR OPEN-END MANAGEMENT INVESTMENT COMPANIES. |
The information is disclosed as part of the Financial Statements included in Item 7 of this Form N-CSR.
| ITEM 9. | PROXY DISCLOSURES FOR OPEN-END MANAGEMENT INVESTMENT COMPANIES. |
The information is disclosed as part of the Financial Statements included in Item 7 of this Form N-CSR.
| ITEM 10. | REMUNERATION PAID TO DIRECTORS, OFFICERS, AND OTHERS OF OPEN-END MANAGEMENT INVESTMENT COMPANIES. |
The information is disclosed as part of the Financial Statements included in Item 7 of this Form N-CSR.
| ITEM 11. | STATEMENT REGARDING BASIS FOR APPROVAL OF INVESTMENT ADVISORY CONTRACT. |
The information is disclosed as part of the Financial Statements included in Item 7 of this Form N-CSR, as applicable.
| ITEM 12. | DISCLOSURE OF PROXY VOTING POLICIES AND PROCEDURES FOR CLOSED-END MANAGEMENT INVESTMENT COMPANIES. |
Not applicable.
| ITEM 13. | PORTFOLIO MANAGERS OF CLOSED-END MANAGEMENT INVESTMENT COMPANIES. |
Not applicable.
| ITEM 14. | PURCHASES OF EQUITY SECURITIES BY CLOSED-END MANAGEMENT INVESTMENT COMPANY AND AFFILIATED PURCHASERS. |
Not applicable.
| ITEM 15. | SUBMISSION OF MATTERS TO A VOTE OF SECURITY HOLDERS. |
| | |
| | There have been no changes to the procedures by which shareholders may recommend nominees to the Registrant’s Board of Trustees that would require disclosure herein. |
| ITEM 16. | CONTROLS AND PROCEDURES. |
| (a) | The Registrant’s chief executive officer and chief financial officer have concluded that the Registrant’s disclosure controls and procedures (as defined in Rule 30a- 3(c) under the Investment Company Act of 1940, as amended (the “1940 Act”)) are effective as of a date within 90 days of the filing date of this report that includes the disclosure required by this paragraph, based on their evaluation of the disclosure controls and procedures required by Rule 30a-3(b) under the 1940 Act and 15d-15(b) under the Securities Exchange Act of 1934. |
| (b) | There were no changes in the registrant’s internal control over financial reporting (as defined in Rule 30a-3(d) under the 1940 Act) that occurred during the period covered by this report that have materially affected, or are likely to materially affect the registrant’s internal control over financial reporting. |
| ITEM 17. | DISCLOSURE OF SECURITIES LENDING ACTIVITIES FOR CLOSED-END MANAGEMENT INVESTMENT COMPANIES. |
Not applicable.
| ITEM 18. | RECOVERY OF ERRONEOUSLY AWARDED COMPENSATION. |
(a) (1) Code of Ethics attached hereto.
Exhibit 99.CODE ETH
(a) (2) Certifications pursuant to section 302 of the Sarbanes-Oxley Act of 2002 attached hereto.
Exhibit 99.CERT
(b) Certifications pursuant to Section 906 of the Sarbanes-Oxley Act of 2002 attached hereto.
Exhibit 99.906CERT
SIGNATURES
Pursuant to the requirements of the Securities Exchange Act of 1934 and the Investment Company Act of 1940, the registrant has duly caused this Report to be signed on its behalf by the undersigned, there unto duly authorized.
| FRANKLIN FUND ALLOCATOR SERIES | |
| | | |
| By: | /s/ Christopher Kings | |
| | Christopher Kings | |
| | Chief Executive Officer – Finance and Administration | |
| | | |
| Date: | February 28, 2025 | |
Pursuant to the requirements of the Securities Exchange Act of 1934 and the Investment Company Act of 1940, this report has been signed below by the following persons on behalf of the registrant and in the capacities and on the dates indicated.
| By: | /s/ Christopher Kings | |
| | Christopher Kings | |
| | Chief Executive Officer – Finance and Administration | |
| | | |
| Date: | February 28, 2025 | |
| By: | /s/ Jeffrey White | |
| | Jeffrey White | |
| | Chief Financial Officer, Chief Accounting Officer and Treasurer | |
| | | |
| Date: | February 28, 2025 | |