UNITED STATES
SECURITIES AND EXCHANGE COMMISSION
Washington, DC 20549
FORMN-CSR
CERTIFIED SHAREHOLDER REPORT OF REGISTERED MANAGEMENT INVESTMENT
COMPANIES
Investment Company Act file number 811-07851
Franklin Fund Allocator Series
(Exact name of registrant as specified in charter)
One Franklin Parkway, San Mateo, CA 94403-1906
(Address of principal executive offices) (Zip code)
Craig S. Tyle, One Franklin Parkway, San Mateo, CA 94403-1906
(Name and address of agent for service)
Registrant’s telephone number, including area code: 650312-2000
Date of fiscal year end: 5/31
Date of reporting period: 5/31/19
Item 1. Reports to Stockholders.

| | | | | | |
| | Franklin Payout 2019 Fund | | | | Franklin Payout 2021 Fund |
| | | |
| | Franklin Payout 2020 Fund | | | | Franklin Payout 2022 Fund |
Internet Delivery of Fund Reports Unless You Request Paper Copies:Effective January 1, 2021, as permitted by the SEC, paper copies of the Fund’s shareholder reports will no longer be sent by mail, unless you specifically request them from the Fund or your financial intermediary. Instead, the reports will be made available on a website, and you will be notified by mail each time a report is posted and provided with a website link to access the report.
If you already elected to receive shareholder reports electronically, you will not be affected by this change and you need not take any action. If you have not signed up for electronic delivery, we would encourage you to join fellow shareholders who have. You may elect to receive shareholder reports and other communications electronically from the Fund by calling (800)321-8563 or by contacting your financial intermediary.
You may elect to continue to receive paper copies of all your future shareholder reports free of charge by contacting your financial intermediary or, if you invest directly with a Fund, calling (800)321-8563 to let the Fund know of your request. Your election to receive reports in paper will apply to all funds held in your account.
FRANKLIN TEMPLETON
Successful investing begins with ambition. And achievement only comes when you reach for it. That’s why we continually strive to deliver better outcomes for investors. No matter what your goals are, our deep, global investment expertise allows us to offer solutions that can help.
During our more than 70 years of experience, we’ve managed through all kinds of markets—up, down and those in between. We’re always preparing for what may come next. It’s because of this, combined with our strength as one of the world’s largest asset managers that we’ve earned the trust of millions of investors around the world.
Contents
| | |
| | Not FDIC Insured | May Lose Value | No Bank Guarantee |
| | |
| | | |
| Not part of the annual report | | 1 |
ANNUAL REPORT
Economic and Market Overview
The U.S. economy grew during the 12 months ended May 31, 2019. After moderating for two consecutive quarters, the economy grew significantly faster in 2019’s first quarter, driven by growth in consumer spending, inventory investment, exports, business investment, and state and local government spending. The manufacturing and services sectors expanded during the period. The unemployment rate decreased from 3.8% in May 2018 to 3.6% atperiod-end.1 The annual inflation rate, as measured by the Consumer Price Index, decreased from 2.8% in May 2018 to 1.8% atperiod-end.1
The U.S. Federal Reserve (Fed) raised its target range for the federal funds rate by 0.25% three times during the period, to 2.25%–2.50%, and continued reducing its balance sheet as part of its plan to normalize monetary policy. At its March 2019 meeting, the Fed held its target range for the federal funds rate unchanged and signaled no rate hike in 2019. Furthermore, the Fed mentioned it would end its balance sheet normalization by the end of September 2019. At its April/May meeting, the Fed reiterated its patient approach to future rate adjustments.
The10-year Treasury yield, which moves inversely to its price, decreased during the period. The yield rose to multi-year highs several times in 2018 amid investor concerns about higher inflation and the Fed’s interest-rate path. Concerns that other central banks might scale back monetary stimulus, several better-than-expected U.S. economic reports and periods of optimism about a potential U.S.-China trade deal also supported the yield. However, some factors weighed on the Treasury yield at certain points during the period, including concerns about political turmoil in Italy, political uncertainties in the U.S., tensions between the U.S. and North Korea, slower domestic and global economic growth, and the Fed’s patient approach to its monetary policy decisions. Nearperiod-end, the10-year yield fell below certain short-term yields due to escalating U.S.-China trade tensions and President Trump’s threat to impose tariffs on Mexico because of immigration disputes. Overall, the10-year
Treasury yield declined from 2.83% at the beginning of the period to 2.14% atperiod-end.
The foregoing information reflects our analysis and opinions as of May 31, 2019. The information is not a complete analysis of every aspect of any market, country, industry, security or fund. Statements of fact are from sources considered reliable.
1. Source: Bureau of Labor Statistics.
Franklin Payout 2019 Fund
This annual report for Franklin Payout 2019 Fund covers the fiscal year ended May 31, 2019.
Your Fund’s Goals and Main Investments
The Fund seeks capital preservation and income with a predetermined maturity date. Under normal market conditions, the Fund invests predominantly in U.S. dollar-denominated investment-grade debt securities and investments, including government and corporate debt securities and asset-backed securities and municipal securities.
Performance Overview
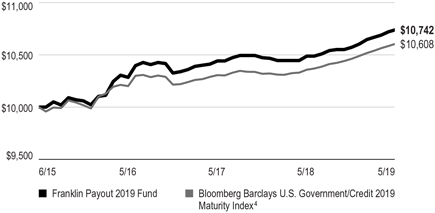
The Fund’s Advisor Class shares posted a +2.42% cumulative total return for the 12 months under review. In comparison, the Fund’s benchmark, the Bloomberg Barclays U.S. Government/Credit 2019 Maturity Index, returned +2.42%.1 The index includes investment-grade, U.S. dollar-denominated, fixed-rate Treasuries, government-related and corporate securities and foreign debt maturing in 2019. You can find more of the Fund’s performance data in the Performance Summary beginning on page 5.
Performance data represent past performance, which does not guarantee future results. Investment return and principal value will fluctuate, and you may have a gain or loss when you sell your shares. Current performance may differ from figures shown. For most recentmonth-end performance, call a Franklin Templeton Institutional Services representative at (800)321-8563.
Investment Strategy
We focus on investment-grade securities and investments or in unrated securities and investments we determine are of comparable quality. Our focus on the portfolio’s credit quality is intended to reduce credit risk and help to preserve capital. We may invest a significant portion of the Fund’s assets in U.S. dollar-denominated foreign securities, including debt issued by supranational entities. In choosing investments, we select securities in various market sectors based on our assessment of changing economic, market, industry and issuer conditions. We use atop-down analysis of
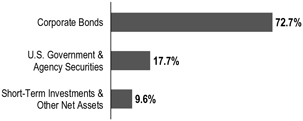
Portfolio Composition
Based on Total Net Assets as of 5/31/19
macroeconomic trends, combined with abottom-up fundamental analysis of market sectors, industries and issuers, to try to take advantage of varying sector reactions to economic events.
Although the Fund may invest in individual securities of any maturity, the Fund is a term fund and is managed to mature in 2019. Over time, the Fund’s duration and weighted average maturity declined as 2019 approached. In the later months of operation, when the debt securities held by the Fund mature, the proceeds from such securities will be held in cash, cash equivalents and money market instruments, including affiliated money market funds, or invested in short-term bonds. In early December 2019, the Fund is expected to consist almost entirely of cash, cash equivalents and money market instruments. The Fund is designed for investors who seek an investment with a payout schedule to help meet their retirement spending needs, particularly those who are nearing retirement or are in retirement. There is no guarantee the Fund will meet an investor’s retirement spending needs.
|
What is duration? Duration is a measure of a bond’s price sensitivity to interest-rate changes. In general, a portfolio of securities with a lower duration can be expected to be less sensitive to interest-rate changes than a portfolio with a higher duration. |
Manager’s Discussion
During the period under review, the Fund’s exposure to investment-grade corporate securities was the primary
1. Source: FactSet.
The index is unmanaged and includes reinvestment of any income or distributions. It does not reflect any fees, expenses or sales charges. One cannot invest directly in an index, and an index is not representative of the Fund’s portfolio.
See www.franklintempletondatasources.com for additional data provider information.
The dollar value, number of shares or principal amount, and names of all portfolio holdings are listed in the Fund’s Statement of Investments (SOI).
The SOI begins on page 29.
FRANKLIN PAYOUT 2019 FUND
Maturity
5/31/19
| | | | |
| | | % of Total
Market Value | |
0 to 1 Year | | | 95.1% | |
1 to 2 Years | | | 4.9% | |
Top 10 Holdings*
5/31/19
| | | | |
| Issue/Issuer | | % of Total
Net Assets | |
Federal Home Loan Bank (FHLB) | | | 9.0% | |
Federal National Mortgage Association (FNMA) | | | 4.9% | |
Federal Farm Credit Bank (FFCB) | | | 3.7% | |
Anheuser-Busch InBev Worldwide Inc. | | | 2.5% | |
Westpac Banking Corp. | | | 2.5% | |
Morgan Stanley | | | 2.5% | |
Boeing Capital Corp. | | | 2.5% | |
Emerson Electric Co. | | | 2.5% | |
Lockheed Martin Corp. | | | 2.5% | |
Deere & Co. | | | 2.5% | |
*Securities are listed by issuer, which may appear by another name in the SOI.
contributor to returns. In contrast, our yield curve positioning detracted from returns.
Atperiod-end, we remained overweighted and focused on investment-grade corporate credit exposures in the portfolio. This focus is based on our belief that valuations remained relatively attractive on a longer-term basis as well as the increased earnings potential available from this sector. Conversely, we maintained an underweighted allocation to the U.S. Treasury sector as valuations and income levels remained unattractive to us. Additionally, we maintained an overweighted allocation to the agency sector. Finally, we maintained a slightly longer duration in the portfolio compared with the index, driven largely by our focus on bonds with final maturity dates closer to the Fund’s predetermined maturity date.
Thank you for your participation in Franklin Payout 2019 Fund. We look forward to serving your future investment needs.
| | | | |
 | | | | 
Roger A. Bayston, CFA |
| | | | |
| | |
 | | | | 
David Yuen, CFA, FRM |
| | |
| | | | Portfolio Management Team |
The foregoing information reflects our analysis, opinions and portfolio holdings as of May 31, 2019, the end of the reporting period. The way we implement our main investment strategies and the resulting portfolio holdings may change depending on factors such as market and economic conditions. These opinions may not be relied upon as investment advice or an offer for a particular security. The information is not a complete analysis of every aspect of any market, country, industry, security or the Fund. Statements of fact are from sources considered reliable, but the investment manager makes no representation or warranty as to their completeness or accuracy. Although historical performance is no guarantee of future results, these insights may help you understand our investment management philosophy.
CFA® is a trademark owned by CFA Institute.
FRANKLIN PAYOUT 2019 FUND
Performance Summary as of May 31, 2019
The performance table and graph do not reflect any taxes that a shareholder would pay on Fund dividends, capital gain distributions, if any, or any realized gains on the sale of Fund shares. Total return reflects reinvestment of the Fund’s dividends and capital gain distributions, if any, and any unrealized gains or losses. Your dividend income will vary depending on dividends or interest paid by securities in the Fund’s portfolio, adjusted for operating expenses of each class. Capital gain distributions are net profits realized from the sale of portfolio securities.
Performance as of 5/31/191
Cumulative total return excludes sales charges. Average annual total return includes maximum sales charges. Sales charges will vary depending on the size of the investment and the class of share purchased. The maximum and minimum is 0%.Advisor Class:no sales charges. For other share classes, call a Franklin Templeton Institutional Services representative at(800)321-8563.
| | | | | | | | |
| Share Class | | Cumulative
Total Return2 | | | Average Annual
Total Return3 | |
| |
| | |
Advisor | | | | | | | | |
1-Year | | | +2.42% | | | | +2.42% | |
| |
3-Year | | | +4.44% | | | | +1.46% | |
| |
Since Inception (6/1/15) | | | +7.42% | | | | +1.81% | |
| |
Performance data represent past performance, which does not guarantee future results. Investment return and principal value will fluctuate, and you may have a gain or loss when you sell your shares. Current performance may differ from figures shown. For most recentmonth-end performance, call a Franklin Templeton Institutional Services representative at(800)321-8563.
See page 7 for Performance Summary footnotes.
FRANKLIN PAYOUT 2019 FUND
PERFORMANCE SUMMARY
Total Return Index Comparison for a Hypothetical $10,000 Investment1
Total return represents the change in value of an investment over the periods shown. It includes any applicable maximum sales charge, Fund expenses, account fees and reinvested distributions. The unmanaged index includes reinvestment of any income or distributions. It differs from the Fund in composition and does not pay management fees or expenses. One cannot invest directly in an index.
Advisor Class(6/1/15–5/31/19)
See page 7 for Performance Summary footnotes.
FRANKLIN PAYOUT 2019 FUND
PERFORMANCE SUMMARY
Distributions(6/1/18–5/31/19)
| | |
| Share Class | | Net Investment
Income |
R6 | | $0.1903 |
Advisor | | $0.1888 |
Total Annual Operating Expenses5
| | | | | | |
| Share Class | | With Fee
Waiver | | | Without Fee
Waiver |
| | |
Advisor | | | 0.45% | | | 2.69% |
Each class of shares is available to certain eligible investors and has different annual fees and expenses, as described in the prospectus.
All investments involve risks, including possible loss of principal. Changes in the financial strength of a bond issuer or in a bond’s credit rating may affect its value. Interest rate movements will affect the Fund’s share price and yield. Bond prices generally move in the opposite direction of interest rates. As the prices of bonds in the Fund adjust to a rise in interest rates, the Fund’s share price may decline. Because the Fund can only distribute what it earns, the Fund’s distributions to shareholders may decline when prevailing interest rates fall or when the Fund experiences defaults on debt securities it holds. Interest earned on floating rate loans varies with changes in prevailing interest rates. Therefore, while floating rate loans offer higher interest income when interest rates rise, they will also generate less income when interest rates decline. The Fund is actively managed but there is no guarantee that the manager’s investment decisions will achieve the desired results. The Fund’s prospectus also includes a description of the main investment risks.
1. The Fund has an expense reduction and a fee waiver associated with any investments it makes in a Franklin Templeton money fund and/or other Franklin Templeton fund, contractually guaranteed through 9/30/19. Fund investment results reflect the expense reduction and fee waiver; without these reductions, the results would have been lower.
2. Cumulative total return represents the change in value of an investment over the periods indicated.
3. Average annual total return represents the average annual change in value of an investment over the periods indicated. Return for less than one year, if any, has not been annualized.
4. Source: Morningstar. The Bloomberg Barclays U.S. Government/Credit 2019 Maturity Index includes investment-grade, U.S. dollar-denominated, fixed-rate Treasuries, government-related and corporate securities and foreign debt maturing in 2019.
5. Figures are as stated in the Fund’s current prospectus and may differ from the expense ratios disclosed in the Your Fund’s Expenses and Financial Highlights sections in this report. In periods of market volatility, assets may decline significantly, causing total annual Fund operating expenses to become higher than the figures shown.
See www.franklintempletondatasources.com for additional data provider information.
FRANKLIN PAYOUT 2019 FUND
Your Fund’s Expenses
As a Fund shareholder, you can incur two types of costs: (1) transaction costs, including sales charges (loads) on Fund purchases and redemptions, if applicable; and (2) ongoing Fund costs, including management fees, distribution and service(12b-1) fees, if applicable, and other Fund expenses. All mutual funds have ongoing costs, sometimes referred to as operating expenses. The table below shows ongoing costs of investing in the Fund and can help you understand these costs and compare them with those of other mutual funds. The table assumes a $1,000 investment held for the six months indicated.
Actual Fund Expenses
The table below provides information about actual account values and actual expenses in the columns under the heading “Actual.” In these columns the Fund’s actual return, which includes the effect of Fund expenses, is used to calculate the “Ending Account Value” for each class of shares. You can estimate the expenses you paid during the period by following these steps (of course, your account value and expenses will differ from those in this illustration): Divide your account value by $1,000 (if your account had an $8,600 value, then $8,600÷ $1,000 = 8.6). Then multiply the result by the number in the row for your class of shares under the headings “Actual” and “Expenses Paid During Period” (if Actual Expenses Paid During Period were $7.50, then 8.6 x $7.50 = $64.50). In this illustration, the actual expenses paid this period are $64.50.
Hypothetical Example for Comparison with Other Funds
Under the heading “Hypothetical” in the table, information is provided about hypothetical account values and hypothetical expenses based on the Fund’s actual expense ratio and an assumed rate of return of 5% per year before expenses, which is not the Fund’s actual return. This information may not be used to estimate the actual ending account balance or expenses you paid for the period, but it can help you compare ongoing costs of investing in the Fund with those of other funds. To do so, compare this 5% hypothetical example for the class of shares you hold with the 5% hypothetical examples that appear in the shareholder reports of other funds.
Please note that expenses shown in the table are meant to highlight ongoing costs and do not reflect any transactional costs. Therefore, information under the heading “Hypothetical” is useful in comparing ongoing costs only, and will not help you compare total costs of owning different funds. In addition, if transactional costs were included, your total costs would have been higher.
| | | | | | | | | | | | | | | | | | |
| | | | | | | Actual (actual return after expenses) | | | | Hypothetical
(5% annual return before expenses) | | | | |
Share
Class | | Beginning
Account
Value 12/1/18 | | | | Ending
Account
Value 5/31/19 | | Expenses
Paid During
Period
12/1/18–5/31/191,2 | | | | Ending
Account
Value 5/31/19 | | Expenses
Paid During
Period
12/1/18–5/31/191,2 | | | | Net
Annualized
Expense Ratio2 |
| R6 | | $1,000 | | | | $1,016.20 | | $1.46 | | | | $1,023.49 | | $1.46 | | | | 0.29% |
| Advisor | | $1,000 | | | | $1,016.10 | | $1.46 | | | | $1,023.49 | | $1.46 | | | | 0.29% |
1. Expenses are equal to the annualized expense ratio for thesix-month period as indicated above—in the far right column—multiplied by the simple average account value over the period indicated, and then multiplied by 182/365 to reflect theone-half year period.
2. Reflects expenses after fee waivers and expense reimbursements. Does not include acquired fund fees and expenses.
Franklin Payout 2020 Fund
This annual report for Franklin Payout 2020 Fund covers the fiscal year ended May 31, 2019.
Your Fund’s Goals and Main Investments
The Fund seeks capital preservation and income with a predetermined maturity date. Under normal market conditions, the Fund invests predominantly in U.S. dollar-denominated investment-grade debt securities and investments, including government and corporate debt securities and asset-backed securities and municipal securities.
Performance Overview
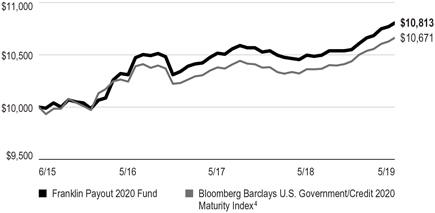
The Fund’s Advisor Class shares posted a +3.02% cumulative total return for the 12 months under review. In comparison, the Fund’s benchmark, the Bloomberg Barclays U.S. Government/Credit 2020 Maturity Index, returned +2.98%.1 The index includes investment-grade, U.S. dollar-denominated, fixed-rate Treasuries, government-related and corporate securities and foreign debt maturing in 2020. You can find more of the Fund’s performance data in the Performance Summary beginning on page 11.
Performance data represent past performance, which does not guarantee future results. Investment return and principal value will fluctuate, and you may have a gain or loss when you sell your shares. Current performance may differ from figures shown. For most recentmonth-end performance, call a Franklin Templeton Institutional Services representative at (800)321-8563.
Investment Strategy
We focus on investment-grade securities and investments or in unrated securities and investments we determine are of comparable quality. Our focus on the portfolio’s credit quality is intended to reduce credit risk and help to preserve capital. We may invest a significant portion of the Fund’s assets in U.S. dollar-denominated foreign securities, including debt issued by supranational entities. In choosing investments, we select securities in various market sectors based on our assessment of changing economic, market, industry and issuer conditions. We use atop-down analysis of
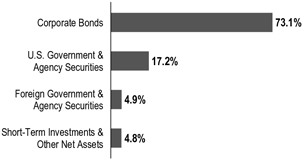
Portfolio Composition
Based on Total Net Assets as of 5/31/19
macroeconomic trends, combined with abottom-up fundamental analysis of market sectors, industries and issuers, to try to take advantage of varying sector reactions to economic events.
Although the Fund may invest in individual securities of any maturity, the Fund is a term fund and is managed to mature in 2020. Over time, the Fund’s duration and weighted average maturity will decline as 2020 approaches. In the later months of operation, when the debt securities held by the Fund mature, the proceeds from such securities will be held in cash, cash equivalents and money market instruments, including affiliated money market funds, or invested in short-term bonds. In early December 2020, the Fund is expected to consist almost entirely of cash, cash equivalents and money market instruments. The Fund is designed for investors who seek an investment with a payout schedule to help meet their retirement spending needs, particularly those who are nearing retirement or are in retirement. There is no guarantee the Fund will meet an investor’s retirement spending needs.
What is duration?
Duration is a measure of a bond’s price sensitivity to interest-rate changes. In general, a portfolio of securities with a lower duration can be expected to be less sensitive to interest-rate changes than a portfolio with a higher duration.
1. Source: FactSet.
The index is unmanaged and includes reinvestment of any income or distributions. It does not reflect any fees, expenses or sales charges. One cannot invest directly in an index, and an index is not representative of the Fund’s portfolio.
See www.franklintempletondatasources.com for additional data provider information.
The dollar value, number of shares or principal amount, and names of all portfolio holdings are listed in the Fund’s Statement of Investments (SOI).
The SOI begins on page 33.
FRANKLIN PAYOUT 2020 FUND
Maturity
5/31/19
| | | | |
| | | % of Total
Market Value | |
0 to 1 Year | | | 4.6% | |
1 to 2 Years | | | 95.4% | |
| |
Top 10 Holdings* | | | | |
5/31/19 | | | | |
| |
| Issue/Issuer | | % of Total
Net Assets | |
| |
U.S. Treasury Note | | | 12.2% | |
| |
Federal Home Loan Bank (FHLB) | | | 5.0% | |
| |
Morgan Stanley | | | 2.5% | |
| |
Emerson Electric Co. | | | 2.5% | |
| |
Hershey Co. | | | 2.5% | |
| |
JPMorgan Chase & Co. | | | 2.5% | |
| |
Travelers Cos. Inc. | | | 2.5% | |
| |
Northern Trust Corp. | | | 2.5% | |
| |
TransCanada PipeLines Ltd. | | | 2.5% | |
| |
UnitedHealth Group Inc. | | | 2.5% | |
*Securities are listed by issuer, which may appear by another name in the SOI.
Manager’s Discussion
During the period under review, the Fund’s exposure to investment-grade corporate securities was the primary contributor to returns, although security selection within the sector detracted. Additionally, yield curve positioning also contributed to performance. The Fund’s exposure to below investment-grade corporate securities and sovereign emerging markets securities detracted from results.
Atperiod-end, we remained overweighted and focused on investment-grade corporate credit exposures in the portfolio. This focus is based on our belief that valuations remained relatively attractive on a longer-term basis as well as the increased earnings potential available from this sector. Conversely, we maintained an underweighted allocation to the U.S. Treasury sector as valuations and income levels remained unattractive to us. Additionally, we maintained an overweighted allocation to the agency sector. Finally, we maintained a slightly longer duration in the portfolio compared with the index, driven largely by our focus on bonds with final maturity dates closer to the Fund’s predetermined maturity date.
Thank you for your participation in Franklin Payout 2020 Fund. We look forward to serving your future investment needs.
| | | | |
 | | | | 
Roger A. Bayston, CFA |
| | |
 | | | | 
David Yuen, CFA, FRM |
| | |
| | | | Portfolio Management Team |
The foregoing information reflects our analysis, opinions and portfolio holdings as of May 31, 2019, the end of the reporting period. The way we implement our main investment strategies and the resulting portfolio holdings may change depending on factors such as market and economic conditions. These opinions may not be relied upon as investment advice or an offer for a particular security. The information is not a complete analysis of every aspect of any market, country, industry, security or the Fund. Statements of fact are from sources considered reliable, but the investment manager makes no representation or warranty as to their completeness or accuracy. Although historical performance is no guarantee of future results, these insights may help you understand our investment management philosophy.
FRANKLIN PAYOUT 2020 FUND
Performance Summary as of May 31, 2019
The performance table and graph do not reflect any taxes that a shareholder would pay on Fund dividends, capital gain distributions, if any, or any realized gains on the sale of Fund shares. Total return reflects reinvestment of the Fund’s dividends and capital gain distributions, if any, and any unrealized gains or losses. Your dividend income will vary depending on dividends or interest paid by securities in the Fund’s portfolio, adjusted for operating expenses of each class. Capital gain distributions are net profits realized from the sale of portfolio securities.
Performance as of 5/31/191
Cumulative total return excludes sales charges. Average annual total return includes maximum sales charges. Sales charges will vary depending on the size of the investment and the class of share purchased. The maximum and minimum is 0%.Advisor Class:no sales charges. For other share classes, call a Franklin Templeton Institutional Services representative at(800)321-8563.
| | | | | | |
Share Class | | Cumulative Total Return2 | |
| Average Annual
Total Return |
3 |
| |
| | |
Advisor | | | | | | |
1-Year | | +3.02% | | | +3.02% | |
| |
| | |
3-Year | | +4.88% | | | +1.60% | |
| |
| | |
Since Inception (6/1/15) | | +8.13% | | | +1.97% | |
| |
Performance data represent past performance, which does not guarantee future results. Investment return and principal value will fluctuate, and you may have a gain or loss when you sell your shares. Current performance may differ from figures shown. For most recentmonth-end performance, call a Franklin Templeton Institutional Services representative at (800)321-8563.
See page 13 for Performance Summary footnotes.
FRANKLIN PAYOUT 2020 FUND
PERFORMANCE SUMMARY
Total Return Index Comparison for a Hypothetical $10,000 Investment1
Total return represents the change in value of an investment over the periods shown. It includes any applicable maximum sales charge, Fund expenses, account fees and reinvested distributions. The unmanaged index includes reinvestment of any income or distributions. It differs from the Fund in composition and does not pay management fees or expenses. One cannot invest directly in an index.
Advisor Class(6/1/15–5/31/19)
See page 13 for Performance Summary footnotes.
FRANKLIN PAYOUT 2020 FUND
PERFORMANCE SUMMARY
Distributions(6/1/18–5/31/19)
| | | | | | |
| Share Class | | Net Investment Income | | | |
| | |
R6 | | | $0.2064 | | | |
| | |
Advisor | | | $0.2049 | | | |
Total Annual Operating Expenses5
| | | | |
| | |
| Share Class | | With Fee
Waiver | | Without Fee
Waiver |
| | |
Advisor | | 0.45% | | 2.83% |
Each class of shares is available to certain eligible investors and has different annual fees and expenses, as described in the prospectus.
All investments involve risks, including possible loss of principal. Changes in the financial strength of a bond issuer or in a bond’s credit rating may affect its value. Interest rate movements will affect the Fund’s share price and yield. Bond prices generally move in the opposite direction of interest rates. As the prices of bonds in the Fund adjust to a rise in interest rates, the Fund’s share price may decline. Because the Fund can only distribute what it earns, the Fund’s distributions to shareholders may decline when prevailing interest rates fall or when the Fund experiences defaults on debt securities it holds. Interest earned on floating rate loans varies with changes in prevailing interest rates. Therefore, while floating rate loans offer higher interest income when interest rates rise, they will also generate less income when interest rates decline. The Fund is actively managed but there is no guarantee that the manager’s investment decisions will achieve the desired results. The Fund’s prospectus also includes a description of the main investment risks.
1. The Fund has an expense reduction and a fee waiver associated with any investments it makes in a Franklin Templeton money fund and/or other Franklin Templeton fund, contractually guaranteed through 9/30/19. Fund investment results reflect the expense reduction and fee waiver; without these reductions, the results would have been lower.
2. Cumulative total return represents the change in value of an investment over the periods indicated.
3. Average annual total return represents the average annual change in value of an investment over the periods indicated. Return for less than one year, if any, has not been annualized.
4. Source: Morningstar. The Bloomberg Barclays U.S. Government/Credit 2020 Maturity Index includes investment-grade, U.S. dollar-denominated, fixed-rate Treasuries, government-related and corporate securities and foreign debt maturing in 2020.
5. Figures are as stated in the Fund’s current prospectus and may differ from the expense ratios disclosed in the Your Fund’s Expenses and Financial Highlights sections in this report. In periods of market volatility, assets may decline significantly, causing total annual Fund operating expenses to become higher than the figures shown.
See www.franklintempletondatasources.com for additional data provider information.
FRANKLIN PAYOUT 2020 FUND
Your Fund’s Expenses
As a Fund shareholder, you can incur two types of costs: (1) transaction costs, including sales charges (loads) on Fund purchases and redemptions, if applicable; and (2) ongoing Fund costs, including management fees, distribution and service(12b-1) fees, if applicable, and other Fund expenses. All mutual funds have ongoing costs, sometimes referred to as operating expenses. The table below shows ongoing costs of investing in the Fund and can help you understand these costs and compare them with those of other mutual funds. The table assumes a $1,000 investment held for the six months indicated.
Actual Fund Expenses
The table below provides information about actual account values and actual expenses in the columns under the heading “Actual.” In these columns the Fund’s actual return, which includes the effect of Fund expenses, is used to calculate the “Ending Account Value” for each class of shares. You can estimate the expenses you paid during the period by following these steps (of course, your account value and expenses will differ from those in this illustration): Divide your account value by $1,000 (if your account had an $8,600 value, then $8,600÷ $1,000 = 8.6). Then multiply the result by the number in the row for your class of shares under the headings “Actual” and “Expenses Paid During Period” (if Actual Expenses Paid During Period were $7.50, then 8.6 x $7.50 = $64.50). In this illustration, the actual expenses paid this period are $64.50.
Hypothetical Example for Comparison with Other Funds
Under the heading “Hypothetical” in the table, information is provided about hypothetical account values and hypothetical expenses based on the Fund’s actual expense ratio and an assumed rate of return of 5% per year before expenses, which is not the Fund’s actual return. This information may not be used to estimate the actual ending account balance or expenses you paid for the period, but it can help you compare ongoing costs of investing in the Fund with those of other funds. To do so, compare this 5% hypothetical example for the class of shares you hold with the 5% hypothetical examples that appear in the shareholder reports of other funds.
Please note that expenses shown in the table are meant to highlight ongoing costs and do not reflect any transactional costs. Therefore, information under the heading “Hypothetical” is useful in comparing ongoing costs only, and will not help you compare total costs of owning different funds. In addition, if transactional costs were included, your total costs would have been higher.
| | | | | | | | | | | | | | | | | | |
| | | | | | | Actual (actual return after expenses) | | | | Hypothetical (5% annual return before expenses) | | | | |
Share
Class | | Beginning Account Value 12/1/18 | | | | Ending Account Value 5/31/19 | | Expenses Paid During Period 12/1/18–5/31/191,2 | | | | Ending Account Value 5/31/19 | | Expenses Paid During Period 12/1/18–5/31/191,2 | | | | Net Annualized Expense Ratio2 |
| R6 | | $1,000 | | | | $1,025.20 | | $1.46 | | | | $1,023.49 | | $1.46 | | | | 0.29% |
| Advisor | | $1,000 | | | | $1,025.00 | | $1.46 | | | | $1,023.49 | | $1.46 | | | | 0.29% |
1. Expenses are equal to the annualized expense ratio for thesix-month period as indicated above—in the far right column—multiplied by the simple average account value over the period indicated, and then multiplied by 182/365 to reflect theone-half year period.
2. Reflects expenses after fee waivers and expense reimbursements. Does not include acquired fund fees and expenses.
Franklin Payout 2021 Fund
This annual report for Franklin Payout 2021 Fund covers the fiscal year ended May 31, 2019.
Your Fund’s Goals and Main Investments
The Fund seeks capital preservation and income with a predetermined maturity date. Under normal market conditions, the Fund invests predominantly in U.S. dollar-denominated investment-grade debt securities and investments, including government and corporate debt securities and asset-backed securities and municipal securities.
Performance Overview
The Fund’s Advisor Class shares posted a +4.02% cumulative total return for the 12 months under review. In comparison, the Fund’s benchmark, the Bloomberg Barclays U.S. Government/Credit 2021 Maturity Index, returned +4.05%.1 The index includes investment-grade, US dollar-denominated, fixed-rate Treasuries, government-related and corporate securities and foreign debt maturing in 2021. You can find more of the Fund’s performance data in the Performance Summary beginning on page 17.
Performance data represent past performance, which does not guarantee future results. Investment return and principal value will fluctuate, and you may have a gain or loss when you sell your shares. Current performance may differ from figures shown. For most recentmonth-end performance, call a Franklin Templeton Institutional Services representative at (800)321-8563.
Investment Strategy
We focus on investment-grade securities and investments or in unrated securities and investments we determine are of comparable quality. Our focus on the portfolio’s credit quality is intended to reduce credit risk and help to preserve capital. We may invest a significant portion of the Fund’s assets in U.S. dollar-denominated foreign securities, including debt issued by supranational entities. In choosing investments, we select securities in various market sectors based on our assessment of changing economic, market, industry and issuer conditions. We use atop-down analysis of
Portfolio Composition
Based on Total Net Assets as of 5/31/19
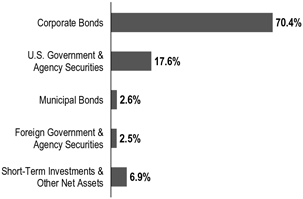
macroeconomic trends, combined with abottom-up fundamental analysis of market sectors, industries and issuers, to try to take advantage of varying sector reactions to economic events.
Although the Fund may invest in individual securities of any maturity, the Fund is a term fund and is managed to mature in 2021. Over time, the Fund’s duration and weighted average maturity will decline as 2021 approaches. In the later months of operation, when the debt securities held by the Fund mature, the proceeds from such securities will be held in cash, cash equivalents and money market instruments, including affiliated money market funds, or invested in short-term bonds. In early December 2021, the Fund is expected to consist almost entirely of cash, cash equivalents and money market instruments. The Fund is designed for investors who seek an investment with a payout schedule to help meet their retirement spending needs, particularly those who are nearing retirement or are in retirement. There is no guarantee the Fund will meet an investor’s retirement spending needs.
Manager’s Discussion
During the period under review, the Fund’s longer duration in the portfolio compared with the index as well as its security selection within the U.S. agency sector were the primary contributors to returns. Additionally, allocation to
1. Source: FactSet.
The index is unmanaged and includes reinvestment of any income or distributions. It does not reflect any fees, expenses or sales charges. One cannot invest directly in an index, and an index is not representative of the Fund’s portfolio.
See www.franklintempletondatasources.com for additional data provider information.
The dollar value, number of shares or principal amount, and names of all portfolio holdings are listed in the Fund’s Statement of Investments (SOI).
The SOI begins on page 38.
FRANKLIN PAYOUT 2021 FUND
What is duration?
Duration is a measure of a bond’s price sensitivity to interest-rate changes. In general, a portfolio of securities with a lower duration can be expected to be less sensitive to interest-rate changes than a portfolio with a higher duration.
Maturity
5/31/19
| | | | |
| | | % of Total
Market Value | |
0 to 1 Year | | | 6.3% | |
2 to 3 Years | | | 93.7% | |
Top 10 Holdings*
5/31/19
| | | | |
| Issue/Issuer | | % of Total
Net Assets | |
| |
U.S. Treasury Note | | | 7.8% | |
| |
FHLB | | | 5.0% | |
| |
FFCB | | | 4.9% | |
| |
California State GO | | | 2.7% | |
| |
Telstra Corp. Ltd. | | | 2.6% | |
| |
Total Capital SA | | | 2.5% | |
| |
Gilead Sciences Inc. | | | 2.5% | |
| |
General Electric Co. | | | 2.5% | |
| |
Berkshire Hathaway Inc. | | | 2.5% | |
| |
Simon Property Group LP | | | 2.5% | |
*Securities are listed by issuer, which may appear by another name in the SOI.
investment-grade corporate securities also contributed to returns, although the majority of this effect was offset by negative security selection within the sector.
Atperiod-end, we remained overweighted and focused on investment-grade corporate credit exposures in the portfolio. This focus is based on our belief that valuations remained relatively attractive on a longer-term basis as well as the increased earnings potential available from this sector. Conversely, we maintained an underweighted allocation to the U.S. Treasury sector as valuations and income levels remained unattractive to us. Additionally, we maintained an overweighted allocation to the agency sector. Finally, we maintained a slightly longer duration in the portfolio compared with the index, driven largely by our focus on bonds with final maturity dates closer to the Fund’s predetermined maturity date.
Thank you for your participation in Franklin Payout 2021 Fund. We look forward to serving your future investment needs.
| | | | |
 | | | | 
Roger A. Bayston, CFA |
| | | | |
| | |
 | | | | 
David Yuen, CFA, FRM |
| | |
| | | | | Portfolio Management Team |
The foregoing information reflects our analysis, opinions and portfolio holdings as of May 31, 2019, the end of the reporting period. The way we implement our main investment strategies and the resulting portfolio holdings may change depending on factors such as market and economic conditions. These opinions may not be relied upon as investment advice or an offer for a particular security. The information is not a complete analysis of every aspect of any market, country, industry, security or the Fund. Statements of fact are from sources considered reliable, but the investment manager makes no representation or warranty as to their completeness or accuracy. Although historical performance is no guarantee of future results, these insights may help you understand our investment management philosophy.
FRANKLIN PAYOUT 2021 FUND
Performance Summary as of May 31, 2019
The performance table and graph do not reflect any taxes that a shareholder would pay on Fund dividends, capital gain distributions, if any, or any realized gains on the sale of Fund shares. Total return reflects reinvestment of the Fund’s dividends and capital gain distributions, if any, and any unrealized gains or losses. Your dividend income will vary depending on dividends or interest paid by securities in the Fund’s portfolio, adjusted for operating expenses of each class. Capital gain distributions are net profits realized from the sale of portfolio securities.
Performance as of 5/31/191
Cumulative total return excludes sales charges. Average annual total return includes maximum sales charges. Sales charges will vary depending on the size of the investment and the class of share purchased. The maximum and minimum is 0%.Advisor Class:no sales charges. For other share classes, call a Franklin Templeton Institutional Services representative at(800)321-8563.
| | | | | | |
Share Class | | Cumulative Total Return2 | |
| Average Annual
Total Return |
3 |
| |
Advisor | | | | | | |
1-Year | | +4.02% | | | +4.02% | |
| |
3-Year | | +5.08% | | | +1.67% | |
| |
Since Inception (6/1/15) | | +9.86% | | | +2.38% | |
| |
Performance data represent past performance, which does not guarantee future results. Investment return and principal value will fluctuate, and you may have a gain or loss when you sell your shares. Current performance may differ from figures shown. For most recentmonth-end performance, call a Franklin Templeton Institutional Services representative at (800)321-8563.
See page 19 for Performance Summary footnotes.
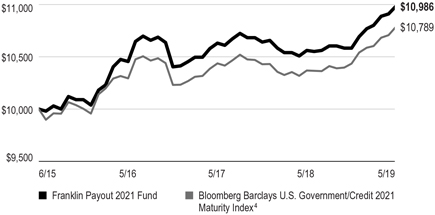
FRANKLIN PAYOUT 2021 FUND
PERFORMANCE SUMMARY
Total Return Index Comparison for a Hypothetical $10,000 Investment1
Total return represents the change in value of an investment over the periods shown. It includes any applicable maximum sales charge, Fund expenses, account fees and reinvested distributions. The unmanaged index includes reinvestment of any income or distributions. It differs from the Fund in composition and does not pay management fees or expenses. One cannot invest directly in an index.
Advisor Class(6/1/15–5/31/19)
See page 19 for Performance Summary footnotes.
FRANKLIN PAYOUT 2021 FUND
PERFORMANCE SUMMARY
| | | | | | | | |
| Distributions(6/1/18–5/31/19) | | |
| | | | |
| Share Class | | Net Investment
Income | | Long-Term
Capital Gain | | Total | | |
| | | | |
R6 | | $0.2278 | | $0.0053 | | $0.2331 | | |
| | | | |
Advisor | | $0.2263 | | $0.0053 | | $0.2316 | | |
| | |
| Total Annual Operating Expenses5 | | | | |
| | | | |
| Share Class | | With Fee
Waiver | | Without Fee
Waiver | | | | |
| | | | |
Advisor | | 0.45% | | 2.59% | | | | |
Each class of shares is available to certain eligible investors and has different annual fees and expenses, as described in the prospectus.
All investments involve risks, including possible loss of principal. Changes in the financial strength of a bond issuer or in a bond’s credit rating may affect its value. Interest rate movements will affect the Fund’s share price and yield. Bond prices generally move in the opposite direction of interest rates. As the prices of bonds in the Fund adjust to a rise in interest rates, the Fund’s share price may decline. Because the Fund can only distribute what it earns, the Fund’s distributions to shareholders may decline when prevailing interest rates fall or when the Fund experiences defaults on debt securities it holds. Interest earned on floating rate loans varies with changes in prevailing interest rates. Therefore, while floating rate loans offer higher interest income when interest rates rise, they will also generate less income when interest rates decline. The Fund is actively managed but there is no guarantee that the manager’s investment decisions will achieve the desired results. The Fund’s prospectus also includes a description of the main investment risks.
1. The Fund has an expense reduction and a fee waiver associated with any investments it makes in a Franklin Templeton money fund and/or other Franklin Templeton fund, contractually guaranteed through 9/30/19. Fund investment results reflect the expense reduction and fee waiver; without these reductions, the results would have been lower.
2. Cumulative total return represents the change in value of an investment over the periods indicated.
3. Average annual total return represents the average annual change in value of an investment over the periods indicated. Return for less than one year, if any, has not been annualized.
4. Source: Morningstar. The Bloomberg Barclays U.S. Government/Credit 2021 Maturity Index includes investment-grade, U.S. dollar-denominated, fixed-rate Treasuries, government-related and corporate securities and foreign debt maturing in 2021.
5. Figures are as stated in the Fund’s current prospectus and may differ from the expense ratios disclosed in the Your Fund’s Expenses and Financial Highlights sections in this report. In periods of market volatility, assets may decline significantly, causing total annual Fund operating expenses to become higher than the figures shown.
See www.franklintempletondatasources.com for additional data provider information.
FRANKLIN PAYOUT 2021 FUND
Your Fund’s Expenses
As a Fund shareholder, you can incur two types of costs: (1) transaction costs, including sales charges (loads) on Fund purchases and redemptions, if applicable; and (2) ongoing Fund costs, including management fees, distribution and service(12b-1) fees, if applicable, and other Fund expenses. All mutual funds have ongoing costs, sometimes referred to as operating expenses. The table below shows ongoing costs of investing in the Fund and can help you understand these costs and compare them with those of other mutual funds. The table assumes a $1,000 investment held for the six months indicated.
Actual Fund Expenses
The table below provides information about actual account values and actual expenses in the columns under the heading “Actual.” In these columns the Fund’s actual return, which includes the effect of Fund expenses, is used to calculate the “Ending Account Value” for each class of shares. You can estimate the expenses you paid during the period by following these steps (of course, your account value and expenses will differ from those in this illustration): Divide your account value by $1,000 (if your account had an $8,600 value, then $8,600÷ $1,000 = 8.6). Then multiply the result by the number in the row for your class of shares under the headings “Actual” and “Expenses Paid During Period” (if Actual Expenses Paid During Period were $7.50, then 8.6 x $7.50 = $64.50). In this illustration, the actual expenses paid this period are $64.50.
Hypothetical Example for Comparison with Other Funds
Under the heading “Hypothetical” in the table, information is provided about hypothetical account values and hypothetical expenses based on the Fund’s actual expense ratio and an assumed rate of return of 5% per year before expenses, which is not the Fund’s actual return. This information may not be used to estimate the actual ending account balance or expenses you paid for the period, but it can help you compare ongoing costs of investing in the Fund with those of other funds. To do so, compare this 5% hypothetical example for the class of shares you hold with the 5% hypothetical examples that appear in the shareholder reports of other funds.
Please note that expenses shown in the table are meant to highlight ongoing costs and do not reflect any transactional costs. Therefore, information under the heading “Hypothetical” is useful in comparing ongoing costs only, and will not help you compare total costs of owning different funds. In addition, if transactional costs were included, your total costs would have been higher.
| | | | | | | | | | | | | | | | | | |
| | | | | | | Actual (actual return after expenses) | | | | Hypothetical
(5% annual return before expenses) | | | | |
Share
Class | | Beginning Account
Value 12/1/18 | | | | Ending Account Value 5/31/19 | | Expenses Paid During Period 12/1/18–5/31/191,2 | | | | Ending Account Value 5/31/19 | | Expenses Paid During Period 12/1/18–5/31/191,2 | | | | Net Annualized Expense Ratio2 |
| R6 | | $1,000 | | | | $1,037.20 | | $1.47 | | | | $1,023.49 | | $1.46 | | | | 0.29% |
| Advisor | | $1,000 | | | | $1,038.10 | | $1.47 | | | | $1,023.49 | | $1.46 | | | | 0.29% |
1. Expenses are equal to the annualized expense ratio for thesix-month period as indicated above—in the far right column—multiplied by the simple average account value over the period indicated, and then multiplied by 182/365 to reflect theone-half year period.
2. Reflects expenses after fee waivers and expense reimbursements. Does not include acquired fund fees and expenses.
Franklin Payout 2022 Fund
This annual report for Franklin Payout 2022 Fund covers the fiscal year ended May 31, 2019.
Your Fund’s Goals and Main Investments
The Fund seeks capital preservation and income with a predetermined maturity date. Under normal market conditions, the Fund invests predominantly in U.S. dollar-denominated investment-grade debt securities and investments, including government and corporate debt securities and asset-backed securities and municipal securities.
Performance Overview
The Fund’s Advisor Class shares posted a +5.48% cumulative total return for the period under review. In comparison, the Fund’s benchmark, the Bloomberg Barclays U.S. Government/Credit 2022 Maturity Index, returned
+5.15%.1 The index includes investment-grade, U.S. dollar-denominated, fixed-rate Treasuries, government-related and corporate securities and foreign debt maturing in 2022. You can find more of the Fund’s performance data in the Performance Summary beginning on page 23.
Performance data represent past performance, which does not guarantee future results. Investment return and principal value will fluctuate, and you may have a gain or loss when you sell your shares. Current performance may differ from figures shown. For most recentmonth-end performance, call a Franklin Templeton Institutional Services representative at (800)321-8563.
Investment Strategy
We focus on investment-grade securities and investments or in unrated securities and investments we determine are of comparable quality. Our focus on the portfolio’s credit quality is intended to reduce credit risk and help to preserve capital. We may invest a significant portion of the Fund’s assets in U.S. dollar-denominated foreign securities, including debt issued by supranational entities. In choosing investments, we select securities in various market sectors based on our assessment of changing economic, market, industry and issuer conditions. We use atop-down analysis of
Portfolio Composition
Based on Total Net Assets as of 5/31/19
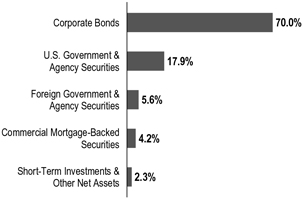
macroeconomic trends, combined with abottom-up fundamental analysis of market sectors, industries and issuers, to try to take advantage of varying sector reactions to economic events.
Although the Fund may invest in individual securities of any maturity, the Fund is a term fund and is managed to mature in 2022. Over time, the Fund’s duration and weighted average maturity will decline as 2022 approaches. In the later months of operation, when the debt securities held by the Fund mature, the proceeds from such securities will be held in cash, cash equivalents and money market instruments, including affiliated money market funds, or invested in short-term bonds. In early December 2022, the Fund is expected to consist almost entirely of cash, cash equivalents and money market instruments. The Fund is designed for investors who seek an investment with a payout schedule to help meet their retirement spending needs, particularly those who are nearing retirement or are in retirement. There is no guarantee the Fund will meet an investor’s retirement spending needs.
Manager’s Discussion
During the period under review, the Fund’s longer duration in the portfolio compared with the index as well as its exposure to investment-grade corporate securities were the primary contributors to returns. In contrast, our exposure to sovereign
1. Source: FactSet.
The index is unmanaged and includes reinvestment of any income or distributions. It does not reflect any fees, expenses or sales charges. One cannot invest directly in an index, and an index is not representative of the Fund’s portfolio.
See www.franklintempletondatasources.com for additional data provider information.
The dollar value, number of shares or principal amount, and names of all portfolio holdings are listed in the Fund’s Statement of Investments (SOI).
The SOI begins on page 43.
FRANKLIN PAYOUT 2022 FUND
| | |
| | What is duration? |
| |
| | | Duration is a measure of a bond’s price sensitivity to interest-rate changes. In general, a portfolio of securities with a lower duration can be expected to be less sensitive to interest-rate changes than a portfolio with a higher duration. |
Maturity
5/31/19
| | | | |
| | | % of Total
Market Value | |
0 to 1 Year | | | 1.8% | |
3 to 4 Years | | | 94.0% | |
4 to 5 Years | | | 2.8% | |
6 to 7 Years | | | 1.4% | |
| |
| Top 10 Holdings* | | | | |
| 5/31/19 | | | | |
| |
| Issue/Issuer | | % of Total
Net Assets | |
| |
U.S. Treasury Note | | | 9.5% | |
| |
FHLB | | | 8.5% | |
| |
JPMorgan Chase & Co. | | | 2.8% | |
| |
Metlife Inc. | | | 2.8% | |
| |
Swiss Re Treasury U.S. Corp. | | | 2.8% | |
| |
International Business Machines Corp. | | | 2.8% | |
| |
Bank of Montreal | | | 2.8% | |
| |
American Express Credit Account Master Trust | | | 2.8% | |
| |
Caterpillar Financial Services Corp. | | | 2.8% | |
| |
United Parcel Service Inc. | | | 2.8% | |
*Securities are listed by issuer, which may appear by another name in the SOI.
developed and emerging markets securities were significant detractors during the period.
Atperiod-end, we remained overweighted and focused on investment-grade corporate credit exposures in the portfolio. This focus is based on our belief that valuations remained relatively attractive on a longer-term basis as well as the increased earnings potential available from this sector. Conversely, we maintained an underweighted allocation to the U.S. Treasury sector as valuations and income levels remained unattractive to us. Additionally, we maintained an overweighted allocation to the agency sector. Finally, we maintained a slightly longer duration in the portfolio compared with the index, driven largely by our focus on bonds with final maturity dates closer to the Fund’s predetermined maturity date.
Thank you for your participation in Franklin Payout 2022 Fund. We look forward to serving your future investment needs.
| | |
 | |  |
| | Roger A. Bayston, CFA |
| |
 | |  |
| | David Yuen, CFA, FRM |
| |
| | Portfolio Management Team |
The foregoing information reflects our analysis, opinions and portfolio holdings as of May 31, 2019, the end of the reporting period. The way we implement our main investment strategies and the resulting portfolio holdings may change depending on factors such as market and economic conditions. These opinions may not be relied upon as investment advice or an offer for a particular security. The information is not a complete analysis of every aspect of any market, country, industry, security or the Fund. Statements of fact are from sources considered reliable, but the investment manager makes no representation or warranty as to their completeness or accuracy. Although historical performance is no guarantee of future results, these insights may help you understand our investment management philosophy.
FRANKLIN PAYOUT 2022 FUND
Performance Summary as of May 31, 2019
The performance table and graph do not reflect any taxes that a shareholder would pay on Fund dividends, capital gain distributions, if any, or any realized gains on the sale of Fund shares. Total return reflects reinvestment of the Fund’s dividends and capital gain distributions, if any, and any unrealized gains or losses. Your dividend income will vary depending on dividends or interest paid by securities in the Fund’s portfolio, adjusted for operating expenses of each class. Capital gain distributions are net profits realized from the sale of portfolio securities.
Performance as of 5/31/191
Cumulative total return excludes sales charges. Average annual total return includes maximum sales charges. Sales charges will vary depending on the size of the investment and the class of share purchased. The maximum and minimum is 0%.Advisor Class:no sales charges. For other share classes, call a Franklin Templeton Institutional Services representative at(800)321-8563.
| | | | | | |
Share Class | | Cumulative Total Return2 | |
| Average Annual
Total Return |
3 |
| |
| | |
Advisor | | | | | | |
| | |
1-Year | | +5.48% | | | +5.48% | |
| |
| | |
Since Inception (1/23/18) | | +4.85% | | | +3.57% | |
| |
Performance data represent past performance, which does not guarantee future results. Investment return and principal value will fluctuate, and you may have a gain or loss when you sell your shares. Current performance may differ from figures shown. For most recentmonth-end performance, call a Franklin Templeton Institutional Services representative at (800)321-8563.
See page 25 for Performance Summary footnotes.
FRANKLIN PAYOUT 2022 FUND
PERFORMANCE SUMMARY
Total Return Index Comparison for a Hypothetical $10,000 Investment1
Total return represents the change in value of an investment over the periods shown. It includes any applicable maximum sales charge, Fund expenses, account fees and reinvested distributions. The unmanaged index includes reinvestment of any income or distributions. It differs from the Fund in composition and does not pay management fees or expenses. One cannot invest directly in an index.
Advisor Class(1/23/18–5/31/19)
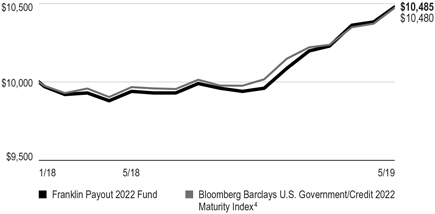
See page 25 for Performance Summary footnotes.
FRANKLIN PAYOUT 2022 FUND
PERFORMANCE SUMMARY
Distributions(6/1/18–5/31/19)
| | | | | | | | | | | | |
| Share Class | | Net Investment
Income | | | | | | | |
| | | | | | | | | |
R6 | | | $0.2350 | | | | | | | | | |
| | | | | | | | | |
Advisor | | | $0.2328 | | | | | | | | | |
| | | | | | | | | |
|
| Total Annual Operating Expenses5 | |
| | | |
| Share Class | | With Fee
Waiver | | | | | | Without Fee
Waiver | |
| |
Advisor | | | 0.44% | | | | | | | | 3.33% | |
| |
Each class of shares is available to certain eligible investors and has different annual fees and expenses, as described in the prospectus.
All investments involve risks, including possible loss of principal. Changes in the financial strength of a bond issuer or in a bond’s credit rating may affect its value. Interest rate movements will affect the Fund’s share price and yield. Bond prices generally move in the opposite direction of interest rates. As the prices of bonds in the Fund adjust to a rise in interest rates, the Fund’s share price may decline. Because the Fund can only distribute what it earns, the Fund’s distributions to shareholders may decline when prevailing interest rates fall or when the Fund experiences defaults on debt securities it holds. Interest earned on floating rate loans varies with changes in prevailing interest rates. Therefore, while floating rate loans offer higher interest income when interest rates rise, they will also generate less income when interest rates decline. The Fund is actively managed but there is no guarantee that the manager’s investment decisions will achieve the desired results. The Fund’s prospectus also includes a description of the main investment risks.
1. The Fund has an expense reduction and a fee waiver associated with any investments it makes in a Franklin Templeton money fund and/or other Franklin Templeton fund, contractually guaranteed through 9/30/19. Fund investment results reflect the expense reduction and fee waiver; without these reductions, the results would have been lower.
2. Cumulative total return represents the change in value of an investment over the periods indicated.
3. Average annual total return represents the average annual change in value of an investment over the periods indicated. Return for less than one year, if any, has not been annualized.
4. Source: Morningstar. The Bloomberg Barclays U.S. Government/Credit 2022 Maturity Index includes investment-grade, U.S. dollar-denominated, fixed-rate Treasuries, government-related and corporate securities and foreign debt maturing in 2022.
5. Figures are as stated in the Fund’s current prospectus and may differ from the expense ratios disclosed in the Your Fund’s Expenses and Financial Highlights sections in this report. In periods of market volatility, assets may decline significantly, causing total annual Fund operating expenses to become higher than the figures shown.
See www.franklintempletondatasources.com for additional data provider information.
FRANKLIN PAYOUT 2022 FUND
Your Fund’s Expenses
As a Fund shareholder, you can incur two types of costs: (1) transaction costs, including sales charges (loads) on Fund purchases and redemptions, if applicable; and (2) ongoing Fund costs, including management fees, distribution and service(12b-1) fees, if applicable, and other Fund expenses. All mutual funds have ongoing costs, sometimes referred to as operating expenses. The table below shows ongoing costs of investing in the Fund and can help you understand these costs and compare them with those of other mutual funds. The table assumes a $1,000 investment held for the six months indicated.
Actual Fund Expenses
The table below provides information about actual account values and actual expenses in the columns under the heading “Actual.” In these columns the Fund’s actual return, which includes the effect of Fund expenses, is used to calculate the “Ending Account Value” for each class of shares. You can estimate the expenses you paid during the period by following these steps (of course, your account value and expenses will differ from those in this illustration): Divide your account value by $1,000 (if your account had an $8,600 value, then $8,600÷ $1,000 = 8.6). Then multiply the result by the number in the row for your class of shares under the headings “Actual” and “Expenses Paid During Period” (if Actual Expenses Paid During Period were $7.50, then 8.6 x $7.50 = $64.50). In this illustration, the actual expenses paid this period are $64.50.
Hypothetical Example for Comparison with Other Funds
Under the heading “Hypothetical” in the table, information is provided about hypothetical account values and hypothetical expenses based on the Fund’s actual expense ratio and an assumed rate of return of 5% per year before expenses, which is not the Fund’s actual return. This information may not be used to estimate the actual ending account balance or expenses you paid for the period, but it can help you compare ongoing costs of investing in the Fund with those of other funds. To do so, compare this 5% hypothetical example for the class of shares you hold with the 5% hypothetical examples that appear in the shareholder reports of other funds.
Please note that expenses shown in the table are meant to highlight ongoing costs and do not reflect any transactional costs. Therefore, information under the heading “Hypothetical” is useful in comparing ongoing costs only, and will not help you compare total costs of owning different funds. In addition, if transactional costs were included, your total costs would have been higher.
| | | | | | | | | | | | | | | | | | | | | | |
| | | | | | | Actual (actual return after expenses) | | | | Hypothetical (5% annual return before expenses) | | | | |
Share
Class | | Beginning
Account Value | | | | Ending
Account
Value 5/31/19 | | Expenses
Paid During
Period
1/23/18–5/31/191,2 | | | | Ending
Account
Value 5/31/19 | | Expenses
Paid During
Period
12/1/18–5/31/191,2 | | | | Net
Annualized
Expense
Ratio2 |
| R6 | | $1,000 | | | | $1,052.90 | | $1.48 | | | | $1,023.49 | | $1.46 | | | | 0.29% |
| Advisor | | $1,000 | | | | $1,052.70 | | $1.43 | | | | $1,023.54 | | $1.41 | | | | 0.28% |
1. Expenses are equal to the annualized expense ratio for thesix-month period as indicated above—in the far right column—multiplied by the simple average account value over the period indicated, and then multiplied by 182/365 to reflect theone-half year period.
2. Reflects expenses after fee waivers and expense reimbursements. Does not include acquired fund fees and expenses.
FRANKLIN FUND ALLOCATOR SERIES
Financial Highlights
Franklin Payout 2019 Fund
| | | | | | | | | | | | | | | | | | | | | | | | | | | | |
| | | Year Ended May 31, | |
| | | | | | | |
| | | 2019 | | | | | | 2018 | | | | | | 2017 | | | | | | 2016a | |
| | | | | | | |
Class R6 | | | | | | | | | | | | | | | | | | | | | | | | | | | | |
Per share operating performance (for a share outstanding throughout the year) | | | | | | | | | | | | | | | | | | | | | | | | | | | | |
| | | | | | | |
Net asset value, beginning of year | | | $ 9.99 | | | | | | | | $10.13 | | | | | | | | $10.16 | | | | | | | | $10.00 | |
| | | | | | | |
Income from investment operationsb: | | | | | | | | | | | | | | | | | | | | | | | | | | | | |
| | | | | | | |
Net investment incomec | | | 0.19 | | | | | | | | 0.19 | | | | | | | | 0.18 | | | | | | | | 0.18 | |
| | | | | | | |
Net realized and unrealized gains (losses) | | | 0.05 | | | | | | | | (0.15 | ) | | | | | | | (0.03 | ) | | | | | | | 0.10 | |
| | | | | | | |
Total from investment operations | | | 0.24 | | | | | | | | 0.04 | | | | | | | | 0.15 | | | | | | | | 0.28 | |
| | | | | | | |
Less distributions from: | | | | | | | | | | | | | | | | | | | | | | | | | | | | |
| | | | | | | |
Net investment income | | | (0.19 | ) | | | | | | | (0.18 | ) | | | | | | | (0.18 | ) | | | | | | | (0.12 | ) |
| | | | | | | |
Net realized gains | | | — | | | | | | | | (— | )d | | | | | | | — | | | | | | | | — | |
| | | | | | | |
Total distributions | | | (0.19 | ) | | | | | | | (0.18 | ) | | | | | | | (0.18 | ) | | | | | | | (0.12 | ) |
| | | | | | | |
Net asset value, end of year | | | $10.04 | | | | | | | | $ 9.99 | | | | | | | | $10.13 | | | | | | | | $10.16 | |
| | | | | | | |
Total return | | | 2.44% | | | | | | | | 0.45% | | | | | | | | 1.52% | | | | | | | | 2.85% | |
| | | | | | | |
Ratios to average net assets | | | | | | | | | | | | | | | | | | | | | | | | | | | | |
| | | | | | | |
Expenses before waiver and payments by affiliates | | | 3.03% | | | | | | | | 2.60% | | | | | | | | 2.66% | | | | | | | | 3.57% | |
| | | | | | | |
Expenses net of waiver and payments by affiliates | |
| 0.29%
| e
| | | | | | | 0.30% | | | | | | | | 0.30% | | | | | | | | 0.29% | |
| | | | | | | |
Net investment income | | | 1.86% | | | | | | | | 1.88% | | | | | | | | 1.81% | | | | | | | | 1.80% | |
| | | | | | | |
Supplemental data | | | | | | | | | | | | | | | | | | | | | | | | | | | | |
| | | | | | | |
Net assets, end of year (000’s) | | | $2,032 | | | | | | | | $2,022 | | | | | | | | $2,051 | | | | | | | | $2,057 | |
| | | | | | | |
Portfolio turnover rate | | | 2.60% | | | | | | | | 1.29% | | | | | | | | —% | | | | | | | | —% | f |
aFor the year June 1, 2015 (commencement of operations) to May 31, 2016.
bThe amount shown for a share outstanding throughout the period may not correlate with the Statement of Operations for the period due to the timing of sales and repurchases of the Fund’s shares in relation to income earned and/or fluctuating fair value of the investments of the Fund.
cBased on average daily shares outstanding.
dAmount rounds to less than $0.01 per share.
eBenefit of expense reduction rounds to less than 0.01%.
fRounds to less than 0.01%.
| | |
| | | |
| The accompanying notes are an integral part of these financial statements. | Annual Report | | 27 |
FRANKLIN FUND ALLOCATOR SERIES
FINANCIAL HIGHLIGHTS
Franklin Payout 2019 Fund(continued)
| | | | | | | | | | | | | | | | |
| | | Year Ended May 31, | |
| | | 2019 | | | 2018 | | | 2017 | | | 2016a | |
| | | | |
| | | | | | | | | | | | | | | | |
Advisor Class | | | | | | | | | | | | | | | | |
| | | | |
Per share operating performance (for a share outstanding throughout the year) | | | | | | | | | | | | | | | | |
| | | | |
Net asset value, beginning of year | | | $9.99 | | | | $10.13 | | | | $10.16 | | | | $10.00 | |
| | | | |
Income from investment operationsb: | | | | | | | | | | | | | | | | |
| | | | |
Net investment incomec | | | 0.19 | | | | 0.19 | | | | 0.18 | | | | 0.18 | |
| | | | |
Net realized and unrealized gains (losses) | | | 0.05 | | | | (0.15 | ) | | | (0.03 | ) | | | 0.10 | |
| | | | |
Total from investment operations | | | 0.24 | | | | 0.04 | | | | 0.15 | | | | 0.28 | |
| | | | |
Less distributions from: | | | | | | | | | | | | | | | | |
| | | | |
Net investment income | | | (0.19 | ) | | | (0.18 | ) | | | (0.18 | ) | | | (0.12 | ) |
| | | | |
Net realized gains | | | — | | | | (— | )d | | | — | | | | — | |
| | | | |
Total distributions | | | (0.19 | ) | | | (0.18 | ) | | | (0.18 | ) | | | (0.12 | ) |
| | | | |
Net asset value, end of year | | | $10.04 | | | | $9.99 | | | | $10.13 | | | | $10.16 | |
| | | | |
Total return | | | 2.42% | | | | 0.44% | | | | 1.52% | | | | 2.85% | |
| | | | |
Ratios to average net assets | | | | | | | | | | | | | | | | |
| | | | |
Expenses before waiver and payments by affiliates | | | 3.03% | | | | 2.60% | | | | 2.66% | | | | 3.57% | |
| | | | |
Expenses net of waiver and payments by affiliates | | | 0.30% | e | | | 0.31% | | | | 0.30% | | | | 0.29% | |
| | | | |
Net investment income | | | 1.85% | | | | 1.87% | | | | 1.81% | | | | 1.80% | |
| | | | |
Supplemental data | | | | | | | | | | | | | | | | |
| | | | |
Net assets, end of year (000’s) | | | $2,032 | | | | $2,022 | | | | $2,051 | | | | $2,057 | |
| | | | |
Portfolio turnover rate | | | 2.60% | | | | 1.29% | | | | —% | | | | —% | f |
aFor the year June 1, 2015 (commencement of operations) to May 31, 2016.
bThe amount shown for a share outstanding throughout the period may not correlate with the Statement of Operations for the period due to the timing of sales and repurchases of the Fund’s shares in relation to income earned and/or fluctuating fair value of the investments of the Fund.
cBased on average daily shares outstanding.
dAmount rounds to less than $0.01 per share.
eBenefit of expense reduction rounds to less than 0.01%.
fRounds to less than 0.01%.
| | |
| | | |
| 28 | | Annual Report | The accompanying notes are an integral part of these financial statements. |
FRANKLIN FUND ALLOCATOR SERIES
Statement of Investments, May 31, 2019
Franklin Payout 2019 Fund
| | | | | | | | | | | | | | |
| | | | | Country | | | Principal
Amount* | | Value | |
| | | | |
| | Corporate Bonds 72.7% | | | | | | | | | | | | |
| | Banks 14.8% | | | | | | | | | | | | |
| | | | |
| | Bank of Nova Scotia, secured note, 2.125%, 9/11/20 | | | Canada | | | | $100,000 | | | | $ 99,894 | |
| | HSBC USA Inc., senior note, 2.375%, 11/13/19 | | | United States | | | | 100,000 | | | | 99,893 | |
| | JPMorgan Chase & Co., senior note, 2.20%, 10/22/19 | | | United States | | | | 100,000 | | | | 99,891 | |
| | Royal Bank of Canada, secured note, 2.20%, 9/23/20 | | | Canada | | | | 100,000 | | | | 99,895 | |
| | The Toronto-Dominion Bank, senior note, 2.25%, 11/05/19 | | | Canada | | | | 100,000 | | | | 99,963 | |
| | Westpac Banking Corp., senior note, 4.875%, 11/19/19 | | | Australia | | | | 100,000 | | | | 101,076 | |
| | | | | | | | | | | | | | |
| | | | |
| | | | | | | | | | | | | 600,612 | |
| | | | | | | | | | | | | | |
| | Capital Goods 17.3% | | | | | | | | | | | | |
| | Boeing Capital Corp., senior note, 4.70%, 10/27/19 | | | United States | | | | 100,000 | | | | 100,826 | |
| | Caterpillar Financial Services Corp., senior note, 2.25%, 12/01/19 | | | United States | | | | 100,000 | | | | 99,938 | |
| | Deere & Co., senior note, 4.375%, 10/16/19 | | | United States | | | | 100,000 | | | | 100,683 | |
| | Emerson Electric Co., senior bond, 4.875%, 10/15/19 | | | United States | | | | 100,000 | | | | 100,795 | |
| | General Electric Co., senior secured note, first lien, 2.10%, 12/11/19 | | | United States | | | | 100,000 | | | | 99,598 | |
| | Lockheed Martin Corp., senior note, 4.25%, 11/15/19 | | | United States | | | | 100,000 | | | | 100,734 | |
| | United Technologies Corp., senior note, 1.50%, 11/01/19 | | | United States | | | | 100,000 | | | | 99,583 | |
| | | | | | | | | | | | | | |
| | | | |
| | | | | | | | | | | | | 702,157 | |
| | | | | | | | | | | | | | |
| | Commercial & Professional Services 1.2% | | | | | | | | | | | | |
| | Republic Services Inc., senior note, 5.50%, 9/15/19 | | | United States | | | | 50,000 | | | | 50,352 | |
| | | | | | | | | | | | | | |
| | Diversified Financials 4.9% | | | | | | | | | | | | |
| | Goldman Sachs Group Inc., senior note, 2.55%, 10/23/19 | | | United States | | | | 100,000 | | | | 100,012 | |
| | Morgan Stanley, senior note, 5.625%, 9/23/19 | | | United States | | | | 100,000 | | | | 100,855 | |
| | | | | | | | | | | | | | |
| | | | |
| | | | | | | | | | | | | 200,867 | |
| | | | | | | | | | | | | | |
| | Energy 8.6% | | | | | | | | | | | | |
| | Chevron Corp., senior note, 2.193%, 11/15/19 | | | United States | | | | 100,000 | | | | 99,891 | |
| | Enterprise Products Operating LLC, senior note, 2.55%, 10/15/19 | | | United States | | | | 50,000 | | | | 49,949 | |
| | Equinor ASA, senior note, 2.25%, 11/08/19 | | | Norway | | | | 100,000 | | | | 99,728 | |
| | Kinder Morgan Inc., senior note, 3.05%, 12/01/19 | | | United States | | | | 50,000 | | | | 50,051 | |
| | Plains All American Pipeline LP/PAA Finance Corp., senior note, 2.60%, 12/15/19 | | | United States | | | | 50,000 | | | | 49,905 | |
| | | | | | | | | | | | | | |
| | | | |
| | | | | | | | | | | | | 349,524 | |
| | | | | | | | | | | | | | |
| | Food & Staples Retailing 3.7% | | | | | | | | | | | | |
| | Costco Wholesale Corp., senior note, 1.70%, 12/15/19 | | | United States | | | | 100,000 | | | | 99,539 | |
| | Walgreens Boots Alliance Inc., senior note, 2.70%, 11/18/19 | | | United States | | | | 50,000 | | | | 49,972 | |
| | | | | | | | | | | | | | |
| | | | |
| | | | | | | | | | | | | 149,511 | |
| | | | | | | | | | | | | | |
| | Food, Beverage & Tobacco 3.7% | | | | | | | | | | | | |
| | Anheuser-Busch InBev Worldwide Inc., senior note, 6.875%, 11/15/19 | | | Belgium | | | | 100,000 | | | | 101,575 | |
| | Mead Johnson Nutrition Co., senior note, 4.90%, 11/01/19 | | | United Kingdom | | | | 50,000 | | | | 50,432 | |
| | | | | | | | | | | | | | |
| | | | |
| | | | | | | | | | | | | 152,007 | |
| | | | | | | | | | | | | | |
| | Health Care Equipment & Services 4.9% | | | | | | | | | | | | |
| | Becton Dickinson and Co., senior note, 2.675%, 12/15/19 | | | United States | | | | 50,000 | | | | 49,971 | |
| | UnitedHealth Group Inc., senior note, 2.30%, 12/15/19 | | | United States | | | | 100,000 | | | | 99,916 | |
| | Zimmer Biomet Holdings Inc., senior bond, 4.625%, 11/30/19 | | | United States | | | | 50,000 | | | | 50,457 | |
| | | | | | | | | | | | | | |
| | | | |
| | | | | | | | | | | | | 200,344 | |
| | | | | | | | | | | | | | |
FRANKLIN FUND ALLOCATOR SERIES
STATEMENT OF INVESTMENTS
Franklin Payout 2019 Fund(continued)
| | | | | | | | | | | | |
| | | Country | | | Principal
Amount* | | Value | |
| | | |
Corporate Bonds(continued) | | | | | | | | | | | | |
Materials 2.5% | | | | | | | | | | | | |
PPG Industries Inc., senior note, 2.30%, 11/15/19 | | | United States | | | $ | 100,000 | | | $ | 99,875 | |
| | | | | | | | | | | | |
| | | |
Media & Entertainment 2.5% | | | | | | | | | | | | |
Discovery Communications LLC, senior note, 2.75%, 11/15/19 | | | United States | | | | 50,000 | | | | 49,942 | |
Viacom Inc., senior note, 2.75%, 12/15/19 | | | United States | | | | 50,000 | | | | 49,926 | |
| | | | | | | | | | | | |
| | | | | | | | | | | 99,868 | |
| | | | | | | | | | | | |
| | | |
Pharmaceuticals, Biotechnology & Life Sciences 2.4% | | | | | | | | | | | | |
Johnson & Johnson, senior note, 1.875%, 12/05/19 | | | United States | | | | 100,000 | | | | 99,762 | |
| | | | | | | | | | | | |
| | | |
Utilities 6.2% | | | | | | | | | | | | |
DTE Energy Co., senior note, 2.40%, 12/01/19 | | | United States | | | | 50,000 | | | | 49,928 | |
Georgia Power Co., senior note, 4.25%, 12/01/19 | | | United States | | | | 100,000 | | | | 100,659 | |
Progress Energy Inc., senior bond, 4.875%, 12/01/19 | | | United States | | | | 50,000 | | | | 50,545 | |
Public Service Electric and Gas Co., secured note, 2.00%, 8/15/19 | | | United States | | | | 50,000 | | | | 49,922 | |
| | | | | | | | | | | | |
| | | | | | | | | | | 251,054 | |
| | | | | | | | | | | | |
| | | |
Total Corporate Bonds (Cost $2,961,355) | | | | | | | | | | | 2,955,933 | |
| | | | | | | | | | | | |
| | | |
U.S. Government and Agency Securities 17.7% | | | | | | | | | | | | |
FFCB, 1.95%, 12/17/19 | | | United States | | | | 150,000 | | | | 149,795 | |
FHLB, | | | | | | | | | | | | |
1.25%, 12/13/19 | | | United States | | | | 160,000 | | | | 159,052 | |
2.375%, 12/13/19 | | | United States | | | | 210,000 | | | | 210,070 | |
FNMA, 1.75%, 11/26/19 | | | United States | | | | 200,000 | | | | 199,407 | |
| | | | | | | | | | | | |
Total U.S. Government and Agency Securities
(Cost $720,803) | | | | | | | | | | | 718,324 | |
| | | | | | | | | | | | |
| | | |
Total Investments before Short Term Investments (Cost $3,682,158) | | | | | | | | | | | 3,674,257 | |
| | | | | | | | | | | | |
| | | |
| | | | | | Shares | | | |
| | | |
Short Term Investments (Cost $386,344) 9.5% | | | | | | | | | | | | |
| | | |
Money Market Funds 9.5% | | | | | | | | | | | | |
a,bInstitutional Fiduciary Trust Money Market Portfolio, 2.08% | | | United States | | | | 386,344 | | | | 386,344 | |
| | | | | | | | | | | | |
| | | |
Total Investments (Cost $4,068,502) 99.9% | | | | | | | | | | | 4,060,601 | |
Other Assets, less Liabilities 0.1% | | | | | | | | | | | 4,235 | |
| | | | | | | | | | | | |
| | | |
Net Assets 100.0% | | | | | | | | | | $ | 4,064,836 | |
| | | | | | | | | | | | |
See Abbreviations on page 57.
*The principal amount is stated in U.S. dollars unless otherwise indicated.
aSee Note 3(d) regarding investments in affiliated management investment companies.
bThe rate shown is the annualizedseven-day effective yield at period end.
| | |
| | | |
| 30 | | Annual Report | The accompanying notes are an integral part of these financial statements. |
FRANKLIN FUND ALLOCATOR SERIES
Financial Highlights
Franklin Payout 2020 Fund
| | | | | | | | | | | | | | | | |
| | | Year Ended May 31, | |
| | | 2019 | | | 2018 | | | 2017 | | | 2016a | |
| | | | | |
Class R6 | | | | | | | | | | | | | | | | |
| | | | |
Per share operating performance (for a share outstanding throughout the year) | | | | | | | | | | | | | | | | |
| | | | |
Net asset value, beginning of year | | | $ 9.95 | | | | $10.17 | | | | $10.17 | | | | $10.00 | |
| | | | |
Income from investment operationsb: | | | | | | | | | | | | | | | | |
| | | | |
Net investment incomec | | | 0.21 | | | | 0.20 | | | | 0.21 | | | | 0.20 | |
| | | | |
Net realized and unrealized gains (losses) | | | 0.09 | | | | (0.22 | ) | | | (0.01 | ) | | | 0.11 | |
| | | | |
Total from investment operations | | | 0.30 | | | | (0.02 | ) | | | 0.20 | | | | 0.31 | |
| | | | |
Less distributions from: | | | | | | | | | | | | | | | | |
| | | | |
Net investment income | | | (0.21 | ) | | | (0.20 | ) | | | (0.20 | ) | | | (0.14 | ) |
| | | | |
Net asset value, end of year | | | $10.04 | | | | $ 9.95 | | | | $10.17 | | | | $10.17 | |
| | | | |
| | | | | | | | | | | | | | | | |
Total return | | | 3.03% | | | | (0.18)% | | | | 1.99% | | | | 3.10% | |
| | | | |
Ratios to average net assets | | | | | | | | | | | | | | | | |
| | | | |
Expenses before waiver and payments by affiliates | | | 3.23% | | | | 2.74% | | | | 2.72% | | | | 3.59% | |
| | | | |
Expenses net of waiver and payments by affiliates | | | 0.29% | | | | 0.30% | | | | 0.30% | | | | 0.29% | |
| | | | |
Net investment income | | | 2.07% | | | | 2.03% | | | | 2.02% | | | | 2.01% | |
| | | | |
Supplemental data | | | | | | | | | | | | | | | | |
| | | | |
Net assets, end of year (000’s) | | | $2,037 | | | | $2,018 | | | | $2,062 | | | | $2,061 | |
| | | | |
Portfolio turnover rate | | | 6.50% | | | | —% | | | | 1.28% | | | | 4.23% | |
aFor the year June 1, 2015 (commencement of operations) to May 31, 2016.
bThe amount shown for a share outstanding throughout the period may not correlate with the Statement of Operations for the period due to the timing of sales and repurchases of the Fund’s shares in relation to income earned and/or fluctuating fair value of the investments of the Fund.
cBased on average daily shares outstanding.
| | |
| | | |
| The accompanying notes are an integral part of these financial statements. | Annual Report | | 31 |
FRANKLIN FUND ALLOCATOR SERIES
FINANCIAL HIGHLIGHTS
Franklin Payout 2020 Fund(continued)
| | | | | | | | | | | | | | | | |
| | | Year Ended May 31, | |
| | | 2019 | | | 2018 | | | 2017 | | | 2016a | |
| | | | | |
Advisor Class | | | | | | | | | | | | | | | | |
| | | | |
Per share operating performance (for a share outstanding throughout the year) | | | | | | | | | | | | | | | | |
| | | | |
Net asset value, beginning of year | | | $ 9.95 | | | | $10.17 | | | | $10.17 | | | | $10.00 | |
| | | | |
Income from investment operationsb: | | | | | | | | | | | | | | | | |
| | | | |
Net investment incomec | | | 0.21 | | | | 0.20 | | | | 0.21 | | | | 0.20 | |
| | | | |
Net realized and unrealized gains (losses) | | | 0.08 | | | | (0.22 | ) | | | (0.01 | ) | | | 0.11 | |
| | | | |
Total from investment operations | | | 0.29 | | | | (0.02 | ) | | | 0.20 | | | | 0.31 | |
| | | | |
Less distributions from: | | | | | | | | | | | | | | | | |
| | | | |
Net investment income | | | (0.20 | ) | | | (0.20 | ) | | | (0.20 | ) | | | (0.14 | ) |
| | | | |
Net asset value, end of year | | | $10.04 | | | | $ 9.95 | | | | $10.17 | | | | $10.17 | |
| | | | |
| | | | | | | | | | | | | | | | |
Total return | | | 3.02% | | | | (0.18)% | | | | 2.00% | | | | 3.10% | |
| | | | |
Ratios to average net assets | | | | | | | | | | | | | | | | |
| | | | |
Expenses before waiver and payments by affiliates | | | 3.23% | | | | 2.74% | | | | 2.72% | | | | 3.59% | |
| | | | |
Expenses net of waiver and payments by affiliates | | | 0.30% | | | | 0.31% | | | | 0.30% | | | | 0.29% | |
| | | | |
Net investment income | | | 2.06% | | | | 2.02% | | | | 2.02% | | | | 2.01% | |
| | | | |
Supplemental data | | | | | | | | | | | | | | | | |
| | | | |
Net assets, end of year (000’s) | | | $2,037 | | | | $2,018 | | | | $2,062 | | | | $2,061 | |
| | | | |
Portfolio turnover rate | | | 6.50% | | | | —% | | | | 1.28% | | | | 4.23% | |
aFor the year June 1, 2015 (commencement of operations) to May 31, 2016.
bThe amount shown for a share outstanding throughout the period may not correlate with the Statement of Operations for the period due to the timing of sales and repurchases of the Fund’s shares in relation to income earned and/or fluctuating fair value of the investments of the Fund.
cBased on average daily shares outstanding.
| | |
| | | |
| 32 | | Annual Report | The accompanying notes are an integral part of these financial statements. |
FRANKLIN FUND ALLOCATOR SERIES
Statement of Investments, May 31, 2019
Franklin Payout 2020 Fund
| | | | | | | | | | | | |
| | | Country/
Organization | | | Principal
Amount* | | Value | |
| | | |
Corporate Bonds 73.1% | | | | | | | | | | | | |
Banks 5.0% | | | | | | | | | | | | |
Bank of America Corp., senior note, 2.625%, 10/19/20 | | | United States | | | | $100,000 | | | $ | 100,068 | |
JPMorgan Chase & Co., senior note, 4.25%, 10/15/20 | | | United States | | | | 100,000 | | | | 102,314 | |
| | | | | | | | | | | | |
| | | |
| | | | | | | | | | | 202,382 | |
| | | | | | | | | | | | |
Capital Goods 11.1% | | | | | | | | | | | | |
Boeing Co., senior note, 1.65%, 10/30/20 | | | United States | | | | 100,000 | | | | 98,934 | |
Caterpillar Financial Services Corp., senior note, 2.50%, 11/13/20 | | | United States | | | | 100,000 | | | | 100,168 | |
Emerson Electric Co., senior bond, 4.25%, 11/15/20 | | | United States | | | | 100,000 | | | | 102,679 | |
Lockheed Martin Corp., senior note, 2.50%, 11/23/20 | | | United States | | | | 50,000 | | | | 50,093 | |
Raytheon Co., senior note, 3.125%, 10/15/20 | | | United States | | | | 100,000 | | | | 101,042 | |
| | | | | | | | | | | | |
| | | |
| | | | | | | | | | | 452,916 | |
| | | | | | | | | | | | |
Consumer Services 2.5% | | | | | | | | | | | | |
Carnival Corp., senior note, 3.95%, 10/15/20 | | | United States | | | | 50,000 | | | | 50,912 | |
Yum! Brands Inc., senior bond, 3.875%, 11/01/20 | | | United States | | | | 50,000 | | | | 50,125 | |
| | | | | | | | | | | | |
| | | |
| | | | | | | | | | | 101,037 | |
| | | | | | | | | | | | |
Diversified Financials 5.0% | | | | | | | | | | | | |
Morgan Stanley, senior note, 5.50%, 7/24/20 | | | United States | | | | 100,000 | | | | 103,133 | |
Northern Trust Corp., senior note, 3.45%, 11/04/20 | | | United States | | | | 100,000 | | | | 101,676 | |
| | | | | | | | | | | | |
| | | |
| | | | | | | | | | | 204,809 | |
| | | | | | | | | | | | |
Energy 13.6% | | | | | | | | | | | | |
Energy Transfer Operating LP, senior note, 4.15%, 10/01/20 | | | United States | | | | 50,000 | | | | 50,773 | |
Enterprise Products Operating LLC, senior note, 5.20%, 9/01/20 | | | United States | | | | 50,000 | | | | 51,598 | |
Equinor ASA, senior note, 2.90%, 11/08/20 | | | Norway | | | | 100,000 | | | | 100,639 | |
Kinder Morgan Energy Partners LP, senior bond, 5.30%, 9/15/20 | | | United States | | | | 50,000 | | | | 51,597 | |
Pride International Inc., senior bond, 6.875%, 8/15/20 | | | United States | | | | 50,000 | | | | 49,875 | |
aSchlumberger Finance Canada Ltd., senior note, 144A, 2.20%, 11/20/20 | | | United States | | | | 100,000 | | | | 99,571 | |
TransCanada PipeLines Ltd., senior bond, 3.80%, 10/01/20 | | | Canada | | | | 100,000 | | | | 101,608 | |
The Williams Cos. Inc., senior note, 4.125%, 11/15/20 | | | United States | | | | 50,000 | | | | 50,848 | |
| | | | | | | | | | | | |
| | | |
| | | | | | | | | | | 556,509 | |
| | | | | | | | | | | | |
Food, Beverage & Tobacco 7.5% | | | | | | | | | | | | |
Coca Cola Co., senior note, 3.15%, 11/15/20 | | | United States | | | | 100,000 | | | | 101,217 | |
Hershey Co., senior note, 4.125%, 12/01/20 | | | United States | | | | 100,000 | | | | 102,667 | |
PepsiCo Inc., senior bond, 3.125%, 11/01/20 | | | United States | | | | 100,000 | | | | 100,972 | |
| | | | | | | | | | | | |
| | | |
| | | | | | | | | | | 304,856 | |
| | | | | | | | | | | | |
Health Care Equipment & Services 7.5% | | | | | | | | | | | | |
Becton Dickinson and Co., senior note, 3.25%, 11/12/20 | | | United States | | | | 50,000 | | | | 50,363 | |
Cigna Holding Co., senior bond, 4.375%, 12/15/20 | | | United States | | | | 50,000 | | | | 51,070 | |
Express Scripts Holding Co., senior note, 2.60%, 11/30/20 | | | United States | | | | 50,000 | | | | 49,887 | |
Laboratory Corp. of America Holdings, senior note, 4.625%, 11/15/20 | | | United States | | | | 50,000 | | | | 51,160 | |
UnitedHealth Group Inc., senior note, 3.875%, 10/15/20 | | | United States | | | | 100,000 | | | | 101,563 | |
| | | | | | | | | | | | |
| | | |
| | | | | | | | | | | 304,043 | |
| | | | | | | | | | | | |
Household & Personal Products 2.5% | | | | | | | | | | | | |
Colgate-Palmolive Co., senior note, 2.95%, 11/01/20 | | | United States | | | | 100,000 | | | | 101,263 | |
| | | | | | | | | | | | |
FRANKLIN FUND ALLOCATOR SERIES
STATEMENT OF INVESTMENTS
Franklin Payout 2020 Fund(continued)
| | | | | | | | | | | | |
| | | Country/
Organization | | | Principal
Amount* | | Value | |
| | | |
Corporate Bonds(continued) | | | | | | | | | | | | |
| | | |
Insurance 6.2% | | | | | | | | | | | | |
| | | |
Berkshire Hathaway Finance Corp., senior note, 2.90%, 10/15/20 | | | United States | | | | $100,000 | | | | $ 100,922 | |
| | | |
Prudential Financial Inc., senior note, 4.50%, 11/15/20 | | | United States | | | | 50,000 | | | | 51,443 | |
| | | |
Travelers Cos. Inc., senior note, 3.90%, 11/01/20 | | | United States | | | | 100,000 | | | | 102,150 | |
| | | | | | | | | | | | |
| | | |
| | | | | | | | | | | 254,515 | |
| | | | | | | | | | | | |
| | | |
Materials 2.0% | | | | | | | | | | | | |
| | | |
The Dow Chemical Co., senior bond, 4.25%, 11/15/20 | | | United States | | | | 31,000 | | | | 31,596 | |
| | | |
aGeorgia-Pacific LLC, senior note, 144A, 5.40%, 11/01/20 | | | United States | | | | 50,000 | | | | 51,908 | |
| | | | | | | | | | | | |
| | | |
| | | | | | | | | | | 83,504 | |
| | | | | | | | | | | | |
| | | |
Pharmaceuticals, Biotechnology & Life Sciences 2.5% | | | | | | | | | | | | |
| | | |
Amgen Inc., senior note, 3.45%, 10/01/20 | | | United States | | | | 50,000 | | | | 50,647 | |
| | | |
Celgene Corp., senior bond, 3.95%, 10/15/20 | | | United States | | | | 50,000 | | | | 51,075 | |
| | | | | | | | | | | | |
| | | |
| | | | | | | | | | | 101,722 | |
| | | | | | | | | | | | |
| | | |
Technology Hardware & Equipment 2.7% | | | | | | | | | | | | |
| | | |
Apple Inc., senior note, 2.00%, 11/13/20 | | | United States | | | | 100,000 | | | | 99,702 | |
| | | |
HP Inc., senior note, 3.75%, 12/01/20 | | | United States | | | | 9,000 | | | | 9,152 | |
| | | | | | | | | | | | |
| | | |
| | | | | | | | | | | 108,854 | |
| | | | | | | | | | | | |
Utilities 5.0% | | | | | | | | | | | | |
| | | |
Alabama Power Co., senior note, 3.375%, 10/01/20 | | | United States | | | | 100,000 | | | | 100,942 | |
| | | |
Exelon Corp., senior note, 5.15%, 12/01/20 | | | United States | | | | 50,000 | | | | 51,533 | |
| | | |
Exelon Generation Co. LLC, senior bond, 4.00%, 10/01/20 | | | United States | | | | 50,000 | | | | 50,719 | |
| | | | | | | | | | | | |
| | | |
| | | | | | | | | | | 203,194 | |
| | | | | | | | | | | | |
| | | |
Total Corporate Bonds (Cost $2,980,627) | | | | | | | | | | | 2,979,604 | |
| | | | | | | | | | | | |
| | | |
Foreign Government and Agency Securities 4.9% | | | | | | | | | | | | |
| | | |
Inter-American Development Bank, senior note, 2.125%, 11/09/20 | | | Supranational | b | | | 100,000 | | | | 100,089 | |
| | | |
International Bank for Reconstruction and Development, senior note, 2.125%, 11/01/20 | | | Supranational | b | | | 100,000 | | | | 100,096 | |
| | | | | | | | | | | | |
| | | |
Total Foreign Government and Agency Securities
(Cost $200,677) | | | | | | | | | | | 200,185 | |
| | | | | | | | | | | | |
| | | |
U.S. Government and Agency Securities 17.2% | | | | | | | | | | | | |
| | | |
FHLB, 3.125%, 12/11/20 | | | United States | | | | 200,000 | | | | 203,235 | |
| | | |
U.S. Treasury Note, | | | | | | | | | | | | |
| | | |
2.625%, 11/15/20 | | | United States | | | | 145,000 | | | | 146,198 | |
| | | |
2.00%, 11/30/20 | | | United States | | | | 145,000 | | | | 144,932 | |
| | | |
2.375%, 12/31/20 | | | United States | | | | 205,000 | | | | 206,117 | |
| | | | | | | | | | | | |
| | | |
Total U.S. Government and Agency Securities
(Cost $702,939) | | | | | | | | | | | 700,482 | |
| | | | | | | | | | | | |
| | | |
Total Investments before Short Term Investments (Cost $3,884,243) | | | | | | | | | | | 3,880,271 | |
| | | | | | | | | | | | |
FRANKLIN FUND ALLOCATOR SERIES
STATEMENT OF INVESTMENTS
Franklin Payout 2020 Fund(continued)
| | | | | | | | | | | | |
| | | Country/
Organization | | | Shares | | | Value | |
| |
Short Term Investments (Cost $186,412) 4.6% | | | | | |
| | | |
Money Market Funds 4.6% | | | | | | | | | | | | |
| c,dInstitutional Fiduciary Trust Money Market Portfolio, 2.08% | | | United States | | | | 186,412 | | | | $ 186,412 | |
| | | | | | | | | | | | |
| | | |
Total Investments (Cost $4,070,655) 99.8% | | | | | | | | | | | 4,066,683 | |
| | | |
Other Assets, less Liabilities 0.2% | | | | | | | | | | | 6,715 | |
| | | | | | | | | | | | |
| | | |
Net Assets 100.0% | | | | | | | | | | | $4,073,398 | |
| | | | | | | | | | | | |
See Abbreviations on page 57.
*The principal amount is stated in U.S. dollars unless otherwise indicated.
aSecurity was purchased pursuant to Rule 144A under the Securities Act of 1933 and may be sold in transactions exempt from registration only to qualified institutional buyers or in a public offering registered under the Securities Act of 1933. These securities have been deemed liquid under guidelines approved by the Trust’s Board of Trustees. At May 31, 2019, the aggregate value of these securities was $151,479, representing 3.7% of net assets.
bA supranational organization is an entity formed by two or more central governments through international treaties.
cSee Note 3(d) regarding investments in affiliated management investment companies.
dThe rate shown is the annualizedseven-day effective yield at period end.
| | |
| | | |
| The accompanying notes are an integral part of these financial statements. | Annual Report | | 35 |
FRANKLIN FUND ALLOCATOR SERIES
Financial Highlights
Franklin Payout 2021 Fund
| | | | | | | | | | | | | | | | |
| | | Year Ended May 31, | |
| | | 2019 | | | 2018 | | | 2017 | | | 2016a | |
| | | | | |
Class R6 | | | | | | | | | | | | | | | | |
| | | | |
Per share operating performance (for a share outstanding throughout the year) | | | | | | | | | | | | | | | | |
| | | | |
Net asset value, beginning of year | | | $ 9.96 | | | | $10.25 | | | | $10.30 | | | | $10.00 | |
| | | | |
Income from investment operationsb: | | | | | | | | | | | | | | | | |
| | | | |
Net investment incomec | | | 0.23 | | | | 0.23 | | | | 0.23 | | | | 0.22 | |
| | | | |
Net realized and unrealized gains (losses) | | | 0.17 | | | | (0.29 | ) | | | (0.06 | ) | | | 0.23 | |
| | | | |
Total from investment operations | | | 0.40 | | | | (0.06 | ) | | | 0.17 | | | | 0.45 | |
| | | | |
Less distributions from: | | | | | | | | | | | | | | | | |
| | | | |
Net investment income | | | (0.23 | ) | | | (0.23 | ) | | | (0.22 | ) | | | (0.15 | ) |
| | | | |
Net realized gains | | | (0.01 | ) | | | — | | | | — | | | | — | |
| | | | |
| Total distributions | | | (0.24 | ) | | | (0.23 | ) | | | (0.22 | ) | | | (0.15 | ) |
| | | | |
Net asset value, end of year | | | $10.12 | | | | $ 9.96 | | | | $10.25 | | | | $10.30 | |
| | | | |
| | | | | | | | | | | | | | | | |
| | | | |
Total return | | | 4.04% | | | | (0.65 | )% | | | 1.68% | | | | 4.55% | |
| | | | |
Ratios to average net assets | | | | | | | | | | | | | | | | |
| | | | |
Expenses before waiver and payments by affiliates | | | 3.05% | | | | 2.50% | | | | 2.85% | | | | 3.56% | |
| | | | |
Expenses net of waiver and payments by affiliates | | | 0.29% | | | | 0.30% | | | | 0.30% | | | | 0.29% | |
| | | | |
Net investment income | | | 2.32% | | | | 2.25% | | | | 2.22% | | | | 2.21% | |
| | | | |
Supplemental data | | | | | | | | | | | | | | | | |
| | | | |
Net assets, end of year (000’s) | | | $2,054 | | | | $2,022 | | | | $2,081 | | | | $2,090 | |
| | | | |
Portfolio turnover rate | | | 7.67% | | | | —% | | | | —% | | | | —% | |
aFor the year June 1, 2015 (commencement of operations) to May 31, 2016.
bThe amount shown for a share outstanding throughout the period may not correlate with the Statement of Operations for the period due to the timing of sales and repurchases of the Fund’s shares in relation to income earned and/or fluctuating fair value of the investments of the Fund.
cBased on average daily shares outstanding.
| | |
| | | |
| 36 | | Annual Report | The accompanying notes are an integral part of these financial statements. |
FRANKLIN FUND ALLOCATOR SERIES
FINANCIAL HIGHLIGHTS
Franklin Payout 2021 Fund(continued)
| | | | | | | | | | | | | | | | |
| | | Year Ended May 31, | |
| | | 2019 | | | 2018 | | | 2017 | | | 2016a | |
| | | | |
Advisor Class | | | | | | | | | | | | | | | | |
| | | | |
Per share operating performance (for a share outstanding throughout the year) | | | | | | | | | | | | | | | | |
| | | | |
Net asset value, beginning of year | | | $ 9.96 | | | | $10.25 | | | | $10.30 | | | | $10.00 | |
| | | | |
Income from investment operationsb: | | | | | | | | | | | | | | | | |
| | | | |
Net investment incomec | | | 0.23 | | | | 0.23 | | | | 0.23 | | | | 0.22 | |
| | | | |
Net realized and unrealized gains (losses) | | | 0.17 | | | | (0.29 | ) | | | (0.06 | ) | | | 0.23 | |
| | | | |
Total from investment operations | | | 0.40 | | | | (0.06 | ) | | | 0.17 | | | | 0.45 | |
| | | | |
Less distributions from: | | | | | | | | | | | | | | | | |
| | | | |
Net investment income | | | (0.23 | ) | | | (0.23 | ) | | | (0.22 | ) | | | (0.15 | ) |
| | | | |
Net realized gains | | | (0.01 | ) | | | — | | | | — | | | | — | |
| | | | |
Total distributions | | | (0.24 | ) | | | (0.23 | ) | | | (0.22 | ) | | | (0.15 | ) |
| | | | |
Net asset value, end of year | | | $10.12 | | | | $ 9.96 | | | | $10.25 | | | | $10.30 | |
| | | | |
Total return | | | 4.02% | | | | (0.65 | )% | | | 1.69% | | | | 4.55% | |
| | | | |
Ratios to average net assets | | | | | | | | | | | | | | | | |
| | | | |
Expenses before waiver and payments by affiliates | | | 3.05% | | | | 2.50% | | | | 2.85% | | | | 3.56% | |
| | | | |
Expenses net of waiver and payments by affiliates | | | 0.30% | | | | 0.31% | | | | 0.30% | | | | 0.29% | |
| | | | |
Net investment income | | | 2.31% | | | | 2.23% | | | | 2.22% | | | | 2.21% | |
| | | | |
Supplemental data | | | | | | | | | | | | | | | | |
| | | | |
Net assets, end of year (000’s) | | | $2,054 | | | | $2,022 | | | | $2,081 | | | | $2,090 | |
| | | | |
Portfolio turnover rate | | | 7.67% | | | | —% | | | | —% | | | | —% | |
aFor the year June 1, 2015 (commencement of operations) to May 31, 2016.
bThe amount shown for a share outstanding throughout the period may not correlate with the Statement of Operations for the period due to the timing of sales and repurchases of the Fund’s shares in relation to income earned and/or fluctuating fair value of the investments of the Fund.
cBased on average daily shares outstanding.
| | |
| | | |
| The accompanying notes are an integral part of these financial statements. | Annual Report | | 37 |
FRANKLIN FUND ALLOCATOR SERIES
Statement of Investments, May 31, 2019
Franklin Payout 2021 Fund
| | | | | | | | | | | | |
| | | Country/
Organization | | | Principal
Amount* | | Value | |
| | | |
Corporate Bonds 70.4% | | | | | | | | | | | | |
Capital Goods 12.3% | | | | | | | | | | | | |
The Boeing Co., senior note, 2.35%, 10/30/21 | | | United States | | | $ | 100,000 | | | $ | 100,113 | |
Caterpillar Financial Services Corp., senior note, 1.931%, 10/01/21 | | | United States | | | | 100,000 | | | | 98,785 | |
Emerson Electric Co., senior note, 2.625%, 12/01/21 | | | United States | | | | 100,000 | | | | 100,616 | |
General Electric Co., senior note, 4.65%, 10/17/21 | | | United States | | | | 100,000 | | | | 103,963 | |
John Deere Capital Corp., senior bond, 3.15%, 10/15/21 | | | United States | | | | 100,000 | | | | 101,830 | |
| | | | | | | | | | | | |
| | | |
| | | | | | | | | | | 505,307 | |
| | | | | | | | | | | | |
| | | |
Consumer Services 2.4% | | | | | | | | | | | | |
Marriott International Inc., senior note, N, 3.125%, 10/15/21 | | | United States | | | | 50,000 | | | | 50,436 | |
Yum! Brands Inc., senior bond, 3.75%, 11/01/21 | | | United States | | | | 50,000 | | | | 50,000 | |
| | | | | | | | | | | | |
| | | |
| | | | | | | | | | | 100,436 | |
| | | | | | | | | | | | |
| | | |
Diversified Financials 5.0% | | | | | | | | | | | | |
Bank of New York Mellon Corp., senior note, 3.55%, 9/23/21 | | | United States | | | | 100,000 | | | | 102,188 | |
Berkshire Hathaway Inc., senior note, 3.75%, 8/15/21 | | | United States | | | | 100,000 | | | | 103,333 | |
| | | | | | | | | | | | |
| | | |
| | | | | | | | | | | 205,521 | |
| | | | | | | | | | | | |
| | | |
Energy 11.2% | | | | | | | | | | | | |
BP Capital Markets PLC, senior note, 3.561%, 11/01/21 | | | United Kingdom | | | | 100,000 | | | | 102,578 | |
Equinor ASA, senior note, 2.75%, 11/10/21 | | | Norway | | | | 100,000 | | | | 100,957 | |
Halliburton Co., senior bond, 3.25%, 11/15/21 | | | United States | | | | 100,000 | | | | 101,364 | |
Total Capital SA, senior bond, 4.25%, 12/15/21 | | | France | | | | 100,000 | | | | 104,347 | |
The Williams Companies Inc., senior note, 4.00%, 11/15/21 | | | United States | | | | 50,000 | | | | 51,420 | |
| | | | | | | | | | | | |
| | | |
| | | | | | | | | | | 460,666 | |
| | | | | | | | | | | | |
| | | |
Food & Staples Retailing 2.5% | | | | | | | | | | | | |
The Kroger Co., senior note, 2.95%, 11/01/21 | | | United States | | | | 50,000 | | | | 50,350 | |
Walgreens Boots Alliance Inc., senior note, 3.30%, 11/18/21 | | | United States | | | | 50,000 | | | | 50,726 | |
| | | | | | | | | | | | |
| | | |
| | | | | | | | | | | 101,076 | |
| | | | | | | | | | | | |
| | | |
Food, Beverage & Tobacco 6.1% | | | | | | | | | | | | |
General Mills Inc., senior bond, 3.15%, 12/15/21 | | | United States | | | | 50,000 | | | | 50,610 | |
PepsiCo Inc., senior note, 1.70%, 10/06/21 | | | United States | | | | 100,000 | | | | 98,728 | |
Philip Morris International Inc., senior note, 2.90%, 11/15/21 | | | United States | | | | 100,000 | | | | 100,897 | |
| | | | | | | | | | | | |
| | | |
| | | | | | | | | | | 250,235 | |
| | | | | | | | | | | | |
| | | |
Health Care Equipment & Services 3.8% | | | | | | | | | | | | |
Express Scripts Holding Co., senior note, 4.75%, 11/15/21 | | | United States | | | | 50,000 | | | | 52,437 | |
UnitedHealth Group Inc., senior note, 3.375%, 11/15/21 | | | United States | | | | 100,000 | | | | 101,929 | |
| | | | | | | | | | | | |
| | | |
| | | | | | | | | | | 154,366 | |
| | | | | | | | | | | | |
| | | |
Insurance 1.3% | | | | | | | | | | | | |
Prudential Financial Inc., senior note, 4.50%, 11/16/21 | | | United States | | | | 50,000 | | | | 52,315 | |
| | | | | | | | | | | | |
| | | |
Materials 4.7% | | | | | | | | | | | | |
Air Products & Chemicals Inc., senior note, 3.00%, 11/03/21 | | | United States | | | | 100,000 | | | | 101,625 | |
The Dow Chemical Co., senior bond, 4.125%, 11/15/21 | | | United States | | | | 50,000 | | | | 51,608 | |
Ecolab Inc., senior note, 4.35%, 12/08/21 | | | United States | | | | 40,000 | | | | 41,891 | |
| | | | | | | | | | | | |
| | | |
| | | | | | | | | | | 195,124 | |
| | | | | | | | | | | | |
FRANKLIN FUND ALLOCATOR SERIES
STATEMENT OF INVESTMENTS
Franklin Payout 2021 Fund(continued)
| | | | | | | | | | | | |
| | | Country/
Organization | | | Principal
Amount* | | | Value | |
Corporate Bonds (continued) | | | | | | | | | | | | |
Pharmaceuticals, Biotechnology & Life Sciences 6.2% | | | | | | | | | | | | |
Gilead Sciences Inc., senior note, 4.40%, 12/01/21 | | | United States | | | $ | 100,000 | | | $ | 104,076 | |
Johnson & Johnson, senior note, 2.45%, 12/05/21 | | | United States | | | | 100,000 | | | | 100,302 | |
PerkinElmer Inc., senior note, 5.00%, 11/15/21 | | | United States | | | | 50,000 | | | | 52,216 | |
| | | | | | | | | | | | |
| | | |
| | | | | | | | | | | 256,594 | |
| | | | | | | | | | | | |
| | | |
Real Estate 2.5% | | | | | | | | | | | | |
| | | |
Simon Property Group LP, senior bond, 4.125%, 12/01/21 | | | United States | | | | 100,000 | | | | 103,274 | |
| | | | | | | | | | | | |
| | | |
Semiconductors & Semiconductor Equipment 2.5% | | | | | | | | | | | | |
| | | |
Intel Corp., senior note, 3.30%, 10/01/21 | | | United States | | | | 100,000 | | | | 102,209 | |
| | | | | | | | | | | | |
| | | |
Software & Services 2.5% | | | | | | | | | | | | |
| | | |
International Business Machines Corp., senior note, 2.90%, 11/01/21 | | | United States | | | | 100,000 | | | | 100,860 | |
| | | | | | | | | | | | |
| | | |
Telecommunication Services 2.6% | | | | | | | | | | | | |
| | | |
aTelstra Corp. Ltd., senior bond, 144A, 4.80%, 10/12/21 | | | Australia | | | | 100,000 | | | | 104,794 | |
| | | | | | | | | | | | |
| | | |
Transportation 1.2% | | | | | | | | | | | | |
| | | |
Norfolk Southern Corp., senior bond, 3.25%, 12/01/21 | | | United States | | | | 50,000 | | | | 50,782 | |
| | | | | | | | | | | | |
| | | |
Utilities 3.6% | | | | | | | | | | | | |
| | | |
Baltimore Gas & Electric Co., senior note, 3.50%, 11/15/21 | | | United States | | | | 50,000 | | | | 51,143 | |
| | | |
Duke Energy Corp., senior note, 1.80%, 9/01/21 | | | United States | | | | 100,000 | | | | 98,402 | |
| | | | | | | | | | | | |
| | | |
| | | | | | | | | | | 149,545 | |
| | | | | | | | | | | | |
| | | |
Total Corporate Bonds (Cost $2,878,063) | | | | | | | | | | | 2,893,104 | |
| | | | | | | | | | | | |
| | | |
Foreign Government and Agency Securities (Cost $100,070) 2.5% | | | | | | | | | | | | |
| | | |
European Investment Bank, senior note, 2.125%, 10/15/21 | |
| Supranationalb
|
| | | 100,000 | | | | 100,365 | |
| | | | | | | | | | | | |
| | | |
U.S. Government and Agency Securities 17.6% | | | | | | | | | | | | |
FFCB, 2.00%, 12/01/21 | | | United States | | | | 200,000 | | | | 200,147 | |
FHLB, 2.625%, 12/10/21 | | | United States | | | | 200,000 | | | | 203,351 | |
| | | |
U.S. Treasury Note, | | | | | | | | | | | | |
1.875%, 11/30/21 | | | United States | | | | 160,000 | | | | 159,856 | |
2.125%, 12/31/21 | | | United States | | | | 160,000 | | | | 160,913 | |
| | | | | | | | | | | | |
| | | |
Total U.S. Government and Agency Securities
(Cost $721,702) | | | | | | | | | | | 724,267 | |
| | | | | | | | | | | | |
| | | |
Municipal Bonds (Cost $107,068) 2.6% | | | | | | | | | | | | |
| | | |
California State GO, Various Purpose, 5.70%, 11/01/21 | | | United States | | | | 100,000 | | | | 108,477 | |
| | | | | | | | | | | | |
| | | |
Total Investments before Short Term Investments (Cost $3,806,903) | | | | | | | | | | | 3,826,213 | |
| | | | | | | | | | | | |
FRANKLIN FUND ALLOCATOR SERIES
STATEMENT OF INVESTMENTS
Franklin Payout 2021 Fund(continued)
| | | | | | | | | | | | |
| | | Country/
Organization | | | Shares | | | Value | |
Short Term Investments (Cost $274,467) 6.7% | | | | | | | | | | | | |
| | | |
Money Market Funds 6.7% | | | | | | | | | | | | |
| | | |
c,dInstitutional Fiduciary Trust Money Market Portfolio, 2.08% | | | United States | | | | 274,467 | | | $ | 274,467 | |
| | | | | | | | | | | | |
Total Investments (Cost $4,081,370) 99.8% | | | | | | | | | | | 4,100,680 | |
Other Assets, less Liabilities 0.2% | | | | | | | | | | | 7,835 | |
| | | | | | | | | | | | |
| | | |
Net Assets 100.0% | | | | | | | | | | $ | 4,108,515 | |
| | | | | | | | | | | | |
See Abbreviations on page 57.
*The principal amount is stated in U.S. dollars unless otherwise indicated.
aSecurity was purchased pursuant to Rule 144A under the Securities Act of 1933 and may be sold in transactions exempt from registration only to qualified institutional buyers or in a public offering registered under the Securities Act of 1933. This security has been deemed liquid under guidelines approved by the Trust’s Board of Trustees. At May 31, 2019, the value of this security was $104,794, representing 2.6% of net assets.
bA supranational organization is an entity formed by two or more central governments through international treaties.
cSee Note 3(d) regarding investments in affiliated management investment companies.
dThe rate shown is the annualizedseven-day effective yield at period end.
| | |
| | | |
| 40 | | Annual Report | The accompanying notes are an integral part of these financial statements. |
FRANKLIN FUND ALLOCATOR SERIES
Financial Highlights
Franklin Payout 2022 Fund
| | | | | | | | |
| |
| | | Year Ended May 31, | |
| | | 2019 | | | 2018a | |
| | |
Class R6 | | | | | | | | |
| | |
Per share operating performance (for a share outstanding throughout the year) | | | | | | | | |
| | |
Net asset value, beginning of year | | | $9.94 | | | | $10.00 | |
| | |
Income from investment operationsb: | | | | | | | | |
| | |
Net investment incomec | | | 0.25 | | | | 0.08 | |
| | |
Net realized and unrealized gains (losses) | | | 0.29 | | | | (0.14 | ) |
| | |
Total from investment operations | | | 0.54 | | | | (0.06 | ) |
| | |
Less distributions from: | | | | | | | | |
| | |
Net investment income | | | (0.24 | ) | | | — | |
| | |
Net asset value, end of year | | | $10.24 | | | | $ 9.94 | |
| | |
Total returnd | | | 5.51% | | | | (0.60)% | |
| | |
Ratios to average net assetse | | | | | | | | |
| | |
Expenses before waiver and payments by affiliates | | | 4.62% | | | | 4.58% | |
| | |
Expenses net of waiver and payments by affiliates | | | 0.29%f | | | | 0.30% | |
| | |
Net investment income | | | 2.50% | | | | 2.36% | |
| | |
Supplemental data | | | | | | | | |
| | |
Net assets, end of year (000’s) | | | $1,792 | | | | $1,739 | |
| | |
Portfolio turnover rate | | | —% | | | | —% | |
aFor the period January 23, 2018 (commencement of operations) to May 31, 2018.
bThe amount shown for a share outstanding throughout the period may not correlate with the Statement of Operations for the period due to the timing of sales and repurchases of the Fund’s shares in relation to income earned and/or fluctuating fair value of the investments of the Fund.
cBased on average daily shares outstanding.
dTotal return is not annualized for periods less than one year.
eRatios are annualized for periods less than one year, except fornon-recurring expenses, if any.
fBenefit of expense reduction rounds to less than 0.01%.
| | |
| | | |
| The accompanying notes are an integral part of these financial statements. | Annual Report | | 41 |
FRANKLIN FUND ALLOCATOR SERIES
FINANCIAL HIGHLIGHTS
Franklin Payout 2022 Fund(continued)
| | | | | | | | |
| |
| | | Year Ended May 31, | |
| | | 2019 | | | 2018a | |
| | |
Advisor Class | | | | | | | | |
| | |
Per share operating performance (for a share outstanding throughout the year) | | | | | | | | |
| | |
Net asset value, beginning of year | | | $ 9.94 | | | | $10.00 | |
| | |
Income from investment operationsb: | | | | | | | | |
| | |
Net investment incomec | | | 0.25 | | | | 0.08 | |
| | |
Net realized and unrealized gains (losses) | | | 0.28 | | | | (0.14 | ) |
| | |
Total from investment operations | | | 0.53 | | | | (0.06 | ) |
| | |
Less distributions from: | | | | | | | | |
| | |
Net investment income | | | (0.23 | ) | | | — | |
| | |
Net asset value, end of year | | | $10.24 | | | | $ 9.94 | |
| | |
Total returnd | | | 5.48% | | | | (0.60)% | |
| | |
Ratios to average net assetse | | | | | | | | |
| | |
Expenses before waiver and payments by affiliates | | | 4.62% | | | | 4.58% | |
| | |
Expenses net of waiver and payments by affiliates | | | 0.30%f | | | | 0.33% | |
| | |
Net investment income | | | 2.49% | | | | 2.33% | |
| | |
Supplemental data | | | | | | | | |
| | |
Net assets, end of year (000’s) | | | $1,792 | | | | $1,739 | |
| | |
Portfolio turnover rate | | | —% | | | | —% | |
aFor the period January 23, 2018 (commencement of operations) to May 31, 2018.
bThe amount shown for a share outstanding throughout the period may not correlate with the Statement of Operations for the period due to the timing of sales and repurchases of the Fund’s shares in relation to income earned and/or fluctuating fair value of the investments of the Fund.
cBased on average daily shares outstanding.
dTotal return is not annualized for periods less than one year.
eRatios are annualized for periods less than one year, except fornon-recurring expenses, if any.
fBenefit of expense reduction rounds to less than 0.01%.
| | |
| | | |
| 42 | | Annual Report | The accompanying notes are an integral part of these financial statements. |
FRANKLIN FUND ALLOCATOR SERIES
Statement of Investments, May 31, 2019
Franklin Payout 2022 Fund
| | | | | | | | | | | | |
| | | Country/
Organization | | | Principal
Amount* | | Value | |
| | | |
Corporate Bonds 70.0% | | | | | | | | | | | | |
Banks 9.8% | | | | | | | | | | | | |
Bank of America Corp., senior note, 2.503%, 10/21/22 | | | United States | | | $ | 100,000 | | | $ | 99,513 | |
Bank of Montreal, senior note, 2.55%, 11/06/22 | | | Canada | | | | 100,000 | | | | 100,544 | |
Citigroup Inc., senior note, 2.70%, 10/27/22 | | | United States | | | | 50,000 | | | | 49,899 | |
JPMorgan Chase & Co., senior note, 3.25%, 9/23/22 | | | United States | | | | 100,000 | | | | 101,860 | |
| | | | | | | | | | | | |
| | | |
| | | | | | | | | | | 351,816 | |
| | | | | | | | | | | | |
| | | |
Capital Goods 9.7% | | | | | | | | | | | | |
Caterpillar Financial Services Corp., senior note, 2.55%, 11/29/22 | | | United States | | | | 100,000 | | | | 100,450 | |
General Dynamics Corp., senior bond, 2.25%, 11/15/22 | | | United States | | | | 100,000 | | | | 99,736 | |
General Electric Co., senior note, 2.70%, 10/09/22 | | | United States | | | | 100,000 | | | | 98,994 | |
Raytheon Co., senior bond, 2.50%, 12/15/22 | | | United States | | | | 50,000 | | | | 50,050 | |
| | | | | | | | | | | | |
| | | |
| | | | | | | | | | | 349,230 | |
| | | | | | | | | | | | |
| | | |
Commercial & Professional Services 1.4% | | | | | | | | | | | | |
Equifax Inc., senior note, 3.30%, 12/15/22 | | | United States | | | | 50,000 | | | | 50,829 | |
| | | | | | | | | | | | |
Diversified Financials 2.8% | | | | | | | | | | | | |
American Express Co., senior note, 2.65%, 12/02/22 | | | United States | | | | 100,000 | | | | 99,987 | |
| | | | | | | | | | | | |
Energy 5.7% | | | | | | | | | | | | |
aAPT Pipelines Ltd., senior note, 144A, 3.875%, 10/11/22 | | | Australia | | | | 50,000 | | | | 51,475 | |
ONEOK Partners LP, senior bond, 3.375%, 10/01/22 | | | United States | | | | 50,000 | | | | 50,781 | |
aSchlumberger Finance Canada Ltd., senior note, 144A, 2.65%, 11/20/22 | | | United States | | | | 100,000 | | | | 100,199 | |
| | | | | | | | | | | | |
| | | |
| | | | | | | | | | | 202,455 | |
| | | | | | | | | | | | |
| | | |
Food & Staples Retailing 2.8% | | | | | | | | | | | | |
Walmart Inc., senior note, 2.35%, 12/15/22 | | | United States | | | | 100,000 | | | | 100,004 | |
| | | | | | | | | | | | |
Food, Beverage & Tobacco 2.8% | | | | | | | | | | | | |
Philip Morris International Inc., senior note, 2.50%, 11/02/22 | | | United States | | | | 100,000 | | | | 100,011 | |
| | | | | | | | | | | | |
Health Care Equipment & Services 2.8% | | | | | | | | | | | | |
UnitedHealth Group Inc., senior note, 2.375%, 10/15/22 | | | United States | | | | 100,000 | | | | 99,573 | |
| | | | | | | | | | | | |
Household & Personal Products 2.8% | | | | | | | | | | | | |
Colgate-Palmolive Co., senior note, 2.25%, 11/15/22 | | | United States | | | | 100,000 | | | | 100,311 | |
| | | | | | | | | | | | |
Insurance 8.4% | | | | | | | | | | | | |
aMassmutual Global Funding II, secured note, 144A, 2.50%, 10/17/22 | | | United States | | | | 100,000 | | | | 99,979 | |
Metlife Inc., senior bond, 3.048%, 12/15/22 | | | United States | | | | 100,000 | | | | 101,201 | |
aSwiss Re Treasury U.S. Corp., senior note, 144A, 2.875%, 12/06/22 | | | Switzerland | | | | 100,000 | | | | 100,855 | |
| | | | | | | | | | | | |
| | | |
| | | | | | | | | | | 302,035 | |
| | | | | | | | | | | | |
| | | |
Materials 1.4% | | | | | | | | | | | | |
The Dow Chemical Co., senior bond, 3.00%, 11/15/22 | | | United States | | | | 50,000 | | | | 50,456 | |
| | | | | | | | | | | | |
Media & Entertainment 2.8% | | | | | | | | | | | | |
TWDC Enterprises 18 Corp., senior bond, 2.35%, 12/01/22 | | | United States | | | | 100,000 | | | | 99,773 | |
| | | | | | | | | | | | |
Pharmaceuticals, Biotechnology & Life Sciences 1.4% | | | | | | | | | | | | |
AbbVie Inc., senior note, 2.90%, 11/06/22 | | | United States | | | | 50,000 | | | | 50,144 | |
| | | | | | | | | | | | |
Real Estate 1.4% | | | | | | | | | | | | |
Realty Income Corp., senior bond, 3.25%, 10/15/22 | | | United States | | | | 50,000 | | | | 50,895 | |
| | | | | | | | | | | | |
FRANKLIN FUND ALLOCATOR SERIES
STATEMENT OF INVESTMENTS
Franklin Payout 2022 Fund(continued)
| | | | | | | | | | | | |
| | | Country/
Organization | | | Principal
Amount* | | Value | |
| | | |
Corporate Bonds(continued) | | | | | | | | | | | | |
| | | |
Software & Services 4.2% | | | | | | | | | | | | |
| | | |
Fiserv Inc., senior bond, 3.50%, 10/01/22 | | | United States | | | | $ 50,000 | | | | $ 51,314 | |
| | | |
International Business Machines Corp., senior note, 2.875%, 11/09/22 | | | United States | | | | 100,000 | | | | 100,801 | |
| | | | | | | | | | | | |
| | | |
| | | | | | | | | | | 152,115 | |
| | | | | | | | | | | | |
| | | |
Technology Hardware & Equipment 1.4% | | | | | | | | | | | | |
| | | |
NetApp Inc., senior bond, 3.25%, 12/15/22 | | | United States | | | | 50,000 | | | | 50,834 | |
| | | | | | | | | | | | |
| | | |
Telecommunication Services 1.4% | | | | | | | | | | | | |
| | | |
Verizon Communications Inc., senior note, 2.45%, 11/01/22 | | | United States | | | | 50,000 | | | | 50,061 | |
| | | | | | | | | | | | |
| | | |
Transportation 2.8% | | | | | | | | | | | | |
| | | |
United Parcel Service Inc., senior bond, 2.45%, 10/01/22 | | | United States | | | | 100,000 | | | | 100,375 | |
| | | | | | | | | | | | |
| | | |
Utilities 4.2% | | | | | | | | | | | | |
| | | |
AEP Texas Inc., senior note, 2.40%, 10/01/22 | | | United States | | | | 50,000 | | | | 49,861 | |
| | | |
NiSource Inc., senior note, 2.65%, 11/17/22 | | | United States | | | | 50,000 | | | | 49,725 | |
| | | |
Public Service Enterprise Group Inc., senior note, 2.65%, 11/15/22 | | | United States | | | | 50,000 | | | | 49,924 | |
| | | | | | | | | | | | |
| | | |
| | | | | | | | | | | 149,510 | |
| | | | | | | | | | | | |
| | | |
Total Corporate Bonds (Cost $2,483,194) | | | | | | | | | | | 2,510,414 | |
| | | | | | | | | | | | |
| | | |
Foreign Government and Agency Securities 5.6% | | | | | | | | | | | | |
| | | |
International Bank for Reconstruction and Development, senior note, 1.875%, 10/07/22 | | | Supranationalb | | | | 100,000 | | | | 99,745 | |
| | | |
International Finance Corp., 2.00%, 10/24/22 | | | Supranationalb | | | | 100,000 | | | | 100,176 | |
| | | | | | | | | | | | |
Total Foreign Government and Agency Securities
(Cost $195,873) | | | | | | | | | | | 199,921 | |
| | | | | | | | | | | | |
| | | |
U.S. Government and Agency Securities 17.9% | | | | | | | | | | | | |
| | | |
FHLB,
1.875%, 12/09/22 | | | United States | | | | 150,000 | | | | 149,613 | |
| | | |
2.50%, 12/09/22 | | | United States | | | | 150,000 | | | | 152,727 | |
| | | |
U.S. Treasury Note,
1.625%, 11/15/22 | | | United States | | | | 170,000 | | | | 168,439 | |
| | | |
2.00%, 11/30/22 | | | United States | | | | 170,000 | | | | 170,558 | |
| | | | | | | | | | | | |
| | | |
Total U.S. Government and Agency Securities
(Cost $626,852) | | | | | | | | | | | 641,337 | |
| | | | | | | | | | | | |
| | | |
Commercial Mortgage-Backed Securities 4.2% | | | | | | | | | | | | |
| | | |
Diversified Financials 4.2% | | | | | | | | | | | | |
| | | |
American Express Credit Account Master Trust,2017-7, A, 2.35%, 5/15/25 | | | United States | | | | 100,000 | | | | 100,478 | |
| | | |
Capital One Multi-Asset Execution Trust,2017-A6, A6, 2.29%, 7/15/25 | | | United States | | | | 50,000 | | | | 50,200 | |
| | | | | | | | | | | | |
Total Commercial Mortgage-Backed Securities (Cost $147,176) | | | | | | | | | | | 150,678 | |
| | | | | | | | | | | | |
| | | |
Total Investments before Short Term Investments (Cost $3,453,095) | | | | | | | | | | | 3,502,350 | |
| | | | | | | | | | | | |
FRANKLIN FUND ALLOCATOR SERIES
STATEMENT OF INVESTMENTS
Franklin Payout 2022 Fund(continued)
| | | | | | | | | | | | |
| | | Country/
Organization | | | Shares | | | Value | |
| | | |
Short Term Investments (Cost $56,466) 1.6% | | | | | | | | | | | | |
| | | |
Money Market Funds 1.6% | | | | | | | | | | | | |
c,dInstitutional Fiduciary Trust Money Market Portfolio, 2.08% | | | United States | | | | 56,466 | | | | $ 56,466 | |
| | | | | | | | | | | | |
| | | |
Total Investments (Cost $3,509,561) 99.3% | | | | | | | | | | | 3,558,816 | |
Other Assets, less Liabilities 0.7% | | | | | | | | | | | 24,255 | |
| | | | | | | | | | | | |
| | | |
Net Assets 100.0% | | | | | | | | | | | $3,583,071 | |
| | | | | | | | | | | | |
See Abbreviations on page 57.
*The principal amount is stated in U.S. dollars unless otherwise indicated.
aSecurity was purchased pursuant to Rule 144A under the Securities Act of 1933 and may be sold in transactions exempt from registration only to qualified institutional buyers or in a public offering registered under the Securities Act of 1933. These securities have been deemed liquid under guidelines approved by the Trust’s Board of Trustees. At May 31, 2019, the aggregate value of these securities was $352,508, representing 9.8% of net assets.
bA supranational organization is an entity formed by two or more central governments through international treaties.
cSee Note 3(d) regarding investments in affiliated management investment companies.
dThe rate shown is the annualizedseven-day effective yield at period end.
| | |
| | | |
| The accompanying notes are an integral part of these financial statements. | Annual Report | | 45 |
FRANKLIN FUND ALLOCATOR SERIES
FINANCIAL STATEMENTS
Statements of Assets and Liabilities
May 31, 2019
| | | | | | | | | | | | | | | | |
| | | Franklin
Payout 2019
Fund | | | Franklin
Payout 2020
Fund | | | Franklin
Payout 2021
Fund | | | Franklin
Payout 2022
Fund | |
| | | | |
Assets: | | | | | | | | | | | | | | | | |
Investments in securities: | | | | | | | | | | | | | | | | |
Cost - Unaffiliated issuers | | | $3,682,158 | | | | $3,884,243 | | | | $3,806,903 | | | | $3,453,095 | |
Cost -Non-controlled affiliates (Note 3d) | | | 386,344 | | | | 186,412 | | | | 274,467 | | | | 56,466 | |
| | | | |
| | | | |
Value - Unaffiliated issuers | | | $3,674,257 | | | | $3,880,271 | | | | $3,826,213 | | | | $3,502,350 | |
Value -Non-controlled affiliates (Note 3d) | | | 386,344 | | | | 186,412 | | | | 274,467 | | | | 56,466 | |
Receivables: | | | | | | | | | | | | | | | | |
Interest | | | 22,615 | | | | 21,497 | | | | 25,100 | | | | 16,281 | |
Affiliates | | | 24,487 | | | | 28,398 | | | | 25,682 | | | | 49,002 | |
Other assets | | | 3 | | | | 3 | | | | 3 | | | | 3 | |
| | | | |
| | | | |
Total assets | | | 4,107,706 | | | | 4,116,581 | | | | 4,151,465 | | | | 3,624,102 | |
| | | | |
| | | | |
Liabilities: | | | | | | | | | | | | | | | | |
Payables: | | | | | | | | | | | | | | | | |
Transfer agent fees | | | 69 | | | | 69 | | | | 70 | | | | 63 | |
Professional fees | | | 40,861 | | | | 40,852 | | | | 40,643 | | | | 39,893 | |
Accrued expenses and other liabilities | | | 1,940 | | | | 2,262 | | | | 2,237 | | | | 1,075 | |
| | | | |
| | | | |
Total liabilities | | | 42,870 | | | | 43,183 | | | | 42,950 | | | | 41,031 | |
| | | | |
| | | | |
Net assets, at value | | | $4,064,836 | | | | $4,073,398 | | | | $4,108,515 | | | | $3,583,071 | |
| | | | |
Net assets consist of: | | | | | | | | | | | | | | | | |
Paid-in capital | | | $4,043,899 | | | | $4,049,677 | | | | $4,054,606 | | | | $3,496,135 | |
Total distributable earnings (loss) | | | 20,937 | | | | 23,721 | | | | 53,909 | | | | 86,936 | |
| | | | |
| | | | |
Net assets, at value | | | $4,064,836 | | | | $4,073,398 | | | | $4,108,515 | | | | $3,583,071 | |
| | | | |
| | | | |
Class R6: | | | | | | | | | | | | | | | | |
Net assets, at value | | | $2,032,428 | | | | $2,036,706 | | | | $2,054,260 | | | | $1,791,506 | |
| | | | |
Shares outstanding | | | 202,465 | | | | 202,763 | | | | 203,001 | | | | 175,000 | |
| | | | |
Net asset value and maximum offering price per share | | | $10.04 | | | | $10.04 | | | | $10.12 | | | | $10.24 | |
| | | | |
| | | | |
Advisor Class: | | | | | | | | | | | | | | | | |
Net assets, at value | | | $2,032,408 | | | | $2,036,692 | | | | $2,054,255 | | | | $1,791,565 | |
| | | | |
Shares outstanding | | | 202,465 | | | | 202,763 | | | | 203,001 | | | | 175,000 | |
| | | | |
Net asset value and maximum offering price per share | | | $10.04 | | | | $10.04 | | | | $10.12 | | | | $10.24 | |
| | | | |
| | |
| | | |
| 46 | | Annual Report | The accompanying notes are an integral part of these financial statements. |
FRANKLIN FUND ALLOCATOR SERIES
FINANCIAL STATEMENTS
Statements of Operations
for the year ended May 31, 2019
| | | | | | | | | | | | | | | | |
| | | Franklin
Payout 2019
Fund | | | Franklin
Payout 2020
Fund | | | Franklin
Payout 2021
Fund | | | Franklin Payout 2022
Fund | |
| | | | |
Investment income: | | | | | | | | | | | | | | | | |
Dividends: | | | | | | | | | | | | | | | | |
Non-controlled affiliates (Note 3d) | | | $ 4,387 | | | | $ 3,426 | | | | $ 3,759 | | | | $ 585 | |
Interest: | | | | | | | | | | | | | | | | |
Unaffiliated issuers | | | 82,792 | | | | 91,948 | | | | 101,676 | | | | 96,896 | |
| | | | |
| | | | |
Total investment income | | | 87,179 | | | | 95,374 | | | | 105,435 | | | | 97,481 | |
| | | | |
| | | | |
Expenses: | | | | | | | | | | | | | | | | |
Management fees (Note 3a) | | | 12,144 | | | | 12,102 | | | | 12,132 | | | | 10,464 | |
Transfer agent fees: (Note 3c) | | | | | | | | | | | | | | | | |
Class R6 | | | 409 | | | | 409 | | | | 410 | | | | 361 | |
Advisor Class | | | 409 | | | | 408 | | | | 410 | | | | 368 | |
Custodian fees (Note 4) | | | 532 | | | | 528 | | | | 529 | | | | 28 | |
Reports to shareholders | | | 6,481 | | | | 5,781 | | | | 6,693 | | | | 7,381 | |
Registration and filing fees | | | 35,850 | | | | 35,848 | | | | 35,851 | | | | 33,808 | |
Professional fees | | | 57,317 | | | | 57,165 | | | | 53,751 | | | | 56,442 | |
Pricing fees | | | 5,056 | | | | 13,420 | | | | 9,123 | | | | 6,966 | |
Amortization of offering costs | | | — | | | | — | | | | — | | | | 40,523 | |
Other | | | 4,680 | | | | 4,622 | | | | 4,622 | | | | 4,756 | |
| | | | |
| | | | |
Total expenses | | | 122,878 | | | | 130,283 | | | | 123,521 | | | | 161,097 | |
Expense reductions (Note 4) | | | (7 | ) | | | — | | | | — | | | | (27 | ) |
Expenses waived/paid by affiliates (Note 3e) | | | (110,848 | ) | | | (118,301 | ) | | | (111,510 | ) | | | (150,703 | ) |
| | | | |
| | | | |
Net expenses | | | 12,023 | | | | 11,982 | | | | 12,011 | | | | 10,367 | |
| | | | |
| | | | |
Net investment income | | | 75,156 | | | | 83,392 | | | | 93,424 | | | | 87,114 | |
| | | | |
| | | | |
Realized and unrealized gains (losses): | | | | | | | | | | | | | | | | |
Net realized gain (loss) from: | | | | | | | | | | | | | | | | |
Investments: | | | | | | | | | | | | | | | | |
Unaffiliated issuers | | | (926 | ) | | | (5,944 | ) | | | (6,310 | ) | | | — | |
| | | | |
| | | | |
Net change in unrealized appreciation (depreciation) on: | | | | | | | | | | | | | | | | |
Investments: | | | | | | | | | | | | | | | | |
Unaffiliated issuers | | | 23,245 | | | | 43,541 | | | | 72,495 | | | | 99,663 | |
| | | | |
| | | | |
Net realized and unrealized gain (loss) | | | 22,319 | | | | 37,597 | | | | 66,185 | | | | 99,663 | |
| | | | |
| | | | |
Net increase (decrease) in net assets resulting from operations | | | $ 97,475 | | | | $ 120,989 | | | | $ 159,609 | | | | $ 186,777 | |
| | | | |
| | |
| | | |
| The accompanying notes are an integral part of these financial statements. | Annual Report | | 47 |
FRANKLIN FUND ALLOCATOR SERIES
FINANCIAL STATEMENTS
Statements of Changes in Net Assets
| | | | | | | | | | | | | | | | |
| | | Franklin Payout 2019 Fund | | | Franklin Payout 2020 Fund | |
| | |
| | | Year Ended May 31, | | | Year Ended May 31, | |
| | | | |
| | | 2019 | | | 2018 | | | 2019 | | | 2018 | |
| | | | |
Increase (decrease) in net assets: | | | | | | | | | | | | | | | | |
Operations: | | | | | | | | | | | | | | | | |
Net investment income | | | $ 75,156 | | | | $ 76,208 | | | | $ 83,392 | | | | $ 82,706 | |
Net realized gain (loss) | | | (926 | ) | | | (838 | ) | | | (5,944 | ) | | | — | |
Net change in unrealized appreciation (depreciation) | | | 23,245 | | | | (58,830 | ) | | | 43,541 | | | | (89,518 | ) |
| | | | |
| | | | |
Net increase (decrease) in net assets resulting from operations | | | 97,475 | | | | 16,540 | | | | 120,989 | | | | (6,812 | ) |
| | | | |
| | | | |
Distributions to shareholders: (Note 1c) | | | | | | | | | | | | | | | | |
Class R6 | | | (38,529 | ) | | | (37,538 | ) | | | (41,851 | ) | | | (41,140 | ) |
Advisor Class | | | (38,225 | ) | | | (37,354 | ) | | | (41,546 | ) | | | (40,958 | ) |
| | | | |
| | | | |
Total distributions to shareholders | | | (76,754 | ) | | | (74,892 | ) | | | (83,397 | ) | | | (82,098 | ) |
| | | | |
| | | | |
Net increase (decrease) in net assets | | | 20,721 | | | | (58,352 | ) | | | 37,592 | | | | (88,910 | ) |
| | | | |
Net assets: | | | | | | | | | | | | | | | | |
Beginning of year | | | 4,044,115 | | | | 4,102,467 | | | | 4,035,806 | | | | 4,124,716 | |
| | | | |
| | | | |
End of year (Note 1c) | | | $4,064,836 | | | | $4,044,115 | | | | $4,073,398 | | | | $4,035,806 | |
| | | | |
| | |
| | | |
| 48 | | Annual Report | The accompanying notes are an integral part of these financial statements. |
FRANKLIN FUND ALLOCATOR SERIES
FINANCIAL STATEMENTS
Statements of Changes in Net Assets(continued)
| | | | | | | | | | | | | | | | |
| | | Franklin Payout 2021 Fund | | | Franklin Payout 2022 Fund | |
| | |
| | | Year Ended May 31, | | | Year Ended May 31, | |
| | | | |
| | | 2019 | | | 2018 | | | 2019 | | | 2018a | |
| | | | |
Increase (decrease) in net assets: | | | | | | | | | | | | | | | | |
Operations: | | | | | | | | | | | | | | | | |
Net investment income | | | $ 93,424 | | | | $ 92,032 | | | | $ 87,114 | | | | $ 28,567 | |
Net realized gain (loss) | | | (6,310 | ) | | | 2,147 | | | | — | | | | — | |
Net change in unrealized appreciation (depreciation) | | | 72,495 | | | | (122,177 | ) | | | 99,663 | | | | (50,408 | ) |
| | | | |
| | | | |
Net increase (decrease) in net assets resulting from operations | | | 159,609 | | | | (27,998 | ) | | | 186,777 | | | | (21,841 | ) |
| | | | |
| | | | |
Distributions to shareholders: (Note 1c) | | | | | | | | | | | | | | | | |
Class R6 | | | (47,320 | ) | | | (45,858 | ) | | | (41,125 | ) | | | — | |
Advisor Class | | | (47,015 | ) | | | (45,675 | ) | | | (40,740 | ) | | | — | |
| | | | |
| | | | |
Total distributions to shareholders | | | (94,335 | ) | | | (91,533 | ) | | | (81,865 | ) | | | — | |
| | | | |
| | | | |
Capital share transactions: (Note 2) | | | | | | | | | | | | | | | | |
Class R6 | | | — | | | | — | | | | — | | | | 1,750,000 | |
Advisor Class | | | — | | | | — | | | | — | | | | 1,750,000 | |
| | | | |
| | | | |
Total capital share transactions | | | — | | | | — | | | | — | | | | 3,500,000 | |
| | | | |
| | | | |
Net increase (decrease) in net assets | | | 65,274 | | | | (119,531 | ) | | | 104,912 | | | | 3,478,159 | |
| | | | |
Net assets: | | | | | | | | | | | | | | | | |
Beginning of year | | | 4,043,241 | | | | 4,162,772 | | | | 3,478,159 | | | | — | |
| | | | |
| | | | |
End of year (Note 1c) | | | $4,108,515 | | | | $4,043,241 | | | | $3,583,071 | | | | $3,478,159 | |
| | | | |
aFor the period January 23, 2018 (commencement of operations) to May 31, 2018.
| | |
| | | |
| The accompanying notes are an integral part of these financial statements. | Annual Report | | 49 |
FRANKLIN FUND ALLOCATOR SERIES
Notes to Financial Statements
1. Organization and Significant Accounting Policies
Franklin Fund Allocator Series (Trust) is registered under the Investment Company Act of 1940 (1940 Act) as anopen-end management investment company, consisting oftwenty-two separate funds, four of which are included in this report (Funds) and applies the specialized accounting and reporting guidance in U.S. Generally Accepted Accounting Principles (U.S. GAAP). The Funds offer two classes of shares: Class R6 and Advisor Class. Each class of shares may differ by its voting rights on matters affecting a single class and fees due to differing arrangements for transfer agent fees.
The following summarizes the Funds’ significant accounting policies.
a. Financial Instrument Valuation
The Funds’ investments in financial instruments are carried at fair value daily. Fair value is the price that would be received to sell an asset or paid to transfer a liability in an orderly transaction between market participants on the measurement date. The Funds calculate the net asset value (NAV) per share each business day as of 4 p.m. Eastern time or the regularly scheduled close of the New York Stock Exchange (NYSE), whichever is earlier. Under compliance policies and procedures approved by the Trust’s Board of Trustees (the Board), the Funds’ administrator has responsibility for oversight of valuation, including leading the cross-functional Valuation Committee (VC). The Funds may utilize independent pricing services, quotations from securities and financial instrument dealers, and other market sources to determine fair value.
Debt securities generally trade in theover-the-counter market rather than on a securities exchange. The Funds’ pricing services use multiple valuation techniques to determine fair value. In instances where sufficient market activity exists, the pricing services may utilize a market-based approach through which quotes from market makers are used to determine fair value. In instances where sufficient market activity may not exist or is limited, the pricing services also utilize proprietary valuation models which may consider market characteristics such as benchmark yield curves, credit spreads, estimated default rates, anticipated market interest rate volatility, coupon rates, anticipated timing of principal repayments, underlying collateral, and other unique security features in order to estimate the relevant cash flows, which are then discounted to calculate the fair value.
Investments inopen-end mutual funds are valued at the closing NAV.
The Funds have procedures to determine the fair value of financial instruments for which market prices are not reliable or readily available. Under these procedures, the Funds primarily employ a market-based approach which may use related or comparable assets or liabilities, recent transactions, market multiples, book values, and other relevant information for the investment to determine the fair value of the investment. An income-based valuation approach may also be used in which the anticipated future cash flows of the investment are discounted to calculate fair value. Discounts may also be applied due to the nature or duration of any restrictions on the disposition of the investments. Due to the inherent uncertainty of valuations of such investments, the fair values may differ significantly from the values that would have been used had an active market existed.
b. Income and Deferred Taxes
It is each Fund’s policy to qualify as a regulated investment company under the Internal Revenue Code. Each Fund intends to distribute to shareholders substantially all of its taxable income and net realized gains to relieve it from federal income and excise taxes. As a result, no provision for U.S. federal income taxes is required.
The Funds may be subject to foreign taxation related to income received, capital gains on the sale of securities and certain foreign currency transactions in the foreign jurisdictions in which the Funds invest. Foreign taxes, if any, are recorded based on the tax regulations and rates that exist in the foreign markets in which the Funds invest. When a capital gain tax is determined to apply, certain or all Funds record an estimated deferred tax liability in an amount that would be payable if the securities were disposed of on the valuation date.
Each Fund may recognize an income tax liability related to its uncertain tax positions under U.S. GAAP when the uncertain tax position has a less than 50% probability that it will be sustained upon examination by the tax authorities based on its technical merits. As of May 31, 2019, the each Fund has determined that no tax liability is required in its financial statements related to uncertain tax positions for any open tax years (or expected to be taken in future tax years). Open tax years are those that remain subject to examination and are based on the statute of limitations in each jurisdiction in which the Fund invests.
FRANKLIN FUND ALLOCATOR SERIES
NOTES TO FINANCIAL STATEMENTS
c. Security Transactions, Investment Income, Expenses and Distributions
Security transactions are accounted for on trade date. Realized gains and losses on security transactions are determined on a specific identification basis. Interest income and estimated expenses are accrued daily. Amortization of premium and accretion of discount on debt securities are included in interest income. Distributions to shareholders are recorded on theex-dividend date. Distributable earnings are determined according to income tax regulations (tax basis) and may differ from earnings recorded in accordance with U.S. GAAP. These differences may be permanent or temporary. Permanent differences are reclassified among capital accounts to reflect their tax character. These reclassifications have no impact on net assets or the results of operations. Temporary differences are not reclassified, as they may reverse in subsequent periods.*
Common expenses incurred by the Trust are allocated among the Funds based on the ratio of net assets of each Fund to the combined net assets of the Trust or based on the ratio of number of shareholders of each Fund to the combined number of shareholders of the Trust. Fund specific expenses are charged directly to the Fund that incurred the expense.
Realized and unrealized gains and losses and net investment income, excluding class specific expenses, are allocated daily to each class of shares based upon the relative proportion of
net assets of each class. Differences in per share distributions by class are generally due to differences in class specific expenses.
d. Accounting Estimates
The preparation of financial statements in accordance with U.S. GAAP requires management to make estimates and assumptions that affect the reported amounts of assets and liabilities at the date of the financial statements and the amounts of income and expenses during the reporting period. Actual results could differ from those estimates.
e. Guarantees and Indemnifications
Under the Trust’s organizational documents, its officers and trustees are indemnified by the Trust against certain liabilities arising out of the performance of their duties to the Trust. Additionally, in the normal course of business, the Trust, on behalf of the Funds, enters into contracts with service providers that contain general indemnification clauses. The Trust’s maximum exposure under these arrangements is unknown as this would involve future claims that may be made against the Trust that have not yet occurred. Currently, the Trust expects the risk of loss to be remote.
*Effective during the current reporting period, it is no longer required to present certain line items in the Statements of Changes in Net Assets. The below prior period amounts affected by this change are shown as they were in the prior year Statements of Changes in Net Assets.
For the year ended May 31, 2018, distributions to shareholders were as follows:
| | | | | | | | | | | | | | | | | | | | | | | | | | | | |
| | | Franklin
Payout 2019
Fund | | | | | | Franklin
Payout 2020
Fund | | | | | | Franklin
Payout 2021
Fund | | | | | | Franklin
Payout 2022
Fund | |
| | | | | | | |
Distributions from net investment income: | | | | | | | | | | | | | | | | | | | | | | | | | | | | |
Class R6 | | | $(36,910 | ) | | | | | | | $(41,140 | ) | | | | | | | $(45,858 | ) | | | | | | | $ — | |
Advisor Class | | | (36,727 | ) | | | | | | | (40,958 | ) | | | | | | | (45,675 | ) | | | | | | | — | |
Distributions from net realized gains: | | | | | | | | | | | | | | | | | | | | | | | | | | | | |
Class R6 | | | (628 | ) | | | | | | | — | | | | | | | | — | | | | | | | | — | |
Advisor Class | | | (627 | ) | | | | | | | — | | | | | | | | — | | | | | | | | — | |
FRANKLIN FUND ALLOCATOR SERIES
NOTES TO FINANCIAL STATEMENTS
1. Organization and Significant Accounting Policies (continued)
For the year ended May 31, 2018, undistributed net investment income included in net assets were as follows:
| | | | |
| Fund | | Undistributed net
investment income | |
| |
Franklin Payout 2019 Fund | | | $33,423 | |
Franklin Payout 2020 Fund | | | $34,734 | |
Franklin Payout 2021 Fund | | | $39,673 | |
Franklin Payout 2022 Fund | | | $29,791 | |
2. Shares of Beneficial Interest
At May 31, 2019, there were an unlimited number of shares authorized (without par value). During the years ended May 31, 2018 and 2019, there were no transactions of the Funds’ shares, except for Franklin Payout 2022 Fund. Transactions in the Fund’s shares were as follows:
| | | | | | | | |
| | | Franklin Payout 2022 Funda | |
| | |
| | | Shares | | | Amount | |
| | |
Class R6 Shares: | | | | | | | | |
Year ended May 31, 2018 | | | | | | | | |
Shares sold | | | 175,000 | | | | $1,750,000 | |
| | | | |
| | |
Advisor Class Shares: | | | | | | | | |
Year ended May 31, 2018 | | | | | | | | |
Shares sold | | | 175,000 | | | | $1,750,000 | |
| | | | |
aFor the period January 23, 2018 (commencement of operations) to May 31, 2018.
3. Transactions with Affiliates
Franklin Resources, Inc. is the holding company for various subsidiaries that together are referred to as Franklin Templeton. Certain officers and trustees of the Funds are also officers and/or directors of the following subsidiaries:
| | |
| Subsidiary | | Affiliation |
| Franklin Advisers, Inc. (Advisers) | | Investment manager |
| Franklin Templeton Services, LLC (FT Services) | | Administrative manager |
| Franklin Templeton Distributors, Inc. (Distributors) | | Principal underwriter |
| Franklin Templeton Investor Services, LLC (Investor Services) | | Transfer agent |
a. Management Fees
The Funds pay an investment management fee to Advisers of 0.30% per year of the average daily net assets of each of the Funds.
FRANKLIN FUND ALLOCATOR SERIES
NOTES TO FINANCIAL STATEMENTS
b. Administrative Fees
Under an agreement with Advisers, FT Services provides administrative services to the Funds. The fee is paid by Advisers based on each of the Funds’ average daily net assets, and is not an additional expense of the Funds.
c. Transfer Agent Fees
Each class of shares pays transfer agent fees to Investor Services for its performance of shareholder servicing obligations. The fees are based on an annualized asset based fee of 0.02% plus a transaction based fee. In addition, each class reimburses Investor Services for out of pocket expenses incurred and, except for Class R6, reimburses shareholder servicing fees paid to third parties. Class R6 pays Investor Services transfer agent fees specific to that class.
For the year ended May 31, 2019, the Funds paid transfer agent fees as noted in the Statements of Operations of which the following amounts were retained by Investor Services:
| | | | | | | | | | | | | | | | | | | | | | | | | | | | | | | | | | | | |
| | | | | | Franklin
Payout 2019
Fund | | | | | | Franklin
Payout 2020
Fund | | | | | | Franklin
Payout 2021
Fund | | | | | | Franklin
Payout 2022
Fund | | | | |
Transfer agent fees | | | | | | | $814 | | | | | | | | $811 | | | | | | | | $816 | | | | | | | | $720 | | | | | |
d. Investments in Affiliated Management Investment Companies
Certain or all Funds invest in one or more affiliated management investment companies for purposes other than exercising a controlling influence over the management or policies. Management fees paid by the Funds are waived on assets invested in the affiliated management investment companies, as noted in the Statements of Operations, in an amount not to exceed the management and administrative fees paid directly or indirectly by each affiliate. During the year ended May 31, 2019, investments in affiliated management investment companies were as follows:
| | | | | | | | | | | | | | | | | | | | | | | | | | | | | | | | |
| | | Number of
Shares Held
at Beginning
of Year | | | Gross
Additions | | | Gross
Reductions | | | Number of
Shares
Held at End
of Year | | | Value at End
of Year | | | Dividend
Income | | | Realized
Gain (Loss) | | | Net Change in
Unrealized
Appreciation
(Depreciation) | |
| | | | | | | | |
Franklin Payout 2019 Fund | | | | | | | | | | | | | | | | | | | | | | | | | | | | | | | | |
Non-Controlled Affiliates | | | | | | | | | | | | | | | | | | | | | | | | | | | | | | | | |
Institutional Fiduciary Trust Money Market Portfolio, 2.08% | | | 225,829 | | | | 436,082 | | | | (275,567 | ) | | | 386,344 | | | $ | 386,344 | | | | $4,387 | | | | $ — | | | | $ — | |
| | | | | | | | |
Franklin Payout 2020 Fund | | | | | | | | | | | | | | | | | | | | | | | | | | | | | | | | |
Non-Controlled Affiliates | | | | | | | | | | | | | | | | | | | | | | | | | | | | | | | | |
Institutional Fiduciary Trust Money Market Portfolio, 2.08% | | | 151,792 | | | | 319,990 | | | | (285,370 | ) | | | 186,412 | | | $ | 186,412 | | | | $3,426 | | | | $ — | | | | $ — | |
| | | | | | | | |
Franklin Payout 2021 Fund | | | | | | | | | | | | | | | | | | | | | | | | | | | | | | | | |
Non-Controlled Affiliates | | | | | | | | | | | | | | | | | | | | | | | | | | | | | | | | |
Institutional Fiduciary Trust Money Market Portfolio, 2.08% | | | 258,523 | | | | 402,236 | | | | (386,292 | ) | | | 274,467 | | | $ | 274,467 | | | | $3,759 | | | | $ — | | | | $ — | |
| | | | | | | | |
Franklin Payout 2022 Fund | | | | | | | | | | | | | | | | | | | | | | | | | | | | | | | | |
Non-Controlled Affiliates | | | | | | | | | | | | | | | | | | | | | | | | | | | | | | | | |
Institutional Fiduciary Trust Money Market Portfolio, 2.08% | | | 35,244 | | | | 245,108 | | | | (223,886 | ) | | | 56,466 | | | $ | 56,466 | | | | $ 585 | | | | $ — | | | | $ — | |
FRANKLIN FUND ALLOCATOR SERIES
NOTES TO FINANCIAL STATEMENTS
3. Transactions with Affiliates(continued)
e. Waiver and Expense Reimbursements
Advisers have contractually agreed in advance to waive or limit its fees and to assume as its own expense certain expenses otherwise payable by the Funds so that the expenses (excluding acquired fund fees and expenses and certainnon-routine expenses or costs, including those relating to litigation, indemnification, reorganizations, and liquidations) for Advisor Class of the Funds do not exceed 0.44% and for Class R6 do not exceed 0.29%, based on the average net assets of each class until September 30, 2019. Total expenses waived or paid are not subject to recapture subsequent to the Funds’ fiscal year end.
f. Other Affiliated Transactions
At May 31, 2019, Advisers owned 100% of the Funds’ outstanding shares. Investment activities of this shareholder could have a material impact on the Funds.
4. Expense Offset Arrangement
The Funds have entered into an arrangement with their custodian whereby credits realized as a result of uninvested cash balances are used to reduce a portion of the Funds’ custodian expenses. During the year ended May 31, 2019, the custodian fees were reduced as noted in the Statements of Operations.
5. Income Taxes
For tax purposes, capital losses may be carried over to offset future capital gains.
At May 31, 2019, the capital loss carryforwards were as follows:
| | | | | | | | | | | | |
| | | Franklin
Payout 2019
Fund | | | Franklin
Payout 2020
Fund | | | Franklin
Payout 2021
Fund | |
| | | |
Capital loss carryforwards not subject to expiration: | | | | | | | | | | | | |
Short term | | | $ 273 | | | | $ 972 | | | | $ — | |
Long term | | | 2,713 | | | | 6,063 | | | | 6,235 | |
| | | |
Total capital loss carryforwards | | | $2,986 | | | | $7,035 | | | | $6,235 | |
The tax character of distributions paid during the years ended May 31, 2019 and 2018, was as follows:
| | | | | | | | | | | | | | | | | | | | | | | | | | | | | | | | | | | | | | | | | | | | |
| | | Franklin | | | Franklin | | | Franklin | |
| | | Payout 2019 Fund | | | Payout 2020 Fund | | | Payout 2021 Fund | |
| | | | | | | | | | | |
| | | 2019 | | | | | | 2018 | | | | | | 2019 | | | | | | 2018 | | | | | | 2019 | | | | | | 2018 | |
| | | | | | | | | | | |
Distributions paid from: | | | | | | | | | | | | | | | | | | | | | | | | | | | | | | | | | | | | | | | | | | | | |
Ordinary income | | $ | 76,754 | | | | | | | $ | 73,669 | | | | | | | $ | 83,397 | | | | | | | $ | 82,098 | | | | | | | $ | 92,188 | | | | | | | $ | 91,533 | |
Long term capital gain | | | — | | | | | | | | 1,223 | | | | | | | | — | | | | | | | | — | | | | | | | | 2,147 | | | | | | | | — | |
| | | | | | | | | | | |
| | $ | 76,754 | | | | | | | $ | 74,892 | | | | | | | $ | 83,397 | | | | | | | $ | 82,098 | | | | | | | $ | 94,335 | | | | | | | $ | 91,533 | |
FRANKLIN FUND ALLOCATOR SERIES
NOTES TO FINANCIAL STATEMENTS
| | | | | | | | | | | | |
| | | Franklin | |
| | | Payout 2022 Fund | |
| | | 2019 | | | | | | 2018 | |
| | | |
Distributions paid from: | | | | | | | | | | | | |
Ordinary income | | | $ 81,865 | | | | | | | | $ — | |
Long term capital gain | | | — | | | | | | | | — | |
| | | |
| | | $ 81,865 | | | | | | | | $ — | |
At May 31, 2019, the cost of investments, net unrealized appreciation (depreciation) and undistributed ordinary income for income tax purposes were as follows:
| | | | | | | | | | | | | | | | | | | | | | | | | | | | |
| | | Franklin
Payout 2019
Fund | | | | | | Franklin
Payout 2020
Fund | | | | | | Franklin
Payout 2021
Fund | | | | | | Franklin
Payout 2022
Fund | |
Cost of investments | | | $4,067,906 | | | | | | | | $4,070,655 | | | | | | | | $4,079,063 | | | | | | | | $3,508,610 | |
| | | | | | | |
Unrealized appreciation | | | $ 783 | | | | | | | | $ 3,963 | | | | | | | | $ 22,589 | | | | | | | | $ 50,206 | |
Unrealized depreciation | | | (8,088) | | | | | | | | (7,935) | | | | | | | | (972) | | | | | | | | — | |
Net unrealized appreciation (depreciation) | | | $ (7,305) | | | | | | | | $ (3,972) | | | | | | | | $ 21,617 | | | | | | | | $ 50,206 | |
| | | | | | | |
Distributable earnings: | | | | | | | | | | | | | | | | | | | | | | | | | | | | |
Undistributed ordinary income | | | $ 31,227 | | | | | | | | $ 34,730 | | | | | | | | $ 38,530 | | | | | | | | $ 36,731 | |
Differences between income and/or capital gains as determined on a book basis and a tax basis are primarily due to differing treatments of bond discounts and premiums and offering costs.
6. Investment Transactions
Purchases and sales of investments (excluding short term securities) for the year ended May 31, 2019, were as follows:
| | | | | | | | | | | | | | | | | | | | | | | | | | | | |
| | | Franklin
Payout 2019
Fund | | | | | | Franklin
Payout 2020
Fund | | | | | | Franklin
Payout 2021
Fund | | | | | | Franklin
Payout 2022
Fund | |
Purchases | | | $ 98,342 | | | | | | | | $248,381 | | | | | | | | $292,330 | | | | | | | | $ — | |
Sales | | | $235,335 | | | | | | | | $251,517 | | | | | | | | $304,171 | | | | | | | | $ — | |
7. Credit Facility
The Funds, together with other U.S. registered and foreign investment funds (collectively, Borrowers), managed by Franklin Templeton, are borrowers in a joint syndicated senior unsecured credit facility totaling $2 billion (Global Credit Facility) which matures on February 7, 2020. This Global Credit Facility provides a source of funds to the Borrowers for temporary and emergency purposes, including the ability to meet future unanticipated or unusually large redemption requests.
Under the terms of the Global Credit Facility, the Funds shall, in addition to interest charged on any borrowings made by the Funds and other costs incurred by the Funds, pay their share of fees and expenses incurred in connection with the implementation and maintenance of the Global Credit Facility, based upon their relative share of the aggregate net assets of
FRANKLIN FUND ALLOCATOR SERIES
NOTES TO FINANCIAL STATEMENTS
7. Credit Facility (continued)
all of the Borrowers, including an annual commitment fee of 0.15% based upon the unused portion of the Global Credit Facility. These fees are reflected in other expenses in the Statements of Operations. During the year ended May 31, 2019, the Funds did not use the Global Credit Facility.
8. Fair Value Measurements
The Funds follow a fair value hierarchy that distinguishes between market data obtained from independent sources (observable inputs) and the Funds’ own market assumptions (unobservable inputs). These inputs are used in determining the value of the Funds’ financial instruments and are summarized in the following fair value hierarchy:
| | • | | Level 1 – quoted prices in active markets for identical financial instruments |
| | • | | Level 2 – other significant observable inputs (including quoted prices for similar financial instruments, interest rates, prepayment speed, credit risk, etc.) |
| | • | | Level 3 – significant unobservable inputs (including the Funds’ own assumptions in determining the fair value of financial instruments) |
The input levels are not necessarily an indication of the risk or liquidity associated with financial instruments at that level.
A summary of inputs used as of May 31, 2019, in valuing the Funds’ assets carried at fair value, is as follows:
| | | | | | | | | | | | | | | | |
| | | Level 1 | | | Level 2 | | | Level 3 | | | Total | |
| | | | |
Franklin Payout 2019 Fund | | | | | | | | | | | | | | | | |
| | | | |
Assets: | | | | | | | | | | | | | | | | |
| | | | |
Investments in Securities:a | | | | | | | | | | | | | | | | |
| | | | |
Corporate Bonds | | $ | — | | | $ | 2,955,933 | | | $ | — | | | $ | 2,955,933 | |
| | | | |
U.S. Government and Agency Securities | | | — | | | | 718,324 | | | | — | | | | 718,324 | |
| | | | |
Short Term Investments | | | 386,344 | | | | — | | | | — | | | | 386,344 | |
| | | | |
Total Investments in Securities | | $ | 386,344 | | | $ | 3,674,257 | | | $ | — | | | $ | 4,060,601 | |
| | | | |
Franklin Payout 2020 Fund | | | | | | | | | | | | | | | | |
| | | | |
Assets: | | | | | | | | | | | | | | | | |
| | | | |
Investments in Securities:a | | | | | | | | | | | | | | | | |
| | | | |
Corporate Bonds | | $ | — | | | $ | 2,979,604 | | | $ | — | | | $ | 2,979,604 | |
| | | | |
Foreign Government and Agency Securities | | | — | | | | 200,185 | | | | — | | | | 200,185 | |
| | | | |
U.S. Government and Agency Securities | | | — | | | | 700,482 | | | | — | | | | 700,482 | |
| | | | |
Short Term Investments | | | 186,412 | | | | — | | | | — | | | | 186,412 | |
| | | | |
Total Investments in Securities | | $ | 186,412 | | | $ | 3,880,271 | | | $ | — | | | $ | 4,066,683 | |
| | | | |
Franklin Payout 2021 Fund | | | | | | | | | | | | | | | | |
| | | | |
Assets: | | | | | | | | | | | | | | | | |
| | | | |
Investments in Securities:a | | | | | | | | | | | | | | | | |
| | | | |
Corporate Bonds | | $ | — | | | $ | 2,893,104 | | | $ | — | | | $ | 2,893,104 | |
| | | | |
Foreign Government and Agency Securities | | | — | | | | 100,365 | | | | — | | | | 100,365 | |
| | | | |
U.S. Government and Agency Securities | | | — | | | | 724,267 | | | | — | | | | 724,267 | |
| | | | |
Municipal Bonds | | | — | | | | 108,477 | | | | — | | | | 108,477 | |
| | | | |
Short Term Investments | | | 274,467 | | | | — | | | | — | | | | 274,467 | |
FRANKLIN FUND ALLOCATOR SERIES
NOTES TO FINANCIAL STATEMENTS
| | | | | | | | | | | | |
| | | Level 1 | | Level 2 | | | Level 3 | | Total | |
| | | | |
Franklin Payout 2021 Fund(continued) | | | | | | | | | | | | |
| | | | |
Total Investments in Securities | | $ 274,467 | | $ | 3,826,213 | | | $ — | | $ | 4,100,680 | |
| | | | |
Franklin Payout 2022 Fund | | | | | | | | | | | | |
| | | | |
Assets: | | | | | | | | | | | | |
| | | | |
Investments in Securities:a | | | | | | | | | | | | |
| | | | |
Corporate Bonds | | $ — | | $ | 2,510,414 | | | $ — | | $ | 2,510,414 | |
| | | | |
Foreign Government and Agency Securities | | — | | | 199,921 | | | — | | | 199,921 | |
| | | | |
U.S. Government and Agency Securities | | — | | | 641,337 | | | — | | | 641,337 | |
| | | | |
Commercial Mortgage-Backed Securities | | — | | | 150,678 | | | — | | | 150,678 | |
| | | | |
Short Term Investments | | 56,466 | | | — | | | — | | | 56,466 | |
| | | | |
Total Investments in Securities | | $ 56,466 | | $ | 3,502,350 | | | $ — | | $ | 3,558,816 | |
aFor detailed categories, see the accompanying Statement of Investments.
9. Subsequent Events
The Funds have evaluated subsequent events through the issuance of the financial statements and determined that no events have occurred that require disclosure.
Abbreviations
| | | | |
| Selected Portfolio | | |
| | |
| FFCB | | Federal Farm Credit Bank | | |
| | |
| FHLB | | Federal Home Loan Bank | | |
| | |
| FNMA | | Federal National Mortgage Association | | |
| | |
| GO | | General Obligation | | |
FRANKLIN FUND ALLOCATOR SERIES
Report of Independent Registered Public Accounting Firm
To the Board of Trustees of Franklin Fund Allocator Series and Shareholders of Franklin Payout 2019 Fund, Franklin Payout 2020 Fund, Franklin Payout 2021 Fund and Franklin Payout 2022 Fund
Opinions on the Financial Statements
We have audited the accompanying statements of assets and liabilities, including the statements of investments, of Franklin Payout 2019 Fund, Franklin Payout 2020 Fund, Franklin Payout 2021 Fund and Franklin Payout 2022 Fund (the “Funds”) as of May 31, 2019, the related statements of operations, the statements of changes in net assets, including the related notes, and each of the financial highlights for each of the periods listed in the table below (collectively referred to as the “financial statements”). In our opinion, the financial statements present fairly, in all material respects, the financial position of the Funds as of May 31, 2019, the results of each of their operations, changes in each of their net assets, and each of the financial highlights for each of the periods listed in the table below in conformity with accounting principles generally accepted in the United States of America.
| | | | | | |
Franklin Fund Allocator Series | | Statements of operations | | Statements of changes in net assets | | Financial highlights |
| | | |
Franklin Payout 2019 Fund, Franklin Payout 2020 Fund and Franklin Payout 2021 Fund | | For the year ended May 31, 2019 | | For the two years ended May 31, 2019 | | For the years ended May 31, 2019, 2018, 2017 and 2016 |
| | | |
Franklin Payout 2022 Fund | | For the year ended May 31, 2019 | | For the year ended May 31, 2019 and for the period January 23, 2018 (commencement of operations) through May 31, 2018 | | For the year ended May 31, 2019 and for the period January 23, 2018 (commencement of operations) through May 31, 2018 |
Basis for Opinions
These financial statements are the responsibility of the Funds’ management. Our responsibility is to express an opinion on the Funds’ financial statements based on our audits. We are a public accounting firm registered with the Public Company Accounting Oversight Board (United States) (PCAOB) and are required to be independent with respect to the Funds in accordance with the U.S. federal securities laws and the applicable rules and regulations of the Securities and Exchange Commission and the PCAOB.
We conducted our audits of these financial statements in accordance with the standards of the PCAOB. Those standards require that we plan and perform the audit to obtain reasonable assurance about whether the financial statements are free of material misstatement, whether due to error or fraud.
Our audits included performing procedures to assess the risks of material misstatement of the financial statements, whether due to error or fraud, and performing procedures that respond to those risks. Such procedures included examining, on a test basis, evidence regarding the amounts and disclosures in the financial statements. Our audits also included evaluating the accounting principles used and significant estimates made by management, as well as evaluating the overall presentation of the financial statements. Our procedures included confirmation of securities owned as of May 31, 2019 by correspondence with the custodian and transfer agent. We believe that our audits provide a reasonable basis for our opinions.
PricewaterhouseCoopers LLP
San Francisco, California
July 17, 2019
We have served as the auditor of one or more investment companies in the Franklin Templeton funds since 1948.
FRANKLIN FUND ALLOCATOR SERIES
Tax Information (unaudited)
Under Section 852(b)(3)(C) of the Internal Revenue Code, the Franklin Payout 2021 Fund hereby reports the maximum amount allowable but no less than $2,147 as a long term capital gain dividend for the fiscal year ended May 31, 2019.
FRANKLIN FUND ALLOCATOR SERIES
Board Members and Officers
The name, year of birth and address of the officers and board members, as well as their affiliations, positions held with the Trust, principal occupations during at least the past five years and number of U.S. registered portfolios overseen in the Franklin Templeton fund complex, are shown below. Generally, each board member serves until that person’s successor is elected and qualified.
Independent Board Members
| | | | | | | | |
Name, Year of Birth and Address | | Position | | Length of
Time Served | | Number of Portfolios in Fund Complex Overseen by Board Member* | | Other Directorships Held
During at Least the Past 5 Years |
Harris J. Ashton (1932) | | Trustee | | Since 1995 | | 138 | | Bar-S Foods (meat packing company) |
| One Franklin Parkway | | | | | | | | (1981-2010). |
| San Mateo, CA 94403-1906 | | | | | | | | |
Principal Occupation During at Least the Past 5 Years: | | | | |
Director of various companies; andformerly, Director, RBC Holdings, Inc. (bank holding company) (until 2002); and President, Chief Executive Officer and Chairman of the Board, General Host Corporation (nursery and craft centers) (until 1998). |
| | | | |
Terrence J. Checki (1945) One Franklin Parkway San Mateo, CA 94403-1906 | | Trustee | | Since 2017 | | 114 | | Hess Corporation (exploration of oil and gas) (2014-present). |
Principal Occupation During at Least the Past 5 Years: | | | | |
Member of the Council on Foreign Relations (1996-present); Member of the National Committee on U.S.-China Relations (1999-present); member of the Board of Trustees of the Economic Club of New York (2013-present); member of the Board of Trustees of the Foreign Policy Association (2005-present) and member of various other boards of trustees and advisory boards; andformerly, Executive Vice President of the Federal Reserve Bank of New York and Head of its Emerging Markets and Internal Affairs Group and Member of Management Committee (1995-2014); and Visiting Fellow at the Council on Foreign Relations (2014). |
| | | | |
Mary C. Choksi (1950) One Franklin Parkway San Mateo, CA 94403-1906 | | Trustee | | Since 2014 | | 138 | | Avis Budget Group Inc. (car rental) (2007-present), Omnicom Group Inc. (advertising and marketing communications services) (2011-present) and White Mountains Insurance Group, Ltd. (holding company) (2017-present). |
Principal Occupation During at Least the Past 5 Years: | | | | |
Director of various companies; andformerly, Founder and Senior Advisor, Strategic Investment Group (investment management group) (2015-2017); Founding Partner and Senior Managing Director, Strategic Investment Group (1987-2015); Founding Partner and Managing Director, Emerging Markets Management LLC (investment management firm) (1987-2011); and Loan Officer/Senior Loan Officer/Senior Pension Investment Officer, World Bank Group (international financial institution) (1977-1987). |
| | | | |
Edith E. Holiday (1952) One Franklin Parkway San Mateo, CA 94403-1906 | | Lead Independent Trustee | | Trustee since 1998 and Lead Independent Trustee since March 2019 | | 138 | | Hess Corporation (exploration of oil and gas) (1993-present), Canadian National Railway (railroad) (2001-present), White Mountains Insurance Group, Ltd. (holding company) (2004-present), Santander Consumer USA Holdings, Inc. (consumer finance) (2016-Present), RTI International Metals, Inc. (manufacture and distribution of titanium)(1999-2015) and H.J. Heinz Company (processed foods and allied products) (1994-2013). |
Principal Occupation During at Least the Past 5 Years:
Director or Trustee of various companies and trusts; andformerly, Assistant to the President of the United States and Secretary of the Cabinet(1990-1993); General Counsel to the United States Treasury Department (1989-1990); and Counselor to the Secretary and Assistant Secretary for Public Affairs and Public Liaison–United States Treasury Department (1988-1989).
FRANKLIN FUND ALLOCATOR SERIES
Independent Board Members (continued)
| | | | | | | | |
Name, Year of Birth and Address | | Position | | Length of
Time Served | | Number of Portfolios in Fund Complex Overseen by Board Member* | | Other Directorships Held
During at Least the Past 5 Years |
J. Michael Luttig (1954) One Franklin Parkway | | Trustee | | Since 2009 | | 138 | | Boeing Capital Corporation (aircraft financing) (2006-2013). |
San Mateo, CA 94403-1906 | | | | | | | | |
Principal Occupation During at Least the Past 5 Years: | | | | |
Executive Vice President, Counselor and Senior Advisor to Boeing Chairman and Board of Directors, The Boeing Company (aerospace company) (May 2019); andformerly, General Counsel and member of the Executive Council, The Boeing Company (2006-2019) and Federal Appeals Court Judge, U.S. Court of Appeals for the Fourth Circuit (1991-2006). |
| | | | | |
Larry D. Thompson (1945) One Franklin Parkway San Mateo, CA 94403-1906 | | Trustee | | Since 2007 | | 138 | | The Southern Company (energy company) (2014-present; previously 2010-2012), Graham Holdings Company (education and media organization) (2011-present) and Cbeyond, Inc. (business communications provider)(2010-2012). |
Principal Occupation During at Least the Past 5 Years:
Director of various companies; Counsel, Finch McCranie, LLP (law firm) (2015-present); Independent Compliance Monitor and Auditor, Volkswagen AG (manufacturer of automobiles and commercial vehicles) (2017-present); John A. Sibley Professor of Corporate and Business Law, University of Georgia School of Law (2015-present; previously 2011-2012); andformerly, Executive Vice President – Government Affairs, General Counsel and Corporate Secretary, PepsiCo, Inc. (consumer products) (2012-2014); Senior Vice President – Government Affairs, General Counsel and Secretary, PepsiCo, Inc. (2004-2011); Senior Fellow of The Brookings Institution (2003-2004); Visiting Professor, University of Georgia School of Law (2004); and Deputy Attorney General, U.S. Department of Justice (2001-2003).
Interested Board Members and Officers
| | | | | | | | |
Name, Year of Birth and Address | | Position | | Length of
Time Served | | Number of Portfolios in
Fund Complex Overseen
by Board Member* | | Other Directorships Held
During at Least the Past 5 Years |
| | | | | |
**Gregory E. Johnson (1961) One Franklin Parkway San Mateo, CA 94403-1906 | | Trustee | | Since 2007 | | 152 | | None |
Principal Occupation During at Least the Past 5 Years: | | | | |
Chairman of the Board, Member – Office of the Chairman, Director and Chief Executive Officer, Franklin Resources, Inc.; officer and/or director or trustee, as the case may be, of some of the other subsidiaries of Franklin Resources, Inc. and of 42 of the investment companies in Franklin Templeton; Vice Chairman, Investment Company Institute; andformerly, President, Franklin Resources, Inc. (1994-2015). |
| | | | | |
**Rupert H. Johnson, Jr. (1940) One Franklin Parkway San Mateo, CA 94403-1906 | | Chairman of the Board
and Trustee | | Since 2013 | | 138 | | None |
Principal Occupation During at Least the Past 5 Years: | | | | |
Vice Chairman, Member – Office of the Chairman and Director, Franklin Resources, Inc.; Director, Franklin Advisers, Inc. and officer and/or director or trustee, as the case may be, of some of the other subsidiaries of Franklin Resources, Inc. and of 40 of the investment companies in Franklin Templeton. |
| | | | | |
Alison E. Baur (1964) One Franklin Parkway San Mateo, CA 94403-1906 | | Vice President | | Since 2012 | | Not Applicable | | Not Applicable |
| Principal Occupation During at Least the Past 5 Years: | | | | |
Deputy General Counsel, Franklin Templeton; and officer of some of the other subsidiaries of Franklin Resources, Inc. and of 44 of the investment companies in Franklin Templeton. |
FRANKLIN FUND ALLOCATOR SERIES
Interested Board Members and Officers (continued)
| | | | | | | | |
Name, Year of Birth
and Address | | Position | | Length of Time Served | | Number of Portfolios in
Fund Complex Overseen
by Board Member* | | Other Directorships Held
During at Least the Past 5 Years |
| | | | | |
Gaston Gardey (1967) One Franklin Parkway San Mateo, CA 94403-1906 | | Treasurer, Chief Financial Officer, and Chief Accounting Officer | | Since 2009 | | Not Applicable | | Not Applicable |
Principal Occupation During at Least the Past 5 Years: | | | | |
Treasurer, U.S. Fund Administration & Reporting, and officer of 26 of the investment companies in Franklin Templeton. |
| | | | | |
Aliya S. Gordon (1973) One Franklin Parkway San Mateo, CA 94403-1906 | | Vice President | | Since 2009 | | Not Applicable | | Not Applicable |
Principal Occupation During at Least the Past 5 Years: |
Senior Associate General Counsel, and officer of 44 of the investment companies in Franklin Templeton. |
| | | | | |
Steven J. Gray (1955) One Franklin Parkway San Mateo, CA 94403-1906 | | Vice Presidentand Co-Secretary | | Vice President since 2009 andCo-Secretary since January 2019 | | Not Applicable | | Not Applicable |
Principal Occupation During at Least the Past 5 Years: |
Senior Associate General Counsel, Franklin Templeton; Vice President, Franklin Templeton Distributors, Inc. and FASA, LLC; and officer of 44 of the investment companies in Franklin Templeton. |
| | | | | |
Matthew T. Hinkle (1971) One Franklin Parkway San Mateo, CA 94403-1906 | | Chief Executive Officer – Finance and Administration | | Since 2017 | | Not Applicable | | Not Applicable |
Principal Occupation During at Least the Past 5 Years: | | | | |
Senior Vice President, Franklin Templeton Services, LLC; officer of 44 of the investment companies in Franklin Templeton; andformerly, Vice President, Global Tax (2012-April 2017) and Treasurer/Assistant Treasurer, Franklin Templeton (2009-2017). |
| | | | | |
Robert Lim (1948) One Franklin Parkway San Mateo, CA 94403-1906 | | Vice President AML – Compliance | | Since 2016 | | Not Applicable | | Not Applicable |
Principal Occupation During at Least the Past 5 Years: |
Vice President, Franklin Templeton Companies, LLC; Chief Compliance Officer, Franklin Templeton Distributors, Inc. and Franklin Templeton Investor Services, LLC; and officer of 44 of the investment companies in Franklin Templeton. |
| | | | | |
Kimberly H. Novotny (1972) 300 S.E. 2nd Street Fort Lauderdale, FL 33301-1923 | | Vice President | | Since 2013 | | Not Applicable | | Not Applicable |
Principal Occupation During at Least the Past 5 Years: | | | | |
Associate General Counsel, Franklin Templeton; Vice President and Corporate Secretary, Fiduciary Trust International of the South; Vice President, Templeton Investment Counsel, LLC; Assistant Secretary, Franklin Resources, Inc.; and officer of 44 of the investment companies in Franklin Templeton. |
| | | | | |
Edward D. Perks (1970) One Franklin Parkway San Mateo, CA 94403-1906 | | President and Chief Executive Officer – Investment Management | | Since December 2018 | | Not Applicable | | Not Applicable |
Principal Occupation During at Least the Past 5 Years: |
President and Director, Franklin Advisers, Inc.; and officer of nine of the investment companies in Franklin Templeton (since December 2018). |
FRANKLIN FUND ALLOCATOR SERIES
Interested Board Members and Officers (continued)
| | | | | | | | |
Name, Year of Birth and Address | | Position | | Length of Time Served | | Number of Portfolios in
Fund Complex Overseen
by Board Member* | | Other Directorships Held
During at Least the Past 5 Years |
| | | | |
| Robert C. Rosselot (1960) | | Chief Compliance Officer | | Since 2013 | | Not Applicable | | Not Applicable |
300 S.E. 2nd Street Fort Lauderdale, FL 33301-1923 | | | | | | |
| | | | | | |
| Principal Occupation During at Least the Past 5 Years: | | | | |
Director, Global Compliance, Franklin Templeton; Vice President, Franklin Templeton Companies, LLC; officer of 44 of the investment companies in Franklin Templeton; andformerly, Senior Associate General Counsel, Franklin Templeton (2007-2013); and Secretary and Vice President, Templeton Group of Funds (2004-2013). |
| | | | |
| Navid J. Tofigh (1972) | | Vice President | | Since 2015 | | Not Applicable | | Not Applicable |
One Franklin Parkway San Mateo, CA 94403-1906 | | | | | | | | |
| | |
| Principal Occupation During at Least the Past 5 Years: | | | | |
Associate General Counsel, and officer of 44 of the investment companies in Franklin Templeton. | | |
| | | | |
Craig S. Tyle (1960) | | Vice President | | Since 2005 | | Not Applicable | | Not Applicable |
One Franklin Parkway San Mateo, CA 94403-1906 | | | | | | | | |
| | |
| Principal Occupation During at Least the Past 5 Years: | | | | |
General Counsel, Executive Vice President and Secretary, Franklin Resources, Inc.; and officer of some of the other subsidiaries of Franklin Resources, Inc. and of 44 of the investment companies in Franklin Templeton. |
| | | | |
Lori A. Weber (1964) 300 S.E. 2nd Street Fort Lauderdale, FL 33301-1923 | | Vice President
and
Co-Secretary | | Vice President since 2011 andCo-Secretary since January 2019 | | Not Applicable | | Not Applicable |
| | |
| Principal Occupation During at Least the Past 5 Years: | | | | |
Senior Associate General Counsel, Franklin Templeton; Assistant Secretary, Franklin Resources, Inc.; Vice President and Secretary, Templeton Investment Counsel, LLC; and officer of 44 of the investment companies in Franklin Templeton. |
*We base the number of portfolios on each separate series of the U.S. registered investment companies within the Franklin Templeton fund complex. These portfolios have a common investment manager or affiliated investment managers.
**Gregory E. Johnson is considered to be an interested person of the Fund under the federal securities laws due to his position as an officer and director of Franklin Resources, Inc. (Resources), which is the parent company of the Fund’s investment manager and distributor. Rupert H. Johnson, Jr. is considered to be an interested person of the Fund under the federal securities laws due to his position as an officer and director and major shareholder of Resources.
Note 1: Rupert H. Johnson, Jr. is the uncle of Gregory E. Johnson.
Note 2: Effective March 12, 2019, John B. Wilson ceased to be a trustee of the Trust.
Note 3: Officer information is current as of the date of this report. It is possible that after this date, information about officers may change.
The Sarbanes-Oxley Act of 2002 and Rules adopted by the Securities and Exchange Commission require the Fund to disclose whether the Fund’s Audit Committee includes at least one member who is an audit committee financial expert within the meaning of such Act and Rules. The Fund’s Board has determined that there is at least one such financial expert on the Audit Committee and has designated Mary C. Choksi as its audit committee financial expert. The Board believes that Ms. Choksi qualifies as such an expert in view of her extensive business background and experience. She currently serves as a director of Avis Budget Group, Inc. (2007-present) and formerly, Founder and Senior Advisor, Strategic Investment Group (1987 to 2017). Ms. Choksi has been a Member of the Fund’s Audit Committee since 2014. As a result of such background and experience, the Board believes that Ms. Choksi has acquired an understanding of generally accepted accounting principles and financial statements, the general application of such principles in connection with the accounting estimates, accruals and reserves, and analyzing and evaluating financial statements that present a breadth and level of complexity of accounting issues generally comparable to those of the Fund, as well as an understanding of internal controls and procedures for financial reporting and an understanding of audit committee functions. Ms. Choksi is an independent Board member as that term is defined under the relevant Securities and Exchange Commission Rules and Releases.
The Statement of Additional Information (SAI) includes additional information about the board members and is available, without charge, upon request. Shareholders may call (800) DIALBEN/342-5236 to request the SAI.
FRANKLIN FUND ALLOCATOR SERIES
Shareholder Information
Board Approval of Investment
Management Agreements
FRANKLIN FUND ALLOCATOR SERIES
Franklin Payout 2019 Fund
Franklin Payout 2020 Fund
Franklin Payout 2021 Fund
Franklin Payout 2022 Fund
(each a Fund)
At anin-person meeting held on February 26, 2019 (Meeting), the Board of Trustees (Board) of Franklin Fund Allocator Series (Trust), including a majority of the trustees who are not “interested persons” as defined in the Investment Company Act of 1940 (Independent Trustees), reviewed and approved the continuance of the investment management agreement between Franklin Advisers, Inc. (Manager) and the Trust, on behalf of each Fund (each a Management Agreement) for an additionalone-year period. The Independent Trustees received advice from and met separately with Independent Trustee counsel in considering whether to approve the continuation of each Management Agreement. Although the Management Agreements for the Funds were considered at the same Board meeting, the Board considered the information provided to it about the Funds together and with respect to each Fund separately as the Board deemed appropriate.
In considering the continuation of each Management Agreement, the Board reviewed and considered information provided by the Manager at the Meeting and throughout the year at meetings of the Board and its committees. The Board also reviewed and considered information provided in response to a detailed set of requests for information submitted to the Manager by Independent Trustee counsel on behalf of the Independent Trustees in connection with the annual contract renewal process. In addition, prior to the Meeting, the Independent Trustees held a telephonic contract renewal meeting at which the Independent Trustees conferred amongst themselves and Independent Trustee counsel about contract renewal matters. The Board reviewed and considered all of the factors it deemed relevant in approving the continuance of each Management Agreement, including, but not limited to: (i) the nature, extent and quality of the services provided by the Manager; (ii) the investment performance of each Fund; (iii) the costs of the services provided and profits realized by the Manager and its affiliates from the relationship with each Fund; (iv) the extent to which economies of scale are realized as each Fund grows; and
(v) whether fee levels reflect these economies of scale for the benefit of Fund investors.
In approving the continuance of each Management Agreement, the Board, including a majority of the Independent Trustees, determined that the terms of the Management Agreement are fair and reasonable and that the continuance of such Management Agreement is in the interests of the applicable Fund and its shareholders. While attention was given to all information furnished, the following discusses some primary factors relevant to the Board’s determination.
Nature, Extent and Quality of Services
The Board reviewed and considered information regarding the nature, extent and quality of investment management services provided by the Manager and its affiliates to the Funds and their shareholders. This information included, among other things, the qualifications, background and experience of the senior management and investment personnel of the Manager; the structure of investment personnel compensation; oversight of third-party service providers; investment performance reports and related financial information for each Fund; reports on expenses, shareholder services, marketing support payments made to financial intermediaries and third party servicing arrangements; legal and compliance matters; risk controls; pricing and other services provided by the Manager and its affiliates; and management fees charged by the Manager and its affiliates to US funds and other accounts, including management’s explanation of differences among accounts where relevant. The Board also reviewed and considered an annual report on payments made by Franklin Templeton Investments (FTI) or the Funds to financial intermediaries, as well as a memorandum relating to third-party servicing arrangements in response to a guidance update in 2016 from the US Securities and Exchange Commission (SEC) relating to mutual fund distribution andsub-accounting fees. The Board noted management’s continuing efforts and expenditures in establishing effective business continuity plans and developing strategies to address areas of heightened concern in the mutual fund industry, such as cybersecurity and liquidity risk management. The Board also recognized management’s commitment to facilitating Board oversight of liquidity through the designation of a liquidity/risk administrator and the development of reports that highlight the amount of illiquid investments for each Fund.
FRANKLIN FUND ALLOCATOR SERIES
SHAREHOLDER INFORMATION
The Board also reviewed and considered the benefits provided to Fund shareholders of investing in a fund that is part of the Franklin Templeton family of funds. The Board noted the financial position of Franklin Resources, Inc. (FRI), the Manager’s parent, and its commitment to the mutual fund business as evidenced by its continued introduction of new funds, reassessment of the fund offerings in response to the market environment and project initiatives and capital investments relating to the services provided to the Funds by the FTI organization.
Following consideration of such information, the Board was satisfied with the nature, extent and quality of services provided by the Manager and its affiliates to the Funds and their shareholders.
Fund Performance
The Board reviewed and considered the performance results of each Fund over various time periods ended December 31, 2018, noting that the Franklin Payout 2022 Fund did not commence operations until January 23, 2018. The Board considered the performance returns for each Fund in comparison to the performance returns of mutual funds deemed comparable to the Fund included in a universe (Performance Universe) selected by Broadridge Financial Solutions, Inc. (Broadridge), an independent provider of investment company data. The Board received a description of the methodology used by Broadridge to select the mutual funds included in a Performance Universe. The Board also reviewed and considered Fund performance reports provided and discussions that occurred with portfolio managers at Board meetings throughout the year. A summary of each Fund’s performance results is below.
Franklin Payout 2019 Fund– The Performance Universe for the Fund included the Fund and all retail and institutional short investment-grade debt funds. The Fund commenced operations on June 1, 2015, and thus has been in operation for less than 10 years. The Board noted that the Fund’s annualized income return for theone-year period was below the median of its Performance Universe, but for the three-year period was above the median of its Performance Universe. The Board further noted that the Fund’s annualized total return for theone- and three-year periods was above the median of its Performance Universe. Given the Fund’s income-oriented investment objective and short operating history, the Board concluded that the Fund’s performance was acceptable. In doing so, the Board noted that, while below the median, the annualized income return for theone-year period was 1.91%.
Franklin Payout 2020 Fund – The Performance Universe for the Fund included the Fund and all retail and institutional short investment-grade debt funds. The Fund commenced operations on June 1, 2015, and thus has been in operation for less than 10 years. The Board noted that the Fund’s annualized income return for theone-year period was below the median of its Performance Universe, but for the three-year period was above the median of its Performance Universe. The Board further noted that the Fund’s annualized total return for theone-year period was below the median of its Performance Universe, but for the three-year period was above the median of its Performance Universe. Given the Fund’s income-oriented investment objective and short operating history, the Board concluded that the Fund’s performance was acceptable. In doing so, the Board noted that, while below the median, the annualized income return for theone-year period was 2.09%.
Franklin Payout 2021 Fund – The Performance Universe for the Fund included the Fund and all retail and institutional short investment-grade debt funds. The Fund commenced operations on June 1, 2015, and thus has been in operation for less than 10 years. The Board noted that the Fund’s annualized income return for theone- and three-year periods was above the median of its Performance Universe. The Board further noted that the Fund’s annualized total return for theone-year period was below the median and in the 5th quintile (worst) of its Performance Universe, but for the three-year period was above the median and in the 1st quintile (best) of its Performance Universe. Given the Fund’s income-oriented investment objective and short operating history, the Board concluded that the Fund’s performance was satisfactory.
Franklin Payout 2022 Fund – The Board noted that the Fund commenced operations on January 23, 2018, and thus the Fund did not have a full year of performance.
Comparative Fees and Expenses
The Board reviewed and considered information regarding each Fund’s actual total expense ratio and its various components, including, as applicable, management fees; transfer agent expenses; underlying fund expenses; Rule12b-1 andnon-Rule12b-1 service fees; and othernon-management fees. The Board also noted the quarterly and annual reports it receives on all marketing support payments made by FTI to financial intermediaries. The Board considered the actual total expense ratio and, separately, the contractual management fee rate, without the effect of fee waivers, if any (Management Rate) of each
FRANKLIN FUND ALLOCATOR SERIES
SHAREHOLDER INFORMATION
Fund in comparison to the median expense ratio and median Management Rate, respectively, of other mutual funds deemed comparable to and with a similar expense structure to the Fund selected by Broadridge (Expense Group). Broadridge fee and expense data is based upon information taken from each fund’s most recent annual report, which reflects historical asset levels that may be quite different from those currently existing, particularly in a period of market volatility. While recognizing such inherent limitation and the fact that expense ratios and Management Rates generally increase as assets decline and decrease as assets grow, the Board believed the independent analysis conducted by Broadridge to be an appropriate measure of comparative fees and expenses. The Broadridge Management Rate includes administrative charges, and the actual total expense ratio, for comparative consistency, was shown for (i) Advisor Class shares for each of the Franklin Payout 2019 Fund, Franklin Payout 2020 Fund and Franklin Payout 2021 Fund and for Institutional Class, Class I, Class IS, Class F3 and Class R6 shares for certain other funds in each Fund’s respective Expense Group that have multiple classes of shares; and (ii) Advisor Class shares for the Franklin Payout 2022 Fund and for Institutional Class, Class I, Class I+, Class S, Servicing Class and Class Z shares for certain other funds in the Fund’s Expense Group that have multiple classes of shares. The Board received a description of the methodology used by Broadridge to select the mutual funds included in an Expense Group.
The Expense Group for each of the Franklin Payout 2019 Fund, Franklin Payout 2020 Fund and Franklin Payout 2021 Fund included the respective Fund and 14 other short investment-grade debt funds. The Expense Group for the Franklin Payout 2022 Fund included the Fund and 10 other short-intermediate investment-grade debt funds. The Board noted that the Management Rates and actual total expense ratios for these Funds were below the medians of their respective Expense Groups. The Board concluded that the Management Rates charged to these Funds are reasonable. In doing so, the Board noted that the actual total expense ratio for each Fund reflected a fee waiver from management.
Profitability
The Board reviewed and considered information regarding the profits realized by the Manager and its affiliates in connection with the operation of each Fund. In this respect, the Board considered the Fund profitability analysis provided by the Manager that addresses the overall profitability of FTI’s US fund business, as well as its profits in providing investment management and other services to each of the
individual funds during the12-month period ended September 30, 2018, being the most recent fiscalyear-end for FRI. The Board noted that although management continually makes refinements to its methodologies used in calculating profitability in response to organizational and product-related changes, the overall methodology has remained consistent with that used in the Funds’ profitability report presentations from prior years. Additionally, PricewaterhouseCoopers LLP, auditor to FRI and certain Franklin Templeton funds, has been engaged by the Manager to periodically review and assess the allocation methodologies to be used solely by the Funds’ Board with respect to the profitability analysis.
The Board noted management’s belief that costs incurred in establishing the infrastructure necessary for the type of mutual fund operations conducted by the Manager and its affiliates may not be fully reflected in the expenses allocated to each Fund in determining its profitability, as well as the fact that the level of profits, to a certain extent, reflected operational cost savings and efficiencies initiated by management. The Board also noted management’s expenditures in improving shareholder services provided to the Funds, as well as the need to implement systems and meet additional regulatory and compliance requirements resulting from recent SEC and other regulatory requirements.
The Board also considered the extent to which the Manager and its affiliates might derive ancillary benefits from fund operations, including revenues generated from transfer agent services, potential benefits resulting from personnel and systems enhancements necessitated by fund growth, as well as increased leverage with service providers and counterparties. Based upon its consideration of all these factors, the Board concluded that the level of profits realized by the Manager and its affiliates from providing services to each Fund was not excessive in view of the nature, extent and quality of services provided to each Fund.
Economies of Scale
The Board reviewed and considered the extent to which the Manager may realize economies of scale, if any, as each Fund grows larger and whether each Fund’s management fee structure reflects any economies of scale for the benefit of shareholders. The Board considered the Manager’s view that any analyses of potential economies of scale in managing a particular fund are inherently limited in light of the joint and common costs and investments the Manager incurs across the Franklin Templeton family of funds as a
FRANKLIN FUND ALLOCATOR SERIES
SHAREHOLDER INFORMATION
whole. The Board noted that at the end of 2018, each Fund’s net assets were approximately $4 million or below and that the Franklin Payout 2022 Fund did not commence operations until January 23, 2018. The Board recognized that there would not likely be any economies of scale until each Fund’s assets grow.
Conclusion
Based on its review, consideration and evaluation of all factors it believed relevant, including the above-described factors and conclusions, the Board unanimously approved the continuation of each Management Agreement for an additionalone-year period.
Proxy Voting Policies and Procedures
The Trust’s investment manager has established Proxy Voting Policies and Procedures (Policies) that the Trust uses to determine how to vote proxies relating to portfolio securities. Shareholders may view the Trust’s complete Policies online at franklintempleton.com. Alternatively, shareholders may request copies of the Policies free of charge by calling the Proxy Group collect at (954)527-7678 or by sending a written request to: Franklin Templeton Companies, LLC, 300 S.E. 2nd Street, Fort Lauderdale, FL 33301, Attention: Proxy Group. Copies of the Trust’s proxy voting records are also made available online at franklintempleton.com and posted on the U.S. Securities and Exchange Commission’s website at sec.gov and reflect the most recent12-month period ended June 30.
Quarterly Statement of Investments
The Trust files a complete statement of investments with the U.S. Securities and Exchange Commission for the first and third quarters for each fiscal year as an exhibit to its report on FormN-PORT. Shareholders may view the filed FormN-PORT by visiting the Commission’s website at sec.gov. The filed form may also be viewed and copied at the Commission’s Public Reference Room in Washington, DC. Information regarding the operations of the Public Reference Room may be obtained by calling(800) SEC-0330.
Householding of Reports and Prospectuses
You will receive each Fund’s financial reports every six months as well as an annual updated summary prospectus (prospectus available upon request). To reduce Fund expenses, we try to identify related shareholders in a
household and send only one copy of the financial reports and summary prospectus. This process, called “householding,” will continue indefinitely unless you instruct us otherwise. If you prefer not to have these documents householded, please call us at (800)632-2301. At any time you may view current prospectuses/summary prospectuses and financial reports on our website. If you choose, you may receive these documents through electronic delivery.
This page intentionally left blank.
Authorized for distribution only when accompanied or preceded by a summary prospectus and/or prospectus. Investors should carefully consider a fund’s investment goals, risks, charges and expenses before investing. A prospectus contains this and other information; please read it carefully before investing.
To help ensure we provide you with quality service, all calls to and from our service areas are monitored and/or recorded.
| | | | | | |

| | Annual Report | | | | |
| | Franklin Fund Allocator Series | | |
| | Investment Manager | | Distributor | | Shareholder Services |
| | Franklin Advisers, Inc. | | Franklin Templeton Distributors, Inc. | | (800)321-8563 |
| | |
| © 2019 Franklin Templeton Investments. All rights reserved. | | FAS3 A 07/19 |
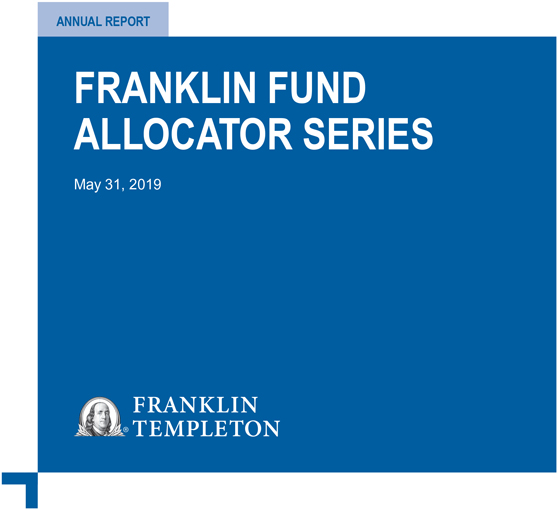
| | | | |
Franklin NextStep Conservative Fund | | | | Franklin NextStep Growth Fund |
| | | | |
Franklin NextStep Moderate Fund | | | | |
| | | | |
Sign up for electronic delivery at franklintempleton.com/edelivery
Internet Delivery of Fund Reports Unless You Request Paper Copies: Effective January 1, 2021, as permitted by the SEC, paper copies of the Fund’s shareholder reports will no longer be sent by mail, unless you specifically request them from the Fund or your financial intermediary. Instead, the reports will be made available on a website, and you will be notified by mail each time a report is posted and provided with a website link to access the report.
If you already elected to receive shareholder reports electronically, you will not be affected by this change and you need not take any action. If you have not signed up for electronic delivery, we would encourage you to join fellow shareholders who have. You may elect to receive shareholder reports and other communications electronically from the Fund by calling (800)632-2301 or by contacting your financial intermediary.
You may elect to continue to receive paper copies of all your future shareholder reports free of charge by contacting your financial intermediary or, if you invest directly with a Fund, calling (800)632-2301 to let the Fund know of your request. Your election to receive reports in paper will apply to all funds held in your account.
FRANKLIN TEMPLETON
Successful investing begins with ambition. And achievement only comes when you reach for it. That’s why we continually strive to deliver better outcomes for investors. No matter what your goals are, our deep, global investment expertise allows us to offer solutions that can help.
During our more than 70 years of experience, we’ve managed through all kinds of markets—up, down and those in between. We’re always preparing for what may come next. It’s because of this, combined with our strength as one of the world’s largest asset managers that we’ve earned the trust of millions of investors around the world.
Contents
|
Visitnextstepfunds.comfor fund updates and to find helpful financial planning tools. |
| | |
| | Not FDIC Insured | May Lose Value | No Bank Guarantee |
| | | | |
| | | | | |
nextstepfunds.com | | Not part of the annual report | | 1 |
ANNUAL REPORT
Economic and Market Overview
The global economy expanded during the 12 months ended May 31, 2019, despite weakness in certain regions. Global developed and emerging market stocks were aided by upbeat economic data in some regions, encouraging corporate earnings reports, the U.S. Federal Reserve’s (Fed’s) recent indications of a patient approach to its monetary policy and periods of optimism about a potential U.S.-China trade deal.
However, various factors weighed on global markets, notably the escalation of U.S.-China trade tensions, as the U.S. raised tariffs on Chinese goods in May and China announced higher tariffs on U.S. goods effective in June. Markets were further pressured atperiod-end when President Trump threatened to impose tariffs on Mexico due to immigration disputes. Concerns about political uncertainties in the U.S. and the European Union, the Fed’s interest-rate hikes in 2018 and the European Central Bank’s (ECB’s) unwinding of its bond purchase program also hurt investor confidence. In this environment, global stocks, as measured by the MSCI All Country World Index, posted a-0.75% total return for the12-month period.1
The U.S. economy grew during the12-month period. After moderating for two consecutive quarters, the economy grew significantly faster in 2019’s first quarter, driven by growth in consumer spending, inventory investment, exports, business investment, and state and local government spending. The manufacturing and services sectors expanded during the period. The unemployment rate decreased from 3.8% in May 2018 to 3.6% atperiod-end.2 The annual inflation rate, as measured by the Consumer Price Index, decreased from 2.8% in May 2018 to 1.8% atperiod-end.2
The Fed raised its target range for the federal funds rate by 0.25% three times during the period, to 2.25%–2.50%, and continued reducing its balance sheet as part of its plan to normalize monetary policy. At its March 2019 meeting, the Fed held its target range for the federal funds rate unchanged and signaled no rate hike in 2019. Furthermore, the Fed mentioned it would end its balance sheet normalization by the end of September 2019. At its April/May meeting, the Fed reiterated its patient approach to future rate adjustments.
In Europe, the U.K.’s quarterly gross domestic product (GDP) growth accelerated in 2018’s third quarter, moderated in the fourth quarter and accelerated again in 2019’s first quarter. The Bank of England raised its key policy rate once during the period. The eurozone’s quarterly GDP growth moderated in 2018’s third quarter before accelerating in the next two quarters. However, the bloc’s annual inflation rate decreased during the period. The ECB kept its benchmark interest rate unchanged during the period and concluded its bond purchase program at the end of 2018. At its April meeting, the ECB reiterated its expectation to keep its benchmark interest rate unchanged through at least the end of 2019 and stated it would provide details of its new monetary stimulus program at upcoming meetings.
In Asia, Japan’s quarterly GDP growth contracted in 2018’s third quarter, but accelerated in the next two quarters. The Bank of Japan left its benchmark interest rate unchanged and indicated it would keep the rate unchanged through the spring of 2020, while continuing its monetary stimulus measures.
In emerging markets, Brazil’s quarterly GDP growth accelerated in 2018’s third quarter, slowed in the fourth quarter and contracted in 2019’s first quarter. The Central Bank of Brazil left its benchmark interest rate unchanged during the period. Russia’s annual GDP growth held steady in 2018’s third quarter, accelerated in the fourth quarter and then moderated in 2019’s first quarter. The Bank of Russia increased its key rate twice during the period. China’s annual GDP growth rate stabilized in 2019’s first quarter after moderating for three consecutive quarters. The People’s Bank of China left its benchmark interest rate unchanged, but it took measures to improve financial liquidity to mitigate the effects of the U.S.-China trade dispute and support economic growth. Overall, emerging market stocks, as measured by the MSCI Emerging Markets Index, posted a-8.34% total return during the12-month period.1
|
The foregoing information reflects our analysis and opinions as of May 31, 2019. The information is not a complete analysis of every aspect of any market, country, industry, security or fund. Statements of fact are from sources considered reliable. |
1. Source: Morningstar.
2. Source: Bureau of Labor Statistics
See www.franklintempletondatasources.com for additional data provider information.
| | | | |
| | | | | |
| 2 | | Annual Report | | nextstepfunds.com |
Franklin NextStep Conservative Fund
This annual report for Franklin NextStep Conservative Fund covers the fiscal year ended May 31, 2019.
Your Fund’s Goals and Main Investments
The Fund seeks the highest level of long-term total return consistent with a conservative level of risk.1 As a “fund of funds,” it seeks to achieve its investment goal by investing its assets in underlying funds (i.e., other mutual funds and exchange-traded funds (ETFs)) managed by Franklin Templeton as well as those managed by unaffiliated investment managers. Under normal market conditions, we allocate the Fund’s assets among the broad asset classes of equity and debt investments by investing primarily in a distinctly weighted combination of underlying funds, based on each underlying fund’s predominant asset class. These underlying funds, in turn, invest in a variety of U.S. and foreign equity, debt and derivative investments.
Performance Overview
The Fund’s Class A shares posted a +3.59% cumulative total return for the 12 months under review. In comparison, the Fund’s blended benchmark, which is 60% Bloomberg Barclays U.S. Aggregate Bond Index, 15% Standard & Poor’s 500® Index (S&P 500®), 15% Bloomberg Barclays Multiverse ex USD (USD Hedged) Index and 10% MSCI All Country World Index (ACWI) ex USA Index, posted a +5.02% total return.2 You can find more of the Fund’s performance data in the Performance Summary beginning on page 6.
Performance data represent past performance, which does not guarantee future results. Investment return and principal value will fluctuate, and you may have a gain or loss when you sell your shares. Current performance may differ from figures shown. For most recentmonth-end performance, go tonextstepfunds.comor call(800)342-5236.
Investment Strategy
The Fund seeks to maintain a target exposure, principally through investment in underlying funds, of 25% to equities and equity-related securities and 75% to debt securities. The
Asset Allocation*
Based on Total Net Assets as of 5/31/19
*The asset allocation is based on the Statement of Investments (SOI), which classifies each underlying fund and other fund investments into a broad asset class based on its predominant investments under normal market conditions.
Fund’s asset allocation may change from time to time and deviate from its target exposure based on market conditions and our strategic and tactical asset allocation views. However, the Fund’s equity and debt investments will typically be in the 10%–30% and 70%–90% range, respectively. The risk profile of underlying funds will be considered when determining allocations. The Fund may also invest directly in securities of each asset class and may use currency forwards for hedging purposes.
|
What is a currency forward contract? A currency forward contract is an agreement between the Fund and a counterparty to buy or sell a foreign currency in exchange for another currency at a specific exchange rate on a future date. Currency forward contracts are privately traded in the interbank market, not on a centralized exchange. |
Risk control will be an integral part of the Fund’s investment process. Among other things, we will analyze portfolio volatility, portfolio concentration, expected extreme events and expected instability in returns among various asset classes and types of investments. When selecting equity
1. The risk/reward potential is based on the Fund’s goal and level of risk. It is not indicative of the Fund’s actual or implied performance or portfolio composition, which may change on a continuous basis.
2. Source: Morningstar.
The indexes are unmanaged and include reinvestment of any income or distributions. They do not reflect any fees, expenses or sale charges. One cannot invest directly in an index, and an index is not representative of the Fund’s portfolio.
See www.franklintempletondatasources.com for additional data provider information.
The dollar value, number of shares or principal amount, and names of all portfolio holdings are listed in the Fund’s SOI, which begins on page 27.
| | | | |
| | | | | |
| nextstepfunds.com | | Annual Report | | 3 |
FRANKLIN NEXTSTEP CONSERVATIVE FUND
funds for purchase or sale, we consider the underlying funds’ foreign and domestic exposure, market capitalization ranges and investment style (growth vs. value). When selecting debt funds for purchase or sale, we focus primarily on maximizing income appropriate to the Fund’s risk profile and consider the overall credit quality, duration and maturity of the underlying funds’ portfolios.
|
What is duration? Duration is a measure of a bond’s price sensitivity to interest-rate changes. In general, a portfolio of securities with a lower duration can be expected to be less sensitive to interest-rate changes than a portfolio with a higher duration. |
Top 10 Fund Holdings
5/31/19
| | | | |
| | | % of Total
Net Assets | |
| |
Franklin Low Duration Total Return Fund – Class R6 | | | 12.6% | |
| |
Prudential Core Bond Fund – Class Q | | | 11.3% | |
| |
Franklin Strategic Income Fund – Class R6 | | | 11.2% | |
| |
iShares Core U.S. Aggregate Bond ETF | | | 11.0% | |
| |
Templeton Global Total Return Fund – Class R6 | | | 9.8% | |
| |
iShares7-10 Year Treasury Bond ETF | | | 9.8% | |
| |
Delaware Corporate Bond Fund – Class I | | | 8.7% | |
| |
iShares Core S&P 500 ETF | | | 6.8% | |
| |
Franklin Growth Fund – Class R6 | | | 3.8% | |
| |
iShares S&P 500 Value ETF | | | 3.0% | |
Manager’s Discussion
The Fund’s performance can be attributed to our cross-asset allocation within fixed income, equities and alternatives, as well as manager selection decisions within those asset classes.
On May 31, 2019, the portfolio was diversified across capitalization sizes, regions and investment styles for both our fixed income and equity allocations. Atperiod-end, Franklin NextStep Conservative Fund allocated 74.4% of total net assets to fixed income, 22.7% to equity and 3.2% to cash. Domestic fixed income exposure was 86.8% of the total fixed income weighting, with the balance represented by foreign fixed income. Franklin Low Duration Total Return Fund – Class R6, at 12.6% of the Fund’s total net assets, was our largest fixed income weighting atperiod-end. On the equity side, domestic exposure was 66.5% of the Fund’s total equity weighting, with the balance represented by foreign equity. iShares Core S&P 500 ETF was our largest
equity weighting atperiod-end with 6.8% of the Fund’s total net assets.
During the reporting period, overall fixed income and equity positioning detracted from the Fund’s relative performance.
A low duration theme in the fixed income allocation hampered relative results for the12-month period, while underlying bond funds provided positive absolute returns. Exposure to corporate high-yield bonds also detracted, primarily due to the market turmoil andrisk-off environment in the fourth quarter of 2018. In contrast, exposure to corporate investment-grade bonds and longer-dated U.S. Treasuries strengthened results.
In equity, positioning in the U.S. benefited from a modest regional overweight and from underlying funds that followed growth strategies. However, these contributions to equity performance were more than offset by weak results in emerging markets and Europe. The Fund was modestly overweight emerging markets and modestly underweight Europe. In addition, value-oriented equity funds detracted.
Our largest domestic fixed income fund holding, Franklin Low Duration Total Return Fund – Class R6, underperformed the Bloomberg Barclays U.S. Aggregate Bond Index, and our only global fixed income fund holding, Templeton Global Total Return Fund – Class R6, underperformed the Bloomberg Barclays Multiverse ex USD (USD Hedged) Index. On the equity side, our largest domestic equity fund holding, iShares Core S&P 500 ETF, performed in line with the S&P 500, while our largest foreign equity fund holding, Goldman Sachs Emerging Markets Equity Insights Fund, underperformed the MSCI Europe Index.
Thank you for your participation in Franklin NextStep Conservative Fund. We look forward to serving your future investment needs.
| | | | |
| | | | | |
| 4 | | Annual Report | | nextstepfunds.com |
FRANKLIN NEXTSTEP CONSERVATIVE FUND
| | |
 | | 
Thomas A. Nelson, CFA |
| |
 | | 
May Tong, CFA |
| |
| | | Portfolio Management Team |
The foregoing information reflects our analysis, opinions and portfolio holdings as of May 31, 2019, the end of the reporting period. The way we implement our main investment strategies and the resulting portfolio holdings may change depending on factors such as market and economic conditions. These opinions may not be relied upon as investment advice or an offer for a particular security. The information is not a complete analysis of every aspect of any market, country, industry, security or the Fund. Statements of fact are from sources considered reliable, but the investment manager makes no representation or warranty as to their completeness or accuracy. Although historical performance is no guarantee of future results, these insights may help you understand our investment management philosophy.
CFA® is a trademark owned by CFA Institute.
| | | | |
| | | | | |
| nextstepfunds.com | | Annual Report | | 5 |
FRANKLIN NEXTSTEP CONSERVATIVE FUND
Performance Summary as of May 31, 2019
The performance table and graphs do not reflect any taxes that a shareholder would pay on Fund dividends, capital gain distributions, if any, or any realized gains on the sale of Fund shares. Total return reflects reinvestment of the Fund’s dividends and capital gain distributions, if any, and any unrealized gains or losses. Your dividend income will vary depending on dividends or interest paid by securities in the Fund’s portfolio, adjusted for operating expenses of each class. Capital gain distributions are net profits realized from the sale of portfolio securities.
Performance as of 5/31/191
Cumulative total return excludes sales charges. Average annual total return includes maximum sales charges. Sales charges will vary depending on the size of the investment and the class of share purchased. The maximum is 5.50% and the minimum is 0%.Class A:5.50% maximum initial sales charge;Advisor Class:no sales charges. For other share classes, visitnextstepfunds.com.
| | | | | | |
Share Class | | Cumulative Total Return2 | |
| Average Annual
Total Return |
3 |
| |
| | |
A4 | | | | | | |
1-Year | | +3.59% | | | -2.12% | |
| |
3-Year | | +11.31% | | | +1.69% | |
| |
Since Inception (2/5/16) | | +16.05% | | | +2.83% | |
| |
| | |
Advisor5 | | | | | | |
1-Year | | +3.85% | | | +3.85% | |
| |
3-Year | | +12.15% | | | +3.90% | |
| |
Since Inception (2/5/16) | | +16.92% | | | +4.83% | |
| |
Performance data represent past performance, which does not guarantee future results. Investment return and principal value will fluctuate, and you may have a gain or loss when you sell your shares. Current performance may differ from figures shown. For most recentmonth-end performance, go tonextstepfunds.comor call(800)342-5236.
See page 8 for Performance Summary footnotes.
| | | | |
| | | | | |
| 6 | | Annual Report | | nextstepfunds.com |
FRANKLIN NEXTSTEP CONSERVATIVE FUND
PERFORMANCE SUMMARY
Total Return Index Comparison for a Hypothetical $10,000 Investment1
Total return represents the change in value of an investment over the periods shown. It includes any applicable maximum sales charge, Fund expenses, account fees and reinvested distributions. The unmanaged indexes include reinvestment of any income or distributions. They differ from the Fund in composition and do not pay management fees or expenses. One cannot invest directly in an index.
Class A(2/5/16–5/31/19)
Advisor Class(2/5/16–5/31/19)
See page 8 for Performance Summary footnotes.
| | | | |
| | | | | |
| nextstepfunds.com | | Annual Report | | 7 |
FRANKLIN NEXTSTEP CONSERVATIVE FUND
PERFORMANCE SUMMARY
Distributions(6/1/18–5/31/19)
| | | | | | | | |
| Share Class | | Net Investment
Income | | Short-Term
Capital Gain | | Long-Term
Capital Gain | | Total |
| | | | |
A | | $0.2762 | | $0.0508 | | $0.0738 | | $0.4008 |
| | | | |
C | | $0.1919 | | $0.0508 | | $0.0738 | | $0.3165 |
| | | | |
Advisor | | $0.3019 | | $0.0508 | | $0.0738 | | $0.4265 |
Total Annual Operating Expenses7
| | | | |
| Share Class | | With Fee
Waiver | | Without Fee
Waiver |
| | |
A | | 1.00% | | 3.86% |
| | |
Advisor | | 0.75% | | 3.61% |
Each class of shares is available to certain eligible investors and has different annual fees and expenses, as described in the prospectus.
While an asset allocation plan can be a valuable tool to help reduce overall volatility, all investments involve risks, including possible loss of principal. Because the Fund invests in underlying funds, which may engage in a variety of investment strategies involving certain risks, the Fund is subject to those same risks. In addition, the Fund’s shareholders will indirectly bear the fees and expenses of the underlying funds. The risks described herein are the principal risks of the Fund and the underlying funds. Typically, the more aggressive the investment, or the greater the potential return, the more risk involved. Generally, investors should be comfortable with some fluctuation in the value of their investments, especially over the short term. Stock prices fluctuate, sometimes rapidly and dramatically, due to factors affecting individual companies, particular industries or sectors, or general market conditions. Bond prices generally move in the opposite direction of interest rates. Thus, as prices of bonds in a fund adjust to a rise in interest rates, that fund’s share price may decline. Foreign investing carries additional risks such as currency and market volatility and political or social instability, risks which are heightened in developing countries. Investments in derivatives involve costs and create economic leverage, which may result in significant volatility and cause the funds to participate in losses (as well as gains) that significantly exceed the funds’ initial investment. These risks are described in the Fund’s prospectus. Investors should consult their financial advisor for help selecting the appropriate fund of funds, or fund combination, based on an evaluation of their investment objectives and risk tolerance. The Fund is actively managed but there is no guarantee that the manager’s investment decisions will produce the desired results.
1. The Fund has an expense reduction contractually guaranteed through 9/30/19. Fund investment results reflect the expense reduction; without this reduction, the results would have been lower.
2. Cumulative total return represents the change in value of an investment over the periods indicated.
3. Average annual total return represents the average annual change in value of an investment over the period indicated. Return for less than one year, if any, has not been annualized.
4. Prior to 9/10/18, these shares were offered at a higher initial sales charge of 5.75%, thus actual returns would have differed. Total returns with sales charges have been restated to reflect the current maximum initial sales charge of 5.50%.
5. Effective 6/15/16, the Fund began offering Advisor Class shares, which do not have sales charges or a Rule12b-1 plan. Performance quotations for this class reflect the following methods of calculation: (a) For periods prior to 6/15/16, a restated figure is used based upon the Fund’s Class A performance, excluding the effect of Class A’s maximum initial sales charge, but reflecting the effect of the Class A Rule12b-1 fees; and (b) for periods after 6/15/16, actual Advisor Class performance is used reflecting all charges and fees applicable to that class. Since 6/15/16 (commencement of sales), the cumulative and average annual total returns of Advisor Class shares were +12.04% and +3.92%.
6. Source: Morningstar. The S&P 500 is a market capitalization-weighted index of 500 stocks designed to measure total U.S. equity market performance. The MSCI ACWI ex USA Index is a free float-adjusted, market capitalization-weighted index designed to measure equity market performance in global developed and emerging markets excluding the U.S. The Bloomberg Barclays U.S. Aggregate Bond Index is a market capitalization-weighted index representing the U.S. investment-grade, fixed-rate, taxable bond market with index components for government and corporate, mortgage pass-through and asset-backed securities. All issues included areSEC-registered, taxable, dollar denominated and nonconvertible, must have at least one year to final maturity, and must be rated investment grade(Baa3/BBB-/BBB- or above) using the middle rating of Moody’s, Standard & Poor’s and Fitch, respectively. The Bloomberg Barclays Multiverse ex USD (USD Hedged) Index provides a broad-based measure of the global fixed income bond market. The index represents the union of the Global Aggregate Index and the Global High Yield Index and captures investment-grade and high-yield securities in all eligible currencies.
7. Figures are as stated in the Fund’s current prospectus, including the effect of acquired fund fees and expenses, and may differ from the expense ratios disclosed in the Your Fund’s Expenses and Financial Highlights sections in this report. In periods of market volatility, assets may decline significantly, causing total annual Fund operating expenses to become higher than the figures shown.
See www.franklintempletondatasources.com for additional data provider information.
| | | | |
| | | | | |
| 8 | | Annual Report | | nextstepfunds.com |
FRANKLIN NEXTSTEP CONSERVATIVE FUND
Your Fund’s Expenses
As a Fund shareholder, you can incur two types of costs: (1) transaction costs, including sales charges (loads) on Fund purchases and redemptions; and (2) ongoing Fund costs, including management fees, distribution and service(12b-1) fees, and other Fund expenses. All mutual funds have ongoing costs, sometimes referred to as operating expenses. The table below shows ongoing costs of investing in the Fund and can help you understand these costs and compare them with those of other mutual funds. The table assumes a $1,000 investment held for the six months indicated.
Actual Fund Expenses
The table below provides information about actual account values and actual expenses in the columns under the heading “Actual.” In these columns the Fund’s actual return, which includes the effect of Fund expenses, is used to calculate the “Ending Account Value” for each class of shares. You can estimate the expenses you paid during the period by following these steps (of course, your account value and expenses will differ from those in this illustration): Divide your account value by $1,000 (if your account had an $8,600 value, then $8,600÷ $1,000 = 8.6). Then multiply the result by the number in the row for your class of shares under the headings “Actual” and “Expenses Paid During Period” (if Actual Expenses Paid During Period were $7.50, then 8.6 x $7.50 = $64.50). In this illustration, the actual expenses paid this period are $64.50.
Hypothetical Example for Comparison with Other Funds
Under the heading “Hypothetical” in the table, information is provided about hypothetical account values and hypothetical expenses based on the Fund’s actual expense ratio and an assumed rate of return of 5% per year before expenses, which is not the Fund’s actual return. This information may not be used to estimate the actual ending account balance or expenses you paid for the period, but it can help you compare ongoing costs of investing in the Fund with those of other funds. To do so, compare this 5% hypothetical example for the class of shares you hold with the 5% hypothetical examples that appear in the shareholder reports of other funds.
Please note that expenses shown in the table are meant to highlight ongoing costs and do not reflect any transactional costs. Therefore, information under the heading “Hypothetical” is useful in comparing ongoing costs only, and will not help you compare total costs of owning different funds. In addition, if transactional costs were included, your total costs would have been higher.
| | | | | | | | | | | | | | | | | | |
| | | | | | | Actual (actual return after expenses) | | | | Hypothetical (5% annual return before expenses) | | | | |
Share
Class | | Beginning Account Value 12/1/18 | | | | Ending Account Value 5/31/19 | | Expenses Paid During Period 12/1/18–5/31/191,2 | | | | Ending Account Value 5/31/19 | | Expenses Paid During Period
12/1/18–5/31/191, 2 | | | | Net Annualized Expense Ratio2 |
| A | | $1,000 | | | | $1,038.70 | | $3.05 | | | | $1,021.94 | | $3.02 | | | | 0.60% |
| C | | $1,000 | | | | $1,034.80 | | $6.85 | | | | $1,018.20 | | $6.79 | | | | 1.35% |
| Advisor | | $1,000 | | | | $1,039.90 | | $1.78 | | | | $1,023.19 | | $1.77 | | | | 0.35% |
1. Expenses are equal to the annualized expense ratio for thesix-month period as indicated above—in the far right column—multiplied by the simple average account value over the period indicated, and then multiplied by 182/365 to reflect theone-half year period.
2. Reflects expenses after fee waivers and expense reimbursements. Does not include acquired fund fees and expenses.
| | | | |
| | | | | |
nextstepfunds.com | | Annual Report | | 9 |
Franklin NextStep Moderate Fund
This annual report for Franklin NextStep Moderate Fund covers the fiscal year ended May 31, 2019.
Your Fund’s Goals and Main Investments
The Fund seeks the highest level of long-term total return consistent with a moderate level of risk.1 As a “fund of funds,” it seeks to achieve its investment goal by investing its assets in underlying funds (i.e., other mutual funds and exchange-traded funds (ETFs)) managed by Franklin Templeton as well as those managed by unaffiliated investment managers. Under normal market conditions, we allocate the Fund’s assets among the broad asset classes of equity, debt and alternative investments by investing primarily in a distinctly weighted combination of underlying funds, based on each underlying fund’s predominant asset class. These underlying funds, in turn, invest in a variety of U.S. and foreign equity, debt and derivative investments.
Performance Overview
The Fund’s Class A shares posted a cumulative total return of +0.55% for the 12 months under review. In comparison, the Fund’s blended benchmark, which is 35% Standard & Poor’s 500 Index (S&P 500), 25% Bloomberg Barclays U.S. Aggregate Bond Index, 25% MSCI All Country World Index (ACWI) ex USA Index and 15% Bloomberg Barclays Multiverse ex USD (USD Hedged) Index, posted a +2.71% total return.2 You can find more of the Fund’s performance data in the Performance Summary beginning on page 13.
Performance data represent past performance, which does not guarantee future results. Investment return and principal value will fluctuate, and you may have a gain or loss when you sell your shares. Current performance may differ from figures shown. For most recentmonth-end performance, go tonextstepfunds.comor call(800)342-5236.
Investment Strategy
The Fund seeks to maintain a target exposure, principally through investment in underlying funds, of 60% to equities and equity-related securities and 40% to debt securities. The Fund may also invest up to 5% in alternative investment
Asset Allocation*
Based on Total Net Assets as of 5/31/19
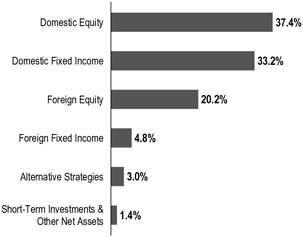
*The asset allocation is based on the Statement of Investments (SOI), which classifies each underlying fund and other fund investments into a broad asset class based on its predominant investments under normal market conditions.
funds. The Fund’s asset allocation may change from time to time and deviate from its target exposure based on market conditions and our strategic and tactical asset allocation views. However, the Fund’s equity, debt and alternative investments will typically be in the 45%–65%, 35%–55% and 0%–5% range, respectively. The risk profile of underlying funds will be considered when determining allocations. The Fund may also invest directly in securities of each asset class and may use currency forwards for hedging purposes.
What is a currency forward contract?
A currency forward contract is an agreement between the Fund and a counterparty to buy or sell a foreign currency in exchange for another currency at a specific exchange rate on a future date. Currency forward contracts are privately traded in the interbank market, not on a centralized exchange.
Risk control will be an integral part of the Fund’s investment process. Among other things, we will analyze portfolio volatility, portfolio concentration, expected extreme events
1. The risk/reward potential is based on the Fund’s goal and level of risk. It is not indicative of the Fund’s actual or implied performance or portfolio composition, which may change on a continuous basis.
2. Source: Morningstar.
The indexes are unmanaged and include reinvestment of any income or distributions. They do not reflect any fees, expenses or sale charges. One cannot invest directly in an index, and an index is not representative of the Fund’s portfolio.
See www.franklintempletondatasources.com for additional data provider information.
The dollar value, number of shares or principal amount, and names of all portfolio holdings are listed in the Fund’s SOI, which begins on page 32.
| | | | |
| | | | | |
10 | | Annual Report | | nextstepfunds.com |
FRANKLIN NEXTSTEP MODERATE FUND
and expected instability in returns among various asset classes and types of investments. When selecting equity funds for purchase or sale, we consider the underlying funds’ foreign and domestic exposure, market capitalization ranges and investment style (growth vs. value).
Top 10 Fund Holdings
5/31/19
| | | | |
| | | % of Total
Net Assets | |
| |
iShares Core S&P 500 ETF | | | 16.8% | |
| |
Franklin Growth Fund – Class R6 | | | 9.4% | |
| |
iShares S&P 500 Value ETF | | | 7.4% | |
| |
Franklin Low Duration Total Return Fund – Class R6 | | | 6.5% | |
| |
Prudential Core Bond Fund – Class Q | | | 5.9% | |
| |
Franklin Strategic Income Fund – Class R6 | | | 5.8% | |
| |
iShares Core U.S. Aggregate Bond ETF | | | 5.6% | |
| |
iShares7-10 Year Treasury Bond ETF | | | 5.0% | |
| |
Templeton Global Total Return Fund – Class R6 | | | 4.8% | |
| |
Goldman Sachs Emerging Markets Equity Insights Fund | | | 4.6% | |
| |
When selecting debt funds for purchase or sale, we focus primarily on maximizing income appropriate to the Fund’s risk profile and consider the overall credit quality, duration and maturity of the underlying funds’ portfolios. When selecting alternative investment funds for purchase or sale, we focus primarily on the specific alternative strategy employed by the fund; how the fund generates alpha (a measurement of how well the fund performed compared to a benchmark index); how the fund is expected to correlate to different markets; the strategies, methods and techniques the underlying fund uses to hedge certain markets or investments; and how a fund’s net asset value typically reduces when the market falls (the lower correlation between these two factors, the better).
What is duration?
Duration is a measure of a bond’s price sensitivity to interest-rate changes. In general, a portfolio of securities with a lower duration can be expected to be less sensitive to interest-rate changes than a portfolio with a higher duration.
Manager’s Discussion
The Fund’s performance can be attributed to our cross-asset allocation within fixed income, equities and alternatives, as well as manager selection decisions within those asset classes.
On May 31, 2019, the portfolio was diversified across capitalization sizes, regions and investment styles for both our equity and fixed income allocations. Atperiod-end, Franklin NextStep Moderate Fund allocated 57.6% of total net assets to equity, 38.0% to fixed income, 3.0% to alternatives and 1.5% to cash. On the equity side, domestic exposure was 64.9% of the Fund’s total equity weighting, with the balance represented by foreign equity. iShares Core S&P 500 ETF was our largest equity weighting atperiod-end with 16.8% of the Fund’s total net assets. Domestic fixed income exposure was 87.4% of the total fixed income weighting, with the balance represented by foreign fixed income. Franklin Low Duration Total Return Fund – Class R6, at 6.5% of the Fund’s total net assets, was our largest fixed income weighting atperiod-end.
During the reporting period, overall equity and fixed income positioning detracted from the Fund’s relative performance. Off-benchmark exposure to commodities also weakened results in alternative investments.
In equity, positioning in the U.S. benefited from a modest regional overweight and from underlying funds that followed growth strategies. However, these contributions to equity performance were more than offset by weak results in emerging markets and Europe. The Fund was overweight emerging markets and modestly underweight Europe. In addition, value-oriented equity funds detracted.
A low duration theme in the fixed income allocation hampered relative results for the12-month period, while underlying bond funds provided positive absolute returns. Exposure to corporate high-yield bonds also detracted from relative performance, primarily due to the market turmoil andrisk-off environment in the fourth quarter of 2018. In contrast, exposure to corporate investment-grade bonds and longer-dated U.S. Treasuries strengthened results.
On the equity side, our largest domestic equity fund holding, iShares Core S&P 500 ETF, performed in line with the S&P 500, while our largest foreign equity fund holding, Goldman Sachs Emerging Markets Equity Insights Fund, underper-formed the MSCI Europe Index. Our largest domestic fixed income fund holding, Franklin Low Duration Total Return Fund – Class R6, underperformed the Bloomberg Barclays U.S. Aggregate Bond Index, and our only global fixed income fund holding, Templeton Global Total Return Fund – Class R6, underperformed the Bloomberg Barclays Multiverse ex USD (USD Hedged) Index.
| | | | |
| | | | | |
| nextstepfunds.com | | Annual Report | | 11 |
FRANKLIN NEXTSTEP MODERATE FUND
Thank you for your participation in Franklin NextStep Moderate Fund. We look forward to serving your future investment needs.
| | | | |

| | | | 
|
| | Thomas A. Nelson, CFA |
| | |

| | | | 
|
| | May Tong, CFA |
| | |
| | | | Portfolio Management Team |
|
The foregoing information reflects our analysis, opinions and portfolio holdings as of May 31, 2019, the end of the reporting period. The way we implement our main investment strategies and the resulting portfolio holdings may change depending on factors such as market and economic conditions. These opinions may not be relied upon as investment advice or an offer for a particular security. The information is not a complete analysis of every aspect of any market, country, industry, security or the Fund. Statements of fact are from sources considered reliable, but the investment manager makes no representation or warranty as to their completeness or accuracy. Although historical performance is no guarantee of future results, these insights may help you understand our investment management philosophy.
| | | | |
| | | | | |
| 12 | | Annual Report | | nextstepfunds.com |
FRANKLIN NEXTSTEP MODERATE FUND
Performance Summary as of May 31, 2019
The performance table and graphs do not reflect any taxes that a shareholder would pay on Fund dividends, capital gain distributions, if any, or any realized gains on the sale of Fund shares. Total return reflects reinvestment of the Fund’s dividends and capital gain distributions, if any, and any unrealized gains or losses. Your dividend income will vary depending on dividends or interest paid by securities in the Fund’s portfolio, adjusted for operating expenses of each class. Capital gain distributions are net profits realized from the sale of portfolio securities.
Performance as of 5/31/191
Cumulative total return excludes sales charges. Average annual total return includes maximum sales charges. Sales charges will vary depending on the size of the investment and the class of share purchased. The maximum is 5.50% and the minimum is 0%.Class A:5.50% maximum initial sales charge;Advisor Class:no sales charges. For other share classes, visitnextstepfunds.com.
| | | | |
| Share Class | | Cumulative
Total Return2 | | Average Annual
Total Return3 |
| | |
A4 | | | | |
| | |
1-Year | | +0.55% | | -5.00% |
| | |
3-Year | | +16.75% | | +3.33% |
| | |
Since Inception (2/5/16) | | +26.11% | | +5.44% |
| | |
Advisor5 | | | | |
| | |
1-Year | | +0.86% | | +0.86% |
| | |
3-Year | | +17.74% | | +5.59% |
| | |
Since Inception (2/5/16) | | +27.18% | | +7.52% |
Performance data represent past performance, which does not guarantee future results. Investment return and principal value will fluctuate, and you may have a gain or loss when you sell your shares. Current performance may differ from figures shown. For most recentmonth-end performance, go tonextstepfunds.comor call(800)342-5236.
See page 15 for Performance Summary footnotes.
| | | | |
| | | |
| nextstepfunds.com | | Annual Report | | 13 |
FRANKLIN NEXTSTEP MODERATE FUND
PERFORMANCE SUMMARY
Total Return Index Comparison for a Hypothetical $10,000 Investment1
Total return represents the change in value of an investment over the periods shown. It includes any applicable maximum sales charge, Fund expenses, account fees and reinvested distributions. The unmanaged indexes include reinvestment of any income or distributions. They differ from the Fund in composition and do not pay management fees or expenses. One cannot invest directly in an index.
Class A(2/5/16–5/31/19)
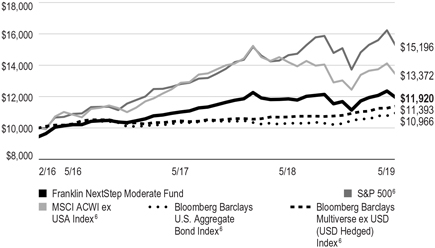
Advisor Class(2/5/16–5/31/19)
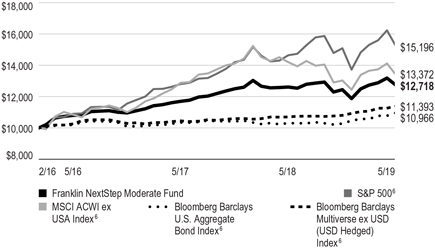
See page 15 for Performance Summary footnotes.
| | | | |
| | | |
| 14 | | Annual Report | | nextstepfunds.com |
FRANKLIN NEXTSTEP MODERATE FUND
PERFORMANCE SUMMARY
Distributions(6/1/18–5/31/19)
| | | | | | | | |
| Share Class | | Net Investment
Income | | Short-Term Capital Gain | | Long-Term Capital Gain | | Total |
| | | | |
A | | $0.2394 | | $0.1313 | | $0.1644 | | $0.5351 |
| | | | |
C | | $0.1335 | | $0.1313 | | $0.1644 | | $0.4292 |
| | | | |
Advisor | | $0.2745 | | $0.1313 | | $0.1644 | | $0.5702 |
|
| Total Annual Operating Expenses7 |
| | | | |
| Share Class | | With Fee Waiver | | Without Fee Waiver | | | | |
| | | | |
A | | 1.09% | | 1.76% | | | | |
| | | | |
Advisor | | 0.84% | | 1.51% | | | | |
Each class of shares is available to certain eligible investors and has different annual fees and expenses, as described in the prospectus.
While an asset allocation plan can be a valuable tool to help reduce overall volatility, all investments involve risks, including possible loss of principal. Because the Fund invests in underlying funds, which may engage in a variety of investment strategies involving certain risks, the Fund is subject to those same risks. In addition, the Fund’s shareholders will indirectly bear the fees and expenses of the underlying funds. The risks described herein are the principal risks of the Fund and the underlying funds. Typically, the more aggressive the investment, or the greater the potential return, the more risk involved. Generally, investors should be comfortable with some fluctuation in the value of their investments, especially over the short term. Stock prices fluctuate, sometimes rapidly and dramatically, due to factors affecting individual companies, particular industries or sectors, or general market conditions. Bond prices generally move in the opposite direction of interest rates. Thus, as prices of bonds in a fund adjust to a rise in interest rates, that fund’s share price may decline. Foreign investing carries additional risks such as currency and market volatility and political or social instability, risks which are heightened in developing countries. Investments in derivatives involve costs and create economic leverage, which may result in significant volatility and cause the funds to participate in losses (as well as gains) that significantly exceed the funds’ initial investment. These risks are described in the Fund’s prospectus. Investors should consult their financial advisor for help selecting the appropriate fund of funds, or fund combination, based on an evaluation of their investment objectives and risk tolerance. The Fund is actively managed but there is no guarantee that the manager’s investment decisions will produce the desired results.
1. The Fund has an expense reduction contractually guaranteed through 9/30/19. Fund investment results reflect the expense reduction; without this reduction, the results would have been lower.
2. Cumulative total return represents the change in value of an investment over the periods indicated.
3. Average annual total return represents the average annual change in value of an investment over the period indicated. Return for less than one year, if any, has not been annualized.
4. Prior to 9/10/18, these shares were offered at a higher initial sales charge of 5.75%, thus actual returns would have differed. Total returns with sales charges have been restated to reflect the current maximum initial sales charge of 5.50%.
5. Effective 6/15/16, the Fund began offering Advisor Class shares, which do not have sales charges or a Rule12b-1 plan. Performance quotations for this class reflect the following methods of calculation: (a) For periods prior to 6/15/16, a restated figure is used based upon the Fund’s Class A performance, excluding the effect of Class A’s maximum initial sales charge, but reflecting the effect of the Class A Rule12b-1 fees; and (b) for periods after 6/15/16, actual Advisor Class performance is used reflecting all charges and fees applicable to that class. Since 6/15/16 (commencement of sales), the cumulative and average annual total returns of Advisor Class shares were +18.73% and +5.97%.
6. Source: Morningstar. The S&P 500 is a market capitalization-weighted index of 500 stocks designed to measure total U.S. equity market performance. The MSCI ACWI ex USA Index is a free float-adjusted, market capitalization-weighted index designed to measure equity market performance in global developed and emerging markets excluding the U.S. The Bloomberg Barclays U.S. Aggregate Bond Index is a market capitalization-weighted index representing the U.S. investment-grade, fixed-rate, taxable bond market with index components for government and corporate, mortgage pass-through and asset-backed securities. All issues included areSEC-registered, taxable, dollar denominated and nonconvertible, must have at least one year to final maturity, and must be rated investment grade(Baa3/BBB-/BBB- or above) using the middle rating of Moody’s, Standard & Poor’s and Fitch, respectively. The Bloomberg Barclays Multiverse ex USD (USD Hedged) Index provides a broad-based measure of the global fixed income bond market. The index represents the union of the Global Aggregate Index and the Global High Yield Index and captures investment-grade and high-yield securities in all eligible currencies.
7. Figures are as stated in the Fund’s current prospectus, including the effect of acquired fund fees and expenses, and may differ from the expense ratios disclosed in the Your Fund’s Expenses and Financial Highlights sections in this report. In periods of market volatility, assets may decline significantly, causing total annual Fund operating expenses to become higher than the figures shown.
See www.franklintempletondatasources.com for additional data provider information.
| | | | |
| | | |
| nextstepfunds.com | | Annual Report | | 15 |
FRANKLIN NEXTSTEP MODERATE FUND
Your Fund’s Expenses
As a Fund shareholder, you can incur two types of costs: (1) transaction costs, including sales charges (loads) on Fund purchases and redemptions; and (2) ongoing Fund costs, including management fees, distribution and service(12b-1) fees, and other Fund expenses. All mutual funds have ongoing costs, sometimes referred to as operating expenses. The table below shows ongoing costs of investing in the Fund and can help you understand these costs and compare them with those of other mutual funds. The table assumes a $1,000 investment held for the six months indicated.
Actual Fund Expenses
The table below provides information about actual account values and actual expenses in the columns under the heading “Actual.” In these columns the Fund’s actual return, which includes the effect of Fund expenses, is used to calculate the “Ending Account Value” for each class of shares. You can estimate the expenses you paid during the period by following these steps (of course, your account value and expenses will differ from those in this illustration): Divide your account value by $1,000 (if your account had an $8,600 value, then $8,600÷ $1,000 = 8.6). Then multiply the result by the number in the row for your class of shares under the headings “Actual” and “Expenses Paid During Period” (if Actual Expenses Paid During Period were $7.50, then 8.6 x $7.50 = $64.50). In this illustration, the actual expenses paid this period are $64.50.
Hypothetical Example for Comparison with Other Funds
Under the heading “Hypothetical” in the table, information is provided about hypothetical account values and hypothetical expenses based on the Fund’s actual expense ratio and an assumed rate of return of 5% per year before expenses, which is not the Fund’s actual return. This information may not be used to estimate the actual ending account balance or expenses you paid for the period, but it can help you compare ongoing costs of investing in the Fund with those of other funds. To do so, compare this 5% hypothetical example for the class of shares you hold with the 5% hypothetical examples that appear in the shareholder reports of other funds.
Please note that expenses shown in the table are meant to highlight ongoing costs and do not reflect any transactional costs. Therefore, information under the heading “Hypothetical” is useful in comparing ongoing costs only, and will not help you compare total costs of owning different funds. In addition, if transactional costs were included, your total costs would have been higher.
| | | | | | | | | | | | | | | | | | |
| | | | | | | Actual
(actual return after expenses) | | | | Hypothetical
(5% annual return before expenses) | | |
Share Class | | Beginning
Account
Value 12/1/18 | | | | Ending
Account
Value 5/31/19 | | Expenses
Paid During
Period
12/1/18–5/31/191,
2 | | | | Ending
Account
Value 5/31/19 | | Expenses
Paid During
Period
12/1/18–5/31/191,
2 | | | | Net
Annualized
Expense
Ratio2 |
A | | $1,000 | | | | $1,020.30 | | $3.02 | | | | $1,021.94 | | $3.02 | | | | 0.60% |
C | | $1,000 | | | | $1,017.00 | | $6.74 | | | | $1,018.25 | | $6.74 | | | | 1.34% |
Advisor | | $1,000 | | | | $1,022.40 | | $1.76 | | | | $1,023.19 | | $1.77 | | | | 0.35% |
1. Expenses are equal to the annualized expense ratio for thesix-month period as indicated above—in the far right column—multiplied by the simple average account value over the period indicated, and then multiplied by 182/365 to reflect theone-half year period.
2. Reflects expenses after fee waivers and expense reimbursements. Does not include acquired fund fees and expenses.
| | | | |
| | | | | |
| 16 | | Annual Report | | nextstepfunds.com |
Franklin NextStep Growth Fund
This annual report for Franklin NextStep Growth Fund covers the fiscal year ended May 31, 2019.
Your Fund’s Goals and Main Investments
The Fund seeks the highest level of long-term total return consistent with a growth-oriented level of risk.1 As a “fund of funds,” it seeks to achieve its investment goal by investing its assets in underlying funds (i.e., other mutual funds and exchange-traded funds (ETFs)) managed by Franklin Templeton as well as those managed by unaffiliated investment managers. Under normal market conditions, we allocate the Fund’s assets among the broad asset classes of equity, debt and alternative investments by investing primarily in a distinctly weighted combination of underlying funds, based on each underlying fund’s predominant asset class. These underlying funds, in turn, invest in a variety of U.S. and foreign equity, debt and derivative investments.
Performance Overview
The Fund’s Class A shares posted a cumulative total return of-0.26% for the 12 months under review. In comparison, the Fund’s blended benchmark, which is 45% Standard & Poor’s 500® Index (S&P 500®), 30% MSCI All Country World Index (ACWI) ex USA Index, 15% Bloomberg Barclays U.S. Aggregate Bond Index and 10% Bloomberg Barclays Multiverse ex USD (USD Hedged) Index, posted a +1.77% total return.2 You can find more of the Fund’s performance data in the Performance Summary beginning on page 20.
Performance data represent past performance, which does not guarantee future results. Investment return and principal value will fluctuate, and you may have a gain or loss when you sell your shares. Current performance may differ from figures shown. For most recentmonth-end performance, go tonextstepfunds.comor call(800)342-5236.
Investment Strategy
The Fund seeks to maintain a target exposure, principally through investment in underlying funds, of 75% to equities and equity-related securities and 25% to debt securities. The Fund may also invest up to 10% in alternative investment
Asset Allocation*
Based on Total Net Assets as of 5/31/19
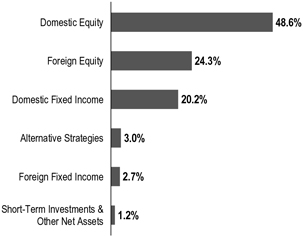
*The asset allocation is based on the Statement of Investments (SOI), which classifies each underlying fund and other fund investments into a broad asset class based on its predominant investments under normal market conditions.
funds. The Fund’s asset allocation may change from time to time and deviate from its target exposure based on market conditions and our strategic and tactical asset allocation views. However, the Fund’s equity, debt and alternative investments will typically be in the 60%–80%, 20%–40% and 0%–10% range, respectively. The risk profile of underlying funds will be considered when determining allocations. The Fund may also invest directly in securities of each asset class and may use currency forwards for hedging purposes.
What is a currency forward contract?
A currency forward contract is an agreement between the Fund and a counterparty to buy or sell a foreign currency in exchange for another currency at a specific exchange rate on a future date. Currency forward contracts are privately traded in the interbank market, not on a centralized exchange.
Risk control will be an integral part of the Fund’s investment process. Among other things, we will analyze portfolio volatility, portfolio concentration, expected extreme events
1. The risk/reward potential is based on the Fund’s goal and level of risk. It is not indicative of the Fund’s actual or implied performance or portfolio composition, which may change on a continuous basis.
2. Source: Morningstar.
The indexes are unmanaged and include reinvestment of any income or distributions. They do not reflect any fees, expenses or sale charges. One cannot invest directly in an index, and an index is not representative of the Fund’s portfolio.
See www.franklintempletondatasources.com for additional data provider information.
The dollar value, number of shares or principal amount, and names of all portfolio holdings are listed in the Fund’s SOI, which begins on page 37.
| | | | |
| | | | | |
| nextstepfunds.com | | Annual Report | | 17 |
FRANKLIN NEXTSTEP GROWTH FUND
and expected instability in returns among various asset classes and types of investments. When selecting equity funds for purchase or sale, we consider the underlying funds’ foreign and domestic exposure, market capitalization ranges and investment style (growth vs. value).
Top 10 Fund Holdings
5/31/19
| | | | |
| | | % of Total
Net Assets | |
| |
iShares Core S&P 500 ETF | | | 21.9% | |
| |
Franklin Growth Fund – Class R6 | | | 12.2% | |
| |
iShares S&P 500 Value ETF | | | 9.7% | |
| |
Goldman Sachs Emerging Markets Equity Insights Fund | | | 5.6% | |
| |
Pioneer Fundamental Growth Fund – Class K | | | 4.9% | |
| |
Franklin Mutual European Fund – Class R6 | | | 4.1% | |
| |
Columbia Contrarian Europe Fund – Class Z | | | 4.1% | |
| |
Franklin Low Duration Total Return Fund – Class R6 | | | 3.9% | |
| |
iShares Core MSCI Emerging Markets ETF | | | 3.8% | |
| |
Prudential Core Bond Fund – Class Q | | | 3.5% | |
When selecting debt funds for purchase or sale, we focus primarily on maximizing income appropriate to the Fund’s risk profile and consider the overall credit quality, duration and maturity of the underlying funds’ portfolios. When selecting alternative investment funds for purchase or sale, we focus primarily on the specific alternative strategy employed by the fund; how the fund generates alpha (a measurement of how well the fund performed compared to a benchmark index); how the fund is expected to correlate to different markets; the strategies, methods and techniques the underlying fund uses to hedge certain markets or investments; and how a fund’s net asset value typically reduces when the market falls (the lower correlation between these two factors, the better).
What is duration?
Duration is a measure of a bond’s price sensitivity to interest-rate changes. In general, a portfolio of securities with a lower duration can be expected to be less sensitive to interest-rate changes than a portfolio with a higher duration.
Manager’s Discussion
The Fund’s performance can be attributed to our cross-asset allocation within fixed income, equities and alternatives, as well as manager selection decisions within those asset classes.
On May 31, 2019, the portfolio was diversified across capitalization sizes, regions and investment styles for both our equity and fixed income allocations. Atperiod-end, Franklin NextStep Growth Fund allocated 72.9% of total net assets to equity, 22.9% to fixed income, 3.0% to alternatives and 1.4% to cash. On the equity side, domestic exposure was 66.7% of the Fund’s total equity weighting, with the balance represented by foreign equity. iShares Core S&P 500 ETF was our largest equity weighting atperiod-end with 21.9% of the Fund’s total net assets. Domestic fixed income exposure was 88.2% of the total fixed income weighting, with the balance represented by foreign fixed income. Franklin Low Duration Total Return Fund – Class R6, at 3.9% of the Fund’s total net assets, was our largest fixed income weighting atperiod-end.
During the reporting period, overall equity and fixed income positioning detracted from the Fund’s relative performance.Off-benchmark exposure to commodities also weakened results in alternative investments.
In equity, positioning in the U.S. benefited from a modest regional overweight and from underlying funds following growth strategies. However, these contributions to equity performance were more than offset by a slight underweight to the asset class, and by weak results in emerging markets and Europe. The Fund was overweight emerging markets and modestly underweight Europe.
A low duration theme in the fixed income allocation hampered relative results for the12-month period, while underlying bond funds provided positive absolute returns. Exposure to corporate high-yield bonds also detracted from relative performance, primarily due to the market turmoil andrisk-off environment in the fourth quarter of 2018. In contrast, exposure to corporate investment-grade bonds and longer-dated U.S. Treasuries strengthened results.
Our largest domestic equity fund holding, iShares Core S&P 500 ETF, performed in line with the S&P 500, while our largest foreign equity fund holding, Goldman Sachs Emerging Markets Equity Insights Fund, underperformed the MSCI Europe Index. On the fixed income side, our largest domestic fixed income fund holding, Franklin Low Duration Total Return Fund – Class R6, underperformed the Bloomberg Barclays U.S. Aggregate Bond Index, and our only global fixed income fund holding, Templeton Global Total Return Fund – Class R6, underperformed the Bloomberg Barclays Multiverse ex USD (USD Hedged) Index.
| | | | |
| | | | | |
| 18 | | Annual Report | | nextstepfunds.com |
FRANKLIN NEXTSTEP GROWTH FUND
Thank you for your participation in Franklin NextStep Growth Fund. We look forward to serving your future investment needs.
| | |
| |
| |
Thomas A. Nelson, CFA |
| |
| |
May Tong, CFA |
| |
| | Portfolio Management Team |
The foregoing information reflects our analysis, opinions and portfolio holdings as of May 31, 2019, the end of the reporting period. The way we implement our main investment strategies and the resulting portfolio holdings may change depending on factors such as market and economic conditions. These opinions may not be relied upon as investment advice or an offer for a particular security. The information is not a complete analysis of every aspect of any market, country, industry, security or the Fund. Statements of fact are from sources considered reliable, but the investment manager makes no representation or warranty as to their completeness or accuracy. Although historical performance is no guarantee of future results, these insights may help you understand our investment management philosophy.
| | | | |
| | | | | |
| nextstepfunds.com | | Annual Report | | 19 |
FRANKLIN NEXTSTEP GROWTH FUND
Performance Summary as of May 31, 2019
The performance table and graphs do not reflect any taxes that a shareholder would pay on Fund dividends, capital gain distributions, if any, or any realized gains on the sale of Fund shares. Total return reflects reinvestment of the Fund’s dividends and capital gain distributions, if any, and any unrealized gains or losses. Your dividend income will vary depending on dividends or interest paid by securities in the Fund’s portfolio, adjusted for operating expenses of each class. Capital gain distributions are net profits realized from the sale of portfolio securities.
Performance as of 5/31/191
Cumulative total return excludes sales charges. Average annual total return includes maximum sales charges. Sales charges will vary depending on the size of the investment and the class of share purchased. The maximum is 5.50% and the minimum is 0%.Class A:5.50% maximum initial sales charge;Advisor Class:no sales charges. For other share classes, visitnextstepfunds.com.
| | | | | | |
| | |
| Share Class | | Cumulative
Total Return2 | | Average Annual
Total Return3 |
| | |
A4 | | | | | | |
| | |
1-Year | | -0.26% | | | -5.74% | |
| | |
3-Year | | +18.99% | | | +4.00% | |
| | |
Since Inception (2/5/16) | | +29.48% | | | +6.28% | |
| | |
Advisor5 | | | | | | |
1-Year | | -0.02% | | | -0.02% | |
3-Year | | +19.88% | | | +6.23% | |
Since Inception (2/5/16) | | +30.44% | | | +8.34% | |
Performance data represent past performance, which does not guarantee future results. Investment return and principal value will fluctuate, and you may have a gain or loss when you sell your shares. Current performance may differ from figures shown. For most recentmonth-end performance, go tonextstepfunds.comor call(800)342-5236.
See page 22 for Performance Summary footnotes.
| | | | |
| | | | | |
| 20 | | Annual Report | | nextstepfunds.com |
FRANKLIN NEXTSTEP GROWTH FUND
PERFORMANCE SUMMARY
Total Return Index Comparison for a Hypothetical $10,000 Investment1
Total return represents the change in value of an investment over the periods shown. It includes any applicable maximum sales charge, Fund expenses, account fees and reinvested distributions. The unmanaged indexes include reinvestment of any income or distributions. They differ from the Fund in composition and do not pay management fees or expenses. One cannot invest directly in an index.
Class A(2/5/16–5/31/19)
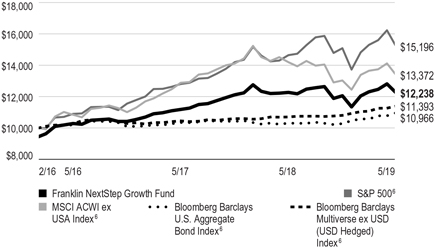
Advisor Class(2/5/16–5/31/19)
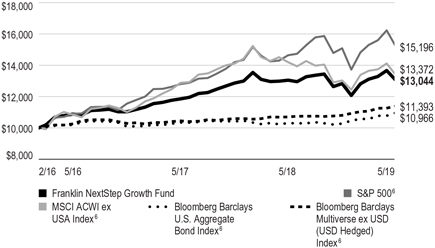
See page 22 for Performance Summary footnotes.
| | | | |
| | | | | |
| nextstepfunds.com | | Annual Report | | 21 |
FRANKLIN NEXTSTEP GROWTH FUND
PERFORMANCE SUMMARY
Distributions (6/1/18–5/31/19)
| | | | | | | | | | | | | | | | |
| Share Class | | Net Investment Income | | | Short-Term Capital Gain | | | Long-Term Capital Gain | | | Total | |
A | | | $0.1640 | | | | $0.0764 | | | | $0.1591 | | | | $0.3995 | |
C | | | $0.1099 | | | | $0.0764 | | | | $0.1591 | | | | $0.3454 | |
Advisor | | | $0.1823 | | | | $0.0764 | | | | $0.1591 | | | | $0.4178 | |
Total Annual Operating Expenses7
| | | | | | | | |
| Share Class | | With Fee
Waiver | | | Without Fee
Waiver | |
| | |
A | | | 1.10% | | | | 2.42% | |
| | |
Advisor | | | 0.85% | | | | 2.17% | |
Each class of shares is available to certain eligible investors and has different annual fees and expenses, as described in the prospectus.
While an asset allocation plan can be a valuable tool to help reduce overall volatility, all investments involve risks, including possible loss of principal. Because the Fund invests in underlying funds, which may engage in a variety of investment strategies involving certain risks, the Fund is subject to those same risks. In addition, the Fund’s shareholders will indirectly bear the fees and expenses of the underlying funds. The risks described herein are the principal risks of the Fund and the underlying funds. Typically, the more aggressive the investment, or the greater the potential return, the more risk involved. Generally, investors should be comfortable with some fluctuation in the value of their investments, especially over the short term. Stock prices fluctuate, sometimes rapidly and dramatically, due to factors affecting individual companies, particular industries or sectors, or general market conditions. Bond prices generally move in the opposite direction of interest rates. Thus, as prices of bonds in a fund adjust to a rise in interest rates, that fund’s share price may decline. Foreign investing carries additional risks such as currency and market volatility and political or social instability, risks which are heightened in developing countries. Investments in derivatives involve costs and create economic leverage, which may result in significant volatility and cause the funds to participate in losses (as well as gains) that significantly exceed the funds’ initial investment. These risks are described in the Fund’s prospectus. Investors should consult their financial advisor for help selecting the appropriate fund of funds, or fund combination, based on an evaluation of their investment objectives and risk tolerance. The Fund is actively managed but there is no guarantee that the manager’s investment decisions will produce the desired results.
1. The Fund has an expense reduction contractually guaranteed through 9/30/19. Fund investment results reflect the expense reduction; without this reduction, the results would have been lower.
2. Cumulative total return represents the change in value of an investment over the periods indicated.
3. Average annual total return represents the average annual change in value of an investment over the period indicated. Return for less than one year, if any, has not been annualized.
4. Prior to 9/10/18, these shares were offered at a higher initial sales charge of 5.75%, thus actual returns would have differed. Total returns with sales charges have been restated to reflect the current maximum initial sales charge of 5.50%.
5. Effective 6/15/16, the Fund began offering Advisor Class shares, which do not have sales charges or a Rule12b-1 plan. Performance quotations for this class reflect the following methods of calculation: (a) For periods prior to 6/15/16, a restated figure is used based upon the Fund’s Class A performance, excluding the effect of Class A’s maximum initial sales charge, but reflecting the effect of the Class A Rule12b-1 fees; and (b) for periods after 6/15/16, actual Advisor Class performance is used reflecting all charges and fees applicable to that class. Since 6/15/16 (commencement of sales), the cumulative and average annual total returns of Advisor Class shares were +21.33% and +6.75%.
6. Source: Morningstar. The S&P 500 is a market capitalization-weighted index of 500 stocks designed to measure total U.S. equity market performance. The MSCI ACWI ex USA Index is a free float-adjusted, market capitalization-weighted index designed to measure equity market performance in global developed and emerging markets excluding the U.S. The Bloomberg Barclays U.S. Aggregate Bond Index is a market capitalization-weighted index representing the U.S. investment-grade, fixed-rate, taxable bond market with index components for government and corporate, mortgage pass-through and asset-backed securities. All issues included areSEC-registered, taxable, dollar denominated and nonconvertible, must have at least one year to final maturity, and must be rated investment grade(Baa3/BBB-/BBB- or above) using the middle rating of Moody’s, Standard & Poor’s and Fitch, respectively. The Bloomberg Barclays Multiverse ex USD (USD Hedged) Index provides a broad-based measure of the global fixed income bond market. The index represents the union of the Global Aggregate Index and the Global High Yield Index and captures investment-grade and high-yield securities in all eligible currencies.
7. Figures are as stated in the Fund’s current prospectus, including the effect of acquired fund fees and expenses, and may differ from the expense ratios disclosed in the Your Fund’s Expenses and Financial Highlights sections in this report. In periods of market volatility, assets may decline significantly, causing total annual Fund operating expenses to become higher than the figures shown.
See www.franklintempletondatasources.com for additional data provider information.
| | | | |
| | | | | |
| 22 | | Annual Report | | nextstepfunds.com |
FRANKLIN NEXTSTEP GROWTH FUND
Your Fund’s Expenses
As a Fund shareholder, you can incur two types of costs: (1) transaction costs, including sales charges (loads) on Fund purchases and redemptions; and (2) ongoing Fund costs, including management fees, distribution and service(12b-1) fees, and other Fund expenses. All mutual funds have ongoing costs, sometimes referred to as operating expenses. The table below shows ongoing costs of investing in the Fund and can help you understand these costs and compare them with those of other mutual funds. The table assumes a $1,000 investment held for the six months indicated.
Actual Fund Expenses
The table below provides information about actual account values and actual expenses in the columns under the heading “Actual.” In these columns the Fund’s actual return, which includes the effect of Fund expenses, is used to calculate the “Ending Account Value” for each class of shares. You can estimate the expenses you paid during the period by following these steps (of course, your account value and expenses will differ from those in this illustration): Divide your account value by $1,000 (if your account had an $8,600 value, then $8,600÷ $1,000 = 8.6). Then multiply the result by the number in the row for your class of shares under the headings “Actual” and “Expenses Paid During Period” (if Actual Expenses Paid During Period were $7.50, then 8.6 x $7.50 = $64.50). In this illustration, the actual expenses paid this period are $64.50.
Hypothetical Example for Comparison with Other Funds
Under the heading “Hypothetical” in the table, information is provided about hypothetical account values and hypothetical expenses based on the Fund’s actual expense ratio and an assumed rate of return of 5% per year before expenses, which is not the Fund’s actual return. This information may not be used to estimate the actual ending account balance or expenses you paid for the period, but it can help you compare ongoing costs of investing in the Fund with those of other funds. To do so, compare this 5% hypothetical example for the class of shares you hold with the 5% hypothetical examples that appear in the shareholder reports of other funds.
Please note that expenses shown in the table are meant to highlight ongoing costs and do not reflect any transactional costs. Therefore, information under the heading “Hypothetical” is useful in comparing ongoing costs only, and will not help you compare total costs of owning different funds. In addition, if transactional costs were included, your total costs would have been higher.
| | | | | | | | | | | | | | | | | | |
| | | | | | | Actual (actual return after expenses) | | | | Hypothetical (5% annual return before expenses) | | | | |
Share Class | | Beginning
Account Value 12/1/18 | | | | Ending Account Value 5/31/19 | | Expenses Paid During
Period 12/1/18–5/31/191, 2 | | | | Ending Account Value 5/31/19 | | Expenses Paid During
Period 12/1/18–5/31/191, 2 | | | | Net Annualized
Expense Ratio2 |
A | | $1,000 | | | | $1,015.20 | | $3.01 | | | | $1,021.94 | | $3.02 | | | | 0.60% |
C | | $1,000 | | | | $1,011.20 | | $6.77 | | | | $1,018.20 | | $6.79 | | | | 1.35% |
Advisor | | $1,000 | | | | $1,016.80 | | $1.76 | | | | $1,023.19 | | $1.77 | | | | 0.35% |
1. Expenses are equal to the annualized expense ratio for thesix-month period as indicated above—in the far right column—multiplied by the simple average account value over the period indicated, and then multiplied by 182/365 to reflect theone-half year period.
2. Reflects expenses after fee waivers and expense reimbursements. Does not include acquired fund fees and expenses.
| | | | |
| | | | | |
| nextstepfunds.com | | Annual Report | | 23 |
FRANKLIN FUND ALLOCATOR SERIES
Financial Highlights
Franklin NextStep Conservative Fund
| | | | | | | | | | | | | | | | |
| | | Year Ended May 31, | |
| | | 2019 | | | 2018 | | | 2017 | | | 2016a | |
| | | | | |
Class A | | | | | | | | | | | | | | | | |
| | | | |
Per share operating performance (for a share outstanding throughout the year) | | | | | | | | | | | | | | | | |
| | | | |
Net asset value, beginning of year | | | $10.80 | | | | $10.80 | | | | $10.42 | | | | $10.00 | |
| | | | |
Income from investment operationsb: | | | | | | | | | | | | | | | | |
| | | | |
Net investment incomec,d | | | 0.29 | | | | 0.18 | | | | 0.13 | | | | 0.03 | |
| | | | |
Net realized and unrealized gains (losses) | | | 0.08 | | | | 0.10 | | | | 0.37 | | | | 0.40 | |
| | | | |
Total from investment operations | | | 0.37 | | | | 0.28 | | | | 0.50 | | | | 0.43 | |
| | | | |
Less distributions from: | | | | | | | | | | | | | | | | |
| | | | |
Net investment income | | | (0.28 | ) | | | (0.18 | ) | | | (0.09 | ) | | | (0.01 | ) |
| | | | |
Net realized gains | | | (0.12 | ) | | | (0.10 | ) | | | (0.03 | ) | | | — | |
| | | | |
Total distributions | | | (0.40 | ) | | | (0.28 | ) | | | (0.12 | ) | | | (0.01 | ) |
| | | | |
Net asset value, end of year | | | $10.77 | | | | $10.80 | | | | $10.80 | | | | $10.42 | |
| | | | |
Total returne | | | 3.59% | | | | 2.46% | | | | 4.87% | | | | 4.26% | |
| | | | |
Ratios to average net assetsf | | | | | | | | | | | | | | | | |
| | | | |
Expenses before waiver and payments by affiliatesg | | | 4.03% | | | | 3.58% | | | | 6.40% | | | | 23.36% | |
| | | | |
Expenses net of waiver and payments by affiliatesg | | | 0.60% | | | | 0.60% | | | | 0.60% | | | | 0.60% | |
| | | | |
Net investment incomed | | | 2.70% | | | | 1.67% | | | | 1.24% | | | | 0.84% | |
| | | | |
Supplemental data | | | | | | | | | | | | | | | | |
| | | | |
Net assets, end of year (000’s) | | | $1,526 | | | | $837 | | | | $1,010 | | | | $549 | |
| | | | |
Portfolio turnover rate | | | 47.98% | | | | 40.15% | | | | 103.41% | | | | 23.45% | |
aFor the period February 5, 2016 (commencement of operations) to May 31, 2016.
bThe amount shown for a share outstanding throughout the period may not correlate with the Statement of Operations for the period due to the timing of sales and repurchases of the Fund’s shares in relation to income earned and/or fluctuating fair value of the investments of the Fund.
cBased on average daily shares outstanding.
dRecognition of net investment income by the Fund is affected by the timing of declaration of dividends by the Underlying Funds and exchange traded funds in which the Fund invests.
eTotal return does not reflect sales commissions or contingent deferred sales charges, if applicable, and is not annualized for periods less than one year.
fRatios are annualized for periods less than one year, except fornon-recurring expenses, if any.
gDoes not include expenses of the Underlying Funds and exchange traded funds in which the Fund invests. The weighted average indirect expenses of the Underlying Funds and exchange traded funds was 0.37% for the year ended May 31, 2019.
| | | | |
| | | | | |
| 24 | | Annual Report | The accompanying notes are an integral part of these financial statements. | | nextstepfunds.com |
FRANKLIN FUND ALLOCATOR SERIES
FINANCIAL HIGHLIGHTS
Franklin NextStep Conservative Fund(continued)
| | | | | | | | | | | | | | | | |
| | | Year Ended May 31, | |
| | | 2019 | | | 2018 | | | 2017 | | | 2016a | |
| | | | | |
Class C | | | | | | | | | | | | | | | | |
| | | | |
Per share operating performance (for a share outstanding throughout the year) | | | | | | | | | | | | | | | | |
| | | | |
Net asset value, beginning of year | | | $10.73 | | | | $10.73 | | | | $10.39 | | | | $10.00 | |
| | | | |
Income from investment operationsb: | | | | | | | | | | | | | | | | |
| | | | |
Net investment incomec,d | | | 0.21 | | | | 0.10 | | | | 0.05 | | | | — | e |
| | | | |
Net realized and unrealized gains (losses) | | | 0.08 | | | | 0.08 | | | | 0.37 | | | | 0.40 | |
| | | | |
Total from investment operations | | | 0.29 | | | | 0.18 | | | | 0.42 | | | | 0.40 | |
| | | | |
Less distributions from: | | | | | | | | | | | | | | | | |
| | | | |
Net investment income | | | (0.19 | ) | | | (0.08 | ) | | | (0.05 | ) | | | (0.01 | ) |
| | | | |
Net realized gains | | | (0.12 | ) | | | (0.10 | ) | | | (0.03 | ) | | | — | |
| | | | |
Total distributions | | | (0.31 | ) | | | (0.18 | ) | | | (0.08 | ) | | | (0.01 | ) |
| | | | |
Net asset value, end of year | | | $10.71 | | | | $10.73 | | | | $10.73 | | | | $10.39 | |
| | | | |
Total returnf | | | 2.89% | | | | 1.67% | | | | 4.07% | | | | 3.96% | |
| | | | |
Ratios to average net assetsg | | | | | | | | | | | | | | | | |
| | | | |
Expenses before waiver and payments by affiliatesh | | | 4.78% | | | | 4.33% | | | | 7.15% | | | | 24.11% | |
| | | | |
Expenses net of waiver and payments by affiliatesh | | | 1.35% | | | | 1.35% | | | | 1.35% | | | | 1.35% | |
| | | | |
Net investment incomed | | | 1.95% | | | | 0.92% | | | | 0.49% | | | | 0.09% | |
| | | | |
Supplemental data | | | | | | | | | | | | | | | | |
| | | | |
Net assets, end of year (000’s) | | | $1,930 | | | | $2,131 | | | | $2,452 | | | | $373 | |
| | | | |
Portfolio turnover rate | | | 47.98% | | | | 40.15% | | | | 103.41% | | | | 23.45% | |
aFor the period February 5, 2016 (commencement of operations) to May 31, 2016.
bThe amount shown for a share outstanding throughout the period may not correlate with the Statement of Operations for the period due to the timing of sales and repurchases of the Fund’s shares in relation to income earned and/or fluctuating fair value of the investments of the Fund.
cBased on average daily shares outstanding.
dRecognition of net investment income by the Fund is affected by the timing of declaration of dividends by the Underlying Funds and exchange traded funds in which the Fund invests.
eAmount rounds to less than $0.01 per share.
fTotal return does not reflect sales commissions or contingent deferred sales charges, if applicable, and is not annualized for periods less than one year.
gRatios are annualized for periods less than one year, except fornon-recurring expenses, if any.
hDoes not include expenses of the Underlying Funds and exchange traded funds in which the Fund invests. The weighted average indirect expenses of the Underlying Funds and exchange traded funds was 0.37% for the year ended May 31, 2019.
| | | | |
| | | | | |
| nextstepfunds.com | | The accompanying notes are an integral part of these financial statements. | Annual Report | | 25 |
FRANKLIN FUND ALLOCATOR SERIES
FINANCIAL HIGHLIGHTS
Franklin NextStep Conservative Fund(continued)
| | | | | | | | | | | | |
| | | Year Ended May 31, | |
| | | 2019 | | | 2018 | | | 2017a | |
| | | | |
Advisor Class | | | | | | | | | | | | |
| | | |
Per share operating performance (for a share outstanding throughout the year) | | | | | | | | | | | | |
| | | |
Net asset value, beginning of year | | | $10.80 | | | | $10.82 | | | | $10.43 | |
| | | |
Income from investment operationsb: | | | | | | | | | | | | |
| | | |
Net investment incomec,d | | | 0.32 | | | | 0.21 | | | | 0.15 | |
| | | |
Net realized and unrealized gains (losses) | | | 0.07 | | | | 0.09 | | | | 0.37 | |
| | | |
Total from investment operations | | | 0.39 | | | | 0.30 | | | | 0.52 | |
| | | |
Less distributions from: | | | | | | | | | | | | |
| | | |
Net investment income | | | (0.30 | ) | | | (0.22 | ) | | | (0.10 | ) |
| | | |
Net realized gains | | | (0.12 | ) | | | (0.10 | ) | | | (0.03 | ) |
| | | |
Total distributions | | | (0.42 | ) | | | (0.32 | ) | | | (0.13 | ) |
| | | |
Net asset value, end of year | | | $10.77 | | | | $10.80 | | | | $10.82 | |
| | | |
Total returne | | | 3.85% | | | | 2.82% | | | | 4.94% | |
| | | |
Ratios to average net assetsf | | | | | | | | | | | | |
| | | |
Expenses before waiver and payments by affiliatesg | | | 3.78% | | | | 3.33% | | | | 6.15% | |
| | | |
Expenses net of waiver and payments by affiliatesg | | | 0.35% | | | | 0.35% | | | | 0.35% | |
| | | |
Net investment incomed | | | 2.95% | | | | 1.92% | | | | 1.49% | |
| | | |
Supplemental data | | | | | | | | | | | | |
| | | |
Net assets, end of year (000’s) | | | $224 | | | | $195 | | | | $5 | |
| | | |
Portfolio turnover rate | | | 47.98% | | | | 40.15% | | | | 103.41% | |
aFor the period June 15, 2016 (effective date) to May 31, 2017.
bThe amount shown for a share outstanding throughout the period may not correlate with the Statement of Operations for the period due to the timing of sales and repurchases of the Fund’s shares in relation to income earned and/or fluctuating fair value of the investments of the Fund.
cBased on average daily shares outstanding.
dRecognition of net investment income by the Fund is affected by the timing of declaration of dividends by the Underlying Funds and exchange traded funds in which the Fund invests.
eTotal return is not annualized for periods less than one year.
fRatios are annualized for periods less than one year, except fornon-recurring expenses, if any.
gDoes not include expenses of the Underlying Funds and exchange traded funds in which the Fund invests. The weighted average indirect expenses of the Underlying Funds and exchange traded funds was 0.37% for the year ended May 31, 2019.
| | | | |
| | | | | |
| 26 | | Annual Report | The accompanying notes are an integral part of these financial statements. | | nextstepfunds.com |
FRANKLIN FUND ALLOCATOR SERIES
Statement of Investments, May 31, 2019
Franklin NextStep Conservative Fund
| | | | | | | | |
| | | Shares | | | Value | |
| | |
Investments in Underlying Funds and Exchange Traded Funds 97.1% | | | | | | | | |
| | |
Domestic Equity 15.1% | | | | | | | | |
| | |
aFranklin Growth Fund, Class R6 | | | 1,366 | | | $ | 139,253 | |
| | |
iShares Core S&P 500 ETF | | | 895 | | | | 248,184 | |
| | |
iShares S&P 500 Value ETF | | | 1,015 | | | | 110,128 | |
| | |
Pioneer Fundamental Growth Fund, Class K | | | 2,429 | | | | 58,080 | |
| | | | | | | | |
| | |
| | | | | | | 555,645 | |
| | | | | | | | |
| | |
Domestic Fixed Income 64.6% | | | | | | | | |
| | |
Delaware Corporate Bond Fund, Class I | | | 55,135 | | | | 320,887 | |
| | |
aFranklin Low Duration Total Return Fund, Class R6 | | | 47,465 | | | | 462,304 | |
| | |
aFranklin Strategic Income Fund, Class R6 | | | 43,115 | | | | 413,471 | |
| | |
iShares7-10 Year Treasury Bond ETF | | | 3,295 | | | | 358,858 | |
| | |
iShares Core U.S. Aggregate Bond ETF | | | 3,671 | | | | 405,278 | |
| | |
Prudential Core Bond Fund, Class Q | | | 41,719 | | | | 416,776 | |
| | | | | | | | |
| | |
| | | | | | | 2,377,574 | |
| | | | | | | | |
| | |
Foreign Equity 7.6% | | | | | | | | |
| | |
Columbia Contrarian Europe Fund, Class Z | | | 6,356 | | | | 41,437 | |
| | |
aFranklin Mutual European Fund, Class R6 | | | 2,478 | | | | 47,207 | |
| | |
Goldman Sachs Emerging Markets Equity Insights Fund | | | 6,826 | | | | 61,432 | |
| | |
Hennessy Japan Fund, Class I | | | 627 | | | | 22,195 | |
| | |
iShares Core MSCI Emerging Markets ETF | | | 967 | | | | 47,499 | |
| | |
iShares Core MSCI Europe ETF | | | 1,025 | | | | 46,094 | |
| | |
iShares MSCI Japan ETF | | | 282 | | | | 14,867 | |
| | | | | | | | |
| | |
| | | | | | | 280,731 | |
| | | | | | | | |
| | |
Foreign Fixed Income 9.8% | | | | | | | | |
| | |
aTempleton Global Total Return Fund, Class R6 | | | 31,109 | | | | 359,001 | |
| | | | | | | | |
| | |
Total Investments in Underlying Funds and Exchange Traded Funds before Short Term Investments (Cost $3,453,134) | | | | | | | 3,572,951 | |
| | | | | | | | |
| | |
Short Term Investments 3.2% | | | | | | | | |
| | |
Money Market Funds (Cost $109,360) 3.0% | | | | | | | | |
| | |
a,bInstitutional Fiduciary Trust Money Market Portfolio, 2.08% | | | 109,360 | | | | 109,360 | |
| | | | | | | | |
| | | | |
| | | | | |
| nextstepfunds.com | | Annual Report | | 27 |
FRANKLIN FUND ALLOCATOR SERIES
STATEMENT OF INVESTMENTS
Franklin NextStep Conservative Fund(continued)
| | | | | | | | |
| | | Principal
Amount | | | Value | |
| | |
Short Term Investments (continued) | | | | | | | | |
Repurchase Agreements (Cost $8,949) 0.2% | | | | | | | | |
cJoint Repurchase Agreement, 2.48%, 6/03/19 (Maturity Value $8,951) | | | | | | | | |
BNP Paribas Securities Corp. (Maturity Value $7,741) | | | | | | | | |
Deutsche Bank Securities Inc. (Maturity Value $952) | | | | | | | | |
HSBC Securities (USA) Inc. (Maturity Value $258) | | | | | | | | |
Collateralized by U.S. Government Agency Securities, 4.50%, 1/20/40; and U.S. Treasury Notes, 2.00% - 3.125%, 5/15/21 - 7/31/22 (valued at $9,131) | | | $8,949 | | | $ | 8,949 | |
| | | | | | | | |
| | |
Total Investments (Cost $3,571,443) 100.3% | | | | | | | 3,691,260 | |
Other Assets, less Liabilities (0.3)% | | | | | | | (10,043 | ) |
| | | | | | | | |
| | |
Net Assets 100.0% | | | | | | $ | 3,681,217 | |
| | | | | | | | |
See Abbreviations on page 53.
aSee Note 3(f) regarding investments in FT Underlying Funds.
bThe rate shown is the annualizedseven-day effective yield at period end.
cSee Note 1(b) regarding repurchase agreement.
| | | | |
| | | | | |
| 28 | | Annual Report | The accompanying notes are an integral part of these financial statements. | | nextstepfunds.com |
FRANKLIN FUND ALLOCATOR SERIES
Financial Highlights
Franklin NextStep Moderate Fund
| | | | | | | | | | | | | | | | |
| | | Year Ended May 31, | |
| | | 2019 | | | 2018 | | | 2017 | | | 2016a | |
| | | | |
Class A | | | | | | | | | | | | | | | | |
| | | | |
Per share operating performance (for a share outstanding throughout the year) | | | | | | | | | | | | | | | | |
| | | | |
Net asset value, beginning of year | | | $11.98 | | | | $11.53 | | | | $10.80 | | | | $10.00 | |
| | | | |
| | | | |
Income from investment operationsb: | | | | | | | | | | | | | | | | |
| | | | |
Net investment incomec,d | | | 0.23 | | | | 0.15 | | | | 0.11 | | | | 0.01 | |
| | | | |
Net realized and unrealized gains (losses) | | | (0.18 | ) | | | 0.72 | | | | 0.75 | | | | 0.79 | |
| | | | |
| | | | |
Total from investment operations | | | 0.05 | | | | 0.87 | | | | 0.86 | | | | 0.80 | |
| | | | |
| | | | |
Less distributions from: | | | | | | | | | | | | | | | | |
| | | | |
Net investment income | | | (0.24 | ) | | | (0.12 | ) | | | (0.10 | ) | | | (—) | e |
| | | | |
Net realized gains | | | (0.30 | ) | | | (0.30 | ) | | | (0.03 | ) | | | — | |
| | | | |
| | | | |
Total distributions | | | (0.54 | ) | | | (0.42 | ) | | | (0.13 | ) | | | (—) | e |
| | | | |
| | | | |
Net asset value, end of year | | | $11.49 | | | | $11.98 | | | | $11.53 | | | | $10.80 | |
| | | | |
| | | | |
Total returnf | | | 0.55% | | | | 7.56% | | | | 7.95% | | | | 8.02% | |
| | | | |
Ratios to average net assetsg | | | | | | | | | | | | | | | | |
| | | | |
Expenses before waiver and payments by affiliatesh | | | 1.43% | | | | 1.30% | | | | 2.39% | | | | 6.08% | |
| | | | |
Expenses net of waiver and payments by affiliatesh | | | 0.60% | | | | 0.60% | | | | 0.60% | | | | 0.60% | |
| | | | |
Net investment incomed | | | 1.99% | | | | 1.29% | | | | 0.94% | | | | 0.34% | |
| | | | |
Supplemental data | | | | | | | | | | | | | | | | |
| | | | |
Net assets, end of year (000’s) | | | $7,026 | | | | $7,132 | | | | $7,259 | | | | $3,280 | |
| | | | |
Portfolio turnover rate | | | 35.85% | | | | 65.66% | | | | 75.56% | | | | 13.45% | |
aFor the period February 5, 2016 (Commencement of operations) to May 31, 2016.
bThe amount shown for a share outstanding throughout the period may not correlate with the Statement of Operations for the period due to the timing of sales and repurchases of the Fund’s shares in relation to income earned and/or fluctuating fair value of the investments of the Fund.
cBased on average daily shares outstanding.
dRecognition of net investment income by the Fund is affected by the timing of declaration of dividends by the Underlying Funds and exchange traded funds in which the Fund invests.
eAmount rounds to less than $0.01 per share.
fTotal return does not reflect sales commissions or contingent deferred sales charges, if applicable, and is not annualized for periods less than one year.
gRatios are annualized for periods less than one year, except fornon-recurring expenses, if any.
hDoes not include expenses of the Underlying Funds and exchange traded funds in which the Fund invests. The weighted average indirect expenses of the Underlying Funds and exchange traded funds was 0.42% for the year ended May 31, 2019.
| | | | |
| | | | | |
| nextstepfunds.com | | The accompanying notes are an integral part of these financial statements. | Annual Report | | 29 |
FRANKLIN FUND ALLOCATOR SERIES
FINANCIAL HIGHLIGHTS
Franklin NextStep Moderate Fund (continued)
| | | | | | | | | | | | | | | | |
| | | Year Ended May 31, | |
| | | 2019 | | | 2018 | | | 2017 | | | 2016a | |
| | | | |
Class C | | | | | | | | | | | | | | | | |
| | | | |
Per share operating performance (for a share outstanding throughout the year) | | | | | | | | | | | | | | | | |
| | | | |
Net asset value, beginning of year | | | $11.86 | | | | $11.46 | | | | $10.78 | | | | $10.00 | |
| | | | |
| | | | |
Income from investment operationsb: | | | | | | | | | | | | | | | | |
| | | | |
Net investment income (loss)c,d | | | 0.15 | | | | 0.06 | | | | 0.02 | | | | (0.02) | |
| | | | |
Net realized and unrealized gains (losses) | | | (0.19 | ) | | | 0.71 | | | | 0.75 | | | | 0.80 | |
| | | | |
| | | | |
Total from investment operations | | | (0.04 | ) | | | 0.77 | | | | 0.77 | | | | 0.78 | |
| | | | |
| | | | |
Less distributions from: | | | | | | | | | | | | | | | | |
| | | | |
Net investment income | | | (0.13 | ) | | | (0.07 | ) | | | (0.06 | ) | | | (—) | e |
| | | | |
Net realized gains | | | (0.30 | ) | | | (0.30 | ) | | | (0.03 | ) | | | — | |
| | | | |
| | | | |
Total distributions | | | (0.43 | ) | | | (0.37 | ) | | | (0.09 | ) | | | (—) | e |
| | | | |
| | | | |
Net asset value, end of year | | | $11.39 | | | | $11.86 | | | | $11.46 | | | | $10.78 | |
| | | | |
| | | | |
Total returnf | | | (0.11)% | | | | 6.70% | | | | 7.14% | | | | 7.82% | |
| | | | |
Ratios to average net assetsg | | | | | | | | | | | | | | | | |
| | | | |
Expenses before waiver and payments by affiliatesh | | | 2.16% | | | | 2.05% | | | | 3.14% | | | | 6.83% | |
| | | | |
Expenses net of waiver and payments by affiliatesh | | | 1.33% | | | | 1.35% | | | | 1.35% | | | | 1.35% | |
| | | | |
Net investment income (loss)d | | | 1.26% | | | | 0.54% | | | | 0.19% | | | | (0.41)% | |
| | | | |
Supplemental data | | | | | | | | | | | | | | | | |
| | | | |
Net assets, end of year (000’s) | | | $5,395 | | | | $6,969 | | | | $7,017 | | | | $1,369 | |
| | | | |
Portfolio turnover rate | | | 35.85% | | | | 65.66% | | | | 75.56% | | | | 13.45% | |
aFor the period February 5, 2016 (commencement of operations) to May 31, 2016.
bThe amount shown for a share outstanding throughout the period may not correlate with the Statement of Operations for the period due to the timing of sales and repurchases of the Fund’s shares in relation to income earned and/or fluctuating fair value of the investments of the Fund.
cBased on average daily shares outstanding.
dRecognition of net investment income by the Fund is affected by the timing of declaration of dividends by the Underlying Funds and exchange traded funds in which the Fund invests.
eAmount rounds to less than $0.01 per share.
fTotal return does not reflect sales commissions or contingent deferred sales charges, if applicable, and is not annualized for periods less than one year.
gRatios are annualized for periods less than one year, except fornon-recurring expenses, if any.
hDoes not include expenses of the Underlying Funds and exchange traded funds in which the Fund invests. The weighted average indirect expenses of the Underlying Funds and exchange traded funds was 0.42% for the year ended May 31, 2019.
| | | | |
| | | | | |
| 30 | | Annual Report | The accompanying notes are an integral part of these financial statements. | | nextstepfunds.com |
FRANKLIN FUND ALLOCATOR SERIES
FINANCIAL HIGHLIGHTS
Franklin NextStep Moderate Fund (continued)
| | | | | | | | | | | | |
| | | Year Ended May 31, | |
| | | 2019 | | | 2018 | | | 2017a | |
| | | |
Advisor Class | | | | | | | | | | | | |
| | | |
Per share operating performance (for a share outstanding throughout the year) | | | | | | | | | | | | |
| | | |
Net asset value, beginning of year | | | $12.01 | | | | $11.55 | | | | $10.71 | |
| | | | |
| | | |
Income from investment operationsb: | | | | | | | | | | | | |
| | | |
Net investment incomec,d | | | 0.27 | | | | 0.19 | | | | 0.12 | |
| | | |
Net realized and unrealized gains (losses) | | | (0.19 | ) | | | 0.71 | | | | 0.86 | |
| | | | |
| | | |
Total from investment operations | | | 0.08 | | | | 0.90 | | | | 0.98 | |
| | | | |
| | | |
Less distributions from: | | | | | | | | | | | | |
| | | |
Net investment income | | | (0.27 | ) | | | (0.14 | ) | | | (0.11) | |
| | | |
Net realized gains | | | (0.30 | ) | | | (0.30 | ) | | | (0.03) | |
| | | | |
| | | |
Total distributions | | | (0.57 | ) | | | (0.44 | ) | | | (0.14) | |
| | | | |
| | | |
Net asset value, end of year | | | $11.52 | | | | $12.01 | | | | $11.55 | |
| | | | |
| | | |
Total returne | | | 0.86% | | | | 7.79% | | | | 9.21% | |
| | | |
Ratios to average net assetsf | | | | | | | | | | | | |
| | | |
Expenses before waiver and payments by affiliatesg | | | 1.18% | | | | 1.05% | | | | 2.14% | |
| | | |
Expenses net of waiver and payments by affiliatesg | | | 0.35% | | | | 0.35% | | | | 0.35% | |
| | | |
Net investment incomed | | | 2.24% | | | | 1.54% | | | | 1.19% | |
| | | |
Supplemental data | | | | | | | | | | | | |
| | | |
Net assets, end of year (000’s) | | | $93 | | | | $216 | | | | $116 | |
| | | |
Portfolio turnover rate | | | 35.85% | | | | 65.66% | | | | 75.56% | |
aFor the period June 15, 2016 (effective date) to May 31, 2017.
bThe amount shown for a share outstanding throughout the period may not correlate with the Statement of Operations for the period due to the timing of sales and repurchases of the Fund’s shares in relation to income earned and/or fluctuating fair value of the investments of the Fund.
cBased on average daily shares outstanding.
dRecognition of net investment income by the Fund is affected by the timing of declaration of dividends by the Underlying Funds and exchange traded funds in which the Fund invests.
eTotal return is not annualized for periods less than one year.
fRatios are annualized for periods less than one year, except fornon-recurring expenses, if any.
gDoes not include expenses of the Underlying Funds and exchange traded funds in which the Fund invests. The weighted average indirect expenses of the Underlying Funds and exchange traded funds was 0.42% for the year ended May 31, 2019.
| | | | |
| | | | | |
| nextstepfunds.com | | The accompanying notes are an integral part of these financial statements. | Annual Report | | 31 |
FRANKLIN FUND ALLOCATOR SERIES
Statement of Investments, May 31, 2019
Franklin NextStep Moderate Fund
| | | | | | | | |
| | | Shares | | | Value | |
| | |
Investments in Underlying Funds and Exchange Traded Funds 98.6% | | | | | | | | |
| | |
Alternative Strategies 3.0% | | | | | | | | |
| | |
| a,bFranklin K2 Alternative Strategies Fund, Class R6 | | | 11,114 | | | $ | 126,032 | |
| | |
| bFranklin Pelagos Commodities Strategy Fund, Class R6 | | | 46,097 | | | | 249,383 | |
| | | | | | | | |
| | |
| | | | | | | 375,415 | |
| | | | | | | | |
Domestic Equity 37.4% | | | | | | | | |
| | |
| bFranklin Growth Fund, Class R6 | | | 11,525 | | | | 1,175,115 | |
| | |
iShares Core S&P 500 ETF | | | 7,585 | | | | 2,103,320 | |
| | |
iShares S&P 500 Value ETF | | | 8,582 | | | | 931,147 | |
| | |
Pioneer Fundamental Growth Fund, Class K | | | 19,879 | | | | 475,307 | |
| | | | | | | | |
| | |
| | | | | | | 4,684,889 | |
| | | | | | | | |
Domestic Fixed Income 33.2% | | | | | | | | |
| | |
Delaware Corporate Bond Fund, Class I | | | 96,859 | | | | 563,717 | |
| | |
| bFranklin Low Duration Total Return Fund, Class R6 | | | 82,952 | | | | 807,950 | |
| | |
| bFranklin Strategic Income Fund, Class R6 | | | 75,350 | | | | 722,612 | |
| | |
iShares7-10 Year Treasury Bond ETF | | | 5,760 | | | | 627,322 | |
| | |
iShares Core U.S. Aggregate Bond ETF | | | 6,348 | | | | 700,819 | |
| | |
Prudential Core Bond Fund, Class Q | | | 73,288 | | | | 732,152 | |
| | | | | | | | |
| | |
| | | | | | | 4,154,572 | |
| | | | | | | | |
Foreign Equity 20.2% | | | | | | | | |
| | |
Columbia Contrarian Europe Fund, Class Z | | | 65,839 | | | | 429,270 | |
| | |
| bFranklin Mutual European Fund, Class R6 | | | 22,447 | | | | 427,616 | |
| | |
Goldman Sachs Emerging Markets Equity Insights Fund | | | 64,469 | | | | 580,225 | |
| | |
Hennessy Japan Fund, Class I | | | 5,819 | | | | 205,873 | |
| | |
iShares Core MSCI Emerging Markets ETF | | | 7,811 | | | | 383,676 | |
| | |
iShares Core MSCI Europe ETF | | | 8,085 | | | | 363,583 | |
| | |
iShares MSCI Japan ETF | | | 2,552 | | | | 134,541 | |
| | | | | | | | |
| | |
| | | | | | | 2,524,784 | |
| | | | | | | | |
Foreign Fixed Income 4.8% | | | | | | | | |
| | |
| bTempleton Global Total Return Fund, Class R6 | | | 52,383 | | | | 604,494 | |
| | | | | | | | |
| | |
Total Investments in Underlying Funds and Exchange Traded Funds
before Short Term Investments (Cost $11,707,745) | | | | | | | 12,344,154 | |
| | | | | | | | |
| | |
Short Term Investments 1.5% | | | | | | | | |
| | |
Money Market Funds (Cost $172,573) 1.4% | | | | | | | | |
| b,cInstitutional Fiduciary Trust Money Market Portfolio, 2.08% | | | 172,573 | | | | 172,573 | |
| | | | | | | | |
| | | | |
| | | | | |
| 32 | | Annual Report | | nextstepfunds.com |
FRANKLIN FUND ALLOCATOR SERIES
STATEMENT OF INVESTMENTS
Franklin NextStep Moderate Fund (continued)
| | | | | | | | |
| | | Principal
Amount | | | Value | |
| | |
Short Term Investments(continued) | | | | | | | | |
| | |
Repurchase Agreements (Cost $14,592) 0.1% | | | | | | | | |
| | |
| dJoint Repurchase Agreement, 2.48%, 6/03/19 (Maturity Value $14,595) | | | | | | | | |
| | |
BNP Paribas Securities Corp. (Maturity Value $12,622) | | | | | | | | |
| | |
Deutsche Bank Securities Inc. (Maturity Value $1,552) | | | | | | | | |
| | |
HSBC Securities (USA) Inc. (Maturity Value $421) | | | | | | | | |
| | |
Collateralized by U.S. Government Agency Securities, 4.50%, 1/20/40; and U.S. Treasury Notes, 2.00% - 3.125%, 5/15/21 - 7/31/22 (valued at $14,889) | | | $14,592 | | | $ | 14,592 | |
| | | | | | | | |
| | |
Total Investments (Cost $11,894,910) 100.1% | | | | | | | 12,531,319 | |
| | |
Other Assets, less Liabilities (0.1)% | | | | | | | (16,793 | ) |
| | | | | | | | |
| | |
Net Assets 100.0% | | | | | | $ | 12,514,526 | |
| | | | | | | | |
See Abbreviations on page 53.
aNon-income producing.
bSee Note 3(f) regarding investments in FT Underlying Funds.
cThe rate shown is the annualizedseven-day effective yield at period end.
dSee Note 1(b) regarding joint repurchase agreement.
| | | | |
| | | | | |
| nextstepfunds.com | | The accompanying notes are an integral part of these financial statements. | Annual Report | | 33 |
FRANKLIN FUND ALLOCATOR SERIES
Financial Highlights
Franklin NextStep Growth Fund
| | | | | | | | | | | | | | | | |
| | | Year Ended May 31, | |
| | | 2019 | | | 2018 | | | 2017 | | | 2016a | |
| | | | | |
Class A | | | | | | | | | | | | | | | | |
| | | | |
Per share operating performance (for a share outstanding throughout the year) | | | | | | | | | | | | | | | | |
| | | | |
Net asset value, beginning of year | | | $12.39 | | | | $11.72 | | | | $10.88 | | | | $10.00 | |
| | | | |
Income from investment operationsb: | | | | | | | | | | | | | | | | |
| | | | |
Net investment incomec,d | | | 0.20 | | | | 0.14 | | | | 0.09 | | | | — | e |
| | | | |
Net realized and unrealized gains (losses) | | | (0.26 | ) | | | 1.00 | | | | 0.85 | | | | 0.88 | |
| | | | |
Total from investment operations | | | (0.06 | ) | | | 1.14 | | | | 0.94 | | | | 0.88 | |
| | | | |
Less distributions from: | | | | | | | | | | | | | | | | |
| | | | |
Net investment income | | | (0.16 | ) | | | (0.12 | ) | | | (0.08 | ) | | | (— | )e |
| | | | |
Net realized gains | | | (0.24 | ) | | | (0.35 | ) | | | (0.02 | ) | | | — | |
| | | | |
Total distributions | | | (0.40 | ) | | | (0.47 | ) | | | (0.10 | ) | | | (— | )e |
| | | | |
Net asset value, end of year | | | $11.93 | | | | $12.39 | | | | $11.72 | | | | $10.88 | |
| | | | |
Total returnf | | | (0.26)% | | | | 9.73% | | | | 8.72% | | | | 8.81% | |
| | | | |
Ratios to average net assetsg | | | | | | | | | | | | | | | | |
| | | | |
Expenses before waiver and payments by affiliatesh | | | 2.17% | | | | 1.99% | | | | 4.93% | | | | 17.15% | |
| | | | |
Expenses net of waiver and payments by affiliatesh | | | 0.60% | | | | 0.60% | | | | 0.60% | | | | 0.60% | |
| | | | |
Net investment incomed | | | 1.67% | | | | 1.10% | | | | 0.79% | | | | 0.07% | |
| | | | |
Supplemental data | | | | | | | | | | | | | | | | |
| | | | |
Net assets, end of year (000’s) | | | $3,939 | | | | $4,337 | | | | $4,065 | | | | $1,129 | |
| | | | |
Portfolio turnover rate | | | 36.43% | | | | 75.06% | | | | 87.45% | | | | 24.56% | |
aFor the period February 5, 2016 (commencement of operations) to May 31, 2016.
bThe amount shown for a share outstanding throughout the period may not correlate with the Statement of Operations for the period due to the timing of sales and repurchases of the Fund’s shares in relation to income earned and/or fluctuating fair value of the investments of the Fund.
cBased on average daily shares outstanding.
dRecognition of net investment income by the Fund is affected by the timing of declaration of dividends by the Underlying Funds and exchange traded funds in which the Fund invests.
eAmount rounds to less than $0.01 per share.
fTotal return does not reflect sales commissions or contingent deferred sales charges, if applicable, and is not annualized for periods less than one year.
gRatios are annualized for periods less than one year, except fornon-recurring expenses, if any.
hDoes not include expenses of the Underlying Funds and exchange traded funds in which the Fund invests. The weighted average indirect expenses of the Underlying Funds and exchange traded funds was 0.43% for the year ended May 31, 2019.
| | | | |
| | | | | |
| 34 | | Annual Report | The accompanying notes are an integral part of these financial statements. | | nextstepfunds.com |
FRANKLIN FUND ALLOCATOR SERIES
FINANCIAL HIGHLIGHTS
Franklin NextStep Growth Fund(continued)
| | | | | | | | | | | | | | | | |
| | | Year Ended May 31, | |
| | | | |
| | | 2019 | | | 2018 | | | 2017 | | | 2016a | |
| | | | | |
Class C | | | | | | | | | | | | | | | | |
| | | | |
Per share operating performance (for a share outstanding throughout the year) | | | | | | | | | | | | | | | | |
| | | | |
Net asset value, beginning of year | | | $12.27 | | | | $11.65 | | | | $10.86 | | | | $10.00 | |
| | | | |
Income from investment operationsb: | | | | | | | | | | | | | | | | |
| | | | |
Net investment income (loss)c,d | | | 0.11 | | | | 0.04 | | | | 0.01 | | | | (0.02 | ) |
| | | | |
Net realized and unrealized gains (losses) | | | (0.26 | ) | | | 1.00 | | | | 0.85 | | | | 0.88 | |
| | | | |
Total from investment operations | | | (0.15 | ) | | | 1.04 | | | | 0.86 | | | | 0.86 | |
| | | | |
Less distributions from: | | | | | | | | | | | | | | | | |
| | | | |
Net investment income | | | (0.11 | ) | | | (0.07 | ) | | | (0.05 | ) | | | (— | )e |
| | | | |
Net realized gains | | | (0.24 | ) | | | (0.35 | ) | | | (0.02 | ) | | | — | |
| | | | |
Total distributions | | | (0.35 | ) | | | (0.42 | ) | | | (0.07 | ) | | | (— | )e |
| | | | |
Net asset value, end of year | | | $11.77 | | | | $12.27 | | | | $11.65 | | | | $10.86 | |
| | | | |
Total returnf | | | (1.05)% | | | | 8.99% | | | | 7.89% | | | | 8.61% | |
| | | | |
Ratios to average net assetsg | | | | | | | | | | | | | | | | |
| | | | |
Expenses before waiver and payments by affiliatesh | | | 2.92% | | | | 2.74% | | | | 5.68% | | | | 17.90% | |
| | | | |
Expenses net of waiver and payments by affiliatesh | | | 1.35% | | | | 1.35% | | | | 1.35% | | | | 1.35% | |
| | | | |
Net investment income (loss)d | | | 0.92% | | | | 0.35% | | | | 0.04% | | | | (0.68)% | |
| | | | |
Supplemental data | | | | | | | | | | | | | | | | |
| | | | |
Net assets, end of year (000’s) | | | $3,220 | | | | $3,504 | | | | $2,665 | | | | $661 | |
| | | | |
Portfolio turnover rate | | | 36.43% | | | | 75.06% | | | | 87.45% | | | | 24.56% | |
aFor the period February 5, 2016 (commencement of operations) to May 31, 2016.
bThe amount shown for a share outstanding throughout the period may not correlate with the Statement of Operations for the period due to the timing of sales and repurchases of the Fund’s shares in relation to income earned and/or fluctuating fair value of the investments of the Fund.
cBased on average daily shares outstanding.
dRecognition of net investment income by the Fund is affected by the timing of declaration of dividends by the Underlying Funds and exchange traded funds in which the Fund invests.
eAmount rounds to less than $0.01 per share.
fTotal return does not reflect sales commissions or contingent deferred sales charges, if applicable, and is not annualized for periods less than one year.
gRatios are annualized for periods less than one year, except fornon-recurring expenses, if any.
hDoes not include expenses of the Underlying Funds and exchange traded funds in which the Fund invests. The weighted average indirect expenses of the Underlying Funds and exchange traded funds was 0.43% for the year ended May 31, 2019.
| | | | |
| | | | | |
| nextstepfunds.com | | The accompanying notes are an integral part of these financial statements. | Annual Report | | 35 |
FRANKLIN FUND ALLOCATOR SERIES
FINANCIAL HIGHLIGHTS
Franklin NextStep Growth Fund(continued)
| | | | | | | | | | | | |
| | | Year Ended May 31, | |
| | | |
| | | 2019 | | | 2018 | | | 2017a | |
| | | |
Advisor Class | | | | | | | | | | | | |
| | | |
Per share operating performance (for a share outstanding throughout the year) | | | | | | | | | | | | |
| | | |
Net asset value, beginning of year | | | $12.42 | | | | $11.74 | | | | $10.75 | |
| | | |
Income from investment operationsb: | | | | | | | | | | | | |
| | | |
Net investment incomec,d | | | 0.22 | | | | 0.17 | | | | 0.12 | |
| | | |
Net realized and unrealized gains (losses) | | | (0.24 | ) | | | 1.00 | | | | 0.99 | |
| | | |
Total from investment operations | | | (0.02 | ) | | | 1.17 | | | | 1.11 | |
| | | |
Less distributions from: | | | | | | | | | | | | |
| | | |
Net investment income | | | (0.18 | ) | | | (0.14 | ) | | | (0.10 | ) |
| | | |
Net realized gains | | | (0.24 | ) | | | (0.35 | ) | | | (0.02 | ) |
| | | |
Total distributions | | | (0.42 | ) | | | (0.49 | ) | | | (0.12 | ) |
| | | |
Net asset value, end of year | | | $11.98 | | | | $12.42 | | | | $11.74 | |
| | | |
Total returne | | | (0.02)% | | | | 10.07% | | | | 10.25% | |
| | | |
Ratios to average net assetsf | | | | | | | | | | | | |
| | | |
Expenses before waiver and payments by affiliatesg | | | 1.92% | | | | 1.74% | | | | 4.68% | |
| | | |
Expenses net of waiver and payments by affiliatesg | | | 0.35% | | | | 0.35% | | | | 0.35% | |
| | | |
Net investment incomed | | | 1.92% | | | | 1.35% | | | | 1.04% | |
| | | |
Supplemental data | | | | | | | | | | | | |
| | | |
Net assets, end of year (000’s) | | | $6 | | | | $6 | | | | $5 | |
| | | |
Portfolio turnover rate | | | 36.43% | | | | 75.06% | | | | 87.45% | |
aFor the period June 15, 2016 (effective date) to May 31, 2017.
bThe amount shown for a share outstanding throughout the period may not correlate with the Statement of Operations for the period due to the timing of sales and repurchases of the Fund’s shares in relation to income earned and/or fluctuating fair value of the investments of the Fund.
cBased on average daily shares outstanding.
dRecognition of net investment income by the Fund is affected by the timing of declaration of dividends by the Underlying Funds and exchange traded funds in which the Fund invests.
eTotal return is not annualized for periods less than one year.
fRatios are annualized for periods less than one year, except fornon-recurring expenses, if any.
gDoes not include expenses of the Underlying Funds and exchange traded funds in which the Fund invests. The weighted average indirect expenses of the Underlying Funds and exchange traded funds was 0.43% for the year ended May 31, 2019.
| | | | |
| | | | | |
| 36 | | Annual Report | The accompanying notes are an integral part of these financial statements. | | nextstepfunds.com |
FRANKLIN FUND ALLOCATOR SERIES
Statement of Investments, May 31, 2019
Franklin NextStep Growth Fund
| | | | | | | | |
| | | Shares | | | Value | |
Investments in Underlying Funds and Exchange Traded Funds 98.8% | | | | | | | | |
Alternative Strategies 3.0% | | | | | | | | |
a,b Franklin K2 Alternative Strategies Fund, Class R6 | | | 6,396 | | | $ | 72,531 | |
| bFranklin Pelagos Commodities Strategy Fund, Class R6 | | | 26,530 | | | | 143,526 | |
| | | | | | | | |
| | |
| | | | | | | 216,057 | |
| | | | | | | | |
Domestic Equity 48.6% | | | | | | | | |
| bFranklin Growth Fund, Class R6 | | | 8,570 | | | | 873,845 | |
iShares Core S&P 500 ETF | | | 5,645 | | | | 1,565,358 | |
iShares S&P 500 Value ETF | | | 6,381 | | | | 692,339 | |
Pioneer Fundamental Growth Fund, Class K | | | 14,705 | | | | 351,600 | |
| | | | | | | | |
| | |
| | | | | | | 3,483,142 | |
| | | | | | | | |
Domestic Fixed Income 20.2% | | | | | | | | |
Delaware Corporate Bond Fund, Class I | | | 33,572 | | | | 195,391 | |
| bFranklin Low Duration Total Return Fund, Class R6 | | | 28,902 | | | | 281,501 | |
| bFranklin Strategic Income Fund, Class R6 | | | 26,253 | | | | 251,765 | |
iShares7-10 Year Treasury Bond ETF | | | 2,005 | | | | 218,365 | |
iShares Core U.S. Aggregate Bond ETF | | | 2,236 | | | | 246,854 | |
Prudential Core Bond Fund, Class Q | | | 25,403 | | | | 253,780 | |
| | | | | | | | |
| | |
| | | | | | | 1,447,656 | |
| | | | | | | | |
Foreign Equity 24.3% | | | | | | | | |
Columbia Contrarian Europe Fund, Class Z | | | 44,620 | | | | 290,922 | |
| bFranklin Mutual European Fund, Class R6 | | | 15,291 | | | | 291,300 | |
Goldman Sachs Emerging Markets Equity Insights Fund | | | 44,784 | | | | 403,058 | |
Hennessy Japan Fund, Class I | | | 3,952 | | | | 139,804 | |
iShares Core MSCI Emerging Markets ETF | | | 5,493 | | | | 269,816 | |
iShares Core MSCI Europe ETF | | | 5,545 | | | | 249,359 | |
iShares MSCI Japan ETF | | | 1,754 | | | | 92,471 | |
| | | | | | | | |
| | |
| | | | | | | 1,736,730 | |
| | | | | | | | |
Foreign Fixed Income 2.7% | | | | | | | | |
| bTempleton Global Total Return Fund, Class R6 | | | 16,956 | | | | 195,668 | |
| | | | | | | | |
| | |
Total Investments in Underlying Funds and Exchange Traded Funds before Short Term Investments (Cost $6,676,452) | | | | | | | 7,079,253 | |
| | | | | | | | |
| | | | | | | | | |
Short Term Investments 1.4% | | | | | | | | |
| | |
Money Market Funds (Cost $86,317) 1.2% | | | | | | | | |
b,cInstitutional Fiduciary Trust Money Market Portfolio, 2.08% | | | 86,317 | | | | 86,317 | |
| | | | | | | | |
| | | | |
| | | | | |
| nextstepfunds.com | | Annual Report | | 37 |
FRANKLIN FUND ALLOCATOR SERIES
STATEMENT OF INVESTMENTS
Franklin NextStep Growth Fund(continued)
| | | | | | | | |
| | | Principal
Amount | | | Value | |
| | |
Short Term Investments(continued) | | | | | | | | |
Repurchase Agreements (Cost $12,521) 0.2% | | | | | | | | |
| | | | | | | |
dJoint Repurchase Agreement, 2.48%, 6/03/19 (Maturity Value $12,524) | | | | | | | | |
BNP Paribas Securities Corp. (Maturity Value $10,831) | | | | | | | | |
Deutsche Bank Securities Inc. (Maturity Value $1,332) | | | | | | | | |
HSBC Securities (USA) Inc. (Maturity Value $361) | | | | | | | | |
Collateralized by U.S. Government Agency Securities, 4.50%, 1/20/40; and U.S. Treasury Notes, 2.00% - 3.125%, 5/15/21 - 7/31/22 (valued at $12,776) | | $ | 12,521 | | | $ | 12,521 | |
| | | | | | | | |
Total Investments (Cost $6,775,290) 100.2% | | | | | | | 7,178,091 | |
Other Assets, less Liabilities (0.2)% | | | | | | | (13,786 | ) |
| | | | | | | | |
| | |
Net Assets 100.0% | | | | | | $ | 7,164,305 | |
| | | | | | | | |
See Abbreviations on page 53.
aNon-income producing.
bSee Note 3(f) regarding investments in FT Underlying Funds.
cThe rate shown is the annualizedseven-day effective yield at period end.
dSee Note 1(b) regarding joint repurchase agreement.
| | | | |
| | | | | |
| 38 | | Annual Report | The accompanying notes are an integral part of these financial statements. | | nextstepfunds.com |
FRANKLIN FUND ALLOCATOR SERIES
FINANCIAL STATEMENTS
Statements of Assets and Liabilities
May 31, 2019
| | | | | | | | | | | | |
| | | Franklin
NextStep
Conservative
Fund | | | Franklin
NextStep
Moderate
Fund | | | Franklin
NextStep
Growth
Fund | |
Assets: | | | | | | | | | | | | |
Investments in securities: | | | | | | | | | | | | |
Cost - Unaffiliated issuers | | | $2,064,003 | | | $ | 7,773,934 | | | $ | 4,681,806 | |
Cost -Non-controlled affiliates (Note 3f) | | | 1,498,491 | | | | 4,106,384 | | | | 2,080,963 | |
Cost - Unaffiliated repurchase agreements | | | 8,949 | | | | 14,592 | | | | 12,521 | |
| | | |
Value - Unaffiliated issuers | | | $2,151,715 | | | $ | 8,230,952 | | | $ | 4,969,117 | |
Value -Non-controlled affiliates (Note 3f) | | | 1,530,596 | | | | 4,285,775 | | | | 2,196,453 | |
Value - Unaffiliated repurchase agreements | | | 8,949 | | | | 14,592 | | | | 12,521 | |
Receivables: | | | | | | | | | | | | |
Capital shares sold | | | 521 | | | | 573 | | | | — | |
Dividends | | | 1,185 | | | | 2,093 | | | | 738 | |
Affiliates | | | 23,868 | | | | 21,768 | | | | 23,305 | |
Other assets | | | 3 | | | | 10 | | | | 5 | |
| | | |
Total assets | | | 3,716,837 | | | | 12,555,763 | | | | 7,202,139 | |
Liabilities: | | | | | | | | | | | | |
Payables: | | | | | | | | | | | | |
Investment securities purchased | | | 1,185 | | | | 2,093 | | | | 738 | |
Capital shares redeemed | | | — | | | | — | | | | 500 | |
Distribution fees | | | 1,971 | | | | 6,259 | | | | 3,665 | |
Transfer agent fees | | | 342 | | | | 1,704 | | | | 884 | |
Custodian fees | | | 5,001 | | | | 5,000 | | | | 5,000 | |
Professional fees | | | 24,395 | | | | 23,495 | | | | 24,142 | |
Accrued expenses and other liabilities | | | 2,726 | | | | 2,686 | | | | 2,905 | |
| | | |
Total liabilities | | | 35,620 | | | | 41,237 | | | | 37,834 | |
| | | |
Net assets, at value | | | $3,681,217 | | | $ | 12,514,526 | | | $ | 7,164,305 | |
Net assets consist of: | | | | | | | | | | | | |
Paid-in capital | | | $3,576,563 | | | $ | 11,745,722 | | | $ | 6,683,791 | |
Total distributable earnings (loss) | | | 104,654 | | | | 768,804 | | | | 480,514 | |
| | | |
Net assets, at value | | | $3,681,217 | | | $ | 12,514,526 | | | $ | 7,164,305 | |
Class A: | | | | | | | | | | | | |
Net assets, at value | | | $1,526,476 | | | $ | 7,026,114 | | | $ | 3,938,976 | |
Shares outstanding | | | 141,726 | | | | 611,665 | | | | 330,253 | |
Net asset value per sharea | | | $10.77 | | | | $11.49 | | | | $11.93 | |
Maximum offering price per share (net asset value per share ÷ 94.50%) | | | $11.40 | | | | $12.16 | | | | $12.62 | |
Class C: | | | | | | | | | | | | |
Net assets, at value | | | $1,930,259 | | | $ | 5,395,405 | | | $ | 3,219,760 | |
Shares outstanding | | | 180,243 | | | | 473,703 | | | | 273,632 | |
Net asset value and maximum offering price per sharea | | | $10.71 | | | | $11.39 | | | | $11.77 | |
Advisor Class: | | | | | | | | | | | | |
Net assets, at value | | | $ 224,482 | | | $ | 93,007 | | | $ | 5,569 | |
Shares outstanding | | | 20,843 | | | | 8,076 | | | | 465 | |
Net asset value and maximum offering price per share | | | $10.77 | | | | $11.52 | | | | $11.98 | |
aRedemption price is equal to net asset value less contingent deferred sales charges, if applicable.
| | | | |
| | | | | |
| nextstepfunds.com | | The accompanying notes are an integral part of these financial statements. | Annual Report | | 39 |
FRANKLIN FUND ALLOCATOR SERIES
FINANCIAL STATEMENTS
Statements of Operations
for the year ended May 31, 2019
| | | | | | | | | | | | |
| | | Franklin | | | Franklin | | | Franklin | |
| | | NextStep | | | NextStep | | | NextStep | |
| | | Conservative | | | Moderate | | | Growth | |
| | | Fund | | | Fund | | | Fund | |
Investment income: | | | | | | | | | | | | |
Dividends: | | | | | | | | | | | | |
Unaffiliated issuers | | $ | 52,915 | | | $ | 195,511 | | | $ | 104,751 | |
Non-controlled affiliates (Note 3f) | | | 59,580 | | | | 154,750 | | | | 63,699 | |
Interest: | | | | | | | | | | | | |
Unaffiliated issuers | | | 127 | | | | 377 | | | | 218 | |
| | | | |
| | | |
Total investment income | | | 112,622 | | | | 350,638 | | | | 168,668 | |
| | | | |
| | | |
Expenses: | | | | | | | | | | | | |
Management fees (Note 3a) | | | 8,530 | | | | 33,810 | | | | 18,598 | |
Distribution fees: (Note 3c) | | | | | | | | | | | | |
Class A | | | 2,892 | | | | 17,768 | | | | 10,116 | |
Class C | | | 20,386 | | | | 61,422 | | | | 33,846 | |
Transfer agent fees: (Note 3e) | | | | | | | | | | | | |
Class A | | | 915 | | | | 5,335 | | | | 3,620 | |
Class C | | | 1,616 | | | | 4,709 | | | | 3,027 | |
Advisor Class | | | 172 | | | | 104 | | | | 5 | |
Custodian fees (Note 4) | | | 13,995 | | | | 12,895 | | | | 12,739 | |
Reports to shareholders | | | 8,047 | | | | 5,684 | | | | 8,596 | |
Registration and filing fees | | | 46,982 | | | | 48,871 | | | | 47,711 | |
Professional fees | | | 39,631 | | | | 38,763 | | | | 38,941 | |
Other | | | 9,236 | | | | 9,038 | | | | 9,283 | |
| | | | |
| | | |
Total expenses | | | 152,402 | | | | 238,399 | | | | 186,482 | |
Expenses waived/paid by affiliates (Note 3g) | | | (117,161 | ) | | | (111,886 | ) | | | (116,481 | ) |
| | | | |
| | | |
Net expenses | | | 35,241 | | | | 126,513 | | | | 70,001 | |
| | | | |
| | | |
Net investment income | | | 77,381 | | | | 224,125 | | | | 98,667 | |
| | | | |
Realized and unrealized gains (losses): | | | | | | | | | | | | |
Net realized gain (loss) from: | | | | | | | | | | | | |
Sale of investments: | | | | | | | | | | | | |
Unaffiliated issuers | | | (5,040 | ) | | | 154,535 | | | | 72,617 | |
Non-controlled affiliates (Note 3f) | | | (2,623 | ) | | | (10,465 | ) | | | (5,674 | ) |
Capital gain distributions from Underlying Funds: | | | | | | | | | | | | |
Unaffiliated issuers | | | 3,510 | | | | 32,422 | | | | 22,208 | |
Non-controlled affiliates (Note 3f) | | | 1,498 | | | | 16,393 | | | | 10,717 | |
| | | | |
Net realized gain (loss) | | | (2,655 | ) | | | 192,885 | | | | 99,868 | |
| | | | |
Net change in unrealized appreciation (depreciation) on: | | | | | | | | | | | | |
Investments: | | | | | | | | | | | | |
Unaffiliated issuers | | | 37,998 | | | | (334,494 | ) | | | (203,026 | ) |
Non-controlled affiliates (Note 3f) | | | (2,437 | ) | | | (76,297 | ) | | | (32,330 | ) |
| | | | |
Net change in unrealized appreciation (depreciation) | | | 35,561 | | | | (410,791 | ) | | | (235,356 | ) |
| | | | |
Net realized and unrealized gain (loss) | | | 32,906 | | | | (217,906 | ) | | | (135,488 | ) |
| | | | |
Net increase (decrease) in net assets resulting from operations | | $ | 110,287 | | | $ | 6,219 | | | $ | (36,821 | ) |
| | | | |
| | | | |
| | | | | |
| 40 | | Annual Report | The accompanying notes are an integral part of these financial statements. | | nextstepfunds.com |
FRANKLIN FUND ALLOCATOR SERIES
FINANCIAL STATEMENTS
Statements of Changes in Net Assets
| | | | | | | | | | | | | | | | |
| | | Franklin NextStep | | | Franklin NextStep | |
| | | Conservative Fund | | | Moderate Fund | |
| | | Year Ended May 31, | | | Year Ended May 31, | |
| | | 2019 | | | 2018 | | | 2019 | | | 2018 | |
Increase (decrease) in net assets: | | | | | | | | | | | | | | | | |
Operations: | | | | | | | | | | | | | | | | |
Net investment income | | $ | 77,381 | | | $ | 38,572 | | | | $ 224,125 | | | $ | 139,703 | |
Net realized gain (loss) | | | (2,655 | ) | | | 92,567 | | | | 192,885 | | | | 708,063 | |
Net change in unrealized appreciation (depreciation) | | | 35,561 | | | | (54,091 | ) | | | (410,791 | ) | | | 226,737 | |
| | | | |
| | | | |
Net increase (decrease) in net assets resulting from operations | | | 110,287 | | | | 77,048 | | | | 6,219 | | | | 1,074,503 | |
| | | | |
| | | | |
Distributions to shareholders: (Note 1d) | | | | | | | | | | | | | | | | |
Class A | | | (43,548 | ) | | | (22,280 | ) | | | (320,033 | ) | | | (267,143 | ) |
Class C | | | (59,233 | ) | | | (40,150 | ) | | | (220,610 | ) | | | (234,737 | ) |
Advisor Class | | | (8,761 | ) | | | (3,124 | ) | | | (6,424 | ) | | | (7,841 | ) |
| | | | |
| | | | |
Total distributions to shareholders | | | (111,542 | ) | | | (65,554 | ) | | | (547,067 | ) | | | (509,721 | ) |
| | | | |
| | | | |
Capital share transactions: (Note 2) | | | | | | | | | | | | | | | | |
Class A | | | 687,630 | | | | (176,570 | ) | | | 182,790 | | | | (422,975 | ) |
Class C | | | (197,873 | ) | | | (333,179 | ) | | | (1,330,125 | ) | | | (313,125 | ) |
Advisor Class | | | 30,156 | | | | 193,249 | | | | (114,475 | ) | | | 95,486 | |
| | | | |
| | | | |
Total capital share transactions | | | 519,913 | | | | (316,500 | ) | | | (1,261,810 | ) | | | (640,614 | ) |
| | | | |
| | | | |
Net increase (decrease) in net assets | | | 518,658 | | | | (305,006 | ) | | | (1,802,658 | ) | | | (75,832 | ) |
Net assets: | | | | | | | | | | | | | | | | |
Beginning of year | | | 3,162,559 | | | | 3,467,565 | | | | 14,317,184 | | | | 14,393,016 | |
| | | | |
| | | | |
End of year (Note 1d) | | | $3,681,217 | | | $ | 3,162,559 | | | | $12,514,526 | | | $ | 14,317,184 | |
| | | | |
| | | | |
| | | | | |
| nextstepfunds.com | | The accompanying notes are an integral part of these financial statements. | Annual Report | | 41 |
FRANKLIN FUND ALLOCATOR SERIES
FINANCIAL STATEMENTS
Statements of Changes in Net Assets(continued)
| | | | | | | | |
| | | Franklin NextStep
Growth Fund | |
| |
| | | Year Ended May 31, | |
| | |
| | | 2019 | | | 2018 | |
| | |
Increase (decrease) in net assets: | | | | | | | | |
| | |
Operations: | | | | | | | | |
Net investment income | | $ | 98,667 | | | $ | 58,862 | |
Net realized gain (loss) | | | 99,868 | | | | 351,001 | |
Net change in unrealized appreciation (depreciation) | | | (235,356 | ) | | | 230,066 | |
| | | | |
| | |
Net increase (decrease) in net assets resulting from operations | | | (36,821 | ) | | | 639,929 | |
| | | | |
| | |
Distributions to shareholders: (Note 1d) | | | | | | | | |
Class A | | | (131,106 | ) | | | (165,468 | ) |
Class C | | | (96,241 | ) | | | (100,870 | ) |
Advisor Class | | | (195 | ) | | | (227 | ) |
| | | | |
Total distributions to shareholders | | | (227,542 | ) | | | (266,565 | ) |
| | | | |
| | |
Capital share transactions: (Note 2) | | | | | | | | |
Class A | | | (264,264 | ) | | | 35,494 | |
Class C | | | (154,141 | ) | | | 703,819 | |
Advisor Class | | | (260 | ) | | | — | |
| | | | |
| | |
Total capital share transactions | | | (418,665 | ) | | | 739,313 | |
| | | | |
| | |
Net increase (decrease) in net assets | | | (683,028 | ) | | | 1,112,677 | |
| | |
Net assets: | | | | | | | | |
| | |
Beginning of year | | | 7,847,333 | | | | 6,734,656 | |
| | | | |
| | |
End of year (Note 1d) | | | $7,164,305 | | | | $ 7,847,333 | |
| | | | |
| | | | |
| | | | | |
| 42 | | Annual Report | The accompanying notes are an integral part of these financial statements. | | nextstepfunds.com |
FRANKLIN FUND ALLOCATOR SERIES
Notes to Financial Statements
1. Organization and Significant Accounting Policies
Franklin Fund Allocator Series (Trust) is registered under the Investment Company Act of 1940 (1940 Act) as anopen-end management investment company, consisting oftwenty-two separate funds, three of which are included in this report (Funds) and applies the specialized accounting and reporting guidance in U.S. Generally Accepted Accounting Principles (U.S. GAAP). The Funds invest primarily in mutual funds (Underlying Funds) and exchange traded funds (ETFs), including affiliated funds managed by Franklin Templeton (FT Underlying Funds). The Funds offer three classes of shares: Class A, Class C, and Advisor Class. Beginning on October 19, 2018, Class C shares automatically convert to Class A shares after they have been held for 10 years. Each class of shares may differ by its initial sales load, contingent deferred sales charges, voting rights on matters affecting a single class, its exchange privilege and fees due to differing arrangements for distribution and transfer agent fees.
The accounting policies of the Underlying Funds are outlined in their respective shareholder reports. A copy of the Underlying Funds’ shareholder reports, in which each fund invests, is available on the U.S. Securities and Exchange Commission (SEC) website at sec.gov. The Underlying Funds’ shareholder reports are not covered by this report.
The following summarizes the Funds’ significant accounting policies.
a. Financial Instrument Valuation
The Funds’ investments in financial instruments are carried at fair value daily. Fair value is the price that would be received to sell an asset or paid to transfer a liability in an orderly transaction between market participants on the measurement date. The Funds calculate the net asset value (NAV) per share each business day as of 4 p.m. Eastern time or the regularly scheduled close of the New York Stock Exchange (NYSE), whichever is earlier. Under compliance policies and procedures approved by the Trust’s Board of Trustees (the Board), the Funds’ administrator has responsibility for oversight of valuation, including leading the cross-functional Valuation Committee (VC). The Funds may utilize independent pricing services, quotations from securities and financial instrument dealers, and other market sources to determine fair value.
Investments in the Underlying Funds are valued at their closing NAV each trading day. ETFs listed on an exchange or on the NASDAQ National Market System are valued at the last quoted sale price or the official closing price of the day, respectively.
Investments in repurchase agreements are valued at cost, which approximates fair value.
The Funds have procedures to determine the fair value of financial instruments for which market prices are not reliable or readily available. Under these procedures, the Funds primarily employ a market-based approach which may use related or comparable assets or liabilities, recent transactions, market multiples, book values, and other relevant information for the investment to determine the fair value of the investment. An income-based valuation approach may also be used in which the anticipated future cash flows of the investment are discounted to calculate fair value. Discounts may also be applied due to the nature or duration of any restrictions on the disposition of the investments. Due to the inherent uncertainty of valuations of such investments, the fair values may differ significantly from the values that would have been used had an active market existed.
b. Joint Repurchase Agreement
Certain or all Funds enter into a joint repurchase agreement whereby their uninvested cash balance is deposited into a joint cash account with other funds managed by the investment manager or an affiliate of the investment manager and is used to invest in one or more repurchase agreements. The value and face amount of the joint repurchase agreement are allocated to the funds based on theirpro-rata interest. A repurchase agreement is accounted for as a loan by the Fund to the seller, collateralized by securities which are delivered to the Funds’ custodian. The fair value, including accrued interest, of the initial collateralization is required to be at least 102% of the dollar amount invested by the funds, with the value of the underlying securities marked to market daily to maintain coverage of at least 100%. Repurchase agreements are subject to the terms of Master Repurchase Agreements (MRAs) with approved counterparties (sellers). The MRAs contain various provisions, including but not limited to events of default and maintenance of collateral for repurchase agreements. In the event of default by either the seller or the Funds, certain MRAs may permit thenon-defaulting party to net andclose-out all transactions, if any, traded under such agreements. The Funds may sell
| | | | |
| | | | | |
| nextstepfunds.com | | Annual Report | | 43 |
FRANKLIN FUND ALLOCATOR SERIES
NOTES TO FINANCIAL STATEMENTS
1. Organization and Significant Accounting Policies(continued)
b. Joint Repurchase Agreement(continued)
securities it holds as collateral and apply the proceeds towards the repurchase price and any other amounts owed by the seller to the Funds in the event of default by the seller. This could involve costs or delays in addition to a loss on the securities if their value falls below the repurchase price owed by the seller. The joint repurchase agreement held by the Funds at year end, as indicated in the Statements of Investments, had been entered into on May 31, 2019.
c. Income Taxes
It is each Fund’s policy to qualify as a regulated investment company under the Internal Revenue Code. Each Fund intends to distribute to shareholders substantially all of its taxable income and net realized gains to relieve it from federal income and excise taxes. As a result, no provision for U.S. federal income taxes is required.
Each Fund may recognize an income tax liability related to its uncertain tax positions under U.S. GAAP when the uncertain tax position has a less than 50% probability that it will be sustained upon examination by the tax authorities based on its technical merits. As of May 31, 2019, each Fund has determined that no tax liability is required in its financial statements related to uncertain tax positions for any open tax years (or expected to be taken in future tax years). Open tax years are those that remain subject to examination and are based on the statute of limitations in each jurisdiction in which the Fund invests.
d. Security Transactions, Investment Income, Expenses and Distributions
Security transactions are accounted for on trade date. Realized gains and losses on security transactions are determined on a specific identification basis. Interest income and estimated expenses are accrued daily. Dividend income and realized gain distributions by Underlying Funds and ETFs are recorded on theex-dividend date. Distributions to shareholders are recorded on theex-dividend date. Distributable earnings are determined according to income tax regulations (tax basis) and may differ from earnings recorded in accordance with U.S. GAAP. These differences may be permanent or temporary. Permanent differences are
reclassified among capital accounts to reflect their tax character. These reclassifications have no impact on net assets or the results of operations. Temporary differences are not reclassified, as they may reverse in subsequent periods.*
Common expenses incurred by the Trust are allocated among the Funds based on the ratio of net assets of each Fund to the combined net assets of the Trust or based on the ratio of number of shareholders of each Fund to the combined number of shareholders of the Trust. Fund specific expenses are charged directly to the Fund that incurred the expense.
The Funds indirectly bear their proportionate share of expenses from the Underlying Funds and ETFs. Since the Underlying Funds and ETFs have varied expense levels and the Funds may own different proportions of the Underlying Funds and ETFs at different times, the amount of expenses incurred indirectly by the Funds will vary.
Realized and unrealized gains and losses and net investment income, excluding class specific expenses, are allocated daily to each class of shares based upon the relative proportion of net assets of each class. Differences in per share distributions by class are generally due to differences in class specific expenses.
e. Accounting Estimates
The preparation of financial statements in accordance with U.S. GAAP requires management to make estimates and assumptions that affect the reported amounts of assets and liabilities at the date of the financial statements and the amounts of income and expenses during the reporting period. Actual results could differ from those estimates.
f. Guarantees and Indemnifications
Under the Trust’s organizational documents, its officers and trustees are indemnified by the Trust against certain liabilities arising out of the performance of their duties to the Trust. Additionally, in the normal course of business, the Trust, on behalf of the Funds, enters into contracts with service providers that contain general indemnification clauses. The Trust’s maximum exposure under these arrangements is unknown as this would involve future claims that may be made against the Trust that have not yet occurred. Currently, the Trust expects the risk of loss to be remote.
| | | | |
| | | | | |
| 44 | | Annual Report | | nextstepfunds.com |
FRANKLIN FUND ALLOCATOR SERIES
NOTES TO FINANCIAL STATEMENTS
*Effective during the current reporting period, it is no longer required to present certain line items in the Statements of Changes in Net Assets. The below prior period amounts affected by this change are shown as they were in the prior year Statements of Changes in Net Assets.
For the year ended May 31, 2018, distributions to shareholders were as follows:
| | | | | | | | | | | | | | | | | | | | |
| | | Franklin
NextStep
Conservative
Fund | | | | | | Franklin
NextStep
Moderate
Fund | | | | | | Franklin
NextStep
Growth
Fund | |
| | | | | |
Distributions from net investment income: | | | | | | | | | | | | | | | | | | | | |
Class A | | | $(15,102 | ) | | | | | | | $ (75,800 | ) | | | | | | | $ (42,890 | ) |
Class C | | | (18,649 | ) | | | | | | | (42,302 | ) | | | | | | | (16,860 | ) |
Advisor Class | | | (1,585 | ) | | | | | | | (2,148 | ) | | | | | | | (66 | ) |
Distributions from net realized gains: | | | | | | | | | | | | | | | | | | | | |
Class A | | | (7,178 | ) | | | | | | | (191,343 | ) | | | | | | | (122,578 | ) |
Class C | | | (21,501 | ) | | | | | | | (192,435 | ) | | | | | | | (84,010 | ) |
Advisor Class | | | (1,539 | ) | | | | | | | (5,693 | ) | | | | | | | (161 | ) |
For the year ended May 31, 2018, undistributed net investment income included in net assets were as follows:
| | | | |
| Fund | | Undistributed net
investment income | |
| |
Franklin NextStep Conservative Fund | | | $10,893 | |
Franklin NextStep Moderate Fund | | | $22,160 | |
Franklin NextStep Growth Fund | | | $ — | |
2. Shares of Beneficial Interest
At May 31, 2019, there were an unlimited number of shares authorized (without par value). Transactions in the Funds’ shares were as follows:
| | | | | | | | | | | | | | | | | | | | |
| | | Franklin NextStep
Conservative Fund | | | | | | Franklin NextStep
Moderate Fund | |
| | | | | |
| | | Shares | | | Amount | | | | | | Shares | | | Amount | |
| | | | | |
Class A Shares: | | | | | | | | | | | | | | | | | | | | |
Year ended May 31, 2019 | | | | | | | | | | | | | | | | | | | | |
Shares solda | | | 84,273 | | | | $ 903,913 | | | | | | | | 76,691 | | | $ | 906,080 | |
Shares issued in reinvestment of distributions | | | 4,176 | | | | 43,548 | | | | | | | | 29,271 | | | | 320,033 | |
Shares redeemed | | | (24,223 | ) | | | (259,831 | ) | | | | | | | (89,621 | ) | | | (1,043,323 | ) |
| | | | | |
Net increase (decrease) | | | 64,226 | | | | $ 687,630 | | | | | | | | 16,341 | | | $ | 182,790 | |
| | | | | |
Year ended May 31, 2018 | | | | | | | | | | | | | | | | | | | | |
Shares sold | | | 10,875 | | | | $ 118,019 | | | | | | | | 63,151 | | | $ | 750,145 | |
Shares issued in reinvestment of distributions | | | 2,046 | | | | 22,280 | | | | | | | | 22,276 | | | | 267,143 | |
Shares redeemed | | | (28,910 | ) | | | (316,869 | ) | | | | | | | (119,568 | ) | | | (1,440,263 | ) |
| | | | | |
Net increase (decrease) | | | (15,989 | ) | | | $(176,570 | ) | | | | | | | (34,141 | ) | | $ | (422,975 | ) |
| | | | |
| | | | | |
| nextstepfunds.com | | Annual Report | | 45 |
FRANKLIN FUND ALLOCATOR SERIES
NOTES TO FINANCIAL STATEMENTS
2. Shares of Beneficial Interest(continued)
| | | | | | | | | | | | | | | | | | | | |
| | | Franklin NextStep
Conservative Fund | | | | | | Franklin NextStep
Moderate Fund | |
| | | | | |
| | | Shares | | | Amount | | | | | | Shares | | | Amount | |
| | | | | |
Class C Shares: | | | | | | | | | | | | | | | | | | | | |
Year ended May 31, 2019 | | | | | | | | | | | | | | | | | | | | |
Shares sold | | | 9,662 | | | $ | 102,367 | | | | | | | | 44,278 | | | $ | 516,264 | |
Shares issued in reinvestment of distributions | | | 5,711 | | | | 59,233 | | | | | | | | 20,543 | | | | 220,610 | |
Shares redeemeda | | | (33,626 | ) | | | (359,473 | ) | | | | | | | (178,605 | ) | | | (2,066,999 | ) |
| | | | | |
Net increase (decrease) | | | (18,253 | ) | | $ | (197,873 | ) | | | | | | | (113,784 | ) | | $ | (1,330,125 | ) |
| | | | | |
Year ended May 31, 2018 | | | | | | | | | | | | | | | | | | | | |
Shares sold | | | 30,167 | | | $ | 328,898 | | | | | | | | 74,701 | | | $ | 887,582 | |
Shares issued in reinvestment of distributions | | | 3,698 | | | | 40,150 | | | | | | | | 19,714 | | | | 234,737 | |
Shares redeemed | | | (63,991 | ) | | | (702,227 | ) | | | | | | | (119,351 | ) | | | (1,435,444 | ) |
| | | | | |
Net increase (decrease) | | | (30,126 | ) | | $ | (333,179 | ) | | | | | | | (24,936 | ) | | $ | (313,125 | ) |
| | | | | |
Advisor Class Shares: | | | | | | | | | | | | | | | | | | | | |
Year ended May 31, 2019 | | | | | | | | | | | | | | | | | | | | |
Shares sold | | | 5,007 | | | $ | 54,000 | | | | | | | | 585 | | | $ | 6,900 | |
Shares issued in reinvestment of distributions | | | 820 | | | | 8,557 | | | | | | | | 581 | | | | 6,424 | |
Shares redeemed | | | (3,021 | ) | | | (32,401 | ) | | | | | | | (11,058 | ) | | | (127,799 | ) |
| | | | | |
Net increase (decrease) | | | 2,806 | | | $ | 30,156 | | | | | | | | (9,892 | ) | | $ | (114,475 | ) |
| | | | | |
Year ended May 31, 2018 | | | | | | | | | | | | | | | | | | | | |
Shares sold | | | 18,156 | | | $ | 199,719 | | | | | | | | 10,847 | | | $ | 131,212 | |
Shares issued in reinvestment of distributions | | | 274 | | | | 2,974 | | | | | | | | 653 | | | | 7,841 | |
Shares redeemed | | | (872 | ) | | | (9,444 | ) | | | | | | | (3,608 | ) | | | (43,567 | ) |
| | | | | |
Net increase (decrease) | | | 17,558 | | | $ | 193,249 | | | | | | | | 7,892 | | | $ | 95,486 | |
aMay include a portion of Class C shares that were automatically converted to Class A.
| | | | | | | | | | | | |
| | | Franklin NextStep
Growth Fundb | |
| | | |
| | | Shares | | | | | | Amount | |
Class A Shares: | | | | | | | | | | | | |
Year ended May 31, 2019 | | | | | | | | | | | | |
Shares solda | | | 36,778 | | | | | | | $ | 439,754 | |
Shares issued in reinvestment of distributions | | | 11,713 | | | | | | | | 130,838 | |
Shares redeemed | | | (68,264 | ) | | | | | | | (834,856 | ) |
| | | |
Net increase (decrease) | | | (19,773 | ) | | | | | | $ | (264,264 | ) |
| | | |
Year ended May 31, 2018 | | | | | | | | | | | | |
Shares sold | | | 32,000 | | | | | | | $ | 395,596 | |
Shares issued in reinvestment of distributions | | | 13,387 | | | | | | | | 165,468 | |
Shares redeemed | | | (42,044 | ) | | | | | | | (525,570 | ) |
| | | |
Net increase (decrease) | | | 3,343 | | | | | | | $ | 35,494 | |
| | | | |
| | | | | |
| 46 | | Annual Report | | nextstepfunds.com |
FRANKLIN FUND ALLOCATOR SERIES
NOTES TO FINANCIAL STATEMENTS
| | | | | | | | |
| | | Franklin NextStep Growth Fundb | |
| | | Shares | | | Amount | |
| | |
Class C Shares: | | | | | | | | |
Year ended May 31, 2019 | | | | | | | | |
Shares sold | | | 16,915 | | | $ | 203,462 | |
Shares issued in reinvestment of distributions | | | 8,775 | | | | 96,241 | |
Shares redeemeda | | | (37,757 | ) | | | (453,844) | |
| | | | |
| | |
Net increase (decrease) | | | (12,067 | ) | | $ | (154,141) | |
| | | | |
Year ended May 31, 2018 | | | | | | | | |
Shares sold | | | 122,620 | | | $ | 1,509,045 | |
Shares issued in reinvestment of distributions | | | 8,214 | | | | 100,870 | |
Shares redeemed | | | (73,905 | ) | | | (906,096) | |
| | | | |
| | |
Net increase (decrease) | | | 56,929 | | | $ | 703,819 | |
| | | | |
| | |
Advisor Class Shares: | | | | | | | | |
Year ended May 31, 2019 | | | | | | | | |
Shares sold | | | 6,377 | | | $ | 75,319 | |
Shares redeemed | | | (6,377 | ) | | | (75,579) | |
| | | | |
| | |
Net increase (decrease) | | | — | | | $ | (260) | |
| | | | |
aMay include a portion of Class C shares that were automatically converted to Class A.
bDuring the year ended May 31, 2018, Advisor Class did not record any share transactions.
3. Transactions with Affiliates
Franklin Resources, Inc. is the holding company for various subsidiaries that together are referred to as Franklin Templeton. Certain officers and trustees of the Trust are also officers and/or directors of certain of the FT Underlying Funds and of the following subsidiaries:
| | |
| Subsidiary | | Affiliation |
| |
| Franklin Advisers, Inc. (Advisers) | | Investment manager |
| |
| Franklin Templeton Investments Corp. (FTIC) | | Investment manager |
| |
| Franklin Templeton Services, LLC (FT Services) | | Administrative manager |
| |
| Franklin Templeton Distributors, Inc. (Distributors) | | Principal underwriter |
| |
| Franklin Templeton Investor Services, LLC (Investor Services) | | Transfer agent |
a. Management Fees
The Funds pay an investment management fee to Advisers of 0.25% per year of the average daily net assets of each of the Funds for investment advisory services, consisting principally of determining the allocation of assets of the Funds among the Underlying Funds and ETFs.
Under a subadvisory agreement, FTIC, an affiliate of Advisers, provides subadvisory services to Funds. The subadvisory fee is paid by Advisers based on each Fund’s average daily net assets, and is not an additional expense of the Funds.
| | | | |
| | | | | |
| nextstepfunds.com | | Annual Report | | 47 |
FRANKLIN FUND ALLOCATOR SERIES
NOTES TO FINANCIAL STATEMENTS
3. Transactions with Affiliates(continued)
b. Administrative Fees
Under an agreement with Advisers, FT Services provides administrative services to the Funds. The fee is paid by Advisers based on each of the Funds’ average net assets, and is not an additional expense of the Funds.
c. Distribution Fees
The Board has adopted distribution plans for each share class, with the exception of Advisor Class shares, pursuant to Rule12b-1 under the 1940 Act. Under the Funds’ Class A reimbursement distribution plans, the Funds reimburse Distributors for costs incurred in connection with the servicing, sale and distribution of each Fund’s shares up to the maximum annual plan rate for each class. Under the Class A reimbursement distribution plans, costs exceeding the maximum for the current plan year cannot be reimbursed in subsequent periods. In addition, under the Funds’ Class C compensation distribution plans, the Funds pay Distributors for costs incurred in connection with the servicing, sale and distribution of each Fund’s shares up to the maximum annual plan rate. The plan year, for purposes of monitoring compliance with the maximum annual plan rates, is February 1 through January 31 for each Fund.
The maximum annual plan rates, based on the average daily net assets, for each class, are as follows:
| | |
Class A | | 0.25% |
Class C | | 1.00% |
d. Sales Charges/Underwriting Agreements
Front-end sales charges and contingent deferred sales charges (CDSC) do not represent expenses of the Funds. These charges are deducted from the proceeds of sales of fund shares prior to investment or from redemption proceeds prior to remittance, as applicable. Distributors has advised the Funds of the following commission transactions related to the sales and redemptions of the Funds’ shares for the year:
| | | | | | | | | | | | |
| | | Franklin NextStep Conservative Fund | | | Franklin
NextStep
Moderate
Fund | | | Franklin
NextStep
Growth
Fund | |
| | | |
Sales charges retained net of commissions paid to unaffiliated brokers/dealers | | | $3,201 | | | | $4,056 | | | | $924 | |
CDSC retained | | | $ — | | | | $2,543 | | | | $ — | |
Effective September 10, 2018, the Board approved changes to certainfront-end sales charges and dealer commissions on Class A shares. Further details are disclosed in the Funds’ Prospectus.
e. Transfer Agent Fees
Each class of shares pays transfer agent fees to Investor Services for its performance of shareholder servicing obligations. The fees are based on an annualized asset based fee of 0.02% plus a transaction based fee. In addition, each class reimburses Investor Services for out of pocket expenses incurred and, reimburses shareholder servicing fees paid to third parties. These fees are allocated daily based upon their relative proportion of such classes’ aggregate net assets.
| | | | |
| | | | | |
| 48 | | Annual Report | | nextstepfunds.com |
FRANKLIN FUND ALLOCATOR SERIES
NOTES TO FINANCIAL STATEMENTS
For the year ended May 31, 2019, the Funds paid transfer agent fees as noted in the Statements of Operations of which the following amounts were retained by Investor Services:
| | | | | | | | | | | | |
| | | Franklin
NextStep
Conservative
Fund | | | Franklin
NextStep
Moderate
Fund | | | Franklin
NextStep
Growth
Fund | |
| | | |
Transfer agent fees | | | $1,243 | | | | $4,004 | | | | $2,588 | |
f. Investments in FT Underlying Funds
The Funds invest in FT Underlying Funds which are managed by Advisers or by an affiliate of Advisers. The Funds do not invest in FT Underlying Funds for the purpose of exercising a controlling influence over the management or policies. Investment management fees paid by the Funds are waived on assets invested in Institutional Fiduciary Trust Money Market Portfolio (Sweep Money Fund), as noted in the Statements of Operations, in an amount not to exceed the management and administrative fees paid directly or indirectly by the Sweep Money Fund.
Investments in FT Underlying Funds for the year ended May 31, 2019, were as follows:
| | | | | | | | | | | | | | | | | | | | | | | | | | | | | | | | |
| FT Underlying Funds | | Number of
Shares Held
at Beginning
of Year | | | Gross
Additions | | | Gross
Reductions | | | Number of
Shares
Held at End
of Year | | | Value at End of Year | | | Dividend
Income | | | Realized
Gain
(Loss) | | | Net Change in
Unrealized
Appreciation
(Depreciation) | |
| | | | | | | | |
Franklin NextStep Conservative Fund | | | | | | | | | | | | | | | | | | | | | | | | | | | | | | | | |
Non-Controlled Affiliates | | | | | | | | | | | | | | | | | | | | | | | | | | | | | | | | |
Franklin Growth Fund, Class R6 | | | 1,205 | | | | 562 | | | | (401 | ) | | | 1,366 | | | $ | 139,253 | | | $ | 1,130 | | | $ | 2,096 | a | | $ | 3,861 | |
Franklin Low Duration Total Return Fund, Class R6 | | | 39,966 | | | | 13,212 | | | | (5,713 | ) | | | 47,465 | | | | 462,304 | | | | 14,880 | | | | (1,238 | ) | | | 2,384 | |
Franklin Mutual European Fund, Class R6 | | | 2,876 | | | | 1,123 | | | | (1,521 | ) | | | 2,478 | | | | 47,207 | | | | 1,741 | | | | 829 | | | | (5,307 | ) |
Franklin Strategic Income Fund, Class R6 | | | 36,404 | | | | 12,201 | | | | (5,490 | ) | | | 43,115 | | | | 413,471 | | | | 18,620 | | | | (1,763 | ) | | | 2,080 | |
Institutional Fiduciary Trust Money Market Portfolio, 2.08% | | | 64,807 | | | | 1,346,227 | | | | (1,301,674 | ) | | | 109,360 | | | | 109,360 | | | | 1,903 | | | | — | | | | — | |
Templeton Global Total Return Fund, Class R6 | | | 28,324 | | | | 10,851 | | | | (8,066 | ) | | | 31,109 | | | | 359,001 | | | | 21,306 | | | | (1,049 | ) | | | (5,455 | ) |
| | | | | | | | | | | | | | | | | | | | |
| | | | | | | | |
Total Affiliated Securities | | | | | | | | | | | | | | | | | | $ | 1,530,596 | | | $ | 59,580 | | | $ | (1,125 | ) | | $ | (2,437 | ) |
| | | | | | | | | | | | | | | | | | | | |
Franklin NextStep Moderate Fund | | | | | | | | | | | | | | | | | | | | | | | | | | | | | | | | |
Non-Controlled Affiliates | | | | | | | | | | | | | | | | | | | | | | | | | | | | | | | | |
Franklin Growth Fund, Class R6 | | | 12,416 | | | | 2,295 | | | | (3,186 | ) | | | 11,525 | | | $ | 1,175,115 | | | $ | 10,175 | | | $ | 27,116 | a | | $ | 21,834 | |
Franklin K2 Alternative Strategies Fund, Class R6 | | | 12,562 | | | | 1,071 | | | | (2,519 | ) | | | 11,114 | | | | 126,032 | | | | — | | | | 3,842 | a | | | (1,858 | ) |
Franklin Low Duration Total Return Fund, Class R6 | | | 87,005 | | | | 18,291 | | | | (22,344 | ) | | | 82,952 | | | | 807,950 | | | | 29,402 | | | | (5,057 | ) | | | 6,175 | |
Franklin Mutual European Fund, Class R6 | | | 31,377 | | | | 5,647 | | | | (14,577 | ) | | | 22,447 | | | | 427,616 | | | | 17,683 | | | | (2,490 | ) | | | (45,372 | ) |
Franklin Pelagos Commodities Strategy Fund, Class R6 | | | 41,451 | | | | 14,537 | | | | (9,891 | ) | | | 46,097 | | | | 249,383 | | | | 17,944 | | | | (3,855 | ) | | | (58,596 | ) |
Franklin Strategic Income Fund, Class R6 | | | 79,159 | | | | 16,864 | | | | (20,673 | ) | | | 75,350 | | | | 722,612 | | | | 36,428 | | | | (7,418 | ) | | | 6,603 | |
Institutional Fiduciary Trust Money Market Portfolio, 2.08% | | | 75 | | | | 3,641,815 | | | | (3,469,317 | ) | | | 172,573 | | | | 172,573 | | | | 2,792 | | | | — | | | | — | |
Templeton Global Total Return Fund, Class R6 | | | 60,835 | | | | 13,484 | | | | (21,936 | ) | | | 52,383 | | | | 604,494 | | | | 40,326 | | | | (6,210 | ) | | | (5,083 | ) |
| | | | | | | | | | | | | | | | | | | | |
| | | | | | | | |
Total Affiliated Securities | | | | | | | | | | | | | | | | | | $ | 4,285,775 | | | $ | 154,750 | | | $ | 5,928 | | | $ | (76,297 | ) |
| | | | | | | | | | | | | | | | | | | | |
| | | | |
| | | | | |
| nextstepfunds.com | | Annual Report | | 49 |
FRANKLIN FUND ALLOCATOR SERIES
NOTES TO FINANCIAL STATEMENTS
3. Transactions with Affiliates(continued)
f. Investments in FT Underlying Funds(continued)
| | | | | | | | | | | | | | | | | | | | | | | | | | | | | | | | |
| FT Underlying Funds | | Number of
Shares Held
at Beginning
of Year | | | Gross
Additions | | | Gross
Reductions | | | Number of
Shares
Held at End
of Year | | | Value at End of Year | | | Dividend
Income | | | Realized
Gain
(Loss) | | | Net Change in
Unrealized
Appreciation
(Depreciation) | |
| | | | | | | | |
Franklin NextStep Growth Fund | | | | | | | | | | | | | | | | | | | | | | | | | | | | | | | | |
Non-Controlled Affiliates | | | | | | | | | | | | | | | | | | | | | | | | | | | | | | | | |
Franklin Growth Fund, Class R6 | | | 8,782 | | | | 1,798 | | | | (2,010 | ) | | | 8,570 | | | $ | 873,845 | | | $ | 6,875 | | | $ | 15,773 | a | | | $23,429 | |
Franklin K2 Alternative Strategies Fund, Class R6 | | | 6,910 | | | | 598 | | | | (1,112 | ) | | | 6,396 | | | | 72,531 | | | | — | | | | 1,960 | a | | | (737 | ) |
Franklin Low Duration Total Return Fund, Class R6 | | | 26,694 | | | | 9,011 | | | | (6,803 | ) | | | 28,902 | | | | 281,501 | | | | 9,448 | | | | (1,529 | ) | | | 2,150 | |
Franklin Mutual European Fund, Class R6 | | | 20,540 | | | | 4,547 | | | | (9,796 | ) | | | 15,291 | | | | 291,300 | | | | 11,474 | | | | (4,423 | ) | | | (25,925 | ) |
Franklin Pelagos Commodities Strategy Fund, Class R6 | | | 22,671 | | | | 8,176 | | | | (4,317 | ) | | | 26,530 | | | | 143,526 | | | | 10,052 | | | | (906 | ) | | | (33,642 | ) |
Franklin Strategic Income Fund, Class R6 | | | 24,287 | | | | 8,228 | | | | (6,262 | ) | | | 26,253 | | | | 251,765 | | | | 11,718 | | | | (2,343 | ) | | | 2,448 | |
Institutional Fiduciary Trust Money Market Portfolio, 2.08% | | | 86,213 | | | | 1,639,604 | | | | (1,639,500 | ) | | | 86,317 | | | | 86,317 | | | | 1,598 | | | | — | | | | — | |
Templeton Global Total Return Fund, Class R6 | | | 19,948 | | | | 5,145 | | | | (8,137 | ) | | | 16,956 | | | | 195,668 | | | | 12,534 | | | | (3,489 | ) | | | (53 | ) |
| | | | | | | | | | | | | | | | | | | | |
Total Affiliated Securities | | | | | | | | | | | | | | | | | | $ | 2,196,453 | | | | $63,699 | | | | $5,043 | | | | $(32,330 | ) |
| | | | | | | | | | | | | | | | | | | | |
aIncludes capital gain distributions received.
g. Waiver and Expense Reimbursements
Advisers has contractually agreed in advance to waive or limit its fees and to assume as its own expense certain expenses otherwise payable by the Funds so that the expenses (excluding distribution fees, and acquired fund fees and expenses and certainnon-routine expenses or costs, including those relating to litigation, indemnification, reorganizations, and liquidations) for each class of the Funds do not exceed 0.35%, based on the average net assets of each class until September 30, 2019. Total expenses waived or paid are not subject to recapture subsequent to the Funds’ fiscal year end.
4. Expense Offset Arrangement
The Funds have entered into an arrangement with their custodian whereby credits realized as a result of uninvested cash balances are used to reduce a portion of the Funds’ custodian expenses. During the year ended May 31, 2019, there were no credits earned.
| | | | |
| | | | | |
| 50 | | Annual Report | | nextstepfunds.com |
FRANKLIN FUND ALLOCATOR SERIES
NOTES TO FINANCIAL STATEMENTS
5. Income Taxes
The tax character of distributions paid during the years ended May 31, 2019 and 2018, was as follows:
| | | | | | | | | | | | | | | | | | | | | | | | |
| | | Franklin NextStep
Conservative Fund | | | Franklin NextStep
Moderate Fund | | | Franklin NextStep
Growth Fund | |
| | | | | | |
| | | 2019 | | | 2018 | | | 2019 | | | 2018 | | | 2019 | | | 2018 | |
Distributions paid from: | | | | | | | | | | | | | | | | | | | | | | | | |
Ordinary income | | $ | 87,941 | | | $ | 56,849 | | | $ | 363,313 | | | $ | 451,797 | | | $ | 130,954 | | | $ | 233,001 | |
Long term capital gain | | | 23,601 | | | | 8,705 | | | | 183,754 | | | | 57,924 | | | | 96,588 | | | | 33,564 | |
| | | | |
| | | | | | |
| | $ | 111,542 | | | $ | 65,554 | | | $ | 547,067 | | | $ | 509,721 | | | $ | 227,542 | | | $ | 266,565 | |
| | | | |
At May 31, 2019, the cost of investments, net unrealized appreciation (depreciation), undistributed ordinary income and undistributed long term capital gains for income tax purposes were as follows:
| | | | | | | | | | | | |
| | | Franklin
NextStep
Conservative
Fund | | | Franklin
NextStep
Moderate
Fund | | | Franklin
NextStep
Growth
Fund | |
Cost of investments | | | $3,603,353 | | | $ | 11,966,692 | | | $ | 6,813,999 | |
| | | |
Unrealized appreciation | | | $ 131,547 | | | $ | 775,359 | | | $ | 487,478 | |
Unrealized depreciation | | | (43,640 | ) | | | (210,732 | ) | | | (123,386 | ) |
| | | |
Net unrealized appreciation (depreciation) | | | $ 87,907 | | | $ | 564,627 | | | $ | 364,092 | |
| | | |
Distributable earnings: | | | | | | | | | | | | |
Undistributed ordinary income | | | $ 16,629 | | | $ | 32,272 | | | $ | 17,504 | |
Undistributed long term capital gains | | | 119 | | | | 171,903 | | | | 98,917 | |
| | | |
Total distributable earnings | | | $ 16,748 | | | $ | 204,175 | | | $ | 116,421 | |
Differences between income and/or capital gains as determined on a book basis and a tax basis are primarily due to differing treatment of wash sales.
The Funds utilized a tax accounting practice to treat a portion of the proceeds from capital shares redeemed as a distribution from realized capital gains.
6. Investment Transactions
Purchases and sales of Underlying Funds and ETFs (excluding short term securities) for the year ended May 31, 2019, were as follows:
| | | | | | | | | | | | |
| | | Franklin
NextStep
Conservative
Fund | | | Franklin
NextStep
Moderate
Fund | | | Franklin
NextStep
Growth
Fund | |
| | | |
Purchases | | | $1,976,203 | | | | $4,784,465 | | | | $2,674,872 | |
| | | | |
| | | | | |
| nextstepfunds.com | | Annual Report | | 51 |
FRANKLIN FUND ALLOCATOR SERIES
NOTES TO FINANCIAL STATEMENTS
6. Investment Transactions (continued)
| | | | | | | | | | | | | | | | | | | | |
| | | Franklin
NextStep
Conservative
Fund | | | | | | Franklin
NextStep
Moderate
Fund | | | | | | Franklin
NextStep
Growth
Fund | |
| | | | | |
Sales | | | $1,589,292 | | | | | | | | $6,566,522 | | | | | | | | $3,311,906 | |
7. Credit Facility
The Funds, together with other U.S. registered and foreign investment funds (collectively, Borrowers), managed by Franklin Templeton, are borrowers in a joint syndicated senior unsecured credit facility totaling $2 billion (Global Credit Facility) which matures on February 7, 2020. This Global Credit Facility provides a source of funds to the Borrowers for temporary and emergency purposes, including the ability to meet future unanticipated or unusually large redemption requests.
Under the terms of the Global Credit Facility, the Funds shall, in addition to interest charged on any borrowings made by the Funds and other costs incurred by the Funds, pay their share of fees and expenses incurred in connection with the implementation and maintenance of the Global Credit Facility, based upon their relative share of the aggregate net assets of all of the Borrowers, including an annual commitment fee of 0.15% based upon the unused portion of the Global Credit Facility. These fees are reflected in other expenses in the Statements of Operations. During the year ended May 31, 2019, the Funds did not use the Global Credit Facility.
8. Fair Value Measurements
The Funds follow a fair value hierarchy that distinguishes between market data obtained from independent sources (observable inputs) and the Funds’ own market assumptions (unobservable inputs). These inputs are used in determining the value of the Funds’ financial instruments and are summarized in the following fair value hierarchy:
| | • | Level 1 – quoted prices in active markets for identical financial instruments |
| | • | Level 2 – other significant observable inputs (including quoted prices for similar financial instruments, interest rates, prepayment speed, credit risk, etc.) |
| | • | Level 3 – significant unobservable inputs (including the Funds’ own assumptions in determining the fair value of financial instruments) |
The input levels are not necessarily an indication of the risk or liquidity associated with financial instruments at that level.
A summary of inputs used as of May 31, 2019, in valuing the Funds’ assets carried at fair value, is as follows:
| | | | | | | | | | | | | | | | |
| | | Level 1 | | | Level 2 | | | Level 3 | | | Total | |
| | | | |
Franklin NextStep Conservative Fund | | | | | | | | | | | | | | | | |
Assets: | | | | | | | | | | | | | | | | |
Investments in Securities:a | | | | | | | | | | | | | | | | |
Underlying Funds and Exchange Traded Funds | | $ | 3,572,951 | | | $ | — | | | $ | — | | | $ | 3,572,951 | |
Short Term Investments | | | 109,360 | | | | 8,949 | | | | — | | | | 118,309 | |
| | | | |
Total Investments in Securities | | $ | 3,682,311 | | | $ | 8,949 | | | $ | — | | | $ | 3,691,260 | |
| | | | |
| | | | | |
| 52 | | Annual Report | | nextstepfunds.com |
FRANKLIN FUND ALLOCATOR SERIES
NOTES TO FINANCIAL STATEMENTS
| | | | | | | | | | | | | | | | |
| | | Level 1 | | | Level 2 | | | Level 3 | | | Total | |
| | | | |
Franklin NextStep Moderate Fund | | | | | | | | | | | | | | | | |
| | | | |
Assets: | | | | | | | | | | | | | | | | |
Investments in Securities:a | | | | | | | | | | | | | | | | |
Underlying Funds and Exchange Traded Funds | | $ | 12,344,154 | | | $ | — | | | $ | — | | | $ | 12,344,154 | |
Short Term Investments | | | 172,573 | | | | 14,592 | | | | — | | | | 187,165 | |
| | | | |
Total Investments in Securities | | $ | 12,516,727 | | | $ | 14,592 | | | $ | — | | | $ | 12,531,319 | |
| | | | |
Franklin NextStep Growth Fund | | | | | | | | | | | | | | | | |
| | | | |
Assets: | | | | | | | | | | | | | | | | |
Investments in Securities:a | | | | | | | | | | | | | | | | |
Underlying Funds and Exchange Traded Funds | | $ | 7,079,253 | | | $ | — | | | $ | — | | | $ | 7,079,253 | |
Short Term Investments | | | 86,317 | | | | 12,521 | | | | — | | | | 98,838 | |
| | | | |
Total Investments in Securities | | $ | 7,165,570 | | | $ | 12,521 | | | $ | — | | | $ | 7,178,091 | |
aFor detailed categories, see the accompanying Statement of Investments.
9. Subsequent Events
The Funds have evaluated subsequent events through the issuance of the financial statements and determined that no events have occurred that require disclosure.
Abbreviations
ETF Exchange Traded Fund
| | | | |
| | | | | |
| nextstepfunds.com | | Annual Report | | 53 |
FRANKLIN FUND ALLOCATOR SERIES
Report of Independent Registered Public Accounting Firm
To the Board of Trustees and Shareholders of Franklin Fund Allocator Series and Shareholders of Franklin NextStep Conservative Fund, Franklin NextStep Moderate Fund and Franklin NextStep Growth Fund
Opinions on the Financial Statements
We have audited the accompanying statements of assets and liabilities, including the statements of investments, of Franklin NextStep Conservative Fund, Franklin NextStep Moderate Fund and Franklin NextStep Growth Fund (the “Funds”) as of May 31, 2019, the related statements of operations for the year ended May 31, 2019, the statements of changes in net assets for each of the two years in the period ended May 31, 2019, including the related notes, and the financial highlights for each of the periods indicated therein (collectively referred to as the “financial statements”). In our opinion, the financial statements present fairly, in all material respects, the financial position of each of the Funds as of May 31, 2019, the results of each of their operations for the year then ended, the changes in each of their net assets for each of the two years in the period ended May 31, 2019 and each of the financial highlights for each of the periods indicated therein in conformity with accounting principles generally accepted in the United States of America.
Basis for Opinions
These financial statements are the responsibility of the Funds’ management. Our responsibility is to express an opinion on the Funds’ financial statements based on our audits. We are a public accounting firm registered with the Public Company Accounting Oversight Board (United States) (PCAOB) and are required to be independent with respect to the Funds in accordance with the U.S. federal securities laws and the applicable rules and regulations of the Securities and Exchange Commission and the PCAOB.
We conducted our audits of these financial statements in accordance with the standards of the PCAOB. Those standards require that we plan and perform the audit to obtain reasonable assurance about whether the financial statements are free of material misstatement, whether due to error or fraud.
Our audits included performing procedures to assess the risks of material misstatement of the financial statements, whether due to error or fraud, and performing procedures that respond to those risks. Such procedures included examining, on a test basis, evidence regarding the amounts and disclosures in the financial statements. Our audits also included evaluating the accounting principles used and significant estimates made by management, as well as evaluating the overall presentation of the financial statements. Our procedures included confirmation of securities owned as of May 31, 2019 by correspondence with the custodian, transfer agent and brokers; when replies were not received from brokers, we performed other auditing procedures. We believe that our audits provide a reasonable basis for our opinions.
PricewaterhouseCoopers LLP
San Francisco, California
July 17, 2019
We have served as the auditor of one or more investment companies in the Franklin Templeton funds since 1948.
| | | | |
| | | | | |
| 54 | | Annual Report | | nextstepfunds.com |
FRANKLIN FUND ALLOCATOR SERIES
Tax Information (unaudited)
Under Section 852(b)(3)(C) of the Internal Revenue Code, the Funds hereby report the maximum amount allowable but no less than the following amounts as long term capital gain dividends for the fiscal year ended May 31, 2019:
| | | | | | | | | | |
Franklin
NextStep
Conservative
Fund | | | Franklin
NextStep
Moderate
Fund | | | Franklin
NextStep
Growth
Fund | |
| | |
| | $26,099 | | | | $210,907 | | | | $105,719 | |
Under Section 871(k)(2)(C) of the Internal Revenue Code, the Funds hereby report the maximum amount allowable but no less than the following amounts as short term capital gain dividends for purposes of the tax imposed under Section 871(a)(1)(A) of the Internal Revenue Code for the fiscal year ended May 31, 2019:
| | | | | | | | | | |
Franklin
NextStep
Conservative
Fund | | | Franklin
NextStep
Moderate
Fund | | | Franklin
NextStep
Growth
Fund | |
| | |
| | $16,235 | | | | $146,758 | | | | $46,382 | |
Under Section 854(b)(1)(A) of the Internal Revenue Code, the Funds hereby report the following percentage amounts of the ordinary income dividends as income qualifying for the dividends received deduction for the fiscal year ended May 31, 2019:
| | | | | | | | | | |
Franklin
NextStep
Conservative
Fund | | | Franklin
NextStep
Moderate
Fund | | | Franklin
NextStep
Growth
Fund | |
| | |
| | 9.26% | | | | 18.87% | | | | 34.85% | |
Under Section 854(b)(1)(B) of the Internal Revenue Code, the Funds hereby report the maximum amount allowable but no less than the following amounts as qualified dividends for purposes of the maximum rate under Section 1(h)(11) of the Internal Revenue Code for the fiscal year ended May 31, 2019:
| | | | | | | | | | |
Franklin
NextStep
Conservative
Fund | | | Franklin
NextStep
Moderate
Fund | | | Franklin
NextStep
Growth
Fund | |
| | |
| | $13,794 | | | | $134,629 | | | | $92,064 | |
During the year ended May 31, 2019, the Fund, a qualified fund of funds under Section 852(g)(2) of the Internal Revenue Code, received an allocation of foreign taxes paid from one or more of its underlying funds. The Fund elects to treat foreign taxes paid as allowed under Section 853 of the Internal Revenue Code. This election will allow shareholders of record as of the 2019 distribution date, to treat its proportionate share of foreign taxes paid by the underlying funds as having been paid directly by them. The shareholder shall consider these amounts as foreign taxes paid in the tax year in which they receive the Fund distribution.
| | | | |
| | | | | |
| nextstepfunds.com | | Annual Report | | 55 |
FRANKLIN FUND ALLOCATOR SERIES
Board Members and Officers
The name, year of birth and address of the officers and board members, as well as their affiliations, positions held with the Trust, principal occupations during at least the past five years and number of U.S. registered portfolios overseen in the Franklin Templeton fund complex, are shown below. Generally, each board member serves until that person’s successor is elected and qualified.
Independent Board Members
| | | | | | | | |
Name, Year of Birth and Address | | Position | | Length of
Time Served | | Number of Portfolios in
Fund Complex Overseen
by Board Member* | | Other Directorships Held
During at Least the Past 5 Years |
Harris J. Ashton (1932) One Franklin Parkway San Mateo, CA 94403-1906 | | Trustee | | Since 1995 | | 138 | | Bar-S Foods (meat packing company) (1981-2010). |
| | |
| Principal Occupation During at Least the Past 5 Years: | | | | |
Director of various companies; andformerly, Director, RBC Holdings, Inc. (bank holding company) (until 2002); and President, Chief Executive Officer and Chairman of the Board, General Host Corporation (nursery and craft centers) (until 1998). |
| | | | | |
Terrence J. Checki (1945) One Franklin Parkway San Mateo, CA 94403-1906 | | Trustee | | Since 2017 | | 114 | | Hess Corporation (exploration of oil and gas) (2014-present). |
| | |
| Principal Occupation During at Least the Past 5 Years: | | | | |
Member of the Council on Foreign Relations (1996-present); Member of the National Committee on U.S.-China Relations (1999-present); member of the Board of Trustees of the Economic Club of New York (2013-present); member of the Board of Trustees of the Foreign Policy Association (2005-present) and member of various other boards of trustees and advisory boards; andformerly, Executive Vice President of the Federal Reserve Bank of New York and Head of its Emerging Markets and Internal Affairs Group and Member of Management Committee (1995-2014); and Visiting Fellow at the Council on Foreign Relations (2014). |
| | | | | |
Mary C. Choksi (1950) One Franklin Parkway San Mateo, CA 94403-1906 | | Trustee | | Since 2014 | | 138 | | Avis Budget Group Inc. (car rental) (2007-present), Omnicom Group Inc. (advertising and marketing communications services) (2011-present) and White Mountains Insurance Group, Ltd. (holding company) (2017-present). |
| | |
| Principal Occupation During at Least the Past 5 Years: | | | | |
Director of various companies; andformerly, Founder and Senior Advisor, Strategic Investment Group (investment management group) (2015-2017); Founding Partner and Senior Managing Director, Strategic Investment Group (1987-2015); Founding Partner and Managing Director, Emerging Markets Management LLC (investment management firm) (1987-2011); and Loan Officer/Senior Loan Officer/Senior Pension Investment Officer, World Bank Group (international financial institution) (1977-1987). |
| | | | | |
Edith E. Holiday (1952) One Franklin Parkway San Mateo, CA 94403-1906 | | Lead Independent Trustee | | Trustee since 1998 and Lead Independent Trustee since March 2019 | | 138 | | Hess Corporation (exploration of oil and gas) (1993-present), Canadian National Railway (railroad) (2001-present), White Mountains Insurance Group, Ltd. (holding company) (2004-present), Santander Consumer USA Holdings, Inc. (consumer finance) (2016-Present), RTI International Metals, Inc. (manufacture and distribution of titanium) (1999-2015) and H.J. Heinz Company (processed foods and allied products) (1994-2013). |
| Principal Occupation During at Least the Past 5 Years: | | | | |
Director or Trustee of various companies and trusts; andformerly, Assistant to the President of the United States and Secretary of the Cabinet (1990-1993); General Counsel to the United States Treasury Department (1989-1990); and Counselor to the Secretary and Assistant Secretary for Public Affairs and Public Liaison–United States Treasury Department (1988-1989). |
| | | | |
| | | | | |
| 56 | | Annual Report | | nextstepfunds.com |
FRANKLIN FUND ALLOCATOR SERIES
Independent Board Members (continued)
| | | | | | | | |
Name, Year of Birth
and Address | | Position | | Length of
Time Served | | Number of Portfolios in
Fund Complex Overseen
by Board Member* | | Other Directorships Held During at Least the Past 5 Years |
J. Michael Luttig (1954) One Franklin Parkway San Mateo, CA 94403-1906 | | Trustee | | Since 2009 | | 138 | | Boeing Capital Corporation (aircraft financing) (2006-2013). |
|
| Principal Occupation During at Least the Past 5 Years: |
Executive Vice President, Counselor and Senior Advisor to Boeing Chairman and Board of Directors, The Boeing Company (aerospace company) (May 2019); andformerly, General Counsel and member of the Executive Council, The Boeing Company (2006-2019) and Federal Appeals Court Judge, U.S. Court of Appeals for the Fourth Circuit (1991-2006). |
| | | | |
Larry D. Thompson (1945) One Franklin Parkway San Mateo, CA 94403-1906 | | Trustee | | Since 2007 | | 138 | | The Southern Company (energy company) (2014-present; previously 2010-2012), Graham Holdings Company (education and media organization) (2011-present) and Cbeyond, Inc. (business communications provider) (2010-2012). |
|
| Principal Occupation During at Least the Past 5 Years: |
Director of various companies; Counsel, Finch McCranie, LLP (law firm) (2015-present); Independent Compliance Monitor and Auditor, Volkswagen AG (manufacturer of automobiles and commercial vehicles) (2017-present); John A. Sibley Professor of Corporate and Business Law, University of Georgia School of Law (2015-present; previously 2011-2012); andformerly, Executive Vice President – Government Affairs, General Counsel and Corporate Secretary, PepsiCo, Inc. (consumer products) (2012-2014); Senior Vice President – Government Affairs, General Counsel and Secretary, PepsiCo, Inc. (2004-2011); Senior Fellow of The Brookings Institution (2003-2004); Visiting Professor, University of Georgia School of Law (2004); and Deputy Attorney General, U.S. Department of Justice (2001-2003). |
Interested Board Members and Officers
| | | | | | | | |
Name, Year of Birth
and Address | | Position | | Length of
Time Served | | Number of Portfolios in
Fund Complex Overseen
by Board Member* | | Other Directorships Held During at Least the Past 5 Years |
| | | | |
**Gregory E. Johnson (1961) One Franklin Parkway San Mateo, CA 94403-1906 | | Trustee | | Since 2007 | | 152 | | None |
|
| Principal Occupation During at Least the Past 5 Years: |
Chairman of the Board, Member - Office of the Chairman, Director and Chief Executive Officer, Franklin Resources, Inc.; officer and/or director or trustee, as the case may be, of some of the other subsidiaries of Franklin Resources, Inc. and of 42 of the investment companies in Franklin Templeton; Vice Chairman, Investment Company Institute; andformerly, President, Franklin Resources, Inc. (1994-2015). |
| | | | |
**Rupert H. Johnson, Jr. (1940) One Franklin Parkway San Mateo,CA 94403-1906 | | Chairman of the Board and Trustee | | Since 2013 | | 138 | | None |
|
| Principal Occupation During at Least the Past 5 Years: |
Vice Chairman, Member – Office of the Chairman and Director, Franklin Resources, Inc.; Director, Franklin Advisers, Inc.; and officer and/or director or trustee, as the case may be, of some of the other subsidiaries of Franklin Resources, Inc. and of 40 of the investment companies in Franklin Templeton. |
| | | | |
| Alison E. Baur (1964) | | Vice President | | Since 2012 | | Not Applicable | | Not Applicable |
One Franklin Parkway San Mateo, CA 94403-1906 | | | | | | | | |
|
| Principal Occupation During at Least the Past 5 Years: |
Deputy General Counsel, Franklin Templeton; and officer of some of the other subsidiaries of Franklin Resources, Inc. and of 44 of the investment companies in Franklin Templeton. |
| | | | |
| | | | | |
| nextstepfunds.com | | Annual Report | | 57 |
FRANKLIN FUND ALLOCATOR SERIES
Interested Board Members and Officers (continued)
| | | | | | | | |
Name, Year of Birth and Address | | Position | | Length of Time Served | | Number of Portfolios in
Fund Complex Overseen by Board Member* | | Other Directorships Held
During at Least the Past 5 Years |
| | | | |
Gaston Gardey (1967) One Franklin Parkway San Mateo, CA 94403-1906 | | Treasurer, Chief Financial Officer, and Chief Accounting Officer | | Since 2009 | | Not Applicable | | Not Applicable |
|
Treasurer, U.S. Fund Administration & Reporting and officer of 26 of the investment companies in Franklin Templeton. |
| | | | |
| Aliya S. Gordon (1973) | | Vice President | | Since 2009 | | Not Applicable | | Not Applicable |
One Franklin Parkway San Mateo, CA 94403-1906 | | | | | | | | |
| | |
| Principal Occupation During at Least the Past 5 Years: | | | | |
Senior Associate General Counsel and officer of 44 of the investment companies in Franklin Templeton. |
| | | | |
Steven J. Gray (1955) One Franklin Parkway San Mateo, CA 94403-1906 | | Vice President and Co-Secretary | | Vice President
since 2009and Co-Secretary since January 2019 | | Not Applicable | | Not Applicable |
| | |
| Principal Occupation During at Least the Past 5 Years: | | | | |
Senior Associate General Counsel, Franklin Templeton; Vice President, Franklin Templeton Distributors, Inc. and FASA, LLC; and officer of 44 of the investment companies in Franklin Templeton. |
| | | | |
Matthew T. Hinkle (1971) One Franklin Parkway San Mateo, CA 94403-1906 | | Chief Executive Officer – Finance and Administration | | Since 2017 | | Not Applicable | | Not Applicable |
| | |
| Principal Occupation During at Least the Past 5 Years: | | | | |
Senior Vice President, Franklin Templeton Services, LLC; officer of 44 of the investment companies in Franklin Templeton; andformerly, Vice President, Global Tax (2012-April 2017) and Treasurer/Assistant Treasurer, Franklin Templeton (2009-2017). |
| | | | |
Robert Lim (1948) One Franklin Parkway San Mateo, CA 94403-1906 | | Vice President – AML Compliance | | Since 2016 | | Not Applicable | | Not Applicable |
| | |
| Principal Occupation During at Least the Past 5 Years: | | | | |
Vice President, Franklin Templeton Companies, LLC; Chief Compliance Officer, Franklin Templeton Distributors, Inc. and Franklin Templeton Investor Services, LLC; and officer of 44 of the investment companies in Franklin Templeton. |
| | | | |
| Kimberly H. Novotny (1972) | | Vice President | | Since 2013 | | Not Applicable | | Not Applicable |
300 S.E. 2nd Street Fort Lauderdale, FL 33301-1923 | | | | | | | | |
| | |
| Principal Occupation During at Least the Past 5 Years: | | | | |
Associate General Counsel, Franklin Templeton; Vice President and Corporate Secretary, Fiduciary Trust International of the South; Vice President, Templeton Investment Counsel, LLC; Assistant Secretary, Franklin Resources, Inc.; and officer of 44 of the investment companies in Franklin Templeton. |
| | | | |
Edward D. Perks (1970) One Franklin Parkway San Mateo, CA 94403-1906 | | President and Chief Executive Officer – Investment Management | | Since December 2018 | | Not Applicable | | Not Applicable |
| | |
| Principal Occupation During at Least the Past 5 Years: | | | | |
President and Director, Franklin Advisers, Inc.; and officer of nine of the investment companies in Franklin Templeton (since December 2018). |
| | | | |
| | | | | |
| 58 | | Annual Report | | nextstepfunds.com |
FRANKLIN FUND ALLOCATOR SERIES
Interested Board Members and Officers (continued)
| | | | | | | | |
Name, Year of Birth and Address | | Position | | Length of Time Served | | Number of Portfolios in
Fund Complex Overseen by Board Member* | | Other Directorships Held
During at Least the Past 5 Years |
| | | | |
Robert C. Rosselot (1960) 300 S.E. 2nd Street Fort Lauderdale, FL 33301-1923 | | Chief Compliance Officer | | Since 2013 | | Not Applicable | | Not Applicable |
| | |
| Principal Occupation During at Least the Past 5 Years: | | | | |
Director, Global Compliance, Franklin Templeton; Vice President, Franklin Templeton Companies, LLC; officer of 44 of the investment companies in Franklin Templeton; andformerly, Senior Associate General Counsel, Franklin Templeton (2007-2013); and Secretary and Vice President, Templeton Group of Funds (2004-2013). |
| | | | |
Navid J. Tofigh (1972) One Franklin Parkway San Mateo, CA 94403-1906 | | Vice President | | Since 2015 | | Not Applicable | | Not Applicable |
| | |
| Principal Occupation During at Least the Past 5 Years: | | | | |
Associate General Counsel and officer of 44 of the investment companies in Franklin Templeton. |
| | | | |
Craig S. Tyle (1960) One Franklin Parkway San Mateo, CA 94403-1906 | | Vice President | | Since 2005 | | Not Applicable | | Not Applicable |
| | |
| Principal Occupation During at Least the Past 5 Years: | | | | |
General Counsel, Executive Vice President and Secretary, Franklin Resources, Inc.; and officer of some of the other subsidiaries of Franklin Resources, Inc. and of 44 of the investment companies in Franklin Templeton. |
| | | | |
Lori A. Weber (1964) 300 S.E. 2nd Street Fort Lauderdale, FL 33301-1923 | | Vice President and
Co-Secretary | | Vice President
since 2011and Co-Secretary since January 2019 | | Not Applicable | | Not Applicable |
| | |
| Principal Occupation During at Least the Past 5 Years: | | | | |
Senior Associate General Counsel, Franklin Templeton; Assistant Secretary, Franklin Resources, Inc.; Vice President and Secretary, Templeton Investment Counsel, LLC; and officer of 44 of the investment companies in Franklin Templeton. |
*We base the number of portfolios on each separate series of the U.S. registered investment companies within the Franklin Templeton fund complex. These portfolios have a common investment manager or affiliated investment managers.
**Gregory E. Johnson is considered to be an interested person of the Fund under the federal securities laws due to his position as an officer and director of Franklin Resources, Inc. (Resources), which is the parent company of the Fund’s investment manager and distributor. Rupert H. Johnson, Jr. is considered to be an interested person of the Fund under the federal securities laws due to his position as an officer and director and major shareholder of Resources.
Note 1: Rupert H. Johnson, Jr. is the uncle of Gregory E. Johnson.
Note 2: Effective March 12, 2019, John B. Wilson ceased to be a trustee of the Trust.
Note 3: Officer information is current as of the date of this report. It is possible that after this date, information about officers may change.
The Sarbanes-Oxley Act of 2002 and Rules adopted by the Securities and Exchange Commission require the Fund to disclose whether the Fund’s Audit Committee includes at least one member who is an audit committee financial expert within the meaning of such Act and Rules. The Fund’s Board has determined that there is at least one such financial expert on the Audit Committee and has designated Mary C. Choksi as its audit committee financial expert. The Board believes that Ms. Choksi qualifies as such an expert in view of her extensive business background and experience. She currently serves as a director of Avis Budget Group, Inc. (2007-present) and formerly, Founder and Senior Advisor, Strategic Investment Group (1987 to 2017). Ms. Choksi has been a Member of the Fund’s Audit Committee since 2014. As a result of such background and experience, the Board believes that Ms. Choksi has acquired an understanding of generally accepted accounting principles and financial statements, the general application of such principles in connection with the accounting estimates, accruals and reserves, and analyzing and evaluating financial statements that present a breadth and level of complexity of accounting issues generally comparable to those of the Fund, as well as an understanding of internal controls and procedures for financial reporting and an understanding of audit committee functions. Ms. Choksi is an independent Board member as that term is defined under the relevant Securities and Exchange Commission Rules and Releases.
The Statement of Additional Information (SAI) includes additional information about the board members and is available, without charge, upon request. Shareholders may call (800) DIALBEN/342-5236 to request the SAI.
| | | | |
| | | | | |
| nextstepfunds.com | | Annual Report | | 59 |
FRANKLIN FUND ALLOCATOR SERIES
Shareholder Information
Board Approval of Investment
Management Agreements
FRANKLIN FUND ALLOCATOR SERIES
Franklin NextStep Conservative Fund
Franklin NextStep Moderate Fund
Franklin NextStep Growth Fund
(each a Fund)
At anin-person meeting held on February 26, 2019 (Meeting), the Board of Trustees (Board) of Franklin Fund Allocator Series (Trust), including a majority of the trustees who are not “interested persons” as defined in the Investment Company Act of 1940 (Independent Trustees), reviewed and approved the continuance of the investment management agreement between Franklin Advisers, Inc. (Manager) and the Trust, on behalf of each Fund (each a Management Agreement) for an additionalone-year period. The Independent Trustees received advice from and met separately with Independent Trustee counsel in considering whether to approve the continuation of each Management Agreement. Although the Management Agreements for the Funds were considered at the same Board meeting, the Board considered the information provided to it about the Funds together and with respect to each Fund separately as the Board deemed appropriate.
In considering the continuation of each Management Agreement, the Board reviewed and considered information provided by the Manager at the Meeting and throughout the year at meetings of the Board and its committees. The Board also reviewed and considered information provided in response to a detailed set of requests for information submitted to the Manager by Independent Trustee counsel on behalf of the Independent Trustees in connection with the annual contract renewal process. In addition, prior to the Meeting, the Independent Trustees held a telephonic contract renewal meeting at which the Independent Trustees conferred amongst themselves and Independent Trustee counsel about contract renewal matters. The Board reviewed and considered all of the factors it deemed relevant in approving the continuance of each Management Agreement, including, but not limited to: (i) the nature, extent and quality of the services provided by the Manager; (ii) the investment performance of each Fund; (iii) the costs of the services provided and profits realized by the Manager and its affiliates from the relationship with each Fund; (iv) the extent to which economies of scale are realized as each Fund grows; and (v) whether fee levels reflect these economies of scale for the benefit of Fund investors.
In approving the continuance of each Management Agreement, the Board, including a majority of the Independent Trustees, determined that the terms of the Management Agreement are fair and reasonable and that the continuance of such Management Agreement is in the interests of the applicable Fund and its shareholders. While attention was given to all information furnished, the following discusses some primary factors relevant to the Board’s determination.
Nature, Extent and Quality of Services
The Board reviewed and considered information regarding the nature, extent and quality of investment management services provided by the Manager and its affiliates to the Funds and their shareholders. This information included, among other things, the qualifications, background and experience of the senior management and investment personnel of the Manager; the structure of investment personnel compensation; oversight of third-party service providers; investment performance reports and related financial information for each Fund; reports on expenses, shareholder services, marketing support payments made to financial intermediaries and third party servicing arrangements; legal and compliance matters; risk controls; pricing and other services provided by the Manager and its affiliates; and management fees charged by the Manager and its affiliates to US funds and other accounts, including management’s explanation of differences among accounts where relevant. The Board also reviewed and considered an annual report on payments made by Franklin Templeton Investments (FTI) or the Funds to financial intermediaries, as well as a memorandum relating to third-party servicing arrangements in response to a guidance update in 2016 from the US Securities and Exchange Commission (SEC) relating to mutual fund distribution andsub-accounting fees. The Board noted management’s continuing efforts and expenditures in establishing effective business continuity plans and developing strategies to address areas of heightened concern in the mutual fund industry, such as cybersecurity and liquidity risk management. The Board also recognized management’s commitment to facilitating Board oversight of liquidity through the designation of a liquidity/risk administrator and the development of reports that highlight the amount of illiquid investments for each Fund.
The Board also reviewed and considered the benefits provided to Fund shareholders of investing in a fund that is part of the Franklin Templeton family of funds. The Board noted the financial position of Franklin Resources, Inc. (FRI),
| | | | |
| | | | | |
| 60 | | Annual Report | | nextstepfunds.com |
FRANKLIN FUND ALLOCATOR SERIES
SHAREHOLDER INFORMATION
the Manager’s parent, and its commitment to the mutual fund business as evidenced by its continued introduction of new funds, reassessment of the fund offerings in response to the market environment and project initiatives and capital investments relating to the services provided to the Funds by the FTI organization.
Following consideration of such information, the Board was satisfied with the nature, extent and quality of services provided by the Manager and its affiliates to the Funds and their shareholders.
Fund Performance
The Board reviewed and considered the performance results of each Fund over various time periods ended December 31, 2018. The Board considered the performance returns for each Fund in comparison to the performance returns of mutual funds deemed comparable to the Fund included in a universe (Performance Universe) selected by Broadridge Financial Solutions, Inc. (Broadridge), an independent provider of investment company data. The Board received a description of the methodology used by Broadridge to select the mutual funds included in a Performance Universe. The Board also reviewed and considered Fund performance reports provided and discussions that occurred with portfolio managers at Board meetings throughout the year. A summary of each Fund’s performance results is below.
Franklin NextStep Conservative Fund – The Performance Universe for the Fund included the Fund and all retail and institutional mixed-asset target allocation conservative funds. The Fund commenced operations on February 5, 2016, and thus has been in operation for less than three calendar years. The Board noted that the Fund’s annualized total return for theone-year period was above the median of its Performance Universe. The Board concluded that the Fund’s performance was satisfactory, particularly given their short period of operation.
Franklin NextStep Moderate Fund and Franklin NextStep Growth Fund– The Performance Universe for the Franklin NextStep Moderate Fund included the Fund and all retail and institutional mixed-asset target allocation moderate funds. The Franklin NextStep Growth Fund included the Fund and all retail and institutional mixed-asset target allocation growth funds. Each Fund commenced operations on February 5, 2016, and thus has been in operation for less than three calendar years. The Board noted that the Funds’ annualized total returns for theone-year period were below the medians of their respective Performance Universes. The Board
concluded that it would need more time to evaluate the Funds’ performance given their short period of operation.
Comparative Fees and Expenses
The Board reviewed and considered information regarding each Fund’s actual total expense ratio and its various components, including, as applicable, management fees; transfer agent expenses; underlying fund expenses; Rule12b-1 andnon-Rule12b-1 service fees; and othernon-management fees. The Board also noted the quarterly and annual reports it receives on all marketing support payments made by FTI to financial intermediaries. The Board considered the actual total expense ratio and, separately, the contractual management fee rate, without the effect of fee waivers, if any (Management Rate) of each Fund in comparison to the median expense ratio and median Management Rate, respectively, of other mutual funds deemed comparable to and with a similar expense structure to the Fund selected by Broadridge (Expense Group). Broadridge fee and expense data is based upon information taken from each fund’s most recent annual report, which reflects historical asset levels that may be quite different from those currently existing, particularly in a period of market volatility. While recognizing such inherent limitation and the fact that expense ratios and Management Rates generally increase as assets decline and decrease as assets grow, the Board believed the independent analysis conducted by Broadridge to be an appropriate measure of comparative fees and expenses. The Broadridge Management Rate includes administrative charges, and the actual total expense ratio, for comparative consistency, was shown for (i) Class A shares for the Franklin NextStep Conservative Fund and for Class A and Class Y shares for each other fund in the Expense Group with multiple share classes; and (ii) Class A shares for each of the Franklin NextStep Moderate Fund and Franklin NextStep Growth Fund and for Class A, Investor Class and Class Y shares for each other fund in the Fund’s respective Expense Group with multiple share classes. The Board received a description of the methodology used by Broadridge to select the mutual funds included in an Expense Group.
The Expense Group for the Franklin NextStep Conservative Fund included the Fund, three other mixed-asset target allocation conservative funds and three mixed-asset target allocation moderate funds. The Expense Group for the Franklin NextStep Moderate Fund included the Fund, two other mixed-asset target allocation moderate funds, four mixed-asset target allocation conservative funds and one mixed-asset target allocation growth fund. The Expense
| | | | |
| | | | | |
| nextstepfunds.com | | Annual Report | | 61 |
FRANKLIN FUND ALLOCATOR SERIES
SHAREHOLDER INFORMATION
Group for the Franklin NextStep Growth Fund included the Fund, one other mixed-asset target allocation growth fund, four mixed-asset target allocation conservative funds and two mixed-asset target allocation moderate funds. The Board noted that the Management Rates and actual total expense ratios for these Funds were below the medians of their respective Expense Groups. The Board further noted that the Funds invest in third-party mutual funds or exchange-traded funds in excess of the statutory limitations under the Investment Company Act of 1940 by relying on exemptive relief provided by the US Securities and Exchange Commission to each underlying fund. Pursuant to the conditions of the exemptive relief, the Board determined that the Management Rate paid by each Fund is based on services provided that are in addition to, rather than duplicative of, the services provided under the investment management agreements of the underlying funds in which the Funds invest. The Board concluded that the Management Rates charged to these Funds are reasonable. In doing so, the Board noted that each Fund’s actual total expense ratio reflected a fee waiver from management.
Profitability
The Board reviewed and considered information regarding the profits realized by the Manager and its affiliates in connection with the operation of each Fund. In this respect, the Board considered the Fund profitability analysis provided by the Manager that addresses the overall profitability of FTI’s US fund business, as well as its profits in providing investment management and other services to each of the individual funds during the12-month period ended September 30, 2018, being the most recent fiscalyear-end for FRI. The Board noted that although management continually makes refinements to its methodologies used in calculating profitability in response to organizational and product-related changes, the overall methodology has remained consistent with that used in the Funds’ profitability report presentations from prior years. Additionally, PricewaterhouseCoopers LLP, auditor to FRI and certain Franklin Templeton funds, has been engaged by the Manager to periodically review and assess the allocation methodologies to be used solely by the Funds’ Board with respect to the profitability analysis.
The Board noted management’s belief that costs incurred in establishing the infrastructure necessary for the type of mutual fund operations conducted by the Manager and its affiliates may not be fully reflected in the expenses allocated to each Fund in determining its profitability, as well as the fact that the level of profits, to a certain extent, reflected
operational cost savings and efficiencies initiated by management. The Board also noted management’s expenditures in improving shareholder services provided to the Funds, as well as the need to implement systems and meet additional regulatory and compliance requirements resulting from recent SEC and other regulatory requirements.
The Board also considered the extent to which the Manager and its affiliates might derive ancillary benefits from fund operations, including revenues generated from transfer agent services, potential benefits resulting from personnel and systems enhancements necessitated by fund growth, as well as increased leverage with service providers and counterparties. Based upon its consideration of all these factors, the Board concluded that the level of profits realized by the Manager and its affiliates from providing services to each Fund, particularly in light of the short period of operation, was not excessive in view of the nature, extent and quality of services provided to each Fund.
Economies of Scale
The Board reviewed and considered the extent to which the Manager may realize economies of scale, if any, as each Fund grows larger and whether the Fund’s management fee structure reflects any economies of scale for the benefit of shareholders. The Board considered management’s view that any analyses of potential economies of scale in managing a particular fund are inherently limited in light of the joint and common costs and investments the Manager incur across the Franklin Templeton family of funds as a whole. The Board also noted that the Funds commenced operations on February 5, 2016 and that, as of December 31, 2018, each Fund’s net assets were approximately $12 million or below. The Board recognized that there would not likely be any economies of scale until each Fund’s assets grow.
Conclusion
Based on its review, consideration and evaluation of all factors it believed relevant, including the above-described factors and conclusions, the Board unanimously approved the continuation of each Management Agreement for an additionalone-year period.
Proxy Voting Policies and Procedures
The Trust’s investment manager has established Proxy Voting Policies and Procedures (Policies) that the Trust uses to determine how to vote proxies relating to portfolio
| | | | |
| | | | | |
| 62 | | Annual Report | | nextstepfunds.com |
FRANKLIN FUND ALLOCATOR SERIES
SHAREHOLDER INFORMATION
securities. Shareholders may view the Trust’s complete Policies online at franklintempleton.com. Alternatively, shareholders may request copies of the Policies free of charge by calling the Proxy Group collect at (954)527-7678 or by sending a written request to: Franklin Templeton Companies, LLC, 300 S.E. 2nd Street, Fort Lauderdale, FL 33301, Attention: Proxy Group. Copies of the Trust’s proxy voting records are also made available online at franklintempleton.com and posted on the U.S. Securities and Exchange Commission’s website at sec.gov and reflect the most recent12-month period ended June 30.
Quarterly Statement of Investments
The Trust files a complete statement of investments with the U.S. Securities and Exchange Commission for the first and third quarters for each fiscal year as an exhibit to its report on FormN-PORT. Shareholders may view the filed FormN-PORT by visiting the Commission’s website at sec.gov. The filed form may also be viewed and copied at the Commission’s Public Reference Room in Washington, DC. Information regarding the operations of the Public Reference Room may be obtained by calling(800) SEC-0330.
Householding of Reports and Prospectuses
You will receive each Fund’s financial reports every six months as well as an annual updated summary prospectus (prospectus available upon request). To reduce Fund expenses, we try to identify related shareholders in a household and send only one copy of the financial reports and summary prospectus. This process, called “householding,” will continue indefinitely unless you instruct us otherwise. If you prefer not to have these documents householded, please call us at (800)632-2301. At any time you may view current prospectuses/summary prospectuses and financial reports on our website. If you choose, you may receive these documents through electronic delivery.
| | | | |
| | | | | |
| nextstepfunds.com | | Annual Report | | 63 |
This page intentionally left blank.
Authorized for distribution only when accompanied or preceded by a summary prospectus and/or prospectus. Investors should carefully consider a fund’s investment goals, risks, charges and expenses before investing. A prospectus contains this and other information; please read it carefully before investing.
To help ensure we provide you with quality service, all calls to and from our service areas are monitored and/or recorded.
| | | | | | |
| | | |
| | | | |
 | | Annual Report Franklin Fund Allocator Series | | |
| | | | | | |
| | Investment Manager | | Distributor | | Shareholder Services |
| | Franklin Advisers, Inc. | | Franklin Templeton Distributors, Inc. | | (800)632-2301 |
| | | | (800) DIAL BEN®/342-5236 | | |
| | | | nextstepfunds.com | | |
| | |
| © 2019 Franklin Templeton Investments. All rights reserved. | | FAS5 A 07/19 |
Item 2. Code of Ethics.
(a) The Registrant has adopted a code of ethics that applies to its principal executive officers and principal financial and accounting officer.
(c) N/A
(d) N/A
(f) Pursuant to Item 13 (a) (1), the Registrant is attaching as an exhibit a copy of its code of ethics that applies to its principal executive officers and principal financial and accounting officer.
Item 3. Audit Committee Financial Expert.
(a) (1) The Registrant has an audit committee financial expert serving on its audit committee.
(2) The audit committee financial expert is Mary C. Choksi and she is “independent” as defined under the relevant Securities and Exchange Commission Rules and Releases.
Item 4. Principal Accountant Fees and Services.
(a) Audit Fees
The aggregate fees paid to the principal accountant for professional services rendered by the principal accountant for the audit of the registrant’s annual financial statements or for services that are normally provided by the principal accountant in connection with statutory and regulatory filings or engagements were $210,527 for the fiscal year ended May 31, 2019 and $247,911 for the fiscal year ended May 31, 2018.
(b) Audit-Related Fees
There were no fees paid to the principal accountant for assurance and related services rendered by the principal accountant to the registrant that are reasonably related to the performance of the audit of the registrant’s financial statements and are not reported under paragraph (a) of Item 4.
There were no fees paid to the principal accountant for assurance and related services rendered by the principal accountant to the registrant’s investment adviser and any entity controlling, controlled by or under common control with the investment adviser that provides ongoing services to the registrant that are reasonably related to the performance of the audit of their financial statements.
(c) Tax Fees
There were no fees paid to the principal accountant for professional services rendered by the principal accountant to the registrant for tax compliance, tax advice and tax planning.
The aggregate fees paid to the principal accountant for professional services rendered by the principal accountant to the registrant’s investment adviser and any entity controlling, controlled by or under common control with the investment adviser that provides ongoing services to the registrant for tax compliance, tax advice and tax planning were $25,000 for the fiscal year ended May 31, 2019 and $0 for the fiscal year ended May 31, 2018. The services for which these fees were paid included professional fees in connection with tax treatment of equipment lease transactions, professional fees in connection with an Indonesia withholding tax refund claim and tax consulting services related to the operating agreement and term sheet for the launch of a new fund.
(d) All Other Fees
The aggregate fees paid to the principal accountant for products and services rendered by the principal accountant to the registrant not reported in paragraphs (a) - (c) of Item 4 were $0 for the fiscal year ended May 31, 2019 and $15 for the fiscal year ended May 31, 2018. The services for which these fees were paid included review of materials provided to the fund Board in connection with the investment management contract renewal process.
The aggregate fees paid to the principal accountant for products and services rendered by the principal accountant to the registrant’s investment adviser and any entity controlling, controlled by or under common control with the investment adviser that provides ongoing services to the registrant not reported in paragraphs (a) - (c) of Item 4 were $24,000 for the fiscal year ended May 31, 2019 and $14,000 for the fiscal year ended May 31, 2018. The services for which these fees were paid included the issuance of an Auditor’s Certificate for South Korean regulatory shareholders disclosures, assets under management certification, and benchmarking services in connection with the ICI TA survey.
(e) (1) The registrant’s audit committee is directly responsible for approving the services to be provided by the auditors, including:
(i) pre-approval of all audit and audit related services;
(ii) pre-approval of allnon-audit related services to be provided to the Fund by the auditors;
(iii) pre-approval of allnon-audit related services to be provided to the registrant by the auditors to the registrant’s investment adviser or to any entity that controls, is controlled by or is under common control with the registrant’s investment adviser and that provides ongoing services to the registrant where thenon-audit services relate directly to the operations or financial reporting of the registrant; and
(iv) �� establishment by the audit committee, if deemed necessary or appropriate, as an alternative to committeepre-approval of services to be provided by the auditors, as required by paragraphs (ii) and (iii) above, of policies and procedures to permit such services to bepre-approved by other means, such as through establishment of guidelines or by action of a designated member or members of the committee; provided the policies and procedures are detailed as to the
particular service and the committee is informed of each service and such policies and procedures do not include delegation of audit committee responsibilities, as contemplated under the Securities Exchange Act of 1934, to management; subject, in the case of (ii) through (iv), to any waivers, exceptions or exemptions that may be available under applicable law or rules.
(e) (2) None of the services provided to the registrant described in paragraphs (b) - (d) of Item 4 were approved by the audit committee pursuant to paragraph (c) (7) (i) (C) of Rule2-01 of regulationS-X.
(f) No disclosures are required by this Item 4 (f).
(g) The aggregatenon-audit fees paid to the principal accountant for services rendered by the principal accountant to the registrant and the registrant’s investment adviser and any entity controlling, controlled by or under common control with the investment adviser that provides ongoing services to the registrant were $49,000 for the fiscal year ended May 31, 2019 and $14,015 for the fiscal year ended May 31, 2018.
(h) The registrant’s audit committee of the board has considered whether the provision ofnon-audit services that were rendered to the registrant’s investment adviser (not including anysub-adviser whose role is primarily portfolio management and is subcontracted with or overseen by another investment adviser), and any entity controlling, controlled by, or under common control with the investment adviser that provides ongoing services to the registrant that were notpre-approved pursuant to paragraph (c) (7) (ii) of Rule2-01 of RegulationS-X is compatible with maintaining the principal accountant’s independence.
| | |
| Item 5. Audit Committee of Listed Registrants. | | N/A |
| |
| Item 6. Schedule of Investments. | | N/A |
| |
| Item 7. Disclosure of Proxy Voting Policies and Procedures for Closed-End Management Investment Companies. | | N/A |
| |
| Item 8. Portfolio Managers ofClosed-End Management Investment Companies. | | N/A |
| |
| Item 9. Purchases of Equity Securities byClosed-End Management Investment Company and Affiliated Purchasers. | | N/A |
Item 10. Submission of Matters to a Vote of Security Holders.
There have been no changes to the procedures by which shareholders may recommend nominees to the Registrant’s Board of Trustees that would require disclosure herein.
Item 11. Controls and Procedures.
(a) Evaluation of Disclosure Controls and Procedures. The Registrant maintains disclosure controls and procedures that are designed to provide reasonable assurance that information required to be disclosed in the Registrant’s filings under the Securities Exchange Act of 1934, as amended, and the Investment Company Act of 1940 is recorded, processed, summarized and reported within the periods specified in the rules and forms of the Securities and Exchange Commission. Such information is accumulated and communicated to the Registrant’s management, including its principal executive officer and principal financial officer, as appropriate, to allow timely decisions regarding required disclosure. The Registrant’s management, including the principal executive officer and the principal financial officer, recognizes that any set of controls and procedures, no matter how well designed and operated, can provide only reasonable assurance of achieving the desired control objectives.
Within 90 days prior to the filing date of this Shareholder Report onForm N-CSR, the Registrant had carried out an evaluation, under the supervision and with the participation of the Registrant’s management, including the Registrant’s principal executive officer and the Registrant’s principal financial officer, of the effectiveness of the design and operation of the Registrant’s disclosure controls and procedures. Based on such evaluation, the Registrant’s principal executive officer and principal financial officer concluded that the Registrant’s disclosure controls and procedures are effective.
(b) Changes in Internal Controls. There have been no changes in the Registrant’s internal control over financial reporting that occurred during the period covered by this report that has materially affected, or is reasonably likely to materially affect the internal control over financial reporting.
| | |
| Item 12. Disclosure of Securities Lending Activities forClosed-End Management Investment Company. | | N/A |
Item 13. Exhibits.
(a) (1) Code of Ethics
(a) (2) Certifications pursuant to Section 302 of the Sarbanes-Oxley Act of 2002 of Matthew T. Hinkle, Chief Executive Officer – Finance and Administration, and Gaston Gardey, Chief Financial Officer and Chief Accounting Officer
(b) Certifications pursuant to Section 906 of the Sarbanes-Oxley Act of 2002 of Matthew T. Hinkle, Chief Executive Officer – Finance and Administration, and Gaston Gardey, Chief Financial Officer and Chief Accounting Officer
SIGNATURES
Pursuant to the requirements of the Securities Exchange Act of 1934 and the Investment Company Act of 1940, the registrant has duly caused this report to be signed on its behalf by the undersigned, thereunto duly authorized.
FRANKLIN FUND ALLOCATOR SERIES
By S\MATTHEW T. HINKLE
Matthew T. Hinkle
Chief Executive Officer – Finance and Administration
Date July 31, 2019
Pursuant to the requirements of the Securities Exchange Act of 1934 and the Investment Company Act of 1940, this report has been signed below by the following persons on behalf of the registrant and in the capacities and on the dates indicated.
By S\MATTHEW T. HINKLE
Matthew T. Hinkle
Chief Executive Officer – Finance and Administration
Date July 31, 2019
By S\GASTON GARDEY
Gaston Gardey
Chief Financial Officer and Chief Accounting Officer
Date July 31, 2019