 Merrill Lynch Power & Gas Leaders Conference C. John Wilder Chairman and CEO September 26, 2006 Exhibit 99.1 |
 1 Safe Harbor Statement This presentation contains forward-looking statements, which are subject to various risks and uncertainties. Discussion of risks and uncertainties that could cause actual results to differ materially from management's current projections, forecasts, estimates and expectations is contained in the company's SEC filings. In addition to the risks and uncertainties set forth in the company's SEC filings, the forward-looking statements in this presentation could be affected by actions of rating agencies, delays in implementing any future price-to-beat fuel factor adjustments, the ability of the company to attract and retain profitable customers, changes in demand for electricity, the impact of weather, changes in wholesale electricity prices or energy commodity prices, the company’s ability to hedge against changes in commodity prices and market heat rates, the company’s ability to fund certain investments described herein, delays in approval of, or failure to obtain, air and other environmental permits, changes in competitive market rules, changes in environmental laws or regulations, changes in electric generation and emissions control technologies, changes in projected demand for electricity in Texas, the ability of the company to attract and retain skilled labor for planning and building new generating units, changes in the cost and availability of materials necessary for the planned new generation units, the ability of the company to manage the significant construction program to a timely conclusion with limited cost overruns, the ability of the company to implement the initiatives that are part of its performance improvement program and growth strategy, and the terms under which the company executes those initiatives, and the decisions made and actions taken as a result of the company’s financial and growth strategies. Updates on the progress of the company’s power generation development program are expected to be provided on a quarterly basis. Today’s presentation does not include updates on the progress of the program. |
 2 Competition Across The Texas Electric Value Chain Competition in wholesale markets Competition in retail markets Deregulation has created intense competition and retail switching Expected margins continue to remain below those seen in other competitive markets TXU continues to focus on delivering value to its customers and profitably growing share Successful generation construction requires high performance across the entire value chain TXU has developed a scaled program needed to execute in this complex environment It is unlikely that other developers will build in the near term |
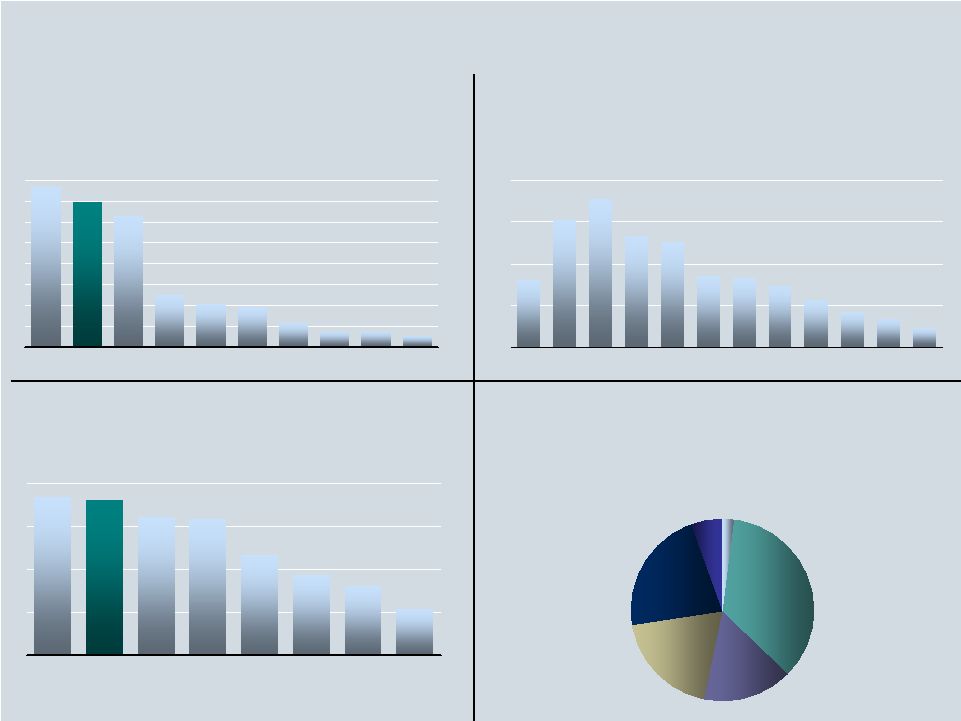 3 ERCOT Requires New Baseload Generation To Meet The Needs Of A Rapidly Growing Economy And Aging Generation Fleet 16 30 36 27 25 17 16 15 11 9 7 5 00 02 04 06E 08E 10E 6.3 5.7 5.2 2.4 2.0 2.0 1.4 1.1 0.9 1.1 CA TX FL AZ GA NC VA NV WA MD …and stressing an aging generation fleet ERCOT generation fleet age 06; Percent of generation capacity 35% 16% 6% 2% 22% 19% >50yrs <10yrs 10-20yrs 21-30yrs 31-40yrs 41-50yrs 100% = 78 GW …that will deplete the current reserve margins… ERCOT reserve margins 00-11E; Percent Texas has a rapidly growing population… Total population growth 05-15E; Millions of people …continuing to keep gas on the margin… 06; Percent of time gas on the margin 92 80 79 58 47 40 90+ 27 FRCC ERCOT WECC NEPOOL Entergy SPP PJM VACAR |
  4 Failure to execute along any one of these dimensions can lead to significant value destruction Value creation through new build Construction Scale is necessary to negotiate the tight world-wide markets for raw materials and labor Operations Value creation requires consistent top decile operations across reliability and cost Fuel sourcing Long-term off-take Hedging/long-term PPA’s are necessary to stabilize cash flows to raise capital and lock in value Tight rail fundamentals require long-term scale purchases to negotiate economic rates Successful Execution Of A New Generation Facility Requires High Performance Across The Entire Value Chain |
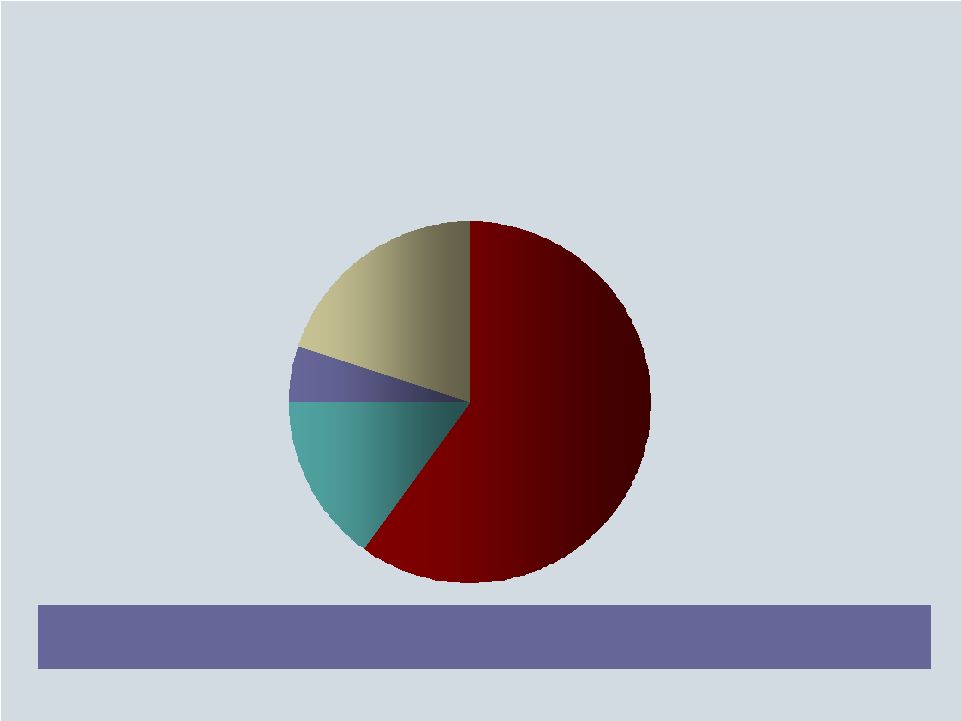 5 Competition For New Generation Spans Not Only Across Regions, But Across The World Net new coal generation capacity 05-10E; Percent Over the next 5 years, more than 90% of total coal generation development will be built outside of the U.S. Source: EIA 15 5 60 20 China India U.S. Other 100%= 183 GW |
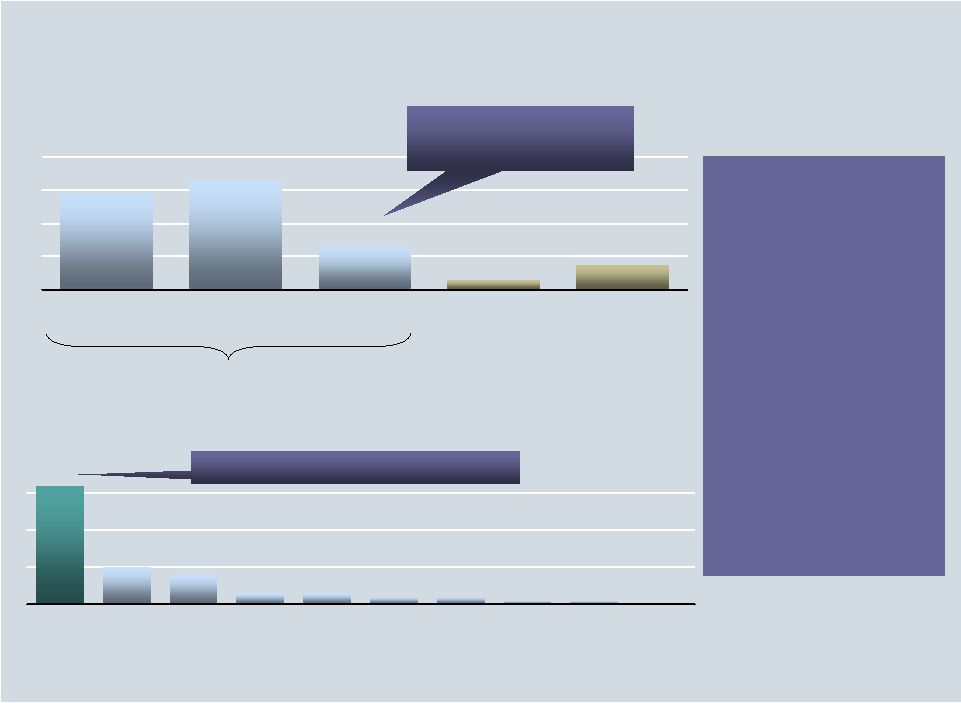
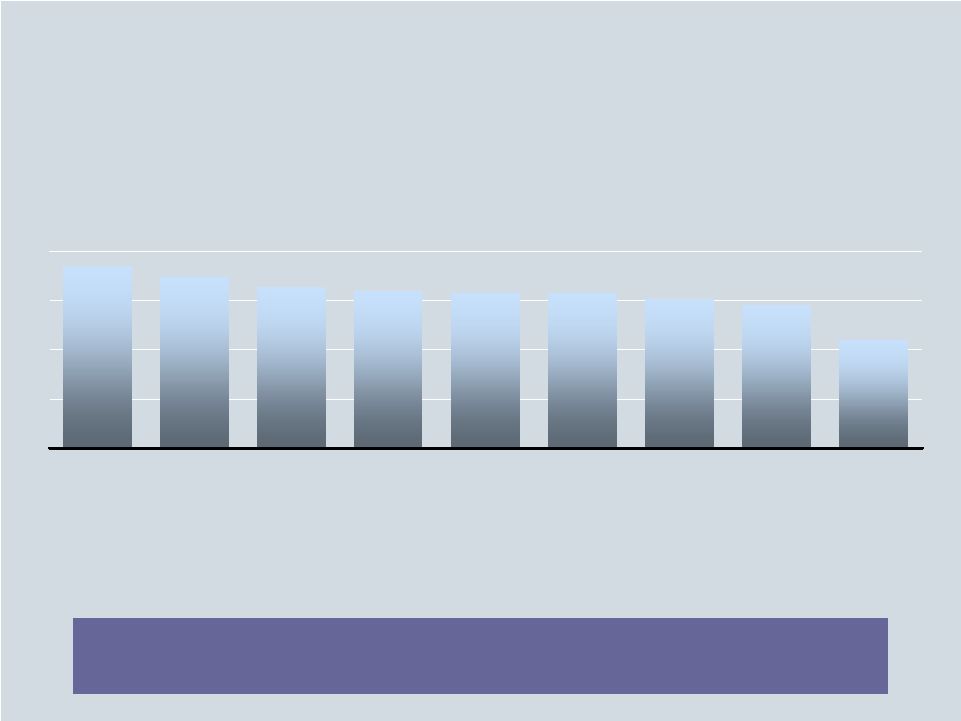 6 ~1,100 1,450 1,518 1,576 1,576 1,600 1,635 1,733 1,850 It Is Very Difficult For Sub-Scale Builders To Drive Down Cost And Shorten Schedule… Recent anecdotes SCPC construction cost estimates/targets 05-06; $/KW A B C D E F G Time from permit to online 39 45 53 54 59 47 - Recent evidence suggests cost escalations of up to 67% from initial estimates TXU reference plant target 30-32 |
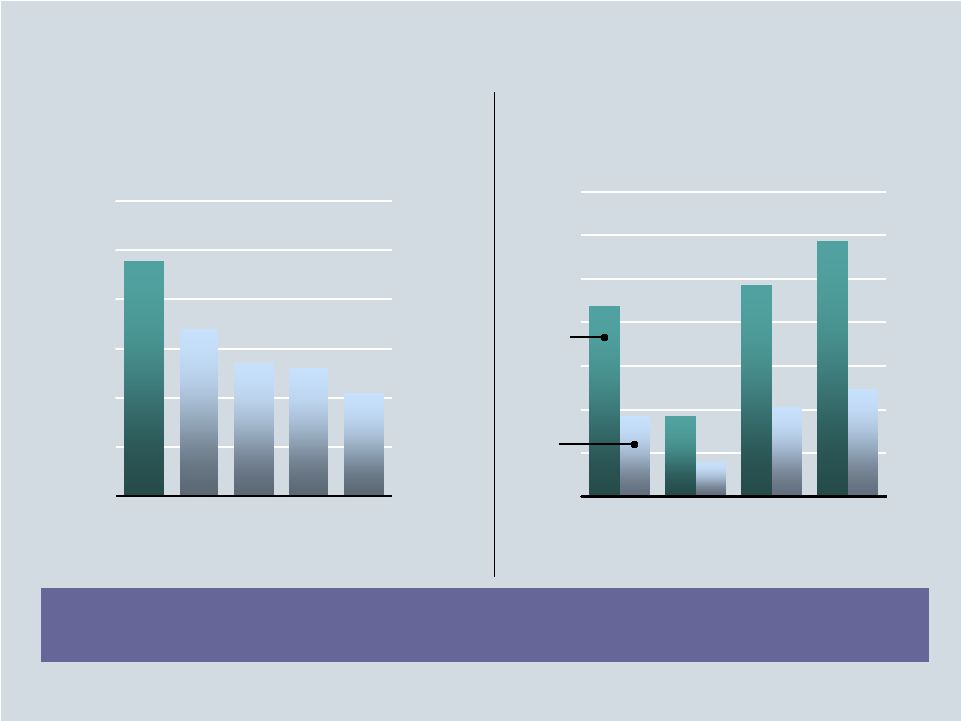 7 … And To Negotiate Economic Rail Rates, Especially With Captive Rail 21 26 27 34 48 Powder River Basin (PRB) coal consumption 05; Million tons 1 TXU includes current consumption, expected fuel switching and planned ERCOT PRB reference plants. Source: MSHA and commercial information, CURE TXU 1 Ameren AEP Southern Xcel TXU will become the largest shipper of PRB coal and can have dual rail access at all units Implications of captive rail 01; $/ton 44 18 48 59 18 8 20 25 Farming Coal Chemicals Lumber Captive Non- captive |
 8 High Performance Operations Are Needed To Drive Down The Total Cost Of Production Lignite operations performance 1 03-08E; Mixed measures (n=140) 4 th Quartile 3 rd Quartile Median 1 st Quartile Top 08E 03 Capacity factor (%) 58.6 68.7 76.2 96.3 15.65 05 84.6 #14 89.8 #4 92 Non-fuel O&M ($/MWh) 3.35 #34 3.53 #37 2.60 44.56 6.22 4.47 3.52 1.92 Every 1% improvement in capacity factor is worth $27/KW of value Every $1/MWh reduction in non-fuel O&M is worth $68/KW of value 1 Normalized for scrubbing and fuel type |
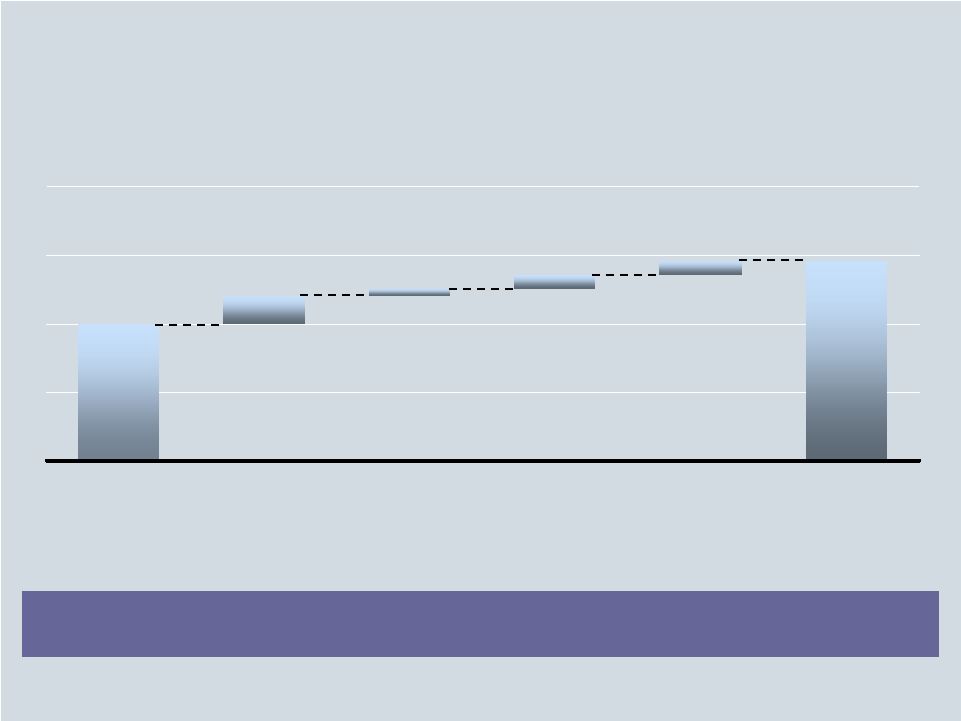 9 Taken Together, TXU Will Be Able To Provide Lower Cost Power Than Its Competitors The TXU model provides a ~$19/MWh all-in cost advantage over the typical developer Breakeven power price 06E; Index (TXU=1.00) 1.00 1.46 0.11 0.09 0.06 0.20 TXU reference plant Capital cost disadvantage Operational disadvantage Build schedule disadvantage Typical competitor plant Fuel disadvantage |
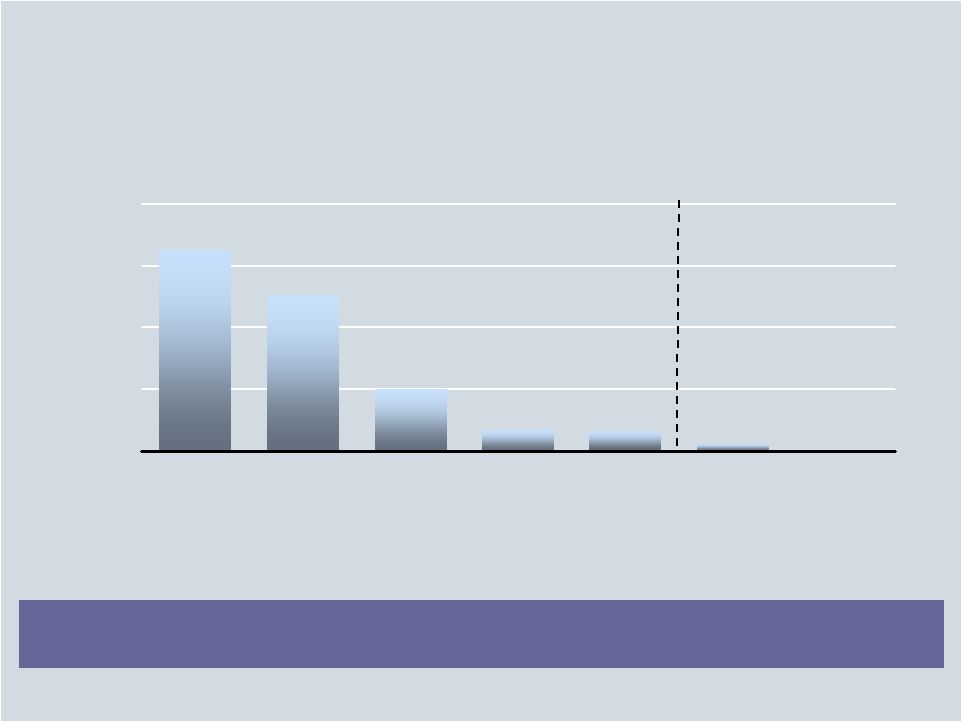 10 Liquidity of NYMEX gas market 06-12; Average daily contract transactions 9,750 7,550 3,000 1,025 975 350 0 The Shorter Construction Timeline Allows TXU To Access The Forward Gas Market To Economically Hedge Output 06 The drop off in liquidity makes it difficult for a plant coming online in 2012 or later to materially hedge its output through the NYMEX market 07 08 09 10 11 12 All TXU plants online Competitor plants online DevCo position relative to total market (Percent) 1.7 2.3 5.5 16.1 16.9 47.1 n/a |
 11 Based Upon A Shorter Construction Schedule And Lower Costs Of Production, TXU Is The Natural Provider For Long-Term PPAs In Texas Incremental Texas municipal and cooperative load 05-15E; Percent TXU expects to sell forward approximately 75% of the incremental municipal and cooperative load 31% 42% 27% Active negotiations Targeted demand Demand not targeted (n=15 counterparties) 100% = 3.6 GW |
 12 TXU’s development strategy significantly decreases the risks associated with high capital cost, long lead-time coal generation investments Distribution of value 06; Percent of trials NPV 06; $ millions P (NPV < 0) = 75% P (NPV < 0) = 5% TXU reference plant Typical developer 0 The Combination Of Superior Performance And Ability To Hedge Will Make TXU’s Investment Thesis Attractive To Both Debt And Equity Investors |
 13 Competition Across The Texas Electric Value Chain Competition in wholesale markets Competition in retail markets Deregulation has created intense competition and retail switching Expected margins continue to remain below those seen in other competitive markets TXU continues to focus on delivering value to its customers and profitably growing share Successful generation construction requires high performance across the entire value chain TXU has developed a scaled program needed to execute in this complex environment It is unlikely that other developers will build in the near term |
 14 Net incumbent switch rates Aug 06; Percent of load 1 73 82 32 7 19 Net residential incumbent switch rates Oct 05-Aug 06; Percent of load 1 32 8 10 3 3 0.3 0.0 TX MA NY CT PA DC MD OH CA NJ 2 2 0.3 1 Texas data as of 08/31/06 per ERCOT - business switching reflects load whereas residential reflects customer counts; NJ as of 7/06 from NJ Board of Public Utilities; PA as of 10/05 from PA PUC; data for other states from July/August 06 KEMA Retail Energy Foresight Report and ranges from 3/31/06-7/21/06. Ohio excludes load attributable to municipal aggregation per OPUC August 2005 report. Source: KEMA, FCC, CERA, NJ Board of Public Utilities, Ohio PUC, ERCOT, Texas PUC 2003 Scope of Competition Data Responses ERCOT retail switching Large Business Small-Med Business Residential TX Local phone after 4 years Long distance after 4 years The Texas Electric Retail Market Has Seen Significant Switching, Making Texas The Only Functioning Competitive Retail Market 4.6X local phone 1.7X long distance “I know of no society that has been marked by a large measure of political freedom, and that has not also used something comparable to a free market to organize the bulk of economic activity.” Milton Friedman 10X the nine region average |
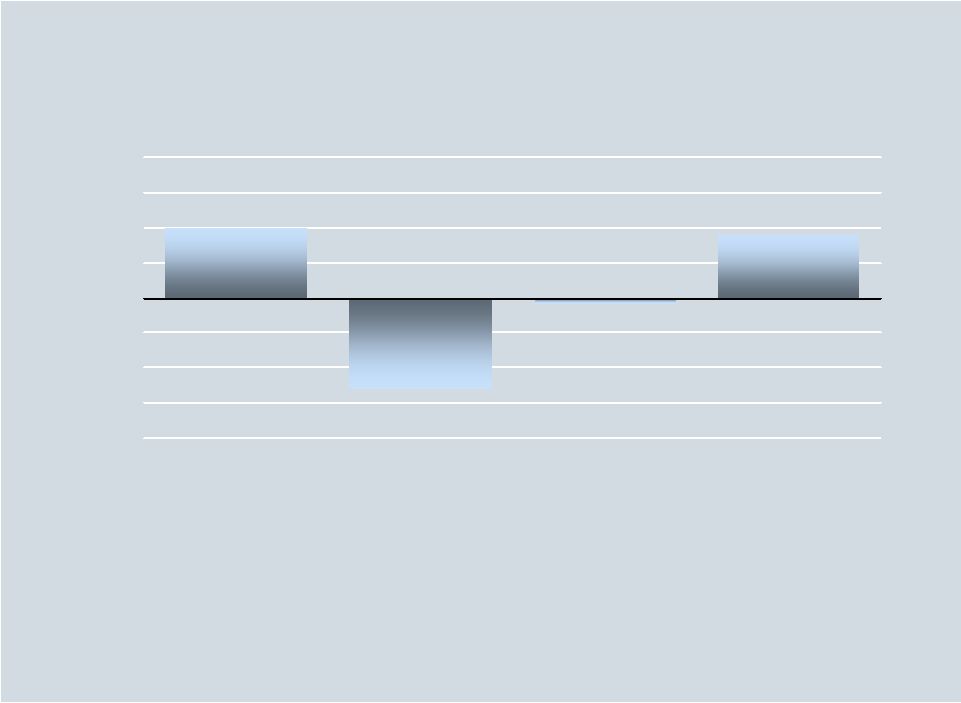 15 Competition Continues To Maintain Forward Margins At Levels Below Those Seen At Market Open 1 Based on a residential customer with 1,500kWh average usage per month and PUC standard load profile; energy cost based on NYMEX 12-month strip 2 NYMEX closing prices as of 9/15/06 North Texas incumbent retail net margins 1 02-07E; Index (1/1/02=1.0) 07E Before 10/05 filing Retail market open (1/1/02) Post 10/05 filing NYMEX Gas Fuel factor gas 1.0 -1.3 -0.1 0.9 $7.99 2 $11.53 $11.53 $11.53 $11.53 $7.87 $3.11 $3.11 |
 16 North Texas Has The Most Competitive Rate Structure… CPL First Choice 2 TXU Energy Reliant WTU 14.7 14.6 Annualized Price to Beat 1 06; Cents/kWh 16.2 19.0 17.5 Incumbent customers 4 (Thousands) 13.2 14.0 16.0 3 16.3 3 15.4 Best available price from incumbent TXU Energy leads the industry by providing both the lowest PTB and the lowest best available price among incumbents in their historical service areas 1,823 129 1,222 429 89 1 Annualized residential price at 1,500 kWh average monthly usage pattern based upon PTB in effect as of 9/21/06. 2 First Choice Power has filed for a PTB fuel factor adjustment that will result in a lower PTB if approved by the PUCT. 3 Existing residential customers as of 6/30/06 began paying this price on 7/1/06. 4 As of 12/31/05 per PUCT. Source: PUCT, TXU Energy |
 17 12 13 14 15 16 17 18 19 Residential single family offers from incumbent providers 1 06; Cents/kWh Average Undiscounted PTB 16.4 cents/kWh TXU continues to focus on delivering its customers the most value at the lowest price … And TXU Energy Offers 10 Of The 11 Lowest Single Family Prices Among Incumbents In Their Historical Areas TXU PTB CPL PTB 3 WTU PTB 3 RRI PTB FC PTB 2 1 For residential customers with an average usage of 1,500 kWh per month (average for single family), excluding any applicable one-time incentives. Time periods for prices and offers shown vary. Shows all known offers currently available for customer enrollment by incumbent providers in their historical service areas including renewable products as of 9/22/06. TXU Energy low income discount funded by TXU Energy. 2 First Choice Power has filed for a PTB fuel factor adjustment that will result in a lower PTB if approved by the PUCT. 3 Denotes full, undiscounted Price to Beat. CPL and WTU provide existing Residential customers as of 6/30/06 a discounted PTB (Direct Electricity Plan ) which is priced at 16.0 and 16.3 cents/kWh respectively in the two service areas. Both price points are included on the chart. tm |
 18 TXU Continues To Deliver Its Customers Superior Service And Value 8.2 3.0 Apr 06 Jul 06 TXU continues to improve the value it delivers to its customers Relative customer satisfaction with ERCOT retail providers in incumbent territory 06; Ratio of very satisfied responses/very unsatisfied responses 3.7 3.0 Apr 06 Jul 06 4.7 2.8 Apr 06 Jul 06 5.5 3.1 Apr 06 Jul 06 Relative customer value from ERCOT retail providers in incumbent territory 06; Ratio of excellent and very good responses/poor responses 3.3 2.3 Apr 06 Jul 06 4.0 2.1 Apr 06 Jul 06 TXU Incumbent A Incumbent B TXU Incumbent A Incumbent B |
 19 Competition Across The Texas Electric Value Chain Competition in wholesale markets Competition in retail markets Deregulation has created intense competition and retail switching Expected margins continue to remain below those seen in other competitive markets TXU continues to focus on delivering value to its customers and profitably growing share Successful generation construction requires high performance across the entire value chain TXU has developed a scaled program needed to execute in this complex environment It is unlikely that other developers will build in the near term |