UNITED STATES
SECURITIES AND EXCHANGE COMMISSION
Washington, D.C. 20549
FORM N-CSR
CERTIFIED SHAREHOLDER REPORT OF REGISTERED
MANAGEMENT INVESTMENT COMPANIES
Investment Company Act file number 811-07831
FMI Funds, Inc.
(Exact name of registrant as specified in charter)
100 East Wisconsin Avenue, Suite 2200
Milwaukee, WI 53202
(Address of principal executive offices) (Zip code)
Ted D. Kellner
Fiduciary Management, Inc.
100 East Wisconsin Avenue, Suite 2200
Milwaukee, WI 53202
(Name and address of agent for service)
(414) 226-4555
Registrant's telephone number, including area code:
Date of fiscal year end: September 30
Date of reporting period: September 30, 2009
Item 1. Reports to Stockholders.
ANNUAL REPORT
September 30, 2009
FMI
Focus Fund
A NO-LOAD
MUTUAL FUND
FMI Focus Fund
Ted D. Kellner, CFA
President
October 30, 2009
Dear Fellow Shareholders:
In our letter to you on October 28, 2008, as both the economy and the securities markets were in precipitous declines, we commented, “we do believe, however, that the foundation is being laid for excellent investment returns in the next two to four years.” As detailed in the enclosed letter from Rick and Glenn, the returns for the first nine months of 2009 have indeed been excellent, with the Fund up 35.80%. More important, however, are the long-term returns, which significantly exceed the various benchmarks against which the FMI Focus Fund is judged – and can be seen in the tables in Rick and Glenn’s letter. Additionally, the Fund’s performance has been recognized by several rating services around the country in the past number of months due to both its short and long-term performance.
Most recently, Andrew Gogerty of Morningstar, in his June 26, 2009 “Morningstar’s Take” on the FMI Focus Fund, commented, “The cornerstone of this small-blend fund’s appeal is a prudent investment approach,” and that “The fund’s long-term record remains one of the category’s best, and the decision to lower its management fee from 1.25% to 1.00% in January 2009 increases the chance that it will continue to outperform. This fund earns our recommendation.” We are extremely pleased with the strong relative rates of return of the FMI Focus Fund and the recognition it is receiving.
Another very important investment yardstick is the “real” rate of return that we as shareholders enjoy. Real rate of return is defined as the return over and above inflation, and this is important to us as investors because it enhances the purchasing power of our dollars. As noted on the return table on page 2, the annualized 10- year return for the Fund is 9.51%, while inflation increased by 2.55% per year over the same period, for a real rate of return of 6.96%. Many investors, including us, view these real rates of return to be more important than the aforementioned relative rates of return, and quite strong from an investment perspective. Rick and Glenn have focused their efforts on both of these investment metrics, and over time, they have enhanced the investment returns for all of us as shareholders. In that regard, their stewardship of the assets of the FMI Focus Fund, as noted by Morningstar, has indeed been noteworthy.
While enjoying a very strong period of performance, Rick and Glenn have positioned the portfolio in companies that they believe will serve us well in the investment environment of today, and for the next twelve months, as detailed in their letter to shareholders.
As always, we thank you very much for your continued support of, and investment in, the FMI Focus Fund.
Sincerely,
Ted D. Kellner, CFA
President
100 E. Wisconsin Ave., Suite 2200 • Milwaukee, WI 53202 • 414-226-4555
www.fmifunds.com
 |  |
| Richard E. Lane | Glenn W. Primack |
| Portfolio Manager | Portfolio Manager |
October 12, 2009
Dear Fellow Shareholders,
The FMI Focus Fund had one of its strongest quarters in recent memory, rising 25.25% vs 19.28% for the Russell 2000 Index. Year to date, the Focus Fund is up 35.80% against 22.43% for the Russell 2000. For perspective, the S & P 500 Index has returned 19.26% year to date through September 30th. Technology (Arrow Electronics, Inc. - ARW, Altera Corp. - ALTR, MKS Instruments, Inc. - MKSI, Citrix Systems, Inc. - CTXS), consumer discretionary (Brunswick Corp. - BC, Winnebago Industries, Inc. - WGO, Royal Caribbean Cruises Ltd. - RCL, Nordstrom, Inc. - JWN, Zumiez Inc. - ZUMZ), and industrials (Cytec Industries Inc. - CYT, Kennametal Inc. - KMT) led the charge. Merger and acquisition activity picked up in the quarter as well. Our holding in Omniture, Inc. (OMTR) is in the process of being acquired by Adobe Systems Inc. (ADBE) (more on this later in the letter). On the other side of the acquisition ledger, our holding in MB Financial, Inc. (MBFI), the Chicago-based regional bank, actually doubled in price on the heels of an FDIC brokered deal whereby MB picked up the Chicago deposits of bankrupted Corus Bankshares Inc. (CORS) for a nominal price. This transaction greatly strengthened MB’s franchise, indeed, a once in a lifetime opportunity-born out of the financial chaos of the past few years. We are looking very hard at some other analogous opportunities in the banking arena.
THE VALUE OF A $10,000 INVESTMENT IN THE FMI FOCUS FUND FROM
ITS INCEPTION (12/16/96) TO 9/30/09 AS COMPARED TO THE
RUSSELL 2000(1) AND THE RUSSELL 2000 GROWTH(2)
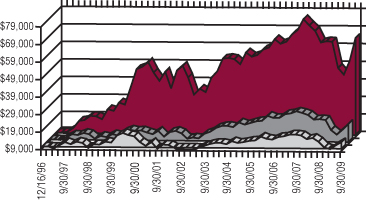 | | FMI Focus Fund $65,429
Russell 2000(1) $20,350
Russell 2000 Growth(2) $13,931 |
Results From Fund Inception (12/16/96) Through 9/30/09
| | | | Annualized Total | Annualized Total | Annualized Total Return* |
| | Total Return* | Total Return* For the | Return* For the 5 | Return* For the 10 | Through 9/30/09 From |
| | Last 3 Months | Year Ended 9/30/09 | Years Ended 9/30/09 | Years Ended 9/30/09 | Fund Inception 12/16/96 |
| FMI Focus Fund | 25.25% | 3.52% | 5.53% | 9.51% | 15.82% |
| Russell 2000 | 19.28% | -9.55% | 2.41% | 4.88% | 5.71% |
| Russell 2000 Growth | 15.95% | -6.32% | 2.91% | 1.10% | 2.63% |
| (1) | The Russell 2000 Index measures the performance of the 2,000 smallest companies in the Russell 3000 Index which comprises the 3,000 largest U.S. companies based on total market capitalization. |
| (2) | The Russell 2000 Growth Index measures the performance of those Russell 2000 companies with higher price-to-book ratios and higher forecasted growth values. |
| * | Total return includes change in share prices and in each case includes reinvestments of any dividends, interest and capital gain distributions. Performance data quoted represents past performance; past performance does not guarantee future results. Investment return and principal value of an investment will fluctuate so that an investor’s shares, when redeemed, may be worth more or less than their original cost. Current performance of the Fund may be lower or higher than the performance quoted. Performance data current to the most recent month end may be obtained by visiting www.fmifunds.com. The graph and the table do not reflect the deduction of taxes that a shareholder would pay on Fund distributions or the redemption of Fund shares. |
Has the financial storm passed?
This is an important question and is obviously on every investor’s mind. As soothsaying is not on our resume, we can only offer an educated guess. We have been saying for some time now that the typical recession lasts twelve to eighteen months, while the one we appear to be emerging from lasted close to two years. Fiscal and monetary policies have set new records with respect to their aggressiveness. Finally, stock prices fell a staggering 50% plus peak to trough, clearly reflecting the severity of the issues from the housing and credit bubbles to the worldwide collapse in lending. The worldwide economic policies put in place to combat the downturn appear to be working and the focus now appears to be just how robust the recovery will be. We have written frequently about the credit bubble and overleveraged consumers, particularly here in the United States. We do think the worst has passed, that we are not in the proverbial eye of the hurricane, but we are paying very close attention “just in case we’re wrong”.
In any event, we put a lot of capital to work last spring when equity prices were under extreme duress. This is the principle reason we are enjoying strong results this year. We made some strategic bets on companies like boat and engine builder Brunswick, RV manufacturer Winnebago, and cruise liner Royal Caribbean. The market feared for the very existence of these companies, seriously pricing in the possibility of failure. The managements of these venerable franchises hardly stood still. They battened down the hatches, leaned out their operations and really focused on cash flow and capital preservation - kudos to these management teams. We also put money to work in cyclicals whose stocks were reflecting Armageddon as well as some terrific secular growth companies like Sapient Corp. (SAPE), the digital advertiser, and Ulta Salon, Cosmetics & Fragrance, Inc. (ULTA), the category killer in cosmetics, at bargain prices.
The market has now had quite a move off the bottom and we have taken a few chips off the table. While we are bottom- up, one-company-at-a-time investors, this has been an extraordinary cycle. One has been forced to spend more time thinking through macro issues. We hope we are near the end of that. However the cycle plays out, we believe last spring’s panic gave us a significant number of great entry points for new positions as well as adding to existing ones.
Rick Lane’s Brazil Experience
One of the great aspects of being in this business is the interesting research trips. I just returned from one of my best, visiting companies in Brazil. In my opinion, China, India, and Brazil will represent the investable growth markets for the balance of my investment career. They are big consumer markets with tens of millions of citizens moving into the middle class. China is a huge player in manufacturing and India in IT. Brazil has all of the above and is very significant in agriculture and energy.
The purpose of my trip was to find ways to play this growth, either through U.S. based companies with operations significant enough to move the needle, or publicly held Brazilian companies in industries in which Broadview Advisors/FMI Focus research staff members have expertise. In many ways, this trip was as big of an eye opener to me as my first trip to China many years ago. Notwithstanding previous South American trips, this one focused on the emerging business in Brazil and a lot of things are coming together all at once in Brazil. Obviously, Rio de Janero just won the 2016 Olympics, but they are also holding the 2014 World Cup games, which many consider to be the biggest sporting event in the world. My understanding is that between the two events, Brazil will need to: build some 26 world class stadiums, double the number of hotels in Rio, build a new mass transit system in Rio, and do all the attendant things countries do to make themselves beautiful to the outside world. As this is the first Olympics ever held in South America, no doubt an enormous effort will be made.
While these are big projects, another simultaneous effort will likely dwarf the sporting events. Petrobras Petroleo Brasileiro, the enormous Brazilian energy company is slated to spend some $175 billion to develop oil and gas fields off of its coast. That is over the next 5 years, a truly staggering number for a country their size. Indeed, and perhaps not surprising, the Chinese are going to help them finance it.
Brazil’s growth prospects were already exceptional prior to the above developments, with them, the prospects are simply amazing! The country has millions of citizens coming into the middle class which is a good thing in and of itself. “Skin in the game” to a bigger percent of the population lends political stability. However, this growing middle class will drive their consumer economy as well. Many of the companies I visited with were also running out of manufacturing capacity and were planning on expanding - quite a concept sitting here in the U.S. with our 65% utilization rate. Brazilians are twice-blessed when it comes to energy because their sugar cane based ethanol actually makes economic sense, some 30% cheaper to produce than our corn based ethanol. They manufacture “flex cars” that burn either fuel and can even be mixed. Financial services are very underpenetrated, really just in their infancy. Home ownership rates seem destined to go up as affordability improves through longer mortgages, lower interest rates and lower down payments (don’t worry, they are a long way from subprime lending standards). Equity ownership is very low in Brazil and reminds me of some European countries in the 1970s and 1980s. As the middle class grows and discovers equities, that can really power a bull market.
So, Brazil is blessed with abundant natural resources and, at least for now, a pragmatic and effective government. Political risk is the principal risk, in my view. I am comfortable with the currency, and in fact, excluding the political risk scenario, Brazil really has nowhere to go but up against the U.S. dollar.
U.S. based companies I visited included portfolio companies Brady Corp. (BRC) and Rockwell Automation, Inc. (ROK). I was impressed with both operations. Both companies will enjoy much faster growth rates in Brazil than in their home markets. I also visited the Brazilian operations of Emerson Electric Co. (EMR) and Johnson Controls Inc. (JCI). We saw several of Brazil’s agriculture companies but perhaps the most interesting were Petrobras, previously mentioned, and WEG S.A., Brazil’s largest motor manufacturer. WEG is located south of Sao Paulo in the “German” part of Brazil. Indeed, WEG has German roots and their operation is the largest facility I have ever seen, encompassing some 10 million square feet under one roof. I actually took a bus ride through it. WEG is vertically integrated to the point of making their own castings in their own foundry, to growing trees to produce their own pallets. Amazing to see! Their vertical integration has given them such a structural cost advantage that they have an 80% market share and have driven the likes of General Electric out of the Brazilian market.
The Petrobras refinery tour and subsequent discussion with several of their engineers yielded a very pleasant discovery-they think very highly of portfolio company Dresser-Rand Group, Inc. (DRC). The scope of the planned capital spending by Petrobras bodes very well for Dresser.
We will, no doubt, have more to say on Brazil and its impact on our companies in future shareholder letters.
Online Advertising
We have asked Aaron Garcia, Broadview’s media analyst, to provide some comments on the Omniture acquisition and our further investment in this sector.
As we briefly mentioned, it was announced in September that Omniture is being acquired by Adobe Systems Inc. for $21.50/share. Omniture is another successful investment in online advertising; an industry that is outperforming traditional advertising through the down cycle and seems poised for a quicker recovery. This is our third investment in the interactive industry that has ended in acquisition. The acquisitions of Aquantive, Digitas, and Omniture by significantly larger and more mature companies showcase the scarcity value of strong interactive franchises as well as the financial opportunity in this fast growing industry. Currently, online spending is outperforming the traditional advertising industry as marketing officers hold flat or grow interactive ad spend while simultaneously cutting television, print and radio. Further, industry commentary suggests that interactive spending will recover more swiftly than traditional mediums from the recession.
Neither our thesis nor our investment appetite has changed in this space. We believe there are few well managed companies in this space with mature management and sustainable business models. Always looking forward, we believe we’ve found another winner with our investment in Sapient Corp. (SAPE). In our opinion, investors have yet to appreciate the changes that SAPE has made in its business model. The marriage of web development with an interactive agency address one of the largest untapped areas of growth online, branded advertising. The interactive advertising industry has developed along direct response - search, email marketing, lead generation, etc. - due to its measurability. However, advertisers are frustrated with a lack of availability of branded advertising online even as their confidence in television, print and radio has fallen. Banners are ineffective. Search is too limited for creative interaction with a consumer. Video is still developing. We believe that as agencies design interactive, entertaining, and useful web applications and sites for a consumer, branding through this experience can be very effective. Sapient is one of the few interactive agencies that understands this need and is poised to capitalize on it.
******
Our Board of Directors has declared a distribution effective October 29, 2009 of $0.028 per share from net investment income payable October 30, 2009 to shareholders of record on October 28, 2009.
In closing, we would sincerely like to thank our loyal shareholders. This past year has been harrowing for all of us, but it has also created many outstanding investment opportunities for those of us who kept our heads and wits about us. Indeed, there may be future challenges ahead, but we believe our consistent discipline, both on the buy and the sell side of the equation, will put us in good stead.
Take Care,
 |  |
| Richard E. Lane, CFA | Glenn W. Primack |
| Portfolio Manager | Portfolio Manager |
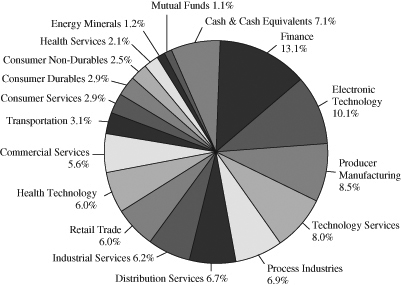
FMI Focus Fund
COST DISCUSSION
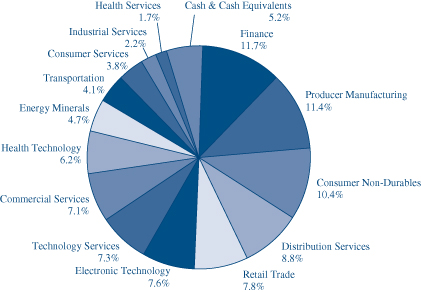
Industry Sectors as of September 30, 2009
As a shareholder of the Fund you incur ongoing costs, including management fees and other Fund expenses. You do not incur transaction costs such as sales charges (loads) on purchase payments, reinvested dividends, or other distributions; redemption fees; and exchange fees because the Fund does not charge these fees. This example is intended to help you understand your ongoing costs (in dollars) of investing in FMI Focus Fund and to compare these costs with the ongoing costs of investing in other mutual funds.
The example is based on an investment of $1,000 invested at the beginning of the period and held for the entire period from April 1, 2009 through September 30, 2009.
Actual Expenses
The first line of the table below provides information about actual account values and actual expenses. You may use the information in this line, together with the amount you invested, to estimate the expenses that you paid over the period. Simply divide your account value by $1,000 (for example, an $8,600 account value divided by $1,000 = 8.6), then multiply the result by the number in the first line under the heading entitled “Expenses Paid During Period” to estimate the expenses you paid on your account during this period.
In addition to the costs highlighted and described below, the only Fund transaction costs you might currently incur would be wire fees ($15 per wire), if you choose to have proceeds from a redemption wired to your bank account instead of receiving a check. Additionally, U.S. Bank charges an annual processing fee ($15) if you maintain an IRA account with the Fund. To determine your total costs of investing in the Fund, you would need to add any applicable wire or IRA processing fees you’ve incurred during the period to the costs provided in the example at the end of this article.
Hypothetical Example for Comparison Purposes
The second line of the table below provides information about hypothetical account values and hypothetical expenses based on the Fund’s actual expense ratio and an assumed rate of return of 5% per year before expenses, which is not the Fund’s actual return. The hypothetical account values and expenses may not be used to estimate the actual ending account balance or expenses you paid for the period. You may use this information to compare the ongoing costs of investing in the Fund and other funds. To do so, compare this 5% hypothetical example with the 5% hypothetical examples that appear in the shareholder reports of the other funds.
Please note that the expenses shown in the table are meant to highlight your ongoing costs only and do not reflect any transactional costs, such as sales charges (loads), redemption fees or exchange fees. Therefore, the second line of the table is useful in comparing ongoing costs only, and will not help you determine the relative total costs of owning different funds. In addition, if these transactional costs were included, your costs would have been higher.
| | Beginning | Ending | Expenses Paid |
| | Account | Account | During Period* |
| | Value 4/01/09 | Value 9/30/09 | 4/01/09-9/30/09 |
| FMI Focus Fund Actual | $1,000.00 | $1,471.50 | $7.93 |
| Hypothetical (5% return before expenses) | $1,000.00 | $1,018.70 | $6.48 |
| * | Expenses are equal to the Fund’s annualized expense ratio of 1.28%, multiplied by the average account value over the period, multiplied by 183/365 (to reflect the one-half year period between April 1, 2009 and September 30, 2009). |
MANAGEMENT’S DISCUSSION OF FUND PERFORMANCE
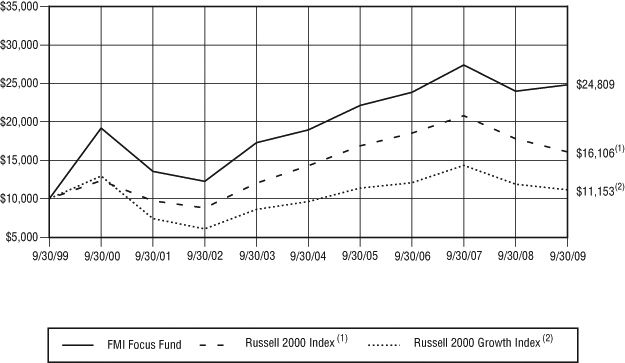
We witnessed events in 2009 which provided challenges and opportunities unlike any we have seen in the history of the FMI Focus Fund. Having peaked late in 2007 and losing 25% of their value by September of 2008, U.S. equity markets fell dramatically in our first fiscal quarter of 2009, bringing total losses peak-to-trough of 55% as measured by the S&P 500 Index. We held up better than our benchmarks through this downturn. However, we did make investments in strong franchises prior to reaching the bottom which did have a negative impact on performance. As long-term investors, we didn’t try to time the bottom, but rather looked for entry points that we could be proud of two to three years out. Through this, we continued to keep some cash at the ready. The market reached bottom in March and as we looked around the landscape at companies cut in half over the previous year, we invested more heavily in the consumer discretionary and information technology sectors. Our overweight of the IT sector and solid selection of consumer stocks were the drivers of performance over the last six months. While a twelve month return of 3.52% wouldn’t generally be something to hang your hat on, we fared well against the Russell 2000 loss of 9.55%, the Russell 2000 Growth loss of 6.32% and also the S&P 500 loss of 6.91%.
| | | COMPARISON OF CHANGE IN VALUE OF $10,000 INVESTMENT IN FMI Focus Fund, Russell 2000 Index(1) and Russell 2000 Growth Index(2) | |
| | | Past performance does not predict future performance. The graph and the table do not reflect the deduction of taxes that a shareholder would pay on Fund distributions or the redemption of Fund shares. | |
| | (1) | The Russell 2000 Index measures the performance of the 2,000 smallest companies in the Russell 3000 Index which comprises the 3,000 largest U.S. companies based on total market capitalization. | |
| | (2) | The Russell 2000 Growth Index measures the performance of those Russell 2000 companies with higher price-to-book ratios and higher forecasted growth values. | |
| AVERAGE ANNUAL TOTAL RETURN |
| 1-Year | 5-Year | 10-Year |
| 3.52% | 5.53% | 9.51% |
FMI Focus Fund
STATEMENT OF ASSETS AND LIABILITIES
| ASSETS: | | | |
| Investments in securities, at value (cost $366,731,481) | | $ | 401,116,457 | |
| Receivable from investments sold | | | 2,626,117 | |
| Receivable from shareholders for purchases | | | 819,770 | |
| Dividends receivable | | | 247,087 | |
| Total assets | | $ | 404,809,431 | |
| LIABILITIES: | | | | |
| Payable to adviser for management and administrative fees | | $ | 356,397 | |
| Payable to shareholders for redemptions | | | 332,406 | |
| Other liabilities | | | 121,746 | |
| Total liabilities | | | 810,549 | |
| NET ASSETS: | | | | |
| Capital Stock, $0.0001 par value; 100,000,000 shares authorized; 17,779,758 shares outstanding | | | 457,969,300 | |
| Net unrealized appreciation on investments | | | 34,384,976 | |
| Accumulated net realized loss on investments | | | (88,785,463 | ) |
| Undistributed net investment income | | | 430,069 | |
| Net assets | | | 403,998,882 | |
| Total liabilities and net assets | | $ | 404,809,431 | |
| CALCULATION OF NET ASSET VALUE PER SHARE: | | | | |
| Net asset value, offering and redemption price per share ($403,998,882 ÷ 17,779,758 shares outstanding) | | $ | 22.72 | |
The accompanying notes to financial statements are an integral part of this statement.
SCHEDULE OF INVESTMENTS
| Shares | | | | Cost | | | Value | |
| LONG-TERM INVESTMENTS — 92.9% (a) | | | | | | |
COMMON STOCKS — 91.8% (a) | | | | | | |
COMMERCIAL SERVICES SECTOR — 5.6% | | | | | | |
| | | Advertising/Marketing Services — 1.5% | | | | | | |
| | 839,600 | | The Interpublic Group of Companies, Inc.* | | $ | 3,931,086 | | | $ | 6,313,792 | |
| | | | Miscellaneous Commercial Services — 1.7% | | | | | | | | |
| | 224,900 | | Cintas Corp. | | | 6,768,889 | | | | 6,816,719 | |
| | | | Personnel Services — 2.4% | | | | | | | | |
| | 430,500 | | AMN Healthcare Services, Inc.* | | | 5,805,309 | | | | 4,094,055 | |
| | 521,300 | | MPS Group, Inc.* | | | 6,218,700 | | | | 5,484,076 | |
| | | | | | | 12,024,009 | | | | 9,578,131 | |
| CONSUMER DURABLES SECTOR — 2.9% | | | | | | | | |
| | | | Recreational Products — 2.9% | | | | | | | | |
| | 516,200 | | Brunswick Corp. | | | 2,193,033 | | | | 6,184,076 | |
| | 363,300 | | Winnebago Industries, Inc. | | | 3,151,481 | | | | 5,344,143 | |
| | | | | | | 5,344,514 | | | | 11,528,219 | |
FMI Focus Fund
SCHEDULE OF INVESTMENTS (Continued)
| Shares | | | | Cost | | | Value | |
| LONG-TERM INVESTMENTS — 92.9% (a) (Continued) | | | | | | |
COMMON STOCKS — 91.8% (a) (Continued) | | | | | | |
CONSUMER NON-DURABLES SECTOR — 2.5% | | | | | | |
| | | Apparel/Footwear — 2.5% | | | | | | |
| | 576,800 | | Liz Claiborne, Inc. | | $ | 13,875,762 | | | $ | 2,843,624 | |
| | 431,583 | | Volcom, Inc.* | | | 8,212,796 | | | | 7,112,488 | |
| | | | | | | 22,088,558 | | | | 9,956,112 | |
| CONSUMER SERVICES SECTOR — 2.9% | | | | | | | | |
| | | | Hotels/Resorts/Cruiselines — 1.5% | | | | | | | | |
| | 256,700 | | Royal Caribbean Cruises Ltd. | | | 3,702,469 | | | | 6,181,336 | |
| | | | Restaurants — 1.4% | | | | | | | | |
| | 315,100 | | Burger King Holdings Inc. | | | 5,595,097 | | | | 5,542,609 | |
DISTRIBUTION SERVICES SECTOR — 6.7% | | | | | | | | |
| | | | Electronics Distributors — 3.7% | | | | | | | | |
| | 414,392 | | Arrow Electronics, Inc.* | | | 10,485,412 | | | | 11,665,135 | |
| | 116,554 | | ScanSource, Inc.* | | | 2,274,292 | | | | 3,300,809 | |
| | | | | | | 12,759,704 | | | | 14,965,944 | |
| | | | Medical Distributors — 1.2% | | | | | | | | |
| | 171,548 | | Patterson Companies Inc.* | | | 3,453,330 | | | | 4,674,683 | |
| | | | Wholesale Distributors — 1.8% | | | | | | | | |
| | 142,600 | | Beacon Roofing Supply, Inc.* | | | 1,296,929 | | | | 2,278,748 | |
| | 299,400 | | Interline Brands, Inc.* | | | 4,946,207 | | | | 5,044,890 | |
| | | | | | | 6,243,136 | | | | 7,323,638 | |
| ELECTRONIC TECHNOLOGY SECTOR — 10.1% | | | | | | | | |
| | | | Aerospace & Defense — 1.5% | | | | | | | | |
| | 508,570 | | Hexcel Corp.* | | | 3,796,618 | | | | 5,818,041 | |
| | | | Computer Peripherals — 1.7% | | | | | | | | |
| | 262,900 | | NetApp, Inc.* | | | 5,911,950 | | | | 7,014,172 | |
| | | | Computer Processing Hardware — 0.7% | | | | | | | | |
| | 210,800 | | NCR Corp.* | | | 2,152,601 | | | | 2,913,256 | |
| | | | Electronic Equipment/Instruments — 1.6% | | | | | | | | |
| | 462,900 | | Intermec Inc.* | | | 5,040,210 | | | | 6,526,890 | |
| | | | Electronic Production Equipment — 1.7% | | | | | | | | |
| | 352,400 | | MKS Instruments, Inc.* | | | 5,820,225 | | | | 6,797,796 | |
| | | | Semiconductors — 2.9% | | | | | | | | |
| | 563,200 | | Altera Corp. | | | 9,831,806 | | | | 11,551,232 | |
ENERGY MINERALS SECTOR — 1.2% | | | | | | | | |
| | | | Coal — 1.2% | | | | | | | | |
| | 225,600 | | Arch Coal, Inc. | | | 4,280,192 | | | | 4,992,528 | |
FMI Focus Fund
SCHEDULE OF INVESTMENTS (Continued)
| Shares | | | | Cost | | | Value | |
| LONG-TERM INVESTMENTS — 92.9% (a) (Continued) | | | | | | |
COMMON STOCKS — 91.8% (a) (Continued) | | | | | | |
| | | | | | | |
| FINANCE SECTOR — 13.1% | | | | | | |
| | | Finance/Rental/Leasing — 0.9% | | | | | | |
| | 188,500 | | Rent-A-Center, Inc.* | | $ | 2,798,586 | | | $ | 3,558,880 | |
| | | | Insurance Brokers/Services — 1.3% | | | | | | | | |
| | 222,800 | | Arthur J. Gallagher & Co. | | | 6,042,228 | | | | 5,429,636 | |
| | | | Life/Health Insurance — 2.8% | | | | | | | | |
| | 234,300 | | Genworth Financial Inc. | | | 3,107,250 | | | | 2,799,885 | |
| | 192,500 | | Reinsurance Group of America, Inc. | | | 5,971,662 | | | | 8,585,500 | |
| | | | | | | 9,078,912 | | | | 11,385,385 | |
| | | | Multi-Line Insurance — 2.8% | | | | | | | | |
| | 145,383 | | PartnerRe Ltd. | | | 8,856,684 | | | | 11,185,768 | |
| | | | Property/Casualty Insurance — 1.5% | | | | | | | | |
| | 512,280 | | Old Republic International Corp. | | | 6,741,929 | | | | 6,239,570 | |
| | | | Regional Banks — 2.6% | | | | | | | | |
| | 433,586 | | Associated Banc-Corp | | | 7,014,595 | | | | 4,951,552 | |
| | 209,567 | | FirstMerit Corp. | | | 3,237,949 | | | | 3,988,060 | |
| | 27,500 | | Home Bancshares Inc. | | | 545,875 | | | | 602,800 | |
| | 82,000 | | TCF Financial Corp. | | | 1,178,242 | | | | 1,069,280 | |
| | | | | | | 11,976,661 | | | | 10,611,692 | |
| | | | Savings Banks — 1.2% | | | | | | | | |
| | 220,600 | | MB Financial, Inc. | | | 2,719,930 | | | | 4,625,982 | |
| | | | | | | | | | | | |
| HEALTH SERVICES SECTOR — 2.1% | | | | | | | | |
| | | | Health Industry Services — 1.5% | | | | | | | | |
| | 383,200 | | HealthSouth Corp.* | | | 5,129,948 | | | | 5,993,248 | |
| | | | Medical/Nursing Services — 0.6% | | | | | | | | |
| | 90,200 | | VCA Antech, Inc.* | | | 2,477,409 | | | | 2,425,478 | |
HEALTH TECHNOLOGY SECTOR — 6.0% | | | | | | | | |
| | | | Biotechnology — 2.4% | | | | | | | | |
| | 263,900 | | Charles River Laboratories International, Inc.* | | | 10,143,455 | | | | 9,759,022 | |
| | | | Medical Specialties — 2.5% | | | | | | | | |
| | 321,900 | | Hologic, Inc.* | | | 4,372,500 | | | | 5,259,846 | |
| | 257,800 | | Wright Medical Group, Inc.* | | | 3,811,757 | | | | 4,604,308 | |
| | | | | | | 8,184,257 | | | | 9,864,154 | |
| | | | Pharmaceuticals: Other — 1.1% | | | | | | | | |
| | 184,400 | | ICON PLC - SP-ADR* | | | 4,410,612 | | | | 4,515,956 | |
INDUSTRIAL SERVICES SECTOR — 6.2% | | | | | | | | |
| | | | Contract Drilling — 0.6% | | | | | | | | |
| | 107,600 | | Rowan Companies, Inc. | | | 2,750,763 | | | | 2,482,332 | |
| | | | Engineering & Construction — 0.6% | | | | | | | | |
| | 118,000 | | Chicago Bridge & Iron Co. N.V. NYS | | | 2,115,056 | | | | 2,204,240 | |
FMI Focus Fund
SCHEDULE OF INVESTMENTS (Continued)
| Shares | | | | Cost | | | Value | |
| LONG-TERM INVESTMENTS — 92.9% (a) (Continued) | | | | | | |
COMMON STOCKS — 91.8% (a) (Continued) | | | | | | |
INDUSTRIAL SERVICES SECTOR — 6.2% (Continued) | | | | | | |
| | | Environmental Services — 1.4% | | | | | | |
| | 217,400 | | Republic Services, Inc. | | $ | 4,311,286 | | | $ | 5,776,318 | |
| | | | Oil & Gas Pipelines — 1.7% | | | | | | | | |
| | 128,800 | | Kinder Morgan Energy Partners, L.P. | | | 5,721,031 | | | | 6,957,776 | |
| | | | Oilfield Services/Equipment — 1.9% | | | | | | | | |
| | 180,300 | | Dresser-Rand Group, Inc.* | | | 3,986,981 | | | | 5,601,921 | |
| | 90,000 | | Exterran Holdings Inc.* | | | 2,332,111 | | | | 2,136,600 | |
| | | | | | | 6,319,092 | | | | 7,738,521 | |
| PROCESS INDUSTRIES SECTOR — 6.9% | | | | | | | | |
| | | | Chemicals: Major Diversified — 1.0% | | | | | | | | |
| | 161,900 | | Celanese Corp. | | | 4,346,876 | | | | 4,047,500 | |
| | | | Chemicals: Specialty — 3.4% | | | | | | | | |
| | 312,581 | | Cytec Industries Inc. | | | 14,387,614 | | | | 10,149,505 | |
| | 176,400 | | Rockwood Holdings Inc.* | | | 2,288,465 | | | | 3,628,548 | |
| | | | | | | 16,676,079 | | | | 13,778,053 | |
| | | | Containers/Packaging — 2.5% | | | | | | | | |
| | 196,662 | | Pactiv Corp.* | | | 3,665,731 | | | | 5,123,045 | |
| | 251,500 | | Sealed Air Corp. | | | 4,185,538 | | | | 4,936,945 | |
| | | | | | | 7,851,269 | | | | 10,059,990 | |
| PRODUCER MANUFACTURING SECTOR — 8.5% | | | | | | | | |
| | | | Auto Parts: Original Equipment Manufacturer — 0.2% | | | | | | | | |
| | 91,700 | | Modine Manufacturing Co. | | | 655,655 | | | | 850,059 | |
| | | | Electrical Products — 3.2% | | | | | | | | |
| | 684,595 | | Molex Inc. Cl A | | | 17,262,302 | | | | 12,863,540 | |
| | | | Industrial Machinery — 4.2% | | | | | | | | |
| | 110,465 | | Kadant Inc.* | | | 1,470,307 | | | | 1,339,941 | |
| | 631,153 | | Kennametal Inc. | | | 11,531,216 | | | | 15,532,675 | |
| | | | | | | 13,001,523 | | | | 16,872,616 | |
| | | | Miscellaneous Manufacturing — 0.9% | | | | | | | | |
| | 130,900 | | Brady Corp. | | | 3,034,097 | | | | 3,759,448 | |
RETAIL TRADE SECTOR — 6.0% | | | | | | | | |
| | | | Apparel/Footwear Retail — 0.8% | | | | | | | | |
| | 192,106 | | Zumiez Inc.* | | | 2,196,855 | | | | 3,152,460 | |
| | | | Department Stores — 1.9% | | | | | | | | |
| | 136,800 | | Kohl’s Corp.* | | | 5,003,284 | | | | 7,804,440 | |
| | | | Discount Stores — 0.3% | | | | | | | | |
| | 50,000 | | Family Dollar Stores, Inc. | | | 909,330 | | | | 1,320,000 | |
| | | | Specialty Stores — 3.0% | | | | | | | | |
| | 231,900 | | PetSmart, Inc. | | | 5,023,947 | | | | 5,043,825 | |
| | 428,500 | | Ulta Salon, Cosmetics & Fragrance, Inc.* | | | 3,428,058 | | | | 7,074,535 | |
| | | | | | | 8,452,005 | | | | 12,118,360 | |
FMI Focus Fund
SCHEDULE OF INVESTMENTS (Continued)
| Shares or Principal Amount | | Cost | | | Value | |
| LONG-TERM INVESTMENTS — 92.9% (a) (Continued) | | | | | | |
COMMON STOCKS — 91.8% (a) (Continued) | | | | | | |
TECHNOLOGY SERVICES SECTOR — 8.0% | | | | | | |
| | | Data Processing Services — 1.7% | | | | | | |
| | 144,300 | | Fiserv, Inc.* | | $ | 4,934,944 | | | $ | 6,955,260 | |
| | | | Information Technology Services — 3.6% | | | | | | | | |
| | 113,800 | | Citrix Systems, Inc.* | | | 2,786,723 | | | | 4,464,374 | |
| | 1,260,700 | | Sapient Corp.* | | | 9,246,515 | | | | 10,136,028 | |
| | | | | | | 12,033,238 | | | | 14,600,402 | |
| | | | Internet Software/Services — 1.2% | | | | | | | | |
| | 218,000 | | Omniture, Inc.* | | | 2,799,761 | | | | 4,673,920 | |
| | | | Packaged Software — 1.5% | | | | | | | | |
| | 429,000 | | Parametric Technology Corp.* | | | 3,707,835 | | | | 5,928,780 | |
TRANSPORTATION SECTOR — 3.1% | | | | | | | | |
| | | | Air Freight/Couriers — 1.4% | | | | | | | | |
| | 388,900 | | UTI Worldwide, Inc. | | | 6,672,069 | | | | 5,631,272 | |
| | | | Trucking — 1.7% | | | | | | | | |
| | 378,600 | | Werner Enterprises, Inc. | | | 6,893,049 | | | | 7,053,318 | |
| | | | Total common stocks | | | 334,952,404 | | | | 370,718,474 | |
| | | | | | | | | | | | |
| MUTUAL FUNDS — 1.1% (a) | | | | | | | | |
| | 210,200 | | SPDR KBW Regional Banking ETF | | | 5,862,558 | | | | 4,481,464 | |
| | | | Total long-term investments | | | 340,814,962 | | | | 375,199,938 | |
| | | | | | | | | | | | |
| SHORT-TERM INVESTMENTS — 6.4% (a) | | | | | | | | |
| | | | U.S. Treasury Securities — 2.5% | | | | | | | | |
| $ | 10,000,000 | | U.S. Treasury Bills, 0.20%, due 10/15/09 | | | 9,999,366 | | | | 9,999,366 | |
| | | | Variable Rate Demand Note — 3.9% | | | | | | | | |
| | 15,917,153 | | U.S. Bank, N.A., 0.00% | | | 15,917,153 | | | | 15,917,153 | |
| | | | Total short-term investments | | | 25,916,519 | | | | 25,916,519 | |
| | | | Total investments — 99.3% | | $ | 366,731,481 | | | | 401,116,457 | |
| | | | Other assets less liabilities — 0.7% (a) | | | | | | | 2,882,425 | |
| | | | TOTAL NET ASSETS — 100.0% | | | | | | $ | 403,998,882 | |
| * | Non-income producing security. |
| (a) | Percentages for the various classifications relate to net assets. |
ETF – Exchange Traded Fund
L.P. – Limited Partnership
N.V. – Netherlands Antilles Limited Liability Corp.
NYS – New York Registered Shares
SP-ADR – Sponsored American Depositary Receipts
The accompanying notes to financial statements are an integral part of this schedule.
FMI Focus Fund
STATEMENT OF OPERATIONS
For the Year Ended September 30, 2009
| INCOME: | | | |
| Dividends | | $ | 5,252,809 | |
| Interest | | | 78,973 | |
| Total income | | | 5,331,782 | |
| EXPENSES: | | | | |
| Management fees | | | 3,762,620 | |
| Transfer agent fees | | | 495,042 | |
| Administrative and accounting services | | | 259,107 | |
| Printing and postage expense | | | 154,400 | |
| Custodian fees | | | 79,218 | |
| Professional fees | | | 61,814 | |
| Registration fees | | | 42,064 | |
| Board of Directors fees | | | 40,000 | |
| Insurance expense | | | 10,852 | |
| Other expenses | | | 8,410 | |
| Total expenses | | | 4,913,527 | |
| NET INVESTMENT INCOME | | | 418,255 | |
| NET REALIZED LOSS ON INVESTMENTS | | | (81,148,063 | ) |
| NET CHANGE IN UNREALIZED APPRECIATION ON INVESTMENTS | | | 47,923,338 | |
| NET LOSS ON INVESTMENTS | | | (33,224,725 | ) |
| NET DECREASE IN NET ASSETS RESULTING FROM OPERATIONS | | $ | (32,806,470 | ) |
STATEMENTS OF CHANGES IN NET ASSETS
For the Years Ended September 30, 2009 and 2008
| | | 2009 | | | 2008 | |
| OPERATIONS: | | | | | | |
| Net investment income (loss) | | $ | 418,255 | | | $ | (2,873,647 | ) |
| Net realized (loss) gain on investments | | | (81,148,063 | ) | | | 101,431,267 | |
| Net increase (decrease) in unrealized appreciation on investments | | | 47,923,338 | | | | (203,862,755 | ) |
| Net decrease in net assets from operations | | | (32,806,470 | ) | | | (105,305,135 | ) |
| DISTRIBUTIONS TO SHAREHOLDERS: | | | | | | | | |
| Distributions from net realized gains($4.9924 and $2.40297 per share, respectively) | | | (92,095,117 | ) | | | (63,183,602 | ) |
| FUND SHARE ACTIVITIES: | | | | | | | | |
| Proceeds from shares issued (3,822,079 and 1,716,362 shares, respectively) | | | 72,277,475 | | | | 51,589,427 | |
| Net asset value of shares issued in distributions reinvested | | | | | | | | |
| (5,161,593 and 1,885,744 shares, respectively) | | | 88,469,706 | | | | 61,475,293 | |
| Cost of shares redeemed (12,137,596 and 9,052,799 shares, respectively) | | | (225,022,482 | ) | | | (270,256,180 | ) |
| Net decrease in net assets derived from Fund share activities | | | (64,275,301 | ) | | | (157,191,460 | ) |
| TOTAL DECREASE | | | (189,176,888 | ) | | | (325,680,197 | ) |
| NET ASSETS AT THE BEGINNING OF THE YEAR | | | 593,175,770 | | | | 918,855,967 | |
| NET ASSETS AT THE END OF THE YEAR (Includes undistributed net investment income | | | | | | | | |
| of $430,069 and $0, respectively) | | $ | 403,998,882 | | | $ | 593,175,770 | |
The accompanying notes to financial statements are an integral part of these statements.
FMI Focus Fund
FINANCIAL HIGHLIGHTS
(Selected data for each share of the Fund outstanding throughout each year)
| | | Years Ended September 30, | |
| | | 2009 | | | 2008 | | | 2007 | | | 2006 | | | 2005 | |
| PER SHARE OPERATING PERFORMANCE: | | | | | | | | | | | | | | | |
| Net asset value, beginning of year | | $ | 28.34 | | | $ | 34.83 | | | $ | 34.42 | | | $ | 35.83 | | | $ | 32.14 | |
| Income from investment operations: | | | | | | | | | | | | | | | | | | | | |
| Net investment income (loss) | | | 0.02 | | | | (0.11 | ) | | | (0.06 | ) | | | (0.13 | ) | | | (0.21 | ) |
| Net realized and unrealized (losses) gains on investments | | | (0.65 | ) | | | (3.98 | ) | | | 4.77 | | | | 2.44 | | | | 5.44 | |
| Total from investment operations | | | (0.63 | ) | | | (4.09 | ) | | | 4.71 | | | | 2.31 | | | | 5.23 | |
| Less distributions: | | | | | | | | | | | | | | | | | | | | |
| Distributions from net investment income | | | — | | | | — | | | | — | | | | — | | | | — | |
| Distributions from net realized gains | | | (4.99 | ) | | | (2.40 | ) | | | (4.30 | ) | | | (3.72 | ) | | | (1.54 | ) |
| Total from distributions | | | (4.99 | ) | | | (2.40 | ) | | | (4.30 | ) | | | (3.72 | ) | | | (1.54 | ) |
| Net asset value, end of year | | $ | 22.72 | | | $ | 28.34 | | | $ | 34.83 | | | $ | 34.42 | | | $ | 35.83 | |
| TOTAL RETURN | | | 3.52% | | | | (12.58% | ) | | | 14.87% | | | | 7.75% | | | | 16.83% | |
| RATIOS/SUPPLEMENTAL DATA: | | | | | | | | | | | | | | | | | | | | |
| Net assets, end of year (in 000’s $) | | | 403,999 | | | | 593,176 | | | | 918,856 | | | | 902,646 | | | | 1,053,437 | |
| Ratio of expenses to average net assets | | | 1.40% | | | | 1.53% | | | | 1.52% | | | | 1.50% | | | | 1.48% | |
| Ratio of net investment income (loss) to average net assets | | | 0.12% | | | | (0.37% | ) | | | (0.17% | ) | | | (0.38% | ) | | | (0.61% | ) |
| Portfolio turnover rate | | | 58% | | | | 72% | | | | 41% | | | | 49% | | | | 63% | |
The accompanying notes to financial statements are an integral part of this statement.
NOTES TO FINANCIAL STATEMENTS
| (1) | Summary of Significant Accounting Policies — |
The following is a summary of significant accounting policies of the FMI Focus Fund (the “Fund”), a series of FMI Funds, Inc. (the “Company”) which is registered as a diversified, open-end management investment company under the Investment Company Act of 1940 (the “Act”), as amended. The Company was incorporated under the laws of Maryland on September 5, 1996 and the Fund commenced operations on December 16, 1996. The assets and liabilities of each Fund in the Company are segregated as a shareholder’s interest is limited to the Fund in which the shareholder owns shares. The investment objective of the Fund is to seek capital appreciation principally through investing in common stocks and warrants, engaging in short sales, investing in foreign securities and effecting transactions in stock index futures contracts, options on stock index futures contracts, and options on securities and stock indexes.
| | (a) | Each security, excluding short-term investments, is valued at the last sale price reported by the principal security exchange on which the issue is traded. Securities that are traded on the Nasdaq Markets are valued at the Nasdaq Official Closing Price or if no sale is reported, at the latest bid price. Securities which are traded over-the-counter are valued at the latest bid price. Securities sold short which are listed on a national securities exchange or the Nasdaq Stock Market but which were not traded on the valuation date are valued at the most recent ask price. Unlisted equity securities for which market quotations are readily available are valued at the most recent bid price. Options purchased or written by the Fund are valued at the average of the most recent bid and ask prices. Securities for which quotations are not readily available are valued at fair value as determined by the investment adviser under the supervision of the Board of Directors. The fair value of a security is the amount which the Fund might reasonably expect to receive upon a current sale. The fair value of a security may differ from the last quoted price and the Fund may not be able to sell a security at the estimated fair value. Market quotations may not be available, for example, if trading in particular securities was halted during the day and not resumed prior to the close of trading on the New York Stock Exchange. As of September 30, 2009 there were no securities that were internally fair valued. Variable rate demand notes are recorded at par value which approximates market value. Short-term investments with maturities of 60 days or less are valued at amortized cost which approximates value. For financial reporting purposes, investment transactions are recorded on the trade date. |
FMI Focus Fund
NOTES TO FINANCIAL STATEMENTS (Continued)
| (1) | Summary of Significant Accounting Policies — (Continued) |
| | | The Fund adopted the provisions of the Financial Accounting Standards Board (“FASB”) Accounting Standards Codification “Fair Value Measurements and Disclosures” Topic 820 (“ASC 820”), effective October 1, 2008. Under ASC 820, fair value is defined as the price that would be received to sell an asset or paid to transfer a liability (i.e., the “exit price”) in an orderly transaction between market participants at the measurement date. |
| | | In determining fair value, the Fund uses various valuation approaches. ASC 820 establishes a fair value hierarchy for inputs used in measuring fair value that maximizes the use of observable inputs and minimizes the use of unobservable inputs by generally requiring that the most observable inputs be used when available. Observable inputs are those that market participants would use in pricing the asset or liability based on market data obtained from sources independent of the Fund. Unobservable inputs reflect the Fund’s assumptions about the inputs market participants would use in pricing the asset or liability developed based on the best information available in the circumstances. The inputs or methodologies used for valuing securities are not necessarily an indication of the risks associated with investing in those securities. |
The fair value hierarchy is categorized into three levels based on the inputs as follows:
| | Level 1 — | Valuations based on unadjusted quoted prices in active markets for identical assets. |
| | Level 2 — | Valuations based on quoted prices for similar securities or in markets that are not active or for which all significant inputs are observable, either directly or indirectly. |
| | Level 3— | Valuations based on inputs that are unobservable and significant to the overall fair value measurement. |
The following table summarizes the Fund’s investments as of September 30, 2009, based on the inputs used to value them:
| Valuation Inputs | | Investments in Securities | |
| Level 1 — Common Stocks | | $ | 370,718,474 | |
| Mutual Funds | | | 4,481,464 | |
| Total Level 1 | | | 375,199,938 | |
| Level 2 — Short-Term U.S. Treasury Securities | | | 9,999,366 | |
| Variable Rate Demand Note | | | 15,917,153 | |
| Total Level 2 | | | 25,916,519 | |
| Level 3 — | | | — | |
| Total | | $ | 401,116,457 | |
| | (b) | Net realized gains and losses on sales of securities are computed on the identified cost basis. |
| | (c) | Dividend income is recorded on the ex-dividend date. Interest income is recorded on an accrual basis. |
| | (d) | The Fund has investments in short-term variable rate demand notes, which are unsecured instruments. The Fund may be susceptible to credit risk with respect to these notes to the extent the issuer defaults on its payment obligation. The Fund’s policy is to monitor the creditworthiness of the issuer and nonperformance by these issuers is not anticipated. |
| | (e) | Accounting principles generally accepted in the United States of America (“GAAP”) require that permanent differences between income for financial reporting and tax purposes be reclassified in the capital accounts. |
| | (f) | The preparation of financial statements in conformity with GAAP requires management to make estimates and assumptions that affect the reported amounts of assets and liabilities and disclosure of contingent assets and liabilities at the date of the financial statements and the reported amounts of revenues and expenses during the reporting period. Actual results could differ from these estimates. |
| | (g) | The Fund may sell securities short. For financial statement purposes, an amount equal to the settlement amount would be included in the statement of net assets as a liability. The amount of the liability is subsequently marked-to-market to reflect the current value of the short position. Subsequent fluctuations in the market prices of securities sold, but not yet purchased, may require purchasing the securities at prices which may differ from the market value reflected on the statement of net assets. The Fund is liable for any dividends payable on securities while those securities are in a short position. Under the Act, the Fund is required to maintain collateral for its short positions consisting of liquid securities. The collateral is required to be adjusted daily to reflect changes in the value of the securities sold short. For the year ended September 30, 2009, there were no securities sold short. |
FMI Focus Fund
NOTES TO FINANCIAL STATEMENTS (Continued)
| (1) | Summary of Significant Accounting Policies — (Continued) |
| | (h) | The Fund may own certain securities that are restricted. Restricted securities include Section 4(2) commercial paper, securities issued in a private placement, or securities eligible for resale pursuant to Rule 144A under the Securities Act of 1933 (the “1933 Act”). A restricted security cannot be resold to the general public without prior registration under the 1933 Act or pursuant to the resale limitations provided by Rule 144A under the 1933 Act, or an exemption from the registration requirements of the 1933 Act. As of September 30, 2009, there were no restricted securities held by the Fund. |
| | (i) | No provision has been made for Federal income taxes since the Fund has elected to be taxed as a “regulated investment company” and intends to distribute substantially all net investment company taxable income and net capital gains to its shareholders and otherwise comply with the provisions of the Internal Revenue Code applicable to regulated investment companies. |
| | (j) | The Fund has reviewed all open tax years and major jurisdictions, which include Federal and the state of Maryland, and concluded that there are no significant uncertain tax positions that would require recognition in the financial statements. Open tax years are those that are open for exam by taxing authorities and, as of September 30, 2009, open Federal tax years include the tax years ended September 30, 2006 through 2009. The Fund has no examinations in progress and is also not aware of any tax positions for which it is reasonably possible that the total amounts of unrecognized tax benefits will significantly change in the next twelve months. |
| (2) | Investment Adviser and Management Agreement and Transactions With Related Parties — |
The Fund has a management agreement with Fiduciary Management, Inc. (“FMI”), with whom certain officers and directors of the Fund are affiliated, to serve as investment adviser and manager. Prior to January 1, 2009, the Fund paid FMI a monthly management fee at an annual rate of 1.25% of the daily net assets. Under the terms of the agreement, the Fund will pay FMI a monthly management fee at an annual rate of 1.00% of the daily net assets. The Fund has an administrative agreement with FMI to supervise all aspects of the Fund’s operations except those performed by FMI pursuant to the management agreement. Under the terms of the agreement, the Fund paid FMI a monthly administrative fee at the annual rate of 0.2% of the daily net assets up to and including $30,000,000, 0.1% on the next $70,000,000 and 0.05% of the daily net assets of the Fund in excess of $100,000,000.
FMI entered into a sub-advisory agreement with Broadview Advisors, LLC, with whom a certain director of the Fund is affiliated, to assist it in the day-to-day management of the Fund. Broadview Advisors, LLC, determines which securities will be purchased, retained or sold for the Fund. FMI pays Broadview Advisors, LLC 0.85% of the first $500 million of the average daily net assets of the Fund and 0.80% of the Fund’s average daily net assets in excess of $500 million. Prior to January 1, 2009, FMI paid Broadview Advisors, LLC 0.76% of the Fund’s management fee of 1.25% of the daily net assets.
Under the management agreement, FMI will reimburse the Fund for expenses over 2.75% of the daily net assets of the Fund. No such reimbursements were required for the year ended September 30, 2009.
The Fund has entered into a Distribution Plan (the “Plan”), pursuant to Rule 12b-1 under the Act. The Plan provides that the Fund may incur certain costs which may not exceed the lesser of a monthly amount equal to 0.25% of the Fund’s daily net assets or the actual distribution costs incurred during the year. Amounts payable under the Plan are paid monthly for any activities or expenses primarily intended to result in the sale of shares of the Fund. For the year ended September 30, 2009, no such expenses were incurred.
Under the Fund’s organizational documents, each director, officer, employee or other agent of the Fund (including the Fund’s investment manager) is indemnified, to the extent permitted by the Act, against certain liabilities that may arise out of performance of their duties to the Fund. Additionally, in the normal course of business, the Fund enters into contracts that contain a variety of indemnification clauses. The Fund’s maximum exposure under these arrangements is unknown as this would involve future claims that may be made against the Fund that have not yet occurred. However, the Fund has not had prior claims or losses pursuant to these contracts and believes the risk of loss to be remote.
At September 30, 2009, one financial intermediary is the record owner of approximately 48% of the Fund’s shares.
U.S. Bank, N.A. has made available to the Fund a $66,000,000 credit facility pursuant to a Credit Agreement (“Agreement”) effective November 18, 2002 for the purpose of having cash available to satisfy redemption requests and to purchase portfolio securities. Principal and interest of such loan under the Agreement are due not more than 31 days after the date of the loan. Amounts under the credit facility bear interest at a rate per annum equal to the current prime rate minus one percent on the amount borrowed. Advances will be collateralized by securities owned by the Fund. During the year ended September 30, 2009, the Fund did not borrow against the Agreement. The Credit Agreement expires on June 5, 2010.
FMI Focus Fund
NOTES TO FINANCIAL STATEMENTS (Continued)
| (4) | Distribution to Shareholders — |
Net investment income and net realized gains, if any, are distributed to shareholders at least annually. On October 29, 2009, the Fund declared a distribution of $430,069 from net investment income ($0.028 per share). The distribution will be paid on October 30, 2009 to shareholders of record on October 28, 2009.
| (5) | Investment Transactions — |
For the year ended September 30, 2009, purchases and proceeds of sales of investment securities (excluding short-term investments) were $194,347,964 and $296,625,067, respectively.
| (6) | Income Tax Information — |
The following information for the Fund is presented on an income tax basis as of September 30, 2009:
| | | | Gross | | Gross | | Net Unrealized | | Distributable | | Distributable | |
| | Cost of | | Unrealized | | Unrealized | | Appreciation | | Ordinary | | Long-Term | |
| | Investments | | Appreciation | | Depreciation | | on Investments | | Income | | Capital Gains | |
| | $378,817,042 | | $62,891,472 | | $40,592,057 | | $22,299,415 | | $430,069 | | $— | |
The difference between the cost amount for financial statement and federal income tax purposes is due primarily to timing differences in recognizing certain gains and losses in security transactions.
The tax components of dividends paid during the years ended September 30, 2009 and 2008, capital loss carryovers, which may be used to offset future capital gains, subject to Internal Revenue Code limitations (expiring in 2017), as of September 30, 2009, and tax basis post-October losses as of September 30, 2009, which are not recognized for tax purposes until the first day of the following fiscal year are:
| | September 30, 2009 | | September 30, 2008 | |
| | Ordinary | | Long-Term | | Net Capital | | | | Ordinary | | Long-Term | |
| | Income | | Capital Gains | | Loss | | Post-October | | Income | | Capital Gains | |
| | Distributions | | Distributions | | Carryovers | | Losses | | Distributions | | Distributions | |
| | $3,914,370 | | $88,180,747 | | $16,810,453 | | $59,889,449 | | $4,935,599 | | $58,248,003 | |
For corporate shareholders of the Fund, the percentage of dividend income distributed for the year ended September 30, 2009, which is designated as qualifying for the dividends received deduction is 100% (unaudited).
For all shareholders of the Fund, the percentage of dividend income distributed for the year ended September 30, 2009, which is designated as qualified dividend income under the Jobs and Growth Tax Relief Act of 2003, is 100% (unaudited).
Effective October 1, 2009, U.S. Bancorp Fund Services, LLC, began serving as the administrator and accounting services agent for the Fund. Subsequent events have been evaluated through October 30, 2009, which is the date the financial statements were issued. Subsequent events have not been evaluated after this date.
FMI Focus Fund
REPORT OF INDEPENDENT REGISTERED PUBLIC ACCOUNTING FIRM
To the Board of Directors and Shareholders of FMI Focus Fund
In our opinion, the accompanying statement of assets and liabilities, including the schedule of investments, and the related statements of operations and of changes in net assets and the financial highlights present fairly, in all material respects, the financial position of FMI Focus Fund (the “Fund”) at September 30, 2009, the results of its operations for the year then ended, the changes in its net assets for each of the two years in the period then ended and the financial highlights for each of the five years in the period then ended, in conformity with accounting principles generally accepted in the United States of America. These financial statements and financial highlights (hereafter referred to as “financial statements”) are the responsibility of the Fund’s management; our responsibility is to express an opinion on these financial statements based on our audits. We conducted our audits of these financial statements in accordance with the standards of the Public Company Accounting Oversight Board (United States). Those standards require that we plan and perform the audit to obtain reasonable assurance about whether the financial statements are free of material misstatement. An audit includes examining, on a test basis, evidence supporting the amounts and disclosures in the financial statements, assessing the accounting principles used and significant estimates made by management, and evaluating the overall financial statement presentation. We believe that our audits, which included confirmation of securities at September 30, 2009 by correspondence with the custodian and brokers, provide a reasonable basis for our opinion.

Milwaukee, Wisconsin
October 30, 2009
FMI Focus Fund
DIRECTORS AND OFFICERS
| | | Term of | Principal | # of Funds | Other |
| | Position | Office and | Occupation(s) | in Complex | Directorships |
| Name, Age | Held with | Length of | During Past | Overseen | Held by |
| and Address | the Fund | Time Served | Five Years | by Director | Director |
| Non-Interested Directors | | | | | |
| Barry K. Allen, 61 | Director | Indefinite Term | Mr. Allen is President of Allen | 4 | BCE, Inc. (Bell |
| c/o Fiduciary | | Since 1996 | Enterprises, LLC (Brookfield, WI) a | | Canada Enterprise), |
| Management, Inc. | | | private equity investments management | | Harley-Davidson, |
| 100 E. Wisconsin Ave. | | | company, and Senior Advisor for | | Inc., FMI Common, |
| Suite 2200 | | | Providence Equity Partners (Providence, | | Stock Fund, Inc. and |
| Milwaukee, WI 53202 | | | RI) since September, 2007. He was | | FMI Mutual |
| | | | Executive Vice President of Qwest | | Funds, Inc. |
| | | | Communications International, Inc. | | |
| | | | (Denver, CO) from September, 2002 to | | |
| | | | June, 2007. | | |
| Robert C. Arzbaecher, 49 | Director | Indefinite Term | Mr. Arzbaecher is President and | 4 | Actuant Corporation, |
| c/o Fiduciary | | Since 2007 | Chief Executive Officer of Actuant | | CF Industries |
| Management, Inc. | | | Corporation (Butler, WI), a | | Holdings, Inc., |
| 100 E. Wisconsin Ave. | | | manufacturer of a broad range of | | FMI Common Stock |
| Suite 2200 | | | industrial products and systems, and | | Fund, Inc. and FMI |
| Milwaukee, WI 53202 | | | the Chairman of the Board of | | Mutual Funds, Inc. |
| | | | Directors of Actuant Corporation. | | |
| Gordon H. | Director | Indefinite Term | Mr. Gunnlaugsson retired from M&I | 4 | FMI Common Stock |
| Gunnlaugsson, 65 | | Since 2001 | Corporation (Milwaukee, WI) in | | Fund, Inc. and FMI |
| c/o Fiduciary | | | December, 2000. | | Mutual Funds, Inc. |
| Management, Inc. | | | | | |
| 100 E. Wisconsin Ave. | | | | | |
| Suite 2200 | | | | | |
Milwaukee, WI 53202 | | | | | |
| Paul S. Shain, 46 | Director | Indefinite Term | Mr. Shain is President and Chief | 4 | FMI Common Stock |
| c/o Fiduciary | | Since 2001 | Executive Officer of Singlewire | | Fund, Inc. and FMI |
| Management, Inc. | | | Software, LLC (Madison, WI), a provider | | Mutual Funds, Inc. |
| 100 E. Wisconsin Ave. | | | of IP-based paging and emergency | | |
| Suite 2200 | | | notification systems. Prior to joining | | |
| Milwaukee, WI 53202 | | | Singlewire in April, 2009, Mr. Shain was | | |
| | | | Senior Vice President of CDW | | |
| | | | Corporation (Vernon Hills, IL) and Chief | | |
| | | | Executive Officer of Berbee Information | | |
| | | | Networks, a strategic business unit of | | |
| | | | CDW which CDW acquired in 2006. | | |
| | | | Mr. Shain was employed in various capacities | | |
| | | | by CDW and Berbee Information Networks | | |
| | | | from January, 2000 to October, 2008. | | |
FMI Focus Fund
DIRECTORS AND OFFICERS (Continued)
| | | Term of | Principal | # of Funds | Other |
| | Position | Office and | Occupation(s) | in Complex | Directorships |
| Name, Age | Held with | Length of | During Past | Overseen | Held by |
| and Address | the Fund | Time Served | Five Years | by Director | Director or Officer |
| Interested Directors | | | | | |
| Patrick J. English,* 48 | Director | Indefinite Term | Mr. English is President of Fiduciary | 3 | FMI Common Stock |
| c/o Fiduciary | | Since 1997 | Management, Inc. and has been employed | | Fund, Inc. |
| Management, Inc. | Vice | One Year Term | by the Adviser in various capacities | | |
| 100 E. Wisconsin Ave. | President | Since 1996 | since December, 1986. | | |
| Suite 2200 | | | | | |
Milwaukee, WI 53202 | | | | | |
| Ted D. Kellner,* 63 | Director | Indefinite Term | Mr. Kellner is Chairman of the Board | 3 | Marshall & Ilsley |
| c/o Fiduciary | | Since 1996 | and Chief Executive Officer of Fiduciary | | Corporation |
| Management, Inc. | President | One Year Term | Management, Inc. which he co-founded | | and FMI Common |
| 100 E. Wisconsin Ave. | and | Since 1996 | in 1980. | | Stock Fund, Inc. |
| Suite 2200 | Treasurer | | | | |
Milwaukee, WI 53202 | | | | | |
| Richard E. Lane*, 53 | Director | Indefinite Term | Mr. Lane is President of Broadview | 2 | None |
| 100 E. Wisconsin Ave. | | Since 2001 | Advisors, LLC, the sub-adviser to the | | |
| Suite 2250 | | | Fund. | | |
Milwaukee, WI 53202 | | | | | |
| Other Officers | | | | | |
| John S. Brandser, 47 | Vice | One Year Term | Mr. Brandser is Senior Vice President, | N/A | FMI Mutual |
| c/o Fiduciary | President | Since 2008 | Secretary and Chief Operating Officer | | Funds, Inc. |
| Management, Inc. | | | of Fiduciary Management, Inc. and | | |
| 100 E. Wisconsin Ave. | | | has been employed by the Adviser in | | |
| Suite 2200 | | | various capacities since March, 1995. | | |
Milwaukee, WI 53202 | | | | | |
| Kathleen M. Lauters, 57 | Chief | At Discretion | Ms. Lauters has been the Fund’s Chief | N/A | None |
| c/o Fiduciary | Compliance | of Board | Compliance Officer since | | |
| Management, Inc. | Officer | Since 2004 | September, 2004. | | |
| 100 E. Wisconsin Ave. | | | | | |
| Suite 2200 | | | | | |
Milwaukee, WI 53202 | | | | | |
| Donald S. Wilson, 66 | Vice | One Year Term | Mr. Wilson is Vice Chairman, Treasurer | N/A | FMI Common Stock |
| c/o Fiduciary | President | Since 1996 | and Chief Compliance Officer of | | Fund, Inc. and FMI |
| Management, Inc. | and | | Fiduciary Management, Inc. | | Mutual Funds, Inc. |
| 100 E. Wisconsin Ave. | Secretary | | which he co-founded in 1980. | | |
| Suite 2200 | | | | | |
| Milwaukee, WI 53202 | | | | | |
__________
| * | Messrs. English and Kellner are interested directors of the Fund because they are officers of the Fund and the Adviser. Mr. Lane is an interested director of the Fund because he is an officer of the Fund’s sub-adviser. |
For additional information about the Directors and Officers or for a description of the policies and procedures that the Fund uses to determine how to vote proxies relating to portfolio securities, please call (800) 811-5311 and request a Statement of Additional Information. One will be mailed to you free of charge. The Statement of Additional Information is also available on the website of the Securities and Exchange Commission (the “Commission”) at http://www.sec.gov. Information on how the Fund voted proxies relating to portfolio securities is available on the Fund’s website at http://www.fmifunds.com or the website of the Commission no later than August 31 for the prior 12 months ending June 30. The Fund files its complete schedule of portfolio holdings with the Commission for the first and third quarters of each fiscal year on Form N-Q. The Fund’s Form N-Q is available on the Commission’s website. The Fund’s Form N-Q may be reviewed and copied at the Commission’s Public Reference Room in Washington, D.C., and that information on the operation of the Public Reference Room may be obtained by calling 1-800-SEC-0330.
FMI Focus Fund
100 East Wisconsin Avenue, Suite 2200
Milwaukee, Wisconsin 53202
www.fmifunds.com
414-226-4555
BOARD OF DIRECTORS
BARRY K. ALLEN
ROBERT C. ARZBAECHER
PATRICK J. ENGLISH
GORDON H. GUNNLAUGSSON
TED D. KELLNER
RICHARD E. LANE
PAUL S. SHAIN
INVESTMENT ADVISER
FIDUCIARY MANAGEMENT, INC.
100 East Wisconsin Avenue, Suite 2200
Milwaukee, Wisconsin 53202
PORTFOLIO MANAGER
BROADVIEW ADVISORS, LLC
100 East Wisconsin Avenue, Suite 2250
Milwaukee, Wisconsin 53202
TRANSFER AGENT AND
DIVIDEND DISBURSING AGENT
U.S. BANCORP FUND SERVICES, LLC
615 East Michigan Street
Milwaukee, Wisconsin 53202
800-811-5311 or 414-765-4124
CUSTODIAN
U.S. BANK, N.A.
1555 North RiverCenter Drive, Suite 302
Milwaukee, Wisconsin 53212
INDEPENDENT REGISTERED
PUBLIC ACCOUNTING FIRM
PRICEWATERHOUSECOOPERS LLP
100 East Wisconsin Avenue, Suite 1800
Milwaukee, Wisconsin 53202
LEGAL COUNSEL
FOLEY & LARDNER LLP
777 East Wisconsin Avenue
Milwaukee, Wisconsin 53202
This report is not authorized for use as an offer of sale or a solicitation of an offer to buy shares of FMI Focus Fund unless accompanied or preceded by the Fund’s current prospectus.
ANNUAL REPORT
September 30, 2009
FMI
Large Cap
Fund
A NO-LOAD
MUTUAL FUND
FMI
Large Cap
Fund
September 30, 2009
Dear Fellow Shareholders:
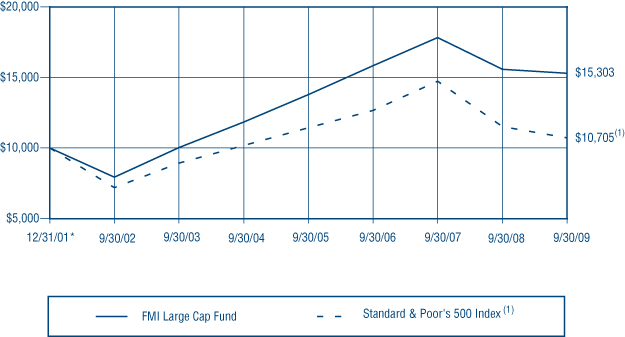
The FMI Large Cap Fund gained 14.40% in the quarter compared to 15.61% for the benchmark Standard & Poor’s 500 Index. Strong absolute returns were driven largely by stocks perceived to be beneficiaries of an expanding economy and included Rockwell, Tyco International and Best Buy. Despite a nearly 50% rebound in the price of American Express, the Fund’s financial sector accounted for all of the underperformance compared to the S&P 500. The perception that we are through the financial storm drove this beaten-down S&P 500 sector significantly higher. We remain somewhat wary of and underweight this group. The Fund is slightly ahead of the S&P 500 on a calendar year-to-date basis (20.20% vs. 19.26%), a result that is pleasing given the fact that our portfolio typically lags in strong rallies. The Fund’s focus on both low valuation and franchises that are perhaps less cyclical than those owned by the typical fund or the benchmark usually provides good protection in difficult markets and recessions, but often trails coming out of tough times, as speculation increases and investors’ attentions move to cyclicals and so-called “high beta” stocks.
The spectacular rise (over 50%) in the stock market from early March seems disconnected from the underlying fundamentals, which remain very poor. On the other hand, one could argue that the S&P 500’s move from 1565 or so in October of 2007 to below 700 in March of this year was an overreaction to the financial crisis and recession. On balance, today’s 1060 S&P 500 price appears to incorporate fairly optimistic expectations of future economic growth. Using The Leuthold Group’s data, 2009 earnings for the S&P 500 on an operating and reported (including write-offs) basis are estimated to be $60 and $50, respectively. This yields respective P/E ratios of 17.7 and 21.2. The corresponding P/E ratios using 2010 estimates are 14.0 and 17.7. If these numbers prove correct, they will represent a 21% and 27% growth in operating earnings for 2009 and 2010, respectively. On a reported basis, the corresponding figures are 236% (2008 experienced very heavy write-offs) and 20%.
For new investors, the September and March quarterly letters contain an abbreviated general commentary and an outline of a number of portfolio investments. The June and December letters have a lengthier commentary with no individual company discussion. Past letters are available on the FMI Funds website at www.fmifunds.com. |
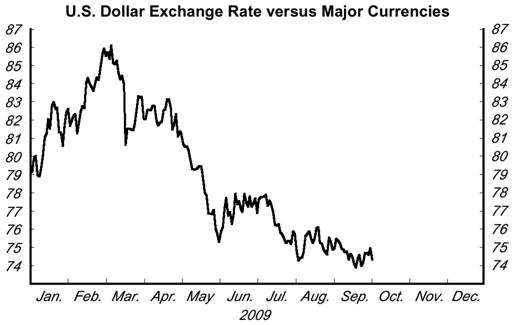
Source: Federal Reserve Board
While it is not unusual to have strong earnings growth as the economy emerges from recession, the market seems to believe this outcome is a foregone conclusion. We have little doubt that eventually better times will come, but there is currently meager fundamental improvement. Demand remains incredibly weak across a wide spectrum of industries. We are acutely attuned to signs of revenue growth, as this will be the indicator that a bona fide recovery is indeed underway, but so far the evidence is unconvincing. Unemployment continues to rise, with the official rate of 9.7% near the high of the 1982 recession. If “discouraged” workers (unemployed but not actively looking for work over the previous four weeks) and nondiscretionary part-time workers (those who would rather have full-time employment) are added, the figure is 16.8%, a post-depression high. Consumer confidence has bounced off the bottom, but remains over 30% below where it stood a few years ago. Business leaders are still hunkered down as they try to digest the implications of massive government intervention (health care, environment, financial
regulation, tariffs and taxes). Many Americans are very concerned about the huge and rapidly increasing budget deficits, and this sentiment appears to be shared by our trading partners as the dollar nears an all time low.
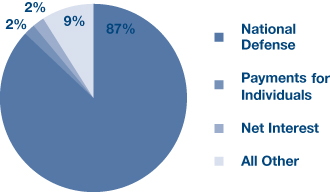
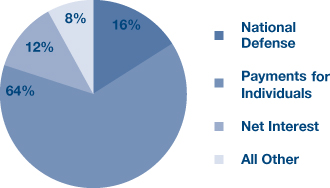
Faith in the system, inflation expectations, interest rates and tax policy all impact business confidence and the direction of the economy. As government debt relative to GDP moves toward World War II levels, there are those that say not to worry; after all, the U.S. managed through that period and went on to a generally prosperous second half of the century. We are struck by the shallowness of this argument. A recent piece from JP Morgan cited Office of Management and Budget (OMB) data that showed, in 1945, nearly 90% of the budget was defense. Only 2% of the budget went to “payments for individuals” which includes social security, Medicare and welfare, among other programs. Based on the OMB’s 2014 projection (today’s pie chart isn’t significantly different), 64% of the budget will go to “payments for individuals.” It was relatively easy to slash defense spending once WWII ended (and we did). The growth in government programs and bureaucracies in recent decades has been nearly impossible to control, much less reduce. Today we are layering on explosive government spending due to financial bailouts and new fiscal programs. Ultimately we may have to deal with inflation, but not today.
1945: Breakdown of budget outlays: Actual Allocation of Governmentexpenditure | | 2014E: Breakdown of budget outlays: Projected Allocation of Governmentexpenditure |
Source: OMB – U.S. Office of Management and Budget
Though the current environment poses very significant challenges to business creation/expansion and employment growth, history shows that negative conditions don’t persist forever. Forces often move in counter directions, checking excesses and setting the stage for better times. When confidence improves, businesses will take advantage of abundant and attractively priced labor, low capital costs and excess capacity. Consumers are saving more and while this depresses near term GDP growth, it sets the stage for more sustainable investment and consumption down the road. Additionally, there are signs of recovery in a few countries in Asia and Europe and that will help stimulate demand in the United States.
As alluded to earlier, stocks that are particularly economically sensitive have had explosive moves off the bottom. Many seem to now reflect a best case scenario. At the same time, a number of companies with steady demand characteristics have underperformed in this market. We’ve made some moves to take advantage of this situation, including the sale of Robert Half, Cisco Systems, and General Electric. We’ve also reduced our exposure to Rockwell, Grainger and American Express. On the flip side, we initiated purchases in 3M, DENTSPLY and Nestlé and increased the weightings of Sysco, Time Warner and Berkshire Hathaway. The portfolio remains well diversified, but somewhat more defensive than a quarter ago. Below we have highlighted two recent additions.
DENTSPLY INTERNATIONAL INC. (NASDAQ: XRAY)
Description
DENTSPLY International (“XRAY”) engages in the design, development, manufacture, and marketing of dental consumables, dental lab products, and dental specialty products worldwide. The company’s dental consumable products (35% of sales) include dental anesthetics, prophylaxis paste, dental sealants, impression materials, restorative materials, tooth whiteners, and topical fluoride; small equipment, including high and low speed hand pieces, intraoral curing light systems, dental diagnostic systems, and ultrasonic scalers and polishers used in dental offices. Its dental lab products (18% of sales) comprise dental prosthetics, including artificial teeth, precious metal dental alloys, dental ceramics, and crown and
bridge materials, as well as equipment, such as computer aided ceramic machining systems, and porcelain furnaces used in the preparation of dental appliances by dental laboratories. The company’s specialty product line (47% of sales) consists of endodontic/orthodontic instruments and materials as well as dental implants.
Good Business
| | • | XRAY is the world’s largest pure-play dental company and dominates the majority of its addressable markets. In addition, the global dental market offers attractive long-term revenue growth prospects. |
| | • | Approximately 80% of XRAY’s revenue is generated through the sale of dental consumables and can be considered recurring in nature. |
| | • | The company owns strong brands, and its product breadth is unparalleled in the global dental industry. |
| | • | The vast majority of XRAY’s products are not subject to reimbursement risk. |
| | • | XRAY comfortably earns its cost of capital. The company’s trailing 10-year average return on invested capital (ROIC) is 13%. |
| | • | The business is easy to understand. |
| | • | The balance sheet is strong, with approximately $200 million in cash and $450 million in total debt. Net debt is only 0.5 times EBITDA and XRAY’s interest coverage is 12.7 times. |
Valuation
| | • | The stock is down approximately 30% from its high. |
| | • | Over the past ten years, XRAY’s shares have traded for an average enterprise value-to-sales (EV/Sales) multiple of 2.7. This compares to the current multiple of 2.3. |
| | • | Over the past 15 years, XRAY’s shares have traded for an average enterprise value-to-earnings before interest, taxes, depreciation and amortization (EV/EBITDA) multiple of 12.6. This compares to the current multiple of 10.0. |
| | • | XRAY’s price-to-earnings (P/E) multiple has averaged 22.5 over the past 20 years, compared to the current P/E ratio of 18.4. |
Management
| | • | Current Chairman and CEO, Bret Wise, joined XRAY in 2002 as CFO; he became COO in 2006, and in January 2007, was promoted to his role as CEO. Mr. Wise is well-respected within the dental industry and appears to be focused on ROIC. |
| | • | XRAY employees own 6% of the diluted shares outstanding. Directors and executive officers beneficially own 1.8% of the company’s outstanding shares. This increases the odds that management and employees will think and act like shareholders. |
Investment Thesis
The severity and breadth of the current downturn in the economy has led to weakness in traditionally recession resistant industries, including the dental group. Rising unemployment doesn’t bode well for high-ticket and more discretionary dental products (i.e., dental implants and orthodontics) in the near term. These products happen to be XRAY’s most profitable, and exhibit the highest growth rates. However, we believe the recent poor stock price performance, driven by concerns surrounding near term economic-related weakness, offers an attractive opportunity to invest in a high quality franchise with solid long-term growth prospects.
NESTLÉ S.A. (OTCBB: NSRGY)
Description
Nestlé is the world’s largest food and beverage company with a multi-decade heritage in geographies across the globe. The company’s nearly 30 “billionaire” brands, each with annual sales of more than CHF 1 billion, account for approximately 70% of Food and Beverage sales, and contribute above average growth and margins. The company’s brand franchises are some of the strongest in the world, including Carnation, Coffee-mate, Dreyer’s, Nescafé, Nestea, Lean Cuisine, Perrier, Nestlé Chocolate and many more.
Good Business
| | • | Nestlé’s global franchise is unmatched in terms of product breadth, geographical spread, differentiated localized tastes and nutritional content. |
| | • | The revenue is recurring. |
| | • | Over the past eight years, Nestlé’s ROIC has averaged 19%. |
| | • | Nestlé’s AA rated balance sheet is one of the strongest in the industry. |
| | • | Nestlé’s top twenty customers account for just 10% of revenues. |
Valuation
| | • | Over the past 5 years Nestlé has averaged a forward P/E ratio of 15.4, ranging from a low of 12 to a high of 18.6. Currently the P/E (adjusted for the Alcan and L’Oréal holdings) is 11. |
| | • | Nestlé trades for less than 8 times EV/EBITDA. The company’s 5-year average multiple is 10. |
| | • | Excluding the company’s ownership stakes in Alcon and L’Oréal, the core Food & Beverage business is trading at 1.1 times revenues, which is very inexpensive compared to other branded food franchises. |
Management
| | • | Paul Bulcke has been Nestlé’s CEO since April 2008. Bulcke has held various management positions at Nestlé since 1980. |
| | • | James Singh is Nestlé’s current CFO, since 2008. Previously Singh was the company’s VP in charge of acquisitions and business development. |
| | • | Despite a strong ROIC profile, Nestlé has occasionally overpaid for acquisitions. Current management has committed publicly to being highly disciplined with respect to deals. |
| | • | Nestlé’s operating management team is considered deep by industry consultants and analysts. |
Investment Thesis
Nestlé has one of the strongest brand franchises in the world. Demand for its products tends to be relatively stable, which should bode well for the stock if worldwide economies remain weaker than expected. The company has a superior ROIC profile and a very attractive balance sheet. The valuation is undemanding. Over time Nestlé should generate high single-digit earnings growth and an expanding dividend.
******
Our Board of Directors has declared a distribution effective October 29, 2009, of $0.13294 per share from net investment income, payable October 30, 2009 to shareholders of record on October 28, 2009.
We appreciate your confidence in the FMI Large Cap Fund.
Sincerely,
 |  |  |
| Ted D. Kellner, CFA | Donald S. Wilson, CFA | Patrick J. English, CFA |
| President and | Vice President | Vice President and |
| Portfolio Manager | | Portfolio Manager |
100 E. Wisconsin Ave., Suite 2200 • Milwaukee, WI 53202 • 414-226-4555
www.fmifunds.com
FMI Large Cap Fund
COST DISCUSSION
Industry Sectors as of September 30, 2009
As a shareholder of the Fund you incur ongoing costs, including management fees and other Fund expenses. You do not incur transaction costs such as sales charges (loads) on purchase payments, reinvested dividends, or other distributions; redemption fees; and exchange fees because the Fund does not charge these fees. This example is intended to help you understand your ongoing costs (in dollars) of investing in FMI Large Cap Fund and to compare these costs with the ongoing costs of investing in other mutual funds.
The example is based on an investment of $1,000 invested at the beginning of the period and held for the entire period from April 1, 2009 through September 30, 2009.
Actual Expenses
The first line of the table below provides information about actual account values and actual expenses. You may use the information in this line, together with the amount you invested, to estimate the expenses that you paid over the period. Simply divide your account value by $1,000 (for example, an $8,600 account value divided by $1,000 = 8.6), then multiply the result by the number in the first line under the heading entitled “Expenses Paid During Period” to estimate the expenses you paid on your account during this period.
In addition to the costs highlighted and described below, the only Fund transaction costs you might currently incur would be wire fees ($15 per wire), if you choose to have proceeds from a redemption wired to your bank account instead of receiving a check. Additionally, U.S. Bank charges an annual processing fee ($15) if you maintain an IRA account with the Fund. To determine your total costs of investing in the Fund, you would need to add any applicable wire or IRA processing fees you’ve incurred during the period to the costs provided in the example at the end of this article.
Hypothetical Example for Comparison Purposes
The second line of the table below provides information about hypothetical account values and hypothetical expenses based on the Fund’s actual expense ratio and an assumed rate of return of 5% per year before expenses, which is not the Fund’s actual return. The hypothetical account values and expenses may not be used to estimate the actual ending account balance or expenses you paid for the period. You may use this information to compare the ongoing costs of investing in the Fund and other funds. To do so, compare this 5% hypothetical example with the 5% hypothetical examples that appear in the shareholder reports of the other funds.
Please note that the expenses shown in the table are meant to highlight your ongoing costs only and do not reflect any transactional costs, such as sales charges (loads), redemption fees or exchange fees. Therefore, the second line of the table is useful in comparing ongoing costs only, and will not help you determine the relative total costs of owning different funds. In addition, if these transactional costs were included, your costs would have been higher.
| | Beginning | Ending | Expenses Paid |
| | Account | Account | During Period* |
| | Value 4/01/09 | Value 9/30/09 | 4/01/09-9/30/09 |
| FMI Large Cap Fund Actual | $1,000.00 | $1,313.90 | $5.51 |
| Hypothetical (5% return before expenses) | $1,000.00 | $1,020.30 | $4.81 |
| * | Expenses are equal to the Fund’s annualized expense ratio of 0.95%, multiplied by the average account value over the period, multiplied by 183/365 (to reflect the one-half year period between April 1, 2009 and September 30, 2009). |
FMI Large Cap Fund
MANAGEMENT’S DISCUSSION OF FUND PERFORMANCE
During the fiscal year ended September 30, 2009, the FMI Large Cap Fund (the “Fund”) had a total return of negative 1.79%. This compared favorably to a -6.91% return of the benchmark S&P 500. Finance, Commercial Services and Energy Minerals positively impacted relative results. The Fund’s underweight position in Finance was a significant contributor in the quarter. Electronic Technology, Technology Services and Health Technology were negative relative contributing sectors in the fiscal year. Rockwell, Schlumberger and BP were among the strongest individual contributors. Cardinal Health, Tyco Electronics and Covidien detracted from performance. Staples, General Electric and Time Warner were sold during the fiscal year for fundamental reasons. Robert Half and Cisco were sold due to valuation. At the fiscal year end, the Fund is overweight the benchmark in Producer Manufacturing, Consumer Non-Durables and Commercial Services. The Fund is underweight Finance, Electronic Technology and Health Technology. Overall, the Fund remains exposed to most of the major industrial sectors of the economy. Extreme worries about mortgages, derivatives and banking in the first fiscal quarter softened as the year progressed, giving way to optimism about an economic rebound as the quarter ended. The Fund’s adviser believes difficult economic conditions may continue for some time. The Fund continues to sell at a discount to the S&P 500, based on most valuation measures. Over long time periods, lower valuation stocks have outperformed higher valuation stocks. Future results, however, may differ from the past.
| | | COMPARISON OF CHANGE IN VALUE OF $10,000 INVESTMENT IN FMI Large Cap Fund and Standard & Poor’s 500 Index(1) | |
| | | *Inception date Past performance does not predict future performance. The graph and the table do not reflect the deduction of taxes that a shareholder would pay on Fund distributions or the redemption of Fund shares. | |
| | | | |
| | (1) | The Standard & Poor’s 500 Index consists of 500 selected common stocks, most of which are listed on the New York Stock Exchange. The Standard & Poor’s Ratings Group designates the stocks to be included in the Index on a statistical basis. A particular stock’s weighting in the Index is based on its relative total market value (i.e., its market price per share times the number of shares outstanding). Stocks may be added or deleted from the Index from time to time. | |
| TOTAL RETURN |
| 1-Year | 5-Year | |
| -1.79% | 5.28% | 5.64% |
FMI Large Cap Fund
STATEMENT OF ASSETS AND LIABILITIES
| ASSETS: | | | |
| Investments in securities, at value (cost $1,918,299,848) | | $ | 2,041,595,786 | |
| Receivable from shareholders for purchases | | | 9,366,474 | |
| Dividends receivable | | | 4,207,272 | |
| Cash | | | 39,293 | |
| Other receivables | | | 3,027 | |
| Total assets | | $ | 2,055,211,852 | |
| LIABILITIES: | | | | |
| Payable to shareholders for redemptions | | $ | 2,051,601 | |
| Payable to adviser for management and administrative fees | | | 1,129,632 | |
| Other liabilities | | | 329,608 | |
| Total liabilities | | | 3,510,841 | |
| NET ASSETS: | | | | |
| Capital Stock, $0.0001 par value; 300,000,000 shares authorized; 154,583,715 shares outstanding | | | 2,028,083,511 | |
| Net unrealized appreciation on investments | | | 123,295,938 | |
| Accumulated net realized loss on investments | | | (121,273,542 | ) |
| Undistributed net investment income | | | 21,595,104 | |
| Net assets | | | 2,051,701,011 | |
| Total liabilities and net assets | | $ | 2,055,211,852 | |
| CALCULATION OF NET ASSET VALUE PER SHARE: | | | | |
| Net asset value, offering and redemption price per share ($2,051,701,011 ÷ 154,583,715 shares outstanding) | | $ | 13.27 | |
The accompanying notes to financial statements are an integral part of this statement.
Shares | | | | Cost | | | Value | |
| COMMON STOCKS — 94.8% (a) | | | | | | |
COMMERCIAL SERVICES SECTOR — 7.1% | | | | | | |
| | | Financial Publishing/Services — 2.6% | | | | | | |
| | 2,145,900 | | McGraw-Hill | | | | | | |
| | | | Companies, Inc. | | $ | 53,642,695 | | | $ | 53,947,926 | |
| | | | Miscellaneous Commercial Services — 4.5% | | | | | | | | |
| | 3,053,000 | | Cintas Corp. | | | 87,035,808 | | | | 92,536,430 | |
CONSUMER NON-DURABLES SECTOR — 10.4% | | | | | | | | |
| | | | Beverages: Alcoholic — 4.2% | | | | | | | | |
| | 1,384,000 | | Diageo | | | | | | | | |
| | | | PLC - SP-ADR | | | 89,716,022 | | | | 85,102,160 | |
| | | | Food: Major Diversified — 2.5% | | | | | | | | |
| | 1,217,000 | | Nestlé | | | | | | | | |
| | | | S.A. - SP-ADR | | | 50,353,906 | | | | 51,795,520 | |
| | | | Household/Personal Care — 3.7% | | | | | | | | |
| | 1,298,000 | | Kimberly-Clark | | | | | | | | |
| | | | Corp. | | | 76,676,255 | | | | 76,556,040 | |
CONSUMER SERVICES SECTOR — 3.8% | | | | | | | | |
| | | | Media Conglomerates — 3.8% | | | | | | | | |
| | 2,738,000 | | Time Warner Inc. | | | 81,419,735 | | | | 78,799,640 | |
DISTRIBUTION SERVICES SECTOR — 8.8% | | | | | | | | |
| | | | Food Distributors — 3.7% | | | | | | | | |
| | 3,023,000 | | Sysco Corp. | | | 79,373,423 | | | | 75,121,550 | |
| | | | Medical Distributors — 2.3% | | | | | | | | |
| | 1,743,000 | | Cardinal Health, Inc. | | | 50,616,072 | | | | 46,712,400 | |
| | | | Wholesale Distributors — 2.8% | | | | | | | | |
| | 646,000 | | Grainger (W.W.), Inc. | | | 45,883,184 | | | | 57,726,560 | |
ELECTRONIC TECHNOLOGY SECTOR — 7.6% | | | | | | | | |
| | | | Electronic Components — 4.0% | | | | | | | | |
| | 3,656,000 | | Tyco Electronics Ltd. | | | 87,197,191 | | | | 81,455,680 | |
| | | | Electronic Equipment/Instruments — 3.6% | | | | | | | | |
| | 1,851,000 | | CANON INC. SP-ADR | | | 71,299,102 | | | | 74,021,490 | |
FMI Large Cap Fund
SCHEDULE OF INVESTMENTS (Continued)
Shares or Principal Amount | | | | Cost | | | Value | |
| COMMON STOCKS — 94.8% (a) (Continued) | | | | | | |
ENERGY MINERALS SECTOR — 4.7% | | | | | | |
| | | Integrated Oil — 4.7% | | | | | | |
| | 1,831,000 | | BP PLC - SP-ADR | | $ | 94,203,087 | | | $ | 97,464,130 | |
FINANCE SECTOR — 11.7% | | | | | | | | |
| | | | Financial Conglomerates — 2.5% | | | | | | | | |
| | 1,523,000 | | American Express Co. | | | 35,010,300 | | | | 51,629,700 | |
| | | | Major Banks — 4.6% | | | | | | | | |
| | 3,270,000 | | Bank of New York | | | | | | | | |
| | | | Mellon Corp. | | | 104,539,020 | | | | 94,797,300 | |
| | | | Property/Casualty Insurance — 4.6% | | | | | | | | |
| | 28,000 | | Berkshire Hathaway | | | | | | | | |
| | | | Inc. Cl B* | | | 86,539,302 | | | | 93,044,000 | |
HEALTH SERVICES SECTOR — 1.7% | | | | | | | | |
| | | | Health Industry Services — 1.7% | | | | | | | | |
| | 1,556,100 | | CareFusion Corp.* | | | 32,903,787 | | | | 33,922,980 | |
HEALTH TECHNOLOGY SECTOR — 6.2% | | | | | | | | |
| | | Medical Specialties — 6.2% | | | | | | | | |
| | 1,658,000 | | Covidien PLC | | | 69,380,734 | | | | 71,725,080 | |
| | 1,606,000 | | DENTSPLY | | | | | | | | |
| | | | International Inc. | | | 45,652,047 | | | | 55,471,240 | |
| | | | | | | 115,032,781 | | | | 127,196,320 | |
| INDUSTRIAL SERVICES SECTOR — 2.2% | | | | | | | | |
| | | | Oilfield Services/Equipment — 2.2% | | | | | | | | |
| | 760,000 | | Schlumberger Ltd. | | | 28,397,560 | | | | 45,296,000 | |
PRODUCER MANUFACTURING SECTOR — 11.4% | | | | | | | | |
| | | | Industrial Conglomerates — 8.4% | | | | | | | | |
| | 1,193,000 | | 3M Co. | | | 72,161,024 | | | | 88,043,400 | |
| | 2,458,000 | | Tyco | | | | | | | | |
| | | | International Ltd. | | | 68,659,084 | | | | 84,751,840 | |
| | | | | | | 140,820,108 | | | | 172,795,240 | |
| | | | Industrial Machinery — 3.0% | | | | | | | | |
| | 1,418,000 | | Rockwell | | | | | | | | |
| | | | Automation, Inc. | | | 37,380,913 | | | | 60,406,800 | |
RETAIL TRADE SECTOR — 7.8% | | | | | | | | |
| | | | Discount Stores — 4.8% | | | | | | | | |
| | 2,014,000 | | Wal-Mart Stores, Inc. | | | 98,770,791 | | | | 98,867,260 | |
| | | | Electronics/Appliance Stores — 3.0% | | | | | | | | |
| | 1,649,000 | | Best Buy Co., Inc. | | | 49,977,792 | | | | 61,870,480 | |
TECHNOLOGY SERVICES SECTOR — 7.3% | | | | | | | | |
| | | | Data Processing Services — 3.8% | | | | | | | | |
| | 1,961,000 | | Automatic Data | | | | | | | | |
| | | | Processing, Inc. | | | 75,268,428 | | | | 77,067,300 | |
| | | | Information Technology Services — 3.5% | | | | | | | | |
| | 1,937,000 | | Accenture PLC | | | 61,514,420 | | | | 72,191,990 | |
TRANSPORTATION SECTOR — 4.1% | | | | | | | | |
| | | | Air Freight/Couriers — 4.1% | | | | | | | | |
| | 1,487,000 | | United Parcel | | | | | | | | |
| | | | Service, Inc. Cl B | | | 87,428,166 | | | | 83,970,890 | |
| | | | Total common | | | | | | | | |
| | | | stocks | | | 1,820,999,848 | | | | 1,944,295,786 | |
SHORT-TERM INVESTMENTS — 4.7% (a) | | | | | | | | |
| | | | Commercial Paper — 4.7% | | | | | | | | |
| $ | 97,300,000 | | U.S. Bank, N.A., 0.04%, | | | | | | | | |
| | | | due 10/01/09 | | | 97,300,000 | | | | 97,300,000 | |
| | | | Total short-term | | | | | | | | |
| | | | investments | | | 97,300,000 | | | | 97,300,000 | |
| | | | Total investments | | | | | | | | |
| | | | — 99.5% | | $ | 1,918,299,848 | | | | 2,041,595,786 | |
| | | | Cash and | | | | | | | | |
| | | | receivables, less | | | | | | | | |
| | | | liabilities | | | | | | | | |
| | | | — 0.5% (a) | | | | | | | 10,105,225 | |
| | | | TOTAL NET ASSETS | | | | | | | | |
| | | | — 100.0% | | | | | | $ | 2,051,701,011 | |
| * | Non-income producing security. |
| (a) | Percentages for the various classifications relate to net assets. |
SP-ADR – Sponsored American Depositary Receipts
The accompanying notes to financial statements are an integral part of this schedule.
FMI Large Cap Fund
STATEMENT OF OPERATIONS
For the Year Ended September 30, 2009
| INCOME: | | | |
| Dividends | | $ | 43,354,998 | |
| Interest | | | 314,346 | |
| Total income | | | 43,669,344 | |
| EXPENSES: | | | | |
| Management fees | | | 11,801,546 | |
| Transfer agent fees | | | 1,753,086 | |
| Administrative and accounting services | | | 870,167 | |
| Custodian fees | | | 343,296 | |
| Printing and postage expense | | | 221,910 | |
| Registration fees | | | 153,091 | |
| Professional fees | | | 53,485 | |
| Insurance expense | | | 51,679 | |
| Board of Directors fees | | | 29,000 | |
| Other expenses | | | 34,985 | |
| Net expenses | | | 15,312,245 | |
| NET INVESTMENT INCOME | | | 28,357,099 | |
| NET REALIZED LOSS ON INVESTMENTS | | | (96,323,075 | ) |
| NET INCREASE IN UNREALIZED APPRECIATION ON INVESTMENTS | | | 197,343,740 | |
| NET GAIN ON INVESTMENTS | | | 101,020,665 | |
| NET INCREASE IN NET ASSETS RESULTING FROM OPERATIONS | | $ | 129,377,764 | |
STATEMENTS OF CHANGES IN NET ASSETS
For the Years Ended September 30, 2009 and 2008
| | | 2009 | | | 2008 | |
| OPERATIONS: | | | | | | |
| Net investment income | | $ | 28,357,099 | | | $ | 8,594,441 | |
| Net realized loss on investments | | | (96,323,075 | ) | | | (14,847,464 | ) |
| Net increase (decrease) in unrealized appreciation on investments | | | 197,343,740 | | | | (112,702,435 | ) |
| Net increase (decrease) in net assets from operations | | | 129,377,764 | | | | (118,955,458 | ) |
| DISTRIBUTIONS TO SHAREHOLDERS: | | | | | | | | |
| Distributions from net investment income ($0.1143 and $0.1341 per share, respectively) | | | (13,823,123 | ) | | | (5,339,265 | ) |
| Distributions from net realized gains ($0.4294 per share) | | | — | | | | (17,326,247 | ) |
| Total distributions | | | (13,823,123 | ) | | | (22,665,512 | ) |
| FUND SHARE ACTIVITIES: | | | | | | | | |
| Proceeds from shares issued (128,668,799 and 58,850,086 shares, respectively) | | | 1,436,242,758 | | | | 862,301,900 | |
| Net asset value of shares issued in distributions reinvested | | | | | | | | |
| (816,243 and 1,439,344 shares, respectively) | | | 9,086,079 | | | | 22,538,745 | |
| Cost of shares redeemed (58,450,432 and 16,236,082 shares, respectively) | | | (649,382,681 | ) | | | (241,894,860 | ) |
| Net increase in net assets derived from Fund share activities | | | 795,946,156 | | | | 642,945,785 | |
| TOTAL INCREASE | | | 911,500,797 | | | | 501,324,815 | |
| NET ASSETS AT THE BEGINNING OF THE YEAR | | | 1,140,200,214 | | | | 638,875,399 | |
| NET ASSETS AT THE END OF THE YEAR (Includes undistributed | | | | | | | | |
| net investment income of $21,595,104 and $7,061,128, respectively) | | $ | 2,051,701,011 | | | $ | 1,140,200,214 | |
The accompanying notes to financial statements are an integral part of these statements.
FMI Large Cap Fund
FINANCIAL HIGHLIGHTS
(Selected data for each share of the Fund outstanding throughout each year)
| | | Years Ended September 30, | |
| | | 2009 | | | 2008 | | | 2007 | | | 2006 | | | 2005 | |
| PER SHARE OPERATING PERFORMANCE: | | | | | | | | | | | | | | | |
| Net asset value, beginning of year | | $ | 13.65 | | | $ | 16.18 | | | $ | 14.79 | | | $ | 13.29 | | | $ | 11.66 | |
| Income from investment operations: | | | | | | | | | | | | | | | | | | | | |
| Net investment income | | | 0.20 | | | | 0.17 | | | | 0.17 | | | | 0.12 | | | | 0.08 | |
| Net realized and unrealized | | | | | | | | | | | | | | | | | | | | |
| (losses) gains on investments | | | (0.47 | )* | | | (2.14 | ) | | | 1.65 | | | | 1.78 | | | | 1.82 | |
| Total from investment operations | | | (0.27 | ) | | | (1.97 | ) | | | 1.82 | | | | 1.90 | | | | 1.90 | |
| Less distributions: | | | | | | | | | | | | | | | | | | | | |
| Distributions from net investment income | | | (0.11 | ) | | | (0.13 | ) | | | (0.10 | ) | | | (0.03 | ) | | | (0.07 | ) |
| Distributions from net realized gains | | | — | | | | (0.43 | ) | | | (0.33 | ) | | | (0.37 | ) | | | (0.20 | ) |
| Total from distributions | | | (0.11 | ) | | | (0.56 | ) | | | (0.43 | ) | | | (0.40 | ) | | | (0.27 | ) |
| Net asset value, end of year | | $ | 13.27 | | | $ | 13.65 | | | $ | 16.18 | | | $ | 14.79 | | | $ | 13.29 | |
| TOTAL RETURN | | | (1.79% | ) | | | (12.58% | ) | | | 12.52% | | | | 14.82% | | | | 16.60% | |
| RATIOS/SUPPLEMENTAL DATA: | | | | | | | | | | | | | | | | | | | | |
| Net assets, end of year (in 000’s $) | | | 2,051,701 | | | | 1,140,200 | | | | 638,875 | | | | 165,806 | | | | 73,903 | |
| Ratio of expenses (after reimbursement) | | | | | | | | | | | | | | | | | | | | |
| to average net assets (a) | | | 0.97% | | | | 1.00% | | | | 1.00% | | | | 1.00% | | | | 1.00% | |
| Ratio of net investment income | | | | | | | | | | | | | | | | | | | | |
| to average net assets (b) | | | 1.80% | | | | 1.13% | | | | 1.06% | | | | 0.88% | | | | 0.64% | |
| Portfolio turnover rate | | | 32% | | | | 30% | | | | 19% | | | | 29% | | | | 40% | |
| * | The amount shown may not correlate with the aggregate gains and losses of portfolio securities due to the timing of subscriptions and redemptions of Fund shares. |
| (a) | Computed after giving effect to adviser's expense limitation undertaking. If the Fund had paid all of its expenses for the years ended September 30, 2008, 2007, 2006 and 2005, the ratios would have been 1.02%, 1.03%, 1.11% and 1.33%, respectively. |
| (b) | If the Fund had paid all of its expenses for the years ended September 30, 2008, 2007, 2006 and 2005, the ratios would have been 1.11%, 1.03%, 0.77% and 0.31%, respectively. |
The accompanying notes to financial statements are an integral part of this statement.
NOTES TO FINANCIAL STATEMENTS
| (1) | Summary of Significant Accounting Policies — |
The following is a summary of significant accounting policies of the FMI Large Cap Fund (the “Fund”), a series of FMI Funds, Inc. (the “Company”) which is registered as a non-diversified, open-end management investment company under the Investment Company Act of 1940 (the “Act”), as amended. The Company was incorporated under the laws of Maryland on September 5, 1996 and the Fund commenced operations on December 31, 2001. The assets and liabilities of each Fund in the Company are segregated and a shareholder’s interest is limited to the Fund in which the shareholder owns shares. The investment objective of the Fund is to seek long-term capital appreciation principally through investing in a limited number of large capitalization value stocks.
| | (a) | Each security, excluding short-term investments, is valued at the last sale price reported by the principal security exchange on which the issue is traded. Securities that are traded on the Nasdaq Markets are valued at the Nasdaq Official Closing Price, or if no sale is reported, the latest bid price. Securities that are traded over-the-counter are valued at the latest bid price. Unlisted equity securities for which market quotations are readily available are valued at the most recent bid price. Securities for which quotations are not readily available are valued at fair value as determined by the investment adviser under the supervision of the Board of Directors. The fair value of a security is the amount which the Fund might reasonably expect to receive upon a current sale. The fair value of a security may differ from the last quoted price and the Fund may not be able to sell a security at the estimated fair value. Market quotations may not be available, for example, if trading in particular securities was halted during the day and not resumed prior to the close of trading on the New York Stock Exchange. As of September 30, 2009, there were no securities that were internally fair valued. |
FMI Large Cap Fund
NOTES TO FINANCIAL STATEMENTS (Continued)
| (1) | Summary of Significant Accounting Policies — (Continued) |
| | | Variable rate demand notes are recorded at par value which approximates market value. Short-term investments with maturities of 60 days or less are valued at amortized cost which approximates value. For financial reporting purposes, investment transactions are recorded on the trade date. |
| | | The Fund adopted the provisions of the Financial Accounting Standards Board (“FASB”) Accounting Standards Codification “Fair Value Measurements and Disclosures” Topic 820 (“ASC 820”), effective October 1, 2008. Under ASC 820, fair value is defined as the price that would be received to sell an asset or paid to transfer a liability (i.e., the “exit price”) in an orderly transaction between market participants at the measurement date. |
| | | In determining fair value, the Fund uses various valuation approaches. ASC 820 establishes a fair value hierarchy for inputs used in measuring fair value that maximizes the use of observable inputs and minimizes the use of unobservable inputs by generally requiring that the most observable inputs be used when available. Observable inputs are those that market participants would use in pricing the asset or liability based on market data obtained from sources independent of the Fund. Unobservable inputs reflect the Fund’s assumptions about the inputs market participants would use in pricing the asset or liability developed based on the best information available in the circumstances. The inputs or methodologies used for valuing securities are not necessarily an indication of the risks associated with investing in those securities. |
The fair value hierarchy is categorized into three levels based on the inputs as follows:
| | Level 1 — | Valuations based on unadjusted quoted prices in active markets for identical assets. |
| | Level 2 — | Valuations based on quoted prices for similar securities or in markets that are not active or for which all significant inputs are observable, either directly or indirectly. |
| | Level 3 — | Valuations based on inputs that are unobservable and significant to the overall fair value measurement. |
The following table summarizes the Fund’s investments as of September 30, 2009, based on the inputs used to value them:
| Valuation Inputs | | Investments in Securities | |
| Level 1 — Common Stocks | | $ | 1,944,295,786 | |
| Level 2 — Short-Term Commercial Paper | | | 97,300,000 | |
| Level 3 — | | | — | |
| Total | | $ | 2,041,595,786 | |
| | (b) | Net realized gains and losses on sales of securities are computed on the identified cost basis. |
| | (c) | Dividend income is recorded on the ex-dividend date. Interest income is recorded on an accrual basis. |
| | (d) | The Fund may have investments in short-term variable rate demand notes, which are unsecured instruments. The Fund may be susceptible to credit risk with respect to these notes to the extent the issuer defaults on its payment obligation. The Fund’s policy is to monitor the creditworthiness of the issuer and nonperformance by these issuers is not anticipated. |
| | (e) | Accounting principles generally accepted in the United States of America (“GAAP”) require that permanent differences between income for financial reporting and tax purposes be reclassified in the capital accounts. |
| | (f) | The preparation of financial statements in conformity with GAAP requires management to make estimates and assumptions that affect the reported amounts of assets and liabilities and disclosure of contingent assets and liabilities at the date of the financial statements and the reported amounts of revenues and expenses during the reporting period. Actual results could differ from these estimates. |
| | (g) | The Fund may own certain securities that are restricted. Restricted securities include Section 4(2) commercial paper, securities issued in a private placement, or securities eligible for resale pursuant to Rule 144A under the Securities Act of 1933 (the “1933 Act”). A restricted security cannot be resold to the general public without prior registration under the 1933 Act or pursuant to the resale limitations provided by Rule 144A under the 1933 Act, or an exemption from the registration requirements of the 1933 Act. |
| | (h) | No provision has been made for Federal income taxes since the Fund has elected to be taxed as a “regulated investment company” and intends to distribute substantially all net investment company taxable income and net capital gains to its shareholders and otherwise comply with the provisions of the Internal Revenue Code applicable to regulated investment companies. |
| | (i) | The Fund has reviewed all open tax years and major jurisdictions, which include Federal and the state of Maryland, and concluded that there are no significant uncertain tax positions that would require recognition in the financial statements. Open tax years are those that |
FMI Large Cap Fund
NOTES TO FINANCIAL STATEMENTS (Continued)
| (1) | Summary of Significant Accounting Policies — (Continued) |
| | | are open for exam by taxing authorities and, as of September 30, 2009, open Federal tax years include the tax years ended September 30, 2006 through 2009. The Fund has no examinations in progress and is also not aware of any tax positions for which it is reasonably possible that the total amounts of unrecognized tax benefits will significantly change in the next twelve months. |
| (2) | Investment Adviser and Management Agreement and Transactions With Related Parties — |
The Fund has a management agreement with Fiduciary Management, Inc. (“FMI”), with whom certain officers and directors of the Fund are affiliated, to serve as investment adviser and manager. Under the terms of the agreement, the Fund will pay FMI a monthly management fee at the annual rate of 0.75% of the daily net assets. The Fund has an administrative agreement with FMI to supervise all aspects of the Fund’s operations except those performed by FMI pursuant to the management agreement. Under the terms of the agreement, the Fund paid FMI a monthly administrative fee at the annual rate of 0.20% of the daily net assets up to and including $30,000,000, 0.10% on the next $70,000,000 and 0.05% of the daily net assets of the Fund in excess of $100,000,000.
Under the management agreement, FMI will reimburse the Fund for expenses over 1.20% of the daily net assets of the Fund. In addition to the reimbursement required under the management agreement, FMI will voluntarily reimburse the Fund for expenses over 1.00%. For the year ended September 30, 2009 there were no contractual or voluntary reimbursements required.
The Fund has entered into a Distribution Plan (the “Plan”), pursuant to Rule 12b-1 under the Act. The Plan provides that the Fund may incur certain costs which may not exceed the lesser of a monthly amount equal to 0.25% of the Fund’s daily net assets or the actual distribution costs incurred during the year. Amounts payable under the Plan are paid monthly for any activities or expenses primarily intended to result in the sale of shares of the Fund. For the year ended September 30, 2009, no such expenses were incurred.
Under the Fund’s organizational documents, each director, officer, employee or other agent of the Fund (including the Fund’s investment manager) is indemnified, to the extent permitted by the Act, against certain liabilities that may arise out of performance of their duties to the Fund. Additionally, in the normal course of business, the Fund enters into contracts that contain a variety of indemnification clauses. The Fund’s maximum exposure under these arrangements is unknown as this would involve future claims that may be made against the Fund that have not yet occurred. However, the Fund has not had prior claims or losses pursuant to these contracts and believes the risk of loss to be remote.
At September 30, 2009, one financial intermediary is the record owner of approximately 34% of the Fund’s shares.
U.S. Bank, N.A. has made available to the Fund a $400,000,000 credit facility pursuant to a Credit Agreement (“Agreement”) effective July 14, 2008 for the purposes of having cash available to satisfy redemption requests. Principal and interest of such loan under the Agreement are due not more than 31 days after the date of the loan. Amounts under the credit facility bear interest at a rate per annum equal to the current prime rate minus one percent on the amount borrowed. Advances will be collateralized by securities owned by the Fund. During the year ended September 30, 2009, the Fund did not borrow against the Agreement. The Credit Agreement expires on June 5, 2010.
| (4) | Distribution to Shareholders — |
Net investment income and net realized gains, if any, are distributed to shareholders at least annually. On October 29, 2009, the Fund declared a distribution of $21,595,104 from net investment income ($0.13294 per share). The distribution will be paid on October 30, 2009 to shareholders of record on October 28, 2009.
| (5) | Investment Transactions — |
For the year ended September 30, 2009, purchases and proceeds of sales of investment securities (excluding short-term investments) were $1,293,408,005 and $475,181,665, respectively.
| (6) | Income Tax Information — |
The following information for the Fund is presented on an income tax basis as of September 30, 2009:
| | | | Gross | | Gross | | Net Unrealized | | Distributable | | Distributable | |
| | Cost of | | Unrealized | | Unrealized | | Appreciation | | Ordinary | | Long-Term | |
| | Investments | | Appreciation | | Depreciation | | on Investments | | Income | | Capital Gains | |
| | $1,935,161,602 | | $228,685,801 | | $122,251,617 | | $106,434,184 | | $21,595,104 | | $— | |
FMI Large Cap Fund
NOTES TO FINANCIAL STATEMENTS (Continued)
| (6) | Income Tax Information — (Continued) |
The difference, if any, between the cost amounts for financial statement and federal income tax purposes is due primarily to timing differences in recognizing certain gains and losses on security transactions.
The tax components of dividends paid during the years ended September 30, 2009 and 2008, capital loss carryovers, which may be used to offset future capital gains, subject to Internal Revenue Code limitations (expiring in 2017), as of September 30, 2009, and tax basis post-October losses as of September 30, 2009, which are not recognized for tax purposes until the first day of the following fiscal year are:
| | September 30, 2009 | | September 30, 2008 | |
| | Ordinary | | Long-Term | | Net Capital | | | | Ordinary | | Long-Term | |
| | Income | | Capital Gains | | Loss | | Post-October | | Income | | Capital Gains | |
| | Distributions | | Distributions | | Carryovers | | Losses | | Distributions | | Distributions | |
| | $13,823,123 | | $— | | $22,891,907 | | $81,519,624 | | $15,034,839 | | $7,630,673 | |
For corporate shareholders of the Fund, the percentage of dividend income distributed for the year ended September 30, 2009 which is designated as qualifying for the dividends received deduction is 100% (unaudited).
For all shareholders of the Fund, the percentage of dividend income distributed for the year ended September 30, 2009 which is designated as qualified dividend income under the Jobs and Growth Tax Relief Act of 2003, is 99.9% (unaudited).
Effective October 1, 2009, U.S. Bancorp Fund Services, LLC, began serving as the administrator and accounting services agent for the Fund. Subsequent events have been evaluated through October 30, 2009, which is the date the financial statements were issued. Subsequent events have not been evaluated after this date.
REPORT OF INDEPENDENT REGISTERED PUBLIC ACCOUNTING FIRM
To the Board of Directors and Shareholders
of FMI Large Cap Fund
In our opinion, the accompanying statement of assets and liabilities, including the schedule of investments, and the related statements of operations and of changes in net assets and the financial highlights present fairly, in all material respects, the financial position of FMI Large Cap Fund (the “Fund” a series of FMI Funds, Inc.) at September 30, 2009, the results of its operations for the year then ended, the changes in its net assets for each of the two years in the period then ended and the financial highlights for each of the five years in the period then ended, in conformity with accounting principles generally accepted in the United States of America. These financial statements and financial highlights (hereafter referred to as “financial statements”) are the responsibility of the Fund’s management; our responsibility is to express an opinion on these financial statements based on our audits. We conducted our audits of these financial statements in accordance with the standards of the Public Company Accounting Oversight Board (United States). Those standards require that we plan and perform the audit to obtain reasonable assurance about whether the financial statements are free of material misstatement. An audit includes examining, on a test basis, evidence supporting the amounts and disclosures in the financial statements, assessing the accounting principles used and significant estimates made by management, and evaluating the overall financial statement presentation. We believe that our audits, which included confirmation of securities at September 30, 2009 by correspondence with the custodian and brokers, provide a reasonable basis for our opinion.
Milwaukee, Wisconsin
October 30, 2009
FMI Large Cap Fund
DIRECTORS AND OFFICERS
| | | | | | |
| | | Term of | Principal | # of Funds | Other |
| | Position | Office and | Occupation(s) | in Complex | Directorships |
| Name, Age | Held with | Length of | During Past | Overseen | Held by |
| and Address | the Fund | Time Served | Five Years | by Director | Director |
| Non-Interested Directors | | | | | |
| Barry K. Allen, 61 | Director | Indefinite Term | Mr. Allen is President of Allen | 4 | BCE, Inc. (Bell |
| c/o Fiduciary | | Since 2001 | Enterprises, LLC, (Brookfield, WI) a | | Canada Enterprise), |
| Management, Inc. | | | private equity investments management | | Harley-Davidson, |
| 100 E. Wisconsin Ave. | | | company, and Senior Advisor for | | Inc., FMI Common |
| Suite 2200 | | | Providence Equity Partners (Providence, | | Stock Fund, Inc. and |
| Milwaukee, WI 53202 | | | RI) since September, 2007. He was | | FMI Mutual |
| | | | Executive Vice President of Qwest | | Funds, Inc. |
| | | | Communications International, Inc. | | |
| | | | (Denver, CO) from September, 2002 to | | |
| | | | June, 2007. | | |
| Robert C. Arzbaecher, 49 | Director | Indefinite Term | Mr. Arzbaecher is President and | 4 | Actuant Corporation, |
| c/o Fiduciary | | Since 2007 | Chief Executive Officer of Actuant | | CF Industries |
| Management, Inc. | | | Corporation (Butler, WI), a | | Holdings, Inc., |
| 100 E. Wisconsin Ave. | | | manufacturer of a broad range of | | FMI Common Stock |
| Suite 2200 | | | industrial products and systems, and | | Fund, Inc. and FMI |
| Milwaukee, WI 53202 | | | the Chairman of the Board of | | Mutual Funds, Inc. |
| | | | Directors of Actuant Corporation. | | |
| Gordon H. | Director | Indefinite Term | Mr. Gunnlaugsson retired from M&I | 4 | FMI Common Stock |
| Gunnlaugsson, 65 | | Since 2001 | Corporation (Milwaukee, WI) in | | Fund, Inc. and FMI |
| c/o Fiduciary | | | December, 2000. | | Mutual Funds, Inc. |
| Management, Inc. | | | | | |
| 100 E. Wisconsin Ave. | | | | | |
| Suite 2200 | | | | | |
Milwaukee, WI 53202 | | | | | |
| Paul S. Shain, 46 | Director | Indefinite Term | Mr. Shain is President and Chief | 4 | FMI Common Stock |
| c/o Fiduciary | | Since 2001 | Executive Officer of Singlewire | | Fund, Inc. and FMI |
| Management, Inc. | | | Software, LLC (Madison, WI), a provider | | Mutual Funds, Inc. |
| 100 E. Wisconsin Ave. | | | of IP-based paging and emergency | | |
| Suite 2200 | | | notification systems. Prior to joining | | |
| Milwaukee, WI 53202 | | | Singlewire in April, 2009, Mr. Shain was | | |
| | | | Senior Vice President of CDW | | |
| | | | Corporation (Vernon Hills, IL) and Chief | | |
| | | | Executive Officer of Berbee Information | | |
| | | | Networks, a strategic business unit of | | |
| | | | CDW which CDW acquired in 2006. | | |
| | | | Mr. Shain was employed in various capacities | | |
| | | | by CDW and Berbee Information Networks | | |
| | | | from January, 2000 to October, 2008. | | |
FMI Large Cap Fund
DIRECTORS AND OFFICERS (Continued)
| | | Term of | Principal | # of Funds | Other |
| | Position | Office and | Occupation(s) | in Complex | Directorships |
| Name, Age | Held with | Length of | During Past | Overseen | Held by |
| and Address | the Fund | Time Served | Five Years | by Director | Director or Officer |
| Interested Directors | | | | | |
| Patrick J. English,* 48 | Director | Indefinite Term | Mr. English is President of Fiduciary | 3 | FMI Common Stock |
| c/o Fiduciary | | Since 2001 | Management, Inc. and has been employed | | Fund, Inc. |
| Management, Inc. | Vice | One Year Term | by the Adviser in various capacities | | |
| 100 E. Wisconsin Ave. | President | Since 2001 | since December, 1986. | | |
| Suite 2200 | | | | | |
Milwaukee, WI 53202 | | | | | |
| Ted D. Kellner,* 63 | Director | Indefinite Term | Mr. Kellner is Chairman of the Board | 3 | Marshall & Ilsley |
| c/o Fiduciary | | Since 2001 | and Chief Executive Officer of Fiduciary | | Corporation |
| Management, Inc. | President | One Year Term | Management, Inc. which he co-founded | | and FMI Common |
| 100 E. Wisconsin Ave. | and | Since 2001 | in 1980. | | Stock Fund, Inc. |
| Suite 2200 | Treasurer | | | | |
Milwaukee, WI 53202 | | | | | |
| Richard E. Lane*, 53 | Director | Indefinite Term | Mr. Lane is President of Broadview | 2 | None |
| 100 E. Wisconsin Ave. | | Since 2001 | Advisors, LLC, the sub-adviser to the FMI | | |
| Suite 2250 | | | Focus Fund. | | |
Milwaukee, WI 53202 | | | | | |
| Other Officers | | | | | |
| John S. Brandser, 47 | Vice | One Year Term | Mr. Brandser is Senior Vice President, | N/A | FMI Mutual |
| c/o Fiduciary | President | Since 2008 | Secretary and Chief Operating Officer | | Funds, Inc. |
| Management, Inc. | | | of Fiduciary Management, Inc. and | | |
| 100 E. Wisconsin Ave. | | | has been employed by the Adviser in | | |
| Suite 2200 | | | various capacities since March, 1995. | | |
Milwaukee, WI 53202 | | | | | |
| Kathleen M. Lauters, 57 | Chief | At Discretion | Ms. Lauters has been the Fund’s Chief | N/A | None |
| c/o Fiduciary | Compliance | of Board | Compliance Officer since | | |
| Management, Inc. | Officer | Since 2004 | September, 2004. | | |
| 100 E. Wisconsin Ave. | | | | | |
| Suite 2200 | | | | | |
Milwaukee, WI 53202 | | | | | |
| Donald S. Wilson, 66 | Vice | One Year Term | Mr. Wilson is Vice Chairman, Treasurer | N/A | FMI Common Stock |
| c/o Fiduciary | President | Since 2001 | and Chief Compliance Officer of | | Fund, Inc. and FMI |
| Management, Inc. | and | | Fiduciary Management, Inc. | | Mutual Funds, Inc. |
| 100 E. Wisconsin Ave. | Secretary | | which he co-founded in 1980. | | |
| Suite 2200 | | | | | |
| Milwaukee, WI 53202 | | | | | |
__________
| * | Messrs. English and Kellner are interested directors of the Fund because they are officers of the Fund and the Adviser. Mr. Lane is an interested director of the Fund because he is an officer of the FMI Focus Fund’s sub-adviser. |
For additional information about the Directors and Officers or for a description of the policies and procedures that the Fund uses to determine how to vote proxies relating to portfolio securities, please call (800) 811-5311 and request a Statement of Additional Information. One will be mailed to you free of charge. The Statement of Additional Information is also available on the website of the Securities and Exchange Commission (the “Commission”) at http://www.sec.gov. Information on how the Fund voted proxies relating to portfolio securities is available on the Fund’s website at http://www.fmifunds.com or the website of the Commission no later than August 31 for the prior 12 months ending June 30. The Fund files its complete schedule of portfolio holdings with the Commission for the first and third quarters of each fiscal year on Form N-Q. The Fund’s Form N-Q is available on the Commission’s website. The Fund’s Form N-Q may be reviewed and copied at the Commission’s Public Reference Room in Washington, D.C., and that information on the operation of the Public Reference Room may be obtained by calling 1-800-SEC-0330.
FMI Large Cap Fund
100 East Wisconsin Avenue, Suite 2200
Milwaukee, Wisconsin 53202
www.fmifunds.com
414-226-4555
BOARD OF DIRECTORS
BARRY K. ALLEN
ROBERT C. ARZBAECHER
PATRICK J. ENGLISH
GORDON H. GUNNLAUGSSON
TED D. KELLNER
RICHARD E. LANE
PAUL S. SHAIN
INVESTMENT ADVISER
FIDUCIARY MANAGEMENT, INC.
100 East Wisconsin Avenue, Suite 2200
Milwaukee, Wisconsin 53202
TRANSFER AGENT AND
DIVIDEND DISBURSING AGENT
U.S. BANCORP FUND SERVICES, LLC
615 East Michigan Street
Milwaukee, Wisconsin 53202
800-811-5311
or
414-765-4124
CUSTODIAN
U.S. BANK, N.A.
1555 North RiverCenter Drive, Suite 302
Milwaukee, Wisconsin 53212
INDEPENDENT REGISTERED
PUBLIC ACCOUNTING FIRM
PRICEWATERHOUSECOOPERS LLP
100 East Wisconsin Avenue, Suite 1800
Milwaukee, Wisconsin 53202
LEGAL COUNSEL
FOLEY & LARDNER LLP
777 East Wisconsin Avenue
Milwaukee, Wisconsin 53202
This report is not authorized for use as an offer of sale or a solicitation of an offer to buy shares of FMI Large Cap Fund unless accompanied or preceded by the Fund’s current prospectus. Performance data quoted represents past performance; past performance does not guarantee future results. The investment return and principal value of an investment will fluctuate so that an investor’s shares, when redeemed, may be worth more or less than their original cost. Current performance of the Fund may be lower or higher than the performance quoted. Performance data current to the most recent month end may be obtained by visiting www.fmifunds.com.
Item 2. Code of Ethics.
Registrant has adopted a code of ethics. See attached Exhibit 12 (a)(1).
Item 3. Audit Committee Financial Expert.
Registrant’s Board of Directors has determined that Mr. Gordon Gunnlaugsson, a member of its audit committee, is an audit committee financial expert. Mr. Gunnlaugsson is “independent” as such term is defined in Form N-CSR.
Item 4. Principal Accountant Fees and Services.
(a) Audit Fees
$42,925 (FY 2009) and $39,963 (FY 2008) are the aggregate fees billed for each of the last two fiscal years for professional services rendered by the principal accountant to the registrant for the audit of the registrant’s annual financial statements or services that are normally provided by the accountant in connection with statutory and regulatory filings or engagements for those fiscal years.
(b) Audit-Related Fees
There were no fees billed in the last two fiscal years for Audit-Related Fees.
There were no fees billed in the last two fiscal years for professional services rendered by the principal accountant to the registrant for tax compliance, tax advice, tax planning and tax return preparation.
There were no fees billed in the last two fiscal years for professional services rendered by the principal accountant to registrant’s investment adviser for tax compliance, tax advice and tax planning that were required to be approved by the audit committee pursuant to paragraph (c)(7)(ii) of Rule 2-01 of Regulation S-X.
(d) All Other Fees
There were no fees billed in the last two fiscal years for products and services provided by the principal accountant to the registrant, other than the services reported in paragraphs (a) – (c) of this Item 4.
There were no fees billed in the last two fiscal years for products and services provided by the principal accountant to registrant’s investment adviser, which were required to be approved by the audit committee pursuant to paragraph (c)(7)(ii) or Rule 2-01 or Regulation S-X.
(e) (1) None
(e) (2) None
(f) Not applicable.
(g) See the tax fees disclosed in paragraph (c) of this Item 4.
(h) Not applicable, as no non-audit services were provided to registrant’s investment adviser.
Item 5. Audit Committee of Listed Registrants.
Not applicable.
Item 6. Schedule of Investments.
(a) The Schedules of Investments in securities of unaffiliated issuers are included as part of the report to shareholders filed under Item 1 of this Form.
(b) Not applicable.
Item 7. Disclosure of Proxy Voting Policies and Procedures for Closed-End Management Investment Companies
Not applicable.
Item 8. Portfolio Managers of Closed-End Management Investment Companies.
Not applicable.
Item 9. Purchases of Equity Securities By Closed-End Management Investment Company and Affiliated Purchasers.
Not applicable.
Item 10. Submission of Matters to a Vote of Security Holders.
None.
Item 11. Controls and Procedures.
| (a) | The disclosure controls and procedures of the FMI Funds, Inc. are periodically evaluated. As of September 30, 2009, the date of the last evaluation, we concluded that our disclosure controls and procedures are adequate. |
| (b) | The internal controls of the FMI Funds, Inc. are periodically evaluated. |
There were no changes to FMI Funds’ internal control over financial reporting that occurred during the second fiscal quarter of the period covered by this report that have materially affected, or are reasonably likely to materially affect, such controls.
Item 12. Exhibits.
| (a) | (1) Any code of ethics or amendment thereto. Filed herewith. |
| | (2) Certifications pursuant to Section 302 of the Sarbanes-Oxley Act of 2002. Filed herewith. |
| (3) | Any written solicitation to purchase securities under Rule 23c-1 under the Act sent or given during the period covered by the report by or on behalf of the Registrant to 10 or more persons. Not Applicable. |
| (b) | Certification pursuant to Section 906 of the Sarbanes-Oxley Act of 2002. Furnished herewith. |
SIGNATURES
Pursuant to the requirements of the Securities Exchange Act of 1934 and the Investment Company Act of 1940, the registrant has duly caused this report to be signed on its behalf by the undersigned, thereunto duly authorized.
FMI Funds, Inc.
Registrant
By /s/Ted D. Kellner
Ted D. Kellner, Principal Executive Officer
Date November 13, 2009
Pursuant to the requirements of the Securities Exchange Act of 1934 and the Investment Company Act of 1940, this report has been signed below by the following persons on behalf of the registrant and in the capacities and on the dates indicated.
FMI Funds, Inc.
Registrant
By /s/Ted D. Kellner
Ted D. Kellner, Principal Financial Officer
Date November 13, 2009