Exhibit 99.1

PTX Strategic Update June 2017
2 Table of Contents ▪ Zohydro ER Update ▪ Other Product Updates ▪ Updated Summary Forecast ▪ Proposed Transaction Overview ▪ Appendix
Zohydro ER Update

4 Zohydro ER PPD Pilot • PPD for Zohydro ER provides eligible commercially insured patients their first Zohydro ER prescription for $0 and either $0 or $20 for subsequent prescriptions based on coverage with the intent of no medication gap • Pilot will be comprised of 1 sales specialist and 3 HCPs from each Sales Region; 12 - week pilot designed to: • Measure impact (prescription growth and spill over) • Measure return on investment • Identify best practices and enhance execution • A Class II opioid product has significant challenges to distribution and Managed Care fulfilment (e.g. hard copy prescription s, DEA limits, prior authorizations, and pharmacy stocking) • Full roll - out to begin in April 2017 with a staged approach that includes Sales Specialists and additional pharmacies • Pilot program uses one national pharmacy Pilot Program Description

5 Opioid Market Total Market: 199M TRx Total Market: 18M TRx Hydrocodone 43.0% (85.4) Oxycodone 26.0% (51.6) Tramadol 20.0% (39.7) Codeine 7.0% (13.9) Other 4.0% (7.9) Fentanyl 26.0% (4.6) Oxycodone 24.0% (4.2) Buprenorphine 4.0% (0.7) Hydrocodone 1.0% (0.2) Morphine 37.0% (6.5) Other 8.0% (1.4) Source: ERO: PHAST November, 2016 Note : Figures represent 12 months ended November 2016 IR Opioid Market (Million TRx ) ER Opioid Market (Million TRx ) • Branded ER opioid market (excluding Oxycontin ) grew 12% in 2016
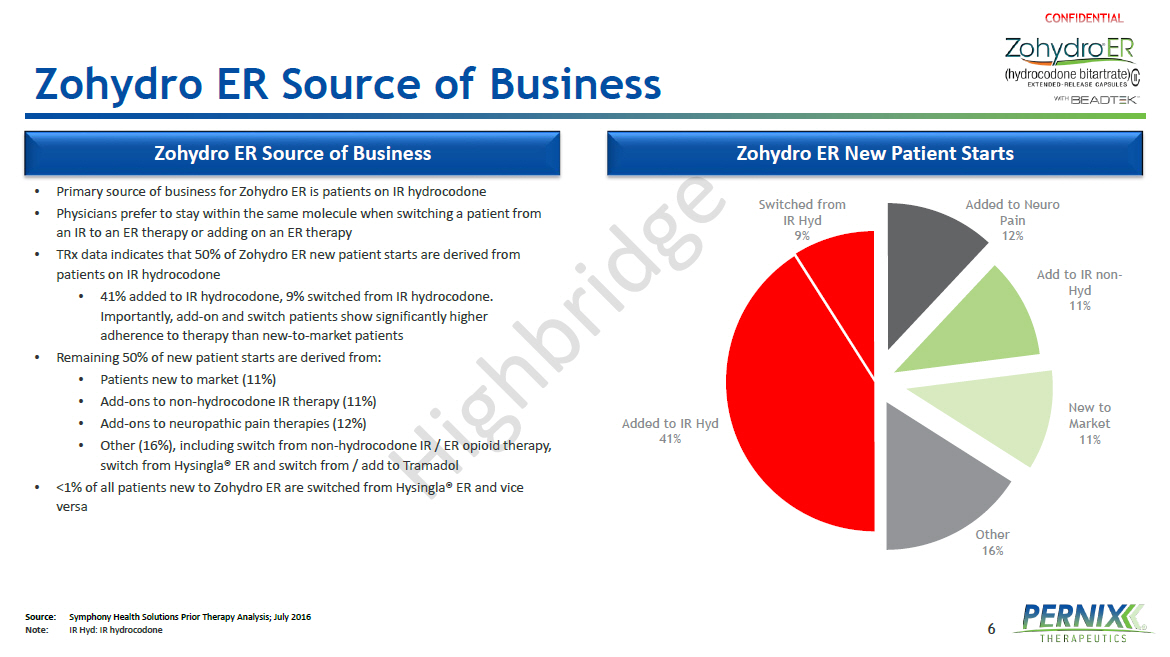
6 Zohydro ER Source of Business • Primary source of business for Zohydro ER is patients on IR hydrocodone • Physicians prefer to stay within the same molecule when switching a patient from an IR to an ER therapy or adding on an ER therapy • TRx data indicates that 50% of Zohydro ER new patient starts are derived from patients on IR hydrocodone • 41% added to IR hydrocodone, 9% switched from IR hydrocodone. Importantly, add - on and switch patients show significantly higher adherence to therapy than new - to - market patients • Remaining 50% of new patient starts are derived from: • Patients new to market (11%) • Add - ons to non - hydrocodone IR therapy (11%) • Add - ons to neuropathic pain therapies (12%) • Other (16%), including switch from non - hydrocodone IR / ER opioid therapy, switch from Hysingla ® ER and switch from / add to Tramadol • <1% of all patients new to Zohydro ER are switched from Hysingla ® ER and vice versa Added to IR Hyd 41% Switched from IR Hyd 9% Added to Neuro Pain 12% Add to IR non - Hyd 11% New to Market 11% Other 16% Zohydro ER Source of Business Zohydro ER New Patient Starts Source: Symphony Health Solutions Prior Therapy Analysis; July 2016 Note : IR Hyd : IR hydrocodone
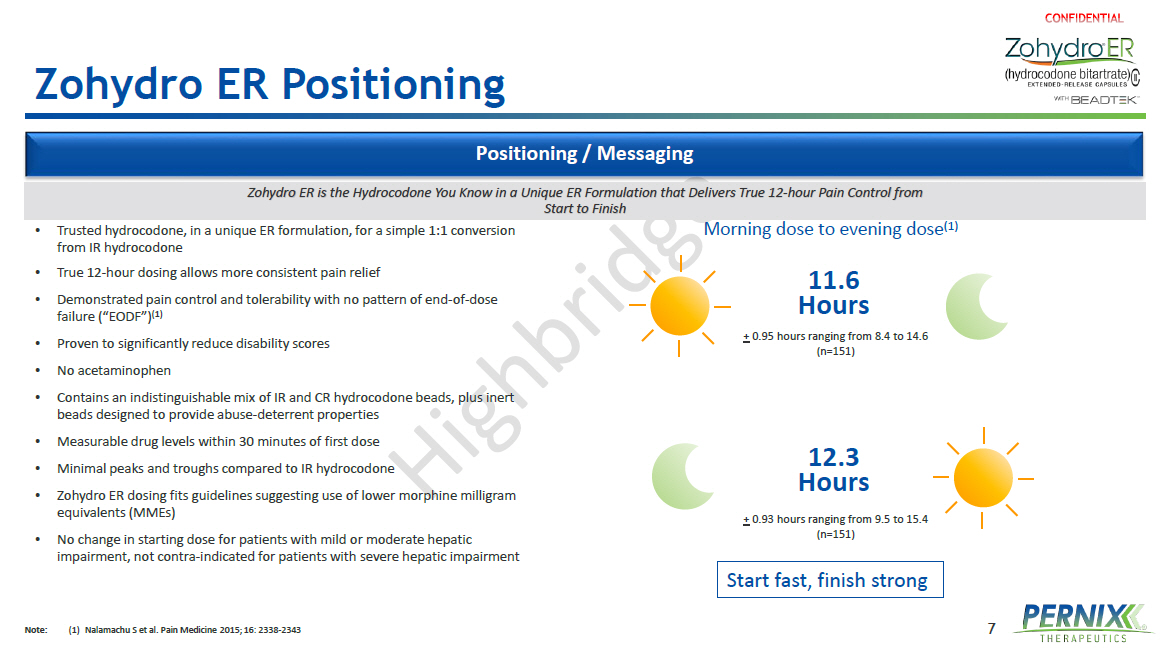
7 Zohydro ER Positioning Positioning / Messaging • Trusted hydrocodone, in a unique ER formulation, for a simple 1:1 conversion from IR hydrocodone • True 12 - hour dosing allows more consistent pain relief • Demonstrated pain control and tolerability with no pattern of end - of - dose failure (“EODF”) (1) • Proven to significantly reduce disability scores • No acetaminophen • Contains an indistinguishable mix of IR and CR hydrocodone beads, plus inert beads designed to provide abuse - deterrent properties • Measurable drug levels within 30 minutes of first dose • Minimal peaks and troughs compared to IR hydrocodone • Zohydro ER dosing fits guidelines suggesting use of lower morphine milligram equivalents (MMEs ) • No change in starting dose for patients with mild or moderate hepatic impairment, not contra - indicated for patients with severe hepatic impairment Start fast, finish strong Morning dose to evening dose (1) 11.6 Hours 12.3 Hours + 0.95 hours ranging from 8.4 to 14.6 (n=151) + 0.93 hours ranging from 9.5 to 15.4 (n=151) Zohydro ER is the Hydrocodone You Know in a Unique ER Formulation that Delivers True 12 - hour Pain Control from Start to Finish Note: (1) Nalamachu S et al. Pain Medicine 2015; 16: 2338 - 2343

8 Enhanced IP Portfolio for Zohydro ER • Formulation patents expire in 2019 • Teva /Actavis litigation resolved that Teva /Actavis’ proposed generic version infringes upon Patents 9,132,096 and 6,902,742, and cannot sell its product prior to the expiration of the two patents (2034 at the earliest) (1) • Settlement with Alvogen regarding Recro patents on terms that are confidential • Both Alvogen and Teva /Actavis have also challenged Hepatic Impairment Patents; trial date with respect to 2033 hepatic impairment patents scheduled for April 2018 • On February 23, 2016, Pernix announced issuance of a patent that covers Zohydro ER (Patent Number: 9,265,760; expiry: July 25, 2033) • Claim Scope: broadly directed to a method of dosing patients with hepatic impairment without adjustment in start dose ; this critical safety information claimed by the patent can be found throughout the Zohydro ER label • Expected to present significant barrier for generic entry • 5 additional Orange Book patents in this family issued, bringing total number of Orange Book patents to 11 U.S. Patent Appl. No. General Claim Scope Expiration Date Ownership 6,228,398 Multiparticulate modified release compositions 11/01/2019 In - Licensed from Recro 6,902,742 Multiparticulate modified release compositions 11/01/2019 In - Licensed from Recro 9,265,760 Critical safety information relating to dosing patients with hepatic impairment 7/25/2033 Solely owned by Pernix 9,339,499 Method of treating patients with hepatic impairment 7/25/2033 Solely owned by Pernix 9,326,982 Method of treating patients with hepatic impairment 7/25/2033 Solely owned by Pernix 9,333,201 Method of treating patients with hepatic impairment 7/25/2033 Solely owned by Pernix 9,421,200 Method of treating patients with hepatic impairment 7/25/2033 Solely owned by Pernix 9,433,619 Method of treating patients with hepatic impairment 7/25/2033 Solely owned by Pernix 9,132,096 Abuse deterrent compositions 9/12/2034 In - Licensed from Recro 9,452,163 Abuse deterrent compositions 9/12/2034 In - Licensed from Recro 9,486,451 Abuse deterrent compositions 9/12/2034 In - Licensed from Recro Ruled to be infringed by Teva /Actavis’ proposed generic formulation Note: (1) Appeal pending IP Settlement Update Zohydro ER Issued Patents Hepatic Impairment Patent Issuance
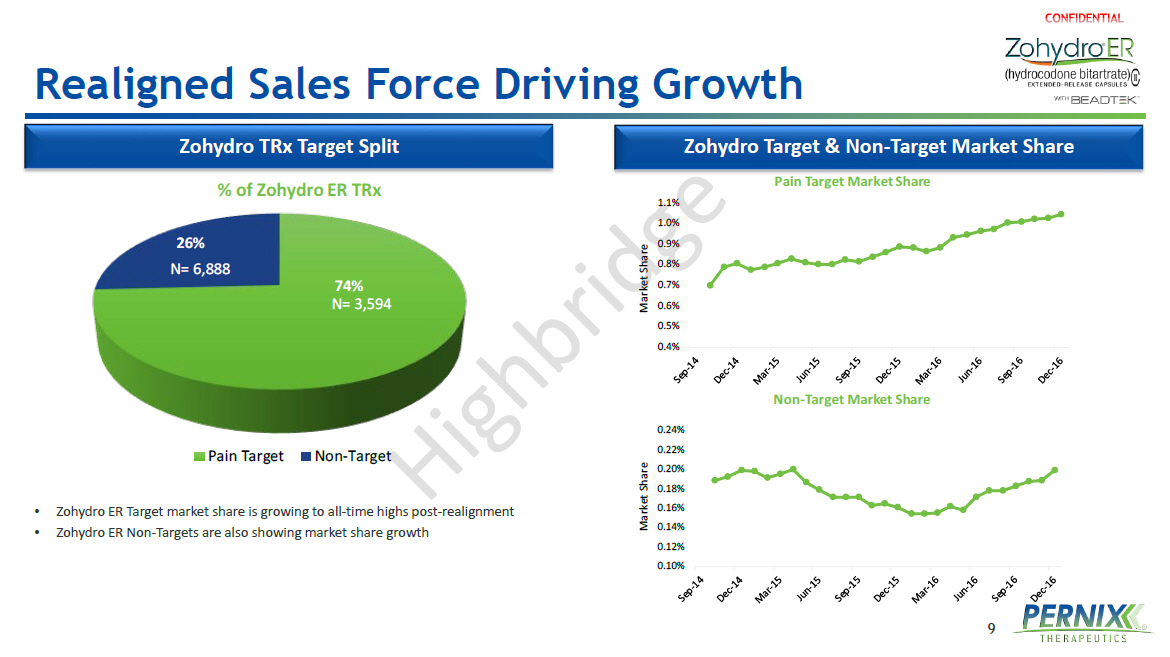
9 Realigned Sales Force Driving Growth Zohydro Target & Non - Target Market Share Zohydro TRx Target Split • Zohydro ER Target market share is growing to all - time highs post - realignment • Zohydro ER Non - Targets are also showing market share growth 74% 26% % of Zohydro ER TRx Pain Target Non-Target N= 6,888 N= 3,594 0.4% 0.5% 0.6% 0.7% 0.8% 0.9% 1.0% 1.1% Market Share Pain Target Market Share 0.10% 0.12% 0.14% 0.16% 0.18% 0.20% 0.22% 0.24% Market Share Non - Target Market Share
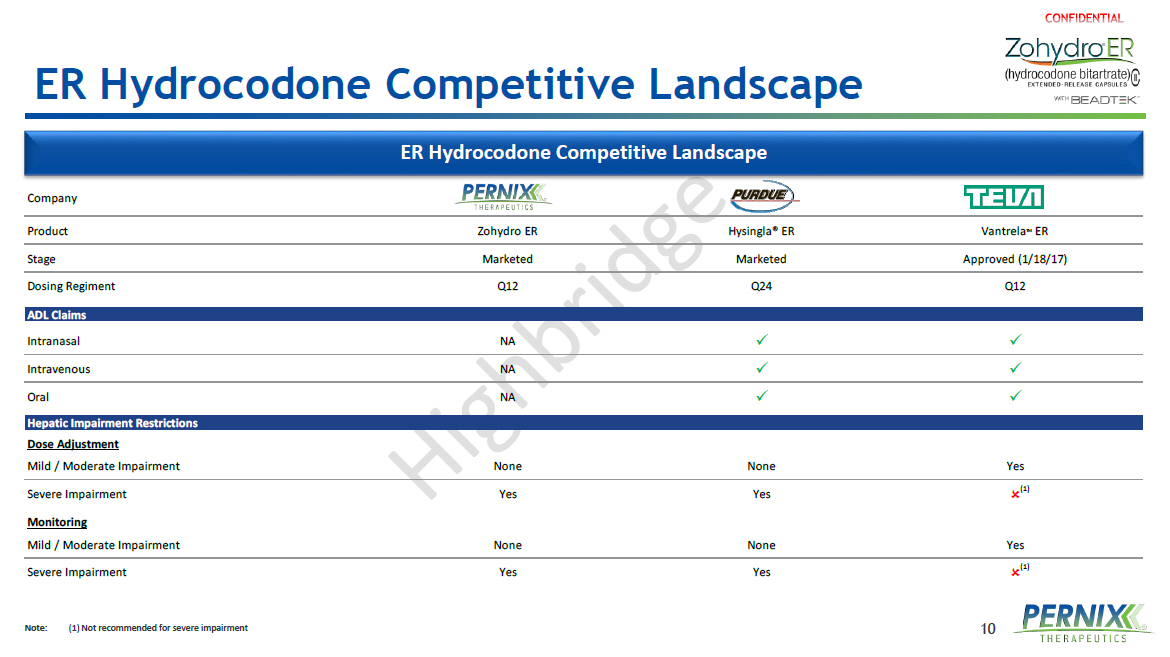
10 ER Hydrocodone Competitive Landscape Note : (1) Not recommended for severe impairment Company Product Zohydro ER Hysingla® ER Vantrela TM ER Stage Marketed Marketed Approved (1/18/17) Dosing Regiment Q12 Q24 Q12 ADL Claims Intranasal NA x x Intravenous NA x x Oral NA x x Hepatic Impairment Restrictions Dose Adjustment Mild / Moderate Impairment None None Yes Severe Impairment Yes Yes Monitoring Mild / Moderate Impairment None None Yes Severe Impairment Yes Yes ER Hydrocodone Competitive Landscape (1) (1)

11 Attributes Valued by Healthcare Professionals Healthcare Professional Survey – Importance of Attributes for Selecting Therapy (1) 70% 69% 67% 67% 48% 47% 41% 41% 39% 39% 36% 33% 33% 31% 31% 31% 23% 19% 17% 7.8 7.8 6.4 6.7 9.0 9.1 11.0 10.9 10.5 11.3 11.5 11.1 12.1 12.1 12.4 11.7 11.9 12.3 11.7 0% 10% 20% 30% 40% 50% 60% 70% 80% Mean Ranking Affordable patient out of pocket cost Tolerability Efficacy Ease of access Includes abuse deterrent technology Efficacy data in range of pain conditions Familiarity with the molecule Availability of value-added services Dosage regimen No end of dose failure Route of administration Well established conversion ratios Has Human Abuse Liability data in the label Mechanism of action No dose adjustment in pts with hepatic impairment Does not include APAP Rapid onset of action Patient preference CIII as opposed to CII Importance Rating (% Selecting "Very/Extremely Important") Source: Encuity ATU, Aug 2016 Note: (1) n= 84; Question posed: “…please rate each of the following attributes on a scale from 1 (Not At All Important) to 7 (Extremely Important) in terms of their i nfl uence on your choice of treatment of an opioid for around - the - clock pain control. Once you have rated each attribute, please rank the top 5 attributes in terms of their importance in maki ng a decision to prescribe an opioid treatment for around - the - clock pain control from 1 (Most important) through 2, 3, 4 and 5 (2nd, 3rd, 4th and 5th most important )”
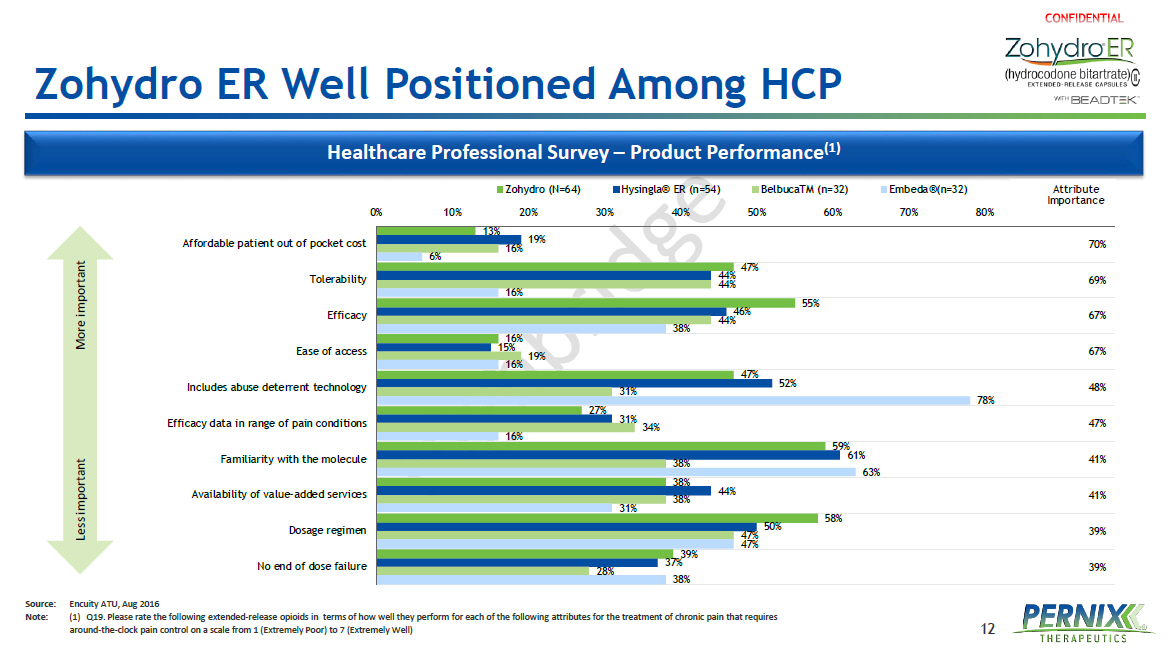
12 Zohydro ER Well Positioned Among HCP Healthcare Professional Survey – Product Performance (1) 13% 47% 55% 16% 47% 27% 59% 38% 58% 39% 19% 44% 46% 15% 52% 31% 61% 44% 50% 37% 16% 44% 44% 19% 31% 34% 38% 38% 47% 28% 6% 16% 38% 16% 78% 16% 63% 31% 47% 38% 39% 39% 41% 41% 47% 48% 67% 67% 69% 70% 0% 10% 20% 30% 40% 50% 60% 70% 80% Mean Ranking Affordable patient out of pocket cost Tolerability Efficacy Ease of access Includes abuse deterrent technology Efficacy data in range of pain conditions Familiarity with the molecule Availability of value-added services Dosage regimen No end of dose failure Zohydro (N=64) Hysingla® ER (n=54) BelbucaTM (n=32) Embeda®(n=32) Attribute Importance Less important More important Source: Encuity ATU, Aug 2016 Note: (1) Q19 . Please rate the following extended - release opioids in terms of how well they perform for each of the following attributes for the treatment of chronic pain that requires around - the - clock pain control on a scale from 1 (Extremely Poor) to 7 (Extremely Well )
13 Update on Availability of Zohydro ER 20mg Strength The Company expects that the 20mg strength of Zohydro ER will be on back order until at least the first quarter of 2018 due to a manufacturing issue with its supplier Pernix continues to market and distribute the other strengths of Zohydro ER, including the 10mg, 15mg, 30mg, 40mg, and 50mg strengths Pernix is working closely with wholesalers and prescribers to minimize any disruption caused by the stockout, and with its supplier to ensure the return of the 20mg strength to the marketplace as soon as possible While utilization of 10mg, 15mg and 30mg strengths of Zohydro ER are expected to increase in order to fulfill patient needs, the Company anticipates the temporary stockout to impact the overall prescription volume Pernix is currently evaluating the scope of any potential impact to its financial performance
Other Product Updates
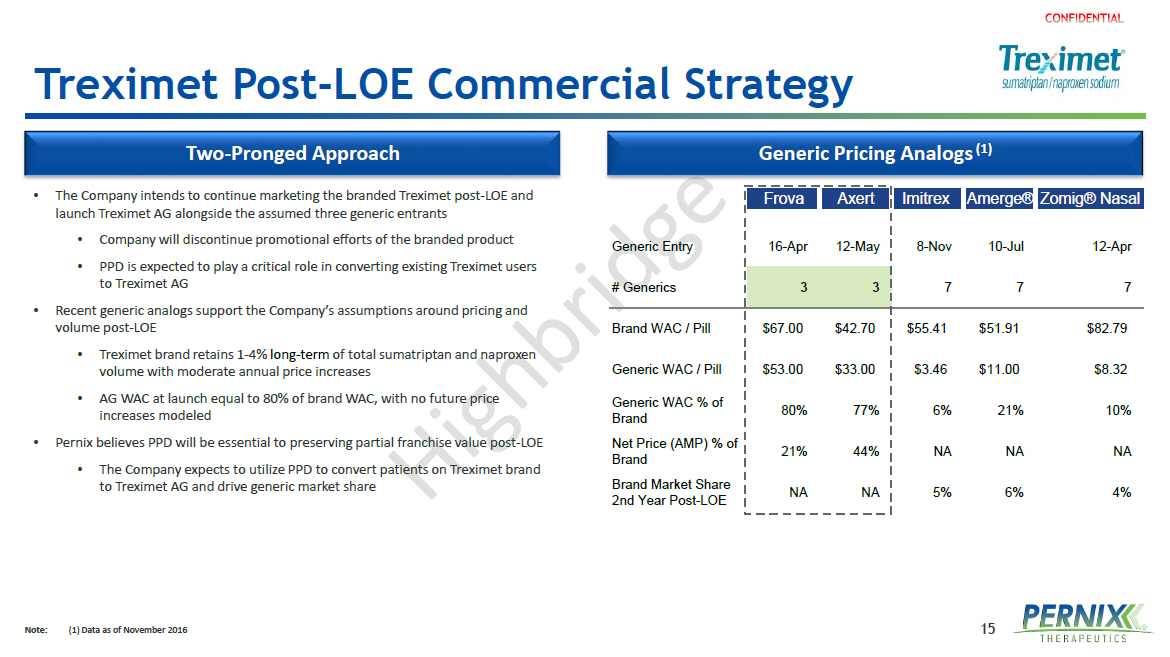
15 Frova Axert Imitrex Amerge®Zomig® Nasal Generic Entry 16-Apr 12-May 8-Nov 10-Jul 12-Apr # Generics 3 3 7 7 7 Brand WAC / Pill $67.00 $42.70 $55.41 $51.91 $82.79 Generic WAC / Pill $53.00 $33.00 $3.46 $11.00 $8.32 Generic WAC % of Brand 80% 77% 6% 21% 10% Net Price (AMP) % of Brand 21% 44% NA NA NA Brand Market Share 2nd Year Post-LOE NA NA 5% 6% 4% Treximet Post - LOE Commercial Strategy Note : (1) Data as of November 2016 • The Company intends to continue marketing the branded Treximet post - LOE and launch Treximet AG alongside the assumed three generic entrants • Company will discontinue promotional efforts of the branded product • PPD is expected to play a critical role in converting existing Treximet users to Treximet AG • Recent generic analogs support the Company’s assumptions around pricing and volume post - LOE • Treximet brand retains 1 - 4% long - term of total sumatriptan and naproxen volume with moderate annual price increases • AG WAC at launch equal to 80% of brand WAC, with no future price increases modeled • Pernix believes PPD will be essential to preserving partial franchise value post - LOE • The Company expects to utilize PPD to convert patients on Treximet brand to Treximet AG and drive generic market share Two - Pronged Approach Generic Pricing Analogs (1)
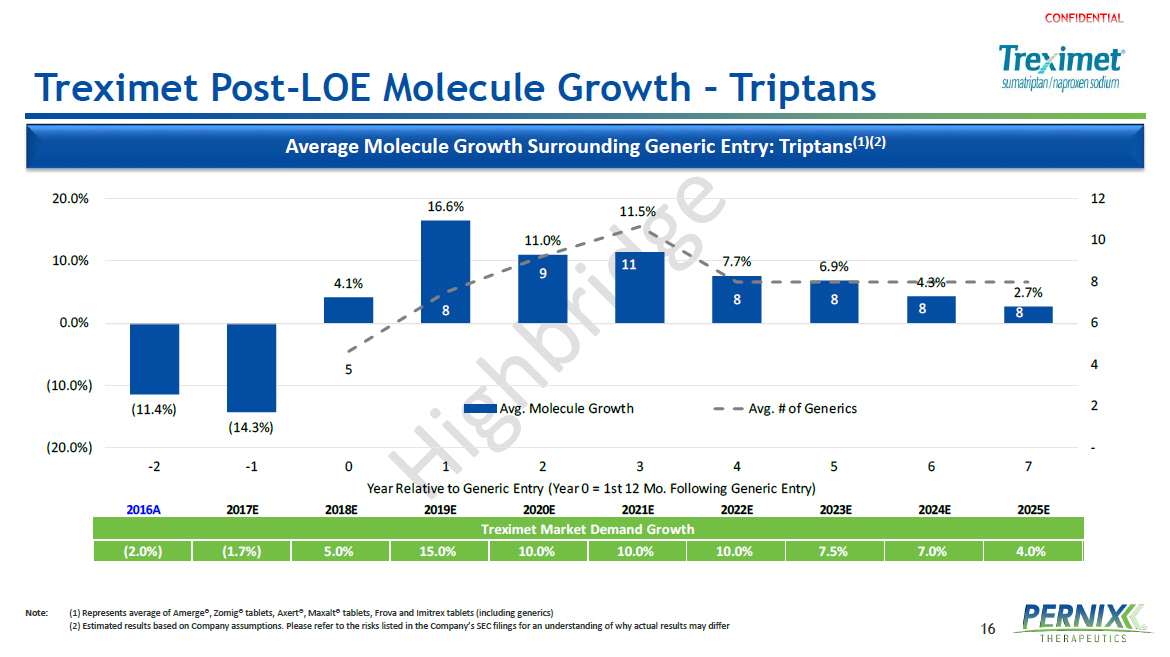
16 Treximet Post - LOE Molecule Growth – Triptans Note : (1) Represents average of Amerge ®, Zomig® tablets, Axert®, Maxalt® tablets, Frova and Imitrex tablets (including generics ) ( 2) Estimated results based on Company assumptions. Please refer to the risks listed in the Company’s SEC filings for an understanding of why actual results may differ Average Molecule Growth Surrounding Generic Entry: Triptans (1 )(2) 2016A 2017E 2018E 2019E 2020E 2021E 2022E 2023E 2024E 2025E Treximet Market Demand Growth (2.0%) (1.7%) 5.0% 15.0% 10.0% 10.0% 10.0% 7.5% 7.0% 4.0% (11.4%) (14.3%) 4.1% 16.6% 11.0% 11.5% 7.7% 6.9% 4.3% 2.7% 5 8 9 11 8 8 8 8 - 2 4 6 8 10 12 (20.0%) (10.0%) 0.0% 10.0% 20.0% -2 -1 0 1 2 3 4 5 6 7 Year Relative to Generic Entry (Year 0 = 1st 12 Mo. Following Generic Entry) Avg. Molecule Growth Avg. # of Generics
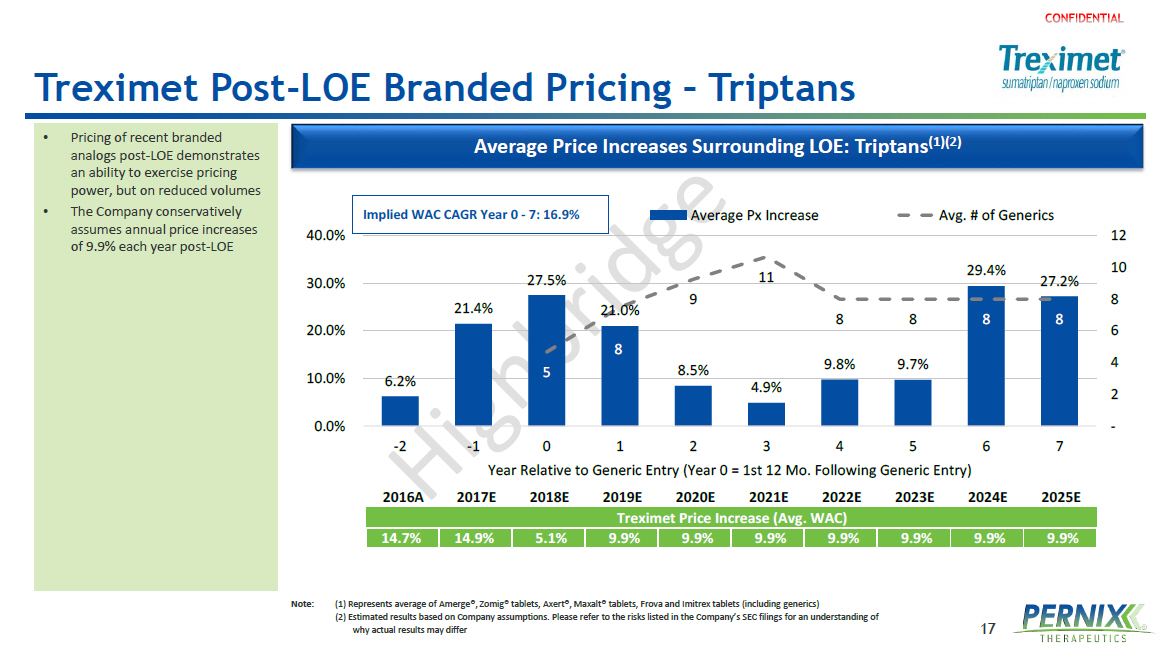
17 Treximet Post - LOE Branded Pricing – Triptans • Pricing of recent branded analogs post - LOE demonstrates an ability to exercise pricing power, but on reduced volumes • The Company conservatively assumes annual price increases of 9.9% each year post - LOE Average Price Increases Surrounding LOE: Triptans (1)(2) 2016A 2017E 2018E 2019E 2020E 2021E 2022E 2023E 2024E 2025E Treximet Price Increase (Avg. WAC) 14.7% 14.9% 5.1% 9.9% 9.9% 9.9% 9.9% 9.9% 9.9% 9.9% 6.2% 21.4% 27.5% 21.0% 8.5% 4.9% 9.8% 9.7% 29.4% 27.2% 5 8 9 11 8 8 8 8 - 2 4 6 8 10 12 0.0% 10.0% 20.0% 30.0% 40.0% -2 -1 0 1 2 3 4 5 6 7 Year Relative to Generic Entry (Year 0 = 1st 12 Mo. Following Generic Entry) Average Px Increase Avg. # of Generics Implied WAC CAGR Year 0 - 7: 16.9% Note : (1) Represents average of Amerge ®, Zomig® tablets, Axert®, Maxalt® tablets, Frova and Imitrex tablets (including generics ) ( 2) Estimated results based on Company assumptions. Please refer to the risks listed in the Company’s SEC filings for an understanding of why actual results may differ
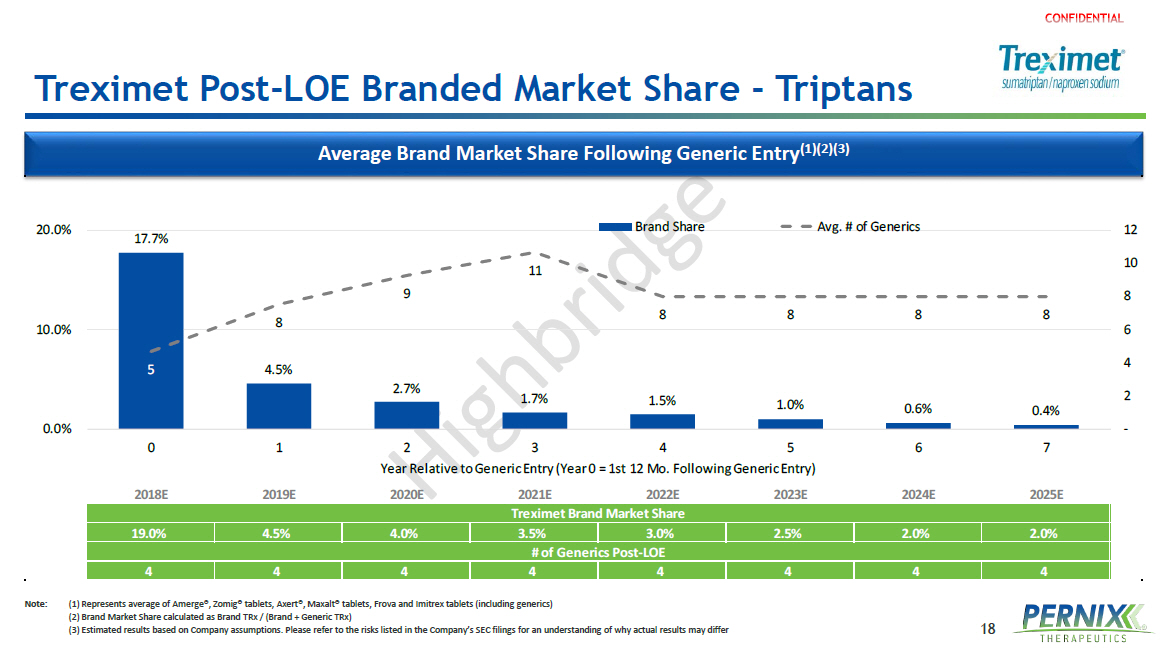
18 Treximet Post - LOE Branded Market Share - Triptans Note: ( 1) Represents average of Amerge®, Zomig® tablets, Axert®, Maxalt® tablets, Frova and Imitrex tablets (including generics ) (2) Brand Market Share calculated as Brand TRx / (Brand + Generic TRx ) (3) Estimated results based on Company assumptions. Please refer to the risks listed in the Company’s SEC filings for an understanding of why actual results may differ Average Brand Market Share Following Generic Entry (1)(2)(3) 2018E 2019E 2020E 2021E 2022E 2023E 2024E 2025E Treximet Brand Market Share 19.0% 4.5% 4.0% 3.5% 3.0% 2.5% 2.0% 2.0% # of Generics Post-LOE 4 4 4 4 4 4 4 4 17.7% 4.5% 2.7% 1.7% 1.5% 1.0% 0.6% 0.4% 5 8 9 11 8 8 8 8 - 2 4 6 8 10 12 0.0% 10.0% 20.0% 0 1 2 3 4 5 6 7 Year Relative to Generic Entry (Year 0 = 1st 12 Mo. Following Generic Entry) Brand Share Avg. # of Generics
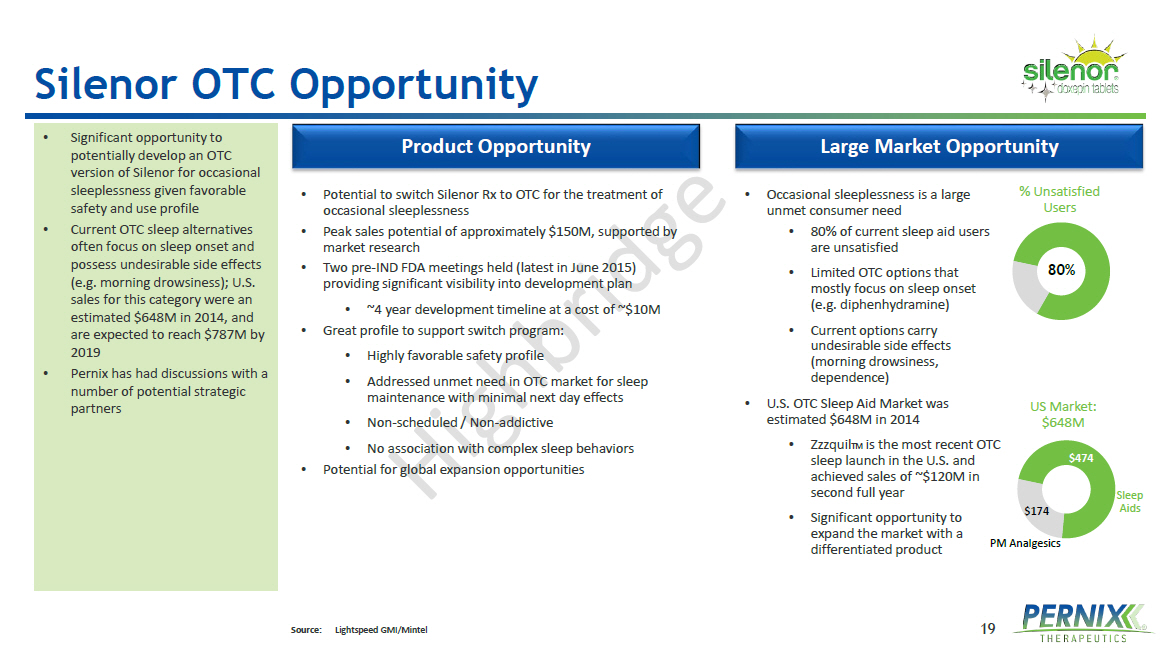
19 Silenor OTC Opportunity Large Market Opportunity Product Opportunity • Potential to switch Silenor Rx to OTC for the treatment of occasional sleeplessness • Peak sales potential of approximately $150M, supported by market research • Two pre - IND FDA meetings held (latest in June 2015) providing significant visibility into development plan • ~4 year development timeline at a cost of ~$ 10M • Great profile to support switch program: • Highly favorable safety profile • Addressed unmet need in OTC market for sleep maintenance with minimal next day effects • Non - scheduled / Non - addictive • No association with complex sleep behaviors • Potential for global expansion opportunities • Occasional sleeplessness is a large unmet consumer need • 80% of current sleep aid users are unsatisfied • Limited OTC options that mostly focus on sleep onset (e.g. diphenhydramine ) • Current options carry undesirable side effects (morning drowsiness, dependence) • U.S . OTC Sleep Aid Market was estimated $ 648M in 2014 • Zzzquil TM is the most recent OTC sleep launch in the U.S. and achieved sales of ~$ 120M in second full year • Significant opportunity to expand the market with a differentiated product • Significant opportunity to potentially develop an OTC version of Silenor for occasional sleeplessness given favorable safety and use profile • Current OTC sleep alternatives often focus on sleep onset and possess undesirable side effects (e.g. morning drowsiness); U.S. sales for this category were an estimated $ 648M in 2014, and are expected to reach $ 787M by 2019 • Pernix has had discussions with a number of potential strategic partners Source: Lightspeed GMI/Mintel 80% % Unsatisfied Users $474 $174 US Market: $648M Sleep Aids PM Analgesics
Updated Summary Forecast
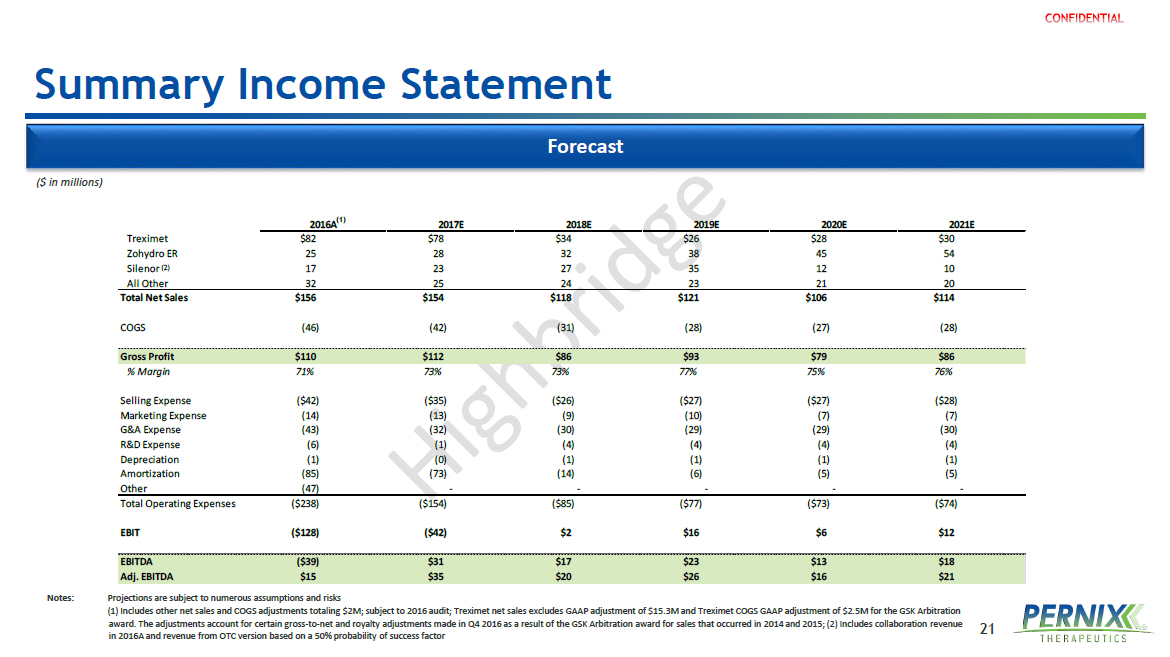
21 2016A 2017E 2018E 2019E 2020E 2021E Treximet $82 $78 $34 $26 $28 $30 Zohydro ER 25 28 32 38 45 54 Silenor 17 23 27 35 12 10 All Other 32 25 24 23 21 20 Total Net Sales $156 $154 $118 $121 $106 $114 COGS (46) (42) (31) (28) (27) (28) Gross Profit $110 $112 $86 $93 $79 $86 % Margin 71% 73% 73% 77% 75% 76% Selling Expense ($42) ($35) ($26) ($27) ($27) ($28) Marketing Expense (14) (13) (9) (10) (7) (7) G&A Expense (43) (32) (30) (29) (29) (30) R&D Expense (6) (1) (4) (4) (4) (4) Depreciation (1) (0) (1) (1) (1) (1) Amortization (85) (73) (14) (6) (5) (5) Other (47) - - - - - Total Operating Expenses ($238) ($154) ($85) ($77) ($73) ($74) EBIT ($128) ($42) $2 $16 $6 $12 EBITDA ($39) $31 $17 $23 $13 $18 Adj. EBITDA $15 $35 $20 $26 $16 $21 Summary Income Statement Forecast (1) ($ in millions) Notes: Projections are subject to numerous assumptions and risks (1) Includes other net sales and COGS adjustments totaling $2M; subject to 2016 audit; Treximet net sales excludes GAAP adjustment of $15.3M and Treximet COGS GAAP adjustment of $2.5M for the GSK Arbitration award. The adjustments account for certain gross - to - net and royalty adjustments made in Q4 2016 as a result of the GSK Arbitration award for sales that occurred in 2014 and 2015; (2) Includes collaboration revenue in 2016A and revenue from OTC version based on a 50% probability of success factor (2)

22 Pro Forma 2016 Adj. EBITDA 2016 Pro Forma Adj. EBITDA Bridge • Pro forma Adj. EBITDA represents Adj. EBITDA with the annualized benefit of the sales force re - alignment and adjustment for de - stocking of inventory • In 2015, the Company observed significant wholesaler inventory buildup in anticipation of the upcoming 2016 price increase. The adjustment in pro forma Adj. EBITDA approximates what true demand would have generated if not for the YE 2015 inventory buildup. While this type of behavior is common, the Company does not foresee a buildup of similar magnitude in the coming years ($ in millions) $15.0 $32.3 $5.0 $7.2 $0.6 $4.6 $- $5 $10 $15 $20 $25 $30 $35 $40 2016 Adj. EBITDA De-Stocking Adjustments Sales Headcount Reduction Other Headcount Reduction Non-Recurring Operating Expenses Pro Forma 2016 Adj. EBITDA
Proposed Transaction Overview

24 Key Transaction Considerations The Company is pursuing a transaction to meaningfully enhance its liquidity position while providing incremental capital to inves t i n new products that optimize Pernix’s growth engine for the future Key goals of the transaction: Refinance existing ABL facility Provide incremental new money capital Provide for incremental deleveraging Uses of incremental new money capital: De - risk the balance sheet and provide additional operating cushion Fund operating expenses and other liabilities Invest in acquisitions, licensing and co - promotion transactions The Company has already identified numerous actionable transactions that could enhance both its Neurology and Pain portfolios, leverage its salesforce and meaningfully grow EBITDA The Company’s intention is to target opportunities with attractive payback periods, limited upfront investments and attractive up sid e potential Active dialogues are ongoing regarding 4 potential transactions in the Neurology space and 5 potential transactions in the Pain spac e
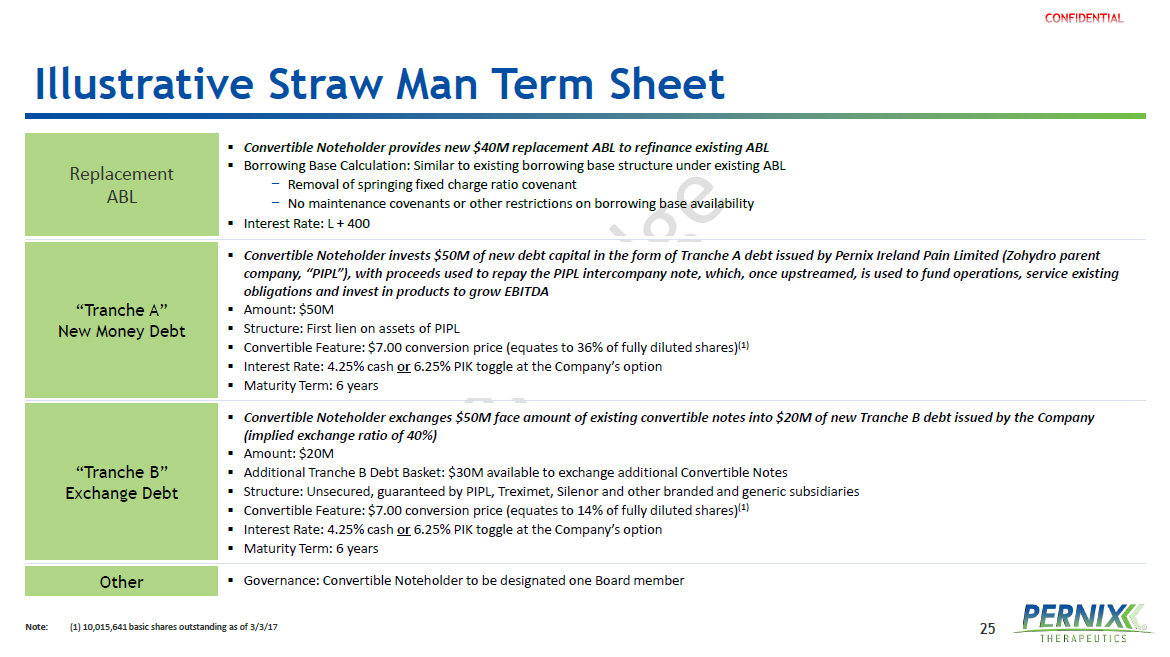
25 Illustrative Straw Man Term Sheet Note: ( 1) 10,015,641 basic shares outstanding as of 3/3/17 (2) Replacement ABL ▪ Convertible Noteholder provides new $40M replacement ABL to refinance existing ABL ▪ Borrowing Base Calculation: Similar to existing borrowing base structure under existing ABL − Removal of springing fixed charge ratio covenant − No maintenance covenants or other restrictions on borrowing base availability ▪ Interest Rate: L + 400 “Tranche A” New Money Debt ▪ Convertible Noteholder invests $50M of new debt capital in the form of Tranche A debt issued by Pernix Ireland Pain Limited ( Zoh ydro parent company, “PIPL”), with proceeds used to repay the PIPL intercompany note, which, once upstreamed, is used to fund operations, se rvice existing obligations and invest in products to grow EBITDA ▪ Amount: $50M ▪ Structure: First lien on assets of PIPL ▪ Convertible Feature: $7.00 conversion price (equates to 36% of fully diluted shares) (1) ▪ Interest Rate: 4.25% cash or 6.25% PIK toggle at the Company’s option ▪ Maturity Term: 6 years “Tranche B” Exchange Debt ▪ Convertible Noteholder exchanges $50M face amount of existing convertible notes into $20M of new Tranche B debt issued by the Co mpany (implied exchange ratio of 40%) ▪ Amount: $20M ▪ Additional Tranche B Debt Basket: $30M available to exchange additional Convertible Notes ▪ Structure: Unsecured, guaranteed by PIPL, Treximet, Silenor and other branded and generic subsidiaries ▪ Convertible Feature: $7.00 conversion price (equates to 14% of fully diluted shares) (1) ▪ Interest Rate: 4.25% cash or 6.25% PIK toggle at the Company’s option ▪ Maturity Term: 6 years Other ▪ Governance: Convertible Noteholder to be designated one Board member

Appendix
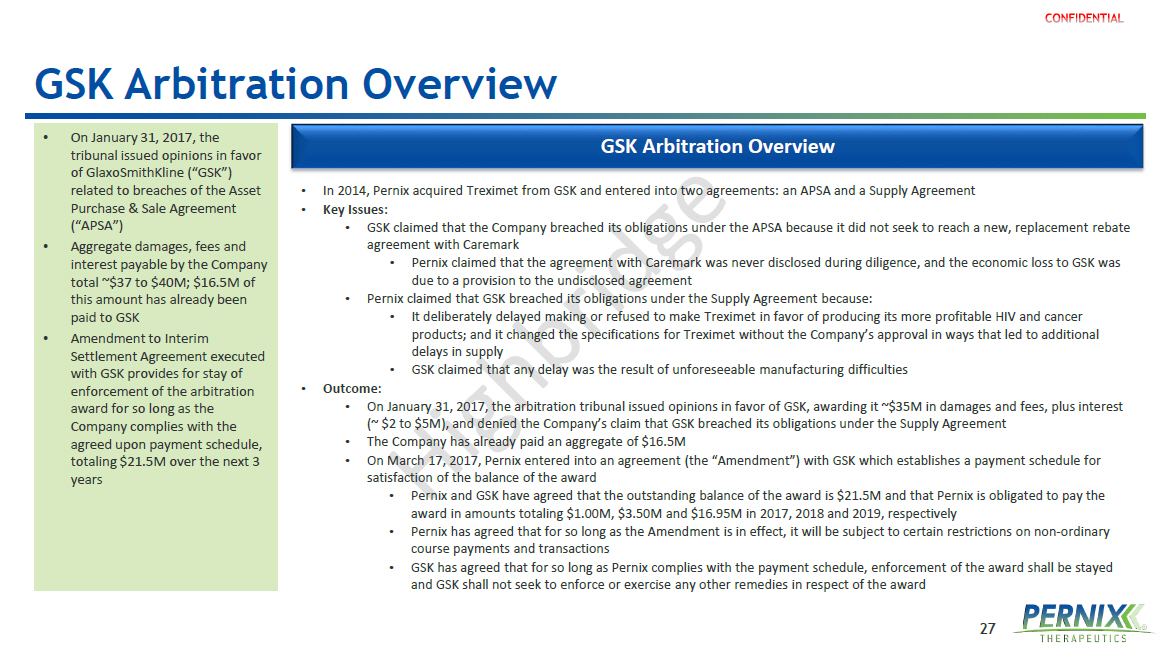
27 GSK Arbitration Overview GSK Arbitration Overview • In 2014, Pernix acquired Treximet from GSK and entered into two agreements: an APSA and a Supply Agreement • Key Issues: • GSK claimed that the Company breached its obligations under the APSA because it did not seek to reach a new, replacement rebate agreement with Caremark • Pernix claimed that the agreement with Caremark was never disclosed during diligence, and the economic loss to GSK was due to a provision to the undisclosed agreement • Pernix claimed that GSK breached its obligations under the Supply Agreement because: • It deliberately delayed making or refused to make Treximet in favor of producing its more profitable HIV and cancer products; and it changed the specifications for Treximet without the Company’s approval in ways that led to additional delays in supply • GSK claimed that any delay was the result of unforeseeable manufacturing difficulties • Outcome: • On January 31, 2017, the arbitration tribunal issued opinions in favor of GSK, awarding it ~$35M in damages and fees, plus in ter est (~ $2 to $5M), and denied the Company’s claim that GSK breached its obligations under the Supply Agreement • The Company has already paid an aggregate of $16.5M • On March 17, 2017, Pernix entered into an agreement (the “Amendment”) with GSK which establishes a payment schedule for satisfaction of the balance of the award • Pernix and GSK have agreed that the outstanding balance of the award is $ 21.5M and that Pernix is obligated to pay the award in amounts totaling $ 1.00M , $ 3.50M and $16.95M in 2017, 2018 and 2019, respectively • Pernix has agreed that for so long as the Amendment is in effect, it will be subject to certain restrictions on non - ordinary course payments and transactions • GSK has agreed that for so long as Pernix complies with the payment schedule, enforcement of the award shall be stayed and GSK shall not seek to enforce or exercise any other remedies in respect of the award • On January 31, 2017, the tribunal issued opinions in favor of GlaxoSmithKline (“GSK”) related to breaches of the Asset Purchase & Sale Agreement (“APSA”) • Aggregate damages, fees and interest payable by the Company total ~$37 to $ 40M; $ 16.5M of this amount has already been paid to GSK • Amendment to Interim Settlement Agreement executed with GSK provides for stay of enforcement of the arbitration award for so long as the Company complies with the agreed upon payment schedule, totaling $21.5M over the next 3 years