Exhibit 99.2
Transaction Overview & Corporate Strategy Update July 2017

2 Safe Harbor Statement Triptans TRx (99%) This presentation includes forward - looking statements, including statements regarding the progress and timing of our product dev elopment programs and related trials; our future opportunities; our strategy, future operations, anticipated financial position, future revenues and projected costs; our management’s prospe cts , plans and objectives; and any other statements about management’s future expectations, beliefs, goals, plans or prospects constitute forward - looking statements. We may, in some case s, use words such as “anticipate,” “believe,” “could,” “estimate,” “expect,” “intend,” “may,” “plan,” “project,” “should,” “target,” “will,” “would” or other words that convey unce rta inty of future events or outcomes to identify these forward - looking statements. Among the factors that could cause actual results to differ materially from those indicated in the forwa rd - looking statements are risks and uncertainties inherent in our business including, without limitation: our ability to identify, consummate and integrate and business development opportunit ies , our ability to comply with the covenants under our indebtedness, including the Exchangeable Senior Notes, our new asset - based revolving credit facility and our new delayed draw te rm loan; the rate and degree of market acceptance of, and our ability and our distribution and marketing partners' ability to obtain reimbursement for, any approved products; our ability to successfully execute our sales and marketing strategy, including to successfully recruit and retain sales and marketing personnel; our ability to obtain additional financing; our ability to mai nta in regulatory approvals for our products; the accuracy of our estimates regarding expenses, future revenues and capital requirements; our ability to manage our anticipated future growth; the abilit y o f our products to compete with generic products as well as new products that may be developed by our competitors; our ability and our distribution and marketing partners' ability to comply wi th regulatory requirements regarding the sales, marketing and manufacturing of our products, including our ability to address the temporary stockout of the 20mg strength of Zohydro ER wit h B eadTek; the performance of our manufacturers, over which we have limited control; our ability to obtain and maintain intellectual property protection for our products; our ability to op era te our business without infringing the intellectual property rights of others; the success and timing of our clinical development efforts; the loss of key scientific or management personnel; regul ato ry developments in the United States and foreign countries; our ability to either acquire or develop and commercialize other product candidates in addition to our current products; the outc ome of any litigation to which we may be subject and other risks described under the heading “Risk Factors” in our most recent annual report on Form 10 - K, our quarterly reports on Form 10 - Q and our current report on Form 8 - K being filed with the SEC on the date hereof, as well as any amendments thereto reflected in subsequent filings with the SEC. If one or more of these factors mat erialize, or if any underlying assumptions prove incorrect, our actual results, performance or achievements may vary materially from any future results, performance or achievements expresse d o r implied by these forward - looking statements. We qualify all of the forward - looking statements in this presentation by these cautionary statements. Although we believe that t he expectations reflected in our forward - looking statements are reasonable, we cannot guarantee future results, events, levels of activity, performance or achievement. Given these uncertain tie s, you should not place undue reliance on these forward - looking statements. We undertake no obligation to publicly update or revise any forward - looking statements, whether as a result of new i nformation, future events or otherwise, unless required by law. Pernix is a registered trademark of Pernix Therapeutics, LLC. Other trademarks referenced herein are the property of their re spe ctive owners. ©2017 Pernix Therapeutics Holdings, Inc.

3 Overview of Refinancing & Settlement Transactions On July 20, 2017, Pernix Therapeutics Holdings, Inc. (“Pernix” or the “Company”) announced a series of transactions intended to improve liquidity, extend debt maturities and enable the Company to create value for all stakeholders New ABL Facility New Delayed Draw Term Loan New 4.25% / 5.25% Exchangeable Senior Notes Revised Settlement with GSK Description ▪ New $40 million asset - based revolving credit facility ▪ $45 million delay - draw term loan , comprised of: (a) i mmediate access to $30 million, and (b) additional $15 million designated for certain uses ▪ Additional $20 million commitment with lender consent ▪ Exchange of ~$52 million principal amount of 4.25% Convertible Senior Notes into ~$36 million of New 4.25% / 5.25% Exchangeable Senior Notes ▪ Reduced payment schedule consisting of $6.7 million due in two installments during 2017 (1) Key Terms ▪ Interest: L + 750 ▪ Maturity: 2022 ▪ Interest: 7.50% Cash, or 8.50% Cash/PIK ▪ Maturity: 2022 ▪ Interest: 4.25% Cash, or 5.25% Cash/PIK ▪ Maturity: 2022 ▪ Issued 9.9% pro forma equity ▪ $3.45 million due within 10 business days of transaction ▪ $3.2 million due 12/31/17 Goal ▪ Refinances Wells Fargo credit facility maturing on 7/31/17 ▪ Provides liquidity ▪ Provides liquidity and growth capital ▪ De - leveraging and captures 30% discount on portion of 4.25% Convertible Senior Notes ▪ Framework for future deals ▪ Reduces total obligations due to GSK by up to $14 million ▪ De - leveraging 1) Up to $2 million additional due to GSK if Pernix enters into certain transactions before 9/20/2021 with holders of the 4.2 5% Convertible Senior Notes due 2021.
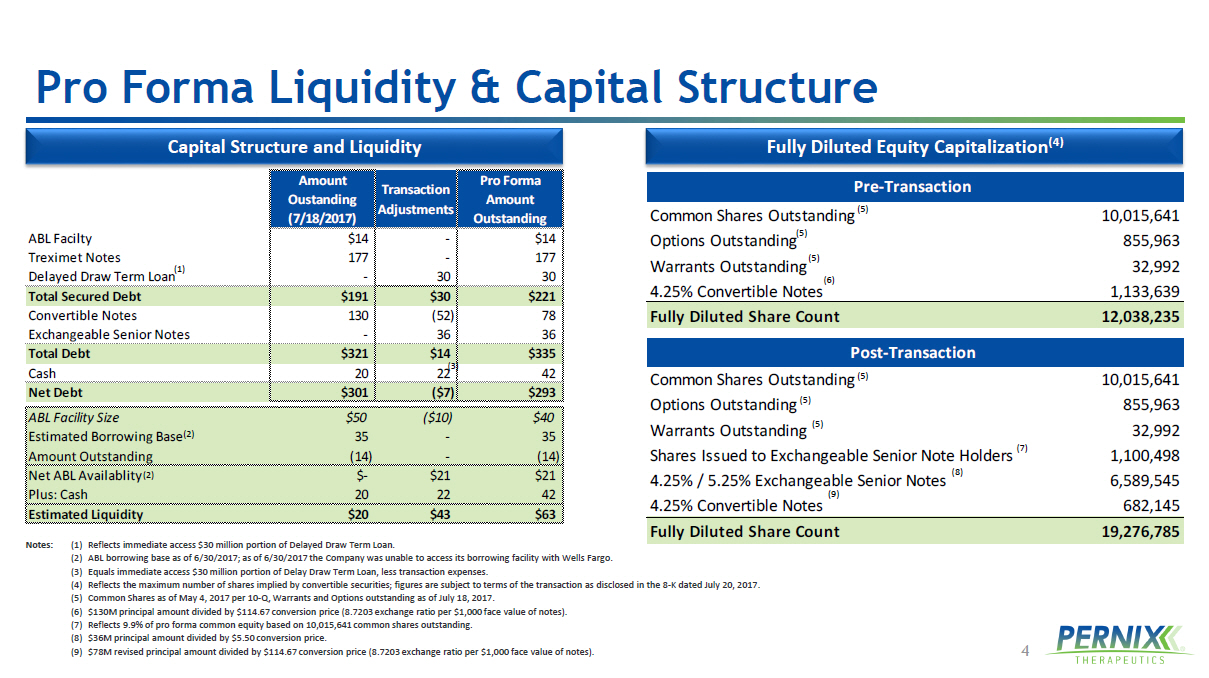
4 Amount Oustanding (7/18/2017) Transaction Adjustments Pro Forma Amount Outstanding ABL Facilty $14 - $14 Treximet Notes 177 - 177 Delayed Draw Term Loan - 30 30 Total Secured Debt $191 $30 $221 Convertible Notes 130 (52) 78 Exchangeable Senior Notes - 36 36 Total Debt $321 $14 $335 Cash 20 22 42 Net Debt $301 ($7) $293 ABL Facility Size $50 ($10) $40 Estimated Borrowing Base 35 - 35 Amount Outstanding (14) - (14) Net ABL Availablity $- $21 $21 Plus: Cash 20 22 42 Estimated Liquidity $20 $43 $63 Post-Transaction Common Shares Outstanding 10,015,641 Options Outstanding 855,963 Warrants Outstanding 32,992 Shares Issued to Exchangeable Senior Note Holders 1,100,498 4.25% / 5.25% Exchangeable Senior Notes 6,589,545 4.25% Convertible Notes 682,145 Fully Diluted Share Count 19,276,785 Pre-Transaction Common Shares Outstanding 10,015,641 Options Outstanding 855,963 Warrants Outstanding 32,992 4.25% Convertible Notes 1,133,639 Fully Diluted Share Count 12,038,235 Pro Forma Liquidity & Capital Structure Fully Diluted Equity Capitalization (4) Capital Structure and Liquidity (2) (1) Notes: (1) Reflects immediate access $30 million portion of Delayed Draw Term Loan. (2) ABL borrowing base as of 6/30/2017; as of 6/30/2017 the Company was unable to access its borrowing facility with Wells Farg o. (3) Equals immediate access $30 million portion of Delay Draw Term Loan, less transaction expenses. (4) Reflects the maximum number of shares implied by convertible securities; figures are subject to terms of the transaction as disclosed in the 8 - K dated July 20, 2017. (5) Common Shares as of May 4, 2017 per 10 - Q, Warrants and Options outstanding as of July 18, 2017. (6) $130M principal amount divided by $114.67 conversion price (8.7203 exchange ratio per $1,000 face value of notes). (7) Reflects 9.9% of pro forma common equity based on 10,015,641 common shares outstanding. (8) $36M principal amount divided by $5.50 conversion price. (9) $78M revised principal amount divided by $114.67 conversion price (8.7203 exchange ratio per $1,000 face value of notes). (5) (5) (5) (5) (5) (5) (6) (7) (8) (9) (2) (3)
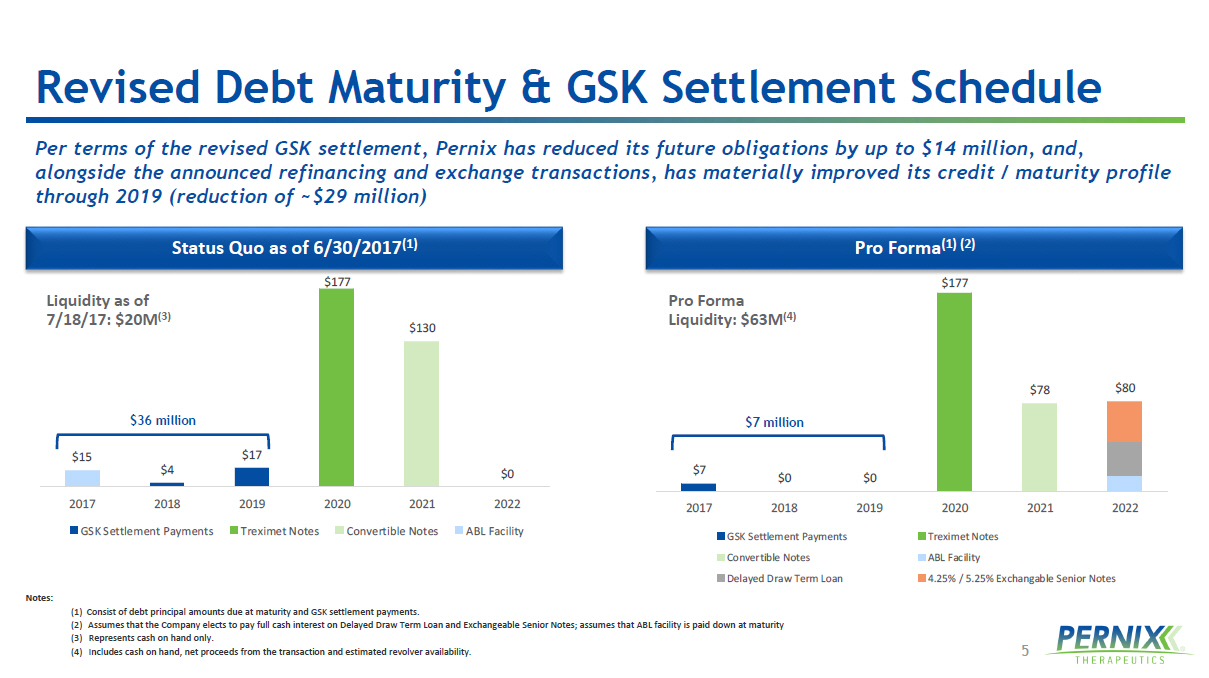
5 $7 $0 $0 $177 $78 $80 2017 2018 2019 2020 2021 2022 GSK Settlement Payments Treximet Notes Convertible Notes ABL Facility Delayed Draw Term Loan 4.25% / 5.25% Exchangable Senior Notes $15 $4 $17 $177 $130 $0 2017 2018 2019 2020 2021 2022 GSK Settlement Payments Treximet Notes Convertible Notes ABL Facility Revised Debt Maturity & GSK Settlement Schedule Pro Forma (1) (2) Status Quo as of 6/30/2017 (1) Notes: (1) Consist of debt principal amounts due at maturity and GSK settlement payments. (2) Assumes that the Company elects to pay full cash interest on Delayed Draw Term Loan and Exchangeable Senior Notes; assumes that ABL facility is paid down at maturity (3) Represents cash on hand only. (4) Includes cash on hand, net proceeds from the transaction and estimated revolver availability. Pro Forma Liquidity: $63M (4) Liquidity as of 7/18/17: $20M (3) Per terms of the revised GSK settlement, Pernix has reduced its future obligations by up to $14 million, and, alongside the announced refinancing and exchange transactions, has materially improved its credit / maturity profile through 2019 (reduction of ~$29 million) $36 million $7 million

6 Drive Net Sales by Focusing on Core Strengths in Neurology and Pain Grow Profitability and Maximize Cash Flow Expand and Diversify Product Portfolio Corporate Strategy Overview Pernix Therapeutics is a patient centered, growth oriented specialty pharmaceutical company focused on developing, acquiring and commercializing innovative products in the areas of Pain, Neurology and adjacent indications
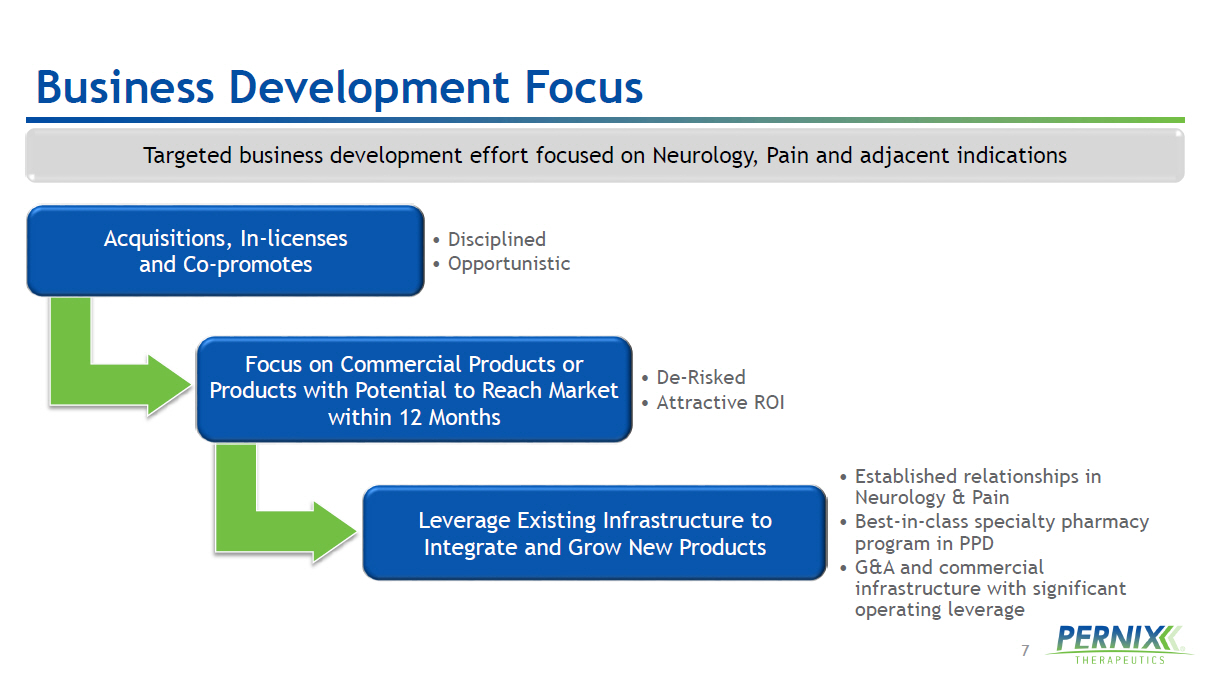
7 Business Development Focus Targeted business development effort focused on Neurology, Pain and adjacent indications Acquisitions, In - licenses and Co - promotes • Disciplined • Opportunistic Focus on Commercial Products or Products with Potential to Reach Market within 12 Months • De - Risked • Attractive ROI Leverage Existing Infrastructure to Integrate and Grow New Products • Established relationships in Neurology & Pain • Best - in - class specialty pharmacy program in PPD • G&A and commercial infrastructure with significant operating leverage
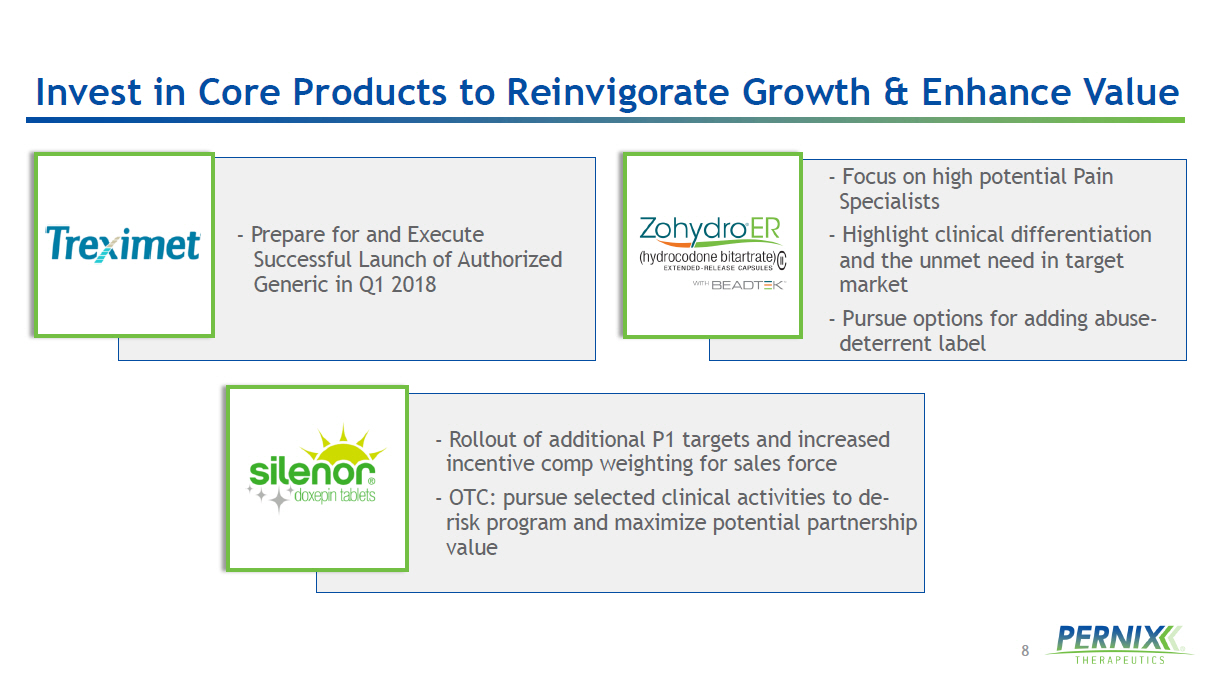
8 Invest in Core Products to Reinvigorate Growth & Enhance Value - Prepare for and Execute Successful Launch of Authorized Generic in Q1 2018 - Focus on high potential Pain Specialists - Highlight clinical differentiation and the unmet need in target market - Pursue options for adding abuse - deterrent label - Rollout of additional P1 targets and increased incentive comp weighting for sales force - OTC: pursue selected clinical activities to de - risk program and maximize potential partnership value
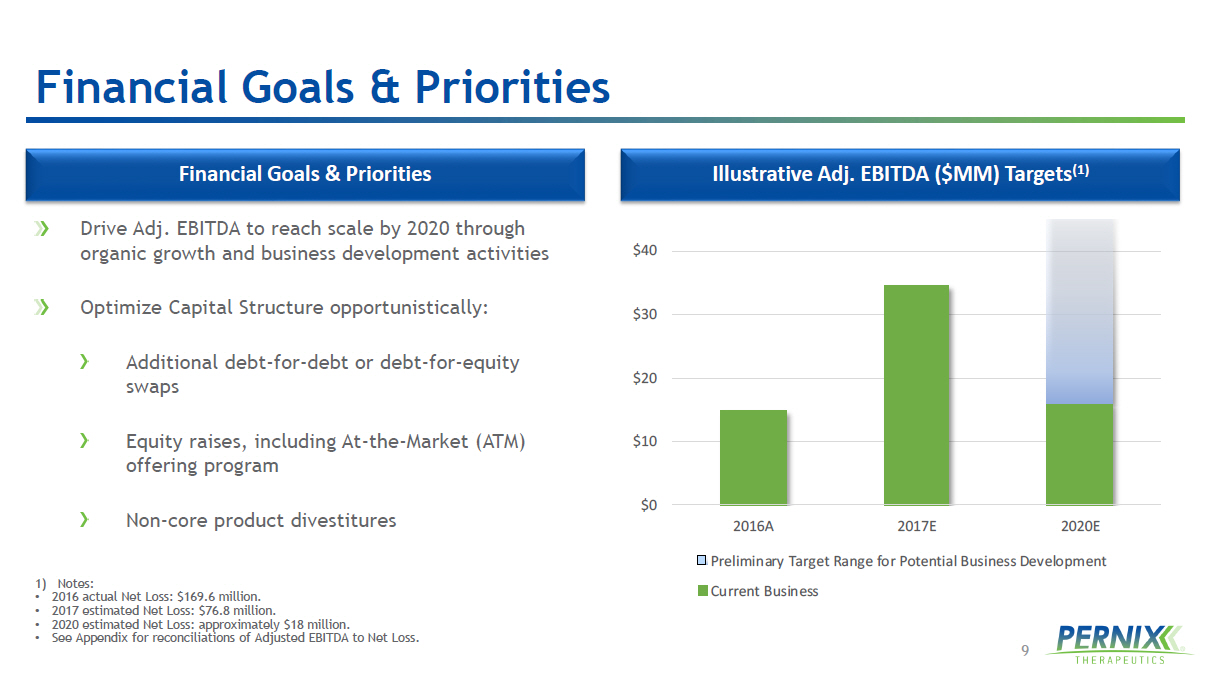
9 $0 $10 $20 $30 $40 2016A 2017E 2020E Preliminary Target Range for Potential Business Development Current Business Financial Goals & Priorities Drive Adj. EBITDA to reach scale by 2020 through organic growth and business development activities Optimize Capital Structure opportunistically: Additional debt - for - debt or debt - for - equity swaps Equity raises, including At - the - Market (ATM) offering program Non - core product divestitures 1) Notes: • 2016 actual Net Loss: $169.6 million. • 2017 estimated Net Loss: $76.8 million. • 2020 estimated Net Loss: approximately $18 million. • See Appendix for reconciliations of Adjusted EBITDA to Net Loss. Financial Goals & Priorities Illustrative Adj. EBITDA ($MM) Targets (1)

Appendix
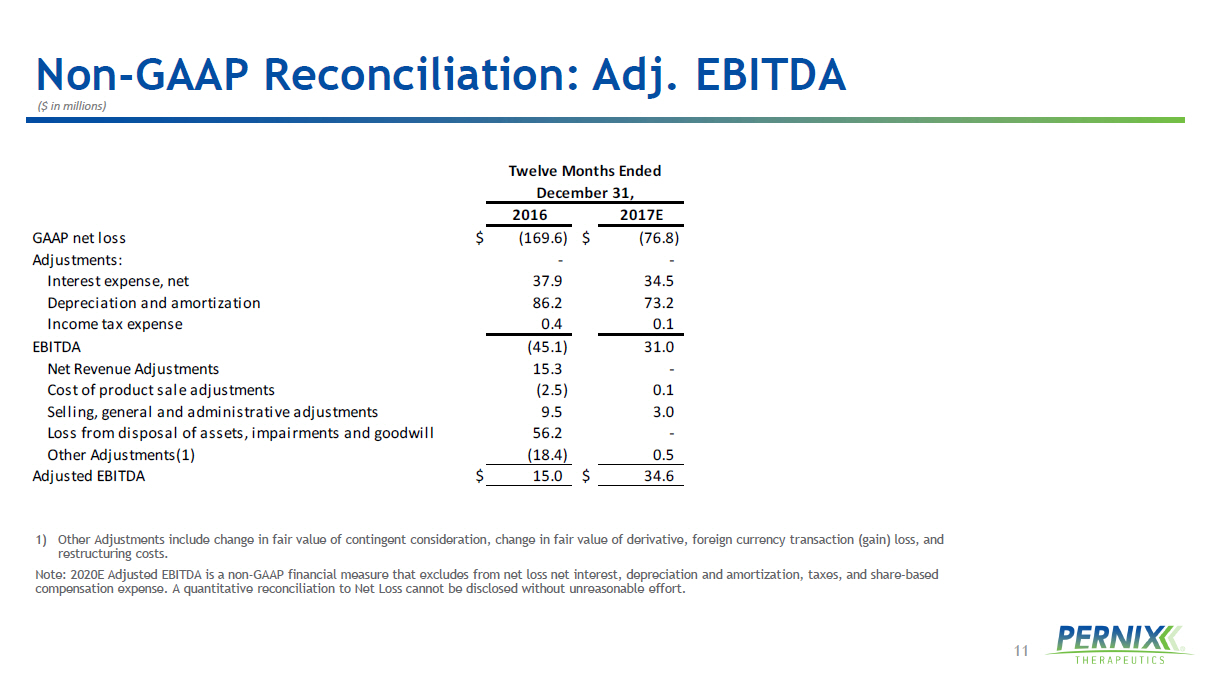
11 Non - GAAP Reconciliation: Adj. EBITDA ($ in millions) 1) Other Adjustments include change in fair value of contingent consideration, change in fair value of derivative, foreign curre ncy transaction (gain) loss, and restructuring costs. Note: 2020E Adjusted EBITDA is a non - GAAP financial measure that excludes from net loss net interest, depreciation and amortizat ion, taxes, and share - based compensation expense. A quantitative reconciliation to Net Loss cannot be disclosed without unreasonable effort. 2016 2017E GAAP net loss $ (169.6) $ (76.8) Adjustments: - - Interest expense, net 37.9 34.5 Depreciation and amortization 86.2 73.2 Income tax expense 0.4 0.1 EBITDA (45.1) 31.0 Net Revenue Adjustments 15.3 - Cost of product sale adjustments (2.5) 0.1 Selling, general and administrative adjustments 9.5 3.0 Loss from disposal of assets, impairments and goodwill 56.2 - Other Adjustments(1) (18.4) 0.5 Adjusted EBITDA $ 15.0 $ 34.6 Twelve Months Ended December 31,
12 Non - GAAP Financial Measures To supplement our financial results determined by GAAP, we have also disclosed in this presentation and the table below the f oll owing non - GAAP information: adjusted earnings before interest, taxes, depreciation and amortization (EBITDA). Adjusted EBITDA is a non - GAAP financial measure that excludes the impact of certain items and, therefore, has not been calculate d in accordance with GAAP. This non - GAAP financial measure excludes from net loss net interest, depreciation and amortization, taxes, net revenue adjustments, deal expenses, sh are - based compensation expense, amortization of inventory step - up included in cost of product sales, royalty expense adjustments, severance expenses, non - recurring arbitration and litigation expenses, certain research and development expenses, cost of inducement, change in fair value of contingent consideration and derivative liabilities, dispos al of assets and impairments of intangibles and goodwill, foreign currency transactions, extinguishment of debt and restructuring costs. In addition, from time to time in the future t her e may be other items that we may exclude for the purposes of our use of adjusted EBITDA; likewise, we may in the future cease to exclude items that we have historically exclu ded for the purpose of adjusted EBITDA. We believe that adjusted EBITDA provides meaningful supplemental information regarding our operating results because it exclu des or adjusts amounts that management and the board of directors do not consider part of core operating results or that are non - recurring when assessing the performance of th e organization. We believe that inclusion of adjusted EBITDA provides consistency and comparability with past reports of financial results and provides consistency in calculations by outside analysts reviewing our results. Accordingly, we believe that adjusted EBITDA is useful to investors in allowing for greater transparency of supplemental information used by man agement. We believe that these non - GAAP financial measures are helpful in understanding our past financial performance and potential futu re results, but there are limitations associated with the use of these non - GAAP financial measures. These non - GAAP financial measures are not prepared in accordance with GAAP, do not reflect a comprehensive system of accounting and may not be completely comparable to similarly titled measures of other companies due to potential differences in the exac t m ethod of calculation between companies. Adjustment items that are excluded from our non - GAAP financial measures can have a material impact on net earnings. As a result, these non - GAAP financial measures have limitations and should not be considered in isolation from, or as a substitute for, net loss, cash flow from operations or ot her measures of performance prepared in accordance with GAAP. We compensate for these limitations by using these non - GAAP financial measures as a supplement to GAAP financial measures and by reconciling the non - GAAP financial measure to its most comparable GAAP financial measure. Investors are encouraged to review the reconciliations of the non - GAAP fi nancial measure to its most comparable GAAP financial measure that is included below in this presentation.