Exhibit (c)(i)
Appraisal Report by Banco Itaú BBA, exhibit to Notice of Voluntary Public Tender Offer for Acquisition of All Preferred Shares of Net Serviços de Comunicações S.A., filed with theComissão de Valores Mobiliários, the Brazilian Securities Commission, on August 20, 2010 (English Translation)
In connection with the proposed transaction, Empresa Brasileira de Telecomunicações S.A. – Embratel (“Embratel”) will file with the U.S. Securities and Exchange Commission (the “SEC”) a Tender Offer Statement under Section 14(d)(1) or 13(e)(1) of the Securities Exchange Act of 1934 (the “Tender Offer Statement”). Investors and security holders are urged to read the Tender Offer Statement and its exhibits regarding the proposed transaction when it becomes available because it will contain important information. You may obtain a free copy of the Tender Offer Statement and its exhibits (when available) and other related documents filed by Embratel with the SEC at the SEC’s website at www.sec.gov.
This document contains certain forward-looking statements that reflect the current views and/or expectations Embratel and its management with respect to its performance, business and future events. We use words such as “believe,” “anticipate,” “plan,” “expect,” “intend,” “target,” “estimate,” “project,” “predict,” “forecast,” “guideline,” “should” and other similar expressions to identify forward-looking statements, but they are not the only way we identify such statements. Such statements are subject to a number of risks, uncertainties and assumptions. We caution you that a number of important factors could cause actual results to differ materially from the plans, objectives, expectations, estimates and intentions expressed in this release. Embratel is under no obligation and expressly disclaims any intention or obligation to update or revise any forward-looking statements, whether as a result of new information, future events or otherwise.
 August, 2010 Appraisal Report Contracting Party: Empresa Brasileira de Telecomunicações S.A. - Embratel Subject Matters: NET Serviços de Comunicações S.A. DRAFT |
2 Contents Important Notes SECTION 1 Executive Summary SECTION 2 Information on Itaú BBA SECTION 3 Telecommunications Industry and Overview of NET SECTION 4 NET’s Valuation APPENDIX A Glossary of Terms and Definitions APPENDIX B Average Target Price |
 3 Important Notes MATERIAL LEGAL INFORMATION – in having access to this valuation report you confirm that you have read and that you will comply with the information set forth below: We, Banco Itaú BBA (“Itaú BBA”) were hired by Empresa Brasileira de Telecomunicações S.A. – Embratel (“Embratel”) to prepare an economic-financial valuation report (“Valuation Report”) about Net Serviços de Comunicações S.A., (“Net” or “Company”), in the context of a voluntary tender offer by Embratel for preferred shares of Net (“Tender Offer”). The information on this Valuation Report was obtained exclusively from public sources. As a result, we have used (i) the audited consolidated financial statements of the Company, publicly available for the fiscal years ended on December 31, 2007, 2008 and 2009 and for the six-month period ended June 30, 2010; and (ii) research reports and financial, economic and market studies, as well as other publications related to the business of the Company, the performance of its shares and expected profitability of its shares, prepared by independent market research analysts, (jointly referred to as “Information”). The Information was obtained from public sources we believe to be reliable, however, we have not independently verified the Information and we are not responsible for its accuracy, correctness or sufficiency. We did not have contact with the management of the Company, nor any non-public information about the Company and its businesses. Any estimates or projections presented here were obtained from public sources, as no meetings or discussions about this information were held with the management of the Company or Embratel, with no guarantee whether these estimates and projections will materialize. We do not assume any responsibility for these estimates and projections, or the way in which they were obtained. We are not responsible for conducting and have not conducted an independent verification of the Information obtained. This Valuation Report was prepared in accordance with Instruction No. 361 issued by the Brazilian Securities Commission (“CVM”) and does not constitute a proposal, solicitation, advice or recommendation from Itaú BBA, whether to tender shares in the Tender Offer or not. Any decisions related to the Tender Offer that are made by Embratel, its shareholders and holders of shares issued by the Company addressees of the Tender Offer (“Shareholders”) are in their sole and exclusive responsibilities according to their own analysis of risks and benefits involved in the Tender Offer. As a result, we are not responsible for the decisions taken by Embratel, its partners and Shareholders in relation to the Tender Offer. Embratel or any third-party that we authorize to use this Valuation Report, will exempt us, our directors, officers, employees and/or representatives from any responsibility for losses, damages, expenses and judicial orders, which may arise, directly or indirectly, from the compilation of this Valuation Report, also agreeing to indemnify us for any losses, damages, expenses and judicial orders resulting from this Valuation Report. We are not liable for any direct or indirect losses and/or damages, or lost profits which may arise from this Valuation Report. The base date used in this Valuation Report is June 30, 2010, and it was completed and delivered on August 5, 2010. Shareholders must conduct their own analyses in relation to the appropriateness and opportunity of participating in the Tender Offer and must consult their own legal, tax and financial counsel in order to form their own opinions about the Tender Offer independently. This Valuation Report must be read and interpreted in light of its qualifications and restrictions mentioned here. The reader must consider in its analysis, the restrictions and characteristics of the sources used. |
 4 Important Notes This Valuation Repost must be used exclusively for the Tender Offer, which was duly disclosed to the market through Material Fact dated August 5, 2010, released in the Brazilian Valor Econômico newspaper, published on August 5, 2010. In the course of our work, we assume that the Information is true, accurate and complete and that no other information, which could have been relevant with respect to our work, was not made available to us. In addition, we have analyzed the consistency of the Information based on our experience and good sense, but we do not assume any responsibility for independent evaluations of any Information or independent verification or assessment of any assets or liabilities (contingent or not) of the Company and we have not received any such assessment. We have not been asked to conduct, and have not conducted any physical inspection of the properties or facilities of the Company. Finally, we have not assessed the solvency or fair value of the Company. In light of the limitations mentioned above, we do not make, and will not make, either expressly or implicitly, any representation or warranty regarding any Information used in the preparation of this Valuation Report and there are no provisions that could be interpreted as a representation in relation to the past, present or future. The analysis contained in this Valuation Report involves complex considerations and judgments in relation to the financial and operational characteristics and other factors that could affect the acquisition, public negotiation and other assets of the Company, as well as considerations about the business segments or the analyzed operations, the appropriate and material methods of the financial analysis and the application of these methods to specific circumstances. The estimates contained in the analysis and the resulting variation of any analysis is not indicative of real amounts or indicative of future results or amounts, which may be more or less favorable than the ones suggested by the referred analysis. In addition, the analyses referring to business evaluations and securities do not constitute valuations or reflect the prices in which the business were actually acquired or sold, the real value of the shares in the moments of issuance in a transaction or the prices by which the shares may be negotiated at any time. In case any of these premises do not materialize, or than in any way, the Information proves to be incorrect, incomplete or imprecise, the conclusions may alter in a substantial way. Additionally, for our analysis based on the discounted cash flow methodology, we assumed a macroeconomic scenario as compiled and published by the Brazilian Central Bank, which may be substantially different from future results. Given that the analysis and amounts are based on forecasts of future results, they are not necessarily indicative of the real and future financial results of the Company, which may be materially more or less favorable than the ones suggested by this Valuation Report. In addition, given that these analyses are intrinsically subject to uncertainties, and are based on several events and factors which are out of our control, the control of the Company and Embratel, we are not responsible in any way if the results of the Company, differ substantially from the results presented in this Valuation Report. There is no guarantee that the future results of the Company will correspond to the financial projections we based our analysis on and that the differences between the projections used and the financial results of the Company are not material. The future results of the Company may also be affected by economic and market conditions. The preparation of this Valuation Report is in no way a commitment to result from Itáu BBA. The preparation of a financial analysis is a complex process, which involves various definitions in respect to the most appropriate and relevant financial analysis methods, and the application of these methods. We arrived at a final conclusion based on the results of the analysis performed by us as a whole, and we did not reach individual conclusions based on or related to any of the factors or methods of our analysis. Therefore, we believe our analysis, must be considered as a whole and that the examination of parts of our analysis and specific factors without considering the full context of our analysis and conclusions may lead to incomplete and incorrect interpretations of the processes used in our analyses and conclusions. |
 5 Important Notes This Valuation Report provides only an estimate, according to our criteria, of the value derived from the discounted cash flow evaluation methodology or from having prices of for comparable companies, as the case may be, which are methodologies largely used in financial evaluations of companies that do not evaluate any other aspect or implication of the Tender Offer or any contract, agreement or understanding entered into in connection with the Tender Offer. We do not express any opinion on the value for which the shares related to the Tender Offer could be traded on any securities market at any time. Additionally, this Valuation Report is not and must not be used as (i) a fairness opinion about the Tender Offer or (ii) a recommendation of any aspects of the Tender Offer. Additionally, this Valuation Report is not about the strategy and commercial merits of the Tender Offer, nor the eventual strategic or commercial decision of Embratel and its partners or the shareholders of the Company of undergoing the Tender Offer. This Valuation Report does not constitute a judgment, opinion or recommendation to the Company, its shareholders or any third-parties about the convenience, fairness of price or opportunity about the Tender Offer, and it also does not endorse any investment decision. Our Valuation Report is necessarily based on information provided to us as of the date of this Valuation Report and takes into account economic and market conditions and other conditions as they are and as can be evaluated on this date. Although future events and other developments could affect the conclusions presented in this Valuation Report, we do not have any obligation to update, revise, rectify or revoke this Valuation Report, wholly or partly, as a result of any subsequent development or for any other reason. Our analysis does not distinguish any type or class of representative shares of the Company’s share capital and does not include benefits or operational, tax or any other losses, including spreads, nor any synergy, additional value or/and costs, existing, at the closing of the deal, if effected, or any other operation. Our analysis is not and will not be considered a recommendation regarding the manner how Embratel, the shareholders and/or management should vote or decide regarding the transaction. Besides acting as an intermediate institution regarding the deal, we may render other financial advising services to Embratel or to the Company regarding the deal. This Valuation Report cannot be reproduced or publicized without our prior written consent, except the use of those interested in the offer in accordance with the terms of CVM Instruction No. 361. We declare that: – On the date of this Valuation Report, we, our controlling shareholders and related persons are not owners of the shares issued by the Company or Embratel, except that persons related to us posses, under their discretionary decision, 1,968,736 preferential shares issued by the Company and 412, 873 common shares issued by Embratel Participações S.A. – We do not present any conflict of interest with Embratel or the Company, its controlling shareholders and management, reducing its independence necessary to its position’s performance elaborating this Valuation Report. – We will receive from Embratel, the fixed value, in reais, at the date of the liquidation of the Tender Offer, US$400,000.00. – We received from the Company US$466,000 for coordination and distribution services of Unsecured and Unsubordinated Notes issued by the Company on January 2010. We did not receive other amounts from Embratel or the Company regarding compensation for consultant services, valuation, auditing or similar services 12 months prior to this date. Itaú BBA and other companies from the Itaú Unibanco Group maintain commercial relations in the ordinary course of business of commercial and investment banking with Embratel, the Company and other companies of the group, by which they receive and expect to receive future compensation. |
 6 Important Notes Embratel and its partners agreed to reimburse our expenses and indemnify us and certain other persons as a result of the contracting of our services. We receive a commission regarding the preparation of this Valuation Report independently of the launch of the transaction. Our internal approval process regarding the Itaú BBA’s Valuation Report includes revising, by an Internal Valuation Committee, of the independent analysis made by the execution team of the Valuation Report. We have provided, from time to time, in the past, investment banking services and other financial services to Embratel, its controlling shareholders, subsidiaries and companies under common control (“Affiliates”) for which we were remunerated, and may, in the future, provide these services to Embratel, the Company and its affiliates, for which we expect to be remunerated. We are a financial institution that provides a variety of financial services and other services related to securities, brokerage and investment banking. In the normal course of our activities, we may acquire, hold or sell, on our behalf or on the behalf of our clients, shares, debt instruments and other securities and financial instruments (including bank loans and other obligations) of Embratel, the Company and/or its affiliates involved in this transaction, as well as provide investment banking services to such companies, controlling shareholders or affiliates. The professionals in the research departments of the Itaú Unibanco Group, including Itaú BBA, may base their analyses and publications on different operational and market assumptions and on different analysis methodologies compared with those used in the preparation of this Valuation Report, with the result that the research reports and other publications prepared by them may contain different results and conclusions when compared with those herein presented. We also adopted policies and procedures for preserving the independence between investment baking and other areas and departments of Itaú BBA and other companies of the Itaú Unibanco Group, including, but not limited to asset management and the proprietary desk for trading shares, debt instruments, securities and other financial instruments. We do not render any accountability, auditing, legal or tax services related to this Valuation Report. The financial calculation included in this Valuation Report may not always result in an exact number due to rounding. This Valuation Report is an intellectual property of Itaú BBA. Banco Itaú BBA S.A. Fernando Meira Pedro Garcia de Souza |
 SECTION 1 Executive Summary |
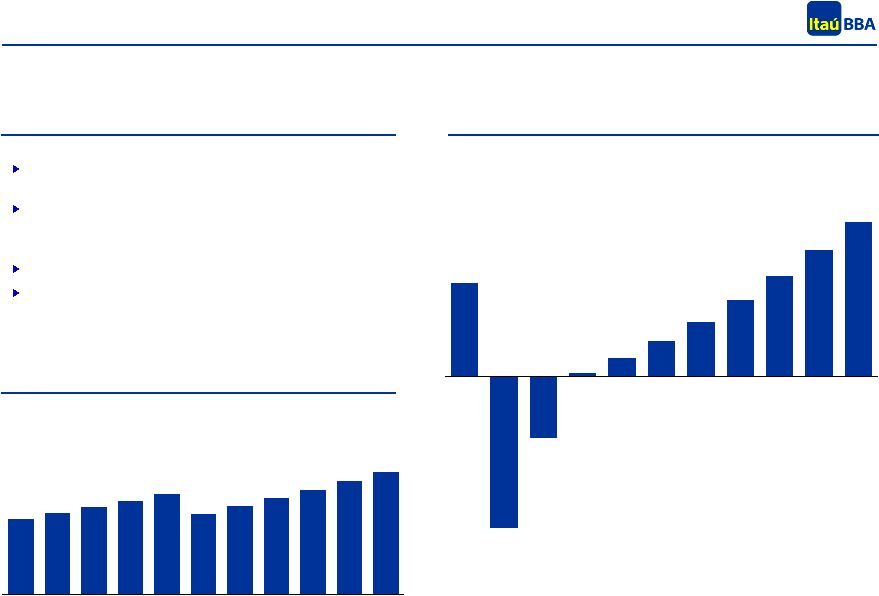
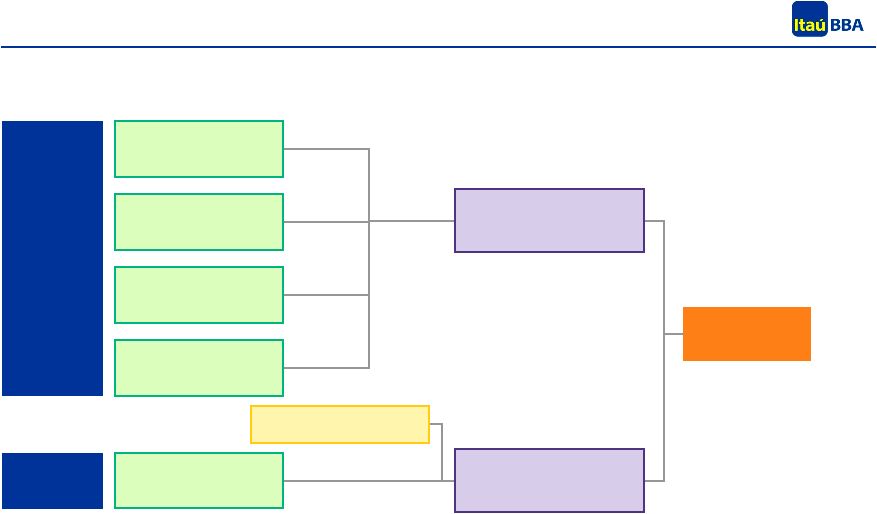
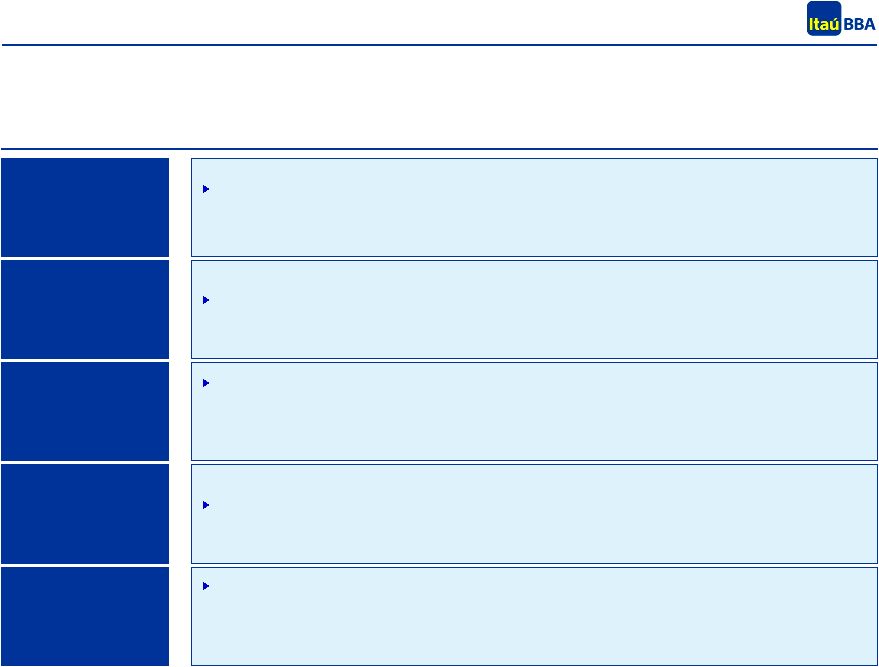 8 The estimated value ranges of NET were calculated based on the methodologies most frequently used for economic-financial valuation of companies in the telecommunications sector Valuation Methodology and Main Assumptions Main methodologies used Historical Average Share Prices We analyzed NET’s historical share price on the period of 12 months prior to this appraisal report – We used the historical average weighted by the trading volume at BM&F Bovespa in the last 1, 3, 6 and 12 months Book Value We calculated the company’s book value per share based on the financial statements as of June 30th, 2010 – The book value may not indicate accordingly the future profit generation potential of the company Discounted Cash Flow Present value of free cash flows to firm, based on public information (market consensus) on NET and on the telecommunications market in Brazil – We discounted the cash flows using a WACC in nominal US dollars and we also assumed a perpetuity growth rate after 2020 (last year in the projection period) Trading Multiples of Comparables Companies We have analyzed the current trading multiples of Brazilian companies in the telecommunications sector – We believe that the multiple that best estimates the company’s value is the EV/EBITDA Multiples of Precedent Transactions We have analyzed the multiples of precedent transactions in the Brazilian Pay TV sector – Multiples of precedent transactions are used to estimate the company’s value in the case of a strategic transaction – Main metric is the EV/EBITDA multiple |
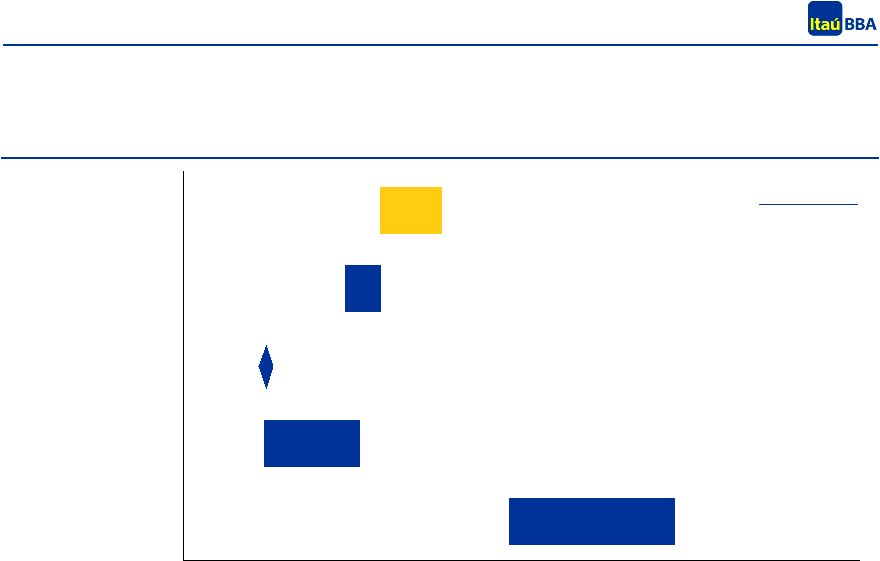 9 15,057 10,674 4,162 6,304 7,238 6,688 3,610 7,238 8,866 2,000 7,000 12,000 17,000 Discounted Cash Flow Historical Average Price Book Value Multiples of Comparable Companies Multiples of Precedent Transactions Valuation Summary NET’s valuation analysis contemplated five different methodologies NET’s Valuation Results – Equity value and implied EV / EBITDA 10E multiple 6 (R$ mm) Notes: 1 Based on public information about NET. Valuation range based on a WACC of 8.9% and 9.9% in nominal US$. It considers a perpetuity growth rate of 3.5% 2 Average price weighted by NET’s trading volume at stock exchange in the last 3 months prior to August 3rd, 2010 and in the last 12 months prior to August 3rd, 2010 3 Book value based on financial statements as of June 30th, 2010 4 Trading multiples of Brazilian companies in the telecommunications sector. Range based on sample’s minimum and maximum values 5 EV / EBITDA LTM (last twelve months) multiples of precedent transactions in the Brazilian Pay TV sector. Range based on sample’s minimum and maximum values 6 EBITDA 10E of R$1.5 billion, based on projections of the discounted cash flow analysis 1 2 3 4 5 5.5x 6.5x 21.10 25.85 Legend EV / EBITDA 10E Price per Share 4.9x 5.5x 18.38 21.10 3.1x 10.53 3.5x 5.1x 12.13 19.50 7.7x 10.6x 31.12 43.90 |
 10 SECTION 2 Information on Itaú BBA |
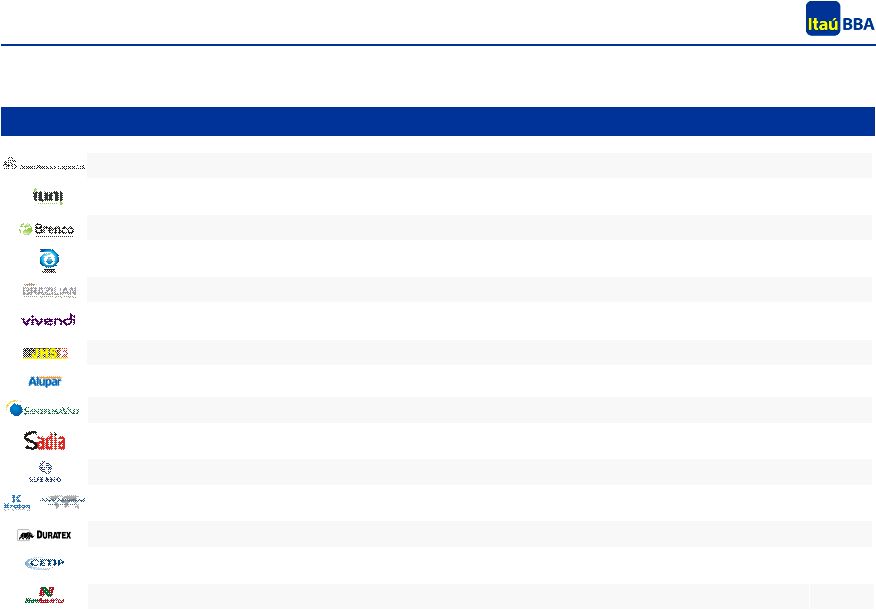 11 Itaú BBA Qualifications Itaú BBA’s experience with valuation is proved by its consistent participation as financial advisor in M&A transactions Company Transaction Date Financial advisor to Cetip in the sale of 30% of its capital stock to Advent International, in the amount of US$170 million May/2009 Financial advisor to Nova América in the sale to Cosan Mar/2009 Financial advisor to Duretex in the merger of Duratex and Satipel, in the amount of US$1.9 billion Jun/2009 Financial advisor to the shareholders of Kroton and Advent in the sale of 50% of Advent’s control, in the amount of US$200 million Jun/2009 Financial advisor to Grupo Suzano in the merger of insurance brokerage operationswith Sonae Jun/2009 Preparation of the Valuation Report in the merger with Perdigão, in the amount of US$4.6 billion Aug/2009 Financial advisor to Santelisa Vale in the sale of 60% of its capital stock to Louis Dreyfus Commodities Nov/2009 Financial advisor of Vivendi in the acquisition of GVT Financial advisor to JHSF in the sale of Shopping Metrô Santa Cruz to BR Malls Oct/2009 Financial advisor to Brazilian Finance & Real Estate in the sale of 21% of its capital stock to Equity International Financial advisor to Usina Moema Participações in the its sale to Bunge, in the amount of US$1 billion Financial advisor to Brenco in its merger with ETH, in the amount of US$2.3 billion Financial advisor to Iuni in its sale to Kroton, in the amount of US$293 million Financial advisor to Renuka in the acquisition of interest in Equipav, in the amount of US$1.5 billion Financial advisor to Alupar in capitalization by FI-FGTS, in the amount of US$400 million Sep/2009 Feb/2010 Feb/2010 Jan/2010 Dec/2009 Apr/2010 Mar/2010 |
 12 Company Transaction Date Financial Advisor to MMX in the sale of 49% of interest in MMX Minas-Rio to Anglo American, in the amount of US$1.58 billion Jan/2008 Financial advisor to the shareholders of Rodovia das Cataratas in its sale to Ecorodovias, in the amount of US$245 million Jan/2008 Financial advisor to the shareholders of Big TV in its sale to Net, in the amount of US$1.24 billion Dec/2007 Financial Advisor to Klabin Segall in the merger with Setin, in the amount of US$112 million Oct/2007 Financial Advisor to the shareholders of Suzano Petroquímica in its merger with Petrobras, in the amount of US$1.24 billion Aug/2007 Financial Advisor to Santos Brasil in the merge with Mesquita, in the amount of US$51 million Aug/2007 Financial Advisor to Energisa in the sale of the generation assets, including 11 PCHs and 4 projects, in the amount of US$156 million Jul/2007 Financial Advisor to the shareholders of Serasa in the sale of 65% of Serasa’s interest to Experian, in the amount of US$1.78 billion Jun/2007 Financial Advisor in the process of deverticalization of CEEE’s generation and distribution assets in the amount of US$179 million Dec/2006 Financial Advisor to International Paper in the sale of Amcel, in the amount of US$56 million Nov/2006 Financial advisor to Grupo Rede in the asset swapwith EDB involving Lajeado and Enersul, in the amount of US$782 million Jun/2008 Preparation of the Valuation Report in the merger of petrochemical assets with Petrobrás, in the amount of US$1.7 billion May/2008 Preparation of the Valuation Report in the sale of Oi/Telemar’s interest, in the amount of US$3.0 billion Apr/2008 Financial Advisor to the shareholders of Vivax in the mergerwith Net, in the amount of US$676 million Oct/2006 Financial Advisor to Fertibrás in the sale of Fertibrás’ control to Yara International, in the amount of US$339 million Jul/2006 Financial Advisor to CEMIG, Andrade Gutierrez, JLA Part. and Pactual in the merger with Light, in the amount of US$2.1 billion Mar/2006 Itaú BBA Qualifications (cont’d) Itaú BBA’s experience with valuation is proved by its consistent participation as financial advisor in M&A transactions |
 13 Background of the Evaluators Fernando Henrique Meira de Castro, Senior Vice President Fernando Meira advises companies in M&A transactions, segment where he has worked for about 12 years, having participated in more than 100 projects with this nature. In the last 12 months, Fernando Meira advised Iuni Educacional in its sale to Kroton, Moema’s shareholders in its sale to Bunge, Brenco in the merger with ETH of Odebrecht Group, Suzano’s shareholders in the merger of its insurance brokerage operations with Sonae, Nova América in the merger with Cosan and Santa Elisa Vale in its sale to Louis Dreyfus. Additionally, Fernando Meira has participated in several relevant transactions involving control restructuring and acquisitions / stock exchange of listed companies, including: BR Distribuidora’s delisting, Atlas-Schindler’s delisting and Cosipa’s delisting. Among the companies which Fernando has advised in M&A transactions in previous years, we highlight Suzano Petroquímica, Energisa, Serasa, Vivax, Cemig, Andrade Gutierrez, Ampla Energia, Petrobras, Petrobras Distribuidora, Petrobras Química, Electrolux, Elevadores Atlas-Schindler, Ipiranga Group, Jereissati Group / Iguatemi, Lorentzen Group, Rede, Vicunha Group, Multibrás, Petroquímica União - PQU, Promon, Tubos and Conexões Tigre, Votorantim Cimentos and Pão de Açúcar. Prior to Itaú BBA, Fernando worked in the strategic planning department of Esso for 5 years, where he was part of Exxon Corporation’s M&A team. Fernando holds a degree in Mechanical Engineering and a Marter’s Degree in Finance from Fundação Getúlio Vargas and in Marketing’s from UC Berkeley. Pedro Garcia is an Associate Director of Itaú BBA’s Investment Banking team. Before joining Itaú BBA, he worked as Associate for Merrill Lynch’s and UBS Pactual’s Investment Banking teams. Pedro is fluent in Portuguese and English and holds a degree in business administration from Fundação Getulio Vargas as first student of his class. Pedro has participated in the origination and execution of several transactions involving bonds and equity offerings and mergers and acquisitions, such as Energias do Brasil IPO and debt capitalization in the amount of US$507 million, Tractebel Energia follow-on offering in the amount of US$423 million and CESP primary equity offering in the amount of US$1.5 billion, among others. He has also participated in Endesa Brasil’s restructuring, in Usiminas corporate bond offering in the amount of US$200 million, in the acquistion of Usina Santa Luiza by São Martinho, Santa Cruz and Cosan for US$130 million and in the sale of CMS Energy Brazil to CPFL Energia for US$211 million, among others. Pedro Garcia de Souza, Associate Director Felippe Bento joined Itaú BBA Investment Banking in October, 2009. Before joining Itaú BBA, Felippe worked as analyst in Vergent Partners, a M&A boutique. In 2009, he executed the incorporation of Tenda by Gafisa and the capitalization of Gol’s Smiles Program by Banco Bradesco and Banco do Brasil in the amount of R$252 million. He has also executed the appraisal reports for Sadia-Perdigão and Itaú-Unibanco mergers. In 2008, he advised NEOgás do Brasil in its sale to Global Environment Fund in the amount of R$60 million. In 2007, Felippe participated in the sale of Providência to a consortium led by AIG Capital in the amount of R$1 billion. Felippe is fluent in Portuguese and English and holds a degree as of 2007 in business administration from Fundação Getulio Vargas. Felippe Andrade Ferreira Bento, Analyst |
 14 SECTION 3 Telecommunications Industry and NET’s Overview |
 15 Overview of the Global Telecommunications Industry Overall Description (Broadband) Broadband As of the end of 2009, there was a total of 477 mm broadband subscriptions in the world: – Growth of 14.8% against 2008 (415 mm subscriptions) China is in 1st place by number of subscriptions with 22% market share, USA in 2nd (18%), Japan in 3rd (7%) and Brazil, with 2.4%, in 10th Among the OECD member countries, as of the end of 2009, there were 23.3 subscribers on average for each 100 inhabitants, of which 6.7 (29%) were cable technology Fixed Telephony 1 As of the end of 2009, there was a total of 1,220 mm fixed telephone lines in the world: – Reduction of 2.6% compared to 2008, mainly because of the reduction of 27 mm lines in China China is in the 1st place by number of fixed telephone lines with 26% market share, USA in 2nd (13%), Germany in 3rd (4%) and Brazil, with 3.4%, in 6th Sector Highlights (Broadband) Broadband - Subscriptions (mm) - 2009 Fixed Telephony – Access Lines (mm) – 2009 1 104 85 32 25 19 18 16 13 12 11 Source: Teleco and International Telecommunication Union Note: 1 Considerers analog fixed telephones, ISDN, public payphones and VoIP 49 45 44 41 37 36 34 34 155 314 Main Highlights of the Market in the World World Market Evolution Brazil still represents a small portion of the sector in the world… … and there are high expectations for growth in its market share on the upcoming years |
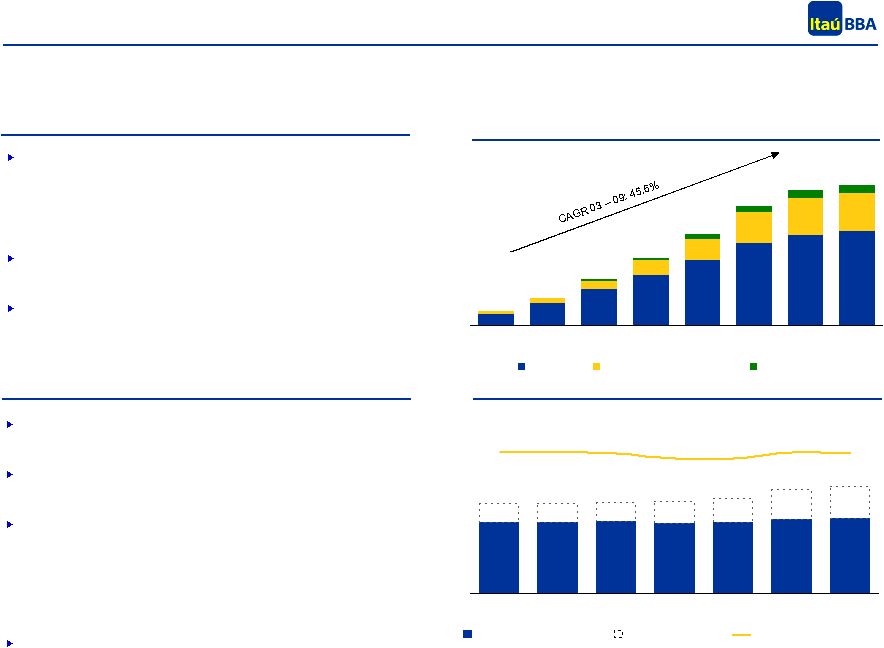 16 39.2 39.6 39.8 38.8 39.4 41.2 41.5 49.8 50.0 50.5 51.2 57.9 59.6 52.7 21.8 21.7 21.6 20.8 20.9 21.7 21.6 2003 2004 2005 2006 2007 2008 2009 As of the end of 2009, there was a total of 59.6 mm installed fixed telephony access lines in Brazil, of which 41.5 mm (70%) were in service While the total number of installed accesses presented a compound annual growth rate of 3.0% between 2003 and 2009, the number of accesses in service increased 1.0% per annum on average The fixed telephony system in Brazil is divided in 3 regions: – Region I: Southeast, except the state of São Paulo, Northeast and North, except for the states of Acre, Rondônia and Tocantins – Region II: states of Acre, Rondônia and Tocantins, Mid-West and South – Region III: state of São Paulo As of the end of 2009, main operators were Oi, with 64% accesses in service, and Telefónica, with 34% 1.0 1.9 3.2 4.3 5.6 7.0 7.7 8.0 0.3 0.6 1.2 1.8 2.6 3.1 3.2 0.1 0.1 0.1 0.4 0.4 0.6 0.6 0.2 2003 2004 2005 2006 2007 2008 2009 1T10 ADSL Pay TV (Cable Modem) Other (Wireless) Total Accesses (mm) Overview of the Brazilian Telecommunications Industry Brazilian Broadband Market As of March 2010, Brazil had a total of 11.8 mm installed connections and density of 6.12 connections per 100 inhabitants: – ADSL: 8 mm connections (68% of total) – Pay TV (Cable Modem): 3.2 mm (27%) – Other (Wireless): 0.6 mm (5%) As of April 2010, there were 28.7 mm active internet users, of which 72.4% had a connection with downstream speeds between 128 kbps and 2 MB and 13.4% with downstream speeds greater than 2 MB Main broadband connection providers are Oi, with 36% access lines, NET with 25%, and Telefónica with 24% (data as of Mar/2010) Broadband - Connections (mm) Source: Teleco Brazilian Fixed Telephony Market Fixed Telephony – Installed Accesses (mm) Accesses in Service (mm) Accesses in Service / 100 Inhabitants 1.2 2.3 3.9 5.7 7.7 10.0 11.4 11.8 High growth market in the broadband and pay TV segments… …and relatively stagnated in the fixed telephony segment |
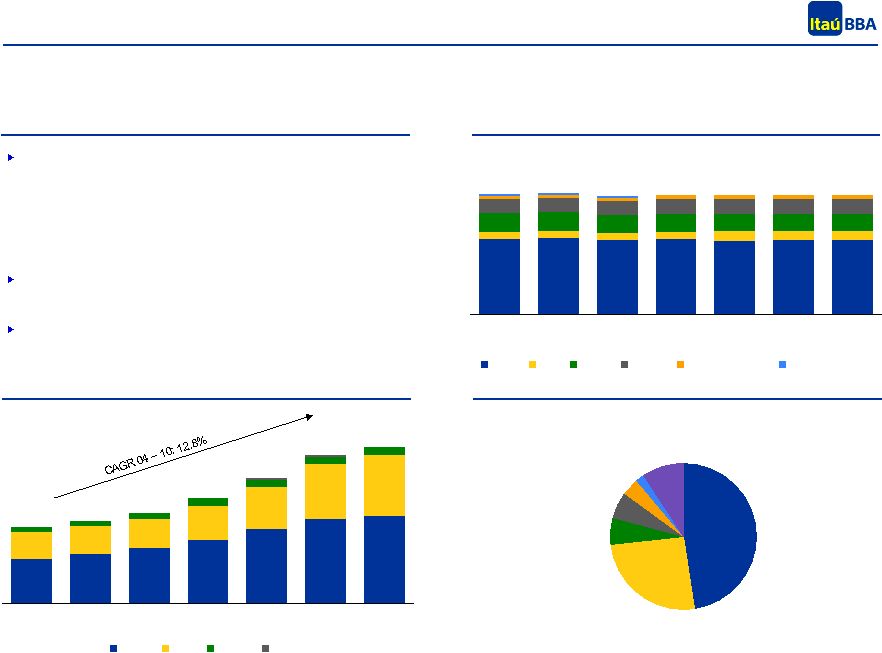 17 Net 47% Sky / Directv 26% Telefónica 6% Abril 2% Embratel 6% Oi 4% Other 9% 2,270 2,511 2,842 3,220 3,811 4,314 4,463 1,351 1,438 1,479 1,762 2,092 2,780 3,085 230 227 258 347 347 355 397 22 24 24 3,851 4,176 4,579 5,341 6,322 7,473 7,919 2004 2005 2006 2007 2008 2009 2010 Cable DTH MMDS Pay TV Overview of the Brazilian Pay TV Market Brazilian Pay TV Market As of March 2010, there was a total of 7.9 mm Pay TV subscribers in Brazil, distributed among 4 technologies: – Cable TV (56.4% of subscribers) – DTH (39.0%) – MMDS (4.4%) – Pay TV (0.3%) The number of operators remained almost stable between 2003 and Mar/2010, from 178 to 173 operators, with 63%, on average, operating in the Cable TV technology As of March 2010, 91% of the market was distributed among 6 operators, with NET holding a 47% market share by number of subscribers Number of Operators by Technology Source: Teleco and Anatel Market Evolution in Brazil – Number of Subscribers (‘000) Market Share by Number of Subscribers – 1Q10 175 176 172 173 173 173 173 The Brazilian Pay TV market presented historically high growth rates… … and is currently substantially concentrated 111 112 109 111 108 109 109 10 10 10 10 14 13 13 28 28 27 27 26 26 26 21 21 21 22 22 22 22 4 4 4 3 3 3 3 1 1 1 2004 2005 2006 2007 2008 2009 2010 Cable DTH MMDS Pay TV MMDS and Cable MMDS and Pay TV |
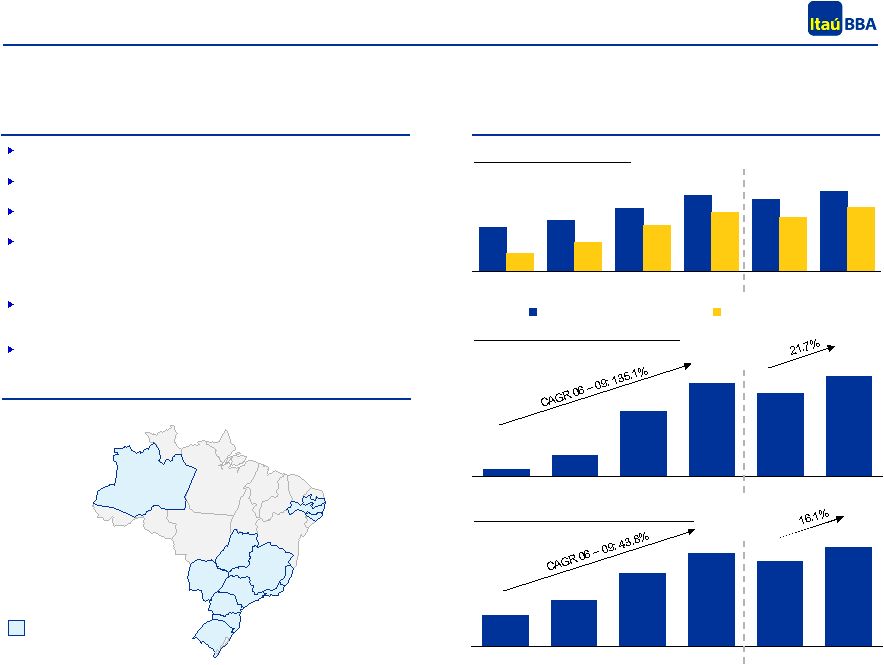 18 3.4 5.1 8.0 10.1 9.3 10.8 2006 2007 2008 2009 2Q09 2Q10 0.2 0.6 1.8 2.6 2.3 2.8 2006 2007 2008 2009 2Q09 2Q10 Overview of NET Overview of NET Founded in 1991, NET Serviços is Latin America's largest multi-service cable company, operating in 93 cities in Brazil Services: pay TV, programming packages, pay-per-view, broadband internet and voice Network with more than 47 thousand km of cables that connect more than 10.7 mm homes According to 2nd quarter 2010 numbers, the company had: – 3.9 mm Pay TV clients (NET) – 3.1 mm broadband internet subscribers (NET Virtua) – 2.8 mm voice services subscribers (NET Fone through Embratel) In 2010, the company introduced new downstream speeds in broadband internet access, becoming a providers of downstream speeds of 5Mb, 10Mb, 20Mb, 50Mb and 100Mb Consolidated 2Q10 ARPU (Average Revenue per User) was R$135.44, an increase of 2% against R$132.54 as of 2Q09 Client Base Evolution Geographic Presence Pay TV and Broadband (mm) Fixed Telephony – Service Lines (mm) Revenue Generating Units – RGUs (mm) Source: Company AM PB PE AL MG GO MT SP RJ PR SC RS ES States where the company has operations NET operates in the broadband, Pay TV and fixed telephony segments, with approximately 10.8 million revenue generating units 2.1 2.5 3.1 3.7 3.5 3.9 0.9 1.4 2.2 2.9 2.6 3.1 2006 2007 2008 2009 2Q09 2Q10 Clients - Pay TV Clients - Broadband |
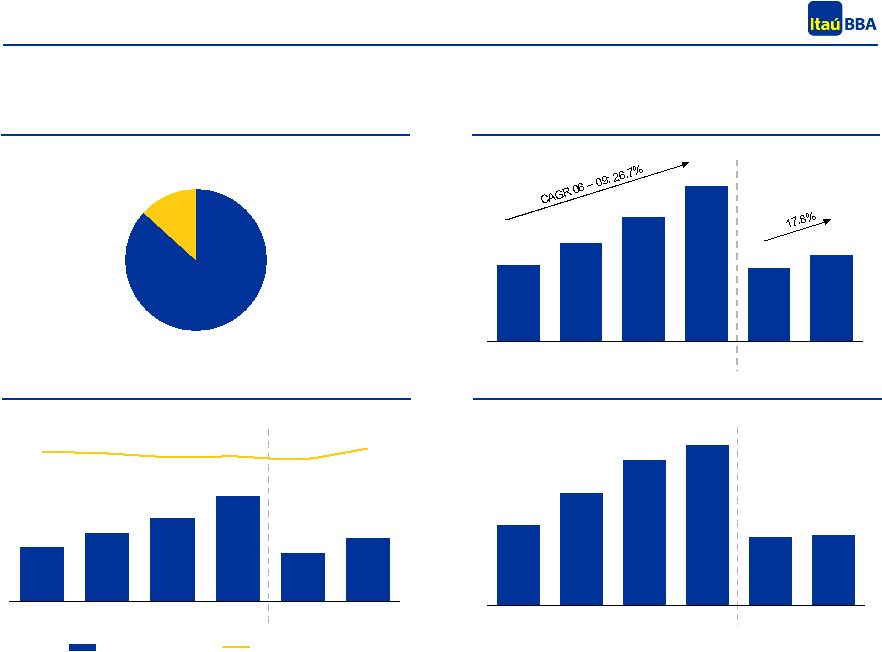 19 2,267 2,902 3,690 4,613 2,183 2,571 2006 2007 2008 2009 6M09 6M10 639 804 979 1,242 572 744 28% 28% 27% 27% 26% 29% 2006 2007 2008 2009 6M09 6M10 EBITDA (R$ mm) EBITDA Margin (%) Overview of NET: Financial Highlights Gross Revenue Breakdown – 6M10 (R$ mm) Net Revenues (R$ mm) Source: Company EBITDA (R$ mm) and EBITDA Margin (%) Capex (R$ mm) Monthly Payment 87% Adhesion and Other 13% 551 770 993 1,100 465 477 2006 2007 2008 2009 6M09 6M10 |
 20 SECTION 4 NET’s Valuation |
 21 SECTION 4A Volume Weighted Average Price |
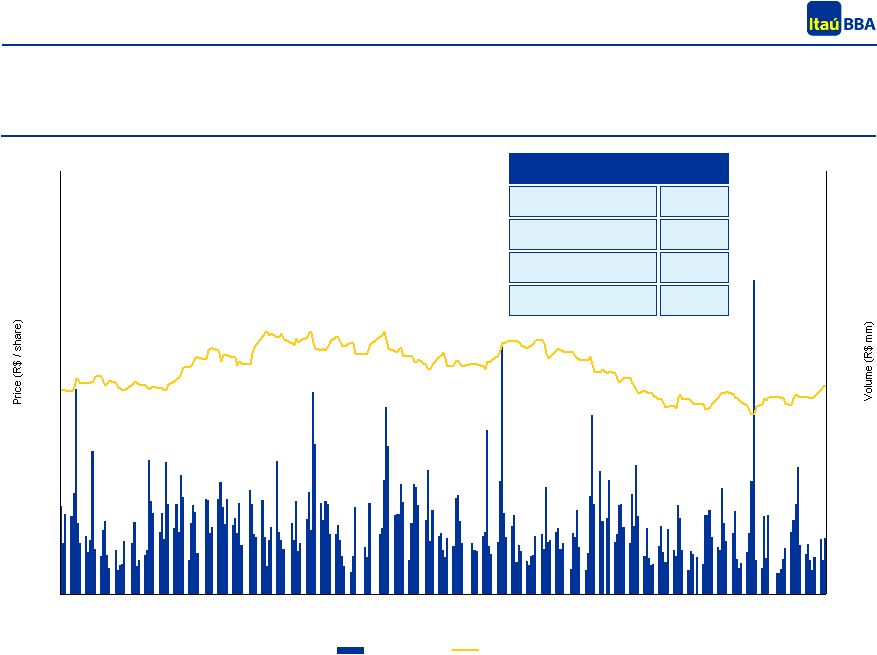 22 0 5 10 15 20 25 30 35 40 Aug-09 Oct-09 Dec-09 Feb-10 Apr-10 Jun-10 Jul-10 0 20 40 60 80 100 120 140 160 180 Volume (R$ mm) Weighted Price (R$/share) Volume Weighted Average Price NET: Volume Weighted Average Share Price (R$/share) Source: Bloomberg as of August 3rd 2010 Weighted Average (R$ / share) Last 6 Months Last 12 Months 20.19 21.10 The volume weighted average price of NET’s shares was R$18.38/share on the last three months and R$21.10/share on the last twelve months Last Month Last 3 Months 18.62 18.38 |
 23 SECTION 4B Book Value per Share |
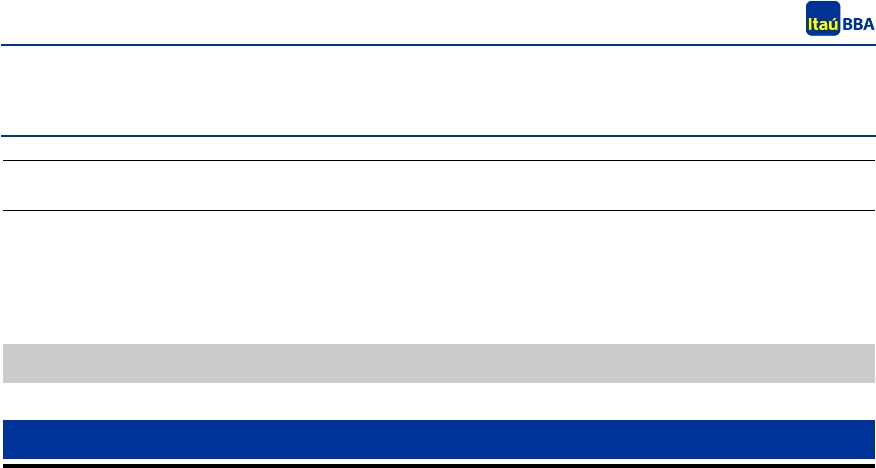 24 Book Value per Share Book Value per Share Source: Company’s Reports The book value per NET’s share is R$10.53, according to the financial statements as of June 30 th , 2010 Book Value per Share Calculation (R$ mm) 30-Jun-2010 Total Assets 8,440.3 (-) Total Liabilities 4,830.4 (-) Minority Interest 0.0 Shareholders' Equity 3,609.9 Shares Outstanding (mm) 343.0 Book Value per Share (R$) 10.53 |
 25 SECTION 4C Discounted Cash Flow |
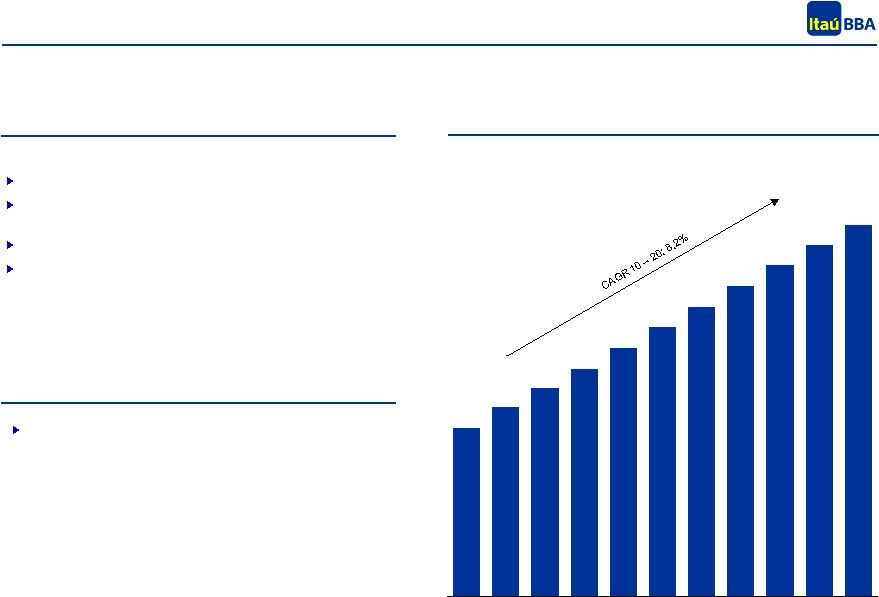 26 5,332 5,987 6,588 7,217 7,864 8,524 9,190 9,855 10,511 11,150 11,763 2010 2011 2012 2013 2014 2015 2016 2017 2018 2019 2020 Operating and Financial Projections General Assumptions Source: Research Reports The DCF valuation was based on public information as released by equity research analysts Net Revenues (R$ mm) Valuation base date of June 30th, 2010 Cash flows projected in nominal R$, converted to US$ and discounted at a nominal US$ discount rate Projection period until 2020 Exchange rate until 2014 projected according to Focus report, released weekly by the Brazilian Central Bank. After 2014, exchange rate projected assuming PPP (Purchasing Power Parity) Net Revenues based on public market information (market consensus) – Market consensus until 2013 – After 2014, considers convergence of the growth rate to 5.5% in 2020 Assumptions |
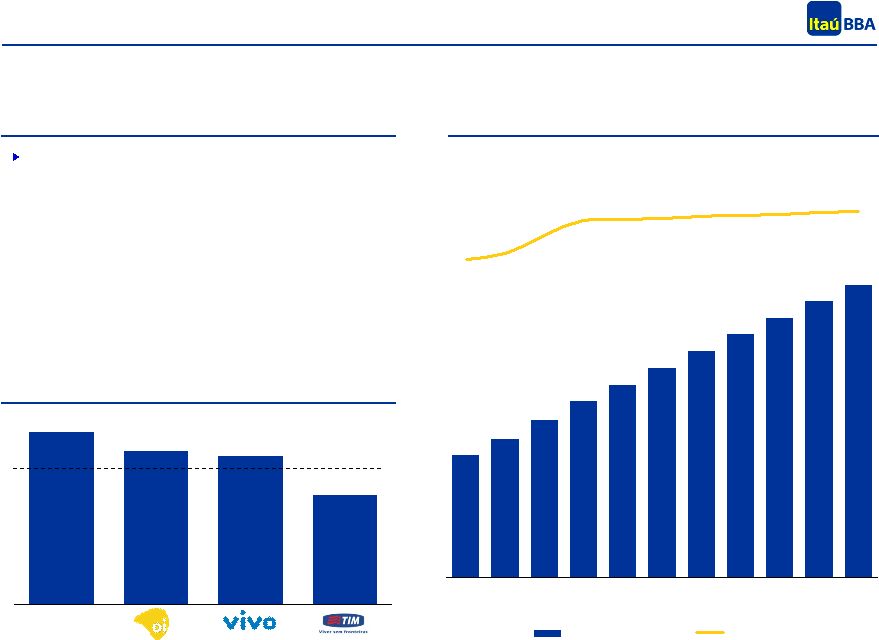 27 37.2% 33.0% 31.9% 23.5% Source: Research Reports and Companies’ Reports EBITDA (R$ mm) EBITDA was based on public market information (market consensus) – Market consensus until 2013 – After 2014, considers convergence of the EBITDA margin to the average 2009 EBITDA margin of the following comparable companies: Oi, Vivo, Tim and Telesp Long Term EBITDA Margin Assumption (Average 2009 EBITDA Margin of the Comparables) Telesp Average: 31.4% Operating and Financial Projections (cont’d) Assumptions 1,540 1,746 1,986 2,231 2,436 2,647 2,860 3,074 3,286 3,494 3,694 28.9% 29.2% 30.2% 30.9% 31.0% 31.1% 31.1% 31.2% 31.3% 31.3% 31.4% 2010 2011 2012 2013 2014 2015 2016 2017 2018 2019 2020 EBITDA (R$ mm) EBITDA Margin (%) The DCF valuation was based on public information as released by equity research analysts |
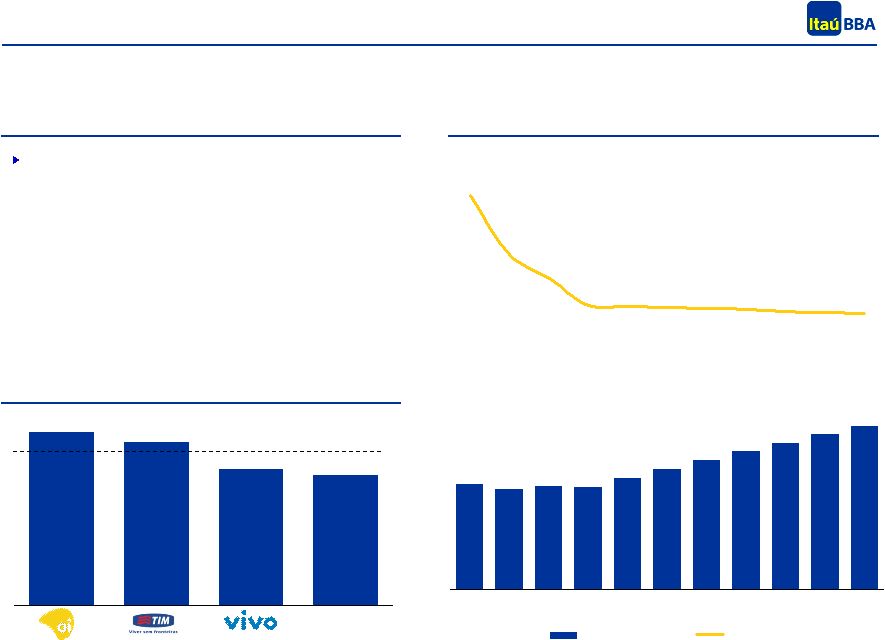 28 17.1% 16.4% 14.5% 14.1% CAPEX (R$ mm) CAPEX based on public market information (market consensus) – Market consensus until 2013 – After 2014, considers convergence of the CAPEX to Net Revenues ratio to the average 2009 CAPEX to Net Revenues ratio of the following comparable companies: Oi, Vivo, Tim and Telesp Telesp Average: 15.5% Operating and Financial Projections (cont’d) Assumptions Source: Research Reports and Companies’ Reports 1,181 1,126 1,152 1,151 1,250 1,349 1,449 1,548 1,645 1,738 1,826 22.1% 17.5% 16.0% 15.9% 15.8% 15.8% 15.7% 15.6% 15.6% 15.5% 18.8% 2010 2011 2012 2013 2014 2015 2016 2017 2018 2019 2020 CAPEX (R$ mm) % of Net Revenues Long Term CAPEX Assumption (Average 2009 CAPEX/Net Revenues of the Comparables) The DCF valuation was based on public information as released by equity research analysts |
 29 Source: Research Reports and Companies’ Reports Note: 1 Considers amortization of the leasing contract with Embratel over the next 5 years, following a straight-line method Working Capital Variation (R$ mm) Working Capital based on market estimates, converging to 0.5% of Net Revenues in 2020 Straight-line depreciation based on the estimated life of the companies’ assets – Average depreciation rate of 5.5% per year Amortization¹ based on public information Income tax rate of 34% Depreciation and Amortization (R$ mm) Operating and Financial Projections (cont’d) Assumptions 804 870 934 998 1,064 860 937 1,021 1,109 1,203 1,302 2010 2011 2012 2013 2014 2015 2016 2017 2018 2019 2020 35.7 (57.4) (23.3) 1.5 7.0 13.4 20.8 29.0 38.1 48.1 58.8 2010 2011 2012 2013 2014 2015 2016 2017 2018 2019 2020 The DCF valuation was based on public information as released by equity research analysts |
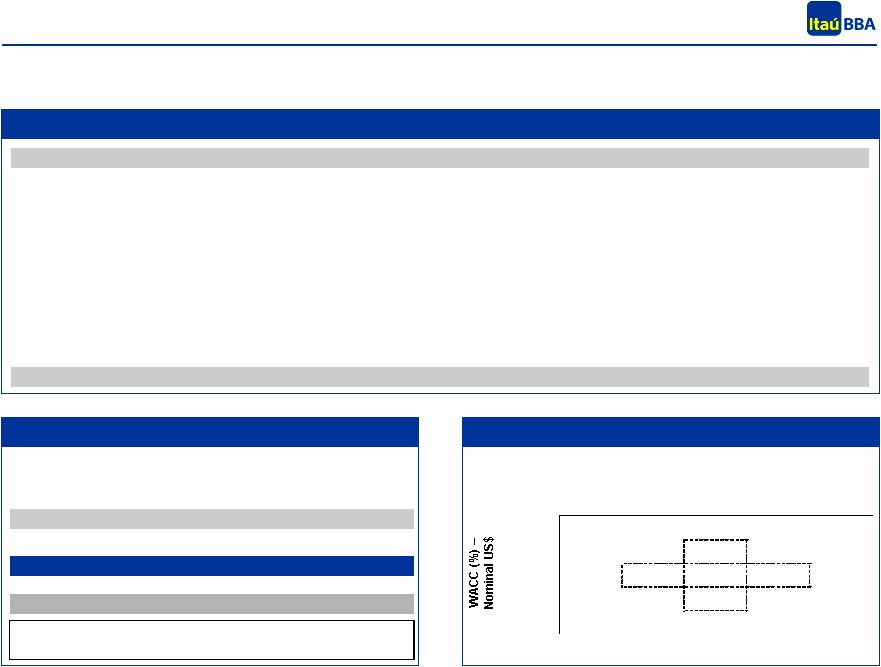
 Discount Rate – Weighted Average Cost of Capital Cost of Equity Market Risk Premium 7.1% ³ Risk Free Rate 4.2% ¹ Cost of Equity (US$, nominal) 11.1% Re-levered Regional Beta 0.664 4 Brazil Risk Premium 2.3% ² The discount rate was calculated based on the “Capital Asset Pricing Model” (CAPM), resulting in a 9.4% rate in nominal US$ Notes: 1 Based on the 3-month average of the 30-year US Treasury YTM - Source: Bloomberg 2 Based on the 3-month average of the Brazil EMBI - Source: Bloomberg 3 Based on the arithmetic average of the historical difference between the return of the S&P 500 and the Treasury bonds (1935 – 2009) - Source: Ibbotson Associates’ Stocks, Bonds, Bills and Inflation 2010 Yearbook 4 Based on the average of the peers universe. Source: Bloomberg. The following companies were considered: Telemar Norte Leste, Vivo, Telesp, Tim e NET 5 NET’s long term marginal cost of debt in US$ estimated based on the Global Notes 2020 YTM 6 Based on the NET’s income tax rate 7 Estimated current capital structure of NET Effective Tax Rate 34.0% 6 Cost of Debt Cost of Debt Before Taxes 6.8% 5 Cost of Debt after Taxes (US$) 4.5% Nominal Discount Rate (US$) 9.4% 74% 7 26% 7 30 |
 31 DCF Valuation Results Discounted Cash Flow to Firm (R$ mm) Discounted Cash Flow Results (R$ mm) Price per Share (R$) Perpetuity Growth (%) – Nominal US$ R$ mm 2010 2011 2012 2013 2014 2015 2016 2017 2018 2019 2020 EBITDA 1,540 1,746 1,986 2,231 2,436 2,647 2,860 3,074 3,286 3,494 3,694 (-) Depreciation and Amortization (804) (870) (934) (998) (1,064) (860) (937) (1,021) (1,109) (1,203) (1,302) EBIT 736 876 1,053 1,233 1,372 1,787 1,923 2,053 2,177 2,290 2,392 Income Tax and Social Contribution (250) (298) (358) (419) (467) (608) (654) (698) (740) (779) (813) Income Tax and Social Contribution Rate 34.0% 34.0% 34.0% 34.0% 34.0% 34.0% 34.0% 34.0% 34.0% 34.0% 34.0% NOPLAT 486 578 695 814 906 1,180 1,269 1,355 1,437 1,512 1,578 (+) Depreciation and Amortization 804 870 934 998 1,064 860 937 1,021 1,109 1,203 1,302 (-) Working Capital Variation (36) 57 23 (1) (7) (13) (21) (29) (38) (48) (59) (-) Capex (1,181) (1,126) (1,152) (1,151) (1,250) (1,349) (1,449) (1,548) (1,645) (1,738) (1,826) Free Cash Flow 73 379 500 659 713 676 737 799 863 929 996 Present Value of Free Cash Flows (US$ mm) 2,141.7 Present Value of Terminal Value (US$ mm) 3,057.4 Firm Value (US$ mm) 5,199.1 Firm Value (R$ mm) 9,186.3 Net Debt (R$ mm) 1,203.8 Equity Value (R$ mm) 7,982.5 Number of Shares (mm) 343.0 Price per Share (R$) 23.27 Implied EV/EBITDA 2010E 6.0x Implied EV/EBITDA 2011E 5.3x 23.3 2.5% 3.0% 3.5% 4.0% 4.5% 10.4% 17.60 18.37 19.25 20.27 21.46 9.9% 19.12 20.04 21.10 22.35 23.83 9.4% 20.86 21.97 23.27 24.82 26.67 8.9% 22.88 24.24 25.85 27.79 30.17 8.4% 25.25 26.94 28.96 31.45 34.57 |
 32 SECTION 4D Comparable Companies Trading Multiples |
 33 Companies Price per Share Market Cap EV EV / EBITDA P / E (R$) (R$ mm) (R$ mm) 2010E 2011E 2010E 2011E Telemar Norte Leste 45.90 10,942 37,711 3.6x 3.5x 7.5x 7.0x Vivo Participações 46.35 18,521 21,876 3.9x 3.7x 13.5x 9.7x TELESP 37.66 19,050 19,929 3.5x 3.6x 9.1x 8.5x TIM Participações 5.03 12,453 14,973 4.1x 3.6x 27.1x 12.8x Net Serviços 19.50 6,688 7,892 5.1x 4.5x 19.4x 14.3x Minimum 3.5x 3.5x 7.5x 7.0x Maximum 5.1x 4.5x 27.1x 14.3x Source: Earnings Releases, Capital IQ and Bloomberg as of August 3rd, 2010 Notes: 1 Based on NET’s consensus EBITDA projection for 2010 of R$1.5 billion 2 Based on net debt as of June 30th, 2010 Comparable Companies Trading Multiples Trading Multiples Trading Multiples Valuation 1,2 1 EV/EBITDA 2010E Firm Value (R$ mm) Equity Value (R$ mm) Value per Share (R$) Minimum 3.5x 5,366 4,162 12.13 Maximum 5.1x 7,892 6,688 19.50 |
 34 SECTION 4E Precedent Transactions Multiples |
 35 Source: Companies’ Reports 1 Based on NET’s LTM EBITDA as of June, 2010, of R$1.4 billion 2 Based on NET’s net debt as of June 30th, 2010 Precedent Transactions Multiples Precedent Transactions Multiples Precedent Transactions Multiples Valuation 1,2 Date Acquirer Target EV / LTM EBITDA 2006 Telefónica TVA 9.3x 2006 Net Serviços Vivax 11.5x 2007 Net Serviços Big TV 8.4x Minimum 8.4x Maximum 11.5x EV/EBITDA LTM Firm Value (R$ mm) Equity Value (R$ mm) Value per Share (R$) Minimum 8.4x 11,878 10,674 31.12 Maximum 11.5x 16,261 15,057 43.90 |
 36 APPENDIX A Glossary of Terms and Definitions |
 37 Glossary of Terms and Definitions EBITDA Earnings Before Interest , Taxes, Depreciation and Amortization Firm Value or Enterprise Value Enterprise Value / Firm Value, or sum of Equity Value, Net Debt and Minority Interest Capex Capital Expenditures, or Investments for maintenance and/or capacity expansion CAGR Compounded Average Growth Rate EBIT Earnings Before Interest and Taxes WACC Weighted Average Cost of Capital ADSL Asymmetric Digital Subscriber Line ARPU Average Revenue per User |
 38 MMDS Multichannel Multipoint Distribution Service VoIP Voice over Internet Protocol DTH Direct to Home Broadband Refers to downstream speed transmission capacity greater than that of ISDN of 1.5 or 2 Megabits per second ISDN Integrated Services Digital Network WLL Wireless Local Loop Cable TV Cable TV Service is the telecommunications service that consists in the distribution, to subscribers, through physical means of transportation Market Consensus Includes projections from the research departments of the following institutions: Itaú Securities, Morgan Stanley, Credit Suisse, JP Morgan, Santander, BofA Merrill Lynch, Deutsche Bank and Goldman Sachs Glossary of Terms and Definitions (cont’d) |
 39 APPENDIX B Average Target Price |
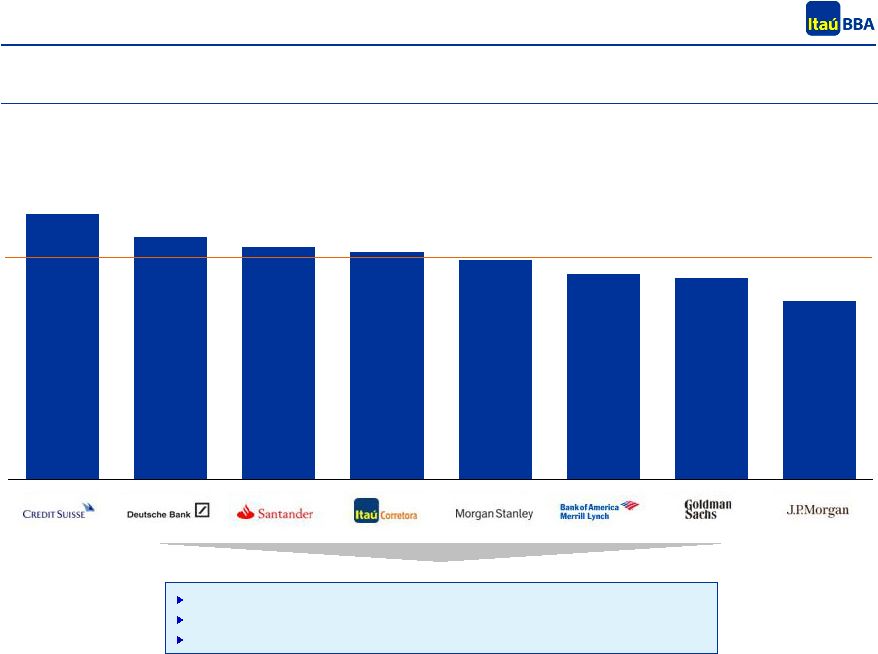 40 29.78 27.15 26.00 25.50 24.53 23.00 22.50 20.00 Research Analysts’ Target Price for NET Source: Bloomberg Target Price for NET (R$/share) Minimum target price: R$20.00 Maximum target price: R$29.78 Average target price: R$24.81 Average: R$24.81 |