UNITED STATES
SECURITIES AND EXCHANGE COMMISSION
Washington, D.C. 20549
FORMN-CSR
CERTIFIED SHAREHOLDER REPORT OF REGISTERED MANAGEMENT INVESTMENT COMPANIES
Investment Company Act file number:811-07899 and811-07885
Name of Fund: BlackRock Index Funds, Inc.
iShares MSCI EAFE International Index Fund
iShares Russell 2000Small-Cap Index Fund
Quantitative Master Series LLC
Master Small Cap Index Series
Fund Address: 100 Bellevue Parkway, Wilmington, DE 19809
Name and address of agent for service: John M. Perlowski, Chief Executive Officer, BlackRock Index Funds, Inc.
and Quantitative Master Series LLC, 55 East 52nd Street, New York, NY 10055
Registrants’ telephone number, including area code: (800)441-7762
Date of fiscal year end: 12/31/2019
Date of reporting period: 12/31/2019
Item 1 – Report to Stockholders
| | |
 | | DECEMBER 31, 2019 |
BlackRock Index Funds, Inc.
| · | | iShares MSCI EAFE International Index Fund |
| · | | iShares Russell 2000 Small-Cap Index Fund |
Beginning on January 1, 2021, as permitted by regulations adopted by the Securities and Exchange Commission, paper copies of each Fund’s shareholder reports will no longer be sent by mail, unless you specifically request paper copies of the reports from BlackRock or from your financial intermediary, such as a broker-dealer or bank. Instead, the reports will be made available on a website, and you will be notified by mail each time a report is posted and provided with a website link to access the report.
You may elect to receive all future reports in paper free of charge. If you hold accounts directly with BlackRock, you can call(800) 441-7762 to inform BlackRock that you wish to continue receiving paper copies of your shareholder reports. If you hold accounts through a financial intermediary, you can follow the instructions included with this disclosure, if applicable, or contact your financial intermediary to request that you continue to receive paper copies of your shareholder reports. Please note that not all financial intermediaries may offer this service. Your election to receive reports in paper will apply to all funds advised by BlackRock Advisors, LLC, BlackRock Fund Advisors or their affiliates, or all funds held with your financial intermediary, as applicable.
If you already elected to receive shareholder reports electronically, you will not be affected by this change and you need not take any action. You may elect to receive electronic delivery of shareholder reports and other communications by: (i) accessing the BlackRock website at blackrock.com/edelivery and logging into your accounts, if you hold accounts directly with BlackRock, or (ii) contacting your financial intermediary, if you hold accounts through a financial intermediary. Please note that not all financial intermediaries may offer this service.
|
| Not FDIC Insured • May Lose Value • No Bank Guarantee |
The Markets in Review
Dear Shareholder,
U.S. equities and bonds finished the last year of the decade with impressive returns, putting an exclamation point on a decade of strong performance despite the fears and doubts about the economy that were ultimately laid to rest with unprecedented monetary stimulus and a sluggish yet resolute performance from the U.S. economy. In many ways, it was fitting that the themes of 2019 — geopolitical uncertainty, fears of recession, and decisive monetary stimulus — put the capstone on a decade that was defined by grappling with these competing forces.
Equity and bond markets posted solid returns, particularly in the second half of the year, as investors began to realize that the U.S. economy was maintaining the modest yet steady growth that has characterized this economic cycle. U.S. large cap equities advanced the most, while equities at the high end of the risk spectrum — emerging markets and U.S. small cap — lagged while still posting solid returns.
Fixed-income securities played an important role in diversified portfolios by delivering strong returns amid economic uncertainty, as interest rates declined (and bond prices rose). Long-term bonds, particularly long-term Treasuries, generally posted the strongest returns, as inflation remained low. Investment-grade and high-yield corporate bonds also posted solid returns, as the credit fundamentals in corporate markets remained relatively solid.
As equity performance faltered in late 2018 and global economic growth slowed, the U.S. Federal Reserve (the “Fed”) shifted away from policies designed to decrease inflation in favor of renewed efforts to stimulate economic activity. The Fed left interest rates unchanged in January 2019, then reduced interest rates three times thereafter, starting in July 2019. Similarly, the Fed took measures to support liquidity in short-term lending markets. Following in the Fed’s footsteps, the European Central Bank announced aggressive economic stimulus measures, including lower interest rates and the return of its bond purchasing program. The Bank of Japan signaled a continuation of accommodative monetary policy, while China committed to looser credit conditions and an increase in fiscal spending.
The outpouring of global economic stimulus led to a sharp rally in risk assets throughout the world despite the headwind of rising geopolitical and trade tensions. Hopes continued to remain high as the current economic expansion became the longest in U.S. history.
Looking ahead, we believe U.S. economic growth will stabilize and gradually improve in 2020. The primary drivers of recent market performance — trade and monetary policies — could take a back seat to a nascent expansion in manufacturing and a recent uptick in global growth. The headwinds of policy uncertainty in 2019 could become tailwinds in 2020 due topro-cyclical policy shifts.
Overall, we favor increasing investment risk to benefit from the brighter outlook. In addition to having a positive view for equities overall, we favor emerging market equities over developed market equities. Increasing cyclical exposure through value-style investing and maintaining a meaningful emphasis on high-quality companies through quality factors also makes sense for diversified investors. In fixed income, government bonds continue to be important portfolio stabilizers, while emerging market bonds, particularly local currency bonds, offer relatively attractive income opportunities.
In this environment, investors need to think globally, extend their scope across a broad array of asset classes, and be nimble as market conditions change. We encourage you to talk with your financial advisor and visitblackrock.com for further insight about investing in today’s markets.
Sincerely,

Rob Kapito
President, BlackRock Advisors, LLC

Rob Kapito
President, BlackRock Advisors, LLC
| | | | |
| Total Returns as of December 31, 2019 |
| | | 6-month | | 12-month |
U.S. large cap equities
(S&P 500® Index) | | 10.92% | | 31.49% |
U.S. small cap equities
(Russell 2000® Index) | | 7.30 | | 25.52 |
International equities
(MSCI Europe, Australasia, Far East Index) | | 7.01 | | 22.01 |
Emerging market equities
(MSCI Emerging Markets Index) | | 7.09 | | 18.42 |
3-month Treasury bills
(ICE BofAML3-Month U.S. Treasury Bill Index) | | 1.03 | | 2.28 |
U.S. Treasury securities
(ICE BofAML10-Year U.S. Treasury Index) | | 1.36 | | 8.91 |
U.S. investment grade bonds
(Bloomberg Barclays U.S. Aggregate Bond Index) | | 2.45 | | 8.72 |
Tax-exempt municipal bonds
(S&P Municipal Bond Index) | | 2.21 | | 7.26 |
U.S. high yield bonds
(Bloomberg Barclays U.S. Corporate High Yield 2% Issuer Capped Index) | | 3.98 | | 14.32 |
| Past performance is no guarantee of future results. Index performance is shown for illustrative purposes only. You cannot invest directly in an index. |
| | |
| 2 | | THIS PAGEISNOT PARTOF YOUR FUND REPORT |
Table of Contents

| | |
| Fund Summary as of December 31, 2019 | | iShares MSCI EAFE International Index Fund |
Investment Objective
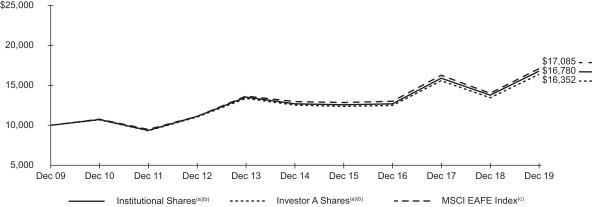
iShares MSCI EAFE International Index Fund’s (the “Fund”) investment objective is to match the performance of the MSCI EAFE Index (Europe, Australia, Far East) (the “MSCI EAFE Index”) in U.S. dollars with net dividends as closely as possible before the deduction of Fund expenses.
Portfolio Management Commentary
How did the Fund perform?
For the 12-month period ended December 31, 2019, the Fund’s Institutional Shares returned 21.80%, Investor A Shares returned 21.53%, Class K Shares returned 21.94%, and Investor P Shares returned 21.51%. The benchmark MSCI EAFE Index returned 22.01% for the same period.
Returns for the Fund’s respective share classes differ from the benchmark index based on individual share-class expenses.
Describe the market environment.
In the first quarter of 2019, eurozone equity markets all advanced but to varying degrees as the recovery in equity market sentiment from 2018 lows occurred despite slowing economic activity across the region. Partially contributing to the bullish sentiment was the European Central Bank’s (“ECB”) reaffirmation of accommodative monetary policy and announcement of a new round of targeted longer-term refinancing operations. Within the eurozone, Germany underperformed amid continued weakness in the manufacturing and export sectors. Elsewhere in the eurozone, Italy outperformed major European countries despite two consecutive quarters of real gross domestic product contraction and political uncertainty as first quarter macro trends were relatively constructive. The U.K. equity component rallied and contributed the most to MSCI EAFE Index’s total return despite ongoing Brexit uncertainty.
In Asia-Pacific, Japan underperformed as uncertainty around U.S. trade protectionism, an upcomingsales-tax hike, and low levels of growth weighed on sentiment. Still, continued monetary support by the Bank of Japan and a globalrisk-on appetite benefited the country’s equity market. The yen fell 3.7% from intra-quarter highs, a tailwind for export names. Elsewhere, Hong Kong rallied amid a rebound in mainland Chinese sentiment.
In the second quarter of 2019, European equity markets contributed to just over three-quarters of the MSCI EAFE Index’s total return. Sentiment in the region was also supported by accommodative monetary policy, the increased expectations of further stimulus, higher than normal capacity utilization rates, and labor markets near full employment. Within the eurozone, Germany and France outperformed while Finland and Luxembourg underperformed.
Australia outperformed in the Asia-Pacific region as a decline in economic growth was driven by a June rate cut. Japan underperformed the benchmark but registered in positive territory as investors balancedrisk-on bids for the yen, trade tensions, and declining export volumes. In the third quarter of 2019 within the eurozone, Germany underperformed and contributed the most to the MSCI EAFE Index’s decline. Belgium was the best-performing country in the eurozone due to an outsized gain in materials giant Umicore. Eurozone economic activity showed signs of synchronized deceleration. This prompted an aggressive response from the ECB, which announced a stimulus package that included a rate cut, resumption of quantitative easing, and atwo-tier excess liquidity system for banks. Simultaneously, the ECB cut both its growth and inflation forecasts, and lowered its forward guidance. In the United Kingdom, continued Brexit uncertainty drove volatility throughout the quarter ahead of the October 31 deadline. Parliament passed legislation that forced the government to ask for an extension if it could not reach a deal with the European Union (“EU”), which buoyed the sterling. Separately, the Bank of England remained on hold despite economic weakness.
By the fourth quarter of 2019, the United Kingdom outperformed and contributed the most to the MSCI EAFE Index’s overall total return amid a dense quarter of Brexit developments. Prime Minister Boris Johnson was able to agree to a new Brexit deal with the EU in October, but the October 31 deadline was pushed back to January 31, 2020 due to a stalemate in Parliament. On continental Europe, both France and Germany outperformed the MSCI EAFE Index benchmark. Economic activity in Europe was better than in recent quarters, with the perceived easing in trade tensions — both between the United States and China, and the United States and EU — contributing to positive sentiment. Monetary policy remained accommodative, and the ECB resumed balance sheet expansion. Despite the easy monetary policy, the incremental increase in economic activity helped foster positive expectations.
In Asia-Pacific, Japan, Hong Kong and Australia recorded positive gains but underperformed the MSCI EAFE Index benchmark. Ongoing tensions in Hong Kong and unimpressive growth out of China weighed on the region.
All sectors returned positive results in the MSCI EAFE Index (in USD) in 2019. Top contributors were information technology (+37.93%), health care (+31.32%), and industrials (+27.02%). Bottom contributors for the year were energy +(8.13%), communication services (+13.03%), and real estate (+15.38%).
Describe recent portfolio activity.
During the12-month period, as changes were made to the composition of the MSCI EAFE Index, the Fund purchased and sold securities to maintain its objective of replicating the risks and return of the benchmark index.
Describe portfolio positioning at period end.
The Fund remains positioned to match the risk characteristics of its benchmark index, irrespective of the market’s future direction.
The views expressed reflect the opinions of BlackRock as of the date of this report and are subject to change based on changes in market, economic or other conditions. These views are not intended to be a forecast of future events and are no guarantee of future results.
| | |
| 4 | | 2019 BLACKROCK ANNUAL REPORTTO SHAREHOLDERS |
| | |
| Fund Summary as of December 31, 2019 (continued) | | iShares MSCI EAFE International Index Fund |
TOTAL RETURN BASED ON A $10,000 INVESTMENT
| (a) | Assuming transaction costs and other operating expenses, including administration fees, if any. |
| (b) | Prior to August 1, 2016, the Fund invested all of its assets in Master International Index Series, a series of Quantitative Master Series LLC. Master International Index Series invested in a statistically selected sample of equity securities included in the MSCI EAFE Index and in derivative instruments linked to the MSCI EAFE Index. On August 1, 2016, the Fund ceased to invest in the Master International Index Series as part of a “master/feeder” structure and instead began to operate as a stand-alone fund. |
| (c) | An index designed to represent the performance of large- and mid-cap securities across 21 developed markets in Europe, Australasia and the Far East, excluding the U.S. and Canada. As of March 29, 2019, it had 920 constituents and covered approximately 85% of the free float-adjusted market capitalization in each country. |
Performance Summary for the Period Ended December 31, 2019
| | | | | | | | | | | | | | | | | | | | | | | | | | | | | | | | | | | | | | | | |
| | | | | | | | | Average Annual Total Returns (a) | |
| | | | | | | | | 1 Year | | | | | | 5 Years | | | | | | 10 Years | |
| | | 6-Month Total Returns | | | | | | w/o sales charge | | | w/sales charge | | | | | | w/o sales charge | | | w/sales charge | | | | | | w/o sales charge | | | w/sales charge | |
Institutional | | | 6.81 | % | | | | | | | 21.80 | % | | | N/A | | | | | | | | 5.75 | % | | | N/A | | | | | | | | 5.31 | % | | | N/A | |
Investor A | | | 6.66 | | | | | | | | 21.53 | | | | N/A | | | | | | | | 5.49 | | | | N/A | | | | | | | | 5.04 | | | | N/A | |
Class K | | | 6.78 | | | | | | | | 21.94 | | | | N/A | | | | | | | | 5.80 | | | | N/A | | | | | | | | 5.35 | | | | N/A | |
Investor P | | | 6.68 | | | | | | | | 21.51 | | | | 15.13 | % | | | | | | | 5.49 | | | | 4.36 | % | | | | | | | 5.05 | | | | 4.49 | % |
MSCI EAFE Index | | | 7.01 | | | | | | | | 22.01 | | | | N/A | | | | | | | | 5.67 | | | | N/A | | | | | | | | 5.50 | | | | N/A | |
| | (a) | Assuming maximum sales charges, if any. Average annual total returns with and without sales charges reflect reductions for distribution and service fees. See “About Fund Performance” on page 9 for a detailed description of share classes, including any related fees, and how performance was calculated for certain share classes. | |
N/A — Not applicable as share class and index do not have a sales charge.
Past performance is not indicative of future results.
Performance results may include adjustments made for financial reporting purposes in accordance with U.S. generally accepted accounting principles.
Expense Example
| | | | | | | | | | | | | | | | | | | | | | | | | | | | | | | | |
| | | Actual | | | | | | Hypothetical (b) | | | | |
| | | Beginning
Account Value
(07/01/19) | | | Ending
Account Value
(12/31/19) | | | Expenses
Paid During
the Period (a) | | | | | | Beginning
Account Value
(07/01/19) | | | Ending
Account Value
(12/31/19) | | | Expenses
Paid During
the Period (a) | | | Annualized
Expense
Ratio | |
Institutional | | $ | 1,000.00 | | | $ | 1,068.10 | | | $ | 0.47 | | | | | | | $ | 1,000.00 | | | $ | 1,024.75 | | | $ | 0.46 | | | | 0.09 | % |
Investor A | | | 1,000.00 | | | | 1,066.60 | | | | 1.88 | | | | | | | | 1,000.00 | | | | 1,023.39 | | | | 1.84 | | | | 0.36 | |
Class K | | | 1,000.00 | | | | 1,067.80 | | | | 0.16 | | | | | | | | 1,000.00 | | | | 1,025.05 | | | | 0.15 | | | | 0.03 | |
Investor P | | | 1,000.00 | | | | 1,066.80 | | | | 1.93 | | | | | | | | 1,000.00 | | | | 1,023.34 | | | | 1.89 | | | | 0.37 | |
| | (a) | For each class of the Fund, expenses are equal to the annualized expense ratio for the class, multiplied by the average account value over the period, multiplied by 184/365 (to reflect theone-half year period shown). | |
| | (b) | Hypothetical 5% annual return before expenses is calculated by prorating the number of days in the most recent fiscal half year divided by 365. | |
See “Disclosure of Expenses” on page 9 for further information on how expenses were calculated.
| | |
| Fund Summary as of December 31, 2019 (continued) | | iShares MSCI EAFE International Index Fund |
Portfolio Information
TEN LARGEST HOLDINGS
| | | | |
| Security | | Percent of
Net Assets | |
Nestle SA, Registered Shares | | | 2 | % |
Roche Holding AG | | | 2 | |
Novartis AG, Registered Shares | | | 1 | |
Toyota Motor Corp. | | | 1 | |
HSBC Holdings PLC | | | 1 | |
TOTAL SA | | | 1 | |
SAP SE | | | 1 | |
AstraZeneca PLC | | | 1 | |
LVMH Moet Hennessy Louis Vuitton SE | | | 1 | |
BP PLC | | | 1 | |
GEOGRAPHIC ALLOCATION
| | | | |
| Country | | Percent of
Net Assets | |
Japan | | | 24 | % |
United Kingdom | | | 14 | |
France | | | 11 | |
Switzerland | | | 10 | |
Germany | | | 9 | |
Australia | | | 7 | |
Netherlands | | | 5 | |
Hong Kong | | | 3 | |
Spain | | | 3 | |
Sweden | | | 2 | |
Italy | | | 2 | |
Denmark | | | 2 | |
Singapore | | | 1 | |
Finland | | | 1 | |
United States | | | 1 | |
Other(a) | | | 5 | |
| | (a) | Includes holdings within countries that are less than 1% of net assets. Please refer to the Schedule of Investments for such countries. | |
| | |
| 6 | | 2019 BLACKROCK ANNUAL REPORTTO SHAREHOLDERS |
| | |
| Fund Summary as of December 31, 2019 | | iSharesRusell 2000 Small-Cap Index Fund |
Investment Objective
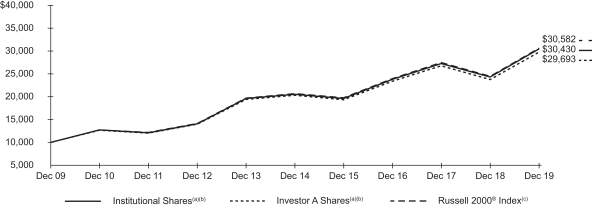
iShares Russell 2000 Small-Cap Index Fund’s (the “Fund”) investment objective is to match the performance of the Russell 2000® Index as closely as possible before the deduction of Fund expenses.
Portfolio Management Commentary
How did the Fund perform?
For the 12-month period ended December 31, 2019, the Fund’s Institutional Shares returned 25.50%, Investor A Shares returned 25.20%, Class K Shares returned 25.62%, and Investor P Shares returned 25.25%. The benchmark Russell 2000® Index returned 25.52% for the same period.
Returns for the Fund’s respective share classes differ from the benchmark index based on individual share-class expenses. The Fund invests all of its assets in Master Small Cap Index Series (the “Series”), a series of Quantitative Master Series LLC.
Describe the market environment.
All eleven of the Global Industry Classification Standard sectors advanced in the first quarter of 2019 as positive headlines regarding Sino-American trade negotiations, relatively strong corporate earnings growth, and the Fed’s dovish pivot helped investor sentiment recover from steep losses in the fourth quarter of 2018. The technology sector outperformed with real estate the second best-performing sector as a decline in interest rates throughout the quarter drove demand for bond proxies. Health care shares underperformed as political risks weighed on sentiment, but still posted a respectable gain.
In its January 2019 announcement, the Fed indicated that it would refrain from interest rate hikes for the foreseeable future, with a dovish assessment of U.S. economic conditions and transparency around balance sheet normalization. This reduced market-based expectations of interest rate hikes, serving as a boon for both equities and bonds. Less optimism was evident in the U.S. rates market. The pause in interest rate hiking by the Fed coupled with lowered forecasts for growth drove investors into longer-duration government bonds.
The prospect of an easier monetary policy buoyed equities broadly in the second quarter of 2019. At the June Federal Open Market Committee announcement, Fed Chair Jerome Powell noted that should trade tensions weigh on the committee’s economic outlook or should the shortfall of inflation from the target rate persist longer than expected, the Fed would provide more accommodation to sustain the expansion.
Trade tensions were a source of intra-quarter volatility. In May, President Trump threatened an increase in tariffs and protectionism against both China and Mexico. However, these announcements did not materialize, and sentiment eased by June month end.
Looking to interest rates, the10-year U.S. Treasury yield declined 0.50% in the second quarter to 2% — the lowest level since 2016. The yield curve remained a source of uncertainty as thethree-month/10-year Treasury spread remained in negative territory while thefive-year/30-year Treasury spread expanded throughout the quarter.
In the third quarter of 2019, trade tensions were a key focus for both domestic and global investors. Markets suffered in early August on the back of President Trump’s promise to impose 10% tariffs on all Chinese imports that were not already subject to 25% tariffs. U.S.-China tensions did ostensibly ease ahead of a new round of trade talks in October. In monetary policy, the Fed lowered the target range for the federal funds rates at both its July and September meetings.
On the macroeconomic front, survey-based U.S. economic indicators continued to soften in the manufacturing and consumer sectors, while hard economic data releases exhibited resilience. In interest rates, the frequently monitoredtwo-year/ten-year Treasury yield spread inverted for the first time since the global financial crisis in August but ended the quarter in positive territory.
In the fourth quarter of 2019, risk appetite was boosted broadly by expectations of a U.S.-China trade deal, strong economic growth, and easy monetary policy. U.S. tariffs on China were originally scheduled to increase on December 15 but were avoided due to persistent negotiations between the United States and China. Additionally, news that the United States did not impose tariffs on European Union auto exports helped support sentiment. On the macroeconomic front, the U.S. services and employment sectors remained buoyant.
In November, 266,000 jobs were added to the economy, revising the third quarter unemployment rate down to 3.5% from 3.7%. Overall, the supportive macroeconomic data and boosted risk appetite drove selling of Treasuries in the quarter. Despite the strength in the U.S. economy, the Fed cut the benchmark federal funds rate to 1.75% in October, marking the third rate cut of the year.
Describe recent portfolio activity.
During the12-month period, as changes were made to the composition of the Russell 2000® Index, the Series purchased and sold securities to maintain its objective of replicating the risks and return of the benchmark index.
Describe portfolio positioning at period end.
The Series remains positioned to match the risk characteristics of its benchmark index, irrespective of the market’s future direction.
The views expressed reflect the opinions of BlackRock as of the date of this report and are subject to change based on changes in market, economic or other conditions. These views are not intended to be a forecast of future events and are no guarantee of future results.
| | |
| Fund Summary as of December 31, 2019 (continued) | | iShares Russell 2000 Small-Cap Index Fund |
TOTAL RETURN BASED ON A $10,000 INVESTMENT
| (a) | Assuming transaction costs and other operating expenses, including administration fees, if any. |
| (b) | The Fund invests all of its assets in the Series. The Series may invest in a statistically selected sample of the stocks included in the Russell 2000® Index and in derivative instruments linked to the Russell 2000® Index. |
| (c) | An unmanaged index that is a subset of the Russell 3000® Index representing approximately 10% of the total market capitalization of that index. It includes approximately 2000 of the smallest securities based on a combination of their market cap and current index membership. |
Performance Summary for the Period Ended December 31, 2019
| | | | | | | | | | | | | | | | | | | | | | | | | | | | | | | | | | | | | | | | |
| | | | | | | | | Average Annual Total Returns (a) | |
| | | | | | | | | 1 Year | | | | | | 5 Years | | | | | | 10 Years | |
| | | 6-Month Total Returns | | | | | | w/o sales charge | | | w/sales charge | | | | | | w/o sales charge | | | w/sales charge | | | | | | w/o sales charge | | | w/sales charge | |
Institutional | | | 7.31 | % | | | | | | | 25.50 | % | | | N/A | | | | | | | | 8.22 | % | | | N/A | | | | | | | | 11.77 | % | | | N/A | |
Investor A | | | 7.18 | | | | | | | | 25.20 | | | | N/A | | | | | | | | 7.97 | | | | N/A | | | | | | | | 11.50 | | | | N/A | |
Class K | | | 7.39 | | | | | | | | 25.62 | | | | N/A | | | | | | | | 8.29 | | | | N/A | | | | | | | | 11.84 | | | | N/A | |
Investor P | | | 7.23 | | | | | | | | 25.25 | | | | 18.68 | % | | | | | | | 7.96 | | | | 6.80 | % | | | | | | | 11.50 | | | | 10.90 | % |
Russell 2000® Index | | | 7.30 | | | | | | | | 25.52 | | | | N/A | | | | | | | | 8.23 | | | | N/A | | | | | | | | 11.83 | | | | N/A | |
| | (a) | Assuming maximum sales charges, if any. Average annual total returns with and without sales charges reflect reductions for distribution and service fees. See “About Fund Performance” on page 9 for a detailed description of share classes, including related fees, if any, and how performance was calculated for certain share classes. | |
N/A — Not applicable as share class and index do not have a sales charge.
Past performance is not indicative of future results.
Performance results may include adjustments made for financial reporting purposes in accordance with U.S. generally accepted accounting principles.
Expense Example
| | | | | | | | | | | | | | | | | | | | | | | | | | | | | | | | |
| | | Actual | | | | | | Hypothetical (b) | | | | |
| | | Beginning
Account Value
(07/01/19) | | | Ending
Account Value
(12/31/19) | | | Expenses
Paid During
the Period (a) | | | | | | Beginning
Account Value
(07/01/19) | | | Ending
Account Value
(12/31/19) | | | Expenses
Paid During
the Period (a) | | | Annualized
Expense
Ratio | |
Institutional | | $ | 1,000.00 | | | $ | 1,073.10 | | | $ | 0.63 | | | | | | | $ | 1,000.00 | | | $ | 1,024.60 | | | $ | 0.61 | | | | 0.12 | % |
Investor A | | | 1,000.00 | | | | 1,071.80 | | | | 1.93 | | | | | | | | 1,000.00 | | | | 1,023.34 | | | | 1.89 | | | | 0.37 | |
Class K | | | 1,000.00 | | | | 1,073.90 | | | | 0.37 | | | | | | | | 1,000.00 | | | | 1,024.85 | | | | 0.36 | | | | 0.07 | |
Investor P | | | 1,000.00 | | | | 1,072.30 | | | | 1.93 | | | | | | | | 1,000.00 | | | | 1,023.34 | | | | 1.89 | | | | 0.37 | |
| | (a) | For each class of the Fund, expenses are equal to the annualized net expense ratio for the class, multiplied by the average account value over the period, multiplied by 184/365 (to reflect theone-half year period shown). Because the Fund invests all of its assets in the Series, the expense example reflects the net expenses of both the Fund and the Series. | |
| | (b) | Hypothetical 5% annual return before expenses is calculated by prorating the number of days in the most recent fiscal half year divided by 365. | |
See “Disclosure of Expenses” on page 9 for further information on how expenses were calculated.
| | |
| 8 | | 2019 BLACKROCK ANNUAL REPORTTO SHAREHOLDERS |
About Fund Performance
Institutional and Class K Shares are not subject to any sales charge. These shares bear no ongoing distribution or service fees and are available only to certain eligible investors. Class K Shares performance shown prior to the Class K Shares inception date of March 31, 2011 is that of Institutional Shares. The performance of the Funds’ Class K Shares would be substantially similar to Institutional Shares because Class K Shares and Institutional Shares invest in the same portfolio of securities and performance would only differ to the extent that Class K Shares and Institutional Shares have different expenses. The actual returns of Class K Shares would have been higher than those of the Institutional Shares because Class K Shares have lower expenses than the Institutional Shares.
Investor A Shares are not subject to any sales charge and bear no ongoing distribution fee. These shares are subject to an ongoing service fee of 0.25% per year. These shares are generally available through financial intermediaries.
Investor P Shares are subject to a maximum initial sales charge (front-end load) of 5.25% and a service fee of 0.25% per year (but no distribution fee). These shares are only available to investors purchasing shares through registered representatives of an insurance company’s broker-dealer that has entered into an agreement with each Fund’s distributor to offer such shares.
Investor P Share performance shown prior to the Investor P Shares inception date of August 6, 2018 is that of Institutional Shares (which have no distribution or service fees) and was restated to reflect Investor P Shares fees.
Performance information reflects past performance and does not guarantee future results. Current performance may be lower or higher than the performance data quoted. Refer toblackrock.com to obtain performance data current to the most recent month-end. Performance results do not reflect the deduction of taxes that a shareholder would pay on fund distributions or the redemption of fund shares. Figures shown in the performance tables on the previous pages assume reinvestment of all distributions, if any, at net asset value (“NAV”) on the ex-dividend date. Investment return and principal value of shares will fluctuate so that shares, when redeemed, may be worth more or less than their original cost. Distributions paid to each class of shares will vary because of the different levels of service, distribution and transfer agency fees applicable to each class, which are deducted from the income available to be paid to shareholders.
BlackRock Advisors, LLC (“BAL” or the “Manager” and/or “Administrator”), each Fund’s investment adviser and/or administrator, has contractually agreed to waive and/or reimburse a portion of each Fund’s expenses. Without such waiver and/or reimbursement, each Fund’s performance would have been lower. With respect to each Fund’s contractual waiver, the Administrator is under no obligation to continue waiving and/or reimbursing its fees after the applicable termination date of such agreement. See Note 6 of the Notes to Financial Statements for additional information on waivers and/or reimbursements.
Disclosure of Expenses
Shareholders of these Funds may incur the following charges: (a) transactional expenses, such as sales charge and (b) operating expenses, including investment advisory fees, administration fees, service fees, including 12b-1 fees, acquired fund fees and expenses and other fund expenses. The expense examples on the previous pages (which are based on a hypothetical investment of $1,000 invested on July 1, 2019 and held through December 31, 2019) are intended to assist shareholders both in calculating expenses based on an investment in each Fund and in comparing these expenses with similar costs of investing in other mutual funds.
The expense examples provide information about actual account values and actual expenses. In order to estimate the expenses a shareholder paid during the period covered by this report, shareholders can divide their account value by $1,000 and then multiply the result by the number corresponding to their Fund and share class under the heading entitled “Expenses Paid During the Period.”
The expense examples also provide information about hypothetical account values and hypothetical expenses based on a Fund’s actual expense ratio and an assumed rate of return of 5% per year before expenses. In order to assist shareholders in comparing the ongoing expenses of investing in these Funds and other funds, compare the 5% hypothetical examples with the 5% hypothetical examples that appear in shareholder reports of other funds.
The expenses shown in the expense examples are intended to highlight shareholders’ ongoing costs only and do not reflect transactional expenses, such as sales charge, if any. Therefore, the hypothetical examples are useful in comparing ongoing expenses only, and will not help shareholders determine the relative total expenses of owning different funds. If these transactional expenses were included, shareholder expenses would have been higher.
Derivative Financial Instruments
International Index and the Series may invest in various derivative financial instruments. These instruments are used to obtain exposure to a security, commodity, index, market, and/or other assets without owning or taking physical custody of securities, commodities and/or other referenced assets or to manage market, equity, credit, interest rate, foreign currency exchange rate, commodity and/or other risks. Derivative financial instruments may give rise to a form of economic leverage and involve risks, including the imperfect correlation between the value of a derivative financial instrument and the underlying asset, possible default of the counterparty to the transaction or illiquidity of the instrument. International Index’s and the Series’ successful use of a derivative financial instrument depends on the investment adviser’s ability to predict pertinent market movements accurately, which cannot be assured. The use of these instruments may result in losses greater than if they had not been used, may limit the amount of appreciation International Index or the Series can realize on an investment and/or may result in lower distributions paid to shareholders. International Index’s and the Series’ investments in these instruments, if any, are discussed in detail in the Notes to Financial Statements.
| | | | |
| ABOUT FUND PERFORMANCE / DISCLOSUREOF EXPENSES / DERIVATIVE FINANCIAL INSTRUMENTS | | | 9 | |
| | |
Schedule of Investments December 31, 2019 | | iShares MSCI EAFE International Index Fund (Percentages shown are based on Net Assets) |
| | | | | | | | |
| Security | | Shares | | | Value | |
|
Common Stocks — 99.1% | |
|
| Australia — 7.5% | |
AGL Energy Ltd. | | | 378,475 | | | $ | 5,447,612 | |
Alumina Ltd. | | | 1,342,980 | | | | 2,169,189 | |
AMP Ltd. | | | 1,963,110 | | | | 2,640,770 | |
APA Group(a) | | | 662,693 | | | | 5,158,693 | |
Aristocrat Leisure Ltd. | | | 311,673 | | | | 7,364,568 | |
ASX Ltd. | | | 106,696 | | | | 5,874,697 | |
Aurizon Holdings Ltd. | | | 1,100,235 | | | | 4,037,779 | |
AusNet Services | | | 942,041 | | | | 1,123,370 | |
Australia & New Zealand Banking Group Ltd. | | | 1,556,723 | | | | 26,847,202 | |
Bendigo & Adelaide Bank Ltd. | | | 283,674 | | | | 1,946,527 | |
BGP Holdings PLC(b)(c) | | | 966,939 | | | | 11 | |
BHP Group Ltd. | | | 1,629,848 | | | | 44,628,987 | |
BHP Group PLC | | | 1,168,544 | | | | 27,383,555 | |
BlueScope Steel Ltd. | | | 272,690 | | | | 2,888,222 | |
Boral Ltd. | | | 648,649 | | | | 2,040,702 | |
Brambles Ltd. | | | 856,099 | | | | 7,046,296 | |
Caltex Australia Ltd. | | | 143,810 | | | | 3,429,053 | |
Challenger Ltd. | | | 324,301 | | | | 1,845,443 | |
CIMIC Group Ltd. | | | 57,364 | | | | 1,333,691 | |
Coca-Cola Amatil Ltd. | | | 283,247 | | | | 2,199,598 | |
Cochlear Ltd. | | | 31,542 | | | | 4,971,209 | |
Coles Group Ltd. | | | 627,351 | | | | 6,530,574 | |
Commonwealth Bank of Australia | | | 979,419 | | | | 54,943,251 | |
Computershare Ltd. | | | 264,950 | | | | 3,123,736 | |
Crown Resorts Ltd. | | | 197,126 | | | | 1,662,009 | |
CSL Ltd. | | | 250,773 | | | | 48,620,384 | |
Dexus | | | 596,746 | | | | 4,912,282 | |
Flight Centre Travel Group Ltd. | | | 29,652 | | | | 917,139 | |
Fortescue Metals Group Ltd. | | | 766,613 | | | | 5,778,999 | |
Goodman Group | | | 917,621 | | | | 8,623,053 | |
GPT Group | | | 1,037,703 | | | | 4,087,556 | |
Harvey Norman Holdings Ltd. | | | 284,027 | | | | 811,211 | |
Incitec Pivot Ltd. | | | 943,007 | | | | 2,106,757 | |
Insurance Australia Group Ltd. | | | 1,299,034 | | | | 6,979,858 | |
Lendlease Group(a) | | | 329,705 | | | | 4,076,315 | |
Macquarie Group Ltd. | | | 178,907 | | | | 17,326,121 | |
Magellan Financial Group Ltd. | | | 64,651 | | | | 2,590,235 | |
Medibank Pvt Ltd. | | | 1,507,516 | | | | 3,340,986 | |
Mirvac Group | | | 2,240,024 | | | | 5,013,840 | |
National Australia Bank Ltd. | | | 1,605,820 | | | | 27,787,267 | |
Newcrest Mining Ltd. | | | 422,447 | | | | 8,921,647 | |
Oil Search Ltd. | | | 756,554 | | | | 3,857,697 | |
Orica Ltd. | | | 209,914 | | | | 3,236,976 | |
Origin Energy Ltd. | | | 990,000 | | | | 5,869,949 | |
Qantas Airways Ltd. | | | 410,501 | | | | 2,046,141 | |
QBE Insurance Group Ltd. | | | 710,303 | | | | 6,418,625 | |
Ramsay Health Care Ltd. | | | 90,268 | | | | 4,592,639 | |
REA Group Ltd. | | | 30,619 | | | | 2,224,371 | |
Rio Tinto Ltd. | | | 204,652 | | | | 14,479,127 | |
Rio Tinto PLC | | | 623,673 | | | | 36,918,301 | |
Santos Ltd. | | | 947,245 | | | | 5,449,463 | |
Scentre Group | | | 2,941,882 | | | | 7,917,355 | |
SEEK Ltd. | | | 187,504 | | | | 2,967,755 | |
Sonic Healthcare Ltd. | | | 254,454 | | | | 5,130,536 | |
South32 Ltd. | | | 2,856,137 | | | | 5,392,717 | |
Stockland | | | 1,273,537 | | | | 4,132,069 | |
Suncorp Group Ltd. | | | 697,623 | | | | 6,337,088 | |
Sydney Airport(a) | | | 633,222 | | | | 3,847,280 | |
Tabcorp Holdings Ltd. | | | 1,107,568 | | | | 3,521,075 | |
Telstra Corp. Ltd. | | | 2,299,713 | | | | 5,712,466 | |
TPG Telecom Ltd. | | | 183,755 | | | | 865,799 | |
Transurban Group(a) | | | 1,492,173 | | | | 15,618,644 | |
Treasury Wine Estates Ltd. | | | 403,959 | | | | 4,601,393 | |
| | | | | | | | |
| Security | | Shares | | | Value | |
|
| Australia (continued) | |
Vicinity Centres | | | 1,836,358 | | | $ | 3,211,901 | |
Washington H Soul Pattinson & Co. Ltd. | | | 71,770 | | | | 1,082,724 | |
Wesfarmers Ltd. | | | 629,777 | | | | 18,302,400 | |
Westpac Banking Corp. | | | 1,925,598 | | | | 32,882,929 | |
WiseTech Global Ltd. | | | 79,398 | | | | 1,303,886 | |
Woodside Petroleum Ltd. | | | 513,200 | | | | 12,408,452 | |
Woolworths Group Ltd. | | | 696,426 | | | | 17,663,768 | |
Worley Ltd. | | | 174,357 | | | | 1,883,500 | |
| | | | | | | | |
| | | | 618,407,420 | |
|
| Austria — 0.2% | |
ANDRITZ AG | | | 40,926 | | | | 1,759,418 | |
Erste Group Bank AG(c) | | | 160,120 | | | | 6,014,451 | |
OMV AG | | | 81,581 | | | | 4,570,560 | |
Raiffeisen Bank International AG | | | 90,008 | | | | 2,252,850 | |
Verbund AG | | | 37,315 | | | | 1,872,648 | |
voestalpine AG | | | 66,795 | | | | 1,852,602 | |
| | | | | | | | |
| | | | 18,322,529 | |
|
| Belgium — 1.0% | |
Ageas | | | 98,207 | | | | 5,807,233 | |
Anheuser-Busch InBev SA | | | 420,292 | | | | 34,422,071 | |
Colruyt SA | | | 30,648 | | | | 1,597,883 | |
Galapagos NV(c) | | | 24,419 | | | | 5,085,196 | |
Groupe Bruxelles Lambert SA | | | 44,109 | | | | 4,654,420 | |
KBC Group NV | | | 140,265 | | | | 10,575,221 | |
Proximus SADP | | | 88,638 | | | | 2,539,809 | |
Solvay SA | | | 41,659 | | | | 4,848,812 | |
Telenet Group Holding NV | | | 24,777 | | | | 1,113,802 | |
UCB SA | | | 70,731 | | | | 5,628,389 | |
Umicore SA(d) | | | 109,066 | | | | 5,315,221 | |
| | | | | | | | |
| | | | 81,588,057 | |
|
| Canada — 0.0% | |
Barrick Gold Corp. | | | 1 | | | | 18 | |
| | | | | | | | |
|
| Chile — 0.0% | |
Antofagasta PLC | | | 216,911 | | | | 2,626,300 | |
| | | | | | | | |
|
| China — 0.4% | |
BeiGene Ltd., ADR(c) | | | 20,146 | | | | 3,339,401 | |
BOC Hong Kong Holdings Ltd. | | | 2,040,534 | | | | 7,083,559 | |
Budweiser Brewing Co. APAC Ltd.(c)(e) | | | 665,300 | | | | 2,245,472 | |
Prosus NV(c) | | | 268,244 | | | | 20,075,796 | |
Yangzijiang Shipbuilding Holdings Ltd. | | | 1,271,583 | | | | 1,059,949 | |
| | | | | | | | |
| | | | 33,804,177 | |
|
| Colombia — 0.0% | |
Millicom International Cellular SA, SDR | | | 56,834 | | | | 2,729,390 | |
| | | | | | | | |
|
| Denmark — 1.8% | |
AP Moeller — Maersk A/S, Class B | | | 3,454 | | | | 4,981,504 | |
AP Moeller — Maersk A/S, Class A | | | 2,194 | | | | 2,973,922 | |
Carlsberg A/S, Class B | | | 60,128 | | | | 8,973,260 | |
Chr Hansen Holding A/S | | | 57,231 | | | | 4,548,000 | |
Coloplast A/S, Class B | | | 66,273 | | | | 8,221,897 | |
Danske Bank A/S | | | 344,840 | | | | 5,578,923 | |
Demant A/S(c) | | | 56,892 | | | | 1,791,686 | |
DSV PANALPINA A/S | | | 119,972 | | | | 13,827,165 | |
Genmab A/S(c) | | | 35,012 | | | | 7,786,790 | |
H Lundbeck A/S | | | 38,865 | | | | 1,485,829 | |
ISS A/S | | | 94,429 | | | | 2,265,808 | |
Novo Nordisk A/S, Class B | | | 978,974 | | | | 56,730,402 | |
Novozymes A/S, Class B | | | 121,134 | | | | 5,927,735 | |
Orsted A/S(e) | | | 105,776 | | | | 10,939,854 | |
Pandora A/S | | | 57,850 | | | | 2,516,558 | |
Tryg A/S | | | 69,513 | | | | 2,060,811 | |
Vestas Wind Systems A/S | | | 104,358 | | | | 10,540,828 | |
| | | | | | | | |
| | | | 151,150,972 | |
| | |
| 10 | | 2019 BLACKROCK ANNUAL REPORTTO SHAREHOLDERS |
| | |
Schedule of Investments (continued) December 31, 2019 | | iShares MSCI EAFE International Index Fund (Percentages shown are based on Net Assets) |
| | | | | | | | |
| Security | | Shares | | | Value | |
|
| Finland — 1.1% | |
Elisa OYJ | | | 77,028 | | | $ | 4,255,313 | |
Fortum OYJ | | | 249,675 | | | | 6,162,833 | |
Kone OYJ, Class B | | | 186,311 | | | | 12,182,474 | |
Metso OYJ | | | 55,506 | | | | 2,192,767 | |
Neste OYJ | | | 230,171 | | | | 8,008,830 | |
Nokia OYJ | | | 3,121,653 | | | | 11,546,580 | |
Nokian Renkaat OYJ | | | 69,692 | | | | 2,004,473 | |
Nordea Bank Abp | | | 1,809,028 | | | | 14,635,365 | |
Orion OYJ, Class B | | | 57,619 | | | | 2,668,430 | |
Sampo OYJ, Class A | | | 245,289 | | | | 10,710,080 | |
Stora Enso OYJ, Class R | | | 322,171 | | | | 4,687,839 | |
UPM-Kymmene OYJ | | | 300,012 | | | | 10,408,763 | |
Wartsila OYJ Abp | | | 255,300 | | | | 2,821,952 | |
| | | | | | | | |
| | | | 92,285,699 | |
|
| France — 11.2% | |
Accor SA | | | 103,173 | | | | 4,842,814 | |
Aeroports de Paris | | | 16,802 | | | | 3,326,688 | |
Air Liquide SA | | | 260,980 | | | | 36,999,325 | |
Airbus SE | | | 322,873 | | | | 47,386,494 | |
Alstom SA | | | 105,190 | | | | 4,998,527 | |
Amundi SA(e) | | | 35,766 | | | | 2,812,512 | |
Arkema SA | | | 37,607 | | | | 4,021,221 | |
Atos SE | | | 54,004 | | | | 4,512,731 | |
AXA SA | | | 1,069,001 | | | | 30,205,950 | |
BioMerieux | | | 24,926 | | | | 2,222,255 | |
BNP Paribas SA | | | 622,327 | | | | 36,989,919 | |
Bollore SA | | | 512,662 | | | | 2,240,287 | |
Bouygues SA | | | 123,651 | | | | 5,270,864 | |
Bureau Veritas SA | | | 166,884 | | | | 4,362,670 | |
Capgemini SE | | | 87,612 | | | | 10,715,372 | |
Carrefour SA | | | 334,673 | | | | 5,628,748 | |
Casino Guichard-Perrachon SA(d) | | | 30,282 | | | | 1,416,437 | |
Cie de Saint-Gobain | | | 274,732 | | | | 11,254,626 | |
Cie Generale des Etablissements Michelin SCA | | | 93,790 | | | | 11,541,714 | |
CNP Assurances | | | 95,438 | | | | 1,901,616 | |
Covivio | | | 25,616 | | | | 2,909,205 | |
Credit Agricole SA | | | 629,281 | | | | 9,156,880 | |
Danone SA | | | 340,654 | | | | 28,289,919 | |
Dassault Aviation SA | | | 1,349 | | | | 1,770,413 | |
Dassault Systemes SE | | | 72,146 | | | | 11,898,701 | |
Edenred | | | 132,610 | | | | 6,872,439 | |
Eiffage SA | | | 43,867 | | | | 5,032,719 | |
Electricite de France SA | | | 333,115 | | | | 3,716,989 | |
Engie SA | | | 1,010,578 | | | | 16,369,666 | |
EssilorLuxottica SA | | | 155,983 | | | | 23,846,911 | |
Eurazeo SE | | | 22,563 | | | | 1,548,749 | |
Eutelsat Communications SA | | | 102,400 | | | | 1,664,351 | |
Faurecia SE | | | 39,065 | | | | 2,120,745 | |
Gecina SA | | | 24,832 | | | | 4,445,507 | |
Getlink SE | | | 247,128 | | | | 4,308,644 | |
Hermes International | | | 17,551 | | | | 13,147,596 | |
ICADE | | | 15,918 | | | | 1,733,263 | |
Iliad SA | | | 13,988 | | | | 1,819,448 | |
Ingenico Group SA | | | 33,191 | | | | 3,610,460 | |
Ipsen SA | | | 20,858 | | | | 1,851,496 | |
JCDecaux SA | | | 41,710 | | | | 1,288,754 | |
Kering SA | | | 41,920 | | | | 27,621,697 | |
Klepierre SA | | | 114,854 | | | | 4,369,497 | |
L’Oreal SA | | | 139,685 | | | | 41,305,888 | |
Legrand SA | | | 146,788 | | | | 11,987,263 | |
LVMH Moet Hennessy Louis Vuitton SE | | | 153,802 | | | | 71,664,600 | |
Natixis SA | | | 521,201 | | | | 2,321,698 | |
Orange SA | | | 1,105,114 | | | | 16,240,979 | |
Pernod Ricard SA | | | 117,940 | | | | 21,103,894 | |
| | | | | | | | |
| Security | | Shares | | | Value | |
|
| France (continued) | |
Peugeot SA | | | 319,754 | | | $ | 7,698,768 | |
Publicis Groupe SA | | | 122,250 | | | | 5,542,985 | |
Remy Cointreau SA | | | 12,568 | | | | 1,543,679 | |
Renault SA | | | 108,046 | | | | 5,130,825 | |
Safran SA | | | 181,081 | | | | 27,969,641 | |
Sanofi | | | 623,458 | | | | 62,612,284 | |
Sartorius Stedim Biotech | | | 14,800 | | | | 2,456,616 | |
Schneider Electric SE | | | 304,932 | | | | 31,328,629 | |
SCOR SE | | | 89,620 | | | | 3,772,627 | |
SEB SA | | | 12,114 | | | | 1,801,687 | |
Societe Generale SA | | | 450,123 | | | | 15,708,375 | |
Sodexo SA | | | 47,906 | | | | 5,677,225 | |
Suez | | | 189,089 | | | | 2,865,315 | |
Teleperformance | | | 32,042 | | | | 7,828,429 | |
Thales SA | | | 59,767 | | | | 6,219,043 | |
TOTAL SA | | | 1,327,459 | | | | 73,661,373 | |
UbiSoft Entertainment SA(c) | | | 45,767 | | | | 3,170,883 | |
Unibail-Rodamco-Westfield | | | 76,809 | | | | 12,117,933 | |
Valeo SA | | | 135,046 | | | | 4,786,469 | |
Veolia Environnement SA | | | 297,294 | | | | 7,910,503 | |
Vinci SA | | | 282,023 | | | | 31,409,904 | |
Vivendi SA | | | 472,494 | | | | 13,682,251 | |
Wendel SA | | | 15,780 | | | | 2,102,014 | |
Worldline SA(c)(e) | | | 57,039 | | | | 4,043,549 | |
| | | | | | | | |
| | | | 917,710,148 | |
|
| Germany — 8.1% | |
adidas AG | | | 99,782 | | | | 32,436,000 | |
Allianz SE, Registered Shares | | | 234,840 | | | | 57,542,323 | |
Aroundtown SA | | | 513,293 | | | | 4,610,283 | |
BASF SE | | | 508,166 | | | | 38,283,510 | |
Bayer AG, Registered Shares | | | 515,952 | | | | 41,945,140 | |
Bayerische Motoren Werke AG | | | 184,872 | | | | 15,142,068 | |
Beiersdorf AG | | | 53,896 | | | | 6,447,541 | |
Brenntag AG | | | 86,844 | | | | 4,711,867 | |
Carl Zeiss Meditec AG, Bearer Shares | | | 22,606 | | | | 2,873,891 | |
Commerzbank AG | | | 560,075 | | | | 3,459,032 | |
Continental AG | | | 60,493 | | | | 7,817,525 | |
Covestro AG(e) | | | 96,191 | | | | 4,475,775 | |
Daimler AG, Registered Shares | | | 503,148 | | | | 27,816,182 | |
Delivery Hero SE(c)(e) | | | 62,535 | | | | 4,956,475 | |
Deutsche Bank AG, Registered Shares | | | 1,071,838 | | | | 8,305,155 | |
Deutsche Boerse AG | | | 105,127 | | | | 16,485,239 | |
Deutsche Lufthansa AG, Registered Shares | | | 132,677 | | | | 2,442,198 | |
Deutsche Post AG, Registered Shares | | | 549,441 | | | | 20,892,029 | |
Deutsche Telekom AG, Registered Shares | | | 1,842,566 | | | | 30,111,529 | |
Deutsche Wohnen SE, Bearer Shares | | | 200,636 | | | | 8,161,232 | |
E.ON SE | | | 1,222,572 | | | | 13,065,472 | |
Evonik Industries AG | | | 99,930 | | | | 3,052,092 | |
Fraport AG Frankfurt Airport Services Worldwide | | | 20,752 | | | | 1,761,534 | |
Fresenius Medical Care AG & Co. KGaA | | | 119,244 | | | | 8,779,676 | |
Fresenius SE & Co. KGaA | | | 227,294 | | | | 12,790,618 | |
GEA Group AG | | | 84,886 | | | | 2,806,986 | |
Hannover Rueck SE | | | 33,894 | | | | 6,535,256 | |
HeidelbergCement AG | | | 83,647 | | | | 6,078,199 | |
Henkel AG & Co. KGaA | | | 57,498 | | | | 5,404,382 | |
Hochtief AG | | | 13,110 | | | | 1,669,111 | |
Infineon Technologies AG | | | 684,954 | | | | 15,476,088 | |
KION Group AG | | | 35,936 | | | | 2,471,224 | |
Knorr-Bremse AG | | | 27,162 | | | | 2,764,936 | |
LANXESS AG | | | 47,059 | | | | 3,159,697 | |
Merck KGaA | | | 73,449 | | | | 8,659,177 | |
METRO AG | | | 106,728 | | | | 1,717,379 | |
MTU Aero Engines AG | | | 28,771 | | | | 8,197,597 | |
Muenchener Rueckversicherungs-Gesellschaft AG, Registered Shares | | | 79,706 | | | | 23,520,677 | |
| | | | |
| SCHEDULE OF INVESTMENTS | | | 11 | |
| | |
Schedule of Investments (continued) December 31, 2019 | | iShares MSCI EAFE International Index Fund (Percentages shown are based on Net Assets) |
| | | | | | | | |
| Security | | Shares | | | Value | |
|
| Germany (continued) | |
Puma SE | | | 45,898 | | | $ | 3,519,550 | |
RWE AG | | | 317,305 | | | | 9,722,846 | |
SAP SE | | | 543,755 | | | | 73,188,408 | |
Siemens AG, Registered Shares | | | 423,251 | | | | 55,272,998 | |
Siemens Healthineers AG(e) | | | 84,315 | | | | 4,041,808 | |
Symrise AG | | | 69,319 | | | | 7,286,042 | |
Telefonica Deutschland Holding AG | | | 416,854 | | | | 1,208,240 | |
Thyssenkrupp AG(d) | | | 222,147 | | | | 2,985,013 | |
TUI AG | | | 234,664 | | | | 2,961,521 | |
Uniper SE | | | 114,345 | | | | 3,779,287 | |
United Internet AG, Registered Shares | | | 69,690 | | | | 2,282,295 | |
Volkswagen AG | | | 18,074 | | | | 3,500,660 | |
Vonovia SE | | | 283,629 | | | | 15,233,533 | |
Wirecard AG(d) | | | 66,387 | | | | 8,005,127 | |
Zalando SE(c)(e) | | | 77,099 | | | | 3,888,113 | |
| | | | | | | | |
| | | | 663,700,536 | |
|
| Hong Kong — 2.9% | |
AIA Group Ltd. | | | 6,688,283 | | | | 70,347,094 | |
ASM Pacific Technology Ltd.(d) | | | 176,583 | | | | 2,451,037 | |
Bank of East Asia Ltd.(d) | | | 674,587 | | | | 1,506,104 | |
CK Asset Holdings Ltd. | | | 1,434,589 | | | | 10,352,316 | |
CK Infrastructure Holdings Ltd. | | | 354,344 | | | | 2,521,754 | |
CLP Holdings Ltd. | | | 904,261 | | | | 9,492,404 | |
Dairy Farm International Holdings Ltd. | | | 188,420 | | | | 1,075,878 | |
Hang Lung Properties Ltd. | | | 1,174,565 | | | | 2,579,045 | |
Hang Seng Bank Ltd. | | | 423,148 | | | | 8,746,459 | |
Henderson Land Development Co. Ltd. | | | 802,774 | | | | 3,939,254 | |
HK Electric Investments & HK Electric Investments Ltd.(a) | | | 1,383,116 | | | | 1,363,183 | |
HKT Trust & HKT Ltd.(a) | | | 2,111,417 | | | | 2,975,591 | |
Hong Kong & China Gas Co. Ltd. | | | 5,633,893 | | | | 11,007,886 | |
Hong Kong Exchanges & Clearing Ltd. | | | 659,943 | | | | 21,440,045 | |
Hongkong Land Holdings Ltd. | | | 655,993 | | | | 3,773,306 | |
Jardine Matheson Holdings Ltd. | | | 124,686 | | | | 6,938,490 | |
Jardine Strategic Holdings Ltd. | | | 123,086 | | | | 3,774,812 | |
Kerry Properties Ltd. | | | 362,920 | | | | 1,152,663 | |
Link REIT | | | 1,172,943 | | | | 12,426,124 | |
Melco Resorts & Entertainment Ltd. — ADR | | | 114,513 | | | | 2,767,779 | |
MTR Corp. Ltd. | | | 862,533 | | | | 5,097,151 | |
New World Development Co. Ltd. | | | 3,440,296 | | | | 4,715,760 | |
NWS Holdings Ltd. | | | 739,895 | | | | 1,037,009 | |
PCCW Ltd. | | | 2,244,959 | | | | 1,328,333 | |
Power Assets Holdings Ltd. | | | 728,118 | | | | 5,326,631 | |
Sino Land Co. Ltd. | | | 1,683,975 | | | | 2,444,305 | |
Sun Hung Kai Properties Ltd. | | | 882,088 | | | | 13,509,062 | |
Swire Pacific Ltd., Class A | | | 268,700 | | | | 2,496,140 | |
Swire Properties Ltd. | | | 681,736 | | | | 2,258,486 | |
Techtronic Industries Co. Ltd. | | | 774,131 | | | | 6,318,220 | |
Vitasoy International Holdings Ltd.(d) | | | 418,000 | | | | 1,516,343 | |
WH Group Ltd.(e) | | | 5,338,607 | | | | 5,519,980 | |
Wharf Real Estate Investment Co. Ltd. | | | 671,939 | | | | 4,099,877 | |
Wheelock & Co. Ltd. | | | 460,306 | | | | 3,068,531 | |
Yue Yuen Industrial Holdings Ltd. | | | 396,983 | | | | 1,171,613 | |
| | | | | | | | |
| | | | 240,538,665 | |
|
| Ireland — 0.6% | |
AerCap Holdings NV(c) | | | 66,320 | | | | 4,076,690 | |
AIB Group PLC | | | 474,475 | | | | 1,653,071 | |
Bank of Ireland Group PLC | | | 558,940 | | | | 3,076,183 | |
CRH PLC(c) | | | 438,684 | | | | 17,595,134 | |
Flutter Entertainment PLC | | | 43,531 | | | | 5,290,592 | |
Kerry Group PLC, Class A | | | 88,704 | | | | 11,054,369 | |
Kingspan Group PLC | | | 84,800 | | | | 5,179,293 | |
Smurfit Kappa Group PLC | | | 123,588 | | | | 4,765,200 | |
| | | | | | | | |
| | | | 52,690,532 | |
| | | | | | | | |
| Security | | Shares | | | Value | |
|
| Israel — 0.5% | |
Azrieli Group Ltd. | | | 22,414 | | | $ | 1,641,877 | |
Bank Hapoalim BM | | | 614,570 | | | | 5,103,871 | |
Bank LeumiLe-Israel BM | | | 804,550 | | | | 5,867,526 | |
Check Point Software Technologies Ltd.(c)(d) | | | 66,714 | | | | 7,402,586 | |
Elbit Systems Ltd. | | | 13,681 | | | | 2,131,683 | |
Israel Chemicals Ltd. | | | 413,828 | | | | 1,954,308 | |
Israel Discount Bank Ltd., Series A | | | 653,776 | | | | 3,036,274 | |
Mizrahi Tefahot Bank Ltd. | | | 80,585 | | | | 2,149,563 | |
Nice Ltd.(c) | | | 35,914 | | | | 5,568,798 | |
Teva Pharmaceutical Industries Ltd. — ADR(c)(d) | | | 592,613 | | | | 5,807,607 | |
Wix.com Ltd.(c) | | | 24,497 | | | | 2,997,943 | |
| | | | | | | | |
| | | | 43,662,036 | |
|
| Italy — 2.1% | |
Assicurazioni Generali SpA | | | 606,249 | | | | 12,515,884 | |
Atlantia SpA | | | 278,503 | | | | 6,499,951 | |
Davide Campari-Milano SpA | | | 311,115 | | | | 2,842,749 | |
Enel SpA | | | 4,499,927 | | | | 35,746,624 | |
Eni SpA | | | 1,412,992 | | | | 21,945,501 | |
Ferrari NV | | | 67,584 | | | | 11,221,352 | |
FinecoBank Banca Fineco SpA | | | 333,208 | | | | 3,997,098 | |
Intesa Sanpaolo SpA | | | 8,234,451 | | | | 21,691,091 | |
Leonardo SpA | | | 210,623 | | | | 2,470,046 | |
Mediobanca Banca di Credito Finanziario SpA | | | 332,283 | | | | 3,658,612 | |
Moncler SpA | | | 96,991 | | | | 4,365,314 | |
Pirelli & C SpA(e) | | | 246,823 | | | | 1,424,581 | |
Poste Italiane SpA(e) | | | 286,108 | | | | 3,251,010 | |
Prysmian SpA | | | 133,527 | | | | 3,223,238 | |
Recordati SpA | | | 58,724 | | | | 2,475,492 | |
Snam SpA | | | 1,151,647 | | | | 6,055,129 | |
Telecom Italia SpA | | | 3,267,276 | | | | 2,000,935 | |
Telecom Italia SpA(c) | | | 5,047,112 | | | | 3,151,965 | |
Terna Rete Elettrica Nazionale SpA | | | 777,986 | | | | 5,203,101 | |
UniCredit SpA | | | 1,114,850 | | | | 16,295,720 | |
| | | | | | | | |
| | | | 170,035,393 | |
|
| Japan — 24.3% | |
ABC-Mart, Inc. | | | 17,535 | | | | 1,196,963 | |
Acom Co. Ltd. | | | 200,154 | | | | 908,131 | |
Advantest Corp. | | | 112,100 | | | | 6,322,229 | |
Aeon Co. Ltd. | | | 365,146 | | | | 7,535,294 | |
AEON Financial Service Co. Ltd. | | | 73,858 | | | | 1,163,752 | |
Aeon Mall Co. Ltd. | | | 58,255 | | | | 1,033,300 | |
AGC, Inc. | | | 102,248 | | | | 3,656,179 | |
Air Water, Inc. | | | 81,316 | | | | 1,186,532 | |
Aisin Seiki Co. Ltd. | | | 83,346 | | | | 3,087,109 | |
Ajinomoto Co., Inc. | | | 249,454 | | | | 4,152,736 | |
Alfresa Holdings Corp. | | | 104,251 | | | | 2,117,861 | |
Alps Alpine Co. Ltd. | | | 115,828 | | | | 2,629,217 | |
Amada Holdings Co. Ltd. | | | 181,549 | | | | 2,064,891 | |
ANA Holdings, Inc. | | | 62,511 | | | | 2,086,837 | |
Aozora Bank Ltd. | | | 69,458 | | | | 1,834,993 | |
Asahi Group Holdings Ltd. | | | 200,702 | | | | 9,156,123 | |
Asahi Intecc Co. Ltd. | | | 112,200 | | | | 3,285,354 | |
Asahi Kasei Corp. | | | 679,468 | | | | 7,629,343 | |
Astellas Pharma, Inc. | | | 1,040,643 | | | | 17,763,758 | |
Bandai Namco Holdings, Inc. | | | 112,504 | | | | 6,843,864 | |
Bank of Kyoto Ltd. | | | 30,641 | | | | 1,306,559 | |
Benesse Holdings, Inc. | | | 37,894 | | | | 996,034 | |
Bridgestone Corp. | | | 316,041 | | | | 11,740,956 | |
Brother Industries Ltd. | | | 117,763 | | | | 2,432,187 | |
Calbee, Inc. | | | 46,523 | | | | 1,515,780 | |
Canon, Inc. | | | 555,648 | | | | 15,207,234 | |
Casio Computer Co. Ltd. | | | 113,681 | | | | 2,271,744 | |
Central Japan Railway Co. | | | 79,540 | | | | 15,993,006 | |
| | |
| 12 | | 2019 BLACKROCK ANNUAL REPORTTO SHAREHOLDERS |
| | |
Schedule of Investments (continued) December 31, 2019 | | iShares MSCI EAFE International Index Fund (Percentages shown are based on Net Assets) |
| | | | | | | | |
| Security | | Shares | | | Value | |
|
| Japan (continued) | |
Chiba Bank Ltd. (The) | | | 311,270 | | | $ | 1,789,783 | |
Chubu Electric Power Co., Inc. | | | 348,411 | | | | 4,925,085 | |
Chugai Pharmaceutical Co. Ltd. | | | 121,510 | | | | 11,190,492 | |
Chugoku Electric Power Co., Inc. | | | 162,421 | | | | 2,135,041 | |
Coca-Cola Bottlers Japan Holdings, Inc. | | | 68,511 | | | | 1,750,475 | |
Concordia Financial Group Ltd. | | | 590,670 | | | | 2,425,702 | |
Credit Saison Co. Ltd. | | | 80,840 | | | | 1,402,069 | |
CyberAgent, Inc. | | | 55,929 | | | | 1,948,329 | |
Dai Nippon Printing Co. Ltd. | | | 127,468 | | | | 3,447,696 | |
Dai-ichi Life Holdings, Inc. | | | 607,100 | | | | 10,005,173 | |
Daicel Corp. | | | 141,756 | | | | 1,355,237 | |
Daifuku Co. Ltd. | | | 56,676 | | | | 3,425,205 | |
Daiichi Sankyo Co. Ltd. | | | 313,854 | | | | 20,728,252 | |
Daikin Industries Ltd. | | | 137,868 | | | | 19,451,763 | |
Daito Trust Construction Co. Ltd. | | | 40,370 | | | | 4,988,771 | |
Daiwa House Industry Co. Ltd. | | | 306,376 | | | | 9,484,433 | |
Daiwa House REIT Investment Corp. | | | 1,019 | | | | 2,664,515 | |
Daiwa Securities Group, Inc. | | | 846,252 | | | | 4,272,228 | |
Denso Corp. | | | 238,090 | | | | 10,752,700 | |
Dentsu, Inc. | | | 121,582 | | | | 4,189,210 | |
Disco Corp. | | | 14,859 | | | | 3,489,266 | |
East Japan Railway Co. | | | 165,144 | | | | 14,906,214 | |
Eisai Co. Ltd. | | | 137,115 | | | | 10,259,760 | |
Electric Power Development Co. Ltd. | | | 71,287 | | | | 1,730,319 | |
FamilyMart Co. Ltd. | | | 142,468 | | | | 3,412,066 | |
FANUC Corp. | | | 107,651 | | | | 19,879,351 | |
Fast Retailing Co. Ltd. | | | 32,241 | | | | 19,153,535 | |
Fuji Electric Co. Ltd. | | | 70,994 | | | | 2,156,606 | |
FUJIFILM Holdings Corp. | | | 199,308 | | | | 9,518,125 | |
Fujitsu Ltd. | | | 107,604 | | | | 10,120,783 | |
Fukuoka Financial Group, Inc. | | | 85,893 | | | | 1,641,076 | |
GMO Payment Gateway, Inc.(d) | | | 23,000 | | | | 1,575,070 | |
Hakuhodo DY Holdings, Inc. | | | 136,792 | | | | 2,201,123 | |
Hamamatsu Photonics KK | | | 79,087 | | | | 3,241,020 | |
Hankyu Hanshin Holdings, Inc. | | | 128,863 | | | | 5,512,198 | |
Hikari Tsushin, Inc. | | | 11,406 | | | | 2,866,302 | |
Hino Motors Ltd. | | | 137,321 | | | | 1,452,237 | |
Hirose Electric Co. Ltd. | | | 18,292 | | | | 2,338,294 | |
Hisamitsu Pharmaceutical Co., Inc. | | | 28,241 | | | | 1,375,378 | |
Hitachi Chemical Co. Ltd. | | | 61,905 | | | | 2,593,560 | |
Hitachi Construction Machinery Co. Ltd. | | | 61,505 | | | | 1,832,070 | |
Hitachi High-Technologies Corp. | | | 37,917 | | | | 2,685,262 | |
Hitachi Ltd. | | | 533,213 | | | | 22,499,315 | |
Hitachi Metals Ltd. | | | 112,686 | | | | 1,658,705 | |
Honda Motor Co. Ltd. | | | 902,035 | | | | 25,528,978 | |
Hoshizaki Corp. | | | 29,665 | | | | 2,644,936 | |
Hoya Corp. | | | 210,878 | | | | 20,130,827 | |
Hulic Co. Ltd. | | | 148,967 | | | | 1,793,592 | |
Idemitsu Kosan Co. Ltd. | | | 105,900 | | | | 2,926,199 | |
IHI Corp. | | | 77,640 | | | | 1,816,852 | |
Iida Group Holdings Co. Ltd. | | | 81,722 | | | | 1,432,220 | |
Inpex Corp. | | | 542,200 | | | | 5,617,044 | |
Isetan Mitsukoshi Holdings Ltd. | | | 177,308 | | | | 1,592,176 | |
Isuzu Motors Ltd. | | | 309,382 | | | | 3,657,131 | |
ITOCHU Corp. | | | 745,373 | | | | 17,275,267 | |
Itochu Techno-Solutions Corp. | | | 53,900 | | | | 1,517,939 | |
J. Front Retailing Co. Ltd. | | | 137,968 | | | | 1,924,277 | |
Japan Airlines Co. Ltd. | | | 64,762 | | | | 2,016,422 | |
Japan Airport Terminal Co. Ltd. | | | 30,512 | | | | 1,692,962 | |
Japan Exchange Group, Inc. | | | 277,036 | | | | 4,877,238 | |
Japan Post Bank Co. Ltd. | | | 217,900 | | | | 2,090,705 | |
Japan Post Holdings Co. Ltd. | | | 885,829 | | | | 8,330,744 | |
Japan Post Insurance Co. Ltd. | | | 117,800 | | | | 2,008,082 | |
Japan Prime Realty Investment Corp. | | | 463 | | | | 2,035,754 | |
| | | | | | | | |
| Security | | Shares | | | Value | |
|
| Japan (continued) | |
Japan Real Estate Investment Corp. | | | 724 | | | $ | 4,804,819 | |
Japan Retail Fund Investment Corp. | | | 1,435 | | | | 3,087,985 | |
Japan Tobacco, Inc. | | | 670,041 | | | | 14,939,601 | |
JFE Holdings, Inc. | | | 279,612 | | | | 3,587,822 | |
JGC Holdings Corp. | | | 125,057 | | | | 1,990,411 | |
JSR Corp. | | | 109,128 | | | | 1,996,237 | |
JTEKT Corp. | | | 114,233 | | | | 1,349,446 | |
JXTG Holdings, Inc. | | | 1,719,063 | | | | 7,802,100 | |
Kajima Corp. | | | 258,577 | | | | 3,437,828 | |
Kakaku.com, Inc. | | | 77,116 | | | | 1,969,010 | |
Kamigumi Co. Ltd. | | | 60,911 | | | | 1,338,937 | |
Kansai Electric Power Co., Inc. | | | 395,751 | | | | 4,584,697 | |
Kansai Paint Co. Ltd. | | | 89,875 | | | | 2,195,566 | |
Kao Corp. | | | 266,307 | | | | 21,963,688 | |
Kawasaki Heavy Industries Ltd. | | | 80,716 | | | | 1,764,187 | |
KDDI Corp. | | | 970,675 | | | | 28,961,396 | |
Keihan Holdings Co. Ltd. | | | 52,929 | | | | 2,570,049 | |
Keikyu Corp. | | | 122,039 | | | | 2,352,785 | |
Keio Corp. | | | 55,729 | | | | 3,372,119 | |
Keisei Electric Railway Co. Ltd. | | | 71,587 | | | | 2,773,950 | |
Keyence Corp. | | | 100,880 | | | | 35,422,842 | |
Kikkoman Corp. | | | 79,464 | | | | 3,890,140 | |
Kintetsu Group Holdings Co. Ltd. | | | 96,498 | | | | 5,234,027 | |
Kirin Holdings Co. Ltd. | | | 451,055 | | | | 9,844,983 | |
Kobayashi Pharmaceutical Co. Ltd. | | | 28,665 | | | | 2,427,960 | |
Koito Manufacturing Co. Ltd. | | | 59,247 | | | | 2,743,487 | |
Komatsu Ltd. | | | 511,954 | | | | 12,287,631 | |
Konami Holdings Corp. | | | 54,699 | | | | 2,247,719 | |
Konica Minolta, Inc. | | | 276,077 | | | | 1,798,389 | |
Kose Corp. | | | 17,459 | | | | 2,544,893 | |
Kubota Corp. | | | 589,789 | | | | 9,261,598 | |
Kuraray Co. Ltd. | | | 175,914 | | | | 2,131,700 | |
Kurita Water Industries Ltd. | | | 54,729 | | | | 1,624,080 | |
Kyocera Corp. | | | 176,100 | | | | 12,002,214 | |
Kyowa Kirin Co. Ltd. | | | 124,997 | | | | 2,944,973 | |
Kyushu Electric Power Co., Inc. | | | 204,831 | | | | 1,777,110 | |
Kyushu Railway Co. | | | 88,746 | | | | 2,971,001 | |
Lawson, Inc. | | | 29,288 | | | | 1,662,464 | |
LINE Corp.(c) | | | 32,170 | | | | 1,580,583 | |
Lion Corp. | | | 123,539 | | | | 2,401,433 | |
LIXIL Group Corp. | | | 147,327 | | | | 2,542,399 | |
M3, Inc. | | | 248,513 | | | | 7,494,060 | |
Makita Corp. | | | 125,939 | | | | 4,349,286 | |
Marubeni Corp. | | | 863,164 | | | | 6,377,375 | |
Marui Group Co. Ltd. | | | 104,151 | | | | 2,539,465 | |
Maruichi Steel Tube Ltd. | | | 28,300 | | | | 795,300 | |
Mazda Motor Corp. | | | 323,398 | | | | 2,755,814 | |
McDonald’s Holdings Co. Japan Ltd. | | | 37,494 | | | | 1,806,415 | |
Mebuki Financial Group, Inc. | | | 521,586 | | | | 1,329,814 | |
Medipal Holdings Corp. | | | 103,098 | | | | 2,275,411 | |
MEIJI Holdings Co. Ltd. | | | 63,334 | | | | 4,280,122 | |
Mercari, Inc.(c) | | | 41,700 | | | | 852,514 | |
MINEBEA MITSUMI, Inc. | | | 200,808 | | | | 4,147,919 | |
MISUMI Group, Inc. | | | 154,656 | | | | 3,827,755 | |
Mitsubishi Chemical Holdings Corp. | | | 707,509 | | | | 5,271,776 | |
Mitsubishi Corp. | | | 750,697 | | | | 19,886,981 | |
Mitsubishi Electric Corp. | | | 1,007,321 | | | | 13,715,364 | |
Mitsubishi Estate Co. Ltd. | | | 648,182 | | | | 12,402,873 | |
Mitsubishi Gas Chemical Co., Inc. | | | 94,393 | | | | 1,438,000 | |
Mitsubishi Heavy Industries Ltd. | | | 180,205 | | | | 6,987,781 | |
Mitsubishi Materials Corp. | | | 60,176 | | | | 1,633,157 | |
Mitsubishi Motors Corp. | | | 316,616 | | | | 1,319,741 | |
Mitsubishi Tanabe Pharma Corp. | | | 122,339 | | | | 2,244,320 | |
Mitsubishi UFJ Financial Group, Inc. | | | 6,803,870 | | | | 36,783,992 | |
| | | | |
| SCHEDULE OF INVESTMENTS | | | 13 | |
| | |
Schedule of Investments (continued) December 31, 2019 | | iShares MSCI EAFE International Index Fund (Percentages shown are based on Net Assets) |
| | | | | | | | |
| Security | | Shares | | | Value | |
|
| Japan (continued) | |
Mitsubishi UFJ Lease & Finance Co. Ltd. | | | 206,473 | | | $ | 1,329,209 | |
Mitsui & Co. Ltd. | | | 919,400 | | | | 16,342,813 | |
Mitsui Chemicals, Inc. | | | 100,751 | | | | 2,454,224 | |
Mitsui Fudosan Co. Ltd. | | | 491,820 | | | | 12,020,040 | |
Mitsui OSK Lines Ltd. | | | 63,934 | | | | 1,758,212 | |
Mizuho Financial Group, Inc. | | | 13,398,712 | | | | 20,639,625 | |
MonotaRO Co Ltd. | | | 64,600 | | | | 1,719,715 | |
MS&AD Insurance Group Holdings, Inc. | | | 255,724 | | | | 8,441,109 | |
Murata Manufacturing Co. Ltd. | | | 314,325 | | | | 19,346,253 | |
Nabtesco Corp. | | | 66,992 | | | | 1,974,050 | |
Nagoya Railroad Co. Ltd. | | | 99,951 | | | | 3,103,772 | |
NEC Corp. | | | 136,874 | | | | 5,664,455 | |
Nexon Co. Ltd.(c) | | | 258,448 | | | | 3,428,385 | |
NGK Insulators Ltd. | | | 147,268 | | | | 2,561,876 | |
NGK Spark Plug Co. Ltd. | | | 92,964 | | | | 1,802,014 | |
NH Foods Ltd. | | | 47,576 | | | | 1,970,761 | |
Nidec Corp. | | | 124,210 | | | | 16,965,059 | |
Nikon Corp. | | | 176,762 | | | | 2,161,738 | |
Nintendo Co. Ltd. | | | 61,982 | | | | 24,790,325 | |
Nippon Building Fund, Inc. | | | 749 | | | | 5,490,358 | |
Nippon Express Co. Ltd. | | | 40,570 | | | | 2,378,171 | |
Nippon Paint Holdings Co. Ltd. | | | 81,316 | | | | 4,186,283 | |
Nippon Prologis REIT, Inc. | | | 1,077 | | | | 2,743,021 | |
Nippon Shinyaku Co. Ltd. | | | 26,300 | | | | 2,277,411 | |
Nippon Steel Corp. | | | 454,056 | | | | 6,843,948 | |
Nippon Telegraph & Telephone Corp. | | | 715,032 | | | | 18,071,496 | |
Nippon Yusen KK | | | 84,722 | | | | 1,527,001 | |
Nissan Chemical Corp. | | | 69,411 | | | | 2,906,779 | |
Nissan Motor Co. Ltd. | | | 1,279,715 | | | | 7,415,611 | |
Nisshin Seifun Group, Inc. | | | 111,173 | | | | 1,939,686 | |
Nissin Foods Holdings Co. Ltd. | | | 35,841 | | | | 2,662,009 | |
Nitori Holdings Co. Ltd. | | | 45,023 | | | | 7,106,937 | |
Nitto Denko Corp. | | | 86,526 | | | | 4,865,166 | |
Nomura Holdings, Inc. | | | 1,794,418 | | | | 9,233,690 | |
Nomura Real Estate Holdings, Inc. | | | 67,458 | | | | 1,618,000 | |
Nomura Real Estate Master Fund, Inc. | | | 2,352 | | | | 4,023,166 | |
Nomura Research Institute Ltd. | | | 192,963 | | | | 4,126,711 | |
NSK Ltd. | | | 203,385 | | | | 1,922,638 | |
NTT Data Corp. | | | 354,717 | | | | 4,743,979 | |
NTT DOCOMO, Inc. | | | 739,315 | | | | 20,594,454 | |
Obayashi Corp. | | | 374,234 | | | | 4,156,490 | |
Obic Co. Ltd. | | | 36,794 | | | | 4,956,180 | |
Odakyu Electric Railway Co. Ltd. | | | 164,985 | | | | 3,848,937 | |
Oji Holdings Corp. | | | 482,026 | | | | 2,606,787 | |
Olympus Corp. | | | 641,912 | | | | 9,893,598 | |
Omron Corp. | | | 108,228 | | | | 6,308,409 | |
Ono Pharmaceutical Co. Ltd. | | | 216,131 | | | | 4,934,339 | |
Oracle Corp. Japan | | | 21,035 | | | | 1,909,111 | |
Oriental Land Co. Ltd. | | | 111,104 | | | | 15,159,178 | |
ORIX Corp. | | | 730,100 | | | | 12,098,752 | |
OrixJ-REIT, Inc. | | | 1,347 | | | | 2,919,680 | |
Osaka Gas Co. Ltd. | | | 210,808 | | | | 4,031,319 | |
Otsuka Corp. | | | 58,782 | | | | 2,347,455 | |
Otsuka Holdings Co. Ltd. | | | 219,455 | | | | 9,782,038 | |
Pan Pacific International Holdings Corp. | | | 245,336 | | | | 4,070,438 | |
Panasonic Corp. | | | 1,232,757 | | | | 11,562,250 | |
Park24 Co. Ltd. | | | 61,076 | | | | 1,495,508 | |
PeptiDream, Inc.(c) | | | 52,300 | | | | 2,672,703 | |
Persol Holdings Co. Ltd. | | | 104,475 | | | | 1,957,981 | |
Pigeon Corp. | | | 67,000 | | | | 2,453,285 | |
Pola Orbis Holdings, Inc. | | | 50,723 | | | | 1,208,174 | |
Rakuten, Inc. | | | 486,400 | | | | 4,155,404 | |
Recruit Holdings Co. Ltd. | | | 750,694 | | | | 28,117,489 | |
Renesas Electronics Corp.(c) | | | 415,408 | | | | 2,838,046 | |
Resona Holdings, Inc. | | | 1,196,799 | | | | 5,216,281 | |
| | | | | | | | |
| Security | | Shares | | | Value | |
|
| Japan (continued) | |
Ricoh Co. Ltd. | | | 366,481 | | | $ | 3,987,863 | |
Rinnai Corp. | | | 17,835 | | | | 1,393,791 | |
Rohm Co. Ltd. | | | 51,400 | | | | 4,101,156 | |
Ryohin Keikaku Co. Ltd. | | | 135,060 | | | | 3,147,753 | |
Sankyo Co. Ltd. | | | 28,665 | | | | 952,043 | |
Santen Pharmaceutical Co. Ltd. | | | 202,249 | | | | 3,851,456 | |
SBI Holdings, Inc. | | | 129,597 | | | | 2,736,085 | |
Secom Co. Ltd. | | | 115,357 | | | | 10,294,767 | |
Sega Sammy Holdings, Inc. | | | 91,332 | | | | 1,322,454 | |
Seibu Holdings, Inc. | | | 113,551 | | | | 1,867,877 | |
Seiko Epson Corp. | | | 158,703 | | | | 2,396,235 | |
Sekisui Chemical Co. Ltd. | | | 209,278 | | | | 3,630,954 | |
Sekisui House Ltd. | | | 333,999 | | | | 7,132,498 | |
Seven & i Holdings Co. Ltd. | | | 418,459 | | | | 15,338,783 | |
Seven Bank Ltd. | | | 304,840 | | | | 998,685 | |
SG Holdings Co. Ltd. | | | 80,452 | | | | 1,812,243 | |
Sharp Corp.(d) | | | 124,369 | | | | 1,900,670 | |
Shimadzu Corp. | | | 116,163 | | | | 3,632,786 | |
Shimamura Co. Ltd. | | | 10,430 | | | | 792,929 | |
Shimano, Inc. | | | 39,470 | | | | 6,403,254 | |
Shimizu Corp. | | | 307,006 | | | | 3,127,415 | |
Shin-Etsu Chemical Co. Ltd. | | | 201,726 | | | | 22,184,421 | |
Shinsei Bank Ltd. | | | 108,511 | | | | 1,655,572 | |
Shionogi & Co. Ltd.(d) | | | 149,021 | | | | 9,218,660 | |
Shiseido Co. Ltd. | | | 221,278 | | | | 15,712,944 | |
Shizuoka Bank Ltd. | | | 232,201 | | | | 1,727,169 | |
Showa Denko KK | | | 75,087 | | | | 1,978,956 | |
SMC Corp. | | | 31,541 | | | | 14,424,180 | |
Softbank Corp. | | | 922,400 | | | | 12,369,079 | |
SoftBank Group Corp. | | | 866,200 | | | | 37,607,823 | |
Sohgo Security Services Co. Ltd. | | | 41,947 | | | | 2,270,377 | |
Sompo Holdings, Inc. | | | 187,642 | | | | 7,368,626 | |
Sony Corp. | | | 703,568 | | | | 47,770,622 | |
Sony Financial Holdings, Inc. | | | 84,293 | | | | 2,023,442 | |
Square Enix Holdings Co. Ltd. | | | 51,400 | | | | 2,559,406 | |
Stanley Electric Co. Ltd. | | | 71,734 | | | | 2,071,767 | |
Subaru Corp. | | | 333,046 | | | | 8,249,493 | |
Sumco Corp. | | | 137,815 | | | | 2,283,426 | |
Sumitomo Chemical Co. Ltd. | | | 835,360 | | | | 3,793,007 | |
Sumitomo Corp. | | | 663,440 | | | | 9,854,296 | |
Sumitomo Dainippon Pharma Co. Ltd. | | | 87,093 | | | | 1,687,438 | |
Sumitomo Electric Industries Ltd. | | | 423,980 | | | | 6,367,398 | |
Sumitomo Heavy Industries Ltd. | | | 59,082 | | | | 1,678,213 | |
Sumitomo Metal Mining Co. Ltd. | | | 130,815 | | | | 4,212,242 | |
Sumitomo Mitsui Financial Group, Inc. | | | 735,427 | | | | 27,163,255 | |
Sumitomo Mitsui Trust Holdings, Inc. | | | 186,526 | | | | 7,373,549 | |
Sumitomo Realty & Development Co. Ltd. | | | 184,349 | | | | 6,431,840 | |
Sumitomo Rubber Industries Ltd. | | | 86,904 | | | | 1,059,685 | |
Sundrug Co. Ltd. | | | 40,423 | | | | 1,462,583 | |
Suntory Beverage & Food Ltd. | | | 76,440 | | | | 3,191,268 | |
Suzuken Co. Ltd. | | | 39,370 | | | | 1,604,638 | |
Suzuki Motor Corp. | | | 205,619 | | | | 8,582,934 | |
Sysmex Corp. | | | 93,822 | | | | 6,387,862 | |
T&D Holdings, Inc. | | | 307,906 | | | | 3,893,689 | |
Taiheiyo Cement Corp. | | | 66,587 | | | | 1,954,534 | |
Taisei Corp. | | | 111,810 | | | | 4,631,283 | |
Taisho Pharmaceutical Holdings Co. Ltd. | | | 21,100 | | | | 1,557,077 | |
Taiyo Nippon Sanso Corp. | | | 70,193 | | | | 1,553,648 | |
Takeda Pharmaceutical Co. Ltd. | | | 823,408 | | | | 32,567,590 | |
TDK Corp. | | | 72,858 | | | | 8,187,720 | |
Teijin Ltd. | | | 104,551 | | | | 1,953,236 | |
Terumo Corp. | | | 350,506 | | | | 12,433,955 | |
THK Co. Ltd. | | | 69,758 | | | | 1,872,880 | |
Tobu Railway Co. Ltd. | | | 108,198 | | | | 3,916,870 | |
Toho Co. Ltd. | | | 62,782 | | | | 2,616,261 | |
| | |
| 14 | | 2019 BLACKROCK ANNUAL REPORTTO SHAREHOLDERS |
| | |
Schedule of Investments (continued) December 31, 2019 | | iShares MSCI EAFE International Index Fund (Percentages shown are based on Net Assets) |
| | | | | | | | |
| Security | | Shares | | | Value | |
|
| Japan (continued) | |
Toho Gas Co. Ltd. | | | 39,623 | | | $ | 1,617,894 | |
Tohoku Electric Power Co., Inc. | | | 244,290 | | | | 2,421,789 | |
Tokio Marine Holdings, Inc. | | | 352,487 | | | | 19,735,317 | |
Tokyo Century Corp. | | | 23,512 | | | | 1,251,871 | |
Tokyo Electric Power Co. Holdings, Inc.(c) | | | 827,812 | | | | 3,543,493 | |
Tokyo Electron Ltd. | | | 86,793 | | | | 18,949,513 | |
Tokyo Gas Co. Ltd. | | | 199,655 | | | | 4,851,396 | |
Tokyu Corp. | | | 270,565 | | | | 5,003,474 | |
Tokyu Fudosan Holdings Corp. | | | 330,273 | | | | 2,280,637 | |
Toppan Printing Co. Ltd. | | | 162,100 | | | | 3,348,701 | |
Toray Industries, Inc. | | | 767,314 | | | | 5,198,950 | |
Toshiba Corp. | | | 275,170 | | | | 9,339,745 | |
Tosoh Corp. | | | 129,274 | | | | 1,991,568 | |
TOTO Ltd. | | | 78,687 | | | | 3,322,724 | |
Toyo Seikan Group Holdings Ltd. | | | 86,693 | | | | 1,492,350 | |
Toyo Suisan Kaisha Ltd. | | | 50,123 | | | | 2,128,512 | |
Toyoda Gosei Co. Ltd. | | | 41,517 | | | | 1,036,654 | |
Toyota Industries Corp. | | | 80,000 | | | | 4,603,204 | |
Toyota Motor Corp. | | | 1,263,709 | | | | 89,042,790 | |
Toyota Tsusho Corp. | | | 116,681 | | | | 4,098,725 | |
Trend Micro, Inc. | | | 69,334 | | | | 3,547,806 | |
Tsuruha Holdings, Inc. | | | 21,835 | | | | 2,803,569 | |
Unicharm Corp. | | | 226,802 | | | | 7,658,469 | |
United Urban Investment Corp. | | | 1,678 | | | | 3,151,381 | |
USS Co. Ltd. | | | 119,363 | | | | 2,256,353 | |
Welcia Holdings Co. Ltd. | | | 26,100 | | | | 1,658,114 | |
West Japan Railway Co. | | | 91,940 | | | | 7,952,219 | |
Yakult Honsha Co. Ltd. | | | 67,582 | | | | 3,724,613 | |
Yamada Denki Co. Ltd. | | | 351,092 | | | | 1,862,905 | |
Yamaha Corp. | | | 79,364 | | | | 4,400,215 | |
Yamaha Motor Co. Ltd. | | | 158,427 | | | | 3,173,764 | |
Yamato Holdings Co. Ltd. | | | 177,562 | | | | 3,027,359 | |
Yamazaki Baking Co. Ltd. | | | 69,658 | | | | 1,244,738 | |
Yaskawa Electric Corp. | | | 132,845 | | | | 5,004,399 | |
Yokogawa Electric Corp. | | | 124,663 | | | | 2,189,215 | |
Yokohama Rubber Co. Ltd. | | | 70,329 | | | | 1,364,026 | |
Z Holdings Corp. | | | 1,474,627 | | | | 6,226,040 | |
ZOZO, Inc. | | | 60,951 | | | | 1,165,677 | |
| | | | | | | | |
| | | | 2,002,963,361 | |
|
| Luxembourg — 0.2% | |
ArcelorMittal SA | | | 364,121 | | | | 6,415,693 | |
Eurofins Scientific SE(d) | | | 6,331 | | | | 3,509,553 | |
SES SA | | | 204,330 | | | | 2,864,962 | |
Tenaris SA | | | 271,082 | | | | 3,071,338 | |
| | | | | | | | |
| | | | 15,861,546 | |
|
| Macau — 0.3% | |
Galaxy Entertainment Group Ltd. | | | 1,198,058 | | | | 8,819,639 | |
Sands China Ltd. | | | 1,362,460 | | | | 7,279,718 | |
SJM Holdings Ltd. | | | 1,195,053 | | | | 1,360,762 | |
Wynn Macau Ltd. | | | 933,275 | | | | 2,299,705 | |
| | | | | | | | |
| | | | 19,759,824 | |
|
| Netherlands — 4.7% | |
ABN AMRO Group NV CVA(e) | | | 233,984 | | | | 4,264,668 | |
Adyen NV(c)(e) | | | 5,723 | | | | 4,707,714 | |
Aegon NV | | | 1,009,400 | | | | 4,620,634 | |
Akzo Nobel NV | | | 124,556 | | | | 12,720,148 | |
Altice Europe NV, Class A(c) | | | 377,195 | | | | 2,442,526 | |
ASML Holding NV | | | 235,504 | | | | 69,722,471 | |
EXOR NV | | | 60,959 | | | | 4,726,239 | |
Heineken Holding NV | | | 63,747 | | | | 6,195,726 | |
Heineken NV | | | 143,415 | | | | 15,306,371 | |
ING Groep NV | | | 2,155,802 | | | | 25,917,924 | |
Koninklijke Ahold Delhaize NV | | | 656,335 | | | | 16,455,892 | |
| | | | | | | | |
| Security | | Shares | | | Value | |
|
| Netherlands (continued) | |
Koninklijke DSM NV | | | 98,804 | | | $ | 12,918,188 | |
Koninklijke KPN NV | | | 2,012,134 | | | | 5,954,660 | |
Koninklijke Philips NV | | | 497,103 | | | | 24,300,234 | |
Koninklijke Vopak NV | | | 41,463 | | | | 2,253,114 | |
NN Group NV | | | 168,346 | | | | 6,400,980 | |
NXP Semiconductors NV | | | 153,965 | | | | 19,593,586 | |
QIAGEN NV(c) | | | 129,953 | | | | 4,427,927 | |
Randstad NV | | | 67,800 | | | | 4,154,452 | |
Royal Dutch Shell PLC, B Shares | | | 2,063,381 | | | | 61,248,709 | |
Royal Dutch Shell PLC, Class A | | | 2,367,221 | | | | 70,103,403 | |
Wolters Kluwer NV | | | 154,159 | | | | 11,255,995 | |
| | | | | | | | |
| | | | 389,691,561 | |
|
| New Zealand — 0.3% | |
a2 Milk Co. Ltd.(c)(d) | | | 421,017 | | | | 4,262,951 | |
Auckland International Airport Ltd. | | | 541,082 | | | | 3,189,343 | |
Fisher & Paykel Healthcare Corp. Ltd. | | | 314,685 | | | | 4,709,563 | |
Fletcher Building Ltd. | | | 428,366 | | | | 1,468,304 | |
Mercury NZ Ltd. | | | 288,455 | | | | 981,229 | |
Meridian Energy Ltd. | | | 769,605 | | | | 2,592,417 | |
Ryman Healthcare Ltd. | | | 210,092 | | | | 2,309,029 | |
Spark New Zealand Ltd. | | | 1,015,961 | | | | 2,962,553 | |
| | | | | | | | |
| | | | 22,475,389 | |
|
| Norway — 0.6% | |
Aker BP ASA | | | 61,958 | | | | 2,033,485 | |
DNB ASA | | | 527,383 | | | | 9,868,866 | |
Equinor ASA | | | 569,927 | | | | 11,365,637 | |
Gjensidige Forsikring ASA | | | 104,513 | | | | 2,193,824 | |
Mowi ASA | | | 240,219 | | | | 6,245,914 | |
Norsk Hydro ASA | | | 723,916 | | | | 2,691,961 | |
Orkla ASA | | | 422,829 | | | | 4,287,828 | |
Schibsted ASA, Class B | | | 57,609 | | | | 1,646,297 | |
Telenor ASA | | | 413,552 | | | | 7,413,200 | |
Yara International ASA | | | 99,824 | | | | 4,159,045 | |
| | | | | | | | |
| | | | 51,906,057 | |
|
| Portugal — 0.2% | |
Banco Espirito Santo SA, Registered Shares(b)(c) | | | 47,542 | | | | 1 | |
EDP — Energias de Portugal SA | | | 1,457,875 | | | | 6,326,292 | |
Galp Energia SGPS SA | | | 280,422 | | | | 4,707,740 | |
Jeronimo Martins SGPS SA | | | 137,108 | | | | 2,259,442 | |
| | | | | | | | |
| | | | 13,293,475 | |
|
| Russia — 0.0% | |
Evraz PLC | | | 283,733 | | | | 1,519,339 | |
| | | | | | | | |
|
| Singapore — 1.3% | |
Ascendas Real Estate Investment Trust | | | 1,598,765 | | | | 3,532,237 | |
CapitaLand Commercial Trust | | | 1,553,160 | | | | 2,300,233 | |
CapitaLand Ltd. | | | 1,452,030 | | | | 4,051,913 | |
CapitaLand Mall Trust | | | 1,268,100 | | | | 2,321,338 | |
City Developments Ltd. | | | 266,378 | | | | 2,168,005 | |
ComfortDelGro Corp. Ltd. | | | 1,277,539 | | | | 2,260,486 | |
DBS Group Holdings Ltd. | | | 996,909 | | | | 19,221,641 | |
Genting Singapore Ltd. | | | 3,419,725 | | | | 2,341,788 | |
Jardine Cycle & Carriage Ltd. | | | 56,295 | | | | 1,258,911 | |
Keppel Corp. Ltd.(d) | | | 797,142 | | | | 4,016,454 | |
Mapletree Commercial Trust | | | 1,065,900 | | | | 1,895,440 | |
Oversea-Chinese Banking Corp. Ltd. | | | 1,773,287 | | | | 14,506,479 | |
SATS Ltd. | | | 368,198 | | | | 1,385,941 | |
Sembcorp Industries Ltd. | | | 546,686 | | | | 931,004 | |
Singapore Airlines Ltd. | | | 291,060 | | | | 1,956,882 | |
Singapore Exchange Ltd. | | | 472,626 | | | | 3,112,776 | |
Singapore Press Holdings Ltd. | | | 770,385 | | | | 1,247,945 | |
Singapore Technologies Engineering Ltd. | | | 877,579 | | | | 2,570,112 | |
Singapore Telecommunications Ltd. | | | 4,589,246 | | | | 11,505,777 | |
| | | | |
| SCHEDULE OF INVESTMENTS | | | 15 | |
| | |
Schedule of Investments (continued) December 31, 2019 | | iShares MSCI EAFE International Index Fund (Percentages shown are based on Net Assets) |
| | | | | | | | |
| Security | | Shares | | | Value | |
|
| Singapore (continued) | |
Suntec Real Estate Investment Trust | | | 1,051,500 | | | $ | 1,439,441 | |
United Overseas Bank Ltd. | | | 697,405 | | | | 13,715,598 | |
UOL Group Ltd. | | | 238,599 | | | | 1,476,692 | |
Venture Corp. Ltd. | | | 158,227 | | | | 1,908,813 | |
Wilmar International Ltd. | | | 1,079,783 | | | | 3,308,128 | |
| | | | | | | | |
| | | | 104,434,034 | |
|
| South Africa — 0.2% | |
Anglo American PLC | | | 567,824 | | | | 16,312,399 | |
| | | | | | | | |
|
| Spain — 2.8% | |
ACS Actividades de Construccion y Servicios SA | | | 143,149 | | | | 5,742,297 | |
Aena SME SA(e) | | | 37,348 | | | | 7,160,278 | |
Amadeus IT Group SA | | | 238,607 | | | | 19,541,134 | |
Banco Bilbao Vizcaya Argentaria SA | | | 3,689,326 | | | | 20,713,079 | |
Banco de Sabadell SA | | | 3,056,884 | | | | 3,579,329 | |
Banco Santander SA | | | 9,176,525 | | | | 38,474,850 | |
Bankia SA | | | 719,067 | | | | 1,539,629 | |
Bankinter SA | | | 377,887 | | | | 2,775,654 | |
CaixaBank SA | | | 2,017,291 | | | | 6,352,567 | |
Cellnex Telecom SA(e) | | | 140,728 | | | | 6,070,387 | |
Enagas SA | | | 113,468 | | | | 2,894,280 | |
Endesa SA | | | 178,537 | | | | 4,767,781 | |
Ferrovial SA | | | 273,706 | | | | 8,292,509 | |
Grifols SA | | | 165,044 | | | | 5,831,246 | |
Iberdrola SA | | | 3,359,467 | | | | 34,621,211 | |
Industria de Diseno Textil SA | | | 605,886 | | | | 21,412,317 | |
Mapfre SA | | | 597,574 | | | | 1,584,492 | |
Naturgy Energy Group SA | | | 166,104 | | | | 4,182,666 | |
Red Electrica Corp. SA | | | 246,652 | | | | 4,969,979 | |
Repsol SA | | | 796,105 | | | | 12,506,934 | |
Siemens Gamesa Renewable Energy SA | | | 128,334 | | | | 2,260,047 | |
Telefonica SA | | | 2,595,511 | | | | 18,150,672 | |
| | | | | | | | |
| | | | 233,423,338 | |
|
| Sweden — 2.5% | |
Alfa Laval AB | | | 170,326 | | | | 4,289,531 | |
Assa Abloy AB, Class B | | | 553,463 | | | | 12,937,445 | |
Atlas Copco AB, A Shares | | | 368,641 | | | | 14,714,552 | |
Atlas Copco AB, Class B | | | 214,722 | | | | 7,455,372 | |
Boliden AB | | | 157,303 | | | | 4,177,757 | |
Electrolux AB, Class B | | | 126,679 | | | | 3,114,192 | |
Epiroc AB, Class A | | | 370,429 | | | | 4,530,071 | |
Epiroc AB, Class B | | | 233,340 | | | | 2,773,177 | |
Essity AB, Class B | | | 333,624 | | | | 10,744,772 | |
Hennes & Mauritz AB, Class B | | | 451,217 | | | | 9,203,716 | |
Hexagon AB, Class B | | | 141,575 | | | | 7,935,458 | |
Husqvarna AB, Class B | | | 229,890 | | | | 1,842,269 | |
ICA Gruppen AB | | | 44,087 | | | | 2,059,390 | |
Industrivarden AB, Class C | | | 96,303 | | | | 2,322,400 | |
Investor AB, Class B | | | 252,560 | | | | 13,788,211 | |
Kinnevik AB | | | 130,602 | | | | 3,200,404 | |
L E Lundbergforetagen AB, B Shares | | | 41,054 | | | | 1,802,208 | |
Lundin Petroleum AB | | | 109,092 | | | | 3,704,157 | |
Sandvik AB | | | 624,554 | | | | 12,164,661 | |
Securitas AB, Class B | | | 168,919 | | | | 2,910,340 | |
Skandinaviska Enskilda Banken AB, Class A | | | 917,260 | | | | 8,625,800 | |
Skanska AB, Class B | | | 178,408 | | | | 4,035,875 | |
SKF AB, Class B | | | 217,008 | | | | 4,393,613 | |
Svenska Handelsbanken AB, Class A | | | 834,632 | | | | 8,989,193 | |
Swedbank AB, Class A | | | 509,541 | | | | 7,574,827 | |
Swedish Match AB | | | 91,317 | | | | 4,704,350 | |
Tele2 AB, Class B | | | 276,130 | | | | 4,007,762 | |
Telefonaktiebolaget LM Ericsson, Class B | | | 1,706,522 | | | | 14,911,264 | |
Telia Co. AB | | | 1,471,472 | | | | 6,322,216 | |
Volvo AB, Class B | | | 821,804 | | | | 13,757,975 | |
| | | | | | | | |
| | | | 202,992,958 | |
| | | | | | | | |
| Security | | Shares | | | Value | |
|
| Switzerland — 9.7% | |
ABB Ltd., Registered Shares | | | 1,023,629 | | | $ | 24,693,143 | |
Adecco Group AG, Registered Shares | | | 85,746 | | | | 5,421,051 | |
Alcon, Inc.(c) | | | 231,583 | | | | 13,117,235 | |
Baloise Holding AG, Registered Shares | | | 27,001 | | | | 4,886,787 | |
Barry Callebaut AG, Registered Shares | | | 1,685 | | | | 3,719,614 | |
Chocoladefabriken Lindt & Spruengli AG | | | 549 | | | | 4,263,004 | |
Chocoladefabriken Lindt & Spruengli AG, Registered Shares | | | 57 | | | | 5,035,648 | |
Cie Financiere Richemont SA, Registered Shares | | | 289,938 | | | | 22,658,917 | |
Clariant AG, Registered Shares(c) | | | 118,082 | | | | 2,638,940 | |
Coca-Cola HBC AG(c) | | | 110,983 | | | | 3,772,310 | |
Credit Suisse Group AG, Registered Shares(c) | | | 1,414,235 | | | | 19,117,169 | |
Dufry AG, Registered Shares(c) | | | 24,064 | | | | 2,386,216 | |
EMS-Chemie Holding AG, Registered Shares | | | 4,423 | | | | 2,907,833 | |
Geberit AG, Registered Shares | | | 20,475 | | | | 11,492,237 | |
Givaudan SA, Registered Shares | | | 5,129 | | | | 16,069,130 | |
Glencore PLC(c) | | | 5,998,984 | | | | 18,679,138 | |
Julius Baer Group Ltd.(c) | | | 125,803 | | | | 6,485,510 | |
Kuehne + Nagel International AG, Registered Shares | | | 29,878 | | | | 5,039,422 | |
LafargeHolcim Ltd., Registered Shares(c) | | | 269,680 | | | | 14,961,161 | |
Lonza Group AG, Registered Shares(c) | | | 41,334 | | | | 15,078,944 | |
Nestle SA, Registered Shares | | | 1,646,528 | | | | 178,261,675 | |
Novartis AG, Registered Shares | | | 1,188,570 | | | | 112,545,182 | |
Pargesa Holding SA, Bearer Shares | | | 21,600 | | | | 1,794,556 | |
Partners Group Holding AG | | | 10,436 | | | | 9,564,876 | |
Roche Holding AG | | | 388,706 | | | | 126,330,481 | |
Schindler Holding AG, Participation Certificates | | | 22,563 | | | | 5,737,796 | |
Schindler Holding AG, Registered Shares | | | 10,284 | | | | 2,518,471 | |
SGS SA, Registered Shares | | | 2,852 | | | | 7,810,697 | |
Sika AG, Registered Shares | | | 70,338 | | | | 13,209,150 | |
Sonova Holding AG, Registered Shares | | | 30,725 | | | | 7,023,995 | |
STMicroelectronics NV | | | 376,767 | | | | 10,165,402 | |
Straumann Holding AG, Registered Shares | | | 5,802 | | | | 5,691,368 | |
Swatch Group AG, Bearer Shares | | | 16,211 | | | | 4,526,198 | |
Swatch Group AG, Registered Shares | | | 31,376 | | | | 1,659,783 | |
Swiss Life Holding AG, Registered Shares | | | 18,587 | | | | 9,324,542 | |
Swiss Prime Site AG, Registered Shares(c) | | | 42,021 | | | | 4,861,585 | |
Swiss Re AG | | | 161,299 | | | | 18,120,721 | |
Swisscom AG, Registered Shares | | | 14,331 | | | | 7,586,484 | |
Temenos AG, Registered Shares(c) | | | 34,597 | | | | 5,472,872 | |
UBS Group AG, Registered Shares(c) | | | 2,135,096 | | | | 26,943,603 | |
Vifor Pharma AG | | | 25,945 | | | | 4,735,100 | |
Zurich Insurance Group AG | | | 82,489 | | | | 33,836,923 | |
| | | | | | | | |
| | | | 800,144,869 | |
|
| United Arab Emirates — 0.0% | |
NMC Health PLC(d) | | | 51,841 | | | | 1,214,602 | |
| | | | | | | | |
|
| United Kingdom — 14.3% | |
3i Group PLC | | | 537,730 | | | | 7,824,892 | |
Admiral Group PLC | | | 104,477 | | | | 3,192,647 | |
Ashtead Group PLC | | | 248,078 | | | | 7,932,225 | |
Associated British Foods PLC | | | 190,170 | | | | 6,542,016 | |
AstraZeneca PLC | | | 725,824 | | | | 72,649,129 | |
Auto Trader Group PLC(e) | | | 530,619 | | | | 4,190,376 | |
Aveva Group PLC | | | 35,057 | | | | 2,162,758 | |
Aviva PLC | | | 2,156,012 | | | | 11,967,044 | |
BAE Systems PLC | | | 1,768,842 | | | | 13,243,880 | |
Barclays PLC | | | 9,543,478 | | | | 22,756,179 | |
Barratt Developments PLC | | | 558,716 | | | | 5,532,086 | |
Berkeley Group Holdings PLC | | | 67,403 | | | | 4,338,212 | |
BP PLC | | | 11,270,959 | | | | 70,903,379 | |
British American Tobacco PLC | | | 1,269,094 | | | | 53,939,123 | |
British Land Co. PLC | | | 506,580 | | | | 4,286,449 | |
BT Group PLC | | | 4,684,345 | | | | 11,936,599 | |
Bunzl PLC | | | 186,150 | | | | 5,091,336 | |
Burberry Group PLC | | | 226,679 | | | | 6,618,028 | |
| | |
| 16 | | 2019 BLACKROCK ANNUAL REPORTTO SHAREHOLDERS |
| | |
Schedule of Investments (continued) December 31, 2019 | | iShares MSCI EAFE International Index Fund (Percentages shown are based on Net Assets) |
| | | | | | | | |
| Security | | Shares | | | Value | |
|
| United Kingdom (continued) | |
Centrica PLC | | | 3,201,920 | | | $ | 3,787,447 | |
CK Hutchison Holdings Ltd. | | | 1,487,117 | | | | 14,180,379 | |
CNH Industrial NV | | | 570,733 | | | | 6,266,588 | |
Coca-Cola European Partners PLC | | | 129,468 | | | | 6,587,332 | |
Compass Group PLC | | | 880,867 | | | | 22,076,089 | |
Croda International PLC | | | 72,234 | | | | 4,906,757 | |
DCC PLC | | | 54,366 | | | | 4,715,658 | |
Diageo PLC | | | 1,308,745 | | | | 55,146,137 | |
Direct Line Insurance Group PLC | | | 781,173 | | | | 3,232,141 | |
easyJet PLC | | | 89,168 | | | | 1,679,644 | |
Experian PLC | | | 505,547 | | | | 17,137,766 | |
Fiat Chrysler Automobiles NV | | | 595,378 | | | | 8,827,387 | |
G4S PLC | | | 904,143 | | | | 2,614,655 | |
GlaxoSmithKline PLC | | | 2,760,010 | | | | 64,852,018 | |
GVC Holdings PLC | | | 305,399 | | | | 3,576,867 | |
Halma PLC | | | 213,230 | | | | 5,971,001 | |
Hargreaves Lansdown PLC | | | 159,968 | | | | 4,103,372 | |
HSBC Holdings PLC | | | 11,170,331 | | | | 87,446,212 | |
Imperial Brands PLC | | | 529,741 | | | | 13,105,942 | |
Informa PLC | | | 692,617 | | | | 7,877,567 | |
InterContinental Hotels Group PLC | | | 96,726 | | | | 6,646,501 | |
Intertek Group PLC | | | 88,963 | | | | 6,893,577 | |
ITV PLC | | | 1,957,040 | | | | 3,915,596 | |
J. Sainsbury PLC | | | 1,020,500 | | | | 3,111,760 | |
JD Sports Fashion PLC | | | 234,798 | | | | 2,608,038 | |
Johnson Matthey PLC | | | 108,070 | | | | 4,297,011 | |
Kingfisher PLC | | | 1,163,213 | | | | 3,348,573 | |
Land Securities Group PLC | | | 389,737 | | | | 5,115,886 | |
Legal & General Group PLC | | | 3,295,437 | | | | 13,237,958 | |
Lloyds Banking Group PLC | | | 38,792,343 | | | | 32,136,377 | |
London Stock Exchange Group PLC | | | 172,956 | | | | 17,775,029 | |
M&G PLC(c) | | | 1,434,774 | | | | 4,507,989 | |
Marks & Spencer Group PLC | | | 1,113,280 | | | | 3,156,659 | |
Meggitt PLC | | | 415,996 | | | | 3,623,311 | |
Melrose Industries PLC | | | 2,662,522 | | | | 8,480,726 | |
Micro Focus International PLC | | | 186,401 | | | | 2,616,253 | |
Mondi PLC | | | 268,377 | | | | 6,293,221 | |
National Grid PLC | | | 1,923,193 | | | | 24,034,457 | |
Next PLC | | | 74,171 | | | | 6,911,453 | |
Ocado Group PLC(c) | | | 255,302 | | | | 4,331,711 | |
Pearson PLC | | | 455,733 | | | | 3,850,076 | |
Persimmon PLC | | | 177,607 | | | | 6,343,962 | |
Prudential PLC | | | 1,434,774 | | | | 27,491,174 | |
Reckitt Benckiser Group PLC | | | 391,413 | | | | 31,793,883 | |
RELX PLC | | | 1,084,334 | | | | 27,372,198 | |
Rentokil Initial PLC | | | 1,038,687 | | | | 6,225,440 | |
Rolls-Royce Holdings PLC(c) | | | 953,853 | | | | 8,620,932 | |
Royal Bank of Scotland Group PLC | | | 2,652,664 | | | | 8,509,593 | |
RSA Insurance Group PLC | | | 564,279 | | | | 4,229,102 | |
Sage Group PLC | | | 610,024 | | | | 6,051,857 | |
Schroders PLC | | | 70,979 | | | | 3,134,156 | |
Segro PLC | | | 602,905 | | | | 7,179,067 | |
Severn Trent PLC | | | 134,391 | | | | 4,477,059 | |
Smith & Nephew PLC | | | 493,756 | | | | 11,899,881 | |
Smiths Group PLC | | | 222,556 | | | | 4,970,819 | |
Spirax-Sarco Engineering PLC | | | 41,345 | | | | 4,866,863 | |
SSE PLC | | | 562,060 | | | | 10,719,744 | |
St. James’s Place PLC | | | 293,957 | | | | 4,531,270 | |
Standard Chartered PLC | | | 1,508,170 | | | | 14,211,616 | |
Standard Life Aberdeen PLC | | | 1,286,952 | | | | 5,599,043 | |
Taylor Wimpey PLC | | | 1,775,244 | | | | 4,551,850 | |
Tesco PLC | | | 5,414,281 | | | | 18,298,275 | |
Unilever NV | | | 813,823 | | | | 46,705,850 | |
Unilever PLC | | | 613,855 | | | | 35,138,676 | |
United Utilities Group PLC | | | 377,199 | | | | 4,720,228 | |
Vodafone Group PLC | | | 14,768,792 | | | | 28,671,737 | |
| | | | | | | | |
| Security | | Shares | | | Value | |
|
| United Kingdom (continued) | |
Weir Group PLC | | | 138,535 | | | $ | 2,770,696 | |
Whitbread PLC | | | 75,122 | | | | 4,821,226 | |
WM Morrison Supermarkets PLC | | | 1,323,533 | | | | 3,502,797 | |
WPP PLC | | | 693,570 | | | | 9,760,094 | |
| | | | | | | | |
| | | | 1,177,258,567 | |
|
| United States — 0.3% | |
Carnival PLC | | | 88,190 | | | | 4,227,258 | |
CyberArk Software Ltd.(c)(d) | | | 20,890 | | | | 2,435,356 | |
Ferguson PLC | | | 128,348 | | | | 11,680,546 | |
James Hardie Industries PLC | | | 245,504 | | | | 4,798,241 | |
| | | | | | | | |
| | | | 23,141,401 | |
| | | | | | | | |
| |
Total Common Stocks — 99.1%
(Cost — $6,522,714,165) | | | | 8,165,644,592 | |
| | | | | | | | |
|
Preferred Stocks — 0.6% | |
|
Germany — 0.6% | |
Bayerische Motoren Werke AG, Preference Shares | | | 32,402 | | | | 1,994,731 | |
Fuchs Petrolub SE, Preference Shares | | | 38,917 | | | | 1,933,530 | |
Henkel AG & Co. KGaA, Preference Shares | | | 97,422 | | | | 10,063,737 | |
Porsche Automobil Holding SE, Preference Shares | | | 84,724 | | | | 6,286,369 | |
Sartorius AG, Preference Shares | | | 19,582 | | | | 4,185,884 | |
Volkswagen AG, Preference Shares | | | 102,763 | | | | 20,227,698 | |
| | | | | | | | |
| |
Total Preferred Stocks — 0.6%
(Cost — $36,475,993) | | | | 44,691,949 | |
| | | | | | | | |
| |
Total Preferred Securities — 0.6% | | | | 44,691,949 | |
| | | | | | | | |
|
Rights — 0.0% | |
|
Spain — 0.0% | |
Repsol SA, (Expires 01/21/20)(c) | | | 796,105 | | | | 377,735 | |
| | | | | | | | |
| |
Total Rights — 0.0%
(Cost — $376,485) | | | | 377,735 | |
| | | | | | | | |
| |
Total Long-Term Investments — 99.7%
(Cost — $6,559,566,643) | | | | 8,210,714,276 | |
| | | | | | | | |
|
Short-Term Securities — 0.5% | |
BlackRock Cash Funds: Institutional,
SL Agency Shares, | | | | | | | | |
1.84%(f)(g)(h) | | $ | 43,028,944 | | | | 43,046,155 | |
| | | | | | | | |
| |
Total Short-Term Securities — 0.5%
(Cost — $43,043,556) | | | | 43,046,155 | |
| | | | | | | | |
| |
Total Investments — 100.2%
(Cost — $6,602,610,199) | | | | 8,253,760,431 | |
| |
Liabilities in Excess of Other Assets — (0.2)% | | | | (15,925,443 | ) |
| | | | | | | | |
| |
Net Assets — 100.0% | | | $ | 8,237,834,988 | |
| | | | | | | | |
| (a) | A security contractually bound to one or more other securities to form a single saleable unit which cannot be sold separately. |
| (b) | Security is valued using significant unobservable inputs and is classified as Level 3 in the fair value hierarchy. |
| (c) | Non-income producing security. |
| (d) | Security, or a portion of the security, is on loan. |
| (e) | Security exempt from registration pursuant to Rule 144A under the Securities Act of 1933, as amended. These securities may be resold in transactions exempt from registration to qualified institutional investors. |
| (f) | Annualized7-day yield as of period end. |
| (g) | All or a portion of the Security was purchased with the cash collateral from loaned securities. |
| | | | |
| SCHEDULE OF INVESTMENTS | | | 17 | |
| | |
Schedule of Investments (continued) December 31, 2019 | | iShares MSCI EAFE International Index Fund |
| (h) | During the year ended December 31, 2019, investments in issuers considered to be an affiliate/affiliates of the Fund for purposes of Section 2(a)(3) of the Investment Company Act of 1940, as amended, were as follows: |
| | | | | | | | | | | | | | | | | | | | | | | | | | | | |
| Affiliate | | Shares
Held at
12/31/18 | | | Net
Activity | | | Shares
Held at
12/31/19 | | | Value at
12/31/19 | | | Income | | | Net
Realized
Gain (Loss) (a) | | | Change in
Unrealized
Appreciation
(Depreciation) | |
BlackRock Cash Funds: Institutional, SL Agency Shares | | | 28,516,828 | | | | 14,512,116 | | | | 43,028,944 | | | $ | 43,046,155 | | | $ | 818,937 | (b) | | $ | (1,549 | ) | | $ | 2,201 | |
BlackRock Cash Funds: Treasury, SL Agency Shares | | | — | | | | — | | | | — | | | | — | | | | 135,451 | | | | — | | | | — | |
| | | | | | | | | | | | | | | | | | | | | | | | | | | | |
| | | | | | | | | | | | | | $ | 43,046,155 | | | $ | 954,388 | | | $ | (1,549 | ) | | $ | 2,201 | |
| | | | | | | | | | | | | | | | | | | | | | | | | | | | |
| | (a) | Includes net capital gain distributions, if applicable. | |
| | (b) | Represents securities lending income earned from the reinvestment of cash collateral from loaned securities, net of fees and collateral investment expenses, and other payments to and from borrowers of securities. | |
Derivative Financial Instruments Outstanding as of Period End
Futures Contracts
| | | | | | | | | | | | | | | | |
| Description | | Number of
Contracts | | | Expiration
Date | | | Notional
Amount (000) | | | Value/
Unrealized
Appreciation
(Depreciation) | |
Long Contracts | | | | | | | | | | | | | | | | |
Nikkei 225 Index | | | 52 | | | | 03/12/20 | | | $ | 5,593 | | | $ | (122,026 | ) |
SPI 200 Index | | | 39 | | | | 03/19/20 | | | | 4,518 | | | | (118,310 | ) |
Euro Stoxx 50 Index | | | 425 | | | | 03/20/20 | | | | 17,777 | | | | (86,146 | ) |
FTSE 100 Index | | | 106 | | | | 03/20/20 | | | | 10,529 | | | | 20,635 | |
| | | | | | | | | | | | | | | | |
| | | | | | | | | | | | | | $ | (305,847 | ) |
| | | | | | | | | | | | | | | | |
Derivative Financial Instruments Categorized by Risk Exposure
As of period end, the fair values of derivative financial instruments located in the Statements of Assets and Liabilities were as follows:
| | | | | | | | | | | | | | | | | | | | | | | | | | | | |
| | | Commodity Contracts | | | Credit
Contracts | | | Equity
Contracts | | | Foreign
Currency
Exchange
Contracts | | | Interest Rate Contracts | | | Other
Contracts | | | Total | |
Assets — Derivative Financial Instruments | | | | | | | | | | | | | | | | | | | | | | | | | | | | |
Future contracts | | | | | | | | | | | | | | | | | | | | | | | | | | | | |
Unrealized appreciation on future contracts(a) | | $ | — | | | | — | | | $ | 20,635 | | | $ | — | | | $ | — | | | $ | — | | | $ | 20,635 | |
| | | | | | | | | | | | | | | | | | | | | | | | | | | | |
Liabilities — Derivative Financial Instruments | | | | | | | | | | | | | | | | | | | | | | | | | | | | |
Future contracts | | | | | | | | | | | | | | | | | | | | | | | | | | | | |
Unrealized depreciation on future contracts(a) | | $ | — | | | | — | | | $ | 326,482 | | | $ | — | | | $ | — | | | $ | — | | | $ | 326,482 | |
| | | | | | | | | | | | | | | | | | | | | | | | | | | | |
| | (a) | Includes cumulative appreciation (depreciation) on futures contracts, if any, as reported in the Schedule of Investments. Only current day’s variation margin is reported within the Statements of Assets and Liabilities. | |
For the year ended December 31, 2019, the effect of derivative financial instruments in the Statements of Operations was as follows:
| | | | | | | | | | | | | | | | | | | | | | | | | | | | |
| | | Commodity Contracts | | | Credit Contracts | | | Equity Contracts | | | Foreign
Currency
Exchange
Contracts | | | Interest
Rate
Contracts | | | Other
Contracts | | | Total | |
Net Realized Gain (Loss) from: | | | | | | | | | | | | | | | | | | | | | | | | | | | | |
Future contracts | | $ | — | | | $ | — | | | $ | 17,404,397 | | | $ | — | | | $ | — | | | $ | — | | | $ | 17,404,397 | |
| | | | | | | | | | | | | | | | | | | | | | | | | | | | |
| | | | | | | |
| Net Change in Unrealized Appreciation (Depreciation) on: | | | | | | | | | | | | | | | | | | | | | |
Future contracts | | $ | — | | | $ | — | | | $ | 156,294 | | | $ | — | | | $ | — | | | $ | — | | | $ | 156,294 | |
| | | | | | | | | | | | | | | | | | | | | | | | | | | | |
Average Quarterly Balances of Outstanding Derivative Financial Instruments
| | | | |
Futures contracts: | |
Average notional value of contracts — long | | $ | 86,874,449 | |
Average notional value of contracts — short | | | — | (a) |
| | (a) | Derivatives not held atquarter-end. The risk exposure table serves as an indicator of activity during the period. | |
| | |
| 18 | | 2019 BLACKROCK ANNUAL REPORTTO SHAREHOLDERS |
| | |
Schedule of Investments (continued) December 31, 2019 | | iShares MSCI EAFE International Index Fund |
For more information about the Fund’s investment risks regarding derivative financial instruments, refer to the Notes to Financial Statements.
Fair Value Hierarchy as of Period End
Various inputs are used in determining the fair value of investments and derivative financial instruments. For information about the Fund’s policy regarding valuation of investments and derivative financial instruments, refer to the Notes to Financial Statements.
The following tables summarize the Fund’s investments and derivative financial instruments categorized in the disclosure hierarchy:
| | | | | | | | | | | | | | | | |
| | | Level 1 | | | Level 2 | | | Level 3 | | | Total | |
Assets: | |
Investments: | |
Common Stocks: | |
Australia | | $ | — | | | $ | 618,407,409 | | | $ | 11 | | | $ | 618,407,420 | |
Austria | | | 1,872,648 | | | | 16,449,881 | | | | — | | | | 18,322,529 | |
Belgium | | | 1,597,883 | | | | 79,990,174 | | | | — | | | | 81,588,057 | |
Canada | | | — | | | | 18 | | | | — | | | | 18 | |
Chile | | | — | | | | 2,626,300 | | | | — | | | | 2,626,300 | |
China | | | 5,584,873 | | | | 28,219,304 | | | | — | | | | 33,804,177 | |
Colombia | | | — | | | | 2,729,390 | | | | — | | | | 2,729,390 | |
Denmark | | | 51,833,043 | | | | 99,317,929 | | | | — | | | | 151,150,972 | |
Finland | | | 12,264,144 | | | | 80,021,555 | | | | — | | | | 92,285,699 | |
France | | | 28,635,546 | | | | 889,074,602 | | | | — | | | | 917,710,148 | |
Germany | | | 56,111,028 | | | | 607,589,508 | | | | — | | | | 663,700,536 | |
Hong Kong | | | 5,206,840 | | | | 235,331,825 | | | | — | | | | 240,538,665 | |
Ireland | | | 27,254,015 | | | | 25,436,517 | | | | — | | | | 52,690,532 | |
Israel | | | 16,208,136 | | | | 27,453,900 | | | | — | | | | 43,662,036 | |
Italy | | | — | | | | 170,035,393 | | | | — | | | | 170,035,393 | |
Japan | | | — | | | | 2,002,963,361 | | | | — | | | | 2,002,963,361 | |
Luxembourg | | | 6,374,515 | | | | 9,487,031 | | | | — | | | | 15,861,546 | |
Macau | | | — | | | | 19,759,824 | | | | — | | | | 19,759,824 | |
Netherlands | | | 19,593,586 | | | | 370,097,975 | | | | — | | | | 389,691,561 | |
New Zealand | | | — | | | | 22,475,389 | | | | — | | | | 22,475,389 | |
Norway | | | — | | | | 51,906,057 | | | | — | | | | 51,906,057 | |
Portugal | | | — | | | | 13,293,474 | | | | 1 | | | | 13,293,475 | |
Russia | | | — | | | | 1,519,339 | | | | — | | | | 1,519,339 | |
Singapore | | | — | | | | 104,434,034 | | | | — | | | | 104,434,034 | |
South Africa | | | — | | | | 16,312,399 | | | | — | | | | 16,312,399 | |
Spain | | | 2,894,280 | | | | 230,529,058 | | | | — | | | | 233,423,338 | |
Sweden | | | 8,625,800 | | | | 194,367,158 | | | | — | | | | 202,992,958 | |
Switzerland | | | 9,298,652 | | | | 790,846,217 | | | | — | | | | 800,144,869 | |
United Arab Emirates | | | — | | | | 1,214,602 | | | | — | | | | 1,214,602 | |
United Kingdom | | | 35,064,153 | | | | 1,142,194,414 | | | | — | | | | 1,177,258,567 | |
United States | | | 2,435,356 | | | | 20,706,045 | | | | — | | | | 23,141,401 | |
Preferred Stocks (a) | | | — | | | | 44,691,949 | | | | — | | | | 44,691,949 | |
Rights (a) | | | 377,735 | | | | — | | | | — | | | | 377,735 | |
Short-Term Securities | | | 43,046,155 | | | | — | | | | — | | | | 43,046,155 | |
| | | | | | | | | | | | | | | | |
| | $ | 334,278,388 | | | $ | 7,919,482,031 | | | $ | 12 | | | $ | 8,253,760,431 | |
| | | | | | | | | | | | | | | | |
Derivative Financial Instruments(b) | |
Assets: | |
Equity contracts | | $ | 20,635 | | | $ | — | | | $ | — | | | $ | 20,635 | |
Liabilities: | |
Equity contracts | | | (326,482 | ) | | | — | | | | — | | | | (326,482 | ) |
| | | | | | | | | | | | | | | | |
| | $ | (305,847 | ) | | $ | — | | | $ | — | | | $ | (305,847 | ) |
| | | | | | | | | | | | | | | | |
| | (a) | See above Schedule of Investments for values in each country. | |
| | (b) | Derivative financial instruments are futures contracts which are valued at the unrealized appreciation (depreciation) on the instrument. | |
See notes to financial statements.
| | | | |
| SCHEDULE OF INVESTMENTS | | | 19 | |
Statements of Assets and Liabilities
December 31, 2019
| | | | | | | | |
| | | iShares MSCI EAFE International
Index Fund | | | iShares Russell 2000 Small-Cap Index Fund | |
| | |
ASSETS | | | | | | | | |
Investments at value — unaffiliated (including securities loaned at value of $41,309,101)(a) | | $ | 8,210,714,276 | | | $ | — | |
Investments at value — Master Small Cap Index Series | | | — | | | | 2,304,511,039 | |
Investments at value — affiliated(b) | | | 43,046,155 | | | | — | |
Cash pledged for futures contracts | | | 2,728,220 | | | | — | |
Foreign currency at value(c) | | | 30,737,428 | | | | — | |
Receivables: | | | | | | | | |
Investments sold | | | 58,120 | | | | — | |
Securities lending income — affiliated | | | 30,400 | | | | — | |
Capital shares sold | | | 11,881,066 | | | | 7,029,296 | |
Dividends — affiliated | | | 11,408 | | | | — | |
Dividends — unaffiliated | | | 18,814,147 | | | | — | |
Prepaid expenses | | | 99,310 | | | | 55,035 | |
| | | | | | | | |
Total assets | | | 8,318,120,530 | | | | 2,311,595,370 | |
| | | | | | | | |
| | |
LIABILITIES | | | | | | | | |
Bank overdraft | | | 17,279,704 | | | | — | |
Cash collateral on securities loaned at value | | | 43,043,457 | | | | — | |
Payables: | | | | | | | | |
Investments purchased | | | 3,777 | | | | — | |
Capital shares redeemed | | | 18,069,635 | | | | 7,014,679 | |
Contributions to the Master Small Cap Index Series | | | — | | | | 14,617 | |
Administration fees | | | — | | | | 27 | |
Investment advisory fees | | | 135,894 | | | | — | |
Directors’ and Officer’s fees | | | 31,922 | | | | 689 | |
Other accrued expenses | | | 988,750 | | | | 258,694 | |
Other affiliates | | | 48,216 | | | | — | |
Professional fees | | | 94,490 | | | | — | |
Service fees | | | 102,911 | | | | 119,875 | |
Variation margin on futures contracts | | | 486,786 | | | | — | |
| | | | | | | | |
Total liabilities | | | 80,285,542 | | | | 7,408,581 | |
| | | | | | | | |
| | |
NET ASSETS | | $ | 8,237,834,988 | | | $ | 2,304,186,789 | |
| | | | | | | | |
| | |
NET ASSETS CONSIST OF | | | | | | | | |
Paid-in capital | | $ | 7,475,863,310 | | | $ | 2,027,373,358 | |
Accumulated earnings | | | 761,971,678 | | | | 276,813,431 | |
| | | | | | | | |
NET ASSETS | | $ | 8,237,834,988 | | | $ | 2,304,186,789 | |
| | | | | | | | |
See notes to financial statements.
| | |
| 20 | | 2019 BLACKROCK ANNUAL REPORTTO SHAREHOLDERS |
Statements of Assets and Liabilities (continued)
December 31, 2019
| | | | | | | | |
| | | iShares MSCI EAFE International
Index Fund | | | iShares Russell 2000 Small-Cap Index Fund | |
| | |
NET ASSET VALUE | | | | | | | | |
| | |
| Institutional | | | | | | |
Net assets | | $ | 876,550,849 | | | $ | 227,380,955 | |
| | | | | | | | |
Shares outstanding, $0.0001 par value | | | 63,236,402 | | | | 11,111,814 | |
| | | | | | | | |
Net asset value | | $ | 13.86 | | | $ | 20.46 | |
| | | | | | | | |
Shares authorized | | | 1.208 billion | | | | 208 million | |
| | | | | | | | |
| | |
| Investor A | | | | | | |
Net assets | | $ | 340,749,992 | | | $ | 273,412,971 | |
| | | | | | | | |
Shares outstanding, $0.0001 par value | | | 24,735,506 | | | | 13,344,086 | |
| | | | | | | | |
Net asset value | | $ | 13.78 | | | $ | 20.49 | |
| | | | | | | | |
Shares authorized | | | 208 million | | | | 208 million | |
| | | | | | | | |
| | |
| Class K | | | | | | |
Net assets | | $ | 6,870,922,226 | | | $ | 1,502,229,421 | |
| | | | | | | | |
Shares outstanding, $0.0001 par value | | | 495,287,524 | | | | 73,206,081 | |
| | | | | | | | |
Net asset value | | $ | 13.87 | | | $ | 20.52 | |
| | | | | | | | |
Shares authorized | | | 1.208 billion | | | | 1.208 billion | |
| | | | | | | | |
| | |
| Investor P | | | | | | |
Net assets | | $ | 149,611,921 | | | $ | 301,163,442 | |
| | | | | | | | |
Shares outstanding, $0.0001 par value | | | 10,897,887 | | | | 14,742,718 | |
| | | | | | | | |
Net asset value | | $ | 13.73 | | | $ | 20.43 | |
| | | | | | | | |
Shares authorized | | | 2 billion | | | | 2 billion | |
| | | | | | | | |
| | |
(a) Investments at cost — unaffiliated | | $ | 6,559,566,643 | | | $ | — | |
(b) Investments at cost — affiliated | | $ | 43,043,556 | | | $ | — | |
(c) Foreign currency at cost | | $ | 30,382,569 | | | $ | — | |
See notes to financial statements.
Statements of Operations
Year Ended December 31, 2019
| | | | | | | | |
| | | iShares MSCI
EAFE International
Index Fund | | | iShares Russell
2000 Small-Cap
Index Fund | |
| | |
INVESTMENT INCOME | | | | | | | | |
Dividends — affiliated | | $ | 135,451 | | | $ | — | |
Dividends — unaffiliated | | | 285,974,285 | | | | — | |
Interest — unaffiliated | | | 140,715 | | | | — | |
Securities lending income — affiliated — net | | | 818,937 | | | | — | |
Foreign taxes withheld | | | (23,630,232 | ) | | | — | |
Net investment income allocated from the Master Small Cap Index Series: | | | | | | | | |
Dividends — affiliated | | | — | | | | 945,269 | |
Dividends — unaffiliated | | | — | | | | 27,307,091 | |
Interest — unaffiliated | | | — | | | | 17,702 | |
Securities lending income — affiliated — net | | | — | | | | 2,492,414 | |
Foreign taxes withheld | | | — | | | | (8,832 | ) |
Expenses | | | — | | | | (440,647 | ) |
Fees waived | | | — | | | | 20,691 | |
| | | | | | | | |
Total investment income | | | 263,439,156 | | | | 30,333,688 | |
| | | | | | | | |
| | |
EXPENSES | | | | | | | | |
Transfer agent — class specific | | | 1,352,947 | | | | 760,632 | |
Service — class specific | | | 1,187,201 | | | | 1,424,736 | |
Investment advisory | | | 794,383 | | | | — | |
Custodian | | | 485,772 | | | | — | |
Registration | | | 176,409 | | | | 100,143 | |
Professional | | | 165,602 | | | | 59,921 | |
Printing | | | 128,730 | | | | 44,005 | |
Directors and Officer | | | 103,182 | | | | 995 | |
Accounting services | | | 102,625 | | | | 3,078 | |
Offering | | | 26,855 | | | | 26,855 | |
Administration | | | — | | | | 815,978 | |
Miscellaneous | | | 144,412 | | | | 15,883 | |
| | | | | | | | |
Total expenses | | | 4,668,118 | | | | 3,252,226 | |
Less: | | | | | | | | |
Fees waived and/or reimbursed by the Manager | | | (4,555 | ) | | | — | |
Fees waived and/or reimbursed by the Administrator | | | — | | | | (59,634 | ) |
Transfer agent fees waived and/or reimbursed — class specific | | | (43,165 | ) | | | (385,379 | ) |
| | | | | | | | |
Total expenses after fees waived and/or reimbursed | | | 4,620,398 | | | | 2,807,213 | |
| | | | | | | | |
Net investment income | | | 258,818,758 | | | | 27,526,475 | |
| | | | | | | | |
| | |
REALIZED AND UNREALIZED GAIN (LOSS) | | | | | | | | |
Net realized gain (loss) from: | | | | | | | | |
Futures contracts | | | 17,404,397 | | | | — | |
Foreign currency transactions | | | (153,809 | ) | | | — | |
Investments — affiliated | | | (1,549 | ) | | | — | |
Investments — unaffiliated | | | (48,851,011 | ) | | | — | |
Net realized gain (loss) allocated from the Master Small Cap Index Series from: | | | | | | | | |
Futures contracts | | | — | | | | 5,692,338 | |
Foreign currency transactions | | | — | | | | (229 | ) |
Investments — affiliated | | | — | | | | 1,360,493 | |
Investments — unaffiliated | | | — | | | | 27,651,732 | |
Swaps | | | — | | | | 948,113 | |
| | | | | | | | |
| | | (31,601,972 | ) | | | 35,652,447 | |
| | | | | | | | |
Net change in unrealized appreciation (depreciation) on: | | | | | | | | |
Futures contracts | | | 156,294 | | | | — | |
Foreign currency translations | | | 613,196 | | | | — | |
Investments — affiliated | | | 2,201 | | | | — | |
Investments — unaffiliated | | | 1,355,744,304 | | | | — | |
Net change in unrealized appreciation (depreciation) allocated from the Master Small Cap Index Series on: | | | | | | | | |
Futures contracts | | | — | | | | (130,094 | ) |
Foreign currency translations | | | — | | | | 228 | |
Investments — affiliated | | | — | | | | 2,677,056 | |
Investments — unaffiliated | | | — | | | | 377,456,183 | |
Swaps | | | — | | | | 167,785 | |
| | | | | | | | |
| | | 1,356,515,995 | | | | 380,171,158 | |
| | | | | | | | |
Net realized and unrealized gain | | | 1,324,914,023 | | | | 415,823,605 | |
| | | | | | | | |
NET INCREASE IN NET ASSETS RESULTING FROM OPERATIONS | | $ | 1,583,732,781 | | | $ | 443,350,080 | |
| | | | | | | | |
See notes to financial statements.
| | |
| 22 | | 2019 BLACKROCK ANNUAL REPORTTO SHAREHOLDERS |
Statements of Changes in Net Assets
| | | | | | | | |
| | | iShares MSCI EAFE
International Index Fund | |
| | | Year Ended December 31, | |
| | | 2019 | | | 2018 | |
| | |
INCREASE (DECREASE) IN NET ASSETS | | | | | | | | |
| | |
OPERATIONS | | | | | | | | |
Net investment income | | $ | 258,818,758 | | | $ | 337,289,066 | |
Net realized loss | | | (31,601,972 | ) | | | (586,310,846 | ) |
Net change in unrealized appreciation (depreciation) | | | 1,356,515,995 | | | | (1,185,549,571 | ) |
| | | | | | | | |
Net increase (decrease) in net assets resulting from operations | | | 1,583,732,781 | | | | (1,434,571,351 | ) |
| | | | | | | | |
| | |
DISTRIBUTIONS(a) | | | | | | | | |
From net investment income | | | | | | | | |
Institutional | | | (28,671,489 | ) | | | (31,056,943 | ) |
Investor A | | | (10,102,636 | ) | | | (12,478,689 | ) |
Class K | | | (224,970,295 | ) | | | (295,243,133 | ) |
Investor P | | | (4,447,915 | ) | | | (5,990,065 | ) |
From return of capital | | | | | | | | |
Institutional | | | — | | | | (27,464 | ) |
Investor A | | | — | | | | (12,803 | ) |
Class K | | | — | | | | (353,907 | ) |
Investor P | | | — | | | | (634 | ) |
| | | | | | | | |
Decrease in net assets resulting from distributions to shareholders | | | (268,192,335 | ) | | | (345,163,638 | ) |
| | | | | | | | |
| | |
CAPITAL SHARE TRANSACTIONS | | | | | | | | |
Net decrease in net assets derived from capital share transactions | | | (694,405,126 | ) | | | (1,192,655,494 | ) |
| | | | | | | | |
| | |
NET ASSETS | | | | | | | | |
Total increase (decrease) in net assets | | | 621,135,320 | | | | (2,972,390,483 | ) |
Beginning of year | | | 7,616,699,668 | | | | 10,589,090,151 | |
| | | | | | | | |
End of year | | $ | 8,237,834,988 | | | $ | 7,616,699,668 | |
| | | | | | | | |
| (a) | Distributions for annual periods determined in accordance with U.S. federal income tax regulations. |
See notes to financial statements.
Statements of Changes in Net Assets (continued)
| | | | | | | | |
| | | iShares Russell 2000
Small-Cap Index Fund | |
| | | Year Ended December 31, | |
| | | 2019 | | | 2018 | |
| | |
INCREASE (DECREASE) IN NET ASSETS | | | | | | | | |
| | |
OPERATIONS | | | | | | | | |
Net investment income | | $ | 27,526,475 | | | $ | 17,642,340 | |
Net realized gain | | | 35,652,447 | | | | 38,328,580 | |
Net change in unrealized appreciation (depreciation) | | | 380,171,158 | | | | (297,167,901 | ) |
| | | | | | | | |
Net increase (decrease) in net assets resulting from operations | | | 443,350,080 | | | | (241,196,981 | ) |
| | | | | | | | |
| | |
DISTRIBUTIONS TO SHAREHOLDERS(a) | | | | | | | | |
Institutional | | | (7,506,356 | ) | | | (7,927,401 | ) |
Investor A | | | (8,329,821 | ) | | | (9,765,499 | ) |
Class K | | | (50,010,333 | ) | | | (37,062,473 | ) |
Investor P | | | (9,373,153 | ) | | | (10,799,093 | ) |
| | | | | | | | |
Decrease in net assets resulting from distributions to shareholders | | | (75,219,663 | ) | | | (65,554,466 | ) |
| | | | | | | | |
| | |
CAPITAL SHARE TRANSACTIONS | | | | | | | | |
Net increase in net assets derived from capital share transactions | | | 269,152,880 | | | | 1,081,493,624 | |
| | | | | | | | |
| | |
NET ASSETS | | | | | | | | |
Total increase in net assets | | | 637,283,297 | | | | 774,742,177 | |
Beginning of year | | | 1,666,903,492 | | | | 892,161,315 | |
| | | | | | | | |
End of year | | $ | 2,304,186,789 | | | $ | 1,666,903,492 | |
| | | | | | | | |
| (a) | Distributions for annual periods determined in accordance with U.S. federal income tax regulations. |
See notes to financial statements.
| | |
| 24 | | 2019 BLACKROCK ANNUAL REPORTTO SHAREHOLDERS |
Financial Highlights
(For a share outstanding throughout each period)
| | | | | | | | | | | | | | | | | | | | |
| | | iShares MSCI EAFE International Index Fund | |
| |
| | | Institutional | |
| |
| | | Year Ended December 31, | |
| | | 2019 | | | 2018 | | | 2017 | | | 2016 | | | 2015 | |
| | | | | |
Net asset value, beginning of year | | $ | 11.76 | | | $ | 14.18 | | | $ | 11.60 | | | $ | 11.81 | | | $ | 12.21 | |
| | | | | | | | | | | | | | | | | | | | |
Net investment income(a) | | | 0.42 | | | | 0.42 | | | | 0.39 | | | | 0.28 | | | | 0.34 | |
Net realized and unrealized gain (loss) | | | 2.14 | | | | (2.31 | ) | | | 2.53 | | | | (0.16 | ) | | | (0.46 | ) |
| | | | | | | | | | | | | | | | | | | | |
Net increase (decrease) from investment operations | | | 2.56 | | | | (1.89 | ) | | | 2.92 | | | | 0.12 | | | | (0.12 | ) |
| | | | | | | | | | | | | | | | | | | | |
| | | | | |
Distributions(b) | | | | | | | | | | | | | | | | | | | | |
From net investment income | | | (0.46 | ) | | | (0.53 | ) | | | (0.34 | ) | | | (0.33 | ) | | | (0.28 | ) |
From return of capital | | | — | | | | (0.00 | )(c) | | | — | | | | — | | | | — | |
| | | | | | | | | | | | | | | | | | | | |
Total distributions | | | (0.46 | ) | | | (0.53 | ) | | | (0.34 | ) | | | (0.33 | ) | | | (0.28 | ) |
| | | | | | | | | | | | | | | | | | | | |
| | | | | |
Net asset value, end of year | | $ | 13.86 | | | $ | 11.76 | | | $ | 14.18 | | | $ | 11.60 | | | $ | 11.81 | |
| | | | | | | | | | | | | | | | | | | | |
| | | | | |
Total Return(d) | | | | | | | | | | | | | | | | | | | | |
Based on net asset value | | | 21.80 | % | | | (13.37 | )% | | | 25.24 | % | | | 0.99 | % | | | (0.91 | )% |
| | | | | | | | | | | | | | | | | | | | |
| | | | | |
Ratios to Average Net Assets(e) | | | | | | | | | | | | | | | | | | | | |
Total expenses | | | 0.08 | % | | | 0.11 | %(f)(g) | | | 0.09 | % | | | 0.15 | %(h) | | | 0.12 | %(h) |
| | | | | | | | | | | | | | | | | | | | |
Total expenses after fees waived and/or reimbursed and paid indirectly | | | 0.08 | % | | | 0.10 | %(f)(g) | | | 0.09 | % | | | 0.11 | %(h) | | | 0.09 | %(h) |
| | | | | | | | | | | | | | | | | | | | |
Net investment income | | | 3.23 | % | | | 3.02 | %(f) | | | 2.92 | % | | | 2.44 | %(h) | | | 2.68 | %(h) |
| | | | | | | | | | | | | | | | | | | | |
| | | | | |
Supplemental Data | | | | | | | | | | | | | | | | | | | | |
Net assets, end of year (000) | | $ | 876,551 | | | $ | 753,659 | | | $ | 705,986 | | | $ | 649,763 | | | $ | 2,702,936 | |
| | | | | | | | | | | | | | | | | | | | |
Portfolio turnover rate | | | 4 | % | | | 43 | % | | | 23 | % | | | 42 | %(i) | | | 9 | %(j) |
| | | | | | | | | | | | | | | | | | | | |
| (a) | Based on average shares outstanding. |
| (b) | Distributions for annual periods determined in accordance with U.S. federal income tax regulations. |
| (c) | Amount is greater than $(0.005) per share. |
| (d) | Where applicable, assumes the reinvestment of distributions. |
| (e) | Includes the Fund’s share of the Master International Index’s allocated fees waived, the expense ratios were as follows: |
| | | | | | | | | | | | | | | | | | | | |
| | | 2019 | | | 2018 | | | 2017 | | | 2016 | | | 2015 | |
Expense ratios | | | N/A | | | | N/A | | | | N/A | | | | 0.16 | % | | | 0.13 | % |
| (f) | Excludes 0.01% of expenses incurred indirectly as a result of investments in underlying funds. |
| (g) | Includes reorganization costs, offering and board reorganization and consolidation expenses associated with the Fund’s reorganization. Without these expenses, total expenses and total expenses after fees waived and/or reimbursed would have been 0.10% and 0.09% respectively. |
| (h) | Includes the Fund’s share of the Master International Index’s allocated expenses and/or net investment income. |
| (i) | Portfolio turnover rate includes transactions from Master International Index prior to August 1, 2016. |
| (j) | Portfolio turnover rate of Master International Index. |
See notes to financial statements.
Financial Highlights (continued)
(For a share outstanding throughout each period)
| | | | | | | | | | | | | | | | | | | | |
| | | iShares MSCI EAFE International Index Fund (continued) | |
| |
| | | Investor A | |
| |
| | | Year Ended December 31, | |
| | | 2019 | | | 2018 | | | 2017 | | | 2016 | | | 2015 | |
| | | | | |
Net asset value, beginning of year | | $ | 11.69 | | | $ | 14.09 | | | $ | 11.54 | | | $ | 11.75 | | | $ | 12.12 | |
| | | | | | | | | | | | | | | | | | | | |
Net investment income(a) | | | 0.39 | | | | 0.38 | | | | 0.34 | | | | 0.32 | | | | 0.32 | |
Net realized and unrealized gain (loss) | | | 2.12 | | | | (2.28 | ) | | | 2.52 | | | | (0.23 | ) | | | (0.46 | ) |
| | | | | | | | | | | | | | | | | | | | |
Net increase (decrease) from investment operations | | | 2.51 | | | | (1.90 | ) | | | 2.86 | | | | 0.09 | | | | (0.14 | ) |
| | | | | | | | | | | | | | | | | | | | |
| | | | | |
Distributions(b) | | | | | | | | | | | | | | | | | | | | |
From net investment income | | | (0.42 | ) | | | (0.50 | ) | | | (0.31 | ) | | | (0.30 | ) | | | (0.23 | ) |
From return of capital | | | (0.00 | ) | | | (0.00 | )(c) | | | — | | | | — | | | | — | |
| | | | | | | | | | | | | | | | | | | | |
Total distributions | | | (0.42 | ) | | | (0.50 | ) | | | (0.31 | ) | | | (0.30 | ) | | | (0.23 | ) |
| | | | | | | | | | | | | | | | | | | | |
| | | | | |
Net asset value, end of year | | $ | 13.78 | | | $ | 11.69 | | | $ | 14.09 | | | $ | 11.54 | | | $ | 11.75 | |
| | | | | | | | | | | | | | | | | | | | |
| | | | | |
Total Return(d) | | | | | | | | | | | | | | | | | | | | |
Based on net asset value | | | 21.53 | % | | | (13.57 | )% | | | 24.84 | % | | | 0.78 | % | | | (1.14 | )% |
| | | | | | | | | | | | | | | | | | | | |
| | | | | |
Ratios to Average Net Assets(e) | | | | | | | | | | | | | | | | | | | | |
Total expenses | | | 0.35 | % | | | 0.36 | %(f)(g) | | | 0.36 | % | | | 0.38 | %(h) | | | 0.42 | %(h) |
| | | | | | | | | | | | | | | | | | | | |
Total expenses after fees waived and/or reimbursed and paid indirectly | | | 0.35 | % | | | 0.36 | %(f)(g) | | | 0.35 | % | | | 0.37 | %(h) | | | 0.37 | %(h) |
| | | | | | | | | | | | | | | | | | | | |
Net investment income | | | 3.00 | % | | | 2.74 | %(f) | | | 2.60 | % | | | 2.78 | %(h) | | | 2.54 | %(h) |
| | | | | | | | | | | | | | | | | | | | |
| | | | | |
Supplemental Data | | | | | | | | | | | | | | | | | | | | |
Net assets, end of year (000) | | $ | 340,750 | | | $ | 305,043 | | | $ | 373,846 | | | $ | 238,053 | | | $ | 168,008 | |
| | | | | | | | | | | | | | | | | | | | |
Portfolio turnover rate | | | 4 | % | | | 43 | % | | | 23 | % | | | 42 | %(i) | | | 9 | %(j) |
| | | | | | | | | | | | | | | | | | | | |
| (a) | Based on average shares outstanding. |
| (b) | Distributions for annual periods determined in accordance with U.S. federal income tax regulations. |
| (c) | Amount is greater than $(0.005) per share. |
| (d) | Where applicable, assumes the reinvestment of distributions. |
| (e) | Includes the Fund’s share of the Master International Index’s allocated fees waived, the expense ratios were as follows: |
| | | | | | | | | | | | | | | | | | | | |
| | | 2019 | | | 2018 | | | 2017 | | | 2016 | | | 2015 | |
Expense ratios | | | N/A | | | | N/A | | | | N/A | | | | 0.39 | % | | | 0.43 | % |
| | | | | | | | | | | | | | | | | | | | |
| (f) | Excludes 0.01% of expenses incurred indirectly as a result of investments in underlying funds. |
| (g) | Includes reorganization costs, offering and board reorganization and consolidation expenses associated with the Fund’s reorganization. Without these expenses, total expenses and total expenses after fees waived and/or reimbursed would have been 0.36% and 0.35% respectively. |
| (h) | Includes the Fund’s share of the Master International Index’s allocated expenses and/or net investment income. |
| (i) | Portfolio turnover rate includes transactions from Master International Index prior to August 1, 2016. |
| (j) | Portfolio turnover rate of Master International Index. |
See notes to financial statements.
| | |
| 26 | | 2019 BLACKROCK ANNUAL REPORTTO SHAREHOLDERS |
Financial Highlights (continued)
(For a share outstanding throughout each period)
| | | | | | | | | | | | | | | | | | | | |
| | | iShares MSCI EAFE International Index Fund (continued) | |
| |
| | | Class K | |
| |
| | | Year Ended December 31, | |
| | | 2019 | | | 2018 | | | 2017 | | | 2016 | | | 2015 | |
| | | | | |
Net asset value, beginning of year | | $ | 11.76 | | | $ | 14.18 | | | $ | 11.61 | | | $ | 11.82 | | | $ | 12.21 | |
| | | | | | | | | | | | | | | | | | | | |
Net investment income(a) | | | 0.43 | | | | 0.43 | | | | 0.38 | | | | 0.38 | | | | 0.28 | |
Net realized and unrealized gain (loss) | | | 2.14 | | | | (2.31 | ) | | | 2.54 | | | | (0.26 | ) | | | (0.38 | ) |
| | | | | | | | | | | | | | | | | | | | |
Net increase (decrease) from investment operations | | | 2.57 | | | | (1.88 | ) | | | 2.92 | | | | 0.12 | | | | (0.10 | ) |
| | | | | | | | | | | | | | | | | | | | |
| | | | | |
Distributions(b) | | | | | | | | | | | | | | | | | | | | |
From net investment income | | | (0.46 | ) | | | (0.54 | ) | | | (0.35 | ) | | | (0.33 | ) | | | (0.29 | ) |
From return of capital | | | — | | | | (0.00 | )(c) | | | — | | | | — | | | | — | |
| | | | | | | | | | | | | | | | | | | | |
Total distributions | | | (0.46 | ) | | | (0.54 | ) | | | (0.35 | ) | | | (0.33 | ) | | | (0.29 | ) |
| | | | | | | | | | | | | | | | | | | | |
| | | | | |
Net asset value, end of year | | $ | 13.87 | | | $ | 11.76 | | | $ | 14.18 | | | $ | 11.61 | | | $ | 11.82 | |
| | | | | | | | | | | | | | | | | | | | |
| | | | | |
Total Return(d) | | | | | | | | | | | | | | | | | | | | |
Based on net asset value | | | 21.94 | % | | | (13.33 | )% | | | 25.17 | % | | | 1.03 | % | | | (0.81 | )% |
| | | | | | | | | | | | | | | | | | | | |
| | | | | |
Ratios to Average Net Assets(e) | | | | | | | | | | | | | | | | | | | | |
Total expenses | | | 0.03 | % | | | 0.06 | %(f)(g) | | | 0.06 | % | | | 0.07 | %(h) | | | 0.12 | %(h) |
| | | | | | | | | | | | | | | | | | | | |
Total expenses after fees waived and/or reimbursed and paid indirectly | | | 0.03 | % | | | 0.05 | %(f)(g) | | | 0.06 | % | | | 0.07 | %(h) | | | 0.07 | %(h) |
| | | | | | | | | | | | | | | | | | | | |
Net investment income | | | 3.28 | % | | | 3.12 | %(f) | | | 2.80 | % | | | 3.25 | %(h) | | | 2.25 | %(h) |
| | | | | | | | | | | | | | | | | | | | |
| | | | | |
Supplemental Data | | | | | | | | | | | | | | | | | | | | |
Net assets, end of year (000) | | $ | 6,870,922 | | | $ | 6,420,732 | | | $ | 9,509,257 | | | $ | 4,042,470 | | | $ | 113,314 | |
| | | | | | | | | | | | | | | | | | | | |
Portfolio turnover rate | | | 4 | % | | | 43 | % | | | 23 | % | | | 42 | %(i) | | | 9 | %(j) |
| | | | | | | | | | | | | | | | | | | | |
| (a) | Based on average shares outstanding. |
| (b) | Distributions for annual periods determined in accordance with U.S. federal income tax regulations. |
| (c) | Amount is greater than $(0.005) per share. |
| (d) | Where applicable, assumes the reinvestment of distributions. |
| (e) | Includes the Fund’s share of the Master International Index’s allocated fees waived, the expense ratios were as follows: |
| | | | | | | | | | | | | | | | | | | | |
| | | 2019 | | | 2018 | | | 2017 | | | 2016 | | | 2015 | |
Expense ratios | | | N/A | | | | N/A | | | | N/A | | | | 0.08 | % | | | 0.13 | % |
| | | | | | | | | | | | | | | | | | | | |
| (f) | Excludes 0.01% of expenses incurred indirectly as a result of investments in underlying funds. |
| (g) | Includes reorganization costs, offering and board reorganization and consolidation expenses associated with the Fund’s reorganization. Without these expenses, total expenses and total expenses after fees waived and/or reimbursed would have been 0.05% and 0.04% respectively. |
| (h) | Includes the Fund’s share of the Master International Index’s allocated expenses and/or net investment income. |
| (i) | Portfolio turnover rate includes transactions from Master International Index prior to August 1, 2016. |
| (j) | Portfolio turnover rate of Master International Index. |
See notes to financial statements.
Financial Highlights (continued)
(For a share outstanding throughout each period)
| | | | | | | | |
| | | iShares MSCI EAFE International
Index Fund (continued) | |
| |
| | | Investor P | |
| | | Year Ended
December 31, 2019 | | | Period from
08/06/18(a)
to 12/31/18 | |
| | |
Net asset value, beginning of period | | $ | 11.65 | | | $ | 13.87 | |
| | | | | | | | |
Net investment income(b) | | | 0.39 | | | | 0.01 | |
Net realized and unrealized gain (loss) | | | 2.11 | | | | (1.70 | ) |
| | | | | | | | |
Net increase (decrease) from investment operations | | | 2.50 | | | | (1.69 | ) |
| | | | | | | | |
| | |
Distributions(c) | | | | | | | | |
From net investment income | | | (0.42 | ) | | | (0.53 | ) |
From return of capital | | | — | | | | (0.00 | )(d) |
| | | | | | | | |
| | |
Total distributions | | | (0.42 | ) | | | (0.53 | ) |
| | | | | | | | |
| | |
Net asset value, end of period | | $ | 13.73 | | | $ | 11.65 | |
| | | | | | | | |
| | |
Total Return(e) | | | | | | | | |
Based on net asset value | | | 21.51 | % | | | (12.25 | )%(f)(g) |
| | | | | | | | |
| | |
Ratios to Average Net Assets | | | | | | | | |
Total expenses | | | 0.39 | % | | | 0.33 | %(h)(i) |
| | | | | | | | |
Total expenses after fees waived and/or reimbursed and paid indirectly | | | 0.36 | % | | | 0.32 | %(i) |
| | | | | | | | |
Net investment income | | | 2.97 | % | | | 0.23 | % |
| | | | | | | | |
| | |
Supplemental Data | | | | | | | | |
Net assets, end of period (000) | | $ | 149,612 | | | $ | 137,266 | |
| | | | | | | | |
Portfolio turnover rate | | | 4 | % | | | 43 | % |
| | | | | | | | |
| (a) | Commencement of operations. |
| (b) | Based on average shares outstanding. |
| (c) | Distributions for annual periods determined in accordance with U.S. federal income tax regulations. |
| (d) | Amount is greater than $(0.005) per share. |
| (e) | Where applicable, excludes the effects of any sales charges and assumes the reinvestment of distributions. |
| (f) | Aggregate total return. |
| (h) | Excludes 0.01% of expenses incurred indirectly as a result of investments in underlying funds. |
| (i) | Reorganization costs, offering and board realignment and consolidation expenses were not annualized in the calculation of the expense ratios. If these expenses were annualized, the total expenses and total expenses after fees waived and/or reimbursed would have been 0.34% and 0.33% respectively. |
See notes to financial statements.
| | |
| 28 | | 2019 BLACKROCK ANNUAL REPORTTO SHAREHOLDERS |
Financial Highlights (continued)
(For a share outstanding throughout each period)
| | | | | | | | | | | | | | | | | | | | |
| | | iShares Russell 2000Small-Cap Index Fund | |
| |
| | | Institutional | |
| |
| | | Year Ended December 31, | |
| | | 2019 | | | 2018 | | | 2017 | | | 2016 | | | 2015 | |
| | | | | |
Net asset value, beginning of year | | $ | 16.87 | | | $ | 19.72 | | | $ | 17.76 | | | $ | 15.32 | | | $ | 16.60 | |
| | | | | | | | | | | | | | | | | | | | |
Net investment income(a) | | | 0.27 | | | | 0.28 | | | | 0.25 | | | | 0.23 | | | | 0.24 | |
Net realized and unrealized gain (loss) | | | 4.02 | | | | (2.40 | ) | | | 2.34 | | | | 3.03 | | | | (0.97 | ) |
| | | | | | | | | | | | | | | | | | | | |
Net increase (decrease) from investment operations | | | 4.29 | | | | (2.12 | ) | | | 2.59 | | | | 3.26 | | | | (0.73 | ) |
| | | | | | | | | | | | | | | | | | | | |
| | | | | |
Distributions(b) | | | | | | | | | | | | | | | | | | | | |
From net investment income | | | (0.28 | ) | | | (0.20 | ) | | | (0.21 | ) | | | (0.22 | ) | | | (0.14 | ) |
From net realized gain | | | (0.42 | ) | | | (0.53 | ) | | | (0.42 | ) | | | (0.60 | ) | | | (0.41 | ) |
| | | | | | | | | | | | | | | | | | | | |
Total distributions | | | (0.70 | ) | | | (0.73 | ) | | | (0.63 | ) | | | (0.82 | ) | | | (0.55 | ) |
| | | | | | | | | | | | | | | | | | | | |
| | | | | |
Net asset value, end of year | | $ | 20.46 | | | $ | 16.87 | | | $ | 19.72 | | | $ | 17.76 | | | $ | 15.32 | |
| | | | | | | | | | | | | | | | | | | | |
| | | | | |
Total Return(c) | | | | | | | | | | | | | | | | | | | | |
Based on net asset value | | | 25.50 | % | | | (10.94 | )% | | | 14.55 | % | | | 21.33 | % | | | (4.43 | )% |
| | | | | | | | | | | | | | | | | | | | |
| | | | | |
Ratios to Average Net Assets(d)(e) | | | | | | | | | | | | | | | | | | | | |
Total expenses | | | 0.16 | % | | | 0.18 | %(f) | | | 0.18 | % | | | 0.19 | %(g) | | | 0.22 | % |
| | | | | | | | | | | | | | | | | | | | |
Total expenses after fees waived and/or reimbursed | | | 0.12 | % | | | 0.12 | %(f) | | | 0.11 | % | | | 0.14 | %(g) | | | 0.16 | % |
| | | | | | | | | | | | | | | | | | | | |
Net investment income | | | 1.38 | % | | | 1.38 | % | | | 1.36 | % | | | 1.44 | %(g) | | | 1.47 | % |
| | | | | | | | | | | | | | | | | | | | |
| | | | | |
Supplemental Data | | | | | | | | | | | | | | | | | | | | |
Net assets, end of year (000) | | $ | 227,381 | | | $ | 200,990 | | | $ | 167,351 | | | $ | 229,491 | | | $ | 148,148 | |
| | | | | | | | | | | | | | | | | | | | |
Portfolio turnover rate of the Series | | | 20 | % | | | 28 | % | | | 30 | % | | | 39 | % | | | 37 | % |
| | | | | | | | | | | | | | | | | | | | |
| (a) | Based on average shares outstanding. |
| (b) | Distributions for annual periods determined in accordance with U.S. federal income tax regulations. |
| (c) | Where applicable, assumes the reinvestment of distributions. |
| (d) | Includes the Fund’s share of the Series’ allocated expenses and/or net investment income. |
| (e) | Includes the Fund’s share of the Series’ allocated fees waived of less than 0.01%. |
| (f) | Includes reorganization costs, offering and board reorganization and consolidation expenses associated with the Fund’s reorganization. Without these expenses, total expenses and total expenses after fees waived and/or reimbursed would have been 0.16% and 0.10% respectively. |
| (g) | Excludes expenses incurred indirectly of 0.01% as a result of the Series’ investments in underlying funds. |
See notes to financial statements.
Financial Highlights (continued)
(For a share outstanding throughout each period)
| | | | | | | | | | | | | | | | | | | | |
| | | iShares Russell 2000Small-Cap Index Fund (continued) | |
| |
| | | Investor A | |
| |
| | | Year Ended December 31, | |
| | | 2019 | | | 2018 | | | 2017 | | | 2016 | | | 2015 | |
| | | | | |
Net asset value, beginning of year | | $ | 16.89 | | | $ | 19.74 | | | $ | 17.78 | | | $ | 15.34 | | | $ | 16.61 | |
| | | | | | | | | | | | | | | | | | | | |
Net investment income(a) | | | 0.22 | | | | 0.22 | | | | 0.21 | | | | 0.18 | | | | 0.18 | |
Net realized and unrealized gain (loss) | | | 4.03 | | | | (2.40 | ) | | | 2.34 | | | | 3.03 | | | | (0.95 | ) |
| | | | | | | | | | | | | | | | | | | | |
Net increase (decrease) from investment operations | | | 4.25 | | | | (2.18 | ) | | | 2.55 | | | | 3.21 | | | | (0.77 | ) |
| | | | | | | | | | | | | | | | | | | | |
| | | | | |
Distributions(b) | | | | | | | | | | | | | | | | | | | | |
From net investment income | | | (0.23 | ) | | | (0.14 | ) | | | (0.17 | ) | | | (0.17 | ) | | | (0.09 | ) |
From net realized gain | | | (0.42 | ) | | | (0.53 | ) | | | (0.42 | ) | | | (0.60 | ) | | | (0.41 | ) |
| | | | | | | | | | | | | | | | | | | | |
Total distributions | | | (0.65 | ) | | | (0.67 | ) | | | (0.59 | ) | | | (0.77 | ) | | | (0.50 | ) |
| | | | | | | | | | | | | | | | | | | | |
| | | | | |
Net asset value, end of year | | $ | 20.49 | | | $ | 16.89 | | | $ | 19.74 | | | $ | 17.78 | | | $ | 15.34 | |
| | | | | | | | | | | | | | | | | | | | |
| | | | | |
Total Return(c) | | | | | | | | | | | | | | | | | | | | |
Based on net asset value | | | 25.20 | % | | | (11.19 | )% | | | 14.35 | % | | | 21.04 | % | | | (4.66 | )% |
| | | | | | | | | | | | | | | | | | | | |
| | | | | |
Ratios to Average Net Assets(d)(e) | | | | | | | | | | | | | | | | | | | | |
Total expenses | | | 0.42 | % | | | 0.43 | %(f) | | | 0.45 | % | | | 0.49 | %(g) | | | 0.53 | % |
| | | | | | | | | | | | | | | | | | | | |
Total expenses after fees waived and/or reimbursed | | | 0.37 | % | | | 0.37 | %(f) | | | 0.37 | % | | | 0.41 | %(g) | | | 0.43 | % |
| | | | | | | | | | | | | | | | | | | | |
Net investment income | | | 1.14 | % | | | 1.08 | % | | | 1.13 | % | | | 1.14 | %(g) | | | 1.09 | % |
| | | | | | | | | | | | | | | | | | | | |
| | | | | |
Supplemental Data | | | | | | | | | | | | | | | | | | | | |
Net assets, end of year (000) | | $ | 273,413 | | | $ | 254,591 | | | $ | 249,980 | | | $ | 116,722 | | | $ | 87,930 | |
| | | | | | | | | | | | | | | | | | | | |
Portfolio turnover rate of the Series | | | 20 | % | | | 28 | % | | | 30 | % | | | 39 | % | | | 37 | % |
| | | | | | | | | | | | | | | | | | | | |
| (a) | Based on average shares outstanding. |
| (b) | Distributions for annual periods determined in accordance with U.S. federal income tax regulations. |
| (c) | Where applicable, assumes the reinvestment of distributions. |
| (d) | Includes the Fund’s share of the Series’ allocated expenses and/or net investment income. |
| (e) | Includes the Fund’s share of the Series’ allocated fees waived of less than 0.01%. |
| (f) | Includes reorganization costs, offering and board reorganization and consolidation expenses associated with the Fund’s reorganization. Without these expenses, total expenses and total expenses after fees waived and/or reimbursed would have been 0.41% and 0.35% respectively. |
| (g) | Excludes expenses incurred indirectly of 0.01% as a result of the Series’ investments in underlying funds. |
See notes to financial statements.
| | |
| 30 | | 2019 BLACKROCK ANNUAL REPORTTO SHAREHOLDERS |
Financial Highlights (continued)
(For a share outstanding throughout each period)
| | | | | | | | | | | | | | | | | | | | |
| | | iShares Russell 2000Small-Cap Index Fund (continued) | |
| |
| | | Class K | |
| |
| | | Year Ended December 31, | |
| | | 2019 | | | 2018 | | | 2017 | | | 2016 | | | 2015 | |
| | | | | |
Net asset value, beginning of year | | $ | 16.91 | | | $ | 19.77 | | | $ | 17.79 | | | $ | 15.35 | | | $ | 16.62 | |
| | | | | | | | | | | | | | | | | | | | |
Net investment income(a) | | | 0.28 | | | | 0.30 | | | | 0.27 | | | | 0.24 | | | | 0.25 | |
Net realized and unrealized gain (loss) | | | 4.04 | | | | (2.43 | ) | | | 2.34 | | | | 3.02 | | | | (0.97 | ) |
| | | | | | | | | | | | | | | | | | | | |
Net increase (decrease) from investment operations | | | 4.32 | | | | (2.13 | ) | | | 2.61 | | | | 3.26 | | | | (0.72 | ) |
| | | | | | | | | | | | | | | | | | | | |
| | | | | |
Distributions(b) | | | | | | | | | | | | | | | | | | | | |
From net investment income | | | (0.29 | ) | | | (0.20 | ) | | | (0.21 | ) | | | (0.22 | ) | | | (0.14 | ) |
From net realized gain | | | (0.42 | ) | | | (0.53 | ) | | | (0.42 | ) | | | (0.60 | ) | | | (0.41 | ) |
| | | | | | | | | | | | | | | | | | | | |
Total distributions | | | (0.71 | ) | | | (0.73 | ) | | | (0.63 | ) | | | (0.82 | ) | | | (0.55 | ) |
| | | | | | | | | | | | | | | | | | | | |
| | | | | |
Net asset value, end of year | | $ | 20.52 | | | $ | 16.91 | | | $ | 19.77 | | | $ | 17.79 | | | $ | 15.35 | |
| | | | | | | | | | | | | | | | | | | | |
| | | | | |
Total Return(c) | | | | | | | | | | | | | | | | | | | | |
Based on net asset value | | | 25.62 | % | | | (10.93 | )% | | | 14.69 | % | | | 21.32 | % | | | (4.41 | )% |
| | | | | | | | | | | | | | | | | | | | |
| | | | | |
Ratios to Average Net Assets(d)(e) | | | | | | | | | | | | | | | | | | | | |
Total expenses | | | 0.08 | % | | | 0.11 | %(f) | | | 0.14 | % | | | 0.17 | %(g) | | | 0.21 | % |
| | | | | | | | | | | | | | | | | | | | |
Total expenses after fees waived and/or reimbursed | | | 0.07 | % | | | 0.07 | %(f) | | | 0.07 | % | | | 0.10 | %(g) | | | 0.13 | % |
| | | | | | | | | | | | | | | | | | | | |
Net investment income | | | 1.44 | % | | | 1.44 | % | | | 1.40 | % | | | 1.48 | %(g) | | | 1.50 | % |
| | | | | | | | | | | | | | | | | | | | |
| | | | | |
Supplemental Data | | | | | | | | | | | | | | | | | | | | |
Net assets, end of year (000) | | $ | 1,502,229 | | | $ | 945,929 | | | $ | 474,830 | | | $ | 60,086 | | | $ | 8,338 | |
| | | | | | | | | | | | | | | | | | | | |
Portfolio turnover rate of the Series | | | 20 | % | | | 28 | % | | | 30 | % | | | 39 | % | | | 37 | % |
| | | | | | | | | | | | | | | | | | | | |
| (a) | Based on average shares outstanding. |
| (b) | Distributions for annual periods determined in accordance with U.S. federal income tax regulations. |
| (c) | Where applicable, assumes the reinvestment of distributions. |
| (d) | Includes the Fund’s share of the Series’ allocated expenses and/or net investment income. |
| (e) | Includes the Fund’s share of the Series’ allocated fees waived of less than 0.01%. |
| (f) | Includes reorganization costs, offering and board reorganization and consolidation expenses associated with the Fund’s reorganization. Without these expenses, total expenses and total expenses after fees waived and/or reimbursed would have been 0.10% and 0.05% respectively. |
| (g) | Excludes expenses incurred indirectly of 0.01% as a result of the Series’ investments in underlying funds. |
See notes to financial statements.
Financial Highlights (continued)
(For a share outstanding throughout each period)
| | | | | | | | |
| | | iShares Russell 2000Small-Cap
Index Fund (continued) | |
| |
| | | Investor P | |
| | | Year Ended
December 31, 2019 | | | Period from
08/06/18 (a)
to 12/31/18 | |
| | |
Net asset value, beginning of period | | $ | 16.84 | | | $ | 21.76 | |
| | | | | | | | |
Net investment income(b) | | | 0.22 | | | | 0.17 | |
Net realized and unrealized gain (loss) | | | 4.02 | | | | (4.38 | ) |
| | | | | | | | |
Net increase (decrease) from investment operations | | | 4.24 | | | | (4.21 | ) |
| | | | | | | | |
| | |
Distributions(c) | | | | | | | | |
From net investment income | | | (0.23 | ) | | | (0.19 | ) |
From net realized gain | | | (0.42 | ) | | | (0.52 | ) |
| | | | | | | | |
| | |
Total distributions | | | (0.65 | ) | | | (0.71 | ) |
| | | | | | | | |
| | |
Net asset value, end of period | | $ | 20.43 | | | $ | 16.84 | |
| | | | | | | | |
| | |
Total Return(d) | | | | | | | | |
Based on net asset value | | | 25.25 | % | | | (19.49 | )%(e) |
| | | | | | | | |
| | |
Ratios to Average Net Assets(f)(g) | | | | | | | | |
Total expenses | | | 0.40 | % | | | 0.39 | %(h)(i)(j) |
| | | | | | | | |
Total expenses after fees waived and/or reimbursed | | | 0.36 | % | | | 0.35 | %(h)(i)(j) |
| | | | | | | | |
Net investment income | | | 1.14 | % | | | 2.12 | %(h) |
| | | | | | | | |
| | |
Supplemental Data | | | | | | | | |
Net assets, end of period (000) | | $ | 301,163 | | | $ | 265,393 | |
| | | | | | | | |
Portfolio turnover rate of the Series | | | 20 | % | | | 28 | % |
| | | | | | | | |
| (a) | Commencement of operations. |
| (b) | Based on average Common Shares outstanding. |
| (c) | Distributions for annual periods determined in accordance with U.S. federal income tax regulations. |
| (d) | Where applicable, excludes the effects of any sales charges and assumes the reinvestment of distributions. |
| (e) | Aggregate total return. |
| (f) | Includes the Fund’s share of the Series’ allocated expenses and/or net investment income. |
| (g) | Includes the Fund’s share of the Series’ allocated fees waived of less than 0.01%. |
| (i) | Reorganization costs, offering and board realignment and consolidation expenses were not annualized in the calculation of the expense ratios. If these expenses were annualized, the total expenses and total expenses after fees waived and/or reimbursed would have been 0.40% and 0.37% respectively. |
| (j) | Includes reorganization costs, offering and board reorganization and consolidation expenses associated with the Fund’s reorganization. Without these expenses, total expenses and total expenses after fees waived and/or reimbursed would have been 0.38% and 0.35% respectively. |
See notes to financial statements.
| | |
| 32 | | 2019 BLACKROCK ANNUAL REPORTTO SHAREHOLDERS |
Notes to Financial Statements
iShares MSCI EAFE International Index Fund and iShares Russell 2000Small-Cap Index Fund are each a series of BlackRock Index Funds, Inc. (the “Corporation”), which is registered under the Investment Company Act of 1940, as amended (the “1940 Act”), as anopen-end management investment company. The Corporation is organized as a Maryland corporation. The following are referred to herein collectively as the “Funds” or individually, as a “Fund”:
| | | | |
| Fund Name | | Herein Referred To As | | Diversification
Classification |
iShares MSCI EAFE International Index Fund | | International Index | | Diversified |
iShares Russell 2000Small-Cap Index Fund | | Small Cap Index | | Diversified |
Small Cap Index seeks to achieve its investment objective by investing all of its assets in Master Small Cap Index Series (the “Series”), a series of Quantitative Master Series LLC (the “Master LLC”), and an affiliate of Small Cap Index, which has the same investment objective and strategies as Small Cap Index. The value of Small Cap Index’s investment in the Series reflects Small Cap Index’s proportionate interest in the net assets of the Series. The performance of Small Cap Index is directly affected by the performance of the Series. As of December 31, 2019, the percentage of Series owned by the Small Cap Index was 69.29%. The financial statements of the Series, including the Schedule of Investments, are included elsewhere in this report and should be read in conjunction with the Small Cap Index’s financial statements.
Each Fund offers multiple classes of shares. All classes of shares have identical voting, dividend, liquidation and other rights and are subject to the same terms and conditions, except that certain classes bear expenses related to the shareholder servicing and distribution of such shares. Institutional and Class K Shares are sold only to certain eligible investors. Investor A and Investor P Shares bear certain expenses related to shareholder servicing of such shares. Investor A Shares are generally available through financial intermediaries. Investor P Shares are only available through registered representatives of an insurance company’s broker-dealer that has entered into an agreement with the Fund’s distributor to offer such shares. Each class has exclusive voting rights with respect to matters relating to its shareholder servicing and distribution expenditures.
| | | | | | | | |
| Share Class | | Initial Sales Charge | | CDSC | | | Conversion Privilege |
Institutional and Class K Shares | | No | | | No | | | None |
Investor A | | No | | | No | | | None |
Investor P | | Yes | | | No | (a) | | None |
| | (a) | Investor P Shares may be subject to a contingent deferred sales charge (“CDSC”) for certain redemptions where no initial sales charge was paid at the time of purchase. | |
The Board of Directors of the Corporation and Board of Directors of the Master LLC are referred to throughout this report as the “Board of Directors” or the “Board” and the members are referred to as “Directors.”
The Funds, together with certain other registered investment companies advised by BlackRock Advisors, LLC (the “Manager”) or its affiliates are included in a complex of equity, multi-asset, index and money market funds referred to as the BlackRock Multi-Asset Complex.
Prior Year Reorganization:The Board and shareholders of the Corporation and the Board of Trustees of State Farm Mutual Fund Trust and the shareholders of State Farm International Index Fund (the “International Target Fund”) approved the reorganization of the International Target Fund into International Index. As a result, International Index acquired substantially all of the assets and assumed substantially all of the liabilities of the International Target Fund in exchange for an equal aggregate value of newly-issued shares of International Index.
Each shareholder of the International Target Fund received shares of International Index in an amount equal to the aggregate net asset value (“NAV”) of the shareholder’s International Target Fund shares, as determined at the close of business on November 16, 2018.
The reorganization was accomplished by atax-free exchange of shares of International Index in the following amounts and at the following conversion ratio:
| | | | | | | | |
| International Target Fund’s Share Class | | Shares Prior to Reorganization | | Conversion Ratio | | International Index Share Class | | Shares of the Fund |
Premier | | 7,025,140.2220 | | 0.89467166 | | Investor P | | 6,285,193.864 |
Premier | | 166,709.9140 | | 0.89469954 | | Investor A | | 149,155.283 |
Legacy Class B | | 61,463.3420 | | 0.92581919 | | Investor P | | 56,903.942 |
Legacy Class B | | 4,282.9220 | | 0.92584804 | | Investor A | | 3,965.335 |
Class A | | 4,891,156.0400 | | 0.89673570 | | Investor P | | 4,386,074.235 |
Class A | | 153,458.9890 | | 0.89676364 | | Investor A | | 137,616.442 |
Class B | | 62,767.8450 | | 0.91927657 | | Investor P | | 57,701.009 |
Class B | | 2,936.6980 | | 0.91930521 | | Investor A | | 2,699.722 |
Institutional | | 3,670,218.8870 | | 0.89050926 | | Institutional | | 3,268,363.905 |
Class R-1 | | 120,205.5860 | | 0.90066906 | | Investor P | | 108,265.452 |
Class R-2 | | 533,637.5540 | | 0.89485080 | | Investor P | | 477,525.992 |
Class R-3 | | 118,219.1110 | | 0.89274156 | | Institutional | | 105,539.114 |
| | | | |
| NOTESTO FINANCIAL STATEMENTS | | | 33 | |
Notes to Financial Statements (continued)
The International Target Fund’s net assets and composition of net assets on November 16, 2018, the valuation date of the reorganization were as follows:
| | | | |
| | | International
Target Fund | |
Net assets | | $ | 193,446,599 | |
Paid-in-capital | | | 179,663,354 | |
Accumulated earnings | | | 13,783,245 | |
For financial reporting purposes, assets received and shares issued by International Index were recorded at fair value. However, the cost basis of the investments received from the International Target Fund was carried forward to align ongoing reporting of International Index’s realized and unrealized gains and losses with amounts distributable to shareholders for tax purposes.
The net assets of International Index before the reorganization were $9,759,121,537. The aggregate net assets of International Index immediately after the reorganization amounted to $9,952,568,136. The International Target Fund’s fair value and cost of investments prior to the reorganization were as follows:
| | | | | | | | |
| Target Fund | | Fair Value
of Investments | | | Cost of
Investments | |
State Farm International Index Fund | | $ | 190,381,092 | | | $ | 171,610,706 | |
The purpose of the transaction was to combine the assets of the International Target Fund with the assets of International Index. The reorganization was atax-free event and was effective on November 19, 2018.
Assuming the acquisition had been completed on January 1, 2018, the beginning of the fiscal reporting period of International Index, the pro forma results of operations for the year ended December 31, 2018, are as follows:
| | • | | Net investment income (loss): $344,168,873 |
| | • | | Net realized and change in unrealized gain (loss) on investments: $(1,799,889,862) |
| | • | | Net increase (decrease) in net assets resulting from operations: $(1,455,720,989) |
Because the combined investment portfolios have been managed as a single integrated portfolio since the acquisition was completed, it is not practicable to separate the amounts of revenue and earnings of International Target Fund that have been included in International Index’s Statement of Operations since November 19, 2018.
Reorganization costs incurred by International Index in connection with the reorganization were expensed by International Index.
The Board and shareholders of the Corporation and the Board of Trustees of State Farm Mutual Fund Trust and the shareholders of State Farm Small Cap Index Fund (the “Small Cap Target Fund”) approved the reorganization of Small Cap Target Fund into Small Cap Index. As a result, Small Cap Index acquired substantially all of the assets and assumed substantially all of the liabilities of the Small Cap Target Fund in exchange for an equal aggregate value of newly-issued shares of Small Cap Index.
Each shareholder of the Small Cap Target Fund received shares of Small Cap Index in an amount equal to the aggregate NAV of the shareholder’s Small Cap Target Fund shares, as determined at the close of business on November 16, 2018.
On November 16, 2018, all of the portfolio securities previously held by the Small Cap Target Fund were subsequently contributed by Small Cap Index to the Series in exchange for an investment in the Series.
The reorganization was accomplished by atax-free exchange of shares of Small Cap Index in the following amounts and at the following conversion ratio:
| | | | | | | | |
| Small Cap Target Fund’s Share Class | | Shares Prior to Reorganization | | Conversion Ratio | | Small Cap Index Share Class | | Shares of the Fund |
Premier | | 10,138,288.9280 | | 0.77850573 | | Investor P | | 7,892,716.023 |
Premier | | 405,404.1800 | | 0.77873781 | | Investor A | | 315,703.563 |
Legacy Class B | | 134,848.2850 | | 0.76095247 | | Investor P | | 102,613.136 |
Legacy Class B | | 17,460.3830 | | 0.76117932 | | Investor A | | 13,290.482 |
Class A | | 8,458,622.1820 | | 0.78780516 | | Investor P | | 6,663,746.201 |
Class A | | 498,377.0230 | | 0.78804002 | | Investor A | | 392,741.039 |
Class B | | 96,115.7450 | | 0.77049437 | | Investor P | | 74,056.640 |
Class B | | 8,407.8400 | | 0.77072407 | | Investor A | | 6,480.125 |
Institutional | | 5,883,976.9230 | | 0.79470854 | | Institutional | | 4,676,046.710 |
Class R-1 | | 137,387.9650 | | 0.78676965 | | Investor P | | 108,092.681 |
Class R-2 | | 546,102.3290 | | 0.78796680 | | Investor P | | 430,310.505 |
Class R-3 | | 82,919.9910 | | 0.79812922 | | Institutional | | 66,180.868 |
| | |
| 34 | | 2019 BLACKROCK ANNUAL REPORTTO SHAREHOLDERS |
Notes to Financial Statements (continued)
The Small Cap Target Fund’s net assets and composition of net assets on November 16, 2018, the valuation date of the reorganization were as follows:
| | | | |
| | | Small Cap
Target Fund | |
Net assets | | $ | 410,734,751 | |
Paid-in-capital | | | 330,355,424 | |
Accumulated earnings | | | 80,379,327 | |
For financial reporting purposes, assets received and shares issued by Small Cap Index were recorded at fair value. However, the cost basis of the investments received from the Small Cap Target Fund was carried forward to align ongoing reporting of Small Cap Index’s realized and unrealized gains and losses with amounts distributable to shareholders for tax purposes.
The net assets of Small Cap Index before the reorganization were $1,613,800,953. The aggregate net assets of Small Cap Index immediately after the reorganization amounted to $2,024,535,704. The Small Cap Target Fund’s fair value and cost of investments prior to the reorganization were as follows:
| | | | | | | | |
| Target Fund | | Fair Value
of Investments | | | Cost of
Investments | |
State Farm Small Cap Index Fund | | $ | 406,256,934 | | | $ | 326,299,543 | |
The purpose of this transaction was to combine the assets of the Small Cap Target Fund with the assets of Small Cap Index. The reorganization was atax-free event and was effective on November 19, 2018.
Assuming the acquisition had been completed on January 1, 2018, the beginning of the fiscal reporting period of Small Cap Index, the pro forma results of operations for the year ended December 31, 2018, are as follows:
| | • | | Net investment income (loss): $21,165,827. |
| | • | | Net realized and change in unrealized gain (loss) on investments: $(248,579,262). |
| | • | | Net increase (decrease) in net assets resulting from operations: $(227,413,435). |
Because the combined investment portfolios have been managed as a single integrated portfolio since the acquisition was completed, it is not practicable to separate the amounts of revenue and earnings of Small Cap Target Fund that have been included in Small Cap Index’s Statement of Operations since November 19, 2018.
Reorganization costs incurred by Small Cap Index in connection with the reorganization were expensed by Small Cap Index.
| 2. | SIGNIFICANT ACCOUNTING POLICIES |
The financial statements are prepared in conformity with accounting principles generally accepted in the United States of America (“U.S. GAAP”), which may require management to make estimates and assumptions that affect the reported amounts of assets and liabilities in the financial statements, disclosure of contingent assets and liabilities at the date of the financial statements and the reported amounts of increases and decreases in net assets from operations during the reporting period. Actual results could differ from those estimates. Each Fund is considered an investment company under U.S. GAAP and follows the accounting and reporting guidance applicable to investment companies. Below is a summary of significant accounting policies:
Investment Transactions and Income Recognition:For International Index, for financial reporting purposes, investment transactions are recorded on the dates the transactions are executed. Realized gains and losses on investment transactions are determined on the identified cost basis. Dividend income is recorded on theex-dividend date. Dividends from foreign securities where theex-dividend date may have passed are subsequently recorded when International Index is informed of theex-dividend date. Under the applicable foreign tax laws, a withholding tax at various rates may be imposed on capital gains, dividends and interest. Upon notification from issuers, a portion of the dividend income received from a real estate investment trust may be redesignated as a reduction of cost of the related investment and/or realized gain. Income, expenses and realized and unrealized gains and losses are allocated daily to each class based on its relative net assets. For Small Cap Index, for financial reporting purposes, contributions to and withdrawals from the Series are accounted for on a trade date basis. Small Cap Index records its proportionate share of the Series’ income, expenses and realized and unrealized gains and losses on a daily basis.
Foreign Currency Translation:International Index’s books and records are maintained in U.S. dollars. Securities and other assets and liabilities denominated in foreign currencies are translated into U.S. dollars using exchange rates determined as of the close of trading on the New York Stock Exchange (“NYSE”). Purchases and sales of investments are recorded at the rates of exchange prevailing on the respective dates of such transactions. Generally, when the U.S. dollar rises in value against a foreign currency, the investments denominated in that currency will lose value; the opposite effect occurs if the U.S. dollar falls in relative value.
International Index does not isolate the portion of the results of operations arising as a result of changes in the exchange rates from the changes in the market prices of investments held or sold for financial reporting purposes. Accordingly, the effects of changes in exchange rates on investments are not segregated in the Statements of Operations from the effects of changes in market prices of those investments, but are included as a component of net realized and unrealized gain (loss) from investments. The Fund reports realized currency gains (losses) on foreign currency related transactions as components of net realized gain (loss) for financial reporting purposes, whereas such components are generally treated as ordinary income for U.S. federal income tax purposes.
Segregation and Collateralization: In cases where International Index enters into certain investments (e.g., futures contracts) that would be treated as “senior securities” for 1940 Act purposes, International Index may segregate or designate on its books and records cash or liquid assets having a market value at least equal to the amount of
| | | | |
| NOTESTO FINANCIAL STATEMENTS | | | 35 | |
Notes to Financial Statements (continued)
its future obligations under such investments. Doing so allows the investments to be excluded from treatment as a “senior security.” Furthermore, if required by an exchange or counterparty agreement, International Index may be required to deliver/deposit cash and/or securities to/with an exchange, or broker-dealer or custodian as collateral for certain investments or obligations.
Distributions:Distributions paid by the Funds are recorded on theex-dividend date. The portion of distributions, if any, that exceeds a fund’s current and accumulated earnings and profits, as measured on a tax basis, constitute anon-taxable return of capital. The character and timing of distributions are determined in accordance with U.S. federal income tax regulations, which may differ from U.S. GAAP.
Indemnifications:In the normal course of business, a Fund enters into contracts that contain a variety of representations that provide general indemnification. A Fund’s maximum exposure under these arrangements is unknown because it involves future potential claims against the Fund, which cannot be predicted with any certainty.
Offering Costs: Offering costs are amortized over a12-month period beginning with the commencement of operations of a class of shares.
Other: Expenses directly related to the Fund or its classes are charged to that Fund or the applicable class. Other operating expenses shared by several funds, including other funds managed by the Manager and/or Administrator, are prorated among those funds on the basis of relative net assets or other appropriate methods. Expenses directly related to the Funds and other shared expenses prorated to the Funds are allocated daily to each class based on its relative net assets or other appropriate methods.
| 3. | INVESTMENT VALUATION AND FAIR VALUE MEASUREMENTS |
Investment Valuation Policies:The Funds’ investments are valued at fair value (also referred to as “market value” within the financial statements) as of the close of trading on the NYSE (generally 4:00 p.m., Eastern time). U.S. GAAP defines fair value as the price the Funds would receive to sell an asset or pay to transfer a liability in an orderly transaction between market participants at the measurement date. The Funds determine the fair values of their financial instruments using various independent dealers or pricing services under policies approved by the Board. The BlackRock Global Valuation Methodologies Committee (the “Global Valuation Committee”) is the committee formed by management to develop global pricing policies and procedures and to oversee the pricing function for all financial instruments.
Small Cap Index’s policy is to value its financial instruments at fair value. Small Cap Index records its investment in the Series at fair value based on the Small Cap Index’s proportionate interest in the net assets of the Series. Valuation of securities held by the Series is discussed in Note 3 of the Series’ Notes to Financial Statements, which are included elsewhere in this report.
Fair Value Inputs and Methodologies: The following methods and inputs are used to establish the fair value of International Index’s assets and liabilities:
| | • | | Equity investments traded on a recognized securities exchange are valued at the official closing price each day, if available. For equity investments traded on more than one exchange, the official closing price on the exchange where the stock is primarily traded is used. Equity investments traded on a recognized exchange for which there were no sales on that day may be valued at the last available bid (long positions) or ask (short positions) price. |
Generally, trading in foreign instruments is substantially completed each day at various times prior to the close of trading on the NYSE. Occasionally, events affecting the values of such instruments may occur between the foreign market close and the close of trading on the NYSE that may not be reflected in the computation of the International Index’s net assets. Each business day, International Index uses a pricing service to assist with the valuation of certain foreign exchange-traded equity securities and foreign exchange-traded andover-the-counter (“OTC”) options (the “Systematic Fair Value Price”). Using current market factors, the Systematic Fair Value Price is designed to value such foreign securities and foreign options at fair value as of the close of trading on the NYSE, which follows the close of the local markets.
| | • | | Investments inopen-end U.S. mutual funds are valued at net asset value (“NAV”) each business day. |
| | • | | Futures contracts traded on exchanges are valued at their last sale price. |
If events (e.g., a company announcement, market volatility or a natural disaster) occur that are expected to materially affect the value of such investments, or in the event that the application of these methods of valuation results in a price for an investment that is deemed not to be representative of the market value of such investment, or if a price is not available, the investment will be valued by the Global Valuation Committee, or its delegate, in accordance with a policy approved by the Board as reflecting fair value (“Fair Valued Investments”). The fair valuation approaches that may be used by the Global Valuation Committee will include market approach, income approach and cost approach. Valuation techniques such as discounted cash flow, use of market comparables and matrix pricing are types of valuation approaches and are typically used in determining fair value. When determining the price for Fair Valued Investments, the Global Valuation Committee, or its delegate, seeks to determine the price that International Index might reasonably expect to receive or pay from the current sale or purchase of that asset or liability in anarm’s-length transaction. Fair value determinations shall be based upon all available factors that the Global Valuation Committee, or its delegate, deems relevant and consistent with the principles of fair value measurement. The pricing of all Fair Valued Investments is subsequently reported to the Board or a committee thereof on a quarterly basis.
| | |
| 36 | | 2019 BLACKROCK ANNUAL REPORTTO SHAREHOLDERS |
Notes to Financial Statements (continued)
For investments in equity or debt issued by privately held companies or funds (“Private Company” or collectively, the “Private Companies”) and other Fair Valued Investments, the fair valuation approaches that are used by Global Valuation Committee and third party pricing services utilize one or a combination of, but not limited to, the following inputs.
| | |
| | | Standard Inputs Generally Considered By Third Party Pricing Services |
Market approach | | (i) recentmarket transactions, including subsequent rounds of financing, in the underlying investment or comparable issuers; (ii) recapitalizations and other transactions across the capital structure; and (iii) market multiples of comparable issuers. |
Income approach | | (i) future cash flows discounted to present and adjusted as appropriate for liquidity, credit, and/or market risks; (ii) quoted prices for similar investments or assets in active markets; and (iii) other risk factors, such as interest rates, yield curves, volatilities, prepayment speeds, loss severities, credit risks, recovery rates, liquidation amounts and/or default rates. |
Cost approach | | (i) audited or unaudited financial statements, investor communications and financial or operational metrics issued by the Private Company; (ii) changes in the valuation of relevant indices or publicly traded companies comparable to the Private Company; (iii) relevant news and other public sources; and (iv) known secondary market transactions in the Private Company’s interests and merger or acquisition activity in companies comparable to the Private Company. |
Investments in series of preferred stock issued by Private Companies are typically valued utilizing market approach in determining the enterprise value of the company. Such investments often contain rights and preferences that differ from other series of preferred and common stock of the same issuer. Valuation techniques such as an option pricing model (“OPM”), a probability weighted expected return model (“PWERM”) or a hybrid of those techniques are used in allocating enterprise value of the company, as deemed appropriate under the circumstances. The use of OPM and PWERM techniques involve a determination of the exit scenarios of the investment in order to appropriately allocate the enterprise value of the company among the various parts of its capital structure.
The Private Companies are not subject to the public company disclosure, timing, and reporting standards as other investments held by International Index. Typically, the most recently available information by a Private Company is as of a date that is earlier than the date International Index is calculating its NAV. This factor may result in a difference between the value of the investment and the price International Index could receive upon the sale of the investment.
Fair Value Hierarchy:Various inputs are used in determining the fair value of investments and derivative financial instruments. These inputs to valuation techniques are categorized into a fair value hierarchy consisting of three broad levels for financial statement purposes as follows:
| | • | | Level 1 — Unadjusted price quotations in active markets/exchanges for identical assets or liabilities that International Index has the ability to access |
| | • | | Level 2 — Other observable inputs (including, but not limited to, quoted prices for similar assets or liabilities in markets that are active, quoted prices for identical or similar assets or liabilities in markets that are not active, inputs other than quoted prices that are observable for the assets or liabilities (such as interest rates, yield curves, volatilities, prepayment speeds, loss severities, credit risks and default rates) or other market–corroborated inputs) |
| | • | | Level 3 — Unobservable inputs based on the best information available in the circumstances, to the extent observable inputs are not available (including the Global Valuation Committee’s assumptions used in determining the fair value of investments and derivative financial instruments) |
The hierarchy gives the highest priority to unadjusted quoted prices in active markets for identical assets or liabilities (Level 1 measurements) and the lowest priority to unobservable inputs (Level 3 measurements). Accordingly, the degree of judgment exercised in determining fair value is greatest for instruments categorized in Level 3. The inputs used to measure fair value may fall into different levels of the fair value hierarchy. In such cases, for disclosure purposes, the fair value hierarchy classification is determined based on the lowest level input that is significant to the fair value measurement in its entirety. Investments classified within Level 3 have significant unobservable inputs used by the Global Valuation Committee in determining the price for Fair Valued Investments. Level 3 investments include equity or debt issued by Private Companies. There may not be a secondary market, and/or there are a limited number of investors. The categorization of a value determined for investments and derivative financial instruments is based on the pricing transparency of the investments and derivative financial instruments and is not necessarily an indication of the risks associated with investing in those securities.
| 4. | SECURITIES AND OTHER INVESTMENTS |
Preferred Stocks:Preferred stock has a preference over common stock in liquidation (and generally in receiving dividends as well), but is subordinated to the liabilities of the issuer in all respects. As a general rule, the market value of preferred stock with a fixed dividend rate and no conversion element varies inversely with interest rates and perceived credit risk, while the market price of convertible preferred stock generally also reflects some element of conversion value. Because preferred stock is junior to debt securities and other obligations of the issuer, deterioration in the credit quality of the issuer will cause greater changes in the value of a preferred stock than in a more senior debt security with similar stated yield characteristics. Unlike interest payments on debt securities, preferred stock dividends are payable only if declared by the issuer’s board of directors. Preferred stock also may be subject to optional or mandatory redemption provisions.
Securities Lending: International Index may lend its securities to approved borrowers, such as brokers, dealers and other financial institutions. The borrower pledges and maintains with International Index collateral consisting of cash, an irrevocable letter of credit issued by a bank, or securities issued or guaranteed by the U.S. Government. The initial collateral received by International Index is required to have a value of at least 102% of the current value of the loaned securities for securities traded on U.S. exchanges and a value of at least 105% for all other securities. The collateral is maintained thereafter at a value equal to at least 100% of the current market value of the securities on loan. The market value of the loaned securities is determined at the close of each business day of International Index and any additional required collateral is
| | | | |
| NOTESTO FINANCIAL STATEMENTS | | | 37 | |
Notes to Financial Statements (continued)
delivered to International Index, or excess collateral returned by International Index, on the next business day. During the term of the loan, International Index is entitled to all distributions made on or in respect of the loaned securities, but does not receive interest income on securities received as collateral. Loans of securities are terminable at any time and the borrower, after notice, is required to return borrowed securities within the standard time period for settlement of securities transactions.
The market value of any securities on loan, all of which were classified as common stocks in the International Index’s Schedule of Investments, and the value of any related collateral are shown separately in the Statements of Assets and Liabilities as a component of investments at value-unaffiliated, and collateral on securities loaned at value, respectively. As of period end, any securities on loan were collateralized by cash and/or U.S. Government obligations. Cash collateral invested by the securities lending agent, BlackRock Institutional Trust Company, N.A. (“BTC”), if any, is disclosed in the Schedule of Investments.
Securities lending transactions are entered into by International Index under Master Securities Lending Agreements (each, an “MSLA”), which provide the right, in the event of default (including bankruptcy or insolvency), for thenon-defaulting party to liquidate the collateral and calculate a net exposure to the defaulting party or request additional collateral. In the event that a borrower defaults, International Index, as lender, would offset the market value of the collateral received against the market value of the securities loaned. When the value of the collateral is greater than that of the market value of the securities loaned, the lender is left with a net amount payable to the defaulting party. However, bankruptcy or insolvency laws of a particular jurisdiction may impose restrictions on or prohibitions against such a right of offset in the event of an MSLA counterparty’s bankruptcy or insolvency. Under the MSLA, absent an event of default, the borrower can resell orre-pledge the loaned securities, and International Index can reinvest cash collateral received in connection with loaned securities. Upon an event of default, the parties’ obligations to return the securities or collateral to the other party are extinguished, and the parties can resell orre-pledge the loaned securities or the collateral received in connection with the loaned securities in order to satisfy the defaulting party’s net payment obligation for all transactions under the MSLA. The defaulting party remains liable for any deficiency.
As of period end, the following table is a summary of International Index’s securities lending agreements by counterparty which are subject to offset under an MSLA:
| | | | | | | | | | | | |
| Counterparty | | Securities
Loaned at Value | | | Cash Collateral Received (a) | | | Net
Amount | |
Bank of America N.A. | | $ | 1,416,437 | | | $ | (1,416,437 | ) | | $ | — | |
Citigroup Global Markets Inc | | | 958,754 | | | | (958,754 | ) | | | — | |
Macquarie Bank Limited | | | 141,826 | | | | (141,826 | ) | | | — | |
Morgan Stanley & Co LLC | | | 25,581,891 | | | | (25,581,891 | ) | | | — | |
Morgan Stanley & Co. LLC (US Equity Sec Lending) | | | 13,140,613 | | | | (13,140,613 | ) | | | — | |
Wells Fargo Bank, National Association | | | 69,580 | | | | (69,580 | ) | | | — | |
| | | | | | | | | | | | |
| | $ | 41,309,101 | | | $ | (41,309,101 | ) | | $ | — | |
| | | | | | | | | | | | |
| | (a) | Collateral received in excess of the market value of securities on loan is not presented in this table. The total cash collateral received by Fund is disclosed in the Fund’s Statements of Assets and Liabilities. | |
The risks of securities lending include the risk that the borrower may not provide additional collateral when required or may not return the securities when due. To mitigate these risks, the International Index benefits from a borrower default indemnity provided by BlackRock, Inc. (“BlackRock”). BlackRock’s indemnity allows for full replacement of the securities loaned to the extent the collateral received does not cover the value on the securities loaned in the event of borrower default. International Index could incur a loss if the value of an investment purchased with cash collateral falls below the market value of loaned securities or if the value of an investment purchased with cash collateral falls below the value of the original cash collateral received. Such losses are borne entirely by the Funds.
| 5. | DERIVATIVE FINANCIAL INSTRUMENTS |
International Index engages in various portfolio investment strategies using derivative contracts both to increase the returns of International Index and/or to manage its exposure to certain risks such as credit risk, equity risk, interest rate risk, foreign currency exchange rate risk, commodity price risk or other risks (e.g., inflation risk). Derivative financial instruments categorized by risk exposure are included in the Schedule of Investments. These contracts may be transacted on an exchange or OTC.
Futures Contracts:Futures contracts are purchased or sold to gain exposure to, or manage exposure to, changes in interest rates (interest rate risk) and changes in the value of equity securities (equity risk) or foreign currencies (foreign currency exchange rate risk).
Futures contracts are agreements between International Index and a counterparty to buy or sell a specific quantity of an underlying instrument at a specified price and on a specified date. Depending on the terms of a contract, it is settled either through physical delivery of the underlying instrument on the settlement date or by payment of a cash amount on the settlement date. Upon entering into a futures contract, International Index is required to deposit initial margin with the broker in the form of cash or securities in an amount that varies depending on a contract’s size and risk profile. The initial margin deposit must then be maintained at an established level over the life of the contract. Amounts pledged, which are considered restricted, are included in cash pledged for futures contracts in the Statements of Assets and Liabilities.
Securities deposited as initial margin are designated in the Schedule of Investments and cash deposited, if any, is shown as cash pledged for futures contracts in the Statements of Assets and Liabilities. Pursuant to the contract, International Index agrees to receive from or pay to the broker an amount of cash equal to the daily fluctuation in market value of the contract (“variation margin”). Variation margin is recorded as unrealized appreciation (depreciation) and, if any, shown as variation margin receivable (or payable) on futures contracts in the Statements of Assets and Liabilities. When the contract is closed, a realized gain or loss is recorded in the Statements of Operations equal to the difference between the notional amount of the contract at the time it was opened and the notional amount at the time it was closed. The use of futures contracts involves the risk of an imperfect correlation in the movements in the price of futures contracts and interest, foreign currency exchange rates or underlying assets.
| | |
| 38 | | 2019 BLACKROCK ANNUAL REPORTTO SHAREHOLDERS |
Notes to Financial Statements (continued)
| 6. | INVESTMENT ADVISORY AND ADMINISTRATION AGREEMENT AND OTHER TRANSACTIONS WITH AFFILIATES |
Investment Advisory: The Corporation, on behalf of International Index, entered into an Investment Advisory Agreement with the Manager, International Index’s investment adviser and an indirect, wholly-owned subsidiary of BlackRock, to provide investment advisory and administrative services. The Manager is responsible for the management of International Index’s portfolio and provides the personnel, facilities, equipment and certain other services necessary to the operations of International Index.
For such services, International Index pays the Manager a monthly fee at an annual rate of 0.01% of the average daily value of International Index’s net assets.
With respect to International Index, the Manager entered into a separatesub-advisory agreement with BlackRock Fund Advisors (“BFA”), an affiliate of the Manager. The Manager pays BFA for services it provides for that portion of International Index for which BFA acts assub-adviser a monthly fee that is equal to a percentage of the investment advisory fees paid by International Index to the Manager.
Service Fees:The Corporation, on behalf of the Funds, entered into a Distribution Agreement and a Distribution and Service Plan with BlackRock Investments, LLC (“BRIL”), an affiliate of the Manager and/or Administrator. Pursuant to the Distribution and Service Plan and in accordance with Rule12b-1 under the 1940 Act, each Fund pays BRIL ongoing service fees. The fees are accrued daily and paid monthly at annual rates based upon the average daily net assets of the relevant share class of each Fund as follows:
| | | | | | | | |
| | | International Index | | | Small Cap Index | |
Investor A | | | 0.25 | % | | | 0.25 | % |
Investor P | | | 0.25 | % | | | 0.25 | % |
BRIL and broker-dealers, pursuant tosub-agreements with BRIL, provide shareholder servicing to the Funds. The ongoing service fee compensates BRIL and each broker-dealer for providing shareholder servicing related services to shareholders.
For the year ended December 31, 2019, the following table shows the class specific service fees borne directly by each share class of each Fund:
| | | | | | | | |
| | | International Index | | | Small Cap Index | |
Investor A | | $ | 825,684 | | | $ | 697,443 | |
Investor P | | | 361,517 | | | | 727,293 | |
| | | $ | 1,187,201 | | | $ | 1,424,736 | |
Administration:The Corporation, on behalf of Small Cap Index, entered into an Administration Agreement with the Administrator, an indirect, wholly-owned subsidiary of BlackRock, to provide administrative services (other than investment advice and related portfolio activities). For such services, Small Cap Index pays the Administrator a monthly fee at an annual rate of 0.04% of the average daily net assets of Small Cap Index. Small Cap Index does not pay an investment advisory fee or investment management fee.
Transfer Agent:Pursuant to written agreements, certain financial intermediaries, some of which may be affiliates, provide the Funds withsub-accounting, recordkeeping,sub-transfer agency and other administrative services with respect to servicing of underlying investor accounts. For these services, these entities receive an asset-based fee or an annual fee per shareholder account, which will vary depending on share class and/or net assets. For the year ended December 31, 2019, the Funds did not pay any amounts to affiliates in return for these services.
The Manager and/or Administrator maintains a call center that is responsible for providing certain shareholder services to the Funds. Shareholder services include responding to inquiries and processing purchases and sales based upon instructions from shareholders. For the year ended December 31, 2019, each Fund reimbursed the Manager and/or Administrator the following amounts for costs incurred in running the call center, which are included in transfer agent — class specific in the Statements of Operations:
| | | | | | | | | | | | | | | | | | | | |
| | | Institutional | | | Investor A | | | Class K | | | Investor P | | | Total | |
International Index | | $ | 4,832 | | | $ | 15,383 | | | $ | 13,295 | | | $ | 2,535 | | | $ | 36,045 | |
Small Cap Index | | | 4,983 | | | | 23,669 | | | | 3,428 | | | | 3,498 | | | | 35,578 | |
For the year ended December 31, 2019, the following table shows the class specific transfer agent fees borne directly by each class of each Fund:
| | | | | | | | | | | | | | | | | | | | |
| | | Institutional | | | Investor A | | | Class K | | | Investor P | | | Total | |
International Index | | $ | 483,394 | | | $ | 236,830 | | | $ | 475,603 | | | $ | 157,120 | | | $ | 1,352,947 | |
Small Cap Index | | | 184,007 | | | | 259,722 | | | | 78,879 | | | | 238,024 | | | | 760,632 | |
Other Fees: For the year ended December 31, 2019, affiliates earned underwriting discounts, direct commissions and dealer concessions on sales of each Fund’s Investor P Shares as follows:
| | | | | | | | |
| | | International Index | | | Small Cap Index | |
Investor P | | $ | 8,652 | | | $ | 16,808 | |
| | | | |
| NOTESTO FINANCIAL STATEMENTS | | | 39 | |
Notes to Financial Statements (continued)
Expense Limitations, Waivers and Reimbursements:With respect to International Index, the Manager voluntarily agreed to waive its investment advisory fees by the amount of investment advisory fees the Fund pays to the Manager indirectly through its investment in affiliated money market funds (the “affiliated money market fund waiver”). The amount of waivers and/or reimbursements of fees and expenses made pursuant to the expense limitations described below will be reduced by the amount of the affiliated money market fund waiver. This amount is included in fees waived and/or reimbursed by the Manager in the Statements of Operations. For the year ended December 31, 2019, the Manager waived $4,555 in advisory fees pursuant to this agreement.
The Manager has contractually agreed to waive its investment advisory fee with respect to any portion of International Index’s assets invested in affiliated equity and fixed-income mutual funds and affiliated exchange-traded funds that have a contractual management fee through April 30, 2021. The contractual agreement may be terminated upon 90 days’ notice by a majority of the directors who are not “interested persons” of the Corporation, as defined in the 1940 Act (“Independent Directors”), or by a vote of a majority of the outstanding voting securities of International Index. This amount is included in fees waived and/or reimbursed by the Manager in the Statements of Operations. For the year ended December 31, 2019, there was no fees waived and/or reimbursed by the Manager pursuant to this arrangement.
With respect to each Fund, the Manager and/or Administrator contractually agreed to waive and/or reimburse fees or expenses in order to limit expenses, excluding interest expense, dividend expense, tax expense, acquired fund fees and expenses, and certain other fund expenses, which constitute extraordinary expenses not incurred in the ordinary course of each Fund’s business (“expense limitation”). The expense limitations as a percentage of each Fund’s average daily net assets are as follows:
| | | | |
Institutional | | | 0.12 | % |
Investor A | | | 0.37 | |
Class K | | | 0.07 | |
Investor P | | | 0.37 | |
The Manager and/or Administrator has agreed not to reduce or discontinue these contractual expense limitations through April 30, 2021, unless approved by the Board, including a majority of the Independent Directors or by a vote of a majority of the outstanding voting securities of the Funds. For the year ended December 31, 2019, the Manager and/or Administrator waived and/or reimbursed the following amounts, which are shown as fees waived and/or reimbursed by the Manager or the Administrator in the Statements of Operations.
| | | | | | | | | | | | | | | | | | | | |
| | | Institutional | | | Investor A | | | Class K | | | Investor P | | | Total | |
Small Cap Index | | $ | 6,482 | | | $ | 8,215 | | | $ | 36,371 | | | $ | 8,566 | | | $ | 59,634 | |
These amounts waived and/or reimbursed are included in transfer agent fees waived and/or reimbursed — class specific in the Statements of Operations. For the year ended December 31, 2019, class specific expense waivers and/or reimbursements are as follows:
| | | | | | | | | | | | | | | | | | | | |
| | | Institutional | | | Investor A | | | Class K | | | Investor P | | | Total | |
International Index | | $ | — | | | $ | — | | | $ | — | | | $ | 43,165 | | | $ | 43,165 | |
Small Cap Index | | | 74,066 | | | | 120,097 | | | | 78,496 | | | | 112,720 | | | | 385,379 | |
Securities Lending:The U.S. Securities and Exchange Commission (“SEC”) has issued an exemptive order which permits BTC, an affiliate of the Manager, to serve as securities lending agent for International Index, subject to applicable conditions. As securities lending agent, BTC bears all operational costs directly related to securities lending. International Index is responsible for fees in connection with the investment of cash collateral received for securities on loan (the “collateral investment fees”). The cash collateral is invested in a money market fund managed by the Manager or its affiliates. However, BTC has agreed to reduce the amount of securities lending income it receives in order to effectively limit the collateral investment fees International Index bears to an annual rate of 0.04%. The shares of such money market fund will not be subject to a sales load, distribution fee or service fee. The money market fund in which the cash collateral has been invested may, under certain circumstances, impose a liquidity fee of up to 2% of the value redeemed or temporarily restrict redemptions for up to 10 business days during a 90 day period, in the event that the money market fund’s weekly liquid assets fall below certain thresholds.
Securities lending income is equal to the total of income earned from the reinvestment of cash collateral, net of fees and other payments to and from borrowers of securities, and less the collateral investment fees. International Index retains a portion of securities lending income and remits a remaining portion to BTC as compensation for its services as securities lending agent.
Pursuant to the current securities lending agreement, International Index retains 82% of securities lending income (which excludes collateral investment fees), and this amount retained can never be less than 70% of the total of securities lending income plus the collateral investment fees.
In addition, commencing the business day following the date that the aggregate securities lending income earned across the BlackRock Multi-Asset Complex in a calendar year exceeds a specified threshold, International Index, pursuant to the securities lending agreement, will retain for the remainder of that calendar year securities lending income in an amount equal to 85% of securities lending income (which excludes collateral investment fees), and this amount retained can never be less than 70% of the total of securities lending income plus the collateral investment fees.
The share of securities lending income earned by International Index is shown as securities lending income — affiliated — net in the Statements of Operations. For the year ended December 31, 2019, International Index paid BTC $173,376 for securities lending agent services.
Interfund Lending:In accordance with an exemptive order (the “Order”) from the SEC, each Fund may participate in a joint lending and borrowing facility for temporary purposes (the “Interfund Lending Program”), subject to compliance with the terms and conditions of the Order, and to the extent permitted by each Fund’s investment policies and restrictions. Each Fund is currently permitted to borrow and lend under the Interfund Lending Program.
| | |
| 40 | | 2019 BLACKROCK ANNUAL REPORTTO SHAREHOLDERS |
Notes to Financial Statements (continued)
A lending BlackRock fund may lend in aggregate up to 15% of its net assets, but may not lend more than 5% of its net assets to any one borrowing fund through the Interfund Lending Program. A borrowing BlackRock fund may not borrow through the Interfund Lending Program or from any other source more than 33 1/3% of its total assets (or any lower threshold provided for by the fund’s investment restrictions). If a borrowing BlackRock fund’s total outstanding borrowings exceed 10% of its total assets, each of its outstanding interfund loans will be subject to collateralization of at least 102% of the outstanding principal value of the loan. All interfund loans are for temporary or emergency purposes and the interest rate to be charged will be the average of the highest current overnight repurchase agreement rate available to a lending fund and the bank loan rate, as calculated according to a formula established by the Board.
During the year ended December 31, 2019, the Funds did not participate in the Interfund Lending Program.
Directors and Officers:Certain directors and/or officers of the Corporation are directors and/or officers of BlackRock or its affiliates. The Funds reimburse the Manager and/or Administrator for a portion of the compensation paid to the Funds’ Chief Compliance Officer, which is included in Directors and Officer in the Statements of Operations.
Other Transactions:International Index may purchase securities from, or sell securities to, an affiliated fund provided the affiliation is due solely to having a common investment adviser, common officers, or common directors. For the year ended December 31, 2019, the purchase and sale transactions and any net realized gains (losses) with affiliated funds in compliance with Rule17a-7 under the 1940 Act were as follows:
| | | | | | | | | | | | | | |
| Purchases | | | | | Sales | | | | | Net Realized Gain (Loss) | |
| $ | 29,944,947 | | | | | $ | 22,480,714 | | | | | $ | (1,466,163 | ) |
For International Index, for the year ended December 31, 2019, purchases and sales of investments, excluding short-term securities were $342,295,327 and $1,057,345,157, respectively.
It is each Fund’s policy to comply with the requirements of the Internal Revenue Code of 1986, as amended, applicable to regulated investment companies, and to distribute substantially all of its taxable income to its shareholders. Therefore, no U.S. federal income tax provision is required.
Each Fund files U.S. federal and various state and local tax returns. No income tax returns are currently under examination. The statute of limitations on the Fund’s U.S. federal tax returns generally remains open for each of the four years ended December 31, 2019. The statutes of limitations on each Fund’s state and local tax returns may remain open for an additional year depending upon the jurisdiction.
Management has analyzed tax laws and regulations and their application to the Fund as of December 31, 2019, inclusive of the open tax return years, and does not believe that there are any uncertain tax positions that require recognition of a tax liability in the Fund’s financial statements.
U.S. GAAP requires that certain components of net assets be adjusted to reflect permanent differences between financial and tax reporting. These reclassifications have no effect on net assets or net asset values per share. As of period end, the following permanent differences attributable to the non-deductible expenses were reclassified to the following accounts:
| | | | | | | | |
| | | International Index | | | Small Cap Index | |
Paid in capital | | $ | (308,683 | ) | | $ | (26,855 | ) |
Accumulated Earnings | | | 308,683 | | | | 26,855 | |
The tax character of distributions paid was as follows:
| | | | | | | | |
| | | International Index | | | Small Cap Index | |
Ordinary income | | | | | | | | |
12/31/19 | | $ | 268,192,335 | | | $ | 41,020,154 | |
12/31/18 | | | 344,768,830 | | | | 30,322,395 | |
Long-term capital gains | | | | | | | | |
12/31/19 | | | — | | | | 34,199,509 | |
12/31/18 | | | — | | | | 38,963,396 | |
Tax return of capital | | | | | | | | |
12/31/18 | | | 394,808 | | | | — | |
| | | | | | | | |
Total | | | | | | | | |
12/31/19 | | $ | 268,192,335 | | | $ | 75,219,663 | |
| | | | | | | | |
12/31/18 | | $ | 345,163,638 | | | $ | 69,285,791 | |
| | | | | | | | |
| | | | |
| NOTESTO FINANCIAL STATEMENTS | | | 41 | |
Notes to Financial Statements (continued)
As of period ended, the tax components of accumulated net earnings were as follows:
| | | | | | | | |
| | | International Index | | | Small Cap Index | |
Undistributed net investment income | | $ | 2,089,119 | | | $ | 902,829 | |
Non-expiring Capital loss carryforwards(a) | | | (622,792,312 | ) | | | — | |
Net unrealized gains (losses)(b) | | | 1,382,674,871 | | | | 278,799,779 | |
Qualified late-year losses(c) | | | — | | | | (2,889,177 | ) |
| | | | | | | | |
| | $ | 761,971,678 | | | $ | 276,813,431 | |
| | | | | | | | |
| | (a) | Amounts available to offset future realized capital gains. | |
| | (b) | The difference between book-basis and tax-basis net unrealized gains (losses) was attributable primarily to the timing of income recognition on partnership interests, the tax deferral of losses on wash sales, the realization for tax purposes of unrealized gains / (losses) on certain futures and foreign currency contracts, and the realization for tax purposes of unrealized gains on investments in passive foreign investment companies and classification of settlement proceeds. | |
| | (c) | The Fund has elected to defer certain qualified late-year losses, classification of settlement and recognize such losses in the next taxable year. | |
As of December 31, 2019, gross unrealized appreciation and depreciation for investments and derivatives based on cost for U.S. federal income tax purposes were as follows:
| | | | |
| | | International Index | |
Tax cost | | $ | 6,871,505,081 | |
| | | | |
Gross unrealized appreciation | | $ | 1,866,677,822 | |
Gross unrealized depreciation | | | (484,657,531 | ) |
| | | | |
Net unrealized appreciation (depreciation) | | $ | 1,382,020,291 | |
| | | | |
The Corporation, on behalf of International Index, along with certain other funds managed by the Manager and its affiliates (“Participating Funds”), is a party to a364-day, $2.25 billion credit agreement with a group of lenders. Under this agreement, International Index may borrow to fund shareholder redemptions. Excluding commitments designated for certain individual funds, the Participating Funds, including the International Index, can borrow up to an aggregate commitment amount of $1.75 billion at any time outstanding, subject to asset coverage and other limitations as specified in the agreement. The credit agreement has the following terms: a fee of 0.10% per annum on unused commitment amounts and interest at a rate equal to the higher of(a) one-month LIBOR (but, in any event, not less than 0.00%) on the date the loan is made plus 0.80% per annum or (b) the Fed Funds rate (but, in any event, not less than 0.00%) in effect from time to time plus 0.80% per annum on amounts borrowed. The agreement expires in April 2020 unless extended or renewed. Prior to April 18, 2019, Participating Funds paid an upfront commitment fee of 0.02% on the total commitment amounts, in addition to administration, legal and arrangement fees, which are included in miscellaneous expenses in the Statements of Operations. These fees were allocated among such funds based upon portions of the aggregate commitment available to them and relative net assets of Participating Funds. During the year ended December 31, 2019, International Index did not borrow under the credit agreement.
In the normal course of business, International Index invests in securities or other instruments and may enter into certain transactions, and such activities subject International Index to various risks, including among others, fluctuations in the market (market risk) or failure of an issuer to meet all of its obligations. The value of securities or other instruments may also be affected by various factors, including, without limitation: (i) the general economy; (ii) the overall market as well as local, regional or global political and/or social instability; (iii) regulation, taxation or international tax treaties between various countries; or (iv) currency, interest rate and price fluctuations. International Index’s prospectus provides details of the risks to which International Index is subject.
International Index may be exposed to additional risks when reinvesting cash collateral in money market funds that do not seek to maintain a stable NAV per share of $1.00 and which may be subject to redemption gates or liquidity fees under certain circumstances.
Valuation Risk:The market values of equities, such as common stocks and preferred securities or equity related investments, such as futures and options, may decline due to general market conditions which are not specifically related to a particular company. They may also decline due to factors which affect a particular industry or industries. International Index may invest in illiquid investments. An illiquid investment is any investment that The Fund reasonably expects cannot be sold or disposed of in current market conditions in seven calendar days or less without the sale or disposition significantly changing the market value of the investment. The Fund may experience difficulty in selling illiquid investments in a timely manner at the price that it believes the investments are worth. Prices may fluctuate widely over short or extended periods in response to company, market or economic news. Markets also tend to move in cycles, with periods of rising and falling prices. This volatility may cause International Index’s NAV to experience significant increases or decreases over short periods of time. If there is a general decline in the securities and other markets, the NAV of International Index may lose value, regardless of the individual results of the securities and other instruments in which International Index invests.
The price International Index could receive upon the sale of any particular portfolio investment may differ from International Index’s valuation of the investment, particularly for securities that trade in thin or volatile markets or that are valued using a fair valuation technique or a price provided by an independent pricing service. Changes to significant unobservable inputs and assumptions (i.e., publicly traded company multiples, growth rate, time to exit) due to the lack of observable inputs may significantly impact the resulting fair value and therefore International Index’s results of operations. As a result, the price received upon the sale of an investment may be less than the value ascribed by International Index, and International Index could realize a greater than expected loss or lesser than expected gain upon the sale of the investment. International Index’s ability to value its investments may also be impacted by technological issues and/or errors by pricing services or other third party service providers.
Counterparty Credit Risk:International Index may be exposed to counterparty credit risk, or the risk that an entity may fail to or be unable to perform on its commitments related to unsettled or open transactions. International Index manages counterparty credit risk by entering into transactions only with counterparties that the Manager
| | |
| 42 | | 2019 BLACKROCK ANNUAL REPORTTO SHAREHOLDERS |
Notes to Financial Statements (continued)
believes have the financial resources to honor their obligations and by monitoring the financial stability of those counterparties. Financial assets, which potentially expose International Index to market, issuer and counterparty credit risks, consist principally of financial instruments and receivables due from counterparties. The extent of the International Index’s exposure to market, issuer and counterparty credit risks with respect to these financial assets is approximately their value recorded in the Statements of Assets and Liabilities, less any collateral held by International Index.
A derivative contract may suffer amark-to-market loss if the value of the contract decreases due to an unfavorable change in the market rates or values of the underlying instrument. Losses can also occur if the counterparty does not perform under the contract.
With exchange-traded futures, there is less counterparty credit risk to International Index since the exchange or clearinghouse, as counterparty to such instruments, guarantees against a possible default. The clearinghouse stands between the buyer and the seller of the contract; therefore, credit risk is limited to failure of the clearinghouse. While offset rights may exist under applicable law, International Index does not have a contractual right of offset against a clearing broker or clearinghouse in the event of a default (including the bankruptcy or insolvency). Additionally, credit risk exists in exchange-traded futures with respect to initial and variation margin that is held in a clearing broker’s customer accounts. While clearing brokers are required to segregate customer margin from their own assets, in the event that a clearing broker becomes insolvent or goes into bankruptcy and at that time there is a shortfall in the aggregate amount of margin held by the clearing broker for all its clients, typically the shortfall would be allocated on a pro rata basis across all the clearing broker’s customers, potentially resulting in losses to International Index.
Concentration Risk: International Index invests a substantial amount of its assets in issuers located in a single country or a limited number of countries. When the Fund concentrates its investments in this manner, it assumes the risk that economic, political and social conditions in those countries may have a significant impact on their investment performance. Foreign issuers may not be subject to the same uniform accounting, auditing and financial reporting standards and practices as used in the United States. Foreign securities markets may also be more volatile and less liquid than U.S. securities and may be less subject to governmental supervision not typically associated with investing in U.S. securities. Investment percentages in specific countries are presented in the Schedule of Investments.
International Index invests a significant portion of its assets in securities of issuers located in Europe or with significant exposure to European issuers or countries. The European financial markets have recently experienced volatility and adverse trends due to concerns about economic downturns in, or rising government debt levels of, several European countries. These events may spread to other countries in Europe and may affect the value and liquidity of certain of the International Index’s investments.
Responses to the financial problems by European governments, central banks and others, including austerity measures and reforms, may not work, may result in social unrest and may limit future growth and economic recovery or have other unintended consequences. Further defaults or restructurings by governments and others of their debt could have additional adverse effects on economies, financial markets and asset valuations around the world. In addition, the United Kingdom has voted to withdraw from the European Union, and one or more other countries may withdraw from the European Union and/or abandon the Euro, the common currency of the European Union. The impact of these actions, especially if they occur in a disorderly fashion, is not clear but could be significant and far reaching.
International Index invests a significant portion of its assets in securities of issuers located in Asia or with significant exposure to Asian issuers or countries. The Asian financial markets have recently experienced volatility and adverse trends due to concerns in several Asian countries regarding monetary policy, government intervention in the markets, rising government debt levels or economic downturns. These events may spread to other countries in Asia and may affect the value and liquidity of certain of the International Index’s investments.
| 11. | CAPITAL SHARE TRANSACTIONS |
Transactions in capital shares for each class were as follows:
| | | | | | | | | | | | | | | | |
| | | Year Ended
12/31/19 | | | Year Ended
12/31/18 | |
| International Index | | Shares | | | Amount | | | Shares | | | Amount | |
Institutional | | | | | | | | | | | | | | | | |
Shares sold | | | 20,331,613 | | | $ | 265,429,037 | | | | 32,149,256 | | | $ | 431,096,176 | |
Shares issued in reinvestment of distributions | | | 1,921,999 | | | | 26,216,064 | | | | 2,415,327 | | | | 28,862,839 | |
Shares issued in reorganization | | | — | | | | — | | | | 3,373,903 | | | | 43,679,673 | |
Shares redeemed | | | (23,125,321 | ) | | | (302,728,751 | ) | | | (23,626,064 | ) | | | (318,767,724 | ) |
| | | | | | | | | | | | | | | | |
Net increase (decrease) | | | (871,709 | ) | | $ | (11,083,650 | ) | | | 14,312,422 | | | $ | 184,870,964 | |
| | | | | | | | | | | | | | | | |
| | | | |
Investor A | | | | | | | | | | | | | | | | |
Shares sold | | | 10,905,246 | | | $ | 141,651,440 | | | | 11,078,586 | | | $ | 151,939,564 | |
Shares issued in reinvestment of distributions | | | 740,537 | | | | 10,041,682 | | | | 1,046,349 | | | | 12,434,612 | |
Shares issued in reorganization | | | — | | | | — | | | | 293,437 | | | | 3,767,286 | |
Shares redeemed | | | (13,013,797 | ) | | | (169,434,000 | ) | | | (12,851,181 | ) | | | (175,919,010 | ) |
| | | | | | | | | | | | | | | | |
Net decrease | | | (1,368,014 | ) | | $ | (17,740,878 | ) | | | (432,809 | ) | | $ | (7,777,548 | ) |
| | | | | | | | | | | | | | | | |
| | | | |
Class K | | | | | | | | | | | | | | | | |
Shares sold | | | 87,821,428 | | | $ | 1,145,861,059 | | | | 298,830,319 | | | $ | 4,137,594,519 | |
Shares issued in reinvestment of distributions | | | 15,942,879 | | | | 217,620,304 | | | | 24,047,735 | | | | 287,862,330 | |
Shares redeemed | | | (154,236,643 | ) | | | (2,017,774,065 | ) | | | (447,546,241 | ) | | | (5,946,093,723 | ) |
| | | | | | | | | | | | | | | | |
Net decrease | | | (50,472,336 | ) | | $ | (654,292,702 | ) | | | (124,668,187 | ) | | $ | (1,520,636,874 | ) |
| | | | | | | | | | | | | | | | |
| | | | |
| NOTESTO FINANCIAL STATEMENTS | | | 43 | |
Notes to Financial Statements (continued)
| | | | | | | | | | | | | | | | |
| | | Year Ended
12/31/19 | | | Year Ended
12/31/18 | |
| International Index | | Shares | | | Amount | | | Shares | | | Amount | |
| | | | |
Investor P | | | | | | | | | | | | | | | | |
Shares sold | | | 674,405 | | | $ | 8,730,993 | | | | 69,862 | | | $ | 870,804 | |
Shares issued in reinvestment of distributions | | | 328,784 | | | | 4,441,874 | | | | 506,182 | | | | 5,983,078 | |
Shares issued in reorganization | | | — | | | | — | | | | 11,371,665 | | | | 145,999,640 | |
Shares redeemed | | | (1,890,213 | ) | | | (24,460,763 | ) | | | (162,798 | ) | | | (1,965,558 | ) |
| | | | | | | | | | | | | | | | |
Net increase (decrease) | | | (887,024 | ) | | $ | (11,287,896 | ) | | | 11,784,911 | | | $ | 150,887,964 | |
| | | | | | | | | | | | | | | | |
Total Net decrease | | | (53,599,083 | ) | | $ | (694,405,126 | ) | | | (99,003,663 | ) | | $ | (1,192,655,494 | ) |
| | | | | | | | | | | | | | | | |
| | | | | | | | | | | | | | | | |
| | | |
| | | Year Ended
12/31/19 | | | Year Ended
12/31/18 | |
| Small-Cap Index | | Shares | | | Amount | | | Shares | | | Amount | |
Institutional | | | | | | | | | | | | | | | | |
Shares sold | | | 3,592,601 | | | $ | 69,580,751 | | | | 3,846,086 | | | $ | 75,910,168 | |
Shares issued in reinvestment of distributions | | | 368,502 | | | | 7,425,324 | | | | 441,848 | | | | 7,812,915 | |
Shares issued in reorganization | | | — | | | | — | | | | 4,742,227 | | | | 93,993,542 | |
Shares redeemed | | | (4,766,212 | ) | | | (91,979,972 | ) | | | (5,597,874 | ) | | | (113,329,554 | ) |
| | | | | | | | | | | | | | | | |
Net increase (decrease) | | | (805,109 | ) | | $ | (14,973,897 | ) | | | 3,432,287 | | | $ | 64,387,071 | |
| | | | | | | | | | | | | | | | |
| | | | |
Investor A | | | | | | | | | | | | | | | | |
Shares sold | | | 4,247,146 | | | $ | 82,378,182 | | | | 6,007,538 | | | $ | 122,943,077 | |
Shares issued in reinvestment of distributions | | | 404,884 | | | | 8,170,561 | | | | 542,055 | | | | 9,614,414 | |
Shares issued in reorganization | | | — | | | | — | | | | 728,215 | | | | 14,412,111 | |
Shares redeemed | | | (6,385,884 | ) | | | (123,589,696 | ) | | | (4,864,627 | ) | | | (98,251,584 | ) |
| | | | | | | | | | | | | | | | |
Net increase (decrease) | | | (1,733,854 | ) | | $ | (33,040,953 | ) | | | 2,413,181 | | | $ | 48,718,018 | |
| | | | | | | | | | | | | | | | |
| | | | |
Class K | | | | | | | | | | | | | | | | |
Shares sold | | | 28,513,761 | | | $ | 554,627,760 | | | | 50,807,052 | | | $ | 1,030,948,264 | |
Shares issued in reinvestment of distributions | | | 2,471,848 | | | | 49,956,052 | | | | 2,088,698 | | | | 37,057,378 | |
Shares redeemed | | | (13,712,219 | ) | | | (268,010,304 | ) | | | (20,977,651 | ) | | | (410,587,509 | ) |
| | | | | | | | | | | | | | | | |
Net increase | | | 17,273,390 | | | $ | 336,573,508 | | | | 31,918,099 | | | $ | 657,418,133 | |
| | | | | | | | | | | | | | | | |
| | | | |
Investor P | | | | | | | | | | | | | | | | |
Shares sold | | | 764,226 | | | $ | 14,806,788 | | | | 120,990 | | | $ | 2,233,494 | |
Shares issued in reinvestment of distributions | | | 465,565 | | | | 9,367,159 | | | | 613,215 | | | | 10,792,580 | |
Shares issued in reorganization | | | — | | | | — | | | | 15,271,535 | | | | 302,329,098 | |
Shares redeemed | | | (2,247,336 | ) | | | (43,579,725 | ) | | | (245,477 | ) | | | (4,384,770 | ) |
| | | | | | | | | | | | | | | | |
Net increase (decrease) | | | (1,017,545 | ) | | $ | (19,405,778 | ) | | | 15,760,263 | | | $ | 310,970,402 | |
| | | | | | | | | | | | | | | | |
Total Net Increase | | | 13,716,882 | | | $ | 269,152,880 | | | | 53,523,830 | | | $ | 1,081,493,624 | |
| | | | | | | | | | | | | | | | |
As of December 31, 2019, shares owned by BlackRock Financial Management Inc., an affiliate of the Funds, were as follows:
| | | | | | | | |
| | | iShares
MSCI EAFE
International
Index Fund | | | iShares
Russell 2000
Small-Cap
Index Fund | |
Investor P | | | 14,420 | | | | 9,191 | |
Management has evaluated the impact of all subsequent events on the Funds through the date the financial statements were issued and has determined that there were no subsequent events requiring adjustment or additional disclosure in the financial statements.
| | |
| 44 | | 2019 BLACKROCK ANNUAL REPORTTO SHAREHOLDERS |
| | |
| Report of Independent Registered Public Accounting Firm | | |
To the Shareholders of iShares MSCI EAFE International Index Fund and iShares Russell 2000 Small-Cap Index Fund and the Board of Directors of BlackRock Index Funds, Inc.:
Opinion on the Financial Statements and Financial Highlights
We have audited the accompanying statements of assets and liabilities of iShares MSCI EAFE International Index Fund and iShares Russell 2000 Small-Cap Index Fund of BlackRock Index Funds, Inc. (the “Funds”), including the schedule of investments of iShares MSCI EAFE International Index Fund, as of December 31, 2019, the related statements of operations for the year then ended, the statements of changes in net assets for each of the two years in the period then ended, the financial highlights for each of the five years in the period then ended, and the related notes. In our opinion, the financial statements and financial highlights present fairly, in all material respects, the financial position of the Funds as of December 31, 2019, and the results of their operations for the year then ended, the changes in their net assets for each of the two years in the period then ended, and the financial highlights for each of the five years in the period then ended, in conformity with accounting principles generally accepted in the United States of America.
Basis for Opinion
These financial statements and financial highlights are the responsibility of the Funds’ management. Our responsibility is to express an opinion on Funds’ financial statements and financial highlights based on our audits. We are a public accounting firm registered with the Public Company Accounting Oversight Board (United States) (PCAOB) and are required to be independent with respect to the Funds in accordance with the U.S. federal securities laws and the applicable rules and regulations of the Securities and Exchange Commission and the PCAOB.
We conducted our audits in accordance with the standards of the PCAOB. Those standards require that we plan and perform the audit to obtain reasonable assurance about whether the financial statements and financial highlights are free of material misstatement, whether due to error or fraud. The Funds are not required to have, nor were we engaged to perform, an audit of their internal control over financial reporting. As part of our audits we are required to obtain an understanding of internal control over financial reporting but not for the purpose of expressing an opinion on the effectiveness of the Funds’ internal control over financial reporting. Accordingly, we express no such opinion.
Our audits included performing procedures to assess the risks of material misstatement of the financial statements and financial highlights, whether due to error or fraud, and performing procedures that respond to those risks. Such procedures included examining, on a test basis, evidence regarding the amounts and disclosures in the financial statements and financial highlights. Our audits also included evaluating the accounting principles used and significant estimates made by management, as well as evaluating the overall presentation of the financial statements and financial highlights. Our procedures included confirmation of securities owned as of December 31, 2019, by correspondence with the custodian and brokers; when replies were not received from brokers, we performed other auditing procedures. We believe that our audits provide a reasonable basis for our opinion.
Deloitte & Touche LLP
Boston, Massachusetts
February 24, 2020
We have served as the auditor of one or more BlackRock investment companies since 1992.
| | | | |
| REPORT OF INDEPENDENT REGISTERED PUBLIC ACCOUNTING FIRM | | | 45 | |
| | |
| Important Tax Information (unaudited) | | |
During the fiscal year ended December 31, 2019, the following information is provided with respect to the ordinary income distributions paid by the Funds.
| | | | | | | | | | |
| | | Payable Date | | iShares MSCI EAFE
International Index Fund | | | iShares Russell 2000
Small-Cap Index | |
Qualified Dividend Income for Individuals(a)(b) | | 12/13/2019 | | | 90.83% | | | | 49.99% | |
Qualified Business Income(a) | | 12/13/2019 | | | — | | | | 7.15% | |
Dividends Qualifying for the Dividend Received Deduction for Corporations(a) | | 12/13/2019 | | | — | | | | 48.13% | |
Foreign Source Income | | 12/13/2019 | | | 89.67% | | | | — | |
Foreign Taxes Paid Per Share(c) | | 12/13/2019 | | $ | 0.038681 | | | | — | |
Federal Obligation Interest(d) | | 12/13/2019 | | | | | | | 1.24% | |
Qualified Interest Income and Short-Term Capital Gains for non-U.S. Residents(e) | | 12/13/2019 | | | — | | | | 28.37% | |
| | (a) | The Fund hereby designates the percentage indicated above or the maximum amount allowable by law. | |
| | (b) | Expressed as a percentage of the cash distribution grossed-up for foreign taxes. | |
| | (c) | The foreign taxes paid represent taxes incurred by the Fund on income received by the Fund from foreign sources. Foreign taxes paid may be included in taxable income with an offsetting deduction from gross income or may be taken as a credit for taxes paid to foreign governments. You should consult your tax advisor regarding the appropriate treatment of foreign taxes paid. | |
| | (d) | The law varies in each state as to whether and what percentage of ordinary dividend income attributable to federal obligations is exempt from state income tax. We recommend that you consult your tax advisor to determine if any portion of the dividends you received is exempt from state income taxes | |
| | (e) | Represents the portion of the taxable ordinary income dividends eligible for exemption from U.S. withholding tax for nonresident aliens and foreign corporations. | |
Additionally, iShares Russell 2000 Small-Cap Index Fund distributed long-term capital gains of $0.315902 per share to shareholders of record on December 11, 2019.
| | |
| 46 | | 2019 BLACKROCK ANNUAL REPORTTO SHAREHOLDERS |
| | |
| Series Portfolio Information as of December 31, 2019 | | Master Small Cap Index Series |
TEN LARGEST HOLDINGS
| | | | |
| Security | | Percent of
Net Assets | |
iShares Russell 2000 ETF | | | 0.5 | % |
Novocure Ltd. | | | 0.3 | |
Medicines Co. | | | 0.3 | |
Generac Holdings, Inc. | | | 0.3 | |
Lumentum Holdings, Inc. | | | 0.3 | |
Teladoc Health, Inc. | | | 0.3 | |
Arrowhead Pharmaceuticals, Inc. | | | 0.3 | |
Haemonetics Corp. | | | 0.3 | |
Marriott Vacations Worldwide Corp. | | | 0.3 | |
Performance Food Group Co. | | | 0.3 | |
SECTOR ALLOCATION
| | | | |
| Sector | | Percent of
Net Assets | |
Health Care | | | 18 | % |
Financials | | | 17 | |
Industrials | | | 16 | |
Information Technology | | | 13 | |
Short-Term Securities | | | 13 | |
Consumer Discretionary | | | 11 | |
Real Estate | | | 8 | |
Materials | | | 4 | |
Utilities | | | 4 | |
Energy | | | 3 | |
Consumer Staples | | | 3 | |
Communication Services | | | 2 | |
Investment companies | | | — | (a) |
Liabilities in Excess of Other Assets | | | (12 | ) |
| | (a) | Represents less than 1%. | |
For Series compliance purposes, the Series’ sector classifications refer to one or more of the sector sub-classifications used by one or more widely recognized market indexes, and/or as defined by the investment adviser. These definitions may not apply for purposes of this report, which may combine such sector sub-classifications for reporting ease.
| | | | |
| SERIES PORTFOLIO INFORMATION | | | 47 | |
| | |
Schedule of Investments December 31, 2019 | | Master Small Cap Index Series (Percentages shown are based on Net Assets) |
| | | | | | | | |
| Security | | Shares | | | Value | |
|
Common Stocks — 98.5% | |
|
| Advertising Agencies — 0.2% | |
Boston Omaha Corp., Class A(a)(b) | | | 15,594 | | | $ | 328,098 | |
Cardlytics, Inc.(b) | | | 23,130 | | | | 1,453,952 | |
Clear Channel Outdoor Holdings, Inc.(b) | | | 75,454 | | | | 215,798 | |
Emerald Expositions Events, Inc. | | | 36,756 | | | | 387,776 | |
Fluent, Inc.(a)(b) | | | 64,666 | | | | 161,665 | |
Marchex, Inc., Class B(b) | | | 54,767 | | | | 207,019 | |
MDC Partners, Inc., Class A(b) | | | 88,049 | | | | 244,776 | |
National CineMedia, Inc. | | | 96,299 | | | | 702,020 | |
QuinStreet, Inc.(b) | | | 70,546 | | | | 1,080,059 | |
Viad Corp. | | | 31,100 | | | | 2,099,250 | |
| | | | | | | | |
| | | | 6,880,413 | |
|
| Aerospace — 1.0% | |
AAR Corp. | | | 51,730 | | | | 2,333,023 | |
Aerojet Rocketdyne Holdings, Inc.(a)(b) | | | 112,826 | | | | 5,151,635 | |
AeroVironment, Inc.(b) | | | 33,106 | | | | 2,043,965 | |
Astronics Corp.(a)(b) | | | 41,456 | | | �� | 1,158,695 | |
Axon Enterprise, Inc.(b) | | | 90,087 | | | | 6,601,575 | |
Cubic Corp.(a) | | | 48,286 | | | | 3,069,541 | |
Ducommun, Inc.(b) | | | 16,670 | | | | 842,335 | |
Kaman Corp. | | | 42,741 | | | | 2,817,487 | |
Kratos Defense & Security Solutions, Inc.(a)(b) | | | 139,166 | | | | 2,506,380 | |
Moog, Inc., Class A | | | 49,654 | | | | 4,236,976 | |
Triumph Group, Inc.(a) | | | 77,157 | | | | 1,949,757 | |
| | | | | | | | |
| | | | 32,711,369 | |
|
| Agriculture, Fishing & Ranching — 0.4% | |
Alico, Inc. | | | 6,182 | | | | 221,501 | |
Andersons, Inc. | | | 48,596 | | | | 1,228,507 | |
Cadiz, Inc.(a)(b) | | | 20,453 | | | | 225,392 | |
Cal-Maine Foods, Inc. | | | 53,803 | | | | 2,300,078 | |
Calavo Growers, Inc. | | | 28,283 | | | | 2,562,157 | |
Fresh Del Monte Produce, Inc.(a) | | | 48,130 | | | | 1,683,587 | |
Limoneira Co. | | | 23,776 | | | | 457,213 | |
Sanderson Farms, Inc. | | | 31,310 | | | | 5,517,448 | |
| | | | | | | | |
| | | | 14,195,883 | |
|
| Air Transport — 0.6% | |
Air Transport Services Group, Inc.(b) | | | 90,299 | | | | 2,118,414 | |
Allegiant Travel Co. | | | 20,077 | | | | 3,494,201 | |
Atlas Air Worldwide Holdings, Inc.(a)(b) | | | 35,694 | | | | 984,084 | |
Era Group, Inc.(a)(b) | | | 30,613 | | | | 311,334 | |
Hawaiian Holdings, Inc. | | | 73,271 | | | | 2,146,108 | |
Mesa Air Group, Inc.(a)(b) | | | 31,670 | | | | 283,130 | |
SkyWest, Inc. | | | 77,312 | | | | 4,996,674 | |
Spirit Airlines, Inc.(b) | | | 105,935 | | | | 4,270,240 | |
| | | | | | | | |
| | | | 18,604,185 | |
|
| Alternative Energy — 0.2% | |
Ameresco, Inc., Class A(a)(b) | | | 33,960 | | | | 594,300 | |
Green Brick Partners, Inc.(b) | | | 37,548 | | | | 431,051 | |
Green Plains, Inc. | | | 56,094 | | | | 865,531 | |
REX American Resources Corp.(a)(b) | | | 8,560 | | | | 701,578 | |
Sunnova Energy International, Inc.(b) | | | 20,457 | | | | 228,300 | |
TerraForm Power, Inc., Class A | | | 133,983 | | | | 2,061,998 | |
Vivint Solar, Inc.(a)(b) | | | 67,427 | | | | 489,520 | |
| | | | | | | | |
| | | | 5,372,278 | |
|
| Aluminum — 0.1% | |
Century Aluminum Co.(b) | | | 75,737 | | | | 569,163 | |
Kaiser Aluminum Corp. | | | 24,512 | | | | 2,718,136 | |
| | | | | | | | |
| | | | 3,287,299 | |
|
| Asset Management & Custodian — 0.9% | |
Ares Management Corp., Class A | | | 112,251 | | | | 4,006,238 | |
Arlington Asset Investment Corp., Class A | | | 57,878 | | | | 322,380 | |
| | | | | | | | |
| Security | | Shares | | | Value | |
|
| Asset Management & Custodian (continued) | |
Artisan Partners Asset Management, Inc., Class A | | | 77,405 | | | $ | 2,501,730 | |
AssetMark Financial Holdings(a)(b) | | | 21,460 | | | | 622,769 | |
B. Riley Financial, Inc. | | | 31,882 | | | | 802,789 | |
BrightSphere Investment Group PLC(b) | | | 107,278 | | | | 1,096,381 | |
Cohen & Steers, Inc. | | | 35,142 | | | | 2,205,512 | |
Cowen, Inc., Class A(b) | | | 43,374 | | | | 683,140 | |
Diamond Hill Investment Group, Inc. | | | 4,949 | | | | 695,136 | |
Federated Investors, Inc., Class B | | | 151,871 | | | | 4,949,476 | |
Focus Financial Partners, Inc., Class A(b) | | | 46,974 | | | | 1,384,324 | |
GAMCO Investors, Inc., Class A(a) | | | 7,838 | | | | 152,763 | |
Hamilton Lane, Inc., Class A | | | 35,185 | | | | 2,097,026 | |
Oppenheimer Holdings, Inc., Class A | | | 14,824 | | | | 407,363 | |
PJT Partners, Inc., Class A | | | 34,944 | | | | 1,577,023 | |
Pzena Investment Management, Inc., Class A | | | 26,782 | | | | 230,861 | |
Sculptor Capital Management, Inc. | | | 26,217 | | | | 579,396 | |
Silvercrest Asset Management Group, Inc., Class A | | | 12,496 | | | | 157,200 | |
Virtus Investment Partners, Inc. | | | 10,297 | | | | 1,253,351 | |
Waddell & Reed Financial, Inc., Class A | | | 111,642 | | | | 1,866,654 | |
Westwood Holdings Group, Inc. | | | 12,597 | | | | 373,123 | |
WisdomTree Investments, Inc. | | | 205,565 | | | | 994,935 | |
| | | | | | | | |
| | | | 28,959,570 | |
|
| Auto Parts — 0.9% | |
Adient PLC(b) | | | 135,434 | | | | 2,877,972 | |
American Axle & Manufacturing Holdings, Inc.(b) | | | 172,970 | | | | 1,861,157 | |
Dana, Inc. | | | 224,685 | | | | 4,089,267 | |
Dorman Products, Inc.(b) | | | 41,573 | | | | 3,147,908 | |
Fox Factory Holding Corp.(b) | | | 58,109 | | | | 4,042,643 | |
Gentherm, Inc.(a)(b) | | | 51,103 | | | | 2,268,462 | |
Meritor, Inc.(a)(b) | | | 118,536 | | | | 3,104,458 | |
Standard Motor Products, Inc. | | | 32,529 | | | | 1,731,193 | |
Stoneridge, Inc.(a)(b) | | | 41,099 | | | | 1,205,023 | |
Tenneco, Inc., Class A | | | 78,619 | | | | 1,029,909 | |
Visteon Corp.(a)(b) | | | 43,130 | | | | 3,734,627 | |
| | | | | | | | |
| | | | 29,092,619 | |
|
| Auto Services — 0.1% | |
Cooper Tire & Rubber Co. | | | 77,649 | | | | 2,232,409 | |
| | | | | | | | |
|
| Back Office Support, HR & Consulting — 1.8% | |
ASGN, Inc.(b) | | | 78,921 | | | | 5,601,023 | |
Barrett Business Services, Inc. | | | 11,159 | | | | 1,009,443 | |
BG Staffing, Inc. | | | 15,185 | | | | 332,400 | |
CBIZ, Inc.(b) | | | 79,682 | | | | 2,148,227 | |
Conduent, Inc.(a)(b) | | | 267,112 | | | | 1,656,094 | |
CRA International, Inc. | | | 11,861 | | | | 646,069 | |
DHI Group, Inc.(b) | | | 80,180 | | | | 241,342 | |
Exela Technologies, Inc.(a)(b) | | | 64,951 | | | | 26,481 | |
ExlService Holdings, Inc.(b) | | | 51,772 | | | | 3,596,083 | |
Forrester Research, Inc. | | | 16,348 | | | | 681,712 | |
FTI Consulting, Inc.(a)(b) | | | 58,390 | | | | 6,461,437 | |
GP Strategies Corp.(b) | | | 19,286 | | | | 255,154 | |
Hackett Group, Inc. | | | 37,694 | | | | 608,381 | |
Heidrick & Struggles International, Inc. | | | 29,151 | | | | 947,408 | |
Huron Consulting Group, Inc.(b) | | | 34,628 | | | | 2,379,636 | |
ICF International, Inc. | | | 28,026 | | | | 2,567,742 | |
Insperity, Inc. | | | 58,704 | | | | 5,050,892 | |
Kelly Services, Inc., Class A | | | 51,099 | | | | 1,153,815 | |
Kforce, Inc. | | | 36,013 | | | | 1,429,716 | |
Korn Ferry | | | 87,756 | | | | 3,720,854 | |
Liquidity Services, Inc.(b) | | | 42,149 | | | | 251,208 | |
MAXIMUS, Inc. | | | 98,239 | | | | 7,307,999 | |
NV5 Global, Inc.(a)(b) | | | 16,066 | | | | 810,530 | |
PRGX Global, Inc.(a)(b) | | | 30,221 | | | | 148,687 | |
Resources Connection, Inc. | | | 47,097 | | | | 769,094 | |
StarTek, Inc.(b) | | | 24,267 | | | | 193,651 | |
| | |
| 48 | | 2019 BLACKROCK ANNUAL REPORTTO SHAREHOLDERS |
| | |
Schedule of Investments (continued) December 31, 2019 | | Master Small Cap Index Series (Percentages shown are based on Net Assets) |
| | | | | | | | |
| Security | | Shares | | | Value | |
|
| Back Office Support, HR & Consulting (continued) | |
Sykes Enterprises, Inc.(b) | | | 59,178 | | | $ | 2,188,994 | |
Target Hospitality Corp.(a)(b) | | | 49,812 | | | | 249,060 | |
TriNet Group, Inc.(a)(b) | | | 69,015 | | | | 3,906,939 | |
TrueBlue, Inc.(a)(b) | | | 61,410 | | | | 1,477,525 | |
TTEC Holdings, Inc. | | | 22,211 | | | | 880,000 | |
| | | | | | | | |
| | | | 58,697,596 | |
|
| Banks: Diversified — 9.6% | |
1st Constitution Bancorp | | | 11,579 | | | | 256,243 | |
1st Source Corp. | | | 26,399 | | | | 1,369,580 | |
ACNB Corp. | | | 10,705 | | | | 404,863 | |
Allegiance Bancshares, Inc.(a)(b) | | | 30,369 | | | | 1,141,874 | |
Amalgamated Bank, Class A | | | 21,692 | | | | 421,909 | |
Ambac Financial Group, Inc.(b) | | | 69,786 | | | | 1,505,284 | |
Amerant Bancorp, Inc.(a)(b) | | | 30,132 | | | | 656,576 | |
American National Bankshares, Inc. | | | 16,526 | | | | 653,934 | |
Ameris Bancorp | | | 94,371 | | | | 4,014,542 | |
Ames National Corp. | | | 13,884 | | | | 389,585 | |
Arrow Financial Corp. | | | 19,700 | | | | 744,660 | |
Atlantic Capital Bancshares, Inc.(b) | | | 35,042 | | | | 643,021 | |
Atlantic Union Bankshares Corp. | | | 125,520 | | | | 4,713,276 | |
BancFirst Corp. | | | 30,321 | | | | 1,893,243 | |
Banco Latinoamericano de Comercio Exterior SA | | | 46,340 | | | | 990,749 | |
Bancorp, Inc.(a)(b) | | | 78,264 | | | | 1,015,084 | |
BancorpSouth Bank | | | 159,655 | | | | 5,014,764 | |
Bank First Corp. | | | 9,082 | | | | 635,831 | |
Bank of Commerce Holdings | | | 26,926 | | | | 311,534 | |
Bank of Marin Bancorp | | | 20,670 | | | | 931,183 | |
Bank of NT Butterfield & Son Ltd. | | | 90,803 | | | | 3,361,527 | |
Bank of Princeton | | | 8,790 | | | | 276,797 | |
Bank7 Corp. | | | 5,814 | | | | 110,233 | |
Bankwell Financial Group, Inc. | | | 10,436 | | | | 300,974 | |
Banner Corp. | | | 48,360 | | | | 2,736,692 | |
Bar Harbor Bankshares | | | 23,460 | | | | 595,649 | |
Baycom Corp.(b) | | | 16,794 | | | | 381,896 | |
BCB Bancorp, Inc. | | | 21,356 | | | | 294,499 | |
Boston Private Financial Holdings, Inc. | | | 108,995 | | | | 1,311,210 | |
Bridge Bancorp, Inc. | | | 25,468 | | | | 853,942 | |
Bridgewater Bancshares, Inc.(b) | | | 36,905 | | | | 508,551 | |
Bryn Mawr Bank Corp. | | | 35,335 | | | | 1,457,215 | |
Business First Bancshares, Inc. | | | 19,278 | | | | 480,601 | |
Byline Bancorp, Inc. | | | 37,600 | | | | 735,832 | |
C&F Financial Corp. | | | 5,021 | | | | 277,812 | |
Cadence BanCorp | | | 189,433 | | | | 3,434,420 | |
Cambridge Bancorp | | | 6,684 | | | | 535,723 | |
Camden National Corp. | | | 25,808 | | | | 1,188,716 | |
Capital Bancorp, Inc.(b) | | | 12,344 | | | | 183,802 | |
Capital City Bank Group, Inc. | | | 21,308 | | | | 649,894 | |
Capitol Federal Financial, Inc. | | | 203,623 | | | | 2,795,744 | |
Capstar Financial Holdings, Inc. | | | 23,851 | | | | 397,119 | |
Carolina Financial Corp. | | | 32,641 | | | | 1,411,070 | |
Carter Bank & Trust(a)(b) | | | 35,795 | | | | 849,057 | |
Cathay General Bancorp | | | 128,441 | | | | 4,887,180 | |
CBTX, Inc. | | | 28,088 | | | | 874,099 | |
CenterState Bank Corp. | | | 192,050 | | | | 4,797,409 | |
Central Pacific Financial Corp. | | | 35,589 | | | | 1,052,723 | |
Central Valley Community Bancorp | | | 18,349 | | | | 397,623 | |
Century Bancorp, Inc., Class A | | | 4,568 | | | | 410,937 | |
Chemung Financial Corp. | | | 5,635 | | | | 239,488 | |
Citizens & Northern Corp. | | | 18,420 | | | | 520,365 | |
City Holding Co. | | | 25,105 | | | | 2,057,355 | |
Civista Bancshares, Inc. | | | 24,771 | | | | 594,504 | |
CNB Financial Corp. | | | 22,441 | | | | 733,372 | |
Coastal Financial Corp./WA(b) | | | 12,097 | | | | 199,238 | |
Codorus Valley Bancorp, Inc. | | | 15,022 | | | | 345,957 | |
| | | | | | | | |
| Security | | Shares | | | Value | |
|
| Banks: Diversified (continued) | |
Colony Bankcorp, Inc. | | | 11,529 | | | $ | 190,229 | |
Columbia Banking System, Inc. | | | 105,777 | | | | 4,303,537 | |
Columbia Financial, Inc.(a)(b) | | | 82,355 | | | | 1,395,094 | |
Community Bank System, Inc. | | | 77,558 | | | | 5,501,965 | |
Community Bankers Trust Corp. | | | 33,570 | | | | 298,102 | |
Community Financial Corp. | | | 7,638 | | | | 271,684 | |
Community Trust Bancorp, Inc. | | | 24,012 | | | | 1,119,920 | |
ConnectOne Bancorp, Inc. | | | 51,980 | | | | 1,336,926 | |
CrossFirst Bankshares, Inc.(b) | | | 10,127 | | | | 146,031 | |
Customers Bancorp, Inc.(b) | | | 43,921 | | | | 1,045,759 | |
CVB Financial Corp. | | | 206,219 | | | | 4,450,206 | |
Eagle Bancorp, Inc. | | | 49,855 | | | | 2,424,449 | |
Enterprise Bancorp, Inc. | | | 13,701 | | | | 464,053 | |
Enterprise Financial Services Corp. | | | 38,421 | | | | 1,852,276 | |
Equity Bancshares, Inc., Class A(a)(b) | | | 23,085 | | | | 712,634 | |
Esquire Financial Holdings, Inc.(b) | | | 9,912 | | | | 258,406 | |
Evans Bancorp, Inc. | | | 7,228 | | | | 289,843 | |
Farmers & Merchants Bancorp, Inc./Archbold | | | 15,649 | | | | 471,817 | |
Farmers National Banc Corp. | | | 40,062 | | | | 653,812 | |
FB Financial Corp. | | | 26,825 | | | | 1,062,002 | |
Fidelity D&D Bancorp, Inc.(a) | | | 4,350 | | | | 270,614 | |
Financial Institutions, Inc. | | | 24,212 | | | | 777,205 | |
First Bancorp, Inc. | | | 15,794 | | | | 477,453 | |
First BanCorp, Puerto Rico | | | 324,190 | | | | 3,433,172 | |
First Bancorp/Southern Pines NC | | | 49,023 | | | | 1,956,508 | |
First Bancshares, Inc.(a) | | | 25,880 | | | | 919,258 | |
First Bank/Hamilton | | | 25,273 | | | | 279,267 | |
First Busey Corp. | | | 88,453 | | | | 2,432,457 | |
First Business Financial Services, Inc. | | | 13,033 | | | | 343,159 | |
First Choice Bancorp | | | 15,625 | | | | 421,250 | |
First Commonwealth Financial Corp. | | | 146,135 | | | | 2,120,419 | |
First Community Bancshares, Inc. | | | 23,705 | | | | 735,329 | |
First Financial Bancorp | | | 148,184 | | | | 3,769,801 | |
First Financial Bankshares, Inc. | | | 198,233 | | | | 6,957,978 | |
First Financial Corp. | | | 20,771 | | | | 949,650 | |
First Foundation, Inc. | | | 61,364 | | | | 1,067,734 | |
First Guaranty Bancshares, Inc. | | | 8,000 | | | | 174,160 | |
First Internet Bancorp | | | 15,484 | | | | 367,126 | |
First Interstate Bancsystem, Inc., Class A | | | 60,758 | | | | 2,546,975 | |
First Merchants Corp. | | | 89,036 | | | | 3,703,007 | |
First Mid Bancshares, Inc. | | | 22,989 | | | | 810,362 | |
First Midwest Bancorp, Inc. | | | 161,719 | | | | 3,729,240 | |
First Northwest Bancorp | | | 13,646 | | | | 247,402 | |
First of Long Island Corp. | | | 37,806 | | | | 948,174 | |
Flagstar Bancorp, Inc. | | | 55,453 | | | | 2,121,077 | |
FNCB Bancorp, Inc. | | | 26,335 | | | | 222,531 | |
Franklin Financial Network, Inc.(a) | | | 20,468 | | | | 702,666 | |
Franklin Financial Services Corp. | | | 6,555 | | | | 253,613 | |
FS Bancorp, Inc. | | | 6,173 | | | | 393,776 | |
Fulton Financial Corp. | | | 251,053 | | | | 4,375,854 | |
FVCBankcorp, Inc.(a)(b) | | | 18,875 | | | | 329,746 | |
German American Bancorp, Inc. | | | 38,621 | | | | 1,375,680 | |
Glacier Bancorp, Inc. | | | 134,158 | | | | 6,169,926 | |
Great Western Bancorp, Inc. | | | 80,467 | | | | 2,795,424 | |
Guaranty Bancshares, Inc. | | | 12,827 | | | | 421,752 | |
Hancock Whitney Corp. | | | 144,178 | | | | 6,326,531 | |
Hanmi Financial Corp. | | | 35,695 | | | | 713,722 | |
HarborOne Bancorp, Inc.(a)(b) | | | 42,242 | | | | 464,240 | |
Hawthorn Bancshares, Inc. | | | 8,966 | | | | 228,633 | |
Heartland Financial USA, Inc. | | | 60,031 | | | | 2,985,942 | |
Heritage Commerce Corp. | | | 104,705 | | | | 1,343,365 | |
Home BancShares, Inc. | | | 239,655 | | | | 4,711,617 | |
Hope Bancorp, Inc. | | | 182,868 | | | | 2,717,418 | |
Horizon Bancorp | | | 57,633 | | | | 1,095,027 | |
| | | | |
| SCHEDULE OF INVESTMENTS | | | 49 | |
| | |
Schedule of Investments (continued) December 31, 2019 | | Master Small Cap Index Series (Percentages shown are based on Net Assets) |
| | | | | | | | |
| Security | | Shares | | | Value | |
|
| Banks: Diversified (continued) | |
Howard Bancorp, Inc.(a)(b) | | | 19,824 | | | $ | 334,629 | |
Iberiabank Corp. | | | 84,510 | | | | 6,323,883 | |
Independent Bank Corp. | | | 84,955 | | | | 5,032,162 | |
Independent Bank Group, Inc. | | | 60,994 | | | | 3,381,507 | |
International Bancshares Corp. | | | 90,956 | | | | 3,917,475 | |
Investar Holding Corp. | | | 14,431 | | | | 346,344 | |
Lakeland Bancorp, Inc. | | | 85,728 | | | | 1,489,953 | |
Lakeland Financial Corp. | | | 38,053 | | | | 1,861,933 | |
LCNB Corp. | | | 19,333 | | | | 373,127 | |
Level One Bancorp, Inc. | | | 7,830 | | | | 197,003 | |
Live Oak Bancshares, Inc.(a) | | | 39,516 | | | | 751,199 | |
Luther Burbank Corp. | | | 30,245 | | | | 348,725 | |
Macatawa Bank Corp. | | | 40,246 | | | | 447,938 | |
Mackinac Financial Corp. | | | 14,286 | | | | 249,434 | |
MainStreet Bancshares, Inc.(b) | | | 11,141 | | | | 256,243 | |
Mercantile Bank Corp. | | | 24,935 | | | | 909,379 | |
Merchants Bancorp | | | 13,014 | | | | 256,506 | |
Metrocity Bankshares, Inc. | | | 24,708 | | | | 432,637 | |
Metropolitan Bank Holding Corp.(b) | | | 10,942 | | | | 527,733 | |
Mid Penn Bancorp, Inc. | | | 10,654 | | | | 306,835 | |
Midland States Bancorp, Inc. | | | 34,106 | | | | 987,710 | |
MVB Financial Corp. | | | 14,846 | | | | 369,962 | |
National Bank Holdings Corp., Class A | | | 45,195 | | | | 1,591,768 | |
National Bankshares, Inc. | | | 9,828 | | | | 441,572 | |
NBT Bancorp, Inc. | | | 63,747 | | | | 2,585,578 | |
Nicolet Bankshares, Inc.(a)(b) | | | 14,573 | | | | 1,076,216 | |
Northeast Bank(b) | | | 11,696 | | | | 257,195 | |
Northrim BanCorp, Inc. | | | 10,547 | | | | 403,950 | |
Norwood Financial Corp. | | | 8,952 | | | | 348,233 | |
Oak Valley Bancorp | | | 10,559 | | | | 205,478 | |
OFG Bancorp | | | 78,947 | | | | 1,863,939 | |
Ohio Valley Banc Corp. | | | 6,322 | | | | 250,478 | |
Old National Bancorp | | | 262,066 | | | | 4,793,187 | |
Old Second Bancorp, Inc. | | | 44,786 | | | | 603,267 | |
OP Bancorp | | | 20,263 | | | | 210,127 | |
Opus Bank | | | 34,255 | | | | 886,177 | |
Origin Bancorp, Inc. | | | 29,560 | | | | 1,118,550 | |
Orrstown Financial Services, Inc. | | | 16,902 | | | | 382,323 | |
Pacific Mercantile Bancorp(b) | | | 30,165 | | | | 244,940 | |
Pacific Premier Bancorp, Inc. | | | 89,181 | | | | 2,907,747 | |
Park National Corp. | | | 21,842 | | | | 2,236,184 | |
Parke Bancorp, Inc. | | | 14,206 | | | | 360,690 | |
PCB Bancorp | | | 19,273 | | | | 333,037 | |
PCSB Financial Corp. | | | 25,307 | | | | 512,467 | |
Peapack Gladstone Financial Corp. | | | 29,393 | | | | 908,244 | |
Penns Woods Bancorp, Inc. | | | 10,773 | | | | 383,088 | |
People’s Utah Bancorp | | | 25,061 | | | | 754,837 | |
Peoples Bancorp of North Carolina, Inc. | | | 7,111 | | | | 233,596 | |
Peoples Bancorp, Inc. | | | 32,001 | | | | 1,109,155 | |
Peoples Financial Services Corp. | | | 10,742 | | | | 540,860 | |
Pioneer Bancorp, Inc.(a)(b) | | | 16,841 | | | | 257,836 | |
Preferred Bank | | | 21,874 | | | | 1,314,409 | |
Premier Financial Bancorp, Inc. | | | 20,476 | | | | 371,435 | |
Provident Financial Services, Inc. | | | 95,942 | | | | 2,364,970 | |
QCR Holdings, Inc. | | | 23,046 | | | | 1,010,798 | |
RBB Bancorp | | | 25,984 | | | | 550,081 | |
Red River Bancshares, Inc.(a)(b) | | | 10,173 | | | | 570,298 | |
Reliant Bancorp Inc. | | | 15,959 | | | | 354,928 | |
Renasant Corp. | | | 88,031 | | | | 3,118,058 | |
Republic Bancorp, Inc., Class A | | | 15,178 | | | | 710,330 | |
Republic First Bancorp, Inc.(a)(b) | | | 66,556 | | | | 278,204 | |
S&T Bancorp, Inc. | | | 57,297 | | | | 2,308,496 | |
Sandy Spring Bancorp, Inc. | | | 58,924 | | | | 2,232,041 | |
SB One Bancorp | | | 12,221 | | | | 304,547 | |
| | | | | | | | |
| Security | | Shares | | | Value | |
|
| Banks: Diversified (continued) | |
Seacoast Banking Corp. of Florida(b) | | | 78,415 | | | $ | 2,397,147 | |
Select Bancorp, Inc.(b) | | | 25,476 | | | | 313,355 | |
ServisFirst Bancshares, Inc. | | | 81,966 | | | | 3,088,479 | |
Shore Bancshares, Inc. | | | 20,160 | | | | 349,978 | |
Sierra Bancorp | | | 21,851 | | | | 636,301 | |
Simmons First National Corp., Class A | | | 140,602 | | | | 3,766,728 | |
SmartFinancial, Inc. | | | 19,773 | | | | 467,631 | |
South Plains Financial, Inc. | | | 24,064 | | | | 502,216 | |
South State Corp. | | | 52,304 | | | | 4,537,372 | |
Southern First Bancshares, Inc.(b) | | | 10,774 | | | | 457,787 | |
Southern National Bancorp of Virginia, Inc. | | | 30,730 | | | | 502,435 | |
Southside Bancshares, Inc. | | | 49,859 | | | | 1,851,763 | |
Spirit of Texas Bancshares, Inc.(a)(b) | | | 21,878 | | | | 503,194 | |
Stock Yards Bancorp, Inc. | | | 31,665 | | | | 1,300,165 | |
Summit Financial Group, Inc. | | | 17,962 | | | | 486,591 | |
Tompkins Financial Corp. | | | 22,661 | | | | 2,073,481 | |
TowneBank | | | 110,273 | | | | 3,067,795 | |
Trico Bancshares | | | 44,991 | | | | 1,836,083 | |
TriState Capital Holdings, Inc.(a)(b) | | | 37,372 | | | | 976,157 | |
Triumph Bancorp, Inc.(a)(b) | | | 37,540 | | | | 1,427,271 | |
TrustCo Bank Corp. NY | | | 143,381 | | | | 1,243,113 | |
Trustmark Corp. | | | 100,232 | | | | 3,459,006 | |
UMB Financial Corp. | | | 70,378 | | | | 4,830,746 | |
Union Bankshares, Inc. | | | 5,888 | | | | 213,499 | |
United Bankshares, Inc. | | | 150,723 | | | | 5,826,951 | |
United Community Banks, Inc. | | | 82,241 | | | | 2,539,602 | |
United Community Financial Corp. | | | 72,700 | | | | 847,682 | |
United Security Bancshares | | | 21,059 | | | | 225,963 | |
Unity Bancorp, Inc. | | | 12,337 | | | | 278,446 | |
Univest Financial Corp. | | | 44,605 | | | | 1,194,522 | |
Valley National Bancorp | | | 598,739 | | | | 6,855,562 | |
Veritex Holdings, Inc. | | | 80,072 | | | | 2,332,497 | |
Washington Trust Bancorp, Inc. | | | 23,349 | | | | 1,255,943 | |
WesBanco, Inc. | | | 107,833 | | | | 4,075,009 | |
West BanCorp., Inc. | | | 24,770 | | | | 634,855 | |
Westamerica BanCorp | | | 40,646 | | | | 2,754,579 | |
| | | | | | | | |
| | | | 318,883,480 | |
|
| Banks: Savings, Thrift & Mortgage Lending — 1.4% | |
Axos Financial, Inc.(b) | | | 89,064 | | | | 2,696,858 | |
Banc of California, Inc. | | | 70,197 | | | | 1,205,984 | |
BankFinancial Corp. | | | 21,105 | | | | 276,053 | |
Berkshire Hills Bancorp, Inc. | | | 71,424 | | | | 2,348,421 | |
Brookline Bancorp, Inc. | | | 105,892 | | | | 1,742,982 | |
Dime Community Bancshares, Inc. | | | 49,604 | | | | 1,036,228 | |
Entegra Financial Corp.(a)(b) | | | 10,661 | | | | 321,536 | |
ESSA Bancorp, Inc. | | | 14,566 | | | | 246,894 | |
First Capital, Inc. | | | 5,137 | | | | 375,001 | |
First Defiance Financial Corp. | | | 30,721 | | | | 967,404 | |
First Financial Northwest, Inc. | | | 12,137 | | | | 181,327 | |
Flushing Financial Corp. | | | 41,720 | | | | 901,361 | |
Great Southern Bancorp, Inc. | | | 20,032 | | | | 1,268,426 | |
Greene County Bancorp, Inc. | | | 4,997 | | | | 143,864 | |
Heritage Financial Corp. | | | 55,415 | | | | 1,568,245 | |
Hingham Institution for Savings | | | 2,193 | | | | 460,969 | |
Home Bancorp, Inc. | | | 12,170 | | | | 476,942 | |
HomeStreet, Inc.(a)(b) | | | 30,285 | | | | 1,029,690 | |
Investors Bancorp, Inc. | | | 356,126 | | | | 4,243,241 | |
Kearny Financial Corp. | | | 127,600 | | | | 1,764,708 | |
Ladder Capital Corp. | | | 159,745 | | | | 2,881,800 | |
Malvern Bancorp, Inc.(a)(b) | | | 11,531 | | | | 266,251 | |
Meridian Bancorp, Inc. | | | 74,670 | | | | 1,500,120 | |
MutualFirst Financial, Inc. | | | 9,146 | | | | 362,822 | |
Northfield Bancorp, Inc. | | | 67,997 | | | | 1,153,229 | |
Northwest Bancshares, Inc. | | | 155,827 | | | | 2,591,403 | |
| | |
| 50 | | 2019 BLACKROCK ANNUAL REPORTTO SHAREHOLDERS |
| | |
Schedule of Investments (continued) December 31, 2019 | | Master Small Cap Index Series (Percentages shown are based on Net Assets) |
| | | | | | | | |
| Security | | Shares | | | Value | |
|
| Banks: Savings, Thrift & Mortgage Lending (continued) | |
OceanFirst Financial Corp. | | | 78,158 | | | $ | 1,996,155 | |
Ocwen Financial Corp.(b) | | | 204,304 | | | | 279,896 | |
Ponce de Leon Federal Bank(b) | | | 12,884 | | | | 189,395 | |
Provident Bancorp, Inc.(a)(b) | | | 13,469 | | | | 167,689 | |
Provident Financial Holdings, Inc. | | | 9,273 | | | | 203,079 | |
Prudential Bancorp, Inc. | | | 12,857 | | | | 238,240 | |
Richmond Mutual BanCorp., Inc.(a)(b) | | | 20,397 | | | | 325,536 | |
Riverview Bancorp, Inc. | | | 33,005 | | | | 270,971 | |
Southern Missouri Bancorp, Inc. | | | 12,310 | | | | 472,212 | |
Sterling Bancorp, Inc. | | | 27,375 | | | | 221,738 | |
Territorial Bancorp, Inc. | | | 12,609 | | | | 390,122 | |
Timberland Bancorp, Inc. | | | 11,454 | | | | 340,642 | |
Washington Federal, Inc. | | | 124,764 | | | | 4,572,601 | |
Waterstone Financial, Inc. | | | 36,905 | | | | 702,302 | |
Western New England Bancorp, Inc. | | | 36,802 | | | | 354,403 | |
WSFS Financial Corp.(a) | | | 81,183 | | | | 3,571,240 | |
| | | | | | | | |
| | | | 46,307,980 | |
|
| Beverage: Brewers & Distillers — 0.2% | |
Boston Beer Co., Inc., Class A(a)(b) | | | 12,903 | | | | 4,875,399 | |
Craft Brew Alliance, Inc.(a)(b) | | | 17,977 | | | | 296,620 | |
Primo Water Corp.(a)(b) | | | 54,215 | | | | 608,563 | |
| | | | | | | | |
| | | | 5,780,582 | |
|
| Beverage: Soft Drinks — 0.1% | |
Celsius Holdings, Inc.(a)(b) | | | 40,695 | | | | 196,557 | |
Coca-Cola Consolidated, Inc.(a) | | | 7,256 | | | | 2,061,067 | |
Farmer Bros Co.(b) | | | 16,144 | | | | 243,128 | |
National Beverage Corp.(a)(b) | | | 18,352 | | | | 936,319 | |
New Age Beverages Corp.(a)(b) | | | 116,112 | | | | 211,324 | |
| | | | | | | | |
| | | | 3,648,395 | |
|
| Biotechnology — 7.4% | |
Acceleron Pharma, Inc.(b) | | | 73,500 | | | | 3,896,970 | |
Acer Therapeutics, Inc.(a)(b) | | | 12,789 | | | | 51,284 | |
Acorda Therapeutics, Inc.(a)(b) | | | 67,973 | | | | 138,665 | |
ADMA Biologics, Inc.(a)(b) | | | 77,032 | | | | 308,128 | |
Aduro Biotech, Inc.(a)(b) | | | 95,516 | | | | 112,709 | |
Adverum Biotechnologies, Inc.(a)(b) | | | 83,782 | | | | 965,169 | |
Aeglea BioTherapeutics, Inc.(b) | | | 39,362 | | | | 300,726 | |
Affimed NV(a)(b) | | | 142,675 | | | | 390,929 | |
Agenus, Inc.(b) | | | 165,392 | | | | 673,145 | |
AgeX Therapeutics, Inc.(a)(b) | | | 31,755 | | | | 57,794 | |
Aimmune Therapeutics, Inc.(a)(b) | | | 68,993 | | | | 2,309,196 | |
Akcea Therapeutics, Inc.(a)(b) | | | 19,185 | | | | 324,994 | |
Akebia Therapeutics, Inc.(b) | | | 182,199 | | | | 1,151,498 | |
Akero Therapeutics, Inc.(b) | | | 7,286 | | | | 161,713 | |
Albireo Pharma, Inc.(b) | | | 16,171 | | | | 411,067 | |
Aldeyra Therapeutics, Inc.(a)(b) | | | 33,673 | | | | 195,640 | |
Alector, Inc.(a)(b) | | | 46,967 | | | | 809,241 | |
Allakos, Inc.(a)(b) | | | 30,071 | | | | 2,867,571 | |
Allogene Therapeutics, Inc.(a)(b) | | | 60,115 | | | | 1,561,788 | |
AMAG Pharmaceuticals, Inc.(a)(b) | | | 52,112 | | | | 634,203 | |
Amicus Therapeutics, Inc.(a)(b) | | | 423,584 | | | | 4,125,708 | |
AnaptysBio, Inc.(b) | | | 37,929 | | | | 616,346 | |
Anavex Life Sciences Corp.(a)(b) | | | 64,094 | | | | 166,003 | |
ANI Pharmaceuticals, Inc.(b) | | | 14,169 | | | | 873,802 | |
Apellis Pharmaceuticals, Inc.(b) | | | 78,122 | | | | 2,392,096 | |
Applied Therapeutics, Inc.(a)(b) | | | 11,425 | | | | 311,674 | |
Aprea Therapeutics, Inc.(b) | | | 10,046 | | | | 461,011 | |
Arcus Biosciences, Inc.(b) | | | 49,619 | | | | 501,152 | |
Ardelyx, Inc.(a)(b) | | | 72,872 | | | | 546,904 | |
Arena Pharmaceuticals, Inc.(b) | | | 83,177 | | | | 3,777,899 | |
ArQule, Inc.(b) | | | 174,632 | | | | 3,485,655 | |
Arvinas Holding Co. LLC(b) | | | 33,338 | | | | 1,369,858 | |
Assembly Biosciences, Inc.(a)(b) | | | 34,896 | | | | 713,972 | |
| | | | | | | | |
| Security | | Shares | | | Value | |
|
| Biotechnology (continued) | |
Atara Biotherapeutics, Inc.(a)(b) | | | 79,592 | | | $ | 1,310,880 | |
Athenex, Inc.(b) | | | 106,067 | | | | 1,619,643 | |
Athersys, Inc.(a)(b) | | | 193,428 | | | | 237,916 | |
Atreca, Inc., Class A(a)(b) | | | 9,924 | | | | 153,524 | |
Audentes Therapeutics, Inc.(b) | | | 70,326 | | | | 4,208,308 | |
Avid Bioservices, Inc.(a)(b) | | | 86,860 | | | | 666,216 | |
Avrobio, Inc.(a)(b) | | | 31,821 | | | | 640,557 | |
Axcella Health, Inc.(b) | | | 1,299 | | | | 5,209 | |
Baudax Bio, Inc.(a)(b) | | | 11,614 | | | | 80,369 | |
Beyondspring, Inc.(a)(b) | | | 18,517 | | | | 287,013 | |
BioCryst Pharmaceuticals, Inc.(b) | | | 257,344 | | | | 887,837 | |
BioDelivery Sciences International, Inc.(b) | | | 128,783 | | | | 813,909 | |
Biohaven Pharmaceutical Holding Co. Ltd.(b) | | | 60,395 | | | | 3,287,904 | |
BioTelemetry, Inc.(a)(b) | | | 51,244 | | | | 2,372,597 | |
Bioxcel Therapeutics, Inc.(b) | | | 9,001 | | | | 131,505 | |
Blueprint Medicines Corp.(b) | | | 77,738 | | | | 6,227,591 | |
Bridgebio Pharma, Inc.(a)(b) | | | 34,950 | | | | 1,224,997 | |
Calithera Biosciences, Inc.(a)(b) | | | 70,848 | | | | 404,542 | |
Calyxt, Inc.(b) | | | 13,922 | | | | 97,593 | |
CASI Pharmaceuticals, Inc.(a)(b) | | | 74,900 | | | | 231,441 | |
Castle Biosciences, Inc.(a)(b) | | | 5,633 | | | | 193,606 | |
Catalyst Pharmaceuticals, Inc.(a)(b) | | | 149,855 | | | | 561,956 | |
CEL-SCI Corp.(a)(b) | | | 41,944 | | | | 383,788 | |
Celcuity, Inc.(b) | | | 8,565 | | | | 91,132 | |
Cellular Biomedicine Group, Inc.(b) | | | 18,390 | | | | 298,654 | |
Checkpoint Therapeutics, Inc.(b) | | | 34,417 | | | | 59,197 | |
ChemoCentryx, Inc.(b) | | | 62,639 | | | | 2,477,372 | |
Chiasma, Inc.(a)(b) | | | 51,911 | | | | 257,479 | |
Clovis Oncology, Inc.(a)(b) | | | 77,425 | | | | 807,156 | |
Codexis, Inc.(a)(b) | | | 81,868 | | | | 1,309,069 | |
Coherus Biosciences, Inc.(b) | | | 96,215 | | | | 1,732,351 | |
Collegium Pharmaceutical, Inc.(a)(b) | | | 49,881 | | | | 1,026,551 | |
Constellation Pharmaceuticals, Inc.(a)(b) | | | 24,018 | | | | 1,131,488 | |
Contra GTX, Inc.(a)(b)(c) | | | 944 | | | | 1,935 | |
Corbus Pharmaceuticals Holdings, Inc.(a)(b) | | | 91,045 | | | | 497,106 | |
Cortexyme, Inc.(a)(b) | | | 16,037 | | | | 900,317 | |
Crinetics Pharmaceuticals, Inc.(a)(b) | | | 16,753 | | | | 420,333 | |
Cue Biopharma, Inc.(a)(b) | | | 30,876 | | | | 490,156 | |
Cyclerion Therapeutics, Inc.(a)(b) | | | 35,776 | | | | 97,311 | |
Cymabay Therapeutics, Inc.(b) | | | 106,168 | | | | 208,089 | |
Cytokinetics, Inc.(a)(b) | | | 86,459 | | | | 917,330 | |
CytomX Therapeutics, Inc.(a)(b) | | | 68,663 | | | | 570,590 | |
CytoSorbents Corp.(b) | | | 45,712 | | | | 175,991 | |
Deciphera Pharmaceuticals, Inc.(b) | | | 30,983 | | | | 1,928,382 | |
Denali Therapeutics, Inc.(a)(b) | | | 74,029 | | | | 1,289,585 | |
Dermira, Inc.(b) | | | 72,795 | | | | 1,103,572 | |
Dynavax Technologies Corp.(a)(b) | | | 128,544 | | | | 735,272 | |
Editas Medicine, Inc.(a)(b) | | | 84,446 | | | | 2,500,446 | |
Eidos Therapeutics, Inc.(a)(b) | | | 17,220 | | | | 988,256 | |
Eiger Biopharmaceuticals, Inc.(b) | | | 35,440 | | | | 528,056 | |
Emergent Biosolutions, Inc.(b) | | | 70,990 | | | | 3,829,910 | |
Enochian Biosciences, Inc.(b) | | | 26,154 | | | | 131,293 | |
Enzo Biochem, Inc.(b) | | | 67,446 | | | | 177,383 | |
Epizyme, Inc.(b) | | | 120,840 | | | | 2,972,664 | |
Evelo Biosciences, Inc.(a)(b) | | | 20,162 | | | | 81,858 | |
Evofem Biosciences, Inc.(a)(b) | | | 21,125 | | | | 130,341 | |
EyePoint Pharmaceuticals, Inc.(a)(b) | | | 92,423 | | | | 143,256 | |
Fate Therapeutics, Inc.(a)(b) | | | 97,386 | | | | 1,905,844 | |
FibroGen, Inc.(a)(b) | | | 124,742 | | | | 5,350,184 | |
Five Prime Therapeutics, Inc.(b) | | | 50,910 | | | | 233,677 | |
Forty Seven, Inc.(b) | | | 34,075 | | | | 1,341,533 | |
Fulcrum Therapeutics, Inc.(b) | | | 6,921 | | | | 115,165 | |
G1 Therapeutics, Inc.(a)(b) | | | 52,487 | | | | 1,387,231 | |
GenMark Diagnostics, Inc.(a)(b) | | | 84,092 | | | | 404,483 | |
| | | | |
| SCHEDULE OF INVESTMENTS | | | 51 | |
| | |
Schedule of Investments (continued) December 31, 2019 | | Master Small Cap Index Series (Percentages shown are based on Net Assets) |
| | | | | | | | |
| Security | | Shares | | | Value | |
|
| Biotechnology (continued) | |
Geron Corp.(a)(b) | | | 269,250 | | | $ | 366,180 | |
Global Blood Therapeutics, Inc.(a)(b) | | | 90,749 | | | | 7,213,638 | |
GlycoMimetics, Inc.(a)(b) | | | 51,030 | | | | 269,949 | |
Gossamer Bio, Inc.(a)(b) | | | 66,600 | | | | 1,040,958 | |
Gritstone Oncology, Inc.(b) | | | 37,815 | | | | 339,201 | |
Halozyme Therapeutics, Inc.(a)(b) | | | 235,254 | | | | 4,171,053 | |
Harpoon Therapeutics, Inc.(b) | | | 11,199 | | | | 165,633 | |
Heron Therapeutics, Inc.(a)(b) | | | 136,686 | | | | 3,212,121 | |
Homology Medicines, Inc.(b) | | | 38,240 | | | | 791,568 | |
Hookipa Pharma, Inc.(a)(b) | | | 21,540 | | | | 263,434 | |
ImmunoGen, Inc.(b) | | | 224,399 | | | | 1,145,557 | |
Immunomedics, Inc.(a)(b) | | | 275,258 | | | | 5,824,459 | |
Inovio Pharmaceuticals, Inc.(a)(b) | | | 141,150 | | | | 465,795 | |
Insmed, Inc.(a)(b) | | | 137,500 | | | | 3,283,500 | |
Intellia Therapeutics, Inc.(a)(b) | | | 59,698 | | | | 875,770 | |
Intercept Pharmaceuticals, Inc.(b) | | | 38,851 | | | | 4,814,416 | |
Intrexon Corp.(a)(b) | | | 110,844 | | | | 607,425 | |
Invitae Corp.(a)(b) | | | 133,806 | | | | 2,158,291 | |
Iovance Biotherapeutics, Inc.(a)(b) | | | 182,485 | | | | 5,051,185 | |
Jounce Therapeutics, Inc.(b) | | | 23,416 | | | | 204,422 | |
Kadmon Holdings, Inc.(a)(b) | | | 253,277 | | | | 1,147,345 | |
Kala Pharmaceuticals, Inc.(a)(b) | | | 32,605 | | | | 120,312 | |
Kaleido Biosciences, Inc.(a)(b) | | | 29,927 | | | | 150,234 | |
KalVista Pharmaceuticals, Inc.(a)(b) | | | 17,701 | | | | 315,255 | |
Karuna Therapeutics, Inc.(b) | | | 7,064 | | | | 532,202 | |
Karyopharm Therapeutics, Inc.(b) | | | 91,299 | | | | 1,750,202 | |
Kezar Life Sciences, Inc.(b) | | | 23,224 | | | | 93,128 | |
Kindred Biosciences, Inc.(a)(b) | | | 56,408 | | | | 478,340 | |
Kiniksa Pharmaceuticals Ltd., Class A(a)(b) | | | 21,069 | | | | 233,023 | |
Kodiak Sciences, Inc.(a)(b) | | | 36,658 | | | | 2,637,543 | |
Krystal Biotech, Inc.(a)(b) | | | 16,307 | | | | 903,082 | |
Kura Oncology, Inc.(b) | | | 52,743 | | | | 725,216 | |
Lexicon Pharmaceuticals, Inc.(a)(b) | | | 62,527 | | | | 259,487 | |
Ligand Pharmaceuticals, Inc.(b) | | | 27,705 | | | | 2,889,354 | |
Lineage Cell Therapeutics, Inc.(a)(b) | | | 162,712 | | | | 144,814 | |
LogicBio Therapeutics, Inc.(a)(b) | | | 12,342 | | | | 88,862 | |
MacroGenics, Inc.(a)(b) | | | 73,761 | | | | 802,520 | |
Madrigal Pharmaceuticals, Inc.(b) | | | 12,093 | | | | 1,101,793 | |
Magenta Therapeutics, Inc.(a)(b) | | | 29,530 | | | | 447,675 | |
MannKind Corp.(a)(b) | | | 284,218 | | | | 366,641 | |
Marinus Pharmaceuticals, Inc.(b) | | | 74,919 | | | | 161,825 | |
Marker Therapeutics, Inc.(a)(b) | | | 40,458 | | | | 116,519 | |
MediciNova, Inc.(a)(b) | | | 62,297 | | | | 419,882 | |
MeiraGTx Holdings PLC(a)(b) | | | 26,231 | | | | 525,145 | |
Menlo Therapeutics, Inc.(b) | | | 23,125 | | | | 107,300 | |
Mersana Therapeutics, Inc.(a)(b) | | | 53,620 | | | | 307,243 | |
Millendo Therapeutics, Inc.(a)(b) | | | 14,021 | | | | 94,502 | |
Minerva Neurosciences, Inc.(b) | | | 44,404 | | | | 315,712 | |
Mirati Therapeutics, Inc.(b) | | | 42,058 | | | | 5,419,594 | |
Mirum Pharmaceuticals, Inc.(a)(b) | | | 8,546 | | | | 209,548 | |
Molecular Templates, Inc.(b) | | | 26,289 | | | | 367,652 | |
Momenta Pharmaceuticals, Inc.(b) | | | 153,188 | | | | 3,022,399 | |
Morphic Holding, Inc.(a)(b) | | | 7,537 | | | | 129,335 | |
Mustang Bio, Inc.(b) | | | 41,563 | | | | 169,577 | |
Myriad Genetics, Inc.(b) | | | 109,385 | | | | 2,978,554 | |
Natera, Inc.(b) | | | 98,143 | | | | 3,306,438 | |
Neon Therapeutics, Inc.(b) | | | 21,282 | | | | 25,113 | |
NextCure, Inc.(b) | | | 22,558 | | | | 1,270,692 | |
NGM Biopharmaceuticals, Inc.(a)(b) | | | 40,271 | | | | 744,611 | |
Novavax, Inc.(a)(b) | | | 35,038 | | | | 139,451 | |
Odonate Therapeutics, Inc.(b) | | | 18,228 | | | | 591,499 | |
Omeros Corp.(a)(b) | | | 72,026 | | | | 1,014,846 | |
Oncocyte Corp.(b) | | | 32,093 | | | | 72,209 | |
OPKO Health, Inc.(a)(b) | | | 665,279 | | | | 977,960 | |
| | | | | | | | |
| Security | | Shares | | | Value | |
|
| Biotechnology (continued) | |
Pacific Biosciences of California, Inc.(b) | | | 221,597 | | | $ | 1,139,009 | |
Palatin Technologies, Inc.(a)(b) | | | 306,818 | | | | 239,993 | |
PDL BioPharma, Inc.(a)(b) | | | 176,257 | | | | 571,954 | |
Personalis, Inc.(a)(b) | | | 13,578 | | | | 148,000 | |
Pfenex, Inc.(a)(b) | | | 46,312 | | | | 508,506 | |
PhaseBio Pharmaceuticals, Inc.(b) | | | 20,486 | | | | 125,169 | |
Phathom Pharmaceuticals, Inc.(b) | | | 16,742 | | | | 521,346 | |
Pieris Pharmaceuticals, Inc.(b) | | | 70,119 | | | | 253,831 | |
Precision BioSciences, Inc.(a)(b) | | | 60,632 | | | | 842,178 | |
Prevail Therapeutics, Inc.(b) | | | 11,310 | | | | 179,037 | |
Principia Biopharma, Inc.(b) | | | 29,174 | | | | 1,598,152 | |
Progenics Pharmaceuticals, Inc.(a)(b) | | | 134,270 | | | | 683,434 | |
Protagonist Therapeutics, Inc.(b) | | | 30,167 | | | | 212,677 | |
Prothena Corp. PLC(b) | | | 61,467 | | | | 973,023 | |
PTC Therapeutics, Inc.(b) | | | 95,761 | | | | 4,599,401 | |
Pulse Biosciences, Inc.(a)(b) | | | 17,440 | | | | 233,870 | |
Puma Biotechnology, Inc.(b) | | | 46,625 | | | | 407,969 | |
Ra Pharmaceuticals, Inc.(b) | | | 53,738 | | | | 2,521,924 | |
RadNet, Inc.(a)(b) | | | 64,622 | | | | 1,311,827 | |
Recro Pharma, Inc.(a)(b) | | | 29,930 | | | | 548,617 | |
REGENXBIO, Inc.(b) | | | 51,769 | | | | 2,120,976 | |
Repligen Corp.(b) | | | 82,011 | | | | 7,586,017 | |
Replimune Group, Inc.(b) | | | 17,769 | | | | 254,985 | |
resTORbio, Inc.(a)(b) | | | 22,328 | | | | 33,269 | |
Retrophin, Inc.(b) | | | 63,494 | | | | 901,615 | |
Rhythm Pharmaceuticals, Inc.(b) | | | 53,075 | | | | 1,218,602 | |
Rigel Pharmaceuticals, Inc.(b) | | | 257,459 | | | | 550,962 | |
Rocket Pharmaceuticals, Inc.(a)(b) | | | 45,495 | | | | 1,035,466 | |
Rockwell Medical, Inc.(b) | | | 95,504 | | | | 233,030 | |
RTI Surgical Holdings, Inc.(b) | | | 84,809 | | | | 232,377 | |
Rubius Therapeutics, Inc.(a)(b) | | | 53,717 | | | | 510,311 | |
Sangamo Therapeutics, Inc.(a)(b) | | | 178,069 | | | | 1,490,438 | |
Savara, Inc.(a)(b) | | | 46,044 | | | | 206,277 | |
Scholar Rock Holding Corp.(b) | | | 27,102 | | | | 357,204 | |
Seres Therapeutics, Inc.(a)(b) | | | 54,186 | | | | 186,942 | |
Solid Biosciences, Inc.(b) | | | 29,220 | | | | 130,029 | |
Sorrento Therapeutics, Inc.(a)(b) | | | 193,195 | | | | 652,999 | |
Spero Therapeutics, Inc.(a)(b) | | | 16,220 | | | | 155,955 | |
SpringWorks Therapeutics, Inc.(a)(b) | | | 16,241 | | | | 625,116 | |
Stemline Therapeutics, Inc.(a)(b) | | | 68,992 | | | | 733,385 | |
Stoke Therapeutics, Inc.(a)(b) | | | 13,957 | | | | 395,262 | |
Strongbridge Biopharma PLC(b) | | | 54,034 | | | | 112,931 | |
Sutro Biopharma, Inc.(b) | | | 16,245 | | | | 178,695 | |
Syneos Health, Inc.(a)(b) | | | 98,241 | | | | 5,842,883 | |
Synlogic, Inc.(a)(b) | | | 23,429 | | | | 60,447 | |
Synthorx, Inc.(b) | | | 14,335 | | | | 1,001,873 | |
Syros Pharmaceuticals, Inc.(a)(b) | | | 52,611 | | | | 363,542 | |
TCR2 Therapeutics, Inc.(b) | | | 17,804 | | | | 254,241 | |
Tocagen, Inc.(a)(b) | | | 31,275 | | | | 16,676 | |
Translate Bio, Inc.(a)(b) | | | 60,930 | | | | 495,970 | |
Tricida, Inc.(a)(b) | | | 33,934 | | | | 1,280,669 | |
Turning Point Therapeutics, Inc.(a)(b) | | | 43,569 | | | | 2,713,913 | |
Twist Bioscience Corp.(a)(b) | | | 33,648 | | | | 706,608 | |
Tyme Technologies, Inc.(a)(b) | | | 98,792 | | | | 138,309 | |
UNITY Biotechnology, Inc.(b) | | | 40,280 | | | | 290,419 | |
UroGen Pharma Ltd.(a)(b) | | | 28,940 | | | | 965,728 | |
Vanda Pharmaceuticals, Inc.(a)(b) | | | 80,563 | | | | 1,322,039 | |
VBI Vaccines, Inc.(b) | | | 319,281 | | | | 440,608 | |
Veracyte, Inc.(b) | | | 73,339 | | | | 2,047,625 | |
Vericel Corp.(b) | | | 68,099 | | | | 1,184,923 | |
Verrica Pharmaceuticals, Inc.(b) | | | 19,910 | | | | 316,370 | |
Viking Therapeutics, Inc.(a)(b) | | | 100,368 | | | | 804,951 | |
X4 Pharmaceuticals, Inc.(b) | | | 17,875 | | | | 191,263 | |
XBiotech, Inc.(a)(b) | | | 29,295 | | | | 546,791 | |
| | |
| 52 | | 2019 BLACKROCK ANNUAL REPORTTO SHAREHOLDERS |
| | |
Schedule of Investments (continued) December 31, 2019 | | Master Small Cap Index Series (Percentages shown are based on Net Assets) |
| | | | | | | | |
| Security | | Shares | | | Value | |
|
| Biotechnology (continued) | |
Xencor, Inc.(b) | | | 73,055 | | | $ | 2,512,361 | |
Xeris Pharmaceuticals, Inc.(b) | | | 40,501 | | | | 285,532 | |
Y-mAbs Therapeutics, Inc.(a)(b) | | | 38,684 | | | | 1,208,875 | |
ZIOPHARM Oncology, Inc.(a)(b) | | | 249,347 | | | | 1,176,918 | |
| | | | | | | | |
| | | | 247,072,892 | |
|
| Building Materials — 1.3% | |
Armstrong Flooring, Inc.(b) | | | 25,819 | | | | 110,247 | |
BlueLinx Holdings, Inc.(a)(b) | | | 13,479 | | | | 192,076 | |
Builders FirstSource, Inc.(b) | | | 176,031 | | | | 4,472,948 | |
Caesarstone Ltd. | | | 34,907 | | | | 526,048 | |
Continental Building Products, Inc.(a)(b) | | | 53,902 | | | | 1,963,650 | |
Cornerstone Building Brands, Inc.(a)(b) | | | 70,149 | | | | 596,968 | |
Gibraltar Industries, Inc.(b) | | | 49,847 | | | | 2,514,283 | |
Griffon Corp. | | | 56,568 | | | | 1,150,027 | |
Louisiana-Pacific Corp. | | | 188,385 | | | | 5,589,383 | |
Masonite International Corp.(b) | | | 38,304 | | | | 2,765,932 | |
Patrick Industries, Inc. | | | 34,830 | | | | 1,826,137 | |
PGT Innovations, Inc.(b) | | | 87,716 | | | | 1,307,845 | |
Quanex Building Products Corp. | | | 49,922 | | | | 852,668 | |
Simpson Manufacturing Co., Inc. | | | 69,181 | | | | 5,550,392 | |
Summit Materials, Inc., Class A(a)(b) | | | 175,206 | | | | 4,187,423 | |
Trex Co., Inc.(b) | | | 92,453 | | | | 8,309,676 | |
| | | | | | | | |
| | | | 41,915,703 | |
|
| Building: Climate Control — 0.2% | |
AAON, Inc.(a) | | | 63,418 | | | | 3,133,483 | |
Comfort Systems USA, Inc. | | | 56,729 | | | | 2,827,941 | |
| | | | | | | | |
| | | | 5,961,424 | |
|
| Building: Roofing, Wallboard & Plumbing — 0.2% | |
Beacon Roofing Supply, Inc.(a)(b) | | | 105,157 | | | | 3,362,921 | |
Forterra, Inc.(a)(b) | | | 28,521 | | | | 329,703 | |
Foundation Building Materials, Inc.(a)(b) | | | 36,693 | | | | 710,009 | |
JELD-WEN Holding, Inc.(a)(b) | | | 104,495 | | | | 2,446,228 | |
| | | | | | | | |
| | | | 6,848,861 | |
|
| Cable Television Services — 0.2% | |
Liberty Latin America Ltd., Class A(b) | | | 72,537 | | | | 1,399,964 | |
Liberty Latin America Ltd., Class C(a)(b) | | | 175,799 | | | | 3,421,049 | |
WideOpenWest, Inc.(b) | | | 39,377 | | | | 292,177 | |
| | | | | | | | |
| | | | 5,113,190 | |
|
| Casinos & Gambling — 0.6% | |
Boyd Gaming Corp. | | | 124,458 | | | | 3,726,272 | |
Century Casinos, Inc.(b) | | | 40,692 | | | | 322,281 | |
Eldorado Resorts, Inc.(b) | | | 102,385 | | | | 6,106,241 | |
Inspired Entertainment, Inc.(b) | | | 13,208 | | | | 89,154 | |
Monarch Casino & Resort, Inc.(a)(b) | | | 17,332 | | | | 841,469 | |
Penn National Gaming, Inc.(b) | | | 170,337 | | | | 4,353,814 | |
Scientific Games Corp., Class A(b) | | | 86,142 | | | | 2,306,883 | |
Twin River Worldwide Holdings, Inc. | | | 29,962 | | | | 768,525 | |
| | | | | | | | |
| | | | 18,514,639 | |
|
| Cement — 0.0% | |
Concrete Pumping Holdings, Inc.(a)(b) | | | 22,653 | | | | 123,912 | |
US Concrete, Inc.(a)(b) | | | 24,781 | | | | 1,032,376 | |
| | | | | | | | |
| | | | 1,156,288 | |
|
| Chemicals: Diversified — 0.7% | |
AdvanSix, Inc.(a)(b) | | | 42,616 | | | | 850,615 | |
American Vanguard Corp.(a) | | | 43,305 | | | | 843,148 | |
CSW Industrials, Inc. | | | 22,807 | | | | 1,756,139 | |
GCP Applied Technologies, Inc.(a)(b) | | | 83,683 | | | | 1,900,441 | |
Hawkins, Inc. | | | 14,559 | | | | 666,948 | |
Ingevity Corp.(a)(b) | | | 65,385 | | | | 5,713,341 | |
Innophos Holdings, Inc. | | | 30,351 | | | | 970,625 | |
Landec Corp.(b) | | | 37,064 | | | | 419,194 | |
| | | | | | | | |
| Security | | Shares | | | Value | |
|
| Chemicals: Diversified (continued) | |
LSB Industries, Inc.(a)(b) | | | 32,481 | | | $ | 136,420 | |
Marrone Bio Innovations, Inc.(b) | | | 74,453 | | | | 75,198 | |
OMNOVA Solutions, Inc.(b) | | | 67,885 | | | | 686,317 | |
PolyOne Corp. | | | 118,512 | | | | 4,360,057 | |
Rayonier Advanced Materials, Inc. | | | 74,401 | | | | 285,700 | |
Sensient Technologies Corp. | | | 65,553 | | | | 4,332,398 | |
| | | | | | | | |
| | | | 22,996,541 | |
|
| Chemicals: Specialty — 0.7% | |
A. Schulman, Inc.(c) | | | 28,192 | | | | 12,207 | |
Advanced Emissions Solutions, Inc. | | | 25,557 | | | | 268,349 | |
Amyris, Inc.(a)(b) | | | 116,867 | | | | 361,119 | |
Balchem Corp. | | | 49,727 | | | | 5,053,755 | |
FutureFuel Corp. | | | 39,911 | | | | 494,497 | |
Innospec, Inc. | | | 37,539 | | | | 3,883,034 | |
Kraton Corp.(b) | | | 48,453 | | | | 1,226,830 | |
Livent Corp.(a)(b) | | | 227,421 | | | | 1,944,450 | |
Orion Engineered Carbons SA | | | 93,217 | | | | 1,799,088 | |
Park Aerospace Corp. | | | 28,864 | | | | 469,617 | |
PQ Group Holdings, Inc.(a)(b) | | | 58,496 | | | | 1,004,961 | |
Quaker Chemical Corp.(a) | | | 20,263 | | | | 3,333,669 | |
Stepan Co. | | | 31,612 | | | | 3,238,333 | |
Tronox Holdings PLC, Class A(b) | | | 141,238 | | | | 1,612,938 | |
Valhi, Inc. | | | 42,640 | | | | 79,737 | |
| | | | | | | | |
| | | | 24,782,584 | |
|
| Coal — 0.2% | |
Arch Coal, Inc., Class A | | | 23,868 | | | | 1,712,290 | |
CONSOL Energy, Inc.(a)(b) | | | 41,675 | | | | 604,704 | |
Contura Energy, Inc.(a)(b) | | | 28,968 | | | | 262,160 | |
Hallador Energy Co. | | | 30,352 | | | | 90,146 | |
Peabody Energy Corp. | | | 116,487 | | | | 1,062,362 | |
Ramaco Resources, Inc.(b) | | | 10,891 | | | | 38,990 | |
Warrior Met Coal, Inc.(a) | | | 80,287 | | | | 1,696,464 | |
| | | | | | | | |
| | | | 5,467,116 | |
|
| Commercial Banks — 0.0% | |
HomeTrust Bancshares, Inc. | | | 24,494 | | | | 657,174 | |
| | | | | | | | |
|
| Commercial Finance & Mortgage Companies — 0.2% | |
Federal Agricultural Mortgage Corp., Class C | | | 14,004 | | | | 1,169,334 | |
Medallion Financial Corp.(a)(b) | | | 31,714 | | | | 230,561 | |
Meta Financial Group, Inc. | | | 55,113 | | | | 2,012,176 | |
MMA Capital Holdings, Inc.(b) | | | 7,816 | | | | 248,549 | |
On Deck Capital, Inc.(a)(b) | | | 101,310 | | | | 419,423 | |
PennyMac Financial Services, Inc.(f) | | | 3,162 | | | | 107,634 | |
RE/MAX Holdings, Inc., Class A | | | 27,594 | | | | 1,062,093 | |
Walker & Dunlop, Inc. | | | 44,036 | | | | 2,848,249 | |
| | | | | | | | |
| | | | 8,098,019 | |
|
| Commercial Services & Supplies — 0.0% | |
Collectors Universe, Inc. | | | 12,576 | | | | 289,877 | |
Information Services Group, Inc.(a)(b) | | | 50,774 | | | | 128,458 | |
National Research Corp., Class A | | | 18,673 | | | | 1,231,298 | |
| | | | | | | | |
| | | | 1,649,633 | |
|
| Commercial Services: Rental & Leasing — 1.0% | |
Aircastle Ltd. | | | 81,081 | | | | 2,595,403 | |
CAI International, Inc.(a)(b) | | | 24,842 | | | | 719,921 | |
GATX Corp. | | | 55,016 | | | | 4,558,076 | |
GMS, Inc.(b) | | | 66,979 | | | | 1,813,791 | |
H&E Equipment Services, Inc. | | | 49,316 | | | | 1,648,634 | |
Herc Holdings, Inc.(a)(b) | | | 37,223 | | | | 1,821,694 | |
Marlin Business Services Corp. | | | 13,753 | | | | 302,291 | |
McGrath RentCorp | | | 37,810 | | | | 2,893,977 | |
Mobile Mini, Inc. | | | 69,079 | | | | 2,618,785 | |
NOW, Inc.(b) | | | 166,622 | | | | 1,872,831 | |
| | | | |
| SCHEDULE OF INVESTMENTS | | | 53 | |
| | |
Schedule of Investments (continued) December 31, 2019 | | Master Small Cap Index Series (Percentages shown are based on Net Assets) |
| | | | | | | | |
| Security | | Shares | | | Value | |
|
| Commercial Services: Rental & Leasing (continued) | |
Rush Enterprises, Inc., Class B | | | 6,485 | | | $ | 296,365 | |
SiteOne Landscape Supply, Inc.(a)(b) | | | 64,220 | | | | 5,821,543 | |
Triton International Ltd. | | | 85,442 | | | | 3,434,768 | |
Willis Lease Finance Corp.(a)(b) | | | 4,412 | | | | 259,911 | |
WillScot Corp.(a)(b) | | | 79,720 | | | | 1,474,023 | |
| | | | | | | | |
| | | | 32,132,013 | |
|
| Commercial Vehicles & Parts — 0.3% | |
Blue Bird Corp.(b) | | | 22,464 | | | | 514,875 | |
Commercial Vehicle Group, Inc.(b) | | | 47,027 | | | | 298,621 | |
Cooper-Standard Holdings, Inc.(b) | | | 25,893 | | | | 858,612 | |
Miller Industries, Inc. | | | 17,093 | | | | 634,663 | |
Modine Manufacturing Co.(b) | | | 76,898 | | | | 592,115 | |
Motorcar Parts of America, Inc.(a)(b) | | | 28,826 | | | | 635,037 | |
Navistar International Corp.(b) | | | 76,574 | | | | 2,216,051 | |
REV Group, Inc. | | | 41,973 | | | | 513,330 | |
Rush Enterprises, Inc., Class A | | | 43,075 | | | | 2,002,987 | |
Spartan Motors, Inc. | | | 53,382 | | | | 965,147 | |
Wabash National Corp. | | | 81,494 | | | | 1,197,147 | |
| | | | | | | | |
| | | | 10,428,585 | |
|
| Communications Technology — 1.1% | |
ADTRAN, Inc. | | | 73,590 | | | | 727,805 | |
Anixter International, Inc.(a)(b) | | | 47,071 | | | | 4,335,239 | |
Anterix, Inc.(a)(b) | | | 16,727 | | | | 722,774 | |
Avaya Holdings Corp.(a)(b) | | | 171,277 | | | | 2,312,239 | |
Bandwidth, Inc., Class A(b) | | | 24,821 | | | | 1,589,785 | |
Bel Fuse, Inc., Class B | | | 14,803 | | | | 303,461 | |
Calix, Inc.(b) | | | 72,117 | | | | 576,936 | |
Casa Systems, Inc.(a)(b) | | | 47,733 | | | | 195,228 | |
Comtech Telecommunications Corp. | | | 36,484 | | | | 1,294,817 | |
DASAN Zhone Solutions, Inc.(b) | | | 11,498 | | | | 101,872 | |
Digi International, Inc.(b) | | | 42,999 | | | | 761,942 | |
Extreme Networks, Inc.(b) | | | 181,410 | | | | 1,336,992 | |
GSI Technology, Inc.(b) | | | 24,864 | | | | 176,286 | |
Harmonic, Inc.(a)(b) | | | 133,750 | | | | 1,043,250 | |
Infinera Corp.(a)(b) | | | 273,188 | | | | 2,169,113 | |
Inseego Corp.(a)(b) | | | 70,044 | | | | 513,423 | |
Intelsat SA(a)(b) | | | 104,812 | | | | 736,828 | |
InterDigital, Inc. | | | 48,172 | | | | 2,624,892 | |
KVH Industries, Inc.(b) | | | 24,212 | | | | 269,480 | |
Loral Space & Communications, Inc.(b) | | | 19,852 | | | | 641,617 | |
Lumentum Holdings, Inc.(a)(b) | | | 121,230 | | | | 9,613,539 | |
Maxar Technologies, Inc.(a)(b) | | | 93,012 | | | | 1,457,498 | |
NeoPhotonics Corp.(b) | | | 59,931 | | | | 528,591 | |
NETGEAR, Inc.(a)(b) | | | 47,852 | | | | 1,172,853 | |
Ooma, Inc.(b) | | | 29,844 | | | | 394,836 | |
Pareteum Corp.(a)(b) | | | 163,104 | | | | 71,325 | |
Plantronics, Inc. | | | 51,623 | | | | 1,411,373 | |
Ribbon Communications, Inc.(b) | | | 92,125 | | | | 285,588 | |
Telenav, Inc.(a)(b) | | | 50,055 | | | | 243,267 | |
| | | | | | | | |
| | | | 37,612,849 | |
|
| Computer Services Software & Systems — 5.8% | |
A10 Networks, Inc.(a)(b) | | | 85,422 | | | | 586,849 | |
ACI Worldwide, Inc.(a)(b) | | | 177,855 | | | | 6,738,037 | |
Alarm.com Holdings, Inc.(b) | | | 56,742 | | | | 2,438,204 | |
Altair Engineering, Inc., Class A(a)(b) | | | 64,200 | | | | 2,305,422 | |
American Software, Inc., Class A | | | 44,550 | | | | 662,904 | |
Appfolio, Inc., Class A(b) | | | 24,401 | | | | 2,682,890 | |
Appian Corp.(a)(b) | | | 53,938 | | | | 2,060,971 | |
Avid Technology, Inc.(a)(b) | | | 43,995 | | | | 377,477 | |
Benefitfocus, Inc.(a)(b) | | | 45,751 | | | | 1,003,777 | |
Blackbaud, Inc. | | | 75,460 | | | | 6,006,616 | |
Blackline, Inc.(b) | | | 68,298 | | | | 3,521,445 | |
Blucora, Inc.(b) | | | 74,718 | | | | 1,953,128 | |
| | | | | | | | |
| Security | | Shares | | | Value | |
|
| Computer Services Software & Systems (continued) | |
Bottomline Technologies DE, Inc.(b) | | | 69,601 | | | $ | 3,730,614 | |
Box, Inc., Class A(a)(b) | | | 220,935 | | | | 3,707,289 | |
Brightcove, Inc.(a)(b) | | | 59,136 | | | | 513,892 | |
Cargurus, Inc.(b) | | | 119,530 | | | | 4,205,065 | |
Cision Ltd.(b) | | | 141,813 | | | | 1,413,876 | |
Cloudera, Inc.(a)(b) | | | 379,820 | | | | 4,417,307 | |
CommVault Systems, Inc.(b) | | | 70,414 | | | | 3,143,281 | |
ComScore, Inc.(a)(b) | | | 74,772 | | | | 369,374 | |
Cornerstone OnDemand, Inc.(b) | | | 87,981 | | | | 5,151,288 | |
CSG Systems International, Inc. | | | 50,797 | | | | 2,630,269 | |
Digimarc Corp.(a)(b) | | | 18,258 | | | | 612,738 | |
Digital Turbine, Inc.(a)(b) | | | 122,187 | | | | 871,193 | |
Domo, Inc., Class B(b) | | | 27,002 | | | | 586,483 | |
Ebix, Inc. | | | 36,032 | | | | 1,203,829 | |
Endurance International Group Holdings, Inc.(a)(b) | | | 109,978 | | | | 516,897 | |
Envestnet, Inc.(a)(b) | | | 76,411 | | | | 5,320,498 | |
ePlus, Inc.(b) | | | 20,694 | | | | 1,744,297 | |
Eventbrite, Inc., Class A(b) | | | 56,729 | | | | 1,144,224 | |
Everbridge, Inc.(a)(b) | | | 51,341 | | | | 4,008,705 | |
EverQuote, Inc., Class A(b) | | | 13,693 | | | | 470,355 | |
Evolent Health, Inc., Class A(a)(b) | | | 114,925 | | | | 1,040,071 | |
ForeScout Technologies, Inc.(a)(b) | | | 68,205 | | | | 2,237,124 | |
Groupon, Inc.(a)(b) | | | 700,483 | | | | 1,674,154 | |
GTY Technology Holdings, Inc.(b) | | | 59,865 | | | | 352,605 | |
Ideanomics, Inc.(a)(b) | | | 76,370 | | | | 65,350 | |
Inovalon Holdings, Inc., Class A(a)(b) | | | 110,600 | | | | 2,081,492 | |
Intelligent Systems Corp.(a)(b) | | | 10,671 | | | | 426,200 | |
Leaf Group Ltd.(b) | | | 25,791 | | | | 103,164 | |
Limelight Networks, Inc.(a)(b) | | | 176,168 | | | | 718,765 | |
LivePerson, Inc.(a)(b) | | | 98,302 | | | | 3,637,174 | |
LiveRamp Holdings, Inc.(a)(b) | | | 103,517 | | | | 4,976,062 | |
Majesco(a)(b) | | | 11,110 | | | | 91,657 | |
ManTech International Corp., Class A | | | 41,359 | | | | 3,303,757 | |
Meet Group, Inc.(b) | | | 110,011 | | | | 551,155 | |
Mercury Systems, Inc.(b) | | | 83,785 | | | | 5,790,381 | |
MicroStrategy, Inc., Class A(b) | | | 12,826 | | | | 1,829,372 | |
Mitek Systems, Inc.(b) | | | 36,057 | | | | 275,836 | |
NetScout Systems, Inc.(a)(b) | | | 112,432 | | | | 2,706,238 | |
NIC, Inc. | | | 100,983 | | | | 2,256,970 | |
OneSpan, Inc.(a)(b) | | | 50,832 | | | | 870,244 | |
PAR Technology Corp.(b) | | | 17,894 | | | | 550,062 | |
Parsons Corp.(b) | | | 29,559 | | | | 1,220,196 | |
PDF Solutions, Inc.(b) | | | 44,019 | | | | 743,481 | |
Perficient, Inc.(b) | | | 50,158 | | | | 2,310,779 | |
Perspecta, Inc. | | | 218,399 | | | | 5,774,470 | |
Phunware, Inc.(b) | | | 46,302 | | | | 55,099 | |
Ping Identity Holding Corp.(b) | | | 21,431 | | | | 520,773 | |
Progress Software Corp. | | | 68,671 | | | | 2,853,280 | |
PROS Holdings, Inc.(b) | | | 50,811 | | | | 3,044,595 | |
Q2 Holdings, Inc.(a)(b) | | | 68,602 | | | | 5,562,250 | |
QAD, Inc., Class A(a) | | | 17,017 | | | | 866,676 | |
Rapid7, Inc.(a)(b) | | | 80,348 | | | | 4,501,095 | |
Rimini Street, Inc.(a)(b) | | | 29,448 | | | | 114,258 | |
SailPoint Technologies Holding, Inc.(a)(b) | | | 132,415 | | | | 3,124,994 | |
Science Applications International Corp. | | | 90,528 | | | | 7,877,747 | |
SecureWorks Corp., Class A(b) | | | 12,735 | | | | 212,165 | |
SharpSpring, Inc.(b) | | | 15,791 | | | | 181,123 | |
ShotSpotter, Inc.(a)(b) | | | 12,431 | | | | 316,990 | |
Shutterstock, Inc.(b) | | | 29,510 | | | | 1,265,389 | |
Simulations Plus, Inc.(a) | | | 18,653 | | | | 542,243 | |
SPS Commerce, Inc.(b) | | | 54,023 | | | | 2,993,955 | |
SVMK, Inc.(a)(b) | | | 141,690 | | | | 2,532,000 | |
Synchronoss Technologies, Inc.(b) | | | 58,230 | | | | 276,592 | |
TechTarget, Inc.(b) | | | 35,348 | | | | 922,583 | |
| | |
| 54 | | 2019 BLACKROCK ANNUAL REPORTTO SHAREHOLDERS |
| | |
Schedule of Investments (continued) December 31, 2019 | | Master Small Cap Index Series (Percentages shown are based on Net Assets) |
| | | | | | | | |
| Security | | Shares | | | Value | |
|
| Computer Services Software & Systems (continued) | |
Telaria, Inc.(a)(b) | | | 67,371 | | | $ | 593,538 | |
Tenable Holdings, Inc.(b) | | | 57,292 | | | | 1,372,716 | |
TiVo Corp. | | | 189,008 | | | | 1,602,788 | |
Travelzoo(a)(b) | | | 7,629 | | | | 81,630 | |
Tucows, Inc., Class A(b) | | | 14,649 | | | | 905,015 | |
Unisys Corp.(b) | | | 78,964 | | | | 936,513 | |
Upland Software, Inc.(b) | | | 35,352 | | | | 1,262,420 | |
Upwork, Inc.(b) | | | 87,274 | | | | 931,214 | |
Varonis Systems, Inc.(a)(b) | | | 45,791 | | | | 3,558,419 | |
Verint Systems, Inc.(a)(b) | | | 106,012 | | | | 5,868,824 | |
Verra Mobility Corp.(b) | | | 204,830 | | | | 2,865,572 | |
VirnetX Holding Corp.(a)(b) | | | 95,942 | | | | 364,580 | |
Virtusa Corp.(a)(b) | | | 45,075 | | | | 2,043,250 | |
Workiva, Inc.(a)(b) | | | 56,743 | | | | 2,386,043 | |
Yelp, Inc.(b) | | | 107,115 | | | | 3,730,815 | |
Yext, Inc.(b) | | | 156,979 | | | | 2,263,637 | |
Zix Corp.(a)(b) | | | 82,760 | | | | 561,113 | |
Zuora, Inc., Class A(b) | | | 147,896 | | | | 2,119,350 | |
| | | | | | | | |
| | | | 192,897,197 | |
|
| Computer Technology — 0.4% | |
3D Systems Corp.(a)(b) | | | 179,133 | | | | 1,567,414 | |
AstroNova, Inc. | | | 10,458 | | | | 143,484 | |
Diebold Nixdorf, Inc.(b) | | | 119,682 | | | | 1,263,842 | |
Immersion Corp.(a)(b) | | | 49,155 | | | | 365,222 | |
Impinj, Inc.(b) | | | 29,156 | | | | 753,974 | |
Insight Enterprises, Inc.(b) | | | 54,732 | | | | 3,847,112 | |
PC Connection, Inc. | | | 17,539 | | | | 870,987 | |
Safeguard Scientifics, Inc. | | | 31,399 | | | | 344,761 | |
Stratasys Ltd.(b) | | | 79,399 | | | | 1,605,845 | |
Synaptics, Inc.(a)(b) | | | 51,950 | | | | 3,416,751 | |
| | | | | | | | |
| | | | 14,179,392 | |
|
| Construction — 0.5% | |
Aegion Corp.(b) | | | 46,605 | | | | 1,042,554 | |
Construction Partners, Inc., Class A(a)(b) | | | 34,939 | | | | 589,421 | |
EMCOR Group, Inc. | | | 86,411 | | | | 7,457,269 | |
Granite Construction, Inc. | | | 72,432 | | | | 2,004,193 | |
Great Lakes Dredge & Dock Corp.(a)(b) | | | 94,111 | | | | 1,066,278 | |
Primoris Services Corp. | | | 66,900 | | | | 1,487,856 | |
Sterling Construction Co., Inc.(b) | | | 40,153 | | | | 565,354 | |
Tutor Perini Corp.(b) | | | 61,610 | | | | 792,305 | |
| | | | | | | | |
| | | | 15,005,230 | |
|
| Consumer Electronics — 0.2% | |
Fitbit, Inc., Series A(a)(b) | | | 349,939 | | | | 2,299,099 | |
Sonos, Inc.(b) | | | 109,674 | | | | 1,713,108 | |
Universal Electronics, Inc.(b) | | | 20,919 | | | | 1,093,227 | |
ZAGG, Inc.(a)(b) | | | 42,849 | | | | 347,505 | |
| | | | | | | | |
| | | | 5,452,939 | |
|
| Consumer Lending — 0.5% | |
Curo Group Holdings Corp.(b) | | | 26,324 | | | | 320,626 | |
Elevate Credit, Inc.(a)(b) | | | 36,127 | | | | 160,765 | |
Encore Capital Group, Inc.(b) | | | 47,716 | | | | 1,687,238 | |
Enova International, Inc.(a)(b) | | | 51,061 | | | | 1,228,528 | |
Ezcorp, Inc., Class A(b) | | | 78,583 | | | | 535,936 | |
FirstCash, Inc. | | | 65,433 | | | | 5,275,863 | |
Marcus & Millichap, Inc.(b) | | | 35,538 | | | | 1,323,791 | |
Nelnet, Inc., Class A | | | 27,502 | | | | 1,601,716 | |
PRA Group, Inc.(b) | | | 69,509 | | | | 2,523,177 | |
Regional Management Corp.(b) | | | 14,161 | | | | 425,255 | |
World Acceptance Corp.(b) | | | 9,661 | | | | 834,710 | |
| | | | | | | | |
| | | | 15,917,605 | |
|
| Consumer Services: Miscellaneous — 0.2% | |
Cars.com, Inc.(b) | | | 104,351 | | | | 1,275,169 | |
| | | | | | | | |
| Security | | Shares | | | Value | |
|
| Consumer Services: Miscellaneous (continued) | |
Chuy’s Holdings, Inc.(b) | | | 25,781 | | | $ | 668,244 | |
Core-Mark Holding Co., Inc. | | | 70,306 | | | | 1,911,620 | |
Waitr Holdings, Inc.(a)(b) | | | 78,322 | | | | 25,220 | |
WW International, Inc.(a)(b) | | | 72,849 | | | | 2,783,560 | |
| | | | | | | | |
| | | | 6,663,813 | |
|
| Containers & Packaging — 0.1% | |
Greif, Inc., Class A | | | 39,946 | | | | 1,765,613 | |
Greif, Inc., Class B | | | 9,179 | | | | 475,197 | |
Myers Industries, Inc. | | | 54,484 | | | | 908,793 | |
UFP Technologies, Inc.(b) | | | 10,793 | | | | 535,441 | |
Veritiv Corp.(b) | | | 19,536 | | | | 384,273 | |
| | | | | | | | |
| | | | 4,069,317 | |
|
| Cosmetics — 0.1% | |
elf Beauty, Inc.(b) | | | 40,875 | | | | 659,314 | |
Inter Parfums, Inc. | | | 27,367 | | | | 1,989,855 | |
Revlon, Inc., Class A(a)(b) | | | 10,960 | | | | 234,763 | |
| | | | | | | | |
| | | | 2,883,932 | |
|
| Diversified Financial Services — 0.7% | |
Altisource Portfolio Solutions SA(a)(b) | | | 8,939 | | | | 172,791 | |
Associated Capital Group, Inc., Class A | | | 3,113 | | | | 122,030 | |
Cannae Holdings, Inc.(b) | | | 104,381 | | | | 3,881,929 | |
Greenhill & Co., Inc.(a) | | | 25,163 | | | | 429,784 | |
Hannon Armstrong Sustainable Infrastructure Capital, Inc. | | | 97,798 | | | | 3,147,140 | |
Houlihan Lokey, Inc. | | | 70,351 | | | | 3,438,053 | |
MBIA, Inc.(b) | | | 125,681 | | | | 1,168,833 | |
MidWestOne Financial Group, Inc. | | | 18,414 | | | | 667,139 | |
Moelis & Co., Class A | | | 73,330 | | | | 2,340,694 | |
Piper Jaffray Cos. | | | 21,415 | | | | 1,711,915 | |
Stifel Financial Corp. | | | 104,458 | | | | 6,335,378 | |
Tiptree, Inc. | | | 40,194 | | | | 327,179 | |
| | | | | | | | |
| | | | 23,742,865 | |
|
| Diversified Manufacturing Operations — 0.6% | |
Barnes Group, Inc. | | | 72,787 | | | | 4,509,883 | |
Federal Signal Corp. | | | 93,442 | | | | 3,013,504 | |
Harsco Corp.(b) | | | 122,866 | | | | 2,827,147 | |
Luxfer Holdings PLC | | | 40,091 | | | | 742,084 | |
Lydall, Inc.(a)(b) | | | 26,188 | | | | 537,378 | |
OSI Systems, Inc.(b) | | | 25,996 | | | | 2,618,837 | |
Raven Industries, Inc. | | | 54,917 | | | | 1,892,440 | |
Standex International Corp. | | | 19,231 | | | | 1,525,980 | |
TriMas Corp.(a)(b) | | | 68,912 | | | | 2,164,526 | |
| | | | | | | | |
| | | | 19,831,779 | |
|
| Diversified Materials & Processing — 0.4% | |
Belden, Inc.(a) | | | 60,269 | | | | 3,314,795 | |
Cabot Microelectronics Corp. | | | 44,787 | | | | 6,463,660 | |
Encore Wire Corp. | | | 31,102 | | | | 1,785,255 | |
Energous Corp.(a)(b) | | | 41,531 | | | | 73,510 | |
Insteel Industries, Inc. | | | 28,497 | | | | 612,401 | |
Koppers Holdings, Inc.(b) | | | 29,052 | | | | 1,110,367 | |
NL Industries, Inc.(b) | | | 9,941 | | | | 38,869 | |
Synalloy Corp. | | | 12,192 | | | | 157,399 | |
Tredegar Corp. | | | 40,150 | | | | 897,352 | |
Uranium Energy Corp.(a)(b) | | | 266,127 | | | | 244,624 | |
| | | | | | | | |
| | | | 14,698,232 | |
|
| Diversified Media — 0.1% | |
EW Scripps Co., Class A | | | 84,243 | | | | 1,323,457 | |
Hemisphere Media Group, Inc.(a)(b) | | | 25,247 | | | | 374,918 | |
| | | | | | | | |
| | | | 1,698,375 | |
|
| Diversified Retail — 0.4% | |
Big Lots, Inc. | | | 60,012 | | | | 1,723,545 | |
BJ’s Wholesale Club Holdings, Inc.(a)(b) | | | 172,306 | | | | 3,918,239 | |
| | | | |
| SCHEDULE OF INVESTMENTS | | | 55 | |
| | |
Schedule of Investments (continued) December 31, 2019 | | Master Small Cap Index Series (Percentages shown are based on Net Assets) |
| | | | | | | | |
| Security | | Shares | | | Value | |
|
| Diversified Retail (continued) | |
Dillard’s, Inc., Class A(a) | | | 16,067 | | | $ | 1,180,603 | |
Duluth Holdings, Inc., Class B(a)(b) | | | 16,032 | | | | 168,817 | |
Gaia, Inc.(a)(b) | | | 16,011 | | | | 127,928 | |
Hudson Ltd., Class A(a)(b) | | | 60,751 | | | | 931,920 | |
JC Penney Co., Inc.(a)(b) | | | 490,373 | | | | 549,218 | |
Overstock.com, Inc.(a)(b) | | | 41,020 | | | | 289,191 | |
PriceSmart, Inc. | | | 34,699 | | | | 2,464,323 | |
Stitch Fix, Inc., Class A(a)(b) | | | 65,196 | | | | 1,672,929 | |
Winmark Corp. | | | 3,837 | | | | 760,877 | |
Youngevity International, Inc.(a)(b) | | | 12,324 | | | | 40,176 | |
| | | | | | | | |
| | | | 13,827,766 | |
|
| Drug & Grocery Store Chains — 0.1% | |
Diplomat Pharmacy, Inc.(b) | | | 89,957 | | | | 359,828 | |
Ingles Markets, Inc., Class A | | | 21,863 | | | | 1,038,711 | |
PetMed Express, Inc. | | | 30,599 | | | | 719,689 | |
Rite Aid Corp.(b) | | | 84,203 | | | | 1,302,620 | |
Village Super Market, Inc., Class A | | | 13,373 | | | | 310,254 | |
Weis Markets, Inc. | | | 14,635 | | | | 592,571 | |
| | | | | | | | |
| | | | 4,323,673 | |
|
| Education Services — 0.8% | |
Adtalem Global Education, Inc.(b) | | | 90,174 | | | | 3,153,385 | |
American Public Education, Inc.(b) | | | 24,266 | | | | 664,646 | |
Chegg, Inc.(b) | | | 184,511 | | | | 6,994,812 | |
Franklin Covey Co.(b) | | | 15,297 | | | | 493,022 | |
HealthStream, Inc.(b) | | | 40,059 | | | | 1,089,605 | |
Houghton Mifflin Harcourt Co.(a)(b) | | | 162,052 | | | | 1,012,825 | |
K12, Inc.(b) | | | 59,966 | | | | 1,220,308 | |
Laureate Education, Inc., Class A(a)(b) | | | 184,112 | | | | 3,242,212 | |
Perdoceo Education Corp.(a)(b) | | | 107,225 | | | | 1,971,868 | |
Rosetta Stone, Inc.(b) | | | 31,991 | | | | 580,317 | |
Strategic Education, Inc. | | | 32,936 | | | | 5,233,530 | |
| | | | | | | | |
| | | | 25,656,530 | |
|
| Electronic Components — 0.9% | |
Acacia Research Corp.(b) | | | 15,133 | | | | 40,254 | |
American Superconductor Corp.(a)(b) | | | 32,628 | | | | 256,130 | |
AVX Corp. | | | 71,142 | | | | 1,456,277 | |
KEMET Corp. | | | 89,352 | | | | 2,416,972 | |
Methode Electronics, Inc. | | | 56,436 | | | | 2,220,757 | |
Novanta, Inc.(b) | | | 52,006 | | | | 4,599,411 | |
NVE Corp. | | | 7,368 | | | | 526,075 | |
Rogers Corp.(a)(b) | | | 28,577 | | | | 3,564,409 | |
Sanmina Corp.(a)(b) | | | 105,302 | | | | 3,605,540 | |
ScanSource, Inc.(b) | | | 39,873 | | | | 1,473,307 | |
Tech Data Corp.(b) | | | 55,524 | | | | 7,973,246 | |
TTM Technologies, Inc.(b) | | | 153,666 | | | | 2,312,673 | |
| | | | | | | | |
| | | | 30,445,051 | |
|
| Electronic Entertainment — 0.0% | |
Glu Mobile, Inc.(b) | | | 180,029 | | | | 1,089,175 | |
PlayAGS, Inc.(a)(b) | | | 40,757 | | | | 494,382 | |
PolarityTE, Inc.(a)(b) | | | 20,951 | | | | 54,473 | |
| | | | | | | | |
| | | | 1,638,030 | |
|
| Electronics — 0.4% | |
Agilysys, Inc.(b) | | | 32,307 | | | | 820,921 | |
Coda Octopus Group, Inc.(a)(b) | | | 6,915 | | | | 57,879 | |
Daktronics, Inc. | | | 55,489 | | | | 337,928 | |
II-VI, Inc.(b) | | | 138,057 | | | | 4,648,379 | |
Integer Holdings Corp.(b) | | | 50,190 | | | | 4,036,782 | |
iRobot Corp.(a)(b) | | | 42,762 | | | | 2,165,040 | |
Iteris, Inc.(b) | | | 62,088 | | | | 309,819 | |
nLight, Inc.(a)(b) | | | 51,241 | | | | 1,039,167 | |
| | | | | | | | |
| | | | 13,415,915 | |
| | | | | | | | |
| Security | | Shares | | | Value | |
|
| Energy Equipment — 0.4% | |
Arcosa, Inc. | | | 75,679 | | | $ | 3,371,500 | |
Bloom Energy Corp., Class A(a)(b) | | | 84,577 | | | | 631,790 | |
Enphase Energy, Inc.(a)(b) | | | 141,826 | | | | 3,705,913 | |
Matador Resources Co.(a)(b) | | | 171,446 | | | | 3,080,885 | |
SunPower Corp.(b) | | | 97,999 | | | | 764,392 | |
Sunrun, Inc.(a)(b) | | | 176,186 | | | | 2,433,129 | |
TPI Composites, Inc.(b) | | | 44,681 | | | | 827,045 | |
| | | | | | | | |
| | | | 14,814,654 | |
|
| Energy Equipment & Services — 0.0% | |
Geospace Technologies Corp.(a)(b) | | | 20,499 | | | | 343,768 | |
| | | | | | | | |
|
| Engineering & Contracting Services — 0.9% | |
Argan, Inc. | | | 22,705 | | | | 911,379 | |
Dycom Industries, Inc.(a)(b) | | | 46,954 | | | | 2,213,881 | |
Exponent, Inc.(a) | | | 79,907 | | | | 5,514,382 | |
IES Holdings, Inc.(b) | | | 12,322 | | | | 316,183 | |
KBR, Inc. | | | 220,038 | | | | 6,711,159 | |
MasTec, Inc.(b) | | | 92,697 | | | | 5,947,439 | |
Mistras Group, Inc.(a)(b) | | | 27,467 | | | | 391,954 | |
MYR Group, Inc.(b) | | | 24,374 | | | | 794,349 | |
Tetra Tech, Inc. | | | 85,568 | | | | 7,372,539 | |
VSE Corp. | | | 13,499 | | | | 513,502 | |
Willdan Group, Inc.(a)(b) | | | 15,589 | | | | 495,418 | |
| | | | | | | | |
| | | | 31,182,185 | |
|
| Entertainment — 0.1% | |
AMC Entertainment Holdings, Inc., Class A(a) | | | 78,425 | | | | 567,797 | |
Golden Entertainment, Inc.(b) | | | 25,566 | | | | 491,379 | |
IMAX Corp.(a)(b) | | | 81,079 | | | | 1,656,444 | |
LiveXLive Media, Inc.(b) | | | 47,090 | | | | 72,754 | |
Reading International, Inc., Class A(a)(b) | | | 25,513 | | | | 285,490 | |
| | | | | | | | |
| | | | 3,073,864 | |
|
| Environmental, Maintenance, & Security Service — 0.8% | |
ABM Industries, Inc. | | | 102,828 | | | | 3,877,644 | |
BrightView Holdings, Inc.(a)(b) | | | 48,124 | | | | 811,852 | |
Brink’s Co. | | | 77,096 | | | | 6,991,065 | |
Charah Solutions, Inc.(a)(b) | | | 12,674 | | | | 30,925 | |
Healthcare Services Group, Inc. | | | 115,586 | | | | 2,811,052 | |
MSA Safety, Inc. | | | 54,523 | | | | 6,889,526 | |
SP Plus Corp.(b) | | | 35,358 | | | | 1,500,240 | |
UniFirst Corp. | | | 23,381 | | | | 4,722,494 | |
| | | | | | | | |
| | | | 27,634,798 | |
|
| Fertilizers — 0.0% | |
Intrepid Potash, Inc.(a)(b) | | | 146,366 | | | | 396,652 | |
| | | | | | | | |
|
| Financial Data & Systems — 0.5% | |
Cardtronics PLC, Class A(a)(b) | | | 57,670 | | | | 2,574,966 | |
Cass Information Systems, Inc. | | | 21,879 | | | | 1,263,293 | |
Donnelley Financial Solutions, Inc.(b) | | | 48,034 | | | | 502,916 | |
Everi Holdings, Inc.(b) | | | 106,828 | | | | 1,434,700 | |
EVERTEC, Inc. | | | 94,426 | | | | 3,214,261 | |
Evo Payments, Inc., Class A(a)(b) | | | 54,869 | | | | 1,449,090 | |
Green Dot Corp., Class A(b) | | | 74,707 | | | | 1,740,673 | |
I3 Verticals, Inc., Class A(b) | | | 22,354 | | | | 631,501 | |
International Money Express, Inc.(a)(b) | | | 32,545 | | | | 391,842 | |
LendingClub Corp.(b) | | | 102,252 | | | | 1,290,420 | |
Paysign, Inc.(a)(b) | | | 46,615 | | | | 473,142 | |
Priority Technology Holdings, Inc.(a)(b) | | | 9,786 | | | | 23,976 | |
Value Line, Inc. | | | 1,578 | | | | 45,620 | |
| | | | | | | | |
| | | | 15,036,400 | |
|
| Food & Staples Retailing — 0.0% | |
Natural Grocers by Vitamin Cottage, Inc. | | | 13,345 | | | | 131,715 | |
| | | | | | | | |
| | |
| 56 | | 2019 BLACKROCK ANNUAL REPORTTO SHAREHOLDERS |
| | |
Schedule of Investments (continued) December 31, 2019 | | Master Small Cap Index Series (Percentages shown are based on Net Assets) |
| | | | | | | | |
| Security | | Shares | | | Value | |
|
| Foods — 1.2% | |
B&G Foods, Inc.(a) | | | 99,816 | | | $ | 1,789,701 | |
BellRing Brands, Inc., Class A(a)(b) | | | 61,877 | | | | 1,317,361 | |
Bridgford Foods Corp.(b) | | | 2,585 | | | | 64,082 | |
Chefs’ Warehouse, Inc.(a)(b) | | | 38,026 | | | | 1,449,171 | |
Freshpet, Inc.(a)(b) | | | 54,882 | | | | 3,242,977 | |
HF Foods Group, Inc.(a)(b) | | | 11,789 | | | | 229,886 | |
Hostess Brands, Inc.(b) | | | 197,858 | | | | 2,876,855 | |
J&J Snack Foods Corp. | | | 23,887 | | | | 4,401,658 | |
John B Sanfilippo & Son, Inc. | | | 13,427 | | | | 1,225,617 | |
Lancaster Colony Corp. | | | 29,384 | | | | 4,704,378 | |
Medifast, Inc. | | | 17,529 | | | | 1,920,828 | |
Nature’s Sunshine Products, Inc.(b) | | | 12,706 | | | | 113,465 | |
Performance Food Group Co.(b) | | | 161,697 | | | | 8,324,162 | |
Seneca Foods Corp., Class A(b) | | | 10,209 | | | | 416,425 | |
Simply Good Foods Co.(a)(b) | | | 130,908 | | | | 3,736,114 | |
SpartanNash Co. | | | 55,329 | | | | 787,885 | |
Tootsie Roll Industries, Inc. | | | 32,859 | | | | 1,121,806 | |
United Natural Foods, Inc.(a)(b) | | | 81,387 | | | | 712,950 | |
| | | | | | | | |
| | | | 38,435,321 | |
|
| Forest Products — 0.2% | |
Boise Cascade Co. | | | 61,054 | | | | 2,230,303 | |
Universal Forest Products, Inc. | | | 89,615 | | | | 4,274,635 | |
| | | | | | | | |
| | | | 6,504,938 | |
|
| Forms & Bulk Printing Services — 0.2% | |
Deluxe Corp. | | | 66,450 | | | | 3,317,184 | |
Ennis, Inc. | | | 39,520 | | | | 855,608 | |
InnerWorkings, Inc.(b) | | | 67,993 | | | | 374,641 | |
Quad/Graphics, Inc. | | | 49,055 | | | | 229,087 | |
RR Donnelley & Sons Co. | | | 108,819 | | | | 429,835 | |
| | | | | | | | |
| | | | 5,206,355 | |
|
| Fruit & Grain Processing — 0.0% | |
MGP Ingredients, Inc. | | | 20,221 | | | | 979,707 | |
| | | | | | | | |
|
| Funeral Parlors & Cemeteries — 0.2% | |
Carriage Services, Inc. | | | 25,480 | | | | 652,288 | |
Hillenbrand, Inc. | | | 112,775 | | | | 3,756,535 | |
Matthews International Corp., Class A | | | 47,495 | | | | 1,812,884 | |
| | | | | | | | |
| | | | 6,221,707 | |
|
| Gas Pipeline — 0.0% | |
Altus Midstream Co., Class A(a)(b) | | | 75,216 | | | | 215,118 | |
NextDecade Corp.(b) | | | 17,065 | | | | 104,779 | |
| | | | | | | | |
| | | | 319,897 | |
|
| Glass — 0.0% | |
Apogee Enterprises, Inc. | | | 40,407 | | | | 1,313,228 | |
| | | | | | | | |
|
| Gold — 0.2% | |
Coeur Mining, Inc.(b) | | | 379,789 | | | | 3,068,695 | |
Gold Resource Corp.(a) | | | 92,310 | | | | 511,397 | |
Novagold Resources, Inc.(a)(b) | | | 359,103 | | | | 3,217,563 | |
| | | | | | | | |
| | | | 6,797,655 | |
|
| Health Care Equipment & Supplies — 0.1% | |
Inogen, Inc.(a)(b) | | | 28,407 | | | | 1,941,050 | |
| | | | | | | | |
|
| Health Care Facilities — 0.7% | |
Apollo Medical Holdings, Inc.(a)(b) | | | 9,593 | | | | 176,607 | |
Brookdale Senior Living, Inc.(b) | | | 285,042 | | | | 2,072,255 | |
Ensign Group, Inc. | | | 78,661 | | | | 3,568,850 | |
Genesis Healthcare, Inc.(a)(b) | | | 126,184 | | | | 206,942 | |
Hanger, Inc.(b) | | | 55,967 | | | | 1,545,249 | |
Joint Corp.(a)(b) | | | 20,432 | | | | 329,772 | |
National HealthCare Corp. | | | 19,896 | | | | 1,719,611 | |
Select Medical Holdings Corp.(b) | | | 178,484 | | | | 4,165,817 | |
Tenet Healthcare Corp.(b) | | | 161,564 | | | | 6,144,279 | |
| | | | | | | | |
| Security | | Shares | | | Value | |
|
| Health Care Facilities (continued) | |
U.S. Physical Therapy, Inc.(a) | | | 19,407 | | | $ | 2,219,190 | |
| | | | | | | | |
| | | | 22,148,572 | |
|
| Health Care Management Services — 0.2% | |
Computer Programs & Systems, Inc. | | | 19,173 | | | | 506,167 | |
Magellan Health, Inc.(b) | | | 34,135 | | | | 2,671,064 | |
Option Care Health, Inc.(a)(b) | | | 190,615 | | | | 710,994 | |
Progyny, Inc.(b) | | | 18,047 | | | | 495,390 | |
Triple-S Management Corp., Class B(b) | | | 35,528 | | | | 656,913 | |
| | | | | | | | |
| | | | 5,040,528 | |
|
| Health Care Services — 2.5% | |
Accelerate Diagnostics, Inc.(a)(b) | | | 42,200 | | | | 713,180 | |
Addus HomeCare Corp.(a)(b) | | | 20,318 | | | | 1,975,316 | |
Allscripts Healthcare Solutions, Inc.(a)(b) | | | 256,139 | | | | 2,514,004 | |
Amedisys, Inc.(b) | | | 49,050 | | | | 8,187,426 | |
AMN Healthcare Services, Inc.(a)(b) | | | 73,952 | | | | 4,607,949 | |
Cara Therapeutics, Inc.(a)(b) | | | 61,641 | | | | 993,036 | |
Care.com, Inc.(b) | | | 33,367 | | | | 501,506 | |
Catasys, Inc.(a)(b) | | | 11,039 | | | | 180,046 | |
CorVel Corp.(b) | | | 13,867 | | | | 1,211,421 | |
Cross Country Healthcare, Inc.(b) | | | 55,357 | | | | 643,248 | |
Flexion Therapeutics, Inc.(a)(b) | | | 52,139 | | | | 1,079,277 | |
Globus Medical, Inc., Class A(b) | | | 117,417 | | | | 6,913,513 | |
Health Catalyst, Inc.(b) | | | 12,401 | | | | 430,315 | |
HealthEquity, Inc.(b) | | | 108,522 | | | | 8,038,225 | |
HMS Holdings Corp.(b) | | | 139,548 | | | | 4,130,621 | |
LHC Group, Inc.(a)(b) | | | 46,487 | | | | 6,404,049 | |
Livongo Health, Inc.(a)(b) | | | 22,110 | | | | 554,077 | |
NeoGenomics, Inc.(a)(b) | | | 147,222 | | | | 4,306,243 | |
NextGen Healthcare, Inc.(b) | | | 84,829 | | | | 1,363,202 | |
Omnicell, Inc.(a)(b) | | | 63,984 | | | | 5,228,772 | |
OptimizeRx Corp.(a)(b) | | | 21,306 | | | | 218,813 | |
Pennant Group Inc.(b) | | | 39,040 | | | | 1,291,053 | |
Phibro Animal Health Corp., Class A | | | 31,464 | | | | 781,251 | |
Phreesia, Inc.(a)(b) | | | 15,848 | | | | 422,191 | |
R1 RCM, Inc.(a)(b) | | | 160,621 | | | | 2,084,861 | |
Ryman Hospitality Properties, Inc. | | | 71,194 | | | | 6,169,672 | |
Surgery Partners, Inc.(a)(b) | | | 36,526 | | | | 571,815 | |
Tabula Rasa HealthCare, Inc.(a)(b) | | | 30,272 | | | | 1,473,641 | |
Teladoc Health, Inc.(a)(b) | | | 113,515 | | | | 9,503,476 | |
Tivity Health, Inc.(b) | | | 73,671 | | | | 1,498,836 | |
| | | | | | | | |
| | | | 83,991,035 | |
|
| Health Care: Miscellaneous — 0.1% | |
Medpace Holdings, Inc.(b) | | | 43,087 | | | | 3,621,893 | |
Providence Service Corp.(b) | | | 18,007 | | | | 1,065,654 | |
| | | | | | | | |
| | | | 4,687,547 | |
|
| Home Building — 1.0% | |
Beazer Homes USA, Inc.(a)(b) | | | 44,557 | | | | 629,590 | |
Century Communities, Inc.(b) | | | 40,374 | | | | 1,104,229 | |
Installed Building Products, Inc.(b) | | | 34,978 | | | | 2,408,935 | |
KB Home | | | 132,415 | | | | 4,537,862 | |
Legacy Housing Corp.(a)(b) | | | 8,543 | | | | 142,155 | |
LGI Homes, Inc.(b) | | | 31,273 | | | | 2,209,437 | |
M/I Homes, Inc.(b) | | | 41,266 | | | | 1,623,817 | |
MDC Holdings, Inc. | | | 81,516 | | | | 3,110,651 | |
Meritage Homes Corp.(b) | | | 55,950 | | | | 3,419,104 | |
Taylor Morrison Home Corp., Class A(b) | | | 162,266 | | | | 3,547,135 | |
TopBuild Corp.(a)(b) | | | 52,408 | | | | 5,402,217 | |
TRI Pointe Group, Inc.(b) | | | 218,293 | | | | 3,401,005 | |
William Lyon Homes, Class A(b) | | | 49,220 | | | | 983,416 | |
| | | | | | | | |
| | | | 32,519,553 | |
|
| Hotel/Motel — 0.1% | |
Marcus Corp. | | | 34,789 | | | | 1,105,247 | |
| | | | |
| SCHEDULE OF INVESTMENTS | | | 57 | |
| | |
Schedule of Investments (continued) December 31, 2019 | | Master Small Cap Index Series (Percentages shown are based on Net Assets) |
| | | | | | | | |
| Security | | Shares | | | Value | |
|
| Hotel/Motel (continued) | |
Red Lion Hotels Corp.(a)(b) | | | 37,919 | | | $ | 141,438 | |
Red Rock Resorts, Inc., Class A | | | 107,818 | | | | 2,582,241 | |
| | | | | | | | |
| | | | 3,828,926 | |
|
| Household Appliances — 0.0% | |
Hamilton Beach Brands Holding Co., Class A | | | 9,881 | | | | 188,727 | |
National Presto Industries, Inc. | | | 7,687 | | | | 679,454 | |
| | | | | | | | |
| | | | 868,181 | |
|
| Household Equipment & Products — 0.6% | |
Central Garden & Pet Co.(a)(b) | | | 16,903 | | | | 525,176 | |
Central Garden & Pet Co., Class A(a)(b) | | | 64,700 | | | | 1,899,592 | |
Helen of Troy Ltd.(a)(b) | | | 38,784 | | | | 6,972,975 | |
Novocure Ltd.(a)(b) | | | 135,341 | | | | 11,405,186 | |
Tupperware Brands Corp. | | | 75,677 | | | | 649,309 | |
| | | | | | | | |
| | | | 21,452,238 | |
|
| Household Furnishings — 0.4% | |
American Woodmark Corp.(a)(b) | | | 26,371 | | | | 2,756,033 | |
Bassett Furniture Industries, Inc. | | | 14,828 | | | | 247,331 | |
Ethan Allen Interiors, Inc. | | | 36,869 | | | | 702,723 | |
Flexsteel Industries, Inc. | | | 11,157 | | | | 222,247 | |
Hooker Furniture Corp. | | | 17,974 | | | | 461,752 | |
La-Z-Boy, Inc. | | | 69,279 | | | | 2,180,903 | |
Lifetime Brands, Inc. | | | 17,497 | | | | 121,604 | |
Lovesac Co.(a)(b) | | | 13,634 | | | | 218,826 | |
Purple Innovation, Inc.(b) | | | 5,679 | | | | 49,464 | |
RH(a)(b) | | | 25,549 | | | | 5,454,712 | |
Select Interior Concepts, Inc., Class A(b) | | | 31,954 | | | | 287,266 | |
Sleep Number Corp.(b) | | | 44,490 | | | | 2,190,688 | |
| | | | | | | | |
| | | | 14,893,549 | |
|
| Insurance: Life — 0.5% | |
American Equity Investment Life Holding Co.(a) | | | 134,382 | | | | 4,022,053 | |
Citizens, Inc.(a)(b) | | | 74,930 | | | | 505,778 | |
CNO Financial Group, Inc. | | | 254,010 | | | | 4,605,201 | |
FBL Financial Group, Inc., Class A | | | 15,684 | | | | 924,258 | |
FGL Holdings(a) | | | 224,493 | | | | 2,390,851 | |
GWG Holdings, Inc.(a)(b) | | | 2,383 | | | | 23,401 | |
Health Insurance Innovations, Inc., Class A(a)(b) | | | 14,822 | | | | 285,916 | |
Independence Holding Co. | | | 7,576 | | | | 318,798 | |
National Western Life Group, Inc., Class A | | | 3,576 | | | | 1,040,187 | |
Third Point Reinsurance Ltd.(b) | | | 117,258 | | | | 1,233,554 | |
Trupanion, Inc.(a)(b) | | | 44,240 | | | | 1,657,231 | |
| | | | | | | | |
| | | | 17,007,228 | |
|
| Insurance: Multi-Line — 0.4% | |
BRP Group, Inc.(a)(b) | | | 23,423 | | | | 375,939 | |
Crawford & Co., Class A | | | 25,171 | | | | 288,711 | |
eHealth, Inc.(a)(b) | | | 35,561 | | | | 3,416,701 | |
Goosehead Insurance, Inc., Class A | | | 18,008 | | | | 763,539 | |
Horace Mann Educators Corp. | | | 57,897 | | | | 2,527,783 | |
James River Group Holdings Ltd. | | | 46,221 | | | | 1,904,768 | |
Mr Cooper Group, Inc.(a)(b) | | | 118,484 | | | | 1,482,235 | |
PICO Holdings, Inc.(b) | | | 14,026 | | | | 155,969 | |
ProSight Global, Inc.(a)(b) | | | 14,074 | | | | 227,014 | |
Watford Holdings Ltd.(b) | | | 31,902 | | | | 802,654 | |
| | | | | | | | |
| | | | 11,945,313 | |
|
| Insurance: Property-Casualty — 2.1% | |
AMERISAFE, Inc. | | | 28,534 | | | | 1,884,100 | |
Argo Group International Holdings Ltd. | | | 53,739 | | | | 3,533,339 | |
Donegal Group, Inc., Class A | | | 15,945 | | | | 236,305 | |
Employers Holdings, Inc. | | | 34,017 | | | | 1,420,210 | |
Enstar Group Ltd.(b) | | | 18,214 | | | | 3,767,748 | |
Essent Group Ltd. | | | 148,778 | | | | 7,734,968 | |
FedNat Holding Co. | | | 19,373 | | | | 322,173 | |
Genworth Financial, Inc., Class A(b) | | | 788,312 | | | | 3,468,573 | |
| | | | | | | | |
| Security | | Shares | | | Value | |
|
| Insurance: Property-Casualty (continued) | |
Global Indemnity Ltd. | | | 12,837 | | | $ | 380,360 | |
Greenlight Capital Re Ltd., Class A(a)(b) | | | 46,226 | | | | 467,345 | |
Hallmark Financial Services, Inc.(b) | | | 21,560 | | | | 378,809 | |
HCI Group, Inc. | | | 10,177 | | | | 464,580 | |
Heritage Insurance Holdings, Inc. | | | 42,366 | | | | 561,349 | |
Hilltop Holdings, Inc. | | | 110,536 | | | | 2,755,662 | |
Investors Title Co. | | | 2,320 | | | | 369,344 | |
Kinsale Capital Group, Inc.(a) | | | 31,551 | | | | 3,207,475 | |
National General Holdings Corp. | | | 104,668 | | | | 2,313,163 | |
NI Holdings, Inc.(b) | | | 16,737 | | | | 287,876 | |
NMI Holdings, Inc., Class A(b) | | | 103,431 | | | | 3,431,841 | |
Palomar Holdings, Inc.(a)(b) | | | 19,369 | | | | 977,941 | |
ProAssurance Corp. | | | 75,946 | | | | 2,744,688 | |
Protective Insurance Corp., Class B | | | 15,162 | | | | 243,957 | |
Radian Group, Inc.(a) | | | 315,891 | | | | 7,947,818 | |
RLI Corp.(a) | | | 62,764 | | | | 5,650,015 | |
Safety Insurance Group, Inc. | | | 23,051 | | | | 2,132,909 | |
Selective Insurance Group, Inc. | | | 92,189 | | | | 6,009,801 | |
State Auto Financial Corp. | | | 32,234 | | | | 999,899 | |
Stewart Information Services Corp. | | | 32,704 | | | | 1,333,996 | |
United Fire Group, Inc. | | | 36,617 | | | | 1,601,261 | |
United Insurance Holdings Corp. | | | 32,883 | | | | 414,655 | |
Universal Insurance Holdings, Inc. | | | 47,725 | | | | 1,335,823 | |
| | | | | | | | |
| | | | 68,377,983 | |
|
| International Trade & Diversified Logistic — 0.1% | |
CryoPort, Inc.(a)(b) | | | 48,814 | | | | 803,478 | |
Radiant Logistics, Inc.(b) | | | 58,889 | | | | 328,012 | |
Vectrus, Inc.(a)(b) | | | 17,572 | | | | 900,741 | |
| | | | | | | | |
| | | | 2,032,231 | |
|
| Internet Software & Services — 0.1% | |
ChannelAdvisor Corp.(b) | | | 40,154 | | | | 362,992 | |
eGain Corp.(b) | | | 30,794 | | | | 243,889 | |
Gogo, Inc.(b) | | | 85,100 | | | | 544,640 | |
Quotient Technology, Inc.(b) | | | 116,148 | | | | 1,145,219 | |
TrueCar, Inc.(b) | | | 160,468 | | | | 762,223 | |
| | | | | | | | |
| | | | 3,058,963 | |
|
| Leisure Time — 1.0% | |
Acushnet Holdings Corp. | | | 55,041 | | | | 1,788,832 | |
American Outdoor Brands Corp.(b) | | | 83,937 | | | | 778,935 | |
Bluegreen Vacations Corp. | | | 8,128 | | | | 84,043 | |
Callaway Golf Co. | | | 144,349 | | | | 3,060,199 | |
Churchill Downs, Inc. | | | 54,279 | | | | 7,447,079 | |
Clarus Corp.(a) | | | 31,194 | | | | 422,991 | |
Drive Shack, Inc.(a)(b) | | | 94,139 | | | | 344,549 | |
Escalade, Inc. | | | 15,982 | | | | 157,103 | |
Johnson Outdoors, Inc., Class A | | | 7,607 | | | | 583,457 | |
Liberty TripAdvisor Holdings, Inc., Series A(a)(b) | | | 112,406 | | | | 826,184 | |
Lindblad Expeditions Holdings, Inc.(b) | | | 36,078 | | | | 589,875 | |
Marriott Vacations Worldwide Corp. | | | 65,456 | | | | 8,428,115 | |
OneSpaWorld Holdings Ltd.(b) | | | 71,210 | | | | 1,199,176 | |
RCI Hospitality Holdings, Inc. | | | 13,880 | | | | 284,540 | |
SeaWorld Entertainment, Inc.(b) | | | 72,835 | | | | 2,309,598 | |
Sturm Ruger & Co., Inc. | | | 25,943 | | | | 1,220,099 | |
Vista Outdoor, Inc.(b) | | | 89,570 | | | | 669,984 | |
YETI Holdings, Inc.(b) | | | 63,087 | | | | 2,194,166 | |
| | | | | | | | |
| | | | 32,388,925 | |
|
| Life Sciences Tools & Services — 0.0% | |
WaVe Life Sciences Ltd.(b) | | | 34,891 | | | | 279,651 | |
| | | | | | | | |
|
| Luxury Items — 0.1% | |
Movado Group, Inc. | | | 24,267 | | | | 527,565 | |
Signet Jewelers Ltd. | | | 80,223 | | | | 1,744,048 | |
| | | | | | | | |
| | | | 2,271,613 | |
| | |
| 58 | | 2019 BLACKROCK ANNUAL REPORTTO SHAREHOLDERS |
| | |
Schedule of Investments (continued) December 31, 2019 | | Master Small Cap Index Series (Percentages shown are based on Net Assets) |
| | | | | | | | |
| Security | | Shares | | | Value | |
|
| Machinery: Agricultural — 0.1% | |
Alamo Group, Inc.(a) | | | 15,390 | | | $ | 1,932,214 | |
Lindsay Corp. | | | 16,585 | | | | 1,591,994 | |
Titan International, Inc. | | | 74,416 | | | | 269,386 | |
Titan Machinery, Inc.(a)(b) | | | 29,102 | | | | 430,128 | |
| | | | | | | | |
| | | | 4,223,722 | |
|
| Machinery: Construction & Handling — 0.2% | |
Astec Industries, Inc.(a) | | | 34,235 | | | | 1,437,870 | |
Douglas Dynamics, Inc. | | | 34,590 | | | | 1,902,450 | |
Manitowoc Co., Inc.(a)(b) | | | 53,461 | | | | 935,568 | |
NACCO Industries, Inc., Class A | | | 5,686 | | | | 266,275 | |
Terex Corp. | | | 97,868 | | | | 2,914,509 | |
| | | | | | | | |
| | | | 7,456,672 | |
|
| Machinery: Engines — 0.0% | |
Briggs & Stratton Corp. | | | 61,862 | | | | 412,001 | |
| | | | | | | | |
|
| Machinery: Industrial — 1.5% | |
Actuant Corp., Class A | | | 85,407 | | | | 2,223,144 | |
Altra Industrial Motion Corp. | | | 100,351 | | | | 3,633,710 | |
Applied Industrial Technologies, Inc. | | | 59,226 | | | | 3,949,782 | |
Chart Industries, Inc.(a)(b) | | | 55,625 | | | | 3,754,131 | |
Columbus McKinnon Corp. | | | 35,225 | | | | 1,410,057 | |
DXP Enterprises, Inc.(b) | | | 25,016 | | | | 995,887 | |
EnPro Industries, Inc. | | | 31,771 | | | | 2,124,845 | |
EVI Industries, Inc.(a) | | | 6,784 | | | | 183,439 | |
Gencor Industries, Inc.(b) | | | 12,664 | | | | 147,789 | |
Graham Corp. | | | 14,327 | | | | 313,475 | |
Hyster-Yale Materials Handling, Inc. | | | 15,426 | | | | 909,517 | |
John Bean Technologies Corp.(a) | | | 48,496 | | | | 5,463,559 | |
Kadant, Inc. | | | 16,642 | | | | 1,753,068 | |
Kennametal, Inc. | | | 126,832 | | | | 4,678,833 | |
Mayville Engineering Co., Inc.(b) | | | 9,414 | | | | 88,303 | |
MTS Systems Corp. | | | 27,373 | | | | 1,314,725 | |
Omega Flex, Inc. | | | 4,454 | | | | 477,870 | |
Proto Labs, Inc.(b) | | | 41,966 | | | | 4,261,647 | |
SPX Corp.(b) | | | 68,239 | | | | 3,472,000 | |
SPX FLOW, Inc.(b) | | | 64,674 | | | | 3,160,619 | |
Tennant Co. | | | 27,581 | | | | 2,149,112 | |
Twin Disc, Inc.(b) | | | 14,509 | | | | 159,889 | |
Welbilt, Inc.(a)(b) | | | 202,984 | | | | 3,168,580 | |
| | | | | | | | |
| | | | 49,793,981 | |
|
| Machinery: Specialty — 0.1% | |
Albany International Corp., Class A | | | 47,508 | | | | 3,606,808 | |
Hurco Cos., Inc. | | | 9,295 | | | | 356,556 | |
| | | | | | | | |
| | | | 3,963,364 | |
|
| Manufactured Housing — 0.2% | |
Cavco Industries, Inc.(b) | | | 13,437 | | | | 2,625,321 | |
Skyline Champion Corp.(b) | | | 77,726 | | | | 2,463,914 | |
| | | | | | | | |
| | | | 5,089,235 | |
|
| Medical & Dental Instruments & Supplies — 2.1% | |
Alphatec Holdings, Inc.(a)(b) | | | 59,217 | | | | 420,145 | |
American Renal Associates Holdings, Inc.(a)(b) | | | 27,388 | | | | 284,014 | |
AngioDynamics, Inc.(b) | | | 56,174 | | | | 899,346 | |
Anika Therapeutics, Inc.(b) | | | 20,816 | | | | 1,079,310 | |
Antares Pharma, Inc.(b) | | | 251,012 | | | | 1,179,756 | |
Apyx Medical Corp.(a)(b) | | | 51,661 | | | | 437,052 | |
AtriCure, Inc.(b) | | | 65,195 | | | | 2,119,489 | |
Atrion Corp. | | | 2,221 | | | | 1,669,082 | |
Avanos Medical, Inc.(a)(b) | | | 73,047 | | | | 2,461,684 | |
Axogen, Inc.(a)(b) | | | 52,630 | | | | 941,551 | |
BioLife Solutions, Inc.(b) | | | 10,419 | | | | 168,579 | |
Cardiovascular Systems, Inc.(b) | | | 56,975 | | | | 2,768,415 | |
Cerus Corp.(a)(b) | | | 213,420 | | | | 900,632 | |
| | | | | | | | |
| Security | | Shares | | | Value | |
|
| Medical & Dental Instruments & Supplies (continued) | |
Community Health Systems, Inc.(a)(b) | | | 132,822 | | | $ | 385,184 | |
CONMED Corp. | | | 42,071 | | | | 4,704,800 | |
CryoLife, Inc.(a)(b) | | | 56,280 | | | | 1,524,625 | |
Cutera, Inc.(b) | | | 21,533 | | | | 771,097 | |
Intersect ENT, Inc.(b) | | | 47,561 | | | | 1,184,269 | |
Invacare Corp. | | | 51,819 | | | | 467,407 | |
LeMaitre Vascular, Inc.(a) | | | 25,152 | | | | 904,214 | |
LivaNova PLC(b) | | | 74,985 | | | | 5,656,119 | |
Meridian Bioscience, Inc. | | | 64,740 | | | | 632,510 | |
Merit Medical Systems, Inc.(b) | | | 83,623 | | | | 2,610,710 | |
NanoString Technologies, Inc.(a)(b) | | | 51,897 | | | | 1,443,775 | |
Neogen Corp.(b) | | | 79,172 | | | | 5,166,765 | |
NuVasive, Inc.(a)(b) | | | 80,194 | | | | 6,202,204 | |
Ocular Therapeutix, Inc.(a)(b) | | | 63,112 | | | | 249,292 | |
OraSure Technologies, Inc.(a)(b) | | | 93,935 | | | | 754,298 | |
Organogenesis Holdings, Inc.(b) | | | 15,729 | | | | 75,657 | |
Orthofix Medical, Inc.(b) | | | 28,047 | | | | 1,295,210 | |
OrthoPediatrics Corp.(a)(b) | | | 13,797 | | | | 648,321 | |
Owens & Minor, Inc.(a) | | | 94,976 | | | | 491,026 | |
Patterson Cos., Inc. | | | 137,592 | | | | 2,817,884 | |
Quidel Corp.(a)(b) | | | 54,673 | | | | 4,102,115 | |
SeaSpine Holdings Corp.(b) | | | 24,204 | | | | 290,690 | |
Senseonics Holdings, Inc.(a)(b) | | | 189,093 | | | | 173,209 | |
Sientra, Inc.(b) | | | 59,637 | | | | 533,155 | |
STAAR Surgical Co.(a)(b) | | | 69,193 | | | | 2,433,518 | |
Surmodics, Inc.(b) | | | 20,323 | | | | 841,982 | |
TransEnterix, Inc.(a)(b) | | | 21,383 | | | | 31,433 | |
TransMedics Group, Inc.(b) | | | 25,739 | | | | 489,298 | |
Utah Medical Products, Inc. | | | 5,347 | | | | 576,941 | |
ViewRay, Inc.(a)(b) | | | 108,319 | | | | 457,106 | |
Wright Medical Group NV(a)(b) | | | 194,860 | | | | 5,939,333 | |
| | | | | | | | |
| | | | 69,183,202 | |
|
| Medical Equipment — 1.3% | |
Accuray, Inc.(a)(b) | | | 132,000 | | | | 372,240 | |
BioSig Technologies, Inc.(a)(b) | | | 24,204 | | | | 143,288 | |
CareDx, Inc.(a)(b) | | | 63,929 | | | | 1,378,949 | |
ConforMIS, Inc.(a)(b) | | | 100,669 | | | | 151,004 | |
ElectroCore, Inc.(a)(b) | | | 17,217 | | | | 27,375 | |
Fluidigm Corp.(a)(b) | | | 105,384 | | | | 366,736 | |
Glaukos Corp.(a)(b) | | | 60,075 | | | | 3,272,285 | |
Haemonetics Corp.(b) | | | 80,256 | | | | 9,221,414 | |
Inspire Medical Systems, Inc.(a)(b) | | | 20,714 | | | | 1,537,186 | |
IntriCon Corp.(b) | | | 12,590 | | | | 226,620 | |
iRadimed Corp.(a)(b) | | | 6,885 | | | | 160,971 | |
iRhythm Technologies, Inc.(a)(b) | | | 43,855 | | | | 2,986,087 | |
Lantheus Holdings, Inc.(a)(b) | | | 59,269 | | | | 1,215,607 | |
Luminex Corp. | | | 64,914 | | | | 1,503,408 | |
Misonix, Inc.(a)(b) | | | 11,339 | | | | 211,019 | |
Natus Medical, Inc.(b) | | | 52,446 | | | | 1,730,194 | |
Neuronetics, Inc.(b) | | | 20,360 | | | | 91,416 | |
Nevro Corp.(a)(b) | | | 46,186 | | | | 5,428,702 | |
Quanterix Corp.(a)(b) | | | 19,788 | | | | 467,590 | |
Shockwave Medical, Inc.(b) | | | 40,283 | | | | 1,769,229 | |
SI-BONE, Inc.(b) | | | 24,595 | | | | 528,793 | |
Silk Road Medical, Inc.(a)(b) | | | 27,068 | | | | 1,093,006 | |
Soliton, Inc.(a)(b) | | | 7,988 | | | | 87,708 | |
Tactile Systems Technology, Inc.(a)(b) | | | 28,207 | | | | 1,904,255 | |
Tandem Diabetes Care, Inc.(a)(b) | | | 86,568 | | | | 5,160,318 | |
Vapotherm, Inc.(a)(b) | | | 22,498 | | | | 273,576 | |
Varex Imaging Corp.(a)(b) | | | 58,258 | | | | 1,736,671 | |
Zynex, Inc.(a)(b) | | | 24,287 | | | | 191,139 | |
| | | | | | | | |
| | | | 43,236,786 | |
| | | | |
| SCHEDULE OF INVESTMENTS | | | 59 | |
| | |
Schedule of Investments (continued) December 31, 2019 | | Master Small Cap Index Series (Percentages shown are based on Net Assets) |
| | | | | | | | |
| Security | | Shares | | | Value | |
|
| Metal Fabricating — 0.8% | |
Advanced Drainage Systems, Inc.(a) | | | 72,496 | | | $ | 2,815,745 | |
Compx International, Inc. | | | 2,464 | | | | 35,950 | |
DMC Global, Inc. | | | 21,869 | | | | 982,793 | |
Eastern Co. | | | 8,070 | | | | 246,377 | |
Haynes International, Inc. | | | 18,551 | | | | 663,755 | |
Lawson Products, Inc.(b) | | | 6,505 | | | | 338,911 | |
LB Foster Co., Class A(b) | | | 14,942 | | | | 289,576 | |
MRC Global, Inc.(b) | | | 122,377 | | | | 1,669,222 | |
Mueller Industries, Inc. | | | 85,659 | | | | 2,719,673 | |
Mueller Water Products, Inc., Class A | | | 241,273 | | | | 2,890,451 | |
NN, Inc. | | | 64,226 | | | | 594,090 | |
Northwest Pipe Co.(b) | | | 14,669 | | | | 488,624 | |
RBC Bearings, Inc.(a)(b) | | | 37,701 | | | | 5,969,576 | |
Rexnord Corp.(b) | | | 162,611 | | | | 5,304,371 | |
Worthington Industries, Inc. | | | 59,722 | | | | 2,519,074 | |
| | | | | | | | |
| | | | 27,528,188 | |
|
| Metals & Minerals: Diversified — 0.6% | |
Cleveland-Cliffs, Inc. | | | 415,108 | | | | 3,486,907 | |
Commercial Metals Co. | | | 184,320 | | | | 4,104,807 | |
Compass Minerals International, Inc. | | | 52,692 | | | | 3,212,104 | |
Energy Fuels, Inc.(a)(b) | | | 140,175 | | | | 267,734 | |
Ferroglobe PLC(c) | | | 42,394 | | | | 1 | |
Hecla Mining Co.(a) | | | 799,149 | | | | 2,709,115 | |
Materion Corp. | | | 31,375 | | | | 1,865,244 | |
Minerals Technologies, Inc. | | | 54,402 | | | | 3,135,187 | |
Oil-Dri Corp. of America | | | 8,000 | | | | 290,000 | |
Ring Energy, Inc.(a)(b) | | | 90,112 | | | | 237,896 | |
SunCoke Energy, Inc. | | | 115,600 | | | | 720,188 | |
U.S. Silica Holdings, Inc. | | | 112,356 | | | | 690,989 | |
United States Lime & Minerals, Inc. | | | 3,036 | | | | 274,151 | |
| | | | | | | | |
| | | | 20,994,323 | |
|
| Miscellaneous Consumer Staples — 0.0% | |
cbdMD, Inc.(a)(b) | | | 14,089 | | | | 31,841 | |
| | | | | | | | |
|
| Office Supplies & Equipment — 0.4% | |
ACCO Brands Corp. | | | 149,533 | | | | 1,399,629 | |
Herman Miller, Inc. | | | 91,750 | | | | 3,821,387 | |
HNI Corp. | | | 66,163 | | | | 2,478,466 | |
Kimball International, Inc., Class B | | | 55,437 | | | | 1,145,883 | |
Knoll, Inc. | | | 75,633 | | | | 1,910,489 | |
Pitney Bowes, Inc. | | | 234,090 | | | | 943,383 | |
Steelcase, Inc., Class A | | | 136,258 | | | | 2,787,839 | |
| | | | | | | | |
| | | | 14,487,076 | |
|
| Offshore Drilling & Other Services — 0.1% | |
Diamond Offshore Drilling, Inc.(a)(b) | | | 99,970 | | | | 718,784 | |
Noble Corp. PLC(a)(b) | | | 383,683 | | | | 468,093 | |
Pacific Drilling SA(b) | | | 44,926 | | | | 183,298 | |
SEACOR Marine Holdings, Inc.(b) | | | 28,977 | | | | 399,593 | |
| | | | | | | | |
| | | | 1,769,768 | |
|
| Oil Well Equipment & Services — 0.8% | |
Cactus, Inc., Class A | | | 72,917 | | | | 2,502,511 | |
Covia Holdings Corp.(a)(b) | | | 62,110 | | | | 126,704 | |
Dril-Quip, Inc.(a)(b) | | | 56,669 | | | | 2,658,343 | |
Flotek Industries, Inc.(a)(b) | | | 83,384 | | | | 166,768 | |
Forum Energy Technologies, Inc.(b) | | | 123,556 | | | | 207,574 | |
Frank’s International NV(a)(b) | | | 164,555 | | | | 850,749 | |
FTS International, Inc.(b) | | | 48,704 | | | | 50,652 | |
Helix Energy Solutions Group, Inc.(b) | | | 220,314 | | | | 2,121,624 | |
Independence Contract Drilling, Inc.(a)(b) | | | 65,413 | | | | 65,204 | |
KLX Energy Services Holdings, Inc.(b) | | | 31,321 | | | | 201,707 | |
Liberty Oilfield Services, Inc., Class A | | | 81,935 | | | | 911,117 | |
Mammoth Energy Services, Inc. | | | 18,588 | | | | 40,894 | |
Matrix Service Co.(b) | | | 41,056 | | | | 939,361 | |
| | | | | | | | |
| Security | | Shares | | | Value | |
|
| Oil Well Equipment & Services (continued) | |
McDermott International, Inc.(a)(b) | | | 276,717 | | | $ | 187,227 | |
Nabors Industries Ltd. | | | 547,273 | | | | 1,576,146 | |
National Energy Services Reunited Corp.(a)(b) | | | 35,797 | | | | 326,469 | |
Natural Gas Services Group, Inc.(b) | | | 18,775 | | | | 230,182 | |
NCS Multistage Holdings, Inc.(a)(b) | | | 14,363 | | | | 30,162 | |
Newpark Resources, Inc.(a)(b) | | | 137,755 | | | | 863,724 | |
NexTier Oilfield Solutions Inc.(b) | | | 246,861 | | | | 1,653,969 | |
Nine Energy Service, Inc.(a)(b) | | | 23,730 | | | | 185,569 | |
Oceaneering International, Inc.(a)(b) | | | 153,783 | | | | 2,292,905 | |
Oil States International, Inc.(a)(b) | | | 92,697 | | | | 1,511,888 | |
Parker Drilling Co.(b) | | | 14,333 | | | | 322,492 | |
ProPetro Holding Corp.(a)(b) | | | 123,974 | | | | 1,394,707 | |
RigNet, Inc.(a)(b) | | | 21,835 | | | | 144,111 | |
RPC, Inc. | | | 89,434 | | | | 468,634 | |
SEACOR Holdings, Inc.(b) | | | 28,131 | | | | 1,213,853 | |
Seadrill Ltd.(a)(b) | | | 87,528 | | | | 222,321 | |
Select Energy Services, Inc., Class A(b) | | | 91,045 | | | | 844,898 | |
Smart Sand, Inc.(b) | | | 31,470 | | | | 79,304 | |
Solaris Oilfield Infrastructure, Inc., Class A | | | 47,798 | | | | 669,172 | |
TETRA Technologies, Inc.(a)(b) | | | 185,359 | | | | 363,304 | |
U.S Well Services, Inc.(b) | | | 29,965 | | | | 56,634 | |
| | | | | | | | |
| | | | 25,480,879 | |
|
| Oil, Gas & Consumable Fuels — 0.2% | |
Archrock, Inc. | | | 197,824 | | | | 1,986,153 | |
Ardmore Shipping Corp.(b) | | | 50,603 | | | | 457,957 | |
DHT Holdings, Inc. | | | 162,505 | | | | 1,345,541 | |
Dorian LPG Ltd.(b) | | | 42,071 | | | | 651,259 | |
Exterran Corp.(b) | | | 46,837 | | | | 366,734 | |
Plug Power, Inc.(a)(b) | | | 364,519 | | | | 1,151,880 | |
| | | | | | | | |
| | | | 5,959,524 | |
|
| Oil: Crude Producers — 1.3% | |
Abraxas Petroleum Corp.(a)(b) | | | 239,135 | | | | 83,960 | |
Amplify Energy Corp. | | | 20,050 | | | | 132,531 | |
Berry Petroleum Corp. | | | 97,138 | | | | 916,011 | |
Bonanza Creek Energy, Inc.(b) | | | 28,935 | | | | 675,343 | |
Brigham Minerals, Inc., Class A | | | 24,179 | | | | 518,398 | |
California Resources Corp.(a)(b) | | | 74,674 | | | | 674,306 | |
Callon Petroleum Co.(b) | | | 590,867 | | | | 2,853,888 | |
Chaparral Energy, Inc., Class A(b) | | | 46,381 | | | | 81,631 | |
CNX Resources Corp.(b) | | | 287,919 | | | | 2,548,083 | |
Comstock Resources, Inc.(a)(b) | | | 22,489 | | | | 185,084 | |
CVR Energy, Inc. | | | 45,290 | | | | 1,831,075 | |
Denbury Resources, Inc.(b) | | | 774,423 | | | | 1,091,936 | |
Earthstone Energy, Inc., Class A(b) | | | 32,802 | | | | 207,637 | |
Evolution Petroleum Corp. | | | 40,577 | | | | 221,956 | |
Extraction Oil & Gas, Inc.(a)(b) | | | 128,206 | | | | 271,797 | |
Falcon Minerals Corp. | | | 58,877 | | | | 415,672 | |
Goodrich Petroleum Corp.(a)(b) | | | 11,977 | | | | 120,249 | |
Gulfport Energy Corp.(b) | | | 246,641 | | | | 749,789 | |
HighPoint Resources Corp.(a)(b) | | | 171,738 | | | | 290,237 | |
Jagged Peak Energy, Inc.(a)(b) | | | 98,180 | | | | 833,548 | |
Laredo Petroleum, Inc.(b) | | | 276,805 | | | | 794,430 | |
Magnolia Oil & Gas Corp., Class A(a)(b) | | | 155,138 | | | | 1,951,636 | |
Montage Resources Corp.(b) | | | 31,941 | | | | 253,612 | |
Northern Oil and Gas, Inc.(b) | | | 469,585 | | | | 1,098,829 | |
Oasis Petroleum, Inc.(a)(b) | | | 492,662 | | | | 1,606,078 | |
ONE Gas, Inc. | | | 80,699 | | | | 7,551,005 | |
Overseas Shipholding Group, Inc., Class A(a)(b) | | | 96,610 | | | | 222,203 | |
Panhandle Oil and Gas, Inc., Class A | | | 23,154 | | | | 259,556 | |
PDC Energy, Inc.(b) | | | 97,838 | | | | 2,560,420 | |
Penn Virginia Corp.(a)(b) | | | 20,540 | | | | 623,389 | |
PrimeEnergy Resources Corp.(a)(b) | | | 776 | | | | 117,378 | |
QEP Resources, Inc. | | | 369,883 | | | | 1,664,473 | |
| | |
| 60 | | 2019 BLACKROCK ANNUAL REPORTTO SHAREHOLDERS |
| | |
Schedule of Investments (continued) December 31, 2019 | | Master Small Cap Index Series (Percentages shown are based on Net Assets) |
| | | | | | | | |
| Security | | Shares | | | Value | |
|
| Oil: Crude Producers (continued) | |
Rosehill Resources, Inc.(b) | | | 15,579 | | | $ | 19,941 | |
SandRidge Energy, Inc.(a)(b) | | | 45,940 | | | | 194,786 | |
SilverBow Resources, Inc.(b) | | | 9,744 | | | | 96,466 | |
SM Energy Co. | | | 173,186 | | | | 1,946,611 | |
Southwestern Energy Co.(a)(b) | | | 840,771 | | | | 2,034,666 | |
SRC Energy, Inc.(b) | | | 375,074 | | | | 1,545,305 | |
Talos Energy, Inc.(a)(b) | | | 30,758 | | | | 927,354 | |
Tellurian, Inc.(a)(b) | | | 146,501 | | | | 1,066,527 | |
Unit Corp.(b) | | | 80,214 | | | | 55,797 | |
W&T Offshore, Inc.(b) | | | 145,215 | | | | 807,395 | |
Whiting Petroleum Corp.(a)(b) | | | 140,975 | | | | 1,034,756 | |
| | | | | | | | |
| | | | 43,135,744 | |
|
| Oil: Refining & Marketing — 0.4% | |
Clean Energy Fuels Corp.(b) | | | 203,985 | | | | 477,325 | |
Delek US Holdings, Inc. | | | 116,239 | | | | 3,897,494 | |
Par Pacific Holdings, Inc.(b) | | | 54,696 | | | | 1,271,135 | |
Renewable Energy Group, Inc.(a)(b) | | | 57,065 | | | | 1,537,902 | |
Trecora Resources(b) | | | 31,866 | | | | 227,842 | |
World Fuel Services Corp. | | | 99,630 | | | | 4,325,934 | |
| | | | | | | | |
| | | | 11,737,632 | |
|
| Paints & Coatings — 0.2% | |
Chase Corp. | | | 11,300 | | | | 1,338,824 | |
Ferro Corp.(b) | | | 125,239 | | | | 1,857,294 | |
HB Fuller Co. | | | 79,250 | | | | 4,086,923 | |
Kronos Worldwide, Inc. | | | 34,088 | | | | 456,779 | |
| | | | | | | | |
| | | | 7,739,820 | |
|
| Paper — 0.2% | |
Clearwater Paper Corp.(b) | | | 24,521 | | | | 523,769 | |
Neenah, Inc. | | | 25,838 | | | | 1,819,770 | |
PH Glatfelter Co. | | | 67,223 | | | | 1,230,181 | |
Schweitzer-Mauduit International, Inc. | | | 47,882 | | | | 2,010,565 | |
Verso Corp., Class A(a)(b) | | | 54,188 | | | | 977,010 | |
| | | | | | | | |
| | | | 6,561,295 | |
|
| Personal Care — 0.3% | |
Edgewell Personal Care Co.(b) | | | 83,486 | | | | 2,584,727 | |
Lifevantage Corp.(a)(b) | | | 20,864 | | | | 325,687 | |
USANA Health Sciences, Inc.(a)(b) | | | 20,008 | | | | 1,571,628 | |
WD-40 Co. | | | 21,387 | | | | 4,152,072 | |
| | | | | | | | |
| | | | 8,634,114 | |
|
| Pharmaceuticals — 3.0% | |
Abeona Therapeutics, Inc.(a)(b) | | | 48,057 | | | | 157,146 | |
ACADIA Pharmaceuticals, Inc.(a)(b) | | | 175,512 | | | | 7,508,403 | |
AcelRx Pharmaceuticals, Inc.(a)(b) | | | 118,774 | | | | 250,613 | |
Achillion Pharmaceuticals, Inc.(a)(b) | | | 212,292 | | | | 1,280,121 | |
Aclaris Therapeutics, Inc.(b) | | | 46,762 | | | | 88,380 | |
Adamas Pharmaceuticals, Inc.(b) | | | 33,709 | | | | 127,757 | |
Aerie Pharmaceuticals, Inc.(a)(b) | | | 65,357 | | | | 1,579,679 | |
Akorn, Inc.(b) | | | 144,384 | | | | 216,576 | |
Amneal Pharmaceuticals, Inc.(a)(b) | | | 203,659 | | | | 981,636 | |
Amphastar Pharmaceuticals, Inc.(b) | | | 55,773 | | | | 1,075,861 | |
Arrowhead Pharmaceuticals, Inc.(b) | | | 145,658 | | | | 9,239,087 | |
Assertio Therapeutics, Inc.(b) | | | 96,285 | | | | 120,356 | |
Axonics Modulation Technologies, Inc.(b) | | | 24,040 | | | | 666,148 | |
Axsome Therapeutics, Inc.(b) | | | 39,109 | | | | 4,042,306 | |
Biospecifics Technologies Corp.(a)(b) | | | 9,292 | | | | 529,087 | |
Cerecor, Inc.(b) | | | 32,033 | | | | 172,658 | |
Chimerix, Inc.(b) | | | 75,882 | | | | 154,041 | |
ChromaDex Corp.(b) | | | 59,595 | | | | 256,855 | |
Concert Pharmaceuticals, Inc.(b) | | | 32,884 | | | | 303,355 | |
Corcept Therapeutics, Inc.(a)(b) | | | 148,956 | | | | 1,802,368 | |
Corium International, Inc.(a)(c) | | | 34,301 | | | | 6,174 | |
CorMedix, Inc.(a)(b) | | | 35,679 | | | | 259,743 | |
| | | | | | | | |
| Security | | Shares | | | Value | |
|
| Pharmaceuticals (continued) | |
Dicerna Pharmaceuticals, Inc.(a)(b) | | | 80,443 | | | $ | 1,772,159 | |
Eagle Pharmaceuticals, Inc.(a)(b) | | | 13,925 | | | | 836,614 | |
Eloxx Pharmaceuticals, Inc.(a)(b) | | | 37,597 | | | | 276,714 | |
Enanta Pharmaceuticals, Inc.(a)(b) | | | 26,425 | | | | 1,632,537 | |
Endo International PLC(a)(b) | | | 349,313 | | | | 1,638,278 | |
Esperion Therapeutics, Inc.(a)(b) | | | 41,435 | | | | 2,470,769 | |
Evolus, Inc.(a)(b) | | | 35,087 | | | | 427,009 | |
Galectin Therapeutics, Inc.(a)(b) | | | 71,645 | | | | 204,905 | |
Heska Corp.(a)(b) | | | 10,726 | | | | 1,029,052 | |
Innoviva, Inc.(a)(b) | | | 98,240 | | | | 1,391,078 | |
Intra-Cellular Therapies, Inc.(b) | | | 68,666 | | | | 2,355,931 | |
Ironwood Pharmaceuticals, Inc.(a)(b) | | | 238,124 | | | | 3,169,430 | |
La Jolla Pharmaceutical Co.(b) | | | 31,028 | | | | 121,940 | |
Lannett Co., Inc.(a)(b) | | | 48,894 | | | | 431,245 | |
Liquidia Technologies, Inc.(b) | | | 20,040 | | | | 85,671 | |
Mallinckrodt PLC(a)(b) | | | 127,473 | | | | 444,881 | |
Medicines Co.(b) | | | 117,851 | | | | 10,010,264 | |
MEI Pharma, Inc.(b) | | | 101,748 | | | | 252,335 | |
MyoKardia, Inc.(a)(b) | | | 70,731 | | | | 5,155,229 | |
Omthera Pharmaceuticals, Inc.(c) | | | 1,326 | | | | — | |
Optinose, Inc.(a)(b) | | | 38,200 | | | | 352,204 | |
Osmotica Pharmaceuticals PLC(a)(b) | | | 12,318 | | | | 86,103 | |
Pacira BioSciences, Inc.(a)(b) | | | 66,864 | | | | 3,028,939 | |
Paratek Pharmaceuticals, Inc.(b) | | | 47,099 | | | | 189,809 | |
PetIQ, Inc.(b) | | | 29,959 | | | | 750,473 | |
Portola Pharmaceuticals, Inc.(a)(b) | | | 123,608 | | | | 2,951,759 | |
Prestige Consumer Healthcare, Inc.(a)(b) | | | 85,366 | | | | 3,457,323 | |
Radius Health, Inc.(a)(b) | | | 69,939 | | | | 1,409,970 | |
Reata Pharmaceuticals, Inc., Class A(a)(b) | | | 34,884 | | | | 7,131,336 | |
Revance Therapeutics, Inc.(a)(b) | | | 79,761 | | | | 1,294,521 | |
SIGA Technologies, Inc.(a)(b) | | | 85,261 | | | | 406,695 | |
Spectrum Pharmaceuticals, Inc.(b) | | | 172,313 | | | | 627,219 | |
Supernus Pharmaceuticals, Inc.(b) | | | 76,132 | | | | 1,805,851 | |
Syndax Pharmaceuticals, Inc.(a)(b) | | | 30,439 | | | | 267,254 | |
TG Therapeutics, Inc.(b) | | | 138,682 | | | | 1,539,370 | |
TherapeuticsMD, Inc.(a)(b) | | | 378,284 | | | | 915,447 | |
Theravance Biopharma, Inc.(a)(b) | | | 68,434 | | | | 1,771,756 | |
Ultragenyx Pharmaceutical, Inc.(a)(b) | | | 84,381 | | | | 3,603,913 | |
Voyager Therapeutics, Inc.(a)(b) | | | 37,289 | | | | 520,182 | |
Zogenix, Inc.(b) | | | 65,866 | | | | 3,433,595 | |
Zynerba Pharmaceuticals, Inc.(a)(b) | | | 35,338 | | | | 213,442 | |
| | | | | | | | |
| | | | 100,281,552 | |
|
| Photography — 0.0% | |
GoPro, Inc., Class A(a)(b) | | | 202,386 | | | | 878,355 | |
| | | | | | | | |
|
| Plastics — 0.1% | |
Trinseo SA | | | 68,331 | | | | 2,542,597 | |
| | | | | | | | |
|
| Power Transmission Equipment — 0.5% | |
Advanced Energy Industries, Inc.(a)(b) | | | 58,789 | | | | 4,185,777 | |
Generac Holdings, Inc.(b) | | | 96,697 | | | | 9,726,751 | |
Powell Industries, Inc. | | | 13,627 | | | | 667,587 | |
Vicor Corp.(a)(b) | | | 27,560 | | | | 1,287,603 | |
| | | | | | | | |
| | | | 15,867,718 | |
|
| Printing & Copying Services — 0.2% | |
Casella Waste Systems, Inc., Class A(b) | | | 72,044 | | | | 3,316,186 | |
Cimpress PLC(a)(b) | | | 31,408 | | | | 3,950,184 | |
| | | | | | | | |
| | | | 7,266,370 | |
|
| Producer Durables: Miscellaneous — 0.1% | |
Advanced Disposal Services, Inc.(b) | | | 113,031 | | | | 3,715,329 | |
Park-Ohio Holdings Corp. | | | 12,970 | | | | 436,440 | |
| | | | | | | | |
| | | | 4,151,769 | |
| | | | |
| SCHEDULE OF INVESTMENTS | | | 61 | |
| | |
Schedule of Investments (continued) December 31, 2019 | | Master Small Cap Index Series (Percentages shown are based on Net Assets) |
| | | | | | | | |
| Security | | Shares | | | Value | |
|
| Production Technology Equipment — 0.5% | |
Axcelis Technologies, Inc.(a)(b) | | | 49,920 | | | $ | 1,202,822 | |
Brooks Automation, Inc.(a) | | | 109,609 | | | | 4,599,194 | |
Cohu, Inc. | | | 62,156 | | | | 1,420,264 | |
Ichor Holdings Ltd.(b) | | | 34,113 | | | | 1,134,939 | |
Onto Innovation, Inc.(a)(b) | | | 74,846 | | | | 2,734,873 | |
Photronics, Inc.(b) | | | 99,012 | | | | 1,560,429 | |
Ultra Clean Holdings, Inc.(b) | | | 60,778 | | | | 1,426,460 | |
Veeco Instruments, Inc.(a)(b) | | | 74,674 | | | | 1,096,588 | |
Xperi Corp. | | | 76,320 | | | | 1,411,920 | |
| | | | | | | | |
| | | | 16,587,489 | |
|
| Publishing — 0.2% | |
Daily Journal Corp.(a)(b) | | | 1,761 | | | | 511,430 | |
Eros International PLC(a)(b) | | | 111,906 | | | | 379,361 | |
Gannett Co., Inc. | | | 181,816 | | | | 1,159,986 | |
Lee Enterprises, Inc.(b) | | | 79,941 | | | | 113,516 | |
Meredith Corp. | | | 61,476 | | | | 1,996,126 | |
Scholastic Corp. | | | 45,441 | | | | 1,747,207 | |
Tribune Publishing Co. | | | 29,240 | | | | 384,798 | |
| | | | | | | | |
| | | | 6,292,424 | |
|
| Radio & TV Broadcasters — 0.4% | |
Central European Media Enterprises Ltd., Class A(b) | | | 137,660 | | | | 623,600 | |
Cumulus Media, Inc., Class A(a)(b) | | | 22,052 | | | | 387,454 | |
Entercom Communications Corp., Class A | | | 190,229 | | | | 882,663 | |
Entravision Communications Corp., Class A | | | 92,608 | | | | 242,633 | |
Gray Television, Inc.(b) | | | 140,621 | | | | 3,014,914 | |
Liberty Media Corp.-Liberty Braves, Class A(b) | | | 14,633 | | | | 433,868 | |
Liberty Media Corp.-Liberty Braves, Class C(a)(b) | | | 55,084 | | | | 1,627,181 | |
MSG Networks, Inc., Class A(a)(b) | | | 84,209 | | | | 1,465,237 | |
Saga Communications, Inc., Class A | | | 5,672 | | | | 172,429 | |
TEGNA, Inc. | | | 335,799 | | | | 5,604,485 | |
| | | | | | | | |
| | | | 14,454,464 | |
|
| Railroad Equipment — 0.0% | |
Greenbrier Cos., Inc. | | | 49,242 | | | | 1,596,918 | |
| | | | | | | | |
|
| Real Estate — 0.6% | |
Avalon GloboCare Corp.(a)(b) | | | 32,360 | | | | 62,455 | |
Consolidated-Tomoka Land Co.(a) | | | 7,569 | | | | 456,562 | |
Cushman & Wakefield PLC(a)(b) | | | 183,596 | | | | 3,752,702 | |
eXp World Holdings, Inc.(a)(b) | | | 38,516 | | | | 436,386 | |
Griffin Industrial Realty, Inc. | | | 1,381 | | | | 54,619 | |
Kennedy-Wilson Holdings, Inc. | | | 189,503 | | | | 4,225,917 | |
Newmark Group, Inc., Class A | | | 223,183 | | | | 3,002,927 | |
Realogy Holdings Corp. | | | 177,040 | | | | 1,713,747 | |
Redfin Corp.(a)(b) | | | 143,525 | | | | 3,034,118 | |
Retail Value, Inc. | | | 21,849 | | | | 804,043 | |
RMR Group, Inc., Class A | | | 23,309 | | | | 1,063,823 | |
St. Joe Co.(a)(b) | | | 52,449 | | | | 1,040,064 | |
Stratus Properties, Inc.(b) | | | 8,765 | | | | 271,540 | |
Tejon Ranch Co.(a)(b) | | | 32,350 | | | | 516,953 | |
| | | | | | | | |
| | | | 20,435,856 | |
|
| Real Estate Investment Trusts (REITs) — 7.8% | |
Acadia Realty Trust | | | 128,315 | | | | 3,327,208 | |
AG Mortgage Investment Trust, Inc. | | | 49,010 | | | | 755,734 | |
Agree Realty Corp. | | | 63,868 | | | | 4,481,618 | |
Alexander & Baldwin, Inc. | | | 105,975 | | | | 2,221,236 | |
Alexander’s, Inc. | | | 3,265 | | | | 1,078,593 | |
American Assets Trust, Inc. | | | 74,532 | | | | 3,421,019 | |
American Finance Trust, Inc. | | | 167,007 | | | | 2,214,513 | |
Anworth Mortgage Asset Corp. | | | 147,748 | | | | 520,073 | |
Apollo Commercial Real Estate Finance, Inc. | | | 238,322 | | | | 4,358,909 | |
Ares Commercial Real Estate Corp. | | | 41,993 | | | | 665,169 | |
Armada Hoffler Properties, Inc. | | | 87,788 | | | | 1,610,910 | |
ARMOUR Residential REIT, Inc. | | | 90,625 | | | | 1,619,469 | |
| | | | | | | | |
| Security | | Shares | | | Value | |
|
| Real Estate Investment Trusts (REITs) (continued) | |
Ashford Hospitality Trust, Inc. | | | 136,620 | | | $ | 381,170 | |
Blackstone Mortgage Trust, Inc., Class A | | | 195,405 | | | | 7,272,974 | |
Bluerock Residential Growth REIT, Inc. | | | 33,801 | | | | 407,302 | |
Braemar Hotels & Resorts, Inc. | | | 45,314 | | | | 404,654 | |
BRT Apartments Corp. | | | 14,514 | | | | 246,303 | |
Capstead Mortgage Corp. | | | 145,357 | | | | 1,151,227 | |
CareTrust REIT, Inc. | | | 148,713 | | | | 3,067,949 | |
Catchmark Timber Trust, Inc., Class A | | | 74,840 | | | | 858,415 | |
CBL & Associates Properties, Inc. | | | 259,934 | | | | 272,931 | |
Cedar Realty Trust, Inc. | | | 130,138 | | | | 383,907 | |
Chatham Lodging Trust | | | 69,445 | | | | 1,273,621 | |
Cherry Hill Mortgage Investment Corp. | | | 23,578 | | | | 344,003 | |
CIM Commercial Trust Corp. | | | 2,006 | | | | 29,087 | |
City Office REIT, Inc. | | | 87,710 | | | | 1,185,839 | |
Clipper Realty, Inc. | | | 20,582 | | | | 218,169 | |
Colony Credit Real Estate, Inc. | | | 125,377 | | | | 1,649,961 | |
Community Healthcare Trust, Inc. | | | 28,406 | | | | 1,217,481 | |
CoreCivic, Inc. | | | 184,887 | | | | 3,213,336 | |
CorEnergy Infrastructure Trust, Inc. | | | 20,233 | | | | 904,617 | |
DiamondRock Hospitality Co. | | | 311,041 | | | | 3,446,334 | |
Diversified Healthcare Trust | | | 368,672 | | | | 3,111,592 | |
Dynex Capital, Inc. | | | 36,509 | | | | 618,462 | |
Easterly Government Properties, Inc. | | | 121,551 | | | | 2,884,405 | |
EastGroup Properties, Inc. | | | 58,056 | | | | 7,702,290 | |
Ellington Financial, Inc. | | | 48,392 | | | | 887,025 | |
Essential Properties Realty Trust, Inc. | | | 120,876 | | | | 2,998,934 | |
Exantas Capital Corp. | | | 46,332 | | | | 547,181 | |
Farmland Partners, Inc. | | | 40,968 | | | | 277,763 | |
First Industrial Realty Trust, Inc. | | | 194,776 | | | | 8,085,152 | |
Four Corners Property Trust, Inc. | | | 105,737 | | | | 2,980,726 | |
Franklin Street Properties Corp. | | | 158,405 | | | | 1,355,947 | |
Front Yard Residential Corp. | | | 76,575 | | | | 944,936 | |
Geo Group, Inc. | | | 184,802 | | | | 3,069,561 | |
Getty Realty Corp. | | | 51,703 | | | | 1,699,478 | |
Gladstone Commercial Corp. | | | 46,920 | | | | 1,025,671 | |
Gladstone Land Corp. | | | 24,356 | | | | 315,897 | |
Global Medical REIT, Inc. | | | 47,416 | | | | 627,314 | |
Global Net Lease, Inc. | | | 148,518 | | | | 3,011,945 | |
Granite Point Mortgage Trust, Inc. | | | 81,596 | | | | 1,499,734 | |
Great Ajax Corp. | | | 25,638 | | | | 379,699 | |
Healthcare Realty Trust, Inc. | | | 200,626 | | | | 6,694,890 | |
Hersha Hospitality Trust | | | 52,760 | | | | 767,658 | |
Independence Realty Trust, Inc. | | | 145,668 | | | | 2,051,005 | |
Industrial Logistics Properties Trust | | | 100,102 | | | | 2,244,287 | |
Innovative Industrial Properties, Inc.(a) | | | 18,196 | | | | 1,380,531 | |
Invesco Mortgage Capital, Inc. | | | 221,876 | | | | 3,694,235 | |
Investors Real Estate Trust | | | 17,991 | | | | 1,304,347 | |
iStar, Inc. | | | 91,782 | | | | 1,331,757 | |
Jernigan Capital, Inc. | | | 39,963 | | | | 764,892 | |
Kite Realty Group Trust | | | 127,972 | | | | 2,499,293 | |
KKR Real Estate Finance Trust, Inc. | | | 42,248 | | | | 862,704 | |
Lexington Realty Trust | | | 379,887 | | | | 4,034,400 | |
LTC Properties, Inc. | | | 65,976 | | | | 2,953,746 | |
Mack-Cali Realty Corp. | | | 133,783 | | | | 3,094,401 | |
Monmouth Real Estate Investment Corp. | | | 142,703 | | | | 2,066,339 | |
National Health Investors, Inc. | | | 63,734 | | | | 5,193,046 | |
National Storage Affiliates Trust | | | 91,650 | | | | 3,081,273 | |
New Senior Investment Group, Inc. | | | 128,023 | | | | 979,376 | |
New York Mortgage Trust, Inc. | | | 425,651 | | | | 2,651,806 | |
NexPoint Residential Trust, Inc. | | | 31,611 | | | | 1,422,495 | |
Office Properties Income Trust | | | 73,679 | | | | 2,368,043 | |
One Liberty Properties, Inc. | | | 23,662 | | | | 643,370 | |
Orchid Island Capital, Inc. | | | 96,581 | | | | 564,999 | |
Pebblebrook Hotel Trust | | | 200,671 | | | | 5,379,990 | |
| | |
| 62 | | 2019 BLACKROCK ANNUAL REPORTTO SHAREHOLDERS |
| | |
Schedule of Investments (continued) December 31, 2019 | | Master Small Cap Index Series (Percentages shown are based on Net Assets) |
| | | | | | | | |
| Security | | Shares | | | Value | |
|
| Real Estate Investment Trusts (REITs) (continued) | |
Pennsylvania Real Estate Investment Trust(a) | | | 106,394 | | | $ | 567,080 | |
PennyMac Mortgage Investment Trust(f) | | | 134,041 | | | | 2,987,774 | |
Physicians Realty Trust | | | 292,499 | | | | 5,539,931 | |
Piedmont Office Realty Trust, Inc., Class A | | | 195,024 | | | | 4,337,334 | |
PotlatchDeltic Corp. | | | 102,877 | | | | 4,451,488 | |
Preferred Apartment Communities, Inc., Class A | | | 66,475 | | | | 885,447 | |
PS Business Parks, Inc. | | | 31,211 | | | | 5,145,758 | |
QTS Realty Trust, Inc., Class A | | | 90,532 | | | | 4,913,172 | |
Ready Capital Corp. | | | 48,136 | | | | 742,257 | |
Redwood Trust, Inc. | | | 180,954 | | | | 2,992,979 | |
Retail Opportunity Investments Corp. | | | 173,923 | | | | 3,071,480 | |
Rexford Industrial Realty, Inc. | | | 171,393 | | | | 7,827,518 | |
RLJ Lodging Trust | | | 265,953 | | | | 4,712,687 | |
RPT Realty | | | 120,399 | | | | 1,810,801 | |
Sabra Health Care REIT, Inc. | | | 306,904 | | | | 6,549,331 | |
Safehold, Inc.(a) | | | 16,601 | | | | 669,020 | |
Saul Centers, Inc. | | | 18,352 | | | | 968,619 | |
Seritage Growth Properties, Class A | | | 52,081 | | | | 2,087,406 | |
STAG Industrial, Inc. | | | 200,566 | | | | 6,331,869 | |
Summit Hotel Properties, Inc. | | | 158,589 | | | | 1,956,988 | |
Sunstone Hotel Investors, Inc. | | | 346,722 | | | | 4,826,370 | |
Tanger Factory Outlet Centers, Inc.(a) | | | 141,126 | | | | 2,078,786 | |
Terreno Realty Corp. | | | 101,520 | | | | 5,496,293 | |
TPG RE Finance Trust, Inc. | | | 76,557 | | | | 1,551,810 | |
UMH Properties, Inc. | | | 53,999 | | | | 849,404 | |
Uniti Group, Inc. | | | 292,333 | | | | 2,400,054 | |
Universal Health Realty Income Trust | | | 19,802 | | | | 2,323,963 | |
Urban Edge Properties | | | 177,787 | | | | 3,409,955 | |
Urstadt Biddle Properties, Inc., Class A | | | 45,674 | | | | 1,134,542 | |
Washington Prime Group, Inc. | | | 287,799 | | | | 1,047,588 | |
Washington Real Estate Investment Trust | | | 123,889 | | | | 3,615,081 | |
Western Asset Mortgage Capital Corp. | | | 79,393 | | | | 820,130 | |
Whitestone REIT | | | 58,086 | | | | 791,131 | |
Xenia Hotels & Resorts, Inc. | | | 187,127 | | | | 4,043,814 | |
| | | | | | | | |
| | | | 259,194,186 | |
|
| Real Estate Management & Development — 0.1% | |
American Realty Investors, Inc.(b) | | | 3,807 | | | | 65,214 | |
BBX Capital Corp. | | | 62,738 | | | | 299,260 | |
CorePoint Lodging, Inc. | | | 60,840 | | | | 649,771 | |
Forestar Group, Inc.(b) | | | 23,146 | | | | 482,594 | |
Maui Land & Pineapple Co., Inc.(b) | | | 9,778 | | | | 110,003 | |
Rafael Holdings, Inc., Class B(a)(b) | | | 16,361 | | | | 291,880 | |
Transcontinental Realty Investors, Inc.(b) | | | 2,104 | | | | 83,908 | |
| | | | | | | | |
| | | | 1,982,630 | |
|
| Recreational Vehicles & Boats — 0.3% | |
Camping World Holdings, Inc., Class A | | | 50,239 | | | | 740,523 | |
LCI Industries | | | 37,963 | | | | 4,066,976 | |
Malibu Boats, Inc., Class A(b) | | | 32,126 | | | | 1,315,560 | |
Marine Products Corp. | | | 11,193 | | | | 161,179 | |
MasterCraft Boat Holdings, Inc.(b) | | | 28,164 | | | | 443,583 | |
Winnebago Industries, Inc. | | | 48,038 | | | | 2,545,053 | |
| | | | | | | | |
| | | | 9,272,874 | |
|
| Rental & Leasing Services: Consumer — 0.2% | |
Avis Budget Group, Inc.(b) | | | 95,522 | | | | 3,079,629 | |
Hertz Global Holdings, Inc.(a)(b) | | | 156,721 | | | | 2,468,356 | |
Rent-A-Center, Inc. | | | 75,223 | | | | 2,169,431 | |
| | | | | | | | |
| | | | 7,717,416 | |
|
| Restaurants — 1.3% | |
Biglari Holdings, Inc., Class B(b) | | | 1,451 | | | | 166,023 | |
BJ’s Restaurants, Inc. | | | 31,562 | | | | 1,198,094 | |
Bloomin’ Brands, Inc. | | | 134,398 | | | | 2,966,164 | |
Brinker International, Inc. | | | 57,817 | | | | 2,428,314 | |
| | | | | | | | |
| Security | | Shares | | | Value | |
|
| Restaurants (continued) | |
Carrols Restaurant Group, Inc.(a)(b) | | | 53,679 | | | $ | 378,437 | |
Cheesecake Factory, Inc. | | | 64,236 | | | | 2,496,211 | |
Cracker Barrel Old Country Store, Inc. | | | 37,604 | | | | 5,781,239 | |
Dave & Buster’s Entertainment, Inc. | | | 52,713 | | | | 2,117,481 | |
Del Taco Restaurants, Inc.(a)(b) | | | 44,875 | | | | 354,737 | |
Denny’s Corp.(b) | | | 89,822 | | | | 1,785,661 | |
Dine Brands Global, Inc. | | | 25,233 | | | | 2,107,460 | |
El Pollo Loco Holdings, Inc.(b) | | | 31,836 | | | | 481,997 | |
Fiesta Restaurant Group, Inc.(a)(b) | | | 35,926 | | | | 355,308 | |
Habit Restaurants, Inc., Class A(a)(b) | | | 31,671 | | | | 330,329 | |
J Alexander’s Holdings, Inc.(b) | | | 19,348 | | | | 184,967 | |
Jack in the Box, Inc. | | | 40,151 | | | | 3,132,983 | |
Kura Sushi USA, Inc., Class A(a)(b) | | | 5,130 | | | | 130,558 | |
Nathan’s Famous, Inc. | | | 4,466 | | | | 316,550 | |
Noodles & Co.(a)(b) | | | 43,009 | | | | 238,270 | |
Papa John’s International, Inc. | | | 34,352 | | | | 2,169,329 | |
Potbelly Corp.(a)(b) | | | 31,092 | | | | 131,208 | |
Red Robin Gourmet Burgers, Inc.(b) | | | 20,098 | | | | 663,636 | |
Ruth’s Hospitality Group, Inc. | | | 43,677 | | | | 950,630 | |
Shake Shack, Inc., Class A(a)(b) | | | 44,798 | | | | 2,668,617 | |
Texas Roadhouse, Inc. | | | 101,995 | | | | 5,744,358 | |
Wingstop, Inc.(a) | | | 45,319 | | | | 3,907,857 | |
| | | | | | | | |
| | | | 43,186,418 | |
|
| Scientific Instruments: Control & Filter — 0.6% | |
Arlo Technologies, Inc.(b) | | | 113,184 | | | | 476,505 | |
Brady Corp., Class A | | | 74,570 | | | | 4,269,878 | |
CIRCOR International, Inc.(b) | | | 30,249 | | | | 1,398,714 | |
Energy Recovery, Inc.(a)(b) | | | 56,921 | | | | 557,257 | |
ESCO Technologies, Inc. | | | 39,467 | | | | 3,650,697 | |
Gorman-Rupp Co. | | | 27,125 | | | | 1,017,187 | |
Helios Technologies, Inc. | | | 45,258 | | | | 2,092,277 | |
Napco Security Technologies, Inc.(b) | | | 17,966 | | | | 528,021 | |
Thermon Group Holdings, Inc.(b) | | | 49,580 | | | | 1,328,744 | |
Watts Water Technologies, Inc., Class A | | | 42,628 | | | | 4,252,569 | |
Wrap Technologies, Inc.(a)(b) | | | 11,358 | | | | 72,578 | |
| | | | | | | | |
| | | | 19,644,427 | |
|
| Scientific Instruments: Electrical — 0.4% | |
Allied Motion Technologies, Inc.(a) | | | 10,681 | | | | 518,029 | |
Atkore International Group, Inc.(b) | | | 72,284 | | | | 2,924,611 | |
AZZ, Inc. | | | 39,636 | | | | 1,821,274 | |
EnerSys | | | 66,093 | | | | 4,945,739 | |
Franklin Electric Co., Inc. | | | 71,382 | | | | 4,091,616 | |
Preformed Line Products Co. | | | 4,586 | | | | 276,765 | |
| | | | | | | | |
| | | | 14,578,034 | |
|
| Scientific Instruments: Gauges & Meters — 0.3% | |
Badger Meter, Inc.(a) | | | 44,169 | | | | 2,867,893 | |
FARO Technologies, Inc.(b) | | | 26,773 | | | | 1,348,020 | |
Itron, Inc.(b) | | | 52,963 | | | | 4,446,244 | |
Mesa Laboratories, Inc.(a) | | | 6,650 | | | | 1,658,510 | |
Transcat, Inc.(b) | | | 11,266 | | | | 358,935 | |
Vishay Precision Group, Inc.(a)(b) | | | 15,923 | | | | 541,382 | |
| | | | | | | | |
| | | | 11,220,984 | |
|
| Scientific Instruments: Pollution Control — 0.5% | |
CECO Environmental Corp.(b) | | | 46,316 | | | | 354,781 | |
Covanta Holding Corp. | | | 182,550 | | | | 2,709,042 | |
Darling Ingredients, Inc.(a)(b) | | | 258,180 | | | | 7,249,694 | |
Evoqua Water Technologies Corp.(b) | | | 115,614 | | | | 2,190,885 | |
Heritage-Crystal Clean, Inc.(a)(b) | | | 23,280 | | | | 730,294 | |
Team, Inc.(a)(b) | | | 45,891 | | | | 732,879 | |
US Ecology, Inc. | | | 37,235 | | | | 2,156,279 | |
| | | | | | | | |
| | | | 16,123,854 | |
| | | | |
| SCHEDULE OF INVESTMENTS | | | 63 | |
| | |
Schedule of Investments (continued) December 31, 2019 | | Master Small Cap Index Series (Percentages shown are based on Net Assets) |
| | | | | | | | |
| Security | | Shares | | | Value | |
|
| Securities Brokerage & Services — 0.1% | |
GAIN Capital Holdings, Inc. | | | 31,038 | | | $ | 122,600 | |
INTL. FCStone, Inc.(a)(b) | | | 24,232 | | | | 1,183,249 | |
Ladenburg Thalmann Financial Services, Inc. | | | 185,001 | | | | 643,803 | |
Siebert Financial Corp.(b) | | | 11,369 | | | | 98,342 | |
| | | | | | | | |
| | | | 2,047,994 | |
|
| Semiconductors & Components — 1.8% | |
Acacia Communications, Inc.(b) | | | 59,165 | | | | 4,011,979 | |
Adesto Technologies Corp.(a)(b) | | | 42,380 | | | | 360,230 | |
Alpha & Omega Semiconductor Ltd.(a)(b) | | | 30,886 | | | | 420,667 | |
Amkor Technology, Inc.(b) | | | 152,884 | | | | 1,987,492 | |
AXT, Inc.(a)(b) | | | 60,137 | | | | 261,596 | |
CEVA, Inc.(b) | | | 33,831 | | | | 912,084 | |
Cirrus Logic, Inc.(b) | | | 92,249 | | | | 7,602,240 | |
Diodes, Inc.(b) | | | 63,354 | | | | 3,571,265 | |
DSP Group, Inc.(b) | | | 33,014 | | | | 519,640 | |
FormFactor, Inc.(b) | | | 114,823 | | | | 2,981,953 | |
Inphi Corp.(a)(b) | | | 69,425 | | | | 5,138,839 | |
Lattice Semiconductor Corp.(a)(b) | | | 199,816 | | | | 3,824,478 | |
MACOM Technology Solutions Holdings, Inc.(b) | | | 71,473 | | | | 1,901,182 | |
MaxLinear, Inc.(b) | | | 100,669 | | | | 2,136,196 | |
Power Integrations, Inc.(a) | | | 43,737 | | | | 4,326,027 | |
Rambus, Inc.(a)(b) | | | 170,380 | | | | 2,346,985 | |
Semtech Corp.(b) | | | 101,777 | | | | 5,384,003 | |
Silicon Laboratories, Inc.(b) | | | 66,391 | | | | 7,700,028 | |
SMART Global Holdings, Inc.(a)(b) | | | 20,430 | | | | 775,114 | |
Vishay Intertechnology, Inc. | | | 204,901 | | | | 4,362,342 | |
| | | | | | | | |
| | | | 60,524,340 | |
|
| Semiconductors & Semiconductor Equipment — 0.1% | |
Ambarella, Inc.(a)(b) | | | 48,719 | | | | 2,950,423 | |
| | | | | | | | |
|
| Shipping — 0.5% | |
Diamond S Shipping, Inc.(b) | | | 33,649 | | | | 563,284 | |
Eagle Bulk Shipping, Inc.(a)(b) | | | 68,018 | | | | 312,883 | |
GasLog Ltd. | | | 61,635 | | | | 603,407 | |
Genco Shipping & Trading Ltd.(a) | | | 22,650 | | | | 240,543 | |
Golar LNG Ltd. | | | 145,093 | | | | 2,063,222 | |
International Seaways, Inc.(b) | | | 38,807 | | | | 1,154,896 | |
Matson, Inc. | | | 65,646 | | | | 2,678,357 | |
Nordic American Tankers Ltd. | | | 214,439 | | | | 1,055,040 | |
Safe Bulkers, Inc.(b) | | | 74,538 | | | | 126,715 | |
Scorpio Tankers, Inc.(a) | | | 72,926 | | | | 2,868,909 | |
SFL Corp. Ltd. | | | 124,680 | | | | 1,812,847 | |
Teekay Corp.(a) | | | 104,805 | | | | 557,563 | |
Teekay Tankers Ltd., Class A(b) | | | 36,105 | | | | 865,437 | |
Tidewater, Inc.(a)(b) | | | 59,544 | | | | 1,148,008 | |
| | | | | | | | |
| | | | 16,051,111 | |
|
| Software — 0.5% | |
Castlight Health, Inc., Class B(b) | | | 156,665 | | | | 208,364 | |
Five9, Inc.(a)(b) | | | 92,377 | | | | 6,058,084 | |
Instructure, Inc.(a)(b) | | | 55,153 | | | | 2,658,926 | |
MobileIron, Inc.(a)(b) | | | 148,718 | | | | 722,769 | |
Model N, Inc.(b) | | | 50,537 | | | | 1,772,333 | |
Qualys, Inc.(a)(b) | | | 52,486 | | | | 4,375,758 | |
Rubicon Project, Inc.(b) | | | 76,541 | | | | 624,575 | |
| | | | | | | | |
| | | | 16,420,809 | |
|
| Specialty Retail — 2.3% | |
1-800-Flowers.com, Inc., Class A(a)(b) | | | 38,399 | | | | 556,785 | |
Aaron’s, Inc. | | | 104,353 | | | | 5,959,600 | |
Abercrombie & Fitch Co., Class A | | | 102,061 | | | | 1,764,635 | |
America’sCar-Mart, Inc.(b) | | | 9,639 | | | | 1,057,013 | |
American Eagle Outfitters, Inc. | | | 249,914 | | | | 3,673,736 | |
Asbury Automotive Group, Inc.(b) | | | 29,814 | | | | 3,332,907 | |
Ascena Retail Group, Inc.(a)(b) | | | 11,667 | | | | 89,428 | |
| | | | | | | | |
| Security | | Shares | | | Value | |
|
| Specialty Retail (continued) | |
At Home Group, Inc.(b) | | | 73,924 | | | $ | 406,582 | |
Barnes & Noble Education, Inc.(a)(b) | | | 62,905 | | | | 268,604 | |
Bed Bath & Beyond, Inc.(a) | | | 188,289 | | | | 3,257,400 | |
BMC Stock Holdings, Inc.(b) | | | 103,507 | | | | 2,969,616 | |
Boot Barn Holdings, Inc.(b) | | | 43,213 | | | | 1,924,275 | |
Buckle, Inc. | | | 44,762 | | | | 1,210,364 | |
Caleres, Inc. | | | 63,303 | | | | 1,503,446 | |
Cato Corp., Class A | | | 34,245 | | | | 595,863 | |
Chico’s FAS, Inc. | | | 179,811 | | | | 685,080 | |
Children’s Place, Inc. | | | 23,725 | | | | 1,483,287 | |
Citi Trends, Inc. | | | 17,177 | | | | 397,132 | |
Conn’s, Inc.(b) | | | 30,828 | | | | 381,959 | |
Container Store Group, Inc.(a)(b) | | | 23,519 | | | | 99,250 | |
Designer Brands, Inc., Class A | | | 99,966 | | | | 1,573,465 | |
Express, Inc.(a)(b) | | | 100,811 | | | | 490,950 | |
GameStop Corp., Class A(a) | | | 127,018 | | | | 772,269 | |
Genesco, Inc.(b) | | | 22,658 | | | | 1,085,771 | |
GNC Holdings, Inc., Class A(a)(b) | | | 126,560 | | | | 341,712 | |
Group 1 Automotive, Inc. | | | 27,239 | | | | 2,723,900 | |
Guess?, Inc. | | | 73,279 | | | | 1,639,984 | |
Haverty Furniture Cos., Inc. | | | 27,688 | | | | 558,190 | |
Hibbett Sports, Inc.(b) | | | 27,669 | | | | 775,839 | |
J. Jill, Inc. | | | 23,985 | | | | 27,103 | |
Lands’ End, Inc.(b) | | | 16,179 | | | | 271,807 | |
Lithia Motors, Inc., Class A | | | 35,163 | | | | 5,168,961 | |
Lumber Liquidators Holdings, Inc.(a)(b) | | | 43,958 | | | | 429,470 | |
MarineMax, Inc.(b) | | | 32,403 | | | | 540,806 | |
Michaels Cos., Inc.(b) | | | 132,632 | | | | 1,072,993 | |
Monro, Inc.(a) | | | 50,419 | | | | 3,942,766 | |
Murphy USA, Inc.(b) | | | 45,851 | | | | 5,364,567 | |
National Vision Holdings, Inc.(a)(b) | | | 120,992 | | | | 3,923,771 | |
Office Depot, Inc. | | | 844,824 | | | | 2,314,818 | |
Party City Holdco, Inc.(a)(b) | | | 81,545 | | | | 190,815 | |
RealReal, Inc.(a)(b) | | | 27,115 | | | | 511,118 | |
Regis Corp.(a)(b) | | | 38,664 | | | | 690,926 | |
RTW RetailWinds, Inc.(a)(b) | | | 43,216 | | | | 34,616 | |
Sally Beauty Holdings, Inc.(b) | | | 186,381 | | | | 3,401,453 | |
Shoe Carnival, Inc.(a) | | | 14,556 | | | | 542,648 | |
Sonic Automotive, Inc., Class A | | | 37,808 | | | | 1,172,048 | |
Sportsman’s Warehouse Holdings, Inc.(a)(b) | | | 65,664 | | | | 527,282 | |
Stamps.com, Inc.(b) | | | 25,868 | | | | 2,160,495 | |
Systemax, Inc. | | | 19,007 | | | | 478,216 | |
Tailored Brands, Inc.(a) | | | 76,761 | | | | 317,790 | |
Tilly’s, Inc., Class A | | | 33,361 | | | | 408,672 | |
Zumiez, Inc.(b) | | | 31,076 | | | | 1,073,365 | |
| | | | | | | | |
| | | | 76,145,548 | |
|
| Steel — 0.3% | |
AK Steel Holding Corp.(b) | | | 483,237 | | | | 1,589,850 | |
Allegheny Technologies, Inc.(a)(b) | | | 194,795 | | | | 4,024,465 | |
Carpenter Technology Corp. | | | 72,742 | | | | 3,621,097 | |
Olympic Steel, Inc. | | | 13,771 | | | | 246,776 | |
Ryerson Holding Corp.(b) | | | 23,421 | | | | 277,070 | |
Schnitzer Steel Industries, Inc., Class A | | | 39,675 | | | | 860,154 | |
TimkenSteel Corp.(a)(b) | | | 60,089 | | | | 472,300 | |
| | | | | | | | |
| | | | 11,091,712 | |
|
| Technology: Miscellaneous — 0.3% | |
Benchmark Electronics, Inc. | | | 58,111 | | | | 1,996,694 | |
CTS Corp. | | | 50,311 | | | | 1,509,833 | |
Fabrinet(b) | | | 56,230 | | | | 3,645,953 | |
Kimball Electronics, Inc.(b) | | | 38,035 | | | | 667,514 | |
Plexus Corp.(a)(b) | | | 44,639 | | | | 3,434,525 | |
| | | | | | | | |
| | | | 11,254,519 | |
| | |
| 64 | | 2019 BLACKROCK ANNUAL REPORTTO SHAREHOLDERS |
| | |
Schedule of Investments (continued) December 31, 2019 | | Master Small Cap Index Series (Percentages shown are based on Net Assets) |
| | | | | | | | |
| Security | | Shares | | | Value | |
|
| Telecommunications Equipment — 0.3% | |
Airgain, Inc.(a)(b) | | | 13,818 | | | $ | 147,714 | |
Akoustis Technologies, Inc.(a)(b) | | | 38,858 | | | | 310,864 | |
Applied Optoelectronics, Inc.(a)(b) | | | 29,336 | | | | 348,512 | |
CalAmp Corp.(b) | | | 49,691 | | | | 476,040 | |
Cambium Networks Corp.(b) | | | 6,614 | | | | 57,806 | |
Clearfield, Inc.(b) | | | 16,199 | | | | 225,814 | |
Knowles Corp.(b) | | | 125,626 | | | | 2,656,990 | |
Sonim Technologies, Inc.(b) | | | 5,379 | | | | 19,526 | |
Tessco Technologies, Inc. | | | 9,764 | | | | 109,552 | |
Viavi Solutions, Inc.(a)(b) | | | 355,036 | | | | 5,325,540 | |
Vocera Communications, Inc.(a)(b) | | | 48,332 | | | | 1,003,372 | |
| | | | | | | | |
| | | | 10,681,730 | |
|
| Textile Products — 0.1% | |
Culp, Inc. | | | 16,851 | | | | 229,511 | |
Interface, Inc. | | | 89,380 | | | | 1,482,814 | |
Unifi, Inc.(b) | | | 22,265 | | | | 562,414 | |
| | | | | | | | |
| | | | 2,274,739 | |
|
| Textiles Apparel & Shoes — 0.9% | |
Centric Brands, Inc.(b) | | | 24,642 | | | | 53,473 | |
Crocs, Inc.(b) | | | 108,738 | | | | 4,555,035 | |
Deckers Outdoor Corp.(b) | | | 44,395 | | | | 7,496,540 | |
Delta Apparel, Inc.(b) | | | 9,596 | | | | 298,436 | |
Fossil Group, Inc.(b) | | | 72,594 | | | | 572,041 | |
G-III Apparel Group Ltd.(a)(b) | | | 69,832 | | | | 2,339,372 | |
Kontoor Brands, Inc.(b) | | | 69,249 | | | | 2,907,765 | |
Oxford Industries, Inc. | | | 25,632 | | | | 1,933,165 | |
Rocky Brands, Inc. | | | 10,928 | | | | 321,611 | |
Steven Madden Ltd. | | | 129,719 | | | | 5,579,214 | |
Superior Group of Cos., Inc. | | | 15,900 | | | | 215,286 | |
Vera Bradley, Inc.(b) | | | 31,682 | | | | 373,848 | |
Vince Holding Corp.(b) | | | 4,847 | | | | 83,901 | |
Weyco Group, Inc. | | | 9,709 | | | | 256,803 | |
Wolverine World Wide, Inc. | | | 126,700 | | | | 4,274,858 | |
| | | | | | | | |
| | | | 31,261,348 | |
|
| Tobacco — 0.2% | |
22nd Century Group, Inc.(a)(b) | | | 180,340 | | | | 198,374 | |
Greenlane Holdings, Inc., Class A(a)(b) | | | 9,262 | | | | 30,148 | |
Pyxus International, Inc.(a)(b) | | | 12,563 | | | | 112,313 | |
Turning Point Brands, Inc.(a) | | | 12,816 | | | | 366,538 | |
Universal Corp. | | | 37,907 | | | | 2,162,973 | |
Vector Group Ltd. | | | 172,321 | | | | 2,307,378 | |
| | | | | | | | |
| | | | 5,177,724 | |
|
| Toys — 0.0% | |
Funko, Inc., Class A(a)(b) | | | 39,584 | | | | 679,261 | |
| | | | | | | | |
|
| Transportation Miscellaneous — 0.2% | |
Costamare, Inc. | | | 98,259 | | | | 936,408 | |
Echo Global Logistics, Inc.(b) | | | 40,669 | | | | 841,848 | |
General Finance Corp.(a)(b) | | | 16,982 | | | | 187,991 | |
Hub Group, Inc., Class A(b) | | | 49,914 | | | | 2,560,089 | |
Scorpio Bulkers, Inc. | | | 83,936 | | | | 534,672 | |
Textainer Group Holdings Ltd.(a)(b) | | | 81,018 | | | | 867,703 | |
Wesco Aircraft Holdings, Inc.(b) | | | 82,482 | | | | 908,952 | |
| | | | | | | | |
| | | | 6,837,663 | |
|
| Truckers — 0.4% | |
ArcBest Corp. | | | 38,663 | | | | 1,067,099 | |
Covenant Transportation Group, Inc., Class A(b) | | | 18,034 | | | | 233,089 | |
Daseke, Inc.(a)(b) | | | 68,269 | | | | 215,730 | |
Forward Air Corp.(a) | | | 43,544 | | | | 3,045,903 | |
FRP Holdings, Inc.(a)(b) | | | 10,756 | | | | 535,756 | |
Heartland Express, Inc.(a) | | | 70,120 | | | | 1,476,026 | |
Marten Transport Ltd. | | | 60,208 | | | | 1,293,870 | |
| | | | | | | | |
| Security | | Shares | | | Value | |
|
| Truckers (continued) | |
PAM Transportation Services, Inc.(b) | | | 2,919 | | | $ | 168,455 | |
Roadrunner Transportation Systems, Inc.(a)(b) | | | 5,327 | | | | 49,062 | |
Saia, Inc.(a)(b) | | | 40,535 | | | | 3,774,619 | |
Universal Logistics Holdings, Inc. | | | 12,578 | | | | 238,479 | |
US Xpress Enterprises, Inc., Class A(b) | | | 33,215 | | | | 167,071 | |
Werner Enterprises, Inc. | | | 70,786 | | | | 2,575,903 | |
YRC Worldwide, Inc.(a)(b) | | | 50,834 | | | | 129,627 | |
| | | | | | | | |
| | | | 14,970,689 | |
|
| Utilities: Electrical — 1.8% | |
ALLETE, Inc. | | | 80,074 | | | | 6,499,607 | |
Atlantic Power Corp.(b) | | | 165,051 | | | | 384,569 | |
Avista Corp. | | | 102,127 | | | | 4,911,287 | |
Black Hills Corp. | | | 94,321 | | | | 7,407,971 | |
Clearway Energy, Inc., Class A | | | 53,830 | | | | 1,029,230 | |
Clearway Energy, Inc., Class C | | | 112,473 | | | | 2,243,836 | |
El Paso Electric Co. | | | 62,696 | | | | 4,256,432 | |
Genie Energy Ltd., Class B | | | 22,491 | | | | 173,855 | |
MGE Energy, Inc. | | | 53,902 | | | | 4,248,556 | |
NorthWestern Corp. | | | 78,234 | | | | 5,607,031 | |
Otter Tail Corp. | | | 61,460 | | | | 3,152,283 | |
Pattern Energy Group, Inc., Class A | | | 143,497 | | | | 3,839,262 | |
PNM Resources, Inc. | | | 122,797 | | | | 6,227,036 | |
Portland General Electric Co. | | | 138,674 | | | | 7,736,623 | |
Spark Energy, Inc., Class A | | | 18,805 | | | | 173,570 | |
Unitil Corp. | | | 22,594 | | | | 1,396,761 | |
| | | | | | | | |
| | | | 59,287,909 | |
|
| Utilities: Gas Distributors — 0.9% | |
Chesapeake Utilities Corp. | | | 24,688 | | | | 2,365,851 | |
New Jersey Resources Corp. | | | 137,141 | | | | 6,112,374 | |
Northwest Natural Holding Co. | | | 47,043 | | | | 3,468,480 | |
RGC Resources, Inc. | | | 11,641 | | | | 332,700 | |
South Jersey Industries, Inc. | | | 143,067 | | | | 4,718,350 | |
Southwest Gas Holdings, Inc. | | | 83,880 | | | | 6,372,364 | |
Spire, Inc. | | | 76,789 | | | | 6,397,291 | |
| | | | | | | | |
| | | | 29,767,410 | |
|
| Utilities: Miscellaneous — 0.1% | |
Ormat Technologies, Inc. | | | 61,289 | | | | 4,567,256 | |
| | | | | | | | |
|
| Utilities: Telecommunications — 0.8% | |
8x8, Inc.(a)(b) | | | 144,767 | | | | 2,649,236 | |
ATN International, Inc. | | | 17,191 | | | | 952,210 | |
Boingo Wireless, Inc.(b) | | | 67,449 | | | | 738,567 | |
Cincinnati Bell, Inc.(b) | | | 61,447 | | | | 643,350 | |
Cogent Communications Holdings, Inc. | | | 68,287 | | | | 4,493,967 | |
Consolidated Communications Holdings, Inc. | | | 108,114 | | | | 419,482 | |
Frontier Communications Corp.(a)(b) | | | 153,873 | | | | 136,885 | |
GTT Communications, Inc.(a)(b) | | | 50,539 | | | | 573,618 | |
IDT Corp., Class B(b) | | | 25,202 | | | | 181,706 | |
Iridium Communications, Inc.(b) | | | 152,948 | | | | 3,768,639 | |
j2 Global, Inc. | | | 72,023 | | | | 6,749,275 | |
ORBCOMM, Inc.(b) | | | 114,678 | | | | 482,794 | |
Shenandoah Telecommunications Co.(a) | | | 74,464 | | | | 3,098,447 | |
Spok Holdings, Inc. | | | 28,546 | | | | 349,118 | |
Vonage Holdings Corp.(a)(b) | | | 349,699 | | | | 2,591,270 | |
| | | | | | | | |
| | | | 27,828,564 | |
|
| Utilities: Water — 0.5% | |
American States Water Co. | | | 56,631 | | | | 4,906,510 | |
AquaVenture Holdings Ltd.(b) | | | 21,650 | | | | 587,148 | |
Artesian Resources Corp., Class A | | | 12,450 | | | | 463,264 | |
California Water Service Group | | | 74,240 | | | | 3,827,814 | |
Consolidated Water Co. Ltd. | | | 22,746 | | | | 370,760 | |
Global Water Resources, Inc. | | | 18,165 | | | | 238,870 | |
Middlesex Water Co. | | | 25,101 | | | | 1,595,671 | |
| | | | |
| SCHEDULE OF INVESTMENTS | | | 65 | |
| | |
Schedule of Investments (continued) December 31, 2019 | | Master Small Cap Index Series (Percentages shown are based on Net Assets) |
| | | | | | | | |
| Security | | Shares | | | Value | |
|
| Utilities: Water (continued) | |
Pure Cycle Corp.(a)(b) | | | 26,427 | | | $ | 332,716 | |
SJW Group | | | 40,652 | | | | 2,888,731 | |
York Water Co. | | | 20,289 | | | | 935,526 | |
| | | | | | | | |
| | | | 16,147,010 | |
| | | | | | | | |
| |
Total Common Stocks — 98.5%
(Cost — $2,820,285,947) | | | | 3,275,198,401 | |
| | | | | | | | |
|
Investment Companies — 0.5% | |
iShares Russell 2000 ETF(a)(f) | | | 97,425 | | | | 16,140,400 | |
| | | | | | | | |
| |
Total Investment Companies — 0.5%
(Cost — $14,026,470) | | | | 16,140,400 | |
| | | | | | | | |
| |
Total Long-Term Investments — 99.0%
(Cost — $2,834,312,417) | | | | 3,291,338,801 | |
| | | | | | | | |
|
Short-Term Securities — 12.6% | |
BlackRock Cash Funds: Institutional,
SL Agency Shares, | | | | | | | | |
1.84%(d)(e)(f) | | | 391,429,044 | | | | 391,585,616 | |
BlackRock Cash Funds: Treasury,
SL Agency Shares, | | | | | | | | |
1.52%(d)(f) | | | 28,859,257 | | | | 28,859,257 | |
| | | | | | | | |
| |
Total Short-Term Securities — 12.6%
(Cost — $420,396,820) | | | | 420,444,873 | |
| | | | | | | | |
| |
Total Investments — 111.6%
(Cost — $3,254,709,237) | | | | 3,711,783,674 | |
| |
Liabilities in Excess of Other Assets — (11.6)% | | | | (386,100,096 | ) |
| | | | | | | | |
| |
Net Assets — 100.0% | | | $ | 3,325,683,578 | |
| | | | | | | | |
| (a) | Security, or a portion of the security, is on loan. |
| (b) | Non-income producing security. |
| (c) | Security is valued using significant unobservable inputs and is classified as Level 3 in the fair value hierarchy. |
| (d) | Annualized7-day yield as of period end. |
| (e) | Security was purchased with the cash collateral from loaned securities. |
| (f) | During the year ended December 31, 2019, investments in issuers considered to be an affiliate/affiliates of the Series for purposes of Section 2(a)(3) of the Investment Company Act of 1940, as amended, and/or related parties of the were as follows: |
| | | | | | | | | | | | | | | | | | | | | | | | | | | | | | | | |
| Affiliated Persons and/or Related Parties | | Shares
Held at
12/31/18 | | | Shares
Purchased | | | Shares
Sold | | | Shares
Held at
12/31/19 | | | Value at
12/31/19 | | | Income | | | Net
Realized
Gain (Loss) (a) | | | Change in
Unrealized
Appreciation
(Depreciation) | |
BlackRock Cash Funds: Institutional, SL Agency Shares | | | 180,710,459 | | | | 210,718,585 | (b) | | | — | | | | 391,429,044 | | | $ | 391,585,616 | | | $ | 3,576,601 | (c) | | $ | (3,722 | ) | | $ | 44,745 | |
BlackRock Cash Funds: Treasury, SL Agency Shares | | | 43,842,543 | | | | — | | | | (14,983,286 | )(b) | | | 28,859,257 | | | | 28,859,257 | | | | 818,199 | | | | — | | | | — | |
PennyMac Financial Services, Inc. | | | 3,162 | | | | — | | | | — | | | | 3,162 | | | | 107,634 | | | | 379 | | | | — | | | | 40,411 | |
PennyMac Mortgage Investment Trust | | | 75,714 | | | | 58,327 | | | | — | | | | 134,041 | | | | 2,987,774 | | | | 215,732 | | | | — | | | | 344,266 | |
iShares Russell 2000 ETF | | | 64,533 | | | | 826,901 | | | | (794,009 | ) | | | 97,425 | | | | 16,140,400 | | | | 328,023 | | | | 1,975,451 | | | | 2,711,293 | |
| | | | | | | | | | | | | | | | | | | | | | | | | | | | | | | | |
| | | | | | | | | | | | | | | | | | $ | 439,680,681 | | | $ | 4,938,934 | | | $ | 1,971,729 | | | $ | 3,140,715 | |
| | | | | | | | | | | | | | | | | | | | | | | | | | | | | | | | |
| | (a) | Includes net capital gain distributions, if applicable. | |
| | (b) | Represents net shares purchased (sold) | |
| | (c) | Represents securities lending income earned from the reinvestment of cash collateral from loaned securities, net of fees and collateral investment expenses, and other payments to and from borrowers of securities. | |
Derivative Financial Instruments Outstanding as of Period End
Futures Contracts
| | | | | | | | | | | | | | | | |
| Description | | Number of
Contracts | | | Expiration
Date | | | Notional
Amount (000) | | | Value/
Unrealized
Appreciation
(Depreciation) | |
Long Contracts | | | | | | | | | | | | | | | | |
Russell 2000E-Mini Index | | | 294 | | | | 03/20/20 | | | $ | 24,558 | | | $ | 83,401 | |
| | | | | | | | | | | | | | | | |
| | |
| 66 | | 2019 BLACKROCK ANNUAL REPORTTO SHAREHOLDERS |
| | |
Schedule of Investments (continued) December 31, 2019 | | Master Small Cap Index Series |
OTC Total Return Swaps(a)
| | | | | | | | | | | | | | | | | | | | | | |
| Reference Entity | | Counterparty | | Expiration Date | | | Net Notional
Amount | | | Unrealized Appreciation (Depreciation) | | | Net Value of Reference
Entities | | | Gross Notional Amount Net Asset Percentage | |
Equity Securities Long/Short: | | JPMorgan Chase Bank N.A. | | | 02/08/23 | | | | $1,919,937 | | | $ | 61,849 | (b) | | | $1,978,249 | | | | 0.06 | % |
| | Goldman Sachs Bank USA | | | 02/27/23 | | | | 2,605,337 | | | | (39,539 | )(c) | | | 2,562,121 | | | | 0.08 | |
| | | | | | | | | | | | | | | | | | | | | | |
Total | | | $ | 4,525,274 | | | $ | 22,310 | | | $ | 4,540,370 | | | | | |
| | | | | | | | | | | | | | | | | |
| | (a) | In regards to total return swaps with multiple financing rate benchmarks, the Series’ receives or pays the total return on a portfolio of long positions underlying the total return swap. In addition, the Series pays or receives a variable rate of interest, based on a specified benchmark, plus or minus a spread of 65 basis points. The benchmark and spread are determined based upon the country and/or currency of the individual underlying positions. The following are the specified benchmarks used in determining the variable rate of interest: | |
| | | USD - 1D Overnight Bank Funding Rate | |
| | | USD - 1D Overnight Fed Funds Effective Rate | |
| | (b) | Amount includes $3,537 of net dividends and financing fees. | |
| | (c) | Amount includes $ 3,677 of net dividends and financing fees. | |
The following table represents the individual long and short positions and related values of the equity securities underlying the total return swap with JPMorgan Chase Bank N.A. as of December 31, 2019 expiration dates 02/08/23:
| | | | | | | | | | | | |
| Security | | Shares | | | Value | | | % of
Basket
Value | |
|
Reference Entity — Long | |
|
| Banks: Diversified | |
Banner Corp. | | | 4,143 | | | $ | 234,452 | | | | 11.9 | % |
Boston Private Financial Holdings, Inc. | | | 8,372 | | | | 100,715 | | | | 5.1 | |
Central Pacific Financial Corp. | | | 6,077 | | | | 179,758 | | | | 9.1 | |
Hanmi Financial Corp. | | | 7,638 | | | | 152,722 | | | | 7.7 | |
| | | | | | | | | | | | |
|
| Banks: Diversified | |
United Community Banks, Inc. | | | 16,881 | | | | 521,285 | | | | 26.3 | |
| | | | | | | | | | | | |
| | | | 1,188,932 | | | | | |
|
| Banks: Savings, Thrift & Mortgage Lending | |
Brookline Bancorp, Inc. | | | 11,206 | | | | 184,451 | | | | 9.3 | |
| | | | | | | | | | | | |
|
| Computer Services Software & Systems | |
Mitek Systems, Inc. | | | 19,025 | | | | 145,541 | | | | 7.4 | |
| | | | | | | | | | | | |
|
| Insurance: Multi-Line | |
Horace Mann Educators Corp. | | | 3,858 | | | | 168,440 | | | | 8.5 | |
| | | | | | | | | | | | |
|
| Leisure Time | |
Clarus Corp. | | | 4,991 | | | | 67,678 | | | | 3.4 | |
| | | | | | | | | | | | |
|
| Office Supplies & Equipment | |
Pitney Bowes, Inc. | | | 10,327 | | | | 41,618 | | | | 2.1 | |
| | | | | | | | | | | | |
|
| Specialty Retail | |
GameStop Corp. | | | 11,904 | | | | 72,376 | | | | 3.7 | |
| | | | | | | | | | | | |
|
| Utilities: Telecommunications | |
Cincinnati Bell, Inc. | | | 10,431 | | | | 109,213 | | | | 5.5 | |
| | | | | | | | | | | | |
| | |
Total Reference Entity — Long | | | | 1,978,249 | | | | | |
| | | | | | | | | | | | |
| | |
Net Value of Reference Entity — JPMorgan Chase Bank N.A. | | | $ | 1,978,249 | | | | | |
| | | | | | | | | | | | |
The following table represents the individual long and short positions and related values of the equity securities underlying the total return swap with Goldman Sachs & Co. as of December 31, 2019 expiration dates 02/27/23:
| | | | | | | | | | | | |
| Security | | Shares | | | Value | | | % of
Basket
Value | |
|
Reference Entity — Long | |
|
| Banks: Diversified | |
Boston Private Financial Holdings, Inc. | | | 6,477 | | | $ | 77,918 | | | | 3.0 | % |
Columbia Banking System, Inc. | | | 4,502 | | | | 183,164 | | | | 7.2 | |
First Financial Bancorp | | | 2,354 | | | | 59,886 | | | | 2.3 | |
First Midwest Bancorp, Inc. | | | 2,825 | | | | 65,144 | | | | 2.6 | |
Great Western Bancorp, Inc. | | | 5,481 | | | | 190,410 | | | | 7.4 | |
Hanmi Financial Corp. | | | 1,899 | | | | 37,971 | | | | 1.5 | |
United Community Banks, Inc. | | | 18,518 | | | | 571,836 | | | | 22.3 | |
| | | | | | | | | | | | |
| | | | 1,186,329 | | | | | |
|
| Electronic Components | |
Acacia Research Corp. | | | 57,405 | | | | 152,697 | | | | 6.0 | |
| | | | | | | | | | | | |
|
| Insurance: Life | |
American Equity Investment Life Holding Co. | | | 2,656 | | | | 79,494 | | | | 3.1 | |
| | | | | | | | | | | | |
|
| Insurance: Multi-Line | |
PICO Holdings, Inc. | | | 13,289 | | | | 147,774 | | | | 5.8 | |
| | | | | | | | | | | | |
|
| Insurance: Property-Casualty | |
Employers Holdings, Inc. | | | 13,122 | | | | 547,843 | | | | 21.4 | |
ProAssurance Corp. | | | 3,641 | | | | 131,586 | | | | 5.1 | |
Stewart Information Services Corp. | | | 3,658 | | | | 149,210 | | | | 5.8 | |
| | | | | | | | | | | | |
| | | | 828,639 | | | | | |
|
| Real Estate Management & Development | |
BBX Capital Corp. | | | 35,050 | | | | 167,188 | | | | 6.5 | |
| | | | | | | | | | | | |
| | |
Total Reference Entity — Long | | | | 2,562,121 | | | | | |
| | | | | | | | | | | | |
| | |
Net Value of Reference Entity — Goldman Sachs & Co. | | | $ | 2,562,121 | | | | | |
| | | | | | | | | | | | |
| | | | |
| SCHEDULE OF INVESTMENTS | | | 67 | |
| | |
Schedule of Investments (continued) December 31, 2019 | | Master Small Cap Index Series |
Balances Reported in the Statement of Assets and Liabilities for OTC Derivatives
| | | | | | | | | | | | | | | | |
| | | Swap
Premiums
Paid | | | Swap
Premiums
Received | | | Unrealized
Appreciation | | | Unrealized
Depreciation | |
OTC Swaps | | $ | — | | | $ | — | | | $ | 61,849 | | | $ | (39,539 | ) |
Derivative Financial Instruments Categorized by Risk Exposure
As of period end, the fair values of derivative financial instruments located in the Statement of Assets and Liabilities were as follows:
| | | | | | | | | | | | | | | | | | | | | | | | | | | | |
| | | Commodity
Contracts | | | Credit
Contracts | | | Equity
Contracts | | | Foreign
Currency
Exchange
Contracts | | | Interest
Rate
Contracts | | | Other
Contracts | | | Total | |
Assets — Derivative Financial Instruments | | | | | | | | | | | | | | | | | | | | | | | | | | | | |
Futures contracts(a) | | | | | | | | | | | | | | | | | | | | | | | | | | | | |
Unrealized appreciation on futures contracts(a) | | $ | — | | | $ | — | | | $ | 83,401 | | | $ | — | | | $ | — | | | $ | — | | | $ | 83,401 | |
Swaps — OTC | | | | | | | | | | | | | | | | | | | | | | | | | | | | |
Unrealized appreciation on OTC swaps; | | | — | | | | — | | | | 61,849 | | | | — | | | | — | | | | — | | | | 61,849 | |
| | | | | | | | | | | | | | | | | | | | | | | | | | | | |
| | $ | — | | | $ | — | | | $ | 145,250 | | | $ | — | | | $ | — | | | $ | — | | | $ | 145,250 | |
| | | | | | | | | | | | | | | | | | | | | | | | | | | | |
| | | | | | | |
| Liabilities — Derivative Financial Instruments | | | | | | | | | | | | | | | | | | | | | |
Swaps — OTC | | | | | | | | | | | | | | | | | | | | | | | | | | | | |
Unrealized depreciation on OTC swaps; | | $ | — | | | $ | — | | | $ | 39,539 | | | $ | — | | | $ | — | | | $ | — | | | $ | 39,539 | |
| | | | | | | | | | | | | | | | | | | | | | | | | | | | |
| | (a) | Net cumulative unrealized appreciation (depreciation) on futures contracts, if any, are reported in the Schedule of Investments. In the Statement of Assets and Liabilities, only current day’s variation margin is reported in receivables or payables and the net cumulative unrealized appreciation (depreciation) is included in accumulated earnings (loss). | |
For the year ended December 31, 2019, the effect of derivative financial instruments in the Statement of Operations was as follows:
| | | | | | | | | | | | | | | | | | | | | | | | | | | | |
| | | Commodity
Contracts | | | Credit
Contracts | | | Equity
Contracts | | | Foreign
Currency
Exchange
Contracts | | | Interest
Rate
Contracts | | | Other
Contracts | | | Total | |
Net Realized Gain (Loss) from: | | | | | | | | | | | | | | | | | | | | | | | | | | | | |
Futures contracts | | $ | — | | | $ | — | | | $ | 8,079,387 | | | $ | — | | | $ | — | | | $ | — | | | $ | 8,079,387 | |
Swaps | | | — | | | | — | | | | 1,343,607 | | | | — | | | | — | | | | — | | | | 1,343,607 | |
| | | | | | | | | | | | | | | | | | | | | | | | | | | | |
| | $ | — | | | $ | — | | | $ | 9,422,994 | | | $ | — | | | $ | — | | | $ | — | | | $ | 9,422,994 | |
| | | | | | | | | | | | | | | | | | | | | | | | | | | | |
| | | | | | | |
| Net Change in Unrealized Appreciation (Depreciation) on: | | | | | | | | | | | | | | | | | | | | | |
Futures contracts | | $ | — | | | $ | — | | | $ | (123,181 | ) | | $ | — | | | $ | — | | | $ | — | | | $ | (123,181 | ) |
Swaps | | | — | | | | — | | | | 221,656 | | | | — | | | | — | | | | — | | | | 221,656 | |
| | | | | | | | | | | | | | | | | | | | | | | | | | | | |
| | $ | — | | | $ | — | | | $ | 98,475 | | | $ | — | | | $ | — | | | $ | — | | | $ | 98,475 | |
| | | | | | | | | | | | | | | | | | | | | | | | | | | | |
Average Quarterly Balances of Outstanding Derivative Financial Instruments
| | | | |
Futures contracts: | |
Average notional value of contracts — long | | $ | 24,614,021 | |
Total return swaps: | |
Average notional value | | $ | 6,451,977 | |
For more information about the Series’ investment risks regarding derivative financial instruments, refer to the Notes to Financial Statements.
Derivative Financial Instruments — Offsetting as of Period End
The Series derivative assets and liabilities (by type) were as follows:
| | | | | | | | |
| | | Assets | | | Liabilities | |
Futures contracts | | $ | 37,921 | | | $ | — | |
Swaps — OTC(a) | | | 61,849 | | | | 39,539 | |
| | | | | | | | |
Total derivative assets and liabilities in the Statement of Assets and Liabilities | | $ | 99,770 | | | $ | 39,539 | |
| | | | | | | | |
Derivatives not subject to a Master Netting Agreement or similar agreement (“MNA”) | | | (37,921 | ) | | | — | |
| | | | | | | | |
Total derivative assets and liabilities subject to an MNA | | $ | 61,849 | | | $ | 39,539 | |
| | | | | | | | |
| | (a) | Includes unrealized appreciation (depreciation) on OTC swaps and swap premiums (paid/received) in the Statement of Assets and Liabilities. | |
| | |
| 68 | | 2019 BLACKROCK ANNUAL REPORTTO SHAREHOLDERS |
| | |
Schedule of Investments (continued) December 31, 2019 | | Master Small Cap Index Series |
The following table presents the Series’ derivative assets (and liabilities) by counterparty net of amounts available for offset under an MNA and net of the related collateral received (and pledged) by the Series:
| | | | | | | | | | | | | | | | | | | | |
| Counterparty | | Derivative
Assets
Subject to
an MNA by
Counterparty | | | Derivatives
Available
for Offset | | | Non-cash
Collateral
Received | | | Cash
Collateral
Received | | | Net Amount
of Derivative
Assets (a) | |
JPMorgan Chase Bank N.A. | | $ | 61,849 | | | $ | — | | | $ | — | | | $ | — | | | $ | 61,849 | |
| | | | | | | | | | | | | | | | | | | | |
| | | | | | | | | | | | | | | | | | | | |
| Counterparty | | Derivative
Liabilities
Subject to
an MNA by
Counterparty | | | Derivatives
Available
for Offset | | | Non-cash
Collateral
Pledged | | | Cash
Collateral
Pledged | | | Net Amount
of Derivative
Liabilities (b) | |
Goldman Sachs Bank USA | | $ | 39,539 | | | $ | — | | | $ | — | | | $ | — | | | $ | 39,539 | |
| | | | | | | | | | | | | | | | | | | | |
| | (a) | Net amount represents the net amount receivable due to counterparty in the event of default. | |
| | (b) | Net amount represents the net amount payable due to counterparty in the event of default. | |
Fair Value Hierarchy as of Period End
Various inputs are used in determining the fair value of investments and derivative financial instruments. For information about the Series’ policy regarding valuation of investments and derivative financial instruments, refer to the Notes to Financial Statements.
The following tables summarize the Series’ investments and derivative financial instruments categorized in the disclosure hierarchy:
| | | | | | | | | | | | | | | | |
| | | Level 1 | | | Level 2 | | | Level 3 | | | Total | |
Assets: | |
Investments: | |
Long-Term Investments(a): | |
Common Stocks | | $ | 3,275,178,084 | | | $ | — | | | $ | 20,317 | | | $ | 3,275,198,401 | |
Investment Companies | | | 16,140,400 | | | | — | | | | — | | | | 16,140,400 | |
Short-Term Securities | | | 420,444,873 | | | | — | | | | — | | | | 420,444,873 | |
| | | | | | | | | | | | | | | | |
| | $ | 3,711,763,357 | | | $ | — | | | $ | 20,317 | | | $ | 3,711,783,674 | |
| | | | | | | | | | | | | | | | |
Derivative Financial Instruments(b) | |
Assets: | |
Equity contracts | | $ | 83,401 | | | $ | 61,849 | | | $ | — | | | $ | 145,250 | |
Liabilities: | |
Equity contracts | | | — | | | | (39,539 | ) | | | | | | | (39,539 | ) |
| | | | | | | | | | | | | | | | |
Total | | $ | 83,401 | | | $ | 22,310 | | | $ | — | | | $ | 105,711 | |
| | | | | | | | | | | | | | | | |
| | (a) | See above Schedule of Investments for values in each industry. | |
| | (b) | Derivative financial instruments are swaps and futures contracts. Swaps and futures contracts are valued at the unrealized appreciation (depreciation) on the instrument. | |
See notes to financial statements.
| | | | |
| SCHEDULE OF INVESTMENTS | | | 69 | |
Statement of Assets and Liabilities
December 31, 2019
| | | | |
| | | Master Small Cap
Index Series | |
|
ASSETS | |
Investments at value — unaffiliated (including securities loaned at value of $381,440,505) (cost — $2,817,619,997) | | $ | 3,272,102,993 | |
Investments at value — affiliated (cost — $437,089,240) | | | 439,680,681 | |
Cash pledged for futures contracts | | | 1,009,000 | |
Receivables: | |
Investments sold | | | 29,529 | |
Securities lending income — affiliated | | | 462,454 | |
Contributions from investors | | | 156,075 | |
Dividends — unaffiliated | | | 3,923,446 | |
Interest — unaffiliated | | | 43,410 | |
Variation margin on futures contracts | | | 37,921 | |
Unrealized appreciation on OTC swaps | | | 61,849 | |
Prepaid expenses | | | 13,645 | |
| | | | |
Total assets | | | 3,717,521,003 | |
| | | | |
|
LIABILITIES | |
Bank overdraft | | | 809 | |
Cash collateral on securities loaned at value | | | 391,572,116 | |
Payables: | |
Investments purchased | | | 31,716 | |
Directors’ fees | | | 12,094 | |
Investment advisory fees | | | 49,109 | |
Other accrued expenses | | | 114,736 | |
Other affiliates | | | 17,306 | |
Unrealized depreciation on OTC swaps | | | 39,539 | |
| | | | |
Total liabilities | | | 391,837,425 | |
| | | | |
| |
NET ASSETS | | $ | 3,325,683,578 | |
| | | | |
|
NET ASSETS CONSIST OF | |
Investors’ capital | | $ | 2,868,503,430 | |
Net unrealized appreciation (depreciation) | | | 457,180,148 | |
| | | | |
NET ASSETS | | $ | 3,325,683,578 | |
| | | | |
See notes to financial statements.
| | |
| 70 | | 2019 BLACKROCK ANNUAL REPORTTO SHAREHOLDERS |
Statement of Operations
Year Ended December 31, 2019
| | | | |
| | | Master Small Cap
Index Series | |
|
INVESTMENT INCOME | |
Dividends — affiliated | | $ | 1,362,333 | |
Dividends — unaffiliated | | | 38,820,458 | |
Interest — unaffiliated | | | 25,121 | |
Securities lending income — affiliated — net | | | 3,576,601 | |
Foreign taxes withheld | | | (12,787 | ) |
| | | | |
Total investment income | | | 43,771,726 | |
| | | | |
|
EXPENSES | |
Investment advisory | | | 290,667 | |
Custodian | | | 104,136 | |
Professional | | | 102,453 | |
Directors and Officer | | | 51,115 | |
Accounting services | | | 46,937 | |
Printing | | | 5,097 | |
Miscellaneous | | | 28,581 | |
| | | | |
Total expenses | | | 628,986 | |
Less fees waived and/or reimbursed by the Manager | | | (29,505 | ) |
| | | | |
Total expenses after fees waived and/or reimbursed | | | 599,481 | |
| | | | |
Net investment income | | | 43,172,245 | |
| | | | |
|
REALIZED AND UNREALIZED GAIN (LOSS) | |
Net realized gain (loss) from: | |
Futures contracts | | | 8,079,387 | |
Foreign currency transactions | | | (316 | ) |
Investments — affiliated | | | 1,971,729 | |
Investments — unaffiliated | | | 63,328,268 | |
Swaps | | | 1,343,607 | |
| | | | |
| | | 74,722,675 | |
| | | | |
Net change in unrealized appreciation (depreciation) on: | |
Futures contracts | | | (123,181 | ) |
Foreign currency translations | | | 316 | |
Investments — affiliated | | | 3,140,715 | |
Investments — unaffiliated | | | 514,869,458 | |
Swaps | | | 221,656 | |
| | | | |
| | | 518,108,964 | |
| | | | |
Net realized and unrealized gain | | | 592,831,639 | |
| | | | |
NET INCREASE IN NET ASSETS RESULTING FROM OPERATIONS | | $ | 636,003,884 | |
| | | | |
See notes to financial statements.
Statements of Changes in Net Assets
| | | | | | | | |
| | | Master Small Cap Index Series | |
| | | Year Ended December 31, | |
| | | 2019 | | | 2018 | |
|
INCREASE (DECREASE) IN NET ASSETS | |
|
OPERATIONS | |
Net investment income | | $ | 43,172,245 | | | $ | 26,170,323 | |
Net realized gain | | | 74,722,675 | | | | 62,795,001 | |
Net change in unrealized appreciation (depreciation) | | | 518,108,964 | | | | (398,025,975 | ) |
| | | | | | | | |
Net increase (decrease) in net assets resulting from operations | | | 636,003,884 | | | | (309,060,651 | ) |
| | | | | | | | |
|
CAPITAL TRANSACTIONS | |
Proceeds from contributions | | | 1,078,306,760 | | | | 2,037,746,224 | |
Value of withdrawals | | | (698,357,321 | ) | | | (697,110,580 | ) |
| | | | | | | | |
Net increase in net assets derived from capital transactions | | | 379,949,439 | | | | 1,340,635,644 | |
| | | | | | | | |
|
NET ASSETS | |
Total increase in net assets | | | 1,015,953,323 | | | | 1,031,574,993 | |
Beginning of year | | | 2,309,730,255 | | | | 1,278,155,262 | |
| | | | | | | | |
End of year | | $ | 3,325,683,578 | | | $ | 2,309,730,255 | |
| | | | | | | | |
See notes to financial statements.
| | |
| 72 | | 2019 BLACKROCK ANNUAL REPORTTO SHAREHOLDERS |
Financial Highlights
| | | | | | | | | | | | | | | | | | | | |
| | | Master Small Cap Index Series | |
| | | Year Ended December 31, | |
| | | 2019 | | | 2018 | | | 2017 | | | 2016 | | | 2015 | |
| | | | | |
| Total Return | | | | | | | | | | | | | | | |
Total return | | | 25.70 | % | | | (10.96 | )% | | | 14.69 | % | | | 21.49 | % | | | (4.33 | )% |
| | | | | | | | | | | | | | | | | | | | |
| | | | | |
Ratios to Average Net Assets | | | | | | | | | | | | | | | | | | | | |
Total expenses | | | 0.02 | % | | | 0.03 | % | | | 0.06 | % | | | 0.07 | %(a) | | | 0.08 | % |
| | | | | | | | | | | | | | | | | | | | |
Total expenses after fees waived and paid indirectly | | | 0.02 | % | | | 0.03 | % | | | 0.05 | % | | | 0.06 | %(a) | | | 0.07 | % |
| | | | | | | | | | | | | | | | | | | | |
Net investment income | | | 1.49 | % | | | 1.49 | % | | | 1.41 | % | | | 1.49 | %(a) | | | 1.39 | % |
| | | | | | | | | | | | | | | | | | | | |
| | | | | |
Supplemental Data | | | | | | | | | | | | | | | | | | | | |
Net assets, end of year (000) | | $ | 3,325,684 | | | $ | 2,309,730 | | | $ | 1,278,155 | | | $ | 666,690 | | | $ | 465,442 | |
| | | | | | | | | | | | | | | | | | | | |
Portfolio turnover rate | | | 20 | % | | | 28 | % | | | 30 | % | | | 39 | % | | | 37 | % |
| | | | | | | | | | | | | | | | | | | | |
| (a) | Excludes expenses incurred indirectly of 0.01% as a result of the Series’ investments in underlying funds. |
See notes to financial statements.
Notes to Financial Statements
Master Small Cap Index Series (“Master Small Cap Index” or the “Series”) is a series of Quantitative Master Series LLC (the “Master LLC”) which is registered under the Investment Company Act of 1940, as amended (the “1940 Act”), as anopen-end management investment company. The Master LLC is classified as diversified. The Series’ Limited Liability Company Agreement permits the Board of Directors of the Master LLC (the “Board”) to issuenon-transferable interests, subject to certain limitations.
The Series, together with certain other registered investment companies advised by BlackRock Advisors, LLC (the “Manager”) or its affiliates, is included in a complex of equity, multi-asset, index and money market funds referred to as the BlackRock Multi-Asset Complex.
Prior Year Reorganization: The Board of BlackRock Index Funds, Inc. and the Board of State Farm Mutual Fund Trust and the shareholders of State Farm Small Cap Index Fund (the “Target Fund”) approved the reorganization of the Target Fund into iShares Russell 2000Small-Cap Index Fund (the “Fund”). As a result, the Fund acquired all of the assets and assumed certain stated liabilities of the Target Fund in exchange for an equal aggregate value of newly-issued shares of the Fund.
On November 19, 2018, all of the portfolio securities previously held by the Target Fund were subsequently contributed by the Fund to Master Small Cap Index in exchange for an investment in Master Small Cap Index.
For financial reporting purposes, assets received and shares issued by the Fund were recorded at fair value. However, the cost basis of the investments received from the Target Fund was carried forward by Master Small Cap Index to align ongoing reporting of the Fund’s realized and unrealized gains and losses with amounts distributable to shareholders for tax purposes.
The Target Fund’s fair value and cost of investments prior to the reorganization were as follows:
| | | | | | | | |
| Target Fund | | Fair Value
of Investments | | | Cost Value of
Investments | |
State Farm Small Cap Index Fund | | $ | 406,256,934 | | | $ | 326,299,543 | |
| 2. | SIGNIFICANT ACCOUNTING POLICIES |
The financial statements are prepared in conformity with accounting principles generally accepted in the United States of America (“U.S. GAAP”), which may require management to make estimates and assumptions that affect the reported amounts of assets and liabilities in the financial statements, disclosure of contingent assets and liabilities at the date of the financial statements and the reported amounts of increases and decreases in net assets from operations during the reporting period. Actual results could differ from those estimates. The Series is considered an investment company under U.S. GAAP and follows the accounting and reporting guidance applicable to investment companies. Below is a summary of significant accounting policies:
Investment Transactions and Income Recognition: For financial reporting purposes, investment transactions are recorded on the dates the transactions are executed. Realized gains and losses on investment transactions are determined on the identified cost basis. Dividend income is recorded on theex-dividend date. Dividends from foreign securities where theex-dividend date may have passed are subsequently recorded when the Series is informed of theex-dividend date. Under the applicable foreign tax laws, a withholding tax at various rates may be imposed on capital gains, dividends and interest. Upon notification from issuers, a portion of the dividend income received from a real estate investment trust may be redesignated as a reduction of cost of the related investment and/or realized gain.
Foreign Currency Translation:The Series’ books and records are maintained in U.S. dollars. Securities and other assets and liabilities denominated in foreign currencies are translated into U.S. dollars using exchange rates determined as of the close of trading on the New York Stock Exchange (“NYSE”). Purchases and sales of investments are recorded at the rates of exchange prevailing on the respective dates of such transactions. Generally, when the U.S. dollar rises in value against a foreign currency, the investments denominated in that currency will lose value; the opposite effect occurs if the U.S. dollar falls in relative value.
The Series does not isolate the portion of the results of operations arising as a result of changes in the exchange rates from the changes in the market prices of investments held or sold for financial reporting purposes. Accordingly, the effects of changes in exchange rates on investments are not segregated in the Statement of Operations from the effects of changes in market prices of those investments, but are included as a component of net realized and unrealized gain (loss) from investments. The Series reports realized currency gains (losses) on foreign currency related transactions as components of net realized gain (loss) for financial reporting purposes, whereas such components are generally treated as ordinary income for U.S. federal income tax purposes.
Segregation and Collateralization: In cases where the Series enters into certain investments (e.g., futures contracts and swaps) that would be treated as “senior securities” for 1940 Act purposes, the Series may segregate or designate on itsbooks and records cash or liquid assets having a market value at least equal to the amount of its future obligations under such investments. Doing so allows the investment to be excluded from treatment as a “senior security.” Furthermore, if required by an exchange or counterparty agreement, the Series may be required to deliver/deposit cash and/or securities to/with an exchange, or broker-dealer or custodian as collateral for certain investments or obligations.
Indemnifications:In the normal course of business, the Series enters into contracts that contain a variety of representations that provide general indemnification. The Series’ maximum exposure under these arrangements is unknown because it involves future potential claims against the Series, which cannot be predicted with any certainty.
Other:Expenses directly related to the Series are charged to the Series. Other operating expenses shared by several funds, including other funds managed by the Manager, are prorated among those funds on the basis of relative net assets or other appropriate methods.
| | |
| 74 | | 2019 BLACKROCK ANNUAL REPORTTO SHAREHOLDERS |
Notes to Financial Statements (continued)
| 3. | INVESTMENT VALUATION AND FAIR VALUE MEASUREMENTS |
Investment Valuation Policies: The Series’ investments are valued at fair value (also referred to as “market value” within the financial statements) as of the close of trading on the (NYSE generally 4:00 p.m., Eastern time). U.S. GAAP defines fair value as the price the Series would receive to sell an asset or pay to transfer a liability in an orderly transaction between market participants at the measurement date. The Series determines the fair values of its financial instruments using various independent dealers or pricing services under policies approved by the Board. The BlackRock Global Valuation Methodologies Committee (the “Global Valuation Committee”) is the committee formed by management to develop global pricing policies and procedures and to oversee the pricing function for all financial instruments.
Fair Value Inputs and Methodologies: The following methods and inputs are used to establish the fair value of the Series’ assets and liabilities:
| | • | | Equity investments traded on a recognized securities exchange are valued at the official closing price each day, if available. For equity investments traded on more than one exchange, the official closing price on the exchange where the stock is primarily traded is used. Equity investments traded on a recognized exchange for which there were no sales on that day may be valued at the last available bid (long positions) or ask (short positions) price. |
Generally, trading in foreign instruments is substantially completed each day at various times prior to the close of trading on the NYSE. Occasionally, events affecting the values of such instruments may occur between the foreign market close and the close of trading on the NYSE that may not be reflected in the computation of the Series’ net assets. Each business day, the Series uses a pricing service to assist with the valuation of certain foreign exchange-traded equity securities and foreign exchange-traded andover-the-counter (“OTC”) options (the “Systematic Fair Value Price”). Using current market factors, the Systematic Fair Value Price is designed to value such foreign securities and foreign options at fair value as of the close of trading on the NYSE, which follows the close of the local markets.
| | • | | Investments inopen-end U.S. mutual funds are valued at net asset value (“NAV”) each business day. |
| | • | | Futures contracts traded on exchanges are valued at their last sale price. |
| | • | | Swap agreements are valued utilizing quotes received daily by the Series’ pricing service or through brokers, which are derived using daily swap curves and models that incorporate a number of market data factors, such as discounted cash flows, trades and values of the underlying reference instruments. |
If events (e.g., a company announcement, market volatility or a natural disaster) occur that are expected to materially affect the value of such investments, or in the event that the application of these methods of valuation results in a price for an investment that is deemed not to be representative of the market value of such investment, or if a price is not available, the investment will be valued by the Global Valuation Committee, or its delegate, in accordance with a policy approved by the Board as reflecting fair value (“Fair Valued Investments”). The fair valuation approaches that may be used by the Global Valuation Committee will include market approach, income approach and cost approach. Valuation techniques such as discounted cash flow, use of market comparables and matrix pricing are types of valuation approaches and are typically used in determining fair value. When determining the price for Fair Valued Investments, the Global Valuation Committee, or its delegate, seeks to determine the price that the Series might reasonably expect to receive or pay from the current sale or purchase of that asset or liability in anarm’s-length transaction. Fair value determinations shall be based upon all available factors that the Global Valuation Committee, or its delegate, deems relevant and consistent with the principles of fair value measurement. The pricing of all Fair Valued Investments is subsequently reported to the Board or a committee thereof on a quarterly basis.
For investments in equity or debt issued by privately held companies or funds (“Private Company” or collectively, the “Private Companies”) and other Fair Valued Investments, the fair valuation approaches that are used by the Global Valuation Committee and third party pricing services utilize one or a combination of, but not limited to, the following inputs.
| | |
| | | Standard Inputs Generally Considered By Third Party Pricing Services |
Market approach | | (i) recent market transactions, including subsequent rounds of financing, in the underlying investment or comparable issuers; (ii) recapitalizations and other transactions across the capital structure; and (iii) market multiples of comparable issuers. |
Income approach | | (i) future cash flows discounted to present and adjusted as appropriate for liquidity, credit, and/or market risks; (ii) quoted prices for similar investments or assets in active markets; and (iii) other risk factors, such as interest rates, yield curves, volatilities, prepayment speeds, loss severities, credit risks, recovery rates, liquidation amounts and/or default rates. |
Cost approach | | (i) audited or unaudited financial statements, investor communications and financial or operational metrics issued by the Private Company; (ii) changes in the valuation of relevant indices or publicly traded companies comparable to the Private Company; (iii) relevant news and other public sources; and (iv) known secondary market transactions in the Private Company’s interests and merger or acquisition activity in companies comparable to the Private Company. |
Investments in series of preferred stock issued by Private Companies are typically valued utilizing market approach in determining the enterprise value of the company. Such investments often contain rights and preferences that differ from other series of preferred and common stock of the same issuer. Valuation techniques such as an option pricing model (“OPM”), a probability weighted expected return model (“PWERM”) or a hybrid of those techniques are used in allocating enterprise value of the company, as deemed appropriate under the circumstances. The use of OPM and PWERM techniques involve a determination of the exit scenarios of the investment in order to appropriately allocate the enterprise value of the company among the various parts of its capital structure.
The Private Companies are not subject to the public company disclosure, timing, and reporting standards as other investments held by the Series. Typically, the most recently available information by a Private Company is as of a date that is earlier than the date the Series is calculating its NAV. This factor may result in a difference between the value of the investment and the price the Series could receive upon the sale of the investment.
| | | | |
| NOTESTO FINANCIAL STATEMENTS | | | 75 | |
Notes to Financial Statements (continued)
Fair Value Hierarchy: Various inputs are used in determining the fair value of investments and derivative financial instruments. These inputs to valuation techniques are categorized into a fair value hierarchy consisting of three broad levels for financial statement purposes as follows:
| | • | | Level 1 — Unadjusted price quotations in active markets/exchanges for identical assets or liabilities that the Series has the ability to access |
| | • | | Level 2 — Other observable inputs (including, but not limited to, quoted prices for similar assets or liabilities in markets that are active, quoted prices for identical or similar assets or liabilities in markets that are not active, inputs other than quoted prices that are observable for the assets or liabilities (such as interest rates, yield curves, volatilities, prepayment speeds, loss severities, credit risks and default rates) or other market–corroborated inputs) |
| | • | | Level 3 — Unobservable inputs based on the best information available in the circumstances, to the extent observable inputs are not available (including the Series’ own assumptions used in determining the fair value of investments and derivative financial investments) |
The hierarchy gives the highest priority to unadjusted quoted prices in active markets for identical assets or liabilities (Level 1 measurements) and the lowest priority to unobservable inputs (Level 3 measurements). Accordingly, the degree of judgment exercised in determining fair value is greatest for instruments categorized in Level 3. The inputs used to measure fair value may fall into different levels of the fair value hierarchy. In such cases, for disclosure purposes, the fair value hierarchy classification is determined based on the lowest level input that is significant to the fair value measurement in its entirety. Investments classified within Level 3 have significant unobservable inputs used by the Global Valuation Committee in determining the price for Fair Valued Investments. Level 3 investments include equity or debt issued by Private Companies. There may not be a secondary market, and/or there are a limited number of investors. The categorization of a value determined for investments and derivative financial instruments is based on the pricing transparency of the investments and derivative financial instruments and is not necessarily an indication of the risks associated with investing in those securities.
| 4. | SECURITIES AND OTHER INVESTMENTS |
Securities Lending:The Series may lend its securities to approved borrowers, such as brokers, dealers and other financial institutions. The borrower pledges and maintains with the Series collateral consisting of cash, an irrevocable letter of credit issued by a bank, or securities issued or guaranteed by the U.S. Government. The initial collateral received by the Series is required to have a value of at least 102% of the current value of the loaned securities for securities traded on U.S. exchanges and a value of at least 105% for all other securities. The collateral is maintained thereafter at a value equal to at least 100% of the current market value of the securities on loan. The market value of the loaned securities is determined at the close of each business day of the Series and any additional required collateral is delivered to the Series, or excess collateral returned by the Series, on the next business day. During the term of the loan, the Series is entitled to all distributions made on or in respect of the loaned securities, but does not receive interest income on securities received as collateral. Loans of securities are terminable at any time and the borrower, after notice, is required to return borrowed securities within the standard time period for settlement of securities transactions.
The market value of any securities on loan, all of which were classified as common stock in the Series’ Schedule of Investments, and the value of any related collateral are shown separately in the Statement of Assets and Liabilities as a component of investments at value – unaffiliated, and collateral on securities loaned at value, respectively. As of period end, any securities on loan were collateralized by cash and/or U.S. Government obligations. Cash collateral invested by the securities lending agent, BlackRock Institutional Trust Company, N.A. (“BTC”), if any, is disclosed in the Schedule of Investments.
Securities lending transactions are entered into by the Series under Master Securities Lending Agreements (each, an “MSLA”), which provide the right, in the event of default (including bankruptcy or insolvency), for thenon-defaulting party to liquidate the collateral and calculate a net exposure to the defaulting party or request additional collateral. In the event that a borrower defaults, the Series, as lender, would offset the market value of the collateral received against the market value of the securities loaned. When the value of the collateral is greater than that of the market value of the securities loaned, the lender is left with a net amount payable to the defaulting party. However, bankruptcy or insolvency laws of a particular jurisdiction may impose restrictions on or prohibitions against such a right of offset in the event of an MSLA counterparty’s bankruptcy or insolvency. Under the MSLA, absent an event of default, the borrower can resell orre-pledge the loaned securities, and the Series can reinvest cash collateral received in connection with loaned securities. Upon an event of default, the parties’ obligations to return the securities or collateral to the other party are extinguished, and the parties can resell orre-pledge the loaned securities or the collateral received in connection with the loaned securities in order to satisfy the defaulting party’s net payment obligation for all transactions under the MSLA. The defaulting party remains liable for any deficiency.
As of period end, the following table is a summary of the Series’ securities lending agreements by counterparty which are subject to offset under an MSLA:
| | | | | | | | | | | | |
| Counterparty | | Securities
Loaned at Value | | | Cash Collateral
Received (a) | | | Net Amount (b) | |
Barclays Capital, Inc. | | $ | 26,628,700 | | | $ | (26,628,700) | | | $ | — | |
BNP Paribas Securities Corp. | | | 5,835,719 | | | | (5,835,719 | ) | | | — | |
Bank of America N.A. | | | 39,776,329 | | | | (39,776,329 | ) | | | — | |
Citadel Clearing LLC | | | 694,698 | | | | (688,787 | ) | | | 5,911 | |
Citigroup Global Markets, Inc. | | | 53,868,709 | | | | (53,868,709 | ) | | | — | |
Credit Suisse AG Dublin Branch | | | 49,987,622 | (c) | | | (49,987,622 | ) | | | — | |
Credit Suisse Securities (USA) LLC | | | 20,183,721 | | | | (20,183,721 | ) | | | — | |
ING Financial Markets LLC | | | 394,682 | | | | (394,682 | ) | | | — | |
Jefferies LLC | | | 1,758,140 | | | | (1,758,140 | ) | | | — | |
JP Morgan Securities LLC | | | 85,210,028 | | | | (85,210,028 | ) | | | — | |
Scotia Capital (USA), Inc. | | | 5,120,814 | | | | (5,120,814 | ) | | | — | |
State Street Bank & Trust Company | | | 359,829 | | | | (359,829 | ) | | | — | |
TD Prime Services LLC | | | 5,123,173 | | | | (5,123,173 | ) | | | — | |
Wells Fargo Bank, National Association | | | 39,147,441 | | | | (39,147,441 | ) | | | — | |
Wells Fargo Securities LLC | | | 47,350,900 | | | | (47,350,900 | ) | | | — | |
| | | | | | | | | | | | |
| | $ | 381,440,505 | | | $ | (381,434,594) | | | $ | 5,911 | |
| | | | | | | | | | | | |
| | |
| 76 | | 2019 BLACKROCK ANNUAL REPORTTO SHAREHOLDERS |
Notes to Financial Statements (continued)
| | (a) | Collateral received in excess of the market value of securities on loan is not presented in this table. The total cash collateral received by Series’ is disclosed in the Series’ Statement of Assets and Liabilities. | |
| | (b) | The market value of the loaned securities is determined as of December 31, 2019. Additional collateral is delivered to the Series’ on the next business day in accordance with the MSLA. The net amount would be subject to the borrower default indemnity in the event of default by the counterparty. | |
| | (c) | Securities loaned with a value of $20,866 have been sold and are pending settlement as of 12/31/2019. | |
The risks of securities lending include the risk that the borrower may not provide additional collateral when required or may not return the securities when due. To mitigate these risks, the Series benefits from a borrower default indemnity provided by BlackRock, Inc. (“BlackRock”).BlackRock’s indemnity allows for full replacement of the securities loaned to the extent the collateral received does not cover the value on the securities loaned in the event of borrower default. The Series could incur a loss if the value of an investment purchased with cash collateral falls below the market value of loaned securities or if the value of an investment purchased with cash collateral falls below the value of the original cash collateral received. Such losses are borne entirely by the Series’.
| 5. | DERIVATIVE FINANCIAL INSTRUMENTS |
The Series engages in various portfolio investment strategies using derivative contracts both to increase the returns of the Series and/or to manage its exposure to certain risks such as credit risk, equity risk, interest rate risk, foreign currency exchange rate risk, commodity price risk or other risks (e.g., inflation risk). Derivative financial instruments categorized by risk exposure are included in the Schedule of Investments. These contracts may be transacted on an exchange or OTC.
Futures Contracts:Futures contracts are purchased or sold to gain exposure to, or manage exposure to, changes in interest rates (interest rate risk) and changes in the value of equity securities (equity risk) or foreign currencies (foreign currency exchange rate risk).
Futures contracts are agreements between the Series and a counterparty to buy or sell a specific quantity of an underlying instrument at a specified price and on a specified date. Depending on the terms of a contract, it is settled either through physical delivery of the underlying instrument on the settlement date or by payment of a cash amount on the settlement date. Upon entering into a futures contract, the Series is required to deposit initial margin with the broker in the form of cash or securities in an amount that varies depending on a contract’s size and risk profile. The initial margin deposit must then be maintained at an established level over the life of the contract. Amounts pledged, which are considered restricted, are included in cash pledged for futures contracts in the Statement of Assets and Liabilities.
Securities deposited as initial margin are designated in the Schedule of Investments and cash deposited, if any, is shown as cash pledged for futures contracts in the Statement of Assets and Liabilities. Pursuant to the contract, the Series agrees to receive from or pay to the broker an amount of cash equal to the daily fluctuation in market value of the contract (“variation margin”). Variation margin is recorded as unrealized appreciation (depreciation) and, if any, shown as variation margin receivable (or payable) on futures contracts in the Statement of Assets and Liabilities. When the contract is closed, a realized gain or loss is recorded in the Statement of Operations equal to the difference between the notional amount of the contract at the time it was opened and the notional amount at the time it was closed. The use of futures contracts involves the risk of an imperfect correlation in the movements in the price of futures contracts and interest, foreign currency exchange rates or underlying assets.
Swaps:Swap contracts are entered into to manage exposure to issuers, markets and securities. Such contracts are agreements between the Series and a counterparty to make periodic net payments on a specified notional amount or a net payment upon termination. Swap agreements are privately negotiated in the OTC market and may be entered into as a bilateral contract (“OTC swaps”) or centrally cleared (“centrally cleared swaps”).
For OTC swaps, any upfront premiums paid and any upfront fees received are shown as swap premiums paid and swap premiums received, respectively, in the Statement of Assets and Liabilities and amortized over the term of the contract. The daily fluctuation in market value is recorded as unrealized appreciation (depreciation) on OTC Swaps in the Statement of Assets and Liabilities. Payments received or paid are recorded in the Statement of Operations as realized gains or losses, respectively. When an OTC swap is terminated, a realized gain or loss is recorded in the Statement of Operations equal to the difference between the proceeds from (or cost of) the closing transaction and the Series’ basis in the contract, if any. Generally, the basis of the contract is the premium received or paid.
In a centrally cleared swap, immediately following execution of the swap contract, the swap contract is novated to a central counterparty (the “CCP”) and the Series’ counterparty on the swap agreement becomes the CCP. The Series is required to interface with the CCP through the broker. Upon entering into a centrally cleared swap, the Series is required to deposit initial margin with the broker in the form of cash or securities in an amount that varies depending on the size and risk profile of the particular swap. Securities deposited as initial margin are designated in the Schedule of Investments and cash deposited is shown as cash pledged for centrally cleared swaps in the Statement of Assets and Liabilities. Amounts pledged, which are considered restricted cash, are included in cash pledged for centrally cleared swaps in the Statement of Assets and Liabilities. Pursuant to the contract, the Series agrees to receive from or pay to the broker an amount of cash equal to the daily fluctuation in market value of the contract (“variation margin”). Variation margin is recorded as unrealized appreciation (depreciation) and shown as variation margin receivable (or payable) on centrally cleared swaps in the Statement of Assets and Liabilities. Payments received from (paid to) the counterparty, including at termination, are recorded as realized gains (losses) in the Statement of Operations.
| | • | | Total return swaps — Total return swaps are entered into to obtain exposure to a security or market without owning such security or investing directly in such market or to exchange the risk/return of one security or market (e.g., fixed-income) with another security or market (e.g., equity or commodity prices) (equity risk, commodity price risk and/or interest rate risk). |
Total return swaps are agreements in which there is an exchange of cash flows whereby one party commits to make payments based on the total return (distributions plus capital gains/losses) of an underlying instrument, or basket or underlying instruments, in exchange for fixed or floating rate interest payments. If the total return of the instrument(s) or index underlying the transaction exceeds or falls short of the offsetting fixed or floating interest rate obligation, the Series receives payment from or makes a payment to the counterparty.
Certain total return swaps are designed to function as a portfolio of direct investments in long and short equity positions. This means that the Series has the ability to trade in and out of these long and short positions within the swap and will receive the economic benefits and risks equivalent to direct investment in these positions, subject to certain adjustments due to events related to the counterparty. Benefits and risks include capital appreciation (depreciation), corporate actions
| | | | |
| NOTESTO FINANCIAL STATEMENTS | | | 77 | |
Notes to Financial Statements (continued)
and dividends received and paid, all of which are reflected in the swap’s market value. The market value also includes interest charges and credits (“financing fees”) related to the notional values of the long and short positions and cash balances within the swap. These interest charges and credits are based on a specified benchmark rate plus or minus a specified spread determined based upon the country and/or currency of the positions in the portfolio.
Positions within the swap and financing fees are reset periodically. During a reset, any unrealized appreciation (depreciation) on positions and accrued financing fees become available for cash settlement between the Series and the counterparty. The amounts that are available for cash settlement are recorded as realized gains or losses in the Statement of Operations. Cash settlement in and out of the swap may occur at a reset date or any other date, at the discretion of the Series and the counterparty, over the life of the agreement. Certain swaps have no stated expiration and can be terminated by either party at any time.
Swap transactions involve, to varying degrees, elements of interest rate, credit and market risk in excess of the amounts recognized in the Statement of Assets and Liabilities. Such risks involve the possibility that there will be no liquid market for these agreements, that the counterparty to the agreements may default on its obligation to perform or disagree as to the meaning of the contractual terms in the agreements, and that there may be unfavorable changes in interest rates and/or market values associated with these transactions.
Master Netting Arrangements: In order to define its contractual rights and to secure rights that will help it mitigate its counterparty risk, the Series’ may enter into an International Swaps and Derivatives Association, Inc. Master Agreement (“ISDA Master Agreement”) or similar agreement with its counterparties. An ISDA Master Agreement is a bilateral agreement between the Series and a counterparty that governs certain OTC derivatives and typically contains, among other things, collateral posting terms and netting provisions in the event of a default and/or termination event. Under an ISDA Master Agreement, the Series may, under certain circumstances, offset with the counterparty certain derivative financial instruments’ payables and/or receivables with collateral held and/or posted and create one single net payment. The provisions of the ISDA Master Agreement typically permit a single net payment in the event of default including the bankruptcy or insolvency of the counterparty. Bankruptcy or insolvency laws of a particular jurisdiction may restrict or prohibit the right of offset in bankruptcy, insolvency or other events.
Collateral Requirements: For derivatives traded under an ISDA Master Agreement, the collateral requirements are typically calculated by netting themark-to-market amount for each transaction under such agreement and comparing that amount to the value of any collateral currently pledged by the Series and the counterparty.
Cash collateral that has been pledged to cover obligations of the Series and cash collateral received from the counterparty, if any, is reported separately in the Statement of Assets and Liabilities as cash pledged as collateral and cash received as collateral, respectively.Non-cash collateral pledged by the Series, if any, is noted in the Schedule of Investments. Generally, the amount of collateral due from or to a counterparty is subject to a certain minimum transfer amount threshold before a transfer is required, which is determined at the close of business of the Series. Any additional required collateral is delivered to/pledged by the Series on the next business day. Typically, the counterparty is not permitted to sell,re-pledge or use cash andnon-cash collateral it receives. The Series generally agrees not to usenon-cash collateral that it receives but may, absent default or certain other circumstances defined in the underlying ISDA Master Agreement, be permitted to use cash collateral received. In such cases, interest may be paid pursuant to the collateral arrangement with the counterparty. To the extent amounts due to the Series from its counterparties are not fully collateralized, it bears the risk of loss from counterpartynon-performance. Likewise, to the extent the Series has delivered collateral to a counterparty and stand ready to perform under the terms of its agreement with such counterparty, it bears the risk of loss from a counterparty in the amount of the value of the collateral in the event the counterparty fails to return such collateral. Based on the terms of agreements, collateral may not be required for all derivative contracts.
For financial reporting purposes, the Series does not offset derivative assets and derivative liabilities that are subject to netting arrangements, if any, in the Statement of Assets and Liabilities.
| 6. | INVESTMENT ADVISORY AGREEMENT AND OTHER TRANSACTIONS WITH AFFILIATES |
Investment Advisory:The Master LLC, on behalf of the Series, entered into an Investment Advisory Agreement with the Manager, the Series’ investment adviser and an indirect, wholly-owned subsidiary of BlackRock, to provide investment advisory and administrative services. The Manager is responsible for the management of the Series’ portfolio and provides the personnel, facilities, equipment and certain other services necessary to the operations of the Series.
For such services, the Series pays the Manager a monthly fee at an annual rate equal to 0.01% of the average daily value of the Series’ net assets.
With respect to the Series, the Manager entered into asub-advisory agreement with BlackRock Fund Advisors (“BFA”), an affiliate of the Manager. The Manager pays BFA, for services it provides, for that portion of the Series for which BFA acts assub-adviser, a monthly fee that is equal to a percentage of the investment advisory fees paid by the Series to the Manager.
Waivers and Reimbursements:The Manager voluntarily agreed to waive its investment advisory fees by the amount of investment advisory fees the Series pays to the Manager indirectly through its investment in affiliated money market funds (the “affiliated money market fund waiver”). The amount of waivers and/or reimbursements of fees and expenses made pursuant to the expense limitation described below will be reduced by the amount of the affiliated money market fund waiver. This amount is included in fees waived and/or reimbursed by the Manager in the Statement of Operations. For the year ended December 31, 2019, the amount waived was $27,332.
The Manager has contractually agreed to waive its investment advisory fee with respect to any portion of the Series’ assets invested in affiliated equity and fixed-income mutual funds and affiliated exchange-traded funds that have a contractual management fee through April 30, 2021. The contractual agreement may be terminated upon 90 days’ notice by a majority of the directors who are not ‘interested persons’ of the Master LLC as defined in the 1940 Act (“Independent Directors”) or by a vote of a majority of the outstanding voting securities of the Series. This amount is included in fees waived and/or reimbursed by the Manager in the Statement of Operations. For the year ended December 31, 2019, the Manager waived $2,173 in investment advisory fees pursuant to this arrangement.
For the year ended December 31, 2019, the Series reimbursed the Manager for certain accounting services, which is included in accounting services in the Statement of Operations. The reimbursement was $37,341.
| | |
| 78 | | 2019 BLACKROCK ANNUAL REPORTTO SHAREHOLDERS |
Notes to Financial Statements (continued)
The Manager contractually agreed to waive and/or reimburse fees or expenses in order to limit expenses, excluding interest expense, dividend expense, tax expense, acquired fund fees and expenses, and certain other fund expenses, which constitute extraordinary expenses not incurred in the ordinary course of the Series’ business (“expense limitation”). The expense limitation as a percentage of average daily net assets is 0.07%.
The Manager has agreed not to reduce or discontinue this contractual expense limitation through April 30, 2021, unless approved by the Board, including a majority of the Independent Directors or by a vote of a majority of the outstanding voting securities of the Series.
Securities Lending:The U.S. Securities and Exchange Commission (“SEC”) has issued an exemptive order which permits BTC, an affiliate of the Manager, to serve as securities lending agent for the Series, subject to applicable conditions. As securities lending agent, BTC bears all operational costs directly related to securities lending. The Series is responsible for fees in connection with the investment of cash collateral received for securities on loan (the “collateral investment fees”). The cash collateral is invested in a money market fund managed by the Manager or its affiliates. However, BTC has agreed to reduce the amount of securities lending income it receives in order to effectively limit the collateral investment fees the Series bears to an annual rate of 0.04%. The shares of such money market fund will not be subject to a sales load, distribution fee or service fee. The money market fund in which the cash collateral has been invested may, under certain circumstances, impose a liquidity fee of up to 2% of the value redeemed or temporarily restrict redemptions for up to 10 business days during a 90 day period, in the event that the money market fund’s weekly liquid assets fall below certain thresholds.
Securities lending income is equal to the total of income earned from the reinvestment of cash collateral, net of fees and other payments to and from borrowers of securities, and less the collateral investment fees. The Series retains a portion of securities lending income and remits a remaining portion to BTC as compensation for its services as securities lending agent
Pursuant to the current securities lending agreement, the Series retains 73.5% of securities lending income (which excludes collateral investment fees), and this amount retained can never be less than 70% of the total of securities lending income plus the collateral investment fees.
In addition, commencing the business day following the date that the aggregate securities lending income earned across the BlackRock Multi-Asset Complex in a calendar year exceeds a specified threshold, the Series, pursuant to the securities lending agreement, will retain for the remainder of that calendar year securities lending income in an amount equal to 80% of securities lending income (which excludes the current collateral investment fees), and this amount retained can never be less than 70% of the total of securities lending income plus the collateral investment fees.
The share of securities lending income earned by the Series is shown as securities lending income — affiliated — net in the Statement of Operations. For the year ended December 31, 2019, the Series paid BTC $1,175,636 for securities lending agent services.
Interfund Lending:In accordance with an exemptive order (the “Order”) from the SEC, the Series may participate in a joint lending and borrowing facility for temporary purposes (the “Interfund Lending Program”), subject to compliance with the terms and conditions of the Order, and to the extent permitted by the Series’ investment policies and restrictions. The Series is currently permitted to borrow and lend under the Interfund Lending Program.
A lending BlackRock fund may lend in aggregate up to 15% of its net assets, but may not lend more than 5% of its net assets to any one borrowing fund through the Interfund Lending Program. A borrowing BlackRock fund may not borrow through the Interfund Lending Program or from any other source more than 33 1/3% of its total assets (or any lower threshold provided for by the fund’s investment restrictions). If a borrowing BlackRock fund’s total outstanding borrowings exceed 10% of its total assets, each of its outstanding interfund loans will be subject to collateralization of at least 102% of the outstanding principal value of the loan. All interfund loans are for temporary or emergency purposes and the interest rate to be charged will be the average of the highest current overnight repurchase agreement rate available to a lending fund and the bank loan rate, as calculated according to a formula established by the Board.
During the year ended December 31, 2019, the Series did not participate in the Interfund Lending Program.
Directors and Officers:Certain directors and/or officers of the Master LLC are directors and/or officers of BlackRock or its affiliates.
Other Transactions: The Series may purchase securities from, or sell securities to, an affiliated fund provided the affiliation is due solely to having a common investment adviser, common officers, or common directors. For the year ended December 31, 2019, the purchase and sale transactions and any net realized gains (losses) with an affiliated fund in compliance with Rule17a-7 under the 1940 Act were as follows:
| | | | | | | | | | | | | | |
| Purchases | | | | | Sales | | | | | Net Realized Gain (Loss) | |
| $ | 143,395,415 | | | | | $ | 142,107,860 | | | | | $ | 17,577,919 | |
For the year ended December 31, 2019, purchases and sales of investments, excluding short-term securities, were $1,073,057,702 and $637,964,402, respectively.
The Series is classified as a partnership for U.S. federal income tax purposes. As such, each investor in the Series is treated as the owner of its proportionate share of net assets, income, expenses and realized and unrealized gains and losses of the Series. Therefore, no U.S. federal income tax provision is required. It is intended that the Series’ assets will be managed so an investor in the Series can satisfy the requirements of Subchapter M of the Internal Revenue Code of 1986, as amended.
| | | | |
| NOTESTO FINANCIAL STATEMENTS | | | 79 | |
Notes to Financial Statements (continued)
The Series files U.S. federal and various state and local tax returns. No income tax returns are currently under examination. The statute of limitations on the Series’ U.S. federal tax returns generally remains open for each of the four years ended December 31, 2019. The statutes of limitations on the Series’ state and local tax returns may remain open for an additional year depending upon the jurisdiction.
Management has analyzed tax laws and regulations and their application to the Series as of December 31, 2019, inclusive of the open tax return years, and does not believe that there are any uncertain tax positions that require recognition of a tax liability in the Series’ financial statements.
As of December 31, 2019, gross unrealized appreciation and depreciation for investments and derivatives based on cost for U.S. federal income tax purposes were as follows:
| | | | |
Tax cost | | $ | 3,296,803,543 | |
| | | | |
Gross unrealized appreciation | | $ | 695,730,658 | |
Gross unrealized depreciation | | | (280,743,314 | ) |
| | | | |
Net unrealized appreciation | | $ | 414,987,344 | |
| | | | |
The Master LLC, on behalf of the Series along with certain other funds managed by the Manager and its affiliates (“Participating Funds”), is a party to a364-day, $2.25 billion credit agreement with a group of lenders. Under this agreement, the Series may borrow to fund shareholder redemptions. Excluding commitments designated for certain individual funds, the Participating Funds, including the Series, can borrow up to an aggregate commitment amount of $1.75 billion at any time outstanding, subject to asset coverage and other limitations as specified in the agreement. The credit agreement has the following terms: a fee of 0.10% per annum on unused commitment amounts and interest at a rate equal to the higher of(a) one-month LIBOR (but, in any event, not less than 0.00%) on the date the loan is made plus 0.80% per annum or (b) the Fed Funds rate (but, in any event, not less than 0.00%) in effect from time to time plus 0.80% per annum on amounts borrowed. The agreement expires in April 2020 unless extended or renewed. Prior to April 18, 2019, Participating Funds paid an upfront commitment fee of 0.02% on the total commitment amounts, in addition to administration, legal and arrangement fees, which are included in miscellaneous expenses in the Statement of Operations. These fees were allocated among such funds based upon portions of the aggregate commitment available to them and relative net assets of Participating Funds. During the year ended December 31, 2019, the Series did not borrow under the credit agreement.
In the normal course of business, the Series invests in securities or other instruments and may enter into certain transactions, and such activities subject the Series to various risks, including among others, fluctuations in the market (market risk) or failure of an issuer to meet all of its obligations. The value of securities or other instruments may also be affected by various factors, including, without limitation: (i) the general economy; (ii) the overall market as well as local, regional or global political and/or social instability; (iii) regulation, taxation or international tax treaties between various countries; or (iv) currency, interest rate and price fluctuations. The Series’ prospectus provides details of the risks to which the Series is subject.
The Series may be exposed to additional risks when reinvesting cash collateral in money market funds that do not seek to maintain a stable NAV per share of $1.00, which may be subject to redemption gates or liquidity fees under certain circumstances.
Valuation Risk: The market values of equities, such as common stocks and preferred securities or equity related investments, such as futures and options, may decline due to general market conditions which are not specifically related to a particular company. They may also decline due to factors which affect a particular industry or industries. The Series may invest in illiquid investments. An illiquid investment is any investment that the Series reasonably expects cannot be sold or disposed of in current market conditions in seven calendar days or less without the sale or disposition significantly changing the market value of the investment. The Series may experience difficulty in selling those investments in a timely manner at the price that it believes the investments are worth. Prices may fluctuate widely over short or extended periods in response to company, market or economic news. Markets also tend to move in cycles, with periods of rising and falling prices. This volatility may cause the Series’ NAV to experience significant increases or decreases over short periods of time. If there is a general decline in the securities and other markets, the NAV of the Series may lose value, regardless of the individual results of the securities and other instruments in which the Series invests.
The price the Series could receive upon the sale of any particular portfolio investment may differ from the Series’ valuation of the investment, particularly for securities that trade in thin or volatile markets or that are valued using a fair valuation technique or a price provided by an independent pricing service. Changes to significant unobservable inputs and assumptions (i.e., publicly traded company multiples, growth rate, time to exit) due to the lack of observable inputs may significantly impact the resulting fair value and therefore the Series’ results of operations. As a result, the price received upon the sale of an investment may be less than the value ascribed by the Series, and the Series could realize a greater than expected loss or lesser than expected gain upon the sale of the investment. The Series’ ability to value its investments may also be impacted by technological issues and/or errors by pricing services or other third party service providers.
Counterparty Credit Risk:The Series may be exposed to counterparty credit risk, or the risk that an entity may fail to or be unable to perform on its commitments related to unsettled or open transactions. The Series manages counterparty credit risk by entering into transactions only with counterparties that the Manager believes have the financial resources to honor their obligations and by monitoring the financial stability of those counterparties. Financial assets, which potentially expose the Series to market, issuer and counterparty credit risks, consist principally of financial instruments and receivables due from counterparties. The extent of the Series’ exposure to market, issuer and counterparty credit risks with respect to these financial assets is approximately their value recorded in the Statement of Assets and Liabilities, less any collateral held by the Series.
| | |
| 80 | | 2019 BLACKROCK ANNUAL REPORTTO SHAREHOLDERS |
Notes to Financial Statements (continued)
A derivative contract may suffer amark-to-market loss if the value of the contract decreases due to an unfavorable change in the market rates or values of the underlying instrument. Losses can also occur if the counterparty does not perform under the contract.
The Series’ risk of loss from counterparty credit risk on OTC derivatives is generally limited to the aggregate unrealized gain less the value of any collateral held by the Series.
With exchange-traded futures and centrally cleared swaps, there is less counterparty credit risk to the Series since the exchange or clearinghouse, as counterparty to such instruments, guarantees against a possible default. The clearinghouse stands between the buyer and the seller of the contract; therefore, credit risk is limited to failure of the clearinghouse. While offset rights may exist under applicable law, the Series does not have a contractual right of offset against a clearing broker or clearinghouse in the event of a default (including the bankruptcy or insolvency). Additionally, credit risk exists inexchange-traded futures and centrally cleared swaps with respect to initial and variation margin that is held in a clearing broker’s customer accounts. While clearing brokers are required to segregate customer margin from their own assets, in the event that a clearing broker becomes insolvent or goes into bankruptcy and at that time there is a shortfall in the aggregate amount of margin held by the clearing broker for all its clients, typically the shortfall would be allocated on a pro rata basis across all the clearing broker’s customers, potentially resulting in losses to the Series.
Management has evaluated the impact of all subsequent events on the Series through the date the financial statements were issued and has determined that there were no subsequent events requiring adjustment or additional disclosure in the financial statements.
| | | | |
| NOTESTO FINANCIAL STATEMENTS | | | 81 | |
| | |
| Report of Independent Registered Public Accounting Firm | | |
To the Investors of Master Small Cap Index Series and the Board of Directors of Quantitative Master Series LLC:
Opinion on the Financial Statements and Financial Highlights
We have audited the accompanying statement of assets and liabilities of Master Small Cap Index Series of Quantitative Master Series LLC (the “Fund”), including the schedule of investments, as of December 31, 2019, the related statement of operations for the year then ended, the statements of changes in net assets for each of the two years in the period then ended, the financial highlights for each of the five years in the period then ended, and the related notes. In our opinion, the financial statements and financial highlights present fairly, in all material respects, the financial position of the Fund as of December 31, 2019 and the results of its operations for the year then ended, the changes in its net assets for each of the two years in the period then ended, and the financial highlights for each of the five years in the period then ended, in conformity with accounting principles generally accepted in the United States of America.
Basis for Opinion
These financial statements and financial highlights are the responsibility of the Fund’s management. Our responsibility is to express an opinion on the Fund’s financial statements and financial highlights based on our audits. We are a public accounting firm registered with the Public Company Accounting Oversight Board (United States) (PCAOB) and are required to be independent with respect to the Fund in accordance with the U.S. federal securities laws and the applicable rules and regulations of the Securities and Exchange Commission and the PCAOB.
We conducted our audits in accordance with the standards of the PCAOB. Those standards require that we plan and perform the audit to obtain reasonable assurance about whether the financial statements and financial highlights are free of material misstatement, whether due to error or fraud. The Fund is not required to have, nor were we engaged to perform, an audit of its internal control over financial reporting. As part of our audits we are required to obtain an understanding of internal control over financial reporting but not for the purpose of expressing an opinion on the effectiveness of the Fund’s internal control over financial reporting. Accordingly, we express no such opinion.
Our audits included performing procedures to assess the risks of material misstatement of the financial statements and financial highlights, whether due to error or fraud, and performing procedures that respond to those risks. Such procedures included examining, on a test basis, evidence regarding the amounts and disclosures in the financial statements and financial highlights. Our audits also included evaluating the accounting principles used and significant estimates made by management, as well as evaluating the overall presentation of the financial statements and financial highlights. Our procedures included confirmation of securities owned as of December 31, 2019, by correspondence with the custodian and brokers; when replies were not received from brokers, we performed other auditing procedures. We believe that our audits provide a reasonable basis for our opinion.
Deloitte & Touche LLP
Boston, Massachusetts
February 24, 2020
We have served as the auditor of one or more BlackRock investment companies since 1992.
| | |
| 82 | | 2019 BLACKROCK ANNUAL REPORTTO SHAREHOLDERS |
Statement Regarding Liquidity Risk Management Program
The Securities and Exchange Commission adopted Rule 22e-4 under the Investment Company Act of 1940, as amended (the “Liquidity Rule”) to promote effective liquidity risk management throughout the open-end investment company industry, thereby reducing the risk that funds will be unable to meet their redemption obligations and mitigating dilution of the interests of fund shareholders.
The Board of Directors (the “Board”) of BlackRock Index Funds, Inc. and Quantitative Master Series LLC, on behalf of iShares MSCI EAFE International Index Fund and iShares Russell 2000 Small-Cap Index Fund and Master Small Cap Index Series respectively, met on November 12-13, 2019 (the “Meeting”) to review the liquidity risk management program (the “Program”) applicable to the BlackRock open-end funds, excluding money market funds (each, a “Fund”), pursuant to the Liquidity Rule. The Board has appointed BlackRock Advisors, LLC or BlackRock Fund Advisors (“BlackRock”), each an investment adviser to certain Funds, as the program administrator for each Fund’s Program, as applicable. BlackRock has delegated oversight of the Program to the 40 Act Liquidity Risk Management Committee (the “Committee”). At the Meeting, the Committee, on behalf of BlackRock, provided the Board with a report that addressed the operation of the Program and assessed its adequacy and effectiveness of implementation, including the operation of each Fund’s Highly Liquid Investment Minimum (“HLIM”) where applicable, and any material changes to the Program (the “Report”). The Report covered the period from December 1, 2018 through September 30, 2019 (the “Program Reporting Period”).
The Report described the Program’s liquidity classification methodology for categorizing a Fund’s investments (including derivative transactions) into one of four liquidity buckets. It also described BlackRock’s methodology in establishing a Fund’s HLIM and noted that the Committee reviews and ratifies the HLIM assigned to each Fund no less frequently than annually.
The Report noted that the Program complied with the key factors for consideration under the Liquidity Rule for assessing, managing and periodically reviewing a Fund’s liquidity risk, as follows:
A. The Fund’s investment strategy and liquidity of portfolio investments during both normal and reasonably foreseeable stressed conditions:During the Program Reporting Period, the Committee reviewed whether each Fund’s strategy is appropriate for an open-end fund structure with a focus on Funds with more significant and consistent holdings of less liquid and illiquid assets. The Committee also factored a Fund’s concentration in an issuer into the liquidity classification methodology by taking issuer position sizes into account. Where a Fund participated in borrowings for investment purposes (such as tender option bonds and reverse repurchase agreements), such borrowings were factored into the Program’s calculation of a Fund’s liquidity bucketing. Derivative exposure was also considered in such calculation.
B. Short-term and long-term cash flow projections during both normal and reasonably foreseeable stressed conditions:During the Program Reporting Period, the Committee reviewed historical net redemption activity and used this information as a component to establish each Fund’s reasonably anticipated trading size (“RATS”). Each Fund has adopted an in-kind redemption policy which may be utilized to meet larger redemption requests. The Committee may also take into consideration a Fund’s shareholder ownership concentration (which, depending on product type and distribution channel, may or may not be available), a Fund’s distribution channels, and the degree of certainty associated with a Fund’s short-term and long-term cash flow projections.
C. Holdings of cash and cash equivalents, as well as borrowing arrangements:The Committee considered the terms of the credit facility applicable to the Funds, the financial health of the institution providing the facility and the fact that the credit facility is shared among multiple Funds (including that a portion of the aggregate commitment amount is specifically designated for BlackRock Floating Rate Income Portfolio and BlackRock Credit Strategies Income Fund, each a series of BlackRock Funds V). The Committee also considered other types of borrowing available to the Funds, such as the ability to use reverse repurchase agreements and interfund lending, as applicable.
There were no material changes to the Program during the Program Reporting Period. The Report provided to the Board stated that the Committee concluded that based on the operation of the functions, as described in the Report, the Program is operating as intended and is effective in implementing the requirements of the Liquidity Rule.
| | | | |
| STATEMENT REGARDING LIQUIDITY RISK MANAGEMENT PROGRAM | | | 83 | |
Director and Officer Information
| | | | | | | | |
| Independent Directors (a) |
| | | | | |
Name
Year of Birth (b) | | Position(s) Held
(Length of Service) (c) | | Principal Occupation(s) During Past Five Years | | Number of BlackRock-Advised
Registered Investment Companies
(“RICs”) Consisting of
Investment Portfolios
(“Portfolios”) Overseen | | Public Company and
Other Investment Company
Directorships Held During
Past Five Years |
Mark Stalnecker 1951 | | Chair of the Board
(Since 2019) and
Director
(Since 2015) | | Chief Investment Officer, University of Delaware from 1999 to 2013; Trustee and Chair of the Finance and Investment Committees, Winterthur Museum and Country Estate from 2005 to 2016; Member of the Investment Committee, Delaware Public Employees’ Retirement System since 2002; Member of the Investment Committee, Christiana Care Health System from 2009 to 2017; Member of the Investment Committee, Delaware Community Foundation from 2013 to 2014; Director and Chair of the Audit Committee, SEI Private Trust Co. from 2001 to 2014. | | 37 RICs consisting of 177 Portfolios | | None |
Bruce R. Bond 1946 | | Director
(Since 2019) | | Board Member, Amsphere Limited (software) since 2018; Trustee and Member of the Governance Committee, State Street Research Mutual Funds from 1997 to 2005; Board Member of Governance, Audit and Finance Committee, Avaya Inc. (computer equipment) from 2003 to 2007. | | 37 RICs consisting of 177 Portfolios | | None |
Susan J. Carter 1956 | | Director
(Since 2016) | | Director, Pacific Pension Institute from 2014 to 2018; Advisory Board Member, Center for Private Equity and Entrepreneurship at Tuck School of Business since 1997; Senior Advisor, Commonfund Capital, Inc. (“CCI”) (investment adviser) in 2015; Chief Executive Officer, CCI from 2013 to 2014; President & Chief Executive Officer, CCI from 1997 to 2013; Advisory Board Member, Girls Who Invest from 2015 to 2018 and Board Member thereof since 2018; Advisory Board Member, Bridges Fund Management since 2016; Trustee, Financial Accounting Foundation since 2017; Practitioner Advisory Board Member, Private Capital Research Institute (“PCRI”) since 2017. | | 37 RICs consisting of 177 Portfolios | | None |
Collette Chilton 1958 | | Director
(Since 2015) | | Chief Investment Officer, Williams College since 2006; Chief Investment Officer, Lucent Asset Management Corporation from 1998 to 2006. | | 37 RICs consisting of 177 Portfolios | | None |
Neil A. Cotty 1954 | | Director
(Since 2016) | | Bank of America Corporation from 1996 to 2015, serving in various senior finance leadership roles, including Chief Accounting Officer from 2009 to 2015, Chief Financial Officer of Global Banking, Markets and Wealth Management from 2008 to 2009, Chief Accounting Officer from 2004 to 2008, Chief Financial Officer of Consumer Bank from 2003 to 2004, Chief Financial Officer of Global Corporate Investment Bank from 1999 to 2002. | | 37 RICs consisting of 177 Portfolios | | None |
Lena G. Goldberg 1949 | | Director
(Since 2019) | | Senior Lecturer, Harvard Business School, since 2008; Director, Charles Stark Draper Laboratory, Inc. since 2013; FMR LLC/Fidelity Investments (financial services) from 1996 to 2008, serving in various senior roles including Executive Vice President — Strategic Corporate Initiatives and Executive Vice President and General Counsel; Partner, Sullivan & Worcester LLP from 1985 to 1996 and Associate thereof from 1979 to 1985. | | 37 RICs consisting of 177 Portfolios | | None |
Robert M. Hernandez 1944 | | Director
(Since 2019) | | Director, Vice Chairman and Chief Financial Officer of USX Corporation (energy and steel business) from 1991 to 2001; Director andnon-executive Chairman, RTI International Metals, Inc. from 1990 to 2015; Director, TE Connectivity (electronics) from 2006 to 2012. | | 37 RICs consisting of 177 Portfolios | | Chubb Limited (insurance company); Eastman Chemical Company |
| | |
| 84 | | 2019 BLACKROCK ANNUAL REPORTTO SHAREHOLDERS |
Director and Officer Information (continued)
| | | | | | | | |
| Independent Directors (a)(continued) |
| | | | | |
Name
Year of Birth (b) | | Position(s) Held
(Length of Service) (c) | | Principal Occupation(s) During Past Five Years | | Number of BlackRock-Advised
Registered Investment Companies
(“RICs”) Consisting of
Investment Portfolios
(“Portfolios”) Overseen | | Public Company and
Other Investment Company
Directorships Held During
Past Five Years |
Henry R. Keizer 1956 | | Director
(Since 2019) | | Director, Park Indemnity Ltd. (captive insurer) since 2010; Director, MUFG Americas Holdings Corporation and MUFG Union Bank, N.A. (financial and bank holding company) from 2014 to 2016; Director, American Institute of Certified Public Accountants from 2009 to 2011; Director, KPMG LLP (audit, tax and advisory services) from 2004 to 2005 and 2010 to 2012; Director, KPMG International in 2012, Deputy Chairman and Chief Operating Officer thereof from 2010 to 2012 and U.S. Vice Chairman of Audit thereof from 2005 to 2010; Global Head of Audit, KPMGI (consortium of KPMG firms) from 2006 to 2010; Director, YMCA of Greater New York from 2006 to 2010. | | 37 RICs consisting of 177 Portfolios | | Hertz Global Holdings (car rental); Montpelier Re Holdings, Ltd. (publicly held property and casualty reinsurance) from 2013 until 2015; Sealed Air Corp. (packaging); WABCO (commercial vehicle safety systems) |
Cynthia A. Montgomery 1952 | | Director
(Since 2007) | | Professor, Harvard Business School since 1989. | | 37 RICs consisting of 177 Portfolios | | Newell Rubbermaid, Inc. (manufacturing) |
Donald C. Opatrny 1952 | | Director
(Since 2019) | | Trustee, Vice Chair, Member of the Executive Committee and Chair of the Investment Committee, Cornell University since 2004; President, Trustee and Member of the Investment Committee, The Aldrich Contemporary Art Museum from 2007 to 2014; Member of the Board and Investment Committee, University School from 2007 to 2018; Member of the Investment Committee, Mellon Foundation from 2009 to 2015; Trustee, Artstor (a Mellon Foundation affiliate) from 2010 to 2015; President and Trustee, the Center for the Arts, Jackson Hole from 2011 to 2018; Director, Athena Capital Advisors LLC (investment management firm) since 2013; Trustee and Chair of the Investment Committee, Community Foundation of Jackson Hole since 2014; Member of Affordable Housing Supply Board of Jackson, Wyoming since 2018; Member, Investment Funds Committee, State of Wyoming since 2017; Trustee, Phoenix Art Museum since 2018. | | 37 RICs consisting of 177 Portfolios | | None |
Joseph P. Platt 1947 | | Director
(Since 2007) | | General Partner, Thorn Partners, LP (private investments) since 1998; Director, WQED Multi-Media (public broadcastingnot-for-profit) since 2001; Chair, Basic Health International(non-profit) since 2015. | | 37 RICs consisting of 177 Portfolios | | Greenlight Capital Re, Ltd. (reinsurance company); Consol Energy Inc. |
Kenneth L. Urish 1951 | | Director
(Since 2007) | | Managing Partner, Urish Popeck & Co., LLC (certified public accountants and consultants) since 1976; Past-Chairman of the Professional Ethics Committee of the Pennsylvania Institute of Certified Public Accountants and Committee Member thereof since 2007; Member of External Advisory Board, The Pennsylvania State University Accounting Department since founding in 2001; Principal, UP Strategic Wealth Investment Advisors, LLC since 2013; Trustee, The Holy Family Institute from 2001 to 2010; President and Trustee, Pittsburgh Catholic Publishing Associates from 2003 to 2008; Director,Inter-Tel from 2006 to 2007. | | 37 RICs consisting of 177 Portfolios | | None |
Claire A. Walton 1957 | | Director
(Since 2016) | | Chief Operating Officer and Chief Financial Officer of Liberty Square Asset Management, LP from 1998 to 2015; General Partner of Neon Liberty Capital Management, LLC since 2003; Director, Boston Hedge Fund Group from 2009 to 2018; Director, Woodstock Ski Runners since 2013; Director, Massachusetts Council on Economic Education from 2013 to 2015. | | 37 RICs consisting of 177 Portfolios | | None |
| | | | |
DIRECTORAND OFFICER INFORMATION | | | 85 | |
Director and Officer Information (continued)
| | | | | | | | |
| Interested Directors (a)(d) |
| | | | | |
Name
Year of Birth (b) | | Position(s) Held
(Length of Service) (c) | | Principal Occupation(s) During Past Five Years | | Number of BlackRock-Advised
Registered Investment Companies
(“RICs”) Consisting of
Investment Portfolios
(“Portfolios”) Overseen | | Public Company and
Other Investment Company
Directorships Held During
Past Five Years |
Robert Fairbairn 1965 | | Director
(Since 2018) | | Vice Chairman of BlackRock, Inc. since 2019; Member of BlackRock’s Global Executive and Global Operating Committees;Co-Chair of BlackRock’s Human Capital Committee; Senior Managing Director of BlackRock, Inc. from 2010 to 2019; oversaw BlackRock’s Strategic Partner Program and Strategic Product Management Group from 2012 to 2019; Member of the Board of Managers of BlackRock Investments, LLC from 2011 to 2018; Global Head of BlackRock’s Retail and iShares® businesses from 2012 to 2016. | | 123 RICs consisting of 287 Portfolios | | None |
John M. Perlowski (e) 1964 | | Director
(Since 2015);
President and Chief Executive Officer
(Since 2010) | | Managing Director of BlackRock, Inc. since 2009; Head of BlackRock Global Accounting and Product Services since 2009; Advisory Director of Family Resource Network (charitable foundation) since 2009. | | 124 RICs consisting of 288 Portfolios | | None |
(a) The address of each Director is c/o BlackRock, Inc., 55 East 52nd Street, New York, New York 10055. |
(b) Independent Directors serve until their resignation, retirement, removal or death, or until December 31 of the year in which they turn 75. The Board may determine to extend the terms of Independent Directors on acase-by-case basis, as appropriate. |
(c) Following the combination of MLIM and BlackRock, Inc. in September 2006, the various legacy MLIM and legacy BlackRock fund boards were realigned and consolidated into three new fund boards in 2007. Furthermore, effective January 1, 2019, three BlackRock Fund Complexes were realigned and consolidated into two BlackRock Fund Complexes. As a result, although the chart shows the year that each Independent Director joined the Board, certain Independent Directors first became members of the boards of other BlackRock-advised Funds, legacy MLIM funds or legacy BlackRock funds as follows: Bruce R. Bond, 2005; Robert M. Hernandez, 1996; Cynthia A. Montgomery, 1994; Joseph P. Platt, 1999; Kenneth L. Urish, 1999; Lena G. Goldberg, 2016; Henry R. Keizer, 2016; Donald C. Opatrny, 2015. |
(d) Mr. Fairbairn and Mr. Perlowski are both “interested persons,” as defined in the 1940 Act, of the Corporation/Master LLC based on their positions with BlackRock, Inc. and its affiliates. Mr. Fairbairn and Mr. Perlowski are also board members of the BlackRock Fixed-Income Complex. |
(e) Mr. Perlowski is also a trustee of the BlackRock Credit Strategies Fund. |
| | |
| 86 | | 2019 BLACKROCK ANNUAL REPORTTO SHAREHOLDERS |
Director and Officer Information (continued)
| | | | |
| Officers Who Are Not Directors (a) |
| | | |
Name
Year of Birth (b) | | Position(s) Held
(Length of Service) | | Principal Occupation(s) During Past Five Years |
Jennifer McGovern 1977 | | Vice President
(Since 2014) | | Managing Director of BlackRock, Inc. since 2016; Director of BlackRock, Inc. from 2011 to 2015; Head of Product Development and Oversight for BlackRock’s Strategic Product Management Group since 2019; Head of Product Structure and Oversight for BlackRock’s U.S. Wealth Advisory Group from 2013 to 2019. |
Neal J. Andrews 1966 | | Chief Financial Officer
(Since 2007) | | Chief Financial Officer of the iShares® exchange traded funds since 2019; Managing Director of BlackRock, Inc. since 2006. |
Jay M. Fife 1970 | | Treasurer
(Since 2007) | | Managing Director of BlackRock, Inc. since 2007. |
Charles Park 1967 | | Chief Compliance Officer
(Since 2014) | | Anti-Money Laundering Compliance Officer for certain BlackRock-advised Funds from 2014 to 2015; Chief Compliance Officer of BlackRock Advisors, LLC and the BlackRock-advised Funds in the BlackRock Multi-Asset Complex and the BlackRock Fixed-Income Complex since 2014; Principal of and Chief Compliance Officer for iShares® Delaware Trust Sponsor LLC since 2012 and BlackRock Fund Advisors (“BFA”) since 2006; Chief Compliance Officer for theBFA-advised iShares® exchange traded funds since 2006; Chief Compliance Officer for BlackRock Asset Management International Inc. since 2012. |
Lisa Belle 1968 | | Anti-Money Laundering Compliance Officer
(Since 2019) | | Managing Director of BlackRock, Inc. since 2019; Global Financial Crime Head for Asset and Wealth Management of JP Morgan from 2013 to 2019; Managing Director of RBS Securities from 2012 to 2013; Head of Financial Crimes for Barclays Wealth Americas from 2010 to 2012. |
Janey Ahn 1975 | | Secretary
(Since 2019) | | Managing Director of BlackRock, Inc. since 2018; Director of BlackRock, Inc. from 2009 to 2017. |
(a) The address of each Officer is c/o BlackRock, Inc., 55 East 52nd Street, New York, New York 10055. |
(b) Officers of the Corporation/Master LLC serve at the pleasure of the Board. |
Further information about the Corporation’s/Master LLC’s Directors and Officers is available in the Corporation’s/Master LLC’s Statement of Additional Information, which can be obtained without charge by calling (800)441-7762.
Effective September 19, 2019, Lisa Belle replaced John MacKessy as the Anti-Money Laundering Compliance Officer of the Corporation/Master LLC.
Effective September 19, 2019, Janey Ahn replaced Benjamin Archibald as the Secretary of the Corporation/Master LLC.
Effective December 31, 2019, Robert M. Hernandez retired as Director of the Corporation/Master LLC.
Investment Adviser and Administrator(a)
BlackRock Advisors, LLC
Wilmington, DE 19809
Sub-Adviser
BlackRock Fund Advisors
San Francisco, CA 94105
Accounting Agent and Custodian
State Street Bank and Trust Company
Boston, MA 02111
Transfer Agent
BNY Mellon Investment Servicing (US) Inc.
Wilmington, DE 19809
Independent Registered Public Accounting Firm
Deloitte & Touche LLP
Boston, MA 02116
Distributor
BlackRock Investments, LLC
New York, NY 10022
Legal Counsel
Sidley Austin LLP
New York, NY 10019
Address of the Corporation/Master LLC
100 Bellevue Parkway
Wilmington, DE 19809
| (a) | Administrator to iShares Russell 2000 Small-Cap Index Fund. |
| | | | |
DIRECTORAND OFFICER INFORMATION | | | 87 | |
Additional Information
General Information
Householding
The Funds will mail only one copy of shareholder documents, including prospectuses, annual and semi-annual reports and proxy statements, to shareholders with multiple accounts at the same address. This practice is commonly called “householding” and is intended to reduce expenses and eliminate duplicate mailings of shareholder documents. Mailings of your shareholder documents may be householded indefinitely unless you instruct us otherwise. If you do not want the mailing of these documents to be combined with those for other members of your household, please call the Funds at(800) 441-7762.
Availability of Quarterly Schedule of Investments
The Funds/Series file their complete schedule of portfolio holdings with the SEC for the first and third quarters of each fiscal year as an exhibit to its reports on Form N-PORT, and for reporting periods ended prior to March 31, 2019, filed such information on FormN-Q. The Funds’/Series’ Forms N-PORT andN-Q are available on the SEC’s website at sec.gov. The Funds’/Series’ FormsN-Q may also be obtained upon request and without charge by calling(800) 441-7762.
Availability of Proxy Voting Policies and Procedures
A description of the policies and procedures that the Funds/Series use to determine how to vote proxies relating to portfolio securities is available upon request and without charge (1) by calling(800) 441-7762; (2) atblackrock.com; and (3) on the SEC’s website at sec.gov.
Availability of Proxy Voting Record
Information about how the Funds/Series voted proxies relating to securities held in the Funds’/Series’ portfolios during the most recent12-month period ended June 30 is available upon request and without charge (1) atblackrock.com or by calling(800) 441-7762; and (2) on the SEC’s website at sec.gov.
BlackRock’s Mutual Fund Family
BlackRock offers a diverse lineup of open-end mutual funds crossing all investment styles and managed by experts in equity, fixed-income and tax-exempt investing. Visitblackrock.com for more information.
Shareholder Privileges
Account Information
Call us at(800) 441-7762 from 8:00 AM to 6:00 PM ET on any business day to get information about your account balances, recent transactions and share prices. You can also visitblackrock.com for more information.
Automatic Investment Plans
Investor class shareholders who want to invest regularly can arrange to have $50 or more automatically deducted from their checking or savings account and invested in any of the BlackRock funds.
Systematic Withdrawal Plans
Investor class shareholders can establish a systematic withdrawal plan and receive periodic payments of $50 or more from their BlackRock funds, as long as their account balance is at least $10,000.
Retirement Plans
Shareholders may make investments in conjunction with Traditional, Rollover, Roth, Coverdell, Simple IRAs, SEP IRAs and 403(b) Plans.
| | |
| 88 | | 2019 BLACKROCK ANNUAL REPORTTO SHAREHOLDERS |
Additional Information (continued)
BlackRock Privacy Principles
BlackRock is committed to maintaining the privacy of its current and former fund investors and individual clients (collectively, “Clients”) and to safeguarding theirnon-public personal information. The following information is provided to help you understand what personal information BlackRock collects, how we protect that information and why in certain cases we share such information with select parties.
If you are located in a jurisdiction where specific laws, rules or regulations require BlackRock to provide you with additional or different privacy-related rights beyond what is set forth below, then BlackRock will comply with those specific laws, rules or regulations.
BlackRock obtains or verifies personalnon-public information from and about you from different sources, including the following: (i) information we receive from you or, if applicable, your financial intermediary, on applications, forms or other documents; (ii) information about your transactions with us, our affiliates, or others; (iii) information we receive from a consumer reporting agency; and (iv) from visits to our websites.
BlackRock does not sell or disclose tonon-affiliated third parties anynon-public personal information about its Clients, except as permitted by law or as is necessary to respond to regulatory requests or to service Client accounts. Thesenon-affiliated third parties are required to protect the confidentiality and security of this information and to use it only for its intended purpose.
We may share information with our affiliates to service your account or to provide you with information about other BlackRock products or services that may be of interest to you. In addition, BlackRock restricts access tonon-public personal information about its Clients to those BlackRock employees with a legitimate business need for the information. BlackRock maintains physical, electronic and procedural safeguards that are designed to protect thenon-public personal information of its Clients, including procedures relating to the proper storage and disposal of such information.
Glossary of Terms Used in this Report
| | |
| Portfolio Abbreviations |
| |
| ADR | | American Depositary Receipts |
| |
| CVA | | Certificaten Van Aandelen (Dutch Certificate) |
| |
| ETF | | Exchange-Traded Fund |
| |
| FTSE | | Financial Times Stock Exchange |
| |
| MSCI | | Morgan Stanley Capital International |
| |
| REIT | | Real Estate Investment Trust |
| | | | |
| ADDITIONAL INFORMATION / GLOSSARYOF TERMS USEDINTHIS REPORT | | | 89 | |
Want to know more?
blackrock.com | 877-275-1255 (1-877-ASK-1BLK)
This report is intended for current holders. It is not authorized for use as an offer of sale or a solicitation of an offer to buy shares of a Fund unless preceded or accompanied by that Fund’s current prospectus. Past performance results shown in this report should not be considered a representation of future performance. Investment returns and principal value of shares will fluctuate so that shares, when redeemed, may be worth more or less than their original cost. Statements and other information herein are as dated and are subject to change.
Index2-12/19-AR
| Item 2 – | Code of Ethics – Each registrant (or each, a “Fund”) has adopted a code of ethics, as of the end of the period covered by this report, applicable to the registrants’ principal executive officer, principal financial officer, principal accounting officer or controller, or persons performing similar functions. During the period covered by this report, the code of ethics was amended to update certain information and to make othernon-material changes. During the period covered by this report, there have been no waivers granted under the code of ethics. The registrants undertake to provide a copy of the code of ethics to any person upon request, without charge, who calls1-800-441-7762. |
| Item 3 – | Audit Committee Financial Expert – Each registrant’s board of directors (the “board of directors”), has determined that (i) the registrant has the following audit committee financial expert serving on its audit committee and (ii) each audit committee financial expert is independent: |
Neil A. Cotty
Robert M. Hernandez
Henry R. Keizer
Kenneth L. Urish
Claire A. Walton
Under applicable securities laws, a person determined to be an audit committee financial expert will not be deemed an “expert” for any purpose, including without limitation for the purposes of Section 11 of the Securities Act of 1933, as a result of being designated or identified as an audit committee financial expert. The designation or identification of a person as an audit committee financial expert does not impose on such person any duties, obligations, or liabilities greater than the duties, obligations, and liabilities imposed on such person as a member of the audit committee and board of directors in the absence of such designation or identification. The designation or identification of a person as an audit committee financial expert does not affect the duties, obligations, or liability of any other member of the audit committee or board of directors.
| Item 4 – | Principal Accountant Fees and Services |
The following table presents fees billed by Deloitte & Touche LLP (“D&T”) in each of the last two fiscal years for the services rendered to the Funds:
| | | | | | | | | | | | | | | | |
| | | (a) Audit Fees | | (b) Audit-Related Fees1 | | (c) Tax Fees2 | | (d) All Other Fees |
| Entity Name | | Current
Fiscal Year End | | Previous
Fiscal Year End | | Current
Fiscal Year End | | Previous
Fiscal Year End | | Current
Fiscal Year End | | Previous
Fiscal Year End | | Current
Fiscal Year End | | Previous
Fiscal Year End |
| iShares MSCI EAFE International Index Fund of BlackRock Index Funds, Inc. | | $33,660 | | $32,436 | | $0 | | $2,000 | | $16,500 | | $16,800 | | $0 | | $0 |
| iShares Russell 2000Small-Cap Index Fund of BlackRock Index Funds, Inc. | | $8,160 | | $8,160 | | $0 | | $2,000 | | $24,550 | | $14,400 | | $0 | | $0 |
| Master Small Cap Index Series of Quantitative Master Series LLC | | $29,376 | | $29,376 | | $0 | | $0 | | $17,300 | | $17,300 | | $0 | | $0 |
The following table presents fees billed by D&T that were required to be approved by each registrant’s audit committee (each a “Committee”) for services that relate directly to the operations or financial reporting of each Fund and that are rendered on behalf of BlackRock Advisors, LLC (the “investment adviser” or “BlackRock”)and entities
2
controlling, controlled by, or under common control with BlackRock (not including anysub-adviser whose role is primarily portfolio management and is subcontracted with or overseen by another investment adviser) that provide ongoing services to each Fund (“Affiliated Service Providers”):
| | | | |
| | | Current Fiscal Year End | | Previous Fiscal Year End |
(b) Audit-Related Fees1 | | $0 | | $0 |
(c) Tax Fees2 | | $0 | | $0 |
(d) All Other Fees3 | | $2,050,500 | | $2,274,000 |
1 The nature of the services includes assurance and related services reasonably related to the performance of the audit or review of financial statements not included in Audit Fees, including accounting consultations, agreed-upon procedure reports, attestation reports, comfort letters,out-of-pocket expenses and internal control reviews not required by regulators.
2 The nature of the services includes tax compliance and/or tax preparation, including services relating to the filing or amendment of federal, state or local income tax returns, regulated investment company qualification reviews, taxable income and tax distribution calculations.
3Non-audit fees of $2,050,500 and $2,274,000 for the current fiscal year and previous fiscal year, respectively, were paid to each Fund’s principal accountant in their entirety by BlackRock, in connection with services provided to the Affiliated Service Providers of each Fund and of certain other funds sponsored and advised by BlackRock or its affiliates for a service organization review and an accounting research tool subscription. These amounts represent aggregate fees paid by BlackRock and were not allocated on a per fund basis.
(e)(1) Audit CommitteePre-Approval Policies and Procedures:
Each Committee has adopted policies and procedures with regard to thepre-approval of services. Audit, audit-related and tax compliance services provided to the registrant on an annual basis require specificpre-approval by the registrant’s Committee. The Committee also must approve othernon-audit services provided to the registrant and thosenon-audit services provided to the Investment Adviser and Affiliated Service Providers that relate directly to the operations and the financial reporting of the registrant. Certain of thesenon-audit services that the Committee believes are (a) consistent with the SEC’s auditor independence rules and (b) routine and recurring services that will not impair the independence of the independent accountants may be approved by the Committee without consideration on a specificcase-by-case basis (“generalpre-approval”). The term of any generalpre-approval is 12 months from the date of thepre-approval, unless the Committee provides for a different period. Tax or othernon-audit services provided to the registrants which have a direct impact on the operations or financial reporting of the registrant will only be deemedpre-approved provided that any individual project does not exceed $10,000 attributable to the registrant or $50,000 per project. For this purpose, multiple projects will be aggregated to determine if they exceed the previously mentioned cost levels.
Any proposed services exceeding thepre-approved cost levels will require specificpre-approval by the registrant’s Committee, as will any other services not subject to generalpre-approval (e.g., unanticipated but permissible services). The Committee is informed of each service approved subject to generalpre-approval at the next regularly scheduledin-person board meeting. At this meeting, an analysis of such services is presented to the Committee for ratification. The Committee may delegate to the Committee Chairman the authority to approve the provision of and fees for any specific engagement of permittednon-audit services, including services exceedingpre-approved cost levels.
(e)(2) None of the services described in each of Items 4(b) through (d) were approved by either Committee pursuant to the de minimus exception in paragraph (c)(7)(i)(C) of Rule2-01 of RegulationS-X.
(f) Not Applicable
(g) ) The aggregatenon-audit fees, defined as the sum of the fees shown under “Audit-Related Fees,” “Tax Fees” and “All Other Fees,” paid to the accountant for services rendered by the accountant to the registrant, the Investment Adviser and the Affiliated Service Providers were:
3
| | | | | | |
| | | Entity Name | | Current Fiscal Year End | | Previous Fiscal Year End |
| | iShares MSCI EAFE International Index Fund of BlackRock Index Funds, Inc. | | $16,500 | | $18,800 |
| | iShares Russell 2000Small-Cap Index Fund of BlackRock Index Funds, Inc. | | $24,550 | | $16,400 |
| | Master Small Cap Index Series of Quantitative Master Series LLC | | $17,300 | | $17,300 |
Additionally, the amounts billed by D&T in connection with services provided to the Affiliated Service Providers of the Funds and of other funds sponsored and advised by BlackRock or its affiliates during the current and previous fiscal years for a service organization review and an accounting research tool subscription were:
| | |
Current Fiscal Year
End | | Previous Fiscal
Year End |
$2,050,500 | | $2,274,000 |
These amounts represent aggregate fees paid by BlackRock and were not allocated on a per fund basis.
(h) The Committee has considered and determined that the provision ofnon-audit services that were rendered to the Investment Adviser and the Affiliated Service Providers that were notpre-approved pursuant to paragraph (c)(7)(ii) of Rule2-01 of RegulationS-X is compatible with maintaining the principal accountant’s independence.
| Item 5 – | Audit Committee of Listed Registrants – Not Applicable |
(a) The registrants’ Schedules of Investments are included as part of the Report to Stockholders filed under Item 1 of this Form.
(b) Not Applicable due to no such divestments during the semi-annual period covered since the previous FormN-CSR filing.
| Item 7 – | Disclosure of Proxy Voting Policies and Procedures forClosed-End Management Investment Companies – Not Applicable |
| Item 8 – | Portfolio Managers ofClosed-End Management Investment Companies – Not Applicable |
| Item 9 – | Purchases of Equity Securities byClosed-End Management Investment Company and Affiliated Purchasers – Not Applicable |
| Item 10 – | Submission of Matters to a Vote of Security Holders – There have been no material changes to these procedures. |
| Item 11 – | Controls and Procedures |
(a) – The registrants’ principal executive and principal financial officers, or persons performing similar functions, have concluded that the registrants’ disclosure controls and procedures (as defined in Rule30a-3(c) under the Investment Company Act of 1940, as amended (the “1940 Act”)) are effective as of a date within 90 days of the filing of this report based on the evaluation of these controls and procedures required by Rule30a-3(b) under the 1940 Act and Rule 15(d)-15(b) under the Securities Exchange Act of 1934, as amended.
4
(b) – There were no changes in the registrants’ internal control over financial reporting (as defined in Rule30a-3(d) under the 1940 Act) that occurred during the period covered by this report that have materially affected, or are reasonably likely to materially affect, the registrants’ internal control over financial reporting.
| Item 12 – | Disclosure of Securities Lending Activities forClosed-End Management Investment Companies – Not Applicable to the registrants. |
| Item 13 – | Exhibits attached hereto |
(a)(1) – Code of Ethics – See Item 2
(a)(2) – Certifications – Attached hereto
(a)(3) – Not Applicable
(a)(4) – Not Applicable
(b) – Certifications – Attached hereto
5
Pursuant to the requirements of the Securities Exchange Act of 1934 and the Investment Company Act of 1940, each registrant has duly caused this report to be signed on its behalf by the undersigned, thereunto duly authorized.
| | |
BlackRock Index Funds, Inc. and Quantitative Master Series LLC |
| |
By: | | /s/ John M. Perlowski |
| | John M. Perlowski |
| | Chief Executive Officer (principal executive officer) of |
| | BlackRock Index Funds, Inc. and Quantitative Master Series LLC |
|
| Date: March 6, 2020 |
Pursuant to the requirements of the Securities Exchange Act of 1934 and the Investment Company Act of 1940, this report has been signed below by the following persons on behalf of each registrant and in the capacities and on the dates indicated.
| | |
| By: | | /s/ John M. Perlowski |
| | John M. Perlowski |
| | Chief Executive Officer (principal executive officer) of |
| | BlackRock Index Funds, Inc. and Quantitative Master Series LLC |
|
| Date: March 6, 2020 |
| |
| By: | | /s/ Neal J. Andrews |
| | Neal J. Andrews |
| | Chief Financial Officer (principal financial officer) of |
| | BlackRock Index Funds, Inc. and Quantitative Master Series LLC |
Date: March 6, 2020
6