UNITED STATES
SECURITIES AND EXCHANGE COMMISSION
Washington, D.C. 20549
FORM N-CSR
CERTIFIED SHAREHOLDER REPORT OF REGISTERED MANAGEMENT INVESTMENT COMPANIES
Investment Company Act file number: 811-07899 and 811-07885
| Name of Fund: | | BlackRock Index Funds, Inc. |
| | | iShares MSCI EAFE International Index Fund |
| | | iShares Russell 2000 Small-Cap Index Fund |
| | | Quantitative Master Series LLC |
| | | Master Small Cap Index Series |
| Fund Address: | | 100 Bellevue Parkway, Wilmington, DE 19809 |
Name and address of agent for service: John M. Perlowski, Chief Executive Officer, BlackRock Index Funds, Inc. and Quantitative Master Series LLC, 55 East 52nd Street, New York, NY 10055
Registrants’ telephone number, including area code: (800) 441-7762
Date of fiscal year end: 12/31/2021
Date of reporting period: 12/31/2021
Item 1 – Report to Stockholders
| | (a) | The Report to Shareholders is attached herewith. |
| | |

| | DECEMBER 31, 2021 |
BlackRock FundsSM
· iShares Municipal Bond Index Fund
· iShares Short-Term TIPS Bond Index Fund
BlackRock Index Funds, Inc.
· iShares MSCI EAFE International Index Fund
· iShares Russell 2000 Small-Cap Index Fund
|
Not FDIC Insured • May Lose Value • No Bank Guarantee |
The Markets in Review
Dear Shareholder,
The 12-month reporting period as of December 31, 2021 saw a continuation of the resurgent growth that followed the initial coronavirus (or “COVID-19”) pandemic reopening, albeit at a slower pace. The global economy weathered the emergence of several variant strains and the resulting peaks and troughs in infections amid optimism that increasing vaccinations and economic adaptation could help contain the pandemic’s disruptions. Continued growth meant that the U.S. economy regained and then surpassed its pre-pandemic output. However, a rapid rebound in consumer spending pushed up against supply constraints and led to elevated inflation.
Equity prices rose with the broader economy, as the implementation of mass vaccination campaigns and passage of an additional fiscal stimulus package and infrastructure bill further boosted stocks. In the United States, both large-and small-capitalization stocks posted a strong advance, and many equity indices neared or surpassed all-time highs late in the reporting period. International equities from developed markets also gained, although emerging market stocks declined, pressured by a strengthening U.S. dollar.
The 10-year U.S. Treasury yield (which is inversely related to bond prices) rose during the reporting period as the economy expanded rapidly and inflation reached its highest annualized reading in decades. In the corporate bond market, support from the U.S. Federal Reserve (the “Fed”) assuaged credit concerns and led to solid returns for high-yield corporate bonds, outpacing investment-grade corporate bonds, which declined.
The Fed maintained accommodative monetary policy during the reporting period by maintaining near-zero interest rates and by asserting that inflation could exceed its 2% target for a sustained period without triggering a rate increase. However, the Fed’s tone shifted late in the year, as it reduced its bond-buying program and used its market guidance to raise the prospect of higher rates in 2022.
Looking ahead, we believe that the global expansion will continue to broaden as Europe and other developed market economies gain momentum, although the Delta and Omicron variants of the coronavirus remain a threat, particularly in emerging markets. While we expect inflation to abate somewhat as supply bottlenecks are resolved, we anticipate that inflation will remain higher than the pre-COVID norm. The Fed is poised to raise interest rates next year in response, but the Fed’s policy shift means that tightening is likely to be less aggressive than what we’ve seen in previous cycles.
In this environment, we favor an overweight to equities, as we believe low interest rates and continued economic growth will support further gains, albeit likely more modest than what we saw in 2021. Sectors that are better poised to manage the transition to a lower-carbon world, such as technology and health care, are particularly attractive in the long term. U.S. and other developed-market equities have room for further growth, while we believe Chinese equities stand to gain from a more accommodative monetary and fiscal environment as the Chinese economy slows. We are underweight long-term credit, but inflation-protected U.S. Treasuries, Asian fixed income, and emerging market local-currency bonds offer potential opportunities. We believe that international diversification and a focus on sustainability can help provide portfolio resilience, and the disruption created by the coronavirus appears to be accelerating the shift toward sustainable investments.
In this environment, our view is that investors need to think globally, extend their scope across a broad array of asset classes, and be nimble as market conditions change. We encourage you to talk with your financial advisor and visit blackrock.com for further insight about investing in today’s markets.
Sincerely,

Rob Kapito
President, BlackRock Advisors, LLC

Rob Kapito
President, BlackRock Advisors, LLC
| | | | |
Total Returns as of December 31, 2021 |
| | | |
| | | 6-Month | | 12-Month |
| | |
U.S. large cap equities
(S&P 500® Index) | | 11.67% | | 28.71% |
| | |
U.S. small cap equities
(Russell 2000® Index) | | (2.31) | | 14.82 |
| | |
International equities
(MSCI Europe, Australasia, Far East Index) | | 2.24 | | 11.26 |
| | |
Emerging market equities
(MSCI Emerging Markets Index) | | (9.30) | | (2.54) |
| | |
3-month Treasury bills
(ICE BofA 3-Month U.S. Treasury Bill Index) | | 0.02 | | 0.05 |
| | |
U.S. Treasury securities
(ICE BofA 10-Year U.S. Treasury Index) | | 0.44 | | (3.68) |
| | |
U.S. investment grade bonds
(Bloomberg U.S. Aggregate Bond Index) | | 0.06 | | (1.54) |
| | |
Tax-exempt municipal bonds
(S&P Municipal Bond Index) | | 0.52 | | 1.77 |
| | |
U.S. high yield bonds
(Bloomberg U.S. Corporate High Yield 2% Issuer Capped Index) | | 1.59 | | 5.26 |
|
| Past performance is not an indication of future results. Index performance is shown for illustrative purposes only. You cannot invest directly in an index. |
| | |
| 2 | | THIS PAGE IS NOT PART OF YOUR FUND REPORT |
Table of Contents

| | |
| Fund Summary as of December 31, 2021 | | iShares Municipal Bond Index Fund |
Investment Objective
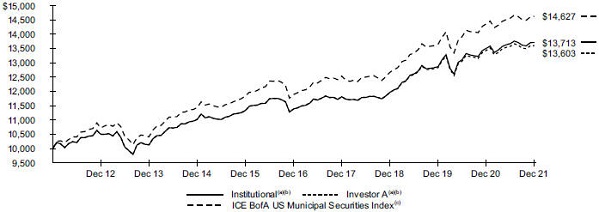
iShares Municipal Bond Index Fund’s (the “Fund”) investment objective is to seek to provide investment results that correspond to the total return performance of fixed-income securities in the aggregate, as represented by the ICE BofA US Municipal Securities Index (the “Underlying Index”).
Portfolio Management Commentary
How did the Fund perform?
For the 12-month period ended December 31, 2021, the Fund’s Institutional Shares returned 1.54%, Investor A Shares returned 1.28%, Investor P Shares returned 1.29%, and Class K Shares returned 1.58%. The Fund’s benchmark, the ICE BofA US Municipal Securities Index, returned 1.83% for the same period.
Returns for the Fund’s respective share classes differ from the benchmark indexes based on individual share-class expenses.
Describe the market environment.
The global markets in 2021 began the process of recovery from the COVID-19 pandemic and geopolitical uncertainty. The year started with a positive tone for risk assets as vaccines were rolled out and signs of recovery emerged. The reopening of the economy, continued government stimulus and a dovish Fed contributed to a risk-on environment in the first half of the year. The Fed maintained its exceptionally accommodative stance through most of 2021 as the economy continued to recover with minor setbacks due to the COVID-19 Delta and, more recently, the COVID-19 Omicron variant. The U.S. unemployment rate trended downward throughout the year, beginning at 6.4% in January and ending the year at 3.9%.
As the economy showed continued signs of recovery and inflation remained elevated, the Fed began tapering its asset purchases in November 2021. The final Federal Open Market Committee (“FOMC”) meeting of the year, held in December 2021, announced a doubling in the pace of tapering. At the new pace, the Fund will wrap up its asset purchases in the middle of March 2022, and the expectation is that fed funds rate hikes will follow shortly thereafter. This was reflected in the December Summary of Economic Projections and “dot plot” that showed that FOMC participants anticipate that three increases in the Fed’s benchmark overnight lending rate will be appropriate in 2022. The 10-year U.S. Treasury yield rose by 59 basis points (0.59%) to 1.52% at year end.
Municipal bonds outperformed comparable-maturity U.S. Treasuries for the year on strong credit fundamentals and as U.S. Treasury yields were more directly impacted by the prospect of Fed tightening.
Describe recent portfolio activity.
During the period, the Fund maintained its objective of seeking to provide investment results that correspond to the total return performance of the Underlying Index by selecting securities in accordance with their relative proportion within the Underlying Index. Other factors considered in security selection included transaction costs and maturity.
Describe portfolio positioning at period end.
The Fund remained positioned to attempt to match the risk characteristics of the Underlying Index, irrespective of the market’s future direction.
The views expressed reflect the opinions of BlackRock as of the date of this report and are subject to change based on changes in market, economic or other conditions. These views are not intended to be a forecast of future events and are no guarantee of future results.
| | |
| 4 | | 2 0 2 1 BLACK ROCK ANNUAL REPORT TO SHAREHOLDERS |
| | |
| Fund Summary as of December 31, 2021 (continued) | | iShares Municipal Bond Index Fund |
TOTAL RETURN BASED ON A $10,000 INVESTMENT
| | (a) | Assuming transaction costs and other operating expenses, including administration fees, if any. On November 19, 2018, the Fund acquired all of the assets and assumed certain stated liabilities of the State Farm Tax Advantaged Bond Fund (the “Predecessor Fund”), a series of State Farm Mutual Fund Trust, through a tax-free reorganization (the “Reorganization”). The Predecessor Fund is the performance and accounting survivor of the Reorganization; accordingly the Fund assumed the performance and financial history of the Predecessor Fund upon completion of the Reorganization. | |
| | (b) | The Fund generally invests at least 80% of its assets, plus the amount of any borrowings for investment purposes, in securities or other financial instruments that are components of or have economic characteristics similar to the securities in the Underlying Index. | |
| | (c) | An index that tracks the performance of U.S. dollar denominated investment grade tax-exempt debt publicly issued by U.S. states and territories, and their political subdivisions, in the U.S. domestic market. | |
Performance
| | | | | | | | | | | | | | | | | | | | | | | | | | | | | | | | |
| | | | | | | | | Average Annual Total Returns(a) | |
| | | | | | | | | | | | |
| | | | | |
| | | | | | | | | 1 Year | | | 5 Years | | | 10 Years | |
| | | | | | | | |
| | | Standardized
30-Day Yields | | | Unsubsidized
30-Day Yields | | | Without Sales Charge | | | With Sales Charge | | | Without
Sales
Charge | | | With Sales Charge | | | Without
Sales
Charge | | | With Sales Charge | |
| | | | | | | | |
Institutional | | | 0.79 | % | | | 0.78 | % | | | 1.54 | % | | | N/A | | | | 3.79 | % | | | N/A | | | | 3.21 | % | | | N/A | |
Investor A | | | 0.53 | | | | 0.50 | | | | 1.28 | | | | N/A | | | | 3.62 | | | | N/A | | | | 3.13 | | | | N/A | |
Investor P | | | 0.52 | | | | 0.52 | | | | 1.29 | | | | (2.77 | )% | | | 3.62 | | | | 2.78 | % | | | 3.12 | | | | 2.70 | % |
Class K | | | 0.83 | | | | 0.77 | | | | 1.58 | | | | N/A | | | | 3.81 | | | | N/A | | | | 3.22 | | | | N/A | |
ICE BofA US Municipal Securities Index | | | — | | | | — | | | | 1.83 | | | | N/A | | | | 4.23 | | | | N/A | | | | 3.88 | | | | N/A | |
| | (a) | Assuming maximum sales charges, if any. Average annual total returns with and without sales charges reflect reductions for distribution and service fees. See “About Fund Performance” for a detailed description of share classes, including any related sales charges and fees, and how performance was calculated for certain share classes. On November 19, 2018, the Fund acquired all of the assets and assumed certain stated liabilities of the State Farm Tax Advantaged Bond Fund (the “Predecessor Fund”), a series of State Farm Mutual Fund Trust, through a tax-free reorganization (the “Reorganization”). The Predecessor Fund is the performance and accounting survivor of the Reorganization; accordingly the Fund assumed the performance and financial history of the Predecessor Fund upon completion of the Reorganization. | |
N/A — Not applicable as the share class and index do not have a sales charge.
Past performance is not an indication of future results.
Performance results may include adjustments made for financial reporting purposes in accordance with U.S. generally accepted accounting principles.
Expense Example
| | | | | | | | | | | | | | | | | | | | | | | | | | | | | | |
| | | Actual | | | | | Hypothetical(a) | | | | |
| | | | | | | | | | | | | | |
| | | | | | | | |
| | | Beginning | | | Ending | | | Expenses | | | | | Beginning | | | Ending | | | Expenses | | | Annualized | |
| | | Account Value | | | Account Value | | | Paid During | | | | | Account Value | | | Account Value | | | Paid During | | | Expense | |
| | | | (07/01/21) | | | | (12/31/21) | | | | the Period | (b) | | | | | (07/01/21) | | | | (12/31/21) | | | | the Period | (b) | | | Ratio | |
| | | | | | | | |
Institutional | | | $ 1,000.00 | | | | $ 1,003.20 | | | | $ 1.21 | | | | | | $ 1,000.00 | | | | $ 1,024.00 | | | | $ 1.22 | | | | 0.24 | % |
Investor A | | | 1,000.00 | | | | 1,001.90 | | | | 2.52 | | | | | | 1,000.00 | | | | 1,022.68 | | | | 2.55 | | | | 0.50 | |
Investor P | | | 1,000.00 | | | | 1,001.90 | | | | 2.47 | | | | | | 1,000.00 | | | | 1,022.74 | | | | 2.50 | | | | 0.49 | |
Class K | | | 1,000.00 | | | | 1,003.40 | | | | 1.01 | | | | | | 1,000.00 | | | | 1,024.20 | | | | 1.02 | | | | 0.20 | |
| | (a) | Hypothetical 5% annual return before expenses is calculated by prorating the number of days in the most recent fiscal half year divided by 365. | |
| | (b) | For each class of the Fund, expenses are equal to the annualized expense ratio for the class, multiplied by the average account value over the period, multiplied by 184/365 (to reflect the one-half year period shown). | |
See “Disclosure of Expenses” for further information on how expenses were calculated.
| | |
| Fund Summary as of December 31, 2021 (continued) | | iShares Municipal Bond Index Fund |
Portfolio Information
| | | | |
| SECTOR ALLOCATION | |
| | |
| Sector(a)(b) | | Percent of Total Investments | |
| |
State | | | 31 | % |
| |
Transportation | | | 26 | |
| |
County/City/Special District/School District | | | 16 | |
| |
Utilities | | | 16 | |
| |
Health | | | 6 | |
| |
Education | | | 4 | |
| |
Tobacco | | | 1 | |
| | | | |
| CALL/MATURITY SCHEDULE | |
| | |
| Calendar Year Ended December 31,(a)(c) | | Percentage | |
| |
2022 | | | 8 | % |
| |
2023 | | | 9 | |
| |
2024 | | | 8 | |
| |
2025 | | | 11 | |
| |
2026 | | | 16 | |
| | | | |
| CREDIT QUALITY ALLOCATION | |
| | |
| Credit Rating(a)(d) | | Percent of Total Investments | |
| |
AAA/Aaa | | | 21 | % |
| |
AA/Aa | | | 55 | |
| |
A | | | 17 | |
| |
BBB/Baa | | | 6 | |
| |
N/R(e) | | | 1 | |
| (a) | Excludes short-term securities. |
| (b) | For Fund compliance purposes, the Fund’s sector classifications refer to one or more of the sector sub-classifications used by one or more widely recognized market indexes or rating group indexes, and/or as defined by the investment adviser. These definitions may not apply for purposes of this report, which may combine such sector sub-classifications for reporting ease. |
| (c) | Scheduled maturity dates and/or bonds that are subject to potential calls by issuers over the next five years. |
| (d) | For financial reporting purposes, credit quality ratings shown above reflect the highest rating assigned by either S&P Global Ratings or Moody’s Investors Service, Inc. if ratings differ. These rating agencies are independent, nationally recognized statistical rating organizations and are widely used. Investment grade ratings are credit ratings of BBB/Baa or higher. Below investment grade ratings are credit ratings of BB/Ba or lower. Investments designated N/R are not rated by either rating agency. Unrated investments do not necessarily indicate low credit quality. Credit quality ratings are subject to change. |
| (e) | The investment adviser evaluates the credit quality of unrated investments based upon certain factors including, but not limited to, credit ratings for similar investments and financial analysis of sectors and individual investments. Using this approach, the investment adviser has deemed certain of these unrated securities as investment grade quality. As of December 31, 2021, the market value of unrated securities deemed by the investment adviser to be investment grade represents less than 1% of the Fund’s total investments. |
| | |
| 6 | | 2 0 2 1 BLACK ROCK ANNUAL REPORT TO SHAREHOLDERS |
| | |
| Fund Summary as of December 31, 2021 | | iShares Short-Term TIPS Bond Index Fund |
Investment Objective
iShares Short-Term TIPS Bond Index Fund’s (the “Fund”) investment objective is to seek to track the investment results of an index composed of U.S. 0-5 Year Treasury Inflation-Protected Securities.
Portfolio Management Commentary
How did the Fund perform?
For the 12-month period ended December 31, 2021, the Fund’s Institutional Shares returned 5.18%, Investor A Shares returned 4.89%, and Class K Shares returned 5.19%. The Fund’s benchmark, the Bloomberg U.S. Treasury Inflation-Protected Securities (TIPS) 0-5 Years Index (Series-L), the (“Underlying Index”), returned 5.34% for the same period.
On December 31, 2021, Bloomberg priced the Fund’s benchmark index at 1 pm EST while BlackRock funds priced at 4 pm EST. This event caused some pricing noise and underperformance across both the index and active books, including the iShares Short Term TIPS Index Fund, when looking at the official return. This effect was offset on January 3, 2022 as the benchmark reverted to 4 pm EST pricing.
What factors influenced performance?
Prices for Treasury inflation-protected securities (“TIPS”) are influenced by changes in inflation expectations as well as the direction of nominal U.S. Treasury yields. For the 12-month period, the Bloomberg US TIPS Index posted a return of 5.96% while the Fund’s benchmark, the Bloomberg U.S. TIPS 0-5 Years Index, returned 5.34%, with returns for both indexes limited by rising longer-term nominal U.S. Treasury yields.
The global markets in 2021 began the process of recovery from the COVID-19 pandemic and geopolitical uncertainty. The year started with a positive tone for risk assets as vaccines were rolled out and signs of recovery emerged. The reopening of the economy, continued government stimulus and a dovish Fed contributed to a risk-on environment in the first half of the year. The Fed maintained its exceptionally accommodative stance through most of 2021 as the economy continued to recover with minor setbacks due to the COVID-19 Delta variant and, more recently, the COVID-19 Omicron variant. The U.S. unemployment rate trended downward throughout the year, beginning at 6.4% in January and ending the year at 3.9%.
As the economy showed continued signs of recovery and inflation remained elevated, the Fed began tapering its asset purchases in November 2021. The final Federal Open Market Committee (“FOMC”) meeting of the year, held in December 2021, announced a doubling in the pace of tapering. At the new pace, the Fund will wrap up its asset purchases in the middle of March 2022, and the expectation is that fed funds rate hikes will follow shortly thereafter. This was reflected in the December Summary of Economic Projections and “dot plot” that showed that FOMC participants anticipate that three increases in the Fed’s benchmark overnight lending rate will be appropriate in 2022. The 10-year U.S. Treasury yield rose by 59 basis points (0.59%) over the 12 months to 1.52% at year end.
Describe recent portfolio activity.
During the period, the Fund maintained its objective of seeking to provide investment results that correspond to the total return performance of the Underlying Index by selecting securities in accordance with their relative proportion within the Underlying Index. Other factors considered in security selection included transaction costs and maturity.
Describe portfolio positioning at period end.
The Fund remains positioned to attempt to match the risk and return characteristics of the Underlying Index, irrespective of the future direction of inflation expectations.
The views expressed reflect the opinions of BlackRock as of the date of this report and are subject to change based on changes in market, economic or other conditions. These views are not intended to be a forecast of future events and are no guarantee of future results.
| | |
| Fund Summary as of December 31, 2021 (continued) | | iShares Short-Term TIPS Bond Index Fund |
TOTAL RETURN BASED ON A $10,000 INVESTMENT
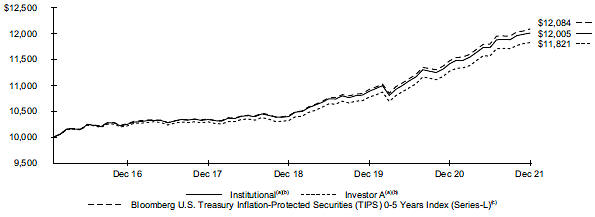
The Fund commenced operations on February 16, 2016.
| | (a) | Assuming transaction costs and other operating expenses, including investment advisory fees, if any. | |
| | (b) | The Fund generally invests at least 90% of its assets, plus the amount of any borrowing for investment purposes, in securities of the Underlying Index. From time to time when conditions warrant, however, the Fund may invest at least 80% of its assets in securities of the Underlying Index. The Fund may invest a portion of the remainder of its assets in securities not included in the Underlying Index, but which BlackRock Advisors, LLC believes will help the Fund track the Underlying Index. | |
| | (c) | Bloomberg U.S. Treasury Inflation-Protected Securities (TIPS) 0-5 Years Index (Series-L) (formerly Bloomberg Barclays U.S. Treasury Inflation-Protected Securities (TIPS) 0-5 Years Index (Series-L), an index that measures the performance of the inflation-protected public obligations of the U.S. Treasury that have a remaining maturity of less than five years. | |
Performance
| | | | | | | | | | | | |
| | | Average Annual Total Returns(a) | |
| | | |
| | | | 1 Year | | | | 5 Years | | |
| Since
Inception |
(b) |
| | | |
Institutional | | | 5.18 | % | | | 3.21 | % | | | 3.16 | % |
Investor A | | | 4.89 | | | | 2.96 | | | | 2.89 | |
Class K | | | 5.19 | | | | 3.23 | | | | 3.18 | |
Bloomberg U.S. Treasury Inflation-Protected Securities (TIPS) 0-5 Years Index (Series-L) | | | 5.34 | | | | 3.32 | | | | 3.28 | |
| | (a) | Average annual total returns reflect reductions for distribution and service fees. See “About Fund Performance” for a detailed description of share classes, including any related fees. | |
| | (b) | The Fund commenced operations on February 16, 2016. | |
Past performance is not an indication of future results.
Performance results may include adjustments made for financial reporting purposes in accordance with U.S. generally accepted accounting principles.
Expense Example
| | | | | | | | | | | | | | | | | | | | | | | | | | | | | | | | |
| | | Actual | | | | | | Hypothetical(a) | | | | |
| | | | | | | | | | | | | | | | |
| | | | | | | | |
| | |
| Beginning
Account Value (07/01/21) |
| |
| Ending
Account Value (12/31/21) |
| |
| Expenses
Paid During the Period |
(b) | | | | | |
| Beginning
Account Value (07/01/21) |
| |
| Ending
Account Value (12/31/21) |
| |
| Expenses
Paid During the Period |
(b) | |
| Annualized
Expense Ratio |
|
| | | | | | | | |
Institutional | | | $ 1,000.00 | | | | $ 1,024.00 | | | | $ 0.36 | | | | | | | | $ 1,000.00 | | | | $ 1,024.85 | | | | $ 0.36 | | | | 0.07 | % |
Investor A | | | 1,000.00 | | | | 1,022.60 | | | | 1.84 | | | | | | | | 1,000.00 | | | | 1,023.39 | | | | 1.84 | | | | 0.36 | |
Class K | | | 1,000.00 | | | �� | 1,024.10 | | | | 0.31 | | | | | | | | 1,000.00 | | | | 1,024.90 | | | | 0.31 | | | | 0.06 | |
| | (a) | Hypothetical 5% annual return before expenses is calculated by prorating the number of days in the most recent fiscal half year divided by 365. | |
| | (b) | For each class of the Fund, expenses are equal to the annualized expense ratio for the class, multiplied by the average account value over the period, multiplied by 184/365 (to reflect the one-half year period shown). | |
See “Disclosure of Expenses” for further information on how expenses were calculated.
| | |
| 8 | | 2 0 2 1 BLACK ROCK ANNUAL REPORT TO SHAREHOLDERS |
| | |
| Fund Summary as of December 31, 2021 (continued) | | iShares Short-Term TIPS Bond Index Fund |
Portfolio Information
ALLOCATION BY MATURITY
| | | | |
| | |
| Period | |
| Percent of
Total Investments |
(a) |
| |
0-1 Year | | | 13 | % |
| |
1-2 Years | | | 21 | |
| |
2-3 Years | | | 21 | |
| |
3-4 Years | | | 26 | |
| |
4-5 Years | | | 19 | |
| (a) | | Exclude short-term securities. |
FIVE LARGEST FUND HOLDINGS
| | | | |
| | |
| Holding | | Percent of
Total Investments | |
| |
U.S. Treasury Inflation Protected Security, 0.13%, 01/15/2023 | | | 8 | % |
| |
U.S. Treasury Inflation Protected Security, 0.13%, 10/15/2025 | | | 7 | |
| |
U.S. Treasury Inflation Protected Security, 0.38%, 07/15/2023 | | | 7 | |
| |
U.S. Treasury Inflation Protected Security, 0.25%, 01/15/2025 | | | 6 | |
| |
U.S. Treasury Inflation Protected Security, 0.38%, 07/15/2025 | | | 6 | |
| | |
| Fund Summary as of December 31, 2021 | | iShares MSCI EAFE International Index Fund |
Investment Objective
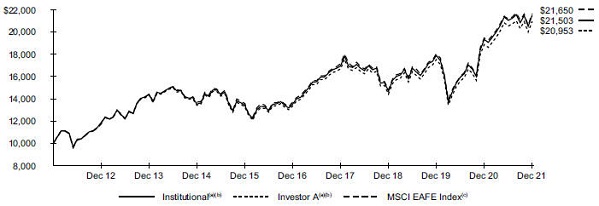
iShares MSCI EAFE International Index Fund’s (the “Fund”) investment objective is to match the performance of the MSCI EAFE Index (Europe, Australasia, Far East) (the “MSCI EAFE Index”) in U.S. dollars with net dividends as closely as possible before the deduction of Fund expenses.
Portfolio Management Commentary
How did the Fund perform?
For the 12-month period ended December 31, 2021, the Fund’s Institutional Shares returned 11.28%, Investor A Shares returned 11.01%, Investor P Shares returned 11.05%, and Class K Shares returned 11.33%. The MSCI EAFE Index returned 11.26% for the same period.
Returns for the Fund’s respective share classes differ from the benchmark index based on individual share-class expenses.
Describe the market environment.
The vaccination rollout in developed markets during the first quarter of 2021 boosted optimism for a global economic recovery. However, the reappearance of high numbers of daily COVID-19 cases across Europe weighed down on the general sentiment, especially as social restrictions were tightened again across Europe.
After a relatively slow start in the second quarter of 2021, the vaccination rate across developed markets picked up, leading to more economic activities restarting. The prospect for strong growth, signaled by strong economic data, also boosted European equities over the quarter. Strong corporate earnings in Europe supported market performance as companies benefited from a combination of demand recovery and supply constraints. Services increased over the quarter, as the ease of COVID-19 restrictions helped fuel higher demand. However, despite the improving economic outlook, the European Central Bank policy makers signaled that it was still too soon to withdraw stimulus measures, while despite the Bank of England announcing its plans to slow its quantitative easing program.
In Japan, the consistent increase in COVID-19 cases led the government to extend the state of emergency until June 20, 2021. While market performance was initially weighed down by the slow vaccination campaign, the market began to rally in the second quarter of 2021 as the government rolled out mass vaccination efforts throughout the country. The Japanese equity market started to recover by the end of May, but investors’ concerns over the low vaccination rate persisted, resulting in slight negative performance for the quarter.
In the third quarter of 2021, the COVID-19 pandemic continued to have a negative impact on economic recovery, but to a lesser degree in developed countries as vaccination rates increased. However, concerns regarding inflation, supply chain disruption, and rising energy prices hindered developed markets’ performance.
In Europe, strong earnings reports and easing of restrictions boosted market performance, and many economies began to recover in the first two months of the third quarter. However, an increase in energy prices due to energy shortages, along with concerns of inflation and supply chain disruption, hindered market performance and gross domestic product growth.
In Asia, the concerns regarding the debt crisis of the Chinese property developer Evergrande dampened market performance, especially in Hong Kong. The Japanese market continued its recovery throughout the third quarter of 2021 despite the state of emergency implemented in Tokyo. Japanese equities were supported by strong earnings reports and increased hopes of stimulus and economic reopening, as COVID-19 cases declined.
During the fourth quarter of 2021, developed non-U.S. equity markets posted a gain in October on the back of strong corporate earnings reports and robust economic data. However, the emergence of the new COVID-19 Omicron variant dampened markets performance in November and put pressure on central banks as they faced rising inflation rates on the back of supply chain disruptions. In December, markets rebounded as the new variant was reported to be less severe than expected despite higher transmissibility.
In Europe, the market recovered in December 2021 after concerns regarding the Omicron variant were lessened. The European Central Bank committed to end the emergency bond buying program in March 2022 but promised to keep low borrowing costs over 2022 and to keep the door open for restarting emergency support in the event of turbulence. On the other hand, the Bank of England raised the policy interest rate in December from 0.10% to 0.25%, signaling that inflation risk outweighed the disruptions risk of the Omicron variant.
Asian developed markets finished the fourth quarter of 2021 in negative territory. The uncertainty of the impact of the Omicron variant and higher commodity prices weighed down on the performance of Asian markets. Japanese equities were the worst performer on the back of a weakened yen and renewed ambiguity regarding new mobility restrictions.
In the fourth quarter of 2021, from a sector perspective within the MSCI EAFE Index, materials (+8.80%), consumer staples (+6.96%) and real estate (+6.29%) were among the best performers. Communication services (-7.68%), energy (-7.37%), and financials (+2.08%) were among the worst performers.
Describe recent portfolio activity.
During the 12-month period, as changes were made to the composition of the MSCI EAFE Index, the Fund purchased and sold securities to maintain its objective of matching the risks and return of the benchmark index.
Describe portfolio positioning at period end.
The Fund remains positioned to match the risk characteristics of the benchmark index, irrespective of the market’s future direction.
The views expressed reflect the opinions of BlackRock as of the date of this report and are subject to change based on changes in market, economic or other conditions. These views are not intended to be a forecast of future events and are no guarantee of future results.
| | |
| 10 | | 2 0 2 1 BLACK ROCK ANNUAL REPORT TO SHAREHOLDERS |
| | |
| Fund Summary as of December 31, 2021 (continued) | | iShares MSCI EAFE International Index Fund |
TOTAL RETURN BASED ON A $10,000 INVESTMENT
| | (a) | Assuming transaction costs and other operating expenses, including administration fees, if any. | |
| | (b) | Prior to August 1, 2016, the Fund invested all of its assets in Master International Index Series, a series of Quantitative Master Series LLC. Master International Index Series invested in a statistically selected sample of equity securities included in the MSCI EAFE Index and in derivative instruments linked to the MSCI EAFE Index. On August 1, 2016, the Fund ceased to invest in the Master International Index Series as part of a “master/feeder” structure and instead began to operate as a stand-alone fund. | |
| | (c) | An equity index which captures large- and mid-cap representation across certain developed markets countries around the world, excluding the United States and Canada. The index covers approximately 85% of the free float adjusted market capitalization in each country. | |
Performance
| | | | | | | | | | | | | | | | | | | | | | | | |
| | | Average Annual Total Returns(a) | |
| | | 1 Year | | | 5 Years | | | 10 Years | |
| | | | | | |
| | | Without
Sales
Charge | | | With
Sales
Charge | | | Without
Sales
Charge | | | With
Sales
Charge | | | Without
Sales
Charge | | | With
Sales
Charge | |
| | | | | | |
Institutional | | | 11.28 | % | | | N/A | | | | 9.70 | % | | | N/A | | | | 7.96 | % | | | N/A | |
Investor A | | | 11.01 | | | | N/A | | | | 9.40 | | | | N/A | | | | 7.68 | | | | N/A | |
Investor P | | | 11.05 | | | | 5.22 | % | | | 9.42 | | | | 8.25 | % | | | 7.69 | | | | 7.11 | % |
Class K | | | 11.33 | | | | N/A | | | | 9.74 | | | | N/A | | | | 8.00 | | | | N/A | |
MSCI EAFE Index | | | 11.26 | | | | N/A | | | | 9.55 | | | | N/A | | | | 8.03 | | | | N/A | |
| | (a) | Assuming maximum sales charges, if any. Average annual total returns with and without sales charges reflect reductions for distribution and service fees. See “About Fund Performance” for a detailed description of share classes, including any related sales charges and fees, and how performance was calculated for certain share classes. | |
N/A — Not applicable as the share class and index do not have a sales charge.
Past performance is not an indication of future results.
Performance results may include adjustments made for financial reporting purposes in accordance with U.S. generally accepted accounting principles.
Expense Example
| | | | | | | | | | | | | | | | | | | | | | | | | | | | | | | | |
| | | Actual | | | | | | Hypothetical(a) | | | | |
| | | | | | | | | | | | | | | | |
| | | | | | | | |
| | | Beginning | | | | Ending | | | | Expenses | | | | | | | | Beginning | | | | Ending | | | | Expenses | | | | Annualized | |
| | | Account Value | | | | Account Value | | | | Paid During | | | | | | | | Account Value | | | | Account Value | | | | Paid During | | | | Expense | |
| | | | (07/01/21) | | | | (12/31/21) | | | | the Period | (b) | | | | | | | (07/01/21) | | | | (12/31/21) | | | | the Period | (b) | | | Ratio | |
| | | | | | | | |
Institutional | | | $ 1,000.00 | | | | $ 1,021.60 | | | | $ 0.46 | | | | | | | | $ 1,000.00 | | | | $ 1,024.75 | | | | $ 0.46 | | | | 0.09 | % |
Investor A | | | 1,000.00 | | | | 1,020.50 | | | | 1.73 | | | | | | | | 1,000.00 | | | | 1,023.49 | | | | 1.73 | | | | 0.34 | |
Investor P | | | 1,000.00 | | | | 1,020.60 | | | | 1.73 | | | | | | | | 1,000.00 | | | | 1,023.49 | | | | 1.73 | | | | 0.34 | |
Class K | | | 1,000.00 | | | | 1,021.50 | | | | 0.20 | | | | | | | | 1,000.00 | | | | 1,025.00 | | | | 0.20 | | | | 0.04 | |
| | (a) | Hypothetical 5% annual return before expenses is calculated by prorating the number of days in the most recent fiscal half year divided by 365. | |
| | (b) | For each class of the Fund, expenses are equal to the annualized expense ratio for the class, multiplied by the average account value over the period, multiplied by 184/365 (to reflect the one-half year period shown). | |
See “Disclosure of Expenses” for further information on how expenses were calculated.
| | |
| Fund Summary as of December 31, 2021 (continued) | | iShares MSCI EAFE International Index Fund |
Portfolio Information
TEN LARGEST HOLDINGS
| | | | |
| | |
| Security | | Percent of Net Assets | |
| |
Nestle SA, Registered Shares | | | 2 | % |
ASML Holding NV | | | 2 | |
Roche Holding AG | | | 2 | |
LVMH Moet Hennessy Louis Vuitton SE | | | 1 | |
Toyota Motor Corp. | | | 1 | |
Novartis AG, Registered Shares | | | 1 | |
Novo Nordisk A/S, Class B | | | 1 | |
AstraZeneca PLC | | | 1 | |
Sony Group Corp. | | | 1 | |
SAP SE | | | 1 | |
GEOGRAPHIC ALLOCATION
| | | | |
| | |
| Country/Geographic Region | | Percent of Net Assets | |
| |
Japan | | | 22 | % |
United Kingdom | | | 13 | |
France | | | 11 | |
Switzerland | | | 11 | |
Germany | | | 9 | |
Australia | | | 7 | |
Netherlands | | | 6 | |
Sweden | | | 4 | |
Denmark | | | 3 | |
Hong Kong | | | 2 | |
Spain | | | 2 | |
Italy | | | 2 | |
Finland | | | 1 | |
Singapore | | | 1 | |
Ireland | | | 1 | |
Belgium | | | 1 | |
Israel | | | 1 | |
Norway | | | 1 | |
United States | | | 1 | |
Other# | | | — | (a) |
Other Assets Less Liabilities | | | 1 | |
| (a) | Rounds to less than 1% of net assets. |
| # | Includes holdings within countries/geographic regions that are less than 1% of net assets. Please refer to the Schedule of Investments for such countries/geographic regions. |
| | |
| 12 | | 2 0 2 1 BLACK ROCK ANNUAL REPORT TO SHAREHOLDERS |
| | |
Fund Summary as of December 31, 2021 | | iShares Russell 2000 Small-Cap Index Fund |
Investment Objective
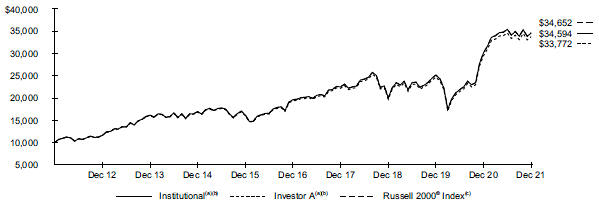
iShares Russell 2000 Small-Cap Index Fund’s (the “Fund”) investment objective is to match the performance of the Russell 2000® Index as closely as possible before the deduction of Fund expenses.
Portfolio Management Commentary
How did the Fund perform?
For the 12-month period ended December 31, 2021, the Fund’s Institutional Shares returned 14.73%, Investor A Shares returned 14.38%, Investor P Shares returned 14,42%, and Class K Shares returned 14.78%. The Russell 2000® Index returned 14.82% for the same period.
Returns for the Fund’s respective share classes differ from the benchmark index based on individual share-class expenses. The Fund invests all of its assets in Master Small Cap Index Series (the “Series”), a series of Quantitative Master Series LLC.
Describe the market environment.
In the first quarter of 2021, following the strong end to 2020, favorable conditions continued with signs of a sooner-than-expected economic activity restart. Monetary conditions remained supportive, as the Fed signaled a continuing environment of low interest rates. With both the Senate and Congress passing a new $1.9 trillion stimulus package, and the United States starting to lead in the vaccine rollout, optimism continued to rise for strong economic growth in the first quarter. Despite the heightened volatility at the beginning of the quarter related to retail trading activity, the positive news about the stimulus package and the potential infrastructure bill soothed the market and supported a positive return over the first quarter.
The U.S. equity market rallied in the second quarter of 2021 as the vaccination campaign continued to accelerate, and as more signs started to emerge for a sooner-than-expected economic activity restart. The U.S. Consumer Price Index increased by more than 4% (one-year as of April 2021), which raised questions on whether this surge was sparked by temporary factors at play. However, the inflation concerns and the Fed’s cautious optimism about the recovery muted the market rally in May. In June, the U.S. equity market extended its rally, supported by the prospect of more fiscal stimulus, as President Biden reached a bipartisan $1 trillion agreement for infrastructure spending.
In the third quarter of 2021, U.S. equities continued climbing in August on the back of strong economic data and quarterly earnings reports. The positive return in markets came despite the increase in COVID-19 Delta variant cases in the United States. The Fed announcement in August was in line with expectations, as Fed Chair Jerome Powell suggested that tapering may start before year end during his Jackson Hole speech.
The positive sentiment of July and August was offset in September amid concerns regarding potential contagion from the unfolding debt crisis at Chinese property developer, Evergrande. Concerns that higher inflation and supply chain issues would last longer than expected also weighed down on the market. Lastly, the continuing disagreement in Washington D.C. regarding the debt ceiling and the infrastructure bill dampened U.S. equity performance. However, Congress passed a bill, toward the end of the third quarter, extending government funding until December 3, 2021.
Following a strong earnings season in the fourth quarter of 2021 that boosted the positive sentiment early in the quarter, the emergence of the new COVID-19 Omicron variant and the concerns about higher inflation rates weighed down on U.S. market performance in November. However, preliminary data showed that the coronavirus vaccine was effective against the Omicron variant, and the Fed shared more clarity on next year’s policy path, leading to strong positive returns to end the fourth quarter. The falling unemployment rate and the $550 billion bipartisan infrastructure bill signed by President Biden supported market performance over the fourth quarter.
The Fed’s stance on monetary policy was at the forefront of market discussions over the fourth quarter of 2021. Fed Chair Jerome Powell conceded that inflation had been far stickier than initially anticipated. These inflation pressures have been exacerbated as consumer demand continued to increase with supply chain bottlenecks and labor shortages. The Fed brought forward the dates of tapering to Spring 2022.
In the fourth quarter of 2021, from a sector perspective within the Russell 2000® Index, utilities (+10.87%), real estate (+8.44%) and industrials (+7.71%) were among the best performers, while communication services (-9.99%), health care (-9.58%), and energy (-3.16%) were among the worst performers.
Describe recent portfolio activity.
During the 12-month period, as changes were made to the composition of the Russell 2000® Index, the Series purchased and sold securities to maintain its objective of matching the risks and return of the benchmark index.
The Series had slightly elevated cash positions at times during the period, which had no material impact on Fund performance.
Describe portfolio positioning at period end.
The Series remains positioned to match the risk characteristics of its benchmark index, irrespective of the market’s future direction.
The views expressed reflect the opinions of BlackRock as of the date of this report and are subject to change based on changes in market, economic or other conditions. These views are not intended to be a forecast of future events and are no guarantee of future results.
| | |
| Fund Summary as of December 31, 2021 (continued) | | iShares Russell 2000 Small-Cap Index Fund |
TOTAL RETURN BASED ON A $10,000 INVESTMENT
| | (a) | Assuming transaction costs and other operating expenses, including administration fees, if any. | |
| | (b) | The Fund invests all of its assets in the Series. The Series may invest in a statistically selected sample of the stocks included in the Russell 2000® Index and in derivative instruments linked to the Russell 2000® Index. | |
| | (c) | An index that measures the performance of the small-cap segment of the U.S. equity universe. It is a subset of the Russell 3000® Index representing approximately 10% of the total market capitalization of that index. It includes approximately 2,000 of the smallest securities based on a combination of their market cap and current index membership. | |
Performance
| | | | | | | | | | | | | | | | | | | | | | | | |
| | | Average Annual Total Returns(a) | |
| | | | |
| | | |
| | | 1 Year | | | 5 Years | | | 10 Years | |
| | | | | | |
| | | Without
Sales
Charge | | | With
Sales
Charge | | | Without
Sales
Charge | | | With
Sales
Charge | | | Without
Sales
Charge | | | With
Sales
Charge | |
| | | | | | |
Institutional | | | 14.73 | % | | | N/A | | | | 12.00 | % | | | N/A | | | | 13.21 | % | | | N/A | |
Investor A | | | 14.38 | | | | N/A | | | | 11.72 | | | | N/A | | | | 12.94 | | | | N/A | |
Investor P | | | 14.42 | | | | 8.41 | % | | | 11.72 | | | | 10.52 | % | | | 12.93 | | | | 12.32 | % |
Class K | | | 14.78 | | | | N/A | | | | 12.06 | | | | N/A | | | | 13.28 | | | | N/A | |
Russell 2000® Index | | | 14.82 | | | | N/A | | | | 12.02 | | | | N/A | | | | 13.23 | | | | N/A | |
| | (a) | Assuming maximum sales charges, if any. Average annual total returns with and without sales charges reflect reductions for distribution and service fees. See “About Fund Performance” for a detailed description of share classes, including any related sales charges and fees, and how performance was calculated for certain share classes. | |
N/A — Not applicable as the share class and index do not have a sales charge.
Past performance is not an indication of future results.
Performance results may include adjustments made for financial reporting purposes in accordance with U.S. generally accepted accounting principles.
Expense Example
| | | | | | | | | | | | | | | | | | | | | | | | | | | | | | | | |
| | | Actual | | | | | | Hypothetical(a) | | | | |
| | | | | | | | | | | | | | | | |
| | | | | | | | |
| | | Beginning | | | | Ending | | | | Expenses | | | | | | | | Beginning | | | | Ending | | | | Expenses | | | | Annualized | |
| | | Account Value | | | | Account Value | | | | Paid During | | | | | | | | Account Value | | | | Account Value | | | | Paid During | | | | Expense | |
| | | | (07/01/21) | | | | (12/31/21) | | | | the Period | (b) | | | | | | | (07/01/21) | | | | (12/31/21) | | | | the Period | (b) | | | Ratio | |
| | | | | | | | |
Institutional | | | $ 1,000.00 | | | | $ 976.90 | | | | $ 0.60 | | | | | | | | $ 1,000.00 | | | | $ 1,024.60 | | | | $ 0.61 | | | | 0.12 | % |
Investor A | | | 1,000.00 | | | | 975.10 | | | | 1.84 | | | | | | | | 1,000.00 | | | | 1,023.34 | | | | 1.89 | | | | 0.37 | |
Investor P | | | 1,000.00 | | | | 975.30 | | | | 1.84 | | | | | | | | 1,000.00 | | | | 1,023.34 | | | | 1.89 | | | | 0.37 | |
Class K | | | 1,000.00 | | | | 977.10 | | | | 0.30 | | | | | | | | 1,000.00 | | | | 1,024.90 | | | | 0.31 | | | | 0.06 | |
| | (a) | Hypothetical 5% annual return before expenses is calculated by prorating the number of days in the most recent fiscal half year divided by 365. | |
| | (b) | For each class of the Fund, expenses are equal to the annualized expense ratio for the class, multiplied by the average account value over the period, multiplied by 184/365 (to reflect the one-half year period shown). Because the Fund invests all of its assets in the Master Portfolio, the expense example reflects the net expenses of both the Fund and the Master Portfolio in which it invests. | |
See “Disclosure of Expenses” for further information on how expenses were calculated.
| | |
| 14 | | 2 0 2 1 BLACK ROCK ANNUAL REPORT TO SHAREHOLDERS |
About Fund Performance
Institutional and Class K Shares are not subject to any sales charge. These shares bear no ongoing distribution or service fees and are available only to certain eligible investors.
On November 19, 2018, the iShares Municipal Bond Index Fund acquired all of the assets and assumed certain stated liabilities, of the State Farm Tax Advantaged Bond Fund (the “Predecessor Fund”), a series of State Farm Mutual Fund Trust, in a tax-free reorganization (the “Reorganization”). The Predecessor Fund is the performance and accounting survivor of the Reorganization. Accordingly, information provided herein for periods prior to the Reorganization is that of the Predecessor Fund. See Note 1 of the Notes to Financial Statements for additional information regarding the Reorganization.
Institutional and Class K Shares performance of iShares Municipal Bond Index Fund shown prior to the Institutional and Class K Shares inception date of November 19, 2018 is that of Investor A Shares, which reflect the performance of Premier Shares of the Predecessor Fund. The performance of iShares Municipal Bond Index Fund’s Institutional and Class K Shares would be substantially similar to Investor A Shares because Institutional Shares, Class K Shares and Investor A Shares invest in the same portfolio of securities and performance would only differ to the extent that Institutional Shares, Class K Shares and Investor A Shares have different expenses. The actual returns of Institutional and Class K Shares would have been higher than those of the Investor A Shares because Institutional and Class K Shares have lower expenses than the Investor A Shares.
Investor A Shares are not subject to any sales charge and bear no ongoing distribution fee. These shares are subject to an ongoing service fee of 0.25% per year. These shares are generally available through financial intermediaries. Investor A Shares performance of iShares Municipal Bond Index Fund shown prior to the Reorganization is that of the Premier Shares of the Predecessor Fund.
Investor P Shares (available in iShares MSCI EAFE International Index Fund and iShares Russell 2000 Small-Cap Index Fund) are subject to a maximum initial sales charge (front-end load) of 5.25% and a service fee of 0.25% per year (but no distribution fee). These shares are only available to investors purchasing shares through registered representatives of an insurance company’s broker-dealer that has entered into an agreement with iShares MSCI EAFE International Index Fund and iShares Russell 2000 Small-Cap Index Fund’s distributor to offer such shares. Investor P Share performance of iShares MSCI EAFE International Index Fund and iShares Russell 2000 Small-Cap Index Fund shown prior to the Investor P Shares inception date of August 6, 2018 is that of Institutional Shares (which have no distribution or service fees) and was restated to reflect Investor P Shares fees.
Investor P Shares (available in iShares Municipal Bond Index Fund) are subject to a maximum initial sales charge (front-end load) of 4.00% and a service fee of 0.25% per year (but no distribution fee). Certain redemptions of these shares may be subject to a contingent deferred sales charge (“CDSC”) where no initial sales charge was paid at the time of purchase. These shares are only available to investors purchasing shares through registered representatives of an insurance company’s broker-dealer that has entered into an agreement with the Fund’s distributor to offer such shares. Investor P Shares performance shown prior to the Reorganization is that of the Premier Shares of the Predecessor Fund.
Past performance is not an indication of future results. Financial markets have experienced extreme volatility and trading in many instruments has been disrupted. These circumstances may continue for an extended period of time and may continue to affect adversely the value and liquidity of each Fund’s investments. As a result, current performance may be lower or higher than the performance data quoted. Refer to blackrock.com to obtain performance data current to the most recent month-end. Performance results do not reflect the deduction of taxes that a shareholder would pay on Fund distributions or the redemption of Fund shares. Figures shown in the performance table(s) assume reinvestment of all distributions, if any, at net asset value (“NAV”) on the ex-dividend date or payable date, as applicable. Investment return and principal value of shares will fluctuate so that shares, when redeemed, may be worth more or less than their original cost. Distributions paid to each class of shares will vary because of the different levels of service, distribution and transfer agency fees applicable to each class, which are deducted from the income available to be paid to shareholders.
BlackRock Advisors, LLC (the “Manager”), each Fund’s investment adviser, has contractually and/or voluntarily agreed to waive and/or reimburse a portion of each Fund’s expenses. Without such waiver(s) and/or reimbursement(s), each Fund’s performance would have been lower. With respect to each Fund’s voluntary waiver(s), if any, the Manager is under no obligation to waive and/or reimburse or to continue waiving and/or reimbursing its fees and such voluntary waiver(s) may be reduced or discontinued at any time. With respect to each Fund’s contractual waiver(s), if any, the Manager is under no obligation to continue waiving and/or reimbursing its fees after the applicable termination date of such agreement. See the Notes to Financial Statements for additional information on waivers and/or reimbursements.
The standardized 30-day yield includes the effects of any waivers and/or reimbursements. The unsubsidized 30-day yield excludes the effects of any waivers and/or reimbursements.
| | |
ABOUT FUND PERFORMANCE | | 15 |
Disclosure of Expenses
Shareholders of each Fund may incur the following charges: (a) transactional expenses, such as sales charges; and (b) operating expenses, including investment advisory fees, service and distribution fees, including 12b-1 fees, acquired fund fees and expenses, and other fund expenses. The expense examples shown (which are based on a hypothetical investment of $1,000 invested at the beginning of the period (or from the commencement of operations if less than 6 months) and held through the end of the period) are intended to assist shareholders both in calculating expenses based on an investment in each Fund and in comparing these expenses with similar costs of investing in other mutual funds.
The expense examples provide information about actual account values and actual expenses. Annualized expense ratios reflect contractual and voluntary fee waivers, if any. In order to estimate the expenses a shareholder paid during the period covered by this report, shareholders can divide their account value by $1,000 and then multiply the result by the number corresponding to their Fund and share class under the heading entitled “Expenses Paid During the Period.”
The expense examples also provide information about hypothetical account values and hypothetical expenses based on a Fund’s actual expense ratio and an assumed rate of return of 5% per year before expenses. In order to assist shareholders in comparing the ongoing expenses of investing in these Funds and other funds, compare the 5% hypothetical examples with the 5% hypothetical examples that appear in shareholder reports of other funds.
The expenses shown in the expense examples are intended to highlight shareholders’ ongoing costs only and do not reflect transactional expenses, such as sales charges, if any. Therefore, the hypothetical examples are useful in comparing ongoing expenses only and will not help shareholders determine the relative total expenses of owning different funds. If these transactional expenses were included, shareholder expenses would have been higher.
Derivative Financial Instruments
The Funds may invest in various derivative financial instruments. These instruments are used to obtain exposure to a security, commodity, index, market, and/or other assets without owning or taking physical custody of securities, commodities and/or other referenced assets or to manage market, equity, credit, interest rate, foreign currency exchange rate, commodity and/or other risks. Derivative financial instruments may give rise to a form of economic leverage and involve risks, including the imperfect correlation between the value of a derivative financial instrument and the underlying asset, possible default of the counterparty to the transaction or illiquidity of the instrument. The Funds’ successful use of a derivative financial instrument depends on the investment adviser’s ability to predict pertinent market movements accurately, which cannot be assured. The use of these instruments may result in losses greater than if they had not been used, may limit the amount of appreciation a Fund can realize on an investment and/or may result in lower distributions paid to shareholders. The Funds’ investments in these instruments, if any, are discussed in detail in the Notes to Financial Statements.
| | |
| 16 | | 2 0 2 1 BLACK ROCK ANNUAL REPORT TO SHAREHOLDERS |
| | |
Schedule of Investments December 31, 2021 | | iShares Municipal Bond Index Fund (Percentages shown are based on Net Assets) |
| | | | | | | | |
| Security | | Par (000) | | | Value | |
| | |
Municipal Bonds | | | | | | | | |
| | |
| Alabama — 0.5% | | | | | | |
| | |
| State — 0.2% | | | | | | |
Alabama Public School and College Authority, Refunding RB, Series A, 4.00%, 11/01/38 | | $ | 395 | | | $ | 476,015 | |
| | | | | | | | |
| | |
| Transportation — 0.3% | | | | | | |
Alabama Federal Aid Highway Finance Authority, Refunding RB, Series B, 5.00%, 09/01/24(a) | | | 900 | | | | 1,010,363 | |
| | | | | | | | |
| | |
Total Municipal Bonds in Alabama | | | | | | | 1,486,378 | |
| | | | | | | | |
| | |
| Arizona — 1.7% | | | | | | |
|
| County/City/Special District/School District — 0.2% | |
City of Phoenix, Refunding GO, 5.00%, 07/01/24 | | | 650 | | | | 723,944 | |
| | | | | | | | |
| | |
| Health — 0.3% | | | | | | |
Arizona Health Facilities Authority, Refunding RB, Series A, 4.00%, 01/01/23(b) | | | 1,000 | | | | 1,000,000 | |
| | | | | | | | |
| | |
| Transportation — 0.3% | | | | | | |
Arizona Department of Transportation State Highway Fund Revenue, Refunding RB, Sub-Series A, 5.00%, 07/01/22(b) | | | 1,000 | | | | 1,023,654 | |
| | | | | | | | |
| | |
| Utilities — 0.9% | | | | | | |
Salt River Project Agricultural Improvement & Power District, Refunding RB, Series A, 5.00%, 01/01/34 | | | 2,480 | | | | 2,975,039 | |
| | | | | | | | |
| | |
Total Municipal Bonds in Arizona | | | | | | | 5,722,637 | |
| | | | | | | | |
| | |
| California — 21.0% | | | | | | |
|
| County/City/Special District/School District — 4.4% | |
Coast Community College District, Refunding GO, Series A, 4.00%, 08/01/23(b) | | | 1,000 | | | | 1,059,347 | |
Contra Costa Community College District, GO, Series A, 4.00%, 08/01/39 | | | 1,000 | | | | 1,083,398 | |
El Camino Community College District Foundation, GO, CAB, Series C, 0.00%, 08/01/38(c) | | | 680 | | | | 472,787 | |
Fremont Union High School District, Refunding GO, Series A, 5.00%, 08/01/44 | | | 1,350 | | | | 1,643,627 | |
Los Angeles Community College District, Refunding GO, Series A, 5.00%, 08/01/24(b) | | | 1,000 | | | | 1,118,720 | |
Los Angeles County Facilities Inc., RB, Series A, 4.00%, 12/01/48 | | | 1,000 | | | | 1,159,709 | |
Los Angeles Unified School District, GO, Series B-1, 5.00%, 07/01/33 | | | 1,500 | | | | 1,850,002 | |
Sacramento City Financing Authority, Refunding RB, Series E, (AMBAC), 5.25%, 12/01/30 | | | 250 | | | | 322,127 | |
San Diego Community College District, Refunding GO, 4.00%, 08/01/26(b) | | | 500 | | | | 578,563 | |
San Diego Unified School District, GO | | | | | | | | |
Series I, 5.00%, 07/01/41 | | | 1,000 | | | | 1,214,390 | |
Series I, 5.00%, 07/01/47 | | | 2,075 | | | | 2,503,820 | |
Series L, 4.00%, 07/01/49 | | | 1,000 | | | | 1,176,095 | |
San Marcos Unified School District, GO, CAB, Series B, 0.00%, 08/01/51(c) | | | 350 | | | | 168,378 | |
| | | | | | | | |
| | |
| | | | | | | 14,350,963 | |
| | |
| Education — 2.3% | | | | | | |
California Educational Facilities Authority, RB, Series U-6, 5.00%, 05/01/45 | | | 1,260 | | | | 1,957,899 | |
California State University, Refunding RB Series A, 4.00%, 11/01/35 | | | 500 | | | | 564,380 | |
| | | | | | | | |
| Security | | Par (000) | | | Value | |
| | |
| Education (continued) | | | | | | |
California State University, Refunding RB (continued) | |
Series A, 4.00%, 11/01/38 | | $ | 500 | | | $ | 562,680 | |
Series A, 5.00%, 11/01/43 | | | 540 | | | | 625,750 | |
Series A, 5.00%, 11/01/48 | | | 1,030 | | | | 1,275,615 | |
University of California, Refunding RB | | | | | | | | |
Series AR, 5.00%, 05/15/41 | | | 605 | | | | 712,986 | |
Series AY, 5.00%, 05/15/32 | | | 500 | | | | 610,211 | |
Series AY, 5.00%, 05/15/36 | | | 1,000 | | | | 1,216,313 | |
| | | | | | | | |
| | |
| | | | | | | 7,525,834 | |
| | |
| Health — 1.1% | | | | | | |
California Health Facilities Financing Authority Refunding RB, 5.00%, 08/15/51 | | | 1,000 | | | | 1,284,424 | |
California Health Facilities Financing Authority, RB, Series A, 5.00%, 11/15/48 | | | 1,950 | | | | 2,377,871 | |
| | | | | | | | |
| | |
| | | | | | | 3,662,295 | |
| | |
| State — 5.8% | | | | | | |
California State Public Works Board, RB, Series A, 5.00%, 03/01/38 | | | 1,000 | | | | 1,050,563 | |
California State Public Works Board, Refunding RB | | | | | | | | |
Series B, 5.00%, 10/01/26 | | | 250 | | | | 300,588 | |
Series C, 4.00%, 11/01/32 | | | 500 | | | | 574,416 | |
Series C, 5.00%, 11/01/34 | | | 685 | | | | 818,475 | |
State of California, GO, 5.00%, 03/01/45 | | | 1,000 | | | | 1,123,816 | |
State of California, Refunding GO | | | | | | | | |
5.00%, 10/01/24 | | | 475 | | | | 534,826 | |
5.00%, 10/01/25 | | | 1,000 | | | | 1,166,631 | |
5.00%, 08/01/26 | | | 540 | | | | 626,800 | |
5.00%, 08/01/27 | | | 1,000 | | | | 1,198,265 | |
5.00%, 08/01/31 | | | 1,000 | | | | 1,188,301 | |
5.00%, 09/01/31 | | | 565 | | | | 673,314 | |
5.00%, 12/01/31 | | | 2,000 | | | | 2,171,749 | |
4.00%, 09/01/32 | | | 250 | | | | 286,496 | |
4.00%, 09/01/33 | | | 1,000 | | | | 1,144,834 | |
5.00%, 08/01/35 | | | 1,000 | | | | 1,221,756 | |
4.00%, 09/01/35 | | | 1,000 | | | | 1,143,023 | |
5.00%, 09/01/35 | | | 1,000 | | | | 1,189,181 | |
5.00%, 02/01/38 | | | 1,000 | | | | 1,048,495 | |
5.00%, 12/01/43 | | | 500 | | | | 542,737 | |
5.00%, 08/01/46 | | | 1,000 | | | | 1,177,453 | |
| | | | | | | | |
| | |
| | | | | | | 19,181,719 | |
| | |
| Tobacco — 0.9% | | | | | | |
Golden State Tobacco Securitization Corp., Refunding RB, Series A, (SAP), 5.00%, 06/01/25(b) | | | 2,400 | | | | 2,773,924 | |
| | | | | | | | |
| | |
| Transportation — 2.9% | | | | | | |
Bay Area Toll Authority, RB, Series F-1,
4.00%, 04/01/56 | | | 1,000 | | | | 1,145,682 | |
Bay Area Toll Authority, Refunding RB,
4.00%, 04/01/38 | | | 500 | | | | 577,548 | |
City of Long Beach California Harbor Revenue, Refunding ARB, Series C, 5.00%, 05/15/47 | | | 500 | | | | 600,019 | |
City of Los Angeles Department of Airports, ARB, Sub- Series B, 5.00%, 05/15/42 | | | 1,500 | | | | 1,817,035 | |
City of Los Angeles Department of Airports, Refunding RB, Series B, 5.00%, 05/15/35 | | | 400 | | | | 406,937 | |
Foothill-Eastern Transportation Corridor Agency, Refunding RB, CAB(c) | | | | | | | | |
Series A, (AGM), 0.00%, 01/15/36 | | | 500 | | | | 370,605 | |
Series A, (AGM), 0.00%, 01/15/37 | | | 1,000 | | | | 720,232 | |
| | |
FUND SCHEDULES OF INVESTMENTS | | 17 |
| | |
Schedule of Investments (continued) December 31, 2021 | | iShares Municipal Bond Index Fund (Percentages shown are based on Net Assets) |
| | | | | | | | |
| Security | | Par (000) | | | Value | |
| | |
| Transportation (continued) | | | | | | |
Riverside County Transportation Commission Refunding RB, 4.00%, 06/01/37 | | $ | 1,154 | | | $ | 1,387,701 | |
San Francisco City & County Airport Comm-San Francisco International Airport, Refunding ARB | | | | | | | | |
Series E, 5.00%, 05/01/48 | | | 1,190 | | | | 1,459,510 | |
Series A, AMT, 4.00%, 05/01/49 | | | 1,000 | | | | 1,135,947 | |
| | | | | | | | |
| | |
| | | | | | | 9,621,216 | |
| | |
| Utilities — 3.6% | | | | | | |
City of San Francisco California Public Utilities Commission Water Revenue, Refunding RB, 5.00%, 11/01/35 | | | 1,305 | | | | 1,560,650 | |
East Bay Municipal Utility District Water System Revenue, Refunding RB, Series B, 5.00%, 06/01/33 | | | 1,435 | | | | 1,758,518 | |
Los Angeles Department of Water & Power Power System Revenue, RB, Series D, 5.00%, 07/01/44 | | | 1,500 | | | | 1,658,392 | |
Los Angeles Department of Water & Power Power System Revenue, Refunding RB | | | | | | | | |
Series A, 5.00%, 07/01/30 | | | 1,500 | | | | 1,697,841 | |
Series A, 5.00%, 07/01/37 | | | 1,000 | | | | 1,229,098 | |
Sacramento Municipal Utility District, RB, Series A, 5.00%, 08/15/41 | | | 575 | | | | 615,106 | |
San Diego Public Facilities Financing Authority, Refunding RB, Series A, Subordinate, 5.00%, 08/01/43 | | | 500 | | | | 619,312 | |
San Francisco City & County Public Utilities Commission Wastewater Revenue, Refunding RB, Series B, 4.00%, 10/01/42 | | | 1,500 | | | | 1,539,955 | |
State of California Department of Water Resources, Refunding RB, Series AW,
5.00%, 12/01/26(b) | | | 1,000 | | | | 1,214,843 | |
| | | | | | | | |
| | |
| | | | | | | 11,893,715 | |
| | | | | | | | |
| | |
Total Municipal Bonds in California | | | | | | | 69,009,666 | |
| | |
| Colorado — 1.9% | | | | | | |
|
| County/City/Special District/School District — 0.5% | |
City & County of Denver Colorado, Refunding RB, Series A, 4.00%, 08/01/46 | | | 1,500 | | | | 1,656,099 | |
| | | | | | | | |
| | |
| Health — 0.3% | | | | | | |
Colorado Health Facilities Authority, Refunding RB, Series A, 5.00%, 08/01/44 | | | 1,000 | | | | 1,227,991 | |
| | | | | | | | |
| | |
| State — 0.2% | | | | | | |
State of Colorado, COP, Series N,
4.00%, 03/15/43 | | | 500 | | | | 572,015 | |
| | | | | | | | |
| | |
| Transportation — 0.5% | | | | | | |
City & County of Denver Colorado Airport System Revenue, Refunding ARB, Series A, AMT, 5.00%, 12/01/35 | | | 1,000 | | | | 1,230,694 | |
E-470 Public Highway Authority, Refunding RB, Series A, 5.00%, 09/01/40 | | | 400 | | | | 444,469 | |
| | | | | | | | |
| | |
| | | | | | | 1,675,163 | |
| | |
| Utilities — 0.4% | | | | | | |
Board of Water Commissioners City & County of Denver, RB, Series A, 4.00%, 12/15/26 | | | 1,230 | | | | 1,233,434 | |
| | | | | | | | |
| | |
Total Municipal Bonds in Colorado | | | | | | | 6,364,702 | |
| | | | | | | | |
| | |
| Connecticut — 2.2% | | | | | | |
| | |
| Health — 0.4% | | | | | | |
Connecticut State Health & Educational Facilities Authority, Refunding RB, 5.00%, 12/01/45 | | | 1,000 | | | | 1,171,051 | |
| | | | | | | | |
| | | | | | | | |
| Security | | Par (000) | | | Value | |
| | |
| State — 1.8% | | | | | | |
State of Connecticut Special Tax Revenue, RB | | | | | | | | |
Series A, 5.00%, 09/01/24 | | $ | 400 | | | $ | 447,917 | |
Series A, 5.00%, 10/01/29 | | | 725 | | | | 782,509 | |
Series A, 4.00%, 05/01/36 | | | 1,000 | | | | 1,199,640 | |
Series A, 4.00%, 09/01/36 | | | 430 | | | | 484,470 | |
State of Connecticut, GO | | | | | | | | |
Series A, 5.00%, 10/15/23 | | | 850 | | | | 920,433 | |
Series A, 5.00%, 10/15/27 | | | 400 | | | | 432,178 | |
Series B, 5.00%, 06/15/28 | | | 400 | | | | 459,928 | |
Series B, 4.00%, 06/15/33 | | | 850 | | | | 939,553 | |
State of Connecticut, Refunding GO, Series B, 5.00%, 05/15/25 | | | 250 | | | | 287,399 | |
| | | | | | | | |
| | |
| | | | | | | 5,954,027 | |
| | | | | | | | |
| | |
Total Municipal Bonds in Connecticut | | | | | | | 7,125,078 | |
| | |
| District of Columbia — 2.5% | | | | | | |
| | |
| State — 0.5% | | | | | | |
District of Columbia, GO | | | | | | | | |
Series D, 5.00%, 06/01/26 | | | 500 | | | | 596,732 | |
Series D, 4.00%, 06/01/34 | | | 1,000 | | | | 1,159,649 | |
| | | | | | | | |
| | |
| | | | | | | 1,756,381 | |
| | |
| Transportation — 1.1% | | | | | | |
Metropolitan Washington Airports Authority Aviation Revenue, Refunding RB, Series A, AMT,
4.00%, 10/01/51 | | | 1,500 | | | | 1,754,253 | |
Washington Metropolitan Area Transit Authority, RB, Series A, 4.00%, 07/15/45 | | | 1,500 | | | | 1,773,838 | |
| | | | | | | | |
| | |
| | | | | | | 3,528,091 | |
| | |
| Utilities — 0.9% | | | | | | |
District of Columbia Water & Sewer Authority, Refunding RB | | | | | | | | |
Sub-Series A, 5.00%, 10/01/45 | | | 1,510 | | | | 1,743,355 | |
Series C, Sub-Lien, 5.00%, 10/01/44 | | | 1,000 | | | | 1,111,704 | |
| | | | | | | | |
| | |
| | | | | | | 2,855,059 | |
| | | | | | | | |
| | |
Total Municipal Bonds in District of Columbia | | | | | | | 8,139,531 | |
| | |
| Florida — 2.7% | | | | | | |
|
| County/City/Special District/School District — 0.7% | |
County of Miami-Dade Florida Transit System, RB, Series A, 4.00%, 07/01/50 | | | 1,500 | | | | 1,743,718 | |
School Board of Miami-Dade County, Refunding COP, Series D, 5.00%, 02/01/27 | | | 500 | | | | 585,233 | |
| | | | | | | | |
| | |
| | | | | | | 2,328,951 | |
| | |
| State — 0.3% | | | | | | |
State of Florida, Refunding GO, Series A,
5.00%, 07/01/25 | | | 1,000 | | | | 1,157,363 | |
| | | | | | | | |
| | |
| Transportation — 1.7% | | | | | | |
Central Florida Expressway Authority, Refunding RB, Series B, Senior Lien,
5.00%, 07/01/33 | | | 1,000 | | | | 1,179,564 | |
County of Broward Florida Airport System Revenue, Refunding ARB, Series Q-1, 5.00%, 10/01/22(b) | | | 1,000 | | | | 1,036,039 | |
Greater Orlando Aviation Authority, ARB, Series A, AMT, 5.00%, 10/01/54 | | | 850 | | | | 1,035,460 | |
| | |
| 18 | | 2 0 2 1 BLACK ROCK ANNUAL REPORT TO SHAREHOLDERS |
| | |
Schedule of Investments (continued) December 31, 2021 | | iShares Municipal Bond Index Fund (Percentages shown are based on Net Assets) |
| | | | | | | | |
| Security | | Par
(000) | | | Value | |
| | |
| Transportation (continued) | | | | | | |
Miami-Dade County Expressway Authority, Refunding RB, Series B, 5.00%, 07/01/25 | | $ | 1,000 | | | $ | 1,111,119 | |
State of Florida Department of Transportation Turnpike System Revenue, RB, Series A, 4.00%, 07/01/48 | | | 1,000 | | | | 1,147,899 | |
| | | | | | | | |
| | |
| | | | | | | 5,510,081 | |
| | | | | | | | |
| | |
Total Municipal Bonds in Florida | | | | | | | 8,996,395 | |
| | |
| Georgia — 2.0% | | | | | | |
|
| County/City/Special District/School District — 0.5% | |
Gwinnett County School District, GO, 5.00%, 02/01/40 | | | 400 | | | | 502,901 | |
Metropolitan Atlanta Rapid Transit Authority, Refunding RB, Series B, 5.00%, 07/01/35 | | | 1,000 | | | | 1,185,998 | |
| | | | | | | | |
| | |
| | | | | | | 1,688,899 | |
| | |
| State — 0.9% | | | | | | |
State of Georgia, GO, Series A, 5.00%, 02/01/29 | | | 650 | | | | 765,340 | |
State of Georgia, Refunding GO, Series C, 5.00%, 07/01/28 | | | 1,710 | | | | 2,105,850 | |
| | | | | | | | |
| | |
| | | | | | | 2,871,190 | |
| | |
| Transportation — 0.4% | | | | | | |
City of Atlanta Georgia Department of Aviation, Refunding RB, Series A, 5.00%, 07/01/29 | | | 1,000 | | | | 1,286,939 | |
| | | | | | | | |
| | |
| Utilities — 0.2% | | | | | | |
City of Atlanta Georgia Water & Wastewater Revenue, Refunding RB, 5.00%, 05/01/25(b) | | | 500 | | | | 575,270 | |
| | | | | | | | |
| | |
Total Municipal Bonds in Georgia | | | | | | | 6,422,298 | |
| | | | | | | | |
| | |
| Hawaii — 0.2% | | | | | | |
| | |
| State — 0.2% | | | | | | |
State of Hawaii, Refunding GO, Series A, 5.00%, 11/01/22(b) | | | 500 | | | | 519,905 | |
| | | | | | | | |
| | |
| Illinois — 3.9% | | | | | | |
| | |
| Health — 0.4% | | | | | | |
Illinois Finance Authority, Refunding RB, 5.00%, 12/01/40 | | | 1,000 | | | | 1,172,225 | |
| | | | | | | | |
| | |
| State — 2.1% | | | | | | |
Metropolitan Pier & Exposition Authority, RB, (AGM), 0.00%, 06/15/46(c) | | | 1,105 | | | | 587,771 | |
State of Illinois, GO | | | | | | | | |
5.00%, 05/01/39 | | | 1,500 | | | | 1,638,257 | |
Series C, 5.00%, 11/01/29 | | | 1,000 | | | | 1,201,304 | |
Series D, 5.00%, 11/01/24 | | | 1,000 | | | | 1,120,962 | |
Series D, 5.00%, 11/01/26 | | | 500 | | | | 593,305 | |
State of Illinois, Refunding GO | | | | | | | | |
5.00%, 02/01/22 | | | 500 | | | | 501,802 | |
Series A, 5.00%, 10/01/25 | | | 500 | | | | 576,586 | |
Series A, 5.00%, 10/01/28 | | | 500 | | | | 615,790 | |
| | | | | | | | |
| | |
| | | | | | | 6,835,777 | |
| | |
| Transportation — 1.4% | | | | | | |
Chicago O’Hare International Airport, ARB, Series E, Senior Lien, 5.00%, 01/01/24 | | | 410 | | | | 447,340 | |
Chicago O’Hare International Airport, Refunding ARB | | | | | | | | |
Series B, Senior Lien, 4.00%, 01/01/44 | | | 1,000 | | | | 1,145,308 | |
Series B, Senior Lien, 5.00%, 01/01/48 | | | 1,000 | | | | 1,216,465 | |
| | | | | | | | |
| Security | | Par
(000) | | | Value | |
| | |
| Transportation (continued) | | | | | | |
Chicago Transit Authority Capital Grant Receipts Revenue Refunding RB, 5.00%, 06/01/28 | | $ | 190 | | | $ | 236,290 | |
Illinois State Toll Highway Authority, RB, Series B, 5.00%, 01/01/41 | | | 1,000 | | | | 1,169,463 | |
Illinois State Toll Highway Authority, Refunding RB | | | | | | | | |
Series A, 5.00%, 01/01/25 | | | 100 | | | | 113,285 | |
Series A, 5.00%, 01/01/30 | | | 250 | | | | 315,662 | |
| | | | | | | | |
| | |
| | | | | | | 4,643,813 | |
| | | | | | | | |
| | |
Total Municipal Bonds in Illinois | | | | | | | 12,651,815 | |
| | |
| Indiana — 0.0% | | | | | | |
| | |
| State — 0.0% | | | | | | |
Indiana Finance Authority, Refunding RB, Series C, 5.00%, 12/01/24 | | | 100 | | | | 113,406 | |
| | | | | | | | |
| | |
| Kansas — 0.7% | | | | | | |
|
| County/City/Special District/School District — 0.1% | |
University of Kansas Hospital Authority Refunding RB, 5.00%, 03/01/27(b) | | | 155 | | | | 187,942 | |
| | | | | | | | |
| | |
| Health — 0.1% | | | | | | |
University of Kansas Hospital Authority Refunding RB, 5.00%, 03/01/47 | | | 425 | | | | 504,665 | |
| | | | | | | | |
| | |
| Transportation — 0.5% | | | | | | |
State of Kansas Department of Transportation, RB
5.00%, 09/01/27 | | | 1,000 | | | | 1,160,073 | |
5.00%, 09/01/34 | | | 500 | | | | 578,098 | |
| | | | | | | | |
| | |
| | | | | | | 1,738,171 | |
| | | | | | | | |
| | |
Total Municipal Bonds in Kansas | | | | | | | 2,430,778 | |
| | |
| Louisiana(b) — 0.5% | | | | | | |
|
| County/City/Special District/School District — 0.3% | |
State of Louisiana Gasoline & Fuels Tax Revenue, Refunding RB, Series C-1, 2nd Lien, 5.00%, 05/01/23 | | | 925 | | | | 983,434 | |
| | | | | | | | |
| | |
| State — 0.2% | | | | | | |
State of Louisiana, Refunding GO, Series C, 5.00%, 07/15/22 | | | 500 | | | | 512,870 | |
| | | | | | | | |
| | |
Total Municipal Bonds in Louisiana | | | | | | | 1,496,304 | |
| | | | | | | | |
| | |
| Maryland — 1.0% | | | | | | |
| | |
| State — 0.7% | | | | | | |
State of Maryland, GO | | | | | | | | |
Series A, 5.00%, 03/15/28 | | | 450 | | | | 564,780 | |
Series A, 5.00%, 03/15/31 | | | 400 | | | | 486,518 | |
State of Maryland, Refunding GO, Series B, 5.00%, 08/01/25 | | | 1,000 | | | | 1,161,515 | |
| | | | | | | | |
| | |
| | | | | | | 2,212,813 | |
| | |
| Transportation — 0.3% | | | | | | |
State of Maryland Department of Transportation, ARB
4.00%, 12/15/28 | | | 405 | | | | 433,718 | |
4.00%, 11/01/29 | | | 695 | | | | 762,734 | |
| | | | | | | | |
| | |
| | | | | | | 1,196,452 | |
| | | | | | | | |
| | |
Total Municipal Bonds in Maryland | | | | | | | 3,409,265 | |
| | |
FUND SCHEDULES OF INVESTMENTS | | 19 |
| | |
Schedule of Investments (continued) December 31, 2021 | | iShares Municipal Bond Index Fund (Percentages shown are based on Net Assets) |
| | | | | | | | |
| Security | | Par
(000) | | | Value | |
| | |
| Massachusetts — 3.3% | | | | | | |
| | |
| Education — 0.7% | | | | | | |
Massachusetts Development Finance Agency, RB, Series P, 5.00%, 07/01/50 | | $ | 500 | | | $ | 804,235 | |
Massachusetts Development Finance Agency, Refunding RB, Series A, 4.00%, 07/15/36 | | | 1,000 | | | | 1,142,300 | |
University of Massachusetts Building Authority, Refunding RB, Series 1, 5.00%, 11/01/24(b) | | | 400 | | | | 452,145 | |
| | | | | | | | |
| | |
| | | | | | | 2,398,680 | |
| | |
| Health — 0.4% | | | | | | |
Massachusetts Development Finance Agency, Refunding RB, 5.00%, 07/01/34 | | | 1,000 | | | | 1,228,428 | |
| | | | | | | | |
| | |
| State — 2.2% | | | | | | |
Commonwealth of Massachusetts, GO | | | | | | | | |
Series A, 5.00%, 03/01/26 | | | 725 | | | | 857,641 | |
Series A, 5.00%, 01/01/48 | | | 1,000 | | | | 1,221,462 | |
Series C, 5.00%, 05/01/29 | | | 1,000 | | | | 1,062,067 | |
Series E, 4.00%, 04/01/46 | | | 530 | | | | 583,463 | |
Series F, 5.00%, 11/01/37 | | | 500 | | | | 616,862 | |
Series F, 5.00%, 11/01/42 | | | 1,000 | | | | 1,231,581 | |
Series G, 4.00%, 09/01/32 | | | 1,325 | | | | 1,517,774 | |
| | | | | | | | |
| | |
| | | | | | | 7,090,850 | |
| | | | | | | | |
| | |
Total Municipal Bonds in Massachusetts | | | | | | | 10,717,958 | |
| | |
| Michigan — 1.0% | | | | | | |
| | |
| Education — 0.2% | | | | | | |
University of Michigan, Refunding RB, 5.00%, 04/01/46 | | | 585 | | | | 684,887 | |
| | | | | | | | |
| | |
| Health — 0.4% | | | | | | |
Michigan Finance Authority, Refunding RB, Series A, 5.00%, 12/01/41 | | | 1,000 | | | | 1,260,369 | |
| | | | | | | | |
| | |
| State — 0.4% | | | | | | |
State of Michigan Trunk Line Revenue, RB, Series B, 5.00%, 11/15/45 | | | 1,000 | | | | 1,288,253 | |
| | | | | | | | |
| | |
Total Municipal Bonds in Michigan | | | | | | | 3,233,509 | |
| | | | | | | | |
| | |
| Missouri — 0.9% | | | | | | |
| | |
| Transportation — 0.5% | | | | | | |
Missouri Highway & Transportation Commission, Refunding RB, Series A, 1st Lien, 5.00%, 05/01/24 | | | 1,500 | | | | 1,662,754 | |
| | | | | | | | |
| | |
| Utilities — 0.4% | | | | | | |
Metropolitan St. Louis Sewer District, Refunding RB | | | | | | | | |
Series B, 5.00%, 05/01/25(b) | | | 330 | | | | 378,497 | |
Series B, 5.00%, 05/01/45 | | | 705 | | | | 797,913 | |
| | | | | | | | |
| | |
| | | | | | | 1,176,410 | |
| | | | | | | | |
| | |
Total Municipal Bonds in Missouri | | | | | | | 2,839,164 | |
| | |
| New Jersey — 5.3% | | | | | | |
| | |
| Health — 0.3% | | | | | | |
New Jersey Health Care Facilities Financing Authority RB, 4.00%, 07/01/51 | | | 1,000 | | | | 1,181,645 | |
| | | | | | | | |
| | |
| State — 2.2% | | | | | | |
New Jersey Economic Development Authority, RB, Series EEE, 5.00%, 06/15/48 | | | 1,000 | | | | 1,201,035 | |
New Jersey Economic Development Authority, Refunding RB | | | | | | | | |
Series NN, 5.00%, 03/01/22 | | | 500 | | | | 503,750 | |
Series NN, 5.00%, 03/01/25 | | | 500 | | | | 526,089 | |
Series NN, 5.00%, 03/01/30 | | | 1,000 | | | | 1,051,445 | |
| | | | | | | | |
| Security | | Par
(000) | | | Value | |
| | |
| State (continued) | | | | | | |
New Jersey Transportation Trust Fund Authority, RB, Series S, 5.00%, 06/15/46 | | $ | 500 | | | $ | 601,430 | |
New Jersey Transportation Trust Fund Authority, RB, CAB, Series A, 0.00%, 12/15/38(c) | | | 530 | | | | 353,220 | |
New Jersey Transportation Trust Fund Authority, Refunding RB, Series A, 5.00%, 12/15/36 | | | 1,000 | | | | 1,223,859 | |
State of New Jersey, GO, Series A, 4.00%, 06/01/31 | | | 1,500 | | | | 1,845,943 | |
| | | | | | | | |
| | |
| | | | | | | 7,306,771 | |
| | |
| Transportation — 2.8% | | | | | | |
New Jersey Transportation Trust Fund Authority, RB | | | | | | | | |
Series A, 0.00%, 12/15/25(c) | | | 100 | | | | 95,570 | |
Series AA, 5.00%, 06/15/25 | | | 150 | | | | 165,971 | |
Series AA, 4.75%, 06/15/38 | | | 280 | | | | 311,726 | |
New Jersey Transportation Trust Fund Authority, RB, CAB(c) | | | | | | | | |
Series A, 0.00%, 12/15/32 | | | 250 | | | | 200,219 | |
Series A, 0.00%, 12/15/35 | | | 3,075 | | | | 2,258,241 | |
New Jersey Transportation Trust Fund Authority, Refunding RB | | | | | | | | |
Series A, 4.00%, 12/15/31 | | | 1,000 | | | | 1,172,267 | |
Series D, 5.00%, 12/15/24 | | | 250 | | | | 282,008 | |
New Jersey Turnpike Authority, RB, Series A, 5.00%, 01/01/34 | | | 1,000 | | | | 1,106,644 | |
New Jersey Turnpike Authority, Refunding RB | | | | | | | | |
Series B, 5.00%, 01/01/23(b) | | | 840 | | | | 880,084 | |
Series E, 5.00%, 01/01/29 | | | 1,000 | | | | 1,238,795 | |
Series E, 5.00%, 01/01/32 | | | 1,100 | | | | 1,355,769 | |
| | | | | | | | |
| | |
| | | | | | | 9,067,294 | |
| | | | | | | | |
| | |
Total Municipal Bonds in New Jersey | | | | | | | 17,555,710 | |
| | |
| New York — 24.6% | | | | | | |
|
| County/City/Special District/School District — 7.0% | |
City of New York, GO | | | | | | | | |
Series B-1, 5.00%, 12/01/41 | | | 1,390 | | | | 1,655,902 | |
Series D, 5.00%, 12/01/35 | | | 500 | | | | 628,424 | |
Series D, 4.00%, 12/01/41 | | | 1,000 | | | | 1,163,004 | |
Series F-1, 5.00%, 04/01/34 | | | 1,115 | | | | 1,378,983 | |
Series F-1, 5.00%, 03/01/43 | | | 1,000 | | | | 1,283,354 | |
Series F-1, 5.00%, 03/01/50 | | | 1,000 | | | | 1,272,199 | |
City of New York, Refunding GO | | | | | | | | |
Series I, 5.00%, 08/01/22(b) | | | 835 | | | | 858,460 | |
Series I, 5.00%, 08/01/26 | | | 165 | | | | 169,529 | |
Hudson Yards Infrastructure Corp., Refunding RB, Series A, 5.00%, 02/15/42 | | | 910 | | | | 1,075,439 | |
Nassau County Interim Finance Authority, Refunding RB, Series A, 4.00%, 11/15/34 | | | 310 | | | | 384,602 | |
New York City Industrial Development Agency, Refunding RB, (AGM), 4.00%, 03/01/45 | | | 300 | | | | 346,635 | |
New York City Transitional Finance Authority Future Tax Secured Revenue RB, 3.00%, 08/01/41 | | | 1,500 | | | | 1,617,000 | |
New York City Transitional Finance Authority Future Tax Secured Revenue, RB | | | | | | | | |
5.00%, 05/01/37 | | | 1,000 | | | | 1,174,802 | |
Series A-1, 5.00%, 08/01/36 | | | 500 | | | | 623,863 | |
Series A-1, 5.00%, 08/01/42 | | | 1,000 | | | | 1,237,485 | |
Series B-1, 5.00%, 08/01/40 | | | 1,500 | | | | 1,770,600 | |
Series C-2, 5.00%, 05/01/36 | | | 1,000 | | | | 1,238,619 | |
Sub-Series I, 5.00%, 05/01/42 | | | 1,620 | | | | 1,714,975 | |
| | |
| 20 | | 2 0 2 1 BLACK ROCK ANNUAL REPORT TO SHAREHOLDERS |
| | |
Schedule of Investments (continued) December 31, 2021 | | iShares Municipal Bond Index Fund (Percentages shown are based on Net Assets) |
| | | | | | | | |
| Security | | Par (000) | | | Value | |
|
| County/City/Special District/School District (continued) | |
New York State Thruway Authority RB,
4.00%, 03/15/56 | | $ | 1,000 | | | $ | 1,166,366 | |
New York State Urban Development Corp. RB, 4.00%, 03/15/36 | | | 2,000 | | | | 2,379,887 | |
| | | | | | | | |
| | |
| | | | | | | 23,140,128 | |
| | |
| Education — 0.7% | | | | | | |
New York State Dormitory Authority, RB, 5.00%, 10/01/45 | | | 1,500 | | | | 2,323,754 | |
| | | | | | | | |
| | |
| Health — 0.4% | | | | | | |
New York State Dormitory Authority, Refunding RB, 1st Series, 5.00%, 07/01/42 | | | 1,000 | | | | 1,208,530 | |
| | | | | | | | |
| | |
| State — 6.4% | | | | | | |
New York City Transitional Finance Authority Building Aid Revenue, RB, Series S-1, Subordinate, (SAW), 5.00%, 07/15/31 | | | 1,000 | | | | 1,135,397 | |
New York City Transitional Finance Authority Building Aid Revenue, Refunding RB | | | | | | | | |
Series S-1, (SAW), 5.00%, 07/15/35 | | | 2,000 | | | | 2,434,712 | |
Series -2A, Subordinate, (SAW), 4.00%, 07/15/36 | | | 1,455 | | | | 1,708,574 | |
New York State Dormitory Authority, RB | | | | | | | | |
Series A, 5.00%, 03/15/35 | | | 740 | | | | 912,256 | |
Series A, 5.00%, 02/15/39 | | | 1,000 | | | | 1,182,173 | |
Series A, 5.00%, 03/15/45 | | | 1,000 | | | | 1,222,091 | |
Series B, 5.00%, 03/15/42 | | | 2,000 | | | | 2,018,679 | |
New York State Dormitory Authority, Refunding RB | | | | | | | | |
Series A, 5.00%, 03/15/24(a) | | | 600 | | | | 661,593 | |
Series A, 5.00%, 03/15/28 | | | 250 | | | | 312,978 | |
Series A, 4.00%, 03/15/43 | | | 500 | | | | 579,600 | |
Series A, 3.00%, 03/15/49 | | | 1,500 | | | | 1,585,277 | |
Series D, 4.00%, 02/15/47 | | | 1,000 | | | | 1,160,267 | |
Series E, 5.00%, 03/15/27 | | | 500 | | | | 611,045 | |
Series E, 5.00%, 09/15/28(b) | | | 5 | | | | 6,321 | |
Series E, 5.00%, 03/15/29 | | | 995 | | | | 1,262,479 | |
New York State Urban Development Corp., Refunding RB | | | | | | | | |
Series A, 5.00%, 03/15/24 | | | 1,000 | | | | 1,101,957 | |
Series A, 5.00%, 03/15/27 | | | 600 | | | | 732,566 | |
Series A, 5.00%, 03/15/39 | | | 1,000 | | | | 1,269,751 | |
Sales Tax Asset Receivable Corp., Refunding RB, Series A, 5.00%, 10/15/24(b) | | | 1,000 | | | | 1,128,322 | |
| | | | | | | | |
| | |
| | | | | | | 21,026,038 | |
| | |
| Transportation — 5.0% | | | | | | |
Metropolitan Transportation Authority, Refunding RB | | | | | | | | |
Series B, 5.00%, 11/15/37 | | | 1,075 | | | | 1,248,569 | |
Series B-1, 5.00%, 11/15/47 | | | 1,000 | | | | 1,205,644 | |
Series D, 5.00%, 11/15/25 | | | 1,235 | | | | 1,282,522 | |
Series D-1, 5.00%, 11/15/34(d) | | | 1,000 | | | | 1,120,962 | |
Series E-1, 5.00%, 11/15/42 | | | 1,260 | | | | 1,305,686 | |
Sub-Series C-1, 5.00%, 11/15/34 | | | 1,000 | | | | 1,201,378 | |
New York State Thruway Authority, Refunding RB, Series B, Subordinate, 4.00%, 01/01/50 | | | 1,000 | | | | 1,148,034 | |
Port Authority of New York & New Jersey, Refunding ARB
179th Series, 5.00%, 12/01/32 | | | 1,000 | | | | 1,086,876 | |
194th Series, 5.00%, 10/15/34 | | | 1,395 | | | | 1,614,242 | |
194th Series, 5.00%, 10/15/41 | | | 835 | | | | 960,833 | |
Triborough Bridge & Tunnel Authority, RB, Series A, 4.00%, 11/15/42 | | | 1,000 | | | | 1,026,680 | |
Triborough Bridge & Tunnel Authority, Refunding RB Series A, 5.00%, 11/15/31 | | | 1,000 | | | | 1,179,902 | |
| | | | | | | | |
| Security | | Par
(000) | | | Value | |
| | |
| Transportation (continued) | | | | | | |
Triborough Bridge & Tunnel Authority, Refunding RB (continued) | | | | | | | | |
Series A, 5.00%, 11/15/40 | | $ | 600 | | | $ | 682,206 | |
Series B, 5.00%, 11/15/38 | | | 1,000 | | | | 1,212,220 | |
| | | | | | | | |
| | |
| | | | | | | 16,275,754 | |
| | |
| Utilities — 5.1% | | | | | | |
Long Island Power Authority, Refunding RB, Series B, 5.00%, 09/01/41 | | | 1,500 | | | | 1,764,234 | |
New York City Water & Sewer System, RB | | | | | | | | |
Series CC-1, 5.00%, 06/15/48 | | | 1,000 | | | | 1,202,415 | |
Series DD-1, 4.00%, 06/15/49 | | | 1,000 | | | | 1,148,733 | |
Series DD-2, 5.00%, 06/15/24 | | | 500 | | | | 522,808 | |
New York City Water & Sewer System, Refunding RB | | | | | | | | |
Series DD, 5.00%, 06/15/35 | | | 2,500 | | | | 2,769,858 | |
Series DD, 5.00%, 06/15/39 | | | 420 | | | | 464,468 | |
Series EE, 5.00%, 06/15/36 | | | 1,000 | | | | 1,163,663 | |
New York Power Authority, Refunding RB,
Series A, 4.00%, 11/15/50 | | | 1,000 | | | | 1,173,706 | |
New York State Dormitory Authority RB,
5.00%, 10/01/48 | | | 1,000 | | | | 1,582,005 | |
New York State Environmental Facilities Corp., Refunding RB, Series A, Subordinate, 4.00%, 06/15/46 | | | 1,475 | | | | 1,640,710 | |
Utility Debt Securitization Authority, Refunding RB | | | | | | | | |
Series TE, Restructured, 5.00%, 12/15/34 | | | 1,000 | | | | 1,087,518 | |
Series TE, Restructured, 5.00%, 12/15/41 | | | 2,000 | | | | 2,167,697 | |
| | | | | | | | |
| | |
| | | | | | | 16,687,815 | |
| | | | | | | | |
| | |
Total Municipal Bonds in New York. | | | | | | | 80,662,019 | |
| | |
| North Carolina(c) — 0.3% | | | | | | |
| | |
| Transportation — 0.3% | | | | | | |
North Carolina Turnpike Authority, RB, CAB
0.00%, 01/01/49 | | | 1,000 | | | | 446,157 | |
Series B, (AGC), 0.00%, 01/01/34 | | | 500 | | | | 394,250 | |
| | | | | | | | |
| | |
Total Municipal Bonds in North Carolina | | | | | | | 840,407 | |
| | |
| Ohio — 1.0% | | | | | | |
| | |
| State — 0.2% | | | | | | |
State of Ohio, Refunding GO, Series B, 5.00%, 09/15/25 | | | 510 | | | | 593,869 | |
| | | | | | | | |
| | |
| Transportation — 0.4% | | | | | | |
Ohio Turnpike & Infrastructure Commission, RB, Series A, 5.00%, 02/15/46 | | | 1,000 | | | | 1,290,304 | |
| | | | | | | | |
| | |
| Utilities — 0.4% | | | | | | |
American Municipal Power, Inc., Refunding RB, 5.00%, 02/15/33 | | | 1,000 | | | | 1,278,496 | |
| | | | | | | | |
| | |
Total Municipal Bonds in Ohio | | | | | | | 3,162,669 | |
| | | | | | | | |
| | |
| Pennsylvania — 3.2% | | | | | | |
| | |
| Health — 0.8% | | | | | | |
Geisinger Authority, Refunding RB, 5.00%, 04/01/50 | | | 1,000 | | | | 1,244,279 | |
Pennsylvania Higher Educational Facilities Authority, RB, 5.00%, 08/15/49 | | | 1,000 | | | | 1,245,590 | |
| | | | | | | | |
| | |
| | | | | | | 2,489,869 | |
| | |
| State — 1.3% | | | | | | |
Commonwealth of Pennsylvania, GO
1st Series, 5.00%, 03/15/29 | | | 1,000 | | | | 1,138,402 | |
2nd Series, 5.00%, 10/15/26 | | | 685 | | | | 741,120 | |
| | |
FUND SCHEDULES OF INVESTMENTS | | 21 |
| | |
Schedule of Investments (continued) December 31, 2021 | | iShares Municipal Bond Index Fund (Percentages shown are based on Net Assets) |
| | | | | | | | |
| Security | | Par
(000) | | | Value | |
| | |
| State (continued) | | | | | | |
Commonwealth of Pennsylvania, Refunding GO, 1st Series, 5.00%, 01/01/28 | | $ | 1,105 | | | $ | 1,333,759 | |
Pennsylvania Economic Development Financing Authority, RB, AMT, 5.00%, 12/31/38 | | | 1,000 | | | | 1,169,457 | |
| | | | | | | | |
| | |
| | | | | | | 4,382,738 | |
| | |
| Transportation — 1.1% | | | | | | |
Delaware River Port Authority, ARB, Series A, 5.00%, 01/01/39 | | | 125 | | | | 155,297 | |
Delaware River Port Authority, Refunding RB, Series B, 5.00%, 01/01/26 | | | 250 | | | | 293,151 | |
Pennsylvania Turnpike Commission, RB | | | | | | | | |
Series A-1, 5.00%, 12/01/47 | | | 1,000 | | | | 1,214,045 | |
Series C, 5.00%, 12/01/23(b) | | | 760 | | | | 828,008 | |
Series C, 5.00%, 12/01/43 | | | 240 | | | | 259,848 | |
Series A, Subordinate, 4.00%, 12/01/46 | | | 425 | | | | 492,576 | |
Series A, Subordinate, 4.00%, 12/01/50 | | | 480 | | | | 555,535 | |
| | | | | | | | |
| | |
| | | | | | | 3,798,460 | |
| | | | | | | | |
| | |
Total Municipal Bonds in Pennsylvania | | | | | | | 10,671,067 | |
| | |
| South Carolina — 0.4% | | | | | | |
| | |
| Utilities — 0.4% | | | | | | |
South Carolina Public Service Authority Refunding RB, 5.00%, 12/01/51 | | | 305 | | | | 390,037 | |
South Carolina Public Service Authority, Refunding RB, Series A, 4.00%, 12/01/40 | | | 750 | | | | 887,487 | |
| | | | | | | | |
| | |
Total Municipal Bonds in South Carolina | | | | | | | 1,277,524 | |
| | | | | | | | |
| | |
| Tennessee — 2.1% | | | | | | |
|
| County/City/Special District/School District — 0.3% | |
Metropolitan Government of Nashville & Davidson County Tennessee, Refunding GO,
4.00%, 07/01/30 | | | 765 | | | | 892,946 | |
| | | | | | | | |
| | |
| State — 1.5% | | | | | | |
State of Tennessee, Refunding GO, Series A, 4.00%, 08/01/22(b) | | | 5,000 | | | | 5,110,571 | |
| | | | | | | | |
| | |
| Transportation — 0.3% | | | | | | |
Metropolitan Nashville Airport Authority, ARB, Series A, 5.00%, 07/01/45 | | | 900 | | | | 1,027,146 | |
| | | | | | | | |
| | |
Total Municipal Bonds in Tennessee | | | | | | | 7,030,663 | |
| | | | | | | | |
| | |
| Texas — 9.2% | | | | | | |
|
| County/City/Special District/School District — 0.9% | |
Carrollton-Farmers Branch Independent School District, Refunding GO(b) | | | | | | | | |
Series 2018, (PSF), 4.00%, 02/15/22 | | | 310 | | | | 311,332 | |
Series A, (PSF), 4.00%, 02/15/23 | | | 445 | | | | 463,337 | |
Cypress-Fairbanks Independent School District, Refunding GO, Series C, (PSF),
5.00%, 02/15/44 | | | 500 | | | | 546,752 | |
Dallas Area Rapid Transit, Refunding RB, Series A, 5.00%, 12/01/23 | | | 800 | | | | 871,267 | |
Lewisville Independent School District, Refunding GO, Series B, 5.00%, 08/15/28 | | | 570 | | | | 658,956 | |
| | | | | | | | |
| | |
| | | | | | | 2,851,644 | |
| | |
| Education — 0.1% | | | | | | |
Board of Regents of the University of Texas System, RB, Series E, 5.00%, 08/15/27 | | | 400 | | | | 494,609 | |
| | | | | | | | |
| | | | | | | | |
| Security | | Par (000) | | | Value | |
| | |
| Health — 0.4% | | | | | | |
Tarrant County Cultural Education Facilities Finance Corp., Refunding RB, Series A, 5.00%, 11/15/45 | | $ | 1,000 | | | $ | 1,169,116 | |
| | | | | | | | |
| | |
| State — 0.7% | | | | | | |
State of Texas, Refunding GO
5.00%, 04/01/24(b) | | | 1,000 | | | | 1,103,132 | |
Series A, 5.00%, 10/01/36 | | | 1,000 | | | | 1,154,940 | |
| | | | | | | | |
| | |
| | | | | | | 2,258,072 | |
| | |
| Transportation — 4.6% | | | | | | |
Central Texas Regional Mobility Authority, RB | | | | | | | | |
Series C, 5.00%, 01/01/27 | | | 1,000 | | | | 1,161,003 | |
Series A, Senior Lien, 5.00%, 07/01/25(b) | | | 1,000 | | | | 1,154,349 | |
Central Texas Regional Mobility Authority, Refunding RB, Series A, Senior Lien,
5.00%, 01/01/23(b) | | | 1,000 | | | | 1,046,899 | |
Central Texas Turnpike System, RB, Series C, 5.00%, 08/15/37 | | | 1,000 | | | | 1,115,450 | |
Central Texas Turnpike System, RB, CAB, Series A, (AMBAC), 0.00%, 08/15/30(c) | | | 270 | | | | 236,720 | |
Dallas Fort Worth International Airport, Refunding RB, Series A, 4.00%, 11/01/34 | | | 1,250 | | | | 1,512,534 | |
Grand Parkway Transportation Corp., RB
5.00%, 02/01/23 | | | 570 | | | | 597,959 | |
Series A, 5.00%, 10/01/35 | | | 695 | | | | 864,590 | |
Grand Parkway Transportation Corp., Refunding RB, 4.00%, 10/01/49 | | | 500 | | | | 579,511 | |
Harris County Toll Road Authority, Refunding RB, Series A, Senior Lien, 5.00%, 08/15/31 | | | 1,000 | | | | 1,238,198 | |
North Texas Tollway Authority, Refunding RB | | | | | | | | |
Series A, 5.00%, 01/01/38 | | | 1,000 | | | | 1,225,618 | |
Series A, 5.00%, 01/01/43 | | | 1,815 | | | | 2,218,115 | |
Series B, 5.00%, 01/01/34 | | | 1,000 | | | | 1,126,482 | |
State of Texas, Refunding GO, Series A, 5.00%, 10/01/24(b) | | | 1,000 | | | | 1,124,779 | |
| | | | | | | | |
| | |
| | | | | | | 15,202,207 | |
| | |
| Utilities — 2.5% | | | | | | |
City of Austin Texas Electric Utility Revenue, Refunding RB, Series A, 5.00%, 11/15/45 | | | 1,000 | | | | 1,140,500 | |
City of Austin Texas Water & Wastewater System Revenue, Refunding RB, 5.00%, 11/15/42 | | | 2,000 | | | | 2,077,797 | |
City of Garland Texas Electric Utility System Revenue, Refunding RB, 4.00%, 03/01/49 | | | 1,000 | | | | 1,143,829 | |
City of San Antonio Texas Electric & Gas Systems Revenue, Refunding RB, Series A,
5.00%, 02/01/26 | | | 500 | | | | 587,656 | |
Lower Colorado River Authority, Refunding RB, Series A, 5.00%, 05/15/36 | | | 750 | | | | 762,990 | |
Texas Water Development Board, RB | | | | | | | | |
Series A, 4.00%, 10/15/37 | | | 1,180 | | | | 1,381,207 | |
Series B, 5.00%, 04/15/49 | | | 1,000 | | | | 1,241,170 | |
| | | | | | | | |
| | |
| | | | | | | 8,335,149 | |
| | | | | | | | |
| | |
Total Municipal Bonds in Texas | | | | | | | 30,310,797 | |
| | |
| Utah — 0.2% | | | | | | |
| | |
| State — 0.2% | | | | | | |
| | |
State of Utah, GO, 5.00%, 07/01/25 | | | 450 | | | | 521,323 | |
| | | | | | | | |
| | |
| 22 | | 2 0 2 1 BLACK ROCK ANNUAL REPORT TO SHAREHOLDERS |
| | |
Schedule of Investments (continued) December 31, 2021 | | iShares Municipal Bond Index Fund (Percentages shown are based on Net Assets) |
| | | | | | | | |
| Security | | Par
(000) | | | Value | |
| | |
| Virginia — 1.9% | | | | | | |
|
| County/City/Special District/School District — 0.7% | |
City of Alexandria Virginia, GO, Series A, (SAW), 3.00%, 07/15/46 | | $ | 1,000 | | | $ | 1,109,626 | |
County of Fairfax Virginia, Refunding GO, Series A, (SAW), 4.00%, 10/01/27 | | | 1,000 | | | | 1,142,054 | |
| | | | | | | | |
| | |
| | | | | | | 2,251,680 | |
| | |
| State — 0.4% | | | | | | |
Virginia College Building Authority, Refunding RB, Series E, 5.00%, 02/01/30 | | | 1,000 | | | | 1,238,222 | |
| | | | | | | | |
| | |
| Transportation — 0.6% | | | | | | |
Virginia Commonwealth Transportation Board, Refunding RB | | | | | | | | |
5.00%, 09/15/23 | | | 500 | | | | 540,032 | |
5.00%, 03/15/27 | | | 285 | | | | 346,744 | |
Series A, 5.00%, 05/15/31 | | | 1,000 | | | | 1,235,211 | |
| | | | | | | | |
| | |
| | | | | | | 2,121,987 | |
| | |
| Utilities — 0.2% | | | | | | |
City of Richmond Virginia Public Utility Revenue, Refunding RB, 5.00%, 01/15/26 | | | 500 | | | | 589,442 | |
| | | | | | | | |
| | |
Total Municipal Bonds in Virginia | | | | | | | 6,201,331 | |
| | | | | | | | |
| | |
| Washington — 3.4% | | | | | | |
|
| County/City/Special District/School District — 0.1% | |
Central Puget Sound Regional Transit Authority, Refunding RB, Series S-1, 5.00%, 11/01/25(b) | | | 485 | | | | 567,823 | |
| | | | | | | | |
| | |
| State — 1.5% | | | | | | |
State of Washington, GO, Series A,
5.00%, 08/01/43 | | | 1,250 | | | | 1,544,720 | |
State of Washington, Refunding GO | | | | | | | | |
Series B, 5.00%, 07/01/23 | | | 1,000 | | | | 1,070,945 | |
Series B, 5.00%, 07/01/30 | | | 1,000 | | | | 1,168,721 | |
Series R, 5.00%, 07/01/31 | | | 1,000 | | | | 1,129,025 | |
| | | | | | | | |
| | |
| | | | | | | 4,913,411 | |
| | |
| Transportation — 1.1% | | | | | | |
Central Puget Sound Regional Transit Authority, RB, Series S-1, 5.00%, 11/01/46 | | | 1,000 | | | | 1,551,377 | |
Port of Seattle Washington, Refunding RB, Series A, 5.00%, 08/01/31 | | | 2,000 | | | | 2,053,006 | |
| | | | | | | | |
| | |
| | | | | | | 3,604,383 | |
| | |
| Utilities — 0.7% | | | | | | |
County of King Washington Sewer Revenue, Refunding RB, Series B, 5.00%, 07/01/23(b) | | | 2,075 | | | | 2,221,886 | |
| | | | | | | | |
| | |
Total Municipal Bonds in Washington | | | | | | | 11,307,503 | |
| | | | | | | | |
| | | | | | | | |
| Security | | Par (000) | | | Value | |
| | |
| Wisconsin — 1.2% | | | | | | |
| | |
| Health — 0.4% | | | | | | |
Wisconsin Health & Educational Facilities Authority, Refunding RB, Series A, 5.00%, 11/15/39 | | $ | 1,000 | | | $ | 1,169,116 | |
| | | | | | | | |
| | |
| State — 0.8% | | | | | | |
State of Wisconsin, Refunding GO
5.00%, 11/01/27 | | | 770 | | | | 942,149 | |
5.00%, 11/01/29 | | | 525 | | | | 640,332 | |
Series 2, 5.00%, 11/01/26 | | | 980 | | | | 1,182,296 | |
| | | | | | | | |
| | |
| | | | | | | 2,764,777 | |
| | | | | | | | |
| | |
Total Municipal Bonds in Wisconsin | | | | | | | 3,933,893 | |
| | | | | | | | |
| | |
Total Long-Term Investments —98.8%
(Cost: $300,045,711) | | | | | | | 324,153,695 | |
| | | | | | | | |
| | |
| | | Shares | | | | |
| | |
| Short-Term Securities | | | | | | |
| | |
| Money Market Funds — 0.2% | | | | | | |
BlackRock Liquidity Funds, MuniCash, Institutional Class, 0.01%(e)(f) | | | 725,011 | | | | 725,084 | |
| | | | | | | | |
| | |
Total Short-Term Securities — 0.2%
(Cost: $725,084) | | | | | | | 725,084 | |
| | | | | | | | |
| | |
Total Investments — 99.0%
(Cost: $300,770,795) | | | | | | | 324,878,779 | |
| | |
Other Assets Less Liabilities — 1.0% | | | | | | | 3,351,800 | |
| | | | | | | | |
| | |
Net Assets — 100.0% | | | | | | $ | 328,230,579 | |
| | | | | | | | |
| (a) | Security is collateralized by municipal bonds or U.S. Treasury obligations. |
| (b) | U.S. Government securities held in escrow, are used to pay interest on this security as well as to retire the bond in full at the date indicated, typically at a premium to par. |
| (d) | Variable rate security. Interest rate resets periodically. The rate shown is the effective interest rate as of period end. Security description also includes the reference rate and spread if published and available. |
| (e) | Affiliate of the Fund. |
| (f) | Annualized 7-day yield as of period end. |
Affiliates
Investments in issuers considered to be affiliate(s) of the Fund during the year ended December 31, 2021 for purposes of Section 2(a)(3) of the Investment Company Act of 1940, as amended, were as follows:
| | | | | | | | | | | | | | | | | | | | | | | | | | | | | | | | | | | | |
| | | | | | | | | | |
| Affiliated Issuer | | Value at 12/31/20 | | | Purchases at Cost | | | Proceeds from Sales | | | Net Realized Gain (Loss) | | | Change in Unrealized Appreciation (Depreciation) | | | Value at 12/31/21 | | | Shares Held at 12/31/21 | | | Income | | | Capital Gain Distributions from Underlying Funds | |
BlackRock Liquidity Funds, MuniCash, Institutional Class | | $ | 4,146,259 | | | $ | — | | | $ | (3,420,852 | )(a) | | $ | 1,274 | | | $ | (1,597 | ) | | $ | 725,084 | | | | 725,011 | | | $ | 401 | | | $ | — | |
| | | | | | | | | | | | | | | | | | | | | | | | | | | | | | | | | | | | |
| | (a) | Represents net amount purchased (sold). | |
| | |
FUND SCHEDULES OF INVESTMENTS | | 23 |
| | |
Schedule of Investments (continued) December 31, 2021 | | iShares Municipal Bond Index Fund |
Fair Value Hierarchy as of Period End
Various inputs are used in determining the fair value of financial instruments. For a description of the input levels and information about the Fund’s policy regarding valuation of financial instruments, refer to the Notes to Financial Statements.
The following table summarizes the Fund’s financial instruments categorized in the fair value hierarchy. The breakdown of the Fund’s financial instruments into major categories is disclosed in the Schedule of Investments above.
| | | | | | | | | | | | | | | | |
| | | | | |
| | | Level 1 | | | Level 2 | | | Level 3 | | | Total | |
| | | | |
Assets | | | | | | | | | | | | | | | | |
Investments | | | | | | | | | | | | | | | | |
Long-Term Investments | | | | | | | | | | | | | | | | |
Municipal Bonds | | $ | — | | | $ | 324,153,695 | | | $ | — | | | $ | 324,153,695 | |
Short-Term Securities | | | | | | | | | | | | | | | | |
Money Market Funds | | | 725,084 | | | | — | | | | — | | | | 725,084 | |
| | | | | | | | | | | | | | | | |
| | | | |
| | $ | 725,084 | | | $ | 324,153,695 | | | $ | — | | | $ | 324,878,779 | |
| | | | | | | | | | | | | | | | |
See notes to financial statements.
| | |
| 24 | | 2 0 2 1 BLACK ROCK ANNUAL REPORT TO SHAREHOLDERS |
| | |
Schedule of Investments December 31, 2021 | | iShares Short-Term TIPS Bond Index Fund (Percentages shown are based on Net Assets) |
| | | | | | | | |
| Security | | Par (000) | | | Value | |
| | |
| U.S. Treasury Obligations | | | | | | |
U.S. Treasury Inflation Protected Security
0.13%, 01/15/22 - 10/15/26 | | $ | 57,964 | | | $ | 61,187,119 | |
0.63%, 04/15/23 - 01/15/26 | | | 14,534 | | | | 15,486,230 | |
0.38%, 07/15/23 - 07/15/25 | | | 12,724 | | | | 13,584,161 | |
0.50%, 04/15/24 | | | 2,956 | | | | 3,150,819 | |
0.25%, 01/15/25 | | | 6,085 | | | | 6,518,870 | |
2.38%, 01/15/25 | | | 2,142 | | | | 2,438,882 | |
| | | | | | | | |
| | |
Total Long-Term Investments — 97.8%
(Cost: $100,740,697) | | | | | | | 102,366,081 | |
| | | | | | | | |
| | | | | | | | |
| Security | | Shares | | | Value | |
| |
| | |
| Short-Term Securities | | | | | | |
| | |
| Money Market Funds — 2.7% | | | | | | |
BlackRock Cash Funds: Treasury, SL Agency Shares, 0.01%(a)(b) | | | 2,879,900 | | | $ | 2,879,900 | |
| | | | | | | | |
| | |
Total Short-Term Securities — 2.7%
(Cost: $2,879,900) | | | | | | | 2,879,900 | |
| | | | | | | | |
| | |
Total Investments — 100.5%
(Cost: $103,620,597) | | | | | | | 105,245,981 | |
| |
Liabilities in Excess of Other Assets — (0.5)% | | | | (527,335 | ) |
| | | | | | | | |
| | |
Net Assets — 100.0% | | | | | | $ | 104,718,646 | |
| | | | | | | | |
| (a) | Affiliate of the Fund. |
| (b) | Annualized 7-day yield as of period end. |
Affiliates
Investments in issuers considered to be affiliate(s) of the Fund during the year ended December 31, 2021 for purposes of Section 2(a)(3) of the Investment Company Act of 1940, as amended, were as follows:
| | | | | | | | | | | | | | | | | | | | | | | | | | | | | | | | | | | | |
| | | | | | | | | | |
| Affiliated Issuer | | Value at 12/31/20 | | | Purchases at Cost | | | Proceeds from Sales | | | Net Realized Gain (Loss) | | | Change in Unrealized Appreciation (Depreciation) | | | Value at 12/31/21 | | | Shares Held at 12/31/21 | | | Income
| | | Capital Gain Distributions from Underlying Funds | |
BlackRock Cash Funds: Treasury, SL Agency Shares | | $ | 2,084,465 | | | $ | 795,435 | (a) | | $ | — | | | $ | — | | | $ | — | | | $ | 2,879,900 | | | | 2,879,900 | | | $ | 2,175 | (b) | | $ | — | |
| | | | | | | | | | | | | | | | | | | | | | | | | | | | | | | | | | | | |
| | (a) | Represents net amount purchased (sold). | |
| | (b) | All or a portion represents securities lending income earned from the reinvestment of cash collateral from loaned securities, net of fees and collateral investment expenses, and other payments to and from borrowers of securities. | |
Fair Value Hierarchy as of Period End
Various inputs are used in determining the fair value of financial instruments. For a description of the input levels and information about the Fund’s policy regarding valuation of financial instruments, refer to the Notes to Financial Statements.
The following table summarizes the Fund’s financial instruments categorized in the fair value hierarchy. The breakdown of the Fund’s financial instruments into major categories is disclosed in the Schedule of Investments above.
| | | | | | | | | | | | | | | | |
| | | | | |
| | | Level 1 | | | Level 2 | | | Level 3 | | | Total | |
| | | | |
Assets | | | | | | | | | | | | | | | | |
Investments | | | | | | | | | | | | | | | | |
Long-Term Investments | | | | | | | | | | | | | | | | |
U.S. Treasury Obligations | | $ | — | | | $ | 102,366,081 | | | $ | — | | | $ | 102,366,081 | |
Short-Term Securities | | | | | | | | | | | | | | | | |
Money Market Funds | | | 2,879,900 | | | | — | | | | — | | | | 2,879,900 | |
| | | | | | | | | | | | | | | | |
| | | | |
| | $ | 2,879,900 | | | $ | 102,366,081 | | | $ | — | | | $ | 105,245,981 | |
| | | | | | | | | | | | | | | | |
See notes to financial statements.
| | |
FUND SCHEDULES OF INVESTMENTS | | 25 |
| | |
Schedule of Investments December 31, 2021 | | iShares MSCI EAFE International Index Fund (Percentages shown are based on Net Assets) |
| | | | | | | | |
| Security | | Shares | | | Value | |
|
Common Stocks | |
|
| Australia — 7.3% | |
Afterpay Ltd.(a) | | | 105,803 | | | $ | 6,387,028 | |
Ampol Ltd. | | | 117,320 | | | | 2,533,284 | |
APA Group(b) | | | 582,894 | | | | 4,264,328 | |
Aristocrat Leisure Ltd. | | | 293,252 | | | | 9,302,703 | |
ASX Ltd. | | | 94,725 | | | | 6,401,912 | |
Aurizon Holdings Ltd. | | | 891,440 | | | | 2,264,817 | |
AusNet Services Ltd. | | | 956,400 | | | | 1,789,120 | |
Australia & New Zealand Banking Group Ltd. | | | 1,389,824 | | | | 27,840,026 | |
BHP Group Ltd. | | | 1,440,293 | | | | 43,484,929 | |
BHP Group PLC | | | 1,031,099 | | | | 30,680,060 | |
BlueScope Steel Ltd. | | | 249,072 | | | | 3,802,419 | |
Brambles Ltd. | | | 708,527 | | | | 5,481,394 | |
Cochlear Ltd. | | | 32,297 | | | | 5,069,026 | |
Coles Group Ltd. | | | 649,903 | | | | 8,479,988 | |
Commonwealth Bank of Australia | | | 866,102 | | | | 63,668,267 | |
Computershare Ltd. | | | 268,510 | | | | 3,908,738 | |
Crown Resorts Ltd.(a) | | | 183,048 | | | | 1,593,410 | |
CSL Ltd. | | | 233,457 | | | | 49,376,207 | |
Dexus | | | 530,056 | | | | 4,285,961 | |
Domino’s Pizza Enterprises Ltd. | | | 29,220 | | | | 2,507,997 | |
Endeavour Group Ltd. | | | 665,955 | | | | 3,268,077 | |
Evolution Mining Ltd. | | | 907,192 | | | | 2,691,446 | |
Fortescue Metals Group Ltd. | | | 823,145 | | | | 11,570,745 | |
Glencore PLC(a) | | | 4,874,993 | | | | 24,839,443 | |
Goodman Group | | | 811,712 | | | | 15,647,223 | |
GPT Group | | | 950,537 | | | | 3,748,152 | |
IDP Education Ltd. | | | 100,244 | | | | 2,525,373 | |
Insurance Australia Group Ltd. | | | 1,218,796 | | | | 3,777,075 | |
Lendlease Corp. Ltd.(b) | | | 331,413 | | | | 2,580,560 | |
Macquarie Group Ltd. | | | 171,054 | | | | 25,570,049 | |
Magellan Financial Group Ltd. | | | 65,625 | | | | 1,014,071 | |
Medibank Pvt Ltd. | | | 1,325,490 | | | | 3,228,365 | |
Mirvac Group | | | 1,941,960 | | | | 4,110,690 | |
National Australia Bank Ltd. | | | 1,607,646 | | | | 33,755,908 | |
Newcrest Mining Ltd. | | | 399,100 | | | | 7,147,924 | |
Northern Star Resources Ltd. | | | 546,849 | | | | 3,760,870 | |
Orica Ltd. | | | 196,302 | | | | 1,957,575 | |
Origin Energy Ltd. | | | 874,231 | | | | 3,336,491 | |
Qantas Airways Ltd.(a) | | | 448,876 | | | | 1,637,437 | |
QBE Insurance Group Ltd. | | | 721,911 | | | | 5,961,348 | |
Ramsay Health Care Ltd. | | | 90,100 | | | | 4,682,501 | |
REA Group Ltd. | | | 25,435 | | | | 3,101,584 | |
Reece Ltd. | | | 142,733 | | | | 2,807,017 | |
Rio Tinto Ltd. | | | 181,522 | | | | 13,246,056 | |
Santos Ltd. | | | 1,570,797 | | | | 7,235,832 | |
Scentre Group | | | 2,542,244 | | | | 5,848,120 | |
SEEK Ltd. | | | 161,663 | | | | 3,853,992 | |
Sonic Healthcare Ltd. | | | 221,798 | | | | 7,522,573 | |
South32 Ltd. | | | 2,271,160 | | | | 6,642,194 | |
Stockland | | | 1,180,549 | | | | 3,642,011 | |
Suncorp Group Ltd. | | | 617,486 | | | | 4,971,428 | |
Sydney Airport(a)(b) | | | 636,448 | | | | 4,018,201 | |
Tabcorp Holdings Ltd. | | | 1,069,255 | | | | 3,906,318 | |
Telstra Corp. Ltd. | | | 2,038,194 | | | | 6,194,473 | |
Transurban Group(b) | | | 1,488,851 | | | | 14,954,457 | |
Treasury Wine Estates Ltd. | | | 348,274 | | | | 3,140,156 | |
Vicinity Centres | | | 1,890,498 | | | | 2,325,000 | |
Washington H Soul Pattinson & Co. Ltd. | | | 104,210 | | | | 2,245,996 | |
Wesfarmers Ltd. | | | 553,533 | | | | 23,882,974 | |
Westpac Banking Corp. | | | 1,790,982 | | | | 27,784,419 | |
| | | | | | | | |
| Security | | Shares | | | Value | |
|
| Australia (continued) | |
WiseTech Global Ltd. | | | 70,375 | | | $ | 2,984,704 | |
Woodside Petroleum Ltd. | | | 470,277 | | | | 7,497,137 | |
Woolworths Group Ltd. | | | 618,860 | | | | 17,107,474 | |
| | | | | | | | |
| | |
| | | | | | | 624,845,053 | |
| | |
| Austria — 0.2% | | | | | | |
Erste Group Bank AG | | | 167,860 | | | | 7,869,338 | |
OMV AG | | | 70,882 | | | | 4,008,570 | |
Raiffeisen Bank International AG | | | 72,372 | | | | 2,125,604 | |
Verbund AG | | | 33,646 | | | | 3,781,280 | |
voestalpine AG | | | 56,256 | | | | 2,041,146 | |
| | | | | | | | |
| | |
| | | | | | | 19,825,938 | |
| | |
| Belgium — 0.8% | | | | | | |
Ageas SA | | | 84,274 | | | | 4,364,318 | |
Anheuser-Busch InBev SA/NV | | | 371,983 | | | | 22,426,837 | |
Elia Group SA/NV | | | 15,411 | | | | 2,031,259 | |
Etablissements Franz Colruyt NV | | | 25,552 | | | | 1,084,234 | |
Groupe Bruxelles Lambert SA | | | 55,276 | | | | 6,173,602 | |
KBC Group NV | | | 121,514 | | | | 10,440,633 | |
Proximus SADP | | | 74,741 | | | | 1,459,673 | |
Sofina SA | | | 7,626 | | | | 3,745,950 | |
Solvay SA | | | 35,670 | | | | 4,146,847 | |
UCB SA | | | 61,731 | | | | 7,045,110 | |
Umicore SA | | | 94,873 | | | | 3,870,287 | |
| | | | | | | | |
| | |
| | | | | | | 66,788,750 | |
| | |
| Chile — 0.0% | | | | | | |
Antofagasta PLC | | | 189,795 | | | | 3,451,839 | |
| | | | | | | | |
| | |
| China — 0.2% | | | | | | |
BOC Hong Kong Holdings Ltd. | | | 1,814,034 | | | | 5,949,132 | |
Budweiser Brewing Co. APAC Ltd.(c) | | | 857,600 | | | | 2,254,592 | |
Chow Tai Fook Jewellery Group Ltd.(a) | | | 980,400 | | | | 1,766,562 | |
Futu Holdings Ltd., ADR(a)(d) | | | 27,094 | | | | 1,173,170 | |
Wilmar International Ltd. | | | 957,983 | | | | 2,948,262 | |
| | | | | | | | |
| | |
| | | | | | | 14,091,718 | |
| | |
| Denmark — 2.7% | | | | | | |
Ambu A/S, B Shares | | | 80,632 | | | | 2,128,184 | |
AP Moeller - Maersk A/S, Class A | | | 1,542 | | | | 5,115,683 | |
AP Moeller - Maersk A/S, Class B | | | 2,820 | | | | 10,065,461 | |
Carlsberg A/S, Class B | | | 49,015 | | | | 8,462,329 | |
Chr Hansen Holding A/S | | | 50,768 | | | | 4,003,077 | |
Coloplast A/S, Class B | | | 57,782 | | | | 10,173,978 | |
Danske Bank A/S | | | 337,829 | | | | 5,832,278 | |
Demant A/S(a) | | | 52,008 | | | | 2,663,129 | |
DSV A/S | | | 99,591 | | | | 23,207,517 | |
Genmab A/S(a) | | | 32,094 | | | | 12,810,416 | |
GN Store Nord A/S | | | 61,450 | | | | 3,855,727 | |
Novo Nordisk A/S, Class B | | | 822,086 | | | | 92,341,520 | |
Novozymes A/S, B Shares | | | 100,290 | | | | 8,234,792 | |
Orsted A/S(c) | | | 92,610 | | | | 11,860,291 | |
Pandora A/S | | | 48,920 | | | | 6,085,201 | |
Rockwool International A/S, B Shares | | | 4,063 | | | | 1,774,222 | |
Tryg A/S | | | 177,378 | | | | 4,377,266 | |
Vestas Wind Systems A/S | | | 493,010 | | | | 15,014,681 | |
| | | | | | | | |
| | |
| | | | | | | 228,005,752 | |
| | |
| Finland — 1.2% | | | | | | |
Elisa OYJ | | | 70,091 | | | | 4,315,918 | |
Fortum OYJ | | | 217,222 | | | | 6,662,292 | |
Kesko OYJ, B Shares | | | 131,457 | | | | 4,381,566 | |
Kone OYJ, Class B | | | 166,452 | | | | 11,944,374 | |
Neste OYJ | | | 207,675 | | | | 10,220,884 | |
| | |
| 26 | | 2 0 2 1 BLACK ROCK ANNUAL REPORT TO SHAREHOLDERS |
| | |
Schedule of Investments (continued) December 31, 2021 | | iShares MSCI EAFE International Index Fund (Percentages shown are based on Net Assets) |
| | | | | | | | |
| Security | | Shares | | | Value | |
|
| Finland (continued) | |
Nokia OYJ(a) | | | 2,632,186 | | | $ | 16,671,437 | |
Nordea Bank Abp | | | 1,581,727 | | | | 19,294,770 | |
Orion OYJ, Class B | | | 51,063 | | | | 2,121,094 | |
Sampo OYJ, A Shares | | | 244,076 | | | | 12,215,521 | |
Stora Enso OYJ, R Shares | | | 285,467 | | | | 5,239,276 | |
UPM-Kymmene OYJ | | | 259,545 | | | | 9,875,323 | |
Wartsila OYJ Abp | | | 227,835 | | | | 3,195,561 | |
| | | | | | | | |
| | |
| | | | | | | 106,138,016 | |
| | |
| France — 11.1% | | | | | | |
Accor SA(a) | | | 84,247 | | | | 2,730,732 | |
Aeroports de Paris(a)(d) | | | 14,626 | | | | 1,886,807 | |
Air Liquide SA | | | 231,281 | | | | 40,336,400 | |
Airbus SE(a) | | | 287,798 | | | | 36,821,975 | |
Alstom SA | | | 154,900 | | | | 5,500,567 | |
Amundi SA(c) | | | 29,251 | | | | 2,412,752 | |
Arkema SA | | | 30,571 | | | | 4,314,932 | |
AXA SA | | | 944,914 | | | | 28,123,718 | |
BioMerieux | | | 19,938 | | | | 2,835,156 | |
BNP Paribas SA | | | 549,129 | | | | 37,967,343 | |
Bollore SA | | | 425,399 | | | | 2,379,499 | |
Bouygues SA | | | 112,818 | | | | 4,038,433 | |
Bureau Veritas SA | | | 141,519 | | | | 4,698,279 | |
Capgemini SE | | | 78,280 | | | | 19,184,899 | |
Carrefour SA | | | 309,078 | | | | 5,666,476 | |
Cie de Saint-Gobain | | | 246,992 | | | | 17,375,036 | |
Cie Generale des Etablissements Michelin SCA | | | 82,803 | | | | 13,561,823 | |
CNP Assurances | | | 82,617 | | | | 2,043,542 | |
Covivio | | | 25,036 | | | | 2,055,099 | |
Credit Agricole SA | | | 606,406 | | | | 8,645,717 | |
Danone SA | | | 318,916 | | | | 19,823,646 | |
Dassault Aviation SA | | | 12,174 | | | | 1,316,705 | |
Dassault Systemes SE | | | 324,556 | | | | 19,260,887 | |
Edenred | | | 120,947 | | | | 5,585,133 | |
Eiffage SA | | | 41,059 | | | | 4,233,335 | |
Electricite de France SA | | | 230,814 | | | | 2,714,670 | |
Engie SA | | | 892,695 | | | | 13,216,689 | |
EssilorLuxottica SA | | | 140,178 | | | | 29,840,642 | |
Eurazeo SE | | | 19,159 | | | | 1,671,532 | |
Faurecia SE | | | 56,471 | | | | 2,686,665 | |
Gecina SA | | | 22,099 | | | | 3,092,329 | |
Getlink SE | | | 211,770 | | | | 3,507,394 | |
Hermes International | | | 15,461 | | | | 27,016,136 | |
Ipsen SA | | | 18,820 | | | | 1,722,213 | |
Kering SA | | | 36,620 | | | | 29,382,113 | |
Klepierre SA(a) | | | 99,336 | | | | 2,350,511 | |
La Francaise des Jeux SAEM(c) | | | 46,840 | | | | 2,075,841 | |
Legrand SA | | | 130,566 | | | | 15,292,025 | |
L’Oreal SA | | | 122,513 | | | | 58,415,750 | |
LVMH Moet Hennessy Louis Vuitton SE | | | 135,531 | | | | 112,007,375 | |
Orange SA | | | 973,966 | | | | 10,404,078 | |
Orpea SA | | | 25,121 | | | | 2,519,339 | |
Pernod Ricard SA | | | 102,277 | | | | 24,605,559 | |
Publicis Groupe SA | | | 111,984 | | | | 7,544,814 | |
Remy Cointreau SA | | | 11,027 | | | | 2,680,322 | |
Renault SA(a) | | | 92,514 | | | | 3,209,342 | |
Safran SA | | | 166,860 | | | | 20,427,530 | |
Sanofi | | | 555,119 | | | | 55,702,835 | |
Sartorius Stedim Biotech | | | 13,501 | | | | 7,414,825 | |
Schneider Electric SE | | | 263,908 | | | | 51,883,098 | |
SEB SA | | | 13,714 | | | | 2,137,064 | |
Societe Generale SA | | | 396,236 | | | | 13,618,120 | |
Sodexo SA(a) | | | 43,731 | | | | 3,833,807 | |
| | | | | | | | |
| Security | | Shares | | | Value | |
|
| France (continued) | |
Suez SA | | | 173,699 | | | $ | 3,917,551 | |
Teleperformance | | | 28,675 | | | | 12,819,904 | |
Thales SA | | | 51,346 | | | | 4,367,826 | |
TotalEnergies SE | | | 1,224,588 | | | | 62,331,784 | |
Ubisoft Entertainment SA(a) | | | 45,185 | | | | 2,204,135 | |
Unibail-Rodamco-Westfield(a)(d) | | | 61,821 | | | | 4,326,187 | |
Valeo | | | 110,521 | | | | 3,332,913 | |
Veolia Environnement SA | | | 320,001 | | | | 11,751,679 | |
Vinci SA | | | 262,589 | | | | 27,733,280 | |
Vivendi SE | | | 375,939 | | | | 5,085,291 | |
Wendel SE | | | 13,339 | | | | 1,598,351 | |
Worldline SA(a)(c) | | | 116,259 | | | | 6,470,994 | |
| | | | | | | | |
| | |
| | | | | | | 949,711,404 | |
| | |
| Germany — 8.1% | | | | | | |
Adidas AG | | | 92,950 | | | | 26,764,510 | |
Allianz SE, Registered Shares | | | 201,279 | | | | 47,473,385 | |
BASF SE | | | 448,395 | | | | 31,470,761 | |
Bayer AG, Registered Shares | | | 479,613 | | | | 25,613,388 | |
Bayerische Motoren Werke AG | | | 161,639 | | | | 16,170,725 | |
Bechtle AG | | | 39,418 | | | | 2,804,968 | |
Beiersdorf AG | | | 49,496 | | | | 5,073,590 | |
Brenntag SE | | | 75,492 | | | | 6,817,215 | |
Carl Zeiss Meditec AG | | | 19,371 | | | | 4,063,577 | |
Commerzbank AG(a) | | | 495,331 | | | | 3,747,463 | |
Continental AG, Class A(a) | | | 53,845 | | | | 5,657,248 | |
Covestro AG(c) | | | 94,647 | | | | 5,825,331 | |
Daimler AG, Registered Shares | | | 417,830 | | | | 31,923,943 | |
Daimler Truck Holding AG(a) | | | 207,371 | | | | 7,623,404 | |
Delivery Hero SE(a)(c) | | | 78,733 | | | | 8,714,998 | |
Deutsche Bank AG, Registered Shares(a) | | | 1,010,706 | | | | 12,588,357 | |
Deutsche Boerse AG | | | 92,757 | | | | 15,488,044 | |
Deutsche Lufthansa AG, Registered
Shares(a)(d) | | | 287,691 | | | | 2,014,396 | |
Deutsche Post AG, Registered Shares | | | 483,920 | | | | 31,126,098 | |
Deutsche Telekom AG, Registered Shares | | | 1,627,158 | | | | 30,065,789 | |
E.ON SE | | | 1,096,053 | | | | 15,232,329 | |
Evonik Industries AG | | | 100,928 | | | | 3,260,527 | |
Fresenius Medical Care AG & Co. KGaA | | | 100,324 | | | | 6,503,824 | |
Fresenius SE & Co. KGaA | | | 203,865 | | | | 8,194,024 | |
GEA Group AG | | | 73,840 | | | | 4,033,095 | |
Hannover Rueck SE | | | 29,552 | | | | 5,602,955 | |
HeidelbergCement AG | | | 73,104 | | | | 4,947,462 | |
HelloFresh SE(a) | | | 80,519 | | | | 6,170,819 | |
Henkel AG & Co. KGaA | | | 50,015 | | | | 3,898,724 | |
Infineon Technologies AG | | | 637,542 | | | | 29,351,449 | |
KION Group AG | | | 34,730 | | | | 3,793,408 | |
Knorr-Bremse AG | | | 34,913 | | | | 3,448,164 | |
LANXESS AG | | | 39,984 | | | | 2,472,558 | |
LEG Immobilien SE | | | 35,428 | | | | 4,939,469 | |
Merck KGaA | | | 63,095 | | | | 16,231,634 | |
MTU Aero Engines AG | | | 26,225 | | | | 5,324,824 | |
Muenchener Rueckversicherungs-Gesellschaft AG in Muenchen, Registered Shares | | | 68,395 | | | | 20,190,796 | |
Nemetschek SE | | | 28,583 | | | | 3,654,736 | |
Puma SE | | | 51,630 | | | | 6,305,274 | |
Rational AG | | | 2,474 | | | | 2,530,317 | |
Rwe AG | | | 314,235 | | | | 12,731,713 | |
SAP SE | | | 509,785 | | | | 71,746,887 | |
Scout24 AG(c) | | | 42,221 | | | | 2,948,136 | |
Siemens AG, Registered Shares | | | 373,468 | | | | 64,685,696 | |
Siemens Energy AG(a) | | | 196,232 | | | | 5,006,720 | |
Siemens Healthineers AG(c) | | | 137,083 | | | | 10,220,798 | |
Symrise AG | | | 62,809 | | | | 9,289,114 | |
| | |
FUND SCHEDULES OF INVESTMENTS | | 27 |
| | |
Schedule of Investments (continued) December 31, 2021 | | iShares MSCI EAFE International Index Fund (Percentages shown are based on Net Assets) |
| | | | | | | | |
| Security | | Shares | | | Value | |
|
| Germany (continued) | |
Telefonica Deutschland Holding AG | | | 501,074 | | | $ | 1,389,873 | |
Uniper SE | | | 45,514 | | | | 2,161,010 | |
United Internet AG, Registered Shares | | | 48,127 | | | | 1,908,056 | |
Volkswagen AG(d) | | | 15,958 | | | | 4,665,062 | |
Vonovia SE | | | 360,173 | | | | 19,846,310 | |
Zalando SE(a)(c) | | | 109,114 | | | | 8,789,839 | |
| | | | | | | | |
| | |
| | | | | | | 692,502,792 | |
| | |
| Hong Kong — 2.5% | | | | | | |
AIA Group Ltd. | | | 5,905,483 | | | | 59,603,098 | |
CK Asset Holdings Ltd. | | | 982,589 | | | | 6,198,136 | |
CK Infrastructure Holdings Ltd. | | | 326,844 | | | | 2,082,392 | |
CLP Holdings Ltd. | | | 810,761 | | | | 8,192,553 | |
ESR Cayman Ltd.(a)(c) | | | 987,200 | | | | 3,339,311 | |
Galaxy Entertainment Group Ltd.(a) | | | 1,066,058 | | | | 5,530,284 | |
Hang Lung Properties Ltd. | | | 1,024,565 | | | | 2,107,588 | |
Hang Seng Bank Ltd. | | | 373,648 | | | | 6,842,079 | |
Henderson Land Development Co. Ltd. | | | 722,774 | | | | 3,083,045 | |
HK Electric Investments & HK Electric Investments Ltd., Class SS(b) | | | 1,319,116 | | | | 1,294,155 | |
HKT Trust & HKT Ltd., Class SS(b) | | | 1,850,417 | | | | 2,486,351 | |
Hong Kong & China Gas Co. Ltd. | | | 5,521,383 | | | | 8,612,054 | |
Hong Kong Exchanges & Clearing Ltd. | | | 560,543 | | | | 32,782,777 | |
Hongkong Land Holdings Ltd. | | | 581,093 | | | | 3,021,460 | |
Jardine Matheson Holdings Ltd. | | | 105,986 | | | | 5,827,917 | |
Link REIT | | | 1,025,243 | | | | 9,031,641 | |
Melco Resorts & Entertainment Ltd., ADR(a) | | | 106,328 | | | | 1,082,419 | |
MTR Corp. Ltd.(d) | | | 764,533 | | | | 4,104,053 | |
New World Development Co. Ltd. | | | 760,824 | | | | 3,012,311 | |
Power Assets Holdings Ltd. | | | 684,618 | | | | 4,267,447 | |
Sino Land Co. Ltd. | | | 1,651,975 | | | | 2,056,970 | |
SITC International Holdings Co. Ltd. | | | 670,000 | | | | 2,423,180 | |
Sun Hung Kai Properties Ltd. | | | 636,088 | | | | 7,718,450 | |
Swire Pacific Ltd., Class A | | | 251,200 | | | | 1,428,823 | |
Swire Properties Ltd. | | | 579,736 | | | | 1,453,329 | |
Techtronic Industries Co. Ltd. | | | 672,131 | | | | 13,398,862 | |
WH Group Ltd.(c) | | | 4,446,107 | | | | 2,791,056 | |
Wharf Real Estate Investment Co. Ltd. | | | 823,245 | | | | 4,183,106 | |
Xinyi Glass Holdings Ltd. | | | 921,000 | | | | 2,306,941 | |
| | | | | | | | |
| | |
| | | | | | | 210,261,788 | |
| | |
| Ireland — 1.1% | | | | | | |
CRH PLC | | | 380,299 | | | | 20,133,035 | |
Experian PLC | | | 450,092 | | | | 22,169,670 | |
Flutter Entertainment PLC(a) | | | 81,539 | | | | 12,908,736 | |
James Hardie Industries PLC | | | 216,414 | | | | 8,711,127 | |
Kerry Group PLC, Class A | | | 77,399 | | | | 9,985,683 | |
Kingspan Group PLC | | | 75,195 | | | | 8,969,633 | |
Smurfit Kappa Group PLC | | | 120,289 | | | | 6,629,895 | |
| | | | | | | | |
| | |
| | | | | | | 89,507,779 | |
| | |
| Isle of Man — 0.1% | | | | | | |
Entain PLC(a) | | | 286,176 | | | | 6,541,031 | |
| | | | | | | | |
| | |
| Israel — 0.7% | | | | | | |
Azrieli Group Ltd. | | | 20,426 | | | | 1,948,856 | |
Bank Hapoalim BM | | | 546,744 | | | | 5,627,066 | |
Bank Leumi Le-Israel BM | | | 699,272 | | | | 7,500,401 | |
Check Point Software Technologies Ltd.(a) | | | 52,808 | | | | 6,155,301 | |
CyberArk Software Ltd.(a)(d) | | | 19,136 | | | | 3,315,886 | |
Elbit Systems Ltd. | | | 12,868 | | | | 2,224,291 | |
Fiverr International Ltd.(a)(d) | | | 14,040 | | | | 1,596,348 | |
ICL Group Ltd. | | | 340,539 | | | | 3,280,109 | |
Inmode Ltd.(a) | | | 25,258 | | | | 1,782,710 | |
| | | | | | | | |
| Security | | Shares | | | Value | |
|
| Israel (continued) | |
Isracard Ltd. | | | 1 | | | $ | 3 | |
Israel Discount Bank Ltd., Class A | | | 560,236 | | | | 3,761,572 | |
Kornit Digital Ltd.(a)(d) | | | 22,850 | | | | 3,478,913 | |
Mizrahi Tefahot Bank Ltd. | | | 67,712 | | | | 2,607,631 | |
Nice Ltd.(a) | | | 30,815 | | | | 9,344,820 | |
Teva Pharmaceutical Industries Ltd., ADR(a) | | | 542,363 | | | | 4,344,328 | |
Wix.com Ltd.(a) | | | 27,594 | | | | 4,354,057 | |
| | | | | | | | |
| | |
| | | | | | | 61,322,292 | |
| | |
| Italy — 2.0% | | | | | | |
Amplifon SpA | | | 59,928 | | | | 3,224,615 | |
Assicurazioni Generali SpA | | | 542,303 | | | | 11,461,421 | |
Atlantia SpA(a) | | | 243,513 | | | | 4,831,728 | |
Davide Campari-Milano NV | | | 256,494 | | | | 3,742,829 | |
DiaSorin SpA | | | 12,117 | | | | 2,305,211 | |
Enel SpA | | | 3,970,643 | | | | 31,749,571 | |
Eni SpA | | | 1,232,159 | | | | 17,124,266 | |
Ferrari NV | | | 61,537 | | | | 15,839,988 | |
FinecoBank Banca Fineco SpA | | | 293,542 | | | | 5,140,660 | |
Infrastrutture Wireless Italiane SpA(c) | | | 164,606 | | | | 1,996,019 | |
Intesa Sanpaolo SpA | | | 8,062,947 | | | | 20,825,973 | |
Mediobanca Banca di Credito Finanziario SpA | | | 307,830 | | | | 3,534,035 | |
Moncler SpA | | | 100,208 | | | | 7,241,855 | |
Nexi SpA(a)(c) | | | 226,816 | | | | 3,594,212 | |
Poste Italiane SpA(c) | | | 251,450 | | | | 3,294,061 | |
Prysmian SpA | | | 125,278 | | | | 4,712,476 | |
Recordati Industria Chimica e Farmaceutica SpA | | | 50,326 | | | | 3,231,637 | |
Snam SpA | | | 988,137 | | | | 5,951,721 | |
Telecom Italia SpA/Milano | | | 4,795,703 | | | | 2,359,373 | |
Terna SPA | | | 690,545 | | | | 5,586,260 | |
UniCredit SpA | | | 1,040,522 | | | | 15,994,221 | |
| | | | | | | | |
| | |
| | | | | | | 173,742,132 | |
| | |
| Japan — 22.3% | | | | | | |
Advantest Corp. | | | 97,400 | | | | 9,223,696 | |
Aeon Co. Ltd. | | | 319,246 | | | | 7,523,409 | |
AGC, Inc. | | | 95,148 | | | | 4,545,512 | |
Aisin Corp. | | | 71,846 | | | | 2,756,554 | |
Ajinomoto Co., Inc. | | | 228,054 | | | | 6,942,445 | |
ANA Holdings, Inc.(a) | | | 76,911 | | | | 1,607,815 | |
Asahi Group Holdings Ltd. | | | 222,302 | | | | 8,653,945 | |
Asahi Intecc Co. Ltd. | | | 105,700 | | | | 2,270,815 | |
Asahi Kasei Corp. | | | 614,568 | | | | 5,789,444 | |
Astellas Pharma, Inc. | | | 908,943 | | | | 14,793,528 | |
Azbil Corp. | | | 59,500 | | | | 2,713,708 | |
Bandai Namco Holdings, Inc. | | | 97,504 | | | | 7,623,679 | |
Benefit One Inc. | | | 38,400 | | | | 1,649,838 | |
Bridgestone Corp. | | | 277,341 | | | | 11,906,984 | |
Brother Industries Ltd. | | | 116,563 | | | | 2,246,694 | |
Canon, Inc. | | | 490,048 | | | | 11,954,064 | |
Capcom Co. Ltd. | | | 85,400 | | | | 2,011,284 | |
Central Japan Railway Co. | | | 70,240 | | | | 9,346,974 | |
Chiba Bank Ltd. | | | 259,470 | | | | 1,484,303 | |
Chubu Electric Power Co., Inc. | | | 319,711 | | | | 3,376,951 | |
Chugai Pharmaceutical Co. Ltd. | | | 326,430 | | | | 10,640,312 | |
Concordia Financial Group Ltd. | | | 540,070 | | | | 1,961,291 | |
Cosmos Pharmaceutical Corp. | | | 9,800 | | | | 1,440,726 | |
CyberAgent, Inc. | | | 194,716 | | | | 3,245,881 | |
Dai Nippon Printing Co. Ltd. | | | 109,068 | | | | 2,744,894 | |
Daifuku Co. Ltd. | | | 48,776 | | | | 3,988,650 | |
Dai-ichi Life Holdings, Inc. | | | 490,400 | | | | 9,891,352 | |
Daiichi Sankyo Co. Ltd. | | | 855,462 | | | | 21,772,719 | |
Daikin Industries Ltd. | | | 121,668 | | | | 27,560,135 | |
| | |
| 28 | | 2 0 2 1 BLACK ROCK ANNUAL REPORT TO SHAREHOLDERS |
| | |
Schedule of Investments (continued) December 31, 2021 | | iShares MSCI EAFE International Index Fund (Percentages shown are based on Net Assets) |
| | | | | | | | |
| Security | | Shares | | | Value | |
|
| Japan (continued) | |
Daito Trust Construction Co. Ltd. | | | 32,370 | | | $ | 3,713,521 | |
Daiwa House Industry Co. Ltd. | | | 276,476 | | | | 7,945,666 | |
Daiwa House REIT Investment Corp. | | | 1,057 | | | | 3,202,056 | |
Daiwa Securities Group, Inc. | | | 695,252 | | | | 3,923,301 | |
Denso Corp. | | | 211,590 | | | | 17,534,637 | |
Dentsu Group, Inc. | | | 106,882 | | | | 3,804,275 | |
Disco Corp. | | | 14,259 | | | | 4,358,299 | |
East Japan Railway Co. | | | 147,244 | | | | 9,051,901 | |
Eisai Co. Ltd. | | | 116,015 | | | | 6,585,917 | |
ENEOS Holdings, Inc. | | | 1,503,763 | | | | 5,617,774 | |
FANUC Corp. | | | 93,651 | | | | 19,906,634 | |
Fast Retailing Co. Ltd. | | | 28,441 | | | | 16,167,131 | |
Fuji Electric Co. Ltd. | | | 61,094 | | | | 3,337,448 | |
FUJIFILM Holdings Corp. | | | 176,108 | | | | 13,055,634 | |
Fujitsu Ltd. | | | 96,004 | | | | 16,496,028 | |
GLP J-REIT | | | 2,067 | | | | 3,572,846 | |
GMO Payment Gateway, Inc. | | | 20,800 | | | | 2,590,154 | |
Hakuhodo DY Holdings, Inc. | | | 112,492 | | | | 1,871,861 | |
Hamamatsu Photonics KK | | | 69,087 | | | | 4,412,578 | |
Hankyu Hanshin Holdings, Inc. | | | 113,663 | | | | 3,230,161 | |
Hikari Tsushin, Inc. | | | 10,306 | | | | 1,587,202 | |
Hino Motors Ltd. | | | 137,521 | | | | 1,133,993 | |
Hirose Electric Co. Ltd. | | | 15,592 | | | | 2,620,383 | |
Hitachi Construction Machinery Co. Ltd. | | | 53,505 | | | | 1,546,023 | |
Hitachi Ltd. | | | 472,713 | | | | 25,608,435 | |
Hitachi Metals Ltd.(a) | | | 104,886 | | | | 1,943,438 | |
Honda Motor Co. Ltd. | | | 795,935 | | | | 22,644,933 | |
Hoshizaki Corp. | | | 26,965 | | | | 2,028,789 | |
Hoya Corp. | | | 180,478 | | | | 26,781,443 | |
Hulic Co. Ltd. | | | 185,367 | | | | 1,762,745 | |
Ibiden Co. Ltd. | | | 50,800 | | | | 3,016,784 | |
Idemitsu Kosan Co. Ltd. | | | 100,800 | | | | 2,572,391 | |
Iida Group Holdings Co. Ltd. | | | 71,922 | | | | 1,672,722 | |
Inpex Corp. | | | 492,700 | | | | 4,284,321 | |
Isuzu Motors Ltd. | | | 288,582 | | | | 3,591,830 | |
Ito En Ltd. | | | 25,800 | | | | 1,355,591 | |
ITOCHU Corp. | | | 580,273 | | | | 17,752,801 | |
Itochu Techno-Solutions Corp. | | | 48,300 | | | | 1,553,702 | |
Japan Airlines Co. Ltd.(a) | | | 70,162 | | | | 1,331,907 | |
Japan Exchange Group, Inc. | | | 249,936 | | | | 5,475,943 | |
Japan Metropolitan Fund Invest | | | 3,364 | | | | 2,898,074 | |
Japan Post Bank Co. Ltd. | | | 202,400 | | | | 1,855,328 | |
Japan Post Holdings Co. Ltd. | | | 1,191,829 | | | | 9,284,671 | |
Japan Post Insurance Co. Ltd. | | | 108,300 | | | | 1,739,716 | |
Japan Real Estate Investment Corp. | | | 618 | | | | 3,508,155 | |
Japan Tobacco, Inc. | | | 587,441 | | | | 11,861,573 | |
JFE Holdings, Inc. | | | 236,612 | | | | 3,018,697 | |
JSR Corp. | | | 100,628 | | | | 3,824,213 | |
Kajima Corp. | | | 216,277 | | | | 2,485,567 | |
Kakaku.com, Inc. | | | 64,716 | | | | 1,730,070 | |
Kansai Electric Power Co., Inc. | | | 349,651 | | | | 3,268,182 | |
Kansai Paint Co. Ltd. | | | 88,475 | | | | 1,923,977 | |
Kao Corp. | | | 232,007 | | | | 12,151,204 | |
KDDI Corp. | | | 787,375 | | | | 23,025,759 | |
Keio Corp. | | | 49,529 | | | | 2,185,325 | |
Keisei Electric Railway Co. Ltd. | | | 64,787 | | | | 1,752,651 | |
Keyence Corp. | | | 94,980 | | | | 59,719,443 | |
Kikkoman Corp. | | | 71,264 | | | | 6,001,216 | |
Kintetsu Group Holdings Co. Ltd.(a) | | | 82,598 | | | | 2,308,996 | |
Kirin Holdings Co. Ltd. | | | 402,355 | | | | 6,480,681 | |
Kobayashi Pharmaceutical Co. Ltd. | | | 26,465 | | | | 2,081,671 | |
Kobe Bussan Co. Ltd. | | | 65,800 | | | | 2,547,611 | |
Koei Tecmo Holdings Co. Ltd. | | | 28,300 | | | | 1,111,190 | |
| | | | | | | | |
| Security | | Shares | | | Value | |
|
| Japan (continued) | |
Koito Manufacturing Co. Ltd. | | | 50,347 | | | $ | 2,666,581 | |
Komatsu Ltd. | | | 425,854 | | | | 9,959,016 | |
Konami Holdings Corp. | | | 44,999 | | | | 2,159,931 | |
Kose Corp. | | | 16,059 | | | | 1,821,765 | |
Kubota Corp. | | | 499,089 | | | | 11,097,768 | |
Kurita Water Industries Ltd. | | | 47,529 | | | | 2,253,280 | |
Kyocera Corp. | | | 156,200 | | | | 9,766,565 | |
Kyowa Kirin Co. Ltd. | | | 133,697 | | | | 3,645,342 | |
Lasertec Corp. | | | 36,700 | | | | 11,241,263 | |
Lawson, Inc. | | | 25,088 | | | | 1,190,409 | |
Lion Corp. | | | 113,239 | | | | 1,513,782 | |
Lixil Corp. | | | 132,027 | | | | 3,522,075 | |
M3, Inc. | | | 214,213 | | | | 10,800,911 | |
Makita Corp. | | | 110,239 | | | | 4,679,609 | |
Marubeni Corp. | | | 763,864 | | | | 7,442,325 | |
Mazda Motor Corp.(a) | | | 276,598 | | | | 2,122,305 | |
McDonald’s Holdings Co. Japan Ltd. | | | 38,394 | | | | 1,699,165 | |
Medipal Holdings Corp. | | | 87,098 | | | | 1,632,645 | |
MEIJI Holdings Co. Ltd. | | | 58,834 | | | | 3,512,022 | |
Mercari, Inc.(a) | | | 51,300 | | | | 2,610,011 | |
MINEBEA MITSUMI, Inc. | | | 178,308 | | | | 5,066,375 | |
MISUMI Group, Inc. | | | 139,356 | | | | 5,725,019 | |
Mitsubishi Chemical Holdings Corp. | | | 616,209 | | | | 4,570,650 | |
Mitsubishi Corp. | | | 616,497 | | | | 19,575,689 | |
Mitsubishi Electric Corp. | | | 886,321 | | | | 11,250,101 | |
Mitsubishi Estate Co. Ltd. | | | 577,382 | | | | 8,009,722 | |
Mitsubishi Gas Chemical Co., Inc. | | | 79,893 | | | | 1,354,304 | |
Mitsubishi HC Capital, Inc. | | | 329,773 | | | | 1,631,563 | |
Mitsubishi Heavy Industries Ltd. | | | 158,605 | | | | 3,667,011 | |
Mitsubishi UFJ Financial Group, Inc. | | | 5,967,570 | | | | 32,477,153 | |
Mitsui & Co. Ltd. | | | 761,700 | | | | 18,050,660 | |
Mitsui Chemicals, Inc. | | | 89,151 | | | | 2,396,397 | |
Mitsui Fudosan Co. Ltd. | | | 446,120 | | | | 8,842,442 | |
Miura Co. Ltd. | | | 43,100 | | | | 1,483,737 | |
Mizuho Financial Group, Inc. | | | 1,177,651 | | | | 14,957,641 | |
MonotaRO Co. Ltd. | | | 122,000 | | | | 2,194,291 | |
MS&AD Insurance Group Holdings, Inc. | | | 217,524 | | | | 6,698,062 | |
Murata Manufacturing Co. Ltd. | | | 280,425 | | | | 22,367,388 | |
NEC Corp. | | | 120,474 | | | | 5,570,682 | |
Nexon Co. Ltd. | | | 240,348 | | | | 4,647,425 | |
NGK Insulators Ltd. | | | 127,468 | | | | 2,157,396 | |
Nidec Corp. | | | 218,320 | | | | 25,826,011 | |
Nihon M&A Center Holdings, Inc. | | | 150,100 | | | | 3,681,824 | |
Nintendo Co. Ltd. | | | 54,682 | | | | 25,583,362 | |
Nippon Building Fund, Inc. | | | 716 | | | | 4,170,449 | |
Nippon Express Co. Ltd.(a)(e) | | | 37,870 | | | | 2,243,624 | |
Nippon Paint Holdings Co. Ltd. | | | 342,280 | | | | 3,737,968 | |
Nippon Prologis REIT, Inc. | | | 1,023 | | | | 3,616,032 | |
Nippon Sanso Holdings Corp. | | | 75,693 | | | | 1,655,606 | |
Nippon Shinyaku Co. Ltd. | | | 24,700 | | | | 1,719,989 | |
Nippon Steel Corp. | | | 418,256 | | | | 6,832,648 | |
Nippon Telegraph & Telephone Corp. | | | 628,432 | | | | 17,186,522 | |
Nippon Yusen KK | | | 79,122 | | | | 6,033,282 | |
Nissan Chemical Corp. | | | 58,911 | | | | 3,426,265 | |
Nissan Motor Co. Ltd.(a) | | | 1,138,115 | | | | 5,481,780 | |
Nisshin Seifun Group, Inc. | | | 99,973 | | | | 1,442,248 | |
Nissin Foods Holdings Co. Ltd. | | | 30,541 | | | | 2,228,985 | |
Nitori Holdings Co. Ltd. | | | 39,223 | | | | 5,866,643 | |
Nitto Denko Corp. | | | 69,726 | | | | 5,386,502 | |
Nomura Holdings, Inc. | | | 1,502,218 | | | | 6,543,133 | |
Nomura Real Estate Holdings, Inc. | | | 59,858 | | | | 1,379,245 | |
Nomura Real Estate Master Fund, Inc. | | | 2,042 | | | | 2,873,784 | |
Nomura Research Institute Ltd. | | | 163,063 | | | | 6,971,073 | |
| | |
FUND SCHEDULES OF INVESTMENTS | | 29 |
| | |
Schedule of Investments (continued) December 31, 2021 | | iShares MSCI EAFE International Index Fund (Percentages shown are based on Net Assets) |
| | | | | | | | |
| Security | | Shares | | | Value | |
|
| Japan (continued) | |
NTT Data Corp. | | | 308,517 | | | $ | 6,618,066 | |
Obayashi Corp. | | | 314,634 | | | | 2,435,060 | |
Obic Co. Ltd. | | | 34,194 | | | | 6,399,379 | |
Odakyu Electric Railway Co. Ltd. | | | 141,885 | | | | 2,637,852 | |
Oji Holdings Corp. | | | 388,226 | | | | 1,880,977 | |
Olympus Corp. | | | 539,812 | | | | 12,430,373 | |
Omron Corp. | | | 90,428 | | | | 9,010,907 | |
Ono Pharmaceutical Co. Ltd. | | | 182,131 | | | | 4,526,938 | |
Open House Co. Ltd. | | | 39,400 | | | | 2,058,906 | |
Oracle Corp. Japan | | | 18,735 | | | | 1,423,363 | |
Oriental Land Co. Ltd. | | | 97,604 | | | | 16,458,677 | |
ORIX Corp. | | | 598,100 | | | | 12,206,126 | |
Orix JREIT, Inc. | | | 1,262 | | | | 1,972,818 | |
Osaka Gas Co. Ltd. | | | 186,708 | | | | 3,088,013 | |
Otsuka Corp. | | | 55,382 | | | | 2,640,759 | |
Otsuka Holdings Co. Ltd. | | | 190,755 | | | | 6,939,841 | |
Pan Pacific International Holdings Corp. | | | 198,436 | | | | 2,735,209 | |
Panasonic Corp. | | | 1,081,257 | | | | 11,886,028 | |
Persol Holdings Co. Ltd. | | | 85,475 | | | | 2,485,036 | |
Pola Orbis Holdings, Inc. | | | 45,823 | | | | 763,676 | |
Rakuten Group, Inc.(a) | | | 427,500 | | | | 4,289,218 | |
Recruit Holdings Co. Ltd. | | | 662,394 | | | | 40,310,442 | |
Renesas Electronics Corp.(a) | | | 611,408 | | | | 7,594,116 | |
Resona Holdings, Inc. | | | 1,027,699 | | | | 3,993,820 | |
Ricoh Co. Ltd. | | | 322,681 | | | | 3,007,744 | |
Rinnai Corp. | | | 17,835 | | | | 1,609,540 | |
Rohm Co. Ltd. | | | 42,100 | | | | 3,829,812 | |
Ryohin Keikaku Co. Ltd. | | | 125,060 | | | | 1,906,917 | |
Santen Pharmaceutical Co. Ltd. | | | 176,249 | | | | 2,151,779 | |
SBI Holdings, Inc. | | | 117,797 | | | | 3,212,976 | |
SCSK Corp. | | | 75,800 | | | | 1,508,585 | |
Secom Co. Ltd. | | | 102,557 | | | | 7,126,302 | |
Seiko Epson Corp. | | | 134,603 | | | | 2,424,255 | |
Sekisui Chemical Co. Ltd. | | | 182,878 | | | | 3,058,477 | |
Sekisui House Ltd. | | | 301,399 | | | | 6,484,822 | |
Seven & i Holdings Co. Ltd. | | | 367,859 | | | | 16,181,378 | |
SG Holdings Co. Ltd. | | | 158,504 | | | | 3,716,671 | |
Sharp Corp. | | | 106,169 | | | | 1,219,304 | |
Shimadzu Corp. | | | 116,363 | | | | 4,914,940 | |
Shimano, Inc. | | | 36,470 | | | | 9,712,664 | |
Shimizu Corp. | | | 274,606 | | | | 1,702,651 | |
Shin-Etsu Chemical Co. Ltd. | | | 172,926 | | | | 30,015,693 | |
Shionogi & Co. Ltd. | | | 128,921 | | | | 9,069,120 | |
Shiseido Co. Ltd. | | | 194,278 | | | | 10,838,083 | |
Shizuoka Bank Ltd. | | | 214,801 | | | | 1,533,469 | |
SMC Corp. | | | 27,941 | | | | 18,884,147 | |
Softbank Corp. | | | 1,402,200 | | | | 17,710,582 | |
SoftBank Group Corp. | | | 588,800 | | | | 28,227,151 | |
Sohgo Security Services Co. Ltd. | | | 35,847 | | | | 1,424,409 | |
Sompo Holdings, Inc. | | | 155,142 | | | | 6,542,911 | |
Sony Group Corp. | | | 615,668 | | | | 77,745,431 | |
Square Enix Holdings Co. Ltd. | | | 41,400 | | | | 2,123,801 | |
Stanley Electric Co. Ltd. | | | 62,834 | | | | 1,577,577 | |
Subaru Corp. | | | 301,546 | | | | 5,387,966 | |
SUMCO Corp. | | | 160,115 | | | | 3,260,387 | |
Sumitomo Chemical Co. Ltd. | | | 738,460 | | | | 3,482,437 | |
Sumitomo Corp. | | | 549,840 | | | | 8,137,297 | |
Sumitomo Dainippon Pharma Co. Ltd. | | | 84,293 | | | | 972,523 | |
Sumitomo Electric Industries Ltd. | | | 370,780 | | | | 4,839,043 | |
Sumitomo Metal Mining Co. Ltd. | | | 119,015 | | | | 4,507,624 | |
Sumitomo Mitsui Financial Group, Inc. | | | 637,427 | | | | 21,766,397 | |
Sumitomo Mitsui Trust Holdings, Inc. | | | 165,726 | | | | 5,541,603 | |
| | | | | | | | |
| Security | | Shares | | | Value | |
|
| Japan (continued) | |
Sumitomo Realty & Development Co. Ltd. | | | 148,949 | | | $ | 4,391,140 | |
Suntory Beverage & Food Ltd. | | | 67,540 | | | | 2,445,824 | |
Suzuki Motor Corp. | | | 180,019 | | | | 6,942,043 | |
Sysmex Corp. | | | 81,422 | | | | 10,990,465 | |
T&D Holdings, Inc. | | | 259,006 | | | | 3,309,000 | |
Taisei Corp. | | | 91,910 | | | | 2,794,991 | |
Taisho Pharmaceutical Holdings Co. Ltd. | | | 19,600 | | | | 904,735 | |
Takeda Pharmaceutical Co. Ltd. | | | 772,408 | | | | 21,093,142 | |
TDK Corp. | | | 189,774 | | | | 7,406,097 | |
Terumo Corp. | | | 315,606 | | | | 13,331,385 | |
TIS, Inc. | | | 107,700 | | | | 3,202,572 | |
Tobu Railway Co. Ltd. | | | 90,898 | | | | 2,074,288 | |
Toho Co. Ltd. | | | 54,382 | | | | 2,327,131 | |
Tokio Marine Holdings, Inc. | | | 306,487 | | | | 17,062,020 | |
Tokyo Century Corp. | | | 19,212 | | | | 932,617 | |
Tokyo Electric Power Co. Holdings, Inc.(a) | | | 754,312 | | | | 1,950,056 | |
Tokyo Electron Ltd. | | | 72,893 | | | | 41,955,195 | |
Tokyo Gas Co. Ltd. | | | 182,655 | | | | 3,278,725 | |
Tokyu Corp. | | | 248,065 | | | | 3,297,697 | |
Toppan Inc. | | | 126,200 | | | | 2,368,233 | |
Toray Industries, Inc. | | | 667,414 | | | | 3,954,185 | |
Toshiba Corp. | | | 199,670 | | | | 8,216,103 | |
Tosoh Corp. | | | 129,574 | | | | 1,925,018 | |
TOTO Ltd. | | | 68,187 | | | | 3,145,978 | |
Toyo Suisan Kaisha Ltd. | | | 42,723 | | | | 1,811,386 | |
Toyota Industries Corp. | | | 71,900 | | | | 5,751,493 | |
Toyota Motor Corp. | | | 5,177,145 | | | | 95,687,024 | |
Toyota Tsusho Corp. | | | 104,481 | | | | 4,816,232 | |
Trend Micro, Inc.(a) | | | 66,134 | | | | 3,671,496 | |
Tsuruha Holdings, Inc. | | | 19,335 | | | | 1,856,522 | |
Unicharm Corp. | | | 196,602 | | | | 8,553,595 | |
USS Co. Ltd. | | | 105,563 | | | | 1,649,286 | |
Welcia Holdings Co. Ltd. | | | 47,200 | | | | 1,474,196 | |
West Japan Railway Co. | | | 103,940 | | | | 4,347,074 | |
Yakult Honsha Co. Ltd. | | | 61,782 | | | | 3,223,119 | |
Yamaha Corp. | | | 64,564 | | | | 3,185,291 | |
Yamaha Motor Co. Ltd. | | | 147,327 | | | | 3,538,663 | |
Yamato Holdings Co. Ltd. | | | 140,262 | | | | 3,294,968 | |
Yaskawa Electric Corp. | | | 117,545 | | | | 5,767,421 | |
Yokogawa Electric Corp. | | | 109,863 | | | | 1,982,964 | |
Z Holdings Corp. | | | 1,308,227 | | | | 7,548,457 | |
ZOZO, Inc. | | | 62,251 | | | | 1,940,994 | |
| | | | | | | | |
| | |
| | | | | | | 1,904,533,112 | |
| | |
| Jordan — 0.0% | | | | | | |
Hikma Pharmaceuticals PLC | | | 83,302 | | | | 2,501,646 | |
| | | | | | | | |
| | |
| Luxembourg — 0.3% | | | | | | |
ArcelorMittal SA | | | 329,046 | | | | 10,555,348 | |
Aroundtown SA | | | 480,846 | | | | 2,900,639 | |
Eurofins Scientific SE | | | 65,198 | | | | 8,077,481 | |
Tenaris SA | | | 227,275 | | | | 2,372,070 | |
| | | | | | | | |
| | |
| | | | | | | 23,905,538 | |
| | |
| Macau — 0.0% | | | | | | |
Sands China Ltd.(a) | | | 1,211,660 | | | | 2,812,017 | |
| | | | | | | | |
| | |
| Malta — 0.0% | | | | | | |
BGP Holdings Ltd.(a)(e) | | | 966,939 | | | | 11 | |
| | | | | | | | |
| | |
| Netherlands — 6.2% | | | | | | |
ABN AMRO Bank NV(c) | | | 203,588 | | | | 2,992,682 | |
Adyen NV(a)(c) | | | 9,664 | | | | 25,367,996 | |
Aegon NV | | | 861,215 | | | | 4,281,577 | |
Akzo Nobel NV | | | 91,725 | | | | 10,077,356 | |
| | |
| 30 | | 2 0 2 1 BLACK ROCK ANNUAL REPORT TO SHAREHOLDERS |
| | |
Schedule of Investments (continued) December 31, 2021 | | iShares MSCI EAFE International Index Fund (Percentages shown are based on Net Assets) |
| | | | | | | | |
| Security | | Shares | | | Value | |
|
| Netherlands (continued) | |
Argenx SE(a) | | | 22,380 | | | $ | 7,958,505 | |
ASM International NV | | | 22,997 | | | | 10,151,276 | |
ASML Holding NV | | | 201,785 | | | | 161,633,788 | |
Euronext NV(c) | | | 42,167 | | | | 4,383,847 | |
EXOR NV | | | 53,325 | | | | 4,773,529 | |
Heineken Holding NV | | | 56,544 | | | | 5,213,630 | |
Heineken NV | | | 126,540 | | | | 14,240,773 | |
IMCD NV | | | 27,824 | | | | 6,149,190 | |
ING Groep NV | | | 1,905,920 | | | | 26,498,010 | |
JDE Peet’s NV | | | 48,648 | | | | 1,505,750 | |
Just Eat Takeaway.com NV(a)(c) | | | 87,919 | | | | 4,776,717 | |
Koninklijke Ahold Delhaize NV | | | 510,516 | | | | 17,519,039 | |
Koninklijke DSM NV | | | 85,329 | | | | 19,216,628 | |
Koninklijke KPN NV | | | 1,627,035 | | | | 5,056,994 | |
Koninklijke Philips NV | | | 447,868 | | | | 16,576,313 | |
NN Group NV | | | 131,908 | | | | 7,133,621 | |
Prosus NV(a) | | | 455,552 | | | | 37,731,095 | |
QIAGEN NV(a) | | | 111,776 | | | | 6,198,040 | |
Randstad NV | | | 59,047 | | | | 4,028,023 | |
Royal Dutch Shell PLC, A Shares | | | 2,002,197 | | | | 43,876,946 | |
Royal Dutch Shell PLC, B Shares | | | 1,797,535 | | | | 39,467,701 | |
Stellantis NV | | | 993,728 | | | | 18,760,170 | |
Universal Music Group NV | | | 354,085 | | | | 9,989,453 | |
Wolters Kluwer NV | | | 130,600 | | | | 15,371,733 | |
| | | | | | | | |
| | |
| | | | | | | 530,930,382 | |
| | |
| New Zealand — 0.3% | | | | | | |
Auckland International Airport Ltd.(a) | | | 602,462 | | | | 3,171,259 | |
Fisher & Paykel Healthcare Corp. Ltd. | | | 281,927 | | | | 6,316,168 | |
Mercury NZ Ltd. | | | 341,301 | | | | 1,429,849 | |
Meridian Energy Ltd. | | | 634,997 | | | | 2,107,727 | |
Ryman Healthcare Ltd. | | | 204,551 | | | | 1,715,224 | |
Spark New Zealand Ltd. | | | 898,639 | | | | 2,779,030 | |
Xero Ltd.(a) | | | 65,019 | | | | 6,655,291 | |
| | | | | | | | |
| | |
| | | | | | | 24,174,548 | |
| | |
| Norway — 0.7% | | | | | | |
Adevinta ASA(a) | | | 132,652 | | | | 1,762,158 | |
Aker BP ASA | | | 60,525 | | | | 1,861,059 | |
DNB Bank ASA | | | 454,127 | | | | 10,387,578 | |
Equinor ASA | | | 477,114 | | | | 12,633,638 | |
Gjensidige Forsikring ASA | | | 98,626 | | | | 2,392,758 | |
Mowi ASA | | | 211,551 | | | | 5,006,720 | |
Norsk Hydro ASA | | | 647,270 | | | | 5,093,100 | |
Orkla ASA | | | 361,488 | | | | 3,623,396 | |
Schibsted ASA, Class A | | | 35,193 | | | | 1,356,855 | |
Schibsted ASA, B Shares | | | 46,855 | | | | 1,580,180 | |
Telenor ASA | | | 343,189 | | | | 5,394,606 | |
Yara International ASA | | | 83,883 | | | | 4,229,229 | |
| | | | | | | | |
| | |
| | | | | | | 55,321,277 | |
| | |
| Poland — 0.0% | | | | | | |
InPost SA(a) | | | 96,259 | | | | 1,161,444 | |
| | | | | | | | |
| | |
| Portugal — 0.2% | | | | | | |
Banco Espirito Santo SA, Registered Shares(a)(e) | | | 47,542 | | | | — | |
EDP - Energias de Portugal SA | | | 1,354,348 | | | | 7,439,844 | |
Galp Energia SGPS SA | | | 241,255 | | | | 2,340,931 | |
Jeronimo Martins SGPS SA | | | 137,226 | | | | 3,140,258 | |
| | | | | | | | |
| | |
| | | | | | | 12,921,033 | |
| | |
| Singapore — 1.2% | | | | | | |
Ascendas Real Estate Investment Trust | | | 1,649,175 | | | | 3,613,315 | |
CapitaLand Integrated Commercial Trust | | | 2,405,601 | | | | 3,639,605 | |
| | | | | | | | |
| Security | | Shares | | | Value | |
|
| Singapore (continued) | |
Capitaland Investment Ltd.(a) | | | 1,310,530 | | | $ | 3,313,573 | |
City Developments Ltd. | | | 199,178 | | | | 1,007,718 | |
DBS Group Holdings Ltd. | | | 884,209 | | | | 21,414,618 | |
Genting Singapore Ltd.(d) | | | 2,959,825 | | | | 1,702,517 | |
Keppel Corp. Ltd. | | | 714,742 | | | | 2,718,165 | |
Mapletree Commercial Trust | | | 1,079,200 | | | | 1,598,035 | |
Mapletree Logistics Trust | | | 1,502,141 | | | | 2,118,523 | |
Oversea-Chinese Banking Corp. Ltd. | | | 1,652,987 | | | | 13,990,463 | |
Sea Ltd., ADR(a) | | | 67,263 | | | | 15,047,406 | |
Singapore Airlines Ltd.(a)(d) | | | 676,599 | | | | 2,508,658 | |
Singapore Exchange Ltd. | | | 329,026 | | | | 2,271,255 | |
Singapore Technologies Engineering Ltd. | | | 790,979 | | | | 2,207,398 | |
Singapore Telecommunications Ltd. | | | 4,031,046 | | | | 6,939,367 | |
United Overseas Bank Ltd. | | | 576,105 | | | | 11,505,804 | |
UOL Group Ltd. | | | 224,399 | | | | 1,181,191 | |
Venture Corp. Ltd. | | | 133,927 | | | | 1,819,913 | |
| | | | | | | | |
| | |
| | | | | | | 98,597,524 | |
| | |
| Spain — 2.2% | | | | | | |
ACS Actividades de Construccion y Servicios SA | | | 121,421 | | | | 3,237,212 | |
Aena SME SA(a)(c) | | | 36,762 | | | | 5,789,424 | |
Amadeus IT Group SA(a) | | | 219,931 | | | | 14,881,462 | |
Banco Bilbao Vizcaya Argentaria SA | | | 3,255,217 | | | | 19,306,626 | |
Banco Santander SA | | | 8,465,583 | | | | 28,114,847 | |
CaixaBank SA | | | 2,171,737 | | | | 5,932,401 | |
Cellnex Telecom SA(c) | | | 248,732 | | | | 14,408,447 | |
EDP Renovaveis SA | | | 138,694 | | | | 3,448,968 | |
Enagas SA | | | 102,462 | | | | 2,380,327 | |
Endesa SA | | | 157,288 | | | | 3,620,994 | |
Ferrovial SA | | | 238,955 | | | | 7,472,998 | |
Grifols SA | | | 149,130 | | | | 2,869,656 | |
Iberdrola SA | | | 2,797,093 | | | | 33,117,514 | |
Industria de Diseno Textil SA | | | 532,535 | | | | 17,174,269 | |
Naturgy Energy Group SA(d) | | | 96,293 | | | | 3,131,946 | |
Red Electrica Corp. SA | | | 180,542 | | | | 3,904,110 | |
Repsol SA | | | 715,590 | | | | 8,474,821 | |
Siemens Gamesa Renewable Energy SA(a) | | | 118,064 | | | | 2,803,769 | |
Telefonica SA | | | 2,593,722 | | | | 11,246,915 | |
| | | | | | | | |
| | |
| | | | | | | 191,316,706 | |
| | |
| Sweden — 3.7% | | | | | | |
Alfa Laval AB | | | 153,923 | | | | 6,183,015 | |
Assa Abloy AB, Class B | | | 489,315 | | | | 14,914,797 | |
Atlas Copco AB, A Shares | | | 327,829 | | | | 22,653,253 | |
Atlas Copco AB, B Shares | | | 189,703 | | | | 11,143,201 | |
Boliden AB | | | 134,236 | | | | 5,176,103 | |
Electrolux AB | | | 108,554 | | | | 2,629,142 | |
Embracer Group AB(a)(d) | | | 273,112 | | | | 2,897,445 | |
Epiroc AB, Class A | | | 321,726 | | | | 8,135,095 | |
Epiroc AB, Class B | | | 187,692 | | | | 3,969,162 | |
EQT AB | | | 144,114 | | | | 7,812,424 | |
Essity AB, Class B | | | 299,188 | | | | 9,760,947 | |
Evolution AB(c) | | | 84,105 | | | | 11,887,480 | |
Fastighets AB Balder, B Shares(a) | | | 52,021 | | | | 3,743,637 | |
Getinge AB | | | 112,219 | | | | 4,890,746 | |
H & M Hennes & Mauritz AB, B Shares | | | 356,597 | | | | 6,997,184 | |
Hexagon AB, B Shares | | | 961,782 | | | | 15,235,149 | |
Husqvarna AB, B Shares | | | 207,754 | | | | 3,321,758 | |
Industrivarden AB, A Shares | | | 65,197 | | | | 2,071,585 | |
Industrivarden AB, C Shares | | | 77,886 | | | | 2,440,221 | |
Investment AB Latour, B Shares | | | 71,256 | | | | 2,895,021 | |
Investor AB | | | 243,588 | | | | 6,408,229 | |
Investor AB, B Shares | | | 889,457 | | | | 22,319,416 | |
| | |
FUND SCHEDULES OF INVESTMENTS | | 31 |
| | |
Schedule of Investments (continued) December 31, 2021 | | iShares MSCI EAFE International Index Fund (Percentages shown are based on Net Assets) |
| | | | | | | | |
| Security | | Shares | | | Value | |
|
| Sweden (continued) | |
Kinnevik AB, Class B(a) | | | 116,431 | | | $ | 4,139,543 | |
L E Lundbergforetagen AB, B Shares | | | 36,578 | | | | 2,049,305 | |
Lifco AB | | | 115,376 | | | | 3,446,124 | |
Lundin Energy AB | | | 99,108 | | | | 3,546,358 | |
Nibe Industrier AB, B Shares | | | 693,466 | | | | 10,478,226 | |
Sagax AB, Class B | | | 77,338 | | | | 2,601,456 | |
Sandvik AB | | | 551,144 | | | | 15,362,326 | |
Securitas AB, B Shares | | | 150,793 | | | | 2,074,377 | |
Sinch AB(a)(c) | | | 253,106 | | | | 3,193,775 | |
Skandinaviska Enskilda Banken AB, Class A | | | 797,395 | | | | 11,070,677 | |
Skanska AB, B Shares | | | 163,733 | | | | 4,231,045 | |
SKF AB, B Shares | | | 187,909 | | | | 4,443,994 | |
Svenska Cellulosa AB SCA, Class B | | | 297,350 | | | | 5,276,268 | |
Svenska Handelsbanken AB, A Shares | | | 711,314 | | | | 7,687,840 | |
Swedbank AB, A Shares | | | 440,752 | | | | 8,857,277 | |
Swedish Match AB | | | 773,270 | | | | 6,138,745 | |
Tele2 AB, B Shares | | | 248,274 | | | | 3,541,793 | |
Telefonaktiebolaget LM Ericsson, B Shares | | | 1,424,927 | | | | 15,678,528 | |
Telia Co. AB | | | 1,305,188 | | | | 5,104,542 | |
Volvo AB, A Shares | | | 97,974 | | | | 2,298,225 | |
Volvo AB, B Shares | | | 697,930 | | | | 16,140,669 | |
| | | | | | | | |
| | |
| | | | | | | 314,846,103 | |
| | |
| Switzerland — 10.6% | | | | | | |
ABB Ltd., Registered Shares | | | 801,866 | | | | 30,561,339 | |
Adecco Group AG, Registered Shares | | | 74,585 | | | | 3,800,654 | |
Alcon, Inc. | | | 243,950 | | | | 21,517,695 | |
Bachem Holding AG | | | 2,976 | | | | 2,330,346 | |
Baloise Holding AG, Registered Shares | | | 22,313 | | | | 3,641,767 | |
Barry Callebaut AG, Registered Shares | | | 1,717 | | | | 4,168,276 | |
Chocoladefabriken Lindt & Spruengli AG | | | 514 | | | | 7,124,473 | |
Chocoladefabriken Lindt & Spruengli AG, Registered Shares | | | 53 | | | | 7,107,770 | |
Cie Financiere Richemont SA, Class A, Registered Shares | | | 254,837 | | | | 38,081,520 | |
Clariant AG, Registered Shares(a) | | | 103,845 | | | | 2,157,150 | |
Coca-Cola HBC AG(a) | | | 99,461 | | | | 3,443,869 | |
Credit Suisse Group AG, Registered Shares | | | 1,294,763 | | | | 12,553,529 | |
EMS-Chemie Holding AG, Registered Shares | | | 3,666 | | | | 4,097,050 | |
Geberit AG, Registered Shares | | | 17,514 | | | | 14,276,251 | |
Givaudan SA, Registered Shares | | | 4,508 | | | | 23,651,689 | |
Holcim Ltd., Registered Shares(a) | | | 256,015 | | | | 13,020,675 | |
Julius Baer Group Ltd. | | | 107,718 | | | | 7,203,345 | |
Kuehne + Nagel International AG, Registered Shares | | | 26,528 | | | | 8,543,533 | |
Logitech International SA, Registered Shares | | | 84,509 | | | | 7,089,259 | |
Lonza Group AG, Registered Shares | | | 36,355 | | | | 30,268,735 | |
Nestle SA, Registered Shares | | | 1,374,264 | | | | 191,871,013 | |
Novartis AG, Registered Shares | | | 1,069,621 | | | | 93,989,709 | |
Partners Group Holding AG | | | 11,080 | | | | 18,290,968 | |
Roche Holding AG | | | 358,626 | | | | 149,291,730 | |
Schindler Holding AG | | | 19,967 | | | | 5,359,741 | |
Schindler Holding AG, Registered Shares | | | 9,685 | | | | 2,588,197 | |
SGS SA, Registered Shares | | | 2,944 | | | | 9,814,402 | |
Sika AG, Registered Shares | | | 69,217 | | | | 28,767,774 | |
Sonova Holding AG, Registered Shares | | | 26,723 | | | | 10,443,262 | |
STMicroelectronics NV | | | 333,397 | | | | 16,394,772 | |
Straumann Holding AG, Registered Shares | | | 5,071 | | | | 10,723,091 | |
Swatch Group AG | | | 13,927 | | | | 4,241,272 | |
Swatch Group AG, Registered Shares | | | 26,076 | | | | 1,524,576 | |
Swiss Life Holding AG, Registered Shares | | | 15,408 | | | | 9,413,931 | |
Swiss Prime Site AG, Registered Shares | | | 36,814 | | | | 3,613,954 | |
Swiss Re AG | | | 147,250 | | | | 14,535,556 | |
| | | | | | | | |
| Security | | Shares | | | Value | |
| | |
| Switzerland (continued) | | | | | | |
Swisscom AG, Registered Shares | | | 12,645 | | | $ | 7,133,348 | |
Temenos AG, Registered Shares | | | 32,918 | | | | 4,537,460 | |
UBS Group AG, Registered Shares | | | 1,717,123 | | | | 30,821,127 | |
VAT Group AG(c) | | | 13,174 | | | | 6,528,025 | |
Vifor Pharma AG | | | 23,463 | | | | 4,168,149 | |
Zurich Insurance Group AG | | | 73,454 | | | | 32,178,654 | |
| | | | | | | | |
| | |
| | | | | | | 900,869,636 | |
| | |
| United Arab Emirates — 0.0% | | | | | | |
NMC Health PLC(a)(e) | | | 45,379 | | | | 1 | |
| | | | | | | | |
| | |
| United Kingdom — 12.7% | | | | | | |
3i Group PLC | | | 473,694 | | | | 9,285,941 | |
Abrdn PLC | | | 1,080,370 | | | | 3,519,860 | |
Admiral Group PLC | | | 95,329 | | | | 4,080,503 | |
Anglo American PLC | | | 630,866 | | | | 25,948,918 | |
Ashtead Group PLC | | | 218,461 | | | | 17,611,132 | |
Associated British Foods PLC | | | 175,209 | | | | 4,796,161 | |
AstraZeneca PLC | | | 756,268 | | | | 88,308,912 | |
Auto Trader Group PLC(c) | | | 465,237 | | | | 4,659,287 | |
AVEVA Group PLC | | | 57,980 | | | | 2,675,325 | |
Aviva PLC | | | 1,909,553 | | | | 10,644,177 | |
BAE Systems PLC | | | 1,570,053 | | | | 11,708,186 | |
Barclays PLC | | | 8,263,731 | | | | 21,049,876 | |
Barratt Developments PLC | | | 500,208 | | | | 5,079,352 | |
Berkeley Group Holdings PLC | | | 55,614 | | | | 3,601,292 | |
BP PLC | | | 9,822,844 | | | | 44,012,443 | |
British American Tobacco PLC | | | 1,064,212 | | | | 39,516,008 | |
British Land Co. PLC | | | 423,727 | | | | 3,059,873 | |
BT Group PLC | | | 4,341,203 | | | | 9,986,933 | |
Bunzl PLC | | | 164,830 | | | | 6,439,133 | |
Burberry Group PLC | | | 199,045 | | | | 4,912,878 | |
CK Hutchison Holdings Ltd. | | | 1,315,117 | | | | 8,467,280 | |
CNH Industrial NV | | | 498,334 | | | | 9,634,888 | |
Coca-Cola European Partners PLC | | | 100,532 | | | | 5,622,755 | |
Compass Group PLC(a) | | | 870,952 | | | | 19,608,338 | |
Croda International PLC | | | 67,915 | | | | 9,302,416 | |
DCC PLC | | | 48,667 | | | | 3,984,034 | |
Diageo PLC | | | 1,139,421 | | | | 62,299,027 | |
Evraz PLC | | | 245,721 | | | | 2,008,969 | |
Ferguson PLC | | | 108,686 | | | | 19,305,527 | |
GlaxoSmithKline PLC | | | 2,456,449 | | | | 53,483,649 | |
Halma PLC | | | 185,197 | | | | 8,029,931 | |
Hargreaves Lansdown PLC | | | 176,713 | | | | 3,247,307 | |
HSBC Holdings PLC | | | 9,971,926 | | | | 60,223,037 | |
Imperial Brands PLC | | | 460,305 | | | | 10,087,489 | |
Informa PLC(a) | | | 737,931 | | | | 5,166,681 | |
InterContinental Hotels Group PLC(a) | | | 89,745 | | | | 5,801,927 | |
Intertek Group PLC | | | 79,057 | | | | 6,031,052 | |
J Sainsbury PLC | | | 847,406 | | | | 3,167,574 | |
JD Sports Fashion PLC | | | 1,276,549 | | | | 3,763,908 | |
Johnson Matthey PLC | | | 93,147 | | | | 2,588,365 | |
Kingfisher PLC | | | 1,037,945 | | | | 4,774,280 | |
Land Securities Group PLC | | | 340,947 | | | | 3,598,341 | |
Legal & General Group PLC | | | 2,923,521 | | | | 11,806,027 | |
Lloyds Banking Group PLC | | | 34,651,244 | | | | 22,502,217 | |
London Stock Exchange Group PLC | | | 160,592 | | | | 15,106,910 | |
M&G PLC | | | 1,251,324 | | | | 3,385,223 | |
Melrose Industries PLC | | | 2,151,466 | | | | 4,678,974 | |
Mondi PLC | | | 237,887 | | | | 5,900,527 | |
National Grid PLC | | | 1,765,741 | | | | 25,460,725 | |
Natwest Group PLC | | | 2,818,846 | | | | 8,632,194 | |
Next PLC | | | 64,927 | | | | 7,181,122 | |
| | |
| 32 | | 2 0 2 1 BLACK ROCK ANNUAL REPORT TO SHAREHOLDERS |
| | |
Schedule of Investments (continued) December 31, 2021 | | iShares MSCI EAFE International Index Fund (Percentages shown are based on Net Assets) |
| | | | | | | | |
| Security | | Shares | | | Value | |
|
| United Kingdom (continued) | |
Ocado Group PLC(a) | | | 238,839 | | | $ | 5,433,907 | |
Pearson PLC | | | 366,560 | | | | 3,040,884 | |
Persimmon PLC | | | 156,246 | | | | 6,055,941 | |
Phoenix Group Holdings PLC | | | 315,439 | | | | 2,792,271 | |
Prudential PLC | | | 1,276,925 | | | | 22,081,666 | |
Reckitt Benckiser Group PLC | | | 348,675 | | | | 30,015,203 | |
RELX PLC | | | 944,063 | | | | 30,820,732 | |
Rentokil Initial PLC | | | 907,869 | | | | 7,186,458 | |
Rio Tinto PLC | | | 548,285 | | | | 36,157,330 | |
Rolls-Royce Holdings PLC(a) | | | 4,088,566 | | | | 6,824,371 | |
Sage Group PLC | | | 517,129 | | | | 5,983,667 | |
Schroders PLC | | | 59,830 | | | | 2,887,886 | |
Segro PLC | | | 582,915 | | | | 11,344,534 | |
Severn Trent PLC | | | 122,878 | | | | 4,906,754 | |
Smith & Nephew PLC | | | 429,223 | | | | 7,490,959 | |
Smiths Group PLC | | | 191,001 | | | | 4,088,429 | |
Spirax-Sarco Engineering PLC | | | 35,977 | | | | 7,829,688 | |
SSE PLC | | | 511,346 | | | | 11,431,227 | |
St James’s Place PLC | | | 264,269 | | | | 6,039,136 | |
Standard Chartered PLC | | | 1,292,890 | | | | 7,861,783 | |
Taylor Wimpey PLC | | | 1,754,821 | | | | 4,183,718 | |
Tesco PLC | | | 3,774,567 | | | | 14,860,748 | |
Unilever PLC | | | 1,266,925 | | | | 67,966,025 | |
United Utilities Group PLC | | | 335,009 | | | | 4,943,206 | |
Vodafone Group PLC | | | 13,524,053 | | | | 20,370,413 | |
Whitbread PLC(a) | | | 97,205 | | | | 3,954,069 | |
WPP PLC | | | 579,575 | | | | 8,825,609 | |
| | | | | | | | |
| | |
| | | | | | | 1,081,123,498 | |
| | | | | | | | |
| | |
Total Common Stocks — 98.4%
(Cost: $5,906,008,562) | | | | | | | 8,391,750,760 | |
| | | | | | | | |
| | |
Preferred Securities | | | | | | | | |
| | |
| Preferred Stocks — 0.5% | | | | | | |
| | |
| Germany — 0.5% | | | | | | |
Bayerische Motoren Werke AG, Preference Shares | | | 27,970 | | | | 2,319,457 | |
Fuchs Petrolub SE, Preference Shares | | | 33,901 | | | | 1,531,953 | |
| | | | | | | | |
| Security | | Shares | | | Value | |
|
| Germany (continued) | |
Henkel AG & Co. KGaA, Preference Shares | | | 86,993 | | | $ | 7,019,559 | |
Porsche Automobil Holding SE, Preference Shares | | | 74,755 | | | | 7,057,825 | |
Sartorius AG, Preference Shares | | | 12,764 | | | | 8,632,804 | |
Volkswagen AG, Preference Shares | | | 90,601 | | | | 18,200,210 | |
| | | | | | | | |
| | |
| | | | | | | 44,761,808 | |
| | | | | | | | |
| | |
Total Preferred Securities — 0.5%
(Cost: $32,186,952) | | | | | | | 44,761,808 | |
| | | | | | | | |
| |
Total Long-Term Investments — 98.9%
(Cost: $5,938,195,514) | | | | 8,436,512,568 | |
| | | | | | | | |
|
Short-Term Securities | |
|
| Money Market Funds — 0.5% | |
BlackRock Cash Funds: Institutional, SL Agency Shares, 0.10%(f)(g)(h) | | | 17,805,845 | | | | 17,811,186 | |
| | |
BlackRock Cash Funds: Treasury, SL Agency Shares, 0.01%(f)(g) | | | 25,217,563 | | | | 25,217,563 | |
| | | | | | | | |
| |
Total Short-Term Securities — 0.5%
(Cost: $43,030,352) | | | | 43,028,749 | |
| | | | | | | | |
| |
Total Investments — 99.4%
(Cost: $5,981,225,866) | | | | 8,479,541,317 | |
Other Assets Less Liabilities — 0.6% | | | | 47,875,977 | |
| | | | | | | | |
| | |
Net Assets — 100.0% | | | | | | $ | 8,527,417,294 | |
| | | | | | | | |
| (a) | Non-income producing security. |
| (b) | A security contractually bound to one or more other securities to form a single saleable unit which cannot be sold separately. |
| (c) | Security exempt from registration pursuant to Rule 144A under the Securities Act of 1933, as amended. These securities may be resold in transactions exempt from registration to qualified institutional investors. |
| (d) | All or a portion of this security is on loan. |
| (e) | Security is valued using significant unobservable inputs and is classified as Level 3 in the fair value hierarchy. |
| (f) | Affiliate of the Fund. |
| (g) | Annualized 7-day yield as of period end. |
| (h) | All or a portion of this security was purchased with the cash collateral from loaned securities. |
Affiliates
Investments in issuers considered to be affiliate(s) of the Fund during the year ended December 31, 2021 for purposes of Section 2(a)(3) of the Investment Company Act of 1940, as amended, were as follows:
| | | | | | | | | | | | | | | | | | | | | | | | | | | | | | | | | | | | |
| |
| | | | | | | | | |
| Affiliated Issuer | | Value at 12/31/20 | | | Purchases at Cost | | | Proceeds from Sales | | | Net Realized Gain (Loss) | | | Change in Unrealized Appreciation (Depreciation) | | | Value at 12/31/21 | | | Shares Held at 12/31/21 | | | Income | | | Capital Gain Distributions from Underlying Funds | |
| |
| | | | | | | | | |
BlackRock Cash Funds: Institutional, SL Agency Shares | | $ | 30,455,641 | | | $ | — | | | | $ (12,640,096 | )(a) | | $ | 10,791 | | | $ | (15,150 | ) | | $ | 17,811,186 | | | | 17,805,845 | | | $ | 306,136 | (b) | | $ | — | |
BlackRock Cash Funds: Treasury, SL Agency Shares | | | 28,526,482 | | | | — | | | | (3,308,919 | )(a) | | | — | | | | — | | | | 25,217,563 | | | | 25,217,563 | | | | 1,790 | | | | — | |
| | | | | | | | | | | | | | | | | | | | | | | | | | | | | | | | | | | | |
| | | | | | | | | |
| | | | | | | | | | | | | | $ | 10,791 | | | $ | (15,150 | ) | | $ | 43,028,749 | | | | | | | $ | 307,926 | | | $ | — | |
| | | | | | | | | | | | | | | | | | | | | | | | | | | | | | | | | | | | |
| | (a) | Represents net amount purchased (sold). | |
| | (b) | All or a portion represents securities lending income earned from the reinvestment of cash collateral from loaned securities, net of fees and collateral investment expenses, and other payments to and from borrowers of securities. | |
| | |
FUND SCHEDULES OF INVESTMENTS | | 33 |
| | |
Schedule of Investments (continued) December 31, 2021 | | iShares MSCI EAFE International Index Fund |
Derivative Financial Instruments Outstanding as of Period End
Futures Contracts
| | | | | | | | | | | | | | | | |
| |
| | | | |
| Description | | Number of Contracts | | | Expiration Date | | | Notional Amount (000) | | | Value/ Unrealized Appreciation (Depreciation) | |
| |
| | | | |
Long Contracts | | | | | | | | | | | | | | | | |
Nikkei 225 Index | | | 145 | | | | 03/10/22 | | | $ | 18,152 | | | $ | 127,892 | |
SPI 200 Index | | | 76 | | | | 03/17/22 | | | | 10,159 | | | | 120,231 | |
Euro Stoxx 50 Index | | | 602 | | | | 03/18/22 | | | | 29,301 | | | | 647,925 | |
FTSE 100 Index | | | 174 | | | | 03/18/22 | | | | 17,267 | | | | 272,414 | |
| | | | | | | | | | | | | | | | |
| | | | |
| | | | | | | | | | | | | | $ | 1,168,462 | |
| | | | | | | | | | | | | | | | |
Derivative Financial Instruments Categorized by Risk Exposure
As of period end, the fair values of derivative financial instruments located in the Statements of Assets and Liabilities were as follows:
| | | | | | | | | | | | | | | | | | | | | | | | | | | | |
| |
| | | | | | | |
| | | Commodity Contracts | | | Credit Contracts | | | Equity Contracts | | | Foreign Currency Exchange Contracts | | | Interest Rate Contracts | | | Other Contracts | | | Total | |
| |
| | | | | | | |
Assets — Derivative Financial Instruments | | | | | | | | | | | | | | | | | | | | | | | | | | | | |
Futures contracts | | | | | | | | | | | | | | | | | | | | | | | | | | | | |
Unrealized appreciation on futures contracts(a) | | $ | — | | | $ | — | | | $ | 1,168,462 | | | $ | — | | | $ | — | | | $ | — | | | $ | 1,168,462 | |
| | | | | | | | | | | | | | | | | | | | | | | | | | | | |
| | (a) | Net cumulative unrealized appreciation (depreciation) on futures contracts and centrally cleared swaps, if any, are reported in the Schedule of Investments. In the Statements of Assets and Liabilities, only current day’s variation margin is reported in receivables or payables and the net cumulative unrealized appreciation (depreciation) is included in accumulated earnings (loss). | |
For the period ended December 31, 2021, the effect of derivative financial instruments in the Statements of Operations was as follows:
| | | | | | | | | | | | | | | | | | | | | | | | | | | | |
| |
| | | | | | | |
| | | Commodity Contracts | | | Credit Contracts | | | Equity Contracts | | | Foreign Currency Exchange Contracts | | | Interest Rate Contracts | | | Other Contracts | | | Total | |
| |
| | | | | | | |
Net Realized Gain (Loss) from: | | | | | | | | | | | | | | | | | | | | | | | | | | | | |
Futures contracts | | $ | — | | | $ | — | | | $ | 7,940,992 | | | $ | — | | | $ | — | | | $ | — | | | $ | 7,940,992 | |
| | | | | | | | | | | | | | | | | | | | | | | | | | | | |
| | | | | | | |
Net Change in Unrealized Appreciation (Depreciation) on: | | | | | | | | | | | | | | | | | | | | | | | | | | | | |
Futures contracts | | $ | — | | | $ | — | | | $ | 266,476 | | | $ | — | | | $ | — | | | $ | — | | | $ | 266,476 | |
| | | | | | | | | | | | | | | | | | | | | | | | | | | | |
Average Quarterly Balances of Outstanding Derivative Financial Instruments
| | | | |
| | |
Futures contracts: | | | | |
Average notional value of contracts — long | | $ | 94,380,691 | |
For more information about the Fund’s investment risks regarding derivative financial instruments, refer to the Notes to Financial Statements.
Fair Value Hierarchy as of Period End
Various inputs are used in determining the fair value of financial instruments. For a description of the input levels and information about the Fund’s policy regarding valuation of financial instruments, refer to the Notes to Financial Statements.
The following table summarizes the Fund’s financial instruments categorized in the fair value hierarchy. The breakdown of the Fund’s financial instruments into major categories is disclosed in the Schedule of Investments above.
| | | | | | | | | | | | | | | | |
| |
| | | | |
| | | Level 1 | | | Level 2 | | | Level 3 | | | Total | |
| |
| | | | |
Assets | | | | | | | | | | | | | | | | |
Investments | | | | | | | | | | | | | | | | |
Long-Term Investments | | | | | | | | | | | | | | | | |
Common Stocks | | | | | | | | | | | | | | | | |
Australia | | $ | — | | | $ | 624,845,053 | | | $ | — | | | $ | 624,845,053 | |
Austria | | | — | | | | 19,825,938 | | | | — | | | | 19,825,938 | |
| | |
| 34 | | 2 0 2 1 BLACK ROCK ANNUAL REPORT TO SHAREHOLDERS |
| | |
Schedule of Investments (continued) December 31, 2021 | | iShares MSCI EAFE International Index Fund |
Fair Value Hierarchy as of Period End (continued)
| | | | | | | | | | | | | | | | |
| |
| | | | |
| | | Level 1 | | | Level 2 | | | Level 3 | | | Total | |
| |
| | | | |
Common Stocks (continued) | | | | | | | | | | | | | | | | |
Belgium | | $ | — | | | $ | 66,788,750 | | | $ | — | | | $ | 66,788,750 | |
Chile | | | — | | | | 3,451,839 | | | | — | | | | 3,451,839 | |
China | | | 1,173,170 | | | | 12,918,548 | | | | — | | | | 14,091,718 | |
Denmark | | | — | | | | 228,005,752 | | | | — | | | | 228,005,752 | |
Finland | | | — | | | | 106,138,016 | | | | — | | | | 106,138,016 | |
France | | | 6,752,707 | | | | 942,958,697 | | | | — | | | | 949,711,404 | |
Germany | | | 7,623,404 | | | | 684,879,388 | | | | — | | | | 692,502,792 | |
Hong Kong | | | 4,484,162 | | | | 205,777,626 | | | | — | | | | 210,261,788 | |
Ireland | | | — | | | | 89,507,779 | | | | — | | | | 89,507,779 | |
Isle of Man | | | — | | | | 6,541,031 | | | | — | | | | 6,541,031 | |
Israel | | | 25,027,543 | | | | 36,294,749 | | | | — | | | | 61,322,292 | |
Italy | | | — | | | | 173,742,132 | | | | — | | | | 173,742,132 | |
Japan | | | — | | | | 1,902,289,488 | | | | 2,243,624 | | | | 1,904,533,112 | |
Jordan | | | — | | | | 2,501,646 | | | | — | | | | 2,501,646 | |
Luxembourg | | | — | | | | 23,905,538 | | | | — | | | | 23,905,538 | |
Macau | | | — | | | | 2,812,017 | | | | — | | | | 2,812,017 | |
Malta | | | — | | | | — | | | | 11 | | | | 11 | |
Netherlands | | | 15,046,447 | | | | 515,883,935 | | | | — | | | | 530,930,382 | |
New Zealand | | | — | | | | 24,174,548 | | | | — | | | | 24,174,548 | |
Norway | | | 1,580,180 | | | | 53,741,097 | | | | — | | | | 55,321,277 | |
Poland | | | 1,161,444 | | | | — | | | | — | | | | 1,161,444 | |
Portugal | | | 3,140,258 | | | | 9,780,775 | | | | — | | | | 12,921,033 | |
Singapore | | | 15,047,406 | | | | 83,550,118 | | | | — | | | | 98,597,524 | |
Spain | | | — | | | | 191,316,706 | | | | — | | | | 191,316,706 | |
Sweden | | | — | | | | 314,846,103 | | | | — | | | | 314,846,103 | |
Switzerland | | | 14,232,243 | | | | 886,637,393 | | | | — | | | | 900,869,636 | |
United Arab Emirates | | | — | | | | — | | | | 1 | | | | 1 | |
United Kingdom | | | 5,622,755 | | | | 1,075,500,743 | | | | — | | | | 1,081,123,498 | |
Preferred Securities | | | | | | | | | | | | | | | | |
Preferred Stocks | | | — | | | | 44,761,808 | | | | — | | | | 44,761,808 | |
Short-Term Securities | | | | | | | | | | | | | | | | |
Money Market Funds | | | 43,028,749 | | | | — | | | | — | | | | 43,028,749 | |
| | | | | | | | | | | | | | | | |
| | | | |
| | $ | 143,920,468 | | | $ | 8,333,377,213 | | | $ | 2,243,636 | | | $ | 8,479,541,317 | |
| | | | | | | | | | | | | | | | |
Derivative Financial Instruments(a) | | | | | | | | | | | | | | | | |
Assets | | | | | | | | | | | | | | | | |
Equity Contracts | | $ | — | | | $ | 1,168,462 | | | $ | — | | | $ | 1,168,462 | |
| | | | | | | | | | | | | | | | |
| | (a) | Derivative financial instruments are futures contracts. Futures contracts are valued at the unrealized appreciation (depreciation) on the instrument. | |
See notes to financial statements.
| | |
FUND SCHEDULES OF INVESTMENTS | | 35 |
Statements of Assets and Liabilities
December 31, 2021
| | | | | | | | | | | | | | | | |
| | | iShares Municipal Bond Index Fund | | | iShares Short-Term TIPS Bond Index Fund | | | iShares MSCI EAFE International Index Fund | | | iShares Russell 2000 Small-Cap Index Fund | |
| |
| | | | |
ASSETS | | | | | | | | | | | | | | | | |
Investments, at value — unaffiliated(a)(b) | | $ | 324,153,695 | | | $ | 102,366,081 | | | $ | 8,436,512,568 | | | $ | — | |
Investments, at value — Master Small Cap Index Series | | | — | | | | — | | | | — | | | | 3,366,639,817 | |
Investments, at value — affiliated(c) | | | 725,084 | | | | 2,879,900 | | | | 43,028,749 | | | | — | |
Cash pledged for futures contracts | | | — | | | | — | | | | 5,722,452 | | | | — | |
Foreign currency, at value(d) | | | — | | | | — | | | | 62,205,044 | | | | — | |
Receivables: | | | | | | | | | | | | | | | | |
Investments sold | | | — | | | | 1,152,910 | | | | 2,224 | | | | — | |
Securities lending income — affiliated | | | — | | | | 232 | | | | 7,771 | | | | — | |
Capital shares sold | | | 143,753 | | | | 444,645 | | | | 10,845,093 | | | | 3,223,313 | |
Dividends — unaffiliated | | | — | | | | — | | | | 19,858,271 | | | | — | |
Dividends — affiliated | | | 11 | | | | 11 | | | | 77 | | | | — | |
Interest — unaffiliated | | | 3,693,224 | | | | 113,010 | | | | — | | | | — | |
From the Manager | | | — | | | | 12,544 | | | | — | | | | — | |
Withdrawals from the Master Portfolio | | | — | | | | — | | | | — | | | | 8,612,055 | |
Prepaid expenses | | | 53,181 | | | | 10,392 | | | | 11,195 | | | | 37,588 | |
| | | | | | | | | | | | | | | | |
| | | | |
Total assets | | | 328,768,948 | | | | 106,979,725 | | | | 8,578,193,444 | | | | 3,378,512,773 | |
| | | | | | | | | | | | | | | | |
| | | | |
LIABILITIES | | | | | | | | | | | | | | | | |
Bank overdraft | | | — | | | | — | | | | 99,616 | | | | — | |
Collateral on securities loaned | | | — | | | | — | | | | 17,836,635 | | | | — | |
Payables: | | | | | | | | | | | | | | | | |
Investments purchased | | | 163 | | | | 2,140,870 | | | | 21,215,434 | | | | — | |
Accounting services fees | | | 2,997 | | | | 3,018 | | | | — | | | | 1,655 | |
Administration fees | | | — | | | | — | | | | 278,534 | | | | 112,201 | |
Capital shares redeemed | | | 243,996 | | | | 31,696 | | | | 10,511,674 | | | | 11,835,368 | |
Custodian fees | | | 1,389 | | | | 395 | | | | — | | | | — | |
Income dividend distributions | | | 42,936 | | | | 43,083 | | | | — | | | | — | |
Investment advisory fees | | | 27,410 | | | | — | | | | 69,676 | | | | — | |
Directors’ and Officer’s fees | | | 3,707 | | | | 3,407 | | | | 16,318 | | | | 943 | |
Recoupment of past waived fees | | | 9,579 | | | | 886 | | | | — | | | | — | |
Other accrued expenses | | | 27,993 | | | | 8,913 | | | | 270,304 | | | | 15,530 | |
Professional fees | | | 56,663 | | | | 25,933 | | | | 91,259 | | | | 18,873 | |
Service fees | | | 67,740 | | | | 386 | | | | 111,547 | | | | 123,935 | |
Transfer agent fees | | | 53,796 | | | | 2,492 | | | | 17,984 | | | | 205,517 | |
Variation margin on futures contracts | | | — | | | | — | | | | 257,169 | | | | — | |
| | | | | | | | | | | | | | | | |
| | | | |
Total liabilities | | | 538,369 | | | | 2,261,079 | | | | 50,776,150 | | | | 12,314,022 | |
| | | | | | | | | | | | | | | | |
| | | | |
NET ASSETS | | $ | 328,230,579 | | | $ | 104,718,646 | | | $ | 8,527,417,294 | | | $ | 3,366,198,751 | |
| | | | | | | | | | | | | | | | |
| | | | |
NET ASSETS CONSIST OF | | | | | | | | | | | | | | | | |
Paid-in capital | | $ | 303,764,607 | | | $ | 103,220,022 | | | $ | 7,284,742,363 | | | $ | 2,505,835,934 | |
Accumulated earnings | | | 24,465,972 | | | | 1,498,624 | | | | 1,242,674,931 | | | | 860,362,817 | |
| | | | | | | | | | | | | | | | |
| | | | |
NET ASSETS | | $ | 328,230,579 | | | $ | 104,718,646 | | | $ | 8,527,417,294 | | | $ | 3,366,198,751 | |
| | | | | | | | | | | | | | | | |
| | | | |
(a) Investments, at cost — unaffiliated | | $ | 300,045,711 | | | $ | 100,740,697 | | | $ | 5,938,195,514 | | | $ | — | |
(b) Securities loaned, at value | | $ | — | | | $ | — | | | $ | 17,089,493 | | | $ | — | |
(c) Investments, at cost — affiliated | | $ | 725,084 | | | $ | 2,879,900 | | | $ | 43,030,352 | | | $ | — | |
(d) Foreign currency, at cost | | $ | — | | | $ | — | | | $ | 62,204,078 | | | $ | — | |
| | |
| 36 | | 2 0 2 1 BLACK ROCK ANNUAL REPORT TO SHAREHOLDERS |
Statements of Assets and Liabilities (continued)
December 31, 2021
| | | | | | | | | | | | | | | | |
| | | iShares Municipal Bond Index Fund | | | iShares Short-Term TIPS Bond Index Fund | | | iShares MSCI EAFE International Index Fund | | | iShares Russell 2000 Small-Cap Index Fund | |
| |
| | | | |
NET ASSET VALUE | | | | | | | | | | | | | | | | |
| | | | |
| Institutional | | | | | | | | | | | | |
| | | | |
Net assets | | $ | 11,794,114 | | | $ | 18,004,454 | | | $ | 1,058,978,136 | | | $ | 479,450,673 | |
| | | | | | | | | | | | | | | | |
| | | | |
Shares outstanding | | | 969,624 | | | | 1,736,635 | | | | 66,816,428 | | | | 18,614,884 | |
| | | | | | | | | | | | | | | | |
| | | | |
Net asset value | | $ | 12.16 | | | $ | 10.37 | | | $ | 15.85 | | | $ | 25.76 | |
| | | | | | | | | | | | | | | | |
| | | | |
Shares authorized | | | Unlimited | | | | Unlimited | | | | 1.208 billion | | | | 208 million | |
| | | | | | | | | | | | | | | | |
| | | | |
Par value | | $ | 0.001 | | | $ | 0.001 | | | $ | 0.0001 | | | $ | 0.0001 | |
| | | | | | | | | | | | | | | | |
| | | | |
| Investor A | | | | | | | | | | | | |
| | | | |
Net assets | | $ | 23,347,586 | | | $ | 1,908,129 | | | $ | 385,287,059 | | | $ | 243,110,092 | |
| | | | | | | | | | | | | | | | |
| | | | |
Shares outstanding | | | 1,919,303 | | | | 183,377 | | | | 24,475,394 | | | | 9,424,782 | |
| | | | | | | | | | | | | | | | |
| | | | |
Net asset value | | $ | 12.16 | | | $ | 10.41 | | | $ | 15.74 | | | $ | 25.79 | |
| | | | | | | | | | | | | | | | |
| | | | |
Shares authorized | | | Unlimited | | | | Unlimited | | | | 208 million | | | | 208 million | |
| | | | | | | | | | | | | | | | |
| | | | |
Par value | | $ | 0.001 | | | $ | 0.001 | | | $ | 0.0001 | | | $ | 0.0001 | |
| | | | | | | | | | | | | | | | |
| | | | |
| Investor P | | | | | | | | | | | | |
| | | | |
Net assets | | $ | 292,982,960 | | | | N/A | | | $ | 153,681,703 | | | $ | 354,746,053 | |
| | | | | | | | | | | | | | | | |
| | | | |
Shares outstanding | | | 24,085,269 | | | | N/A | | | | 9,797,418 | | | | 13,803,434 | |
| | | | | | | | | | | | | | | | |
| | | | |
Net asset value | | $ | 12.16 | | | | N/A | | | $ | 15.69 | | | $ | 25.70 | |
| | | | | | | | | | | | | | | | |
| | | | |
Shares authorized | | | Unlimited | | | | N/A | | | | 2 billion | | | | 2 billion | |
| | | | | | | | | | | | | | | | |
| | | | |
Par value | | $ | 0.001 | | | | N/A | | | $ | 0.0001 | | | $ | 0.0001 | |
| | | | | | | | | | | | | | | | |
| | | | |
| Class K | | | | | | | | | | | | |
| | | | |
Net assets | | $ | 105,919 | | | $ | 84,806,063 | | | $ | 6,929,470,396 | | | $ | 2,288,891,933 | |
| | | | | | | | | | | | | | | | |
| | | | |
Shares outstanding | | | 8,707 | | | | 8,149,726 | | | | 436,832,436 | | | | 88,579,259 | |
| | | | | | | | | | | | | | | | |
| | | | |
Net asset value | | $ | 12.16 | | | $ | 10.41 | | | $ | 15.86 | | | $ | 25.84 | |
| | | | | | | | | | | | | | | | |
| | | | |
Shares authorized | | | Unlimited | | | | Unlimited | | | | 1.208 billion | | | | 1.208 billion | |
| | | | | | | | | | | | | | | | |
| | | | |
Par value | | $ | 0.001 | | | $ | 0.001 | | | $ | 0.0001 | | | $ | 0.0001 | |
| | | | | | | | | | | | | | | | |
See notes to financial statements.
| | |
FUND FINANCIAL STATEMENTS | | 37 |
Statements of Operations
Year Ended December 31, 2021
| | | | | | | | | | | | | | | | | | |
| | | iShares Municipal Bond Index Fund | | | iShares Short-Term TIPS Bond Index Fund | | | iShares MSCI
EAFE International Index Fund | | | iShares Russell 2000 Small-Cap Index Fund | |
| |
| | | | | |
INVESTMENT INCOME | | | | | | | | | | | | | | | | | | |
Dividends — unaffiliated | | $ | — | | | $ | — | | | | | $ | 209,159,208 | | | $ | — | |
Dividends — affiliated | | | 401 | | | | 226 | | | | | | 3,094 | | | | — | |
Interest — unaffiliated | | | 8,965,027 | | | | 3,757,318 | | | | | | — | | | | — | |
Securities lending income — affiliated — net | | | — | | | | 1,949 | | | | | | 304,832 | | | | — | |
Non-cash dividends — unaffiliated | | | — | | | | — | | | | | | 12,789,831 | | | | — | |
Foreign withholding tax claims | | | — | | | | — | | | | | | 175,914 | | | | — | |
Foreign taxes withheld | | | — | | | | — | | | | | | (19,386,024 | ) | | | — | |
Net investment income allocated from the Master Small Cap Index Series: | | | | | | | | | | | | | | | | | | |
Dividends — unaffiliated | | | — | | | | — | | | | | | — | | | | 32,558,529 | |
Dividends — affiliated | | | — | | | | — | | | | | | — | | | | 276,278 | |
Interest - unaffliated | | | — | | | | — | | | | | | — | | | | 1,029 | |
Securities lending income — affiliated — net | | | — | | | | — | | | | | | — | | | | 1,428,875 | |
Foreign taxes withheld | | | — | | | | — | | | | | | — | | | | (83,732 | ) |
Expenses | | | — | | | | — | | | | | | — | | | | (495,959 | ) |
Fees waived | | | — | | | | — | | | | | | — | | | | 20,268 | |
| | | | | | | | | | | | | | | | | | |
| | | | | |
Total investment income | | | 8,965,428 | | | | 3,759,493 | | | | | | 203,046,855 | | | | 33,705,288 | |
| | | | | | | | | | | | | | | | | | |
| | | | | |
EXPENSES | | | | | | | | | | | | | | | | | | |
Service — class specific | | | 822,955 | | | | 3,781 | | | | | | 1,326,940 | | | | 1,575,230 | |
Investment advisory | | | 338,168 | | | | 8,031 | | | | | | 768,593 | | | | — | |
Transfer agent — class specific | | | 193,774 | | | | 14,999 | | | | | | — | | | | 846,946 | |
Professional | | | 106,100 | | | | 92,023 | | | | | | 129,480 | | | | 82,220 | |
Registration | | | 76,618 | | | | 55,059 | | | | | | — | | | | 111,605 | |
Printing and postage | | | 19,493 | | | | 27,946 | | | | | | — | | | | 22,702 | |
Recoupment of past waived and/or reimbursed fees — class specific | | | 9,579 | | | | 886 | | | | | | — | | | | — | |
Accounting services | | | 9,015 | | | | 9,028 | | | | | | — | | | | 4,985 | |
Directors and Officer | | | 8,541 | | | | 7,986 | | | | | | 44,744 | | | | 1,064 | |
Custodian | | | 4,215 | | | | 968 | | | | | | — | | | | — | |
Administration | | | — | | | | — | | | | | | — | | | | 1,304,729 | |
Administration — class specific | | | — | | | | — | | | | | | 3,111,055 | | | | — | |
Miscellaneous | | | 68,752 | | | | 14,609 | | | | | | 550 | | | | 17,838 | |
| | | | | | | | | | | | | | | | | | |
| | | | | |
Total expenses | | | 1,657,210 | | | | 235,316 | | | | | | 5,381,362 | | | | 3,967,319 | |
Less: | | | | | | | | | | | | | | | | | | |
Fees waived and/or reimbursed by the Administrator | | | — | | | | — | | | | | | — | | | | (4,369 | ) |
Fees waived and/or reimbursed by the Manager | | | (3,101 | ) | | | (167,192 | ) | | | | | (185,210 | ) | | | — | |
Transfer agent fees waived and/or reimbursed — class specific | | | (10,277 | ) | | | (14,145 | ) | | | | | — | | | | (150,615 | ) |
| | | | | | | | | | | | | | | | | | |
| | | | | |
Total expenses after fees waived and/or reimbursed | | | 1,643,832 | | | | 53,979 | | | | | | 5,196,152 | | | | 3,812,335 | |
| | | | | | | | | | | | | | | | | | |
| | | | | |
Net investment income | | | 7,321,596 | | | | 3,705,514 | | | | | | 197,850,703 | | | | 29,892,953 | |
| | | | | | | | | | | | | | | | | | |
| | | | | |
REALIZED AND UNREALIZED GAIN (LOSS) | | | | | | | | | | | | | | | | | | |
Net realized gain (loss) from: | | | | | | | | | | | | | | | | | | |
Investments — unaffiliated | | | 494,696 | | | | 6,506 | | | | | | (13,462,822 | ) | | | — | |
Investments — affiliated | | | 1,274 | | | | — | | | | | | 10,791 | | | | — | |
Foreign currency transactions | | | — | | | | — | | | | | | (7,940,018 | ) | | | — | |
Futures contracts | | | — | | | | — | | | | | | 7,940,992 | | | | — | |
Net realized gain allocated from the Master Small Cap Index Series from: | | | | | | | | | | | | | | | | | | |
Investments — unaffiliated | | | — | | | | — | | | | | | — | | | | 222,897,134 | |
Investments — affiliated | | | — | | | | — | | | | | | — | | | | 1,346,903 | |
Futures contracts | | | — | | | | — | | | | | | — | | | | 1,556,543 | |
Swaps | | | — | | | | — | | | | | | — | | | | 658,945 | |
| | | | | | | | | | | | | | | | | | |
| | | | | |
| | | 495,970 | | | | 6,506 | | | | | | (13,451,057 | ) | | | 226,459,525 | |
| | | | | | | | | | | | | | | | | | |
| | |
| 38 | | 2 0 2 1 BLACK ROCK ANNUAL REPORT TO SHAREHOLDERS |
Statements of Operations (continued)
Year Ended December 31, 2021
| | | | | | | | | | | | | | | | | | | | |
| | | iShares Municipal Bond Index Fund | | | iShares Short-Term TIPS Bond Index Fund | | | iShares MSCI EAFE International Index Fund | | | iShares Russell
2000 Small-Cap Index Fund | |
| |
| | | | | | |
Net change in unrealized appreciation (depreciation) on: | | | | | | | | | | | | | | | | | | | | |
Investments — unaffiliated | | | | $ | (3,400,627 | ) | | $ | 266,540 | | | | | $ | 598,983,734 | | | $ | — | |
Investments — affiliated | | | | | (1,597 | ) | | | — | | | | | | (15,150 | ) | | | — | |
Foreign currency translations | | | | | — | | | | — | | | | | | (1,968,203 | ) | | | — | |
Futures contracts | | | | | — | | | | — | | | | | | 266,476 | | | | — | |
Net change in unrealized appreciation (depreciation) allocated from Master Small Cap Index Series on: | | | | | | | | | | | | | | | | | | | | |
Investments — unaffiliated | | | | | — | | | | — | | | | | | — | | | | 150,153,329 | |
Investments — affiliated | | | | | — | | | | — | | | | | | — | | | | 39,830 | |
Futures contracts | | | | | — | | | | — | | | | | | — | | | | (6,906 | ) |
Swaps | | | | | — | | | | — | | | | | | — | | | | (979 | ) |
| | | | | | | | | | | | | | | | | | | | |
| | | | | | |
| | | | | (3,402,224 | ) | | | 266,540 | | | | | | 597,266,857 | | | | 150,185,274 | |
| | | | | | | | | | | | | | | | | | | | |
| | | | | | |
Net realized and unrealized gain (loss) | | | | | (2,906,254 | ) | | | 273,046 | | | | | | 583,815,800 | | | | 376,644,799 | |
| | | | | | | | | | | | | | | | | | | | |
| | | | | | |
NET INCREASE IN NET ASSETS RESULTING FROM OPERATIONS | | | | $ | 4,415,342 | | | $ | 3,978,560 | | | | | $ | 781,666,503 | | | $ | 406,537,752 | |
| | | | | | | | | | | | | | | | | | | | |
See notes to financial statements.
| | |
FUND FINANCIAL STATEMENTS | | 39 |
Statements of Changes in Net Assets
| | | | | | | | | | | | | | | | | | | | |
| | | iShares Municipal Bond Index Fund | | | | | | iShares Short-Term TIPS Bond
Index Fund | |
| | | |
| | | Year Ended December 31, | | | | | | Year Ended December 31, | |
| | | | | | | | | | | | |
| | | | | |
| | | 2021 | | | 2020 | | | | | | 2021 | | | 2020 | |
| |
| | | | | |
INCREASE (DECREASE) IN NET ASSETS | | | | | | | | | | | | | | | | | | | | |
| | | | | |
OPERATIONS | | | | | | | | | | | | | | | | | | | | |
Net investment income | | $ | 7,321,596 | | | $ | 7,731,382 | | | | | | | $ | 3,705,514 | | | $ | 489,933 | |
Net realized gain (loss) | | | 495,970 | | | | 767,093 | | | | | | | | 6,506 | | | | (17,788 | ) |
Net change in unrealized appreciation (depreciation) | | | (3,402,224 | ) | | | 7,265,897 | | | | | | | | 266,540 | | | | 1,249,446 | |
| | | | | | | | | | | | | | | | | | | | |
| | | | | |
Net increase in net assets resulting from operations | | | 4,415,342 | | | | 15,764,372 | | | | | | | | 3,978,560 | | | | 1,721,591 | |
| | | | | | | | | | | | | | | | | | | | |
| | | | | |
DISTRIBUTIONS TO SHAREHOLDERS(a) | | | | | | | | | | | | | | | | | | | | |
Institutional | | | (232,970 | ) | | | (79,249 | ) | | | | | | | (734,030 | ) | | | (161,714 | ) |
Investor A | | | (552,520 | ) | | | (555,959 | ) | | | | | | | (58,170 | ) | | | (7,803 | ) |
Investor P | | | (7,117,939 | ) | | | (7,699,970 | ) | | | | | | | — | | | | — | |
Class K | | | (2,799 | ) | | | (2,823 | ) | | | | | | | (2,932,006 | ) | | | (322,417 | ) |
| | | | | | | | | | | | | | | | | | | | |
| | | | | |
Decrease in net assets resulting from distributions to shareholders | | | (7,906,228 | ) | | | (8,338,001 | ) | | | | | | | (3,724,206 | ) | | | (491,934 | ) |
| | | | | | | | | | | | | | | | | | | | |
| | | | | |
CAPITAL SHARE TRANSACTIONS | | | | | | | | | | | | | | | | | | | | |
Net increase (decrease) in net assets derived from capital share transactions | | | (14,587,213 | ) | | | (19,069,783 | ) | | | | | | | 44,904,403 | | | | 40,760,633 | |
| | | | | | | | | | | | | | | | | | | | |
| | | | | |
NET ASSETS | | | | | | | | | | | | | | | | | | | | |
Total increase (decrease) in net assets | | | (18,078,099 | ) | | | (11,643,412 | ) | | | | | | | 45,158,757 | | | | 41,990,290 | |
Beginning of year | | | 346,308,678 | | | | 357,952,090 | | | | | | | | 59,559,889 | | | | 17,569,599 | |
| | | | | | | | | | | | | | | | | | | | |
| | | | | |
End of year | | $ | 328,230,579 | | | $ | 346,308,678 | | | | | | | $ | 104,718,646 | | | $ | 59,559,889 | |
| | | | | | | | | | | | | | | | | | | | |
| (a) | Distributions for annual periods determined in accordance with U.S. federal income tax regulations. |
See notes to financial statements.
| | |
| 40 | | 2 0 2 1 B LACK ROCK ANNUAL REPORT TO SHAREHOLDERS |
Statements of Changes in Net Assets (continued)
| | | | | | | | | | | | | | | | | | | | | | |
| | | iShares MSCI EAFE International Index Fund | | | | | iShares Russell 2000 Small-Cap Index Fund | |
| | | |
| | | Year Ended December 31, | | | | | Year Ended December 31, | |
| | | | | | | | |
| | | | | | | |
| | | | | 2021 | | | 2020 | | | | | | | 2021 | | | 2020 | |
| |
| | | | | | | |
INCREASE (DECREASE) IN NET ASSETS | | | | | | | | | | | | | | | | | | | | | | |
| | | | | | | |
OPERATIONS | | | | | | | | | | | | | | | | | | | | | | |
Net investment income | | | | $ | 197,850,703 | | | $ | 145,663,273 | | | | | | | $ | 29,892,953 | | | $ | 25,488,135 | |
Net realized gain (loss) | | | | | (13,451,057 | ) | | | (319,994,595 | ) | | | | | | | 226,459,525 | | | | (3,821,572 | ) |
Net change in unrealized appreciation (depreciation) | | | | | 597,266,857 | | | | 250,780,805 | | | | | | | | 150,185,274 | | | | 449,403,875 | |
| | | | | | | | | | | | | | | | | | | | | | |
| | | | | | | |
Net increase in net assets resulting from operations | | | | | 781,666,503 | | | | 76,449,483 | | | | | | | | 406,537,752 | | | | 471,070,438 | |
| | | | | | | | | | | | | | | | | | | | | | |
| | | | | | | |
DISTRIBUTIONS TO SHAREHOLDERS(a) | | | | | | | | | | | | | | | | | | | | | | |
Institutional | | | | | (31,413,447 | ) | | | (18,981,824 | ) | | | | | | | (34,044,604 | ) | | | (4,630,689 | ) |
Investor A | | | | | (10,423,294 | ) | | | (6,032,650 | ) | | | | | | | (16,774,863 | ) | | | (3,073,130 | ) |
Investor P | | | | | (4,183,302 | ) | | | (2,476,048 | ) | | | | | | | (24,685,571 | ) | | | (3,977,992 | ) |
Class K | | | | | (203,630,682 | ) | | | (100,271,486 | ) | | | | | | | (162,398,277 | ) | | | (26,461,320 | ) |
| | | | | | | | | | | | | | | | | | | | | | |
| | | | | | | |
Decrease in net assets resulting from distributions to shareholders | | | | | (249,650,725 | ) | | | (127,762,008 | ) | | | | | | | (237,903,315 | ) | | | (38,143,131 | ) |
| | | | | | | | | | | | | | | | | | | | | | |
| | | | | | | |
CAPITAL SHARE TRANSACTIONS | | | | | | | | | | | | | | | | | | | | | | |
Net increase (decrease) in net assets derived from capital share transactions | | | | | 1,348,384,504 | | | | (1,539,505,451 | ) | | | | | | | 443,268,536 | | | | 17,181,682 | |
| | | | | | | | | | | | | | | | | | | | | | |
| | | | | | | |
NET ASSETS | | | | | | | | | | | | | | | | | | | | | | |
Total increase (decrease) in net assets | | | | | 1,880,400,282 | | | | (1,590,817,976 | ) | | | | | | | 611,902,973 | | | | 450,108,989 | |
Beginning of year | | | | | 6,647,017,012 | | | | 8,237,834,988 | | | | | | | | 2,754,295,778 | | | | 2,304,186,789 | |
| | | | | | | | | | | | | | | | | | | | | | |
| | | | | | | |
End of year | | | | $ | 8,527,417,294 | | | $ | 6,647,017,012 | | | | | | | $ | 3,366,198,751 | | | $ | 2,754,295,778 | |
| | | | | | | | | | | | | | | | | | | | | | |
| (a) | Distributions for annual periods determined in accordance with U.S. federal income tax regulations. |
See notes to financial statements.
| | |
FUND FINANCIAL STATEMENTS | | 41 |
Financial Highlights
(For a share outstanding throughout each period)
| | | | | | | | | | | | | | | | | | | | |
| | | iShares Municipal Bond Index Fund | |
| |
| | | Institutional | |
| | | | | | | | | | | | Period from | |
| | | Year Ended December 31, | | | | | | | | 11/19/18 | (a) |
| | | | |
| | | 2021 | | | 2020 | | | 2019 | | | to 12/31/18 | |
| | | | | |
Net asset value, beginning of period | | $ | 12.29 | | | $ | 12.02 | | | $ | 11.59 | | | | | | | $ | 11.48 | |
| | | | | | | | | | | | | | | | | | | | |
| | | | | |
Net investment income(b) | | | 0.29 | | | | 0.30 | | | | 0.30 | | | | | | | | 0.04 | |
Net realized and unrealized gain (loss) | | | (0.11 | ) | | | 0.29 | | | | 0.56 | | | | | | | | 0.14 | |
| | | | | | | | | | | | | | | | | | | | |
| | | | | |
Net increase from investment operations | | | 0.18 | | | | 0.59 | | | | 0.86 | | | | | | | | 0.18 | |
| | | | | | | | | | | | | | | | | | | | |
| | | | | |
Distributions(c) | | | | | | | | | | | | | | | | | | | | |
From net investment income | | | (0.29 | ) | | | (0.30 | ) | | | (0.30 | ) | | | | | | | (0.04 | ) |
From net realized gain | | | (0.02 | ) | | | (0.02 | ) | | | (0.13 | ) | | | | | | | (0.03 | ) |
| | | | | | | | | | | | | | | | | | | | |
| | | | | |
Total distributions | | | (0.31 | ) | | | (0.32 | ) | | | (0.43 | ) | | | | | | | (0.07 | ) |
| | | | | | | | | | | | | | | | | | | | |
| | | | | |
Net asset value, end of period | | $ | 12.16 | | | $ | 12.29 | | | $ | 12.02 | | | | | | | $ | 11.59 | |
| | | | | | | | | | | | | | | | | | | | |
| | | | | |
Total Return(d) | | | | | | | | | | | | | | | | | | | | |
Based on net asset value | | | 1.54 | % | | | 4.97 | % | | | 7.52 | % | | | | | | | 1.56 | %(e) |
| | | | | | | | | | | | | | | | | | | | |
| | | | | |
Ratios to Average Net Assets(f) | | | | | | | | | | | | | | | | | | | | |
Total expenses | | | 0.25 | % | | | 0.23 | % | | | 0.30 | %(g) | | | | | | | 0.32 | %(h)(i)(j) |
| | | | | | | | | | | | | | | | | | | | |
| | | | | |
Total expenses after fees waived and/or reimbursed | | | 0.24 | % | | | 0.22 | % | | | 0.23 | %(g) | | | | | | | 0.17 | %(h)(i)(j) |
| | | | | | | | | | | | | | | | | | | | |
| | | | | |
Net investment income | | | 2.40 | % | | | 2.46 | % | | | 2.49 | % | | | | | | | 2.74 | %(h) |
| | | | | | | | | | | | | | | | | | | | |
| | | | | |
Supplemental Data | | | | | | | | | | | | | | | | | | | | |
Net assets, end of period (000) | | $ | 11,794 | | | $ | 6,115 | | | $ | 477 | | | | | | | $ | 101 | |
| | | | | | | | | | | | | | | | | | | | |
| | | | | |
Portfolio turnover rate | | | 7 | % | | | 8 | % | | | 24 | % | | | | | | | 3 | % |
| | | | | | | | | | | | | | | | | | | | |
| (a) | Commencement of operations. |
| (b) | Based on average shares outstanding. |
| (c) | Distributions for annual periods determined in accordance with U.S. federal income tax regulations. |
| (d) | Where applicable, assumes the reinvestment of distributions. |
| (e) | Aggregate total return. |
| (f) | Excludes fees and expenses incurred indirectly as a result of investments in underlying funds. |
| (g) | Includes non-recurring expenses of offering costs. Without these costs, total expenses and total expenses after fees waived and/or reimbursed and paid indirectly would have been 0.24% and 0.23%, respectively. |
| (i) | Reorganization and offering costs were not annualized in the calculation of the expense ratios. If these expenses were annualized, the total expenses and total expenses after fees waived and/or reimbursed and paid indirectly would have been 0.69% and 0.21%, respectively. |
| (j) | Includes reorganization and offering costs associated with the Fund’s reorganization. Without these costs, total expenses and total expenses after fees waived and/or reimbursed and paid indirectly would have been 0.26% and 0.16%, respectively. |
See notes to financial statements.
| | |
| 42 | | 2 0 2 1 BLACK ROCK ANNUAL REPORT TO SHAREHOLDERS |
Financial Highlights (continued)
(For a share outstanding throughout each period)
| | | | | | | | | | | | | | | | | | | | |
| | | iShares Municipal Bond Index Fund (continued) | |
| |
| | | Investor A | |
| |
| | | Year Ended December 31, | |
| | | | | |
| | | | 2021 | | | | 2020 | | | | 2019 | | | | 2018 | (a) | | | 2017 | |
| | | | | |
Net asset value, beginning of year | | $ | 12.29 | | | $ | 12.02 | | | $ | 11.59 | | | $ | 11.81 | | | $ | 11.68 | |
| | | | | | | | | | | | | | | | | | | | |
Net investment income(b) | | | 0.26 | | | | 0.27 | | | | 0.27 | | | | 0.39 | | | | 0.31 | |
Net realized and unrealized gain (loss) | | | (0.11 | ) | | | 0.29 | | | | 0.56 | | | | (0.25 | ) | | | 0.13 | |
| | | | | | | | | | | | | | | | | | | | |
| | | | | |
Net increase from investment operations | | | 0.15 | | | | 0.56 | | | | 0.83 | | | | 0.14 | | | | 0.44 | |
| | | | | | | | | | | | | | | | | | | | |
| | | | | |
Distributions(c) | | | | | | | | | | | | | | | | | | | | |
From net investment income | | | (0.26 | ) | | | (0.27 | ) | | | (0.27 | ) | | | (0.31 | ) | | | (0.31 | ) |
From net realized gain | | | (0.02 | ) | | | (0.02 | ) | | | (0.13 | ) | | | (0.05 | ) | | | — | |
| | | | | | | | | | | | | | | | | | | | |
| | | | | |
Total distributions | | | (0.28 | ) | | | (0.29 | ) | | | (0.40 | ) | | | (0.36 | ) | | | (0.31 | ) |
| | | | | | | | | | | | | | | | | | | | |
| | | | | |
Net asset value, end of year | | $ | 12.16 | | | $ | 12.29 | | | $ | 12.02 | | | $ | 11.59 | | | $ | 11.81 | |
| | | | | | | | | | | | | | | | | | | | |
| | | | | |
Total Return(d) | | | | | | | | | | | | | | | | | | | | |
Based on net asset value | | | 1.28 | % | | | 4.70 | % | | | 7.24 | % | | | 1.24 | % | | | 3.83 | % |
| | | | | | | | | | | | | | | | | | | | |
| | | | | |
Ratios to Average Net Assets(e) | | | | | | | | | | | | | | | | | | | | |
Total expenses | | | 0.53 | % | | | 0.50 | % | | | 0.62 | %(f) | | | 0.77 | %(g) | | | 0.56 | % |
| | | | | | | | | | | | | | | | | | | | |
| | | | | |
Total expenses after fees waived and/or reimbursed | | | 0.50 | % | | | 0.48 | % | | | 0.50 | %(f) | | | 0.41 | %(g) | | | 0.37 | % |
| | | | | | | | | | | | | | | | | | | | |
| | | | | |
Net investment income | | | 2.15 | % | | | 2.22 | % | | | 2.25 | % | | | 3.36 | % | | | 2.61 | % |
| | | | | | | | | | | | | | | | | | | | |
| | | | | |
Supplemental Data | | | | | | | | | | | | | | | | | | | | |
Net assets, end of year (000) | | $ | 23,348 | | | $ | 23,315 | | | $ | 23,805 | | | $ | 25,418 | | | $ | 396,544 | |
| | | | | | | | | | | | | | | | | | | | |
| | | | | |
Portfolio turnover rate | | | 7 | % | | | 8 | % | | | 24 | % | | | 3 | % | | | 1 | % |
| | | | | | | | | | | | | | | | | | | | |
| (a) | On November 19, 2018, State Farm Tax Advantaged Bond Fund was reorganized into the Fund. The activity in the table above is for the accounting survivor, State Farm Tax Advantaged Bond Fund Premier Class, for the periods prior to the date of the reorganization, and for the post-reorganization combined fund thereafter. |
| (b) | Based on average shares outstanding. |
| (c) | Distributions for annual periods determined in accordance with U.S. federal income tax regulations. |
| (d) | Where applicable, assumes the reinvestment of distributions. |
| (e) | Excludes fees and expenses incurred indirectly as a result of investments in underlying funds. |
| (f) | Includes non-recurring expenses of offering costs. Without these costs, total expenses and total expenses after fees waived and/or reimbursed and paid indirectly would have been 0.56% and 0.50%, respectively. |
| (g) | Includes reorganization and offering costs associated with the Fund’s reorganization. Without these costs, total expenses and total expenses after fees waived and/or reimbursed and paid indirectly would have been 0.70% and 0.41%, respectively. |
See notes to financial statements.
| | |
FUND FINANCIAL HIGHLIGHTS | | 43 |
Financial Highlights (continued)
(For a share outstanding throughout each period)
| | | | | | | | | | | | | | | | | | | | |
| | | iShares Municipal Bond Index Fund (continued) | |
| |
| | | Investor P | |
| |
| | | Year Ended December 31, | |
| | | | | |
| | | | 2021 | | | | 2020 | | | | 2019 | | | | 2018 | (a) | | | 2017 | |
| | | | | |
Net asset value, beginning of year | | $ | 12.29 | | | $ | 12.02 | | | $ | 11.59 | | | $ | 11.81 | | | $ | 11.68 | |
| | | | | | | | | | | | | | | | | | | | |
| | | | | |
Net investment income(b) | | | 0.26 | | | | 0.27 | | | | 0.27 | | | | 0.39 | | | | 0.31 | |
Net realized and unrealized gain (loss) | | | (0.11 | ) | | | 0.29 | | | | 0.56 | | | | (0.25 | ) | | | 0.13 | |
| | | | | | | | | | | | | | | | | | | | |
| | | | | |
Net increase from investment operations | | | 0.15 | | | | 0.56 | | | | 0.83 | | | | 0.14 | | | | 0.44 | |
| | | | | | | | | | | | | | | | | | | | |
| | | | | |
Distributions(c) | | | | | | | | | | | | | | | | | | | | |
From net investment income | | | (0.26 | ) | | | (0.27 | ) | | | (0.27 | ) | | | (0.31 | ) | | | (0.31 | ) |
From net realized gain | | | (0.02 | ) | | | (0.02 | ) | | | (0.13 | ) | | | (0.05 | ) | | | — | |
| | | | | | | | | | | | | | | | | | | | |
| | | | | |
Total distributions | | | (0.28 | ) | | | (0.29 | ) | | | (0.40 | ) | | | (0.36 | ) | | | (0.31 | ) |
| | | | | | | | | | | | | | | | | | | | |
| | | | | |
Net asset value, end of year | | $ | 12.16 | | | $ | 12.29 | | | $ | 12.02 | | | $ | 11.59 | | | $ | 11.81 | |
| | | | | | | | | | | | | | | | | | | | |
| | | | | |
Total Return(d) | | | | | | | | | | | | | | | | | | | | |
Based on net asset value | | | 1.29 | % | | | 4.69 | % | | | 7.25 | % | | | 1.24 | % | | | 3.83 | % |
| | | | | | | | | | | | | | | | | | | | |
| | | | | |
Ratios to Average Net Assets(e) | | | | | | | | | | | | | | | | | | | | |
Total expenses | | | 0.49 | % | | | 0.50 | % | | | 0.53 | %(f) | | | 0.77 | %(g) | | | 0.56 | % |
| | | | | | | | | | | | | | | | | | | | |
| | | | | |
Total expenses after fees waived and/or reimbursed | | | 0.49 | % | | | 0.49 | % | | | 0.50 | %(f) | | | 0.41 | %(g) | | | 0.37 | % |
| | | | | | | | | | | | | | | | | | | | |
| | | | | |
Net investment income | | | 2.16 | % | | | 2.21 | % | | | 2.26 | % | | | 3.35 | % | | | 2.61 | % |
| | | | | | | | | | | | | | | | | | | | |
| | | | | |
Supplemental Data | | | | | | | | | | | | | | | | | | | | |
Net assets, end of year (000) | | $ | 292,983 | | | $ | 316,772 | | | $ | 333,565 | | | $ | 352,137 | | | $ | 396,544 | |
| | | | | | | | | | | | | | | | | | | | |
| | | | | |
Portfolio turnover rate | | | 7 | % | | | 8 | % | | | 24 | % | | | 3 | % | | | 1 | % |
| | | | | | | | | | | | | | | | | | | | |
| (a) | On November 19, 2018, State Farm Tax Advantaged Bond Fund was reorganized into the Fund. The activity in the table above is for the accounting survivor, State Farm Tax Advantaged Bond Fund Premier Class, for the periods prior to the date of the reorganization, and for the post-reorganization combined fund thereafter. |
| (b) | Based on average shares outstanding. |
| (c) | Distributions for annual periods determined in accordance with U.S. federal income tax regulations. |
| (d) | Where applicable, excludes the effects of any sales charges and assumes the reinvestment of distributions. |
| (e) | Excludes fees and expenses incurred indirectly as a result of investments in underlying funds. |
| (f) | Includes non-recurring expenses of offering costs. Without these costs, total expenses and total expenses after fees waived and/or reimbursed and paid indirectly would have been 0.47% and 0.50%, respectively. |
| (g) | Includes reorganization and offering costs associated with the Fund’s reorganization. Without these costs, total expenses and total expenses after fees waived and/or reimbursed and paid indirectly would have been 0.70% and 0.41%, respectively. |
See notes to financial statements.
| | |
| 44 | | 2 0 2 1 BLACK ROCK ANNUAL REPORT TO SHAREHOLDERS |
Financial Highlights (continued)
(For a share outstanding throughout each period)
| | | | | | | | | | | | | | | | | | | | |
| | | iShares Municipal Bond Index Fund (continued) | |
| |
| | | Class K | |
| | | | |
| | | | | | | | | | | | Period from | |
| | | Year Ended December 31, | | | | | | | | 11/19/18 | (a) |
| | | | |
| | | 2021 | | | 2020 | | | 2019 | | | to 12/31/18 | |
| | | | | |
Net asset value, beginning of period | | $ | 12.29 | | | $ | 12.02 | | | $ | 11.59 | | | | | | | $ | 11.48 | |
| | | | | | | | | | | | | | | | | | | | |
Net investment income(b) | | | 0.30 | | | | 0.30 | | | | 0.30 | | | | | | | | 0.04 | |
Net realized and unrealized gain (loss) | | | (0.11 | ) | | | 0.29 | | | | 0.56 | | | | | | | | 0.14 | |
| | | | | | | | | | | | | | | | | | | | |
| | | | | |
Net increase from investment operations | | | 0.19 | | | | 0.59 | | | | 0.86 | | | | | | | | 0.18 | |
| | | | | | | | | | | | | | | | | | | | |
| | | | | |
Distributions(c) | | | | | | | | | | | | | | | | | | | | |
From net investment income | | | (0.30 | ) | | | (0.30 | ) | | | (0.30 | ) | | | | | | | (0.04 | ) |
From net realized gain | | | (0.02 | ) | | | (0.02 | ) | | | (0.13 | ) | | | | | | | (0.03 | ) |
| | | | | | | | | | | | | | | | | | | | |
| | | | | |
Total distributions | | | (0.32 | ) | | | (0.32 | ) | | | (0.43 | ) | | | | | | | (0.07 | ) |
| | | | | | | | | | | | | | | | | | | | |
| | | | | |
Net asset value, end of period | | $ | 12.16 | | | $ | 12.29 | | | $ | 12.02 | | | | | | | $ | 11.59 | |
| | | | | | | | | | | | | | | | | | | | |
| | | | | |
Total Return(d) | | | | | | | | | | | | | | | | | | | | |
Based on net asset value | | | 1.58 | % | | | 5.00 | % | | | 7.57 | % | | | | | | | 1.57 | %(e) |
| | | | | | | | | | | | | | | | | | | | |
| | | | | |
Ratios to Average Net Assets(f) | | | | | | | | | | | | | | | | | | | | |
Total expenses | | | 0.25 | % | | | 0.24 | % | | | 0.27 | %(g) | | | | | | | 0.33 | %(h)(i)(j) |
| | | | | | | | | | | | | | | | | | | | |
| | | | | |
Total expenses after fees waived and/or reimbursed | | | 0.20 | % | | | 0.20 | % | | | 0.20 | %(g) | | | | | | | 0.16 | %(h)(i)(j) |
| | | | | | | | | | | | | | | | | | | | |
| | | | | |
Net investment income | | | 2.45 | % | | | 2.50 | % | | | 2.55 | % | | | | | | | 2.74 | %(h) |
| | | | | | | | | | | | | | | | | | | | |
| | | | | |
Supplemental Data | | | | | | | | | | | | | | | | | | | | |
Net assets, end of period (000) | | $ | 106 | | | $ | 107 | | | $ | 105 | | | | | | | $ | 101 | |
| | | | | | | | | | | | | | | | | | | | |
| | | | | |
Portfolio turnover rate | | | 7 | % | | | 8 | % | | | 24 | % | | | | | | | 3 | % |
| | | | | | | | | | | | | | | | | | | | |
| (a) | Commencement of operations. |
| (b) | Based on average shares outstanding. |
| (c) | Distributions for annual periods determined in accordance with U.S. federal income tax regulations. |
| (d) | Where applicable, assumes the reinvestment of distributions. |
| (e) | Aggregate total return. |
| (f) | Excludes fees and expenses incurred indirectly as a result of investments in underlying funds. |
| (g) | Includes non-recurring expenses of offering costs. Without these costs, total expenses and total expenses after fees waived and/or reimbursed and paid indirectly would have been 0.21% and 0.20%, respectively. |
| (i) | Reorganization and offering costs were not annualized in the calculation of the expense ratios. If these expenses were annualized, the total expenses and total expenses after fees waived and/or reimbursed and paid indirectly would have been 0.70% and 0.20%, respectively. |
| (j) | Includes reorganization and offering costs associated with the Fund’s reorganization. Without these costs, total expenses and total expenses after fees waived and/or reimbursed and paid indirectly would have been 0.27% and 0.15%, respectively. |
See notes to financial statements.
| | |
FUND FINANCIAL HIGHLIGHTS | | 45 |
Financial Highlights (continued)
(For a share outstanding throughout each period)
| | | | | | | | | | | | | | | | | | | | |
| | | iShares Short-Term TIPS Bond Index Fund | |
| |
| | | Institutional | |
| |
| | | Year Ended December 31, | |
| | | | | |
| | | | 2021 | | | | 2020 | | | | 2019 | | | | 2018 | | | | 2017 | |
| | | | | |
Net asset value, beginning of year | | $ | 10.30 | | | $ | 9.98 | | | $ | 9.74 | | | $ | 9.95 | | | $ | 10.05 | |
| | | | | | | | | | | | | | | | | | | | |
Net investment income(a) | | | 0.46 | | | | 0.25 | | | | 0.15 | | | | 0.22 | | | | 0.16 | |
Net realized and unrealized gain (loss) | | | 0.07 | | | | 0.23 | | | | 0.30 | | | | (0.16 | ) | | | (0.08 | ) |
| | | | | | | | | | | | | | | | | | | | |
| | | | | |
Net increase from investment operations | | | 0.53 | | | | 0.48 | | | | 0.45 | | | | 0.06 | | | | 0.08 | |
| | | | | | | | | | | | | | | | | | | | |
| | | | | |
Distributions(b) | | | | | | | | | | | | | | | | | | | | |
From net investment income | | | (0.46 | ) | | | (0.16 | ) | | | (0.21 | ) | | | (0.26 | ) | | | (0.18 | ) |
From net realized gain | | | — | | | | (0.00 | )(c) | | | — | | | | (0.01 | ) | | | — | |
Return of capital | | | — | | | | — | | | | — | | | | — | | | | (0.00 | )(c) |
| | | | | | | | | | | | | | | | | | | | |
| | | | | |
Total distributions | | | (0.46 | ) | | | (0.16 | ) | | | (0.21 | ) | | | (0.27 | ) | | | (0.18 | ) |
| | | | | | | | | | | | | | | | | | | | |
| | | | | |
Net asset value, end of year | | $ | 10.37 | | | $ | 10.30 | | | $ | 9.98 | | | $ | 9.74 | | | $ | 9.95 | |
| | | | | | | | | | | | | | | | | | | | |
| | | | | |
Total Return(d) | | | | | | | | | | | | | | | | | | | | |
Based on net asset value | | | 5.18 | % | | | 4.89 | % | | | 4.66 | % | | | 0.56 | % | | | 0.88 | % |
| | | | | | | | | | | | | | | | | | | | |
| | | | | |
Ratios to Average Net Assets(e) | | | | | | | | | | | | | | | | | | | | |
Total expenses | | | 0.29 | % | | | 0.55 | % | | | 3.24 | % | | | 4.96 | % | | | 5.07 | % |
| | | | | | | | | | | | | | | | | | | | |
| | | | | |
Total expenses after fees waived and/or reimbursed | | | 0.07 | % | | | 0.07 | % | | | 0.11 | % | | | 0.09 | % | | | 0.08 | % |
| | | | | | | | | | | | | | | | | | | | |
| | | | | |
Net investment income | | | 4.41 | % | | | 2.51 | % | | | 1.47 | % | | | 2.19 | % | | | 1.64 | % |
| | | | | | | | | | | | | | | | | | | | |
| | | | | |
Supplemental Data | | | | | | | | | | | | | | | | | | | | |
Net assets, end of year (000) | | $ | 18,004 | | | $ | 16,549 | | | $ | 721 | | | $ | 976 | | | $ | 3,348 | |
| | | | | | | | | | | | | | | | | | | | |
| | | | | |
Portfolio turnover rate | | | 10 | % | | | 22 | % | | | 45 | % | | | 80 | % | | | 200 | % |
| | | | | | | | | | | | | | | | | | | | |
| (a) | Based on average shares outstanding. |
| (b) | Distributions for annual periods determined in accordance with U.S. federal income tax regulations. |
| (c) | Amount is greater than $(0.005) per share. |
| (d) | Where applicable, assumes the reinvestment of distributions. |
| (e) | Excludes fees and expenses incurred indirectly as a result of investments in underlying funds. |
See notes to financial statements.
| | |
| 46 | | 2 0 2 1 BLACK ROCK ANNUAL REPORT TO SHAREHOLDERS |
Financial Highlights (continued)
(For a share outstanding throughout each period)
| | | | | | | | | | | | | | | | | | | | |
| | | iShares Short-Term TIPS Bond Index Fund (continued) | |
| |
| | | Investor A | |
| |
| | | Year Ended December 31, | |
| | | | | |
| | | 2021 | | | 2020 | | | 2019 | | | 2018 | | | 2017 | |
| | | | | |
Net asset value, beginning of year | | $ | 10.34 | | | $ | 9.97 | | | $ | 9.74 | | | $ | 9.95 | | | $ | 10.04 | |
| | | | | | | | | | | | | | | | | | | | |
Net investment income(a) | | | 0.40 | | | | 0.07 | | | | 0.19 | | | | 0.20 | | | | 0.14 | |
Net realized and unrealized gain (loss) | | | 0.10 | | | | 0.39 | | | | 0.23 | | | | (0.18 | ) | | | (0.07 | ) |
| | | | | | | | | | | | | | | | | | | | |
| | | | | |
Net increase from investment operations | | | 0.50 | | | | 0.46 | | | | 0.42 | | | | 0.02 | | | | 0.07 | |
| | | | | | | | | | | | | | | | | | | | |
| | | | | |
Distributions(b) | | | | | | | | | | | | | | | | | | | | |
From net investment income | | | (0.43 | ) | | | (0.09 | ) | | | (0.19 | ) | | | (0.22 | ) | | | (0.16 | ) |
From net realized gain | | | — | | | | (0.00 | )(c) | | | — | | | | (0.01 | ) | | | — | |
Return of capital | | | — | | | | — | | | | — | | | | — | | | | (0.00 | )(c) |
| | | | | | | | | | | | | | | | | | | | |
| | | | | |
Total distributions | | | (0.43 | ) | | | (0.09 | ) | | | (0.19 | ) | | | (0.23 | ) | | | (0.16 | ) |
| | | | | | | | | | | | | | | | | | | | |
| | | | | |
Net asset value, end of year | | $ | 10.41 | | | $ | 10.34 | | | $ | 9.97 | | | $ | 9.74 | | | $ | 9.95 | |
| | | | | | | | | | | | | | | | | | | | |
| | | | | |
Total Return(d) | | | | | | | | | | | | | | | | | | | | |
Based on net asset value | | | 4.89 | % | | | 4.64 | % | | | 4.39 | % | | | 0.22 | % | | | 0.76 | % |
| | | | | | | | | | | | | | | | | | | | |
| | | | | |
Ratios to Average Net Assets(e) | | | | | | | | | | | | | | | | | | | | |
Total expenses | | | 0.71 | % | | | 1.18 | % | | | 3.36 | % | | | 6.40 | % | | | 6.24 | % |
| | | | | | | | | | | | | | | | | | | | |
| | | | | |
Total expenses after fees waived and/or reimbursed | | | 0.36 | % | | | 0.36 | % | | | 0.36 | % | | | 0.36 | % | | | 0.36 | % |
| | | | | | | | | | | | | | | | | | | | |
| | | | | |
Net investment income | | | 3.79 | % | | | 0.71 | % | | | 1.94 | % | | | 2.00 | % | | | 1.35 | % |
| | | | | | | | | | | | | | | | | | | | |
| | | | | |
Supplemental Data | | | | | | | | | | | | | | | | | | | | |
Net assets, end of year (000) | | $ | 1,908 | | | $ | 1,475 | | | $ | 737 | | | $ | 526 | | | $ | 256 | |
| | | | | | | | | | | | | | | | | | | | |
| | | | | |
Portfolio turnover rate | | | 10 | % | | | 22 | % | | | 45 | % | | | 80 | % | | | 200 | % |
| | | | | | | | | | | | | | | | | | | | |
| (a) | Based on average shares outstanding. |
| (b) | Distributions for annual periods determined in accordance with U.S. federal income tax regulations. |
| (c) | Amount is greater than $(0.005) per share. |
| (d) | Where applicable, assumes the reinvestment of distributions. |
| (e) | Excludes fees and expenses incurred indirectly as a result of investments in underlying funds. |
See notes to financial statements.
| | |
FUND FINANCIAL HIGHLIGHTS | | 47 |
Financial Highlights (continued)
(For a share outstanding throughout each period)
| | | | | | | | | | | | | | | | | | | | |
| | | iShares Short-Term TIPS Bond Index Fund (continued) | |
| |
| | | Class K | |
| |
| | | Year Ended December 31, | |
| | | | | |
| | | 2021 | | | 2020 | | | 2019 | | | 2018 | | | 2017 | |
| | | | | |
Net asset value, beginning of year | | $ | 10.34 | | | $ | 9.98 | | | $ | 9.76 | | | $ | 9.95 | | | $ | 10.05 | |
| | | | | | | | | | | | | | | | | | | | |
| | | | | |
Net investment income(a) | | | 0.49 | | | | 0.12 | | | | 0.25 | | | | 0.31 | | | | 0.25 | |
Net realized and unrealized gain (loss) | | | 0.04 | | | | 0.36 | | | | 0.21 | | | | (0.25 | ) | | | (0.16 | ) |
| | | | | | | | | | | | | | | | | | | | |
| | | | | |
Net increase from investment operations | | | 0.53 | | | | 0.48 | | | | 0.46 | | | | 0.06 | | | | 0.09 | |
| | | | | | | | | | | | | | | | | | | | |
| | | | | |
Distributions(b) | | | | | | | | | | | | | | | | | | | | |
From net investment income | | | (0.46 | ) | | | (0.12 | ) | | | (0.24 | ) | | | (0.24 | ) | | | (0.19 | ) |
From net realized gain | | | — | | | | (0.00 | )(c) | | | — | | | | (0.01 | ) | | | — | |
Return of capital | | | — | | | | — | | | | — | | | | — | | | | (0.00 | )(c) |
| | | | | | | | | | | | | | | | | | | | |
| | | | | |
Total distributions | | | (0.46 | ) | | | (0.12 | ) | | | (0.24 | ) | | | (0.25 | ) | | | (0.19 | ) |
| | | | | | | | | | | | | | | | | | | | |
| | | | | |
Net asset value, end of year | | $ | 10.41 | | | $ | 10.34 | | | $ | 9.98 | | | $ | 9.76 | | | $ | 9.95 | |
| | | | | | | | | | | | | | | | | | | | |
| | | | | |
Total Return(d) | | | | | | | | | | | | | | | | | | | | |
Based on net asset value | | | 5.19 | % | | | 4.87 | % | | | 4.72 | % | | | 0.60 | % | | | 0.89 | % |
| | | | | | | | | | | | | | | | | | | | |
| | | | | |
Ratios to Average Net Assets(e) | | | | | | | | | | | | | | | | | | | | |
Total expenses | | | 0.28 | % | | | 0.71 | % | | | 2.14 | % | | | 5.80 | % | | | 2.82 | % |
| | | | | | | | | | | | | | | | | | | | |
| | | | | |
Total expenses after fees waived and/or reimbursed | | | 0.06 | % | | | 0.06 | % | | | 0.06 | % | | | 0.06 | % | | | 0.06 | % |
| | | | | | | | | | | | | | | | | | | | |
| | | | | |
Net investment income | | | 4.69 | % | | | 1.17 | % | | | 2.55 | % | | | 3.13 | % | | | 2.45 | % |
| | | | | | | | | | | | | | | | | | | | |
| | | | | |
Supplemental Data | | | | | | | | | | | | | | | | | | | | |
Net assets, end of year (000) | | $ | 84,806 | | | $ | 41,536 | | | $ | 16,112 | | | $ | 1,788 | | | $ | 1,138 | |
| | | | | | | | | | | | | | | | | | | | |
| | | | | |
Portfolio turnover rate | | | 10 | % | | | 22 | % | | | 45 | % | | | 80 | % | | | 200 | % |
| | | | | | | | | | | | | | | | | | | | |
| (a) | Based on average shares outstanding. |
| (b) | Distributions for annual periods determined in accordance with U.S. federal income tax regulations. |
| (c) | Amount is greater than $(0.005) per share. |
| (d) | Where applicable, assumes the reinvestment of distributions. |
| (e) | Excludes fees and expenses incurred indirectly as a result of investments in underlying funds. |
See notes to financial statements.
| | |
| 48 | | 2 0 2 1 BLACK ROCK ANNUAL REPORT TO SHAREHOLDERS |
Financial Highlights (continued)
(For a share outstanding throughout each period)
| | | | | | | | | | | | | | | | | | | | |
| | | iShares MSCI EAFE International Index Fund | |
| |
| | | Institutional | |
| |
| | | Year Ended December 31, | |
| | | | | |
| | | 2021 | | | 2020 | | | 2019 | | | 2018 | | | 2017 | |
| | | | | |
Net asset value, beginning of year | | $ | 14.68 | | | $ | 13.86 | | | $ | 11.76 | | | $ | 14.18 | | | $ | 11.60 | |
| | | | | | | | | | | | | | | | | | | | |
| | | | | |
Net investment income(a) | | | 0.41 | | | | 0.30 | | | | 0.42 | | | | 0.42 | | | | 0.39 | |
Net realized and unrealized gain (loss)(b) | | | 1.24 | | | | 0.81 | | | | 2.14 | | | | (2.31 | ) | | | 2.53 | |
| | | | | | | | | | | | | | | | | | | | |
| | | | | |
Net increase (decrease) from investment operations | | | 1.65 | | | | 1.11 | | | | 2.56 | | | | (1.89 | ) | | | 2.92 | |
| | | | | | | | | | | | | | | | | | | | |
| | | | | |
Distributions(c) | | | | | | | | | | | | | | | | | | | | |
From net investment income | | | (0.48 | ) | | | (0.29 | ) | | | (0.46 | ) | | | (0.53 | ) | | | (0.34 | ) |
Return of capital | | | — | | | | — | | | | — | | | | (0.00 | )(d) | | | — | |
| | | | | | | | | | | | | | | | | | | | |
| | | | | |
Total distributions | | | (0.48 | ) | | | (0.29 | ) | | | (0.46 | ) | | | (0.53 | ) | | | (0.34 | ) |
| | | | | | | | | | | | | | | | | | | | |
| | | | | |
Net asset value, end of year | | $ | 15.85 | | | $ | 14.68 | | | $ | 13.86 | | | $ | 11.76 | | | $ | 14.18 | |
| | | | | | | | | | | | | | | | | | | | |
| | | | | |
Total Return(e) | | | | | | | | | | | | | | | | | | | | |
Based on net asset value | | | 11.28 | % | | | 8.03 | % | | | 21.80 | % | | | (13.37 | )% | | | 25.24 | % |
| | | | | | | | | | | | | | | | | | | | |
| | | | | |
Ratios to Average Net Assets(f) | | | | | | | | | | | | | | | | | | | | |
Total expenses | | | 0.09 | % | | | 0.09 | % | | | 0.08 | % | | | 0.11 | %(g) | | | 0.09 | % |
| | | | | | | | | | | | | | | | | | | | |
| | | | | |
Total expenses after fees waived and/or reimbursed | | | 0.09 | % | | | 0.09 | % | | | 0.08 | % | | | 0.10 | %(g) | | | 0.09 | % |
| | | | | | | | | | | | | | | | | | | | |
| | | | | |
Net investment income | | | 2.57 | % | | | 2.35 | % | | | 3.23 | % | | | 3.02 | % | | | 2.92 | % |
| | | | | | | | | | | | | | | | | | | | |
| | | | | |
Supplemental Data | | | | | | | | | | | | | | | | | | | | |
Net assets, end of year (000) | | $ | 1,058,978 | | | $ | 1,004,855 | | | $ | 876,551 | | | $ | 753,659 | | | $ | 705,986 | |
| | | | | | | | | | | | | | | | | | | | |
| | | | | |
Portfolio turnover rate | | | 3 | % | | | 8 | % | | | 4 | % | | | 43 | % | | | 23 | % |
| | | | | | | | | | | | | | | | | | | | |
| (a) | Based on average shares outstanding. |
| (b) | The amounts reported for a share outstanding may not accord with the change in aggregate gains and losses in securities for the fiscal period due to the timing of capital share transactions in relation to the fluctuating market values of the Fund’s underlying securities. |
| (c) | Distributions for annual periods determined in accordance with U.S. federal income tax regulations. |
| (d) | Amount is greater than $(0.005) per share. |
| (e) | Where applicable, assumes the reinvestment of distributions. |
| (f) | Excludes fees and expenses incurred indirectly as a result of investments in underlying funds. |
| (g) | Includes reorganization costs, offering and board reorganization and consolidation expenses associated with the Fund’s reorganization. Without these expenses, total expenses and total expenses after fees waived and/or reimbursed would have been 0.10% and 0.09% respectively. |
See notes to financial statements.
| | |
FUND FINANCIAL HIGHLIGHTS | | 49 |
Financial Highlights (continued)
(For a share outstanding throughout each period)
| | | | | | | | | | | | | | | | | | | | |
| | | iShares MSCI EAFE International Index Fund (continued) | |
| |
| | | Investor A | |
| |
| | | Year Ended December 31, | |
| | | | | |
| | | 2021 | | | 2020 | | | 2019 | | | 2018 | | | 2017 | |
| | | | | |
Net asset value, beginning of year | | $ | 14.58 | | | $ | 13.78 | | | $ | 11.69 | | | $ | 14.09 | | | $ | 11.54 | |
| | | | | | | | | | | | | | | | | | | | |
| | | | | |
Net investment income(a) | | | 0.36 | | | | 0.27 | | | | 0.39 | | | | 0.38 | | | | 0.34 | |
Net realized and unrealized gain (loss)(b) | | | 1.24 | | | | 0.78 | | | | 2.12 | | | | (2.28 | ) | | | 2.52 | |
| | | | | | | | | | | | | | | | | | | | |
| | | | | |
Net increase (decrease) from investment operations | | | 1.60 | | | | 1.05 | | | | 2.51 | | | | (1.90 | ) | | | 2.86 | |
| | | | | | | | | | | | | | | | | | | | |
| | | | | |
Distributions(c) | | | | | | | | | | | | | | | | | | | | |
From net investment income | | | (0.44 | ) | | | (0.25 | ) | | | (0.42 | ) | | | (0.50 | ) | | | (0.31 | ) |
Return of capital | | | — | | | | — | | | | — | | | | (0.00 | )(d) | | | — | |
| | | | | | | | | | | | | | | | | | | | |
| | | | | |
Total distributions | | | (0.44 | ) | | | (0.25 | ) | | | (0.42 | ) | | | (0.50 | ) | | | (0.31 | ) |
| | | | | | | | | | | | | | | | | | | | |
| | | | | |
Net asset value, end of year | | $ | 15.74 | | | $ | 14.58 | | | $ | 13.78 | | | $ | 11.69 | | | $ | 14.09 | |
| | | | | | | | | | | | | | | | | | | | |
| | | | | |
Total Return(e) | | | | | | | | | | | | | | | | | | | | |
Based on net asset value | | | 11.01 | % | | | 7.68 | % | | | 21.53 | % | | | (13.57 | )% | | | 24.84 | % |
| | | | | | | | | | | | | | | | | | | | |
| | | | | |
Ratios to Average Net Assets(f) | | | | | | | | | | | | | | | | | | | | |
Total expenses | | | 0.34 | % | | | 0.35 | % | | | 0.35 | % | | | 0.36 | %(g) | | | 0.36 | % |
| | | | | | | | | | | | | | | | | | | | |
| | | | | |
Total expenses after fees waived and/or reimbursed | | | 0.34 | % | | | 0.35 | % | | | 0.35 | % | | | 0.36 | %(g) | | | 0.35 | % |
| | | | | | | | | | | | | | | | | | | | |
| | | | | |
Net investment income | | | 2.31 | % | | | 2.11 | % | | | 3.00 | % | | | 2.74 | % | | | 2.60 | % |
| | | | | | | | | | | | | | | | | | | | |
| | | | | |
Supplemental Data | | | | | | | | | | | | | | | | | | | | |
Net assets, end of year (000) | | $ | 385,287 | | | $ | 351,999 | | | $ | 340,750 | | | $ | 305,043 | | | $ | 373,846 | |
| | | | | | | | | | | | | | | | | | | | |
| | | | | |
Portfolio turnover rate | | | 3 | % | | | 8 | % | | | 4 | % | | | 43 | % | | | 23 | % |
| | | | | | | | | | | | | | | | | | | | |
| (a) | Based on average shares outstanding. |
| (b) | The amounts reported for a share outstanding may not accord with the change in aggregate gains and losses in securities for the fiscal period due to the timing of capital share transactions in relation to the fluctuating market values of the Fund’s underlying securities. |
| (c) | Distributions for annual periods determined in accordance with U.S. federal income tax regulations. |
| (d) | Amount is greater than $(0.005) per share. |
| (e) | Where applicable, assumes the reinvestment of distributions. |
| (f) | Excludes fees and expenses incurred indirectly as a result of investments in underlying funds. |
| (g) | Includes reorganization costs, offering and board reorganization and consolidation expenses associated with the Fund’s reorganization. Without these expenses, total expenses and total expenses after fees waived and/or reimbursed would have been 0.36% and 0.35% respectively. |
See notes to financial statements.
| | |
| 50 | | 2 0 2 1 BLACK ROCK ANNUAL REPORT TO SHAREHOLDERS |
Financial Highlights (continued)
(For a share outstanding throughout each period)
| | | | | | | | | | | | | | | | | | | | |
| | | iShares MSCI EAFE International Index Fund (continued) | |
| |
| | | Investor P | |
| | | | | | | | | | | | | | | | |
| | | | | | | | | | | | | | | Period from | |
| | | Year Ended December 31, | | | | | | | | 08/06/18 | (a) |
| | | | | |
| | | 2021 | | | 2020 | | | 2019 | | | | | | to 12/31/18 | |
| | | | | | |
Net asset value, beginning of period | | $ | 14.53 | | | $ | 13.73 | | | $ | 11.65 | | | | | | | $ | 13.87 | |
| | | | | | | | | | | | | | | | | | | | |
| | | | | |
Net investment income(b) | | | 0.36 | | | | 0.26 | | | | 0.39 | | | | | | | | 0.01 | |
Net realized and unrealized gain (loss)(c) | | | 1.24 | | | | 0.79 | | | | 2.11 | | | | | | | | (1.70 | ) |
| | | | | | | | | | | | | | | | | | | | |
| | | | | |
Net increase (decrease) from investment operations | | | 1.60 | | | | 1.05 | | | | 2.50 | | | | | | | | (1.69 | ) |
| | | | | | | | | | | | | | | | | | | | |
| | | | | |
Distributions(d) | | | | | | | | | | | | | | | | | | | | |
From net investment income | | | (0.44 | ) | | | (0.25 | ) | | | (0.42 | ) | | | | | | | (0.53 | ) |
Return of capital | | | — | | | | — | | | | — | | | | | | | | (0.00 | )(e) |
| | | | | | | | | | | | | | | | | | | | |
| | | | | |
Total distributions | | | (0.44 | ) | | | (0.25 | ) | | | (0.42 | ) | | | | | | | (0.53 | ) |
| | | | | | | | | | | | | | | | | | | | |
| | | | | |
Net asset value, end of period | | $ | 15.69 | | | $ | 14.53 | | | $ | 13.73 | | | | | | | $ | 11.65 | |
| | | | | | | | | | | | | | | | | | | | |
| | | | | |
Total Return(f) | | | | | | | | | | | | | | | | | | | | |
Based on net asset value | | | 11.05 | % | | | 7.68 | % | | | 21.51 | % | | | | | | | (12.25 | )%(g) |
| | | | | | | | | | | | | | | | | | | | |
| | | | | |
Ratios to Average Net Assets(h) | | | | | | | | | | | | | | | | | | | | |
Total expenses | | | 0.34 | % | | | 0.37 | % | | | 0.39 | % | | | | | | | 0.33 | %(i)(j) |
| | | | | | | | | | | | | | | | | | | | |
| | | | | |
Total expenses after fees waived and/or reimbursed | | | 0.34 | % | | | 0.37 | % | | | 0.36 | % | | | | | | | 0.32 | %(i)(j) |
| | | | | | | | | | | | | | | | | | | | |
| | | | | |
Net investment income | | | 2.30 | % | | | 2.08 | % | | | 2.97 | % | | | | | | | 0.23 | %(i) |
| | | | | | | | | | | | | | | | | | | | |
| | | | | |
Supplemental Data | | | | | | | | | | | | | | | | | | | | |
Net assets, end of period (000) | | $ | 153,682 | | | $ | 146,759 | | | $ | 149,612 | | | | | | | $ | 137,266 | |
| | | | | | | | | | | | | | | | | | | | |
| | | | | |
Portfolio turnover rate | | | 3 | % | | | 8 | % | | | 4 | % | | | | | | | 43 | % |
| | | | | | | | | | | | | | | | | | | | |
| (a) | Commencement of operations. |
| (b) | Based on average shares outstanding. |
| (c) | The amounts reported for a share outstanding may not accord with the change in aggregate gains and losses in securities for the fiscal period due to the timing of capital share transactions in relation to the fluctuating market values of the Fund’s underlying securities. |
| (d) | Distributions for annual periods determined in accordance with U.S. federal income tax regulations. |
| (e) | Amount is greater than $(0.005) per share. |
| (f) | Where applicable, excludes the effects of any sales charges and assumes the reinvestment of distributions. |
| (g) | Aggregate total return. |
| (h) | Excludes fees and expenses incurred indirectly as a result of investments in underlying funds. |
| (j) | Reorganization costs, offering and board realignment and consolidation expenses were not annualized in the calculation of the expense ratios. If these expenses were annualized, the total expenses and total expenses after fees waived and/or reimbursed would have been 0.34% and 0.33% respectively. |
See notes to financial statements.
| | |
FUND FINANCIAL HIGHLIGHTS | | 51 |
Financial Highlights (continued)
(For a share outstanding throughout each period)
| | | | | | | | | | | | | | | | | | | | |
| | | iShares MSCI EAFE International Index Fund (continued) | |
| |
| | | Class K | |
| |
| | | Year Ended December 31, | |
| | | | | |
| | | 2021 | | | 2020 | | | 2019 | | | 2018 | | | 2017 | |
| | | | | | |
Net asset value, beginning of year | | $ | 14.69 | | | $ | 13.87 | | | $ | 11.76 | | | $ | 14.18 | | | $ | 11.61 | |
| | | | | | | | | | | | | | | | | | | | |
| | | | | |
Net investment income(a) | | | 0.41 | | | | 0.31 | | | | 0.43 | | | | 0.43 | | | | 0.38 | |
Net realized and unrealized gain (loss)(b) | | | 1.24 | | | | 0.80 | | | | 2.14 | | | | (2.31 | ) | | | 2.54 | |
| | | | | | | | | | | | | | | | | | | | |
| | | | | |
Net increase (decrease) from investment operations | | | 1.65 | | | | 1.11 | | | | 2.57 | | | | (1.88 | ) | | | 2.92 | |
| | | | | | | | | | | | | | | | | | | | |
| | | | | |
Distributions(c) | | | | | | | | | | | | | | | | | | | | |
From net investment income | | | (0.48 | ) | | | (0.29 | ) | | | (0.46 | ) | | | (0.54 | ) | | | (0.35 | ) |
Return of capital | | | — | | | | — | | | | — | | | | (0.00 | )(d) | | | — | |
| | | | | | | | | | | | | | | | | | | | |
| | | | | |
Total distributions | | | (0.48 | ) | | | (0.29 | ) | | | (0.46 | ) | | | (0.54 | ) | | | (0.35 | ) |
| | | | | | | | | | | | | | | | | | | | |
| | | | | |
Net asset value, end of year | | $ | 15.86 | | | $ | 14.69 | | | $ | 13.87 | | | $ | 11.76 | | | $ | 14.18 | |
| | | | | | | | | | | | | | | | | | | | |
| | | | | |
Total Return(e) | | | | | | | | | | | | | | | | | | | | |
Based on net asset value | | | 11.33 | % | | | 8.07 | % | | | 21.94 | % | | | (13.33 | )% | | | 25.17 | % |
| | | | | | | | | | | | | | | | | | | | |
| | | | | |
Ratios to Average Net Assets(f) | | | | | | | | | | | | | | | | | | | | |
Total expenses | | | 0.04 | % | | | 0.04 | % | | | 0.03 | % | | | 0.06 | %(g) | | | 0.06 | % |
| | | | | | | | | | | | | | | | | | | | |
| | | | | |
Total expenses after fees waived and/or reimbursed | | | 0.04 | % | | | 0.04 | % | | | 0.03 | % | | | 0.05 | %(g) | | | 0.06 | % |
| | | | | | | | | | | | | | | | | | | | |
| | | | | |
Net investment income | | | 2.60 | % | | | 2.39 | % | | | 3.28 | % | | | 3.12 | % | | | 2.80 | % |
| | | | | | | | | | | | | | | | | | | | |
| | | | | |
Supplemental Data | | | | | | | | | | | | | | | | | | | | |
Net assets, end of year (000) | | $ | 6,929,470 | | | $ | 5,143,404 | | | $ | 6,870,922 | | | $ | 6,420,732 | | | $ | 9,509,257 | |
| | | | | | | | | | | | | | | | | | | | |
| | | | | |
Portfolio turnover rate | | | 3 | % | | | 8 | % | | | 4 | % | | | 43 | % | | | 23 | % |
| | | | | | | | | | | | | | | | | | | | |
| (a) | Based on average shares outstanding. |
| (b) | The amounts reported for a share outstanding may not accord with the change in aggregate gains and losses in securities for the fiscal period due to the timing of capital share transactions in relation to the fluctuating market values of the Fund’s underlying securities. |
| (c) | Distributions for annual periods determined in accordance with U.S. federal income tax regulations. |
| (d) | Amount is greater than $(0.005) per share. |
| (e) | Where applicable, assumes the reinvestment of distributions. |
| (f) | Excludes fees and expenses incurred indirectly as a result of investments in underlying funds. |
| (g) | Includes reorganization costs, offering and board reorganization and consolidation expenses associated with the Fund’s reorganization. Without these expenses, total expenses and total expenses after fees waived and/or reimbursed would have been 0.05% and 0.04% respectively. |
See notes to financial statements.
| | |
| 52 | | 2 0 2 1 BLACK ROCK ANNUAL REPORT TO SHAREHOLDERS |
Financial Highlights (continued)
(For a share outstanding throughout each period)
| | | | | | | | | | | | | | | | | | | | |
| | | iShares Russell 2000 Small-Cap Index Fund | |
| |
| | | Institutional | |
| |
| | | Year Ended December 31, | |
| | | | | |
| | | 2021 | | | 2020 | | | 2019 | | | 2018 | | | 2017 | |
| | | | | | |
Net asset value, beginning of year | | $ | 24.19 | | | $ | 20.46 | | | $ | 16.87 | | | $ | 19.72 | | | $ | 17.76 | |
| | | | | | | | | | | | | | | | | | | | |
| | | | | |
Net investment income(a) | | | 0.25 | | | | 0.23 | | | | 0.27 | | | | 0.28 | | | | 0.25 | |
Net realized and unrealized gain (loss) | | | 3.28 | | | | 3.84 | | | | 4.02 | | | | (2.40 | ) | | | 2.34 | |
| | | | | | | | | | | | | | | | | | | | |
| | | | | |
Net increase (decrease) from investment operations | | | 3.53 | | | | 4.07 | | | | 4.29 | | | | (2.12 | ) | | | 2.59 | |
| | | | | | | | | | | | | | | | | | | | |
| | | | | |
Distributions(b) | | | | | | | | | | | | | | | | | | | | |
From net investment income | | | (0.29 | ) | | | (0.25 | ) | | | (0.28 | ) | | | (0.20 | ) | | | (0.21 | ) |
From net realized gain | | | (1.67 | ) | | | (0.09 | ) | | | (0.42 | ) | | | (0.53 | ) | | | (0.42 | ) |
| | | | | | | | | | | | | | | | | | | | |
| | | | | |
Total distributions | | | (1.96 | ) | | | (0.34 | ) | | | (0.70 | ) | | | (0.73 | ) | | | (0.63 | ) |
| | | | | | | | | | | | | | | | | | | | |
| | | | | |
Net asset value, end of year | | $ | 25.76 | | | $ | 24.19 | | | $ | 20.46 | | | $ | 16.87 | | | $ | 19.72 | |
| | | | | | | | | | | | | | | | | | | | |
| | | | | |
Total Return(c) | | | | | | | | | | | | | | | | | | | | |
Based on net asset value | | | 14.73 | % | | | 19.97 | % | | | 25.50 | % | | | (10.94 | )% | | | 14.55 | % |
| | | | | | | | | | | | | | | | | | | | |
| | | | | |
Ratios to Average Net Assets(d)(e)(f) | | | | | | | | | | | | | | | | | | | | |
Total expenses | | | 0.12 | % | | | 0.16 | % | | | 0.16 | % | | | 0.18 | %(g) | | | 0.18 | % |
| | | | | | | | | | | | | | | | | | | | |
| | | | | |
Total expenses after fees waived and/or reimbursed | | | 0.12 | % | | | 0.12 | % | | | 0.12 | % | | | 0.12 | %(g) | | | 0.11 | % |
| | | | | | | | | | | | | | | | | | | | |
| | | | | |
Net investment income | | | 0.93 | % | | | 1.22 | % | | | 1.38 | % | | | 1.38 | % | | | 1.36 | % |
| | | | | | | | | | | | | | | | | | | | |
| | | | | |
Supplemental Data | | | | | | | | | | | | | | | | | | | | |
Net assets, end of year (000) | | $ | 479,451 | | | $ | 331,429 | | | $ | 227,381 | | | $ | 200,990 | | | $ | 167,351 | |
| | | | | | | | | | | | | | | | | | | | |
| | | | | |
Portfolio turnover rate of the Series | | | 31 | % | | | 27 | % | | | 20 | % | | | 28 | % | | | 30 | % |
| | | | | | | | | | | | | | | | | | | | |
| (a) | Based on average Common Shares outstanding. |
| (b) | Distributions for annual periods determined in accordance with U.S. federal income tax regulations. |
| (c) | Where applicable, assumes the reinvestment of distributions. |
| (d) | Includes the Fund’s share of the Series’ allocated net expenses and/or net investment income. |
| (e) | Includes the Fund’s share of the Series’ allocated fees waived of less than 0.01%. |
| (f) | Excludes fees and expenses incurred indirectly as a result of investments in underlying funds. |
| (g) | Includes reorganization costs, offering and board reorganization and consolidation expenses associated with the Fund’s reorganization. Without these expenses, total expenses and total expenses after fees waived and/or reimbursed would have been 0.16% and 0.10% respectively. |
See notes to financial statements.
| | |
FUND FINANCIAL HIGHLIGHTS | | 53 |
Financial Highlights (continued)
(For a share outstanding throughout each period)
| | | | | | | | | | | | | | | | | | | | |
| | | iShares Russell 2000 Small-Cap Index Fund (continued) | |
| |
| | | Investor A | |
| |
| | | Year Ended December 31, | |
| | | | | |
| | | | 2021 | | | | 2020 | | | | 2019 | | | | 2018 | | | | 2017 | |
| | | | | |
Net asset value, beginning of year | | $ | 24.22 | | | $ | 20.49 | | | $ | 16.89 | | | $ | 19.74 | | | $ | 17.78 | |
| | | | | | | | | | | | | | | | | | | | |
Net investment income(a) | | | 0.18 | | | | 0.17 | | | | 0.22 | | | | 0.22 | | | | 0.21 | |
Net realized and unrealized gain (loss) | | | 3.28 | | | | 3.85 | | | | 4.03 | | | | (2.40 | ) | | | 2.34 | |
| | | | | | | | | | | | | | | | | | | | |
| | | | | |
Net increase (decrease) from investment operations | | | 3.46 | | | | 4.02 | | | | 4.25 | | | | (2.18 | ) | | | 2.55 | |
| | | | | | | | | | | | | | | | | | | | |
| | | | | |
Distributions(b) | | | | | | | | | | | | | | | | | | | | |
From net investment income | | | (0.22 | ) | | | (0.20 | ) | | | (0.23 | ) | | | (0.14 | ) | | | (0.17 | ) |
From net realized gain | | | (1.67 | ) | | | (0.09 | ) | | | (0.42 | ) | | | (0.53 | ) | | | (0.42 | ) |
| | | | | | | | | | | | | | | | | | | | |
| | | | | |
Total distributions | | | (1.89 | ) | | | (0.29 | ) | | | (0.65 | ) | | | (0.67 | ) | | | (0.59 | ) |
| | | | | | | | | | | | | | | | | | | | |
| | | | | |
Net asset value, end of year | | $ | 25.79 | | | $ | 24.22 | | | $ | 20.49 | | | $ | 16.89 | | | $ | 19.74 | |
| | | | | | | | | | | | | | | | | | | | |
| | | | | |
Total Return(c) | | | | | | | | | | | | | | | | | | | | |
| | | | | |
Based on net asset value | | | 14.38 | % | | | 19.66 | % | | | 25.20 | % | | | (11.19 | )% | | | 14.35 | % |
| | | | | | | | | | | | | | | | | | | | |
| | | | | |
Ratios to Average Net Assets(d)(e)(f) | | | | | | | | | | | | | | | | | | | | |
Total expenses | | | 0.40 | % | | | 0.41 | % | | | 0.42 | % | | | 0.43 | %(g) | | | 0.45 | % |
| | | | | | | | | | | | | | | | | | | | |
| | | | | |
Total expenses after fees waived and/or reimbursed. | | | 0.37 | % | | | 0.37 | % | | | 0.37 | % | | | 0.37 | %(g) | | | 0.37 | % |
| | | | | | | | | | | | | | | | | | | | |
| | | | | |
Net investment income | | | 0.66 | % | | | 0.93 | % | | | 1.14 | % | | | 1.08 | % | | | 1.13 | % |
| | | | | | | | | | | | | | | | | | | | |
| | | | | |
Supplemental Data | | | | | | | | | | | | | | | | | | | | |
Net assets, end of year (000) | | $ | 243,110 | | | $ | 257,905 | | | $ | 273,413 | | | $ | 254,591 | | | $ | 249,980 | |
| | | | | | | | | | | | | | | | | | | | |
| | | | | |
Portfolio turnover rate of the Series | | | 31 | % | | | 27 | % | | | 20 | % | | | 28 | % | | | 30 | % |
| | | | | | | | | | | | | | | | | | | | |
| (a) | Based on average Common Shares outstanding. |
| (b) | Distributions for annual periods determined in accordance with U.S. federal income tax regulations. |
| (c) | Where applicable, assumes the reinvestment of distributions. |
| (d) | Includes the Fund’s share of the Series’ allocated net expenses and/or net investment income. |
| (e) | Includes the Fund’s share of the Series’ allocated fees waived of less than 0.01%. |
| (f) | Excludes fees and expenses incurred indirectly as a result of investments in underlying funds. |
| (g) | Includes reorganization costs, offering and board reorganization and consolidation expenses associated with the Fund’s reorganization. Without these expenses, total expenses and total expenses after fees waived and/or reimbursed would have been 0.41% and 0.35% respectively. |
See notes to financial statements.
| | |
| 54 | | 2 0 2 1 BLACK ROCK ANNUAL REPORT TO SHAREHOLDERS |
Financial Highlights (continued)
(For a share outstanding throughout each period)
| | | | | | | | | | | | | | | | | | | | |
| | | iShares Russell 2000 Small-Cap Index Fund (continued) | |
| |
| | | Investor P | |
| | | | | | | | | | | | Period from | |
| | | Year Ended December 31, | | | | | | | | 08/06/18 | (a) |
| | | | |
| | | 2021 | | | 2020 | | | 2019 | | | to 12/31/18 | |
| | | | | |
Net asset value, beginning of period | | $ | 24.14 | | | $ | 20.43 | | | $ | 16.84 | | | | | | | $ | 21.76 | |
| | | | | | | | | | | | | | | | | | | | |
Net investment income(b) | | | 0.18 | | | | 0.18 | | | | 0.22 | | | | | | | | 0.17 | |
Net realized and unrealized gain (loss) | | | 3.27 | | | | 3.82 | | | | 4.02 | | | | | | | | (4.38 | ) |
| | | | | | | | | | | | | | | | | | | | |
| | | | | |
Net increase (decrease) from investment operations | | | 3.45 | | | | 4.00 | | | | 4.24 | | | | | | | | (4.21 | ) |
| | | | | | | | | | | | | | | | | | | | |
| | | | | |
Distributions(c) | | | | | | | | | | | | | | | | | | | | |
From net investment income | | | (0.22 | ) | | | (0.20 | ) | | | (0.23 | ) | | | | | | | (0.19 | ) |
From net realized gain | | | (1.67 | ) | | | (0.09 | ) | | | (0.42 | ) | | | | | | | (0.52 | ) |
| | | | | | | | | | | | | | | | | | | | |
| | | | | |
Total distributions | | | (1.89 | ) | | | (0.29 | ) | | | (0.65 | ) | | | | | | | (0.71 | ) |
| | | | | | | | | | | | | | | | | | | | |
| | | | | |
Net asset value, end of period | | $ | 25.70 | | | $ | 24.14 | | | $ | 20.43 | | | | | | | $ | 16.84 | |
| | | | | | | | | | | | | | | | | | | | |
| | | | | |
Total Return(d) | | | | | | | | | | | | | | | | | | | | |
| | | | | |
Based on net asset value | | | 14.42 | % | | | 19.65 | % | | | 25.25 | % | | | | | | | (19.49 | )%(e) |
| | | | | | | | | | | | | | | | | | | | |
| | | | | |
Ratios to Average Net Assets(f)(g)(h) | | | | | | | | | | | | | | | | | | | | |
Total expenses | | | 0.38 | % | | | 0.41 | % | | | 0.40 | % | | | | | | | 0.39 | %(i)(j)(k) |
| | | | | | | | | | | | | | | | | | | | |
| | | | | |
Total expenses after fees waived and/or reimbursed | | | 0.37 | % | | | 0.37 | % | | | 0.36 | % | | | | | | | 0.35 | %(i)(j)(k) |
| | | | �� | | | | | | | | | | | | | | | | |
| | | | | |
Net investment income | | | 0.67 | % | | | 0.95 | % | | | 1.14 | % | | | | | | | 2.12 | %(i) |
| | | | | | | | | | | | | | | | | | | | |
| | | | | |
Supplemental Data | | | | | | | | | | | | | | | | | | | | |
Net assets, end of period (000) | | $ | 354,746 | | | $ | 329,486 | | | $ | 301,163 | | | | | | | $ | 265,393 | |
| | | | | | | | | | | | | | | | | | | | |
| | | | | |
Portfolio turnover rate of the Series | | | 31 | % | | | 27 | % | | | 20 | % | | | | | | | 28 | % |
| | | | | | | | | | | | | | | | | | | | |
| (a) | Commencement of operations. |
| (b) | Based on average Common Shares outstanding. |
| (c) | Distributions for annual periods determined in accordance with U.S. federal income tax regulations. |
| (d) | Where applicable, excludes the effects of any sales charges and assumes the reinvestment of distributions. |
| (e) | Aggregate total return. |
| (f) | Includes the Fund’s share of the Series’ allocated net expenses and/or net investment income. |
| (g) | Includes the Fund’s share of the Series’ allocated fees waived of less than 0.01%. |
| (h) | Excludes fees and expenses incurred indirectly as a result of investments in underlying funds. |
| (j) | Includes reorganization costs, offering and board reorganization and consolidation expenses associated with the Fund’s reorganization. Without these expenses, total expenses and total expenses after fees waived and/or reimbursed would have been 0.38% and 0.35% respectively. |
| (k) | Reorganization costs, offering and board realignment and consolidation expenses were not annualized in the calculation of the expense ratios. If these expenses were annualized, the total expenses and total expenses after fees waived and/or reimbursed would have been 0.40% and 0.37% respectively. |
See notes to financial statements.
| | |
FUND FINANCIAL HIGHLIGHTS | | 55 |
Financial Highlights (continued)
(For a share outstanding throughout each period)
| | | | | | | | | | | | | | | | | | | | |
| | | iShares Russell 2000 Small-Cap Index Fund (continued) | |
| |
| | | Class K | |
| |
| | | Year Ended December 31, | |
| | | | | |
| | | | 2021 | | | | 2020 | | | | 2019 | | | | 2018 | | | | 2017 | |
| | | | | |
Net asset value, beginning of year | | $ | 24.26 | | | $ | 20.52 | | | $ | 16.91 | | | $ | 19.77 | | | $ | 17.79 | |
| | | | | | | | | | | | | | | | | | | | |
Net investment income(a) | | | 0.27 | | | | 0.24 | | | | 0.28 | | | | 0.30 | | | | 0.27 | |
Net realized and unrealized gain (loss) | | | 3.29 | | | | 3.85 | | | | 4.04 | | | | (2.43 | ) | | | 2.34 | |
| | | | | | | | | | | | | | | | | | | | |
| | | | | |
Net increase (decrease) from investment operations | | | 3.56 | | | | 4.09 | | | | 4.32 | | | | (2.13 | ) | | | 2.61 | |
| | | | | | | | | | | | | | | | | | | | |
| | | | | |
Distributions(b) | | | | | | | | | | | | | | | | | | | | |
From net investment income | | | (0.31 | ) | | | (0.26 | ) | | | (0.29 | ) | | | (0.20 | ) | | | (0.21 | ) |
From net realized gain | | | (1.67 | ) | | | (0.09 | ) | | | (0.42 | ) | | | (0.53 | ) | | | (0.42 | ) |
| | | | | | | | | | | | | | | | | | | | |
| | | | | |
Total distributions | | | (1.98 | ) | | | (0.35 | ) | | | (0.71 | ) | | | (0.73 | ) | | | (0.63 | ) |
| | | | | | | | | | | | | | | | | | | | |
| | | | | |
Net asset value, end of year | | $ | 25.84 | | | $ | 24.26 | | | $ | 20.52 | | | $ | 16.91 | | | $ | 19.77 | |
| | | | | | | | | | | | | | | | | | | | |
| | | | | |
Total Return(c) | | | | | | | | | | | | | | | | | | | | |
| | | | | |
Based on net asset value | | | 14.78 | % | | | 20.00 | % | | | 25.62 | % | | | (10.93 | )% | | | 14.69 | % |
| | | | | | | | | | | | | | | | | | | | |
| | | | | |
Ratios to Average Net Assets(d)(e)(f) | | | | | | | | | | | | | | | | | | | | |
Total expenses | | | 0.07 | % | | | 0.08 | % | | | 0.08 | % | | | 0.11 | %(g) | | | 0.14 | % |
| | | | | | | | | | | | | | | | | | | | |
| | | | | |
Total expenses after fees waived and/or reimbursed | | | 0.07 | % | | | 0.07 | % | | | 0.07 | % | | | 0.07 | %(g) | | | 0.07 | % |
| | | | | | | | | | | | | | | | | | | | |
| | | | | |
Net investment income | | | 0.99 | % | | | 1.26 | % | | | 1.44 | % | | | 1.44 | % | | | 1.40 | % |
| | | | | | | | | | | | | | | | | | | | |
| | | | | |
Supplemental Data | | | | | | | | | | | | | | | | | | | | |
Net assets, end of year (000) | | $ | 2,288,892 | | | $ | 1,835,475 | | | $ | 1,502,229 | | | $ | 945,929 | | | $ | 474,830 | |
| | | | | | | | | | | | | | | | | | | | |
| | | | | |
Portfolio turnover rate of the Series | | | 31 | % | | | 27 | % | | | 20 | % | | | 28 | % | | | 30 | % |
| | | | | | | | | | | | | | | | | | | | |
| (a) | Based on average Common Shares outstanding. |
| (b) | Distributions for annual periods determined in accordance with U.S. federal income tax regulations. |
| (c) | Where applicable, assumes the reinvestment of distributions. |
| (d) | Includes the Fund’s share of the Series’ allocated net expenses and/or net investment income. |
| (e) | Includes the Fund’s share of the Series’ allocated fees waived of less than 0.01%. |
| (f) | Excludes fees and expenses incurred indirectly as a result of investments in underlying funds. |
| (g) | Includes reorganization costs, offering and board reorganization and consolidation expenses associated with the Fund’s reorganization. Without these expenses, total expenses and total expenses after fees waived and/or reimbursed would have been 0.10% and 0.05% respectively. |
See notes to financial statements.
| | |
| 56 | | 2 0 2 1 BLACK ROCK ANNUAL REPORT TO SHAREHOLDERS |
Notes to Financial Statements
BlackRock FundsSM (the “Trust”) and BlackRock Index Funds, Inc. (the “Corporation”), are each registered under the Investment Company Act of 1940, as amended (the “1940 Act”), as open-end management investment companies. BlackRock FundsSM is organized as a Massachusetts business trust. BlackRock Index Funds, Inc. is organized as a Maryland corporation. The following, each of which is a series of one of BlackRock FundsSM or BlackRock Index Funds, Inc., are referred to herein collectively as the “Funds” or individually as a “Fund”:
| | | | | | |
| | | | |
| Registrant Name | | Fund Name | | Herein Referred To As | | Diversification
Classification |
| | | |
BlackRock FundsSM | | iShares Municipal Bond Index Fund | | Municipal Bond Index | | Diversified |
| | iShares Short-Term TIPS Bond Index Fund | | Short-Term TIPS Bond Index | | Diversified |
BlackRock Index Funds, Inc. | | iShares MSCI EAFE International Index Fund | | International Index | | Diversified |
| | | iShares Russell 2000 Small-Cap Index Fund | | Small Cap Index | | Diversified |
Small Cap Index seeks to achieve its investment objective by investing all of its assets in Master Small Cap Index Series (the “Series”), a series of Quantitative Master Series LLC (the “Master LLC”), and an affiliate of Small Cap Index, which has the same investment objective and strategies as Small Cap Index. The value of Small Cap Index’s investment in the Series reflects Small Cap Index’s proportionate interest in the net assets of the Series. The performance of Small Cap Index is directly affected by the performance of the Series. At December 31, 2021, the percentage of the Series owned by Small Cap Index was 73.7%. The financial statements of the Series, including the Schedule of Investments, are included elsewhere in this report and should be read in conjunction with Small Cap Index’s financial statements.
Each Fund offers multiple classes of shares. All classes of shares have identical voting, dividend, liquidation and other rights and are subject to the same terms and conditions, except that certain classes bear expenses related to the shareholder servicing and distribution of such shares. Institutional and Class K Shares are sold only to certain eligible investors. Investor A and Investor P Shares bear certain expenses related to shareholder servicing of such shares. Investor A Shares are generally available through financial intermediaries. Investor P Shares are only available through registered representatives of an insurance company’s broker-dealer that has entered into an agreement with the Fund’s distributor to offer such shares. Each class has exclusive voting rights with respect to matters relating to its shareholder servicing and distribution expenditures.
| | | | | | | | |
| | | | |
| Share Class | | Initial Sales Charge | | CDSC | | | Conversion Privilege |
| | | |
Institutional, Investor A and Class K Shares | | No | | | No | | | None |
Investor P Shares | | Yes | | | No | (a) | | None |
| | (a) | Investor P Shares may be subject to a contingent deferred sales charge (“CDSC”) for certain redemptions where no initial sales charge was paid at the time of purchase. | |
The Board of Trustees of the Trust and the Board of Directors of the Corporation are collectively referred to throughout this report as the “Board”, and the directors/trustees thereof are collectively referred to throughout this report as “Directors”.
The Funds, together with certain other registered investment companies advised by BlackRock Advisors, LLC (the “Manager”) or its affiliates, are included in a complex of open-end equity, multi-asset, index and money market funds referred to as the BlackRock Multi-Asset Complex.
| 2. | SIGNIFICANT ACCOUNTING POLICIES |
The financial statements are prepared in conformity with accounting principles generally accepted in the United States of America (“U.S. GAAP”), which may require management to make estimates and assumptions that affect the reported amounts of assets and liabilities in the financial statements, disclosure of contingent assets and liabilities at the date of the financial statements and the reported amounts of increases and decreases in net assets from operations during the reporting period. Actual results could differ from those estimates. Each Fund is considered an investment company under U.S. GAAP and follows the accounting and reporting guidance applicable to investment companies. Below is a summary of significant accounting policies:
Investment Transactions and Income Recognition: For Municipal Bond Index, Short-Term TIPS Bond Index and International Index, for financial reporting purposes, investment transactions are recorded on the dates the transactions are executed (the “trade dates”). Realized gains and losses on investment transactions are determined using the specific identification method. Dividend income and capital gain distributions, if any, are recorded on the ex-dividend dates. Non-cash dividends, if any, are recorded on the ex-dividend dates at fair value. Dividends from foreign securities where the ex-dividend dates may have passed are subsequently recorded when International Index is informed of the ex-dividend dates. Under the applicable foreign tax laws, a withholding tax at various rates may be imposed on capital gains, dividends and interest. Upon notification from issuers, a portion of the dividend income received from a real estate investment trust may be redesignated as a reduction of cost of the related investment and/or realized gain. Interest income, including amortization and accretion of premiums and discounts on debt securities. Income, expenses and realized and unrealized gains and losses are allocated daily to each class based on its relative net assets.
For Small Cap Index, for financial reporting purposes, contributions to and withdrawals from the Series are accounted for on a trade date basis. Small Cap Index records its proportionate share of the Series’ income, expenses and realized and unrealized gains and losses on a daily basis. Realized and unrealized gains and losses are adjusted utilizing partnership tax allocation rules. In addition, Small Cap Index accrues its own expenses. Income, expenses and realized and unrealized gains and losses are allocated daily to each class based on its relative net assets.
Foreign Currency Translation: Each Fund’s books and records are maintained in U.S. dollars. Securities and other assets and liabilities denominated in foreign currencies are translated into U.S. dollars using exchange rates determined as of the close of trading on the New York Stock Exchange (“NYSE”). Purchases and sales of investments are recorded at the rates of exchange prevailing on the respective dates of such transactions. Generally, when the U.S. dollar rises in value against a foreign currency, the investments denominated in that currency will lose value; the opposite effect occurs if the U.S. dollar falls in relative value.
| | |
FUND NOTES TO FINANCIAL STATEMENTS | | 57 |
Notes to Financial Statements (continued)
Each Fund does not isolate the effect of fluctuations in foreign exchange rates from the effect of fluctuations in the market prices of investments for financial reporting purposes. Accordingly, the effects of changes in exchange rates on investments are not segregated in the Statements of Operations from the effects of changes in market prices of those investments, but are included as a component of net realized and unrealized gain (loss) from investments. Each Fund reports realized currency gains (losses) on foreign currency related transactions as components of net realized gain (loss) for financial reporting purposes, whereas such components are generally treated as ordinary income for U.S. federal income tax purposes.
Foreign Taxes: The International Index may be subject to foreign taxes (a portion of which may be reclaimable) on income, stock dividends, capital gains on investments, or certain foreign currency transactions. All foreign taxes are recorded in accordance with the applicable foreign tax regulations and rates that exist in the foreign jurisdictions in which the Fund invests. These foreign taxes, if any, are paid by the Fund and are reflected in its Statements of Operations as follows: foreign taxes withheld at source are presented as a reduction of income, foreign taxes on securities lending income are presented as a reduction of securities lending income, foreign taxes on stock dividends are presented as “Foreign taxes withheld”, and foreign taxes on capital gains from sales of investments and foreign taxes on foreign currency transactions are included in their respective net realized gain (loss) categories. Foreign taxes payable or deferred as of December 31, 2021, if any, are disclosed in the Statements of Assets and Liabilities.
The Funds file withholding tax reclaims in certain jurisdictions to recover a portion of amounts previously withheld. The Funds may record a reclaim receivable based on collectability, which includes factors such as the jurisdiction’s applicable laws, payment history and market convention. The Statements of Operations include tax reclaims recorded as well as professional and other fees, if any, associated with recovery of foreign withholding taxes.
Segregation and Collateralization: In cases where a Fund enters into certain investments (e.g., futures contracts) that would be treated as “senior securities” for 1940 Act purposes, a Fund may segregate or designate on its books and records cash or liquid assets having a market value at least equal to the amount of its future obligations under such investments. Doing so allows the investments to be excluded from treatment as a “senior security.” Furthermore, if required by an exchange or counterparty agreement, the Funds may be required to deliver/deposit cash and/or securities to/with an exchange, or broker-dealer or custodian as collateral for certain investments or obligations.
Distributions: Distributions paid by International Index and Small Cap Index are recorded on the ex-dividend dates. Distributions from net investment income for Municipal Bond Index and Short-Term TIPS Bond Index are declared daily and paid monthly. Distributions of capital gains are recorded on the ex-dividend dates and made at least annually. The character and timing of distributions are determined in accordance with U.S. federal income tax regulations, which may differ from U.S. GAAP.
Indemnifications: In the normal course of business, a Fund enters into contracts that contain a variety of representations that provide general indemnification. A Fund’s maximum exposure under these arrangements is unknown because it involves future potential claims against a Fund, which cannot be predicted with any certainty.
Other: Expenses directly related to a Fund or its classes are charged to that Fund or the applicable class. Expenses directly related to the Funds and other shared expenses prorated to the Funds are allocated daily to each class based on their relative net assets or other appropriate methods. Other operating expenses shared by several funds, including other funds managed by the Manager, are prorated among those funds on the basis of relative net assets or other appropriate methods.
| 3. | INVESTMENT VALUATION AND FAIR VALUE MEASUREMENTS |
Investment Valuation Policies: Each Fund’s investments are valued at fair value (also referred to as “market value” within the financial statements) each day that the Fund is open for business and, for financial reporting purposes, as of the report date. U.S. GAAP defines fair value as the price a fund would receive to sell an asset or pay to transfer a liability in an orderly transaction between market participants at the measurement date. Each Fund determines the fair values of its financial instruments using various independent dealers or pricing services under policies approved by the Board. If a security’s market price is not readily available or does not otherwise accurately represent the fair value of the security, the security will be valued in accordance with a policy approved by the Board as reflecting fair value. Small Cap Index’s policy is to value its financial instruments at fair value. The BlackRock Global Valuation Methodologies Committee (the “Global Valuation Committee”) is the committee formed by management to develop global pricing policies and procedures and to oversee the pricing function for all financial instruments. Small Cap Index records its investment in the Series at fair value based on the Small Cap Index’s proportionate interest in the net assets of the Series. Valuation of securities held by the Series is discussed in Note 3 of the Series’ Notes to Financial Statements, which are included elsewhere in this report.
Fair Value Inputs and Methodologies: The following methods and inputs are used to establish the fair value of each Fund’s assets and liabilities:
| | • | | Equity investments traded on a recognized securities exchange are valued at that day’s official closing price, as applicable, on the exchange where the stock is primarily traded. Equity investments traded on a recognized exchange for which there were no sales on that day may be valued at the last available bid (long positions) or ask (short positions) price. |
| | • | | Fixed-income investments for which market quotations are readily available are generally valued using the last available bid price or current market quotations provided by independent dealers or third-party pricing services. Floating rate loan interests are valued at the mean of the bid prices from one or more independent brokers or dealers as obtained from a third-party pricing service. Pricing services generally value fixed-income securities assuming orderly transactions of an institutional round lot size, but a fund may hold or transact in such securities in smaller, odd lot sizes. Odd lots may trade at lower prices than institutional round lots. The pricing services may use matrix pricing or valuation models that utilize certain inputs and assumptions to derive values, including transaction data (e.g., recent representative bids and offers), market data, credit quality information, perceived market movements, news, and other relevant information. Certain fixed-income securities, including asset-backed and mortgage related securities may be valued based on valuation models that consider the estimated cash flows of each tranche of the entity, establish a benchmark yield and develop an estimated tranche specific spread to the benchmark yield based on the unique attributes of the tranche. The amortized cost method of valuation may be used with respect to debt obligations with sixty days or less remaining to maturity unless the Manager determines such method does not represent fair value. |
| | • | | Investments in open-end U.S. mutual funds (including money market funds) are valued at that day’s published net asset value (“NAV”). |
| | |
| 58 | | 2 0 2 1 BLACK ROCK ANNUAL REPORT TO SHAREHOLDERS |
Notes to Financial Statements (continued)
| | • | | Futures contracts are valued based on that day’s last reported settlement or trade price on the exchange where the contract is traded. |
Generally, trading in foreign instruments is substantially completed each day at various times prior to the close of trading on the NYSE. Each business day, the Funds use current market factors supplied by independent pricing services to value certain foreign instruments (“Systematic Fair Value Price”). The Systematic Fair Value Price is designed to value such foreign securities at fair value as of the close of trading on the NYSE, which follows the close of the local markets.
If events (e.g., market volatility, company announcement or a natural disaster) occur that are expected to materially affect the value of such investment, or in the event that application of these methods of valuation results in a price for an investment that is deemed not to be representative of the market value of such investment, or if a price is not available, the investment will be valued by the Global Valuation Committee, or its delegate, in accordance with a policy approved by the Board as reflecting fair value (“Fair Valued Investments”). The fair valuation approaches that may be used by the Global Valuation Committee include market approach, income approach and cost approach. Valuation techniques such as discounted cash flow, use of market comparables and matrix pricing are types of valuation approaches and are typically used in determining fair value. When determining the price for Fair Valued Investments, the Global Valuation Committee, or its delegate, seeks to determine the price that each Fund might reasonably expect to receive or pay from the current sale or purchase of that asset or liability in an arm’s-length transaction. Fair value determinations shall be based upon all available factors that the Global Valuation Committee, or its delegate, deems relevant and consistent with the principles of fair value measurement. The pricing of all Fair Valued Investments is subsequently reported to the Board or a committee thereof on a quarterly basis.
For investments in equity or debt issued by privately held companies or funds (“Private Company” or collectively, the “Private Companies”) and other Fair Valued Investments, the fair valuation approaches that are used by the Global Valuation Committee and third-party pricing services utilize one or a combination of, but not limited to, the following inputs.
| | | | |
| | |
| | | Standard Inputs Generally Considered By Third-Party Pricing Services |
| | |
Market approach | | (i) | | recent market transactions, including subsequent rounds of financing, in the underlying investment or comparable issuers; |
| | (ii) | | recapitalizations and other transactions across the capital structure; and |
| | (iii) | | market multiples of comparable issuers. |
| | | |
Income approach | | (i) | | future cash flows discounted to present and adjusted as appropriate for liquidity, credit, and/or market risks; |
| | (ii) | | quoted prices for similar investments or assets in active markets; and |
| | (iii) | | other risk factors, such as interest rates, yield curves, volatilities, prepayment speeds, loss severities, credit risks, recovery rates, liquidation amounts and/or default rates. |
| | | |
Cost approach | | (i) | | audited or unaudited financial statements, investor communications and financial or operational metrics issued by the Private Company; |
| | (ii) | | changes in the valuation of relevant indices or publicly traded companies comparable to the Private Company; |
| | (iii) | | relevant news and other public sources; and |
| | | (iv) | | known secondary market transactions in the Private Company’s interests and merger or acquisition activity in companies comparable to the Private Company. |
Investments in series of preferred stock issued by Private Companies are typically valued utilizing market approach in determining the enterprise value of the company. Such investments often contain rights and preferences that differ from other series of preferred and common stock of the same issuer. Enterprise valuation techniques such as an option pricing model (“OPM”), a probability weighted expected return model (“PWERM”), current value method or a hybrid of those techniques are used as deemed appropriate under the circumstances. The use of these valuation techniques involve a determination of the exit scenarios of the investment in order to appropriately allocate the enterprise value of the company among the various parts of its capital structure.
The Private Companies are not subject to the public company disclosure, timing, and reporting standards applicable to other investments held by a Fund. Typically, the most recently available information by a Private Company is as of a date that is earlier than the date a Fund is calculating its NAV. This factor may result in a difference between the value of the investment and the price a Fund could receive upon the sale of the investment.
Fair Value Hierarchy: Various inputs are used in determining the fair value of financial instruments. These inputs to valuation techniques are categorized into a fair value hierarchy consisting of three broad levels for financial reporting purposes as follows:
| | • | | Level 1 – Unadjusted price quotations in active markets/exchanges for identical assets or liabilities that each Fund has the ability to access; |
| | • | | Level 2 – Other observable inputs (including, but not limited to, quoted prices for similar assets or liabilities in markets that are active, quoted prices for identical or similar assets or liabilities in markets that are not active, inputs other than quoted prices that are observable for the assets or liabilities (such as interest rates, yield curves, volatilities, prepayment speeds, loss severities, credit risks and default rates) or other market–corroborated inputs); and |
| | • | | Level 3 – Unobservable inputs based on the best information available in the circumstances, to the extent observable inputs are not available (including the Global Valuation Committee’s assumptions used in determining the fair value of financial instruments). |
The hierarchy gives the highest priority to unadjusted quoted prices in active markets for identical assets or liabilities (Level 1 measurements) and the lowest priority to unobservable inputs (Level 3 measurements). Accordingly, the degree of judgment exercised in determining fair value is greatest for instruments categorized in Level 3. The inputs used to measure fair value may fall into different levels of the fair value hierarchy. In such cases, for disclosure purposes, the fair value hierarchy classification is determined based on the lowest level input that is significant to the fair value measurement in its entirety. Investments classified within Level 3 have significant unobservable inputs used by the Global Valuation Committee in determining the price for Fair Valued Investments. Level 3 investments include equity or debt issued by Private Companies that may not have a secondary market and/or may have a limited number of investors. The categorization of a value determined for financial instruments is based on the pricing transparency of the financial instruments and is not necessarily an indication of the risks associated with investing in those securities.
| | |
FUND NOTES TO FINANCIAL STATEMENTS | | 59 |
Notes to Financial Statements (continued)
| 4. | SECURITIES AND OTHER INVESTMENTS |
Inflation-Indexed Bonds: Inflation-indexed bonds (other than municipal inflation-indexed and certain corporate inflation-indexed bonds) are fixed-income securities whose principal value is periodically adjusted according to the rate of inflation. If the index measuring inflation rises or falls, the principal value of inflation-indexed bonds (other than municipal inflation-indexed and certain corporate inflation-indexed bonds) will be adjusted upward or downward, and consequently the interest payable on these securities (calculated with respect to a larger or smaller principal amount) will be increased or reduced, respectively. Any upward or downward adjustment in the principal amount of an inflation-indexed bond is included as interest income in the Statements of Operations, even though investors do not receive their principal until maturity. Repayment of the original bond principal upon maturity (as adjusted for inflation) is guaranteed in the case of U.S. Treasury inflation-indexed bonds. For bonds that do not provide a similar guarantee, the adjusted principal value of the bond repaid at maturity may be less than the original principal. With regard to municipal inflation-indexed bonds and certain corporate inflation-indexed bonds, the inflation adjustment is typically reflected in the semi-annual coupon payment. As a result, the principal value of municipal inflation-indexed bonds and such corporate inflation-indexed bonds does not adjust according to the rate of inflation.
Zero-Coupon Bonds: Zero-coupon bonds are normally issued at a significant discount from face value and do not provide for periodic interest payments. These bonds may experience greater volatility in market value than other debt obligations of similar maturity which provide for regular interest payments.
Preferred Stocks: Preferred stock has a preference over common stock in liquidation (and generally in receiving dividends as well), but is subordinated to the liabilities of the issuer in all respects. As a general rule, the market value of preferred stock with a fixed dividend rate and no conversion element varies inversely with interest rates and perceived credit risk, while the market price of convertible preferred stock generally also reflects some element of conversion value. Because preferred stock is junior to debt securities and other obligations of the issuer, deterioration in the credit quality of the issuer will cause greater changes in the value of a preferred stock than in a more senior debt security with similar stated yield characteristics. Unlike interest payments on debt securities, preferred stock dividends are payable only if declared by the issuer’s board of directors. Preferred stock also may be subject to optional or mandatory redemption provisions.
Securities Lending: Certain Funds may lend their securities to approved borrowers, such as brokers, dealers and other financial institutions. The borrower pledges and maintains with the Funds collateral consisting of cash, an irrevocable letter of credit issued by a bank, or securities issued or guaranteed by the U.S. Government. The initial collateral received by each Fund is required to have a value of at least 102% of the current value of the loaned securities for securities traded on U.S. exchanges and a value of at least 105% for all other securities. The collateral is maintained thereafter at a value equal to at least 100% of the current market value of the securities on loan. The market value of the loaned securities is determined at the close of each business day of the Fund and any additional required collateral is delivered to the Fund, or excess collateral returned by the Fund, on the next business day. During the term of the loan, the Funds are entitled to all distributions made on or in respect of the loaned securities, but do not receive interest income on securities received as collateral. Loans of securities are terminable at any time and the borrower, after notice, is required to return borrowed securities within the standard time period for settlement of securities transactions.
As of period end, any securities on loan were collateralized by cash and/or U.S. Government obligations. Cash collateral invested by the securities lending agent, BlackRock Institutional Trust Company, N.A. (“BTC”), if any, is disclosed in the Schedules of Investments. Any non-cash collateral received cannot be sold, re-invested or pledged by the Fund, except in the event of borrower default. The securities on loan, if any, are disclosed in the Funds Schedules of Investments. The market value of any securities on loan and the value of any related collateral are shown separately in the Statements of Assets and Liabilities as a component of investments at value — unaffiliated and collateral on securities loaned at value, respectively.
Securities lending transactions are entered into by the Funds under Master Securities Lending Agreements (each, an “MSLA”), which provide the right, in the event of default (including bankruptcy or insolvency), for the non-defaulting party to liquidate the collateral and calculate a net exposure to the defaulting party or request additional collateral. In the event that a borrower defaults, the Funds, as lender, would offset the market value of the collateral received against the market value of the securities loaned. When the value of the collateral is greater than that of the market value of the securities loaned, the lender is left with a net amount payable to the defaulting party. However, bankruptcy or insolvency laws of a particular jurisdiction may impose restrictions on or prohibitions against such a right of offset in the event of an MSLA counterparty’s bankruptcy or insolvency. Under the MSLA, absent an event of default, the borrower can resell or re-pledge the loaned securities, and a Fund can reinvest cash collateral received in connection with loaned securities. Upon an event of default, the parties’ obligations to return the securities or collateral to the other party are extinguished, and the parties can resell or re-pledge the loaned securities or the collateral received in connection with the loaned securities in order to satisfy the defaulting party’s net payment obligation for all transactions under the MSLA. The defaulting party remains liable for any deficiency.
As of period end, the following table is a summary of the International Index securities on loan by counterparty which are subject to offset under an MSLA:
| | | | | | | | | | | | | | | | | | | | | | | | | | | | | | | | |
| | | | | | |
| | | | | |
| Securities
|
| |
| Cash Collateral
|
| |
| Non-Cash Collateral
|
| |
| Net
|
|
Counterparty | | | Loaned at Value | | | | | | | | Received | (a) | | | | | | | Received at Fair Value | (a) | | | Amount | |
| | | | | | | | |
Credit Suisse Securities (USA) LLC | | | | | | $ | 1,527,009 | | | | | | | $ | (1,527,009 | ) | | | | | | $ | — | | | | | | | $ | — | |
Goldman Sachs & Co. LLC | | | | | | | 1,700,693 | | | | | | | | (1,700,693 | ) | | | | | | | — | | | | | | | | — | |
J.P. Morgan Securities LLC | | | | | | | 3,038,638 | | | | | | | | (3,038,638 | ) | | | | | | | — | | | | | | | | — | |
Morgan Stanley & Co. LLC | | | | | | | 8,710,380 | | | | | | | | (8,710,380 | ) | | | | | | | — | | | | | | | | — | |
Wells Fargo Bank N.A. | | | | | | | 2,112,773 | | | | | | | | (2,112,773 | ) | | | | | | | — | | | | | | | | — | |
| | | | | | | | | | | | | | | | | | | | | | | | | | | | | | | | |
| | | | | | | | |
| | | | | | $ | 17,089,493 | | | | | | | $ | (17,089,493 | ) | | | | | | $ | — | | | | | | | $ | — | |
| | | | | | | | | | | | | | | | | | | | | | | | | | | | | | | | |
| | (a) | Collateral received in excess of the market value of securities on loan is not presented in this table. The total cash collateral received by each Fund is disclosed in the Fund’s Statements of Assets and Liabilities. | |
The risks of securities lending include the risk that the borrower may not provide additional collateral when required or may not return the securities when due. To mitigate these risks, the Funds benefit from a borrower default indemnity provided by BlackRock, Inc. (“BlackRock”). BlackRock’s indemnity allows for full replacement of the securities loaned to the extent the collateral received does not cover the value on the securities loaned in the event of borrower default. Each Fund could incur a loss if the value of an
| | |
| 60 | | 2 0 2 1 BLACK ROCK ANNUAL REPORT TO SHAREHOLDERS |
Notes to Financial Statements (continued)
investment purchased with cash collateral falls below the market value of loaned securities or if the value of an investment purchased with cash collateral falls below the value of the original cash collateral received. Such losses are borne entirely by the Funds.
| 5. | DERIVATIVE FINANCIAL INSTRUMENTS |
The Funds engage in various portfolio investment strategies using derivative contracts both to increase the returns of the Funds and/or to manage their exposure to certain risks such as credit risk, equity risk, interest rate risk, foreign currency exchange rate risk, commodity price risk or other risks (e.g., inflation risk). Derivative financial instruments categorized by risk exposure are included in the Schedules of Investments. These contracts may be transacted on an exchange or over-the-counter (“OTC”).
Futures Contracts: Futures contracts are purchased or sold to gain exposure to, or manage exposure to, changes in interest rates (interest rate risk) and changes in the value of equity securities (equity risk) or foreign currencies (foreign currency exchange rate risk).
Futures contracts are exchange-traded agreements between the Funds and a counterparty to buy or sell a specific quantity of an underlying instrument at a specified price and on a specified date. Depending on the terms of a contract, it is settled either through physical delivery of the underlying instrument on the settlement date or by payment of a cash amount on the settlement date. Upon entering into a futures contract, the Funds are required to deposit initial margin with the broker in the form of cash or securities in an amount that varies depending on a contract’s size and risk profile. The initial margin deposit must then be maintained at an established level over the life of the contract. Amounts pledged, which are considered restricted, are included in cash pledged for futures contracts in the Statements of Assets and Liabilities.
Securities deposited as initial margin are designated in the Schedules of Investments and cash deposited, if any, are shown as cash pledged for futures contracts in the Statements of Assets and Liabilities. Pursuant to the contract, the Funds agree to receive from or pay to the broker an amount of cash equal to the daily fluctuation in market value of the contract (“variation margin”). Variation margin is recorded as unrealized appreciation (depreciation) and, if any, shown as variation margin receivable (or payable) on futures contracts in the Statements of Assets and Liabilities. When the contract is closed, a realized gain or loss is recorded in the Statements of Operations equal to the difference between the notional amount of the contract at the time it was opened and the notional amount at the time it was closed. The use of futures contracts involves the risk of an imperfect correlation in the movements in the price of futures contracts and interest rates, foreign currency exchange rates or underlying assets.
| 6. | INVESTMENT ADVISORY AGREEMENT AND OTHER TRANSACTIONS WITH AFFILIATES |
Investment Advisory: Each of the Trust and the Corporation, on behalf of the Funds, entered into an Investment Advisory Agreement with the Manager, the Funds’ investment adviser and an indirect, wholly-owned subsidiary of BlackRock, Inc. (“BlackRock”), to provide investment advisory and administrative services. The Manager is responsible for the management of each Fund’s portfolio and provides the personnel, facilities, equipment and certain other services necessary to the operations of each Fund.
For such services, each Fund pays the Manager a monthly fee at an annual rate equal to the following percentages of the average daily value of each Fund’s net assets.
| | | | | | | | | | |
| | | | |
| | | Municipal Bond Index | | | Short-Term TIPS Bond Index | | | International Index |
| | | |
Investment advisory fees | | | 0.10 | % | | | 0.01 | % | | 0.01% |
Service Fees: The Funds entered into a Distribution Agreement and Distribution and Service Plans with BlackRock Investments, LLC (“BRIL”), an affiliate of the Manager. Pursuant to the Distribution and Service Plan and in accordance with Rule 12b-1 under the 1940 Act, each Fund pays BRIL ongoing service and distribution fees. The fees are accrued daily and paid monthly at annual rates based upon the average daily net assets of the relevant share class of each Fund as follows:
| | | | | | | | | | | | | | | | | | | | | | | | | | | | | | | | | | | | |
| | | | | | |
| | | | | Municipal Bond Index | | | Short-Term TIPS Bond Index | | | International Index | | | Small Cap Index | | | |
| | | | | | | | | | | | | | | | | | | | |
| | | | | | | | | | |
| | | Share
Class | | Service Fees | | | Distribution Fees | | | Service Fees | | | Distribution Fees | | | Service Fees | | | Distribution Fees | | | Service Fees | | | Distribution Fees | | | |
| | | | | | | | | | |
| | Investor A | | | 0.25 | % | | | N/A | | | | 0.25 | % | | | N/A | | | | 0.25 | % | | | N/A | | | | 0.25 | % | | | N/A | | | |
| | Investor P | | | 0.25 | | | | N/A | | | | N/A | | | | N/A | | | | 0.25 | | | | N/A | | | | 0.25 | | | | N/A | | | |
BRIL and broker-dealers, pursuant to sub-agreements with BRIL, provide shareholder servicing and distribution services to the Funds. The ongoing service and/or distribution fee compensates BRIL and each broker-dealer for providing shareholder servicing and/or distribution related services to shareholders.
For the year ended December 31, 2021, the following table shows the class specific service and distribution fees borne directly by each share class of each Fund:
| | | | | | | | | | |
| | | | |
| Fund Name | | Investor A | | | Investor P | | | Total |
| | | |
Municipal Bond Index | | $ | 59,315 | | | $ | 763,640 | | | $ 822,955 |
Short-Term TIPS Bond Index | | | 3,781 | | | | — | | | 3,781 |
International Index | | | 944,772 | | | | 382,168 | | | 1,326,940 |
Small Cap Index | | | 663,459 | | | | 911,771 | | | 1,575,230 |
Administration: The Corporation, on behalf of Small Cap Index and International Index, entered into an Administration Agreement with BlackRock Advisors, LLC (the “Administrator”), an indirect, wholly-owned subsidiary of BlackRock, to provide administrative services (other than investment advice and related portfolio activities). For such services, Small Cap Index pays the Administrator a monthly fee at an annual rate of 0.04% of the average daily net assets of Small Cap Index. Small Cap Index does not pay an investment advisory fee or investment management fee. Effective January 1, 2021 for International Index, the Administrator is entitled to receive for these administrative services an annual fee of 0.08% based on the average daily net assets of each Fund’s Institutional, Investor A and Investor P Shares and 0.03% of the average daily net assets of Class K Shares.
| | |
FUND NOTES TO FINANCIAL STATEMENTS | | 61 |
Notes to Financial Statements (continued)
For the year ended December 31, 2021, the following table shows the class specific administration fees borne directly by each share class of each Fund:
| | | | | | | | | | | | | | | | | | | | |
| | | | | | |
| Fund Name | | Institutional | | | Investor A | | | Investor P | | | Class K | | | Total | |
| | | | | |
International Index | | $ | 863,518 | | | $ | 302,360 | | | $ | 122,296 | | | $ | 1,822,881 | | | $ | 3,111,055 | |
Transfer Agent: Pursuant to written agreements, certain financial intermediaries, some of which may be affiliates, provide the Funds with sub-accounting, recordkeeping, sub-transfer agency and other administrative services with respect to servicing of underlying investor accounts. For these services, these entities receive an asset-based fee or an annual fee per shareholder account, which will vary depending on share class and/or net assets. For the year ended December 31, 2021, the Funds did not pay any amounts to affiliates in return for these services.
The Manager maintains a call center that is responsible for providing certain shareholder services to the Funds. Shareholder services include responding to inquiries and processing purchases and sales based upon instructions from shareholders. For the year ended December 31, 2021, each Fund reimbursed the Manager the following amounts for costs incurred in running the call center, which are included in transfer agent — class specific in the Statements of Operations:
| | | | | | | | | | | | | | | | | | | | |
| |
| | | | | |
| Fund Name | | Institutional | | | Investor A | | | Investor P | | | Class K | | | Total | |
| |
| | | | | |
Municipal Bond Index | | $ | 30 | | | $ | 7,182 | | | $ | 1,327 | | | $ | 17 | | | $ | 8,556 | |
Short-Term TIPS Bond Index | | | 54 | | | | 533 | | | | — | | | | 1,023 | | | | 1,610 | |
Small Cap Index | | | 6,324 | | | | 34,055 | | | | 3,914 | | | | 4,995 | | | | 49,288 | |
| |
For the year ended December 31, 2021, the following table shows the class specific transfer agent fees borne directly by each share class of each Fund:
| | | | | | | | | | | | | | | | | | | | |
| |
| | | | | |
| Fund Name | | Institutional | | | Investor A | | | Investor P | | | Class K | | | Total | |
| |
| | | | | |
Municipal Bond Index | | $ | 5,358 | | | $ | 21,208 | | | $ | 167,141 | | | $ | 67 | | | $ | 193,774 | |
Short-Term TIPS Bond Index | | | 98 | | | | 2,736 | | | | — | | | | 12,165 | | | | 14,999 | |
Small Cap Index | | | 268,945 | | | | 240,240 | | | | 257,364 | | | | 80,397 | | | | 846,946 | |
| |
Other Fees: For the year ended December 31, 2021, affiliates earned underwriting discounts, direct commissions and dealer concessions on sales of each Fund’s Investor P Shares as follows:
| | |
| | |
| Fund Name | | Investor P |
| |
Municipal Bond Index | | $ 11,383 |
International Index | | 10,407 |
Small Cap Index | | 22,525 |
For the year ended December 31, 2021, affiliates received CDSCs as follows:
| | |
| | |
| Fund Name | | Investor P |
| |
Municipal Bond Index | | $ 179 |
Small Cap Index | | 8 |
Expense Limitations, Waivers, Reimbursements, and Recoupments: The Manager contractually agreed to waive its investment advisory fees by the amount of investment advisory fees each Fund pays to the Manager indirectly through its investment in affiliated money market funds (the “affiliated money market fund waiver”) through June 30, 2023 with respect to Municipal Bond Index, Short-Term TIPS Bond Index and International Index. The contractual agreement may be terminated upon 90 days’ notice by a majority of the directors who are not “interested persons” of the Trust or the Corporation, as defined in the 1940 Act (“Independent Directors”), or by a vote of a majority of the outstanding voting securities of a Fund. The amount of waivers and/or reimbursements of fees and expenses made pursuant to the expense limitations described below will be reduced by the amount of the affiliated money market fund waiver. These amounts are included in fees waived and/or reimbursed by the Manager in the Statements of Operations. For the year ended December 31, 2021, the amounts waived were as follows:
| | | | |
| | |
| Fund Name | | Fees Waived and/or Reimbursed by the Manager | |
| |
Municipal Bond Index | | $ | 1,120 | |
Short-Term TIPS Bond Index | | | 1,377 | |
International Index | | | 10,986 | |
The Manager has contractually agreed to waive its investment advisory fee with respect to any portion of each Fund’s assets invested in affiliated equity and fixed-income mutual funds and affiliated exchange-traded funds that have a contractual management fee through June 30, 2023 with respect to Municipal Bond Index, Short-Term TIPS Bond Index and International Index. The contractual agreement may be terminated upon 90 days’ notice by a majority of the Independent Trustees, or by a vote of a majority of the outstanding voting securities of a Fund. For the year ended December 31, 2021, there were no fees waived and/or reimbursed by the Manager pursuant to this arrangement.
The Manager contractually agreed to waive and/or reimburse fees or expenses in order to limit expenses, excluding interest expense, dividend expense, tax expense, acquired fund fees and expenses, and certain other fund expenses, which constitute extraordinary expenses not incurred in the ordinary course of each Fund’s business (“expense limitation”). The expense limitations as a percentage of average daily net assets are as follows:
| | | | | | | | | | | | | | | | |
| |
| | | | |
| Fund Name | | Institutional | | | Investor A | | | Investor P | | | Class K | |
| |
| | | | |
Municipal Bond Index | | | 0.25 | % | | | 0.50 | % | | | 0.50 | % | | | 0.20 | % |
| |
| | |
| 62 | | 2 0 2 1 BLACK ROCK ANNUAL REPORT TO SHAREHOLDERS |
Notes to Financial Statements (continued)
| | | | | | | | | | | | | | | | |
| |
| | | | |
| Fund Name | | Institutional | | | Investor A | | | Investor P | | | Class K | |
| |
Short-Term TIPS Bond Index | | | 0.11 | % | | | 0.36 | % | | | — | | | | 0.06 | % |
Small Cap Index | | | 0.12 | | | | 0.37 | | | | 0.37 | % | | | 0.07 | |
| |
The Manager has agreed not to reduce or discontinue the contractual expense limitations through June 30, 2023 with respect to Municipal Bond Index, Short-Term TIPS Bond Index and Small-Cap Index, unless approved by the Board, including a majority of the Independent Directors, or by a vote of a majority of the outstanding voting securities of a Fund. For the year ended December 31, 2021, amounts included in the Statements of Operations were as follows:
| | | | | | | | |
| |
| | |
| Fund Name | | Fees Waived and/or Reimbursed by the Manager | | | Fees Waived and/or Reimbursed by the Administrator | |
| |
| | |
Municipal Bond Index | | $ | 1,981 | | | $ | — | |
Short-Term TIPS Bond Index | | | 165,815 | | | | — | |
Small Cap Index | | | — | | | | 4,369 | |
| |
With respect to International Index, the fees and expenses of the Fund’s Independent Trustees, counsel to the Independent Trustees and the Fund’s independent registered public accounting firm (together, the “independent expenses”) are paid directly by the Fund. The manager has contractually agreed to reimburse the Fund or provide an offsetting credit for such independent expenses through June 30, 2031. This amount is included in fees waived and/or reimbursed by the Manager in the Statement of Operations. For the year ended December 31, 2021, the amount waived and/or reimbursed was $174,224.
For the year ended December 31, 2021, class specific expense waivers and/or reimbursements are as follows:
| | | | | | | | | | | | | | | | | | | | |
| |
| |
| | | Transfer Agent Fees Waived and/or Reimbursed - Class Specific | |
| | | | |
| | | | | |
| Fund Name | | Institutional | | | Investor A | | | Investor P | | | Class K | | | Total | |
| |
| | | | | |
Municipal Bond Index | | $ | 189 | | | $ | 5,974 | | | $ | 4,062 | | | $ | 52 | | | $ | 10,277 | |
Short-Term TIPS Bond Index | | | — | | | | 1,982 | | | | — | | | | 12,163 | | | | 14,145 | |
Small Cap Index | | | 16,698 | | | | 86,453 | | | | 45,416 | | | | 2,048 | | | | 150,615 | |
| |
With respect to the contractual expense limitation, if during a Fund’s fiscal year the operating expenses of a share class, that at any time during the prior two fiscal years received a waiver and/or reimbursement from the Manager, are less than the current expense limitation for that share class, the Manager is entitled to be reimbursed by such share class up to the lesser of: (a) the amount of fees waived and/or expenses reimbursed during those prior two fiscal years under the agreement and (b) an amount not to exceed either the current expense limitation of that share class or the expense limitation of the share class in effect at the time that the share class received the applicable waiver and/or reimbursement, provided that:
| | (1) | each Fund, of which the share class is a part, has more than $50 million in assets for the fiscal year, and |
| | (2) | the Manager or an affiliate continues to serve as a Fund’s investment adviser or administrator. |
This repayment applies only to the contractual expense limitation on net expenses and does not apply to the contractual investment advisory fee waiver described above or any voluntary waivers that may be in effect from time to time. Effective February 16, 2023 for Short-Term TIPS Bond Index and November 16, 2025 for Municipal Bond Index, the repayment arrangement between each Fund and the Manager pursuant to which such Fund may be required to repay amounts waived and/or reimbursed under each Fund’s contractual caps on net expenses will be terminated.
For the year ended December 31, 2021, the Manager recouped the following fund level and class specific waivers and/or reimbursements previously recorded by the Funds:
| | | | | | | | |
| | | |
| Fund Name | | Institutional | | | Investor P | |
| | |
Municipal Bond Index | | $ | 52 | | | $ | 9,527 | |
Short-Term TIPS Bond Index | | | 886 | | | | — | |
As of December 31, 2021, the fund level and class specific waivers and/or reimbursements subject to possible future recoupment under the expense limitation agreement are as follows:
| | | | | | | | |
| |
| |
| | | Expiring | |
| | | | |
| | |
| Fund Name/Fund Level/Share Class | | December 31, 2022 | | | December 31, 2023 | |
| |
| | |
Municipal Bond Index | | | | | | | | |
Fund Level | | $ | 16,665 | | | $ | 1,981 | |
Institutional | | | — | | | | 189 | |
Investor A | | | 3,359 | | | | 5,974 | |
Investor P | | | — | | | | 4,062 | |
Class K | | | 35 | | | | 52 | |
| |
| | | | | | | | |
| | | | | | | | |
| |
| |
| | | Expiring | |
| | | | |
| | |
| Fund Name/Fund Level/Share Class | | December 31, 2022 | | | February 16, 2023 | |
| |
| | |
Short-Term TIPS Bond Index | | | | | | | | |
Fund Level | | $ | 202,508 | | | $ | 165,815 | |
| |
| | |
FUND NOTES TO FINANCIAL STATEMENTS | | 63 |
Notes to Financial Statements (continued)
| | | | |
|
| |
| | | Expiring |
| | |
| Fund Name/Fund Level/Share Class | | December 31, 2022 | | February 16, 2023 |
|
Institutional | | — | | — |
Investor A | | 1,581 | | 1,982 |
Class K | | 8,574 | | 12,163 |
|
The following fund level and class specific waivers and/or reimbursements previously recorded by the Funds, which were subject to recoupment by the Manager, expired on December 31, 2021:
| | | | |
| |
| |
| Fund Name/Fund Level/Share Class | | Expired December 31, 2021 | |
| |
| |
Municipal Bond Index | | | | |
Fund Level | | $ | 117,994 | |
Institutional | | | — | |
Investor A | | | 20,437 | |
Investor P | | | — | |
Class K | | | 38 | |
Short-Term TIPS Bond Index | | | | |
Fund Level | | | 178,375 | |
Institutional | | | — | |
Investor A | | | 1,410 | |
Class K | | | 3,831 | |
| |
Securities Lending: The U.S. Securities and Exchange Commission (“SEC”) has issued an exemptive order which permits BTC, an affiliate of the Manager, to serve as securities lending agent for the Funds, subject to applicable conditions. As securities lending agent, BTC bears all operational costs directly related to securities lending, including any custodial costs. The Funds are responsible for fees in connection with the investment of cash collateral received for securities on loan (the “collateral investment fees”). The cash collateral is invested in a money market fund, BlackRock Cash Funds: Institutional or BlackRock Cash Funds: Treasury, managed by the Manager or its affiliates. However, BTC has agreed to reduce the amount of securities lending income it receives in order to effectively limit the collateral investment fees the Funds bear to an annual rate of 0.04%. The SL Agency Shares of such money market fund will not be subject to a sales load, distribution fee or service fee. The money market fund in which the cash collateral has been invested may, under certain circumstances, impose a liquidity fee of up to 2% of the value redeemed or temporarily restrict redemptions for up to 10 business days during a 90 day period, in the event that the money market fund’s weekly liquid assets fall below certain thresholds.
Securities lending income is equal to the total of income earned from the reinvestment of cash collateral, net of fees and other payments to and from borrowers of securities, and less the collateral investment fees. Each Fund retains a portion of securities lending income and remits a remaining portion to BTC as compensation for its services as securities lending agent.
Pursuant to the current securities lending agreement, each Fund retains 82% of securities lending income (which excludes collateral investment fees), and this amount retained can never be less than 70% of the total of securities lending income plus the collateral investment fees.
In addition, commencing the business day following the date that the aggregate securities lending income earned across the BlackRock Multi-Asset Complex in a calendar year exceeds a specified threshold, each Fund, pursuant to the securities lending agreement, will retain for the remainder of that calendar year securities lending income in an amount equal to 85% of securities lending income (which excludes collateral investment fees), and this amount retained can never be less than 70% of the total of securities lending income plus the collateral investment fees.
The share of securities lending income earned by each Fund is shown as securities lending income — affiliated — net in the Statements of Operations. For the year ended December 31, 2021, each Fund paid BTC the following amounts for securities lending agent services:
| | | | |
| |
| |
| Fund Name | | Amounts | |
| |
Short-Term TIPS Bond Index | | $ | 827 | |
International Index | | | 71,853 | |
| |
Interfund Lending: In accordance with an exemptive order (the “Order”) from the SEC, each Fund may participate in a joint lending and borrowing facility for temporary purposes (the “Interfund Lending Program”), subject to compliance with the terms and conditions of the Order, and to the extent permitted by each Fund’s investment policies and restrictions. Each Fund is currently permitted to borrow and lend under the Interfund Lending Program.
A lending BlackRock fund may lend in aggregate up to 15% of its net assets but may not lend more than 5% of its net assets to any one borrowing fund through the Interfund Lending Program. A borrowing BlackRock fund may not borrow through the Interfund Lending Program or from any other source more than 33 1/3% of its total assets (or any lower threshold provided for by the fund’s investment restrictions). If a borrowing BlackRock fund’s total outstanding borrowings exceed 10% of its total assets, each of its outstanding interfund loans will be subject to collateralization of at least 102% of the outstanding principal value of the loan. All interfund loans are for temporary or emergency purposes and the interest rate to be charged will be the average of the highest current overnight repurchase agreement rate available to a lending fund and the bank loan rate, as calculated according to a formula established by the Board.
| | |
| 64 | | 2 0 2 1 BLACK ROCK ANNUAL REPORT TO SHAREHOLDERS |
Notes to Financial Statements (continued)
During the year ended December 31, 2021, the Funds did not participate in the Interfund Lending Program.
Directors and Officers: Certain directors and/or officers of the Trust and the Corporation are directors and/or officers of BlackRock or its affiliates. The Funds reimburse the Manager for a portion of the compensation paid to the Trust’s and the Corporation’s Chief Compliance Officer, which is included in Directors and Officer in the Statements of Operations.
Other Transactions: International Index may purchase securities from, or sell securities to, an affiliated fund provided the affiliation is due solely to having a common investment adviser, common officers, or common directors. For the year ended December 31, 2021, the purchase and sale transactions and any net realized gains (losses) with affiliated funds in compliance with Rule 17a-7 under the 1940 Act were as follows:
| | | | | | | | | | | | |
| |
| | | |
| Fund Name | | Purchases | | | Sales | | | Net Realized Gain (Loss) | |
| |
| | | |
International Index | | $ | 263,173,808 | | | $ | 17,729,883 | | | $ | (1,091,789 | ) |
| |
For the year ended December 31, 2021, purchases and sales of investments, excluding short-term investments, were as follows:
| | | | | | | | |
| |
| | |
| Fund Name | | Purchases | | | Sales | |
| |
| | |
Municipal Bond Index | | $ | 23,545,258 | | | $ | 31,134,850 | |
Short-Term TIPS Bond Index | | | 49,861,843 | | | | 7,590,065 | |
International Index | | | 1,493,139,538 | | | | 208,046,846 | |
| |
It is each Fund’s policy to comply with the requirements of the Internal Revenue Code of 1986, as amended, applicable to regulated investment companies, and to distribute substantially all of its taxable income to its shareholders. Therefore, no U.S. federal income tax provision is required.
Each Fund files U.S. federal and various state and local tax returns. No income tax returns are currently under examination. The statute of limitations on each Fund’s U.S. federal tax returns generally remains open for a period of three fiscal years after they are filed. The statutes of limitations on each Fund’s state and local tax returns may remain open for an additional year depending upon the jurisdiction.
Management has analyzed tax laws and regulations and their application to the Funds as of December 31, 2021, inclusive of the open tax return years, and does not believe that there are any uncertain tax positions that require recognition of a tax liability in the Funds’ financial statements.
U.S. GAAP requires that certain components of net assets be adjusted to reflect permanent differences between financial and tax reporting. These reclassifications have no effect on net assets or NAVs per share. As of period end, permanent differences attributable to certain deemed distributions were reclassified to the following accounts:
| | | | | | | | |
| |
| | |
| Fund Name | | Paid-in Capital | | | Accumulated Earnings (Loss) | |
| |
Small Cap Index | | $ | 18,012,358 | | | $ | (18,012,358 | ) |
| |
The tax character of distributions paid was as follows:
| | | | | | | | |
| |
| | |
| Fund Name | | Year Ended 12/31/21 | | | Year Ended 12/31/20 | |
| |
| | |
Municipal Bond Index | | | | | | | | |
Tax-exempt income(a) | | $ | 7,302,123 | | | $ | 7,767,473 | |
Ordinary income | | | — | | | | 11,616 | |
Long-term capital gains | | | 604,105 | | | | 558,912 | |
| | | | | | | | |
| | |
| | $ | 7,906,228 | | | $ | 8,338,001 | |
| | | | | | | | |
Short-Term TIPS Bond Index | | | | | | | | |
Ordinary income | | $ | 3,724,206 | | | $ | 491,934 | |
| | | | | | | | |
| | |
International Index | | | | | | | | |
Ordinary income | | $ | 249,650,725 | | | $ | 127,762,008 | |
| | | | | | | | |
| | |
Small Cap Index | | | | | | | | |
Ordinary income | | $ | 75,850,658 | | | $ | 33,976,890 | |
Long-term capital gains | | | 162,052,657 | | | | 4,166,241 | |
| | | | | | | | |
| | |
| | $ | 237,903,315 | | | $ | 38,143,131 | |
| | | | | | | | |
| | (a) | The Funds designate these amounts paid during the fiscal year ended December 31, 2021, as exempt-interest dividends. | |
| | |
FUND NOTES TO FINANCIAL STATEMENTS | | 65 |
Notes to Financial Statements (continued)
As of December 31, 2021, the tax components of accumulated earnings (loss) were as follows:
| | | | | | | | | | | | | | | | | | | | | | | | | | | | | | | | | | |
| | | | | | | |
| | | | | | | | | |
| | Fund Name | |
| Undistributed
Tax-Exempt Income |
| |
| Undistributed
Ordinary Income |
| |
| Undistributed
Long-Term Capital Gains |
| |
| Non-Expiring
Capital Loss Carryforwards(a) |
| |
| Net Unrealized
Gains (Losses)(b) |
| |
| Qualified
Late-Year Loss(c) |
| | | Total | | | | | |
| | | | | | | |
| | | | | | | | | |
| | Municipal Bond Index | | $ | 253,969 | | | $ | — | | | $ | 105,270 | | | $ | — | | | $ | 24,106,733 | | | $ | — | | | $ | 24,465,972 | | | | | |
| | Short-Term TIPS Bond Index | | | — | | | | 19,960 | | | | — | | | | (68,856 | ) | | | 1,547,759 | | | | (239 | ) | | | 1,498,624 | | | | | |
| | International Index | | | — | | | | 12,612,619 | | | | — | | | | (949,177,340 | ) | | | 2,183,634,549 | | | | (4,394,897 | ) | | | 1,242,674,931 | | | | | |
| | Small Cap Index | | | — | | | | 1,057,436 | | | | 7,811,321 | | | | — | | | | 851,494,060 | | | | — | | | | 860,362,817 | | | | | |
| | | | | | | |
| | (a) | Amounts available to offset future realized capital gains. | |
| | (b) | The difference between book-basis and tax-basis net unrealized gains (losses) was attributable primarily to the timing of income recognition on partnership interests, amortization methods on fixed income securities, the tax deferral of losses on wash sales, the realization for tax purposes of unrealized gains / (losses) on certain futures and foreign currency contracts, the characterization of corporate actions and the realization for tax purposes of unrealized gains on investments in passive foreign investment companies. | |
| | (c) | The Fund has elected to defer certain qualified late-year losses and recognize such losses in the next taxable year. | |
During the year ended December 31, 2021, the Funds listed below utilized the following amounts of their respective capital loss carryforward:
| | | | |
| |
| |
| Fund Name | | Amounts | |
| |
Short-Term TIPS Bond Index | | $ | 11,969 | |
| |
As of December 31, 2021, gross unrealized appreciation and depreciation based on cost of investments (including short positions and derivatives, if any) for U.S. federal income tax purposes were as follows:
| | | | | | | | | | | | | | | | |
| |
| | | | |
| Fund Name | | Tax Cost | | | Gross Unrealized Appreciation | | | Gross Unrealized Depreciation | | | Net Unrealized Appreciation (Depreciation) | |
| |
| | | | |
Municipal Bond Index | | $ | 300,772,046 | | | $ | 24,127,398 | | | $ | (20,665 | ) | | $ | 24,106,733 | |
Short-Term TIPS Bond Index | | | 103,698,222 | | | | 1,668,852 | | | | (121,093 | ) | | | 1,547,759 | |
International Index | | | 6,296,219,431 | | | | 2,659,951,332 | | | | (476,381,323 | ) | | | 2,183,570,009 | |
| |
The Trust and the Corporation, on behalf of the Funds, along with certain other funds managed by the Manager and its affiliates (“Participating Funds”), is a party to a 364-day, $2.25 billion credit agreement with a group of lenders. Under this agreement, the Funds may borrow to fund shareholder redemptions. Excluding commitments designated for certain individual funds, the Participating Funds, including the Funds, can borrow up to an aggregate commitment amount of $1.75 billion at any time outstanding, subject to asset coverage and other limitations as specified in the agreement. The credit agreement has the following terms: a fee of 0.10% per annum on unused commitment amounts and interest at a rate equal to the higher of (a) one-month London Interbank Offered Rate (“LIBOR”) (but, in any event, not less than 0.00%) on the date the loan is made plus 0.80% per annum or (b) the Fed Funds rate (but, in any event, not less than 0.00%) in effect from time to time plus 0.80% per annum on amounts borrowed. The agreement expires in April 2022 unless extended or renewed. These fees were allocated among such funds based upon portions of the aggregate commitment available to them and relative net assets of Participating Funds. During the year ended December 31, 2021, the Funds did not borrow under the credit agreement.
In the normal course of business, the Funds invest in securities or other instruments and may enter into certain transactions, and such activities subject each Fund to various risks, including among others, fluctuations in the market (market risk) or failure of an issuer to meet all of its obligations. The value of securities or other instruments may also be affected by various factors, including, without limitation: (i) the general economy; (ii) the overall market as well as local, regional or global political and/or social instability; (iii) regulation, taxation or international tax treaties between various countries; or (iv) currency, interest rate and price fluctuations. Local, regional or global events such as war, acts of terrorism, the spread of infectious illness or other public health issues, recessions, or other events could have a significant impact on the Funds and their investments. Each Fund’s prospectus provides details of the risks to which each Fund is subject.
Short-Term TIPS Bond Index and International Index may be exposed to additional risks when reinvesting cash collateral in money market funds that do not seek to maintain a stable NAV per share of $1.00, which may be subject to redemption gates or liquidity fees under certain circumstances.
Market Risk: Municipal Bond Index and Short-Term TIPS Bond Index may be exposed to prepayment risk, which is the risk that borrowers may exercise their option to prepay principal earlier than scheduled during periods of declining interest rates, which would force each Fund to reinvest in lower yielding securities. Municipal Bond Index and Short-Term TIPS Bond Indexmay also be exposed to reinvestment risk, which is the risk that income from each Fund’s portfolio will decline if each Fund invests the proceeds from matured, traded or called fixed-income securities at market interest rates that are below each Fund portfolio’s current earnings rate.
Municipal securities are subject to the risk that litigation, legislation or other political events, local business or economic conditions, credit rating downgrades, or the bankruptcy of the issuer could have a significant effect on an issuer’s ability to make payments of principal and/or interest or otherwise affect the value of such securities. Municipal securities can be significantly affected by political or economic changes, including changes made in the law after issuance of the securities, as well as uncertainties in the municipal market related to, taxation, legislative changes or the rights of municipal security holders, including in connection with an issuer insolvency. Municipal securities backed by current or anticipated revenues from a specific project or specific assets can be negatively affected by the discontinuance of the tax benefits supporting the project
| | |
| 66 | | 2 0 2 1 BLACK ROCK ANNUAL REPORT TO SHAREHOLDERS |
Notes to Financial Statements (continued)
or assets or the inability to collect revenues for the project or from the assets. Municipal securities may be less liquid than taxable bonds, and there may be less publicly available information on the financial condition of municipal security issuers than for issuers of other securities.
An outbreak of respiratory disease caused by a novel coronavirus has developed into a global pandemic and has resulted in closing borders, quarantines, disruptions to supply chains and customer activity, as well as general concern and uncertainty. The impact of this pandemic, and other global health crises that may arise in the future, could affect the economies of many nations, individual companies and the market in general in ways that cannot necessarily be foreseen at the present time. This pandemic may result in substantial market volatility and may adversely impact the prices and liquidity of a fund’s investments. The duration of this pandemic and its effects cannot be determined with certainty.
Valuation Risk: The market values of equities, such as common stocks and preferred securities or equity related investments, such as futures and options, may decline due to general market conditions which are not specifically related to a particular company. They may also decline due to factors which affect a particular industry or industries. A Fund may invest in illiquid investments. An illiquid investment is any investment that a Fund reasonably expects cannot be sold or disposed of in current market conditions in seven calendar days or less without the sale or disposition significantly changing the market value of the investment. A Fund may experience difficulty in selling illiquid investments in a timely manner at the price that it believes the investments are worth. Prices may fluctuate widely over short or extended periods in response to company, market or economic news. Markets also tend to move in cycles, with periods of rising and falling prices. This volatility may cause each Fund’s NAV to experience significant increases or decreases over short periods of time. If there is a general decline in the securities and other markets, the NAV of a Fund may lose value, regardless of the individual results of the securities and other instruments in which a Fund invests.
The price a Fund could receive upon the sale of any particular portfolio investment may differ from a Fund’s valuation of the investment, particularly for securities that trade in thin or volatile markets or that are valued using a fair valuation technique or a price provided by an independent pricing service. Changes to significant unobservable inputs and assumptions (i.e., publicly traded company multiples, growth rate, time to exit) due to the lack of observable inputs may significantly impact the resulting fair value and therefore a Fund’s results of operations. As a result, the price received upon the sale of an investment may be less than the value ascribed by a Fund, and a Fund could realize a greater than expected loss or lesser than expected gain upon the sale of the investment. A Fund’s ability to value its investments may also be impacted by technological issues and/or errors by pricing services or other third-party service providers.
Counterparty Credit Risk: The Funds may be exposed to counterparty credit risk, or the risk that an entity may fail to or be unable to perform on its commitments related to unsettled or open transactions, including making timely interest and/or principal payments or otherwise honoring its obligations. The Funds manage counterparty credit risk by entering into transactions only with counterparties that the Manager believes have the financial resources to honor their obligations and by monitoring the financial stability of those counterparties. Financial assets, which potentially expose the Funds to market, issuer and counterparty credit risks, consist principally of financial instruments and receivables due from counterparties. The extent of the Funds’ exposure to market, issuer and counterparty credit risks with respect to these financial assets is approximately their value recorded in the Statements of Assets and Liabilities, less any collateral held by the Funds.
A derivative contract may suffer a mark-to-market loss if the value of the contract decreases due to an unfavorable change in the market rates or values of the underlying instrument. Losses can also occur if the counterparty does not perform under the contract.
With exchange-traded futures and centrally cleared swaps, there is less counterparty credit risk to the Funds since the exchange or clearinghouse, as counterparty to such instruments, guarantees against a possible default. The clearinghouse stands between the buyer and the seller of the contract; therefore, credit risk is limited to failure of the clearinghouse. While offset rights may exist under applicable law, a Fund does not have a contractual right of offset against a clearing broker or clearinghouse in the event of a default (including the bankruptcy or insolvency). Additionally, credit risk exists in exchange-traded futures and centrally cleared swaps with respect to initial and variation margin that is held in a clearing broker’s customer accounts. While clearing brokers are required to segregate customer margin from their own assets, in the event that a clearing broker becomes insolvent or goes into bankruptcy and at that time there is a shortfall in the aggregate amount of margin held by the clearing broker for all its clients, typically the shortfall would be allocated on a pro rata basis across all the clearing broker’s customers, potentially resulting in losses to the Funds.
Concentration Risk: A diversified portfolio, where this is appropriate and consistent with a fund’s objectives, minimizes the risk that a price change of a particular investment will have a material impact on the NAV of a fund. The investment concentrations within each Fund’s portfolio are disclosed in its Schedule of Investments.
Certain Funds invest a substantial amount of their assets in issuers located in a single state or limited number of states. When a Fund concentrates its investments in this manner, it assumes the risk that economic, regulatory, political or social conditions affecting that state or group of states could have a significant impact on the fund and could affect the income from, or the value or liquidity of, the fund’s portfolio. Investment percentages in specific states or U.S. territories are presented in the Schedules of Investments.
Certain Funds invest a significant portion of their assets in securities within a single or limited number of market sectors. When a Fund concentrates its investments in this manner, it assumes the risk that economic, regulatory, political and social conditions affecting such sectors may have a significant impact on the Fund and could affect the income from, or the value or liquidity of, the Fund’s portfolio. Investment percentages in specific sectors are presented in the Schedules of Investments.
Certain Funds invest a significant portion of their assets in fixed-income securities and/or use derivatives tied to the fixed-income markets. Changes in market interest rates or economic conditions may affect the value and/or liquidity of such investments. Interest rate risk is the risk that prices of bonds and other fixed-income securities will increase as interest rates fall and decrease as interest rates rise. The Funds may be subject to a greater risk of rising interest rates due to the current period of historically low rates.
Certain Funds invest a significant portion of their assets in securities of issuers located in Europe or with significant exposure to European issuers or countries. The European financial markets have recently experienced volatility and adverse trends due to concerns about economic downturns in, or rising government debt levels of, several European countries. These events may spread to other countries in Europe and may affect the value and liquidity of certain of the Funds’ investments.
Responses to the financial problems by European governments, central banks and others, including austerity measures and reforms, may not work, may result in social unrest and may limit future growth and economic recovery or have other unintended consequences. Further defaults or restructurings by governments and others of their debt could
| | |
FUND NOTES TO FINANCIAL STATEMENTS | | 67 |
Notes to Financial Statements (continued)
have additional adverse effects on economies, financial markets and asset valuations around the world. In addition, the United Kingdom has withdrawn from the European Union, and one or more other countries may withdraw from the European Union and/or abandon the Euro, the common currency of the European Union. The impact of these actions, especially if they occur in a disorderly fashion, is not clear but could be significant and far reaching.
Certain Funds invest a significant portion of their assets in securities of issuers located in Asia or with significant exposure to Asian issuers or countries. The Asian financial markets have recently experienced volatility and adverse trends due to concerns in several Asian countries regarding monetary policy, government intervention in the markets, rising government debt levels or economic downturns. These events may spread to other countries in Asia and may affect the value and liquidity of certain of the Funds’ investments.
LIBOR Transition Risk: The United Kingdom’s Financial Conduct Authority announced a phase out of the LIBOR. Although many LIBOR rates will cease to be published or no longer will be representative of the underlying market they seek to measure after December 31, 2021, a selection of widely used USD LIBOR rates will continue to be published through June 2023 in order to assist with the transition. The Funds may be exposed to financial instruments tied to LIBOR to determine payment obligations, financing terms, hedging strategies or investment value. The transition process away from LIBOR might lead to increased volatility and illiquidity in markets for, and reduce the effectiveness of new hedges placed against instruments whose terms currently include LIBOR. The ultimate effect of the LIBOR transition process on the Funds is uncertain.
| 11. | CAPITAL SHARE TRANSACTIONS |
Transactions in capital shares for each class were as follows:
| | | | | | | | | | | | | | | | | | | | | | | | | | | | |
| |
| | | |
| | | Year Ended 12/31/21 | | | | | | Year Ended 12/31/20 | |
| | | | | | | | | | | | |
| | | | | | | |
| Fund Name / Share Class | | Shares | | | | | | Amounts | | | | | | Shares | | | | | | Amounts | |
| |
| | | | | | | |
Municipal Bond Index | | | | | | | | | | | | | | | | | | | | | | | | | | | | |
Institutional | | | | | | | | | | | | | | | | | | | | | | | | | | | | |
Shares sold | | | 650,586 | | | | | | | $ | 7,957,426 | | | | | | | | 527,852 | | | | | | | $ | 6,373,345 | |
Shares issued in reinvestment of distributions | | | 18,813 | | | | | | | | 229,880 | | | | | | | | 6,176 | | | | | | | | 75,290 | |
Shares redeemed | | | (197,401 | ) | | | | | | | (2,412,656 | ) | | | | | | | (76,103 | ) | | | | | | | (912,767 | ) |
| | | | | | | | | | | | | | | | | | | | | | | | | | | | |
| | | | | | | |
| | | 471,998 | | | | | | | $ | 5,774,650 | | | | | | | | 457,925 | | | | | | | $ | 5,535,868 | |
| | | | | | | | | | | | | | | | | | | | | | | | | | | | |
Investor A | | | | | | | | | | | | | | | | | | | | | | | | | | | | |
Shares sold | | | 245,063 | | | | | | | $ | 3,009,149 | | | | | | | | 249,370 | | | | | | | $ | 3,026,784 | |
Shares issued in reinvestment of distributions | | | 39,449 | | | | | | | | 482,182 | | | | | | | | 39,734 | | | | | | | | 482,349 | |
Shares redeemed | | | (262,213 | ) | | | | | | | (3,206,037 | ) | | | | | | | (372,148 | ) | | | | | | | (4,458,279 | ) |
| | | | | | | | | | | | | | | | | | | | | | | | | | | | |
| | | | | | | |
| | | 22,299 | | | | | | | $ | 285,294 | | | | | | | | (83,044 | ) | | | | | | $ | (949,146 | ) |
| | | | | | | | | | | | | | | | | | | | | | | | | | | | |
Investor P | | | | | | | | | | | | | | | | | | | | | | | | | | | | |
Shares sold | | | 1,203,054 | | | | | | | $ | 14,753,952 | | | | | | | | 1,241,638 | | | | | | | $ | 14,991,034 | |
Shares issued in reinvestment of distributions | | | 584,095 | | | | | | | | 7,139,511 | | | | | | | | 631,465 | | | | | | | | 7,663,856 | |
Shares redeemed | | | (3,476,299 | ) | | | | | | | (42,540,620 | ) | | | | | | | (3,844,076 | ) | | | | | | | (46,311,395 | ) |
| | | | | | | | | | | | | | | | | | | | | | | | | | | | |
| | | | | | | |
| | | (1,689,150 | ) | | | | | | $ | (20,647,157 | ) | | | | | | | (1,970,973 | ) | | | | | | $ | (23,656,505 | ) |
| | | | | | | | | | | | | | | | | | | | | | | | | | | | |
Class K | | | | | | | | | | | | | | | | | | | | | | | | | | | | |
Shares sold | | | — | | | | | | | $ | — | | | | | | | | — | | | | | | | $ | — | |
Shares issued in reinvestment of distributions | | | — | | | | | | | | — | | | | | | | | — | | | | | | | | — | |
Shares redeemed | | | — | | | | | | | | — | | | | | | | | — | | | | | | | | — | |
| | | | | | | | | | | | | | | | | | | | | | | | | | | | |
| | | | | | | |
| | | — | | | | | | | $ | — | | | | | | | | — | | | | | | | $ | — | |
| | | | | | | | | | | | | | | | | | | | | | | | | | | | |
| | | | | | | |
| | | (1,194,853 | ) | | | | | | $ | (14,587,213 | ) | | | | | | | (1,596,092 | ) | | | | | | $ | (19,069,783 | ) |
| | | | | | | | | | | | | | | | | | | | | | | | | | | | |
|
| |
| | | |
| | | Year Ended 12/31/21 | | | | | | Year Ended 12/31/20 | |
| | | | | | | | | | | | |
| | | | | | | |
| Fund Name / Share Class | | Shares | | | | | | Amounts | | | | | | Shares | | | | | | Amounts | |
| |
| | | | | | | |
Short-Term TIPS Bond Index | | | | | | | | | | | | | | | | | | | | | | | | | | | | |
Institutional | | | | | | | | | | | | | | | | | | | | | | | | | | | | |
Shares sold | | | 305,714 | | | | | | | $ | 3,176,102 | | | | | | | | 1,538,927 | | | | | | | $ | 15,651,855 | |
Shares issued in reinvestment of distributions | | | 69,714 | | | | | | | | 725,448 | | | | | | | | 15,764 | | | | | | | | 160,899 | |
Shares redeemed | | | (245,716 | ) | | | | | | | (2,546,137 | ) | | | | | | | (20,028 | ) | | | | | | | (197,981 | ) |
| | | | | | | | | | | | | | | | | | | | | | | | | | | | |
| | | | | | | |
| | | 129,712 | | | | | | | $ | 1,355,413 | | | | | | | | 1,534,663 | | | | | | | $ | 15,614,773 | |
| | | | | | | | | | | | | | | | | | | | | | | | | | | | |
Investor A | | | | | | | | | | | | | | | | | | | | | | | | | | | | |
Shares sold | | | 171,246 | | | | | | | $ | 1,784,237 | | | | | | | | 105,697 | | | | | | | $ | 1,079,056 | |
Shares issued in reinvestment of distributions | | | 5,235 | | | | | | | | 54,679 | | | | | | | | 708 | | | | | | | | 7,134 | |
Shares redeemed | | | (135,842 | ) | | | | | | | (1,420,598 | ) | | | | | | | (37,518 | ) | | | | | | | (378,343 | ) |
| | | | | | | | | | | | | | | | | | | | | | | | | | | | |
| | | | | | | |
| | | 40,639 | | | | | | | $ | 418,318 | | | | | | | | 68,887 | | | | | | | $ | 707,847 | |
| | | | | | | | | | | | | | | | | | | | | | | | | | | | |
| | |
| 68 | | 2 0 2 1 BLACK ROCK ANNUAL REPORT TO SHAREHOLDERS |
Notes to Financial Statements (continued)
| | | | | | | | | | | | | | | | | | | | | | | | | | | | |
| |
| | | |
| | | Year Ended 12/31/21 | | | | | | Year Ended 12/31/20 | |
| | | | | | | | | | | | |
| | | | | | | |
| Fund Name / Share Class (continued) | | Shares | | | | | | Amounts | | | | | | Shares | | | | | | Amounts | |
| |
| | | | | | | |
Short-Term TIPS Bond Index (continued) | | | | | | | | | | | | | | | | | | | | | | | | | | | | |
Class K | | | | | | | | | | | | | | | | | | | | | | | | | | | | |
Shares sold | | | 5,666,442 | | | | | | | $ | 59,144,353 | | | | | | | | 3,597,381 | | | | | | | $ | 36,446,814 | |
Shares issued in reinvestment of distributions | | | 273,883 | | | | | | | | 2,860,402 | | | | | | | | 30,909 | | | | | | | | 312,634 | |
Shares redeemed | | | (1,808,850 | ) | | | | | | | (18,874,083 | ) | | | | | | | (1,224,848 | ) | | | | | | | (12,321,435 | ) |
| | | | | | | | | | | | | | | | | | | | | | | | | | | | |
| | | | | | | |
| | | 4,131,475 | | | | | | | $ | 43,130,672 | | | | | | | | 2,403,442 | | | | | | | $ | 24,438,013 | |
| | | | | | | | | | | | | | | | | | | | | | | | | | | | |
| | | | | | | |
| | | 4,301,826 | | | | | | | $ | 44,904,403 | | | | | | | | 4,006,992 | | | | | | | $ | 40,760,633 | |
| | | | | | | | | | | | | | | | | | | | | | | | | | | | |
| | | | | | | | | | | | | | | | | | | | | | | | | | | | |
| |
| | | |
| | | Year Ended 12/31/21 | | | | | | Year Ended 12/31/20 | |
| | | | | | | | | | | | |
| | | | | | | |
| Fund Name / Share Class | | Shares | | | | | | Amounts | | | | | | Shares | | | | | | Amounts | |
| |
| | | | | | | |
International Index | | | | | | | | | | | | | | | | | | | | | | | | | | | | |
Institutional | | | | | | | | | | | | | | | | | | | | | | | | | | | | |
Shares sold | | | 23,127,179 | | | | | | | $ | 364,411,891 | | | | | | | | 36,055,673 | | | | | | | $ | 432,943,808 | |
Shares issued in reinvestment of distributions | | | 1,891,131 | | | | | | | | 29,454,601 | | | | | | | | 1,213,193 | | | | | | | | 17,385,549 | |
Shares redeemed | | | (26,665,328 | ) | | | | | | | (423,071,784 | ) | | | | | | | (32,041,822 | ) | | | | | | | (387,367,687 | ) |
| | | | | | | | | | | | | | | | | | | | | | | | | | | | |
| | | | | | | |
| | | (1,647,018 | ) | | | | | | $ | (29,205,292 | ) | | | | | | | 5,227,044 | | | | | | | $ | 62,961,670 | |
| | | | | | | | | | | | | | | | | | | | | | | | | | | | |
| | | | | | | |
Investor A | | | | | | | | | | | | | | | | | | | | | | | | | | | | |
Shares sold | | | 8,903,542 | | | | | | | $ | 138,961,412 | | | | | | | | 10,068,833 | | | | | | | $ | 124,413,156 | |
Shares issued in reinvestment of distributions | | | 655,384 | | | | | | | | 10,142,811 | | | | | | | | 421,138 | | | | | | | | 5,991,136 | |
Shares redeemed | | | (9,224,259 | ) | | | | | | | (144,389,967 | ) | | | | | | | (11,084,750 | ) | | | | | | | (139,444,486 | ) |
| | | | | | | | | | | | | | | | | | | | | | | | | | | | |
| | | | | | | |
| | | 334,667 | | | | | | | $ | 4,714,256 | | | | | | | | (594,779 | ) | | | | | | $ | (9,040,194 | ) |
| | | | | | | | | | | | | | | | | | | | | | | | | | | | |
| | | | | | | |
Investor P | | | | | | | | | | | | | | | | | | | | | | | | | | | | |
Shares sold | | | 605,499 | | | | | | | $ | 9,492,012 | | | | | | | | 539,569 | | | | | | | $ | 6,667,907 | |
Shares issued in reinvestment of distributions | | | 270,934 | | | | | | | | 4,177,007 | | | | | | | | 174,418 | | | | | | | | 2,472,469 | |
Shares redeemed | | | (1,179,110 | ) | | | | | | | (18,358,506 | ) | | | | | | | (1,511,779 | ) | | | | | | | (18,866,767 | ) |
| | | | | | | | | | | | | | | | | | | | | | | | | | | | |
| | | | | | | |
| | | (302,677 | ) | | | | | | $ | (4,689,487 | ) | | | | | | | (797,792 | ) | | | | | | $ | (9,726,391 | ) |
| | | | | | | | | | | | | | | | | | | | | | | | | | | | |
| | | | | | | |
Class K | | | | | | | | | | | | | | | | | | | | | | | | | | | | |
Shares sold | | | 136,820,358 | | | | | | | $ | 2,164,004,055 | | | | | | | | 86,478,810 | | | | | | | $ | 1,086,784,228 | |
Shares issued in reinvestment of distributions | | | 12,681,596 | | | | | | | | 197,623,368 | | | | | | | | 6,757,548 | | | | | | | | 96,913,800 | |
Shares redeemed | | | (62,785,698 | ) | | | | | | | (984,062,396 | ) | | | | | | | (238,407,702 | ) | | | | | | | (2,767,398,564 | ) |
| | | | | | | | | | | | | | | | | | | | | | | | | | | | |
| | | | | | | |
| | | 86,716,256 | | | | | | | $ | 1,377,565,027 | | | | | | | | (145,171,344 | ) | | | | | | $ | (1,583,700,536 | ) |
| | | | | | | | | | | | | | | | | | | | | | | | | | | | |
| | | | | | | |
| | | 85,101,228 | | | | | | | $ | 1,348,384,504 | | | | | | | | (141,336,871 | ) | | | | | | $ | (1,539,505,451 | ) |
| | | | | | | | | | | | | | | | | | | | | | | | | | | | |
| | | | | | | | | | | | | | | | | | | | | | | | | | | | |
| |
| | | |
| | | Year Ended 12/31/21 | | | | | | Year Ended 12/31/20 | |
| | | | | | | | | | | | |
| | | | | | | |
| Fund Name / Share Class | | Shares | | | | | | Amounts | | | | | | Shares | | | | | | Amounts | |
| |
| | | | | | | |
Small Cap Index | | | | | | | | | | | | | | | | | | | | | | | | | | | | |
Institutional | | | | | | | | | | | | | | | | | | | | | | | | | | | | |
Shares sold | | | 8,680,716 | | | | | | | $ | 240,094,727 | | | | | | | | 7,274,334 | | | | | | | $ | 131,368,583 | |
Shares issued in reinvestment of distributions | | | 1,322,710 | | | | | | | | 33,755,049 | | | | | | | | 196,130 | | | | | | | | 4,588,006 | |
Shares redeemed | | | (5,088,628 | ) | | | | | | | (138,990,726 | ) | | | | | | | (4,882,192 | ) | | | | | | | (88,356,989 | ) |
| | | | | | | | | | | | | | | | | | | | | | | | | | | | |
| | | | | | | |
| | | 4,914,798 | | | | | | | $ | 134,859,050 | | | | | | | | 2,588,272 | | | | | | | $ | 47,599,600 | |
| | | | | | | | | | | | | | | | | | | | | | | | | | | | |
| | | | | | | |
Investor A | | | | | | | | | | | | | | | | | | | | | | | | | | | | |
Shares sold | | | 3,401,943 | | | | | | | $ | 94,188,064 | | | | | | | | 3,519,232 | | | | | | | $ | 64,827,304 | |
Shares issued in reinvestment of distributions | | | 640,818 | | | | | | | | 16,377,948 | | | | | | | | 129,265 | | | | | | | | 3,018,237 | |
Shares redeemed | | | (5,267,709 | ) | | | | | | | (146,988,976 | ) | | | | | | | (6,342,853 | ) | | | | | | | (117,082,253 | ) |
| | | | | | | | | | | | | | | | | | | | | | | | | | | | |
| | | | | | | |
| | | (1,224,948 | ) | | | | | | $ | (36,422,964 | ) | | | | | | | (2,694,356 | ) | | | | | | $ | (49,236,712 | ) |
| | | | | | | | | | | | | | | | | | | | | | | | | | | | |
| | | | | | | |
Investor P | | | | | | | | | | | | | | | | | | | | | | | | | | | | |
Shares sold | | | 1,120,863 | | | | | | | $ | 30,459,520 | | | | | | | | 922,473 | | | | | | | $ | 16,362,434 | |
Shares issued in reinvestment of distributions | | | 968,853 | | | | | | | | 24,668,150 | | | | | | | | 170,625 | | | | | | | | 3,975,291 | |
Shares redeemed | | | (1,935,582 | ) | | | | | | | (52,802,385 | ) | | | | | | | (2,186,516 | ) | | | | | | | (40,047,212 | ) |
| | | | | | | | | | | | | | | | | | | | | | | | | | | | |
| | | | | | | |
| | | 154,134 | | | | | | | $ | 2,325,285 | | | | | | | | (1,093,418 | ) | | | | | | $ | (19,709,487 | ) |
| | | | | | | | | | | | | | | | | | | | | | | | | | | | |
| | |
FUND NOTES TO FINANCIAL STATEMENTS | | 69 |
Notes to Financial Statements (continued)
| | | | | | | | | | | | | | | | | | | | | | | | | | | | |
| |
| | | |
| | | Year Ended 12/31/21 | | | | | | Year Ended 12/31/20 | |
| | | | | | | | | | | | |
| | | | | | | |
| Fund Name / Share Class (continued) | | Shares | | | | | | Amounts | | | | | | Shares | | | | | | Amounts | |
| |
Small Cap Index (continued) | | | | | | | | | | | | | | | | | | | | | | | | | | | | |
Class K | | | | | | | | | | | | | | | | | | | | | | | | | | | | |
Shares sold | | | 27,344,333 | | | | | | | $ | 747,541,231 | | | | | | | | 28,669,918 | | | | | | | $ | 514,018,462 | |
Shares issued in reinvestment of distributions | | | 6,339,905 | | | | | | | | 162,274,538 | | | | | | | | 1,126,186 | | | | | | | | 26,411,311 | |
Shares redeemed | | | (20,752,569 | ) | | | | | | | (567,308,604 | ) | | | | | | | (27,354,595 | ) | | | | | | | (501,901,492 | ) |
| | | | | | | | | | | | | | | | | | | | | | | | | | | | |
| | | | | | | |
| | | 12,931,669 | | | | | | | $ | 342,507,165 | | | | | | | | 2,441,509 | | | | | | | $ | 38,528,281 | |
| | | | | | | | | | | | | | | | | | | | | | | | | | | | |
| | | | | | | |
| | | 16,775,653 | | | | | | | $ | 443,268,536 | | | | | | | | 1,242,007 | | | | | | | $ | 17,181,682 | |
| | | | | | | | | | | | | | | | | | | | | | | | | | | | |
As of December 31, 2021, shares owned by BlackRock HoldCo 2, Inc., an affiliate of the Fund, were as follows:
| | | | | | | | | | | | | | | | |
| |
| | | | |
| Fund Name | | Institutional | | | Investor A | | | Class K | | | Total | |
| |
Short-Term TIPS Bond Index | | | 5,000 | | | | 5,000 | | | | 90,000 | | | | 100,000 | |
| |
As of December 31, 2021, shares owned by BlackRock Financial Management, Inc., an affiliate of the Funds, were as follows:
| | | | | | | | | | | | | | | | | | | | |
| |
| | | | | |
| Fund Name | | Institutional | | | Investor A | | | Investor P | | | Class K | | | Total | |
| |
Municipal Bond Index | | | 8,707 | | | | 871 | | | | 871 | | | | 8,707 | | | | 19,156 | |
International Index | | | — | | | | — | | | | 14,420 | | | | — | | | | 14,420 | |
Small Cap Index | | | — | | | | — | | | | 9,191 | | | | — | | | | 9,191 | |
| |
Management has evaluated the impact of all subsequent events on the Funds through the date the financial statements were issued and has determined that there were no subsequent events requiring adjustment or additional disclosure in the financial statements.
| | |
| 70 | | 2 0 2 1 BLACK ROCK ANNUAL REPORT TO SHAREHOLDERS |
Report of Independent Registered Public Accounting Firm
To the Shareholders of iShares Municipal Bond Index Fund, iShares Short-Term TIPS Bond Index Fund, iShares MSCI EAFE International Index Fund, and iShares Russell 2000 Small-Cap Index Fund and the Board of Directors/Trustees of BlackRock FundsSM and BlackRock Index Funds, Inc.:
Opinion on the Financial Statements and Financial Highlights
We have audited the accompanying statements of assets and liabilities of iShares Municipal Bond Index Fund and iShares Short-Term TIPS Bond Index Fund of BlackRock FundsSM and iShares MSCI EAFE International Index Fund and iShares Russell 2000 Small-Cap Index Fund of BlackRock Index Funds, Inc. (collectively, the “Funds”), including the schedules of investments of iShares Municipal Bond Index Fund, iShares Short-Term TIPS Bond Index Fund, and iShares MSCI EAFE International Index Fund, as of December 31, 2021, the related statements of operations for the year then ended, the statements of changes in net assets for each of the two years in the period then ended, the financial highlights for the periods indicated in the table below, and the related notes. In our opinion, the financial statements and financial highlights present fairly, in all material respects, the financial position of the Funds as of December 31, 2021, and the results of their operations for the year then ended, the changes in their net assets for each of the two years in the period then ended, and the financial highlights for the periods indicated in the table below, in conformity with accounting principles generally accepted in the United States of America.
| | |
| | |
Fund | | Financial Highlights |
| |
iShares Municipal Bond Index Fund | | For each of the four years in the period ended December 31, 2021 |
| |
iShares Short-Term TIPS Bond Index Fund | | For each of the five years in the period ended December 31, 2021 |
| |
iShares MSCI EAFE International Index Fund | | For each of the five years in the period ended December 31, 2021 |
| |
iShares Russell 2000 Small-Cap Index Fund | | For each of the five years in the period ended December 31, 2021 |
The financial highlights of iShares Municipal Bond Index Fund for the year ended December 31, 2017 were audited by other auditors whose report dated February 27, 2018, expressed an unqualified opinion on those financial highlights.
Basis for Opinion
These financial statements and financial highlights are the responsibility of the Funds’ management. Our responsibility is to express an opinion on the Funds’ financial statements and financial highlights based on our audits. We are a public accounting firm registered with the Public Company Accounting Oversight Board (United States) (PCAOB) and are required to be independent with respect to the Funds in accordance with the U.S. federal securities laws and the applicable rules and regulations of the Securities and Exchange Commission and the PCAOB.
We conducted our audits in accordance with the standards of the PCAOB. Those standards require that we plan and perform the audit to obtain reasonable assurance about whether the financial statements and financial highlights are free of material misstatement, whether due to error or fraud. The Funds are not required to have, nor were we engaged to perform, an audit of their internal control over financial reporting. As part of our audits we are required to obtain an understanding of internal control over financial reporting but not for the purpose of expressing an opinion on the effectiveness of the Funds’ internal control over financial reporting. Accordingly, we express no such opinion.
Our audits included performing procedures to assess the risks of material misstatement of the financial statements and financial highlights, whether due to error or fraud, and performing procedures that respond to those risks. Such procedures included examining, on a test basis, evidence regarding the amounts and disclosures in the financial statements and financial highlights. Our audits also included evaluating the accounting principles used and significant estimates made by management, as well as evaluating the overall presentation of the financial statements and financial highlights. Our procedures included confirmation of securities owned as of December 31, 2021, by correspondence with the custodian and brokers; when replies were not received from brokers, we performed other auditing procedures. We believe that our audits provide a reasonable basis for our opinion.
Deloitte & Touche LLP
Boston, Massachusetts
February 24, 2022
We have served as the auditor of one or more BlackRock investment companies since 1992.
| | |
FUND REPORT OF INDEPENDENT REGISTERED PUBLIC ACCOUNTING FIRM | | 71 |
Important Tax Information (unaudited)
The following amounts, or maximum amounts allowable by law, are hereby designated as qualified dividend income for individuals for the fiscal year ended December 31, 2021:
| | | | |
| |
| |
| Fund Name | | Qualified Dividend Income | |
| |
| |
International Index | | $ | 218,621,910 | |
Small Cap Index | | | 29,451,365 | |
| |
The following amounts, or maximum amounts allowable by law, are hereby designated as qualified business income for individuals for the fiscal year ended December 31, 2021:
| | | | |
| |
| |
| Fund Name | | Qualified Business Income | |
| |
| |
Small Cap Index | | $ | 4,391,073 | |
| |
The Funds hereby designate the following amounts, or maximum amounts allowable by law, as capital gain dividends, subject to a long-term capital gains tax rate of not greater than 20%, for the fiscal year ended December 31, 2021:
| | | | |
| |
| |
| Fund Name | | 20% Rate Long-Term Capital Gain Dividends | |
| |
| |
Municipal Bond Index | | $ | 44,561 | |
Small Cap Index | | | 180,020,579 | |
| |
The Funds intend to pass through to their shareholders the following amounts, or maximum amounts allowable by law, of foreign source income earned and foreign taxes paid for the fiscal year ended December 31, 2021:
| | | | | | | | |
| |
| | |
| Fund Name | | Foreign Source Income Earned | | | Foreign Taxes Paid | |
| |
| | |
International Index | | $ | 206,489,232 | | | $ | 16,826,407 | |
| |
The Fund hereby designates the following amount, or maximum amount allowable by law, of distributions from direct federal obligation interest for the fiscal year ended December 31, 2021:
| | | | |
| |
| |
| Fund Name | | Federal Obligation Interest | |
| |
| |
Short-Term TIPS Bond Index | | $ | 3,724,406 | |
| |
The law varies in each state as to whether and what percent of ordinary income dividends attributable to federal obligations is exempt from state income tax. Shareholders are advised to check with their tax advisers to determine if any portion of the dividends received is exempt from state income tax.
The following percentage, or maximum percentage allowable by law, of ordinary income distributions paid during the fiscal year ended December 31, 2021 qualified for the dividends-received deduction for corporate shareholders:
| | |
| | |
| Fund Name | | Dividends-Received Deduction |
| |
Small Cap Index | | 37.81% |
The Fund hereby designates the following amount, or maximum amount allowable by law, as interest income eligible to be treated as a Section 163(j) interest dividend for the fiscal year ended December 31, 2021:
| | | | |
| |
| |
| Fund Name | | Interest Dividend | |
| |
| |
Short-Term TIPS Bond Index | | $ | 3,724,406 | |
| |
The Funds hereby designate the following amounts, or maximum amounts allowable by law, as interest-related dividends eligible for exemption from U.S. withholding tax for nonresident aliens and foreign corporations for the fiscal year ended December 31, 2021:
| | | | | | | | |
| |
| | |
| Fund Name | | Interest Related Dividends | | | Qualified Short-Term Capital Gains
| |
| |
| | |
Short-Term TIPS Bond Index | | $ | 3,724,406 | | | $ | — | |
Small Cap Index | | | — | | | | 40,788,717 | |
| |
| | |
| 72 | | 2 0 2 1 BLACK ROCK ANNUAL REPORT TO SHAREHOLDERS |
| | |
| Series Portfolio Information as of December 31, 2021 | | Master Small Cap Index Series |
TEN LARGEST HOLDINGS
| | | | |
| | |
| Security | | Percent of Net Assets | |
| |
iShares Russell 2000 ETF | | | 1 | % |
AMC Entertainment Holdings, Inc., Class A | | | 1 | |
Synaptics, Inc. | | | 1 | |
Lattice Semiconductor Corp. | | | 1 | |
EastGroup Properties, Inc. | | | — | (a) |
BJ’s Wholesale Club Holdings, Inc. | | | — | (a) |
Tetra Tech, Inc. | | | — | (a) |
Saia, Inc. | | | — | (a) |
Ovintiv, Inc. | | | — | (a) |
Tenet Healthcare Corp. | | | — | (a) |
SECTOR ALLOCATION
| | | | |
| | |
| Sector(b) | | Percent of Net Assets | |
| |
Health Care | | | 18 | % |
Financials | | | 16 | |
Industrials | | | 15 | |
Information Technology | | | 15 | |
Consumer Discretionary | | | 11 | |
Real Estate | | | 7 | |
Energy | | | 4 | |
Materials | | | 4 | |
Consumer Staples | | | 3 | |
Communication Services | | | 3 | |
Utilities | | | 3 | |
Investment Companies | | | 1 | |
Short-Term Securities | | | 6 | |
Liabilities in Excess of Other Assets | | | (6 | ) |
| (a) | Rounds to less than 1% of net assets. | |
| (b) | For Master Small Cap Index Series (the “Master Portfolio”) compliance purposes, the Master Portfolio’s sector classifications refer to one or more of the sector subclassifications used by one or more widely recognized market indexes or ratings group indexes, and/or as defined by the investment adviser. These definitions may not apply for purposes of this report, which may combine such sector sub-classifications for reporting ease. |
| | |
SERIES PORTFOLIO INFORMATION | | 73 |
| | |
Schedule of Investments December 31, 2021 | | Master Small Cap Index Series (Percentages shown are based on Net Assets) |
| | | | | | | | |
| Security | | Shares | | | Value | |
| | |
Common Stocks | | | | | | | | |
| | |
| Advertising Agencies — 0.4% | | | | | | |
Advantage Solutions, Inc.(a)(b) | | | 114,518 | | | $ | 918,434 | |
Boston Omaha Corp., Class A(a) | | | 31,949 | | | | 917,895 | |
Cardlytics, Inc.(a) | | | 49,616 | | | | 3,279,121 | |
Chimera Investment Corp. | | | 358,658 | | | | 5,408,563 | |
Clear Channel Outdoor Holdings, Inc.(a) | | | 547,175 | | | | 1,811,149 | |
Emerald Holding, Inc.(a) | | | 39,174 | | | | 155,521 | |
Entercom Communications Corp.(a) | | | 178,691 | | | | 459,236 | |
Fluent, Inc.(a) | | | 60,797 | | | | 120,986 | |
National CineMedia, Inc. | | | 97,245 | | | | 273,259 | |
QuinStreet, Inc.(a)(b) | | | 76,554 | | | | 1,392,517 | |
Thryv Holdings, Inc.(a) | | | 11,521 | | | | 473,859 | |
Viad Corp.(a) | | | 31,036 | | | | 1,328,030 | |
| | | | | | | | |
| | |
| | | | | | | 16,538,570 | |
| | |
| Aerospace — 0.6% | | | | | | |
AAR Corp.(a) | | | 51,973 | | | | 2,028,506 | |
Aerojet Rocketdyne Holdings, Inc. | | | 114,825 | | | | 5,369,217 | |
AeroVironment, Inc.(a) | | | 34,922 | | | | 2,166,212 | |
AerSale Corp.(a) | | | 14,018 | | | | 248,679 | |
Astronics Corp.(a) | | | 36,144 | | | | 433,728 | |
Byrna Technologies, Inc.(a)(b) | | | 28,185 | | | | 376,270 | |
Cadre Holdings, Inc.(a) | | | 9,038 | | | | 229,746 | |
Ducommun, Inc.(a) | | | 15,716 | | | | 735,037 | |
Kaman Corp. | | | 42,238 | | | | 1,822,570 | |
Kratos Defense & Security Solutions, Inc.(a) | | | 188,076 | | | | 3,648,675 | |
Macerich Co. | | | 327,662 | | | | 5,661,999 | |
Moog, Inc., Class A | | | 44,564 | | | | 3,608,347 | |
Triumph Group, Inc.(a) | | | 96,585 | | | | 1,789,720 | |
| | | | | | | | |
| | |
| | | | | | | 28,118,706 | |
| | |
| Agriculture, Fishing & Ranching — 0.3% | | | | | | |
Andersons, Inc. | | | 47,652 | | | | 1,844,609 | |
AquaBounty Technologies, Inc.(a) | | | 77,821 | | | | 163,424 | |
Cadiz, Inc.(a) | | | 33,554 | | | | 129,519 | |
Calavo Growers, Inc. | | | 26,356 | | | | 1,117,494 | |
Cal-Maine Foods, Inc. | | | 62,013 | | | | 2,293,861 | |
Fresh Del Monte Produce, Inc. | | | 50,937 | | | | 1,405,861 | |
GrowGeneration Corp.(a)(b) | | | 85,028 | | | | 1,109,615 | |
Limoneira Co. | | | 25,358 | | | | 380,370 | |
MedAvail Holdings, Inc.(a)(b) | | | 16,244 | | | | 22,742 | |
Sanderson Farms, Inc. | | | 31,121 | | | | 5,946,601 | |
| | | | | | | | |
| | |
| | | | | | | 14,414,096 | |
| | |
| Air Transport(a) — 0.5% | | | | | | |
Air Transport Services Group, Inc.(b) | | | 90,356 | | | | 2,654,659 | |
Allegiant Travel Co. | | | 23,474 | | | | 4,390,577 | |
Atlas Air Worldwide Holdings, Inc. | | | 44,080 | | | | 4,148,809 | |
Frontier Group Holdings, Inc. | | | 52,782 | | | | 716,252 | |
Hawaiian Holdings, Inc. | | | 76,108 | | | | 1,398,104 | |
Mesa Air Group, Inc. | | | 50,631 | | | | 283,534 | |
SkyWest, Inc. | | | 76,042 | | | | 2,988,451 | |
Spirit Airlines, Inc.(b) | | | 151,224 | | | | 3,304,244 | |
Sun Country Airlines Holdings, Inc. | | | 49,089 | | | | 1,337,675 | |
| | | | | | | | |
| | |
| | | | | | | 21,222,305 | |
| | |
| Alternative Energy(a) — 0.3% | | | | | | |
Aemetis, Inc.(b) | | | 45,137 | | | | 555,185 | |
Alto Ingredients, Inc. | | | 106,079 | | | | 510,240 | |
Ameresco, Inc., Class A | | | 47,230 | | | | 3,846,411 | |
Centrus Energy Corp., Class A | | | 13,577 | | | | 677,628 | |
Green Brick Partners, Inc. | | | 46,392 | | | | 1,407,069 | |
Green Plains, Inc. | | | 51,340 | | | | 1,784,579 | |
| | | | | | | | |
| Security | | Shares | | | Value | |
|
| Alternative Energy (continued) | |
Infrastructure and Energy Alternatives, Inc. | | | 43,682 | | | $ | 401,874 | |
REX American Resources Corp. | | | 8,390 | | | | 805,440 | |
Sunnova Energy International, Inc. | | | 131,841 | | | | 3,681,001 | |
| | | | | | | | |
| | |
| | | | | | | 13,669,427 | |
| | |
| Aluminum — 0.2% | | | | | | |
Arconic Corp.(a) | | | 163,376 | | | | 5,393,042 | |
Century Aluminum Co.(a)(b) | | | 78,532 | | | | 1,300,490 | |
Kaiser Aluminum Corp. | | | 24,030 | | | | 2,257,378 | |
| | | | | | | | |
| | |
| | | | | | | 8,950,910 | |
| | |
| Asset Management & Custodian — 1.1% | | | | | | |
Artisan Partners Asset Management, Inc., Class A | | | 89,949 | | | | 4,285,170 | |
Assetmark Financial Holdings, Inc.(a) | | | 30,920 | | | | 810,413 | |
B. Riley Financial, Inc. | | | 30,730 | | | | 2,730,668 | |
Brightsphere Investment Group, Inc. | | | 88,735 | | | | 2,271,616 | |
Cohen & Steers, Inc. | | | 37,827 | | | | 3,499,376 | |
Cowen, Inc., Class A | | | 39,841 | | | | 1,438,260 | |
Diamond Hill Investment Group, Inc. | | | 4,531 | | | | 880,056 | |
Federated Hermes, Inc. | | | 142,529 | | | | 5,356,240 | |
Focus Financial Partners, Inc., Class A(a)(b) | | | 91,319 | | | | 5,453,571 | |
GAMCO Investors, Inc., Class A | | | 8,691 | | | | 217,101 | |
GCM Grosvenor, Inc., Class A | | | 67,362 | | | | 707,301 | |
Hamilton Lane, Inc., Class A | | | 53,303 | | | | 5,523,257 | |
Open Lending Corp., Class A(a) | | | 159,784 | | | | 3,591,944 | |
Oppenheimer Holdings, Inc., Class A | | | 13,902 | | | | 644,636 | |
PJT Partners, Inc., Class A(b) | | | 35,998 | | | | 2,667,092 | |
Pzena Investment Management, Inc., Class A | | | 27,206 | | | | 257,641 | |
Sculptor Capital Management, Inc. | | | 36,904 | | | | 787,900 | |
StepStone Group, Inc., Class A | | | 61,912 | | | | 2,573,682 | |
Virtus Investment Partners, Inc. | | | 11,204 | | | | 3,328,708 | |
WisdomTree Investments, Inc. | | | 213,451 | | | | 1,306,320 | |
| | | | | | | | |
| | |
| | | | | | | 48,330,952 | |
| | |
| Auto Parts — 1.2% | | | | | | |
Adient PLC(a)(b) | | | 144,850 | | | | 6,935,418 | |
American Axle & Manufacturing Holdings, Inc.(a) | | | 170,779 | | | | 1,593,368 | |
Canoo, Inc.(a)(b) | | | 162,997 | | | | 1,258,337 | |
CarParts.com, Inc.(a)(b) | | | 75,443 | | | | 844,962 | |
Dana, Inc. | | | 222,219 | | | | 5,071,038 | |
Dorman Products, Inc.(a) | | | 40,227 | | | | 4,546,053 | |
Fisker, Inc.(a) | | | 249,830 | | | | 3,929,826 | |
Fox Factory Holding Corp.(a) | | | 64,601 | | | | 10,988,630 | |
Gentherm, Inc.(a) | | | 50,792 | | | | 4,413,825 | |
Lordstown Motors Corp., Class A(a) | | | 233,619 | | | | 805,985 | |
Meritor, Inc.(a) | | | 105,280 | | | | 2,608,838 | |
Standard Motor Products, Inc. | | | 31,903 | | | | 1,671,398 | |
Stoneridge, Inc.(a) | | | 40,062 | | | | 790,824 | |
Tenneco, Inc., Class A(a) | | | 107,572 | | | | 1,215,564 | |
Visteon Corp.(a) | | | 42,136 | | | | 4,682,995 | |
Workhorse Group, Inc.(a)(b) | | | 188,524 | | | | 821,965 | |
XL Fleet Corp.(a) | | | 61,159 | | | | 202,436 | |
XPEL Inc.(a) | | | 28,102 | | | | 1,918,804 | |
| | | | | | | | |
| | |
| | | | | | | 54,300,266 | |
| | |
| Auto Services — 0.2% | | | | | | |
Goodyear Tire & Rubber Co.(a) | | | 422,830 | | | | 9,014,736 | |
| | | | | | | | |
| | |
| Back Office Support, HR & Consulting — 1.6% | | | | | | |
ASGN, Inc.(a) | | | 77,971 | | | | 9,621,621 | |
Atlas Technical Consultants, Inc.(a)(b) | | | 22,742 | | | | 191,488 | |
Barrett Business Services, Inc. | | | 11,581 | | | | 799,784 | |
CBIZ, Inc.(a) | | | 74,391 | | | | 2,910,176 | |
Conduent, Inc.(a) | | | 256,673 | | | | 1,370,634 | |
CRA International, Inc. | | | 11,737 | | | | 1,095,766 | |
| | |
| 74 | | 2 0 2 1 BLACK ROCK ANNUAL REPORT TO SHAREHOLDERS |
| | |
Schedule of Investments (continued) December 31, 2021 | | Master Small Cap Index Series (Percentages shown are based on Net Assets) |
| | | | | | | | |
| Security | | Shares | | | Value | |
|
| Back Office Support, HR & Consulting (continued) | |
ExlService Holdings, Inc.(a) | | | 50,331 | | | $ | 7,286,419 | |
Forrester Research, Inc.(a) | | | 17,200 | | | | 1,010,156 | |
Hackett Group, Inc. | | | 38,500 | | | | 790,405 | |
Heidrick & Struggles International, Inc. | | | 29,596 | | | | 1,294,233 | |
HireQuest, Inc. | | | 10,587 | | | | 213,434 | |
Huron Consulting Group, Inc.(a) | | | 34,108 | | | | 1,701,989 | |
ICF International, Inc. | | | 28,233 | | | | 2,895,294 | |
Insperity, Inc. | | | 55,651 | | | | 6,572,940 | |
Kelly Services, Inc., Class A | | | 52,428 | | | | 879,217 | |
Kforce, Inc. | | | 31,362 | | | | 2,359,050 | |
Korn Ferry | | | 82,509 | | | | 6,248,406 | |
Liquidity Services, Inc.(a) | | | 40,114 | | | | 885,717 | |
Maximus, Inc. | | | 94,414 | | | | 7,521,963 | |
NV5 Global, Inc.(a) | | | 20,081 | | | | 2,773,588 | |
PAE, Inc.(a)(b) | | | 106,559 | | | | 1,058,131 | |
Rekor Systems, Inc.(a) | | | 53,352 | | | | 349,456 | |
Resources Connection, Inc. | | | 47,710 | | | | 851,146 | |
StarTek, Inc.(a)(b) | | | 27,578 | | | | 143,957 | |
Target Hospitality Corp.(a) | | | 49,812 | | | | 177,331 | |
TriNet Group, Inc.(a) | | | 62,303 | | | | 5,934,984 | |
TrueBlue, Inc.(a) | | | 53,309 | | | | 1,475,060 | |
TTEC Holdings, Inc. | | | 28,285 | | | | 2,561,207 | |
| | | | | | | | |
| | |
| | | | | | | 70,973,552 | |
| | |
| Banks: Diversified — 8.0% | | | | | | |
1st Source Corp. | | | 25,200 | | | | 1,249,920 | |
Allegiance Bancshares, Inc. | | | 31,564 | | | | 1,332,316 | |
Ambac Financial Group, Inc.(a) | | | 68,315 | | | | 1,096,456 | |
Amerant Bancorp, Inc.(a) | | | 40,461 | | | | 1,397,928 | |
American National Bankshares, Inc. | | | 17,212 | | | | 648,548 | |
Ameris Bancorp | | | 102,221 | | | | 5,078,339 | |
Arrow Financial Corp. | | | 22,514 | | | | 793,168 | |
Associated Banc-Corp. | | | 224,705 | | | | 5,076,086 | |
Atlantic Capital Bancshares, Inc.(a) | | | 29,118 | | | | 837,725 | |
Atlantic Union Bankshares Corp. | | | 114,822 | | | | 4,281,712 | |
BancFirst Corp. | | | 27,025 | | | | 1,906,884 | |
Banco Latinoamericano de Comercio Exterior SA, Class E | | | 48,028 | | | | 797,265 | |
Bancorp, Inc.(a) | | | 77,374 | | | | 1,958,336 | |
Bank First Corp.(b) | | | 10,024 | | | | 724,134 | |
Bank of Marin Bancorp | | | 22,444 | | | | 835,590 | |
Bank of NT Butterfield & Son Ltd. | | | 76,267 | | | | 2,906,535 | |
Banner Corp. | | | 52,372 | | | | 3,177,409 | |
Bar Harbor Bankshares | | | 21,850 | | | | 632,121 | |
Blue Ridge Bankshares, Inc. | | | 21,103 | | | | 377,744 | |
Bridgewater Bancshares, Inc.(a) | | | 35,112 | | | | 621,131 | |
Bryn Mawr Bank Corp. | | | 29,867 | | | | 1,344,314 | |
Business First Bancshares, Inc. | | | 28,633 | | | | 810,600 | |
Byline Bancorp, Inc. | | | 37,376 | | | | 1,022,234 | |
Cadence Bank | | | 223,939 | | | | 6,671,143 | |
Cambridge Bancorp | | | 10,129 | | | | 947,973 | |
Camden National Corp. | | | 23,340 | | | | 1,124,054 | |
Capital Bancorp, Inc. | | | 13,728 | | | | 359,674 | |
Capital City Bank Group, Inc. | | | 21,636 | | | | 571,190 | |
Capitol Federal Financial, Inc. | | | 198,169 | | | | 2,245,255 | |
Capstar Financial Holdings, Inc. | | | 27,812 | | | | 584,886 | |
Carter Bankshares, Inc.(a) | | | 35,497 | | | | 546,299 | |
Cathay General Bancorp | | | 113,031 | | | | 4,859,203 | |
CBTX, Inc. | | | 31,455 | | | | 912,195 | |
Central Pacific Financial Corp. | | | 36,134 | | | | 1,017,895 | |
CIT Group, Inc. | | | 151,962 | | | | 7,801,729 | |
Citizens & Northern Corp. | | | 21,059 | | | | 550,061 | |
| | | | | | | | |
| Security | | Shares | | | Value | |
|
| Banks: Diversified (continued) | |
City Holding Co. | | | 23,672 | | | $ | 1,936,133 | |
Civista Bancshares, Inc. | | | 26,232 | | | | 640,061 | |
CNB Financial Corp. | | | 23,280 | | | | 616,920 | |
Coastal Financial Corp.(a) | | | 14,039 | | | | 710,654 | |
Columbia Banking System, Inc. | | | 111,572 | | | | 3,650,636 | |
Columbia Financial, Inc.(a) | | | 61,595 | | | | 1,284,872 | |
Community Bank System, Inc. | | | 80,268 | | | | 5,978,361 | |
Community Trust Bancorp, Inc. | | | 22,638 | | | | 987,243 | |
ConnectOne Bancorp, Inc. | | | 54,957 | | | | 1,797,643 | |
CrossFirst Bankshares, Inc.(a) | | | 70,864 | | | | 1,106,187 | |
Customers Bancorp, Inc.(a) | | | 45,036 | | | | 2,944,003 | |
CVB Financial Corp. | | | 196,554 | | | | 4,208,221 | |
Eagle Bancorp, Inc. | | | 47,681 | | | | 2,781,710 | |
Eastern Bankshares, Inc. | | | 261,999 | | | | 5,284,520 | |
Enterprise Bancorp, Inc. | | | 13,849 | | | | 622,097 | |
Enterprise Financial Services Corp. | | | 53,555 | | | | 2,521,905 | |
Equity Bancshares, Inc., Class A | | | 20,806 | | | | 705,948 | |
Farmers National Banc Corp. | | | 50,373 | | | | 934,419 | |
FB Financial Corp. | | | 50,587 | | | | 2,216,722 | |
Fidelity D&D Bancorp, Inc. | | | 6,449 | | | | 380,491 | |
Financial Institutions, Inc. | | | 26,478 | | | | 842,000 | |
First Bancorp, Inc. | | | 16,608 | | | | 521,491 | |
First BanCorp, Puerto Rico | | | 315,153 | | | | 4,342,808 | |
First Bancorp/Southern Pines NC | | | 51,199 | | | | 2,340,818 | |
First Bancshares, Inc. | | | 32,134 | | | | 1,241,015 | |
First Bank/Hamilton | | | 24,595 | | | | 356,873 | |
First Busey Corp. | | | 77,953 | | | | 2,114,085 | |
First Commonwealth Financial Corp. | | | 139,403 | | | | 2,242,994 | |
First Community Bancshares, Inc. | | | 25,204 | | | | 842,318 | |
First Financial Bancorp | | | 141,314 | | | | 3,445,235 | |
First Financial Bankshares, Inc. | | | 198,367 | | | | 10,084,978 | |
First Financial Corp. | | | 15,868 | | | | 718,662 | |
First Foundation, Inc. | | | 57,517 | | | | 1,429,873 | |
First Internet Bancorp | | | 14,564 | | | | 685,091 | |
First Interstate Bancsystem, Inc., Class A | | | 62,564 | | | | 2,544,478 | |
First Merchants Corp. | | | 85,114 | | | | 3,565,425 | |
First Mid Bancshares, Inc. | | | 23,111 | | | | 988,920 | |
First Midwest Bancorp, Inc. | | | 171,475 | | | | 3,511,808 | |
First of Long Island Corp. | | | 40,270 | | | | 869,429 | |
Five Star Bancorp | | | 17,219 | | | | 516,570 | |
Flagstar Bancorp, Inc. | | | 78,762 | | | | 3,775,850 | |
FS Bancorp, Inc. | | | 12,270 | | | | 412,640 | |
Fulton Financial Corp. | | | 242,048 | | | | 4,114,816 | |
German American Bancorp, Inc. | | | 38,518 | | | | 1,501,432 | |
Glacier Bancorp, Inc. | | | 168,420 | | | | 9,549,414 | |
Great Western Bancorp, Inc. | | | 80,841 | | | | 2,745,360 | |
Guaranty Bancshares, Inc. | | | 11,719 | | | | 440,400 | |
Hancock Whitney Corp. | | | 132,107 | | | | 6,607,992 | |
Hanmi Financial Corp. | | | 35,695 | | | | 845,258 | |
HarborOne Bancorp, Inc. | | | 79,912 | | | | 1,185,894 | |
HBT Financial, Inc. | | | 16,051 | | | | 300,635 | |
Heartland Financial USA, Inc. | | | 60,975 | | | | 3,085,945 | |
Heritage Commerce Corp. | | | 96,249 | | | | 1,149,213 | |
Home BancShares, Inc. | | | 233,363 | | | | 5,682,389 | |
Hope Bancorp, Inc. | | | 162,875 | | | | 2,395,891 | |
Horizon Bancorp, Inc. | | | 66,840 | | | | 1,393,614 | |
Howard Bancorp, Inc.(a) | | | 20,178 | | | | 439,679 | |
Independent Bank Corp. | | | 97,898 | | | | 6,291,148 | |
Independent Bank Group, Inc. | | | 57,278 | | | | 4,132,608 | |
International Bancshares Corp. | | | 81,607 | | | | 3,459,321 | |
Lakeland Bancorp, Inc. | | | 75,630 | | | | 1,436,214 | |
Lakeland Financial Corp. | | | 36,651 | | | | 2,937,211 | |
| | |
SERIES SCHEDULE OF INVESTMENTS | | 75 |
| | |
Schedule of Investments (continued) December 31, 2021 | | Master Small Cap Index Series (Percentages shown are based on Net Assets) |
| | | | | | | | |
| Security | | Shares | | | Value | |
|
| Banks: Diversified (continued) | |
Live Oak Bancshares, Inc.(b) | | | 48,894 | | | $ | 4,267,957 | |
Luther Burbank Corp. | | | 30,326 | | | | 425,777 | |
Macatawa Bank Corp. | | | 45,179 | | | | 398,479 | |
Mercantile Bank Corp. | | | 22,520 | | | | 788,876 | |
Merchants Bancorp | | | 16,391 | | | | 775,786 | |
Metrocity Bankshares, Inc. | | | 28,203 | | | | 776,429 | |
Metropolitan Bank Holding Corp.(a) | | | 14,713 | | | | 1,567,376 | |
Mid Penn Bancorp, Inc. | | | 17,993 | | | | 571,098 | |
Midland States Bancorp, Inc. | | | 32,587 | | | | 807,832 | |
MVB Financial Corp. | | | 14,651 | | | | 608,310 | |
National Bank Holdings Corp., Class A | | | 42,117 | | | | 1,850,621 | |
NBT Bancorp, Inc. | | | 65,310 | | | | 2,515,741 | |
Nicolet Bankshares, Inc.(a)(b) | | | 18,443 | | | | 1,581,487 | |
Northrim BanCorp, Inc. | | | 9,948 | | | | 432,340 | |
OFG Bancorp | | | 73,665 | | | | 1,956,542 | |
Old National Bancorp | | | 241,751 | | | | 4,380,528 | |
Old Second Bancorp, Inc. | | | 47,962 | | | | 603,842 | |
Origin Bancorp, Inc. | | | 33,731 | | | | 1,447,735 | |
Orrstown Financial Services, Inc. | | | 17,730 | | | | 446,796 | |
Pacific Premier Bancorp, Inc. | | | 121,865 | | | | 4,878,256 | |
Park National Corp. | | | 21,882 | | | | 3,004,617 | |
PCSB Financial Corp. | | | 24,272 | | | | 462,139 | |
Peapack Gladstone Financial Corp. | | | 30,765 | | | | 1,089,081 | |
Peoples Bancorp, Inc. | | | 39,600 | | | | 1,259,676 | |
Peoples Financial Services Corp. | | | 10,739 | | | | 565,838 | |
Pioneer Bancorp, Inc.(a) | | | 20,117 | | | | 227,724 | |
Preferred Bank/Los Angeles CA | | | 13,047 | | | | 936,644 | |
Primis Financial Corp. | | | 32,511 | | | | 488,965 | |
Provident Financial Services, Inc. | | | 116,700 | | | | 2,826,474 | |
QCR Holdings, Inc. | | | 24,093 | | | | 1,349,208 | |
RBB Bancorp | | | 26,421 | | | | 692,230 | |
Red River Bancshares, Inc. | | | 7,783 | | | | 416,391 | |
Reliant Bancorp, Inc. | | | 23,597 | | | | 837,693 | |
Renasant Corp. | | | 83,410 | | | | 3,165,409 | |
Republic Bancorp, Inc., Class A | | | 15,627 | | | | 794,477 | |
Republic First Bancorp, Inc.(a) | | | 77,302 | | | | 287,563 | |
S&T Bancorp, Inc. | | | 55,903 | | | | 1,762,063 | |
Sandy Spring Bancorp, Inc. | | | 66,961 | | | | 3,219,485 | |
Seacoast Banking Corp. of Florida | | | 81,313 | | | | 2,877,667 | |
ServisFirst Bancshares, Inc. | | | 76,093 | | | | 6,463,339 | |
Sierra Bancorp | | | 23,052 | | | | 625,862 | |
Silvergate Capital Corp., Class A(a)(b) | | | 42,114 | | | | 6,241,295 | |
Simmons First National Corp., Class A | | | 166,048 | | | | 4,911,700 | |
SmartFinancial, Inc. | | | 21,356 | | | | 584,300 | |
South Plains Financial, Inc. | | | 17,062 | | | | 474,494 | |
South State Corp. | | | 106,974 | | | | 8,569,687 | |
Southern First Bancshares, Inc.(a) | | | 11,833 | | | | 739,444 | |
Southside Bancshares, Inc. | | | 48,411 | | | | 2,024,548 | |
Spirit of Texas Bancshares, Inc. | | | 21,126 | | | | 608,006 | |
Stock Yards Bancorp, Inc. | | | 36,772 | | | | 2,348,995 | |
Summit Financial Group, Inc. | | | 19,115 | | | | 524,707 | |
Texas Capital Bancshares, Inc.(a) | | | 77,685 | | | | 4,680,521 | |
Third Coast Bancshares, Inc.(a) | | | 4,782 | | | | 124,236 | |
Tompkins Financial Corp. | | | 22,163 | | | | 1,852,384 | |
TowneBank | | | 103,982 | | | | 3,284,791 | |
Trico Bancshares | | | 40,262 | | | | 1,729,656 | |
TriState Capital Holdings, Inc.(a) | | | 44,534 | | | | 1,347,599 | |
Triumph Bancorp, Inc.(a)(b) | | | 36,006 | | | | 4,287,594 | |
TrustCo Bank Corp. | | | 30,655 | | | | 1,021,118 | |
Trustmark Corp. | | | 95,350 | | | | 3,095,061 | |
UMB Financial Corp. | | | 66,742 | | | | 7,081,994 | |
United Bankshares, Inc. | | | 201,239 | | | | 7,300,951 | |
| | | | | | | | |
| Security | | Shares | | | Value | |
|
| Banks: Diversified (continued) | |
United Community Banks, Inc. | | | 120,164 | | | $ | 4,318,694 | |
Univest Financial Corp. | | | 45,724 | | | | 1,368,062 | |
Valley National Bancorp | | | 609,660 | | | | 8,382,825 | |
Veritex Holdings, Inc. | | | 71,024 | | | | 2,825,335 | |
Washington Trust Bancorp, Inc. | | | 26,664 | | | | 1,503,050 | |
WesBanco, Inc. | | | 93,018 | | | | 3,254,700 | |
West BanCorp., Inc. | | | 26,795 | | | | 832,521 | |
Westamerica BanCorp | | | 40,498 | | | | 2,337,950 | |
| | | | | | | | |
| | |
| | | | | | | 367,585,164 | |
|
| Banks: Savings, Thrift & Mortgage Lending — 1.0% | |
Amalgamated Financial Corp. | | | 20,899 | | | | 350,476 | |
Axos Financial, Inc.(a) | | | 87,022 | | | | 4,865,400 | |
Banc of California, Inc. | | | 80,914 | | | | 1,587,533 | |
BankUnited, Inc. | | | 135,480 | | | | 5,732,159 | |
Berkshire Hills Bancorp, Inc. | | | 65,241 | | | | 1,854,802 | |
Brookline Bancorp, Inc. | | | 112,560 | | | | 1,822,346 | |
Finance Of America Cos., Inc., Class A(a) | | | 44,228 | | | | 175,585 | |
Flushing Financial Corp. | | | 44,444 | | | | 1,079,989 | |
Great Southern Bancorp, Inc. | | | 14,826 | | | | 878,441 | |
Heritage Financial Corp. | | | 53,775 | | | | 1,314,261 | |
Hingham Institution for Savings | | | 2,201 | | | | 924,156 | |
Home Bancorp, Inc. | | | 12,224 | | | | 507,418 | |
Home Point Capital, Inc. | | | 7,506 | | | | 33,777 | |
HomeStreet, Inc. | | | 27,559 | | | | 1,433,068 | |
Investors Bancorp, Inc. | | | 348,182 | | | | 5,274,957 | |
Kearny Financial Corp. | | | 98,841 | | | | 1,309,643 | |
Ladder Capital Corp. | | | 180,104 | | | | 2,159,447 | |
Northfield Bancorp, Inc. | | | 74,887 | | | | 1,210,174 | |
Northwest Bancshares, Inc. | | | 184,801 | | | | 2,616,782 | |
OceanFirst Financial Corp. | | | 89,605 | | | | 1,989,231 | |
Premier Financial Corp. | | | 55,468 | | | | 1,714,516 | |
Provident Bancorp, Inc. | | | 32,679 | | | | 607,829 | |
Southern Missouri Bancorp, Inc. | | | 12,070 | | | | 629,692 | |
Washington Federal, Inc. | | | 98,218 | | | | 3,278,517 | |
Waterstone Financial, Inc. | | | 33,179 | | | | 725,293 | |
WSFS Financial Corp. | | | 72,072 | | | | 3,612,249 | |
| | | | | | | | |
| | |
| | | | | | | 47,687,741 | |
|
| Beverage: Soft Drinks — 0.4% | |
Celsius Holdings, Inc.(a) | | | 82,527 | | | | 6,154,039 | |
Coca-Cola Consolidated, Inc. | | | 7,185 | | | | 4,448,880 | |
Duckhorn Portfolio, Inc.(a) | | | 54,933 | | | | 1,282,136 | |
National Beverage Corp. | | | 35,891 | | | | 1,626,939 | |
NewAge, Inc.(a)(b) | | | 243,878 | | | | 251,194 | |
Primo Water Corp. | | | 240,603 | | | | 4,241,831 | |
Zevia PBC, Class A(a)(b) | | | 14,065 | | | | 99,158 | |
| | | | | | | | |
| | |
| | | | | | | 18,104,177 | |
|
| Biotechnology — 8.2% | |
2seventy bio, Inc.(a) | | | 34,034 | | | | 872,291 | |
4D Molecular Therapeutics, Inc.(a) | | | 42,274 | | | | 927,492 | |
89bio, Inc.(a)(b) | | | 12,295 | | | | 160,696 | |
9 Meters Biopharma, Inc.(a) | | | 312,482 | | | | 305,826 | |
Acumen Pharmaceuticals, Inc.(a) | | | 14,760 | | | | 99,778 | |
Adagio Therapeutics, Inc.(a)(b) | | | 32,171 | | | | 233,561 | |
Adicet Bio, Inc.(a) | | | 32,454 | | | | 567,620 | |
Aduro Biotech, Inc.(c) | | | 21,953 | | | | 65,859 | |
Adverum Biotechnologies, Inc.(a) | | | 136,226 | | | | 239,758 | |
Aeglea BioTherapeutics, Inc.(a) | | | 71,346 | | | | 338,894 | |
Aerovate Therapeutics, Inc.(a) | | | 11,232 | | | | 132,425 | |
Affimed NV(a) | | | 178,550 | | | | 985,596 | |
Agenus, Inc.(a) | | | 341,122 | | | | 1,098,413 | |
Agios Pharmaceuticals, Inc.(a) | | | 82,856 | | | | 2,723,477 | |
| | |
| 76 | | 2 0 2 1 BLACK ROCK ANNUAL REPORT TO SHAREHOLDERS |
| | |
Schedule of Investments (continued) December 31, 2021 | | Master Small Cap Index Series (Percentages shown are based on Net Assets) |
| | | | | | | | |
| Security | | Shares | | | Value | |
| | |
| Biotechnology (continued) | | | | | | |
Akebia Therapeutics, Inc.(a) | | | 277,261 | | | $ | 626,610 | |
Akero Therapeutics, Inc.(a) | | | 38,642 | | | | 817,278 | |
Akouos, Inc.(a) | | | 36,026 | | | | 306,221 | |
Albireo Pharma, Inc.(a) | | | 25,915 | | | | 603,560 | |
Aldeyra Therapeutics, Inc.(a) | | | 73,079 | | | | 292,316 | |
Alector, Inc.(a) | | | 89,457 | | | | 1,847,287 | |
Aligos Therapeutics, Inc.(a)(b) | | | 36,306 | | | | 430,952 | |
Allakos, Inc.(a)(b) | | | 54,307 | | | | 531,666 | |
Allogene Therapeutics, Inc.(a) | | | 103,112 | | | | 1,538,431 | |
Allovir, Inc.(a) | | | 44,294 | | | | 573,164 | |
Alpine Immune Sciences, Inc.(a) | | | 25,129 | | | | 348,037 | |
Altimmune, Inc.(a) | | | 61,429 | | | | 562,690 | |
ALX Oncology Holdings, Inc.(a) | | | 26,983 | | | | 579,865 | |
Amicus Therapeutics, Inc.(a)(b) | | | 403,125 | | | | 4,656,094 | |
AnaptysBio, Inc.(a) | | | 29,368 | | | | 1,020,538 | |
Anavex Life Sciences Corp.(a) | | | 102,609 | | | | 1,779,240 | |
ANI Pharmaceuticals, Inc.(a) | | | 16,566 | | | | 763,361 | |
Annexon, Inc.(a)(b) | | | 46,724 | | | | 536,859 | |
Apellis Pharmaceuticals, Inc.(a) | | | 109,583 | | | | 5,181,084 | |
Applied Molecular Transport, Inc.(a) | | | 37,144 | | | | 519,273 | |
Applied Therapeutics, Inc.(a) | | | 33,159 | | | | 296,773 | |
Arbutus Biopharma Corp.(a) | | | 118,224 | | | | 459,891 | |
Arcturus Therapeutics Holdings, Inc.(a)(b) | | | 32,372 | | | | 1,198,088 | |
Arcus Biosciences, Inc.(a)(b) | | | 68,699 | | | | 2,780,249 | |
Arcutis Biotherapeutics, Inc.(a) | | | 43,527 | | | | 902,750 | |
Ardelyx, Inc.(a)(b) | | | 152,253 | | | | 167,478 | |
Arena Pharmaceuticals, Inc.(a) | | | 94,696 | | | | 8,801,046 | |
Arvinas, Inc.(a) | | | 72,161 | | | | 5,927,305 | |
Atara Biotherapeutics, Inc.(a) | | | 133,582 | | | | 2,105,252 | |
Athenex, Inc.(a)(b) | | | 159,533 | | | | 216,965 | |
Athersys, Inc.(a)(b) | | | 255,927 | | | | 231,000 | |
Atossa Therapeutics, Inc.(a)(b) | | | 177,719 | | | | 284,350 | |
Atreca, Inc., Class A(a)(b) | | | 45,165 | | | | 136,850 | |
Aura Biosciences, Inc.(a) | | | 6,760 | | | | 114,785 | |
Avid Bioservices, Inc.(a)(b) | | | 91,969 | | | | 2,683,655 | |
Avidity Biosciences, Inc.(a) | | | 57,734 | | | | 1,372,337 | |
Avita Medical, Inc.(a) | | | 35,610 | | | | 426,608 | |
Avrobio, Inc.(a) | | | 52,376 | | | | 201,648 | |
Beam Therapeutics, Inc.(a)(b) | | | 78,409 | | | | 6,248,413 | |
Beyondspring, Inc.(a)(b) | | | 35,019 | | | | 158,636 | |
BioAtla, Inc.(a) | | | 23,389 | | | | 459,126 | |
BioCryst Pharmaceuticals, Inc.(a) | | | 275,710 | | | | 3,818,583 | |
BioDelivery Sciences International, Inc.(a) | | | 139,121 | | | | 431,275 | |
Biohaven Pharmaceutical Holding Co. Ltd.(a) | | | 85,319 | | | | 11,757,811 | |
Biomea Fusion, Inc.(a) | | | 29,655 | | | | 220,930 | |
Bioventus, Inc., Class A(a)(b) | | | 46,155 | | | | 668,786 | |
Bioxcel Therapeutics, Inc.(a) | | | 25,925 | | | | 527,055 | |
Black Diamond Therapeutics, Inc.(a) | | | 46,156 | | | | 246,011 | |
Bluebird Bio, Inc.(a)(b) | | | 102,103 | | | | 1,020,009 | |
Blueprint Medicines Corp.(a) | | | 89,734 | | | | 9,611,409 | |
Bolt Biotherapeutics, Inc.(a)(b) | | | 35,008 | | | | 171,539 | |
Bridgebio Pharma, Inc.(a) | | | 162,470 | | | | 2,710,000 | |
Brooklyn ImmunoTherapeutics, Inc.(a) | | | 44,700 | | | | 186,399 | |
C4 Therapeutics, Inc.(a) | | | 59,298 | | | | 1,909,396 | |
Cardiff Oncology, Inc.(a) | | | 53,346 | | | | 320,609 | |
Caribou Biosciences, Inc.(a) | | | 29,300 | | | | 442,137 | |
Castle Biosciences, Inc.(a) | | | 33,145 | | | | 1,420,926 | |
Catalyst Pharmaceuticals, Inc.(a) | | | 150,582 | | | | 1,019,440 | |
Celcuity, Inc.(a) | | | 10,906 | | | | 143,850 | |
Celldex Therapeutics, Inc.(a) | | | 70,437 | | | | 2,721,686 | |
CEL-SCI Corp.(a) | | | 55,169 | | | | 391,700 | |
Century Therapeutics, Inc.(a)(b) | | | 22,525 | | | | 357,247 | |
Cerevel Therapeutics Holdings, Inc.(a) | | | 62,420 | | | | 2,023,656 | |
| | | | | | | | |
| Security | | Shares | | | Value | |
| | |
| Biotechnology (continued) | | | | | | |
ChemoCentryx, Inc.(a) | | | 81,906 | | | $ | 2,982,197 | |
Chinook Therapeutics, Inc.(a) | | | 58,543 | | | | 954,836 | |
Clene, Inc.(a)(b) | | | 31,295 | | | | 128,310 | |
Clovis Oncology, Inc.(a)(b) | | | 166,183 | | | | 450,356 | |
Codexis, Inc.(a) | | | 91,580 | | | | 2,863,707 | |
Codiak Biosciences, Inc.(a) | | | 22,710 | | | | 252,989 | |
Cogent Biosciences, Inc.(a) | | | 54,386 | | | | 466,632 | |
Coherus Biosciences, Inc.(a) | | | 101,091 | | | | 1,613,412 | |
Collegium Pharmaceutical, Inc.(a) | | | 52,060 | | | | 972,481 | |
Contra GTX, Inc.(b)(c) | | | 944 | | | | 968 | |
Cortexyme, Inc.(a) | | | 30,019 | | | | 378,840 | |
Crinetics Pharmaceuticals, Inc.(a) | | | 70,314 | | | | 1,997,621 | |
Cue Biopharma, Inc.(a) | | | 46,824 | | | | 529,579 | |
Cullinan Oncology, Inc.(a) | | | 39,446 | | | | 608,652 | |
Curis, Inc.(a)(b) | | | 130,842 | | | | 622,808 | |
Cymabay Therapeutics, Inc.(a) | | | 104,476 | | | | 353,129 | |
Cytokinetics, Inc.(a) | | | 121,640 | | | | 5,544,351 | |
CytomX Therapeutics, Inc.(a) | | | 111,108 | | | | 481,098 | |
CytoSorbents Corp.(a) | | | 64,033 | | | | 268,298 | |
Day One Biopharmaceuticals, Inc.(a) | | | 18,845 | | | | 317,538 | |
Deciphera Pharmaceuticals, Inc.(a) | | | 62,795 | | | | 613,507 | |
Denali Therapeutics, Inc.(a) | | | 139,410 | | | | 6,217,686 | |
Design Therapeutics, Inc.(a)(b) | | | 38,869 | | | | 832,185 | |
Douglas Elliman, Inc. | | | 109,704 | | | | 1,261,596 | |
Dynavax Technologies Corp.(a) | | | 165,212 | | | | 2,324,533 | |
Dyne Therapeutics, Inc.(a) | | | 44,808 | | | | 532,767 | |
Editas Medicine, Inc.(a) | | | 105,523 | | | | 2,801,636 | |
Eiger Biopharmaceuticals, Inc.(a) | | | 48,670 | | | | 252,597 | |
Eliem Therapeutics, Inc.(a)(b) | | | 10,890 | | | | 113,909 | |
Emergent BioSolutions, Inc.(a) | | | 74,869 | | | | 3,254,555 | |
Entrada Therapeutics, Inc.(a)(b) | | | 12,531 | | | | 214,531 | |
Epizyme, Inc.(a) | | | 137,866 | | | | 344,665 | |
Erasca, Inc.(a)(b) | | | 30,012 | | | | 467,587 | |
Evelo Biosciences, Inc.(a)(b) | | | 47,428 | | | | 287,888 | |
EyePoint Pharmaceuticals, Inc.(a) | | | 32,802 | | | | 401,496 | |
Fate Therapeutics, Inc.(a) | | | 124,526 | | | | 7,286,016 | |
FibroGen, Inc.(a) | | | 133,924 | | | | 1,888,328 | |
Finch Therapeutics Group, Inc.(a) | | | 13,935 | | | | 138,932 | |
Foghorn Therapeutics, Inc.(a) | | | 32,469 | | | | 742,566 | |
Forma Therapeutics Holdings, Inc.(a) | | | 52,861 | | | | 751,683 | |
Forte Biosciences, Inc.(a)(b) | | | 16,626 | | | | 35,580 | |
Fortress Biotech, Inc.(a) | | | 112,543 | | | | 281,358 | |
Frequency Therapeutics, Inc.(a)(b) | | | 60,914 | | | | 312,489 | |
Fulcrum Therapeutics, Inc.(a) | | | 41,003 | | | | 725,343 | |
G1 Therapeutics, Inc.(a)(b) | | | 62,743 | | | | 640,606 | |
Gemini Therapeutics, Inc.(a)(b) | | | 30,941 | | | | 90,038 | |
Generation Bio Co.(a)(b) | | | 72,200 | | | | 511,176 | |
Geron Corp.(a) | | | 436,582 | | | | 532,630 | |
Global Blood Therapeutics, Inc.(a) | | | 95,649 | | | | 2,799,646 | |
Gossamer Bio, Inc.(a) | | | 99,910 | | | | 1,129,982 | |
Graphite Bio, Inc.(a) | | | 24,627 | | | | 306,114 | |
Greenwich Lifesciences, Inc.(a) | | | 5,921 | | | | 144,058 | |
Gritstone bio, Inc.(a) | | | 65,192 | | | | 838,369 | |
GT Biopharma, Inc.(a) | | | 34,934 | | | | 106,549 | |
Halozyme Therapeutics, Inc.(a) | | | 212,482 | | | | 8,543,901 | |
Harpoon Therapeutics, Inc.(a) | | | 35,617 | | | | 268,908 | |
Harvard Bioscience, Inc.(a) | | | 61,301 | | | | 432,172 | |
Heron Therapeutics, Inc.(a)(b) | | | 142,674 | | | | 1,302,614 | |
Homology Medicines, Inc.(a) | | | 66,601 | | | | 242,428 | |
Hookipa Pharma, Inc.(a) | | | 22,901 | | | | 53,359 | |
Humanigen, Inc.(a) | | | 67,653 | | | | 251,669 | |
iBio, Inc.(a) | | | 316,447 | | | | 173,729 | |
Icosavax, Inc.(a)(b) | | | 19,539 | | | | 447,052 | |
| | |
SERIES SCHEDULE OF INVESTMENTS | | 77 |
| | |
Schedule of Investments (continued) December 31, 2021 | | Master Small Cap Index Series (Percentages shown are based on Net Assets) |
| | | | | | | | |
| Security | | Shares | | | Value | |
|
| Biotechnology (continued) | |
Ideaya Biosciences, Inc.(a) | | | 50,300 | | | $ | 1,189,092 | |
IGM Biosciences, Inc.(a) | | | 14,052 | | | | 412,145 | |
Imago Biosciences, Inc.(a)(b) | | | 14,561 | | | | 345,241 | |
Immuneering Corp., Class A(a)(b) | | | 12,353 | | | | 199,748 | |
Immunic, Inc.(a) | | | 28,435 | | | | 272,123 | |
ImmunityBio, Inc.(a)(b) | | | 101,128 | | | | 614,858 | |
ImmunoGen, Inc.(a)(b) | | | 302,558 | | | | 2,244,980 | |
Immunovant, Inc.(a) | | | 58,435 | | | | 497,866 | |
Impel Neuropharma, Inc.(a)(b) | | | 10,369 | | | | 89,484 | |
Inhibrx, Inc.(a)(b) | | | 42,656 | | | | 1,862,788 | |
Inovio Pharmaceuticals, Inc.(a)(b) | | | 314,243 | | | | 1,568,073 | |
Inozyme Pharma, Inc.(a) | | | 17,048 | | | | 116,267 | |
Insmed, Inc.(a) | | | 181,119 | | | | 4,933,682 | |
Instil Bio, Inc.(a)(b) | | | 83,593 | | | | 1,430,276 | |
Intellia Therapeutics, Inc.(a)(b) | | | 106,783 | | | | 12,626,022 | |
Intercept Pharmaceuticals, Inc.(a)(b) | | | 38,914 | | | | 633,909 | |
Invitae Corp.(a)(b) | | | 305,417 | | | | 4,663,718 | |
iTeos Therapeutics, Inc.(a) | | | 30,882 | | | | 1,437,866 | |
IVERIC bio, Inc.(a) | | | 176,152 | | | | 2,945,261 | |
Janux Therapeutics, Inc.(a)(b) | | | 24,304 | | | | 479,518 | |
Jounce Therapeutics, Inc.(a) | | | 59,732 | | | | 498,762 | |
Kala Pharmaceuticals, Inc.(a)(b) | | | 61,146 | | | | 73,987 | |
Kaleido Biosciences, Inc.(a) | | | 19,163 | | | | 45,800 | |
KalVista Pharmaceuticals, Inc.(a) | | | 33,923 | | | | 448,801 | |
Karuna Therapeutics, Inc.(a) | | | 33,928 | | | | 4,444,568 | |
Karyopharm Therapeutics, Inc.(a)(b) | | | 109,244 | | | | 702,439 | |
KemPharm, Inc.(a)(b) | | | 42,902 | | | | 373,676 | |
Keros Therapeutics, Inc.(a) | | | 23,575 | | | | 1,379,373 | |
Kezar Life Sciences, Inc.(a) | | | 54,942 | | | | 918,630 | |
Kiniksa Pharmaceuticals Ltd., Class A(a) | | | 44,646 | | | | 525,483 | |
Kinnate Biopharma, Inc.(a) | | | 38,328 | | | | 679,172 | |
Kodiak Sciences, Inc.(a) | | | 51,580 | | | | 4,372,952 | |
Kronos Bio, Inc.(a)(b) | | | 58,058 | | | | 789,008 | |
Krystal Biotech, Inc.(a) | | | 27,467 | | | | 1,921,317 | |
Kura Oncology, Inc.(a) | | | 97,596 | | | | 1,366,344 | |
Kymera Therapeutics, Inc.(a)(b) | | | 52,634 | | | | 3,341,733 | |
Lexicon Pharmaceuticals, Inc.(a) | | | 102,558 | | | | 404,079 | |
Ligand Pharmaceuticals, Inc.(a) | | | 23,084 | | | | 3,565,555 | |
Lineage Cell Therapeutics, Inc.(a)(b) | | | 177,498 | | | | 434,870 | |
Lyell Immunopharma, Inc.(a) | | | 35,757 | | | | 276,759 | |
MacroGenics, Inc.(a) | | | 93,307 | | | | 1,497,577 | |
Madrigal Pharmaceuticals, Inc.(a) | | | 18,136 | | | | 1,536,845 | |
Magenta Therapeutics, Inc.(a) | | | 54,237 | | | | 240,270 | |
MannKind Corp.(a)(b) | | | 377,716 | | | | 1,650,619 | |
Marinus Pharmaceuticals, Inc.(a) | | | 55,784 | | | | 662,714 | |
MaxCyte, Inc.(a) | | | 145,289 | | | | 1,480,495 | |
MeiraGTx Holdings plc(a) | | | 45,301 | | | | 1,075,446 | |
Mersana Therapeutics, Inc.(a) | | | 104,963 | | | | 652,870 | |
MiMedx Group, Inc.(a) | | | 165,237 | | | | 998,031 | |
Mirum Pharmaceuticals, Inc.(a) | | | 8,546 | | | | 136,309 | |
Molecular Templates, Inc.(a) | | | 68,237 | | | | 267,489 | |
Monte Rosa Therapeutics, Inc.(a) | | | 17,497 | | | | 357,289 | |
Morphic Holding, Inc.(a) | | | 32,042 | | | | 1,518,150 | |
Mustang Bio, Inc.(a) | | | 105,659 | | | | 175,394 | |
Myriad Genetics, Inc.(a) | | | 121,562 | | | | 3,355,111 | |
Neoleukin Therapeutics, Inc.(a) | | | 49,979 | | | | 240,899 | |
NexImmune, Inc.(a)(b) | | | 8,158 | | | | 37,608 | |
NGM Biopharmaceuticals, Inc.(a) | | | 49,964 | | | | 884,862 | |
Nkarta, Inc.(a) | | | 22,072 | | | | 338,805 | |
Nurix Therapeutics, Inc.(a) | | | 49,846 | | | | 1,443,042 | |
Nuvalent, Inc., Class A(a) | | | 16,230 | | | | 309,019 | |
Ocugen, Inc.(a)(b) | | | 278,977 | | | | 1,269,345 | |
Olema Pharmaceuticals, Inc.(a) | | | 38,665 | | | | 361,904 | |
| | | | | | | | |
| Security | | Shares | | | Value | |
|
| Biotechnology (continued) | |
Omega Therapeutics, Inc.(a) | | | 9,752 | | | $ | 110,490 | |
Omeros Corp.(a)(b) | | | 90,803 | | | | 583,863 | |
Oncocyte Corp.(a) | | | 110,088 | | | | 238,891 | |
Oncorus, Inc.(a) | | | 30,013 | | | | 158,169 | |
Oncternal Therapeutics, Inc.(a) | | | 65,934 | | | | 149,670 | |
OPKO Health, Inc.(a)(b) | | | 605,169 | | | | 2,910,863 | |
ORIC Pharmaceuticals, Inc.(a) | | | 48,221 | | | | 708,849 | |
Outlook Therapeutics, Inc.(a)(b) | | | 125,636 | | | | 170,865 | |
Oyster Point Pharma, Inc.(a)(b) | | | 21,266 | | | | 388,317 | |
Pacific Biosciences of California, Inc.(a)(b) | | | 297,677 | | | | 6,090,471 | |
Passage Bio, Inc.(a) | | | 59,966 | | | | 380,784 | |
Personalis, Inc.(a) | | | 54,190 | | | | 773,291 | |
Phathom Pharmaceuticals, Inc.(a) | | | 30,061 | | | | 591,300 | |
PMV Pharmaceuticals, Inc.(a) | | | 39,497 | | | | 912,381 | |
Portage Biotech, Inc.(a) | | | 6,706 | | | | 71,955 | |
Poseida Therapeutics, Inc.(a) | | | 48,124 | | | | 327,724 | |
Praxis Precision Medicines, Inc.(a) | | | 49,737 | | | | 979,819 | |
Precigen, Inc.(a) | | | 144,839 | | | | 537,353 | |
Precision BioSciences, Inc.(a)(b) | | | 77,298 | | | | 572,005 | |
Prelude Therapeutics, Inc.(a)(b) | | | 14,971 | | | | 186,389 | |
Prometheus Biosciences, Inc.(a)(b) | | | 45,801 | | | | 1,810,972 | |
Protagonist Therapeutics, Inc.(a) | | | 68,775 | | | | 2,352,105 | |
Prothena Corp. PLC(a) | | | 55,442 | | | | 2,738,835 | |
Provention Bio, Inc.(a)(b) | | | 80,450 | | | | 452,129 | |
PTC Therapeutics, Inc.(a)(b) | | | 105,581 | | | | 4,205,291 | |
Pulse Biosciences, Inc.(a) | | | 21,148 | | | | 313,202 | |
Puma Biotechnology, Inc.(a) | | | 47,281 | | | | 143,734 | |
Pyxis Oncology, Inc.(a) | | | 15,394 | | | | 168,872 | |
RadNet, Inc.(a) | | | 71,625 | | | | 2,156,629 | |
Rallybio Corp.(a) | | | 4,500 | | | | 42,930 | |
Rapt Therapeutics, Inc.(a) | | | 32,957 | | | | 1,210,511 | |
Recursion Pharmaceuticals, Inc., Class A(a) | | | 176,629 | | | | 3,025,655 | |
REGENXBIO, Inc.(a) | | | 59,760 | | | | 1,954,152 | |
Relay Therapeutics, Inc.(a) | | | 107,404 | | | | 3,298,377 | |
Relmada Therapeutics, Inc.(a) | | | 22,508 | | | | 507,105 | |
Replimune Group, Inc.(a) | | | 47,471 | | | | 1,286,464 | |
Revolution Medicines, Inc.(a)(b) | | | 89,866 | | | | 2,261,927 | |
Rhythm Pharmaceuticals, Inc.(a) | | | 67,808 | | | | 676,724 | |
Rigel Pharmaceuticals, Inc.(a) | | | 256,348 | | | | 679,322 | |
Rocket Pharmaceuticals, Inc.(a)(b) | | | 63,341 | | | | 1,382,734 | |
Rubius Therapeutics, Inc.(a) | | | 68,336 | | | | 661,492 | |
Sana Biotechnology, Inc.(a)(b) | | | 131,093 | | | | 2,029,320 | |
Sangamo Therapeutics, Inc.(a) | | | 182,613 | | | | 1,369,598 | |
Scholar Rock Holding Corp.(a)(b) | | | 42,334 | | | | 1,051,577 | |
Selecta Biosciences, Inc.(a) | | | 154,589 | | | | 503,960 | |
Sensei Biotherapeutics, Inc.(a) | | | 33,652 | | | | 195,182 | |
Seres Therapeutics, Inc.(a) | | | 105,148 | | | | 875,883 | |
Sesen Bio, Inc.(a)(b) | | | 303,015 | | | | 246,957 | |
Shattuck Labs, Inc.(a) | | | 39,554 | | | | 336,605 | |
Sigilon Therapeutics, Inc.(a) | | | 10,362 | | | | 28,599 | |
Silverback Therapeutics, Inc.(a)(b) | | | 32,599 | | | | 217,109 | |
Singular Genomics Systems, Inc.(a) | | | 19,168 | | | | 221,582 | |
Solid Biosciences, Inc.(a) | | | 103,306 | | | | 180,786 | |
Sorrento Therapeutics, Inc.(a)(b) | | | 453,020 | | | | 2,106,543 | |
Spero Therapeutics, Inc.(a)(b) | | | 36,207 | | | | 579,674 | |
SpringWorks Therapeutics, Inc.(a) | | | 44,774 | | | | 2,775,093 | |
Spruce Biosciences, Inc.(a)(b) | | | 9,625 | | | | 42,928 | |
SQZ Biotechnologies Co.(a) | | | 33,371 | | | | 298,003 | |
Stoke Therapeutics, Inc.(a) | | | 28,614 | | | | 686,450 | |
Summit Therapeutics, Inc.(a) | | | 34,667 | | | | 93,254 | |
Surface Oncology, Inc.(a) | | | 50,001 | | | | 239,005 | |
Sutro Biopharma, Inc.(a) | | | 65,442 | | | | 973,777 | |
Syros Pharmaceuticals, Inc.(a) | | | 112,522 | | | | 366,822 | |
| | |
| 78 | | 2 0 2 1 BLACK ROCK ANNUAL REPORT TO SHAREHOLDERS |
| | |
Schedule of Investments (continued) December 31, 2021 | | Master Small Cap Index Series (Percentages shown are based on Net Assets) |
| | | | | | | | |
| Security | | Shares | | | Value | |
| | |
| Biotechnology (continued) | | | | | | |
Talaris Therapeutics, Inc.(a) | | | 32,454 | | | $ | 496,222 | |
Taysha Gene Therapies, Inc.(a)(b) | | | 32,800 | | | | 382,120 | |
TCR2 Therapeutics, Inc.(a) | | | 43,536 | | | | 202,878 | |
Tenaya Therapeutics, Inc.(a) | | | 21,583 | | | | 408,998 | |
Travere Therapeutics, Inc.(a) | | | 90,084 | | | | 2,796,207 | |
Trevena, Inc.(a)(b) | | | 237,659 | | | | 138,436 | |
Turning Point Therapeutics, Inc.(a) | | | 70,544 | | | | 3,364,949 | |
Twist Bioscience Corp.(a)(b) | | | 72,404 | | | | 5,603,346 | |
Tyra Biosciences, Inc.(a)(b) | | | 16,362 | | | | 230,213 | |
UroGen Pharma Ltd.(a)(b) | | | 29,912 | | | | 284,463 | |
Vanda Pharmaceuticals, Inc.(a) | | | 84,079 | | | | 1,319,200 | |
Vaxart, Inc.(a)(b) | | | 187,570 | | | | 1,176,064 | |
Vaxcyte, Inc.(a) | | | 61,780 | | | | 1,469,746 | |
VBI Vaccines, Inc.(a) | | | 276,911 | | | | 647,972 | |
Vera Therapeutics, Inc.(a) | | | 15,094 | | | | 403,312 | |
Veracyte, Inc.(a) | | | 104,018 | | | | 4,285,542 | |
Verastem, Inc.(a) | | | 257,792 | | | | 528,474 | |
Vericel Corp.(a)(b) | | | 71,237 | | | | 2,799,614 | |
Verrica Pharmaceuticals, Inc.(a)(b) | | | 21,272 | | | | 194,852 | |
Verve Therapeutics, Inc.(a)(b) | | | 24,058 | | | | 887,018 | |
Viking Therapeutics, Inc.(a) | | | 101,263 | | | | 465,810 | |
Vincerx Pharma, Inc.(a)(b) | | | 22,974 | | | | 234,105 | |
Vir Biotechnology, Inc.(a) | | | 91,938 | | | | 3,849,444 | |
Viracta Therapeutics, Inc.(a) | | | 53,640 | | | | 195,786 | |
VistaGen Therapeutics, Inc.(a) | | | 281,092 | | | | 548,129 | |
Vor BioPharma, Inc.(a)(b) | | | 29,060 | | | | 337,677 | |
Werewolf Therapeutics, Inc.(a)(b) | | | 37,944 | | | | 451,913 | |
XBiotech, Inc. | | | 21,897 | | | | 243,714 | |
Xencor, Inc.(a) | | | 86,873 | | | | 3,485,345 | |
Xilio Therapeutics, Inc.(a) | | | 12,495 | | | | 199,920 | |
XOMA Corp.(a)(b) | | | 9,810 | | | | 204,539 | |
Y-mAbs Therapeutics, Inc.(a) | | | 53,449 | | | | 866,408 | |
Zentalis Pharmaceuticals, Inc.(a) | | | 55,809 | | | | 4,691,305 | |
ZIOPHARM Oncology, Inc.(a)(b) | | | 326,456 | | | | 355,837 | |
| | | | | | | | |
| | |
| | | | | | | 375,203,300 | |
| | |
| Building Materials — 0.8% | | | | | | |
Aspen Aerogels, Inc.(a) | | | 33,994 | | | | 1,692,561 | |
BlueLinx Holdings, Inc.(a) | | | 14,233 | | | | 1,362,952 | |
Caesarstone Ltd. | | | 34,219 | | | | 388,044 | |
Cornerstone Building Brands, Inc.(a) | | | 83,579 | | | | 1,457,618 | |
Gibraltar Industries, Inc.(a) | | | 50,132 | | | | 3,342,802 | |
Griffon Corp. | | | 69,919 | | | | 1,991,293 | |
Masonite International Corp.(a) | | | 36,515 | | | | 4,306,944 | |
Patrick Industries, Inc. | | | 34,860 | | | | 2,812,853 | |
PGT Innovations, Inc.(a) | | | 87,158 | | | | 1,960,184 | |
Quanex Building Products Corp. | | | 49,618 | | | | 1,229,534 | |
Simpson Manufacturing Co., Inc. | | | 66,740 | | | | 9,281,532 | |
Summit Materials, Inc., Class A(a)(b) | | | 182,110 | | | | 7,309,895 | |
| | | | | | | | |
| | |
| | | | | | | 37,136,212 | |
|
| Building: Climate Control — 0.3% | |
AAON, Inc. | | | 64,111 | | | | 5,092,337 | |
Comfort Systems USA, Inc. | | | 54,665 | | | | 5,408,555 | |
View, Inc.(a)(b) | | | 207,380 | | | | 810,856 | |
| | | | | | | | |
| | |
| | | | | | | 11,311,748 | |
|
| Building: Roofing, Wallboard & Plumbing(a) — 0.2% | |
Beacon Roofing Supply, Inc. | | | 85,554 | | | | 4,906,522 | |
Forterra, Inc. | | | 43,495 | | | | 1,034,311 | |
JELD-WEN Holding, Inc.(b) | | | 140,474 | | | | 3,702,895 | |
| | | | | | | | |
| | |
| | | | | | | 9,643,728 | |
| | | | | | | | |
| Security | | Shares | | | Value | |
| | |
| Cable Television Services(a) — 0.1% | | | | | | |
AMC Networks, Inc., Class A(b) | | | 44,617 | | | $ | 1,536,609 | |
Liberty Latin America Ltd., Class A | | | 87,902 | | | | 1,024,937 | |
Liberty Latin America Ltd., Class C | | | 212,722 | | | | 2,425,031 | |
WideOpenWest, Inc. | | | 80,336 | | | | 1,728,831 | |
| | | | | | | | |
| | |
| | | | | | | 6,715,408 | |
| | |
| Casinos & Gambling — 0.4% | | | | | | |
Accel Entertainment, Inc.(a) | | | 86,055 | | | | 1,120,436 | |
Century Casinos, Inc.(a) | | | 41,366 | | | | 503,838 | |
Full House Resorts, Inc.(a) | | | 47,443 | | | | 574,535 | |
Golden Nugget Online Gaming, Inc.(a) | | | 61,035 | | | | 607,298 | |
International Game Technology PLC | | | 153,061 | | | | 4,424,993 | |
Monarch Casino & Resort, Inc.(a) | | | 20,052 | | | | 1,482,845 | |
Scientific Games Corp., Class A(a) | | | 147,220 | | | | 9,838,713 | |
| | | | | | | | |
| | |
| | | | | | | 18,552,658 | |
| | |
| Cement — 0.0% | | | | | | |
Concrete Pumping Holdings, Inc.(a) | | | 40,542 | | | | 332,444 | |
| | | | | | | | |
| | |
| Chemicals: Diversified — 0.8% | | | | | | |
AdvanSix, Inc. | | | 41,573 | | | | 1,964,324 | |
American Vanguard Corp. | | | 45,118 | | | | 739,484 | |
Avient Corp. | | | 139,695 | | | | 7,815,935 | |
Cabot Corp. | | | 86,327 | | | | 4,851,578 | |
CSW Industrials, Inc. | | | 22,663 | | | | 2,739,050 | |
Danimer Scientific, Inc.(a)(b) | | | 137,072 | | | | 1,167,854 | |
Ecovyst, Inc. | | | 78,142 | | | | 800,174 | |
GCP Applied Technologies, Inc.(a) | | | 75,230 | | | | 2,381,782 | |
Hawkins, Inc. | | | 29,814 | | | | 1,176,162 | |
Ingevity Corp.(a) | | | 61,102 | | | | 4,381,013 | |
Landec Corp.(a) | | | 42,588 | | | | 472,727 | |
Marrone Bio Innovations, Inc.(a)(b) | | | 93,408 | | | | 67,273 | |
PureCycle Technologies, Inc.(a) | | | 80,001 | | | | 765,610 | |
Rayonier Advanced Materials, Inc.(a) | | | 91,699 | | | | 523,601 | |
Sensient Technologies Corp. | | | 64,905 | | | | 6,494,394 | |
Valhi, Inc. | | | 1,656 | | | | 47,610 | |
Zymergen, Inc.(a) | | | 119,999 | | | | 802,793 | |
| | | | | | | | |
| | |
| | | | | | | 37,191,364 | |
|
| Chemicals: Specialty — 0.9% | |
Amyris, Inc.(a)(b) | | | 273,295 | | | | 1,478,526 | |
Balchem Corp. | | | 49,341 | | | | 8,318,892 | |
FutureFuel Corp. | | | 39,115 | | | | 298,838 | |
Innospec, Inc. | | | 37,582 | | | | 3,395,158 | |
Kraton Corp.(a) | | | 47,918 | | | | 2,219,562 | |
Livent Corp.(a) | | | 248,171 | | | | 6,050,409 | |
Orion Engineered Carbons SA(a) | | | 92,002 | | | | 1,689,157 | |
Park Aerospace Corp. | | | 31,735 | | | | 418,902 | |
Quaker Chemical Corp. | | | 20,726 | | | | 4,783,146 | |
Stepan Co. | | | 33,182 | | | | 4,124,191 | |
Trinseo PLC | | | 59,656 | | | | 3,129,554 | |
Tronox Holdings PLC, Class A | | | 176,558 | | | | 4,242,689 | |
| | | | | | | | |
| | |
| | | | | | | 40,149,024 | |
| | |
| Coal — 0.2% | | | | | | |
Arch Resources, Inc. | | | 23,277 | | | | 2,125,656 | |
CONSOL Energy, Inc.(a)(b) | | | 52,488 | | | | 1,192,002 | |
Peabody Energy Corp.(a) | | | 140,332 | | | | 1,413,143 | |
Warrior Met Coal, Inc. | | | 79,131 | | | | 2,034,458 | |
| | | | | | | | |
| | |
| | | | | | | 6,765,259 | |
| | |
SERIES SCHEDULE OF INVESTMENTS | | 79 |
| | |
Schedule of Investments (continued) December 31, 2021 | | Master Small Cap Index Series (Percentages shown are based on Net Assets) |
| | | | | | | | |
| Security | | Shares | | | Value | |
| | |
| Commercial Banks — 0.1% | | | | | | |
Dime Community Bancshares, Inc. | | | 53,787 | | | $ | 1,891,151 | |
HomeTrust Bancshares, Inc. | | | 24,560 | | | | 760,869 | |
| | | | | | | | |
| | |
| | | | | | | 2,652,020 | |
|
| Commercial Finance & Mortgage Companies — 0.4% | |
Federal Agricultural Mortgage Corp., Class C | | | 13,758 | | | | 1,705,029 | |
Meta Financial Group, Inc. | | | 44,548 | | | | 2,657,734 | |
Ocwen Financial Corp.(a)(b) | | | 12,838 | | | | 513,135 | |
PennyMac Financial Services, Inc. | | | 47,991 | | | | 3,348,812 | |
RE/MAX Holdings, Inc., Class A | | | 28,201 | | | | 859,848 | |
Velocity Financial Inc.(a)(b) | | | 17,616 | | | | 241,339 | |
Walker & Dunlop, Inc. | | | 44,593 | | | | 6,728,192 | |
| | | | | | | | |
| | |
| | | | | | | 16,054,089 | |
|
| Commercial Services & Supplies — 0.0% | |
Aris Water Solution, Inc.(a) | | | 26,865 | | | | 347,902 | |
National Research Corp. | | | 20,953 | | | | 869,968 | |
| | | | | | | | |
| | |
| | | | | | | 1,217,870 | |
|
| Commercial Services: Rental & Leasing — 0.6% | |
GATX Corp. | | | 53,958 | | | | 5,621,884 | |
GMS, Inc.(a) | | | 65,608 | | | | 3,943,697 | |
H&E Equipment Services, Inc. | | | 48,832 | | | | 2,161,793 | |
Herc Holdings, Inc. | | | 38,179 | | | | 5,976,922 | |
Marlin Business Services Corp. | | | 12,216 | | | | 284,388 | |
McGrath RentCorp | | | 36,892 | | | | 2,960,952 | |
NOW, Inc.(a) | | | 167,068 | | | | 1,426,761 | |
Rush Enterprises, Inc., Class B | | | 10,246 | | | | 552,977 | |
Triton International Ltd. | | | 102,226 | | | | 6,157,072 | |
Willis Lease Finance Corp.(a) | | | 4,940 | | | | 185,991 | |
| | | | | | | | |
| | |
| | | | | | | 29,272,437 | |
|
| Commercial Vehicles & Parts — 0.3% | |
Blue Bird Corp.(a)(b) | | | 22,856 | | | | 357,468 | |
Commercial Vehicle Group, Inc.(a)(b) | | | 48,409 | | | | 390,177 | |
Cooper-Standard Holdings, Inc.(a) | | | 25,764 | | | | 577,371 | |
Miller Industries, Inc. | | | 17,235 | | | | 575,649 | |
Modine Manufacturing Co.(a) | | | 83,369 | | | | 841,193 | |
Motorcar Parts of America, Inc.(a) | | | 27,475 | | | | 468,998 | |
REV Group, Inc. | | | 43,602 | | | | 616,969 | |
Rush Enterprises, Inc., Class A | | | 64,016 | | | | 3,561,850 | |
Shyft Group, Inc. | | | 52,875 | | | | 2,597,749 | |
Wabash National Corp. | | | 73,987 | | | | 1,444,226 | |
| | | | | | | | |
| | |
| | | | | | | 11,431,650 | |
|
| Communications Technology — 0.9% | |
908 Devices, Inc.(a)(d) | | | 28,929 | | | | 748,393 | |
ADTRAN, Inc. | | | 72,278 | | | | 1,650,107 | |
Anterix, Inc.(a) | | | 17,633 | | | | 1,036,115 | |
Avaya Holdings Corp.(a)(b) | | | 124,977 | | | | 2,474,545 | |
Aviat Networks, Inc.(a) | | | 10,089 | | | | 323,655 | |
Bandwidth, Inc., Class A(a) | | | 35,537 | | | | 2,550,135 | |
Calix, Inc.(a) | | | 84,373 | | | | 6,747,309 | |
Casa Systems, Inc.(a) | | | 46,447 | | | | 263,355 | |
Comtech Telecommunications Corp. | | | 39,454 | | | | 934,665 | |
Digi International, Inc.(a) | | | 50,826 | | | | 1,248,795 | |
DZS, Inc.(a) | | | 31,355 | | | | 508,578 | |
EchoStar Corp., Class A(a) | | | 56,163 | | | | 1,479,895 | |
Extreme Networks, Inc.(a) | | | 194,529 | | | | 3,054,105 | |
Harmonic, Inc.(a)(b) | | | 143,427 | | | | 1,686,702 | |
Infinera Corp.(a)(b) | | | 279,719 | | | | 2,682,505 | |
Inseego Corp.(a)(b) | | | 129,668 | | | | 755,964 | |
InterDigital, Inc. | | | 47,093 | | | | 3,373,272 | |
KVH Industries, Inc.(a) | | | 27,118 | | | | 249,214 | |
| | | | | | | | |
| Security | | Shares | | | Value | |
|
| Communications Technology (continued) | |
Maxar Technologies, Inc.(b) | | | 111,071 | | | $ | 3,279,927 | |
NeoPhotonics Corp.(a) | | | 78,517 | | | | 1,206,806 | |
NETGEAR, Inc.(a) | | | 45,468 | | | | 1,328,120 | |
Ooma, Inc.(a) | | | 33,106 | | | | 676,687 | |
Plantronics, Inc.(a) | | | 63,846 | | | | 1,873,242 | |
Ribbon Communications, Inc.(a) | | | 123,523 | | | | 747,314 | |
| | | | | | | | |
| | |
| | | | | | | 40,879,405 | |
|
| Computer Services Software & Systems — 7.1% | |
A10 Networks, Inc. | | | 89,959 | | | | 1,491,520 | |
ACI Worldwide, Inc.(a) | | | 180,809 | | | | 6,274,072 | |
Alarm.com Holdings, Inc.(a)(b) | | | 72,237 | | | | 6,126,420 | |
Alkami Technology, Inc.(a)(b) | | | 42,030 | | | | 843,122 | |
Altair Engineering, Inc., Class A(a)(b) | | | 71,501 | | | | 5,528,457 | |
American Software, Inc., Class A | | | 47,528 | | | | 1,243,808 | |
Appfolio, Inc., Class A(a) | | | 29,323 | | | | 3,549,842 | |
Appian Corp.(a) | | | 60,302 | | | | 3,932,293 | |
Asana, Inc., Class A(a)(b) | | | 109,045 | | | | 8,129,305 | |
Aterian, Inc.(a)(b) | | | 44,027 | | | | 180,951 | |
Avid Technology, Inc.(a) | | | 55,839 | | | | 1,818,676 | |
Benefitfocus, Inc.(a) | | | 41,692 | | | | 444,437 | |
BigCommerce Holdings, Inc., Series-1(a) | | | 74,168 | | | | 2,623,322 | |
Blackbaud, Inc.(a) | | | 73,159 | | | | 5,778,098 | |
Blackline, Inc.(a) | | | 83,110 | | | | 8,605,209 | |
Blucora, Inc.(a) | | | 74,016 | | | | 1,281,957 | |
Bottomline Technologies DE, Inc.(a) | | | 68,661 | | | | 3,877,287 | |
Box, Inc., Class A(a) | | | 213,836 | | | | 5,600,365 | |
Brightcove, Inc.(a) | | | 60,050 | | | | 613,711 | |
BTRS Holdings, Inc.(a) | | | 97,883 | | | | 765,445 | |
Cargurus, Inc.(a)(b) | | | 146,182 | | | | 4,917,562 | |
Cerence, Inc.(a)(b) | | | 57,986 | | | | 4,444,047 | |
Cleanspark, Inc.(a) | | | 53,633 | | | | 510,586 | |
CommVault Systems, Inc.(a) | | | 70,090 | | | | 4,830,603 | |
ComScore, Inc.(a)(b) | | | 128,700 | | | | 429,858 | |
CoreCard Corp.(a) | | | 11,424 | | | | 443,251 | |
Covetrus, Inc.(a) | | | 159,416 | | | | 3,183,537 | |
CSG Systems International, Inc. | | | 49,745 | | | | 2,866,307 | |
DarioHealth Corp.(a)(b) | | | 19,922 | | | | 258,388 | |
Digimarc Corp.(a)(b) | | | 20,994 | | | | 828,843 | |
Digital Turbine, Inc.(a) | | | 139,017 | | | | 8,478,647 | |
DigitalOcean Holdings, Inc.(a) | | | 77,701 | | | | 6,241,721 | |
Domo, Inc., Class B(a) | | | 43,274 | | | | 2,146,390 | |
E2open Parent Holdings, Inc.(a)(b) | | | 304,627 | | | | 3,430,100 | |
Ebix, Inc. | | | 40,048 | | | | 1,217,459 | |
Envestnet, Inc.(a) | | | 83,050 | | | | 6,589,187 | |
ePlus, Inc.(a) | | | 40,828 | | | | 2,199,813 | |
Eventbrite, Inc., Class A(a)(b) | | | 120,750 | | | | 2,105,880 | |
EverQuote, Inc., Class A(a) | | | 28,951 | | | | 453,373 | |
Evolent Health, Inc., Class A(a) | | | 121,994 | | | | 3,375,574 | |
fuboTV, Inc.(a)(b) | | | 208,197 | | | | 3,231,217 | |
GAN Ltd.(a)(b) | | | 60,822 | | | | 558,954 | |
Grid Dynamics Holdings, Inc.(a) | | | 69,630 | | | | 2,643,851 | |
Groupon, Inc.(a)(b) | | | 38,791 | | | | 898,400 | |
GTY Technology Holdings, Inc.(a)(b) | | | 47,244 | | | | 316,535 | |
HyreCar, Inc.(a)(b) | | | 26,547 | | | | 125,036 | |
Ideanomics, Inc.(a)(b) | | | 669,102 | | | | 802,922 | |
JFrog Ltd.(a)(b) | | | 82,508 | | | | 2,450,488 | |
Limelight Networks, Inc.(a) | | | 191,256 | | | | 656,008 | |
LivePerson, Inc.(a)(b) | | | 100,848 | | | | 3,602,291 | |
LiveRamp Holdings, Inc.(a) | | | 101,174 | | | | 4,851,293 | |
Magnite, Inc.(a)(b) | | | 197,424 | | | | 3,454,920 | |
ManTech International Corp., Class A | | | 42,003 | | | | 3,063,279 | |
| | |
| 80 | | 2 0 2 1 BLACK ROCK ANNUAL REPORT TO SHAREHOLDERS |
| | |
Schedule of Investments (continued) December 31, 2021 | | Master Small Cap Index Series (Percentages shown are based on Net Assets) |
| | | | | | | | |
| Security | | Shares | | | Value | |
|
| Computer Services Software & Systems (continued) | |
Marathon Digital Holdings, Inc.(a)(b) | | | 146,118 | | | $ | 4,801,437 | |
MicroStrategy, Inc., Class A(a)(b) | | | 12,963 | | | | 7,058,224 | |
Mimecast Ltd.(a) | | | 93,269 | | | | 7,421,414 | |
Mitek Systems, Inc.(a) | | | 64,044 | | | | 1,136,781 | |
Momentive Global, Inc.(a) | | | 197,779 | | | | 4,183,026 | |
Multiplan Corp.(a) | | | 585,556 | | | | 2,594,013 | |
NetScout Systems, Inc.(a) | | | 107,219 | | | | 3,546,804 | |
ON24, Inc.(a) | | | 40,833 | | | | 708,453 | |
OneSpan, Inc.(a) | | | 56,990 | | | | 964,841 | |
Ouster, Inc.(a)(b) | | | 241,544 | | | | 1,256,029 | |
PagerDuty, Inc.(a)(b) | | | 125,743 | | | | 4,369,569 | |
PAR Technology Corp.(a)(b) | | | 38,384 | | | | 2,025,524 | |
Parsons Corp.(a)(b) | | | 40,667 | | | | 1,368,445 | |
Paya Holdings, Inc.(a)(b) | | | 130,042 | | | | 824,466 | |
PDF Solutions, Inc.(a) | | | 47,692 | | | | 1,516,129 | |
Perficient, Inc.(a) | | | 49,889 | | | | 6,450,149 | |
Ping Identity Holding Corp.(a) | | | 93,245 | | | | 2,133,446 | |
Progress Software Corp. | | | 67,570 | | | | 3,261,604 | |
PROS Holdings, Inc.(a) | | | 61,030 | | | | 2,104,925 | |
Q2 Holdings, Inc.(a)(b) | | | 83,754 | | | | 6,653,418 | |
Rackspace Technology, Inc.(a) | | | 83,603 | | | | 1,126,132 | |
Rapid7, Inc.(a)(b) | | | 85,998 | | | | 10,121,105 | |
Rimini Street, Inc.(a) | | | 67,974 | | | | 405,805 | |
Riot Blockchain, Inc.(a)(b) | | | 136,190 | | | | 3,041,123 | |
SailPoint Technologies Holding, Inc.(a) | | | 140,108 | | | | 6,772,821 | |
Sapiens International Corp. NV | | | 47,514 | | | | 1,636,857 | |
Schrodinger, Inc.(a) | | | 68,985 | | | | 2,402,748 | |
SecureWorks Corp., Class A(a) | | | 13,813 | | | | 220,594 | |
ShotSpotter, Inc.(a) | | | 12,012 | | | | 354,594 | |
Shutterstock, Inc. | | | 35,613 | | | | 3,948,769 | |
Simulations Plus, Inc. | | | 23,257 | | | | 1,100,056 | |
Smith Micro Software, Inc.(a) | | | 68,015 | | | | 334,634 | |
Sprout Social, Inc., Class A(a) | | | 69,123 | | | | 6,268,765 | |
SPS Commerce, Inc.(a) | | | 55,096 | | | | 7,842,916 | |
Sumo Logic, Inc.(a)(b) | | | 135,020 | | | | 1,830,871 | |
TechTarget, Inc.(a) | | | 39,934 | | | | 3,820,086 | |
Telos Corp.(a) | | | 60,834 | | | | 938,060 | |
Tenable Holdings, Inc.(a) | | | 141,247 | | | | 7,778,472 | |
Tucows, Inc., Class A(a)(b) | | | 14,386 | | | | 1,205,835 | |
Unisys Corp.(a) | | | 100,338 | | | | 2,063,953 | |
Upland Software, Inc.(a) | | | 45,169 | | | | 810,332 | |
Upwork, Inc.(a) | | | 180,263 | | | | 6,157,784 | |
Varonis Systems, Inc.(a) | | | 164,523 | | | | 8,025,432 | |
Verint Systems, Inc.(a)(b) | | | 98,719 | | | | 5,183,735 | |
Veritone, Inc.(a) | | | 43,131 | | | | 969,585 | |
Verra Mobility Corp.(a) | | | 220,116 | | | | 3,396,390 | |
Viant Technology, Inc., Class A(a) | | | 18,892 | | | | 183,347 | |
VirnetX Holding Corp.(a) | | | 96,165 | | | | 250,029 | |
Workiva, Inc.(a) | | | 65,456 | | | | 8,541,353 | |
Yelp, Inc.(a) | | | 109,618 | | | | 3,972,556 | |
Yext, Inc.(a)(b) | | | 170,035 | | | | 1,686,747 | |
Zuora, Inc., Class A(a)(b) | | | 170,041 | | | | 3,176,366 | |
| | | | | | | | |
| | |
| | | | | | | 324,261,166 | |
| | |
| Computer Technology — 0.8% | | | | | | |
3D Systems Corp.(a) | | | 190,090 | | | | 4,094,539 | |
Cantaloupe, Inc.(a) | | | 85,825 | | | | 762,126 | |
Corsair Gaming, Inc.(a)(b) | | | 41,270 | | | | 867,083 | |
Diebold Nixdorf, Inc.(a) | | | 118,421 | | | | 1,071,710 | |
Identiv, Inc.(a) | | | 36,399 | | | | 1,024,268 | |
Impinj, Inc.(a) | | | 28,793 | | | | 2,553,939 | |
| | | | | | | | |
| Security | | Shares | | | Value | |
| | |
| Computer Technology (continued) | | | | | | |
Insight Enterprises, Inc.(a) | | | 52,559 | | | $ | 5,602,789 | |
PC Connection, Inc. | | | 16,720 | | | | 721,134 | |
Quantum Corp.(a) | | | 90,596 | | | | 500,090 | |
Super Micro Computer, Inc.(a) | | | 66,714 | | | | 2,932,080 | |
Synaptics, Inc.(a) | | | 59,946 | | | | 17,354,966 | |
| | | | | | | | |
| | |
| | | | | | | 37,484,724 | |
| | |
| Construction — 0.4% | | | | | | |
Construction Partners, Inc., Class A(a) | | | 44,683 | | | | 1,314,127 | |
EMCOR Group, Inc. | | | 81,858 | | | | 10,427,891 | |
Granite Construction, Inc. | | | 70,185 | | | | 2,716,159 | |
Great Lakes Dredge & Dock Corp.(a) | | | 96,393 | | | | 1,515,298 | |
Innovate Corp.(a)(b) | | | 77,220 | | | | 285,714 | |
Primoris Services Corp. | | | 81,337 | | | | 1,950,461 | |
Sterling Construction Co., Inc.(a) | | | 41,720 | | | | 1,097,236 | |
Tutor Perini Corp.(a) | | | 62,081 | | | | 767,942 | |
| | | | | | | | |
| | |
| | | | | | | 20,074,828 | |
| | |
| Consumer Electronics(a) — 0.2% | | | | | | |
Sonos, Inc. | | | 184,224 | | | | 5,489,875 | |
Universal Electronics, Inc. | | | 20,123 | | | | 820,012 | |
VOXX International Corp. | | | 30,284 | | | | 307,988 | |
Vuzix Corp.(b) | | | 88,923 | | | | 770,963 | |
| | | | | | | | |
| | |
| | | | | | | 7,388,838 | |
| | |
| Consumer Lending — 0.7% | | | | | | |
Curo Group Holdings Corp. | | | 32,093 | | | | 513,809 | |
Encore Capital Group, Inc.(a)(b) | | | 44,587 | | | | 2,769,298 | |
Enova International, Inc.(a)(b) | | | 55,026 | | | | 2,253,865 | |
Ezcorp, Inc., Class A(a) | | | 71,050 | | | | 523,638 | |
LendingTree, Inc.(a) | | | 17,681 | | | | 2,167,691 | |
Marcus & Millichap, Inc.(a) | | | 35,893 | | | | 1,847,054 | |
MoneyGram International, Inc.(a) | | | 135,919 | | | | 1,072,401 | |
Navient Corp. | | | 241,904 | | | | 5,133,203 | |
Nelnet, Inc., Class A | | | 26,260 | | | | 2,565,077 | |
Oportun Financial Corp.(a) | | | 30,188 | | | | 611,307 | |
PRA Group, Inc.(a)(b) | | | 65,675 | | | | 3,297,542 | |
PROG Holdings, Inc.(a) | | | 99,718 | | | | 4,498,279 | |
Regional Management Corp. | | | 12,891 | | | | 740,717 | |
World Acceptance Corp.(a)(b) | | | 6,745 | | | | 1,655,425 | |
| | | | | | | | |
| | |
| | | | | | | 29,649,306 | |
|
| Consumer Services: Miscellaneous — 0.3% | |
Cars.com, Inc.(a) | | | 103,348 | | | | 1,662,869 | |
Chuy’s Holdings, Inc.(a) | | | 30,052 | | | | 905,166 | |
FirstCash Holdings, Inc. | | | 61,033 | | | | 4,565,879 | |
Franchise Group, Inc. | | | 43,571 | | | | 2,272,664 | |
KAR Auction Services, Inc.(a) | | | 184,992 | | | | 2,889,575 | |
Udemy, Inc.(a)(b) | | | 19,831 | | | | 387,498 | |
WW International, Inc.(a)(b) | | | 83,641 | | | | 1,349,129 | |
| | | | | | | | |
| | |
| | | | | | | 14,032,780 | |
|
| Containers & Packaging — 0.3% | |
Greif, Inc., Class A | | | 38,555 | | | | 2,327,565 | |
Greif, Inc., Class B | | | 10,120 | | | | 604,974 | |
Myers Industries, Inc. | | | 53,403 | | | | 1,068,594 | |
O-I Glass, Inc.(a) | | | 243,024 | | | | 2,923,579 | |
Pactiv Evergreen, Inc. | | | 71,171 | | | | 902,448 | |
Ranpak Holdings Corp.(a) | | | 57,281 | | | | 2,152,620 | |
UFP Technologies, Inc.(a) | | | 11,366 | | | | 798,575 | |
Veritiv Corp.(a) | | | 21,928 | | | | 2,687,715 | |
| | | | | | | | |
| | |
| | | | | | | 13,466,070 | |
| | |
SERIES SCHEDULE OF INVESTMENTS | | 81 |
| | |
Schedule of Investments (continued) December 31, 2021 | | Master Small Cap Index Series (Percentages shown are based on Net Assets) |
| | | | | | | | |
| Security | | Shares | | | Value | |
| | |
| Cosmetics — 0.1% | | | | | | |
elf Beauty, Inc.(a) | | | 73,849 | | | $ | 2,452,525 | |
Inter Parfums, Inc. | | | 27,159 | | | | 2,903,297 | |
Revlon, Inc., Class A(a) | | | 11,949 | | | | 135,502 | |
| | | | | | | | |
| | |
| | | | | | | 5,491,324 | |
| | |
| Diversified Financial Services — 0.7% | | | | | | |
Alerus Financial Corp. | | | 21,917 | | | | 641,730 | |
Associated Capital Group, Inc., Class A | | | 3,113 | | | | 133,859 | |
Cannae Holdings, Inc.(a) | | | 130,054 | | | | 4,571,398 | |
European Wax Center, Inc., Class A(a)(b) | | | 19,489 | | | | 591,491 | |
Greenhill & Co., Inc. | | | 22,224 | | | | 398,476 | |
Hannon Armstrong Sustainable Infrastructure Capital, Inc. | | | 117,560 | | | | 6,244,787 | |
Houlihan Lokey, Inc. | | | 78,265 | | | | 8,101,993 | |
MBIA, Inc.(a)(b) | | | 76,509 | | | | 1,208,077 | |
MidWestOne Financial Group, Inc. | | | 23,793 | | | | 770,180 | |
Moelis & Co., Class A | | | 93,741 | | | | 5,859,750 | |
Piper Sandler Cos | | | 26,738 | | | | 4,773,000 | |
StoneMor, Inc.(a) | | | 58,858 | | | | 134,196 | |
Tiptree, Inc. | | | 37,480 | | | | 518,349 | |
| | | | | | | | |
| | |
| | | | | | | 33,947,286 | |
|
| Diversified Manufacturing Operations — 0.5% | |
Barnes Group, Inc. | | | 72,670 | | | | 3,385,695 | |
Custom Truck One Source, Inc.(a)(b) | | | 69,317 | | | | 554,536 | |
Enerpac Tool Group Corp. | | | 91,998 | | | | 1,865,719 | |
Federal Signal Corp. | | | 92,507 | | | | 4,009,253 | |
Harsco Corp.(a) | | | 120,328 | | | | 2,010,681 | |
Luxfer Holdings PLC | | | 41,578 | | | | 802,871 | |
OSI Systems, Inc.(a) | | | 26,193 | | | | 2,441,188 | |
PowerSchool Holdings, Inc., Class A(a) | | | 82,665 | | | | 1,361,493 | |
Standex International Corp. | | | 18,771 | | | | 2,077,199 | |
TriMas Corp. | | | 66,474 | | | | 2,459,538 | |
| | | | | | | | |
| | |
| | | | | | | 20,968,173 | |
|
| Diversified Materials & Processing — 0.3% | |
Belden, Inc.(b) | | | 67,719 | | | | 4,451,170 | |
Encore Wire Corp. | | | 30,164 | | | | 4,316,468 | |
Insteel Industries, Inc. | | | 28,902 | | | | 1,150,589 | |
Koppers Holdings, Inc.(a) | | | 31,212 | | | | 976,936 | |
NL Industries, Inc. | | | 9,941 | | | | 73,563 | |
Tredegar Corp. | | | 40,253 | | | | 475,790 | |
Uranium Energy Corp.(a) | | | 390,842 | | | | 1,309,321 | |
| | | | | | | | |
| | |
| | | | | | | 12,753,837 | |
| | |
| Diversified Media — 0.0% | | | | | | |
EW Scripps Co., Class A | | | 87,591 | | | | 1,694,886 | |
Hemisphere Media Group, Inc.(a) | | | 26,455 | | | | 192,328 | |
| | | | | | | | |
| | |
| | | | | | | 1,887,214 | |
| | |
| Diversified Retail — 1.0% | | | | | | |
Big Lots, Inc. | | | 49,529 | | | | 2,231,281 | |
BJ’s Wholesale Club Holdings, Inc.(a)(b) | | | 209,641 | | | | 14,039,658 | |
Dillard’s, Inc., Class A | | | 8,929 | | | | 2,187,784 | |
Duluth Holdings, Inc., Class B(a)(b) | | | 17,500 | | | | 265,650 | |
Global Industrial Co. | | | 19,080 | | | | 780,372 | |
Macy’s, Inc. | | | 481,066 | | | | 12,594,308 | |
Overstock.com, Inc.(a) | | | 65,835 | | | | 3,884,923 | |
Porch Group, Inc.(a) | | | 117,922 | | | | 1,838,404 | |
PriceSmart, Inc. | | | 36,353 | | | | 2,659,949 | |
Revolve Group, Inc.(a)(b) | | | 54,999 | | | | 3,082,144 | |
| | | | | | | | |
| Security | | Shares | | | Value | |
| | |
| Diversified Retail (continued) | | | | | | |
Stitch Fix, Inc., Class A(a) | | | 125,386 | | | $ | 2,372,303 | |
Winmark Corp. | | | 5,226 | | | | 1,297,564 | |
| | | | | | | | |
| | |
| | | | | | | 47,234,340 | |
|
| Drug & Grocery Store Chains — 0.2% | |
Ingles Markets, Inc., Class A | | | 21,431 | | | | 1,850,352 | |
PetMed Express, Inc. | | | 31,341 | | | | 791,674 | |
Rite Aid Corp.(a) | | | 86,181 | | | | 1,265,999 | |
Sprouts Farmers Market, Inc.(a) | | | 172,382 | | | | 5,116,298 | |
Village Super Market, Inc., Class A | | | 13,818 | | | | 323,203 | |
Weis Markets, Inc. | | | 25,358 | | | | 1,670,585 | |
| | | | | | | | |
| | |
| | | | | | | 11,018,111 | |
| | |
| Education Services — 0.5% | | | | | | |
2U, Inc.(a) | | | 111,499 | | | | 2,237,785 | |
Adtalem Global Education, Inc.(a) | | | 75,850 | | | | 2,242,126 | |
American Public Education, Inc.(a) | | | 30,013 | | | | 667,789 | |
Coursera, Inc.(a) | | | 112,131 | | | | 2,740,482 | |
Franklin Covey Co.(a) | | | 19,637 | | | | 910,371 | |
Graham Holdings Co., Class B | | | 5,812 | | | | 3,660,572 | |
HealthStream, Inc.(a) | | | 37,902 | | | | 999,097 | |
Houghton Mifflin Harcourt Co.(a) | | | 195,413 | | | | 3,146,149 | |
Laureate Education, Inc., Class A | | | 152,071 | | | | 1,861,349 | |
Perdoceo Education Corp.(a) | | | 105,907 | | | | 1,245,466 | |
Strategic Education, Inc. | | | 37,320 | | | | 2,158,589 | |
Stride, Inc.(a) | | | 63,284 | | | | 2,109,256 | |
| | | | | | | | |
| | |
| | | | | | | 23,979,031 | |
| | |
| Electronic Components — 0.8% | | | | | | |
Acacia Research Corp.(a) | | | 73,479 | | | | 376,947 | |
American Superconductor Corp.(a) | | | 40,149 | | | | 436,821 | |
Array Technologies, Inc.(a)(b) | | | 195,805 | | | | 3,072,180 | |
Eos Energy Enterprises, Inc.(a) | | | 69,490 | | | | 522,565 | |
Methode Electronics, Inc. | | | 59,022 | | | | 2,902,112 | |
MicroVision, Inc.(a)(b) | | | 251,799 | | | | 1,261,513 | |
Novanta, Inc.(a) | | | 53,938 | | | | 9,510,888 | |
NVE Corp. | | | 7,682 | | | | 524,681 | |
Rogers Corp.(a) | | | 28,684 | | | | 7,830,732 | |
Sanmina Corp.(a) | | | 96,828 | | | | 4,014,489 | |
ScanSource, Inc.(a) | | | 38,392 | | | | 1,346,791 | |
Stem, Inc.(a) | | | 174,733 | | | | 3,314,685 | |
TTM Technologies, Inc.(a) | | | 161,307 | | | | 2,403,474 | |
Velodyne Lidar, Inc.(a)(b) | | | 116,349 | | | | 539,859 | |
| | | | | | | | |
| | |
| | | | | | | 38,057,737 | |
|
| Electronic Entertainment — 0.0% | |
PlayAGS, Inc.(a) | | | 39,489 | | | | 268,130 | |
Turtle Beach Corp.(a) | | | 23,215 | | | | 516,766 | |
Via Renewables, Inc. | | | 18,805 | | | | 214,941 | |
| | | | | | | | |
| | |
| | | | | | | 999,837 | |
| | |
| Electronics(a) — 0.5% | | | | | | |
Agilysys, Inc. | | | 32,091 | | | | 1,426,766 | |
Daktronics, Inc. | | | 60,802 | | | | 307,050 | |
II-VI, Inc.(b) | | | 162,282 | | | | 11,088,729 | |
Integer Holdings Corp. | | | 50,207 | | | | 4,297,217 | |
iRobot Corp.(b) | | | 40,703 | | | | 2,681,514 | |
Iteris, Inc. | | | 65,743 | | | | 262,972 | |
nLight, Inc.(b) | | | 66,595 | | | | 1,594,950 | |
| | | | | | | | |
| | |
| | | | | | | 21,659,198 | |
|
| Energy Equipment — 0.7% | |
API Group Corp.(a)(e) | | | 308,931 | | | | 7,961,152 | |
Arcosa, Inc. | | | 74,559 | | | | 3,929,259 | |
| | |
| 82 | | 2 0 2 1 BLACK ROCK ANNUAL REPORT TO SHAREHOLDERS |
| | |
Schedule of Investments (continued) December 31, 2021 | | Master Small Cap Index Series (Percentages shown are based on Net Assets) |
| | | | | | | | |
| Security | | Shares | | | Value | |
|
| Energy Equipment (continued) | |
Beam Global(a)(b) | | | 13,184 | | | $ | 245,222 | |
Bloom Energy Corp., Class A(a) | | | 217,917 | | | | 4,778,920 | |
Expro Group Holdings NV(a) | | | 72,447 | | | | 1,039,615 | |
FuelCell Energy, Inc.(a)(b) | | | 567,150 | | | | 2,949,180 | |
Matador Resources Co. | | | 168,796 | | | | 6,231,948 | |
SunPower Corp.(a)(b) | | | 122,477 | | | | 2,556,095 | |
TPI Composites, Inc.(a) | | | 54,901 | | | | 821,319 | |
| | | | | | | | |
| | |
| | | | | | | 30,512,710 | |
|
| Engineering & Contracting Services — 1.1% | |
Argan, Inc. | | | 22,506 | | | | 870,757 | |
Dycom Industries, Inc.(a)(b) | | | 45,071 | | | | 4,225,857 | |
Exponent, Inc. | | | 79,481 | | | | 9,277,817 | |
Fluor Corp.(a) | | | 217,727 | | | | 5,393,098 | |
IES Holdings, Inc.(a) | | | 12,597 | | | | 637,912 | |
KBR, Inc. | | | 216,606 | | | | 10,314,778 | |
Mistras Group, Inc.(a) | | | 27,467 | | | | 204,080 | |
MYR Group, Inc.(a) | | | 25,004 | | | | 2,764,192 | |
NETSTREIT Corp. | | | 59,568 | | | | 1,364,107 | |
Tetra Tech, Inc. | | | 82,588 | | | | 14,023,442 | |
VSE Corp. | | | 17,038 | | | | 1,038,296 | |
Willdan Group, Inc.(a) | | | 16,539 | | | | 582,173 | |
| | | | | | | | |
| | |
| | | | | | | 50,696,509 | |
| | |
| Entertainment(a) — 0.7% | | | | | | |
AMC Entertainment Holdings, Inc., Class A(b) | | | 790,106 | | | | 21,490,883 | |
Chicken Soup For The Soul Entertainment, Inc. | | | 10,364 | | | | 143,438 | |
Cinemark Holdings, Inc. | | | 165,507 | | | | 2,667,973 | |
CuriosityStream, Inc. | | | 38,908 | | | | 230,724 | |
Golden Entertainment, Inc. | | | 25,903 | | | | 1,308,878 | |
IMAX Corp. | | | 75,894 | | | | 1,353,949 | |
Lions Gate Entertainment Corp., Class A(b) | | | 101,470 | | | | 1,688,461 | |
Lions Gate Entertainment Corp., Class B | | | 167,979 | | | | 2,585,197 | |
| | | | | | | | |
| | |
| | | | | | | 31,469,503 | |
|
| Environmental, Maintenance, & Security Service — 0.5% | |
ABM Industries, Inc. | | | 103,681 | | | | 4,235,369 | |
BrightView Holdings, Inc.(a) | | | 60,499 | | | | 851,826 | |
Brink’s Co. | | | 74,063 | | | | 4,856,311 | |
Healthcare Services Group, Inc. | | | 114,242 | | | | 2,032,365 | |
IBEX Holdings Ltd.(a) | | | 10,191 | | | | 131,362 | |
Montrose Environmental Group, Inc.(a) | | | 39,987 | | | | 2,819,483 | |
SP Plus Corp.(a) | | | 34,800 | | | | 982,056 | |
UniFirst Corp. | | | 23,116 | | | | 4,863,607 | |
Vivint Smart Home, Inc.(a) | | | 139,486 | | | | 1,364,173 | |
| | | | | | | | |
| | |
| | | | | | | 22,136,552 | |
| | |
| Financial Data & Systems — 0.5% | | | | | | |
Atlanticus Holdings Corp.(a) | | | 7,396 | | | | 527,483 | |
Cass Information Systems, Inc. | | | 22,211 | | | | 873,337 | |
Donnelley Financial Solutions, Inc.(a) | | | 44,696 | | | | 2,106,969 | |
Everi Holdings, Inc.(a) | | | 132,475 | | | | 2,828,341 | |
EVERTEC, Inc. | | | 92,630 | | | | 4,629,647 | |
Evo Payments, Inc., Class A(a) | | | 71,609 | | | | 1,833,190 | |
Green Dot Corp., Class A(a) | | | 80,675 | | | | 2,923,662 | |
GreenBox POS(a)(b) | | | 25,085 | | | | 105,357 | |
I3 Verticals, Inc., Class A(a) | | | 35,711 | | | | 813,854 | |
International Money Express, Inc.(a) | | | 48,440 | | | | 773,102 | |
LendingClub Corp.(a) | | | 151,758 | | | | 3,669,509 | |
Priority Technology Holdings, Inc.(a) | | | 9,786 | | | | 69,285 | |
Repay Holdings Corp.(a)(b) | | | 131,837 | | | | 2,408,662 | |
Value Line, Inc. | | | 1,578 | | | | 73,882 | |
| | | | | | | | |
| | |
| | | | | | | 23,636,280 | |
| | | | | | | | |
| Security | | Shares | | | Value | |
| | |
| Food & Staples Retailing — 0.0% | | | | | | |
Natural Grocers by Vitamin Cottage, Inc. | | | 14,822 | | | $ | 211,214 | |
| | | | | | | | |
| | |
| Foods — 1.3% | | | | | | |
AppHarvest, Inc.(a) | | | 106,445 | | | | 414,071 | |
B&G Foods, Inc. | | | 98,417 | | | | 3,024,354 | |
BellRing Brands, Inc., Class A(a) | | | 60,091 | | | | 1,714,396 | |
Chefs’ Warehouse, Inc.(a) | | | 48,326 | | | | 1,609,256 | |
HF Foods Group, Inc.(a) | | | 54,160 | | | | 458,194 | |
Hostess Brands, Inc.(a) | | | 210,468 | | | | 4,297,756 | |
J&J Snack Foods Corp. | | | 22,736 | | | | 3,591,379 | |
John B Sanfilippo & Son, Inc. | | | 13,010 | | | | 1,172,982 | |
Laird Superfood, Inc.(a)(b) | | | 11,995 | | | | 156,415 | |
Lancaster Colony Corp. | | | 29,065 | | | | 4,813,164 | |
Medifast, Inc. | | | 17,607 | | | | 3,687,434 | |
Mission Produce, Inc.(a) | | | 53,823 | | | | 845,021 | |
Nature’s Sunshine Products, Inc. | | | 21,667 | | | | 400,839 | |
Performance Food Group Co.(a)(b) | | | 232,667 | | | | 10,677,089 | |
Seneca Foods Corp., Class A(a) | | | 10,032 | | | | 481,034 | |
Simply Good Foods Co.(a) | | | 130,580 | | | | 5,428,211 | |
Sovos Brands, Inc.(a)(b) | | | 36,975 | | | | 556,474 | |
SpartanNash Co. | | | 55,087 | | | | 1,419,041 | |
Tattooed Chef, Inc.(a)(b) | | | 72,463 | | | | 1,126,075 | |
Tootsie Roll Industries, Inc. | | | 24,156 | | | | 875,172 | |
TreeHouse Foods, Inc.(a) | | | 79,504 | | | | 3,222,297 | |
United Natural Foods, Inc.(a) | | | 84,930 | | | | 4,168,364 | |
Utz Brands, Inc.(b) | | | 90,489 | | | | 1,443,299 | |
Vita Coco Co., Inc.(a) | | | 13,927 | | | | 155,565 | |
Vital Farms, Inc.(a)(b) | | | 37,935 | | | | 685,106 | |
Whole Earth Brands, Inc.(a) | | | 54,847 | | | | 589,057 | |
| | | | | | | | |
| | |
| | | | | | | 57,012,045 | |
| | |
| Forest Products — 0.3% | | | | | | |
Boise Cascade Co. | | | 60,609 | | | | 4,315,361 | |
UFP Industries, Inc. | | | 92,124 | | | | 8,476,329 | |
| | | | | | | | |
| | |
| | | | | | | 12,791,690 | |
|
| Forms & Bulk Printing Services — 0.1% | |
Deluxe Corp. | | | 64,081 | | | | 2,057,641 | |
Ennis, Inc. | | | 39,632 | | | | 774,013 | |
RR Donnelley & Sons Co.(a) | | | 108,685 | | | | 1,223,793 | |
| | | | | | | | |
| | |
| | | | | | | 4,055,447 | |
| | |
| Fruit & Grain Processing — 0.0% | | | | | | |
MGP Ingredients, Inc. | | | 21,388 | | | | 1,817,766 | |
| | | | | | | | |
|
| Funeral Parlors & Cemeteries — 0.2% | |
Carriage Services, Inc. | | | 22,705 | | | | 1,463,110 | |
Hillenbrand, Inc. | | | 111,856 | | | | 5,815,393 | |
Matthews International Corp., Class A | | | 46,359 | | | | 1,699,985 | |
| | | | | | | | |
| | |
| | | | | | | 8,978,488 | |
| | |
| Gas Pipeline — 0.2% | | | | | | |
Altus Midstream Co., Class A | | | 4,956 | | | | 303,852 | |
Equitrans Midstream Corp. | | | 626,311 | | | | 6,476,056 | |
| | | | | | | | |
| | |
| | | | | | | 6,779,908 | |
| | |
| Glass — 0.0% | | | | | | |
Apogee Enterprises, Inc. | | | 38,941 | | | | 1,875,009 | |
| | | | | | | | |
| | |
| Gold(a) — 0.1% | | | | | | |
Coeur Mining, Inc. | | | 393,167 | | | | 1,981,562 | |
Novagold Resources, Inc. | | | 362,619 | | | | 2,487,566 | |
| | | | | | | | |
| | |
| | | | | | | 4,469,128 | |
| | |
| Health Care Equipment & Supplies(a) — 0.0% | | | | | | |
Inogen, Inc. | | | 31,294 | | | | 1,063,996 | |
| | |
SERIES SCHEDULE OF INVESTMENTS | | 83 |
| | |
Schedule of Investments (continued) December 31, 2021 | | Master Small Cap Index Series (Percentages shown are based on Net Assets) |
| | | | | | | | |
| Security | | Shares | | | Value | |
|
| Health Care Equipment & Supplies (continued) | |
Paragon 28, Inc. | | | 12,970 | | | $ | 229,439 | |
PROCEPT BioRobotics Corp. | | | 10,631 | | | | 265,882 | |
| | | | | | | | |
| | |
| | | | | | | 1,559,317 | |
| | |
| Health Care Facilities — 0.8% | | | | | | |
Apollo Medical Holdings, Inc.(a)(b) | | | 57,911 | | | | 4,255,300 | |
Brookdale Senior Living, Inc.(a) | | | 280,529 | �� | | | 1,447,530 | |
CVRx, Inc.(a) | | | 11,889 | | | | 145,402 | |
Ensign Group, Inc. | | | 80,117 | | | | 6,726,623 | |
Hanger, Inc.(a) | | | 57,173 | | | | 1,036,547 | |
Joint Corp.(a) | | | 21,917 | | | | 1,439,728 | |
LifeStance Health Group, Inc.(a)(b) | | | 68,301 | | | | 650,226 | |
National HealthCare Corp. | | | 18,914 | | | | 1,285,017 | |
Ontrak, Inc.(a) | | | 12,797 | | | | 80,493 | |
Pliant Therapeutics, Inc.(a) | | | 38,444 | | | | 518,994 | |
RxSight, Inc.(a) | | | 12,164 | | | | 136,845 | |
Select Medical Holdings Corp. | | | 169,130 | | | | 4,972,422 | |
Sight Sciences, Inc.(a)(b) | | | 16,298 | | | | 286,356 | |
Tenet Healthcare Corp.(a) | | | 162,528 | | | | 13,276,912 | |
U.S. Physical Therapy, Inc. | | | 19,451 | | | | 1,858,543 | |
| | | | | | | | |
| | |
| | | | | | | 38,116,938 | |
|
| Health Care Management Services(a) — 0.4% | |
1Life Healthcare, Inc.(b) | | | 179,187 | | | | 3,148,315 | |
Computer Programs & Systems, Inc. | | | 20,882 | | | | 611,843 | |
Magellan Health, Inc. | | | 36,600 | | | | 3,476,634 | |
Option Care Health, Inc.(b) | | | 243,104 | | | | 6,913,878 | |
Progyny, Inc. | | | 98,583 | | | | 4,963,654 | |
Triple-S Management Corp. | | | 34,718 | | | | 1,238,738 | |
| | | | | | | | |
| | |
| | | | | | | 20,353,062 | |
| | |
| Health Care Services — 2.3% | | | | | | |
Accelerate Diagnostics, Inc.(a)(b) | | | 52,110 | | | | 272,014 | |
Accolade, Inc.(a)(b) | | | 76,076 | | | | 2,005,363 | |
Addus HomeCare Corp.(a) | | | 24,018 | | | | 2,245,923 | |
Agiliti, Inc.(a)(b) | | | 38,298 | | | | 886,982 | |
AirSculpt Technologies, Inc.(a) | | | 10,949 | | | | 188,213 | |
Alignment Healthcare, Inc.(a) | | | 121,217 | | | | 1,704,311 | |
Allscripts Healthcare Solutions, Inc.(a)(b) | | | 185,663 | | | | 3,425,482 | |
American Well Corp., Class A(a) | | | 281,434 | | | | 1,699,861 | |
AMN Healthcare Services, Inc.(a) | | | 72,113 | | | | 8,821,583 | |
Aveanna Healthcare Holdings, Inc.(a) | | | 58,037 | | | | 429,474 | |
Biodesix, Inc.(a)(b) | | | 20,553 | | | | 108,725 | |
Butterfly Network, Inc.(a)(b) | | | 192,306 | | | | 1,286,527 | |
Cara Therapeutics, Inc.(a) | | | 69,817 | | | | 850,371 | |
Convey Health Solutions Holdings, Inc.(a) | | | 18,454 | | | | 154,275 | |
CorVel Corp.(a) | | | 13,403 | | | | 2,787,824 | |
Cross Country Healthcare, Inc.(a) | | | 55,174 | | | | 1,531,630 | |
Cue Health, Inc.(a) | | | 21,772 | | | | 291,963 | |
Forian, Inc.(a) | | | 26,005 | | | | 234,565 | |
Health Catalyst, Inc.(a)(b) | | | 79,975 | | | | 3,168,610 | |
HealthEquity, Inc.(a)(b) | | | 125,407 | | | | 5,548,006 | |
Inari Medical, Inc.(a) | | | 52,963 | | | | 4,833,933 | |
LHC Group, Inc.(a) | | | 46,927 | | | | 6,439,792 | |
MEDNAX, Inc.(a) | | | 116,472 | | | | 3,169,203 | |
ModivCare, Inc.(a) | | | 18,848 | | | | 2,794,970 | |
NantHealth, Inc.(a) | | | 45,434 | | | | 47,933 | |
NeoGenomics, Inc.(a) | | | 173,816 | | | | 5,930,602 | |
NextGen Healthcare, Inc.(a) | | | 85,835 | | | | 1,527,005 | |
Omnicell, Inc.(a)(b) | | | 66,926 | | | | 12,076,128 | |
OptimizeRx Corp.(a) | | | 26,897 | | | | 1,670,573 | |
Ortho Clinical Diagnostics Holdings PLC(a) | | | 183,751 | | | | 3,930,434 | |
Pennant Group, Inc.(a) | | | 38,847 | | | | 896,589 | |
| | | | | | | | |
| Security | | Shares | | | Value | |
|
| Health Care Services (continued) | |
Phibro Animal Health Corp., Class A | | | 31,916 | | | $ | 651,725 | |
Phreesia, Inc.(a) | | | 76,105 | | | | 3,170,534 | |
Privia Health Group, Inc.(a) | | | 25,352 | | | | 655,856 | |
R1 RCM, Inc.(a) | | | 181,775 | | | | 4,633,445 | |
Ryman Hospitality Properties, Inc.(a) | | | 82,374 | | | | 7,575,113 | |
SOC Telemed, Inc.(a)(b) | | | 91,663 | | | | 117,329 | |
Surgery Partners, Inc.(a) | | | 52,025 | | | | 2,778,655 | |
Tabula Rasa HealthCare, Inc.(a) | | | 35,951 | | | | 539,265 | |
Talis Biomedical Corp.(a) | | | 18,330 | | | | 73,503 | |
Tivity Health, Inc.(a) | | | 66,397 | | | | 1,755,537 | |
Viemed Healthcare, Inc.(a)(b) | | | 53,389 | | | | 278,691 | |
| | | | | | | | |
| | |
| | | | | | | 103,188,517 | |
|
| Health Care: Miscellaneous(a) — 0.2% | |
Absci Corp. | | | 21,122 | | | | 173,200 | |
Berkeley Lights, Inc.(b) | | | 74,314 | | | | 1,351,029 | |
Medpace Holdings, Inc. | | | 44,456 | | | | 9,675,404 | |
| | | | | | | | |
| | |
| | | | | | | 11,199,633 | |
| | |
| Home Building — 1.0% | | | | | | |
Beazer Homes USA, Inc.(a) | | | 43,548 | | | | 1,011,185 | |
Century Communities, Inc. | | | 45,831 | | | | 3,748,517 | |
Hovnanian Enterprises, Inc., Class A(a)(b) | | | 8,030 | | | | 1,022,139 | |
Installed Building Products, Inc. | | | 36,334 | | | | 5,076,586 | |
KB Home | | | 122,343 | | | | 5,472,402 | |
Legacy Housing Corp.(a)(b) | | | 14,089 | | | | 372,936 | |
LGI Homes, Inc.(a) | | | 33,107 | | | | 5,114,369 | |
M/I Homes, Inc.(a) | | | 43,678 | | | | 2,715,898 | |
MDC Holdings, Inc. | | | 87,634 | | | | 4,892,606 | |
Meritage Homes Corp.(a) | | | 56,563 | | | | 6,904,080 | |
Taylor Morrison Home Corp.(a) | | | 183,231 | | | | 6,405,756 | |
Tri Pointe Homes, Inc.(a)(b) | | | 170,149 | | | | 4,745,456 | |
| | | | | | | | |
| | |
| | | | | | | 47,481,930 | |
| | |
| Hotel/Motel — 0.2% | | | | | | |
Bally’s Corp.(a) | | | 49,563 | | | | 1,886,368 | |
F45 Training Holdings, Inc.(a) | | | 29,995 | | | | 326,645 | |
First Watch Restaurant Group, Inc.(a) | | | 14,916 | | | | 249,992 | |
Krispy Kreme, Inc.(b) | | | 32,752 | | | | 619,668 | |
Marcus Corp.(a) | | | 34,260 | | | | 611,884 | |
NEOGAMES SA(a) | | | 15,101 | | | | 419,506 | |
Red Rock Resorts, Inc., Class A | | | 91,308 | | | | 5,022,853 | |
Xponential Fitness, Inc., Class A(a) | | | 13,609 | | | | 278,168 | |
| | | | | | | | |
| | |
| | | | | | | 9,415,084 | |
| | |
| Household Appliances — 0.0% | | | | | | |
Hamilton Beach Brands Holding Co., Class A | | | 10,779 | | | | 154,786 | |
National Presto Industries, Inc. | | | 7,716 | | | | 632,943 | |
Snap One Holdings Corp.(a) | | | 19,472 | | | | 410,470 | |
Traeger, Inc.(a)(b) | | | 32,873 | | | | 399,736 | |
| | | | | | | | |
| | |
| | | | | | | 1,597,935 | |
| | |
| Household Equipment & Products — 0.6% | | | | | | |
Central Garden & Pet Co.(a) | | | 21,461 | | | | 1,129,493 | |
Central Garden & Pet Co., Class A(a) | | | 54,278 | | | | 2,597,202 | |
Energizer Holdings, Inc. | | | 104,572 | | | | 4,193,337 | |
Helen of Troy Ltd.(a) | | | 36,917 | | | | 9,025,099 | |
LiveOne, Inc.(a)(b) | | | 71,532 | | | | 91,561 | |
Tupperware Brands Corp.(a) | | | 74,751 | | | | 1,142,943 | |
Weber, Inc.(a)(b) | | | 28,168 | | | | 364,212 | |
Zurn Water Solutions Corp. | | | 185,968 | | | | 6,769,235 | |
| | | | | | | | |
| | |
| | | | | | | 25,313,082 | |
| | |
| Household Furnishings — 0.3% | | | | | | |
American Woodmark Corp.(a) | | | 25,369 | | | | 1,654,059 | |
| | |
| 84 | | 2 0 2 1 BLACK ROCK ANNUAL REPORT TO SHAREHOLDERS |
| | |
Schedule of Investments (continued) December 31, 2021 | | Master Small Cap Index Series (Percentages shown are based on Net Assets) |
| | | | | | | | |
| Security | | Shares | | | Value | |
|
| Household Furnishings (continued) | |
Bassett Furniture Industries, Inc. | | | 13,681 | | | $ | 229,430 | |
Casper Sleep, Inc.(a)(b) | | | 46,098 | | | | 307,935 | |
Ethan Allen Interiors, Inc. | | | 34,222 | | | | 899,697 | |
Flexsteel Industries, Inc. | | | 9,438 | | | | 253,505 | |
Hooker Furniture Corp. | | | 18,337 | | | | 426,885 | |
Kirkland’s, Inc.(a) | | | 21,128 | | | | 315,441 | |
La-Z-Boy, Inc. | | | 67,768 | | | | 2,460,656 | |
Lifetime Brands, Inc. | | | 19,521 | | | | 311,750 | |
Lovesac Co.(a) | | | 19,504 | | | | 1,292,335 | |
Purple Innovation, Inc.(a)(b) | | | 87,727 | | | | 1,164,137 | |
Sleep Number Corp.(a) | | | 33,581 | | | | 2,572,305 | |
| | | | | | | | |
| | |
| | | | | | | 11,888,135 | |
| | |
| Insurance: Life — 0.5% | | | | | | |
American Equity Investment Life Holding Co. | | | 126,739 | | | | 4,932,682 | |
Bright Health Group, Inc.(a)(b) | | | 82,015 | | | | 282,132 | |
Citizens, Inc.(a)(b) | | | 76,911 | | | | 408,397 | |
CNO Financial Group, Inc. | | | 191,552 | | | | 4,566,600 | |
Independence Holding Co. | | | 6,465 | | | | 366,436 | |
MetroMile, Inc.(a) | | | 139,867 | | | | 306,309 | |
National Western Life Group, Inc., Class A | | | 4,419 | | | | 947,610 | |
Selectquote, Inc.(a)(b) | | | 203,308 | | | | 1,841,971 | |
Trean Insurance Group, Inc.(a) | | | 31,544 | | | | 281,057 | |
Trupanion, Inc.(a) | | | 58,449 | | | | 7,717,021 | |
| | | | | | | | |
| | |
| | | | | | | 21,650,215 | |
|
| Insurance: Multi-Line — 0.4% | |
American National Group, Inc. | | | 11,478 | | | | 2,167,506 | |
BRP Group, Inc., Class A(a)(b) | | | 73,211 | | | | 2,643,649 | |
Crawford & Co., Class A | | | 27,856 | | | | 208,641 | |
eHealth, Inc.(a) | | | 39,271 | | | | 1,001,411 | |
Goosehead Insurance, Inc., Class A | | | 27,656 | | | | 3,597,492 | |
Horace Mann Educators Corp. | | | 66,033 | | | | 2,555,477 | |
James River Group Holdings Ltd. | | | 48,689 | | | | 1,402,730 | |
Maiden Holdings Ltd.(a) | | | 93,379 | | | | 285,740 | |
Mr Cooper Group, Inc.(a) | | | 94,847 | | | | 3,946,584 | |
SiriusPoint Ltd.(a) | | | 130,195 | | | | 1,058,485 | |
| | | | | | | | |
| | |
| | | | | | | 18,867,715 | |
|
| Insurance: Property-Casualty — 1.5% | |
AMERISAFE, Inc. | | | 28,588 | | | | 1,538,892 | |
Argo Group International Holdings Ltd. | | | 48,436 | | | | 2,814,616 | |
Donegal Group, Inc., Class A | | | 16,442 | | | | 234,956 | |
Employers Holdings, Inc. | | | 44,106 | | | | 1,825,106 | |
Enstar Group Ltd.(a) | | | 19,021 | | | | 4,709,409 | |
Essent Group Ltd. | | | 166,016 | | | | 7,558,708 | |
Genworth Financial, Inc., Class A(a) | | | 761,926 | | | | 3,085,800 | |
Greenlight Capital Re Ltd., Class A(a) | | | 45,606 | | | | 357,551 | |
HCI Group, Inc. | | | 9,261 | | | | 773,664 | |
Heritage Insurance Holdings, Inc. | | | 37,672 | | | | 221,511 | |
Hilltop Holdings, Inc. | | | 94,419 | | | | 3,317,884 | |
Investors Title Co. | | | 2,120 | | | | 417,958 | |
Kinsale Capital Group, Inc. | | | 32,922 | | | | 7,831,815 | |
NI Holdings, Inc.(a) | | | 17,790 | | | | 336,409 | |
NMI Holdings, Inc., Class A(a) | | | 128,480 | | | | 2,807,288 | |
Palomar Holdings, Inc.(a) | | | 37,737 | | | | 2,444,226 | |
ProAssurance Corp. | | | 79,587 | | | | 2,013,551 | |
Radian Group, Inc. | | | 276,128 | | | | 5,834,585 | |
RLI Corp. | | | 61,260 | | | | 6,867,246 | |
Safety Insurance Group, Inc. | | | 21,829 | | | | 1,856,120 | |
Selective Insurance Group, Inc. | | | 90,729 | | | | 7,434,334 | |
State Auto Financial Corp. | | | 27,251 | | | | 1,408,604 | |
| | | | | | | | |
| Security | | Shares | | | Value | |
|
| Insurance: Property-Casualty (continued) | |
Stewart Information Services Corp. | | | 40,510 | | | $ | 3,229,862 | |
United Fire Group, Inc. | | | 30,461 | | | | 706,391 | |
United Insurance Holdings Corp. | | | 29,849 | | | | 129,545 | |
Universal Insurance Holdings, Inc. | | | 42,660 | | | | 725,220 | |
| | | | | | | | |
| | |
| | | | | | | 70,481,251 | |
|
| International Trade & Diversified Logistic(a) — 0.1% | |
CryoPort, Inc. | | | 62,113 | | | | 3,675,226 | |
Radiant Logistics, Inc. | | | 64,753 | | | | 472,049 | |
Vectrus, Inc. | | | 17,636 | | | | 807,200 | |
| | | | | | | | |
| | |
| | | | | | | 4,954,475 | |
|
| Internet Software & Services(a) — 0.2% | |
1stdibs.com, Inc.(b) | | | 10,479 | | | | 131,092 | |
aka Brands Holding Corp. | | | 13,206 | | | | 122,155 | |
ChannelAdvisor Corp. | | | 48,022 | | | | 1,185,183 | |
eGain Corp. | | | 34,204 | | | | 341,356 | |
Flywire Corp.(b) | | | 96,502 | | | | 3,672,866 | |
Gogo, Inc.(b) | | | 90,829 | | | | 1,228,916 | |
Lulu’s Fashion Lounge Holdings, Inc.(b) | | | 11,108 | | | | 113,635 | |
MediaAlpha, Inc., Class A | | | 32,376 | | | | 499,885 | |
Outbrain, Inc. | | | 11,684 | | | | 163,576 | |
Quotient Technology, Inc. | | | 131,056 | | | | 972,436 | |
Remitly Global, Inc. | | | 17,502 | | | | 360,891 | |
Rent the Runway, Inc. | | | 26,754 | | | | 218,045 | |
Society Pass, Inc.(b) | | | 3,943 | | | | 41,047 | |
TrueCar, Inc. | | | 150,084 | | | | 510,286 | |
Xometry, Inc., Class A | | | 12,099 | | | | 620,074 | |
| | | | | | | | |
| | |
| | | | | | | 10,181,443 | |
| | |
| Leisure Time — 0.9% | | | | | | |
Acushnet Holdings Corp. | | | 52,222 | | | | 2,771,944 | |
American Outdoor Brands, Inc.(a) | | | 20,502 | | | | 408,605 | |
AMMO, Inc.(a)(b) | | | 131,835 | | | | 718,501 | |
Callaway Golf Co.(a) | | | 176,805 | | | | 4,851,529 | |
Clarus Corp. | | | 40,047 | | | | 1,110,103 | |
Drive Shack, Inc.(a) | | | 124,388 | | | | 177,875 | |
Escalade, Inc. | | | 15,322 | | | | 241,934 | |
Genius Brands International, Inc.(a)(b) | | | 431,518 | | | | 453,094 | |
Hilton Grand Vacations, Inc.(a) | | | 131,281 | | | | 6,841,053 | |
Johnson Outdoors, Inc., Class A | | | 7,691 | | | | 720,570 | |
Latham Group, Inc.(a)(b) | | | 48,590 | | | | 1,216,208 | |
Liberty TripAdvisor Holdings, Inc., Class A(a) | | | 111,831 | | | | 242,673 | |
Life Time Group Holdings, Inc.(a) | | | 57,717 | | | | 993,310 | |
Lindblad Expeditions Holdings, Inc.(a) | | | 48,608 | | | | 758,285 | |
Madison Square Garden Entertainment Corp.(a)(b) | | | 39,820 | | | | 2,800,939 | |
Nautilus, Inc.(a) | | | 45,255 | | | | 277,413 | |
OneSpaWorld Holdings Ltd.(a) | | | 87,454 | | | | 876,289 | |
Portillo’s, Inc.(a)(b) | | | 35,782 | | | | 1,343,256 | |
RCI Hospitality Holdings, Inc.(b) | | | 12,464 | | | | 970,696 | |
SeaWorld Entertainment, Inc.(a) | | | 78,989 | | | | 5,123,226 | |
Smith & Wesson Brands, Inc. | | | 72,601 | | | | 1,292,298 | |
Sturm Ruger & Co., Inc. | | | 26,031 | | | | 1,770,629 | |
Vista Outdoor, Inc.(a) | | | 87,805 | | | | 4,045,176 | |
| | | | | | | | |
| | |
| | | | | | | 40,005,606 | |
| | |
| Life Sciences Tools & Services(a) — 0.0% | | | | | | |
Codex DNA, Inc. | | | 6,550 | | | | 70,740 | |
IsoPlexis Corp. | | | 8,859 | | | | 81,414 | |
WaVe Life Sciences Ltd. | | | 65,179 | | | | 204,662 | |
| | | | | | | | |
| | |
| | | | | | | 356,816 | |
| | |
SERIES SCHEDULE OF INVESTMENTS | | 85 |
| | |
Schedule of Investments (continued) December 31, 2021 | | Master Small Cap Index Series (Percentages shown are based on Net Assets) |
| | | | | | | | |
| Security | | Shares | | | Value | |
| | |
| Luxury Items — 0.2% | | | | | | |
Movado Group, Inc. | | | 24,262 | | | $ | 1,014,880 | |
Signet Jewelers Ltd. | | | 80,924 | | | | 7,042,816 | |
Stagwell, Inc.(a) | | | 94,929 | | | | 823,034 | |
| | | | | | | | |
| | |
| | | | | | | 8,880,730 | |
| | |
| Machinery: Agricultural — 0.2% | | | | | | |
Alamo Group, Inc. | | | 15,002 | | | | 2,207,994 | |
Integral Ad Science Holding Corp.(a) | | | 26,556 | | | | 589,809 | |
Lindsay Corp. | | | 16,731 | | | | 2,543,112 | |
Titan International, Inc.(a) | | | 75,991 | | | | 832,861 | |
Titan Machinery, Inc.(a) | | | 29,884 | | | | 1,006,792 | |
| | | | | | | | |
| | |
| | | | | | | 7,180,568 | |
| | |
| Machinery: Construction & Handling — 0.2% | | | | | | |
Astec Industries, Inc. | | | 34,547 | | | | 2,393,071 | |
Douglas Dynamics, Inc. | | | 35,071 | | | | 1,369,873 | |
Manitowoc Co., Inc.(a) | | | 51,092 | | | | 949,800 | |
Terex Corp. | | | 105,098 | | | | 4,619,057 | |
| | | | | | | | |
| | |
| | | | | | | 9,331,801 | |
| | |
| Machinery: Industrial — 1.5% | | | | | | |
AgEagle Aerial Systems, Inc.(a) | | | 100,550 | | | | 157,864 | |
Altra Industrial Motion Corp. | | | 99,406 | | | | 5,126,367 | |
Applied Industrial Technologies, Inc. | | | 58,786 | | | | 6,037,322 | |
Chart Industries, Inc.(a) | | | 55,902 | | | | 8,915,810 | |
Columbus McKinnon Corp. | | | 42,217 | | | | 1,952,958 | |
Desktop Metal, Inc., Class A(a) | | | 282,083 | | | | 1,396,311 | |
DXP Enterprises, Inc.(a) | | | 25,709 | | | | 659,950 | |
EnPro Industries, Inc. | | | 31,587 | | | | 3,476,781 | |
EVI Industries, Inc.(a) | | | 7,342 | | | | 229,291 | |
Hydrofarm Holdings Group, Inc.(a)(b) | | | 58,984 | | | | 1,668,657 | |
Hyliion Holdings Corp.(a) | | | 177,447 | | | | 1,100,171 | |
Hyster-Yale Materials Handling, Inc. | | | 14,893 | | | | 612,102 | |
John Bean Technologies Corp. | | | 48,132 | | | | 7,391,150 | |
Kadant, Inc. | | | 17,523 | | | | 4,038,701 | |
Kennametal, Inc. | | | 128,617 | | | | 4,618,637 | |
Mayville Engineering Co., Inc.(a) | | | 12,557 | | | | 187,225 | |
Nikola Corp.(a)(b) | | | 349,906 | | | | 3,453,572 | |
Omega Flex, Inc. | | | 5,283 | | | | 670,677 | |
Proto Labs, Inc.(a) | | | 42,842 | | | | 2,199,937 | |
SPX Corp.(a) | | | 67,529 | | | | 4,030,131 | |
SPX FLOW, Inc. | | | 63,742 | | | | 5,512,408 | |
Tennant Co. | | | 28,513 | | | | 2,310,694 | |
Welbilt, Inc.(a) | | | 200,830 | | | | 4,773,729 | |
| | | | | | | | |
| | |
| | | | | | | 70,520,445 | |
| | |
| Machinery: Specialty — 0.1% | | | | | | |
Albany International Corp., Class A | | | 47,157 | | | | 4,171,037 | |
| | | | | | | | |
| | |
| Manufactured Housing(a) — 0.2% | | | | | | |
Cavco Industries, Inc. | | | 14,005 | | | | 4,448,688 | |
Skyline Champion Corp. | | | 80,682 | | | | 6,372,265 | |
| | | | | | | | |
| | |
| | | | | | | 10,820,953 | |
|
| Medical & Dental Instruments & Supplies — 2.0% | |
Akoya Biosciences, Inc.(a) | | | 22,635 | | | | 346,542 | |
Alphatec Holdings, Inc.(a) | | | 109,346 | | | | 1,249,825 | |
AngioDynamics, Inc.(a) | | | 56,604 | | | | 1,561,138 | |
Anika Therapeutics, Inc.(a) | | | 21,406 | | | | 766,977 | |
Antares Pharma, Inc.(a)(b) | | | 243,433 | | | | 869,056 | |
Apyx Medical Corp.(a) | | | 50,717 | | | | 650,192 | |
Asensus Surgical, Inc.(a)(b) | | | 353,864 | | | | 392,789 | |
AtriCure, Inc.(a) | | | 68,329 | | | | 4,750,915 | |
Atrion Corp. | | | 2,173 | | | | 1,531,748 | |
Avanos Medical, Inc.(a) | | | 72,524 | | | | 2,514,407 | |
| | | | | | | | |
| Security | | Shares | | | Value | |
| |
| Medical & Dental Instruments & Supplies (continued) | | | | �� |
Axogen, Inc.(a) | | | 59,838 | | | $ | 560,682 | |
BioLife Solutions, Inc.(a) | | | 16,221 | | | | 604,557 | |
Cardiovascular Systems, Inc.(a) | | | 60,505 | | | | 1,136,284 | |
Cerus Corp.(a)(b) | | | 256,778 | | | | 1,748,658 | |
Community Health Systems, Inc.(a) | | | 190,841 | | | | 2,540,094 | |
CONMED Corp. | | | 44,469 | | | | 6,303,925 | |
CryoLife, Inc.(a) | | | 58,286 | | | | 1,186,120 | |
Cutera, Inc.(a) | | | 26,637 | | | | 1,100,641 | |
Eargo, Inc.(a) | | | 55,191 | | | | 281,474 | |
Exagen, Inc.(a) | | | 20,018 | | | | 232,809 | |
InfuSystem Holdings, Inc.(a) | | | 26,205 | | | | 446,271 | |
Intersect ENT, Inc.(a) | | | 51,512 | | | | 1,406,793 | |
Invacare Corp.(a) | | | 50,360 | | | | 136,979 | |
LeMaitre Vascular, Inc. | | | 29,168 | | | | 1,465,109 | |
LivaNova PLC(a) | | | 81,953 | | | | 7,165,151 | |
Meridian Bioscience, Inc.(a)(b) | | | 65,750 | | | | 1,341,300 | |
Merit Medical Systems, Inc.(a) | | | 78,484 | | | | 4,889,553 | |
NanoString Technologies, Inc.(a) | | | 69,960 | | | | 2,954,411 | |
Neogen Corp.(a) | | | 165,309 | | | | 7,506,682 | |
NuVasive, Inc.(a) | | | 78,900 | | | | 4,140,672 | |
Ocular Therapeutix, Inc.(a) | | | 116,515 | | | | 812,110 | |
OraSure Technologies, Inc.(a)(b) | | | 106,969 | | | | 929,561 | |
Organogenesis Holdings, Inc.(a) | | | 57,622 | | | | 532,427 | |
Orthofix Medical, Inc.(a) | | | 27,983 | | | | 869,991 | |
OrthoPediatrics Corp.(a) | | | 21,120 | | | | 1,264,243 | |
Outset Medical, Inc.(a) | | | 71,671 | | | | 3,303,316 | |
Owens & Minor, Inc. | | | 110,980 | | | | 4,827,630 | |
Patterson Cos., Inc. | | | 132,088 | | | | 3,876,783 | |
Pulmonx Corp.(a) | | | 39,886 | | | | 1,279,144 | |
Retractable Technologies, Inc.(a) | | | 22,619 | | | | 156,750 | |
SeaSpine Holdings Corp.(a) | | | 50,511 | | | | 687,960 | |
Senseonics Holdings, Inc.(a)(b) | | | 651,308 | | | | 1,738,992 | |
Sientra, Inc.(a) | | | 81,563 | | | | 299,336 | |
STAAR Surgical Co.(a) | | | 72,709 | | | | 6,638,332 | |
Surmodics, Inc.(a) | | | 20,853 | | | | 1,004,072 | |
TransMedics Group, Inc.(a)(b) | | | 40,514 | | | | 776,248 | |
Treace Medical Concepts, Inc.(a) | | | 45,327 | | | | 844,895 | |
Utah Medical Products, Inc. | | | 5,607 | | | | 560,700 | |
ViewRay, Inc.(a) | | | 220,882 | | | | 1,217,060 | |
| | | | | | | | |
| | |
| | | | | | | 93,401,304 | |
| | |
| Medical Equipment(a) — 1.4% | | | | | | |
Accuray, Inc.(b) | | | 139,476 | | | | 665,301 | |
Acutus Medical, Inc. | | | 21,186 | | | | 72,244 | |
AdaptHealth Corp.(b) | | | 109,766 | | | | 2,684,876 | |
Alpha Teknova, Inc. | | | 9,420 | | | | 192,922 | |
Apria, Inc. | | | 29,961 | | | | 976,729 | |
Bionano Genomics, Inc.(b) | | | 445,543 | | | | 1,332,174 | |
CareDx, Inc. | | | 77,575 | | | | 3,528,111 | |
ClearPoint Neuro, Inc. | | | 27,334 | | | | 306,688 | |
Cytek Biosciences, Inc. | | | 22,296 | | | | 363,871 | |
Fluidigm Corp.(b) | | | 114,760 | | | | 449,859 | |
Glaukos Corp. | | | 69,676 | | | | 3,096,401 | |
Haemonetics Corp. | | | 76,828 | | | | 4,074,957 | |
Icad, Inc.(b) | | | 29,695 | | | | 213,804 | |
Inspire Medical Systems, Inc.(b) | | | 41,222 | | | | 9,483,533 | |
iRadimed Corp. | | | 9,949 | | | | 459,743 | |
iRhythm Technologies, Inc.(b) | | | 45,126 | | | | 5,310,879 | |
Lantheus Holdings, Inc. | | | 102,712 | | | | 2,967,350 | |
Natus Medical, Inc.(b) | | | 50,504 | | | | 1,198,460 | |
Neuronetics, Inc. | | | 36,640 | | | | 163,414 | |
Nevro Corp. | | | 52,806 | | | | 4,280,982 | |
PAVmed, Inc. | | | 106,420 | | | | 261,793 | |
| | |
| 86 | | 2 0 2 1 BLACK ROCK ANNUAL REPORT TO SHAREHOLDERS |
| | |
Schedule of Investments (continued) December 31, 2021 | | Master Small Cap Index Series (Percentages shown are based on Net Assets) |
| | | | | | | | |
| Security | | Shares | | | Value | |
| | |
| Medical Equipment (continued) | | | | | | |
Quanterix Corp. | | | 47,493 | | | $ | 2,013,703 | |
Quotient Ltd. | | | 108,765 | | | | 281,701 | |
Rapid Micro Biosystems, Inc., Class A(b) | | | 11,718 | | | | 124,680 | |
Seer, Inc., Class A | | | 63,328 | | | | 1,444,512 | |
Shockwave Medical, Inc. | | | 51,683 | | | | 9,216,629 | |
SI-BONE, Inc. | | | 51,670 | | | | 1,147,591 | |
Silk Road Medical, Inc.(b) | | | 52,567 | | | | 2,239,880 | |
Stereotaxis, Inc. | | | 75,290 | | | | 466,798 | |
Tactile Systems Technology, Inc. | | | 28,932 | | | | 550,576 | |
Vapotherm, Inc. | | | 35,037 | | | | 725,616 | |
Varex Imaging Corp.(b) | | | 59,454 | | | | 1,875,774 | |
Zynex, Inc. | | | 37,297 | | | | 371,851 | |
| | | | | | | | |
| | |
| | | | | | | 62,543,402 | |
| | |
| Medical Services(a) — 0.1% | | | | | | |
Aspira Women’s Health, Inc.(b) | | | 130,095 | | | | 230,268 | |
DermTech, Inc.(b) | | | 35,735 | | | | 564,613 | |
Fulgent Genetics, Inc. | | | 32,112 | | | | 3,230,146 | |
Innovage Holding Corp. | | | 27,096 | | | | 135,480 | |
Inotiv, Inc.(b) | | | 22,472 | | | | 945,397 | |
NeuroPace, Inc. | | | 9,798 | | | | 98,764 | |
| | | | | | | | |
| | |
| | | | | | | 5,204,668 | |
| | |
| Metal Fabricating — 0.6% | | | | | | |
Compx International, Inc. | | | 2,464 | | | | 55,366 | |
DMC Global, Inc.(a) | | | 28,677 | | | | 1,135,896 | |
GrafTech International Ltd. | | | 307,810 | | | | 3,641,392 | |
Haynes International, Inc. | | | 18,971 | | | | 765,100 | |
Lawson Products, Inc.(a) | | | 6,868 | | | | 376,023 | |
MRC Global, Inc.(a) | | | 121,138 | | | | 833,430 | |
Mueller Industries, Inc. | | | 86,005 | | | | 5,105,257 | |
Mueller Water Products, Inc., Class A | | | 242,461 | | | | 3,491,438 | |
NN, Inc.(a) | | | 62,601 | | | | 256,664 | |
Northwest Pipe Co.(a) | | | 14,320 | | | | 455,376 | |
RBC Bearings, Inc.(a)(b) | | | 42,818 | | | | 8,647,952 | |
Worthington Industries, Inc. | | | 50,893 | | | | 2,781,811 | |
| | | | | | | | |
| | |
| | | | | | | 27,545,705 | |
| | |
| Metals & Minerals: Diversified — 0.8% | | | | | | |
Commercial Metals Co. | | | 183,362 | | | | 6,654,207 | |
Compass Minerals International, Inc. | | | 52,140 | | | | 2,663,311 | |
Constellium SE(a) | | | 189,964 | | | | 3,402,255 | |
Energy Fuels, Inc.(a)(b) | | | 235,510 | | | | 1,796,941 | |
Ferroglobe PLC(c) | | | 42,394 | | | | — | |
Gatos Silver, Inc.(a) | | | 69,724 | | | | 723,735 | |
Hecla Mining Co. | | | 814,248 | | | | 4,250,375 | |
Intrepid Potash, Inc.(a) | | | 14,601 | | | | 623,901 | |
Materion Corp. | | | 31,315 | | | | 2,879,101 | |
Minerals Technologies, Inc. | | | 50,874 | | | | 3,721,433 | |
MP Materials Corp.(a) | | | 116,237 | | | | 5,279,485 | |
Oil-Dri Corp. of America | | | 8,646 | | | | 282,984 | |
Perpetua Resources Corp.(a) | | | 49,879 | | | | 236,925 | |
PolyMet Mining Corp.(a)(b) | | | 61,631 | | | | 154,077 | |
SunCoke Energy, Inc. | | | 124,359 | | | | 819,526 | |
U.S. Silica Holdings, Inc.(a) | | | 111,690 | | | | 1,049,886 | |
United States Lime & Minerals, Inc.(b) | | | 3,248 | | | | 419,057 | |
| | | | | | | | |
| | |
| | | | | | | 34,957,199 | |
| | |
| Office Supplies & Equipment — 0.3% | | | | | | |
ACCO Brands Corp. | | | 141,218 | | | | 1,166,461 | |
Eastman Kodak Co.(a) | | | 69,585 | | | | 325,658 | |
HNI Corp. | | | 66,581 | | | | 2,799,731 | |
Kimball International, Inc., Class B | | | 54,723 | | | | 559,816 | |
MillerKnoll, Inc. | | | 114,134 | | | | 4,472,911 | |
| | | | | | | | |
| Security | | Shares | | | Value | |
| | |
| Office Supplies & Equipment (continued) | | | | | | |
Pitney Bowes, Inc. | | | 200,937 | | | $ | 1,332,212 | |
Steelcase, Inc., Class A | | | 132,169 | | | | 1,549,021 | |
| | | | | | | | |
| | |
| | | | | | | 12,205,810 | |
| | |
| Oil & Gas Producers — 0.1% | | | | | | |
Civitas Resources, Inc. | | | 66,592 | | | | 3,261,010 | |
Crescent Energy, Inc.(a)(b) | | | 45,323 | | | | 574,696 | |
HighPeak Energy, Inc.(b) | | | 9,232 | | | | 135,156 | |
Kosmos Energy Ltd.(a) | | | 688,537 | | | | 2,382,338 | |
| | | | | | | | |
| | |
| | | | | | | 6,353,200 | |
| | |
| Oil Well Equipment & Services — 0.6% | | | | | | |
Bristow Group, Inc.(a)(b) | | | 36,429 | | | | 1,153,707 | |
Cactus, Inc., Class A | | | 85,553 | | | | 3,262,136 | |
ChampionX Corp.(a) | | | 311,973 | | | | 6,304,974 | |
Dril-Quip, Inc.(a) | | | 53,209 | | | | 1,047,153 | |
FTS International, Inc., Class A(a) | | | 13,775 | | | | 361,594 | |
Helix Energy Solutions Group, Inc.(a) | | | 214,480 | | | | 669,178 | |
Helmerich & Payne, Inc. | | | 162,590 | | | | 3,853,383 | |
Liberty Oilfield Services, Inc., Class A(a) | | | 142,279 | | | | 1,380,106 | |
Matrix Service Co.(a) | | | 40,520 | | | | 304,710 | |
Nabors Industries Ltd.(a)(b) | | | 10,577 | | | | 857,689 | |
National Energy Services Reunited Corp.(a)(b) | | | 55,777 | | | | 527,093 | |
Newpark Resources, Inc.(a) | | | 134,778 | | | | 396,247 | |
NexTier Oilfield Solutions, Inc.(a) | | | 264,387 | | | | 938,574 | |
Oceaneering International, Inc.(a) | | | 151,036 | | | | 1,708,217 | |
Oil States International, Inc.(a) | | | 89,068 | | | | 442,668 | |
Patterson-UTI Energy, Inc. | | | 283,998 | | | | 2,399,783 | |
ProPetro Holding Corp.(a) | | | 129,891 | | | | 1,052,117 | |
RPC, Inc.(a) | | | 103,658 | | | | 470,607 | |
Select Energy Services, Inc., Class A(a) | | | 95,170 | | | | 592,909 | |
Solaris Oilfield Infrastructure, Inc., Class A | | | 44,889 | | | | 294,023 | |
TETRA Technologies, Inc.(a) | | | 185,918 | | | | 528,007 | |
| | | | | | | | |
| | |
| | | | | | | 28,544,875 | |
| | |
| Oil, Gas & Consumable Fuels — 0.1% | | | | | | |
Archrock, Inc. | | | 206,690 | | | | 1,546,041 | |
DHT Holdings, Inc. | | | 217,681 | | | | 1,129,764 | |
Dorian LPG Ltd. | | | 47,150 | | | | 598,334 | |
Frontline Ltd.(a)(b) | | | 184,534 | | | | 1,304,655 | |
| | | | | | | | |
| | |
| | | | | | | 4,578,794 | |
| | |
| Oil: Crude Producers — 2.6% | | | | | | |
Antero Resources Corp.(a) | | | 437,549 | | | | 7,657,108 | |
Berry Corp. | | | 106,962 | | | | 900,620 | |
Brigham Minerals, Inc., Class A | | | 69,749 | | | | 1,471,006 | |
California Resources Corp. | | | 123,959 | | | | 5,294,289 | |
Callon Petroleum Co.(a) | | | 72,770 | | | | 3,438,383 | |
Centennial Resource Development, Inc., Class A(a)(b) | | | 282,159 | | | | 1,687,311 | |
Chesapeake Energy Corp. | | | 160,722 | | | | 10,369,783 | |
CNX Resources Corp.(a) | | | 320,346 | | | | 4,404,758 | |
Comstock Resources, Inc.(a)(b) | | | 138,213 | | | | 1,118,143 | |
CVR Energy, Inc. | | | 46,161 | | | | 775,966 | |
Denbury, Inc.(a) | | | 76,802 | | | | 5,882,265 | |
Earthstone Energy, Inc., Class A(a) | | | 37,268 | | | | 407,712 | |
Falcon Minerals Corp. | | | 63,528 | | | | 309,381 | |
Gevo, Inc.(a)(b) | | | 303,982 | | | | 1,301,043 | |
Laredo Petroleum, Inc.(a) | | | 19,197 | | | | 1,154,316 | |
Magnolia Oil & Gas Corp., Class A | | | 219,346 | | | | 4,139,059 | |
Meta Materials, Inc.(a)(b) | | | 308,991 | | | | 760,118 | |
Murphy Oil Corp. | | | 224,748 | | | | 5,868,170 | |
Northern Oil and Gas, Inc. | | | 81,533 | | | | 1,677,949 | |
Oasis Petroleum, Inc. | | | 30,512 | | | | 3,844,207 | |
| | |
SERIES SCHEDULE OF INVESTMENTS | | 87 |
| | |
Schedule of Investments (continued) December 31, 2021 | | Master Small Cap Index Series (Percentages shown are based on Net Assets) |
| | | | | | | | |
| Security | | Shares | | | Value | |
| | |
| Oil: Crude Producers (continued) | | | | | | |
ONE Gas, Inc. | | | 80,984 | | | $ | 6,283,549 | |
Ovintiv, Inc. | | | 400,974 | | | | 13,512,824 | |
PDC Energy, Inc. | | | 148,967 | | | | 7,266,610 | |
Range Resources Corp.(a) | | | 365,671 | | | | 6,519,914 | |
Ranger Oil Corp., Class A(a) | | | 33,033 | | | | 889,248 | |
Riley Exploration Permian, Inc. | | | 3,456 | | | | 66,770 | |
SM Energy Co. | | | 183,508 | | | | 5,409,816 | |
Southwestern Energy Co.(a) | | | 1,553,894 | | | | 7,241,146 | |
Talos Energy, Inc.(a) | | | 56,899 | | | | 557,610 | |
Tellurian, Inc.(a)(b) | | | 566,220 | | | | 1,743,958 | |
Ur-Energy, Inc.(a) | | | 266,438 | | | | 325,054 | |
W&T Offshore, Inc.(a) | | | 145,832 | | | | 471,037 | |
Whiting Petroleum Corp.(a) | | | 60,514 | | | | 3,914,046 | |
| | | | | | | | |
| | |
| | | | | | | 116,663,169 | |
| | |
| Oil: Refining & Marketing — 0.3% | | | | | | |
Clean Energy Fuels Corp.(a) | | | 237,786 | | | | 1,457,628 | |
Delek US Holdings, Inc.(a) | | | 99,741 | | | | 1,495,118 | |
Par Pacific Holdings, Inc.(a) | | | 66,218 | | | | 1,091,935 | |
PBF Energy, Inc., Class A(a) | | | 146,181 | | | | 1,895,967 | |
Renewable Energy Group, Inc.(a) | | | 69,048 | | | | 2,930,397 | |
World Fuel Services Corp. | | | 95,561 | | | | 2,529,500 | |
| | | | | | | | |
| | |
| | | | | | | 11,400,545 | |
| | |
| Paints & Coatings — 0.2% | | | | | | |
Chase Corp. | | | 11,191 | | | | 1,114,176 | |
Ferro Corp.(a) | | | 126,320 | | | | 2,757,566 | |
HB Fuller Co. | | | 79,949 | | | | 6,475,869 | |
Kronos Worldwide, Inc. | | | 34,905 | | | | 523,924 | |
| | | | | | | | |
| | |
| | | | | | | 10,871,535 | |
| | |
| Paper — 0.1% | | | | | | |
Clearwater Paper Corp.(a) | | | 25,092 | | | | 920,124 | |
Glatfelter Corp. | | | 66,295 | | | | 1,140,274 | |
Neenah, Inc. | | | 25,262 | | | | 1,169,125 | |
Schweitzer-Mauduit International, Inc. | | | 47,249 | | | | 1,412,745 | |
Verso Corp., Class A | | | 41,096 | | | | 1,110,414 | |
| | | | | | | | |
| | |
| | | | | | | 5,752,682 | |
| | |
| Personal Care — 0.4% | | | | | | |
Beauty Health Co.(a)(b) | | | 131,979 | | | | 3,188,613 | |
Edgewell Personal Care Co. | | | 83,038 | | | | 3,795,667 | |
Honest Co., Inc.(a) | | | 126,537 | | | | 1,023,684 | |
Nu Skin Enterprises, Inc., Class A | | | 76,358 | | | | 3,875,169 | |
Sterling Check Corp.(a)(b) | | | 24,310 | | | | 498,598 | |
Thorne HealthTech, Inc.(a)(b) | | | 8,069 | | | | 50,108 | |
USANA Health Sciences, Inc.(a) | | | 18,055 | | | | 1,827,166 | |
Veru, Inc.(a) | | | 95,480 | | | | 562,377 | |
WD-40 Co. | | | 20,894 | | | | 5,111,508 | |
| | | | | | | | |
| | |
| | | | | | | 19,932,890 | |
| | |
| Pharmaceuticals(a) — 2.0% | | | | | | |
ACADIA Pharmaceuticals, Inc.(b) | | | 182,779 | | | | 4,266,062 | |
Aclaris Therapeutics, Inc.(b) | | | 76,857 | | | | 1,117,501 | |
Aerie Pharmaceuticals, Inc. | | | 68,373 | | | | 479,978 | |
Alkermes PLC | | | 245,714 | | | | 5,715,308 | |
Amneal Pharmaceuticals, Inc. | | | 149,149 | | | | 714,424 | |
Amphastar Pharmaceuticals, Inc.(b) | | | 57,581 | | | | 1,341,061 | |
Ampio Pharmaceuticals, Inc. | | | 271,916 | | | | 154,992 | |
Angion Biomedica Corp. | | | 24,033 | | | | 69,696 | |
Arrowhead Pharmaceuticals, Inc. | | | 155,248 | | | | 10,292,942 | |
Atea Pharmaceuticals, Inc. | | | 97,104 | | | | 868,110 | |
Athira Pharma, Inc. | | | 48,613 | | | | 633,427 | |
| | | | | | | | |
| Security | | Shares | | | Value | |
| | |
| Pharmaceuticals (continued) | | | | | | |
Avalo Therapeutics, Inc. | | | 81,296 | | | $ | 138,203 | |
Axonics, Inc. | | | 69,925 | | | | 3,915,800 | |
Axsome Therapeutics, Inc.(b) | | | 42,099 | | | | 1,590,500 | |
Cassava Sciences, Inc.(b) | | | 59,100 | | | | 2,582,670 | |
Chimerix, Inc. | | | 110,285 | | | | 709,133 | |
ChromaDex Corp.(b) | | | 84,727 | | | | 316,879 | |
Citius Pharmaceuticals, Inc.(b) | | | 169,706 | | | | 261,347 | |
Corcept Therapeutics, Inc.(b) | | | 148,544 | | | | 2,941,171 | |
CorMedix, Inc.(b) | | | 52,097 | | | | 237,041 | |
Cyteir Therapeutics, Inc. | | | 11,795 | | | | 134,109 | |
DICE Therapeutics, Inc. | | | 20,147 | | | | 509,921 | |
Durect Corp. | | | 330,083 | | | | 325,429 | |
Eagle Pharmaceuticals, Inc. | | | 17,404 | | | | 886,212 | |
Edgewise Therapeutics, Inc.(b) | | | 59,660 | | | | 911,605 | |
Enanta Pharmaceuticals, Inc. | | | 29,502 | | | | 2,206,160 | |
Endo International PLC | | | 345,914 | | | | 1,300,637 | |
Esperion Therapeutics, Inc. | | | 39,709 | | | | 198,545 | |
Evolus, Inc. | | | 51,241 | | | | 333,579 | |
Harmony Biosciences Holdings, Inc. | | | 35,086 | | | | 1,496,067 | |
Heska Corp. | | | 15,256 | | | | 2,784,067 | |
Ikena Oncology, Inc. | | | 40,587 | | | | 508,961 | |
Infinity Pharmaceuticals, Inc. | | | 128,670 | | | | 289,508 | |
Innoviva, Inc. | | | 65,510 | | | | 1,130,048 | |
Intra-Cellular Therapies, Inc. | | | 107,872 | | | | 5,646,020 | |
Ironwood Pharmaceuticals, Inc. | | | 222,059 | | | | 2,589,208 | |
Landos Biopharma, Inc. | | | 8,208 | | | | 39,398 | |
MEI Pharma, Inc. | | | 169,441 | | | | 452,407 | |
Mind Medicine MindMed, Inc. | | | 548,974 | | | | 757,584 | |
Nuvation Bio, Inc.(b) | | | 243,541 | | | | 2,070,098 | |
Oramed Pharmaceuticals, Inc. | | | 45,675 | | | | 652,239 | |
Pacira BioSciences, Inc. | | | 67,293 | | | | 4,049,020 | |
Paratek Pharmaceuticals, Inc.(b) | | | 68,365 | | | | 306,959 | |
PetIQ, Inc. | | | 43,291 | | | | 983,139 | |
Prestige Consumer Healthcare, Inc. | | | 76,423 | | | | 4,635,055 | |
Radius Health, Inc. | | | 70,039 | | | | 484,670 | |
Rain Therapeutics, Inc. | | | 23,238 | | | | 299,305 | |
Reata Pharmaceuticals, Inc., Class A(b) | | | 43,243 | | | | 1,140,318 | |
Revance Therapeutics, Inc.(b) | | | 106,318 | | | | 1,735,110 | |
Seelos Therapeutics, Inc. | | | 195,283 | | | | 318,311 | |
SIGA Technologies, Inc.(b) | | | 80,100 | | | | 602,352 | |
Spectrum Pharmaceuticals, Inc.(b) | | | 283,421 | | | | 359,945 | |
Supernus Pharmaceuticals, Inc. | | | 74,652 | | | | 2,176,852 | |
Syndax Pharmaceuticals, Inc.(b) | | | 67,817 | | | | 1,484,514 | |
Tarsus Pharmaceuticals, Inc.(b) | | | 11,888 | | | | 267,480 | |
Terns Pharmaceuticals, Inc. | | | 19,690 | | | | 139,208 | |
TG Therapeutics, Inc.(b) | | | 198,713 | | | | 3,775,547 | |
TherapeuticsMD, Inc.(b) | | | 743,278 | | | | 264,235 | |
Theravance Biopharma, Inc. | | | 91,479 | | | | 1,010,843 | |
Theseus Pharmaceuticals, Inc.(b) | | | 14,910 | | | | 189,059 | |
Tonix Pharmaceuticals Holding Corp. | | | 815,817 | | | | 291,818 | |
Ventyx Biosciences, Inc.(b) | | | 13,957 | | | | 277,186 | |
Zogenix, Inc.(b) | | | 84,910 | | | | 1,379,788 | |
| | | | | | | | |
| | |
| | | | | | | 89,738,761 | |
| | |
| Photography — 0.0% | | | | | | |
GoPro, Inc., Class A(a) | | | 196,802 | | | | 2,029,029 | |
| | | | | | | | |
| | |
| Power Transmission Equipment — 0.2% | | | | | | |
Advanced Energy Industries, Inc. | | | 57,835 | | | | 5,266,455 | |
Babcock & Wilcox Enterprises, Inc.(a)(b) | | | 83,634 | | | | 754,379 | |
| | |
| 88 | | 2 0 2 1 BLACK ROCK ANNUAL REPORT TO SHAREHOLDERS |
| | |
Schedule of Investments (continued) December 31, 2021 | | Master Small Cap Index Series (Percentages shown are based on Net Assets) |
| | | | | | | | |
| Security | | Shares | | | Value | |
| |
| Power Transmission Equipment (continued) | | | | |
Powell Industries, Inc. | | | 13,696 | | | $ | 403,895 | |
Vicor Corp.(a) | | | 32,268 | | | | 4,097,390 | |
| | | | | | | | |
| | |
| | | | | | | 10,522,119 | |
| | |
| Printing & Copying Services(a) — 0.2% | | | | | | |
Casella Waste Systems, Inc., Class A | | | 75,295 | | | | 6,431,699 | |
Cimpress PLC | | | 26,653 | | | | 1,908,621 | |
| | | | | | | | |
| | |
| | | | | | | 8,340,320 | |
| | |
| Producer Durables: Miscellaneous — 0.1% | | | | | | |
First Advantage Corp.(a) | | | 84,224 | | | | 1,603,625 | |
Park-Ohio Holdings Corp. | | | 13,595 | | | | 287,806 | |
Solo Brands, Inc.(a) | | | 18,058 | | | | 282,247 | |
| | | | | | | | |
| | |
| | | | | | | 2,173,678 | |
| | |
| Production Technology Equipment — 0.6% | | | | | | |
Axcelis Technologies, Inc.(a) | | | 50,638 | | | | 3,775,569 | |
Cohu, Inc.(a) | | | 74,642 | | | | 2,843,114 | |
HireRight Holdings Corp.(a)(b) | | | 33,150 | | | | 530,400 | |
Ichor Holdings Ltd.(a) | | | 43,766 | | | | 2,014,549 | |
Onto Innovation, Inc.(a) | | | 74,347 | | | | 7,526,147 | |
Photronics, Inc.(a) | | | 93,999 | | | | 1,771,881 | |
Ultra Clean Holdings, Inc.(a)(b) | | | 68,172 | | | | 3,910,346 | |
Veeco Instruments, Inc.(a) | | | 74,636 | | | | 2,124,887 | |
Xperi Holding Corp. | | | 160,911 | | | | 3,042,827 | |
| | | | | | | | |
| | |
| | | | | | | 27,539,720 | |
| | |
| Publishing — 0.2% | | | | | | |
Daily Journal Corp.(a) | | | 1,917 | | | | 683,851 | |
Eros STX Global Corp.(a) | | | 485,200 | | | | 116,303 | |
Gannett Co., Inc.(a) | | | 227,591 | | | | 1,213,060 | |
John Wiley & Sons, Inc., Class A | | | 65,886 | | | | 3,773,291 | |
Scholastic Corp. | | | 39,729 | | | | 1,587,571 | |
| | | | | | | | |
| | |
| | | | | | | 7,374,076 | |
| | |
| Radio & TV Broadcasters — 0.4% | | | | | | |
Entravision Communications Corp., Class A | | | 88,471 | | | | 599,833 | |
Gray Television, Inc. | | | 131,240 | | | | 2,645,798 | |
iHeartMedia, Inc., Class A(a)(b) | | | 171,185 | | | | 3,601,733 | |
Liberty Media Corp.-Liberty Braves, Class A(a) | | | 14,423 | | | | 414,661 | |
Liberty Media Corp.-Liberty Braves, Class C(a)(b) | | | 55,093 | | | | 1,548,113 | |
Sinclair Broadcast Group, Inc., Class A | | | 70,620 | | | | 1,866,487 | |
TEGNA, Inc. | | | 338,748 | | | | 6,287,163 | |
| | | | | | | | |
| | |
| | | | | | | 16,963,788 | |
| | |
| Railroad Equipment — 0.1% | | | | | | |
Greenbrier Cos., Inc. | | | 48,934 | | | | 2,245,581 | |
Trinity Industries, Inc. | | | 118,304 | | | | 3,572,781 | |
| | | | | | | | |
| | |
| | | | | | | 5,818,362 | |
| | |
| Real Estate — 0.7% | | | | | | |
Cushman & Wakefield PLC(a) | | | 212,583 | | | | 4,727,846 | |
eXp World Holdings, Inc. | | | 96,062 | | | | 3,236,329 | |
Kennedy-Wilson Holdings, Inc. | | | 182,632 | | | | 4,361,252 | |
Newmark Group, Inc., Class A | | | 228,003 | | | | 4,263,656 | |
Realogy Holdings Corp.(a)(b) | | | 175,973 | | | | 2,958,106 | |
Redfin Corp.(a)(b) | | | 157,904 | | | | 6,061,935 | |
Retail Value, Inc. | | | 26,815 | | | | 172,152 | |
RMR Group, Inc., Class A | | | 22,731 | | | | 788,311 | |
St. Joe Co. | | | 50,794 | | | | 2,643,828 | |
Tejon Ranch Co.(a) | | | 32,564 | | | | 621,321 | |
| | | | | | | | |
| | |
| | | | | | | 29,834,736 | |
| |
| Real Estate Investment Trusts (REITs) — 7.1% | | | | |
Acadia Realty Trust | | | 130,884 | | | | 2,857,198 | |
AFC Gamma, Inc. | | | 16,662 | | | | 379,227 | |
| | | | | | | | |
| Security | | Shares | | | Value | |
| |
| Real Estate Investment Trusts (REITs) (continued) | | | | |
Agree Realty Corp. | | | 105,419 | | | $ | 7,522,700 | |
Alexander & Baldwin, Inc. | | | 110,075 | | | | 2,761,782 | |
Alexander’s, Inc. | | | 3,225 | | | | 839,468 | |
American Assets Trust, Inc. | | | 76,906 | | | | 2,886,282 | |
American Finance Trust, Inc. | | | 186,406 | | | | 1,701,887 | |
Angel Oak Mortgage, Inc. | | | 10,642 | | | | 174,316 | |
Apartment Investment and Management Co., Class A(a) | | | 231,104 | | | | 1,784,123 | |
Apollo Commercial Real Estate Finance, Inc. | | | 214,194 | | | | 2,818,793 | |
Apple Hospitality REIT, Inc. | | | 326,329 | | | | 5,270,213 | |
Arbor Realty Trust, Inc. | | | 219,852 | | | | 4,027,689 | |
Ares Commercial Real Estate Corp. | | | 71,882 | | | | 1,045,164 | |
Armada Hoffler Properties, Inc. | | | 89,285 | | | | 1,358,918 | |
ARMOUR Residential REIT, Inc. | | | 132,737 | | | | 1,302,150 | |
Ashford Hospitality Trust, Inc.(a) | | | 27,598 | | | | 264,941 | |
Blackstone Mortgage Trust, Inc., Class A | | | 240,581 | | | | 7,366,590 | |
Braemar Hotels & Resorts, Inc.(a) | | | 80,835 | | | | 412,259 | |
Brandywine Realty Trust | | | 263,181 | | | | 3,531,889 | |
BrightSpire Capital, Inc. | | | 129,290 | | | | 1,326,515 | |
Broadmark Realty Capital, Inc. | | | 189,714 | | | | 1,789,003 | |
Broadstone Net Lease, Inc. | | | 240,863 | | | | 5,978,220 | |
BRT Apartments Corp. | | | 16,395 | | | | 393,316 | |
CareTrust REIT, Inc. | | | 149,492 | | | | 3,412,902 | |
Catchmark Timber Trust, Inc., Class A | | | 76,183 | | | | 663,554 | |
Centerspace | | | 21,754 | | | | 2,412,519 | |
Chatham Lodging Trust(a) | | | 71,747 | | | | 984,369 | |
City Office REIT, Inc. | | | 66,662 | | | | 1,314,575 | |
Clipper Realty, Inc. | | | 23,302 | | | | 231,622 | |
Community Healthcare Trust, Inc. | | | 37,930 | | | | 1,792,951 | |
CoreCivic, Inc.(a) | | | 182,732 | | | | 1,821,838 | |
Corporate Office Properties Trust | | | 173,441 | | | | 4,851,145 | |
CTO Realty Growth, Inc. | | | 9,099 | | | | 558,861 | |
DiamondRock Hospitality Co.(a) | | | 323,151 | | | | 3,105,481 | |
DigitalBridge Group, Inc.(a) | | | 741,743 | | | | 6,178,719 | |
Diversified Healthcare Trust | | | 362,135 | | | | 1,118,997 | |
Dynex Capital, Inc. | | | 52,173 | | | | 871,811 | |
Easterly Government Properties, Inc. | | | 132,524 | | | | 3,037,450 | |
EastGroup Properties, Inc. | | | 61,807 | | | | 14,082,725 | |
Ellington Financial, Inc. | | | 80,835 | | | | 1,381,470 | |
Empire State Realty Trust, Inc., Class A | | | 218,930 | | | | 1,948,477 | |
Equity Commonwealth(a) | | | 179,397 | | | | 4,646,382 | |
Essential Properties Realty Trust, Inc. | | | 185,625 | | | | 5,351,569 | |
Farmland Partners, Inc. | | | 43,014 | | | | 514,017 | |
Four Corners Property Trust, Inc. | | | 117,543 | | | | 3,456,940 | |
Franklin BSP Realty Trust, Inc.(a) | | | 47,192 | | | | 705,048 | |
Franklin Street Properties Corp. | | | 150,867 | | | | 897,659 | |
Geo Group, Inc. | | | 181,328 | | | | 1,405,292 | |
Getty Realty Corp. | | | 60,261 | | | | 1,933,775 | |
Gladstone Commercial Corp. | | | 57,026 | | | | 1,469,560 | |
Gladstone Land Corp. | | | 47,201 | | | | 1,593,506 | |
Global Medical REIT, Inc. | | | 93,832 | | | | 1,665,518 | |
Global Net Lease, Inc. | | | 159,692 | | | | 2,440,094 | |
Granite Point Mortgage Trust, Inc. | | | 91,236 | | | | 1,068,374 | |
Great Ajax Corp. | | | 35,257 | | | | 463,982 | |
Healthcare Realty Trust, Inc. | | | 226,973 | | | | 7,181,426 | |
Hersha Hospitality Trust(a) | | | 52,620 | | | | 482,525 | |
Independence Realty Trust, Inc. | | | 159,885 | | | | 4,129,830 | |
Indus Realty Trust, Inc. | | | 8,662 | | | | 702,142 | |
Industrial Logistics Properties Trust | | | 98,858 | | | | 2,476,393 | |
Innovative Industrial Properties, Inc. | | | 36,292 | | | | 9,541,530 | |
Invesco Mortgage Capital, Inc. | | | 439,731 | | | | 1,222,452 | |
iStar, Inc. | | | 105,086 | | | | 2,714,371 | |
| | |
SERIES SCHEDULE OF INVESTMENTS | | 89 |
| | |
Schedule of Investments (continued) December 31, 2021 | | Master Small Cap Index Series (Percentages shown are based on Net Assets) |
| | | | | | | | |
| Security | | Shares | | | Value | |
| |
| Real Estate Investment Trusts (REITs) (continued) | | | | |
Kite Realty Group Trust | | | 332,608 | | | $ | 7,244,202 | |
KKR Real Estate Finance Trust, Inc. | | | 54,000 | | | | 1,124,820 | |
LTC Properties, Inc. | | | 59,517 | | | | 2,031,910 | |
LXP Industrial Trust | | | 427,045 | | | | 6,670,443 | |
MFA Financial, Inc. | | | 689,374 | | | | 3,143,545 | |
Monmouth Real Estate Investment Corp. | | | 145,021 | | | | 3,046,891 | |
National Health Investors, Inc. | | | 67,316 | | | | 3,868,651 | |
National Storage Affiliates Trust | | | 124,242 | | | | 8,597,546 | |
New York Mortgage Trust, Inc. | | | 586,018 | | | | 2,179,987 | |
NexPoint Residential Trust, Inc. | | | 34,729 | | | | 2,911,332 | |
Office Properties Income Trust | | | 73,057 | | | | 1,814,736 | |
One Liberty Properties, Inc. | | | 25,572 | | | | 902,180 | |
Orchid Island Capital, Inc. | | | 197,622 | | | | 889,299 | |
Outfront Media, Inc. | | | 223,676 | | | | 5,998,990 | |
Paramount Group, Inc. | | | 281,875 | | | | 2,350,837 | |
Pebblebrook Hotel Trust | | | 199,700 | | | | 4,467,289 | |
PennyMac Mortgage Investment Trust | | | 151,398 | | | | 2,623,727 | |
Phillips Edison & Co., Inc. | | | 28,262 | | | | 933,776 | |
Physicians Realty Trust | | | 339,205 | | | | 6,387,230 | |
Piedmont Office Realty Trust, Inc., Class A | | | 188,849 | | | | 3,471,045 | |
Plymouth Industrial REIT, Inc. | | | 47,841 | | | | 1,530,912 | |
Postal Realty Trust, Inc., Class A | | | 22,832 | | | | 452,074 | |
PotlatchDeltic Corp. | | | 101,099 | | | | 6,088,182 | |
Preferred Apartment Communities, Inc. | | | 78,063 | | | | 1,409,818 | |
PS Business Parks, Inc. | | | 30,823 | | | | 5,676,672 | |
Ready Capital Corp. | | | 89,562 | | | | 1,399,854 | |
Redwood Trust, Inc. | | | 173,328 | | | | 2,286,196 | |
Retail Opportunity Investments Corp. | | | 179,348 | | | | 3,515,221 | |
RLJ Lodging Trust | | | 252,091 | | | | 3,511,628 | |
RPT Realty | | | 124,389 | | | | 1,664,325 | |
Sabra Health Care REIT, Inc. | | | 351,382 | | | | 4,757,712 | |
Safehold, Inc. | | | 31,779 | | | | 2,537,553 | |
Saul Centers, Inc. | | | 18,784 | | | | 995,928 | |
Seritage Growth Properties, Class A(a) | | | 60,705 | | | | 805,555 | |
Service Properties Trust | | | 249,927 | | | | 2,196,858 | |
STAG Industrial, Inc. | | | 269,687 | | | | 12,934,189 | |
Summit Hotel Properties, Inc.(a) | | | 157,085 | | | | 1,533,150 | |
Sunstone Hotel Investors, Inc.(a) | | | 330,699 | | | | 3,879,099 | |
Tanger Factory Outlet Centers, Inc. | | | 156,896 | | | | 3,024,955 | |
Terreno Realty Corp. | | | 112,476 | | | | 9,593,078 | |
TPG RE Finance Trust, Inc. | | | 91,270 | | | | 1,124,446 | |
UMH Properties, Inc. | | | 66,822 | | | | 1,826,245 | |
Uniti Group, Inc. | | | 301,129 | | | | 4,218,817 | |
Universal Health Realty Income Trust | | | 19,651 | | | | 1,168,645 | |
Urban Edge Properties | | | 177,499 | | | | 3,372,481 | |
Urstadt Biddle Properties, Inc., Class A | | | 46,471 | | | | 989,832 | |
Veris Residential, Inc(a) | | | 133,767 | | | | 2,458,637 | |
Washington Real Estate Investment Trust | | | 129,439 | | | | 3,345,998 | |
Whitestone REIT | | | 68,280 | | | | 691,676 | |
Xenia Hotels & Resorts, Inc.(a) | | | 174,426 | | | | 3,158,855 | |
| | | | | | | | |
| | |
| | | | | | | 326,431,521 | |
| |
| Real Estate Management & Development(a) — 0.1% | | | | |
Bluegreen Vacations Holding Corp. | | | 22,087 | | | | 775,254 | |
CorePoint Lodging, Inc. | | | 63,254 | | | | 993,088 | |
Fathom Holdings, Inc. | | | 9,557 | | | | 195,536 | |
Forestar Group, Inc. | | | 25,815 | | | | 561,476 | |
Rafael Holdings, Inc., Class B | | | 14,154 | | | | 72,185 | |
| | | | | | | | |
| | |
| | | | | | | 2,597,539 | |
| | |
| Recreational Vehicles & Boats — 0.4% | | | | | | |
Arcimoto, Inc.(a)(b) | | | 42,318 | | | | 329,234 | |
Camping World Holdings, Inc., Class A | | | 64,814 | | | | 2,618,486 | |
| | | | | | | | |
| Security | | Shares | | | Value | |
| |
| Recreational Vehicles & Boats (continued) | | | | |
Lazydays Holdings, Inc.(a) | | | 10,594 | | | $ | 228,195 | |
LCI Industries | | | 37,952 | | | | 5,915,578 | |
Malibu Boats, Inc., Class A(a) | | | 31,562 | | | | 2,169,256 | |
Marine Products Corp. | | | 12,431 | | | | 155,388 | |
MasterCraft Boat Holdings, Inc.(a) | | | 28,157 | | | | 797,688 | |
Winnebago Industries, Inc. | | | 49,571 | | | | 3,713,859 | |
| | | | | | | | |
| | |
| | | | | | | 15,927,684 | |
| | |
| Rental & Leasing Services: Consumer — 0.7% | | | | | | |
Avis Budget Group, Inc.(a) | | | 63,268 | | | | 13,119,885 | |
Rent-A-Center, Inc. | | | 100,893 | | | | 4,846,900 | |
WillScot Mobile Mini Holdings Corp.(a)(b) | | | 323,831 | | | | 13,225,258 | |
| | | | | | | | |
| | |
| | | | | | | 31,192,043 | |
| | |
| Restaurants — 1.3% | | | | | | |
Biglari Holdings, Inc., Class B(a) | | | 1,622 | | | | 231,249 | |
BJ’s Restaurants, Inc.(a) | | | 33,625 | | | | 1,161,744 | |
Bloomin’ Brands, Inc.(a) | | | 135,656 | | | | 2,846,063 | |
Brinker International, Inc.(a) | | | 70,134 | | | | 2,566,203 | |
Carrols Restaurant Group, Inc. | | | 50,844 | | | | 150,498 | |
Cheesecake Factory, Inc.(a) | | | 69,976 | | | | 2,739,560 | |
Cracker Barrel Old Country Store, Inc. | | | 36,215 | | | | 4,658,698 | |
Dave & Buster’s Entertainment, Inc.(a) | | | 66,426 | | | | 2,550,758 | |
Del Taco Restaurants, Inc. | | | 45,428 | | | | 565,579 | |
Denny’s Corp.(a) | | | 93,989 | | | | 1,503,824 | |
Dine Brands Global, Inc.(a) | | | 24,999 | | | | 1,895,174 | |
El Pollo Loco Holdings, Inc.(a) | | | 27,176 | | | | 385,627 | |
Esports Technologies, Inc.(a) | | | 17,117 | | | | 351,926 | |
Fiesta Restaurant Group, Inc.(a) | | | 26,448 | | | | 291,192 | |
Hall of Fame Resort & Entertainment Co.(a) | | | 82,051 | | | | 124,718 | |
Jack in the Box, Inc. | | | 33,474 | | | | 2,928,306 | |
Kura Sushi USA, Inc., Class A(a)(b) | | | 7,172 | | | | 579,784 | |
Nathan’s Famous, Inc. | | | 4,875 | | | | 284,651 | |
Noodles & Co.(a) | | | 67,772 | | | | 614,692 | |
ONE Group Hospitality, Inc.(a) | | | 37,490 | | | | 472,749 | |
Papa John’s International, Inc. | | | 50,568 | | | | 6,749,311 | |
Red Robin Gourmet Burgers, Inc.(a) | | | 23,276 | | | | 384,752 | |
Rush Street Interactive, Inc.(a) | | | 80,879 | | | | 1,334,503 | |
Ruth’s Hospitality Group, Inc.(a) | | | 49,520 | | | | 985,448 | |
Shake Shack, Inc., Class A(a) | | | 57,167 | | | | 4,125,171 | |
Texas Roadhouse, Inc. | | | 107,326 | | | | 9,582,065 | |
Wingstop, Inc. | | | 45,656 | | | | 7,889,357 | |
| | | | | | | | |
| | |
| | | | | | | 57,953,602 | |
| | |
| Scientific Instruments: Control & Filter — 0.7% | | | | | | |
Arlo Technologies, Inc.(a) | | | 128,310 | | | | 1,345,972 | |
Brady Corp., Class A | | | 72,335 | | | | 3,898,856 | |
CIRCOR International, Inc.(a) | | | 29,639 | | | | 805,588 | |
Energy Recovery, Inc.(a) | | | 62,036 | | | | 1,333,154 | |
ESCO Technologies, Inc. | | | 39,173 | | | | 3,525,178 | |
Gorman-Rupp Co. | | | 33,421 | | | | 1,488,906 | |
Helios Technologies, Inc. | | | 49,488 | | | | 5,204,653 | |
Napco Security Technologies, Inc.(a)(b) | | | 21,723 | | | | 1,085,715 | |
Resideo Technologies, Inc.(a) | | | 221,300 | | | | 5,760,439 | |
Thermon Group Holdings, Inc.(a) | | | 50,449 | | | | 854,102 | |
Watts Water Technologies, Inc., Class A | | | 42,142 | | | | 8,182,712 | |
| | | | | | | | |
| | |
| | | | | | | 33,485,275 | |
| | |
| Scientific Instruments: Electrical — 0.7% | | | | | | |
Advent Technologies Holdings, Inc.(a)(b) | | | 24,565 | | | | 172,201 | |
Allied Motion Technologies, Inc. | | | 17,656 | | | | 644,267 | |
Atkore, Inc.(a) | | | 70,550 | | | | 7,844,454 | |
AZZ, Inc. | | | 38,572 | | | | 2,132,646 | |
EnerSys | | | 65,675 | | | | 5,192,265 | |
Franklin Electric Co., Inc. | | | 70,927 | | | | 6,706,857 | |
| | |
| 90 | | 2 0 2 1 BLACK ROCK ANNUAL REPORT TO SHAREHOLDERS |
| | |
Schedule of Investments (continued) December 31, 2021 | | Master Small Cap Index Series (Percentages shown are based on Net Assets) |
| | | | | | | | |
| Security | | Shares | | | Value | |
| |
| Scientific Instruments: Electrical (continued) | | | | |
FTC Solar, Inc.(a) | | | 28,767 | | | $ | 217,479 | |
Preformed Line Products Co. | | | 4,580 | | | | 296,326 | |
Romeo Power, Inc.(a) | | | 201,721 | | | | 736,282 | |
WESCO International, Inc.(a)(b) | | | 68,256 | | | | 8,981,807 | |
| | | | | | | | |
| | |
| | | | | | | 32,924,584 | |
| |
| Scientific Instruments: Gauges & Meters — 0.4% | | | | |
Badger Meter, Inc. | | | 44,358 | | | | 4,726,789 | |
FARO Technologies, Inc.(a) | | | 27,502 | | | | 1,925,690 | |
Itron, Inc.(a) | | | 68,866 | | | | 4,718,698 | |
Luna Innovations, Inc.(a) | | | 44,281 | | | | 373,732 | |
Mesa Laboratories, Inc. | | | 7,765 | | | | 2,547,619 | |
Transcat, Inc.(a)(b) | | | 10,356 | | | | 957,205 | |
Vishay Precision Group, Inc.(a) | | | 19,811 | | | | 735,384 | |
| | | | | | | | |
| | |
| | | | | | | 15,985,117 | |
| |
| Scientific Instruments: Pollution Control(a) — 0.2% | | | | |
CECO Environmental Corp. | | | 50,515 | | | | 314,708 | |
Evoqua Water Technologies Corp. | | | 177,107 | | | | 8,279,752 | |
Heritage-Crystal Clean, Inc. | | | 23,588 | | | | 755,288 | |
Sharps Compliance Corp. | | | 23,152 | | | | 165,074 | |
Team, Inc. | | | 44,286 | | | | 48,272 | |
US Ecology, Inc. | | | 48,476 | | | | 1,548,323 | |
| | | | | | | | |
| | |
| | | | | | | 11,111,417 | |
| | |
| Securities Brokerage & Services — 0.1% | | | | | | |
BGC Partners, Inc., Class A | | | 480,495 | | | | 2,234,301 | |
StoneX Group, Inc.(a) | | | 25,339 | | | | 1,552,014 | |
| | | | | | | | |
| | |
| | | | | | | 3,786,315 | |
| | |
| Semiconductors & Components — 2.5% | | | | | | |
Alpha & Omega Semiconductor Ltd.(a) | | | 32,249 | | | | 1,952,999 | |
Amkor Technology, Inc. | | | 155,567 | | | | 3,856,506 | |
Atomera, Inc.(a)(b) | | | 30,157 | | | | 606,759 | |
AXT, Inc.(a)(b) | | | 60,435 | | | | 532,432 | |
CEVA, Inc.(a) | | | 33,442 | | | | 1,446,032 | |
CMC Materials, Inc. | | | 43,556 | | | | 8,349,250 | |
Diodes, Inc.(a) | | | 66,506 | | | | 7,303,024 | |
EMCORE Corp.(a) | | | 53,291 | | | | 371,971 | |
FormFactor, Inc.(a) | | | 118,712 | | | | 5,427,513 | |
Kopin Corp.(a) | | | 116,604 | | | | 476,910 | |
Kulicke & Soffa Industries, Inc. | | | 93,762 | | | | 5,676,352 | |
Lattice Semiconductor Corp.(a) | | | 207,541 | | | | 15,993,110 | |
MACOM Technology Solutions Holdings, Inc., Class H(a) | | | 74,220 | | | | 5,811,426 | |
MaxLinear, Inc.(a) | | | 108,489 | | | | 8,178,986 | |
Power Integrations, Inc. | | | 92,430 | | | | 8,585,823 | |
Rambus, Inc.(a) | | | 165,133 | | | | 4,853,259 | |
Semtech Corp.(a) | | | 98,865 | | | | 8,792,064 | |
Silicon Laboratories, Inc.(a) | | | 61,048 | | | | 12,601,528 | |
SiTime Corp.(a) | | | 24,355 | | | | 7,124,812 | |
SkyWater Technology, Inc.(a)(b) | | | 11,711 | | | | 189,952 | |
SMART Global Holdings, Inc.(a) | | | 26,574 | | | | 1,886,488 | |
Vishay Intertechnology, Inc. | | | 204,884 | | | | 4,480,813 | |
| | | | | | | | |
| | |
| | | | | | | 114,498,009 | |
|
| Semiconductors & Semiconductor Equipment — 0.2% | |
Ambarella, Inc.(a) | | | 54,049 | | | | 10,966,002 | |
| | | | | | | | |
| | |
| Shipping — 0.5% | | | | | | |
A-Mark Precious Metals, Inc. | | | 13,821 | | | | 844,463 | |
Eagle Bulk Shipping, Inc. | | | 13,991 | | | | 636,590 | |
Genco Shipping & Trading Ltd. | | | 48,588 | | | | 777,408 | |
Golar LNG Ltd.(a) | | | 152,905 | | | | 1,894,493 | |
International Seaways, Inc. | | | 70,537 | | | | 1,035,483 | |
| | | | | | | | |
| Security | | Shares | | | Value | |
| | |
| Shipping (continued) | | | | | | |
Matson, Inc. | | | 63,725 | | | $ | 5,737,162 | |
Nordic American Tankers Ltd. | | | 249,030 | | | | 420,861 | |
Safe Bulkers, Inc.(a)(b) | | | 98,949 | | | | 373,038 | |
Scorpio Tankers, Inc. | | | 74,867 | | | | 959,046 | |
SFL Corp. Ltd. | | | 190,747 | | | | 1,554,588 | |
SITE Centers Corp. | | | 263,679 | | | | 4,174,039 | |
Teekay Corp.(a) | | | 100,908 | | | | 316,851 | |
Teekay Tankers Ltd., Class A(a) | | | 35,500 | | | | 386,950 | |
Tidewater, Inc.(a) | | | 67,412 | | | | 721,982 | |
Two Harbors Investment Corp. | | | 520,771 | | | | 3,004,849 | |
| | | | | | | | |
| | |
| | | | | | | 22,837,803 | |
| | |
| Software(a) — 0.3% | | | | | | |
Arteris, Inc.(b) | | | 7,031 | | | | 148,424 | |
AvidXchange Holdings, Inc. | | | 39,644 | | | | 597,039 | |
Castlight Health, Inc., Class B | | | 165,644 | | | | 255,092 | |
Consensus Cloud Solutions, Inc. | | | 24,454 | | | | 1,415,153 | |
Couchbase, Inc. | | | 14,847 | | | | 370,581 | |
CS Disco, Inc.(b) | | | 12,222 | | | | 436,936 | |
Enfusion, Inc. | | | 33,617 | | | | 703,940 | |
EngageSmart, Inc. | | | 24,935 | | | | 601,432 | |
EverCommerce, Inc. | | | 24,143 | | | | 380,252 | |
Instructure Holdings, Inc.(b) | | | 18,639 | | | | 446,963 | |
Intapp, Inc.(b) | | | 16,462 | | | | 414,184 | |
Kaltura, Inc. | | | 25,079 | | | | 84,516 | |
MeridianLink, Inc.(b) | | | 18,512 | | | | 399,489 | |
Model N, Inc. | | | 54,686 | | | | 1,642,221 | |
Qualys, Inc. | | | 52,160 | | | | 7,157,395 | |
Stronghold Digital Mining, Inc. | | | 10,336 | | | | 132,818 | |
Weave Communications, Inc. | | | 8,748 | | | | 132,795 | |
| | | | | | | | |
| | |
| | | | | | | 15,319,230 | |
| | |
| Specialty Retail — 2.1% | | | | | | |
1-800-Flowers.com, Inc., Class A(a) | | | 40,523 | | | | 947,023 | |
Aaron’s Co., Inc. | | | 50,244 | | | | 1,238,515 | |
Abercrombie & Fitch Co., Class A(a) | | | 89,633 | | | | 3,121,917 | |
Academy Sports & Outdoors, Inc.(a) | | | 118,820 | | | | 5,216,198 | |
Alta Equipment Group, Inc.(a) | | | 28,647 | | | | 419,392 | |
American Eagle Outfitters, Inc. | | | 233,195 | | | | 5,904,497 | |
America’s Car-Mart, Inc.(a) | | | 9,390 | | | | 961,536 | |
Arko Corp.(a) | | | 183,996 | | | | 1,613,645 | |
Asbury Automotive Group, Inc.(a)(b) | | | 35,462 | | | | 6,125,351 | |
Barnes & Noble Education, Inc.(a) | | | 67,497 | | | | 459,655 | |
Bed Bath & Beyond, Inc.(a) | | | 155,804 | | | | 2,271,622 | |
Big 5 Sporting Goods Corp.(b) | | | 31,459 | | | | 598,036 | |
Blink Charging Co.(a)(b) | | | 55,247 | | | | 1,464,598 | |
Boot Barn Holdings, Inc.(a) | | | 44,923 | | | | 5,527,775 | |
Buckle, Inc. | | | 45,430 | | | | 1,922,143 | |
Caleres, Inc. | | | 56,599 | | | | 1,283,665 | |
CarLotz, Inc.(a) | | | 108,646 | | | | 246,626 | |
Cato Corp., Class A | | | 31,728 | | | | 544,452 | |
Chico’s FAS, Inc.(a) | | | 182,679 | | | | 982,813 | |
Children’s Place, Inc.(a) | | | 21,467 | | | | 1,702,118 | |
Citi Trends, Inc.(a) | | | 12,704 | | | | 1,203,704 | |
Conn’s, Inc.(a) | | | 27,774 | | | | 653,245 | |
Container Store Group, Inc.(a) | | | 47,106 | | | | 470,118 | |
Designer Brands, Inc., Class A(a) | | | 92,336 | | | | 1,312,095 | |
Genesco, Inc.(a) | | | 22,064 | | | | 1,415,847 | |
Group 1 Automotive, Inc. | | | 26,886 | | | | 5,248,685 | |
Guess?, Inc. | | | 60,371 | | | | 1,429,585 | |
Haverty Furniture Cos., Inc. | | | 24,812 | | | | 758,503 | |
Hibbett, Inc. | | | 22,933 | | | | 1,649,571 | |
JOANN, Inc. | | | 17,579 | | | | 182,470 | |
| | |
SERIES SCHEDULE OF INVESTMENTS | | 91 |
| | |
Schedule of Investments (continued) December 31, 2021 | | Master Small Cap Index Series (Percentages shown are based on Net Assets) |
| | | | | | | | |
| Security | | Shares | | | Value | |
| | |
| Specialty Retail (continued) | | | | | | |
Lands’ End, Inc.(a)(b) | | | 24,446 | | | $ | 479,875 | |
Lumber Liquidators Holdings, Inc.(a) | | | 43,286 | | | | 738,892 | |
MarineMax, Inc.(a) | | | 31,838 | | | | 1,879,716 | |
Monro, Inc. | | | 50,694 | | | | 2,953,939 | |
Murphy USA, Inc. | | | 36,988 | | | | 7,369,489 | |
National Vision Holdings, Inc.(a) | | | 124,980 | | | | 5,997,790 | |
ODP Corp.(a) | | | 70,731 | | | | 2,778,314 | |
OneWater Marine, Inc., Class A | | | 15,646 | | | | 953,937 | |
Party City Holdco, Inc.(a)(b) | | | 167,392 | | | | 932,373 | |
RealReal, Inc.(a) | | | 123,880 | | | | 1,438,247 | |
Regis Corp.(a)(b) | | | 61,213 | | | | 106,511 | |
Sally Beauty Holdings, Inc.(a) | | | 171,266 | | | | 3,161,570 | |
Shift Technologies, Inc.(a) | | | 92,987 | | | | 317,086 | |
Shoe Carnival, Inc. | | | 28,626 | | | | 1,118,704 | |
Sonic Automotive, Inc., Class A | | | 33,338 | | | | 1,648,564 | |
Sportsman’s Warehouse Holdings, Inc.(a) | | | 65,177 | | | | 769,089 | |
Tilly’s, Inc., Class A | | | 36,062 | | | | 580,959 | |
Torrid Holdings, Inc.(a) | | | 18,211 | | | | 179,925 | |
TravelCenters of America, Inc.(a) | | | 18,773 | | | | 969,062 | |
Urban Outfitters, Inc.(a) | | | 104,673 | | | | 3,073,199 | |
Zumiez, Inc.(a) | | | 32,366 | | | | 1,553,244 | |
| | | | | | | | |
| | |
| | | | | | | 95,875,885 | |
| | |
| Steel — 0.2% | | | | | | |
Allegheny Technologies, Inc.(a)(b) | | | 195,804 | | | | 3,119,158 | |
Carpenter Technology Corp. | | | 73,234 | | | | 2,137,700 | |
Olympic Steel, Inc. | | | 14,995 | | | | 352,383 | |
Ryerson Holding Corp. | | | 24,661 | | | | 642,419 | |
Schnitzer Steel Industries, Inc., Class A | | | 40,642 | | | | 2,110,133 | |
TimkenSteel Corp.(a) | | | 69,113 | | | | 1,140,364 | |
| | | | | | | | |
| | |
| | | | | | | 9,502,157 | |
| | |
| Technology: Miscellaneous — 0.4% | | | | | | |
Aeva Technologies, Inc.(a)(b) | | | 159,176 | | | | 1,203,370 | |
Benchmark Electronics, Inc. | | | 54,239 | | | | 1,469,877 | |
CTS Corp. | | | 48,687 | | | | 1,787,787 | |
Fabrinet(a) | | | 56,631 | | | | 6,709,074 | |
Kimball Electronics, Inc.(a) | | | 36,993 | | | | 804,968 | |
Plexus Corp.(a) | | | 42,785 | | | | 4,102,654 | |
| | | | | | | | |
| | |
| | | | | | | 16,077,730 | |
| | |
| Telecommunications Equipment(a) — 0.4% | | | | | | |
Akoustis Technologies, Inc. | | | 76,033 | | | | 507,900 | |
CalAmp Corp. | | | 52,331 | | | | 369,457 | |
Cambium Networks Corp. | | | 16,382 | | | | 419,871 | |
Clearfield, Inc. | | | 17,213 | | | | 1,453,121 | |
Knowles Corp.(b) | | | 136,482 | | | | 3,186,855 | |
Telesat Corp. | | | 19,206 | | | | 550,636 | |
Viavi Solutions, Inc. | | | 367,298 | | | | 6,471,791 | |
Vocera Communications, Inc. | | | 52,657 | | | | 3,414,280 | |
| | | | | | | | |
| | |
| | | | | | | 16,373,911 | |
| | |
| Textile Products — 0.0% | | | | | | |
Interface, Inc. | | | 87,070 | | | | 1,388,767 | |
Unifi, Inc.(a) | | | 21,341 | | | | 494,044 | |
| | | | | | | | |
| | |
| | | | | | | 1,882,811 | |
| | |
| Textiles Apparel & Shoes — 0.7% | | | | | | |
Crocs, Inc.(a) | | | 89,193 | | | | 11,436,327 | |
Fossil Group, Inc.(a) | | | 71,549 | | | | 736,239 | |
G-III Apparel Group Ltd.(a) | | | 66,829 | | | | 1,847,154 | |
Kontoor Brands, Inc. | | | 79,733 | | | | 4,086,316 | |
Oxford Industries, Inc. | | | 25,042 | | | | 2,542,264 | |
| | | | | | | | |
| Security | | Shares | | | Value | |
| | |
| Textiles Apparel & Shoes (continued) | | | | | | |
PLBY Group, Inc.(a) | | | 43,230 | | | $ | 1,151,647 | |
Rocky Brands, Inc. | | | 10,512 | | | | 418,378 | |
Steven Madden Ltd. | | | 123,869 | | | | 5,756,193 | |
Superior Group of Cos., Inc. | | | 17,077 | | | | 374,669 | |
Vera Bradley, Inc.(a) | | | 48,038 | | | | 408,803 | |
Wolverine World Wide, Inc. | | | 124,625 | | | | 3,590,446 | |
| | | | | | | | |
| | |
| | | | | | | 32,348,436 | |
| | |
| Thrifts & Mortgage Finance — 0.2% | | | | | | |
22nd Century Group, Inc.(a)(b) | | | 275,084 | | | | 850,010 | |
Blue Foundry Bancorp(a) | | | 41,952 | | | | 613,758 | |
Greenlane Holdings, Inc., Class A(a) | | | 13,787 | | | | 13,292 | |
Karat Packaging, Inc.(a) | | | 3,011 | | | | 60,852 | |
Turning Point Brands, Inc. | | | 23,259 | | | | 878,725 | |
Universal Corp. | | | 36,468 | | | | 2,002,823 | |
Vector Group Ltd. | | | 219,409 | | | | 2,518,815 | |
| | | | | | | | |
| | |
| | | | | | | 6,938,275 | |
| | |
| Toys — 0.0% | | | | | | |
Funko, Inc., Class A(a) | | | 41,634 | | | | 782,719 | |
| | | | | | | | |
| | |
| Transportation Miscellaneous — 0.2% | | | | | | |
Costamare, Inc. | | | 80,468 | | | | 1,017,920 | |
Hub Group, Inc., Class A(a) | | | 50,674 | | | | 4,268,778 | |
Textainer Group Holdings Ltd.(a) | | | 73,007 | | | | 2,607,080 | |
| | | | | | | | |
| | |
| | | | | | | 7,893,778 | |
| | |
| Truckers — 0.7% | | | | | | |
ArcBest Corp. | | | 38,852 | | | | 4,656,412 | |
Covenant Logistics Group, Inc.(a) | | | 17,465 | | | | 461,600 | |
Daseke, Inc.(a)(b) | | | 62,326 | | | | 625,753 | |
Forward Air Corp. | | | 40,972 | | | | 4,961,300 | |
FRP Holdings, Inc.(a) | | | 10,729 | | | | 620,136 | |
Heartland Express, Inc.(b) | | | 71,615 | | | | 1,204,564 | |
Marten Transport Ltd. | | | 89,906 | | | | 1,542,787 | |
PAM Transportation Services, Inc.(a) | | | 6,494 | | | | 461,139 | |
Saia, Inc.(a) | | | 40,618 | | | | 13,689,485 | |
Universal Logistics Holdings, Inc. | | | 12,578 | | | | 237,221 | |
US Xpress Enterprises, Inc., Class A(a)(b) | | | 35,947 | | | | 211,009 | |
Werner Enterprises, Inc. | | | 94,684 | | | | 4,512,639 | |
Yellow Corp.(a) | | | 74,942 | | | | 943,520 | |
| | | | | | | | |
| | |
| | | | | | | 34,127,565 | |
| | |
| Utilities: Electrical — 1.1% | | | | | | |
ALLETE, Inc. | | | 80,493 | | | | 5,340,711 | |
Avista Corp. | | | 108,126 | | | | 4,594,274 | |
Black Hills Corp. | | | 97,777 | | | | 6,900,123 | |
Clearway Energy, Inc., Class A | | | 60,105 | | | | 2,012,315 | |
Clearway Energy, Inc., Class C | | | 119,907 | | | | 4,320,249 | |
MGE Energy, Inc. | | | 55,564 | | | | 4,570,139 | |
NorthWestern Corp. | | | 81,246 | | | | 4,644,021 | |
Otter Tail Corp. | | | 62,225 | | | | 4,444,110 | |
PNM Resources, Inc. | | | 131,662 | | | | 6,005,104 | |
Portland General Electric Co. | | | 137,779 | | | | 7,291,265 | |
Unitil Corp. | | | 25,260 | | | | 1,161,707 | |
| | | | | | | | |
| | |
| | | | | | | 51,284,018 | |
| | |
| Utilities: Gas Distributors — 0.6% | | | | | | |
Chesapeake Utilities Corp. | | | 26,238 | | | | 3,825,763 | |
New Jersey Resources Corp. | | | 147,829 | | | | 6,069,859 | |
Northwest Natural Holding Co. | | | 46,253 | | | | 2,256,221 | |
South Jersey Industries, Inc. | | | 158,933 | | | | 4,151,330 | |
| | |
| 92 | | 2 0 2 1 BLACK ROCK ANNUAL REPORT TO SHAREHOLDERS |
| | |
Schedule of Investments (continued) December 31, 2021 | | Master Small Cap Index Series (Percentages shown are based on Net Assets) |
| | | | | | | | |
| Security | | Shares | | | Value | |
| |
| | |
| Utilities: Gas Distributors (continued) | | | | | | |
Southwest Gas Holdings, Inc. | | | 92,552 | | | $ | 6,483,268 | |
Spire, Inc. | | | 77,857 | | | | 5,077,833 | |
| | | | | | | | |
| | |
| | | | | | | 27,864,274 | |
| | |
| Utilities: Miscellaneous — 0.3% | | | | | | |
Brookfield Infrastructure Corp., Class A | | | 94,572 | | | | 6,455,485 | |
Ormat Technologies, Inc. | | | 69,402 | | | | 5,503,578 | |
| | | | | | | | |
| | |
| | | | | | | 11,959,063 | |
| | |
| Utilities: Telecommunications — 0.9% | | | | | | |
8x8, Inc.(a) | | | 173,675 | | | | 2,910,793 | |
ATN International, Inc. | | | 16,240 | | | | 648,788 | |
Cogent Communications Holdings, Inc. | | | 65,393 | | | | 4,785,460 | |
Consolidated Communications Holdings, Inc.(a) | | | 111,749 | | | | 835,883 | |
Globalstar, Inc.(a)(b) | | | 915,952 | | | | 1,062,504 | |
IDT Corp., Class B(a) | | | 30,847 | | | | 1,362,203 | |
Iridium Communications, Inc.(a) | | | 181,239 | | | | 7,483,358 | |
Radius Global Infrastructure, Inc., Class A(a) | | | 89,671 | | | | 1,443,703 | |
Shenandoah Telecommunications Co. | | | 73,368 | | | | 1,870,884 | |
Telephone & Data Systems, Inc. | | | 155,652 | | | | 3,136,388 | |
United States Cellular Corp.(a) | | | 23,362 | | | | 736,370 | |
Vonage Holdings Corp.(a) | | | 370,078 | | | | 7,693,922 | |
Ziff Davis, Inc.(a)(b) | | | 66,609 | | | | 7,384,274 | |
| | | | | | | | |
| | |
| | | | | | | 41,354,530 | |
| | |
| Utilities: Water — 0.4% | | | | | | |
American States Water Co. | | | 56,208 | | | | 5,814,156 | |
Artesian Resources Corp., Class A | | | 13,005 | | | | 602,522 | |
California Water Service Group | | | 80,017 | | | | 5,750,022 | |
Global Water Resources, Inc. | | | 19,411 | | | | 331,928 | |
Middlesex Water Co. | | | 26,037 | | | | 3,132,251 | |
Pure Cycle Corp.(a) | | | 31,022 | | | | 452,921 | |
SJW Group | | | 42,757 | | | | 3,129,812 | |
York Water Co. | | | 20,459 | | | | 1,018,449 | |
| | | | | | | | |
| | |
| | | | | | | 20,232,061 | |
| | | | | | | | |
| | |
Total Common Stocks — 99.4%
(Cost: $3,248,087,950) | | | | | | | 4,541,535,676 | |
| | | | | | | | |
| | | | | | | | |
| Security | | Shares | | | Value | |
| |
| | |
Investment Companies | | | | | | | | |
| | |
| Equity Funds — 0.5% | | | | | | |
iShares Russell 2000 ETF(b)(d) | | | 105,698 | | | $ | 23,512,520 | |
| | | | | | | | |
| | |
Total Investment Companies — 0.5%
(Cost: $21,761,493) | | | | | | | 23,512,520 | |
| | | | | | | | |
| | |
Total Long-Term Investments —99.9%
(Cost: $3,269,849,443) | | | | | | | 4,565,048,196 | |
| | | | | | | | |
| | |
Short-Term Securities | | | | | | | | |
| | |
| Money Market Funds — 6.5% | | | | | | |
BlackRock Cash Funds: Institutional, SL Agency Shares, 0.10%(d)(f)(g) | | | 262,564,793 | | | | 262,643,563 | |
BlackRock Cash Funds: Treasury, SL Agency Shares, 0.01%(d)(f) | | | 32,243,211 | | | | 32,243,211 | |
| | | | | | | | |
| |
Total Short-Term Securities —6.5%
(Cost: $294,815,975) | | | | 294,886,774 | |
| | | | | | | | |
| |
Total Investments — 106.4%
(Cost: $3,564,665,418) | | | | 4,859,934,970 | |
| |
Liabilities in Excess of Other Assets — (6.4)% | | | | (290,999,985 | ) |
| | | | | | | | |
| |
Net Assets — 100.0% | | | $ | 4,568,934,985 | |
| | | | | | | | |
| (a) | Non-income producing security. |
| (b) | All or a portion of this security is on loan. |
| (c) | Security is valued using significant unobservable inputs and is classified as Level 3 in the fair value hierarchy. |
| (d) | Affiliate of the Series. |
| (e) | Security exempt from registration pursuant to Rule 144A under the Securities Act of 1933, as amended. These securities may be resold in transactions exempt from registration to qualified institutional investors. |
| (f) | Annualized 7-day yield as of period end. |
| (g) | All or a portion of this security was purchased with the cash collateral from loaned securities. |
For Series compliance purposes, the Series’s industry classifications refer to one or more of the industry sub-classifications used by one or more widely recognized market indexes or rating group indexes, and/or as defined by the investment adviser. These definitions may not apply for purposes of this report, which may combine such industry sub-classifications for reporting ease.
Affiliates
Investments in issuers considered to be affiliate(s) of the Series during the year ended December 31, 2021 for purposes of Section 2(a)(3) of the Investment Company Act of 1940, as amended, were as follows:
| | | | | | | | | | | | | | | | | | | | | | | | | | | | | | | | | | | | | | | | | | |
| | | | | | | |
| | | | | | | | | | | |
| | | Affiliated Issuer | | Value at
12/31/20 | | | Purchases at Cost | | | Proceeds from Sales | | | Net Realized Gain (Loss) | | | Change in Unrealized Appreciation (Depreciation) | | | Value at
12/31/21 | | | Shares Held at 12/31/21 | | | Income | | | Capital Gain Distributions from Underlying Funds | | | | |
| | | | | | | |
| | BlackRock Cash Funds: Institutional, SL Agency Shares | | $ | 294,236,196 | | | $ | — | | | $ | (31,496,936 | )(a) | | $ | (3,983 | ) | | $ | (91,714 | ) | | $ | 262,643,563 | | | | 262,564,793 | | | $ | 2,008,222 | (b) | | $ | — | | | | | |
| | BlackRock Cash Funds: Treasury, SL Agency Shares | | | 14,601,134 | | | | 17,642,077 | (a) | | | — | | | | — | | | | — | | | | 32,243,211 | | | | 32,243,211 | | | | 4,411 | | | | — | | | | | |
| | iShares Russell 2000 ETF | | | 8,597,035 | | | | 290,263,154 | | | | (277,325,329 | ) | | | 1,831,892 | | | | 145,768 | | | | 23,512,520 | | | | 105,698 | | | | 346,117 | | | | — | | | | | |
| | | | | | | | | | | | | | | | | | | | | | | | | | | | | | | | | | | | | | | | | | |
| | | | | | | | | | | |
| | | | | | | | | | | | | | | | $ | 1,827,909 | | | $ | 54,054 | | | $ | 318,399,294 | | | | | | | $ | 2,358,750 | | | $ | — | | | | | |
| | | | | | | | | | | | | | | | | | | | | | | | | | | | | | | | | | | | | | | | | | |
| | (a) | Represents net amount purchased (sold). | |
| | (b) | All or a portion represents securities lending income earned from the reinvestment of cash collateral from loaned securities, net of fees and collateral investment expenses, and other payments to and from borrowers of securities. | |
| | |
SERIES SCHEDULE OF INVESTMENTS | | 93 |
| | |
Schedule of Investments (continued) December 31, 2021 | | Master Small Cap Index Series |
Derivative Financial Instruments Outstanding as of Period End
Futures Contracts
| | | | | | | | | | | | | | | | |
| |
| | | | |
| Description | | Number of Contracts | | | Expiration Date | | | Notional Amount (000) | | | Value/ Unrealized Appreciation (Depreciation) | |
| |
| | | | |
Long Contracts | | | | | | | | | | | | | | | | |
Russell 2000 E-Mini Index | | | 176 | | | | 03/18/22 | | | $ | 19,737 | | | $ | 183,362 | |
| | | | | | | | | | | | | | | | |
OTC Total Return Swaps
| | | | | | | | | | | | | | | | | | | | | | | | |
| | | | | | | | |
| Reference Entity | | Payment Frequency | | Counterparty(a) | | Termination Date | | | Net Notional | | | Accrued Unrealized Appreciation (Depreciation) | | | Net Value of Reference Entity | | | Gross Notional Amount Net Asset Percentage | |
| | | | | | | |
Equity Securities Long | | Monthly | | Goldman Sachs Bank USA(b) | | | 02/27/23 | | | $ | 2,748,571 | | | $ | 103,015 | (c) | | $ | 2,829,697 | | | | 0.1 | % |
| | | | | | | |
| | Monthly | | HSBC Bank USA N.A.(d) | | | 02/10/23 | | | | 2,737,254 | | | | (38,794 | )(e) | | | 2,695,876 | | | | 0.1 | |
| | | | | | | |
| | Monthly | | JPMorgan Chase Bank N.A.(f) | | | 02/08/23 | | | | 2,765,513 | | | | 85,207 | (g) | | | 2,844,427 | | | | 0.1 | |
| | | | | | | | | | | | | | | | | | | | | | | | |
| | | | | | | |
| | | | | | | | | | | | | | $ | 149,428 | | | $ | 8,370,000 | | | | | |
| | | | | | | | | | | | | | | | | | | | | | | | |
| | (a) | The Series receives the total return on a portfolio of long positions underlying the total return swap. The Series pays the total return on a portfolio of short positions underlying the total return swap. In addition, the Series pays or receives a variable rate of interest, based on a specified benchmark. The benchmark and spread are determined based upon the country and/or currency of the individual underlying positions. | |
| | (c) | Amount includes $21,889 of net dividends and financing fees. | |
| | (e) | Amount includes $2,584 of net dividends and financing fees. | |
| | (g) | Amount includes $6,293 of net dividends and financing fees. | |
The following are the specified benchmarks (plus or minus a range) used in determining the variable rate of interest:
| | | | | | |
| | (b) | | (d) | | (f) |
| Range: | | 65 basis points | | 65 basis points | | 65 basis points |
| Benchmarks: | | USD - 1D Overnight Fed Funds Effective Rate (FEDL01) | | USD - 1D Overnight Bank Funding Rate (OBFR01) | | USD - 1D Overnight Bank Funding Rate (OBFR01) |
The following table represents the individual long positions and related values of the equity securities underlying the total return swap with Goldman Sachs Bank USA as of period end, termination date February 27, 2023:
| | | | | | | | | | | | |
| Security | | Shares | | | Value | | | % of Basket Value | |
| | | |
Reference Entity — Long | | | | | | | | | | | | |
| | | |
| Common Stocks | | | | | | | | | |
| | | |
| Banks: Diversified | | | | | | | | | |
Cadence Bank | | | 64,340 | | | $ | 1,916,689 | | | | 67.7 | % |
Central Pacific Financial Corp. | | | 277 | | | | 7,803 | | | | 0.3 | |
Columbia Banking System Inc. | | | 7,952 | | | | 260,189 | | | | 9.2 | |
Hanmi Financial Corp. | | | 3,913 | | | | 92,660 | | | | 3.3 | |
OFG Bancorp | | | 1,400 | | | | 37,184 | | | | 1.3 | |
United Community Banks, Inc. | | | 7,489 | | | | 269,155 | | | | 9.5 | |
| | | | | | | | | | | | |
| | | |
| | | | | | | 2,583,680 | | | | | |
| | |
| Banks: Savings, Thrift & Mortgage Lending | | | | | | | |
Homestreet, Inc. | | | 3,601 | | | | 187,252 | | | | 6.6 | |
| | | | | | | | | | | | |
| | | |
| Insurance: Property-Casualty | | | | | | | | | |
Genworth Financial, Inc., Class A | | | 14,510 | | | | 58,765 | | | | 2.1 | |
| | | | | | | | | | | | |
| | |
Net Value of Reference Entity — Goldman
Sachs Bank USA | | | $ | 2,829,697 | | | | | |
| | | | | | | | | | | | |
The following table represents the individual long positions and related values of the equity securities underlying the total return swap with HSBC Bank PLC as of period end, termination date February 10, 2023:
| | | | | | | | | | | | |
| Security | | Shares | | | Value | | | % of Basket Value | |
| | | |
Reference Entity — Long | | | | | | | | | | | | |
| | | |
| Common Stocks | | | | | | | | | |
| | | |
| Banks: Diversified | | | | | | | | | |
First Financial Bancorp | | | 2,100 | | | $ | 51,198 | | | | 1.9 | % |
Hope Bancorp, Inc. | | | 7,157 | | | | 105,279 | | | | 3.9 | |
Preferred Bank | | | 7,149 | | | | 513,227 | | | | 19.0 | |
United Community Banks Inc. | | | 6,981 | | | | 250,897 | | | | 9.3 | |
| | | | | | | | | | | | |
| | | |
| | | | | | | 920,601 | | | | | |
| | | |
| Banks: Savings, Thrift & Mortgage Lending | | | | | | | | | |
Bankunited, Inc. | | | 1,089 | | | | 46,076 | | | | 1.7 | |
Berkshire Hills Bancorp, Inc. | | | 8,765 | | | | 249,189 | | | | 9.3 | |
| | | | | | | | | | | | |
| | | |
| | | | | | | 295,265 | | | | | |
| | | |
| Computer Services Software & Systems | | | | | | | | | |
Envestnet, Inc. | | | 551 | | | | 43,717 | | | | 1.6 | |
| | | | | | | | | | | | |
| | | |
| Insurance: Property-Casualty | | | | | | | | | |
James River Group Holdings Ltd. | | | 6,372 | | | | 183,577 | | | | 6.8 | |
| | | | | | | | | | | | |
| | |
| 94 | | 2 0 2 1 BLACK ROCK ANNUAL REPORT TO SHAREHOLDERS |
| | |
Schedule of Investments (continued) December 31, 2021 | | Master Small Cap Index Series |
| | | | | | | | | | | | |
| Security | | Shares | | | Value | | | % of Basket Value | |
| | | |
| Office Supplies & Equipment | | | | | | | | | |
Pitney Bowes Inc. | | | 74,700 | | | $ | 495,261 | | | | 18.4 | % |
| | | | | | | | | | | | |
| | | |
| Oil, Gas & Consumable Fuels | | | | | | | | | |
Green Plains, Inc. | | | 21,791 | | | | 757,455 | | | | 28.1 | |
| | | | | | | | | | | | |
| | |
Net Value of Reference Entity — HSBC Bank PLC | | | $ | 2,695,876 | | | | | |
| | | | | | | | | | | | |
The following table represents the individual long positions and related values of the equity securities underlying the total return swap with JPMorgan Chase Bank N.A. as of period end, termination date February 8, 2023:
| | | | | | | | | | | | |
| Security | | Shares | | | Value | | | % of Basket Value | |
| | | |
Reference Entity — Long | | | | | | | | | | | | |
| | | |
| Common Stocks | | | | | | | | | |
| | | |
| Banks: Diversified | | | | | | | | | |
Bancorp, Inc. (The) | | | 2,204 | | | $ | 55,783 | | | | 2.0 | % |
Banner Corp. | | | 131 | | | | 7,948 | | | | 0.3 | |
Central Pacific Financial Corp. | | | 6,077 | | | | 171,189 | | | | 6.0 | |
Community Bank System Inc. | | | 1,436 | | | | 106,953 | | | | 3.8 | |
Customers Bancorp Inc. | | | 757 | | | | 49,485 | | | | 1.7 | |
First Bancorp | | | 1,007 | | | | 46,040 | | | | 1.6 | |
Flagstar Bancorp Inc. | | | 1,002 | | | | 48,036 | | | | 1.7 | |
Great Western Bancorp Inc. | | | 2,950 | | | | 100,182 | | | | 3.5 | |
Hanmi Financial Corp. | | | 7,638 | | | | 180,868 | | | | 6.4 | |
Heritage Financial Corp. | | | 900 | | | | 21,996 | | | | 0.8 | |
| | | | | | | | | | | | |
| Security | | Shares | | | Value | | | % of Basket Value | |
| | | |
| Banks: Diversified (continued) | | | | | | | | | |
Independent Bank Corp. | | | 1,437 | | | $ | 117,159 | | | | 4.1 | % |
Lakeland Financial Corp. | | | 580 | | | | 46,481 | | | | 1.6 | |
National Bank Holding, Class A | | | 1,220 | | | | 53,607 | | | | 1.9 | |
Old National Bancorp | | | 8,967 | | | | 162,482 | | | | 5.7 | |
Simmons First National Corp., Class A | | | 7,244 | | | | 214,277 | | | | 7.5 | |
United Community Banks, Inc. | | | 908 | | | | 32,634 | | | | 1.2 | |
| | | | | | | | | | | | |
| | | |
| | | | | | | 1,415,120 | | | | | |
| | |
| Commercial Finance & Mortgage Companies | | | | | | | |
Meta Financial Group Inc. | | | 3,260 | | | | 194,492 | | | | 6.8 | |
| | | | | | | | | | | | |
| | | |
| Financial Data & Systems | | | | | | | | | |
Green Dot Corp., Class A | | | 1,559 | | | | 56,498 | | | | 2.0 | |
| | | | | | | | | | | | |
| | | |
| Insurance: Property-Casualty | | | | | | | | | |
Pacific Premier Bancorp, Inc. | | | 21,295 | | | | 852,439 | | | | 30.0 | |
ProAssurance Corp. | | | 2,114 | | | | 53,484 | | | | 1.9 | |
Stewart Information Services | | | 589 | | | | 46,961 | | | | 1.6 | |
| | | | | | | | | | | | |
| | | |
| | | | | | | 952,884 | | | | | |
| | | |
| Real Estate Investment Trusts (REITs) | | | | | | | | | |
Acadia Realty Trust | | | 2,126 | | | | 46,411 | | | | 1.6 | |
Getty Realty Corp. | | | 1,693 | | | | 54,328 | | | | 1.9 | |
Invesco Mortgage Capital | | | 44,854 | | | | 124,694 | | | | 4.4 | |
| | | | | | | | | | | | |
| | | |
| | | | | | | 225,433 | | | | | |
| | | | | | | | | | | | |
| | |
Net Value of Reference Entity — JPMorgan Chase Bank N.A. | | | $ | 2,844,427 | | | | | |
| | | | | | | | | | | | |
Balances Reported in the Statement of Assets and Liabilities for OTC Swaps
| | | | | | | | | | | | | | | | |
| | | | | |
| Description | | Swap Premiums Paid | | | Swap
Premiums
Received | | | Unrealized
Appreciation | | | Unrealized
Depreciation | |
| | | | |
OTC Swaps | | $ | — | | | $ | — | | | $ | 188,222 | | | $ | (38,794 | ) |
Derivative Financial Instruments Categorized by Risk Exposure
As of period end, the fair values of derivative financial instruments located in the Statement of Assets and Liabilities were as follows:
| | | | | | | | | | | | | | | | | | | | | | | | | | | | |
| |
| | | | | | | |
| | | Commodity
Contracts | | | Credit
Contracts | | | Equity
Contracts | | | Foreign Currency Exchange Contracts | | | Interest Rate Contracts | | | Other Contracts | | | Total | |
| |
| | | | | | | |
Assets — Derivative Financial Instruments | | | | | | | | | | | | | | | | | | | | | | | | | | | | |
Futures contracts | | | | | | | | | | | | | | | | | | | | | | | | | | | | |
Unrealized appreciation on futures contracts(a) | | $ | — | | | $ | — | | | $ | 183,362 | | | $ | — | | | $ | — | | | $ | — | | | $ | 183,362 | |
Swaps — OTC | | | | | | | | | | | | | | | | | | | | | | | | | | | | |
Unrealized appreciation on OTC swaps; Swap premiums paid | | | — | | | | — | | | | 188,222 | | | | — | | | | — | | | | — | | | | 188,222 | |
| | | | | | | | | | | | | | | | | | | | | | | | | | | | |
| | | | | | | |
| | $ | — | | | $ | — | | | $ | 371,584 | | | $ | — | | | $ | — | | | $ | — | | | $ | 371,584 | |
| | | | | | | | | | | | | | | | | | | | | | | | | | | | |
| | | | | | | |
Liabilities — Derivative Financial Instruments | | | | | | | | | | | | | | | | | | | | | | | | | | | | |
Swaps — OTC | | | | | | | | | | | | | | | | | | | | | | | | | | | | |
Unrealized depreciation on OTC swaps; Swap premiums received | | $ | — | | | $ | — | | | $ | 38,794 | | | $ | — | | | $ | — | | | $ | — | | | $ | 38,794 | |
| | | | | | | | | | | | | | | | | | | | | | | | | | | | |
| | (a) | Net cumulative unrealized appreciation (depreciation) on futures contracts and centrally cleared swaps, if any, are reported in the Series Schedule of Investments. In the Statement of Assets and Liabilities, only current day’s variation margin is reported in receivables or payables and the net cumulative unrealized appreciation (depreciation) is included in net unrealized appreciation (depreciation). | |
| | |
SERIES SCHEDULE OF INVESTMENTS | | 95 |
| | |
Schedule of Investments (continued) December 31, 2021 | | Master Small Cap Index Series |
For the period ended December 31, 2021, the effect of derivative financial instruments in the Statement of Operations was as follows:
| | | | | | | | | | | | | | | | | | | | | | | | | | | | |
| |
| | | | | | | |
| | | Commodity Contracts | | | Credit Contracts | | | Equity Contracts | | | Foreign Currency Exchange Contracts | | | Interest Rate Contracts | | | Other Contracts | | | Total | |
| |
| | | | | | | |
Net Realized Gain (Loss) from: | | | | | | | | | | | | | | | | | | | | | | | | | | | | |
Futures contracts | | $ | — | | | $ | — | | | $ | 2,233,894 | | | $ | — | | | $ | — | | | $ | — | | | $ | 2,233,894 | |
Swaps | | | — | | | | — | | | | 919,956 | | | | — | | | | — | | | | — | | | | 919,956 | |
| | | | | | | | | | | | | | | | | | | | | | | | | | | | |
| | | | | | | |
| | $ | — | | | $ | — | | | $ | 3,153,850 | | | $ | — | | | $ | — | | | $ | — | | | $ | 3,153,850 | |
| | | | | | | | | | | | | | | | | | | | | | | | | | | | |
| | | | | | | |
Net Change in Unrealized Appreciation (Depreciation) on: | | | | | | | | | | | | | | | | | | | | | | | | | | | | |
Futures contracts | | $ | — | | | $ | — | | | $ | (9,368 | ) | | $ | — | | | $ | — | | | $ | — | | | $ | (9,368 | ) |
Swaps | | | — | | | | — | | | | (1,328 | ) | | | — | | | | — | | | | — | | | | (1,328 | ) |
| | | | | | | | | | | | | | | | | | | | | | | | | | | | |
| | | | | | | |
| | $ | — | | | $ | — | | | $ | (10,696 | ) | | $ | — | | | $ | — | | | $ | — | | | $ | (10,696 | ) |
| | | | | | | | | | | | | | | | | | | | | | | | | | | | |
Average Quarterly Balances of Outstanding Derivative Financial Instruments
| | | | |
| | |
Futures contracts: | | | | |
Average notional value of contracts — long | | $ | 30,997,566 | |
Total return swaps: | | | | |
Average notional value | | $ | 4,300,987 | |
For more information about the Series’s investment risks regarding derivative financial instruments, refer to the Notes to Financial Statements.
Derivative Financial Instruments — Offsetting as of Period End
The Series’s derivative assets and liabilities (by type) were as follows:
| | | | | | | | | | |
| |
| | | |
| | | Assets | | | | | Liabilities | |
| |
| | | |
Derivative Financial Instruments | | | | | | | | | | |
Futures contracts | | $ | — | | | | | $ | 43,507 | |
Swaps — OTC(a) | | | 188,222 | | | | | | 38,794 | |
| | | | | | | | | | |
| | | |
Total derivative assets and liabilities in the Statement of Assets and Liabilities | | | 188,222 | | | | | | 82,301 | |
| | | | | | | | | | |
Derivatives not subject to a Master Netting Agreement or similar agreement (“MNA”) | | | — | | | | | | (43,507 | ) |
| | | | | | | | | | |
| | | |
Total derivative assets and liabilities subject to an MNA | | $ | 188,222 | | | | | $ | 38,794 | |
| | | | | | | | | | |
| | (a) | Includes unrealized appreciation (depreciation) on OTC swaps and swap premiums (paid/received) in the Statement of Assets and Liabilities. | |
The following table presents the Series’s derivative assets and liabilities by counterparty net of amounts available for offset under an MNA and net of the related collateral received (and pledged) by the Series:
| | | | | | | | | | | | | | | | | | | | |
| |
| | | | | |
| Counterparty | | Derivative Assets Subject to an MNA by Counterparty | | | Derivatives Available for Offset | | | Non-Cash Collateral Received | | | Cash Collateral Received | | | Net Amount of Derivative Assets | |
| |
| | | | | |
Goldman Sachs Bank USA | | $ | 103,015 | | | $ | — | | | $ | — | | | $ | — | | | $ | 103,015 | |
JPMorgan Chase Bank N.A. | | | 85,207 | | | | — | | | | — | | | | — | | | | 85,207 | |
| | | | | | | | | | | | | | | | | | | | |
| | | | | |
| | $ | 188,222 | | | $ | — | | | $ | — | | | $ | — | | | $ | 188,222 | |
| | | | | | | | | | | | | | | | | | | | |
| | | | | |
| | | | | | | | | | | | | | | | | | | | |
| |
| | | | | |
| Counterparty | | Derivative Liabilities Subject to an MNA by Counterparty | | | Derivatives Available for Offset | | | Non-Cash Collateral Pledged | | | Cash Collateral Pledged | | | Net Amount of Derivative Liabilities | |
| |
| | | | | |
HSBC Bank USA N.A. | | $ | 38,794 | | | $ | — | | | $ | — | | | $ | — | | | $ | 38,794 | |
| | | | | | | | | | | | | | | | | | | | |
| | |
| 96 | | 2 0 2 1 BLACK ROCK ANNUAL REPORT TO SHAREHOLDERS |
| | |
Schedule of Investments (continued) December 31, 2021 | | Master Small Cap Index Series |
Fair Value Hierarchy as of Period End
Various inputs are used in determining the fair value of financial instruments. For a description of the input levels and information about the Series’s policy regarding valuation of financial instruments, refer to the Notes to Financial Statements.
The following table summarizes the Series’s financial instruments categorized in the fair value hierarchy. The breakdown of the Series’s financial instruments into major categories is disclosed in the Schedule of Investments above.
| | | | | | | | | | | | | | | | |
| |
| | | | |
| | | Level 1 | | | Level 2 | | | Level 3 | | | Total | |
| |
| | | | |
Assets | | | | | | | | | | | | | | | | |
Investments | | | | | | | | | | | | | | | | |
Long-Term Investments | | | | | | | | | | | | | | | | |
Common Stocks | | $ | 4,541,468,849 | | | $ | — | | | $ | 66,827 | | | $ | 4,541,535,676 | |
Investment Companies | | | 23,512,520 | | | | — | | | | — | | | | 23,512,520 | |
Short-Term Securities | | | | | | | | | | | | | | | | |
Money Market Funds | | | 294,886,774 | | | | — | | | | — | | | | 294,886,774 | |
| | | | | | | | | | | | | | | | |
| | | | |
| | $ | 4,859,868,143 | | | $ | — | | | $ | 66,827 | | | $ | 4,859,934,970 | |
| | | | | | | | | | | | | | | | |
| | | | |
Derivative Financial Instruments(a) | | | | | | | | | | | | | | | | |
Assets | | | | | | | | | | | | | | | | |
Equity Contracts | | $ | 183,362 | | | $ | 188,222 | | | $ | — | | | $ | 371,584 | |
Liabilities | | | | | | | | | | | | | | | | |
Equity Contracts | | | — | | | | (38,794 | ) | | | — | | | | (38,794 | ) |
| | | | | | | | | | | | | | | | |
| | | | |
| | $ | 183,362 | | | $ | 149,428 | | | $ | — | | | $ | 332,790 | |
| | | | | | | | | | | | | | | | |
| | (a) | Derivative financial instruments are swaps and futures contracts. Swaps and futures contracts are valued at the unrealized appreciation (depreciation) on the instrument. | |
See notes to financial statements.
| | |
SERIES SCHEDULE OF INVESTMENTS | | 97 |
Statement of Assets and Liabilities
December 31, 2021
| | | | |
| | | Master Small Cap Index Series | |
| |
| |
ASSETS | | | | |
Investments, at value — unaffiliated(a)(b) | | $ | 4,541,535,676 | |
Investments, at value — affiliated(c) | | | 318,399,294 | |
Cash | | | 436,112 | |
Cash pledged for futures contracts | | | 1,279,000 | |
Receivables: | | | | |
Investments sold | | | 13,329,968 | |
Securities lending income — affiliated | | | 128,868 | |
Dividends — unaffiliated | | | 3,589,917 | |
Dividends — affiliated | | | 150 | |
Unrealized appreciation on OTC swaps | | | 188,222 | |
Prepaid expenses | | | 16,280 | |
Other assets | | | 4,174 | |
| | | | |
| |
Total assets | | | 4,878,907,661 | |
| | | | |
| |
LIABILITIES | | | | |
Collateral on securities loaned | | | 262,635,254 | |
Payables: | | | | |
Investments purchased | | | 5,559,838 | |
Swaps | | | 15,757 | |
Accounting services fees | | | 3,011 | |
Withdrawals to investors | | | 41,545,315 | |
Custodian fees | | | 32,177 | |
Investment advisory fees | | | 36,308 | |
Directors’ fees | | | 6,556 | |
Other accrued expenses | | | 11,855 | |
Other affiliate fees | | | 1,631 | |
Professional fees | | | 42,673 | |
Variation margin on futures contracts | | | 43,507 | |
Unrealized depreciation on OTC swaps | | | 38,794 | |
| | | | |
| |
Total liabilities | | | 309,972,676 | |
| | | | |
| |
NET ASSETS | | $ | 4,568,934,985 | |
| | | | |
| |
NET ASSETS CONSIST OF | | | | |
Investors’ capital | | $ | 3,273,332,643 | |
Net unrealized appreciation (depreciation) | | | 1,295,602,342 | |
| | | | |
| |
NET ASSETS | | $ | 4,568,934,985 | |
| | | | |
| |
(a) Investments, at cost — unaffiliated | | $ | 3,248,087,950 | |
(b) Securities loaned, at value | | $ | 251,860,903 | |
(c) Investments, at cost — affiliated | | $ | 316,577,468 | |
See notes to financial statements.
| | |
| 98 | | 2 0 2 1 BLACK ROCK ANNUAL REPORT TO SHAREHOLDERS |
Statement of Operations
Year Ended December 31, 2021
| | | | | | | | |
| | | Master Small Cap Index Series | |
| |
| | |
INVESTMENT INCOME | | | | | | | | |
Dividends — unaffiliated | | | | | | $ | 45,015,412 | |
Dividends — affiliated | | | | | | | 374,943 | |
Interest — unaffiliated | | | | | | | 1,427 | |
Securities lending income — affiliated — net | | | | | | | 1,983,807 | |
Foreign taxes withheld | | | | | | | (116,353 | ) |
| | | | | | | | |
| | |
Total investment income | | | | | | | 47,259,236 | |
| | | | | | | | |
| | |
EXPENSES | | | | | | | | |
Investment advisory | | | | | | | 452,023 | |
Professional | | | | | | | 72,740 | |
Custodian | | | | | | | 72,206 | |
Accounting services | | | | | | | 25,009 | |
Directors | | | | | | | 18,226 | |
Miscellaneous | | | | | | | 47,561 | |
| | | | | | | | |
| | |
Total expenses | | | | | | | 687,765 | |
Less: | | | | | | | | |
Fees waived and/or reimbursed by the Manager | | | | | | | (28,093 | ) |
| | | | | | | | |
| | |
Total expenses after fees waived and/or reimbursed | | | | | | | 659,672 | |
| | | | | | | | |
| | |
Net investment income | | | | | | | 46,599,564 | |
| | | | | | | | |
| | |
REALIZED AND UNREALIZED GAIN (LOSS) | | | | | | | | |
Net realized gain from: | | | | | | | | |
Investments — unaffiliated | | | | | | | 320,238,963 | |
Investments — affiliated | | | | | | | 1,827,909 | |
Futures contracts | | | | | | | 2,233,894 | |
Swaps | | | | | | | 919,956 | |
| | | | | | | | |
| | |
| | | | | | | 325,220,722 | |
| | | | | | | | |
Net change in unrealized appreciation (depreciation) on: | | | | | | | | |
Investments — unaffiliated | | | | | | | 204,565,054 | |
Investments — affiliated | | | | | | | 54,054 | |
Futures contracts | | | | | | | (9,368 | ) |
Swaps | | | | | | | (1,328 | ) |
| | | | | | | | |
| | |
| | | | | | | 204,608,412 | |
| | | | | | | | |
| | |
Net realized and unrealized gain | | | | | | | 529,829,134 | |
| | | | | | | | |
| | |
NET INCREASE IN NET ASSETS RESULTING FROM OPERATIONS | | | | | | $ | 576,428,698 | |
| | | | | | | | |
See notes to financial statements.
| | |
SERIES FINANCIAL STATEMENTS | | 99 |
Statements of Changes in Net Assets
| | | | | | | | |
| | | Master Small Cap Index Series | |
| | | | |
| |
| | | Year Ended December 31, | |
| | | | |
| | |
| | | 2021 | | | 2020 | |
| |
| | |
INCREASE (DECREASE) IN NET ASSETS | | | | | | | | |
| | |
OPERATIONS | | | | | | | | |
Net investment income | | $ | 46,599,564 | | | $ | 40,760,858 | |
Net realized gain | | | 325,220,722 | | | | 16,530,624 | |
Net change in unrealized appreciation (depreciation) | | | 204,608,412 | | | | 633,813,782 | |
| | | | | | | | |
| | |
Net increase in net assets resulting from operations | | | 576,428,698 | | | | 691,105,264 | |
| | | | | | | | |
| | |
CAPITAL TRANSACTIONS | | | | | | | | |
Proceeds from contributions | | | 1,298,147,027 | | | | 935,046,677 | |
Value of withdrawals | | | (1,200,858,901 | ) | | | (1,056,617,358 | ) |
| | | | | | | | |
| | |
Net increase (decrease) in net assets derived from capital transactions | | | 97,288,126 | | | | (121,570,681 | ) |
| | | | | | | | |
| | |
NET ASSETS | | | | | | | | |
Total increase in net assets | | | 673,716,824 | | | | 569,534,583 | |
Beginning of year | | | 3,895,218,161 | | | | 3,325,683,578 | |
| | | | | | | | |
| | |
End of year | | $ | 4,568,934,985 | | | $ | 3,895,218,161 | |
| | | | | | | | |
See notes to financial statements.
| | |
| 100 | | 2 0 2 1 BLACK ROCK ANNUAL REPORT TO SHAREHOLDERS |
Financial Highlights
| | | | | | | | | | | | | | | | | | | | |
| | | Master Small Cap Index Series | |
| |
| | | Year Ended December 31, | |
| | | | | |
| | | 2021 | | | 2020 | | | 2019 | | | 2018 | | | 2017 | |
| | | | | |
Total Return | | | | | | | | | | | | | | | | | | | | |
Total return | | | 14.84 | % | | | 20.08 | % | | | 25.70 | % | | | (10.96 | )% | | | 14.69 | % |
| | | | | | | | | | | | | | | | | | | | |
| | | | | |
Ratios to Average Net Assets(a) | | | | | | | | | | | | | | | | | | | | |
Total expenses | | | 0.02 | % | | | 0.03 | % | | | 0.02 | % | | | 0.03 | % | | | 0.06 | % |
| | | | | | | | | | | | | | | | | | | | |
| | | | | |
Total expenses after fees waived and/or reimbursed | | | 0.01 | % | | | 0.02 | % | | | 0.02 | % | | | 0.03 | % | | | 0.05 | % |
| | | | | | | | | | | | | | | | | | | | |
| | | | | |
Net investment income | | | 1.03 | % | | | 1.29 | % | | | 1.49 | % | | | 1.49 | % | | | 1.41 | % |
| | | | | | | | | | | | | | | | | | | | |
| | | | | |
Supplemental Data | | | | | | | | | | | | | | | | | | | | |
Net assets, end of year (000) | | $ | 4,568,935 | | | $ | 3,895,218 | | | $ | 3,325,684 | | | $ | 2,309,730 | | | $ | 1,278,155 | |
| | | | | | | | | | | | | | | | | | | | |
| | | | | |
Portfolio turnover rate | | | 31 | % | | | 27 | % | | | 20 | % | | | 28 | % | | | 30 | % |
| | | | | | | | | | | | | | | | | | | | |
| (a) | Excludes fees and expenses incurred indirectly as a result of investments in underlying funds. |
See notes to financial statements.
| | |
SERIES FINANCIAL HIGHLIGHTS | | 101 |
Notes to Financial Statements
Quantitative Master Series LLC (the “Master LLC”) is registered under the Investment Company Act of 1940, as amended (the “1940 Act”), as an open-end management investment company. The Master LLC is organized as a Delaware statutory trust. Master Small Cap Index Series (“the “Series”) is a series of the Master LLC. The Series is classified as diversified. The Series’ Limited Liability Company Agreement permits the Board of Directors of the Master LLC (the “Board”) to issue non-transferable interests, subject to certain limitations.
The Series, together with certain other registered investment companies advised by BlackRock Advisors, LLC (the “Manager”) or its affiliates, is included in a complex of open-end equity, multi-asset, index and money market funds referred to as the BlackRock Multi-Asset Complex.
| 2. | SIGNIFICANT ACCOUNTING POLICIES |
The financial statements are prepared in conformity with accounting principles generally accepted in the United States of America (“U.S. GAAP”), which may require management to make estimates and assumptions that affect the reported amounts of assets and liabilities in the financial statements, disclosure of contingent assets and liabilities at the date of the financial statements and the reported amounts of increases and decreases in net assets from operations during the reporting period. Actual results could differ from those estimates. The Series is considered an investment company under U.S. GAAP and follows the accounting and reporting guidance applicable to investment companies. Below is a summary of significant accounting policies:
Investment Transactions and Income Recognition: For financial reporting purposes, investment transactions are recorded on the dates the transactions are executed. Realized gains and losses on investment transactions are determined using the specific identification method. Dividend income and capital gain distributions, if any, are recorded on the ex-dividend dates. Non-cash dividends, if any, are recorded on the ex-dividend dates at fair value. Dividends from foreign securities where the ex-dividend dates may have passed are subsequently recorded when the Series is informed of the ex-dividend dates. Under the applicable foreign tax laws, a withholding tax at various rates may be imposed on capital gains, dividends and interest. Upon notification from issuers, a portion of the dividend income received from a real estate investment trust may be redesignated as a reduction of cost of the related investment and/or realized gain.
Foreign Taxes: The Series may be subject to foreign taxes (a portion of which may be reclaimable) on income, stock dividends, capital gains on investments, or certain foreign currency transactions. All foreign taxes are recorded in accordance with the applicable foreign tax regulations and rates that exist in the foreign jurisdictions in which the Series invests. These foreign taxes, if any, are paid by the Series and are reflected in its Statement of Operations as follows: foreign taxes withheld at source are presented as a reduction of income, foreign taxes on securities lending income are presented as a reduction of securities lending income, foreign taxes on stock dividends are presented as “Foreign taxes withheld”, and foreign taxes on capital gains from sales of investments and foreign taxes on foreign currency transactions are included in their respective net realized gain (loss) categories. Foreign taxes payable or deferred as of December 31, 2021, if any, are disclosed in the Statement of Assets and Liabilities.
The Series files withholding tax reclaims in certain jurisdictions to recover a portion of amounts previously withheld. The Series may record a reclaim receivable based on collectability, which includes factors such as the jurisdiction’s applicable laws, payment history and market convention. The Statement of Operations includes tax reclaims recorded as well as professional and other fees, if any, associated with recovery of foreign withholding taxes.
Segregation and Collateralization: In cases where the Series enters into certain investments (e.g., futures contracts and swaps) that would be treated as “senior securities” for 1940 Act purposes, the Series may segregate or designate on its books and records cash or liquid assets having a market value at least equal to the amount of its future obligations under such investments. Doing so allows the investments to be excluded from treatment as a “senior security.” Furthermore, if required by an exchange or counterparty agreement, the Series may be required to deliver/deposit cash and/or securities to/with an exchange, or broker-dealer or custodian as collateral for certain investments or obligations.
Indemnifications: In the normal course of business, the Series enters into contracts that contain a variety of representations that provide general indemnification. The Series’ maximum exposure under these arrangements is unknown because it involves future potential claims against the Series, which cannot be predicted with any certainty.
Other: Expenses directly related to the Series are charged to the Series. Other operating expenses shared by several funds, including other funds managed by the Manager, are prorated among those funds on the basis of relative net assets or other appropriate methods.
| 3. | INVESTMENT VALUATION AND FAIR VALUE MEASUREMENTS |
Investment Valuation Policies: The Series’ investments are valued at fair value (also referred to as “market value” within the financial statements) each day that the Series is open for business and, for financial reporting purposes, as of the report date. U.S. GAAP defines fair value as the price a fund would receive to sell an asset or pay to transfer a liability in an orderly transaction between market participants at the measurement date. The Series determines the fair values of its financial instruments using various independent dealers or pricing services under policies approved by the Board. If a security’s market price is not readily available or does not otherwise accurately represent the fair value of the security, the security will be valued in accordance with a policy approved by the Board as reflecting fair value. The BlackRock Global Valuation Methodologies Committee (the “Global Valuation Committee”) is the committee formed by management to develop global pricing policies and procedures and to oversee the pricing function for all financial instruments.
| | |
| 102 | | 2 0 2 1 BLACK ROCK ANNUAL REPORT TO SHAREHOLDERS |
Notes to Financial Statements (continued)
Fair Value Inputs and Methodologies: The following methods and inputs are used to establish the fair value of the Series’ assets and liabilities:
| | • | | Equity investments traded on a recognized securities exchange are valued at that day’s official closing price, as applicable, on the exchange where the stock is primarily traded. Equity investments traded on a recognized exchange for which there were no sales on that day may be valued at the last available bid (long positions) or ask (short positions) price. |
| | • | | Investments in open-end U.S. mutual funds (including money market funds) are valued at that day’s published net asset value (“NAV”). |
| | • | | Futures contracts are valued based on that day’s last reported settlement or trade price on the exchange where the contract is traded. |
| | • | | Swap agreements are valued utilizing quotes received daily by independent pricing services or through brokers, which are derived using daily swap curves and models that incorporate a number of market data factors, such as discounted cash flows, trades and values of the underlying reference instruments. |
Generally, trading in foreign instruments is substantially completed each day at various times prior to the close of trading on the New York Stock Exchange (“NYSE”). Each business day, the Series uses current market factors supplied by independent pricing services to value certain foreign instruments (“Systematic Fair Value Price”). The Systematic Fair Value Price is designed to value such foreign securities at fair value as of the close of trading on the NYSE, which follows the close of the local markets.
If events (e.g., market volatility, company announcement or a natural disaster) occur that are expected to materially affect the value of such investment, or in the event that application of these methods of valuation results in a price for an investment that is deemed not to be representative of the market value of such investment, or if a price is not available, the investment will be valued by the Global Valuation Committee, or its delegate, in accordance with a policy approved by the Board as reflecting fair value (“Fair Valued Investments”). The fair valuation approaches that may be used by the Global Valuation Committee include market approach, income approach and cost approach. Valuation techniques such as discounted cash flow, use of market comparables and matrix pricing are types of valuation approaches and are typically used in determining fair value. When determining the price for Fair Valued Investments, the Global Valuation Committee, or its delegate, seeks to determine the price that the Series might reasonably expect to receive or pay from the current sale or purchase of that asset or liability in an arm’s-length transaction. Fair value determinations shall be based upon all available factors that the Global Valuation Committee, or its delegate, deems relevant and consistent with the principles of fair value measurement. The pricing of all Fair Valued Investments is subsequently reported to the Board or a committee thereof on a quarterly basis.
For investments in equity or debt issued by privately held companies or funds (“Private Company” or collectively, the “Private Companies”) and other Fair Valued Investments, the fair valuation approaches that are used by the Global Valuation Committee and third-party pricing services utilize one or a combination of, but not limited to, the following inputs.
| | |
| | |
| | | Standard Inputs Generally Considered By Third-Party Pricing Services |
| |
Market approach | | (i) recent market transactions, including subsequent rounds of financing, in the underlying investment or comparable issuers; |
| | (ii) recapitalizations and other transactions across the capital structure; and |
| | | (iii) market multiples of comparable issuers. |
| |
Income approach | | (i) future cash flows discounted to present and adjusted as appropriate for liquidity, credit, and/or market risks; |
| | (ii) quoted prices for similar investments or assets in active markets; and |
| | | (iii) other risk factors, such as interest rates, yield curves, volatilities, prepayment speeds, loss severities, credit risks, recovery rates, liquidation amounts and/or default rates. |
| |
Cost approach. | | (i) audited or unaudited financial statements, investor communications and financial or operational metrics issued by the Private Company; |
| | (ii) changes in the valuation of relevant indices or publicly traded companies comparable to the Private Company; |
| | (iii) relevant news and other public sources; and |
| | | (iv) known secondary market transactions in the Private Company’s interests and merger or acquisition activity in companies comparable to the Private Company. |
Investments in series of preferred stock issued by Private Companies are typically valued utilizing market approach in determining the enterprise value of the company. Such investments often contain rights and preferences that differ from other series of preferred and common stock of the same issuer. Enterprise valuation techniques such as an option pricing model (“OPM”), a probability weighted expected return model (“PWERM”), current value method or a hybrid of those techniques are used as deemed appropriate under the circumstances. The use of these valuation techniques involve a determination of the exit scenarios of the investment in order to appropriately allocate the enterprise value of the company among the various parts of its capital structure.
The Private Companies are not subject to the public company disclosure, timing, and reporting standards applicable to other investments held by the Series. Typically, the most recently available information by a Private Company is as of a date that is earlier than the date the Series is calculating its NAV. This factor may result in a difference between the value of the investment and the price the Series could receive upon the sale of the investment.
Fair Value Hierarchy: Various inputs are used in determining the fair value of financial instruments. These inputs to valuation techniques are categorized into a fair value hierarchy consisting of three broad levels for financial reporting purposes as follows:
| | • | | Level 1 – Unadjusted price quotations in active markets/exchanges for identical assets or liabilities that the Series has the ability to access; |
| | • | | Level 2 – Other observable inputs (including, but not limited to, quoted prices for similar assets or liabilities in markets that are active, quoted prices for identical or similar assets or liabilities in markets that are not active, inputs other than quoted prices that are observable for the assets or liabilities (such as interest rates, yield curves, volatilities, prepayment speeds, loss severities, credit risks and default rates) or other market–corroborated inputs); and |
| | |
SERIES NOTES TO FINANCIAL STATEMENTS | | 103 |
Notes to Financial Statements (continued)
| | • | | Level 3 – Unobservable inputs based on the best information available in the circumstances, to the extent observable inputs are not available (including the Global Valuation Committee’s assumptions used in determining the fair value of financial instruments). |
The hierarchy gives the highest priority to unadjusted quoted prices in active markets for identical assets or liabilities (Level 1 measurements) and the lowest priority to unobservable inputs (Level 3 measurements). Accordingly, the degree of judgment exercised in determining fair value is greatest for instruments categorized in Level 3. The inputs used to measure fair value may fall into different levels of the fair value hierarchy. In such cases, for disclosure purposes, the fair value hierarchy classification is determined based on the lowest level input that is significant to the fair value measurement in its entirety. Investments classified within Level 3 have significant unobservable inputs used by the Global Valuation Committee in determining the price for Fair Valued Investments. Level 3 investments include equity or debt issued by Private Companies that may not have a secondary market and/or may have a limited number of investors. The categorization of a value determined for financial instruments is based on the pricing transparency of the financial instruments and is not necessarily an indication of the risks associated with investing in those securities.
| 4. | SECURITIES AND OTHER INVESTMENTS |
Securities Lending: The Series may lend its securities to approved borrowers, such as brokers, dealers and other financial institutions. The borrower pledges and maintains with the Series collateral consisting of cash, an irrevocable letter of credit issued by a bank, or securities issued or guaranteed by the U.S. Government. The initial collateral received by the Series is required to have a value of at least 102% of the current value of the loaned securities for securities traded on U.S. exchanges and a value of at least 105% for all other securities. The collateral is maintained thereafter at a value equal to at least 100% of the current market value of the securities on loan. The market value of the loaned securities is determined at the close of each business day of the Series and any additional required collateral is delivered to the Series, or excess collateral returned by the Series, on the next business day. During the term of the loan, the Series is entitled to all distributions made on or in respect of the loaned securities, but does not receive interest income on securities received as collateral. Loans of securities are terminable at any time and the borrower, after notice, is required to return borrowed securities within the standard time period for settlement of securities transactions.
The market value of any securities on loan, all of which were classified as common stocks in the Series’ Schedule of Investments, and the value of any related collateral are shown separately in the Statement of Assets and Liabilities as a component of investments at value - unaffiliated, and collateral on securities loaned at value, respectively. As of period end, any securities on loan were collateralized by cash and/or U.S. Government obligations. Cash collateral invested by the securities lending agent, BlackRock Institutional Trust Company, N.A. (“BTC”), if any, is disclosed in the Schedule of Investments.
Securities lending transactions are entered into by the Series under Master Securities Lending Agreements (each, an “MSLA”), which provide the right, in the event of default (including bankruptcy or insolvency), for the non-defaulting party to liquidate the collateral and calculate a net exposure to the defaulting party or request additional collateral. In the event that a borrower defaults, the Series, as lender, would offset the market value of the collateral received against the market value of the securities loaned. When the value of the collateral is greater than that of the market value of the securities loaned, the lender is left with a net amount payable to the defaulting party. However, bankruptcy or insolvency laws of a particular jurisdiction may impose restrictions on or prohibitions against such a right of offset in the event of an MSLA counterparty’s bankruptcy or insolvency. Under the MSLA, absent an event of default, the borrower can resell or re-pledge the loaned securities, and the Series can reinvest cash collateral received in connection with loaned securities. Upon an event of default, the parties’ obligations to return the securities or collateral to the other party are extinguished, and the parties can resell or re-pledge the loaned securities or the collateral received in connection with the loaned securities in order to satisfy the defaulting party’s net payment obligation for all transactions under the MSLA. The defaulting party remains liable for any deficiency.
As of period end, the following table is a summary of the Series’ securities on loan by counterparty which are subject to offset under an MSLA:
| | | | | | | | | | | | | | | | | | | | | | | | | | | | |
| |
| | | | | | | Securities | | | | Cash Collateral | | | | Non-Cash Collateral | | | | | | | | Net | |
Counterparty | | | Loaned at Value | | | | | | | | Received | (a) | | | Received at Fair Value | (a) | | | Amount | |
| |
| | | | | | | |
Barclays Capital, Inc. | | | | | | $ | 9,507,274 | | | | | | | $ | (9,507,274 | ) | | $ | — | | | | | | | $ | — | |
BNP Paribas SA | | | | | | | 2,313,007 | | | | | | | | (2,313,007 | ) | | | — | | | | | | | | — | |
BofA Securities, Inc. | | | | | | | 52,908,145 | | | | | | | | (52,908,145 | ) | | | — | | | | | | | | — | |
Citadel Clearing LLC | | | | | | | 54,474 | | | | | | | | (54,474 | ) | | | — | | | | | | | | — | |
Citigroup Global Markets, Inc. | | | | | | | 13,514,459 | | | | | | | | (13,514,459 | ) | | | — | | | | | | | | — | |
Credit Suisse Securities (USA) LLC | | | | | | | 17,172,803 | | | | | | | | (17,172,803 | ) | | | — | | | | | | | | — | |
J.P. Morgan Securities LLC | | | | | | | 101,109,904 | | | | | | | | (101,109,904 | ) | | | — | | | | | | | | — | |
Jefferies LLC | | | | | | | 804,739 | | | | | | | | (804,739 | ) | | | — | | | | | | | | — | |
Nomura Securities International, Inc. | | | | | | | 541,847 | | | | | | | | (541,847 | ) | | | — | | | | | | | | — | |
Pershing LLC | | | | | | | 18,190 | | | | | | | | (18,190 | ) | | | — | | | | | | | | — | |
Scotia Capital (USA), Inc. | | | | | | | 4,336,279 | | | | | | | | (4,336,279 | ) | | | — | | | | | | | | — | |
State Street Bank & Trust Co. | | | | | | | 12,279,004 | | | | | | | | (12,279,004 | ) | | | — | | | | | | | | — | |
Toronto Dominion Bank | | | | | | | 9,473,306 | | | | | | | | (9,473,306 | ) | | | — | | | | | | | | — | |
UBS AG | | | | | | | 10,727,308 | | | | | | | | (10,727,308 | ) | | | — | | | | | | | | — | |
UBS Securities LLC | | | | | | | 5,596,589 | | | | | | | | (5,596,589 | ) | | | — | | | | | | | | — | |
Virtu Americas LLC | | | | | | | 138,892 | | | | | | | | (138,892 | ) | | | — | | | | | | | | — | |
Wells Fargo Bank N.A | | | | | | | 1,818,159 | | | | | | | | (1,818,159 | ) | | | — | | | | | | | | — | |
Wells Fargo Securities LLC | | | | | | | 9,546,524 | | | | | | | | (9,546,524 | ) | | | — | | | | | | | | — | |
| | | | | | | | | | | | | | | | | | | | | | | | | | | | |
| | | | | | | |
| | | | | | $ | 251,860,903 | | | | | | | $ | (251,860,903 | ) | | $ | — | | | | | | | $ | — | |
| | | | | | | | | | | | | | | | | | | | | | | | | | | | |
| | (a) | Collateral received in excess of the market value of securities on loan is not presented in this table. The total cash collateral received by the Series is disclosed in the Series’s Statement of Assets and Liabilities. | |
| | |
| 104 | | 2 0 2 1 BLACK ROCK ANNUAL REPORT TO SHAREHOLDERS |
Notes to Financial Statements (continued)
The risks of securities lending include the risk that the borrower may not provide additional collateral when required or may not return the securities when due. To mitigate these risks, the Series benefits from a borrower default indemnity provided by BlackRock, Inc. (“BlackRock”). BlackRock’s indemnity allows for full replacement of the securities loaned to the extent the collateral received does not cover the value on the securities loaned in the event of borrower default. The Series could incur a loss if the value of an investment purchased with cash collateral falls below the market value of loaned securities or if the value of an investment purchased with cash collateral falls below the value of the original cash collateral received. Such losses are borne entirely by the Series.
| 5. | DERIVATIVE FINANCIAL INSTRUMENTS |
The Series engages in various portfolio investment strategies using derivative contracts both to increase the returns of the Series and/or to manage its exposure to certain risks such as credit risk, equity risk, interest rate risk, foreign currency exchange rate risk, commodity price risk or other risks (e.g., inflation risk). Derivative financial instruments categorized by risk exposure are included in the Schedule of Investments. These contracts may be transacted on an exchange or over-the-counter (“OTC”).
Futures Contracts: Futures contracts are purchased or sold to gain exposure to, or manage exposure to, changes in interest rates (interest rate risk) and changes in the value of equity securities (equity risk) or foreign currencies (foreign currency exchange rate risk).
Futures contracts are exchange-traded agreements between the Series and a counterparty to buy or sell a specific quantity of an underlying instrument at a specified price and on a specified date. Depending on the terms of a contract, it is settled either through physical delivery of the underlying instrument on the settlement date or by payment of a cash amount on the settlement date. Upon entering into a futures contract, the Series is required to deposit initial margin with the broker in the form of cash or securities in an amount that varies depending on a contract’s size and risk profile. The initial margin deposit must then be maintained at an established level over the life of the contract. Amounts pledged, which are considered restricted, are included in cash pledged for futures contracts in the Statement of Assets and Liabilities.
Securities deposited as initial margin are designated in the Schedule of Investments and cash deposited, if any, are shown as cash pledged for futures contracts in the Statement of Assets and Liabilities. Pursuant to the contract, the Series agrees to receive from or pay to the broker an amount of cash equal to the daily fluctuation in market value of the contract (“variation margin”). Variation margin is recorded as unrealized appreciation (depreciation) and, if any, shown as variation margin receivable (or payable) on futures contracts in the Statement of Assets and Liabilities. When the contract is closed, a realized gain or loss is recorded in the Statement of Operations equal to the difference between the notional amount of the contract at the time it was opened and the notional amount at the time it was closed. The use of futures contracts involves the risk of an imperfect correlation in the movements in the price of futures contracts and interest rates, foreign currency exchange rates or underlying assets.
Swaps: Swap contracts are entered into to manage exposure to issuers, markets and securities. Such contracts are agreements between the Series and a counterparty to make periodic net payments on a specified notional amount or a net payment upon termination. Swap agreements are privately negotiated in the OTC market and may be entered into as a bilateral contract (“OTC swaps”) or centrally cleared (“centrally cleared swaps”).
For OTC swaps, any upfront premiums paid and any upfront fees received are shown as swap premiums paid and swap premiums received, respectively, in the Statement of Assets and Liabilities and amortized over the term of the contract. The daily fluctuation in market value is recorded as unrealized appreciation (depreciation) on OTC Swaps in the Statement of Assets and Liabilities. Payments received or paid are recorded in the Statement of Operations as realized gains or losses, respectively. When an OTC swap is terminated, a realized gain or loss is recorded in the Statement of Operations equal to the difference between the proceeds from (or cost of) the closing transaction and the Series’ basis in the contract, if any. Generally, the basis of the contract is the premium received or paid.
In a centrally cleared swap, immediately following execution of the swap contract, the swap contract is novated to a central counterparty (the “CCP”) and the CCP becomes the Series’ counterparty on the swap. The Series is required to interface with the CCP through the broker. Upon entering into a centrally cleared swap, the Series is required to deposit initial margin with the broker in the form of cash or securities in an amount that varies depending on the size and risk profile of the particular swap. Securities deposited as initial margin are designated in the Schedule of Investments and cash deposited is shown as cash pledged for centrally cleared swaps in the Statement of Assets and Liabilities. Amounts pledged, which are considered restricted cash, are included in cash pledged for centrally cleared swaps in the Statement of Assets and Liabilities. Pursuant to the contract, the Series agrees to receive from or pay to the broker an amount of cash equal to the daily fluctuation in market value of the contract (“variation margin”). Variation margin is recorded as unrealized appreciation (depreciation) and shown as variation margin receivable (or payable) on centrally cleared swaps in the Statement of Assets and Liabilities. Payments received from (paid to) the counterparty are amortized over the term of the contract and recorded as realized gains (losses) in the Statement of Operations, including those at termination.
| | • | | Total return swaps — Total return swaps are entered into to obtain exposure to a security or market without owning such security or investing directly in such market or to exchange the risk/return of one security or market (e.g., fixed-income) with another security or market (e.g., equity or commodity prices) (equity risk, commodity price risk and/or interest rate risk). |
Total return swaps are agreements in which there is an exchange of cash flows whereby one party commits to make payments based on the total return (distributions plus capital gains/losses) of an underlying instrument, or basket of underlying instruments, in exchange for fixed or floating rate interest payments. If the total return of the instrument(s) or index underlying the transaction exceeds or falls short of the offsetting fixed or floating interest rate obligation, the Series receives payment from or makes a payment to the counterparty.
Certain total return swaps are designed to function as a portfolio of direct investments in long and short equity positions. This means that the Series has the ability to trade in and out of these long and short positions within the swap and will receive the economic benefits and risks equivalent to direct investment in these positions, subject to certain adjustments due to events related to the counterparty. Benefits and risks include capital appreciation (depreciation), corporate actions and dividends received and paid, all of which are reflected in the swap’s market value. The market value also includes interest charges and credits (“financing fees”) related to the notional values of the long and short positions and cash balances within the swap. These interest charges and credits are based on a specified benchmark rate plus or minus a specified spread determined based upon the country and/or currency of the positions in the portfolio.
| | |
SERIES NOTES TO FINANCIAL STATEMENTS | | 105 |
Notes to Financial Statements (continued)
Positions within the swap and financing fees are reset periodically. During a reset, any unrealized appreciation (depreciation) on positions and accrued financing fees become available for cash settlement between the Series and the counterparty. The amounts that are available for cash settlement are recorded as realized gains or losses in the Statement of Operations. Cash settlement in and out of the swap may occur at a reset date or any other date, at the discretion of the Series and the counterparty, over the life of the agreement. Certain swaps have no stated expiration and can be terminated by either party at any time.
Swap transactions involve, to varying degrees, elements of interest rate, credit and market risk in excess of the amounts recognized in the Statement of Assets and Liabilities. Such risks involve the possibility that there will be no liquid market for these agreements, that the counterparty to the agreements may default on its obligation to perform or disagree as to the meaning of the contractual terms in the agreements, and that there may be unfavorable changes in interest rates and/or market values associated with these transactions.
Master Netting Arrangements: In order to define its contractual rights and to secure rights that will help it mitigate its counterparty risk, the Series may enter into an International Swaps and Derivatives Association, Inc. Master Agreement (“ISDA Master Agreement”) or similar agreement with its counterparties. An ISDA Master Agreement is a bilateral agreement between a Series and a counterparty that governs certain OTC derivatives and typically contains, among other things, collateral posting terms and netting provisions in the event of a default and/or termination event. Under an ISDA Master Agreement, a Series may, under certain circumstances, offset with the counterparty certain derivative financial instruments’ payables and/or receivables with collateral held and/or posted and create one single net payment. The provisions of the ISDA Master Agreement typically permit a single net payment in the event of default including the bankruptcy or insolvency of the counterparty. However, bankruptcy or insolvency laws of a particular jurisdiction may impose restrictions on or prohibitions against the right of offset in bankruptcy, insolvency or other events.
Collateral Requirements: For derivatives traded under an ISDA Master Agreement, the collateral requirements are typically calculated by netting the mark-to-market amount for each transaction under such agreement and comparing that amount to the value of any collateral currently pledged by the Series and the counterparty.
Cash collateral that has been pledged to cover obligations of the Series and cash collateral received from the counterparty, if any, is reported separately in the Statement of Assets and Liabilities as cash pledged as collateral and cash received as collateral, respectively. Non-cash collateral pledged by the Series, if any, is noted in the Schedule of Investments. Generally, the amount of collateral due from or to a counterparty is subject to a certain minimum transfer amount threshold before a transfer is required, which is determined at the close of business of the Series. Any additional required collateral is delivered to/pledged by the Series on the next business day. Typically, the counterparty is not permitted to sell, re-pledge or use cash and non-cash collateral it receives. The Series generally agrees not to use non-cash collateral that it receives but may, absent default or certain other circumstances defined in the underlying ISDA Master Agreement, be permitted to use cash collateral received. In such cases, interest may be paid pursuant to the collateral arrangement with the counterparty. To the extent amounts due to the Series from the counterparties are not fully collateralized, the Series bears the risk of loss from counterparty non-performance. Likewise, to the extent the Series has delivered collateral to a counterparty and stands ready to perform under the terms of its agreement with such counterparty, the Series bears the risk of loss from a counterparty in the amount of the value of the collateral in the event the counterparty fails to return such collateral. Based on the terms of agreements, collateral may not be required for all derivative contracts.
For financial reporting purposes, the Series does not offset derivative assets and derivative liabilities that are subject to netting arrangements, if any, in the Statement of Assets and Liabilities.
| 6. | INVESTMENT ADVISORY AGREEMENT AND OTHER TRANSACTIONS WITH AFFILIATES |
Investment Advisory: The Master LLC, on behalf of the Series, entered into an Investment Advisory Agreement with the Manager, the Series’ investment adviser and an indirect, wholly-owned subsidiary of BlackRock, to provide investment advisory and administrative services. The Manager is responsible for the management of the Series’s portfolio and provides the personnel, facilities, equipment and certain other services necessary to the operations of the Series.
For such services, the Series pays the Manager a monthly fee at an annual rate equal to 0.01% of the average daily value of the Series’ net assets.
For the year ended December 31, 2021, the Series reimbursed the Manager for certain accounting services, which is included in accounting services in the Statement of Operations. The reimbursements were $15,978.
With respect to the Series, the Manager entered into a sub-advisory agreement with BlackRock Fund Advisors (“BFA”), an affiliate of the Manager. The Manager pays BFA for services it provides for that portion of the Series for which BFA acts as sub-adviser, a monthly fee that is equal to a percentage of the investment advisory fees paid by the Series to the Manager.
Expense Limitations, Waivers and Reimbursements: The Manager contractually agreed to waive its investment advisory fees by the amount of investment advisory fees the Series pays to the Manager indirectly through its investment in affiliated money market funds (the “affiliated money market fund waiver”) through June 30, 2023. The contractual agreement may be terminated upon 90 days’ notice by a majority of the directors who are not “interested persons” of the Series, as defined in the 1940 Act (“Independent Directors”), or by a vote of a majority of the outstanding voting securities of the Series. The amount of waivers and/or reimbursements of fees and expenses made pursuant to the expense limitation described below will be reduced by the amount of the affiliated money market fund waiver. This amount is included in fees waived and/or reimbursed by the Manager in the Statement of Operations. For the year ended December 31, 2021, the amount waived was $25,097.
The Manager has contractually agreed to waive its investment advisory fee with respect to any portion of the Series’ assets invested in affiliated equity and fixed-income mutual funds and affiliated exchange-traded funds that have a contractual management fee through June 30, 2023. The contractual agreement may be terminated upon 90 days’ notice by a majority of the Independent Directors, or by a vote of a majority of the outstanding voting securities of the Series. This amount is included in fees waived and/or reimbursed by the Manager in the Statement of Operations. For the year ended December 31, 2021, the Manager waived $2,996 in investment advisory fees pursuant to this arrangement.
| | |
| 106 | | 2 0 2 1 BLACK ROCK ANNUAL REPORT TO SHAREHOLDERS |
Notes to Financial Statements (continued)
The Manager contractually agreed to waive and/or reimburse fees or expenses in order to limit expenses, excluding interest expense, dividend expense, tax expense, acquired fund fees and expenses, and certain other fund expenses, which constitute extraordinary expenses not incurred in the ordinary course of the Series’ business (“expense limitation”). The expense limitation as a percentage of average daily net assets is 0.07%.
The Manager has agreed not to reduce or discontinue the contractual expense limitations through June 30, 2023, unless approved by the Board, including a majority of the Independent Directors, or by a vote of a majority of the outstanding voting securities of the Series. For the year ended December 31, 2021, there were no fees waived and/or reimbursed by the Manager pursuant to this agreement.
Securities Lending: The U.S. Securities and Exchange Commission (“SEC”) has issued an exemptive order which permits BTC, an affiliate of the Manager, to serve as securities lending agent for the Series, subject to applicable conditions. As securities lending agent, BTC bears all operational costs directly related to securities lending, including any custodial costs. The Series is responsible for fees in connection with the investment of cash collateral received for securities on loan (the “collateral investment fees”). The cash collateral is invested in a money market fund, BlackRock Cash Funds: Institutional or BlackRock Cash Funds: Treasury, managed by the Manager or its affiliates. However, BTC has agreed to reduce the amount of securities lending income it receives in order to effectively limit the collateral investment fees the Series bears to an annual rate of 0.04%. The SL Agency Shares of such money market fund will not be subject to a sales load, distribution fee or service fee. The money market fund in which the cash collateral has been invested may, under certain circumstances, impose a liquidity fee of up to 2% of the value redeemed or temporarily restrict redemptions for up to 10 business days during a 90 day period, in the event that the money market fund’s weekly liquid assets fall below certain thresholds.
Securities lending income is equal to the total of income earned from the reinvestment of cash collateral, net of fees and other payments to and from borrowers of securities, and less the collateral investment fees. The Series retains a portion of securities lending income and remits a remaining portion to BTC as compensation for its services as securities lending agent.
Pursuant to the current securities lending agreement, the Series retains 77% of securities lending income (which excludes collateral investment fees), and this amount retained can never be less than 70% of the total of securities lending income plus the collateral investment fees.
In addition, commencing the business day following the date that the aggregate securities lending income earned across the BlackRock Multi-Asset Complex in a calendar year exceeds a specified threshold, the Series, pursuant to the securities lending agreement, will retain for the remainder of that calendar year securities lending income in an amount equal to 81% of securities lending income (which excludes collateral investment fees), and this amount retained can never be less than 70% of the total of securities lending income plus the collateral investment fees.
The share of securities lending income earned by the Series is shown as securities lending income — affiliated — net in the Statement of Operations. For the year ended December 31, 2021, the Series paid BTC $673,341 for securities lending agent services.
Interfund Lending: In accordance with an exemptive order (the “Order”) from the SEC, the Series may participate in a joint lending and borrowing facility for temporary purposes (the “Interfund Lending Program”), subject to compliance with the terms and conditions of the Order, and to the extent permitted by the Series’ investment policies and restrictions. The Series is currently permitted to borrow and lend under the Interfund Lending Program.
A lending BlackRock fund may lend in aggregate up to 15% of its net assets but may not lend more than 5% of its net assets to any one borrowing fund through the Interfund Lending Program. A borrowing BlackRock fund may not borrow through the Interfund Lending Program or from any other source more than 33 1/3% of its total assets (or any lower threshold provided for by the fund’s investment restrictions). If a borrowing BlackRock fund’s total outstanding borrowings exceed 10% of its total assets, each of its outstanding interfund loans will be subject to collateralization of at least 102% of the outstanding principal value of the loan. All interfund loans are for temporary or emergency purposes and the interest rate to be charged will be the average of the highest current overnight repurchase agreement rate available to a lending fund and the bank loan rate, as calculated according to a formula established by the Board.
During the year ended December 31, 2021, the Series did not participate in the Interfund Lending Program.
Directors and Officers: Certain directors and/or officers of Master LLC are directors and/or officers of BlackRock or its affiliates.
Other Transactions: The Series may purchase securities from, or sell securities to, an affiliated fund provided the affiliation is due solely to having a common investment adviser, common officers, or common directors. For the year ended December 31, 2021, the purchase and sale transactions and any net realized gains (losses) with affiliated funds in compliance with Rule 17a-7 under the 1940 Act were as follows:
| | | | | | | | | | |
| | | | |
| Series Name | | Purchases | | | Sales | | | Net Realized
Gain (Loss) |
| | | |
Master Small Cap Index Series | | $ | 109,560,663 | | | $ | 300,274,474 | | | $ 130,976,824 |
For the year ended December 31, 2021, purchases and sales of investments, excluding short-term investments, were $1,541,200,101 and $1,375,420,678, respectively.
The Series is classified as a partnership for U.S. federal income tax purposes. As such, each investor in the Series is treated as the owner of its proportionate share of net assets, income, expenses and realized and unrealized gains and losses of the Series. Therefore, no U.S. federal income tax provision is required. It is intended that the Series’ assets will be managed so an investor in the Series can satisfy the requirements of Subchapter M of the Internal Revenue Code of 1986, as amended.
| | |
SERIES NOTES TO FINANCIAL STATEMENTS | | 107 |
Notes to Financial Statements (continued)
The Series files U.S. federal and various state and local tax returns. No income tax returns are currently under examination. The statute of limitations on the Series’s U.S. federal tax returns generally remains open for a period of three fiscal years after they are filed. The statutes of limitations on the Series’s state and local tax returns may remain open for an additional year depending upon the jurisdiction.
Management has analyzed tax laws and regulations and their application to the Series as of December 31, 2021, inclusive of the open tax return years, and does not believe that there are any uncertain tax positions that require recognition of a tax liability in the Series’ financial statements.
As of December 31, 2021, gross unrealized appreciation and depreciation based on cost of investments (including short positions and derivatives, if any) for U.S. federal income tax purposes were as follows:
| | | | | | | | | | | | | | | | |
| |
| | | | |
| Series Name | | Tax Cost | | | Gross Unrealized Appreciation | | | Gross Unrealized Depreciation | | | Net Unrealized Appreciation (Depreciation) | |
| |
| | | | |
Master Small Cap Index Series | | $ | 3,644,573,012 | | | $ | 1,615,252,966 | | | $ | (399,592,152 | ) | | $ | 1,215,660,814 | |
| | | | | | | | | | | | | | | | |
The Master LLC, on behalf of the Series, along with certain other funds managed by the Manager and its affiliates (“Participating Funds”), is a party to a 364-day, $2.25 billion credit agreement with a group of lenders. Under this agreement, the Series may borrow to fund shareholder redemptions. Excluding commitments designated for certain individual funds, the Participating Funds, including the Series, can borrow up to an aggregate commitment amount of $1.75 billion at any time outstanding, subject to asset coverage and other limitations as specified in the agreement. The credit agreement has the following terms: a fee of 0.10% per annum on unused commitment amounts and interest at a rate equal to the higher of (a) one-month London Interbank Offered Rate (“LIBOR”) (but, in any event, not less than 0.00%) on the date the loan is made plus 0.80% per annum or (b) the Fed Funds rate (but, in any event, not less than 0.00%) in effect from time to time plus 0.80% per annum on amounts borrowed. The agreement expires in April 2022 unless extended or renewed. These fees were allocated among such funds based upon portions of the aggregate commitment available to them and relative net assets of Participating Funds. During the year ended December 31, 2021, the Series did not borrow under the credit agreement.
In the normal course of business, the Series invests in securities or other instruments and may enter into certain transactions, and such activities subject the Series to various risks, including among others, fluctuations in the market (market risk) or failure of an issuer to meet all of its obligations. The value of securities or other instruments may also be affected by various factors, including, without limitation: (i) the general economy; (ii) the overall market as well as local, regional or global political and/or social instability; (iii) regulation, taxation or international tax treaties between various countries; or (iv) currency, interest rate and price fluctuations. Local, regional or global events such as war, acts of terrorism, the spread of infectious illness or other public health issues, recessions, or other events could have a significant impact on the Series and its investments. The Series’ prospectus provides details of the risks to which the Series is subject.
The Series may be exposed to additional risks when reinvesting cash collateral in money market funds that do not seek to maintain a stable NAV per share of $1.00, which may be subject to redemption gates or liquidity fees under certain circumstances.
Market Risk: An outbreak of respiratory disease caused by a novel coronavirus has developed into a global pandemic and has resulted in closing borders, quarantines, disruptions to supply chains and customer activity, as well as general concern and uncertainty. The impact of this pandemic, and other global health crises that may arise in the future, could affect the economies of many nations, individual companies and the market in general in ways that cannot necessarily be foreseen at the present time. This pandemic may result in substantial market volatility and may adversely impact the prices and liquidity of a fund’s investments. The duration of this pandemic and its effects cannot be determined with certainty.
Valuation Risk: The market values of equities, such as common stocks and preferred securities or equity related investments, such as futures and options, may decline due to general market conditions which are not specifically related to a particular company. They may also decline due to factors which affect a particular industry or industries. The Series may invest in illiquid investments. An illiquid investment is any investment that the Series reasonably expects cannot be sold or disposed of in current market conditions in seven calendar days or less without the sale or disposition significantly changing the market value of the investment. The Series may experience difficulty in selling illiquid investments in a timely manner at the price that it believes the investments are worth. Prices may fluctuate widely over short or extended periods in response to company, market or economic news. Markets also tend to move in cycles, with periods of rising and falling prices. This volatility may cause the Series’ NAV to experience significant increases or decreases over short periods of time. If there is a general decline in the securities and other markets, the NAV of the Series may lose value, regardless of the individual results of the securities and other instruments in which the Series invests.
The price the Series could receive upon the sale of any particular portfolio investment may differ from the Series’ valuation of the investment, particularly for securities that trade in thin or volatile markets or that are valued using a fair valuation technique or a price provided by an independent pricing service. Changes to significant unobservable inputs and assumptions (i.e., publicly traded company multiples, growth rate, time to exit) due to the lack of observable inputs may significantly impact the resulting fair value and therefore the Series’ results of operations. As a result, the price received upon the sale of an investment may be less than the value ascribed by the Series, and the Series could realize a greater than expected loss or lesser than expected gain upon the sale of the investment. The Series’ ability to value its investments may also be impacted by technological issues and/or errors by pricing services or other third-party service providers.
Counterparty Credit Risk: The Series may be exposed to counterparty credit risk, or the risk that an entity may fail to or be unable to perform on its commitments related to unsettled or open transactions, including making timely interest and/or principal payments or otherwise honoring its obligations. The Series manages counterparty credit risk by entering into transactions only with counterparties that the Manager believes have the financial resources to honor their obligations and by monitoring the financial stability
| | |
| 108 | | 2 0 2 1 BLACK ROCK ANNUAL REPORT TO SHAREHOLDERS |
Notes to Financial Statements (continued)
of those counterparties. Financial assets, which potentially expose the Series to market, issuer and counterparty credit risks, consist principally of financial instruments and receivables due from counterparties. The extent of the Series’ exposure to market, issuer and counterparty credit risks with respect to these financial assets is approximately their value recorded in the Statement of Assets and Liabilities, less any collateral held by the Series.
A derivative contract may suffer a mark-to-market loss if the value of the contract decreases due to an unfavorable change in the market rates or values of the underlying instrument. Losses can also occur if the counterparty does not perform under the contract.
With exchange-traded futures, there is less counterparty credit risk to the Series since the exchange or clearinghouse, as counterparty to such instruments, guarantees against a possible default. The clearinghouse stands between the buyer and the seller of the contract; therefore, credit risk is limited to failure of the clearinghouse. While offset rights may exist under applicable law, the Series does not have a contractual right of offset against a clearing broker or clearinghouse in the event of a default (including the bankruptcy or insolvency). Additionally, credit risk exists in exchange-traded futures with respect to initial and variation margin that is held in a clearing broker’s customer accounts. While clearing brokers are required to segregate customer margin from their own assets, in the event that a clearing broker becomes insolvent or goes into bankruptcy and at that time there is a shortfall in the aggregate amount of margin held by the clearing broker for all its clients, typically the shortfall would be allocated on a pro rata basis across all the clearing broker’s customers, potentially resulting in losses to the Series.
Concentration Risk: A diversified portfolio, where this is appropriate and consistent with a fund’s objectives, minimizes the risk that a price change of a particular investment will have a material impact on the NAV of a fund. The investment concentrations within the Series’ portfolio are disclosed in its Schedule of Investments.
LIBOR Transition Risk: The United Kingdom’s Financial Conduct Authority announced a phase out of the LIBOR. Although many LIBOR rates will cease to be published or no longer will be representative of the underlying market they seek to measure after December 31, 2021, a selection of widely used USD LIBOR rates will continue to be published through June 2023 in order to assist with the transition. The Series may be exposed to financial instruments tied to LIBOR to determine payment obligations, financing terms, hedging strategies or investment value. The transition process away from LIBOR might lead to increased volatility and illiquidity in markets for, and reduce the effectiveness of new hedges placed against instruments whose terms currently include LIBOR. The ultimate effect of the LIBOR transition process on the Series is uncertain.
Management has evaluated the impact of all subsequent events on the Series through the date the financial statements were issued and has determined that there were no subsequent events requiring adjustment or additional disclosure in the financial statements.
| | |
SERIES NOTES TO FINANCIAL STATEMENTS | | 109 |
Report of Independent Registered Public Accounting Firm
To the Investors of Master Small Cap Index Series and the Board of Directors of Quantitative Master Series LLC:
Opinion on the Financial Statements and Financial Highlights
We have audited the accompanying statement of assets and liabilities of Master Small Cap Index Series of Quantitative Master Series LLC (the “Fund”), including the schedule of investments, as of December 31, 2021, the related statement of operations for the year then ended, the statements of changes in net assets for each of the two years in the period then ended, the financial highlights for each of the five years in the period then ended, and the related notes. In our opinion, the financial statements and financial highlights present fairly, in all material respects, the financial position of the Fund as of December 31, 2021, and the results of its operations for the year then ended, the changes in its net assets for each of the two years in the period then ended, and the financial highlights for each of the five years in the period then ended, in conformity with accounting principles generally accepted in the United States of America.
Basis for Opinion
These financial statements and financial highlights are the responsibility of the Fund’s management. Our responsibility is to express an opinion on the Fund’s financial statements and financial highlights based on our audits. We are a public accounting firm registered with the Public Company Accounting Oversight Board (United States) (PCAOB) and are required to be independent with respect to the Fund in accordance with the U.S. federal securities laws and the applicable rules and regulations of the Securities and Exchange Commission and the PCAOB.
We conducted our audits in accordance with the standards of the PCAOB. Those standards require that we plan and perform the audit to obtain reasonable assurance about whether the financial statements and financial highlights are free of material misstatement, whether due to error or fraud. The Fund is not required to have, nor were we engaged to perform, an audit of its internal control over financial reporting. As part of our audits we are required to obtain an understanding of internal control over financial reporting but not for the purpose of expressing an opinion on the effectiveness of the Fund’s internal control over financial reporting. Accordingly, we express no such opinion.
Our audits included performing procedures to assess the risks of material misstatement of the financial statements and financial highlights, whether due to error or fraud, and performing procedures that respond to those risks. Such procedures included examining, on a test basis, evidence regarding the amounts and disclosures in the financial statements and financial highlights. Our audits also included evaluating the accounting principles used and significant estimates made by management, as well as evaluating the overall presentation of the financial statements and financial highlights. Our procedures included confirmation of securities owned as of December 31, 2021, by correspondence with the custodian and brokers; when replies were not received from brokers, we performed other auditing procedures. We believe that our audits provide a reasonable basis for our opinion.
Deloitte & Touche LLP
Boston, Massachusetts
February 24, 2022
We have served as the auditor of one or more BlackRock investment companies since 1992.
| | |
| 110 | | 2 0 2 1 BLACK ROCK ANNUAL REPORT TO SHAREHOLDERS |
Statement Regarding Liquidity Risk Management Program
In compliance with Rule 22e-4 under the Investment Company Act of 1940, as amended (the “Liquidity Rule”), BlackRock FundsSM (the “Trust”), BlackRock Index Funds, Inc. and Quantitative Master Series LLC (the “Corporations”) have adopted and implemented a liquidity risk management program (the “Program”) for iShares Municipal Bond Index Fund, iShares Short-Term TIPS Bond Index Fund, iShares MSCI EAFE International Index Fund, iShares Russell 2000 Small-Cap Index Fund and Master Small Cap Index Series (the “Funds”), each a series of the Trust or the respective Corporation, which is reasonably designed to assess and manage each Fund’s liquidity risk.
The Board of Directors (the “Board”) of the Corporations, on behalf of the Funds, met on November 9-10, 2021 (the “Meeting”) to review the Program. The Board previously appointed BlackRock Advisors, LLC or BlackRock Fund Advisors (“BlackRock”), each an investment adviser to certain BlackRock funds, as the program administrator for each Fund’s Program, as applicable. BlackRock also previously delegated oversight of the Program to the 40 Act Liquidity Risk Management Committee (the “Committee”). At the Meeting, the Committee, on behalf of BlackRock, provided the Board with a report that addressed the operation of the Program and assessed its adequacy and effectiveness of implementation, including the management of each Fund’s Highly Liquid Investment Minimum (“HLIM”) where applicable, and any material changes to the Program (the “Report”). The Report covered the period from October 1, 2020 through September 30, 2021 (the “Program Reporting Period”).
The Report described the Program’s liquidity classification methodology for categorizing each Fund’s investments (including derivative transactions) into one of four liquidity buckets. It also referenced the methodology used by BlackRock to establish each Fund’s HLIM and noted that the Committee reviews and ratifies the HLIM assigned to each Fund no less frequently than annually. The Report also discussed notable events affecting liquidity over the Program Reporting Period, including the imposition of capital controls in certain countries.
The Report noted that the Program complied with the key factors for consideration under the Liquidity Rule for assessing, managing and periodically reviewing each Fund’s liquidity risk, as follows:
| a) | The Fund’s investment strategy and liquidity of portfolio investments during both normal and reasonably foreseeable stressed conditions. During the Program Reporting Period, the Committee reviewed whether each Fund’s strategy is appropriate for an open-end fund structure with a focus on funds with more significant and consistent holdings of less liquid and illiquid assets. The Committee also factored a fund’s concentration in an issuer into the liquidity classification methodology by taking issuer position sizes into account. Where a fund participated in borrowings for investment purposes (such as tender option bonds or reverse repurchase agreements), such borrowings were factored into the Program’s calculation of a fund’s liquidity bucketing. Derivative exposure was also considered in such calculation. |
| b) | Short-term and long-term cash flow projections during both normal and reasonably foreseeable stressed conditions. During the Program Reporting Period, the Committee reviewed historical redemption activity and used this information as a component to establish each Fund’s reasonably anticipated trading size (“RATS”). Each Fund has adopted an in-kind redemption policy which may be utilized to meet larger redemption requests. The Committee may also take into consideration a fund’s shareholder ownership concentration (which, depending on product type and distribution channel, may or may not be available), a fund’s distribution channels, and the degree of certainty associated with a fund’s short-term and long-term cash flow projections. |
| c) | Holdings of cash and cash equivalents, as well as borrowing arrangements. The Committee considered the terms of the credit facility committed to each Fund, the financial health of the institution providing the facility and the fact that the credit facility is shared among multiple funds (including that a portion of the aggregate commitment amount is specifically designated for BlackRock Floating Rate Income Portfolio, a series of BlackRock Funds V). The Committee also considered other types of borrowing available to the Funds, such as the ability to use reverse repurchase agreements and interfund lending, as applicable. |
There were no material changes to the Program during the Program Reporting Period other than the enhancement of certain model components in the Program’s methodology. The Report provided to the Board stated that the Committee concluded that based on the operation of the functions, as described in the Report, the Program is operating as intended and is effective in implementing the requirements of the Liquidity Rule.
| | |
STATEMENT REGARDING LIQUIDITY RISK MANAGEMENT PROGRAM | | 111 |
Director and Officer Information
| | | | | | | | |
| Independent Directors(a) |
| | | | | |
Name Year of Birth(b) | | Position(s) Held (Length of Service)(c) | | Principal Occupation(s) During Past Five Years | | Number of BlackRock-Advised Registered Investment Companies (“RICs”) Consisting of Investment Portfolios (“Portfolios”) Overseen | | Public Company and Other Investment Company Directorships Held During Past Five Years |
| | | | |
Mark Stalnecker 1951 | | Chair of the Board (Since 2019) and Director
(Since 2015) | | Chief Investment Officer, University of Delaware from 1999 to 2013; Trustee and Chair of the Finance and Investment Committees, Winterthur Museum and Country Estate from 2005 to 2016; Member of the Investment Committee, Delaware Public Employees’ Retirement System since 2002; Member of the Investment Committee, Christiana Care Health System from 2009 to 2017; Member of the Investment Committee, Delaware Community Foundation from 2013 to 2014; Director and Chair of the Audit Committee, SEI Private Trust Co. from 2001 to 2014. | | 30 RICs consisting of 159 Portfolios | | None |
| | | | |
Bruce R. Bond 1946 | | Director
(Since 2019) | | Board Member, Amsphere Limited (software) since 2018; Trustee and Member of the Governance Committee, State Street Research Mutual Funds from 1997 to 2005; Board Member of Governance, Audit and Finance Committee, Avaya Inc. (computer equipment) from 2003 to 2007. | | 30 RICs consisting of 159 Portfolios | | None |
| | | | |
Susan J. Carter 1956 | | Director
(Since 2016) | | Director, Pacific Pension Institute from 2014 to 2018; Advisory Board Member, Center for Private Equity and Entrepreneurship at Tuck School of Business since 1997; Senior Advisor, Commonfund Capital, Inc. (“CCI”) (investment adviser) in 2015; Chief Executive Officer, CCI from 2013 to 2014; President & Chief Executive Officer, CCI from 1997 to 2013; Advisory Board Member, Girls Who Invest from 2015 to 2018 and Board Member thereof since 2018; Advisory Board Member, Bridges Fund Management since 2016; Trustee, Financial Accounting Foundation since 2017; Practitioner Advisory Board Member, Private Capital Research Institute (“PCRI”) since 2017; Lecturer in the Practice of Management, Yale School of Management since 2019; Advisor to Finance Committee, Altman Foundation since 2020. | | 30 RICs consisting of 159 Portfolios | | None |
| | | | |
Collette Chilton 1958 | | Director
(Since 2015) | | Chief Investment Officer, Williams College since 2006; Chief Investment Officer, Lucent Asset Management Corporation from 1998 to 2006; Director, Boys and Girls Club of Boston since 2017; Director, B1 Capital since 2018; Director, David and Lucile Packard Foundation since 2020. | | 30 RICs consisting of 159 Portfolios | | None |
| | | | |
Neil A. Cotty 1954 | | Director
(Since 2016) | | Bank of America Corporation from 1996 to 2015, serving in various senior finance leadership roles, including Chief Accounting Officer from 2009 to 2015, Chief Financial Officer of Global Banking, Markets and Wealth Management from 2008 to 2009, Chief Accounting Officer from 2004 to 2008, Chief Financial Officer of Consumer Bank from 2003 to 2004, Chief Financial Officer of Global Corporate Investment Bank from 1999 to 2002. | | 30 RICs consisting of 159 Portfolios | | None |
| | | | |
Lena G. Goldberg 1949 | | Director
(Since 2019) | | Director, Charles Stark Draper Laboratory, Inc. since 2013; Senior Lecturer, Harvard Business School, from 2008 to 2021; FMR LLC/Fidelity Investments (financial services) from 1996 to 2008, serving in various senior roles including Executive Vice President - Strategic Corporate Initiatives and Executive Vice President and General Counsel; Partner, Sullivan & Worcester LLP from 1985 to 1996 and Associate thereof from 1979 to 1985. | | 30 RICs consisting of 159 Portfolios | | None |
| | |
| 112 | | 2 0 2 1 BLACK ROCK ANNUAL REPORT TO SHAREHOLDERS |
Director and Officer Information (continued)
| | | | | | | | |
| Independent Directors(a) (continued) |
| | | | | |
Name Year of Birth(b) | | Position(s) Held (Length of Service)(c) | | Principal Occupation(s) During Past Five Years | | Number of BlackRock-Advised Registered Investment Companies (“RICs”) Consisting of Investment Portfolios (“Portfolios”) Overseen | | Public Company and Other Investment Company Directorships Held During Past Five Years |
| | | | |
Henry R. Keizer 1956 | | Director
(Since 2019) | | Director, Park Indemnity Ltd. (captive insurer) since 2010; Director, MUFG Americas Holdings Corporation and MUFG Union Bank, N.A. (financial and bank holding company) from 2014 to 2016; Director, American Institute of Certified Public Accountants from 2009 to 2011; Director, KPMG LLP (audit, tax and advisory services) from 2004 to 2005 and 2010 to 2012; Director, KPMG International in 2012, Deputy Chairman and Chief Operating Officer thereof from 2010 to 2012 and U.S. Vice Chairman of Audit thereof from 2005 to 2010; Global Head of Audit, KPMGI (consortium of KPMG firms) from 2006 to 2010; Director, YMCA of Greater New York from 2006 to 2010. | | 30 RICs consisting of 159 Portfolios | | Hertz Global Holdings (car rental); Sealed Air Corp. (packaging); GrafTech International Ltd. (materials manufacturing); Montpelier Re Holdings, Ltd. (publicly held property and casualty reinsurance) from 2013 to 2015; WABCO (commercial vehicle safety systems) from 2015 to 2020. |
| | | | |
Cynthia A. Montgomery 1952 | | Director
(Since 2007) | | Professor, Harvard Business School since 1989. | | 30 RICs consisting of 159 Portfolios | | Newell Rubbermaid, Inc. (manufacturing) from 1995 to 2016. |
| | | | |
Donald C. Opatrny 1952 | | Director
(Since 2019) | | Trustee, Vice Chair, Member of the Executive Committee and Chair of the Investment Committee, Cornell University from 2004 to 2019; President, Trustee and Member of the Investment Committee, The Aldrich Contemporary Art Museum from 2007 to 2014; Member of the Board and Investment Committee, University School from 2007 to 2018; Member of the Investment Committee, Mellon Foundation from 2009 to 2015; Trustee, Artstor (a Mellon Foundation affiliate) from 2010 to 2015; President and Trustee, the Center for the Arts, Jackson Hole from 2011 to 2018; Director, Athena Capital Advisors LLC (investment management firm) since 2013; Trustee and Chair of the Investment Committee, Community Foundation of Jackson Hole since 2014; Member of Affordable Housing Supply Board of Jackson, Wyoming since 2017; Member, Investment Funds Committee, State of Wyoming since 2017; Trustee, Phoenix Art Museum since 2018; Trustee, Arizona Community Foundation and Member of Investment Committee since 2020. | | 30 RICs consisting of 159 Portfolios | | None |
| | | | |
Joseph P. Platt 1947 | | Director
(Since 2007) | | General Partner, Thorn Partners, LP (private investments) since 1998; Director, WQED Multi-Media (public broadcasting not-for-profit) since 2001; Chair, Basic Health International (non-profit) since 2015. | | 30 RICs consisting of 159 Portfolios | | Greenlight Capital Re, Ltd. (reinsurance company); Consol Energy Inc. |
| | |
DIRECTOR AND OFFICER INFORMATION | | 113 |
Director and Officer Information (continued)
| | | | | | | | |
| Independent Directors(a) (continued) |
| | | | | |
Name Year of Birth(b) | | Position(s) Held (Length of Service)(c) | | Principal Occupation(s) During Past Five Years | | Number of BlackRock-Advised Registered Investment Companies (“RICs”) Consisting of Investment Portfolios (“Portfolios”) Overseen | | Public Company and Other Investment Company Directorships Held During Past Five Years |
| | | | |
Kenneth L. Urish 1951 | | Director
(Since 2007) | | Managing Partner, Urish Popeck & Co., LLC (certified public accountants and consultants) since 1976; Past- Chairman of the Professional Ethics Committee of the Pennsylvania Institute of Certified Public Accountants and Committee Member thereof since 2007; Member of External Advisory Board, The Pennsylvania State University Accounting Department since founding in 2001; Principal, UP Strategic Wealth Investment Advisors, LLC since 2013; Trustee, The Holy Family Institute from 2001 to 2010; President and Trustee, Pittsburgh Catholic Publishing Associates from 2003 to 2008; Director, Inter- Tel from 2006 to 2007; Member, Advisory Board, ESG Competent Boards since 2020. | | 30 RICs consisting of 159 Portfolios | | None |
| | | | |
Claire A. Walton 1957 | | Director
(Since 2016) | | Chief Operating Officer and Chief Financial Officer of Liberty Square Asset Management, LP from 1998 to 2015; General Partner of Neon Liberty Capital Management, LLC since 2003; Director, Boston Hedge Fund Group from 2009 to 2018; Director, Woodstock Ski Runners since 2013; Director, Massachusetts Council on Economic Education from 2013 to 2015. | | 30 RICs consisting of 159 Portfolios | | None |
| | |
| 114 | | 2 0 2 1 BLACK ROCK ANNUAL REPORT TO SHAREHOLDERS |
Director and Officer Information (continued)
| | | | | | | | |
| Interested Directors(a)(d) |
| | | | | |
Name Year of Birth(b) | | Position(s) Held (Length of Service)(c) | | Principal Occupation(s) During Past Five Years | | Number of BlackRock-Advised Registered Investment Companies (“RICs”) Consisting of Investment Portfolios (“Portfolios”) Overseen | | Public Company and Other Investment Company Directorships Held During Past Five Years |
| | | | |
Robert Fairbairn 1965 | | Director
(Since 2018) | | Vice Chairman of BlackRock, Inc. since 2019; Member of BlackRock’s Global Executive and Global Operating Committees; Co-Chair of BlackRock’s Human Capital Committee; Senior Managing Director of BlackRock, Inc. from 2010 to 2019; oversaw BlackRock’s Strategic Partner Program and Strategic Product Management Group from 2012 to 2019; Member of the Board of Managers of BlackRock Investments, LLC from 2011 to 2018; Global Head of BlackRock’s Retail and iShares® businesses from 2012 to 2016. | | 103 RICs consisting of 261 Portfolios | | None |
| | | | |
John M. Perlowski(e) 1964 | | Director
(Since 2015) President and Chief Executive Officer
(Since 2010) | | Managing Director of BlackRock, Inc. since 2009; Head of BlackRock Global Accounting and Product Services since 2009; Advisory Director of Family Resource Network (charitable foundation) since 2009. | | 105 RICs consisting of 263 Portfolios | | None |
(a) The address of each Director is c/o BlackRock, Inc., 55 East 52nd Street, New York, New York 10055. (b) Independent Directors serve until their resignation, retirement, removal or death, or until December 31 of the year in which they turn 75. The Board may determine to extend the terms of Independent Directors on a case-by-case basis, as appropriate. (c) Following the combination of Merrill Lynch Investment Managers, L.P. (“MLIM”) and BlackRock, Inc. in September 2006, the various legacy MLIM and legacy BlackRock fund boards were realigned and consolidated into three new fund boards in 2007. Furthermore, effective January 1, 2019, three BlackRock Fund Complexes were realigned and consolidated into two BlackRock Fund Complexes. As a result, although the chart shows the year that each Independent Director joined the Board, certain Independent Directors first became members of the boards of other BlackRock-advised Funds, legacy MLIM funds or legacy BlackRock funds as follows: Bruce R. Bond, 2005; Cynthia A. Montgomery, 1994; Joseph P. Platt, 1999; Kenneth L. Urish, 1999; Lena G. Goldberg, 2016; Henry R. Keizer, 2016; Donald C. Opatrny, 2015. (d) Mr. Fairbairn and Mr. Perlowski are both “interested persons,” as defined in the 1940 Act, of the Trust/Corporations based on their positions with BlackRock, Inc. and its affiliates. Mr. Fairbairn and Mr. Perlowski are also board members of the BlackRock Fixed-Income Complex. (e) Mr. Perlowski is also a trustee of the BlackRock Credit Strategies Fund and BlackRock Private Investments Fund. |
|
| Officers Who Are Not Directors(a) |
| | | |
Name Year of Birth(b) | | Position(s) Held (Length of Service) | | Principal Occupation(s) During Past Five Years |
| | |
Thomas Callahan 1968 | | Vice President
(Since 2016) | | Managing Director of BlackRock, Inc. since 2013; Member of the Board of Managers of BlackRock Investments, LLC (principal underwriter) since 2019 and Managing Director thereof since 2017; Head of BlackRock’s Global Cash Management Business since 2016; Co-Head of the Global Cash Management Business from 2014 to 2016; Deputy Head of the Global Cash Management Business from 2013 to 2014; Member of the Cash Management Group Executive Committee since 2013; Chief Executive Officer of NYSE Liffe U.S. from 2008 to 2013. |
| | |
Jennifer McGovern 1977 | | Vice President
(Since 2014) | | Managing Director of BlackRock, Inc. since 2016; Director of BlackRock, Inc. from 2011 to 2015; Head of Americas Product Development and Governance for BlackRock’s Global Product Group since 2019; Head of Product Structure and Oversight for BlackRock’s U.S. Wealth Advisory Group from 2013 to 2019. |
| | |
Trent Walker 1974 | | Chief Financial Officer
(Since 2021) | | Managing Director of BlackRock, Inc. since September 2019; Executive Vice President of PIMCO from 2016 to 2019; Senior Vice President of PIMCO from 2008 to 2015; Treasurer from 2013 to 2019 and Assistant Treasurer from 2007 to 2017 of PIMCO Funds, PIMCO Variable Insurance Trust, PIMCO ETF Trust, PIMCO Equity Series, PIMCO Equity Series VIT, PIMCO Managed Accounts Trust, 2 PIMCO-sponsored interval funds and 21 PIMCO-sponsored closed-end funds. |
| | |
Jay M. Fife 1970 | | Treasurer
(Since 2007) | | Managing Director of BlackRock, Inc. since 2007. |
| | |
Charles Park 1967 | | Chief Compliance Officer
(Since 2014) | | Anti-Money Laundering Compliance Officer for certain BlackRock-advised Funds from 2014 to 2015; Chief Compliance Officer of BlackRock Advisors, LLC and the BlackRock-advised Funds in the BlackRock Multi-Asset Complex and the BlackRock Fixed-Income Complex since 2014; Principal of and Chief Compliance Officer for iShares® Delaware Trust Sponsor LLC since 2012 and BlackRock Fund Advisors (“BFA”) since 2006; Chief Compliance Officer for the BFA-advised iShares® exchange traded funds since 2006; Chief Compliance Officer for BlackRock Asset Management International Inc. since 2012. |
| | |
DIRECTOR AND OFFICER INFORMATION | | 115 |
Director and Officer Information (continued)
| | | | | | | | |
| Officers Who Are Not Directors(a) (continued) |
| | | |
Name Year of Birth(b) | | Position(s) Held (Length of Service) | | Principal Occupation(s) During Past Five Years |
| | |
Lisa Belle 1968 | | Anti-Money Laundering Compliance Officer
(Since 2019) | | Managing Director of BlackRock, Inc. since 2019; Global Financial Crime Head for Asset and Wealth Management of JP Morgan from 2013 to 2019; Managing Director of RBS Securities from 2012 to 2013; Head of Financial Crimes for Barclays Wealth Americas from 2010 to 2012. |
| | |
Janey Ahn 1975 | | Secretary
(Since 2019) | | Managing Director of BlackRock, Inc. since 2018; Director of BlackRock, Inc. from 2009 to 2017. |
(a) The address of each Officer is c/o BlackRock, Inc., 55 East 52nd Street, New York, New York 10055. (b) Officers of the Trust/Corporation serve at the pleasure of the Board. |
Further information about the Trust’s/Corporations’ Directors and Officers is available in the Trust’s/Corporations’ Statement of Additional Information, which can be obtained without charge by calling (800) 441-7762.
Effective December 31, 2021, Bruce R. Bond retired as a Director of the Trust/Corporation.
| | |
| 116 | | 2 0 2 1 BLACK ROCK ANNUAL REPORT TO SHAREHOLDERS |
Additional Information
Regulation Regarding Derivatives
On October 28, 2020, the Securities and Exchange Commission (the “SEC”) adopted regulations governing the use of derivatives by registered investment companies (“Rule 18f-4”). The Funds will be required to implement and comply with Rule 18f-4 by August 19, 2022. Once implemented, Rule 18f-4 will impose limits on the amount of derivatives a fund can enter into, eliminate the asset segregation framework currently used by funds to comply with Section 18 of the 1940 Act, treat derivatives as senior securities and require funds whose use of derivatives is more than a limited specified exposure amount to establish and maintain a comprehensive derivatives risk management program and appoint a derivatives risk manager.
Dividend Policy
Each Fund’s dividend policy is to distribute all or a portion of its net investment income to its shareholders on a monthly/quarterly basis. In order to provide shareholders with a more stable level of dividend distributions, the distributions paid by a Fund for any particular month/quarter may be more or less than the amount of net investment income earned by a Fund during such month/quarter. The portion of distributions that exceeds a Fund current and accumulated earnings and profits, which are measured on a tax basis, will constitute a nontaxable return of capital. The Funds’ current accumulated but undistributed net investment income, if any, is disclosed as accumulated earnings (loss) in the Statements of Assets and Liabilities, which comprises part of the financial information included in this report.
General Information
Quarterly performance, semi-annual and annual reports, current net asset value and other information regarding the Funds may be found on BlackRock’s website, which can be accessed at blackrock.com. Any reference to BlackRock’s website in this report is intended to allow investors public access to information regarding the Funds and does not, and is not intended to, incorporate BlackRock’s website in this report.
Householding
The Funds will mail only one copy of shareholder documents, including prospectuses, annual and semi-annual reports, Rule 30e-3 notices and proxy statements, to shareholders with multiple accounts at the same address. This practice is commonly called “householding” and is intended to reduce expenses and eliminate duplicate mailings of shareholder documents. Mailings of your shareholder documents may be householded indefinitely unless you instruct us otherwise. If you do not want the mailing of these documents to be combined with those for other members of your household, please call the Funds at (800) 441-7762.
Availability of Quarterly Schedule of Investments
The Funds file their complete schedules of portfolio holdings with the SEC for the first and third quarters of each fiscal year as an exhibit to their reports on Form N-PORT. The Funds’ Forms N-PORT are available on the SEC’s website at sec.gov. Additionally, each Fund makes its portfolio holdings for the first and third quarters of each fiscal year available at blackrock.com/fundreports.
Availability of Proxy Voting Policies, Procedures and Voting Records
A description of the policies and procedures that the Funds use to determine how to vote proxies relating to portfolio securities and information about how the Funds voted proxies relating to securities held in the Funds’ portfolios during the most recent 12-month period ended June 30 is available without charge, upon request (1) by calling (800) 441-7762; (2) on the BlackRock website at blackrock.com; and (3) on the SEC’s website at sec.gov.
BlackRock’s Mutual Fund Family
BlackRock offers a diverse lineup of open-end mutual funds crossing all investment styles and managed by experts in equity, fixed-income and tax-exempt investing. Visit blackrock.com for more information.
Shareholder Privileges
Account Information
Call us at (800) 441-7762 from 8:00 AM to 6:00 PM ET on any business day to get information about your account balances, recent transactions and share prices. You can also visit blackrock.com for more information.
Automatic Investment Plans
Investor class shareholders who want to invest regularly can arrange to have $50 or more automatically deducted from their checking or savings account and invested in any of the BlackRock funds.
| | |
ADDITIONAL INFORMATION | | 117 |
Additional Information (continued)
Systematic Withdrawal Plans
Investor class shareholders can establish a systematic withdrawal plan and receive periodic payments of $50 or more from their BlackRock funds, as long as their account balance is at least $10,000.
Retirement Plans
Shareholders may make investments in conjunction with Traditional, Rollover, Roth, Coverdell, Simple IRAs, SEP IRAs and 403(b) Plans.
BlackRock Privacy Principles
BlackRock is committed to maintaining the privacy of its current and former fund investors and individual clients (collectively, “Clients”) and to safeguarding their non-public personal information. The following information is provided to help you understand what personal information BlackRock collects, how we protect that information and why in certain cases we share such information with select parties.
If you are located in a jurisdiction where specific laws, rules or regulations require BlackRock to provide you with additional or different privacy-related rights beyond what is set forth below, then BlackRock will comply with those specific laws, rules or regulations.
BlackRock obtains or verifies personal non-public information from and about you from different sources, including the following: (i) information we receive from you or, if applicable, your financial intermediary, on applications, forms or other documents; (ii) information about your transactions with us, our affiliates, or others; (iii) information we receive from a consumer reporting agency; and (iv) from visits to our websites.
BlackRock does not sell or disclose to non-affiliated third parties any non-public personal information about its Clients, except as permitted by law or as is necessary to respond to regulatory requests or to service Client accounts. These non-affiliated third parties are required to protect the confidentiality and security of this information and to use it only for its intended purpose.
We may share information with our affiliates to service your account or to provide you with information about other BlackRock products or services that may be of interest to you. In addition, BlackRock restricts access to non-public personal information about its Clients to those BlackRock employees with a legitimate business need for the information. BlackRock maintains physical, electronic and procedural safeguards that are designed to protect the non-public personal information of its Clients, including procedures relating to the proper storage and disposal of such information.
Fund and Service Providers
Investment Adviser and Administrator(a)
BlackRock Advisors, LLC
Wilmington, DE 19809
Investment Adviser (b)
BlackRock Fund Advisors
San Francisco, CA 94105
Sub-Adviser
BlackRock International Limited
Edinburgh, EH3 8BL
United Kingdom
Accounting Agent and Custodian
State Street Bank and Trust Company
Boston, MA 02111
Transfer Agent
BNY Mellon Investment Servicing (US) Inc.
Wilmington, DE 19809
Distributor
BlackRock Investments, LLC
New York, NY 10022
Independent Registered Public Accounting Firm
Deloitte & Touche LLP
Boston, MA 02116
Legal Counsel
Sidley Austin LLP
New York, NY 10019
Address of the Funds/Corporation/Master LLC
100 Bellevue Parkway
Wilmington, DE 19809
| (a) | Administrator to iShares Russell 2000 Small-Cap Index Fund and iShares MSCI |
EAFE International Index Fund.
| (b) | For iShares Municipal Bond Index Fund. |
| | |
| 118 | | 2 0 2 1 BLACK ROCK ANNUAL REPORT TO SHAREHOLDERS |
Glossary of Terms Used in this Report
| | |
| Portfolio Abbreviation |
| |
| ADR | | American Depositary Receipt |
| |
| AGC | | Assured Guaranty Corp. |
| |
| AGM | | Assured Guaranty Municipal Corp. |
| |
| AMBAC | | AMBAC Assurance Corp. |
| |
| AMT | | Alternative Minimum Tax |
| |
| ARB | | Airport Revenue Bonds |
| |
| CAB | | Capital Appreciation Bonds |
| |
| COP | | Certificates of Participation |
| |
| ETF | | Exchange-Traded Fund |
| |
| FTSE | | Financial Times Stock Exchange |
| |
| GO | | General Obligation Bonds |
| |
| PSF | | Permanent School Fund |
| |
| RB | | Revenue Bond |
| |
| REIT | | Real Estate Investment Trust |
| |
| SAP | | Subject to Appropriations |
| |
| SAW | | State Aid Withholding |
| |
| SCA | | Societe en Commandite par Actions |
| | |
GLOSSARY OF TERMS USED IN THIS REPORT | | 119 |
Want to know more?
blackrock.com | 800-441-7762
This report is intended for current holders. It is not authorized for use as an offer of sale or a solicitation of an offer to buy shares of the Funds unless preceded or accompanied by the Fund’s current prospectus. Past performance results shown in this report should not be considered a representation of future performance. Investment returns and principal value of shares will fluctuate so that shares, when redeemed, may be worth more or less than their original cost. Statements and other information herein are as dated and are subject to change.
iSIndex-12/21-AR
| Item 2 – | Code of Ethics – Each registrant (or each, a “Fund”) has adopted a code of ethics, as of the end of the period covered by this report, applicable to the registrants’ principal executive officer, principal financial officer, principal accounting officer or controller, or persons performing similar functions. During the period covered by this report, the code of ethics was amended to update certain information and to make other non-material changes. During the period covered by this report, there have been no waivers granted under the code of ethics. The registrants undertake to provide a copy of the code of ethics to any person upon request, without charge, who calls 1-800-441-7762. |
| Item 3 – | Audit Committee Financial Expert – Each registrant’s board of directors (the “board of directors”), has determined that (i) the registrant has the following audit committee financial experts serving on its audit committee and (ii) each audit committee financial expert is independent: |
Neil A. Cotty
Henry R. Keizer
Kenneth L. Urish
Under applicable securities laws, a person determined to be an audit committee financial expert will not be deemed an “expert” for any purpose, including without limitation for the purposes of Section 11 of the Securities Act of 1933, as a result of being designated or identified as an audit committee financial expert. The designation or identification of a person as an audit committee financial expert does not impose on such person any duties, obligations, or liabilities greater than the duties, obligations, and liabilities imposed on such person as a member of the audit committee and board of directors in the absence of such designation or identification. The designation or identification of a person as an audit committee financial expert does not affect the duties, obligations, or liability of any other member of the audit committee or board of directors.
| Item 4 – | Principal Accountant Fees and Services |
The following table presents fees billed by Deloitte & Touche LLP (“D&T”) in each of the last two fiscal years for the services rendered to the Funds:
| | | | | | | | | | | | | | | | |
| | (a) Audit Fees | | (b) Audit-Related
Fees1 | | (c) Tax Fees2 | | (d) All Other Fees |
Entity Name | | Current Fiscal
Year
End | | Previous Fiscal Year End | | Current Fiscal Year End | | Previous Fiscal
Year End | | Current Fiscal
Year
End | | Previous Fiscal
Year End | | Current Fiscal Year End | | Previous Fiscal
Year End |
| iShares MSCI EAFE International Index Fund of BlackRock Index Funds, Inc. | | $32,623 | | $33,660 | | $207 | | $0 | | $16,400 | | $15,800 | | $0 | | $0 |
| iShares Russell 2000 Small-Cap Index Fund of BlackRock Index Funds, Inc. | | $7,878 | | $8,160 | | $207 | | $0 | | $23,500 | | $23,200 | | $0 | | $0 |
| Master Small Cap Index Series of Quantitative Master Series LLC | | $28,482 | | $29,376 | | $207 | | $0 | | $16,800 | | $16,800 | | $0 | | $0 |
The following table presents fees billed by D&T that were required to be approved by each registrant’s audit committee (each a “Committee”) for services that relate directly to the operations or financial reporting of each Fund
and that are rendered on behalf of BlackRock Advisors, LLC (the “Investment Adviser” or “BlackRock”)and entities controlling, controlled by, or under common control with BlackRock (not including any sub-adviser whose role is primarily portfolio management and is subcontracted with or overseen by another investment adviser) that provide ongoing services to each Fund (“Affiliated Service Providers”):
| | | | |
| | Current Fiscal Year End | | Previous Fiscal Year End |
| (b) Audit-Related Fees1 | | $0 | | $0 |
| (c) Tax Fees2 | | $0 | | $0 |
| (d) All Other Fees3 | | $2,032,000 | | $1,984,000 |
1 The nature of the services includes assurance and related services reasonably related to the performance of the audit or review of financial statements not included in Audit Fees, including accounting consultations, agreed-upon procedure reports, attestation reports, comfort letters, out-of-pocket expenses and internal control reviews not required by regulators.
2 The nature of the services includes tax compliance and/or tax preparation, including services relating to the filing or amendment of federal, state or local income tax returns, regulated investment company qualification reviews, taxable income and tax distribution calculations.
3 Non-audit fees of $2,032,000 and $1,984,000 for the current fiscal year and previous fiscal year, respectively, were paid to each Fund’s principal accountant in their entirety by BlackRock, in connection with services provided to the Affiliated Service Providers of each Fund and of certain other funds sponsored and advised by BlackRock or its affiliates for a service organization review and an accounting research tool subscription. These amounts represent aggregate fees paid by BlackRock and were not allocated on a per fund basis.
(e)(1) Audit Committee Pre-Approval Policies and Procedures:
Each Committee has adopted policies and procedures with regard to the pre-approval of services. Audit, audit-related and tax compliance services provided to the registrant on an annual basis require specific pre-approval by the Committee. The Committee also must approve other non-audit services provided to the registrant and those non-audit services provided to the Investment Adviser and Affiliated Service Providers that relate directly to the operations and the financial reporting of the registrant. Certain of these non-audit services that the Committee believes are (a) consistent with the SEC’s auditor independence rules and (b) routine and recurring services that will not impair the independence of the independent accountants may be approved by the Committee without consideration on a specific case-by-case basis (“general pre-approval”). The term of any general pre-approval is 12 months from the date of the pre-approval, unless the Committee provides for a different period. Tax or other non-audit services provided to the registrants which have a direct impact on the operations or financial reporting of the registrant will only be deemed pre-approved provided that any individual project does not exceed $10,000 attributable to the registrant or $50,000 per project. For this purpose, multiple projects will be aggregated to determine if they exceed the previously mentioned cost levels.
Any proposed services exceeding the pre-approved cost levels will require specific pre-approval by the registrant’s Committee, as will any other services not subject to general pre-approval (e.g., unanticipated but permissible services). The Committee is informed of each service approved subject to general pre-approval at the next regularly scheduled in-person board meeting. At this meeting, an analysis of such services is presented to the Committee for ratification. The Committee may delegate to the Committee Chairman the authority to approve the provision of and fees for any specific engagement of permitted non-audit services, including services exceeding pre-approved cost levels.
(e)(2) None of the services described in each of Items 4(b) through (d) were approved by the Committee pursuant to the de minimis exception in paragraph (c)(7)(i)(C) of Rule 2-01 of Regulation S-X.
(f) Not Applicable
(g) The aggregate non-audit fees, defined as the sum of the fees shown under “Audit-Related Fees,” “Tax Fees” and “All Other Fees,” paid to the accountant for services rendered by the accountant to the registrant, the Investment Adviser and the Affiliated Service Providers were:
| | | | | | | | |
| | Entity Name | | Current Fiscal Year End | | Previous Fiscal Year End | | |
| | iShares MSCI EAFE International Index Fund of BlackRock Index Funds, Inc. | | $16,607 | | $15,800 |
| | iShares Russell 2000 Small-Cap Index Fund of BlackRock Index Funds, Inc. | | $23,707 | | $23,200 |
| | Master Small Cap Index Series of Quantitative Master Series LLC | | $17,007 | | $16,800 |
Additionally, the amounts billed by D&T in connection with services provided to the Affiliated Service Providers of the Funds and of other funds sponsored and advised by BlackRock or its affiliates during the current and previous fiscal years for a service organization review and an accounting research tool subscription were:
| | |
Current Fiscal Year End | | Previous Fiscal Year End |
$2,032,000 | | $1,984,000 |
These amounts represent aggregate fees paid by BlackRock and were not allocated on a per fund basis.
(h) The Committee has considered and determined that the provision of non-audit services that were rendered to the Investment Adviser and the Affiliated Service Providers that were not pre-approved pursuant to paragraph (c)(7)(ii) of Rule 2-01 of Regulation S-X is compatible with maintaining the principal accountant’s independence.
| Item 5 – | Audit Committee of Listed Registrants – Not Applicable |
(a) The registrants’ Schedules of Investments are included as part of the Report to Stockholders filed under Item 1(a) of this Form.
(b) Not Applicable due to no such divestments during the semi-annual period covered since the previous Form N-CSR filing.
| Item 7 – | Disclosure of Proxy Voting Policies and Procedures for Closed-End Management Investment Companies – Not Applicable |
| Item 8 – | Portfolio Managers of Closed-End Management Investment Companies – Not Applicable |
| Item 9 – | Purchases of Equity Securities by Closed-End Management Investment Company and Affiliated Purchasers – Not Applicable |
| Item 10 – | Submission of Matters to a Vote of Security Holders – There have been no material changes to these procedures. |
| Item 11 – | Controls and Procedures |
(a) The registrants’ principal executive and principal financial officers, or persons performing similar functions, have concluded that the registrants’ disclosure controls and procedures (as defined in Rule 30a-3(c) under the Investment Company Act of 1940, as amended (the “1940 Act”)) are effective as of a date within 90 days of the filing of this report based on the evaluation of these controls and procedures required by Rule 30a-3(b) under the 1940 Act and Rule 15d-15(b) under the Securities Exchange Act of 1934, as amended.
(b) There were no changes in the registrants’ internal control over financial reporting (as defined in Rule 30a-3(d) under the 1940 Act) that occurred during the period covered by this report that have materially affected, or are reasonably likely to materially affect, the registrants’ internal control over financial reporting.
| Item 12 – | Disclosure of Securities Lending Activities for Closed-End Management Investment Companies – Not Applicable |
| Item 13 – | Exhibits attached hereto |
(a)(1) Code of Ethics – See Item 2
(a)(2) Section 302 Certifications are attached
(a)(3) Any written solicitation to purchase securities under Rule 23c-1 – Not Applicable
(a)(4) Change in Registrant’s independent public accountant – Not Applicable
(b) Section 906 Certifications are attached
Pursuant to the requirements of the Securities Exchange Act of 1934 and the Investment Company Act of 1940, each registrant has duly caused this report to be signed on its behalf by the undersigned, thereunto duly authorized.
BlackRock Index Funds, Inc. and Quantitative Master Series LLC
| | |
By: | | /s/ John M. Perlowski |
| | John M. Perlowski |
| | Chief Executive Officer (principal executive officer) of |
| | BlackRock Index Funds, Inc. and Quantitative Master Series LLC |
Date: February 24, 2022
Pursuant to the requirements of the Securities Exchange Act of 1934 and the Investment Company Act of 1940, this report has been signed below by the following persons on behalf of each registrant and in the capacities and on the dates indicated.
| | |
By: | | /s/ John M. Perlowski |
| | John M. Perlowski |
| | Chief Executive Officer (principal executive officer) of |
| | BlackRock Index Funds, Inc. and Quantitative Master Series LLC |
Date: February 24, 2022
| | |
By: | | /s/ Trent Walker |
| | Trent Walker |
| | Chief Financial Officer (principal financial officer) of |
| | BlackRock Index Funds, Inc. and Quantitative Master Series LLC |
Date: February 24, 2022