See Notes to Financial Statements.
| |
|
| |
Financial Highlights | BlackRock S&P 500 Index Fund |
| | | | | | | | | | | | | | | | | | | |
| | Institutional | |
| |
|
|
| | Six Months
Ended
June 30,
2010
(Unaudited) | | | | | | | | | | | |
| | | | | | | | | | | | |
| | | Year Ended December 31, | |
| | |
|
|
| | | 2009 | | 2008 | | 2007 | | 2006 | | 2005 | |
|
|
|
|
|
|
|
|
|
|
|
|
|
|
Per Share Operating Performance | | | | | | | | | | | | | | | | | | | |
|
|
|
|
|
|
|
|
|
|
|
|
|
|
|
|
|
|
|
|
Net asset value, beginning of period | | $ | 13.63 | | $ | 11.00 | | $ | 18.01 | | $ | 17.40 | | $ | 15.29 | | $ | 14.84 | |
| |
|
|
|
|
|
|
|
|
|
|
|
|
|
|
|
|
|
|
Net investment income1 | | | 0.11 | | | 0.23 | | | 0.31 | | | 0.30 | | | 0.26 | | | 0.23 | |
Net realized and unrealized gain (loss) | | | (1.04 | ) | | 2.64 | | | (7.01 | ) | | 0.62 | | | 2.11 | | | 0.46 | |
| |
|
|
|
|
|
|
|
|
|
|
|
|
|
|
|
|
|
|
Net increase (decrease) from investment operations | | | (0.93 | ) | | 2.87 | | | (6.70 | ) | | 0.92 | | | 2.37 | | | 0.69 | |
| |
|
|
|
|
|
|
|
|
|
|
|
|
|
|
|
|
|
|
Dividends from net investment income | | | — | | | (0.24 | ) | | (0.31 | ) | | (0.31 | ) | | (0.26 | ) | | (0.24 | ) |
| |
|
|
|
|
|
|
|
|
|
|
|
|
|
|
|
|
|
|
Net asset value, end of period | | $ | 12.70 | | $ | 13.63 | | $ | 11.00 | | $ | 18.01 | | $ | 17.40 | | $ | 15.29 | |
| |
|
|
|
|
|
|
|
|
|
|
|
|
|
|
|
|
|
|
| | | | | | | | | | | | | | | | | | | |
|
|
|
|
|
|
|
|
|
|
|
|
|
|
|
|
|
|
|
|
Total Investment Return2 | | | | | | | | | | | | | | | | | | | |
|
|
|
|
|
|
|
|
|
|
|
|
|
|
|
|
|
|
|
|
Based on net asset value | | | (6.82 | )%3 | | 26.15 | % | | (37.20 | )% | | 5.29 | % | | 15.49 | % | | 4.63 | % |
| |
|
|
|
|
|
|
|
|
|
|
|
|
|
|
|
|
|
|
| | | | | | | | | | | | | | | | | | | |
|
|
|
|
|
|
|
|
|
|
|
|
|
|
|
|
|
|
|
|
Ratios to Average Net Assets4 | | | | | | | | | | | | | | | | | | | |
|
|
|
|
|
|
|
|
|
|
|
|
|
|
|
|
|
|
|
|
Total expenses | | | 0.34 | %5 | | 0.35 | % | | 0.35 | % | | 0.34 | % | | 0.35 | % | | 0.35 | % |
| |
|
|
|
|
|
|
|
|
|
|
|
|
|
|
|
|
|
|
Net investment income | | | 1.61 | %5 | | 2.02 | % | | 2.00 | % | | 1.64 | % | | 1.61 | % | | 1.52 | % |
| |
|
|
|
|
|
|
|
|
|
|
|
|
|
|
|
|
|
|
| | | | | | | | | | | | | | | | | | | |
|
|
|
|
|
|
|
|
|
|
|
|
|
|
|
|
|
|
|
|
Supplemental Data | | | | | | | | | | | | | | | | | | | |
|
|
|
|
|
|
|
|
|
|
|
|
|
|
|
|
|
|
|
|
Net assets, end of period (000) | | $ | 879,145 | | $ | 951,380 | | $ | 813,527 | | $ | 1,779,030 | | $ | 1,699,791 | | $ | 1,544,023 | |
| |
|
|
|
|
|
|
|
|
|
|
|
|
|
|
|
|
|
|
Portfolio turnover of the Series | | | 3 | % | | 7 | % | | 8 | % | | 4 | % | | 4 | % | | 11 | % |
| |
|
|
|
|
|
|
|
|
|
|
|
|
|
|
|
|
|
|
| |
1 | Based on average shares outstanding. |
| |
2 | Where applicable, total investment returns include the reinvestment of dividends and distributions. |
| |
3 | Aggregate total investment return. |
| |
4 | Includes the Fund’s share of the Series’ allocated expenses and/or net investment income. |
| |
5 | Annualized. |
| | |
See Notes to Financial Statements. |
|
10 | BLACKROCK S&P 500 INDEX FUND | JUNE 30, 2010 |
| |
|
| |
Financial Highlights (concluded) | BlackRock S&P 500 Index Fund |
| | | | | | | | | | | | | | | | | | | |
| | Investor A |
| |
|
| | Six Months
Ended
June 30,
2010
(Unaudited) | | |
| | | Year Ended December 31, |
| | |
|
| | | 2009 | | 2008 | | 2007 | | 2006 | | 2005 | |
|
|
|
|
|
|
|
|
|
|
|
|
|
|
|
|
|
|
|
|
Per Share Operating Performance | | | | | | | | | | | | | | | | | | | |
|
|
|
|
|
|
|
|
|
|
|
|
|
|
|
|
|
|
|
|
Net asset value, beginning of period | | $ | 13.61 | | $ | 10.98 | | $ | 17.96 | | $ | 17.36 | | $ | 15.26 | | $ | 14.81 | |
| |
|
|
|
|
|
|
|
|
|
|
|
|
|
|
|
|
|
|
Net investment income1 | | | 0.09 | | | 0.20 | | | 0.27 | | | 0.25 | | | 0.22 | | | 0.19 | |
Net realized and unrealized gain (loss) | | | (1.03 | ) | | 2.64 | | | (6.98 | ) | | 0.61 | | | 2.10 | | | 0.46 | |
| |
|
|
|
|
|
|
|
|
|
|
|
|
|
|
|
|
|
|
Net increase (decrease) from investment operations | | | (0.94 | ) | | 2.84 | | | (6.71 | ) | | 0.86 | | | 2.32 | | | 0.65 | |
| |
|
|
|
|
|
|
|
|
|
|
|
|
|
|
|
|
|
|
Dividends from net investment income | | | — | | | (0.21 | ) | | (0.27 | ) | | (0.26 | ) | | (0.22 | ) | | (0.20 | ) |
| |
|
|
|
|
|
|
|
|
|
|
|
|
|
|
|
|
|
|
Net asset value, end of period | | $ | 12.67 | | $ | 13.61 | | $ | 10.98 | | $ | 17.96 | | $ | 17.36 | | $ | 15.26 | |
| |
|
|
|
|
|
|
|
|
|
|
|
|
|
|
|
|
|
|
| | | | | | | | | | | | | | | | | | | |
|
|
|
|
|
|
|
|
|
|
|
|
|
|
|
|
|
|
|
|
Total Investment Return2 | | | | | | | | | | | | | | | | | | | |
|
|
|
|
|
|
|
|
|
|
|
|
|
|
|
|
|
|
|
|
Based on net asset value | | | (6.91 | )%3 | | 25.92 | % | | (37.36 | )% | | 4.97 | % | | 15.18 | % | | 4.38 | % |
| |
|
|
|
|
|
|
|
|
|
|
|
|
|
|
|
|
|
|
| | | | | | | | | | | | | | | | | | | |
|
|
|
|
|
|
|
|
|
|
|
|
|
|
|
|
|
|
|
|
Ratios to Average Net Assets4 | | | | | | | | | | | | | | | | | | | |
|
|
|
|
|
|
|
|
|
|
|
|
|
|
|
|
|
|
|
|
Total expenses | | | 0.60 | %5 | | 0.61 | % | | 0.60 | % | | 0.60 | % | | 0.60 | % | | 0.60 | % |
| |
|
|
|
|
|
|
|
|
|
|
|
|
|
|
|
|
|
|
Net investment income | | | 1.36 | %5 | | 1.76 | % | | 1.75 | % | | 1.38 | % | | 1.36 | % | | 1.27 | % |
| |
|
|
|
|
|
|
|
|
|
|
|
|
|
|
|
|
|
|
| | | | | | | | | | | | | | | | | | | |
|
|
|
|
|
|
|
|
|
|
|
|
|
|
|
|
|
|
|
|
Supplemental Data | | | | | | | | | | | | | | | | | | | |
|
|
|
|
|
|
|
|
|
|
|
|
|
|
|
|
|
|
|
|
Net assets, end of period (000) | | $ | 651,760 | | $ | 705,608 | | $ | 579,920 | | $ | 930,377 | | $ | 969,213 | | $ | 896,796 | |
| |
|
|
|
|
|
|
|
|
|
|
|
|
|
|
|
|
|
|
Portfolio turnover of the Series | | | 3 | % | | 7 | % | | 8 | % | | 4 | % | | 4 | % | | 11 | % |
| |
|
|
|
|
|
|
|
|
|
|
|
|
|
|
|
|
|
|
| | |
| 1 | Based on average shares outstanding. |
| | |
| 2 | Where applicable, total investment returns include the reinvestment of dividends and distributions. |
| | |
| 3 | Aggregate total investment return. |
| | |
| 4 | Includes the Fund’s share of the Series’ allocated expenses and/or net investment income. |
| | |
| 5 | Annualized. |
| | | |
See Notes to Financial Statements. |
|
| BLACKROCK S&P 500 INDEX FUND | JUNE 30, 2010 | 11 |
| |
|
| |
Notes to Financial Statements (Unaudited) | BlackRock S&P 500 Index Fund |
1. Organization and Significant Accounting Policies:
BlackRock S&P 500 Index Fund (the “Fund”), is a series of BlackRock Index Funds, Inc. (the “Corporation), registered under the Investment Company Act of 1940, as amended (the “1940 Act”), as a non-diversified, open-end management investment company. The Fund is organized as a Maryland corporation. The Fund seeks to achieve its investment objective by investing all of its assets in Master S&P 500 Index Series (the “Series”) of Quantitative Master Series LLC. The value of the Fund’s investment in the Series reflects the Fund’s proportionate interest in the net assets of the Series. The percentage of the Series owned by the Fund at June 30, 2010 was 74.2%. The performance of the Fund is directly affected by the performance of the Series. The financial statements of the Series, including the Schedule of Investments, are included elsewhere in this report and should be read in conjunction with the Fund’s financial statements. The Fund’s financial statements are prepared in conformity with accounting principles generally accepted in the United States of America (“US GAAP”), which may require management to make estimates and assumptions that affect the reported amounts and disclosures in the financial statements. Actual results could differ from those estimates. The Fund offers multiple classes of shares. Institutional Shares are sold without a sales charge and only to certain eligible investors. Investor A Shares are sold without a front-end sales charge. Both classes of shares have identical voting, dividend, liquidation and other rights and the same terms and conditions, except that Investor A Shares bear certain expenses related to the shareholder servicing of such shares and have exclusive voting rights with respect to matters relating to its shareholder servicing expenditures.
The following is a summary of significant accounting policies followed by the Fund:
Valuation: The Fund’s policy is to fair value its financial instruments at market value. The Fund records its investment in the Series at fair value based on the Fund’s proportionate interest in the net assets of the Series. Valuation of securities held by the Series, including categorization of fair value measurements, is discussed in Note 1 of the Series’ Notes to Financial Statements, which are included elsewhere in this report.
Investment Transactions and Investment Income: For financial reporting purposes, investment transactions in the Series are accounted for on a trade date basis. The Fund records daily its proportionate share of the Series’ income, expenses and realized and unrealized gains and losses. In addition, the Fund accrues its own expenses. Income and realized and unrealized gains and losses on investments are allocated daily to each class based on its relative net assets.
Dividends and Distributions: Dividends and distributions paid by the Fund are recorded on the ex-dividend dates. The amount and timing of dividends and distributions are determined in accordance with federal income tax regulations, which may differ from US GAAP.
Income Taxes: It is the Fund’s policy to comply with the requirements of the Internal Revenue Code of 1986, as amended, applicable to regulated investment companies and to distribute substantially all of its taxable income to its shareholders. Therefore, no federal income tax provision is required.
The Fund files US federal and various state and local tax returns. No income tax returns are currently under examination. The statute of limitations on the Fund’s US federal tax returns remains open for each of the four years ended December 31, 2009. The statutes of limitations on the Fund’s state and local tax returns may remain open for an additional year depending upon the jurisdiction. There are no uncertain tax positions that require recognition of a tax liability.
Other: Expenses directly related to the Fund or its classes are charged to that Fund or class. Other operating expenses shared by several funds are pro rated among those funds on the basis of relative net assets or other appropriate methods. Other expenses of the Fund are allocated daily to each class based on its relative net assets.
| | |
|
12 | BLACKROCK S&P 500 INDEX FUND | JUNE 30, 2010 |
| |
|
| |
Notes to Financial Statements (continued) | BlackRock S&P 500 Index Fund |
2. Administration Agreement and Other Transactions with Affiliates:
The PNC Financial Services Group, Inc. (“PNC”), Bank of America Corporation (“BAC”) and Barclays Bank PLC (“Barclays”) are the largest stockholders of BlackRock, Inc. (“BlackRock”). Due to the ownership structure, PNC is an affiliate of the Fund for 1940 Act purposes, but BAC and Barclays are not.
The Corporation, on behalf of the Fund, entered into an Administration Agreement with BlackRock Advisors, LLC (the “Administrator”), an indirect, wholly owned subsidiary of BlackRock, to provide administrative services (other than investment advice and related portfolio activities). For such services, the Fund pays the Administrator a monthly fee at an annual rate of 0.195% of the average daily value of the Fund’s net assets. Prior to June 1, 2010, the Fund paid the Administrator a monthly fee at an annual rate of 0.245% of the average daily value of the Fund’s net assets. The Fund does not pay an Advisory fee or investment management fee.
The Administrator has agreed voluntarily to waive and/or reimburse fees and/or expenses to limit the net annual operating expenses (excluding dividend expense, interest expense, acquired fund fees and expenses and certain other Fund expenses) will not exceed 0.40% for Institutional Shares and 0.65% for Investor A Shares of average daily net assets. These voluntary waivers or reimbursements may be reduced or discontinued at any time without notice.
The Corporation, on behalf of the Fund, entered into a Distribution Agreement and Distribution Plan with BlackRock Investments, LLC (“BRIL”), an affiliate of BlackRock. Pursuant to the Distribution Plan and in accordance with Rule 12b-1 under the 1940 Act, the Fund pays BRIL ongoing service and distribution fees. The fees are accrued daily and paid monthly at an annual rate of 0.25% based upon the average daily net assets of Investor A Shares.
Pursuant to sub-agreements with BRIL, broker-dealers and BRIL provide shareholder servicing and distribution services to the Fund. The ongoing service and/or distribution fee compensates BRIL and each broker-dealer for providing shareholder servicing services to Investor A shareholders. PNC Global Investment Servicing (U.S.) Inc. (“PNCGIS”), an indirect, wholly owned subsidiary of PNC and an affiliate of the Administrator, serves as transfer agent and dividend disbursing agent. Effective July 1, 2010, PNCGIS was sold to The Bank of New York Mellon Corporation and is no longer considered an affiliate of the Administrator. At the close of the sale, PNCGIS changed its name to BNY Mellon Investment Servicing (US) Inc. Transfer agency fees borne by the Fund are comprised of those fees charged for all shareholder communications including mailing of shareholder reports, dividend and distribution notices, and proxy materials for shareholder meetings, as well as per account and per transaction fees related to servicing and maintenance of shareholder accounts, including the issuing, redeeming and transferring of shares, check writing, anti-money laundering services, and customer identification services.
The Administrator maintains a call center, which is responsible for providing certain shareholder services to the Fund, such as responding to shareholder inquiries and processing transactions based upon instructions from shareholders with respect to the subscription and redemption of Fund shares. For the six months ended June 30, 2010, the Fund reimbursed the Administrator the following amounts for costs incurred in running the call center, which are included in transfer agent — class specific in the Statement of Operations.
| | | | |
|
|
|
|
|
Institutional | | $ | 2,320 | |
Investor A | | $ | 5,073 | |
|
|
|
|
|
Certain officers and/or directors of the Corporation are officers and/or directors of BlackRock or its affiliates. The Fund reimburses the Administrator for compensation paid to the Corporation’s Chief Compliance Officer.
3. Capital Loss Carryforwards:
As of December 31, 2009, the Fund had capital loss carryforwards available to offset future realized gains through the indicated expiration dates:
| | | | |
|
|
|
|
|
Expires December 31, | | | | |
|
|
|
|
|
2010 | | $ | 3,255,552 | |
2011 | | | 7,823,922 | |
2012 | | | 21,618,948 | |
2013 | | | 28,402,088 | |
2014 | | | 26,517,609 | |
2017 | | | 14,948,603 | |
| |
|
|
Total | | $ | 102,566,722 | |
| |
|
|
| | | |
|
| BLACKROCK S&P 500 INDEX FUND | JUNE 30, 2010 | 13 |
| |
|
| |
Notes to Financial Statements (concluded) | BlackRock S&P 500 Index Fund |
4. Capital Share Transactions:
Transactions in capital shares for each class were as follows:
| | | | | | | | | | | | | |
| | Six Months Ended
June 30, 2010 | | Year Ended
December 31, 2009 | |
| |
|
|
|
| | Shares | | Amount | | Shares | | Amount | |
|
|
|
|
|
|
|
|
|
|
Institutional | | | | | | | | | | | | | |
|
|
|
|
|
|
|
|
|
|
|
|
|
|
Shares sold | | | 15,860,746 | | $ | 219,233,169 | | | 35,619,342 | | $ | 404,077,679 | |
Shares issued to shareholders in reinvestment of dividends | | | — | | | — | | | 1,198,921 | | | 16,162,043 | |
| |
|
|
|
|
|
|
|
|
|
|
|
|
Total issued | | | 15,860,746 | | | 219,233,169 | | | 36,818,263 | | | 420,239,722 | |
Shares redeemed | | | (16,457,810 | ) | | (227,244,383 | ) | | (40,985,628 | ) | | (471,515,439 | ) |
| |
|
|
|
|
|
|
|
|
|
|
|
|
Net decrease | | | (597,064 | ) | $ | (8,011,214 | ) | | (4,167,365 | ) | $ | (51,275,717 | ) |
| |
|
|
|
|
|
|
|
|
|
|
|
|
| | | | | | | | | | | | | |
|
|
|
|
|
|
|
|
|
|
|
|
|
|
Investor A | | | | | | | | | | | | | |
|
|
|
|
|
|
|
|
|
|
|
|
|
|
Shares sold | | | 5,448,470 | | $ | 75,427,223 | | | 18,020,743 | | $ | 194,637,914 | |
Shares issued to shareholders in reinvestment of dividends | | | — | | | — | | | 747,595 | | | 10,058,773 | |
| |
|
|
|
|
|
|
|
|
|
|
|
|
Total issued | | | 5,448,470 | | | 75,427,223 | | | 18,768,338 | | | 204,696,687 | |
Shares redeemed | | | (5,849,518 | ) | | (80,860,579 | ) | | (19,707,775 | ) | | (219,664,882 | ) |
| |
|
|
|
|
|
|
|
|
|
|
|
|
Net decrease | | | (401,048 | ) | $ | (5,433,356 | ) | | (939,437 | ) | $ | (14,968,195 | ) |
| |
|
|
|
|
|
|
|
|
|
|
|
|
5. Subsequent Events:
Management’s evaluation of the impact of all subsequent events on the Portfolio’s financial statements was completed through the date the financial statements were issued and the following item was noted:
The Fund paid a net investment income dividend on July 23, 2010 to shareholders of record on July 21, 2010 as follows:
| | | | |
|
|
|
|
| | Dividend
Per Share | |
|
|
|
|
Institutional | | $ | 0.008451 | |
Investor A | | $ | 0.008351 | |
|
|
|
|
|
| | |
|
14 | BLACKROCK S&P 500 INDEX FUND | JUNE 30, 2010 |
| |
|
| |
Portfolio Information | Master S&P 500 Index Series |
| | | | |
|
|
|
|
|
As of June 30, 2010 | | | |
|
|
|
|
| | | |
Ten Largest Holdings | | Percent of
Long-Term Investments | |
|
|
|
|
|
Exxon Mobil Corp. | | 3 | % | |
Apple, Inc. | | 2 | | |
Microsoft Corp. | | 2 | | |
The Procter & Gamble Co. | | 2 | | |
Johnson & Johnson | | 2 | | |
International Business Machines Corp. | | 2 | | |
General Electric Co. | | 2 | | |
JPMorgan Chase & Co. | | 2 | | |
Bank of America Corp. | | 2 | | |
AT&T Inc. | | 2 | | |
|
|
|
|
|
| | | | |
Sector Allocation | | Percent of
Long-Term Investments | |
|
|
|
|
|
Information Technology | | 19 | % | |
Financials | | 16 | | |
Health Care | | 12 | | |
Consumer Staples | | 12 | | |
Energy | | 11 | | |
Industrials | | 10 | | |
Consumer Discretionary | | 10 | | |
Utilities | | 4 | | |
Materials | | 3 | | |
Telecommunication Services | | 3 | | |
|
|
|
|
|
| |
| For Series compliance purposes, the Series’ sector classifications refer to any one or more of the industry sub-classifications used by one or more widely recognized market indexes or ratings group indexes, and/or as defined by Series management. This definition may not apply for purposes of this report, which may combine sector sub-classifications for reporting ease. |
| | | |
|
| BLACKROCK S&P 500 INDEX FUND | JUNE 30, 2010 | 15 |
| |
|
|
Schedule of Investments June 30, 2010 (Unaudited) | Master S&P 500 Index Series |
| (Percentages shown are based on Net Assets) |
| | | | | | | |
Common Stocks | | Shares | | Value | |
|
|
|
|
|
|
Aerospace & Defense — 2.8% | | | | | | | |
Boeing Co. | | | 166,339 | | $ | 10,437,772 | |
General Dynamics Corp. | | | 85,020 | | | 4,978,771 | |
Goodrich Corp. | | | 26,936 | | | 1,784,510 | |
Honeywell International, Inc. | | | 167,220 | | | 6,526,597 | |
ITT Corp. | | | 40,784 | | | 1,832,017 | |
L-3 Communications Holdings, Inc. | | | 25,167 | | | 1,782,830 | |
Lockheed Martin Corp. | | | 68,370 | | | 5,093,565 | |
Northrop Grumman Corp. | | | 66,890 | | | 3,641,492 | |
Precision Castparts Corp. | | | 31,345 | | | 3,226,027 | |
Raytheon Co. | | | 82,896 | | | 4,011,338 | |
Rockwell Collins, Inc. | | | 35,034 | | | 1,861,356 | |
United Technologies Corp. | | | 204,706 | | | 13,287,467 | |
| | | | |
|
|
|
| | | | | | 58,463,742 | |
|
|
|
|
|
|
|
|
Air Freight & Logistics — 1.0% | | | | | | | |
C.H. Robinson Worldwide, Inc. (a) | | | 35,766 | | | 1,990,735 | |
Expeditors International Washington, Inc. | | | 47,362 | | | 1,634,463 | |
FedEx Corp. | | | 68,233 | | | 4,783,816 | |
United Parcel Service, Inc., Class B | | | 218,040 | | | 12,404,295 | |
| | | | |
|
|
|
| | | | | | 20,813,309 | |
|
|
|
|
|
|
|
|
Airlines — 0.1% | | | | | | | |
Southwest Airlines Co. | | | 161,170 | | | 1,790,599 | |
|
|
|
|
|
|
|
|
Auto Components — 0.2% | | | | | | | |
The Goodyear Tire & Rubber Co. (b) | | | 55,536 | | | 552,028 | |
Johnson Controls, Inc. | | | 146,299 | | | 3,931,054 | |
| | | | |
|
|
|
| | | | | | 4,483,082 | |
|
|
|
|
|
|
|
|
Automobiles — 0.4% | | | | | | | |
Ford Motor Co. (a)(b) | | | 744,158 | | | 7,501,113 | |
Harley-Davidson, Inc. (a) | | | 50,281 | | | 1,117,746 | |
| | | | |
|
|
|
| | | | | | 8,618,859 | |
|
|
|
|
|
|
|
|
Beverages — 2.6% | | | | | | | |
Brown-Forman Corp., Class B | | | 23,391 | | | 1,338,667 | |
The Coca-Cola Co. | | | 505,598 | | | 25,340,572 | |
Coca-Cola Enterprises, Inc. | | | 71,291 | | | 1,843,585 | |
Constellation Brands, Inc., Class A (b) | | | 42,080 | | | 657,290 | |
Dr. Pepper Snapple Group, Inc. | | | 53,902 | | | 2,015,396 | |
Molson Coors Brewing Co., Class B | | | 35,372 | | | 1,498,358 | |
PepsiCo, Inc. | | | 353,811 | | | 21,564,780 | |
| | | | |
|
|
|
| | | | | | 54,258,648 | |
|
|
|
|
|
|
|
|
Biotechnology — 1.4% | | | | | | | |
Amgen, Inc. (b) | | | 210,160 | | | 11,054,416 | |
Biogen Idec, Inc. (b) | | | 57,806 | | | 2,742,895 | |
Celgene Corp. (b) | | | 100,435 | | | 5,104,106 | |
Cephalon, Inc. (b) | | | 15,869 | | | 900,566 | |
Genzyme Corp. (b) | | | 58,523 | | | 2,971,213 | |
Gilead Sciences, Inc. (b) | | | 195,236 | | | 6,692,690 | |
| | | | |
|
|
|
| | | | | | 29,465,886 | |
|
|
|
|
|
|
|
|
Building Products — 0.0% | | | | | | | |
Masco Corp. | | | 81,007 | | | 871,635 | |
|
|
|
|
|
|
|
|
Capital Markets — 2.4% | | | | | | | |
Ameriprise Financial, Inc. | | | 56,827 | | | 2,053,160 | |
The Bank of New York Mellon Corp. | | | 265,978 | | | 6,566,997 | |
The Charles Schwab Corp. | | | 212,349 | | | 3,011,109 | |
E*Trade Financial Corp. (b) | | | 45,198 | | | 534,240 | |
Federated Investors, Inc., Class B (a) | | | 20,698 | | | 428,656 | |
| | | | | | | |
Common Stocks | | Shares | | Value | |
|
|
|
|
|
|
|
|
Capital Markets (concluded) | | | | | | | |
Franklin Resources, Inc. | | | 32,864 | | $ | 2,832,548 | |
The Goldman Sachs Group, Inc. | | | 112,938 | | | 14,825,371 | |
Invesco Ltd. | | | 100,580 | | | 1,692,761 | |
Janus Capital Group, Inc. | | | 40,132 | | | 356,372 | |
Legg Mason, Inc. | | | 36,654 | | | 1,027,412 | |
Morgan Stanley | | | 306,433 | | | 7,112,310 | |
Northern Trust Corp. | | | 52,861 | | | 2,468,609 | |
State Street Corp. | | | 109,094 | | | 3,689,559 | |
T. Rowe Price Group, Inc. | | | 57,419 | | | 2,548,829 | |
| | | | |
|
|
|
| | | | | | 49,147,933 | |
|
|
|
|
|
|
|
|
Chemicals — 1.9% | | | | | | | |
Air Products & Chemicals, Inc. | | | 46,060 | | | 2,985,148 | |
Airgas, Inc. | | | 18,662 | | | 1,160,776 | |
CF Industries Holdings, Inc. | | | 15,732 | | | 998,195 | |
The Dow Chemical Co. | | | 253,282 | | | 6,007,849 | |
E.I. du Pont de Nemours & Co. | | | 197,788 | | | 6,841,487 | |
Eastman Chemical Co. | | | 16,488 | | | 879,800 | |
Ecolab, Inc. | | | 50,407 | | | 2,263,778 | |
FMC Corp. | | | 16,434 | | | 943,805 | |
International Flavors & Fragrances, Inc. | | | 18,062 | | | 766,190 | |
Monsanto Co. | | | 119,072 | | | 5,503,508 | |
PPG Industries, Inc. | | | 36,860 | | | 2,226,713 | |
Praxair, Inc. | | | 67,057 | | | 5,095,661 | |
The Sherwin-Williams Co. | | | 19,741 | | | 1,365,880 | |
Sigma-Aldrich Corp. | | | 27,319 | | | 1,361,306 | |
| | | | |
|
|
|
| | | | | | 38,400,096 | |
|
|
|
|
|
|
|
|
Commercial Banks — 3.1% | | | | | | | |
BB&T Corp. | | | 150,609 | | | 3,962,523 | |
Comerica, Inc. | | | 37,717 | | | 1,389,117 | |
Fifth Third Bancorp | | | 176,666 | | | 2,171,225 | |
First Horizon National Corp. (b) | | | 52,753 | | | 604,017 | |
Huntington Bancshares, Inc. | | | 151,139 | | | 837,310 | |
KeyCorp | | | 188,434 | | | 1,449,057 | |
M&T Bank Corp. (a) | | | 18,466 | | | 1,568,687 | |
Marshall & Ilsley Corp. | | | 115,021 | | | 825,851 | |
The PNC Financial Services Group, Inc. (c) | | | 114,812 | | | 6,486,878 | |
Regions Financial Corp. | | | 256,545 | | | 1,688,066 | |
SunTrust Banks, Inc. | | | 108,911 | | | 2,537,626 | |
U.S. Bancorp | | | 420,610 | | | 9,400,634 | |
Wells Fargo & Co. | | | 1,141,719 | | | 29,228,006 | |
Zions Bancorporation | | | 33,618 | | | 725,140 | |
| | | | |
|
|
|
| | | | | | 62,874,137 | |
|
|
|
|
|
|
|
|
Commercial Services & Supplies — 0.5% | | | | | | | |
Avery Dennison Corp. | | | 24,812 | | | 797,210 | |
Cintas Corp. | | | 30,144 | | | 722,552 | |
Iron Mountain, Inc. (a) | | | 41,087 | | | 922,814 | |
Pitney Bowes, Inc. | | | 46,662 | | | 1,024,697 | |
R.R. Donnelley & Sons Co. | | | 46,921 | | | 768,097 | |
Republic Services, Inc., Class A | | | 72,036 | | | 2,141,630 | |
Stericycle, Inc. (b) | | | 19,103 | | | 1,252,775 | |
Waste Management, Inc. | | | 107,1666 | | | 3,356,353 | |
| | | | |
|
|
|
| | | | | | 10,986,128 | |
|
|
|
|
|
|
|
|
| | |
See Notes to Financial Statements. |
|
16 | BLACKROCK S&P 500 INDEX FUND | JUNE 30, 2010 |
| |
|
|
Schedule of Investments (continued) | Master S&P 500 Index Series |
| (Percentages shown are based on Net Assets) |
| | | | | | | |
Common Stocks | | Shares | | Value | |
|
|
|
|
|
|
|
|
Communications Equipment — 2.3% | | | | | | | |
Cisco Systems, Inc. (b) | | | 1,252,957 | | $ | 26,700,514 | |
Harris Corp. | | | 29,384 | | | 1,223,844 | |
JDS Uniphase Corp. (b) | | | 51,672 | | | 508,452 | |
Juniper Networks, Inc. (b) | | | 113,948 | | | 2,600,293 | |
Motorola, Inc. (b) | | | 511,508 | | | 3,335,032 | |
QUALCOMM, Inc. | | | 359,878 | | | 11,818,393 | |
Tellabs, Inc. | | | 89,089 | | | 569,279 | |
| | | | |
|
|
|
| | | | | | 46,755,807 | |
|
|
|
|
|
|
|
|
Computers & Peripherals — 4.5% | | | | | | | |
Apple, Inc. (b) | | | 199,490 | | | 50,177,720 | |
Dell, Inc. (b) | | | 375,421 | | | 4,527,577 | |
EMC Corp. (b) | | | 449,036 | | | 8,217,359 | |
Hewlett-Packard Co. | | | 512,160 | | | 22,166,285 | |
Lexmark International, Inc., Class A (b) | | | 17,644 | | | 582,781 | |
NetApp, Inc. (b) | | | 74,702 | | | 2,787,132 | |
QLogic Corp. (b) | | | 25,881 | | | 430,142 | |
SanDisk Corp. (b) | | | 49,701 | | | 2,090,921 | |
Teradata Corp. (b) | | | 37,547 | | | 1,144,433 | |
Western Digital Corp. (b) | | | 49,220 | | | 1,484,475 | |
| | | | |
|
|
|
| | | | | | 93,608,825 | |
|
|
|
|
|
|
|
|
Construction & Engineering — 0.2% | | | | | | | |
Fluor Corp. | | | 38,421 | | | 1,632,892 | |
Jacobs Engineering Group, Inc. (b) | | | 26,500 | | | 965,660 | |
Quanta Services, Inc. (b) | | | 46,600 | | | 962,290 | |
| | | | |
|
|
|
| | | | | | 3,560,842 | |
|
|
|
|
|
|
|
|
Construction Materials — 0.1% | | | | | | | |
Vulcan Materials Co. (a) | | | 28,396 | | | 1,244,597 | |
|
|
|
|
|
|
|
|
Consumer Finance — 0.8% | | | | | | | |
American Express Co. | | | 262,994 | | | 10,440,862 | |
Capital One Financial Corp. | | | 100,570 | | | 4,052,971 | |
Discover Financial Services, Inc. | | | 121,608 | | | 1,700,080 | |
SLM Corp. (b) | | | 109,196 | | | 1,134,546 | |
| | | | |
|
|
|
| | | | | | 17,328,459 | |
|
|
|
|
|
|
|
|
Containers & Packaging — 0.2% | | | | | | | |
Ball Corp. | | | 20,256 | | | 1,070,124 | |
Bemis Co. | | | 23,430 | | | 632,610 | |
Owens-Illinois, Inc. (b) | | | 36,191 | | | 957,252 | |
Pactiv Corp. (b) | | | 29,789 | | | 829,624 | |
Sealed Air Corp. | | | 36,435 | | | 718,498 | |
| | | | |
|
|
|
| | | | | | 4,208,108 | |
|
|
|
|
|
|
|
|
Distributors — 0.1% | | | | | | | |
Genuine Parts Co. | | | 35,595 | | | 1,404,223 | |
|
|
|
|
|
|
|
|
Diversified Consumer Services — 0.2% | | | | | | | |
Apollo Group, Inc., Class A (b) | | | 26,731 | | | 1,135,265 | |
DeVry, Inc. | | | 14,176 | | | 744,098 | |
H&R Block, Inc. | | | 72,230 | | | 1,133,289 | |
| | | | |
|
|
|
| | | | | | 3,012,652 | |
|
|
|
|
|
|
|
|
Diversified Financial Services — 4.5% | | | | | | | |
Bank of America Corp. | | | 2,199,720 | | | 31,609,976 | |
CME Group, Inc. | | | 14,465 | | | 4,072,621 | |
Citigroup, Inc. (b) | | | 4,949,769 | | | 18,611,131 | |
IntercontinentalExchange, Inc. (b) | | | 16,400 | | | 1,853,692 | |
| | | | | | | |
Common Stocks | | Shares | | Value | |
|
|
|
|
|
|
Diversified Financial Services (concluded) | | | | | | | |
JPMorgan Chase & Co. | | | 871,910 | | $ | 31,920,625 | |
Leucadia National Corp. | | | 42,400 | | | 827,224 | |
Moody’s Corp. (a) | | | 42,155 | | | 839,728 | |
The NASDAQ Stock Market, Inc. (b) | | | 32,600 | | | 579,628 | |
NYSE Euronext | | | 56,700 | | | 1,566,621 | |
| | | | |
|
|
|
| | | | | | 91,881,246 | |
|
|
|
|
|
|
|
|
Diversified Telecommunication Services — 2.6% | | | | | | | |
AT&T Inc. | | | 1,294,903 | | | 31,323,704 | |
CenturyTel, Inc. (a) | | | 64,835 | | | 2,159,654 | |
Frontier Communications Corp. (a) | | | 73,004 | | | 519,058 | |
Qwest Communications International, Inc. | | | 320,628 | | | 1,683,297 | |
Verizon Communications, Inc. | | | 620,151 | | | 17,376,631 | |
Windstream Corp. (a) | | | 105,640 | | | 1,115,558 | |
| | | | |
|
|
|
| | | | | | 54,177,902 | |
|
|
|
|
|
|
|
|
Electric Utilities — 1.9% | | | | | | | |
Allegheny Energy, Inc. | | | 38,719 | | | 800,709 | |
American Electric Power Co., Inc. | | | 103,953 | | | 3,357,682 | |
Duke Energy Corp. | | | 285,830 | | | 4,573,280 | |
Edison International | | | 72,393 | | | 2,296,306 | |
Entergy Corp. | | | 41,770 | | | 2,991,567 | |
Exelon Corp. | | | 144,019 | | | 5,468,402 | |
FirstEnergy Corp. | | | 67,034 | | | 2,361,608 | |
NextEra Energy, Inc. | | | 90,254 | | | 4,400,785 | |
Northeast Utilities, Inc. | | | 37,495 | | | 955,373 | |
PPL Corp. | | | 102,774 | | | 2,564,211 | |
Pepco Holdings, Inc. | | | 50,846 | | | 797,265 | |
Pinnacle West Capital Corp. | | | 24,483 | | | 890,202 | |
Progress Energy, Inc. | | | 63,060 | | | 2,473,213 | |
The Southern Co. | | | 179,796 | | | 5,983,611 | |
| | | | |
|
|
|
| | | | | | 39,914,214 | |
|
|
|
|
|
|
|
|
Electrical Equipment — 0.5% | | | | | | | |
Emerson Electric Co. | | | 165,570 | | | 7,233,753 | |
Rockwell Automation, Inc. | | | 31,917 | | | 1,566,806 | |
Roper Industries, Inc. | | | 20,700 | | | 1,158,372 | |
| | | | |
|
|
|
| | | | | | 9,958,931 | |
|
|
|
|
|
|
|
|
Electronic Equipment, Instruments &
Components — 0.6% | | | | | | | |
Agilent Technologies, Inc. (b) | | | 77,489 | | | 2,203,012 | |
Amphenol Corp., Class A | | | 38,772 | | | 1,522,964 | |
Corning, Inc. | | | 343,320 | | | 5,544,618 | |
Flir Systems, Inc. (b) | | | 33,500 | | | 974,515 | |
Jabil Circuit, Inc. | | | 42,986 | | | 571,714 | |
Molex, Inc. | | | 31,381 | | | 572,390 | |
| | | | |
|
|
|
| | | | | | 11,389,213 | |
|
|
|
|
|
|
|
|
Energy Equipment & Services — 1.7% | | | | | | | |
Baker Hughes, Inc. | | | 94,870 | | | 3,943,746 | |
Cameron International Corp. (b) | | | 54,496 | | | 1,772,210 | |
Diamond Offshore Drilling, Inc. (a) | | | 14,658 | | | 911,581 | |
FMC Technologies, Inc. (b) | | | 27,364 | | | 1,440,988 | |
Halliburton Co. | | | 198,851 | | | 4,881,792 | |
Helmerich & Payne, Inc. | | | 24,000 | | | 876,480 | |
Nabors Industries Ltd. (b) | | | 60,822 | | | 1,071,683 | |
National Oilwell Varco, Inc. | | | 90,953 | | | 3,007,816 | |
Rowan Cos., Inc. (b) | | | 23,618 | | | 518,179 | |
Schlumberger Ltd. (a) | | | 261,688 | | | 14,481,814 | |
Smith International, Inc. | | | 53,801 | | | 2,025,608 | |
| | | | |
|
|
|
| | | | | | 34,931,897 | |
|
|
|
|
|
|
|
|
| | | |
See Notes to Financial Statements. | | |
|
|
|
|
| BLACKROCK S&P 500 INDEX FUND | JUNE 30, 2010 | 17 |
| |
|
|
Schedule of Investments (continued) | Master S&P 500 Index Series |
| (Percentages shown are based on Net Assets) |
| | | | | | | |
Common Stocks | | Shares | | Value | |
|
|
|
|
|
|
|
|
Food & Staples Retailing — 2.5% | | | | | | | |
CVS Caremark Corp. | | | 298,561 | | $ | 8,753,809 | |
Costco Wholesale Corp. | | | 96,106 | | | 5,269,492 | |
The Kroger Co. | | | 139,918 | | | 2,754,985 | |
SUPERVALU, Inc. | | | 47,810 | | | 518,260 | |
SYSCO Corp. | | | 130,815 | | | 3,737,385 | |
Safeway, Inc. | | | 83,503 | | | 1,641,669 | |
Wal-Mart Stores, Inc. | | | 455,757 | | | 21,908,239 | |
Walgreen Co. | | | 214,655 | | | 5,731,288 | |
Whole Foods Market, Inc. (b) | | | 36,690 | | | 1,321,574 | |
| | | | |
|
|
|
| | | | | | 51,636,701 | |
|
|
|
|
|
|
|
|
Food Products — 1.9% | | | | | | | |
Archer-Daniels-Midland Co. | | | 142,082 | | | 3,668,557 | |
Campbell Soup Co. | | | 42,239 | | | 1,513,423 | |
ConAgra Foods, Inc. | | | 98,489 | | | 2,296,764 | |
Dean Foods Co. (b) | | | 41,149 | | | 414,370 | |
General Mills, Inc. | | | 144,604 | | | 5,136,334 | |
H.J. Heinz Co. | | | 68,573 | | | 2,963,725 | |
The Hershey Co. | | | 37,146 | | | 1,780,408 | |
Hormel Foods Corp. | | | 16,034 | | | 649,056 | |
The J.M. Smucker Co. | | | 26,669 | | | 1,606,007 | |
Kellogg Co. | | | 55,265 | | | 2,779,830 | |
Kraft Foods, Inc. | | | 381,561 | | | 10,683,708 | |
McCormick & Co., Inc. | | | 29,800 | | | 1,131,208 | |
Mead Johnson Nutrition Co. | | | 44,178 | | | 2,214,201 | |
Sara Lee Corp. | | | 147,145 | | | 2,074,745 | |
Tyson Foods, Inc., Class A | | | 68,745 | | | 1,126,731 | |
| | | | |
|
|
|
| | | | | | 40,039,067 | |
|
|
|
|
|
|
|
|
Gas Utilities — 0.2% | | | | | | | |
EQT Corp. | | | 32,338 | | | 1,168,695 | |
Nicor, Inc. | | | 10,658 | | | 431,649 | |
Oneok, Inc. | | | 23,900 | | | 1,033,675 | |
Questar Corp. | | | 38,965 | | | 1,772,518 | |
| | | | |
|
|
|
| | | | | | 4,406,537 | |
|
|
|
|
|
|
|
|
Health Care Equipment & Supplies — 1.8% | | | | | | | |
Baxter International, Inc. | | | 130,677 | | | 5,310,713 | |
Becton Dickinson & Co. | | | 51,190 | | | 3,461,468 | |
Boston Scientific Corp. (b) | | | 336,891 | | | 1,953,968 | |
C.R. Bard, Inc. | | | 21,406 | | | 1,659,607 | |
CareFusion Corp. (b) | | | 40,168 | | | 911,813 | |
Dentsply International, Inc. | | | 33,322 | | | 996,661 | |
Hospira, Inc. (b) | | | 36,520 | | | 2,098,074 | |
Intuitive Surgical, Inc. (b) | | | 8,482 | | | 2,677,089 | |
Medtronic, Inc. | | | 242,848 | | | 8,808,097 | |
St. Jude Medical, Inc. (b) | | | 72,204 | | | 2,605,842 | |
Stryker Corp. | | | 62,579 | | | 3,132,705 | |
Varian Medical Systems, Inc. (b) | | | 27,821 | | | 1,454,482 | |
Zimmer Holdings, Inc. (b) | | | 44,494 | | | 2,404,901 | |
| | | | |
|
|
|
| | | | | | 37,475,420 | |
|
|
|
|
|
|
|
|
Health Care Providers & Services — 2.1% | | | | | | | |
Aetna, Inc. | | | 92,511 | | | 2,440,440 | |
AmerisourceBergen Corp. | | | 60,844 | | | 1,931,797 | |
Cardinal Health, Inc. | | | 78,396 | | | 2,634,890 | |
Cigna Corp. | | | 60,057 | | | 1,865,370 | |
Coventry Health Care, Inc. (b) | | | 34,091 | | | 602,729 | |
DaVita, Inc. (b) | | | 23,126 | | | 1,443,987 | |
Express Scripts, Inc. (b) | | | 121,245 | | | 5,700,940 | |
Humana, Inc. (b) | | | 36,576 | | | 1,670,426 | |
| | | | | | | |
Common Stocks | | Shares | | Value | |
|
|
|
|
|
|
|
|
Health Care Providers & Services (concluded) | | | | | | | |
Laboratory Corp. of America Holdings (b) | | | 23,423 | | $ | 1,764,923 | |
McKesson Corp. | | | 59,447 | | | 3,992,460 | |
Medco Health Solutions, Inc. (b) | | | 100,736 | | | 5,548,539 | |
Patterson Cos., Inc. | | | 21,563 | | | 615,192 | |
Quest Diagnostics, Inc. | | | 33,562 | | | 1,670,381 | |
Tenet Healthcare Corp. (b) | | | 97,485 | | | 423,085 | |
UnitedHealth Group, Inc. | | | 249,374 | | | 7,082,222 | |
WellPoint, Inc. (b) | | | 93,720 | | | 4,585,720 | |
| | | | |
|
|
|
| | | | | | 43,973,101 | |
|
|
|
|
|
|
|
|
Health Care Technology — 0.1% | | | | | | | |
Cerner Corp. (b) | | | 15,200 | | | 1,153,528 | |
|
|
|
|
|
|
|
|
Hotels, Restaurants & Leisure — 1.6% | | | | | | | |
Carnival Corp. | | | 96,006 | | | 2,903,221 | |
Darden Restaurants, Inc. | | | 30,011 | | | 1,165,927 | |
International Game Technology | | | 63,390 | | | 995,223 | |
Marriott International, Inc., Class A (a) | | | 55,229 | | | 1,653,556 | |
McDonald’s Corp. (a) | | | 236,179 | | | 15,557,111 | |
Starbucks Corp. | | | 162,135 | | | 3,939,881 | |
Starwood Hotels & Resorts Worldwide, Inc. | | | 40,822 | | | 1,691,256 | |
Wyndham Worldwide Corp. | | | 40,594 | | | 817,563 | |
Wynn Resorts Ltd. | | | 14,714 | | | 1,122,237 | |
Yum! Brands, Inc. | | | 101,679 | | | 3,969,548 | |
| | | | |
|
|
|
| | | | | | 33,815,523 | |
|
|
|
|
|
|
|
|
Household Durables — 0.4% | | | | | | | |
D.R. Horton, Inc. | | | 62,311 | | | 612,517 | |
Fortune Brands, Inc. | | | 34,017 | | | 1,332,786 | |
Harman International Industries, Inc. (b) | | | 14,257 | | | 426,142 | |
Leggett & Platt, Inc. | | | 34,006 | | | 682,160 | |
Lennar Corp., Class A | | | 33,306 | | | 463,287 | |
Newell Rubbermaid, Inc. | | | 62,633 | | | 916,947 | |
Pulte Group, Inc. (b) | | | 71,175 | | | 589,329 | |
Stanley Black & Decker, Inc. | | | 35,094 | | | 1,772,949 | |
Whirlpool Corp. | | | 16,117 | | | 1,415,395 | |
| | | | |
|
|
|
| | | | | | 8,211,512 | |
|
|
|
|
|
|
|
|
Household Products — 2.6% | | | | | | | |
Clorox Co. | | | 30,326 | | | 1,885,064 | |
Colgate-Palmolive Co. | | | 107,599 | | | 8,474,497 | |
Kimberly-Clark Corp. | | | 90,228 | | | 5,470,524 | |
The Procter & Gamble Co. | | | 631,816 | | | 37,896,324 | |
| | | | |
|
|
|
| | | | | | 53,726,409 | |
|
|
|
|
|
|
|
|
IT Services — 3.1% | | | | | | | |
Automatic Data Processing, Inc. | | | 110,043 | | | 4,430,331 | |
Cognizant Technology Solutions Corp. (b) | | | 64,999 | | | 3,253,850 | |
Computer Sciences Corp. | | | 34,340 | | | 1,553,885 | |
Fidelity National Information Services, Inc. | | | 72,564 | | | 1,946,166 | |
Fiserv, Inc. (b) | | | 34,075 | | | 1,555,865 | |
International Business Machines Corp. | | | 281,332 | | | 34,738,875 | |
MasterCard, Inc., Class A | | | 21,246 | | | 4,239,214 | |
Paychex, Inc. | | | 69,679 | | | 1,809,564 | |
SAIC, Inc. (b) | | | 64,800 | | | 1,084,752 | |
Total System Services, Inc. | | | 45,504 | | | 618,854 | |
Visa, Inc., Class A | | | 98,809 | | | 6,990,737 | |
The Western Union Co. | | | 147,460 | | | 2,198,629 | |
| | | | |
|
|
|
| | | | | | 64,420,722 | |
|
|
|
|
|
|
|
|
| | |
See Notes to Financial Statements. |
|
18 | BLACKROCK S&P 500 INDEX FUND | JUNE 30, 2010 |
| |
|
|
Schedule of Investments (continued) | Master S&P 500 Index Series |
| (Percentages shown are based on Net Assets) |
| | | | | | | |
Common Stocks | | Shares | | Value | |
|
|
|
|
|
|
|
|
Independent Power Producers & Energy Traders — 0.2% | | | | | | | |
The AES Corp. (b) | | | 149,694 | | $ | 1,383,173 | |
Constellation Energy Group, Inc. | | | 44,992 | | | 1,450,992 | |
NRG Energy, Inc. (b) | | | 57,897 | | | 1,227,995 | |
| | | | |
|
|
|
| | | | | | 4,062,160 | |
|
|
|
|
|
|
|
|
Industrial Conglomerates — 2.3% | | | | | | | |
3M Co. | | | 156,340 | | | 12,349,296 | |
General Electric Co. | | | 2,340,069 | | | 33,743,795 | |
Textron, Inc. (a) | | | 59,138 | | | 1,003,572 | |
| | | | |
|
|
|
| | | | | | 47,096,663 | |
|
|
|
|
|
|
|
|
Insurance — 4.0% | | | | | | | |
Aflac, Inc. | | | 103,562 | | | 4,418,991 | |
The Allstate Corp. | | | 116,777 | | | 3,355,003 | |
American International Group, Inc. (a)(b) | | | 29,279 | | | 1,008,369 | |
Aon Corp. | | | 59,340 | | | 2,202,701 | |
Assurant, Inc. | | | 24,533 | | | 851,295 | |
Berkshire Hathaway, Inc. (a)(b) | | | 362,955 | | | 28,923,884 | |
Chubb Corp. | | | 72,632 | | | 3,632,326 | |
Cincinnati Financial Corp. | | | 36,362 | | | 940,685 | |
Genworth Financial, Inc., Class A (b) | | | 106,275 | | | 1,389,014 | |
Hartford Financial Services Group, Inc. | | | 98,560 | | | 2,181,133 | |
Lincoln National Corp. | | | 67,431 | | | 1,637,899 | |
Loews Corp. | | | 77,123 | | | 2,568,967 | |
Marsh & McLennan Cos., Inc. | | | 118,060 | | | 2,662,253 | |
MetLife, Inc. | | | 180,246 | | | 6,806,089 | |
Principal Financial Group, Inc. | | | 71,289 | | | 1,671,014 | |
The Progressive Corp. | | | 148,849 | | | 2,786,453 | |
Prudential Financial, Inc. | | | 102,443 | | | 5,497,092 | |
Torchmark Corp. | | | 18,802 | | | 930,887 | |
The Travelers Cos., Inc. | | | 108,671 | | | 5,352,047 | |
UnumProvident Corp. | | | 74,259 | | | 1,611,420 | |
XL Capital Ltd., Class A | | | 75,635 | | | 1,210,916 | |
| | | | |
|
|
|
| | | | | | 81,638,438 | |
|
|
|
|
|
|
|
|
Internet & Catalog Retail — 0.5% | | | | | | | |
Amazon.com, Inc. (b) | | | 75,255 | | | 8,222,362 | |
Expedia, Inc. | | | 47,500 | | | 892,050 | |
Priceline.com, Inc. (b) | | | 10,219 | | | 1,804,062 | |
| | | | |
|
|
|
| | | | | | 10,918,474 | |
|
|
|
|
|
|
|
|
Internet Software & Services — 1.7% | | | | | | | |
Akamai Technologies, Inc. (a)(b) | | | 38,371 | | | 1,556,711 | |
eBay, Inc. (b) | | | 248,937 | | | 4,881,655 | |
Google, Inc., Class A (b) | | | 53,029 | | | 23,595,254 | |
Monster Worldwide, Inc. (b) | | | 28,851 | | | 336,114 | |
VeriSign, Inc. (b) | | | 41,367 | | | 1,098,294 | |
Yahoo! Inc. (b) | | | 258,040 | | | 3,568,693 | |
| | | | |
|
|
|
| | | | | | 35,036,721 | |
|
|
|
|
|
|
|
|
Leisure Equipment & Products — 0.2% | | | | | | | |
Eastman Kodak Co. (a)(b) | | | 63,127 | | | 273,971 | |
Hasbro, Inc. | | | 28,104 | | | 1,155,075 | |
Mattel, Inc. | | | 78,370 | | | 1,658,309 | |
| | | | |
|
|
|
| | | | | | 3,087,355 | |
|
|
|
|
|
|
|
|
| | | | | | | |
Common Stocks | | Shares | | Value | |
|
|
|
|
|
|
Life Sciences Tools & Services — 0.5% | | | | | | | |
Life Technologies Corp. (b) | | | 40,167 | | $ | 1,897,891 | |
Millipore Corp. (b) | | | 12,591 | | | 1,342,830 | |
PerkinElmer, Inc. | | | 27,215 | | | 562,534 | |
Thermo Fisher Scientific, Inc. (b) | | | 89,341 | | | 4,382,176 | |
Waters Corp. (b) | | | 20,992 | | | 1,358,182 | |
| | | | |
|
|
|
| | | | | | 9,543,613 | |
|
|
|
|
|
|
|
|
Machinery — 1.7% | | | | | | | |
Caterpillar, Inc. | | | 137,402 | | | 8,253,738 | |
Cummins, Inc. | | | 43,505 | | | 2,833,481 | |
Danaher Corp. | | | 114,468 | | | 4,249,052 | |
Deere & Co. | | | 92,577 | | | 5,154,687 | |
Dover Corp. | | | 41,558 | | | 1,736,709 | |
Eaton Corp. | | | 36,263 | | | 2,373,051 | |
Flowserve Corp. | | | 12,600 | | | 1,068,480 | |
Illinois Tool Works, Inc. | | | 84,082 | | | 3,470,905 | |
PACCAR, Inc. | | | 80,584 | | | 3,212,884 | |
Pall Corp. | | | 26,636 | | | 915,479 | |
Parker Hannifin Corp. | | | 35,780 | | | 1,984,359 | |
Snap-On, Inc. | | | 13,479 | | | 551,426 | |
| | | | |
|
|
|
| | | | | | 35,804,251 | |
|
|
|
|
|
|
|
|
Media — 3.1% | | | | | | | |
CBS Corp., Class B | | | 150,623 | | | 1,947,555 | |
Comcast Corp., Class A | | | 619,029 | | | 10,752,534 | |
DIRECTV, Class A (b) | | | 199,380 | | | 6,762,970 | |
Discovery Communications, Inc., Class A (a)(b) | | | 62,992 | | | 2,249,444 | |
Gannett Co., Inc. | | | 49,990 | | | 672,865 | |
Interpublic Group of Cos., Inc. (b) | | | 110,591 | | | 788,514 | |
The McGraw-Hill Cos., Inc. | | | 70,334 | | | 1,979,199 | |
Meredith Corp. | | | 8,445 | | | 262,893 | |
The New York Times Co., Class A (b) | | | 27,298 | | | 236,128 | |
News Corp., Class A | | | 496,190 | | | 5,934,432 | |
Omnicom Group, Inc. | | | 66,384 | | | 2,276,971 | |
Scripps Networks Interactive | | | 20,374 | | | 821,887 | |
Time Warner Cable, Inc. | | | 77,848 | | | 4,054,324 | |
Time Warner, Inc. | | | 251,198 | | | 7,262,134 | |
Viacom, Inc., Class B | | | 134,033 | | | 4,204,615 | |
Walt Disney Co. (a) | | | 428,613 | | | 13,501,310 | |
The Washington Post Co., Class B | | | 1,406 | | | 577,135 | |
| | | | |
|
|
|
| | | | | | 64,284,910 | |
|
|
|
|
|
|
|
|
Metals & Mining — 1.1% | | | | | | | |
AK Steel Holding Corp. | | | 21,525 | | | 256,578 | |
Alcoa, Inc. | | | 221,005 | | | 2,223,310 | |
Allegheny Technologies, Inc. (a) | | | 22,113 | | | 977,173 | |
Cliffs Natural Resources, Inc. | | | 29,065 | | | 1,370,705 | |
Freeport-McMoRan Copper & Gold, Inc., Class B | | | 103,473 | | | 6,118,359 | |
Newmont Mining Corp. | | | 107,148 | | | 6,615,318 | |
Nucor Corp. | | | 68,251 | | | 2,612,648 | |
Titanium Metals Corp. (b) | | | 20,000 | | | 351,800 | |
United States Steel Corp. (a) | | | 30,652 | | | 1,181,635 | |
| | | | |
|
|
|
| | | | | | 21,707,526 | |
|
|
|
|
|
|
|
|
Multi-Utilities — 1.4% | | | | | | | |
Ameren Corp. | | | 53,301 | | | 1,266,965 | |
CMS Energy Corp. | | | 52,599 | | | 770,575 | |
CenterPoint Energy, Inc. | | | 88,652 | | | 1,166,660 | |
Consolidated Edison, Inc. | | | 61,502 | | | 2,650,736 | |
DTE Energy Co. | | | 36,857 | | | 1,681,048 | |
Dominion Resources, Inc. | | | 130,767 | | | 5,065,914 | |
Integrys Energy Group, Inc. | | | 17,523 | | | 766,456 | |
| | | |
See Notes to Financial Statements. | | |
|
|
|
|
| BLACKROCK S&P 500 INDEX FUND | JUNE 30, 2010 | 19 |
| |
|
|
| |
Schedule of Investments (continued) | Master S&P 500 Index Series |
| (Percentages shown are based on Net Assets) |
| | | | | | | |
Common Stocks | | Shares | | Value | |
|
|
|
|
|
|
|
|
Multi-Utilities (concluded) | | | | | | | |
NiSource, Inc. | | | 62,215 | | $ | 902,118 | |
PG&E Corp. | | | 82,031 | | | 3,371,474 | |
Public Service Enterprise Group, Inc. | | | 111,900 | | | 3,505,827 | |
SCANA Corp. | | | 25,358 | | | 906,802 | |
Sempra Energy | | | 53,551 | | | 2,505,651 | |
TECO Energy, Inc. (a) | | | 48,971 | | | 737,993 | |
Wisconsin Energy Corp. | | | 26,290 | | | 1,333,955 | |
Xcel Energy, Inc. | | | 101,676 | | | 2,095,542 | |
| | | | |
|
|
|
| | | | | | 28,727,716 | |
|
|
|
|
|
|
|
|
Multiline Retail — 0.8% | | | | | | | |
Big Lots, Inc. (b) | | | 19,097 | | | 612,823 | |
Family Dollar Stores, Inc. | | | 28,688 | | | 1,081,251 | |
JCPenney Co., Inc. | | | 50,457 | | | 1,083,816 | |
Kohl’s Corp. (b) | | | 66,854 | | | 3,175,565 | |
Macy’s, Inc. | | | 90,896 | | | 1,627,038 | |
Nordstrom, Inc. | | | 36,974 | | | 1,190,193 | |
Sears Holdings Corp. (b) | | | 10,777 | | | 696,733 | |
Target Corp. | | | 161,573 | | | 7,944,545 | |
| | | | |
|
|
|
| | | | | | 17,411,964 | |
|
|
|
|
|
|
|
|
Office Electronics — 0.1% | | | | | | | |
Xerox Corp. | | | 298,597 | | | 2,400,720 | |
|
|
|
|
|
|
|
|
Oil, Gas & Consumable Fuels — 8.9% | | | | | | | |
Anadarko Petroleum Corp. | | | 108,387 | | | 3,911,687 | |
Apache Corp. | | | 74,003 | | | 6,230,313 | |
Cabot Oil & Gas Corp., Class A | | | 23,621 | | | 739,810 | |
Chesapeake Energy Corp. | | | 141,323 | | | 2,960,717 | |
Chevron Corp. | | | 440,389 | | | 29,884,798 | |
ConocoPhillips | | | 326,335 | | | 16,019,785 | |
Consol Energy, Inc. | | | 48,577 | | | 1,639,959 | |
Denbury Resources, Inc. (b) | | | 85,442 | | | 1,250,871 | |
Devon Energy Corp. | | | 97,507 | | | 5,940,126 | |
EOG Resources, Inc. | | | 55,202 | | | 5,430,221 | |
El Paso Corp. | | | 156,423 | | | 1,737,860 | |
Exxon Mobil Corp. (d) | | | 1,121,950 | | | 64,029,687 | |
Hess Corp. | | | 63,433 | | | 3,193,217 | |
Marathon Oil Corp. | | | 154,535 | | | 4,804,493 | |
Massey Energy Co. | | | 21,433 | | | 586,193 | |
Murphy Oil Corp. | | | 42,490 | | | 2,105,379 | |
Noble Energy, Inc. | | | 37,748 | | | 2,277,337 | |
Occidental Petroleum Corp. | | | 178,260 | | | 13,752,759 | |
Peabody Energy Corp. | | | 58,085 | | | 2,272,866 | |
Pioneer Natural Resources Co. | | | 25,798 | | | 1,533,691 | |
Range Resources Corp. | | | 34,241 | | | 1,374,776 | |
Southwestern Energy Co. (b) | | | 75,117 | | | 2,902,521 | |
Spectra Energy Corp. | | | 143,471 | | | 2,879,463 | |
Sunoco, Inc. | | | 25,363 | | | 881,871 | |
Tesoro Corp. (a) | | | 31,600 | | | 368,772 | |
Valero Energy Corp. | | | 122,007 | | | 2,193,686 | |
Williams Cos., Inc. | | | 129,538 | | | 2,367,955 | |
| | | | |
|
|
|
| | | | | | 183,270,813 | |
|
|
|
|
|
|
|
|
Paper & Forest Products — 0.2% | | | | | | | |
International Paper Co. | | | 96,223 | | | 2,177,527 | |
MeadWestvaco Corp. | | | 38,939 | | | 864,446 | |
Weyerhaeuser Co. | | | 47,137 | | | 1,659,222 | |
| | | | |
|
|
|
| | | | | | 4,701,195 | |
|
|
|
|
|
|
|
|
| | | | | | | |
Common Stocks | | Shares | | Value | |
|
|
|
|
|
|
|
|
Personal Products — 0.2% | | | | | | | |
Avon Products, Inc. | | | 94,846 | | $ | 2,513,419 | |
The Estée Lauder Cos., Inc., Class A | | | 26,460 | | | 1,474,616 | |
| | | | |
|
|
|
| | | | | | 3,988,035 | |
|
|
|
|
|
|
|
|
Pharmaceuticals — 6.1% | | | | | | | |
Abbott Laboratories (d) | | | 338,639 | | | 15,841,532 | |
Allergan, Inc. | | | 67,925 | | | 3,957,311 | |
Bristol-Myers Squibb Co. | | | 375,836 | | | 9,373,350 | |
Eli Lilly & Co. | | | 221,535 | | | 7,421,422 | |
Forest Laboratories, Inc. (b) | | | 67,535 | | | 1,852,485 | |
Johnson & Johnson | | | 604,458 | | | 35,699,289 | |
King Pharmaceuticals, Inc. (b) | | | 58,173 | | | 441,533 | |
Merck & Co, Inc. | | | 683,381 | | | 23,897,834 | |
Mylan, Inc. (a)(b) | | | 65,675 | | | 1,119,102 | |
Pfizer, Inc. | | | 1,770,034 | | | 25,240,685 | |
Watson Pharmaceuticals, Inc. (b) | | | 24,139 | | | 979,319 | |
| | | | |
|
|
|
| | | | | | 125,823,862 | |
|
|
|
|
|
|
|
|
Professional Services — 0.1% | | | | | | | |
Dun & Bradstreet Corp. | | | 11,643 | | | 781,478 | |
Equifax, Inc. | | | 28,824 | | | 808,801 | |
Robert Half International, Inc. | | | 33,972 | | | 800,041 | |
| | | | |
|
|
|
| | | | | | 2,390,320 | |
|
|
|
|
|
|
|
|
Real Estate Investment Trusts (REITs) — 1.3% | | | | | | | |
Apartment Investment & Management Co., Class A | | | 27,209 | | | 527,038 | |
AvalonBay Communities, Inc. | | | 17,847 | | | 1,666,374 | |
Boston Properties, Inc. | | | 30,868 | | | 2,202,123 | |
Equity Residential | | | 61,262 | | | 2,550,950 | |
HCP, Inc. | | | 63,402 | | | 2,044,715 | |
Health Care REIT, Inc. | | | 26,386 | | | 1,111,378 | |
Host Marriott Corp. | | | 142,277 | | | 1,917,894 | |
Kimco Realty Corp. | | | 86,541 | | | 1,163,111 | |
Plum Creek Timber Co., Inc. (a) | | | 36,630 | | | 1,264,834 | |
ProLogis | | | 106,568 | | | 1,079,534 | |
Public Storage | | | 29,946 | | | 2,632,553 | |
Simon Property Group, Inc. (a) | | | 63,795 | | | 5,151,446 | |
Ventas, Inc. | | | 34,600 | | | 1,624,470 | |
Vornado Realty Trust | | | 34,214 | | | 2,495,911 | |
| | | | |
|
|
|
| | | | | | 27,432,331 | |
|
|
|
|
|
|
|
|
Real Estate Management & Development — 0.0% | | | | | | | |
CB Richard Ellis Group, Inc. (b) | | | 57,119 | | | 777,390 | |
|
|
|
|
|
|
|
|
Road & Rail — 0.8% | | | | | | | |
CSX Corp. | | | 84,698 | | | 4,203,562 | |
Norfolk Southern Corp. | | | 80,547 | | | 4,273,018 | |
Ryder System, Inc. | | | 12,473 | | | 501,789 | |
Union Pacific Corp. | | | 110,542 | | | 7,683,774 | |
| | | | |
|
|
|
| | | | | | 16,662,143 | |
|
|
|
|
|
|
|
|
Semiconductors & Semiconductor Equipment — 2.6% | | | | | | | |
Advanced Micro Devices, Inc. (a)(b) | | | 127,474 | | | 933,110 | |
Altera Corp. | | | 64,750 | | | 1,606,447 | |
Analog Devices, Inc. | | | 65,798 | | | 1,833,132 | |
Applied Materials, Inc. | | | 291,914 | | | 3,508,806 | |
Broadcom Corp., Class A | | | 95,448 | | | 3,146,921 | |
First Solar, Inc. (a)(b) | | | 10,385 | | | 1,182,125 | |
Intel Corp. | | | 1,218,940 | | | 23,708,383 | |
KLA-Tencor Corp. | | | 37,266 | | | 1,038,976 | |
| | |
See Notes to Financial Statements. | |
|
20 | BLACKROCK S&P 500 INDEX FUND | JUNE 30, 2010 |
| |
|
|
| |
Schedule of Investments (continued) | Master S&P 500 Index Series |
| (Percentages shown are based on Net Assets) |
| | | | | | | |
Common Stocks | | Shares | | Value | |
|
|
|
|
|
|
|
|
Semiconductors & Semiconductor Equipment (concluded) | | | | | | | |
LSI Corp. (b) | | | 151,275 | | $ | 695,865 | |
Linear Technology Corp. | | | 47,909 | | | 1,332,349 | |
MEMC Electronic Materials, Inc. (b) | | | 52,000 | | | 513,760 | |
Microchip Technology, Inc. (a) | | | 41,400 | | | 1,148,436 | |
Micron Technology, Inc. (b) | | | 183,643 | | | 1,559,129 | |
National Semiconductor Corp. | | | 49,695 | | | 668,895 | |
Novellus Systems, Inc. (b) | | | 21,292 | | | 539,965 | |
Nvidia Corp. (b) | | | 122,368 | | | 1,249,377 | |
Teradyne, Inc. (b) | | | 39,461 | | | 384,745 | |
Texas Instruments, Inc. | | | 269,912 | | | 6,283,551 | |
Xilinx, Inc. | | | 58,684 | | | 1,482,358 | |
| | | | |
|
|
|
| | | | | | 52,816,330 | |
|
|
|
|
|
|
|
|
Software — 3.7% | | | | | | | |
Adobe Systems, Inc. (b) | | | 114,342 | | | 3,022,059 | |
Autodesk, Inc. (b) | | | 49,034 | | | 1,194,468 | |
BMC Software, Inc. (b) | | | 38,828 | | | 1,344,613 | |
CA, Inc. | | | 88,303 | | | 1,624,775 | |
Citrix Systems, Inc. (b) | | | 39,925 | | | 1,686,033 | |
Compuware Corp. (b) | | | 53,918 | | | 430,266 | |
Electronic Arts, Inc. (b) | | | 70,382 | | | 1,013,501 | |
Intuit, Inc. (b) | | | 69,692 | | | 2,423,191 | |
McAfee, Inc. (b) | | | 35,814 | | | 1,100,206 | |
Microsoft Corp. | | | 1,672,755 | | | 38,490,092 | |
Novell, Inc. (b) | | | 81,131 | | | 460,824 | |
Oracle Corp. | | | 857,709 | | | 18,406,435 | |
Red Hat, Inc. (b) | | | 42,422 | | | 1,227,693 | |
Salesforce.com, Inc. (b) | | | 24,439 | | | 2,097,355 | |
Symantec Corp. (b) | | | 172,518 | | | 2,394,550 | |
| | | | |
|
|
|
| | | | | | 76,916,061 | |
|
|
|
|
|
|
|
|
Specialty Retail — 2.0% | | | | | | | |
Abercrombie & Fitch Co., Class A | | | 18,310 | | | 561,934 | |
AutoNation, Inc. (a)(b) | | | 21,380 | | | 416,910 | |
AutoZone, Inc. (b) | | | 6,228 | | | 1,203,374 | |
Bed Bath & Beyond, Inc. (b) | | | 56,931 | | | 2,111,002 | |
Best Buy Co., Inc. | | | 74,923 | | | 2,536,893 | |
CarMax, Inc. (b) | | | 48,925 | | | 973,608 | |
GameStop Corp., Class A (a)(b) | | | 34,200 | | | 642,618 | |
The Gap, Inc. | | | 98,485 | | | 1,916,518 | |
Home Depot, Inc. | | | 368,649 | | | 10,347,977 | |
Limited Brands, Inc. | | | 57,746 | | | 1,274,454 | |
Lowe’s Cos., Inc. | | | 313,549 | | | 6,402,671 | |
O’Reilly Automotive, Inc. (b) | | | 30,808 | | | 1,465,228 | |
Office Depot, Inc. (b) | | | 64,547 | | | 260,770 | |
RadioShack Corp. | | | 28,429 | | | 554,650 | |
Ross Stores, Inc. | | | 26,233 | | | 1,397,957 | |
Staples, Inc. | | | 158,479 | | | 3,019,025 | |
TJX Cos., Inc. | | | 90,672 | | | 3,803,690 | |
Tiffany & Co. (a) | | | 28,063 | | | 1,063,868 | |
Urban Outfitters, Inc. (b) | | | 29,200 | | | 1,004,188 | |
| | | | |
|
|
|
| | | | | | 40,957,335 | |
|
|
|
|
|
|
|
|
Textiles, Apparel & Luxury Goods — 0.5% | | | | | | | |
Coach, Inc. | | | 66,936 | | | 2,446,511 | |
Nike, Inc., Class B | | | 85,891 | | | 5,801,937 | |
Polo Ralph Lauren Corp. | | | 14,429 | | | 1,052,740 | |
VF Corp. | | | 19,794 | | | 1,408,937 | |
| | | | |
|
|
|
| | | | | | 10,710,125 | |
|
|
|
|
|
|
|
|
| | | | | | | |
Common Stocks | | Shares | | Value | |
|
|
|
|
|
|
|
|
Thrifts & Mortgage Finance — 0.1% | | | | | | | |
Hudson City Bancorp, Inc. | | | 106,619 | | $ | 1,305,017 | |
People’s United Financial, Inc. | | | 79,660 | | | 1,075,410 | |
| | | | |
|
|
|
| | | | | | 2,380,427 | |
|
|
|
|
|
|
|
|
Tobacco — 1.6% | | | | | | | |
Altria Group, Inc. | | | 457,475 | | | 9,167,799 | |
Lorillard, Inc. | | | 33,535 | | | 2,413,849 | |
Philip Morris International, Inc. | | | 406,279 | | | 18,623,829 | |
Reynolds American, Inc. (a) | | | 37,680 | | | 1,963,882 | |
| | | | |
|
|
|
| | | | | | 32,169,359 | |
|
|
|
|
|
|
|
|
Trading Companies & Distributors — 0.1% | | | | | | | |
Fastenal Co. (a) | | | 29,394 | | | 1,475,285 | |
W.W. Grainger, Inc. | | | 13,792 | | | 1,371,614 | |
| | | | |
|
|
|
| | | | | | 2,846,899 | |
|
|
|
|
|
|
|
|
Wireless Telecommunication Services — 0.4% | | | | | | | |
American Tower Corp., Class A (b) | | | 88,981 | | | 3,959,655 | |
MetroPCS Communications, Inc. (b) | | | 60,300 | | | 493,857 | |
Sprint Nextel Corp. (b) | | | 659,267 | | | 2,795,292 | |
| | | | |
|
|
|
| | | | | | 7,248,804 | |
|
|
|
|
|
|
|
|
Total Long-Term Investments
(Cost — $2,052,790,824) — 99.1% | | | | | | 2,045,221,430 | |
|
|
|
|
|
|
|
|
| | | | | | | |
Short-Term Securities | | | | | | | |
|
|
|
|
|
|
|
|
BlackRock Liquidity Funds, TempFund, Institutional Class, 0.16% (c)(e) | | | 16,545,037 | | | 16,545,037 | |
|
|
|
|
|
|
|
|
| | | | | | | |
| | Beneficial
Interest
(000) | | | | |
|
|
|
|
|
|
|
|
BlackRock Liquidity Series, LLC
Money Market Series, 0.27% (c)(e)(f) | | $ | 92,298 | | | 92,298,450 | |
|
|
|
|
|
|
|
|
Total Short-Term Securities
(Cost — $108,843,487) — 5.2% | | | | | | 108,843,487 | |
|
|
|
|
|
|
|
|
Total Investments Before Short Positions
(Cost — $2,161,634,311*) — 104.3% | | | | | | 2,154,064,917 | |
|
|
|
|
|
|
|
|
| | | | | | | |
Short Positions (g) | | Shares | | | | |
|
|
|
|
|
|
|
|
Gas Utilities — (0.0)% | | | | | | | |
Questar Corp. — New Shares (a) | | | 38,965 | | | (629,285 | ) |
|
|
|
|
|
|
|
|
Total Short Positions (Proceeds — $629,177) — (0.0)% | | | | | | (629,285 | ) |
|
|
|
|
|
|
|
|
Total Investments, Net of Short Positions — 104.3% | | | | | | 2,153,435,632 | |
Liabilities in Excess of Other Assets — (4.3)% | | | | | | (89,137,494 | ) |
| | | | |
|
|
|
Net Assets — 100.0% | | | | | $ | 2,064,298,138 | |
| | | | |
|
|
|
|
|
|
|
|
|
|
|
|
| |
* | The cost and unrealized appreciation (depreciation) of investments as of June 30, 2010, as computed for federal income tax purposes were as follows: |
| | | | |
Aggregate cost | | $ | 1,728,145,994 | |
| |
|
|
|
Gross unrealized appreciation | | $ | 654,704,670 | |
Gross unrealized depreciation | | | (228,785,747 | ) |
| |
|
|
|
Net unrealized depreciation | | $ | 425,918,923 | |
| |
|
|
|
| | | |
See Notes to Financial Statements. | | |
|
| BLACKROCK S&P 500 INDEX FUND | JUNE 30, 2010 | 21 |
| |
|
|
| |
Schedule of Investments (concluded) | Master S&P 500 Index Series |
| |
(a) | Security, or a portion of security, is on loan. |
| |
(b) | Non-income producing security. |
| |
(c) | Investments in companies considered to be an affiliate of the Series during the year, for purposes of Section 2(a)(3) of the Investment Company Act of 1940, as amended, were as follows: |
| | | | | | | | | | | | | | | | | | | | | |
|
|
|
|
|
|
|
|
|
|
|
|
|
|
|
|
Affiliate | | Beneficial Interest/
Shares Held
at December 31,
2009 | | Shares
Purchased | | Beneficial
Interest/
Shares Sold | | Beneficial Interest/
Shares Held
at June 30,
2010 | | Value
at June 30,
2010 | | Realized
Loss | | Income | |
|
|
|
|
|
|
|
|
|
|
|
|
|
|
|
|
BlackRock Liquidity Funds, TempFund, Institutional Class | | | 4,444,194 | | 12,100,843 | 1 | | — | | | 16,545,037 | | $ | 16,545,037 | | | — | | $ | 7,699 | |
BlackRock Liquidity Series, LLC Money Market Series | | $ | 270,313,884 | | — | | $ | 178,015,434 | 2 | $ | 92,298,450 | | $ | 92,298,450 | | | — | | $ | 95,291 | |
The PNC Financial Services Group, Inc. | | | 105,339 | | 13,906 | | | 4,433 | | | 114,812 | | $ | 6,486,878 | | $ | (67,890 | ) | $ | 22,078 | |
|
|
|
|
|
|
|
|
|
|
|
|
|
|
|
|
|
|
|
|
|
|
| | |
| 1 | Represents net shares purchased. |
| | |
| 2 | Represents beneficial interest sold. |
| |
(d) | All or a portion of security held as collateral in connection with open financial futures contracts. |
| |
(e) | Represents the current yield as of report date. |
| |
(f) | Security was purchased with the cash collateral from loaned securities. |
| |
(g) | In order to track the performance of its benchmark index, the Series sold non-index securities that it subsequently received in corporate actions occurring on the opening of market trading on the following business day. |
| |
• | Financial futures contracts purchased as of June 30,2010 were as follows: |
| | | | | | | | |
|
|
|
|
|
|
|
|
|
Contracts | | Issue | | Expiration
Date | | Notional
Value | | Unrealized
Depreciation |
|
|
|
|
|
|
|
|
|
373 | | S&P 500 Index | | September 2010 | | $20,314,742 | | $(1,168,652) |
|
|
|
|
|
|
|
|
|
| | |
• | For Series compliance purposes, the Series’ industry classifications refer to any one or more of the industry sub-classifications used by one or more widely recognized market indexes or rating group indexes, and/or as defined by Series management. This definition may not apply for purposes of this report, which may combine such industry sub-classifications for reporting ease. |
| |
• | Fair Value Measurements — Various inputs are used in determining the fair value of investments and derivatives, which are as follows: |
| |
| • | Level 1 — price quotations in active markets/exchanges for identical assets and liabilities |
| | |
| • | Level 2 — other observable inputs (including, but not limited to: quoted prices for similar assets or liabilities in markets that are active, quoted prices for identical or similar assets or liabilities in markets that are not active, inputs other than quoted prices that are observable for the assets or liabilities (such as interest rates, yield curves, volatilities, prepayment speeds, loss severities, credit risks and default rates) or other market-corroborated inputs) |
| | |
| • | Level 3 — unobservable inputs based on the best information available in the circumstances, to the extent observable inputs are not available (including the Series’ own assumptions used in determining the fair value of investments and derivatives) |
The inputs or methodologies used for valuing securities are not necessarily an indication of the risk associated with investing in those securities. For information about the Series’ policy regarding valuation of investments and other significant accounting policies, please refer to Note 1 of the Notes to Financial Statements.
The following tables summarize the inputs used as of June 30, 2010 in determining the fair valuation of the Series’ investments and derivatives:
| | | | | | | | | | | | | |
|
|
|
|
|
|
|
|
|
|
Valuation Inputs | | Level 1 | | Level 2 | | Level 3 | | Total | |
|
|
|
|
|
|
|
|
|
|
Assets: | | | | | | | | | | | | | |
Investments in Securities: | | | | | | | | | | | | | |
Long-Term Investments1 | | $ | 2,045,221,430 | | | — | | | — | | $ | 2,045,221,430 | |
Short-Term Securities | | | 16,545,037 | | $ | 92,298,450 | | | — | | | 108,843,487 | |
Liabilities: | | | | | | | | | | | | | |
Investments in Securities: | | | | | | | | | | | | | |
Short Positions | | | (629,285 | ) | | — | | | — | | | (629,285 | ) |
| |
|
|
|
|
|
|
|
|
|
|
|
|
Total | | $ | 2,061,137,182 | | $ | 92,298,450 | | | — | | $ | 2,153,435,632 | |
| |
|
|
|
|
|
|
|
|
|
|
|
|
| | |
| 1 | See above Schedule of Investments for values in each industry. |
| | | | | | | | |
|
|
|
| | Derivative Financial Instruments2 |
|
|
|
|
|
|
|
|
|
Valuation Inputs | | Level 1 | | Level 2 | | Level 3 | | Total |
|
|
|
|
|
|
|
|
|
Liabilities: | | | | | | | | |
Equity contracts | | $ (1,168,652) | | — | | — | | $ (1,168,652) |
| |
|
|
|
|
|
|
|
| | |
| 2 | Derivative financial instruments are financial futures contracts, which are shown at the unrealized appreciation/depreciation on the instrument. |
| | |
See Notes to Financial Statements. | |
|
22 | BLACKROCK S&P 500 INDEX FUND | JUNE 30, 2010 |
| |
|
|
| |
Statement of Assets and Liabilities | Master S&P 500 Index Series |
| | | | |
June 30, 2010 (Unaudited) | | | | |
|
|
|
|
|
Assets | | | | |
|
|
|
|
|
Investments at value — unaffiliated (including securities loaned of $89,260,632) (cost — $2,047,606,039) | | $ | 2,038,734,552 | |
Investments at value — affiliated (cost — $114,028,272) | | | 115,330,365 | |
Dividends receivable | | | 2,839,986 | |
Investments sold receivable | | | 629,177 | |
Securities lending income receivable — affiliated | | | 19,535 | |
Prepaid expenses | | | 108,641 | |
| |
|
|
|
Total assets | | | 2,157,662,256 | |
| |
|
|
|
| | | | |
|
|
|
|
|
Liabilities | | | | |
|
|
|
|
|
Collateral on securities loaned at value | | | 92,298,450 | |
Short positions at value (proceeds — $629,177) | | | 629,285 | |
Withdrawals payable to investor | | | 116,022 | |
Margin variation receivable | | | 159,917 | |
Other affiliates payable | | | 10,743 | |
Investment advisory fees payable | | | 8,496 | |
Directors’ fees payable | | | 1,098 | |
Other accrued expenses payable | | | 139,974 | |
Other liabilities | | | 133 | |
| |
|
|
|
Total liabilities | | | 93,364,118 | |
| |
|
|
|
Net Assets | | $ | 2,064,298,138 | |
| |
|
|
|
| | | | |
|
|
|
|
|
Net Assets Consist of | | | | |
|
|
|
|
|
Investor’s capital | | $ | 2,073,036,292 | |
Net unrealized appreciation/depreciation | | | (8,738,154 | ) |
| |
|
|
|
Net Assets | | $ | 2,064,298,138 | |
| |
|
|
|
| | | |
See Notes to Financial Statements. | | |
|
|
|
|
| BLACKROCK S&P 500 INDEX FUND | JUNE 30, 2010 | 23 |
| |
|
|
| |
Statement of Operations | Master S&P 500 Index Series |
| | | | |
�� | | | | |
Six Months Ended June 30, 2010 (Unaudited) | | | | |
|
|
|
|
|
Investment Income | | | | |
|
|
|
|
|
Dividends — unaffiliated | | $ | 22,044,932 | |
Securities lending — affiliated | | | 95,291 | |
Dividends — affiliated | | | 29,777 | |
| |
|
|
|
Total income | | | 22,170,000 | |
| |
|
|
|
| | | | |
|
|
|
|
|
Expenses | | | | |
|
|
|
|
|
Accounting services | | | 207,339 | |
Investment advisory | | | 113,586 | |
Custodian | | | 53,479 | |
Professional | | | 51,274 | |
Directors | | | 24,925 | |
Registration | | | 9,918 | |
Printing | | | 3,874 | |
Miscellaneous | | | 26,400 | |
| |
|
|
|
Total expenses | | | 490,795 | |
Less fees waived by advisor | | | (61,068 | ) |
| |
|
|
|
Total expenses after fees waived | | | 429,727 | |
| |
|
|
|
Net investment income | | | 21,740,273 | |
| |
|
|
|
| | | | |
|
|
|
|
|
Realized and Unrealized Gain (Loss) | | | | |
|
|
|
|
|
Net realized loss from: | | | | |
Investments — unaffiliated | | | (4,709,695 | ) |
Investments — affiliated | | | (67,890 | ) |
Financial futures contracts | | | (1,997,310 | ) |
| |
|
|
|
| | | (6,774,895 | ) |
| |
|
|
|
Net change in unrealized appreciation/depreciation on: | | | | |
Investments | | | (159,887,147 | ) |
Short positions | | | (108 | ) |
Financial futures contracts | | | (1,164,013 | ) |
| |
|
|
|
| | | (161,051,268 | ) |
| |
|
|
|
Total realized and unrealized loss | | | (167,826,163 | ) |
| |
|
|
|
Net Decrease in Net Assets Resulting from Operations | | $ | (146,085,890 | ) |
| |
|
|
|
| | |
See Notes to Financial Statements. | |
|
|
|
24 | BLACKROCK S&P 500 INDEX FUND | JUNE 30, 2010 |
| |
|
|
| |
Statements of Changes in Net Assets | Master S&P 500 Index Series |
| | | | | | | |
Increase (Decrease) in Net Assets: | | Six Months
Ended
June 30,
2010
(Unaudited) | | Year Ended
December 31,
2009 | |
|
|
|
|
|
|
Operations | | | | | | | |
|
|
|
|
|
|
|
|
Net investment income | | $ | 21,740,273 | | $ | 46,606,117 | |
Net realized loss | | | (6,774,895 | ) | | (60,806,194 | ) |
Net change in unrealized appreciation/depreciation | | | (161,051,268 | ) | | 510,710,328 | |
| |
|
|
|
|
|
|
Net increase (decrease) in net assets resulting from operations | | | (146,085,890 | ) | | 496,510,251 | |
| |
|
|
|
|
|
|
| | | | | | | |
|
|
|
|
|
|
|
|
Capital Transactions | | | | | | | |
|
|
|
|
|
|
|
|
Proceeds from contributions | | | 319,361,435 | | | 667,013,781 | |
Value of withdrawals | | | (387,636,019 | ) | | (838,713,754 | ) |
| |
|
|
|
|
|
|
Net decrease in net assets derived from capital transactions | | | (68,274,584 | ) | | (171,699,973 | ) |
| |
|
|
|
|
|
|
| | | | | | | |
|
|
|
|
|
|
|
|
Net Assets | | | | | | | |
|
|
|
|
|
|
|
|
Total increase (decrease) in net assets | | | (214,360,474 | ) | | 324,810,278 | |
Beginning of period | | | 2,278,658,612 | | | 1,953,848,334 | |
| |
|
|
|
|
|
|
End of period | | $ | 2,064,298,138 | | $ | 2,278,658,612 | |
| |
|
|
|
|
|
|
| | | |
See Notes to Financial Statements. | | |
|
|
|
|
| BLACKROCK S&P 500 INDEX FUND | JUNE 30, 2010 | 25 |
| |
|
|
| |
Financial Highlights | Master S&P 500 Index Series |
| | | | | | | | | | | | | | | | | | | |
| | | Six Months
Ended
June 30,
2010
(Unaudited) | | | |
| | | | | |
| | | | Year Ended December 31, | |
| | | |
|
|
| | | | 2009 | | 2008 | | 2007 | | 2006 | | 2005 | |
|
|
|
|
|
|
|
|
|
|
|
|
|
|
|
Total Investment Return | | | | | | | | | | | | | | | | | | | |
|
|
|
|
|
|
|
|
|
|
|
|
|
|
|
|
|
|
|
|
Total investment return | | | (6.64 | )%1 | | 26.61 | % | | (36.92 | )% | | 5.56 | % | | 15.85 | % | | 4.96 | % |
| |
|
|
|
|
|
|
|
|
|
|
|
|
|
|
|
|
|
|
| | | | | | | | | | | | | | | | | | | |
|
|
|
|
|
|
|
|
|
|
|
|
|
|
|
|
|
|
|
|
Ratios to Average Net Assets | | | | | | | | | | | | | | | | | | | |
|
|
|
|
|
|
|
|
|
|
|
|
|
|
|
|
|
|
|
|
Total expenses | | | 0.04 | %2 | | 0.05 | % | | 0.04 | % | | 0.04 | % | | 0.04 | % | | 0.03 | % |
| |
|
|
|
|
|
|
|
|
|
|
|
|
|
|
|
|
|
|
Total expenses after fees waived and paid indirectly | | | 0.04 | %2 | | 0.04 | % | | 0.04 | % | | 0.03 | % | | 0.04 | % | | 0.03 | % |
| |
|
|
|
|
|
|
|
|
|
|
|
|
|
|
|
|
|
|
Net investment income | | | 1.91 | %2 | | 2.32 | % | | 2.31 | % | | 1.95 | % | | 1.92 | % | | 1.84 | % |
| |
|
|
|
|
|
|
|
|
|
|
|
|
|
|
|
|
|
|
| | | | | | | | | | | | | | | | | | | |
|
|
|
|
|
|
|
|
|
|
|
|
|
|
|
|
|
|
|
|
Supplemental Data | | | | | | | | | | | | | | | | | | | |
|
|
|
|
|
|
|
|
|
|
|
|
|
|
|
|
|
|
|
|
Net assets, end of period (000) | | $ | 2,064,298 | | $ | 2,278,659 | | $ | 1,953,848 | | $ | 3,721,171 | | $ | 2,810,633 | | $ | 2,945,782 | |
| |
|
|
|
|
|
|
|
|
|
|
|
|
|
|
|
|
|
|
Portfolio turnover | | | 3 | % | | 7 | % | | 8 | % | | 4 | % | | 4 | % | | 11 | % |
| |
|
|
|
|
|
|
|
|
|
|
|
|
|
|
|
|
|
|
| | |
| 1 | Aggregate total investment return. |
| | |
| 2 | Annualized. |
| | |
See Notes to Financial Statements. | |
|
|
|
26 | BLACKROCK S&P 500 INDEX FUND | JUNE 30, 2010 |
| |
|
| |
Notes to Financial Statements (Unaudited) | Master S&P 500 Index Series |
1. Organization and Significant Accounting Policies:
Master S&P 500 Index Series (the “Series”), a non-diversified, open–end management investment company, is a series of Quantitative Master Series LLC (the “Master LLC”). The Master LLC is registered under the Investment Company Act of 1940, as amended (the “1940 Act”), and is organized as a Delaware limited liability company. The Master LLC’s Limited Liability Company Agreement permits the Board of Directors (the “Board”) to issue non-transferable interests, subject to certain limitations. The Series’ financial statements are prepared in conformity with accounting principles generally accepted in the United States of America (“US GAAP”), which may require management to make estimates and assumptions that affect the reported amounts and disclosures in the financial statements. Actual results could differ from those estimates.
The following is a summary of significant accounting policies followed by the Series:
Valuation: The Series’ policy is to fair value its financial instruments and derivatives at market value using independent dealers or pricing services selected under the supervision of the Board. Equity investments traded on a recognized securities exchange or the NASDAQ Global Market System are valued at the last reported sale price that day or the NASDAQ official closing price, if applicable. For equity investments traded on more than one exchange, the last reported sale price on the exchange where the stock is primarily traded is used. Equity investments traded on a recognized exchange for which there were no sales on that day are valued at the last available bid (long positions) or ask (short positions) price. If no bid or ask price is available, the prior day’s price will be used, unless it is determined that such prior day’s price no longer reflects the fair value of the security. Financial futures contracts traded on exchanges are valued at their last sale price. Investments in open-end investment companies are valued at net asset value each business day. Short-term securities with remaining maturities of 60 days or less may be valued at amortized cost, which approximates fair value.
The Series values its investments in BlackRock Liquidity Series, LLC Money Market Series (the “Money Market Series”) at fair value, which is ordinarily based upon its pro rata ownership in the net assets of the underlying fund. The Money Market Series seeks current income consistent with maintaining liquidity and preserving capital. Although the Money Market Series is not registered under the 1940 Act, its investments will follow the parameters of investments by a money market fund that is subject to Rule 2a-7 promulgated by the Securities and Exchange Commission (“SEC”) under the 1940 Act. The Series may withdraw up to 25% of its investment daily, although the manager of the Money Market Series, in its sole discretion, may permit an investor to withdraw more than 25% on any one day.
In the event that application of these methods of valuation results in a price for an investment which is deemed not to be representative of the market value of such investment or is not available, the investment will be valued in accordance with a policy approved by the Board as reflecting fair value (“Fair Value Assets”). When determining the price for Fair Value Assets, the investment advisor and/or the sub-advisor seeks to determine the price that the Series might reasonably expect to receive from the current sale of that asset in an arm’s-length transaction. Fair value determinations shall be based upon all available factors that the investment advisor and/or sub-advisor deems relevant. The pricing of all Fair Value Assets is subsequently reported to the Board or a committee thereof.
Segregation and Collateralization: In cases in which the 1940 Act and the interpretive positions of the SEC require that the Series either delivers collateral or segregates assets in connection with certain investments (e.g., financial futures contracts), the Series will, consistent with SEC rules and/or certain interpretive letters issued by the SEC, segregate collateral or designate on its books and records cash or other liquid securities having a market value at least equal to the amount that would otherwise be required to be physically segregated. Furthermore, based on requirements and agreements with certain exchanges and third party broker-dealers, each party has requirements to deliver/deposit securities as collateral for certain investments.
Securities Lending: The Series may lend securities to financial institutions that provide cash as collateral, which will be maintained at all times in an amount equal to at least 100% of the current market value of the loaned securities. The market value of the loaned securities is determined at the close of business of the Series and any additional required collateral is delivered to the Series on the next business day. Securities lending income, as disclosed in the Statement of Operations, represents the income earned from the investment of the cash collateral, net of rebates paid to, or fees paid by, borrowers and less the fees paid to the securities lending agent. Loans of securities are terminable at any time and the borrower, after notice, is required to return borrowed securities within the standard time period for settlement of securities transactions. In the event that the borrower defaults on its obligation to return borrowed securities because of insolvency or for any other reason, the Series could experience delays and costs in gaining access to the collateral. The Series also could suffer a loss if the value of an investment purchased with cash collateral falls below the market value of loaned securities or if the value of an investment purchased with cash collateral falls below the value of the original cash collateral received.
Investment Transactions and Investment Income: For financial reporting purposes, investment transactions are recorded on the dates the transactions are entered into (the trade dates). Realized gains and losses on investment transactions are determined on the identified cost basis. Dividend income is recorded on the ex-dividend dates. Upon notification from
| | | |
|
| BLACKROCK S&P 500 INDEX FUND | JUNE 30, 2010 | 27 |
| |
|
| |
Notes to Financial Statements (continued) | Master S&P 500 Index Series |
issuers, some of the dividend income received from a real estate investment trust may be redesignated as a reduction of cost of the related investment and/or realized gain. Interest income is recognized on the accrual basis.
Income Taxes: The Series is classified as a partnership for federal income tax purposes. As such, each investor in the Series is treated as owner of its proportionate share of the net assets, income, expenses and realized and unrealized gains and losses of the Series. Therefore, no federal income tax provision is required. It is intended that the Series’ assets will be managed so an investor in the Series can satisfy the requirements of Subchapter M of the Internal Revenue Code of 1986, as amended.
The Series files US federal and various state and local tax returns. No income tax returns are currently under examination. The statute of limitations on the Series US federal tax returns remains open for each of the four years ended December 31, 2009. The statutes of limitations on the Series state and local tax returns may remain open for an additional year depending upon the jurisdiction.
Other: Expenses directly related to the Series are charged to that Series. Other operating expenses shared by several funds are pro rated among those funds on the basis of relative net assets or other appropriate methods. The Series has an arrangement with the custodian whereby fees may be reduced by credits earned on uninvested cash balances, which if applicable are shown as fees paid indirectly in the Statement of Operations. The custodian imposes fees on overdrawn cash balances, which can be offset by accumulated credits earned or may result in additional custody charges.
2. Derivative Financial Instruments:
The Series engages in various portfolio investment strategies using derivative contracts both to increase the returns of the Series and to economically hedge, or protect, its exposure to certain risks such as equity risk. These contracts may be transacted on an exchange. Losses may arise if the value of the contract decreases due to an unfavorable change in the market rates or values of the underlying instrument or if the counterparty does not perform under the contract. Counterparty risk related to exchange-traded financial futures contracts is minimal because of the protection against default provided by the exchange on which they trade. To the extent amounts due to the Series from its counterparties are not fully collateralized contractually or otherwise, the Series bears the risk of loss from counterparty non-performance. See Note 1 “Segregation and Collateralization” for information with respect to collateral practices. In addition, the Series manages counterparty risk by entering into agreements only with counterparties that it believes have the financial resources to honor their obligations and by monitoring the financial stability of those counterparties.
Financial Futures Contracts: The Series purchases or sells financial futures contracts and options on financial futures contracts to gain exposure to, or economically hedge against, changes in the value of equity securities (equity risk). Financial futures contracts are contracts for delayed delivery of securities at a specific future date and at a specific price. Pursuant to the contract, the Series agrees to receive from or pay to the broker an amount of cash equal to the daily fluctuation in value of the contract. Such receipts or payments are known as margin variation and are recognized by the Series as unrealized gains or losses. When the contract is closed, the Series records a realized gain or loss equal to the difference between the value of the contract at the time it was opened and the value at the time it was closed. The use of financial futures transactions involves the risk of an imperfect correlation in the movements in the price of financial futures contracts, interest rates and the underlying assets.
| | | | | | |
Derivative Instruments Categorized by Risk Exposure: | | | | | | |
|
|
Fair Value of Derivative Instruments as of June 30, 2010 |
|
| | Liability Derivatives | |
| |
|
|
| | Statement of
Assets and
Liabilities
Location | | Value | |
|
|
|
|
|
|
Equity contracts | | Net unrealized appreciation/ depreciation* | | $ | 1,168,652 | |
|
|
|
|
|
|
|
| |
* | Includes cumulative appreciation/depreciation of financial futures contracts as reported in the Schedule of Investments. Only current day’s margin variation is reported within the Statement of Assets and Liabilities. |
| | | | |
|
The Effect of Derivative Instruments on the Statement of Operations
Six Months Ended June 30, 2010 |
|
| | Net Realized Loss from | |
| |
|
|
| | Financial Futures Contracts | |
| |
|
|
Equity contracts | | $ | (1,997,310 | ) |
|
|
|
|
|
|
| | Net Change in Unrealized
Appreciation/Depreciation on | |
| |
|
|
| | Financial Futures Contracts | |
| |
|
|
Equity contracts | | $ | (1,164,013 | ) |
|
|
|
|
|
For the six months ended June 30, 2010, the average quarterly balance of outstanding derivative financial instruments was as follows:
| | | | |
|
|
|
|
|
Financial futures contracts: | | | | |
Average number of contracts purchased | | | 205 | |
Average notional value of contracts purchased | | $ | 15,505,330 | |
|
|
|
|
|
| | |
|
28 | BLACKROCK S&P 500 INDEX FUND | JUNE 30, 2010 |
| |
|
| |
Notes to Financial Statements (continued) | Master S&P 500 Index Series |
|
3. Investment Advisory Agreement and Other Transactions with Affiliates: |
|
The PNC Financial Services Group, Inc. (“PNC”), Bank of America Corporation (“BAC”) and Barclays Bank PLC (“Barclays”) are the largest stockholders of BlackRock, Inc. (“BlackRock”). Due to the ownership structure, PNC is an affiliate of the Series for 1940 Act purposes, but BAC and Barclays are not. |
The Master LLC, on behalf of the Series, entered into an Investment Advisory Agreement with BlackRock Advisors, LLC (the “Manager”), the Series’ investment advisor, an indirect, wholly owned subsidiary of BlackRock, to provide investment advisory and administration services.
The Manager is responsible for the management of the Series’ portfolio and provides the necessary personnel, facilities, equipment and certain other services necessary to the operations of the Series. For such services, the Series pays the Manager a monthly fee at an annual rate of 0.01% of the average daily value of the Series’ net assets.
Effective June 1, 2010, the Manager contractually agreed to waive its investment advisory fee by 0.005% of the average daily value of the Series’ net assets until May 1, 2011. This agreement may be terminated upon 90 days notice by a majority of the non-interested directors of the Series, or by a vote of a majority of the outstanding voting securities of the Series. Prior to June 1, 2010, the Manager had entered into an agreement which provided that the investment advisory fee for the Series, when combined with the administrative fee of S&P 500 Index Fund would not exceed 0.25% of average daily net assets until May 1, 2011. As a result, the Series paid a monthly fee at an annual rate of 0.005% of the average daily value of the Series’ net assets. For the six months ended June 30, 2010, the Series waived $56,793, which is included in fees waived by Advisor in the Statement of Operations.
The Manager voluntarily agreed to waive its advisory fees by the amount of investment advisory fees the Series pays to the Manager indirectly through its investment in affiliated money market funds, however the Manager does not waive its advisory fees by the amount of investment advisory fees paid through its investment in other affiliated investment companies, if any. For the six months ended June 30, 2010, the Series waived $4,275, which is included in fees waived by advisor in the Statement of Operations.
The Manager entered into a sub-advisory agreement with BlackRock Investment Management, LLC (“BIM”), an affiliate of the Manager. The Manager pays BIM for services it provides, a monthly fee that is a percentage of the investment advisory fees paid by the Series to the Manager.
For the six months ended June 30, 2010, the Series reimbursed the Manager $21,298 for certain accounting services, which is included in accounting services in the Statement of Operations.
The Master LLC, on behalf of the Series, received an exemptive order from the SEC permitting, among other things, to pay an affiliated securities lending agent a fee based on a share of the income derived from the securities lending activities and has retained BIM as the securities lending agent. BIM may, on behalf of the Series, invest cash collateral received by the Series for such loans, among other things, in a private investment company managed by the Manager or in registered money market funds advised by the Manager or its affiliates. The market value of securities on loan and the value of the related collateral are shown in the Statement of Assets and Liabilities as securities loaned and collateral on securities loaned at value, respectively. The cash collateral invested by BIM is disclosed in the Schedule of Investments. The share of income earned by the Series on such investments is shown as securities lending — affiliated in the Statement of Operations. For the six months ended June 30, 2010, BIM received $22,886 in securities lending agent fees related to securities lending activities for the Series.
Certain officers and/or directors of the Master LLC are officers and/or directors of BlackRock or its affiliates.
4. Investments:
Purchases and sales of investments, excluding short-term securities for the six months ended June 30, 2010, were $57,201,556 and $112,878,086, respectively.
5. Borrowings:
The Master LLC, on behalf of the Series, along with certain other funds managed by the Manager and its affiliates, is a party to a $500 million credit agreement with a group of lenders, which expires in November 2010. The Series may borrow under the credit agreement to fund shareholder redemptions. The Series paid its pro rata share of a 0.02% upfront fee on the aggregate commitment amount which was allocated to the Series based on its net assets as of October 31, 2009, a commitment fee of 0.10% per annum based on the Series’ pro rata share of the unused portion of the credit agreement, which is included in miscellaneous in the Statement of Operations, and interest at a rate equal to the higher of (a) the one-month LIBOR plus 1.25% per annum and (b) the Fed Funds rate plus 1.25% per annum on amounts borrowed. The Series did not borrow under the credit agreement during the six months ended June 30, 2010.
| | | |
|
| BLACKROCK S&P 500 INDEX FUND | JUNE 30, 2010 | 29 |
| |
|
| |
Notes to Financial Statements (concluded) | Master S&P 500 Index Series |
6. Market and Credit Risk:
In the normal course of business, the Series invests in securities and enters into transactions where risks exist due to fluctuations in the market (market risk) or failure of the issuer of a security to meet all its obligations (issuer credit risk). The value of securities held by the Series may decline in response to certain events, including those directly involving the issuers whose securities are owned by the Series; conditions affecting the general economy; overall market changes; local, regional or global political, social or economic instability; and currency and interest rate and price fluctuations. Similar to issuer credit risk, the Series may be exposed to counterparty credit risk, or the risk that an entity with which the Series has unsettled or open transactions may fail to or be unable to perform on its commitments. The Series manages counterparty credit risk by entering into transactions only with counterparties that it believes have the financial resources to honor their obligations and by monitoring the financial stability of those counterparties. Financial assets, which potentially expose the Series to market, issuer and counterparty credit risks, consist principally of financial instruments and receivables due from counterparties. The extent of the Series’ exposure to market, issuer and counterparty credit risks with respect to these financial assets is generally approximated by their value recorded in the Series’ Statement of Assets and Liabilities, less any collateral held by the Series.
7. Subsequent Events:
Management has evaluated the impact of all subsequent events on the Series through the date the financial statements were issued and has determined that there were no subsequent events requiring adjustment or additional disclosure in the financial statements.
| | |
|
30 | BLACKROCK S&P 500 INDEX FUND | JUNE 30, 2010 |
|
|
|
Disclosure of Investment Advisory Agreement and Sub-Advisory Agreement |
The Board of Directors of Quantitative Master Series LLC (the “Master LLC”) met on April 20, 2010 and May 18 – 19, 2010 to consider the approval of the Master LLC’s investment advisory agreement (the “Advisory Agreement”) with BlackRock Advisors, LLC (the “Manager”), the Master LLC’s investment advisor, on behalf of the Master S&P 500 Index Series (the “Master Portfolio”), a series of the Master LLC. The Board of Directors of the Master LLC also considered the approval of the sub-advisory agreement (the “Sub-Advisory Agreement”) between the Manager and BlackRock Investment Management, LLC (the “Sub-Advisor”), with respect to the Master Portfolio. BlackRock S&P 500 Index Fund (the “Fund”), a series of BlackRock Index Funds, Inc. (the “Corporation”), is a “feeder” fund that invests all of its investable assets in the Master Portfolio. Accordingly, the Board of Directors of the Corporation also considered the approval of the Advisory Agreement and the Sub-Advisory Agreement with respect to the Master Portfolio. The Manager and the Sub-Advisor are referred to herein as “BlackRock.” The Advisory Agreement and the Sub-Advisory Agreement are referred to herein as the “Agreements.” For simplicity, the Board of Directors of the Master LLC and the Board of Directors of the Corporation are referred to herein collectively as the “Board,” and the members are referred to as “Board Members.”
Activities and Composition of the Board
The Board consists of thirteen individuals, eleven of whom are not “interested persons” of the Master LLC or the Corporation as defined in the Investment Company Act of 1940, as amended (the “1940 Act”) (the “Independent Board Members”). The Board Members are responsible for the oversight of the operations of the Master LLC or the Corporation, as pertinent, and perform the various duties imposed on the directors of investment companies by the 1940 Act. The Independent Board Members have retained independent legal counsel to assist them in connection with their duties. The Co-Chairs of the Board are each Independent Board Members. The Board has established five standing committees: an Audit Committee, a Governance and Nominating Committee, a Compliance Committee, a Performance Oversight and Contract Committee and an Executive Committee, each of which is composed of Independent Board Members (except for the Executive Committee, which also has one interested Board Member) and is chaired by Independent Board Members. The Board also has one ad hoc committee, the Joint Product Pricing Committee, which consists of Independent Board Members and directors/trustees of the boards of certain other BlackRock-managed funds, who are not “interested persons” of their respective funds.
The Agreements
Pursuant to the 1940 Act, the Board is required to consider the continuation of the Agreements on an annual basis. In connection with this process, the Board assessed, among other things, the nature, scope and quality of the services provided to the Master Portfolio and the Fund by the personnel of BlackRock and its affiliates, including investment management, administrative and shareholder services, oversight of fund accounting and custody, marketing services and assistance in meeting applicable legal and regulatory requirements.
From time to time throughout the year, the Board, acting directly and through its committees, considers at each of its meetings factors that are relevant to its annual consideration of the renewal of the Agreements, including the services and support provided by BlackRock to the Master Portfolio, the Fund and their shareholders. Among the matters the Board considered were: (a) investment performance for one-, three- and five-year periods, as applicable, against peer funds, and applicable benchmarks, if any, as well as senior management’s and portfolio managers’ analysis of the reasons for any over performance or underperformance against its peers and/or benchmark, as applicable; (b) fees, including advisory, administration, if applicable, and other amounts paid to BlackRock and its affiliates by the Master Portfolio and/or the Fund for services, such as transfer agency, marketing and distribution, call center and fund accounting; (c) Master Portfolio’s and/or the Fund’s operating expenses; (d) the resources devoted to and compliance reports relating to the Master Portfolio’s and the Fund’s investment objective, policies and restrictions; (e) the Master LLC’s and the Corporation’s compliance with its respective Code of Ethics and compliance policies and procedures; (f) the nature, cost and character of non-investment management services provided by BlackRock and its affiliates; (g) BlackRock’s and other service providers’ internal controls; (h) BlackRock’s implementation of the proxy voting policies approved by the Board; (i) the use of brokerage commissions and execution quality of portfolio transactions; (j) BlackRock’s implementation of the Master LLC’s and/or the Corporation’s valuation and liquidity procedures; (k) an analysis of contractual and actual management fees for products with similar investment objectives across the open-end fund, closed-end fund and institutional account product channels; and (l) periodic updates on BlackRock’s business.
Board Considerations in Approving the Agreements
The Approval Process: Prior to the April 20, 2010 meeting, the Board requested and received materials specifically relating to the Agreements. The Board is engaged in a process with BlackRock to periodically review the nature and scope of the information provided to better assist its deliberations. The materials provided in connection with the April meeting included: (a) information independently compiled and prepared by Lipper, Inc. (“Lipper”) on fees and expenses of the Master Portfolio and the Fund, as applicable, and the investment performance of the Fund as compared with a peer group of funds as determined by Lipper (collectively, “Peers”); (b) information on the profitability of the Agreements to BlackRock and a discussion of fall-out benefits to BlackRock and its affiliates and significant shareholders; (c) a general analysis provided by BlackRock concerning investment advisory fees charged to other clients, such as institutional clients and closed-end funds, under similar investment mandates, as well as the performance of such other clients, as applicable; (d) the impact of economies of scale; (e) a summary of aggregate amounts paid by the Master Portfolio and/or the Fund to BlackRock; (f) sales and redemption
| | | |
|
| BLACKROCK S&P 500 INDEX FUND | JUNE 30, 2010 | 31 |
|
|
|
Disclosure of Investment Advisory Agreement and Sub-Advisory Agreement (continued) |
data regarding the Fund’s shares; and (g) if applicable, a comparison of management fees to similar BlackRock open-end funds, as classified by Lipper.
At an in-person meeting held on April 20, 2010, the Board reviewed materials relating to its consideration of the Agreements. As a result of the discussions that occurred during the April 20, 2010 meeting, the Board presented BlackRock with questions and requests for additional information and BlackRock responded to these requests with additional written information in advance of the May 18 – 19, 2010 Board meeting.
At an in-person meeting held on May 18 – 19, 2010, the Board of the Master LLC, including the Independent Board Members, unanimously approved the continuation of the Advisory Agreement between the Manager and the Master LLC with respect to the Master Portfolio and the Sub-Advisory Agreement between the Manager and the Sub-Advisor with respect to the Master Portfolio, each for a one-year term ending June 30, 2011. The Board of the Corporation, including the Independent Board Members, also considered the continuation of the Agreements and found the Agreements to be satisfactory. In approving the continuation of the Agreements, the Board considered: (a) the nature, extent and quality of the services provided by BlackRock; (b) the investment performance of the Master Portfolio, the Fund and BlackRock; (c) the advisory fee and the cost of the services and profits to be realized by BlackRock and its affiliates from their relationship with the Master Portfolio and the Fund; (d) economies of scale; and (e) other factors deemed relevant by the Board Members.
The Board also considered other matters it deemed important to the approval process, such as payments made to BlackRock or its affiliates relating to the distribution of Fund shares, services related to the valuation and pricing of portfolio holdings of the Master Portfolio, direct and indirect benefits to BlackRock and its affiliates and significant shareholders from their relationship with the Master Portfolio and the Fund and advice from independent legal counsel with respect to the review process and materials submitted for the Board’s review. The Board noted the willingness of BlackRock personnel to engage in open, candid discussions with the Board. The Board did not identify any particular information as controlling, and each Board Member may have attributed different weights to the various items considered.
A. Nature, Extent and Quality of the Services Provided by BlackRock: The Board, including the Independent Board Members, reviewed the nature, extent and quality of services provided by BlackRock, including the investment advisory services and the resulting performance of the Fund. Throughout the year, the Board compared the Fund’s performance to the performance of a comparable group of mutual funds, and the performance of a relevant benchmark, if any. The Board met with BlackRock’s senior management personnel responsible for investment operations, including the senior investment officers. The Board also reviewed the materials provided by the portfolio management team discussing performance and the investment objective, strategies and outlook.
The Board considered, among other factors, the number, education and experience of BlackRock’s investment personnel generally and the Master Portfolio’s portfolio management team, investments by portfolio managers in the funds they manage, BlackRock’s portfolio trading capabilities, BlackRock’s use of technology, BlackRock’s commitment to compliance and BlackRock’s approach to training and retaining portfolio managers and other research, advisory and management personnel. The Board also reviewed a general description of BlackRock’s compensation structure with respect to the Master Portfolio’s portfolio management team and BlackRock’s ability to attract and retain high-quality talent.
In addition to advisory services, the Board considered the quality of the administrative and non-investment advisory services provided to the Master Portfolio and the Fund. BlackRock and its affiliates and significant shareholders provide the Master Portfolio and the Fund with certain administrative, transfer agency, shareholder and other services (in addition to any such services provided to the Master Portfolio and the Fund by third parties) and officers and other personnel as are necessary for the operations of the Master Portfolio and the Fund. In addition to investment advisory services, BlackRock and its affiliates provide the Master Portfolio and the Fund with other services, including: (i) preparing disclosure documents, such as the prospectus, the statement of additional information and periodic shareholder reports; (ii) assisting with daily accounting and pricing; (iii) overseeing and coordinating the activities of other service providers; (iv) organizing Board meetings and preparing the materials for such Board meetings; (v) providing legal and compliance support; and (vi) performing other administrative functions necessary for the operation of the Master Portfolio and the Fund, such as tax reporting, fulfilling regulatory filing requirements, and call center services. The Board reviewed the structure and duties of BlackRock’s fund administration, accounting, legal and compliance departments and considered BlackRock’s policies and procedures for assuring compliance with applicable laws and regulations.
B. The Investment Performance of the Master Portfolio, the Fund and BlackRock: The Board, including the Independent Board Members, also reviewed and considered the performance history of the Master Portfolio and the Fund, as applicable. The Board noted that the Master Portfolio’s investment results correspond directly to the investment results of the Fund. In preparation for the April 20, 2010 meeting, the Board was provided with reports, independently prepared by Lipper, which included a comprehensive analysis of the Fund’s performance. The Board also reviewed a narrative and statistical analysis of the Lipper data that was prepared by BlackRock, which analyzed various factors that affect Lipper’s rankings. In connection with its review, the Board received and reviewed information regarding the investment performance of the Fund as compared to a representative group of similar funds as determined by Lipper and to all funds in the Fund’s applicable Lipper category. The Board was
| | | |
|
32 | BLACKROCK S&P 500 INDEX FUND | JUNE 30, 2010 | |
|
|
|
Disclosure of Investment Advisory Agreement and Sub-Advisory Agreement (continued) |
provided with a description of the methodology used by Lipper to select peer funds. The Board regularly reviews the performance of the Master Portfolio and the Fund, as applicable, throughout the year. The Board attaches more importance to performance over relatively long periods of time, typically three to five years.
The Board noted that the Fund performed below the median of its Lipper Performance Universe in each of the one-, three- and five-year periods reported. The Board and BlackRock reviewed the reasons for the Fund’s underperformance during these periods compared with its Peers. The Board was informed that, among other things, over the one-, three- and five-year periods the Fund met its objective of matching the risk and return of the S&P 500 Index before the application of fees and expenses.
C. Consideration of the Advisory Fees and the Cost of the Services and Profits to be Realized by BlackRock and its Affiliates from their Relationship with the Master Portfolio and the Fund: The Board, including the Independent Board Members, reviewed the Master Portfolio’s contractual advisory fee rate compared with the other funds in the Fund’s Lipper category. It also compared the Fund’s total expenses, as well as actual management fees, to those of other funds in its Lipper category. The Board considered the services provided and the fees charged by BlackRock to other types of clients with similar investment mandates, including separately managed institutional accounts.
The Board received and reviewed statements relating to BlackRock’s financial condition and profitability with respect to the services it provided the Master Portfolio and the Fund. The Board was also provided with a profitability analysis that detailed the revenues earned and the expenses incurred by BlackRock for services provided to the Master Portfolio and the Fund. The Board reviewed BlackRock’s profitability with respect to the Master Portfolio and the Fund, as applicable, and other funds the Board currently oversees for the year ended December 31, 2009 compared to available aggregate profitability data provided for the year ended Decem-ber 31, 2008. The Board reviewed BlackRock’s profitability with respect to other fund complexes managed by the Manager and/or its affiliates. The Board reviewed BlackRock’s assumptions and methodology of allocating expenses in the profitability analysis, noting the inherent limitations in allocating costs among various advisory products. The Board recognized that profitability may be affected by numerous factors including, among other things, fee waivers and expense reimbursements by the Manager, the types of funds managed, expense allocations and business mix, and the difficulty of comparing profitability as a result of those factors.
The Board noted that, in general, individual fund or product line profitability of other advisors is not publicly available. Nevertheless, to the extent such information was available, the Board considered BlackRock’s operating margin, in general, compared to the operating margin for leading investment management firms whose operations include advising open-end funds, among other product types. That data indicates that operating margins for BlackRock with respect to its registered funds are generally consistent with margins earned by similarly situated publicly traded competitors. In addition, the Board considered, among other things, certain third party data comparing BlackRock’s operating margin with that of other publicly traded asset management firms. That third party data indicates that larger asset bases do not, in themselves, translate to higher profit margins.
In addition, the Board considered the cost of the services provided to the Master Portfolio and the Fund by BlackRock, and BlackRock’s and its affiliates’ profits relating to the management and distribution of the Master Portfolio and the Fund and the other funds advised by BlackRock and its affiliates. As part of its analysis, the Board reviewed BlackRock’s methodology in allocating its costs to the management of the Master Portfolio and the Fund. The Board also considered whether BlackRock has the financial resources necessary to attract and retain high-quality investment management personnel to perform its obligations under the Agreements and to continue to provide the high quality of services that is expected by the Board.
The Board noted that the Master Portfolio’s contractual advisory fee rate was lower than or equal to the median contractual advisory fee rate paid by the Fund’s Peers, in each case before taking into account any expense reimbursements or fee waivers. The Board also noted that BlackRock (i) has contractually agreed to waive one-half of the advisory fee currently paid by the Master Portfolio and (ii) has contractually agreed to waive and/or reimburse fees and/or expenses so that the advisory fee for the Master Portfolio, when combined with the Fund’s administration fee, will not exceed a specified percentage of the Master Portfolio’s average daily net assets. Additionally, the Board noted that BlackRock has voluntarily agreed to waive fees and/or reimburse expenses in order to limit, to a specified amount, the Fund’s total operating expenses on a class-by-class basis, as applicable.
The Board noted that after discussions between the Board, including the Independent Board Members, and BlackRock, the Board approved BlackRock’s proposed contractual administration fee reduction effective June 1, 2010.
D. Economies of Scale: The Board, including the Independent Board Members, considered the extent to which economies of scale might be realized as the assets of the Master Portfolio and the Fund increase. The Board also considered the extent to which the Master Portfolio and the Fund benefit from such economies and whether there should be changes in the advisory fee rate or structure in order to enable the Master Portfolio and the Fund to participate in these economies of scale, for example
| | | |
|
| BLACKROCK S&P 500 INDEX FUND | JUNE 30, 2010 | 33 |
|
|
|
Disclosure of Investment Advisory Agreement and Sub-Advisory Agreement (concluded) |
through the use of breakpoints in the advisory fee based upon the asset level of the Master Portfolio.
E. Other Factors Deemed Relevant by the Board Members: The Board, including the Independent Board Members, also took into account other ancillary or “fall-out” benefits that BlackRock or its affiliates and significant shareholders may derive from their respective relationships with the Master Portfolio and the Fund, both tangible and intangible, such as BlackRock’s ability to leverage its investment professionals who manage other portfolios, an increase in BlackRock’s profile in the investment advisory community, and the engagement of BlackRock’s affiliates and significant shareholders as service providers to the Master Portfolio and the Fund, including for administrative, transfer agency and distribution services. The Board also considered BlackRock’s overall operations and its efforts to expand the scale of, and improve the quality of, its operations. The Board also noted that BlackRock may use and benefit from third party research obtained by soft dollars generated by certain mutual fund transactions to assist in managing all or a number of its other client accounts. The Board further noted that BlackRock completed the acquisition of a complex of exchange-traded funds (“ETFs”) on December 1, 2009, and that BlackRock’s funds may invest in such ETFs without any offset against the management fees payable by the funds to BlackRock.
In connection with its consideration of the Agreements, the Board also received information regarding BlackRock’s brokerage and soft dollar practices. The Board received reports from BlackRock which included information on brokerage commissions and trade execution practices throughout the year.
The Board noted the competitive nature of the open-end fund marketplace, and that shareholders are able to redeem their Fund shares if they believe that the Fund’s and/or the Master Portfolio’s fees and expenses are too high or if they are dissatisfied with the performance of the Fund.
Conclusion
The Board of the Master LLC, including the Independent Board Members, unanimously approved the continuation of the Advisory Agreement between the Manager and the Master LLC, with respect to the Master Portfolio, for a one-year term ending June 30, 2011 and the Sub-Advisory Agreement between the Manager and the Sub-Advisor, with respect to the Master Portfolio, for a one-year term ending June 30, 2011. As part of its approval, the Board of the Master LLC considered the detailed review of BlackRock’s fee structure, as it applies to the Master LLC, being conducted by the ad hoc Joint Product Pricing Committee. Based upon its evaluation of all of the aforementioned factors in their totality, the Board of the Master LLC, including the Independent Board Members, was satisfied that the terms of the Agreements were fair and reasonable and in the best interest of the Master Portfolio and its shareholders. The Board of the Corporation, including the Independent Board Members, also considered the continuation of the Agreements with respect to the Master Portfolio and found the Agreements to be satisfactory. In arriving at a decision to approve the Agreements, the Board of the Master LLC did not identify any single factor or group of factors as all-important or controlling, but considered all factors together, and different Board Members may have attributed different weights to the various factors considered. The Independent Board Members were also assisted by the advice of independent legal counsel in making this determination. The contractual fee arrangements for the Master Portfolio reflect the results of several years of review by the Board Members and predecessor Board Members, and discussions between such Board Members (and predecessor Board Members) and BlackRock. Certain aspects of the arrangements may be the subject of more attention in some years than in others, and the Board Members’ conclusions may be based in part on their consideration of these arrangements in prior years.
| | | |
|
34 | BLACKROCK S&P 500 INDEX FUND | JUNE 30, 2010 | |
Ronald W. Forbes, Co-Chairman of the Board and Director
Rodney D. Johnson, Co-Chairman of the Board and Director
David O. Beim, Director
Richard S. Davis, Director
Henry Gabbay, Director
Dr. Matina Horner, Director
Herbert I. London, Director and Member of the Audit Committee
Cynthia A. Montgomery, Director
Joseph P. Platt, Jr., Director
Robert C. Robb, Jr., Director
Toby Rosenblatt, Director
Kenneth L. Urish, Chairman of the Audit Committee and Director
Frederick W. Winter, Director and Member of the Audit Committee
Anne Ackerley, Fund/Master LLC President and Chief Executive Officer
Jeffrey Holland, Vice President
Brendan Kyne, Vice President
Brian Schmidt, Vice President
Neal Andrews, Chief Financial Officer
Jay Fife, Treasurer
Brian Kindelan, Chief Compliance Officer of the Fund/Master LLC
Howard Surloff, Secretary
Investment Advisor
BlackRock Advisors, LLC
Wilmington, DE 19809
Sub-Advisor
BlackRock Investment Management, LLC
Plainsboro, NJ 08536
Custodian
State Street Bank and Trust Company
Boston, MA 02266
Transfer Agent
BNY Mellon Investment Servicing (US) Inc.
Wilmington, DE 19809
Accounting Agent
State Street Bank and Trust Company
Princeton, NJ 08540
Distributor
BlackRock Investments, LLC
New York, NY 10022
Legal Counsel
Sidley Austin LLP
New York, NY 10019
Independent Registered Public Accounting Firm
Deloitte & Touche LLP
Princeton, NJ 08540
Address of the Fund
100 Bellevue Parkway
Wilmington, DE 19809
| | | |
|
| BLACKROCK S&P 500 INDEX FUND | JUNE 30, 2010 | 35 |
|
|
|
Additional Information |
|
|
General Information |
|
Electronic Delivery
Electronic copies of most financial reports and prospectuses are available on the Fund’s website or shareholders can sign up for e-mail notifications of quarterly statements, annual and semi-annual reports and prospectuses by enrolling in the Fund’s electronic delivery program.
To enroll:
Shareholders Who Hold Accounts with Investment Advisors, Banks or Brokerages:
Please contact your financial advisor. Please note that not all investment advisors, banks or brokerages may offer this service.
Shareholders Who Hold Accounts Directly with BlackRock:
| |
1) | Access the BlackRock website at
http://www.blackrock.com/edelivery |
|
2) | Select “eDelivery” under the “More Information” section |
|
3) | Log into your account |
Householding
The Fund will mail only one copy of shareholder documents, including prospectuses, annual and semi-annual reports and proxy statements, to shareholders with multiple accounts at the same address. This practice is commonly called “householding” and is intended to reduce expenses and eliminate duplicate mailings of shareholder documents. Mailings of your shareholder documents may be householded indefinitely unless you instruct us otherwise. If you do not want the mailing of these documents to be combined with those for other members of your household, please call (800) 441-7762.
Availability of Quarterly Portfolio Schedule of Investments
The Fund/Series files its complete schedule of portfolio holdings with the Securities and Exchange Commission (the “SEC”) for the first and third quarters of each fiscal year on Form N-Q. The Fund’s/Series’ Forms N-Q are available on the SEC’s website at http://www.sec.gov and may also be reviewed and copied at the SEC’s Public Reference Room in Washington, D.C. Information on the operation of the Public Reference Room may be obtained by calling (800) SEC-0330. The Fund’s/Series’ Forms N-Q may also be obtained upon request and without charge by calling (800) 441-7762.
Availability of Proxy Voting Policies and Procedures
A description of the policies and procedures that the Fund/Series uses to determine how to vote proxies relating to portfolio securities is available (1) without charge, upon request, by calling (800) 441-7762; (2) at http://www.blackrock.com; and (3) on the SEC’s website at http://www.sec.gov.
Availability of Proxy Voting Record
Information about how the Fund/Series voted proxies relating to securities held in the Fund’s/Series’ portfolio during the most recent 12-month period ended June 30 is available upon request and without charge (1) at http://www.blackrock.com or by calling (800) 441-7762 and (2) on the SEC’s website at http://www.sec.gov.
| | | |
|
36 | BLACKROCK S&P 500 INDEX FUND | JUNE 30, 2010 | |
|
|
|
Additional Information (continued) |
|
|
Shareholder Privileges |
|
Account Information
Call us at (800) 441-7762 from 8:00 AM to 6:00 PM EST on any business day to get information about your account balances, recent transactions and share prices. You can also reach us on the Web at http://www.blackrock.com/funds.
Automatic Investment Plans
Investor Class shareholders who want to invest regularly can arrange to have $50 or more automatically deducted from their checking or savings account and invested in any of the BlackRock funds.
Systematic Withdrawal Plans
Investor Class shareholders can establish a systematic withdrawal plan and receive periodic payments of $50 or more from their BlackRock funds, as long as their account balance is at least $10,000.
Retirement Plans
Shareholders may make investments in conjunction with Traditional, Rollover, Roth, Coverdell, Simple IRAs, SEP IRAs and 403(b) Plans.
| | | |
|
| BLACKROCK S&P 500 INDEX FUND | JUNE 30, 2010 | 37 |
|
|
|
Additional Information (concluded) |
|
|
|
BlackRock Privacy Principles |
|
BlackRock is committed to maintaining the privacy of its current and former fund investors and individual clients (collectively, “Clients”) and to safeguarding their non-public personal information. The following information is provided to help you understand what personal information BlackRock collects, how we protect that information and why in certain cases we share such information with select parties.
If you are located in a jurisdiction where specific laws, rules or regulations require BlackRock to provide you with additional or different privacy-related rights beyond what is set forth below, then BlackRock will comply with those specific laws, rules or regulations.
BlackRock obtains or verifies personal non-public information from and about you from different sources, including the following: (i) information we receive from you or, if applicable, your financial intermediary, on applications, forms or other documents; (ii) information about your transactions with us, our affiliates, or others; (iii) information we receive from a consumer reporting agency; and (iv) from visits to our websites.
BlackRock does not sell or disclose to non-affiliated third parties any non-public personal information about its Clients, except as permitted by law or as is necessary to respond to regulatory requests or to service Client accounts. These non-affiliated third parties are required to protect the confidentiality and security of this information and to use it only for its intended purpose.
We may share information with our affiliates to service your account or to provide you with information about other BlackRock products or services that may be of interest to you. In addition, BlackRock restricts access to non-public personal information about its Clients to those BlackRock employees with a legitimate business need for the information. BlackRock maintains physical, electronic and procedural safeguards that are designed to protect the non-public personal information of its Clients, including procedures relating to the proper storage and disposal of such information.
| | | |
|
38 | BLACKROCK S&P 500 INDEX FUND | JUNE 30, 2010 | |
|
|
|
A World-Class Mutual Fund Family |
BlackRock offers a diverse lineup of open-end mutual funds crossing all investment styles and managed by experts in equity, fixed income and tax-exempt investing.
|
|
Equity Funds |
|
|
BlackRock All-Cap Energy & Resources Portfolio |
BlackRock Asset Allocation Portfolio† |
BlackRock Balanced Capital Fund† |
BlackRock Basic Value Fund |
BlackRock Capital Appreciation Fund |
BlackRock Energy & Resources Portfolio |
BlackRock Equity Dividend Fund |
BlackRock EuroFund |
BlackRock Focus Growth Fund |
BlackRock Focus Value Fund |
BlackRock Global Allocation Fund† |
BlackRock Global Dynamic Equity Fund |
BlackRock Global Emerging Markets Fund |
BlackRock Global Financial Services Fund |
BlackRock Global Growth Fund |
BlackRock Global Opportunities Portfolio |
BlackRock Global SmallCap Fund |
BlackRock Health Sciences Opportunities Portfolio |
BlackRock Healthcare Fund |
BlackRock Index Equity Portfolio* |
BlackRock International Fund |
BlackRock International Index Fund |
BlackRock International Opportunities Portfolio |
BlackRock International Value Fund |
BlackRock Large Cap Core Fund |
BlackRock Large Cap Core Plus Fund |
BlackRock Large Cap Growth Fund |
BlackRock Large Cap Value Fund |
BlackRock Latin America Fund |
BlackRock Mid-Cap Growth Equity Portfolio |
BlackRock Mid-Cap Value Equity Portfolio |
BlackRock Mid Cap Value Opportunities Fund |
BlackRock Natural Resources Trust |
BlackRock Pacific Fund |
BlackRock Science & Technology Opportunities Portfolio |
BlackRock Small Cap Core Equity Portfolio |
BlackRock Small Cap Growth Equity Portfolio |
BlackRock Small Cap Growth Fund II |
BlackRock Small Cap Index Fund |
BlackRock Small/Mid-Cap Growth Portfolio |
BlackRock S&P 500 Index Fund |
BlackRock U.S. Opportunities Portfolio |
BlackRock Utilities and Telecommunications Fund |
BlackRock Value Opportunities Fund |
BlackRock World Gold Fund |
|
|
Fixed Income Funds |
|
|
BlackRock Bond Portfolio |
BlackRock Emerging Market Debt Portfolio |
BlackRock Floating Rate Income Portfolio |
BlackRock GNMA Portfolio |
BlackRock Government Income Portfolio |
BlackRock High Income Fund |
BlackRock High Yield Bond Portfolio |
BlackRock Income Portfolio† |
BlackRock Income Builder Portfolio† |
BlackRock Inflation Protected Bond Portfolio |
BlackRock Intermediate Government Bond Portfolio |
BlackRock International Bond Portfolio |
BlackRock Long Duration Bond Portfolio |
BlackRock Low Duration Bond Portfolio |
BlackRock Managed Income Portfolio |
BlackRock Multi-Sector Bond Portfolio |
BlackRock Short-Term Bond Fund |
BlackRock Strategic Income Opportunities Portfolio |
BlackRock Total Return Fund |
BlackRock Total Return Portfolio II |
BlackRock World Income Fund |
|
|
Municipal Bond Funds |
|
|
BlackRock AMT-Free Municipal Bond Portfolio |
BlackRock California Municipal Bond Fund |
BlackRock High Yield Municipal Fund |
BlackRock Intermediate Municipal Fund |
BlackRock Kentucky Municipal Bond Portfolio |
BlackRock Municipal Insured Fund |
BlackRock National Municipal Fund |
BlackRock New Jersey Municipal Bond Fund |
BlackRock New York Municipal Bond Fund |
BlackRock Ohio Municipal Bond Portfolio |
BlackRock Pennsylvania Municipal Bond Fund |
BlackRock Short-Term Municipal Fund |
|
|
Target Risk & Target Date Funds† |
|
|
BlackRock Prepared Portfolios |
Conservative Prepared Portfolio |
Moderate Prepared Portfolio |
Growth Prepared Portfolio |
Aggressive Growth Prepared Portfolio |
|
BlackRock Lifecycle Prepared Portfolios |
2010 |
2015 |
2020 |
2025 |
2030 |
2035 |
2040 |
2045 |
2050 |
|
BlackRock LifePath Portfolios Retirement |
2020 |
2025 |
2030 |
2035 |
2040 |
2045 |
2050 |
2055 |
| |
* | See the prospectus for information on specific limitations on investments in the fund. |
|
† | Mixed asset fund. |
BlackRock mutual funds are currently distributed by BlackRock Investments, LLC. You should consider the investment objectives, risks, charges and expenses of the funds under consideration carefully before investing. Each fund’s prospectus contains this and other information and is available at www.blackrock.com or by calling (800) 441-7762 or from your financial advisor. The prospectus should be read carefully before investing.
| | | |
|
| BLACKROCK S&P 500 INDEX FUND | JUNE 30, 2010 | 39 |

This report is transmitted to shareholders only. It is not authorized for use as an offer of sale or a solicitation of an offer to buy shares of the Fund unless accompanied or preceded by the Fund’s current prospectus. Past performance results shown in this report should not be considered a representation of future performance. Investment returns and principal value of shares will fluctuate so that shares, when redeemed, may be worth more or less than their original cost. Statements and other information herein are as dated and are subject to change.
| |

|
|
#Index 4-06/10 |
| |
BlackRock Small Cap
Index Fund | 
|
OF BLACKROCK INDEX FUNDS, INC. | |
| |
SEMI-ANNUAL REPORT | |
JUNE 30, 2010 | (UNAUDITED) | |
NOT FDIC INSURED
MAY LOSE VALUE
NO BANK GUARANTEE
| | |
|
2 | BLACKROCK SMALL CAP INDEX FUND | JUNE 30, 2010 |
Although overall global economic and financial conditions have generally improved over the past year, the past several months have seen high levels of market volatility and diminishing investor confidence sparked by the sovereign debt crisis in Europe and mixed economic data that have raised concerns over the possibility that some economies could slide back into recession. Despite the uneven nature of recent market conditions, we continue to believe that the “Great Recession” likely ended at some point last summer, thanks primarily to massive fiscal and monetary stimulus, and that the global economy remains in recovery mode for most regions of the world. Regarding the US economy, we believe it is unlikely that the United States will experience a “double dip” recession, although we acknowledge that subpar growth is likely to persist for some time.
Global equity markets bottomed in early 2009 and since that time have moved unevenly higher as investors were lured back into the markets by depressed valuations, desire for higher yields and improvements in corporate earnings prospects. Volatility levels, however, have remained elevated — primarily as a result of uneven economic data and lingering deflation issues (especially in Europe). As the period drew to a close, equity markets had endured a significant correction that drove stock prices into negative territory on a year-to-date basis in almost every market. Over a 12-month basis, however, global equities posted positive returns thanks to improving corporate revenues and profits and a reasonably strong macro backdrop. From a geographic perspective, US equities have significantly outpaced their international counterparts over the past six and twelve months, as the domestic economic recovery has been more pronounced and as credit-related issues have held European markets down. Within the United States, smaller cap stocks have noticeably outperformed large caps.
In fixed income markets, yields have been moving unevenly over the past six and twelve months as improving economic conditions have been acting to push Treasury yields higher (and prices correspondingly lower), while concerns over ongoing deflation threats have acted as a counterweight. As the period drew to a close, however, Treasury yields fell sharply as investors flocked to the “safe haven” asset class in the face of escalating uncertainty. As a result, US Treasuries became one of the world’s best-performing asset classes on a six-month basis. High yield bonds have also continued to perform well, thanks in large part to ongoing high levels of investor demand. Meanwhile, municipal bonds performed in line with their taxable counterparts on a 12-month basis, but slightly underperformed over the last six months as investors rotated to the relative safety of Treasuries.
Regarding cash investments, yields on money market securities remain near all-time lows (producing returns only marginally above zero percent), with the Federal Open Market Committee reiterating that economic circumstances are likely to necessitate an accommodative interest rate stance for an “extended period.”
Against this backdrop, the major market averages posted the following returns:
| | | | | | | |
Total Returns as of June 30, 2010 | | 6-month | | 12-month | |
|
|
|
|
|
|
US equities (S&P 500 Index) | | (6.65 | )% | | 14.43 | % | |
|
|
|
|
|
|
|
|
Small cap US equities (Russell 2000 Index) | | (1.95 | ) | | 21.48 | | |
|
|
|
|
|
|
|
|
International equities (MSCI Europe, Australasia, Far East Index) | | (13.23 | ) | | 5.92 | | |
|
|
|
|
|
|
|
|
3-month Treasury bill (BofA Merrill Lynch 3-Month Treasury Bill Index) | | 0.05 | | | 0.16 | | |
|
|
|
|
|
|
|
|
US Treasury securities (BofA Merrill Lynch 10-Year US Treasury Index) | | 9.36 | | | 8.20 | | |
|
|
|
|
|
|
|
|
Taxable fixed income (Barclays Capital US Aggregate Bond Index) | | 5.33 | | | 9.50 | | |
|
|
|
|
|
|
|
|
Tax-exempt fixed income (Barclays Capital Municipal Bond Index) | | 3.31 | | | 9.61 | | |
|
|
|
|
|
|
|
|
High yield bonds (Barclays Capital US Corporate High Yield 2% Issuer Capped Index) | | 4.45 | | | 26.66 | | |
|
|
|
|
|
|
|
|
| |
| Past performance is no guarantee of future results. Index performance shown for illustrative purposes only. You cannot invest directly in an index. |
Although conditions are certainly better than they were a couple of years ago, global financial markets continue to face high volatility and questions about the strength and sustainability of the recovery abound. Through periods of uncertainty, as ever, BlackRock’s full resources are dedicated to the management of our clients’ assets. For additional market perspective and investment insight, visit www.blackrock.com/shareholdermagazine, where you’ll find the most recent issue of our award-winning Shareholder® magazine, as well as its quarterly companion newsletter, Shareholder Perspectives. As always, we thank you for entrusting BlackRock with your investments, and we look forward to your continued partnership in the months and years ahead.
Sincerely,

Rob Kapito
President, BlackRock Advisors, LLC
| | |
|
| THIS PAGE NOT PART OF YOUR FUND REPORT | 3 |
| |
|
| |
Fund Summary as of June 30, 2010 | BlackRock Small Cap Index Fund |
|
|
Portfolio Management Commentary |
|
| |
| How did the Fund perform? |
| |
• | Through the investment of BlackRock Small Cap Index Fund (the “Fund”) in Master Small Cap Index Series (the “Series”) of Quantitative Master Series LLC (the “Master LLC”), for the six months ended June 30, 2010, the Institutional and Investor A Shares of the Fund underperformed its benchmark, the Russell 2000 Index. The Russell 2000 Index is a market-weighted index composed of approximately 2,000 common stocks issued by small-capitalization US companies in a range of businesses. |
| |
• | Returns for the Fund’s respective share classes differ from the benchmark based on individual share-class expenses. |
| |
| Describe the market environment. |
| |
• | At the beginning of 2010, we expected to see a modest cyclical recovery. For the first four months of the year, the cyclical recovery did dominate, but over the past two months, structural problems (especially those in Europe) began to win out, and risk assets (including US equities) have struggled. Financial markets took a dramatic turn in late April, as investor sentiment became dominated by concerns over the European sovereign debt crisis, some less-positive economic data and uncertainty over financial regulatory reform in the United States. Volatility levels moved noticeably higher over the past several months, and investors embarked on a renewed “flight to quality,” abandoning risk assets such as stocks in favor of safer alternatives, most notably US Treasury bonds and gold. |
| |
• | In the United States, the Dow Jones Industrial Average fell 5.00% and the Nasdaq Composite lost 6.63%, while the Russell 2000 Index fell only 1.95%. |
| |
• | Within the benchmark Russell 2000 Index, only three of the ten sectors posted positive returns for the period. Consumer Discretionary (+1.73%), Consumer Staples (+0.83%) and Financials (+0.79%) emerged as the best performing sectors over the period, while Telecommunication Services (–11.65%), Energy (–10.92%) and Materials (–8.03%) experienced the largest negative returns. |
| |
| Describe recent portfolio activity. |
| |
• | During the six-month period, as changes were made to the composition of the Russell 2000 Index, the Series purchased and sold securities to maintain its objective of replicating the risks and return of the benchmark. |
| |
| Describe portfolio positioning at period end. |
| |
• | The Series remains positioned to match the risk characteristics of its benchmark, irrespective of the market’s future direction. |
| |
| The views expressed reflect the opinions of BlackRock as of the date of this report and are subject to change based on changes in market, economic or other conditions. These views are not intended to be a forecast of future events and are no guarantee of future results. |
|
|
Derivative Financial Instruments |
|
The Series may invest in various derivative instruments, including financial futures contracts, as specified in Note 2 of the Notes to Financial Statements, which may constitute forms of economic leverage. Such instruments are used to obtain exposure to a market without owning or taking physical custody of securities or to hedge market and/or equity risks. Such derivative instruments involve risks, including the imperfect correlation between the value of a derivative instrument and the underlying asset or illiquidity of the derivative instrument. The Series’ ability to successfully use a derivative instrument depends on the investment advisor’s ability to accurately predict pertinent market movements, which cannot be assured. The use of derivative instruments may result in losses greater than if they had not been used, may require the Series to sell or purchase portfolio securities at inopportune times or for distressed values, may limit the amount of appreciation the Series can realize on an investment, may result in lower dividends paid to shareholders or may cause the Series to hold a security that it might otherwise sell. The Series’ investments in these instruments are discussed in detail in the Notes to Financial Statements.
| | |
|
4 | BLACKROCK SMALL CAP INDEX FUND | JUNE 30, 2010 |
|
|
|
|
Total Return Based on a $10,000 Investment |
|
| | |
| | 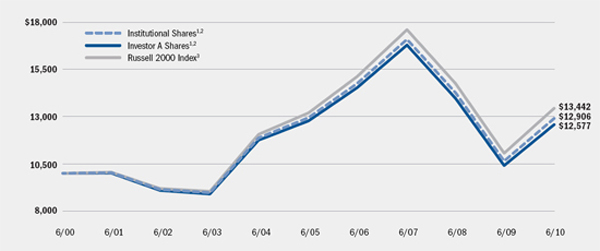
|
| | |
| 1 | Assuming transaction costs and other operating expenses, including investment advisory fees and administration fees, if any. |
| | |
| 2 | The Fund invests all of its assets in Master Small Cap Index Series (the “Series”) of Quantitative Master Series LLC. The Series may invest in a statistically selected sample of the stocks included in the Russell 2000 Index and other types of financial instruments. |
| | |
| 3 | This unmanaged index is a market-weighted index composed of approximately 2,000 common stocks issued by small-capitalization US companies in a range of businesses. |
|
|
Performance Summary for the Period Ended June 30, 2010 |
|
| | | | | | | | | | | | | |
| | | | | Average Annual Total Returns4 | |
| | 6-Month
Total Returns | |
| |
| | | 1 Year | | 5 Years | | 10 Years | |
|
|
|
|
|
|
|
|
|
|
Institutional | | (1.96 | )% | | 21.20 | % | | (0.06 | )% | | 2.58 | % | |
Investor A | | (2.16 | ) | | 20.81 | | | (0.31 | ) | | 2.32 | | |
Russell 2000 Index | | (1.95 | ) | | 21.48 | | | 0.37 | | | 3.00 | | |
|
|
|
|
|
|
|
|
|
|
|
|
|
|
| | |
| 4 | Average annual total returns reflect reductions for service fees. See “About Fund Performance” on page 6 for a detailed description of share classes, including any related fees.
Past performance is not indicative of future results. |
| | |
|
|
|
BLACKROCK SMALL CAP INDEX FUND | JUNE 30, 2010 | 5 |
| |
• | Institutional Shares are not subject to any sales charge. Institutional Shares bear no ongoing distribution or service fees and are available only to eligible investors. |
| |
• | Investor A Shares are not subject to any sales charge and bear no ongoing distribution fee. Investor A Shares are subject to an ongoing service fee of 0.25% per year. |
Performance information reflects past performance and does not guarantee future results. Current performance may be lower or higher than the performance data quoted. Refer to www.blackrock.com/funds to obtain performance data current to the most recent month-end. Performance results do not reflect the deduction of taxes that a shareholder would pay on fund distributions or the redemption of fund shares. Figures shown in the performance tables on page 5 assume reinvestment of all dividends and capital gain distributions, if any, at net asset value on the ex-dividend date. Investment return and principal value of shares will fluctuate so that shares, when redeemed, may be worth more or less than their original cost. Dividends paid to each class of shares will vary because of the different levels of service and transfer agency fees applicable to each class, which are deducted from the income available to be paid to shareholders.
Shareholders of this Fund may incur the following charges: (a) expenses related to transactions, redemption fees and exchange fees; and (b) operating expenses including advisory fees, service and distribution fees including 12b-1 fees and other Fund expenses. The expense example shown below (which is based on a hypothetical investment of $1,000 invested on January 1, 2010 and held through June 30, 2010) is intended to assist shareholders both in calculating expenses based on an investment in the Fund and in comparing these expenses with similar costs of investing in other mutual funds.
The table provides information about actual account values and actual expenses. In order to estimate the expenses a shareholder paid during the period covered by this report, shareholders can divide their account value by $1,000 and then multiply the result by the number corresponding to their share class under the heading entitled “Expenses Paid During the Period.”
The table also provides information about hypothetical account values and hypothetical expenses based on the Fund’s actual expense ratio and an assumed rate of return of 5% per year before expenses. In order to assist shareholders in comparing the ongoing expenses of investing in this Fund and other funds, compare the 5% hypothetical example with the 5% hypothetical examples that appear in other funds’ shareholder reports.
The expenses shown in the table are intended to highlight shareholders’ ongoing costs only and do not reflect any transactional expenses, such as sales charges, redemption fees or exchange fees. Therefore, the hypothetical example is useful in comparing ongoing expenses only, and will not help shareholders determine the relative total expenses of owning different funds. If these transactional expenses were included, shareholder expenses would have been higher.
| | | | | | | | | | | | | | | | | | | | | | |
| | | Actual | | | Hypothetical2 | | | | |
| | |
| | |
| | | | |
| | | Beginning
Account Value
January 1, 2010 | | | Ending
Account Value
June 30, 2010 | | | Expenses Paid
During the Period1 | | | Beginning
Account Value
January 1, 2010 | | | Ending
Account Value
June 30, 2010 | | | Expenses Paid
During the Period1 | | | Annualized
Expense Ratio | |
|
|
|
|
|
|
|
|
|
|
|
|
|
|
|
|
|
|
|
|
|
|
|
Institutional | | | $1,000 | | | $980.40 | | | $2.60 | | | $1,000 | | | $1,022.17 | | | $2.66 | | | 0.53% | |
Investor A | | | $1,000 | | | $978.40 | | | $3.88 | | | $1,000 | | | $1,020.88 | | | $3.96 | | | 0.79% | |
|
|
|
|
|
|
|
|
|
|
|
|
|
|
|
|
|
|
|
|
|
|
|
| | |
| 1 | For each class of the Fund, expenses are equal to the annualized expense ratio for the class, multiplied by the average account value over the period, multiplied by 181/365 (to reflect the one-half year period shown). Because the Fund is a feeder fund, the expense table example reflects the expenses of both the Fund and the Series in which it invests. |
| | |
| 2 | Hypothetical 5% annual return before expenses is calculated by pro rating the number of days in the most recent fiscal half year divided by 365. |
| | |
|
|
|
6 | BLACKROCK SMALL CAP INDEX FUND | JUNE 30, 2010 |
| |
|
|
| |
Statement of Assets and Liabilities | BlackRock Small Cap Index Fund |
| | | | |
June 30, 2010 (Unaudited) | | | | |
|
|
|
|
|
Assets | | | | |
|
|
|
|
|
Investments at value — Master Small Cap Index Series (the “Series”) (cost — $92,696,787) | | $ | 93,183,070 | |
Capital shares sold receivable | | | 146,837 | |
Prepaid expenses | | | 14,889 | |
| |
|
|
|
Total assets | | | 93,344,796 | |
| |
|
|
|
| | | | |
|
|
|
|
|
Liabilities | | | | |
|
|
|
|
|
Withdrawals payable from the Series | | | 89,638 | |
Capital shares redeemed payable | | | 57,199 | |
Administration fees payable | | | 23,511 | |
Distribution fees payable | | | 7,970 | |
Other affiliates payable | | | 1,636 | |
Officer’s fees payable | | | 12 | |
Other accrued expenses payable | | | 17,641 | |
| |
|
|
|
Total liabilities | | | 197,607 | |
| |
|
|
|
Net Assets | | $ | 93,147,189 | |
| |
|
|
|
| | | | |
|
|
|
|
|
Net Assets Consist of | | | | |
|
|
|
|
|
Paid-in capital | | $ | 118,566,498 | |
Undistributed net investment income | | | 178,263 | |
Accumulated net realized loss allocated from the Series | | | (26,083,855 | ) |
Net unrealized appreciation/depreciation allocated from the Series | | | 486,283 | |
| |
|
|
|
Net Assets | | $ | 93,147,189 | |
| |
|
|
|
| | | | |
|
|
|
|
|
Net Asset Value | | | | |
|
|
|
|
|
Institutional — Based on net assets of $56,061,042 and 5,897,295 shares outstanding, 125 million shares authorized, $0.0001 par value | | $ | 9.51 | |
| |
|
|
|
Investor A — Based on net assets of $37,086,147 and 3,904,922 shares outstanding, 125 million shares authorized, $0.0001 par value | | $ | 9.50 | |
| |
|
|
|
| | |
See Notes to Financial Statements. | |
|
BLACKROCK SMALL CAP INDEX FUND | JUNE 30, 2010 | 7 |
| |
|
|
| |
Statement of Operations | BlackRock Small Cap Index Fund |
| | | | |
Six Months Ended June 30, 2010 (Unaudited) | | | | |
|
|
|
|
|
Investment Income | | | | |
|
|
|
|
|
Net investment income allocated from the Series: | | | | |
Dividends — unaffiliated | | $ | 415,146 | |
Foreign taxes withheld | | | (1,240 | ) |
Securities lending — affiliated | | | 34,537 | |
Dividends — affiliated | | | 2,605 | |
Expenses | | | (37,847 | ) |
| |
|
|
|
Total income | | | 413,201 | |
| |
|
|
|
| | | | |
|
|
|
|
|
Expenses | | | | |
|
|
|
|
|
Administration | | | 144,064 | |
Service — Investor A | | | 50,488 | |
Transfer agent — Institutional | | | 16,150 | |
Transfer agent — Investor A | | | 13,186 | |
Printing | | | 26,805 | |
Registration | | | 14,277 | |
Professional | | | 10,397 | |
Officers | | | 23 | |
Miscellaneous | | | 4,091 | |
| |
|
|
|
Total expenses | | | 279,481 | |
Less fees waived by administrator | | | (2,669 | ) |
| |
|
|
|
Total expenses after fees waived | | | 276,812 | |
| |
|
|
|
Net investment income | | | 136,389 | |
| |
|
|
|
| | | | |
|
|
|
|
|
Realized and Unrealized Gain (Loss) Allocated from the Series | | | | |
|
|
|
|
|
Net realized gain from investments and financial futures contracts | | | 571,175 | |
Net change in unrealized appreciation/depreciation on investments and financial futures contracts | | | (2,726,744 | ) |
| |
|
|
|
Total realized and unrealized loss | | | (2,155,569 | ) |
| |
|
|
|
Net Decrease in Net Assets Resulting from Operations | | $ | (2,019,180 | ) |
| |
|
|
|
| | |
See Notes to Financial Statements. | |
|
|
|
8 | BLACKROCK SMALL CAP INDEX FUND | JUNE 30, 2010 |
| |
|
| |
Statements of Changes in Net Assets | BlackRock Small Cap Index Fund |
| | | | | | | |
Increase (Decrease) in Net Assets: | | Six Months
Ended
June 30,
2010
(Unaudited) | | Year Ended
December 31,
2009 | |
|
|
|
|
|
|
Operations | | | | | | | |
|
|
|
|
|
|
|
|
Net investment income | | $ | 136,389 | | $ | 587,044 | |
Net realized gain (loss) | | | 571,175 | | | (8,274,246 | ) |
Net change in unrealized appreciation/depreciation | | | (2,726,744 | ) | | 27,253,654 | |
| |
|
|
|
|
|
|
Net increase (decrease) in net assets resulting from operations | | | (2,019,180 | ) | | 19,566,452 | |
| |
|
|
|
|
|
|
| | | | | | | |
|
|
|
|
|
|
|
|
Dividends to Shareholders From | | | | | | | |
|
|
|
|
|
|
|
|
Net investment income: | | | | | | | |
Institutional | | | — | | | (376,750 | ) |
Investor A | | | — | | | (174,904 | ) |
| |
|
|
|
|
|
|
Decrease in net assets resulting from dividends to shareholders | | | — | | | (551,654 | ) |
| |
|
|
|
|
|
|
| | | | | | | |
|
|
|
|
|
|
|
|
Capital Share Transactions | | | | | | | |
|
|
|
|
|
|
|
|
Net increase (decrease) in net assets derived from capital share transactions | | | 1,081,515 | | | (1,003,872 | ) |
| |
|
|
|
|
|
|
| | | | | | | |
|
|
|
|
|
|
|
|
Redemption Fee | | | | | | | |
|
|
|
|
|
|
|
|
Redemption fee | | | 1,432 | | | 864 | |
| |
|
|
|
|
|
|
| | | | | | | |
|
|
|
|
|
|
|
|
Net Assets | | | | | | | |
|
|
|
|
|
|
|
|
Total increase (decrease) in net assets | | | (936,233 | ) | | 18,011,790 | |
Beginning of period | | | 94,083,422 | | | 76,071,632 | |
| |
|
|
|
|
|
|
End of period | | $ | 93,147,189 | | $ | 94,083,422 | |
| |
|
|
|
|
|
|
Undistributed net investment income | | $ | 178,263 | | $ | 41,874 | |
| |
|
|
|
|
|
|
| | |
See Notes to Financial Statements. | | |
|
BLACKROCK SMALL CAP INDEX FUND | JUNE 30, 2010 | 9 |
| |
|
|
Financial Highlights | BlackRock Small Cap Index Fund |
| | | | | | | | | | | | | | | | | | | |
| | Institutional | |
| |
| |
| | Six Months
Ended
June 30,
2010
(Unaudited) | | | | | | | | | | | |
| | | Year Ended December 31, | |
| | |
|
|
| | | 2009 | | 2008 | | 2007 | | 2006 | | 2005 | |
|
|
|
|
|
|
|
|
|
|
|
|
|
|
|
|
|
|
|
|
Per Share Operating Performance | | | | | | | | | | | | | | | | | | | |
|
|
|
|
|
|
|
|
|
|
|
|
|
|
|
|
|
|
|
|
Net asset value, beginning of period | | $ | 9.70 | | $ | 7.71 | | $ | 13.79 | | $ | 15.48 | | $ | 14.36 | | $ | 14.10 | |
| |
|
|
|
|
|
|
|
|
|
|
|
|
|
|
|
|
|
|
Net investment income1 | | | 0.02 | | | 0.07 | | | 0.14 | | | 0.20 | | | 0.17 | | | 0.10 | |
Net realized and unrealized gain (loss)2 | | | (0.21 | ) | | 1.98 | | | (4.86 | ) | | (0.50 | ) | | 2.34 | | | 0.49 | |
| |
|
|
|
|
|
|
|
|
|
|
|
|
|
|
|
|
|
|
Net increase (decrease) from investment operations | | | (0.19 | ) | | 2.05 | | | (4.72 | ) | | (0.30 | ) | | 2.51 | | | 0.59 | |
| |
|
|
|
|
|
|
|
|
|
|
|
|
|
|
|
|
|
|
Dividends and distributions from: | | | | | | | | | | | | | | | | | | | |
Net investment income | | | — | | | (0.06 | ) | | (0.15 | ) | | (0.20 | ) | | (0.17 | ) | | (0.11 | ) |
Net realized gain | | | — | | | — | | | (1.09 | ) | | (1.19 | ) | | (1.22 | ) | | (0.22 | ) |
Tax return of capital | | | — | | | — | | | (0.12 | ) | | — | | | — | | | — | |
| |
|
|
|
|
|
|
|
|
|
|
|
|
|
|
|
|
|
|
Total dividends and distributions | | | — | | | (0.06 | ) | | (1.36 | ) | | (1.39 | ) | | (1.39 | ) | | (0.33 | ) |
| |
|
|
|
|
|
|
|
|
|
|
|
|
|
|
|
|
|
|
Net asset value, end of period | | $ | 9.51 | | $ | 9.70 | | $ | 7.71 | | $ | 13.79 | | $ | 15.48 | | $ | 14.36 | |
| |
|
|
|
|
|
|
|
|
|
|
|
|
|
|
|
|
|
|
| | | | | | | | | | | | | | | | | | | |
|
|
|
|
|
|
|
|
|
|
|
|
|
|
|
|
|
|
|
|
Total Investment Return3 | | | | | | | | | | | | | | | | | | | |
|
|
|
|
|
|
|
|
|
|
|
|
|
|
|
|
|
|
|
|
Based on net asset value | | | (1.96 | )%4 | | 26.67 | % | | (34.01 | )% | | (1.91 | )% | | 17.49 | % | | 4.16 | % |
| |
|
|
|
|
|
|
|
|
|
|
|
|
|
|
|
|
|
|
| | | | | | | | | | | | | | | | | | | |
|
|
|
|
|
|
|
|
|
|
|
|
|
|
|
|
|
|
|
|
Ratios to Average Net Assets5 | | | | | | | | | | | | | | | | | | | |
|
|
|
|
|
|
|
|
|
|
|
|
|
|
|
|
|
|
|
|
Total expenses | | | 0.53 | %6 | | 0.56 | % | | 0.53 | % | | 0.48 | % | | 0.49 | % | | 0.54 | % |
| |
|
|
|
|
|
|
|
|
|
|
|
|
|
|
|
|
|
|
Total expenses after fees waived | | | 0.53 | %6 | | 0.56 | % | | 0.52 | % | | 0.48 | % | | 0.49 | % | | 0.53 | % |
| |
|
|
|
|
|
|
|
|
|
|
|
|
|
|
|
|
|
|
Net investment income | | | 0.38 | %6 | | 0.85 | % | | 1.19 | % | | 1.23 | % | | 1.10 | % | | 0.69 | % |
| |
|
|
|
|
|
|
|
|
|
|
|
|
|
|
|
|
|
|
| | | | | | | | | | | | | | | | | | | |
|
|
|
|
|
|
|
|
|
|
|
|
|
|
|
|
|
|
|
|
Supplemental Data | | | | | | | | | | | | | | | | | | | |
|
|
|
|
|
|
|
|
|
|
|
|
|
|
|
|
|
|
|
|
Net assets, end of period (000) | | $ | 56,061 | | $ | 55,744 | | $ | 46,285 | | $ | 66,085 | | $ | 79,032 | | $ | 63,671 | |
| |
|
|
|
|
|
|
|
|
|
|
|
|
|
|
|
|
|
|
Portfolio turnover of the Series | | | 16 | % | | 43 | % | | 42 | % | | 26 | % | | 40 | % | | 37 | % |
| |
|
|
|
|
|
|
|
|
|
|
|
|
|
|
|
|
|
|
| |
1 | Based on average shares outstanding. |
| |
2 | Includes a redemption fee, which is less than $0.01 per share. |
| |
3 | Where applicable, total investment returns include the reinvestment of dividends and distributions. |
| |
4 | Aggregate total investment return. |
| |
5 | Includes the Fund’s share of the Series’ allocated expenses and/or net investment income. |
| |
6 | Annualized. |
| | |
See Notes to Financial Statements. |
|
10 | BLACKROCK SMALL CAP INDEX FUND | JUNE 30, 2010 |
| |
|
|
Financial Highlights (concluded) | BlackRock Small Cap Index Fund |
| | | | | | | | | | | | | | | | | | | |
| | Investor A | |
| |
|
|
| | Six Months
Ended
June 30,
2010
(Unaudited) | | | | | | | | | | | |
| | | Year Ended December 31, | |
| | |
|
|
| | | 2009 | | 2008 | | 2007 | | 2006 | | 2005 | |
|
|
|
|
|
|
|
|
|
|
|
|
|
|
|
|
|
|
|
|
Per Share Operating Performance | | | | | | | | | | | | | | | | | | | |
|
|
|
|
|
|
|
|
|
|
|
|
|
|
|
|
|
|
|
|
Net asset value, beginning of period | | $ | 9.71 | | $ | 7.72 | | $ | 13.79 | | $ | 15.47 | | $ | 14.36 | | $ | 14.10 | |
| |
|
|
|
|
|
|
|
|
|
|
|
|
|
|
|
|
|
|
Net investment income1 | | | 0.01 | | | 0.05 | | | 0.11 | | | 0.15 | | | 0.13 | | | 0.06 | |
Net realized and unrealized gain (loss)2 | | | (0.22 | ) | | 1.98 | | | (4.85 | ) | | (0.48 | ) | | 2.33 | | | 0.49 | |
| |
|
|
|
|
|
|
|
|
|
|
|
|
|
|
|
|
|
|
Net increase (decrease) from investment operations | | | (0.21 | ) | | 2.03 | | | (4.74 | ) | | (0.33 | ) | | 2.46 | | | 0.55 | |
| |
|
|
|
|
|
|
|
|
|
|
|
|
|
|
|
|
|
|
Dividends and distributions from: | | | | | | | | | | | | | | | | | | | |
Net investment income | | | — | | | (0.04 | ) | | (0.12 | ) | | (0.16 | ) | | (0.13 | ) | | (0.07 | ) |
Net realized gain | | | — | | | — | | | (1.09 | ) | | (1.19 | ) | | (1.22 | ) | | (0.22 | ) |
Tax return of capital | | | — | | | — | | | (0.12 | ) | | — | | | — | | | — | |
| |
|
|
|
|
|
|
|
|
|
|
|
|
|
|
|
|
|
|
Total dividends and distributions | | | — | | | (0.04 | ) | | (1.33 | ) | | (1.35 | ) | | (1.35 | ) | | (0.29 | ) |
| |
|
|
|
|
|
|
|
|
|
|
|
|
|
|
|
|
|
|
Net asset value, end of period | | $ | 9.50 | | $ | 9.71 | | $ | 7.72 | | $ | 13.79 | | $ | 15.47 | | $ | 14.36 | |
| |
|
|
|
|
|
|
|
|
|
|
|
|
|
|
|
|
|
|
| | | | | | | | | | | | | | | | | | | |
|
|
|
|
|
|
|
|
|
|
|
|
|
|
|
|
|
|
|
|
Total Investment Return3 | | | | | | | | | | | | | | | | | | | |
|
|
|
|
|
|
|
|
|
|
|
|
|
|
|
|
|
|
|
|
Based on net asset value | | | (2.16 | )%4 | | 26.36 | % | | (34.19 | )% | | (2.12 | )% | | 17.14 | % | | 3.88 | % |
| |
|
|
|
|
|
|
|
|
|
|
|
|
|
|
|
|
|
|
| | | | | | | | | | | | | | | | | | | |
|
|
|
|
|
|
|
|
|
|
|
|
|
|
|
|
|
|
|
|
Ratios to Average Net Assets5 | | | | | | | | | | | | | | | | | | | |
|
|
|
|
|
|
|
|
|
|
|
|
|
|
|
|
|
|
|
|
Total expenses | | | 0.79 | %6 | | 0.82 | % | | 0.80 | % | | 0.73 | % | | 0.74 | % | | 0.80 | % |
| |
|
|
|
|
|
|
|
|
|
|
|
|
|
|
|
|
|
|
Total expenses after fees waived | | | 0.79 | %6 | | 0.82 | % | | 0.79 | % | | 0.73 | % | | 0.74 | % | | 0.79 | % |
| |
|
|
|
|
|
|
|
|
|
|
|
|
|
|
|
|
|
|
Net investment income | | | 0.12 | %6 | | 0.59 | % | | 0.91 | % | | 0.98 | % | | 0.84 | % | | 0.43 | % |
| |
|
|
|
|
|
|
|
|
|
|
|
|
|
|
|
|
|
|
| | | | | | | | | | | | | | | | | | | |
|
|
|
|
|
|
|
|
|
|
|
|
|
|
|
|
|
|
|
|
Supplemental Data | | | | | | | | | | | | | | | | | | | |
|
|
|
|
|
|
|
|
|
|
|
|
|
|
|
|
|
|
|
|
Net assets, end of period (000) | | $ | 37,086 | | $ | 38,340 | | $ | 29,787 | | $ | 47,605 | | $ | 54,083 | | $ | 48,896 | |
| |
|
|
|
|
|
|
|
|
|
|
|
|
|
|
|
|
|
|
Portfolio turnover of the Series | | | 16 | % | | 43 | % | | 42 | % | | 26 | % | | 40 | % | | 37 | % |
| |
|
|
|
|
|
|
|
|
|
|
|
|
|
|
|
|
|
|
| |
1 | Based on average shares outstanding. |
| |
2 | Includes a redemption fee, which is less than $0.01 per share. |
| |
3 | Where applicable, total investment returns include the reinvestment of dividends and distributions. |
| |
4 | Aggregate total investment return. |
| |
5 | Includes the Fund’s share of the Series’ allocated expenses and/or net investment income. |
| |
6 | Annualized. |
| | |
See Notes to Financial Statements. | | |
|
BLACKROCK SMALL CAP INDEX FUND | JUNE 30, 2010 | 11 |
| |
|
|
| |
Notes to Financial Statements (Unaudited) | BlackRock Small Cap Index Fund |
1. Organization and Significant Accounting Policies:
BlackRock Small Cap Index Fund (the “Fund”) a series of BlackRock Index Funds, Inc. (the “Corporation”) is registered under the Investment Company Act of 1940, as amended (the “1940 Act”), as a non-diversified, open-end management investment company. The Corporation is organized as a Maryland corporation. The Fund seeks to achieve its investment objective by investing all of its assets in Master Small Cap Index Series (the “Series) of Quantitative Master Series LLC ( the “Master LLC”), which has the same investment objective and strategies as the Fund. The value of the Fund’s investment in the Series reflects the Fund’s proportionate interest in the net assets of the Series. The performance of the Fund is directly affected by the performance of the Series. The percentage of the Series owned by the Fund at June 30, 2010 was 32%. The Fund’s financial statements are prepared in conformity with accounting principles generally accepted in the United States of America (“US GAAP”), which may require management to make estimates and assumptions that affect the reported amounts and disclosures in the financial statements. Actual results could differ from those estimates. The Fund offers two classes of shares. Institutional Shares are sold without a sales charge and only to certain eligible investors. Investor A Shares are generally sold with a front-end sales charge. Both classes of shares have identical voting, dividend, liquidation and other rights and the same terms and conditions, except that Investor A Shares bear certain expenses related to the shareholder servicing of such shares.
The following is a summary of significant accounting policies followed by the Fund:
Valuation: The Fund’s policy is to fair value its financial instruments at market value. The Fund records its investment in the Series at fair value based on the Fund’s proportionate interest in the net assets of the Series. Valuation of securities held by the Series, including categorization of fair value measurements, is discussed in Note 1 of the Series�� Notes to Financial Statements, which are included elsewhere in this report.
Investment Transactions and Investment Income: For financial reporting purposes, investment transactions in the Series are accounted for on a trade date basis. The Fund records daily its proportionate share of the Series’ income, expenses and realized and unrealized gains and losses. In addition, the Fund accrues its own expenses. Income and realized and unrealized gains and losses on investments are allocated daily to each class based on its relative net assets.
Dividends and Distributions: Dividends and distributions paid by the Fund are recorded on the ex-dividend dates. The amount and timing of dividends and distributions are determined in accordance with federal income tax regulations, which may differ from US GAAP.
Income Taxes: It is the Fund’s policy to comply with the requirements of the Internal Revenue Code of 1986, as amended, applicable to regulated investment companies and to distribute substantially all of its taxable income to its shareholders. Therefore, no federal income tax provision is required.
The Fund files US federal and various state and local tax returns. No income tax returns are currently under examination. The statute of limitations on the Fund’s US federal tax returns remains open for each of the four years ended December 31, 2009. The statutes of limitations on the Fund’s state and local tax returns may remain open for an additional year depending upon the jurisdiction. There are no uncertain tax positions that require recognition of a tax liability.
Other: Expenses directly related to the Fund or its classes are charged to the Fund or class. Other operating expenses shared by several funds are pro rated among those funds on the basis of relative net assets or other appropriate methods. Other expenses of the Fund are allocated daily to each class based on its relative net assets.
| | |
|
|
|
12 | BLACKROCK SMALL CAP INDEX FUND | JUNE 30, 2010 |
| |
|
|
| |
Notes to Financial Statements (continued) | BlackRock Small Cap Index Fund |
2. Administration Agreement and Other Transactions with Affiliates:
The PNC Financial Services Group, Inc. (“PNC”), Bank of America Corporation (“BAC”) and Barclays Bank PLC (“Barclays”) are the largest stockholders of BlackRock, Inc. (“BlackRock”). Due to the ownership structure, PNC is an affiliate of the Fund for 1940 Act purposes, but BAC and Barclays are not.
The Corporation, on behalf of the Fund, entered into an Administration Agreement with BlackRock Advisors, LLC (the “Administrator”), an indirect, wholly owned subsidiary of BlackRock, to provide administrative services (other than investment advice and related portfolio activities). For such services, the Fund pays the Administrator a monthly fee at an annual rate of 0.29% of the average daily value of the Fund’s net assets. The Fund does not pay an Advisory fee or investment management fee.
The Administrator voluntarily agreed to waive and/or reimburse fees or expenses in order to limit total annual Fund operating expenses (excluding interest expense, acquired fund fees and expenses and certain other fund expenses) to 0.60% for Institutional Shares and 0.85% for Investor A Shares. These voluntary waivers and reimbursements may be reduced or discontinued at any time without notice. This amount is shown as fees waived by administrator in the Statement of Operations.
The Corporation, on behalf of the Fund, entered into a Distribution Agreement and Distribution Plan with BlackRock Investments, LLC (“BRIL”), which is an affiliate of BlackRock. Pursuant to the Distribution Plan and in accordance with Rule 12b-1 under the 1940 Act, the Fund pays BRIL ongoing service and distribution fees. The fees are accrued daily and paid monthly at annual rates of 0.25% based upon the average daily net assets of Investor A Shares.
Pursuant to sub-agreements with BRIL, broker-dealers and BRIL provide shareholder servicing to the Fund. The ongoing service fee compensates BRIL and each broker-dealer for providing shareholder servicing to Investor A shareholders.
PNC Global Investment Servicing (U.S.) Inc. (“PNCGIS”), an indirect, wholly owned subsidiary of PNC and an affiliate of the Manager, serves as transfer agent and dividend disbursing agent. Effective July 1, 2010, PNCGIS was sold to The Bank of New York Mellon Corporation and is no longer considered an affiliate of the Administrator. At the close of the sale, PNCGIS changed its name to BNY Mellon Investment Servicing (US) Inc. Transfer agency fees borne by the Fund are comprised of those fees charged for all shareholder communications including mailing of shareholder reports, dividend and distribution notices, and proxy materials for shareholder meetings, as well as per account and per transaction fees related to servicing and maintenance of shareholder accounts, including the issuing, redeeming and transferring of shares, check writing, anti-money laundering services, and customer identification services.
The Administrator maintains a call center, which is responsible for providing certain shareholder services to the Fund, such as responding to shareholder inquiries and processing transactions based upon instructions from shareholders with respect to the subscription and redemption of Fund shares. For the six months ended June 30, 2010, the Fund reimbursed the Manager the following amounts for costs incurred in running the call center, which are included in transfer agent in the Statement of Operations.
| | | | |
|
|
|
|
|
Institutional | | $ | 162 | |
Investor A | | $ | 456 | |
|
|
|
|
|
Certain officers and/or directors of the Fund are officers and/or directors of BlackRock or its affiliates. The Fund reimburses the Manager for compensation paid to the Corporation’s Chief Compliance Officer.
3. Capital Loss Carryforwards:
As of December 31, 2009, the Fund had capital loss carryforwards in the amount of $24,323,969 available to offset future realized capital gains, which expires December 31, 2017.
| | |
|
BLACKROCK SMALL CAP INDEX FUND | JUNE 30, 2010 | 13 |
| |
|
|
| |
Notes to Financial Statements (concluded) | BlackRock Small Cap Index Fund |
4. Capital Share Transactions:
Transactions in capital shares for each class were as follows:
| | | | | | | | | | | | | |
| | Six Months Ended
June 30, 2010 | | Year Ended
December 31, 2009 |
| |
| |
|
|
| | Shares | | Amount | | Shares | | Amount |
|
|
|
|
|
|
|
|
|
|
Institutional | | | | | | | | | | | | | |
|
|
|
|
|
|
|
|
|
|
|
|
|
|
Shares sold | | | 1,095,750 | | $ | 11,339,403 | | | 2,468,390 | | $ | 19,948,606 | |
Shares issued to shareholders in reinvestment of dividends | | | — | | | — | | | 37,621 | | | 356,525 | |
| |
|
|
|
|
| |
|
|
|
|
|
|
Total issued | | | 1,095,750 | | | 11,339,403 | | | 2,506,011 | | | 20,305,131 | |
Shares redeemed | | | (942,336 | ) | | (9,732,435 | ) | | (2,765,597 | ) | | (22,094,097 | ) |
| |
|
|
|
|
| |
|
|
|
|
|
|
Net increase (decrease) | | | 153,414 | | $ | 1,606,968 | | | (259,586 | ) | $ | (1,788,966 | ) |
| |
|
|
|
|
| |
|
|
|
|
|
|
| | | | | | | | | | | | | |
|
|
|
|
|
|
|
|
|
|
|
|
|
|
Investor A | | | | | | | | | | | | | |
|
|
|
|
|
|
|
|
|
|
|
|
|
|
Shares sold | | | 397,998 | | $ | 4,120,329 | | | 913,818 | | $ | 7,405,033 | |
Shares issued to shareholders in reinvestment of dividends | | | — | | | — | | | 16,832 | | | 159,562 | |
| |
|
|
|
|
| |
|
|
|
|
|
|
Total issued | | | 397,998 | | | 4,120,329 | | | 930,650 | | | 7,564,595 | |
Shares redeemed | | | (442,251 | ) | | (4,645,782 | ) | | (842,085 | ) | | (6,779,501 | ) |
| |
|
|
|
|
| |
|
|
|
|
|
|
Net increase (decrease) | | | (44,253 | ) | $ | (525,453 | ) | | 88,565 | | $ | 785,094 | |
| |
|
|
|
|
| |
|
|
|
|
|
|
There is a 2% redemption fee on shares redeemed or exchanged that have been held for 30 days or less. The redemption fees are collected and retained by the Fund for the benefit of the remaining shareholders. The redemptions fees are recorded as credit to paid-in-capital.
5. Subsequent Events:
Management’s evaluation of the impact of all subsequent events on the Fund’s financial statements was completed through the date the financial statements were issued and the following item was noted:
The Fund paid a net investment income dividend on July 23, 2010 to shareholders of record on July 21, 2010 as follows:
| | | | | | |
|
|
|
|
|
|
|
| | Dividend Per Share | |
|
|
|
|
Institutional | | | $ | 0.004431 | | |
Investor A | | | $ | 0.004404 | | |
|
|
|
|
|
|
|
| | |
|
|
|
14 | BLACKROCK SMALL CAP INDEX FUND | JUNE 30, 2010 |
| |
|
|
| |
Portfolio Information | Master Small Cap Index Series |
| | | | |
| | | | |
Ten Largest Holdings | | Percent of
Long-Term Investments | |
|
|
|
|
|
Salix Pharmaceuticals Ltd. | | 0.2 | % | |
MFA Financial, Inc. | | 0.2 | | |
Jack Henry & Associates, Inc. | | 0.2 | | |
TIBCO Software, Inc. | | 0.2 | | |
Rock-Tenn Co., Class A | | 0.2 | | |
Nordson Corp. | | 0.2 | | |
ev3, Inc. | | 0.2 | | |
Highwoods Properties, Inc. | | 0.2 | | |
Psychiatric Solutions, Inc. | | 0.2 | | |
Deckers Outdoor Corp. | | 0.2 | | |
|
|
|
|
|
| | | | |
Sector Allocation | | Percent of
Long-Term Investments | |
|
|
|
|
|
Financial Services | | 22 | % | |
Technology | | 16 | | |
Consumer Discretionary | | 15 | | |
Health Care | | 14 | | |
Producer Durables | | 14 | | |
Materials & Processing | | 7 | | |
Energy | | 5 | | |
Utilities | | 4 | | |
Consumer Staples | | 3 | | |
|
|
|
|
|
| |
| For Series compliance purposes, the Series’ sector classifications refer to any one or more of the sector sub-classifications used by one or more widely recognized market indexes, and/or as defined by Series management. This definition may not apply for purposes of this report, which may combine sector sub-classifications for reporting ease. |
| | |
|
BLACKROCK SMALL CAP INDEX FUND | JUNE 30, 2010 | 15 |
| |
|
|
| |
Schedule of Investments June 30, 2010 (Unaudited) | Master Small Cap Index Series |
| (Percentages shown are based on Net Assets) |
| | | | | | | |
Common Stocks | | | Shares | | Value | |
|
|
|
|
|
|
|
|
Advertising Agencies — 0.9% | | | | | | | |
Arbitron, Inc. | | | 8,013 | | $ | 205,373 | |
Constant Contact, Inc. (a)(b) | | | 8,610 | | | 183,651 | |
DG FastChannel, Inc. (a) | | | 7,510 | | | 244,676 | |
Dex One Corp. (a) | | | 15,000 | | | 285,000 | |
Harte-Hanks, Inc. | | | 11,633 | | | 121,565 | |
InterDigital, Inc. (a)(b) | | | 13,144 | | | 324,525 | |
National CineMedia, Inc. | | | 13,123 | | | 218,629 | |
QuinStreet, Inc. (a) | | | 3,136 | | | 36,095 | |
SuperMedia, Inc. (a) | | | 3,894 | | | 71,221 | |
Valassis Communications, Inc. (a) | | | 14,966 | | | 474,722 | |
ValueClick, Inc. (a) | | | 24,393 | | | 260,761 | |
Viad Corp. | | | 6,376 | | | 112,537 | |
| | | | |
|
|
|
| | | | | | 2,538,755 | |
|
|
|
|
|
|
|
|
Aerospace — 1.4% | | | | | | | |
AAR Corp. (a) | | | 11,639 | | | 194,837 | |
AeroVironment, Inc. (a) | | | 4,967 | | | 107,933 | |
Applied Energetics, Inc. (a) | | | 24,385 | | | 25,117 | |
Argon ST, Inc. (a) | | | 4,031 | | | 138,223 | |
Astronics Corp. (a) | | | 2,930 | | | 47,935 | |
Ceradyne, Inc. (a) | | | 7,587 | | | 162,134 | |
Cubic Corp. | | | 4,676 | | | 170,113 | |
Curtiss-Wright Corp. | | | 13,509 | | | 392,301 | |
Ducommun, Inc. | | | 3,300 | | | 56,430 | |
Esterline Technologies Corp. (a) | | | 8,871 | | | 420,929 | |
GenCorp, Inc. (a) | | | 17,546 | | | 76,851 | |
Heico Corp. | | | 8,748 | | | 314,228 | |
Herley Industries, Inc. (a) | | | 4,257 | | | 60,705 | |
Kaman Corp., Class A | | | 7,809 | | | 172,735 | |
Kratos Defense & Security Solutions, Inc. (a) | | | 4,949 | | | 51,965 | |
LMI Aerospace, Inc. (a) | | | 2,724 | | | 42,957 | |
Ladish Co., Inc. (a) | | | 4,734 | | | 107,556 | |
Moog, Inc., Class A (a) | | | 13,539 | | | 436,362 | |
Orbital Sciences Corp. (a) | | | 17,124 | | | 270,046 | |
Teledyne Technologies, Inc. (a) | | | 10,752 | | | 414,812 | |
Triumph Group, Inc. | | | 4,955 | | | 330,152 | |
| | | | |
|
|
|
| | | | | | 3,994,321 | |
|
|
|
|
|
|
|
|
Agriculture, Fishing & Ranching — 0.5% | | | | | | | |
The Andersons, Inc. | | | 5,575 | | | 181,689 | |
Cadiz, Inc. (a) | | | 4,204 | | | 50,742 | |
Cal-Maine Foods, Inc. | | | 4,243 | | | 135,479 | |
Calavo Growers, Inc. | | | 3,536 | | | 63,507 | |
Fresh Del Monte Produce, Inc. (a) | | | 11,876 | | | 240,370 | |
Limoneira Co. | | | 2,434 | | | 52,964 | |
Pilgrims Pride Corp. (a) | | | 15,377 | | | 101,027 | |
Sanderson Farms, Inc. | | | 6,786 | | | 344,322 | |
Seaboard Corp. | | | 96 | | | 144,960 | |
| | | | |
|
|
|
| | | | | | 1,315,060 | |
|
|
|
|
|
|
|
|
Air Transport — 1.0% | | | | | | | |
Air Transport Services Group, Inc. (a) | | | 16,200 | | | 77,112 | |
AirTran Holdings, Inc. (a) | | | 40,304 | | | 195,475 | |
Alaska Air Group, Inc. (a) | | | 10,698 | | | 480,875 | |
Allegiant Travel Co. (b) | | | 4,560 | | | 194,666 | |
Atlas Air Worldwide Holdings, Inc. (a) | | | 7,760 | | | 368,600 | |
Bristow Group, Inc. (a) | | | 10,773 | | | 316,726 | |
Hawaiian Holdings, Inc. (a) | | | 15,735 | | | 81,350 | |
JetBlue Airways Corp. (a) | | | 73,190 | | | 401,813 | |
PHI, Inc. (a) | | | 4,223 | | | 59,502 | |
Pinnacle Airlines Corp. (a) | | | 6,116 | | | 33,271 | |
| | | | | | | |
Common Stocks | | | Shares | | Value | |
|
|
|
|
|
|
|
|
Air Transport (concluded) | | | | | | | |
Republic Airways Holdings, Inc. (a) | | | 10,400 | | $ | 63,544 | |
SkyWest, Inc. | | | 16,732 | | | 204,465 | |
US Airways Group, Inc. (a)(b) | | | 48,454 | | | 417,189 | |
| | | | |
|
|
|
| | | | | | 2,894,588 | |
|
|
|
|
|
|
|
|
Alternative Energy — 0.3% | | | | | | | |
Clean Energy Fuels Corp. (a)(b) | | | 12,215 | | | 182,492 | |
Comverge, Inc. (a) | | | 7,823 | | | 70,094 | |
EnerNOC, Inc. (a)(b) | | | 5,961 | | | 187,414 | |
Green Plains Renewable Energy (a) | | | 4,980 | | | 50,896 | |
Rex American Resources Corp. (a) | | | 2,365 | | | 37,840 | |
Syntroleum Corp. (a) | | | 22,130 | | | 36,293 | |
USEC, Inc. (a) | | | 34,150 | | | 162,554 | |
| | | | |
|
|
|
| | | | | | 727,583 | |
|
|
|
|
|
|
|
|
Aluminum — 0.1% | | | | | | | |
Century Aluminum Co. (a) | | | 19,199 | | | 169,527 | |
Kaiser Aluminum Corp. | | | 4,605 | | | 159,656 | |
| | | | |
|
|
|
| | | | | | 329,183 | |
|
|
|
|
|
|
|
|
Asset Management & Custodian — 0.9% | | | | | | | |
American Capital Ltd. (a)(b) | | | 101,892 | | | 491,120 | |
Apollo Investment Corp. | | | 58,849 | | | 549,061 | |
Artio Global Investors, Inc. | | | 8,318 | | | 130,925 | |
Calamos Asset Management, Inc., Class A | | | 5,840 | | | 54,195 | |
Capital Southwest Corp. | | | 869 | | | 76,394 | |
Cohen & Steers, Inc. (b) | | | 5,134 | | | 106,479 | |
Cowen Group, Inc., Class A (a) | | | 11,221 | | | 46,006 | |
Diamond Hill Investments Group | | | 728 | | | 41,270 | |
Epoch Holding Corp. | | | 4,127 | | | 50,638 | |
Fifth Street Finance Corp. | | | 13,513 | | | 149,048 | |
Financial Engines, Inc. (a) | | | 4,059 | | | 55,203 | |
GAMCO Investors, Inc., Class A | | | 2,066 | | | 76,855 | |
Golub Capital BDC, Inc. | | | 2,265 | | | 32,661 | |
Harris & Harris Group, Inc. (a) | | | 9,712 | | | 39,722 | |
JMP Group, Inc. | | | 4,706 | | | 29,130 | |
MCG Capital Corp. | | | 23,131 | | | 111,723 | |
MVC Capital, Inc. | | | 7,347 | | | 94,923 | |
NGP Capital Resources Co. | | | 6,861 | | | 49,193 | |
National Financial Partners Corp. (a) | | | 12,618 | | | 123,278 | |
Oppenheimer Holdings, Inc. | | | 3,009 | | | 72,066 | |
Solar Capital Ltd. | | | 1,659 | | | 31,952 | |
THL Credit, Inc. (a) | | | 2,766 | | | 31,809 | |
TICC Capital Corp. | | | 8,304 | | | 69,754 | |
Virtus Investment Partners, Inc. (a) | | | 1,648 | | | 30,851 | |
Westwood Holdings Group, Inc. | | | 1,758 | | | 61,794 | |
| | | | |
|
|
|
| | | | | | 2,606,050 | |
|
|
|
|
|
|
|
|
Auto Parts — 0.7% | | | | | | | |
ATC Technology Corp. (a) | | | 5,990 | | | 96,559 | |
American Axle & Manufacturing Holdings, Inc. (a) | | | 16,952 | | | 124,258 | |
Amerigon, Inc. (a) | | | 6,500 | | | 47,970 | |
ArvinMeritor, Inc. (a) | | | 28,139 | | | 368,621 | |
Dana Holding Corp. (a) | | | 42,025 | | | 420,250 | |
Dorman Products, Inc. (a) | | | 3,377 | | | 68,654 | |
Exide Technologies (a) | | | 22,951 | | | 119,345 | |
Fuel Systems Solutions, Inc. (a)(b) | | | 4,251 | | | 110,313 | |
Standard Motor Products, Inc. | | | 5,982 | | | 48,275 | |
Stoneridge, Inc. (a) | | | 4,767 | | | 36,182 | |
Superior Industries International, Inc. | | | 6,929 | | | 93,126 | |
Tenneco, Inc. (a) | | | 17,879 | | | 376,532 | |
U.S. Auto Parts Network, Inc. (a) | | | 4,321 | | | 25,926 | |
| | | | |
|
|
|
| | | | | | 1,936,011 | |
|
|
|
|
|
|
|
|
| | |
See Notes to Financial Statements. | |
|
|
|
16 | BLACKROCK SMALL CAP INDEX FUND | JUNE 30, 2010 |
| |
|
|
| |
Schedule of Investments (continued) | Master Small Cap Index Series |
| (Percentages shown are based on Net Assets) |
| | | | | | | |
Common Stocks | | | Shares | | Value | |
|
|
|
|
|
|
|
|
Auto Services — 0.1% | | | | | | | |
Cooper Tire & Rubber Co. (b) | | | 18,228 | | $ | 355,446 | |
|
|
|
|
|
|
|
|
Back Office Support, HR, & Consulting — 1.4% | | | | | | | |
APAC Customer Services, Inc. (a) | | | 10,021 | | | 57,120 | |
Administaff, Inc. | | | 6,459 | | | 156,049 | |
The Advisory Board Co. (a) | | | 4,685 | | | 201,268 | |
Barrett Business Services, Inc. | | | 2,631 | | | 32,624 | |
CBIZ, Inc. (a) | | | 13,553 | | | 86,197 | |
CDI Corp. | | | 4,021 | | | 62,446 | |
CRA International, Inc. (a) | | | 3,485 | | | 65,623 | |
Compass Diversified Holdings | | | 10,042 | | | 134,663 | |
Corporate Executive Board Co. | | | 10,242 | | | 269,057 | |
CoStar Group, Inc. (a) | | | 6,194 | | | 240,327 | |
Diamond Management & Technology Consultants, Inc. | | | 7,358 | | | 75,861 | |
Dice Holdings, Inc. (a) | | | 5,025 | | | 34,773 | |
ExlService Holdings, Inc. (a) | | | 4,738 | | | 81,351 | |
Forrester Research, Inc. (a) | | | 4,445 | | | 134,506 | |
GP Strategies Corp. (a) | | | 4,600 | | | 33,396 | |
Heidrick & Struggles International, Inc. | | | 5,334 | | | 121,722 | |
Hudson Highland Group, Inc. (a) | | | 10,272 | | | 45,197 | |
Huron Consulting Group, Inc. (a) | | | 6,670 | | | 129,465 | |
ICF International, Inc. (a) | | | 5,280 | | | 126,350 | |
Kelly Services, Inc., Class A (a) | | | 8,245 | | | 122,603 | |
Kforce, Inc. (a) | | | 9,379 | | | 119,582 | |
Korn/Ferry International (a) | | | 13,821 | | | 192,112 | |
LECG Corp. (a) | | | 9,818 | | | 25,527 | |
Liquidity Services, Inc. (a) | | | 4,300 | | | 55,728 | |
LoopNet, Inc. (a) | | | 6,083 | | | 75,003 | |
MAXIMUS, Inc. | | | 5,236 | | | 303,007 | |
Manpower, Inc. | | | — | | | 17 | |
Navigant Consulting, Inc. (a) | | | 15,244 | | | 158,233 | |
On Assignment, Inc. (a) | | | 11,551 | | | 58,102 | |
Resources Connection, Inc. (a) | | | 13,972 | | | 190,019 | |
SFN Group, Inc. (a) | | | 16,030 | | | 87,524 | |
SYKES Enterprises, Inc. (a) | | | 12,455 | | | 177,235 | |
TeleTech Holdings, Inc. (a) | | | 9,140 | | | 117,815 | |
TrueBlue, Inc. (a) | | | 13,277 | | | 148,570 | |
Volt Information Sciences, Inc. (a) | | | 4,837 | | | 40,631 | |
| | | | |
|
|
|
| | | | | | 3,959,703 | |
|
|
|
|
|
|
|
|
Banks: Diversified — 6.2% | | | | | | | |
1st Source Corp. | | | 4,666 | | | 78,949 | |
1st United BanCorp., Inc. (a) | | | 6,966 | | | 51,270 | |
Alliance Financial Corp. | | | 1,610 | | | 44,758 | |
American National Bankshares, Inc. | | | 2,097 | | | 44,855 | |
Ameris Bancorp | | | 7,382 | | | 71,310 | |
Ames National Corp. | | | 2,595 | | | 50,706 | |
Arrow Financial Corp. | | | 2,945 | | | 68,029 | |
Bancfirst Corp. | | | 2,089 | | | 76,228 | |
Banco Latinoamericana De Comercio Exterior SA | | | 8,601 | | | 107,426 | |
The Bancorp, Inc. (a) | | | 7,101 | | | 55,601 | |
Bancorp Rhode Island, Inc. | | | 1,320 | | | 34,584 | |
Bank of Marin Bancorp | | | 1,727 | | | 55,143 | |
Bank of the Ozarks, Inc. | | | 3,914 | | | 138,830 | |
Boston Private Financial Holdings, Inc. | | | 21,013 | | | 135,114 | |
Bridge Bancorp, Inc. | | | 2,116 | | | 51,376 | |
Bryn Mawr Bank Corp. | | | 2,799 | | | 46,967 | |
CNB Financial Corporation | | | 3,069 | | | 33,698 | |
CVB Financial Corp. (b) | | | 26,827 | | | 254,856 | |
Camden National Corp. | | | 2,404 | | | 66,038 | |
Capital City Bank Group, Inc. (b) | | | 3,783 | | | 46,834 | |
Cardinal Financial Corp. | | | 8,913 | | | 82,356 | |
| | | | | | | |
Common Stocks | | | Shares | | Value | |
|
|
|
|
|
|
|
|
Banks: Diversified (continued) | | | | | | | |
Cathay General Bancorp | | | 23,631 | | $ | 244,108 | |
Center Financial Corp. (a) | | | 11,027 | | | 56,789 | |
Centerstate Banks, Inc. | | | 6,845 | | | 69,066 | |
Chemical Financial Corp. | | | 7,349 | | | 160,061 | |
Citizens & Northern Corp. | | | 3,947 | | | 42,233 | |
Citizens Banking Corp. (a) | | | 119,962 | | | 101,968 | |
City Holding Co. | | | 4,704 | | | 131,148 | |
CoBiz Financial, Inc. | | | 10,294 | | | 67,837 | |
Columbia Banking System, Inc. | | | 11,788 | | | 215,249 | |
Community Bank System, Inc. | | | 9,923 | | | 218,604 | |
Community Trust Bancorp, Inc. | | | 4,181 | | | 104,943 | |
Danvers Bancorp, Inc. | | | 5,866 | | | 84,764 | |
Eagle Bancorp, Inc. (a) | | | 5,134 | | | 60,479 | |
Enterprise Financial Services Corp. | | | 4,884 | | | 47,082 | |
F.N.B. Corp. | | | 34,235 | | | 274,907 | |
Financial Institutions, Inc. | | | 3,303 | | | 58,661 | |
First Bancorp, Inc. | | | 2,937 | | | 38,563 | |
First Bancorp, North Carolina | | | 4,594 | | | 66,567 | |
First Busey Corp. (b) | | | 16,534 | | | 74,899 | |
First Commonwealth Financial Corp. | | | 26,125 | | | 137,156 | |
First Community Bancshares, Inc. | | | 4,913 | | | 72,172 | |
First Financial Bancorp | | | 17,309 | | | 258,770 | |
First Financial Bankshares, Inc. | | | 6,139 | | | 295,225 | |
First Financial Corp. | | | 3,422 | | | 88,322 | |
First Merchants Corp. | | | 8,112 | | | 68,790 | |
First Midwest Bancorp, Inc. | | | 22,176 | | | 269,660 | |
The First of Long Island Corp. | | | 1,918 | | | 49,312 | |
First South Bancorp, Inc. | | | 2,851 | | | 30,249 | |
FirstMerit Corp. | | | 32,081 | | | 549,548 | |
German American Bancorp, Inc. | | | 3,588 | | | 54,896 | |
Glacier Bancorp, Inc. | | | 21,509 | | | 315,537 | |
Greene County Bancshares, Inc. (a) | | | 3,759 | | | 48,002 | |
Hancock Holding Co. | | | 8,558 | | | 285,495 | |
Heartland Financial USA, Inc. (b) | | | 4,086 | | | 70,606 | |
Home Bancshares, Inc. | | | 6,655 | | | 151,801 | |
Hudson Valley Holding Corp. | | | 3,608 | | | 83,417 | |
IBERIABANK Corp. | | | 7,945 | | | 409,009 | |
International Bancshares Corp. | | | 15,758 | | | 263,001 | |
Investors Bancorp, Inc. (a) | | | 14,211 | | | 186,448 | |
Lakeland Bancorp, Inc. | | | 6,523 | | | 55,576 | |
Lakeland Financial Corp. | | | 4,970 | | | 99,301 | |
MA Independent Bank Corp. | | | 6,415 | | | 158,322 | |
MB Financial, Inc. | | | 15,893 | | | 292,272 | |
MT First Interstate Bancsystem, Inc. | | | 3,928 | | | 61,787 | |
MainSource Financial Group, Inc. | | | 6,605 | | | 47,358 | |
Merchants Bancshares, Inc. | | | 1,733 | | | 38,507 | |
Meridian Interstate Bancorp, Inc. (a) | | | 3,105 | | | 33,845 | |
Metro Bancorp, Inc. (a) | | | 4,251 | | | 52,457 | |
Midsouth Bancorp, Inc. | | | 2,564 | | | 32,742 | |
NBT Bancorp, Inc. | | | 10,316 | | | 210,653 | |
Nara Bancorp, Inc. (a) | | | 11,626 | | | 98,007 | |
National Bankshares, Inc. | | | 2,223 | | | 53,863 | |
National Penn Bancshares, Inc. | | | 38,212 | | | 229,654 | |
Old National Bancorp | | | 25,936 | | | 268,697 | |
Oriental Financial Group | | | 9,855 | | | 124,764 | |
Orrstown Financial Service, Inc. | | | 2,100 | | | 46,473 | |
Pacific Continental Corp. | | | 5,880 | | | 55,684 | |
PacWest Bancorp | | | 9,298 | | | 170,246 | |
Park National Corp. (b) | | | 3,678 | | | 239,217 | |
Peapack-Gladstone Financial Corp. | | | 2,883 | | | 33,731 | |
Penns Woods Bancorp, Inc. | | | 1,395 | | | 42,436 | |
Peoples Bancorp, Inc. | | | 3,253 | | | 47,169 | |
Pinnacle Financial Partners, Inc. (a) | | | 10,234 | | | 131,507 | |
| | |
See Notes to Financial Statements. | | |
|
|
|
BLACKROCK SMALL CAP INDEX FUND | JUNE 30, 2010 | 17 |
| |
|
|
| |
Schedule of Investments (continued) | Master Small Cap Index Series |
| (Percentages shown are based on Net Assets) |
| | | | | | | |
Common Stocks | | | Shares | | Value | |
|
|
|
|
|
|
|
|
Banks: Diversified (concluded) | | | | | | | |
PrivateBancorp, Inc. | | | 15,651 | | $ | 173,413 | |
Prosperity Bancshares, Inc. | | | 13,829 | | | 480,558 | |
Provident Financial Services, Inc. | | | 17,989 | | | 210,291 | |
Renasant Corp. | | | 6,616 | | | 94,940 | |
Republic Bancorp, Inc., Class A | | | 2,989 | | | 66,954 | |
Rockville Financial, Inc. | | | 2,684 | | | 31,966 | |
Roma Financial Corp. | | | 2,733 | | | 29,680 | |
S&T Bancorp, Inc. (b) | | | 7,470 | | | 147,607 | |
SCBT Financial Corp. | | | 3,877 | | | 136,548 | |
SVB Financial Group (a) | | | 12,436 | | | 512,736 | |
SY Bancorp, Inc. | | | 3,648 | | | 83,831 | |
Sandy Spring Bancorp, Inc. | | | 7,344 | | | 102,889 | |
Sierra Bancorp | | | 3,072 | | | 35,328 | |
Signature Bank (a) | | | 12,173 | | | 462,696 | |
Simmons First National Corp., Class A | | | 5,178 | | | 135,974 | |
Southside Bancshares, Inc. | | | 4,953 | | | 97,277 | |
Southwest Bancorp, Inc. | | | 5,806 | | | 77,162 | |
State Bancorp, Inc. | | | 5,431 | | | 51,595 | |
StellarOne Corp. | | | 7,122 | | | 90,948 | |
Sterling Bancorp | | | 8,268 | | | 74,412 | |
Sterling Bancshares, Inc. | | | 27,802 | | | 130,947 | |
Suffolk Bancorp | | | 2,985 | | | 92,356 | |
Susquehanna Bancshares, Inc. | | | 38,936 | | | 324,337 | |
Taylor Capital Group, Inc. (a) | | | 3,084 | | | 39,907 | |
Texas Capital Bancshares, Inc. (a) | | | 10,935 | | | 179,334 | |
Tompkins Trustco, Inc. | | | 2,401 | | | 90,638 | |
Tower Bancorp, Inc. | | | 1,863 | | | 40,781 | |
Towne Bank (b) | | | 7,182 | | | 104,283 | |
Trico Bancshares | | | 4,347 | | | 73,595 | |
TrustCo Bank Corp. NY | | | 23,237 | | | 130,127 | |
Trustmark Corp. | | | 18,948 | | | 394,497 | |
UMB Financial Corp. | | | 9,330 | | | 331,775 | |
Umpqua Holdings Corp. | | | 34,358 | | | 394,430 | |
Union First Market Bankshares Corp. | | | 5,521 | | | 67,687 | |
United Bankshares, Inc. (b) | | | 11,591 | | | 277,489 | |
United Community Banks, Inc. (a) | | | 28,666 | | | 113,231 | |
Univest Corp. of Pennsylvania | | | 5,148 | | | 89,163 | |
Virginia Commerce Bancorp (a) | | | 6,485 | | | 40,531 | |
Washington Banking Co. | | | 4,760 | | | 60,880 | |
Washington Trust Bancorp, Inc. | | | 4,461 | | | 76,015 | |
Webster Financial Corp. | | | 19,554 | | | 350,799 | |
WesBanco, Inc. | | | 7,031 | | | 118,472 | |
West Bancorp., Inc. (a) | | | 5,064 | | | 34,486 | |
West Coast Bancorp (a) | | | 28,990 | | | 73,924 | |
Westamerica Bancorp. (b) | | | 8,584 | | | 450,832 | |
Western Alliance Bancorp (a) | | | 17,825 | | | 127,805 | |
Whitney Holding Corp. | | | 28,802 | | | 266,418 | |
Wilshire Bancorp, Inc. | | | 6,088 | | | 53,270 | |
Wintrust Financial Corp. | | | 9,271 | | | 309,095 | |
| | | | |
|
|
|
| | | | | | 17,958,449 | |
|
|
|
|
|
|
|
|
Banks: Savings, Thrift & Mortgage Lending — 1.1% | | | | | | | |
Abington Bancorp, Inc. | | | 6,673 | | | 58,189 | |
Astoria Financial Corp. | | | 25,494 | | | 350,797 | |
Bank Mutual Corp. | | | 14,337 | | | 81,434 | |
BankFinancial Corp. | | | 6,200 | | | 51,522 | |
Beneficial Mutual Bancorp, Inc. (a) | | | 10,346 | | | 102,219 | |
Berkshire Hills Bancorp, Inc. | | | 4,386 | | | 85,439 | |
BofI Holding, Inc. (a) | | | 2,218 | | | 31,318 | |
Brookline Bancorp, Inc. | | | 17,740 | | | 157,531 | |
Dime Community Bancshares, Inc. | | | 8,192 | | | 101,007 | |
| | | | | | | |
Common Stocks | | Shares | | Value | |
|
|
|
|
|
|
|
|
Banks: Savings, Thrift & Mortgage Lending (concluded) | | | | | | | |
ESB Financial Corp. | | | 2,997 | | $ | 39,111 | |
ESSA Bancorp, Inc. | | | 4,914 | | | 60,491 | |
First Financial Holdings, Inc. | | | 5,188 | | | 59,403 | |
Flagstar BanCorp., Inc. (a) | | | 14,476 | | | 45,455 | |
Flushing Financial Corp. | | | 9,466 | | | 115,769 | |
Great Southern Bancorp, Inc. | | | 3,095 | | | 62,860 | |
Heritage Financial Corp. (a) | | | 2,942 | | | 44,042 | |
Home Bancorp, Inc. (a) | | | 2,774 | | | 35,812 | |
Home Federal Bancorp, Inc. | | | 5,300 | | | 66,939 | |
Kearny Financial Corp. | | | 4,644 | | | 42,539 | |
NewAlliance Bancshares, Inc. | | | 31,305 | | | 350,929 | |
Northfield Bancorp, Inc. | | | 5,502 | | | 71,416 | |
Northwest Bancshares, Inc. | | | 32,849 | | | 376,778 | |
OceanFirst Financial Corp. | | | 4,601 | | | 55,534 | |
Ocwen Financial Corp. (a) | | | 22,274 | | | 226,972 | |
OmniAmerican Bancorp, Inc. (a) | | | 3,994 | | | 45,092 | |
Oritani Financial Corp. | | | 16,846 | | | 168,460 | |
Provident New York Bancorp | | | 11,920 | | | 105,492 | |
Territorial BanCorp., Inc. | | | 3,793 | | | 71,877 | |
United Financial Bancorp, Inc. | | | 5,370 | | | 73,301 | |
ViewPoint Financial Group | | | 3,233 | | | 44,777 | |
WSFS Financial Corp. | | | 1,549 | | | 55,656 | |
Westfield Financial, Inc. | | | 9,012 | | | 75,070 | |
| | | | |
|
|
|
| | | | | | 3,313,231 | |
|
|
|
|
|
|
|
|
Beverage: Brewers & Distillers — 0.1% | | | | | | | |
Boston Beer Co., Inc., Class A (a) | | | 2,675 | | | 180,429 | |
|
|
|
|
|
|
|
|
Beverage: Soft Drinks — 0.1% | | | | | | | |
Coca-Cola Bottling Co. Consolidated | | | 1,333 | | | 63,877 | |
Farmer Bros. Co. | | | 2,387 | | | 36,020 | |
Heckmann Corp. (a)(b) | | | 27,229 | | | 126,342 | |
National Beverage Corp. | | | 3,470 | | | 42,612 | |
Peet’s Coffee & Tea, Inc. (a) | | | 3,552 | | | 139,487 | |
| | | | |
|
|
|
| | | | | | 408,338 | |
|
|
|
|
|
|
|
|
Biotechnology — 3.1% | | | | | | | |
AMAG Pharmaceuticals, Inc. (a) | | | 6,316 | | | 216,955 | |
AVI BioPharma, Inc. (a) | | | 34,178 | | | 55,027 | |
Accelrys, Inc. (a) | | | 8,858 | | | 57,134 | |
Acorda Therapeutics, Inc. (a) | | | 11,626 | | | 361,685 | |
Affymax, Inc. (a) | | | 6,383 | | | 38,170 | |
Albany Molecular Research, Inc. (a) | | | 7,440 | | | 38,465 | |
Allos Therapeutics, Inc. (a) | | | 23,763 | | | 145,667 | |
Alnylam Pharmaceuticals, Inc. (a) | | | 10,998 | | | 165,190 | |
Arena Pharmaceuticals, Inc. (a)(b) | | | 30,910 | | | 94,894 | |
Ariad Pharmaceuticals, Inc. (a) | | | 33,664 | | | 94,932 | |
Arqule, Inc. (a) | | | 12,752 | | | 54,834 | |
Array Biopharma, Inc. (a) | | | 16,502 | | | 50,331 | |
BioMimetic Therapeutics, Inc. (a) | | | 4,824 | | | 53,643 | |
Biosante Pharmaceuticals, Inc. (a) | | | 20,480 | | | 36,045 | |
Biotime, Inc. (a) | | | 6,680 | | | 41,149 | |
Celera Corp. (a) | | | 24,703 | | | 161,805 | |
Celldex Therapeutics, Inc. (a) | | | 9,844 | | | 44,889 | |
Cepheid, Inc. (a) | | | 17,847 | | | 285,909 | |
Chelsea Therapeutics International, Inc. (a) | | | 10,081 | | | 29,537 | |
Clinical Data, Inc. (a) | | | 3,345 | | | 41,612 | |
Combinatorx, Inc. (a) | | | 21,729 | | | 31,507 | |
Cubist Pharmaceuticals, Inc. (a) | | | 17,260 | | | 355,556 | |
Curis, Inc. (a) | | | 23,604 | | | 32,810 | |
Cypress Bioscience, Inc. (a) | | | 12,166 | | | 27,982 | |
Cytokinetics, Inc. (a) | | | 14,961 | | | 35,458 | |
Cytori Therapeutics, Inc. (a) | | | 12,791 | | | 44,513 | |
| | |
See Notes to Financial Statements. | |
|
|
18 | BLACKROCK SMALL CAP INDEX FUND | JUNE 30, 2010 |
| |
|
|
| |
Schedule of Investments (continued) | Master Small Cap Index Series |
| (Percentages shown are based on Net Assets) |
| | | | | | | |
Common Stocks | | | Shares | | Value | |
|
|
|
|
|
|
|
|
Biotechnology (concluded) | | | | | | | |
CytRx Corp. (a) | | | 37,640 | | $ | 28,983 | |
Dyax Corp. (a) | | | 30,092 | | | 68,309 | |
Dynavax Technologies Corp. (a) | | | 22,519 | | | 41,885 | |
Emergent Biosolutions, Inc. (a) | | | 5,657 | | | 92,435 | |
Enzo Biochem, Inc. (a) | | | 10,424 | | | 42,426 | |
Enzon Pharmaceuticals, Inc. (a)(b) | | | 14,968 | | | 159,409 | |
Exact Sciences Corp. (a) | | | 11,168 | | | 49,139 | |
Exelixis, Inc. (a) | | | 32,821 | | | 113,889 | |
Furiex Pharmaceuticals, Inc. (a) | | | 2,637 | | | 26,792 | |
Genomic Health, Inc. (a)(b) | | | 4,272 | | | 55,237 | |
Geron Corp. (a)(b) | | | 29,274 | | | 146,955 | |
Halozyme Therapeutics, Inc. (a) | | | 21,725 | | | 152,944 | |
Idenix Pharmaceuticals, Inc. (a) | | | 11,092 | | | 55,460 | |
ImmunoGen, Inc. (a) | | | 20,445 | | | 189,525 | |
Immunomedics, Inc. (a)(b) | | | 19,500 | | | 60,255 | |
Incyte Corp. (a) | | | 26,476 | | | 293,089 | |
Inhibitex, Inc. (a) | | | 15,621 | | | 39,833 | |
Inovio Pharmaceuticals, Inc. (a) | | | 26,434 | | | 26,963 | |
InterMune, Inc. (a) | | | 13,725 | | | 128,329 | |
Kensey Nash Corp. (a) | | | 2,432 | | | 57,663 | |
Keryx Biopharmaceuticals, Inc. (a) | | | 15,456 | | | 56,569 | |
Lexicon Genetics, Inc. (a) | | | 60,374 | | | 77,279 | |
Ligand Pharmaceuticals, Inc., Class B (a) | | | 37,409 | | | 54,617 | |
MannKind Corp. (a)(b) | | | 18,741 | | | 119,755 | |
Martek Biosciences Corp. (a) | | | 9,923 | | | 235,274 | |
Maxygen, Inc. (a) | | | 9,719 | | | 53,746 | |
Medivation, Inc. (a)(b) | | | 10,272 | | | 90,804 | |
Metabolix, Inc. (a) | | | 8,165 | | | 116,841 | |
Micromet, Inc. (a) | | | 24,448 | | | 152,555 | |
Momenta Pharmaceuticals, Inc. (a) | | | 12,111 | | | 148,481 | |
NPS Pharmaceuticals, Inc. (a) | | | 17,999 | | | 115,914 | |
Nabi Biopharmaceuticals (a) | | | 13,970 | | | 75,997 | |
Nektar Therapeutics (a) | | | 28,384 | | | 343,446 | |
Neuralstem, Inc. (a) | | | 13,499 | | | 33,747 | |
Neurocrine Biosciences, Inc. (a) | | | 14,916 | | | 83,530 | |
Neurogesx, Inc. (a) | | | 3,644 | | | 24,160 | |
Novavax, Inc. (a)(b) | | | 25,850 | | | 56,094 | |
Omeros Corp. (a) | | | 6,077 | | | 45,091 | |
Onyx Pharmaceuticals, Inc. (a) | | | 18,755 | | | 404,920 | |
Opko Health, Inc. (a) | | | 27,628 | | | 62,439 | |
Orexigen Therapeutics, Inc. (a) | | | 10,000 | | | 42,000 | |
Osiris Therapeutics, Inc. (a) | | | 5,369 | | | 31,194 | |
PDL BioPharma, Inc. | | | 35,489 | | | 199,448 | |
Peregrine Pharmaceuticals, Inc. (a) | | | 16,080 | | | 34,572 | |
Pharmasset, Inc. (a) | | | 8,933 | | | 244,228 | |
Progenics Pharmaceuticals, Inc. (a) | | | 8,908 | | | 48,816 | |
Pure Bioscience (a) | | | 11,689 | | | 27,937 | |
RTI Biologics, Inc. (a) | | | 17,025 | | | 49,883 | |
Rigel Pharmaceuticals, Inc. (a) | | | 16,005 | | | 115,236 | |
Sangamo Biosciences, Inc. (a) | | | 14,038 | | | 52,081 | |
Savient Pharmaceuticals, Inc. (a) | | | 20,161 | | | 254,029 | |
Seattle Genetics, Inc. (a) | | | 25,137 | | | 301,393 | |
Sequenom, Inc. (a) | | | 18,740 | | | 110,753 | |
StemCells, Inc. (a)(b) | | | 39,100 | | | 36,754 | |
Targacept, Inc. (a) | | | 7,207 | | | 139,311 | |
Theravance, Inc. (a) | | | 18,828 | | | 236,668 | |
Vanda Pharmaceuticals, Inc. (a) | | | 8,575 | | | 56,681 | |
ViroPharma, Inc. (a) | | | 23,299 | | | 261,182 | |
ZIOPHARM Oncology, Inc. (a) | | | 15,216 | | | 48,387 | |
ZymoGenetics, Inc. (a) | | | 16,266 | | | 68,642 | |
| | | | |
|
|
|
| | | | | | 9,135,673 | |
|
|
|
|
|
|
|
|
| | | | | | | |
Common Stocks | | | Shares | | Value | |
|
|
|
|
|
|
|
|
Building Materials — 0.9% | | | | | | | |
Acuity Brands, Inc. | | | 12,990 | | $ | 472,576 | |
Ameron International Corp. | | | 2,766 | | | 166,873 | |
Builders FirstSource, Inc. (a) | | | 14,690 | | | 35,256 | |
Gibraltar Industries, Inc. (a) | | | 9,304 | | | 93,970 | |
Griffon Corp. (a) | | | 13,307 | | | 147,175 | |
Headwaters, Inc. (a) | | | 18,810 | | | 53,420 | |
LSI Industries, Inc. | | | 6,524 | | | 31,837 | |
Louisiana-Pacific Corp. (a) | | | 37,659 | | | 251,939 | |
NCI Building Systems, Inc. (a) | | | 5,660 | | | 47,374 | |
Quanex Building Products Corp. | | | 11,482 | | | 198,524 | |
Simpson Manufacturing Co., Inc. | | | 11,690 | | | 286,990 | |
Texas Industries, Inc. | | | 6,233 | | | 184,123 | |
Trex Co., Inc. (a) | | | 4,741 | | | 95,247 | |
Watsco, Inc. | | | 8,294 | | | 480,388 | |
| | | | |
|
|
|
| | | | | | 2,545,692 | |
|
|
|
|
|
|
|
|
Building: Climate Control — 0.1% | | | | | | | |
Aaon, Inc. | | | 3,785 | | | 88,228 | |
Comfort Systems USA, Inc. | | | 11,590 | | | 111,960 | |
Interline Brands, Inc. (a) | | | 9,882 | | | 170,860 | |
| | | | |
|
|
|
| | | | | | 371,048 | |
|
|
|
|
|
|
|
|
Building: Roofing, Wallboard & Plumbing — 0.1% | | | | | | | |
Beacon Roofing Supply, Inc. (a) | | | 13,733 | | | 247,469 | |
|
|
|
|
|
|
|
|
Cable Television Services — 0.1% | | | | | | | |
Knology, Inc. (a) | | | 9,458 | | | 103,376 | |
Mediacom Communications Corp., Class A (a) | | | 12,803 | | | 86,036 | |
| | | | |
|
|
|
| | | | | | 189,412 | |
|
|
|
|
|
|
|
|
Casinos & Gambling — 0.3% | | | | | | | |
Ameristar Casinos, Inc. | | | 8,272 | | | 124,576 | |
Boyd Gaming Corp. (a) | | | 16,324 | | | 138,591 | |
Isle of Capri Casinos, Inc. (a) | | | 5,003 | | | 46,328 | |
Monarch Casino & Resort, Inc. (a) | | | 3,071 | | | 31,109 | |
Multimedia Games, Inc. (a) | | | 8,949 | �� | | 40,271 | |
Pinnacle Entertainment, Inc. (a) | | | 18,409 | | | 174,149 | |
Scientific Games Corp., Class A (a) | | | 19,554 | | | 179,897 | |
Shuffle Master, Inc. (a) | | | 16,308 | | | 130,627 | |
| | | | |
|
|
|
| | | | | | 865,548 | |
|
|
|
|
|
|
|
|
Chemicals: Diversified — 1.3% | | | | | | | |
A Schulman, Inc. | | | 9,477 | | | 179,684 | |
Aceto Corp. | | | 8,177 | | | 46,854 | |
American Vanguard Corp. | | | 6,310 | | | 50,038 | |
Arch Chemicals, Inc. | | | 6,774 | | | 208,233 | |
Georgia Gulf Corp. (a) | | | 10,107 | | | 134,827 | |
Hawkins, Inc. (b) | | | 2,718 | | | 65,449 | |
Innophos Holdings, Inc. | | | 6,469 | | | 168,712 | |
KMG Chemicals, Inc. | | | 1,950 | | | 28,002 | |
LSB Industries, Inc. (a) | | | 5,200 | | | 69,212 | |
Landec Corp. (a) | | | 8,333 | | | 49,081 | |
OM Group, Inc. (a) | | | 9,242 | | | 220,514 | |
Olin Corp. | | | 23,480 | | | 424,753 | |
Omnova Solutions, Inc. (a) | | | 13,628 | | | 106,435 | |
PolyOne Corp. (a) | | | 27,896 | | | 234,884 | |
Rockwood Holdings, Inc. (a) | | | 15,642 | | | 354,917 | |
Sensient Technologies Corp. | | | 14,793 | | | 383,583 | |
Solutia, Inc. (a) | | | 36,205 | | | 474,286 | |
TPC Group, Inc. (a) | | | 2,517 | | | 41,782 | |
W.R. Grace & Co. (a) | | | 21,780 | | | 458,251 | |
Westlake Chemical Corp. | | | 5,884 | | | 109,266 | |
| | | | |
|
|
|
| | | | | | 3,808,763 | |
|
|
|
|
|
|
|
|
| | |
See Notes to Financial Statements. | | |
|
|
|
BLACKROCK SMALL CAP INDEX FUND | JUNE 30, 2010 | 19 |
| |
|
|
| |
Schedule of Investments (continued) | Master Small Cap Index Series |
| (Percentages shown are based on Net Assets) |
| | | | | | | |
Common Stocks | | | Shares | | Value | |
|
|
|
|
|
|
|
|
Chemicals: Specialty — 0.5% | | | | | | | |
Balchem Corp. | | | 8,523 | | $ | 213,075 | |
Calgon Carbon Corp. (a) | | | 16,780 | | | 222,167 | |
Kraton Performance Polymers, Inc. (a) | | | 3,420 | | | 64,262 | |
NewMarket Corp. | | | 3,072 | | | 268,247 | |
Polypore International, Inc. (a) | | | 6,608 | | | 150,266 | |
Quaker Chemical Corp. | | | 3,395 | | | 91,970 | |
Senomyx, Inc. (a) | | | 12,066 | | | 45,730 | |
Stepan Co. | | | 2,341 | | | 160,195 | |
Zep, Inc. | | | 6,589 | | | 114,912 | |
| | | | |
|
|
|
| | | | | | 1,330,824 | |
|
|
|
|
|
|
|
|
Coal — 0.3% | | | | | | | |
Cloud Peak Energy, Inc. (a) | | | 9,460 | | | 125,439 | |
International Coal Group, Inc. (a) | | | 39,462 | | | 151,929 | |
James River Coal Co. (a) | | | 8,287 | | | 131,929 | |
L&L Energy, Inc. (a) | | | 5,132 | | | 44,135 | |
Patriot Coal Corp. (a) | | | 23,433 | | | 275,338 | |
| | | | |
|
|
|
| | | | | | 728,770 | |
|
|
|
|
|
|
|
|
Commercial Finance & Mortgage Companies — 0.1% | | | | | | | |
Asta Funding, Inc. | | | 3,837 | | | 37,871 | |
Federal Agricultural Mortgage Corp., Class B | | | 3,005 | | | 42,160 | |
Medallion Financial Corp. | | | 5,845 | | | 38,577 | |
NewStar Financial, Inc. (a) | | | 8,659 | | | 55,072 | |
| | | | |
|
|
|
| | | | | | 173,680 | |
|
|
|
|
|
|
|
|
Commercial Services: Rental & Leasing — 0.5% | | | | | | | |
Aircastle Ltd. | | | 15,396 | | | 120,859 | |
CAI International, Inc. (a) | | | 3,206 | | | 38,151 | |
Electro Rent Corp. | | | 5,153 | | | 65,907 | |
H&E Equipment Services, Inc. (a) | | | 8,621 | | | 64,571 | |
Marlin Business Services, Inc. (a) | | | 2,802 | | | 33,876 | |
McGrath RentCorp | | | 7,260 | | | 165,383 | |
Mobile Mini, Inc. (a) | | | 10,970 | | | 178,592 | |
PHH Corp. (a)(b) | | | 16,627 | | | 316,578 | |
RSC Holdings, Inc. (a) | | | 14,971 | | | 92,371 | |
TAL International Group, Inc. | | | 5,066 | | | 113,833 | |
United Rentals, Inc. (a) | | | 18,078 | | | 168,487 | |
| | | | |
|
|
|
| | | | | | 1,358,608 | |
|
|
|
|
|
|
|
|
Commercial Vehicles & Parts — 0.2% | | | | | | | |
Commercial Vehicle Group, Inc. (a) | | | 7,476 | | | 76,330 | |
Force Protection, Inc. (a) | | | 21,241 | | | 87,088 | |
Miller Industries, Inc. | | | 3,090 | | | 41,622 | |
Modine Manufacturing Co. (a) | | | 13,946 | | | 107,105 | |
Rush Enterprises, Inc., Class A (a) | | | 9,793 | | | 130,835 | |
Spartan Motors, Inc. | | | 10,027 | | | 42,113 | |
Wabash National Corp. (a) | | | 17,718 | | | 125,975 | |
| | | | |
|
|
|
| | | | | | 611,068 | |
|
|
|
|
|
|
|
|
Communications Technology — 2.6% | | | | | | | |
AboveNet, Inc. (a) | | | 6,735 | | | 317,757 | |
Acme Packet, Inc. (a) | | | 13,167 | | | 353,929 | |
Adtran, Inc. | | | 18,543 | | | 505,668 | |
Anaren, Inc. (a) | | | 4,568 | | | 68,246 | |
Anixter International, Inc. (a) | | | 8,399 | | | 357,797 | |
Aruba Networks, Inc. (a)(b) | | | 22,033 | | | 313,750 | |
Aviat Networks, Inc. (a) | | | 18,591 | | | 67,485 | |
Bel Fuse, Inc. | | | 3,259 | | | 53,806 | |
BigBand Networks, Inc. (a) | | | 15,609 | | | 47,139 | |
Black Box Corp. | | | 5,322 | | | 148,431 | |
| | | | | | | |
Common Stocks | | | Shares | | Value | |
|
|
|
|
|
|
|
|
Communications Technology (concluded) | | | | | | | |
Comtech Telecommunications Corp. (a) | | | 8,487 | | $ | 254,016 | |
Digi International, Inc. (a) | | | 7,738 | | | 63,993 | |
DigitalGlobe, Inc. (a) | | | 8,155 | | | 214,477 | |
EMS Technologies, Inc. (a) | | | 4,700 | | | 70,594 | |
Echelon Corp. (a)(b) | | | 10,208 | | | 74,825 | |
Emulex Corp. (a) | | | 24,180 | | | 221,972 | |
Extreme Networks, Inc. (a) | | | 27,499 | | | 74,247 | |
Finisar Corp. (a) | | | 22,658 | | | 337,604 | |
GSI Technology, Inc. (a) | | | 6,262 | | | 35,819 | |
GeoEye, Inc. (a) | | | 6,798 | | | 211,690 | |
Globecomm Systems, Inc. (a) | | | 6,819 | | | 56,257 | |
Harmonic, Inc. (a) | | | 29,307 | | | 159,430 | |
Hughes Communications, Inc. (a) | | | 3,025 | | | 73,598 | |
Infinera Corp. (a) | | | 26,645 | | | 171,327 | |
Ixia (a) | | | 9,981 | | | 85,737 | |
KVH Industries, Inc. (a) | | | 4,559 | | | 56,623 | |
Loral Space & Communications Ltd. (a) | | | 3,371 | | | 144,009 | |
NETGEAR, Inc. (a) | | | 10,573 | | | 188,622 | |
Network Equipment Technologies, Inc. (a) | | | 9,849 | | | 34,373 | |
Novatel Wireless, Inc. (a) | | | 9,400 | | | 53,956 | |
Oclaro, Inc. (a) | | | 14,947 | | | 165,762 | |
Oplink Communications, Inc. (a) | | | 6,474 | | | 92,773 | |
PC-Tel, Inc. (a) | | | 6,452 | | | 32,518 | |
Plantronics, Inc. | | | 14,449 | | | 413,241 | |
Riverbed Technology, Inc. (a) | | | 18,918 | | | 522,515 | |
SeaChange International, Inc. (a) | | | 8,651 | | | 71,198 | |
Shoretel, Inc. (a) | | | 13,690 | | | 63,522 | |
Sonus Networks, Inc. (a) | | | 62,969 | | | 170,646 | |
Sycamore Networks, Inc. | | | 6,039 | | | 100,368 | |
Syniverse Holdings, Inc. (a) | | | 20,692 | | | 423,152 | |
Tekelec (a) | | | 20,484 | | | 271,208 | |
Viasat, Inc. (a) | | | 9,945 | | | 323,809 | |
| | | | |
|
|
|
| | | | | | 7,467,889 | |
|
|
|
|
|
|
|
|
Computer Services Software & Systems — 6.2% | | | | | | | |
3PAR, Inc. (a) | | | 11,779 | | | 109,662 | |
ACI Worldwide, Inc. (a)(c) | | | 10,249 | | | 199,548 | |
Actuate Corp. (a) | | | 13,953 | | | 62,091 | |
Acxiom Corp. (a) | | | 20,521 | | | 301,453 | |
American Reprographics Co. (a) | | | 11,289 | | | 98,553 | |
American Software, Class A | | | 7,446 | | | 34,401 | |
ArcSight, Inc. (a) | | | 7,433 | | | 166,425 | |
Ariba, Inc. (a) | | | 27,012 | | | 430,301 | |
Art Technology Group, Inc. (a) | | | 47,601 | | | 162,795 | |
Aspen Technology, Inc. (a) | | | 18,777 | | | 204,482 | |
Avid Technology, Inc. (a) | | | 8,943 | | | 113,844 | |
Bell Microproducts, Inc. (a) | | | 10,049 | | | 70,142 | |
Blackbaud, Inc. | | | 13,479 | | | 293,438 | |
Blackboard, Inc. (a) | | | 10,236 | | | 382,110 | |
Blue Coat Systems, Inc. (a) | | | 12,500 | | | 255,375 | |
Bottomline Technologies, Inc. (a) | | | 8,343 | | | 108,709 | |
CACI International, Inc., Class A (a) | | | 9,034 | | | 383,764 | |
CDC Corp., Class A (a) | | | 30,340 | | | 63,107 | |
CSG Systems International, Inc. (a) | | | 10,267 | | | 188,194 | |
Ciber, Inc. (a) | | | 19,702 | | | 54,575 | |
CommVault Systems, Inc. (a) | | | 13,005 | | | 292,612 | |
Compellent Technologies, Inc. (a) | | | 7,042 | | | 85,349 | |
Computer Task Group, Inc. (a) | | | 4,822 | | | 31,150 | |
ComScore, Inc. (a) | | | 6,814 | | | 112,227 | |
Concur Technologies, Inc. (a) | | | 12,059 | | | 514,678 | |
DealerTrack Holdings, Inc. (a) | | | 12,132 | | | 199,571 | |
Delrek, Inc. (a) | | | 6,015 | | | 50,165 | |
DemandTec, Inc. (a) | | | 5,800 | | | 39,150 | |
| | |
See Notes to Financial Statements. |
|
|
|
20 | BLACKROCK SMALL CAP INDEX FUND | JUNE 30, 2010 |
| |
|
|
| |
Schedule of Investments (continued) | Master Small Cap Index Series |
| (Percentages shown are based on Net Assets) |
| | | | | | | |
Common Stocks | | Shares | | Value | |
|
|
|
|
|
|
Computer Services Software & Systems (continued) | | | | | | | |
Digimarc Corp. (a) | | | 2,239 | | $ | 41,981 | |
Digital River, Inc. (a) | | | 11,836 | | | 282,999 | |
DivX, Inc. (a) | | | 10,141 | | | 77,680 | |
Double-Take Software, Inc. (a) | | | 6,507 | | | 68,258 | |
DynaVox, Inc., Class A (a) | | | 2,910 | | | 46,589 | |
EPIQ Systems, Inc. (a) | | | 9,930 | | | 128,395 | |
EarthLink, Inc. | | | 32,160 | | | 255,994 | |
Ebix, Inc. (a)(b) | | | 8,146 | | | 127,729 | |
Epicor Software Corp. (a) | | | 14,572 | | | 116,430 | |
Fortinet, Inc. (a) | | | 11,935 | | | 196,211 | |
Hypercom Corp. (a) | | | 14,288 | | | 66,296 | |
iGate Corp. | | | 7,274 | | | 93,253 | |
infoGROUP, Inc. (a) | | | 11,948 | | | 95,345 | |
Infospace, Inc. (a) | | | 11,014 | | | 82,825 | |
Integral Systems, Inc. (a) | | | 5,614 | | | 35,649 | |
Interactive Intelligence, Inc. (a) | | | 4,034 | | | 66,279 | |
Internap Network Services Corp. (a) | | | 16,205 | | | 67,575 | |
Internet Brands, Inc., Class A (a) | | | 8,900 | | | 91,937 | |
Internet Capital Group, Inc. (a) | | | 11,289 | | | 85,796 | |
JDA Software Group, Inc. (a) | | | 12,520 | | | 275,190 | |
KIT Digital, Inc. (a) | | | 6,183 | | | 54,534 | |
Kenexa Corp. (a) | | | 7,014 | | | 84,168 | |
Keynote Systems, Inc. | | | 4,271 | | | 38,524 | |
Lawson Software, Inc. (a) | | | 41,384 | | | 302,103 | |
Limelight Networks, Inc. (a) | | | 12,872 | | | 56,508 | |
Lionbridge Technologies, Inc. (a) | | | 18,434 | | | 84,243 | |
LivePerson, Inc. (a) | | | 13,488 | | | 92,528 | |
Local.com Corp. (a) | | | 5,102 | | | 34,898 | |
LogMeIn, Inc. (a) | | | 4,574 | | | 119,976 | |
Magma Design Automation, Inc. (a) | | | 16,266 | | | 46,195 | |
Manhattan Associates, Inc. (a) | | | 6,837 | | | 188,359 | |
Mantech International Corp., Class A (a) | | | 6,640 | | | 282,665 | |
Mentor Graphics Corp. (a) | | | 32,123 | | | 284,289 | |
Mercury Computer Systems, Inc. (a) | | | 7,342 | | | 86,122 | |
MicroStrategy, Inc., Class A (a) | | | 2,698 | | | 202,593 | |
Moduslink Global Solutions, Inc. (a) | | | 13,831 | | | 83,401 | |
Monotype Imaging Holdings, Inc. (a) | | | 6,966 | | | 62,764 | |
NCI, Inc., Class A (a) | | | 2,092 | | | 47,237 | |
NIC, Inc. | | | 16,995 | | | 108,938 | |
NetScout Systems, Inc. (a) | | | 9,278 | | | 131,933 | |
NetSuite, Inc. (a) | | | 5,486 | | | 69,343 | |
OpenTable, Inc. (a) | | | 4,796 | | | 198,890 | |
Openwave Systems, Inc. (a) | | | 26,129 | | | 53,042 | |
Opnet Technologies, Inc. | | | 4,149 | | | 60,949 | |
PDF Solutions, Inc. (a) | | | 7,469 | | | 35,851 | |
PROS Holdings, Inc. (a) | | | 6,019 | | | 39,124 | |
Parametric Technology Corp. (a) | | | 34,742 | | | 544,407 | |
Pegasystems, Inc. | | | 4,869 | | | 156,344 | |
Perficient, Inc. (a) | | | 7,167 | | | 63,858 | |
Progress Software Corp. (a) | | | 12,626 | | | 379,159 | |
Quest Software, Inc. (a) | | | 17,902 | | | 322,952 | |
Rackspace Hosting, Inc. (a)(b) | | | 29,055 | | | 532,869 | |
Radiant Systems, Inc. (a) | | | 8,787 | | | 127,060 | |
RealNetworks, Inc. (a) | | | 25,832 | | | 85,246 | |
RightNow Technologies, Inc. (a) | | | 6,671 | | | 104,668 | |
SAVVIS, Inc. (a) | | | 11,422 | | | 168,475 | |
SRA International, Inc., Class A (a) | | | 12,853 | | | 252,819 | |
SS&C Technologies Holdings, Inc. (a) | | | 3,743 | | | 60,000 | |
SYNNEX Corp. (a) | | | 6,747 | | | 172,858 | |
Saba Software, Inc. (a) | | | 9,072 | | | 46,721 | |
| | | | | | | |
Common Stocks | | | Shares | | Value | |
|
|
|
|
|
|
|
|
Computer Services Software & Systems (concluded) | | | | | | | |
Sapient Corp. | | | 30,916 | | $ | 313,488 | |
Smith Micro Software, Inc. (a) | | | 9,251 | | | 87,977 | |
SolarWinds, Inc. (a) | | | 10,495 | | | 168,340 | |
Sonic Solutions, Inc. (a) | | | 7,856 | | | 65,598 | |
SonicWALL, Inc. (a) | | | 16,684 | | | 196,037 | |
Sourcefire, Inc. (a) | | | 8,313 | | | 157,947 | |
Stanley, Inc. (a) | | | 4,219 | | | 157,706 | |
SuccessFactors, Inc. (a) | | | 18,971 | | | 394,407 | |
Support.com, Inc. (a) | | | 14,780 | | | 61,485 | |
Synchronoss Technologies, Inc. (a) | | | 6,195 | | | 117,519 | |
Syntel, Inc. | | | 3,960 | | | 134,442 | |
TIBCO Software, Inc. (a) | | | 49,698 | | | 599,358 | |
TNS, Inc. (a) | | | 7,901 | | | 137,793 | |
Taleo Corp., Class A (a) | | | 11,992 | | | 291,286 | |
TeleCommunication Systems, Inc., Class A (a) | | | 13,870 | | | 57,422 | |
Terremark Worldwide, Inc. (a) | | | 17,798 | | | 139,002 | |
Tier Technologies, Inc., Class B (a) | | | 4,796 | | | 29,160 | |
Tyler Technologies, Inc. (a) | | | 9,295 | | | 144,258 | |
Ultimate Software Group, Inc. (a) | | | 7,524 | | | 247,239 | |
Unica Corp. (a) | | | 5,343 | | | 51,186 | |
Unisys Corp. (a) | | | 12,776 | | | 236,228 | |
United Online, Inc. | | | 25,946 | | | 149,449 | |
VASCO Data Security International, Inc. (a) | | | 8,346 | | | 51,495 | |
VeriFone Systems, Inc. (a) | | | 25,654 | | | 485,630 | |
VirnetX Holding Corp. | | | 10,104 | | | 59,816 | |
Virtusa Corp. (a) | | | 4,485 | | | 41,845 | |
Wave Systems Corp., Class A (a) | | | 24,643 | | | 79,843 | |
Websense, Inc. (a) | | | 12,973 | | | 245,190 | |
Zix Corp. (a) | | | 18,399 | | | 41,582 | |
| | | | |
|
|
|
| | | | | | 18,119,623 | |
|
Computer Technology — 0.9% | | | | | | | |
ADPT Corp. (a) | | | 35,000 | | | 101,150 | |
Cray, Inc. (a) | | | 11,034 | | | 61,570 | |
Hutchinson Technology, Inc. (a) | | | 7,643 | | | 33,094 | |
Imation Corp. (a) | | | 9,203 | | | 84,576 | |
Immersion Corp. (a) | | | 9,000 | | | 45,540 | |
Insight Enterprises, Inc. (a) | | | 14,106 | | | 185,635 | |
Intermec, Inc. (a) | | | 14,702 | | | 150,695 | |
Isilon Systems, Inc. (a) | | | 8,122 | | | 104,286 | |
Netezza Corp. (a) | | | 15,362 | | | 210,152 | |
Network Engines, Inc. (a) | | | 11,600 | | | 31,436 | |
Palm, Inc. (a) | | | 49,394 | | | 281,052 | |
Quantum Corp. (a) | | | 63,826 | | | 119,993 | |
Radisys Corp. (a) | | | 7,569 | | | 72,057 | |
Rimage Corp. (a) | | | 3,020 | | | 47,807 | |
STEC, Inc. (a)(b) | | | 12,189 | | | 153,094 | |
Safeguard Scientifics, Inc. (a) | | | 6,233 | | | 65,820 | |
Silicon Graphics International Corp. (a) | | | 9,459 | | | 66,970 | |
Stratasys, Inc. (a) | | | 6,210 | | | 152,518 | |
Super Micro Computer, Inc. (a) | | | 7,404 | | | 99,954 | |
Synaptics, Inc. (a)(b) | | | 10,123 | | | 278,382 | |
Xyratex Ltd. (a) | | | 9,124 | | | 129,105 | |
| | | | |
|
|
|
| | | | | | 2,474,886 | |
|
|
|
|
|
|
|
|
Construction — 0.5% | | | | | | | |
EMCOR Group, Inc. (a) | | | 19,827 | | | 459,392 | |
Granite Construction, Inc. | | | 10,376 | | | 244,666 | |
Great Lakes Dredge & Dock Corp. | | | 18,018 | | | 108,108 | |
Insituform Technologies, Inc., Class A (a) | | | 11,784 | | | 241,336 | |
Orion Marine Group, Inc. (a) | | | 8,146 | | | 115,673 | |
Primoris Services Corp. | | | 6,696 | | | 42,185 | |
| | |
See Notes to Financial Statements. | | |
|
|
|
BLACKROCK SMALL CAP INDEX FUND | JUNE 30, 2010 | 21 |
| |
|
| |
Schedule of Investments (continued) | Master Small Cap Index Series
(Percentages shown are based on Net Assets) |
| | | | | | | |
Common Stocks | | Shares | | Value | |
|
|
|
|
|
|
|
|
Construction (concluded) | | | | | | | |
Sterling Construction Co., Inc. (a) | | | 4,995 | | $ | 64,635 | |
Tutor Perini Corp. (a) | | | 8,000 | | | 131,840 | |
| | | | |
|
|
|
| | | | | | 1,407,835 | |
|
|
|
|
|
|
|
|
Consumer Electronics — 0.1% | | | | | | | |
Audiovox Corp., Class A (a) | | | 5,923 | | | 43,534 | |
TiVo, Inc. (a) | | | 34,999 | | | 258,293 | |
Universal Electronics, Inc. (a) | | | 4,299 | | | 71,492 | |
| | | | |
|
|
|
| | | | | | 373,319 | |
|
|
|
|
|
|
|
|
Consumer Lending — 0.8% | | | | | | | |
Advance America, Cash Advance Centers, Inc. | | | 16,921 | | | 69,884 | |
Cash America International, Inc. | | | 8,877 | | | 304,215 | |
Credit Acceptance Corp. (a) | | | 1,932 | | | 94,224 | |
Dollar Financial Corp. (a) | | | 7,443 | | | 147,297 | |
Encore Capital Group, Inc. (a) | | | 4,290 | | | 88,417 | |
Ezcorp, Inc. (a) | | | 13,929 | | | 258,383 | |
First Cash Financial Services, Inc. (a) | | | 9,146 | | | 199,383 | |
The First Marblehead Corp. (a) | | | 17,700 | | | 41,595 | |
MGIC Investment Corp. (a) | | | 60,244 | | | 415,081 | |
MoneyGram International, Inc. (a) | | | 25,981 | | | 63,653 | |
Nelnet, Inc., Class A | | | 8,025 | | | 154,722 | |
Portfolio Recovery Associates, Inc. (a) | | | 5,109 | | | 341,179 | |
Student Loan Corp. | | | 1,317 | | | 31,713 | |
World Acceptance Corp. (a) | | | 4,939 | | | 189,213 | |
| | | | |
|
|
|
| | | | | | 2,398,959 | |
|
|
|
|
|
|
|
|
Consumer Services: Miscellaneous — 0.6% | | | | | | | |
Ancestry.com, Inc. (a) | | | 5,738 | | | 101,104 | |
Coinstar, Inc. (a) | | | 9,487 | | | 407,656 | |
Core-Mark Holdings Co., Inc. (a) | | | 3,341 | | | 91,543 | |
The Knot, Inc. (a) | | | 9,100 | | | 70,798 | |
Move, Inc. (a) | | | 47,666 | | | 97,715 | |
Nutrisystem, Inc. (b) | | | 9,439 | | | 216,531 | |
Pre-Paid Legal Services, Inc. (a) | | | 2,270 | | | 103,262 | |
Sotheby’s Holdings, Inc., Class A | | | 20,069 | | | 458,978 | |
Steiner Leisure Ltd. (a) | | | 4,470 | | | 171,827 | |
| | | | |
|
|
|
| | | | | | 1,719,414 | |
|
|
|
|
|
|
|
|
Containers & Packaging — 0.5% | | | | | | | |
AEP Industries, Inc. (a) | | | 1,480 | | | 35,342 | |
Graham Packaging Co., Inc. (a) | | | 5,205 | | | 62,304 | |
Graphic Packaging Holding Co. (a) | | | 33,561 | | | 105,717 | |
Myers Industries, Inc. | | | 10,815 | | | 87,493 | |
Rock-Tenn Co., Class A | | | 11,573 | | | 574,831 | |
Silgan Holdings, Inc. | | | 16,046 | | | 455,386 | |
| | | | |
|
|
|
| | | | | | 1,321,073 | |
|
|
|
|
|
|
|
|
Cosmetics — 0.1% | | | | | | | |
Elizabeth Arden, Inc. (a) | | | 7,466 | | | 108,406 | |
Inter Parfums, Inc. | | | 4,595 | | | 65,387 | |
Revlon, Inc., Class A (a) | | | 3,396 | | | 37,900 | |
| | | | |
|
|
|
| | | | | | 211,693 | |
|
|
|
|
|
|
|
|
Diversified Financial Services — 0.4% | | | | | | | |
American Physicians Service Group, Inc. | | | 2,250 | | | 55,013 | |
Duff & Phelps Corp. | | | 8,332 | | | 105,233 | |
Evercore Partners, Inc., Class A | | | 4,668 | | | 108,998 | |
FBR Capital Markets Corp. (a) | | | 16,015 | | | 53,330 | |
Gleacher & Co, Inc. (a) | | | 23,338 | | | 59,512 | |
Main Street Capital Corp. | | | 3,852 | | | 57,510 | |
MidwestOne Financial Group, Inc. | | | 2,364 | | | 36,595 | |
Piper Jaffray Cos. (a) | | | 5,140 | | | 165,611 | |
| | | | | | | |
Common Stocks | | Shares | | Value | |
|
|
|
|
|
|
|
|
Diversified Financial Services (concluded) | | | | | | | |
Sanders Morris Harris Group, Inc. | | | 6,664 | | $ | 36,985 | |
Stifel Financial Corp. (a) | | | 9,178 | | | 398,233 | |
Thomas Weisel Partners Group, Inc. (a) | | | 6,946 | | | 40,912 | |
Triangle Capital Corp. | | | 3,700 | | | 52,614 | |
| | | | |
|
|
|
| | | | | | 1,170,546 | |
|
|
|
|
|
|
|
|
Diversified Manufacturing Operations — 0.3% | | | | | | | |
A.M. Castle & Co. (a) | | | 5,157 | | | 71,631 | |
Barnes Group, Inc. | | | 14,488 | | | 237,458 | |
Federal Signal Corp. | | | 18,741 | | | 113,195 | |
Lydall, Inc. (a) | | | 5,349 | | | 40,866 | |
OSI Systems, Inc. (a) | | | 4,879 | | | 135,490 | |
Raven Industries, Inc. | | | 4,907 | | | 165,415 | |
Standex International Corp. | | | 3,822 | | | 96,888 | |
Trimas Corp. (a) | | | 4,741 | | | 53,621 | |
| | | | |
|
|
|
| | | | | | 914,564 | |
|
|
|
|
|
|
|
|
Diversified Materials & Processing — 0.8% | | | | | | | |
Belden, Inc. | | | 14,079 | | | 309,738 | |
Cabot Microelectronics Corp. (a) | | | 7,105 | | | 245,762 | |
Clarcor, Inc. | | | 15,016 | | | 533,368 | |
Encore Wire Corp. | | | 5,683 | | | 103,374 | |
Hexcel Corp. (a) | | | 28,858 | | | 447,588 | |
Insteel Industries, Inc. | | | 5,495 | | | 63,852 | |
Koppers Holdings, Inc. | | | 6,232 | | | 140,095 | |
Rogers Corp. (a) | | | 4,777 | | | 132,657 | |
Symyx Technologies, Inc. (a) | | | 10,942 | | | 54,820 | |
Tredegar Corp. | | | 7,422 | | | 121,127 | |
Uranium Energy Corp. (a)(b) | | | 18,951 | | | 44,724 | |
| | | | |
|
|
|
| | | | | | 2,197,105 | |
|
|
|
|
|
|
|
|
Diversified Media — 0.1% | | | | | | | |
Belo Corp., Class A (a) | | | 27,870 | | | 158,580 | |
EW Scripps Co. (a) | | | 10,108 | | | 75,103 | |
Playboy Enterprises, Inc., Class B (a) | | | 7,607 | | | 31,949 | |
| | | | |
|
|
|
| | | | | | 265,632 | |
|
|
|
|
|
|
|
|
Diversified Retail — 0.7% | | | | | | | |
99 Cents Only Stores (a) | | | 13,806 | | | 204,329 | |
The Bon-Ton Stores, Inc. (a) | | | 3,747 | | | 36,533 | |
Dillard’s, Inc., Class A | | | 13,767 | | | 295,991 | |
Fred’s, Inc. | | | 12,008 | | | 132,809 | |
GSI Commerce, Inc. (a) | | | 18,639 | | | 536,803 | |
Gaiam, Inc. | | | 5,289 | | | 32,104 | |
HSN, Inc. (a) | | | 11,723 | | | 281,352 | |
Overstock.com, Inc. (a)(b) | | | 4,521 | | | 81,694 | |
PriceSmart, Inc. | | | 4,889 | | | 113,572 | |
Saks, Inc. (a)(b) | | | 40,531 | | | 307,630 | |
Tuesday Morning Corp. (a) | | | 9,188 | | | 36,660 | |
| | | | |
|
|
|
| | | | | | 2,059,477 | |
|
|
|
|
|
|
|
|
Drug & Grocery Store Chains — 0.7% | | | | | | | |
Arden Group, Inc., Class A | | | 421 | | | 36,993 | |
Casey’s General Stores, Inc. | | | 15,298 | | | 533,900 | |
drugstore.com, Inc. (a) | | | 28,687 | | | 88,356 | |
The Great Atlantic & Pacific Tea Co., Inc. (a)(b) | | | 9,827 | | | 38,325 | |
Ingles Markets, Inc., Class A | | | 4,469 | | | 67,259 | |
Nash Finch Co. | | | 3,900 | | | 133,224 | |
The Pantry, Inc. (a) | | | 7,116 | | | 100,407 | |
PetMed Express, Inc. (b) | | | 6,993 | | | 124,475 | |
Rite Aid Corp. (a) | | | 168,748 | | | 165,373 | |
Ruddick Corp. | | | 13,161 | | | 407,859 | |
Spartan Stores, Inc. | | | 7,079 | | | 97,124 | |
Village Super Market, Inc., Class A | | | 2,149 | | | 56,411 | |
| | |
See Notes to Financial Statements. |
|
22 | BLACKROCK SMALL CAP INDEX FUND | JUNE 30, 2010 |
| |
|
| |
Schedule of Investments (continued) | Master Small Cap Index Series
(Percentages shown are based on Net Assets) |
| | | | | | | |
Common Stocks | | Shares | | Value | |
|
|
|
|
|
|
|
|
Drug & Grocery Store Chains (concluded) | | | | | | | |
Weis Markets, Inc. | | | 3,461 | | $ | 113,902 | |
Winn-Dixie Stores, Inc. (a) | | | 16,954 | | | 163,437 | |
| | | | |
|
|
|
| | | | | | 2,127,045 | |
|
|
|
|
|
|
|
|
Education Services — 0.7% | | | | | | | |
Ambassadors Group, Inc. | | | 5,800 | | | 65,482 | |
American Public Education, Inc. (a) | | | 5,551 | | | 242,579 | |
Archipelago Learning, Inc. (a) | | | 3,702 | | | 42,314 | |
Bridgepoint Education, Inc. (a) | | | 5,887 | | | 93,073 | |
Capella Education Co. (a) | | | 5,034 | | | 409,516 | |
Corinthian Colleges, Inc. (a)(b) | | | 26,265 | | | 258,710 | |
Franklin Covey Co. (a) | | | 4,416 | | | 28,704 | |
Grand Canyon Education, Inc. (a) | | | 9,362 | | | 219,352 | |
K12, Inc. (a) | | | 7,606 | | | 168,701 | |
Lincoln Educational Services Corp. (a) | | | 4,957 | | | 102,064 | |
Renaissance Learning, Inc. | | | 4,064 | | | 59,700 | |
Rosetta Stone, Inc. (a) | | | 3,179 | | | 72,990 | |
School Specialty, Inc. (a) | | | 5,795 | | | 104,716 | |
Universal Technical Institute, Inc. (a) | | | 6,341 | | | 149,901 | |
| | | | |
|
|
|
| | | | | | 2,017,802 | |
|
|
|
|
|
|
|
|
Electronic Components — 0.6% | | | | | | | |
3D Systems Corp. (a) | | | 5,663 | | | 71,071 | |
Acacia Research — Acacia Technologies (a) | | | 10,280 | | | 146,284 | |
Checkpoint Systems, Inc. (a) | | | 11,829 | | | 205,351 | |
Cogent, Inc. (a) | | | 15,757 | | | 141,970 | |
DDi Corp. | | | 4,341 | | | 32,688 | |
Methode Electronics, Inc. | | | 11,486 | | | 111,874 | |
Microvision, Inc. (a)(b) | | | 27,143 | | | 80,343 | |
Multi-Fineline Electronix, Inc. (a) | | | 3,172 | | | 79,173 | |
NVE Corp. (a) | | | 1,453 | | | 63,249 | |
Park Electrochemical Corp. | | | 6,214 | | | 151,684 | |
ScanSource, Inc. (a) | | | 8,100 | | | 201,933 | |
Smart Modular Technologies WWH, Inc. (a) | | | 16,041 | | | 93,840 | |
TTM Technologies, Inc. (a) | | | 24,204 | | | 229,938 | |
Technitrol, Inc. | | | 12,261 | | | 38,745 | |
Universal Display Corp. (a)(b) | | | 9,161 | | | 164,715 | |
| | | | |
|
|
|
| | | | | | 1,812,858 | |
|
|
|
|
|
|
|
|
Electronic Entertainment — 0.2% | | | | | | | |
DTS, Inc. (a) | | | 5,248 | | | 172,502 | |
THQ, Inc. (a) | | | 20,568 | | | 88,854 | |
Take-Two Interactive Software, Inc. (a) | | | 21,193 | | | 190,737 | |
| | | | |
|
|
|
| | | | | | 452,093 | |
|
|
|
|
|
|
|
|
Electronics — 0.5% | | | | | | | |
Agilysys, Inc. | | | 5,739 | | | 38,394 | |
American Science & Engineering, Inc. | | | 2,708 | | | 206,377 | |
CPI International, Inc. (a) | | | 2,382 | | | 37,135 | |
Coherent, Inc. (a) | | | 7,599 | | | 260,646 | |
Daktronics, Inc. (b) | | | 10,489 | | | 78,667 | |
II-VI, Inc. (a) | | | 7,540 | | | 223,410 | |
IPG Photonics Corp. (a) | | | 7,892 | | | 120,195 | |
iRobot Corp. (a)(b) | | | 6,403 | | | 120,312 | |
Newport Corp. (a) | | | 11,302 | | | 102,396 | |
Richardson Electronics Ltd. | | | 4,678 | | | 42,102 | |
Rofin-Sinar Technologies, Inc. (a) | | | 9,613 | | | 200,143 | |
SRS Labs Inc. (a) | | | 3,970 | | | 36,326 | |
Spectrum Control, Inc. (a) | | | 4,019 | | | 56,186 | |
| | | | |
|
|
|
| | | | | | 1,522,289 | |
|
|
|
|
|
|
|
|
Energy Equipment — 0.2% | | | | | | | |
Capstone Turbine Corp. (a) | | | 74,225 | | | 72,740 | |
| | | | | | | |
Common Stocks | | Shares | | Value | |
|
|
|
|
|
|
|
|
Energy Equipment (concluded) | | | | | | | |
Energy Conversion Devices, Inc. (a)(b) | | | 14,124 | | $ | 57,908 | |
Evergreen Solar, Inc. (a)(b) | | | 60,516 | | | 41,272 | |
FuelCell Energy, Inc. (a)(b) | | | 22,326 | | | 26,345 | |
GT Solar International, Inc. (a)(b) | | | 18,825 | | | 105,420 | |
PowerSecure International, Inc. (a) | | | 5,733 | | | 52,113 | |
STR Holdings, Inc. (a) | | | 8,537 | | | 160,496 | |
| | | | |
|
|
|
| | | | | | 516,294 | |
|
|
|
|
|
|
|
|
Engineering & Contracting Services — 0.4% | | | | | | | |
Dycom Industries, Inc. (a) | | | 11,783 | | | 100,745 | |
Exponent, Inc. (a) | | | 4,270 | | | 139,714 | |
Furmamite Corp. (a) | | | 11,632 | | | 46,179 | |
Hill International, Inc. (a) | | | 8,249 | | | 33,491 | |
Layne Christensen Co. (a) | | | 5,980 | | | 145,135 | |
MYR Group, Inc. (a) | | | 6,129 | | | 102,293 | |
Michael Baker Corp. (a) | | | 2,424 | | | 84,598 | |
Mistras Group, Inc. (a) | | | 4,545 | | | 48,722 | |
Tetra Tech, Inc. (a) | | | 18,448 | | | 361,765 | |
VSE Corp. | | | 1,300 | | | 41,366 | |
| | | | |
|
|
|
| | | | | | 1,104,008 | |
|
|
|
|
|
|
|
|
Entertainment — 0.5% | | | | | | | |
Ascent Media Corp., Class A (a) | | | 4,785 | | | 120,869 | |
CKx, Inc. (a) | | | 16,600 | | | 82,834 | |
Cinemark Holdings, Inc. | | | 17,250 | | | 226,838 | |
Lions Gate Entertainment Corp. (a) | | | 20,771 | | | 144,982 | |
Live Nation, Inc. (a) | | | 42,373 | | | 442,798 | |
LodgeNet Interactive Corp. (a) | | | 8,242 | | | 30,578 | |
Rentrak Corp. (a) | | | 3,003 | | | 73,063 | |
Warner Music Group Corp. (a) | | | 13,884 | | | 67,476 | |
World Wrestling Entertainment, Inc. | | | 7,483 | | | 116,435 | |
| | | | |
|
|
|
| | | | | | 1,305,873 | |
|
|
|
|
|
|
|
|
Environmental, Maintenance & Security Service — 0.7% | | | | | | | |
ABM Industries, Inc. | | | 15,588 | | | 326,569 | |
The Brink’s Co. | | | 14,185 | | | 269,940 | |
Cornell Cos., Inc. (a) | | | 3,463 | | | 93,051 | |
DynCorp. International, Inc. (a) | | | 4,664 | | | 81,713 | |
G&K Services, Inc., Class A | | | 5,760 | | | 118,944 | |
The Geo Group, Inc. (a) | | | 14,737 | | | 305,793 | |
Healthcare Services Group, Inc. | | | 13,283 | | | 251,713 | |
Mac-Gray Corp. | | | 3,825 | | | 42,610 | |
Rollins, Inc. | | | 12,756 | | | 263,922 | |
Standard Parking Corp. (a) | | | 4,894 | | | 77,472 | |
Unifirst Corp. | | | 4,225 | | | 185,984 | |
| | | | |
|
|
|
| | | | | | 2,017,711 | |
|
|
|
|
|
|
|
|
Fertilizers — 0.0% | | | | | | | |
Rentech, Inc. (a) | | | 67,534 | | | 66,859 | |
|
|
|
|
|
|
|
|
Financial Data & Systems — 1.0% | | | | | | | |
Advent Software, Inc. (a) | | | 4,735 | | | 222,356 | |
Cardtronics, Inc. (a) | | | 8,306 | | | 107,646 | |
Cass Information Systems, Inc. | | | 2,650 | | | 90,762 | |
CyberSource Corp. (a) | | | 21,275 | | | 543,151 | |
Euronet Worldwide, Inc. (a) | | | 14,840 | | | 189,804 | |
Fair Isaac Corp. | | | 13,693 | | | 298,370 | |
Global Cash Access, Inc. (a) | | | 15,346 | | | 110,645 | |
Heartland Payment Systems, Inc. | | | 11,416 | | | 169,413 | |
Jack Henry & Associates, Inc. | | | 25,493 | | | 608,773 | |
Online Resources Corp. (a) | | | 8,641 | | | 35,860 | |
S1 Corp. (a) | | | 15,922 | | | 95,691 | |
Wright Express Corp. (a) | | | 11,591 | | | 344,253 | |
| | | | |
|
|
|
| | | | | | 2,816,724 | |
|
|
|
|
|
|
|
|
| | |
See Notes to Financial Statements. | | |
|
BLACKROCK SMALL CAP INDEX FUND | JUNE 30, 2010 | 23 |
| |
|
| |
Schedule of Investments (continued) | Master Small Cap Index Series
(Percentages shown are based on Net Assets) |
| | | | | | | |
Common Stocks | | Shares | | Value | |
|
|
|
|
|
|
|
|
Foods — 1.2% | | | | | | | |
American Italian Pasta Co., Class A (a) | | | 6,546 | | $ | 346,087 | |
B&G Foods, Inc., Class A | | | 14,604 | | | 157,431 | |
Chiquita Brands International, Inc. (a) | | | 13,431 | | | 163,187 | |
Diamond Foods, Inc. | | | 6,537 | | | 268,671 | |
Dole Food Co., Inc. (a) | | | 10,938 | | | 114,083 | |
Hain Celestial Group, Inc. (a) | | | 12,323 | | | 248,555 | |
J&J Snack Foods Corp. | | | 4,273 | | | 179,893 | |
John B. Sanfilippo & Son, Inc. (a) | | | 2,787 | | | 40,328 | |
Lancaster Colony Corp. | | | 5,760 | | | 307,354 | |
Lance, Inc. | | | 7,862 | | | 129,644 | |
Medifast, Inc. (a)(b) | | | 4,013 | | | 103,977 | |
Natures Sunshine Prods, Inc. (a) | | | 2,607 | | | 21,821 | |
Nutraceutical International Corp. (a) | | | 3,224 | | | 49,198 | |
Seneca Foods Corp. (a) | | | 2,425 | | | 78,231 | |
Smart Balance, Inc. (a) | | | 19,404 | | | 79,362 | |
Synutra International, Inc. (a)(b) | | | 5,506 | | | 89,032 | |
Tootsie Roll Industries, Inc. (b) | | | 7,110 | | | 168,151 | |
TreeHouse Foods, Inc. (a) | | | 10,391 | | | 474,453 | |
United Natural Foods, Inc. (a) | | | 12,933 | | | 386,438 | |
| | | | |
|
|
|
| | | | | | 3,405,896 | |
|
|
|
|
|
|
|
|
Forest Products — 0.1% | | | | | | | |
Deltic Timber Corp. | | | 3,216 | | | 134,429 | |
Universal Forest Products, Inc. | | | 5,783 | | | 175,283 | |
| | | | |
|
|
|
| | | | | | 309,712 | |
|
|
|
|
|
|
|
|
Forms & Bulk Printing Services — 0.3% | | | | | | | |
Bowne & Co., Inc. | | | 12,199 | | | 136,873 | |
Consolidated Graphics, Inc. (a) | | | 2,846 | | | 123,061 | |
Deluxe Corp. | | | 15,460 | | | 289,875 | |
Ennis, Inc. | | | 7,966 | | | 119,570 | |
Innerworkings, Inc. (a) | | | 7,589 | | | 51,833 | |
M&F Worldwide Corp. (a) | | | 3,238 | | | 87,750 | |
Multi-Color Corp. | | | 3,634 | | | 37,212 | |
Schawk, Inc. | | | 3,513 | | | 52,519 | |
| | | | |
|
|
|
| | | | | | 898,693 | |
|
|
|
|
|
|
|
|
Fruit & Grain Processing — 0.0% | | | | | | | |
MGP Ingredients, Inc. (a) | | | 4,055 | | | 26,885 | |
|
|
|
|
|
|
|
|
Funeral Parlors & Cemeteries — 0.1% | | | | | | | |
Matthews International Corp., Class A | | | 8,962 | | | 262,407 | |
Stewart Enterprises, Inc., Class A (b) | | | 24,407 | | | 132,042 | |
| | | | |
|
|
|
| | | | | | 394,449 | |
|
|
|
|
|
|
|
|
Gas Pipeline — 0.0% | | | | | | | |
Crosstex Energy, Inc. (a) | | | 12,816 | | | 82,151 | |
|
|
|
|
|
|
|
|
Glass — 0.0% | | | | | | | |
Apogee Enterprises, Inc. | | | 8,400 | | | 90,972 | |
|
|
|
|
|
|
|
|
Gold — 0.5% | | | | | | | |
Allied Nevada Gold Corp. (a) | | | 19,087 | | | 375,632 | |
Capital Gold Corp. (a) | | | 15,345 | | | 61,380 | |
Coeur d’Alene Mines Corp. (a)(b) | | | 26,326 | | | 415,424 | |
Golden Star Resources Ltd. (a) | | | 77,301 | | | 338,579 | |
Jaguar Mining, Inc. (a) | | | 25,288 | | | 223,293 | |
US Gold Corp. (a) | | | 27,610 | | | 138,326 | |
| | | | |
|
|
|
| | | | | | 1,552,634 | |
|
|
|
|
|
|
|
|
Health Care Facilities — 0.8% | | | | | | | |
Amsurg Corp. (a) | | | 9,174 | | | 163,481 | |
Assisted Living Concepts, Inc. (a) | | | 2,996 | | | 88,652 | |
Capital Senior Living Corp. (a) | | | 8,668 | | | 43,080 | |
Emeritus Corp. (a)(b) | | | 6,088 | | | 99,295 | |
| | | | | | | |
Common Stocks | | Shares | | Value | |
|
|
|
|
|
|
|
|
Health Care Facilities (concluded) | | | | | | | |
The Ensign Group, Inc. | | | 4,340 | | $ | 71,697 | |
Five Star Quality Care, Inc. (a) | | | 10,222 | | | 30,870 | |
Hanger Orthopedic Group, Inc. (a) | | | 7,743 | | | 139,064 | |
HealthSouth Corp. (a) | | | 28,473 | | | 532,730 | |
Kindred Healthcare, Inc. (a) | | | 11,821 | | | 151,782 | |
LCA-Vision, Inc. (a) | | | 5,807 | | | 32,171 | |
MedCath Corp. (a) | | | 6,451 | | | 50,705 | |
National Healthcare Corp. | | | 2,638 | | | 90,905 | |
Psychiatric Solutions, Inc. (a) | | | 16,999 | | | 556,207 | |
Select Medical Holdings Corp. (a) | | | 14,941 | | | 101,300 | |
Skilled Healthcare Group, Inc., Class A (a) | | | 6,500 | | | 44,135 | |
Sun Healthcare Group, Inc. (a) | | | 13,255 | | | 107,100 | |
Sunrise Senior Living, Inc. (a) | | | 17,074 | | | 47,466 | |
US Physical Therapy, Inc. (a) | | | 3,141 | | | 53,020 | |
| | | | |
|
|
|
| | | | | | 2,403,660 | |
|
|
|
|
|
|
|
|
Health Care Management Services — 1.0% | | | | | | | |
AMERIGROUP Corp. (a) | | | 15,391 | | | 499,900 | |
American Dental Partners, Inc. (a) | | | 5,087 | | | 61,603 | |
Bioscript, Inc. (a) | | | 11,949 | | | 62,613 | |
Catalyst Health Solutions, Inc. (a) | | | 11,325 | | | 390,712 | |
Centene Corp. (a) | | | 14,664 | | | 315,276 | |
Computer Programs & Systems, Inc. | | | 2,981 | | | 121,982 | |
Contiucare Corp. (a) | | | 8,500 | | | 28,475 | |
HealthSpring, Inc. (a) | | | 17,298 | | | 268,292 | |
Magellan Health Services, Inc. (a) | | | 9,855 | | | 357,934 | |
MedQuist, Inc. | | | 3,866 | | | 30,580 | |
Metropolitan Health Networks, Inc. (a) | | | 12,257 | | | 45,719 | |
Molina Healthcare, Inc. (a) | | | 3,927 | | | 113,098 | |
Transcend Services, Inc. (a) | | | 2,879 | | | 38,866 | |
Triple-S Management Corp. (a) | | | 6,174 | | | 114,528 | |
Universal American Financial Corp. (a) | | | 9,529 | | | 137,218 | |
WellCare Health Plans, Inc. (a) | | | 12,671 | | | 300,809 | |
| | | | |
|
|
|
| | | | | | 2,887,605 | |
|
|
|
|
|
|
|
|
Health Care Services — 1.6% | | | | | | | |
AMN Healthcare Services, Inc. (a) | | | 10,290 | | | 76,969 | |
Accretive Health, Inc. (a) | | | 3,486 | | | 46,120 | |
Air Methods Corp. (a) | | | 3,356 | | | 99,841 | |
Alliance Healthcare Services, Inc. (a) | | | 8,390 | | | 33,896 | |
Allied Healthcare International, Inc. (a) | | | 14,629 | | | 33,939 | |
Almost Family, Inc. (a) | | | 2,400 | | | 83,832 | |
Amedisys, Inc. (a)(b) | | | 8,510 | | | 374,185 | |
athenahealth, Inc. (a)(b) | | | 9,983 | | | 260,856 | |
CardioNet, Inc. (a) | | | 7,300 | | | 40,004 | |
Chemed Corp. | | | 6,776 | | | 370,241 | |
Chindex International, Inc. (a) | | | 4,073 | | | 51,035 | |
Corvel Corp. (a) | | | 2,199 | | | 74,304 | |
Cross Country Healthcare, Inc. (a) | | | 9,676 | | | 86,987 | |
Eclipsys Corp. (a) | | | 17,250 | | | 307,740 | |
Gentiva Health Services, Inc. (a) | | | 8,459 | | | 228,478 | |
HMS Holdings Corp. (a) | | | 8,155 | | | 442,164 | |
Health Grades, Inc. (a) | | | 8,104 | | | 48,624 | |
Healthways, Inc. (a) | | | 10,253 | | | 122,216 | |
IPC The Hospitalist Co., Inc. (a) | | | 4,889 | | | 122,714 | |
LHC Group, Inc. (a) | | | 4,589 | | | 127,345 | |
MWI Veterinary Supply, Inc. (a) | | | 3,775 | | | 189,732 | |
Medidata Solutions, Inc. (a) | | | 5,772 | | | 89,408 | |
Odyssey HealthCare, Inc. (a) | | | 10,070 | | | 269,070 | |
Omnicell, Inc. (a) | | | 9,899 | | | 115,719 | |
PharMerica Corp. (a) | | | 9,253 | | | 135,649 | |
Phase Forward, Inc. (a) | | | 12,036 | | | 200,760 | |
Quality Systems, Inc. (b) | | | 5,646 | | | 327,412 | |
| | |
See Notes to Financial Statements. |
|
24 | BLACKROCK SMALL CAP INDEX FUND | JUNE 30, 2010 |
| |
|
| |
Schedule of Investments (continued) | Master Small Cap Index Series
(Percentages shown are based on Net Assets) |
| | | | | | | |
Common Stocks | | Shares | | Value | |
|
|
|
|
|
|
|
|
Health Care Services (concluded) | | | | | | | |
RehabCare Group, Inc. (a) | | | 7,397 | | $ | 161,107 | |
Res-Care, Inc. (a) | | | 7,749 | | | 74,855 | |
Rural/Metro Corp. (a) | | | 5,908 | | | 48,091 | |
Team Health Holdings, Inc. (a) | | | 4,721 | | | 60,995 | |
Virtual Radiologic Corp. (a) | | | 2,290 | | | 39,296 | |
| | | | |
|
|
|
| | | | | | 4,743,584 | |
|
|
|
|
|
|
|
|
Health Care: Miscellaneous — 0.1% | | | | | | | |
MedAssets, Inc. (a) | | | 12,966 | | | 299,255 | |
The Providence Service Corp. (a) | | | 4,019 | | | 56,266 | |
| | | | |
|
|
|
| | | | | | 355,521 | |
|
|
|
|
|
|
|
|
Home Building — 0.2% | | | | | | | |
Beazer Homes USA, Inc. (a)(b) | | | 22,635 | | | 82,165 | |
Hovnanian Enterprises, Inc., Class A (a)(b) | | | 14,514 | | | 53,412 | |
M/I Homes, Inc. (a) | | | 5,786 | | | 55,777 | |
Meritage Homes Corp. (a) | | | 9,663 | | | 157,314 | |
Ryland Group, Inc. | | | 13,220 | | | 209,140 | |
Standard-Pacific Corp. (a) | | | 32,431 | | | 107,995 | |
| | | | |
|
|
|
| | | | | | 665,803 | |
|
|
|
|
|
|
|
|
Hotel/Motel — 0.2% | | | | | | | |
Gaylord Entertainment Co. (a)(b) | | | 10,488 | | | 231,680 | |
Marcus Corp. | | | 6,605 | | | 62,483 | |
Morgans Hotel Group Co. (a) | | | 7,160 | | | 44,106 | |
Orient Express Hotels Ltd., Class A (a) | | | 27,486 | | | 203,396 | |
| | | | |
|
|
|
| | | | | | 541,665 | |
|
|
|
|
|
|
|
|
Household Appliances — 0.0% | | | | | | | |
National Presto Industries, Inc. | | | 1,455 | | | 135,111 | |
|
|
|
|
|
|
|
|
Household Equipment & Products — 0.3% | | | | | | | |
American Greetings Corp., Class A | | | 11,990 | | | 224,932 | |
Blyth, Inc. | | | 1,806 | | | 61,530 | |
CSS Industries, Inc. | | | 2,367 | | | 39,056 | |
Central Garden & Pet Co., Class A (a) | | | 17,383 | | | 155,926 | |
Helen of Troy Ltd. (a) | | | 9,354 | | | 206,349 | |
Libbey, Inc. (a) | | | 5,086 | | | 66,016 | |
| | | | |
|
|
|
| | | | | | 753,809 | |
|
|
|
|
|
|
|
|
Household Furnishings — 0.3% | | | | | | | |
American Woodmark Corp. | | | 2,887 | | | 49,368 | |
Ethan Allen Interiors, Inc. | | | 7,504 | | | 104,981 | |
Furniture Brands International, Inc. (a) | | | 13,457 | | | 70,245 | |
Hooker Furniture Corp. | | | 3,663 | | | 39,048 | |
Kid Brands, Inc. (a) | | | 4,135 | | | 29,069 | |
Kirkland’s, Inc. (a) | | | 5,125 | | | 86,484 | |
La-Z-Boy, Inc. (a) | | | 15,619 | | | 116,049 | |
Lifetime Brands, Inc. (a) | | | 3,048 | | | 44,562 | |
Sealy Corp. (a)(b) | | | 15,196 | | | 40,573 | |
Select Comfort Corp. (a) | | | 16,524 | | | 144,585 | |
| | | | |
|
|
|
| | | | | | 724,964 | |
|
|
|
|
|
|
|
|
Insurance: Life — 0.5% | | | | | | | |
American Equity Investment Life Holding Co. | | | 17,240 | | | 177,917 | |
CNO Financial Group, Inc. (a) | | | 66,420 | | | 328,779 | |
Citizens, Inc. (a) | | | 10,851 | | | 72,268 | |
Delphi Financial Group, Inc., Class A | | | 14,074 | | | 343,546 | |
FBL Financial Group, Inc., Class A | | | 3,994 | | | 83,874 | |
Kansas City Life Insurance Co. | | | 1,294 | | | 38,264 | |
Life Partners Holdings, Inc. (b) | | | 2,400 | | | 49,104 | |
National Western Life Insurance Co., Class A | | | 651 | | | 99,447 | |
The Phoenix Cos., Inc. (a) | | | 35,095 | | | 74,050 | |
| | | | | | | |
Common Stocks | | Shares | | Value | |
|
|
|
|
|
|
|
|
Insurance: Life (concluded) | | | | | | | |
Presidential Life Corp. | | | 6,294 | | $ | 57,275 | |
Primerica, Inc. (a) | | | 7,450 | | | 159,728 | |
| | | | |
|
|
|
| | | | | | 1,484,252 | |
|
|
|
|
|
|
|
|
Insurance: Multi-Line — 0.6% | | | | | | | |
AMBAC Financial Group, Inc. (a)(b) | | | 66,900 | | | 44,823 | |
Alterra Capital Holdings Ltd. | | | 28,798 | | | 540,826 | |
Crawford & Co., Class B (a) | | | 8,394 | | | 26,525 | |
eHealth, Inc. (a) | | | 7,297 | | | 82,967 | |
Flagstone Reinsurance Holdings SA | | | 15,888 | | | 171,908 | |
Horace Mann Educators Corp. | | | 11,797 | | | 180,494 | |
Maiden Holdings Ltd. | | | 15,714 | | | 103,241 | |
Pico Holdings, Inc. (a) | | | 6,784 | | | 203,317 | |
Platinum Underwriters Holdings Ltd. | | | 13,382 | | | 485,633 | |
| | | | |
|
|
|
| | | | | | 1,839,734 | |
|
|
|
|
|
|
|
|
Insurance: Property-Casualty — 1.9% | | | | | | | |
American Physicians Capital, Inc. | | | 2,471 | | | 76,230 | |
American Safety Insurance Holdings Ltd. (a) | | | 3,415 | | | 53,684 | |
Amerisafe, Inc. (a) | | | 5,800 | | | 101,790 | |
AmTrust Financial Services, Inc. | | | 6,892 | | | 82,980 | |
Argo Group International Holdings Ltd. | | | 9,379 | | | 286,904 | |
Baldwin & Lyons, Inc., Class B | | | 2,803 | | | 58,891 | |
CNA Surety Corp. (a) | | | 5,410 | | | 86,939 | |
Donegal Group, Inc., Class A | | | 3,797 | | | 46,665 | |
EMC Insurance Group, Inc. | | | 1,697 | | | 37,215 | |
Employers Holdings, Inc. | | | 10,980 | | | 161,735 | |
Enstar Group Ltd. (a) | | | 2,112 | | | 140,321 | |
FPIC Insurance Group, Inc. (a) | | | 3,100 | | | 79,515 | |
First American Financial Corp. | | | 31,155 | | | 395,045 | |
First Mercury Financial Corp. | | | 4,747 | | | 50,223 | |
Greenlight Capital Re Ltd. (a) | | | 8,600 | | | 216,634 | |
Hallmark Financial Services, Inc. (a) | | | 3,700 | | | 36,815 | |
Harleysville Group, Inc. | | | 3,591 | | | 111,429 | |
Hilltop Holdings, Inc. (a) | | | 12,333 | | | 123,453 | |
Infinity Property & Casualty Corp. | | | 4,082 | | | 188,507 | |
Meadowbrook Insurance Group, Inc. | | | 16,552 | | | 142,844 | |
Montpelier Re Holdings Ltd. | | | 21,267 | | | 317,516 | |
NYMAGIC, Inc. | | | 1,680 | | | 32,407 | |
National Interstate Corp. | | | 2,137 | | | 42,355 | |
Navigators Group, Inc. (a) | | | 3,703 | | | 152,304 | |
PMA Capital Corp., Class A (a) | | | 10,332 | | | 67,675 | |
The PMI Group, Inc. (a) | | | 43,187 | | | 124,811 | |
ProAssurance Corp. (a) | | | 9,685 | | | 549,721 | |
RLI Corp. | | | 5,474 | | | 287,440 | |
Radian Group, Inc. | | | 40,010 | | | 289,672 | |
Safety Insurance Group, Inc. | | | 3,961 | | | 146,636 | |
SeaBright Holdings, Inc. | | | 7,100 | | | 67,308 | |
Selective Insurance Group, Inc. | | | 16,192 | | | 240,613 | |
State Auto Financial Corp. | | | 4,512 | | | 69,981 | |
Stewart Information Services Corp. | | | 5,580 | | | 50,332 | |
Tower Group, Inc. | | | 13,359 | | | 287,619 | |
United America Indemnity, Ltd. (a) | | | 8,747 | | | 64,378 | |
United Fire & Casualty Co. | | | 6,919 | | | 137,135 | |
| | | | |
|
|
|
| | | | | | 5,405,722 | |
|
|
|
|
|
|
|
|
International Trade & Diversified Logistics — 0.0% | | | | | | | |
Global Sources Ltd. (a) | | | 7,205 | | | 56,487 | |
|
|
|
|
|
|
|
|
Leisure Time — 0.6% | | | | | | | |
Callaway Golf Co. | | | 19,553 | | | 118,100 | |
Churchill Downs, Inc. | | | 3,502 | | | 114,866 | |
Interval Leisure Group, Inc. (a) | | | 12,097 | | | 150,608 | |
Life Time Fitness, Inc. (a)(b) | | | 12,512 | | | 397,756 | |
| | |
See Notes to Financial Statements. | | |
|
BLACKROCK SMALL CAP INDEX FUND | JUNE 30, 2010 | 25 |
| |
|
| |
Schedule of Investments (continued) | Master Small Cap Index Series
(Percentages shown are based on Net Assets) |
| | | | | | | |
Common Stocks | | Shares | | Value | |
|
|
|
|
|
|
|
|
Leisure Time (concluded) | | | | | | | |
Pool Corp. | | | 14,922 | | $ | 327,090 | |
Smith & Wesson Holding Corp. (a)(b) | | | 18,518 | | | 75,739 | |
Speedway Motorsports, Inc. | | | 3,755 | | | 50,918 | |
Sport Supply Group, Inc. | | | 2,550 | | | 34,323 | |
Steinway Musical Instruments, Inc. (a) | | | 1,929 | | | 34,317 | |
Sturm Ruger & Co., Inc. (b) | | | 5,800 | | | 83,114 | |
Vail Resorts, Inc. (a) | | | 10,873 | | | 379,576 | |
West Marine, Inc. (a) | | | 4,708 | | | 51,223 | |
| | | | |
|
|
|
| | | | | | 1,817,630 | |
|
|
|
|
|
|
|
|
Luxury Items — 0.0% | | | | | | | |
Movado Group, Inc. (a) | | | 4,878 | | | 52,097 | |
|
|
|
|
|
|
|
|
Machinery: Agricultural — 0.1% | | | | | | | |
Alamo Group, Inc. | | | 2,049 | | | 44,463 | |
Lindsay Manufacturing Co. (b) | | | 3,742 | | | 118,584 | |
Titan International, Inc. (b) | | | 10,664 | | | 106,320 | |
Titan Machinery, Inc. (a) | | | 4,129 | | | 54,214 | |
| | | | |
|
|
|
| | | | | | 323,581 | |
|
|
|
|
|
|
|
|
Machinery: Construction & Handling — 0.1% | | | | | | | |
Astec Industries, Inc. (a) | | | 5,964 | | | 165,382 | |
Douglas Dynamics, Inc. (a) | | | 3,610 | | | 41,515 | |
NACCO Industries, Inc., Class A | | | 1,761 | | | 156,306 | |
| | | | |
|
|
|
| | | | | | 363,203 | |
|
|
|
|
|
|
|
|
Machinery: Engines — 0.1% | | | | | | | |
Briggs & Stratton Corp. (b) | | | 14,974 | | | 254,857 | |
|
|
|
|
|
|
|
|
Machinery: Industrial — 1.2% | | | | | | | |
Actuant Corp., Class A | | | 20,308 | | | 382,400 | |
Altra Holdings, Inc. (a) | | | 8,247 | | | 107,376 | |
Applied Industrial Technologies, Inc. | | | 12,673 | | | 320,880 | |
Chart Industries, Inc. (a) | | | 8,674 | | | 135,141 | |
Colfax Corp. (a) | | | 7,314 | | | 76,139 | |
Columbus McKinnon Corp. (a) | | | 5,910 | | | 82,563 | |
DXP Enterprises, Inc. (a) | | | 2,655 | | | 41,551 | |
EnPro Industries, Inc. (a) | | | 6,208 | | | 174,755 | |
Flow International Corp. (a) | | | 15,069 | | | 35,563 | |
Gerber Scientific, Inc. (a) | | | 7,928 | | | 42,415 | |
Graham Corp. | | | 2,900 | | | 43,471 | |
John Bean Technologies Corp. | | | 8,539 | | | 130,220 | |
Kadant, Inc. (a) | | | 3,870 | | | 67,415 | |
MTS Systems Corp. | | | 4,986 | | | 144,594 | |
Middleby Corp. (a) | | | 4,990 | | | 265,418 | |
Nordson Corp. | | | 10,210 | | | 572,577 | |
Sauer-Danfoss, Inc. (a) | | | 3,667 | | | 44,811 | |
Tecumseh Products Co., Class A (a) | | | 5,904 | | | 65,652 | |
Tennant Co. | | | 5,701 | | | 192,808 | |
Twin Disc, Inc. | | | 2,812 | | | 31,944 | |
Woodward Governor Co. | | | 18,276 | | | 466,586 | |
| | | | |
|
|
|
| | | | | | 3,424,279 | |
|
|
|
|
|
|
|
|
Machinery: Specialty — 0.1% | | | | | | | |
Albany International Corp., Class A | | | 8,262 | | | 133,762 | |
Cascade Corp. | | | 2,762 | | | 98,355 | |
Presstek, Inc. (a) | | | 8,791 | | | 31,032 | |
Xerium Technologies, Inc. (a) | | | 2,278 | | | 32,165 | |
| | | | |
|
|
|
| | | | | | 295,314 | |
|
|
|
|
|
|
|
|
Machinery: Tools — 0.0% | | | | | | | |
Thermadyne Holdings Corp. (a) | | | 2,827 | | | 30,560 | |
|
|
|
|
|
|
|
|
| | | | | | | |
Common Stocks | | Shares | | Value | |
|
|
|
|
|
|
|
|
Manufactured Housing — 0.0% | | | | | | | |
Cavco Industries, Inc. (a) | | | 2,065 | | $ | 72,646 | |
Skyline Corp. | | | 2,279 | | | 41,045 | |
| | | | |
|
|
|
| | | | | | 113,691 | |
|
|
|
|
|
|
|
|
Medical & Dental Instruments & Supplies — 2.9% | | | | | | | |
ATS Medical, Inc. (a) | | | 15,932 | | | 63,250 | |
AGA Medical Holdings, Inc. (a) | | | 4,172 | | | 52,943 | |
Abiomed, Inc. (a) | | | 9,579 | | | 92,725 | |
Align Technology, Inc. (a)(b) | | | 17,751 | | | 263,957 | |
Alphatec Holdings, Inc. (a) | | | 15,557 | | | 72,184 | |
American Medical Systems Holdings, Inc. (a) | | | 22,526 | | | 498,275 | |
AngioDynamics, Inc. (a) | | | 7,482 | | | 110,359 | |
Antares Pharma, Inc. (a) | | | 22,592 | | | 39,762 | |
Atrion Corp. | | | 485 | | | 65,499 | |
CONMED Corp. (a) | | | 8,746 | | | 162,938 | |
Cantel Medical Corp. | | | 3,900 | | | 65,130 | |
Cerus Corp. (a) | | | 12,661 | | | 40,009 | |
Conceptus, Inc. (a)(b) | | | 9,391 | | | 146,312 | |
CryoLife, Inc. (a) | | | 8,828 | | | 47,583 | |
Cutera, Inc. (a) | | | 4,309 | | | 39,686 | |
Delcath Systems, Inc. (a)(b) | | | 11,310 | | | 71,705 | |
Endologix, Inc. (a) | | | 15,024 | | | 68,059 | |
ev3, Inc. (a) | | | 24,904 | | | 558,099 | |
Exactech, Inc. (a) | | | 2,570 | | | 43,896 | |
Hansen Medical, Inc. (a) | | | 13,638 | | | 29,049 | |
Heartware International, Inc. (a) | | | 2,834 | | | 198,578 | |
ICU Medical, Inc. (a) | | | 3,474 | | | 111,759 | |
Immucor, Inc. (a) | | | 20,828 | | | 396,773 | |
Insulet Corp. (a) | | | 11,536 | | | 173,617 | |
Integra LifeSciences Holdings Corp. (a) | | | 6,252 | | | 231,324 | |
Invacare Corp. | | | 8,673 | | | 179,878 | |
Landauer, Inc. | | | 2,845 | | | 173,204 | |
MAKO Surgical Corp. (a)(b) | | | 7,835 | | | 97,546 | |
Medical Action Industries, Inc. (a) | | | 4,374 | | | 52,444 | |
Meridian Bioscience, Inc. | | | 12,175 | | | 206,975 | |
Merit Medical Systems, Inc. (a) | | | 8,461 | | | 135,968 | |
Micrus Endovascular Corp. (a) | | | 4,944 | | | 102,786 | |
Neogen Corp. (a) | | | 6,965 | | | 181,438 | |
NuVasive, Inc. (a) | | | 11,730 | | | 415,946 | |
OraSure Technologies, Inc. (a) | | | 14,175 | | | 65,630 | |
Orthofix International NV (a) | | | 5,308 | | | 170,121 | |
Orthovita, Inc. (a) | | | 20,673 | | | 41,966 | |
Owens & Minor, Inc. | | | 18,720 | | | 531,274 | |
PSS World Medical, Inc. (a) | | | 16,998 | | | 359,508 | |
Quidel Corp. (a) | | | 6,522 | | | 82,764 | |
Rochester Medical Corp. (a) | | | 3,485 | | | 32,933 | |
SenoRx, Inc. (a) | | | 5,168 | | | 56,745 | |
Staar Surgical Co. (a) | | | 10,846 | | | 62,039 | |
Steris Corp. | | | 17,603 | | | 547,101 | |
SurModics, Inc. (a) | | | 5,222 | | | 85,693 | |
Symmetry Medical, Inc. (a) | | | 10,772 | | | 113,537 | |
Synovis Life Technologies, Inc. (a) | | | 3,504 | | | 53,541 | |
Unilife Corp. (a) | | | 14,688 | | | 85,484 | |
Vascular Solutions, Inc. (a) | | | 5,200 | | | 65,000 | |
Volcano Corp. (a) | | | 15,089 | | | 329,242 | |
West Pharmaceutical Services, Inc. | | | 9,818 | | | 358,259 | |
Wright Medical Group, Inc. (a) | | | 11,613 | | | 192,892 | |
Young Innovations, Inc. | | | 1,731 | | | 48,728 | |
| | | | |
|
|
|
| | | | | | 8,472,113 | |
|
|
|
|
|
|
|
|
| | |
See Notes to Financial Statements. |
|
26 | BLACKROCK SMALL CAP INDEX FUND | JUNE 30, 2010 |
| |
|
| |
Schedule of Investments (continued) | Master Small Cap Index Series
(Percentages shown are based on Net Assets) |
| | | | | | | |
Common Stocks | | Shares | | Value | |
|
|
|
|
|
|
|
|
Medical Equipment — 1.6% | | | | | | | |
Abaxis, Inc. (a) | | | 6,631 | | $ | 142,102 | |
Accuray, Inc. (a) | | | 15,482 | | | 102,646 | |
Affymetrix, Inc. (a) | | | 21,334 | | | 125,871 | |
Analogic Corp. | | | 3,861 | | | 175,714 | |
ArthroCare Corp. (a) | | | 8,102 | | | 248,326 | |
Bruker BioSciences Corp. (a) | | | 21,672 | | | 263,532 | |
Caliper Life Sciences, Inc. (a) | | | 13,968 | | | 59,643 | |
Cyberonics, Inc. (a) | | | 8,390 | | | 198,675 | |
Cynosure, Inc., Class A (a) | | | 3,189 | | | 34,346 | |
DexCom, Inc. (a) | | | 17,475 | | | 202,011 | |
Dionex Corp. (a) | | | 5,274 | | | 392,702 | |
Greatbatch, Inc. (a) | | | 6,925 | | | 154,497 | |
Haemonetics Corp. (a) | | | 7,398 | | | 395,941 | |
HealthTronics, Inc. (a) | | | 13,977 | | | 67,509 | |
IRIS International, Inc. (a) | | | 4,995 | | | 50,649 | |
Luminex Corp. (a) | | | 11,218 | | | 181,956 | |
MELA Sciences, Inc. (a)(b) | | | 7,100 | | | 52,824 | |
Masimo Corp. | | | 15,550 | | | 370,246 | |
Merge Healthcare, Inc. (a) | | | 16,158 | | | 47,343 | |
Natus Medical, Inc. (a) | | | 8,590 | | | 139,931 | |
NxStage Medical, Inc. (a) | | | 7,596 | | | 112,725 | |
Palomar Medical Technologies, Inc. (a) | | | 5,600 | | | 62,664 | |
Sirona Dental Systems, Inc. (a) | | | 9,985 | | | 347,877 | |
Solta Medical, Inc. (a) | | | 18,695 | | | 35,521 | |
Somanetics Corp. (a) | | | 3,627 | | | 90,494 | |
SonoSite, Inc. (a) | | | 4,385 | | | 118,877 | |
Spectranetic Corp. (a) | | | 10,358 | | | 53,654 | |
Stereotaxis, Inc. (a) | | | 8,900 | | | 29,459 | |
Syneron Medical Ltd. (a) | | | 10,712 | | | 110,119 | |
Tomotherapy, Inc. (a) | | | 15,541 | | | 49,420 | |
Vital Images, Inc. (a) | | | 4,496 | | | 57,324 | |
Zoll Medical Corp. (a) | | | 6,423 | | | 174,063 | |
| | | | |
|
|
|
| | | | | | 4,648,661 | |
|
|
|
|
|
|
|
|
Medical Services — 0.4% | | | | | | | |
America Service Group, Inc. | | | 2,800 | | | 48,160 | |
Bio-Reference Labs, Inc. (a) | | | 7,170 | | | 158,959 | |
Clarient, Inc. (a) | | | 17,140 | | | 52,791 | |
eResearch Technology, Inc. (a) | | | 14,897 | | | 117,388 | |
Genoptix, Inc. (a) | | | 5,261 | | | 90,489 | |
inVentiv Health, Inc. (a) | | | 10,224 | | | 261,735 | |
Kendle International, Inc. (a) | | | 4,663 | | | 53,718 | |
Parexel International Corp. (a) | | | 17,543 | | | 380,332 | |
| | | | |
|
|
|
| | | | | | 1,163,572 | |
|
|
|
|
|
|
|
|
Metal Fabricating — 0.6% | | | | | | | |
Ampco-Pittsburgh Corp. | | | 2,674 | | | 55,699 | |
Dynamic Materials Corp. | | | 3,900 | | | 62,556 | |
Hawk Corp., Class A (a) | | | 1,630 | | | 41,484 | |
Haynes International, Inc. | | | 3,740 | | | 115,304 | |
Kaydon Corp. | | | 9,968 | | | 327,548 | |
L.B. Foster Co., Class A (a) | | | 3,143 | | | 81,467 | |
Metals USA Holdings Corp. (a) | | | 3,533 | | | 52,818 | |
Mueller Industries, Inc. | | | 11,310 | | | 278,226 | |
Mueller Water Products, Inc., Series A | | | 46,750 | | | 173,443 | |
Northwest Pipe Co. (a) | | | 2,800 | | | 53,200 | |
RBC Bearings, Inc. (a) | | | 6,554 | | | 190,000 | |
RTI International Metals, Inc. (a) | | | 9,016 | | | 217,376 | |
Worthington Industries, Inc. | | | 18,003 | | | 231,519 | |
| | | | |
|
|
|
| | | | | | 1,880,640 | |
|
|
|
|
|
|
|
|
| | | | | | | |
Common Stocks | | Shares | | Value | |
|
|
|
|
|
|
Metals & Minerals: Diversified — 0.6% | | | | | | | |
AMCOL International Corp. | | | 7,154 | | $ | 168,119 | |
Brush Engineered Materials, Inc. (a) | | | 6,133 | | | 122,537 | |
General Moly, Inc. (a)(b) | | | 19,739 | | | 60,796 | |
Globe Specialty Metals, Inc. (a) | | | 18,516 | | | 191,270 | |
Hecla Mining Co. (a)(b) | | | 72,210 | | | 376,936 | |
Minerals Technologies, Inc. | | | 5,611 | | | 266,747 | |
Oil-Dri Corp. of America | | | 1,989 | | | 45,648 | |
Thompson Creek Metals Co., Inc. (a) | | | 41,886 | | | 363,570 | |
US Energy Corp. Wyoming (a) | | | 8,622 | | | 40,955 | |
United States Lime & Minerals Inc. (a) | | | 857 | | | 33,012 | |
| | | | |
|
|
|
| | | | | | 1,669,590 | |
|
|
|
|
|
|
|
|
Miscellaneous Consumer Staples — 0.0% | | | | | | | |
Spectrum Brands Holdings, Inc. (a) | | | 5,543 | | | 140,404 | |
|
|
|
|
|
|
|
|
Office Supplies & Equipment — 0.6% | | | | | | | |
ACCO Brands Corp. (a) | | | 16,844 | | | 84,052 | |
Electronics for Imaging, Inc. (a) | | | 13,775 | | | 134,306 | |
HNI Corp. | | | 13,606 | | | 375,390 | |
Herman Miller, Inc. | | | 17,189 | | | 324,356 | |
Kimball International, Inc., Class B | | | 10,241 | | | 56,633 | |
Knoll, Inc. | | | 14,243 | | | 189,289 | |
Steelcase, Inc., Class A | | | 23,284 | | | 180,451 | |
United Stationers, Inc. (a) | | | 7,232 | | | 393,927 | |
| | | | |
|
|
|
| | | | | | 1,738,404 | |
|
|
|
|
|
|
|
|
Offshore Drilling & Other Services — 0.0% | | | | | | | |
Hercules Offshore, Inc. (a) | | | 35,312 | | | 85,808 | |
Vantage Drilling Co. (a) | | | 39,120 | | | 52,812 | |
| | | | |
|
|
|
| | | | | | 138,620 | |
|
|
|
|
|
|
|
|
Oil Well Equipment & Services — 1.6% | | | | | | | |
Basic Energy Services, Inc. (a) | | | 7,333 | | | 56,464 | |
Boots & Coots, Inc. (a) | | | 25,145 | | | 74,178 | |
CARBO Ceramics, Inc. | | | 5,699 | | | 411,411 | |
Cal Dive International, Inc. (a) | | | 28,504 | | | 166,748 | |
Complete Production Services, Inc. (a) | | | 23,432 | | | 335,078 | |
Dawson Geophysical Co. (a) | | | 2,509 | | | 53,366 | |
Dril-Quip, Inc. (a) | | | 10,159 | | | 447,199 | |
Global Industries Ltd. (a) | | | 30,427 | | | 136,617 | |
Golar LNG Ltd. | | | 11,218 | | | 110,722 | |
Gulf Island Fabrication, Inc. | | | 4,470 | | | 69,374 | |
Helix Energy Solutions Group, Inc. (a) | | | 31,339 | | | 337,521 | |
Hornbeck Offshore Services, Inc. (a) | | | 6,996 | | | 102,142 | |
ION Geophysical Corp. (a) | | | 38,400 | | | 133,632 | |
Key Energy Services, Inc. (a) | | | 37,690 | | | 345,994 | |
Lufkin Industries, Inc. | | | 8,999 | | | 350,871 | |
Matrix Service Co. (a) | | | 8,128 | | | 75,672 | |
Natural Gas Services Group (a) | | | 3,800 | | | 57,494 | |
Newpark Resources, Inc. (a) | | | 26,969 | | | 163,162 | |
OYO Geospace Corp. (a) | | | 1,276 | | | 61,861 | |
Parker Drilling Co. (a) | | | 35,339 | | | 139,589 | |
Pioneer Drilling Co. (a) | | | 16,506 | | | 93,589 | |
RPC, Inc. | | | 8,751 | | | 119,451 | |
Seahawk Drilling, Inc. (a) | | | 3,601 | | | 35,002 | |
Superior Well Services, Inc. (a) | | | 6,970 | | | 116,538 | |
T-3 Energy Services, Inc. (a) | | | 4,033 | | | 112,521 | |
Tesco Corp. (a) | | | 9,221 | | | 113,234 | |
Tetra Technologies, Inc. (a) | | | 22,703 | | | 206,143 | |
Union Drilling, Inc. (a) | | | 5,000 | | | 27,550 | |
Willbros Group, Inc. (a) | | | 11,910 | | | 88,134 | |
| | | | |
|
|
|
| | | | | | 4,541,257 | |
|
|
|
|
|
|
|
|
| | |
See Notes to Financial Statements. | | |
|
BLACKROCK SMALL CAP INDEX FUND | JUNE 30, 2010 | 27 |
| |
|
| |
Schedule of Investments (continued) | Master Small Cap Index Series |
| (Percentages shown are based on Net Assets) |
| | | | | | | |
Common Stocks | | Shares | | Value | |
|
|
|
|
|
|
|
|
Oil: Crude Producers — 2.3% | | | | | | | |
ATP Oil & Gas Corp. (a)(b) | | | 13,437 | | $ | 142,298 | |
American Oil & Gas, Inc. (a) | | | 15,434 | | | 96,926 | |
Apco Oil and Gas International, Inc. | | | 2,877 | | | 67,638 | |
Approach Resources, Inc. (a) | | | 4,519 | | | 31,091 | |
Arena Resources, Inc. (a) | | | 11,820 | | | 377,058 | |
BPZ Resources, Inc. (a)(b) | | | 29,584 | | | 122,774 | |
Berry Petroleum Co., Class A | | | 15,372 | | | 395,368 | |
Bill Barrett Corp. (a) | | | 13,762 | | | 423,457 | |
Brigham Exploration Co. (a) | | | 35,026 | | | 538,700 | |
CAMAC Energy, Inc. (a) | | | 14,747 | | | 55,006 | |
Callon Petroleum Co. (a) | | | 8,829 | | | 55,623 | |
Carrizo Oil & Gas, Inc. (a) | | | 9,485 | | | 147,302 | |
Cheniere Energy, Inc. (a) | | | 17,934 | | | 50,574 | |
Clayton Williams Energy, Inc. (a) | | | 1,839 | | | 77,459 | |
Contango Oil & Gas Co. (a) | | | 3,578 | | | 160,115 | |
Delta Petroleum Corp. (a)(b) | | | 57,892 | | | 49,787 | |
Endeavour International Corp. (a)(b) | | | 44,941 | | | 47,637 | |
Energy Partners Ltd. (a) | | | 8,941 | | | 109,170 | |
Energy XXI Bermuda Ltd. (a) | | | 15,311 | | | 241,608 | |
FX Energy, Inc. (a)(b) | | | 14,142 | | | 51,194 | |
GMX Resources, Inc. (a) | | | 9,519 | | | 61,778 | |
Gastar Exploration Ltd. (a) | | | 13,813 | | | 49,865 | |
GeoResources, Inc. (a) | | | 4,137 | | | 57,628 | |
Goodrich Petroleum Corp. (a) | | | 7,467 | | | 89,604 | |
Gulfport Energy Corp. (a) | | | 8,340 | | | 98,912 | |
Harvest Natural Resources, Inc. (a) | | | 10,327 | | | 76,110 | |
Houston American Energy Corp. | | | 5,613 | | | 55,344 | |
Kodiak Oil & Gas Corp. (a) | | | 36,268 | | | 115,695 | |
Magnum Hunter Resources Corp. (a) | | | 15,097 | | | 65,823 | |
McMoRan Exploration Co. (a) | | | 25,059 | | | 278,405 | |
Miller Petroleum, Inc. (a) | | | 5,648 | | | 32,532 | |
Northern Oil And Gas, Inc. (a) | | | 13,419 | | | 172,300 | |
Panhandle Oil & Gas, Inc. | | | 2,313 | | | 61,133 | |
Penn Virginia Corp. | | | 13,727 | | | 276,050 | |
Petroleum Development Corp. (a) | | | 5,920 | | | 151,670 | |
Petroquest Energy, Inc. (a)(b) | | | 16,789 | | | 113,494 | |
Ram Energy Resources, Inc. (a) | | | 18,416 | | | 38,121 | |
Resolute Energy Corp. (a) | | | 11,653 | | | 142,633 | |
Rex Energy Corp. (a) | | | 9,908 | | | 100,071 | |
Rosetta Resources, Inc. (a) | | | 15,956 | | | 316,088 | |
Stone Energy Corp. (a) | | | 13,032 | | | 145,437 | |
Swift Energy Co. (a) | | | 11,381 | | | 306,263 | |
TransAtlantic Petroleum Ltd. (a) | | | 44,169 | | | 140,016 | |
Vaalco Energy, Inc. | | | 15,700 | | | 87,920 | |
Venoco, Inc. (a) | | | 6,120 | | | 100,796 | |
W&T Offshore, Inc. | | | 10,772 | | | 101,903 | |
Warren Resources, Inc. (a) | | | 22,405 | | | 64,974 | |
| | | | |
|
|
|
| | | | | | 6,541,350 | |
|
|
|
|
|
|
|
|
Oil: Refining & Marketing — 0.2% | | | | | | | |
CVR Energy, Inc. (a) | | | 9,594 | | | 72,147 | |
Delek US Holdings, Inc. | | | 5,108 | | | 37,289 | |
Western Refining, Inc. (a)(b) | | | 16,102 | | | 80,993 | |
World Fuel Services Corp. | | | 18,046 | | | 468,113 | |
| | | | |
|
|
|
| | | | | | 658,542 | |
|
|
|
|
|
|
|
|
Paints & Coatings — 0.2% | | | | | | | |
Ferro Corp. (a) | | | 25,925 | | | 191,067 | |
H.B. Fuller Co. | | | 14,573 | | | 276,742 | |
| | | | |
|
|
|
| | | | | | 467,809 | |
|
|
|
|
|
|
|
|
| | | | | | | |
Common Stocks | | Shares | | Value | |
|
|
|
|
|
|
|
|
Paper — 0.4% | | | | | | | |
Boise, Inc. (a) | | | 21,076 | | $ | 115,707 | |
Buckeye Technologies, Inc. (a) | | | 11,828 | | | 117,688 | |
Clearwater Paper Corp. (a) | | | 3,430 | | | 187,827 | |
Kapstone Paper and Packaging Corp. (a) | | | 11,493 | | | 128,032 | |
Neenah Paper, Inc. | | | 4,400 | | | 80,520 | |
P.H. Glatfelter Co. | | | 13,748 | | | 149,166 | |
Schweitzer-Mauduit International, Inc. | | | 5,451 | | | 275,003 | |
Wausau Paper Corp. (a) | | | 14,696 | | | 99,492 | |
| | | | |
|
|
|
| | | | | | 1,153,435 | |
|
|
|
|
|
|
|
|
Personal Care — 0.1% | | | | | | | |
Female Health Co. | | | 5,798 | | | 30,092 | |
USANA Health Sciences, Inc. (a) | | | 1,919 | | | 70,101 | |
WD-40 Co. | | | 5,183 | | | 173,112 | |
| | | | |
|
|
|
| | | | | | 273,305 | |
|
|
|
|
|
|
|
|
Pharmaceuticals — 1.7% | | | | | | | |
Akorn, Inc. (a) | | | 17,640 | | | 52,391 | |
Alexza Pharmaceuticals, Inc. (a) | | | 13,346 | | | 36,301 | |
Alkermes, Inc. (a) | | | 28,381 | | | 353,343 | |
Ardea Biosciences, Inc. (a) | | | 4,203 | | | 86,414 | |
Auxilium Pharmaceuticals, Inc. (a) | | | 12,631 | | | 296,828 | |
Avanir Pharmaceuticals, Inc. (a) | | | 22,165 | | | 56,964 | |
BMP Sunstone Corp. (a) | | | 8,800 | | | 45,320 | |
BioCryst Pharmaceuticals, Inc. (a)(b) | | | 8,850 | | | 52,304 | |
Biospecifics Technologies (a) | | | 1,320 | | | 26,242 | |
Cadence Pharmaceuticals, Inc. (a)(b) | | | 8,030 | | | 56,290 | |
Cambrex Corp. (a) | | | 10,201 | | | 32,133 | |
Corcept Therapeutics Inc. (a) | | | 8,329 | | | 25,986 | |
Depomed, Inc. (a) | | | 16,956 | | | 47,477 | |
Durect Corp. (a) | | | 27,553 | | | 66,954 | |
Eurand NV (a) | | | 5,745 | | | 55,669 | |
Hi-Tech Pharmacal Co., Inc. (a) | | | 3,015 | | | 69,074 | |
Impax Laboratories, Inc. (a) | | | 18,877 | | | 359,796 | |
Inspire Pharmaceuticals, Inc. (a) | | | 17,600 | | | 87,824 | |
Ironwood Pharmaceuticals, Inc. (a) | | | 6,167 | | | 73,511 | |
Isis Pharmaceuticals, Inc. (a) | | | 28,287 | | | 270,707 | |
Jazz Pharmaceuticals, Inc. (a) | | | 4,786 | | | 37,474 | |
MAP Pharmaceuticals, Inc. (a) | | | 4,360 | | | 57,203 | |
Medicines Co. (a) | | | 16,314 | | | 124,150 | |
Medicis Pharmaceutical Corp., Class A | | | 18,068 | | | 395,328 | |
Obagi Medical Products, Inc. (a) | | | 5,300 | | | 62,646 | |
Optimer Pharmaceuticals, Inc. (a)(b) | | | 10,234 | | | 94,869 | |
Pain Therapeutics, Inc. (a) | | | 11,625 | | | 64,635 | |
Par Pharmaceutical Cos., Inc. (a) | | | 10,572 | | | 274,449 | |
Pharmacyclics, Inc. (a) | | | 11,687 | | | 77,835 | |
Pozen, Inc. (a)(b) | | | 8,114 | | | 56,879 | |
Prestige Brands Holdings, Inc. (a) | | | 13,149 | | | 93,095 | |
Questcor Pharmaceuticals, Inc. (a) | | | 16,801 | | | 171,538 | |
SIGA Technologies, Inc. (a)(b) | | | 9,971 | | | 76,777 | |
Salix Pharmaceuticals Ltd. (a) | | | 17,151 | | | 669,404 | |
Santarus, Inc. (a) | | | 16,300 | | | 40,424 | |
Sciclone Pharmaceuticals, Inc. (a) | | | 11,500 | | | 30,590 | |
Somaxon Pharmaceuticals, Inc. (a) | | | 8,867 | | | 31,921 | |
Spectrum Pharmaceuticals, Inc. (a) | | | 15,332 | | | 60,101 | |
SuperGen, Inc. (a) | | | 16,900 | | | 34,138 | |
Vical, Inc. (a) | | | 17,525 | | | 54,327 | |
Vivus, Inc. (a)(b) | | | 24,475 | | | 234,960 | |
Xenoport, Inc. (a) | | | 8,568 | | | 84,052 | |
| | | | |
|
|
|
| | | | | | 4,978,323 | |
|
|
|
|
|
|
|
|
| | |
See Notes to Financial Statements. | |
|
|
|
28 | BLACKROCK SMALL CAP INDEX FUND | JUNE 30, 2010 |
| |
|
| |
Schedule of Investments (continued) | Master Small Cap Index Series |
| (Percentages shown are based on Net Assets) |
| | | | | | | |
Common Stocks | | Shares | | Value | |
|
|
|
|
|
|
|
|
Photography — 0.1% | | | | | | | |
CPI Corp. | | | 1,600 | | $ | 35,872 | |
Eastman Kodak Co. (a)(b) | | | 80,402 | | | 348,945 | |
| | | | |
|
|
|
| | | | | | 384,817 | |
|
|
|
|
|
|
|
|
Plastics — 0.0% | | | | | | | |
Spartech Corp. (a) | | | 9,426 | | | 96,616 | |
|
|
|
|
|
|
|
|
Power Transmission Equipment — 0.2% | | | | | | | |
Advanced Energy Industries, Inc. (a) | | | 11,090 | | | 136,296 | |
Generac Holdings, Inc. (a) | | | 5,901 | | | 82,673 | |
Maxwell Technologies, Inc. (a) | | | 8,097 | | | 92,306 | |
Powell Industries, Inc. (a) | | | 2,733 | | | 74,720 | |
Power-One, Inc. (a)(b) | | | 22,841 | | | 154,177 | |
Vicor Corp. (a) | | | 6,060 | | | 75,689 | |
| | | | |
|
|
|
| | | | | | 615,861 | |
|
|
|
|
|
|
|
|
Precious Metals & Minerals — 0.1% | | | | | | | |
Horsehead Holding Corp. (a) | | | 13,263 | | | 100,268 | |
Stillwater Mining Co. (a) | | | 13,339 | | | 154,999 | |
| | | | |
|
|
|
| | | | | | 255,267 | |
|
|
|
|
|
|
|
|
Printing & Copying Services — 0.0% | | | | | | | |
Casella Waste Systems, Inc. (a) | | | 9,023 | | | 34,468 | |
Cenveo, Inc. (a) | | | 16,859 | | | 92,387 | |
| | | | |
|
|
|
| | | | | | 126,855 | |
|
|
|
|
|
|
|
|
Producer Durables: Miscellaneous — 0.1% | | | | | | | |
Blount International, Inc. (a) | | | 14,435 | | | 148,248 | |
Park-Ohio Holdings Corp. (a) | | | 2,524 | | | 36,320 | |
| | | | |
|
|
|
| | | | | | 184,568 | |
|
|
|
|
|
|
|
|
Production Technology Equipment — 1.1% | | | | | | | |
ATMI, Inc. (a)(c) | | | 9,522 | | | 139,402 | |
Axcelis Technologies, Inc. (a) | | | 32,969 | | | 51,102 | |
Brooks Automation, Inc. (a) | | | 19,825 | | | 153,247 | |
Cognex Corp. | | | 11,951 | | | 210,099 | |
Cohu, Inc. | | | 7,308 | | | 88,646 | |
Cymer, Inc. (a) | | | 9,022 | | | 271,021 | |
Electro Scientific Industries, Inc. (a) | | | 8,534 | | | 114,014 | |
Entegris, Inc. (a) | | | 39,461 | | | 156,660 | |
FEI Co. (a) | | | 11,372 | | | 224,142 | |
FSI International, Inc. (a) | | | 10,061 | | | 42,156 | |
Intevac, Inc. (a) | | | 6,819 | | | 72,759 | |
Kulicke & Soffa Industries, Inc. (a) | | | 21,206 | | | 148,866 | |
LTX-Credence Corp. (a) | | | 44,577 | | | 126,153 | |
MKS Instruments, Inc. (a) | | | 15,106 | | | 282,784 | |
Mattson Technology, Inc. (a) | | | 15,683 | | | 59,439 | |
Nanometrics, Inc. (a) | | | 5,562 | | | 56,121 | |
Photronics, Inc. (a) | | | 16,527 | | | 74,702 | |
Rudolph Technologies, Inc. (a) | | | 9,702 | | | 73,250 | |
Tessera Technologies, Inc. (a) | | | 15,063 | | | 241,761 | |
Ultra Clean Holdings, Inc. (a) | | | 6,803 | | | 57,961 | |
Ultratech, Inc. (a) | | | 7,331 | | | 119,275 | |
Veeco Instruments, Inc. (a) | | | 12,175 | | | 417,359 | |
| | | | |
|
|
|
| | | | | | 3,180,919 | |
|
|
|
|
|
|
|
|
Publishing — 0.2% | | | | | | | |
AH Belo Corp. (a) | | | 5,951 | | | 39,515 | |
Courier Corp. | | | 3,552 | | | 43,370 | |
The Dolan Co. (a) | | | 9,334 | | | 103,794 | |
Journal Communications, Inc., Class A (a) | | | 13,481 | | | 53,519 | |
Lee Enterprises, Inc. (a) | | | 14,445 | | | 37,124 | |
Martha Stewart Living Omnimedia, Inc., Class A (a)(b) | | | 8,182 | | | 40,255 | |
| | | | | | | |
Common Stocks | | Shares | | Value | |
|
|
|
|
|
|
|
|
Publishing (concluded) | | | | | | | |
McClatchy Co., Class A (a) | | | 18,295 | | $ | 66,594 | |
Media General, Inc., Class A (a) | | | 6,979 | | | 68,115 | |
Scholastic Corp. | | | 9,233 | | | 222,700 | |
| | | | |
|
|
|
| | | | | | 674,986 | |
|
|
|
|
|
|
|
|
Radio & TV Broadcasters — 0.1% | | | | | | | |
Entercom Communications Corp. (a) | | | 7,520 | | | 66,326 | |
Entravision Communications Corp., Class A (a) | | | 16,361 | | | 34,522 | |
Fisher Communications, Inc. (a) | | | 2,214 | | | 37,284 | |
Gray Television, Inc. (a) | | | 15,494 | | | 37,340 | |
Lin TV Corp., Class A (a) | | | 9,380 | | | 50,746 | |
Sinclair Broadcast Group, Inc., Class A (a) | | | 14,285 | | | 83,282 | |
| | | | |
|
|
|
| | | | | | 309,500 | |
|
|
|
|
|
|
|
|
Railroad Equipment — 0.1% | | | | | | | |
American Railcar Industries, Inc. (a) | | | 3,077 | | | 37,170 | |
Freightcar America, Inc. | | | 3,739 | | | 84,576 | |
Greenbrier Cos., Inc. (a) | | | 5,876 | | | 65,812 | |
| | | | |
|
|
|
| | | | | | 187,558 | |
|
|
|
|
|
|
|
|
Railroads — 0.2% | | | | | | | |
Genesee & Wyoming, Inc., Class A (a) | | | 11,625 | | | 433,729 | |
Railamerica, Inc. (a) | | | 7,311 | | | 72,525 | |
| | | | |
|
|
|
| | | | | | 506,254 | |
|
|
|
|
|
|
|
|
Real Estate — 0.2% | | | | | | | |
Avatar Holdings, Inc. (a) | | | 2,784 | | | 53,397 | |
Consolidated-Tomoka Land Co. | | | 1,783 | | | 50,815 | |
Forestar Group, Inc. (a) | | | 10,878 | | | 195,369 | |
HFF, Inc., Class A (a) | | | 6,093 | | | 43,078 | |
Kennedy-Wilson Holdings, Inc. (a) | | | 6,551 | | | 66,165 | |
Tejon Ranch Co. (a) | | | 4,022 | | | 92,828 | |
Thomas Properties Group, Inc. | | | 11,507 | | | 38,088 | |
| | | | |
|
|
|
| | | | | | 539,740 | |
|
|
|
|
|
|
|
|
Real Estate Investment Trusts (REITs) — 7.0% | | | | | | | |
Acadia Realty Trust | | | 12,118 | | | 203,825 | |
Agree Realty Corp. | | | 2,837 | | | 66,159 | |
Alexander’s, Inc. | | | 605 | | | 183,267 | |
American Campus Communities, Inc. | | | 15,684 | | | 428,016 | |
American Capital Agency Corp. | | | 9,830 | | | 259,709 | |
Anworth Mortgage Asset Corp. | | | 33,944 | | | 241,681 | |
Apollo Commercial Real Estate Finance, Inc. | | | 3,545 | | | 58,351 | |
Ashford Hospitality Trust, Inc. (a) | | | 12,616 | | | 92,475 | |
Associated Estates Realty Corp. | | | 9,883 | | | 127,985 | |
BioMed Realty Trust, Inc. | | | 33,767 | | | 543,311 | |
CBL & Associates Properties, Inc. | | | 41,396 | | | 514,966 | |
CapLease, Inc. | | | 18,138 | | | 83,616 | |
Capstead Mortgage Corp. | | | 20,701 | | | 228,953 | |
Cedar Shopping Centers, Inc. | | | 16,867 | | | 101,539 | |
Chatham Lodging Trust (a) | | | 2,902 | | | 51,859 | |
Chesapeake Lodging Trust (a) | | | 2,700 | | | 42,714 | |
Cogdell Spencer, Inc. | | | 13,672 | | | 92,423 | |
Colonial Properties Trust | | | 21,062 | | | 306,031 | |
Colony Financial, Inc. | | | 4,607 | | | 77,858 | |
Cousins Properties, Inc. | | | 27,130 | | | 182,859 | |
CreXus Investment Corp. | | | 4,299 | | | 53,437 | |
Cypress Sharpridge Investments, Inc. | | | 4,963 | | | 62,832 | |
DCT Industrial Trust, Inc. | | | 63,486 | | | 286,957 | |
DiamondRock Hospitality Co. | | | 46,060 | | | 378,613 | |
Dupont Fabros Technology, Inc. | | | 12,285 | | | 301,720 | |
Dynex Capital Corp. | | | 5,596 | | | 51,651 | |
Eastgroup Properties, Inc. | | | 8,039 | | | 286,028 | |
Education Realty Trust, Inc. | | | 17,657 | | | 106,472 | |
| | |
See Notes to Financial Statements. | |
|
BLACKROCK SMALL CAP INDEX FUND | JUNE 30, 2010 | 29 |
| |
|
| |
Schedule of Investments (continued) | Master Small Cap Index Series |
| (Percentages shown are based on Net Assets) |
| | | | | | | |
Common Stocks | | Shares | | Value | |
|
|
|
|
|
|
|
|
Real Estate Investment Trusts (REITs) (continued) | | | | | | | |
Entertainment Properties Trust | | | 13,874 | | $ | 528,183 | |
Equity Lifestyle Properties, Inc. | | | 7,728 | | | 372,721 | |
Equity One, Inc. | | | 10,835 | | | 169,026 | |
Excel Trust, Inc. (a) | | | 4,950 | | | 59,400 | |
Extra Space Storage, Inc. | | | 26,139 | | | 363,332 | |
FelCor Lodging Trust, Inc. (a) | | | 20,109 | | | 100,344 | |
First Industrial Realty Trust, Inc. (a) | | | 19,395 | | | 93,484 | |
First Potomac Realty Trust | | | 11,385 | | | 163,602 | |
Franklin Street Properties Corp. | | | 20,734 | | | 244,869 | |
Getty Realty Corp. | | | 6,400 | | | 143,424 | |
Gladstone Commercial Corp. | | | 3,396 | | | 55,491 | |
Glimcher Realty Trust | | | 20,874 | | | 124,826 | |
Government Properties Income Trust | | | 6,359 | | | 162,282 | |
Hatteras Financial Corp. | | | 10,659 | | | 296,533 | |
Healthcare Realty Trust, Inc. | | | 18,534 | | | 407,192 | |
Hersha Hospitality Trust | | | 33,705 | | | 152,347 | |
Highwoods Properties, Inc. | | | 20,100 | | | 557,976 | |
Home Properties, Inc. | | | 11,685 | | | 526,643 | |
Inland Real Estate Corp. | | | 22,534 | | | 178,469 | |
InvesCo. Mortgage Capital, Inc. | | | 7,613 | | | 152,336 | |
Investors Real Estate Trust | | | 23,381 | | | 206,454 | |
iStar Financial, Inc. (a) | | | 28,545 | | | 127,311 | |
Kilroy Realty Corp. | | | 16,092 | | | 478,415 | |
Kite Realty Group Trust | | | 17,141 | | | 71,649 | |
LTC Properties, Inc. | | | 7,137 | | | 173,215 | |
LaSalle Hotel Properties | | | 20,868 | | | 429,255 | |
Lexington Corporate Properties Trust | | | 29,743 | | | 178,755 | |
MFA Financial, Inc. | | | 82,515 | | | 610,611 | |
MPG Office Trust, Inc. (a) | | | 15,205 | | | 44,551 | |
Medical Properties Trust, Inc. | | | 33,299 | | | 314,343 | |
Mid-America Apartment Communities, Inc. | | | 9,145 | | | 470,693 | |
Mission West Properties, Inc. | | | 7,564 | | | 51,586 | |
Monmouth Real Estate Investment Corp., Class A | | | 9,554 | | | 70,604 | |
National Health Investors, Inc. | | | 7,270 | | | 280,331 | |
National Retail Properties, Inc. | | | 24,593 | | | 527,274 | |
Newcastle Investment Corp. | | | 19,170 | | | 51,376 | |
NorthStar Realty Finance Corp. (b) | | | 23,873 | | | 63,741 | |
Omega Healthcare Investors, Inc. | | | 27,488 | | | 547,836 | |
One Liberty Properties, Inc. | | | 2,710 | | | 40,406 | |
PS Business Parks, Inc. | | | 5,439 | | | 303,387 | |
Parkway Properties, Inc. | | | 6,821 | | | 99,382 | |
Pebblebrook Hotel Trust (a) | | | 5,757 | | | 108,519 | |
Pennsylvania Real Estate Investment Trust (b) | | | 16,753 | | | 204,722 | |
PennyMac Mortgage Investment Trust (a)(d) | | | 5,384 | | | 85,606 | |
Post Properties, Inc. | | | 14,536 | | | 330,403 | |
Potlatch Corp. | | | 11,795 | | | 421,435 | |
RAIT Investment Trust (a) | | | 24,762 | | | 46,305 | |
Ramco-Gershenson Properties Trust | | | 11,649 | | | 117,655 | |
Redwood Trust, Inc. | | | 23,454 | | | 343,367 | |
Resource Capital Corp. | | | 13,458 | | | 76,441 | |
Retail Opportunity Investments Corp. | | | 12,776 | | | 123,288 | |
Saul Centers, Inc. | | | 1,974 | | | 80,204 | |
Sovran Self Storage, Inc. | | | 8,221 | | | 283,049 | |
Starwood Property Trust, Inc. | | | 14,314 | | | 242,622 | |
Strategic Hotel Capital, Inc. (a) | | | 42,484 | | | 186,505 | |
Sun Communities, Inc. | | | 5,893 | | | 152,982 | |
Sunstone Hotel Investors, Inc. (a) | | | 29,684 | | | 294,762 | |
Tanger Factory Outlet Centers, Inc. | | | 11,965 | | | 495,112 | |
Terreno Realty Corp. (a) | | | 3,018 | | | 53,449 | |
Two Harbors Investment Corp. | | | 8,082 | | | 66,676 | |
UMH Properties, Inc. | | | 4,073 | | | 41,015 | |
| | | | | | | |
Common Stocks | | Shares | | Value | |
|
|
|
|
|
|
|
|
Real Estate Investment Trusts (REITs) (concluded) | | | | | | | |
U-Store-It Trust | | | 22,165 | | $ | 165,351 | |
Universal Health Realty Income Trust | | | 3,555 | | | 114,222 | |
Urstadt Biddle Properties, Inc., Class A | | | 5,100 | | | 82,263 | |
Walter Investment Management Corp. | | | 7,872 | | | 128,707 | |
Washington Real Estate Investment Trust | | | 18,064 | | | 498,386 | |
Winthrop Realty Trust | | | 5,921 | | | 75,848 | |
| | | | |
|
|
|
| | | | | | 20,227,856 | |
|
|
|
|
|
|
|
|
Recreational Vehicles & Boats — 0.4% | | | | | | | |
Arctic Cat, Inc. (a) | | | 3,895 | | | 35,483 | |
Brunswick Corp. | | | 26,633 | | | 331,048 | |
Drew Industries, Inc. (a) | | | 5,705 | | | 115,241 | |
Polaris Industries, Inc. | | | 9,304 | | | 508,185 | |
Winnebago Industries, Inc. (a) | | | 8,686 | | | 86,339 | |
| | | | |
|
|
|
| | | | | | 1,076,296 | |
|
|
|
|
|
|
|
|
Rental & Leasing Services: Consumer — 0.4% | | | | | | | |
Amerco, Inc. (a) | | | 2,575 | | | 141,754 | |
Avis Budget Group, Inc. (a) | | | 30,824 | | | 302,692 | |
Dollar Thrifty Automotive Group, Inc. (a) | | | 8,589 | | | 365,977 | |
Rent-A-Center, Inc. (a) | | | 19,678 | | | 398,676 | |
| | | | |
|
|
|
| | | | | | 1,209,099 | |
|
|
|
|
|
|
|
|
Restaurants — 1.4% | | | | | | | |
AFC Enterprises, Inc. (a) | | | 8,088 | | | 73,601 | |
BJ’s Restaurants, Inc. (a) | | | 6,887 | | | 162,533 | |
Biglari Holdings, Inc. (a) | | | 441 | | | 126,523 | |
Bob Evans Farms, Inc. | | | 9,261 | | | 228,006 | |
Buffalo Wild Wings, Inc. (a) | | | 5,479 | | | 200,422 | |
CEC Entertainment, Inc. (a) | | | 6,628 | | | 233,703 | |
CKE Restaurants, Inc. | | | 16,631 | | | 208,386 | |
California Pizza Kitchen, Inc. (a) | | | 5,971 | | | 90,461 | |
The Cheesecake Factory, Inc. (a) | | | 18,127 | | | 403,507 | |
Cracker Barrel Old Country Store, Inc. | | | 7,197 | | | 335,092 | |
Denny’s Corp. (a) | | | 30,612 | | | 79,591 | |
DineEquity, Inc. (a) | | | 5,438 | | | 151,829 | |
Domino’s Pizza, Inc. (a) | | | 10,973 | | | 123,995 | |
Jack in the Box, Inc. (a) | | | 16,539 | | | 321,684 | |
Jamba, Inc. (a) | | | 19,330 | | | 41,173 | |
Krispy Kreme Doughnuts, Inc. (a) | | | 18,203 | | | 61,344 | |
Landry’s Restaurants, Inc. (a) | | | 2,270 | | | 55,524 | |
McCormick & Schmick’s Seafood Restaurants, Inc. (a) | | | 4,974 | | | 37,106 | |
O’Charleys, Inc. (a) | | | 6,066 | | | 32,150 | |
P.F. Chang’s China Bistro, Inc. | | | 6,964 | | | 276,123 | |
Papa John’s International, Inc. (a) | | | 6,392 | | | 147,783 | |
Red Robin Gourmet Burgers, Inc. (a) | | | 4,820 | | | 82,711 | |
Ruby Tuesday, Inc. (a) | | | 19,506 | | | 165,801 | |
Ruth’s Hospitality Group, Inc. (a) | | | 9,465 | | | 39,564 | |
Sonic Corp. (a) | | | 18,590 | | | 144,072 | |
Texas Roadhouse, Inc., Class A (a) | | | 17,371 | | | 219,222 | |
| | | | |
|
|
|
| | | | | | 4,041,906 | |
|
|
|
|
|
|
|
|
Scientific Instruments: Control & Filter — 0.6% | | | | | | | |
Brady Corp. | | | 14,581 | | | 363,358 | |
CIRCOR International, Inc. | | | 5,175 | | | 132,376 | |
ESCO Technologies, Inc. | | | 7,939 | | | 204,429 | |
Energy Recovery, Inc. (a) | | | 12,672 | | | 50,688 | |
The Gorman-Rupp Co. | | | 3,731 | | | 93,462 | |
ICx Technologies, Inc. (a) | | | 3,998 | | | 29,185 | |
L-1 Identity Solutions, Inc. (a) | | | 22,957 | | | 188,018 | |
Mine Safety Appliances Co. | | | 7,819 | | | 193,755 | |
PMFG, Inc. (a) | | | 4,578 | | | 69,357 | |
Robbins & Myers, Inc. | | | 8,062 | | | 175,268 | |
| | |
See Notes to Financial Statements. | |
|
|
|
30 | BLACKROCK SMALL CAP INDEX FUND | JUNE 30, 2010 |
| |
|
| |
Schedule of Investments (continued) | Master Small Cap Index Series |
| (Percentages shown are based on Net Assets) |
| | | | | | | |
Common Stocks | | Shares | | Value | |
|
|
|
|
|
|
|
|
Scientific Instruments: Control & Filter (concluded) | | | | | | | |
Sun Hydraulics, Inc. | | | 3,823 | | $ | 89,688 | |
Watts Water Technologies, Inc., Class A | | | 8,759 | | | 251,033 | |
X-Rite, Inc. (a) | | | 10,766 | | | 39,726 | |
| | | | |
|
|
|
| | | | | | 1,880,343 | |
|
|
|
|
|
|
|
|
Scientific Instruments: Electrical — 1.1% | | | | | | | |
A123 Systems, Inc. (a) | | | 21,936 | | | 206,856 | |
AZZ, Inc. | | | 3,766 | | | 138,476 | |
A.O. Smith Corp. | | | 7,230 | | | 348,414 | |
Advanced Battery Technologies, Inc. (a) | | | 18,142 | | | 59,506 | |
American Superconductor Corp. (a)(b) | | | 13,477 | | | 359,701 | |
Baldor Electric Co. | | | 14,038 | | | 506,491 | |
Ballantyne Strong, Inc. (a) | | | 4,590 | | | 33,232 | |
Broadwind Energy, Inc. (a) | | | 28,531 | | | 79,887 | |
Ener1, Inc. (a)(b) | | | 18,847 | | | 63,703 | |
EnerSys (a) | | | 14,439 | | | 308,561 | |
Franklin Electric Co., Inc. | | | 7,026 | | | 202,489 | |
GrafTech International Ltd. (a) | | | 36,049 | | | 527,036 | |
Houston Wire & Cable Co. | | | 5,400 | | | 58,590 | |
Littelfuse, Inc. (a) | | | 6,609 | | | 208,911 | |
SatCon Technology Corp. (a) | | | 22,564 | | | 64,533 | |
Taser International, Inc. (a) | | | 18,100 | | | 70,590 | |
UQM Technologies, Inc. (a) | | | 11,357 | | | 38,500 | |
| | | | |
|
|
|
| | | | | | 3,275,476 | |
|
|
|
|
|
|
|
|
Scientific Instruments: Gauges & Meters — 0.1% | | | | | | | |
Badger Meter, Inc. | | | 4,487 | | | 173,602 | |
Faro Technologies, Inc. (a) | | | 4,949 | | | 92,596 | |
Keithley Instruments, Inc. | | | 3,591 | | | 31,708 | |
Measurement Specialties, Inc. (a) | | | 4,531 | | | 62,075 | |
Zygo Corp. (a) | | | 5,298 | | | 42,967 | |
| | | | |
|
|
|
| | | | | | 402,948 | |
|
|
|
|
|
|
|
|
Scientific Instruments: Pollution Control — 0.4% | | | | | | | |
Clean Harbors, Inc. (a) | | | 6,874 | | | 456,502 | |
Darling International, Inc. (a) | | | 24,857 | | | 186,676 | |
EnergySolutions, Inc. | | | 26,650 | | | 135,648 | |
Fuel Tech, Inc. (a) | | | 5,653 | | | 35,727 | |
Met-Pro Corp. | | | 4,810 | | | 51,756 | |
Metalico, Inc. (a) | | | 11,625 | | | 46,268 | |
Team, Inc. (a) | | | 5,856 | | | 76,421 | |
US Ecology, Inc. | | | 5,707 | | | 83,151 | |
Waste Services, Inc. (a) | | | 8,326 | | | 97,081 | |
| | | | |
|
|
|
| | | | | | 1,169,230 | |
|
|
|
|
|
|
|
|
Securities Brokerage & Services — 0.6% | | | | | | | |
BGC Partners, Inc. | | | 17,354 | | | 88,679 | |
GFI Group, Inc. | | | 19,718 | | | 110,026 | |
Gladstone Investment Corp. | | | 7,282 | | | 42,454 | |
International Assets Holding Corp., Inc. (a) | | | 3,930 | | | 62,880 | |
Investment Technology Group, Inc. (a) | | | 12,834 | | | 206,114 | |
KBW, Inc. (a) | | | 10,582 | | | 226,878 | |
Knight Capital Group, Inc., Class A (a) | | | 27,794 | | | 383,279 | |
LaBranche & Co., Inc. (a) | | | 11,366 | | | 48,646 | |
Ladenburg Thalmann Financial Services, Inc. (a) | | | 28,230 | | | 35,288 | |
MF Global Holdings Ltd. (a) | | | 25,761 | | | 147,095 | |
MarketAxess Holdings, Inc. | | | 8,261 | | | 113,919 | |
optionsXpress Holdings, Inc. (a) | | | 12,382 | | | 194,893 | |
Penson Worldwide, Inc. (a)(b) | | | 6,251 | | | 35,256 | |
SWS Group, Inc. | | | 8,390 | | | 79,705 | |
TradeStation Group, Inc. (a) | | | 12,177 | | | 82,195 | |
| | | | |
|
|
|
| | | | | | 1,857,307 | |
|
|
|
|
|
|
|
|
| | | | | | | |
Common Stocks | | Shares | | Value | |
|
|
|
|
|
|
|
|
Semiconductors & Components — 2.4% | | | | | | | |
AXT, Inc. (a) | | | 9,878 | | $ | 44,550 | |
Actel Corp. (a) | | | 6,718 | | | 86,125 | |
Advanced Analogic Technologies, Inc. (a) | | | 13,817 | | | 44,076 | |
Amkor Technology, Inc. (a) | | | 31,661 | | | 174,452 | |
Anadigics, Inc. (a) | | | 20,070 | | | 87,505 | |
Applied Micro Circuits Corp. (a) | | | 19,783 | | | 207,326 | |
Cavium Networks, Inc. (a) | | | 13,373 | | | 350,239 | |
Ceva, Inc. (a) | | | 6,500 | | | 81,900 | |
Cirrus Logic, Inc. (a) | | | 19,670 | | | 310,983 | |
Conexant Systems, Inc. (a) | | | 24,961 | | | 55,913 | |
DSP Group, Inc. (a) | | | 7,375 | | | 47,126 | |
Diodes, Inc. (a) | | | 10,251 | | | 162,683 | |
Entropic Communications, Inc. (a) | | | 17,163 | | | 108,813 | |
Exar Corp. (a) | | | 11,472 | | | 79,501 | |
Formfactor, Inc. (a) | | | 15,202 | | | 164,182 | |
Hittite Microwave Corp. (a) | | | 8,196 | | | 366,689 | |
IXYS Corp. (a) | | | 7,474 | | | 66,070 | |
Integrated Device Technology, Inc. (a) | | | 49,076 | | | 242,926 | |
Integrated Silicon Solutions, Inc. (a) | | | 7,952 | | | 59,958 | |
Kopin Corp. (a) | | | 20,596 | | | 69,820 | |
Lattice Semiconductor Corp. (a) | | | 35,243 | | | 152,955 | |
MIPS Technologies, Inc. (a) | | | 14,100 | | | 72,051 | |
MaxLinear, Inc., Class A (a) | | | 2,353 | | | 32,895 | |
Micrel, Inc. | | | 15,328 | | | 156,039 | |
Microsemi Corp. (a) | | | 24,917 | | | 364,536 | |
Microtune, Inc. (a) | | | 17,666 | | | 37,628 | |
Monolithic Power Systems, Inc. (a) | | | 9,767 | | | 174,439 | |
MoSys, Inc. (a) | | | 8,948 | | | 39,550 | |
Netlogic Microsystems, Inc. (a) | | | 18,814 | | | 511,741 | |
Omnivision Technologies, Inc. (a) | | | 15,518 | | | 332,706 | |
PLX Technology, Inc. (a) | | | 11,831 | | | 49,572 | |
Pericom Semiconductor Corp. (a) | | | 7,865 | | | 75,504 | |
Power Integrations, Inc. | | | 7,415 | | | 238,726 | |
RF Micro Devices, Inc. (a) | | | 80,737 | | | 315,682 | |
Rubicon Technology, Inc. (a)(b) | | | 4,338 | | | 129,229 | |
Semtech Corp. (a) | | | 18,583 | | | 304,204 | |
Sigma Designs, Inc. (a)(b) | | | 9,481 | | | 94,905 | |
Silicon Image, Inc. (a) | | | 23,791 | | | 83,506 | |
Spansion, Inc., Class A (a) | | | 3,931 | | | 64,115 | |
Standard Microsystems Corp. (a) | | | 6,829 | | | 158,979 | |
Supertex, Inc. (a) | | | 3,024 | | | 74,572 | |
Trident Microsystems, Inc. (a) | | | 22,663 | | | 32,181 | |
TriQuint Semiconductor, Inc. (a) | | | 46,225 | | | 282,435 | |
Virage Logic Corp. (a) | | | 7,132 | | | 84,799 | |
Volterra Semiconductor Corp. (a) | | | 7,492 | | | 172,765 | |
Zoran Corp. (a) | | | 15,589 | | | 148,719 | |
| | | | |
|
|
|
| | | | | | 6,995,270 | |
|
|
|
|
|
|
|
|
Shipping — 0.7% | | | | | | | |
American Commercial Lines, Inc. (a) | | | 2,846 | | | 64,063 | |
Baltic Trading Ltd. (a) | | | 5,148 | | | 58,533 | |
DHT Holdings, Inc. | | | 15,389 | | | 59,248 | |
Eagle Bulk Shipping, Inc. (a)(b) | | | 18,931 | | | 79,889 | |
Excel Maritime Carriers Ltd. (a) | | | 12,211 | | | 62,520 | |
Genco Shipping & Trading Ltd. (a) | | | 7,618 | | | 114,194 | |
General Maritime Corp. | | | 15,769 | | | 95,245 | |
Gulfmark Offshore, Inc., Class A (a) | | | 7,019 | | | 183,898 | |
Horizon Lines, Inc., Class A | | | 9,959 | | | 42,127 | |
International Shipholding Corp. | | | 1,916 | | | 42,401 | |
Knightsbridge Tankers Ltd. | | | 5,294 | | | 93,121 | |
Nordic American Tanker Shipping Ltd. | | | 14,029 | | | 394,075 | |
Overseas Shipholding Group, Inc. | | | 7,646 | | | 283,208 | |
Scorpio Tankers, Inc. (a) | | | 4,234 | | | 48,479 | |
| | |
See Notes to Financial Statements. | |
|
BLACKROCK SMALL CAP INDEX FUND | JUNE 30, 2010 | 31 |
| |
|
| |
Schedule of Investments (continued) | Master Small Cap Index Series |
| (Percentages shown are based on Net Assets) |
| | | | | | | |
Common Stocks | | Shares | | Value | |
|
|
|
|
|
|
|
|
Shipping (concluded) | | | | | | | |
Ship Finance International Ltd. | | | 13,466 | | $ | 240,772 | |
Teekay Tankers Ltd., Class A | | | 8,271 | | | 92,056 | |
Ultrapetrol Bahamas Ltd. (a) | | | 7,658 | | | 33,312 | |
| | | | |
|
|
|
| | | | | | 1,987,141 | |
|
|
|
|
|
|
|
|
Specialty Retail — 3.4% | | | | | | | |
America’s Car Mart, Inc. (a) | | | 3,000 | | | 67,890 | |
AnnTaylor Stores Corp. (a) | | | 17,652 | | | 287,198 | |
Asbury Automotive Group, Inc. (a) | | | 8,791 | | | 92,657 | |
Barnes & Noble, Inc. | | | 11,497 | | | 148,311 | |
bebe Stores, Inc. | | | 10,082 | | | 64,525 | |
Big 5 Sporting Goods Corp. | | | 6,701 | | | 88,051 | |
Blue Nile, Inc. (a) | | | 3,806 | | | 179,186 | |
Brown Shoe Co., Inc. | | | 13,121 | | | 199,177 | |
The Buckle, Inc. (b) | | | 7,821 | | | 253,557 | |
Build-A-Bear Workshop, Inc. (a) | | | 5,470 | | | 37,087 | |
Cabela’s, Inc., Class A (a)(b) | | | 11,905 | | | 168,337 | |
Casual Male Retail Group, Inc. (a) | | | 13,313 | | | 45,530 | |
The Cato Corp., Class A | | | 8,465 | | | 186,399 | |
Charming Shoppes, Inc. (a) | | | 35,216 | | | 132,060 | |
The Children’s Place Retail Stores, Inc. (a) | | | 8,320 | | | 366,246 | |
Christopher & Banks Corp. | | | 11,093 | | | 68,666 | |
Citi Trends, Inc. (a) | | | 4,526 | | | 149,086 | |
Coldwater Creek, Inc. (a) | | | 18,604 | | | 62,509 | |
Collective Brands, Inc. (a) | | | 19,436 | | | 307,089 | |
DSW, Inc., Class A (a) | | | 4,292 | | | 96,398 | |
Destination Maternity Corp. (a) | | | 1,643 | | | 41,568 | |
Dress Barn, Inc. (a) | | | 17,826 | | | 424,437 | |
Express, Inc. (a) | | | 4,836 | | | 79,165 | |
The Finish Line, Inc., Class A | | | 15,349 | | | 213,812 | |
Genesco, Inc. (a) | | | 7,254 | | | 190,853 | |
Group 1 Automotive, Inc. (a) | | | 7,380 | | | 173,651 | |
Gymboree Corp. (a) | | | 8,878 | | | 379,179 | |
Haverty Furniture Cos., Inc. | | | 5,638 | | | 69,291 | |
hhgregg, Inc. (a) | | | 3,990 | | | 93,047 | |
Hibbett Sports, Inc. (a) | | | 8,580 | | | 205,577 | |
Hot Topic, Inc. | | | 13,641 | | | 69,296 | |
Jo-Ann Stores, Inc. (a) | | | 8,170 | | | 306,457 | |
Jos. A. Bank Clothiers, Inc. (a) | | | 5,515 | | | 297,755 | |
Lithia Motors, Inc., Class A | | | 6,400 | | | 39,552 | |
Lumber Liquidators Holdings, Inc. (a) | | | 6,723 | | | 156,848 | |
MarineMax, Inc. (a) | | | 6,986 | | | 48,483 | |
Men’s Wearhouse, Inc. | | | 15,812 | | | 290,308 | |
Midas, Inc. (a) | | | 4,370 | | | 33,518 | |
Monro Muffler, Inc. | | | 5,964 | | | 235,757 | |
Nu Skin Enterprises, Inc., Class A | | | 14,804 | | | 369,064 | |
OfficeMax, Inc. (a) | | | 25,445 | | | 332,312 | |
Pacific Sunwear of California, Inc. (a) | | | 20,563 | | | 65,802 | |
Penske Auto Group, Inc. (a) | | | 13,303 | | | 151,122 | |
The Pep Boys — Manny, Moe & Jack | | | 15,933 | | | 141,166 | |
Pier 1 Imports, Inc. (a) | | | 31,433 | | | 201,486 | |
Regis Corp. | | | 17,181 | | | 267,508 | |
Retail Ventures, Inc. (a) | | | 7,100 | | | 55,522 | |
Rue21, Inc. (a) | | | 4,466 | | | 135,498 | |
Sally Beauty Co., Inc. (a) | | | 28,075 | | | 230,215 | |
Shoe Carnival, Inc. (a) | | | 2,891 | | | 59,294 | |
Shutterfly, Inc. (a) | | | 8,116 | | | 194,459 | |
Sonic Automotive, Inc. (a) | | | 12,135 | | | 103,876 | |
Stage Stores, Inc. | | | 11,784 | | | 125,853 | |
Stamps.com, Inc. (a) | | | 3,303 | | | 33,856 | |
Stein Mart, Inc. (a) | | | 8,438 | | | 52,569 | |
| | | | | | | |
Common Stocks | | Shares | | Value | |
|
|
|
|
|
|
|
|
Specialty Retail (concluded) | | | | | | | |
Systemax, Inc. | | | 3,350 | | $ | 50,485 | |
The Talbots, Inc. (a) | | | 21,066 | | | 217,190 | |
Ulta Salon Cosmetics & Fragrance, Inc. (a) | | | 9,462 | | | 223,871 | |
Vitacost.com, Inc. (a) | | | 4,529 | | | 40,716 | |
Vitamin Shoppe, Inc. (a) | | | 4,838 | | | 124,095 | |
The Wet Seal, Inc., Class A (a) | | | 30,611 | | | 111,730 | |
Zumiez, Inc. (a) | | | 6,297 | | | 101,445 | |
| | | | |
|
|
|
| | | | | | 9,737,647 | |
|
|
|
|
|
|
|
|
Steel — 0.0% | | | | | | | |
Olympic Steel, Inc. | | | 2,846 | | | 65,372 | |
Universal Stainless & Alloy Products, Inc. (a) | | | 2,234 | | | 35,722 | |
| | | | |
|
|
|
| | | | | | 101,094 | |
|
|
|
|
|
|
|
|
Sugar — 0.0% | | | | | | | |
Imperial Sugar Co., New Shares | | | 3,800 | | | 38,380 | |
|
|
|
|
|
|
|
|
Synthetic Fibers & Chemicals — 0.0% | | | | | | | |
Zoltek Cos., Inc. (a) | | | 8,614 | | | 72,961 | |
|
|
|
|
|
|
|
|
Technology: Miscellaneous — 0.4% | | | | | | | |
Benchmark Electronics, Inc. (a) | | | 18,912 | | | 299,755 | |
CTS Corp. | | | 10,392 | | | 96,022 | |
LaBarge, Inc. (a) | | | 4,029 | | | 45,971 | |
Plexus Corp. (a) | | | 12,110 | | | 323,822 | |
Sanmina-SCI Corp. (a) | | | 23,931 | | | 325,701 | |
Vocus, Inc. (a) | | | 5,183 | | | 79,196 | |
| | | | |
|
|
|
| | | | | | 1,170,467 | |
|
|
|
|
|
|
|
|
Telecommunications Equipment — 0.4% | | | | | | | |
ADC Telecommunications, Inc. (a) | | | 29,267 | | | 216,868 | |
Applied Signal Technology, Inc. | | | 4,140 | | | 81,351 | |
Arris Group, Inc. (a) | | | 38,030 | | | 387,526 | |
Brightpoint, Inc. (a) | | | 21,306 | | | 149,142 | |
Mastec, Inc. (a) | | | 15,770 | | | 148,238 | |
Powerwave Technologies, Inc. (a) | | | 39,877 | | | 61,411 | |
Symmetricom, Inc. (a) | | | 13,696 | | | 69,713 | |
UTStarcom, Inc. (a) | | | 35,961 | | | 66,168 | |
| | | | |
|
|
|
| | | | | | 1,180,417 | |
|
|
|
|
|
|
|
|
Textile Products — 0.1% | | | | | | | |
Culp, Inc. (a) | | | 2,850 | | | 31,236 | |
Interface, Inc., Class A | | | 15,334 | | | 164,687 | |
Unifi, Inc. (a) | | | 13,182 | | | 50,355 | |
| | | | |
|
|
|
| | | | | | 246,278 | |
|
|
|
|
|
|
|
|
Textiles, Apparel & Shoes — 1.9% | | | | | | | |
Carter’s, Inc. (a) | | | 17,755 | | | 466,069 | |
Cherokee, Inc. | | | 2,567 | | | 43,896 | |
Columbia Sportswear Co. (b) | | | 3,398 | | | 158,585 | |
Crocs, Inc. (a) | | | 25,808 | | | 273,049 | |
Deckers Outdoor Corp. (a) | | | 3,859 | | | 551,335 | |
G-III Apparel Group, Ltd. (a) | | | 4,704 | | | 107,675 | |
Iconix Brand Group, Inc. (a) | | | 21,561 | | | 309,832 | |
Joe’s Jeans, Inc. (a) | | | 13,665 | | | 27,057 | |
Jones Apparel Group, Inc. | | | 26,051 | | | 412,908 | |
K-Swiss, Inc., Class A (a) | | | 8,063 | | | 90,547 | |
Kenneth Cole Productions, Inc., Class A (a) | | | 2,624 | | | 28,890 | |
Lacrosse Footwear, Inc. | | | 1,607 | | | 27,062 | |
Liz Claiborne, Inc. (a)(b) | | | 28,565 | | | 120,544 | |
Maidenform Brands, Inc. (a) | | | 6,913 | | | 140,749 | |
Oxford Industries, Inc. | | | 4,306 | | | 90,125 | |
Perry Ellis International, Inc. (a) | | | 3,121 | | | 63,044 | |
Quiksilver, Inc. (a) | | | 39,110 | | | 144,707 | |
R.G. Barry Corp. | | | 2,908 | | | 32,075 | |
Skechers U.S.A., Inc., Class A (a) | | | 10,354 | | | 378,128 | |
| | |
See Notes to Financial Statements. | |
|
|
|
32 | BLACKROCK SMALL CAP INDEX FUND | JUNE 30, 2010 |
| |
|
| |
Schedule of Investments (continued) | Master Small Cap Index Series |
| (Percentages shown are based on Net Assets) |
| | | | | | | |
Common Stocks | | Shares | | Value | |
|
|
|
|
|
|
|
|
Textiles, Apparel & Shoes (concluded) | | | | | | | |
Steven Madden Ltd. (a) | | | 7,373 | | $ | 232,397 | |
Timberland Co., Class A (a) | | | 12,400 | | | 200,260 | |
True Religion Apparel, Inc. (a) | | | 7,649 | | | 168,813 | |
Under Armour, Inc., Class A (a)(b) | | | 10,509 | | | 348,163 | |
Volcom, Inc. (a) | | | 5,857 | | | 108,764 | |
The Warnaco Group, Inc. (a) | | | 13,248 | | | 478,783 | |
Weyco Group, Inc. | | | 2,232 | | | 50,845 | |
Wolverine World Wide, Inc. | | | 14,752 | | | 372,045 | |
| | | | |
|
|
|
| | | | | | 5,426,347 | |
|
|
|
|
|
|
|
|
Tobacco — 0.2% | | | | | | | |
Alliance One International, Inc. (a) | | | 26,971 | | | 96,017 | |
Star Scientific, Inc. (a)(b) | | | 29,459 | | | 48,313 | |
Universal Corp. | | | 7,179 | | | 284,862 | |
Vector Group Ltd. | | | 12,751 | | | 214,472 | |
| | | | |
|
|
|
| | | | | | 643,664 | |
|
|
|
|
|
|
|
|
Toys — 0.1% | | | | | | | |
Jakks Pacific, Inc. (a) | | | 8,650 | | | 124,387 | |
Leapfrog Enterprises, Inc. (a) | | | 10,508 | | | 42,242 | |
RC2 Corp. (a) | | | 6,624 | | | 106,713 | |
| | | | |
|
|
|
| | | | | | 273,342 | |
|
|
|
|
|
|
|
|
Transportation: Miscellaneous — 0.2% | | | | | | | |
Dynamex, Inc. (a) | | | 3,319 | | | 40,492 | |
Echo Global Logistics, Inc. (a) | | | 3,489 | | | 42,601 | |
HUB Group, Inc., Class A (a) | | | 11,232 | | | 337,072 | |
Pacer International, Inc. (a) | | | 10,918 | | | 76,317 | |
Textainer Group Holdings Ltd. | | | 2,909 | | | 70,223 | |
| | | | |
|
|
|
| | | | | | 566,705 | |
|
|
|
|
|
|
|
|
Truckers — 0.7% | | | | | | | |
Arkansas Best Corp. | | | 7,685 | | | 159,464 | |
Celadon Group, Inc. (a) | | | 6,181 | | | 87,399 | |
Forward Air Corp. | | | 8,768 | | | 238,928 | |
Heartland Express, Inc. | | | 14,967 | | | 217,321 | |
Knight Transportation, Inc. | | | 17,681 | | | 357,863 | |
Marten Transport Ltd. (a) | | | 4,731 | | | 98,310 | |
Old Dominion Freight Line, Inc. (a) | | | 8,354 | | | 293,560 | |
Patriot Transportation Holding, Inc. (a) | | | 486 | | | 39,322 | |
Roadrunner Transportation Systems, Inc. (a) | | | 3,336 | | | 47,405 | |
Saia, Inc. (a) | | | 5,023 | | | 75,345 | |
USA Truck, Inc. (a) | | | 2,610 | | | 42,073 | |
Werner Enterprises, Inc. | | | 12,793 | | | 280,039 | |
| | | | |
|
|
|
| | | | | | 1,937,029 | |
|
|
|
|
|
|
|
|
Utilities: Electrical — 1.7% | | | | | | | |
Allete, Inc. | | | 9,300 | | | 318,432 | |
Avista Corp. | | | 16,513 | | | 322,499 | |
Black Hills Corp. | | | 11,807 | | | 336,145 | |
CH Energy Group, Inc. | | | 4,892 | | | 191,962 | |
Central Vermont Public Service Corp. | | | 4,000 | | | 78,960 | |
Cleco Corp. | | | 17,888 | | | 472,422 | |
Dynegy, Inc. (a) | | | 30,896 | | | 118,950 | |
El Paso Electric Co. (a) | | | 13,121 | | | 253,891 | |
The Empire District Electric Co. | | | 12,245 | | | 229,839 | |
IDACORP, Inc. | | | 14,314 | | | 476,227 | |
MGE Energy, Inc. | | | 6,993 | | | 252,028 | |
NorthWestern Corp. | | | 10,842 | | | 284,060 | |
Otter Tail Corp. | | | 10,878 | | | 210,272 | |
PNM Resources, Inc. | | | 26,237 | | | 293,330 | |
Pike Electric Corp. (a) | | | 5,114 | | | 48,174 | |
| | | | | | | |
Common Stocks | | Shares | | Value | |
|
|
|
|
|
|
|
|
Utilities: Electrical (concluded) | | | | | | | |
Portland General Electric Co. | | | 22,494 | | $ | 412,315 | |
UIL Holdings Corp. | | | 9,175 | | | 229,650 | |
Unisource Energy Corp. | | | 10,771 | | | 325,069 | |
Unitil Corp. | | | 3,917 | | | 81,904 | |
| | | | |
|
|
|
| | | | | | 4,936,129 | |
|
|
|
|
|
|
|
|
Utilities: Gas Distributors — 1.2% | | | | | | | |
Chesapeake Utilities Corp. | | | 3,004 | | | 94,326 | |
The Laclede Group, Inc. | | | 6,857 | | | 227,172 | |
New Jersey Resources Corp. | | | 12,243 | | | 430,954 | |
Nicor, Inc. (c) | | | 13,339 | | | 540,229 | |
Northwest Natural Gas Co. | | | 7,884 | | | 343,506 | |
Piedmont Natural Gas Co. | | | 21,252 | | | 537,675 | |
South Jersey Industries, Inc. | | | 8,845 | | | 379,981 | |
Southwest Gas Corp. | | | 13,534 | | | 399,253 | |
WGL Holdings, Inc. | | | 14,991 | | | 510,144 | |
| | | | |
|
|
|
| | | | | | 3,463,240 | |
|
|
|
|
|
|
|
|
Utilities: Telecommunications — 0.9% | | | | | | | |
Alaska Communications Systems Group, Inc. | | | 13,857 | | | 117,646 | |
Atlantic Tele-Network, Inc. | | | 2,830 | | | 116,879 | |
Cbeyond Communications, Inc. (a) | | | 8,142 | | | 101,775 | |
Cincinnati Bell, Inc. (a) | | | 60,401 | | | 181,807 | |
Cogent Communications Group, Inc. (a) | | | 13,732 | | | 104,088 | |
Consolidated Communications Holdings, Inc. | | | 7,815 | | | 132,933 | |
FiberTower Corp. (a) | | | 14,458 | | | 68,242 | |
General Communication, Inc., Class A (a) | | | 14,734 | | | 111,831 | |
Global Crossing Ltd. (a) | | | 9,389 | | | 99,242 | |
Globalstar, Inc. (a) | | | 23,452 | | | 36,116 | |
ICO Global Communications Holdings Ltd. (a) | | | 28,778 | | | 46,332 | |
IDT Corp., Class B (a) | | | 4,600 | | | 58,650 | |
Iridium Communications, Inc. (a) | | | 10,375 | | | 104,165 | |
j2 Global Communications, Inc. (a) | | | 13,482 | | | 294,447 | |
NTELOS Holdings Corp. | | | 8,950 | | | 153,940 | |
Neutral Tandem, Inc. (a) | | | 9,922 | | | 111,622 | |
PAETEC Holding Corp. (a) | | | 37,848 | | | 129,062 | |
Premiere Global Services, Inc. (a) | | | 18,173 | | | 115,217 | |
RCN Corp. (a) | | | 10,738 | | | 159,030 | |
Shenandoah Telecom Co. | | | 7,233 | | | 128,313 | |
USA Mobility, Inc. | | | 6,780 | | | 87,598 | |
Vonage Holdings Corp. (a) | | | 32,033 | | | 73,676 | |
| | | | |
|
|
|
| | | | | | 2,532,611 | |
|
|
|
|
|
|
|
|
Utilities: Water — 0.3% | | | | | | | |
American States Water Co. | | | 5,607 | | | 185,816 | |
Artesian Resources Corp., Class A | | | 2,560 | | | 47,258 | |
California Water Service Group | | | 5,853 | | | 208,952 | |
Connecticut Water Service, Inc. | | | 2,957 | | | 62,156 | |
Consolidated Water Co., Inc. | | | 4,715 | | | 53,657 | |
Middlesex Water Co. | | | 4,598 | | | 72,878 | |
SJW Corp. | | | 4,025 | | | 94,346 | |
Southwest Water Co. | | | 8,584 | | | 89,960 | |
York Water Co. | | | 4,423 | | | 62,807 | |
| | | | |
|
|
|
| | | | | | 877,830 | |
|
|
|
|
|
|
|
|
Total Common Stocks — 96.5% | | | | | | 280,035,773 | |
|
|
|
|
|
|
|
|
| | |
See Notes to Financial Statements. | |
|
BLACKROCK SMALL CAP INDEX FUND | JUNE 30, 2010 | 33 |
| |
|
| |
Schedule of Investments (continued) | Master Small Cap Index Series |
| (Percentages shown are based on Net Assets) |
| | | | | | | |
Investment Companies | | Shares | | Value | |
|
|
|
|
|
|
BlackRock Kelso Capital Corp. (d) | | | 17,107 | | $ | 168,846 | |
Gladstone Capital Corp. | | | 6,400 | | | 69,184 | |
Hercules Technology Growth Capital, Inc. | | | 11,650 | | | 101,771 | |
Kayne Anderson Energy Development Co. | | | 3,254 | | | 49,363 | |
Pennantpark Investment Corp. | | | 9,717 | | | 92,797 | |
Prospect Capital Corp. | | | 19,928 | | | 192,305 | |
|
|
|
|
|
|
|
|
Total Investment Companies — 0.2% | | | | | | 674,266 | |
|
|
|
|
|
|
|
|
| | | | | | | |
|
|
|
|
|
|
|
|
|
Warrants (e) | | | | | | | |
|
|
|
|
|
|
|
|
Alternative Energy — 0.0% | | | | | | | |
GreenHunter Energy, Inc. (Expires 8/27/11) (b)(f) | | | 180 | | | — | |
|
|
|
|
|
|
|
|
Communications Technology — 0.0% | | | | | | | |
Lantronix, Inc. (Expires 2/09/11) | | | 138 | | | — | |
|
|
|
|
|
|
|
|
Total Warrants — 0.0% | | | | | | — | |
|
|
|
|
|
|
|
|
Total Long-Term Investments
(Cost — $265,134,275) — 96.8% | | | | | | 280,710,039 | |
|
|
|
|
|
|
|
|
| | | | | | | |
Short-Term Securities | | Shares | | Value | |
|
|
|
|
|
|
|
|
BlackRock Liquidity Funds, TempFund,
Institutional Class, 0.16% (d)(g) | | | 10,162,728 | | $ | 10,162,728 | |
|
|
|
|
|
|
|
|
| | | | | | | |
| | Beneficial
Interest
(000) | | | | |
|
|
|
|
|
|
|
|
BlackRock Liquidity Series, LLC
Money Market Series, 0.27% (d)(g)(h) | | $ | 14,418 | | | 14,418,243 | |
|
|
|
|
|
|
|
|
Total Short-Term Securities
(Cost — $24,580,971) — 8.5% | | | | | | 24,580,971 | |
|
|
|
|
|
|
|
|
Total Investments (Cost — $289,715,246*) — 105.2% | | | | | | 305,291,010 | |
Liabilities in Excess of Other Assets — (5.2)% | | | | | | (15,218,865 | ) |
| | | | |
|
|
|
Net Assets — 100.0% | | | | | $ | 290,072,145 | |
| | | | |
|
|
|
| |
|
|
* | The cost and unrealized appreciation (depreciation) of investments as of June 30, 2010, as computed for federal income tax purposes were as follows: |
| | | | |
Aggregate cost | | $ | 302,295,372 | |
| |
|
|
|
Gross unrealized appreciation | | $ | 33,709,686 | |
Gross unrealized depreciation | | | (30,714,048 | ) |
| |
|
|
|
Net unrealized appreciation | | $ | 2,995,638 | |
| |
|
|
|
| |
(a) | Non-income producing security. |
| |
(b) | Security, or a portion of security, is on loan. |
| |
(c) | All or a portion of security has been pledged as collateral in connection with open financial futures contracts. |
| |
(d) | Investments in companies considered to be an affiliate of the Series during the period, for purposes of Section 2(a)(3) of the Investment Company Act of 1940, as amended, were as follows: |
| | | | | | | | | | | | | | | | | | | |
|
|
|
|
|
|
|
|
|
|
|
|
|
|
Affiliate | | Shares/
Beneficial
Interest Held
at December 31,
2009 | | Shares/
Beneficial
Interest
Purchased | | Shares/
Beneficial
Interest
Sold | | Shares/
Beneficial
Interest Held
at June 30,
2010 | | Value
at June 30,
2010 | | Income | |
|
|
|
|
|
|
|
|
|
|
|
|
|
|
BlackRock Kelso Capital Corp. | | | 3,100 | | | 14,007 | | | — | | | 17,107 | | $ | 168,846 | | $ | 2,144 | |
BlackRock Liquidity Funds, TempFund,
Institutional Class | | | 9,452,117 | | | 710,611 | 1 | | — | | | 10,162,728 | | $ | 10,162,728 | | $ | 5,223 | |
BlackRock Liquidity Series, LLC | | | | | | | | | | | | | | | | | | | |
Money Market Series | | $ | 17,386,620 | | | — | | $ | (2,968,377 | )2 | $ | 14,418,243 | | $ | 14,418,243 | | $ | 93,053 | |
PennyMac Mortgage Investment Trust | | | 3,500 | | | 1,884 | | | — | | | 5,384 | | $ | 85,606 | | | — | |
|
|
|
|
|
|
|
|
|
|
|
|
|
|
|
|
|
|
|
|
| | |
| 1 | Represents net shares sold. |
| | |
| 2 | Represents net shares purchased. |
| | |
See Notes to Financial Statements. | |
|
34 | BLACKROCK SMALL CAP INDEX FUND | JUNE 30, 2010 |
| |
|
| |
Schedule of Investments (concluded) | Master Small Cap Index Series |
| |
(e) | Warrants entitle the Series to purchase a predetermined number of shares of common stock and are non-income producing. The purchase price and number of shares are subject to adjustment under certain conditions until the expiration date. |
| |
(f) | Restricted security as to resale, representing 0.0% of net assets was as follows: |
| | | | | | | | | | |
|
|
|
|
|
|
|
|
Issue | | Acquisition
Date | | Cost | | Value | |
|
|
|
|
|
|
|
|
GreenHunter Energy, Inc. | | | 06/27/08 | | | — | | | — | |
|
|
|
|
|
|
|
|
| |
(g) | Represents the current yield as of report date. |
| |
(h) | Security was purchased with the cash collateral from loaned securities. |
| |
• | Financial futures contacts purchased as of June 30, 2010 were as follows: |
| | | | | | | | | | | | | |
|
|
|
|
|
|
|
|
|
|
Contracts | | Issue | | Expiration
Date | | Notional
Value | | Unrealized
Depreciation | |
|
|
|
|
|
|
|
|
|
|
153 | | | Russell 2000 MINI | | | September 2010 | | $ | 9,615,472 | | $ | (316,132 | ) |
|
|
|
|
|
|
|
|
|
|
|
|
|
|
| | |
• | For Series compliance purposes, the Series’ industry classifications refer to any one or more of the industry sub-classifications used by one or more widely recognized market indexes or rating group indexes, and/or as defined by Series management. This definition may not apply for purposes of this report, which may combine such industry sub-classifications for reporting ease. |
| |
• | Fair Value Measurements — Various inputs are used in determining the fair value of investments and derivatives, which are as follows: |
| | |
| • | Level 1 — price quotations in active markets/exchanges for identical assets and liabilities |
| | |
| • | Level 2 — other observable inputs (including, but not limited to: quoted prices for similar assets or liabilities in markets that are active, quoted prices for identical or similar assets or liabilities in markets that are not active, inputs other than quoted prices that are observable for the assets or liabilities (such as interest rates, yield curves, volatilities, prepayment speeds, loss severities, credit risks and default rates) or other market-corroborated inputs) |
| | |
| • | Level 3 — unobservable inputs based on the best information available in the circumstances, to the extent observable inputs are not available (including the Series’ own assumptions used in determining the fair value of investments and derivatives) |
The inputs or methodologies used for valuing securities are not necessarily an indication of the risk associated with investing in those securities. For information about the Series’ policy regarding valuation of investments and other significant accounting policies, please refer to Note 1 of the Notes to Financial Statements.
The following tables summarize the inputs used as of June 30, 2010 in determining the fair valuation of the Series’ investments and derivatives:
| | | | | | | | | | | | | |
|
|
|
|
|
|
|
|
|
|
Valuation Inputs | | Level 1 | | Level 2 | | Level 3 | | Total | |
|
|
|
|
|
|
|
|
|
|
Assets: | | | | | | | | | | | | | |
Investments in Securities: | | | | | | | | | | | | | |
Long-Term Investments1 | | $ | 280,710,039 | | | — | | | — | | $ | 280,710,039 | |
Short-Term Securities | | | 10,162,728 | | $ | 14,418,243 | | | — | | | 24,580,971 | |
| |
|
|
|
|
|
|
|
|
|
|
|
|
Total | | $ | 290,872,767 | | $ | 14,418,243 | | | — | | $ | 305,291,010 | |
| |
|
|
|
|
|
|
|
|
|
|
|
|
| | |
| 1 | See above Schedule of Investments for values in each industry. |
| | | | | | | | | | | | | |
|
|
|
|
| | Derivative Financial Instruments2 | |
|
|
|
|
|
|
|
|
|
|
Valuation Inputs | | Level 1 | | Level 2 | | Level 3 | | Total | |
|
|
|
|
|
|
|
|
|
|
Liabilities: | | | | | | | | | | | | | |
Equity contracts | | $ | (316,132 | ) | | — | | | — | | $ | (316,132 | ) |
| |
|
|
|
|
|
|
|
|
| | |
| 2 | Derivative financial instruments are financial futures contacts which are shown at the unrealized appreciation/depreciation on the instrument. |
| | | |
See Notes to Financial Statements. | | |
|
| BLACKROCK SMALL CAP INDEX FUND | JUNE 30, 2010 | 35 |
| |
|
|
Statement of Assets and Liabilities | Master Small Cap Index Series |
| | | | |
June 30, 2010 (Unaudited) | | | | |
|
|
|
|
|
Assets | | | | |
|
|
|
|
|
Investments at value — unaffiliated (including securities loaned of $13,644,499) (cost — $264,865,912) | | $ | 280,455,587 | |
Investments at value — affiliated (cost — $24,849,334) | | | 24,835,423 | |
Cash collateral for financial futures contracts | | | 517,000 | |
Investments sold receivable | | | 1,494,370 | |
Dividends receivable | | | 307,245 | |
Securities lending income receivable — affiliated | | | 33,194 | |
Prepaid expenses | | | 54,144 | |
| |
|
| |
Total assets | | | 307,696,963 | |
| |
|
| |
| | | | |
|
|
|
|
|
Liabilities | | | | |
|
|
|
|
|
Collateral on securities loaned, at value | | | 14,418,243 | |
Investments purchased payable | | | 2,988,212 | |
Withdrawals payable to investors | | | 91,487 | |
Margin variation payable | | | 85,529 | |
Investment advisory fees payable | | | 1,997 | |
Other affiliates payable | | | 1,107 | |
Directors’ fees payable | | | 482 | |
Other accrued expenses payable | | | 37,761 | |
| |
|
| |
Total liabilities | | | 17,624,818 | |
| |
|
| |
Net Assets | | $ | 290,072,145 | |
| |
|
| |
| | | | |
|
|
|
|
|
Net Assets Consist of | | | | |
|
|
|
|
|
Investors’ capital | | $ | 274,812,513 | |
Net unrealized appreciation/depreciation | | | 15,259,632 | |
| |
|
| |
Net Assets | | $ | 290,072,145 | |
| |
|
| |
| | |
See Notes to Financial Statements. |
|
36 | BLACKROCK SMALL CAP INDEX FUND | JUNE 30, 2010 |
| |
|
|
Statement of Operations | Master Small Cap Index Series |
| | | | |
Six Months Ended June 30, 2010 (Unaudited) | | | | |
|
|
|
|
|
Investment Income | | | | |
|
|
|
|
|
Dividends — unaffiliated | | $ | 1,168,923 | |
Foreign taxes withheld | | | (3,021 | ) |
Security lending — affiliated | | | 93,053 | |
Dividends — affiliated | | | 7,367 | |
| |
|
| |
Total income | | | 1,266,322 | |
| |
|
| |
| | | | |
|
|
|
|
|
Expenses | | | | |
|
|
|
|
|
Professional | | | 41,536 | |
Accounting services | | | 32,325 | |
Custodian | | | 23,564 | |
Investment advisory | | | 13,082 | |
Directors | | | 4,052 | |
Printing | | | 698 | |
Other | | | 5,223 | |
| |
|
| |
Total expenses | | | 120,480 | |
Less fees waived by advisor | | | (21,608 | ) |
| |
|
| |
Total expenses after fees waived | | | 98,872 | |
| |
|
| |
Net investment income | | | 1,167,450 | |
| |
|
| |
| | | | |
|
|
|
|
|
Realized and Unrealized Gain (Loss) | | | | |
|
|
|
|
|
Net realized gain (loss) from: | | | | |
Investments | | | 1,959,978 | |
Financial futures contracts | | | (774,407 | ) |
| |
|
| |
| | | 1,185,571 | |
| |
|
| |
Net change in unrealized appreciation/depreciation on: | | | | |
Investments | | | (18,638,780 | ) |
| |
|
| |
Financial futures contracts | | | (404,705 | ) |
| | | (19,043,485 | ) |
| |
|
| |
Total realized and unrealized loss | | | (17,857,914 | ) |
| |
|
| |
Net Decrease in Net Assets Resulting from Operations | | $ | (16,690,464 | ) |
| |
|
| |
| | |
See Notes to Financial Statements. | | |
|
|
|
BLACKROCK SMALL CAP INDEX FUND | JUNE 30, 2010 | 37 |
| |
|
|
Statements of Changes in Net Assets | Master Small Cap Index Series |
| | | | | | | |
Increase (Decrease) in Net Assets: | | Six Months
Ended
June 30,
2010
(Unaudited) | | Year Ended
December 31,
2009 | |
|
|
|
|
|
|
Operations | | | | | | | |
|
|
|
|
|
|
|
|
Net investment income | | $ | 1,167,450 | | $ | 4,243,420 | |
Net realized gain (loss) | | | 1,185,571 | | | (30,867,280 | ) |
Net change in unrealized appreciation/depreciation | | | (19,043,485 | ) | | 124,588,792 | |
| |
|
|
|
|
|
|
Net increase (decrease) in net assets resulting from operations | | | (16,690,464 | ) | | 97,964,932 | |
| |
|
|
|
|
|
|
| | | | | | | |
|
|
|
|
|
|
|
|
Capital Transactions | | | | | | | |
|
|
|
|
|
|
|
|
Proceeds from contributions | | | 133,107,328 | | | 171,416,855 | |
Value of withdrawals | | | (55,981,415 | ) | | (384,465,211 | ) |
| |
|
|
|
|
|
|
Net increase (decrease) in net assets derived from capital transactions | | | 77,125,913 | | | (213,048,356 | ) |
| |
|
|
|
|
|
|
| | | | | | | |
|
|
|
|
|
|
|
|
Net Assets | | | | | | | |
|
|
|
|
|
|
|
|
Total increase (decrease) in net assets | | | 60,435,449 | | | (115,083,424 | ) |
Beginning of period | | | 229,636,696 | | | 344,720,120 | |
| |
|
|
|
|
|
|
End of period | | $ | 290,072,145 | | $ | 229,636,696 | |
| |
|
|
|
|
|
|
| | |
See Notes to Financial Statements. |
|
38 | BLACKROCK SMALL CAP INDEX FUND | JUNE 30, 2010 |
| |
|
|
Financial Highlights | Master Small Cap Index Series |
| | | | | | | | | | | | | | | | | | | |
| | Six Months
Ended
June 30,
2010
(Unaudited) | | | |
| | | Year Ended December 31, | |
| | |
|
| | | 2009 | | 2008 | | 2007 | | 2006 | | 2005 | |
|
|
|
|
|
|
|
|
|
|
|
|
|
|
Total Investment Return | | | | | | | | | | | | | | | | | | | |
|
|
|
|
|
|
|
|
|
|
|
|
|
|
|
|
|
|
|
|
Total investment return | | | (1.84 | )%1 | | 27.37 | % | | (33.57 | )% | | (1.46 | )% | | 18.13 | % | | 4.63 | % |
| |
|
|
|
|
|
|
|
|
|
|
|
|
|
|
|
|
|
|
| | | | | | | | | | | | | | | | | | | |
|
|
|
|
|
|
|
|
|
|
|
|
|
|
|
|
|
|
|
|
Ratios to Average Net Assets | | | | | | | | | | | | | | | | | | | |
|
|
|
|
|
|
|
|
|
|
|
|
|
|
|
|
|
|
|
|
Total expenses | | | 0.09 | %2 | | 0.09 | % | | 0.08 | % | | 0.06 | % | | 0.07 | % | | 0.08 | % |
| |
|
|
|
|
|
|
|
|
|
|
|
|
|
|
|
|
|
|
Total expenses after fees waived and paid indirectly | | | 0.08 | %2 | | 0.07 | % | | 0.07 | % | | 0.06 | % | | 0.07 | % | | 0.07 | % |
| |
|
|
|
|
|
|
|
|
|
|
|
|
|
|
|
|
|
|
Net investment income | | | 0.89 | %2 | | 1.27 | % | | 1.60 | % | | 1.69 | % | | 1.55 | % | | 1.17 | % |
| |
|
|
|
|
|
|
|
|
|
|
|
|
|
|
|
|
|
|
| | | | | | | | | | | | | | | | | | | |
|
|
|
|
|
|
|
|
|
|
|
|
|
|
|
|
|
|
|
|
Supplemental Data | | | | | | | | | | | | | | | | | | | |
|
|
|
|
|
|
|
|
|
|
|
|
|
|
|
|
|
|
|
|
Net assets, end of period (000) | | $ | 290,072 | | $ | 229,637 | | $ | 344,720 | | $ | 630,394 | | $ | 561,373 | | $ | 370,145 | |
| |
|
|
|
|
|
|
|
|
|
|
|
|
|
|
|
|
|
|
Portfolio turnover | | | 16 | % | | 43 | % | | 42 | % | | 26 | % | | 40 | % | | 37 | % |
| |
|
|
|
|
|
|
|
|
|
|
|
|
|
|
|
|
|
|
| | |
| 1 | Aggregate total investment return. |
| | |
| 2 | Annualized. |
| | |
See Notes to Financial Statements. | | |
|
|
|
BLACKROCK SMALL CAP INDEX FUND | JUNE 30, 2010 | 39 |
| |
|
| |
Notes to Financial Statements (Unaudited) | Master Small Cap Index Series |
1. Organization and Significant Accounting Policies:
Master Small Cap Index Series (the “Series”), a non-diversified, open-end management investment company, is a series of Quantitative Master Series LLC (the “Master LLC”). The Master LLC is registered as an investment company under the Investment Company Act of 1940, as amended (the “1940 Act”), and is organized as a Delaware limited liability company. The Master LLC’s Limited Liability Company Agreement permits the Board of Directors of the Master LLC (the “Board”) to issue non-transferable interests, subject to certain limitations. The Series’ financial statements are prepared in conformity with accounting principles generally accepted in the United States of America, which may require management to make estimates and assumptions that affect the reported amounts and disclosures in the financial statements. Actual results could differ from those estimates.
The following is a summary of significant accounting policies followed by the Master LLC:
Valuation: The Series’ policy is to fair value its financial instruments at market value using independent dealers or pricing services selected under the supervision of the Board. Equity investments traded on a recognized securities exchange or the NASDAQ Global Market System are valued at the last reported sale price that day or the NASDAQ official closing price, if applicable. For equity investments traded on more than one exchange, the last reported sale price on the exchange where the stock is primarily traded is used. Equity investments traded on a recognized exchange for which there were no sales on that day are valued at the last available bid price. If no bid price is available, the prior day’s price will be used, unless it is determined that such prior day’s price no longer reflects the fair value of the security. Financial futures contracts traded on exchanges are valued at their last sale price. Investments in open-end investment companies are valued at net asset value each business day. Short-term securities with remaining maturities of 60 days or less may be valued at amortized cost, which approximates fair value.
The Series values its investment in BlackRock Liquidity Series, LLC Money Market Series (the “Money Market Series”) at fair value, which is ordinarily based upon its pro rata ownership in the net assets of the underlying fund. The Money Market Series seeks current income consistent with maintaining liquidity and preserving capital. Although the Money Market Series is not registered under the 1940 Act, its investments will follow the parameters of investments by a money market fund that is subject to Rule 2a-7 promulgated by the Securities and Exchange Commission (the “SEC”) under the 1940 Act. The Series may withdraw up to 25% of its investment daily, although the manager of the Money Market Series, in its sole discretion, may permit an investor to withdraw more than 25% on any one day.
In the event that application of these methods of valuation results in a price for an investment which is deemed not to be representative of the market value of such investment or is not available, the investment will be valued in accordance with a policy approved by the Board as reflecting fair value (“Fair Value Assets”). When determining the price for Fair Value Assets, the investment advisor and/or the sub-advisor seeks to determine the price that the Series might reasonably expect to receive from the current sale of that asset in an arm’s-length transaction. Fair value determinations shall be based upon all available factors that the investment advisor and/or sub-advisor deems relevant. The pricing of all Fair Value Assets is subsequently reported to the Board or a committee thereof.
Segregation and Collateralization: In cases in which the 1940 Act and the interpretive positions of the SEC require that the Series either delivers collateral or segregates assets in connection with certain investments (e.g., financial futures contracts), the Series will, consistent with SEC rules and/or certain interpretive letters issued by the SEC, segregate collateral or designate on its books and records cash or other liquid securities having a market value at least equal to the amount that would otherwise be required to be physically segregated. Furthermore, based on requirements and agreements with certain exchanges and third party broker-dealers, each party has requirements to deliver/deposit securities as collateral for certain investments.
Investment Transactions and Investment Income: For financial reporting purposes, investment transactions are recorded on the dates the transactions are entered into (the trade dates). Realized gains and losses on investment transactions are determined on the identified cost basis. Dividend income is recorded on the ex-dividend dates. Upon notification from issuers, some of the dividend income received from a real estate investment trust may be redesignated as a reduction of cost of the related investment and/or realized gain. Interest income, including amortization of premium and accretion of discount on debt securities, is recognized on the accrual basis.
Securities Lending: The Series may lend securities to financial institutions that provide cash as collateral, which will be maintained at all times in an amount equal to at least 100% of the current market value of the loaned securities. The market value of the loaned securities is determined at the close of business of the Series and any additional required collateral is delivered to the Series on the next business day. Securities lending income, as disclosed in the Statement of Operations, represents the income earned from the investment of the cash collateral, net of rebates paid to, or fees paid by, borrowers and less the fees paid to the securities lending agent. Loans of securities are terminable at any time and the borrower, after notice, is required to return borrowed securities within the standard time period for settlement of securities transactions. In the event that the borrower defaults on its obligation to return borrowed securities because of insolvency or for any other reason, the Series could experience delays and costs in gaining access to the collateral. The Series also could suffer a loss if the value of an investment purchased with cash collateral falls below the market value of loaned securities or if the value of an investment purchased with cash collateral falls below the value of the original cash collateral received.
| | |
|
40 | BLACKROCK SMALL CAP INDEX FUND | JUNE 30, 2010 |
| |
|
|
Notes to Financial Statements (continued) | Master Small Cap Index Series |
Income Taxes: The Series is classified as a partnership for federal income tax purposes. As such, each investor in the Series is treated as owner of its proportionate share of the net assets, income, expenses and realized and unrealized gains and losses of the Master LLC. Therefore, no federal income tax provision is required. It is intended that the Series assets will be managed so an investor in the Series can satisfy the requirements of Subchapter M of the Internal Revenue Code of 1986, as amended.
The Series files US federal and various state and local tax returns. No income tax returns are currently under examination. The statute of limitations on the Series’ US federal tax returns remains open for each of the four years ended December 31, 2009. The statutes of limitations on the Series’ state and local tax returns may remain open for an additional year depending upon the jurisdiction.
2. Derivative Financial Instruments:
The Series engages in various portfolio investment strategies using derivative contracts both to increase the returns of the Series and to economically hedge, or protect, its exposure to certain risks such as equity risk. These contracts may be transacted on an exchange. Losses may arise if the value of the contract decreases due to an unfavorable change in the market rates or values of the underlying instrument or if the counterparty does not perform under the contract. Counterparty risk related to exchange traded financial futures contracts is minimal because of the protection against defaults provided by the exchange on which they trade.
Financial Futures Contracts: The Series purchases or sells financial futures contracts and options on financial futures contracts to gain exposure to, or economically hedge against, changes in the value of equity securities (equity risk). Financial futures contracts are contracts for delayed delivery of securities or currencies at a specific future date and at a specific price or yield. Pursuant to the contract, the Series agrees to receive from or pay to the broker an amount of cash equal to the daily fluctuation in value of the contract. Such receipts or payments are known as margin variation and are recognized by the Series as unrealized gains or losses. When the contract is closed, the Series records a realized gain or loss equal to the difference between the value of the contract at the time it was opened and the value at the time it was closed. The use of financial futures transactions involves the risk of an imperfect correlation in the movements in the price of financial futures contracts, interest rates and the underlying assets.
| | | | | | | |
Derivative Instruments Categorized by Risk Exposure:
|
|
Fair Value of Derivative Instruments as of June 30, 2010 |
|
| | Liability Derivatives | |
| |
|
|
| | Statement of
Assets and
Liabilities
Location | | Value | |
|
|
|
|
|
|
| | Net | | | | |
| | unrealized | | | | |
| | appreciation/ | | | | |
Equity contracts | | depreciation* | | $316,132 | |
|
| | |
| * | Includes cumulative appreciation/depreciation of financial futures contracts as reported in the Schedule of Investments. Only current day’s margin variation is reported within the Statement of Assets and Liabilities. |
| | | |
|
The Effect of Derivative Instruments on the Statement of Operations
Six Months Ended June 30, 2010 |
|
| | Net Realized Loss from | |
| |
| |
| | Financial Futures Contracts | |
| |
| |
Equity contracts | | $(774,407) | |
| |
|
| | Net Change in Unrealized | |
| | Appreciation/Depreciation on | |
| |
| |
| | Financial Futures Contracts | |
| |
| |
Equity contracts | | $(404,705) | |
| |
For the six months ended June 30, 2010, the average quarterly balance of outstanding derivative financial instruments was as follows:
| | | | |
|
Financial futures contracts: | | | | |
Average number of contracts purchased | | | 120 | |
Average notional value of contracts purchased | | $ | 7,727,206 | |
|
3. Investment Advisory Agreement and Other Transactions with Affiliates:
The PNC Financial Services Group, Inc. (“PNC”), Bank of America Corporation (“BAC”) and Barclays Bank PLC (“Barclays”) are the largest stockholders of BlackRock, Inc. (“BlackRock”). Due to the ownership structure, PNC is an affiliate of the Series for 1940 Act purposes, but BAC and Barclays are not.
The Master LLC, on behalf of the Series, entered into an Investment Advisory Agreement with BlackRock Advisors, LLC (the “Manager”), the Series’ investment advisor, an indirect, wholly owned subsidiary of BlackRock, to provide investment advisory and administration services. The Manager is responsible for the management of the Series’ portfolio and provides the necessary personnel, facilities, equipment and certain other services necessary to the operations of the Series. For such services, the Series pays the Manager a monthly fee at an annual rate 0.01% of the Series’ average daily net assets.
The Manager contractually agreed to waive and/or reimburse fees and/or expenses to ensure that the management fee of the Series, when
| | |
|
|
|
BLACKROCK SMALL CAP INDEX FUND | JUNE 30, 2010 | 41 |
| |
|
|
Notes to Financial Statements (continued) | Master Small Cap Index Series |
combined with the administration fee of BlackRock Small Cap Index Fund of BlackRock Index Funds, Inc., will not exceed 0.30%. No fees are currently being waived for the Series.
The Manager entered into a contractual arrangement with the Master LLC with respect to the Series under which the Manager will waive and/or reimburse its fees and/or expenses so that the total annual operating expenses incurred by the Series (excluding interest expense, acquired fund fees and certain other Series’ expenses) will not exceed 0.08% of the average daily value of the Series’ net assets. For the six months ended June 30, 2010, the Manager waived $18,703, which is included in fees waived by advisor in the Statement of Operations.
The Manager has agreed not to reduce or discontinue these contractual waivers or reimbursements before May 1, 2011 unless approved by the Board, including a majority of the non-interested trustees.
The Manager voluntarily agreed to waive its advisory fees by the amount of investment advisory fees the Series pays to the Manager indirectly through its investment in affiliated money market funds; however, the Manager does not waive its advisory fees by the amount of investment advisory fees paid through its investment in other affiliated investment companies, if any. For the six months ended June 30, 2010, the manager waived advisory fees in the amount of $2,905, which is included in fees waived by advisor in the Statement of Operations.
The Manager entered into a sub-advisory agreement with BlackRock Investment Management, LLC (“BIM”), an affiliate of the Manager. The Manager pays BIM for services it provides, a monthly fee that is a percentage of the investment advisory fees paid by the Series to the Manager.
For the six months ended June 30, 2010, the Series reimbursed the Manager $4,186 for certain accounting services, which is included in accounting services in the Statement of Operations.
The Master LLC, on behalf of the Series, received an exemptive order from the SEC permitting, among other things, to pay an affiliated securities lending agent a fee based on a share of the income derived from the securities lending activities and has retained BIM as the securities lending agent. BIM may, on behalf of the Master LLC and the Series, invest cash collateral received by the Series for such loans, among other things, in a private investment company managed by the Manager or in registered money market funds advised by the Manager or its affiliates. The market value of securities on loan and the value of the related collateral are shown in the Statement of Assets and Liabilities as securities loaned and collateral on securities loaned, at value, respectively. The cash collateral invested by BIM is disclosed in the Schedule of Investments. The share of income earned by the Series on such investments is shown as securities lending — affiliated in the Statement of Operations. For the six months ended June 30, 2010, BIM received $23,627 in securities lending agent fees related to securities lending activities for the Series.
Certain officers and/or directors of the Master LLC are officers and/or directors of BlackRock or its affiliates.
4. Investments:
Purchases and sales of investments, excluding short-term securities for the six months ended June 30, 2010, were $115,391,532 and $42,064,540, respectively.
5. Borrowings:
The Master LLC, on behalf of the Series, along with certain other funds managed by the Manager and its affiliates, is a party to a $500 million credit agreement with a group of lenders, which expires in November 2010.The Series may borrow under the credit agreement to fund shareholder redemptions. The Series paid its pro rata share of a 0.02% upfront fee on the aggregate commitment amount which was allocated to the Series based on its net assets as of October 31, 2009, a commitment fee of 0.10% per annum based on the Series’ pro rata share of the unused portion of the credit agreement, which is included in miscellaneous in the Statement of Operations, and interest at a rate equal to the higher of (a) the one-month LIBOR plus 1.25% per annum and (b) the Fed Funds rate plus 1.25% per annum on amounts borrowed. The Series did not borrow under the credit agreement during the six months ended June 30, 2010.
6. Concentration, Market and Credit Risk:
In the normal course of business, the Series invests in securities and enters into transactions where risks exist due to fluctuations in the market (market risk) or failure of the issuer of a security to meet all its obligations (issuer credit risk). The value of securities held by the Series may decline in response to certain events, including those directly involving the issuers whose securities are owned by the Series; conditions affecting the general economy; overall market changes; local, regional or global political, social or economic instability; and currency and interest rate and price fluctuations. Similar to issuer credit risk, the Series may be exposed to counterparty credit risk, or the risk that an entity with which the Series has unsettled or open transactions may fail to or be unable to perform its commitments. The Series manages counterparty credit risk by entering into transactions only with counterparties that it believes have the financial resources to honor their obligations and by monitoring the financial stability of those counterparties. Financial assets, which potentially expose the Series to market, issuer and counterparty credit risks, consist principally of financial instruments and receivables due from counterparties. The extent of the Series’ exposure to market, issuer and counterparty credit risks with respect to these financial assets is generally approximated by their value recorded in the Series’ Statement of Assets and Liabilities, less any collateral held by the Series.
The Series invests a significant portion of its assets in securities in the financial services sector. Changes in economic conditions affecting the sector would have a greater impact on the Series and could affect the value, income and/or liquidity of positions in such securities.
| | |
|
42 | BLACKROCK SMALL CAP INDEX FUND | JUNE 30, 2010 |
| |
|
|
Notes to Financial Statements (concluded) | Master Small Cap Index Series |
7. Subsequent Events:
Management has evaluated the impact of all subsequent events on the Series through the date the financial statements were issued and has determined that there were no subsequent events requiring adjustment or additional disclosure in the financial statements.
| | |
|
|
|
BLACKROCK SMALL CAP INDEX FUND | JUNE 30, 2010 | 43 |
|
|
|
Disclosure of Investment Advisory Agreement and Sub-Advisory Agreement |
The Board of Directors of Quantitative Master Series LLC (the “Master LLC”) met on April 20, 2010 and May 18 – 19, 2010 to consider the approval of the Master LLC’s investment advisory agreement (the “Advisory Agreement”) with BlackRock Advisors, LLC (the “Manager”), the Master LLC’s investment advisor, on behalf of the Master Small Cap Index Series (the “Master Portfolio”), a series of the Master LLC. The Board of Directors of the Master LLC also considered the approval of the sub-advisory agreement (the “Sub-Advisory Agreement”) between the Manager and BlackRock Investment Management, LLC (the “Sub-Advisor”), with respect to the Master Portfolio. BlackRock Small Cap Index Fund (the “Fund”), a series of BlackRock Index Funds, Inc. (the “Corporation”), is a “feeder” fund that invests all of its investable assets in the Master Portfolio. Accordingly, the Board of Directors of the Corporation also considered the approval of the Advisory Agreement and the Sub-Advisory Agreement with respect to the Master Portfolio. The Manager and the Sub-Advisor are referred to herein as “BlackRock.” The Advisory Agreement and the Sub-Advisory Agreement are referred to herein as the “Agreements.” For simplicity, the Board of Directors of the Master LLC and the Board of Directors of the Corporation are referred to herein collectively as the “Board,” and the members are referred to as “Board Members.”
Activities and Composition of the Board
The Board consists of thirteen individuals, eleven of whom are not “interested persons” of the Master LLC or the Corporation as defined in the Investment Company Act of 1940, as amended (the “1940 Act”) (the “Independent Board Members”). The Board Members are responsible for the oversight of the operations of the Master LLC or the Corporation, as pertinent, and perform the various duties imposed on the directors of investment companies by the 1940 Act. The Independent Board Members have retained independent legal counsel to assist them in connection with their duties. The Co-Chairs of the Board are each Independent Board Members. The Board has established five standing committees: an Audit Committee, a Governance and Nominating Committee, a Compliance Committee, a Performance Oversight and Contract Committee and an Executive Committee, each of which is composed of Independent Board Members (except for the Executive Committee, which also has one interested Board Member) and is chaired by Independent Board Members. The Board also has one ad hoc committee, the Joint Product Pricing Committee, which consists of Independent Board Members and directors/ trustees of the boards of certain other BlackRock-managed funds, who are not “interested persons” of their respective funds.
The Agreements
Pursuant to the 1940 Act, the Board is required to consider the continuation of the Agreements on an annual basis. In connection with this process, the Board assessed, among other things, the nature, scope and quality of the services provided to the Master Portfolio and the Fund by the personnel of BlackRock and its affiliates, including investment management, administrative and shareholder services, oversight of fund accounting and custody, marketing services and assistance in meeting applicable legal and regulatory requirements.
From time to time throughout the year, the Board, acting directly and through its committees, considers at each of its meetings factors that are relevant to its annual consideration of the renewal of the Agreements, including the services and support provided by BlackRock to the Master Portfolio, the Fund and their shareholders. Among the matters the Board considered were: (a) investment performance for one-, three- and five-year periods, as applicable, against peer funds, and applicable benchmarks, if any, as well as senior management and portfolio managers’ analysis of the reasons for any over performance or underperformance against its peers and/or benchmark, as applicable; (b) fees, including advisory, administration, if applicable, and other amounts paid to BlackRock and its affiliates by the Master Portfolio and/or the Fund for services, such as transfer agency, marketing and distribution, call center and fund accounting; (c) Master Portfolio’s and/or the Fund’s operating expenses; (d) the resources devoted to and compliance reports relating to the Master Portfolio’s and the Fund’s investment objective, policies and restrictions; (e) the Master LLC’s and the Corporation’s compliance with its respective Code of Ethics and compliance policies and procedures; (f) the nature, cost and character of non-investment management services provided by BlackRock and its affiliates; (g) BlackRock’s and other service providers’ internal controls; (h) BlackRock’s implementation of the proxy voting policies approved by the Board; (i) the use of brokerage commissions and execution quality of portfolio transactions; (j) BlackRock’s implementation of the Master LLC’s and/or the Corporation’s valuation and liquidity procedures; (k) an analysis of contractual and actual management fees for products with similar investment objectives across the open-end fund, closed-end fund and institutional account product channels; and (l) periodic updates on BlackRock’s business.
Board Considerations in Approving the Agreements
The Approval Process: Prior to the April 20, 2010 meeting, the Board requested and received materials specifically relating to the Agreements. The Board is engaged in a process with BlackRock to periodically review the nature and scope of the information provided to better assist its deliberations. The materials provided in connection with the April meeting included: (a) information independently compiled and prepared by Lipper, Inc. (“Lipper”) on fees and expenses of the Master Portfolio and the Fund, as applicable, and the investment performance of the Fund as compared with a peer group of funds as determined by Lipper (collectively, “Peers”); (b) information on the profitability of the Agreements to BlackRock and a discussion of fall-out benefits to BlackRock and its affiliates and significant shareholders; (c) a general analysis provided by BlackRock concerning investment advisory fees charged to other clients, such as institutional clients and closed-end funds, under similar investment mandates, as well as the performance of such other clients, as applicable; (d) the impact of economies of scale; (e) a summary of aggregate amounts paid by the Master Portfolio and/or the Fund to BlackRock; (f) sales and redemption
| | |
|
44 | BLACKROCK SMALL CAP INDEX FUND | JUNE 30, 2010 |
|
|
|
Disclosure of Investment Advisory Agreement and Sub-Advisory Agreement (continued) |
data regarding the Fund’s shares; and (g) if applicable, a comparison of management fees to similar BlackRock open-end funds, as classified by Lipper.
At an in-person meeting held on April 20, 2010, the Board reviewed materials relating to its consideration of the Agreements. As a result of the discussions that occurred during the April 20, 2010 meeting, the Board presented BlackRock with questions and requests for additional information and BlackRock responded to these requests with additional written information in advance of the May 18 – 19, 2010 Board meeting.
At an in-person meeting held on May 18 – 19, 2010, the Board of the Master LLC, including the Independent Board Members, unanimously approved the continuation of the Advisory Agreement between the Manager and the Master LLC with respect to the Master Portfolio and the Sub-Advisory Agreement between the Manager and the Sub-Advisor with respect to the Master Portfolio, each for a one-year term ending June 30, 2011. The Board of the Corporation, including the Independent Board Members, also considered the continuation of the Agreements and found the Agreements to be satisfactory. In approving the continuation of the Agreements, the Board considered: (a) the nature, extent and quality of the services provided by BlackRock; (b) the investment performance of the Master Portfolio, the Fund and BlackRock; (c) the advisory fee and the cost of the services and profits to be realized by BlackRock and its affiliates from their relationship with the Master Portfolio and the Fund; (d) economies of scale; and (e) other factors deemed relevant by the Board Members.
The Board also considered other matters it deemed important to the approval process, such as payments made to BlackRock or its affiliates relating to the distribution of Fund shares, services related to the valuation and pricing of portfolio holdings of the Master Portfolio, direct and indirect benefits to BlackRock and its affiliates and significant shareholders from their relationship with the Master Portfolio and the Fund and advice from independent legal counsel with respect to the review process and materials submitted for the Board’s review. The Board noted the willingness of BlackRock personnel to engage in open, candid discussions with the Board. The Board did not identify any particular information as controlling, and each Board Member may have attributed different weights to the various items considered.
A. Nature, Extent and Quality of the Services Provided by BlackRock: The Board, including the Independent Board Members, reviewed the nature, extent and quality of services provided by BlackRock, including the investment advisory services and the resulting performance of the Fund. Throughout the year, the Board compared the Fund’s performance to the performance of a comparable group of mutual funds, and the performance of a relevant benchmark, if any. The Board met with BlackRock’s senior management personnel responsible for investment operations, including the senior investment officers. The Board also reviewed the materials provided by the portfolio management team discussing performance and the investment objective, strategies and outlook.
The Board considered, among other factors, the number, education and experience of BlackRock’s investment personnel generally and the Master Portfolio’s portfolio management team, investments by portfolio managers in the funds they manage, BlackRock’s portfolio trading capabilities, BlackRock’s use of technology, BlackRock’s commitment to compliance and BlackRock’s approach to training and retaining portfolio managers and other research, advisory and management personnel. The Board also reviewed a general description of BlackRock’s compensation structure with respect to the Master Portfolio’s portfolio management team and BlackRock’s ability to attract and retain high-quality talent.
In addition to advisory services, the Board considered the quality of the administrative and non-investment advisory services provided to the Master Portfolio and the Fund. BlackRock and its affiliates and significant shareholders provide the Master Portfolio and the Fund with certain administrative, transfer agency, shareholder and other services (in addition to any such services provided to the Master Portfolio and the Fund by third parties) and officers and other personnel as are necessary for the operations of the Master Portfolio and the Fund. In addition to investment advisory services, BlackRock and its affiliates provide the Master Portfolio and the Fund with other services, including: (i) preparing disclosure documents, such as the prospectus, the statement of additional information and periodic shareholder reports; (ii) assisting with daily accounting and pricing; (iii) overseeing and coordinating the activities of other service providers; (iv) organizing Board meetings and preparing the materials for such Board meetings; (v) providing legal and compliance support; and (vi) performing other administrative functions necessary for the operation of the Master Portfolio and the Fund, such as tax reporting, fulfilling regulatory filing requirements, and call center services. The Board reviewed the structure and duties of BlackRock’s fund administration, accounting, legal and compliance departments and considered BlackRock’s policies and procedures for assuring compliance with applicable laws and regulations.
B. The Investment Performance of the Master Portfolio, the Fund and BlackRock: The Board, including the Independent Board Members, also reviewed and considered the performance history of the Master Portfolio and the Fund, as applicable. The Board noted that the Master Portfolio’s investment results correspond directly to the investment results of the Fund. In preparation for the April 20, 2010 meeting, the Board was provided with reports, independently prepared by Lipper, which included a comprehensive analysis of the Fund’s performance. The Board also reviewed a narrative and statistical analysis of the Lipper data that was prepared by BlackRock, which analyzed various factors that affect Lipper’s rankings. In connection with its review, the Board received and reviewed information regarding the investment performance of the Fund as compared to a representative group of similar funds as determined by Lipper and to all funds in the Fund’s applicable Lipper category. The Board was
| | |
|
|
|
BLACKROCK SMALL CAP INDEX FUND | JUNE 30, 2010 | 45 |
|
|
|
Disclosure of Investment Advisory Agreement and Sub-Advisory Agreement (continued) |
provided with a description of the methodology used by Lipper to select peer funds. The Board regularly reviews the performance of the Master Portfolio and the Fund, as applicable, throughout the year. The Board attaches more importance to performance over relatively long periods of time, typically three to five years.
The Board noted that the Fund performed below the median of its Lipper Performance Universe in each of the one-, three- and five-year periods reported. The Board and BlackRock reviewed the reasons for the Fund’s underperformance during these periods compared with its Peers. The Board was informed that, among other things, over the one-, three- and five-year periods, the Fund met its objective of matching the risk and return of the Russell 2000 Index prior to fees and expenses.
The Board and BlackRock discussed BlackRock’s strategy for improving the Fund’s performance and BlackRock’s commitment to providing the resources necessary to assist the Master Portfolio’s portfolio managers and to improve the Fund’s performance.
C. Consideration of the Advisory Fees and the Cost of the Services and Profits to be Realized by BlackRock and its Affiliates from their Relationship with the Master Portfolio and the Fund: The Board, including the Independent Board Members, reviewed the Master Portfolio’s contractual advisory fee rate compared with the other funds in the Fund’s Lipper category. It also compared the Fund’s total expenses, as well as actual management fees, to those of other funds in its Lipper category. The Board considered the services provided and the fees charged by BlackRock to other types of clients with similar investment mandates, including separately managed institutional accounts.
The Board received and reviewed statements relating to BlackRock’s financial condition and profitability with respect to the services it provided the Master Portfolio and the Fund. The Board was also provided with a profitability analysis that detailed the revenues earned and the expenses incurred by BlackRock for services provided to the Master Portfolio and the Fund. The Board reviewed BlackRock’s profitability with respect to the Master Portfolio and the Fund, as applicable, and other funds the Board currently oversees for the year ended December 31, 2009 compared to available aggregate profitability data provided for the year ended December 31, 2008. The Board reviewed BlackRock’s profitability with respect to other fund complexes managed by the Manager and/or its affiliates. The Board reviewed BlackRock’s assumptions and methodology of allocating expenses in the profitability analysis, noting the inherent limitations in allocating costs among various advisory products. The Board recognized that profitability may be affected by numerous factors including, among other things, fee waivers and expense reimbursements by the Manager, the types of funds managed, expense allocations and business mix, and the difficulty of comparing profitability as a result of those factors.
The Board noted that, in general, individual fund or product line profitability of other advisors is not publicly available. Nevertheless, to the extent such information was available, the Board considered BlackRock’s operating margin, in general, compared to the operating margin for leading investment management firms whose operations include advising open-end funds, among other product types. That data indicates that operating margins for BlackRock with respect to its registered funds are generally consistent with margins earned by similarly situated publicly traded competitors. In addition, the Board considered, among other things, certain third party data comparing BlackRock’s operating margin with that of other publicly traded asset management firms. That third party data indicates that larger asset bases do not, in themselves, translate to higher profit margins.
In addition, the Board considered the cost of the services provided to the Master Portfolio and the Fund by BlackRock, and BlackRock’s and its affiliates’ profits relating to the management and distribution of the Master Portfolio and the Fund and the other funds advised by BlackRock and its affiliates. As part of its analysis, the Board reviewed BlackRock’s methodology in allocating its costs to the management of the Master Portfolio and the Fund. The Board also considered whether BlackRock has the financial resources necessary to attract and retain high-quality investment management personnel to perform its obligations under the Agreements and to continue to provide the high quality of services that is expected by the Board.
The Board noted that the Fund’s contractual advisory fee rate was lower than or equal to the median contractual advisory fee rate paid by the Fund’s Peers, in each case before taking into account any expense reimbursements or fee waivers. The Board also noted that BlackRock has contractually agreed to waive fees and/or reimburse expenses so that the advisory fee of the Master Portfolio, when combined with the administration fee of the Fund, will not exceed a specified amount. Additionally, the Board noted that BlackRock has contractually agreed to waive fees and/or reimburse expenses in order to limit, to a specified amount, the Master Portfolio’s total operating expenses as a percentage of the Master Portfolio’s average daily net assets and has voluntarily agreed to waive fees and/or reimburse expenses to limit the Fund’s total operating expenses as a percentage of the Fund’s average daily net assets on a class-by-class basis, as applicable.
D. Economies of Scale: The Board, including the Independent Board Members, considered the extent to which economies of scale might be realized as the assets of the Master Portfolio and the Fund increase. The Board also considered the extent to which the Master Portfolio and the Fund benefit from such economies and whether there should be changes in the advisory fee rate or structure in order to enable the Master Portfolio and the Fund to participate in these economies of scale, for example through the use of breakpoints in the advisory fee based upon the asset level of the Master Portfolio.
| | |
|
46 | BLACKROCK SMALL CAP INDEX FUND | JUNE 30, 2010 |
|
|
|
Disclosure of Investment Advisory Agreement and Sub-Advisory Agreement (concluded) |
E. Other Factors Deemed Relevant by the Board Members: The Board, including the Independent Board Members, also took into account other ancillary or “fall-out” benefits that BlackRock or its affiliates and significant shareholders may derive from their respective relationships with the Master Portfolio and the Fund, both tangible and intangible, such as BlackRock’s ability to leverage its investment professionals who manage other portfolios, an increase in BlackRock’s profile in the investment advisory community, and the engagement of BlackRock’s affiliates and significant shareholders as service providers to the Master Portfolio and the Fund, including for administrative, transfer agency and distribution services. The Board also considered BlackRock’s overall operations and its efforts to expand the scale of, and improve the quality of, its operations. The Board also noted that BlackRock may use and benefit from third party research obtained by soft dollars generated by certain mutual fund transactions to assist in managing all or a number of its other client accounts. The Board further noted that BlackRock completed the acquisition of a complex of exchange-traded funds (“ETFs”) on December 1, 2009, and that BlackRock’s funds may invest in such ETFs without any offset against the management fees payable by the funds to BlackRock.
In connection with its consideration of the Agreements, the Board also received information regarding BlackRock’s brokerage and soft dollar practices. The Board received reports from BlackRock which included information on brokerage commissions and trade execution practices throughout the year.
The Board noted the competitive nature of the open-end fund marketplace, and that shareholders are able to redeem their Fund shares if they believe that the Fund’s fees and expenses are too high or if they are dissatisfied with the performance of the Fund.
Conclusion
The Board of the Master LLC, including the Independent Board Members, unanimously approved the continuation of the Advisory Agreement between the Manager and the Master LLC, with respect to the Master Portfolio, for a one-year term ending June 30, 2011 and the Sub-Advisory Agreement between the Manager and the Sub-Advisor, with respect to the Master Portfolio, for a one-year term ending June 30, 2011. As part of its approval, the Board of the Master LLC considered the detailed review of BlackRock’s fee structure, as it applies to the Master LLC, being conducted by the ad hoc Joint Product Pricing Committee. Based upon its evaluation of all of the aforementioned factors in their totality, the Board of the Master LLC, including the Independent Board Members, was satisfied that the terms of the Agreements were fair and reasonable and in the best interest of the Master Portfolio and its shareholders. The Board of the Corporation, including the Independent Board Members, also considered the continuation of the Agreements with respect to the Master Portfolio and found the Agreements to be satisfactory. In arriving at a decision to approve the Agreements, the Board of the Master LLC did not identify any single factor or group of factors as all-important or controlling, but considered all factors together, and different Board Members may have attributed different weights to the various factors considered. The Independent Board Members were also assisted by the advice of independent legal counsel in making this determination. The contractual fee arrangements for the Master Portfolio reflect the results of several years of review by the Board Members and predecessor Board Members, and discussions between such Board Members (and predecessor Board Members) and BlackRock. Certain aspects of the arrangements may be the subject of more attention in some years than in others, and the Board Members’ conclusions may be based in part on their consideration of these arrangements in prior years.
| | |
|
|
|
BLACKROCK SMALL CAP INDEX FUND | JUNE 30, 2010 | 47 |
|
|
|
Officers and Directors |
|
Ronald W. Forbes, Co-Chairman of the Board and Director |
Rodney D. Johnson, Co-Chairman of the Board and Director |
David O. Beim, Director |
Richard S. Davis, Director |
Henry Gabbay, Director |
Dr. Matina Horner, Director |
Herbert I. London, Director and Member of the Audit Committee |
Cynthia A. Montgomery, Director |
Joseph P. Platt, Jr., Director |
Robert C. Robb, Jr., Director |
Toby Rosenblatt, Director |
Kenneth L. Urish, Chairman of the Audit Committee and Director |
Frederick W. Winter, Director and Member of the Audit Committee |
Anne Ackerley, Fund/Master LLC President and Chief Executive Officer |
Jeffrey Holland, Vice President |
Brendan Kyne, Vice President |
Brian Schmidt, Vice President |
Neal Andrews, Chief Financial Officer |
Jay Fife, Treasurer |
Brian Kindelan, Chief Compliance Officer of the Fund/Master LLC |
Howard Surloff, Secretary |
|
Investment Advisor |
BlackRock Advisors, LLC |
Wilmington, DE 19809 |
|
Sub-Advisor |
BlackRock Investment Management, LLC |
Plainsboro, NJ 08536 |
|
Custodian |
State Street Bank and Trust Company |
North Quincy, MA 02171 |
|
Transfer Agent |
BNY Mellon Investment Servicing (US) Inc. |
Wilmington, DE 19809 |
|
Accounting Agent |
State Street Bank and Trust Company |
Princeton, NJ 08540 |
|
Distributor |
BlackRock Investments, LLC |
New York, NY 10022 |
|
Legal Counsel |
Sidley Austin LLP |
New York, NY 10019 |
|
Independent Registered Public Accounting Firm |
Deloitte & Touche LLP |
Princeton, NJ 08540 |
|
Address of the Fund |
100 Bellevue Parkway |
Wilmington, DE 19809 |
| | |
|
48 | BLACKROCK SMALL CAP INDEX FUND | JUNE 30, 2010 |
|
|
|
Additional Information |
|
|
General Information |
|
Electronic Delivery
Electronic copies of most financial reports and prospectuses are available on the Fund’s website or shareholders can sign up for e-mail notifications of quarterly statements, annual and semi-annual reports and prospectuses by enrolling in the Fund’s electronic delivery program.
To enroll:
Shareholders Who Hold Accounts with Investment Advisors, Banks or Brokerages:
Please contact your financial advisor. Please note that not all investment advisors, banks or brokerages may offer this service.
Shareholders Who Hold Accounts Directly with BlackRock:
| |
1) | Access the BlackRock website at |
| http://www.blackrock.com/edelivery |
| |
2) | Select “eDelilvery” under the “More Information” section |
| |
3) | Log into your account |
Householding
The Fund will mail only one copy of shareholder documents, including prospectuses, annual and semi-annual reports and proxy statements, to shareholders with multiple accounts at the same address. This practice is commonly called “householding” and is intended to reduce expenses and eliminate duplicate mailings of shareholder documents. Mailings of your shareholder documents may be householded indefinitely unless you instruct us otherwise. If you do not want the mailing of these documents to be combined with those for other members of your household, please call (800) 441-7762.
Availability of Quarterly Portfolio Schedule of Investments
The Fund/Series file their complete schedule of portfolio holdings with the Securities and Exchange Commission (the “SEC”) for the first and third quarters of each fiscal year on Form N-Q. The Fund’s/Series’ Forms N-Q are available on the SEC’s website at http://www.sec.gov and may also be reviewed and copied at the SEC’s Public Reference Room in Washington, D.C. Information on the operation of the Public Reference Room may be obtained by calling (800) SEC-0330. The Fund’s/Series’ Forms N-Q may also be obtained upon request and without charge by calling (800) 441-7762.
Availability of Proxy Voting Policies and Procedures
A description of the policies and procedures that the Fund/Series uses to determine how to vote proxies relating to portfolio securities is available (1) without charge, upon request, by calling (800) 441-7762; (2) at http://www.blackrock.com; and (3) on the SEC’s website at http://www.sec.gov.
Availability of Proxy Voting Record
Information on how the Fund/Series voted proxies relating to securities held in the Fund’s/Series’ portfolio during the most recent 12-month period ended June 30 is available upon request and without charge (1) at http://www.blackrock.com or by calling (800) 441-7762 and (2) on the SEC’s website at http://www.sec.gov.
| | |
|
|
|
BLACKROCK SMALL CAP INDEX FUND | JUNE 30, 2010 | 49 |
|
|
|
Additional Information (concluded) |
|
|
Shareholder Privileges |
|
Account Information
Call us at (800) 441-7762 from 8:00 AM to 6:00 PM EST on any business day to get information about your account balances, recent transactions and share prices. You can also reach us on the Web at http://www.blackrock.com/funds.
Automatic Investment Plans
Investor Class shareholders who want to invest regularly can arrange to have $50 or more automatically deducted from their checking or savings account and invested in any of the BlackRock funds.
Systematic Withdrawal Plans
Investor Class shareholders can establish a systematic withdrawal plan and receive periodic payments of $50 or more from their BlackRock funds, as long as their account balance is at least $10,000.
Retirement Plans
Shareholders may make investments in conjunction with Traditional, Rollover, Roth, Coverdell, Simple IRAs, SEP IRAs and 403(b) Plans.
|
|
BlackRock Privacy Principles |
|
BlackRock is committed to maintaining the privacy of its current and former fund investors and individual clients (collectively, “Clients”) and to safeguarding their non-public personal information. The following information is provided to help you understand what personal information BlackRock collects, how we protect that information and why in certain cases we share such information with select parties.
If you are located in a jurisdiction where specific laws, rules or regulations require BlackRock to provide you with additional or different privacy-related rights beyond what is set forth below, then BlackRock will comply with those specific laws, rules or regulations.
BlackRock obtains or verifies personal non-public information from and about you from different sources, including the following: (i) information we receive from you or, if applicable, your financial intermediary, on applications, forms or other documents; (ii) information about your transactions with us, our affiliates, or others; (iii) information we receive from a consumer reporting agency; and (iv) from visits to our websites.
BlackRock does not sell or disclose to non-affiliated third parties any non-public personal information about its Clients, except as permitted by law or as is necessary to respond to regulatory requests or to service Client accounts. These non-affiliated third parties are required to protect the confidentiality and security of this information and to use it only for its intended purpose.
We may share information with our affiliates to service your account or to provide you with information about other BlackRock products or services that may be of interest to you. In addition, BlackRock restricts access to non-public personal information about its Clients to those BlackRock employees with a legitimate business need for the information. BlackRock maintains physical, electronic and procedural safeguards that are designed to protect the non-public personal information of its Clients, including procedures relating to the proper storage and disposal of such information.
| | |
|
50 | BLACKROCK SMALL CAP INDEX FUND | JUNE 30, 2010 |
|
|
|
A World-Class Mutual Fund Family |
BlackRock offers a diverse lineup of open-end mutual funds crossing all investment styles and managed by experts in equity, fixed income and tax-exempt investing.
|
|
Equity Funds |
|
|
BlackRock All-Cap Energy & Resources Portfolio |
BlackRock Asset Allocation Portfolio† |
BlackRock Balanced Capital Fund† |
BlackRock Basic Value Fund |
BlackRock Capital Appreciation Fund |
BlackRock Energy & Resources Portfolio |
BlackRock Equity Dividend Fund |
BlackRock EuroFund |
BlackRock Focus Growth Fund |
BlackRock Focus Value Fund |
BlackRock Global Allocation Fund† |
BlackRock Global Dynamic Equity Fund |
BlackRock Global Emerging Markets Fund |
BlackRock Global Financial Services Fund |
BlackRock Global Growth Fund |
BlackRock Global Opportunities Portfolio |
BlackRock Global SmallCap Fund |
BlackRock Health Sciences Opportunities Portfolio |
BlackRock Healthcare Fund |
BlackRock Index Equity Portfolio* |
BlackRock International Fund |
BlackRock International Index Fund |
BlackRock International Opportunities Portfolio |
BlackRock International Value Fund |
BlackRock Large Cap Core Fund |
BlackRock Large Cap Core Plus Fund |
BlackRock Large Cap Growth Fund |
BlackRock Large Cap Value Fund |
BlackRock Latin America Fund |
BlackRock Mid-Cap Growth Equity Portfolio |
BlackRock Mid-Cap Value Equity Portfolio |
BlackRock Mid Cap Value Opportunities Fund |
BlackRock Natural Resources Trust |
BlackRock Pacific Fund |
BlackRock Science & Technology Opportunities Portfolio |
BlackRock Small Cap Core Equity Portfolio |
BlackRock Small Cap Growth Equity Portfolio |
BlackRock Small Cap Growth Fund II |
BlackRock Small Cap Index Fund |
BlackRock Small/Mid-Cap Growth Portfolio |
BlackRock S&P 500 Index Fund |
BlackRock U.S. Opportunities Portfolio |
BlackRock Utilities and Telecommunications Fund |
BlackRock Value Opportunities Fund |
BlackRock World Gold Fund |
|
|
Fixed Income Funds |
|
|
BlackRock Bond Portfolio |
BlackRock Emerging Market Debt Portfolio |
BlackRock Floating Rate Income Portfolio |
BlackRock GNMA Portfolio |
BlackRock Government Income Portfolio |
BlackRock High Income Fund |
BlackRock High Yield Bond Portfolio |
BlackRock Income Portfolio† |
BlackRock Income Builder Portfolio† |
BlackRock Inflation Protected Bond Portfolio |
BlackRock Intermediate Government Bond Portfolio |
BlackRock International Bond Portfolio |
BlackRock Long Duration Bond Portfolio |
BlackRock Low Duration Bond Portfolio |
BlackRock Managed Income Portfolio |
BlackRock Multi-Sector Bond Portfolio |
BlackRock Short-Term Bond Fund |
BlackRock Strategic Income Opportunities Portfolio |
BlackRock Total Return Fund |
BlackRock Total Return Portfolio II |
BlackRock World Income Fund |
|
|
Municipal Bond Funds |
|
|
BlackRock AMT-Free Municipal Bond Portfolio |
BlackRock California Municipal Bond Fund |
BlackRock High Yield Municipal Fund |
BlackRock Intermediate Municipal Fund |
BlackRock Kentucky Municipal Bond Portfolio |
BlackRock Municipal Insured Fund |
BlackRock National Municipal Fund |
BlackRock New Jersey Municipal Bond Fund |
BlackRock New York Municipal Bond Fund |
BlackRock Ohio Municipal Bond Portfolio |
BlackRock Pennsylvania Municipal Bond Fund |
BlackRock Short-Term Municipal Fund |
|
|
Target Risk & Target Date Funds† |
|
|
BlackRock Prepared Portfolios |
Conservative Prepared Portfolio |
Moderate Prepared Portfolio |
Growth Prepared Portfolio |
Aggressive Growth Prepared Portfolio |
|
BlackRock Lifecycle Prepared Portfolios |
2010 |
2015 |
2020 |
2025 |
2030 |
2035 |
2040 |
2045 |
2050 |
|
BlackRock LifePath Portfolios
Retirement |
2020 |
2025 |
2030 |
2035 |
2040 |
2045 |
2050 |
2055 |
| |
* | See the prospectus for information on specific limitations on investments in the fund. |
†
|
Mixed asset fund.
|
BlackRock mutual funds are currently distributed by BlackRock Investments, LLC. You should consider the investment objectives, risks, charges and expenses of the funds under consideration carefully before investing. Each fund’s prospectus contains this and other information and is available at www.blackrock.com or by calling (800) 441-7762 or from your financial advisor. The prospectus should be read carefully before investing.
| | |
|
|
|
BLACKROCK SMALL CAP INDEX FUND | JUNE 30, 2010 | 51 |

This report is transmitted to shareholders only. It is not authorized for use as an offer of sale or a solicitation of an offer to buy shares of the Fund unless accompanied or preceded by the Fund’s current prospectus. Past performance results shown in this report should not be considered a representation of future performance. Investment returns and principal value of shares will fluctuate so that shares, when redeemed, may be worth more or less than their original cost. Statements and other information herein are as dated and are subject to change.

#Index 3-06/10
Item 2 – | Code of Ethics – Not Applicable to this semi-annual report |
| |
Item 3 – | Audit Committee Financial Expert – Not Applicable to this semi-annual report |
| |
Item 4 – | Principal Accountant Fees and Services – Not Applicable to this semi-annual report |
| |
Item 5 – | Audit Committee of Listed Registrants – Not Applicable |
| |
Item 6 – | Investments |
| (a) The registrant’s Schedule of Investments is included as part of the Report to Stockholders filed under Item 1 of this form. |
| (b) Not Applicable due to no such divestments during the semi-annual period covered since the previous Form N-CSR filing. |
| |
Item 7 – | Disclosure of Proxy Voting Policies and Procedures for Closed-End Management Investment Companies – Not Applicable |
| |
Item 8 – | Portfolio Managers of Closed-End Management Investment Companies – Not Applicable |
| |
Item 9 – | Purchases of Equity Securities by Closed-End Management Investment Company and Affiliated Purchasers – Not Applicable |
| |
Item 10 – | Submission of Matters to a Vote of Security Holders – The registrant’s Nominating and Governance Committee will consider nominees to the board of directors recommended by shareholders when a vacancy becomes available. Shareholders who wish to recommend a nominee should send nominations that include biographical information and set forth the qualifications of the proposed nominee to the registrant’s Secretary. There have been no material changes to these procedures. |
| |
Item 11 – | Controls and Procedures |
| |
11(a) – | The registrant’s principal executive and principal financial officers or persons performing similar functions have concluded that the registrant’s disclosure controls and procedures (as defined in Rule 30a-3(c) under the Investment Company Act of 1940, as amended (the “1940 Act”)) are effective as of a date within 90 days of the filing of this report based on the evaluation of these controls and procedures required by Rule 30a-3(b) under the 1940 Act and Rule 15(d)-15(b) under the Securities Exchange Act of 1934, as amended. |
| |
11(b) – | There were no changes in the registrant’s internal control over financial reporting (as defined in Rule 30a-3(d) under the 1940 Act) that occurred during the second fiscal quarter of the period covered by this report that have materially affected, or are reasonably likely to materially affect, the registrant’s internal control over financial reporting. |
| |
Item 12 – | Exhibits attached hereto |
| |
12(a)(1) – | Code of Ethics – Not Applicable to this semi-annual report |
| |
12(a)(2) – | Certifications – Attached hereto |
| |
12(a)(3) – | Not Applicable |
| |
12(b) – | Certifications – Attached hereto |
| |
| Pursuant to the requirements of the Securities Exchange Act of 1934 and the Investment Company Act of 1940, the registrant has duly caused this report to be signed on its behalf by the undersigned, thereunto duly authorized. |
| |
| BlackRock Index Funds, Inc. and Quantitative Master Series LLC |
| |
| | By: | /s/ Anne F. Ackerley | |
| | | Anne F. Ackerley |
| | | Chief Executive Officer of |
| | | BlackRock Index Funds, Inc. and Quantitative Master Series LLC |
| | |
| | Date: September 2, 2010 |
| | |
| | Pursuant to the requirements of the Securities Exchange Act of 1934 and the Investment Company Act of 1940, this report has been signed below by the following persons on behalf of the registrant and in the capacities and on the dates indicated. |
| | |
| | By: | /s/ Anne F. Ackerley | |
| | | Anne F. Ackerley |
| | | Chief Executive Officer (principal executive officer) of |
| | | BlackRock Index Funds, Inc. and Quantitative Master Series LLC |
| | |
| | Date: September 2, 2010 |
| | |
| | By: | /s/ Neal J. Andrews | |
| | | Neal J. Andrews |
| | | Chief Financial Officer (principal financial officer) of |
| | | BlackRock Index Funds, Inc. and Quantitative Master Series LLC |
| | |
| | Date: September 2, 2010 |