six months ended June 30, 2011, the Series waived $2,108, which is included in fees waived by advisor in the Statement of Operations.
The Manager voluntarily agreed to waive its investment advisory fees by the amount of investment advisory fees the Series pays to the Manager indirectly through its investment in affiliated money market funds, however the Manager does not waive its investment advisory fees by the amount of investment advisory fees paid through the Series’ investment in other affiliated investment companies, if any. For the six months ended June 30, 2011, the Series waived $1,207, which is included in fees waived by advisor in the Statement of Operations.
The Manager entered into a sub-advisory agreement with BlackRock Investment Management LLC (“BIM”), an affiliate of the Manager. The Manager pays BIM for services it provides, a monthly fee that is a percentage of the investment advisory fees paid by the Series to the Manager.
For the six months ended June 30, 2011, the Series reimbursed the Manager $4,824 for certain accounting services, which is included in accounting services in the Statement of Operations.
Certain officers and/or directors of the Master LLC are officers and/or directors of BlackRock or its affiliates.
Purchases and sales of investments, excluding short-term securities, for the six months ended June 30, 2011, were $82,207,960 and $12,909,177, respectively.
The Master LLC, on behalf of the Series, along with certain other funds managed by the Manager and its affiliates, is a party to a $500 million credit agreement with a group of lenders, which expires in November 2011. The Series may borrow under the credit agreement to fund shareholder redemptions. The Series pays a commitment fee of 0.08% per annum based on the Series’ pro rata share of the unused portion of the credit agreement and interest at a rate equal to the higher of (a) the one-month LIBOR plus 1.00% per annum and (b) the Fed Funds rate plus 1.00% per annum on amounts borrowed. In addition, the Series paid administration and arrangement fees which were allocated to the Series based on its net assets as of October 31, 2010. The Series did not borrow under the credit agreement during the six months ended June 30, 2011.
In the normal course of business, the Series invests in securities and enters into transactions where risks exist due to fluctuations in the market (market risk) or failure of the issuer of a security to meet all its obligations (issuer credit risk). The value of securities held by the Series may decline in response to certain events, including those directly involving the issuers whose securities are owned by the Series; conditions affecting the general economy; overall market changes; local, regional or global political, social or economic instability; and currency and interest rate and price fluctuations. Similar to issuer credit risk, the Series may be exposed to counterparty credit risk, or the risk that an entity with which the Series has unsettled or open transactions may fail to or be unable to perform on its commitments. The Series manages counterparty credit risk by entering into transactions only with counterparties that it believes have the financial resources to honor their obligations and by monitoring the financial stability of those counterparties. Financial assets, which potentially expose the Series to market, issuer and counterparty credit risks, consist principally of financial instruments and receivables due from counterparties. The extent of the Series’ exposure to market, issuer and counterparty credit risks with respect to these financial assets is generally approximated by their value recorded in the Series’ Statement of Assets and Liabilities, less any collateral held by the Series.
The Series invests a substantial amount of its assets in issuers located in a single country or a limited number of countries. When the Series concentrates its investments in this manner, it assumes the risk that economic, political and social conditions in those countries may have a significant impact on their investment performance. Please see the Schedule of Investments for concentrations in specific countries.
Management has evaluated the impact of all subsequent events on the Series through the date the financial statements were issued and has determined that there were no subsequent events requiring adjustment or additional disclosure in the financial statements.
|
|
Disclosure of Investment Advisory Agreement and Sub-Advisory Agreement |
The Board of Directors of Quantitative Master Series LLC (the “Master LLC”) met on April 5, 2011 and May 17–18, 2011 to consider the approval of the Master LLC’s investment advisory agreement (the “Advisory Agreement”) with BlackRock Advisors, LLC (the “Manager”), the Master LLC’s investment advisor, on behalf of the Master International Index Series (the”Master Portfolio”), a series of the Master LLC. The Board of Directors of the Master LLC also considered the approval of the sub-advisory agreement (the “Sub-Advisory Agreement”) between the Manager and BlackRock Investment Management, LLC (the “Sub-Advisor”), with respect to the Master Portfolio. BlackRock International Index Fund (the “Fund”), a series of BlackRock Index Funds, Inc. (the “Corporation”), is a “feeder” fund that invests all of its investable assets in the Master Portfolio. Accordingly, the Board of Directors of the Corporation also considered the approval of the Advisory Agreement and the Sub-Advisory Agreement with respect to the Master Portfolio. The Manager and the Sub-Advisor are referred to herein as “BlackRock.”The Advisory Agreement and the Sub-Advisory Agreement are referred to herein as the “Agreements.” For simplicity, the Board of Directors of the Master LLC and the Board of Directors of the Corporation are referred to herein collectively as the “Board,” and the members are referred to as “Board Members.”
Activities and Composition of the Board
The Board consists of thirteen individuals, eleven of whom are not “interested persons” of the Master LLC or the Corporation as defined in the Investment Company Act of 1940, as amended (the “1940 Act”) (the “Independent Board Members”). The Board Members are responsible for the oversight of the operations of the Master LLC or the Corporation, as pertinent, and perform the various duties imposed on the directors of investment companies by the 1940 Act. The Independent Board Members have retained independent legal counsel to assist them in connection with their duties. The Co-Chairs of the Board are each Independent Board Members. The Board has established five standing committees: an Audit Committee, a Governance and Nominating Committee, a Compliance Committee, a Performance Oversight and Contract Committee and an Executive Committee, each of which is composed of Independent Board Members (except for the Executive Committee, which also has one interested Board Member) and is chaired by Independent Board Members. The Board also established an ad hoc committee, the Joint Product Pricing Committee, which consisted of Independent Board Members and directors/trustees of the boards of certain other BlackRock-managed funds, who were not “interested persons” of their respective funds.
The Agreements
Pursuant to the 1940 Act, the Board is required to consider the continuation of the Agreements on an annual basis. In connection with this process, the Board assessed, among other things, the nature, scope and quality of the services provided to the Master Portfolio and the Fund by BlackRock, its personnel and its affiliates, including investment management, administrative and shareholder services, oversight of fund accounting and custody, marketing services, risk oversight, compliance program and assistance in meeting applicable legal and regulatory requirements.
The Board, acting directly and through its committees, considers at each of its meetings, and from time to time as appropriate, factors that are relevant to its annual consideration of the renewal of the Agreements, including the services and support provided by BlackRock to the Master Portfolio, the Fund and their shareholders. Among the matters the Board considered were: (a) investment performance for one-, three- and five-year periods, as applicable, against peer funds, and applicable benchmarks, if any, as well as senior management’s and portfolio managers’ analysis of the reasons for any over performance or underperformance against its peers and/or benchmark, as applicable; (b) fees, including advisory, administration, if applicable, and other amounts paid to BlackRock and its affiliates by the Master Portfolio and/or the Fund for services, such as transfer agency, marketing and distribution, call center and fund accounting; (c) the Master Portfolio’s and/or the Fund’s operating expenses and how BlackRock allocates expenses to the Master Portfolio and the Fund; (d) the resources devoted to, risk oversight of, and compliance reports relating to, implementation of the Master Portfolio’s and the Fund’s investment objective, policies and restrictions; (e) the Master LLC’s and the Corporation’s compliance with its respective Code of Ethics and other compliance policies and procedures; (f) the nature, cost and character of non-investment management services provided by BlackRock and its affiliates; (g) BlackRock’s and other service providers’ internal controls and risk and compliance oversight mechanisms; (h) BlackRock’s implementation of the proxy voting policies approved by the Board; (i) the use of brokerage commissions and execution quality of portfolio transactions; (j) BlackRock’s implementation of the Master LLC’s and/or the Corporation’s valuation and liquidity procedures; (k) an analysis of contractual and actual management fees for products with similar investment objectives across the open-end fund, exchange traded fund (“ETF”), closed-end fund and institutional account product channels, as applicable; (l) BlackRock’s compensation methodology for its investment professionals and the incentives it creates; and (m) periodic updates on BlackRock’s business.
Board Considerations in Approving the Agreements
The Approval Process: Prior to the April 5, 2011 meeting, the Board requested and received materials specifically relating to the Agreements. The Board is engaged in a process with BlackRock to review periodically the nature and scope of the information provided to better assist its deliberations. The materials provided in connection with the April meeting included (a) information independently compiled and prepared by Lipper, Inc. (“Lipper”) on fees and expenses of the Master Portfolio and the Fund, as applicable, and the investment performance of the Fund as compared with a peer group of funds as determined by Lipper (collectively, “Peers”), as well as the gross investment performance of the Fund as compared with its benchmark; (b) information on the profitability of the Agreements to BlackRock and a discussion of fall-out benefits to BlackRock and its affiliates and significant shareholders; (c) a general analysis provided by BlackRock concerning investment management fees (a combination of the advisory fee and the administration fee, if any) charged to other clients, such as institutional clients, ETFs and closed-end funds, under
| | |
| | |
36 | BLACKROCK INTERNATIONAL INDEX FUND | JUNE 30, 2011 |
|
|
Disclosure of Investment Advisory Agreement and Sub-Advisory Agreement (continued) |
similar investment mandates, as well as the performance of such other clients, as applicable; (d) the impact of economies of scale; (e) a summary of aggregate amounts paid by the Master Portfolio and/or the Fund to BlackRock; (f) sales and redemption data regarding the Fund’s shares; and (g) if applicable, a comparison of management fees to similar BlackRock open-end funds, as classified by Lipper.
At an in-person meeting held on April 5, 2011, the Board reviewed materials relating to its consideration of the Agreements. As a result of the discussions that occurred during the April 5, 2011 meeting, and as a culmination of the Board’s year-long deliberative process, the Board presented BlackRock with questions and requests for additional information. BlackRock responded to these requests with additional written information in advance of the May 17–18, 2011 Board meeting.
At an in-person meeting held on May 17–18, 2011, the Board of the Master LLC, including the Independent Board Members, unanimously approved the continuation of the Advisory Agreement between the Manager and the Master LLC with respect to the Master Portfolio and the Sub-Advisory Agreement between the Manager and the Sub-Advisor with respect to the Master Portfolio, each for a one-year term ending June 30, 2012. The Board of the Corporation, including the Independent Board Members, also considered the continuation of the Agreements and found the Agreements to be satisfactory. In approving the continuation of the Agreements, the Board of the Master LLC considered: (a) the nature, extent and quality of the services provided by BlackRock; (b) the investment performance of the Master Portfolio, the Fund and BlackRock; (c) the advisory fee and the cost of the services and profits to be realized by BlackRock and its affiliates from their relationship with the Master Portfolio and the Fund; (d) economies of scale; (e) fall out benefits to BlackRock as a result of its relationship with the Master Portfolio and the Fund; and (f) other factors deemed relevant by the Board Members.
The Board also considered other matters it deemed important to the approval process, such as payments made to BlackRock or its affiliates relating to the distribution of Fund shares, services related to the valuation and pricing of portfolio holdings of the Master Portfolio, direct and indirect benefits to BlackRock and its affiliates and significant shareholders from their relationship with the Master Portfolio and the Fund and advice from independent legal counsel with respect to the review process and materials submitted for the Board’s review. The Board noted the willingness of BlackRock personnel to engage in open, candid discussions with the Board. The Board did not identify any particular information as controlling, and each Board Member may have attributed different weights to the various items considered.
A. Nature, Extent and Quality of the Services Provided by BlackRock: The Board, including the Independent Board Members, reviewed the nature, extent and quality of services provided by BlackRock, including the investment advisory services and the resulting performance of the Fund.
Throughout the year, the Board compared the Fund’s performance to the performance of a comparable group of mutual funds and/or the performance of a relevant benchmark, if any. The Board met with BlackRock’s senior management personnel responsible for investment operations, including the senior investment officers. The Board also reviewed the materials provided by the portfolio management team discussing Master Portfolio performance and the Master Portfolio’s investment objective, strategies and outlook.
The Board considered, among other factors, the number, education and experience of BlackRock’s investment personnel generally and the Master Portfolio’s portfolio management team, investments by portfolio managers in the funds they manage, BlackRock’s portfolio trading capabilities, BlackRock’s use of technology, BlackRock’s commitment to compliance, BlackRock’s credit analysis capabilities, BlackRock’s risk analysis capabilities and BlackRock’s approach to training and retaining portfolio managers and other research, advisory and management personnel. The Board engaged in a review of BlackRock’s compensation structure with respect to the Master Portfolio’s portfolio management team and BlackRock’s ability to attract and retain high-quality talent and create performance incentives.
In addition to advisory services, the Board considered the quality of the administrative and non-investment advisory services provided to the Master Portfolio and the Fund. BlackRock and its affiliates and significant shareholders provide the Master Portfolio and the Fund with certain administrative, transfer agency, shareholder and other services (in addition to any such services provided to the Master Portfolio and the Fund by third parties) and officers and other personnel as are necessary for the operations of the Master Portfolio and the Fund. In addition to investment advisory services, BlackRock and its affiliates provide the Master Portfolio and the Fund with other services, including (i) preparing disclosure documents, such as the prospectus, the statement of additional information and periodic shareholder reports; (ii) assisting with daily accounting and pricing; (iii) overseeing and coordinating the activities of other service providers; (iv) organizing Board meetings and preparing the materials for such Board meetings; (v) providing legal and compliance support; and (vi) performing other administrative functions necessary for the operation of the Master Portfolio and the Fund, such as tax reporting, fulfilling regulatory filing requirements and call center services. The Board reviewed the structure and duties of BlackRock’s fund administration, accounting, legal and compliance departments and considered BlackRock’s policies and procedures for assuring compliance with applicable laws and regulations.
B. The Investment Performance of the Master Portfolio, the Fund and BlackRock: The Board, including the Independent Board Members, also reviewed and considered the performance history of the Master Portfolio and the Fund, as applicable. The Board noted that the Master Portfolio’s investment results correspond directly to the investment results of the Fund. In preparation for the April 5, 2011 meeting, the Board worked with BlackRock and Lipper to develop a template for, and was provided with,
| | | |
| | | |
| BLACKROCK INTERNATIONAL INDEX FUND | JUNE 30, 2011 | 37 |
|
|
Disclosure of Investment Advisory Agreement and Sub-Advisory Agreement (continued) |
reports independently prepared by Lipper, which included a comprehensive analysis of the Fund’s performance. The Board also reviewed a narrative and statistical analysis of the Lipper data that was prepared by BlackRock, which analyzed various factors that affect Lipper’s rankings. In connection with its review, the Board received and reviewed information regarding the investment performance of the Fund as compared to funds in the Fund’s applicable Lipper category and the gross investment performance of the Fund as compared with its benchmark. The Board was provided with a description of the methodology used by Lipper to select peer funds. The Board and the Board’s Performance Oversight and Contract Committee regularly review and meet with Master Portfolio management to discuss the performance of the Master Portfolio and the Fund, as applicable, throughout the year.
The Board noted that the Fund’s gross performance exceeded its benchmark index during each of the one-, three- and five-year periods reported.
The Board noted that BlackRock has made changes to the organization of the overall equity group management structure designed to result in a strengthened leadership team with clearer accountability.
C. Consideration of the Advisory/Management Fees and the Cost of the Services and Profits to be Realized by BlackRock and its Affiliates from their Relationship with the Master Portfolio and the Fund: The Board, including the Independent Board Members, reviewed the Master Portfolio’s contractual management fee ratio compared with the other funds in the Fund’s Lipper category. It also compared the Fund’s total expense ratio, as well as actual management fee ratio, to those of other funds in its Lipper category. The Board considered the services provided and the fees charged by BlackRock to other types of clients with similar investment mandates, including separately managed institutional accounts.
The Board received and reviewed statements relating to BlackRock’s financial condition and profitability with respect to the services it provided the Master Portfolio and the Fund. The Board was also provided with a profitability analysis that detailed the revenues earned and the expenses incurred by BlackRock for services provided to the Master Portfolio and the Fund. The Board reviewed BlackRock’s profitability with respect to the Master Portfolio and the Fund, as applicable, and other funds the Board currently oversees for the year ended December 31, 2010 compared to available aggregate profitability data provided for the years ended December 31, 2009 and December 31, 2008. The Board reviewed BlackRock’s profitability with respect to other fund complexes managed by the Manager and/or its affiliates. The Board reviewed BlackRock’s assumptions and methodology of allocating expenses in the profitability analysis, noting the inherent limitations in allocating costs among various advisory products. The Board recognized that profitability may be affected by numerous factors including, among other things, fee waivers and expense reimbursements by the Manager, the types of funds managed, expense allocations and business mix, and the difficulty of comparing profitability as a result of those factors.
The Board noted that, in general, individual fund or product line profitability of other advisors is not publicly available. The Board considered BlackRock’s operating margin, in general, compared to the operating margin for leading investment management firms whose operations include advising open-end funds, among other product types. That data indicates that operating margins for BlackRock, in general and with respect to its registered funds, are generally consistent with margins earned by similarly situated publicly traded competitors. In addition, the Board considered, among other things, certain third party data comparing BlackRock’s operating margin with that of other publicly-traded asset management firms. That third party data indicates that larger asset bases do not, in themselves, translate to higher profit margins.
In addition, the Board considered the cost of the services provided to the Master Portfolio and the Fund by BlackRock, and BlackRock’s and its affiliates’ profits relating to the management and distribution of the Master Portfolio and the Fund and the other funds advised by BlackRock and its affiliates. As part of its analysis, the Board reviewed BlackRock’s methodology in allocating its costs to the management of the Master Portfolio and the Fund. The Board also considered whether BlackRock has the financial resources necessary to attract and retain high-quality investment management personnel to perform its obligations under the Agreements and to continue to provide the high quality of services that is expected by the Board.
The Board noted that the Fund’s contractual management fee ratio (a combination of the advisory fee and the administration fee, if any) was lower than or equal to the median contractual management fee ratio paid by the Fund’s Peers, in each case before taking into account any expense reimbursements or fee waivers. The Board also noted that BlackRock has contractually agreed to waive fees and/or reimburse expenses in order to limit, to a specified amount, the Master Portfolio’s total operating expenses as a percentage of the Master Portfolio’s average daily net assets and has contractually agreed to waive fees and/or reimburse expenses to limit the Fund’s total operating expenses as a percentage of the Fund’s average daily net assets on a class-by-class basis, as applicable.
D. Economies of Scale: The Board, including the Independent Board Members, considered the extent to which economies of scale might be realized as the assets of the Master Portfolio and the Fund increase. The Board also considered the extent to which the Master Portfolio and the Fund benefit from such economies and whether there should be changes in the advisory fee rate or structure in order to enable the Master Portfolio and the Fund to participate in these economies of scale, for example through the use of breakpoints in the advisory fee based upon the asset level of the Master Portfolio.
| | |
| | |
38 | BLACKROCK INTERNATIONAL INDEX FUND | JUNE 30, 2011 |
|
|
Disclosure of Investment Advisory Agreement and Sub-Advisory Agreement (concluded) |
E. Other Factors Deemed Relevant by the Board Members: The Board, including the Independent Board Members, also took into account other ancillary or “fall-out” benefits that BlackRock or its affiliates and significant shareholders may derive from their respective relationships with the Master Portfolio and the Fund, both tangible and intangible, such as BlackRock’s ability to leverage its investment professionals who manage other portfolios and risk management personnel, an increase in BlackRock’s profile in the investment advisory community, and the engagement of BlackRock’s affiliates and significant shareholders as service providers to the Master Portfolio and the Fund, including for administrative, transfer agency, distribution and securities lending services. The Board also considered BlackRock’s overall operations and its efforts to expand the scale of, and improve the quality of, its operations. The Board also noted that BlackRock may use and benefit from third party research obtained by soft dollars generated by certain registered fund transactions to assist in managing all or a number of its other client accounts. The Board further noted that BlackRock’s funds may invest in affiliated ETFs without any offset against the management fees payable by the funds to BlackRock.
In connection with its consideration of the Agreements, the Board also received information regarding BlackRock’s brokerage and soft dollar practices. The Board received reports from BlackRock which included information on brokerage commissions and trade execution practices throughout the year.
The Board noted the competitive nature of the open-end fund marketplace, and that shareholders are able to redeem their Fund shares if they believe that the Fund’s and/or the Master Portfolio’s fees and expenses are too high or if they are dissatisfied with the performance of the Fund.
Conclusion
The Board of the Master LLC, including the Independent Board Members, unanimously approved the continuation of the Advisory Agreement between the Manager and the Master LLC, with respect to the Master Portfolio, for a one-year term ending June 30, 2012 and the Sub-Advisory Agreement between the Manager and the Sub-Advisor, with respect to the Master Portfolio, for a one-year term ending June 30, 2012. As part of its approval, the Board of the Master LLC considered the detailed review of BlackRock’s fee structure, as it applies to the Master LLC, conducted by the ad hoc Joint Product Pricing Committee. Based upon its evaluation of all of the aforementioned factors in their totality, the Board of the Master LLC, including the Independent Board Members, was satisfied that the terms of the Agreements were fair and reasonable and in the best interest of the Master Portfolio and its shareholders. The Board of the Corporation, including the Independent Board Members, also considered the continuation of the Agreements with respect to the Master Portfolio and found the Agreements to be satisfactory. In arriving at its decision to approve the Agreements, the Board of the Master LLC did not identify any single factor or group of factors as all-important or controlling, but considered all factors together, and different Board Members may have attributed different weights to the various factors considered. The Independent Board Members were also assisted by the advice of independent legal counsel in making this determination. The contractual fee arrangements for the Master Portfolio reflect the results of several years of review by the Board Members and predecessor Board Members, and discussions between such Board Members (and predecessor Board Members) and BlackRock. As a result, the Board Members’ conclusions may be based in part on their consideration of these arrangements in prior years.
| | | |
| | | |
| BLACKROCK INTERNATIONAL INDEX FUND | JUNE 30, 2011 | 39 |
|
Ronald W. Forbes, Co-Chair of the Board and Director |
Rodney D. Johnson, Co-Chair of the Board and Director |
David O. Beim, Director |
Richard S. Davis, Director |
Henry Gabbay, Director |
Dr. Matina S. Horner, Director |
Herbert I. London, Director |
Cynthia A. Montgomery, Director |
Joseph P. Platt, Director |
Robert C. Robb, Jr., Director |
Toby Rosenblatt, Director |
Kenneth L. Urish, Director |
Frederick W. Winter, Director |
John M. Perlowski, President and Chief Executive Officer |
Brendan Kyne, Vice President |
Neal Andrews, Chief Financial Officer |
Jay Fife, Treasurer |
Brian Kindelan, Chief Compliance Officer and Anti-Money Laundering Officer |
Ira P. Shapiro, Secretary |
|
Investment Advisor |
BlackRock Advisors, LLC
Wilmington, DE 19809 |
|
Sub-Advisor |
BlackRock Investment Management, LLC
Princeton, NJ 08540 |
|
Custodian |
JPMorgan Chase Bank, N.A.
Brooklyn, NY 11245 |
|
Transfer Agent |
BNY Mellon Investment Servicing (US) Inc.
Wilmington, DE 19809 |
|
Accounting Agent |
State Street Bank and Trust Company
Boston, MA 02116 |
|
Distributor |
BlackRock Investments, LLC
New York, NY 10022 |
|
Legal Counsel |
Sidley Austin LLP
New York, NY 10019 |
|
Independent Registered Public Accounting Firm |
Deloitte & Touche LLP
Princeton, NJ 08540 |
|
Address of the Fund |
100 Bellevue Parkway
Wilmington, DE 19809 |
| | |
| | |
40 | BLACKROCK INTERNATIONAL INDEX FUND | JUNE 30, 2011 |
|
|
Additional Information |
|
General Information |
Electronic Delivery
Electronic copies of most financial reports and prospectuses are available on the Fund’s website or shareholders can sign up for e-mail notifications of quarterly statements, annual and semi-annual reports and prospectuses by enrolling in the Fund’s electronic delivery program.
To enroll:
Shareholders Who Hold Accounts with Investment Advisors, Banks or Brokerages:
Please contact your financial advisor. Please note that not all investment advisors, banks or brokerages may offer this service.
Shareholders Who Hold Accounts Directly with BlackRock:
| |
1) | Access the BlackRock website at http://www.blackrock.com/edelivery |
| |
2) | Select “eDelivery” under the “More Information” section |
| |
3) | Log into your account |
Householding
The Fund will mail only one copy of shareholder documents, including prospectuses, annual and semi-annual reports and proxy statements, to shareholders with multiple accounts at the same address. This practice is commonly called “householding” and is intended to reduce expenses and eliminate duplicate mailings of shareholder documents. Mailings of your shareholder documents may be householded indefinitely unless you instruct us otherwise. If you do not want the mailing of these documents to be combined with those for other members of your household, please call (800) 441-7762.
Availability of Quarterly Schedule of Investments
The Fund/Series file their complete schedule of portfolio holdings with the SEC for the first and third quarters of its fiscal year on Form N-Q. The Fund’s/Series’ Forms N-Q are available on the SEC’s website at http://www.sec.gov and may also be reviewed and copied at the SEC’s Public Reference Room in Washington, D.C. Information on how to access documents on the SEC’s website without charge may be obtained by calling (800) SEC-0330. The Fund’s/Series’ Forms N-Q may also be obtained upon request and without charge by calling (800) 441-7762.
Availability of Proxy Voting Policies and Procedures
A description of the policies and procedures that the Fund/Series use to determine how to vote proxies relating to portfolio securities is available (1) without charge, upon request, by calling (800) 441-7762; (2) at http://www.blackrock.com; and (3) on the SEC website at http://www.sec.gov.
Availability of Proxy Voting Record
Information about how the Fund/Series voted proxies relating to securities held in the Fund’s/Series’ portfolio during the most recent 12-month period ended June 30 is available upon request and without charge (1) at http://www.blackrock.com or by calling (800) 441-7762 and (2) on the SEC’s website at http://www.sec.gov.
| | | |
| | | |
| BLACKROCK INTERNATIONAL INDEX FUND | JUNE 30, 2011 | 41 |
|
|
Additional Information (concluded) |
|
Shareholder Privileges |
Account Information
Call us at (800) 441-7762 from 8:00 AM to 6:00 PM EST on any business day to get information about your account balances, recent transactions and share prices. You can also reach us on the Web at http://www.blackrock.com/funds.
Automatic Investment Plans
Investor Class shareholders who want to invest regularly can arrange to have $50 or more automatically deducted from their checking or savings account and invested in any of the BlackRock funds.
Systematic Withdrawal Plans
Investor Class shareholders can establish a systematic withdrawal plan and receive periodic payments of $50 or more from their BlackRock funds, as long as their account balance is at least $10,000.
Retirement Plans
Shareholders may make investments in conjunction with Traditional, Rollover, Roth, Coverdell, Simple IRAs, SEP IRAs and 403(b) Plans.
|
BlackRock Privacy Principles |
BlackRock is committed to maintaining the privacy of its current and former fund investors and individual clients (collectively, “Clients”) and to safeguarding their non-public personal information. The following information is provided to help you understand what personal information BlackRock collects, how we protect that information and why in certain cases we share such information with select parties.
If you are located in a jurisdiction where specific laws, rules or regulations require BlackRock to provide you with additional or different privacy-related rights beyond what is set forth below, then BlackRock will comply with those specific laws, rules or regulations.
BlackRock obtains or verifies personal non-public information from and about you from different sources, including the following: (i) information we receive from you or, if applicable, your financial intermediary, on applications, forms or other documents; (ii) information about your transactions with us, our affiliates, or others; (iii) information we receive from a consumer reporting agency; and (iv) from visits to our websites.
BlackRock does not sell or disclose to non-affiliated third parties any non-public personal information about its Clients, except as permitted by law or as is necessary to respond to regulatory requests or to service Client accounts. These non-affiliated third parties are required to protect the confidentiality and security of this information and to use it only for its intended purpose.
We may share information with our affiliates to service your account or to provide you with information about other BlackRock products or services that may be of interest to you. In addition, BlackRock restricts access to non-public personal information about its Clients to those BlackRock employees with a legitimate business need for the information. BlackRock maintains physical, electronic and procedural safeguards that are designed to protect the non-public personal information of its Clients, including procedures relating to the proper storage and disposal of such information.
| | |
| | |
42 | BLACKROCK INTERNATIONAL INDEX FUND | JUNE 30, 2011 |
|
|
A World-Class Mutual Fund Family |
BlackRock offers a diverse lineup of open-end mutual funds crossing all investment styles and managed by experts in equity, fixed income and tax-exempt investing.
|
Equity Funds |
|
BlackRock ACWI ex-US Index Fund |
BlackRock All-Cap Energy & Resources Portfolio |
BlackRock Asset Allocation Portfolio† |
BlackRock Balanced Capital Fund† |
BlackRock Basic Value Fund |
BlackRock Capital Appreciation Fund |
BlackRock China Fund |
BlackRock Energy & Resources Portfolio |
BlackRock Equity Dividend Fund |
BlackRock EuroFund |
BlackRock Focus Growth Fund |
BlackRock Focus Value Fund |
BlackRock Global Allocation Fund† |
BlackRock Global Dividend Income Portfolio |
BlackRock Global Dynamic Equity Fund |
BlackRock Global Emerging Markets Fund |
BlackRock Global Growth Fund |
BlackRock Global Opportunities Portfolio |
BlackRock Global SmallCap Fund |
BlackRock Health Sciences Opportunities Portfolio |
BlackRock Healthcare Fund |
BlackRock Index Equity Portfolio |
BlackRock India Fund |
BlackRock International Fund |
BlackRock International Index Fund |
BlackRock International Opportunities Portfolio |
BlackRock Large Cap Core Fund |
BlackRock Large Cap Core Plus Fund |
BlackRock Large Cap Growth Fund |
BlackRock Large Cap Value Fund |
BlackRock Latin America Fund |
BlackRock Mid-Cap Growth Equity Portfolio |
BlackRock Mid-Cap Value Equity Portfolio |
BlackRock Mid Cap Value Opportunities Fund |
BlackRock Natural Resources Trust |
BlackRock Pacific Fund |
BlackRock Russell 1000 Index Fund |
BlackRock Science & Technology Opportunities Portfolio |
BlackRock Small Cap Growth Equity Portfolio |
BlackRock Small Cap Growth Fund II |
BlackRock Small Cap Index Fund |
BlackRock Small/Mid-Cap Growth Portfolio |
BlackRock S&P 500 Index Fund |
BlackRock S&P 500 Stock Fund |
BlackRock U.S. Opportunities Portfolio |
BlackRock Utilities and Telecommunications Fund |
BlackRock Value Opportunities Fund |
BlackRock World Gold Fund |
|
Fixed Income Funds |
|
BlackRock Bond Index Fund |
BlackRock Core Bond Fund |
BlackRock Emerging Market Debt Portfolio |
BlackRock Floating Rate Income Portfolio |
BlackRock GNMA Portfolio |
BlackRock High Income Fund |
BlackRock High Yield Bond Portfolio |
BlackRock Income Portfolio† |
BlackRock Inflation Protected Bond Portfolio |
BlackRock International Bond Portfolio |
BlackRock Long Duration Bond Portfolio |
BlackRock Low Duration Bond Portfolio |
BlackRock Multi-Sector Bond Portfolio |
BlackRock Strategic Income Opportunities Portfolio |
BlackRock Total Return Fund |
BlackRock US Government Bond Fund |
BlackRock World Income Fund |
US Mortgage Portfolio |
|
Municipal Bond Funds |
|
BlackRock California Municipal Bond Fund |
BlackRock High Yield Municipal Fund |
BlackRock Intermediate Municipal Fund |
BlackRock National Municipal Fund |
BlackRock New Jersey Municipal Bond Fund |
BlackRock New York Municipal Bond Fund |
BlackRock Pennsylvania Municipal Bond Fund |
BlackRock Short-Term Municipal Fund |
|
Target Risk & Target Date Funds† |
|
BlackRock Prepared Portfolios |
Conservative Prepared Portfolio |
Moderate Prepared Portfolio |
Growth Prepared Portfolio |
Aggressive Growth Prepared Portfolio |
|
BlackRock Lifecycle Prepared Portfolios |
2015 |
2020 |
2025 |
2030 |
2035 |
2040 |
2045 |
2050 |
|
LifePath Portfolios |
Retirement |
2020 |
2025 |
2030 |
2035 |
2040 |
2045 |
2050 |
2055 |
|
LifePath Index Portfolios |
Retirement |
2020 |
2025 |
2030 |
2035 |
2040 |
2045 |
2050 |
2055 |
BlackRock mutual funds are currently distributed by BlackRock Investments, LLC. You should consider the investment objectives, risks, charges and expenses of the funds under consideration carefully before investing. Each fund’s prospectus contains this and other information and is available at www.blackrock.com or by calling (800) 441-7762 or from your financial advisor. The prospectus should be read carefully before investing.
| | | |
| | | |
| BLACKROCK INTERNATIONAL INDEX FUND | JUNE 30, 2011 | 43 |
This report is transmitted to shareholders only. It is not authorized for use as an offer of sale or a solicitation of an offer to buy shares of the Fund unless accompanied or preceded by the Fund’s current prospectus. Past performance results shown in this report should not be considered a representation of future performance. Investment returns and principal value of shares will fluctuate so that shares, when redeemed, may be worth more or less than their original cost. Statements and other information herein are as dated and are subject to change.

| |
#Index 2-06/11 | 
|
| |

| June 30, 2011 |
Semi-Annual Report (Unaudited)
BlackRock S&P 500 Index Fund | of BlackRock Index Funds, Inc.
|
Not FDIC Insured § No Bank Guarantee § May Lose Value |
| | |
| | |
|
2 | BLACKROCK S&P 500 INDEX FUND | JUNE 30, 2011 |
The recent downgrade of US long-term debt by Standard & Poor’s marked an historic event for financial markets. Stocks tumbled in the days before and after the announcement on August 5 as investors contemplated the pervasiveness of the lower US credit rating across asset classes and the future direction of the global economy. BlackRock was well prepared for the possibility of a downgrade and the firm had no need to execute any forced selling of securities in response to the S&P action. Through periods of uncertainty, as ever, BlackRock’s full resources are dedicated to the management of our clients’ assets.
The pages that follow reflect your mutual fund’s reporting period ended June 30, 2011. Accordingly, the below discussion is intended to provide you with perspective on the performance of your investments during that period.
Economic conditions in the second quarter of 2011 were strikingly similar to the scenario of the same quarter last year. The sovereign debt crisis in Europe, tightening monetary policy in China and a global economic slowdown were again the key concerns that drove investors away from risky assets. The second-quarter correction in 2010 was significant, but markets were revived toward the end of the summer as positive economic news and robust corporate earnings whetted investor appetite for yield. The global economy had finally gained traction and investor fear turned to optimism with the anticipation of a second round of quantitative easing (“QE2”) from the US Federal Reserve Board (the “Fed”). Stock markets rallied despite the ongoing European debt crisis and inflationary pressures looming over emerging markets. Fixed income markets, however, saw yields move sharply upward, pushing prices down, especially on the long end of the historically steep yield curve. While high yield bonds benefited from the risk rally, most fixed income sectors declined in the fourth quarter. The tax-exempt municipal market faced additional headwinds as it became evident that the Build America Bond program would not be extended and municipal finance troubles abounded.
The new year brought spikes of volatility as political turmoil swept across the Middle East/North Africa region and prices of oil and other commodities soared. Natural disasters in Japan disrupted industry supply chains and concerns mounted over US debt and deficit issues. Equities quickly rebounded from each of these events as investors chose to focus on the continuing stream of strong corporate earnings and positive economic data. Global credit markets were surprisingly resilient in this environment and yields regained relative stability in 2011. The tax-exempt market saw relief from its headwinds and steadily recovered from its fourth-quarter lows. Equities, commodities and high yield bonds outpaced higher-quality assets as investors responded to the Fed’s early 2011 reaffirmation that it will keep interest rates low.
However, longer-term headwinds had been brewing. Inflationary pressures intensified in emerging economies, many of which were overheating, and the European debt crisis was not over. Markets were met with a sharp reversal in May when political unrest in Greece pushed the nation closer to defaulting on its debt. This development rekindled fears about the broader debt crisis and its further contagion among peripheral European countries. Concurrently, it became evident that the pace of global economic growth had slowed. Higher oil prices and supply chain disruptions in Japan finally caught up with economic data. Investors pulled back from riskier assets and stocks generally declined throughout most of May and June, but year-to-date performance in global equity markets was positive, and 12-month returns were remarkably strong. In bond markets, yields were volatile but generally moved lower for the period as a whole (pushing prices up). Continued low short-term interest rates kept yields on money market securities near their all-time lows.

“Markets generally moved higher despite heightened volatility during the reporting period.”
Rob Kapito
President, BlackRock Advisors, LLC
| | | | | | | |
Total Returns as of June 30, 2011 | | | 6-month | | | 12-month | |
US large cap equities | | | | | | | |
(S&P 500® Index) | | | 6.02 | % | | 30.69 | % |
US small cap equities | | | | | | | |
(Russell 2000® Index) | | | 6.21 | | | 37.41 | |
International equities | | | | | | | |
(MSCI Europe, Australasia, | | | | | | | |
Far East Index) | | | 4.98 | | | 30.36 | |
Emerging market equities | | | | | | | |
(MSCI Emerging Markets Index) | | | 0.88 | | | 27.80 | |
3-month Treasury bill | | | | | | | |
(BofA Merrill Lynch 3-Month | | | | | | | |
Treasury Bill Index) | | | 0.08 | | | 0.16 | |
US Treasury securities | | | | | | | |
(BofA Merrill Lynch 10-Year | | | | | | | |
US Treasury Index) | | | 3.26 | | | 1.88 | |
US investment grade bonds | | | | | | | |
(Barclays Capital US Aggregate | | | | | | | |
Bond Index) | | | 2.72 | | | 3.90 | |
Tax-exempt municipal bonds | | | | | | | |
(Barclays Capital Municipal | | | | | | | |
Bond Index) | | | 4.42 | | | 3.48 | |
US high yield bonds | | | | | | | |
(Barclays Capital US | | | | | | | |
Corporate High Yield 2% | | | | | | | |
Issuer Capped Index) | | | 4.98 | | | 15.53 | |
| | | | | | | |
|
Past performance is no guarantee of future results. Index performance is shown for illustrative purposes only. You cannot invest directly in an index.
|
Sincerely,

Rob Kapito
President, BlackRock Advisors, LLC
| | |
| | |
|
| THIS PAGE NOT PART OF YOUR FUND REPORT | 3 |
| |
|
Fund Summary as of June 30, 2011 | BlackRock S&P 500 Index Fund |
BlackRock S&P 500 Index Fund’s (the “Fund”), a series of BlackRock Index Funds, Inc. (the “Corporation”), investment objective is to match the performance of the Standard & Poor’s 500® Index (the “S&P 500®”) as closely as possible before the deduction of Fund expenses.
|
Portfolio Management Commentary |
| |
| How did the Fund perform? |
| |
• | For the six months ended June 30, 2011, Institutional and Investor A Shares of the Fund returned 5.85% and 5.80%, respectively, while the benchmark S&P 500® returned 6.02% for the same period. The S&P 500® is an unmanaged index that covers 500 industrial, utility, transportation and financial companies of the US markets (mostly New York Stock Exchange (“NYSE”) issues), representing about 75% of NYSE market capitalization and 30% of NYSE issues. |
| |
• | Returns for the Fund’s respective share classes differ from the benchmark based on individual share-class expenses. The Fund invests all of its assets in Master S&P 500 Index Series (the “Series”), a series of Quantitative Master Series LLC. |
| |
| Describe the market environment. |
| |
• | US equity markets began the year on an upswing. Confidence levels were improving, the economy was recovering and investors were increasing their holdings of riskier assets. US stocks moved higher during the first four months of 2011 despite volatility from significant global events. Political turmoil spread across the Middle East/North Africa region and prices of oil and other commodities rose sharply. March brought devastating natural disasters that left Japan with massive infrastructure damage and a nuclear crisis. In April, Standard & Poor’s (“S&P”) changed its ratings outlook for long-term US and Japanese debt from stable to negative. But equity markets charged forward as investors chose to focus on the continuing stream of strong corporate earnings reports. |
| |
• | Meanwhile, longer-term headwinds had been brewing. Inflationary pressures intensified in emerging economies, many of which were overheating, and the European debt crisis was not over. Financial markets were met with a sharp reversal in May when political unrest in Greece pushed the nation closer to defaulting on its debt. This development rekindled fears about the broader sovereign debt crisis in Europe and its further contagion among peripheral countries. Concurrently, it became evident that the pace of US and global economic growth had slowed. The impact of higher oil prices and supply chain disruptions in Japan finally surfaced in weak economic data. Investors pulled back from riskier assets amid heightened uncertainty and equity markets experienced a correction throughout most of May and June. The last week of June brought a sharp rally on encouraging data from the US manufacturing sector and Germany’s decision to support the refinancing of Greece’s public debt. |
| |
• | From a sector perspective, health care stocks (+13.93%) led the index, driven by increased merger and acquisition activity. Energy stocks (+11.39%) benefited from rising oil prices earlier in the period. All other sectors provided positive returns with the exception of financials (–3.06%), where the banking industry remained under pressure amid heightened concerns about the sovereign debt crisis. |
| |
| Describe recent portfolio activity. |
| |
• | During the six-month period, as changes were made to the composition of the S&P 500®, the Series purchased and sold securities to maintain its objective of replicating the risks and return of the benchmark index. |
| |
| Describe portfolio positioning at period end. |
| |
• | The Series remains positioned to match the risk characteristics of its benchmark index, irrespective of the market’s future direction. |
The views expressed reflect the opinions of BlackRock as of the date of this report and are subject to change based on changes in market, economic or other conditions. These views are not intended to be a forecast of future events and are no guarantee of future results.
|
Derivative Financial Instruments |
The Series may invest in various derivative financial instruments, including financial futures contracts, as specified in Note 2 of the Series’ Notes to Financial Statements, which constitute forms of economic leverage. Such instruments are used to obtain exposure to a market without owning or taking physical custody of securities or to hedge market and/or equity risks. Such derivative financial instruments involve risks, including the imperfect correlation between the value of a derivative financial instrument and the underlying asset or illiquidity of the derivative financial instrument. The Series’ ability to use a derivative financial instrument successfully depends on the investment advisor’s ability to predict pertinent market movements accurately, which cannot be assured. The use of derivative financial instruments may result in losses greater than if they had not been used, may require the Series to sell or purchase portfolio investments at inopportune times or for distressed values, may limit the amount of appreciation the Series can realize on an investment or may cause the Series to hold an investment that it might otherwise sell. The Series’ investments in these instruments are discussed in detail in the Series’ Notes to Financial Statements.
| | |
| | |
|
4 | BLACKROCK S&P 500 INDEX FUND | JUNE 30, 2011 |
|
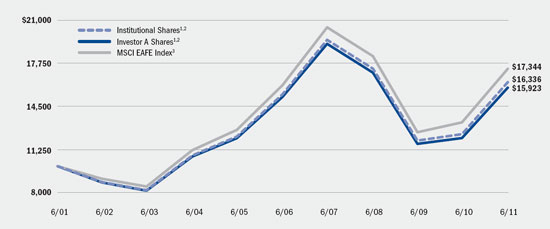
Total Return Based on a $10,000 Investment |
| | |
| | 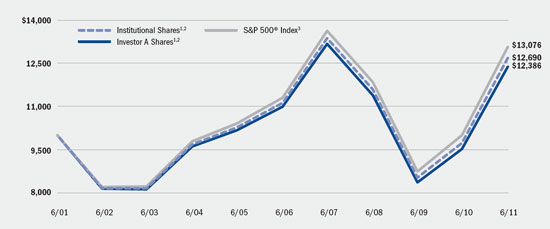
|
| | |
| 1 | Assuming transaction costs and other operating expenses, including investment advisory fees and administration fees, if any. |
| | |
| 2 | The Fund invests all of its assets in the Series. The Series’ investments are allocated among common stocks in approximately the same weightings as the S&P 500® Index. |
| | |
| 3 | This unmanaged index covers 500 industrial, utility, transportation and financial companies of the US markets (mostly NYSE), representing about 75% of NYSE market capitalization and 30% of NYSE issues. |
|
Performance Summary for the Period Ended June 30, 2011 |
| | | | | | | | | | | | | |
| | | | | Average Annual Total Returns4 |
| | 6-Month
Total Returns | | 1 Year | | 5 Years | | 10 Years | |
Institutional | | | 5.85 | % | | 30.36 | % | | 2.66 | % | | 2.41 | % |
Investor A | | | 5.80 | | | 30.03 | | | 2.41 | | | 2.16 | |
S&P 500® Index | | | 6.02 | | | 30.69 | | | 2.94 | | | 2.72 | |
| | |
| 4 | Average annual total returns reflect reductions for service fees. See “About Fund Performance” on page 6 for a detailed description of share classes, including any related fees. Past performance is not indicative of future results. |
| | | |
| | | |
|
| BLACKROCK S&P 500 INDEX FUND | JUNE 30, 2011 | 5 |
| |
• | Institutional Shares are not subject to any sales charge. Institutional Shares bear no ongoing distribution or service fees and are available only to eligible investors. |
| |
• | Investor A Shares are not subject to any sales charge and bear no ongoing distribution fee. Investor A Shares are subject to an ongoing service fee of 0.25% per year. |
Performance information reflects past performance and does not guarantee future results. Current performance may be lower or higher than the performance data quoted. Refer to www.blackrock.com/funds to obtain performance data current to the most recent month end. Performance results do not reflect the deduction of taxes that a shareholder would pay on Fund distributions or the redemption of Fund shares. Figures shown in the performance table on the previous page assume reinvestment of all dividends and capital gain distributions, if any, at net asset value on the ex-dividend date. Investment return and principal value of shares will fluctuate so that shares, when redeemed, may be worth more or less than their original cost. Dividends paid to each class of shares will vary because of the different levels of service and transfer agency fees applicable to each class, which are deducted from the income available to be paid to shareholders. The Fund’s administrator waived a portion of its fee. Without such waiver, the Fund’s performance would have been lower.
Shareholders of this Fund may incur the following charges: (a) expenses related to transactions, including exchange fees; and (b) operating expenses including administration fees, distribution fees, including 12b-1 fees, and other Fund expenses. The expense example shown below (which is based on a hypothetical investment of $1,000 invested on January 1, 2011 and held through June 30, 2011) is intended to assist shareholders both in calculating expenses based on an investment in the Fund and in comparing these expenses with similar costs of investing in other mutual funds.
The table provides information about actual account values and actual expenses. In order to estimate the expenses a shareholder paid during the period covered by this report, shareholders can divide their account value by $1,000 and then multiply the result by the number corresponding to their share class under the heading entitled “Expenses Paid During the Period.”
The table also provides information about hypothetical account values and hypothetical expenses based on the Fund’s actual expense ratio and an assumed rate of return of 5% per year before expenses. In order to assist shareholders in comparing the ongoing expenses of investing in this Fund and other funds, compare the 5% hypothetical example with the 5% hypothetical examples that appear in other funds’ shareholder reports.
The expenses shown in the table are intended to highlight shareholders’ ongoing costs only and do not reflect any transactional expenses, such as sales charges or exchange fees, if any. Therefore, the hypothetical example is useful in comparing ongoing expenses only, and will not help shareholders determine the relative total expenses of owning different funds. If these transactional expenses were included, shareholder expenses would have been higher.
| | | | | | | | | | | | | | | | | | | | | | |
| | Actual | | Hypothetical2 | | | | |
| | Beginning
Account Value
January 1, 2011 | | Ending
Account Value
June 30, 2011 | | Expenses Paid
During the Period1 | | Beginning
Account Value
January 1, 2011 | | Ending
Account Value
June 30, 2011 | | Expenses Paid
During the Period1 | | Annualized
Expense Ratio | |
Institutional | | $ | 1,000.00 | | $ | 1,058.50 | | $ | 1.53 | | $ | 1,000.00 | | $ | 1,023.31 | | $ | 1.51 | | | 0.30 | % |
Investor A | | $ | 1,000.00 | | $ | 1,058.00 | | $ | 2.81 | | $ | 1,000.00 | | $ | 1,022.07 | | $ | 2.76 | | | 0.55 | % |
| | |
| 1 | For each class of the Fund, expenses are equal to the annualized expense ratio for the class, multiplied by the average account value over the period, multiplied by 181/365 (to reflect the one-half year period shown). Because the Fund is a feeder fund, the expense table example reflects the expenses of both the Fund and the Series in which it invests. Expenses are net of waiver. |
| | |
| 2 | Hypothetical 5% annual return before expenses is calculated by pro rating the number of days in the most recent fiscal half year divided by 365. |
| | |
| | |
|
6 | BLACKROCK S&P 500 INDEX FUND | JUNE 30, 2011 |
| |
| |
Statement of Assets and Liabilities | BlackRock S&P 500 Index Fund |
| | | | |
June 30, 2011 (Unaudited) | | | | |
Assets | | | | |
Investments at value — Master S&P 500 Index Series (cost — $1,425,917,945) | | $ | 1,887,799,636 | |
Withdrawals receivable from the Series | | | 3,928,380 | |
Capital shares sold receivable | | | 3,111,545 | |
Prepaid expenses | | | 117,507 | |
Total assets | | | 1,894,957,068 | |
| | | | |
Liabilities | | | | |
Capital shares redeemed payable | | | 7,039,925 | |
Administration fees payable | | | 610,298 | |
Service fees payable | | | 317,990 | |
Officer’s fees payable | | | 406 | |
Total liabilities | | | 7,968,619 | |
Net Assets | | $ | 1,886,988,449 | |
| | | | |
Net Assets Consist of | | | | |
Paid-in capital | | $ | 1,591,881,792 | |
Undistributed net investment income | | | 15,203,711 | |
Accumulated net realized loss allocated from the Series | | | (181,978,745 | ) |
Net unrealized appreciation/depreciation allocated from the Series | | | 461,881,691 | |
Net Assets | | $ | 1,886,988,449 | |
| | | | |
Net Asset Value | | | | |
Institutional — Based on net assets of $1,109,587,325 and 68,136,898 shares outstanding, 250 million shares authorized, $0.0001 par value | | $ | 16.28 | |
Investor A — Based on net assets of $777,401,124 and 47,880,522 shares outstanding, 250 million shares authorized, $0.0001 par value | | $ | 16.24 | |
| | | |
See Notes to Financial Statements. |
| | | |
| BLACKROCK S&P 500 INDEX FUND | JUNE 30, 2011 | 7 |
| |
| |
Statement of Operations | BlackRock S&P 500 Index Fund |
| | | | |
Six Months Ended June 30, 2011 (Unaudited) | | | | |
Investment Income | | | | |
Net investment income allocated from the Series: | | | | |
Dividends — unaffiliated | | $ | 17,971,612 | |
Foreign taxes withheld | | | (7,219 | ) |
Securities lending — affiliated | | | 105,539 | |
Dividends — affiliated | | | 103,817 | |
Expenses | | | (372,405 | ) |
Fees waived | | | 49,706 | |
Total income | | | 17,851,050 | |
| | | | |
Expenses | | | | |
Administration | | | 1,804,737 | |
Service — Investor A | | | 958,010 | |
Transfer agent — Institutional | | | 292,537 | |
Transfer agent — Investor A | | | 228,232 | |
Printing | | | 50,398 | |
Registration | | | 23,675 | |
Licensing | | | 45,049 | |
Professional | | | 13,654 | |
Officer | | | 402 | |
Miscellaneous | | | 7,528 | |
Total expenses | | | 3,424,222 | |
Net investment income | | | 14,426,828 | |
| | | | |
Realized and Unrealized Gain Allocated from the Series | | | | |
Net realized gain from investments, short positions and financial futures contracts | | | 4,655,050 | |
Net change in unrealized appreciation/depreciation on investments, short positions and financial futures contracts | | | 85,345,587 | |
Total realized and unrealized gain | | | 90,000,637 | |
Net Increase in Net Assets Resulting from Operations | | $ | 104,427,465 | |
| | |
See Notes to Financial Statements. |
| | |
8 | BLACKROCK S&P 500 INDEX FUND | JUNE 30, 2011 |
| |
| |
Statements of Changes in Net Assets | BlackRock S&P 500 Index Fund |
| | | | | | | |
Increase (Decrease) in Net Assets: | | Six Months
Ended
June 30,
2011
(Unaudited) | | Year Ended
December 31,
2010 | |
Operations | | | | | | | |
Net investment income | | $ | 14,426,828 | | $ | 27,377,084 | |
Net realized gain | | | 4,655,050 | | | 14,775,569 | |
Net change in unrealized appreciation/depreciation | | | 85,345,587 | | | 187,677,017 | |
Net increase in net assets resulting from operations | | | 104,427,465 | | | 229,829,670 | |
| | | | | | | |
Dividends to Shareholders From | | | | | | | |
Net investment income: | | | | | | | |
Institutional | | | — | | | (17,049,427 | ) |
Investor A | | | — | | | (10,565,502 | ) |
Decrease in net assets resulting from dividends to shareholders | | | — | | | (27,614,929 | ) |
| | | | | | | |
Capital Share Transactions | | | | | | | |
Net increase (decrease) in net assets derived from capital share transactions | | | 21,916,724 | | | (98,558,385 | ) |
| | | | | | | |
Net Assets | | | | | | | |
Total increase in net assets | | | 126,344,189 | | | 103,656,356 | |
Beginning of period | | | 1,760,644,260 | | | 1,656,987,904 | |
End of period | | $ | 1,886,988,449 | | $ | 1,760,644,260 | |
Undistributed net investment income | | $ | 15,203,711 | | $ | 776,883 | |
| | | |
See Notes to Financial Statements. |
| | | |
| BLACKROCK S&P 500 INDEX FUND | JUNE 30, 2011 | 9 |
| |
| |
Financial Highlights | BlackRock S&P 500 Index Fund |
| | | | | | | | | | | | | | | | | | | |
| | Institutional | |
| | Six Months
Ended
June 30,
2011
(Unaudited) | | | | | | | | | | | |
| | | Year Ended December 31, | |
| | | |
| | | 2010 | | 2009 | | 2008 | | 2007 | | 2006 | |
Per Share Operating Performance | | | | | | | | | | | | | | | | | | | |
Net asset value, beginning of period | | $ | 15.38 | | $ | 13.63 | | $ | 11.00 | | $ | 18.01 | | $ | 17.40 | | $ | 15.29 | |
Net investment income1 | | | 0.13 | | | 0.24 | | | 0.23 | | | 0.31 | | | 0.30 | | | 0.26 | |
Net realized and unrealized gain (loss) | | | 0.77 | | | 1.77 | | | 2.64 | | | (7.01 | ) | | 0.62 | | | 2.11 | |
Net increase (decrease) from investment operations | | | 0.90 | | | 2.01 | | | 2.87 | | | (6.70 | ) | | 0.92 | | | 2.37 | |
Dividends from net investment income | | | — | | | (0.26 | ) | | (0.24 | ) | | (0.31 | ) | | (0.31 | ) | | (0.26 | ) |
Net asset value, end of period | | $ | 16.28 | | $ | 15.38 | | $ | 13.63 | | $ | 11.00 | | $ | 18.01 | | $ | 17.40 | |
| | | | | | | | | | | | | | | | | | | |
Total Investment Return2 | | | | | | | | | | | | | | | | | | | |
Based on net asset value | | | 5.85 | %3 | | 14.75 | % | | 26.15 | % | | (37.20 | )% | | 5.29 | % | | 15.49 | % |
| | | | | | | | | | | | | | | | | | | |
Ratios to Average Net Assets4 | | | | | | | | | | | | | | | | | | | |
Total expenses | | | 0.30 | %5 | | 0.33 | % | | 0.35 | % | | 0.35 | % | | 0.34 | % | | 0.35 | % |
Total expenses after fees waived | | | 0.30 | %5 | | 0.33 | % | | 0.35 | % | | 0.35 | % | | 0.34 | % | | 0.35 | % |
Net investment income | | | 1.65 | %5 | | 1.74 | % | | 2.02 | % | | 2.00 | % | | 1.64 | % | | 1.61 | % |
| | | | | | | | | | | | | | | | | | | |
Supplemental Data | | | | | | | | | | | | | | | | | | | |
Net assets, end of period (000) | | $ | 1,109,587 | | $ | 1,018,080 | | $ | 951,380 | | $ | 813,527 | | $ | 1,779,030 | | $ | 1,699,791 | |
Portfolio turnover of the Series | | | 2 | % | | 5 | % | | 7 | % | | 8 | % | | 4 | % | | 4 | % |
| | |
| 1 | Based on average shares outstanding. |
| | |
| 2 | Where applicable, total investment returns include the reinvestment of dividends and distributions. |
| | |
| 3 | Aggregate total investment return. |
| | |
| 4 | Includes the Fund’s share of the Series’ allocated expenses and/or net investment income. |
| | |
| 5 | Annualized. |
| | |
See Notes to Financial Statements. |
| | |
10 | BLACKROCK S&P 500 INDEX FUND | JUNE 30, 2011 |
| |
| |
Financial Highlights (concluded) | BlackRock S&P 500 Index Fund |
| | | | | | | | | | | | | | | | | | | |
| | Investor A | |
| | Six Months
Ended
June 30,
2011
(Unaudited) | | | | | | | | | | | | | | | | |
| | | | | | | | | | | | | | | | | |
| | | Year Ended December 31, | |
| | | 2010 | | 2009 | | 2008 | | 2007 | | 2006 | |
Per Share Operating Performance | | | | | | | | | | | | | | | | | | | |
Net asset value, beginning of period | | $ | 15.35 | | $ | 13.61 | | $ | 10.98 | | $ | 17.96 | | $ | 17.36 | | $ | 15.26 | |
Net investment income1 | | | 0.11 | | | 0.21 | | | 0.20 | | | 0.27 | | | 0.25 | | | 0.22 | |
Net realized and unrealized gain (loss) | | | 0.78 | | | 1.75 | | | 2.64 | | | (6.98 | ) | | 0.61 | | | 2.10 | |
Net increase (decrease) from investment operations | | | 0.89 | | | 1.96 | | | 2.84 | | | (6.71 | ) | | 0.86 | | | 2.32 | |
Dividends from net investment income | | | — | | | (0.22 | ) | | (0.21 | ) | | (0.27 | ) | | (0.26 | ) | | (0.22 | ) |
Net asset value, end of period | | $ | 16.24 | | $ | 15.35 | | $ | 13.61 | | $ | 10.98 | | $ | 17.96 | | $ | 17.36 | |
| | | | | | | | | | | | | | | | | | | |
Total Investment Return2 | | | | | | | | | | | | | | | | | | | |
Based on net asset value | | | 5.80 | %3 | | 14.42 | % | | 25.92 | % | | (37.36 | )% | | 4.97 | % | | 15.18 | % |
| | | | | | | | | | | | | | | | | | | |
Ratios to Average Net Assets4 | | | | | | | | | | | | | | | | | | | |
Total expenses | | | 0.56 | %5 | | 0.58 | % | | 0.61 | % | | 0.60 | % | | 0.60 | % | | 0.60 | % |
Total expenses after fees waived | | | 0.55 | %5 | | 0.58 | % | | 0.61 | % | | 0.60 | % | | 0.60 | % | | 0.60 | % |
Net investment income | | | 1.41 | %5 | | 1.49 | % | | 1.76 | % | | 1.75 | % | | 1.38 | % | | 1.36 | % |
| | | | | | | | | | | | | | | | | | | |
Supplemental Data | | | | | | | | | | | | | | | | | | | |
Net assets, end of period (000) | | $ | 777,401 | | $ | 742,564 | | $ | 705,608 | | $ | 579,920 | | $ | 930,377 | | $ | 969,213 | |
Portfolio turnover of the Series | | | 2 | % | | 5 | % | | 7 | % | | 8 | % | | 4 | % | | 4 | % |
| | |
| 1 | Based on average shares outstanding. |
| | |
| 2 | Where applicable, total investment returns include the reinvestment of dividends and distributions. |
| | |
| 3 | Aggregate total investment return. |
| | |
| 4 | Includes the Fund’s share of the Series’ allocated expenses and/or net investment income. |
| | |
| 5 | Annualized. |
| | | |
See Notes to Financial Statements. |
| | | |
| BLACKROCK S&P 500 INDEX FUND | JUNE 30, 2011 | 11 |
| |
| |
Notes to Financial Statements (Unaudited) | BlackRock S&P 500 Index Fund |
1. Organization and Significant Accounting Policies:
BlackRock S&P 500 Index Fund (the “Fund”), a series of BlackRock Index Funds, Inc. (the “Corporation), is registered under the Investment Company Act of 1940, as amended (the “1940 Act”), as a diversified, open-end management investment company. The Corporation is organized as a Maryland corporation. The Fund seeks to achieve its investment objective by investing all of its assets in Master S&P 500 Index Series (the “Series”), a series of Quantitative Master Series LLC, which has the same investment objective and strategies as the Fund. The value of the Fund’s investment in the Series reflects the Fund’s proportionate interest in the net assets of the Series. The percentage of the Series owned by the Fund at June 30, 2011 was 76.6%. The performance of the Fund is directly affected by the performance of the Series. The financial statements of the Series, including the Schedule of Investments, are included elsewhere in this report and should be read in conjunction with the Fund’s financial statements. The Fund’s financial statements are prepared in conformity with accounting principles generally accepted in the United States of America (“US GAAP”), which may require management to make estimates and assumptions that affect the reported amounts and disclosures in the financial statements. Actual results could differ from those estimates. The Fund offers two classes of shares. Institutional Shares are sold without a sales charge and only to certain eligible investors. Investor A Shares are sold without a front-end sales charge. Both classes of shares have identical voting, dividend, liquidation and other rights and the same terms and conditions except that Investor A Shares bear certain expenses related to the shareholder servicing of such shares and have exclusive voting rights with respect to matters relating to its shareholder servicing expenditures.
The following is a summary of significant accounting policies followed by the Fund:
Valuation: US GAAP defines fair value as the price the Fund would receive to sell an asset or pay to transfer a liability in an orderly transaction between market participants at the measurement date. The Fund fair values its financial instruments at market value. The Fund records its investment in the Series at fair value based on the Fund’s proportionate interest in the net assets of the Series. Valuation of securities held by the Series, including categorization of fair value measurements, is discussed in Note 1 of the Series’ Notes to Financial Statements, which are included elsewhere in this report.
Investment Transactions and Investment Income: For financial reporting purposes, contributions to and withdrawals from the Series are accounted for on a trade date basis. For financial reporting purposes, contributions to and withdrawals from the Series are accounted for on a trade basis. The Fund records daily its proportionate share of the Series’ income, expenses and realized and unrealized gains and losses. Realized and unrealized gains and losses are adjusted for utilizing partnership tax allocation rules. In addition, the Fund accrues its own expenses. Income and realized and unrealized gains and losses on investments are allocated daily to each class based on its relative net assets.
Dividends and Distributions: Dividends and distributions paid by the Fund are recorded on the ex-dividend dates. The amount and timing of dividends and distributions are determined in accordance with federal income tax regulations, which may differ from US GAAP.
Income Taxes: It is the Fund’s policy to comply with the requirements of the Internal Revenue Code of 1986, as amended, applicable to regulated investment companies and to distribute substantially all of its taxable income to its shareholders. Therefore, no federal income tax provision is required.
The Fund files US federal and various state and local tax returns. No income tax returns are currently under examination. The statute of limitations on the Fund’s US federal tax returns remains open for each of the four years ended December 31, 2010. The statutes of limitations on the Fund’s state and local tax returns may remain open for an additional year depending upon the jurisdiction. Management does not believe there are any uncertain tax positions that require recognition of a tax liability.
Recent Accounting Standard: In May 2011, the Financial Accounting Standards Board issued amended guidance to improve disclosure about fair value measurements which will require the following disclosures for fair value measurements categorized as Level 3: quantitative information about the unobservable inputs and assumptions used in the fair value measurement, a description of the valuation policies and procedures and a narrative description of the sensitivity of the fair value measurement to changes in unobservable inputs and the interrelationships between those unobservable inputs. In addition, the amounts and reasons for all transfers in and out of Level 1 and Level 2 will be required to be disclosed. The amended guidance is effective for financial statements for fiscal years beginning after December 15, 2011, and interim periods within those fiscal years. Management is evaluating the impact of this guidance on the Series’ financial statements and disclosures.
Other: Expenses directly related to the Fund or its classes are charged to that Fund or class. Other operating expenses shared by several funds are pro rated among those funds on the basis of relative net assets or other appropriate methods. Other expenses of the Fund are allocated daily to each class based on its relative net assets.
| | |
| | |
12 | BLACKROCK S&P 500 INDEX FUND | JUNE 30, 2011 |
| |
| |
Notes to Financial Statements (continued) | BlackRock S&P 500 Index Fund |
2. Administration Agreement and Other Transactions with Affiliates:
The PNC Financial Services Group, Inc. (“PNC”) and Barclays Bank PLC (“Barclays”) are the largest stockholders of BlackRock, Inc. (“BlackRock”). Due to the ownership structure, PNC is an affiliate of the Fund for 1940 Act purposes, but Barclays is not.
The Corporation, on behalf of the Fund, entered into an Administration Agreement with BlackRock Advisors, LLC (the “Administrator”), an indirect, wholly owned subsidiary of BlackRock, to provide administrative services (other than investment advice and related portfolio activities). For such services, the Fund pays the Administrator a monthly fee at an annual rate of 0.195% of the Fund’s average daily net assets. The Fund does not pay an investment advisory fee or investment management fee.
The Administrator voluntarily agreed to waive and/or reimburse fees or expenses, excluding interest expense, dividend expense, acquired fund fees and expenses and certain other fund expenses, in order to limit expenses. The expense limitation as a percentage of net assets is 0.40% for Institutional Shares and 0.65% for Investor A Shares. The Administrator may reduce or discontinue this waiver and/or reimbursement at any time without notice.
The Corporation, on behalf of the Fund, entered into a Distribution Agreement and Distribution Plan with BlackRock Investments, LLC (“BRIL”), an affiliate of BlackRock. Pursuant to the Distribution Plan and in accordance with Rule 12b-1 under the 1940 Act, the Fund pays BRIL ongoing service fees. The fees are accrued daily and paid monthly at an annual rate of 0.25% based upon the average daily net assets of Investor A Shares. Pursuant to sub-agreements with BRIL, broker-dealers and BRIL provide shareholder servicing and distribution services to the Fund. The ongoing service and/or distribution fee compensates BRIL and each broker-dealer for providing shareholder servicing and/or distribution related services to Investor A shareholders.
The Administrator maintains a call center, which is responsible for providing certain shareholder services to the Fund, such as responding to shareholder inquiries and processing transactions based upon instructions from shareholders with respect to the subscription and redemption of Fund shares. For the six months ended June 30, 2011, the Fund reimbursed the Administrator the following amounts for costs incurred in running the call center, which are included in transfer agent — class specific in the Statement of Operations:
| | | | |
Institutional | | $ | 1,946 | |
Investor A | | $ | 4,352 | |
Certain officers and/or directors of the Corporation are officers and/or directors of BlackRock or its affiliates. The Fund reimburses the Administrator for compensation paid to the Corporation’s Chief Compliance Officer.
3. Capital Loss Carryforwards:
As of December 31, 2010, the Fund had capital loss carryforwards available to offset future realized capital gains through the indicated expiration dates:
| | | | |
Expires December 31, | | | | |
2012 | | $ | 12,985,387 | |
2013 | | | 28,402,088 | |
2014 | | | 26,517,609 | |
2017 | | | 14,948,603 | |
Total | | $ | 82,853,687 | |
Under the recently enacted Regulated Investment Company Modernization Act of 2010, capital losses incurred by the Fund after December 31, 2010 will not be subject to expiration. In addition, these losses must be utilized prior to the losses incurred in pre-enactment taxable years.
| | | |
| | | |
| BLACKROCK S&P 500 INDEX FUND | JUNE 30, 2011 | 13 |
| |
| |
Notes to Financial Statements (concluded) | BlackRock S&P 500 Index Fund |
4. Capital Share Transactions:
Transactions in capital shares for each class were as follows:
| | | | | | | | | | | | | | |
| | Six Months Ended
June 30, 2011 | | Year Ended
December 31, 2010 | |
| | Shares | | Amount | | Shares | | Amount | |
Institutional | | | | | | | | | | | | | | |
Shares sold | | | 15,837,425 | | $ | 254,267,668 | | | | 29,561,942 | | $ | 415,514,624 | |
Shares issued to shareholders in reinvestment of dividends | | | — | | | — | | | | 1,076,994 | | | 16,287,469 | |
Total issued | | | 15,837,425 | | | 254,267,668 | | | | 30,638,936 | | | 431,802,093 | |
Shares redeemed | | | (13,902,091 | ) | | (223,814,933 | ) | | | (34,242,137 | ) | | (481,214,108 | ) |
Net increase (decrease) | | | 1,935,334 | | $ | 30,452,735 | | | | (3,603,201 | ) | $ | (49,412,015 | ) |
| | | | | | | | | | | | | | |
Investor A | | | | | | | | | | | | | | |
Shares sold | | | 5,698,607 | | $ | 90,932,091 | | | | 9,986,596 | | $ | 139,337,943 | |
Shares issued to shareholders in reinvestment of dividends | | | — | | | — | | | | 646,756 | | | 9,759,878 | |
Total issued | | | 5,698,607 | | | 90,932,091 | | | | 10,633,352 | | | 149,097,821 | |
Shares redeemed | | | (6,186,920 | ) | | (99,468,102 | ) | | | (14,119,788 | ) | | (198,244,191 | ) |
Net decrease | | | (488,313 | ) | $ | (8,536,011 | ) | | | (3,486,436 | ) | $ | (49,146,370 | ) |
5. Subsequent Events:
Management’s evaluation of the impact of all subsequent events on the Fund’s financial statements was completed through the date the financial statements were issued and the following items were noted:
The Fund paid a net investment income dividend on July 22, 2011 to Common Shareholders of record on July 20, 2011 as follows:
| | | | |
| | Dividend Per Share | |
Institutional | | $ | 0.006778 | |
Investor A | | $ | 0.006770 | |
| | |
| | |
14 | BLACKROCK S&P 500 INDEX FUND | JUNE 30, 2011 |
| |
| |
Portfolio Information | Master S&P 500 Index Series |
| | | | |
Ten Largest Holdings | | Percent of
Long-Term Investments | |
Exxon Mobil Corp. | | | 3 | % |
Apple, Inc. | | | 3 | |
International Business Machines Corp. | | | 2 | |
Chevron Corp. | | | 2 | |
General Electric Co. | | | 2 | |
Microsoft Corp. | | | 2 | |
AT&T, Inc. | | | 2 | |
Johnson & Johnson | | | 2 | |
The Procter & Gamble Co. | | | 1 | |
Pfizer, Inc. | | | 1 | |
| | | | |
Sector Allocations | | Percent of
Long-Term Investments | |
Information Technology | | | 18 | % |
Financials | | | 15 | |
Energy | | | 13 | |
Health Care | | | 12 | |
Industrials | | | 11 | |
Consumer Discretionary | | | 11 | |
Consumer Staples | | | 10 | |
Materials | | | 4 | |
Utilities | | | 3 | |
Telecommunication Services | | | 3 | |
For Series compliance purposes, the Series’ sector classifications refer to any one or more of the industry sub-classifications used by one or more widely recognized market indexes or ratings group indexes, and/or as defined by Series management. These definitions may not apply for purposes of this report, which may combine sector sub-classifications for report ease.
| | | |
| | | |
| BLACKROCK S&P 500 INDEX FUND | JUNE 30, 2011 | 15 |
| |
| |
Schedule of Investments June 30, 2011 (Unaudited) | Master S&P 500 Index Series |
(Percentages shown are based on Net Assets) |
| | | | | | | |
Common Stocks | | | Shares | | Value | |
Aerospace & Defense — 2.9% | | | | | | | |
Boeing Co. | | | 151,062 | | $ | 11,168,014 | |
General Dynamics Corp. | | | 76,177 | | | 5,676,710 | |
Goodrich Corp. | | | 25,576 | | | 2,442,508 | |
Honeywell International, Inc. | | | 160,975 | | | 9,592,500 | |
ITT Corp. | | | 37,624 | | | 2,217,182 | |
L-3 Communications Holdings, Inc. | | | 21,741 | | | 1,901,251 | |
Lockheed Martin Corp. | | | 58,298 | | | 4,720,389 | |
Northrop Grumman Corp. | | | 59,969 | | | 4,158,850 | |
Precision Castparts Corp. | | | 29,480 | | | 4,853,882 | |
Raytheon Co. | | | 72,549 | | | 3,616,568 | |
Rockwell Collins, Inc. | | | 31,554 | | | 1,946,566 | |
Textron, Inc. | | | 56,141 | | | 1,325,489 | |
United Technologies Corp. | | | 187,396 | | | 16,586,420 | |
| | | | | | 70,206,329 | |
Air Freight & Logistics — 1.0% | | | | | | | |
C.H. Robinson Worldwide, Inc. | | | 33,110 | | | 2,610,392 | |
Expeditors International Washington, Inc. | | | 43,634 | | | 2,233,624 | |
FedEx Corp. | | | 64,687 | | | 6,135,562 | |
United Parcel Service, Inc., Class B | | | 201,822 | | | 14,718,879 | |
| | | | | | 25,698,457 | |
Airlines — 0.1% | | | | | | | |
Southwest Airlines Co. | | | 161,623 | | | 1,845,735 | |
Auto Components — 0.3% | | | | | | | |
The Goodyear Tire & Rubber Co. (a) | | | 49,829 | | | 835,632 | |
Johnson Controls, Inc. | | | 139,023 | | | 5,791,698 | |
| | | | | | 6,627,330 | |
Automobiles — 0.5% | | | | | | | |
Ford Motor Co. (a) | | | 777,071 | | | 10,715,809 | |
Harley-Davidson, Inc. | | | 48,483 | | | 1,986,349 | |
| | | | | | 12,702,158 | |
Beverages — 2.5% | | | | | | | |
Brown-Forman Corp., Class B | | | 21,058 | | | 1,572,822 | |
The Coca-Cola Co. | | | 468,444 | | | 31,521,597 | |
Coca-Cola Enterprises, Inc. | | | 66,551 | | | 1,941,958 | |
Constellation Brands, Inc., Class A (a) | | | 36,677 | | | 763,615 | |
Dr. Pepper Snapple Group, Inc. | | | 44,812 | | | 1,878,967 | |
Molson Coors Brewing Co., Class B | | | 32,338 | | | 1,446,802 | |
PepsiCo, Inc. | | | 323,453 | | | 22,780,795 | |
| | | | | | 61,906,556 | |
Biotechnology — 1.2% | | | | | | | |
Amgen, Inc. (a) | | | 190,259 | | | 11,101,612 | |
Biogen Idec, Inc. (a) | | | 49,511 | | | 5,293,716 | |
Celgene Corp. (a) | | | 94,690 | | | 5,711,701 | |
Cephalon, Inc. (a) | | | 15,730 | | | 1,256,827 | |
Gilead Sciences, Inc. (a) | | | 161,095 | | | 6,670,944 | |
| | | | | | 30,034,800 | |
Building Products — 0.0% | | | | | | | |
Masco Corp. | | | 73,584 | | | 885,216 | |
Capital Markets — 2.3% | | | | | | | |
Ameriprise Financial, Inc. | | | 49,614 | | | 2,861,736 | |
The Bank of New York Mellon Corp. | | | 253,778 | | | 6,501,792 | |
BlackRock, Inc. (c) | | | 19,692 | | | 3,777,122 | |
The Charles Schwab Corp. | | | 204,527 | | | 3,364,469 | |
E*Trade Financial Corp. (a) | | | 51,391 | | | 709,196 | |
Federated Investors, Inc., Class B (b) | | | 19,041 | | | 453,937 | |
Franklin Resources, Inc. | | | 29,516 | | | 3,875,156 | |
| | | | | | | |
Common Stocks | | | Shares | | Value | |
Capital Markets (concluded) | | | | | | | |
The Goldman Sachs Group, Inc. | | | 105,990 | | $ | 14,106,209 | |
Invesco Ltd. | | | 94,615 | | | 2,213,991 | |
Janus Capital Group, Inc. | | | 38,242 | | | 361,005 | |
Legg Mason, Inc. | | | 30,222 | | | 990,073 | |
Morgan Stanley | | | 315,934 | | | 7,269,641 | |
Northern Trust Corp. | | | 49,295 | | | 2,265,598 | |
State Street Corp. | | | 103,274 | | | 4,656,625 | |
T. Rowe Price Group, Inc. | | | 53,071 | | | 3,202,304 | |
| | | | | | 56,608,854 | |
Chemicals — 2.2% | | | | | | | |
Air Products & Chemicals, Inc. | | | 43,381 | | | 4,146,356 | |
Airgas, Inc. | | | 14,327 | | | 1,003,463 | |
CF Industries Holdings, Inc. | | | 14,656 | | | 2,076,316 | |
The Dow Chemical Co. | | | 240,393 | | | 8,654,148 | |
E.I. du Pont de Nemours & Co. | | | 189,986 | | | 10,268,743 | |
Eastman Chemical Co. | | | 14,546 | | | 1,484,710 | |
Ecolab, Inc. | | | 47,373 | | | 2,670,890 | |
FMC Corp. | | | 14,678 | | | 1,262,602 | |
International Flavors & Fragrances, Inc. | | | 16,575 | | | 1,064,778 | |
Monsanto Co. | | | 109,699 | | | 7,957,565 | |
PPG Industries, Inc. | | | 32,149 | | | 2,918,808 | |
Praxair, Inc. | | | 62,317 | | | 6,754,540 | |
The Sherwin-Williams Co. | | | 18,083 | | | 1,516,621 | |
Sigma-Aldrich Corp. | | | 24,835 | | | 1,822,392 | |
| | | | | | 53,601,932 | |
Commercial Banks — 2.7% | | | | | | | |
BB&T Corp. | | | 142,918 | | | 3,835,919 | |
Comerica, Inc. | | | 36,347 | | | 1,256,516 | |
Fifth Third Bancorp | | | 188,000 | | | 2,397,000 | |
First Horizon National Corp. | | | 54,193 | | | 517,001 | |
Huntington Bancshares, Inc. | | | 175,479 | | | 1,151,142 | |
KeyCorp | | | 194,306 | | | 1,618,569 | |
M&T Bank Corp. | | | 25,760 | | | 2,265,592 | |
Marshall & Ilsley Corp. | | | 109,305 | | | 871,161 | |
The PNC Financial Services Group, Inc. (c) | | | 107,858 | | | 6,429,415 | |
Regions Financial Corp. | | | 256,158 | | | 1,588,179 | |
SunTrust Banks, Inc. | | | 110,271 | | | 2,844,992 | |
U.S. Bancorp | | | 394,119 | | | 10,053,976 | |
Wells Fargo & Co. | | | 1,082,296 | | | 30,369,226 | |
Zions Bancorporation | | | 37,685 | | | 904,817 | |
| | | | | | 66,103,505 | |
Commercial Services & Supplies — 0.5% | | | | | | | |
Avery Dennison Corp. | | | 21,640 | | | 835,953 | |
Cintas Corp. | | | 26,022 | | | 859,507 | |
Iron Mountain, Inc. | | | 41,117 | | | 1,401,678 | |
Pitney Bowes, Inc. | | | 42,041 | | | 966,523 | |
R.R. Donnelley & Sons Co. | | | 38,492 | | | 754,828 | |
Republic Services, Inc., Class A | | | 61,916 | | | 1,910,109 | |
Stericycle, Inc. (a) | | | 17,619 | | | 1,570,205 | |
Waste Management, Inc. | | | 97,332 | | | 3,627,564 | |
| | | | | | 11,926,367 | |
Communications Equipment — 2.0% | | | | | | | |
Cisco Systems, Inc. (a) | | | 1,124,931 | | | 17,560,173 | |
F5 Networks, Inc. (a) | | | 16,632 | | | 1,833,678 | |
Harris Corp. | | | 25,956 | | | 1,169,577 | |
JDS Uniphase Corp. (a) | | | 46,470 | | | 774,190 | |
Juniper Networks, Inc. (a) | | | 108,879 | | | 3,429,688 | |
| | |
See Notes to Financial Statements. |
| | |
16 | BLACKROCK S&P 500 INDEX FUND | JUNE 30, 2011 |
| |
| |
Schedule of Investments (continued) | Master S&P 500 Index Series |
(Percentages shown are based on Net Assets) |
| | | | | | | |
Common Stocks | | | Shares | | Value | |
Communications Equipment (concluded) | | | | | | | |
Motorola Mobility Holdings, Inc. (a) | | | 59,942 | | $ | 1,321,122 | |
Motorola Solutions, Inc. (a) | | | 69,545 | | | 3,201,852 | |
QUALCOMM, Inc. | | | 341,647 | | | 19,402,133 | |
Tellabs, Inc. | | | 75,314 | | | 347,198 | |
| | | | | | 49,039,611 | |
Computers & Peripherals — 4.2% | | | | | | | |
Apple, Inc. (a) | | | 189,224 | | | 63,516,820 | |
Dell, Inc. (a) | | | 336,079 | | | 5,602,437 | |
EMC Corp. (a) | | | 421,025 | | | 11,599,239 | |
Hewlett-Packard Co. | | | 424,461 | | | 15,450,380 | |
Lexmark International, Inc., Class A (a) | | | 16,260 | | | 475,768 | |
NetApp, Inc. (a) | | | 75,282 | | | 3,973,384 | |
SanDisk Corp. (a) | | | 48,797 | | | 2,025,075 | |
Western Digital Corp. (a) | | | 47,769 | | | 1,737,836 | |
| | | | | | 104,380,939 | |
Construction & Engineering — 0.2% | | | | | | | |
Fluor Corp. | | | 35,630 | | | 2,303,836 | |
Jacobs Engineering Group, Inc. (a) | | | 25,688 | | | 1,111,006 | |
Quanta Services, Inc. (a) | | | 44,234 | | | 893,527 | |
| | | | | | 4,308,369 | |
Construction Materials — 0.0% | | | | | | | |
Vulcan Materials Co. | | | 26,619 | | | 1,025,630 | |
Consumer Finance — 0.8% | | | | | | | |
American Express Co. | | | 213,985 | | | 11,063,024 | |
Capital One Financial Corp. | | | 94,071 | | | 4,860,649 | |
Discover Financial Services, Inc. | | | 111,683 | | | 2,987,520 | |
SLM Corp. (a) | | | 107,318 | | | 1,804,016 | |
| | | | | | 20,715,209 | |
Containers & Packaging — 0.1% | | | | | | | |
Ball Corp. | | | 34,383 | | | 1,322,370 | |
Bemis Co. | | | 21,556 | | | 728,162 | |
Owens-Illinois, Inc. (a) | | | 33,597 | | | 867,138 | |
Sealed Air Corp. | | | 32,730 | | | 778,647 | |
| | | | | | 3,696,317 | |
Distributors — 0.1% | | | | | | | |
Genuine Parts Co. | | | 32,046 | | | 1,743,302 | |
Diversified Consumer Services — 0.1% | | | | | | | |
Apollo Group, Inc., Class A (a) | | | 24,922 | | | 1,088,593 | |
DeVry, Inc. | | | 12,409 | | | 733,744 | |
H&R Block, Inc. | | | 62,722 | | | 1,006,061 | |
| | | | | | 2,828,398 | |
Diversified Financial Services — 3.8% | | | | | | | |
Bank of America Corp. | | | 2,073,536 | | | 22,725,955 | |
CME Group, Inc. | | | 13,714 | | | 3,998,865 | |
Citigroup, Inc. | | | 597,655 | | | 24,886,354 | |
IntercontinentalExchange, Inc. (a)(b) | | | 15,119 | | | 1,885,491 | |
JPMorgan Chase & Co. | | | 813,122 | | | 33,289,215 | |
Leucadia National Corp. | | | 40,252 | | | 1,372,593 | |
Moody’s Corp. | | | 40,429 | | | 1,550,452 | |
The NASDAQ Stock Market, Inc. (a) | | | 30,831 | | | 780,024 | |
NYSE Euronext | | | 53,546 | | | 1,835,021 | |
| | | | | | 92,323,970 | |
| | | | | | | |
Common Stocks | | | Shares | | Value | |
Diversified Telecommunication Services — 2.7% | | | | | | | |
AT&T, Inc. | | | 1,211,787 | | $ | 38,062,230 | |
CenturyLink, Inc. | | | 123,056 | | | 4,975,154 | |
Frontier Communications Corp. | | | 204,664 | | | 1,651,638 | |
Verizon Communications, Inc. | | | 578,925 | | | 21,553,378 | |
Windstream Corp. | | | 104,298 | | | 1,351,702 | |
| | | | | | 67,594,102 | |
Electric Utilities — 1.8% | | | | | | | |
American Electric Power Co., Inc. | | | 98,416 | | | 3,708,315 | |
Duke Energy Corp. | | | 272,806 | | | 5,136,937 | |
Edison International | | | 66,748 | | | 2,586,485 | |
Entergy Corp. | | | 36,453 | | | 2,489,011 | |
Exelon Corp. | | | 135,766 | | | 5,816,215 | |
FirstEnergy Corp. | | | 85,587 | | | 3,778,666 | |
NextEra Energy, Inc. | | | 86,462 | | | 4,968,106 | |
Northeast Utilities, Inc. | | | 36,274 | | | 1,275,757 | |
PPL Corp. | | | 118,218 | | | 3,290,007 | |
Pepco Holdings, Inc. | | | 45,614 | | | 895,403 | |
Pinnacle West Capital Corp. | | | 22,464 | | | 1,001,445 | |
Progress Energy, Inc. | | | 60,185 | | | 2,889,482 | |
The Southern Co. | | | 174,028 | | | 7,027,251 | |
| | | | | | 44,863,080 | |
Electrical Equipment — 0.5% | | | | | | | |
Emerson Electric Co. | | | 153,776 | | | 8,649,900 | |
Rockwell Automation, Inc. | | | 29,547 | | | 2,563,498 | |
Roper Industries, Inc. | | | 19,662 | | | 1,637,844 | |
| | | | | | 12,851,242 | |
Electronic Equipment, Instruments &
Components — 0.4% | | | | | | | |
Amphenol Corp., Class A | | | 36,224 | | | 1,955,734 | |
Corning, Inc. | | | 321,723 | | | 5,839,272 | |
Flir Systems, Inc. (a) | | | 32,827 | | | 1,106,598 | |
Jabil Circuit, Inc. | | | 40,535 | | | 818,807 | |
Molex, Inc. | | | 28,615 | | | 737,409 | |
| | | | | | 10,457,820 | |
Energy Equipment & Services — 2.4% | | | | | | | |
Baker Hughes, Inc. | | | 89,075 | | | 6,463,282 | |
Cameron International Corp. (a) | | | 50,280 | | | 2,528,581 | |
Diamond Offshore Drilling, Inc. | | | 14,265 | | | 1,004,399 | |
FMC Technologies, Inc. (a)(b) | | | 49,430 | | | 2,213,970 | |
Halliburton Co. | | | 187,143 | | | 9,544,293 | |
Helmerich & Payne, Inc. | | | 21,937 | | | 1,450,474 | |
Nabors Industries Ltd. (a) | | | 59,084 | | | 1,455,830 | |
National Oilwell Varco, Inc. | | | 86,705 | | | 6,781,198 | |
Noble Corp. | | | 51,375 | | | 2,024,689 | |
Rowan Cos., Inc. (a) | | | 25,904 | | | 1,005,334 | |
Schlumberger Ltd. | | | 277,674 | | | 23,991,033 | |
| | | | | | 58,463,083 | |
Food & Staples Retailing — 2.3% | | | | | | | |
CVS Caremark Corp. | | | 277,503 | | | 10,428,563 | |
Costco Wholesale Corp. | | | 89,536 | | | 7,273,905 | |
The Kroger Co. | | | 124,182 | | | 3,079,713 | |
SUPERVALU, Inc. | | | 44,171 | | | 415,649 | |
SYSCO Corp. | | | 119,263 | | | 3,718,620 | |
Safeway, Inc. | | | 72,551 | | | 1,695,517 | |
Wal-Mart Stores, Inc. | | | 390,833 | | | 20,768,866 | |
Walgreen Co. | | | 187,181 | | | 7,947,705 | |
Whole Foods Market, Inc. (a) | | | 30,562 | | | 1,939,159 | |
| | | | | | 57,267,697 | |
| | | |
See Notes to Financial Statements. |
| | | |
| BLACKROCK S&P 500 INDEX FUND | JUNE 30, 2011 | 17 |
| |
| |
Schedule of Investments (continued) | Master S&P 500 Index Series |
(Percentages shown are based on Net Assets) |
| | | | | | | |
Common Stocks | | | Shares | | Value | |
Food Products — 1.8% | | | | | | | |
Archer-Daniels-Midland Co. | | | 139,395 | | $ | 4,202,759 | |
Campbell Soup Co. | | | 37,063 | | | 1,280,527 | |
ConAgra Foods, Inc. | | | 84,097 | | | 2,170,544 | |
Dean Foods Co. (a) | | | 38,051 | | | 466,886 | |
General Mills, Inc. | | | 130,816 | | | 4,868,971 | |
H.J. Heinz Co. | | | 65,885 | | | 3,510,353 | |
The Hershey Co. | | | 31,471 | | | 1,789,126 | |
Hormel Foods Corp. | | | 28,374 | | | 845,829 | |
The J.M. Smucker Co. | | | 23,475 | | | 1,794,429 | |
Kellogg Co. | | | 51,272 | | | 2,836,367 | |
Kraft Foods, Inc. | | | 359,748 | | | 12,673,922 | |
McCormick & Co., Inc. | | | 26,953 | | | 1,336,060 | |
Mead Johnson Nutrition Co. | | | 41,916 | | | 2,831,426 | |
Sara Lee Corp. | | | 119,836 | | | 2,275,686 | |
Tyson Foods, Inc., Class A | | | 61,220 | | | 1,188,892 | |
| | | | | | 44,071,777 | |
Gas Utilities — 0.1% | | | | | | | |
Nicor, Inc. | | | 9,331 | | | 510,779 | |
Oneok, Inc. | | | 22,054 | | | 1,632,216 | |
| | | | | | 2,142,995 | |
Health Care Equipment & Supplies — 1.9% | | | | | | | |
Baxter International, Inc. | | | 116,744 | | | 6,968,449 | |
Becton Dickinson & Co. | | | 44,579 | | | 3,841,373 | |
Boston Scientific Corp. (a) | | | 313,096 | | | 2,163,493 | |
C.R. Bard, Inc. | | | 17,532 | | | 1,926,066 | |
CareFusion Corp. (a) | | | 45,871 | | | 1,246,315 | |
Covidien Plc | | | 101,586 | | | 5,407,423 | |
Dentsply International, Inc. | | | 28,764 | | | 1,095,333 | |
Edwards Lifesciences Corp. (a) | | | 23,389 | | | 2,039,053 | |
Intuitive Surgical, Inc. (a) | | | 8,046 | | | 2,993,997 | |
Medtronic, Inc. | | | 218,676 | | | 8,425,586 | |
St. Jude Medical, Inc. (a) | | | 67,359 | | | 3,211,677 | |
Stryker Corp. | | | 68,313 | | | 4,009,290 | |
Varian Medical Systems, Inc. (a) | | | 23,673 | | | 1,657,584 | |
Zimmer Holdings, Inc. (a) | | | 39,435 | | | 2,492,292 | |
| | | | | | 47,477,931 | |
Health Care Providers & Services — 2.2% | | | | | | | |
Aetna, Inc. | | | 77,270 | | | 3,406,834 | |
AmerisourceBergen Corp. | | | 56,183 | | | 2,325,976 | |
CIGNA Corp. | | | 55,228 | | | 2,840,376 | |
Cardinal Health, Inc. | | | 71,656 | | | 3,254,616 | |
Coventry Health Care, Inc. (a) | | | 30,198 | | | 1,101,321 | |
DaVita, Inc. (a) | | | 19,624 | | | 1,699,635 | |
Express Scripts, Inc. (a) | | | 108,504 | | | 5,857,046 | |
Humana, Inc. | | | 34,566 | | | 2,783,946 | |
Laboratory Corp. of America Holdings (a) | | | 20,559 | | | 1,989,906 | |
McKesson Corp. | | | 51,416 | | | 4,300,948 | |
Medco Health Solutions, Inc. (a) | | | 81,554 | | | 4,609,432 | |
Patterson Cos., Inc. | | | 19,396 | | | 637,934 | |
Quest Diagnostics, Inc. | | | 32,206 | | | 1,903,375 | |
Tenet Healthcare Corp. (a) | | | 99,389 | | | 620,187 | |
UnitedHealth Group, Inc. | | | 221,728 | | | 11,436,730 | |
WellPoint, Inc. | | | 75,154 | | | 5,919,881 | |
| | | | | | 54,688,143 | |
| | | | | | | |
Common Stocks | | | Shares | | Value | |
Health Care Technology — 0.1% | | | | | | | |
Cerner Corp. (a) | | | 29,604 | | $ | 1,809,100 | |
Hotels, Restaurants & Leisure — 1.8% | | | | | | | |
Carnival Corp. | | | 88,408 | | | 3,326,793 | |
Chipotle Mexican Grill, Inc., Class A (a)(b) | | | 6,389 | | | 1,969,026 | |
Darden Restaurants, Inc. | | | 28,067 | | | 1,396,614 | |
International Game Technology | | | 61,276 | | | 1,077,232 | |
Marriott International, Inc., Class A | | | 57,511 | | | 2,041,065 | |
McDonald’s Corp. | | | 212,233 | | | 17,895,487 | |
Starbucks Corp. | | | 153,609 | | | 6,066,019 | |
Starwood Hotels & Resorts Worldwide, Inc. | | | 39,938 | | | 2,238,125 | |
Wyndham Worldwide Corp. | | | 34,847 | | | 1,172,602 | |
Wynn Resorts Ltd. | | | 15,634 | | | 2,244,104 | |
Yum! Brands, Inc. | | | 95,178 | | | 5,257,633 | |
| | | | | | 44,684,700 | |
Household Durables — 0.4% | | | | | | | |
D.R. Horton, Inc. | | | 57,786 | | | 665,695 | |
Fortune Brands, Inc. | | | 31,567 | | | 2,013,028 | |
Harman International Industries, Inc. (a) | | | 14,288 | | | 651,104 | |
Leggett & Platt, Inc. | | | 29,577 | | | 721,087 | |
Lennar Corp., Class A | | | 33,071 | | | 600,239 | |
Newell Rubbermaid, Inc. | | | 58,785 | | | 927,627 | |
Pulte Group, Inc. (a) | | | 69,363 | | | 531,320 | |
Stanley Black & Decker, Inc. | | | 34,421 | | | 2,480,033 | |
Whirlpool Corp. | | | 15,677 | | | 1,274,854 | |
| | | | | | 9,864,987 | |
Household Products — 2.1% | | | | | | | |
Clorox Co. | | | 26,985 | | | 1,819,868 | |
Colgate-Palmolive Co. | | | 100,060 | | | 8,746,245 | |
Kimberly-Clark Corp. | | | 80,421 | | | 5,352,822 | |
The Procter & Gamble Co. | | | 571,169 | | | 36,309,213 | |
| | | | | | 52,228,148 | |
IT Services — 3.2% | | | | | | | |
Automatic Data Processing, Inc. | | | 102,400 | | | 5,394,432 | |
Cognizant Technology Solutions Corp. (a) | | | 62,202 | | | 4,561,895 | |
Computer Sciences Corp. | | | 31,552 | | | 1,197,714 | |
Fidelity National Information Services, Inc. | | | 55,066 | | | 1,695,482 | |
Fiserv, Inc. (a) | | | 29,372 | | | 1,839,568 | |
International Business Machines Corp. | | | 247,840 | | | 42,516,952 | |
MasterCard, Inc., Class A | | | 19,274 | | | 5,808,027 | |
Paychex, Inc. | | | 66,233 | | | 2,034,678 | |
SAIC, Inc. (a) | | | 57,225 | | | 962,525 | |
Teradata Corp. (a) | | | 34,619 | | | 2,084,064 | |
Total System Services, Inc. | | | 33,326 | | | 619,197 | |
Visa, Inc., Class A | | | 98,036 | | | 8,260,513 | |
The Western Union Co. | | | 129,482 | | | 2,593,524 | |
| | | | | | 79,568,571 | |
Independent Power Producers & | | | | | | | |
Energy Traders — 0.2% | | | | | | | |
The AES Corp. (a) | | | 134,859 | | | 1,718,104 | |
Constellation Energy Group, Inc. | | | 41,094 | | | 1,559,928 | |
NRG Energy, Inc. (a) | | | 49,340 | | | 1,212,777 | |
| | | | | | 4,490,809 | |
Industrial Conglomerates — 2.4% | | | | | | | |
3M Co. | | | 145,417 | | | 13,792,802 | |
General Electric Co. | | | 2,170,127 | | | 40,928,595 | |
Tyco International Ltd. | | | 95,653 | | | 4,728,128 | |
| | | | | | 59,449,525 | |
| | |
See Notes to Financial Statements. |
| | |
18 | BLACKROCK S&P 500 INDEX FUND | JUNE 30, 2011 |
| |
| |
Schedule of Investments (continued) | Master S&P 500 Index Series |
(Percentages shown are based on Net Assets) |
| | | | | | | |
Common Stocks | | | Shares | | Value | |
Insurance — 3.8% | | | | | | | |
ACE Ltd. | | | 69,132 | | $ | 4,550,268 | |
Aflac, Inc. | | | 95,689 | | | 4,466,763 | |
The Allstate Corp. | | | 106,435 | | | 3,249,461 | |
American International Group, Inc. (a) | | | 89,116 | | | 2,612,881 | |
Aon Corp. | | | 67,677 | | | 3,471,830 | |
Assurant, Inc. | | | 19,106 | | | 692,975 | |
Berkshire Hathaway, Inc. (a) | | | 354,267 | | | 27,416,723 | |
Chubb Corp. | | | 59,611 | | | 3,732,245 | |
Cincinnati Financial Corp. | | | 33,433 | | | 975,575 | |
Genworth Financial, Inc., Class A (a) | | | 100,906 | | | 1,037,314 | |
Hartford Financial Services Group, Inc. | | | 91,186 | | | 2,404,575 | |
Lincoln National Corp. | | | 64,312 | | | 1,832,249 | |
Loews Corp. | | | 63,534 | | | 2,674,146 | |
Marsh & McLennan Cos., Inc. | | | 112,201 | | | 3,499,549 | |
MetLife, Inc. | | | 216,187 | | | 9,484,124 | |
Principal Financial Group, Inc. | | | 66,041 | | | 2,008,967 | |
The Progressive Corp. | | | 132,859 | | | 2,840,525 | |
Prudential Financial, Inc. | | | 100,007 | | | 6,359,445 | |
Torchmark Corp. | | | 15,212 | | | 975,698 | |
The Travelers Cos., Inc. | | | 85,745 | | | 5,005,793 | |
Unum Group | | | 63,076 | | | 1,607,176 | |
XL Group Plc | | | 63,287 | | | 1,391,048 | |
| | | | | | 92,289,330 | |
Internet & Catalog Retail — 1.0% | | | | | | | |
Amazon.com, Inc. (a) | | | 73,081 | | | 14,944,334 | |
Expedia, Inc. | | | 41,094 | | | 1,191,315 | |
Netflix, Inc. (a) | | | 8,940 | | | 2,348,448 | |
Priceline.com, Inc. (a) | | | 10,173 | | | 5,207,864 | |
| | | | | | 23,691,961 | |
Internet Software & Services — 1.6% | | | | | | | |
Akamai Technologies, Inc. (a) | | | 37,974 | | | 1,195,042 | |
eBay, Inc. (a) | | | 233,544 | | | 7,536,465 | |
Google, Inc., Class A (a) | | | 51,436 | | | 26,046,162 | |
Monster Worldwide, Inc. (a) | | | 26,710 | | | 391,568 | |
VeriSign, Inc. | | | 34,539 | | | 1,155,675 | |
Yahoo! Inc. (a) | | | 266,496 | | | 4,008,100 | |
| | | | | | 40,333,012 | |
Leisure Equipment & Products — 0.1% | | | | | | | |
Hasbro, Inc. | | | 27,820 | | | 1,222,133 | |
Mattel, Inc. | | | 71,011 | | | 1,952,092 | |
| | | | | | 3,174,225 | |
Life Sciences Tools & Services — 0.5% | | | | | | | |
Agilent Technologies, Inc. (a) | | | 71,295 | | | 3,643,888 | |
Life Technologies Corp. (a) | | | 36,656 | | | 1,908,678 | |
PerkinElmer, Inc. | | | 23,295 | | | 626,868 | |
Thermo Fisher Scientific, Inc. (a) | | | 78,454 | | | 5,051,653 | |
Waters Corp. (a) | | | 18,820 | | | 1,801,827 | |
| | | | | | 13,032,914 | |
Machinery — 2.4% | | | | | | | |
Caterpillar, Inc. | | | 131,885 | | | 14,040,477 | |
Cummins, Inc. | | | 40,176 | | | 4,157,814 | |
Danaher Corp. | | | 111,591 | | | 5,913,207 | |
Deere & Co. | | | 85,815 | | | 7,075,447 | |
Dover Corp. | | | 38,308 | | | 2,597,282 | |
Eaton Corp. | | | 69,714 | | | 3,586,785 | |
Flowserve Corp. | | | 11,322 | | | 1,244,175 | |
Illinois Tool Works, Inc. | | | 102,474 | | | 5,788,756 | |
| | | | | | | |
Common Stocks | | | Shares | | Value | |
Machinery (concluded) | | | | | | | |
Ingersoll-Rand Plc | | | 68,013 | | $ | 3,088,470 | |
Joy Global, Inc. | | | 21,578 | | | 2,055,089 | |
PACCAR, Inc. | | | 74,791 | | | 3,821,072 | |
Pall Corp. | | | 23,807 | | | 1,338,668 | |
Parker Hannifin Corp. | | | 33,163 | | | 2,976,048 | |
Snap-On, Inc. | | | 11,937 | | | 745,824 | |
| | | | | | 58,429,114 | |
Media — 3.3% | | | | | | | |
CBS Corp., Class B | | | 136,920 | | | 3,900,851 | |
Cablevision Systems Corp., Class A | | | 47,371 | | | 1,715,304 | |
Comcast Corp., Class A | | | 566,088 | | | 14,344,670 | |
DIRECTV, Class A (a) | | | 157,143 | | | 7,986,007 | |
Discovery Communications, Inc., Class A (a)(b) | | | 56,837 | | | 2,328,044 | |
Gannett Co., Inc. | | | 49,456 | | | 708,210 | |
Interpublic Group of Cos., Inc. | | | 100,404 | | | 1,255,050 | |
The McGraw-Hill Cos., Inc. | | | 62,439 | | | 2,616,819 | |
News Corp., Class A | | | 467,205 | | | 8,269,529 | |
Omnicom Group, Inc. | | | 57,121 | | | 2,750,947 | |
Scripps Networks Interactive | | | 18,656 | | | 911,905 | |
Time Warner Cable, Inc. | | | 68,861 | | | 5,373,912 | |
Time Warner, Inc. | | | 219,165 | | | 7,971,031 | |
Viacom, Inc., Class B | | | 119,766 | | | 6,108,066 | |
Walt Disney Co. | | | 386,808 | | | 15,100,984 | |
The Washington Post Co., Class B | | | 1,037 | | | 434,451 | |
| | | | | | 81,775,780 | |
Metals & Mining — 1.1% | | | | | | | |
AK Steel Holding Corp. | | | 22,572 | | | 355,735 | |
Alcoa, Inc. | | | 217,618 | | | 3,451,421 | |
Allegheny Technologies, Inc. | | | 21,625 | | | 1,372,539 | |
Cliffs Natural Resources, Inc. | | | 29,521 | | | 2,729,216 | |
Freeport-McMoRan Copper & Gold, Inc., Class B | | | 193,783 | | | 10,251,121 | |
Newmont Mining Corp. | | | 101,201 | | | 5,461,818 | |
Nucor Corp. | | | 64,754 | | | 2,669,160 | |
Titanium Metals Corp. | | | 18,479 | | | 338,535 | |
United States Steel Corp. | | | 29,565 | | | 1,361,173 | |
| | | | | | 27,990,718 | |
Multi-Utilities — 1.3% | | | | | | | |
Ameren Corp. | | | 49,003 | | | 1,413,246 | |
CMS Energy Corp. | | | 51,966 | | | 1,023,211 | |
CenterPoint Energy, Inc. | | | 86,537 | | | 1,674,491 | |
Consolidated Edison, Inc. | | | 59,821 | | | 3,184,870 | |
DTE Energy Co. | | | 34,510 | | | 1,726,190 | |
Dominion Resources, Inc. | | | 117,570 | | | 5,675,104 | |
Integrys Energy Group, Inc. | | | 15,752 | | | 816,584 | |
NiSource, Inc. | | | 56,732 | | | 1,148,823 | |
PG&E Corp. | | | 81,621 | | | 3,430,531 | |
Public Service Enterprise Group, Inc. | | | 103,640 | | | 3,382,810 | |
SCANA Corp. | | | 23,091 | | | 909,093 | |
Sempra Energy | | | 48,966 | | | 2,589,322 | |
TECO Energy, Inc. | | | 44,014 | | | 831,424 | |
Wisconsin Energy Corp. | | | 48,121 | | | 1,508,593 | |
Xcel Energy, Inc. | | | 99,138 | | | 2,409,053 | |
| | | | | | 31,723,345 | |
| | | |
See Notes to Financial Statements. |
| | | |
| BLACKROCK S&P 500 INDEX FUND | JUNE 30, 2011 | 19 |
| |
| |
Schedule of Investments (continued) | Master S&P 500 Index Series |
(Percentages shown are based on Net Assets) |
| | | | | | | |
Common Stocks | | | Shares | | Value | |
Multiline Retail — 0.7% | | | | | | | |
Big Lots, Inc. (a) | | | 15,429 | | $ | 511,471 | |
Family Dollar Stores, Inc. | | | 24,627 | | | 1,294,395 | |
JCPenney Co., Inc. | | | 43,688 | | | 1,508,983 | |
Kohl’s Corp. | | | 57,558 | | | 2,878,476 | |
Macy’s, Inc. | | | 87,383 | | | 2,555,079 | |
Nordstrom, Inc. | | | 34,190 | | | 1,604,879 | |
Sears Holdings Corp. (a)(b) | | | 8,863 | | | 633,173 | |
Target Corp. | | | 141,056 | | | 6,616,937 | |
| | | | | | 17,603,393 | |
Office Electronics — 0.1% | | | | | | | |
Xerox Corp. | | | 286,941 | | | 2,987,056 | |
Oil, Gas & Consumable Fuels — 10.3% | | | | | | | |
Alpha Natural Resources, Inc. (a) | | | 46,505 | | | 2,113,187 | |
Anadarko Petroleum Corp. | | | 101,703 | | | 7,806,722 | |
Apache Corp. | | | 78,431 | | | 9,677,601 | |
Cabot Oil & Gas Corp., Class A | | | 21,496 | | | 1,425,400 | |
Chesapeake Energy Corp. | | | 134,552 | | | 3,994,849 | |
Chevron Corp. | | | 411,349 | | | 42,303,131 | |
ConocoPhillips | | | 289,251 | | | 21,748,783 | |
Consol Energy, Inc. | | | 46,499 | | | 2,254,272 | |
Denbury Resources, Inc. (a) | | | 81,680 | | | 1,633,600 | |
Devon Energy Corp. | | | 86,433 | | | 6,811,785 | |
EOG Resources, Inc. | | | 55,010 | | | 5,751,295 | |
EQT Corp. | | | 30,683 | | | 1,611,471 | |
El Paso Corp. | | | 157,498 | | | 3,181,460 | |
Exxon Mobil Corp. (d) | | | 1,007,967 | | | 82,028,354 | |
Hess Corp. | | | 61,955 | | | 4,631,756 | |
Marathon Oil Corp. | | | 145,559 | | | 7,668,048 | |
Murphy Oil Corp. | | | 39,608 | | | 2,600,661 | |
Newfield Exploration Co. (a) | | | 27,057 | | | 1,840,417 | |
Noble Energy, Inc. | | | 36,021 | | | 3,228,562 | |
Occidental Petroleum Corp. | | | 166,347 | | | 17,306,742 | |
Peabody Energy Corp. | | | 55,439 | | | 3,265,911 | |
Pioneer Natural Resources Co. | | | 23,951 | | | 2,145,291 | |
QEP Resources, Inc. | | | 36,397 | | | 1,522,487 | |
Range Resources Corp. | | | 32,689 | | | 1,814,239 | |
Southwestern Energy Co. (a) | | | 71,277 | | | 3,056,358 | |
Spectra Energy Corp. | | | 132,780 | | | 3,639,500 | |
Sunoco, Inc. | | | 24,756 | | | 1,032,573 | |
Tesoro Corp. (a) | | | 29,427 | | | 674,173 | |
Valero Energy Corp. | | | 116,623 | | | 2,982,050 | |
Williams Cos., Inc. | | | 120,700 | | | 3,651,175 | |
| | | | | | 253,401,853 | |
Paper & Forest Products — 0.2% | | | | | | | |
International Paper Co. | | | 89,526 | | | 2,669,666 | |
MeadWestvaco Corp. | | | 34,533 | | | 1,150,294 | |
| | | | | | 3,819,960 | |
Personal Products — 0.2% | | | | | | | |
Avon Products, Inc. | | | 88,235 | | | 2,470,580 | |
The Estée Lauder Cos., Inc., Class A | | | 23,316 | | | 2,452,610 | |
| | | | | | 4,923,190 | |
Pharmaceuticals — 5.7% | | | | | | | |
Abbott Laboratories | | | 318,068 | | | 16,736,738 | |
Allergan, Inc. | | | 62,476 | | | 5,201,127 | |
Bristol-Myers Squibb Co. | | | 348,986 | | | 10,106,635 | |
Eli Lilly & Co. | | | 208,269 | | | 7,816,336 | |
Forest Laboratories, Inc. (a) | | | 58,780 | | | 2,312,405 | |
| | | | | | | |
Common Stocks | | | Shares | | Value | |
Pharmaceuticals (concluded) | | | | | | | |
Hospira, Inc. (a) | | | 34,338 | | $ | 1,945,591 | |
Johnson & Johnson | | | 560,906 | | | 37,311,467 | |
Merck & Co., Inc. | | | 631,617 | | | 22,289,764 | |
Mylan, Inc. (a) | | | 89,912 | | | 2,218,129 | |
Pfizer, Inc. | | | 1,616,778 | | | 33,305,627 | |
Watson Pharmaceuticals, Inc. (a) | | | 25,943 | | | 1,783,062 | |
| | | | | | 141,026,881 | |
Professional Services — 0.1% | | | | | | | |
Dun & Bradstreet Corp. | | | 10,198 | | | 770,357 | |
Equifax, Inc. | | | 25,380 | | | 881,194 | |
Robert Half International, Inc. | | | 30,300 | | | 819,009 | |
| | | | | | 2,470,560 | |
Real Estate Investment Trusts (REITs) — 1.7% | | | | | | | |
Apartment Investment & Management Co., Class A | | | 24,447 | | | 624,132 | |
AvalonBay Communities, Inc. | | | 17,878 | | | 2,295,535 | |
Boston Properties, Inc. | | | 29,821 | | | 3,165,797 | |
Equity Residential | | | 60,182 | | | 3,610,920 | |
HCP, Inc. | | | 83,161 | | | 3,051,177 | |
Health Care REIT, Inc. | | | 36,264 | | | 1,901,321 | |
Host Marriott Corp. | | | 140,481 | | | 2,381,153 | |
Kimco Realty Corp. | | | 83,631 | | | 1,558,882 | |
Plum Creek Timber Co., Inc. | | | 33,264 | | | 1,348,523 | |
ProLogis | | | 92,976 | | | 3,332,260 | |
Public Storage | | | 28,630 | | | 3,264,106 | |
Simon Property Group, Inc. | | | 60,033 | | | 6,977,636 | |
Ventas, Inc. | | | 33,561 | | | 1,769,000 | |
Vornado Realty Trust | | | 33,493 | | | 3,120,878 | |
Weyerhaeuser Co. | | | 110,378 | | | 2,412,863 | |
| | | | | | 40,814,183 | |
Real Estate Management & Development — 0.1% | | | | | | | |
CB Richard Ellis Group, Inc. (a) | | | 59,322 | | | 1,489,575 | |
Road & Rail — 0.9% | | | | | | | |
CSX Corp. | | | 225,158 | | | 5,903,643 | |
Norfolk Southern Corp. | | | 72,097 | | | 5,402,228 | |
Ryder System, Inc. | | | 10,574 | | | 601,132 | |
Union Pacific Corp. | | | 100,369 | | | 10,478,523 | |
| | | | | | 22,385,526 | |
Semiconductors & Semiconductor | | | | | | | |
Equipment — 2.4% | | | | | | | |
Advanced Micro Devices, Inc. (a) | | | 116,858 | | | 816,838 | |
Altera Corp. | | | 66,058 | | | 3,061,788 | |
Analog Devices, Inc. | | | 61,544 | | | 2,408,832 | |
Applied Materials, Inc. | | | 270,140 | | | 3,514,521 | |
Broadcom Corp., Class A (a) | | | 97,413 | | | 3,276,973 | |
First Solar, Inc. (a)(b) | | | 11,023 | | | 1,458,012 | |
Intel Corp. | | | 1,084,959 | | | 24,042,692 | |
KLA-Tencor Corp. | | | 34,409 | | | 1,392,876 | |
LSI Corp. (a) | | | 123,942 | | | 882,467 | |
Linear Technology Corp. | | | 46,811 | | | 1,545,699 | |
MEMC Electronic Materials, Inc. (a) | | | 47,390 | | | 404,237 | |
Microchip Technology, Inc. | | | 38,962 | | | 1,477,050 | |
Micron Technology, Inc. (a) | | | 176,865 | | | 1,322,950 | |
National Semiconductor Corp. | | | 49,667 | | | 1,222,305 | |
Novellus Systems, Inc. (a) | | | 18,156 | | | 656,158 | |
Nvidia Corp. (a) | | | 122,883 | | | 1,958,141 | |
Teradyne, Inc. (a) | | | 38,144 | | | 564,531 | |
Texas Instruments, Inc. | | | 237,659 | | | 7,802,345 | |
Xilinx, Inc. | | | 54,364 | | | 1,982,655 | |
| | | | | | 59,791,070 | |
| | |
See Notes to Financial Statements. |
| | |
20 | BLACKROCK S&P 500 INDEX FUND | JUNE 30, 2011 |
| |
| |
Schedule of Investments (continued) | Master S&P 500 Index Series |
(Percentages shown are based on Net Assets) |
| | | | | | | |
Common Stocks | | | Shares | | Value | |
Software — 3.7% | | | | | | | |
Adobe Systems, Inc. (a) | | | 102,998 | | $ | 3,239,287 | |
Autodesk, Inc. (a) | | | 47,263 | | | 1,824,352 | |
BMC Software, Inc. (a) | | | 36,376 | | | 1,989,767 | |
CA, Inc. | | | 77,904 | | | 1,779,327 | |
Citrix Systems, Inc. (a) | | | 38,440 | | | 3,075,200 | |
Compuware Corp. (a) | | | 44,993 | | | 439,132 | |
Electronic Arts, Inc. (a) | | | 68,001 | | | 1,604,824 | |
Intuit, Inc. (a) | | | 55,845 | | | 2,896,122 | |
Microsoft Corp. | | | 1,518,482 | | | 39,480,532 | |
Oracle Corp. | | | 797,361 | | | 26,241,150 | |
Red Hat, Inc. (a) | | | 39,298 | | | 1,803,778 | |
Salesforce.com, Inc. (a) | | | 24,687 | | | 3,677,869 | |
Symantec Corp. (a) | | | 153,654 | | | 3,030,057 | |
| | | | | | 91,081,397 | |
Specialty Retail — 1.8% | | | | | | | |
Abercrombie & Fitch Co., Class A | | | 17,775 | | | 1,189,503 | |
AutoNation, Inc. (a)(b) | | | 13,147 | | | 481,312 | |
AutoZone, Inc. (a) | | | 5,181 | | | 1,527,618 | |
Bed Bath & Beyond, Inc. (a) | | | 51,013 | | | 2,977,629 | |
Best Buy Co., Inc. | | | 65,950 | | | 2,071,489 | |
CarMax, Inc. (a) | | | 45,925 | | | 1,518,740 | |
GameStop Corp., Class A (a) | | | 28,698 | | | 765,376 | |
The Gap, Inc. | | | 80,086 | | | 1,449,556 | |
Home Depot, Inc. | | | 325,855 | | | 11,802,468 | |
Limited Brands, Inc. | | | 51,664 | | | 1,986,481 | |
Lowe’s Cos., Inc. | | | 266,514 | | | 6,212,441 | |
O’Reilly Automotive, Inc. (a) | | | 27,878 | | | 1,826,288 | |
Ross Stores, Inc. | | | 23,959 | | | 1,919,595 | |
Staples, Inc. | | | 146,471 | | | 2,314,242 | |
TJX Cos., Inc. | | | 79,045 | | | 4,152,234 | |
Tiffany & Co. | | | 26,141 | | | 2,052,591 | |
Urban Outfitters, Inc. (a) | | | 25,820 | | | 726,833 | |
| | | | | | 44,974,396 | |
Textiles, Apparel & Luxury Goods — 0.6% | | | | | | | |
Coach, Inc. | | | 60,112 | | | 3,842,960 | |
NIKE, Inc., Class B | | | 77,485 | | | 6,972,100 | |
Polo Ralph Lauren Corp. | | | 13,167 | | | 1,746,076 | |
VF Corp. | | | 17,912 | | | 1,944,527 | |
| | | | | | 14,505,663 | |
Thrifts & Mortgage Finance — 0.1% | | | | | | | |
Hudson City Bancorp, Inc. | | | 108,338 | | | 887,288 | |
People’s United Financial, Inc. | | | 72,710 | | | 977,223 | |
| | | | | | 1,864,511 | |
Tobacco — 1.7% | | | | | | | |
Altria Group, Inc. | | | 428,370 | | | 11,313,252 | |
Lorillard, Inc. | | | 29,253 | | | 3,184,774 | |
Philip Morris International, Inc. | | | 363,918 | | | 24,298,805 | |
Reynolds American, Inc. | | | 69,299 | | | 2,567,528 | |
| | | | | | 41,364,359 | |
Trading Companies & Distributors — 0.2% | | | | | | | |
Fastenal Co. (b) | | | 60,048 | | | 2,161,127 | |
W.W. Grainger, Inc. | | | 11,881 | | | 1,825,516 | |
| | | | | | 3,986,643 | |
| | | | | | | |
Common Stocks | | | Shares | | Value | |
Wireless Telecommunication Services — 0.4% | | | | | | | |
American Tower Corp., Class A (a) | | | 81,327 | | $ | 4,255,842 | |
MetroPCS Communications, Inc. (a) | | | 54,791 | | | 942,953 | |
Sprint Nextel Corp. (a) | | | 612,353 | | | 3,300,583 | |
| | | | | | 8,499,378 | |
Total Long-Term Investments
(Cost — $1,914,440,280) — 99.8% | | | | | | 2,459,612,687 | |
| | | | | | | |
| | | | | | | |
Short-Term Securities | | | | | | | |
BlackRock Liquidity Funds, TempFund,
Institutional Class, 0.08% (c)(e) | | | 5,712,540 | | | 5,712,540 | |
| | | | | | | |
| | | Beneficial
Interest
(000) | | | | |
BlackRock Liquidity Series, LLC
Money Market Series, 0.09% (c)(e)(f) | | $ | 9,275 | | | 9,275,278 | |
Total Short-Term Securities
(Cost — $14,987,818) — 0.6% | | | | | | 14,987,818 | |
Total Investments Before Short Positions
(Cost — $1,929,428,098*) — 100.4% | | | | | | 2,474,600,505 | |
| | | | | | | |
| | | | | | | |
Short Positions (g) | | | Shares | | | | |
| | | | | | | |
AMC Networks, Inc. Class A | | | 11,842 | | | (515,127 | ) |
Total Short Positions
(Proceeds — $515,088) — (0.0)% | | | | | | (515,127 | ) |
Total Investments, Net of Short Positions — 100.4% | | | | | | 2,474,085,378 | |
Liabilities in Excess of Other Assets — (0.4)% | | | | | | (9,382,241 | ) |
Net Assets — 100.0% | | | | | $ | 2,464,703,137 | |
| |
* | The cost and unrealized appreciation (depreciation) of investments as of June 30, 2011, as computed for federal income tax purposes, were as follows: |
| | | | |
Aggregate cost | | $ | 1,517,953,262 | |
Gross unrealized appreciation | | $ | 1,076,281,999 | |
Gross unrealized depreciation | | | (119,634,756 | ) |
Net unrealized appreciation | | $ | 956,647,243 | |
| |
(a) | Non-income producing security. |
| |
(b) | Security, or a portion of security, is on loan. |
| | | |
See Notes to Financial Statements. |
| | | |
| BLACKROCK S&P 500 INDEX FUND | JUNE 30, 2011 | 21 |
| |
| |
Schedule of Investments (concluded) | Master S&P 500 Index Series |
| |
(c) | Investments in companies considered to be an affiliate of the Series during the period, for purposes of Section 2(a)(3) of the Investment Company Act of 1940, as amended, were as follows: |
| | | | | | | | | | | | | | | | | | | | | | |
Affiliate | | Beneficial Interest/
Shares Held
at December 31,
2010 | | Shares
Purchased | | Beneficial
Interest/
Shares Sold | | Beneficial Interest/
Shares Held
at June 30,
2011 | | Value
at June 30,
2011 | | Realized
Loss | | Income | |
BlackRock, Inc. | | | — | | | 19,950 | | | (258 | ) | | 19,692 | | $ | 3,777,122 | | $ | (1,459 | ) | $ | 26,758 | |
BlackRock Liquidity Funds, TempFund, Institutional Class | | | 11,774,805 | | | — | | | (6,062,265 | )1 | | 5,712,540 | | $ | 5,712,540 | | | — | | $ | 792 | |
BlackRock Liquidity Series, LLC, Money Market Series | | $ | 135,284,520 | | | — | | $ | (126,009,242 | )1 | $ | 9,275,278 | | $ | 9,275,278 | | | — | | $ | 139,184 | |
The PNC Financial Services Group, Inc. | | | 108,792 | | | 1,180 | | | 2,114 | | | 107,858 | | $ | 6,429,415 | | $ | 6,063 | | $ | 107,993 | |
| | |
| 1 | Represents net shares/beneficial interest sold. |
| |
(d) | All or a portion of security has been pledged as collateral in connection with open financial futures contracts. |
| |
(e) | Represents the current yield as of report date. |
| |
(f) | Security was purchased with the cash collateral from loaned securities. |
| |
(g) | In order to track the performance of its benchmark Index, the Series sold non-index securities that it subsequently received in corporate actions occurring on the opening of market trading on the following business day. |
| |
• | Financial futures contracts purchased as of June 30, 2011 were as follows: |
| | | | | | | | | | | | | | | | | |
Contracts | | | | Issue | | | Exchange | | | Expiration
Date | | Notional
Value | | Unrealized
Appreciation | |
140 | | | | S&P 500 | | | Chicago | | | September 2011 | | $ | 8,982,425 | | $ | 226,075 | |
| | | EMini | | | Mercantile | | | | | | | | | | |
| | | | | | Exchange | | | | | | | | | | |
| | |
• | For Series compliance purposes, the Series’ industry classifications refer to any one or more of the industry sub-classifications used by one or more widely recognized market indexes or rating group indexes, and/or as defined by Series management. This definition may not apply for purposes of this report, which may combine such industry sub-classifications for reporting ease. |
| | |
• | Fair Value Measurements — Various inputs are used in determining the fair value of investments and derivative financial instruments. These inputs are categorized in three broad levels for financial statement purposes as follows: |
| | |
| • | Level 1 — price quotations in active markets/exchanges for identical assets and liabilities |
| | |
| • | Level 2 — other observable inputs (including, but not limited to: quoted prices for similar assets or liabilities in markets that are active, quoted prices for identical or similar assets or liabilities in markets that are not active, inputs other than quoted prices that are observable for the assets or liabilities (such as interest rates, yield curves, volatilities, prepayment speeds, loss severities, credit risks and default rates) or other market-corroborated inputs) |
| | |
| • | Level 3 — unobservable inputs based on the best information available in the circumstances, to the extent observable inputs are not available (including the Series’ own assumptions used in determining the fair value of investments and derivative financial instruments) |
The categorization of a value determined for investments and derivative financial instruments is based on the pricing transparency of the investments and derivative financial instrument and does not necessarily correspond to the Series’ perceived risk of investing in those securities. For information about the Series’ policy regarding valuation of investments and derivative financial instruments and other significant accounting policies, please refer to Note 1 of the Series’ Notes to Financial Statements.
The following tables summarize the inputs used as of June 30, 2011 in determining the fair valuation of the Series’ investments and derivative financial instruments:
| | | | | | | | | | | | | |
Valuation Inputs | | Level 1 | | Level 2 | | Level 3 | | Total | |
Assets: | | | | | | | | | | | | | |
Investments: | | | | | | | | | | | | | |
Long-Term Investments2 | | $ | 2,459,612,687 | | | — | | | — | | $ | 2,459,612,687 | |
Short-Term Securities | | | 5,712,540 | | $ | 9,275,278 | | | — | | | 14,987,818 | |
Liabilities: | | | | | | | | | | | | | |
Investments: | | | | | | | | | | | | | |
Short Position | | | (515,127 | ) | | — | | | — | | | (515,127 | ) |
Total | | $ | 2,464,810,100 | | $ | 9,275,278 | | | — | | $ | 2,474,085,378 | |
| | |
| 2 | See above Schedule of Investments for values in each industry. |
| | | | | | | | | | | | | |
Valuation Inputs | | Level 1 | | Level 2 | | Level 3 | | Total | |
Derivative Financial
Instruments3 | | | | | | | | | | | | | |
Assets: | | | | | | | | | | | | | |
Equity contracts | | $ | 226,075 | | | — | | | — | | $ | 226,075 | |
| | |
| 3 | Derivative financial instruments are financial futures contracts, which are valued at the unrealized appreciation/depreciation on the instrument. |
| | |
See Notes to Financial Statements. |
| | |
22 | BLACKROCK S&P 500 INDEX FUND | JUNE 30, 2011 |
| |
| |
Statement of Assets and Liabilities | Master S&P 500 Index Series |
| | | | |
June 30, 2011 (Unaudited) | | | | |
Assets | | | | |
Investments at value — unaffiliated (including securities loaned of $9,157,302) (cost — $1,905,976,700) | | $ | 2,449,406,150 | |
Investments at value — affiliated (cost — $23,451,398) | | | 25,194,355 | |
Dividends receivable | | | 3,135,881 | |
Investments sold receivable | | | 796,562 | |
Margin variation receivable | | | 84,509 | |
Securities lending income receivable — affiliated | | | 111,931 | |
Prepaid expenses | | | 56,982 | |
Other assets | | | 286,987 | |
Total assets | | | 2,479,073,357 | |
| | | | |
Liabilities | | | | |
Collateral on securities loaned at value | | | 9,275,278 | |
Investments sold short at value (proceeds — $515,088) | | | 515,127 | |
Withdrawals payable to investors | | | 4,121,776 | |
Investments purchased payable | | | 217,372 | |
Investment advisory fees payable | | | 38,950 | |
Other affiliates payable | | | 25,711 | |
Directors’ fees payable | | | 830 | |
Other accrued expenses payable | | | 175,176 | |
Total liabilities | | | 14,370,220 | |
Net Assets | | $ | 2,464,703,137 | |
| | | | |
Net Assets Consist of | | | | |
Investors’ capital | | | 1,919,304,694 | |
Net unrealized appreciation/depreciation | | | 545,398,443 | |
Net Assets | | $ | 2,464,703,137 | |
| | | |
See Notes to Financial Statements. |
| | | |
| BLACKROCK S&P 500 INDEX FUND | JUNE 30, 2011 | 23 |
| |
| |
Statement of Operations | Master S&P 500 Index Series |
| | | | |
Six Months Ended June 30, 2011 (Unaudited) | | | | |
Investment Income | | | | |
Dividends — unaffiliated | | $ | 23,714,435 | |
Foreign taxes withheld | | | (9,446 | ) |
Dividends — affiliated | | | 135,543 | |
Securities lending — affiliated | | | 139,184 | |
Total income | | | 23,979,716 | |
| | | | |
Expenses | | | | |
Investment advisory | | | 122,191 | |
Accounting services | | | 201,445 | |
Custodian | | | 58,926 | |
Professional | | | 44,629 | |
Directors | | | 28,779 | |
Registration | | | 10,345 | |
Printing | | | 2,673 | |
Miscellaneous | | | 22,645 | |
Total expenses | | | 491,633 | |
Less fees waived by advisor | | | (65,610 | ) |
Less fees paid indirectly | | | (34 | ) |
Total expenses after fees waived and paid indirectly | | | 425,989 | |
Net investment income | | | 23,553,727 | |
| | | | |
Realized and Unrealized Gain (Loss) | | | | |
Net realized gain from: | | | | |
Investments — unaffiliated | | | 5,530,067 | |
Investments — affiliated | | | 4,604 | |
Financial futures contracts | | | 718,358 | |
| | | 6,253,029 | |
Net change in unrealized appreciation/depreciation on: | | | | |
Investments | | | 113,340,823 | |
Financial futures contracts | | | 215,422 | |
Short positions | | | (39 | ) |
| | | 113,556,206 | |
Total realized and unrealized gain | | | 119,809,235 | |
Net Increase in Net Assets Resulting from Operations | | $ | 143,362,962 | |
| | |
See Notes to Financial Statements. |
| | |
24 | BLACKROCK S&P 500 INDEX FUND | JUNE 30, 2011 |
| |
| |
Statements of Changes in Net Assets | Master S&P 500 Index Series |
| | | | | | | |
Increase (Decrease) in Net Assets: | | Six Months
Ended
June 30,
2011
(Unaudited) | | Year Ended
December 31,
2010 | |
Operations | | | | | | | |
Net investment income | | $ | 23,553,727 | | $ | 46,035,411 | |
Net realized gain (loss) | | | 6,253,029 | | | (5,190,154 | ) |
Net change in unrealized appreciation/depreciation | | | 113,556,206 | | | 279,529,123 | |
Net increase in net assets resulting from operations | | | 143,362,962 | | | 320,374,380 | |
| | | | | | | |
Capital Transactions | | | | | | | |
Proceeds from contributions | | | 376,859,429 | | | 601,567,988 | |
Value of withdrawals | | | (419,503,100 | ) | | (836,617,134 | ) |
Net decrease in net assets derived from capital transactions | | | (42,643,671 | ) | | (235,049,146 | ) |
| | | | | | | |
Net Assets | | | | | | | |
Total increase in net assets | | | 100,719,291 | | | 85,325,234 | |
Beginning of period | | | 2,363,983,846 | | | 2,278,658,612 | |
End of period | | $ | 2,464,703,137 | | $ | 2,363,983,846 | |
| | | |
See Notes to Financial Statements. |
| | | |
| BLACKROCK S&P 500 INDEX FUND | JUNE 30, 2011 | 25 |
| |
| |
Financial Highlights | Master S&P 500 Index Series |
| | | | | | | | | | | | | | | | | | | |
| | Six Months
Ended
June 30,
2011
(Unaudited) | | | | | | | | | | | |
| | | | | | | | | | | | |
| | | Year Ended December 31, | |
| | | 2010 | | 2009 | | 2008 | | 2007 | | 2006 | |
Total Investment Return | | | | | | | | | | | | | | | | | | | |
Total investment return | | | 5.99 | %1 | | 15.11 | % | | 26.61 | % | | (36.92 | )% | | 5.56 | % | | 15.85 | % |
| | | | | | | | | | | | | | | | | | | |
Ratios to Average Net Assets | | | | | | | | | | | | | | | | | | | |
Total expenses | | | 0.04 | %2 | | 0.04 | % | | 0.05 | % | | 0.04 | % | | 0.04 | % | | 0.04 | % |
Total expenses after fees waived and paid indirectly | | | 0.03 | %2 | | 0.04 | % | | 0.04 | % | | 0.04 | % | | 0.03 | % | | 0.04 | % |
Net investment income | | | 1.93 | %2 | | 2.03 | % | | 2.32 | % | | 2.31 | % | | 1.95 | % | | 1.92 | % |
| | | | | | | | | | | | | | | | | | | |
Supplemental Data | | | | | | | | | | | | | | | | | | | |
Net assets, end of period (000) | | $ | 2,464,703 | | $ | 2,363,984 | | $ | 2,278,659 | | $ | 1,953,848 | | $ | 3,721,171 | | $ | 2,810,633 | |
Portfolio turnover | | | 2 | % | | 5 | % | | 7 | % | | 8 | % | | 4 | % | | 4 | % |
| | |
| 1 | Aggregate total investment return. |
| | |
| 2 | Annualized. |
| | |
See Notes to Financial Statements. |
| | |
26 | BLACKROCK S&P 500 INDEX FUND | JUNE 30, 2011 |
| |
| |
Notes to Financial Statements (Unaudited) | Master S&P 500 Index Series |
1. Organization and Significant Accounting Policies:
Master S&P 500 Index Series (the “Series”), a diversified, open-end management investment company, is a series of Quantitative Master Series LLC (the “Master LLC”). The Master LLC is registered as an investment company under the Investment Company Act of 1940, as amended (the “1940 Act”), and is organized as a Delaware limited liability company. The Master LLC’s Limited Liability Company Agreement permits the Board of Directors of the Master LLC (the “Board”) to issue non-transferable interests, subject to certain limitations. The Series’ financial statements are prepared in conformity with accounting principles generally accepted in the United States of America (“US GAAP”), which may require management to make estimates and assumptions that affect the reported amounts and disclosures in the financial statements. Actual results could differ from those estimates.
The following is a summary of significant accounting policies followed by the Series:
Valuation: US GAAP defines fair value as the price the Series would receive to sell an asset or pay to transfer a liability in an orderly transaction between market participants at the measurement date. The Series fair values its financial instruments at market value using independent dealers or pricing services under policies approved by the Board. Equity investments traded on a recognized securities exchange or the NASDAQ Global Market System (“NASDAQ”) are valued at the last reported sale price that day or the NASDAQ official closing price, if applicable. For equity investments traded on more than one exchange, the last reported sale price on the exchange where the stock is primarily traded is used. Equity investments traded on a recognized exchange for which there were no sales on that day are valued at the last available bid (long positions) or ask (short positions) price. If no bid or ask price is available, the prior day’s price will be used, unless it is determined that such prior day’s price no longer reflects the fair value of the security. Financial futures contracts traded on exchanges are valued at their last sale price. Investments in open-end registered investment companies are valued at net asset value each business day. Short-term securities with remaining maturities of 60 days or less may be valued at amortized cost, which approximates fair value.
The Series values its investments in BlackRock Liquidity Series, LLC Money Market Series (the “Money Market Series”) at fair value, which is ordinarily based upon its pro rata ownership in the underlying fund’s net assets. The Money Market Series seeks current income consistent with maintaining liquidity and preserving capital. Although the Money Market Series is not registered under the 1940 Act, its investments will follow the parameters of investments by a money market fund that is subject to Rule 2a-7 under the 1940 Act. The Series may withdraw up to 25% of its investment daily, although the manager of the Money Market Series, in its sole discretion, may permit an investor to withdraw more than 25% on any one day.
In the event that application of these methods of valuation results in a price for an investment which is deemed not to be representative of the market value of such investment or is not available, the investment will be valued in accordance with a policy approved by the Board as reflecting fair value (“Fair Value Assets”). When determining the price for Fair Value Assets, the investment advisor and/or the sub-advisor seeks to determine the price that the Series might reasonably expect to receive from the current sale of that asset in an arm’s-length transaction. Fair value determinations shall be based upon all available factors that the investment advisor and/or sub-advisor deems relevant. The pricing of all Fair Value Assets is subsequently reported to the Board or a committee thereof.
Segregation and Collateralization: In cases in which the 1940 Act and the interpretive positions of the Securities and Exchange Commission (“SEC”) require that the Series either deliver collateral or segregate assets in connection with certain investments (e.g., financial futures contracts), the Series will, consistent with SEC rules and/or certain interpretive letters issued by the SEC, segregate collateral or designate on its books and records cash or liquid securities having a market value at least equal to the amount that would otherwise be required to be physically segregated. Furthermore, based on requirements and agreements with certain exchanges and third party broker-dealers, each party to such transactions has requirements to deliver/deposit securities as collateral for certain investments.
Investment Transactions and Investment Income: For financial reporting purposes, investment transactions are recorded on the dates the transactions are entered into (the trade dates). Realized gains and losses on investment transactions are determined on the identified cost basis. Dividend income is recorded on the ex-dividend dates. Upon notification from issuers, some of the dividend income received from a real estate investment trust may be redesignated as a reduction of cost of the related investment and/or realized gain. Interest income, including amortization and accretion of premiums and discounts on debt securities, is recognized on the accrual basis.
Securities Lending: The Series may lend securities to approved borrowers, such as banks, brokers and other financial institutions. The borrower pledges cash, securities issued or guaranteed by the U.S. government or irrevocable letters of credit issued by a bank as collateral, which will be maintained at all times in an amount equal to at least 100% of the current market value of the loaned securities. The market value of the loaned securities is determined at the close of business of the Series and any additional required collateral is delivered to the Series on the next business day. Securities lending income, as disclosed in the Statement of Operations, represents the income earned from the investment of the
| | | |
| | | |
| BLACKROCK S&P 500 INDEX FUND | JUNE 30, 2011 | 27 |
| |
| |
Notes to Financial Statements (continued) | Master S&P 500 Index Series |
cash collateral, net of rebates paid to, or fees paid by, borrowers and less the fees paid to the securities lending agent. During the term of the loan, the Series earns dividend and interest on the securities loaned but does not receive dividend or interest income on the securities received as collateral. Loans of securities are terminable at any time and the borrower, after notice, is required to return borrowed securities within the standard time period for settlement of securities transactions. In the event that the borrower defaults on its obligation to return borrowed securities because of insolvency or for any other reason, the Series could experience delays and costs in gaining access to the collateral. The Series also could suffer a loss if the value of an investment purchased with cash collateral falls below the market value of loaned securities or if the value of an investment purchased with cash collateral falls below the value of the original cash collateral received.
Income Taxes: The Series is classified as a partnership for federal income tax purposes. As such, each investor in the Series is treated as the owner of its proportionate share of the net assets, income, expenses and realized and unrealized gains and losses of the Series. Therefore, no federal income tax provision is required. It is intended that the Series’ assets will be managed so an investor in the Series can satisfy the requirements of Subchapter M of the Internal Revenue Code of 1986, as amended.
The Series files US federal and various state and local tax returns. No income tax returns are currently under examination. The statute of limitations on the Series’ US federal tax returns remains open for each of the four years ended December 31, 2010. The statutes of limitations on the Series’ state and local tax returns may remain open for an additional year depending upon the jurisdiction. Management does not believe there are any uncertain tax positions that require recognition of a tax liability.
Recent Accounting Standard: In May 2011, the Financial Accounting Standards Board issued amended guidance to improve disclosure about fair value measurements which will require the following disclosures for fair value measurements categorized as Level 3: quantitative information about the unobservable inputs and assumptions used in the fair value measurement, a description of the valuation policies and procedures and a narrative description of the sensitivity of the fair value measurement to changes in unobservable inputs and the interrelationships between those unobservable inputs. In addition, the amounts and reasons for all transfers in and out of Level 1 and Level 2 will be required to be disclosed. The amended guidance is effective for financial statements for fiscal years beginning after December 15, 2011, and interim periods within those fiscal years. Management is evaluating the impact of this guidance on the Series’ financial statements and disclosures.
Other: Expenses directly related to the Series are charged to the Series. Other operating expenses shared by several funds are pro rated among those funds on the basis of relative net assets or other appropriate methods.
The Series has an arrangement with the custodian whereby fees may be reduced by credits earned on uninvested cash balances, which, if applicable, are shown as fees paid indirectly in the Statement of Operations. The custodian imposes fees on overdrawn cash balances, which can be offset by accumulated credits earned or may result in additional custody charges.
2. Derivative Financial Instruments:
The Series engages in various portfolio investment strategies using derivative contracts both to increase the returns of the Series and to economically hedge, or protect, its exposure to certain risks such as equity risk. These contracts may be transacted on an exchange or over-the-counter.
Losses may arise if the value of the contract decreases due to an unfavorable change in the market rates or values of the underlying instrument or if the counterparty does not perform under the contract. Counterparty risk related to exchange-traded financial futures contracts is deemed to be minimal due to the protection against defaults provided by the exchanges on which these contracts trade.
Financial Futures Contracts: The Series purchases or sells financial futures contracts and options on financial futures contracts to gain exposure to, or economically hedge against, changes in the value of equity securities (equity risk). Financial futures contracts are agreements between the Series and the counterparty to buy or sell a specific quantity of an underlying instrument at a specified price and at a specified date. Depending on the terms of the particular contract, futures contracts are settled either through physical delivery of the underlying instrument on the settlement date or by payment of a cash settlement amount on the settlement date. Pursuant to the contract, the Series agrees to receive from or pay to the broker an amount of cash equal to the daily fluctuation in value of the contract. Such receipts or payments are known as margin variation and are recorded by the Series as unrealized appreciation or depreciation. When the contract is closed, the Series records a realized gain or loss equal to the difference between the value of the contract at the time it was opened and the value at the time it was closed. The use of financial futures contracts involves the risk of an imperfect correlation in the movements in the price of financial futures contracts, interest rates and the underlying assets.
| | |
| | |
28 | BLACKROCK S&P 500 INDEX FUND | JUNE 30, 2011 |
| |
| |
Notes to Financial Statements (continued) | Master S&P 500 Index Series |
Derivative Financial Instruments Categorized by Risk Exposure:
|
Fair Value of Derivative Financial Instruments as of June 30, 2011 |
| | | | | | |
| | Asset Derivatives | |
| | Statement of
Assets and
Liabilities
Location | | Value | |
Equity contracts | | Net
unrealized
appreciation/
depreciation* | | $ | 226,075 | |
| |
* | Includes cumulative appreciation/depreciation on financial futures contracts as reported in the Schedule of Investments. Only current day’s margin variation is reported within the Statement of Assets and Liabilities. |
|
The Effect of Derivative Financial Instruments in the Statement of Operations
Six Months Ended June 30, 2011 |
| | | | |
| | Net Realized Gain From | |
| | Financial Futures Contracts | |
Equity contracts | | $ | 718,358 | |
| | | | |
| | Net Change in Unrealized
Appreciation/Depreciation on | |
| | Financial Futures Contracts | |
Equity contracts | | $ | 215,422 | |
For the six months ended June 30, 2011, the average quarterly balances of outstanding derivative financial instruments were as follows:
| | | | |
Financial futures contracts: | | | | |
Average number of contracts purchased | | | 270 | |
Average notional value of contracts purchased | | $ | 17,560,350 | |
3. Investment Advisory Agreement and Other Transactions with Affiliates:
The PNC Financial Services Group, Inc. (“PNC”) and Barclays Bank PLC (“Barclays”) are the largest stockholders of BlackRock, Inc. (“BlackRock”). Due to the ownership structure, PNC is an affiliate of the Series for 1940 Act purposes, but Barclays is not.
The Master LLC, on behalf of the Series, entered into an Investment Advisory Agreement with BlackRock Advisors, LLC (the “Manager”), the Series’ investment advisor, an indirect, wholly owned subsidiary of BlackRock, to provide investment advisory and administration services.
The Manager is responsible for the management of the Series’ portfolio and provides the necessary personnel, facilities, equipment and certain other services necessary to the operations of the Series. For such services, the Series pays the Manager a monthly fee at an annual rate of 0.01% of the Series’ average daily net assets.
The Manager contractually agreed to waive its investment advisory fee by 0.005% of the Series’ average daily net assets. The Manager has agreed not to reduce or discontinue this contractual waiver until May 1, 2012 unless approved by the Board, including a majority of the independent Directors. For the six months ended June 30, 2011, the Manager waived $36,524, which is included in fees waived by advisor in the Statement of Operations.
The Manager voluntarily agreed to waive its investment advisory fees by the amount of investment advisory fees the Series pays to the Manager indirectly through its investment in affiliated money market funds, however the Manager does not waive its investment advisory fees by the amount of investment advisory fees paid through the Series’ investment in other affiliated investment companies, if any. For the six months ended June 30, 2011, the Series waived $29,086, which is included in fees waived by advisor in the Statement of Operations.
The Manager entered into a sub-advisory agreement with BlackRock Investment Management, LLC (“BIM”), an affiliate of the Manager. The Manager pays BIM for services it provides, a monthly fee that is a percentage of the investment advisory fees paid by the Series to the Manager.
For the six months ended June 30, 2011, the Series reimbursed the Manager $13,488 for certain accounting services, which is included in accounting services in the Statement of Operations.
The Master LLC, on behalf of the Series, received an exemptive order from the SEC permitting it, among other things, to pay an affiliated securities lending agent a fee based on a share of the income derived from the securities lending activities and has retained BIM as the securities lending agent. BIM may, on behalf of the Series, invest cash collateral received by the Series for such loans, among other things, in a private investment company managed by the Manager or in registered money market funds advised by the Manager or its affiliates. The market value of securities on loan and the value of the related collateral, if applicable, are shown in the Statement of Assets and Liabilities as securities loaned and collateral on securities loaned at value, respectively. The cash collateral invested by BIM is disclosed in the Schedule of Investments. The share of income earned by the Series on such investments is shown as securities lending — affiliated in the Statement of Operations. For the six months ended June 30, 2011, BIM received $177,135 in securities lending agent fees related to securities lending activities for the Series.
Certain officers and/or directors of the Master LLC are officers and/or directors of BlackRock or its affiliates.
| | | |
| | | |
| BLACKROCK S&P 500 INDEX FUND | JUNE 30, 2011 | 29 |
| |
| |
Notes to Financial Statements (concluded) | Master S&P 500 Index Series |
4. Investments:
Purchases and sales of investments, excluding short-term securities for the six months ended June 30, 2011, were $56,220,869 and $78,462,570, respectively.
5. Borrowings:
The Master LLC, on behalf of the Series, along with certain other funds managed by the Manager and its affiliates, is a party to a $500 million credit agreement with a group of lenders, which expires in November 2011. The Series may borrow under the credit agreement to fund shareholder redemptions. Effective November 2010, the credit agreement was renewed until November 2011 with the following terms: a commitment fee of 0.08% per annum based on the Series’ pro rata share of the unused portion of the credit agreement and interest at a rate equal to the higher of (a) the one-month LIBOR plus 1.00% per annum and (b) the Fed Funds rate plus 1.00% per annum on amounts borrowed. In addition, the Series paid administration and arrangement fees which were allocated to the Series based on its net assets as of October 31, 2010. The Series did not borrow under the credit agreement during the six months ended June 30, 2011.
6. Market and Credit Risk:
In the normal course of business, the Series invests in securities and enters into transactions where risks exist due to fluctuations in the market (market risk) or failure of the issuer of a security to meet all its obligations (issuer credit risk). The value of securities held by the Series may decline in response to certain events, including those directly involving the issuers whose securities are owned by the Series; conditions affecting the general economy; overall market changes; local, regional or global political, social or economic instability; and currency and interest rate and price fluctuations. Similar to issuer credit risk, the Series may be exposed to counterparty credit risk, or the risk that an entity with which the Series has unsettled or open transactions may fail to or be unable to perform on its commitments. The Series manages counterparty credit risk by entering into transactions only with counterparties that it believes have the financial resources to honor their obligations and by monitoring the financial stability of those counterparties. Financial assets, which potentially expose the Series to market, issuer and counterparty credit risks, consist principally of financial instruments and receivables due from counterparties. The extent of the Series’ exposure to market, issuer and counterparty credit risks with respect to these financial assets is generally approximated by their value recorded in the Series’ Statement of Assets and Liabilities, less any collateral held by the Series.
7. Subsequent Events:
Management has evaluated the impact of all subsequent events on the Series through the date the financial statements were issued and has determined that there were no subsequent events requiring adjustment or additional disclosure in the financial statements.
| | |
| | |
30 | BLACKROCK S&P 500 INDEX FUND | JUNE 30, 2011 |
|
|
Disclosure of Investment Advisory Agreement and Sub-Advisory Agreement |
The Board of Directors of Quantitative Master Series LLC (the “Master LLC”) met on April 5, 2011 and May 17–18, 2011 to consider the approval of the Master LLC’s investment advisory agreement (the “Advisory Agreement”) with BlackRock Advisors, LLC (the “Manager”), the Master LLC’s investment advisor, on behalf of the Master S&P 500 Index Series (the “Master Portfolio”), a series of the Master LLC. The Board of Directors of the Master LLC also considered the approval of the sub-advisory agreement (the “Sub-Advisory Agreement”) between the Manager and BlackRock Investment Management, LLC (the “Sub-Advisor”), with respect to the Master Portfolio. BlackRock S&P 500 Index Fund (the “Fund”), a series of BlackRock Index Funds, Inc. (the “Corporation”), is a “feeder” fund that invests all of its investable assets in the Master Portfolio. Accordingly, the Board of Directors of the Corporation also considered the approval of the Advisory Agreement and the Sub-Advisory Agreement with respect to the Master Portfolio. The Manager and the Sub-Advisor are referred to herein as “BlackRock.” The Advisory Agreement and the Sub-Advisory Agreement are referred to herein as the “Agreements.” For simplicity, the Board of Directors of the Master LLC and the Board of Directors of the Corporation are referred to herein collectively as the “Board,” and the members are referred to as “Board Members.”
Activities and Composition of the Board
The Board consists of thirteen individuals, eleven of whom are not “interested persons” of the Master LLC or the Corporation as defined in the Investment Company Act of 1940, as amended (the “1940 Act”) (the “Independent Board Members”). The Board Members are responsible for the oversight of the operations of the Master LLC or the Corporation, as pertinent, and perform the various duties imposed on the directors of investment companies by the 1940 Act. The Independent Board Members have retained independent legal counsel to assist them in connection with their duties. The Co-Chairs of the Board are each Independent Board Members. The Board has established five standing committees: an Audit Committee, a Governance and Nominating Committee, a Compliance Committee, a Performance Oversight and Contract Committee and an Executive Committee, each of which is composed of Independent Board Members (except for the Executive Committee, which also has one interested Board Member) and is chaired by Independent Board Members. The Board also established an ad hoc committee, the Joint Product Pricing Committee, which consisted of Independent Board Members and directors/trustees of the boards of certain other BlackRock-managed funds, who were not “interested persons” of their respective funds.
The Agreements
Pursuant to the 1940 Act, the Board is required to consider the continuation of the Agreements on an annual basis. In connection with this process, the Board assessed, among other things, the nature, scope and quality of the services provided to the Master Portfolio and the Fund by BlackRock, its personnel and its affiliates, including investment management, administrative and shareholder services, oversight of fund accounting and custody, marketing services, risk oversight, compliance program and assistance in meeting applicable legal and regulatory requirements.
The Board, acting directly and through its committees, considers at each of its meetings, and from time to time as appropriate, factors that are relevant to its annual consideration of the renewal of the Agreements, including the services and support provided by BlackRock to the Master Portfolio, the Fund and their shareholders. Among the matters the Board considered were: (a) investment performance for one-, three- and five-year periods, as applicable, against peer funds, and applicable benchmarks, if any, as well as senior management’s and portfolio managers’ analysis of the reasons for any over performance or underperformance against its peers and/or benchmark, as applicable; (b) fees, including advisory, administration, if applicable, and other amounts paid to BlackRock and its affiliates by the Master Portfolio and/or the Fund for services, such as transfer agency, marketing and distribution, call center and fund accounting; (c) the Master Portfolio’s and/or the Fund’s operating expenses and how BlackRock allocates expenses to the Master Portfolio and the Fund; (d) the resources devoted to, risk oversight of, and compliance reports relating to, implementation of the Master Portfolio’s and the Fund’s investment objective, policies and restrictions; (e) the Master LLC’s and the Corporation’s compliance with its respective Code of Ethics and other compliance policies and procedures; (f) the nature, cost and character of non-investment management services provided by BlackRock and its affiliates; (g) BlackRock’s and other service providers’ internal controls and risk and compliance oversight mechanisms; (h) BlackRock’s implementation of the proxy voting policies approved by the Board; (i) the use of brokerage commissions and execution quality of portfolio transactions; (j) BlackRock’s implementation of the Master LLC’s and/or the Corporation’s valuation and liquidity procedures; (k) an analysis of contractual and actual management fees for products with similar investment objectives across the open-end fund, exchange traded fund (“ETF”), closed-end fund and institutional account product channels, as applicable; (l) BlackRock’s compensation methodology for its investment professionals and the incentives it creates; and (m) periodic updates on BlackRock’s business.
Board Considerations in Approving the Agreements
The Approval Process: Prior to the April 5, 2011 meeting, the Board requested and received materials specifically relating to the Agreements. The Board is engaged in a process with BlackRock to review periodically the nature and scope of the information provided to better assist its deliberations. The materials provided in connection with the April meeting included (a) information independently compiled and prepared by Lipper, Inc. (“Lipper”) on fees and expenses of the Master Portfolio and the Fund, as applicable, and the investment performance of the Fund as compared
| | | |
|
BLACKROCK S&P 500 INDEX FUND
|
JUNE 30, 2011
|
31
|
|
|
Disclosure of Investment Advisory Agreement and Sub-Advisory Agreement (continued) |
with a peer group of funds as determined by Lipper (collectively, “Peers”), as well as the gross investment performance of the Fund as compared with its benchmark; (b) information on the profitability of the Agreements to BlackRock and a discussion of fall-out benefits to BlackRock and its affiliates and significant shareholders; (c) a general analysis provided by BlackRock concerning investment management fees (a combination of the advisory fee and the administration fee, if any) charged to other clients, such as institutional clients, ETFs and closed-end funds, under similar investment mandates, as well as the performance of such other clients, as applicable; (d) the impact of economies of scale; (e) a summary of aggregate amounts paid by the Master Portfolio and/or the Fund to BlackRock; (f) sales and redemption data regarding the Fund’s shares; and (g) if applicable, a comparison of management fees to similar BlackRock open-end funds, as classified by Lipper.
At an in-person meeting held on April 5, 2011, the Board reviewed materials relating to its consideration of the Agreements. As a result of the discussions that occurred during the April 5, 2011 meeting, and as a culmination of the Board’s year-long deliberative process, the Board presented BlackRock with questions and requests for additional information. BlackRock responded to these requests with additional written information in advance of the May 17–18, 2011 Board meeting.
At an in-person meeting held on May 17–18, 2011, the Board of the Master LLC, including the Independent Board Members, unanimously approved the continuation of the Advisory Agreement between the Manager and the Master LLC with respect to the Master Portfolio and the Sub-Advisory Agreement between the Manager and the Sub-Advisor with respect to the Master Portfolio, each for a one-year term ending June 30, 2012. The Board of the Corporation, including the Independent Board Members, also considered the continuation of the Agreements and found the Agreements to be satisfactory. In approving the continuation of the Agreements, the Board of the Master LLC considered: (a) the nature, extent and quality of the services provided by BlackRock; (b) the investment performance of the Master Portfolio, the Fund and BlackRock; (c) the advisory fee and the cost of the services and profits to be realized by BlackRock and its affiliates from their relationship with the Master Portfolio and the Fund; (d) economies of scale; (e) fall out benefits to BlackRock as a result of its relationship with the Master Portfolio and the Fund; and (f) other factors deemed relevant by the Board Members.
The Board also considered other matters it deemed important to the approval process, such as payments made to BlackRock or its affiliates relating to the distribution of Fund shares, services related to the valuation and pricing of portfolio holdings of the Master Portfolio, direct and indirect benefits to BlackRock and its affiliates and significant shareholders from their relationship with the Master Portfolio and the Fund and advice from independent legal counsel with respect to the review process and materials submitted for the Board’s review. The Board noted the willingness of BlackRock personnel to engage in open, candid discussions with the Board. The Board did not identify any particular information as controlling, and each Board Member may have attributed different weights to the various items considered.
A. Nature, Extent and Quality of the Services Provided by BlackRock: The Board, including the Independent Board Members, reviewed the nature, extent and quality of services provided by BlackRock, including the investment advisory services and the resulting performance of the Fund. Throughout the year, the Board compared the Fund’s performance to the performance of a comparable group of mutual funds and/or the performance of a relevant benchmark, if any. The Board met with BlackRock’s senior management personnel responsible for investment operations, including the senior investment officers. The Board also reviewed the materials provided by the portfolio management team discussing Master Portfolio performance and the Master Portfolio’s investment objective, strategies and outlook.
The Board considered, among other factors, the number, education and experience of BlackRock’s investment personnel generally and the Master Portfolio’s portfolio management team, investments by portfolio managers in the funds they manage, BlackRock’s portfolio trading capabilities, BlackRock’s use of technology, BlackRock’s commitment to compliance, BlackRock’s credit analysis capabilities, BlackRock’s risk analysis capabilities and BlackRock’s approach to training and retaining portfolio managers and other research, advisory and management personnel. The Board engaged in a review of BlackRock’s compensation structure with respect to the Master Portfolio’s portfolio management team and BlackRock’s ability to attract and retain high-quality talent and create performance incentives.
In addition to advisory services, the Board considered the quality of the administrative and non-investment advisory services provided to the Master Portfolio and the Fund. BlackRock and its affiliates and significant shareholders provide the Master Portfolio and the Fund with certain administrative, transfer agency, shareholder and other services (in addition to any such services provided to the Master Portfolio and the Fund by third parties) and officers and other personnel as are necessary for the operations of the Master Portfolio and the Fund. In addition to investment advisory services, BlackRock and its affiliates provide the Master Portfolio and the Fund with other services, including (i) preparing disclosure documents, such as the prospectus, the statement of additional information and periodic shareholder reports; (ii) assisting with daily accounting and pricing; (iii) overseeing and coordinating the activities of other service providers; (iv) organizing Board meetings and preparing the materials for such Board meetings; (v) providing legal and compliance support; and (vi) performing other administrative functions necessary for the operation of the Master Portfolio and the Fund, such as tax reporting, fulfilling regulatory filing requirements and call center services. The Board reviewed the structure and duties of BlackRock’s fund administration, accounting, legal
| | |
32
|
BLACKROCK S&P 500 INDEX FUND
|
JUNE 30, 2011
|
|
|
Disclosure of Investment Advisory Agreement and Sub-Advisory Agreement (continued) |
and compliance departments and considered BlackRock’s policies and procedures for assuring compliance with applicable laws and regulations.
B. The Investment Performance of the Master Portfolio, the Fund and BlackRock: The Board, including the Independent Board Members, also reviewed and considered the performance history of the Master Portfolio and the Fund, as applicable. The Board noted that the Master Portfolio’s investment results correspond directly to the investment results of the Fund. In preparation for the April 5, 2011 meeting, the Board worked with BlackRock and Lipper to develop a template for, and was provided with, reports independently prepared by Lipper, which included a comprehensive analysis of the Fund’s performance. The Board also reviewed a narrative and statistical analysis of the Lipper data that was prepared by BlackRock, which analyzed various factors that affect Lipper’s rankings. In connection with its review, the Board received and reviewed information regarding the investment performance of the Fund as compared to funds in the Fund’s applicable Lipper category and the gross investment performance of the Fund as compared with its benchmark. The Board was provided with a description of the methodology used by Lipper to select peer funds. The Board and the Board’s Performance Oversight and Contract Committee regularly review and meet with Master Portfolio management to discuss the performance of the Master Portfolio and the Fund, as applicable, throughout the year.
The Board noted that the Fund’s gross performance exceeded its benchmark index during each of the one-, three- and five-year periods reported.
The Board noted that BlackRock has made changes to the organization of the overall equity group management structure designed to result in a strengthened leadership team with clearer accountability.
C. Consideration of the Advisory/Management Fees and the Cost of the Services and Profits to be Realized by BlackRock and its Affiliates from their Relationship with the Master Portfolio and the Fund: The Board, including the Independent Board Members, reviewed the Master Portfolio’s contractual management fee ratio compared with the other funds in the Fund’s Lipper category. It also compared the Fund’s total expense ratio, as well as actual management fee ratio, to those of other funds in its Lipper category. The Board considered the services provided and the fees charged by BlackRock to other types of clients with similar investment mandates, including separately managed institutional accounts.
The Board received and reviewed statements relating to BlackRock’s financial condition and profitability with respect to the services it provided the Master Portfolio and the Fund. The Board was also provided with a profitability analysis that detailed the revenues earned and the expenses incurred by BlackRock for services provided to the Master Portfolio and the Fund. The Board reviewed BlackRock’s profitability with respect to the Master Portfolio and the Fund, as applicable, and other funds the Board currently oversees for the year ended December 31, 2010 compared to available aggregate profitability data provided for the years ended December 31, 2009 and December 31, 2008. The Board reviewed BlackRock’s profitability with respect to other fund complexes managed by the Manager and/or its affiliates. The Board reviewed BlackRock’s assumptions and methodology of allocating expenses in the profitability analysis, noting the inherent limitations in allocating costs among various advisory products. The Board recognized that profitability may be affected by numerous factors including, among other things, fee waivers and expense reimbursements by the Manager, the types of funds managed, expense allocations and business mix, and the difficulty of comparing profitability as a result of those factors.
The Board noted that, in general, individual fund or product line profitability of other advisors is not publicly available. The Board considered BlackRock’s operating margin, in general, compared to the operating margin for leading investment management firms whose operations include advising open-end funds, among other product types. That data indicates that operating margins for BlackRock, in general and with respect to its registered funds, are generally consistent with margins earned by similarly situated publicly traded competitors. In addition, the Board considered, among other things, certain third party data comparing BlackRock’s operating margin with that of other publicly-traded asset management firms. That third party data indicates that larger asset bases do not, in themselves, translate to higher profit margins.
In addition, the Board considered the cost of the services provided to the Master Portfolio and the Fund by BlackRock, and BlackRock’s and its affiliates’ profits relating to the management and distribution of the Master Portfolio and the Fund and the other funds advised by BlackRock and its affiliates. As part of its analysis, the Board reviewed BlackRock’s methodology in allocating its costs to the management of the Master Portfolio and the Fund. The Board also considered whether BlackRock has the financial resources necessary to attract and retain high-quality investment management personnel to perform its obligations under the Agreements and to continue to provide the high quality of services that is expected by the Board.
The Board noted that the Fund’s contractual management fee ratio (a combination of the advisory fee and the administration fee, if any) was above the median contractual management fee ratio paid by the Fund’s Peers, in each case before taking into account any expense reimbursements or fee waivers. The Board also noted that BlackRock has voluntarily agreed to waive fees and/or reimburse expenses in order to limit, to a specified amount, the Fund’s total operating expenses as a percentage of the Fund’s average daily net assets on a class-by-class basis, as applicable. The Board also noted that BlackRock has contractually agreed to waive one-half of the advisory fee currently paid by the Master Portfolio.
| | | |
|
BLACKROCK S&P 500 INDEX FUND
|
JUNE 30, 2011
|
33
|
|
|
Disclosure of Investment Advisory Agreement and Sub-Advisory Agreement (concluded) |
D. Economies of Scale: The Board, including the Independent Board Members, considered the extent to which economies of scale might be realized as the assets of the Master Portfolio and the Fund increase. The Board also considered the extent to which the Master Portfolio and the Fund benefit from such economies and whether there should be changes in the advisory fee rate or structure in order to enable the Master Portfolio and the Fund to participate in these economies of scale, for example through the use of breakpoints in the advisory fee based upon the asset level of the Master Portfolio.
E. Other Factors Deemed Relevant by the Board Members: The Board, including the Independent Board Members, also took into account other ancillary or “fall-out” benefits that BlackRock or its affiliates and significant shareholders may derive from their respective relationships with the Master Portfolio and the Fund, both tangible and intangible, such as BlackRock’s ability to leverage its investment professionals who manage other portfolios and risk management personnel, an increase in BlackRock’s profile in the investment advisory community, and the engagement of BlackRock’s affiliates and significant shareholders as service providers to the Master Portfolio and the Fund, including for administrative, transfer agency, distribution and securities lending services. The Board also considered BlackRock’s overall operations and its efforts to expand the scale of, and improve the quality of, its operations. The Board also noted that BlackRock may use and benefit from third party research obtained by soft dollars generated by certain registered fund transactions to assist in managing all or a number of its other client accounts. The Board further noted that BlackRock’s funds may invest in affiliated ETFs without any offset against the management fees payable by the funds to BlackRock.
In connection with its consideration of the Agreements, the Board also received information regarding BlackRock’s brokerage and soft dollar practices. The Board received reports from BlackRock which included information on brokerage commissions and trade execution practices throughout the year.
The Board noted the competitive nature of the open-end fund marketplace, and that shareholders are able to redeem their Fund shares if they believe that the Fund’s and/or the Master Portfolio’s fees and expenses are too high or if they are dissatisfied with the performance of the Fund.
Conclusion
The Board of the Master LLC, including the Independent Board Members, unanimously approved the continuation of the Advisory Agreement between the Manager and the Master LLC, with respect to the Master Portfolio, for a one-year term ending June 30, 2012 and the Sub-Advisory Agreement between the Manager and the Sub-Advisor, with respect to the Master Portfolio, for a one-year term ending June 30, 2012. As part of its approval, the Board of the Master LLC considered the detailed review of BlackRock’s fee structure, as it applies to the Master LLC, conducted by the ad hoc Joint Product Pricing Committee. Based upon its evaluation of all of the aforementioned factors in their totality, the Board of the Master LLC, including the Independent Board Members, was satisfied that the terms of the Agreements were fair and reasonable and in the best interest of the Master Portfolio and its shareholders. The Board of the Corporation, including the Independent Board Members, also considered the continuation of the Agreements with respect to the Master Portfolio and found the Agreements to be satisfactory. In arriving at its decision to approve the Agreements, the Board of the Master LLC did not identify any single factor or group of factors as all-important or controlling, but considered all factors together, and different Board Members may have attributed different weights to the various factors considered. The Independent Board Members were also assisted by the advice of independent legal counsel in making this determination. The contractual fee arrangements for the Master Portfolio reflect the results of several years of review by the Board Members and predecessor Board Members, and discussions between such Board Members (and predecessor Board Members) and BlackRock. As a result, the Board Members’ conclusions may be based in part on their consideration of these arrangements in prior years.
| | |
34
|
BLACKROCK S&P 500 INDEX FUND
|
JUNE 30, 2011
|
|
|
Officers and Directors |
|
Ronald W. Forbes, Co-Chair of the Board and Director |
Rodney D. Johnson, Co-Chair of the Board and Director |
David O. Beim, Director |
Richard S. Davis, Director |
Henry Gabbay, Director |
Dr. Matina S. Horner, Director |
Herbert I. London, Director |
Cynthia A. Montgomery, Director |
Joseph P. Platt, Director |
Robert C. Robb, Jr., Director |
Toby Rosenblatt, Director |
Kenneth L. Urish, Director |
Frederick W. Winter, Director |
John M. Perlowski, President and Chief Executive Officer |
Brendan Kyne, Vice President |
Neal Andrews, Chief Financial Officer |
Jay Fife, Treasurer |
Brian Kindelan, Chief Compliance Officer and Anti-Money Laundering Officer |
Ira P. Shapiro, Secretary |
|
Investment Advisor |
BlackRock Advisors, LLC |
Wilmington, DE 19809 |
|
Sub-Advisor |
BlackRock Investment Management, LLC |
Princeton, NJ 08540 |
|
Custodian |
State Street Bank and Trust Company |
Boston, MA 02111 |
|
Transfer Agent |
BNY Mellon Investment Servicing (US) Inc. |
Wilmington, DE 19809 |
|
Accounting Agent |
State Street Bank and Trust Company |
Boston, MA 02116 |
|
Distributor |
BlackRock Investments, LLC |
New York, NY 10022 |
|
Legal Counsel |
Sidley Austin LLP |
New York, NY 10019 |
|
Independent Registered Public Accounting Firm |
Deloitte & Touche LLP |
Princeton, NJ 08540 |
|
Address of the Fund |
100 Bellevue Parkway |
Wilmington, DE 19809 |
| | | |
|
BLACKROCK S&P 500 INDEX FUND
|
JUNE 30, 2011
|
35
|
Electronic Delivery
Electronic copies of most financial reports and prospectuses are available on the Fund’s website or shareholders can sign up for e-mail notifications of quarterly statements, annual and semi-annual reports and prospectuses by enrolling in the Fund’s electronic delivery program.
To enroll:
Shareholders Who Hold Accounts with Investment Advisors, Banks or Brokerages:
Please contact your financial advisor. Please note that not all investment advisors, banks or brokerages may offer this service.
Shareholders Who Hold Accounts Directly with BlackRock:
| |
1) | Access the BlackRock website at http://www.blackrock.com/edelivery |
| |
2) | Select “eDelivery” under the “More Information” section |
| |
3) | Log into your account |
Householding
The Fund will mail only one copy of shareholder documents, including prospectuses, annual and semi-annual reports and proxy statements, to shareholders with multiple accounts at the same address. This practice is commonly called “householding” and is intended to reduce expenses and eliminate duplicate mailings of shareholder documents. Mailings of your shareholder documents may be householded indefinitely unless you instruct us otherwise. If you do not want the mailing of these documents to be combined with those for other members of your household, please call (800) 441-7762.
Availability of Quarterly Schedule of Investments
The Fund/Series file their complete schedule of portfolio holdings with the SEC for the first and third quarters of each fiscal year on Form N-Q. The Fund’s/Series’ Forms N-Q are available on the SEC’s website at http://www.sec.gov and may also be reviewed and copied at the SEC’s Public Reference Room in Washington, D.C. Information on how to access documents on the SEC’s website without charge may be obtained by calling (800) SEC-0330. The Fund’s/Series’ Forms N-Q may also be obtained upon request and without charge by calling (800) 441-7762.
Availability of Proxy Voting Policies and Procedures
A description of the policies and procedures that the Fund/Series use to determine how to vote proxies relating to portfolio securities is available (1) without charge, upon request, by calling (800) 441-7762; (2) at http://www.blackrock.com; and (3) on the SEC’s website at http://www.sec.gov.
Availability of Proxy Voting Record
Information about how the Fund/Series voted proxies relating to securities held in the Fund’s/Series’ portfolio during the most recent 12-month period ended June 30 is available upon request and without charge (1) at http://www.blackrock.com or by calling (800) 441-7762 and (2) on the SEC’s website at http://www.sec.gov.
Account Information
Call us at (800) 441-7762 from 8:00 AM to 6:00 PM EST on any business day to get information about your account balances, recent transactions and share prices. You can also reach us on the Web at http://www.blackrock.com/funds.
Automatic Investment Plans
Investor Class shareholders who want to invest regularly can arrange to have $50 or more automatically deducted from their checking or savings account and invested in any of the BlackRock funds.
Systematic Withdrawal Plans
Investor Class shareholders can establish a systematic withdrawal plan and receive periodic payments of $50 or more from their BlackRock funds, as long as their account balance is at least $10,000.
Retirement Plans
Shareholders may make investments in conjunction with Traditional, Rollover, Roth, Coverdell, Simple IRAs, SEP IRAs and 403(b) Plans.
| | |
36
|
BLACKROCK S&P 500 INDEX FUND
|
JUNE 30, 2011
|
|
|
Additional Information (concluded) |
|
BlackRock Privacy Principles |
BlackRock is committed to maintaining the privacy of its current and former fund investors and individual clients (collectively, “Clients”) and to safeguarding their non-public personal information. The following information is provided to help you understand what personal information BlackRock collects, how we protect that information and why in certain cases we share such information with select parties.
If you are located in a jurisdiction where specific laws, rules or regulations require BlackRock to provide you with additional or different privacy-related rights beyond what is set forth below, then BlackRock will comply with those specific laws, rules or regulations.
BlackRock obtains or verifies personal non-public information from and about you from different sources, including the following: (i) information we receive from you or, if applicable, your financial intermediary, on applications, forms or other documents; (ii) information about your transactions with us, our affiliates, or others; (iii) information we receive from a consumer reporting agency; and (iv) from visits to our websites.
BlackRock does not sell or disclose to non-affiliated third parties any non-public personal information about its Clients, except as permitted by law or as is necessary to respond to regulatory requests or to service Client accounts. These non-affiliated third parties are required to protect the confidentiality and security of this information and to use it only for its intended purpose.
We may share information with our affiliates to service your account or to provide you with information about other BlackRock products or services that may be of interest to you. In addition, BlackRock restricts access to non-public personal information about its Clients to those BlackRock employees with a legitimate business need for the information. BlackRock maintains physical, electronic and procedural safeguards that are designed to protect the non-public personal information of its Clients, including procedures relating to the proper storage and disposal of such information.
| | | |
|
BLACKROCK S&P 500 INDEX FUND
|
JUNE 30, 2011
|
37
|
|
|
A World-Class Mutual Fund Family |
BlackRock offers a diverse lineup of open-end mutual funds crossing all investment styles and managed by experts in equity, fixed income and tax-exempt investing.
|
Equity Funds |
BlackRock ACWI ex-US Index Fund |
BlackRock All-Cap Energy & Resources Portfolio |
BlackRock Asset Allocation Portfolio† |
BlackRock Balanced Capital Fund† |
BlackRock Basic Value Fund |
BlackRock Capital Appreciation Fund |
BlackRock China Fund |
BlackRock Energy & Resources Portfolio |
BlackRock Equity Dividend Fund |
BlackRock EuroFund |
BlackRock Focus Growth Fund |
BlackRock Focus Value Fund |
BlackRock Global Allocation Fund† |
BlackRock Global Dividend Income Portfolio |
BlackRock Global Dynamic Equity Fund |
BlackRock Global Emerging Markets Fund |
BlackRock Global Growth Fund |
BlackRock Global Opportunities Portfolio |
BlackRock Global SmallCap Fund |
BlackRock Health Sciences Opportunities Portfolio |
BlackRock Healthcare Fund |
BlackRock Index Equity Portfolio |
BlackRock India Fund |
BlackRock International Fund |
BlackRock International Index Fund |
BlackRock International Opportunities Portfolio |
BlackRock Large Cap Core Fund |
BlackRock Large Cap Core Plus Fund |
BlackRock Large Cap Growth Fund |
BlackRock Large Cap Value Fund |
BlackRock Latin America Fund |
BlackRock Mid-Cap Growth Equity Portfolio |
BlackRock Mid-Cap Value Equity Portfolio |
BlackRock Mid Cap Value Opportunities Fund |
BlackRock Natural Resources Trust |
BlackRock Pacific Fund |
BlackRock Russell 1000 Index Fund |
BlackRock Science & Technology Opportunities Portfolio |
|
BlackRock Small Cap Growth Equity Portfolio |
BlackRock Small Cap Growth Fund II |
BlackRock Small Cap Index Fund |
BlackRock Small/Mid-Cap Growth Portfolio |
BlackRock S&P 500 Index Fund |
BlackRock S&P 500 Stock Fund |
BlackRock U.S. Opportunities Portfolio |
BlackRock Utilities and Telecommunications Fund |
BlackRock Value Opportunities Fund |
BlackRock World Gold Fund |
|
Fixed Income Funds |
BlackRock Bond Index Fund |
BlackRock Core Bond Fund |
BlackRock Emerging Market Debt Portfolio |
BlackRock Floating Rate Income Portfolio |
BlackRock GNMA Portfolio |
BlackRock High Income Fund |
BlackRock High Yield Bond Portfolio |
BlackRock Income Portfolio† |
BlackRock Inflation Protected Bond Portfolio |
BlackRock International Bond Portfolio |
BlackRock Long Duration Bond Portfolio |
BlackRock Low Duration Bond Portfolio |
BlackRock Multi-Sector Bond Portfolio |
BlackRock Strategic Income Opportunities Portfolio |
BlackRock Total Return Fund |
BlackRock US Government Bond Fund |
BlackRock World Income Fund |
US Mortgage Portfolio |
|
Municipal Bond Funds |
BlackRock California Municipal Bond Fund |
BlackRock High Yield Municipal Fund |
BlackRock Intermediate Municipal Fund |
BlackRock National Municipal Fund |
BlackRock New Jersey Municipal Bond Fund |
BlackRock New York Municipal Bond Fund |
BlackRock Pennsylvania Municipal Bond Fund |
BlackRock Short-Term Municipal Fund |
|
Target Risk & Target Date Funds† |
BlackRock Prepared Portfolios |
Conservative Prepared Portfolio |
Moderate Prepared Portfolio |
Growth Prepared Portfolio |
Aggressive Growth Prepared Portfolio |
|
BlackRock Lifecycle Prepared Portfolios |
2015 |
2020 |
2025 |
2030 |
2035 |
2040 |
2045 |
2050 |
LifePath Portfolios
|
Retirement |
2020 |
2025 |
2030 |
2035 |
2040 |
2045 |
2050 |
2055 |
|
LifePath Index Portfolios |
Retirement |
2020 |
2025 |
2030 |
2035 |
2040 |
2045 |
2050 |
2055 |
† Mixed asset fund.
BlackRock mutual funds are currently distributed by BlackRock Investments, LLC. You should consider the investment objectives, risks, charges and expenses of the funds under consideration carefully before investing. Each fund’s prospectus contains this and other information and is available at www.blackrock.com or by calling (800) 441-7762 or from your financial advisor. The prospectus should be read carefully before investing.
| | |
38
|
BLACKROCK S&P 500 INDEX FUND
|
JUNE 30, 2011
|
This report is transmitted to shareholders only. It is not authorized for use as an offer of sale or a solicitation of an offer to buy shares of the Fund unless accompanied or preceded by the Fund’s current prospectus. Past performance results shown in this report should not be considered a representation of future performance. Investment returns and principal value of shares will fluctuate so that shares, when redeemed, may be worth more or less than their original cost. Statements and other information herein are as dated and are subject to change.

| |
#Index 4-06/11 | 
|
| |

| June 30, 2011 |
| |
|
| |
Semi-Annual Report (Unaudited) |
| |
|
BlackRock Small Cap Index Fund | of BlackRock Index Funds, Inc.
|
Not FDIC Insured § No Bank Guarantee § May Lose Value |
| |
| | |
|
2 | BLACKROCK SMALL CAP INDEX FUND | JUNE 30, 2011 |
The recent downgrade of US long-term debt by Standard & Poor’s marked an historic event for financial markets. Stocks tumbled in the days before and after the announcement on August 5 as investors contemplated the pervasiveness of the lower US credit rating across asset classes and the future direction of the global economy. BlackRock was well prepared for the possibility of a downgrade and the firm had no need to execute any forced selling of securities in response to the S&P action. Through periods of uncertainty, as ever, BlackRock’s full resources are dedicated to the management of our clients’ assets.
The pages that follow reflect your mutual fund’s reporting period ended June 30, 2011. Accordingly, the below discussion is intended to provide you with perspective on the performance of your investments during that period.
Economic conditions in the second quarter of 2011 were strikingly similar to the scenario of the same quarter last year. The sovereign debt crisis in Europe, tightening monetary policy in China and a global economic slowdown were again the key concerns that drove investors away from risky assets. The second-quarter correction in 2010 was significant, but markets were revived toward the end of the summer as positive economic news and robust corporate earnings whetted investor appetite for yield. The global economy had finally gained traction and investor fear turned to optimism with the anticipation of a second round of quantitative easing (“QE2”) from the US Federal Reserve Board (the “Fed”). Stock markets rallied despite the ongoing European debt crisis and inflationary pressures looming over emerging markets. Fixed income markets, however, saw yields move sharply upward, pushing prices down, especially on the long end of the historically steep yield curve. While high yield bonds benefited from the risk rally, most fixed income sectors declined in the fourth quarter. The tax-exempt municipal market faced additional headwinds as it became evident that the Build America Bond program would not be extended and municipal finance troubles abounded.
The new year brought spikes of volatility as political turmoil swept across the Middle East/North Africa region and prices of oil and other commodities soared. Natural disasters in Japan disrupted industry supply chains and concerns mounted over US debt and deficit issues. Equities quickly rebounded from each of these events as investors chose to focus on the continuing stream of strong corporate earnings and positive economic data. Global credit markets were surprisingly resilient in this environment and yields regained relative stability in 2011. The tax-exempt market saw relief from its headwinds and steadily recovered from its fourth-quarter lows. Equities, commodities and high yield bonds outpaced higher-quality assets as investors responded to the Fed’s early 2011 reaffirmation that it will keep interest rates low.
However, longer-term headwinds had been brewing. Inflationary pressures intensified in emerging economies, many of which were overheating, and the European debt crisis was not over. Markets were met with a sharp reversal in May when political unrest in Greece pushed the nation closer to defaulting on its debt. This development rekindled fears about the broader debt crisis and its further contagion among peripheral European countries. Concurrently, it became evident that the pace of global economic growth had slowed. Higher oil prices and supply chain disruptions in Japan finally caught up with economic data. Investors pulled back from riskier assets and stocks generally declined throughout most of May and June, but year-to-date performance in global equity markets was positive, and 12-month returns were remarkably strong. In bond markets, yields were volatile but generally moved lower for the period as a whole (pushing prices up). Continued low short-term interest rates kept yields on money market securities near their all-time lows.

“Markets generally moved higher despite heightened volatility during the reporting period.”
Rob Kapito
President, BlackRock Advisors, LLC
| | | | | | | |
Total Returns as of June 30, 2011 | | 6-month | | 12-month | |
US large cap equities (S&P 500® Index) | | 6.02 | % | | 30.69 | % | |
US small cap equities (Russell 2000® Index) | | 6.21 | | | 37.41 | | |
International equities (MSCI Europe, Australasia, Far East Index) | | 4.98 | | | 30.36 | | |
Emerging market equities (MSCI Emerging Markets Index) | | 0.88 | | | 27.80 | | |
3-month Treasury bill (BofA Merrill Lynch 3-Month Treasury Bill Index) | | 0.08 | | | 0.16 | | |
US Treasury securities (BofA Merrill Lynch 10-Year US Treasury Index) | | 3.26 | | | 1.88 | | |
US investment grade bonds (Barclays Capital US Aggregate Bond Index) | | 2.72 | | | 3.90 | | |
Tax-exempt municipal bonds (Barclays Capital Municipal Bond Index) | | 4.42 | | | 3.48 | | |
US high yield bonds (Barclays Capital US Corporate High Yield 2% Issuer Capped Index) | | 4.98 | | | 15.53 | | |
|
Past performance is no guarantee of future results. Index performance is shown for illustrative purposes only. You cannot invest directly in an index. |
Sincerely,

Rob Kapito
President, BlackRock Advisors, LLC
| |
| |
THIS PAGE NOT PART OF YOUR FUND REPORT | 3 |
|
| |
Fund Summary as of June 30, 2011 | BlackRock Small Cap Index Fund |
BlackRock Small Cap Index Fund’s (the “Fund”), a series of BlackRock Index Funds, Inc. (the “Corporation”), investment objective is to match the performance of the Russell 2000® Index (the “Russell 2000®”) as closely as possible before the deduction of Fund expenses.
|
Portfolio Management Commentary |
| |
| How did the Fund perform? |
| |
• | For the six months ended June 30, 2011, the Fund, through its investment in Master Small Cap Index Series (the “Series”) of Quantitative Master Series LLC (the “Master LLC”), slightly underperformed the benchmark Russell 2000®. The Russell 2000® is a market-weighted index composed of approximately 2,000 common stocks issued by small-capitalization US companies in a range of businesses. For the period beginning with its initial trading date of March 31, 2011 through June 30, 2011, the Fund’s Class K Shares returned (1.75)%. For the same period, the benchmark index returned (1.61)%. |
| |
• | Returns for the Fund’s respective share classes differ from the benchmark based on individual share-class expenses. |
| |
| Describe the market environment. |
| |
• | US equity markets began the year on an upswing. Confidence levels were improving, the economy was recovering and investors were increasing their holdings of riskier assets. US stocks moved higher during the first four months of 2011 despite volatility from significant global events. Political turmoil spread across the Middle East/North Africa region and prices of oil and other commodities rose sharply. March brought devastating natural disasters that left Japan with massive infrastructure damage and a nuclear crisis. In April, Standard & Poor’s changed its ratings outlook for long-term US and Japanese debt from stable to negative. But equity markets charged forward as investors chose to focus on the continuing stream of strong corporate earnings reports. |
| |
• | Meanwhile, longer-term headwinds had been brewing. Inflationary pressures intensified in emerging economies, many of which were overheating, and the European debt crisis was not over. Financial markets were met with a sharp reversal in May when political unrest in Greece pushed the nation closer to defaulting on its debt. This development rekindled fears about the broader sovereign debt crisis in Europe and its further contagion among peripheral countries. Concurrently, it became evident that the pace of US and global economic growth had slowed. The impact of higher oil prices and supply chain disruptions in Japan finally surfaced in weak economic data. Investors pulled back from riskier assets amid heightened uncertainty and equity markets experienced a correction throughout most of May and June. The last week of June brought a sharp rally on encouraging data from the US manufacturing sector and Germany’s decision to support the refinancing of Greece’s public debt. |
| |
• | Despite market weakness in the final two months of the period, US stocks advanced year-to-date. Small cap stocks, as represented by the Russell 2000®, climbed 6.21% for the period. Small cap growth stocks outperformed their value counterparts as demonstrated by the Russell 2000® Growth Index (+8.59%) versus the Russell 2000® Value Index (+3.77%), respectively. |
| |
• | Within the benchmark Russell 2000®, all sectors posted positive returns for the period. Telecommunication services (+18.20%), health care (+13.10%), and consumer staples (+11.31%) emerged as the best performing sectors over the period, while financials (+0.73%), industrials (+3.41%) and materials (+5.48%) experienced less positive returns. |
| |
| Describe recent portfolio activity. |
| |
• | During the six-month period, as changes were made to the composition of the Russell 2000®, the Series purchased and sold securities to maintain its objective of replicating the risks and return of the benchmark. |
| |
| Describe portfolio positioning at period end. |
| |
• | The Series remains positioned to match the risk characteristics of its benchmark, irrespective of the market’s future direction. |
| |
| The views expressed reflect the opinions of BlackRock as of the date of this report and are subject to change based on changes in market, economic or other conditions. These views are not intended to be a forecast of future events and are no guarantee of future results. |
|
Derivative Financial Instruments |
The Series may invest in various derivative financial instruments, including financial futures contracts, as specified in Note 2 of the Series’ Notes to Financial Statements, which may constitute forms of economic leverage. Such instruments are used to obtain exposure to a market without owning or taking physical custody of securities or to hedge market and/or equity risks. Such derivative financial instruments involve risks, including the imperfect correlation between the value of a derivative financial instrument and the underlying asset or illiquidity of the derivative financial instrument. The Series’ ability to use a derivative financial instrument successfully depends on the investment advisor’s ability to predict pertinent market movements accurately, which cannot be assured. The use of derivative financial instruments may result in losses greater than if they had not been used, may require the Series to sell or purchase portfolio investments at inopportune times or for distressed values, may limit the amount of appreciation the Series can realize on an investment, may result in lower dividends paid to shareholders or may cause the Series to hold an investment that it might otherwise sell. The Series’ investments in these instruments are discussed in detail in the Series’ Notes to Financial Statements.
| | |
| | |
4 | BLACKROCK SMALL CAP INDEX FUND | JUNE 30, 2011 |
|
Total Return Based on a $10,000 Investment |
| | |
| | 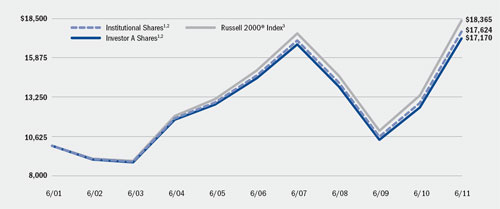
|
| | |
| 1 | Assuming transaction costs and other operating expenses, including investment advisory fees and administration fees, if any. |
| | |
| 2 | The Fund invests all of its assets in Master Small Cap Index Series (the “Series”) of Quantitative Master Series LLC. The Series may invest in a statistically selected sample of the stocks included in the Russell 2000® Index and other types of financial instruments. |
| | |
| 3 | This unmanaged index is comprised of approximately 2,000 smaller-capitalization common stocks from various industrial sectors. |
|
Performance Summary for the Period Ended June 30, 2011 |
| | | | | | | | | | | | | |
| | 6-Month
Total Returns | | Average Annual Total Returns4 | |
| | | 1 Year | | 5 Years | | 10 Years | |
Institutional | | 5.98 | % | | 37.03 | % | | 3.70 | % | | 5.83 | % | |
Investor A | | 5.81 | | | 36.66 | | | 3.41 | | | 5.55 | | |
Class K5 | | 5.99 | | | 37.08 | | | 3.74 | | | 5.88 | | |
Russell 2000® Index | | 6.21 | | | 37.41 | | | 4.08 | | | 6.27 | | |
| | |
| 4 | Average annual total returns reflect reductions for service fees, if any. See “About Fund Performance” on page 6 for a detailed description of share classes, including any related fees, if any. |
| | |
| 5 | Class K commenced operations on March 31, 2011. |
| | |
| | Past performance is not indicative of future results. |
| | | |
| | | |
| BLACKROCK SMALL CAP INDEX FUND | JUNE 30, 2011 | 5 |
| |
• | Institutional and Class K Shares are not subject to any sales charge. Institutional and Class K Shares bear no ongoing distribution or service fees and are available only to eligible investors. Prior to March 31, 2011, Class K Shares’ performance results are those of Institutional Shares restated to reflect Class K Shares’ fees. |
| |
• | Investor A Shares are not subject to any sales charge and bear no ongoing distribution fee. Investor A Shares are subject to an ongoing service fee of 0.25% per year. |
| |
| Performance information reflects past performance and does not guarantee future results. Current performance may be lower or higher than the performance data quoted. Refer to www.blackrock.com/funds to obtain performance data current to the most recent month end. Performance results do not reflect the deduction of taxes that a shareholder would pay on fund distributions or the redemption of fund shares. Figures shown in the performance tables on page 5 assume reinvestment of all dividends and capital gain distributions, if any, at net asset value on the ex-dividend date. Investment return and principal value of shares will fluctuate so that shares, when redeemed, may be worth more or less than their original cost. Dividends paid to each class of shares will vary because of the different levels of service and transfer agency fees applicable to each class, which are deducted from the income available to be paid to shareholders. |
Shareholders of this Fund may incur the following charges: (a) expenses related to transactions and exchange fees; and (b) operating expenses including administration fees, service fees, including 12b-1 fees, and other Fund expenses. The expense example shown below (which is based on a hypothetical investment of $1,000 invested on January 1, 2011 and held through June 30, 2011) is intended to assist shareholders both in calculating expenses based on an investment in the Fund and in comparing these expenses with similar costs of investing in other mutual funds.
The table provides information about actual account values and actual expenses. In order to estimate the expenses a shareholder paid during the period covered by this report, shareholders can divide their account value by $1,000 and then multiply the result by the number corresponding to their share class under the heading entitled “Expenses Paid During the Period.”
The table also provides information about hypothetical account values and hypothetical expenses based on the Fund’s actual expense ratio and an assumed rate of return of 5% per year before expenses. In order to assist shareholders in comparing the ongoing expenses of investing in this Fund and other funds, compare the 5% hypothetical example with the 5% hypothetical examples that appear in other funds’ shareholder reports.
The expenses shown in the table are intended to highlight shareholders’ ongoing costs only and do not reflect any transactional expenses, such as sales charges or exchange fees, if any. Therefore, the hypothetical example is useful in comparing ongoing expenses only, and will not help shareholders determine the relative total expenses of owning different funds. If these transactional expenses were included, shareholder expenses would have been higher.
| | | | | | | | | | | | | | | | | | | | | | |
| | Actual | | Hypothetical2 | | | |
| | Beginning
Account Value
January 1, 2011 | | Ending
Account Value
June 30, 2011 | | Expenses Paid
During the Period1 | | Beginning
Account Value
January 1, 2011 | | Ending
Account Value
June 30, 2011 | | Expenses Paid
During the Period1 | | Annualized
Expense Ratio | |
Institutional | | $ | 1,000.00 | | $ | 1,059.80 | | $ | 1.53 | | $ | 1,000.00 | | $ | 1,023.31 | | $ | 1.51 | | | 0.30 | % |
Investor A | | $ | 1,000.00 | | $ | 1,058.10 | | $ | 2.81 | | $ | 1,000.00 | | $ | 1,022.07 | | $ | 2.76 | | | 0.55 | % |
Class K | | $ | 1,000.00 | | $ | 982.50 | | $ | 0.62 | | $ | 1,000.00 | | $ | 1,023.55 | | $ | 1.25 | | | 0.25 | % |
| | |
| 1 | For Institutional and Investor A Shares of the Fund, expenses are equal to the annualized expense ratio for Institutional and Investor A Shares, multiplied by the average account value over the period, multiplied by 181/365 (to reflect the one-half year period shown). For Class K Shares of the Fund, expenses are equal to the annualized expense ratio for Class K Shares, multiplied by the average account value over the period, multiplied by 91/365. |
| | |
| 2 | Hypothetical 5% annual return before expenses is calculated by pro rating the number of days in the most recent fiscal half year divided by 365. |
| | |
| | |
6 | BLACKROCK SMALL CAP INDEX FUND | JUNE 30, 2011 |
| |
|
Statement of Assets and Liabilities | BlackRock Small Cap Index Fund |
| | | | |
June 30, 2011 (Unaudited) | | | | |
Assets | | | | |
Investments at value — Master Small Cap Index Series (the “Series”) (cost — $106,135,682) | | $ | 132,601,995 | |
Capital shares sold receivable | | | 149,683 | |
Prepaid expenses | | | 17,362 | |
Other assets | | | 2,401 | |
Total assets | | | 132,771,441 | |
| | | | |
Liabilities | | | | |
Contributions payable to the Series | | | 122,013 | |
Capital shares redeemed payable | | | 27,670 | |
Service fees payable | | | 10,221 | |
Administration fees payable | | | 3,169 | |
Officer’s fees payable | | | 39 | |
Total liabilities | | | 163,112 | |
Net Assets | | $ | 132,608,329 | |
| | | | |
Net Assets Consist of | | | | |
Paid-in capital | | | 124,618,449 | |
Undistributed net investment income | | | 508,264 | |
Accumulated net realized loss allocated from the Series | | | (18,984,697 | ) |
Net unrealized appreciation/depreciation allocated from the Series | | | 26,466,313 | |
Net Assets | | $ | 132,608,329 | |
| | | | |
Net Asset Value | | | | |
Institutional — Based on net assets of $80,219,490 and 6,201,494 shares outstanding, 125 million shares authorized, $0.0001 par value | | $ | 12.94 | |
Investor A — Based on net assets of $52,364,273 and 4,053,013 shares outstanding, 125 million shares authorized, $0.0001 par value | | $ | 12.92 | |
Class K — Based on net assets of $24,566 and 1,898 shares outstanding, 125 million shares authorized, $0.0001 par value | | $ | 12.94 | |
| | | |
See Notes to Financial Statements. | | |
|
| BLACKROCK SMALL CAP INDEX FUND | JUNE 30, 2011 | 7 |
| |
| |
Statement of Operations | BlackRock Small Cap Index Fund |
| | | | |
Six Months Ended June 30, 2011 (Unaudited) | | | | |
Investment Income | | | | |
Net investment income allocated from the Series: | | | | |
Dividends — unaffiliated | | $ | 694,356 | |
Foreign taxes withheld | | | (181 | ) |
Securities lending — affiliated | | | 29,478 | |
Dividends — affiliated | | | 8,948 | |
Expenses | | | (53,225 | ) |
Fees waived | | | 5,934 | |
Total income | | | 685,310 | |
| | | | |
Expenses | | | | |
Administration | | | 184,897 | |
Service — Investor A | | | 62,834 | |
Transfer agent — Institutional | | | 19,750 | |
Transfer agent — Investor A | | | 16,103 | |
Printing | | | 41,375 | |
Registration | | | 20,720 | |
Professional | | | 12,923 | |
Officer | | | 24 | |
Miscellaneous | | | 4,461 | |
Total expenses | | | 363,087 | |
Less fees waived by administrator | | | (136,224 | ) |
Less transfer agent fees waived and/or reimbursed — class specific | | | (19,408 | ) |
Total expenses after fees waived and/or reimbursed | | | 207,455 | |
Net investment income | | | 477,855 | |
| | | | |
Realized and Unrealized Gain Allocated from the Series | | | | |
Net realized gain from investments and financial futures contracts | | | 6,073,515 | |
Net change in unrealized appreciation/depreciation on investments, investments sold short, foreign currency transactions and financial futures contracts | | | 647,456 | |
Total realized and unrealized gain | | | 6,720,971 | |
Net Increase in Net Assets Resulting from Operations | | $ | 7,198,826 | |
| | |
See Notes to Financial Statements. | |
|
8 | BLACKROCK SMALL CAP INDEX FUND | JUNE 30, 2011 |
| |
| |
Statements of Changes in Net Assets | BlackRock Small Cap Index Fund |
| | | | | | | |
Increase (Decrease) in Net Assets: | | Six Months
Ended
June 30,
2011
(Unaudited) | |
Year Ended
December 31,
2010
| |
Operations | | | | | | | |
Net investment income | | $ | 477,855 | | $ | 701,254 | |
Net realized gain | | | 6,071,912 | | | 1,597,176 | |
Net change in unrealized appreciation/depreciation | | | 649,059 | | | 22,605,830 | |
Net increase in net assets resulting from operations | | | 7,198,826 | | | 24,904,260 | |
| | | | | | | |
Dividends to Shareholders From | | | | | | | |
Net investment income: | | | | | | | |
Institutional | | | — | | | (491,823 | ) |
Investor A | | | — | | | (221,254 | ) |
Decrease in net assets resulting from dividends to shareholders | | | — | | | (713,077 | ) |
| | | | | | | |
Capital Share Transactions | | | | | | | |
Net increase in net assets derived from capital share transactions | | | 6,711,307 | | | 418,291 | |
| | | | | | | |
Redemption Fee | | | | | | | |
Redemption fee | | | 2,775 | | | 2,525 | |
| | | | | | | |
Net Assets | | | | | | | |
Total increase in net assets | | | 13,912,908 | | | 24,611,999 | |
Beginning of period | | | 118,695,421 | | | 94,083,422 | |
End of period | | $ | 132,608,329 | | $ | 118,695,421 | |
Undistributed net investment income | | $ | 508,264 | | $ | 30,409 | |
| | | |
See Notes to Financial Statements. | | |
|
| BLACKROCK SMALL CAP INDEX FUND | JUNE 30, 2011 | 9 |
| |
| |
Financial Highlights | BlackRock Small Cap Index Fund |
| | | | | | | | | | | | | | | | | | | |
| | Institutional | |
| | Six Months
Ended
June 30,
2011
(Unaudited) | | | | | | | | | | | | | | | | |
| | | | | | | | | | | | |
| | | Year Ended December 31, | |
| | | 2010 | | 2009 | | 2008 | | 2007 | | 2006 | |
Per Share Operating Performance | | | | | | | | | | | | | | | | | | | |
Net asset value, beginning of period | | $ | 12.21 | | $ | 9.70 | | $ | 7.71 | | $ | 13.79 | | $ | 15.48 | | $ | 14.36 | |
Net investment income1 | | | 0.05 | | | 0.08 | | | 0.07 | | | 0.14 | | | 0.20 | | | 0.17 | |
Net realized and unrealized gain (loss)2 | | | 0.68 | | | 2.51 | | | 1.98 | | | (4.86 | ) | | (0.50 | ) | | 2.34 | |
Net increase (decrease) from investment operations | | | 0.73 | | | 2.59 | | | 2.05 | | | (4.72 | ) | | (0.30 | ) | | 2.51 | |
Dividends and distributions from: | | | | | | | | | | | | | | | | | | | |
Net investment income | | | — | | | (0.08 | ) | | (0.06 | ) | | (0.15 | ) | | (0.20 | ) | | (0.17 | ) |
Net realized gain | | | — | | | — | | | — | | | (1.09 | ) | | (1.19 | ) | | (1.22 | ) |
Tax return of capital | | | — | | | — | | | — | | | (0.12 | ) | | — | | | — | |
Total dividends and distributions | | | — | | | (0.08 | ) | | (0.06 | ) | | (1.36 | ) | | (1.39 | ) | | (1.39 | ) |
Net asset value, end of period | | $ | 12.94 | | $ | 12.21 | | $ | 9.70 | | $ | 7.71 | | $ | 13.79 | | $ | 15.48 | |
| | | | | | | | | | | | | | | | | | | |
Total Investment Return3 | | | | | | | | | | | | | | | | | | | |
Based on net asset value | | | 5.98 | %4 | | 26.77 | % | | 26.67 | % | | (34.01 | )% | | (1.91 | )% | | 17.49 | % |
| | | | | | | | | | | | | | | | | | | |
Ratios to Average Net Assets5 | | | | | | | | | | | | | | | | | | | |
Total expenses | | | 0.55 | %6,7 | | 0.57 | % | | 0.56 | % | | 0.53 | % | | 0.48 | % | | 0.49 | % |
Total expenses after fees waived and/or reimbursed | | | 0.30 | %6,7 | | 0.52 | % | | 0.56 | % | | 0.52 | % | | 0.48 | % | | 0.49 | % |
Net investment income | | | 0.85 | %6,7 | | 0.80 | % | | 0.85 | % | | 1.19 | % | | 1.23 | % | | 1.10 | % |
| | | | | | | | | | | | | | | | | | | |
Supplemental Data | | | | | | | | | | | | | | | | | | | |
Net assets, end of period (000) | | $ | 80,219 | | $ | 71,443 | | $ | 55,744 | | $ | 46,285 | | $ | 66,085 | | $ | 79,032 | |
Portfolio turnover of the Series | | | 17 | % | | 42 | % | | 43 | % | | 42 | % | | 26 | % | | 40 | % |
| | |
| 1 | Based on average shares outstanding. |
| | |
| 2 | Includes a redemption fee, which is less than $0.01 per share. |
| | |
| 3 | Where applicable, total investment returns include the reinvestment of dividends and distributions. |
| | |
| 4 | Aggregate total investment return. |
| | |
| 5 | Includes the Fund’s share of the Series’ allocated net expenses and/or net investment income. |
| | |
| 6 | Annualized. |
| | |
| 7 | Includes the Fund’s share of the Series’ allocated fees waived of less than 0.01%. |
| | |
See Notes to Financial Statements. | |
|
10 | BLACKROCK SMALL CAP INDEX FUND | JUNE 30, 2011 |
| |
| |
Financial Highlights (continued) | BlackRock Small Cap Index Fund |
| | | | | | | | | | | | | | | | | | | |
| | Investor A | |
| | Six Months
Ended
June 30,
2011
(Unaudited) | | | | | | | | | | | |
| | | | | | | | | | | | |
| | | | | | | | | | | | |
| | | Year Ended December 31, | |
| | | 2010 | | 2009 | | 2008 | | 2007 | | 2006 | |
Per Share Operating Performance | | | | | | | | | | | | | | | | | | | |
Net asset value, beginning of period | | $ | 12.21 | | $ | 9.71 | | $ | 7.72 | | $ | 13.79 | | $ | 15.47 | | $ | 14.36 | |
Net investment income1 | | | 0.04 | | | 0.06 | | | 0.05 | | | 0.11 | | | 0.15 | | | 0.13 | |
Net realized and unrealized gain (loss)2 | | | 0.67 | | | 2.50 | | | 1.98 | | | (4.85 | ) | | (0.48 | ) | | 2.33 | |
Net increase (decrease) from investment operations | | | 0.71 | | | 2.56 | | | 2.03 | | | (4.74 | ) | | (0.33 | ) | | 2.46 | |
Dividends and distributions from: | | | | | | | | | | | | | | | | | | | |
Net investment income | | | — | | | (0.06 | ) | | (0.04 | ) | | (0.12 | ) | | (0.16 | ) | | (0.13 | ) |
Net realized gain | | | — | | | — | | | — | | | (1.09 | ) | | (1.19 | ) | | (1.22 | ) |
Tax return of capital | | | — | | | — | | | — | | | (0.12 | ) | | — | | | — | |
Total dividends and distributions | | | — | | | (0.06 | ) | | (0.04 | ) | | (1.33 | ) | | (1.35 | ) | | (1.35 | ) |
Net asset value, end of period | | $ | 12.92 | | $ | 12.21 | | $ | 9.71 | | $ | 7.72 | | $ | 13.79 | | $ | 15.47 | |
| | | | | | | | | | | | | | | | | | | |
Total Investment Return3 | | | | | | | | | | | | | | | | | | | |
Based on net asset value | | | 5.81 | %4 | | 26.35 | % | | 26.36 | % | | (34.19 | )% | | (2.12 | )% | | 17.14 | % |
| | | | | | | | | | | | | | | | | | | |
Ratios to Average Net Assets5 | | | | | | | | | | | | | | | | | | | |
Total expenses | | | 0.81 | %6,7 | | 0.80 | % | | 0.82 | % | | 0.80 | % | | 0.73 | % | | 0.74 | % |
Total expenses after fees waived and/or reimbursed | | | 0.55 | %6,7 | | 0.78 | % | | 0.82 | % | | 0.79 | % | | 0.73 | % | | 0.74 | % |
Net investment income | | | 0.60 | %6,7 | | 0.53 | % | | 0.59 | % | | 0.91 | % | | 0.98 | % | | 0.84 | % |
| | | | | | | | | | | | | | | | | | | |
Supplemental Data | | | | | | | | | | | | | | | | | | | |
Net assets, end of period (000) | | $ | 52,364 | | $ | 47,252 | | $ | 38,340 | | $ | 29,787 | | $ | 47,605 | | $ | 54,083 | |
Portfolio turnover of the Series | | | 17 | % | | 42 | % | | 43 | % | | 42 | % | | 26 | % | | 40 | % |
| | |
| 1 | Based on average shares outstanding. |
| | |
| 2 | Includes a redemption fee, which is less than $0.01 per share. |
| | |
| 3 | Where applicable, total investment returns include the reinvestment of dividends and distributions. |
| | |
| 4 | Aggregate total investment return. |
| | |
| 5 | Includes the Fund’s share of the Series’ allocated net expenses and/or net investment income. |
| | |
| 6 | Annualized. |
| | |
| 7 | Includes the Fund’s share of the Series’ allocated fees waived of less than 0.01%. |
| | | |
See Notes to Financial Statements. | | |
|
| BLACKROCK SMALL CAP INDEX FUND | JUNE 30, 2011 | 11 |
| |
| |
Financial Highlights (concluded) | BlackRock Small Cap Index Fund |
| | | | |
| | Class K | |
| | Period
March 31, 20111
through
June 30,
2011
(Unaudited) | |
Per Share Operating Performance | | | | |
Net asset value, beginning of period | | $ | 13.17 | |
Net investment income2 | | | 0.03 | |
Net realized and unrealized gain3 | | | 0.74 | |
Net increase from investment operations | | | 0.77 | |
Net asset value, end of period | | $ | 12.94 | |
| | | | |
Total Investment Return4 | | | | |
Based on net asset value | | | (1.75 | ) %5 |
| | | | |
Ratios to Average Net Assets6 | | | | |
Total expenses | | | 0.50 | %7,8 |
Total expenses after fees waived and/or reimbursed | | | 0.25 | %7,8 |
Net investment income | | | 0.93 | %7,8 |
| | | | |
Supplemental Data | | | | |
Net assets, end of period (000) | | $ | 25 | |
Portfolio turnover of the Series | | | 17 | % |
| | |
| 1 | Commencement of operations. |
| | |
| 2 | Based on average shares outstanding. |
| | |
| 3 | Includes a redemption fee, which is less than $0.01 per share. |
| | |
| 4 | Where applicable, total investment returns include the reinvestment of dividends and distributions. |
| | |
| 5 | Aggregate total investment return. |
| | |
| 6 | Includes the Fund’s share of the Series’ allocated net expenses and/or net investment income. |
| | |
| 7 | Annualized. |
| | |
| 8 | Includes the Fund’s share of the Series’ allocated fees waived of less than 0.01%. |
| | |
See Notes to Financial Statements. |
|
12 | BLACKROCK SMALL CAP INDEX FUND | JUNE 30, 2011 |
| |
| |
Notes to Financial Statements (Unaudited) | BlackRock Small Cap Index Fund |
1. Organization and Significant Accounting Policies:
BlackRock Small Cap Index Fund (the “Fund”), a series of BlackRock Index Funds, Inc. (“the Corporation”), is registered under the Investment Company Act of 1940, as amended (the “1940 Act”), as a diversified, open-end management investment company. The Corporation is organized as a Maryland corporation. The Fund seeks to achieve its investment objective by investing all of its assets in Master Small Cap Index Series (the “Series”), a series of Quantitative Master Series LLC (the “Master LLC”), which has the same investment objective and strategies as the Fund. The value of the Fund’s investment in the Series reflects the Fund’s proportionate interest in the net assets of the Series. The performance of the Fund is directly affected by the performance of the Series. The percentage of the Series owned by the Fund at June 30, 2011 was 38%. The Fund’s financial statements are prepared in conformity with accounting principles generally accepted in the United States of America (“US GAAP”), which may require management to make estimates and assumptions that affect the reported amounts and disclosures in the financial statements. Actual results could differ from those estimates. Institutional Shares and Class K Shares are sold without a sales charge and only to certain eligible investors. Investor A Shares are generally sold without a front-end sales charge. All classes of shares have identical voting, dividend, liquidation and other rights and the same terms and conditions, except that Investor A shares bear certain expenses related to the shareholder servicing of such shares.
The following is a summary of significant accounting policies followed by the Fund:
Valuation: US GAAP defines fair value as the price the Fund would receive to sell an asset or pay to transfer a liability in an orderly transaction between market participants at the measurement date. The Fund’s policy is to fair value its financial instruments at market value. The Fund records its investment in the Series at fair value based on the Fund’s proportionate interest in the net assets of the Series. Valuation of securities held by the Series is discussed in Note 1 of the Series’ Notes to Financial Statements, which are included elsewhere in this report.
Investment Transactions and Investment Income: For financial reporting purposes, contributions to and withdrawals from the Series are accounted for on a trade date basis. The Fund records daily its proportionate share of the Series’ income, expenses and realized and unrealized gains and losses. In addition, the Fund accrues its own expenses. Income, expenses and realized and unrealized gains and losses are allocated daily to each class based on its relative net assets.
Dividends and Distributions: Dividends and distributions paid by the Fund are recorded on the ex-dividend dates. The amount and timing of dividends and distributions are determined in accordance with federal income tax regulations, which may differ from US GAAP.
Income Taxes: It is the Fund’s policy to comply with the requirements of the Internal Revenue Code of 1986, as amended, applicable to regulated investment companies and to distribute substantially all of its taxable income to its shareholders. Therefore, no federal income tax provision is required.
The Fund files US federal and various state and local tax returns. No income tax returns are currently under examination. The statute of limitations on the Fund’s US federal tax returns remains open for each of the four years ended December 31, 2010. The statutes of limitations on the Fund’s state and local tax returns may remain open for an additional year depending upon the jurisdiction. Management does not believe there are any uncertain tax positions that require recognition of a tax liability.
Recent Accounting Standard: In May 2011, the Financial Accounting Standards Board issued amended guidance to improve disclosure about fair value measurements, which will require the following disclosures for fair value measurements categorized as Level 3: quantitative information about unobservable inputs and assumptions used in the fair value measurement, a description of the valuation policies and procedures and a narrative description of sensitivity of the fair value measurement to changes in unobservable inputs and the interrelationships between those unobservable inputs. In addition, the amounts and reasons for all transfers in and out of Level 1 and Level 2 will be required to be disclosed. The amended guidance is effective for financial statements for fiscal years beginning after December 15, 2011, and interim periods within those fiscal years. Management is evaluating the impact of this guidance on the Fund’s financial statements and disclosures.
Other: Expenses directly related to the Fund or its classes are charged to that Fund or class. Other operating expenses shared by several funds are pro rated among those funds on the basis of relative net assets or other appropriate methods. Other expenses of the Fund are allocated daily to each class based on its relative net assets.
The Series has an arrangement with the custodian whereby fees may be reduced by credits earned on uninvested cash balances, which, if applicable, are shown as fees paid indirectly in the Statement of Operations. The custodian imposes fees on overdrawn cash balances, which can be offset by accumulated credits earned or may result in additional custody charges.
| | | |
|
BLACKROCK SMALL CAP INDEX FUND
|
JUNE 30, 2011
|
13
|
| |
| |
Notes to Financial Statements (continued) | BlackRock Small Cap Index Fund |
2. Administration Agreement and Other Transactions with Affiliates:
The PNC Financial Services Group, Inc. (“PNC”) and Barclays Bank PLC (“Barclays”) are the largest stockholders of BlackRock, Inc. (“BlackRock”). Due to the ownership structure, PNC is an affiliate of the Fund for 1940 Act purposes, but Barclays is not.
The Corporation, on behalf of the Fund, entered into an Administration Agreement with BlackRock Advisors, LLC (the “Administrator”), an indirect, wholly owned subsidiary of BlackRock, to provide administration services (other than investment advice and related portfolio activities). For such services, the Fund pays the Administrator a monthly fee at an annual rate of 0.29% of the average daily value of the Fund’s net assets. The Fund does not pay an investment advisory fee or an investment management fee.
The Administrator contractually agreed to waive and/or reimburse fees or expenses, excluding interest expense, dividend expense, acquired fund fees and expenses and certain other fund expenses in order to limit total annual Fund operating expenses as a percentage of average daily net assets to 0.30% for Institutional Shares, 0.55% for Investor A Shares and 0.25% for Class K Shares until May 12, 2012. The Administrator has agreed not to reduce or discontinue this contractual waiver or reimbursement unless approved by the Board of Directors, including a majority of the independent directors.
As a result of these agreements, the Administrator waived and/or reimbursed the following amounts, which are shown as transfer agent fees waived and/or reimbursed — class specific in the Statement of Operations:
| | | | |
Institutional | | $ | 9,752 | |
Investor A | | $ | 9,656 | |
In addition, the Administrator waived $136, 224 which is shown as fees waived by administrator in the Statement of Operations.
The Corporation, on behalf of the Fund, entered into a Distribution Agreement and Distribution and Service Plan with BlackRock Investments, LLC (“BRIL”), an affiliate of the Administrator. Pursuant to the Distribution and Service Plan and in accordance with Rule 12b-1 under the 1940 Act, the Fund pays BRIL ongoing service and distribution fees. The fees are accrued daily and paid monthly at the annual rate of 0.25% based upon the average daily net assets attributable to Investor A Shares.
Pursuant to sub-agreements with BRIL, broker-dealers and BRIL provide shareholder servicing services to the Fund. The ongoing service fee compensates BRIL and each broker-dealer for providing shareholder servicing to Investor A shareholders.
The Administrator maintains a call center, which is responsible for providing certain shareholder services to the Fund, such as responding to shareholder inquiries and processing transactions based upon instructions from shareholders with respect to the subscription and redemption of Fund shares. For the six months ended June 30, 2011, the Fund reimbursed the Administrator the following amounts for costs incurred in running the call center, which are included in transfer agent — class specific in the Statement of Operations:
| | | | |
Institutional | | $ | 160 | |
Investor A | | $ | 426 | |
Certain officers and/or directors of the Corporation are officers and/or directors of BlackRock or its affiliates. The Fund reimburses the Administrator for compensation paid to the Corporation’s Chief Compliance Officer.
3. Capital Loss Carryforwards:
As of December 31, 2010, the Fund had capital loss carryforwards in the amount of $23,086,720 available to offset future realized capital gains, which expires December 31, 2017.
Under the recently enacted Regulated Investment Company Modernization Act of 2010, capital losses incurred by the Fund after December 31, 2010 will not be subject to expiration. In addition, these losses must be utilized prior to the losses incurred in pre-enactment taxable years.
| | |
14
|
BLACKROCK SMALL CAP INDEX FUND
|
JUNE 30, 2011
|
| |
| |
Notes to Financial Statements (concluded) | BlackRock Small Cap Index Fund |
4. Capital Share Transactions:
Transactions in capital shares for each class were as follows:
| | | | | | | | | | | | | | |
| | Six Months Ended
June 30, 2011 | | | Year Ended
December 31, 2010 | |
| | Shares | | Amount | | | Shares | | Amount | |
Institutional | | | | | | | | | | | | | | |
Shares sold | | | 1,323,650 | | $ | 16,777,823 | | | | 2,098,681 | | $ | 22,240,658 | |
Shares issued to shareholders in reinvestment of dividends | | | — | | | — | | | | 39,323 | | | 469,746 | |
Total issued | | | 1,323,650 | | | 16,777,823 | | | | 2,138,004 | | | 22,710,404 | |
Shares redeemed | | | (975,042 | ) | | (12,372,731 | ) | | | (2,028,999 | ) | | (21,560,365 | ) |
Net increase | | | 348,608 | | $ | 4,405,092 | | | | 109,005 | | $ | 1,150,039 | |
| | | | | | | | | | | | | | |
Investor A | | | | | | | | | | | | | | |
Shares sold | | | 501,151 | | $ | 6,344,041 | | | | 747,472 | | $ | 7,965,898 | |
Shares issued to shareholders in reinvestment of dividends | | | — | | | — | | | | 16,979 | | | 201,821 | |
Total issued | | | 501,151 | | | 6,344,041 | | | | 764,451 | | | 8,167,719 | |
Shares redeemed | | | (319,099 | ) | | (4,062,826 | ) | | | (842,665 | ) | | (8,899,467 | ) |
Net increase (decrease) | | | 182,052 | | $ | 2,281,215 | | | | (78,214 | ) | $ | (731,748 | ) |
| | | | | | | | | | | | | | |
Class K1 | | | | | | | | | | | | | | |
Shares sold | | | 1,898 | | $ | 25,000 | | | | — | | | — | |
Shares redeemed | | | — | | | — | | | | — | | | — | |
Net increase | | | 1,898 | | $ | 25,000 | | | | — | | | — | |
| | | | | | | | | | | | | | |
1 For the period March 31, 2011 (commencement of operations) to June 30, 2011. |
There is a 2% redemption fee on shares redeemed or exchanged that have been held for 30 days or less. The redemption fees are collected and retained by the Fund for the benefit of the remaining shareholders. The redemption fees are recorded as a credit to paid-in capital. Effective April 1, 2011, the redemption fee was terminated and is no longer charged by the Fund.
5. Subsequent Events:
Management’s evaluation of the impact of all subsequent events on the Fund’s financial statements was completed through the date the financial statements were issued and the following item was noted:
The Fund paid a net investment income dividend on July 22, 2011 to shareholders of record on July 20, 2011 as follows:
| | | |
| | Dividend Per Share | |
Institutional | | $ | 0.005844 | |
Investor A | | $ | 0.005779 | |
Class K | | $ | 0.005842 | |
| | | |
|
BLACKROCK SMALL CAP INDEX FUND
|
JUNE 30, 2011
|
15
|
| |
| |
Portfolio Information | Master Small Cap Index Series |
| | | | |
Ten Largest Holdings | | Percent of
Long-Term Investments |
HealthSpring, Inc. | | | 0.2 | % |
Sotheby’s Holdings, Inc., Class A | | | 0.2 | |
MFA Financial, Inc. | | | 0.2 | |
Netlogic Microsystems, Inc. | | | 0.2 | |
Berry Petroleum Co., Class A | | | 0.2 | |
Rosetta Resources, Inc. | | | 0.2 | |
Parametric Technology Corp. | | | 0.2 | |
CBL & Associates Properties, Inc. | | | 0.2 | |
Dana Holding Corp. | | | 0.2 | |
Tenneco, Inc. | | | 0.2 | |
| | | | |
Sector Allocations | | Percent of
Long-Term Investments |
Energy | | | 22 | % |
Information Technology | | | 18 | |
Industrials | | | 15 | |
Consumer Discretionary | | | 14 | |
Health Care | | | 12 | |
Financials | | | 7 | |
Materials | | | 5 | |
Consumer Staples | | | 3 | |
Utilities | | | 3 | |
Telecommunication Services | | | 1 | |
For Series compliance purposes, the Series’ sector classifications refer to any one or more of the sector sub-classifications used by one or more widely recognized market indexes, and/or as defined by Series management. These definitions may not apply for purposes of this report, which may combine sector sub-classifications for reporting ease.
| | |
| | |
16 | BLACKROCK SMALL CAP INDEX FUND | JUNE 30, 2011 |
| |
| |
Schedule of Investments June 30, 2011 (Unaudited) | Master Small Cap Index Series
(Percentages shown are based on Net Assets) |
| | | | | | | |
Common Stocks | | Shares | | Value | |
Advertising Agencies — 0.7% | | | | | | | |
Arbitron, Inc. | | | 7,305 | | $ | 301,916 | |
Constant Contact, Inc. (a) | | | 7,998 | | | 202,989 | |
DG FastChannel, Inc. (a) | | | 7,304 | | | 234,093 | |
Harte-Hanks, Inc. | | | 11,078 | | | 89,953 | |
MDC Partners, Inc. | | | 6,254 | | | 112,947 | |
Marchex, Inc., Class B | | | 5,899 | | | 52,383 | |
National CineMedia, Inc. | | | 14,923 | | | 252,348 | |
QuinStreet, Inc. (a) | | | 7,090 | | | 92,028 | |
ReachLocal, Inc. (a) | | | 2,490 | | | 51,867 | |
Travelzoo, Inc. (a) | | | 1,521 | | | 98,318 | |
Valassis Communications, Inc. (a) | | | 13,220 | | | 400,566 | |
ValueClick, Inc. (a) | | | 21,289 | | | 353,398 | |
Viad Corp. | | | 5,559 | | | 123,910 | |
| | | | | | 2,366,716 | |
Aerospace — 1.4% | | | | | | | |
AAR Corp. | | | 10,684 | | | 289,430 | |
AeroVironment, Inc. (a) | | | 4,571 | | | 161,585 | |
Astronics Corp. (a) | | | 2,680 | | | 82,544 | |
Ceradyne, Inc. (a) | | | 6,715 | | | 261,818 | |
Cubic Corp. | | | 4,268 | | | 217,625 | |
Curtiss-Wright Corp. | | | 12,390 | | | 401,064 | |
Ducommun, Inc. | | | 2,899 | | | 59,632 | |
Esterline Technologies Corp. (a) | | | 8,177 | | | 624,723 | |
GenCorp, Inc. (a) | | | 16,471 | | | 105,744 | |
Heico Corp. (b) | | | 11,112 | | | 608,271 | |
Kaman Corp., Class A | | | 7,098 | | | 251,766 | |
Kratos Defense & Security Solutions, Inc. (a) | | | 6,564 | | | 79,818 | |
LMI Aerospace, Inc. (a) | | | 2,612 | | | 63,811 | |
Moog, Inc., Class A (a) | | | 12,195 | | | 530,726 | |
Orbital Sciences Corp. (a) | | | 15,755 | | | 265,472 | |
Teledyne Technologies, Inc. (a) | | | 9,856 | | | 496,348 | |
Triumph Group, Inc. | | | 5,006 | | | 498,498 | |
| | | | | | 4,998,875 | |
Agriculture, Fishing & Ranching — 0.4% | | | | | | | |
Alico, Inc. | | | 508 | | | 13,015 | |
The Andersons, Inc. | | | 4,993 | | | 210,954 | |
Cadiz, Inc. (a) | | | 3,961 | | | 43,016 | |
Cal-Maine Foods, Inc. (b) | | | 3,836 | | | 122,599 | |
Calavo Growers, Inc. | | | 3,140 | | | 66,128 | |
Fresh Del Monte Produce, Inc. | | | 9,835 | | | 262,299 | |
Limoneira Co. | | | 2,332 | | | 52,680 | |
Pilgrims Pride Corp. (a) | | | 13,360 | | | 72,278 | |
Sanderson Farms, Inc. | | | 5,943 | | | 283,957 | |
Seaboard Corp. | | | 85 | | | 205,530 | |
| | | | | | 1,332,456 | |
Air Transport — 0.9% | | | | | | | |
Air Transport Services Group, Inc. (a) | | | 14,517 | | | 99,441 | |
Alaska Air Group, Inc. (a) | | | 9,626 | | | 658,996 | |
Allegiant Travel Co. (a) | | | 4,011 | | | 198,545 | |
Atlas Air Worldwide Holdings, Inc. (a) | | | 7,058 | | | 420,022 | |
Bristow Group, Inc. | | | 9,725 | | | 496,170 | |
Hawaiian Holdings, Inc. (a) | | | 13,687 | | | 78,016 | |
JetBlue Airways Corp. (a) | | | 66,282 | | | 404,320 | |
PHI, Inc. (a) | | | 3,621 | | | 78,684 | |
Republic Airways Holdings, Inc. (a) | | | 13,250 | | | 72,345 | |
SkyWest, Inc. | | | 14,186 | | | 213,641 | |
Spirit Airlines, Inc. (a) | | | 3,793 | | | 45,478 | |
US Airways Group, Inc. (a) | | | 43,606 | | | 388,529 | |
| | | | | | 3,154,187 | |
| | | | | | | |
Common Stocks | | Shares | | Value | |
Alternative Energy — 0.2% | | | | | | | |
Ameresco, Inc. (a) | | | 4,396 | | $ | 62,335 | |
Amyris, Inc. (a) | | | 4,670 | | | 131,180 | |
EnerNOC, Inc. (a) | | | 6,121 | | | 96,345 | |
Gevo, Inc. (a) | | | 1,277 | | | 20,087 | |
Green Plains Renewable Energy (a) | | | 5,223 | | | 56,356 | |
Rex American Resources Corp. (a) | | | 1,946 | | | 32,304 | |
Solazyme, Inc. (a) | | | 2,829 | | | 64,982 | |
Syntroleum Corp. (a)(b) | | | 20,906 | | | 30,732 | |
USEC, Inc. (a) | | | 31,404 | | | 104,889 | |
| | | | | | 599,210 | |
Aluminum — 0.2% | | | | | | | |
Century Aluminum Co. (a) | | | 13,994 | | | 219,006 | |
Kaiser Aluminum Corp. | | | 4,236 | | | 231,370 | |
Noranda Aluminum Holding Corp. (a) | | | 5,704 | | | 86,359 | |
| | | | | | 536,735 | |
Asset Management & Custodian — 0.9% | | | | | | | |
Apollo Investment Corp. | | | 53,195 | | | 543,121 | |
Arlington Asset Investment Corp. | | | 1,799 | | | 56,471 | |
Artio Global Investors, Inc. | | | 7,800 | | | 88,140 | |
CIFC Deerfield Corp. (a) | | | 1,963 | | | 13,447 | |
Calamos Asset Management, Inc., Class A | | | 5,240 | | | 76,085 | |
Capital Southwest Corp. | | | 782 | | | 72,155 | |
Cohen & Steers, Inc. | | | 4,790 | | | 158,788 | |
Cowen Group, Inc., Class A (a) | | | 18,989 | | | 71,399 | |
Diamond Hill Investments Group | | | 737 | | | 59,911 | |
Epoch Holding Corp. | | | 4,009 | | | 71,561 | |
Fifth Street Finance Corp. | | | 18,255 | | | 211,758 | |
Financial Engines, Inc. (a) | | | 10,130 | | | 262,570 | |
GAMCO Investors, Inc., Class A | | | 1,866 | | | 86,377 | |
Golub Capital BDC, Inc. | | | 2,800 | | | 41,804 | |
Harris & Harris Group, Inc. (a) | | | 8,908 | | | 45,698 | |
JMP Group, Inc. | | | 4,768 | | | 33,519 | |
Kohlberg Capital Corp. | | | 3,968 | | | 31,546 | |
MCG Capital Corp. | | | 21,234 | | | 129,103 | |
MVC Capital, Inc. | | | 6,793 | | | 89,871 | |
Medley Capital Corp. | | | 2,260 | | | 26,532 | |
NGP Capital Resources Co. | | | 6,302 | | | 51,676 | |
National Financial Partners Corp. (a) | | | 11,973 | | | 138,168 | |
New Mountain Finance Corp. (a) | | | 1,952 | | | 24,790 | |
Oppenheimer Holdings, Inc. | | | 2,732 | | | 77,070 | |
Pzena Investment Management, Inc., Class A | | | 1,140 | | | 6,475 | |
Solar Capital Ltd. | | | 8,859 | | | 218,729 | |
Solar Senior Capital Ltd. | | | 1,621 | | | 29,097 | |
THL Credit, Inc. | | | 2,919 | | | 37,947 | |
TICC Capital Corp. | | | 8,793 | | | 84,413 | |
Virtus Investment Partners, Inc. (a) | | | 1,473 | | | 89,411 | |
Westwood Holdings Group, Inc. | | | 1,773 | | | 67,551 | |
| | | | | | 2,995,183 | |
Auto Parts — 0.9% | | | | | | | |
American Axle & Manufacturing Holdings, Inc. (a) | | | 17,840 | | | 203,019 | |
Amerigon, Inc. (a) | | | 6,235 | | | 108,364 | |
Dana Holding Corp. (a) | | | 39,232 | | | 717,946 | |
Dorman Products, Inc. (a) | | | 3,009 | | | 119,096 | |
Exide Technologies (a) | | | 20,968 | | | 160,196 | |
Fuel Systems Solutions, Inc. (a) | | | 4,525 | | | 112,899 | |
Meritor, Inc. (a) | | | 25,505 | | | 409,100 | |
Motorcar Parts of America, Inc. (a) | | | 2,726 | | | 40,917 | |
Standard Motor Products, Inc. | | | 5,461 | | | 83,171 | |
Stoneridge, Inc. (a) | | | 6,781 | | | 99,952 | |
Superior Industries International, Inc. | | | 6,329 | | | 139,934 | |
| | | |
See Notes to Financial Statements. |
| | | |
| BLACKROCK SMALL CAP INDEX FUND | JUNE 30, 2011 | 17 |
| |
| |
Schedule of Investments (continued) | Master Small Cap Index Series
(Percentages shown are based on Net Assets) |
| | | | | | | |
Common Stocks | | Shares | | Value | |
Auto Parts (concluded) | | | | | | | |
Tenneco, Inc. (a) | | | 16,276 | | $ | 717,283 | |
Tower International, Inc. (a) | | | 1,424 | | | 25,191 | |
U.S. Auto Parts Network, Inc. (a) | | | 4,614 | | | 35,343 | |
| | | | | | 2,972,411 | |
Auto Services — 0.1% | | | | | | | |
Cooper Tire & Rubber Co. | | | 16,732 | | | 331,126 | |
Back Office Support, HR & Consulting — 1.7% | | | | | | | |
APAC Customer Services, Inc. (a) | | | 9,398 | | | 50,091 | |
The Advisory Board Co. (a) | | | 4,347 | | | 251,604 | |
Barrett Business Services, Inc. | | | 2,404 | | | 34,425 | |
CBIZ, Inc. (a) | | | 10,171 | | | 74,859 | |
CDI Corp. | | | 3,664 | | | 48,695 | |
CRA International, Inc. (a) | | | 2,994 | | | 81,107 | |
Compass Diversified Holdings | | | 10,677 | | | 176,064 | |
Convergys Corp. (a) | | | 27,623 | | | 376,778 | |
Corporate Executive Board Co. | | | 9,296 | | | 405,770 | |
CoStar Group, Inc. (a) | | | 6,740 | | | 399,547 | |
Dice Holdings, Inc. (a) | | | 12,761 | | | 172,529 | |
ExlService Holdings, Inc. (a) | | | 4,375 | | | 101,062 | |
FTI Consulting, Inc. (a) | | | 11,134 | | | 422,424 | |
Forrester Research, Inc. | | | 4,035 | | | 132,994 | |
GP Strategies Corp. (a) | | | 4,345 | | | 59,353 | |
The Hackett Group, Inc. (a) | | | 6,650 | | | 33,848 | |
Heidrick & Struggles International, Inc. | | | 4,762 | | | 107,812 | |
Hudson Highland Group, Inc. (a) | | | 9,157 | | | 48,990 | |
Huron Consulting Group, Inc. (a) | | | 6,072 | | | 183,435 | |
ICF International, Inc. (a) | | | 5,134 | | | 130,301 | |
Insperity, Inc. | | | 6,051 | | | 179,170 | |
Kelly Services, Inc., Class A (a) | | | 7,238 | | | 119,427 | |
Kforce, Inc. (a) | | | 8,692 | | | 113,691 | |
Korn/Ferry International (a) | | | 12,736 | | | 280,065 | |
Liquidity Services, Inc. (a) | | | 4,900 | | | 115,689 | |
LoopNet, Inc. (a) | | | 4,640 | | | 85,283 | |
MAXIMUS, Inc. | | | 4,687 | | | 387,756 | |
Navigant Consulting, Inc. (a) | | | 13,979 | | | 146,640 | |
On Assignment, Inc. (a) | | | 10,354 | | | 101,780 | |
PRGX Global, Inc. (a) | | | 4,411 | | | 31,539 | |
RPX Corp. (a) | | | 2,414 | | | 67,664 | |
Resources Connection, Inc. | | | 12,664 | | | 152,475 | |
SFN Group, Inc. (a) | | | 13,862 | | | 126,006 | |
SYKES Enterprises, Inc. (a) | | | 11,327 | | | 243,870 | |
ServiceSource International, Inc. (a) | | | 2,544 | | | 56,528 | |
Stream Global Services, Inc. (a) | | | 1,055 | | | 3,481 | |
TeleTech Holdings, Inc. (a) | | | 6,939 | | | 146,274 | |
TrueBlue, Inc. (a) | | | 12,026 | | | 174,136 | |
| | | | | | 5,823,162 | |
Banks: Diversified — 5.6% | | | | | | | |
1st Source Corp. | | | 4,428 | | | 91,837 | |
1st United BanCorp., Inc. (a) | | | 8,113 | | | 50,463 | |
Alliance Financial Corp. | | | 1,443 | | | 44,055 | |
Ameris Bancorp (a) | | | 6,844 | | | 60,706 | |
Ames National Corp. | | | 2,617 | | | 47,525 | |
Arrow Financial Corp. | | | 2,863 | | | 70,058 | |
Bancfirst Corp. | | | 1,920 | | | 74,112 | |
Banco Latinoamericana De Comercio Exterior SA | | | 7,904 | | | 136,897 | |
The Bancorp, Inc. (a) | | | 8,448 | | | 88,282 | |
Bancorp Rhode Island, Inc. | | | 1,078 | | | 48,855 | |
BancorpSouth, Inc. | | | 21,319 | | | 264,569 | |
Bank of Kentucky Financial Corp. | | | 933 | | | 20,778 | |
| | | | | | | |
Common Stocks | | | Shares | | Value | |
Banks: Diversified (continued) | | | | | | | |
Bank of Marin Bancorp | | | 1,551 | | $ | 54,859 | |
Bank of the Ozarks, Inc. | | | 3,688 | | | 191,997 | |
Banner Corp. | | | 4,134 | | | 72,345 | |
Boston Private Financial Holdings, Inc. | | | 21,459 | | | 141,200 | |
Bridge Bancorp, Inc. | | | 1,910 | | | 40,645 | |
Bridge Capital Holdings (a) | | | 1,226 | | | 13,584 | |
Bryn Mawr Bank Corp. | | | 2,977 | | | 60,284 | |
CNB Financial Corp. | | | 3,897 | | | 54,129 | |
CVB Financial Corp. | | | 24,666 | | | 228,160 | |
Camden National Corp. | | | 2,247 | | | 73,724 | |
Cape Bancorp, Inc. (a) | | | 1,720 | | | 17,200 | |
Capital Bank Corp. (a) | | | 2,127 | | | 7,423 | |
Capital City Bank Group, Inc. | | | 3,749 | | | 38,465 | |
Cardinal Financial Corp. | | | 8,456 | | | 92,593 | |
Cascade Bancorp (a) | | | 1,008 | | | 10,181 | |
Cathay General Bancorp | | | 21,341 | | | 349,779 | |
Center Bancorp, Inc. | | | 1,527 | | | 15,942 | |
Center Financial Corp. (a) | | | 10,062 | | | 63,894 | |
Centerstate Banks, Inc. | | | 7,749 | | | 53,623 | |
Central Pacific Financial Corp. (a) | | | 3,557 | | | 49,798 | |
Century Bancorp, Inc., Class A | | | 260 | | | 6,880 | |
Chemical Financial Corp. | | | 6,857 | | | 128,637 | |
Citizens & Northern Corp. | | | 3,593 | | | 54,146 | |
City Holding Co. | | | 4,271 | | | 141,071 | |
CoBiz Financial, Inc. | | | 9,926 | | | 64,916 | |
Columbia Banking System, Inc. | | | 10,795 | | | 185,890 | |
Community Bank System, Inc. | | | 9,628 | | | 238,678 | |
Community Trust Bancorp, Inc. | | | 3,812 | | | 105,669 | |
Danvers Bancorp, Inc. (b) | | | 5,595 | | | 121,803 | |
Eagle Bancorp, Inc. (a) | | | 4,991 | | | 66,380 | |
Encore Bancshares, Inc. (a) | | | 1,383 | | | 16,624 | |
Enterprise Bancorp, Inc. | | | 765 | | | 11,529 | |
Enterprise Financial Services Corp. | | | 4,733 | | | 64,037 | |
F.N.B. Corp. | | | 33,626 | | | 348,029 | |
Financial Institutions, Inc. | | | 3,917 | | | 64,317 | |
First Bancorp, Inc. | | | 2,876 | | | 42,737 | |
First Bancorp, North Carolina | | | 4,541 | | | 46,500 | |
First Busey Corp. | | | 19,568 | | | 103,515 | |
First Commonwealth Financial Corp. | | | 28,697 | | | 164,721 | |
First Community Bancshares, Inc. | | | 4,629 | | | 64,806 | |
First Financial Bancorp | | | 16,032 | | | 267,574 | |
First Financial Bankshares, Inc. | | | 8,634 | | | 297,441 | |
First Financial Corp. | | | 3,154 | | | 103,262 | |
First Interstate Bancsystem, Inc. | | | 3,667 | | | 54,052 | |
First Merchants Corp. | | | 7,293 | | | 65,199 | |
First Midwest Bancorp, Inc. | | | 20,437 | | | 251,171 | |
The First of Long Island Corp. | | | 2,056 | | | 57,342 | |
FirstMerit Corp. | | | 29,543 | | | 487,755 | |
German American Bancorp, Inc. | | | 3,849 | | | 63,816 | |
Glacier Bancorp, Inc. | | | 19,581 | | | 263,952 | |
Hampton Roads Bankshares, Inc. (a) | | | 2,370 | | | 23,463 | |
Hancock Holding Co. | | | 13,890 | | | 430,312 | |
Heartland Financial USA, Inc. | | | 3,822 | | | 55,610 | |
Heritage Commerce Corp. (a) | | | 4,119 | | | 21,048 | |
Home Bancshares, Inc. | | | 6,200 | | | 146,568 | |
Hudson Valley Holding Corp. | | | 3,811 | | | 73,590 | |
IBERIABANK Corp. | | | 7,301 | | | 420,830 | |
Independent Bank Corp. | | | 5,961 | | | 156,476 | |
International Bancshares Corp. | | | 14,326 | | | 239,674 | |
Investors Bancorp, Inc. (a) | | | 12,864 | | | 182,669 | |
Lakeland Bancorp, Inc. | | | 6,471 | | | 64,581 | |
Lakeland Financial Corp. | | | 4,629 | | | 103,042 | |
MB Financial, Inc. | | | 14,727 | | | 283,347 | |
| | |
See Notes to Financial Statements. |
| | |
18 | BLACKROCK SMALL CAP INDEX FUND | JUNE 30, 2011 |
| |
| |
Schedule of Investments (continued) | Master Small Cap Index Series
(Percentages shown are based on Net Assets) |
| | | | | | | |
Common Stocks | | | Shares | | Value | |
Banks: Diversified (continued) | | | | | | | |
MainSource Financial Group, Inc. | | | 5,643 | | $ | 46,837 | |
Merchants Bancshares, Inc. | | | 1,496 | | | 36,607 | |
Meridian Interstate Bancorp, Inc. (a) | | | 3,162 | | | 43,288 | |
Metro Bancorp, Inc. (a) | | | 4,106 | | | 46,891 | |
Midsouth Bancorp, Inc. | | | 2,518 | | | 34,320 | |
NBT Bancorp, Inc. | | | 9,604 | | | 212,537 | |
Nara Bancorp, Inc. (a) | | | 10,967 | | | 89,162 | |
National Bankshares, Inc. | | | 2,049 | | | 51,307 | |
National Penn Bancshares, Inc. | | | 33,767 | | | 267,772 | |
Old National Bancorp | | | 25,845 | | | 279,126 | |
Oriental Financial Group | | | 12,461 | | | 160,622 | |
Orrstown Financial Service, Inc. | | | 2,049 | | | 53,909 | |
Pacific Capital Bancorp NA (a) | | | 855 | | | 27,180 | |
Pacific Continental Corp. | | | 5,680 | | | 51,972 | |
PacWest Bancorp | | | 8,328 | | | 171,307 | |
Park National Corp. | | | 3,445 | | | 226,888 | |
Park Sterling Corp. (a) | | | 5,922 | | | 29,373 | |
Penns Woods Bancorp, Inc. | | | 1,246 | | | 42,813 | |
Peoples Bancorp, Inc. | | | 3,241 | | | 36,526 | |
Pinnacle Financial Partners, Inc. (a) | | | 9,462 | | | 147,229 | |
PrivateBancorp, Inc. | | | 15,878 | | | 219,116 | |
Prosperity Bancshares, Inc. | | | 12,634 | | | 553,622 | |
Provident Financial Services, Inc. | | | 16,516 | | | 236,509 | |
Renasant Corp. | | | 7,072 | | | 102,473 | |
Republic Bancorp, Inc., Class A | | | 2,764 | | | 55,004 | |
Rockville Financial, Inc. | | | 7,000 | | | 69,300 | |
Roma Financial Corp. | | | 2,724 | | | 28,602 | |
S&T Bancorp, Inc. | | | 7,103 | | | 132,045 | |
SCBT Financial Corp. | | | 3,923 | | | 112,512 | |
SVB Financial Group (a) | | | 11,515 | | | 687,561 | |
SY Bancorp, Inc. | | | 3,458 | | | 80,398 | |
Sandy Spring Bancorp, Inc. | | | 6,837 | | | 122,998 | |
Seacoast Banking Corp. of Florida (a) | | | 15,334 | | | 23,001 | |
Sierra Bancorp | | | 3,790 | | | 42,903 | |
Signature Bank (a) | | | 11,183 | | | 639,668 | |
Simmons First National Corp., Class A | | | 4,786 | | | 122,809 | |
Southside Bancshares, Inc. | | | 4,825 | | | 95,776 | |
Southwest Bancorp, Inc. (a) | | | 5,646 | | | 55,274 | |
State Bancorp, Inc. | | | 4,485 | | | 59,830 | |
State Bank Financial Corp. (a) | | | 7,713 | | | 126,262 | |
StellarOne Corp. | | | 6,719 | | | 81,367 | |
Sterling Bancorp | | | 8,837 | | | 83,863 | |
Sterling Bancshares, Inc. | | | 26,822 | | | 218,867 | |
Sterling Financial Corp. (a) | | | 6,627 | | | 106,496 | |
Suffolk Bancorp | | | 2,844 | | | 39,702 | |
Sun Bancorp, Inc. (a) | | | 8,103 | | | 29,576 | |
Susquehanna Bancshares, Inc. | | | 35,287 | | | 282,296 | |
Taylor Capital Group, Inc. (a) | | | 3,636 | | | 29,670 | |
Texas Capital Bancshares, Inc. (a) | | | 10,186 | | | 263,104 | |
Tompkins Trustco, Inc. | | | 2,287 | | | 89,742 | |
Tower Bancorp, Inc. | | | 2,849 | | | 78,063 | |
Towne Bank (b) | | | 6,843 | | | 91,559 | |
Trico Bancshares | | | 4,283 | | | 62,532 | |
TrustCo Bank Corp. NY | | | 22,101 | | | 108,295 | |
Trustmark Corp. | | | 17,294 | | | 404,853 | |
UMB Financial Corp. | | | 8,622 | | | 361,089 | |
Umpqua Holdings Corp. | | | 31,077 | | | 359,561 | |
Union First Market Bankshares Corp. | | | 5,200 | | | 63,336 | |
United Bankshares, Inc. (b) | | | 10,792 | | | 264,188 | |
United Community Banks, Inc. (a) | | | 5,281 | | | 55,767 | |
| | | | | | | |
Common Stocks | | | Shares | | Value | |
Banks: Diversified (concluded) | | | | | | | |
Univest Corp. of Pennsylvania | | | 4,951 | | $ | 77,384 | |
Virginia Commerce Bancorp (a) | | | 6,627 | | | 39,166 | |
Washington Banking Co. | | | 4,451 | | | 58,842 | |
Washington Trust Bancorp, Inc. | | | 4,107 | | | 94,338 | |
Webster Financial Corp. | | | 19,407 | | | 407,935 | |
WesBanco, Inc. | | | 6,486 | | | 127,515 | |
West Bancorp., Inc. | | | 4,940 | | | 43,521 | |
West Coast Bancorp (a) | | | 5,344 | | | 89,565 | |
Westamerica Bancorp. | | | 7,810 | | | 384,642 | |
Western Alliance Bancorp (a) | | | 18,707 | | | 132,820 | |
Wilshire Bancorp, Inc. (a) | | | 14,593 | | | 42,903 | |
Wintrust Financial Corp. | | | 9,492 | | | 305,453 | |
| | | | | | 19,280,960 | |
Banks: Savings, Thrift & Mortgage Lending — 0.9% | | | | | | | |
Abington Bancorp, Inc. | | | 6,208 | | | 64,749 | |
Astoria Financial Corp. | | | 23,576 | | | 301,537 | |
Bank Mutual Corp. | | | 13,869 | | | 50,899 | |
BankFinancial Corp. | | | 6,267 | | | 53,081 | |
Beneficial Mutual Bancorp, Inc. (a) | | | 9,905 | | | 81,370 | |
Berkshire Hills Bancorp, Inc. | | | 4,767 | | | 106,733 | |
BofI Holding, Inc. (a) | | | 2,132 | | | 30,722 | |
Brookline Bancorp, Inc. | | | 9,760 | | | 90,475 | |
Charter Financial Corp. | | | 489 | | | 4,841 | |
Clifton Savings Bancorp, Inc. | | | 694 | | | 7,662 | |
Dime Community Bancshares, Inc. | | | 7,889 | | | 114,706 | |
Doral Financial Corp. (a) | | | 31,668 | | | 62,069 | |
ESB Financial Corp. | | | 3,459 | | | 44,690 | |
ESSA Bancorp, Inc. | | | 3,914 | | | 48,612 | |
First Defiance Financial Corp. (a) | | | 1,611 | | | 23,666 | |
First Financial Holdings, Inc. | | | 4,812 | | | 43,164 | |
First Pactrust Bancorp, Inc. | | | 1,584 | | | 23,538 | |
Flagstar BanCorp., Inc. (a) | | | 48,236 | | | 57,401 | |
Flushing Financial Corp. | | | 8,758 | | | 113,854 | |
Fox Chase BanCorp., Inc. | | | 3,035 | | | 41,124 | |
Franklin Financial Corp. (a) | | | 3,109 | | | 37,495 | |
Great Southern Bancorp, Inc. | | | 3,047 | | | 57,741 | |
Heritage Financial Corp. | | | 4,091 | | | 52,897 | |
Home Federal Bancorp, Inc. | | | 4,988 | | | 54,818 | |
Kearny Financial Corp. | | | 4,784 | | | 43,582 | |
Northfield Bancorp, Inc. | | | 5,193 | | | 73,014 | |
Northwest Bancshares, Inc. | | | 29,109 | | | 366,191 | |
OceanFirst Financial Corp. | | | 4,430 | | | 57,369 | |
Ocwen Financial Corp. (a) | | | 20,184 | | | 257,548 | |
OmniAmerican Bancorp, Inc. (a) | | | 3,649 | | | 54,626 | |
Oritani Financial Corp. | | | 15,699 | | | 200,790 | |
Provident New York Bancorp | | | 11,221 | | | 93,808 | |
Territorial BanCorp., Inc. | | | 3,645 | | | 75,524 | |
United Financial Bancorp, Inc. | | | 5,010 | | | 77,304 | |
ViewPoint Financial Group | | | 8,639 | | | 119,218 | |
WSFS Financial Corp. | | | 1,663 | | | 65,938 | |
Westfield Financial, Inc. | | | 8,729 | | | 70,879 | |
| | | | | | 3,123,635 | |
Beverage: Brewers & Distillers — 0.1% | | | | | | | |
Boston Beer Co., Inc., Class A (a) | | | 2,251 | | | 201,690 | |
Central European Distribution Corp. (a) | | | 19,131 | | | 214,267 | |
Craft Brewers Alliance, Inc. (a) | | | 1,996 | | | 17,185 | |
| | | | | | 433,142 | |
| | | |
See Notes to Financial Statements. |
| | | |
| BLACKROCK SMALL CAP INDEX FUND | JUNE 30, 2011 | 19 |
| |
| |
Schedule of Investments (continued) | Master Small Cap Index Series
(Percentages shown are based on Net Assets) |
| | | | | | | |
Common Stocks | | | Shares | | Value | |
Beverage: Soft Drinks — 0.2% | | | | | | | |
Coca-Cola Bottling Co. Consolidated | | | 1,190 | | $ | 80,515 | |
Farmer Bros. Co. | | | 2,067 | | | 20,959 | |
Heckmann Corp. (a) | | | 25,335 | | | 153,024 | |
National Beverage Corp. | | | 3,398 | | | 49,781 | |
Peet’s Coffee & Tea, Inc. (a) | | | 3,389 | | | 195,545 | |
Primo Water Corp. (a) | | | 2,961 | | | 42,609 | |
| | | | | | 542,433 | |
Biotechnology — 3.4% | | | | | | | |
AMAG Pharmaceuticals, Inc. (a) | | | 5,803 | | | 109,096 | |
AVEO Pharmaceuticals, Inc. (a) | | | 7,022 | | | 144,723 | |
AVI BioPharma, Inc. (a) | | | 39,313 | | | 56,218 | |
Accelrys, Inc. (a) | | | 15,273 | | | 108,591 | |
Acorda Therapeutics, Inc. (a) | | | 10,628 | | | 343,391 | |
Aegerion Pharmaceuticals, Inc. (a) | | | 1,849 | | | 29,122 | |
Affymax, Inc. (a) | | | 9,002 | | | 61,844 | |
Albany Molecular Research, Inc. (a) | | | 6,376 | | | 30,669 | |
Alimera Sciences, Inc. (a) | | | 2,430 | | | 19,804 | |
Allos Therapeutics, Inc. (a) | | | 21,828 | | | 46,712 | |
Alnylam Pharmaceuticals, Inc. (a) | | | 10,131 | | | 94,927 | |
Amicus Therapeutics, Inc. (a) | | | 3,373 | | | 20,036 | |
Anthera Pharmaceuticals, Inc. (a) | | | 4,257 | | | 34,780 | |
Arena Pharmaceuticals, Inc. (a) | | | 37,319 | | | 50,754 | |
Ariad Pharmaceuticals, Inc. (a) | | | 35,351 | | | 400,527 | |
Arqule, Inc. (a) | | | 14,622 | | | 91,387 | |
Array Biopharma, Inc. (a) | | | 16,290 | | | 36,490 | |
BG Medicine, Inc. (a) | | | 1,060 | | | 8,438 | |
BioMimetic Therapeutics, Inc. (a) | | | 5,718 | | | 29,276 | |
Biosante Pharmaceuticals, Inc. (a)(b) | | | 25,625 | | | 70,469 | |
Biotime, Inc. (a) | | | 6,846 | | | 35,120 | |
Cell Therapeutics, Inc. (a) | | | 43,752 | | | 68,909 | |
Celldex Therapeutics, Inc. (a) | | | 12,912 | | | 45,838 | |
Cepheid, Inc. (a) | | | 16,573 | | | 574,089 | |
Chelsea Therapeutics International, Inc. (a) | | | 13,894 | | | 70,859 | |
Codexis, Inc. (a) | | | 6,010 | | | 57,876 | |
Complete Genomics, Inc. (a) | | | 2,521 | | | 38,521 | |
Cornerstone Therapeutics, Inc. (a) | | | 1,104 | | | 9,892 | |
Cubist Pharmaceuticals, Inc. (a) | | | 16,090 | | | 579,079 | |
Curis, Inc. (a)(b) | | | 21,225 | | | 75,985 | |
Cytori Therapeutics, Inc. (a)(b) | | | 13,213 | | | 63,290 | |
Dyax Corp. (a) | | | 28,498 | | | 56,426 | |
Dynavax Technologies Corp. (a) | | | 31,052 | | | 85,393 | |
Emergent Biosolutions, Inc. (a) | | | 6,359 | | | 143,395 | |
Enzo Biochem, Inc. (a) | | | 10,078 | | | 42,831 | |
Enzon Pharmaceuticals, Inc. (a) | | | 11,465 | | | 115,223 | |
Exact Sciences Corp. (a) | | | 13,882 | | | 119,385 | |
Exelixis, Inc. (a) | | | 34,569 | | | 309,738 | |
Furiex Pharmaceuticals, Inc. (a) | | | 2,802 | | | 49,848 | |
GTx, Inc. (a) | | | 4,103 | | | 19,653 | |
Genomic Health, Inc. (a) | | | 4,445 | | | 124,060 | |
Geron Corp. (a) | | | 35,103 | | | 140,763 | |
Halozyme Therapeutics, Inc. (a) | | | 22,365 | | | 154,542 | |
Harvard Bioscience, Inc. (a) | | | 4,524 | | | 24,113 | |
Idenix Pharmaceuticals, Inc. (a) | | | 14,338 | | | 71,690 | |
ImmunoGen, Inc. (a) | | | 20,376 | | | 248,383 | |
Immunomedics, Inc. (a)(b) | | | 18,824 | | | 76,614 | |
Incyte Corp. (a) | | | 23,861 | | | 451,927 | |
Inhibitex, Inc. (a) | | | 17,195 | | | 67,404 | |
Insmed, Inc. (a) | | | 6,241 | | | 74,830 | |
InterMune, Inc. (a) | | | 13,182 | | | 472,575 | |
Kensey Nash Corp. (a) | | | 2,151 | | | 54,270 | |
| | | | | | | |
Common Stocks | | | Shares | | Value | |
Biotechnology (concluded) | | | | | | | |
Keryx Biopharmaceuticals, Inc. (a) | | | 18,216 | | $ | 86,162 | |
Lexicon Genetics, Inc. (a) | | | 48,686 | | | 85,687 | |
Ligand Pharmaceuticals, Inc. (a) | | | 5,493 | | | 65,641 | |
MannKind Corp. (a)(b) | | | 20,738 | | | 78,804 | |
Maxygen, Inc. | | | 8,508 | | | 46,539 | |
Medivation, Inc. (a) | | | 8,557 | | | 183,377 | |
Metabolix, Inc. (a) | | | 9,515 | | | 67,937 | |
Micromet, Inc. (a) | | | 25,063 | | | 143,862 | |
Momenta Pharmaceuticals, Inc. (a) | | | 12,361 | | | 240,545 | |
NPS Pharmaceuticals, Inc. (a) | | | 23,393 | | | 221,064 | |
Nabi Biopharmaceuticals (a) | | | 12,076 | | | 64,969 | |
Nektar Therapeutics (a) | | | 31,085 | | | 225,988 | |
Neurocrine Biosciences, Inc. (a) | | | 13,520 | | | 108,836 | |
Novavax, Inc. (a)(b) | | | 27,072 | | | 54,685 | |
Nymox Pharmaceutical Corp. (a) | | | 4,339 | | | 36,231 | |
OncoGenex Pharmaceutical, Inc. (a) | | | 2,335 | | | 39,765 | |
Oncothyreon, Inc. (a) | | | 10,931 | | | 100,456 | |
Onyx Pharmaceuticals, Inc. (a) | | | 17,059 | | | 602,183 | |
Opko Health, Inc. (a) | | | 28,642 | | | 105,689 | |
Orexigen Therapeutics, Inc. (a) | | | 9,144 | | | 14,539 | |
Osiris Therapeutics, Inc. (a) | | | 4,831 | | | 37,392 | |
PDL BioPharma, Inc. | | | 37,771 | | | 221,716 | |
Pacific Biosciences of California, Inc. (a) | | | 8,652 | | | 101,228 | |
Peregrine Pharmaceuticals, Inc. (a)(b) | | | 18,905 | | | 35,163 | |
PharmAthene, Inc. (a) | | | 8,935 | | | 26,269 | |
Progenics Pharmaceuticals, Inc. (a)(b) | | | 8,143 | | | 58,467 | |
RTI Biologics, Inc. (a) | | | 15,457 | | | 41,888 | |
Raptor Pharmaceutical Corp. (a) | | | 8,247 | | | 51,049 | |
Rigel Pharmaceuticals, Inc. (a) | | | 18,171 | | | 166,628 | |
Sangamo Biosciences, Inc. (a)(b) | | | 14,117 | | | 83,149 | |
Savient Pharmaceuticals, Inc. (a)(b) | | | 19,297 | | | 144,535 | |
Seattle Genetics, Inc. (a) | | | 25,937 | | | 532,227 | |
Sequenom, Inc. (a) | | | 26,914 | | | 203,201 | |
Sucampo Pharmaceuticals, Inc., Class A (a) | | | 1,820 | | | 7,462 | |
Sunesis Pharmaceuticals, Inc. (a) | | | 6,815 | | | 14,243 | |
Synta Pharmaceuticals Corp. (a) | | | 5,270 | | | 26,508 | |
Targacept, Inc. (a) | | | 7,465 | | | 157,288 | |
Theravance, Inc. (a) | | | 18,474 | | | 410,308 | |
Transcept Pharmaceuticals, Inc. (a) | | | 1,061 | | | 11,618 | |
Trius Therapeutics, Inc. (a) | | | 1,279 | | | 10,130 | |
Vanda Pharmaceuticals, Inc. (a) | | | 7,715 | | | 55,085 | |
ViroPharma, Inc. (a) | | | 20,464 | | | 378,584 | |
ZIOPHARM Oncology, Inc. (a)(b) | | | 16,244 | | | 99,413 | |
Zalicus, Inc. (a)(b) | | | 20,887 | | | 49,711 | |
| | | | | | 11,805,996 | |
Building Materials — 0.8% | | | | | | | |
Acuity Brands, Inc. | | | 11,641 | | | 649,335 | |
Ameron International Corp. | | | 2,472 | | | 162,361 | |
Builders FirstSource, Inc. (a) | | | 13,105 | | | 28,176 | |
Gibraltar Industries, Inc. (a) | | | 8,426 | | | 95,382 | |
Griffon Corp. (a) | | | 12,864 | | | 129,669 | |
Headwaters, Inc. (a) | | | 16,571 | | | 51,867 | |
LSI Industries, Inc. | | | 5,576 | | | 44,274 | |
Louisiana-Pacific Corp. (a) | | | 35,138 | | | 286,023 | |
NCI Building Systems, Inc. (a) | | | 5,541 | | | 63,112 | |
Quanex Building Products Corp. | | | 10,306 | | | 168,915 | |
Simpson Manufacturing Co., Inc. | | | 10,964 | | | 327,495 | |
Texas Industries, Inc. | | | 6,040 | | | 251,445 | |
Trex Co., Inc. (a) | | | 4,266 | | | 104,432 | |
Watsco, Inc. | | | 7,550 | | | 513,325 | |
| | | | | | 2,875,811 | |
| | |
See Notes to Financial Statements. |
| | |
20 | BLACKROCK SMALL CAP INDEX FUND | JUNE 30, 2011 |
| |
| |
Schedule of Investments (continued) | Master Small Cap Index Series
(Percentages shown are based on Net Assets) |
| | | | | | | |
Common Stocks | | | Shares | | Value | |
Building: Climate Control — 0.1% | | | | | | | |
Aaon, Inc. | | | 5,236 | | $ | 114,343 | |
Comfort Systems USA, Inc. | | | 10,442 | | | 110,790 | |
Interline Brands, Inc. (a) | | | 9,043 | | | 166,120 | |
| | | | | | 391,253 | |
Building: Roofing, Wallboard & Plumbing — 0.2% | | | | | | | |
Beacon Roofing Supply, Inc. (a) | | | 12,373 | | | 282,352 | |
USG Corp. (a) | | | 18,904 | | | 271,083 | |
| | | | | | 553,435 | |
Cable Television Services — 0.0% | | | | | | | |
Knology, Inc. (a) | | | 8,422 | | | 125,067 | |
Casinos & Gambling — 0.3% | | | | | | | |
Ameristar Casinos, Inc. | | | 8,401 | | | 199,188 | |
Boyd Gaming Corp. (a) | | | 14,686 | | | 127,768 | |
Isle of Capri Casinos, Inc. (a) | | | 5,689 | | | 50,348 | |
Monarch Casino & Resort, Inc. (a) | | | 2,544 | | | 26,559 | |
Multimedia Games Holdings Co., Inc. (a) | | | 8,136 | | | 37,019 | |
Pinnacle Entertainment, Inc. (a) | | | 16,709 | | | 248,964 | |
Scientific Games Corp., Class A (a) | | | 16,014 | | | 165,585 | |
Shuffle Master, Inc. (a) | | | 14,795 | | | 138,407 | |
| | | | | | 993,838 | |
Cement — 0.1% | | | | | | | |
Eagle Materials, Inc. | | | 11,524 | | | 321,174 | |
Chemicals: Diversified — 1.0% | | | | | | | |
Aceto Corp. | | | 7,511 | | | 50,399 | |
American Vanguard Corp. | | | 5,721 | | | 74,201 | |
Arch Chemicals, Inc. | | | 6,107 | | | 210,325 | |
Chemtura Corp. (a) | | | 25,516 | | | 464,391 | |
Georgia Gulf Corp. (a) | | | 9,146 | | | 220,784 | |
Hawkins, Inc. | | | 2,391 | | | 86,602 | |
Innophos Holdings, Inc. | | | 5,852 | | | 285,578 | |
KMG Chemicals, Inc. | | | 1,885 | | | 31,743 | |
LSB Industries, Inc. (a) | | | 4,917 | | | 211,038 | |
Landec Corp. (a) | | | 7,596 | | | 50,134 | |
OM Group, Inc. (a) | | | 8,321 | | | 338,166 | |
Olin Corp. | | | 21,400 | | | 484,924 | |
Omnova Solutions, Inc. (a) | | | 12,243 | | | 85,211 | |
PolyOne Corp. | | | 25,165 | | | 389,303 | |
Sensient Technologies Corp. | | | 13,444 | | | 498,369 | |
TPC Group, Inc. (a) | | | 3,441 | | | 134,956 | |
| | | | | | 3,616,124 | |
Chemicals: Specialty — 0.6% | | | | | | | |
Balchem Corp. | | | 7,783 | | | 340,740 | |
Calgon Carbon Corp. (a) | | | 15,316 | | | 260,372 | |
FutureFuel Corp. | | | 5,010 | | | 60,671 | |
Innospec, Inc. (a) | | | 6,226 | | | 209,256 | |
Kraton Performance Polymers, Inc. (a) | | | 8,482 | | | 332,240 | |
NewMarket Corp. | | | 2,430 | | | 414,825 | |
Quaker Chemical Corp. | | | 3,457 | | | 148,685 | |
Senomyx, Inc. (a) | | | 11,358 | | | 58,380 | |
Stepan Co. | | | 2,149 | | | 152,364 | |
Zep, Inc. | | | 6,104 | | | 115,366 | |
| | | | | | 2,092,899 | |
Coal — 0.3% | | | | | | | |
Cloud Peak Energy, Inc. (a) | | | 16,146 | | | 343,910 | |
Hallador Energy Co. | | | 372 | | | 3,567 | |
James River Coal Co. (a) | | | 9,624 | | | 200,372 | |
| | | | | | | |
Common Stocks | | | Shares | | Value | |
Coal (concluded) | | | | | | | |
L&L Energy, Inc. (a)(b) | | | 5,371 | | $ | 27,553 | |
Patriot Coal Corp. (a) | | | 24,478 | | | 544,880 | |
Westmoreland Coal Co. (a) | | | 2,280 | | | 40,470 | |
| | | | | | 1,160,752 | |
Commercial Finance & Mortgage
Companies — 0.1% | | | | | | | |
Federal Agricultural Mortgage Corp., Class B | | | 2,693 | | | 59,569 | |
Medallion Financial Corp. | | | 4,808 | | | 46,878 | |
NewStar Financial, Inc. (a) | | | 7,694 | | | 82,172 | |
Walker & Dunlop, Inc. (a) | | | 2,399 | | | 31,907 | |
| | | | | | 220,526 | �� |
Commercial Services: Rental & Leasing — 0.6% | | | | | | | |
Aircastle Ltd. | | | 15,095 | | | 192,008 | |
CAI International, Inc. (a) | | | 3,241 | | | 66,959 | |
Electro Rent Corp. | | | 4,726 | | | 80,909 | |
Essex Rental Corp. (a) | | | 3,056 | | | 20,139 | |
H&E Equipment Services, Inc. (a) | | | 7,856 | | | 109,905 | |
Marlin Business Services, Inc. (a) | | | 2,680 | | | 33,902 | |
McGrath RentCorp | | | 6,545 | | | 183,784 | |
Mobile Mini, Inc. (a) | | | 10,105 | | | 214,125 | |
PHH Corp. (a) | | | 15,098 | | | 309,811 | |
RSC Holdings, Inc. (a) | | | 17,954 | | | 214,730 | |
SeaCube Container Leasing Ltd. | | | 3,035 | | | 52,141 | |
TAL International Group, Inc. | | | 5,284 | | | 182,457 | |
United Rentals, Inc. (a) | | | 16,720 | | | 424,688 | |
| | | | | | 2,085,558 | |
Commercial Vehicles & Parts — 0.3% | | | | | | | |
Accuride Corp. (a) | | | 10,453 | | | 132,021 | |
Commercial Vehicle Group, Inc. (a) | | | 7,593 | | | 107,745 | |
Force Protection, Inc. (a) | | | 19,298 | | | 95,815 | |
Miller Industries, Inc. | | | 2,893 | | | 54,070 | |
Modine Manufacturing Co. (a) | | | 12,653 | | | 194,477 | |
Rush Enterprises, Inc., Class A (a) | | | 8,812 | | | 167,692 | |
Spartan Motors, Inc. | | | 9,496 | | | 51,278 | |
Wabash National Corp. (a) | | | 18,606 | | | 174,338 | |
| | | | | | 977,436 | |
Communications Technology — 2.5% | | | | | | | |
AboveNet, Inc. | | | 6,259 | | | 441,009 | |
Adtran, Inc. | | | 17,288 | | | 669,218 | |
Anaren, Inc. (a) | | | 4,253 | | | 90,376 | |
Anixter International, Inc. | | | 7,726 | | | 504,817 | |
Aruba Networks, Inc. (a) | | | 22,962 | | | 678,527 | |
Aviat Networks, Inc. (a) | | | 16,926 | | | 66,688 | |
Bel Fuse, Inc. | | | 2,946 | | | 63,899 | |
BigBand Networks, Inc. (a) | | | 13,823 | | | 29,996 | |
Black Box Corp. | | | 4,780 | | | 149,471 | |
Calix, Inc. (a) | | | 9,908 | | | 206,285 | |
Comtech Telecommunications Corp. | | | 7,218 | | | 202,393 | |
Dialogic, Inc. (a) | | | 3,009 | | | 13,540 | |
Digi International, Inc. (a) | | | 7,032 | | | 91,416 | |
DigitalGlobe, Inc. (a) | | | 9,285 | | | 235,932 | |
EMS Technologies, Inc. (a) | | | 4,182 | | | 137,881 | |
Echelon Corp. (a) | | | 9,348 | | | 84,973 | |
Emulex Corp. (a) | | | 23,752 | | | 204,267 | |
Extreme Networks, Inc. (a) | | | 25,983 | | | 84,185 | |
Finisar Corp. (a) | | | 24,130 | | | 435,064 | |
GSI Technology, Inc. (a) | | | 5,695 | | | 41,004 | |
GeoEye, Inc. (a) | | | 6,048 | | | 226,195 | |
Globecomm Systems, Inc. (a) | | | 6,049 | | | 94,122 | |
Harmonic, Inc. (a) | | | 31,341 | | | 226,595 | |
| | | |
See Notes to Financial Statements. |
| | | |
| BLACKROCK SMALL CAP INDEX FUND | JUNE 30, 2011 | 21 |
| |
| |
Schedule of Investments (continued) | Master Small Cap Index Series
(Percentages shown are based on Net Assets) |
| | | | | | | |
Common Stocks | | | Shares | | Value | |
Communications Technology (concluded) | | | | | | | |
Infinera Corp. (a) | | | 27,610 | | $ | 190,785 | |
InterDigital, Inc. | | | 12,156 | | | 496,573 | |
Ixia (a) | | | 10,177 | | | 130,266 | |
KVH Industries, Inc. (a) | | | 4,202 | | | 44,667 | |
Loral Space & Communications Ltd. (a) | | | 2,966 | | | 206,048 | |
Meru Networks, Inc. (a) | | | 2,602 | | | 31,250 | |
NETGEAR, Inc. (a) | | | 9,771 | | | 427,188 | |
NeoPhotonics Corp. (a) | | | 1,882 | | | 13,023 | |
Novatel Wireless, Inc. (a) | | | 9,082 | | | 49,769 | |
Numerex Corp. (a) | | | 1,631 | | | 15,870 | |
Oclaro, Inc. (a) | | | 13,558 | | | 91,110 | |
Oplink Communications, Inc. (a) | | | 5,598 | | | 104,291 | |
Plantronics, Inc. | | | 12,934 | | | 472,479 | |
Procera Networks, Inc. (a) | | | 2,900 | | | 31,117 | |
SeaChange International, Inc. (a) | | | 7,519 | | | 81,055 | |
Shoretel, Inc. (a) | | | 12,552 | | | 128,030 | |
Sonus Networks, Inc. (a) | | | 57,223 | | | 185,403 | |
Sycamore Networks, Inc. | | | 5,416 | | | 120,452 | |
Tekelec (a) | | | 16,747 | | | 152,900 | |
TeleNav, Inc. (a) | | | 4,219 | | | 74,803 | |
Viasat, Inc. (a)(b) | | | 9,674 | | | 418,594 | |
Westell Technologies, Inc., Class A (a) | | | 12,712 | | | 45,382 | |
| | | | | | 8,488,908 | |
Computer Services Software & Systems — 6.5% | | | | | | | |
ACI Worldwide, Inc. (a)(c) | | | 9,084 | | | 306,767 | |
The Active Network, Inc. (a) | | | 3,078 | | | 54,173 | |
Actuate Corp. (a) | | | 10,545 | | | 61,688 | |
Acxiom Corp. (a) | | | 21,406 | | | 280,633 | |
American Reprographics Co. (a) | | | 10,530 | | | 74,447 | |
American Software, Class A | | | 6,755 | | | 56,134 | |
Aspen Technology, Inc. (a) | | | 22,582 | | | 387,959 | |
Avid Technology, Inc. (a) | | | 8,040 | | | 151,474 | |
Blackbaud, Inc. | | | 12,068 | | | 334,525 | |
Blackboard, Inc. (a) | | | 9,444 | | | 409,775 | |
Blue Coat Systems, Inc. (a) | | | 11,599 | | | 253,554 | |
Bottomline Technologies, Inc. (a) | | | 9,188 | | | 227,035 | |
BroadSoft, Inc. (a) | | | 6,042 | | | 230,381 | |
CACI International, Inc., Class A (a) | | | 8,102 | | | 511,074 | |
CSG Systems International, Inc. (a) | | | 9,366 | | | 173,084 | |
Callidus Software, Inc. (a) | | | 7,445 | | | 43,553 | |
Ciber, Inc. (a) | | | 17,831 | | | 98,962 | |
CommVault Systems, Inc. (a) | | | 11,879 | | | 528,022 | |
Computer Task Group, Inc. (a) | | | 4,331 | | | 57,039 | |
ComScore, Inc. (a) | | | 8,451 | | | 218,881 | |
Concur Technologies, Inc. (a) | | | 11,967 | | | 599,188 | |
Convio, Inc. (a) | | | 2,759 | | | 29,825 | |
Cornerstone OnDemand, Inc. (a) | | | 2,798 | | | 49,385 | |
DealerTrack Holdings, Inc. (a) | | | 11,127 | | | 255,365 | |
Deltek, Inc. (a) | | | 6,038 | | | 45,225 | |
Demand Media, Inc. (a) | | | 1,921 | | | 26,030 | |
DemandTec, Inc. (a) | | | 8,347 | | | 75,958 | |
Digimarc Corp. (a) | | | 1,858 | | | 65,086 | |
Digital River, Inc. (a) | | | 10,708 | | | 344,369 | |
DynaVox, Inc., Class A (a) | | | 2,910 | | | 22,116 | |
EPIQ Systems, Inc. | | | 8,801 | | | 125,150 | |
EarthLink, Inc. | | | 30,033 | | | 231,104 | |
Ebix, Inc. (a) | | | 8,266 | | | 157,467 | |
Envestnet, Inc. (a) | | | 4,672 | | | 69,379 | |
ePlus, Inc. (a) | | | 660 | | | 17,450 | |
FalconStor Software, Inc. (a) | | | 6,684 | | | 29,944 | |
| | | | | | | |
Common Stocks | | | Shares | | Value | |
Computer Services Software & Systems
(continued) | | | | | | | |
FriendFinder Networks, Inc. (a) | | | 1,161 | | $ | 4,714 | |
Guidance Software, Inc. (a) | | | 2,655 | | | 21,638 | |
Hypercom Corp. (a) | | | 14,639 | | | 143,901 | |
ICG Group, Inc. (a) | | | 10,220 | | | 124,991 | |
iGate Corp. | | | 8,116 | | | 132,453 | |
Infospace, Inc. (a) | | | 10,197 | | | 92,997 | |
Integral Systems, Inc. (a) | | | 4,592 | | | 55,885 | |
Interactive Intelligence, Inc. (a) | | | 3,939 | | | 138,062 | |
interCLICK, Inc. (a) | | | 5,007 | | | 39,856 | |
Internap Network Services Corp. (a) | | | 14,587 | | | 107,214 | |
IntraLinks Holdings, Inc. (a) | | | 8,519 | | | 147,208 | |
JDA Software Group, Inc. (a) | | | 11,466 | | | 354,185 | |
KIT Digital, Inc. (a) | | | 9,417 | | | 112,439 | |
Kenexa Corp. (a) | | | 7,213 | | | 172,968 | |
Keynote Systems, Inc. | | | 3,996 | | | 86,433 | |
The Keyw Holding Corp. (a) | | | 4,269 | | | 52,893 | |
Lawson Software, Inc. (a) | | | 43,875 | | | 492,277 | |
Limelight Networks, Inc. (a) | | | 17,863 | | | 81,455 | |
Lionbridge Technologies, Inc. (a) | | | 17,116 | | | 54,429 | |
LivePerson, Inc. (a) | | | 14,035 | | | 198,455 | |
LogMeIn, Inc. (a) | | | 5,461 | | | 210,631 | |
Magma Design Automation, Inc. (a) | | | 18,292 | | | 146,153 | |
Manhattan Associates, Inc. (a) | | | 5,958 | | | 205,194 | |
Mantech International Corp., Class A | | | 6,157 | | | 273,494 | |
Mediamind Technologies, Inc. (a) | | | 1,984 | | | 43,529 | |
Mentor Graphics Corp. (a) | | | 26,093 | | | 334,251 | |
Mercury Computer Systems, Inc. (a) | | | 8,174 | | | 152,690 | |
MicroStrategy, Inc., Class A (a) | | | 2,163 | | | 351,877 | |
Moduslink Global Solutions, Inc. | | | 12,361 | | | 55,377 | |
Monotype Imaging Holdings, Inc. (a) | | | 9,334 | | | 131,889 | |
Motricity, Inc. (a) | | | 9,654 | | | 74,625 | |
NCI, Inc., Class A (a) | | | 1,954 | | | 44,395 | |
NIC, Inc. | | | 16,893 | | | 227,380 | |
Ness Technologies, Inc. (a) | | | 8,137 | | | 61,597 | |
NetScout Systems, Inc. (a) | | | 9,921 | | | 207,250 | |
NetSuite, Inc. (a) | | | 7,286 | | | 285,611 | |
OpenTable, Inc. (a) | | | 6,329 | | | 526,066 | |
Openwave Systems, Inc. (a) | | | 23,444 | | | 53,687 | |
Opnet Technologies, Inc. | | | 3,845 | | | 157,414 | |
PDF Solutions, Inc. (a) | | | 6,633 | | | 39,533 | |
PROS Holdings, Inc. (a) | | | 5,716 | | | 99,973 | |
Parametric Technology Corp. (a) | | | 32,068 | | | 735,319 | |
Pegasystems, Inc. | | | 4,542 | | | 211,430 | |
Perficient, Inc. (a) | | | 6,418 | | | 65,849 | |
Progress Software Corp. (a) | | | 18,081 | | | 436,295 | |
QAD, Inc. (a) | | | 1,104 | | | 11,283 | |
QLIK Technologies, Inc. (a) | | | 18,810 | | | 640,669 | |
Quepasa Corp. (a) | | | 1,781 | | | 12,912 | |
Quest Software, Inc. (a) | | | 16,381 | | | 372,340 | |
Radiant Systems, Inc. (a) | | | 10,668 | | | 222,961 | |
RealNetworks, Inc. (a) | | | 23,280 | | | 79,152 | |
RealPage, Inc. (a) | | | 8,033 | | | 212,633 | |
Responsys, Inc. (a) | | | 2,322 | | | 41,169 | |
RightNow Technologies, Inc. (a) | | | 6,619 | | | 214,456 | |
SAVVIS, Inc. (a) | | | 12,106 | | | 478,550 | |
SPS Commerce, Inc. (a) | | | 1,878 | | | 33,410 | |
SRA International, Inc., Class A (a) | | | 12,156 | | | 375,863 | |
SS&C Technologies Holdings, Inc. (a) | | | 6,404 | | | 127,247 | |
SYNNEX Corp. (a) | | | 6,560 | | | 207,952 | |
Saba Software, Inc. (a) | | | 8,157 | | | 73,658 | |
Sapient Corp. (a) | | | 29,182 | | | 438,605 | |
SciQuest, Inc. (a) | | | 3,002 | | | 51,304 | |
| | |
See Notes to Financial Statements. |
| | |
22 | BLACKROCK SMALL CAP INDEX FUND | JUNE 30, 2011 |
| |
| |
Schedule of Investments (continued) | Master Small Cap Index Series
(Percentages shown are based on Net Assets) |
| | | | | | | |
Common Stocks | | | Shares | | Value | |
Computer Services Software & Systems
(concluded) | | | | | | | |
Smith Micro Software, Inc. (a) | | | 9,525 | | $ | 40,100 | |
SolarWinds, Inc. (a) | | | 15,214 | | | 397,694 | |
Sourcefire, Inc. (a) | | | 7,715 | | | 229,290 | |
SuccessFactors, Inc. (a) | | | 21,210 | | | 623,574 | |
Support.com, Inc. (a) | | | 13,789 | | | 66,187 | |
Synchronoss Technologies, Inc. (a) | | | 7,087 | | | 224,870 | |
Syntel, Inc. | | | 4,083 | | | 241,387 | |
TNS, Inc. (a) | | | 7,016 | | | 116,466 | |
Taleo Corp., Class A (a) | | | 11,049 | | | 409,144 | |
TechTarget, Inc. (a) | | | 2,835 | | | 21,461 | |
TeleCommunication Systems, Inc., Class A (a) | | | 12,857 | | | 62,099 | |
Tyler Technologies, Inc. (a) | | | 8,516 | | | 228,058 | |
Ultimate Software Group, Inc. (a) | | | 7,018 | | | 381,990 | |
Unisys Corp. (a) | | | 11,600 | | | 298,120 | |
United Online, Inc. | | | 24,122 | | | 145,456 | |
VASCO Data Security International, Inc. (a) | | | 7,459 | | | 92,865 | |
Verint Systems, Inc. (a) | | | 5,569 | | | 206,276 | |
VirnetX Holding Corp. (a)(b) | | | 10,953 | | | 316,980 | |
Virtusa Corp. (a) | | | 4,009 | | | 75,971 | |
Wave Systems Corp., Class A (b) | | | 23,163 | | | 65,320 | |
Web.Com Group, Inc. (a) | | | 7,543 | | | 92,930 | |
Websense, Inc. (a) | | | 10,820 | | | 280,995 | |
Zix Corp. (a) | | | 17,863 | | | 68,594 | |
| | | | | | 22,628,154 | |
Computer Technology — 0.6% | | | | | | | |
Cray, Inc. (a) | | | 10,372 | | | 66,381 | |
Dot Hill Systems Corp. (a) | | | 12,720 | | | 36,125 | |
Dynamics Research Corp. (a) | | | 1,735 | | | 23,665 | |
Identive Group, Inc. (a) | | | 9,543 | | | 22,140 | |
Imation Corp. (a) | | | 8,404 | | | 79,334 | |
Immersion Corp. (a) | | | 8,029 | | | 68,487 | |
Insight Enterprises, Inc. (a) | | | 12,616 | | | 223,429 | |
Intermec, Inc. (a) | | | 15,344 | | | 169,398 | |
OCZ Technology Group, Inc. (a) | | | 13,659 | | | 109,272 | |
PC Connection, Inc. (a) | | | 1,482 | | | 12,271 | |
Quantum Corp. (a) | | | 61,073 | | | 201,541 | |
Radisys Corp. (a) | | | 5,982 | | | 43,609 | |
Rimage Corp. | | | 2,682 | | | 36,019 | |
STEC, Inc. (a) | | | 11,125 | | | 189,236 | |
Safeguard Scientifics, Inc. (a) | | | 5,697 | | | 107,559 | |
Silicon Graphics International Corp. (a) | | | 8,429 | | | 144,979 | |
Stratasys, Inc. (a) | | | 5,682 | | | 191,484 | |
Super Micro Computer, Inc. (a) | | | 7,325 | | | 117,859 | |
Synaptics, Inc. (a) | | | 9,253 | | | 238,172 | |
Xyratex Ltd. (a) | | | 8,270 | | | 84,850 | |
| | | | | | 2,165,810 | |
Construction — 0.4% | | | | | | | |
EMCOR Group, Inc. (a) | | | 17,967 | | | 526,613 | |
Granite Construction, Inc. | | | 10,133 | | | 248,563 | |
Great Lakes Dredge & Dock Corp. | | | 16,029 | | | 89,442 | |
Insituform Technologies, Inc., Class A (a) | | | 10,662 | | | 223,582 | |
Orion Marine Group, Inc. (a) | | | 7,403 | | | 69,662 | |
Primoris Services Corp. | | | 6,851 | | | 88,378 | |
Sterling Construction Co., Inc. (a) | | | 4,620 | | | 63,617 | |
Tutor Perini Corp. | | | 8,123 | | | 155,799 | |
| | | | | | 1,465,656 | |
| | | | | | | |
Common Stocks | | | Shares | | Value | |
Consumer Electronics — 0.3% | | | | | | | |
Audiovox Corp., Class A (a) | | | 5,250 | | $ | 39,690 | |
RealD, Inc. (a) | | | 10,391 | | | 243,045 | |
TiVo, Inc. (a) | | | 32,258 | | | 331,935 | |
Universal Electronics, Inc. (a) | | | 3,832 | | | 96,796 | |
XO Group, Inc. (a) | | | 8,405 | | | 83,630 | |
Zagg, Inc. (a) | | | 5,330 | | | 71,422 | |
| | | | | | 866,518 | |
Consumer Lending — 1.0% | | | | | | | |
Advance America, Cash Advance Centers, Inc. | | | 15,111 | | | 104,115 | |
Cash America International, Inc. | | | 7,922 | | | 458,446 | |
Credit Acceptance Corp. (a) | | | 1,757 | | | 148,414 | |
Dollar Financial Corp. (a) | | | 11,847 | | | 256,488 | |
Encore Capital Group, Inc. (a) | | | 4,273 | | | 131,267 | |
Ezcorp, Inc. (a) | | | 12,695 | | | 451,625 | |
First Cash Financial Services, Inc. (a) | | | 8,457 | | | 355,109 | |
The First Marblehead Corp. (a) | | | 16,614 | | | 29,407 | |
Imperial Holdings, Inc. (a) | | | 4,178 | | | 42,448 | |
MGIC Investment Corp. (a) | | | 50,699 | | | 301,659 | |
MoneyGram International, Inc. (a) | | | 23,057 | | | 76,549 | |
Nelnet, Inc., Class A | | | 6,998 | | | 154,376 | |
Netspend Holdings, Inc. (a) | | | 8,273 | | | 82,730 | |
Nicholas Financial, Inc. (a) | | | 1,952 | | | 23,190 | |
Portfolio Recovery Associates, Inc. (a) | | | 4,617 | | | 391,475 | |
World Acceptance Corp. (a) | | | 4,292 | | | 281,426 | |
| | | | | | 3,288,724 | |
Consumer Services: Miscellaneous — 0.6% | | | | | | | |
Ancestry.com, Inc. (a) | | | 8,480 | | | 350,987 | |
Coinstar, Inc. (a)(b) | | | 8,430 | | | 459,772 | |
Core-Mark Holdings Co., Inc. (a) | | | 3,079 | | | 109,921 | |
Move, Inc. (a) | | | 43,920 | | | 96,185 | |
NutriSystem, Inc. | | | 7,334 | | | 103,116 | |
Pre-Paid Legal Services, Inc. (a) | | | 2,021 | | | 134,376 | |
Sotheby’s Holdings, Inc., Class A | | | 18,157 | | | 789,830 | |
Steiner Leisure Ltd. (a) | | | 4,090 | | | 186,831 | |
| | | | | | 2,231,018 | |
Containers & Packaging — 0.2% | | | | | | | |
AEP Industries, Inc. (a) | | | 1,326 | | | 38,706 | |
Graham Packaging Co., Inc. (a) | | | 6,456 | | | 162,820 | |
Graphic Packaging Holding Co. (a) | | | 41,985 | | | 228,399 | |
Myers Industries, Inc. | | | 8,907 | | | 91,564 | |
| | | | | | 521,489 | |
Copper — 0.0% | | | | | | | |
Revett Minerals, Inc. (a) | | | 5,138 | | | 23,172 | |
Cosmetics — 0.1% | | | | | | | |
Elizabeth Arden, Inc. (a) | | | 6,658 | | | 193,282 | |
Inter Parfums, Inc. | | | 4,083 | | | 94,031 | |
Revlon, Inc., Class A (a) | | | 3,144 | | | 52,819 | |
| | | | | | 340,132 | |
Diversified Financial Services — 0.4% | | | | | | | |
Duff & Phelps Corp. | | | 7,861 | | | 100,857 | |
Edelman Financial Group, Inc. | | | 5,939 | | | 46,859 | |
Evercore Partners, Inc., Class A | | | 5,164 | | | 172,065 | |
FBR Capital Markets Corp. (a) | | | 14,783 | | | 50,262 | |
Gleacher & Co, Inc. (a) | | | 22,034 | | | 44,949 | |
Intersections, Inc. | | | 2,185 | | | 39,767 | |
Main Street Capital Corp. | | | 5,360 | | | 101,572 | |
| | | |
See Notes to Financial Statements. |
| | | |
| BLACKROCK SMALL CAP INDEX FUND | JUNE 30, 2011 | 23 |
| |
| |
Schedule of Investments (continued) | Master Small Cap Index Series
(Percentages shown are based on Net Assets) |
| | | | | | | |
Common Stocks | | | Shares | | Value | |
Diversified Financial Services (concluded) | | | | | | | |
Piper Jaffray Cos. (a) | | | 4,267 | | $ | 122,932 | |
Stifel Financial Corp. (a) | | | 14,369 | | | 515,272 | |
Triangle Capital Corp. | | | 5,331 | | | 98,410 | |
| | | | | | 1,292,945 | |
Diversified Manufacturing Operations — 0.4% | | | | | | | |
A.M. Castle & Co. (a) | | | 4,604 | | | 76,473 | |
Barnes Group, Inc. | | | 14,377 | | | 356,693 | |
Federal Signal Corp. | | | 17,281 | | | 113,363 | |
Lydall, Inc. (a) | | | 4,920 | | | 58,843 | |
OSI Systems, Inc. (a) | | | 4,992 | | | 214,656 | |
Raven Industries, Inc. | | | 4,777 | | | 266,127 | |
Standex International Corp. | | | 3,346 | | | 102,622 | |
Trimas Corp. (a) | | | 6,699 | | | 165,800 | |
| | | | | | 1,354,577 | |
Diversified Materials & Processing — 0.7% | | | | | | | |
Belden, Inc. | | | 12,742 | | | 444,186 | |
Cabot Microelectronics Corp. (a) | | | 6,325 | | | 293,923 | |
Clarcor, Inc. | | | 13,522 | | | 639,320 | |
Encore Wire Corp. | | | 5,028 | | | 121,778 | |
Harbinger Group, Inc. (a) | | | 1,447 | | | 8,841 | |
Hexcel Corp. (a) | | | 26,342 | | | 576,626 | |
Insteel Industries, Inc. | | | 4,829 | | | 60,556 | |
Koppers Holdings, Inc. | | | 5,586 | | | 211,877 | |
NL Industries, Inc. | | | 1,320 | | | 24,235 | |
Tredegar Corp. | | | 6,573 | | | 120,615 | |
Uranium Energy Corp. (a)(b) | | | 18,856 | | | 57,699 | |
| | | | | | 2,559,656 | |
Diversified Media — 0.1% | | | | | | | |
Belo Corp., Class A (a) | | | 25,223 | | | 189,929 | |
EW Scripps Co. (a) | | | 9,334 | | | 90,260 | |
| | | | | | 280,189 | |
Diversified Retail — 0.5% | | | | | | | |
99 Cents Only Stores (a) | | | 12,579 | | | 254,599 | |
The Bon-Ton Stores, Inc. | | | 3,419 | | | 33,233 | |
Fred’s, Inc. | | | 10,687 | | | 154,213 | |
Geeknet, Inc. (a) | | | 1,036 | | | 27,682 | |
Gordmans Stores, Inc. (a) | | | 1,272 | | | 22,120 | |
HSN, Inc. (a) | | | 10,728 | | | 353,166 | |
Overstock.com, Inc. (a) | | | 3,371 | | | 51,306 | |
PriceSmart, Inc. | | | 4,779 | | | 244,828 | |
Saks, Inc. (a) | | | 31,228 | | | 348,817 | |
Tuesday Morning Corp. (a) | | | 10,449 | | | 48,588 | |
ValueVision Media, Inc., Class A (a) | | | 10,652 | | | 81,488 | |
Winmark Corp. | | | 428 | | | 18,545 | |
| | | | | | 1,638,585 | |
Drug & Grocery Store Chains — 0.7% | | | | | | | |
Arden Group, Inc., Class A | | | 378 | | | 34,783 | |
Casey’s General Stores, Inc. | | | 10,199 | | | 448,756 | |
The Fresh Market, Inc. (a) | | | 7,461 | | | 288,591 | |
GNC Holdings, Inc. (a) | | | 5,837 | | | 127,305 | |
Ingles Markets, Inc., Class A | | | 3,600 | | | 59,580 | |
Nash Finch Co. | | | 3,265 | | | 116,920 | |
The Pantry, Inc. (a) | | | 6,300 | | | 118,377 | |
PetMed Express, Inc. | | | 5,995 | | | 71,041 | |
Rite Aid Corp. (a) | | | 159,370 | | | 211,962 | |
Ruddick Corp. | | | 13,003 | | | 566,151 | |
Spartan Stores, Inc. | | | 6,113 | | | 119,387 | |
Susser Holdings Corp. (a) | | | 1,549 | | | 24,350 | |
| | | | | | | |
Common Stocks | | | Shares | | Value | |
Drug & Grocery Store Chains (concluded) | | | | | | | |
Village Super Market, Inc., Class A | | | 1,694 | | $ | 46,941 | |
Weis Markets, Inc. | | | 2,982 | | | 121,457 | |
Winn-Dixie Stores, Inc. (a) | | | 15,267 | | | 129,006 | |
| | | | | | 2,484,607 | |
Education Services — 0.6% | | | | | | | |
Ambassadors Group, Inc. | | | 5,130 | | | 45,298 | |
American Public Education, Inc. (a) | | | 4,880 | | | 217,209 | |
Archipelago Learning, Inc. (a)(b) | | | 3,904 | | | 38,493 | |
Bridgepoint Education, Inc. (a)(b) | | | 4,854 | | | 121,350 | |
Cambium Learning Group, Inc. (a) | | | 1,353 | | | 4,560 | |
Capella Education Co. (a) | | | 4,246 | | | 177,695 | |
Corinthian Colleges, Inc. (a) | | | 21,058 | | | 89,707 | |
Franklin Covey Co. (a) | | | 4,231 | | | 40,956 | |
Grand Canyon Education, Inc. (a) | | | 7,828 | | | 111,001 | |
HealthStream, Inc. (a) | | | 3,767 | | | 49,988 | |
K12, Inc. (a) | | | 7,016 | | | 232,510 | |
Lincoln Educational Services Corp. | | | 5,608 | | | 96,177 | |
National American University Holdings, Inc. | | | 1,167 | | | 10,982 | |
Renaissance Learning, Inc. | | | 3,699 | | | 46,386 | |
Rosetta Stone, Inc. (a)(b) | | | 3,028 | | | 48,872 | |
School Specialty, Inc. (a) | | | 4,606 | | | 66,280 | |
Strayer Education, Inc. | | | 3,217 | | | 406,597 | |
Universal Technical Institute, Inc. | | | 5,742 | | | 113,519 | |
| | | | | | 1,917,580 | |
Electronic Components — 0.8% | | | | | | | |
3D Systems Corp. (a) | | | 11,243 | | | 221,599 | |
Acacia Research — Acacia Technologies (a) | | | 11,503 | | | 422,045 | |
Checkpoint Systems, Inc. (a) | | | 10,834 | | | 193,712 | |
DDi Corp. | | | 4,159 | | | 39,677 | |
Kemet Corp. (a) | | | 11,618 | | | 166,021 | |
LeCroy Corp. (a) | | | 4,015 | | | 48,341 | |
Methode Electronics, Inc. | | | 10,321 | | | 119,827 | |
Microvision, Inc. (a)(b) | | | 30,963 | | | 37,775 | |
Multi-Fineline Electronix, Inc. (a) | | | 2,482 | | | 53,636 | |
NVE Corp. (a) | | | 1,333 | | | 77,914 | |
Park Electrochemical Corp. | | | 5,635 | | | 157,498 | |
Pulse Electronics Corp. | | | 11,386 | | | 50,326 | |
Rogers Corp. (a) | | | 4,316 | | | 199,399 | |
ScanSource, Inc. (a) | | | 7,288 | | | 273,154 | |
Smart Modular Technologies WWH, Inc. (a) | | | 17,163 | | | 157,213 | |
TTM Technologies, Inc. (a) | | | 14,204 | | | 227,548 | |
Universal Display Corp. (a) | | | 10,331 | | | 362,515 | |
Viasystems Group, Inc. (a) | | | 557 | | | 12,527 | |
| | | | | | 2,820,727 | |
Electronic Entertainment — 0.2% | | | | | | | |
DTS, Inc. (a) | | | 4,748 | | | 192,531 | |
Glu Mobile, Inc. (a) | | | 11,158 | | | 58,803 | |
THQ, Inc. (a) | | | 18,907 | | | 68,443 | |
Take-Two Interactive Software, Inc. (a) | | | 19,523 | | | 298,312 | |
| | | | | | 618,089 | |
Electronics — 0.5% | | | | | | | |
Agilysys, Inc. (a) | | | 4,991 | | | 41,625 | |
American Science & Engineering, Inc. | | | 2,453 | | | 196,240 | |
Coherent, Inc. (a) | | | 6,760 | | | 373,625 | |
Daktronics, Inc. | | | 9,526 | | | 102,786 | |
II-VI, Inc. (a) | | | 13,906 | | | 355,994 | |
iRobot Corp. (a) | | | 6,314 | | | 222,821 | |
Newport Corp. (a) | | | 10,151 | | | 184,444 | |
| | |
See Notes to Financial Statements. |
| | |
24 | BLACKROCK SMALL CAP INDEX FUND | JUNE 30, 2011 |
| |
| |
Schedule of Investments (continued) | Master Small Cap Index Series
(Percentages shown are based on Net Assets) |
| | | | | | | |
Common Stocks | | | Shares | | Value | |
Electronics (concluded) | | | | | | | |
Richardson Electronics Ltd. | | | 4,307 | | $ | 58,532 | |
Rofin-Sinar Technologies, Inc. (a) | | | 7,675 | | | 262,101 | |
SRS Labs, Inc. (a) | | | 3,533 | | | 33,881 | |
| | | | | | 1,832,049 | |
Energy Equipment — 0.2% | | | | | | | |
Capstone Turbine Corp. (a)(b) | | | 68,229 | | | 104,390 | |
FuelCell Energy, Inc. (a)(b) | | | 32,271 | | | 42,275 | |
GT Solar International, Inc. (a) | | | 33,592 | | | 544,190 | |
PowerSecure International, Inc. (a) | | | 5,195 | | | 37,508 | |
STR Holdings, Inc. (a)(b) | | | 7,841 | | | 116,988 | |
| | | | | | 845,351 | |
Engineering & Contracting Services — 0.5% | | | | | | | |
Argan, Inc. (a) | | | 1,168 | | | 11,843 | |
Dycom Industries, Inc. (a) | | | 9,596 | | | 156,799 | |
Exponent, Inc. (a) | | | 3,860 | | | 167,949 | |
Furmamite Corp. (a) | | | 10,313 | | | 81,885 | |
Hill International, Inc. (a) | | | 7,132 | | | 41,080 | |
Layne Christensen Co. (a) | | | 5,323 | | | 161,500 | |
MYR Group, Inc. (a) | | | 5,445 | | | 127,413 | |
Mastec, Inc. (a)(b) | | | 15,108 | | | 297,930 | |
Michael Baker Corp. (a) | | | 2,263 | | | 47,794 | |
Mistras Group, Inc. (a) | | | 4,044 | | | 65,513 | |
Tetra Tech, Inc. (a) | | | 16,828 | | | 378,630 | |
UniTek Global Services, Inc. (a) | | | 2,078 | | | 16,437 | |
VSE Corp. | | | 1,088 | | | 27,091 | |
| | | | | | 1,581,864 | |
Entertainment — 0.4% | | | | | | | |
Ascent Media Corp., Class A (a) | | | 4,024 | | | 213,151 | |
Cinemark Holdings, Inc. | | | 24,758 | | | 512,738 | |
Lions Gate Entertainment Corp. (a) | | | 13,354 | | | 88,404 | |
Live Nation Entertainment, Inc. (a) | | | 38,198 | | | 438,131 | |
Rentrak Corp. (a) | | | 2,896 | | | 51,375 | |
Warner Music Group Corp. (a) | | | 15,437 | | | 126,892 | |
World Wrestling Entertainment, Inc. | | | 6,831 | | | 65,100 | |
| | | | | | 1,495,791 | |
Environmental, Maintenance, & Security Service — 0.7% | | | | | | | |
ABM Industries, Inc. | | | 14,271 | | | 333,085 | |
The Brink’s Co. | | | 12,550 | | | 374,366 | |
G&K Services, Inc., Class A | | | 5,064 | | | 171,467 | |
The Geo Group, Inc. (a) | | | 17,275 | | | 397,843 | |
Healthcare Services Group, Inc. | | | 18,004 | | | 292,565 | |
Mac-Gray Corp. | | | 3,488 | | | 53,890 | |
Rollins, Inc. | | | 17,213 | | | 350,801 | |
Standard Parking Corp. (a) | | | 4,567 | | | 72,935 | |
Swisher Hygiene, Inc. (a)(b) | | | 22,703 | | | 127,818 | |
Unifirst Corp. | | | 3,810 | | | 214,084 | |
| | | | | | 2,388,854 | |
Fertilizers — 0.0% | | | | | | | |
Rentech, Inc. (a) | | | 65,704 | | | 69,646 | |
Financial Data & Systems — 0.8% | | | | | | | |
Advent Software, Inc. (a) | | | 8,780 | | | 247,333 | |
Cardtronics, Inc. (a) | | | 11,414 | | | 267,658 | |
Cass Information Systems, Inc. | | | 2,388 | | | 90,171 | |
Euronet Worldwide, Inc. (a) | | | 13,820 | | | 212,966 | |
Fair Isaac Corp. | | | 10,770 | | | 325,254 | |
Global Cash Access, Inc. (a) | | | 14,592 | | | 46,403 | |
Heartland Payment Systems, Inc. | | | 10,421 | | | 214,673 | |
| | | | | | | |
Common Stocks | | | Shares | | Value | |
Financial Data & Systems (concluded) | | | | | | | |
Higher One Holdings, Inc. (a) | | | 7,994 | | $ | 151,246 | |
Jack Henry & Associates, Inc. | | | 23,259 | | | 698,003 | |
S1 Corp. (a) | | | 14,413 | | | 107,809 | |
Wright Express Corp. (a) | | | 10,421 | | | 542,621 | |
| | | | | | 2,904,137 | |
Foods — 1.1% | | | | | | | |
B&G Foods, Inc., Class A | | | 12,996 | | | 267,977 | |
Chiquita Brands International, Inc. (a) | | | 12,254 | | | 159,547 | |
Diamond Foods, Inc. | | | 5,948 | | | 454,070 | |
Dole Food Co., Inc. (a) | | | 9,695 | | | 131,076 | |
Hain Celestial Group, Inc. (a) | | | 9,731 | | | 324,626 | |
J&J Snack Foods Corp. | | | 3,879 | | | 193,368 | |
Lancaster Colony Corp. | | | 5,024 | | | 305,560 | |
Lifeway Foods, Inc. (a) | | | 446 | | | 4,986 | |
Medifast, Inc. (a) | | | 3,678 | | | 87,279 | |
Natures Sunshine Prods, Inc. (a) | | | 2,765 | | | 53,862 | |
Nutraceutical International Corp. (a) | | | 2,816 | | | 43,310 | |
Omega Protein Corp. (a) | | | 4,841 | | | 66,806 | |
Schiff Nutrition International, Inc. | | | 2,168 | | | 24,260 | |
Seneca Foods Corp. (a) | | | 2,527 | | | 64,641 | |
Smart Balance, Inc. (a) | | | 16,842 | | | 87,242 | |
Snyders-Lance, Inc. | | | 12,290 | | | 265,833 | |
Synutra International, Inc. (a)(b) | | | 5,080 | | | 49,886 | |
Tootsie Roll Industries, Inc. | | | 6,440 | | | 188,434 | |
TreeHouse Foods, Inc. (a) | | | 9,548 | | | 521,416 | |
United Natural Foods, Inc. (a) | | | 13,007 | | | 555,009 | |
| | | | | | 3,849,188 | |
Forest Products — 0.1% | | | | | | | |
Deltic Timber Corp. | | | 2,902 | | | 155,808 | |
Universal Forest Products, Inc. | | | 5,240 | | | 125,551 | |
| | | | | | 281,359 | |
Forms & Bulk Printing Services — 0.3% | | | | | | | |
Consolidated Graphics, Inc. (a) | | | 2,485 | | | 136,551 | |
Deluxe Corp. | | | 13,875 | | | 342,851 | |
Ennis, Inc. | | | 7,023 | | | 122,200 | |
Innerworkings, Inc. (a) | | | 7,131 | | | 59,473 | |
M&F Worldwide Corp. (a) | | | 2,775 | | | 71,706 | |
Multi-Color Corp. | | | 3,179 | | | 78,489 | |
Quad/Graphics, Inc. | | | 6,589 | | | 256,049 | |
Schawk, Inc. | | | 3,316 | | | 54,913 | |
| | | | | | 1,122,232 | |
Fruit & Grain Processing — 0.0% | | | | | | | |
MGP Ingredients, Inc. | | | 3,933 | | | 34,256 | |
Funeral Parlors & Cemeteries — 0.3% | | | | | | | |
Hillenbrand, Inc. | | | 16,112 | | | 381,049 | |
Matthews International Corp., Class A | | | 7,955 | | | 319,393 | |
Stewart Enterprises, Inc., Class A | | | 21,510 | | | 157,023 | |
| | | | | | 857,465 | |
Gas Pipeline — 0.1% | | | | | | | |
Crosstex Energy, Inc. | | | 11,159 | | | 132,792 | |
SemGroup Corp. (a) | | | 10,999 | | | 282,344 | |
| | | | | | 415,136 | |
Glass — 0.0% | | | | | | | |
Apogee Enterprises, Inc. | | | 7,663 | | | 98,163 | |
Gold — 0.4% | | | | | | | |
Coeur d’Alene Mines Corp. (a) | | | 24,113 | | | 584,981 | |
Gold Resource Corp. | | | 7,526 | | | 187,623 | |
Golden Star Resources Ltd. (a) | | | 70,127 | | | 154,280 | |
| | | |
See Notes to Financial Statements. |
| | | |
| BLACKROCK SMALL CAP INDEX FUND | JUNE 30, 2011 | 25 |
| |
| |
Schedule of Investments (continued) | Master Small Cap Index Series
(Percentages shown are based on Net Assets) |
| | | | | | | |
Common Stocks | | | Shares | | Value | |
Gold (concluded) | | | | | | | |
Jaguar Mining, Inc. (a)(b) | | | 23,399 | | $ | 111,847 | |
Midway Gold Corp. (a) | | | 20,031 | | | 39,261 | |
US Gold Corp. (a) | | | 28,517 | | | 171,958 | |
Vista Gold Corp. (a) | | | 17,880 | | | 50,600 | |
| | | | | | 1,300,550 | |
Health Care Facilities — 0.7% | | | | | | | |
Amsurg Corp. (a) | | | 8,394 | | | 219,335 | |
Assisted Living Concepts, Inc. | | | 5,315 | | | 89,186 | |
Capital Senior Living Corp. (a) | | | 7,488 | | | 69,564 | |
Contiucare Corp. (a) | | | 8,969 | | | 55,429 | |
Emeritus Corp. (a) | | | 8,040 | | | 170,850 | |
The Ensign Group, Inc. | | | 4,260 | | | 129,461 | |
Five Star Quality Care, Inc. (a) | | | 9,107 | | | 52,912 | |
Hanger Orthopedic Group, Inc. (a) | | | 8,807 | | | 215,507 | |
HealthSouth Corp. (a) | | | 25,653 | | | 673,391 | |
Kindred Healthcare, Inc. (a) | | | 13,881 | | | 298,033 | |
MedCath Corp. (a) | | | 5,695 | | | 77,395 | |
National Healthcare Corp. | | | 2,539 | | | 125,858 | |
Select Medical Holdings Corp. (a) | | | 12,326 | | | 109,332 | |
Skilled Healthcare Group, Inc., Class A (a) | | | 5,382 | | | 50,914 | |
Sunrise Senior Living, Inc. (a) | | | 15,642 | | | 149,068 | |
US Physical Therapy, Inc. | | | 3,062 | | | 75,723 | |
| | | | | | 2,561,958 | |
Health Care Management Services — 0.9% | | | | | | | |
American Dental Partners, Inc. (a) | | | 4,452 | | | 57,698 | |
Bioscript, Inc. (a) | | | 11,320 | | | 73,467 | |
Centene Corp. (a) | | | 13,437 | | | 477,417 | |
Computer Programs & Systems, Inc. | | | 2,928 | | | 185,869 | |
HealthSpring, Inc. (a) | | | 18,210 | | | 839,663 | |
Magellan Health Services, Inc. (a) | | | 8,602 | | | 470,873 | |
Metropolitan Health Networks, Inc. (a) | | | 11,309 | | | 54,170 | |
Molina Healthcare, Inc. (a) | | | 7,367 | | | 199,793 | |
National Research Corp. | | | 247 | | | 9,023 | |
Triple-S Management Corp. (a) | | | 5,336 | | | 115,951 | |
Universal American Corp. | | | 8,761 | | | 95,933 | |
WellCare Health Plans, Inc. (a) | | | 11,443 | | | 588,285 | |
| | | | | | 3,168,142 | |
Health Care Services — 1.4% | | | | | | | |
AMN Healthcare Services, Inc. (a) | | | 10,802 | | | 89,873 | |
Accretive Health, Inc. (a) | | | 10,628 | | | 305,980 | |
Air Methods Corp. (a) | | | 3,052 | | | 228,107 | |
Alliance Healthcare Services, Inc. (a) | | | 7,482 | | | 28,432 | |
Almost Family, Inc. (a) | | | 2,291 | | | 62,773 | |
Amedisys, Inc. (a) | | | 7,851 | | | 209,072 | |
athenahealth, Inc. (a) | | | 9,454 | | | 388,559 | |
CardioNet, Inc. (a) | | | 7,353 | | | 39,044 | |
Chemed Corp. | | | 5,699 | | | 373,399 | |
Chindex International, Inc. (a) | | | 3,438 | | | 46,826 | |
Corvel Corp. (a) | | | 1,796 | | | 84,232 | |
Cross Country Healthcare, Inc. (a) | | | 8,074 | | | 61,362 | |
ePocrates, Inc. (a) | | | 1,539 | | | 28,379 | |
ExamWorks Group, Inc. (a) | | | 7,094 | | | 180,117 | |
Gentiva Health Services, Inc. (a) | | | 8,243 | | | 171,702 | |
HMS Holdings Corp. (a) | | | 7,597 | | | 583,981 | |
Healthways, Inc. (a) | | | 9,215 | | | 139,884 | |
IPC The Hospitalist Co., Inc. (a) | | | 4,453 | | | 206,397 | |
LHC Group, Inc. (a) | | | 4,322 | | | 99,665 | |
MWI Veterinary Supply, Inc. (a) | | | 3,420 | | | 276,233 | |
Medidata Solutions, Inc. (a) | | | 5,614 | | | 134,006 | |
| | | | | | | |
Common Stocks | | | Shares | | Value | |
Health Care Services (concluded) | | | | | | | |
MedQuist Holdings, Inc. (a) | | | 8,021 | | $ | 103,631 | |
Omnicell, Inc. (a) | | | 9,000 | | | 140,310 | |
PharMerica Corp. (a) | | | 7,944 | | | 101,366 | |
Quality Systems, Inc. | | | 5,218 | | | 455,531 | |
Rural/Metro Corp. (a) | | | 5,042 | | | 86,924 | |
Sun Healthcare Group, Inc. (a) | | | 6,737 | | | 54,031 | |
Team Health Holdings, Inc. (a) | | | 7,012 | | | 157,840 | |
Transcend Services, Inc. (a) | | | 2,463 | | | 72,388 | |
| | | | | | 4,910,044 | |
Health Care: Miscellaneous — 0.1% | | | | | | | |
MedAssets, Inc. (a) | | | 12,616 | | | 168,550 | |
The Providence Service Corp. (a) | | | 3,678 | | | 46,526 | |
| | | | | | 215,076 | |
Home Building — 0.3% | | | | | | | |
Beazer Homes USA, Inc. (a) | | | 21,063 | | | 71,404 | |
Hovnanian Enterprises, Inc., Class A (a)(b) | | | 16,563 | | | 39,917 | |
KB Home | | | 20,318 | | | 198,710 | |
M/I Homes, Inc. (a) | | | 5,245 | | | 64,304 | |
MDC Holdings, Inc. | | | 9,795 | | | 241,349 | |
Meritage Homes Corp. (a) | | | 7,638 | | | 172,313 | |
Ryland Group, Inc. | | | 12,017 | | | 198,641 | |
Standard-Pacific Corp. (a) | | | 28,981 | | | 97,086 | |
| | | | | | 1,083,724 | |
Hotel/Motel — 0.2% | | | | | | | |
Gaylord Entertainment Co. (a) | | | 9,547 | | | 286,410 | |
Marcus Corp. | | | 5,693 | | | 56,247 | |
Morgans Hotel Group Co. (a) | | | 6,613 | | | 47,547 | |
Orient Express Hotels Ltd., Class A (a) | | | 25,972 | | | 279,199 | |
Red Lion Hotels Corp. (a) | | | 2,685 | | | 21,212 | |
| | | | | | 690,615 | |
Household Appliances — 0.0% | | | | | | | |
National Presto Industries, Inc. | | | 1,306 | | | 132,546 | |
Household Equipment & Products — 0.3% | | | | | | | |
American Greetings Corp., Class A | | | 10,843 | | | 260,666 | |
Blyth, Inc. | | | 1,412 | | | 71,094 | |
CSS Industries, Inc. | | | 2,259 | | | 47,281 | |
Central Garden & Pet Co., Class A (a) | | | 13,212 | | | 134,102 | |
Helen of Troy Ltd. (a) | | | 8,319 | | | 287,255 | |
Libbey, Inc. (a) | | | 5,481 | | | 88,902 | |
Summer Infant, Inc. (a) | | | 2,504 | | | 20,332 | |
| | | | | | 909,632 | |
Household Furnishings — 0.2% | | | | | | | |
American Woodmark Corp. | | | 2,692 | | | 46,626 | |
Ethan Allen Interiors, Inc. | | | 6,576 | | | 140,003 | |
Furniture Brands International, Inc. (a) | | | 11,781 | | | 48,773 | |
Kirkland’s, Inc. (a) | | | 4,502 | | | 54,114 | |
La-Z-Boy, Inc. (a) | | | 14,044 | | | 138,614 | |
Lifetime Brands, Inc. | | | 2,733 | | | 32,085 | |
Sealy Corp. (a)(b) | | | 14,087 | | | 35,640 | |
Select Comfort Corp. (a) | | | 14,979 | | | 269,323 | |
| | | | | | 765,178 | |
Insurance: Life — 0.6% | | | | | | | |
American Equity Investment Life Holding Co. | | | 15,929 | | | 202,458 | |
CNO Financial Group, Inc. (a) | | | 59,708 | | | 472,290 | |
Citizens, Inc. (a) | | | 11,072 | | | 75,511 | |
Delphi Financial Group, Inc., Class A | | | 12,938 | | | 377,919 | |
FBL Financial Group, Inc., Class A | | | 3,514 | | | 112,975 | |
Independence Holding Co. | | | 1,158 | | | 12,090 | |
| | |
See Notes to Financial Statements. |
| | |
26 | BLACKROCK SMALL CAP INDEX FUND | JUNE 30, 2011 |
| |
| |
Schedule of Investments (continued) | Master Small Cap Index Series
(Percentages shown are based on Net Assets) |
| | | | | | | |
Common Stocks | | Shares | | Value | |
Insurance: Life (concluded) | | | | | | | |
Kansas City Life Insurance Co. | | | 1,200 | | $ | 37,380 | |
National Western Life Insurance Co., Class A | | | 590 | | | 94,087 | |
The Phoenix Cos., Inc. (a) | | | 31,863 | | | 78,383 | |
Presidential Life Corp. | | | 6,050 | | | 63,162 | |
Primerica, Inc. | | | 8,729 | | | 191,776 | |
Symetra Financial Corp. | | | 16,567 | | | 222,495 | |
| | | | | | 1,940,526 | |
Insurance: Multi-Line — 0.5% | | | | | | | |
Alterra Capital Holdings Ltd. | | | 23,974 | | | 534,620 | |
Crawford & Co., Class B | | | 7,318 | | | 51,738 | |
eHealth, Inc. (a) | | | 6,016 | | | 80,374 | |
Flagstone Reinsurance Holdings SA | | | 13,181 | | | 111,116 | |
Fortegra Financial Corp. (a) | | | 703 | | | 5,512 | |
Horace Mann Educators Corp. | | | 10,743 | | | 167,698 | |
Maiden Holdings Ltd. | | | 13,754 | | | 125,161 | |
Pico Holdings, Inc. (a) | | | 6,186 | | | 179,394 | |
Platinum Underwriters Holdings Ltd. | | | 9,941 | | | 330,439 | |
Primus Guaranty Ltd. (a) | | | 4,664 | | | 24,486 | |
| | | | | | 1,610,538 | |
Insurance: Property-Casualty — 1.4% | | | | | | | |
American Safety Insurance Holdings Ltd. (a) | | | 2,931 | | | 56,099 | |
Amerisafe, Inc. (a) | | | 5,115 | | | 115,701 | |
AmTrust Financial Services, Inc. | | | 6,325 | | | 144,083 | |
Argo Group International Holdings Ltd. | | | 7,371 | | | 219,066 | |
Baldwin & Lyons, Inc., Class B | | | 2,451 | | | 56,790 | |
Donegal Group, Inc., Class A | | | 2,716 | | | 34,765 | |
EMC Insurance Group, Inc. | | | 1,446 | | | 27,619 | |
Employers Holdings, Inc. | | | 10,430 | | | 174,911 | |
Enstar Group Ltd. (a) | | | 1,815 | | | 189,649 | |
FPIC Insurance Group, Inc. (a) | | | 2,302 | | | 95,947 | |
First American Financial Corp. | | | 28,249 | | | 442,097 | |
Global Indemnity Plc (a) | | | 3,750 | | | 83,175 | |
Greenlight Capital Re Ltd. (a) | | | 7,649 | | | 201,092 | |
Hallmark Financial Services, Inc. (a) | | | 3,699 | | | 29,111 | |
Harleysville Group, Inc. | | | 3,192 | | | 99,495 | |
Hilltop Holdings, Inc. (a) | | | 11,133 | | | 98,416 | |
Infinity Property & Casualty Corp. | | | 3,341 | | | 182,619 | |
Meadowbrook Insurance Group, Inc. | | | 14,738 | | | 146,054 | |
Montpelier Re Holdings Ltd. | | | 16,767 | | | 301,806 | |
National Interstate Corp. | | | 1,878 | | | 43,006 | |
Navigators Group, Inc. (a) | | | 3,587 | | | 168,589 | |
OneBeacon Insurance Group Ltd. | | | 4,509 | | | 60,376 | |
The PMI Group, Inc. (a) | | | 41,185 | | | 44,068 | |
ProAssurance Corp. (a) | | | 8,198 | | | 573,860 | |
RLI Corp. | | | 4,891 | | | 302,851 | |
Radian Group, Inc. | | | 35,954 | | | 152,085 | |
Safety Insurance Group, Inc. | | | 3,419 | | | 143,735 | |
SeaBright Holdings, Inc. | | | 5,953 | | | 58,935 | |
Selective Insurance Group, Inc. | | | 14,441 | | | 234,955 | |
State Auto Financial Corp. | | | 3,961 | | | 69,040 | |
Stewart Information Services Corp. | | | 5,205 | | | 52,206 | |
Tower Group, Inc. | | | 9,881 | | | 235,365 | |
United Fire & Casualty Co. | | | 5,978 | | | 103,838 | |
Universal Insurance Holdings, Inc. | | | 3,333 | | | 15,565 | |
| | | | | | 4,956,969 | |
| | | | | | | |
Common Stocks | | Shares | | Value | |
International Trade & Diversified Logistic — 0.0% | | | | | | | |
Global Sources Ltd. (a) | | | 3,842 | | $ | 35,308 | |
Leisure Time — 0.8% | | | | | | | |
Black Diamond, Inc. (a) | | | 2,534 | | | 19,968 | |
Callaway Golf Co. | | | 17,423 | | | 108,371 | |
Churchill Downs, Inc. | | | 3,314 | | | 149,395 | |
International Speedway Corp., Class A | | | 7,304 | | | 207,507 | |
Interval Leisure Group, Inc. (a) | | | 10,977 | | | 150,275 | |
Johnson Outdoors, Inc. (a) | | | 697 | | | 11,933 | |
Life Time Fitness, Inc. (a) | | | 11,379 | | | 454,136 | |
Orbitz Worldwide, Inc. (a) | | | 4,601 | | | 11,456 | |
Pool Corp. | | | 13,016 | | | 388,007 | |
Six Flags Entertainment Corp. | | | 11,006 | | | 412,175 | |
Smith & Wesson Holding Corp. (a) | | | 17,731 | | | 53,193 | |
Speedway Motorsports, Inc. | | | 3,282 | | | 46,539 | |
Steinway Musical Instruments, Inc. (a) | | | 1,760 | | | 45,214 | |
Sturm Ruger & Co., Inc. | | | 5,167 | | | 113,416 | |
Town Sports International Holdings, Inc. (a) | | | 4,918 | | | 37,426 | |
Vail Resorts, Inc. | | | 9,706 | | | 448,611 | |
West Marine, Inc. (a) | | | 4,126 | | | 42,786 | |
| | | | | | 2,700,408 | |
Luxury Items — 0.0% | | | | | | | |
Movado Group, Inc. | | | 4,578 | | | 78,330 | |
Machinery: Agricultural — 0.2% | | | | | | | |
Alamo Group, Inc. | | | 1,737 | | | 41,167 | |
Lindsay Manufacturing Co. | | | 3,408 | | | 234,470 | |
Titan International, Inc. | | | 11,396 | | | 276,467 | |
Titan Machinery, Inc. (a) | | | 4,200 | | | 120,876 | |
| | | | | | 672,980 | |
Machinery: Construction & Handling — 0.1% | | | | | | | |
Astec Industries, Inc. (a) | | | 5,400 | | | 199,692 | |
Douglas Dynamics, Inc. | | | 4,580 | | | 72,318 | |
NACCO Industries, Inc., Class A | | | 1,559 | | | 150,943 | |
| | | | | | 422,953 | |
Machinery: Engines — 0.1% | | | | | | | |
Briggs & Stratton Corp. | | | 13,485 | | | 267,812 | |
Machinery: Industrial — 1.2% | | | | | | | |
Actuant Corp., Class A | | | 18,428 | | | 494,423 | |
Altra Holdings, Inc. (a) | | | 7,360 | | | 176,566 | |
Applied Industrial Technologies, Inc. | | | 11,361 | | | 404,565 | |
Chart Industries, Inc. (a) | | | 7,947 | | | 428,979 | |
Colfax Corp. (a) | | | 6,770 | | | 167,896 | |
Columbus McKinnon Corp. (a) | | | 5,282 | | | 94,865 | |
DXP Enterprises, Inc. (a) | | | 2,433 | | | 61,677 | |
EnPro Industries, Inc. (a) | | | 5,576 | | | 268,038 | |
Flow International Corp. (a) | | | 13,816 | | | 49,185 | |
Gerber Scientific, Inc. (a) | | | 6,986 | | | 77,754 | |
Graham Corp. | | | 2,822 | | | 57,569 | |
John Bean Technologies Corp. | | | 7,811 | | | 150,909 | |
Kadant, Inc. (a) | | | 3,354 | | | 105,685 | |
MTS Systems Corp. | | | 4,205 | | | 175,895 | |
Middleby Corp. (a) | | | 4,989 | | | 469,166 | |
Sauer-Danfoss, Inc. (a) | | | 3,144 | | | 158,426 | |
Tecumseh Products Co., Class A (a) | | | 5,236 | | | 53,407 | |
Tennant Co. | | | 5,137 | | | 205,120 | |
Twin Disc, Inc. | | | 2,308 | | | 89,158 | |
Woodward Governor Co. | | | 16,531 | | | 576,271 | |
| | | | | | 4,265,554 | |
| | | |
See Notes to Financial Statements. |
| | | |
| BLACKROCK SMALL CAP INDEX FUND | JUNE 30, 2011 | 27 |
| |
| |
Schedule of Investments (continued) | Master Small Cap Index Series
(Percentages shown are based on Net Assets) |
| | | | | | | |
Common Stocks | | Shares | | Value | |
Machinery: Specialty — 0.1% | | | | | | | |
Albany International Corp., Class A | | | 7,472 | | $ | 197,186 | |
Cascade Corp. | | | 2,455 | | | 116,784 | |
Hurco Cos., Inc. (a) | | | 1,478 | | | 47,607 | |
Xerium Technologies, Inc. (a) | | | 2,865 | | | 53,146 | |
| | | | | | 414,723 | |
Manufactured Housing — 0.0% | | | | | | | |
Cavco Industries, Inc. (a) | | | 1,898 | | | 85,410 | |
Skyline Corp. | | | 2,276 | | | 39,830 | |
| | | | | | 125,240 | |
Medical & Dental Instruments & Supplies — 2.4% | | | | | | | |
Abiomed, Inc. (a) | | | 8,636 | | | 139,903 | |
Align Technology, Inc. (a) | | | 16,379 | | | 373,441 | |
Alphatec Holdings, Inc. (a) | | | 14,674 | | | 51,066 | |
AngioDynamics, Inc. (a) | | | 6,710 | | | 95,483 | |
Antares Pharma, Inc. (a) | | | 25,435 | | | 56,211 | |
AtriCure, Inc. (a) | | | 3,262 | | | 42,080 | |
Atrion Corp. | | | 435 | | | 86,043 | |
Biolase Technology, Inc. (a) | | | 7,329 | | | 37,671 | |
CONMED Corp. (a) | | | 7,678 | | | 218,669 | |
Cantel Medical Corp. | | | 3,630 | | | 97,683 | |
Cardiovascular Systems, Inc. (a) | | | 3,318 | | | 48,310 | |
Cerus Corp. (a)(b) | | | 13,230 | | | 39,690 | |
Conceptus, Inc. (a) | | | 8,492 | | | 99,102 | |
CryoLife, Inc. (a) | | | 8,419 | | | 47,146 | |
Delcath Systems, Inc. (a)(b) | | | 11,804 | | | 60,909 | |
Endologix, Inc. (a) | | | 13,558 | | | 126,089 | |
Exactech, Inc. (a) | | | 2,362 | | | 42,540 | |
Hansen Medical, Inc. (a) | | | 12,818 | | | 43,709 | |
Heartware International, Inc. (a)(b) | | | 3,204 | | | 237,352 | |
ICU Medical, Inc. (a) | | | 3,211 | | | 140,321 | |
Immucor, Inc. (a) | | | 16,344 | | | 333,744 | |
Insulet Corp. (a) | | | 12,494 | | | 276,992 | |
Integra LifeSciences Holdings Corp. (a) | | | 5,591 | | | 267,306 | |
Invacare Corp. | | | 7,709 | | | 255,862 | |
Landauer, Inc. | | | 2,574 | | | 158,533 | |
MAKO Surgical Corp. (a) | | | 8,672 | | | 257,819 | |
Medical Action Industries, Inc. (a) | | | 4,090 | | | 33,334 | |
Medtox Scientific, Inc. | | | 1,356 | | | 23,689 | |
Meridian Bioscience, Inc. | | | 11,082 | | | 267,187 | |
Merit Medical Systems, Inc. (a) | | | 9,857 | | | 177,130 | |
Neogen Corp. (a) | | | 6,318 | | | 285,637 | |
Neoprobe Corp. (a) | | | 23,238 | | | 77,150 | |
NuVasive, Inc. (a) | | | 10,663 | | | 350,599 | |
OraSure Technologies, Inc. (a) | | | 12,865 | | | 109,738 | |
Orthofix International NV (a) | | | 4,898 | | | 208,018 | |
Owens & Minor, Inc. | | | 16,986 | | | 585,847 | |
PSS World Medical, Inc. (a) | | | 14,893 | | | 417,153 | |
Quidel Corp. (a) | | | 7,384 | | | 111,868 | |
Rockwell Medical Technologies, Inc. (a) | | | 4,057 | | | 52,092 | |
Staar Surgical Co. (a) | | | 10,445 | | | 55,359 | |
Steris Corp. | | | 15,848 | | | 554,363 | |
SurModics, Inc. (a) | | | 4,369 | | | 48,496 | |
Symmetry Medical, Inc. (a) | | | 9,738 | | | 87,350 | |
Synovis Life Technologies, Inc. (a) | | | 3,111 | | | 54,194 | |
Tornier NV (a) | | | 2,657 | | | 71,606 | |
Unilife Corp. (a) | | | 15,093 | | | 78,182 | |
Uroplasty, Inc. (a) | | | 4,999 | | | 37,493 | |
Vascular Solutions, Inc. (a) | | | 4,909 | | | 60,872 | |
Volcano Corp. (a) | | | 13,938 | | | 450,058 | |
| | | | | | | |
Common Stocks | | Shares | | Value | |
Medical & Dental Instruments & Supplies
(concluded) | | | | | | | |
West Pharmaceutical Services, Inc. | | | 8,944 | | $ | 391,389 | |
Wright Medical Group, Inc. (a) | | | 10,522 | | | 157,830 | |
Young Innovations, Inc. | | | 1,618 | | | 46,145 | |
| | | | | | 8,426,453 | |
Medical Equipment — 1.2% | | | | | | | |
Abaxis, Inc. (a) | | | 6,172 | | | 168,187 | |
Accuray, Inc. (a) | | | 18,234 | | | 146,054 | |
Affymetrix, Inc. (a) | | | 19,097 | | | 151,439 | |
Analogic Corp. | | | 3,380 | | | 177,754 | |
ArthroCare Corp. (a) | | | 7,357 | | | 246,239 | |
Bacterin International Holdings, Inc. (a) | | | 4,076 | | | 11,576 | |
Caliper Life Sciences, Inc. (a) | | | 13,084 | | | 106,111 | |
Cyberonics, Inc. (a) | | | 7,756 | | | 216,780 | |
Cynosure, Inc., Class A (a) | | | 3,022 | | | 36,566 | |
DexCom, Inc. (a) | | | 18,181 | | | 263,443 | |
Fluidigm Corp. (a) | | | 1,516 | | | 25,423 | |
Greatbatch, Inc. (a) | | | 6,370 | | | 170,844 | |
Haemonetics Corp. (a) | | | 6,873 | | | 442,415 | |
IRIS International, Inc. (a) | | | 4,884 | | | 48,791 | |
Luminex Corp. (a) | | | 10,169 | | | 212,532 | |
Masimo Corp. | | | 14,105 | | | 418,637 | |
Merge Healthcare, Inc. (a) | | | 14,457 | | | 75,176 | |
Natus Medical, Inc. (a) | | | 7,808 | | | 118,291 | |
NxStage Medical, Inc. (a) | | | 11,843 | | | 246,571 | |
Palomar Medical Technologies, Inc. (a) | | | 5,233 | | | 59,028 | |
Solta Medical, Inc. (a) | | | 17,354 | | | 47,897 | |
SonoSite, Inc. (a) | | | 3,788 | | | 133,224 | |
Spectranetic Corp. (a) | | | 9,345 | | | 58,126 | |
Stereotaxis, Inc. (a) | | | 11,133 | | | 39,077 | |
Synergetics USA, Inc. (a) | | | 4,615 | | | 25,429 | |
Zoll Medical Corp. (a) | | | 5,927 | | | 335,824 | |
| | | | | | 3,981,434 | |
Medical Services — 0.2% | | | | | | | |
Bio-Reference Labs, Inc. (a) | | | 6,678 | | | 139,570 | |
eResearch Technology, Inc. (a) | | | 13,796 | | | 87,881 | |
Kendle International, Inc. (a) | | | 4,012 | | | 60,501 | |
Neostem, Inc. (a) | | | 7,900 | | | 11,692 | |
Parexel International Corp. (a) | | | 15,877 | | | 374,062 | |
RadNet, Inc. (a) | | | 7,210 | | | 31,724 | |
| | | | | | 705,430 | |
Metal Fabricating — 0.7% | | | | | | | |
Ampco-Pittsburgh Corp. | | | 2,459 | | | 57,664 | |
Dynamic Materials Corp. | | | 3,657 | | | 81,990 | |
Haynes International, Inc. | | | 3,311 | | | 205,050 | |
Kaydon Corp. | | | 8,725 | | | 325,617 | |
L.B. Foster Co., Class A | | | 2,651 | | | 87,244 | |
Lawson Products, Inc. | | | 416 | | | 8,183 | |
Metals USA Holdings Corp. (a) | | | 3,328 | | | 49,587 | |
Mueller Industries, Inc. | | | 10,161 | | | 385,204 | |
Mueller Water Products, Inc., Series A | | | 41,848 | | | 166,555 | |
NN, Inc. (a) | | | 4,190 | | | 62,682 | |
Northwest Pipe Co. (a) | | | 2,647 | | | 68,981 | |
RBC Bearings, Inc. (a) | | | 5,950 | | | 224,672 | |
RTI International Metals, Inc. (a) | | | 8,140 | | | 312,332 | |
Worthington Industries, Inc. | | | 15,539 | | | 358,951 | |
| | | | | | 2,394,712 | |
| | |
See Notes to Financial Statements. |
| | |
28 | BLACKROCK SMALL CAP INDEX FUND | JUNE 30, 2011 |
| |
| |
Schedule of Investments (continued) | Master Small Cap Index Series
(Percentages shown are based on Net Assets) |
| | | | | | | |
Common Stocks | | Shares | | Value | |
Metals & Minerals: Diversified — 0.7% | | | | | | | |
AMCOL International Corp. | | | 6,540 | | $ | 249,566 | |
General Moly, Inc. (a)(b) | | | 19,115 | | | 85,253 | |
Globe Specialty Metals, Inc. | | | 17,024 | | | 381,678 | |
Hecla Mining Co. (a) | | | 75,422 | | | 579,995 | |
Materion Corp. (a) | | | 5,535 | | | 204,629 | |
Minerals Technologies, Inc. | | | 4,930 | | | 326,810 | |
Oil-Dri Corp. of America | | | 1,630 | | | 34,915 | |
Paramount Gold and Silver Corp. (a) | | | 30,820 | | | 100,473 | |
Thompson Creek Metals Co., Inc. (a) | | | 41,167 | | | 410,847 | |
US Energy Corp. Wyoming (a) | | | 7,385 | | | 31,534 | |
United States Lime & Minerals, Inc. (a) | | | 747 | | | 30,634 | |
Ur-Energy, Inc. (a) | | | 25,143 | | | 40,229 | |
Uranerz Energy Corp. (a) | | | 16,570 | | | 50,041 | |
Uranium Resources, Inc. (a) | | | 24,271 | | | 40,533 | |
| | | | | | 2,567,137 | |
Miscellaneous Consumer Staples — 0.0% | | | | | | | |
Spectrum Brands Holdings, Inc. (a) | | | 4,582 | | | 146,624 | |
Office Supplies & Equipment — 0.6% | | | | | | | |
ACCO Brands Corp. (a) | | | 15,036 | | | 118,032 | |
AT Cross Co. (a) | | | 1,784 | | | 20,320 | |
Electronics for Imaging, Inc. (a) | | | 12,732 | | | 219,245 | |
HNI Corp. | | | 12,008 | | | 301,641 | |
Herman Miller, Inc. | | | 15,433 | | | 420,086 | |
Kimball International, Inc., Class B | | | 8,839 | | | 56,835 | |
Knoll, Inc. | | | 12,854 | | | 257,980 | |
Steelcase, Inc., Class A | | | 21,239 | | | 241,912 | |
United Stationers, Inc. | | | 12,386 | | | 438,836 | |
| | | | | | 2,074,887 | |
Offshore Drilling & Other Services — 0.1% | | | | | | | |
Hercules Offshore, Inc. (a) | | | 31,242 | | | 172,143 | |
Vantage Drilling Co. (a) | | | 45,575 | | | 82,947 | |
| | | | | | 255,090 | |
Oil Well Equipment & Services — 2.0% | | | | | | | |
Basic Energy Services, Inc. (a) | | | 6,564 | | | 206,569 | |
Cal Dive International, Inc. (a) | | | 25,933 | | | 155,079 | |
Complete Production Services, Inc. (a) | | | 21,214 | | | 707,699 | |
Dawson Geophysical Co. (a) | | | 2,194 | | | 74,925 | |
Dril-Quip, Inc. (a) | | | 9,228 | | | 625,935 | |
Exterran Holdings, Inc. (a) | | | 16,710 | | | 331,359 | |
Flotek Industries, Inc. (a) | | | 13,210 | | | 112,549 | |
Geokinetics, Inc. (a) | | | 2,438 | | | 19,211 | |
Global Geophysical Services, Inc. (a) | | | 4,393 | | | 78,195 | |
Global Industries Ltd. (a) | | | 27,444 | | | 150,393 | |
Golar LNG Ltd. | | | 9,901 | | | 345,446 | |
Gulf Island Fabrication, Inc. | | | 3,927 | | | 126,764 | |
Helix Energy Solutions Group, Inc. (a) | | | 28,508 | | | 472,093 | |
Hornbeck Offshore Services, Inc. (a) | | | 6,175 | | | 169,813 | |
ION Geophysical Corp. (a) | | | 35,329 | | | 334,212 | |
Key Energy Services, Inc. (a) | | | 33,640 | | | 605,520 | |
Lufkin Industries, Inc. | | | 8,184 | | | 704,233 | |
Matrix Service Co. (a) | | | 7,242 | | | 96,898 | |
Mitcham Industries, Inc. (a) | | | 2,448 | | | 42,350 | |
Natural Gas Services Group (a) | | | 3,386 | | | 54,718 | |
Newpark Resources, Inc. (a) | | | 24,455 | | | 221,807 | |
OYO Geospace Corp. (a) | | | 1,176 | | | 117,600 | |
Parker Drilling Co. (a) | | | 31,571 | | | 184,690 | |
Pioneer Drilling Co. (a) | | | 14,748 | | | 224,760 | |
RigNet, Inc. (a) | | | 1,183 | | | 20,111 | |
| | | | | | | |
Common Stocks | | Shares | | Value | |
Oil Well Equipment & Services (concluded) | | | | | | | |
Tesco Corp. (a) | | | 8,209 | | $ | 159,337 | |
Tetra Technologies, Inc. (a) | | | 20,719 | | | 263,753 | |
Union Drilling, Inc. (a) | | | 4,119 | | | 42,385 | |
Willbros Group, Inc. (a) | | | 10,902 | | | 93,103 | |
| | | | | | 6,741,507 | |
Oil: Crude Producers — 3.0% | | | | | | | |
ATP Oil & Gas Corp. (a) | | | 12,187 | | | 186,583 | |
Abraxas Petroleum Corp. (a)(b) | | | 22,579 | | | 86,478 | |
Apco Oil and Gas International, Inc. | | | 2,481 | | | 215,673 | |
Approach Resources, Inc. (a)(b) | | | 5,964 | | | 135,204 | |
BPZ Resources, Inc. (a)(b) | | | 26,912 | | | 88,271 | |
Berry Petroleum Co., Class A | | | 13,861 | | | 736,435 | |
Bill Barrett Corp. (a) | | | 12,660 | | | 586,791 | |
CAMAC Energy, Inc. (a)(b) | | | 16,042 | | | 21,336 | |
Callon Petroleum Co. (a) | | | 10,762 | | | 75,549 | |
Carrizo Oil & Gas, Inc. (a) | | | 10,432 | | | 435,536 | |
Cheniere Energy, Inc. (a) | | | 18,879 | | | 172,932 | |
Clayton Williams Energy, Inc. (a) | | | 1,603 | | | 96,260 | |
Comstock Resources, Inc. (a) | | | 12,597 | | | 362,668 | |
Contango Oil & Gas Co. (a) | | | 3,277 | | | 191,508 | |
Crimson Exploration, Inc. (a) | | | 4,054 | | | 14,392 | |
Endeavour International Corp. (a)(b) | | | 9,805 | | | 147,761 | |
Energy Partners Ltd. (a) | | | 7,894 | | | 116,910 | |
Energy XXI Bermuda Ltd. (a) | | | 20,302 | | | 674,432 | |
Evolution Petroleum Corp. (a) | | | 3,102 | | | 22,024 | |
FX Energy, Inc. (a) | | | 14,395 | | | 126,388 | |
GMX Resources, Inc. (a) | | | 16,450 | | | 73,203 | |
Gastar Exploration Ltd. (a) | | | 16,072 | | | 55,127 | |
GeoResources, Inc. (a) | | | 5,281 | | | 118,770 | |
Goodrich Petroleum Corp. (a) | | | 6,964 | | | 128,207 | |
Gulfport Energy Corp. (a) | | | 10,389 | | | 308,449 | |
Harvest Natural Resources, Inc. (a) | | | 9,317 | | | 102,767 | |
Houston American Energy Corp. | | | 4,685 | | | 84,939 | |
Hyperdynamics Corp. (a) | | | 41,329 | | | 177,715 | |
Isramco, Inc. (a) | | | 178 | | | 11,762 | |
Kodiak Oil & Gas Corp. (a) | | | 48,500 | | | 279,845 | |
Magnum Hunter Resources Corp. (a) | | | 29,730 | | | 200,975 | |
McMoRan Exploration Co. (a) | | | 26,485 | | | 489,443 | |
Northern Oil And Gas, Inc. (a)(b) | | | 16,922 | | | 374,822 | |
Oasis Petroleum, Inc. (a) | | | 15,923 | | | 472,595 | |
Panhandle Oil & Gas, Inc. | | | 2,108 | | | 62,165 | |
Penn Virginia Corp. | | | 12,328 | | | 162,853 | |
Petroleum Development Corp. (a) | | | 6,380 | | | 190,826 | |
Petroquest Energy, Inc. (a)(b) | | | 15,664 | | | 109,961 | |
Resolute Energy Corp. (a) | | | 12,218 | | | 197,443 | |
Rex Energy Corp. (a) | | | 9,242 | | | 94,915 | |
Rosetta Resources, Inc. (a) | | | 14,282 | | | 736,094 | |
Stone Energy Corp. (a) | | | 13,124 | | | 398,838 | |
Swift Energy Co. (a) | | | 11,430 | | | 425,996 | |
Triangle Petroleum Corp. (a) | | | 10,633 | | | 68,689 | |
Vaalco Energy, Inc. (a) | | | 14,221 | | | 85,610 | |
Venoco, Inc. (a) | | | 7,751 | | | 98,748 | |
Voyager Oil & Gas, Inc. (a) | | | 11,326 | | | 33,638 | |
W&T Offshore, Inc. | | | 9,408 | | | 245,737 | |
Warren Resources, Inc. (a) | | | 19,529 | | | 74,406 | |
Zion Oil & Gas, Inc. (a) | | | 5,728 | | | 34,082 | |
| | | | | | 10,391,751 | |
Oil: Integrated — 0.0% | | | | | | | |
Targa Resources, Inc. | | | 4,479 | | | 149,867 | |
| | | |
See Notes to Financial Statements. |
| | | |
| BLACKROCK SMALL CAP INDEX FUND | JUNE 30, 2011 | 29 |
| |
| |
| |
Schedule of Investments (continued) | Master Small Cap Index Series |
| (Percentages shown are based on Net Assets) |
| | | | | | | |
Common Stocks | | Shares | | Value | |
Oil: Refining & Marketing — 0.5% | | | | | | | |
Alon USA Energy, Inc. | | | 2,717 | | $ | 30,621 | |
CVR Energy, Inc. (a) | | | 23,480 | | | 578,078 | |
Clean Energy Fuels Corp. (a)(b) | | | 13,347 | | | 175,513 | |
Delek US Holdings, Inc. | | | 3,973 | | | 62,376 | |
Miller Energy Resources, Inc. (a) | | | 7,968 | | | 50,995 | |
Western Refining, Inc. (a)(b) | | | 14,358 | | | 259,449 | |
World Fuel Services Corp. | | | 18,980 | | | 681,951 | |
| | | | | | 1,838,983 | |
Paints & Coatings — 0.2% | | | | | | | |
Chase Corp. | | | 882 | | | 14,782 | |
Ferro Corp. (a) | | | 23,327 | | | 313,515 | |
H.B. Fuller Co. | | | 13,233 | | | 323,150 | |
| | | | | | 651,447 | |
Paper — 0.4% | | | | | | | |
Boise, Inc. | | | 27,840 | | | 216,873 | |
Buckeye Technologies, Inc. | | | 10,735 | | | 289,630 | |
Clearwater Paper Corp. (a) | | | 3,121 | | | 213,102 | |
Kapstone Paper and Packaging Corp. (a) | | | 10,712 | | | 177,498 | |
Neenah Paper, Inc. | | | 4,104 | | | 87,333 | |
P.H. Glatfelter Co. | | | 12,328 | | | 189,605 | |
Schweitzer-Mauduit International, Inc. | | | 4,732 | | | 265,702 | |
Verso Paper Corp. (a) | | | 2,941 | | | 7,882 | |
Wausau Paper Corp. | | | 13,309 | | | 89,703 | |
| | | | | | 1,537,328 | |
Personal Care — 0.1% | | | | | | | |
Female Health Co. | | | 5,795 | | | 28,975 | |
USANA Health Sciences, Inc. (a) | | | 1,742 | | | 54,490 | |
WD-40 Co. | | | 4,557 | | | 177,905 | |
| | | | | | 261,370 | |
Pharmaceuticals — 1.9% | | | | | | | |
Achillion Pharmaceuticals, Inc. (a) | | | 10,430 | | | 77,599 | |
Acura Pharmaceuticals, Inc. (a) | | | 2,437 | | | 9,431 | |
Akorn, Inc. (a) | | | 15,873 | | | 111,111 | |
Alkermes, Inc. (a) | | | 25,667 | | | 477,406 | |
Ampio Pharmaceuticals, Inc. (a) | | | 4,662 | | | 36,317 | |
Anacor Pharmaceuticals, Inc. (a) | | | 2,215 | | | 14,309 | |
Ardea Biosciences, Inc. (a) | | | 4,439 | | | 113,017 | |
Auxilium Pharmaceuticals, Inc. (a) | | | 12,789 | | | 250,664 | |
Avanir Pharmaceuticals, Inc. (a)(b) | | | 33,054 | | | 111,061 | |
BioCryst Pharmaceuticals, Inc. (a) | | | 7,913 | | | 30,228 | |
Biospecifics Technologies (a) | | | 1,361 | | | 30,486 | |
Cadence Pharmaceuticals, Inc. (a)(b) | | | 10,048 | | | 92,442 | |
Cambrex Corp. (a) | | | 8,344 | | | 38,549 | |
Cleveland Biolabs, Inc. (a) | | | 5,838 | | | 19,908 | |
Columbia Laboratories, Inc. (a) | | | 18,549 | | | 57,316 | |
Corcept Therapeutics, Inc. (a) | | | 10,542 | | | 42,063 | |
Depomed, Inc. (a) | | | 14,910 | | | 121,964 | |
Durect Corp. (a) | | | 23,829 | | | 48,373 | |
Dusa Pharmaceuticals, Inc. (a) | | | 6,076 | | | 37,793 | |
Endocyte, Inc. (a) | | | 3,539 | | | 50,678 | |
Hi-Tech Pharmacal Co., Inc. (a) | | | 2,844 | | | 82,277 | |
ISTA Pharmaceuticals, Inc. (a) | | | 6,830 | | | 52,215 | |
Impax Laboratories, Inc. (a) | | | 17,461 | | | 380,475 | |
Infinity Pharmaceuticals, Inc. (a) | | | 4,063 | | | 33,560 | |
Ironwood Pharmaceuticals, Inc. (a) | | | 13,151 | | | 206,734 | |
Isis Pharmaceuticals, Inc. (a) | | | 26,182 | | | 239,827 | |
Jazz Pharmaceuticals, Inc. (a) | | | 5,950 | | | 198,433 | |
K-V Pharmaceutical Co., Class A (a) | | | 13,662 | | | 37,161 | |
| | | | | | | |
Common Stocks | | Shares | | Value | |
Pharmaceuticals (concluded) | | | | | | | |
Lannett Co., Inc. (a) | | | 3,346 | | $ | 16,663 | |
MAP Pharmaceuticals, Inc. (a) | | | 5,808 | | | 92,754 | |
Medicines Co. (a) | | | 14,632 | | | 241,574 | |
Medicis Pharmaceutical Corp., Class A | | | 16,608 | | | 633,927 | |
Obagi Medical Products, Inc. (a) | | | 4,556 | | | 42,963 | |
Optimer Pharmaceuticals, Inc. (a) | | | 12,272 | | | 145,914 | |
Pacira Pharmaceuticals, Inc. (a) | | | 1,171 | | | 14,052 | |
Pain Therapeutics, Inc. (a) | | | 10,458 | | | 40,472 | |
Par Pharmaceutical Cos., Inc. (a) | | | 9,788 | | | 322,808 | |
Pernix Therapeutics Holdings (a) | | | 449 | | | 3,821 | |
Pharmacyclics, Inc. (a) | | | 12,519 | | | 130,698 | |
Pozen, Inc. (a) | | | 7,363 | | | 30,925 | |
Prestige Brands Holdings, Inc. (a) | | | 13,213 | | | 169,655 | |
Questcor Pharmaceuticals, Inc. (a) | | | 14,437 | | | 347,932 | |
SIGA Technologies, Inc. (a)(b) | | | 9,633 | | | 93,825 | |
Sagent Pharmaceuticals, Inc. (a) | | | 1,669 | | | 45,030 | |
Salix Pharmaceuticals Ltd. (a) | | | 15,747 | | | 627,203 | |
Santarus, Inc. (a) | | | 14,853 | | | 50,055 | |
Sciclone Pharmaceuticals, Inc. (a) | | | 9,741 | | | 58,836 | |
Spectrum Pharmaceuticals, Inc. (a) | | | 14,269 | | | 132,202 | |
SuperGen, Inc. (a) | | | 15,690 | | | 46,756 | |
Vical, Inc. (a) | | | 19,516 | | | 80,406 | |
Vivus, Inc. (a) | | | 22,486 | | | 183,036 | |
Xenoport, Inc. (a) | | | 9,396 | | | 66,900 | |
Zogenix, Inc. (a) | | | 2,264 | | | 9,079 | |
| | | | | | 6,628,883 | |
Photography — 0.1% | | | | | | | |
Eastman Kodak Co. (a)(b) | | | 72,800 | | | 260,624 | |
Plastics — 0.1% | | | | | | | |
A. Schulman, Inc. | | | 8,356 | | | 210,488 | |
Spartech Corp. (a) | | | 8,411 | | | 51,223 | |
| | | | | | 261,711 | |
Power Transmission Equipment — 0.3% | | | | | | | |
Active Power, Inc. (a) | | | 19,131 | | | 46,871 | |
Advanced Energy Industries, Inc. (a) | | | 11,338 | | | 167,689 | |
Generac Holdings, Inc. (a) | | | 6,488 | | | 125,867 | |
Global Power Equipment Group, Inc. (a) | | | 3,900 | | | 103,428 | |
Maxwell Technologies, Inc. (a) | | | 7,773 | | | 125,845 | |
Powell Industries, Inc. (a) | | | 2,427 | | | 88,586 | |
Power-One, Inc. (a)(b) | | | 18,530 | | | 150,093 | |
Vicor Corp. | | | 5,444 | | | 88,029 | |
| | | | | | 896,408 | |
Precious Metals & Minerals — 0.2% | | | | | | | |
Golden Minerals Co. (a) | | | 3,166 | | | 56,292 | |
Horsehead Holding Corp. (a) | | | 11,884 | | | 158,295 | |
Stillwater Mining Co. (a) | | | 27,539 | | | 606,133 | |
| | | | | | 820,720 | |
Printing & Copying Services — 0.0% | | | | | | | |
Casella Waste Systems, Inc. (a) | | | 7,204 | | | 43,944 | |
Cenveo, Inc. (a) | | | 15,384 | | | 98,458 | |
| | | | | | 142,402 | |
Producer Durables: Miscellaneous — 0.1% | | | | | | | |
Blount International, Inc. (a) | | | 13,348 | | | 233,190 | |
Park-Ohio Holdings Corp. (a) | | | 2,394 | | | 50,609 | |
| | | | | | 283,799 | |
| | |
See Notes to Financial Statements. |
| | |
30 | BLACKROCK SMALL CAP INDEX FUND | JUNE 30, 2011 |
| |
| |
| |
Schedule of Investments (continued) | Master Small Cap Index Series |
| (Percentages shown are based on Net Assets) |
| | | | | | | |
Common Stocks | | Shares | | Value | |
Production Technology Equipment — 1.3% | | | | | | | |
ATMI, Inc. (a) | | | 8,555 | | $ | 174,779 | |
Axcelis Technologies, Inc. (a) | | | 29,877 | | | 48,998 | |
Brooks Automation, Inc. (a) | | | 17,840 | | | 193,743 | |
Cognex Corp. | | | 11,090 | | | 392,919 | |
Cohu, Inc. | | | 6,697 | | | 87,798 | |
Cymer, Inc. (a) | | | 8,188 | | | 405,388 | |
Electro Scientific Industries, Inc. (a) | | | 6,330 | | | 122,169 | |
Entegris, Inc. (a) | | | 36,386 | | | 368,226 | |
FEI Co. (a) | | | 10,426 | | | 398,169 | |
FSI International, Inc. (a) | | | 11,111 | | | 30,444 | |
GSI Group, Inc. (a) | | | 6,468 | | | 77,939 | |
Intevac, Inc. (a) | | | 6,492 | | | 66,283 | |
Kulicke & Soffa Industries, Inc. (a) | | | 19,393 | | | 216,038 | |
LTX-Credence Corp. (a) | | | 13,519 | | | 120,860 | |
MKS Instruments, Inc. | | | 13,996 | | | 369,774 | |
Nanometrics, Inc. (a) | | | 5,269 | | | 100,058 | |
Photronics, Inc. (a) | | | 14,924 | | | 126,406 | |
Rudolph Technologies, Inc. (a) | | | 8,745 | | | 93,659 | |
Tessera Technologies, Inc. (a) | | | 13,716 | | | 235,092 | |
Ultra Clean Holdings, Inc. (a) | | | 6,333 | | | 57,504 | |
Ultratech, Inc. (a) | | | 6,860 | | | 208,407 | |
Veeco Instruments, Inc. (a)(b) | | | 10,946 | | | 529,896 | |
| | | | | | 4,424,549 | |
Publishing — 0.3% | | | | | | | |
AH Belo Corp. | | | 5,346 | | | 39,774 | |
Courier Corp. | | | 3,240 | | | 35,802 | |
The Dolan Co. (a) | | | 8,594 | | | 72,791 | |
Journal Communications, Inc., Class A (a) | | | 11,975 | | | 61,911 | |
Martha Stewart Living Omnimedia, Inc., Class A (a)(b) | | | 7,727 | | | 33,535 | |
McClatchy Co., Class A (a)(b) | | | 15,716 | | | 44,162 | |
Meredith Corp. | | | 9,403 | | | 292,715 | |
The New York Times Co., Class A (a) | | | 35,859 | | | 312,691 | |
Primedia, Inc. | | | 4,008 | | | 28,256 | |
Scholastic Corp. | | | 7,156 | | | 190,350 | |
| | | | | | 1,111,987 | |
Radio & TV Broadcasters — 0.2% | | | | | | | |
Central European Media Enterprises Ltd. (a) | | | 9,594 | | | 189,481 | |
Crown Media Holdings, Inc., Class A (a) | | | 5,512 | | | 10,528 | |
Cumulus Media, Inc., Class A (a) | | | 4,732 | | | 16,562 | |
Entercom Communications Corp. (a) | | | 6,915 | | | 60,022 | |
Entravision Communications Corp., Class A (a) | | | 16,076 | | | 29,741 | |
Fisher Communications, Inc. (a) | | | 2,230 | | | 66,499 | |
Global Traffic Network, Inc. (a) | | | 3,503 | | | 40,249 | |
Gray Television, Inc. (a)(b) | | | 14,595 | | | 38,531 | |
Lin TV Corp., Class A (a) | | | 9,076 | | | 44,200 | |
Nexstar Broadcasting Group, Inc., Class A (a) | | | 2,512 | | | 20,624 | |
Outdoor Channel Holdings, Inc. (a) | | | 2,729 | | | 18,666 | |
Saga Communications, Inc. (a) | | | 769 | | | 28,453 | |
Sinclair Broadcast Group, Inc., Class A | | | 13,488 | | | 148,098 | |
Westwood One, Inc. (a) | | | 722 | | | 3,726 | |
| | | | | | 715,380 | |
Railroad Equipment — 0.1% | | | | | | | |
American Railcar Industries, Inc. (a) | | | 2,764 | | | 64,816 | |
Freightcar America, Inc. (a) | | | 3,280 | | | 83,115 | |
Greenbrier Cos., Inc. (a) | | | 5,072 | | | 100,223 | |
| | | | | | 248,154 | |
| | | | | | | |
Common Stocks | | Shares | | Value | |
Railroads — 0.2% | | | | | | | |
Genesee & Wyoming, Inc., Class A (a) | | | 10,640 | | $ | 623,930 | |
Railamerica, Inc. (a) | | | 5,911 | | | 88,665 | |
| | | | | | 712,595 | |
Real Estate — 0.2% | | | | | | | |
Avatar Holdings, Inc. (a) | | | 2,564 | | | 38,998 | |
Consolidated-Tomoka Land Co. | | | 1,330 | | | 38,038 | |
Forestar Group, Inc. (a) | | | 9,686 | | | 159,141 | |
Griffin Land & Nurseries, Inc. | | | 271 | | | 8,805 | |
HFF, Inc., Class A (a) | | | 7,523 | | | 113,522 | |
Kennedy-Wilson Holdings, Inc. (b) | | | 5,929 | | | 72,630 | |
Tejon Ranch Co. (a) | | | 3,736 | | | 127,398 | |
United Capital Corp. (a) | | | 137 | | | 4,103 | |
| | | | | | 562,635 | |
Real Estate Investment Trusts (REITs) — 7.8% | | | | | | | |
ARMOUR Residential REIT, Inc. | | | 12,150 | | | 89,303 | |
Acadia Realty Trust | | | 11,116 | | | 225,988 | |
Agree Realty Corp. | | | 2,640 | | | 58,951 | |
Alexander’s, Inc. | | | 560 | | | 222,320 | |
American Assets Trust, Inc. | | | 8,998 | | | 202,005 | |
American Campus Communities, Inc. | | | 17,938 | | | 637,158 | |
Anworth Mortgage Asset Corp. | | | 32,736 | | | 245,847 | |
Apollo Commercial Real Estate Finance, Inc. | | | 5,188 | | | 83,631 | |
Ashford Hospitality Trust, Inc. | | | 12,814 | | | 159,534 | |
Associated Estates Realty Corp. | | | 11,580 | | | 188,175 | |
BioMed Realty Trust, Inc. | | | 35,292 | | | 679,018 | |
CBL & Associates Properties, Inc. | | | 39,611 | | | 718,147 | |
Campus Crest Communities, Inc. | | | 8,404 | | | 108,748 | |
CapLease, Inc. | | | 19,056 | | | 93,565 | |
Capstead Mortgage Corp. | | | 20,550 | | | 275,370 | |
Cedar Shopping Centers, Inc. | | | 15,776 | | | 81,246 | |
Chatham Lodging Trust | | | 4,114 | | | 66,277 | |
Chesapeake Lodging Trust | | | 7,660 | | | 130,680 | |
Cogdell Spencer, Inc. | | | 13,646 | | | 81,740 | |
Colonial Properties Trust | | | 22,499 | | | 458,980 | |
Colony Financial, Inc. | | | 9,209 | | | 166,407 | |
Coresite Realty Corp. | | | 5,591 | | | 91,692 | |
Cousins Properties, Inc. | | | 25,155 | | | 214,824 | |
CreXus Investment Corp. | | | 13,961 | | | 155,107 | |
Cypress Sharpridge Investments, Inc. | | | 21,508 | | | 275,518 | |
DCT Industrial Trust, Inc. | | | 66,764 | | | 349,176 | |
DiamondRock Hospitality Co. (b) | | | 45,053 | | | 483,419 | |
Dupont Fabros Technology, Inc. | | | 15,495 | | | 390,474 | |
Dynex Capital Corp. | | | 10,145 | | | 98,204 | |
Eastgroup Properties, Inc. | | | 7,343 | | | 312,151 | |
Education Realty Trust, Inc. | | | 20,271 | | | 173,722 | |
Entertainment Properties Trust | | | 12,567 | | | 586,879 | |
Equity Lifestyle Properties, Inc. | | | 6,876 | | | 429,337 | |
Equity One, Inc. | | | 13,281 | | | 247,558 | |
Excel Trust, Inc. | | | 5,340 | | | 58,900 | |
Extra Space Storage, Inc. | | | 25,370 | | | 541,142 | |
FelCor Lodging Trust, Inc. (a) | | | 34,143 | | | 181,982 | |
First Industrial Realty Trust, Inc. (a) | | | 21,290 | | | 243,771 | |
First Potomac Realty Trust | | | 13,998 | | | 214,309 | |
Franklin Street Properties Corp. | | | 19,259 | | | 248,634 | |
Getty Realty Corp. | | | 6,614 | | | 166,871 | |
Gladstone Commercial Corp. | | | 3,431 | | | 59,459 | |
Glimcher Realty Trust | | | 27,366 | | | 259,977 | |
Government Properties Income Trust | | | 7,693 | | | 207,865 | |
Hatteras Financial Corp. | | | 19,644 | | | 554,550 | |
Healthcare Realty Trust, Inc. | | | 19,588 | | | 404,100 | |
Hersha Hospitality Trust | | | 37,620 | | | 209,543 | |
| | | |
See Notes to Financial Statements. |
| | | |
| BLACKROCK SMALL CAP INDEX FUND | JUNE 30, 2011 | 31 |
| |
| |
| |
Schedule of Investments (continued) | Master Small Cap Index Series |
| (Percentages shown are based on Net Assets) |
| |
| | | | | | | |
Common Stocks | | Shares | | Value | |
Real Estate Investment Trusts (REITs) (concluded) | | | | | | | |
Highwoods Properties, Inc. | | | 19,361 | | $ | 641,430 | |
Home Properties, Inc. | | | 10,360 | | | 630,717 | |
Hudson Pacific Properties, Inc. | | | 5,772 | | | 89,639 | |
Inland Real Estate Corp. | | | 21,364 | | | 188,644 | |
InvesCo. Mortgage Capital, Inc. | | | 18,717 | | | 395,490 | |
Investors Real Estate Trust | | | 22,095 | | | 191,343 | |
iStar Financial, Inc. (a) | | | 25,112 | | | 203,658 | |
Kilroy Realty Corp. | | | 15,739 | | | 621,533 | |
Kite Realty Group Trust | | | 16,180 | | | 80,576 | |
LTC Properties, Inc. | | | 8,295 | | | 230,767 | |
LaSalle Hotel Properties | | | 22,877 | | | 602,580 | |
Lexington Corporate Properties Trust (b) | | | 31,544 | | | 287,997 | |
MFA Financial, Inc. | | | 93,102 | | | 748,540 | |
MPG Office Trust, Inc. (a) | | | 13,761 | | | 39,356 | |
Medical Properties Trust, Inc. | | | 30,454 | | | 350,221 | |
Mid-America Apartment Communities, Inc. | | | 9,712 | | | 655,269 | |
Mission West Properties, Inc. | | | 5,886 | | | 51,679 | |
Monmouth Real Estate Investment Corp., Class A | | | 9,853 | | | 83,258 | |
National Health Investors, Inc. | | | 6,558 | | | 291,372 | |
National Retail Properties, Inc. | | | 22,578 | | | 553,387 | |
Newcastle Investment Corp. | | | 21,566 | | | 124,651 | |
NorthStar Realty Finance Corp. | | | 27,024 | | | 108,907 | |
Omega Healthcare Investors, Inc. | | | 27,086 | | | 569,077 | |
One Liberty Properties, Inc. | | | 3,334 | | | 51,477 | |
PS Business Parks, Inc. | | | 4,966 | | | 273,627 | |
Parkway Properties, Inc. | | | 6,199 | | | 105,755 | |
Pebblebrook Hotel Trust | | | 13,169 | | | 265,882 | |
Pennsylvania Real Estate Investment Trust | | | 15,187 | | | 238,436 | |
PennyMac Mortgage Investment Trust (d) | | | 7,667 | | | 127,042 | |
Post Properties, Inc. | | | 13,394 | | | 545,939 | |
Potlatch Corp. | | | 10,794 | | | 380,704 | |
RAIT Investment Trust (a) | | | 31,427 | | | 65,997 | |
RLJ Lodging Trust (a) | | | 6,502 | | | 112,940 | |
Ramco-Gershenson Properties Trust | | | 10,756 | | | 133,159 | |
Redwood Trust, Inc. (b) | | | 21,295 | | | 321,980 | |
Resource Capital Corp. | | | 18,133 | | | 114,601 | |
Retail Opportunity Investments Corp. | | | 11,524 | | | 123,998 | |
STAG Industrial, Inc. | | | 3,042 | | | 37,265 | |
Sabra Healthcare REIT, Inc. | | | 7,136 | | | 119,243 | |
Saul Centers, Inc. | | | 1,882 | | | 74,094 | |
Sovran Self Storage, Inc. | | | 7,436 | | | 304,876 | |
Starwood Property Trust, Inc. | | | 25,096 | | | 514,719 | |
Strategic Hotel Capital, Inc. (a) | | | 46,376 | | | 328,342 | |
Summit Hotel Properties, Inc. | | | 7,377 | | | 83,729 | |
Sun Communities, Inc. | | | 5,611 | | | 209,346 | |
Sunstone Hotel Investors, Inc. (a) | | | 32,004 | | | 296,677 | |
Tanger Factory Outlet Centers, Inc. | | | 22,005 | | | 589,074 | |
Terreno Realty Corp. | | | 3,047 | | | 51,829 | |
Two Harbors Investment Corp. | | | 22,806 | | | 245,165 | |
UMH Properties, Inc. | | | 4,696 | | | 50,247 | |
U-Store-It Trust | | | 27,021 | | | 284,261 | |
Universal Health Realty Income Trust | | | 3,196 | | | 127,776 | |
Urstadt Biddle Properties, Inc., Class A | | | 6,640 | | | 120,250 | |
Walter Investment Management Corp. | | | 7,064 | | | 156,750 | |
Washington Real Estate Investment Trust | | | 17,588 | | | 571,962 | |
Whitestone REIT | | | 1,296 | | | 16,485 | |
Winthrop Realty Trust | | | 8,015 | | | 95,699 | |
| | | | | | 27,011,671 | |
| | | | | | | |
Common Stocks | | Shares | | Value | |
Recreational Vehicles & Boats — 0.2% | | | | | | | |
Arctic Cat, Inc. (a) | | | 3,496 | | $ | 46,951 | |
Brunswick Corp. | | | 23,981 | | | 489,212 | |
Drew Industries, Inc. | | | 5,218 | | | 128,989 | |
Marine Products Corp. (a) | | | 1,233 | | | 8,286 | |
Winnebago Industries, Inc. (a) | | | 8,168 | | | 78,903 | |
| | | | | | 752,341 | |
Rental & Leasing Services: Consumer — 0.5% | | | | | | | |
Amerco, Inc. (a) | | | 2,328 | | | 223,837 | |
Avis Budget Group, Inc. (a) | | | 28,218 | | | 482,246 | |
Dollar Thrifty Automotive Group, Inc. (a) | | | 7,781 | | | 573,771 | |
Rent-A-Center, Inc. | | | 17,107 | | | 522,790 | |
Zipcar, Inc. (a) | | | 2,500 | | | 51,025 | |
| | | | | | 1,853,669 | |
Restaurants — 1.5% | | | | | | | |
AFC Enterprises, Inc. (a) | | | 6,935 | | | 114,081 | |
BJ’s Restaurants, Inc. (a) | | | 6,440 | | | 337,198 | |
Benihana, Inc., Class A (a) | | | 2,680 | | | 28,113 | |
Biglari Holdings, Inc. (a) | | | 340 | | | 132,957 | |
Bob Evans Farms, Inc. | | | 8,170 | | | 285,705 | |
Bravo Brio Restaurant Group, Inc. (a) | | | 4,992 | | | 121,955 | |
Buffalo Wild Wings, Inc. (a) | | | 4,956 | | | 328,632 | |
CEC Entertainment, Inc. | | | 5,409 | | | 216,955 | |
California Pizza Kitchen, Inc. (a) | | | 5,208 | | | 96,192 | |
Caribou Coffee Co., Inc. (a) | | | 2,990 | | | 39,588 | |
Carrols Restaurant Group, Inc. (a) | | | 2,594 | | | 27,081 | |
The Cheesecake Factory, Inc. (a) | | | 15,549 | | | 487,772 | |
Cracker Barrel Old Country Store, Inc. | | | 6,157 | | | 303,602 | |
Denny’s Corp. (a) | | | 27,573 | | | 106,983 | |
DineEquity, Inc. (a) | | | 4,220 | | | 220,579 | |
Domino’s Pizza, Inc. (a) | | | 16,498 | | | 416,409 | |
Einstein Noah Restaurant Group, Inc. | | | 1,177 | | | 17,620 | |
Ellie Mae, Inc. (a) | | | 1,487 | | | 8,535 | |
Jack in the Box, Inc. (a) | | | 13,393 | | | 305,093 | |
Jamba, Inc. (a) | | | 18,231 | | | 39,014 | |
Krispy Kreme Doughnuts, Inc. (a) | | | 15,863 | | | 150,857 | |
Luby’s, Inc. (a) | | | 2,931 | | | 16,179 | |
McCormick & Schmick’s Seafood Restaurants, Inc. (a) | | | 4,030 | | | 34,618 | |
O’Charleys, Inc. (a) | | | 5,152 | | | 37,661 | |
P.F. Chang’s China Bistro, Inc. | | | 6,132 | | | 246,752 | |
Papa John’s International, Inc. (a) | | | 5,380 | | | 178,939 | |
Red Robin Gourmet Burgers, Inc. (a) | | | 3,550 | | | 129,149 | |
Ruby Tuesday, Inc. (a) | | | 17,592 | | | 189,642 | |
Ruth’s Hospitality Group, Inc. (a) | | | 8,621 | | | 48,364 | |
Sonic Corp. (a) | | | 16,873 | | | 179,360 | |
Texas Roadhouse, Inc., Class A | | | 16,625 | | | 291,519 | |
| | | | | | 5,137,104 | |
Scientific Instruments: Control & Filter — 0.8% | | | | | | | |
Brady Corp. | | | 12,756 | | | 408,957 | |
CIRCOR International, Inc. | | | 4,684 | | | 200,616 | |
ESCO Technologies, Inc. | | | 7,196 | | | 264,813 | |
Energy Recovery, Inc. (a) | | | 12,744 | | | 41,673 | |
The Gorman-Rupp Co. | | | 4,176 | | | 137,557 | |
L-1 Identity Solutions, Inc. (a) | | | 20,213 | | | 237,503 | |
Mine Safety Appliances Co. | | | 7,299 | | | 272,545 | |
PMFG, Inc. (a) | | | 5,013 | | | 99,508 | |
Robbins & Myers, Inc. | | | 10,648 | | | 562,747 | |
Sun Hydraulics, Inc. | | | 3,534 | | | 168,925 | |
Thermon Group Holdings, Inc. (a) | | | 2,168 | | | 26,016 | |
| | |
See Notes to Financial Statements. |
| | |
32 | BLACKROCK SMALL CAP INDEX FUND | JUNE 30, 2011 |
| |
| |
| |
Schedule of Investments (continued) | Master Small Cap Index Series |
| (Percentages shown are based on Net Assets) |
| | | | | | | |
Common Stocks | | Shares | | Value | |
Scientific Instruments: Control & Filter (concluded) | | | | | | | |
Watts Water Technologies, Inc., Class A | | | 8,053 | | $ | 285,157 | |
X-Rite, Inc. (a) | | | 8,429 | | | 41,892 | |
| | | | | | 2,747,909 | |
Scientific Instruments: Electrical — 0.7% | | | | | | | |
A123 Systems, Inc. (a)(b) | | | 23,973 | | | 127,536 | |
A.O. Smith Corp. | | | 10,109 | | | 427,611 | |
AZZ, Inc. | | | 3,402 | | | 155,812 | |
American Superconductor Corp. (a) | | | 12,190 | | | 110,198 | |
Broadwind Energy, Inc. (a) | | | 28,774 | | | 41,722 | |
Coleman Cable, Inc. (a) | | | 1,982 | | | 29,116 | |
Ener1, Inc. (a) | | | 19,667 | | | 21,634 | |
EnerSys (a) | | | 13,433 | | | 462,364 | |
Franklin Electric Co., Inc. | | | 6,294 | | | 295,503 | |
Houston Wire & Cable Co. | | | 5,069 | | | 78,823 | |
Littelfuse, Inc. | | | 6,074 | | | 356,665 | |
Preformed Line Products Co. | | | 551 | | | 39,220 | |
SatCon Technology Corp. (a)(b) | | | 25,649 | | | 61,301 | |
Taser International, Inc. (a) | | | 16,980 | | | 77,259 | |
Valence Technology, Inc. (a) | | | 16,291 | | | 19,223 | |
| | | | | | 2,303,987 | |
Scientific Instruments: Gauges & Meters — 0.2% | | | | | | | |
Badger Meter, Inc. | | | 4,063 | | | 150,290 | |
Faro Technologies, Inc. (a) | | | 4,446 | | | 194,735 | |
Measurement Specialties, Inc. (a) | | | 4,126 | | | 147,298 | |
Vishay Precision Group, Inc. (a) | | | 2,917 | | | 49,239 | |
Zygo Corp. (a) | | | 4,684 | | | 61,923 | |
| | | | | | 603,485 | |
Scientific Instruments: Pollution Control — 0.5% | | | | | | | |
Clean Harbors, Inc. (a) | | | 6,319 | | | 652,437 | |
Darling International, Inc. (a) | | | 31,338 | | | 554,683 | |
EnergySolutions, Inc. | | | 21,816 | | | 107,771 | |
Fuel Tech, Inc. (a) | | | 5,194 | | | 34,436 | |
Heritage-Crystal Clean, Inc. (a) | | | 949 | | | 18,202 | |
Met-Pro Corp. | | | 4,635 | | | 52,746 | |
Metalico, Inc. (a) | | | 10,762 | | | 63,496 | |
TRC Cos., Inc. (a) | | | 3,974 | | | 24,838 | |
Team, Inc. (a) | | | 5,265 | | | 127,044 | |
US Ecology, Inc. | | | 5,213 | | | 89,142 | |
WCA Waste Corp. (a) | | | 2,705 | | | 15,581 | |
| | | | | | 1,740,376 | |
Securities Brokerage & Services — 0.5% | | | | | | | |
BGC Partners, Inc. | | | 19,651 | | | 151,902 | |
FXCM Inc. | | | 4,942 | | | 49,025 | |
GFI Group, Inc. | | | 19,147 | | | 87,885 | |
Gain Capital Holdings, Inc. (a) | | | 1,501 | | | 10,222 | |
Gladstone Investment Corp. | | | 6,682 | | | 47,710 | |
International FCStone, Inc. (a) | | | 3,747 | | | 90,715 | |
Investment Technology Group, Inc. (a) | | | 11,141 | | | 156,197 | |
KBW, Inc. | | | 9,685 | | | 181,110 | |
Knight Capital Group, Inc., Class A (a) | | | 27,018 | | | 297,738 | |
Ladenburg Thalmann Financial Services, Inc. (a) | | | 28,848 | | | 39,810 | |
MF Global Holdings Ltd. (a) | | | 43,457 | | | 336,357 | |
MarketAxess Holdings, Inc. | | | 7,684 | | | 192,561 | |
optionsXpress Holdings, Inc. | | | 11,552 | | | 192,687 | |
SWS Group, Inc. | | | 8,270 | | | 49,537 | |
| | | | | | 1,883,456 | |
| | | | | | | |
Common Stocks | | | Shares | | Value | |
Semiconductors & Components — 2.7% | | | | | | | |
AXT, Inc. (a) | | | 8,873 | | $ | 75,243 | |
Advanced Analogic Technologies, Inc. (a) | | | 11,876 | | | 71,909 | |
Aeroflex Holding Corp. (a) | | | 5,025 | | | 91,204 | |
Alpha & Omega Semiconductor, Ltd. (a) | | | 3,022 | | | 40,041 | |
Amkor Technology, Inc. (a) | | | 28,380 | | | 175,105 | |
Amtech Systems, Inc. (a) | | | 2,421 | | | 49,969 | |
Anadigics, Inc. (a) | | | 18,044 | | | 57,921 | |
Applied Micro Circuits Corp. (a) | | | 17,384 | | | 154,022 | |
Cavium, Inc. (a) | | | 13,031 | | | 568,021 | |
Ceva, Inc. (a) | | | 6,279 | | | 191,258 | |
Cirrus Logic, Inc. (a) | | | 17,882 | | | 284,324 | |
DSP Group, Inc. (a) | | | 6,828 | | | 59,404 | |
Diodes, Inc. (a) | | | 9,420 | | | 245,862 | |
eMagin Corp. (a) | | | 4,226 | | | 25,652 | |
Emcore Corp. (a) | | | 22,116 | | | 60,598 | |
Entropic Communications, Inc. (a)(b) | | | 22,782 | | | 202,532 | |
Exar Corp. (a) | | | 10,113 | | | 64,015 | |
Formfactor, Inc. (a) | | | 13,876 | | | 125,717 | |
Hittite Microwave Corp. (a) | | | 8,304 | | | 514,101 | |
IXYS Corp. (a) | | | 6,787 | | | 101,669 | |
Inphi Corp. (a) | | | 5,205 | | | 90,567 | |
Integrated Device Technology, Inc. (a) | | | 40,031 | | | 314,644 | |
Integrated Silicon Solutions, Inc. (a) | | | 7,276 | | | 70,359 | |
Kopin Corp. (a) | | | 17,986 | | | 84,714 | |
Lattice Semiconductor Corp. (a) | | | 31,838 | | | 207,584 | |
MIPS Technologies, Inc. (a) | | | 14,324 | | | 98,979 | |
MaxLinear, Inc., Class A (a) | | | 3,577 | | | 30,977 | |
Micrel, Inc. | | | 13,722 | | | 145,179 | |
Microsemi Corp. (a) | | | 23,075 | | | 473,037 | |
Mindspeed Technologies, Inc. (a) | | | 9,083 | | | 72,664 | |
Monolithic Power Systems, Inc. (a) | | | 8,201 | | | 126,459 | |
MoSys, Inc. (a) | | | 9,544 | | | 54,878 | |
Netlogic Microsystems, Inc. (a) | | | 18,300 | | | 739,686 | |
Omnivision Technologies, Inc. (a) | | | 15,526 | | | 540,460 | |
PLX Technology, Inc. (a) | | | 11,333 | | | 39,325 | |
Pericom Semiconductor Corp. (a) | | | 7,014 | | | 62,705 | |
Power Integrations, Inc. | | | 7,599 | | | 292,030 | |
RF Micro Devices, Inc. (a) | | | 74,166 | | | 453,896 | |
Rambus, Inc. (a) | | | 25,999 | | | 381,665 | |
Rubicon Technology, Inc. (a)(b) | | | 4,739 | | | 79,900 | |
Semtech Corp. (a) | | | 17,559 | | | 480,063 | |
Sigma Designs, Inc. (a) | | | 8,667 | | | 66,216 | |
Silicon Image, Inc. (a) | | | 21,671 | | | 139,995 | |
Spansion, Inc., Class A (a) | | | 13,037 | | | 251,223 | |
Standard Microsystems Corp. (a) | | | 6,297 | | | 169,956 | |
Supertex, Inc. (a) | | | 2,804 | | | 62,810 | |
TriQuint Semiconductor, Inc. (a) | | | 44,215 | | | 450,551 | |
Volterra Semiconductor Corp. (a) | | | 6,691 | | | 165,000 | |
Zoran Corp. (a) | | | 13,603 | | | 114,265 | |
| | | | | | 9,418,354 | |
Shipping — 0.5% | | | | | | | |
Baltic Trading Ltd. | | | 4,859 | | | 27,891 | |
DHT Holdings, Inc. | | | 18,435 | | | 70,606 | |
Eagle Bulk Shipping, Inc. (a)(b) | | | 16,811 | | | 41,691 | |
Excel Maritime Carriers Ltd. (a)(b) | | | 11,924 | | | 36,964 | |
Frontline, Ltd. | | | 13,530 | | | 199,432 | |
Genco Shipping & Trading Ltd. (a)(b) | | | 8,003 | | | 60,183 | |
General Maritime Corp. (b) | | | 28,973 | | | 39,114 | |
Gulfmark Offshore, Inc., Class A (a) | | | 6,386 | | | 282,197 | |
International Shipholding Corp. | | | 1,681 | | | 35,772 | |
Knightsbridge Tankers Ltd. (b) | | | 6,149 | | | 135,463 | |
Nordic American Tanker Shipping Ltd. (b) | | | 12,747 | | | 289,867 | |
| | | |
See Notes to Financial Statements. |
| | | |
| BLACKROCK SMALL CAP INDEX FUND | JUNE 30, 2011 | 33 |
| |
|
Schedule of Investments (continued) | Master Small Cap Index Series
(Percentages shown are based on Net Assets) |
| | | | | | | |
Common Stocks | | | Shares | | | Value | |
Shipping (concluded) | | | | | | | |
Overseas Shipholding Group, Inc. | | | 6,993 | | $ | 188,391 | |
Scorpio Tankers, Inc. (a) | | | 6,498 | | | 64,915 | |
Ship Finance International Ltd. (b) | | | 12,212 | | | 220,060 | |
Teekay Tankers Ltd., Class A (b) | | | 11,115 | | | 104,481 | |
Ultrapetrol Bahamas Ltd. (a) | | | 6,259 | | | 30,919 | |
| | | | | | 1,827,946 | |
Specialty Retail — 3.2% | | | | | | | |
1-800-FLOWERS.COM, Inc., Class A (a) | | | 4,764 | | | 14,768 | |
ANN, Inc. (a) | | | 14,009 | | | 365,635 | |
Aéropostale, Inc. (a) | | | 21,442 | | | 375,235 | |
America’s Car Mart, Inc. (a) | | | 2,552 | | | 84,216 | |
Asbury Automotive Group, Inc. (a) | | | 7,939 | | | 147,110 | |
Ascena Retail Group, Inc. (a) | | | 16,771 | | | 571,053 | |
Barnes & Noble, Inc. | | | 7,834 | | | 129,888 | |
bebe Stores, Inc. | | | 10,195 | | | 62,291 | |
Big 5 Sporting Goods Corp. | | | 6,191 | | | 48,661 | |
Blue Nile, Inc. (a) | | | 3,487 | | | 153,358 | |
Body Central Corp. (a) | | | 2,991 | | | 70,378 | |
Brown Shoe Co., Inc. | | | 11,752 | | | 125,159 | |
The Buckle, Inc. | | | 7,271 | | | 310,472 | |
Build-A-Bear Workshop, Inc. (a) | | | 4,884 | | | 31,795 | |
Cabela’s, Inc., Class A (a) | | | 11,540 | | | 313,311 | |
Casual Male Retail Group, Inc. (a) | | | 12,138 | | | 50,373 | |
The Cato Corp., Class A | | | 7,496 | | | 215,885 | |
Charming Shoppes, Inc. (a) | | | 31,510 | | | 131,082 | |
The Children’s Place Retail Stores, Inc. (a) | | | 7,001 | | | 311,474 | |
Christopher & Banks Corp. | | | 9,978 | | | 57,374 | |
Citi Trends, Inc. (a) | | | 4,046 | | | 61,014 | |
Coldwater Creek, Inc. (a) | | | 15,941 | | | 22,317 | |
Collective Brands, Inc. (a) | | | 16,515 | | | 242,605 | |
Conn’s, Inc. (a) | | | 3,338 | | | 28,874 | |
Cost Plus, Inc. (a) | | | 4,764 | | | 47,640 | |
Destination Maternity Corp. | | | 2,883 | | | 57,602 | |
Express, Inc. | | | 14,595 | | | 318,171 | |
The Finish Line, Inc., Class A | | | 13,939 | | | 298,295 | |
Genesco, Inc. (a) | | | 6,379 | | | 332,346 | |
Group 1 Automotive, Inc. | | | 6,475 | | | 266,640 | |
Haverty Furniture Cos., Inc. | | | 5,411 | | | 62,281 | |
hhgregg, Inc. (a)(b) | | | 4,686 | | | 62,792 | |
Hibbett Sports, Inc. (a) | | | 7,420 | | | 302,068 | |
Hot Topic, Inc. | | | 12,067 | | | 89,778 | |
Jos. A. Bank Clothiers, Inc. (a) | | | 7,441 | | | 372,124 | |
Lithia Motors, Inc., Class A | | | 5,944 | | | 116,681 | |
Lumber Liquidators Holdings, Inc. (a) | | | 6,258 | | | 158,953 | |
MarineMax, Inc. (a) | | | 6,642 | | | 58,184 | |
Men’s Wearhouse, Inc. | | | 13,838 | | | 466,341 | |
Monro Muffler, Inc. | | | 8,237 | | | 307,158 | |
New York & Co. (a) | | | 6,435 | | | 31,853 | |
Nu Skin Enterprises, Inc., Class A | | | 14,595 | | | 548,042 | |
Office Depot, Inc. (a) | | | 73,651 | | | 310,807 | |
OfficeMax, Inc. (a)(b) | | | 23,120 | | | 181,492 | |
Pacific Sunwear of California, Inc. (a) | | | 13,666 | | | 35,668 | |
Penske Auto Group, Inc. | | | 12,024 | | | 273,426 | |
The Pep Boys — Manny, Moe & Jack | | | 14,293 | | | 156,222 | |
Pier 1 Imports, Inc. (a) | | | 28,681 | | | 331,839 | |
Regis Corp. | | | 15,500 | | | 237,460 | |
Rue21, Inc. (a) | | | 4,066 | | | 132,145 | |
Shoe Carnival, Inc. (a) | | | 2,508 | | | 75,616 | |
Shutterfly, Inc. (a) | | | 8,017 | | | 460,336 | |
Sonic Automotive, Inc. | | | 10,882 | | | 159,421 | |
Stage Stores, Inc. | | | 9,762 | | | 164,002 | |
| | | | | | | |
Common Stocks | | Shares | | Value | |
Specialty Retail (concluded) | | | | | | | |
Stamps.com, Inc. | | | 3,243 | | $ | 43,262 | |
Stein Mart, Inc. | | | 7,314 | | | 70,507 | |
Syms Corp. (a) | | | 1,173 | | | 12,645 | |
Systemax, Inc. (a) | | | 2,908 | | | 43,446 | |
The Talbots, Inc. (a)(b) | | | 18,899 | | | 63,123 | |
Vitamin Shoppe, Inc. (a) | | | 6,611 | | | 302,519 | |
The Wet Seal, Inc., Class A (a) | | | 27,612 | | | 123,426 | |
Zale Corp. (a) | | | 8,386 | | | 46,962 | |
Zumiez, Inc. (a) | | | 5,720 | | | 142,828 | |
| | | | | | 11,188,429 | |
Steel — 0.1% | | | | | | | |
Handy & Harman Ltd. (a) | | | 1,262 | | | 19,422 | |
Olympic Steel, Inc. | | | 2,501 | | | 68,852 | |
Shiloh Industries, Inc. | | | 497 | | | 5,358 | |
TMS International Corp. (a) | | | 3,028 | | | 39,515 | |
Universal Stainless & Alloy Products, Inc. (a) | | | 1,918 | | | 89,686 | |
| | | | | | 222,833 | |
Sugar — 0.0% | | | | | | | |
Imperial Sugar Co., New Shares | | | 3,279 | | | 65,580 | |
Synthetic Fibers & Chemicals — 0.0% | | | | | | | |
Zoltek Cos., Inc. (a) | | | 7,558 | | | 79,586 | |
Technology: Miscellaneous — 0.4% | | | | | | | |
Benchmark Electronics, Inc. (a) | | | 16,364 | | | 270,006 | |
CTS Corp. | | | 9,270 | | | 89,641 | |
Fabrinet (a) | | | 5,275 | | | 128,077 | |
Plexus Corp. (a) | | | 10,121 | | | 352,312 | |
Sanmina-SCI Corp. (a) | | | 21,706 | | | 224,223 | |
Vocus, Inc. (a) | | | 4,738 | | | 145,030 | |
| | | | | | 1,209,289 | |
Telecommunications Equipment — 0.2% | | | | | | | |
Arris Group, Inc. (a) | | | 33,395 | | | 387,716 | |
Brightpoint, Inc. (a) | | | 18,722 | | | 151,835 | |
Communications Systems, Inc. | | | 1,254 | | | 22,484 | |
OpNext, Inc. (a) | | | 10,681 | | | 24,353 | |
Powerwave Technologies, Inc. (a) | | | 45,740 | | | 134,933 | |
Symmetricom, Inc. (a) | | | 12,132 | | | 70,730 | |
| | | | | | 792,051 | |
Textile Products — 0.1% | | | | | | | |
Interface, Inc., Class A | | | 14,092 | | | 272,962 | |
Unifi, Inc. (a) | | | 4,056 | | | 55,973 | |
| | | | | | 328,935 | |
Textiles, Apparel & Shoes — 1.6% | | | | | | | |
Carter’s, Inc. (a) | | | 13,249 | | | 407,539 | |
Cherokee, Inc. | | | 2,365 | | | 40,583 | |
Columbia Sportswear Co. | | | 3,151 | | | 199,773 | |
Crocs, Inc. (a) | | | 23,037 | | | 593,203 | |
Delta Apparel, Inc. (a) | | | 1,395 | | | 23,715 | |
G-III Apparel Group, Ltd. (a) | | | 4,357 | | | 150,229 | |
Iconix Brand Group, Inc. (a) | | | 19,633 | | | 475,119 | |
The Jones Group, Inc. | | | 23,422 | | | 254,129 | |
K-Swiss, Inc., Class A (a) | | | 7,370 | | | 78,343 | |
Kenneth Cole Productions, Inc., Class A (a) | | | 2,350 | | | 29,352 | |
Liz Claiborne, Inc. (a) | | | 25,780 | | | 137,923 | |
Maidenform Brands, Inc. (a) | | | 6,400 | | | 177,024 | |
Oxford Industries, Inc. | | | 3,513 | | | 118,599 | |
Perry Ellis International, Inc. (a) | | | 3,337 | | | 84,259 | |
Quiksilver, Inc. (a) | | | 35,103 | | | 164,984 | |
R.G. Barry Corp. | | | 2,519 | | | 28,414 | |
| | | |
See Notes to Financial Statements. | | |
| |
|
34 | BLACKROCK SMALL CAP INDEX FUND | JUNE 30, 2011 | |
| |
|
Schedule of Investments (continued) | Master Small Cap Index Series
(Percentages shown are based on Net Assets) |
| | | | | | | |
Common Stocks | | Shares | | Value | |
Textiles, Apparel & Shoes (concluded) | | | | | | | |
Skechers U.S.A., Inc., Class A (a) | | | 9,966 | | $ | 144,308 | |
Steven Madden Ltd. (a) | | | 10,226 | | | 383,577 | |
Timberland Co., Class A (a) | | | 10,674 | | | 458,662 | |
True Religion Apparel, Inc. (a) | | | 6,969 | | | 202,659 | |
Vera Bradley, Inc. (a) | | | 5,252 | | | 200,626 | |
The Warnaco Group, Inc. (a) | | | 11,817 | | | 617,438 | |
Weyco Group, Inc. | | | 2,078 | | | 51,119 | |
Wolverine World Wide, Inc. | | | 13,325 | | | 556,319 | |
| | | | | | 5,577,896 | |
Tobacco — 0.2% | | | | | | | |
Alliance One International, Inc. (a) | | | 23,287 | | | 75,217 | |
Star Scientific, Inc. (a)(b) | | | 28,652 | | | 128,934 | |
Universal Corp. | | | 6,123 | | | 230,653 | |
Vector Group Ltd. | | | 12,444 | | | 221,379 | |
| | | | | | 656,183 | |
Toys — 0.1% | | | | | | | |
Jakks Pacific, Inc. (a) | | | 7,502 | | | 138,112 | |
Leapfrog Enterprises, Inc. (a) | | | 10,609 | | | 44,770 | |
| | | | | | 182,882 | |
Transportation Miscellaneous — 0.2% | | | | | | | |
Echo Global Logistics, Inc. (a) | | | 3,203 | | | 56,853 | |
HUB Group, Inc., Class A (a) | | | 9,958 | | | 375,018 | |
Odyssey Marine Exploration, Inc. (a) | | | 17,445 | | | 54,603 | |
Pacer International, Inc. (a) | | | 9,452 | | | 44,614 | |
Textainer Group Holdings Ltd. | | | 2,919 | | | 89,730 | |
| | | | | | 620,818 | |
Truckers — 0.7% | | | | | | | |
Arkansas Best Corp. | | | 6,894 | | | 163,595 | |
Celadon Group, Inc. (a) | | | 5,506 | | | 76,864 | |
Covenant Transport Group, Class A (a) | | | 1,275 | | | 9,881 | |
Forward Air Corp. | | | 7,931 | | | 267,989 | |
Heartland Express, Inc. | | | 13,652 | | | 226,077 | |
Knight Transportation, Inc. | | | 16,291 | | | 276,784 | |
Marten Transport Ltd. | | | 4,391 | | | 94,846 | |
Old Dominion Freight Line, Inc. (a) | | | 12,646 | | | 471,696 | |
Patriot Transportation Holding, Inc. (a) | | | 1,417 | | | 31,698 | |
Quality Distribution, Inc. (a) | | | 3,665 | | | 47,718 | |
Roadrunner Transportation Systems, Inc. (a) | | | 2,690 | | | 40,565 | |
Saia, Inc. (a) | | | 4,386 | | | 74,343 | |
Swift Transportation Co. (a) | | | 20,993 | | | 284,455 | |
Universal Truckload Services, Inc. (a) | | | 580 | | | 9,935 | |
Werner Enterprises, Inc. | | | 11,689 | | | 292,809 | |
| | | | | | 2,369,255 | |
Utilities: Electrical — 1.8% | | | | | | | |
Allete, Inc. | | | 8,522 | | | 349,743 | |
Atlantic Power Corp. (a) | | | 17,772 | | | 270,490 | |
Avista Corp. | | | 15,192 | | | 390,282 | |
Black Hills Corp. | | | 10,576 | | | 318,232 | |
CH Energy Group, Inc. | | | 4,311 | | | 229,604 | |
Central Vermont Public Service Corp. | | | 3,667 | | | 132,562 | |
Cleco Corp. | | | 16,362 | | | 570,216 | |
Dynegy, Inc. (a) | | | 28,202 | | | 174,570 | |
El Paso Electric Co. | | | 11,456 | | | 370,029 | |
The Empire District Electric Co. | | | 11,226 | | | 216,213 | |
IDACORP, Inc. | | | 13,253 | | | 523,493 | |
MGE Energy, Inc. | | | 6,334 | | | 256,717 | |
NorthWestern Corp. | | | 9,745 | | | 322,657 | |
| | | | | | | |
Common Stocks | | Shares | | Value | |
Utilities: Electrical (concluded) | | | | | | | |
Otter Tail Corp. | | | 9,796 | | $ | 206,696 | |
PNM Resources, Inc. | | | 23,365 | | | 391,130 | |
Pike Electric Corp. (a) | | | 4,786 | | | 42,308 | |
Portland General Electric Co. | | | 20,206 | | | 510,808 | |
UIL Holdings Corp. | | | 13,638 | | | 441,189 | |
Unisource Energy Corp. | | | 9,854 | | | 367,850 | |
Unitil Corp. | | | 3,236 | | | 85,107 | |
| | | | | | 6,169,896 | |
Utilities: Gas Distributors — 1.1% | | | | | | | |
Chesapeake Utilities Corp. | | | 2,670 | | | 106,880 | |
The Laclede Group, Inc. | | | 6,073 | | | 229,742 | |
New Jersey Resources Corp. | | | 11,089 | | | 494,680 | |
Nicor, Inc. | | | 12,185 | | | 667,007 | |
Northwest Natural Gas Co. | | | 7,102 | | | 320,513 | |
Piedmont Natural Gas Co. | | | 19,263 | | | 582,898 | |
South Jersey Industries, Inc. | | | 8,069 | | | 438,228 | |
Southwest Gas Corp. | | | 12,251 | | | 473,011 | |
WGL Holdings, Inc. | | | 13,643 | | | 525,119 | |
| | | | | | 3,838,078 | |
Utilities: Miscellaneous — 0.0% | | | | | | | |
Ormat Technologies, Inc. | | | 4,339 | | | 95,501 | |
Utilities: Telecommunications — 1.0% | | | | | | | |
8x8, Inc. (a) | | | 16,098 | | | 78,719 | |
Alaska Communications Systems Group, Inc. | | | 12,675 | | | 112,427 | |
Atlantic Tele-Network, Inc. | | | 2,567 | | | 98,470 | |
Boingo Wireless, Inc. (a) | | | 1,305 | | | 11,849 | |
Cbeyond Communications, Inc. (a) | | | 7,559 | | | 100,006 | |
Cincinnati Bell, Inc. (a) | | | 54,680 | | | 181,538 | |
Cogent Communications Group, Inc. (a) | | | 12,585 | | | 214,071 | |
Consolidated Communications Holdings, Inc. | | | 7,053 | | | 137,110 | |
Fairpoint Communications, Inc. (a) | | | 5,360 | | | 49,366 | |
General Communication, Inc., Class A (a) | | | 11,677 | | | 140,941 | |
Global Crossing Ltd. (a) | | | 8,311 | | | 318,976 | |
Globalstar, Inc. (a)(b) | | | 26,299 | | | 32,348 | |
HickoryTech Corp. | | | 2,507 | | | 29,783 | |
ICO Global Communications Holdings Ltd. (a) | | | 38,338 | | | 106,196 | |
IDT Corp., Class B | | | 3,794 | | | 102,514 | |
inContact, Inc. (a) | | | 7,255 | | | 34,461 | |
Iridium Communications, Inc. (a)(b) | | | 11,285 | | | 97,615 | |
j2 Global Communications, Inc. (a) | | | 12,439 | | | 351,153 | |
Leap Wireless International, Inc. (a) | | | 16,334 | | | 265,101 | |
NTELOS Holdings Corp. | | | 8,160 | | | 166,627 | |
Neutral Tandem, Inc. (a) | | | 9,144 | | | 159,289 | |
ORBCOMM, Inc. (a) | | | 7,056 | | | 22,085 | |
PAETEC Holding Corp. (a) | | | 34,397 | | | 164,762 | |
Premiere Global Services, Inc. (a) | | | 14,439 | | | 115,223 | |
Shenandoah Telecom Co. | | | 6,683 | | | 113,745 | |
SureWest Communications | | | 3,170 | | | 53,003 | |
Towerstream Corp. (a) | | | 8,319 | | | 41,512 | |
USA Mobility, Inc. | | | 5,854 | | | 89,332 | |
Vonage Holdings Corp. (a) | | | 37,196 | | | 164,034 | |
| | | | | | 3,552,256 | |
Utilities: Water — 0.2% | | | | | | | |
American States Water Co. | | | 5,040 | | | 174,687 | |
Artesian Resources Corp., Class A | | | 2,270 | | | 40,906 | |
California Water Service Group | | | 10,803 | | | 202,124 | |
Connecticut Water Service, Inc. | | | 2,511 | | | 64,231 | |
Consolidated Water Co., Inc. | | | 4,273 | | | 39,696 | |
Middlesex Water Co. | | | 4,428 | | | 82,272 | |
| | | |
See Notes to Financial Statements. | | |
| |
|
| BLACKROCK SMALL CAP INDEX FUND | JUNE 30, 2011 | 35 |
| |
|
Schedule of Investments (continued) | Master Small Cap Index Series
(Percentages shown are based on Net Assets) |
| | | | | | | |
Common Stocks | | | Shares | | Value | |
Utilities: Water (concluded) | | | | | | | |
Pennichuck Corp. | | | 551 | | $ | 15,841 | |
SJW Corp. | | | 3,647 | | | 88,403 | |
York Water Co. | | | 3,878 | | | 64,181 | |
| | | | | | 772,341 | |
Total Common Stocks — 97.0% | | | | | | 335,896,907 | |
| | | | | | | |
|
Investment Companies | | | | | | | |
Asset Management & Custodian — 0.2% | | | | | | | |
BlackRock Kelso Capital Corp. (d) | | | 19,817 | | | 177,758 | |
Gladstone Capital Corp. | | | 5,990 | | | 55,348 | |
Hercules Technology Growth Capital, Inc. | | | 12,157 | | | 127,892 | |
Pennantpark Investment Corp. | | | 12,406 | | | 139,071 | |
Prospect Capital Corp. | | | 26,418 | | | 267,086 | |
| | | | | | 767,155 | |
Total Investment Companies — 0.2% | | | | | | 767,155 | |
| | | | | | | |
| | | | | | | |
| | | | | | | |
Other Interests (e) | | Beneficial
Interest
(000) | | | | |
Diversified Financial Services — 0.0% | | | | | | | |
Student Loan Corp. | | $ | 1 | | | 2,600 | |
Total Other Interests — 0.0% | | | | | | 2,600 | |
| | | | | | | |
| | | | | | | |
| | | | | | | |
Warrants (f) | | | Shares | | | | |
Alternative Energy — 0.0% | | | | | | | |
GreenHunter Energy, Inc. (Expires 8/27/11) (b)(g) | | | 180 | | | — | |
Total Warrants — 0.0% | | | | | | — | |
Total Long-Term Investments
(Cost — $238,117,513) — 97.2% | | | | | | 336,666,662 | |
| | | | | | | |
Short-Term Securities | | | Shares | | Value | |
BlackRock Liquidity Funds, TempFund,
Institutional Class, 0.09% (d)(h) | | | 5,123,615 | | $ | 5,123,615 | |
| | | | | | | |
| | Beneficial
Interest
(000) | | | | |
BlackRock Liquidity Series, LLC Money Market
Series, 0.07% (d)(h)(i) | | $ | 7,981 | | | 7,981,404 | |
Total Short-Term Securities
(Cost — $13,105,019) — 3.8% | | | | | | 13,105,019 | |
Total Investments Before Short Positions
(Cost — $251,222,532*) — 101.0% | | | | | | 349,771,681 | |
| | | | | | | |
|
Short Positions (j) | | | Shares | | | | |
Banks: Savings, Thrift & Mortgage
Lending — (0.0%) | | | | | | | |
People’s United Financial, Inc. | | | 9,086 | | | (122,116 | ) |
Total Short Positions
(Proceeds — $120,530) — (0.0%) | | | | | | (122,116 | ) |
Total Investments, Net of Short Positions
(Cost — $251,102,002) — 101.0% | | | | | | 349,649,565 | |
Liabilities in Excess of Other Assets — (1.0%) | | | | | | (3,517,084 | ) |
Net Assets — 100.0% | | | | | $ | 346,132,481 | |
| |
|
* | The cost and unrealized appreciation (depreciation) of investments as of June 30, 2011, as computed for federal income tax purposes, were as follows: |
| | | | |
Aggregate cost | | $ | 263,502,286 | |
Gross unrealized appreciation | | $ | 120,435,519 | |
Gross unrealized depreciation | | | (34,166,124 | ) |
Net unrealized appreciation | | $ | 86,269,395 | |
| |
(a) | Non-income producing security. |
| |
(b) | Security, or a portion of security, is on loan. |
| |
(c) | All or a portion of security has been pledged as collateral in connection with open financial futures contracts. |
| | | |
See Notes to Financial Statements. | | |
| |
|
36 | BLACKROCK SMALL CAP INDEX FUND | JUNE 30, 2011 | |
| |
|
Schedule of Investments (continued) | Master Small Cap Index Series |
| |
(d) | Investments in companies considered to be an affiliate of the Series during the year, for purposes of Section 2(a)(3) of the Investment Company Act of 1940, as amended, were as follows: |
| | | | | | | | | | | | | | | | | | | | | | |
Affiliate | | Shares/
Beneficial
Interest Held
at December 31,
2010 | | Shares
Purchased | | Shares/
Beneficial
Interest
Sold | | Shares/
Beneficial
Interest Held
at June 30,
2011 | | Value
at June 30,
2011 | | Realized
Loss | | Income | |
BlackRock Kelso Capital Corp | | | 20,122 | | | 1,268 | | | (1,573 | ) | | 19,817 | | $ | 177,758 | | $ | (2,773 | ) | $ | 13,284 | |
BlackRock Liquidity Funds, TempFund, Institutional Class | | | 7,181,244 | | | — | | | (2,057,629 | )1 | | 5,123,615 | | $ | 5,123,615 | | | — | | $ | 4,665 | |
BlackRock Liquidity Series, LLC Money Market Series | | $ | 8,152,630 | | | — | | $ | (171,226 | )1 | $ | 7,981,404 | | $ | 7,981,404 | | | — | | $ | 128,098 | |
PennyMac Mortgage Investment Trust | | | 5,329 | | | 3,642 | | | (1,304 | ) | | 7,667 | | $ | 127,042 | | $ | (2,530 | ) | $ | 5,409 | |
| | |
| 1 | Represents net shares/beneficial interest sold. |
| |
(e) | Other interests represent beneficial interest in liquidation trusts and other reorganization entities and are non-income producing. |
| |
(f) | Warrants entitle the Series to purchase a predetermined number of shares of common stock and are non-income producing. The purchase price and number of shares are subject to adjustment under certain conditions until the expiration date, if any. |
| |
(g) | Restricted security as to resale, representing 0.0% of net assets was as follows: |
| | | | | | | | | | |
Issue | | Acquisition
Date | | | Cost | | | Value | |
GreenHunter Energy, Inc. | | | 6/27/08 | | | — | | | — | |
| |
(h) | Represents the current yield as of report date. |
| |
(i) | Security was purchased with the cash collateral from loaned securities. |
| |
(j) | In order to track the performance of its benchmark index, the Series sold non-index securities that it subsequently received in corporate actions occurring on the opening of market trading on the following business day. |
| |
• | Financial futures contracts purchased as of June 30, 2011 were as follows: |
| | | | | | | | | | |
Contracts | | Issue | | Exchange | | Expiration
Date | | Notional
Value | | Unrealized
Appreciation |
115 | | Russell | | ICE Futures | | September | | $ 9,492,100 | | $ 254,499 |
| | 2000 EMINI | | US Indices | | 2011 | | | | |
| | |
• | For Series compliance purposes, the Series’ industry classifications refer to any one or more of the industry sub-classifications used by one or more widely recognized market indexes or rating group indexes, and/or as defined by Series’ management. This definition may not apply for purposes of this report, which may combine such industry sub-classifications for reporting ease. |
| |
• | Fair Value Measurements — Various inputs are used in determining the fair value of investments and derivative financial instruments. These inputs are summarized in three broad levels for financial statement purposes as follows: |
| |
| • | Level 1 — price quotations in active markets/exchanges for identical assets and liabilities |
| | |
| • | Level 2 — other observable inputs (including, but not limited to: quoted prices for similar assets or liabilities in markets that are active, quoted prices for identical or similar assets or liabilities in markets that are not active, inputs other than quoted prices that are observable for the assets or liabilities (such as interest rates, yield curves, volatilities, prepayment speeds, loss severities, credit risks and default rates) or other market-corroborated inputs) |
| | |
| • | Level 3 — unobservable inputs based on the best information available in the circumstances, to the extent observable inputs are not available (including the Series’ own assumptions used in determining the fair value of investments and derivative financial instruments) |
| | |
| The categorization of a value determined for investments and derivative financial instruments is based on the pricing transparency of the investment and derivative financial instrument and does not necessarily correspond to the Series’ perceived risk of investing in those securities. For information about the Series’ policy regarding valuation of investments and derivative financial instruments and other significant accounting policies, please refer to Note 1 of the Notes to Financial Statements. |
| | | |
See Notes to Financial Statements. | | |
| |
|
| BLACKROCK SMALL CAP INDEX FUND | JUNE 30, 2011 | 37 |
| |
| |
| |
Schedule of Investments (concluded) | Master Small Cap Index Series |
The following tables summarize the inputs used as of June 30, 2011 in determining the fair valuation of the Series’ investments and derivative financial instruments:
| | | | | | | | | | | | | |
| | | | | | | | | |
Valuation Inputs | | Level 1 | | Level 2 | | Level 3 | | Total | |
Assets: | | | | | | | | | | | | | |
Investments: | | | | | | | | | | | | | |
Long-Term Investments2: | | | | | | | | | | | | | |
Common Stocks | | $ | 335,896,907 | | | — | | | — | | $ | 335,896,907 | |
Investment Companies | | | 767,155 | | | — | | | — | | | 767,155 | |
Warrants | | | — | | $ | 2,600 | | | — | | | 2,600 | |
Short-Term Securities | | | 5,123,615 | | | 7,981,404 | | | — | | | 13,105,019 | |
Liabilities: | | | | | | | | | | | | | |
Short Positions | | | (122,116 | ) | | — | | | — | | | (122,116 | ) |
Total | | $ | 341,665,561 | | $ | 7,984,004 | | | — | | $ | 349,649,565 | |
| | |
| 2 | See above Schedule of Investments for values in each industry. |
| | | | | | | | | | | | | |
Valuation Inputs | | Level 1 | | Level 2 | | Level 3 | | Total | |
Derivative Financial Instruments3 | | | | | | | | | | | | | |
Assets: | | | | | | | | | | | | | |
Equity contracts | | $ | 254,499 | | | — | | | — | | $ | 254,499 | |
| | |
| 3 | Derivative financial instruments are financial futures contracts, which are shown at the unrealized appreciation/depreciation on the instrument. |
| | |
See Notes to Financial Statements. |
| |
| | |
38 | BLACKROCK SMALL CAP INDEX FUND | JUNE 30, 2011 |
| |
| |
| |
Statement of Assets and Liabilities | Master Small Cap Index Series |
| | | | |
June 30, 2011 (Unaudited) | | | | |
Assets | | | | |
Investments at value — unaffiliated (including securities loaned of $7,981,079) (cost — $237,779,014) | | $ | 336,361,862 | |
Investments at value — affiliated (cost — $13,443,518) | | | 13,409,819 | |
Cash pledged as collateral for financial futures contracts | | | 194,000 | |
Contributions receivable from investors | | | 2,768,368 | |
Investments sold receivable | | | 1,102,046 | |
Dividends receivable | | | 410,644 | |
Margin variation receivable | | | 55,104 | |
Securities lending income receivable — affiliated | | | 48,157 | |
Prepaid expenses | | | 9,447 | |
Total assets | | | 354,359,447 | |
| | | | |
Liabilities | | | | |
Collateral on securities loaned at value | | | 7,981,404 | |
Bank overdraft | | | 79,254 | |
Short positions at value (proceeds — $120,530) | | | 122,116 | |
Investment advisory fees payable | | | 1,979 | |
Other affiliates payable | | | 2,826 | |
Directors’ fees payable | | | 153 | |
Other accrued expenses payable | | | 33,732 | |
Other liabilities payable | | | 5,502 | |
Total liabilities | | | 8,226,966 | |
Net Assets | | $ | 346,132,481 | |
| | | | |
Net Assets Consist of | | | | |
Investors’ capital | | $ | 247,330,390 | |
Net unrealized appreciation/depreciation | | | 98,802,091 | |
Net Assets | | $ | 346,132,481 | |
| | |
See Notes to Financial Statements. |
| |
| | |
BLACKROCK SMALL CAP INDEX FUND | JUNE 30, 2011 | 39 |
| |
| |
| |
Statement of Operations | Master Small Cap Index Series |
| | | | |
Six Months Ended June 30, 2011 (Unaudited) | | | | |
Investment Income | | | | |
Dividends — unaffiliated | | $ | 1,861,195 | |
Foreign taxes withheld | | | (488 | ) |
Securities lending — affiliated | | | 128,098 | |
Dividends — affiliated | | | 23,358 | |
Total income | | | 2,012,163 | |
| | | | |
Expenses | | | | |
Investment advisory | | | 17,766 | |
Accounting services | | | 48,351 | |
Custodian | | | 37,174 | |
Professional | | | 35,763 | |
Directors | | | 4,974 | |
Miscellaneous | | | 4,797 | |
Total expenses | | | 148,825 | |
Less fees waived and/or reimbursed by advisor | | | (16,933 | ) |
Total expenses after fees waived and/or reimbursed | | | 131,892 | |
Net investment income | | | 1,880,271 | |
| | | | |
Realized and Unrealized Gain (Loss) | | | | |
Net realized gain (loss) from: | | | | |
Investments — unaffiliated | | | 16,352,200 | |
Investments — affiliated | | | (5,303 | ) |
Financial futures contracts | | | (284,631 | ) |
| | | 16,062,266 | |
Net change in unrealized appreciation/depreciation on: | | | | |
Investments — unaffiliated | | | 3,540,895 | |
Financial futures contracts | | | 254,876 | |
Short positions | | | (1,586 | ) |
Foreign currency transactions | | | 29 | |
| | | 3,794,214 | |
Total realized and unrealized gain | | | 19,856,480 | |
Net Increase in Net Assets Resulting from Operations | | $ | 21,736,751 | |
| | |
See Notes to Financial Statements. |
| |
| | |
40 | BLACKROCK SMALL CAP INDEX FUND | JUNE 30, 2011 |
| |
| |
| |
Statements of Changes in Net Assets | Master Small Cap Index Series |
| | | | | | | |
Increase (Decrease) in Net Assets: | | Six Months
Ended
June 30,
2011
(Unaudited) | | Year Ended
December 31,
2010 | |
Operations | | | | | | | |
Net investment income | | $ | 1,880,271 | | $ | 3,501,724 | |
Net realized gain (loss) | | | 16,062,266 | | | (9,889,317 | ) |
Net change in unrealized appreciation/depreciation | | | 3,794,214 | | | 60,704,760 | |
Net increase in net assets resulting from operations | | | 21,736,751 | | | 54,317,167 | |
| | | | | | | |
Capital Transactions | | | | | | | |
Proceeds from contributions | | | 81,854,088 | | | 226,075,632 | |
Value of withdrawals | | | (95,630,339 | ) | | (171,857,514 | ) |
Net increase (decrease) in net assets derived from capital transactions | | | (13,776,251 | ) | | 54,218,118 | |
| | | | | | | |
Net Assets | | | | | | | |
Total increase in net assets | | | 7,960,500 | | | 108,535,285 | |
Beginning of period | | | 338,171,981 | | | 229,636,696 | |
End of period | | $ | 346,132,481 | | $ | 338,171,981 | |
| | |
See Notes to Financial Statements. |
| |
| | |
BLACKROCK SMALL CAP INDEX FUND | JUNE 30, 2011 | 41 |
| |
| |
Financial Highlights | Master Small Cap Index Series |
| | | | | | | | | | | | | | | | | | | |
| | Six Months
Ended
June 30,
2011
(Unaudited) | | | | | | | | | | | |
| | | | | | | | | | | | |
| | | | | | | | | | | | |
| | | Year Ended December 31, | |
| | | 2010 | | 2009 | | 2008 | | 2007 | | 2006 | |
Total Investment Return | | | | | | | | | | | | | | | | | | | |
Total investment return | | | 6.07 | %1 | | 27.19 | % | | 27.37 | % | | (33.57 | )% | | (1.46 | )% | | 18.13 | % |
| | | | | | | | | | | | | | | | | | | |
Ratios to Average Net Assets | | | | | | | | | | | | | | | | | | | |
Total expenses | | | 0.08 | %2 | | 0.12 | % | | 0.09 | % | | 0.08 | % | | 0.06 | % | | 0.07 | % |
Total expenses after fees waived and/or reimbursed and fees paid indirectly | | | 0.07 | %2 | | 0.08 | % | | 0.07 | % | | 0.07 | % | | 0.06 | % | | 0.07 | % |
Net investment income | | | 1.06 | %2 | | 1.27 | % | | 1.27 | % | | 1.60 | % | | 1.69 | % | | 1.55 | % |
| | | | | | | | | | | | | | | | | | | |
Supplemental Data | | | | | | | | | | | | | | | | | | | |
Net assets, end of period (000) | | $ | 346,132 | | $ | 338,172 | | $ | 229,637 | | $ | 344,720 | | $ | 630,394 | | $ | 561,373 | |
Portfolio turnover | | | 17 | % | | 42 | % | | 43 | % | | 42 | % | | 26 | % | | 40 | % |
| | |
| 1 | Aggregate total investment return. |
| | |
| 2 | Annualized. |
| | |
See Notes to Financial Statements. | |
|
42 | BLACKROCK SMALL CAP INDEX FUND | JUNE 30, 2011 |
| |
| |
Notes to Financial Statements (Unaudited) | Master Small Cap Index Series |
1. Organization and Significant Accounting Policies:
Master Small Cap Index Series (the “Series”), a diversified, open-end management investment company, is a series of Quantitative Master Series LLC (the “Master LLC”). The Master LLC is registered as an investment company under the Investment Company Act of 1940, as amended (the “1940 Act”), and is organized as a Delaware limited liability company. The Master LLC’s Limited Liability Company Agreement permits the Board of Directors of the Master LLC (the “Board”) to issue non-transferable interests, subject to certain limitations. The Series’ financial statements are prepared in conformity with accounting principles generally accepted in the United States of America (“US GAAP”), which may require management to make estimates and assumptions that affect the reported amounts and disclosures in the financial statements. Actual results could differ from those estimates.
The following is a summary of significant accounting policies followed by the Series:
Valuation: US GAAP defines fair value as the price the Series would receive to sell an asset or pay to transfer a liability in an orderly transaction between market participants at the measurement date. The Series fair values its financial instruments at market value using independent dealers or pricing services under policies approved by the Board. Equity investments traded on a recognized securities exchange or the NASDAQ Global Market System (“NASDAQ”) are valued at the last reported sale price that day or the NASDAQ official closing price, if applicable. For equity investments traded on more than one exchange, the last reported sale price on the exchange where the stock is primarily traded is used. Equity investments traded on a recognized exchange for which there were no sales on that day are valued at the last available bid (long positions) or ask (short positions) price. If no bid or ask price is available, the prior day’s price will be used, unless it is determined that such prior day’s price no longer reflects the fair value of the security. Financial futures contracts traded on exchanges are valued at their last sale price. Investments in open-end registered investment companies are valued at net asset value each business day. Short-term securities with remaining maturities of 60 days or less may be valued at amortized cost, which approximates fair value.
The Series values its investments in BlackRock Liquidity Series, LLC Money Market Series (the “Money Market Series”) at fair value, which is ordinarily based upon its pro rata ownership in the underlying fund’s net assets. The Money Market Series seeks current income consistent with maintaining liquidity and preserving capital. Although the Money Market Series is not registered under the 1940 Act, its investments will follow the parameters of investments by a money market fund that is subject to Rule 2a-7 under the 1940 Act. The Fund may withdraw up to 25% of its investment daily, although the manager of the Money Market Series, in its sole discretion, may permit an investor to withdraw more than 25% on any one day.
In the event that application of these methods of valuation results in a price for an investment which is deemed not to be representative of the market value of such investment or is not available, the investment will be valued in accordance with a policy approved by the Board as reflecting fair value (“Fair Value Assets”). When determining the price for Fair Value Assets, the investment advisor and/or the sub-advisor seeks to determine the price that the Series might reasonably expect to receive from the current sale of that asset in an arm’s-length transaction. Fair value determinations shall be based upon all available factors that the investment advisor and/or sub-advisor deems relevant. The pricing of all Fair Value Assets is subsequently reported to the Board or a committee thereof.
Segregation and Collateralization: In cases in which the 1940 Act and the interpretive positions of the Securities and Exchange Commission (“SEC”) require that the Series either deliver collateral or segregate assets in connection with certain investments (e.g., financial futures contracts), the Series will, consistent with SEC rules and/or certain interpretive letters issued by the SEC, segregate collateral or designate on its books and records cash or liquid securities having a market value at least equal to the amount that would otherwise be required to be physically segregated. Furthermore, based on requirements and agreements with certain exchanges and third party broker-dealers, each party to such transactions has requirements to deliver/deposit securities as collateral for certain investments.
Investment Transactions and Investment Income: For financial reporting purposes, investment transactions are recorded on the dates the transactions are entered into (the trade dates). Realized gains and losses on investment transactions are determined on the identified cost basis. Dividend income is recorded on the ex-dividend dates. Under the applicable foreign tax laws, a withholding tax at various rates may be imposed on capital gains, dividends and interest. Upon notification from issuers, some of the dividend income received from a real estate investment trust may be redesignated as a reduction of cost of the related investment and/or realized gain. Interest income, including amortization and accretion of premiums and discounts on debt securities, is recognized on the accrual basis.
Securities Lending: The Series may lend securities to approved borrowers, such as banks, brokers and other financial institutions. The borrower pledges cash, securities issued or guaranteed by the US government or irrevocable letters of credit issued by a bank as collateral, which will be maintained at all times in an amount equal to at least 100% of the current market value of the loaned securities. The market value of the loaned securities is determined at the close of business of the Series and any additional required collateral is delivered to the Series on the next business day. Securities lending income, as disclosed in the Statement of Operations, represents the income earned from the investment of the cash collateral, net of rebates paid to, or fees paid by, borrowers and less the fees paid to the securities lending agent. During the term of the loan, the Series earns dividend and interest on the securities loaned but does
| | | |
| | |
|
| BLACKROCK SMALL CAP INDEX FUND | JUNE 30, 2011 | 43 |
| |
| |
Notes to Financial Statements (continued) | Master Small Cap Index Series |
not receive dividend or interest income on the securities received as collateral. Loans of securities are terminable at any time and the borrower, after notice, is required to return borrowed securities within the standard time period for settlement of securities transactions. In the event that the borrower defaults on its obligation to return borrowed securities because of insolvency or for any other reason, the Series could experience delays and costs in gaining access to the collateral. The Series also could suffer a loss if the value of an investment purchased with cash collateral falls below the market value of loaned securities or if the value of an investment purchased with cash collateral falls below the value of the original cash collateral received. During the period, the Series accepted only cash collateral in connection with securities loaned.
Income Taxes: The Series is classified as a partnership for federal income tax purposes. As such, each investor in the Series is treated as owner of its proportionate share of the net assets, income, expenses and realized and unrealized gains and losses of the Series. Therefore, no federal income tax provision is required. It is intended that the Series’ assets will be managed so an investor in the Series can satisfy the requirements of Subchapter M of the Internal Revenue Code of 1986, as amended.
The Series files US federal and various state and local tax returns. The statute of limitations on the Series’ US federal tax returns remains open for each of the four years ended December 31, 2010. The statutes of limitations on the Series’ state and local tax returns may remain open for an additional year depending upon the jurisdiction. Management does not believe there are any uncertain tax positions that require recognition of a tax liability.
Recent Accounting Standard: In May 2011, the Financial Accounting Standards Board issued amended guidance to improve disclosure about fair value measurements which will require the following disclosures for fair value measurements categorized as Level 3: quantitative information about the unobservable inputs and assumptions used in the fair value measurement, a description of the valuation policies and procedures and a narrative description of the sensitivity of the fair value measurement to changes in unobservable inputs and the interrelationships between those unobservable inputs. In addition, the amounts and reasons for all transfers in and out of Level 1 and Level 2 will be required to be disclosed. The amended guidance is effective for financial statements for fiscal years beginning after December 15, 2011, and interim periods within those fiscal years. Management is evaluating the impact of this guidance on the Series’ financial statements and disclosures.
Other: Expenses directly related to the Series are charged to the Series. Other operating expenses shared by several funds are pro rated among those funds on the basis of relative net assets or other appropriate methods.
The Series has an arrangement with the custodian whereby fees may be reduced by credits earned on uninvested cash balances, which, if applicable, are shown as fees paid indirectly in the Statement of Operations. The custodian imposes fees on overdrawn cash balances, which can be offset by accumulated credits earned or may result in additional custody charges.
2. Derivative Financial Instruments:
The Series engages in various portfolio investment strategies using derivative contracts both to increase the returns of the Series and to economically hedge, or protect, its exposure to certain risks such as equity risk. These contracts may be transacted on an exchange.
Losses may arise if the value of the contract decreases due to an unfavorable change in the market rates or values of the underlying instrument or if the counterparty does not perform under the contract. Counterparty risk related to exchange-traded financial futures contracts and options is deemed to be minimal due to the protection against defaults provided by the exchange on which these contracts trade.
Financial Futures Contracts: The Series purchases or sells financial futures contracts and options on financial futures contracts to gain exposure to, or economically hedge against, changes in the value of equity securities (equity risk). Financial futures contracts are agreements between the Series and the counterparty to buy or sell a specific quantity of an underlying instrument at a specified price and at a specified date. Depending on the terms of the particular contract, futures contracts are settled either through physical delivery of the underlying instrument on the settlement date or by payment of a cash settlement amount on the settlement date. Pursuant to the contract, the Series agrees to receive from or pay to the broker an amount of cash equal to the daily fluctuation in value of the contract. Such receipts or payments are known as margin variation and are recorded by the Series as unrealized appreciation or depreciation. When the contract is closed, the Series records a realized gain or loss equal to the difference between the value of the contract at the time it was opened and the value at the time it was closed. The use of financial futures contracts involves the risk of an imperfect correlation in the movements in the price of financial futures contracts, interest rates and the underlying assets.
| | |
| |
|
44 | BLACKROCK SMALL CAP INDEX FUND | JUNE 30, 2011 |
| |
| |
Notes to Financial Statements (continued) | Master Small Cap Index Series |
Derivative Financial Instruments Categorized by Risk Exposure:
|
|
Fair Values of Derivative Financial Instruments as of June 30, 2011 |
|
| | | | | | |
| | Asset Derivatives | |
| | Statement of
Assets and
Liabilities
Location | | Value | |
Equity contracts | | Net
unrealized
appreciation* | | $ | 254,499 | |
| |
* | Includes cumulative appreciation/depreciation on financial futures contracts as reported in the Schedule of Investments. Only current day’s margin variation is reported within the Statement of Assets and Liabilities. |
|
|
The Effect of Derivative Financial Instruments in the Statement of Operations |
Six Months Ended June 30, 2011 |
|
| | | | |
| | Net Realized Loss from | |
| | Financial Futures Contracts | |
Equity contracts | | $ | (284,631 | ) |
| | | | |
| | Net Change in Unrealized
Appreciation/Depreciation on | |
| | Financial Futures Contracts | |
Equity contracts | | $ | 254,876 | |
For the six months ended June 30, 2011, the average quarterly balances of outstanding derivative financial instruments were as follows:
| | | | |
Financial futures contracts: | | | | |
Average number of contracts purchased | | | 82 | |
Average notional value of contracts purchased | | $ | 6,603,410 | |
3. Investment Advisory Agreement and Other Transactions with Affiliates:
The PNC Financial Services Group, Inc. (“PNC”) and Barclays Bank PLC (“Barclays”) are the largest stockholders of BlackRock, Inc. (“BlackRock”). Due to the ownership structure, PNC is an affiliate of the Series for 1940 Act purposes, but Barclays is not.
The Master LLC, on behalf of the Series, entered into an Investment Advisory Agreement with BlackRock Advisors, LLC (the “Manager”), the Series’ investment advisor, an indirect, wholly owned subsidiary of BlackRock, to provide investment advisory and administration services. The Manager is responsible for the management of the Series’ portfolio and provides the necessary personnel, facilities, equipment and certain other services necessary to the operations of the Series. For such services, the Series pays the Manager a monthly fee at an annual rate of 0.01% of the Series’ average daily net assets.
The Manager entered into a contractual arrangement with the Master LLC with respect to the Series under which the Manager will waive and/or reimburse its fees and/or expenses so that the total annual operating expenses incurred by the Series (excluding dividend expense, interest expense, acquired fund fees and certain other Series’ expenses) will not exceed 0.08% of the average daily value of the Series’ net assets. The Manager has agreed not to reduce or discontinue this contractual waiver or reimbursement before May 1, 2012 unless approved by the Board, including a majority of the independent directors. For the six months ended June 30, 2011, the Series waived and/or reimbursed $14,724, which is included in fees waived and/or reimbursed by advisor in the Statement of Operations.
The Manager voluntarily agreed to waive its investment advisory fees by the amount of investment advisory fees the Series pays to the Manager indirectly through its investment in affiliated money market funds, however the Manager does not waive its investment advisory fees by the amount of investment advisory fees paid through the Series’ investment in other affiliated investment companies, if any. For the six months ended June 30, 2011, the Manager waived $2,209, which is included in fees waived and/or reimbursed by advisor in the Statement of Operations.
The Manager entered into a sub-advisory agreement with BlackRock Investment Management, LLC (“BIM”), an affiliate of the Manager. The Manager pays BIM for services it provides, a monthly fee that is a percentage of the investment advisory fees paid by the Series to the Manager.
For the six months ended June 30, 2011, the Series reimbursed the Manager $2,262 for certain accounting services, which is included in accounting services in the Statement of Operations.
The Master LLC, on behalf of the Series, received an exemptive order from the SEC permitting it, among other things, to pay an affiliated securities lending agent a fee based on a share of the income derived from the securities lending activities and has retained BIM as the securities lending agent. BIM may, on behalf of the Series, invest cash collateral received by the Series for such loans, among other things, in a private investment company managed by the Manager or in registered money market funds advised by the Manager or its affiliates. The market value of securities on loan and the value of the related collateral, if applicable, are shown in the Statement of Assets and Liabilities as securities loaned at value and collateral on securities loaned at value, respectively. The cash collateral invested by BIM is disclosed in the Schedule of Investments. The share of income earned by the Series on such investments is shown as securities lending — affiliated in the Statement of Operations. For the six months ended June 30, 2011, BIM received $40,607 in securities lending agent fees related to securities lending activities for the Series.
| | | |
|
| BLACKROCK SMALL CAP INDEX FUND | JUNE 30, 2011 | 45 |
| |
| |
Notes to Financial Statements (concluded) | Master Small Cap Index Series |
Certain officers and/or directors of the Master LLC are officers and/or directors of BlackRock or its affiliates.
4. Investments:
Purchases and sales of investments, excluding short-term securities, for the period ended June 30, 2011, were $60,835,840 and $69,275,441, respectively.
5. Borrowings:
The Master LLC, on behalf of the Series, along with certain other funds managed by the Manager and its affiliates, is a party to a $500 million credit agreement with a group of lenders, which expires in November 2011. The Series may borrow under the credit agreement to fund shareholder redemptions. The Series pays a commitment fee of 0.08% per annum based on the Series’ pro rata share of the unused portion of the credit agreement and interest at a rate equal to the higher of (a) the one-month LIBOR plus 1.00% per annum and (b) the Fed Funds rate plus 1.00% per annum on amounts borrowed. In addition, the Series paid administration and arrangement fees which were allocated to the Series based on its net assets as of October 31, 2010. The Series did not borrow under the credit agreement during the six months ended June 30, 2011.
6. Concentration, Market and Credit Risk:
In the normal course of business, the Series invests in securities and enters into transactions where risks exist due to fluctuations in the market (market risk) or failure of the issuer of a security to meet all its obligations (issuer credit risk). The value of securities held by the Series may decline in response to certain events, including those directly involving the issuers whose securities are owned by the Series; conditions affecting the general economy; overall market changes; local, regional or global political, social or economic instability; and currency and interest rate and price fluctuations. Similar to issuer credit risk, the Series may be exposed to counterparty credit risk, or the risk that an entity with which the Series has unsettled or open transactions may fail to or be unable to perform on its commitments. The Series manages counterparty credit risk by entering into transactions only with counterparties that it believes have the financial resources to honor their obligations and by monitoring the financial stability of those counterparties. Financial assets, which potentially expose the Series to market, issuer and counterparty credit risks, consist principally of financial instruments and receivables due from counterparties. The extent of the Series’ exposure to market, issuer and counterparty credit risks with respect to these financial assets is generally approximated by their value recorded in the Series’ Statement of Assets and Liabilities, less any collateral held by the Series.
As of June 30, 2011, the Series invested a significant portion of its assets in securities in the energy sector. Changes in economic conditions affecting the energy sector would have a greater impact on the Series and could affect the value, income and/or liquidity of positions in such securities.
7. Subsequent Events:
Management has evaluated the impact of all subsequent events on the Series through the date the financial statements were issued and has determined that there were no subsequent events requiring adjustment or additional disclosure in the financial statements.
| | |
|
46 | BLACKROCK SMALL CAP INDEX FUND | JUNE 30, 2011 |
|
|
|
Disclosure of Investment Advisory Agreement and Sub-Advisory Agreement |
The Board of Directors of Quantitative Master Series LLC (the “Master LLC”) met on April 5, 2011 and May 17–18, 2011 to consider the approval of the Master LLC’s investment advisory agreement (the “Advisory Agreement”) with BlackRock Advisors, LLC (the “Manager”), the Master LLC’s investment advisor, on behalf of the Master Small Cap Index Series (the “Master Portfolio”), a series of the Master LLC. The Board of Directors of the Master LLC also considered the approval of the sub-advisory agreement (the “Sub-Advisory Agreement”) between the Manager and BlackRock Investment Management, LLC (the “Sub-Advisor”), with respect to the Master Portfolio. BlackRock Small Cap Index Fund (the “Fund”), a series of BlackRock Index Funds, Inc. (the “Corporation”), is a “feeder” fund that invests all of its investable assets in the Master Portfolio. Accordingly, the Board of Directors of the Corporation also considered the approval of the Advisory Agreement and the Sub-Advisory Agreement with respect to the Master Portfolio. The Manager and the Sub-Advisor are referred to herein as “BlackRock.” The Advisory Agreement and the Sub-Advisory Agreement are referred to herein as the “Agreements.” For simplicity, the Board of Directors of the Master LLC and the Board of Directors of the Corporation are referred to herein collectively as the “Board,” and the members are referred to as “Board Members.”
Activities and Composition of the Board
The Board consists of thirteen individuals, eleven of whom are not “interested persons” of the Master LLC or the Corporation as defined in the Investment Company Act of 1940, as amended (the “1940 Act”) (the “Independent Board Members”). The Board Members are responsible for the oversight of the operations of the Master LLC or the Corporation, as pertinent, and perform the various duties imposed on the directors of investment companies by the 1940 Act. The Independent Board Members have retained independent legal counsel to assist them in connection with their duties. The Co-Chairs of the Board are each Independent Board Members. The Board has established five standing committees: an Audit Committee, a Governance and Nominating Committee, a Compliance Committee, a Performance Oversight and Contract Committee and an Executive Committee, each of which is composed of Independent Board Members (except for the Executive Committee, which also has one interested Board Member) and is chaired by Independent Board Members. The Board also established an ad hoc committee, the Joint Product Pricing Committee, which consisted of Independent Board Members and directors/trustees of the boards of certain other BlackRock-managed funds, who were not “interested persons” of their respective funds.
The Agreements
Pursuant to the 1940 Act, the Board is required to consider the continuation of the Agreements on an annual basis. In connection with this process, the Board assessed, among other things, the nature, scope and quality of the services provided to the Master Portfolio and the Fund by BlackRock, its personnel and its affiliates, including investment management, administrative and shareholder services, oversight of fund accounting and custody, marketing services, risk oversight, compliance program and assistance in meeting applicable legal and regulatory requirements.
The Board, acting directly and through its committees, considers at each of its meetings, and from time to time as appropriate, factors that are relevant to its annual consideration of the renewal of the Agreements, including the services and support provided by BlackRock to the Master Portfolio, the Fund and their shareholders. Among the matters the Board considered were: (a) investment performance for one-, three- and five-year periods, as applicable, against peer funds, and applicable benchmarks, if any, as well as senior management’s and portfolio managers’ analysis of the reasons for any over performance or underperformance against its peers and/or benchmark, as applicable; (b) fees, including advisory, administration, if applicable, and other amounts paid to BlackRock and its affiliates by the Master Portfolio and/or the Fund for services, such as transfer agency, marketing and distribution, call center and fund accounting; (c) the Master Portfolio’s and/or the Fund’s operating expenses and how BlackRock allocates expenses to the Master Portfolio and the Fund; (d) the resources devoted to, risk oversight of, and compliance reports relating to, implementation of the Master Portfolio’s and the Fund’s investment objective, policies and restrictions; (e) the Master LLC’s and the Corporation’s compliance with its respective Code of Ethics and other compliance policies and procedures; (f) the nature, cost and character of non-investment management services provided by BlackRock and its affiliates; (g) BlackRock’s and other service providers’ internal controls and risk and compliance oversight mechanisms; (h) BlackRock’s implementation of the proxy voting policies approved by the Board; (i) the use of brokerage commissions and execution quality of portfolio transactions; (j) BlackRock’s implementation of the Master LLC’s and/or the Corporation’s valuation and liquidity procedures; (k) an analysis of contractual and actual management fees for products with similar investment objectives across the open-end fund, exchange traded fund (“ETF”), closed-end fund and institutional account product channels, as applicable; (l) BlackRock’s compensation methodology for its investment professionals and the incentives it creates; and (m) periodic updates on BlackRock’s business.
Board Considerations in Approving the Agreements
The Approval Process: Prior to the April 5, 2011 meeting, the Board requested and received materials specifically relating to the Agreements. The Board is engaged in a process with BlackRock to review periodically the nature and scope of the information provided to better assist its deliberations. The materials provided in connection with the April meeting included (a) information independently compiled and prepared by Lipper, Inc. (“Lipper”) on fees and expenses of the Master Portfolio and the Fund, as applicable, and the investment performance of the Fund as compared
| | |
|
| | |
BLACKROCK SMALL CAP INDEX FUND | JUNE 30, 2011 | 47 |
|
|
|
Disclosure of Investment Advisory Agreement and Sub-Advisory Agreement (continued) |
with a peer group of funds as determined by Lipper (collectively, “Peers”), as well as the gross investment performance of the Fund as compared with its benchmark; (b) information on the profitability of the Agreements to BlackRock and a discussion of fall-out benefits to BlackRock and its affiliates and significant shareholders; (c) a general analysis provided by BlackRock concerning investment management fees (a combination of the advisory fee and the administration fee, if any) charged to other clients, such as institutional clients, ETFs and closed-end funds, under similar investment mandates, as well as the performance of such other clients, as applicable; (d) the impact of economies of scale; (e) a summary of aggregate amounts paid by the Master Portfolio and/or the Fund to BlackRock; (f) sales and redemption data regarding the Fund’s shares; and (g) if applicable, a comparison of management fees to similar BlackRock open-end funds, as classified by Lipper.
At an in-person meeting held on April 5, 2011, the Board reviewed materials relating to its consideration of the Agreements. As a result of the discussions that occurred during the April 5, 2011 meeting, and as a culmination of the Board’s year-long deliberative process, the Board presented BlackRock with questions and requests for additional information. BlackRock responded to these requests with additional written information in advance of the May 17–18, 2011 Board meeting.
At an in-person meeting held on May 17–18, 2011, the Board of the Master LLC, including the Independent Board Members, unanimously approved the continuation of the Advisory Agreement between the Manager and the Master LLC with respect to the Master Portfolio and the Sub-Advisory Agreement between the Manager and the Sub-Advisor with respect to the Master Portfolio, each for a one-year term ending June 30, 2012. The Board of the Corporation, including the Independent Board Members, also considered the continuation of the Agreements and found the Agreements to be satisfactory. In approving the continuation of the Agreements, the Board of the Master LLC considered: (a) the nature, extent and quality of the services provided by BlackRock; (b) the investment performance of the Master Portfolio, the Fund and BlackRock; (c) the advisory fee and the cost of the services and profits to be realized by BlackRock and its affiliates from their relationship with the Master Portfolio and the Fund; (d) economies of scale; (e) fall out benefits to BlackRock as a result of its relationship with the Master Portfolio and the Fund; and (f) other factors deemed relevant by the Board Members.
The Board also considered other matters it deemed important to the approval process, such as payments made to BlackRock or its affiliates relating to the distribution of Fund shares, services related to the valuation and pricing of portfolio holdings of the Master Portfolio, direct and indirect benefits to BlackRock and its affiliates and significant shareholders from their relationship with the Master Portfolio and the Fund and advice from independent legal counsel with respect to the review process and materials submitted for the Board’s review. The Board noted the willingness of BlackRock personnel to engage in open, candid discussions with the Board. The Board did not identify any particular information as controlling, and each Board Member may have attributed different weights to the various items considered.
A. Nature, Extent and Quality of the Services Provided by BlackRock: The Board, including the Independent Board Members, reviewed the nature, extent and quality of services provided by BlackRock, including the investment advisory services and the resulting performance of the Fund. Throughout the year, the Board compared the Fund’s performance to the performance of a comparable group of mutual funds and/or the performance of a relevant benchmark, if any. The Board met with BlackRock’s senior management personnel responsible for investment operations, including the senior investment officers. The Board also reviewed the materials provided by the portfolio management team discussing Master Portfolio performance and the Master Portfolio’s investment objective, strategies and outlook.
The Board considered, among other factors, the number, education and experience of BlackRock’s investment personnel generally and the Master Portfolio’s portfolio management team, investments by portfolio managers in the funds they manage, BlackRock’s portfolio trading capabilities, BlackRock’s use of technology, BlackRock’s commitment to compliance, BlackRock’s credit analysis capabilities, BlackRock’s risk analysis capabilities and BlackRock’s approach to training and retaining portfolio managers and other research, advisory and management personnel. The Board engaged in a review of BlackRock’s compensation structure with respect to the Master Portfolio’s portfolio management team and BlackRock’s ability to attract and retain high-quality talent and create performance incentives.
In addition to advisory services, the Board considered the quality of the administrative and non-investment advisory services provided to the Master Portfolio and the Fund. BlackRock and its affiliates and significant shareholders provide the Master Portfolio and the Fund with certain administrative, transfer agency, shareholder and other services (in addition to any such services provided to the Master Portfolio and the Fund by third parties) and officers and other personnel as are necessary for the operations of the Master Portfolio and the Fund. In addition to investment advisory services, BlackRock and its affiliates provide the Master Portfolio and the Fund with other services, including (i) preparing disclosure documents, such as the prospectus, the statement of additional information and periodic shareholder reports; (ii) assisting with daily accounting and pricing; (iii) overseeing and coordinating the activities of other service providers; (iv) organizing Board meetings and preparing the materials for such Board meetings; (v) providing legal and compliance support; and (vi) performing other administrative functions necessary for the operation of the Master Portfolio and the Fund, such as tax reporting, fulfilling regulatory filing requirements and call center services. The Board reviewed the
| | |
|
| | |
48 | BLACKROCK SMALL CAP INDEX FUND | JUNE 30, 2011 |
|
|
|
Disclosure of Investment Advisory Agreement and Sub-Advisory Agreement (continued) |
structure and duties of BlackRock’s fund administration, accounting, legal and compliance departments and considered BlackRock’s policies and procedures for assuring compliance with applicable laws and regulations.
B. The Investment Performance of the Master Portfolio, the Fund and BlackRock: The Board, including the Independent Board Members, also reviewed and considered the performance history of the Master Portfolio and the Fund, as applicable. The Board noted that the Master Portfolio’s investment results correspond directly to the investment results of the Fund. In preparation for the April 5, 2011 meeting, the Board worked with BlackRock and Lipper to develop a template for, and was provided with, reports independently prepared by Lipper, which included a comprehensive analysis of the Fund’s performance. The Board also reviewed a narrative and statistical analysis of the Lipper data that was prepared by BlackRock, which analyzed various factors that affect Lipper’s rankings. In connection with its review, the Board received and reviewed information regarding the investment performance of the Fund as compared to funds in the Fund’s applicable Lipper category and the gross investment performance of the Fund as compared with its benchmark. The Board was provided with a description of the methodology used by Lipper to select peer funds. The Board and the Board’s Performance Oversight and Contract Committee regularly review and meet with Master Portfolio management to discuss the performance of the Master Portfolio and the Fund, as applicable, throughout the year.
The Board noted that the Fund’s gross performance exceeded its benchmark index during each of the one-, three- and five-year periods reported.
The Board noted that BlackRock has made changes to the organization of the overall equity group management structure designed to result in a strengthened leadership team with clearer accountability.
C. Consideration of the Advisory/Management Fees and the Cost of the Services and Profits to be Realized by BlackRock and its Affiliates from their Relationship with the Master Portfolio and the Fund: The Board, including the Independent Board Members, reviewed the Master Portfolio’s contractual management fee ratio compared with the other funds in the Fund’s Lipper category. It also compared the Fund’s total expense ratio, as well as actual management fee ratio, to those of other funds in its Lipper category. The Board considered the services provided and the fees charged by BlackRock to other types of clients with similar investment mandates, including separately managed institutional accounts.
The Board received and reviewed statements relating to BlackRock’s financial condition and profitability with respect to the services it provided the Master Portfolio and the Fund. The Board was also provided with a profitability analysis that detailed the revenues earned and the expenses incurred by BlackRock for services provided to the Master Portfolio and the Fund. The Board reviewed BlackRock’s profitability with respect to the Master Portfolio and the Fund, as applicable, and other funds the Board currently oversees for the year ended December 31, 2010 compared to available aggregate profitability data provided for the years ended December 31, 2009 and December 31, 2008. The Board reviewed BlackRock’s profitability with respect to other fund complexes managed by the Manager and/or its affiliates. The Board reviewed BlackRock’s assumptions and methodology of allocating expenses in the profitability analysis, noting the inherent limitations in allocating costs among various advisory products. The Board recognized that profitability may be affected by numerous factors including, among other things, fee waivers and expense reimbursements by the Manager, the types of funds managed, expense allocations and business mix, and the difficulty of comparing profitability as a result of those factors.
The Board noted that, in general, individual fund or product line profitability of other advisors is not publicly available. The Board considered BlackRock’s operating margin, in general, compared to the operating margin for leading investment management firms whose operations include advising open-end funds, among other product types. That data indicates that operating margins for BlackRock, in general and with respect to its registered funds, are generally consistent with margins earned by similarly situated publicly traded competitors. In addition, the Board considered, among other things, certain third party data comparing BlackRock’s operating margin with that of other publicly-traded asset management firms. That third party data indicates that larger asset bases do not, in themselves, translate to higher profit margins.
In addition, the Board considered the cost of the services provided to the Master Portfolio and the Fund by BlackRock, and BlackRock’s and its affiliates’ profits relating to the management and distribution of the Master Portfolio and the Fund and the other funds advised by BlackRock and its affiliates. As part of its analysis, the Board reviewed BlackRock’s methodology in allocating its costs to the management of the Master Portfolio and the Fund. The Board also considered whether BlackRock has the financial resources necessary to attract and retain high-quality investment management personnel to perform its obligations under the Agreements and to continue to provide the high quality of services that is expected by the Board.
The Board noted that the Fund’s contractual management fee ratio (a combination of the advisory fee and the administration fee, if any) was lower than or equal to the median contractual management fee ratio paid by the Fund’s Peers, in each case before taking into account any expense reimbursements or fee waivers. The Board also noted that BlackRock has contractually agreed to waive fees and/or reimburse expenses in order to limit, to a specified amount, the Master Portfolio’s total operating expenses as a percentage of the Master Portfolio’s average daily net assets and has contractually agreed to waive fees and/or reimburse expenses to limit the Fund’s total operating expenses as a percentage of the Fund’s average daily net assets on a class-by-class basis, as applicable.
| | |
|
| | |
BLACKROCK SMALL CAP INDEX FUND | JUNE 30, 2011 | 49 |
|
|
|
Disclosure of Investment Advisory Agreement and Sub-Advisory Agreement (concluded) |
D. Economies of Scale: The Board, including the Independent Board Members, considered the extent to which economies of scale might be realized as the assets of the Master Portfolio and the Fund increase. The Board also considered the extent to which the Master Portfolio and the Fund benefit from such economies and whether there should be changes in the advisory fee rate or structure in order to enable the Master Portfolio and the Fund to participate in these economies of scale, for example through the use of breakpoints in the advisory fee based upon the asset level of the Master Portfolio.
E. Other Factors Deemed Relevant by the Board Members: The Board, including the Independent Board Members, also took into account other ancillary or “fall-out” benefits that BlackRock or its affiliates and significant shareholders may derive from their respective relationships with the Master Portfolio and the Fund, both tangible and intangible, such as BlackRock’s ability to leverage its investment professionals who manage other portfolios and risk management personnel, an increase in BlackRock’s profile in the investment advisory community, and the engagement of BlackRock’s affiliates and significant shareholders as service providers to the Master Portfolio and the Fund, including for administrative, transfer agency, distribution and securities lending services. The Board also considered BlackRock’s overall operations and its efforts to expand the scale of, and improve the quality of, its operations. The Board also noted that BlackRock may use and benefit from third party research obtained by soft dollars generated by certain registered fund transactions to assist in managing all or a number of its other client accounts. The Board further noted that BlackRock’s funds may invest in affiliated ETFs without any offset against the management fees payable by the funds to BlackRock.
In connection with its consideration of the Agreements, the Board also received information regarding BlackRock’s brokerage and soft dollar practices. The Board received reports from BlackRock which included information on brokerage commissions and trade execution practices throughout the year.
The Board noted the competitive nature of the open-end fund marketplace, and that shareholders are able to redeem their Fund shares if they believe that the Fund’s and/or the Master Portfolio’s fees and expenses are too high or if they are dissatisfied with the performance of the Fund.
Conclusion
The Board of the Master LLC, including the Independent Board Members, unanimously approved the continuation of the Advisory Agreement between the Manager and the Master LLC, with respect to the Master Portfolio, for a one-year term ending June 30, 2012 and the Sub-Advisory Agreement between the Manager and the Sub-Advisor, with respect to the Master Portfolio, for a one-year term ending June 30, 2012. As part of its approval, the Board of the Master LLC considered the detailed review of BlackRock’s fee structure, as it applies to the Master LLC, conducted by the ad hoc Joint Product Pricing Committee. Based upon its evaluation of all of the aforementioned factors in their totality, the Board of the Master LLC, including the Independent Board Members, was satisfied that the terms of the Agreements were fair and reasonable and in the best interest of the Master Portfolio and its shareholders. The Board of the Corporation, including the Independent Board Members, also considered the continuation of the Agreements with respect to the Master Portfolio and found the Agreements to be satisfactory. In arriving at its decision to approve the Agreements, the Board of the Master LLC did not identify any single factor or group of factors as all-important or controlling, but considered all factors together, and different Board Members may have attributed different weights to the various factors considered. The Independent Board Members were also assisted by the advice of independent legal counsel in making this determination. The contractual fee arrangements for the Master Portfolio reflect the results of several years of review by the Board Members and predecessor Board Members, and discussions between such Board Members (and predecessor Board Members) and BlackRock. As a result, the Board Members’ conclusions may be based in part on their consideration of these arrangements in prior years.
| | |
|
| | |
50 | BLACKROCK SMALL CAP INDEX FUND | JUNE 30, 2011 |
|
Ronald W. Forbes, Co-Chair of the Board and Director |
Rodney D. Johnson, Co-Chair of the Board and Director |
David O. Beim, Director |
Richard S. Davis, Director |
Henry Gabbay, Director |
Dr. Matina S. Horner, Director |
Herbert I. London, Director |
Cynthia A. Montgomery, Director |
Joseph P. Platt, Director |
Robert C. Robb, Jr., Director |
Toby Rosenblatt, Director |
Kenneth L. Urish, Director |
Frederick W. Winter, Director |
John M. Perlowski, President and Chief Executive Officer |
Brendan Kyne, Vice President |
Neal Andrews, Chief Financial Officer |
Jay Fife, Treasurer |
Brian Kindelan, Chief Compliance Officer and Anti-Money Laundering Officer |
Ira P. Shapiro, Secretary |
|
Investment Advisor |
|
BlackRock Advisors, LLC |
Wilmington, DE 19809 |
|
Sub-Advisor |
|
BlackRock Investment Management, LLC |
Princeton, NJ 08540 |
|
Custodian |
|
State Street Bank and Trust Company |
Boston, MA 02111 |
|
Transfer Agent |
|
BNY Mellon Investment Servicing (US) Inc. |
Wilmington, DE 19809 |
|
Accounting Agent |
|
State Street Bank and Trust Company |
Boston, MA 02116 |
|
Distributor |
|
BlackRock Investments, LLC |
New York, NY 10022 |
|
Legal Counsel |
|
Sidley Austin LLP |
New York, NY 10019 |
|
Independent Registered Public Accounting Firm |
|
Deloitte & Touche LLP |
Princeton, NJ 08540 |
|
Address of the Fund |
|
100 Bellevue Parkway |
Wilmington, DE 19809 |
| | |
| | |
BLACKROCK SMALL CAP INDEX FUND | JUNE 30, 2011 | 51 |
|
|
Additional Information |
|
General Information |
Electronic Delivery
Electronic copies of most financial reports and prospectuses are available on the Fund’s website or shareholders can sign up for e-mail notifications of quarterly statements, annual and semi-annual reports and prospectuses by enrolling in the Fund’s electronic delivery program.
To enroll:
Shareholders Who Hold Accounts with Investment Advisors, Banks or Brokerages:
Please contact your financial advisor. Please note that not all investment advisors, banks or brokerages may offer this service.
Shareholders Who Hold Accounts Directly with BlackRock:
| |
1) | Access the BlackRock website at http://www.blackrock.com/edelivery |
| |
2) | Select “eDelivery” under the “More Information” section |
| |
3) | Log into your account |
Householding
The Fund will mail only one copy of shareholder documents, including prospectuses, annual and semi-annual reports and proxy statements, to shareholders with multiple accounts at the same address. This practice is commonly called “householding” and is intended to reduce expenses and eliminate duplicate mailings of shareholder documents. Mailings of your shareholder documents may be householded indefinitely unless you instruct us otherwise. If you do not want the mailing of these documents to be combined with those for other members of your household, please call (800) 441-7762.
Availability of Quarterly Schedule of Investments
The Fund/Series file their complete schedule of portfolio holdings with the SEC for the first and third quarters of each fiscal year on Form N-Q. The Fund’s/Series’ Forms N-Q are available on the SEC’s website at http://www.sec.gov and may also be reviewed and copied at the SEC’s Public Reference Room in Washington, D.C. Information on how to access documents on the SEC’s website without charge may be obtained by calling (800) SEC-0330. The Fund’s/Series’ Forms N-Q may also be obtained upon request and without charge by calling (800) 441-7762.
Availability of Proxy Voting Policies and Procedures
A description of the policies and procedures that the Fund/Series use to determine how to vote proxies relating to portfolio securities is available (1) without charge, upon request, by calling (800) 441-7762; (2) at http://www.blackrock.com; and (3) on the SEC’s website at http://www.sec.gov.
Availability of Proxy Voting Record
Information about how the Fund/Series voted proxies relating to securities held in the Fund’s/Series’ portfolio during the most recent 12-month period ended June 30 is available upon request and without charge (1) at http://www.blackrock.com or by calling (800) 441-7762 and (2) on the SEC’s website at http://www.sec.gov.
| | |
|
| | |
52 | BLACKROCK SMALL CAP INDEX FUND | JUNE 30, 2011 |
|
|
Additional Information (concluded) |
|
BlackRock Privacy Principles |
BlackRock is committed to maintaining the privacy of its current and former fund investors and individual clients (collectively, “Clients”) and to safeguarding their non-public personal information. The following information is provided to help you understand what personal information BlackRock collects, how we protect that information and why in certain cases we share such information with select parties.
If you are located in a jurisdiction where specific laws, rules or regulations require BlackRock to provide you with additional or different privacy-related rights beyond what is set forth below, then BlackRock will comply with those specific laws, rules or regulations.
BlackRock obtains or verifies personal non-public information from and about you from different sources, including the following: (i) information we receive from you or, if applicable, your financial intermediary, on applications, forms or other documents; (ii) information about your transactions with us, our affiliates, or others; (iii) information we receive from a consumer reporting agency; and (iv) from visits to our websites.
BlackRock does not sell or disclose to non-affiliated third parties any non-public personal information about its Clients, except as permitted by law or as is necessary to respond to regulatory requests or to service Client accounts. These non-affiliated third parties are required to protect the confidentiality and security of this information and to use it only for its intended purpose.
We may share information with our affiliates to service your account or to provide you with information about other BlackRock products or services that may be of interest to you. In addition, BlackRock restricts access to non-public personal information about its Clients to those BlackRock employees with a legitimate business need for the information. BlackRock maintains physical, electronic and procedural safeguards that are designed to protect the non-public personal information of its Clients, including procedures relating to the proper storage and disposal of such information.
Account Information
Call us at (800) 441-7762 from 8:00 AM to 6:00 PM EST on any business day to get information about your account balances, recent transactions and share prices. You can also reach us on the Web at http://www.blackrock.com/funds.
Automatic Investment Plans
Investor Class shareholders who want to invest regularly can arrange to have $50 or more automatically deducted from their checking or savings account and invested in any of the BlackRock funds.
Systematic Withdrawal Plans
Investor Class shareholders can establish a systematic withdrawal plan and receive periodic payments of $50 or more from their BlackRock funds, as long as their account balance is at least $10,000.
Retirement Plans
Shareholders may make investments in conjunction with Traditional, Rollover, Roth, Coverdell, Simple IRAs, SEP IRAs and 403(b) Plans.
| | |
|
| | |
BLACKROCK SMALL CAP INDEX FUND | JUNE 30, 2011 | 53 |
|
|
|
A World-Class Mutual Fund Family |
BlackRock offers a diverse lineup of open-end mutual funds crossing all investment styles and managed by experts in equity, fixed income and tax-exempt investing.
|
Equity Funds |
|
BlackRock ACWI ex-US Index Fund |
BlackRock All-Cap Energy & Resources Portfolio |
BlackRock Asset Allocation Portfolio† |
BlackRock Balanced Capital Fund† |
BlackRock Basic Value Fund |
BlackRock Capital Appreciation Fund |
BlackRock China Fund |
BlackRock Energy & Resources Portfolio |
BlackRock Equity Dividend Fund |
BlackRock EuroFund |
BlackRock Focus Growth Fund |
BlackRock Focus Value Fund |
BlackRock Global Allocation Fund† |
BlackRock Global Dividend Income Portfolio |
BlackRock Global Dynamic Equity Fund |
BlackRock Global Emerging Markets Fund |
BlackRock Global Growth Fund |
BlackRock Global Opportunities Portfolio |
BlackRock Global SmallCap Fund |
BlackRock Health Sciences Opportunities Portfolio |
BlackRock Healthcare Fund |
BlackRock Index Equity Portfolio |
BlackRock India Fund |
BlackRock International Fund |
BlackRock International Index Fund |
BlackRock International Opportunities Portfolio |
BlackRock Large Cap Core Fund |
BlackRock Large Cap Core Plus Fund |
BlackRock Large Cap Growth Fund |
BlackRock Large Cap Value Fund |
BlackRock Latin America Fund |
BlackRock Mid-Cap Growth Equity Portfolio |
BlackRock Mid-Cap Value Equity Portfolio |
BlackRock Mid Cap Value Opportunities Fund |
BlackRock Natural Resources Trust |
BlackRock Pacific Fund |
BlackRock Russell 1000 Index Fund |
BlackRock Science & Technology Opportunities Portfolio |
BlackRock Small Cap Growth Equity Portfolio |
BlackRock Small Cap Growth Fund II |
BlackRock Small Cap Index Fund |
BlackRock Small/Mid-Cap Growth Portfolio |
BlackRock S&P 500 Index Fund |
BlackRock S&P 500 Stock Fund |
BlackRock U.S. Opportunities Portfolio |
BlackRock Utilities and Telecommunications Fund |
BlackRock Value Opportunities Fund |
BlackRock World Gold Fund |
|
Fixed Income Funds |
|
BlackRock Bond Index Fund |
BlackRock Core Bond Fund |
BlackRock Emerging Market Debt Portfolio |
BlackRock Floating Rate Income Portfolio |
BlackRock GNMA Portfolio |
BlackRock High Income Fund |
BlackRock High Yield Bond Portfolio |
BlackRock Income Portfolio† |
BlackRock Inflation Protected Bond Portfolio |
BlackRock International Bond Portfolio |
BlackRock Long Duration Bond Portfolio |
BlackRock Low Duration Bond Portfolio |
BlackRock Multi-Sector Bond Portfolio |
BlackRock Strategic Income Opportunities Portfolio |
BlackRock Total Return Fund |
BlackRock US Government Bond Fund |
BlackRock World Income Fund |
US Mortgage Portfolio |
|
Municipal Bond Funds |
|
BlackRock California Municipal Bond Fund |
BlackRock High Yield Municipal Fund |
BlackRock Intermediate Municipal Fund |
BlackRock National Municipal Fund |
BlackRock New Jersey Municipal Bond Fund |
BlackRock New York Municipal Bond Fund |
BlackRock Pennsylvania Municipal Bond Fund |
BlackRock Short-Term Municipal Fund |
|
Target Risk & Target Date Funds† |
|
BlackRock Prepared Portfolios |
Conservative Prepared Portfolio |
Moderate Prepared Portfolio |
Growth Prepared Portfolio |
Aggressive Growth Prepared Portfolio |
|
BlackRock Lifecycle Prepared Portfolios |
2015 |
2020 |
2025 |
2030 |
2035 |
2040 |
2045 |
2050 |
|
LifePath Portfolios
Retirement |
2020 |
2025 |
2030 |
2035 |
2040 |
2045 |
2050 |
2055 |
|
LifePath Index Portfolios
Retirement |
2020 |
2025 |
2030 |
2035 |
2040 |
2045 |
2050 |
2055 |
† Mixed asset fund.
BlackRock mutual funds are currently distributed by BlackRock Investments, LLC. You should consider the investment objectives, risks, charges and expenses of the funds under consideration carefully before investing. Each fund’s prospectus contains this and other information and is available at www.blackrock.com or by calling (800) 441-7762 or from your financial advisor. The prospectus should be read carefully before investing.
| | |
|
| | |
54 | BLACKROCK SMALL CAP INDEX FUND | JUNE 30, 2011 |
This report is transmitted to shareholders only. It is not authorized for use as an offer of sale or a solicitation of an offer to buy shares of the Fund unless accompanied or preceded by the Fund’s current prospectus. Past performance results shown in this report should not be considered a representation of future performance. Investment returns and principal value of shares will fluctuate so that shares, when redeemed, may be worth more or less than their original cost. Statements and other information herein are as dated and are subject to change.
| |

|
|
#Index 3-06/11 | 
|
Item 2 – | Code of Ethics – Not Applicable to this semi-annual report |
| |
Item 3 – | Audit Committee Financial Expert – Not Applicable to this semi-annual report |
| |
Item 4 – | Principal Accountant Fees and Services – Not Applicable to this semi-annual report |
| |
Item 5 – | Audit Committee of Listed Registrants – Not Applicable |
| |
Item 6 – | Investments |
| (a) The registrants’ Schedule of Investments is included as part of the Report to Stockholders filed under Item 1 of this Form. |
| (b) Not Applicable due to no such divestments during the semi-annual period covered since the previous Form N-CSR filing. |
| |
Item 7 – | Disclosure of Proxy Voting Policies and Procedures for Closed-End Management Investment Companies – Not Applicable |
| |
Item 8 – | Portfolio Managers of Closed-End Management Investment Companies – Not Applicable |
| |
Item 9 – | Purchases of Equity Securities by Closed-End Management Investment Company and Affiliated Purchasers – Not Applicable |
| |
Item 10 – | Submission of Matters to a Vote of Security Holders –There have been no material changes to these procedures. |
| |
Item 11 – | Controls and Procedures |
| |
11(a) – | The registrants’ principal executive and principal financial officers, or persons performing similar functions, have concluded that the registrants’ disclosure controls and procedures (as defined in Rule 30a-3(c) under the Investment Company Act of 1940, as amended (the “1940 Act”)) are effective as of a date within 90 days of the filing of this report based on the evaluation of these controls and procedures required by Rule 30a-3(b) under the 1940 Act and Rule 15d-15(b) under the Securities Exchange Act of 1934, as amended. |
| |
11(b) – | There were no changes in the registrants’ internal control over financial reporting (as defined in Rule 30a-3(d) under the 1940 Act) that occurred during the second fiscal quarter of the period covered by this report that have materially affected, or are reasonably likely to materially affect, the registrants’ internal control over financial reporting. |
| |
Item 12 – | Exhibits attached hereto |
| |
12(a)(1) – | Code of Ethics – Not Applicable to this semi-annual report |
| |
12(a)(2) – | Certifications – Attached hereto |
| |
12(a)(3) – | Not Applicable |
| |
12(b) – | Certifications – Attached hereto |
| Pursuant to the requirements of the Securities Exchange Act of 1934 and the Investment Company Act of 1940, each registrant has duly caused this report to be signed on its behalf by the undersigned, thereunto duly authorized. |
| |
| BlackRock Index Funds, Inc. and Quantitative Master Series LLC |
| |
| By: | /s/ John M. Perlowski | |
| | John M. Perlowski |
| | Chief Executive Officer (principal executive officer) of |
| | BlackRock Index Funds, Inc. and Quantitative Master Series LLC |
| |
| Date: September 2, 2011 |
| |
| Pursuant to the requirements of the Securities Exchange Act of 1934 and the Investment Company Act of 1940, this report has been signed below by the following persons on behalf of each registrant and in the capacities and on the dates indicated. |
| |
| By: | /s/ John M. Perlowski | |
| | John M. Perlowski |
| | Chief Executive Officer (principal executive officer) of |
| | BlackRock Index Funds, Inc. and Quantitative Master Series LLC |
| |
| Date: September 2, 2011 |
| |
| By: | /s/ Neal J. Andrews | |
| | Neal J. Andrews |
| | Chief Financial Officer (principal financial officer) of |
| | BlackRock Index Funds, Inc. and Quantitative Master Series LLC |
| | |
| Date: September 2, 2011 |