Exhibit 99.1
| | |
 | | News Release |
FOR IMMEDIATE RELEASE
August 7, 2012
MEDIA CONTACT: Michael Cosgrove
703-903-2123
INVESTOR CONTACT: SiSi Cheng
571-382-4732
FREDDIE MAC REPORTS NET INCOME OF $3.0 BILLION,
COMPREHENSIVE INCOME OF $2.9 BILLION FOR SECOND QUARTER 2012
NO TREASURY DRAW REQUIRED
Helped 8.2 Million Families through the Housing Crisis since 2009,
Includes Funding 5.2 Million Refinance Mortgages and Helping Nearly 700,000 Avoid Foreclosure
Second Quarter Financial Results
| • | | Net income improved to $3.0 billion, driven by a $1.7 billion decline in provision for credit losses as compared to first quarter |
| • | | Comprehensive income of $2.9 billion was sufficient to pay $1.8 billion dividend on 10% senior preferred stock |
| • | | No additional draw required from Treasury; net worth of $1.1 billion at June 30, 2012 |
Housing Market Support Since January 1, 2009
| • | | Enabled 5.2 million borrowers to refinance their mortgages |
| • | | Helped nearly 700,000 borrowers avoid foreclosure |
| • | | Funded mortgages for 1.3 million borrowers to purchase a home |
| • | | Provided financing for over one million units of multifamily rental housing |
Credit Quality
| • | | Higher-quality, post-2008 book of business grew to 57 percent of single-family credit guarantee portfolio during second quarter |
| • | | Delinquency rates remained below industry benchmarks |
| | • | | Single-family serious delinquency rate was 3.45 percent at June 30, 2012 |
| | • | | Multifamily delinquency rate was 0.27 percent at June 30, 2012 |
McLean, VA — Freddie Mac (OTC: FMCC) today reported net income of $3.0 billion for the second quarter of 2012, compared to net income of $577 million for the first quarter of 2012. The company also reported comprehensive income of $2.9 billion for the quarter ended June 30, 2012, compared to comprehensive income of $1.8 billion for the quarter ended March 31, 2012.
“Freddie Mac’s commitment to helping homeowners enabled 5.9 million borrowers to refinance or avoid foreclosure since the financial crisis began,” said Freddie Mac CEO Donald H. Layton. “Our work continued during this quarter, as we helped over 350,000 families take advantage of historically low interest rates and an additional 40,000 avoid foreclosure. At the same time, our financial results enabled us to avoid
Freddie Mac Second Quarter 2012 Financial Results
August 7, 2012
Page 2
an additional draw from the U.S. Treasury, despite paying a $1.8 billion cash dividend to the nation’s taxpayers.”
Summary of Second Quarter Financial Results(1)
| | | | | | | | | | | | |
| | | Three Months Ended | |
($ Billions) | | March 31,
2012 | | | June 30,
2012 | | | Change | |
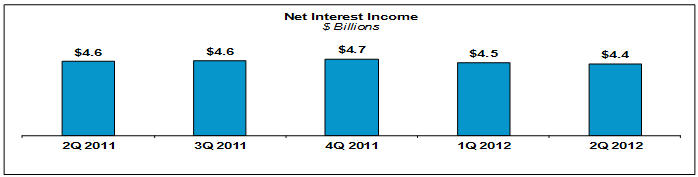
1 Net interest income | | $ | 4.5 | | | $ | 4.4 | | | $ | (0.1 | ) |
2 Provision for credit losses | | | (1.8 | ) | | | (0.2 | ) | | | 1.7 | |
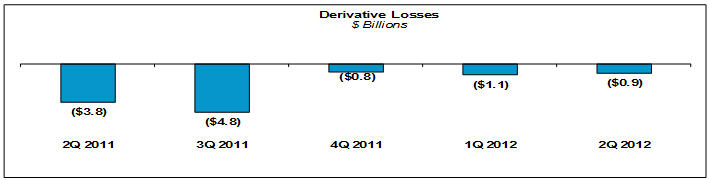
3 Derivative gains (losses) | | | (1.1 | ) | | | (0.9 | ) | | | 0.2 | |
4 Other non-interest income (loss) | | | (0.4 | ) | | | 0.1 | | | | 0.6 | |
5 Non-interest expense | | | (0.6 | ) | | | (0.5 | ) | | | 0.1 | |
6 Income tax benefit | | | 0.0 | | | | 0.1 | | | | 0.1 | |
| | | | | | | | | | | | |
7 Net income | | $ | 0.6 | | | $ | 3.0 | | | $ | 2.4 | |
8 Total other comprehensive income (loss) | | | 1.2 | | | | (0.1 | ) | | | (1.3 | ) |
| | | | | | | | | | | | |
9 Comprehensive income | | $ | 1.8 | | | $ | 2.9 | | | $ | 1.1 | |
| | | | | | | | | | | | |
| (1) | See “Appendix—Financial Results Discussion” section for additional information about the company’s 2Q 2012 financial results. |
The increase in net income for the second quarter of 2012, compared to the first quarter of 2012, primarily reflects a decline in the provision for credit losses due to positive trends in the housing market. The increase in comprehensive income for the second quarter of 2012, compared to the first quarter of 2012, primarily reflects higher net income for the second quarter, partially offset by higher fair value losses on non-agency available-for-sale (AFS) securities that resulted from spread widening.
Treasury Draws and Dividend Payments
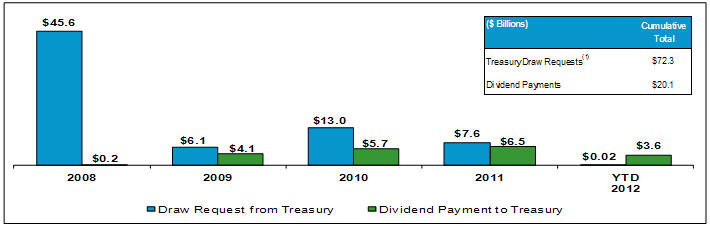
| (1) | Includes the initial liquidation preference of Freddie Mac’s 10% senior preferred stock of $1.0 billion. |
Freddie Mac does not require a draw from Treasury for the second quarter of 2012 because the company had positive net worth at June 30, 2012. The company’s $1.1 billion net worth at June 30, 2012 reflects second quarter comprehensive income of $2.9 billion, partially offset by the $1.8 billion quarterly dividend payment to Treasury on the company’s 10% senior preferred stock.
Freddie Mac Second Quarter 2012 Financial Results
August 7, 2012
Page 3
Through June 30, 2012, Freddie Mac has paid approximately $20.1 billion in cash dividends to Treasury on the 10% senior preferred stock. This represents 28 percent of the company’s cumulative draws received under the Purchase Agreement with Treasury.
Housing Market Support
Freddie Mac continues to support the U.S. housing market by ensuring credit availability for new and refinanced mortgages as well as rental housing. The company also continues to help struggling homeowners avoid foreclosure.
Number of Families Helped
| | | | | | | | | | | | | | | | | | | | |
(Thousands) | | 2009 | | | 2010 | | | 2011 | | | YTD
6/30/2012 | | | Cumulative
Total | |
1 Number of families helped to own or rent a home | | | 2,482 | | | | 2,092 | | | | 1,840 | | | | 1,117 | | | | 7,531 | |
2 Refinance borrowers(1) | | | 1,764 | | | | 1,480 | | | | 1,193 | | | | 781 | | | | 5,218 | |
3 Purchase borrowers(1) | | | 460 | | | | 378 | | | | 326 | | | | 143 | | | | 1,307 | |
4 Multifamily rental units | | | 258 | | | | 234 | | | | 321 | | | | 193 | | | | 1,006 | |
5 Number of families helped to avoid foreclosure(2) | | | 133 | | | | 275 | | | | 208 | | | | 81 | | | | 697 | |
6 Loan modifications | | | 65 | | | | 170 | | | | 109 | | | | 29 | | | | 373 | |
7 Repayment plans | | | 34 | | | | 31 | | | | 33 | | | | 19 | | | | 117 | |
8 Forbearance agreements | | | 15 | | | | 35 | | | | 20 | | | | 8 | | | | 78 | |
9 Short sales & deed-in-lieu of foreclosure transactions | | | 19 | | | | 39 | | | | 46 | | | | 25 | | | | 129 | |
| | | | | | | | | | | | | | | | | | | | |
10 Total(line 1 + line 5) | | | 2,615 | | | | 2,367 | | | | 2,048 | | | | 1,198 | | | | 8,229 | |
| (1) | For the periods presented, a borrower may be counted more than once if the company purchased more than one loan (purchase or refinance mortgage) relating to the same borrower. |
| (2) | These categories are not mutually exclusive and a borrower in one category may also be included within another category in the same period. |
Providing Liquidity– Freddie Mac continues to provide access to affordable financing for new and refinanced mortgages and rental housing. Since 2009, the company has provided over $1.5 trillion in liquidity to the market through its purchases or issuances of loans and mortgage-related securities. This includes approximately $215 billion during the first half of 2012, bringing the number of families that it has helped to own or rent a home to more than 7.5 million since the beginning of 2009.
Market Liquidity Provided
| | | | | | | | | | | | | | | | | | | | |
($ Billions) | | 2009 | | | 2010 | | | 2011 | | | YTD
6/30/2012 | | | Cumulative
Total | |
1Purchase and issuance volume | | | $548 | | | | $412 | | | | $361 | | | | $215 | | | | $1,536 | |
2 Refinance portion of purchase and issuance volume | | | $380 | | | | $306 | | | | $250 | | | | $163 | | | | $1,099 | |
Enabling Refinance Activity– Freddie Mac continues to help borrowers lower their payments and/or reduce their mortgage terms by purchasing refinance mortgages. Since 2009, the company has purchased about $1.1 trillion in refinance mortgages, helping 5.2 million American families save on average $2,500 a year in interest payments. This includes refinance purchases of $163 billion during the first half of 2012,
Freddie Mac Second Quarter 2012 Financial Results
August 7, 2012
Page 4
which represented 84 percent of the company’s single-family mortgage purchase volume for the period, based on unpaid principal balance (UPB).
Since the Home Affordable Refinance Program (HARP) was implemented in 2009, Freddie Mac has purchased HARP loans made to more than 680,000 borrowers, including over 200,000 borrowers during the first half of 2012. The company continues to work to increase HARP program participation with its lenders, and promote awareness with borrowers – including new online resources to determine eligibility and find participating lenders.
Preventing Foreclosure– Freddie Mac continues to help struggling borrowers retain their homes or otherwise avoid foreclosure. Since 2009, the company has helped nearly 700,000 families avoid foreclosure—approximately eight out of every 10 of these borrowers were able to retain their homes through loan modifications and other solutions. This includes helping more than 81,000 homeowners avoid foreclosure in the first half of 2012. In addition, more than 73 percent of the loans modified in the first half of 2011 were current and performing, or had been repaid in full as of June 30, 2012.
Credit Quality
Post-2008 Single-Family Books of Business– Freddie Mac continues to build a strong book of business. The credit quality of single-family loans the company has acquired after 2008 (excluding relief refinance mortgages) is significantly better than that of loans the company acquired from 2005 through 2008, as measured by original loan-to-value (LTV) ratios, FICO scores, and the proportion of loans underwritten with fully documented income.
Credit Quality of Single-Family Credit Guarantee Portfolio Purchases(1)
| | |
| Weighted Average Original LTV Ratio | | Weighted Average Credit Score |
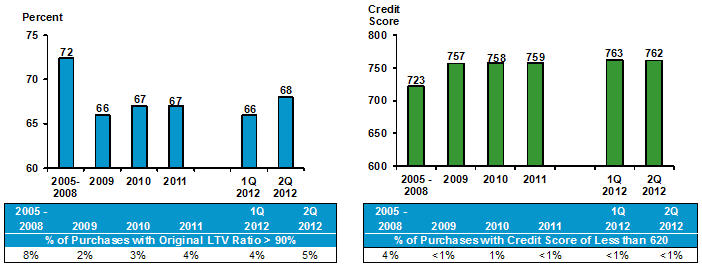
| (1) | Excludes relief refinance mortgages, which represented 30 percent of single-family purchases during the first half of 2012. Relief refinance mortgages with LTV ratios above 80% represented approximately 21 percent of single-family purchases during the first half of 2012. |
2005 to 2008 Single-Family Books of Business – Since the beginning of 2008, on an aggregate basis, the company has recorded a provision for credit losses of $75.2 billion associated with single-family loans and recorded an additional $4.1 billion in losses on loans purchased from the company’s Participation Certificate
Freddie Mac Second Quarter 2012 Financial Results
August 7, 2012
Page 5
trusts, net of recoveries. The majority of these losses are associated with loans originated in 2005 through 2008.
Loans originated in 2005 to 2008 are becoming a smaller portion of the company’s single-family credit guarantee portfolio. At June 30, 2012, loans originated in 2005 to 2008 represented 28 percent of the single-family credit guarantee portfolio, while loans originated after 2008, including HARP loans, accounted for 57 percent of the portfolio, based on UPB.
Single-Family Credit Guarantee Portfolio – Concentration of Credit Risk(1)
| | | | | | | | | | | | |
| | | As of 6/30/2012 | | | YTD
6/30/2012 | |
Year of Origination | | % of Portfolio | | | Serious Delinquency Rate | | | % of Credit Losses | |
2009 - 2012 | | | 57 | % | | | 0.40 | % | | | 3 | % |
2005 - 2008 | | | 28 | | | | 9.21 | % | | | 88 | |
2004 and prior | | | 15 | | | | 2.98 | % | | | 9 | |
| | | | | | | | | | | | |
Total | | | 100 | % | | | 3.45 | % | | | 100 | % |
| (1) | Includes relief refinance mortgages, which represented approximately 14 percent of the single-family credit guarantee portfolio at June 30, 2012. |
Single-family serious delinquency rate was 3.45 percent at June 30, 2012, compared to 3.51 percent at March 31, 2012. While the company’s serious delinquency rate is higher than the rate in years prior to 2009, it is substantially below the rate for the entire U.S. mortgage market. According to the Mortgage Bankers Association’s National Delinquency Survey, the serious delinquency rate on first-lien single-family loans in the U.S. mortgage market was 7.44 percent at March 31, 2012, which is the most current data available.
Multifamily delinquency rate(based on loans 60 days or more past due) was 0.27 percent at June 30, 2012, compared to 0.23 percent at March 31, 2012, and remained below industry benchmarks.
Additional Information
For more information, including that related to Freddie Mac’s financial results, conservatorship and related matters, see the company’s Quarterly Report on Form 10-Q for the quarter ended June 30, 2012, and the company’s Consolidated Financial Statements, Core Tables and Financial Results Supplement. These documents are available on the Investor Relations page of the company’s Web site at www.FreddieMac.com/investors.
Additional information about Freddie Mac and its business is also set forth in the company’s filings with the SEC, which are available on the Investor Relations page of the company’s Web site at www.FreddieMac.com/investors and the SEC’s Web site at www.sec.gov. Freddie Mac encourages all investors and interested members of the public to review these materials for a more complete understanding of the company’s financial results and related disclosures.
* * * *
This press release contains forward-looking statements, which may include statements pertaining to the conservatorship, the company’s current expectations and objectives for its efforts under the Making Home Affordable program, the servicing alignment initiative and other programs to assist the U.S. residential
Freddie Mac Second Quarter 2012 Financial Results
August 7, 2012
Page 6
mortgage market, future business plans, liquidity, capital management, economic and market conditions and trends, market share, the effect of legislative and regulatory developments, implementation of new accounting guidance, credit losses, internal control remediation efforts, and results of operations and financial condition on a GAAP, Segment Earnings and fair value basis. Forward-looking statements involve known and unknown risks and uncertainties, some of which are beyond the company’s control. Management’s expectations for the company’s future necessarily involve a number of assumptions, judgments and estimates, and various factors, including changes in market conditions, liquidity, mortgage-to-debt option-adjusted spread, credit outlook, actions by FHFA, Treasury, the Federal Reserve, SEC, HUD, the Obama Administration, and Congress, and the impacts of legislation or regulations and new or amended accounting guidance, could cause actual results to differ materially from these expectations. These assumptions, judgments, estimates and factors are discussed in the company’s Annual Report on Form 10-K for the year ended December 31, 2011, Quarterly Reports on Form 10-Q for the quarters ended March 31, 2012 and June 30, 2012, and Current Reports on Form 8-K, which are available on the Investor Relations page of the company’s Web site at www.FreddieMac.com/investors and the SEC’s Web site at www.sec.gov. The company undertakes no obligation to update forward-looking statements it makes to reflect events or circumstances after the date of this press release.
Freddie Mac was established by Congress in 1970 to provide liquidity, stability and affordability to the nation’s residential mortgage markets. Freddie Mac supports communities across the nation by providing mortgage capital to lenders. Today Freddie Mac is making home possible for one in four homebuyers and is one of the largest sources of financing for multifamily housing. For more information, visit www.FreddieMac.com.
# # #
Freddie Mac Second Quarter 2012 Financial Results
August 7, 2012
Page 7
Appendix—Financial Results Discussion
Summary Consolidated Statements of Comprehensive Income
| | | | | | | | | | | | |
| | | Three Months Ended | |
($ Millions) | | March 31,
2012 | | | June 30,
2012 | | | Change | |
1Net interest income | | $ | 4,500 | | | $ | 4,386 | | | $ | (114 | ) |
2Provision for credit losses | | | (1,825 | ) | | | (155 | ) | | | 1,670 | |
3 Derivative gains (losses) | | | (1,056 | ) | | | (882 | ) | | | 174 | |
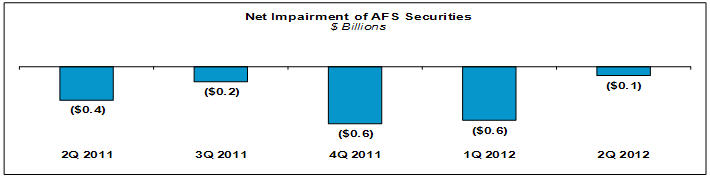
4 Net impairments of AFS securities recognized in earnings | | | (564 | ) | | | (98 | ) | | | 466 | |
5 Other | | | 104 | | | | 229 | | | | 125 | |
| | | | | | | | | | | | |
6 Non-interest income | | | (1,516 | ) | | | (751 | ) | | | 765 | |
7 Administrative expenses | | | (337 | ) | | | (401 | ) | | | (64 | ) |
8 REO operations income (expense) | | | (171 | ) | | | 30 | | | | 201 | |
9 Other | | | (88 | ) | | | (165 | ) | | | (77 | ) |
| | | | | | | | | | | | |
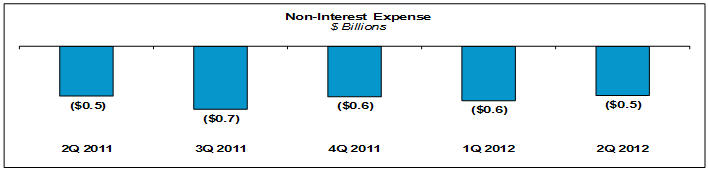
10 Non-interest expense | | | (596 | ) | | | (536 | ) | | | 60 | |
11 Income tax benefit | | | 14 | | | | 76 | | | | 62 | |
| | | | | | | | | | | | |
12Net income | | $ | 577 | | | $ | 3,020 | | | $ | 2,443 | |
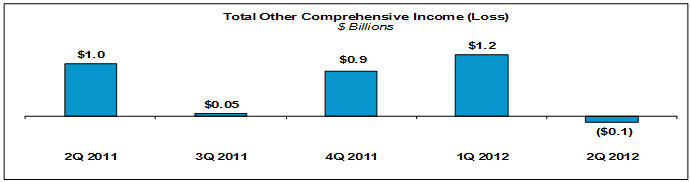
13Total other comprehensive income (loss) | | | 1,212 | | | | (128 | ) | | | (1,340 | ) |
| | | | | | | | | | | | |
14Comprehensive income | | $ | 1,789 | | | $ | 2,892 | | | $ | 1,103 | |
| | | | | | | | | | | | |
Net interest income was $4.4 billion for the second quarter of 2012, compared to $4.5 billion for the first quarter of 2012. Net interest yield was 83 basis points for the second quarter of 2012, unchanged from the first quarter of 2012. The decrease in net interest income primarily reflects a decline in the balance of higher-yielding mortgage-related assets due to continued liquidations, partially offset by lower funding costs.
Provision for credit losses was $155 million for the second quarter of 2012, compared to $1.8 billion for the first quarter of 2012. The decrease in the provision for credit losses primarily reflects lower estimated future losses due to the positive impact of an increase in national home prices.
Freddie Mac Second Quarter 2012 Financial Results
August 7, 2012
Page 8
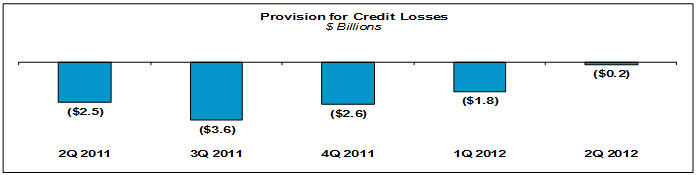
The company’s loan loss reserves were $35.8 billion as of June 30, 2012, compared to $38.3 billion as of March 31, 2012.
Derivative losseswere $882 million for the second quarter of 2012, compared to $1.1 billion for the first quarter of 2012. The decrease in derivative losses reflects net fair value gains on derivatives due to declining interest rates.
Net impairment of AFS securities recognized in earnings was $98 million for the second quarter of 2012, compared to $564 million for the first quarter of 2012. The decrease in net impairments primarily reflects an improvement in forecasted home prices and a decline in interest rates in the second quarter.
Non-interest expensewas $536 million for the second quarter of 2012, compared to $596 million for the first quarter of 2012. The decrease in non-interest expense primarily reflects higher real estate owned (REO) disposition gains due to improved REO fair values and increased REO disposition volume.
Freddie Mac Second Quarter 2012 Financial Results
August 7, 2012
Page 9
Total other comprehensive income (loss)was a loss of $128 million for the second quarter of 2012, compared to income of $1.2 billion for the first quarter of 2012. The shift to total other comprehensive loss in the second quarter primarily reflects the adverse impact of spread widening on non-agency AFS securities, partially offset by higher fair value gains on agency and non-agency AFS securities due to declining long-term interest rates.
Segment Financial Results– Freddie Mac’s operations consist of three reportable segments, which are based on the type of business activities each performs — Investments, Single-family Guarantee and Multifamily. Certain activities that are not part of a reportable segment are included in the All Other category.
Summary of Segment Earnings (Loss) and Comprehensive Income (Loss)
| | | | | | | | | | | | |
| | | Three Months Ended | |
($ Billions) | | March 31,
2012 | | | June 30,
2012 | | | Change | |
Segment Earnings (loss), net of taxes | | | | | | | | | | | | |
1 Investments | | $ | 1.6 | | | $ | 2.5 | | | $ | 0.9 | |
2 Single-family Guarantee | | | (1.7 | ) | | | 0.2 | | | | 1.9 | |
3 Multifamily | | | 0.6 | | | | 0.3 | | | | (0.3 | ) |
4 All Other | | | — | | | | — | | | | — | |
| | | | | | | | | | | | |
5 Total Segment Earnings, net of taxes | | $ | 0.6 | | | $ | 3.0 | | | $ | 2.4 | |
| | | | | | | | | | | | |
Comprehensive income (loss) of segments | | | | | | | | | | | | |
6 Investments | | $ | 2.0 | | | $ | 2.5 | | | $ | 0.5 | |
7 Single-family Guarantee | | | (1.7 | ) | | | 0.2 | | | | 1.9 | |
8 Multifamily | | | 1.5 | | | | 0.2 | | | | (1.3 | ) |
9 All Other | | | — | | | | — | | | | — | |
| | | | | | | | | | | | |
10 Comprehensive income of segments | | $ | 1.8 | | | $ | 2.9 | | | $ | 1.1 | |
| | | | | | | | | | | | |
Freddie Mac Second Quarter 2012 Financial Results
August 7, 2012
Page 10
Investments segment had earnings of $2.5 billion for the second quarter of 2012, compared to $1.6 billion for the first quarter of 2012. The increase in segment earnings was primarily driven by lower security impairments. Comprehensive income for the Investments segment was $2.5 billion for the second quarter of 2012, compared to $2.0 billion for the first quarter of 2012. The increase reflects higher segment earnings, partially offset by an increase in fair value losses on non-agency AFS securities due to spread widening.
Single-family Guarantee segment had earnings of $241 million for the second quarter of 2012, compared to a loss of $1.7 billion for the first quarter of 2012. The shift from segment loss to segment earnings was primarily driven by the lower provision for credit losses. Comprehensive income (loss) for the Single-family Guarantee segment approximated segment earnings (loss) for both the first and second quarters of 2012.
Multifamily segment had earnings of $318 million for the second quarter of 2012, compared to $624 million for the first quarter of 2012. The decrease in segment earnings was primarily due to losses on mortgage loans recorded at fair value which resulted from spread widening in the second quarter. Comprehensive income for the Multifamily segment was $162 million for the second quarter of 2012, compared to $1.5 billion for the first quarter of 2012. The decrease primarily reflects the unfavorable impact of spread widening on commercial mortgage-backed securities.