9 Real estate owned1
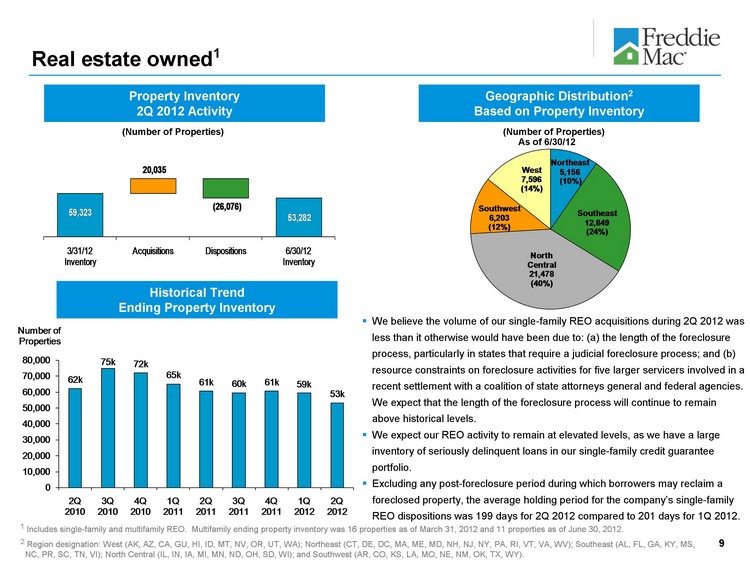
Property Inventory
2Q 2012 Activity
Geographic Distribution2
Based on Property Inventory
Historical Trend
Ending Property Inventory
1 Includes single-family and multifamily REO. Multifamily ending property inventory was 16 properties as of March 31, 2012 and 11 properties as of June 30, 2012.
2 Region designation: West (AK, AZ, CA, GU, HI, ID, MT, NV, OR, UT, WA); Northeast (CT, DE, DC, MA, ME, MD, NH, NJ, NY, PA, RI, VT, VA, WV); Southeast (AL, FL, GA, KY, MS, NC, PR, SC, TN, VI); North Central (IL, IN, IA, MI, MN, ND, OH, SD, WI); and Southwest (AR, CO, KS, LA, MO, NE, NM, OK, TX, WY).
((Number of Properties)
((Number of Properties)
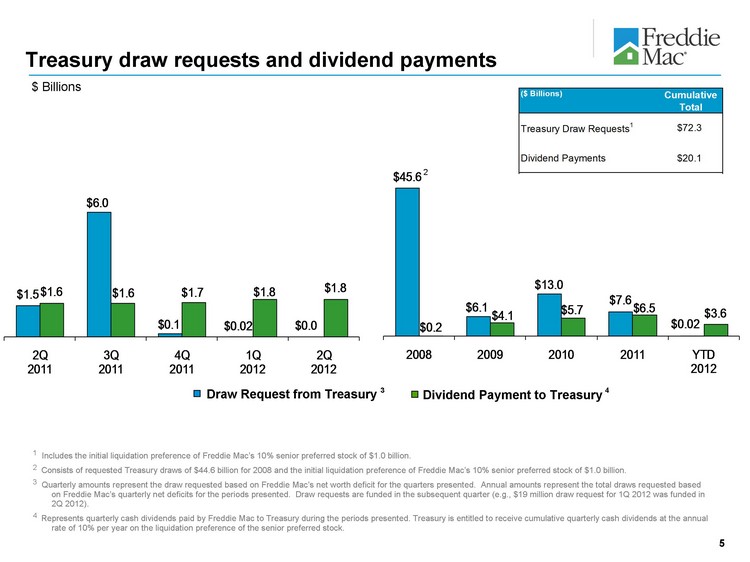
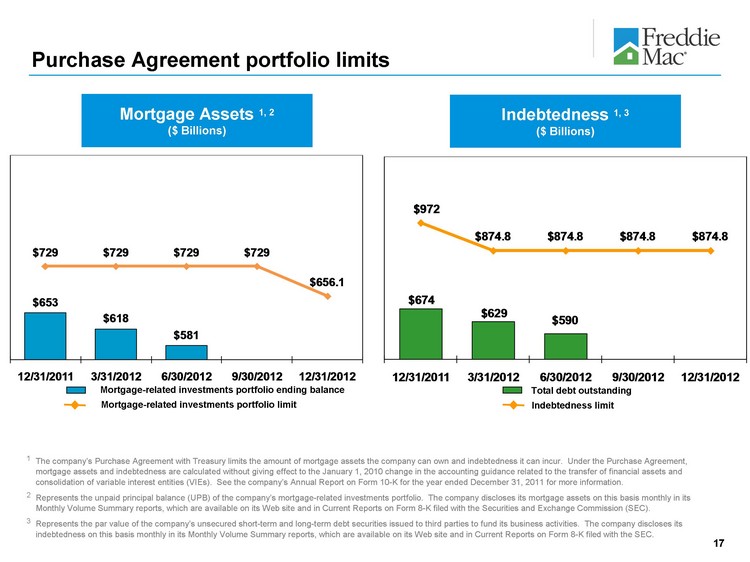
We believe the volume of our single-family REO acquisitions during 2Q 2012 was less than it otherwise would have been due to: (a) the length of the foreclosure process, particularly in states that require a judicial foreclosure process; and (b) resource constraints on foreclosure activities for five larger servicers involved in a recent settlement with a coalition of state attorneys general and federal agencies.
We expect that the length of the foreclosure process will continue to remain above historical levels. We expect our REO activity to remain at elevated levels, as we have a large inventory of seriously delinquent loans in our single-family credit guarantee portfolio.
Excluding any post-foreclosure period during which borrowers may reclaim a foreclosed property, the average holding period for the company’s single-family REO dispositions was 199 days for 2Q 2012 compared to 201 days for 1Q 2012.
As of 6/30/12 |