Exhibit 99.1
| | |
 | | News Release |
FOR IMMEDIATE RELEASE
November 6, 2012
MEDIA CONTACT: Sharon McHale
703-903-2438
INVESTOR CONTACT: Linda Eddy
571-382-4732
FREDDIE MAC REPORTS NET INCOME OF $2.9 BILLION,
COMPREHENSIVE INCOME OF $5.6 BILLION FOR THIRD QUARTER 2012
NO TREASURY DRAW REQUIRED
Helped 8.9 Million Families Through the Housing Crisis Since 2009,
Includes Funding 5.6 Million Refinance Mortgages and Helping Over 740,000 Avoid Foreclosure
Third Quarter Financial Results
| • | | Net income was $2.9 billion. Comprehensive income of $5.6 billion was sufficient to pay $1.8 billion dividend on senior preferred stock |
| • | | Net income and comprehensive income totaled $6.5 billion and $10.3 billion, respectively, for the first nine months of 2012 |
| • | | No additional Treasury draw required; net worth was $4.9 billion at September 30, 2012, up $3.8 billion from June 30, 2012 |
Housing Market Support Since January 1, 2009
| • | | Provided over $1.6 trillion in funding to the mortgage market, which financed: |
| | • | | 1.4 million home purchases and 5.6 million refinancings |
| | • | | 1.1 million units of multifamily rental housing |
| • | | Helped stabilize communities nationwide by enabling 742,000 borrowers to avoid foreclosure and selling approximately two-thirds of REO homes to owner-occupants |
Credit Quality
| • | | Post-2008 book of business grew to 60 percent of single-family credit guarantee portfolio during third quarter |
| • | | Delinquency rates remained below industry benchmarks |
| | • | | Single-family serious delinquency rate declined to 3.37 percent at September 30, 2012 |
| | • | | Multifamily delinquency rate was 0.27 percent at September 30, 2012 |
McLean, VA — Freddie Mac (OTC: FMCC) today reported net income of $2.9 billion for the third quarter of 2012, compared to net income of $3.0 billion for the second quarter of 2012. The company also reported comprehensive income of $5.6 billion for the third quarter of 2012, compared to comprehensive income of $2.9 billion for the second quarter of 2012. For the first nine months of 2012, Freddie Mac’s net income was $6.5 billion and comprehensive income was $10.3 billion.
Freddie Mac Third Quarter 2012 Financial Results
November 6, 2012
Page 2
“Freddie Mac’s strong financial performance this quarter was driven by favorable market conditions, including the continued improvement in the housing market, as well as our ongoing efforts to minimize losses on our legacy book,” said Freddie Mac CEO Donald H. Layton. “Our inventory of delinquent loans is at the lowest level in two years and our higher quality new book of business now comprises 60 percent of our portfolio.
“We continue to help America’s families own, rent and stay in their homes,” Layton added. “We helped nearly nine million families through the housing crisis, funding or refinancing homes and apartments for eight million and helping over 740,000 avoid foreclosure. Through our focus on sustainable homeownership and foreclosure prevention, we are not only helping homeowners across the country, but also enhancing the value of our assets for the nation’s taxpayers.”
Summary of Third Quarter Financial Results(1)
| | | | | | | | | | | | | | |
| | | | | Three Months Ended | |
| | | | | June 30, | | | September 30, | | | | |
| ($ Billions) | | 2012 | | | 2012 | | | Change | |
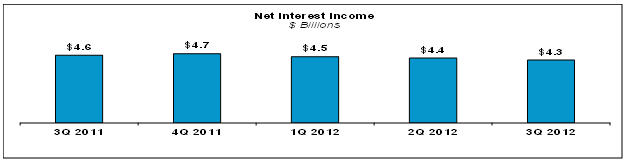
| 1 | | Net interest income | | $ | 4.4 | | | $ | 4.3 | | | $ | (0.1 | ) |
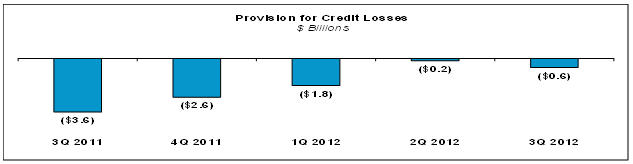
| 2 | | Provision for credit losses | | | (0.2 | ) | | | (0.6 | ) | | | (0.5 | ) |
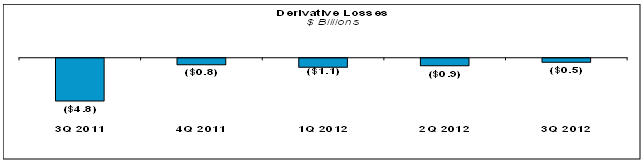
| 3 | | Derivative losses | | | (0.9 | ) | | | (0.5 | ) | | | 0.4 | |
| 4 | | Other non-interest income (loss) | | | 0.1 | | | | (0.1 | ) | | | (0.2 | ) |
| 5 | | Non-interest expense | | | (0.5 | ) | | | (0.5 | ) | | | 0.1 | |
| 6 | | Income tax benefit | | | 0.1 | | | | 0.3 | | | | 0.2 | |
| | | | | | | | | | | | | | |
| 7 | | Net income | | $ | 3.0 | | | $ | 2.9 | | | $ | (0.1 | ) |
| 8 | | Total other comprehensive income (loss) | | | (0.1 | ) | | | 2.7 | | | | 2.8 | |
| | | | | | | | | | | | | | |
| 9 | | Comprehensive income | | $ | 2.9 | | | $ | 5.6 | | | $ | 2.7 | |
| | | | | | | | | | | | | | |
| (1) | See “Appendix — Financial Results Discussion” section for additional information about the company’s 3Q 2012 financial results. |
The slight decrease in net income for the third quarter of 2012, compared to the second quarter of 2012, primarily reflects an increase in the provision for credit losses related to single-family loans, partially offset by lower derivative losses. The increase in comprehensive income for the third quarter of 2012, compared to the second quarter of 2012, primarily reflects fair value gains on the company’s non-agency available-for-sale (AFS) securities due to spread tightening. The fair value of Freddie Mac’s AFS securities may fluctuate considerably from quarter to quarter due to market conditions, which can lead to variability in the company’s comprehensive income results.
Freddie Mac Third Quarter 2012 Financial Results
November 6, 2012
Page 3
Treasury Draws and Dividend Payments
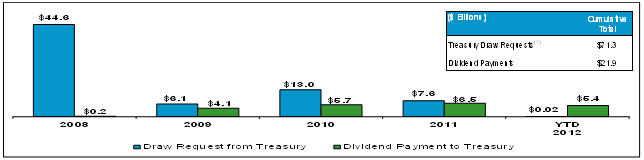
| (1) | Excludes the initial liquidation preference of Freddie Mac’s senior preferred stock of $1.0 billion. |
Freddie Mac does not require a draw from Treasury for the third quarter of 2012 because the company had positive net worth at September 30, 2012. The company’s $4.9 billion net worth at September 30, 2012 reflects $1.1 billion in net worth at June 30, 2012, and third quarter comprehensive income of $5.6 billion, partially offset by the $1.8 billion quarterly dividend payment to Treasury on the company’s senior preferred stock.
Through September 30, 2012, Freddie Mac has paid approximately $21.9 billion in cash dividends to Treasury on the company’s senior preferred stock. This represents 31 percent of the company’s cumulative draws received under the Purchase Agreement with Treasury.
On August 17, 2012, Freddie Mac, acting through FHFA, as Conservator, and Treasury entered into a third amendment to the Purchase Agreement. This amendment, among other items, replaced the fixed 10 percent dividend rate with a net worth sweep dividend and suspended the periodic commitment fees (both beginning in 2013). Under this amendment, Freddie Mac will be required to pay dividends to the extent that its net worth exceeds the permitted capital reserve. The amount of the permitted capital reserve will be $3 billion in 2013 and will be reduced by $600 million each year thereafter until it reaches zero in 2018. The amendment effectively ends the circular practice of taking draws from Treasury to pay dividends to Treasury.
Hurricane Sandy Mortgage Relief
Freddie Mac is taking steps to help affected homeowners in the wake of Hurricane Sandy. The company has authorized its mortgage servicers to provide a full range of mortgage relief options to homeowners with mortgages owned or guaranteed by Freddie Mac whose homes were damaged or destroyed by Hurricane Sandy. The options available to the servicers include: (a) forbearance on mortgage payments for up to one year; (b) suspending foreclosure and eviction proceedings for up to twelve months; (c) waiving assessments of penalties or late fees against borrowers with disaster-damaged homes; and (d) not reporting forbearance or delinquencies caused by the disaster to the nation’s credit bureaus.
The company has also announced revisions to its loan documentation requirements for borrowers affected by Hurricane Sandy, including more flexible timelines and special provisions regarding property inspections and appraisals for Freddie Mac relief refinance mortgages.
Housing Market Support
Freddie Mac continues to support the U.S. housing market by ensuring credit availability for new and refinanced mortgages as well as rental housing. The company also continues to help struggling homeowners avoid foreclosure and stabilize communities nationwide. Since the beginning of 2009, Freddie Mac has helped more than 8.1 million American families own or rent a home, and another 742,000 avoid foreclosure.
Freddie Mac Third Quarter 2012 Financial Results
November 6, 2012
Page 4
Number of Families Helped
| | | | | | | | | | | | | | | | | | | | | | |
| (Thousands) | | 2009 | | | 2010 | | | 2011 | | | YTD
9/30/2012 | | | Cumulative
Total | |
| 1 | | Number of families helped to own or rent a home | | | 2,482 | | | | 2,092 | | | | 1,840 | | | | 1,717 | | | | 8,131 | |
| 2 | | Refinance borrowers(1) | | | 1,764 | | | | 1,480 | | | | 1,193 | | | | 1,173 | | | | 5,610 | |
| 3 | | Purchase borrowers(1) | | | 460 | | | | 378 | | | | 326 | | | | 242 | | | | 1,406 | |
| 4 | | Multifamily rental units | | | 258 | | | | 234 | | | | 321 | | | | 302 | | | | 1,115 | |
| 5 | | Number of families helped to avoid foreclosure(2) | | | 133 | | | | 275 | | | | 208 | | | | 126 | | | | 742 | |
| 6 | | Loan modifications | | | 65 | | | | 170 | | | | 109 | | | | 50 | | | | 394 | |
| 7 | | Repayment plans | | | 34 | | | | 31 | | | | 33 | | | | 26 | | | | 124 | |
| 8 | | Forbearance agreements | | | 15 | | | | 35 | | | | 20 | | | | 11 | | | | 81 | |
| 9 | | Short sales & deed-in-lieu of foreclosure transactions | | | 19 | | | | 39 | | | | 46 | | | | 39 | | | | 143 | |
| 10 | | Total(line 1 + line 5) | | | 2,615 | | | | 2,367 | | | | 2,048 | | | | 1,843 | | | | 8,873 | |
| (1) | For the periods presented, a borrower may be counted more than once if the company purchased more than one loan (purchase or refinance mortgage) relating to the same borrower. |
| (2) | These categories are not mutually exclusive and a borrower in one category may also be included within another category in the same period. For the periods presented, a borrower may subsequently go into foreclosure. |
Providing Liquidity– Freddie Mac continues to provide access to affordable financing for new and refinanced mortgages and rental housing. Since 2009, the company has provided over $1.6 trillion in liquidity to the market through its purchases of loans and issuances of mortgage-related securities, which includes $328 billion during the first nine months of 2012.
Market Liquidity Provided
| | | | | | | | | | | | | | | | | | | | | | |
| ($ Billions) | | 2009 | | | 2010 | | | 2011 | | | YTD
9/30/2012 | | | Cumulative
Total | |
| 1 | | Purchase and issuance volume | | $ | 548 | | | $ | 412 | | | $ | 361 | | | $ | 328 | | | $ | 1,649 | |
| 2 | | Refinance portion of purchase and issuance volume | | $ | 380 | | | $ | 306 | | | $ | 250 | | | $ | 245 | | | $ | 1,181 | |
Enabling Refinance Activity– Freddie Mac continues to help borrowers lower their payments and/or reduce their mortgage terms by purchasing refinance mortgages. Since 2009, the company has purchased $1.2 trillion in refinance mortgages, helping 5.6 million homeowners. The homeowners who refinanced during the first nine months of 2012 will save an average of $3,000 in interest payments over the next 12 months. Refinance purchases of $245 billion accounted for 82 percent of the company’s single-family mortgage purchase volume during the first nine months of 2012, based on unpaid principal balance (UPB).
Freddie Mac continues to work to increase participation in the Home Affordable Refinance Program (HARP). Through HARP, the company is increasingly helping borrowers to refinance their mortgages into more favorable terms, especially in areas of the country with large concentrations of underwater borrowers. In the first nine months of 2012, Freddie Mac purchased 322,000 HARP loans, nearly 75 percent more than the amount Freddie Mac purchased during all of 2011. Since HARP was introduced in 2009, Freddie Mac has purchased HARP loans made to over 802,000 homeowners.
Preventing Foreclosures – Freddie Mac continues to help struggling borrowers retain their homes or otherwise avoid foreclosure. In the first nine months of 2012, the company completed nearly 126,000 loan
Freddie Mac Third Quarter 2012 Financial Results
November 6, 2012
Page 5
workouts, including 50,000 loan modifications, which brings the total number of homeowners the company has helped to avoid foreclosure to over 740,000 since the beginning of 2009. In addition, more than 70 percent of the loans modified in the third quarter of 2011 were current and performing, or had been repaid in full, as of September 30, 2012.
In the third quarter of 2012, as part of the FHFA-directed Servicing Alignment Initiative, Freddie Mac introduced a new short sale program to help more homeowners by making the process easier and quicker for servicers to complete a short sale. This streamlined program became available for new borrower evaluations on November 1, 2012.
Credit Quality
Post-2008 Single-Family Books of Business – Since 2008, Freddie Mac has enhanced its credit and underwriting policies, purchased fewer loans with high-risk characteristics and seen changes in the underwriting practices of lenders and mortgage insurers. These factors have contributed to improvement in the credit quality of loans purchased since 2008 (excluding relief refinance mortgages), relative to loans purchased in 2005 through 2008.
Credit Quality of Single-Family Credit Guarantee Portfolio Purchases Excluding Relief Refinance Mortgages
| | |
| Weighted Average Original LTV Ratio | | Weighted Average Credit Score |

Relief refinance mortgages (which include HARP loans) generally do not include all of the changes in underwriting standards the company has implemented since 2008. During the first nine months of 2012, relief refinance mortgages represented 31 percent of single-family purchases while relief refinance mortgages with LTV ratios above 80 percent (i.e., HARP loans) represented approximately 22 percent of purchases. At September 30, 2012, including relief refinance mortgages, single-family loans purchased by the company during the first nine months of 2012 had a weighted average original LTV ratio of 78 percent and a weighted average FICO credit score at origination of 755.
2005 to 2008 Single-Family Books of Business – Since the beginning of 2008, on an aggregate basis, the company has recorded provision for credit losses of $75.9 billion associated with single-family loans and
Freddie Mac Third Quarter 2012 Financial Results
November 6, 2012
Page 6
recorded an additional $4.0 billion in losses on loans purchased from the company’s PC trusts, net of recoveries. The majority of these losses are associated with loans originated in 2005 through 2008.
Loans originated in 2005 through 2008 are becoming a smaller portion of the company’s single-family credit guarantee portfolio. At September 30, 2012, loans originated in 2005 through 2008 represented 26 percent of the company’s single-family credit guarantee portfolio, while loans originated after 2008, including relief refinance mortgages, accounted for 60 percent of the portfolio, based on UPB.
Single-Family Credit Guarantee Portfolio – Concentration of Credit Risk
| | | | | | | | |
| | | As of 9/30/2012
| | | | YTD
9/30/2012 |
| Year of Origination | | % of Portfolio | | Serious Delinquency Rate | | | | % of Credit Losses |
| 2009 - 2012 | | 60% | | 0.37% | | | | 3% |
| 2005 - 2008 | | 26 | | 9.38% | | | | 88 |
| 2004 and prior | | 14 | | 3.08% | | | | 9 |
| Total | | 100% | | 3.37% | | | | 100% |
Single-family serious delinquency rate was 3.37 percent at September 30, 2012, compared to 3.45 percent at June 30, 2012. While the company’s serious delinquency rate is higher than the rate in years prior to 2009, it is substantially below the rate for the entire U.S. mortgage market. According to the Mortgage Bankers Association’s National Delinquency Survey, the serious delinquency rate on first-lien single-family loans in the U.S. mortgage market was 7.31 percent at June 30, 2012, which is the most current data available.
Multifamily delinquency rate(based on loans 60 days or more past due) was 0.27 percent at September 30, 2012, unchanged from June 30, 2012, and continues to remain below industry benchmarks.
Additional Information
For more information, including that related to Freddie Mac’s financial results, conservatorship and related matters, see the company’s Quarterly Report on Form 10-Q for the quarter ended September 30, 2012, and the company’s Consolidated Financial Statements, Core Tables and Financial Results Supplement. These documents are available on the Investor Relations page of the company’s Web site at www.FreddieMac.com/investors.
Additional information about Freddie Mac and its business is also set forth in the company’s filings with the SEC, which are available on the Investor Relations page of the company’s Web site at www.FreddieMac.com/investors and the SEC’s Web site at www.sec.gov. Freddie Mac encourages all investors and interested members of the public to review these materials for a more complete understanding of the company’s financial results and related disclosures.
* * * *
This press release contains forward-looking statements, which may include statements pertaining to the conservatorship, the company’s current expectations and objectives for its efforts under the Making Home Affordable program, the servicing alignment initiative and other programs to assist the U.S. residential mortgage market, future business plans, liquidity, capital management, economic and market conditions and trends, market share, the effect of legislative and regulatory developments, implementation of new accounting
Freddie Mac Third Quarter 2012 Financial Results
November 6, 2012
Page 7
guidance, credit losses, internal control remediation efforts, and results of operations and financial condition on a GAAP, Segment Earnings and fair value basis. Forward-looking statements involve known and unknown risks and uncertainties, some of which are beyond the company’s control. Management’s expectations for the company’s future necessarily involve a number of assumptions, judgments and estimates, and various factors, including changes in market conditions, liquidity, mortgage-to-debt option-adjusted spread, credit outlook, actions by FHFA, Treasury, the Federal Reserve, SEC, HUD, the Administration, and Congress, and the impacts of legislation or regulations and new or amended accounting guidance, could cause actual results to differ materially from these expectations. These assumptions, judgments, estimates and factors are discussed in the company’s Annual Report on Form 10-K for the year ended December 31, 2011, Quarterly Reports on Form 10-Q for the quarters ended March 31, 2012, June 30, 2012 and September 30, 2012, and Current Reports on Form 8-K, which are available on the Investor Relations page of the company’s Web site at www.FreddieMac.com/investors and the SEC’s Web site at www.sec.gov. The company undertakes no obligation to update forward-looking statements it makes to reflect events or circumstances after the date of this press release.
Freddie Mac was established by Congress in 1970 to provide liquidity, stability and affordability to the nation’s residential mortgage markets. Freddie Mac supports communities across the nation by providing mortgage capital to lenders. Today Freddie Mac is making home possible for one in four homebuyers and is one of the largest sources of financing for multifamily housing. For more information, visit www.FreddieMac.com.
# # #
Freddie Mac Third Quarter 2012 Financial Results
November 6, 2012
Page 8
Appendix—Financial Results Discussion
Summary Consolidated Statements of Comprehensive Income
| | | | | | | | | | | | | | |
| | | | | Three Months Ended | |
| | | | | June 30, | | | September 30, | | | | |
| ($ Millions) | | 2012 | | | 2012 | | | Change | |
| 1 | | Net interest income | | $ | 4,386 | | | $ | 4,269 | | | $ | (117 | ) |
| 2 | | Provision for credit losses | | | (155 | ) | | | (610 | ) | | | (455 | ) |
| 3 | | Derivative losses | | | (882 | ) | | | (488 | ) | | | 394 | |
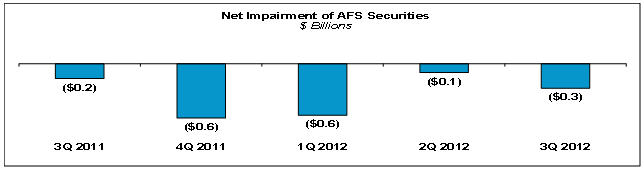
| 4 | | Net impairments of AFS securities recognized in earnings | | | (98 | ) | | | (267 | ) | | | (169 | ) |
| 5 | | Other | | | 229 | | | | 195 | | | | (34 | ) |
| | | | | | | | | | | | | | |
| 6 | | Non-interest income | | | (751 | ) | | | (560 | ) | | | 191 | |
| 7 | | Administrative expenses | | | (401 | ) | | | (401 | ) | | | — | |
| 8 | | REO operations income | | | 30 | | | | 49 | | | | 19 | |
| 9 | | Other | | | (165 | ) | | | (121 | ) | | | 44 | |
| | | | | | | | | | | | | | |
| 10 | | Non-interest expense | | | (536 | ) | | | (473 | ) | | | 63 | |
| 11 | | Income tax benefit | | | 76 | | | | 302 | | | | 226 | |
| | | | | | | | | | | | | | |
| 12 | | Net income | | $ | 3,020 | | | $ | 2,928 | | | $ | (92 | ) |
| 13 | | Total other comprehensive income (loss) | | | (128 | ) | | | 2,702 | | | | 2,830 | |
| | | | | | | | | | | | | | |
| 14 | | Comprehensive income | | $ | 2,892 | | | $ | 5,630 | | | $ | 2,738 | |
| | | | | | | | | | | | | | |
Net interest income was $4.3 billion for the third quarter of 2012, compared to $4.4 billion for the second quarter of 2012. Net interest yield was 82 basis points for the third quarter of 2012, compared to 83 basis points for the second quarter of 2012. The decreases in net interest income and net interest yield primarily reflect a decline in the balance of higher-yielding mortgage-related assets due to continued liquidations, partially offset by lower funding costs.
Provision for credit losses was $610 million for the third quarter of 2012, compared to $155 million for the second quarter of 2012, as national house prices improved to a lesser extent in the third quarter than in the second quarter. The increase also reflects approximately $0.2 billion related to a change in the treatment of single-family loans discharged in bankruptcy.
Freddie Mac Third Quarter 2012 Financial Results
November 6, 2012
Page 9
The company’s loan loss reserves were $33.8 billion as of September 30, 2012, compared to $35.8 billion as of June 30, 2012.
Derivative losseswere $488 million for the third quarter of 2012, compared to $882 million for the second quarter of 2012. The decrease in derivative losses is due to long-term interest rates declining less during the third quarter as compared to the second quarter.
Net impairment of AFS securities recognized in earnings was $267 million for the third quarter of 2012, compared to $98 million for the second quarter of 2012. The increase in net impairments primarily reflects higher estimated defaults on subprime securities, partially offset by the favorable impact of increasing house prices.
Freddie Mac Third Quarter 2012 Financial Results
November 6, 2012
Page 10
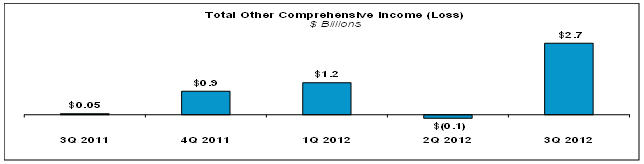
Total other comprehensive incomewas $2.7 billion for the third quarter of 2012, compared to a loss of $128 million for the second quarter of 2012. The shift to total other comprehensive income in the third quarter reflects the favorable impact of spread tightening on the fair value of the company’s non-agency AFS securities.
Segment Financial Results– Freddie Mac’s operations consist of three reportable segments, which are based on the type of business activities each performs — Investments, Single-family Guarantee and Multifamily. Certain activities that are not part of a reportable segment are included in the All Other category.
Summary of Segment Earnings (Loss) and Comprehensive Income (Loss)
| | | | | | | | | | | | | | |
| | | | | Three Months Ended | |
| | | | | June 30, | | | September 30, | | | | |
| ($ Billions) | | 2012 | | | 2012 | | | Change | |
| | Segment Earnings (loss), net of taxes | | | | | | | | | | | | |
| 1 | | Investments | | $ | 2.5 | | | $ | 2.5 | | | $ | 0.0 | |
| 2 | | Single-family Guarantee | | | 0.2 | | | | (0.2 | ) | | | (0.4 | ) |
| 3 | | Multifamily | | | 0.3 | | | | 0.7 | | | | 0.4 | |
| 4 | | All Other | | | — | | | | (0.1 | ) | | | (0.1 | ) |
| | | | | | | | | | | | | | |
| 5 | | Total Segment Earnings, net of taxes | | $ | 3.0 | | | $ | 2.9 | | | $ | (0.1 | ) |
| | | | | | | | | | | | | | |
| | Comprehensive income (loss) of segments | | | | | | | | | | | | |
| 6 | | Investments | | $ | 2.5 | | | $ | 4.5 | | | $ | 2.0 | |
| 7 | | Single-family Guarantee | | | 0.2 | | | | (0.2 | ) | | | (0.4 | ) |
| 8 | | Multifamily | | | 0.2 | | | | 1.4 | | | | 1.2 | |
| 9 | | All Other | | | — | | | | (0.1 | ) | | | (0.1 | ) |
| | | | | | | | | | | | | | |
| 10 | | Comprehensive income of segments | | $ | 2.9 | | | $ | 5.6 | | | $ | 2.7 | |
| | | | | | | | | | | | | | |
Investments segment had earnings of $2.5 billion for the third quarter of 2012, unchanged from the second quarter of 2012. Comprehensive income for the Investments segment was $4.5 billion for the third quarter of 2012, compared to $2.5 billion for the second quarter of 2012. The increase primarily reflects fair value gains on non-agency AFS securities due to spread tightening.
Single-family Guarantee segment had a loss of $163 million for the third quarter of 2012, compared to earnings of $241 million for the second quarter of 2012. The shift from segment earnings to segment loss was primarily driven by the higher provision for credit losses. Comprehensive income for the Single-family Guarantee segment approximated segment earnings for both the second and third quarters of 2012.
Freddie Mac Third Quarter 2012 Financial Results
November 6, 2012
Page 11
Multifamily segment had earnings of $710 million for the third quarter of 2012, compared to $318 million for the second quarter of 2012. The increase in segment earnings was primarily due to gains on mortgage loans recorded at fair value due to spread tightening. Comprehensive income for the Multifamily segment was $1.4 billion for the third quarter of 2012, compared to $162 million for the second quarter of 2012. The increase primarily reflects the favorable impact of spread tightening on commercial mortgage-backed securities as well as higher segment earnings during the third quarter.