Exhibit 99.3
Third Quarter 2012
Financial Results
Supplement
November 6, 2012
Table of contents
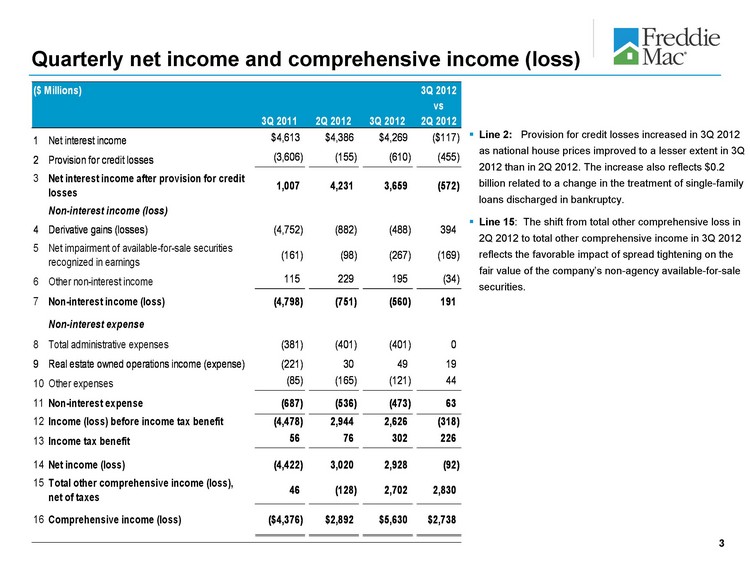
Quarterly net income and comprehensive income (loss)
Line 2: Provision for credit losses increased in 3Q 2012 as national house prices improved to a lesser extent in 3Q 2012 than in 2Q 2012. The increase also reflects $0.2 billion related to a change in the treatment of single-family loans discharged in bankruptcy.
Line 15: The shift from total other comprehensive loss in 2Q 2012 to total other comprehensive income in 3Q 2012 reflects the favorable impact of spread tightening on the fair value of the company’s non-agency available-for-sale securities.
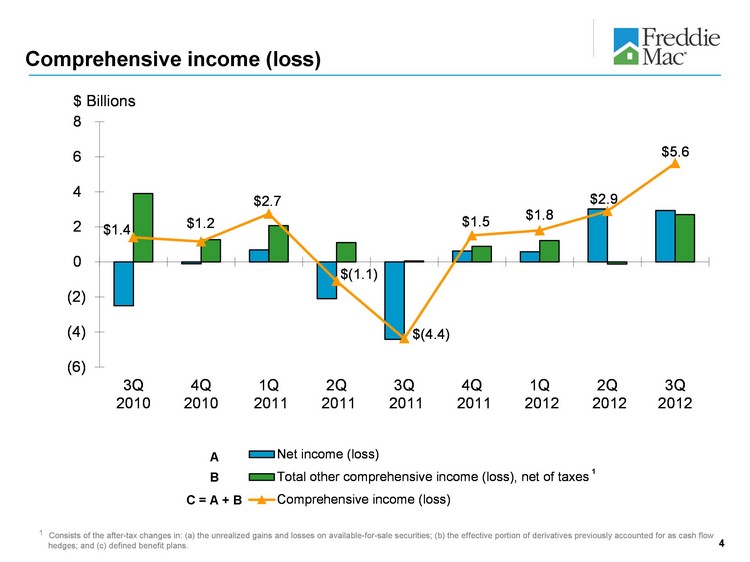
Comprehensive income (loss)
1
1 Consists of the after-tax changes in: (a) the unrealized gains and losses on available-for-sale securities; (b) the effective portion of derivatives previously accounted for as cash flow hedges; and (c) defined benefit plans.
A
B
C = A + B
Dividend Payment to Treasury
Draw Request from Treasury
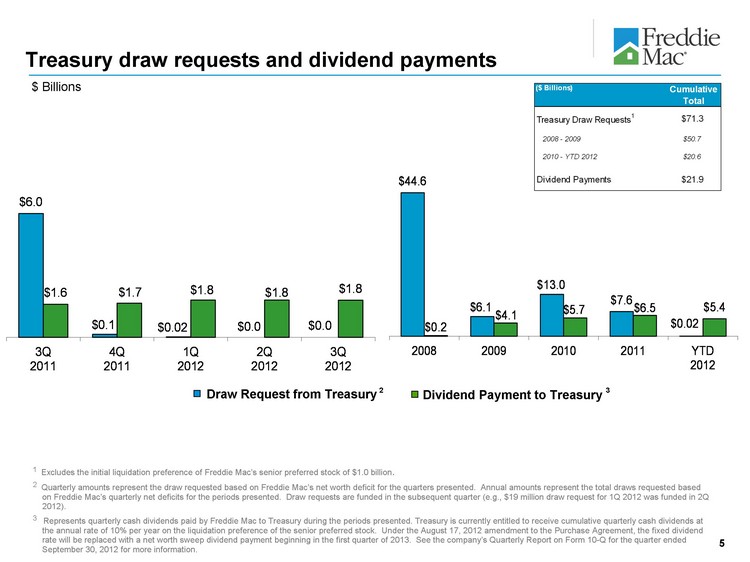
Treasury draw requests and dividend payments
1 Excludes the initial liquidation preference of Freddie Mac’s senior preferred stock of $1.0 billion.
2 Quarterly amounts represent the draw requested based on Freddie Mac’s net worth deficit for the quarters presented. Annual amounts represent the total draws requested based on Freddie Mac’s quarterly net deficits for the periods presented. Draw requests are funded in the subsequent quarter (e.g., $19 million draw request for 1Q 2012 was funded in 2Q 2012).
3 Represents quarterly cash dividends paid by Freddie Mac to Treasury during the periods presented. Treasury is currently entitled to receive cumulative quarterly cash dividends at the annual rate of 10% per year on the liquidation preference of the senior preferred stock. Under the August 17, 2012 amendment to the Purchase Agreement, the fixed dividend rate will be replaced with a net worth sweep dividend payment beginning in the first quarter of 2013. See the company’s Quarterly Report on Form 10-Q for the quarter ended September 30, 2012 for more information.
$ Billions
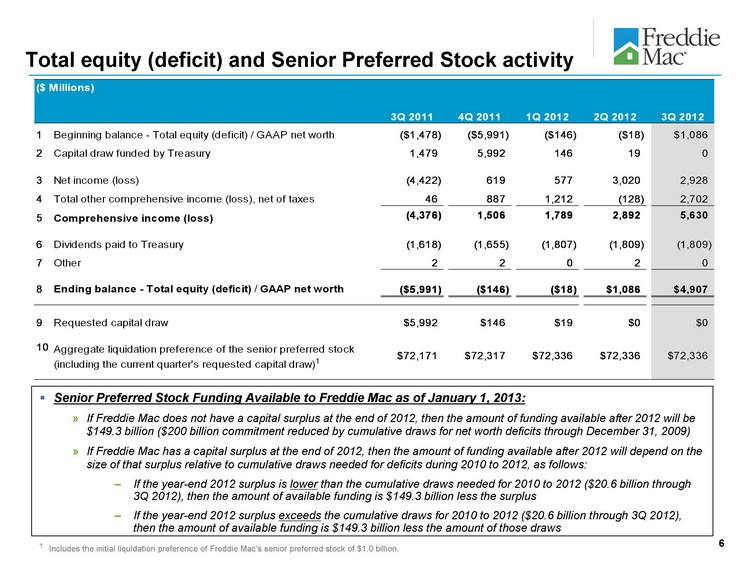
Total equity (deficit) and Senior Preferred Stock activity
Senior Preferred Stock Funding Available to Freddie Mac as of January 1, 2013:
If Freddie Mac does not have a capital surplus at the end of 2012, then the amount of funding available after 2012 will be $149.3 billion ($200 billion commitment reduced by cumulative draws for net worth deficits through December 31, 2009)
If Freddie Mac has a capital surplus at the end of 2012, then the amount of funding available after 2012 will depend on the size of that surplus relative to cumulative draws needed for deficits during 2010 to 2012, as follows:
If the year-end 2012 surplus is lower than the cumulative draws needed for 2010 to 2012 ($20.6 billion through 3Q 2012), then the amount of available funding is $149.3 billion less the surplus
If the year-end 2012 surplus exceeds the cumulative draws for 2010 to 2012 ($20.6 billion through 3Q 2012), then the amount of available funding is $149.3 billion less the amount of those draws
1 Includes the initial liquidation preference of Freddie Mac’s senior preferred stock of $1.0 billion.
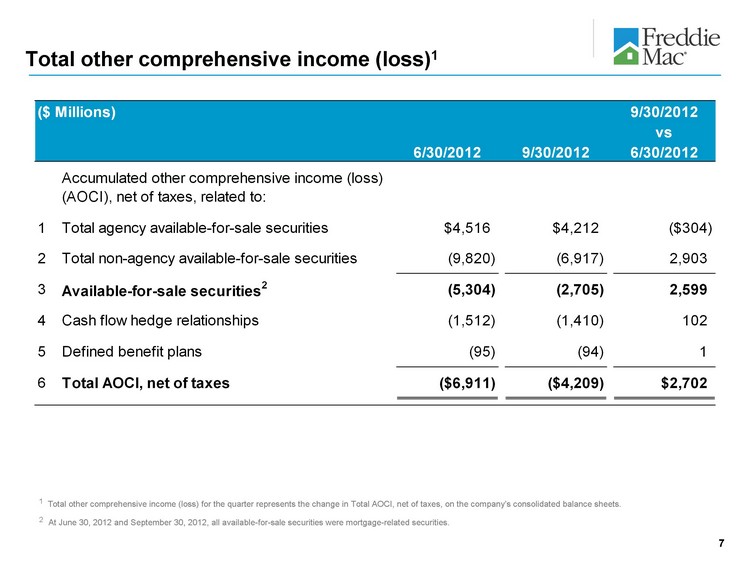
Total other comprehensive income (loss)1
1 Total other comprehensive income (loss) for the quarter represents the change in Total AOCI, net of taxes, on the company’s consolidated balance sheets.
2 At June 30, 2012 and September 30, 2012, all available-for-sale securities were mortgage-related securities.
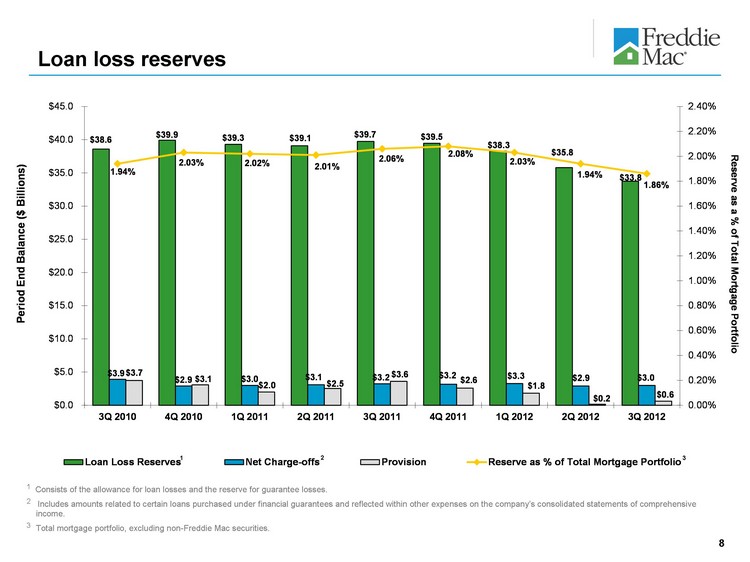
Loan loss reserves
1 Consists of the allowance for loan losses and the reserve for guarantee losses.
2 Includes amounts related to certain loans purchased under financial guarantees and reflected within other expenses on the company’s consolidated statements of comprehensive income.
3 Total mortgage portfolio, excluding non-Freddie Mac securities.
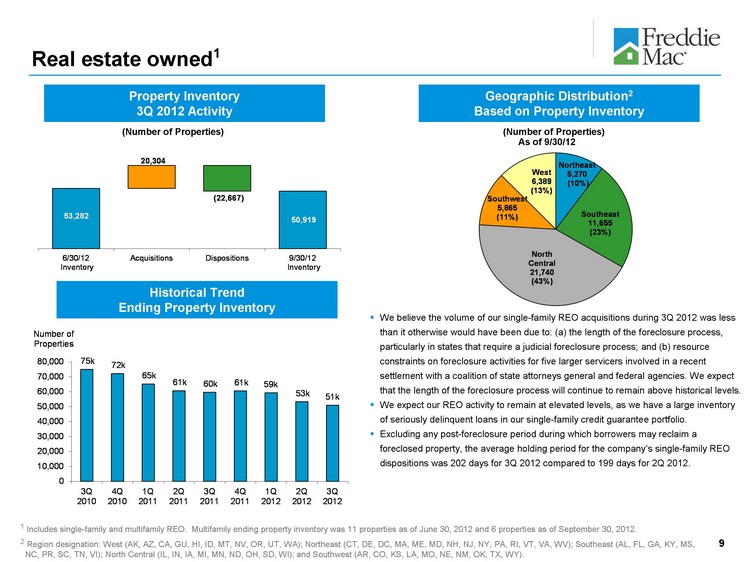
Real estate owned1
Property Inventory
3Q 2012 Activity
Geographic Distribution2
Based on Property Inventory
Historical Trend
Ending Property Inventory
1 Includes single-family and multifamily REO. Multifamily ending property inventory was 11 properties as of June 30, 2012 and 6 properties as of September 30, 2012.
2 Region designation: West (AK, AZ, CA, GU, HI, ID, MT, NV, OR, UT, WA); Northeast (CT, DE, DC, MA, ME, MD, NH, NJ, NY, PA, RI, VT, VA, WV); Southeast (AL, FL, GA, KY, MS, NC, PR, SC, TN, VI); North Central (IL, IN, IA, MI, MN, ND, OH, SD, WI); and Southwest (AR, CO, KS, LA, MO, NE, NM, OK, TX, WY).
((Number of Properties)
((Number of Properties)
As of 9/30/12
We believe the volume of our single-family REO acquisitions during 3Q 2012 was less than it otherwise would have been due to: (a) the length of the foreclosure process, particularly in states that require a judicial foreclosure process; and (b) resource constraints on foreclosure activities for five larger servicers involved in a recent settlement with a coalition of state attorneys general and federal agencies. We expect that the length of the foreclosure process will continue to remain above historical levels.
We expect our REO activity to remain at elevated levels, as we have a large inventory of seriously delinquent loans in our single-family credit guarantee portfolio.
Excluding any post-foreclosure period during which borrowers may reclaim a foreclosed property, the average holding period for the company’s single-family REO dispositions was 202 days for 3Q 2012 compared to 199 days for 2Q 2012.
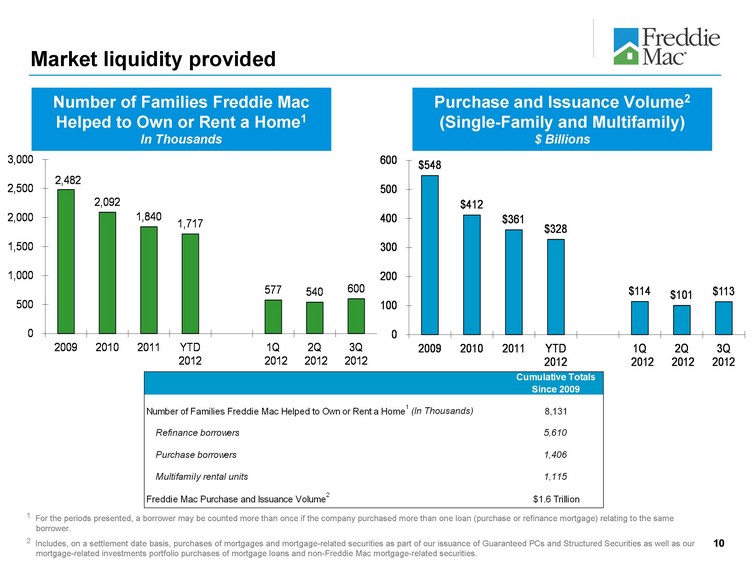
Market liquidity provided
Number of Families Freddie Mac
Helped to Own or Rent a Home1
In Thousands
Purchase and Issuance Volume2
(Single-Family and Multifamily)
$ Billions
1 For the periods presented, a borrower may be counted more than once if the company purchased more than one loan (purchase or refinance mortgage) relating to the same borrower.
2 Includes, on a settlement date basis, purchases of mortgages and mortgage-related securities as part of our issuance of Guaranteed PCs and Structured Securities as well as our mortgage-related investments portfolio purchases of mortgage loans and non-Freddie Mac mortgage-related securities.
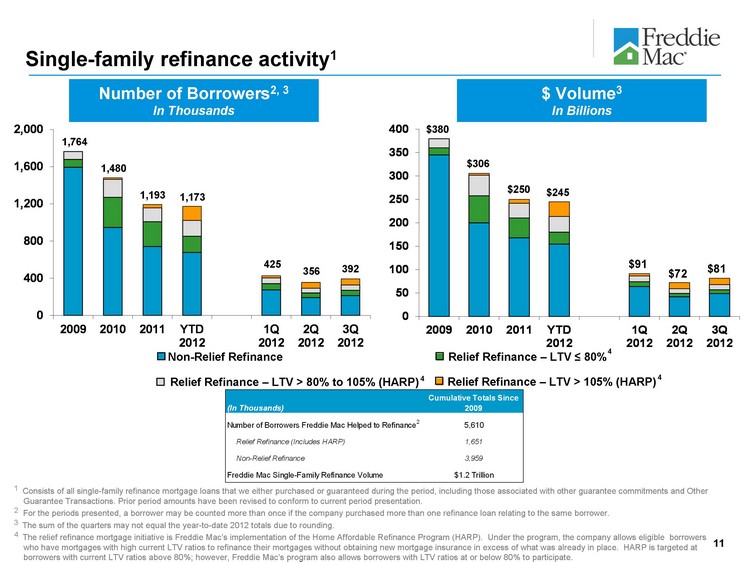
Relief Refinance - LTV > 105% (HARP)
Single-family refinance activity1
Number of Borrowers2, 3
In Thousands
$ Volume3
In Billions
Non-Relief Refinance
Relief Refinance - LTV ^ 80%
Relief Refinance - LTV > 80% to 105% (HARP)
$380
$306
$250
1,764
1,480
1,193
1 Consists of all single-family refinance mortgage loans that we either purchased or guaranteed during the period, including those associated with other guarantee commitments and Other Guarantee Transactions. Prior period amounts have been revised to conform to current period presentation.
2 For the periods presented, a borrower may be counted more than once if the company purchased more than one refinance loan relating to the same borrower.
3 The sum of the quarters may not equal the year-to-date 2012 totals due to rounding.
4 The relief refinance mortgage initiative is Freddie Mac’s implementation of the Home Affordable Refinance Program (HARP). Under the program, the company allows eligible borrowers who have mortgages with high current LTV ratios to refinance their mortgages without obtaining new mortgage insurance in excess of what was already in place. HARP is targeted at borrowers with current LTV ratios above 80%; however, Freddie Mac’s program also allows borrowers with LTV ratios at or below 80% to participate.
425
$91
4
4
4
356
$72
$245
$81
1,173
392
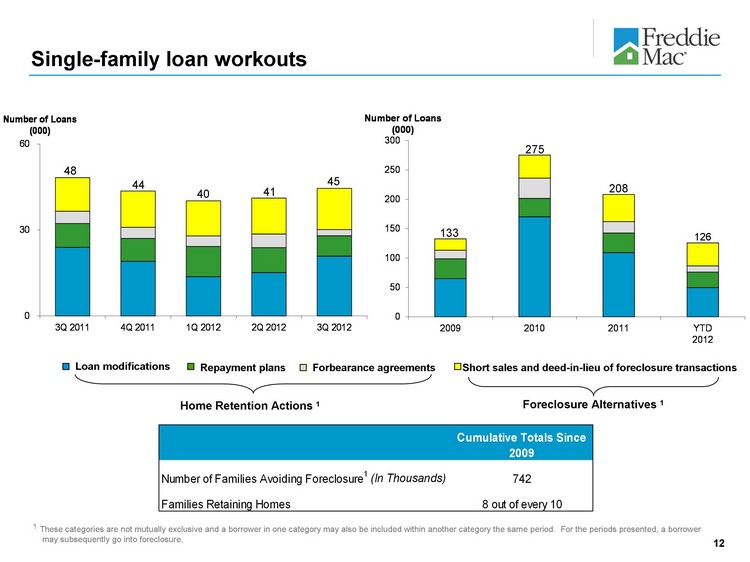
Repayment plans
Loan modifications
Forbearance agreements
Short sales and deed-in-lieu of foreclosure transactions
Single-family loan workouts
Home Retention Actions 1
Foreclosure Alternatives 1
48
133
275
44
208
40
41
1 These categories are not mutually exclusive and a borrower in one category may also be included within another category the same period. For the periods presented, a borrower may subsequently go into foreclosure.
45
126
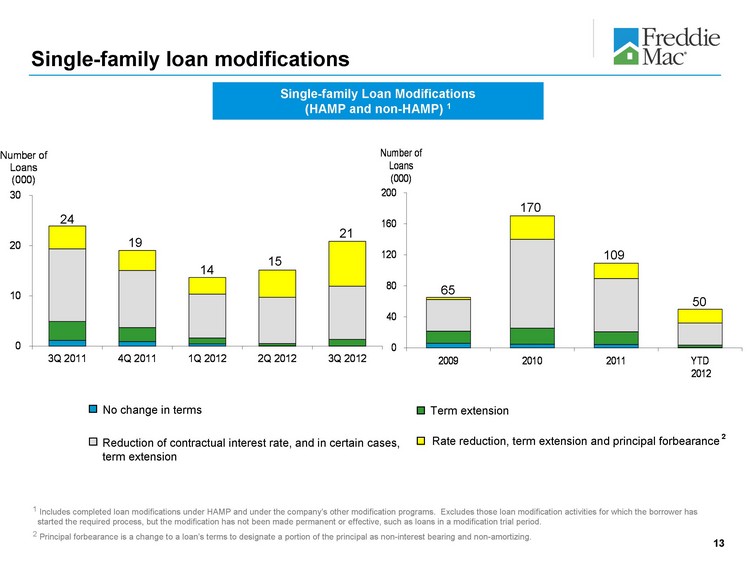
Single-family loan modifications
1 Includes completed loan modifications under HAMP and under the company’s other modification programs. Excludes those loan modification activities for which the borrower has started the required process, but the modification has not been made permanent or effective, such as loans in a modification trial period.
2 Principal forbearance is a change to a loan’s terms to designate a portion of the principal as non-interest bearing and non-amortizing.
Single-family Loan Modifications
(HAMP and non-HAMP) 1
No change in terms
Term extension
Reduction of contractual interest rate, and in certain cases, term extension
Rate reduction, term extension and principal forbearance
24
19
2
65
170
109
14
15
21
50
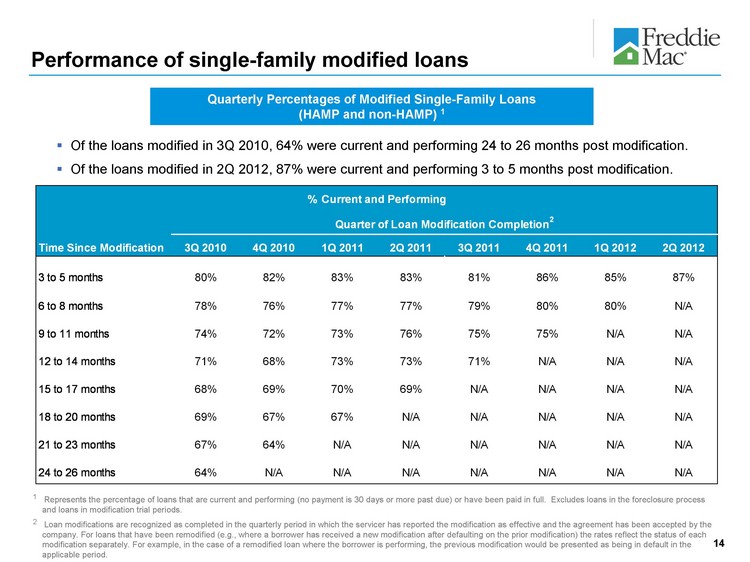
Quarterly Percentages of Modified Single-Family Loans
(HAMP and non-HAMP) 1
Performance of single-family modified loans
Of the loans modified in 3Q 2010, 64% were current and performing 24 to 26 months post modification.
Of the loans modified in 2Q 2012, 87% were current and performing 3 to 5 months post modification.
1 Represents the percentage of loans that are current and performing (no payment is 30 days or more past due) or have been paid in full. Excludes loans in the foreclosure process and loans in modification trial periods.
2 Loan modifications are recognized as completed in the quarterly period in which the servicer has reported the modification as effective and the agreement has been accepted by the company. For loans that have been remodified (e.g., where a borrower has received a new modification after defaulting on the prior modification) the rates reflect the status of each modification separately. For example, in the case of a remodified loan where the borrower is performing, the previous modification would be presented as being in default in the applicable period.
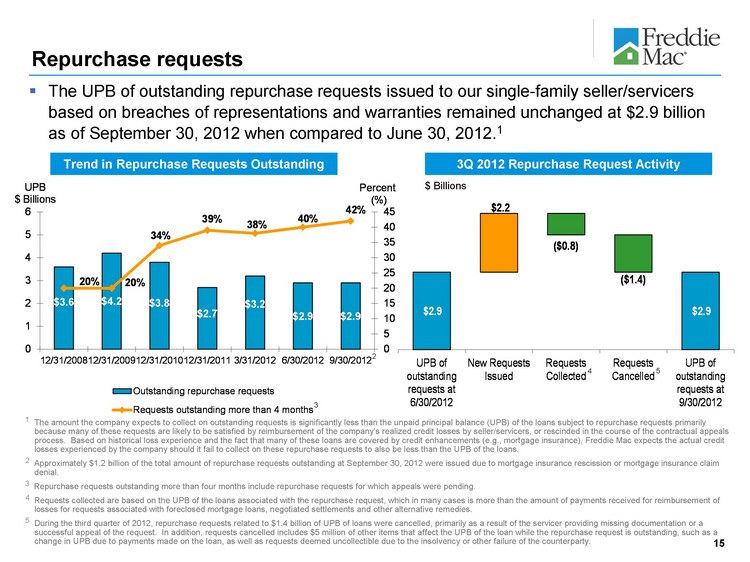
The UPB of outstanding repurchase requests issued to our single-family seller/servicers based on breaches of representations and warranties remained unchanged at $2.9 billion as of September 30, 2012 when compared to June 30, 2012.1
1 The amount the company expects to collect on outstanding requests is significantly less than the unpaid principal balance (UPB) of the loans subject to repurchase requests primarily because many of these requests are likely to be satisfied by reimbursement of the company’s realized credit losses by seller/servicers, or rescinded in the course of the contractual appeals process. Based on historical loss experience and the fact that many of these loans are covered by credit enhancements (e.g., mortgage insurance), Freddie Mac expects the actual credit losses experienced by the company should it fail to collect on these repurchase requests to also be less than the UPB of the loans.
2 Approximately $1.2 billion of the total amount of repurchase requests outstanding at September 30, 2012 were issued due to mortgage insurance rescission or mortgage insurance claim denial.
3 Repurchase requests outstanding more than four months include repurchase requests for which appeals were pending.
4 Requests collected are based on the UPB of the loans associated with the repurchase request, which in many cases is more than the amount of payments received for reimbursement of losses for requests associated with foreclosed mortgage loans, negotiated settlements and other alternative remedies.
5 During the third quarter of 2012, repurchase requests related to $1.4 billion of UPB of loans were cancelled, primarily as a result of the servicer providing missing documentation or a successful appeal of the request. In addition, requests cancelled includes $5 million of other items that affect the UPB of the loan while the repurchase request is outstanding, such as a change in UPB due to payments made on the loan, as well as requests deemed uncollectible due to the insolvency or other failure of the counterparty.
Repurchase requests
Trend in Repurchase Requests Outstanding
3Q 2012 Repurchase Request Activity
4
2
$ Billions
3
5
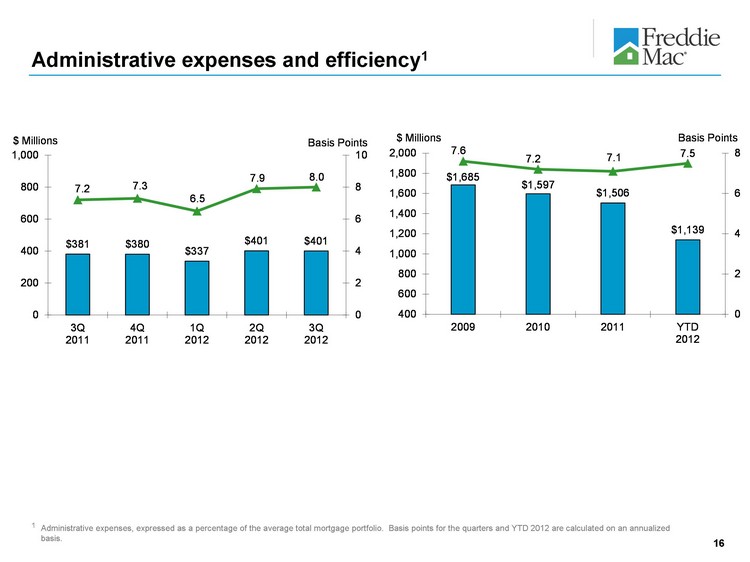
Administrative expenses and efficiency1
1 Administrative expenses, expressed as a percentage of the average total mortgage portfolio. Basis points for the quarters and YTD 2012 are calculated on an annualized basis.
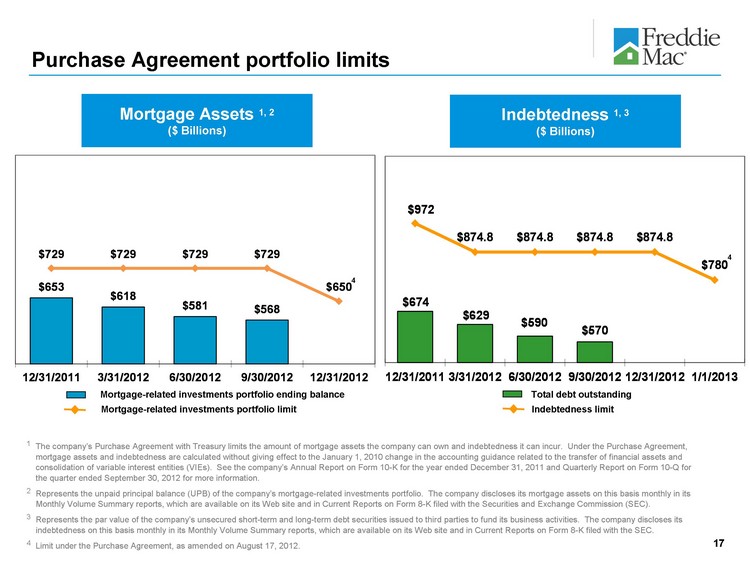
Mortgage-related investments portfolio ending balance
Mortgage-related investments portfolio limit
17
Purchase Agreement portfolio limits
Indebtedness 1, 3
($ Billions)
Mortgage Assets 1, 2
($ Billions)
1 The company’s Purchase Agreement with Treasury limits the amount of mortgage assets the company can own and indebtedness it can incur. Under the Purchase Agreement, mortgage assets and indebtedness are calculated without giving effect to the January 1, 2010 change in the accounting guidance related to the transfer of financial assets and consolidation of variable interest entities (VIEs). See the company’s Annual Report on Form 10-K for the year ended December 31, 2011 and Quarterly Report on Form 10-Q for the quarter ended September 30, 2012 for more information.
2 Represents the unpaid principal balance (UPB) of the company’s mortgage-related investments portfolio. The company discloses its mortgage assets on this basis monthly in its Monthly Volume Summary reports, which are available on its Web site and in Current Reports on Form 8-K filed with the Securities and Exchange Commission (SEC).
3 Represents the par value of the company’s unsecured short-term and long-term debt securities issued to third parties to fund its business activities. The company discloses its indebtedness on this basis monthly in its Monthly Volume Summary reports, which are available on its Web site and in Current Reports on Form 8-K filed with the SEC.
4 Limit under the Purchase Agreement, as amended on August 17, 2012.
Indebtedness limit
Total debt outstanding
4
4
Credit Supplement
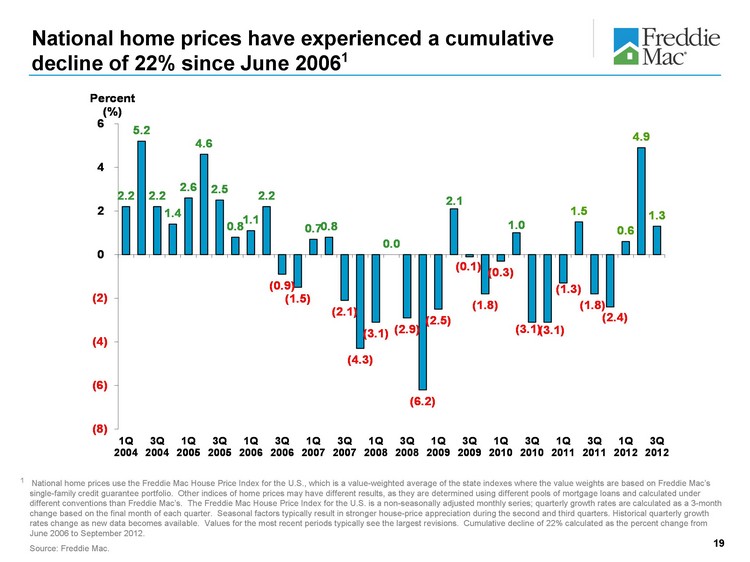
1 National home prices use the Freddie Mac House Price Index for the U.S., which is a value-weighted average of the state indexes where the value weights are based on Freddie Mac’s single-family credit guarantee portfolio. Other indices of home prices may have different results, as they are determined using different pools of mortgage loans and calculated under different conventions than Freddie Mac’s. The Freddie Mac House Price Index for the U.S. is a non-seasonally adjusted monthly series; quarterly growth rates are calculated as a 3-month change based on the final month of each quarter. Seasonal factors typically result in stronger house-price appreciation during the second and third quarters. Historical quarterly growth rates change as new data becomes available. Values for the most recent periods typically see the largest revisions. Cumulative decline of 22% calculated as the percent change from June 2006 to September 2012.
Source: Freddie Mac.
National home prices have experienced a cumulative decline of 22% since June 2006 1
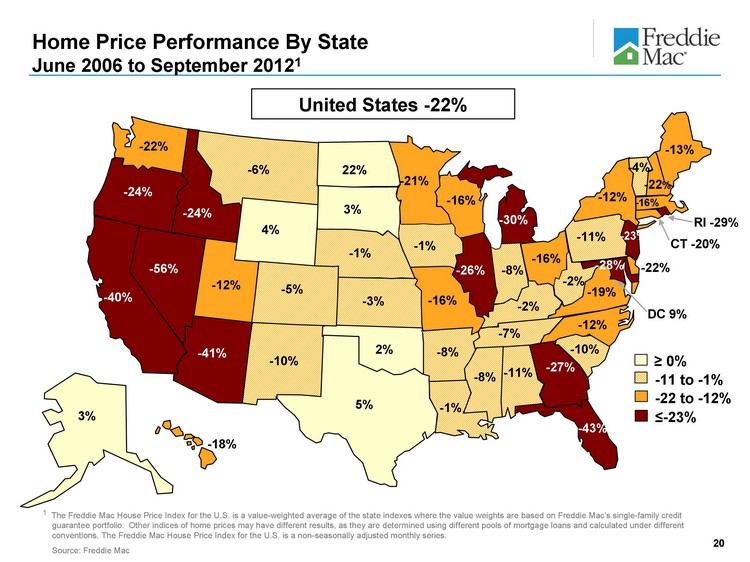
Home Price Performance By State
June 2006 to September 20121
-11%
3%
^ 0%
-11 to -1%
^-23%
-22 to -12%
United States -22%
1 The Freddie Mac House Price Index for the U.S. is a value-weighted average of the state indexes where the value weights are based on Freddie Mac’s single-family credit guarantee portfolio. Other indices of home prices may have different results, as they are determined using different pools of mortgage loans and calculated under different conventions. The Freddie Mac House Price Index for the U.S. is a non-seasonally adjusted monthly series.
Source: Freddie Mac
-8%
-41%
-40%
-5%
CT -20%
DC 9%
-22%
-43%
-27%
-18%
-1%
-24%
-26%
-8%
-3%
-2%
-1%
-16%
-28%
-13%
-30%
-21%
-16%
-8%
-6%
-12%
22%
-1%
-23%
-10%
-56%
-12%
-16%
2%
-24%
-11%
RI -29%
-10%
3%
-7%
5%
-12%
-19%
-4%
-22%
-16%
-2%
4%
-22%
20
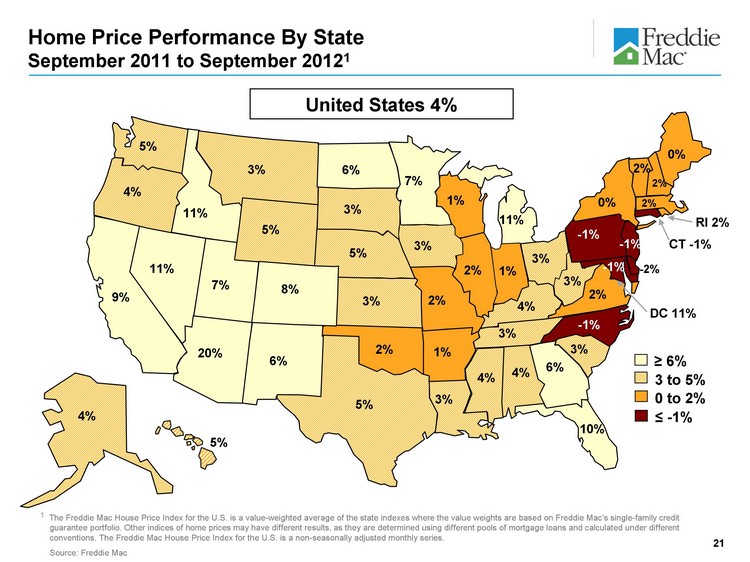
Home Price Performance By State
September 2011 to September 20121
4%
4%
^ 6%
3 to 5%
^ -1%
0 to 2%
1%
20%
9%
8%
CT -1%
DC 11%
-2%
10%
6%
5%
3%
11%
2%
1%
3%
4%
3%
-1%
0%
11%
7%
2%
4%
3%
-1%
6%
5%
-1%
6%
11%
0%
3%
2%
4%
-1%
RI 2%
3%
3%
3%
5%
7%
2%
5%
1%
3%
5%
2%
2%
2%
1 The Freddie Mac House Price Index for the U.S. is a value-weighted average of the state indexes where the value weights are based on Freddie Mac’s single-family credit guarantee portfolio. Other indices of home prices may have different results, as they are determined using different pools of mortgage loans and calculated under different conventions. The Freddie Mac House Price Index for the U.S. is a non-seasonally adjusted monthly series.
Source: Freddie Mac
United States 4%
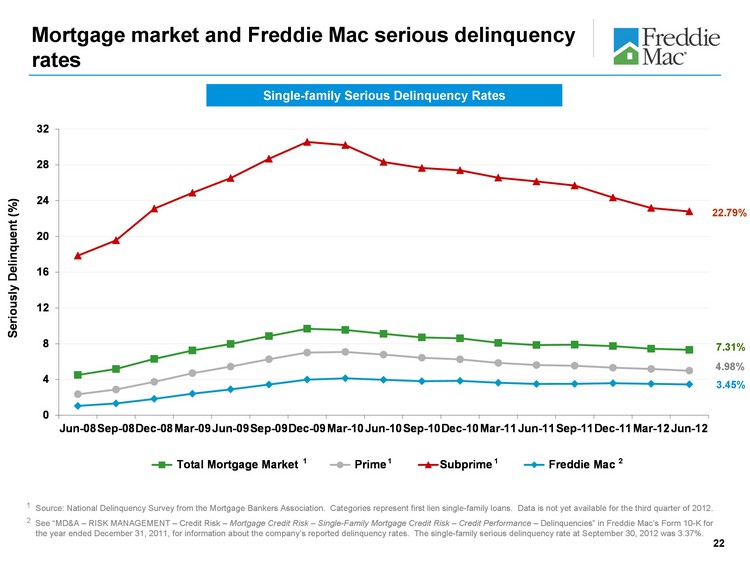
1 Source: National Delinquency Survey from the Mortgage Bankers Association. Categories represent first lien single-family loans. Data is not yet available for the third quarter of 2012.
2 See “MD&A - RISK MANAGEMENT - Credit Risk - Mortgage Credit Risk - Single-Family Mortgage Credit Risk - Credit Performance - Delinquencies” in Freddie Mac’s Form 10-K for the year ended December 31, 2011, for information about the company’s reported delinquency rates. The single-family serious delinquency rate at September 30, 2012 was 3.37%.
1
1
1
22.79%
7.31%
4.98%
3.45%
Single-family Serious Delinquency Rates
Mortgage market and Freddie Mac serious delinquency rates
2
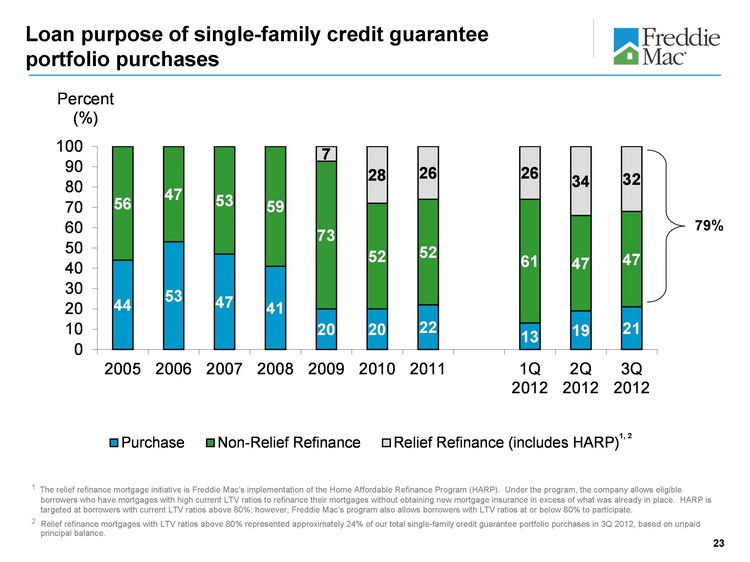
79%
Loan purpose of single-family credit guarantee portfolio purchases
1 The relief refinance mortgage initiative is Freddie Mac’s implementation of the Home Affordable Refinance Program (HARP). Under the program, the company allows eligible borrowers who have mortgages with high current LTV ratios to refinance their mortgages without obtaining new mortgage insurance in excess of what was already in place. HARP is targeted at borrowers with current LTV ratios above 80%; however, Freddie Mac’s program also allows borrowers with LTV ratios at or below 80% to participate.
2 Relief refinance mortgages with LTV ratios above 80% represented approximately 24% of our total single-family credit guarantee portfolio purchases in 3Q 2012, based on unpaid principal balance.
1, 2
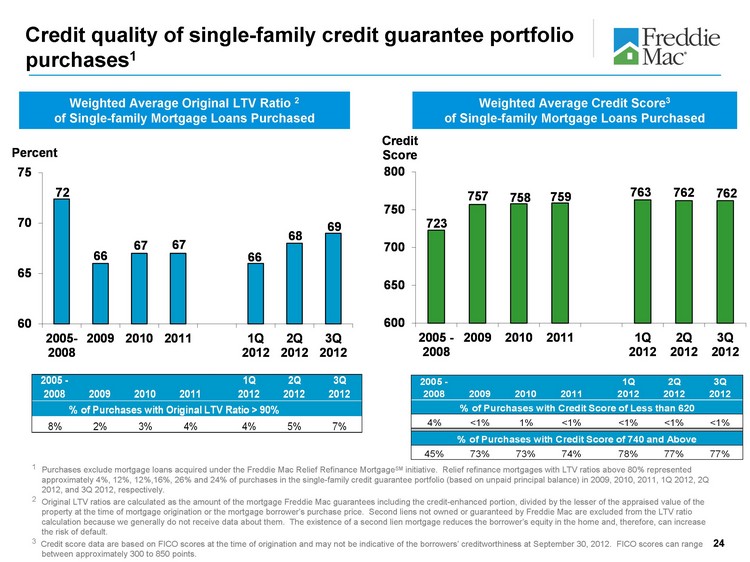
Credit quality of single-family credit guarantee portfolio purchases1
Weighted Average Original LTV Ratio 2
of Single-family Mortgage Loans Purchased
Weighted Average Credit Score3
of Single-family Mortgage Loans Purchased
1 Purchases exclude mortgage loans acquired under the Freddie Mac Relief Refinance MortgageSM initiative. Relief refinance mortgages with LTV ratios above 80% represented approximately 4%, 12%, 12%,16%, 26% and 24% of purchases in the single-family credit guarantee portfolio (based on unpaid principal balance) in 2009, 2010, 2011, 1Q 2012, 2Q 2012, and 3Q 2012, respectively.
2 Original LTV ratios are calculated as the amount of the mortgage Freddie Mac guarantees including the credit-enhanced portion, divided by the lesser of the appraised value of the property at the time of mortgage origination or the mortgage borrower’s purchase price. Second liens not owned or guaranteed by Freddie Mac are excluded from the LTV ratio calculation because we generally do not receive data about them. The existence of a second lien mortgage reduces the borrower’s equity in the home and, therefore, can increase the risk of default.
3 Credit score data are based on FICO scores at the time of origination and may not be indicative of the borrowers’ creditworthiness at September 30, 2012. FICO scores can range between approximately 300 to 850 points.
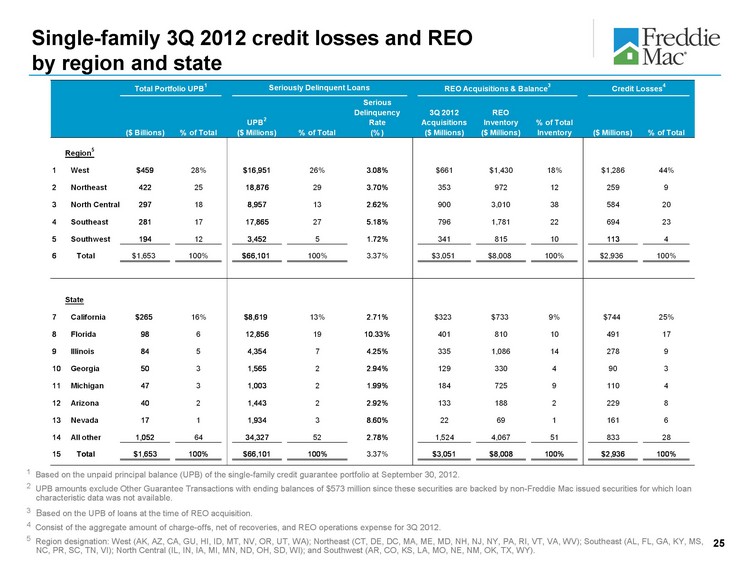
Single-family 3Q 2012 credit losses and REO by region and state
1 Based on the unpaid principal balance (UPB) of the single-family credit guarantee portfolio at September 30, 2012.
2 UPB amounts exclude Other Guarantee Transactions with ending balances of $573 million since these securities are backed by non-Freddie Mac issued securities for which loan characteristic data was not available.
3 Based on the UPB of loans at the time of REO acquisition.
4 Consist of the aggregate amount of charge-offs, net of recoveries, and REO operations expense for 3Q 2012.
5 Region designation: West (AK, AZ, CA, GU, HI, ID, MT, NV, OR, UT, WA); Northeast (CT, DE, DC, MA, ME, MD, NH, NJ, NY, PA, RI, VT, VA, WV); Southeast (AL, FL, GA, KY, MS, NC, PR, SC, TN, VI); North Central (IL, IN, IA, MI, MN, ND, OH, SD, WI); and Southwest (AR, CO, KS, LA, MO, NE, NM, OK, TX, WY).
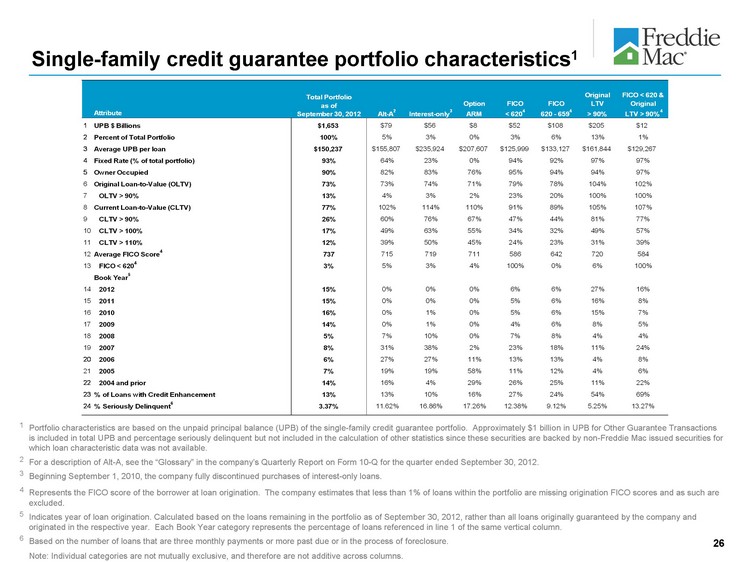
Single-family credit guarantee portfolio characteristics1
1 Portfolio characteristics are based on the unpaid principal balance (UPB) of the single-family credit guarantee portfolio. Approximately $1 billion in UPB for Other Guarantee Transactions is included in total UPB and percentage seriously delinquent but not included in the calculation of other statistics since these securities are backed by non-Freddie Mac issued securities for which loan characteristic data was not available.
2 For a description of Alt-A, see the “Glossary” in the company’s Quarterly Report on Form 10-Q for the quarter ended September 30, 2012.
3 Beginning September 1, 2010, the company fully discontinued purchases of interest-only loans.
4 Represents the FICO score of the borrower at loan origination. The company estimates that less than 1% of loans within the portfolio are missing origination FICO scores and as such are excluded.
5 Indicates year of loan origination. Calculated based on the loans remaining in the portfolio as of September 30, 2012, rather than all loans originally guaranteed by the company and originated in the respective year. Each Book Year category represents the percentage of loans referenced in line 1 of the same vertical column.
6 Based on the number of loans that are three monthly payments or more past due or in the process of foreclosure.
Note: Individual categories are not mutually exclusive, and therefore are not additive across columns.
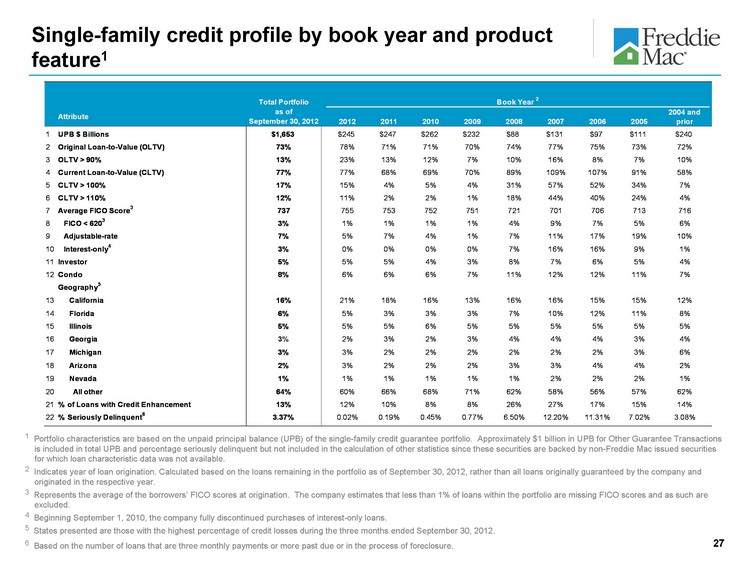
Single-family credit profile by book year and product feature1
1 Portfolio characteristics are based on the unpaid principal balance (UPB) of the single-family credit guarantee portfolio. Approximately $1 billion in UPB for Other Guarantee Transactions is included in total UPB and percentage seriously delinquent but not included in the calculation of other statistics since these securities are backed by non-Freddie Mac issued securities for which loan characteristic data was not available.
2 Indicates year of loan origination. Calculated based on the loans remaining in the portfolio as of September 30, 2012, rather than all loans originally guaranteed by the company and originated in the respective year.
3 Represents the average of the borrowers’ FICO scores at origination. The company estimates that less than 1% of loans within the portfolio are missing FICO scores and as such are excluded.
4 Beginning September 1, 2010, the company fully discontinued purchases of interest-only loans.
5 States presented are those with the highest percentage of credit losses during the three months ended September 30, 2012.
6 Based on the number of loans that are three monthly payments or more past due or in the process of foreclosure.
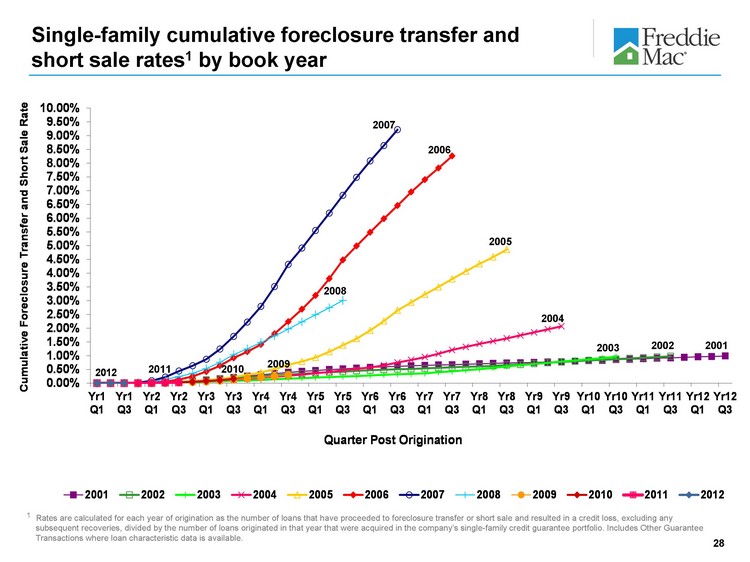
Single-family cumulative foreclosure transfer and short sale rates1 by book year
1 Rates are calculated for each year of origination as the number of loans that have proceeded to foreclosure transfer or short sale and resulted in a credit loss, excluding any subsequent recoveries, divided by the number of loans originated in that year that were acquired in the company’s single-family credit guarantee portfolio. Includes Other Guarantee Transactions where loan characteristic data is available.
2007
2006
2005
2004
2001
2002
2003
2008
2009
2010
2011
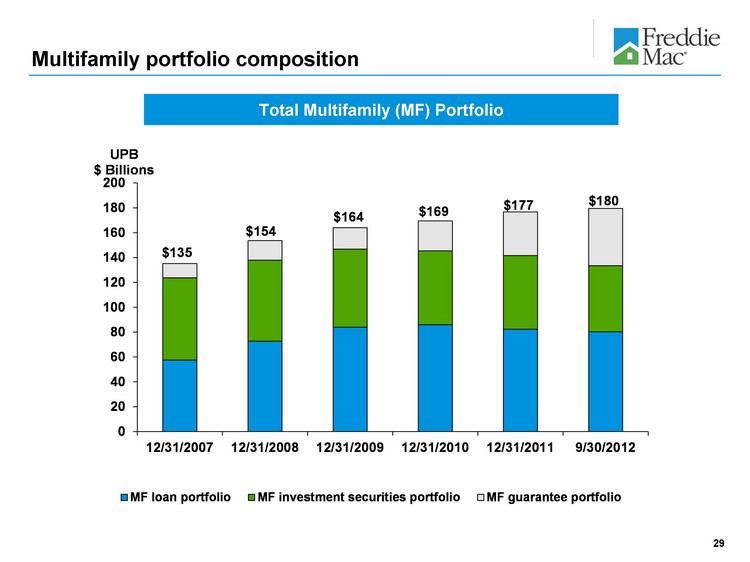
Total Multifamily (MF) Portfolio
Multifamily portfolio composition
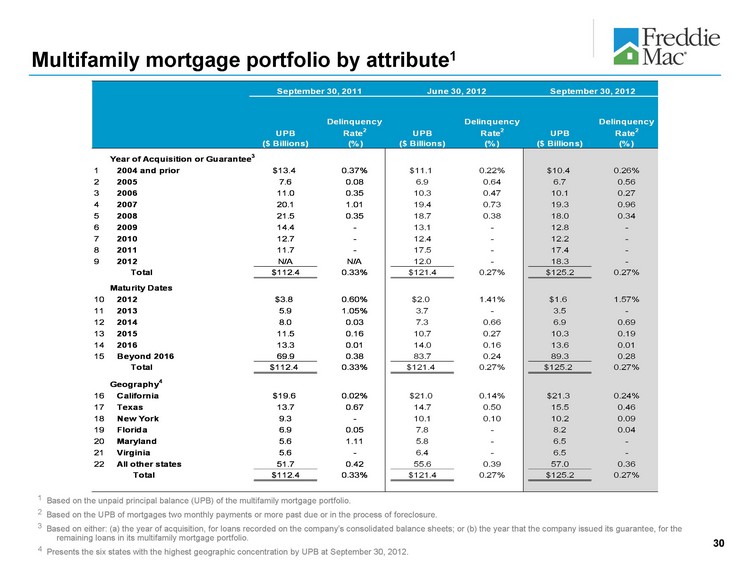
Multifamily mortgage portfolio by attribute1
1 Based on the unpaid principal balance (UPB) of the multifamily mortgage portfolio.
2 Based on the UPB of mortgages two monthly payments or more past due or in the process of foreclosure.
3 Based on either: (a) the year of acquisition, for loans recorded on the company’s consolidated balance sheets; or (b) the year that the company issued its guarantee, for the remaining loans in its multifamily mortgage portfolio.
4 Presents the six states with the highest geographic concentration by UPB at September 30, 2012.
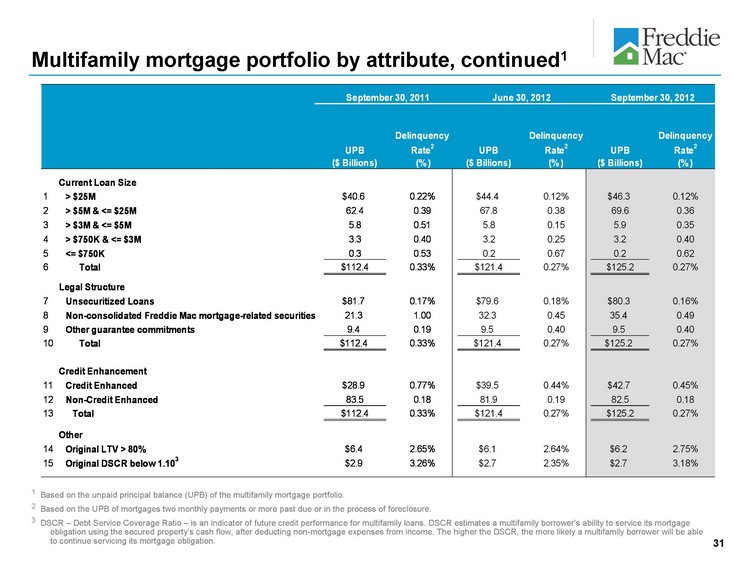
Multifamily mortgage portfolio by attribute, continued1
1 Based on the unpaid principal balance (UPB) of the multifamily mortgage portfolio.
2 Based on the UPB of mortgages two monthly payments or more past due or in the process of foreclosure.
3 DSCR - Debt Service Coverage Ratio - is an indicator of future credit performance for multifamily loans. DSCR estimates a multifamily borrower’s ability to service its mortgage obligation using the secured property’s cash flow, after deducting non-mortgage expenses from income. The higher the DSCR, the more likely a multifamily borrower will be able to continue servicing its mortgage obligation.
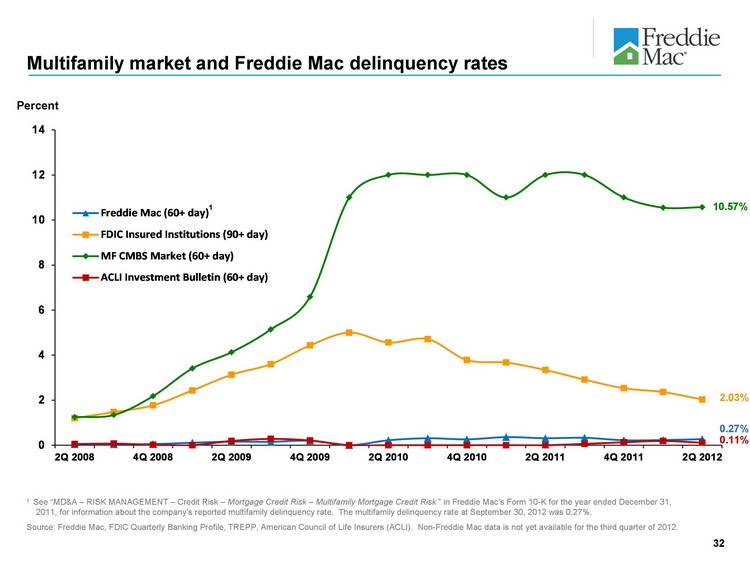
0.11%
Multifamily market and Freddie Mac delinquency rates
Percent
1 See “MD&A - RISK MANAGEMENT - Credit Risk - Mortgage Credit Risk - Multifamily Mortgage Credit Risk “ in Freddie Mac’s Form 10-K for the year ended December 31, 2011, for information about the company’s reported multifamily delinquency rate. The multifamily delinquency rate at September 30, 2012 was 0.27%.
Source: Freddie Mac, FDIC Quarterly Banking Profile, TREPP, American Council of Life Insurers (ACLI). Non-Freddie Mac data is not yet available for the third quarter of 2012.
10.57%
2.03%
0.27%
1
Safe Harbor Statements
Freddie Mac obligations
Freddie Mac’s securities are obligations of Freddie Mac only. The securities, including any interest or return of discount on the securities, are not guaranteed by and are not debts or obligations of the United States or any federal agency or instrumentality other than Freddie Mac. No offer or solicitation of securities This presentation includes information related to, or referenced in the offering documentation for, certain Freddie Mac securities, including offering circulars and related supplements and agreements. Freddie Mac securities may not be eligible for offer or sale in certain jurisdictions or to certain persons. This information is provided for your general information only, is current only as of its specified date and does not constitute an offer to sell or a solicitation of an offer to buy securities. The information does not constitute a sufficient basis for making a decision with respect to the purchase or sale of any security. All information regarding or relating to Freddie Mac securities is qualified in its entirety by the relevant offering circular and any related supplements. Investors should review the relevant offering circular and any related supplements before making a decision with respect to the purchase or sale of any security. In addition, before purchasing any security, please consult your legal and financial advisors for information about and analysis of the security, its risks and its suitability as an investment in your particular circumstances.
Forward-looking statements
Freddie Mac’s presentations may contain forward-looking statements, which may include statements pertaining to the conservatorship, the company’s current expectations and objectives for its efforts under the MHA Program, the servicing alignment initiative and other programs to assist the U.S. residential mortgage market, future business plans, liquidity, capital management, economic and market conditions and trends, market share, the effect of legislative and regulatory developments, implementation of new accounting guidance, credit losses, internal control remediation efforts, and results of operations and financial condition on a GAAP, Segment Earnings and fair value basis. Forward-looking statements involve known and unknown risks and uncertainties, some of which are beyond the company’s control. Management’s expectations for the company’s future necessarily involve a number of assumptions, judgments and estimates, and various factors, including changes in market conditions, liquidity, mortgage-to-debt option-adjusted spread, credit outlook, actions by FHFA, Treasury, the Federal Reserve, SEC, HUD, the Administration and Congress, and the impacts of legislation or regulations and new or amended accounting guidance, could cause actual results to differ materially from these expectations. These assumptions, judgments, estimates and factors are discussed in the company’s Annual Report on Form 10-K for the year ended December 31, 2011, Quarterly Reports on Form 10-Q for the quarters ended March 31, 2012, June 30, 2012 and September 30, 2012 and Current Reports on Form 8-K, which are available on the Investor Relations page of the company’s Web site at www.FreddieMac.com/investors and the SEC’s Web site at www.sec.gov. The company undertakes no obligation to update forward-looking statements it makes to reflect events or circumstances after the date of this presentation.