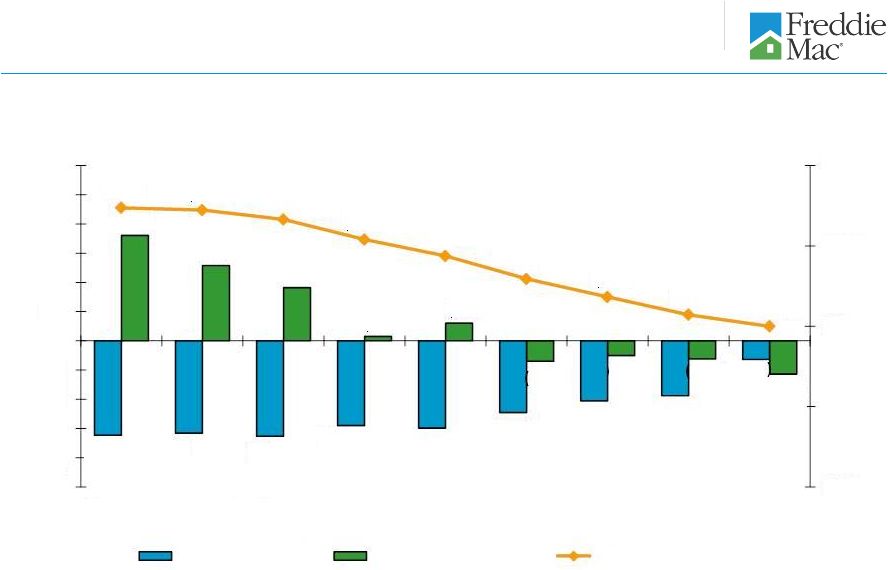
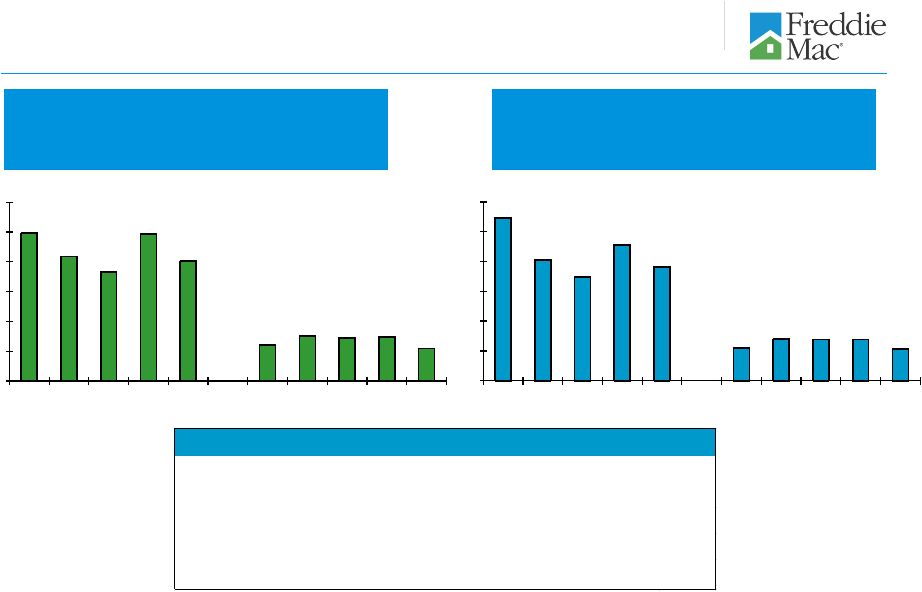
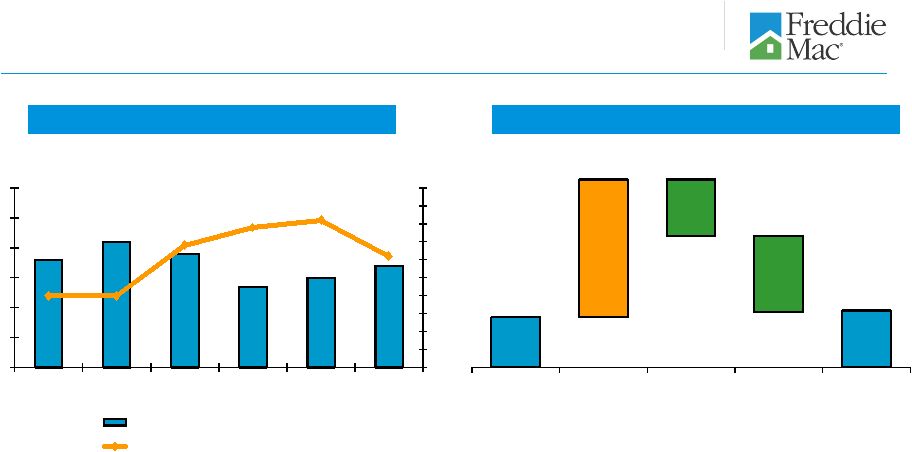
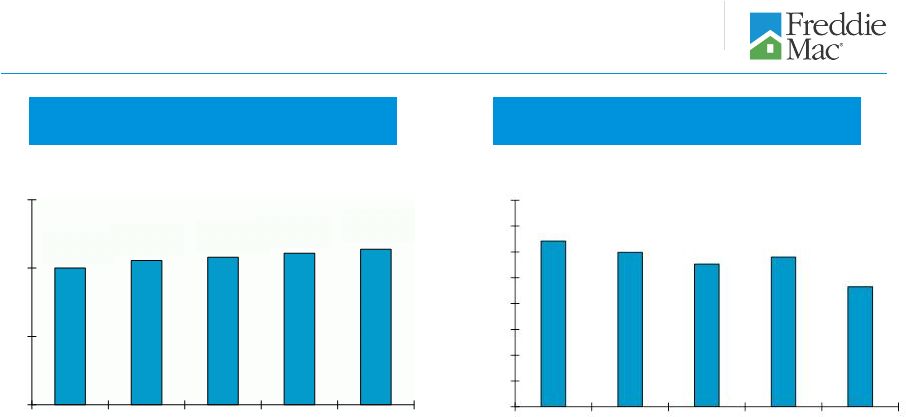
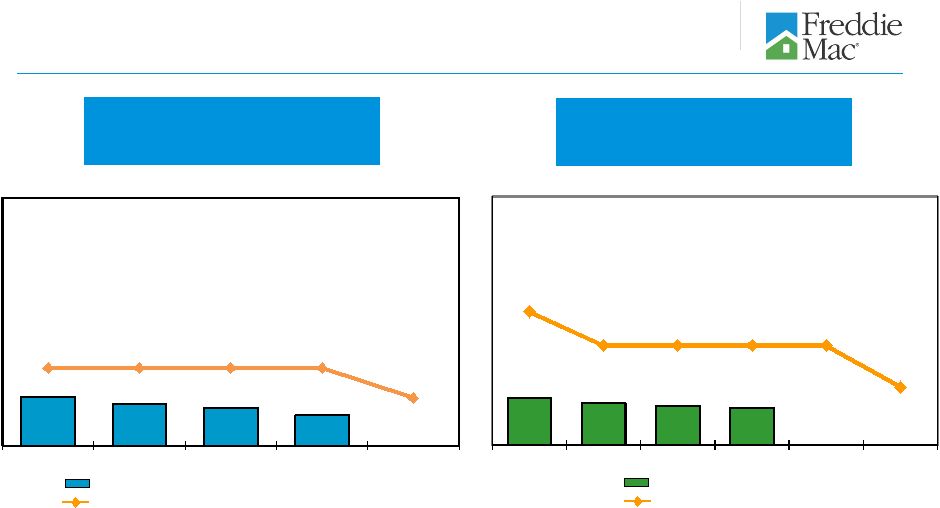
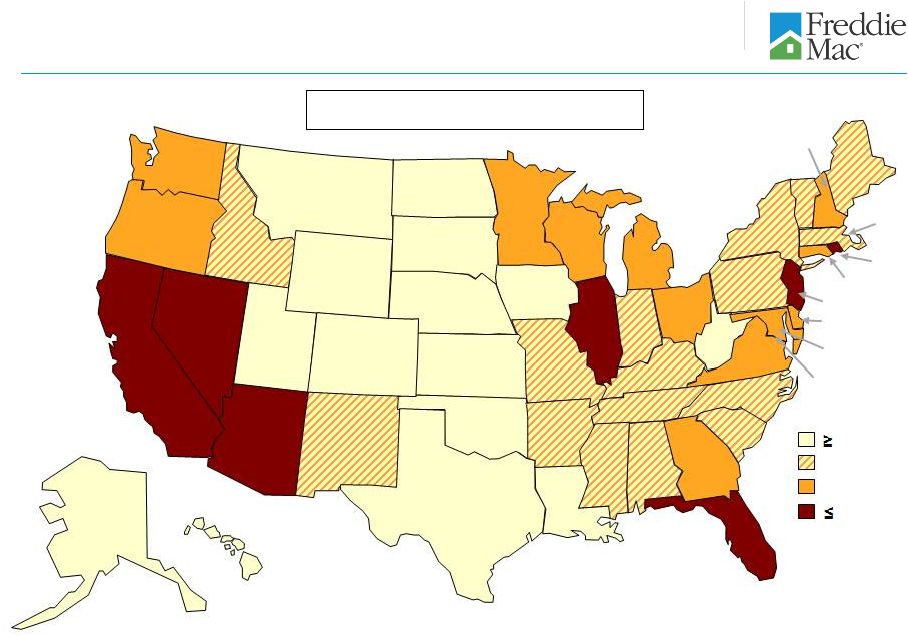
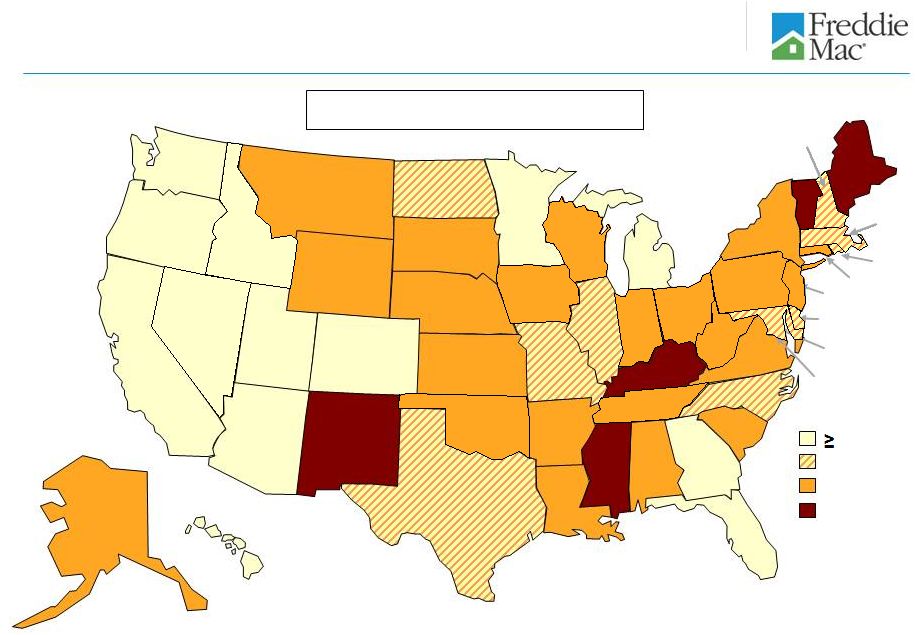
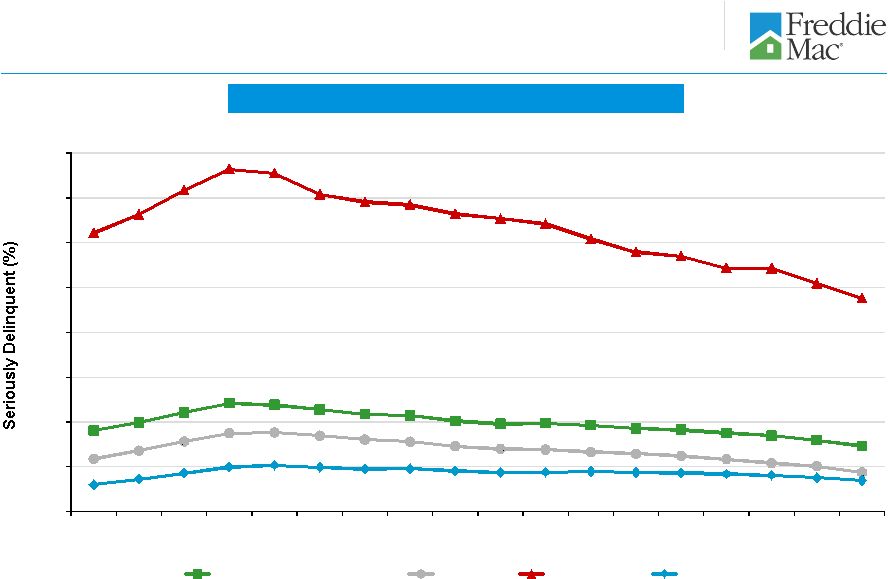
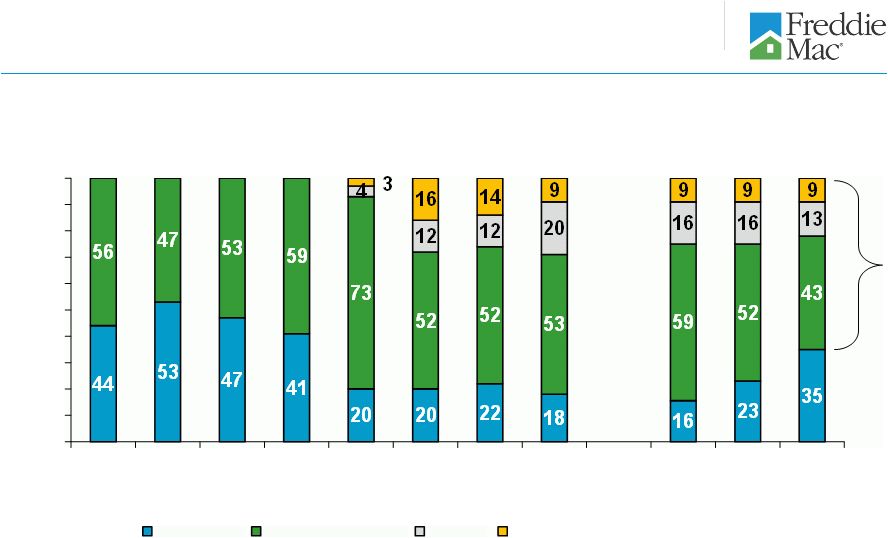
10 Real estate owned Property Inventory 3Q 2013 Activity Geographic Distribution Based on Number of Properties in Inventory Historical Trend Ending Property Inventory 1 Includes single-family and multifamily REO. Multifamily ending property inventory was 5 properties as of June 30, 2013 and 1 property as of September 30, 2013. 2 Region designation: West (AK, AZ, CA, GU, HI, ID, MT, NV, OR, UT, WA); Northeast (CT, DE, DC, MA, ME, MD, NH, NJ, NY, PA, RI, VT, VA, WV); Southeast (AL, FL, GA, KY, MS, NC, PR, SC, TN, VI); North Central (IL, IN, IA, MI, MN, ND, OH, SD, WI); and Southwest (AR, CO, KS, LA, MO, NE, NM, OK, TX, WY). ((Number of Properties) In 3Q13, REO inventory increased as foreclosure activity increased in judicial states and disposition activity moderated. The North Central region comprised 37 percent of our REO property inventory at September 30, 2013. This region generally has experienced more challenging economic conditions, and includes a number of states with longer foreclosure timelines due to the local laws and foreclosure process in the region. Seven of the nine states in the North Central region require a judicial foreclosure process. Foreclosures generally take longer to complete in states where judicial foreclosures (those conducted under the supervision of a court) are required than in states where non-judicial foreclosures are permitted. 44,628 47,120 19,441 (16,949) 6/30/13 Inventory Acquisitions Dispositions 9/30/13 Inventory 60k 45k 61k 59k 53k 51k 49k 48k 47k 30,000 40,000 50,000 60,000 70,000 3Q 2011 4Q 2011 1Q 2012 2Q 2012 3Q 2012 4Q 2012 1Q 2013 2Q 2013 3Q 2013 Number of Properties 6k 12k 18k 5k 5k 7k 13k 17k 4k 5k 0 2,000 4,000 6,000 8,000 10,000 12,000 14,000 16,000 18,000 20,000 Northeast Southeast North Central Southwest West Number of Properties 6/30/2013 9/30/2013 1 2 |