| OMB APPROVAL |
OMB Number: 3235-0570 Expires: March 31, 2017 Estimated average burden hours per response: 20.6 |
| Investment Company Act file number | 811-07917 |
| Wilshire Variable Insurance Trust |
| (Exact name of registrant as specified in charter) |
| 1299 Ocean Avenue, Suite 700 Santa Monica, CA | 90401-1085 |
| (Address of principal executive offices) | (Zip code) |
| Wilshire Associates Incorporated, 1299 Ocean Avenue, Suite 700, Santa Monica, CA 90401-1085 |
| (Name and address of agent for service) |
| Registrant's telephone number, including area code: | (310) 451-3051 |
| Date of fiscal year end: | December 31 | |
| Date of reporting period: | December 31, 2016 |
| Item 1. | Reports to Stockholders. |
Wilshire Variable Insurance Trust |
ANNUAL REPORT Wilshire Global Allocation Fund
|
December 31, 2016 |

Wilshire Variable Insurance Trust
Table of Contents
|
|

Shareholder Letter | 2 |
Fund Commentary | 4 |
Disclosure of Fund Expenses | 6 |
Schedule of Investments | 8 |
Statement of Assets and Liabilities | 9 |
Statement of Operations | 10 |
Statement of Changes in Net Assets | 11 |
Financial Highlights | 13 |
Notes to Financial Statements | 14 |
Report of Independent Registered Public Accounting Firm | 20 |
Additional Fund Information | 21 |
Board Approval of Advisory Agreement | 24 |
Tax Information | 26 |
Shares of the Wilshire Global Allocation Fund are sold only as the underlying investment for variable annuity contracts issued by insurance companies. This report is authorized for use in connection with any offering of the Fund’s shares only if accompanied or preceded by the Fund’s current prospectus.
Shares of the Wilshire Variable Insurance Trust are distributed by Ultimus Fund Distributors, LLC.
Wilshire Variable Insurance Trust
Letter to Shareholders (Unaudited)
|
|
Dear Wilshire Variable Insurance Trust Shareholder:
We are pleased to present this annual report to all shareholders of the Wilshire Variable Insurance Trust. This report covers the period from January 1, 2016 to December 31, 2016 for the Global Allocation Fund.
Market Environment
U.S. Equity Market
The U.S. stock market, represented by the Wilshire 5000 Total Market IndexSM, was up 4.5% for the fourth quarter and 13.4% for 2016. This marks the Index’s eighth straight annual gain. A portion of that “winning streak” is due to a rebound from the global financial crisis sell-off. However, the market has continued to produce strong returns after the initial recovery, with a 14% annualized gain over the past four years. Following several rocky months to begin the year, U.S. equities trended upward for the rest of 2016. The fourth quarter benefitted from strong economic growth and signs of confidence from the Federal Reserve.
During the year, small-cap stocks outpaced large-cap stocks, with the Wilshire U.S. Small-Cap IndexSM and the Wilshire U.S. Large-Cap IndexSM returning 22.4% and 12.5%, respectively. The strong overall return for the Wilshire 5000 Total Market Index masked a wide performance dispersion between investment styles and among industries for the year. Value oriented stocks handedly outpaced growth stocks across the capitalization spectrum. The Wilshire U.S. Large-Cap Value Index and the Wilshire U.S. Small-Cap Value IndexSM outpaced their growth oriented counterparts by 6.47% and 1.071%, respectively. Sector-wise, commodity-influenced and interest rate sensitive sectors rallied as dividend oriented and higher yielding sectors lagged. For the year, Telecom Services, Energy, Financials, and Materials were the top performing sectors returning 27.1%, 26.5%, 24.6%, and 22.8%, respectively, while Real Estate and Health Care trailed returning -4.6% and -2.8%, respectively.
International Equity Market
International developed equities trailed U.S. equities throughout much of the year, but ended the year in positive territory with the MSCI EAFE Index returning 1.0% for 2016. In local currency terms, non-U.S. equity markets were in mostly positive territory for the calendar year. However, a strong U.S. dollar resulted in decreased returns for U.S. investors. Despite a strong 2016, the MSCI Emerging Markets Index returned 11.2% for the year, despite emerging market equities suffered during the fourth quarter following the U.S. election as investors feared weakening prospects for global trade and diminishing exports from emerging market countries. Higher U.S. interest rates and a stronger dollar hurt returns as well.
The first half of the year ended with increased volatility as uncertainty regarding the potential political contagion emanating from the United Kingdom’s “Brexit” vote weighed on markets. Equity markets fell sharply immediately following the referendum, and the British pound slumped to its lowest level in 30 years. As in the U.S., foreign markets bounced back over the last few days of the second quarter erasing some of the earlier losses. During the second half of the year, the European Central Bank announced that they would be buying fewer sovereign bonds per month than previously scheduled as part of their current quantitative easing, but extended the buying period to December 2017. Japan also maintained an accommodative stance with a negative overnight rate.
Bond Market
The U.S. fixed income market, as measured by the Barclays U.S. Aggregate Bond Index, fell 3.0% for the fourth quarter, reversing some gains from the prior quarters, but ended the year in positive territory at 2.7%. After falling for much of the first half of 2016, U.S. Treasury yields reversed course and moved higher for the remainder of the year. The bellwether 10-year Treasury yield reached a historic low of 1.37% in early July before climbing to end the year at 2.45%, accelerating its rise after the November election. At its December meeting, the Federal Open Market Committee decided to increase the federal funds rate by 0.25%, to a range of 0.5% to 0.75%, for only the second time since 2008.
After trending downward for nearly three years, the 10-year Treasury yield pushed higher during the fourth quarter. A similar pattern has been evident in the 10-year breakeven inflation rate. Both shifts this year occurred largely after November 8th. Whether it was the U.S. presidential election results or the removal of an unknown factor that spurred the change is uncertain, the timing is unmistakable. It is worth noting that Treasury yields moved higher during the first half of 2015 as well, before retreating on concerns about global economic growth.
Fund Performance Review
The Global Allocation Fund returned 5.62%, underperforming its custom benchmark by 1.02%. Despite the Fund’s underperformance versus its benchmarks in 2016, we believe the Fund is well positioned for future growth.
2
Wilshire Variable Insurance Trust
Letter to Shareholders (Unaudited) - (Continued)
|
|
As always, we sincerely appreciate your continued support and confidence in Wilshire Associates.
Sincerely,

Jason Schwarz
President, Wilshire Variable Insurance Trust
The performance data quoted represents past performance and does not guarantee future results. Current performance may be lower or higher. The investment return and principal value of an investment will fluctuate so that shares, when redeemed, may be worth more or less than their original cost. Returns assume reinvestment of all distributions. Annuity contract fees are not reflected in returns. If these fees were included, returns would be lower. Recent performance can be found at your particular insurance company.
Index performance is presented for general comparative purposes. Unlike a mutual fund, the performance of an index assumes no transaction costs, management fees or other expenses. An individual cannot directly invest in any index.
This material represents an assessment of the market environment at a specific point in time and is not intended to be a forecast of future events, or a guarantee of future results. This information should not be relied upon by the reader as research or investment advice regarding the Fund or any stock in particular.
There are risks involved with investing, including the possible loss of principal. In addition to the normal risks associated with investing, international investments may involve risk of capital loss from unfavorable fluctuation in currency values, from differences in generally accepted accounting principles or from social, economic, or political instability in other nations. Investments in smaller companies typically exhibit higher volatility. The Fund invests in underlying affiliated funds (“Underlying Funds”) and may invest in unaffiliated funds and exchange-traded funds (“ETFs”). An investor in the Fund should understand that alternatively he or she could allocate investments directly to an Underlying Fund or ETF. By investing indirectly in an Underlying Fund or ETF through the Fund, an investor bears not only his or her proportionate share of certain expenses of the Fund (such as operating costs), but also, indirectly, similar expenses of the Underlying Fund or ETF. The management fee charged to the Fund is based on the average daily net assets not invested in the Underlying Funds.
The Fund is available only through third party insurance company separate accounts established for the purposes of funding variable annuity contracts and variable life insurance policies and may not be purchased directly. The variable annuity contracts and variable life insurance policies are described in the separate prospectuses issued by participating insurance companies. Please see the prospectuses for information about surrender charges, mortality and expense risk fees and other charges that may be assessed by participating insurance companies under the variable annuity contracts or variable life insurance policies.
The Bloomberg Barclays U.S. Aggregate Bond Index is made up of the Bloomberg Barclays U.S. Government/Corporate Bond Index, Mortgage-Backed Securities Index, and Asset-Backed Securities Index, including securities that are of investment grade quality or better, have at least one year to maturity, and have an outstanding par value of at least $100 million.
The MSCI All Country World ex-U.S. Index is an unmanaged capitalization-weighted measure of stock markets of developed and emerging markets, with the exception of U.S.-based companies.
The MSCI EAFE Index is an equity index which captures large and mid-cap representation across developed markets countries around the world, excluding the U.S. and Canada.
The MSCI Emerging Markets Index is a free float-adjusted market capitalization index that is designed to measure equity market performance of emerging markets.
The MSCI Japan Index is a free float-adjusted market capitalization index that is designed to measure developed market equity performance in Japan.
The Wilshire 5000 Total Market IndexSM is widely accepted as the definitive benchmark for the U.S. equity market, and measures performance of all U.S. equity securities with readily available price data.
3
Wilshire Variable Insurance Trust
Wilshire Global Allocation Fund
Commentary (Unaudited) |
|
WILSHIRE GLOBAL ALLOCATION FUND
Average Annual Total Returns
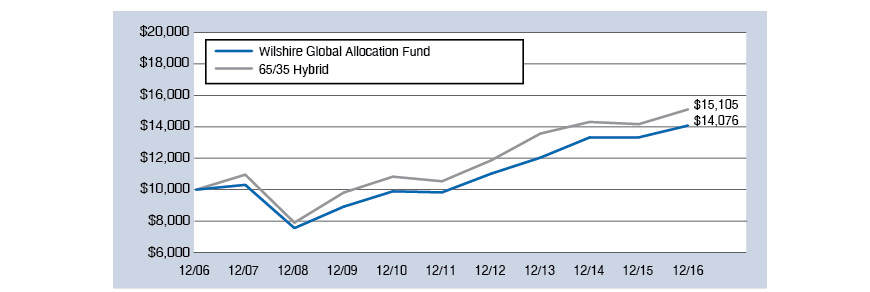
One Year Ended 12/31/16 | 5.62% |
Five Years Ended 12/31/16 | 7.44% |
Ten Years Ended 12/31/16 | 3.48% |
65/35 HYBRID INDEX(1)
Average Annual Total Returns
One Year Ended 12/31/16 | 6.64% |
Five Years Ended 12/31/16 | 7.47% |
Ten Years Ended 12/31/16 | 4.21% |
COMPARATIVE PERFORMANCE
Comparison of Change in Value of a $10,000 Investment in the Wilshire Global Allocation Fund versus
a 65/35 Hybrid of the following 2 indices: the MSCI ACWI and the
Bloomberg Barclays Global Aggregate Bond Index (Hedged) through 12/31/16.
The performance data quoted represents past performance and does not guarantee future results. Current performance may be lower or higher. The investment return and principal value of an investment will fluctuate so that shares, when redeemed, may be worth more or less than their original cost. Returns assume reinvestment of all distributions. Annuity contract fees are not reflected in returns. If these fees were included, returns would be lower. Recent performance can be found at your particular insurance company.
(1) | 65/35 Hybrid is a blend of 65% MSCI All Country World (ACWI) Index and 35% Bloomberg Barclays Global Aggregate Index (Hedged). The MSCI ACWI Index is an unmanaged capitalization-weighted measure of stock markets of developed and emerging markets. The Bloomberg Barclays Global Aggregate Index (Hedged) is a broad-based measure of the global investment grade fixed-rate debt markets from both developed and emerging markets issuers. An individual cannot invest directly in an index. Index performance is presented for general comparative purposes. Unlike a mutual fund, the performance of an index assumes no transaction costs, management fees or other expenses. |
During certain periods, certain fees and expenses were reduced or reimbursed. Without fee reductions and expenses reimbursements, total returns for the periods would have been lower. For the year ended December 31, 2016, the investment adviser reduced its fees in the amount of 0.02% of average net assets.
4
Wilshire Variable Insurance Trust
Wilshire Global Allocation Fund
Commentary (Unaudited) - (Continued) |
|
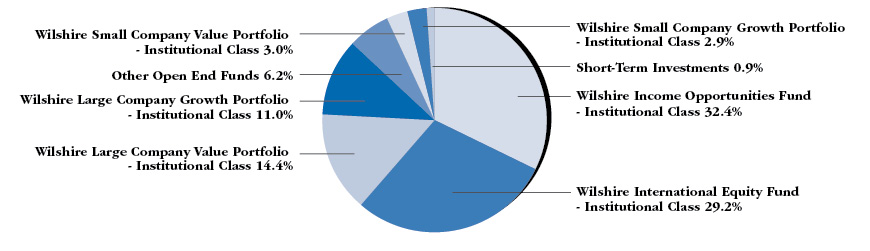
PORTFOLIO SECTOR WEIGHTING*
(As of December 31, 2016)
The U.S. stock market, as represented by the Wilshire 5000 Total Market IndexSM, returned 13.4% during 2016. The year started with a loss as markets tumbled globally as worries over a slowing Chinese economy, falling oil prices, and weakness in US earnings growth rattled investors. Mid-year markets were again shaken as investors were surprised by the outcome of the United Kingdom referendum to exit the European Union. The second half of the year was dominated by the news surrounding the U.S. presidential election. In November, markets responded favorably as investors cheered Donald Trump’s victory. Stocks rallied to close the year on the hope that the new administration would fulfill campaign promises for reduced taxes, reduced regulation, and increased spending on infrastructure.
International stock markets underperformed the U.S. during 2016 as the MSCI All Country World ex-U.S. Index returned 4.5% for the year. Emerging economy stocks outperformed foreign developed securities for the first calendar year since 2012 with the MSCI Emerging Markets Index and the MSCI EAFE Index returning 11.2% and 1.0%, respectively. The second quarter started off by recording gains on behalf of European equities, only to retrench later in the period in the wake of the United Kingdom’s “Brexit” vote. International equity markets rallied during the third quarter with economically sensitive stocks leading. During the fourth quarter, overseas markets experienced a volatile period as the U.S. presidential election outcome took the world by surprise. Protectionist proclamations regarding U.S. trade roiled emerging markets.
The U.S. fixed income market as represented by the Bloomberg Barclays U.S. Aggregate Bond Index returned 2.7% for the year. Volatility spiked at the start of the year as going concerns heightened for commodity-related companies. Yields rallied in the fourth quarter globally, but the sell-off was led by U.S. government bonds. The 10 year U.S. Treasury yield closed the year at 2.45% marking the end to a volatile year which saw yields reach historic lows in July at 1.37% before rallying to a December high of 2.60%.
The Wilshire Global Allocation Fund returned 5.62% in 2017, underperforming the custom benchmark* return of 6.64% by 1.02%. The Fund was hurt by weak performance from the Wilshire Large Company Growth Fund as well as its overweight allocation to developed international equities during the first half of the year. However, an overweight allocation to the Wilshire Large Company Value Fund during the second half of the year and strong performance from the Wilshire Small Company Growth Fund helped mitigate relative underperformance during the period.
Despite the Fund’s underperformance versus its benchmark, we believe the Fund is well-positioned going into 2017 as the market deals with ongoing macroeconomic and geopolitical uncertainties.
* | Custom Benchmark: 1/1/14 – 5/31/14: 50% S&P 500 Index, 15% MSCI EAFE Index, 35% Bloomberg Barclays U.S. Aggregate Index; 6/1/14 to date: 65% MSCI All Country World Index, 35% Bloomberg Barclays Global Aggregated Hedged Index |
5
Wilshire Variable Insurance Trust
Disclosure of Fund Expenses
For the Six Months Ended December 31, 2016 (Unaudited) |
|
All mutual funds have operating expenses. As a shareholder of a mutual fund, you incur ongoing costs, which include costs for investment advisory services, administrative services, distribution and/or shareholder services and shareholder reports (like this one), among others. Operating expenses, which are deducted from a fund’s gross income, directly reduce the investment return of the fund. A fund’s expenses are expressed as a percentage of its average net assets. This figure is known as the expense ratio. The following examples are intended to help you understand the ongoing fees (in dollars) of investing in the Fund and to compare these costs with those of other mutual funds. The examples are based on an investment of $1,000 made at the beginning of the period and held for the entire period from July 1, 2016 to December 31, 2016.
The table on the next page illustrates the Fund’s costs in two ways:
Actual Fund Return: This section helps you to estimate the actual expenses, after any applicable fee reductions, that you paid over the period. The “Ending Account Value” shown is derived from the Fund’s actual return for the period, the “Expense Ratio” column shows the period’s annualized expense ratio, and the “Expenses Paid During Period” column shows the dollar amount that would have been paid by an investor who started with $1,000 in the Fund at the beginning of the period.
You may use the information here, together with your account value, to estimate the expenses that you paid over the period. To do so, simply divide your account value by $1,000 (for example, an $8,600 account value divided by $1,000 = 8.6), then multiply the result by the number given for the Fund in the first line under the heading entitled “Expenses Paid During Period.”
Hypothetical 5% Return: This section is intended to help you compare the Fund’s costs with those of other mutual funds. The “Ending Account Value” shown is derived from hypothetical account values and hypothetical expenses based on the Fund’s actual expense ratio and assumed rate of return. It assumes that the Fund had an annual return of 5% before expenses, but that the expense ratio is unchanged. In this case, because the return used is not the Fund’s actual return, the results do not apply to your investment. This example is useful in making comparisons to other mutual funds because the Securities and Exchange Commission (“SEC”) requires all mutual funds to calculate expenses based on an assumed 5% annual return. You can assess the Fund’s ongoing costs by comparing this hypothetical example with the hypothetical examples that appear in shareholder reports of other funds.
Please note that the expenses shown in the table are meant to highlight and help you compare your ongoing costs only and do not reflect any transactional costs such as sales charges (loads), redemption fees, or exchange fees. Wilshire Variable Insurance Trust has no such charges or fees, but they may be present in other funds to which you compare this data. Therefore, the hypothetical portions of the table are useful in comparing ongoing costs only, and will not help you determine the relative costs of owning different funds.
6
Wilshire Variable Insurance Trust
Disclosure of Fund Expenses - (Continued)
For the Six Months Ended December 31, 2016 (Unaudited) |
|
Beginning Account Value 07/01/16 | Ending Account Value 12/31/16 | Net | Expenses Paid | |
Wilshire Global Allocation Fund | ||||
Based on Actual Fund Return | $1,000.00 | $1,035.40 | 0.49% | $2.51 |
Based on Hypothetical 5% Return | $1,000.00 | $1,022.67 | 0.49% | $2.49 |
(1) | Annualized, based on the Fund's most recent fiscal half-year expenses. |
(2) | The expense ratio does not include the expenses of the underlying funds. |
(3) | Expenses are equal to the Fund's annualized net expense ratio multiplied by the average account value over the period, multiplied by 184/366 (to reflect one-half year period). |
(4) | Expenses shown do not include annuity contract fees. |
7
Wilshire Global Allocation Fund
Schedule of Investments
December 31, 2016 |
|
Shares | Value | |||||||
AFFILIATED REGISTERED INVESTMENT COMPANIES — 93.2% | ||||||||
Wilshire Income Opportunities Fund - Institutional Class | 13,161,773 | $ | 132,933,909 | |||||
Wilshire International Equity Fund - Institutional Class | 13,598,497 | 119,802,761 | ||||||
Wilshire Large Company Growth Portfolio - Institutional Class | 1,244,743 | 45,047,267 | ||||||
Wilshire Large Company Value Portfolio - Institutional Class | 2,926,913 | 59,123,645 | ||||||
Wilshire Small Company Growth Portfolio - Institutional Class | 454,658 | 11,902,935 | ||||||
Wilshire Small Company Value Portfolio - Institutional Class | 512,254 | 12,365,816 | ||||||
Total Affiliated Registered Investment Companies (Cost $403,117,905) | 381,176,333 | |||||||
OTHER OPEN-END FUNDS — 6.1% | ||||||||
Vanguard Total International Bond Index Fund - Admiral Shares (Cost $25,914,606) | 773,239 | 25,145,738 | ||||||
MONEY MARKET FUNDS — 0.9% | ||||||||
Northern Trust Institutional Government Select Portfolio - Institutional Class, 0.38% (a) (Cost $3,785,822) | 3,785,822 | 3,785,822 | ||||||
Total Investments at Value — 100.2% (Cost $432,818,333) | 410,107,893 | |||||||
Liabilities in Excess of Other Assets — (0.2%) | (925,575 | ) | ||||||
Net Assets — 100.0% | $ | 409,182,318 | ||||||
(a) The rate shown is the 7-day effective yield as of December 31, 2016.
As of December 31, 2016, all of the Fund’s investments in securities were considered Level 1, in accordance with the authoritative guidance on fair value measurements and disclosures under U.S. GAAP. For the year ended December 31, 2016, there have been no transfers between Levels. Please see Note 2 in Notes to Financial Statements for further information regarding fair value measurements.
See Notes to Financial Statements.
8
Wilshire Variable Insurance Trust
Statement of Assets and Liabilities
December 31, 2016 |
|
WILSHIRE GLOBAL | ||||
ASSETS: | ||||
Investments in unaffiliated securities, at value (Note 2) | $ | 28,931,560 | ||
Investments in affiliated funds, at value (Note 2) | 381,176,333 | |||
Receivable for investment securities sold | 49,302 | |||
Reclaims receivable | 53,227 | |||
Subscriptions receivable | 38,815 | |||
Dividends receivable | 747 | |||
Prepaid expenses | 1,651 | |||
Total assets | 410,251,635 | |||
LIABILITIES: | ||||
Redemptions payable | 890,452 | |||
Distribution (12b-1) fees payable (Note 4) | 84,986 | |||
Administration fees payable | 19,600 | |||
Investment advisory fees payable (Note 3) | 31,714 | |||
Other accrued expenses | 42,565 | |||
Total liabilities | 1,069,317 | |||
NET ASSETS | $ | 409,182,318 | ||
NET ASSETS consist of: | ||||
Paid-in capital | $ | 417,674,384 | ||
Undistributed net investment income | 9,867,054 | |||
Accumulated net realized gains on investments and foreign currency transactions | 4,358,935 | |||
Net unrealized depreciation of investments | (22,710,440 | ) | ||
Net unrealized depreciation on foreign currency translation | (7,615 | ) | ||
NET ASSETS | $ | 409,182,318 | ||
SHARES OUTSTANDING: | ||||
(Unlimited shares authorized) | 22,129,892 | |||
NET ASSET VALUE: | ||||
(Offering and redemption price per share) | $ | 18.49 | ||
Investments in unaffiliated securities, at cost (Note 2) | $ | 29,700,428 | ||
Investments in affiliated funds, at cost (Note 2) | 403,117,905 | |||
See Notes to Financial Statements.
9
Wilshire Variable Insurance Trust
Statement of Operations
For the Year Ended December 31, 2016 |
|
WILSHIRE GLOBAL | ||||
INVESTMENT INCOME: | ||||
Interest | $ | 1,720,031 | ||
Dividends | 424,084 | |||
Income distributions from affiliated investments | 10,212,152 | |||
Foreign taxes withheld | (50,607 | ) | ||
Total income | 12,305,660 | |||
EXPENSES: | ||||
Distribution (12b-1) fees (Note 4) | 1,041,051 | |||
Investment advisory fees (Note 3)† | 477,537 | |||
Administration fees (Note 3) | 276,393 | |||
Professional fees | 152,471 | |||
Printing fees | 49,883 | |||
Interest expense | 43,277 | |||
Trustees' fees (Note 3) | 41,648 | |||
Pricing fees | 34,579 | |||
Custodian fees | 31,816 | |||
Transfer agent fees | 18,042 | |||
Chief Compliance Officer expenses | 406 | |||
Other | 44,003 | |||
Total expenses | 2,211,106 | |||
Fees reductions by Adviser (Note 3) | (85,331 | ) | ||
Net expenses | 2,125,775 | |||
Net investment income | 10,179,885 | |||
NET REALIZED AND UNREALIZED GAINS (LOSSES) ON INVESTMENTS AND FOREIGN CURRENCY TRANSACTIONS (NOTES 2 and 5): | ||||
Net realized gains (losses) from: | ||||
Unaffiliated investments* | (2,931,344 | ) | ||
Sale of affiliated investment company shares | (4,121,547 | ) | ||
Capital gain distributions from affiliated investment companies | 6,682,839 | |||
Foreign currency transactions | (37,274 | ) | ||
Net change in unrealized appreciation (depreciation) of: | ||||
Unaffiliated investments | 9,981,276 | |||
Investments in affiliated funds | 2,996,990 | |||
Forward contracts and foreign currency transactions and translation of other assets and liabilities denominated in foreign currencies | (17,867 | ) | ||
Net realized and unrealized gains on investments and foreign currencies | 12,553,073 | |||
NET INCREASE IN NET ASSETS RESULTING FROM OPERATIONS | $ | 22,732,958 | ||
† | Includes $167,632 of prior years’ investment advisory fee reductions and expense reimbursements recouped by the Adviser (Note 3). |
* | Includes realized losses as a result of in-kind transactions. See Note 8 in Notes to Financial Statements. |
See Notes to Financial Statements.
10
Wilshire Variable Insurance Trust
Statement of Changes in Net Assets
For the Year Ended December 31, 2016 |
|
WILSHIRE GLOBAL | ||||
OPERATIONS: | ||||
Net investment income | $ | 10,179,885 | ||
Net realized losses on investments, sale of affiliated investment company shares and foreign currency transactions* | (407,326 | ) | ||
Net change in unrealized appreciation (depreciation) of investments and foreign currency transactions and translation of other assets and liabilities denominated in foreign currencies | 12,960,399 | |||
Net increase in net assets resulting from operations | 22,732,958 | |||
DISTRIBUTIONS TO SHAREHOLDERS FROM: | ||||
Net investment income | (6,546,277 | ) | ||
Capital gains | (12,993,288 | ) | ||
Total distributions to shareholders | (19,539,565 | ) | ||
CAPITAL SHARE TRANSACTIONS: (DOLLARS) | ||||
Shares sold | 3,153,995 | |||
Shares issued as reinvestment of distributions | 19,539,564 | |||
Shares redeemed | (48,943,412 | ) | ||
Net decrease in net assets from capital share transactions | (26,249,853 | ) | ||
Net decrease in net assets | (23,056,460 | ) | ||
NET ASSETS: | ||||
Beginning of year | 432,238,778 | |||
End of year | $ | 409,182,318 | ||
Undistributed net investment income at end of year | $ | 9,867,054 | ||
CAPITAL SHARE TRANSACTIONS†: | ||||
Shares sold | 170,667 | |||
Shares issued as reinvestment of distributions | 1,055,622 | |||
Shares redeemed | (2,619,310 | ) | ||
Net decrease in shares outstanding | (1,393,021 | ) | ||
* | Includes realized losses as a result of in-kind transactions. See Note 8 in Notes to Financial Statements. |
† | Includes shares redeemed as a result of in-kind transactions. See Note 8 in Notes to Financial Statements. |
See Notes to Financial Statements.
11
Wilshire Variable Insurance Trust
Statement of Changes in Net Assets
For the Year Ended December 31, 2015 |
|
WILSHIRE GLOBAL | ||||
OPERATIONS: | ||||
Net investment income | $ | 6,854,975 | ||
Net realized gains on investments, sale of affiliated investment company shares and foreign currency transactions | 12,849,038 | |||
Net change in unrealized appreciation (depreciation) of investments and forward contracts and foreign currency transactions and translation of other assets and liabilities denominated in foreign currencies | (18,951,711 | ) | ||
Net increase in net assets resulting from operations | 752,302 | |||
DISTRIBUTIONS TO SHAREHOLDERS FROM: | ||||
Net investment income | (8,633,385 | ) | ||
Capital gains | (21,915,003 | ) | ||
Total distributions to shareholders | (30,548,388 | ) | ||
CAPITAL SHARE TRANSACTIONS: (DOLLARS) | ||||
Shares sold | 6,644,683 | |||
Shares issued as reinvestment of distributions | 30,548,386 | |||
Shares redeemed | (53,508,527 | ) | ||
Net decrease in net assets from capital share transactions | (16,315,458 | ) | ||
Net decrease in net assets | (46,111,544 | ) | ||
NET ASSETS: | ||||
Beginning of year | 478,350,322 | |||
End of year | $ | 432,238,778 | ||
Undistributed net investment income at end of year | $ | 6,490,577 | ||
CAPITAL SHARE TRANSACTIONS: | ||||
Shares sold | 330,431 | |||
Shares issued as reinvestment of distributions | 1,643,525 | |||
Shares redeemed | (2,666,404 | ) | ||
Net decrease in shares outstanding | (692,448 | ) | ||
See Notes to Financial Statements.
12
Wilshire Variable Insurance Trust
Wilshire Global Allocation Fund
Financial Highlights |
|
For a Fund Share Outstanding Throughout Each Year. | ||||||||||||||||||||
Years Ended December 31, | ||||||||||||||||||||
2016 | 2015 | 2014 | 2013 | 2012 | ||||||||||||||||
Net asset value, beginning of year | $ | 18.38 | $ | 19.75 | $ | 19.42 | $ | 16.68 | $ | 15.42 | ||||||||||
Income/(loss) from investment operations: | ||||||||||||||||||||
Net investment income (a) | 0.46 | 0.30 | 0.23 | 0.15 | 0.27 | |||||||||||||||
Net realized and unrealized gains (losses) on investments (b) | 0.57 | (0.30 | ) | 0.19 | 2.90 | 1.60 | ||||||||||||||
Total from investment operations | 1.03 | 0.00 | 0.42 | 3.05 | 1.87 | |||||||||||||||
Less distributions: | ||||||||||||||||||||
From net investment income | (0.31 | ) | (0.37 | ) | (0.09 | ) | (0.31 | ) | (0.61 | ) | ||||||||||
From capital gains | (0.61 | ) | (1.00 | ) | — | — | — | |||||||||||||
Total distributions | (0.92 | ) | (1.37 | ) | (0.09 | ) | (0.31 | ) | (0.61 | ) | ||||||||||
Net asset value, end of year | $ | 18.49 | $ | 18.38 | $ | 19.75 | $ | 19.42 | $ | 16.68 | ||||||||||
Total return (c) | 5.62 | % | 0.04 | % | 2.17 | % | 18.31 | % | 12.11 | % | ||||||||||
Ratios to average net assets/supplemental data: | ||||||||||||||||||||
Net assets, end of year (in 000’s) | $ | 409,182 | $ | 432,239 | $ | 478,350 | $ | 157,820 | $ | 148,169 | ||||||||||
Operating expenses after fee reductions and expense reimbursements and including fees paid indirectly† | 0.51 | %(d) | 0.53 | %(d) | 0.52 | %(d) | 0.29 | % | 0.18 | % | ||||||||||
Operating expenses before fee reductions and expense reimbursements and excluding fees paid indirectly† | 0.53 | % | 0.63 | % | 0.57 | %(e) | 0.29 | % | 0.18 | % | ||||||||||
Net investment income | 2.44 | % | 1.48 | % | 1.17 | % | 0.85 | % | 1.61 | % | ||||||||||
Portfolio turnover rate | 65 | %(f) | 29 | % | 83 | %(f) | 151 | % | 7 | % | ||||||||||
Amounts designated as “—“ are either $0, or have been rounded to $0. | |
(a) | The selected per share data was calculated using the average shares outstanding method for the period. Recognition of net investment income by the Fund is affected by the timing of the declaration of dividends by the underlying investment companies in which the Fund invests. |
(b) | Amount includes capital gains distributions from affiliated investments. The amount of these distributions represents $0.30, $0.47, $0.92, $0.44 and $0.21 per share for the years ended December 31, 2016, 2015, 2014, 2013 and 2012, respectively. |
(c) | If you are an annuity contract owner, the total return does not reflect the expenses that apply to the separate account or related insurance policies through which you invest in the Fund. The inclusion of these charges would reduce the total return figures for all periods shown. |
(d) | The ratio of expenses to average net assets includes interest expense, which is considered outside the expense limitation agreement. Had these expenses been excluded, the ratio would have been 0.50%, 0.50% and 0.50% for the years ended December 31, 2016, 2015 and 2014, respectively. |
(e) | Had the ratio of operating expenses excluding reimbursement/waiver and excluding fees paid indirectly included these expense offsets, the ratio would have remained at 0.57%. |
(f) | Includes the effect of in-kind transactions. |
† | These ratios do not include expenses from the Underlying Funds. |
See Notes to Financial Statements.
13
Wilshire Variable Insurance Trust
Notes to Financial Statements
December 31, 2016 |
|
1. Organization.
The Wilshire Variable Insurance Trust (the “Trust”) is an open-end, diversified management investment company registered under the Investment Company Act of 1940 (the “1940 Act”). The Trust offers units of beneficial interest (shares) in 4 separate investment portfolios. The financial statements herein are those of the Wilshire Global Allocation Fund (the “Fund”). The assets of the Fund are segregated, and a shareholder’s interest is limited to the Fund. The Fund operates under a fund-of-funds structure and invests substantially all of its assets in certain underlying affiliated funds (the “Underlying Funds”), which are mutual funds advised by Wilshire Associates Incorporated (the “Adviser”) and in unaffiliated funds and exchange-traded funds (“ETF” or “ETFs”). The financial statements for the 2015 Fund, 2025 Fund, and 2035 Fund are included in a separate annual report. The Fund may be purchased by separate accounts of insurance companies for certain variable insurance contracts and by plan sponsors of qualified retirement plans.
The investment objective of the Fund is to seek to realize a high long-term total rate of return consistent with prudent investment risks.
On September 22, 2014, the name of the Fund was changed from the Balanced Fund to the Wilshire Global Allocation Fund, and the Equity Fund, Income Fund, International Equity Fund, Small Cap Fund and Socially Responsible Fund were merged into the Fund.
2. Significant Accounting Policies.
In October 2016, the Securities and Exchange Commission (the “SEC”) released its final rule on Investment Company Reporting Modernization (the “Rule”). The Rule, which introduces two new regulatory reporting forms for investment companies – Form N-PORT and Form N-CEN, also contains amendments to Regulation S-X that impact financial statement presentation, particularly the presentation of derivative investments. Although the Trust is still evaluating the impact of the Rule, management believes that many of the Regulation S-X amendments are consistent with the Fund’s current financial statement presentation and expects that the Fund will be able to comply with the Rule’s Regulation S-X amendments by the August 1, 2017 compliance date.
Use of estimates — The Fund is an investment company in conformity with U.S. generally accepted accounting principles (“U.S. GAAP”). Therefore, the Fund follows the accounting and reporting guidelines for investment companies. The preparation of financial statements in conformity with U.S. GAAP requires management to make estimates and assumptions that affect the reported amounts of assets and liabilities and disclosure of contingent assets and liabilities at the date of the financial statements and the reported amounts of increases and decreases in net assets from operations during the period. Actual results could differ from those estimates and these differences could be material.
Security valuation — A security listed or traded on a domestic exchange is valued at its last sales price on the exchange where it is principally traded. In the absence of a current quotation, the security is valued at the mean between the last bid and asked prices on the exchange. Securities traded on National Association of Securities Dealers Automatic Quotation (“NASDAQ”) System are valued at the NASDAQ official closing price. If there is no NASDAQ official closing price available, the most recent bid quotation is used. Securities traded over-the-counter (other than on NASDAQ) are valued at the last current sale price, and if there are no such sales, the most recent bid quotation is used. Values of debt securities are generally reported at the last sales price if the security is actively traded. If a debt security is not actively traded it is valued at an evaluated bid price by employing methodologies that utilize actual market transactions, broker-supplied valuations, or other methodologies designed to identify the market value for such securities. Third-party valuation providers often utilize proprietary models that are subjective and require the use of judgment and the application of various assumptions including, but not limited to, interest rates, prepayment speeds, and default rate assumptions. Debt securities that have a remaining maturity of 60 days or less are valued at prices supplied by the Fund’s pricing agent for such securities, if available, and otherwise are valued at amortized cost if the Pricing Committee concludes it approximates fair value. When market quotations are not readily available, securities are valued according to procedures adopted by the Board of Trustees (the “Board”) or are valued at fair value as determined in good faith by the Pricing Committee, whose members include at least two representatives of the Adviser, one of whom is an officer of the Trust, or the Trust’s Valuation Committee. Securities whose market value using the procedures outlined above do not reflect fair value because a significant valuation event has occurred may be valued at fair value by the Pricing Committee or the Valuation Committee in accordance with the Trust’s valuation procedures. The value of fair valued securities may be different from the last sale price (or the mean
14
Wilshire Variable Insurance Trust
Notes to Financial Statements - (Continued)
December 31, 2016 |
|
between the last bid and asked prices), and there is no guarantee that a fair valued security will be sold at the price at which the Fund is carrying the security. Investments in the Underlying Funds are valued at their net asset value as reported by the Underlying Funds.
Investments in open-end registered investment companies that do not trade on an exchange are valued at the end of day based on its net asset value (“NAV”) per share. Investments in closed-end registered investment companies that trade on an exchange are valued at the last sales price or official closing price as of the close of the customary trading session on the exchange where the security is principally traded.
The Fund’s investment in an ETF is valued at the ETF’s NAV or is valued at market price, depending upon whether the Fund purchased the ETF directly from the ETF in “creation units” or on an exchange, as applicable. For the year ended December 31, 2016, no creation units were purchased by the Fund.
In accordance with the authoritative guidance on fair value measurements and disclosures under U.S. GAAP, the Fund discloses fair value of its investments in a hierarchy that prioritizes the inputs to valuation techniques used to measure the fair value. The objective of a fair value measurement is to determine the price that would be received to sell an asset or paid to transfer a liability in an orderly transaction between market participants at the measurement date (an exit price). Accordingly, the fair value hierarchy gives the highest priority to quoted prices (unadjusted) in active markets for identical assets or liabilities (Level 1) and the lowest priority to unobservable inputs (Level 3). The guidance establishes three levels of the fair value hierarchy as follows:
● | Level 1 – Unadjusted quoted prices in active markets for identical, unrestricted assets or liabilities that the Fund has the ability to access at the measurement date; |
● | Level 2 – Other significant observable inputs (including quoted prices for similar securities, interest rates, prepayment speeds, credit risk, referenced indices, quoted prices in inactive markets, adjusted quoted prices in active markets, etc.); and |
● | Level 3 – Prices, inputs or exotic modeling techniques which are both significant to the fair value measurement and unobservable (supported by little or no market activity). |
The inputs or methodology used for valuing securities are not necessarily an indication of the risks associated with investing in those securities. During the year ended December 31, 2016, there were no significant changes to the Fund’s fair value methodologies.
Fair value measurement classifications are summarized in the Fund’s Schedule of Investments.
Security transactions and investment income — Security transactions are recorded on a trade date basis. Dividend income and distributions on Underlying Funds are recorded on the ex-dividend date or, for certain foreign dividends, as soon as the dividend information becomes available. Interest income and distributions on Underlying Funds, if applicable, are accrued daily. Premium and discount amortization on fixed income securities are accrued daily using the scientific or straight-line method, which approximates the effective interest method. Realized gains and losses on securities sold are determined on the basis of identified cost. Distributions received on securities that represent a return of capital or capital gain are reclassed as a reduction of cost of investments and/or as a realized gain.
Expense policy — Expenses directly attributable to the Fund are charged to the Fund. Expenses not directly attributable to a fund are allocated proportionately among all funds of the Trust daily in relation to the net assets of each fund or upon another reasonable basis. Expenses that are attributable to the Trust and the Wilshire Mutual Funds, Inc. (an affiliated investment company) are allocated across the Trust and the Wilshire Mutual Funds, Inc. based upon relative net assets or another reasonable basis.
Distributions to shareholders — Distributions to shareholders are recorded on the ex-dividend date. Distributions from net investment income, if any, are declared and paid annually. The Fund’s net realized capital gains, unless offset by any available capital loss carryforward, are distributed to shareholders annually. Additional distributions of net investment income and realized capital gains may be made at the discretion of the Board in order to avoid the application of a 4% non-deductible Federal excise tax.
15
Wilshire Variable Insurance Trust
Notes to Financial Statements - (Continued)
December 31, 2016 |
|
Reverse Repurchase Agreements — The Wilshire Global Allocation Fund may enter into reverse repurchase agreements for investment purposes. A reverse repurchase agreement involves the sale of portfolio assets together with an agreement to repurchase the same assets later at a fixed price. At the time the Fund enters into a reverse repurchase agreement, the Portfolio segregates cash, cash equivalents, or other liquid assets, including equity securities and debt securities, at least equal in value to the repurchase price. In the event the buyer of securities under a reverse repurchase agreement files for bankruptcy or becomes insolvent, the Fund’s use of the proceeds under the agreement may be restricted pending a determination by the other party, or its trustee or receiver, whether to enforce the obligation to repurchase the securities. For the year ended December 31, 2016, the average amount of reverse repurchase agreements outstanding and the daily weighted average interest rate for the Fund was $4,269,209 and 1.01%, respectively. As of December 31, 2016, the Fund had no reverse repurchase agreements outstanding.
3. Investment Advisory Fee and Other Transactions.
The Trust employs the Adviser to manage the investment and reinvestment of the assets of the Fund and to continuously review, oversee and administer the Fund’s investment program. Until March 30, 2016, Guggenheim Partners Investment Management, LLC (“Guggenheim”) served as sub-adviser to the Fund. Under a sub-advisory agreement, the Adviser paid Guggenheim a fee out of the advisory fees that it received from the Fund. Fees paid to Guggenheim depended upon the fee rate negotiated with the Adviser and upon the percentage of the Fund’s assets allocated to Guggenheim by the Adviser.
Under an Investment Advisory Agreement dated September 17, 2014, the Fund pays to the Adviser an amount equal to 0.55% of the average daily net assets of the Fund, excluding assets invested in investments in Underlying Funds.
Additionally, the Adviser has contractually agreed to limit expenses of the Fund to 0.50% of average daily net assets (excluding interest expense, taxes, brokerage expenses, dividend expenses on short securities, acquired fund fees and expenses and extraordinary expenses) (“Operating Expense Limit”) through April 30, 2017. The Adviser may recoup the amount of any advisory fee reductions or expense reimbursements within three years after the year in which the Adviser reduced fees or reimbursed expenses if the recoupment does not exceed the Operating Expense Limit that was in place at the time of the fee reduction or expense reimbursement. At December 31, 2016, the amounts of fee reductions and expense reimbursements subject to recoupment by the Adviser were $405,027 expiring in 2018 and $85,331 expiring in 2019.
During the year ended December 31, 2016, the Adviser recouped fee reductions and reimbursed expenses of $167,632.
Because the Underlying Funds and ETFs have varied fee and expense levels and the Fund may own different proportions of the Underlying Funds and ETFs at different times, the amount of fees and expenses incurred indirectly by the Fund will vary.
DST Systems, Inc. serves as the Company’s transfer agent and dividend disbursing agent. The Northern Trust Company (“NTC”) serves as the Company’s custodian. Effective October 1, 2016, Ultimus Fund Solutions, LLC serves as the Trust’s administrator and accounting agent and Ultimus Fund Distributors, LLC (the “Distributor”) serves as the Fund’s distributor.
Prior to October 1, 2016, SEI Investments Global Funds Services served as the Trust’s administrator and accounting agent and SEI Investments Distribution Co. served as the Fund’s distributor.
Officers and Trustees’ expenses — Certain officers of the Trust are affiliated with and receive remuneration from the Adviser. The Trust does not pay any remuneration to its officers. During the year ended December 31, 2016, the Trust and the Wilshire Mutual Funds, Inc. together paid each independent trustee an annual retainer of $18,000, an annual additional Board chairperson retainer of $12,000, a Board in-person meeting fee of $2,000, a Board telephonic meeting fee of $1,000, an annual Committee member retainer of $8,000, an annual Committee chairperson retainer of $8,000 in lieu of the $4,000 Committee member retainer, and a Committee telephonic meeting fee of $500.
4. Distribution and Shareholder Services Plan
The Fund has adopted a Rule 12b-1 distribution and shareholder services plan (the “Distribution Plan”). Pursuant to the Distribution Plan, the Distributor receives from the Fund a distribution and shareholder services fee, computed at the annual rate of 0.25% of average daily net assets.
16
Wilshire Variable Insurance Trust
Notes to Financial Statements - (Continued)
December 31, 2016 |
|
5. Security Transactions.
For the year ended December 31, 2016, aggregate cost of purchases and proceeds from sales and maturities of securities, other than affiliated investments, short-term investments and U.S. Government securities, were as follows:
Purchases | Proceeds from Sales |
$ 65,164,274 | $ 175,736,395 |
Purchases and sales and maturities of U.S. Government securities during the year ended December 31, 2016 were:
Purchases | Proceeds from Sales |
$ 30,227,349 | $ 45,964,691 |
Purchases and sales of affiliated investments during the year ended December 31, 2016 and value as of December 31, 2016 were:
Fund | Value as of December 31, | Purchases | Proceeds from Sales | Realized Gain (Loss) | Change in Unrealized Appreciation (Depreciation) | Value as of December 31, | Income Distributions | |||||||||||||||||
Guggenheim Strategy Fund I | $ | 3,774,209 | $ | 9,048 | $ | (3,772,631 | ) | $ | (13,361 | ) | $ | 2,735 | $ | — | $ | 13,926 | ||||||||
Wilshire Income Opportunities Fund - Institutional Class | — | 158,597,366 | (26,884,439 | ) | 418,348 | 802,634 | 132,933,909 | 3,528,201 | ||||||||||||||||
Wilshire International Equity Fund - Institutional Class | 144,665,251 | 2,273,835 | (27,755,391 | ) | (2,489,713 | ) | 3,108,779 | 119,802,761 | 2,131,660 | |||||||||||||||
Wilshire Large Company Growth Portfolio - Institutional Class | 65,750,450 | 4,943,754 | (22,808,764 | ) | 1,772,813 | (4,610,986 | ) | 45,047,267 | 1,155,546 | |||||||||||||||
Wilshire Large Company Value Portfolio - Institutional Class | 52,608,696 | 10,701,952 | (8,236,057 | ) | 1,165,779 | 2,883,275 | 59,123,645 | 2,596,888 | ||||||||||||||||
Wilshire Small Company Growth Portfolio - Institutional Class | 14,394,955 | 1,222,795 | (4,679,540 | ) | 1,042,830 | (78,105 | ) | 11,902,935 | 409,627 | |||||||||||||||
Wilshire Small Company Value Portfolio - Institutional Class | 13,394,508 | 1,097,594 | (3,679,540 | ) | 664,596 | 888,658 | 12,365,816 | 376,304 | ||||||||||||||||
6. Significant Shareholder Activity.
On December 31, 2016, one omnibus shareholder owned of record 100% of the outstanding shares of the Fund. This one shareholder is the separate account through which shares of the Fund are sold.
7. Tax Information.
No provision for Federal income taxes is required because the Fund has qualified, and intends to continue to qualify, as a regulated investment company under Subchapter M of the Internal Revenue Code of 1986, as amended, and distributes to shareholders all of its taxable income and gains. Federal income tax regulations differ from GAAP; therefore, distributions determined in accordance with tax regulations may differ in amount or character from net investment income and realized gains for financial reporting purposes. Financial reporting records are adjusted for permanent book/tax differences to reflect tax character. Financial records are not adjusted for temporary differences. The Fund is not aware of any tax positions for which it is reasonably possible that the total amounts of unrecognized tax benefits or expenses will significantly change in the next twelve months.
The Fund evaluates tax positions taken or expected to be taken in the course of preparing the Fund’s tax returns to determine whether it is “more-likely than-not” (i.e., greater than 50-percent) that each tax position will be sustained upon examination by a taxing authority based on the technical merits of the position. Tax positions not deemed to meet the more-likely-than-not threshold are recorded as a tax benefit or expense in the current year. The Fund did not record any
17
Wilshire Variable Insurance Trust
Notes to Financial Statements - (Continued)
December 31, 2016 |
|
tax provision in the current period. However, management’s conclusions regarding tax positions taken may be subject to review and adjustment at a later date based on factors including, but not limited to, examination by tax authorities (i.e., the last 3 tax year ends, as applicable), on-going analysis of and changes to tax laws, regulations and interpretations thereof.
The federal tax cost, unrealized appreciation and depreciation at December 31, 2016 for the Fund are as follows:
Tax Cost | Aggregate | Aggregate Depreciation | Net Depreciation |
$ 433,265,188 | $ 2,357,643 | $ (25,514,938) | $ (23,157,295) |
The differences between book and tax-basis unrealized appreciation (depreciation) are attributable primarily to the tax deferral of losses on wash sales.
The tax character of distributions declared during the years ended December 31, 2016 and 2015 were as follows:
2016 | 2016 | 2015 | 2015 |
$ 7,170,925 | $ 12,368,640 | $ 13,562,260 | $ 16,986,128 |
At December 31, 2016, the components of accumulated losses on a tax basis were as follows:
Wilshire Global Allocation Fund | ||||
Undistributed ordinary income | $ | 12,483,514 | ||
Undistributed long-term capital gain | 2,189,330 | |||
Unrealized depreciation | (23,164,910 | ) | ||
Total accumulated losses | $ | (8,492,066 | ) | |
GAAP requires that certain components of net assets be reclassified between financial and income tax reporting. The reclassifications are primarily due to redemptions in-kind and foreign currency adjustments. These reclassifications have no effect on net assets or the net asset value per share. As of December 31, 2016, the Fund made the following reclassifications:
Paid-in capital | $ | (4,383,198 | ) | |
Undistributed net investment income | (257,131 | ) | ||
Accumulated net realized gains on investments and foreign currency transactions | 4,640,329 |
8. In-Kind Transfers.
During the year ended December 31, 2016, shares of beneficial interest of the Wilshire Income Opportunities Fund were issued to the Fund through an affiliated in-kind transfer of investment securities and cash. The securities were transferred at their current value on the date of the transaction.
Contributing Fund | Receiving Fund | Date of | Value of Investment Securities | Cash | Total Assets | Shares | Realized Loss Recognized by Contributing Fund | |||||||||||||||
Wilshire Global | Wilshire Income Opportunities Fund | 3/30/2016 | $ | 156,418,546 | $ | (13,659,576 | ) | $ | 142,758,970 | 14,275,906 | $ | (4,903,488 | ) | |||||||||
18
Wilshire Variable Insurance Trust
Notes to Financial Statements - (Continued)
December 31, 2016 |
|
9. Indemnifications.
In the normal course of business, the Trust, on behalf of the Fund, enters into contracts that provide general indemnifications. The Fund’s maximum exposure under these arrangements is dependent on claims that may be made against the Fund in the future and, therefore, cannot be estimated; however, based on experience, the risk of material loss from such claims is considered remote.
10. Contingencies.
As a part of the merger of the Equity Fund and Socially Responsible Fund into the Fund, the Fund assumed all of the liabilities of the Equity Fund and Socially Responsible Fund, including, without limitation, contingencies relating to lawsuits. The Equity Fund and Socially Responsible Fund were named as defendants and putative members of a proposed defendant class of shareholders in a lawsuit filed on December 7, 2010, in the U.S. Bankruptcy Court for the District of Delaware, and on March 6, 2012, in the District Court for the Southern District of New York, in connection with Tribune Company’s Chapter 11 bankruptcy proceeding. The 2010 lawsuit was brought by the Official Committee of Unsecured Creditors of the Tribune Company and the 2012 lawsuit was brought by Deutsche Bank, as trustee for senior noteholders of Tribune Company. Both lawsuits relate to a leveraged buyout transaction by which Tribune Company converted to a privately-held company in 2007 less than a year prior to Tribune Company’s bankruptcy filing. The putative defendant class is comprised of beneficial owners of shares of Tribune Company who meet certain jurisdictional requirements and received proceeds of the leveraged buyout. The plaintiffs seek to recover those proceeds, together with interest and attorneys’ fees and expenses, as fraudulent transfers under the Bankruptcy Act or various state laws. In September 2013, the District Court dismissed the 2012 lawsuit and in March 2016 the Second Circuit Court of Appeals affirmed this decision. The 2010 lawsuit continues in the District Court. The Adviser does not expect the Fund to be materially impacted by the lawsuits.
11. Subsequent Event Evaluation.
The Fund has evaluated the need for additional disclosures and/or adjustments resulting from subsequent events through the date these financial statements were issued. Based on this evaluation, no additional disclosures or adjustments were required to these financial statements.
19
Wilshire Variable Insurance Trust
Report of Independent Registered Public Accounting Firm |
|
To the Board of Trustees of Wilshire Variable Insurance Trust and Shareholders of
Wilshire Global Allocation Fund:
In our opinion, the accompanying statement of assets and liabilities, including the schedule of investments, and the related statements of operations and of changes in net assets and the financial highlights present fairly, in all material respects, the financial position of Wilshire Global Allocation Fund (hereinafter referred to as the “Fund”) as of December 31, 2016, the results of its operations for the year then ended, the changes in its net assets for each of the two years in the period then ended and the financial highlights for each of the five years in the period then ended, in conformity with accounting principles generally accepted in the United States of America. These financial statements and financial highlights (hereafter referred to as “financial statements”) are the responsibility of the Fund’s management. Our responsibility is to express an opinion on these financial statements based on our audits. We conducted our audits of these financial statements in accordance with the standards of the Public Company Accounting Oversight Board (United States). Those standards require that we plan and perform the audit to obtain reasonable assurance about whether the financial statements are free of material misstatement. An audit includes examining, on a test basis, evidence supporting the amounts and disclosures in the financial statements, assessing the accounting principles used and significant estimates made by management, and evaluating the overall financial statement presentation. We believe that our audits, which included confirmation of securities as of December 31, 2016 by correspondence with the custodian, brokers, and transfer agent, provide a reasonable basis for our opinion.

February 28, 2017
20
Wilshire Variable Insurance Trust
Additional Fund Information (Unaudited)
|
|
A listing of the Trustees and Officers of the Trust, their ages and their principal occupations for the past five years is presented below. The address of each Trustee and Officer is 1299 Ocean Avenue, Suite 700, Santa Monica, California 90401.
Name and Age | Position Held | Term Of | Principal | Number of | Other |
INTERESTED TRUSTEE | |||||
John C. Hindman, 46 | Trustee | Since 2014 | President, Wilshire Associates; formerly, Executive Vice President, Allianz Global Investors of America | 11 | Wilshire Associates; Wilshire Mutual Funds, Inc. (7 Funds) |
NON-INTERESTED TRUSTEES | |||||
Roger A. Formisano, 67 | Trustee | Since 2002 | Vice President, University Medical Foundation, 2006- Present; formerly Director, The Center for Leadership and Applied Business, UW-Madison School of Business; Principal, R.A. Formisano & Company, LLC | 11 | Integrity Mutual Insurance Company, Wilshire Mutual Funds, Inc. (7 Funds) |
Edward Gubman, 65 | Trustee | Since 2011 | Founder and Principal, Strategic Talent Solutions | 11 | Wilshire Mutual Funds, Inc. (7 Funds) |
Suanne K. Luhn, 62 | Trustee | Since 2008 | Retired; formerly Chief Compliance Officer, Bahl & Gaynor (investment adviser) (1990 to 2006) | 11 | Wilshire Mutual Funds, Inc. (7 Funds) |
George J. Zock, 65 | Trustee, Chairman of the Board | Since 1996; Trustee of Predecessor Funds from 1995 to 1996 | Independent Consultant | 11 | Wilshire Mutual Funds, Inc. (7 Funds); Armed Forces Insurance Exchange |
21
Wilshire Variable Insurance Trust
Additional Fund Information (Unaudited) - (Continued)
|
|
Name and Age | Position Held | Term Of | Principal Occupations |
OFFICERS | |||
Jason Schwarz, 42 | President | Since 2012 | President, Wilshire Funds Management Group (since 2005) |
Reena S. Lalji, 45 | Secretary | Since 2009 | Managing Director and General Counsel, Wilshire Associates Incorporated |
Benkai Bouey, 46 | Chief Compliance Officer | Since 2015 | Chief Compliance Officer, Wilshire Associates Incorporated. (since 2012); Attorney, Benkai Bouey, Attorney at Law (2010-2013) |
Michael Wauters, 51 | Treasurer | Since 2009 | Chief Financial Officer, Wilshire Associates Incorporated (since 2009) |
Nathan R. Palmer, 41 | Vice President | Since 2011 | Managing Director, Wilshire Associates Incorporated |
Josh Emanual, 36 | Vice President | Since 2015 | Managing Director of Wilshire Associates Incoporated and Chief Investment Officer of Wilshires Funds Management (since 2015); Chief Investment Officer of The Elements Financial Group, LLC (2010-2015) |
Elizabeth Yakes, 32 | Vice President | Since 2015 | Vice President of Wilshire Associates Incorporated and Portfolio Manager of Wilshire Funds Management |
(1) | Each Trustee serves until the next shareholders’ meeting (and until the election and qualification of a successor), or until death, resignation, removal (as provided in the Trust’s Declaration of Trust) or retirement which takes effect no later than the May 1 following his or her 70th birthday. Officers are elected by the Board on an annual basis to serve until their successors have been elected and qualified. |
The Trust’s Statement of Additional Information includes additional information about the Trustees and Officers of the Trust and is available, without charge, upon request, by calling 1-888-200-6796.
22
Wilshire Variable Insurance Trust
Additional Fund Information (Unaudited) - (Continued)
|
|
Information on Proxy Voting
The SEC has adopted the requirement that all funds file their complete proxy voting records with the SEC on an annual basis on Form N-PX. Such filing, for the 12-month period ended June 30, must be made no later than August 31 of each year.
A description of policies and procedures that the Fund uses to determine how to vote proxies relating to portfolio securities, along with the Fund’s proxy voting record relating to portfolio securities held during the most recent 12-month period ended June 30 is available at no charge, upon request by calling 1-888-200-6796, or on the SEC’s website at http://www.sec.gov.
Information on Form N-Q
The Trust files its complete schedule of portfolio holdings with the SEC for the first and third quarters of each fiscal year on Form N-Q within sixty days after the end of period. The Trust’s Forms N-Q are available on the SEC’s website at http://www.sec.gov, and may be reviewed and copied at the SEC’s Public Reference Room in Washington, DC. Information on the operation of the Public Reference Room may be obtained by calling 1-202-551-8090.
Householding Policy
In order to reduce printing and mailing expenses, only one copy of each prospectus, annual and semi-annual report will be sent to all related accounts at a common address, unless you have indicated otherwise on your Account Application. Contract Owners may revoke their consent to householding at any time by calling 1-800-999-1030. Upon receipt of a Contract Owner’s revocation, the Trust will begin mailing individual copies of the above-referenced documents to the Contract Owner’s attention within 30 days.
23
Wilshire Variable Insurance Trust
Board Approval of Advisory Agreement
(Unaudited) |
|
During the six months ended December 31, 2016, the Board of Trustees (the “Board”) of Wilshire Variable Insurance Trust (the “Trust”) approved the renewal for an additional one-year term of the Trust’s advisory agreement (the “Advisory Agreement”) with Wilshire Associates Incorporated (“Wilshire” or the “Adviser”) on behalf of the Wilshire Global Allocation Fund (the “Fund”).
The information in this summary outlines the Board’s considerations associated with its approval of the Advisory Agreement. In connection with its deliberations regarding the continuation of this relationship, the Board considered such information and factors as it believed to be relevant. As described below, the Board considered the nature, extent and quality of the services performed by Wilshire under the existing advisory arrangement; comparative fees and expense ratios; the profits to be realized by Wilshire; the extent to which Wilshire realizes economies of scale; and whether any fall-out benefits are being realized by Wilshire. In considering these matters, the Board was advised with respect to relevant legal standards by independent legal counsel. In addition, the Trustees who are not “interested persons” of the Trust as defined in the Investment Company Act of 1940 (the “Independent Trustees”) discussed the renewal of the Advisory Agreement with management and in private sessions with independent legal counsel at which no representatives of Wilshire were present.
As required by the Investment Company Act of 1940, the approval was confirmed by a vote of the Independent Trustees. In deciding to approve the renewal of the Advisory Agreement, the Board did not identify any single factor as controlling and this summary does not describe all of the matters considered. However, the Board concluded that each of the various factors referred to below favored such approval.
Information Requested and Received
The Board, including all the Independent Trustees, considered the renewal of the Advisory Agreement pursuant to a process that concluded at the Board’s November 10-11, 2016 meeting, following an extensive process. At the direction of the Independent Trustees, independent legal counsel sent a memorandum to the Adviser requesting information regarding the Advisory Agreement to be provided to the Trustees in advance of a meeting of the Independent Trustees held prior to the Board meeting on November 10-11, 2016.
In response to the request for information, the Trustees received information from the Adviser describing: (i) the nature, extent and quality of services provided; (ii) the investment performance of the Fund as provided by Wilshire based upon data gathered from the Morningstar Direct database (“Morningstar”), along with the comparison to its benchmark index; (iii) the costs of services provided and estimated profits realized by the Adviser; (iv) the extent to which economies of scale are realized; (v) any economies of scale realized by the Adviser and any sharing of such for the benefit of Fund shareholders; (vi) comparisons of services rendered and amounts paid by other registered investment companies as provided by Wilshire based upon data gathered from Morningstar, and (vii) benefits realized by the Adviser from its relationship with the Fund. The Independent Trustees also received a memorandum from independent legal counsel describing their duties in connection with contract approvals, and they were assisted in their review by such counsel.
As a part of its evaluation, the Board considered the assessment of performance made by the Investment Committee (which is comprised solely of Independent Trustees), which met on November 10, 2016 to review the data Wilshire had prepared on performance. Based upon its evaluation of all materials provided, the Board concluded that it was in the best interests of the Fund to renew the Advisory Agreement.
Nature, Extent and Quality of Services
With respect to the nature, extent and quality of services provided by the Adviser, the Board reviewed the functions currently performed by the Adviser, noting that the Adviser performs certain administrative functions on behalf of the Fund. The Board considered the experience and skills of the senior management leading Fund operations, the experience and skills of the personnel performing the functions under the Advisory Agreement and the resources made available to such personnel. The Board determined that the current personnel had the requisite skill sets. The Board also considered the compliance program established by the Adviser and the level of compliance maintained for the Fund. The Board concluded that appropriate resources were being provided under the agreements to administer the Trust’s affairs. The Board reviewed the processes used by the Adviser to select, monitor and replace subadvisers, as well as the Adviser’s revised processes and policies for addressing conflicts of interest. The Board concluded that the Adviser was successful in negotiating favorable subadvisory agreements on behalf of the Fund and that the Adviser had a robust system in place for selecting, monitoring and terminating subadvisers, which system appeared to be reasonable. The Board also reviewed
24
Wilshire Variable Insurance Trust
Board Approval of Advisory Agreement
(Unaudited) - (Continued) |
|
the Adviser’s financial condition, and considered the financial support provided by the Adviser to the Fund pursuant to an expense limitation agreement. Based upon all relevant factors, the Board concluded that the nature, quality and extent of the services provided by the Adviser to the Fund support renewal of the contract.
The Board reviewed information on the performance of the Fund for the annualized one , three , five- and ten-year periods ended September 30, 2016, along with performance information of a peer group of funds determined by Wilshire based upon the Morningstar database and in comparison to the Fund’s benchmark for the same periods. The Board noted that, although the Fund underperformed its benchmark for the one-year period, the Fund’s performance relative to its peers for the one-year period placed it in the second quintile (the first quintile being the best performers and the fifth quintile being the worst performers). The Board also noted that given the change in the Fund’s investment strategy and benchmark as of July 7, 2014, annualized peer returns and performance relative to the benchmark are not comparable for the three-, five- and ten-year periods. Based upon the above performance, the Board determined that it was in the best interests of the Fund to continue the Advisory Agreement.
Advisory Fees
The Board reviewed the Fund’s advisory fee and total expense ratio and reviewed information comparing the actual advisory fee paid and total expense ratio to those of the peer group of funds. The Board concluded the actual fees paid were in a competitive range with the Fund’s peer group. As to total expenses, the Board noted that total expenses are influenced by the small size of the complex. The Board also noted that the Adviser waives advisory fees and reimburses expenses for the Fund pursuant to an expense limitation agreement. The Board noted that the Adviser sub-advises other asset allocation relationships that are similar to the Fund and that the Adviser indicated it charges those sub-advised funds less than it charges the Fund. The Adviser reviewed with the Board the significant differences in the scope of services provided to the Fund and to such sub-advised funds. The Board considered the fee comparisons in light of the scope of services required to manage these different types of relationships. The Board concluded that the advisory fee for the Fund was reasonable.
Profitability to Wilshire and Economies of Scale
With respect to the profitability of the Advisory Agreement, the Board primarily considered the fee structure of the Advisory Agreement, including the costs of the services provided and the profits realized by the Adviser from its relationship with the Fund. The Board concluded that the profits realized by the Adviser were not unreasonable in comparison with the costs of providing investment advisory services to the Fund. In addition, the Board considered the extent to which economies of scale are realized and whether fee levels reasonably reflect economies of scale for the benefit of shareholders. The Board reviewed the Fund’s asset size, the Fund’s expense ratio, the expense limitation agreement in place and considered whether the investment process produced economies of scale. The Board noted that the advisory fee for the Fund includes a breakpoint. The Board concluded that the Fund’s advisory fee reasonably reflected appropriate recognition of any economies of scale.
Fall-Out Benefits
The Board considered the Adviser’s statement that benefits from its relationship with the Fund were limited to the advisory fee paid. The Board determined that the advisory fee was reasonable in light of any fall-out benefits.
Conclusion
Based upon all of the information considered and the conclusions reached, the Board determined that the terms of the Advisory Agreement continue to be fair and reasonable and that the continuation of the Advisory Agreement is in the best interests of the Fund.
25
Wilshire Variable Insurance Trust
Tax Information (Unaudited) |
|
Capital Gain Distribution
For the year ended December 31, 2016, the Fund designated $12,368,640 as long-term capital gain distributions.
Dividends Received Deduction
100% of the distributions made by the Fund will qualify for the dividends received deduction available to corporate shareholders.
26
Wilshire Variable Insurance Trust
Privacy Statement
|
|
At Wilshire Variable Insurance Trust, we appreciate the privacy concerns of our customers. We have established the following policies to maintain the privacy of information you share with us.
Information We Collect
We collect and retain nonpublic personal information about you that may include:
Information we receive on your account applications or other forms such as your name, address, financial information and/or social security number;
Information we receive about your mutual fund transactions, such as purchases, sales, exchanges and account balances; and
Information we collect through the use of Internet “cookies” when you access our website. Cookies are a collection of information stored on the local hard drive of an Internet user, used primarily by web servers to identify previous users and their preferences. A web server cannot find out a user’s name or email address, or anything about the user’s computer using cookies.
Information We May Share
We do not sell any of your nonpublic personal information to third parties. We may share the information we collect with affiliates or with non-affiliated third parties only when those parties are acting on our behalf in servicing your account, or as required by law. These third parties may include:
Administrative service providers who, for example, process transactions for your account, print checks or prepare account statements;
Companies that provide services for us to help market our products to you; and
Governmental or other legal agencies, as required by law.
When information is shared with third parties, they are legally obligated to maintain the confidentiality of the information and to limit their use of it to servicing your account, except as permitted or required by law.
Confidentiality And Security
Within our organization, we restrict access to your nonpublic personal information to authorized employees who need to access such information in order to provide services or products to you. We maintain physical, electronic and procedural safeguards to protect your nonpublic personal information.
As previously mentioned, we may collect information through the use of Internet “cookies” on our website. In addition, in order to provide you with access to your account via the web, it is necessary for us to collect certain nonpublic personal information such as your name, social security number and account information. Special measures such as data encryption and authentication apply to all nonpublic personal information and communications on our web site.
Applicability
Our privacy policies apply only to those individual investors who have a direct customer relationship with us. If you are an individual shareholder of record of any of the Funds, we consider you to be our customer. Shareholders purchasing or owning shares of any of the Funds through their bank, broker, or other financial institution should also consult that financial institution’s privacy policies.
The Wilshire Variable Insurance Trust values your business. We understand the importance of maintaining the integrity of your personal information and are committed to keeping your trust. Please contact us at 888-200-6796 if you have any questions concerning our policy.
27
Wilshire Variable Insurance Trust
Annual Report
December 31, 2016 |
|
Wilshire Variable Insurance Trust | |
Wilshire Global Allocation Fund | |
Board of Trustees | |
Roger A. Formisano Edward Gubman John C. Hindman | Suanne K. Luhn George J. Zock Chairman of the Board |
Officers of the Funds | |
Jason Schwarz President | Nathan R. Palmer Vice President |
Benkai Bouey Chief Compliance Officer | Josh Emanuel Vice President |
Michael Wauters Treasurer | Elizabeth Yakes Vice President |
Gaurav Chopra Assistant Treasurer | Reena Lalji Secretary |
Administrator Ultimus Fund Solutions, LLC
Transfer Agent DST Systems, Inc. 333 W. 11th St. Kansas City, MO 64105
Investment Adviser Wilshire Associates Incorporated 1299 Ocean Avenue Santa Monica, CA 90401-1085
Custodian The Northern Trust Company 50 LaSalle Street Chicago, IL 90401-1085
Independent Registered Public Accounting Firm PricewaterhouseCoopers LLP Two Commerce Square 2001 Market Street, Suite 1700 Philadelphia, PA 19103-7042 | |
28
This Page Intentionally Left Blank.

Wilshire Variable Insurance Trust
Wilshire Associates Incorporated
1299 Ocean Avenue
Santa Monica, CA 90401
1-888-200-6796
WIL-AR-002-0900
Wilshire Variable Insurance Trust |
ANNUAL REPORT 2015 Fund
2025 Fund
2035 Fund
|
December 31, 2016 |
Wilshire Variable Insurance Trust
Table of Contents
|
|
Shareholder Letter | 1 |
Fund Commentaries | 4 |
Disclosure of Fund Expenses | 10 |
Schedules of Investments | 12 |
Statements of Assets and Liabilities | 14 |
Statements of Operations | 15 |
Statements of Changes in Net Assets | 16 |
Financial Highlights | 18 |
Notes to Financial Statements | 21 |
Report of Independent Registered Public Accounting Firm | 28 |
Board Approval of Advisory Agreement | 29 |
Additional Fund Information | 31 |
Tax Information | 34 |
Shares of the 2015 Fund, 2025 Fund and 2035 Fund are sold only as the underlying investment for variable annuity contracts issued by insurance companies. This report is authorized for use in connection with any offering of a Fund’s shares only if accompanied or preceded by the Fund’s current prospectus.
Shares of the Wilshire Variable Insurance Trust are distributed by Ultimus Fund Distributors, LLC.
Wilshire Variable Insurance Trust
Letter To Shareholders (Unaudited)
|
|
Dear Wilshire Variable Insurance Trust Shareholder:
We are pleased to present this annual report to shareholders of the Wilshire Variable Insurance Trust Target Maturity Funds. This report covers the period from January 1, 2016 to December 31, 2016, for the 2015 Fund, 2025 Fund, and 2035 Fund.
Market Environment
U.S. Equity Market
The U.S. stock market, represented by the Wilshire 5000 Total Market IndexSM, was up 4.5% for the fourth quarter and 13.4% for 2016. This marks the Index’s eighth straight annual gain. A portion of that “winning streak” is due to a rebound from the global financial crisis sell-off. However, the market has continued to produce strong returns after the initial recovery, with a 14% annualized gain over the past four years. Following several rocky months to begin the year, U.S. equities trended upward for the rest of 2016. The fourth quarter benefitted from strong economic growth and signs of confidence from the Federal Reserve.
During the year, small-cap stocks outpaced large-cap stocks, with the Wilshire U.S. Small-Cap IndexSM and the Wilshire U.S. Large-Cap IndexSM returning 22.4% and 12.5%, respectively. The strong overall return for the Wilshire 5000 Total Market Index masked a wide performance dispersion between investment styles and among industries for the year. Value oriented stocks handedly outpaced growth stocks across the capitalization spectrum. The Wilshire U.S. Large-Cap Value Index and the Wilshire U.S. Small-Cap Value Index outpaced their growth oriented counterparts by 6.47% and 10.71%, respectively. Sector-wise, commodity-influenced and interest rate sensitive sectors rallied as dividend oriented and higher yielding sectors lagged. For the year, Telecom Services, Energy, Financials, and Materials were the top performing sectors returning 27.1%, 26.5%, 24.6%, and 22.8%, respectively, while Real Estate and Health Care trailed returning -4.6% and -2.8%, respectively.
International Equity Market
International developed equities trailed U.S. equities throughout much of the year, but ended the year in positive territory with the MSCI EAFE Index returning 1.0% for 2016. In local currency terms, non-U.S. equity markets were in mostly positive territory for the calendar year. However, a strong U.S. dollar resulted in decreased returns for U.S. investors. Despite a strong 2016–the MSCI Emerging Markets Index returned 11.2% for the year, despite emerging market equities suffered during the fourth quarter following the U.S. election as investors feared weakening prospects for global trade and diminishing exports from emerging market countries. Higher U.S. interest rates and a stronger dollar hurt returns as well.
The first half of the year ended with increased volatility as uncertainty regarding the potential political contagion emanating from the United Kingdom’s “Brexit” vote weighed on markets. Equity markets fell sharply immediately following the referendum, and the British pound slumped to its lowest level in 30 years. As in the U.S., foreign markets bounced back over the last few days of the second quarter erasing some of the earlier losses. During the second half of the year, the European Central Bank announced that it would be buying fewer sovereign bonds per month than previously scheduled as part of its current quantitative easing, but extended the buying period to December 2017. Japan also maintained an accommodative stance with a negative overnight rate.
Bond Market
The U.S. fixed income market, as measured by the Bloomberg Barclays U.S. Aggregate Bond Index, fell 3.0% for the fourth quarter, reversing some gains from the prior quarters, but ended the year in positive territory at 2.7%. After falling for much of the first half of 2016, U.S. Treasury yields reversed course and moved higher for the remainder of the year. The bellwether 10-year Treasury yield reached a historic low of 1.37% in early July before climbing to end the year at 2.45%, accelerating its rise after the November election. At its December meeting, the Federal Open Market Committee decided to increase the federal funds overnight rate by 0.25%, to a range of 0.50% to 0.75%, for only the second time since 2008.
After trending downward for nearly three years, the 10-year Treasury yield pushed higher during the fourth quarter. A similar pattern has been evident in the 10-year breakeven inflation rate. Both shifts this year occurred largely after November 8th. Whether it was the U.S. presidential election results or the removal of an unknown factor that spurred the change is uncertain, but the timing is unmistakable. It is worth noting that Treasury yields moved higher during the first half of 2015 as well, before retreating on concerns about global economic growth.
1
Wilshire Variable Insurance Trust
Letter To Shareholders (Unaudited) - (Continued)
|
|
Fund Performance Review
The 2015 Fund returned 6.52%, underperforming the S&P Target Date 2015 Index, by 0.03%. The 2025 Fund returned 6.75%, underperforming the S&P Target Date 2025 Index return by 1.07%. The 2035 Fund returned 7.08%, underperforming the S&P Target Date 2035 Index by 1.78%. Despite the Funds’ underperformance versus their benchmarks in 2016, we believe the Funds are well-positioned for future growth.
As always, we sincerely appreciate your continued support and confidence in Wilshire Associates.
Sincerely,

Jason Schwarz
President, Wilshire Variable Insurance Trust
The performance data quoted represents past performance and does not guarantee future results. Current performance may be lower or higher. The investment return and principal value of an investment will fluctuate so that shares, when redeemed, may be worth more or less than their original cost. Annuity contract fees are not reflected in returns. If these fees were included, returns would be lower. Performance data current to the most recent month end may be obtained at http://advisor.wilshire.com.
Index performance is presented for general comparative purposes. Unlike a mutual fund, the performance of an index assumes no transaction costs, management fees or other expenses. An individual cannot directly invest in any index.
This material represents an assessment of the market environment at a specific point in time and is not intended to be a forecast of future events, or a guarantee of future results. This information should not be relied upon by the reader as research or investment advice regarding the Funds or any stock in particular.
There are risks involved with investing, including the possible loss of principal. In addition to the normal risks associated with investing, international investments may involve risk of capital loss from unfavorable fluctuation in currency values, from differences in generally accepted accounting principles or from social, economic, or political instability in other nations. Investments in smaller companies typically exhibit higher volatility. The 2015, 2025 & 2035 Funds operate under a fund of funds structure, pursuant to which the Funds invest in underlying affiliated funds (“Underlying Funds”) and unaffiliated exchange-traded funds (“ETFs”). An investor in the Funds should understand that alternatively he or she could allocate investments directly to an Underlying Fund or ETF. By investing indirectly in an Underlying Fund or ETF through the Funds, an investor bears not only his or her proportionate share of certain expenses of the Funds (such as operating costs), but also, indirectly, similar expenses of an Underlying Fund or ETF. The management fee charged to the Funds is based on the average daily net assets not invested in the Underlying Funds.
There can be no assurance that a Fund will achieve its stated objectives. An investor may experience losses, at any time, including near, at or after the Fund’s target year. In addition, there is no guarantee that an investor’s investment in a Fund will provide any income at or through the years following the Fund’s target year in amounts adequate to meet the investor’s goals or retirement needs.
The Bloomberg Barclays U.S. Aggregate Bond Index is made up of the Bloomberg Barclays U.S. Government/Corporate Bond Index, Mortgage-Backed Securities Index, and Asset-Backed Securities Index, including securities that are of investment grade quality or better, have at least one year to maturity, and have an outstanding par value of at least $100 million.
The MSCI All Country World ex-U.S. Index is an unmanaged capitalization-weighted measure of stock markets of developed and emerging markets, with the exception of U.S.-based companies.
2
Wilshire Variable Insurance Trust
Letter To Shareholders (Unaudited) - (Continued)
|
|
The MSCI EAFE Index is an equity index which captures large and mid-cap representation across developed markets countries around the world, excluding the U.S. and Canada.
The MSCI Emerging Markets Index is a free float-adjusted market capitalization index that is designed to measure equity market performance of emerging markets.
The MSCI Japan Index is a free float-adjusted market capitalization index that is designed to measure developed market equity performance in Japan.
The Wilshire 5000 Total Market IndexSM is widely accepted as the definitive benchmark for the U.S. equity market, and measures performance of all U.S. equity securities with readily available price data.
3
Wilshire Variable Insurance Trust
2015 FUND
Commentary (Unaudited) |
|
2015 FUND
Average Annual Total Returns
One Year Ended 12/31/16 | 6.52% |
Five Years Ended 12/31/16 | 6.31% |
Ten Years Ended 12/31/16 | 3.91% |
S&P TARGET DATE 2015 INDEX(1)
Average Annual Total Returns
One Year Ended 12/31/16 | 6.55% |
Five Years Ended 12/31/16 | 6.78% |
Ten Years Ended 12/31/16 | 4.49% |
COMPARATIVE PERFORMANCE
Comparison of Change in Value of $10,000 Investment in the
2015 Fund and the S&P Target Date 2015 Index through 12/31/16.
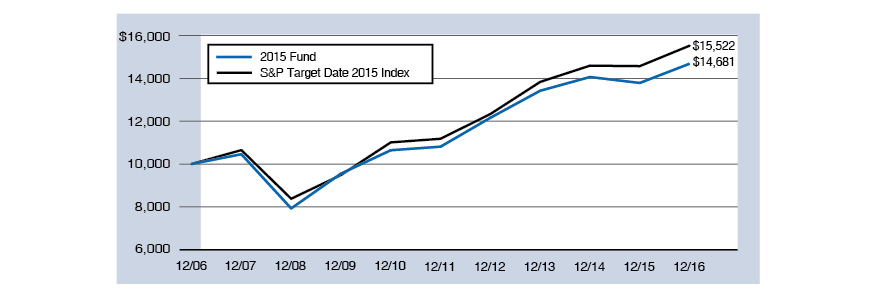
The performance data quoted represents past performance and does not guarantee future results. Current performance may be lower or higher. The investment return and principal value of an investment will fluctuate so that shares, when redeemed, may be worth more or less than their original cost. Returns assume reinvestment of all distributions. Annuity contract fees are not reflected in returns.
(1) | The S&P Target Date 2015 Index (the “Index”) is designed to measure the performance of an investable asset allocation strategy that meets the investment objectives of an investor with an approximate 2015 target retirement horizon. |
Since inception, certain fees and expenses were reduced or reimbursed. Without fee reductions and expense reimbursements, total returns would have been lower. For the year ended December 31, 2016, the investment adviser reduced its fees in the amount of 0.05% of average net assets.
4
Wilshire Variable Insurance Trust
2015 FUND
Commentary (Unaudited) - (Continued) |
|
PORTFOLIO SECTOR WEIGHTING*
(As of December 31, 2016)
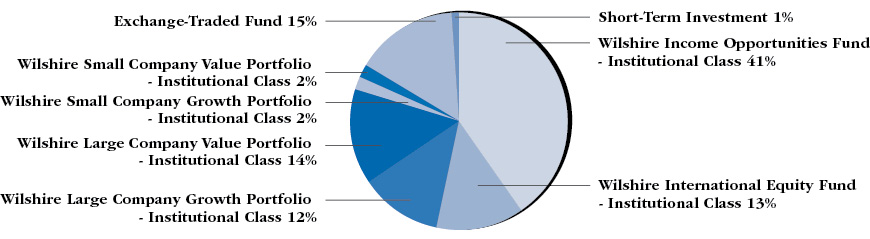
The U.S. stock market, as represented by the Wilshire 5000 Total Market IndexSM, returned 13.4% during 2016. The year started with a loss as markets tumbled globally as worries over a slowing Chinese economy, falling oil prices, and weakness in US earnings growth rattled investors. Mid-year markets were again shaken as investors were surprised by the outcome of the United Kingdom referendum to exit the European Union. The second half of the year was dominated by the news surrounding the U.S. presidential election. In November, markets responded favorably as investors cheered Donald Trump’s victory. Stocks rallied to close the year on the hope that the new administration would fulfill campaign promises for reduced taxes, reduced regulation, and increased spending on infrastructure.
International stock markets underperformed the U.S. during 2016 as the MSCI All Country World ex-U.S. Index returned 4.5% for the year. Emerging economy stocks outperformed foreign developed securities for the first calendar year since 2012 with the MSCI Emerging Markets Index and the MSCI EAFE Index returning 11.2% and 1.0%, respectively. The second quarter started off by recording gains on behalf of European equities, only to retrench later in the period in the wake of the United Kingdom’s “Brexit” vote. International equity markets rallied during the third quarter with economically sensitive stocks leading. During the fourth quarter, overseas markets experienced a volatile period as the U.S. presidential election outcome took the world by surprise. Protectionist proclamations regarding U.S. trade roiled emerging markets.
The U.S. fixed income market as represented by the Bloomberg Barclays U.S. Aggregate Bond Index returned 2.7% for the year. Volatility spiked at the start of the year as going concerns heightened for commodity-related companies. Yields rallied in the fourth quarter globally, but the sell-off was led by U.S. government bonds. The 10 year U.S. Treasury yield closed the year at 2.45% marking the end to a volatile year which saw yields reach historic lows in July at 1.37% before rallying to a December high of 2.60%.
The 2015 ETF Fund returned 6.52% for 2016, performing in-line with the S&P Target Date 2015 Index return of 6.55%. The Fund was hurt by weak performance from the Wilshire Large Company Growth Fund as well as its overweight allocation to developed international equities during the first half of the year. However, an overweight allocation to non-investment grade securities and an overweight allocation to the Wilshire Large Company Value Fund during the second half of the year helped mitigate relative underperformance during the period.
* | Based on percent of Fund’s total investments in securities, at value. |
5
Wilshire Variable Insurance Trust
2025 FUND
Commentary (Unaudited) |
|
2025 FUND
Average Annual Total Returns
One Year Ended 12/31/16 | 6.75% |
Five Years Ended 12/31/16 | 6.77% |
Ten Years Ended 12/31/16 | 3.47% |
S&P TARGET DATE 2025 INDEX(1)
Average Annual Total Returns
One Year Ended 12/31/16 | 7.82% |
Five Years Ended 12/31/16 | 8.37% |
Ten Years Ended 12/31/16 | 4.78% |
COMPARATIVE PERFORMANCE
Comparison of Change in Value of $10,000 Investment in the
2025 Fund and the S&P Target Date 2025 Index through 12/31/16.

The performance data quoted represents past performance and does not guarantee future results. Current performance may be lower or higher. The investment return and principal value of an investment will fluctuate so that shares, when redeemed, may be worth more or less than their original cost. Returns assume reinvestment of all distributions. Annuity contract fees are not reflected in returns.
(1) | The S&P Target Date 2025 Index (the “Index”) is designed to measure the performance of an investable asset allocation strategy that meets the investment objectives of an investor with an approximate 2025 target retirement horizon. |
Since inception, certain fees and expenses were reduced or reimbursed. Without fee reductions and expense reimbursements, total returns would have been lower. For the year ended December 31, 2016, the investment adviser reduced its fees in the amount of 0.02% of average net assets.
6
Wilshire Variable Insurance Trust
2025 FUND
Commentary (Unaudited) - (Continued) |
|
PORTFOLIO SECTOR WEIGHTING*
(As of December 31, 2016)

The U.S. stock market, as represented by the Wilshire 5000 Total Market IndexSM, returned 13.4% during 2016. The year started with a loss as markets tumbled globally as worries over a slowing Chinese economy, falling oil prices, and weakness in US earnings growth rattled investors. Mid-year markets were again shaken as investors were surprised by the outcome of the United Kingdom referendum to exit the European Union. The second half of the year was dominated by the news surrounding the U.S. presidential election. In November, markets responded favorably as investors cheered Donald Trump’s victory. Stocks rallied to close the year on the hope that the new administration would fulfill campaign promises for reduced taxes, reduced regulation, and increased spending on infrastructure.
International stock markets underperformed the U.S. during 2016 as the MSCI All Country World ex-U.S. Index returned 4.5% for the year. Emerging economy stocks outperformed foreign developed securities for the first calendar year since 2012 with the MSCI Emerging Markets Index and the MSCI EAFE Index returning 11.2% and 1.0%, respectively. The second quarter started off by recording gains on behalf of European equities, only to retrench later in the period in the wake of the United Kingdom’s “Brexit” vote. International equity markets rallied during the third quarter with economically sensitive stocks leading. During the fourth quarter, overseas markets experienced a volatile period as the U.S. presidential election outcome took the world by surprise. Protectionist proclamations regarding U.S. trade roiled emerging markets.
The U.S. fixed income market as represented by the Bloomberg Barclays U.S. Aggregate Bond Index returned 2.7% for the year. Volatility spiked at the start of the year as going concerns heightened for commodity-related companies. Yields rallied in the fourth quarter globally, but the sell-off was led by U.S. government bonds. The 10 year U.S. Treasury yield closed the year at 2.45% marking the end to a volatile year which saw yields reach historic lows in July at 1.37% before rallying to a December high of 2.60%.
The 2025 ETF Fund returned 6.75% for 2016, underperforming the S&P Target Date 2025 Index return of 7.82% by 1.07%. The Fund was hurt by weak performance from the Wilshire Large Company Growth Fund as well as its overweight allocation to developed international equities during the first half of the year. However, an overweight allocation to non-investment grade securities and an overweight allocation to the Wilshire Large Company Value Fund during the second half of the year helped mitigate relative underperformance during the period.
* | Based on percent of Fund’s total investments in securities, at value. |
7
Wilshire Variable Insurance Trust
2035 FUND
Commentary (Unaudited) |
|
2035 FUND
Average Annual Total Returns
One Year Ended 12/31/16 | 7.08% |
Five Years Ended 12/31/16 | 7.68% |
Ten Years Ended 12/31/16 | 3.11% |
S&P TARGET DATE 2035 INDEX(1)
Average Annual Total Returns
One Year Ended 12/31/16 | 8.86% |
Five Years Ended 12/31/16 | 9.59% |
Ten Years Ended 12/31/16 | 4.86% |
COMPARATIVE PERFORMANCE
Comparison of Change in Value of $10,000 Investment in the
2035 Fund and the S&P Target Date 2035 Index through 12/31/16.
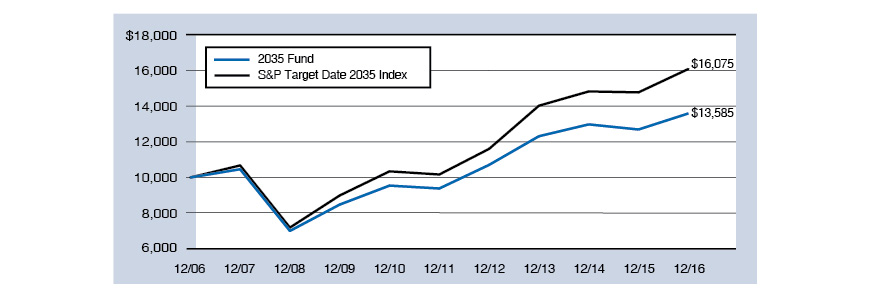
The performance data quoted represents past performance and does not guarantee future results. Current performance may be lower or higher. The investment return and principal value of an investment will fluctuate so that shares, when redeemed, may be worth more or less than their original cost. Returns assume reinvestment of all distributions. Annuity contract fees are not reflected in returns.
(1) | The S&P Target Date 2035 Index (the “Index”) is designed to measure the performance of an investable asset allocation strategy that meets the investment objectives of an investor with an approximate 2035 target retirement horizon. |
Since inception, certain fees and expenses were reduced or reimbursed. Without fee reductions and expense reimbursements, total returns would have been lower. For the year ended December 31, 2016, the investment adviser reduced its fees in the amount of 0.01% of average net assets.
8
Wilshire Variable Insurance Trust
2035 FUND
Commentary (Unaudited) - (Continued) |
|
PORTFOLIO SECTOR WEIGHTING*
(As of December 31, 2016)

The U.S. stock market, as represented by the Wilshire 5000 Total Market IndexSM, returned 13.4% during 2016. The year started with a loss as markets tumbled globally as worries over a slowing Chinese economy, falling oil prices, and weakness in US earnings growth rattled investors. Mid-year markets were again shaken as investors were surprised by the outcome of the United Kingdom referendum to exit the European Union. The second half of the year was dominated by the news surrounding the U.S. presidential election. In November, markets responded favorably as investors cheered Donald Trump’s victory. Stocks rallied to close the year on the hope that the new administration would fulfill campaign promises for reduced taxes, reduced regulation, and increased spending on infrastructure.
International stock markets underperformed the U.S. during 2016 as the MSCI All Country World ex-U.S. Index returned 4.5% for the year. Emerging economy stocks outperformed foreign developed securities for the first calendar year since 2012 with the MSCI Emerging Markets Index and the MSCI EAFE Index returning 11.2% and 1.0%, respectively. The second quarter started off by recording gains on behalf of European equities, only to retrench later in the period in the wake of the United Kingdom’s “Brexit” vote. International equity markets rallied during the third quarter with economically sensitive stocks leading. During the fourth quarter, overseas markets experienced a volatile period as the U.S. presidential election outcome took the world by surprise. Protectionist proclamations regarding U.S. trade roiled emerging markets.
The U.S. fixed income market as represented by the Bloomberg Barclays U.S. Aggregate Bond Index returned 2.7% for the year. Volatility spiked at the start of the year as going concerns heightened for commodity-related companies. Yields rallied in the fourth quarter globally, but the sell-off was led by U.S. government bonds. The 10 year U.S. Treasury yield closed the year at 2.45% marking the end to a volatile year which saw yields reach historic lows in July at 1.37% before rallying to a December high of 2.60%.
The 2035 ETF Fund returned 7.08% for 2016, underperforming the S&P Target Date 2035 Index return of 8.86% by 1.78%. The Fund was hurt by weak performance from the Wilshire Large Company Growth Fund as well as its overweight allocation to developed international equities during the first half of the year. However, an overweight allocation to non-investment grade securities and an overweight allocation to the Wilshire Large Company Value Fund during the second half of the year helped mitigate relative underperformance during the period.
* | Based on percent of Fund’s total investments in securities, at value. |
9
Wilshire Variable Insurance Trust
Disclosure of Fund Expenses
For the Six Months Ended December 31, 2016 (Unaudited) |
|
All mutual funds have operating expenses. As a shareholder of a mutual fund, you incur ongoing costs, which include costs for investment advisory services, administrative services, distribution and/or shareholder services, and shareholder reports (like this one), among others. Operating expenses, which are deducted from a fund’s gross income, directly reduce the investment return of the fund. A fund’s expenses are expressed as a percentage of its average net assets. This figure is known as the expense ratio. The following examples are intended to help you understand the ongoing fees (in dollars) of investing in the Funds and to compare these costs with those of other mutual funds. The examples are based on an investment of $1,000 made at the beginning of the period and held for the entire period from July 1, 2016 to December 31, 2016.
The table on the next page illustrates the Funds’ costs in two ways:
Actual Fund Return: This section helps you to estimate the actual expenses, after any applicable fee reductions, that you paid over the period. The “Ending Account Value” shown is derived from each Fund’s actual return for the period, the “Expense Ratio” column shows the period’s annualized expense ratio, and the “Expenses Paid During Period” column shows the dollar amount that would have been paid by an investor who started with $1,000 in the Funds at the beginning of the period.
You may use the information here, together with your account value, to estimate the expenses that you paid over the period. To do so, simply divide your account value by $1,000 (for example, an $8,600 account value divided by $1,000 = 8.6), then multiply the result by the number given for the Fund in the first line under the heading entitled “Expenses Paid During Period.”
Hypothetical 5% Return: This section is intended to help you compare each Fund’s costs with those of other mutual funds. The “Ending Account Value” shown is derived from hypothetical account values and hypothetical expenses based on the Fund’s actual expense ratio and assumed rate of return. It assumes that each Fund had an annual return of 5% before expenses, but that the expense ratio is unchanged. In this case, because the return used is not each Fund’s actual return, the results do not apply to your investment. This example is useful in making comparisons to other mutual funds because the Securities and Exchange Commission requires all mutual funds to calculate expenses based on an assumed 5% annual return. You can assess each Fund’s ongoing costs by comparing this hypothetical example with the hypothetical examples that appear in shareholder reports of other funds.
Please note that the expenses shown in the table are meant to highlight and help you compare your ongoing costs only and do not reflect any transactional costs such as sales charges (loads), redemption fees, or exchange fees. Wilshire Variable Insurance Trust has no such charges or fees, but they may be present in other funds to which you compare this data. Therefore, the hypothetical portions of the table are useful in comparing ongoing costs only, and will not help you determine the relative costs of owning different funds.
10
Wilshire Variable Insurance Trust
Disclosure of Fund Expenses - (Continued)
For the Six Months Ended December 31, 2016 (Unaudited) |
|
Beginning | Ending | Net | Expenses Paid | |
2015 Fund | ||||
Based on Actual Fund Return | $1,000.00 | $1,028.60 | 0.60% | $3.06 |
Based on Hypothetical 5% Return | $1,000.00 | $1,022.12 | 0.60% | $3.05 |
2025 Fund | ||||
Based on Actual Fund Return | $1,000.00 | $1,036.90 | 0.60% | $3.07 |
Based on Hypothetical 5% Return | $1,000.00 | $1,022.12 | 0.60% | $3.05 |
2035 Fund | ||||
Based on Actual Fund Return | $1,000.00 | $1,050.00 | 0.60% | $3.09 |
Based on Hypothetical 5% Return | $1,000.00 | $1,022.12 | 0.60% | $3.05 |
(1) | The expense ratio does not include the expenses of underlying funds. |
(2) | Annualized, based on the Fund’s expenses for the most recent fiscal half-year. |
(3) | Expenses are equal to the Fund’s annualized net expense ratio multiplied by the average account value over the period, multiplied by 184/366 (to reflect the one-half year period). |
(4) | Expenses shown do not include annuity contract fees. |
11
Wilshire Variable Insurance Trust
Schedules of Investments
December 31, 2016 |
|
2015 Fund | ||||||||
Shares | Value | |||||||
AFFILIATED REGISTERED INVESTMENT COMPANIES — 84.2% | ||||||||
Wilshire Income Opportunities Fund - Institutional Class | 1,129,730 | $ | 11,410,270 | |||||
Wilshire International Equity Fund - Institutional Class | 415,339 | 3,659,137 | ||||||
Wilshire Large Company Growth Portfolio - Institutional Class | 96,085 | 3,477,309 | ||||||
Wilshire Large Company Value Portfolio - Institutional Class | 200,903 | 4,058,237 | ||||||
Wilshire Small Company Growth Portfolio - Institutional Class | 21,315 | 558,038 | ||||||
Wilshire Small Company Value Portfolio - Institutional Class | 23,166 | 559,228 | ||||||
Total Affiliated Registered Investment Companies (Cost $23,811,037) | 23,722,219 | |||||||
EXCHANGE-TRADED FUNDS — 15.1% | ||||||||
Vanguard Total Bond Market ETF (Cost $4,305,407) | 52,625 | 4,251,574 | ||||||
MONEY MARKET FUNDS — 1.0% | ||||||||
Northern Trust Institutional Government Select Portfolio - Institutional Class, 0.38% (a) (Cost $291,112) | 291,112 | 291,112 | ||||||
Total Investments at Value — 100.3% (Cost $28,407,556) | 28,264,905 | |||||||
Liabilities in Excess of Other Assets — (0.3%) | (82,903 | ) | ||||||
Net Assets — 100.0% | $ | 28,182,002 | ||||||
2025 Fund | ||||||||
Shares | Value | |||||||
AFFILIATED REGISTERED INVESTMENT COMPANIES — 87.8% | ||||||||
Wilshire Income Opportunities Fund - Institutional Class | 1,841,142 | $ | 18,595,536 | |||||
Wilshire International Equity Fund - Institutional Class | 1,439,525 | 12,682,217 | ||||||
Wilshire Large Company Growth Portfolio - Institutional Class | 276,965 | 10,023,368 | ||||||
Wilshire Large Company Value Portfolio - Institutional Class | 592,966 | 11,977,912 | ||||||
Wilshire Small Company Growth Portfolio - Institutional Class | 48,025 | 1,257,294 | ||||||
Wilshire Small Company Value Portfolio - Institutional Class | 52,255 | 1,261,441 | ||||||
Total Affiliated Registered Investment Companies (Cost $56,031,145) | 55,797,768 | |||||||
EXCHANGE-TRADED FUNDS — 11.1% | ||||||||
Vanguard Total Bond Market ETF (Cost $7,160,884) | 87,305 | 7,053,371 | ||||||
MONEY MARKET FUNDS — 1.2% | ||||||||
Northern Trust Institutional Government Select Portfolio - Institutional Class, 0.38% (a) (Cost $749,690) | 749,690 | 749,690 | ||||||
Total Investments at Value — 100.1% (Cost $63,941,719) | 63,600,829 | |||||||
Liabilities in Excess of Other Assets — (0.1%) | (31,703 | ) | ||||||
Net Assets — 100.0% | $ | 63,569,126 | ||||||
See Notes to Financial Statements.
12
Wilshire Variable Insurance Trust
Schedules of Investments - (Continued)
December 31, 2016 |
|
2035 Fund | ||||||||
Shares | Value | |||||||
AFFILIATED REGISTERED INVESTMENT COMPANIES — 92.9% | ||||||||
Wilshire Income Opportunities Fund - Institutional Class | 1,419,273 | $ | 14,334,657 | |||||
Wilshire International Equity Fund - Institutional Class | 2,355,839 | 20,754,944 | ||||||
Wilshire Large Company Growth Portfolio - Institutional Class | 476,181 | 17,233,007 | ||||||
Wilshire Large Company Value Portfolio - Institutional Class | 980,916 | 19,814,498 | ||||||
Wilshire Small Company Growth Portfolio - Institutional Class | 94,362 | 2,470,388 | ||||||
Wilshire Small Company Value Portfolio - Institutional Class | 102,546 | 2,475,457 | ||||||
Total Affiliated Registered Investment Companies (Cost $77,408,464) | 77,082,951 | |||||||
EXCHANGE-TRADED FUNDS — 6.0% | ||||||||
Vanguard Total Bond Market ETF (Cost $5,064,923) | 61,441 | 4,963,818 | ||||||
MONEY MARKET FUNDS — 1.1% | ||||||||
Northern Trust Institutional Government Select Portfolio - Institutional Class, 0.38% (a) (Cost $927,539) | 927,539 | 927,539 | ||||||
Total Investments at Value — 100.0% (Cost $83,400,926) | 82,974,308 | |||||||
Other Assets in Excess of Liabilities — 0.0% (b) | 454 | |||||||
Net Assets — 100.0% | $ | 82,974,762 | ||||||
(a) | The rate shown is the 7-day effective yield as of December 31, 2016. |
(b) | Percentage rounds to less than 0.1%. |
As of December 31, 2016, all of the Funds’ investments in securities were considered Level 1, in accordance with the authoritative guidance on fair value measurements and disclosure under U.S. GAAP. As of December 31, 2016, the Funds did not have any transfers between Levels. Please see Note 2 in Notes to Financial Statements for further information regarding fair value measurements.
See Notes to Financial Statements.
13
Wilshire Variable Insurance Trust
Statements of Assets and Liabilities
December 31, 2016 |
|
2015 FUND | 2025 FUND | 2035 FUND | ||||||||||
ASSETS: | ||||||||||||
Investments in unaffiliated securities, at value (Note 2) | $ | 4,542,686 | $ | 7,803,061 | $ | 5,891,357 | ||||||
Investments in affiliated funds, at value (Note 2) | 23,722,219 | 55,797,768 | 77,082,951 | |||||||||
Receivable for Fund shares sold | 33,000 | 81,071 | 189,788 | |||||||||
Receivable for investment securities sold | 7,146 | 41,353 | — | |||||||||
Dividends receivable | 59 | 135 | 180 | |||||||||
Prepaid expenses | 115 | 248 | 316 | |||||||||
Total assets | 28,305,225 | 63,723,636 | 83,164,592 | |||||||||
LIABILITIES: | ||||||||||||
Payable for Fund shares redeemed | 89,434 | 62,076 | 78,619 | |||||||||
Payable for investment securities purchased | — | 38,263 | 46,114 | |||||||||
Investment advisory fees payable (Note 3) | 4,791 | 14,340 | 19,755 | |||||||||
Distribution fees payable (Note 4) | 5,049 | 12,214 | 15,903 | |||||||||
Administration fees payable | 2,150 | 3,750 | 4,750 | |||||||||
Accrued expenses and other payables | 21,799 | 23,867 | 24,689 | |||||||||
Total liabilities | 123,223 | 154,510 | 189,830 | |||||||||
NET ASSETS | $ | 28,182,002 | $ | 63,569,126 | $ | 82,974,762 | ||||||
NET ASSETS consist of: | ||||||||||||
Paid-in capital | $ | 25,181,617 | $ | 56,596,095 | $ | 72,939,835 | ||||||
Undistributed net investment income | 730,807 | 1,661,713 | 2,199,475 | |||||||||
Accumulated net realized gains on investments | 2,412,229 | 5,652,208 | 8,262,070 | |||||||||
Net unrealized depreciation of investments | (142,651 | ) | (340,890 | ) | (426,618 | ) | ||||||
NET ASSETS | $ | 28,182,002 | $ | 63,569,126 | $ | 82,974,762 | ||||||
SHARES OUTSTANDING: | ||||||||||||
(Unlimited shares authorized) | 2,518,695 | 5,450,129 | 7,155,703 | |||||||||
NET ASSET VALUE: | ||||||||||||
(Offering and redemption price per share) | $ | 11.19 | $ | 11.66 | $ | 11.60 | ||||||
Investments in unaffiliated securities, at cost (Note 2) | $ | 4,596,519 | $ | 7,910,574 | $ | 5,992,462 | ||||||
Investments in affiliated funds, at cost (Note 2) | 23,811,037 | 56,031,145 | 77,408,464 | |||||||||
Amounts designated as “—” are either $0, or have been rounded to $0. |
See Notes to Financial Statements.
14
Wilshire Variable Insurance Trust
Statements of Operations
For the Year Ended December 31, 2016 |
|
2015 FUND | 2025 FUND | 2035 FUND | ||||||||||
INVESTMENT INCOME: | ||||||||||||
Dividend income from unaffiliated investments | $ | 229,567 | $ | 429,690 | $ | 428,308 | ||||||
Income distributions from affiliated funds | 670,216 | 1,583,016 | 2,210,130 | |||||||||
Income from Securities Lending (Note 6) | 5,989 | 16,567 | 22,184 | |||||||||
Total income | 905,772 | 2,029,273 | 2,660,622 | |||||||||
EXPENSES: | ||||||||||||
Distribution fees (Note 4) | 72,722 | 152,702 | 191,795 | |||||||||
Investment advisory fees (Note 3) (a) | 41,724 | 106,549 | 137,357 | |||||||||
Administration fees (Note 3) | 19,369 | 40,398 | 50,782 | |||||||||
Professional fees | 27,837 | 37,194 | 41,738 | |||||||||
Custodian fees | 6,819 | 11,243 | 12,893 | |||||||||
Transfer agent fees | 8,028 | 8,937 | 9,273 | |||||||||
Printing fees | 3,846 | 6,875 | 8,484 | |||||||||
Trustees’ fees and expenses (Note 3) | 2,912 | 6,150 | 7,724 | |||||||||
Chief Compliance Officer expenses | 29 | 77 | 101 | |||||||||
Other | 4,517 | 8,152 | 9,670 | |||||||||
Total expenses | 187,803 | 378,277 | 469,817 | |||||||||
Fee reductions by Adviser (Note 3) | (12,838 | ) | (10,719 | ) | (8,675 | ) | ||||||
Net expenses | 174,965 | 367,558 | 461,142 | |||||||||
Net investment income | 730,807 | 1,661,715 | 2,199,480 | |||||||||
NET REALIZED AND UNREALIZED GAINS (LOSSES) ON INVESTMENTS (Notes 2 and 5): | ||||||||||||
Net realized gains from: | ||||||||||||
Unaffiliated investments | 1,766,586 | 3,975,429 | 5,679,302 | |||||||||
Sale of affiliated investment company shares | 173,583 | 357,403 | 388,088 | |||||||||
Capital gain distributions from unaffiliated investment companies | 33,006 | 39,428 | 27,984 | |||||||||
Capital gain distributions from affiliated investment companies | 460,313 | 1,279,951 | 2,171,871 | |||||||||
Net change in unrealized appreciation (depreciation) of: | ||||||||||||
Unaffiliated investments | (1,225,971 | ) | (2,999,504 | ) | (4,723,845 | ) | ||||||
Investments in affiliated funds | (88,818 | ) | (233,376 | ) | (325,513 | ) | ||||||
Net realized and unrealized gains on investments | 1,118,699 | 2,419,331 | 3,217,887 | |||||||||
NET INCREASE IN NET ASSETS RESULTING FROM OPERATIONS | $ | 1,849,506 | $ | 4,081,046 | $ | 5,417,367 | ||||||
(a) | Includes $10,234, $47,123 and $70,289 of prior years’ investment advisory fee reductions and expense reimbursements recouped by the Adviser for 2015 Fund, 2025 Fund and 2035 Fund, respectively (Note 3). |
See Notes to Financial Statements.
15
Wilshire Variable Insurance Trust
Statements of Changes in Net Assets
For the Year Ended December 31, 2016 |
|
2015 FUND | 2025 FUND | 2035 FUND | ||||||||||
OPERATIONS: | ||||||||||||
Net investment income | $ | 730,807 | $ | 1,661,715 | $ | 2,199,480 | ||||||
Net realized gains from sale of unaffiliated investments, sale of affiliated investment company shares and capital gain distributions from investment companies | 2,433,488 | 5,652,211 | 8,267,245 | |||||||||
Net change in unrealized appreciation/(depreciation) on investments | (1,314,789 | ) | (3,232,880 | ) | (5,049,358 | ) | ||||||
Net increase in net assets resulting from operations | 1,849,506 | 4,081,046 | 5,417,367 | |||||||||
DISTRIBUTIONS TO SHAREHOLDERS FROM: | ||||||||||||
Net investment income | (615,426 | ) | (1,098,353 | ) | (1,257,930 | ) | ||||||
Net realized capital gains | (604,558 | ) | (424,909 | ) | (588,856 | ) | ||||||
Total distributions to shareholders | (1,219,984 | ) | (1,523,262 | ) | (1,846,786 | ) | ||||||
CAPITAL SHARE TRANSACTIONS: (DOLLARS) | ||||||||||||
Shares sold | 2,471,725 | 6,691,428 | 10,203,761 | |||||||||
Shares issued as reinvestment of distributions | 1,219,982 | 1,523,261 | 1,846,785 | |||||||||
Shares redeemed | (6,228,706 | ) | (6,174,429 | ) | (5,740,374 | ) | ||||||
Net increase (decrease) in net assets from capital share transactions | (2,536,999 | ) | 2,040,260 | 6,310,172 | ||||||||
Net increase (decrease) in net assets | (1,907,477 | ) | 4,598,044 | 9,880,753 | ||||||||
NET ASSETS: | ||||||||||||
Beginning of year | 30,089,479 | 58,971,082 | 73,094,009 | |||||||||
End of year | $ | 28,182,002 | $ | 63,569,126 | $ | 82,974,762 | ||||||
Undistributed net investment income | $ | 730,807 | $ | 1,661,713 | $ | 2,199,475 | ||||||
CAPITAL SHARE TRANSACTIONS: | ||||||||||||
Shares sold | 219,660 | 584,478 | 907,128 | |||||||||
Shares issued as reinvestment of distributions | 109,024 | 130,304 | 158,522 | |||||||||
Shares redeemed | (551,326 | ) | (534,885 | ) | (508,896 | ) | ||||||
Net increase (decrease) in shares outstanding | (222,642 | ) | 179,897 | 556,754 | ||||||||
See Notes to Financial Statements.
16
Wilshire Variable Insurance Trust
Statements of Changes in Net Assets
For the Year Ended December 31, 2015 |
|
2015 FUND | 2025 FUND | 2035 FUND | ||||||||||
OPERATIONS: | ||||||||||||
Net investment income | $ | 614,640 | $ | 1,097,331 | $ | 1,257,159 | ||||||
Net realized gains from sales of investments and realized gain distributions from investment company shares | 592,369 | 426,039 | 589,734 | |||||||||
Net change in unrealized depreciation on investments | (1,838,315 | ) | (2,975,116 | ) | (3,625,846 | ) | ||||||
Net decrease in net assets resulting from operations | (631,306 | ) | (1,451,746 | ) | (1,778,953 | ) | ||||||
DISTRIBUTIONS TO SHAREHOLDERS FROM: | ||||||||||||
Net investment income | (669,467 | ) | (1,060,799 | ) | (1,247,117 | ) | ||||||
Net realized capital gains | (2,011,437 | ) | (2,272,025 | ) | (2,146,614 | ) | ||||||
Total distributions to shareholders | (2,680,904 | ) | (3,332,824 | ) | (3,393,731 | ) | ||||||
CAPITAL SHARE TRANSACTIONS: (DOLLARS) | ||||||||||||
Shares sold | 3,576,665 | 9,683,017 | 12,856,077 | |||||||||
Shares issued as reinvestment of distributions | 2,680,898 | 3,332,822 | 3,393,728 | |||||||||
Shares redeemed | (7,053,182 | ) | (6,042,328 | ) | (5,952,158 | ) | ||||||
Net increase (decrease) in net assets from capital share transactions | (795,619 | ) | 6,973,511 | 10,297,647 | ||||||||
Net increase (decrease) in net assets | (4,107,829 | ) | 2,188,941 | 5,124,963 | ||||||||
NET ASSETS: | ||||||||||||
Beginning of year | 34,197,308 | 56,782,141 | 67,969,046 | |||||||||
End of year | $ | 30,089,479 | $ | 58,971,082 | $ | 73,094,009 | ||||||
Undistributed net investment income | $ | 615,423 | $ | 1,098,354 | $ | 1,257,922 | ||||||
CAPITAL SHARE TRANSACTIONS: | ||||||||||||
Shares sold | 288,710 | 789,694 | 1,068,650 | |||||||||
Shares issued as reinvestment of distributions | 240,885 | 295,154 | 304,047 | |||||||||
Shares redeemed | (573,157 | ) | (495,973 | ) | (497,059 | ) | ||||||
Net increase (decrease) in shares outstanding | (43,562 | ) | 588,875 | 875,638 | ||||||||
See Notes to Financial Statements.
17
Wilshire Variable Insurance Trust
2015 Fund
Financial Highlights |
|
For a Fund Share Outstanding Throughout Each Year. | ||||||||||||||||||||
Year Ended December 31, | Year Ended December 31, | Year Ended December 31, | Year Ended December 31, | Year Ended December 31, | ||||||||||||||||
Net asset value, beginning of year | $ | 10.98 | $ | 12.28 | $ | 12.24 | $ | 11.39 | $ | 10.37 | ||||||||||
Income (loss) from investment operations: | ||||||||||||||||||||
Net investment income1 | 0.29 | 0.23 | 0.24 | 0.22 | 0.24 | |||||||||||||||
Net realized and unrealized gains (losses) on investments | 0.43 | (0.48 | ) | 0.35 | 0.96 | 1.06 | ||||||||||||||
Total from investment operations | 0.72 | (0.25 | ) | 0.59 | 1.18 | 1.30 | ||||||||||||||
Less distributions: | ||||||||||||||||||||
From net investment income | (0.26 | ) | (0.25 | ) | (0.21 | ) | (0.22 | ) | (0.26 | ) | ||||||||||
From capital gains | (0.25 | ) | (0.80 | ) | (0.34 | ) | (0.11 | ) | (0.02 | ) | ||||||||||
Total distributions | (0.51 | ) | (1.05 | ) | (0.55 | ) | (0.33 | ) | (0.28 | ) | ||||||||||
Net asset value, end of year | $ | 11.19 | $ | 10.98 | $ | 12.28 | $ | 12.24 | $ | 11.39 | ||||||||||
Total return2 | 6.52 | % | (1.98 | %) | 4.78 | % | 10.38 | % | 12.48 | % | ||||||||||
Ratios to average net assets/supplemental data: | ||||||||||||||||||||
Net assets, end of year (in 000’s) | $ | 28,182 | $ | 30,089 | $ | 34,197 | $ | 33,447 | $ | 30,291 | ||||||||||
Operating expenses after fee reductions and expense reimbursements† | 0.60 | % | 0.60 | % | 0.62 | %3 | 0.60 | % | 0.60 | % | ||||||||||
Operating expenses before fee reductions and expense reimbursements† | 0.65 | % | 0.75 | % | 0.75 | % | 0.74 | % | 0.71 | % | ||||||||||
Net investment income | 2.51 | % | 1.85 | % | 1.93 | % | 1.82 | % | 2.15 | % | ||||||||||
Portfolio turnover rate | 108 | % | 21 | % | 38 | % | 23 | % | 11 | % | ||||||||||
† | These ratios do not include expenses from the investment companies in which the Fund invests. |
1 | The selected per share data was calculated using the average shares outstanding method for the period. Recognition of net investment income by the Fund is affected by the timing of the declaration of dividends by the underlying investment companies in which the Fund invests. |
2 | If you are an annuity contract owner, the total return does not reflect the expenses that apply to the separate account or related insurance policies through which you invest in the Fund. The inclusion of these charges would reduce the total return figures for all periods shown. |
3 | The ratio of expenses to average net assets includes extraordinary fees accrued outside the expense limitation agreement. Had these expenses been excluded, the ratio would have been 0.60%. |
See Notes to Financial Statements.
18
Wilshire Variable Insurance Trust
2025 Fund
Financial Highlights |
|
For a Fund Share Outstanding Throughout Each Year. | ||||||||||||||||||||
Year Ended December 31, | Year Ended December 31, | Year Ended December 31, | Year Ended December 31, | Year Ended December 31, | ||||||||||||||||
Net asset value, beginning of year | $ | 11.19 | $ | 12.13 | $ | 11.78 | $ | 10.68 | $ | 9.81 | ||||||||||
Income (loss) from investment operations: | ||||||||||||||||||||
Net investment income1 | 0.31 | 0.22 | 0.24 | 0.21 | 0.23 | |||||||||||||||
Net realized and unrealized gains (losses) on investments | 0.45 | (0.50 | ) | 0.36 | 1.09 | 1.01 | ||||||||||||||
Total from investment operations | 0.76 | (0.28 | ) | 0.60 | 1.30 | 1.24 | ||||||||||||||
Less distributions: | ||||||||||||||||||||
From net investment income | (0.21 | ) | (0.20 | ) | (0.15 | ) | (0.20 | ) | (0.19 | ) | ||||||||||
From capital gains | (0.08 | ) | (0.46 | ) | (0.10 | ) | — | (0.18 | ) | |||||||||||
Total distributions | (0.29 | ) | (0.66 | ) | (0.25 | ) | (0.20 | ) | (0.37 | ) | ||||||||||
Net asset value, end of year | $ | 11.66 | $ | 11.19 | $ | 12.13 | $ | 11.78 | $ | 10.68 | ||||||||||
Total return2 | 6.75 | % | (2.27 | %) | 5.12 | % | 12.22 | % | 12.73 | % | ||||||||||
Ratios to average net assets/supplemental data: | ||||||||||||||||||||
Net assets, end of year (in 000’s) | $ | 63,570 | $ | 58,971 | $ | 56,782 | $ | 48,826 | $ | 38,638 | ||||||||||
Operating expenses after fee reductions and expense reimbursements† | 0.60 | % | 0.60 | % | 0.62 | %3 | 0.60 | % | 0.60 | % | ||||||||||
Operating expenses before fee reductions and expense reimbursements† | 0.62 | % | 0.71 | % | 0.74 | % | 0.71 | % | 0.71 | % | ||||||||||
Net investment income | 2.72 | % | 1.83 | % | 1.98 | % | 1.85 | % | 2.19 | % | ||||||||||
Portfolio turnover rate | 108 | % | 23 | % | 23 | % | 12 | % | 6 | % | ||||||||||
Amounts designated as “—“ are either $0, or have been rounded to $0. | |
† | These ratios do not include expenses from the investment companies in which the Fund invests. |
1 | The selected per share data was calculated using the average shares outstanding method for the period. Recognition of net investment income by the Fund is affected by the timing of the declaration of dividends by the underlying investment companies in which the Fund invests. |
2 | If you are an annuity contract owner, the total return does not reflect the expenses that apply to the separate account or related insurance policies through which you invest in the Fund. The inclusion of these charges would reduce the total return figures for all periods shown. |
3 | The ratio of expenses to average net assets includes extraordinary fees accrued outside the expense limitation agreement. Had these expenses been excluded, the ratio would have been 0.60%. |
See Notes to Financial Statements.
19
Wilshire Variable Insurance Trust
2035 Fund
Financial Highlights |
|
For a Fund Share Outstanding Throughout Each Year. | ||||||||||||||||||||
Year Ended December 31, | Year Ended December 31, | Year Ended December 31, | Year Ended December 31, | Year Ended December 31, | ||||||||||||||||
Net asset value, beginning of year | $ | 11.08 | $ | 11.88 | $ | 11.45 | $ | 10.15 | $ | 9.31 | ||||||||||
Income (loss) from investment operations: | ||||||||||||||||||||
Net investment income1 | 0.31 | 0.21 | 0.23 | 0.21 | 0.23 | |||||||||||||||
Net realized and unrealized gains (losses) on investments | 0.47 | (0.48 | ) | 0.39 | 1.31 | 1.07 | ||||||||||||||
Total from investment operations | 0.78 | (0.27 | ) | 0.62 | 1.52 | 1.30 | ||||||||||||||
Less distributions: | ||||||||||||||||||||
From net investment income | (0.18 | ) | (0.19 | ) | (0.14 | ) | (0.20 | ) | (0.16 | ) | ||||||||||
From capital gains | (0.08 | ) | (0.34 | ) | (0.05 | ) | (0.02 | ) | (0.30 | ) | ||||||||||
Total distributions | (0.26 | ) | (0.53 | ) | (0.19 | ) | (0.22 | ) | (0.46 | ) | ||||||||||
Net asset value, end of year | $ | 11.60 | $ | 11.08 | $ | 11.88 | $ | 11.45 | $ | 10.15 | ||||||||||
Total return2 | 7.08 | % | (2.21 | %) | 5.39 | % | 14.97 | % | 14.09 | % | ||||||||||
Ratios to average net assets/supplemental data: | ||||||||||||||||||||
Net assets, end of year (in 000’s) | $ | 82,975 | $ | 73,094 | $ | 67,969 | $ | 58,033 | $ | 42,750 | ||||||||||
Operating expenses after fee reductions and expense reimbursements† | 0.60 | % | 0.60 | % | 0.62 | %3 | 0.60 | % | 0.60 | % | ||||||||||
Operating expenses before fee reductions and expense reimbursements† | 0.61 | % | 0.71 | % | 0.75 | % | 0.71 | % | 0.71 | % | ||||||||||
Net investment income | 2.87 | % | 1.73 | % | 1.96 | % | 1.93 | % | 2.30 | % | ||||||||||
Portfolio turnover rate | 112 | % | 20 | % | 22 | % | 7 | % | 6 | % | ||||||||||
† | These ratios do not include expenses from the investment companies in which the Fund invests. |
1 | The selected per share data was calculated using the average shares outstanding method for the period. Recognition of net investment income by the Fund is affected by the timing of the declaration of dividends by the underlying investment companies in which the Fund invests. |
2 | If you are an annuity contract owner, the total return does not reflect the expenses that apply to the separate account or related insurance policies through which you invest in the Fund. The inclusion of these charges would reduce the total return figures for all periods shown. |
3 | The ratio of expenses to average net assets includes extraordinary fees accrued outside the expense limitation agreement. Had these expenses been excluded, the ratio would have been 0.60%. |
See Notes to Financial Statements.
20
Wilshire Variable Insurance Trust
Notes to Financial Statements
December 31, 2016 |
|
1. Organization.
The Wilshire Variable Insurance Trust (the “Trust”) is an open-end, diversified management investment company registered under the Investment Company Act of 1940 (the “1940 Act”). The Trust offers units of beneficial interest (shares) in 4 separate investment portfolios. The portfolios presented in these financial statements are: 2015 Fund (formerly the 2015 ETF Fund), 2025 Fund (formerly the 2025 ETF Fund) and 2035 Fund (formerly the 2035 ETF Fund) (collectively the “Funds”, each a “Fund” of the Trust). The Funds operate under a fund of funds structure and at this time invest substantially all of their assets in certain underlying affiliated funds (the “Underlying Funds”), which are mutual funds advised by Wilshire Associates Incorporated (the “Adviser”), and in unaffiliated exchange-traded funds (“ETF” or “ETFs”). The financial statements for the other investment portfolio of the Trust are included in a separate annual report. Shares in the Funds may only be purchased by insurance company separate accounts for certain variable insurance contracts and by plan sponsors of qualified retirement plans.
The investment objective of each Fund is to provide high total return until the Fund’s target retirement date. Thereafter, each Fund’s objective is to seek high current income and, as a secondary objective, capital appreciation. Each Fund is designed to provide a mix of assets with a risk/return profile that is appropriate for the participant’s anticipated target retirement date. The risk/return profile of the Funds will adjust with time and become more conservative.
2. Significant Accounting Policies.
In October 2016, the Securities and Exchange Commission (the “SEC”) released its final rule on Investment Company Reporting Modernization (the “Rule”). The Rule, which introduces two new regulatory reporting forms for investment companies – Form N-PORT and Form N-CEN, also contains amendments to Regulation S-X that impact financial statement presentation, particularly the presentation of derivative investments. Although the Trust is still evaluating the impact of the Rule, management believes that many of the Regulation S-X amendments are consistent with the Funds’ current financial statement presentation and expects that the Funds will be able to comply with the Rule’s Regulation S-X amendments by the August 1, 2017 compliance date.
Use of estimates — Each Fund is an investment company in conformity with U.S. generally accepted accounting principles (“U.S. GAAP”). Therefore, the Funds follow the accounting and reporting guidelines for investment companies. The preparation of financial statements in conformity with U.S. GAAP requires management to make estimates and assumptions that affect the reported amounts of assets and liabilities and disclosure of contingent assets and liabilities at the date of the financial statements and the reported amounts of increases and decreases in net assets from operations during the period. Actual results could differ from those estimates and these differences could be material.
Security valuation — A security listed or traded on a domestic exchange is valued at its last sales price on the exchange where it is principally traded. In the absence of a current quotation, the security is valued at the mean between the last bid and asked prices on the exchange. Securities traded on National Association of Securities Dealers Automatic Quotation (“NASDAQ”) System are valued at the NASDAQ official closing price. If there is no NASDAQ official closing price available, the most recent bid quotation is used. Securities traded over-the-counter (other than on NASDAQ) are valued at the last current sale price, and if there are no such sales, the most recent bid quotation is used. Values of debt securities are generally reported at the last sales price if the security is actively traded. If a debt security is not actively traded it is valued at an evaluated bid price by employing methodologies that utilize actual market transactions, broker-supplied valuations, or other methodologies designed to identify the market value for such securities. Third-party valuation providers often utilize proprietary models that are subjective and require the use of judgment and the application of various assumptions including, but not limited to, interest rates, repayment speeds, and default rate assumptions. Debt securities that have a remaining maturity of 60 days or less are valued at prices supplied by the Funds’ pricing agent for such securities, if available, and otherwise are valued at amortized cost if the Pricing Committee concludes it approximates fair value. When market quotations are not readily available, securities are valued according to procedures adopted by the Board of Trustees (the “Board”) or are valued at fair value as determined in good faith by the Pricing Committee, whose members include at least two representatives of the Adviser, one of whom is an officer of the Trust, or the Trust’s Valuation Committee. Securities whose market value using the procedures outlined above do not reflect fair value because a significant valuation event has occurred may be valued at fair value by the Pricing Committee or the Valuation Committee in accordance with the Trust’s valuation procedures. The value of fair valued securities may be different from the last sale price (or the mean
21
Wilshire Variable Insurance Trust
Notes to Financial Statements - (Continued)
December 31, 2016 |
|
between the last bid and asked prices), and there is no guarantee that a fair valued security will be sold at the price at which a Fund is carrying the security. Investments in the Underlying Funds are valued at their net asset value as reported by the Underlying Funds. Investments in open-end registered investment companies that do not trade on an exchange are valued at the end of day net asset value (“NAV”) per share. Investments in closed-end registered investment companies that trade on an exchange are valued at the last sales price or official closing price as of the close of the customary trading session on the exchange where the security is principally traded.
A Fund’s investment in an ETF is valued at the ETF’s NAV or is valued at market price, depending upon whether a Fund purchased the ETF directly from the ETF in “creation units” or on an exchange, as applicable. During the year ended December 31, 2016, no creation units were purchased by the Funds.
In accordance with the authoritative guidance on fair value measurements and disclosures under U.S. GAAP, the Funds disclose fair value of their investments in a hierarchy that prioritizes the inputs to valuation techniques used to measure the fair value. The objective of a fair value measurement is to determine the price that would be received to sell an asset or paid to transfer a liability in an orderly transaction between market participants at the measurement date (an exit price). Accordingly, the fair value hierarchy gives the highest priority to quoted prices (unadjusted) in active markets for identical assets or liabilities (Level 1) and the lowest priority to unobservable inputs (Level 3). The guidance establishes three levels of the fair value hierarchy as follows:
● | Level 1 – Unadjusted quoted prices in active markets for identical, unrestricted assets or liabilities that the Funds have the ability to access at the measurement date; |
● | Level 2 – Other significant observable inputs (including quoted prices for similar securities, interest rates, prepayment speeds, credit risk, etc.); and |
● | Level 3 – Prices, inputs or exotic modeling techniques which are both significant to the fair value measurement and unobservable (supported by little or no market activity). |
The inputs or methodology used for valuing securities are not necessarily an indication of the risks associated with investing in those securities. During the year ended December 31, 2016, there were no significant changes to the Funds’ fair value methodologies. During the year ended December 31, 2016, there were no Level 2 or Level 3 securities held by the Funds.
Fair value measurement classifications are summarized in the Funds’ Schedules of Investments.
Security transactions and investment income — Security transactions are recorded on a trade date basis. Dividend income and distributions on Underlying Funds are recorded on the ex-dividend date or, for certain foreign dividends, as soon as the dividend information becomes available. Interest income and distributions on Underlying Funds, if applicable, are accrued daily. Premium and discount amortization on fixed income securities are accrued daily using the scientific or straight-line method, which approximates the effective interest method. Realized gains and losses on securities sold are determined on the basis of identified cost. Distributions received on securities that represent a return of capital or capital gain are reclassed as a reduction of cost of investments and/or as a realized gain.
Expense policy — Expenses directly attributable to a Fund are charged to that Fund. Expenses not directly attributable to a Fund are allocated proportionately among all funds of the Trust in relation to the net assets of each fund or another reasonable basis. Expenses that are attributable to both the Trust and the Wilshire Mutual Funds, Inc. (an affiliated investment company) are allocated across the Trust and the Wilshire Mutual Funds, Inc. based upon relative net assets or another reasonable basis.
Distributions to shareholders — Distributions to shareholders are recorded on the ex-dividend date. Distributions from net investment income, if any, are declared and paid annually. The Funds’ net realized capital gains, unless offset by any available capital loss carryforward, are distributed to shareholders annually. Additional distributions of net investment income and net realized capital gains may be made at the discretion of the Board of Trustees in order to avoid the application of a 4% non-deductible federal excise tax.
22
Wilshire Variable Insurance Trust
Notes to Financial Statements - (Continued)
December 31, 2016 |
|
3. Investment Advisory Fee and Other Transactions With Affiliates.
The Trust employs the Adviser to manage the investment and reinvestment of the assets of the Funds and to continuously review, oversee and administer the Funds’ investment programs.
Pursuant to the Investment Advisory Agreement (the “Agreement”) between the Trust and the Adviser, the Adviser receives a management fee of 0.25% based on each Fund’s average daily net assets of each Fund, excluding assets invested in Underlying Funds.
The Adviser has entered into a contractual expense limitation agreement with the Trust to reduce its management fee and/or reimburse expenses to limit annual operating expenses of each Fund (excluding taxes, brokerage expenses, dividend expenses on short securities, acquired fund fees and expenses and extraordinary expenses) to 0.60% of average daily net assets. This agreement to limit expenses continues through at least April 30, 2017. The Adviser may recoup the amount of any management fee reductions or expense reimbursements within three years after the year in which the reduction of reimbursement occurred if the recoupment does not cause a Fund’s expenses to exceed the expense limitation that was in place at the time of the fee reduction or expense reimbursement. At December 31, 2016, the amounts of fee reductions and expense reimbursements subject to recoupment for the 2015 Fund, 2025 Fund and the 2035 Fund were $44,400, $68,756 and $64,966, respectively, expiring in 2017; $51,518, $68,820 and $77,262, respectively, expiring in 2018; and $12,838, $10,719 and $8,675, respectively, expiring in 2019.
During the year ended December 31, 2016, the Adviser reduced its fees and recouped prior years’ fee reductions in the amounts listed below.
Fund | Fees Reduced/ Reimbursed | Fees Recouped | ||||||
2015 Fund | $ | 12,838 | $ | 10,234 | ||||
2025 Fund | 10,719 | 47,123 | ||||||
2035 Fund | 8,675 | 70,289 | ||||||
Because the Underlying Funds and ETFs have varied fee and expense levels and the Funds may own different proportions of the Underlying Funds and ETFs at different times, the amount of fees and expenses incurred indirectly by a Fund will vary.
DST Systems, Inc. serves as the Trust’s transfer agent and dividend disbursing agent. The Northern Trust Company (“Northern Trust”) serves as the Trust’s custodian. Effective October 1, 2016, Ultimus Fund Solutions, LLC serves as the Trust’s administrator and accounting agent and Ultimus Fund Distributors LLC (the “Distributor”) serves as the Fund’s distributor.
Prior to October 1, 2016, SEI Investments Global Funds Services served as the Trust’s administrator and accounting agent and SEI Investments Distribution Co. served as the Fund’s distributor.
Officers’ and Trustees’ expenses — Certain officers of the Trust are affiliated with and receive remuneration from the Adviser. The Trust does not pay any remuneration to its officers. During the year ended December 31, 2016, the Trust and the Wilshire Mutual Funds, Inc. together paid each independent trustee an annual retainer of $18,000, an annual additional Board chairperson retainer of $12,000, a Board in-person meeting fee of $2,000, a Board telephonic meeting fee of $1,000, an annual Committee member retainer of $8,000, and a Committee telephonic meeting fee of $500.
4. Distribution and Shareholder Services Plan.
The Funds have adopted a plan pursuant to Rule 12b-1 under the 1940 Act that provides for a fee of up to 0.25% of each Fund’s average net assets payable to the Distributor to reimburse it for distribution and shareholder services provided to shareholders by the Distributor or other financial intermediaries.
23
Wilshire Variable Insurance Trust
Notes to Financial Statements - (Continued)
December 31, 2016 |
|
5. Security Transactions.
During the year ended December 31, 2016, the aggregate cost of purchases and proceeds from sales of investments, other than affiliated investments and short-term investments were as follows:
Fund | Purchases | Proceeds | ||||||
2015 Fund | $ | 1,920,374 | $ | 27,394,970 | ||||
2025 Fund | 5,741,452 | 56,887,143 | ||||||
2035 Fund | 8,122,512 | 74,970,977 | ||||||
Information regarding the Funds’ investments in the Underlying Funds during the year ended December 31, 2016 is provided in the table below:
Fund | Value as of December 31, 2015 | Purchases | Proceeds from Sales | Realized | Change in Unrealized Appreciation (Depreciation) | Value as of | Income Distributions | |||||||||||||||||
2015 Fund | ||||||||||||||||||||||||
Wilshire Income Opportunities Fund | $ | — | $ | 13,085,714 | $ | (1,623,235 | ) | $ | 35,972 | $ | (88,181 | ) | $ | 11,410,270 | $ | 302,732 | ||||||||
Wilshire International Equity Fund | — | 5,585,667 | (1,874,285 | ) | 5,148 | (57,393 | ) | 3,659,137 | 65,099 | |||||||||||||||
Wilshire Large Company Growth Portfolio | — | 4,488,082 | (770,695 | ) | 26,330 | (266,408 | ) | 3,477,309 | 89,143 | |||||||||||||||
Wilshire Large Company Value Portfolio | — | 4,529,885 | (771,063 | ) | 61,228 | 238,187 | 4,058,237 | 177,698 | ||||||||||||||||
Wilshire Small Company Growth Portfolio | — | 670,841 | (168,071 | ) | 22,018 | 33,250 | 558,038 | 19,049 | ||||||||||||||||
Wilshire Small Company Value Portfolio | — | 664,684 | (180,070 | ) | 22,887 | 51,727 | 559,228 | 16,495 | ||||||||||||||||
2025 Fund | ||||||||||||||||||||||||
Wilshire Income Opportunities Fund | $ | — | $ | 20,052,921 | $ | (1,337,093 | ) | $ | 29,938 | $ | (150,230 | ) | $ | 18,595,536 | $ | 493,897 | ||||||||
Wilshire International Equity Fund | — | 15,697,293 | (2,829,111 | ) | 11,215 | (197,180 | ) | 12,682,217 | 225,615 | |||||||||||||||
Wilshire Large Company Growth Portfolio | — | 12,100,261 | (1,364,915 | ) | 45,158 | (757,136 | ) | 10,023,368 | 257,694 | |||||||||||||||
Wilshire Large Company Value Portfolio | — | 12,983,572 | (1,887,398 | ) | 199,991 | 681,747 | 11,977,912 | 525,465 | ||||||||||||||||
Wilshire Small Company Growth Portfolio | — | 1,388,086 | (237,481 | ) | 33,606 | 73,083 | 1,257,294 | 43,071 | ||||||||||||||||
Wilshire Small Company Value Portfolio | — | 1,372,084 | (264,478 | ) | 37,495 | 116,340 | 1,261,441 | 37,274 | ||||||||||||||||
24
Wilshire Variable Insurance Trust
Notes to Financial Statements - (Continued)
December 31, 2016 |
|
Fund | Value as of December 31, | Purchases | Proceeds from Sales | Realized | Change in Unrealized Appreciation (Depreciation) | Value as of December 31, 2016 | Income Distributions | |||||||||||||||||
2035 Fund | ||||||||||||||||||||||||
Wilshire Income Opportunities Fund | $ | — | $ | 15,003,350 | $ | (522,698 | ) | $ | 12,472 | $ | (158,467 | ) | $ | 14,334,657 | $ | 379,449 | ||||||||
Wilshire International Equity Fund | — | 25,541,131 | (4,491,651 | ) | 29,945 | (324,481 | ) | 20,754,944 | 369,035 | |||||||||||||||
Wilshire Large Company Growth Portfolio | — | 20,642,260 | (2,129,818 | ) | 78,360 | (1,357,795 | ) | 17,233,007 | 441,969 | |||||||||||||||
Wilshire Large Company Value Portfolio | — | 19,862,456 | (1,324,808 | ) | 129,212 | 1,147,638 | 19,814,498 | 865,070 | ||||||||||||||||
Wilshire Small Company Growth Portfolio | — | 2,688,525 | (425,212 | ) | 64,773 | 142,302 | 2,470,388 | 83,913 | ||||||||||||||||
Wilshire Small Company Value Portfolio | — | 2,657,053 | (480,212 | ) | 73,326 | 225,290 | 2,475,457 | 70,694 | ||||||||||||||||
6. Securities Lending.
The Funds may seek additional income by lending their securities on a short-term basis to banks, brokers and dealers in return for cash collateral, which is invested in short-term securities. A Fund may return a portion of the interest earned to the borrower or a third party that is unaffiliated with the Trust and acting as a “placing broker.” A Fund receives compensation for lending securities in the form of fees. A Fund also continues to receive dividends on the securities loaned. Security loans are secured at all times by collateral. It is the Trust’s policy that the collateral be equal to at least 102% of the market value of the securities loaned (105% if the collateral and securities loaned are denominated in different currencies) plus accrued interest when the transaction is entered into, and that the collateral supporting loans be remarked daily. However, due to market fluctuations during the day, the value of securities loaned on a particular day may, during the course of the day, exceed the value of collateral. On each business day, the amount of collateral is adjusted based on the prior day’s market fluctuations and the current day’s lending activity. Gain or loss in the market price of the securities loaned that may occur during the term of the loan are reflected in the value of the Fund. The risks from securities lending are that the borrower may not provide additional collateral when required or return the securities when due or when called for by the Fund. At December 31, 2016, there were no securities on loan.
7. Significant Shareholder Activity.
On December 31, 2016, the Funds had the following concentrations of shareholders holding 10% or more of the outstanding shares of the Funds. These represent omnibus shareholder accounts in the separate account through which shares of the Funds are sold.
Fund | |
2015 Fund (1 omnibus shareholder) | 98% |
2025 Fund (1 omnibus shareholder) | 98% |
2035 Fund (1 omnibus shareholder) | 99% |
8. Tax Information.
No provision for federal income taxes is required because each Fund has qualified, and intends to continue to qualify, as a regulated investment company under Subchapter M of the Internal Revenue Code of 1986, as amended, and distributes to shareholders all of its taxable income and gains. Federal income tax regulations differ from GAAP; therefore, distributions determined in accordance with tax regulations may differ in amount or character from net investment income and realized gains for financial reporting purposes. Financial reporting records are adjusted for permanent book/tax differences to reflect tax character. Financial records are not adjusted for temporary differences. The Funds are not aware of any tax positions for which it is reasonably possible that the total amounts of unrecognized tax benefits or expenses will significantly change in the next twelve months.
25
Wilshire Variable Insurance Trust
Notes to Financial Statements - (Continued)
December 31, 2016 |
|
The Funds evaluate tax positions taken or expected to be taken in the course of preparing a Fund’s tax returns to determine whether it is “more-likely than-not” (i.e., greater than 50-percent) that each tax position will be sustained upon examination by a taxing authority based on the technical merits of the position. Tax positions not deemed to meet the more-likely-than-not threshold are recorded as a tax benefit or expense in the current year. The Funds did not record any tax provision in the current period. However, management’s conclusions regarding tax positions taken may be subject to review and adjustment at a later date based on factors including, but not limited to, examination by tax authorities (i.e., the last 3 tax year ends, as applicable) and on-going analysis of and changes to tax laws, regulations and interpretations thereof.
The federal tax cost, unrealized appreciation and depreciation at December 31, 2016 for each Fund is as follows:
Fund | Tax Cost | Aggregate | Aggregate | Net Unrealized Depreciation | ||||||||||||
2015 Fund | $ | 28,412,450 | $ | 331,470 | $ | (479,015 | ) | $ | (147,545 | ) | ||||||
2025 Fund | 63,954,308 | 899,293 | (1,252,772 | ) | (353,479 | ) | ||||||||||
2035 Fund | 83,410,260 | 1,564,762 | (2,000,174 | ) | (435,952 | ) | ||||||||||
The differences between book and tax-basis unrealized appreciation (depreciation) for each Fund are attributable primarily to the tax deferral of losses on wash sales.
The tax character of distributions declared for the years ended December 31, 2016 and 2015 was as follows:
Fund | 2016 | 2016 | 2015 | 2015 | ||||||||||||
2015 Fund | $ | 621,467 | $ | 598,517 | $ | 669,467 | $ | 2,011,437 | ||||||||
2025 Fund | 1,100,063 | 423,199 | 1,091,182 | 2,241,642 | ||||||||||||
2035 Fund | 1,259,583 | 587,203 | 1,261,067 | 2,132,644 | ||||||||||||
At December 31, 2016, the components of distributable earnings on a tax basis were as follows:
2015 Fund | 2025 Fund | 2035 Fund | ||||||||||
Undistributed ordinary income | $ | 730,807 | $ | 1,661,713 | $ | 2,199,475 | ||||||
Undistributed long-term capital gains | 2,417,123 | 5,664,797 | 8,271,404 | |||||||||
Unrealized depreciation | (147,545 | ) | (353,479 | ) | (435,952 | ) | ||||||
Total distributable earnings | $ | 3,000,385 | $ | 6,973,031 | $ | 10,034,927 | ||||||
GAAP requires that certain components of net assets be reclassified between financial and income tax reporting. These reclassifications are primarily due to the reclassification of distributions paid and have no effect on net assets or the net asset value per share. As of December 31, 2016, the Funds made the following reclassifications:
2015 Fund | 2025 Fund | 2035 Fund | ||||||||||
Paid-in capital | $ | — | $ | 8 | $ | (12 | ) | |||||
Undistributed net investment income | 3 | (3 | ) | 3 | ||||||||
Accumulated net realized gains on investments | (3 | ) | (5 | ) | 9 | |||||||
26
Wilshire Variable Insurance Trust
Notes to Financial Statements - (Continued)
December 31, 2016 |
|
9. Indemnifications.
In the normal course of business, the Trust on behalf of the Funds enters into contracts that provide general indemnifications. The Funds’ maximum exposure under these arrangements is dependent on claims that may be made against the Funds in the future and, therefore, cannot be estimated; however, based on experience, the risk of material loss from such claims is considered remote.
10. Subsequent Event Evaluation.
The Funds have evaluated the need for additional disclosures and/or adjustments resulting from subsequent events through the date these financial statements were issued. Based on this evaluation, no additional disclosures or adjustments were required to these financial statements.
27
Wilshire Variable Insurance Trust
Report Of Independent Registered Public Accounting Firm |
|
To the Board of Trustees of Wilshire Variable Insurance Trust and Shareholders of
2015 Fund, 2025 Fund and 2035 Fund:
In our opinion, the accompanying statements of assets and liabilities, including the schedules of investments, and the related statements of operations and of changes in net assets and the financial highlights present fairly, in all material respects, the financial position of 2015 Fund, 2025 Fund and 2035 Fund (three series of Wilshire Variable Insurance Trust, hereafter referred to as the “Funds”) as of December 31, 2016, the results of each of their operations for the year then ended, the changes in each of their net assets for each of the two years in the period then ended and the financial highlights for each of the five years in the period then ended, in conformity with accounting principles generally accepted in the United States of America. These financial statements and financial highlights (hereafter referred to as “financial statements”) are the responsibility of the Funds’ management. Our responsibility is to express an opinion on these financial statements based on our audits. We conducted our audits of these financial statements in accordance with the standards of the Public Company Accounting Oversight Board (United States). Those standards require that we plan and perform the audit to obtain reasonable assurance about whether the financial statements are free of material misstatement. An audit includes examining, on a test basis, evidence supporting the amounts and disclosures in the financial statements, assessing the accounting principles used and significant estimates made by management, and evaluating the overall financial statement presentation. We believe that our audits, which included confirmation of securities as of December 31, 2016 by correspondence with the custodian, brokers, and transfer agent, provide a reasonable basis for our opinion.
February 28, 2017
28
Wilshire Variable Insurance Trust
Board Approval Of Advisory Agreement (Unaudited) |
|
During the six months ended December 31, 2016, the Board of Trustees (the “Board”) of Wilshire Variable Insurance Trust (the “Trust”) approved the renewal for an additional one-year term of the Trust’s advisory agreement (the “Advisory Agreement”) with Wilshire Associates Incorporated (“Wilshire” or the “Adviser”) on behalf of the Wilshire 2015 Fund, Wilshire 2025 Fund and Wilshire 2035 Fund (the “Funds”).
The information in this summary outlines the Board’s considerations associated with its approval of the Advisory Agreement. In connection with its deliberations regarding the continuation of this relationship, the Board considered such information and factors as it believed to be relevant. As described below, the Board considered the nature, extent and quality of the services performed by Wilshire under the existing advisory arrangement; comparative fees and expense ratios; the profits to be realized by Wilshire; the extent to which Wilshire realizes economies of scale; and whether any fall-out benefits are being realized by Wilshire. In considering these matters, the Board was advised with respect to relevant legal standards by independent legal counsel. In addition, the Trustees who are not “interested persons” of the Trust as defined in the Investment Company Act of 1940 (the “Independent Trustees”) discussed the renewal of the Advisory Agreement with management and in private sessions with independent legal counsel at which no representatives of Wilshire were present.
As required by the Investment Company Act of 1940, the approval was confirmed by a vote of the Independent Trustees. In deciding to approve the renewal of the Advisory Agreement, the Board did not identify any single factor as controlling and this summary does not describe all of the matters considered. However, the Board concluded that each of the various factors referred to below favored such approval.
Information Requested and Received
The Board, including all the Independent Trustees, considered the renewal of the Advisory Agreement pursuant to a process that concluded at the Board’s November 10-11, 2016 meeting, following an extensive process. At the direction of the Independent Trustees, independent legal counsel sent a memorandum to the Adviser requesting information regarding the Advisory Agreement to be provided to the Trustees in advance of a meeting of the Independent Trustees held prior to the Board meeting on November 10-11, 2016.
In response to the request for information, the Trustees received information from the Adviser as to each of the Funds describing: (i) the nature, extent and quality of services provided; (ii) the investment performance of each Fund as provided by Wilshire based upon data gathered from the Morningstar Direct database (“Morningstar”), along with the comparison to its benchmark index; (iii) the costs of services provided and estimated profits realized by the Adviser; (iv) the extent to which economies of scale are realized; (v) any economies of scale realized by the Adviser and any sharing of such for the benefit of Fund shareholders; (vi) comparisons of services rendered and amounts paid by other registered investment companies as provided by Wilshire based upon data gathered from Morningstar, and (vii) benefits realized by the Adviser from its relationship with each Fund. The Independent Trustees also received a memorandum from independent legal counsel describing their duties in connection with contract approvals, and they were assisted in their review by such counsel.
As a part of its evaluation, the Board considered the assessment of performance made by the Investment Committee (which is comprised solely of Independent Trustees), which met on November 10, 2016 to review the data Wilshire had prepared on performance. Based upon its evaluation of all materials provided, the Board concluded that it was in the best interests of each Fund to renew the Advisory Agreement.
Nature, Extent and Quality of Services
With respect to the nature, extent and quality of services provided by the Adviser, the Board reviewed the functions currently performed by the Adviser, noting that the Adviser performs certain administrative functions on behalf of the Funds. The Board considered the experience and skills of the senior management leading Fund operations, the experience and skills of the personnel performing the functions under the Advisory Agreement and the resources made available to such personnel. The Board determined that the current personnel had the requisite skill sets. The Board also considered the compliance program established by the Adviser and the level of compliance maintained for the Funds. The Board concluded that appropriate resources were being provided under the agreements to administer the Trust’s affairs. The
29
Wilshire Variable Insurance Trust
Board Approval Of Advisory Agreement (Unaudited) - (Continued) |
|
Board also reviewed the Adviser’s financial condition, and considered the financial support provided by the Adviser to the Funds pursuant to an expense limitation agreement. Based upon all relevant factors, the Board concluded that the nature, quality and extent of the services provided by the Adviser to each Fund support renewal of the contract.
The Board reviewed information on the performance of each Fund for the annualized one , three and five-year periods ended September 30, 2016, along with performance information of a peer group of funds determined by Wilshire based upon the Morningstar database for the same periods. The Board also reviewed information on the performance of each Fund for the annualized one , three , five and ten year periods ended September 30, 2016 in comparison to each Fund’s benchmark for the same periods. For the Wilshire 2015 Fund, the Board noted that the Fund outperformed the median of its peer group for the one- and three-year periods, was in the third quintile of its peer group for the five-year period (the first quintile being the best performers and the fifth quintile being the worst performers) and outperformed its peer group for the one-year period but underperformed its benchmark for the three-, five- and ten-year periods. For the Wilshire 2025 Fund, the Board noted that the Fund outperformed the median of its peer group for the one-year period, was in the third quintile of its peer group for the three-year period, was in the fourth quintile of its peer group for the five-year period and underperformed its benchmark for all periods reviewed. For the Wilshire 2035 Fund, the Board noted that the Fund underperformed the median of its peer group for the one-, three- and five-year periods and underperformed its benchmark for all periods reviewed, but was in the fourth quintile of its peer group for the one- and three-year periods. Based upon the above performance, the Board determined that it was in the best interests of each Fund to continue the Advisory Agreement.
Advisory Fees
The Board reviewed each Fund’s advisory fee and total expense ratio and reviewed information comparing the actual advisory fee paid and total expense ratio to those of the peer group of funds. The Board concluded that for all Funds, the actual fees paid were in a competitive range with each Fund’s peer group. As to total expenses, the Board noted that total expenses are influenced by the small size of the complex. The Board also noted that the Adviser waives advisory fees and reimburses expenses for the Funds pursuant to an expense limitation agreement. The Board noted that the Adviser sub-advises other asset allocation relationships that are similar to the Funds and that the Adviser indicated it charges those sub-advised funds less than it charges the Funds. The Adviser reviewed with the Board the significant differences in the scope of services provided to the Funds and to such sub-advised funds. The Board considered the fee comparisons in light of the scope of services required to manage these different types of relationships. The Board concluded that the advisory fee for each Fund was reasonable.
Profitability to Wilshire and Economies of Scale
With respect to the profitability of the Advisory Agreement, the Board primarily considered the fee structure of the Advisory Agreement, including the costs of the services provided and the profits realized by the Adviser from its relationship with the Funds. The Board concluded that the profits realized by the Adviser were not unreasonable in comparison with the costs of providing investment advisory services to the Funds. In addition, the Board considered the extent to which economies of scale are realized and whether fee levels reasonably reflect economies of scale for the benefit of shareholders. The Board reviewed each Fund’s asset size, each Fund’s expense ratio, the expense limitation agreement in place and considered whether the investment process produced economies of scale. The Board concluded that each Fund’s advisory fee reasonably reflected appropriate recognition of any economies of scale.
Fall-Out Benefits
The Board considered the Adviser’s statement that benefits from its relationship with the Funds were limited to the advisory fees paid. The Board determined that the advisory fees were reasonable in light of any fall-out benefits.
Conclusion
Based upon all of the information considered and the conclusions reached, the Board determined that the terms of the Advisory Agreement continue to be fair and reasonable and that the continuation of the Advisory Agreement is in the best interests of each Fund.
30
Wilshire Variable Insurance Trust
Additional Fund Information (Unaudited)
|
|
A listing of the Trustees and Officers of the Trust, their ages and their principal occupations for the past five years is presented below. The address of each Trustee and Officer is 1299 Ocean Avenue, Suite 700, Santa Monica, California 90401.
Name and Age | Position Held | Term of | Principal | Number of Funds/Funds in Complex Overseen by Trustee | Other |
INTERESTED TRUSTEE | |||||
John C. Hindman, 46 | Trustee | Since 2014 | President, Wilshire Associates; formerly, Executive Vice President, Allianz Global Investors of America | 10 | Wilshire Associates; Wilshire Mutual Funds, Inc. (6 Funds) |
NON-INTERESTED TRUSTEES | |||||
Roger A. Formisano, 67 | Trustee | Since 2002 | Vice President, University Medical Foundation, 2006- Present; formerly Director, The Center for Leadership and Applied Business, UW-Madison School of Business; Principal, R.A. Formisano & Company, LLC | 10 | Integrity Mutual Insurance Company, Wilshire Mutual Funds, Inc. (6 Funds) |
Edward Gubman, 65 | Trustee | Since 2011 | Founder and Principal, Strategic Talent Solutions | 10 | Wilshire Mutual Funds, Inc. (6 Funds) |
Suanne K. Luhn, 62 | Trustee | Since 2008 | Retired; formerly Chief Compliance Officer, Bahl & Gaynor (investment adviser) (1990 to 2006) | 10 | Wilshire Mutual Funds, Inc. (6 Funds) |
George J. Zock, 65 | Trustee, Chairman of the Board | Since 1996; Trustee of Predecessor Funds from 1995 to 1996 | Independent Consultant | 10 | Wilshire Mutual Funds, Inc. (6 Funds); Armed Forces Insurance Exchange |
31
Wilshire Variable Insurance Trust
Additional Fund Information (Unaudited) - (Continued)
|
|
Name and Age | Position Held | Term of | Principal Occupations |
OFFICERS | |||
Jason Schwarz, 42 | President | Since 2012 | President, Wilshire Funds Management Group (since 2005) |
Reena S. Lalji, 45 | Secretary | Since 2009 | Managing Director and General Counsel, Wilshire Associates Incorporated |
Benkai Bouey, 46 | Chief Compliance Officer | Since 2015 | Chief Compliance Officer, Wilshire Associates Incorporated. (since 2012); Attorney, Benkai Bouey, Attorney at Law (2010-2013) |
Michael Wauters, 51 | Treasurer | Since 2009 | Chief Financial Officer, Wilshire Associates Incorporated (since 2009) |
Nathan R. Palmer, 41 | Vice President | Since 2011 | Managing Director, Wilshire Associates Incorporated |
Josh Emanual, 36 | Vice President | Since 2015 | Managing Director of Wilshire Associates Incoporated and Chief Investment Officer of Wilshires Funds Management (since 2015); Chief Investment Officer of The Elements Financial Group, LLC (2010-2015) |
Elizabeth Yakes, 32 | Vice President | Since 2015 | Vice President of Wilshire Associates Incorporated and Portfolio Manager of Wilshire Funds Management |
(1) | Each Trustee serves until the next shareholders’ meeting (and until the election and qualification of a successor), or until death, resignation, removal (as provided in the Trust’s Declaration of Trust) or retirement which takes effect no later than the May 1 following his or her 70th birthday. Officers are elected by the Board on an annual basis to serve until their successors have been elected and qualified. |
The Trust’s Statement of Additional Information includes additional information about the Trustees and officers of the Trust and is available, without charge, upon request, by calling 1-888-200-6796.
32
Wilshire Variable Insurance Trust
Additional Fund Information (Unaudited) - (Continued)
|
|
Information on Proxy Voting
The Securities and Exchange Commission (“SEC”) has adopted the requirement that all funds file their complete proxy voting records with the SEC on an annual basis on Form N-PX. Such filing, for the 12-month period ended June 30, must be made no later than August 31 of each year.
A description of policies and procedures that the Funds use to determine how to vote proxies relating to portfolio securities, along with each Fund’s proxy voting record relating to portfolio securities held during the most recent 12-month period ended June 30 is available at no charge, upon request by calling 1-888-200-6796, or on the SEC’s website at http://www.sec.gov.
Information on Form N-Q
The Trust files its complete schedule of portfolio holdings with the SEC for the first and third quarters of each fiscal year on Form N-Q within sixty days after the end of period. The Trust’s Forms N-Q are available on the SEC’s website at http://www.sec.gov, and may be reviewed and copied at the SEC’s Public Reference Room in Washington, DC. Information on the operation of the Public Reference Room may be obtained by calling 1-202-551-8090.
Householding Policy
In order to reduce printing and mailing expenses, only one copy of each prospectus, annual and semi-annual report will be sent to all related accounts at a common address, unless you have indicated otherwise on your Account Application. Contract Owners may revoke their consent to householding at any time by calling 1-800-999-1030. Upon receipt of a Contract Owner’s revocation, the Trust will begin mailing individual copies of the above-referenced documents to the Contract Owner’s attention within 30 days.
33
Wilshire Variable Insurance Trust
Tax Information
|
|
For the year ended December 31, 2016, the Funds designated the following long-term capital gain distributions:
Portfolio | Amount | |||
2015 Fund | $ | 598,517 | ||
2025 Fund | $ | 423,199 | ||
2035 Fund | $ | 587,203 | ||
Of the distributions made by the Funds, the corresponding percentages represent the amount of each distribution which will qualify for the dividends received deduction available to corporate shareholders:
Fund | Percentage | |||
2015 Fund | 0.00 | % | ||
2025 Fund | 0.00 | % | ||
2035 Fund | 0.00 | % | ||
34
Wilshire Variable Insurance Trust
Privacy Statement
|
|
At Wilshire Variable Insurance Trust, we appreciate the privacy concerns of our customers. We have established the following policies to maintain the privacy of information you share with us.
Information We Collect
We collect and retain nonpublic personal information about you that may include:
Information we receive on your account applications or other forms such as your name, address, financial information and/or social security number;
Information we receive about your mutual fund transactions, such as purchases, sales, exchanges and account balances; and
Information we collect through the use of Internet “cookies” when you access our website. Cookies are a collection of information stored on the local hard drive of an Internet user, used primarily by web servers to identify previous users and their preferences. A web server cannot find out a user’s name or email address, or anything about the user’s computer using cookies.
Information We May Share
We do not sell any of your nonpublic personal information to third parties. We may share the information we collect with affiliates or with non-affiliated third parties only when those parties are acting on our behalf in servicing your account, or as required by law. These third parties may include:
Administrative service providers who, for example, process transactions for your account, print checks or prepare account statements;
Companies that provide services for us to help market our products to you; and
Governmental or other legal agencies, as required by law.
When information is shared with third parties, they are legally obligated to maintain the confidentiality of the information and to limit their use of it to servicing your account, except as permitted or required by law.
Confidentiality And Security
Within our organization, we restrict access to your nonpublic personal information to authorized employees who need to access such information in order to provide services or products to you. We maintain physical, electronic and procedural safeguards to protect your nonpublic personal information.
As previously mentioned, we may collect information through the use of Internet “cookies” on our website. In addition, in order to provide you with access to your account via the web, it is necessary for us to collect certain nonpublic personal information such as your name, social security number and account information. Special measures such as data encryption and authentication apply to all nonpublic personal information and communications on our web site.
Applicability
Our privacy policies apply only to those individual investors who have a direct customer relationship with us. If you are an individual shareholder of record of any of the Funds, we consider you to be our customer. Shareholders purchasing or owning shares of any of the Funds through their bank, broker, or other financial institution should also consult that financial institution’s privacy policies.
The Wilshire Variable Insurance Trust values your business. We understand the importance of maintaining the integrity of your personal information and are committed to keeping your trust. Please contact us at 888-200-6796 if you have any questions concerning our policy.
35
This Page Intentionally Left Blank.
This Page Intentionally Left Blank.
Wilshire Variable Insurance Trust
Wilshire Associates Incorporated
1299 Ocean Avenue
Santa Monica, CA 90401
1-888-200-6796
WIL-AR-003-0900
| Item 2. | Code of Ethics. |
| Item 3. | Audit Committee Financial Expert. |
| Item 4. | Principal Accountant Fees and Services. |
| (a) | Audit Fees. The aggregate fees billed for professional services rendered by the principal accountant for the audit of the registrant’s annual financial statements or for services that are normally provided by the accountant in connection with statutory and regulatory filings or engagements were $62,475 and $79,240 with respect to the registrant’s fiscal years ended December 31, 2016 and 2015, respectively. |
| (b) | Audit-Related Fees. No fees were billed in either of the last two fiscal years for assurance and related services by the principal accountant that are reasonably related to the performance of the audit of the registrant’s financial statements and are not reported under paragraph (a) of this Item. |
| (c) | Tax Fees. The aggregate fees billed for professional services rendered by the principal accountant for tax compliance, tax advice, and tax planning were $16,575 and $14,874 with respect to the registrant’s fiscal years ended December 31, 2016 and 2015, respectively. The services comprising these fees are tax consulting and the preparation of the registrant’s federal income and excise tax returns. |
| (d) | All Other Fees. No fees were billed in either of the last two fiscal years for products and services provided by the principal accountant, other than the services reported in paragraphs (a) through (c) of this Item. |
| (e)(1) | The audit committee has not adopted pre-approval policies and procedures described in paragraph (c)(7) of Rule 2-01 of Regulation S-X. |
| (e)(2) | None of the services described in paragraph (b) through (d) of this Item were approved by the audit committee pursuant to paragraph (c)(7)(i)(C) of Rule 2-01 of Regulation S-X. |
| (f) | Less than 50% of hours expended on the principal accountant’s engagement to audit the registrant’s financial statements for the most recent fiscal year were attributed to work performed by persons other than the principal accountant’s full-time, permanent employees. |
| (g) | During the fiscal years ended December 31, 2016 and 2015, aggregate non-audit fees of $16,575 and $14,874, respectively, were billed by the registrant’s principal accountant for services rendered to the registrant. During the fiscal years ended December 31, 2016 and 2015, aggregate non-audit fees of $1,325,000 and $1,298,830 respectively, were billed by the registrant’s principal accountant for services rendered to the registrant’s investment adviser (not including any sub-adviser whose role is primarily portfolio management and is subcontracted with or overseen by another investment adviser), and any entity controlling, controlled by, or under common control with the adviser that provides ongoing services to the registrant. |
| (h) | The registrant’s audit committee has determined that the provision of non-audit services that were rendered to the registrant’s investment adviser (not including any sub-adviser whose role is primarily portfolio management and is subcontracted with or overseen by another investment adviser), and any entity controlling, controlled by, or under common control with the investment adviser that provides ongoing services to the registrant, that were not pre-approved pursuant to paragraph (c)(7)(ii) of Rule 2-01 of Regulation S-X is compatible with maintaining the principal accountant’s independence. |
| Item 5. | Audit Committee of Listed Registrants. |
| Item 6. | Schedule of Investments. |
| (a) | Not applicable [schedule filed with Item 1] |
| (b) | Not applicable |
| Item 7. | Disclosure of Proxy Voting Policies and Procedures for Closed-End Management Investment Companies. |
| Item 8. | Portfolio Managers of Closed-End Management Investment Companies. |
| Item 9. | Purchases of Equity Securities by Closed-End Management Investment Company and Affiliated Purchasers. |
| Item 10. | Submission of Matters to a Vote of Security Holders. |
| Item 11. | Controls and Procedures. |
| Item 12. | Exhibits. |
| Exhibit 99.CODE ETH | Code of Ethics |
| Exhibit 99.CERT | Certifications required by Rule 30a-2(a) under the Act |
| Exhibit 99.906CERT | Certifications required by Rule 30a-2(b) under the Act |
| (Registrant) | Wilshire Variable Insurance Trust | ||
| By (Signature and Title)* | /s/ Jason A. Schwarz | ||
| Jason A. Schwarz, President and Principal Executive Officer | |||
| Date | March 10, 2017 | ||
| Pursuant to the requirements of the Securities Exchange Act of 1934 and the Investment Company Act of 1940, this report has been signed below by the following persons on behalf of the registrant and in the capacities and on the dates indicated. | |||
| By (Signature and Title)* | /s/ Jason A. Schwarz | ||
| Jason A. Schwarz, President and Principal Executive Officer | |||
| Date | March 10, 2017 | ||
| By (Signature and Title)* | /s/ Michael Wauters | ||
| Michael Wauters, Treasurer, Principal Financial Officer and Principal Accounting Officer | |||
| Date | March 10, 2017 | ||