SECURITIES AND EXCHANGE COMMISSION
Washington, D.C. 20549

FORM 6-K
REPORT OF FOREIGN PRIVATE ISSUER
Pursuant to Rule 13a-16 or 15d-16 of
the Securities Exchange Act of 1934
For the month of July, 2005
IMSA GROUP
(Translation of Registrant’s name into English)
GRUPO IMSA, S.A. DE C.V.
Ave. Batallón de San Patricio No. 111, Piso 26
Fracc. Valle Oriente
San Pedro Garza García, N.L. 66269, México
(Address of principal executive offices)
(Indicate by check mark whether the registrant files or will file annual reports under cover of Form 20-F or Form 40-F.)
Form 20-F x Form 40-F ¨
(Indicate by check mark whether the registrant by furnishing the information contained in this Form is also thereby furnishing the information to the Commission pursuant to Rule 12g3-2(b) under the Securities Exchange Act of 1934.)
Yes ¨ No x
TABLE OF CONTENTS
| 1. | Press Release issued on July 27, 2005, announcing results for the second quarter of 2005. |
| ||
| Second Quarter 2005 | ||
| BMV | ||
GRUPO IMSA ANNOUNCES SECOND QUARTER 2005 RESULTS
Monterrey, Mexico, July 27, 2005 - Grupo Imsa, S.A. de C.V. (BMV: IMSA) today announced results for the second quarter of 2005.1
SECOND QUARTER 2005 HIGHLIGHTS
| • | During second quarter 2005, revenues in peso terms totaledPs 9,602, practically the same as for the second quarter of 2004. In dollar terms, revenues increased 7.2% compared to the same period of the previous year, toUS$878. |
| • | Second quarter 2005 primary cash flow (EBITDA) in peso terms totaledPs 891, 41.4% below that of second quarter 2004, while second quarter 2005 EBITDA in dollar terms totaledUS$81, a reduction of 37.8% compared to the second quarter of 2004. |
| • | Net debt as of June 30, 2005 wasUS$357, a decline ofUS$76 compared to net debt presented in the balance sheet as of March 31, 2005 and ofUS$424 compared to net debt (including ENERMEX) as of June 30, 2004. |
| • | Net interest coverage defined as primary cash flow (EBITDA) divided by net interest expense was15.3 times for the twelve months ended June 30, 2005, while the total debt to EBITDA ratio for the same period was1.0. |
| • | IMSA ACERO, through Steelscape, began a project to strengthen its position in the U.S. market. The first stage of this initiative involves relocating the company’s painting and metal coating lines from Richmond, California to Shreveport, Louisiana. |
| • | In May, Volkswagen de México recognized IMSA-MEX, a subsidiary of IMSA ACERO, as one of the best steel suppliers of its plant in the state of Puebla, Mexico. |
| • | During the second quarter, Metl-Span, a U.S. subsidiary of IMSATEC, inaugurated a new insulated steel panel plant in Nevada, increasing its production capacity by 30%. |
| 1 | Unless otherwise stated, all figures are presented in millions of June 30, 2005 pesos (Ps), or in millions of nominal U.S. dollars (US$). |
Please refer to the last page of this document for definitions of terms, U.S. dollar conversion methodology and other disclosures.
Page 1 of 16
Consolidated Financial Results
Mr. Eugenio Clariond Reyes, Grupo Imsa’s Chief Executive Officer, stated: “The second quarter of 2005 was significantly better for Grupo Imsa than the previous quarter; however, we continued to adjust our operations to an environment of contracting steel prices combined with expensive existing raw material inventories. Since the end of the second quarter, we have been procuring raw materials at substantially lower prices, a trend which will continue during the third quarter of the year, so Grupo Imsa’s results are reaching a point of inflexion and moving forward we anticipate a more positive environment for the Company. In addition, it is important to highlight the Company’s significant second quarter cash flow, which enabled us to reduce net debt by 76 million dollars and pay a dividend of almost 36 million dollars.”
SALES
In dollar terms, Grupo Imsa’s revenues for the second quarter of 2005 (2Q05) grew 7.2% compared to second quarter 2004 (2Q04) and 8.8% vs. the first quarter of 2005 (1Q05), to US$878. In peso terms, net sales for 2Q05 totaled Ps 9,602, essentially unchanged compared to 2Q04, but 7.4% above 1Q05. The year-over-year revenue stability reflects the strengthening of the Mexican peso vis-à-vis the U.S. dollar offsetting increased international steel prices, and a rise in IMSALUM’s sales. The quarter-over-quarter upswing in sales reflects the second quarter of the year being seasonally more active than the first, accentuated by the Easter vacations falling in the first quarter in 2005.
For 2Q05, domestic sales amounted to Ps 4,977, 3.4% above 2Q04 and 13.0% more than 1Q05. Foreign sales for 2Q05 totaled Ps 4,625, a decrease of 3.5% from 2Q04 but an increase of 2.0% compared to 1Q05. Foreign sales for the quarter represented 48% of total net sales.
The following is a breakdown by business segment for the quarter:
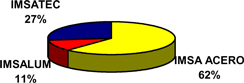
Sales | 2Q05 | 1Q05 | 2Q04 | Ac. 05 | Ac. 04 | ||||||||||
IMSA ACERO | P | s 5,988 | P | s 5,885 | P | s 5,874 | P | s 11,873 | P | s 10,743 | |||||
IMSATEC | 2,557 | 2,186 | 2,732 | 4,742 | 4,858 | ||||||||||
IMSALUM | 1,058 | 867 | 1,002 | 1,924 | 1,831 | ||||||||||
Total Net Sales1 | P | s 9,602 | P | s 8,938 | P | s 9,609 | P | s 18,540 | P | s 17,432 | |||||
TOTAL US$ Average | 878 | 808 | 819 | 1,686 | 1,502 | ||||||||||
| 1 | The sum of these amounts does not equal the consolidated net sales for the periods presented because Corporate and Other has been excluded. |
Please refer to the last page of this document for definitions of terms, U.S. dollar conversion methodology and other disclosures.
Page 2 of 16
OPERATING INCOME
Operating income in nominal dollar terms for 2Q05 fell 48.2% year-over-year but grew 87.4% quarter-over-quarter to US$52. Operating income for 2Q05 in peso terms was Ps 575, a decline of 50.8% vs. 2Q04 but an increase of 87.9% over 1Q05. Grupo Imsa’s operating margin for the quarter was 6.0%, compared to 12.2% for 2Q04 and 3.4% for 1Q05.
OPERATING INCOME PLUS DEPRECIATION AND AMORTIZATION (EBITDA)
EBITDA in dollars for the second quarter of 2005 fell 37.8% year-over-year but grew 42.3% quarter-over-quarter to US$81. In pesos, EBITDA totaled Ps 891, a decline of 41.4% compared to 2Q04 but an increase of 42.6% over 1Q05.
EBITDA contribution per business segment in 2Q05 was as follows:
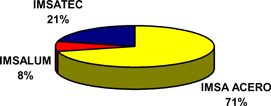
EBITDA | 2Q05 | 1Q05 | 2Q04 | Ac. 05 | Ac. 04 | |||||||||||||||
IMSA ACERO | P | s 669 | P | s 559 | P | s 1,274 | P | s 1,228 | P | s 1,928 | ||||||||||
IMSATEC | 195 | 38 | 192 | 234 | 269 | |||||||||||||||
IMSALUM | 77 | 64 | 84 | 142 | 160 | |||||||||||||||
Corporate | (50 | ) | (36 | ) | (30 | ) | (88 | ) | (55 | ) | ||||||||||
TOTAL | P | s 891 | P | s 625 | P | s 1,520 | P | s 1,516 | P | s 2,302 | ||||||||||
TOTAL US$ Avg. | 81 | 57 | 130 | 138 | 198 | |||||||||||||||
EBITDA Margin | 9.3 | % | 7.0 | % | 15.8 | % | 8.2 | % | 13.2 | % | ||||||||||
INTEGRAL FINANCING COST (INCOME)
The integral financing income for 2Q05 was Ps 228, compared to costs of Ps 243 in 2Q04 and Ps 30 in 1Q05. The main reason for the change in integral financing result was a significant foreign exchange gain in 2Q05 resulting from the appreciation of the Mexican peso, compared to foreign exchange losses in 2Q04 and 1Q05.
Interest expense for 2Q05 fell 17.7% from 2Q04 and 5.8% vs. 1Q05. The year-over-year and quarter-over-quarter declines in interest expense reflect the reduction in debt in 2Q05, combined with the appreciation of the Mexican peso vis-à-vis the U.S. dollar.
Please refer to the last page of this document for definitions of terms, U.S. dollar conversion methodology and other disclosures.
Page 3 of 16
Integral Financing Cost (Income) | 2Q05 | 1Q05 | 2Q04 | Ac.05 | Ac.04 | |||||||||||||||
Interest expense | Ps | 65 | Ps | 69 | Ps | 79 | Ps | 134 | Ps | 148 | ||||||||||
Interest income | (7 | ) | (7 | ) | (6 | ) | (14 | ) | (32 | ) | ||||||||||
Foreign exchange loss (gain) | (262 | ) | 3 | 181 | (259 | ) | 87 | |||||||||||||
Gain from monetary position | (24 | ) | (35 | ) | (11 | ) | (59 | ) | (123 | ) | ||||||||||
Integral financing cost (income) | Ps | (228 | ) | Ps | 30 | Ps | 243 | Ps | (198 | ) | Ps | 80 | ||||||||
MAJORITY NET INCOME
For 2Q05, majority net income was Ps 516, compared to incomes of Ps 634 for 2Q04 and Ps 175 for 1Q05. The year-over-year decline in majority net income reflects the reduction in operating income and the fact that in 2Q04 Grupo Imsa’s net income still included ENERMEX. The quarter-over-quarter rise in majority net income was a result of the growth in operating income, combined with an integral financing income for the quarter, compared to a cost in 1Q05.
Majority Net Income | 2Q05 | 1Q05 | 2Q04 | Ac.05 | Ac.04 | ||||||||||
Majority net income | Ps | 516 | Ps | 175 | Ps | 634 | Ps | 691 | Ps | 1,080 | |||||
Majority net income per equity unit | Ps | 0.92 | Ps | 0.31 | Ps | 1.13 | Ps | 1.23 | Ps | 1.92 | |||||
As of June 30, 2005, Grupo Imsa had 2,803.4 million shares outstanding, equivalent to 560,683,458 UBC equity units.
FINANCIAL POSITION
Net debt as of June 30, 2005 was US$357, a decline of US$76 compared to net debt presented in the balance sheet as of March 31, 2005 and of US$424 compared to net debt (including ENERMEX) as of June 30, 2004. The quarter-over-quarter reduction in net debt reflects a decline in working capital and an increase in operating income. This reduction was posted despite the payment of a dividend of approximately Ps 394 in 2Q05. Total debt as of June 30, 2005 was US$412, US$453 below total debt (including ENERMEX) as of June 30, 2004, largely because of the sale of the battery business.
Net interest coverage – defined as primary cash flow (EBITDA) divided by net interest expense – was 15.3 times for the twelve months ended June 30, 2005, while interest coverage defined as EBITDA divided by gross interest expense was 13.4 times for the same period. The total debt to EBITDA ratio for the past twelve months was 1.0 as of June 30, 2005.
Mr. Marcelo Canales, Grupo Imsa’s CFO, stated: “The Company posted a very solid cash flow in the second quarter, resulting in a significant reduction in debt, further consolidating our financial position and positioning us better to continue our investment and growth plans. We expect to continue generating excess cash flow during the second half of 2005 which will enable us to reduce the Company’s debt even more.”
Please refer to the last page of this document for definitions of terms, U.S. dollar conversion methodology and other disclosures.
Page 4 of 16
Financial Results by Segment
IMSA ACERO
Sales
2Q05 sales volume was 575 thousand tonnes, a decline of 0.1% from 2Q04 but an increase of 2.1% compared to 1Q05. Domestic shipments for the quarter totaled 414 thousand tonnes, 0.4% above 2Q04 and 12.9% more than 1Q05. Foreign volume amounted to 161 thousand tonnes for 2Q05, a decline of 1.2% from 2Q04 and of 17.9% versus 1Q05. Sales volume remained essentially unchanged year-over-year. The increase compared to 1Q05 largely reflects a recovery in demand in the domestic construction industry, since excess inventories in the distribution channels where the company participates have been reduced.
Net sales for 2Q05 reached Ps 5,988, a growth of 1.9% over 2Q04 and of 1.8% compared to 1Q05. The year-over-year upswing reflects increased prices for the company’s products, in line with the rise in international steel prices. The quarter-over-quarter growth was a result of a rise in sales volume and a change in the sales mix to include a greater proportion of domestic sales and higher value added products.
Operating Income and EBITDA
Operating income was Ps 417, a decline of 58.4% from 2Q04 but an increase of 33.2% versus 1Q05. 2Q05 operating margin was 7.0%, compared to margins of 17.1% for 2Q04 and 5.3%% for 1Q05. EBITDA for 2Q05 was Ps 669, a reduction of 47.5% with respect to 2Q04 but a growth of 19.7% versus 1Q05. In dollar terms, EBITDA fell 44.7% year-over-year but increased 19.4% quarter-over-quarter to US$60.
IMSA ACERO experiences a delay between adjustments in international steel prices and in the cost of its raw materials, because of existing inventories and purchases agreed upon approximately one quarter in advance. In 2Q04, the company benefited from this effect which created a significant increase in margins because of the environment of rising prices. However, the 2Q05 environment of declining prices adversely affected IMSA ACERO’s results on a temporary basis because the adjustment time lag maintained raw material costs high compared to final product prices. This effect, combined with increases in the price of raw materials such as zinc and aluminum and energy costs, resulted in a lower operating income in 2Q05 compared to the previous year.
The quarter-over-quarter growth reflects a rise in sales volume, a reduction in the cost of steel used as a raw material, a change in the sales mix to include an increased proportion of domestic sales and higher value added products, and a decline in the price of materials used to coat the steel, such as zinc and aluminum. Steel prices have continued to fall over the past months. For the third quarter of the year, the cost of IMSA ACERO’s raw materials will decline significantly, which, combined with the third quarter being seasonally more dynamic, should produce a recovery in the results of this business segment. In fact, June results were considerably better than those of the first five months of 2005, reflecting the beginning of important reductions in the cost of the company’s steel raw materials.
Please refer to the last page of this document for definitions of terms, U.S. dollar conversion methodology and other disclosures.
Page 5 of 16
IMSATEC
Sales
IMSATEC’s 2Q05 revenues totaled Ps 2,557, representing a reduction of 6.4% from 2Q04 but an increase of 17.0% versus 1Q05. The year-over-year revenue decline reflects lower volumes in the pre-engineered buildings and components segment in the United States, resulting from weaker demand, combined with a reduction in the Mexican peso-U.S. dollar parity, which had an important effect since approximately 80% of IMSATEC’s sales are made outside Mexico. The quarter-over-quarter revenue growth largely reflects the seasonality of IMSATEC’s operations, with the second quarter of the year being seasonally more active than the first in the construction industry in the United States.
Operating Income and EBITDA
The operating income for 2Q05 was Ps 146, an increase of 5.0% over 2Q04 and a monetary improvement of Ps 160 compared to 1Q05. Operating margin for the quarter was 5.7%, compared to -0.6% for 2Q04 and 5.1% in 1Q05. EBITDA for the quarter was Ps 195, an increase of 1.6% vs. 2Q04 and of 413.2% with respect to 1Q05. In dollar terms, EBITDA grew year-over-year by 8.9% and quarter-over-quarter by 409.8% to US$18.
IMSATEC’s operating income grew year-over-year largely because of improved results for the company’s pre-engineered buildings and components businesses in the United States. These operations posted improved margins between the cost of raw materials and final prices in an environment where steel prices were falling, which combined with the results of important efficiency-increasing and cost-cutting initiatives. Additionally, the reinforced plastic panel business posted improved results in 2Q05. Operating expenses as a percent of sales fell from 11.2% in 2Q04 to 10.7% in 2Q05, reflecting ongoing efficiency-increasing and cost-reducing initiatives. The quarter-over-quarter improvement in operating income largely reflects the second quarter of the year being seasonally more active than the first, mainly in the U.S. construction industry.
The third quarter is seasonally stronger than the second for IMSATEC, so the improved environment should produce better results for this business segment in the coming months.
IMSALUM
Sales
IMSALUM’s 2Q05 revenues totaled Ps 1,058, a growth of 5.6% over 2Q04 and of 22.0% compared to 1Q05. The year-over-year upswing in revenues was due to the profiles business raising prices to reflect the higher aluminum costs, combined with a significant increase in the sales volumes of high value added profiles and those for the industrial sector, reflecting the company’s initiatives to expand its presence in these markets. The quarter-over-quarter upswing was mainly due to the second quarter of the year being seasonally stronger than the first in the U.S. ladder business. Moreover, profile exports to the United States grew and service improving initiatives have increased the sales of IMSALUM’s products in its different markets.
Operating Income and EBITDA
Operating income for 2Q05 was Ps 64, representing a decrease of 8.6% from 2Q04 but an increase of 33.3% vs. 1Q05. Operating margin for the quarter was 6.0%, compared to operating
Please refer to the last page of this document for definitions of terms, U.S. dollar conversion methodology and other disclosures.
Page 6 of 16
margins of 7.0% for 2Q04 and 5.5% for 1Q05. IMSALUM’s 2Q05 EBITDA was Ps 77, 8.3% below that of 2Q04 but 20.3% above that of 1Q05. In dollar terms, EBITDA fell 4.2% year-over-year but grew 18.2% quarter-over-quarter to a total of US$7.
The year-over-year decline in operating income mainly reflects the average price of aluminum being 7% higher than in 2Q04, but the company was unable to pass on all of this increase to its product prices. Additionally, freight costs were higher this quarter, because the rise in international oil prices resulted in higher gasoline and diesel costs in the United States. The rise in energy costs has also resulted in increased production costs and in an upswing in the price of other raw materials, such as the fiberglass required to produce ladders. The quarter-over-quarter growth reflects an increase in sales volume which produced greater economies of scale, combined with a 6% decline in aluminum prices which improved the ratio between raw material costs and final product prices. IMSALUM continued to implement continuous improvement projects that reduced expenses and enhanced the operating efficiency of all product lines.
The second half of the year is seasonally more active in the profiles business, and this effect, combined with the results of continuous improvement projects and initiatives to increase sales in specific markets, should produce better results for IMSALUM during the second semester.
Corporate Developments
IMSA ACERO to strengthen its market position in the United States
Steelscape, a U.S. subsidiary of IMSA ACERO, began a two-phase project to strengthen its position in the U.S. market. The first phase consists of relocating its Richmond, California painting and metal coating lines to Shreveport, Louisiana. The second phase, which is yet to be scheduled, will involve the addition of a cold-rolling steel mill, a pickling line and a second metal coating line. In conjunction with these initiatives, Steelscape will upgrade its West Coast facilities, thereby expanding production capacity in order to support growth in that region.
The investment for the entire project is estimated to be approximately US$200, for which the investment for the first phase is expected to be US$70. The relocation of the plant will permit the sale of the Richmond property, significantly lowering the overall net investment. The first phase is expected to begin operations by second quarter 2006.
Steelscape supplies galvanized and pre-painted steel products to the construction industry throughout the United States with an important concentration in the West Coast. The relocation of the company’s 255,000 metric tons per year metal coating line and 155,000 metric tons per year painting line from Richmond to Shreveport reflects its efforts to serve other regions of the U.S. market more effectively. Shreveport was selected as the best site for the project because its strategic location will make the logistics and operation of the plant more efficient and will provide competitive conditions in terms of energy supply and infrastructure.
Mr. Santiago Clariond, CEO of IMSA ACERO, said, “This project, in conjunction with the recent acquisition of an industrial steel painting plant in Fairfield, Alabama, is in line with our strategies to operate with a total presence in the U.S. market and to become the North American construction industry’s largest pre-painted steel supplier. The relocated facility will enable Steelscape to offer
Please refer to the last page of this document for definitions of terms, U.S. dollar conversion methodology and other disclosures.
Page 7 of 16
superior customer service, shorter lead times and more reliable delivery performance to customers in the Midwest and East of the United States, where demand is four times larger than that of the West Coast.”
Volkswagen recognizes IMSA ACERO
In May, Volkswagen de México recognized IMSA-MEX, a subsidiary of IMSA ACERO, with a Volkswagen Group Award 2005 for being one of the best steel suppliers of its plant in the state of Puebla, Mexico.
IMSA-MEX, through its IMSA coated steel division, began supplying galvanized steel – both directly and indirectly – to Volkswagen de México (VWM) six years ago. The steel is produced at IMSA’s plants and shipped to stamping facilities throughout the nation for the manufacture of parts for all VWM models. Because of its outstanding service as a domestic suppler, IMSA-MEX has posted continuously increasing sales volumes, and in 2005 the company expects to satisfy an important part of VWM’s demand for galvanized steel for non-exposed parts.
Mr. Santiago Clariond Reyes, CEO of IMSA ACERO, explained: “We are very pleased with this award. It is a direct reflection of our strategy of continuing to be the leading domestic supplier of steel products for the automotive industry, a market that, like many other industrial sectors in Mexico, has been very dynamic over recent years and continues to have great growth potential. For this reason, we have implemented strategies and made investments in our steel facilities to ensure that we offer world-class coated and non-coated steel products backed by excellent service.” Mr. Clariond continued: “Moreover, our agreement with Volkswagen is an example of the strategy IMSA ACERO is following to develop very high specification, high value added steel in order to clearly differentiate our products from standard, commodity steel.”
New IMSATEC steel panel plant begins operations in the United States
Metl-Span, a U.S. subsidiary of IMSATEC, inaugurated a new insulated steel panel production facility in North Las Vegas. The US$8.5 investment increases Metl-Span’s production capacity by 30% and gives the company production facilities in Texas, Virginia and Nevada, positioning it to better serve the entire U.S. market.
Mr. Benjamin Clariond, President of IMSATEC, stated: “With plants in Mexico, the United States and Chile, IMSATEC is the largest insulated steel panel manufacturer in the Americas. Our leadership consolidation initiatives recognize the enormous market potential in the western United States and the new facility confirms our commitment to serve this region more effectively. Moreover, our production facilities in the west, east and central regions of the United States position us to serve the country’s largest markets rapidly and efficiently.”
New IMSATEC translucent plastic panel plant inaugurated in Europe
IMSATEC, through Stabilit Europa, inaugurated a new facility to produce and market laminated plastic panel. This state-of-the-art plant replaces the smaller former plant, increasing production capacity, adding new product lines, growing operating efficiency and improving customer service, in the company’s efforts to gain the leadership position in the European market. Stabilit Europa currently commands 80% of the Spanish translucent fiberglass-reinforced plastic panel market and 12% of the market of the European Union in general.
* * *
Please refer to the last page of this document for definitions of terms, U.S. dollar conversion methodology and other disclosures.
Page 8 of 16
Grupo Imsa, a holding company, dates back to 1936 and is today one of Mexico’s leading diversified industrial companies, operating in three core businesses: steel processed products; steel and plastic construction products; and aluminum and related products. With manufacturing and distribution facilities in Mexico, the United States, Spain, and throughout Central and South America, Grupo Imsa exports to all continents. In 2004 the Company’s sales reached 3.3 billion dollars, of which close to 50% was generated outside Mexico. Grupo Imsa shares are quoted on the Mexican Stock Market (IMSA).
Contacts:
Adrian Fernandez, Corporate Finance Director, (52-81) 8153-8433
Jose Luis Fornelli, Investor Relations Manager, (52-81) 8153-8416
jose.fornelli@grupoimsa.com
TABLES TO FOLLOW
Please refer to the last page of this document for definitions of terms, U.S. dollar conversion methodology and other disclosures.
Page 9 of 16
GRUPO IMSA, S.A. DE C.V. AND SUBSIDIARIES
CONSOLIDATED BALANCE SHEETS
(Millions of Mexican pesos of
purchasing power as of June 30, 2005)
June 2005 | December 2004 | |||||
ASSETS | ||||||
Current: | ||||||
Cash and cash equivalents | 596 | 358 | ||||
Accounts receivable-trade, net | 5,053 | 4,919 | ||||
Inventories | 7,868 | 8,771 | ||||
Other current assets | 1,544 | 1,210 | ||||
| 15,061 | 15,258 | |||||
Investments in shares | 99 | 123 | ||||
Property, plant and equipment | 17,717 | 18,272 | ||||
Other assets | 313 | 292 | ||||
Excess of cost over fair value of net assets acquired of subsidiaries | 1,134 | 1,132 | ||||
TOTAL ASSETS | 34,324 | 35,077 | ||||
LIABILITIES AND STOCKHOLDERS’ EQUITY | ||||||
Current: | ||||||
Current portion of long-term debt | 269 | 279 | ||||
Bank loans | 290 | 305 | ||||
Accounts payable-trade | 3,228 | 2,974 | ||||
Advances from clients | 261 | 482 | ||||
Other accounts payable and accrued liabilities | 1,404 | 1,757 | ||||
| 5,452 | 5,797 | |||||
Lont-term debt | 3,903 | 4,122 | ||||
Deferred taxes | 4,223 | 4,480 | ||||
Other long-term liabilities | 464 | 335 | ||||
| 8,590 | 8,937 | |||||
TOTAL LIABILITIES | 14,042 | 14,734 | ||||
Excess of fair value of net assets acquired over cost of subsidiaries | 55 | 55 | ||||
Stockholders’ equity: | ||||||
Common stock | 5,285 | 5,285 | ||||
Additional paid-in capital | 3,075 | 3,075 | ||||
Reserve for repurchase of own shares | 140 | 139 | ||||
Retained earnings | 22,868 | 22,481 | ||||
Insufficiency in capital restatement | (7,275 | ) | (6,826 | ) | ||
Initial deferred tax effect | (3,866 | ) | (3,866 | ) | ||
Majority interest | 20,227 | 20,288 | ||||
Minority interest | — | — | ||||
TOTAL STOCKHOLDERS’ EQUITY | 20,227 | 20,288 | ||||
TOTAL LIABILITIES AND STOCKHOLDERS’ EQUITY | 34,324 | 35,077 | ||||
Please refer to the last page of this document for definitions of terms, U.S. dollar conversion methodology and other disclosures.
Page 10 of 16
GRUPO IMSA, S.A. DE C.V. AND SUBSIDIARIES
CONSOLIDATED STATEMENTS OF OPERATIONS
(Millions of Mexican pesos of purchasing power
as of June 30, 2005)
| % Change | ||||||||||||||||||||||||
| 2Q05 | 1Q05 | 2Q04 | Ac. 05 | Ac. 04 | 2Q05/2Q04 | 2Q05/1Q05 | Ac.05 / Ac.04 | |||||||||||||||||
Net sales | 9,602 | 8,938 | 9,609 | 18,540 | 17,432 | -0.1 | % | 7.4 | % | 6.4 | % | |||||||||||||
Domestic sales | 4,977 | 4,404 | 4,814 | 9,382 | 8,869 | 3.4 | % | 13.0 | % | 5.8 | % | |||||||||||||
Foreign sales | 4,625 | 4,534 | 4,795 | 9,158 | 8,563 | -3.5 | % | 2.0 | % | 6.9 | % | |||||||||||||
Cost of sales | 8,261 | 7,977 | 7,684 | 16,238 | 14,322 | 7.5 | % | 3.6 | % | 13.4 | % | |||||||||||||
Operating expenses | 766 | 655 | 757 | 1,421 | 1,503 | 1.2 | % | 16.9 | % | -5.5 | % | |||||||||||||
OPERATING INCOME | 575 | 306 | 1,168 | 881 | 1,607 | -50.8 | % | 87.9 | % | -45.2 | % | |||||||||||||
Interest expense | 65 | 69 | 79 | 134 | 148 | -17.7 | % | -5.8 | % | -9.5 | % | |||||||||||||
Interest income | (7 | ) | (7 | ) | (6 | ) | (14 | ) | (32 | ) | 16.7 | % | 0.0 | % | -56.3 | % | ||||||||
Foreign exchange loss (gain) | (262 | ) | 3 | 181 | (259 | ) | 87 | |||||||||||||||||
Gain from monetary position | (24 | ) | (35 | ) | (11 | ) | (59 | ) | (123 | ) | 118.2 | % | -31.4 | % | -52.0 | % | ||||||||
INTEGRAL FIN. COST, NET | (228 | ) | 30 | 243 | (198 | ) | 80 | |||||||||||||||||
Other expenses net | 5 | 4 | 62 | 9 | 70 | -91.9 | % | 25.0 | % | -87.1 | % | |||||||||||||
INCOME BEFORE INCOME TAXES AND EMPLOYEES’ PROFIT SHARING | 798 | 272 | 863 | 1,070 | 1,457 | -7.5 | % | 193.4 | % | -26.6 | % | |||||||||||||
Income taxes | 260 | 89 | 305 | 349 | 500 | -14.8 | % | 192.1 | % | -30.2 | % | |||||||||||||
Employees’ profit sharing | 22 | 8 | 9 | 30 | 14 | 144.4 | % | 175.0 | % | 114.3 | % | |||||||||||||
INCOME BEFORE DISCONTINUED OPERATIONS | 516 | 175 | 549 | 691 | 943 | -6.0 | % | 194.9 | % | -26.7 | % | |||||||||||||
Discontinued operations | 0 | 0 | 138 | 0 | 248 | |||||||||||||||||||
CONSOLIDATED NET INCOME | 516 | 175 | 687 | 691 | 1,191 | -24.9 | % | 194.9 | % | -42.0 | % | |||||||||||||
Net income of minority interest | 0 | 0 | 53 | 0 | 111 | |||||||||||||||||||
Net income of majority interest | 516 | 175 | 634 | 691 | 1,080 | -18.6 | % | 194.9 | % | -36.0 | % | |||||||||||||
Please refer to the last page of this document for definitions of terms, U.S. dollar conversion methodology and other disclosures.
Page 11 of 16
GRUPO IMSA, S.A. DE C.V. AND SUBSIDIARIES
CONSOLIDATED STATEMENTS OF CHANGES IN FINANCIAL POSITION
(Millions of Mexican pesos of
purchasing power as of June 30, 2005)
| June 2005 | December 2004 | |||||
OPERATING ACTIVITIES: | ||||||
CONSOLIDATED NET INCOME | 691 | 3,036 | ||||
ITEMS NOT (GENERATING) REQUIRING RESOURCES: | ||||||
Depreciation and amortization | 636 | 1,510 | ||||
Amoritzation of excess of fair value of net assets acquired over cost of subsidiaries, net | — | 18 | ||||
Others | 3 | 563 | ||||
| 1,330 | 5,127 | |||||
CHANGES IN CURRENT ASSETS AND LIABILITIES NET OF EFFECTS FROM BUSINESSES ACQUIRED: | ||||||
Accounts receivable-trade | (134 | ) | (1,088 | ) | ||
Inventories | 893 | (3,506 | ) | |||
Other current assets | (334 | ) | (139 | ) | ||
Accounts payable-trade | 253 | (328 | ) | |||
Advances from clients | (221 | ) | 223 | |||
Other accounts payable and accrued liabilities | (352 | ) | 794 | |||
| 105 | (4,044 | ) | ||||
RESOURCES GENERATED FROM OPERATING ACTIVITIES | 1,435 | 1,083 | ||||
FINANCING ACTIVITIES: | ||||||
Proceeds (Payments) of short-term bank loans | (25 | ) | 2 | |||
Proceeds (Payments) from borrowings from banks and issuance of long-term debt | (219 | ) | (4,130 | ) | ||
Common dividends paid | (393 | ) | (993 | ) | ||
Others | — | (1,070 | ) | |||
RESOURCES GENERATED FROM FINANCING ACTIVITIES | (637 | ) | (6,191 | ) | ||
INVESTING ACTIVITIES: | ||||||
Acquisition of property, plant and equipment | (429 | ) | (1,237 | ) | ||
Acquisition of companies and minority interest | — | 3,157 | ||||
Other assets | (131 | ) | 2,678 | |||
RESOURCES USED IN INVESTING ACTIVITIES | (560 | ) | 4,598 | |||
(DECREASE) INCREASE IN CASH AND CASH EQUIVALENTS | 238 | (510 | ) | |||
Cash and cash equivalents at beginning of period | 358 | 868 | ||||
CASH AND CASH EQUIVALENTS AT END OF PERIOD | 596 | 358 | ||||
Please refer to the last page of this document for definitions of terms, U.S. dollar conversion methodology and other disclosures.
Page 12 of 16
GRUPO IMSA S.A. DE C.V. AND SUBSIDIARIES
(Millions of Mexican pesos of purchasing power as of June 30, 2005)
| 2Q05 | 1Q05 | 2Q04 | Ac. 05 | Ac. 04 | 2Q05/2Q04 | 2Q05/1Q05 | Ac.05/Ac.04 | |||||||||||||||||
IMSA ACERO | ||||||||||||||||||||||||
DOMESTIC SALES | 3,915 | 3,548 | 3,904 | 7,463 | 7,081 | 0.3 | % | 10.3 | % | 5.4 | % | |||||||||||||
FOREIGN SALES | 2,073 | 2,337 | 1,970 | 4,410 | 3,662 | 5.2 | % | -11.3 | % | 20.4 | % | |||||||||||||
% Export/Sales | 34.6 | % | 39.7 | % | 33.5 | % | 37.1 | % | 34.1 | % | ||||||||||||||
NET SALES | 5,988 | 5,885 | 5,874 | 11,873 | 10,743 | 1.9 | % | 1.8 | % | 10.5 | % | |||||||||||||
COST OF SALES | 5,242 | 5,337 | 4,582 | 10,577 | 8,762 | 14.4 | % | -1.8 | % | 20.7 | % | |||||||||||||
OPERATING EXPENSES | 329 | 235 | 290 | 565 | 590 | 13.4 | % | 40.0 | % | -4.2 | % | |||||||||||||
OPERATING INCOME | 417 | 313 | 1,002 | 731 | 1,391 | -58.4 | % | 33.2 | % | -47.4 | % | |||||||||||||
OPERATING MARGIN | 7.0 | % | 5.3 | % | 17.1 | % | 6.2 | % | 12.9 | % | ||||||||||||||
EBITDA | 669 | 559 | 1,274 | 1,228 | 1,928 | -47.5 | % | 19.7 | % | -36.3 | % | |||||||||||||
EBITDA MARGIN | 11.2 | % | 9.5 | % | 21.7 | % | 10.3 | % | 17.9 | % | ||||||||||||||
IMSATEC | ||||||||||||||||||||||||
DOMESTIC SALES | 557 | 396 | 499 | 951 | 942 | 11.6 | % | 40.7 | % | 1.0 | % | |||||||||||||
FOREIGN SALES | 2,000 | 1,790 | 2,233 | 3,791 | 3,916 | -10.4 | % | 11.7 | % | -3.2 | % | |||||||||||||
% Export/Sales | 78.2 | % | 81.9 | % | 81.7 | % | 79.9 | % | 80.6 | % | ||||||||||||||
NET SALES | 2,557 | 2,186 | 2,732 | 4,742 | 4,858 | -6.4 | % | 17.0 | % | -2.4 | % | |||||||||||||
COST OF SALES | 2,138 | 1,928 | 2,287 | 4,066 | 4,094 | -6.5 | % | 10.9 | % | -0.7 | % | |||||||||||||
OPERATING EXPENSES | 273 | 272 | 306 | 544 | 602 | -10.8 | % | 0.4 | % | -9.6 | % | |||||||||||||
OPERATING INCOME | 146 | -14 | 139 | 132 | 162 | 5.0 | % | -18.5 | % | |||||||||||||||
OPERATING MARGIN | 5.7 | % | -0.6 | % | 5.1 | % | 2.8 | % | 3.3 | % | ||||||||||||||
EBITDA | 195 | 38 | 192 | 234 | 269 | 1.6 | % | 413.2 | % | -13.0 | % | |||||||||||||
EBITDA MARGIN | 7.6 | % | 1.7 | % | 7.0 | % | 4.9 | % | 5.5 | % | ||||||||||||||
IMSALUM | ||||||||||||||||||||||||
DOMESTIC SALES | 507 | 460 | 410 | 967 | 847 | 23.7 | % | 10.2 | % | 14.2 | % | |||||||||||||
FOREIGN SALES | 551 | 407 | 592 | 957 | 984 | -6.9 | % | 35.4 | % | -2.7 | % | |||||||||||||
% Export/Sales | 52.1 | % | 46.9 | % | 59.1 | % | 49.7 | % | 53.7 | % | ||||||||||||||
NET SALES | 1,058 | 867 | 1,002 | 1,924 | 1,831 | 5.6 | % | 22.0 | % | 5.1 | % | |||||||||||||
COST OF SALES | 881 | 712 | 815 | 1,594 | 1,467 | 8.1 | % | 23.7 | % | 8.7 | % | |||||||||||||
OPERATING EXPENSES | 113 | 107 | 117 | 219 | 231 | -3.4 | % | 5.6 | % | -5.2 | % | |||||||||||||
OPERATING INCOME | 64 | 48 | 70 | 111 | 133 | -8.6 | % | 33.3 | % | -16.5 | % | |||||||||||||
OPERATING MARGIN | 6.0 | % | 5.5 | % | 7.0 | % | 5.8 | % | 7.3 | % | ||||||||||||||
EBITDA | 77 | 64 | 84 | 142 | 160 | -8.3 | % | 20.3 | % | -11.3 | % | |||||||||||||
EBITDA MARGIN | 7.3 | % | 7.4 | % | 8.4 | % | 7.4 | % | 8.7 | % | ||||||||||||||
Please refer to the last page of this document for definitions of terms, U.S. dollar conversion methodology and other disclosures.
Page 13 of 16
SALES VOLUME
| 2Q05 | 1Q05 | 2Q04 | Ac. 05 | Ac. 04 | ||||||
STEEL PROCESSING IMSA ACERO (Tonnes) | ||||||||||
Domestic Sales Volume | 414,354 | 367,051 | 412,753 | 781,405 | 847,204 | |||||
Exports and Foreign Subsidiaries | 160,935 | 196,132 | 162,856 | 357,067 | 364,960 | |||||
Sales Volume | ||||||||||
TOTAL IMSA ACERO | 575,289 | 563,183 | 575,609 | 1,138,472 | 1,212,164 | |||||
| 2Q05 | 1Q05 | 2Q04 | Ac. 05 | Ac. 04 | ||||||
IMSALUM Aluminum (Tonnes) | ||||||||||
TOTAL ALUMINUM | 14,277 | 13,729 | 15,350 | 28,007 | 30,281 | |||||
Please refer to the last page of this document for definitions of terms, U.S. dollar conversion methodology and other disclosures.
Page 14 of 16
Selected Financial Information
Income Statement
US$ Millions(1)
| 2Q05 | 1Q05 | 2Q04 | Ac. 05 | Ac. 04 | ||||||
Net Sales | ||||||||||
IMSA ACERO | 544 | 531 | 502 | 1,076 | 927 | |||||
IMSATEC | 238 | 197 | 232 | 436 | 418 | |||||
IMSALUM | 96 | 79 | 85 | 175 | 157 | |||||
Grupo Imsa(2) | 878 | 808 | 819 | 1,686 | 1,501 | |||||
Operating Income | ||||||||||
IMSA ACERO | 38 | 28 | 86 | 66 | 120 | |||||
IMSATEC | 13 | -1 | 12 | 12 | 14 | |||||
IMSALUM | 6 | 4 | 6 | 10 | 12 | |||||
Grupo Imsa(2) | 52 | 28 | 100 | 79 | 139 | |||||
EBITDA | ||||||||||
IMSA ACERO | 60 | 50 | 109 | 111 | 166 | |||||
IMSATEC | 18 | 4 | 16 | 21 | 23 | |||||
IMSALUM | 7 | 6 | 7 | 13 | 14 | |||||
Grupo Imsa(2) | 81 | 57 | 130 | 138 | 198 | |||||
Majority Net Income | ||||||||||
Grupo Imsa | 47 | 16 | 55 | 63 | 95 | |||||
| (1) | Peso figures converted into dollars by dividing the monthly nominal pesos by the average monthly exchange rate. |
| (2) | The sum of these amounts does not equal the consolidated figures presented because Corporate and Other have been excluded. |
Please refer to the last page of this document for definitions of terms, U.S. dollar conversion methodology and other disclosures.
Page 15 of 16
Disclosures and Definitions
Methodology used for consolidation and presentation of results and other important disclosures
Grupo Imsa consolidates its results in Mexican pesos using Mexican generally accepted accounting principles (Mexican GAAP). Figures in this document are presented in millions of Mexican pesos as of June 30, 2005 (Ps), unless otherwise specified.
In compliance with Bulletin B-15, “Foreign Currency Translation of Foreign Currency Financial Statements,” the restatement factors applied to financial statements of prior periods are calculated on the basis of a weighted average index that takes into consideration the inflation rates of the countries in which Grupo Imsa’s subsidiaries operate and changes in the exchange rates of each country vis-à-vis the Mexican peso. The restatement factor for the twelve-month period of June 2004 – June 2005 was 1.02844; for the three-month period of March 2004 – June 2005, it was 0.98628.
For the convenience of the reader, this document contains U.S. dollar amounts for Grupo Imsa and its three business segments. The conversion from Mexican pesos to U.S. dollars is carried out by dividing nominal monthly peso amounts of the financial statements by the average Mexican peso – U.S. dollar exchange rate for that month, and then adding the results of the divisions into quarterly or accumulated figures. U.S. dollar (US$) figures in this document are presented in millions, unless otherwise specified.
Second quarter 2005 (2Q05) inflation was 0.0%, resulting in an inflation rate of 4.3% for the last twelve months. The Mexican peso appreciated 4.0% against the U.S. dollar during 2Q05 and 5.0% over the past twelve months. The exchange rate used as of June 30, 2005 was 10.8428 pesos per dollar. Since the price and cost structure of Grupo Imsa is mainly denominated in dollars, the performance of the Company is affected when financial information is expressed in real pesos.
The term EBITDA is used throughout this document because Grupo Imsa believes it is a widely accepted financial indicator of its ability to generate cash flow to operate, fund capital expenditures, pay taxes, service or incur debt, and pay dividends. EBITDA should not be considered as an indicator of Grupo Imsa’s financial performance, as a measure of liquidity or as a substitute for the statement of changes in financial position. EBITDA can be reconciled by adding operating income to depreciation and operating amortization, all of which are concepts accepted under Mexican GAAP.
Effective on July 1, 2004, Grupo Imsa, through its battery subsidiary Enermex, S.A. de C.V., divested its automotive battery business, ceding its interest to Johnson Controls, Inc., the company that had been its minority partner since 1998. In accordance with the interpretation of the related accounting bulletins, this transaction was classified as a stockholders’ equity operation and therefore is presented as part of the stockholders’ equity. For purposes of analysis and comparability, the results of the divested companies are presented under a single heading in the Income Statement as “Discontinued operations”. Additionally, all prior years’ operations of such companies were restructured as “Discontinued operations” and are presented as such in the attached financial statements.
This document contains forward-looking statements relating to Grupo Imsa’s future performance or its current expectations or beliefs. These include statements regarding the intent, belief or current expectations of the Company and its management. Investors are cautioned that any such forward-looking statements are not guarantees of future performance and involve a number of risks and uncertainties pertaining to the industries in which the Company participates. Grupo Imsa does not intend, and does not assume any obligation, to update these forward-looking statements.
Definition of terms
EBITDA: Operating income plus depreciation and operating amortization
Net Debt: Total debt, minus cash and cash equivalents
Net Interest Coverage: EBITDA divided by (interest expense minus interest income)
Interest Coverage: EBITDA divided by interest expense
Page 16 of 16
SIGNATURE
Pursuant to the requirements of the Securities Exchange Act of 1934, the registrant has duly caused this report to be signed on its behalf by the undersigned, thereunto duly authorized.
| GRUPO IMSA, S.A. DE C.V. | ||||
| (Registrant) | ||||
| Dated: July 28, 2005 | By: | /s/ MARCELO CANALES CLARIOND | ||
| Name: | Marcelo Canales Clariond | |||
| Title: | Chief Financial Officer | |||