SECURITIES AND EXCHANGE COMMISSION
Washington, D.C. 20549

FORM 6-K
REPORT OF FOREIGN PRIVATE ISSUER
Pursuant to Rule 13a-16 or 15d-16 of
the Securities Exchange Act of 1934
For the month of October, 2005
IMSA GROUP
(Translation of Registrant’s name into English)
GRUPO IMSA, S.A. DE C.V.
Ave. Batallón de San Patricio No. 111, Piso 26
Fracc. Valle Oriente
San Pedro Garza García, N.L. 66269, México
(Address of principal executive offices)
(Indicate by check mark whether the registrant files or will file annual reports under cover of Form 20-F or Form 40-F.)
Form 20-F X Form 40-F
(Indicate by check mark whether the registrant by furnishing the information contained in this Form is also thereby furnishing the information to the Commission pursuant to Rule 12g3-2(b) under the Securities Exchange Act of 1934.)
Yes No X
TABLE OF CONTENTS
| 1. | Press Release issued on October 27, 2005, announcing results for the third quarter of 2005. |
GRUPO IMSA ANNOUNCES THIRD QUARTER 2005 RESULTS
Grupo Imsa’s EBITDA Grew Quarter-over-Quarter for the Second Consecutive Quarter
Monterrey, Mexico, October 27, 2005 - Grupo Imsa, S.A. de C.V. (BMV: IMSA) today announced results for the third quarter of 2005.1
THIRD QUARTER 2005 HIGHLIGHTS
| • | Third quarter 2005 primary cash flow (EBITDA) grew considerably for the second consecutive quarter, rising in dollar terms by 26.8% quarter-over-quarter toUS$103 and in pesos by 20.8% to a total of Ps 1,094; fourth quarter 2005 EBITDA is expected to significantly exceed that of the third quarter. |
| • | IMSA ACERO’s sales volume rose significantly during third quarter 2005 to654 thousand tonnes, an increase of 10.6% over third quarter 2004 and 13.7% above the previous quarter. |
| • | During third quarter 2005, revenues in dollar terms totaledUS$941, an increase of 6.6% compared to the same period of 2004. In peso terms, revenues declined 1.5% year-over-year, to Ps 9,967. |
| • | IMSATEC posted a historic maximum EBITDA ofPs 312 for third quarter 2005, an increase of 61.7% over third quarter 2004 and of 57.6% compared to the previous quarter. |
| • | Grupo Imsa continues its efforts to enhance operating efficiency. During the first nine months of the year, operating expenses as a percent of sales declined to 7.6%, down from 8.1% for the same period of 2004. |
| • | Net interest coverage defined as primary cash flow (EBITDA) divided by net interest expense was16.4 times for the twelve months ended September 30, 2005, while the total debt to EBITDA ratio for the same period was1.2. |
| • | During the quarter Grupo Imsa announced changes in its organizational structure in order to optimize its value chain by increasing the leverage of existing synergies between steel-related businesses, enhance the efficiency of its operations and reduce administrative expenses. As of the fourth quarter of the year, Grupo Imsa will post its results according to the new organizational structure of two business segments: IMSA ACERO and IMSATEC. |
| 1 | Unless otherwise stated, all figures are presented in millions of September 30, 2005 pesos (Ps), or in millions of nominal U.S. dollars (US$). |
Please refer to the last page of this document for definitions of terms, U.S. dollar conversion methodology and other disclosures.
Page 1 of 15

Mr. Eugenio Clariond, Grupo Imsa’s Chairman of the Board and Chief Executive Officer, explained, “After the sale of the automotive battery business last year, we made an in-depth analysis of our organization and concluded that it was no longer necessary to operate with the structure of a traditional industrial group, with centralized corporate offices. Restructuring Grupo Imsa’s activities into two business units allows us to eliminate duplicated functions which until now existed both in our corporate offices and in the business units; the new organization will be much leaner, and more flexible and efficient. We estimate that these changes will result in a considerable increase in operating efficiency and enable us to capitalize on synergies in the different stages of our operating processes as we operate all our steel-related businesses in one business unit. In addition, we expect significant savings in administrative costs, office rents and other indirect expenses.”
SALES
In dollar terms, Grupo Imsa’s revenues for the third quarter of 2005 (3Q05) grew 6.6% compared to third quarter 2004 (3Q04) and 7.1% vs. the second quarter of 2005 (2Q05), to US$941. In peso terms, net sales for 3Q05 totaled Ps 9,967, a decline of 1.5% from 3Q04 but 2.1% above 2Q05. The year-over-year revenue growth in dollar terms reflects an increase in sales volume for most steel-related products, as well as a rise in the price of some products. However, the strengthening of the Mexican peso vis-à-vis the U.S. dollar in 3Q05 compared to 3Q04 resulted in a reduction in sales in peso terms. The quarter-over-quarter upswing in sales reflects the third quarter of the year being seasonally more active than the second, accentuated by a growth in demand in the steel market.
For 3Q05, domestic sales amounted to Ps 4,948, 3.3% above 3Q04 but 2.2% below 2Q05. Foreign sales for 3Q05 totaled Ps 5,019, a decrease of 5.9% from 3Q04 but an increase of 6.8% compared to 2Q05. Foreign sales for the quarter represented 50.4% of total net sales.
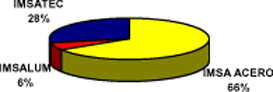
The following is a breakdown by business segment for the quarter:
Please refer to the last page of this document for definitions of terms, U.S. dollar conversion methodology and other disclosures.
Page 2 of 15
Sales | 3Q05 | 2Q05 | 3Q04 | Ac. 05 | Ac. 04 | ||||||||||
IMSA ACERO | Ps | 6,017 | Ps | 6,085 | Ps | 6,203 | Ps | 18,082 | Ps | 17,117 | |||||
IMSATEC | 2,909 | 2,598 | 2,896 | 7,728 | 7,831 | ||||||||||
IMSALUM | 1,041 | 1,075 | 1,021 | 2,996 | 2,881 | ||||||||||
Total Net Sales1 | Ps | 9,967 | Ps | 9,758 | Ps | 10,121 | Ps | 28,806 | Ps | 27,830 | |||||
TOTAL US$ Average | 941 | 878 | 883 | 2,627 | 2,384 | ||||||||||
OPERATING INCOME
Operating income in nominal dollar terms for 3Q05 fell 33.3% year-over-year but grew 39.2% quarter-over-quarter to US$72. Operating income for 3Q05 in peso terms was Ps 782, a decline of 37.6% vs. 3Q04 but an increase of 33.9% over 2Q05. Grupo Imsa’s operating margin for the quarter was 7.8%, compared to 12.4% for 3Q04 and 6.0% for 2Q05.
OPERATING INCOME PLUS DEPRECIATION AND AMORTIZATION (EBITDA)
EBITDA in dollars for the third quarter of 2005 fell 28.0% year-over-year but grew 26.8% quarter-over-quarter to US$103. In pesos, EBITDA totaled Ps 1,094, a decline of 33.5% compared to 3Q04 but an increase of 20.8% over 2Q05.
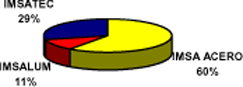
EBITDA contribution per business segment in 3Q05 was as follows:
EBITDA | 3Q05 | 2Q05 | 3Q04 | Ac. 05 | Ac. 04 | |||||||||||||||
IMSA ACERO | Ps | 745 | Ps | 680 | Ps | 1,403 | Ps | 1,994 | Ps | 3,362 | ||||||||||
IMSATEC | 312 | 198 | 193 | 549 | 467 | |||||||||||||||
IMSALUM | 70 | 79 | 80 | 214 | 242 | |||||||||||||||
Corporate | (33 | ) | (51 | ) | (31 | ) | (122 | ) | (87 | ) | ||||||||||
TOTAL | Ps | 1,094 | Ps | 906 | Ps | 1,645 | Ps | 2,635 | Ps | 3,984 | ||||||||||
TOTAL US$ Avg. | 103 | 81 | 142 | 240 | 341 | |||||||||||||||
EBITDA Margin | 11.0 | % | 9.3 | % | 16.3 | % | 9.1 | % | 14.3 | % | ||||||||||
| 1 | The sum of these amounts does not equal the consolidated net sales for the periods presented because Corporate and Other has been excluded. |
Please refer to the last page of this document for definitions of terms, U.S. dollar conversion methodology and other disclosures.
Page 3 of 15
INTEGRAL FINANCING COST (INCOME)
The integral financing cost for 3Q05 was Ps 10, compared to a cost of Ps 35 in 3Q04 and an income of Ps 232 in 2Q05. The main reason for the change in integral financing result compared to 2Q05 was a decline in foreign exchange gain in 3Q05 resulting from a lower appreciation of the Mexican peso compared to the previous quarter.
Interest expense for 3Q05 fell 40.9% from 3Q04 but grew 13.6% vs. 2Q05. The year-over-year decline in interest expense reflects the reduction in the average debt in 3Q05 and the amortization of all the expenses related to the prepayment of debt with funds from the sale of the battery business in 3Q04. The quarter-over-quarter growth was a result of increases in the Libor reference rate to which all the Company’s debt is linked.
Integral Financing Cost (Income) | 3Q05 | 2Q05 | 3Q04 | Ac.05 | Ac.04 | |||||||||||||||
Interest expense | Ps | 75 | Ps | 66 | Ps | 127 | Ps | 211 | Ps | 278 | ||||||||||
Interest income | (16 | ) | (7 | ) | (17 | ) | (30 | ) | (49 | ) | ||||||||||
Foreign exchange loss (gain) | (10 | ) | (266 | ) | 5 | (273 | ) | 94 | ||||||||||||
Gain from monetary position | (39 | ) | (25 | ) | (80 | ) | (99 | ) | (207 | ) | ||||||||||
Integral financing cost (income) | Ps | 10 | Ps | (232 | ) | Ps | 35 | Ps | (191 | ) | Ps | 116 | ||||||||
MAJORITY NET INCOME
For 3Q05, majority net income was Ps 491, compared to incomes of Ps 784 for 3Q04 and Ps 525 for 2Q05. The year-over-year decline in majority net income reflects the reduction in operating income. Despite posting an increased operating income for the quarter, a larger foreign exchange gain in 2Q05 resulted in the quarter-over-quarter decline in majority net income.
Majority Net Income | 3Q05 | 2Q05 | 3Q04 | Ac.05 | Ac.04 | ||||||||||
Majority net income | Ps | 491 | Ps | 525 | Ps | 784 | Ps | 1,193 | Ps | 1,881 | |||||
Majority net income per equity unit | Ps | 0.88 | Ps | 0.94 | Ps | 1.39 | Ps | 2.13 | Ps | 3.34 | |||||
As of September 30, 2005, Grupo Imsa had 2,802.7 million shares outstanding, equivalent to 560,532,358 UBC equity units.
FINANCIAL POSITION
Net debt as of September 30, 2005 was US$366, an increase of US$9 compared to net debt presented in the balance sheet as of June 30, 2005 and of US$7 compared to net debt as of September 30, 2004. The quarter-over-quarter rise in net debt reflects an upswing in working capital. Total debt as of September 30, 2005 was US$419, compared to a total debt of US$410 as of September 30, 2004 and of US$412 as of June 30, 2005.
Net interest coverage – defined as primary cash flow (EBITDA) divided by net interest expense – was 16.4 times for the twelve months ended September 30, 2005, while interest coverage defined as EBITDA divided by gross interest expense was 14.0 times for the same period. The total debt to EBITDA ratio for the past twelve months was 1.2 as of September 30, 2005.
Please refer to the last page of this document for definitions of terms, U.S. dollar conversion methodology and other disclosures.
Page 4 of 15

IMSA ACERO
Sales
3Q05 sales volume was 654 thousand tonnes, an increase of 10.6% over 3Q04 and of 13.7% compared to 2Q05. Domestic shipments for the quarter totaled 480 thousand tonnes, 23.1% above 3Q04 and 15.9% more than 2Q05. Foreign volume amounted to 174 thousand tonnes for 3Q05, a decline of 13.7% from 3Q04 but a growth of 8.0% versus 2Q05. The year-over-year and quarter-over-quarter increases in sales volume largely reflect a recovery in demand in the domestic construction industry, since excess inventories in the distribution channels where the company participates have been reduced. Additionally, over the past year, the company has continued to successfully penetrate industrial sectors, such as the automotive and domestic appliance sectors. It is important to note that the more than 20% expansion of the hot-rolled steel mill in September 2004 allowed IMSA ACERO to take greater advantage of the recovery in the steel market, positioning it strongly to continue making progress in the markets in which it participates. The quarter-over-quarter growth in foreign sales volume was a result of the third quarter of the year being seasonally more active for IMSA ACERO’s businesses in the United States.
Net sales for 3Q05 reached Ps 6,017, a decline of 3.0% from 3Q04 and of 1.1% compared to 2Q05. The year-over-year and quarter-over-quarter revenue reductions reflect lower prices for the company’s products, in line with the North American steel market; the sales mix moving slightly toward non-coated products; and the strengthening of the Mexican peso vis-à-vis the U.S. dollar, with the company’s product prices being strongly linked to the dollar.
Operating Income and EBITDA
Operating income was Ps 504, a decline of 53.5% from 3Q04 but an increase of 18.9% versus 2Q05. 3Q05 operating margin was 8.4%, compared to margins of 17.5% for 3Q04 and 7.0% for 2Q05. EBITDA for 3Q05 was Ps 745, a reduction of 46.9% with respect to 3Q04 but a growth of 9.6% versus 2Q05. In dollar terms, EBITDA fell 41.7% year-over-year but increased 17.0% quarter-over-quarter to US$71.
IMSA ACERO experiences a delay between adjustments in international steel prices and in the cost of its raw materials, because of existing inventories and purchases agreed upon approximately one quarter in advance. In 3Q04, the company benefited from this effect which created a significant increase in margins because of the environment of rising prices. However, in line with the international trend, in 3Q05 the price of the main steel raw materials that the company uses continued to decline, as well as the prices of its final products. As a consequence, IMSA ACERO’s results improved but were not completely normalized, because of the previously mentioned time lag in the adjustment of final product prices to the cost of raw materials. Additionally, increases in the price of raw materials such as zinc and aluminum and in energy costs contributed to the lowering of operating income in 3Q05 compared to same period of the previous year.
The quarter-over-quarter improvement reflects a rise in sales volume, a reduction in the cost of steel used as raw material that was greater than the decline in final product prices and a change in the sales mix to include an increased proportion of domestic sales with higher margins. For the
Please refer to the last page of this document for definitions of terms, U.S. dollar conversion methodology and other disclosures.
Page 5 of 15
fourth quarter of the year, the cost of IMSA ACERO’s raw materials is expected to continue to decline; this effect should combine with increases in the price of certain products and a solid demand for the company’s products to produce fourth quarter results that are significantly superior to those of the first three quarters of 2005. In fact, September results were considerably better than those of the first nine months of 2005, a trend that is expected to continue during the last three months of the year.
IMSATEC
Sales
IMSATEC’s 3Q05 revenues totaled Ps 2,909, representing increases of 0.4% over 3Q04 and 12.0% versus 2Q05. Year-over-year sales remained almost unchanged. The quarter-over-quarter revenue growth largely reflects the seasonality of IMSATEC’s operations, with the third quarter of the year being seasonally more active than the second in the construction industry in the United States, where most of this business segment’s revenues are generated.
Operating Income and EBITDA
The operating income for 3Q05 was Ps 258, an increase of 83.0% over 3Q04 and of 73.2% compared to 2Q05. Operating margin for the quarter was 8.9%, compared to 4.9% for 3Q04 and 5.7% in 2Q05. EBITDA for the quarter was Ps 312, an increase of 61.7% vs. 3Q04 and of 57.6% with respect to 2Q05. In dollar terms, EBITDA grew year-over-year by 66.8% and quarter-over-quarter by 57.6% to US$28.
IMSATEC’s operating income grew year-over-year largely because of improved results for the company’s pre-engineered buildings and components businesses in North America. These operations posted improved margins between the cost of raw materials and final prices in an environment where steel prices had been falling, which combined with the results of important efficiency-increasing and cost-cutting initiatives. Additionally, the reinforced plastic panel business posted improved results in 3Q05. Operating expenses as a percentage of sales for the first nine months of 2005 fell to 11.0% compared to 11.4% for the same period of 2004, and by 4.8% in monetary terms. The quarter-over-quarter improvement in operating income largely reflects the third quarter of the year being seasonally more active than the second, mainly in the U.S. construction industry.
The fourth quarter is seasonally similar to the second quarter of the year for most of IMSATEC’s businesses.
IMSALUM
Sales
IMSALUM’s 3Q05 revenues totaled Ps 1,041, a growth of 2.0% over 3Q04 but a decline of 3.2% compared to 2Q05. The year-over-year revenue upswing was due to the profiles business’s larger sales volumes and an increase in its product prices to reflect higher aluminum costs. The quarter-over-quarter reduction in sales was mainly due to reduced sales in the U.S. ladder business.
Please refer to the last page of this document for definitions of terms, U.S. dollar conversion methodology and other disclosures.
Page 6 of 15
Operating Income and EBITDA
Operating income for 3Q05 was Ps 55, representing a decrease of 19.1% from 3Q04 and of 15.4% vs. 2Q05. Operating margin for the quarter was 5.3%, compared to operating margins of 6.7% for 3Q04 and 6.0% for 2Q05. IMSALUM’s 3Q05 EBITDA was Ps 70, 12.5% below that of 3Q04 and 11.4% down vs. 2Q05. In dollar terms, EBITDA fell 5.1% year-over-year and 4.3% quarter-over-quarter to US$7.
The year-over-year decline in operating income mainly reflects the average price of aluminum being 4% higher than in 3Q04, with the company being unable to pass on all of this increase to its product prices, as well as reduced ladder sales in the U.S. market. Additionally, freight costs were higher this quarter, because the rise in international oil prices resulted in increased gasoline and diesel costs in the United States. The rise in energy costs has also resulted in increased production costs and in an upswing in the price of other raw materials, such as the plastic resin required to produce ladders. The quarter-over-quarter decline mainly reflects a reduction in sales volume and in the price of ladders sold in the United States.
IMSALUM made progress with its continuous improvement initiatives which have reduced expenses and enhanced the operating efficiency of all its product lines. During the third quarter of 2005 the Smyrna, Tennessee facility which produced wooden attic ladders was closed; the company is currently in the process of installing the plant’s production capacity in Monterrey.

Expectations for Yearend 2005
For the second consecutive quarter, Grupo Imsa’s results were significantly better than those of the previous quarter. As stated in last quarter’s report, the improvement in the company’s figures is linked to the procuring of raw materials at lower prices and the company continuing to reduce its steel inventories purchased at costs above the current market level. Additionally, the sales volumes of most of Grupo Imsa’s businesses have grown and continuous improvement projects have been translated into enhanced operating efficiency.
Grupo Imsa expects its fourth quarter EBITDA will be the highest of the year, as the prices of certain products increase, the costs of steel inputs decline as more expensive inventories are used up, and sales volumes remain strong.
Grupo Imsa Changes its Organizational Structure
Grupo Imsa announced changes in its organizational structure, in order to optimize its value chain by increasing the leverage of existing synergies between its steel-related businesses, enhance the efficiency of its operations and reduce administrative expenses.
After the sale of the automotive battery business in 2004 and in order to align its operations and capitalize more effectively on operating and commercial synergies, Grupo Imsa’s Board of Directors decided to consolidate its businesses into two segments, instead of the previous three. In the future, all businesses with activities related to the manufacturing and processing of steel will be part of IMSA ACERO, while businesses related to aluminum and plastic products will be part of IMSATEC, with IMSALUM disappearing as an independent business segment and being absorbed by IMSATEC.
Please refer to the last page of this document for definitions of terms, U.S. dollar conversion methodology and other disclosures.
Page 7 of 15
In order to eliminate duplicity of administrative functions, Grupo Imsa’s different corporate areas will be integrated into the new business units, thereby increasing productivity and efficiency. These changes will allow Grupo Imsa to eliminate 85 job positions, generating annual savings in excess of ten million dollars. The implementation of these initiatives will be gradual and should be concluded by the second quarter of 2006.
Mr. Santiago Clariond, CEO of IMSA ACERO, added, “Consolidating our steel-processing businesses into one business unit will allow us to capitalize better on technology, supply and customer service synergies, and to develop new and better products. This will translate into enhanced control of the steel manufacturing process through the value chain, thereby enabling us to maximize the potential of our assets. For example, managing the flow of steel from slab to the steel used in a metal building in the same business unit will allow us to define the best way to add value to our products. We will also be able to take advantage of commercial relations to channel different products to similar clients.”
Mr. Marcelo Canales, Grupo Imsa’s Chief Financial Officer stated, “This decision demonstrates the commitment of Grupo Imsa’s management to the creation of value for its shareholders. The new organizational structure will allow us to focus better on expanding the businesses where we have the greatest competitive advantages.”
As of the fourth quarter of the year, Grupo Imsa will report its results under the new organizational structure, with two business units: IMSA ACERO and IMSATEC.
* * *
Grupo Imsa, a holding company, dates back to 1936 and is today one of Mexico’s leading diversified industrial companies. With manufacturing and distribution facilities in Mexico, the United States, Spain, and throughout Central and South America, Grupo Imsa exports to all continents. In 2004 the Company’s sales reached 3.3 billion dollars, of which close to 50% was generated outside Mexico. Grupo Imsa shares are quoted on the Mexican Stock Market (IMSA).
Contact:
Jose Luis Fornelli, Investor Relations Manager, (52-81) 8153-8416
jose.fornelli@grupoimsa.com
TABLES TO FOLLOW
Please refer to the last page of this document for definitions of terms, U.S. dollar conversion methodology and other disclosures.
Page 8 of 15
GRUPO IMSA, S.A. DE C.V. AND SUBSIDIARIES
CONSOLIDATED BALANCE SHEETS
(Millions of Mexican pesos of
purchasing power as of September 30, 2005)
September 2005 | December 2004 | |||||
ASSETS | ||||||
Current: | ||||||
Cash and cash equivalents | 570 | 364 | ||||
Accounts receivable-trade, net | 5,301 | 4,999 | ||||
Inventories | 6,708 | 8,914 | ||||
Other current assets | 1,412 | 1,229 | ||||
| 13,991 | 15,506 | |||||
Investments in shares | 99 | 125 | ||||
Property, plant and equipment | 17,990 | 18,570 | ||||
Other assets | 332 | 296 | ||||
Excess of cost over fair value of net assets acquired of subsidiaries | 1,152 | 1,152 | ||||
TOTAL ASSETS | 33,564 | 35,649 | ||||
LIABILITIES AND STOCKHOLDERS’ EQUITY | ||||||
Current: | ||||||
Current portion of long-term debt | 1,444 | 284 | ||||
Bank loans | 367 | 310 | ||||
Accounts payable-trade | 1,763 | 3,023 | ||||
Advances from clients | 180 | 490 | ||||
Other accounts payable and accrued liabilities | 1,501 | 1,785 | ||||
| 5,255 | 5,892 | |||||
Lont-term debt | 2,731 | 4,189 | ||||
Deferred taxes | 4,053 | 4,553 | ||||
Other long-term liabilities | 457 | 341 | ||||
| 7,241 | 9,083 | |||||
TOTAL LIABILITIES | 12,496 | 14,975 | ||||
Excess of fair value of net assets acquired over cost of subsidiaries | 56 | 56 | ||||
Stockholders’ equity: | ||||||
Common stock | 5,328 | 5,328 | ||||
Additional paid-in capital | 3,124 | 3,124 | ||||
Reserve for repurchase of own shares | 141 | 141 | ||||
Retained earnings | 23,645 | 22,848 | ||||
Insufficiency in capital restatement | (7,329 | ) | (6,926 | ) | ||
Initial deferred tax effect | (3,897 | ) | (3,897 | ) | ||
Majority interest | 21,012 | 20,618 | ||||
Minority interest | — | — | ||||
TOTAL STOCKHOLDERS’ EQUITY | 21,012 | 20,618 | ||||
TOTAL LIABILITIES AND STOCKHOLDERS’ EQUITY | 33,564 | 35,649 | ||||
Please refer to the last page of this document for definitions of terms, U.S. dollar conversion methodology and other disclosures.
Page 9 of 15
GRUPO IMSA, S.A. DE C.V. AND SUBSIDIARIES
CONSOLIDATED STATEMENTS OF OPERATIONS
(Millions of Mexican pesos of purchasing power
as of September 30, 2005)
| % Change | ||||||||||||||||||||||||
| 3Q05 | 2Q05 | 3Q04 | Ac. 05 | Ac. 04 | 3Q05/3Q04 | 3Q05/2Q05 | Ac.05 / Ac.04 | |||||||||||||||||
Net sales | 9,967 | 9,758 | 10,121 | 28,806 | 27,830 | -1.5 | % | 2.1 | % | 3.5 | % | |||||||||||||
Domestic sales | 4,948 | 5,058 | 4,789 | 14,481 | 13,799 | 3.3 | % | -2.2 | % | 4.9 | % | |||||||||||||
Foreign sales | 5,019 | 4,700 | 5,332 | 14,325 | 14,031 | -5.9 | % | 6.8 | % | 2.1 | % | |||||||||||||
Cost of sales | 8,442 | 8,395 | 8,131 | 24,942 | 22,681 | 3.8 | % | 0.6 | % | 10.0 | % | |||||||||||||
Operating expenses | 743 | 779 | 736 | 2,187 | 2,263 | 1.0 | % | -4.6 | % | -3.4 | % | |||||||||||||
OPERATING INCOME | 782 | 584 | 1,254 | 1,677 | 2,886 | -37.6 | % | 33.9 | % | -41.9 | % | |||||||||||||
Interest expense | 75 | 66 | 127 | 211 | 278 | -40.9 | % | 13.6 | % | -24.1 | % | |||||||||||||
Interest income | (16 | ) | (7 | ) | (17 | ) | (30 | ) | (49 | ) | -5.9 | % | 128.6 | % | -38.8 | % | ||||||||
Foreign exchange loss (gain) | (10 | ) | (266 | ) | 5 | (273 | ) | 94 | -96.2 | % | ||||||||||||||
Gain from monetary position | (39 | ) | (25 | ) | (80 | ) | (99 | ) | (207 | ) | -51.3 | % | 56.0 | % | -52.2 | % | ||||||||
INTEGRAL FIN. COST, NET | 10 | (232 | ) | 35 | (191 | ) | 116 | -71.4 | % | |||||||||||||||
Other expenses net | 24 | 5 | 19 | 33 | 90 | 26.3 | % | 380.0 | % | -63.3 | % | |||||||||||||
INCOME BEFORE INCOME TAXES AND EMPLOYEES’ PROFIT SHARING | 748 | 811 | 1,200 | 1,835 | 2,680 | -37.7 | % | -7.8 | % | -31.5 | % | |||||||||||||
Income taxes | 243 | 264 | 403 | 598 | 910 | -39.7 | % | -8.0 | % | -34.3 | % | |||||||||||||
Employees’ profit sharing | 14 | 22 | 10 | 44 | 25 | 40.0 | % | -36.4 | % | 76.0 | % | |||||||||||||
INCOME BEFORE DISCONTINUED OPERATIONS | 491 | 525 | 787 | 1,193 | 1,745 | -37.6 | % | -6.5 | % | -31.6 | % | |||||||||||||
Discontinued operations | 0 | 0 | (6 | ) | 0 | 246 | ||||||||||||||||||
CONSOLIDATED NET INCOME | 491 | 525 | 781 | 1,193 | 1,991 | -37.1 | % | -6.5 | % | -40.1 | % | |||||||||||||
Net income of minority interest | 0 | 0 | (3 | ) | 0 | 110 | ||||||||||||||||||
Net income of majority interest | 491 | 525 | 784 | 1,193 | 1,881 | -37.4 | % | -6.5 | % | -36.6 | % | |||||||||||||
Please refer to the last page of this document for definitions of terms, U.S. dollar conversion methodology and other disclosures.
Page 10 of 15
GRUPO IMSA, S.A. DE C.V. AND SUBSIDIARIES
CONSOLIDATED STATEMENTS OF CHANGES IN FINANCIAL POSITION
(Millions of Mexican pesos of
purchasing power as of September 30, 2005)
September 2005 | December 2004 | |||||
OPERATING ACTIVITIES: | ||||||
CONSOLIDATED NET INCOME | 1,193 | 3,086 | ||||
ITEMS NOT (GENERATING) REQUIRING RESOURCES: | ||||||
Depreciation and amortization | 959 | 1,534 | ||||
Amoritzation of excess of fair value of net assets acquired over cost of subsidiaries, net | — | 18 | ||||
Others | (50 | ) | 569 | |||
| 2,102 | 5,207 | |||||
CHANGES IN CURRENT ASSETS AND LIABILITIES NET OF EFFECTS FROM BUSINESSES ACQUIRED: | ||||||
Accounts receivable-trade | (301 | ) | (1,106 | ) | ||
Inventories | 1,856 | (3,563 | ) | |||
Other current assets | (183 | ) | (141 | ) | ||
Accounts payable-trade | (1,260 | ) | (334 | ) | ||
Advances from clients | (310 | ) | 226 | |||
Other accounts payable and accrued liabilities | (284 | ) | 807 | |||
| (482 | ) | (4,111 | ) | |||
RESOURCES GENERATED FROM OPERATING ACTIVITIES | 1,620 | 1,096 | ||||
FINANCING ACTIVITIES: | ||||||
Proceeds (Payments) of short-term bank loans | 1,217 | 2 | ||||
Proceeds (Payments) from borrowings from banks and issuance of long-term debt | (1,458 | ) | (4,197 | ) | ||
Common dividends paid | (396 | ) | (1,009 | ) | ||
Others | — | (1,087 | ) | |||
RESOURCES GENERATED FROM FINANCING ACTIVITIES | (637 | ) | (6,291 | ) | ||
INVESTING ACTIVITIES: | ||||||
Acquisition of property, plant and equipment | (657 | ) | (1,257 | ) | ||
Acquisition of companies and minority interest | — | 3,208 | ||||
Other assets | (120 | ) | 2,721 | |||
RESOURCES USED IN INVESTING ACTIVITIES | (777 | ) | 4,672 | |||
(DECREASE) INCREASE IN CASH AND CASH EQUIVALENTS | 206 | (523 | ) | |||
Cash and cash equivalents at beginning of period | 364 | 887 | ||||
CASH AND CASH EQUIVALENTS AT END OF PERIOD | 570 | 364 | ||||
Please refer to the last page of this document for definitions of terms, U.S. dollar conversion methodology and other disclosures.
Page 11 of 15
GRUPO IMSA S.A. DE C.V. AND SUBSIDIARIES
(Millions of Mexican pesos of purchasing power as of September 30, 2005)
| 3Q05 | 2Q05 | 3Q04 | Ac. 05 | Ac. 04 | 3Q05/3Q04 | 3Q05/2Q05 | Ac.05/Ac.04 | |||||||||||||||||
IMSA ACERO | ||||||||||||||||||||||||
DOMESTIC SALES | 3,938 | 3,978 | 3,853 | 11,522 | 11,047 | 2.2 | % | -1.0 | % | 4.3 | % | |||||||||||||
FOREIGN SALES | 2,079 | 2,107 | 2,350 | 6,560 | 6,070 | -11.5 | % | -1.3 | % | 8.1 | % | |||||||||||||
% Export/Sales | 34.6 | % | 34.6 | % | 37.9 | % | 36.3 | % | 35.5 | % | ||||||||||||||
NET SALES | 6,017 | 6,085 | 6,203 | 18,082 | 17,117 | -3.0 | % | -1.1 | % | 5.6 | % | |||||||||||||
COST OF SALES | 5,222 | 5,326 | 4,817 | 15,971 | 13,719 | 8.4 | % | -2.0 | % | 16.4 | % | |||||||||||||
OPERATING EXPENSES | 291 | 335 | 301 | 865 | 900 | -3.3 | % | -13.1 | % | -3.9 | % | |||||||||||||
OPERATING INCOME | 504 | 424 | 1,085 | 1,246 | 2,498 | -53.5 | % | 18.9 | % | -50.1 | % | |||||||||||||
OPERATING MARGIN | 8.4 | % | 7.0 | % | 17.5 | % | 6.9 | % | 14.6 | % | ||||||||||||||
EBITDA | 745 | 680 | 1,403 | 1,994 | 3,362 | -46.9 | % | 9.6 | % | -40.7 | % | |||||||||||||
EBITDA MARGIN | 12.4 | % | 11.2 | % | 22.6 | % | 11.0 | % | 19.6 | % | ||||||||||||||
IMSATEC | ||||||||||||||||||||||||
DOMESTIC SALES | 487 | 565 | 509 | 1,454 | 1,466 | -4.3 | % | -13.8 | % | -0.8 | % | |||||||||||||
FOREIGN SALES | 2,422 | 2,033 | 2,387 | 6,274 | 6,365 | 1.5 | % | 19.1 | % | -1.4 | % | |||||||||||||
% Export/Sales | 83.3 | % | 78.3 | % | 82.4 | % | 81.2 | % | 81.3 | % | ||||||||||||||
NET SALES | 2,909 | 2,598 | 2,896 | 7,728 | 7,831 | 0.4 | % | 12.0 | % | -1.3 | % | |||||||||||||
COST OF SALES | 2,351 | 2,172 | 2,470 | 6,483 | 6,630 | -4.8 | % | 8.2 | % | -2.2 | % | |||||||||||||
OPERATING EXPENSES | 300 | 277 | 285 | 853 | 896 | 5.3 | % | 8.3 | % | -4.8 | % | |||||||||||||
OPERATING INCOME | 258 | 149 | 141 | 392 | 305 | 83.0 | % | 73.2 | % | 28.5 | % | |||||||||||||
OPERATING MARGIN | 8.9 | % | 5.7 | % | 4.9 | % | 5.1 | % | 3.9 | % | ||||||||||||||
EBITDA | 312 | 198 | 193 | 549 | 467 | 61.7 | % | 57.6 | % | 17.6 | % | |||||||||||||
EBITDA MARGIN | 10.7 | % | 7.6 | % | 6.7 | % | 7.1 | % | 6.0 | % | ||||||||||||||
IMSALUM | ||||||||||||||||||||||||
DOMESTIC SALES | 523 | 515 | 426 | 1,505 | 1,286 | 22.8 | % | 1.6 | % | 17.0 | % | |||||||||||||
FOREIGN SALES | 518 | 560 | 595 | 1,491 | 1,595 | -12.9 | % | -7.5 | % | -6.5 | % | |||||||||||||
% Export/Sales | 49.8 | % | 52.1 | % | 58.3 | % | 49.8 | % | 55.4 | % | ||||||||||||||
NET SALES | 1,041 | 1,075 | 1,021 | 2,996 | 2,881 | 2.0 | % | -3.2 | % | 4.0 | % | |||||||||||||
COST OF SALES | 870 | 895 | 843 | 2,489 | 2,334 | 3.2 | % | -2.8 | % | 6.6 | % | |||||||||||||
OPERATING EXPENSES | 116 | 115 | 110 | 339 | 344 | 5.5 | % | 0.9 | % | -1.5 | % | |||||||||||||
OPERATING INCOME | 55 | 65 | 68 | 168 | 203 | -19.1 | % | -15.4 | % | -17.2 | % | |||||||||||||
OPERATING MARGIN | 5.3 | % | 6.0 | % | 6.7 | % | 5.6 | % | 7.0 | % | ||||||||||||||
EBITDA | 70 | 79 | 80 | 214 | 242 | -12.5 | % | -11.4 | % | -11.6 | % | |||||||||||||
EBITDA MARGIN | 6.7 | % | 7.3 | % | 7.8 | % | 7.1 | % | 8.4 | % | ||||||||||||||
Please refer to the last page of this document for definitions of terms, U.S. dollar conversion methodology and other disclosures.
Page 12 of 15
SALES VOLUME | ||||||||||
| 3Q05 | 2Q05 | 3Q04 | Ac. 05 | Ac. 04 | ||||||
STEEL PROCESSING | ||||||||||
IMSA ACERO (Tonnes) | ||||||||||
Domestic Sales Volume | 480,277 | 414,354 | 390,113 | 1,261,682 | 1,237,317 | |||||
Exports and Foreign SubsidiariesSales Volume | 173,816 | 160,935 | 201,412 | 530,883 | 566,372 | |||||
TOTAL IMSA ACERO | 654,093 | 575,289 | 591,525 | 1,792,565 | 1,803,689 | |||||
| 3Q05 | 2Q05 | 3Q04 | Ac. 05 | Ac. 04 | ||||||
IMSALUM | ||||||||||
Aluminum (Tonnes) | ||||||||||
TOTAL ALUMINUM | 14,675 | 14,277 | 14,760 | 42,682 | 45,041 | |||||
Please refer to the last page of this document for definitions of terms, U.S. dollar conversion methodology and other disclosures.
Page 13 of 15
Selected Financial Information
Income Statement
US$ Millions(1)
| 3Q05 | 2Q05 | 3Q04 | Ac. 05 | Ac. 04 | ||||||
Net Sales | ||||||||||
IMSA ACERO | 570 | 544 | 540 | 1,645 | 1,467 | |||||
IMSATEC | 273 | 238 | 253 | 708 | 671 | |||||
IMSALUM | 98 | 96 | 90 | 273 | 247 | |||||
Grupo Imsa(2) | 941 | 878 | 883 | 2,627 | 2,384 | |||||
Operating Income | ||||||||||
IMSA ACERO | 47 | 38 | 94 | 113 | 213 | |||||
IMSATEC | 23 | 13 | 12 | 35 | 26 | |||||
IMSALUM | 5 | 6 | 6 | 15 | 17 | |||||
Grupo Imsa(2) | 72 | 52 | 108 | 152 | 247 | |||||
EBITDA | ||||||||||
IMSA ACERO | 71 | 60 | 121 | 181 | 287 | |||||
IMSATEC | 28 | 18 | 17 | 49 | 40 | |||||
IMSALUM | 7 | 7 | 7 | 19 | 21 | |||||
Grupo Imsa(2) | 103 | 81 | 142 | 240 | 341 | |||||
Majority Net Income | ||||||||||
Grupo Imsa | 45 | 47 | 69 | 108 | 164 | |||||
| (1) | Peso figures converted into dollars by dividing the monthly nominal pesos by the average monthly exchange rate. |
| (2) | The sum of these amounts does not equal the consolidated figures presented because Corporate and Other have been excluded. |
Please refer to the last page of this document for definitions of terms, U.S. dollar conversion methodology and other disclosures.
Page 14 of 15
Disclosures and Definitions
Methodology used for consolidation and presentation of results and other important disclosures
Grupo Imsa consolidates its results in Mexican pesos using Mexican generally accepted accounting principles (Mexican GAAP). Figures in this document are presented in millions of Mexican pesos as of September 30, 2005 (Ps), unless otherwise specified.
In compliance with Bulletin B-15, “Foreign Currency Translation of Foreign Currency Financial Statements,” the restatement factors applied to financial statements of prior periods are calculated on the basis of a weighted average index that takes into consideration the inflation rates of the countries in which Grupo Imsa’s subsidiaries operate and changes in the exchange rates of each country vis-à-vis the Mexican peso. The restatement factor for the twelve-month period of September 2004 – September 2005 was 1.02103; for the three-month period of June 2005 – September 2005, it was 1.01612.
For the convenience of the reader, this document contains U.S. dollar amounts for Grupo Imsa and its business segments. The conversion from Mexican pesos to U.S. dollars is carried out by dividing nominal monthly peso amounts of the financial statements by the average Mexican peso – U.S. dollar exchange rate for that month, and then adding the results of the divisions into quarterly or accumulated figures. U.S. dollar (US$) figures in this document are presented in millions, unless otherwise specified.
Third quarter 2005 (2Q05) inflation was 0.9%, resulting in an inflation rate of 3.5% for the last twelve months. The Mexican peso depreciated 0.1% against the U.S. dollar during 2Q05 but has appreciated 4.9% over the past twelve months. The exchange rate used as of September 30, 2005 was 10.8495 pesos per dollar. Since the price and cost structure of Grupo Imsa is mainly denominated in dollars, the performance of the Company is affected when financial information is expressed in real pesos.
The term EBITDA is used throughout this document because Grupo Imsa believes it is a widely accepted financial indicator of its ability to generate cash flow to operate, fund capital expenditures, pay taxes, service or incur debt, and pay dividends. EBITDA should not be considered as an indicator of Grupo Imsa’s financial performance, as a measure of liquidity or as a substitute for the statement of changes in financial position. EBITDA can be reconciled by adding operating income to depreciation and operating amortization, all of which are concepts accepted under Mexican GAAP.
Effective on July 1, 2004, Grupo Imsa, through its battery subsidiary Enermex, S.A. de C.V., divested its automotive battery business, ceding its interest to Johnson Controls, Inc., the company that had been its minority partner since 1998. In accordance with the interpretation of the related accounting bulletins, this transaction was classified as a stockholders’ equity operation and therefore is presented as part of the stockholders’ equity. For purposes of analysis and comparability, the results of the divested companies are presented under a single heading in the Income Statement as “Discontinued operations”. Additionally, all prior years’ operations of such companies were restructured as “Discontinued operations” and are presented as such in the attached financial statements.
This document contains forward-looking statements relating to Grupo Imsa’s future performance or its current expectations or beliefs. These include statements regarding the intent, belief or current expectations of the Company and its management. Investors are cautioned that any such forward-looking statements are not guarantees of future performance and involve a number of risks and uncertainties pertaining to the industries in which the Company participates. Grupo Imsa does not intend, and does not assume any obligation, to update these forward-looking statements.
Definition of terms
EBITDA: Operating income plus depreciation and operating amortization
Net Debt: Total debt, minus cash and cash equivalents
Net Interest Coverage: EBITDA divided by (interest expense minus interest income)
Interest Coverage: EBITDA divided by interest expense
Please refer to the last page of this document for definitions of terms, U.S. dollar conversion methodology and other disclosures.
Page 15 of 15
SIGNATURE
Pursuant to the requirements of the Securities Exchange Act of 1934, the registrant has duly caused this report to be signed on its behalf by the undersigned, thereunto duly authorized.
| GRUPO IMSA, S.A. DE C.V. | ||||
(Registrant)
| ||||
Dated: October 31, 2005 | By: | /s/ MARCELO CANALES CLARIOND | ||
| Name: | Marcelo Canales Clariond | |||
| Title: | Chief Financial Officer |