TABLE OF CONTENTS
CNI Charter Funds Semi-Annual Report
| | |
| | |
| 2 | Schedule of Investments |
| 56 | Statements of Assets and Liabilities |
| 60 | Statements of Operations |
| 64 | Statements of Changes in Net Assets |
| 70 | Financial Highlights |
| 74 | Notes to Financial Statements |
| 84 | Disclosure of Fund Expenses |
| 86 | Approval of Sub-Advisory Agreements |
The Funds file their complete schedules of portfolio holdings with the Securities and Exchange Commission for the first and third quarters of each fiscal year on Form N-Q within sixty days after the end of the period. The Funds’ Form N-Q is available on the Commission’s website at http://www.sec.gov, and may be reviewed and copied at the Commission’s Public Reference Room in Washington, DC. Information on the operation of the Public Reference Room may be obtained by calling 1-800-SEC-0330. The most current Form N-Q is also available on the Funds’ website at www.cnicharterfunds.com and without charge, upon request, by calling 1-888-889-0799.
A description of the policies and procedures that the Funds use to determine how to vote proxies relating to the Funds’ portfolio securities, and information on how the Funds voted proxies relating to portfolio securities during the most recent 12-month period ending June 30 is available (1) without charge, upon request, by calling 1-888-889-0799, (2) on the Funds’ website at www.cnicharterfunds.com, and (3) on the Securities and Exchange Commission’s website at www.sec.gov.
CNI CHARTER FUNDS | PAGE 1
| schedule of investments |
March 31, 2011 (Unaudited) |
| Government Money Market Fund |
| | | | | | |
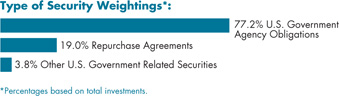
| U.S. Government Agency Obligations [77.2%] | | | | |
| FAMC | | | | | | |
| 5.500%, 07/15/11(A) | | $ | 15,000 | | | $ | 15,212 | |
| FAMC DN | | | | | | | | |
| 0.070%, 04/01/11(B) | | | 21,000 | | | | 21,000 | |
| 0.070%, 04/07/11(B) | | | 39,000 | | | | 38,999 | |
| FFCB | | | | | | | | |
| 0.181%, 04/14/11(C) | | | 50,000 | | | | 50,000 | |
| FFCB DN | | | | | | | | |
| 0.230%, 08/08/11(B) | | | 38,140 | | | | 38,108 | |
| 0.251%, 09/16/11(B) | | | 25,000 | | | | 24,971 | |
| FHLB | | | | | | | | |
| 0.210%, 04/01/11(C) | | | 30,000 | | | | 30,007 | |
| 0.210%, 04/01/11(C) | | | 25,000 | | | | 25,000 | |
| 0.110%, 04/01/11(C) | | | 65,000 | | | | 64,999 | |
| 0.205%, 04/15/11(C) | | | 50,000 | | | | 49,995 | |
| 0.218%, 04/26/11(C) | | | 50,000 | | | | 50,005 | |
| 0.184%, 04/27/11(C) | | | 40,000 | | | | 39,999 | |
| 0.153%, 04/28/11(C) | | | 25,000 | | | | 24,998 | |
| 0.200%, 08/03/11 | | | 25,000 | | | | 24,998 | |
| 0.230%, 10/21/11 | | | 47,000 | | | | 47,007 | |
| 0.350%, 11/07/11 | | | 50,000 | | | | 50,000 | |
| 0.300%, 11/08/11 | | | 50,000 | | | | 50,002 | |
| 0.260%, 11/23/11 | | | 50,000 | | | | 49,992 | |
| 0.750%, 12/21/11 | | | 30,000 | | | | 30,088 | |
| 0.470%, 03/16/12 | | | 25,000 | | | | 25,000 | |
| FHLB DN(B) | | | | | | | | |
| 0.056%, 04/01/11 | | | 444,843 | | | | 444,843 | |
| 0.040%, 04/04/11 | | | 75,000 | | | | 75,000 | |
| 0.127%, 04/06/11 | | | 77,000 | | | | 76,999 | |
| 0.020%, 04/07/11 | | | 100,000 | | | | 100,000 | |
| 0.020%, 04/21/11 | | | 75,000 | | | | 74,999 | |
| 0.100%, 04/25/11 | | | 31,000 | | | | 30,998 | |
| 0.170%, 05/06/11 | | | 50,000 | | | | 49,992 | |
| 0.170%, 05/13/11 | | | 25,697 | | | | 25,692 | |
| 0.250%, 07/15/11 | | | 50,000 | | | | 49,964 | |
| FHLMC DN(B) | | | | | | | | |
| 0.070%, 04/04/11 | | | 91,700 | | | | 91,700 | |
| 0.130%, 04/05/11 | | | 46,500 | | | | 46,499 | |
| 0.165%, 05/02/11 | | | 30,000 | | | | 29,996 | |
| 0.190%, 06/07/11 | | | 50,000 | | | | 49,982 | |
| 0.115%, 06/20/11 | | | 34,151 | | | | 34,142 | |
| 0.150%, 08/02/11 | | | 30,000 | | | | 29,985 | |
| 0.180%, 12/13/11 | | | 50,000 | | | | 49,936 | |
| FNMA | | | | | | | | |
| 5.125%, 04/15/11 | | $ | 25,000 | | | $ | 25,047 | |
| 0.875%, 01/12/12 | | | 25,000 | | | | 25,116 | |
| FNMA DN(B) | | | | | | | | |
| 0.230%, 04/26/11 | | | 25,000 | | | | 24,996 | |
| 0.210%, 05/16/11 | | | 50,000 | | | | 49,987 | |
| 0.220%, 07/18/11 | | | 50,000 | | | | 49,967 | |
| 0.160%, 09/01/11 | | | 50,000 | | | | 49,966 | |
| 0.190%, 12/01/11 | | | 50,000 | | | | 49,936 | |
Total U.S. Government Agency Obligations (Cost $2,286,122) | | | | | | | 2,286,122 | |
Other U.S. Government Related Securities [3.8%] | |
| Straight-A Funding | | | | | | | | |
| 0.250%, 04/11/11 | | | 12,626 | | | | 12,626 | |
| 0.250%, 04/18/11 | | | 30,000 | | | | 29,996 | |
| 0.240%, 06/14/11 | | | 50,093 | | | | 50,068 | |
| 0.200%, 04/01/11 | | | 18,795 | | | | 18,795 | |
Total Other U.S. Government Related Securities (Cost $111,485) | | | | 111,485 | |
Repurchase Agreements(D) [19.0%] | | | | | |
| Nomura | | | | | | | | |
| 0.120%, dated 03/31/11, repurchased on 04/01/11, repurchase price $275,000,917 (collateralized by various U.S. Government obligations, ranging in par value $1,000-$50,390,000, 0.000%-6.250%, 05/12/11-07/15/33; with total market value $280,503,955) | | | 275,000 | | | | 275,000 | |
| Bank of America | | | | | | | | |
| 0.090%, dated 03/31/11, repurchased on 04/01/11, repurchase price $175,000,438 (collateralized by various U.S. Government obligations, ranging in par value $6,189,000-$53,324,000, 0.000%-5.880%, 06/29/11-04/01/36; with total market value $178,500,936) | | | 175,000 | | | | 175,000 | |
| JPMorgan Chase | | | | | | | | |
| 0.080%, dated 03/31/11, repurchased on 04/01/11, repurchase price $50,000,111 (collateralized by a U.S. Treasury Note, par value $51,085,000, 0.375%, 08/31/12; with total market value $51,004,456) | | | 50,000 | | | | 50,000 | |
See accompanying notes to financial statements.
CNI CHARTER FUNDS | PAGE 2
| schedule of investments |
March 31, 2011 (Unaudited) |
Government Money Market Fund (concluded) |
| Barclays | | | | | | | | |
| 0.110%, dated 03/31/11, repurchased on 04/01/11, repurchase price $36,700,122 (collateralized by a U.S. Treasury Note, par value $37,700,112, 4.375%, 2/15/38; with total market value $37,434,002) | | $ | 36,700 | | | $ | 36,700 | |
| Deutsche Bank | | | | | | | | |
| 0.150%, dated 03/31/11, repurchased on 04/01/11, repurchase price $25,000,104 (collateralized by a FHLMC obligation, par value $24,943,000, 1.625%, 4/15/13; with a total market value $25,500,053) | | | 25,000 | | | | 25,000 | |
Total Repurchase Agreements (Cost $561,700) | | | | 561,700 | |
Total Investments [100.0%] (Cost $2,959,307) | | | $ | 2,959,307 | |
Percentages are based on Net Assets of $2,960,040 ($ Thousands).
| (A) | Security exempt from registration under Rule 144A of the Securities Act of 1933. These securities may be resold in transactions exempt from registration normally to qualified institutions. On March 31, 2011, the value of these securities amounted to $15,212 (000), representing 0.5% of the net assets of the Fund. |
| (B) | Zero coupon security. The rate reported is the effective yield at time of purchase. |
| (C) | Floating Rate Security — The rate reported is the rate in effect on March 31, 2011. |
| (D) | Tri-Party Repurchase Agreement. |
DN — Discount Note
FAMC — Federal Agricultural Mortgage Corporation
FFCB — Federal Farm Credit Bank
FHLB — Federal Home Loan Bank
FHLMC — Federal Home Loan Mortgage Corporation
FNMA — Federal National Mortgage Association
As of March 31, 2011, all of the Fund’s investments are Level 2, in accordance with ASC 820.
For the period ended March 31, 2011, there have been no significant transfers between Level 1 and Level 2 assets and liabilities.
For more information on valuation inputs, see Note 2 — Significant Accounting Policies in the Notes to Financial Statements.
See accompanying notes to financial statements.
CNI CHARTER FUNDS | PAGE 3
| schedule of investments |
March 31, 2011 (Unaudited) |
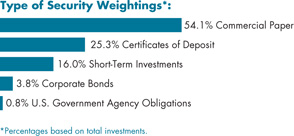
| Prime Money Market Fund |
| | | | | | |
| Commercial Paper [54.0%] | | | | | | |
| Banks [27.7%] | | | | | | |
| Abbey National North America | | | | | | |
| 0.330%, 05/09/11 | | $ | 14,000 | | | $ | 13,995 | |
| 0.280%, 04/01/11 | | | 25,000 | | | | 25,000 | |
| Banco Bilbao Vizcaya Argentaria (A) | | | | | | | | |
| 0.541%, 05/02/11 | | | 20,000 | | | | 19,991 | |
| 0.270%, 04/01/11 | | | 20,000 | | | | 20,000 | |
| Bank of America | | | | | | | | |
| 0.150%, 04/04/11 | | | 30,000 | | | | 30,000 | |
| Bank of Nova Scotia | | | | | | | | |
| 0.130%, 04/04/11 | | | 25,000 | | | | 25,000 | |
| Banque et Caisse d'Epargne de L'Etat | | | | | | | | |
| 0.300%, 05/04/11 | | | 20,000 | | | | 19,995 | |
| 0.250%, 06/30/11 | | | 20,000 | | | | 19,988 | |
| Bayerische Landesbank | | | | | | | | |
| 0.390%, 04/13/11 | | | 20,000 | | | | 19,997 | |
| Credit Agricole North America | | | | | | | | |
| 0.345%, 04/20/11 | | | 20,000 | | | | 19,996 | |
| Danske (A) | | | | | | | | |
| 0.320%, 05/03/11 | | | 25,000 | | | | 24,993 | |
| ING US Funding | | | | | | | | |
| 0.300%, 07/14/11 | | | 20,000 | | | | 19,983 | |
| Korea Development Bank | | | | | | | | |
| 0.501%, 05/09/11 | | | 20,000 | | | | 19,989 | |
| Landesbank Hessen-Thueringen (A) | | | | | | | | |
| 0.300%, 04/11/11 | | | 20,000 | | | | 19,998 | |
| Manhattan Asset Funding (A) | | | | | | | | |
| 0.280%, 04/01/11 | | | 25,000 | | | | 25,000 | |
| 0.270%, 04/06/11 | | | 16,000 | | | | 15,999 | |
| Societe Generale North America | | | | | | | | |
| 0.150%, 04/04/11 | | | 20,000 | | | | 20,000 | |
| | | | | | | 359,924 | |
| Financial Services [16.1%] | | | | | | |
| American Honda Finance | | | | | | |
| 0.220%, 04/04/11 | | $ | 25,000 | | | $ | 24,999 | |
| Arabella Finance (A) | | | | | | | | |
| 0.530%, 04/04/11 | | | 25,000 | | | | 24,999 | |
| General Electric Capital | | | | | | | | |
| 0.391%, 07/15/11 | | | 20,000 | | | | 19,977 | |
| Gotham Funding (A) | | | | | | | | |
| 0.260%, 04/27/11 | | | 30,749 | | | | 30,743 | |
| HSBC Finance | | | | | | | | |
| 0.351%, 07/25/11 | | | 20,000 | | | | 19,978 | |
| John Deere Credit (A) | | | | | | | | |
| 0.190%, 04/12/11 | | | 25,000 | | | | 24,999 | |
| MetLife Short Term Funding (A) | | | | | | | | |
| 0.280%, 04/11/11 | | | 24,000 | | | | 23,998 | |
| Natixis US Finance | | | | | | | | |
| 0.370%, 04/07/11 | | | 20,000 | | | | 19,999 | |
| Toyota Financial Services de Puerto Rico | | | | | | | | |
| 0.371%, 07/11/11 | | | 20,000 | | | | 19,979 | |
| | | | | | | 209,671 | |
| Investment Banker/Broker Dealer [2.7%] | | | | | |
| BNP Paribas Finance | | | | | | | | |
| 0.451%, 08/23/11 | | | 10,000 | | | | 9,982 | |
| 0.170%, 04/04/11 | | | 25,000 | | | | 24,999 | |
Total Investment Banker/Broker Dealer | | | | 34,981 | |
| Investment Companies [1.9%] | | | | | | | | |
| Royal Park Investments Funding (A) | | | | | | | | |
| | | 25,000 | | | | 24,999 | |
| Schools [1.2%] | | | | | | | | |
| University of California | | | | | | | | |
| | | 15,000 | | | | 15,000 | |
| Special Purpose Banks [4.4%] | | | | | | | | |
| Barton Capital (A) | | | | | | | | |
| 0.220%, 04/11/11 | | | 15,489 | | | | 15,488 | |
| 0.170%, 04/04/11 | | | 17,850 | | | | 17,850 | |
| Beethoven Funding (A) | | | | | | | | |
| 0.450%, 04/04/11 | | | 24,000 | | | | 23,999 | |
Total Special Purpose Banks | | | | | | | 57,337 | |
Total Commercial Paper (Cost $701,912) | | | | | | | 701,912 | |
See accompanying notes to financial statements.
CNI CHARTER FUNDS | PAGE 4
| schedule of investments |
March 31, 2011 (Unaudited) |
Prime Money Market Fund (continued) |
| Corporate Bonds [3.8%] | | | | | | | | |
| Banks [1.6%] | | | | | | | | |
| Westpac Banking, MTN | | | | | | | | |
| | $ | 20,500 | | | $ | 20,501 | |
| Financial Services [1.1%] | | | | | | | | |
| General Electric Capital | | | | | | | | |
| | | 13,845 | | | | 13,844 | |
| Security Brokers & Dealers [1.1%] | | | | | |
| Morgan Stanley, MTN | | | | | | | | |
| | | 15,000 | | | | 14,989 | |
Total Corporate Bonds (Cost $49,334) | | | | | | | 49,334 | |
| U.S. Government Agency Obligation [0.8%] | | | | | |
| FHLB | | | | | | | | |
| 0.184%, 10/27/11(B) | | | 10,000 | | | | 10,000 | |
Total U.S. Government Agency Obligation (Cost $10,000) | | | | | | | 10,000 | |
| Certificates of Deposit [25.4%] | | | | | | | | |
| Banco Del Estado De Chile | | | | | | | | |
| 0.260%, 04/05/11 | | | 25,000 | | | | 25,000 | |
| 0.460%, 04/18/11 | | | 20,000 | | | | 20,000 | |
| Bank of Montreal | | | | | | | | |
| 0.620%, 07/21/11 | | | 20,000 | | | | 20,015 | |
| Bank of Montreal Chicago | | | | | | | | |
| 0.338%, 10/31/11 | | | 25,000 | | | | 25,000 | |
| Barclays Bank | | | | | | | | |
| 0.690%, 05/10/11 | | | 25,000 | | | | 25,000 | |
| Bayerische Landesbank | | | | | | | | |
| 0.560%, 05/25/11 | | | 20,000 | | | | 20,000 | |
| Cooperatieve Centrale Raiffeisen-Boerenleenbank BA | | | | | | | | |
| 0.330%, 01/06/12 | | | 20,000 | | | | 20,000 | |
| Dexia Credit Local NY | | | | | | | | |
| 0.470%, 04/01/11 | | | 25,000 | | | | 25,000 | |
| 0.500%, 04/25/11 | | | 20,000 | | | | 20,000 | |
| Landesbank Hessen-Thueringen | | | | | | | | |
| 0.490%, 05/25/11 | | | 10,000 | | | | 10,000 | |
| Natixis NY | | | | | | | | |
| 0.570%, 08/11/11 | | | 10,200 | | | | 10,203 | |
| Norinchukin Bank | | | | | | | | |
| 0.280%, 04/05/11 | | | 20,000 | | | | 20,000 | |
| 0.330%, 05/09/11 | | | 20,000 | | | | 20,000 | |
| | | | | | |
| Skandinaviska Enskilda Banken NY | | | | | | |
| 0.390%, 04/07/11 | | $ | 20,000 | | | $ | 20,000 | |
| Societe Generale NY | | | | | | | | |
| 0.400%, 04/07/11 | | | 25,000 | | | | 25,000 | |
| UniCredit NY | | | | | | | | |
| 0.490%, 05/02/11 | | | 25,000 | | | | 25,000 | |
Total Certificates of Deposit (Cost $330,218) | | | | 330,218 | |
| Cash Equivalent [0.1%] | | | | | | | | |
| Goldman Sachs Financial Square Funds - Government Fund, 0.040%* | | | 1,262,078 | | | | 1,262 | |
Total Cash Equivalent (Cost $1,262) | | | | | | | 1,262 | |
| Repurchase Agreements(C) [15.9%] | | | | | | | | |
| Nomura | | | | | | | | |
| 0.120%, dated 03/31/11, repurchased on 04/01/11, repurchase price $75,000,250 (collateralized by a FHLB obligation and a FHLMC obligation, ranging in par value $21,540,000-$55,685,000, 1.000%-1.250% 02/25/13-12/12/24; with total market value $76,500,311) | | | 75,000 | | | | 75,000 | |
| Bank of America | | | | | | | | |
| 0.090%, dated 03/31/11, repurchased on 04/01/11, repurchase price $50,000,125 (collateralized by FHLB obligation, par value $51,020,000, 0.000%, 7/15/11; with total market value $51,000,612) | | | 50,000 | | | | 50,000 | |
| Deutsche Bank | | | | | | | | |
| 0.150%, dated 03/31/11, repurchased on 04/01/11, repurchase price $50,000,208 (collateralized by a FHLB obligation, par value $51,065,000, 1.000%, 03/21/13; with total market value $51,000,034) | | | 50,000 | | | | 50,000 | |
See accompanying notes to financial statements.
CNI CHARTER FUNDS | PAGE 5
| schedule of investments |
March 31, 2011 (Unaudited) |
Prime Money Market Fund (concluded) |
| | | | | | |
| Barclays | | | | | | |
| 0.110%, dated 03/31/11, repurchased on 04/01/11 repurchase price $39,900,094 (collateralized by U.S. Treasury Bond, par value $31,957,200, 4.375%, 02/15/38; with total market value $31,518,034) | | $ | 30,900 | | | $ | 30,900 | |
Total Repurchase Agreements (Cost $205,900) | | | | 205,900 | |
Total Investments [100.0%] (Cost $1,298,626) | | | $ | 1,298,626 | |
Percentages are based on Net Assets of $1,298,692 ($ Thousands).
| * | The rate reported is the 7-day effective yield as of March 31, 2011. |
| (A) | Security exempt from registration under Rule 144A of the Securities Act of 1933. These securities may be resold in transactions exempt from registration normally to qualified institutions. On March 31, 2011, the value of these securities amounted to $333,557 (000), representing 25.7% of the net assets of the Fund. |
| (B) | Floating Rate Security — The rate reported is the rate in effect on March 31, 2011. |
| (C) | Tri-Party Repurchase Agreement. |
FHLB — Federal Home Loan Bank
FHLMC — Federal Home Loan Mortgage Corporation
MTN — Medium Term Note
The following is a summary of the inputs used as of March 31, 2011 in valuing the Fund’s investments carried at value ($ Thousands) in accordance with ASC 820:
| Investments in Securities | | | | | | | | | | | | |
| Commercial Paper | | $ | — | | | $ | 701,912 | | | $ | | | | $ | 701,912 | |
| Corporate Bonds | | | — | | | | 49,334 | | | | — | | | | 49,334 | |
| U.S. Government Agency Obligation | | | — | | | | 10,000 | | | | — | | | | 10,000 | |
| Certificates of Deposit | | | — | | | | 330,218 | | | | — | | | | 330,218 | |
| Cash Equivalent | | | 1,262 | | | | — | | | | — | | | | 1,262 | |
| Repurchase Agreements | | | — | | | | 205,900 | | | | — | | | | 205,900 | |
| Total Investments in Securities | | $ | 1,262 | | | $ | 1,297,364 | | | $ | — | | | $ | 1,298,626 | |
For the period ended March 31, 2011, there have been no significant transfers between Level 1 and Level 2 assets and liabilities.
For more information on valuation inputs, see Note 2 — Significant Accounting Policies in the Notes to Financial Statements.
See accompanying notes to financial statements.
CNI CHARTER FUNDS | PAGE 6
| schedule of investments |
March 31, 2011 (Unaudited) |
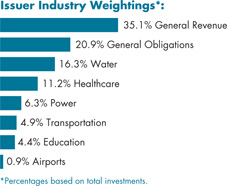
| California Tax Exempt Money Market Fund |
| | | | | | |
| Municipal Bonds [99.3%] | | | | | | |
| California [96.3%] | | | | | | |
| Bay Area Governments Association, SAB (A) | | | | | | |
| Pre-Refunded @ 102 | | | | | | |
| 6.200%, 09/02/11 | | $ | 1,950 | | | $ | 2,037 | |
| Bay Area Toll Authority, RB (B) (C) (D) | | | | | | | | |
| 0.170%, 04/07/11 | | | 4,000 | | | | 4,000 | |
| Bay Area Toll Authority, RB (B) (C) (D) | | | | | | | | |
| 0.150%, 04/07/11 | | | 7,000 | | | | 7,000 | |
| Bay Area Toll Authority, Ser C-1, RB (B) (C) (D) | | | | | | | | |
| 0.220%, 04/07/11 | | | 10,000 | | | | 10,000 | |
| Bay Area Toll Authority, Ser C-1, RB (B) (C) (D) | | | | | | | | |
| 0.180%, 04/07/11 | | | 5,000 | | | | 5,000 | |
| Bay Area Toll Authority, Ser C-3, RB (B) (C) (D) | | | | | | | | |
| 0.160%, 04/07/11 | | | 1,000 | | | | 1,000 | |
| Bay Area Toll Authority, Ser C-4, RB (B) (C) (D) | | | | | | | | |
| 0.200%, 04/07/11 | | | 6,000 | | | | 6,000 | |
| Bay Area Toll Authority, Ser E-3, RB (B) (C) (D) | | | | | | | | |
| 0.170%, 04/07/11 | | | 5,000 | | | | 5,000 | |
| California Infrastructure & Economic Development Bank, RB (B) (D) | | | | | | | | |
| 0.180%, 04/01/11 | | | 6,740 | | | | 6,740 | |
| California State Department of Water Resources, Ser C-1, RB (B) (D) | | | | | | | | |
| 0.210%, 04/07/11 | | | 3,600 | | | | 3,600 | |
| California State, Department of Water Resource & Power, Ser C-9, RB (B) (D) | | | | | | | | |
| 0.220%, 04/07/11 | | | 6,000 | | | | 6,000 | |
| California State, Educational Facilities Authority, Stanford University Project, Ser L-4, RB (B) (D) | | | | | | | | |
| 0.170%, 04/06/11 | | $ | 515 | | | $ | 515 | |
| California State, Health Facilities Financing Authority, Luvile Salter Project, Ser B, RB (B) (D) | | | | | | | | |
| 0.210%, 04/07/11 | | | 11,700 | | | | 11,700 | |
| California State, Health Facilities Financing Authority, Ser B, RB (B) (C) (D) | | | | | | | | |
| 0.220%, 04/06/11 | | | 22,250 | | | | 22,250 | |
| California State, Health Facilities Financing Authority, Ser C, RB (B) (C) (D) | | | | | | | | |
| 0.250%, 04/06/11 | | | 9,475 | | | | 9,475 | |
| California State, Health Facilities Financing Authority, Ser C, RB (B) (C) (D) | | | | | | | | |
| 0.170%, 04/07/11 | | | 18,400 | | | | 18,400 | |
| California State, Infrastructure & Economic Development Authority, J Paul Getty Trust Project, Ser B, RB (B) (D) | | | | | | | | |
| 0.150%, 04/01/11 | | | 11,915 | | | | 11,915 | |
| California State, Ser B, Sub-Ser B-3, GO (B) (C) (D) | | | | | | | | |
| 0.200%, 04/06/11 | | | 5,000 | | | | 5,000 | |
| California Statewide Communities Development Authority, Ser A, RB (B) (C) (D) | | | | | | | | |
| 0.160%, 04/01/11 | | | 12,525 | | | | 12,525 | |
| California Statewide Communities Development Authority, Ser B, RB (B) (C) (D) | | | | | | | | |
| 0.220%, 04/06/11 | | | 12,800 | | | | 12,800 | |
| California Statewide, Communities Development Authority, Masters College Project, RB (B) (C) (D) | | | | | | | | |
| 0.230%, 04/07/11 | | | 3,000 | | | | 3,000 | |
| California Statewide, Communities Development Authority, Ser A, RB (B) (C) (D) | | | | | | | | |
| 0.220%, 04/06/11 | | | 4,000 | | | | 4,000 | |
| East Bay Municipal Utility District, Ser A-2, RB (B) (D) | | | | | | | | |
| 0.180%, 04/06/11 | | | 15,000 | | | | 15,000 | |
| East Bay Municipal Utility District, Sub-Ser A-1, RB (B) (D) | | | | | | | | |
| 0.190%, 04/06/11 | | | 12,020 | | | | 12,020 | |
See accompanying notes to financial statements.
CNI CHARTER FUNDS | PAGE 7
| schedule of investments |
March 31, 2011 (Unaudited) |
California Tax Exempt Money Market Fund (continued) |
| East Bay, Municipal Utilities District Water Authority, Sub-Ser B, RB, AGM (B) (D) | | | | | | | | |
| 0.300%, 04/06/11 | | $ | 10,000 | | | $ | 10,000 | |
| Eastern Municipal Water District, Ser B, COP (B) (D) | | | | | | | | |
| 0.200%, 04/06/11 | | | 10,600 | | | | 10,600 | |
| Elsinore Valley, Municipal Water District, Ser B, COP (B) (C) (D) | | | | | | | | |
| 0.230%, 04/07/11 | | | 15,000 | | | | 15,000 | |
| Glendale, Police Building Project, COP (B) (D) | | | | | | | | |
| 0.250%, 04/07/11 | | | 17,800 | | | | 17,800 | |
| Irvine Ranch, Water District #140-240-105-250, GO (B) (C) (D) | | | | | | | | |
| 0.170%, 04/01/11 | | | 5,800 | | | | 5,800 | |
| Irvine, Improvement Board, Act 1915 Project, District #05-21, Ser A, COP (B) (C) (D) | | | | | | | | |
| 0.240%, 04/01/11 | | | 10,000 | | | | 10,000 | |
| Irvine, Improvement Board, Act 1915 Project, District #93-14, SAB (B) (C) (D) | | | | | | | | |
| 0.200%, 04/01/11 | | | 2,300 | | | | 2,300 | |
| Irvine, Improvement Board, Act 1915 Project, District #97-16, COP (B) (C) (D) | | | | | | | | |
| 0.240%, 04/01/11 | | | 3,500 | | | | 3,500 | |
| Irvine, Improvement Board, Act 1915 Project, District #97-17, SAB (B) (C) (D) | | | | | | | | |
| 0.240%, 04/01/11 | | | 7,150 | | | | 7,150 | |
| Long Beach, TRAN | | | | | | | | |
| 2.000%, 09/30/11 | | | 2,000 | | | | 2,016 | |
| Los Angeles California, Sub-Ser B, RB (B) (C) (D) | | | | | | | | |
| 0.170%, 04/07/11 | | | 5,555 | | | | 5,555 | |
| Los Angeles Community College District, Ser A, GO, NATL-RE (A) | | | | | | | | |
| Pre-Refunded @ 100 | | | | | | | | |
| 5.500%, 08/01/11 | | | 2,500 | | | | 2,542 | |
| Los Angeles County, TRAN | | | | | | | | |
| 2.000%, 06/30/11 | | | 8,000 | | | | 8,022 | |
| Los Angeles County, Metropolitan Transportation Authority, RB (B) (C) (D) | | | | | | | | |
| 0.170%, 04/07/11 | | | 6,575 | | | | 6,575 | |
| Los Angeles County, Metropolitan Transportation Authority, Ser A1, RB (B) (D) | | | | | | | | |
| 0.210%, 04/01/11 | | | 2,800 | | | | 2,800 | |
| Los Angeles County, Metropolitan Transportation Authority, Ser A1, RB (B) (D) | | | | | | | | |
| 0.260%, 04/07/11 | | $ | 12,665 | | | $ | 12,665 | |
| Los Angeles County, Metropolitan Transportation Authority, Ser A2, RB (B) (D) | | | | | | | | |
| 0.210%, 04/01/11 | | | 7,000 | | | | 7,000 | |
| Los Angeles County, Metropolitan Transportation Authority, Ser A3, RB (B) (D) | | | | | | | | |
| 0.290%, 04/07/11 | | | 4,975 | | | | 4,975 | |
| Los Angeles County, Metropolitan Transportation Authority, Ser C4, RB, FGIC (B) (C) (D) | | | | | | | | |
| 0.170%, 04/07/11 | | | 2,000 | | | | 2,000 | |
| Los Angeles, Department of Water & Power, Sub-Ser B-1, RB (B) (D) | | | | | | | | |
| 0.200%, 04/07/11 | | | 5,350 | | | | 5,350 | |
| Los Angeles, Department of Water & Power, Sub-Ser B-2, RB (B) (D) | | | | | | | | |
| 0.200%, 04/01/11 | | | 15,700 | | | | 15,700 | |
| Los Angeles, Department of Water & Power, Sub-Ser B-2, RB (B) (D) | | | | | | | | |
| 0.190%, 04/07/11 | | | 12,600 | | | | 12,600 | |
| Los Angeles, Department of Water & Power, Sub-Ser B-3, RB (B) (D) | | | | | | | | |
| 0.230%, 04/01/11 | | | 5,900 | | | | 5,900 | |
| Los Angeles, Department of Water & Power, Sub-Ser B-3, RB (B) (D) | | | | | | | | |
| 0.180%, 04/07/11 | | | 7,600 | | | | 7,600 | |
| Los Angeles, Department of Water & Power, Sub-Ser B-4, RB (B) (D) | | | | | | | | |
| 0.240%, 04/07/11 | | | 6,400 | | | | 6,400 | |
| Los Angeles, Department of Water & Power, Sub-Ser B-5, RB (B) (D) | | | | | | | | |
| 0.170%, 04/07/11 | | | 10,000 | | | | 10,000 | |
| Los Angeles, Unified School District, Administration Building III Project, Ser B, COP (B) (C) (D) | | | | | | | | |
| 0.240%, 04/06/11 | | | 10,060 | | | | 10,060 | |
| Los Angeles, Wastewater Systems Authority, Sub-Ser C, RB (B) (C) (D) | | | | | | | | |
| 0.180%, 04/07/11 | | | 11,195 | | | | 11,195 | |
See accompanying notes to financial statements.
CNI CHARTER FUNDS | PAGE 8
| schedule of investments |
March 31, 2011 (Unaudited) |
California Tax Exempt Money Market Fund (continued) |
| Oakland-Alameda County, Coliseum Authority, Ser C-2, RB (B) (C) (D) | | | | | | | | |
| 0.210%, 04/06/11 | | $ | 3,500 | | | $ | 3,500 | |
| Oakland-Alameda County, Coliseum Project, Ser C-1, RB (B) (C) (D) | | | | | | | | |
| 0.230%, 04/06/11 | | | 14,400 | | | | 14,400 | |
| Orange County, Water District Authority, Ser A, COP (B) (D) | | | | | | | | |
| 0.200%, 04/06/11 | | | 10,850 | | | | 10,850 | |
| Pasadena, Public Financing Authority, Rose Bowl Refinancing & Improvement Project, RB (B) (C) (D) | | | | | | | | |
| 0.230%, 04/06/11 | | | 10,025 | | | | 10,025 | |
| Riverside County, Public Facilities Authority, Ser C, COP (B) (C) (D) | | | | | | | | |
| 0.240%, 04/06/11 | | | 9,600 | | | | 9,600 | |
| Sacramento County, Sanitation District Financing Authority, Sub-Ser D, RB (B) (C) (D) | | | | | | | | |
| 0.240%, 04/01/11 | | | 3,000 | | | | 3,000 | |
| Sacramento County, Sanitation District Financing Authority, Sub-Ser E, RB (B) (C) (D) | | | | | | | | |
| 0.220%, 04/06/11 | | | 9,500 | | | | 9,500 | |
| Sacramento, TRAN | | | | | | | | |
| 2.000%, 06/30/11 | | | 3,500 | | | | 3,512 | |
| San Bernardino County, Ser A, TRAN | | | | | | | | |
| 2.000%, 06/30/11 | | | 5,000 | | | | 5,020 | |
| San Diego County, Regional Transportation Commission, Ser B, RB (B) (D) | | | | | | | | |
| 0.240%, 04/07/11 | | | 13,080 | | | | 13,080 | |
| San Diego County, Regional Transportation Commission, Ser C, RB (B) (D) | | | | | | | | |
| 0.300%, 04/07/11 | | | 6,890 | | | | 6,890 | |
| San Francisco City & County, Airports Commission, Ser 37C, RB, FSA (B) (D) | | | | | | | | |
| 0.320%, 04/06/11 | | | 7,000 | | | | 7,000 | |
| San Francisco, Unified School District, TRAN | | | | | | | | |
| 2.000%, 06/30/11 | | | 3,500 | | | | 3,513 | |
| Santa Barbara County, TRAN | | | | | | | | |
| 2.000%, 06/30/11 | | | 6,500 | | | | 6,526 | |
| Santa Clara County, Financing Authority, Multiple Facilities Projects, Ser M, RB (B) (C) (D) | | | | | | | | |
| 0.220%, 04/06/11 | | | 10,105 | | | | 10,105 | |
| Santa Clara County, Financing Authority, VMC Facility Replacement Project, Ser B, RB (B) (D) | | | | | | | | |
| 0.220%, 04/06/11 | | $ | 13,475 | | | $ | 13,475 | |
| Santa Clara Valley, Transportation Authority, Ser C, RB (B) (D) | | | | | | | | |
| 0.250%, 04/07/11 | | | 12,000 | | | | 12,000 | |
| Santa Clara Valley, Transportation Authority, Ser D, RB (B) (D) | | | | | | | | |
| 0.250%, 04/07/11 | | | 17,300 | | | | 17,300 | |
| Santa Cruz County, TRAN | | | | | | | | |
| 2.000%, 06/30/11 | | | 8,400 | | | | 8,429 | |
| Southern California, Metropolitan Water District Authority, Ser C-1, RB (B) (D) | | | | | | | | |
| 0.120%, 04/01/11 | | | 19,200 | | | | 19,200 | |
| Southern California, Metropolitan Water District Authority, Water Works Authorization Project, Ser B, RB (B) (D) | | | | | | | | |
| 0.220%, 04/07/11 | | | 11,985 | | | | 11,985 | |
| State of California, GO (B) (C) (D) | | | | | | | | |
| 0.170%, 04/01/11 | | | 22,350 | | | | 22,350 | |
| State of California, GO (B) (C) (D) | | | | | | | | |
| 0.240%, 04/07/11 | | | 25,400 | | | | 25,400 | |
| State of California, GO (B) (C) (D) | | | | | | | | |
| 0.230%, 04/07/11 | | | 9,200 | | | | 9,200 | |
| State of California, Ser A-2, GO (B) (C) (D) | | | | | | | | |
| 0.200%, 04/01/11 | | | 4,275 | | | | 4,275 | |
| State of California, Ser B, GO (A) | | | | | | | | |
| Pre-Refunded @ 100 | | | | | | | | |
| 3.500%, 07/01/11 | | | 600 | | | | 605 | |
| State of California, Ser B-4, GO (B) (C) (D) | | | | | | | | |
| 0.240%, 04/06/11 | | | 15,000 | | | | 15,000 | |
| State of California, Ser C-11, GO (B) (C) (D) | | | | | | | | |
| 0.230%, 04/06/11 | | | 28,560 | | | | 28,560 | |
| State of California, Ser C-4, GO (B) (C) (D) | | | | | | | | |
| 0.170%, 04/01/11 | | | 3,000 | | | | 3,000 | |
| State of California, Sub-Ser A, GO (B) (C) (D) | | | | | | | | |
| 0.200%, 04/06/11 | | | 7,000 | | | | 7,000 | |
See accompanying notes to financial statements.
CNI CHARTER FUNDS | PAGE 9
| schedule of investments |
March 31, 2011 (Unaudited) |
California Tax Exempt Money Market Fund (concluded) |
| State of California, Sub-Ser A, GO (B) (C) (D) | | | | | | | | |
| 0.200%, 04/06/11 | | $ | 5,000 | | | $ | 5,000 | |
| Turlock, Irrigation District, Capital Improvement & Refunding Project, COP (B) (C) (D) | | | | | | | | |
| 0.200%, 04/01/11 | | | 10,175 | | | | 10,175 | |
| Turlock, Irrigation District, RB | | | | | | | | |
| 0.750%, 08/12/11 | | | 6,000 | | | | 6,000 | |
| Tustin, Improvement Board Act, Reassessment District No. 95-2-A, Ser A, SAB (B) (C) (D) | | | | | | | | |
| 0.230%, 04/01/11 | | | 6,603 | | | | 6,603 | |
| | | | | | | 758,160 | |
| Texas [3.0%] | | | | | | | | |
| University of Texas, Ser B, RB (B) (D) | | | | | | | | |
| | | 23,430 | | | | 23,430 | |
Total Municipal Bonds (Cost $781,590) | | | | | | | 781,590 | |
Total Investments [99.3%] (Cost $781,590) | | | | | | $ | 781,590 | |
Percentages are based on Net Assets of $786,782 ($ Thousands).
| (A) | Pre-Refunded Security — The maturity date shown is the pre-refunded date. |
| (B) | Put and Demand Feature — The date reported is the next reset or put date. |
| (C) | Securities are held in conjunction with a letter of credit from a major bank or financial institution. |
| (D) | Floating Rate Security — The rate reported is the rate in effect on March 31, 2011. |
AGM — Assured Guarantee Municipal
COP — Certificate of Participation
FGIC — Financial Guaranty Insurance Company
FSA — Financial Security Assistance
GO — General Obligation
NATL-RE — National Public Finance Guarantee Corporation
RB — Revenue Bond
SAB — Special Assessment Board
Ser — Series
TRAN — Tax and Revenue Anticipation Note
As of March 31, 2011, all of the Fund’s investments are Level 2, in accordance with ASC 820.
For the period ended March 31, 2011, there have been no significant transfers between Level 1 and Level 2 assets and liabilities.
For more information on valuation inputs, see Note 2 — Significant Accounting Policies in the Notes to Financial Statements.
See accompanying notes to financial statements.
CNI CHARTER FUNDS | PAGE 10
| schedule of investments |
March 31, 2011 (Unaudited) |
| Limited Maturity Fixed Income Fund |
| | | | | | |
| Corporate Bonds [37.6%] | | | | | | |
| Aerospace & Defense [1.6%] | | | | | | |
| Boeing | | | | | | |
| | $ | 625 | | | $ | 683 | |
| Banks [16.8%] | | | | | | | | |
| Ally Financial | | | | | | | | |
| 2.200%, 12/19/12 | | | 1,000 | | | | 1,025 | |
| ANZ National International | | | | | | | | |
| 6.200%, 07/19/13 | | | 625 | | | | 683 | |
| Bank of America | | | | | | | | |
| 4.875%, 01/15/13 | | | 150 | | | | 158 | |
| Bank of New York Mellon, MTN | | | | | | | | |
| 5.000%, 03/23/12 | | | 150 | | | | 156 | |
| Barclays Bank, MTN | | | | | | | | |
| 4.500%, 03/10/17(A) | | | 600 | | | | 580 | |
| Citibank | | | | | | | | |
| 1.500%, 07/12/11 | | | 300 | | | | 301 | |
| Citigroup | | | | | | | | |
| 6.375%, 08/12/14 | | | 600 | | | | 663 | |
| Credit Suisse NY, MTN | | | | | | | | |
| 5.000%, 05/15/13 | | | 600 | | | | 640 | |
| Goldman Sachs Group | | | | | | | | |
| 5.125%, 01/15/15 | | | 600 | | | | 641 | |
| JPMorgan Chase, MTN | | | | | | | | |
| 5.600%, 06/01/11 | | | 150 | | | | 151 | |
| 2.050%, 01/24/14 | | | 600 | | | | 599 | |
| Morgan Stanley | | | | | | | | |
| 5.375%, 10/15/15 | | | 600 | | | | 637 | |
| Wachovia, MTN | | | | | | | | |
| 5.500%, 05/01/13 | | | 600 | | | | 647 | |
| Wells Fargo | | | | | | | | |
| 5.300%, 08/26/11 | | | 150 | | | | 153 | |
| | | | | | | 7,034 | |
| Computer System Design & Services [3.0%] | | | | | |
| Hewlett-Packard | | | | | | | | |
| 6.125%, 03/01/14 | | | 600 | | | | 672 | |
| 4.250%, 02/24/12 | | | 150 | | | | 155 | |
| 2.950%, 08/15/12 | | | 120 | | | | 123 | |
| IBM | | | | | | | | |
| 4.750%, 11/29/12 | | $ | 165 | | | $ | 176 | |
| 2.100%, 05/06/13 | | | 140 | | | | 143 | |
Total Computer System Design & Services | | | | 1,269 | |
| Drugs [0.8%] | | | | | | | | |
| Abbott Laboratories | | | | | | | | |
| 5.600%, 05/15/11 | | | 145 | | | | 146 | |
| Pfizer | | | | | | | | |
| 4.450%, 03/15/12 | | | 170 | | | | 176 | |
| | | | | | | 322 | |
| Financial Services [6.8%] | | | | | | | | |
| Boeing Capital | | | | | | | | |
| 6.500%, 02/15/12 | | | 150 | | | | 158 | |
| Caterpillar Financial Services, MTN | | | | | | | | |
| 5.750%, 02/15/12 | | | 150 | | | | 157 | |
| CME Group | | | | | | | | |
| 5.400%, 08/01/13 | | | 625 | | | | 681 | |
| General Electric Capital, MTN | | | | | | | | |
| 2.000%, 09/28/12 | | | 1,000 | | | | 1,020 | |
| HSBC Finance | | | | | | | | |
| 5.500%, 01/19/16 | | | 600 | | | | 659 | |
| John Deere Capital, MTN | | | | | | | | |
| 5.250%, 10/01/12 | | | 150 | | | | 159 | |
| | | | | | | 2,834 | |
| Food, Beverage & Tobacco [0.6%] | | | | | |
| Coca-Cola Refreshments USA | | | | | | | | |
| 3.750%, 03/01/12 | | | 170 | | | | 175 | |
| PepsiCo | | | | | | | | |
| 5.150%, 05/15/12 | | | 60 | | | | 63 | |
Total Food, Beverage & Tobacco | | | | 238 | |
| Foreign Governments [1.8%] | | | | | | | | |
| Province of Ontario Canada | | | | | | | | |
| 4.100%, 06/16/14 | | | 600 | | | | 644 | |
| 1.875%, 11/19/12 | | | 125 | | | | 127 | |
Total Foreign Governments | | | | | | | 771 | |
| Investment Banker/Broker Dealer [4.6%] | | | | | |
| Citigroup Funding | | | | | | | | |
| 2.250%, 12/10/12 | | | 1,000 | | | | 1,025 | |
| Goldman Sachs Group | | | | | | | | |
| 6.600%, 01/15/12 | | | 115 | | | | 120 | |
See accompanying notes to financial statements.
CNI CHARTER FUNDS | PAGE 11
| schedule of investments |
March 31, 2011 (Unaudited) |
Limited Maturity Fixed Income Fund (continued) |
| Merrill Lynch, MTN | | | | | | | | |
| 5.000%, 01/15/15 | | $ | 600 | | | $ | 635 | |
| Morgan Stanley | | | | | | | | |
| 6.600%, 04/01/12 | | | 150 | | | | 159 | |
Total Investment Banker/Broker Dealer | | | | 1,939 | |
| Multi-Media [0.4%] | | | | | | | | |
| Walt Disney, MTN | | | | | | | | |
| | | 150 | | | | 152 | |
| Retail [0.4%] | | | | | | | | |
| Wal-Mart Stores | | | | | | | | |
| | | 170 | | | | 177 | |
| Telephones & Telecommunications [0.4%] | | | | | |
| AT&T | | | | | | | | |
| | | 150 | | | | 156 | |
| Transport-Rail [0.4%] | | | | | | | | |
| Canadian National Railway | | | | | | | | |
| | | 175 | | | | 181 | |
Total Corporate Bonds (Cost $15,510) | | | | | | | 15,756 | |
| U.S. Government Agency Obligations [33.8%] | |
| FHLB | | | | | | | | |
| 5.750%, 05/15/12 | | | 1,750 | | | | 1,854 | |
| FHLMC | | | | | | | | |
| 6.000%, 06/15/11 | | | 600 | | | | 607 | |
| 4.750%, 03/05/12 | | | 1,000 | | | | 1,041 | |
| 4.375%, 07/17/15 | | | 1,300 | | | | 1,422 | |
| 2.125%, 09/21/12 | | | 1,750 | | | | 1,789 | |
| 1.150%, 09/03/13 | | | 1,000 | | | | 995 | |
| FNMA | | | | | | | | |
| 6.125%, 03/15/12 | | | 600 | | | | 633 | |
| 5.375%, 11/15/11 | | | 1,000 | | | | 1,031 | |
| 5.250%, 08/01/12 | | | 1,000 | | | | 1,058 | |
| 5.000%, 03/15/16 | | | 600 | | | | 672 | |
| 5.000%, 02/13/17 | | | 1,000 | | | | 1,118 | |
| 3.000%, 07/28/14 | | | 925 | | | | 932 | |
| 1.750%, 02/22/13 | | | 1,000 | | | | 1,017 | |
Total U.S. Government Agency Obligations (Cost $14,179) | | | | | | | 14,169 | |
| U.S. Treasury Obligations [17.9%] | | | | | |
| U.S. Treasury Notes | | | | | | | | |
| 4.250%, 08/15/15 | | $ | 3,000 | | | $ | 3,293 | |
| 4.125%, 08/31/12 | | | 1,000 | | | | 1,051 | |
| 2.375%, 09/30/14 | | | 1,000 | | | | 1,029 | |
| 1.750%, 11/15/11 | | | 500 | | | | 505 | |
| 1.375%, 03/15/13 | | | 1,600 | | | | 1,618 | |
Total U.S. Treasury Obligations (Cost $7,393) | | | | 7,496 | |
| U.S. Government Mortgage-Backed Obligations [4.4%] | |
| FHLMC, Pool G12806 | | | | | | | | |
| 5.500%, 09/01/22 | | | 188 | | | | 203 | |
| FHLMC, Pool G18247 | | | | | | | | |
| 5.000%, 04/01/23 | | | 130 | | | | 138 | |
| FHLMC, Pool G18251 | | | | | | | | |
| 5.000%, 05/01/23 | | | 198 | | | | 210 | |
| FHLMC, Pool G18321 | | | | | | | | |
| 4.500%, 08/01/24 | | | 110 | | | | 116 | |
| FHLMC, Pool J04241 | | | | | | | | |
| 5.500%, 01/01/22 | | | 120 | | | | 130 | |
| FHLMC, Pool J04459 | | | | | | | | |
| 5.000%, 03/01/22 | | | 88 | | | | 94 | |
| FHLMC, Pool J04508 | | | | | | | | |
| 5.000%, 03/01/22 | | | 89 | | | | 96 | |
| FHLMC, Pool J07575 | | | | | | | | |
| 5.000%, 04/01/23 | | | 121 | | | | 129 | |
| FNMA, Pool 541946 | | | | | | | | |
| 7.500%, 07/01/30 | | | – | | | | 1 | |
| FNMA, Pool 837196 | | | | | | | | |
| 5.500%, 02/01/21 | | | 244 | | | | 264 | |
| FNMA, Pool 933915 | | | | | | | | |
| 4.500%, 06/01/23 | | | 236 | | | | 248 | |
| FNMA, Pool 961783 | | | | | | | | |
| 4.500%, 02/01/23 | | | 214 | | | | 225 | |
Total U.S. Government Mortgage-Backed Obligations (Cost $1,742) | | | | 1,854 | |
| Municipal Bonds [2.9%] | | | | | | | | |
| California [2.9%] | | | | | | | | |
| State of California, Ser A-2, RB | | | | | | | | |
| 3.000%, 06/28/11 | | | 600 | | | | 603 | |
| University of California, RB (A) | | | | | | | | |
| 1.988%, 05/15/50 | | | 600 | | | | 604 | |
| | | | | | | 1,207 | |
Total Municipal Bonds (Cost $1,202) | | | | | | | 1,207 | |
See accompanying notes to financial statements.
CNI CHARTER FUNDS | PAGE 12
| schedule of investments |
March 31, 2011 (Unaudited) |
Limited Maturity Fixed Income Fund (concluded) |
| | | | | | |
| Asset-Backed Securities [0.9%] | | | | | | |
| BMW Vehicle Lease Trust, Ser 2009-1, Cl A3 | | | | | | |
| 2.910%, 03/15/12 | | $ | 63 | | | $ | 63 | |
| Mercedes-Benz Auto Receivables Trust, Ser 2009-1, Cl A4 | | | | | | | | |
| 2.430%, 03/15/16 | | | 165 | | | | 169 | |
| USAA Auto Owner Trust, Ser 2009-2, Cl A4 | | | | | | | | |
| 2.530%, 07/15/15 | | | 135 | | | | 139 | |
Total Asset-Backed Securities (Cost $363) | | | | 371 | |
| Cash Equivalent [1.9%] | | | | | | | | |
| AIM STIT-Treasury Portfolio, 0.020%* | | | 794,779 | | | | 795 | |
Total Cash Equivalent (Cost $795) | | | | | | | 795 | |
Total Investments [99.4%] (Cost $41,184) | | | | | | $ | 41,648 | |
Percentages are based on Net Assets of $41,894 ($ Thousands).
| * | The rate reported is the 7-day current yield as of March 31, 2011. |
| (A) | Floating Rate Security — The rate reported is the rate in effect on March 31, 2011. |
Cl — Class
FHLB — Federal Home Loan Bank
FHLMC — Federal Home Loan Mortgage Corporation
FNMA — Federal National Mortgage Association
MTN — Medium Term Note
RB — Revenue Bond
Ser — Series
Amounts designated as “—” are either $0 or have been rounded to $0.
The following is a summary of the inputs used as of March 31, 2011 in valuing the Fund’s investments carried at value ($ Thousands):
| Investments in Securities | | | | | | | | | | | | |
| Corporate Bonds | | $ | — | | | $ | 15,756 | | | $ | — | | | $ | 15,756 | |
| U.S. Government Agency Obligations | | | — | | | | 14,169 | | | | — | | | | 14,169 | |
| U.S. Treasury Obligations | | | — | | | | 7,496 | | | | — | | | | 7,496 | |
| U.S. Government Mortgage-Backed Obligations | | | — | | | | 1,854 | | | | — | | | | 1,854 | |
| Municipal Bonds | | | — | | | | 1,207 | | | | — | | | | 1,207 | |
| Asset-Backed Securities | | | — | | | | 371 | | | | — | | | | 371 | |
| Cash Equivalent | | | 795 | | | | — | | | | — | | | | 795 | |
| Total Investments in Securities | | $ | 795 | | | $ | 40,853 | | | $ | — | | | $ | 41,648 | |
For the period ended March 31, 2011, there have been no significant transfers between Level 1 and Level 2 assets and liabilities.
For more information on valuation inputs, see Note 2 — Significant Accounting Policies in the Notes to Financial Statements.
See accompanying notes to financial statements.
CNI CHARTER FUNDS | PAGE 13
| schedule of investments |
March 31, 2011 (Unaudited) |
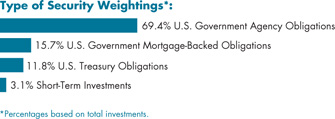
| Government Bond Fund |
| | | | | | |
| U.S. Government Agency Obligations [69.1%] | | | | |
| FAMC | | | | | | |
| 3.250%, 06/25/14 | | $ | 7,000 | | | $ | 7,368 | |
| FFCB | | | | | | | | |
| 3.600%, 03/22/17 | | | 5,000 | | | | 5,011 | |
| FHLB | | | | | | | | |
| 5.250%, 06/18/14 | | | 4,000 | | | | 4,462 | |
| 4.805%, 08/20/15 | | | 6,855 | | | | 7,327 | |
| 4.125%, 03/13/20 | | | 5,000 | | | | 5,160 | |
| 3.500%, 12/09/16 | | | 5,000 | | | | 5,162 | |
| 3.250%, 09/12/14 | | | 7,000 | | | | 7,362 | |
| 3.125%, 03/11/16 | | | 4,000 | | | | 4,137 | |
| 1.375%, 09/12/14 | | | 4,000 | | | | 3,960 | |
| 0.875%, 12/27/13 | | | 6,000 | | | | 5,926 | |
| FHLMC, MTN | | | | | | | | |
| 5.125%, 11/17/17 | | | 5,000 | | | | 5,632 | |
| 4.375%, 07/17/15 | | | 5,000 | | | | 5,468 | |
| 1.500%, 09/23/11(A) | | | 7,000 | | | | 6,960 | |
| FICO STRIP (B) | | | | | | | | |
| 3.942%, 11/02/18 | | | 8,000 | | | | 6,142 | |
| FNMA | | | | | | | | |
| 4.625%, 05/01/13 | | | 3,000 | | | | 3,196 | |
| 3.100%, 03/22/16 | | | 5,000 | | | | 5,084 | |
| 3.000%, 07/28/14 | | | 9,180 | | | | 9,248 | |
| 1.625%, 10/26/15 | | | 4,000 | | | | 3,892 | |
| 1.250%, 09/30/11(A) | | | 7,000 | | | | 6,919 | |
| Israel Government AID Bond (B) | | | | | | | | |
| 3.888%, 05/15/20 | | | 15,528 | | | | 10,872 | |
Total U.S. Government Agency Obligations (Cost $119,069) | | | | 119,288 | |
| U.S. Government Mortgage-Backed Obligations [15.6%] | |
| FHLMC REMIC, Ser 2005-R003, Cl AG | | | | | | | | |
| 5.125%, 10/15/15 | | | 385 | | | | 388 | |
| FHLMC REMIC, Ser 2006-R005, Cl AB | | | | | | | | |
| 5.500%, 12/15/18 | | | 2,321 | | | | 2,407 | |
| FHLMC REMIC, Ser 2006-R007, Cl AC | | | | | | | | |
| 5.875%, 05/15/16 | | | 78 | | | | 78 | |
| | | | | | |
| FHLMC REMIC, Ser 2007-R010, Cl AB | | | | | | |
| 5.500%, 12/15/19 | | $ | 3,839 | | | $ | 4,024 | |
| FHLMC REMIC, Ser 2007-R011, Cl AB | | | | | | | | |
| 5.500%, 12/15/20 | | | 5,974 | | | | 6,284 | |
| FHLMC REMIC, Ser 2007-R012, Cl AB | | | | | | | | |
| 5.500%, 12/15/20 | | | 2,298 | | | | 2,394 | |
| FHLMC REMIC, Ser 2007-R013, Cl AB | | | | | | | | |
| 6.000%, 12/15/21 | | | 303 | | | | 315 | |
| FHLMC REMIC, Ser 2008-R015, Cl AN, | | | | | | | | |
| 3.750%, 02/15/13 | | | 334 | | | | 334 | |
| FNMA ARM (C) | | | | | | | | |
| 4.202%, 03/01/34 | | | 325 | | | | 341 | |
| FNMA REMIC, Ser 2005-25, Cl VH, | | | | | | | | |
| 5.000%, 04/25/16 | | | 3,464 | | | | 3,664 | |
| FNMA REMIC, Ser 2006-R009, Cl AJ | | | | | | | | |
| 5.750%, 12/15/18 | | | 5,844 | | | | 6,095 | |
| GNMA | | | | | | | | |
| 8.000%, 08/15/22 | | | 10 | | | | 12 | |
| 7.500%, 06/15/24 | | | 3 | | | | 4 | |
| 7.500%, 05/15/26 | | | 3 | | | | 4 | |
| 6.000%, 01/15/29 | | | 12 | | | | 13 | |
| 7.000%, 12/15/16 | | | 9 | | | | 10 | |
| 7.500%, 04/15/32 | | | 30 | | | | 35 | |
| GNMA ARM (C) | | | | | | | | |
| 1.875%, 04/20/35 | | | 452 | | | | 466 | |
| 2.000%, 08/20/35 | | | 92 | | | | 95 | |
Total U.S. Government Mortgage-Backed Obligations (Cost $26,780) | | | | 26,963 | |
| U.S. Treasury Obligations [11.7%] | | | | | | | | |
| U.S. Treasury Note | | | | | | | | |
| 2.750%, 12/31/17 | | | 5,000 | | | | 4,977 | |
| 2.625%, 11/15/20 | | | 8,000 | | | | 7,465 | |
| 1.375%, 11/30/15 | | | 8,000 | | | | 7,747 | |
Total U.S. Treasury Obligations (Cost $20,461) | | | | 20,189 | |
| Cash Equivalent [1.3%] | | | | | | | | |
| Goldman Sachs Financial Square Funds - Government Fund, 0.040%* | | | 2,302,014 | | | | 2,302 | |
Total Cash Equivalent (Cost $2,302) | | | | | | | 2,302 | |
See accompanying notes to financial statements.
CNI CHARTER FUNDS | PAGE 14
| schedule of investments |
March 31, 2011 (Unaudited) |
Government Bond Fund (concluded) |
| | | | | | |
| Repurchase Agreement(D) [1.8%] | | | | | | |
| Barclays | | | | | | |
| 0.110%, dated 03/31/11, repurchased on 04/01/2011, repurchase price $3,100,009 (collateralized by a U.S. Treasury obligation, par value $3,158,848, 0.625%, 01/31/13; with total market value $3,162,072) | | $ | 3,100 | | | $ | 3,100 | |
Total Repurchase Agreement (Cost $3,100) | | | | 3,100 | |
Total Investments [99.5%] (Cost $171,712) | | | | | | $ | 171,842 | |
Percentages are based on Net Assets of $172,638 ($ Thousands).
| * | The rate reported is the 7-day effective yield as of March 31, 2011. |
| (A) | Step Bond — The rate reported is the rate in effect on March 31, 2011. The coupon on a step bond changes on a specific date. |
| (B) | Zero coupon security. The rate reported is the effective yield at time of purchase. |
| (C) | Floating Rate Security — The rate reported is the rate in effect on March 31, 2011. |
| (D) | Tri-Party Repurchase Agreement. |
AID — Agency for International Development
ARM — Adjustable Rate Mortgage
Cl — Class
FAMC — Federal Agriculture Mortgage Corporation
FFCB — Federal Farm Credit Bank
FHLB — Federal Home Loan Bank
FHLMC — Federal Home Loan Mortgage Corporation
FICO — Financing Corporation
FNMA — Federal National Mortgage Association
GNMA — Government National Mortgage Association
MTN — Medium Term Note
REMIC — Real Estate Mortgage Investment Conduit
Ser — Series
STRIP — Separate trading of registered interest and principal of securities.
The following is a summary of the inputs used as of March 31, 2011 in valuing the Fund’s investments carried at value ($ Thousands) in accordance with ASC 820:
| Investments in Securities | | | | | | | | | | | | |
| U.S. Government Agency Obligations | | $ | — | | | $ | 119,288 | | | $ | — | | | $ | 119,288 | |
| U.S. Government Mortgage-Backed Obligations | | | — | | | | 26,963 | | | | — | | | | 26,963 | |
| U.S. Treasury Obligations | | | — | | | | 20,189 | | | | — | | | | 20,189 | |
| Cash Equivalent | | | 2,302 | | | | — | | | | — | | | | 2,302 | |
| Repurchase Agreement | | | — | | | | 3,100 | | | | — | | | | 3,100 | |
| Total Investments in Securities | | $ | 2,302 | | | $ | 169,540 | | | $ | — | | | $ | 171,842 | |
For the period ended March 31, 2010, there have been no significant transfers between Level 1 and Level 2 assets and liabilities.
For more information on valuation inputs, see Note 2 — Significant Accounting Policies in the Notes to Financial Statements.
See accompanying notes to financial statements.
CNI CHARTER FUNDS | PAGE 15
| schedule of investments |
March 31, 2011 (Unaudited) |
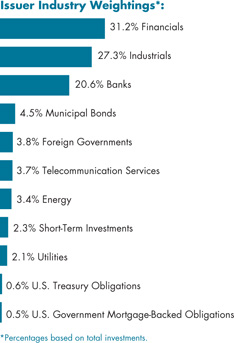
| Corporate Bond Fund |
| | | | | | |
| Corporate Bonds [91.7%] | | | | | | |
| Applications Software [1.7%] | | | | | | |
| Microsoft | | | | | | |
| | $ | 2,000 | | | $ | 2,077 | |
| Autoparts [0.9%] | | | | | | | | |
| Johnson Controls | | | | | | | | |
| | | 1,000 | | | | 1,050 | |
| Banks [18.3%] | | | | | | | | |
| ANZ National Int'l | | | | | | | | |
| 3.250%, 04/02/12(A) | | | 2,000 | | | | 2,051 | |
| Bank of America, FDIC Insured, MTN | | | | | | | | |
| 3.125%, 06/15/12 | | | 1,500 | | | | 1,547 | |
| Bank of Scotland | | | | | | | | |
| 5.000%, 11/21/11(A) | | | 1,000 | | | | 1,023 | |
| Barclays Bank | | | | | | | | |
| 6.050%, 12/04/17(A) | | | 1,000 | | | | 1,042 | |
| Barclays Bank, MTN | | | | | | | | |
| 4.500%, 03/10/17(B) | | | 1,950 | | | | 1,884 | |
| Citigroup Funding, FDIC Insured | | | | | | | | |
| 2.250%, 12/10/12 | | | 2,500 | | | | 2,563 | |
| Deutsche Bank | | | | | | | | |
| 7.250%, 10/15/11 | | | 500 | | | | 517 | |
| Deutsche Bank, MTN | | | | | | | | |
| 3.875%, 08/18/14 | | | 853 | | | | 890 | |
| JPMorgan Chase | | | | | | | | |
| 6.000%, 10/01/17 | | $ | 1,890 | | | $ | 2,067 | |
| JPMorgan Chase, FDIC Insured | | | | | | | | |
| 2.125%, 12/26/12 | | | 2,500 | | | | 2,561 | |
| US Bank, MTN | | | | | | | | |
| 6.375%, 08/01/11 | | | 1,485 | | | | 1,514 | |
| Wachovia Bank | | | | | | | | |
| 4.800%, 11/01/14 | | | 3,240 | | | | 3,450 | |
| Wells Fargo, FDIC Insured | | | | | | | | |
| 3.000%, 12/09/11 | | | 700 | | | | 713 | |
| | | | | | | 21,822 | |
| Chemicals [0.9%] | | | | | | | | |
| Dow Chemical | | | | | | | | |
| | | 1,135 | | | | 1,084 | |
| Communication & Media [3.2%] | | | | | |
| CBS | | | | | | | | |
| 8.875%, 05/15/19 | | | 1,000 | | | | 1,256 | |
| Comcast Cable Communications Holdings | | | | | | | | |
| 8.375%, 03/15/13 | | | 160 | | | | 180 | |
| Time Warner Entertainment | | | | | | | | |
| 8.375%, 03/15/23 | | | 775 | | | | 956 | |
| Walt Disney, MTN | | | | | | | | |
| 5.700%, 07/15/11 | | | 1,395 | | | | 1,417 | |
Total Communication & Media | | | | 3,809 | |
| Computer System Design & Services [6.7%] | | | | | |
| Cisco Systems | | | | | | | | |
| 5.500%, 02/22/16 | | | 1,250 | | | | 1,403 | |
| Dell | | | | | | | | |
| 5.875%, 06/15/19 | | | 1,865 | | | | 2,046 | |
| 5.625%, 04/15/14 | | | 1,000 | | | | 1,103 | |
| Hewlett-Packard | | | | | | | | |
| 6.125%, 03/01/14 | | | 1,470 | | | | 1,647 | |
| International Business Machines | | | | | | | | |
| 7.625%, 10/15/18 | | | 1,450 | | | | 1,815 | |
Total Computer System Design & Services | | | | 8,014 | |
| Diversified Operations [0.5%] | | | | | | | | |
| 3M, MTN | | | | | | | | |
| | | 500 | | | | 540 | |
| Electrical Services [2.1%] | | | | | | | | |
| Alabama Power | | | | | | | | |
| 4.850%, 12/15/12 | | | 1,380 | | | | 1,467 | |
See accompanying notes to financial statements.
CNI CHARTER FUNDS | PAGE 16
| schedule of investments |
March 31, 2011 (Unaudited) |
Corporate Bond Fund (continued) |
| American Electric Power | | | | | | | | |
| 5.250%, 06/01/15 | | $ | 986 | | | $ | 1,069 | |
Total Electrical Services | | | | | | | 2,536 | |
| Finance Auto Loans [0.8%] | | | | | |
| Harley-Davidson Financial Services, MTN | | | | | | | | |
| | | 1,000 | | | | 995 | |
| Financial Services [15.5%] | | | | | | | | |
| Ally Financial, FDIC Insured | | | | | | | | |
| 2.200%, 12/19/12 | | | 4,500 | | | | 4,610 | |
| Boeing Capital | | | | | | | | |
| 6.500%, 02/15/12 | | | 930 | | | | 977 | |
| Caisse Centrale Desjardins du Quebec | | | | | | | | |
| 2.650%, 09/16/15(A) | | | 3,000 | | | | 2,928 | |
| CME Group | | | | | | | | |
| 5.400%, 08/01/13 | | | 95 | | | | 103 | |
| Duke Capital | | | | | | | | |
| 5.500%, 03/01/14 | | | 615 | | | | 668 | |
| General Electric Capital, Ser A, MTN | | | | | | | | |
| 6.000%, 06/15/12 | | | 2,100 | | | | 2,224 | |
| General Electric Capital, FDIC Insured, MTN | | | | | | | | |
| 2.625%, 12/28/12 | | | 2,770 | | | | 2,859 | |
| HSBC Finance | | | | | | | | |
| 5.250%, 04/15/15 | | | 1,250 | | | | 1,346 | |
| Irish Life & Permanent Group Holdings | | | | | | | | |
| 3.600%, 01/14/13(A) | | | 2,000 | | | | 1,750 | |
| National Rural Utilities, Ser C, MTN | | | | | | | | |
| 7.250%, 03/01/12 | | | 1,000 | | | | 1,060 | |
| | | | | | | 18,525 | |
| Food, Beverage & Tobacco [3.6%] | | | | | |
| Anheuser-Busch | | | | | | | | |
| 7.500%, 03/15/12 | | | 665 | | | | 705 | |
| Bottling Group | | | | | | | | |
| 5.500%, 04/01/16 | | | 1,000 | | | | 1,127 | |
| 4.625%, 11/15/12 | | | 1,435 | | | | 1,520 | |
| Dr Pepper Snapple Group | | | | | | | | |
| 2.900%, 01/15/16 | | | 1,000 | | | | 991 | |
Total Food, Beverage & Tobacco | | | | 4,343 | |
| Foreign Governments [3.8%] | | | | | | | | |
| Kingdom of Denmark | | | | | | | | |
| 2.750%, 11/15/11 | | $ | 3,000 | | | $ | 3,041 | |
| Korea National Oil | | | | | | | | |
| 2.875%, 11/09/15 (A) | | | 1,000 | | | | 968 | |
| United Mexican States, MTN | | | | | | | | |
| 5.875%, 01/15/14 | | | 450 | | | | 495 | |
Total Foreign Governments | | | | | | | 4,504 | |
| Internet Security [0.8%] | | | | | | | | |
| Symantec | | | | | | | | |
| | | 1,000 | | | | 973 | |
| Investment Banker/Broker Dealer [12.4%] | | | | | |
| Citigroup | | | | | | | | |
| 5.850%, 08/02/16 | | | 980 | | | | 1,062 | |
| 5.500%, 02/15/17 | | | 250 | | | | 260 | |
| Credit Suisse | | | | | | | | |
| 5.500%, 08/15/13 | | | 1,250 | | | | 1,354 | |
| Goldman Sachs Group | | | | | | | | |
| 5.625%, 01/15/17 | | | 1,700 | | | | 1,791 | |
| Jefferies Group | | | | | | | | |
| 8.500%, 07/15/19 | | | 870 | | | | 1,026 | |
| Macquarie Group | | | | | | | | |
| 6.000%, 01/14/20(A) | | | 2,000 | | | | 2,013 | |
| Merrill Lynch | | | | | | | | |
| 6.050%, 05/16/16 | | | 2,025 | | | | 2,140 | |
| Morgan Stanley, MTN | | | | | | | | |
| 5.500%, 01/26/20 | | | 1,990 | | | | 1,999 | |
| Nomura Holdings, MTN | | | | | | | | |
| 4.125%, 01/19/16 | | | 1,200 | | | | 1,187 | |
| Societe Generale | | | | | | | | |
| 2.200%, 09/14/13(A) | | | 2,000 | | | | 1,998 | |
Total Investment Banker/Broker Dealer | | | | 14,830 | |
| Metals & Mining [0.9%] | | | | | | | | |
| Alcoa | | | | | | | | |
| | | 1,000 | | | | 1,057 | |
| Multi-line Insurance [1.5%] | | | | | | | | |
| MetLife | | | | | | | | |
| | | 1,430 | | | | 1,738 | |
| Petroleum & Fuel Products [5.0%] | | | | | |
| ConocoPhillips Canada Funding I | | | | | | | | |
| 5.625%, 10/15/16 | | | 2,000 | | | | 2,259 | |
| Kinder Morgan Energy Partners | | | | | | | | |
| 5.800%, 03/01/21 | | | 1,000 | | | | 1,074 | |
See accompanying notes to financial statements.
CNI CHARTER FUNDS | PAGE 17
| schedule of investments |
March 31, 2011 (Unaudited) |
Corporate Bond Fund (continued) |
| Shell International Finance | | | | | | | | |
| 3.250%, 09/22/15 | | $ | 1,500 | | | $ | 1,549 | |
| Transocean | | | | | | | | |
| 6.000%, 03/15/18 | | | 1,000 | | | | 1,079 | |
Total Petroleum & Fuel Products | | | | 5,961 | |
| Real Estate Investment Trusts [2.8%] | | | | | |
| HCP | | | | | | | | |
| 5.650%, 12/15/13 | | | 500 | | | | 542 | |
| 5.625%, 05/01/17 | | | 500 | | | | 529 | |
| Health Care REIT | | | | | | | | |
| 4.700%, 09/15/17 | | | 1,000 | | | | 1,003 | |
| Kimco Realty | | | | | | | | |
| 6.875%, 10/01/19 | | | 1,080 | | | | 1,260 | |
Total Real Estate Investment Trusts | | | | 3,334 | |
| Retail [4.0%] | | | | | | | | |
| CVS Caremark | | | | | | | | |
| 6.125%, 08/15/16 | | | 1,000 | | | | 1,126 | |
| Home Depot | | | | | | | | |
| 5.250%, 12/16/13 | | | 1,000 | | | | 1,091 | |
| Kroger | | | | | | | | |
| 5.500%, 02/01/13 | | | 450 | | | | 482 | |
| Target | | | | | | | | |
| 6.000%, 01/15/18 | | | 1,770 | | | | 2,026 | |
| | | | | | | 4,725 | |
| Special Purpose Banks [1.7%] | | | | | | | | |
| Dexia Credit Local | | | | | | | | |
| | | 2,000 | | | | 1,995 | |
| Telephones & Telecommunications [4.6%] | | | | | |
| Deutsche Telekom International Finance | | | | | | | | |
| 5.250%, 07/22/13 | | | 475 | | | | 514 | |
| Motorola Solutions | | | | | | | | |
| 6.000%, 11/15/17 | | | 1,000 | | | | 1,094 | |
| New Cingular Wireless Services | | | | | | | | |
| 8.125%, 05/01/12 | | | 345 | | | | 371 | |
| Telefonica Emisiones | | | | | | | | |
| 6.421%, 06/20/16 | | | 1,000 | | | | 1,111 | |
| Verizon Communications | | | | | | | | |
| 5.550%, 02/15/16 | | | 2,195 | | | | 2,438 | |
Total Telephones & Telecommunications | | | | 5,528 | |
Total Corporate Bonds (Cost $106,293) | | | | | | | 109,440 | |
| Municipal Bonds [4.5%] | | | | | | | | |
| California [3.6%] | | | | | | | | |
| California State, City of Industry, Sales Tax Project, RB, NATL-RE | | | | | | | | |
| 5.000%, 01/01/12 | | $ | 955 | | | $ | 966 | |
| Irvine Ranch, Water District Authority, RB (C) | | | | | | | | |
| Pre-Refunded @ 100 | | | | | | | | |
| 8.180%, 03/15/11 | | | 1,200 | | | | 1,242 | |
| Los Angeles County, Metropolitan Transportation Authority, RB | | | | | | | | |
| 4.280%, 06/01/21 | | | 2,000 | | | | 1,934 | |
| State of California, GO | | | | | | | | |
| 5.700%, 11/01/21 | | | 185 | | | | 188 | |
| | | | | | | 4,330 | |
| Wisconsin [0.9%] | | | | | | | | |
| De Pere, Unified School District, GO, FGIC (C) | | | | | | | | |
| Pre-Refunded @ 100 | | | | | | | | |
| | | 995 | | | | 1,015 | |
Total Municipal Bonds (Cost $5,414) | | | | | | | 5,345 | |
| U.S. Government Mortgage-Backed Obligations [0.5%] | |
| FHLMC REMIC, Ser 2008-R015, Cl AN | | | | | | | | |
| 3.750%, 02/15/13 | | | 19 | | | | 19 | |
| FHLMC REMIC, Ser 2982, Cl NB | | | | | | | | |
| 5.500%, 02/15/29 | | | 134 | | | | 136 | |
| FNMA REMIC, Ser 2002-56, Cl MC | | | | | | | | |
| 5.500%, 09/25/17 | | | 381 | | | | 409 | |
| FNMA REMIC, Ser 2006-B1, Cl AB | | | | | | | | |
| 6.000%, 06/25/16 | | | 41 | | | | 41 | |
Total U.S. Government Mortgage-Backed Obligations (Cost $577) | | | | 605 | |
| U.S. Treasury Obligation [0.5%] | | | | | | | | |
| U.S. Treasury Inflation Protection Security | | | | | | | | |
| 2.000%, 01/15/14 | | | 596 | | | | 649 | |
Total U.S. Treasury Obligation (Cost $603) | | | | 649 | |
See accompanying notes to financial statements.
CNI CHARTER FUNDS | PAGE 18
| schedule of investments |
March 31, 2011 (Unaudited) |
Corporate Bond Fund (concluded) |
| | | | | | |
| Cash Equivalent [0.6%] | | | | | | |
| Goldman Sachs Financial Square Funds - Government Fund, 0.040%* | | | 758,346 | | | $ | 758 | |
Total Cash Equivalent (Cost $758) | | | | | | | 758 | |
| Repurchase Agreement(D) [1.7%] | | | | | | | | |
| Barclays | | | | | | | | |
| 0.110%, dated 03/31/11, repurchased on 04/01/11, repurchase price $2,000,006 (collateralized by a U.S. Treasury obligation, par value $2,037,973, 0.625%, 01/31/13; with total market value $2,040,053) | | $ | 2,000 | | | | 2,000 | |
Total Repurchase Agreement (Cost $2,000) | | | | 2,000 | |
Total Investments [99.5%] (Cost $115,645) | | | | | | $ | 118,797 | |
Percentages are based on Net Assets of $119,407 ($ Thousands).
| * | The rate reported is the 7-day effective yield as of March 31, 2011. |
| (A) | Security exempt from registration under Rule 144A of the Securities Act of 1933. These securities may be resold in transactions exempt from registration normally to qualified institutions. On March 31, 2011, the value of these securities amounted to $16,763 (000), representing 14.1% of the net assets of the Fund. |
| (B) | Floating Rate Security — The rate reported is the rate in effect on March 31, 2011. |
| (C) | Pre-Refunded Security — The maturity date shown is the pre-refunded date. |
| (D) | Tri-Party Repurchase Agreement. |
FDIC Insured — Federal Depositary Insurance Corporation
FGIC — Financial Guaranty Insurance Company
FHLMC — Federal Home Loan Mortgage Corporation
FNMA — Federal National Mortgage Association
GO — General Obligation
MTN — Medium Term Note
NATL-RE — National Public Finance Guarantee Corporation
RB — Revenue Bond
REIT — Real Estate Investment Trust
REMIC — Real Estate Mortgage Investment Conduit
Ser — Series
The following is a summary of the inputs used as of March 31, 2011 in valuing the Fund’s investments carried at value ($ Thousands) in accordance with ASC 820:
| Investments in Securities | | | | | | | | | | | | |
| Corporate Bonds | | $ | — | | | $ | 109,440 | | | $ | — | | | $ | 109,440 | |
| Municipal Bonds | | | — | | | | 5,345 | | | | — | | | | 5,345 | |
| U.S. Government Mortgage-Backed Obligations | | | — | | | | 605 | | | | — | | | | 605 | |
| U.S. Treasury Obligation | | | — | | | | 649 | | | | — | | | | 649 | |
| Cash Equivalent | | | 758 | | | | — | | | | — | | | | 758 | |
| Repurchase Agreement | | | — | | | | 2,000 | | | | — | | | | 2,000 | |
| Total Investments in Securities | | $ | 758 | | | $ | 118,039 | | | $ | — | | | $ | 118,797 | |
For the period ended March 31, 2011, there have been no significant transfers between Level 1 and Level 2 assets and liabilities.
For more information on valuation inputs, see Note 2 — Significant Accounting Policies in the Notes to Financial Statements.
See accompanying notes to financial statements.
CNI CHARTER FUNDS | PAGE 19
| schedule of investments |
March 31, 2011 (Unaudited) |
| California Tax Exempt Bond Fund |
| | | | | | |
| Municipal Bonds [94.4%] | | | | | | |
| Arizona [1.6%] | | | | | | |
| Arizona State, School Facilities Board, Ser C, COP, AGM | | | | | | |
| Callable 09/01/14 @ 100 | | | | | | |
| | $ | 750 | | | $ | 800 | |
| California [81.9%] | | | | | | | | |
| Atwater, Elementary School District, Ser A, GO, NATL-RE FGIC | | | | | | | | |
| Callable 08/01/13 @ 100 | | | | | | | | |
| 5.000%, 08/01/22 | | | 660 | | | | 671 | |
| Azusa, Redevelopment Agency, Mortgage-Backed Securities Program, Ser A, RB, FNMA, ETM | | | | | | | | |
| 6.875%, 10/01/12 | | | 200 | | | | 219 | |
| Bay Area, Infrastructure Financing Authority, State Payment Acceleration Project, RB, NATL-RE FGIC | | | | | | | | |
| Callable 08/01/14 @ 100 | | | | | | | | |
| 5.000%, 08/01/17 | | | 360 | | | | 366 | |
| Burbank, Public Financing Authority, Golden State Redevelopment Project, Ser A, TA, AMBAC (A) | | | | | | | | |
| Pre-Refunded @ 100 | | | | | | | | |
| 5.250%, 12/01/13 | | | 75 | | | | 84 | |
| California State Public Works Board, Ser C, RB, NATL-RE FGIC | | | | | | | | |
| 5.000%, 09/01/20 | | | 750 | | | | 824 | |
| California State Public Works Board, Ser C-1, RB | | | | | | | | |
| Callable 03/01/20 @ 100 | | | | | | | | |
| 5.000%, 03/01/21 | | $ | 600 | | | $ | 651 | |
| California State, Department of Water Resources, Power Supply Project, Ser H-PWR, RB, AGM | | | | | | | | |
| Callable 05/01/18 @ 100 | | | | | | | | |
| 5.000%, 05/01/21 | | | 1,000 | | | | 1,078 | |
| California State, Department of Water Resources, Water Systems Project, Ser J-2, RB | | | | | | | | |
| 7.000%, 12/01/12 | | | 500 | | | | 553 | |
| California State, Department of Water Resources, Water Systems Project, Ser Y, RB, NATL-RE FGIC | | | | | | | | |
| Callable 06/01/13 @ 100 | | | | | | | | |
| 5.250%, 12/01/19 | | | 515 | | | | 559 | |
| California State, Economic Recovery Authority, Ser A, GO, NATL-RE | | | | | | | | |
| Callable 07/01/14 @ 100 | | | | | | | | |
| 5.000%, 07/01/15 | | | 900 | | | | 981 | |
| California State, Educational Facilities Authority, Stanford University Project, Ser T-4, RB | | | | | | | | |
| 5.000%, 03/15/14 | | | 350 | | | | 391 | |
| California State, GO | | | | | | | | |
| Callable 02/01/12 @ 100 | | | | | | | | |
| 5.000%, 02/01/18 | | | 175 | | | | 179 | |
| California State, Infrastructure & Economic Authority, Bay Area Toll Bridges Project, Ser A, RB, AGM (A) | | | | | | | | |
| Pre-Refunded @ 100 | | | | | | | | |
| 5.250%, 07/01/13 | | | 125 | | | | 138 | |
| California State, Public Works Board Lease, Department of Corrections-Administration Project, Ser A, RB, AMBAC | | | | | | | | |
| Callable 03/01/12 @ 100 | | | | | | | | |
| 5.250%, 03/01/18 | | | 155 | | | | 158 | |
| California State, Public Works Board Lease, Department of Mental Health Project, Ser A, RB | | | | | | | | |
| 5.250%, 06/01/13 | | | 200 | | | | 211 | |
| California State, Public Works Board, Ser B-1, RB | | | | | | | | |
| 5.000%, 03/01/19 | | | 500 | | | | 522 | |
See accompanying notes to financial statements.
CNI CHARTER FUNDS | PAGE 20
| schedule of investments |
March 31, 2011 (Unaudited) |
California Tax Exempt Bond Fund (continued) |
| California Statewide Communities Development Authority, Ser A, RB | | | | | | | | |
| 5.000%, 04/01/19 | | $ | 150 | | | $ | 159 | |
| Carlsbad, Public Financing Authority, Municipal Golf Course Project, Ser A, RB, AMBAC | | | | | | | | |
| 4.500%, 09/01/16 | | | 350 | | | | 385 | |
| Castaic Lake Water Agency, Ser A, COP, AMBAC | | | | | | | | |
| Callable 08/01/16 @ 100 | | | | | | | | |
| 5.000%, 08/01/22 | | | 275 | | | | 286 | |
| Castaic Lake, Water Agency, Water Systems Improvement Project, Ser A, COP, NATL-RE | | | | | | | | |
| 7.000%, 08/01/13 | | | 300 | | | | 338 | |
| City & County of San Francisco California, Ser B, COP | | | | | | | | |
| Callable 04/01/19 @ 100 | | | | | | | | |
| 5.000%, 04/01/22 | | | 735 | | | | 766 | |
| Clovis, Public Financing Authority, Ser A, TA, NATL-RE | | | | | | | | |
| 3.250%, 08/01/13 | | | 400 | | | | 393 | |
| Dry Creek, Joint Elementary School District, Ser A, GO, AGM (B) | | | | | | | | |
| 3.212%, 08/01/11 | | | 200 | | | | 199 | |
| El Camino Hospital District, GO, NATL-RE | | | | | | | | |
| Callable 02/01/17 @ 100 | | | | | | | | |
| 5.000%, 08/01/20 | | | 500 | | | | 525 | |
| Escondido, Union School District, Refunding & Financing Project, COP, NATL-RE | | | | | | | | |
| 4.750%, 07/01/19 | | | 735 | | | | 799 | |
| Fresno, Unified School District, Election 2001 Project, Ser D, GO, NATL-RE (A) | | | | | | | | |
| Pre-Refunded @ 102 | | | | | | | | |
| 5.000%, 08/01/13 | | | 200 | | | | 224 | |
| Gilroy, Unified School District, GO (B) | | | | | | | | |
| 3.448%, 04/01/13 | | | 500 | | | | 474 | |
| Gilroy, Unified School District, GO, NATL-RE FGIC | | | | | | | | |
| Callable 08/01/13 @ 100 | | | | | | | | |
| 5.250%, 08/01/19 | | | 800 | | | | 836 | |
| Golden State, Tobacco Settlement, Ser A, RB, AMBAC | | | | | | | | |
| Callable 04/27/11 @ 100 | | | | | | | | |
| 5.000%, 06/01/20 | | $ | 500 | | | $ | 495 | |
| Golden State, Tobacco Settlement, Ser A-1, RB (A) | | | | | | | | |
| Pre-Refunded @ 100 | | | | | | | | |
| 6.750%, 06/01/13 | | | 920 | | | | 1,033 | |
| Jefferson, Unified High School District, Ser A, GO, NATL-RE FGIC | | | | | | | | |
| 5.000%, 08/01/14 | | | 200 | | | | 218 | |
| Kern, High School District, GO, ETM | | | | | | | | |
| 7.100%, 08/01/12 | | | 290 | | | | 315 | |
| Long Beach, Community College District, Ser A, GO | | | | | | | | |
| 9.850%, 01/15/13 | | | 500 | | | | 577 | |
| Los Angeles County, Metropolitan Transportation Authority, Proposition C, Ser A, RB, NATL-RE | | | | | | | | |
| Callable 07/01/14 @ 100 | | | | | | | | |
| 5.000%, 07/01/16 | | | 200 | | | | 221 | |
| Los Angeles County, Metropolitan Transportation Authority, Ser B, RB, AGM | | | | | | | | |
| Callable 07/01/11 @ 101 | | | | | | | | |
| 5.250%, 07/01/15 | | | 250 | | | | 255 | |
| Los Angeles County, Public Works Financing Authority, SAB, AGM | | | | | | | | |
| 5.250%, 10/01/18 | | | 750 | | | | 852 | |
| Los Angeles County, Sanitation Districts Financing Authority, Capital Projects (District #14), Sub-Ser B, RB, NATL-RE FGIC | | | | | | | | |
| 3.750%, 10/01/14 | | | 175 | | | | 184 | |
| Los Angeles Municipal Improvement, Ser E, RB | | | | | | | | |
| 5.000%, 09/01/15 | | | 200 | | | | 219 | |
| Los Angeles, Department of Water & Power, Power Systems Project, Ser A Sub-Ser-Ser A-1, RB, NATL-RE | | | | | | | | |
| 5.000%, 07/01/12 | | | 665 | | | | 701 | |
| Los Angeles, Department of Water & Power, Sub-Ser A-2, RB, AGM | | | | | | | | |
| Callable 07/01/15 @ 100 | | | | | | | | |
| 5.000%, 07/01/25 | | | 1,000 | | | | 1,033 | |
See accompanying notes to financial statements.
CNI CHARTER FUNDS | PAGE 21
| schedule of investments |
March 31, 2011 (Unaudited) |
California Tax Exempt Bond Fund (continued) |
| Los Angeles, Municipal Improvement Authority, Central Library Project, Ser A, RB, NATL-RE | | | | | | | | |
| Callable 06/01/12 @ 100 | | | | | | | | |
| 5.500%, 06/01/18 | | $ | 500 | | | $ | 520 | |
| Los Angeles, Municipal Improvement Authority, Central Library Project, Ser A, RB, NATL-RE | | | | | | | | |
| 5.250%, 06/01/12 | | | 300 | | | | 315 | |
| Los Angeles, Ser A, GO, AGM | | | | | | | | |
| Callable 09/01/12 @ 100 | | | | | | | | |
| 5.000%, 09/01/20 | | | 750 | | | | 781 | |
| Los Angeles, Unified School District, COP, AMBAC | | | | | | | | |
| 5.000%, 10/01/12 | | | 750 | | | | 786 | |
| Los Angeles, Unified School District, Ser A-1, GO, NATL-RE | | | | | | | | |
| Callable 07/01/14 @ 100 | | | | | | | | |
| 5.000%, 07/01/17 | | | 125 | | | | 134 | |
| Los Angeles, Wastewater Systems Authority, Ser A, RB | | | | | | | | |
| 5.000%, 06/01/14 | | | 825 | | | | 913 | |
| Mount San Antonio, Community College District, GO (B) | | | | | | | | |
| 3.787%, 05/01/15 | | | 500 | | | | 440 | |
| North Orange County, Community College District, Ser A, GO, NATL-RE (A) | | | | | | | | |
| Pre-Refunded @ 101 | | | | | | | | |
| 5.375%, 08/01/12 | | | 525 | | | | 563 | |
| Oakley, Civic Center Project, COP | | | | | | | | |
| 4.000%, 05/01/12 | | | 230 | | | | 236 | |
| Orange County, Public Financing Authority, RB, NATL-RE | | | | | | | | |
| 5.000%, 07/01/17 | | | 1,050 | | | | 1,171 | |
| Orange County, Sanitation District, Ser A, COP | | | | | | | | |
| 3.000%, 02/01/17 | | | 500 | | | | 506 | |
| Oxnard, School District, Election 2006 Project, Ser A, GO, CIFG | | | | | | | | |
| 6.750%, 08/01/11 | | | 300 | | | | 306 | |
| Pinole, Redevelopment Agency, Pinole Vista Redevelopment Project, TA, AGM | | | | | | | | |
| Callable 05/05/11 @ 100 | | | | | | | | |
| 5.250%, 08/01/14 | | | 100 | | | | 101 | |
| Port of Oakland, Ser B, RB, NATL-RE | | | | | | | | |
| Callable 11/01/17 @ 100 | | | | | | | | |
| 5.000%, 11/01/23 | | $ | 500 | | | $ | 497 | |
| Port of Oakland, Ser C, RB, NATL-RE | | | | | | | | |
| 5.000%, 11/01/15 | | | 450 | | | | 492 | |
| Sacramento, City Financing Authority, EPA Building Project, Ser A, RB, AMBAC | | | | | | | | |
| Callable 05/12/11 @ 100 | | | | | | | | |
| 4.750%, 05/01/17 | | | 525 | | | | 525 | |
| Sacramento, Municipal Utility District, Ser T, RB, NATL-RE FGIC | | | | | | | | |
| Callable 05/15/14 @ 100 | | | | | | | | |
| 5.250%, 05/15/22 | | | 805 | | | | 836 | |
| Sacramento, Unified School District, GO, NATL-RE | | | | | | | | |
| Callable 07/01/15 @ 100 | | | | | | | | |
| 5.000%, 07/01/18 | | | 300 | | | | 321 | |
| San Diego, Public Facilities Financing Authority, Ser B, RB | | | | | | | | |
| 5.000%, 05/15/14 | | | 750 | | | | 825 | |
| San Diego, Unified School District, Election 1998 Project, Ser E, GO, AGM | | | | | | | | |
| Callable 07/01/13 @ 101 | | | | | | | | |
| 5.250%, 07/01/16 | | | 100 | | | | 109 | |
| San Francisco City & County Airports Commission, Ser B, RB | | | | | | | | |
| 5.000%, 05/01/17 | | | 495 | | | | 542 | |
| San Francisco City & County Redevelopment Agency, Ser B, TA, NATL-RE FGIC | | | | | | | | |
| 5.250%, 08/01/13 | | | 500 | | | | 521 | |
| San Francisco City & County, Redevelopment Agency, Ser B, TA | | | | | | | | |
| 5.000%, 08/01/17 | | | 540 | | | | 550 | |
| San Francisco City & County, Redevelopment Agency, Ser B, TA, NATL-RE | | | | | | | | |
| 5.000%, 08/01/15 | | | 300 | | | | 312 | |
| San Francisco City & County, Redevelopment Agency, Ser B, TA, NATL-RE FGIC | | | | | | | | |
| Callable 08/01/13 @ 100 | | | | | | | | |
| 5.250%, 08/01/18 | | | 600 | | | | 609 | |
See accompanying notes to financial statements.
CNI CHARTER FUNDS | PAGE 22
| schedule of investments |
March 31, 2011 (Unaudited) |
California Tax Exempt Bond Fund (continued) |
| San Francisco, Bay Area Transit Financing Authority, Ser A, RB, NATL-RE | | | | | | | | |
| Callable 07/01/15 @ 100 | | | | | | | | |
| 5.000%, 07/01/24 | | $ | 550 | | | $ | 572 | |
| San Jose, Redevelopment Agency, Ser A, TA, NATL-RE | | | | | | | | |
| Callable 08/01/15 @ 100 | | | | | | | | |
| 5.000%, 08/01/17 | | | 795 | | | | 758 | |
| Santa Margarita, Dana Point Authority, Ser A, RB, AMBAC | | | | | | | | |
| Callable 08/01/14 @ 100 | | | | | | | | |
| 5.000%, 08/01/15 | | | 165 | | | | 181 | |
| Solano County, COP, NATL-RE (A) | | | | | | | | |
| Pre-Refunded @ 100 | | | | | | | | |
| 5.250%, 11/01/12 | | | 100 | | | | 107 | |
| Southern California Public Power Authority, Sub-Ser, RB | | | | | | | | |
| 5.000%, 07/01/17 | | | 1,200 | | | | 1,356 | |
| Southern California, Metropolitan Water District Authority, Ser A, RB | | | | | | | | |
| 5.750%, 07/01/21 | | | 280 | | | | 326 | |
| State of California, GO | | | | | | | | |
| Callable 11/01/20 @ 100 | | | | | | | | |
| 5.000%, 11/01/22 | | | 1,025 | | | | 1,074 | |
| State of California, Ser A, GO, NATL-RE FGIC | | | | | | | | |
| Callable 07/01/11 @ 100 | | | | | | | | |
| 5.000%, 07/01/17 | | | 500 | | | | 505 | |
| State of California, Ser A-2, RB | | | | | | | | |
| 3.000%, 06/28/11 | | | 1,000 | | | | 1,006 | |
| State of California, Ser B, GO (C) | | | | | | | | |
| 4.000%, 07/01/23 | | | 750 | | | | 793 | |
| Tamalpais, Unified High School District, GO, NATL-RE (A) | | | | | | | | |
| Pre-Refunded @ 101 | | | | | | | | |
| 4.875%, 08/01/11 | | | 100 | | | | 103 | |
| University of California, Ser A, RB, AMBAC | | | | | | | | |
| Callable 05/15/13 @ 100 | | | | | | | | |
| 5.125%, 05/15/20 | | | 510 | | | | 546 | |
| University of California, Ser A, RB, NATL-RE | | | | | | | | |
| Callable 05/15/12 @ 101 | | | | | | | | |
| 4.750%, 05/15/23 | | | 500 | | | | 506 | |
| University of California, Ser B, RB, AGM (A) | | | | | | | | |
| Pre-Refunded @ 101 | | | | | | | | |
| 5.000%, 05/15/13 | | | 750 | | | | 823 | |
| University of California, Ser E, RB | | | | | | | | |
| Callable 05/15/17 @ 101 | | | | | | | | |
| 5.000%, 05/15/21 | | $ | 250 | | | $ | 263 | |
| University of California, Ser Q, RB, AGM | | | | | | | | |
| Callable 09/01/11 @ 101 | | | | | | | | |
| 5.000%, 09/01/22 | | | 10 | | | | 10 | |
| | | | | | | 40,912 | |
| Illinois [0.7%] | | | | | | | | |
| Cook County, Forest Preservation District, GO, AMBAC | | | | | | | | |
| Callable 11/15/14 @ 100 | | | | | | | | |
| | | 300 | | | | 329 | |
| New Jersey [0.7%] | | | | | | | | |
| New Jersey State, Turnpike Authority, Ser C, RB, NATL-RE-IBC-BNY, ETM | | | | | | | | |
| | | 315 | | | | 354 | |
| New Mexico [0.8%] | | | | | | | | |
| Santa Fe, Educational Facilities Authority, College of Santa Fe Project, RB (A) | | | | | | | | |
| Pre-Refunded @ 100 | | | | | | | | |
| | | 350 | | | | 403 | |
| New York [2.1%] | | | | | | | | |
| New York City, Housing Development, Ser F, RB | | | | | | | | |
| Callable 05/05/11 @ 100 | | | | | | | | |
| 1.950%, 11/01/12 | | | 500 | | | | 500 | |
| New York State, Local Assistance Correction Authority, Ser E, RB | | | | | | | | |
| 6.000%, 04/01/14 | | | 490 | | | | 534 | |
| | | | | | | 1,034 | |
| South Carolina [1.6%] | | | | | | | | |
| Columbia South Carolina, Tourism Development Fee Pledge Project, COP, AMBAC | | | | | | | | |
| Callable 06/01/13 @ 100 | | | | | | | | |
| 5.250%, 06/01/16 | | | 350 | | | | 367 | |
See accompanying notes to financial statements.
CNI CHARTER FUNDS | PAGE 23
| schedule of investments |
March 31, 2011 (Unaudited) |
California Tax Exempt Bond Fund (concluded) |
| | | | | | |
| South Carolina, Jobs & Economic Development Authority, Palmetto Health Project, Ser C, RB (A) | | | | | | |
| Pre-Refunded @ 100 | | | | | | |
| 6.875%, 08/01/13 | | $ | 400 | | | $ | 454 | |
| | | | | | | 821 | |
| Washington [2.8%] | | | | | | | | |
| Central Puget Sound Regional Transit Authority, Ser A, RB, AMBAC | | | | | | | | |
| Callable 05/01/15 @ 100 | | | | | | | | |
| 5.000%, 11/01/21 | | | 1,000 | | | | 1,053 | |
| King County, NJB Properties Project, Ser A, RB | | | | | | | | |
| 5.000%, 12/01/14 | | | 325 | | | | 363 | |
| | | | | | | 1,416 | |
| West Virginia [1.1%] | | | | | | | | |
| West Virginia State, Economic Development Authority, Correctional Juvenile Project, Ser A, RB, NATL-RE | | | | | | | | |
| Callable 06/01/12 @ 101 | | | | | | | | |
| | | 500 | | | | 525 | |
| Puerto Rico [1.1%] | | | | | | | | |
| Puerto Rico, Sales Tax Financing, Sub-Ser A, RB | | | | | | | | |
| | | 500 | | | | 524 | |
Total Municipal Bonds (Cost $46,698) | | | | | | | 47,118 | |
| Cash Equivalent [3.6%] | | | | | | | | |
| Federated California Municipal Money Market Fund, Cl I, 0.090%* | | | 1,801,196 | | | | 1,801 | |
Total Cash Equivalent (Cost $1,801) | | | | | | | 1,801 | |
Total Investments [98.0%] (Cost $48,499) | | | | | | $ | 48,919 | |
Percentages are based on Net Assets of $49,925 ($ Thousands).
| * | The rate reported is the 7-day current yield as of March 31, 2011. |
| (A) | Pre-Refunded Security — The maturity date shown is the pre-refunded date. |
| (B) | Zero coupon security. The rate reported is the effective yield at time of purchase. |
| (C) | Floating Rate Security — The rate reported is the rate in effect on March 31, 2011. |
AGM — Assured Guarantee Municipal
AMBAC — American Municipal Bond Assurance Company
CIFG — CDC IXIS Financial Guarantee
Cl — Class
COP — Certificate of Participation
ETM — Escrowed to Maturity
FGIC — Financial Guaranty Insurance Company
FNMA — Federal National Mortgage Association
GO — General Obligation
NATL-RE — National Public Finance Guarantee Corporation
RB — Revenue Bond
SAB — Special Assessment Board
Ser — Series
TA — Tax Allocation
The following is a summary of the inputs used as of March 31, 2011 in valuing the Fund’s investments carried at value ($ Thousands):
| Investments in Securities | | | | | | | | | | | | |
| Municipal Bonds | | $ | — | | | $ | 47,118 | | | $ | — | | | $ | 47,118 | |
| Cash Equivalent | | | 1,801 | | | | — | | | | — | | | | 1,801 | |
| Total Investments in Securities | | $ | 1,801 | | | $ | 47,118 | | | $ | — | | | $ | 48,919 | |
For the period ended March 31, 2011, there have been no significant transfers between Level 1 and Level 2 assets and liabilities.
For more information on valuation inputs, see Note 2 — Significant Accounting Policies in the Notes to Financial Statements.
See accompanying notes to financial statements.
CNI CHARTER FUNDS | PAGE 24
| schedule of investments |
March 31, 2011 (Unaudited) |
| Full Maturity Fixed Income Fund |
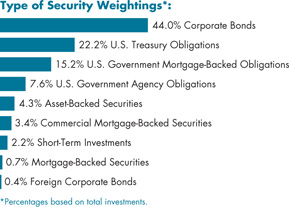
| | | | | | |
| Corporate Bonds [44.1%] | | | | | | |
| Agriculture [0.2%] | | | | | | |
| Bunge NA Finance | | | | | | |
| | $ | 100 | | | $ | 106 | |
| Automotive [0.5%] | | | | | | | | |
| Daimler Finance North America | | | | | | | | |
| 7.300%, 01/15/12 | | | 125 | | | | 131 | |
| Johnson Controls | | | | | | | | |
| 5.500%, 01/15/16 | | | 100 | | | | 111 | |
| | | | | | | 242 | |
| Banks [12.0%] | | | | | | | | |
| ANZ National Int'l | | | | | | | | |
| 2.375%, 12/21/12(A) | | | 100 | | | | 101 | |
| Bank of America | | | | | | | | |
| 10.200%, 07/15/15 | | | 100 | | | | 123 | |
| Bank of America, MTN | | | | | | | | |
| 5.650%, 05/01/18 | | | 330 | | | | 345 | |
| Bank of Nova Scotia | | | | | | | | |
| 2.250%, 01/22/13 | | | 425 | | | | 434 | |
| Barclays Bank | | | | | | | | |
| 5.125%, 01/08/20 | | | 100 | | | | 102 | |
| BB&T, MTN | | | | | | | | |
| 3.375%, 09/25/13 | | | 380 | | | | 395 | |
| Canadian Imperial Bank of Commerce | | | | | | | | |
| 2.350%, 12/11/15 | | | 415 | | | | 403 | |
| Citigroup | | | | | | | | |
| 6.375%, 08/12/14 | | | 455 | | | | 503 | |
| Deutsche Bank, MTN | | | | | | | | |
| 3.450%, 03/30/15 | | | 100 | | | | 102 | |
| Deutsche Bank Trust | | | | | | | | |
| 7.250%, 10/15/11 | | | 46 | | | | 48 | |
| Dresdner Bank - New York | | | | | | | | |
| 7.250%, 09/15/15 | | $ | 150 | | | $ | 161 | |
| European Investment Bank | | | | | | | | |
| 4.625%, 03/21/12 | | | 250 | | | | 260 | |
| Goldman Sachs Group | | | | | | | | |
| 3.625%, 02/07/16 | | | 510 | | | | 505 | |
| JPMorgan Chase | | | | | | | | |
| 4.650%, 06/01/14 | | | 480 | | | | 513 | |
| 4.250%, 10/15/20 | | | 150 | | | | 143 | |
| KeyCorp, MTN | | | | | | | | |
| 3.750%, 08/13/15 | | | 265 | | | | 268 | |
| Kookmin Bank | | | | | | | | |
| 7.250%, 05/14/14(A) | | | 100 | | | | 113 | |
| PNC Funding | | | | | | | | |
| 4.250%, 09/21/15 | | | 380 | | | | 400 | |
| 3.000%, 05/19/14 | | | 125 | | | | 128 | |
| SunTrust Banks | | | | | | | | |
| 5.250%, 11/05/12 | | | 100 | | | | 105 | |
| 3.600%, 04/15/16 | | | 140 | | | | 139 | |
| Wachovia, MTN | | | | | | | | |
| 5.500%, 05/01/13 | | | 275 | | | | 297 | |
| Wells Fargo | | | | | | | | |
| 3.625%, 04/15/15 | | | 125 | | | | 129 | |
| | | | | | | 5,717 | |
| Cable/Media [1.7%] | | | | | | | | |
| Comcast | | | | | | | | |
| 4.950%, 06/15/16 | | | 250 | | | | 267 | |
| DIRECTV Holdings | | | | | | | | |
| 3.500%, 03/01/16 | | | 150 | | | | 150 | |
| TCI Communications | | | | | | | | |
| 7.875%, 08/01/13 | | | 75 | | | | 85 | |
| Time Warner Cable | | | | | | | | |
| 4.125%, 02/15/21 | | | 330 | | | | 309 | |
| | | | | | | 811 | |
| Chemicals [0.9%] | | | | | | | | |
| Dow Chemical | | | | | | | | |
| 2.500%, 02/15/16 | | | 280 | | | | 269 | |
| PPG Industries | | | | | | | | |
| 1.900%, 01/15/16 | | | 180 | | | | 171 | |
| | | | | | | 440 | |
| Computer System Design & Services [0.9%] | | | | | |
| Hewlett-Packard | | | | | | | | |
| | | 450 | | | | 441 | |
See accompanying notes to financial statements.
CNI CHARTER FUNDS | PAGE 25
| schedule of investments |
March 31, 2011 (Unaudited) |
Full Maturity Fixed Income Fund (continued) |
| Data Processing [0.1%] | | | | | | | | |
| Fiserv | | | | | | | | |
| | $ | 55 | | | $ | 59 | |
| Drugs [1.2%] | | | | | | | | |
| McKesson | | | | | | | | |
| 3.250%, 03/01/16 | | | 135 | | | | 136 | |
| Novartis Capital | | | | | | | | |
| 4.125%, 02/10/14 | | | 110 | | | | 118 | |
| Teva Pharmaceutical | | | | | | | | |
| 5.550%, 02/01/16 | | | 75 | | | | 83 | |
| Wyeth | | | | | | | | |
| 5.500%, 02/15/16 | | | 240 | | | | 269 | |
| | | | | | | 606 | |
| Energy [2.1%] | | | | | | | | |
| Baltimore Gas & Electric | | | | | | | | |
| 6.125%, 07/01/13 | | | 230 | | | | 252 | |
| Carolina Power & Light | | | | | | | | |
| 5.150%, 04/01/15 | | | 80 | | | | 87 | |
| Exelon | | | | | | | | |
| 5.625%, 06/15/35 | | | 75 | | | | 70 | |
| Korea Electric Power | | | | | | | | |
| 7.750%, 04/01/13 | | | 95 | | | | 105 | |
| 6.750%, 08/01/27 | | | 75 | | | | 84 | |
| PPL Energy Supply, Ser A | | | | | | | | |
| 5.700%, 10/15/15 | | | 75 | | | | 80 | |
| Public Service of Colorado | | | | | | | | |
| 3.200%, 11/15/20 | | | 215 | | | | 200 | |
| Trans-Allegheny Interstate Line | | | | | | | | |
| 4.000%, 01/15/15(A) | | | 100 | | | | 103 | |
| | | | | | | 981 | |
| Financial Services [4.3%] | | | | | | | | |
| American Express Credit, MTN | | | | | | | | |
| 7.300%, 08/20/13 | | | 405 | | | | 453 | |
| Bank of New York Mellon, MTN | | | | | | | | |
| 3.100%, 01/15/15 | | | 265 | | | | 272 | |
| Caterpillar Financial Services, MTN | | | | | | | | |
| 6.200%, 09/30/13 | | | 225 | | | | 251 | |
| Eksportfinans | | | | | | | | |
| 3.000%, 11/17/14 | | | 210 | | | | 216 | |
| General Electric Capital | | | | | | | | |
| 2.250%, 11/09/15 | | | 250 | | | | 240 | |
| General Electric Capital, MTN | | | | | | | | |
| 6.000%, 08/07/19 | | | 125 | | | | 136 | |
| General Electric Capital, Ser A, MTN | | | | | | | | |
| 6.000%, 06/15/12 | | $ | 75 | | | $ | 79 | |
| HSBC Finance | | | | | | | | |
| 6.676%, 01/15/21(A) | | | 83 | | | | 86 | |
| National Rural Utilities Cooperative Finance | | | | | | | | |
| 10.375%, 11/01/18 | | | 125 | | | | 171 | |
| UFJ Finance Aruba | | | | | | | | |
| 6.750%, 07/15/13 | | | 125 | | | | 138 | |
| | | | | | | 2,042 | |
| Food, Beverage & Tobacco [1.8%] | | | | | |
| Cia de Bebidas das Americas | | | | | | | | |
| 8.750%, 09/15/13 | | | 175 | | | | 200 | |
| General Mills | | | | | | | | |
| 5.650%, 02/15/19 | | | 120 | | | | 133 | |
| Kellogg | | | | | | | | |
| 4.450%, 05/30/16 | | | 230 | | | | 246 | |
| Kraft Foods | | | | | | | | |
| 6.500%, 08/11/17 | | | 235 | | | | 268 | |
Total Food, Beverage & Tobacco | | | | 847 | |
| Insurance [2.5%] | | | | | | | | |
| Aflac | | | | | | | | |
| 3.450%, 08/15/15 | | | 85 | | | | 85 | |
| Berkshire Hathaway | | | | | | | | |
| 3.200%, 02/11/15 | | | 265 | | | | 273 | |
| MetLife | | | | | | | | |
| 5.000%, 06/15/15 | | | 250 | | | | 269 | |
| Protective Life | | | | | | | | |
| 4.300%, 06/01/13 | | | 100 | | | | 104 | |
| Prudential Financial | | | | | | | | |
| 5.375%, 06/21/20 | | | 180 | | | | 188 | |
| Prudential Financial, MTN | | | | | | | | |
| 2.750%, 01/14/13 | | | 100 | | | | 102 | |
| Travelers | | | | | | | | |
| 3.900%, 11/01/20 | | | 185 | | | | 175 | |
| | | | | | | 1,196 | |
| Invest Mgmnt/Advis Serv [0.6%] | | | | | |
| BlackRock | | | | | | | | |
| | | 260 | | | | 272 | |
| Investment Banker/Broker Dealer [2.3%] | | | | | |
| Goldman Sachs Group | | | | | | | | |
| 5.150%, 01/15/14 | | | 75 | | | | 81 | |
See accompanying notes to financial statements.
CNI CHARTER FUNDS | PAGE 26
| schedule of investments |
March 31, 2011 (Unaudited) |
Full Maturity Fixed Income Fund (continued) |
| Jefferies Group | | | | | | | | |
| 6.450%, 06/08/27 | | $ | 100 | | | $ | 100 | |
| Morgan Stanley | | | | | | | | |
| 5.300%, 03/01/13 | | | 485 | | | | 516 | |
| 4.750%, 04/01/14 | | | 75 | | | | 78 | |
| Morgan Stanley, MTN | | | | | | | | |
| 6.625%, 04/01/18 | | | 100 | | | | 110 | |
| TD Ameritrade Holding | | | | | | | | |
| 4.150%, 12/01/14 | | | 200 | | | | 208 | |
Total Investment Banker/Broker Dealer | | | | 1,093 | |
| Machinery-Construction and Mining [0.5%] | |
| Caterpillar | | | | | | | | |
| | | 175 | | | | 225 | |
| Manufacturing [1.1%] | | | | | | | | |
| General Electric | | | | | | | | |
| 5.000%, 02/01/13 | | | 260 | | | | 277 | |
| Tyco International Finance | | | | | | | | |
| 4.125%, 10/15/14 | | | 250 | | | | 266 | |
| | | | | | | 543 | |
| Medical Products [0.3%] | | | | | | | | |
| Zimmer Holdings | | | | | | | | |
| | | 115 | | | | 119 | |
| Medical-HMO [0.4%] | | | | | | | | |
| UnitedHealth Group | | | | | | | | |
| 4.750%, 02/10/14 | | | 40 | | | | 43 | |
| 4.700%, 02/15/21 | | | 165 | | | | 167 | |
| | | | | | | 210 | |
| Metals & Mining [0.4%] | | | | | | | | |
| Rio Tinto Finance USA | | | | | | | | |
| 6.500%, 07/15/18 | | | 100 | | | | 115 | |
| Vale Overseas | | | | | | | | |
| 6.875%, 11/21/36 | | | 100 | | | | 106 | |
| | | | | | | 221 | |
| Multi-Media [1.0%] | | | | | | | | |
| Time Warner | | | | | | | | |
| 5.875%, 11/15/16 | | | 290 | | | | 324 | |
| Viacom | | | | | | | | |
| 6.250%, 04/30/16 | | | 125 | | | | 142 | |
| | | | | | | 466 | |
| Networking Products [0.5%] | | | | | | | | |
| Cisco Systems | | | | | | | | |
| 5.500%, 01/15/40 | | $ | 100 | | | $ | 98 | |
| 4.950%, 02/15/19 | | | 125 | | | | 134 | |
Total Networking Products | | | | | | | 232 | |
| Oil, Gas & Consumable Fuels [1.2%] | | | | | |
| BP Capital Markets | | | | | | | | |
| 3.200%, 03/11/16 | | | 100 | | | | 100 | |
| 3.125%, 10/01/15 | | | 215 | | | | 216 | |
| Total Capital | | | | | | | | |
| 3.125%, 10/02/15 | | | 250 | | | | 255 | |
Total Oil, Gas & Consumable Fuels | | | | 571 | |
| Oil-Field Services [0.3%] | | | | | | | | |
| Weatherford International Bermuda | | | | | |
| | | 140 | | | | 139 | |
| Petroleum & Fuel Products [0.7%] | | | | | |
| Energy Transfer Partners | | | | | | | | |
| 6.625%, 10/15/36 | | | 75 | | | | 78 | |
| Enterprise Products Operating | | | | | | | | |
| 3.700%, 06/01/15 | | | 125 | | | | 129 | |
| Kinder Morgan Energy Partners | | | | | | | | |
| 5.300%, 09/15/20 | | | 125 | | | | 130 | |
Total Petroleum & Fuel Products | | | | 337 | |
| REITS-Health Care [0.6%] | | | | | | | | |
| Health Care REIT | | | | | | | | |
| | | 275 | | | | 265 | |
| REITS-Office Property [0.6%] | | | | | | | | |
| Boston Properties | | | | | | | | |
| | | 270 | | | | 293 | |
| Retail [1.5%] | | | | | | | | |
| Home Depot | | | | | | | | |
| 5.400%, 03/01/16 | | | 305 | | | | 337 | |
| Lowe's | | | | | | | | |
| 5.000%, 10/15/15 | | | 325 | | | | 361 | |
| | | | | | | 698 | |
| Retail-Drug Store [0.6%] | | | | | | | | |
| CVS Caremark | | | | | | | | |
| | | 235 | | | | 259 | |
See accompanying notes to financial statements.
CNI CHARTER FUNDS | PAGE 27
| schedule of investments |
March 31, 2011 (Unaudited) |
Full Maturity Fixed Income Fund (continued) |
| Telephones & Telecommunications [3.0%] | | | | | |
| AT&T | | | | | | | | |
| 5.600%, 05/15/18 | | $ | 310 | | | $ | 340 | |
| British Telecommunications | | | | | | | | |
| 9.875%, 12/15/30 | | | 100 | | | | 138 | |
| Deutsche Telekom International Finance | | | | | | | | |
| 8.750%, 06/15/30 | | | 75 | | | | 98 | |
| Deutsche Telekom International Finance BV | | | | | | | | |
| 6.000%, 07/08/19 | | | 50 | | | | 57 | |
| GTE | | | | | | | | |
| 6.840%, 04/15/18 | | | 100 | | | | 116 | |
| New Cingular Wireless Services | | | | | | | | |
| 8.750%, 03/01/31 | | | 75 | | | | 103 | |
| Telecom Italia Capital | | | | | | | | |
| 7.200%, 07/18/36 | | | 75 | | | | 75 | |
| Telefonica Emisiones | | | | | | | | |
| 6.421%, 06/20/16 | | | 75 | | | | 83 | |
| Verizon Communications | | | | | | | | |
| 3.000%, 04/01/16 | | | 425 | | | | 423 | |
Total Telephones & Telecommunications | | | | 1,433 | |
| Transportation Services [0.3%] | | | | | | | | |
| FedEx | | | | | | | | |
| | | 125 | | | | 137 | |
Total Corporate Bonds (Cost $20,315) | | | | | | | 21,001 | |
| U.S. Treasury Obligations [22.2%] | | | | | |
| U.S. Treasury Bonds | | | | | | | | |
| 6.250%, 08/15/23 | | | 1,575 | | | | 1,956 | |
| 5.250%, 11/15/28 | | | 650 | | | | 732 | |
| 4.375%, 02/15/38 | | | 625 | | | | 615 | |
| U.S. Treasury Notes | | | | | | | | |
| 4.750%, 05/15/14 | | | 780 | | | | 863 | |
| 4.250%, 08/15/13 | | | 550 | | | | 592 | |
| 4.250%, 11/15/17 | | | 135 | | | | 147 | |
| 2.625%, 04/30/16 | | | 425 | | | | 433 | |
| 2.375%, 09/30/14 | | | 975 | | | | 1,003 | |
| 2.375%, 03/31/16 | | | 1,925 | | | | 1,938 | |
| 2.375%, 07/31/17 | | | 1,270 | | | | 1,245 | |
| 1.750%, 07/31/15 | | | 1,085 | | | | 1,077 | |
Total U.S. Treasury Obligations (Cost $10,629) | | | | 10,601 | |
| U.S. Government Mortgage-Backed Obligations [15.4%] | |
| FHLMC, Pool 1B2677 | | | | | | | | |
| 2.650%, 01/01/35(B) | | $ | 13 | | | $ | 14 | |
| FHLMC, Pool 1B2683 | | | | | | | | |
| 2.652%, 01/01/35(B) | | | 10 | | | | 10 | |
| FHLMC, Pool 1B2692 | | | | | | | | |
| 2.506%, 12/01/34(B) | | | 28 | | | | 30 | |
| FHLMC, Pool A93996 | | | | | | | | |
| 4.500%, 09/01/40 | | | 189 | | | | 192 | |
| FHLMC, Pool C03490 | | | | | | | | |
| 4.500%, 08/01/40 | | | 531 | | | | 540 | |
| FHLMC, Pool C20300 | | | | | | | | |
| 6.500%, 01/01/29 | | | 7 | | | | 8 | |
| FHLMC, Pool G08003 | | | | | | | | |
| 6.000%, 07/01/34 | | | 71 | | | | 78 | |
| FHLMC, Pool G11431 | | | | | | | | |
| 6.000%, 02/01/18 | | | 14 | | | | 15 | |
| FHLMC, Pool G11911 | | | | | | | | |
| 5.000%, 02/01/21 | | | 145 | | | | 155 | |
| FHLMC, Pool G13767 | | | | | | | | |
| 4.000%, 03/01/25 | | | 522 | | | | 538 | |
| FHLMC, Pool G18124 | | | | | | | | |
| 6.000%, 06/01/21 | | | 43 | | | | 47 | |
| FHLMC Gold, Pool E01280 | | | | | | | | |
| 5.000%, 12/01/17 | | | 21 | | | | 22 | |
| FHLMC Gold, Pool G04222 | | | | | | | | |
| 5.500%, 04/01/38 | | | 134 | | | | 143 | |
| FHLMC Gold, Pool G11880 | | | | | | | | |
| 5.000%, 12/01/20 | | | 62 | | | | 66 | |
| FHLMC REMIC, Ser 2007-R010, Cl VA | | | | | | | | |
| 5.500%, 04/15/17 | | | 99 | | | | 107 | |
| FHLMC REMIC, Ser 2009-3540, Cl CD, | | | | | | | | |
| 2.000%, 06/15/14 | | | 172 | | | | 173 | |
| FHLMC REMIC, Ser 2730, Cl PD | | | | | | | | |
| 5.000%, 05/15/21 | | | 103 | | | | 106 | |
| FHLMC REMIC, Ser 2804, Cl VC | | | | | | | | |
| 5.000%, 07/15/21 | | | 140 | | | | 150 | |
| FHLMC REMIC, Ser 3122, Cl VA | | | | | | | | |
| 6.000%, 01/15/17 | | | 93 | | | | 97 | |
| FHLMC REMIC, Ser 3132, Cl MA | | | | | | | | |
| 5.500%, 12/15/23 | | | 33 | | | | 34 | |
| FHLMC REMIC, Ser R003, Cl VA | | | | | | | | |
| 5.500%, 08/15/16 | | | 114 | | | | 122 | |
| FHLMC REMIC, Ser R009, Cl AJ | | | | | | | | |
| 5.750%, 12/15/18 | | | 34 | | | | 36 | |
See accompanying notes to financial statements.
CNI CHARTER FUNDS | PAGE 28
| schedule of investments |
March 31, 2011 (Unaudited) |
Full Maturity Fixed Income Fund (continued) |
| FHLMC REMIC, Ser R010, Cl AB | | | | | | | | |
| 5.500%, 12/15/19 | | $ | 108 | | | $ | 114 | |
| FNMA, Pool 252570 | | | | | | | | |
| 6.500%, 07/01/29 | | | 16 | | | | 18 | |
| FNMA, Pool 253183 | | | | | | | | |
| 7.500%, 04/01/30 | | | 1 | | | | 2 | |
| FNMA, Pool 253398 | | | | | | | | |
| 8.000%, 08/01/30 | | | 5 | | | | 6 | |
| FNMA, Pool 254510 | | | | | | | | |
| 5.000%, 11/01/17 | | | 28 | | | | 30 | |
| FNMA, Pool 254545 | | | | | | | | |
| 5.000%, 12/01/17 | | | 56 | | | | 60 | |
| FNMA, Pool 254685 | | | | | | | | |
| 5.000%, 04/01/18 | | | 45 | | | | 48 | |
| FNMA, Pool 254949 | | | | | | | | |
| 5.000%, 11/01/33 | | | 50 | | | | 52 | |
| FNMA, Pool 255814 | | | | | | | | |
| 5.500%, 08/01/35 | | | 125 | | | | 134 | |
| FNMA, Pool 303168 | | | | | | | | |
| 9.500%, 02/01/25 | | | 4 | | | | 5 | |
| FNMA, Pool 725424 | | | | | | | | |
| 5.500%, 04/01/34 | | | 94 | | | | 102 | |
| FNMA, Pool 735060 | | | | | | | | |
| 6.000%, 11/01/34 | | | 53 | | | | 58 | |
| FNMA, Pool 735228 | | | | | | | | |
| 5.500%, 02/01/35 | | | 50 | | | | 54 | |
| FNMA, Pool 735230 | | | | | | | | |
| 5.500%, 02/01/35 | | | 117 | | | | 126 | |
| FNMA, Pool 745275 | | | | | | | | |
| 5.000%, 02/01/36 | | | 564 | | | | 593 | |
| FNMA, Pool 745418 | | | | | | | | |
| 5.500%, 04/01/36 | | | 692 | | | | 744 | |
| FNMA, Pool 827223 | | | | | | | | |
| 2.340%, 04/01/35(B) | | | 106 | | | | 110 | |
| FNMA, Pool 844809 | | | | | | | | |
| 5.000%, 11/01/35 | | | 387 | | | | 407 | |
| FNMA, Pool 995865 | | | | | | | | |
| 4.500%, 07/01/24 | | | 509 | | | | 534 | |
| FNMA, Pool AD0454 | | | | | | | | |
| 5.000%, 11/01/21 | | | 135 | | | | 144 | |
| FNMA, Pool AD8522 | | | | | | | | |
| 4.000%, 08/01/40 | | | 177 | | | | 175 | |
| FNMA REMIC, Ser 136, Cl PK | | | | | | | | |
| 6.000%, 08/25/22 | | | 17 | | | | 19 | |
| FNMA REMIC, Ser 33, Cl LD | | | | | | | | |
| 4.250%, 09/25/22 | | | 70 | | | | 72 | |
| FNMA REMIC, Ser W6, Cl 1A6 | | | | | | | | |
| 5.500%, 07/25/34 | | | 51 | | | | 54 | |
| FNMA REMIC, Ser B2, Cl AB | | | | | | | | |
| 5.500%, 05/25/14 | | | 25 | | | | 25 | |
| GNMA, Pool 479168 | | | | | | | | |
| 8.000%, 02/15/30 | | $ | 8 | | | $ | 9 | |
| GNMA, Pool 780315 | | | | | | | | |
| 9.500%, 12/15/17 | | | 8 | | | | 10 | |
| GNMA, Pool G2 4696 | | | | | | | | |
| 4.500%, 05/20/40 | | | 381 | | | | 393 | |
| GNMA, Pool G2 4747 | | | | | | | | |
| 5.000%, 07/20/40 | | | 165 | | | | 175 | |
| GNMA, Pool G2 4923 | | | | | | | | |
| 4.500%, 01/20/41 | | | 199 | | | | 206 | |
| NCUA Guaranteed Notes, Ser 2010-R1, Cl 2A | | | | | | | | |
| 1.840%, 10/07/20 | | | 165 | | | | 165 | |
Total U.S. Government Mortgage-Backed Obligations (Cost $7,142) | | | | 7,327 | |
| U.S. Government Agency Obligations [7.6%] | |
| FHLB | | | | | | | | |
| 4.500%, 11/15/12 | | | 450 | | | | 477 | |
| FHLMC | | | | | | | | |
| 2.500%, 01/07/14 | | | 525 | | | | 542 | |
| FNMA | | | | | | | | |
| 4.625%, 10/15/13 | | | 995 | | | | 1,080 | |
| 4.375%, 09/15/12 | | | 130 | | | | 137 | |
| 2.875%, 12/11/13 | | | 510 | | | | 532 | |
| 2.375%, 07/28/15 | | | 460 | | | | 465 | |
| 1.750%, 02/22/13 | | | 400 | | | | 407 | |
Total U.S. Government Agency Obligations (Cost $3,559) | | | | | | | 3,640 | |
| Asset-Backed Securities [4.3%] | | | | | | | | |
| Bayview Financial Acquisition Trust, Ser 2007-A, Cl 1A2 | | | | | | | | |
| 6.205%, 05/28/37 (C) | | | 200 | | | | 198 | |
| Chase Issuance Trust, Ser 2006-A4, Cl A4 | | | | | | | | |
| 0.275%, 10/15/13(B) | | | 325 | | | | 325 | |
| Chase Issuance Trust, Ser 2009-A2, Cl A2 | | | | | | | | |
| 1.805%, 04/15/14(B) | | | 400 | | | | 406 | |
| Citibank Credit Card Issuance Trust, Ser 2009-A2, Cl A2 | | | | | | | | |
| 1.805%, 05/15/14(B) | | | 600 | | | | 609 | |
| Cityscape Home Equity Loan Trust, Ser 1997-C, Cl A4 | | | | | | | | |
| 7.000%, 07/25/28 | | | 5 | | | | 4 | |
See accompanying notes to financial statements.
CNI CHARTER FUNDS | PAGE 29
| schedule of investments |
March 31, 2011 (Unaudited) |
Full Maturity Fixed Income Fund (continued) |
| Contimortgage Home Equity Loan Trust, Ser 1997-2, Cl A9 | | | | | | | | |
| 7.090%, 04/15/28 | | $ | 1 | | | $ | 1 | |
| GMAC Mortgage Corporation Loan Trust, Ser 2004-GH1, Cl A6 | | | | | | | | |
| 4.810%, 07/25/35(B) | | | 96 | | | | 93 | |
| Green Tree Financial, Ser 1997-7, Cl A6 | | | | | | | | |
| 6.760%, 07/15/29 | | | 66 | | | | 70 | |
| GSAA Home Equity Trust, Ser 2005-1, Cl AF2 | | | | | | | | |
| 4.316%, 11/25/34(B) | | | 16 | | | | 16 | |
| MBNA Credit Card Master Note Trust, Ser 2002-A3, Cl A3 | | | | | | | | |
| 0.495%, 09/15/14(B) | | | 200 | | | | 200 | |
| RAAC, Ser 2004-SP1, Cl AI4 | | | | | | | | |
| 5.285%, 08/25/27(B) | | | 79 | | | | 80 | |
| Residential Asset Mortgage Products, Ser 2002-RS3, Cl AI5 | | | | | | | | |
| 5.572%, 06/25/32(B) | | | 47 | | | | 36 | |
Total Asset-Backed Securities (Cost $2,052) | | | | 2,038 | |
| Commercial Mortgage-Backed Obligations [3.4%] | |
| Bear Stearns Commercial Mortgage Security, Ser 2007-PW16, Cl AM | | | | | | | | |
| 5.718%, 06/11/40(B) | | | 300 | | | | 301 | |
| Citigroup, Ser 2005-CD1 | | | | | | | | |
| 5.222%, 07/15/44(B) | | | 200 | | | | 215 | |
| Citigroup, Ser 2007-CD4, Cl A2B (C) | | | | | | | | |
| 5.205%, 12/11/49 | | | 150 | | | | 153 | |
| Commercial Mortgage, Ser 2005-C5, Cl A5A | | | | | | | | |
| 5.116%, 06/10/44(B) | | | 200 | | | | 214 | |
| GMAC Mortgage Corporation Loan Trust, Ser 2004-J4, Cl A2 | | | | | | | | |
| 5.500%, 09/25/34 | | | 26 | | | | 26 | |
| JPMorgan Chase, Ser 2006-CB17, Cl ASB | | | | | | | | |
| 5.415%, 12/12/43 | | | 200 | | | | 212 | |
| NCUA Guaranteed Notes, Ser 2010-C1, Cl A2 | | | | | | | | |
| 2.900%, 10/29/20 | | | 225 | | | | 219 | |
| | | | | |
| Wachovia Bank Commercial Mortgage Trust, Ser 2005-C22 | | | | | | |
| 5.270%, 12/15/44(B) | | $ | 250 | | | $ | 269 | |
Total Commercial Mortgage-Backed Obligations (Cost $1,575) | | | | 1,609 | |
| Mortgage-Backed Securities [0.7%] | | | | | |
| Banc of America Alternative Loan Trust, Ser 2004-2, Cl 5A1 | | | | | | | | |
| 5.500%, 03/25/19 | | | 72 | | | | 74 | |
| Chase Mortgage Finance, Ser 2003-S13, Cl A11 | | | | | | | | |
| 5.500%, 11/25/33 | | | 59 | | | | 60 | |
| Residential Accredit Loans, Ser 2004-QS5, Cl A5 | | | | | | | | |
| 4.750%, 04/25/34 | | | 25 | | | | 25 | |
| Residential Accredit Loans, Ser 2004-QS6, Cl A1 | | | | | | | | |
| 5.000%, 05/25/19 | | | 43 | | | | 44 | |
| WaMu Mortgage Pass Through Certificates, Ser 2004-CB2, Cl 5A | | | | | | | | |
| 5.000%, 07/25/19 | | | 116 | | | | 122 | |
Total Mortgage-Backed Securities (Cost $314) | | | | 325 | |
| Foreign Corporate Bonds [0.4%] | | | | | | | | |
| National Bank of Hungary | | | | | | | | |
| 8.875%, 11/01/13 | | | 75 | | | | 83 | |
| United Mexican States, MTN | | | | | | | | |
| 5.125%, 01/15/20 | | | 100 | | | | 104 | |
Total Foreign Corporate Bonds (Cost $176) | | | | 187 | |
| Cash Equivalent [2.2%] | | | | | | | | |
| AIM STIT-Treasury Portfolio, 0.020%* | | | 1,035,729 | | | | 1,036 | |
Total Cash Equivalent (Cost $1,036) | | | | | | | 1,036 | |
Total Investments [100.3%] (Cost $46,798) | | | $ | 47,764 | |
See accompanying notes to financial statements.
CNI CHARTER FUNDS | PAGE 30
| schedule of investments |
March 31, 2011 (Unaudited) |
Full Maturity Fixed Income Fund (concluded) |
Percentages are based on Net Assets of $47,611 ($ Thousands).
| * | The rate reported is the 7-day effective yield as of March 31, 2011. |
| (A) | Security exempt from registration under Rule 144A of the Securities Act of 1933. These securities may be resold in transactions exempt from registration normally to qualified institutions. On March 31, 2011, the value of these securities amounted to $403 (000), representing 0.8% of the net assets of the Fund. |
| (B) | Floating Rate Security — The rate reported is the rate in effect on March 31, 2011. |
| (C) | Step Bond — The rate reflected on the Schedule of Investments is the rate in effect on March 31, 2011. |
Cl — Class
FHLB — Federal Home Loan Bank
FHLMC — Federal Home Loan Mortgage Corporation
FNMA — Federal National Mortgage Association
GNMA — Government National Mortgage Association
MTN — Medium Term Note
REIT — Real Estate Investment Trust
REMIC — Real Estate Mortgage Investment Conduit
Ser — Series
The following is a summary of the inputs used as of March 31, 2011 in valuing the Fund’s investments carried at value ($ Thousands) in accordance with ASC 820:
| Investments in Securities | | | | | | | | | | | | |
| Corporate Bonds | | $ | — | | | $ | 21,001 | | | $ | — | | | $ | 21,001 | |
| U.S. Treasury Obligations | | | — | | | | 10,601 | | | | — | | | | 10,601 | |
| U.S. Government Mortgage-Backed Obligations | | | — | | | | 7,327 | | | | — | | | | 7,327 | |
| U.S. Government Agency Obligations | | | — | | | | 3,640 | | | | — | | | | 3,640 | |
| Asset-Backed Securities | | | — | | | | 2,038 | | | | — | | | | 2,038 | |
| Commercial Mortgage-Backed Securities | | | — | | | | 1,609 | | | | — | | | | 1,609 | |
| Mortgage-Backed Securities | | | — | | | | 325 | | | | — | | | | 325 | |
| Foreign Corporate Bond | | | — | | | | 187 | | | | — | | | | 187 | |
| Cash Equivalent | | | 1,036 | | | | — | | | | — | | | | 1,036 | |
| Total Investments in Securities | | $ | 1,036 | | | $ | 46,728 | | | $ | — | | | $ | 47,764 | |
For the period ended March 31, 2011, there have been no significant transfers between Level 1 and Level 2 assets and liabilities.
For more information on valuation inputs, see Note 2 — Significant Accounting Policies in the Notes to Financial Statements.
See accompanying notes to financial statements.
CNI CHARTER FUNDS | PAGE 31
| schedule of investments |
March 31, 2011 (Unaudited) |
| High Yield Bond Fund |
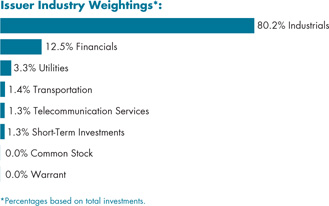
| | | | | | |
| Corporate Bonds [97.7%] | | | | | | |
| Advanced Materials/Prd [0.2%] | | | | | | |
| Polymer Group | | | | | | |
| | $ | 130 | | | $ | 134 | |
| Advertising Agencies [1.1%] | | | | | | | | |
| MDC Partners | | | | | | | | |
| 11.000%, 11/01/16(A) | | | 700 | | | | 782 | |
Total Advertising Agencies | | | | | | | 782 | |
| Aerospace & Defense [1.8%] | | | | | | | | |
| Acquisition Lanza Parent | | | | | | | | |
| 10.000%, 06/01/17(A) | | | 200 | | | | 220 | |
| Kratos Defense & Security Solutions | | | | | | | | |
| 10.000%, 06/01/17 | | | 500 | | | | 551 | |
| Sequa | | | | | | | | |
| 13.500%, 12/01/15(A) | | | 101 | | | | 110 | |
| 11.750%, 12/01/15(A) | | | 400 | | | | 432 | |
Total Aerospace & Defense | | | | | | | 1,313 | |
| Airlines [2.0%] | | | | | | | | |
| Continental Airlines, Ser 2007-1, Cl C | | | | | | | | |
| 7.339%, 04/19/14 | | | 463 | | | | 460 | |
| DAE Aviation Holdings | | | | | | | | |
| 11.250%, 08/01/15(A) | | | 150 | | | | 159 | |
| Delta Airlines | | | | | | | | |
| 12.250%, 03/15/15(A) | | | 250 | | | | 280 | |
| Global Aviation Holdings | | | | | | | | |
| 14.000%, 08/15/13 | | | 500 | | | | 586 | |
| | | | | | | 1,485 | |
| Auto Rent & Lease [0.3%] | | | | | | | | |
| Avis Budget Car Rental | | | | | | | | |
| 7.750%, 05/15/16 | | $ | 100 | | | $ | 103 | |
| H&E Equipment Services | | | | | | | | |
| 8.375%, 07/15/16 | | | 100 | | | | 105 | |
| | | | | | | 208 | |
| Autoparts [1.1%] | | | | | | | | |
| Asbury Automotive Group | | | | | | | | |
| 7.625%, 03/15/17 | | | 100 | | | | 102 | |
| Exide Technologies | | | | | | | | |
| 8.625%, 02/01/18(A) | | | 300 | | | | 320 | |
| Stanadyne | | | | | | | | |
| 10.000%, 08/15/14 | | | 450 | | | | 461 | |
| | | | | | | 883 | |
| B2B/E-Commerce [1.0%] | | | | | | | | |
| GXS Worldwide | | | | | | | | |
| | | 750 | | | | 763 | |
| Banks [0.8%] | | | | | | | | |
| CIT Group | | | | | | | | |
| | | 600 | | | | 601 | |
| Broadcasting & Cable [4.1%] | | | | | | | | |
| Atlantic Broadband Finance | | | | | | | | |
| 9.375%, 01/15/14 | | | 100 | | | | 102 | |
| Barrington Broadcasting Group | | | | | | | | |
| 10.500%, 08/15/14 | | | 100 | | | | 101 | |
| Bonten Media Acquisition | | | | | | | | |
| 9.000%, 06/01/15(A) | | | 181 | | | | 118 | |
| Bresnan Broadband Holdings | | | | | | | | |
| 8.000%, 12/15/18(A) | | | 500 | | | | 528 | |
| Cablevision Systems | | | | | | | | |
| 8.000%, 04/15/20 | | | 400 | | | | 436 | |
| CCO Holdings | | | | | | | | |
| 8.125%, 04/30/20 | | | 250 | | | | 272 | |
| CSC Holdings | | | | | | | | |
| 7.625%, 07/15/18 | | | 100 | | | | 110 | |
| DCP | | | | | | | | |
| 10.750%, 08/15/15(A) | | | 500 | | | | 482 | |
| Fisher Communications | | | | | | | | |
| 8.625%, 09/15/14 | | | 150 | | | | 154 | |
| Kabel BW Erste Beteiligungs GmbH | | | | | | | | |
| 7.500%, 03/15/19(A) | | | 500 | | | | 512 | |
See accompanying notes to financial statements.
CNI CHARTER FUNDS | PAGE 32
| schedule of investments |
March 31, 2011 (Unaudited) |
High Yield Bond Fund (continued) |
| Local TV Finance | | | | | | | | |
| 9.250%, 06/15/15(A) | | $ | 122 | | | $ | 118 | |
| Newport Television | | | | | | | | |
| 13.000%, 03/15/17(A) | | | 130 | | | | 131 | |
Total Broadcasting & Cable | | | | | | | 3,064 | |
| Building & Construction [2.2%] | | | | | |
| APERAM | | | | | | | | |
| 7.375%, 04/01/16(A) | | | 400 | | | | 407 | |
| Cemex | | | | | | | | |
| 9.000%, 01/11/18(A) | | | 400 | | | | 419 | |
| Columbus McKinnon | | | | | | | | |
| 7.875%, 02/01/19(A) | | | 200 | | | | 205 | |
| Dycom Investments | | | | | | | | |
| 7.125%, 01/15/21(A) | | | 300 | | | | 305 | |
| Interline Brands | | | | | | | | |
| 7.000%, 11/15/18 | | | 190 | | | | 195 | |
Total Building & Construction | | | | | | | 1,531 | |
| Chemicals [1.0%] | | | | | | | | |
| Ferro | | | | | | | | |
| 7.875%, 08/15/18 | | | 225 | | | | 239 | |
| Nalco | | | | | | | | |
| 6.625%, 01/15/19(A) | | | 250 | | | | 257 | |
| Nexeo Solutions | | | | | | | | |
| 8.375%, 03/01/18(A) | | | 250 | | | | 255 | |
| | | | | | | 751 | |
| Coal Mining [0.6%] | | | | | | | | |
| Consol Energy | | | | | | | | |
| | | 400 | | | | 443 | |
| Commercial Services [3.0%] | | | | | | | | |
| ARAMARK | | | | | | | | |
| 8.500%, 02/01/15 | | | 500 | | | | 521 | |
| Bankrate | | | | | | | | |
| 11.750%, 07/15/15(A) | | | 250 | | | | 284 | |
| DynCorp International | | | | | | | | |
| 10.375%, 07/01/17(A) | | | 500 | | | | 541 | |
| Iron Mountain | | | | | | | | |
| 8.750%, 07/15/18 | | | 150 | | | | 158 | |
| NCO Group | | | | | | | | |
| 11.875%, 11/15/14 | | | 700 | | | | 613 | |
| Tube City IMS | | | | | | | | |
| 9.750%, 02/01/15 | | | 100 | | | | 105 | |
Total Commercial Services | | | | | | | 2,222 | |
| Communications Software [0.9%] | | | | | |
| Aspect Software | | | | | | | | |
| | $ | 600 | | | $ | 642 | |
| Computer System Design & Services [1.7%] | | | | | |
| Activant Solutions | | | | | | | | |
| 9.500%, 05/01/16 | | | 100 | | | | 103 | |
| Compucom Systems | | | | | | | | |
| 12.500%, 10/01/15(A) | | | 540 | | | | 584 | |
| Stratus Technologies | | | | | | | | |
| 12.000%, 03/29/15(A) | | | 675 | | | | 622 | |
Total Computer System Design & Services | | | | 1,309 | |
| Consumer Products & Services [4.0%] | | | | | |
| American Achievement | | | | | | | | |
| 10.875%, 04/15/16(A) | | | 500 | | | | 491 | |
| MSX International | | | | | | | | |
| 12.500%, 04/01/12(A) | | | 100 | | | | 86 | |
| Prestige Brands | | | | | | | | |
| 8.250%, 04/01/18 | | | 250 | | | | 264 | |
| Reynolds Group Issuer | | | | | | | | |
| 7.125%, 04/15/19(A) | | | 470 | | | | 482 | |
| Scotts Miracle-Gro | | | | | | | | |
| 6.625%, 12/15/20(A) | | | 350 | | | | 359 | |
| Spectrum Brands Holdings | | | | | | | | |
| 9.500%, 06/15/18(A) | | | 700 | | | | 772 | |
| Steinway Musical Instruments | | | | | | | | |
| 7.000%, 03/01/14(A) | | | 100 | | | | 102 | |
| Yankee Acquisition, Ser B | | | | | | | | |
| 9.750%, 02/15/17 | | | 50 | | | | 53 | |
| YCC Holdings | | | | | | | | |
| 10.250%, 02/15/16(A) | | | 400 | | | | 403 | |
Total Consumer Products & Services | | | | 3,012 | |
| Containers & Packaging [2.2%] | | | | | |
| Exopack Holding | | | | | | | | |
| 11.250%, 02/01/14 | | | 250 | | | | 257 | |
| Graphic Packaging International | | | | | | | | |
| 7.875%, 10/01/18 | | | 145 | | | | 155 | |
| Intertape Polymer US | | | | | | | | |
| 8.500%, 08/01/14 | | | 100 | | | | 90 | |
| Pregis | | | | | | | | |
| 12.375%, 10/15/13 | | | 600 | | | | 592 | |
| Pretium Packaging | | | | | | | | |
| 11.500%, 04/01/16(A) | | | 350 | | | | 354 | |
| Solo Cup | | | | | | | | |
| 8.500%, 02/15/14 | | | 200 | | | | 179 | |
Total Containers & Packaging | | | | | | | 1,627 | |
See accompanying notes to financial statements.
CNI CHARTER FUNDS | PAGE 33
| schedule of investments |
March 31, 2011 (Unaudited) |
High Yield Bond Fund (continued) |
| Data Processing/Mgmt [0.8%] | | | | | | | | |
| First Data | | | | | | | | |
| | $ | 571 | | | $ | 592 | |
| Distribution/Wholesale [2.1%] | | | | | | | | |
| Baker & Taylor | | | | | | | | |
| 11.500%, 07/01/13(A) | | | 500 | | | | 433 | |
| Intcomex | | | | | | | | |
| 13.250%, 12/15/14 | | | 600 | | | | 631 | |
| VWR Funding | | | | | | | | |
| 10.250%, 07/15/15 | | | 423 | | | | 447 | |
Total Distribution/Wholesale | | | | | | | 1,511 | |
| Diversified Operations [1.4%] | | | | | | | | |
| Amsted Industries | | | | | | | | |
| 8.125%, 03/15/18(A) | | | 450 | | | | 480 | |
| Griffon | | | | | | | | |
| 7.125%, 04/01/18(A) | | | 500 | | | | 509 | |
Total Diversified Operations | | | | | | | 989 | |
| Drugs [0.4%] | | | | | | | | |
| Giant Funding | | | | | | | | |
| | | 300 | | | | 308 | |
| Electric Utilities [1.5%] | | | | | | | | |
| AES | | | | | | | | |
| 8.000%, 10/15/17 | | | 100 | | | | 108 | |
| 8.000%, 06/01/20 | | | 50 | | | | 54 | |
| CMS Energy | | | | | | | | |
| 8.750%, 06/15/19 | | | 50 | | | | 60 | |
| 6.875%, 12/15/15 | | | 150 | | | | 165 | |
| NRG Energy | | | | | | | | |
| 8.250%, 09/01/20(A) | | | 250 | | | | 260 | |
| 7.375%, 02/01/16 | | | 100 | | | | 103 | |
| PNM Resources | | | | | | | | |
| 9.250%, 05/15/15 | | | 100 | | | | 113 | |
| RRI Energy | | | | | | | | |
| 7.625%, 06/15/14 | | | 200 | | | | 207 | |
| | | | | | | 1,070 | |
| Engines-Internal Combust [0.4%] | | | | | |
| Briggs & Stratton | | | | | | | | |
| | | 250 | | | | 262 | |
| Enterprise Software/Serv [0.6%] | | | | | |
| JDA Software Group | | | | | | | | |
| | | 375 | | | | 410 | |
| Entertainment & Gaming [12.2%] | | | | | |
| Boyd Gaming | | | | | | | | |
| 6.750%, 04/15/14 | | $ | 500 | | | $ | 501 | |
| Caesars Entertainment Operating | | | | | | | | |
| 12.750%, 04/15/18(A) | | | 100 | | | | 101 | |
| 11.250%, 06/01/17 | | | 250 | | | | 284 | |
| 10.000%, 12/15/18 | | | 350 | | | | 319 | |
| CCM Merger | | | | | | | | |
| 8.000%, 08/01/13(A) | | | 175 | | | | 174 | |
| Choctaw Resort Development Enterprise | | | | | | | | |
| 7.250%, 11/15/19(A) | | | 175 | | | | 135 | |
| Chukchansi Economic Development Authority | | | | | | | | |
| 8.000%, 11/15/13(A) | | | 250 | | | | 185 | |
| 3.943%, 11/15/12(A) (B) | | | 250 | | | | 185 | |
| Circus & Eldorado Joint Venture/Silver Legacy Capital | | | | | | | | |
| 10.125%, 03/01/12 | | | 150 | | | | 148 | |
| CityCenter Holdings | | | | | | | | |
| 7.625%, 01/15/16(A) | | | 300 | | | | 310 | |
| Diamond Resorts | | | | | | | | |
| 12.000%, 08/15/18(A) | | | 600 | | | | 642 | |
| Indianapolis Downs & Capital | | | | | | | | |
| 11.000%, 11/01/12(A) (C) | | | 100 | | | | 88 | |
| Inn of the Mountain Gods Resort & Casino | | | | | | | | |
| 8.750%, 11/30/20(A) | | | 45 | | | | 44 | |
| 1.250%, 11/30/20(A) | | | 101 | | | | 55 | |
| Jacobs Entertainment | | | | | | | | |
| 9.750%, 06/15/14 | | | 75 | | | | 76 | |
| Lions Gate Entertainment | | | | | | | | |
| 10.250%, 11/01/16(A) | | | 400 | | | | 424 | |
| Live Nation Entertainment | | | | | | | | |
| 8.125%, 05/15/18(A) | | | 325 | | | | 334 | |
| Mashantucket Western Pequot Tribe | | | | | | | | |
| 8.500%, 11/15/15(A) (C) | | | 170 | | | | 17 | |
| MGM Resorts International | | | | | | | | |
| 11.375%, 03/01/18 | | | 400 | | | | 444 | |
| Mohegan Tribal Gaming Authority | | | | | | | | |
| 7.125%, 08/15/14 | | | 100 | | | | 75 | |
| NAI Entertainment Holdings | | | | | | | | |
| 8.250%, 12/15/17(A) | | | 500 | | | | 535 | |
| Penn National Gaming | | | | | | | | |
| 8.750%, 08/15/19 | | | 250 | | | | 276 | |
| Regal Entertainment Group | | | | | | | | |
| 9.125%, 08/15/18 | | | 225 | | | | 241 | |
| River Rock Entertainment Authority | | | | | | | | |
| 9.750%, 11/01/11 | | | 800 | | | | 672 | |
See accompanying notes to financial statements.
CNI CHARTER FUNDS | PAGE 34
| schedule of investments |
March 31, 2011 (Unaudited) |
High Yield Bond Fund (continued) |
| San Pasqual Casino | | | | | | | | |
| 8.000%, 09/15/13(A) | | $ | 100 | | | $ | 100 | |
| Scientific Games | | | | | | | | |
| 8.125%, 09/15/18(A) | | | 325 | | | | 343 | |
| Seminole Indian Tribe of Florida | | | | | | | | |
| 7.750%, 10/01/17(A) | | | 360 | | | | 381 | |
| Shingle Springs Tribal Gaming Authority | | | | | | | | |
| 9.375%, 06/15/15(A) | | | 100 | | | | 66 | |
| Snoqualmie Entertainment Authority | | | | | | | | |
| 9.125%, 02/01/15(A) | | | 300 | | | | 298 | |
| 4.204%, 02/01/14(A) (B) | | | 400 | | | | 362 | |
| Speedway Motorsports | | | | | | | | |
| 6.750%, 02/01/19(A) | | | 250 | | | | 252 | |
| Tunica-Biloxi Gaming Authority | | | | | | | | |
| 9.000%, 11/15/15(A) | | | 125 | | | | 124 | |
| Vail Resorts | | | | | | | | |
| 6.750%, 02/15/14 | | | 100 | | | | 101 | |
| Waterford Gaming | | | | | | | | |
| 8.625%, 09/15/14(A) (D) | | | 64 | | | | 33 | |
| Wynn Las Vegas | | | | | | | | |
| 7.875%, 05/01/20 | | | 175 | | | | 187 | |
| 7.750%, 08/15/20 | | | 400 | | | | 424 | |
Total Entertainment & Gaming | | | | | | | 8,936 | |
| Financial Services [0.6%] | | | | | | | | |
| Icahn Enterprises | | | | | | | | |
| | | 400 | | | | 411 | |
| Food, Beverage & Tobacco [3.7%] | | | | | |
| B&G Foods | | | | | | | | |
| 7.625%, 01/15/18 | | | 200 | | | | 215 | |
| Beverages & More | | | | | | | | |
| 9.625%, 10/01/14(A) | | | 400 | | | | 420 | |
| Blue Merger Sub | | | | | | | | |
| 7.625%, 02/15/19(A) | | | 350 | | | | 355 | |
| Bumble Bee Acquisition | | | | | | | | |
| 9.000%, 12/15/17(A) | | | 320 | | | | 333 | |
| Bumble Bee Holdco SCA | | | | | | | | |
| 9.625%, 03/15/18(A) | | | 250 | | | | 233 | |
| Darling International | | | | | | | | |
| 8.500%, 12/15/18(A) | | | 350 | | | | 381 | |
| Le-Nature's | | | | | | | | |
| 9.000%, 06/15/13(A) (C) (D) | | | 150 | | | | 22 | |
| US Foodservice | | | | | | | | |
| 10.250%, 06/30/15(A) | | | 500 | | | | 525 | |
| Vector Group | | | | | | | | |
| 11.000%, 08/15/15 | | | 250 | | | | 263 | |
Total Food, Beverage & Tobacco | | | | 2,747 | |
| Gas/Natural Gas [0.2%] | | | | | | | | |
| El Paso | | | | | | | | |
| | $ | 150 | | | $ | 168 | |
| Insurance [3.8%] | | | | | | | | |
| CNO Financial Group | | | | | | | | |
| 9.000%, 01/15/18(A) | | | 500 | | | | 530 | |
| Delphi Financial Group | | | | | | | | |
| 7.875%, 01/31/20 | | | 300 | | | | 329 | |
| Ironshore Holdings US | | | | | | | | |
| 8.500%, 05/15/20(A) | | | 800 | | | | 826 | |
| National Life Insurance | | | | | | | | |
| 10.500%, 09/15/39(A) | | | 150 | | | | 188 | |
| Protective Life | | | | | | | | |
| 8.450%, 10/15/39 | | | 225 | | | | 251 | |
| USI Holdings | | | | | | | | |
| 9.750%, 05/15/15(A) | | | 507 | | | | 520 | |
| 4.188%, 11/15/14(A) (B) | | | 125 | | | | 122 | |
| | | | | | | 2,766 | |
| Investment Banker/Broker Dealer [1.6%] | | | | | |
| E*Trade Financial | | | | | | | | |
| 7.375%, 09/15/13 | | | 400 | | | | 401 | |
| Nuveen Investments | | | | | | | | |
| 10.500%, 11/15/15 | | | 700 | | | | 719 | |
Total Investment Banker/Broker Dealer | | | | 1,120 | |
| Investment Companies [0.9%] | | | | | | | | |
| American Capital | | | | | | | | |
| 7.960%, 12/31/13(A) | | | 105 | | | | 105 | |
| Offshore Group Investments | | | | | | | | |
| 11.500%, 08/01/15(A) | | | 500 | | | | 555 | |
Total Investment Companies | | | | | | | 660 | |
| Machinery [1.5%] | | | | | | | | |
| Case New Holland | | | | | | | | |
| 7.875%, 12/01/17(A) | | | 150 | | | | 167 | |
| CPM Holdings | | | | | | | | |
| 10.875%, 09/01/14(A) | | | 500 | | | | 540 | |
| Thermadyne Holdings | | | | | | | | |
| 9.000%, 12/15/17(A) | | | 350 | | | | 370 | |
| | | | | | | 1,077 | |
See accompanying notes to financial statements.
CNI CHARTER FUNDS | PAGE 35
| schedule of investments |
March 31, 2011 (Unaudited) |
High Yield Bond Fund (continued) |
| Medical Products & Services [3.2%] | | | | | |
| Apria Healthcare Group | | | | | | | | |
| 12.375%, 11/01/14 | | $ | 200 | | | $ | 217 | |
| BioScrip | | | | | | | | |
| 10.250%, 10/01/15 | | | 600 | | | | 625 | |
| Community Health Systems | | | | | | | | |
| 8.875%, 07/15/15 | | | 150 | | | | 158 | |
| DJO Finance | | | | | | | | |
| 9.750%, 10/15/17(A) | | | 210 | | | | 221 | |
| Omnicare | | | | | | | | |
| 7.750%, 06/01/20 | | | 350 | | | | 371 | |
| OnCure Holdings | | | | | | | | |
| 11.750%, 05/15/17 | | | 500 | | | | 501 | |
| STHI Holding | | | | | | | | |
| 8.000%, 03/15/18(A) | | | 200 | | | | 207 | |
Total Medical Products & Services | | | | 2,300 | |
| Metals & Mining [2.4%] | | | | | | | | |
| Aleris International | | | | | | | | |
| 7.625%, 02/15/18(A) | | | 200 | | | | 200 | |
| Atkore International | | | | | | | | |
| 9.875%, 01/01/18(A) | | | 500 | | | | 534 | |
| Midwest Vanadium Pty | | | | | | | | |
| 11.500%, 02/15/18(A) | | | 500 | | | | 516 | |
| Noranda Aluminum Acquisition | | | | | | | | |
| 5.193%, 05/15/15(B) | | | 169 | | | | 163 | |
| Novelis | | | | | | | | |
| 8.375%, 12/15/17(A) | | | 350 | | | | 379 | |
| | | | | | | 1,792 | |
| Miscellaneous Business Services [0.7%] | | | | | |
| Affinion Group | | | | | | | | |
| 11.500%, 10/15/15 | | | 100 | | | | 106 | |
| Carriage Services | | | | | | | | |
| 7.875%, 01/15/15 | | | 200 | | | | 204 | |
| Lamar Media | | | | | | | | |
| 6.625%, 08/15/15 | | | 100 | | | | 102 | |
| MCBC Holdings | | | | | | | | |
| 6.830%, 10/15/14(A) (D) | | | 50 | | | | 25 | |
| Stewart Enterprises | | | | | | | | |
| 6.250%, 02/15/13 | | | 100 | | | | 100 | |
Total Miscellaneous Business Services | | | | 537 | |
| Miscellaneous Manufacturing [2.2%] | | | | | |
| AGY Holding | | | | | | | | |
| 11.000%, 11/15/14 | | | 100 | | | | 96 | |
| Buffalo Thunder Development Authority | | | | | | | | |
| 9.375%, 12/15/14(A) (C) | | | 75 | | | | 27 | |
| CEVA Group | | | | | | | | |
| 11.625%, 10/01/16(A) | | $ | 250 | | | $ | 275 | |
| 11.500%, 04/01/18(A) | | | 100 | | | | 109 | |
| 8.375%, 12/01/17(A) | | | 300 | | | | 306 | |
| Coleman Cable | | | | | | | | |
| 9.000%, 02/15/18 | | | 450 | | | | 473 | |
| Thermon Industries | | | | | | | | |
| 9.500%, 05/01/17 | | | 300 | | | | 324 | |
Total Miscellaneous Manufacturing | | | | 1,610 | |
| Multi-line Insurance [0.3%] | | | | | | | | |
| Unitrin | | | | | | | | |
| | | 195 | | | | 201 | |
| Office Automation and Equip [0.7%] | | | | | |
| CDW | | | | | | | | |
| | | 500 | | | | 528 | |
| Paper & Related Products [0.4%] | | | | | |
| Verso Paper Holdings | | | | | | | | |
| | | 300 | | | | 312 | |
| Petroleum & Fuel Products [5.0%] | | | | | |
| Atlas Pipeline Partners | | | | | | | | |
| 8.125%, 12/15/15 | | | 200 | | | | 208 | |
| Bill Barrett | | | | | | | | |
| 9.875%, 07/15/16 | | | 250 | | | | 281 | |
| Continental Resources | | | | | | | | |
| 7.375%, 10/01/20 | | | 500 | | | | 538 | |
| Copano Energy | | | | | | | | |
| 7.750%, 06/01/18 | | | 100 | | | | 105 | |
| Crestwood Midstream Partners | | | | | | | | |
| 7.750%, 04/01/19(A) | | | 400 | | | | 400 | |
| Energy Transfer Equity | | | | | | | | |
| 7.500%, 10/15/20 | | | 400 | | | | 435 | |
| Helix Energy Solutions Group | | | | | | | | |
| 9.500%, 01/15/16(A) | | | 100 | | | | 105 | |
| Newfield Exploration | | | | | | | | |
| 6.625%, 09/01/14 | | | 150 | | | | 153 | |
| Petroplus Finance | | | | | | | | |
| 7.000%, 05/01/17(A) | | | 150 | | | | 142 | |
| Plains Exploration & Production | | | | | | | | |
| 7.750%, 06/15/15 | | | 150 | | | | 157 | |
| 7.625%, 06/01/18 | | | 100 | | | | 107 | |
| Quicksilver Resources | | | | | | | | |
| 7.125%, 04/01/16 | | | 400 | | | | 395 | |
| SandRidge Energy | | | | | | | | |
| 8.000%, 06/01/18(A) | | | 150 | | | | 157 | |
| 7.500%, 03/15/21(A) | | | 250 | | | | 260 | |
See accompanying notes to financial statements.
CNI CHARTER FUNDS | PAGE 36
| schedule of investments |
March 31, 2011 (Unaudited) |
High Yield Bond Fund (continued) |
| Southern Star Central | | | | | | | | |
| 6.750%, 03/01/16 | | $ | 100 | | | $ | 102 | |
| Southwestern Energy | | | | | | | | |
| 7.500%, 02/01/18 | | | 100 | | | | 113 | |
Total Petroleum & Fuel Products | | | | 3,658 | |
| Printing & Publishing [0.1%] | | | | | | | | |
| MediMedia USA | | | | | | | | |
| | | 50 | | | | 44 | |
| Radio [0.3%] | | | | | | | | |
| Cleveland Unlimited | | | | | | | | |
| | | 250 | | | | 188 | |
| Research and Development [2.6%] | | | | | |
| Alion Science and Technology | | | | | | | | |
| 12.000%, 11/01/14 | | | 485 | | | | 500 | |
| 10.250%, 02/01/15 | | | 330 | | | | 268 | |
| Catalent Pharma Solutions | | | | | | | | |
| 9.500%, 04/15/15 | | | 595 | | | | 610 | |
| PharmaNet Development Group | | | | | | | | |
| 10.875%, 04/15/17(A) | | | 500 | | | | 550 | |
Total Research and Development | | | | 1,928 | |
| Retail [5.2%] | | | | | | | | |
| ACE Hardware | | | | | | | | |
| 9.125%, 06/01/16(A) | | | 100 | | | | 108 | |
| BI-LO | | | | | | | | |
| 9.250%, 02/15/19(A) | | | 450 | | | | 466 | |
| Burlington Coat Factory Warehouse | | | | | | | | |
| 10.000%, 02/15/19(A) | | | 400 | | | | 388 | |
| CKE Restaurants | | | | | | | | |
| 11.375%, 07/15/18 | | | 400 | | | | 441 | |
| Claire's Stores | | | | | | | | |
| 9.625%, 06/01/15 | | | 128 | | | | 128 | |
| Dunkin Finance | | | | | | | | |
| 9.625%, 12/01/18(A) | | | 455 | | | | 464 | |
| Easton-Bell Sports | | | | | | | | |
| 9.750%, 12/01/16 | | | 500 | | | | 562 | |
| Ferrellgas | | | | | | | | |
| 6.500%, 05/01/21(A) | | | 130 | | | | 126 | |
| Mobile Mini | | | | | | | | |
| 7.875%, 12/01/20(A) | | | 225 | | | | 239 | |
| Penske Automotive Group | | | | | | | | |
| 7.750%, 12/15/16 | | | 100 | | | | 103 | |
| Rare Restaurant Group | | | | | | | | |
| 9.250%, 05/15/14(A) | | $ | 100 | | | $ | 88 | |
| Rite Aid | | | | | | | | |
| 9.500%, 06/15/17 | | | 750 | | | | 674 | |
| Sbarro | | | | | | | | |
| 10.375%, 02/01/15(C) (D) | | | 50 | | | | 11 | |
| Sonic Automotive | | | | | | | | |
| 9.000%, 03/15/18 | | | 70 | | | | 74 | |
| 8.625%, 08/15/13 | | | 13 | | | | 13 | |
| | | | | | | 3,885 | |
| Rubber & Plastic [0.2%] | | | | | | | | |
| Cooper Tire & Rubber | | | | | | | | |
| | | 100 | | | | 105 | |
| Schools-Day Care [0.5%] | | | | | | | | |
| Knowledge Learning | | | | | | | | |
| | | 400 | | | | 396 | |
| Semi-Conductors [1.3%] | | | | | | | | |
| Amkor Technology | | | | | | | | |
| 9.250%, 06/01/16 | | | 100 | | | | 105 | |
| Freescale Semiconductor | | | | | | | | |
| 9.250%, 04/15/18(A) | | | 500 | | | | 548 | |
| Stoneridge | | | | | | | | |
| 9.500%, 10/15/17(A) | | | 200 | | | | 221 | |
| | | | | | | 874 | |
| Shipbuilding [0.7%] | | | | | | | | |
| Huntington Ingalls Industries | | | | | | | | |
| 7.125%, 03/15/21(A) | | | 250 | | | | 261 | |
| 6.875%, 03/15/18(A) | | | 250 | | | | 261 | |
| | | | | | | 522 | |
| Steel & Steel Works [1.0%] | | | | | | | | |
| Ryerson | | | | | | | | |
| 12.000%, 11/01/15 | | | 75 | | | | 82 | |
| Standard Steel | | | | | | | | |
| 12.000%, 05/01/15(A) | | | 600 | | | | 621 | |
Total Steel & Steel Works | | | | | | | 703 | |
See accompanying notes to financial statements.
CNI CHARTER FUNDS | PAGE 37
| schedule of investments |
March 31, 2011 (Unaudited) |
High Yield Bond Fund (continued) |
| Telephones & Telecommunications [5.0%] | | | | | |
| Avaya | | | | | | | | |
| 7.000%, 04/01/19(A) | | $ | 250 | | | $ | 244 | |
| Broadview Networks Holdings | | | | | | | | |
| 11.375%, 09/01/12 | | | 100 | | | | 98 | |
| Buccaneer Merger Sub | | | | | | | | |
| 9.125%, 01/15/19(A) | | | 450 | | | | 477 | |
| Clearwire Communications | | | | | | | | |
| 12.000%, 12/01/15(A) | | | 750 | | | | 810 | |
| CommScope | | | | | | | | |
| 8.250%, 01/15/19(A) | | | 500 | | | | 522 | |
| GeoEye | | | | | | | | |
| 8.625%, 10/01/16 | | | 345 | | | | 367 | |
| Level 3 Financing | | | | | | | | |
| 10.000%, 02/01/18 | | | 250 | | | | 251 | |
| Telcordia Technologies | | | | | | | | |
| 11.000%, 05/01/18(A) | | | 740 | | | | 823 | |
| Virgin Media Finance | | | | | | | | |
| 9.125%, 08/15/16 | | | 150 | | | | 159 | |
Total Telephones & Telecommunications | | | | 3,751 | |
| Textile-Home Furnishings [0.4%] | | | | | |
| Empire Today | | | | | | | | |
| | | 250 | | | | 265 | |
| Transactional Software [0.6%] | | | | | | | | |
| Open Solutions | | | | | | | | |
| | | 600 | | | | 420 | |
| Transportation Services [5.1%] | | | | | | | | |
| ACL I | | | | | | | | |
| 10.625%, 02/15/16(A) | | | 500 | | | | 510 | |
| Florida East Coast Railway | | | | | | | | |
| 8.125%, 02/01/17(A) | | | 250 | | | | 261 | |
| Pegasus Solutions | | | | | | | | |
| 10.500%, 04/15/15(A) | | | 100 | | | | 41 | |
| Quality Distribution | | | | | | | | |
| 9.875%, 11/01/18(A) | | | 750 | | | | 778 | |
| Sabre Holdings | | | | | | | | |
| 8.350%, 03/15/16 | | | 600 | | | | 579 | |
| Stena | | | | | | | | |
| 7.000%, 12/01/16 | | | 150 | | | | 149 | |
| Susser Holdings | | | | | | | | |
| 8.500%, 05/15/16 | | | 250 | | | | 271 | |
| Travelport | | | | | | | | |
| 11.875%, 09/01/16 | | | 300 | | | | 280 | |
| 9.875%, 09/01/14 | | | 250 | | | | 243 | |
| United Maritime Group | | | | | | | | |
| 11.750%, 06/15/15 | | | 600 | | | | 622 | |
Total Transportation Services | | | | | | | 3,734 | |
| | | | | | |
| Waste Disposal [0.1%] | | | | | | |
| WCA Waste | | | | | | |
| | $ | 100 | | | $ | 103 | |
Total Corporate Bonds (Cost $68,974) | | | | | | | 71,653 | |
| Convertible Bond [0.1%] | | | | | | | | |
| Food, Beverage & Tobacco [0.1%] | | | | | |
| Vector Group | | | | | | | | |
| 3.875%, 06/15/26(B) | | | 60 | | | | 71 | |
Total Convertible Bond (Cost $62) | | | | | | | 71 | |
| Common Stock [0.0%] | | | | | | | | |
| Broadcasting & Cable [0.0%] | | | | | | | | |
| | | 8,500 | | | | 7 | |
| Building & Construction [0.0%] | | | | | |
| | | 149 | | | | — | |
Total Common Stock (Cost $9) | | | | | | | 7 | |
| Warrant [0.0%] | | | | | | | | |
| Alion Science & Technology, | | | | | | | | |
| Expires 03/15/17 * (D) | | | 280 | | | | — | |
| | | | | | | — | |
| Cash Equivalents [1.3%] | | | | | | |
| Fidelity Institutional Domestic Money Market Portfolio, Cl I, 0.160%** | | | 488,243 | | | | 488 | |
| SEI Daily Income Trust, Prime Obligation Fund, Cl A, 0.080%** | | | 488,243 | | | | 488 | |
Total Cash Equivalents (Cost $976) | | | | | | | 976 | |
Total Investments [99.1%] (Cost $70,021) | | | | | | $ | 72,707 | |
See accompanying notes to financial statements.
CNI CHARTER FUNDS | PAGE 38
| schedule of investments |
March 31, 2011 (Unaudited) |
High Yield Bond Fund (concluded) |
Percentages are based on Net Assets of $73,387 ($ Thousands).
| * | Non-income producing security. |
| ** | The rate reported is the 7-day effective yield as of March 31, 2011. |
| (A) | Security exempt from registration under Rule 144A of the Securities Act of 1933. These securities may be resold in transactions exempt from registration normally to qualified institutions. On March 31, 2011, the value of these securities amounted to $39,583 (000), representing 53.9% of the net assets of the Fund. |
| (B) | Floating Rate Security — The rate reported is the rate in effect on March 31, 2011. |
| (C) | In default on interest payments. Rate shown represents the last coupon rate prior to default. |
| (D) | Security is considered illiquid. |
| (E) | Security is fair valued. |
Cl — Class
Ser — Series
Amounts designated as “—” are either $0 or have been rounded to $0.
The following is a summary of the inputs used as of March 31, 2011 in valuing the Fund’s investments carried at value ($ Thousands) in accordance with ASC 820:
| Investments in Securities | | | | | | | | | | | | |
| Corporate Bonds | | $ | — | | | $ | 71,619 | | | $ | 34 | | | $ | 71,653 | |
| Convertible Bond | | | — | | | | 71 | | | | — | | | | 71 | |
| Common Stock | | | — | | | | — | | | | 7 | | | | 7 | |
| Warrant | | | — | | | | — | | | | — | | | | — | |
| Cash Equivalents | | | 976 | | | | — | | | | — | | | | 976 | |
| Total Investments in Securities | | $ | 976 | | | $ | 71,690 | | | $ | 41 | | | $ | 72,707 | |
The following is a reconciliation of investments in which significant unobservable inputs (Level 3) were used in determining value:
| | | Investments in Corporate Bonds ($Thousands) | | | Investments in Common Stock ($Thousands) | |
| Beginning balance as of October 1, 2010 | | $ | 278 | | | $ | 10 | |
| Accrued discounts/premiums | | | 11 | | | | — | |
| Realized gain/(loss) | | | (32 | ) | | | 3 | |
| Change in unrealized appreciation/(depreciation) | | | (96 | ) | | | (3 | ) |
| Net purchases/sales | | | (161 | ) | | | (3 | ) |
| Net transfer in and/or out of Level 3 | | | 34 | | | | — | |
| Ending balance as of March 31, 2011 | | $ | 34 | | | $ | 7 | |
| Changes in unrealized gains (losses) included in earnings related to securities held at reporting date | | $ | 4 | | | $ | (2 | ) |
For the period ended March 31, 2011, there have been no significant transfers between Level 1 and Level 2 assets and liabilities.
For more information on valuation inputs, see Note 2 — Significant Accounting Policies in the Notes to Financial Statements.
See accompanying notes to financial statements.
CNI CHARTER FUNDS | PAGE 39
| schedule of investments |
March 31, 2011 (Unaudited) |
| Multi-Asset Fund |
| | | | | | |
| Exchange Traded Funds [46.5%] | | | | | | |
| Guggenheim Timber Fund | | | 61,382 | | | $ | 1,426 | |
| iShares MSCI EAFE Index Fund | | | 15,545 | | | | 934 | |
| iShares S&P 500 Growth Index Fund | | | 42,929 | | | | 2,949 | |
| iShares S&P Global Timber Fund | | | 9,309 | | | | 473 | |
| iShares S&P MidCap 400 Index Fund | | | 37,078 | | | | 3,661 | |
| SPDR Barclays Capital High Yield Bond Fund | | | 30,591 | | | | 1,239 | |
| SPDR S&P 500 Fund | | | 31,947 | | | | 4,233 | |
| Vanguard Emerging Markets | | | 31,905 | | | | 1,561 | |
| Vanguard Energy Fund | | | 7,374 | | | | 861 | |
| Vanguard Small Cap Value | | | 38,627 | | | | 3,051 | |
Total Exchange Traded Funds (Cost $17,383) | | | | 20,388 | |
| Affiliated Registered Investment Companies [12.2%] | |
| CNI Corporate Bond Fund, Institutional Class | | | 237,502 | | | | 2,527 | |
| CNI Government Bond Fund, Institutional Class | | | 127,787 | | | | 1,334 | |
| CNI High Yield Bond Fund, Institutional Class | | | 174,717 | | | | 1,512 | |
Total Affiliated Registered Investment Companies (Cost $5,226) | | | | 5,373 | |
| Unaffiliated Registered Investment Companies [21.4%] | |
| Alpine International Real Estate Equity Fund | | | 62,694 | | | | 1,621 | |
| Cohen & Steers International Realty Fund, Inc. | | | 137,819 | | | | 1,531 | |
| Fidelity Floating Rate High Income Fund | | | 215,637 | | | | 2,128 | |
| Oppenheimer International Bond Fund, Class A | | | 391,564 | | | | 2,565 | |
| | | | | | |
| PIMCO Emerging Markets Bond Fund | | | 82,439 | | | $ | 884 | |
| PIMCO Emerging Markets Bond Fund, Institutional Class | | | 60,479 | | | | 671 | |
Total Unaffiliated Registered Investment Companies (Cost $8,971) | | | | | | | 9,400 | |
| Municipal Bond [2.5%] | | | | | | | | |
| California [2.5%] | | | | | | | | |
| State of California, Ser A-2, RB | | | | | | | | |
| 3.000%, 06/28/11 | | | 1,075 | | | | 1,081 | |
Total Municipal Bond (Cost $1,078) | | | | | | | 1,081 | |
| Certificates of Deposit [2.3%] | | | | | | | | |
| Cooperatieve Centrale Raiffeisen-Boerenleenbank BA | | | | | | | | |
| 0.330%, 01/06/12 | | | 1,000 | | | | 1,000 | |
Total Certificates of Deposit (Cost $1,000) | | | | 1,000 | |
| Cash Equivalent [0.9%] | | | | | | | | |
| Goldman Sachs Financial Square Funds - Government Fund, 0.040%* | | | 398,373 | | | | 398 | |
Total Cash Equivalent (Cost $398) | | | | | | | 398 | |
| Repurchase Agreement(A) [13.7%] | | | | | |
| Barclays | | | | | | | | |
| 0.110%, dated 03/31/11, repurchased on 4/1/11, repurchase price $6,000,018 (collaterized by a U.S. Treasury note, par value $6,126,500, 0.625%, 01/31/13; with total market value $6,120,059) | | $ | 6,000 | | | | 6,000 | |
Total Repurchase Agreement (Cost $6,000) | | | | 6,000 | |
Total Investments [99.5%] (Cost $40,056) | | | | | | $ | 43,640 | |
See accompanying notes to financial statements.
CNI CHARTER FUNDS | PAGE 40
| schedule of investments |
March 31, 2011 (Unaudited) |
Multi-Asset Fund (concluded) |
Percentages are based on Net Assets of $43,852 ($ Thousands).
| * | The rate reported is the 7-day effective yield as of March 31, 2011. |
| (A) | Tri-Party Repurchase Agreement. |
EAFE — Europe, Australasia and the Far East
MSCI — Morgan Stanley Capital International
RB — Revenue Bond
Ser — Series
SPDR — Standard & Poor’s Depository Receipts
The following is a summary of the inputs used as of March 31, 2011 in valuing the Fund’s investments carried at value ($ Thousands):
| Investments in Securities | | | | | | | | | | | | |
| Exchange Traded Funds | | $ | 20,388 | | | $ | — | | | $ | — | | | $ | 20,388 | |
| Affiliated Registered Investment Companies | | | 5,373 | | | | — | | | | — | | | | 5,373 | |
| Unaffiliated Registered Investment Companies | | | 9,400 | | | | — | | | | — | | | | 9,400 | |
| Municipal Bond | | | — | | | | 1,081 | | | | — | | | | 1,081 | |
| Certificate of Deposit | | | — | | | | 1,000 | | | | — | | | | 1,000 | |
| Cash Equivalent | | | 398 | | | | — | | | | — | | | | 398 | |
| Repurchase Agreement | | | — | | | | 6,000 | | | | — | | | | 6,000 | |
| Total Investments in Securities | | $ | 35,559 | | | $ | 8,081 | | | $ | — | | | $ | 43,640 | |
For the period ended March 31, 2011, there have been no significant transfers between Level 1 and Level 2 assets and liabilities.
For more information on valuation inputs, see Note 2 — Significant Accounting Policies in the Notes to Financial Statements.
See accompanying notes to financial statements.
CNI CHARTER FUNDS | PAGE 41
| schedule of investments |
March 31, 2011 (Unaudited) |
| Diversified Equity Fund |
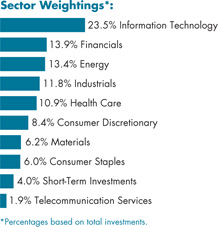
| | | | | | |
| Common Stock [96.2%] | | | | | | |
| Aerospace & Defense [0.9%] | | | | | | |
| Precision Castparts | | | 2,090 | | | $ | 308 | |
| Raytheon | | | 6,715 | | | | 341 | |
Total Aerospace & Defense | | | | | | | 649 | |
| Apparel/Textiles [0.6%] | | | | | | | | |
| Coach | | | 4,660 | | | | 243 | |
| Lululemon Athletica * | | | 2,280 | | | | 203 | |
| | | | | | | 446 | |
| Auto Components [0.4%] | | | | | | | | |
TRW Automotive Holdings * | | | 4,450 | | | | 245 | |
| Automotive [0.7%] | | | | | | | | |
| General Motors * | | | 11,070 | | | | 343 | |
| Honda Motor ADR | | | 4,200 | | | | 158 | |
| | | | | | | 501 | |
| Banks [3.4%] | | | | | | | | |
| Bank of America | | | 36,775 | | | | 490 | |
| KeyCorp | | | 58,550 | | | | 520 | |
| M&T Bank | | | 3,100 | | | | 274 | |
| US Bancorp | | | 43,750 | | | | 1,157 | |
| | | | | | | 2,441 | |
| Beauty Products [0.3%] | | | | | | | | |
| | | 2,090 | | | | 201 | |
| Biotechnology [0.5%] | | | | | | | | |
| Alexion Pharmaceuticals * | | | 1,740 | | | $ | 172 | |
| United Therapeutics * | | | 2,800 | | | | 187 | |
| | | | | | | 359 | |
| Broadcasting & Cable [3.5%] | | | | | | | | |
| Acme Packet * | | | 4,120 | | | | 292 | |
| Aruba Networks * | | | 3,790 | | | | 128 | |
| Ciena * | | | 10,870 | | | | 282 | |
| Cisco Systems | | | 47,425 | | | | 813 | |
| F5 Networks * | | | 1,950 | | | | 200 | |
| Qualcomm | | | 14,800 | | | | 812 | |
Total Broadcasting & Cable | | | | | | | 2,527 | |
| Building & Construction [0.5%] | | | | | |
| | | 9,400 | | | | 338 | |
| Business Services [1.2%] | | | | | | | | |
| Cognizant Technology Solutions, Cl A * | | | 4,800 | | | | 391 | |
| Mastercard, Cl A | | | 1,000 | | | | 252 | |
| VeriFone Systems * | | | 3,900 | | | | 214 | |
| | | | | | | 857 | |
| Chemicals [2.5%] | | | | | | | | |
| Celanese, Cl A | | | 6,160 | | | | 273 | |
| CF Industries Holdings | | | 1,340 | | | | 183 | |
| Dow Chemical | | | 23,625 | | | | 892 | |
| International Flavors & Fragrances | | | 5,530 | | | | 345 | |
| Potash Corp of Saskatchewan | | | 2,700 | | | | 159 | |
| | | | | | | 1,852 | |
| Commercial Banks [0.7%] | | | | | | | | |
| | | 18,700 | | | | 513 | |
| Communication & Media [0.8%] | | | | | |
| Time Warner | | | 9,466 | | | | 338 | |
| Viacom, Cl B | | | 5,510 | | | | 256 | |
Total Communication & Media | | | | 594 | |
| Computer Software [3.9%] | | | | | | | | |
| Microsoft | | | 14,571 | | | | 369 | |
| Oracle | | | 55,075 | | | | 1,838 | |
| Symantec * | | | 33,975 | | | | 630 | |
| | | | | | | 2,837 | |
See accompanying notes to financial statements.
CNI CHARTER FUNDS | PAGE 42
| schedule of investments |
March 31, 2011 (Unaudited) |
Diversified Equity Fund (continued) |
| Computer System Design & Services [5.0%] | |
| Apple * | | | 4,359 | | | $ | 1,519 | |
| Dell * | | | 23,829 | | | | 346 | |
| Hewlett-Packard | | | 15,850 | | | | 649 | |
| IBM | | | 4,600 | | | | 750 | |
| SanDisk * | | | 6,780 | | | | 313 | |
Total Computer System Design & Services | | | | 3,577 | |
| Computers & Peripherals [1.9%] | | | | | |
| | | 50,465 | | | | 1,340 | |
| Construction & Engineering [0.8%] | | | | | |
| Aecom Technology * | | | 17,875 | | | | 496 | |
| KBR | | | 1,890 | | | | 71 | |
Total Construction & Engineering | | | | 567 | |
| Consumer Products & Services [0.2%] | | | | | |
| | | 6,200 | | | | 155 | |
| Containers & Packaging [1.1%] | | | | | |
| Bemis | | | 14,575 | | | | 478 | |
| Crown Holdings * | | | 9,000 | | | | 348 | |
Total Containers & Packaging | | | | | | | 826 | |
| Diversified Manufacturing [3.1%] | | | | | |
| 3M | | | 8,925 | | | | 835 | |
| General Electric | | | 28,525 | | | | 572 | |
| Parker Hannifin | | | 8,950 | | | | 847 | |
Total Diversified Manufacturing | | | | 2,254 | |
| Diversified Metals & Mining [0.8%] | | | | | |
| Cliffs Natural Resources | | | 2,620 | | | | 257 | |
| Goldcorp | | | 6,240 | | | | 311 | |
Total Diversified Metals & Mining | | | | 568 | |
| Drugs [4.3%] | | | | | | | | |
| Abbott Laboratories | | | 17,800 | | | | 873 | |
| Allergan | | | 6,570 | | | | 467 | |
| Bristol-Myers Squibb | | | 6,200 | | | | 164 | |
| Mylan * | | | 46,725 | | | | 1,059 | |
| Shire ADR | | | 3,080 | | | | 268 | |
| Valeant Pharmaceuticals International | | | 4,660 | | | | 232 | |
| | | | | | | 3,063 | |
| Electrical Services [1.3%] | | | | | | | | |
| AMETEK | | | 7,220 | | | $ | 316 | |
| First Solar * | | | 710 | | | | 114 | |
| Rockwell Automation | | | 5,090 | | | | 482 | |
Total Electrical Services | | | | | | | 912 | |
| Entertainment [2.3%] | | | | | | | | |
| Las Vegas Sands * | | | 11,430 | | | | 483 | |
| Royal Caribbean Cruises * | | | 5,130 | | | | 212 | |
| Starbucks | | | 11,100 | | | | 410 | |
| Starwood Hotels & Resorts Worldwide | | | 5,350 | | | | 311 | |
| Wendy's, Cl A | | | 49,500 | | | | 249 | |
| | | | | | | 1,665 | |
| Financial Services [2.5%] | | | | | | | | |
| Capital One Financial | | | 15,925 | | | | 827 | |
| Charles Schwab | | | 22,940 | | | | 414 | |
| Citigroup * | | | 87,520 | | | | 387 | |
| IntercontinentalExchange * | | | 1,540 | | | | 190 | |
| Western Union | | | 1,140 | | | | 24 | |
| | | | | | | 1,842 | |
| Food, Beverage & Tobacco [3.0%] | | | | | |
| Coca-Cola | | | 8,150 | | | | 541 | |
| ConAgra Foods | | | 24,700 | | | | 587 | |
| General Mills | | | 16,800 | | | | 614 | |
| PepsiCo | | | 6,709 | | | | 432 | |
Total Food, Beverage & Tobacco | | | | 2,174 | |
| Healthcare Products & Services [1.9%] | | | | | |
| Agilent Technologies * | | | 6,040 | | | | 270 | |
| Express Scripts, Cl A * | | | 4,710 | | | | 262 | |
| McKesson | | | 4,462 | | | | 353 | |
| Medtronic | | | 6,510 | | | | 256 | |
| Pharmaceutical Product Development | | | 9,100 | | | | 252 | |
Total Healthcare Products & Services | | | | 1,393 | |
| Household Furniture & Fixtures [0.8%] | | | | | |
| Stanley Black & Decker | | | 3,300 | | | | 253 | |
| Toll Brothers * | | | 14,740 | | | | 291 | |
Total Household Furniture & Fixtures | | | | 544 | |
See accompanying notes to financial statements.
CNI CHARTER FUNDS | PAGE 43
| schedule of investments |
March 31, 2011 (Unaudited) |
Diversified Equity Fund (continued) |
| Industrial [0.5%] | | | | | | | | |
| | | 6,010 | | | $ | 378 | |
| Insurance [3.9%] | | | | | | | | |
| Aflac | | | 9,875 | | | | 521 | |
| Berkshire Hathaway, Cl B * | | | 6,222 | | | | 520 | |
| Chubb | | | 4,400 | | | | 270 | |
| HCC Insurance Holdings | | | 15,900 | | | | 498 | |
| Loews | | | 7,000 | | | | 302 | |
| Universal Health Services, Cl B | | | 4,970 | | | | 246 | |
| Unum Group | | | 19,300 | | | | 506 | |
| | | | | | | 2,863 | |
| Investment Banker/Broker Dealer [2.5%] | | | | | |
| Invesco | | | 13,630 | | | | 349 | |
| JPMorgan Chase | | | 18,525 | | | | 854 | |
| Morgan Stanley | | | 20,500 | | | | 560 | |
Total Investment Banker/Broker Dealer | | | | 1,763 | |
| Machinery [2.7%] | | | | | | | | |
| AGCO * | | | 12,960 | | | | 713 | |
| Caterpillar | | | 6,110 | | | | 680 | |
| Cummins | | | 4,705 | | | | 516 | |
| | | | | | | 1,909 | |
| Manufacturing [0.8%] | | | | | | | | |
| | | 13,350 | | | | 598 | |
| Medical Products & Services [3.9%] | | | | | |
| CareFusion * | | | 15,842 | | | | 447 | |
| Covidien | | | 10,270 | | | | 533 | |
| Laboratory Corp of America Holdings * | | | 3,600 | | | | 332 | |
| Patterson | | | 10,500 | | | | 338 | |
| Quest Diagnostics | | | 9,000 | | | | 520 | |
| Stryker | | | 10,500 | | | | 638 | |
Total Medical Products & Services | | | | 2,808 | |
| Metals & Mining [1.0%] | | | | | | | | |
| | | 13,625 | | | | 707 | |
| Office Furniture & Fixtures [1.7%] | | | | | |
| Rovi * | | | 6,550 | | | | 352 | |
| Salesforce.com * | | | 4,440 | | | | 593 | |
| Synopsys * | | | 10,100 | | | | 279 | |
Total Office Furniture & Fixtures | | | | 1,224 | |
| Paper & Related Products [0.8%] | | | | | |
| Packaging Corp of America | | | 6,000 | | | $ | 173 | |
| Sealed Air | | | 14,700 | | | | 392 | |
Total Paper & Related Products | | | | | | | 565 | |
| Petroleum & Fuel Products [13.4%] | | | | | |
| Anadarko Petroleum | | | 17,905 | | | | 1,467 | |
| ChevronTexaco | | | 4,875 | | | | 524 | |
| Cimarex Energy | | | 4,130 | | | | 476 | |
| Concho Resources * | | | 4,390 | | | | 471 | |
| ConocoPhillips | | | 3,600 | | | | 287 | |
| Devon Energy | | | 6,350 | | | | 583 | |
| Exterran Holdings * | | | 22,000 | | | | 522 | |
| National Oilwell Varco | | | 2,450 | | | | 194 | |
| Newfield Exploration * | | | 6,800 | | | | 517 | |
| Noble | | | 11,400 | | | | 520 | |
| Patterson-UTI Energy | | | 12,100 | | | | 356 | |
| Royal Dutch Shell, Cl B ADR | | | 14,725 | | | | 1,078 | |
| Schlumberger | | | 9,550 | | | | 891 | |
| Southwestern Energy * | | | 9,000 | | | | 387 | |
| Spectra Energy | | | 9,400 | | | | 255 | |
| Unit * | | | 2,800 | | | | 173 | |
| Williams | | | 31,800 | | | | 992 | |
Total Petroleum & Fuel Products | | | | 9,693 | |
| Real Estate Management & Development [1.2%] | |
| Brookfield Asset Management, Cl A | | | 21,200 | | | | 688 | |
| CB Richard Ellis Group, Cl A * | | | 7,030 | | | | 188 | |
Total Real Estate Management & Development | | | | | | | 876 | |
| Retail [4.2%] | | | | | | | | |
| Advance Auto Parts | | | 7,875 | | | | 517 | |
| Cia Brasileira de Distribuicao Grupo Pao de Acucar ADR | | | 3,170 | | | | 133 | |
| Kohl's | | | 10,525 | | | | 558 | |
| Staples | | | 23,650 | | | | 459 | |
| Walgreen | | | 10,000 | | | | 401 | |
| Wal-Mart Stores | | | 14,700 | | | | 765 | |
| Whole Foods Market | | | 3,910 | | | | 258 | |
| | | | | | | 3,091 | |
| Semi-Conductors [3.3%] | | | | | | | | |
| Altera | | | 9,820 | | | | 432 | |
| Applied Materials | | | 20,400 | | | | 319 | |
See accompanying notes to financial statements.
CNI CHARTER FUNDS | PAGE 44
| schedule of investments |
March 31, 2011 (Unaudited) |
Diversified Equity Fund (concluded) |
| ASML Holding, Cl G | | | 10,360 | | | $ | 461 | |
| Broadcom, Cl A | | | 12,690 | | | | 500 | |
| Netlogic Microsystems * | | | 6,150 | | | | 258 | |
| NXP Semiconductor * | | | 5,820 | | | | 175 | |
| Varian Semiconductor Equipment Associates * | | | 5,330 | | | | 259 | |
| | | | | | | 2,404 | |
| Telephones & Telecommunications [2.5%] | | | | | |
| AT&T | | | 19,000 | | | | 582 | |
| Research In Motion * | | | 8,075 | | | | 457 | |
| Verizon Communications | | | 19,775 | | | | 762 | |
Total Telephones & Telecommunications | | | | 1,801 | |
| Transportation Services [1.5%] | | | | | |
| | | 11,480 | | | | 1,074 | |
| Web Portals/ISP [2.8%] | | | | | | | | |
| Amazon.com * | | | 2,150 | | | | 387 | |
| Google, Cl A * | | | 2,140 | | | | 1,254 | |
| Juniper Networks * | | | 9,390 | | | | 395 | |
| | | | | | | 2,036 | |
| Wholesale [0.6%] | | | | | | | | |
Mead Johnson Nutrition, Cl A | | | 7,060 | | | | 409 | |
Total Common Stock (Cost $58,400) | | | | | | | 69,439 | |
| Cash Equivalent [4.0%] | | | | | | | | |
| AIM STIT-Treasury Portfolio, 0.020%** | | | 2,905,918 | | | | 2,906 | |
Total Cash Equivalent (Cost $2,906) | | | | | | | 2,906 | |
Total Investments [100.2%] (Cost $61,306) | | | $ | 72,345 | |
Percentages are based on Net Assets of $72,177 ($ Thousands).
| * | Non-income producing security. |
| ** | The rate reported is the 7-day effective yield as of March 31, 2011. |
ADR — American Depositary Receipt
Cl — Class
As of March 31, 2011, all of the Fund’s investments are Level 1, in accordance with ASC 820.
For the period ended March 31, 2011, there have been no significant transfers between Level 1 and Level 2 assets and liabilities.
For more information on valuation inputs, see Note 2 — Significant Accounting Policies in the Notes to Financial Statements.
See accompanying notes to financial statements.
CNI CHARTER FUNDS | PAGE 45
| schedule of investments |
March 31, 2011 (Unaudited) |
| Large Cap Value Equity Fund |
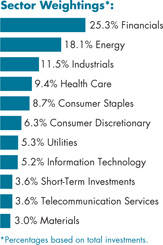
| | | | | | |
| Common Stock [97.1%] | | | | | | |
| Aerospace & Defense [1.6%] | | | | | | |
| General Dynamics | | | 9,000 | | | $ | 689 | |
| Huntington Ingalls Industries * | | | 750 | | | | 31 | |
| L-3 Communications Holdings, Cl 3 | | | 9,700 | | | | 760 | |
| Lockheed Martin | | | 2,200 | | | | 177 | |
| Northrop Grumman | | | 4,500 | | | | 282 | |
Total Aerospace & Defense | | | | | | | 1,939 | |
| Beverages [0.6%] | | | | | | | | |
Molson Coors Brewing, Cl B | | | 15,400 | | | | 722 | |
| Biotechnology [0.9%] | | | | | | | | |
| | | 26,000 | | | | 1,103 | |
| Capital Markets [5.0%] | | | | | | | | |
| Bank of New York Mellon | | | 52,900 | | | | 1,580 | |
| Goldman Sachs Group | | | 11,200 | | | | 1,775 | |
| Morgan Stanley | | | 35,700 | | | | 975 | |
| State Street | | | 34,800 | | | | 1,564 | |
| | | | | | | 5,894 | |
| Commercial Banks [4.2%] | | | | | | | | |
| US Bancorp | | | 74,500 | | | | 1,969 | |
| Wells Fargo | | | 94,960 | | | | 3,010 | |
| | | | | | | 4,979 | |
| Commercial Services & Supplies [2.1%] | | | | | |
| Iron Mountain | | | 42,500 | | | $ | 1,327 | |
| Waste Management | | | 30,500 | | | | 1,139 | |
Total Commercial Services & Supplies | | | | 2,466 | |
| Communications Equipment [1.2%] | | | | | |
| | | 80,000 | | | | 1,372 | |
| Construction Materials [0.9%] | | | | | | | | |
| | | 24,000 | | | | 1,094 | |
| Consumer Finance [1.7%] | | | | | | | | |
| | | 44,900 | | | | 2,030 | |
| Containers & Packaging [1.2%] | | | | | |
| | | 52,100 | | | | 1,389 | |
| Diversified Financial Services [6.5%] | | | | | |
| Bank of America | | | 95,000 | | | | 1,266 | |
| Citigroup * | | | 600,000 | | | | 2,652 | |
| JPMorgan Chase | | | 83,200 | | | | 3,836 | |
Total Diversified Financial Services | | | | 7,754 | |
| Diversified Telecommunication Services [3.6%] | |
| AT&T | | | 76,617 | | | | 2,345 | |
| Verizon Communications | | | 50,500 | | | | 1,946 | |
Total Diversified Telecommunication Services | | | | | | | 4,291 | |
| Electric Utilities [2.6%] | | | | | | | | |
| American Electric Power | | | 4,500 | | | | 158 | |
| Edison International | | | 32,600 | | | | 1,193 | |
| FirstEnergy | | | 13,673 | | | | 507 | |
| NextEra Energy | | | 10,200 | | | | 562 | |
| PPL | | | 24,100 | | | | 610 | |
| | | | | | | 3,030 | |
| Energy Equipment & Services [3.6%] | | | | | |
| Diamond Offshore Drilling | | | 19,800 | | | | 1,538 | |
| National Oilwell Varco | | | 26,200 | | | | 2,077 | |
| Transocean * | | | 8,000 | | | | 624 | |
Total Energy Equipment & Services | | | | 4,239 | |
See accompanying notes to financial statements.
CNI CHARTER FUNDS | PAGE 46
| schedule of investments |
March 31, 2011 (Unaudited) |
Large Cap Value Equity Fund (continued) |
| Food & Staples Retailing [4.8%] | | | | | |
| CVS | | | 52,400 | | | $ | 1,798 | |
| SUPERVALU | | | 124,500 | | | | 1,112 | |
| Sysco | | | 20,000 | | | | 554 | |
| Wal-Mart Stores | | | 42,600 | | | | 2,217 | |
Total Food & Staples Retailing | | | | | | | 5,681 | |
| Food Products [1.6%] | | | | | | | | |
| Archer-Daniels-Midland | | | 26,400 | | | | 951 | |
| Dean Foods * | | | 90,000 | | | | 900 | |
| | | | | | | 1,851 | |
| Health Care Equipment & Supplies [1.6%] | | | | | |
| Baxter International | | | 12,500 | | | | 672 | |
| Becton Dickinson | | | 6,900 | | | | 549 | |
| Covidien | | | 12,800 | | | | 665 | |
Total Health Care Equipment & Supplies | | | | 1,886 | |
| Health Care Providers & Services [2.1%] | | | | | |
| Aetna | | | 34,200 | | | | 1,280 | |
| Cigna | | | 18,500 | | | | 819 | |
| UnitedHealth Group | | | 9,500 | | | | 430 | |
Total Health Care Providers & Services | | | | 2,529 | |
| Household Products [1.8%] | | | | | | | | |
| | | 34,700 | | | | 2,138 | |
| Industrial Conglomerates [3.2%] | | | | | |
| General Electric | | | 160,700 | | | | 3,222 | |
| Tyco International | | | 13,600 | | | | 609 | |
Total Industrial Conglomerates | | | | | | | 3,831 | |
| Insurance [6.6%] | | | | | | | | |
| Aflac | | | 32,500 | | | | 1,715 | |
| Berkshire Hathaway, Cl B * | | | 35,400 | | | | 2,961 | |
| Marsh & McLennan | | | 53,500 | | | | 1,595 | |
| Travelers | | | 27,000 | | | | 1,606 | |
| | | | | | | 7,877 | |
| Leisure Equipment & Products [1.2%] | | | | | |
| | | 54,000 | | | | 1,346 | |
| Machinery [1.1%] | | | | | | | | |
| | | 23,000 | | | $ | 1,264 | |
| Media [3.0%] | | | | | | | | |
| CBS, Cl B | | | 31,250 | | | | 783 | |
| Comcast, Cl A | | | 86,500 | | | | 2,138 | |
| Time Warner | | | 17,933 | | | | 640 | |
| | | | | | | 3,561 | |
| Metals & Mining [0.9%] | | | | | | | | |
| | | 19,800 | | | | 1,081 | |
| Multiline Retail [1.4%] | | | | | | | | |
| | | 33,900 | | | | 1,695 | |
| Multi-Utilities [2.8%] | | | | | | | | |
| Consolidated Edison | | | 7,000 | | | | 355 | |
| PG&E | | | 39,600 | | | | 1,750 | |
| Public Service Enterprise Group | | | 22,100 | | | | 696 | |
| Sempra Energy | | | 10,000 | | | | 535 | |
| | | | | | | 3,336 | |
| Oil, Gas & Consumable Fuels [14.7%] | | | | | |
| Apache | | | 14,000 | | | | 1,833 | |
| BP ADR | | | 24,500 | | | | 1,081 | |
| Chevron | | | 38,240 | | | | 4,108 | |
| ConocoPhillips | | | 46,580 | | | | 3,720 | |
| Devon Energy | | | 13,000 | | | | 1,193 | |
| Exxon Mobil | | | 46,000 | | | | 3,870 | |
| Marathon Oil | | | 30,000 | | | | 1,599 | |
Total Oil, Gas & Consumable Fuels | | | | 17,404 | |
| Pharmaceuticals [4.8%] | | | | | | | | |
| Abbott Laboratories | | | 21,700 | | | | 1,064 | |
| Bristol-Myers Squibb | | | 41,000 | | | | 1,084 | |
| Merck | | | 23,100 | | | | 763 | |
| Pfizer | | | 104,000 | | | | 2,112 | |
| Warner Chilcott, Cl A | | | 28,300 | | | | 659 | |
| | | | | | | 5,682 | |
| Real Estate Management & Development [1.4%] | |
Brookfield Asset Management, Cl A | | | 49,300 | | | | 1,600 | |
See accompanying notes to financial statements.
CNI CHARTER FUNDS | PAGE 47
| schedule of investments |
March 31, 2011 (Unaudited) |
Large Cap Value Equity Fund (concluded) |
| Road & Rail [3.5%] | | | | | | | | |
| CSX | | | 24,400 | | | $ | 1,918 | |
| Union Pacific | | | 23,000 | | | | 2,262 | |
| | | | | | | 4,180 | |
| Semiconductors & Semiconductor Equipment [2.5%] | |
| Intel | | | 72,200 | | | | 1,456 | |
| Texas Instruments | | | 44,900 | | | | 1,552 | |
Total Semiconductors & Semiconductor Equipment | | | | | | | 3,008 | |
| Software [1.6%] | | | | | | | | |
| | | 73,500 | | | | 1,864 | |
| Specialty Retail [0.8%] | | | | | | | | |
| Best Buy | | | 12,200 | | | | 350 | |
| Lowe's | | | 22,500 | | | | 595 | |
| | | | | | | 945 | |
Total Common Stock (Cost $104,281) | | | | | | | 115,061 | |
| Cash Equivalents [3.6%] | | | | | | | | |
| Fidelity Institutional Domestic Money Market Portfolio, Cl I, 0.160%** | | | 2,607,193 | | | | 2,607 | |
| Goldman Sachs Financial Square Funds - Government Fund, 0.040%** | | | 1,716,951 | | | | 1,717 | |
Total Cash Equivalents (Cost $4,324) | | | | | | | 4,324 | |
Total Investments [100.7%] (Cost $108,605) | | | $ | 119,385 | |
Percentages are based on Net Assets of $118,537 ($ Thousands).
| * | Non-income producing security. |
| ** | The rate reported is the 7-day effective yield as of March 31, 2011. |
Cl — Class
As of March 31, 2011, all of the Fund’s investments are Level 1, in accordance with ASC 820.
For the period ended March 31, 2011, there have been no significant transfers between Level 1 and Level 2 assets and liabilities.
For more information on valuation inputs, see note 2 — Significant Accounting Policies in the Notes to Financial Statements.
See accompanying notes to financial statements.
CNI CHARTER FUNDS | PAGE 48
| schedule of investments |
March 31, 2011 (Unaudited) |
| Large Cap Growth Equity Fund |
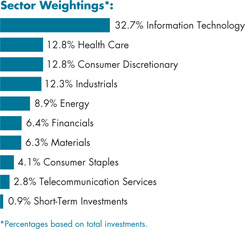
| | | | | | |
| Common Stock [99.2%] | | | | | | |
| Aerospace & Defense [1.5%] | | | | | | |
| | | 11,200 | | | $ | 828 | |
| Air Freight & Logistics [1.8%] | | | | | | | | |
| | | 10,800 | | | | 1,011 | |
| Auto Components [1.6%] | | | | | | | | |
| | | 21,300 | | | | 885 | |
| Beverages [2.2%] | | | | | | | | |
| Dr Pepper Snapple Group | | | 15,100 | | | | 561 | |
| Fomento Economico Mexicano ADR | | | 11,400 | | | | 669 | |
| | | | | | | 1,230 | |
| Biotechnology [4.5%] | | | | | | | | |
| Celgene * | | | 18,200 | | | | 1,047 | |
| Gilead Sciences * | | | 16,800 | | | | 713 | |
| United Therapeutics * | | | 11,600 | | | | 777 | |
| | | | | | | 2,537 | |
| Capital Markets [1.1%] | | | | | | | | |
| | | 4,800 | | | | 600 | |
| Chemicals [1.9%] | | | | | | | | |
| Air Products & Chemicals | | | 5,700 | | | | 514 | |
| EI du Pont de Nemours | | | 10,200 | | | | 561 | |
| | | | | | | 1,075 | |
| Commercial Banks [2.7%] | | | | | | | | |
| Signature Bank NY * | | | 13,600 | | | $ | 767 | |
| Wells Fargo | | | 24,000 | | | | 761 | |
| | | | | | | 1,528 | |
| Commercial Services & Supplies [1.4%] | | | | | |
| | | 26,000 | | | | 781 | |
| Communications Equipment [6.2%] | | | | | |
| F5 Networks * | | | 5,400 | | | | 554 | |
| Finisar * | | | 32,500 | | | | 799 | |
| Juniper Networks * | | | 22,000 | | | | 926 | |
| Qualcomm | | | 22,000 | | | | 1,206 | |
Total Communications Equipment | | | | 3,485 | |
| Computers & Peripherals [7.1%] | | | | | |
| Apple * | | | 9,100 | | | | 3,171 | |
| EMC * | | | 31,000 | | | | 823 | |
Total Computers & Peripherals | | | | | | | 3,994 | |
| Diversified Financial Services [1.4%] | | | | | |
| | | 17,600 | | | | 811 | |
| Diversified Telecommunication Services [1.2%] | |
| | | 16,800 | | | | 647 | |
| Electronic Equipment [1.7%] | | | | | | | | |
| | | 46,900 | | | | 968 | |
| Energy Equipment & Services [4.2%] | | | | | |
| Baker Hughes | | | 10,500 | | | | 771 | |
| National Oilwell Varco | | | 8,500 | | | | 674 | |
| Schlumberger | | | 9,900 | | | | 923 | |
Total Energy Equipment & Services | | | | 2,368 | |
| Food & Staples Retailing [1.0%] | | | | | |
| | | 10,500 | | | | 547 | |
| Health Care Equipment & Supplies [3.2%] | | | | | |
| Baxter International | | | 16,600 | | | | 893 | |
| Intuitive Surgical * | | | 2,700 | | | | 900 | |
Total Health Care Equipment & Supplies | | | | 1,793 | |
See accompanying notes to financial statements.
CNI CHARTER FUNDS | PAGE 49
| schedule of investments |
March 31, 2011 (Unaudited) |
Large Cap Growth Equity Fund (continued) |
| Hotels, Restaurants & Leisure [1.6%] | | | | | |
| | | 24,100 | | | $ | 891 | |
| Insurance [1.2%] | | | | | | | | |
| | | 10,600 | | | | 653 | |
| Internet & Catalog Retail [1.5%] | | | | | |
| | | 1,700 | | | | 861 | |
| Internet Software & Services [2.0%] | | | | | |
| | | 1,900 | | | | 1,114 | |
| IT Services [3.5%] | | | | | | | | |
| IBM | | | 7,700 | | | | 1,256 | |
| Mastercard, Cl A | | | 2,900 | | | | 730 | |
| | | | | | | 1,986 | |
| Life Sciences Tools & Services [1.3%] | | | | | |
| | | 13,600 | | | | 713 | |
| Machinery [6.0%] | | | | | | | | |
| Caterpillar | | | 8,000 | | | | 891 | |
| Cummins | | | 7,400 | | | | 811 | |
| Danaher | | | 13,500 | | | | 701 | |
| Illinois Tool Works | | | 17,900 | | | | 961 | |
| | | | | | | 3,364 | |
| Media [2.9%] | | | | | | | | |
| DIRECTV, Cl A * | | | 17,600 | | | | 824 | |
| Time Warner Cable, Cl A | | | 11,200 | | | | 799 | |
| | | | | | | 1,623 | |
| Metals & Mining [4.4%] | | | | | | | | |
| Alcoa | | | 49,400 | | | | 872 | |
| Allegheny Technologies | | | 12,800 | | | | 866 | |
| Worthington Industries | | | 35,700 | | | | 747 | |
| | | | | | | 2,485 | |
| Multiline Retail [2.8%] | | | | | | | | |
| Kohl's | | | 14,800 | | | | 785 | |
| Target | | | 16,000 | | | | 800 | |
| | | | | | | 1,585 | |
| Oil, Gas & Consumable Fuels [4.7%] | | | | | |
| Chevron | | | 14,200 | | | $ | 1,526 | |
| Peabody Energy | | | 15,500 | | | | 1,115 | |
Total Oil, Gas & Consumable Fuels | | | | 2,641 | |
| Personal Products [0.9%] | | | | | | | | |
| | | 19,600 | | | | 530 | |
| Pharmaceuticals [3.9%] | | | | | | | | |
| Allergan | | | 9,000 | | | | 639 | |
| Mylan * | | | 30,400 | | | | 689 | |
| Shire ADR | | | 9,800 | | | | 854 | |
| | | | | | | 2,182 | |
| Road & Rail [1.7%] | | | | | | | | |
| | | 13,800 | | | | 956 | |
| Semiconductors & Semiconductor Equipment [6.6%] | |
| Altera | | | 19,200 | | | | 845 | |
| Broadcom, Cl A | | | 17,800 | | | | 701 | |
| Cree * | | | 15,200 | | | | 702 | |
| First Solar * | | | 5,400 | | | | 868 | |
| Texas Instruments | | | 18,000 | | | | 622 | |
Total Semiconductors & Semiconductor Equipment | | | | | | | 3,738 | |
| Software [5.5%] | | | | | | | | |
| Microsoft | | | 59,500 | | | | 1,509 | |
| Oracle | | | 46,865 | | | | 1,564 | |
| | | | | | | 3,073 | |
| Specialty Retail [2.4%] | | | | | | | | |
| Lowe's | | | 26,700 | | | | 706 | |
| Staples | | | 34,400 | | | | 668 | |
| | | | | | | 1,374 | |
| Wireless Telecommunication Services [1.6%] | |
MetroPCS Communications * | | | 55,700 | | | | 905 | |
Total Common Stock (Cost $47,524) | | | | | | | 55,762 | |
See accompanying notes to financial statements.
CNI CHARTER FUNDS | PAGE 50
| schedule of investments |
March 31, 2011 (Unaudited) |
Large Cap Growth Equity Fund (concluded) |
| Cash Equivalents [0.9%] | | | | | | | | |
| Fidelity Institutional Domestic Money Market Portfolio, Cl I, 0.160%** | | | 272,728 | | | $ | 273 | |
| Goldman Sachs Financial Square Funds - Government Fund, 0.040%** | | | 215,642 | | | | 215 | |
Total Cash Equivalents (Cost $488) | | | | | | | 488 | |
Total Investments [100.1%] (Cost $48,012) | | | $ | 56,250 | |
Percentages are based on Net Assets of $56,211 ($ Thousands).
| * | Non-income producing security. |
| ** | The rate reported is the 7-day effective yield as of March 31, 2011. |
ADR — American Depositary Receipt
Cl — Class
As of March 31, 2011, all of the Fund’s investments are Level 1, in accordance with ASC 820.
For the period ended March 31, 2011, there have been no significant transfers between Level 1 and Level 2 assets and liabilities.
For more information on valuation inputs, see note 2 — Significant Accounting Policies in the Notes to Financial Statements.
See accompanying notes to financial statements.
CNI CHARTER FUNDS | PAGE 51
| schedule of investments |
March 31, 2011 (Unaudited) |
| Socially Responsible Equity Fund |
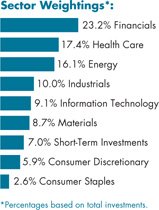
| | | | | | |
| Common Stock [93.0%] | | | | | | |
| Automotive [0.8%] | | | | | | |
| | | 17,000 | | | $ | 638 | |
| Banks [6.7%] | | | | | | | | |
| Cullen | | | 22,500 | | | | 1,328 | |
| M&T Bank | | | 7,000 | | | | 619 | |
| Toronto-Dominion Bank | | | 9,000 | | | | 797 | |
| UMB Financial | | | 17,500 | | | | 654 | |
| US Bancorp | | | 63,000 | | | | 1,665 | |
| | | | | | | 5,063 | |
| Building & Construction [1.1%] | | | | | |
| | | 23,000 | | | | 828 | |
| Business Services [2.9%] | | | | | | | | |
Automatic Data Processing | | | 43,000 | | | | 2,206 | |
| Chemicals [2.5%] | | | | | | | | |
| | | 35,000 | | | | 1,924 | |
| Communication & Media [3.3%] | | | | | |
| Thomson Reuters | | | 34,000 | | | | 1,334 | |
| Time Warner | | | 33,000 | | | | 1,178 | |
Total Communication & Media | | | | 2,512 | |
| Computer Software [2.0%] | | | | | | | | |
| | | 60,000 | | | | 1,522 | |
| Distributors [1.8%] | | | | | | | | |
| | | 25,000 | | | | 1,341 | |
| Drugs [5.2%] | | | | | | | | |
| Abbott Laboratories | | | 46,000 | | | $ | 2,256 | |
| Bristol-Myers Squibb | | | 65,000 | | | | 1,718 | |
| | | | | | | 3,974 | |
| Electrical Equipment [2.9%] | | | | | | | | |
| | | 37,000 | | | | 2,162 | |
| Financial Services [2.0%] | | | | | | | | |
| | | 42,500 | | | | 1,495 | |
| Healthcare Products & Services [6.2%] | | | | | |
| Cardinal Health | | | 47,000 | | | | 1,933 | |
| McKesson | | | 19,000 | | | | 1,502 | |
| Pharmaceutical Product Development | | | 45,000 | | | | 1,247 | |
Total Healthcare Products & Services | | | | 4,682 | |
| Insurance [11.2%] | | | | | | | | |
| Berkshire Hathaway, Cl B * | | | 25,500 | | | | 2,133 | |
| Chubb | | | 34,000 | | | | 2,084 | |
| HCC Insurance Holdings | | | 25,000 | | | | 783 | |
| Loews | | | 53,000 | | | | 2,284 | |
| Mercury General | | | 31,000 | | | | 1,213 | |
| | | | | | | 8,497 | |
| Machinery [1.4%] | | | | | | | | |
| | | 20,000 | | | | 1,099 | |
| Manufacturing [2.0%] | | | | | | | | |
| | | 33,375 | | | | 1,494 | |
| Medical Products & Services [6.0%] | | | | | |
| Laboratory Corp of America Holdings * | | | 14,000 | | | | 1,290 | |
| Patterson | | | 60,000 | | | | 1,931 | |
| Quest Diagnostics | | | 22,500 | | | | 1,299 | |
Total Medical Products & Services | | | | 4,520 | |
| Paper & Related Products [4.2%] | | | | | |
| Packaging Corp of America | | | 53,500 | | | | 1,546 | |
| Sealed Air | | | 60,000 | | | | 1,599 | |
Total Paper & Related Products | | | | | | | 3,145 | |
See accompanying notes to financial statements.
CNI CHARTER FUNDS | PAGE 52
| schedule of investments |
March 31, 2011 (Unaudited) |
Socially Responsible Equity Fund (concluded) |
| Petroleum & Fuel Products [16.1%] | | | | | |
| ConocoPhillips | | | 34,000 | | | $ | 2,715 | |
| Encana | | | 65,000 | | | | 2,244 | |
| Exterran Holdings * | | | 82,500 | | | | 1,958 | |
| Southwestern Energy * | | | 26,000 | | | | 1,117 | |
| Spectra Energy | | | 83,000 | | | | 2,256 | |
| Unit * | | | 30,000 | | | | 1,859 | |
Total Petroleum & Fuel Products | | | | 12,149 | |
| Real Estate Management & Development [3.3%] | |
Brookfield Asset Management, Cl A | | | 77,000 | | | | 2,499 | |
| Retail [2.6%] | | | | | | | | |
| | | 49,000 | | | | 1,967 | |
| Semi-Conductors [4.2%] | | | | | | | | |
| Analog Devices | | | 53,000 | | | | 2,087 | |
| Intel | | | 55,000 | | | | 1,109 | |
| | | | | | | 3,196 | |
| Steel & Steel Works [2.0%] | | | | | | | | |
| | | 32,500 | | | | 1,496 | |
| Waste Management Services [2.6%] | | | | | |
| | | 53,500 | | | | 1,998 | |
Total Common Stock (Cost $57,772) | | | | | | | 70,407 | |
| Cash Equivalent [7.0%] | | | | | | | | |
| AIM STIT-Government TaxAdvantage Portfolio, 0.050%** | | | 5,282,543 | | | | 5,283 | |
Total Cash Equivalent (Cost $5,283) | | | | | | | 5,283 | |
Total Investments [100.0%] (Cost $63,055) | | | $ | 75,690 | |
Percentages are based on Net Assets of $75,716 ($ Thousands).
| * | Non-income producing security. |
| ** | The rate reported is the 7-day current yield as of March 31, 2011. |
ADR — American Depositary Receipt
Cl — Class
As of March 31, 2011, all of the Fund’s investments are Level 1, in accordance with ASC 820.
For the period ended March 31, 2011, there have been no significant transfers between Level 1 and Level 2 assets and liabilities.
For more information on valuation inputs, see Note 2 – Significant Accounting Policies in the Notes to Financial Statements.
See accompanying notes to financial statements.
CNI CHARTER FUNDS | PAGE 53
| schedule of investments |
March 31, 2011 (Unaudited) |
| RCB Small Cap Value Fund |
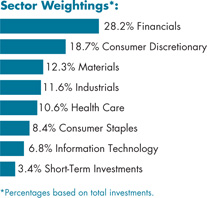
| | | | | | |
| Common Stock [95.0%] | | | | | | |
| Capital Markets [5.8%] | | | | | | |
| Duff & Phelps, Cl A | | | 30,500 | | | $ | 487 | |
| Federated Investors, Cl B | | | 35,755 | | | | 957 | |
| | | | | | | 1,444 | |
| Chemicals [7.8%] | | | | | | | | |
| KMG Chemicals | | | 30,902 | | | | 608 | |
| Nalco Holding | | | 18,800 | | | | 513 | |
| Spartech * | | | 115,000 | | | | 834 | |
| | | | | | | 1,955 | |
| Construction Materials [2.1%] | | | | | | | | |
| | | 17,000 | | | | 514 | |
| Diversified Consumer Services [4.2%] | | | | | |
| | | 23,000 | | | | 1,056 | |
| Electrical Equipment [2.2%] | | | | | | | | |
| | | 16,100 | | | | 556 | |
| Food Products [4.1%] | | | | | | | | |
| | | 15,000 | | | | 1,026 | |
| Health Care Equipment & Supplies [4.2%] | | | | | |
| | | 17,900 | | | | 1,038 | |
| Health Care Providers & Services [2.0%] | | | | | |
| | | 20,000 | | | | 503 | |
| Hotels, Restaurants & Leisure [6.5%] | | | | | |
| International Speedway, Cl A | | | 20,500 | | | $ | 611 | |
| Wendy's/Arby's Group, Cl A | | | 200,000 | | | | 1,006 | |
Total Hotels, Restaurants & Leisure | | | | 1,617 | |
| Household Products [6.4%] | | | | | | | | |
| Central Garden & Pet, Cl A * | | | 113,000 | | | | 1,041 | |
| Scotts Miracle-Gro, Cl A | | | 9,600 | | | | 555 | |
| | | | | | | 1,596 | |
| Insurance [20.1%] | | | | | | | | |
| Alleghany * | | | 3,379 | | | | 1,118 | |
| Hallmark Financial Services * | | | 59,500 | | | | 499 | |
| Hilltop Holdings * | | | 49,200 | | | | 494 | |
| Symetra Financial | | | 80,000 | | | | 1,088 | |
| White Mountains Insurance Group | | | 5,000 | | | | 1,821 | |
| | | | | | | 5,020 | |
| Internet & Catalog Retail [4.8%] | | | | | |
| | | 37,100 | | | | 1,188 | |
| IT Services [4.5%] | | | | | | | | |
| CoreLogic | | | 25,000 | | | | 463 | |
| Global Cash Access Holdings * | | | 200,000 | | | | 654 | |
| | | | | | | 1,117 | |
| Life Sciences Tools & Services [4.2%] | | | | | |
| | | 40,000 | | | | 1,051 | |
| Machinery [6.3%] | | | | | | | | |
| Altra Holdings * | | | 25,700 | | | | 607 | |
| Crane | | | 10,900 | | | | 528 | |
| IDEX | | | 10,000 | | | | 437 | |
| | | | | | | 1,572 | |
| Media [2.1%] | | | | | | | | |
Liberty Media - Capital, Ser A * | | | 7,202 | | | | 531 | |
| Professional Services [2.8%] | | | | | | | | |
| | | 52,200 | | | | 710 | |
See accompanying notes to financial statements.
CNI CHARTER FUNDS | PAGE 54
| schedule of investments |
March 31, 2011 (Unaudited) |
RCB Small Cap Value Fund (concluded) |
| Real Estate Investment Trusts [1.9%] | | | | |
| | | 120,500 | | | $ | 477 | |
| Software [2.2%] | | | | | | | | |
| | | 17,700 | | | | 560 | |
| Specialty Retail [0.8%] | | | | | | | | |
| | | 30,986 | | | | 208 | |
Total Common Stock (Cost $17,160) | | | | | | | 23,739 | |
| Repurchase Agreement(A) [3.3%] | | | | | | | | |
| Morgan Stanley | | | | | | | | |
| 0.040%, dated 03/31/11, repurchased on 4/01/11, repurchase price $835,556 (collateralized by a U.S. Treasury inflation index note, par value $849,060, 2.000%, 07/15/14; with total market value $852,268) | | $ | 836 | | | | 836 | |
Total Repurchase Agreement (Cost $836) | | | | 836 | |
Total Investments [98.4%] (Cost $17,996) | | | | | | $ | 24,575 | |
Percentages are based on Net Assets of $24,981 ($ Thousands).
| * | Non-income producing security. |
| (A) | Tri-Party Repurchase Agreement. |
Cl — Class
Ser — Series
The following is a summary of the inputs used as of March 31, 2011 in valuing the Fund’s investments carried at value ($ Thousands):
| Investments in Securities | | | | | | | | | | | | |
| Common Stock | | $ | 23,739 | | | $ | — | | | $ | — | | | $ | 23,739 | |
| Repurchase Agreement | | | — | | | | 836 | | | | — | | | | 836 | |
| Total Investments in Securities | | $ | 23,739 | | | $ | 836 | | | $ | — | | | $ | 24,575 | |
For the period ended March 31, 2011, there have been no significant transfers between Level 1 and Level 2 assets and liabilities.
For more information on valuation inputs, see Note 2 — Significant Accounting Policies in the Notes to Financial Statements.
See accompanying notes to financial statements.
CNI CHARTER FUNDS | PAGE 55
| statements of assets and liabilities (000) |
March 31, 2011 (Unaudited) |
| | | Government Money Market Fund | | | | | | California Tax Exempt Money Market Fund | |
| ASSETS: | | | | | | | | | |
Cost of securities (including repurchase agreements) | | $ | 2,959,307 | | | $ | 1,298,626 | | | $ | 781,590 | |
| Investments in securities at value | | $ | 2,397,607 | | | $ | 1,092,726 | | | $ | 781,590 | |
| Repurchase agreements at value | | | 561,700 | | | | 205,900 | | | | — | |
| Cash | | | 88 | | | | — | | | | 4,625 | |
| Income receivable | | | 1,097 | | | | 434 | | | | 743 | |
| | | 137 | | | | 64 | | | | 42 | |
| | | 2,960,629 | | | | 1,299,124 | | | | 787,000 | |
| | | | | | | | | | | | | |
| LIABILITIES: | | | | | | | | | | | | |
| Payable for income distributions | | | 12 | | | | 37 | | | | 4 | |
| Investment adviser fees payable | | | 131 | | | | 271 | | | | 74 | |
| Shareholder servicing & distribution fees payable | | | 27 | | | | 25 | | | | 7 | |
| Administrative fees payable | | | 104 | | | | 47 | | | | 31 | |
| Trustees' fees payable | | | 9 | | | | 5 | | | | 3 | |
| | | 306 | | | | 47 | | | | 99 | |
| | | 589 | | | | 432 | | | | 218 | |
| | $ | 2,960,040 | | | $ | 1,298,692 | | | $ | 786,782 | |
| | | | | | | | | | | | | |
| NET ASSETS: | | | | | | | | | | | | |
| Paid-in Capital (unlimited authorization — $0.01 par value) | | $ | 2,960,045 | | | $ | 1,298,690 | | | $ | 786,780 | |
Accumulated net realized gain (loss) on investments | | | (5 | ) | | | 2 | | | | 2 | |
| | $ | 2,960,040 | | | $ | 1,298,692 | | | $ | 786,782 | |
| | | | | | | | | | | | | |
| Institutional Class Shares ($Dollars): | | | | | | | | | | | | |
| Net Assets | | $ | 84,803,818 | | | $ | 525,240,730 | | | $ | 121,458,172 | |
| Total shares outstanding at end of period | | | 84,805,308 | | | | 525,312,621 | | | | 121,459,766 | |
| Net asset value, offering and redemption price per share | | | | | | | | | | | | |
| (net assets ÷ shares outstanding) | | $ | 1.00 | | | $ | 1.00 | | | $ | 1.00 | |
| | | | | | | | | | | | | |
| Class N Shares ($Dollars): | | | | | | | | | | | | |
| Net Assets | | $ | 2,557,173,557 | | | $ | 424,040,403 | | | $ | 606,125,428 | |
| Total shares outstanding at end of period | | | 2,557,175,400 | | | | 424,097,475 | | | | 606,126,346 | |
| Net asset value, offering and redemption price per share | | | | | | | | | | | | |
| (net assets ÷ shares outstanding) | | $ | 1.00 | | | $ | 1.00 | | | $ | 1.00 | |
| | | | | | | | | | | | | |
| Class S Shares ($Dollars): | | | | | | | | | | | | |
| Net Assets | | $ | 318,062,253 | | | $ | 349,411,250 | | | $ | 59,198,142 | |
| Total shares outstanding at end of period | | | 318,063,916 | | | | 349,373,377 | | | | 59,194,380 | |
| Net asset value, offering and redemption price per share | | | | | | | | | | | | |
| (net assets ÷ shares outstanding) | | $ | 1.00 | | | $ | 1.00 | | | $ | 1.00 | |
| Amounts designated as “—” are either $0 or have been rounded to $0. |
See accompanying notes to financial statements.
CNI CHARTER FUNDS | PAGE 56
| statements of assets and liabilities (000) |
March 31, 2011 (Unaudited) |
| | | Limited Maturity Fixed Income Fund | | | | | | | | | California Tax Exempt Bond Fund | |
| ASSETS: | | | | | | | | | | | | |
Cost of securities (including repurchase agreements) | | $ | 41,184 | | | $ | 171,712 | | | $ | 115,645 | | | $ | 48,499 | |
| Investments in securities at value | | $ | 41,648 | | | $ | 168,742 | | | $ | 116,797 | | | $ | 48,919 | |
| Repurchase agreements at value | | | — | | | | 3,100 | | | | 2,000 | | | | — | |
| Dividend and interest receivable | | | 304 | | | | — | | | | — | | | | — | |
| Income receivable | | | — | | | | 785 | | | | 1,324 | | | | 602 | |
| Receivable for capital shares sold | | | 12 | | | | 405 | | | | 301 | | | | 504 | |
| | | 2 | | | | 8 | | | | 5 | | | | 2 | |
| | | 41,966 | | | | 173,040 | | | | 120,427 | | | | 50,027 | |
| | | | | | | | | | | | | | | | | |
| LIABILITIES: | | | | | | | | | | | | | | | | |
| Payable for capital shares redeemed | | | 2 | | | | 206 | | | | 740 | | | | 21 | |
| Payable for income distributions | | | 19 | | | | 83 | | | | 197 | | | | 57 | |
| Investment adviser fees payable | | | 19 | | | | 51 | | | | 41 | | | | 6 | |
| Shareholder servicing & distribution fees payable | | | 5 | | | | 37 | | | | 25 | | | | 11 | |
| Administrative fees payable | | | 2 | | | | 7 | | | | 5 | | | | 2 | |
| | | 25 | | | | 18 | | | | 12 | | | | 5 | |
| | | 72 | | | | 402 | | | | 1,020 | | | | 102 | |
| | $ | 41,894 | | | $ | 172,638 | | | $ | 119,407 | | | $ | 49,925 | |
| | | | | | | | | | | | | | | | | |
| NET ASSETS: | | | | | | | | | | | | | | | | |
| Paid-in Capital (unlimited authorization — $0.01 par value) | | $ | 44,066 | | | $ | 173,495 | | | $ | 116,411 | | | $ | 49,437 | |
| Undistributed (distributions in excess of) net investment income | | | (1 | ) | | | (638 | ) | | | (2 | ) | | | 1 | |
| Accumulated net realized gain (loss) on investments | | | (2,635 | ) | | | (349 | ) | | | (154 | ) | | | 67 | |
Net unrealized appreciation on investments | | | 464 | | | | 130 | | | | 3,152 | | | | 420 | |
| | $ | 41,894 | | | $ | 172,638 | | | $ | 119,407 | | | $ | 49,925 | |
| | | | | | | | | | | | | | | | | |
| Institutional Class Shares ($Dollars): | | | | | | | | | | | | | | | | |
| Net Assets | | $ | 30,965,503 | | | $ | 169,709,075 | | | $ | 117,145,795 | | | $ | 46,687,413 | |
| Total shares outstanding at end of period | | | 2,792,366 | | | | 16,248,847 | | | | 11,012,139 | | | | 4,490,613 | |
| Net asset value, offering and redemption price per share | | | | | | | | | | | | | | | | |
| (net assets ÷ shares outstanding) | | $ | 11.09 | | | $ | 10.44 | | | $ | 10.64 | | | $ | 10.40 | |
| | | | | | | | | | | | | | | | | |
| Class N Shares ($Dollars): | | | | | | | | | | | | | | | | |
| Net Assets | | $ | 10,928,986 | | | $ | 2,928,731 | | | $ | 2,260,852 | | | $ | 3,237,970 | |
| Total shares outstanding at end of period | | | 984,897 | | | | 279,882 | | | | 212,286 | | | | 310,556 | |
| Net asset value, offering and redemption price per share | | | | | | | | | | | | | | | | |
| (net assets ÷ shares outstanding) | | $ | 11.10 | | | $ | 10.46 | | | $ | 10.65 | | | $ | 10.43 | |
| Amounts designated as “—” are either $0 or have been rounded to $0. |
See accompanying notes to financial statements.
CNI CHARTER FUNDS | PAGE 57
| statements of assets and liabilities (000) |
March 31, 2011 (Unaudited) |
| | | Full Maturity Fixed Income Fund | | | | | | | | | | |
| ASSETS: | | | | | | | | | | | | |
Cost of securities (including affiliated investments and repurchase agreements) | | $ | 46,798 | | | $ | 70,021 | | | $ | 40,056 | | | $ | 61,306 | |
| Investments in securities at value | | $ | 47,764 | | | $ | 72,707 | | | $ | 32,267 | | | $ | 72,345 | |
| Affiliated investments at value | | | — | | | | — | | | | 5,373 | | | | — | |
| Repurchase agreements at value | | | — | | | | — | | | | 6,000 | | | | — | |
| Dividend and interest receivable | | | 377 | | | | — | | | | — | | | | 49 | |
| Receivable for investment securities sold | | | — | | | | 358 | | | | — | | | | 745 | |
| Income receivable | | | — | | | | 1,774 | | | | 68 | | | | — | |
| Receivable for capital shares sold | | | 61 | | | | 249 | | | | 243 | | | | 1 | |
| | | 2 | | | | 3 | | | | 2 | | | | 3 | |
| | | 48,204 | | | | 75,091 | | | | 43,953 | | | | 73,143 | |
| | | | | | | | | | | | | | | | | |
| LIABILITIES: | | | | | | | | | | | | | | | | |
| Payable for income distributions | | | 24 | | | | 288 | | | | 63 | | | | 6 | |
| Payable due to custodian | | | — | | | | 792 | | | | — | | | | — | |
| Payable for capital shares redeemed | | | 2 | | | | 50 | | | | — | | | | — | |
| Payable for investment securities purchased | | | 515 | | | | 500 | | | | — | | | | 875 | |
| Investment adviser fees payable | | | 20 | | | | 41 | | | | 18 | | | | 45 | |
| Shareholder servicing & distribution fees payable | | | 2 | | | | 24 | | | | 15 | | | | 1 | |
| Administrative fees payable | | | 2 | | | | 3 | | | | 2 | | | | 3 | |
| | | 28 | | | | 6 | | | | 3 | | | | 36 | |
| | | 593 | | | | 1,704 | | | | 101 | | | | 966 | |
| | $ | 47,611 | | | $ | 73,387 | | | $ | 43,852 | | | $ | 72,177 | |
| | | | | | | | | | | | | | | | | |
| NET ASSETS: | | | | | | | | | | | | | | | | |
| Paid-in Capital (unlimited authorization — $0.01 par value) | | $ | 46,429 | | | $ | 73,437 | | | $ | 43,032 | | | $ | 81,295 | |
| Undistributed (distribution in excess of) net investment income | | | (23 | ) | | | (1 | ) | | | 2 | | | | — | |
| Accumulated net realized gain (loss) on investments | | | 239 | | | | (2,735 | ) | | | (2,766 | ) | | | (20,157 | ) |
Net unrealized appreciation on investments | | | 966 | | | | 2,686 | | | | 3,584 | | | | 11,039 | |
| | $ | 47,611 | | | $ | 73,387 | | | $ | 43,852 | | | $ | 72,177 | |
| | | | | | | | | | | | | | | | | |
| Institutional Class Shares ($Dollars): | | | | | | | | | | | | | | | | |
| Net Assets | | $ | 42,300,383 | | | $ | 45,647,629 | | | $ | 16,486,705 | | | $ | 65,025,534 | |
| Total shares outstanding at end of period | | | 3,999,615 | | | | 5,274,723 | | | | 1,490,334 | | | | 4,621,602 | |
| Net asset value, offering and redemption price per share | | | | | | | | | | | | | | | | |
| (net assets ÷ shares outstanding) | | $ | 10.58 | | | $ | 8.65 | | | $ | 11.06 | | | $ | 14.07 | |
| | | | | | | | | | | | | | | | | |
| Class N Shares ($Dollars): | | | | | | | | | | | | | | | | |
| Net Assets | | $ | 5,310,147 | | | $ | 27,739,071 | | | $ | 27,365,084 | | | $ | 7,151,517 | |
| Total shares outstanding at end of period | | | 502,478 | | | | 3,205,406 | | | | 2,474,688 | | | | 506,925 | |
| Net asset value, offering and redemption price per share | | | | | | | | | | | | | | | | |
| (net assets ÷ shares outstanding) | | $ | 10.57 | | | $ | 8.65 | | | $ | 11.06 | | | $ | 14.11 | |
| Amounts designated as “—” are either $0 or have been rounded to $0. |
See accompanying notes to financial statements.
CNI CHARTER FUNDS | PAGE 58
| statements of assets and liabilities (000) |
March 31, 2011 (Unaudited) |
| | | Large Cap Value Equity Fund | | | Large Cap Growth Equity Fund | | | Socially Responsible Equity Fund | | | | |
| ASSETS: | | | | | | | | | | | | |
Cost of securities (including affiliated investments and repurchase agreements) | | $ | 108,605 | | | $ | 48,012 | | | $ | 63,055 | | | $ | 17,996 | |
| Investments in securities at value | | $ | 119,385 | | | $ | 56,250 | | | $ | 75,690 | | | $ | 23,739 | |
| Repurchase agreements at value | | | — | | | | — | | | | — | | | | 836 | |
| Cash | | | — | | | | — | | | | 11 | | | | — | |
| Income receivable | | | 154 | | | | 43 | | | | — | | | | 21 | |
| Dividend and interest receivable | | | — | | | | — | | | | 112 | | | | — | |
| Receivable for investment securities sold | | | — | | | | — | | | | — | | | | 522 | |
| Receivable for capital shares sold | | | 145 | | | | 84 | | | | 53 | | | | 4 | |
| | | 5 | | | | 2 | | | | 3 | | | | 5 | |
| | | 119,689 | | | | 56,379 | | | | 75,869 | | | | 25,127 | |
| | | | | | | | | | | | | | | | | |
| LIABILITIES: | | | | | | | | | | | | | | | | |
| Payable for income distributions | | | 96 | | | | 6 | | | | — | | | | — | |
| Payable for capital shares redeemed | | | 190 | | | | 111 | | | | 66 | | | | 101 | |
| Payable for investment securities purchased | | | 759 | | | | — | | | | — | | | | — | |
| Investment adviser fees payable | | | 62 | | | | 30 | | | | 47 | | | | 18 | |
| Shareholder servicing & distribution fees payable | | | 28 | | | | 14 | | | | 1 | | | | 12 | |
| Administrative fees payable | | | 5 | | | | 2 | | | | 3 | | | | 1 | |
| | | 12 | | | | 5 | | | | 36 | | | | 14 | |
| | | 1,152 | | | | 168 | | | | 153 | | | | 146 | |
| | $ | 118,537 | | | $ | 56,211 | | | $ | 75,716 | | | $ | 24,981 | |
| | | | | | | | | | | | | | | | | |
| NET ASSETS: | | | | | | | | | | | | | | | | |
| Paid-in Capital (unlimited authorization — $0.01 par value) | | $ | 112,317 | | | $ | 48,901 | | | $ | 74,277 | | | $ | 24,849 | |
| Undistributed (distributions in excess of) net investment income | | | (2 | ) | | | — | | | | 2 | | | | (29 | ) |
| Accumulated net realized loss on investments | | | (4,558 | ) | | | (928 | ) | | | (11,198 | ) | | | (6,418 | ) |
Net unrealized appreciation on investments | | | 10,780 | | | | 8,238 | | | | 12,635 | | | | 6,579 | |
| | $ | 118,537 | | | $ | 56,211 | | | $ | 75,716 | | | $ | 24,981 | |
| | | | | | | | | | | | | | | | | |
| Institutional Class Shares ($Dollars): | | | | | | | | | | | | | | | | |
| Net Assets | | $ | 107,289,030 | | | $ | 45,085,003 | | | $ | 72,149,634 | | | $ | 3,186,908 | |
| Total shares outstanding at end of period | | | 12,129,609 | | | | 5,020,471 | | | | 7,148,232 | | | | 136,980 | |
| Net asset value, offering and redemption price per share | | | | | | | | | | | | | | | | |
| (net assets ÷ shares outstanding) | | $ | 8.85 | | | $ | 8.98 | | | $ | 10.09 | | | $ | 23.27 | |
| | | | | | | | | | | | | | | | | |
| Class N Shares ($Dollars): | | | | | | | | | | | | | | | | |
| Net Assets | | $ | 11,248,334 | | | $ | 11,125,511 | | | $ | 3,566,037 | | | $ | 5,111,051 | |
| Total shares outstanding at end of period | | | 1,273,910 | | | | 1,252,572 | | | | 353,891 | | | | 224,136 | |
| Net asset value, offering and redemption price per share | | | | | | | | | | | | | | | | |
| (net assets ÷ shares outstanding) | | $ | 8.83 | | | $ | 8.88 | | | $ | 10.08 | | | $ | 22.80 | |
| | | | | | | | | | | | | | | | | |
| Class R Shares ($Dollars): | | | | | | | | | | | | | | | | |
| Net Assets | | $ | — | | | $ | — | | | $ | — | | | $ | 16,683,242 | |
| Total shares outstanding at end of period | | | — | | | | — | | | | — | | | | 732,014 | |
| Net asset value and redemption price per share | | | | | | | | | | | | | | | | |
| (net assets ÷ shares outstanding) | | $ | — | | | $ | — | | | $ | — | | | $ | 22.79 | |
| Maximum offering price per share | | | | | | | | | | | | | | | | |
| (net asset value ÷ 96.50%) | | $ | — | | | $ | — | | | $ | — | | | $ | 23.62 | |
| Amounts designated as “—” are either $0 or have been rounded to $0. |
See accompanying notes to financial statements.
CNI CHARTER FUNDS | PAGE 59
| statements of operations |
For the six months ended March 31, 2011 (Unaudited) |
| | | Government Money Market Fund (000) | | | Prime Money Market Fund (000) | | | California Tax Exempt Money Market Fund (000) | |
| INCOME: | | | | | | | | | |
| Interest Income | | $ | 3,053 | | | $ | 2,201 | | | $ | 1,098 | |
| | | — | | | | 2 | | | | — | |
| | | 3,053 | | | | 2,203 | | | | 1,098 | |
| | | | | | | | | | | | | |
| EXPENSES: | | | | | | | | | | | | |
| Investment Advisory Fee | | | 3,857 | | | | 1,616 | | | | 1,193 | |
| Shareholder Servicing Fees — Institutional Class | | | 98 | | | | 645 | | | | 178 | |
Shareholder Servicing Fees — Class N (1) | | | 9,569 | | | | 1,699 | | | | 2,585 | |
Shareholder Servicing Fees — Class S (1) | | | 1,264 | | | | 1,214 | | | | 194 | |
| Administration Fee | | | 742 | | | | 323 | | | | 221 | |
| Transfer Agent Fees | | | 126 | | | | 55 | | | | 38 | |
| Trustee Fees | | | 75 | | | | 35 | | | | 23 | |
| Professional Fees | | | 224 | | | | 104 | | | | 69 | |
| Custody Fees | | | 68 | | | | 30 | | | | 21 | |
| Printing Fees | | | 81 | | | | 38 | | | | 25 | |
| Registration Fees | | | 44 | | | | 22 | | | | 14 | |
Insurance and Other Expenses | | | 155 | | | | 80 | | | | 56 | |
| | | 16,303 | | | | 5,861 | | | | 4,617 | |
| Less, Waivers of: | | | | | | | | | | | | |
| Investment Advisory Fees | | | (2,508 | ) | | | (410 | ) | | | (624 | ) |
| Shareholder Servicing Fees — Institutional Class | | | (98 | ) | | | (645 | ) | | | (178 | ) |
Shareholder Servicing Fees — Class N (1) | | | (9,441 | ) | | | (1,631 | ) | | | (2,550 | ) |
Shareholder Servicing Fees — Class S (1) | | | (1,230 | ) | | | (1,134 | ) | | | (189 | ) |
| Administration Fees | | | (111 | ) | | | (49 | ) | | | (33 | ) |
| | | (126 | ) | | | (55 | ) | | | (38 | ) |
| | | 2,789 | | | | 1,937 | | | | 1,005 | |
| | | | | | | | | | | | | |
| | | 264 | | | | 266 | | | | 93 | |
Net Realized Gain From Securities Transactions | | | — | | | | 2 | | | | — | |
Net Increase in Net Assets Resulting from Operations | | $ | 264 | | | $ | 268 | | | $ | 93 | |
| (1) | Includes class specific distribution expenses. |
| Amounts designated as “—” are either $0 or have been rounded to $0. |
See accompanying notes to financial statements.
CNI CHARTER FUNDS | PAGE 60
| statements of operations |
For the six months ended March 31, 2011 (Unaudited) |
| | | Limited Maturity Fixed Income Fund (000) | | | Government Bond Fund (000) | | | Corporate Bond Fund (000) | | | California Tax Exempt Bond Fund (000) | |
| INCOME: | | | | | | | | | | | | |
| Interest Income | | $ | 478 | | | $ | 1,716 | | | $ | 2,104 | | | $ | 751 | |
| Dividend Income | | | — | | | | — | | | | — | | | | 1 | |
Less: Foreign Taxes Withheld | | | — | | | | — | | | | (2 | ) | | | — | |
| | | 478 | | | | 1,716 | | | | 2,102 | | | | 752 | |
| | | | | | | | | | | | | | | | | |
| EXPENSES: | | | | | | | | | | | | | | | | |
| Investment Advisory Fee | | | 108 | | | | 350 | | | | 224 | | | | 61 | |
| Shareholder Servicing Fees — Institutional Class | | | — | | | | 199 | | | | 137 | | | | 52 | |
Shareholder Servicing Fees — Class N (1) | | | 26 | | | | 8 | | | | 6 | | | | 8 | |
| Administration Fee | | | 11 | | | | 41 | | | | 28 | | | | 11 | |
| Transfer Agent Fees | | | 23 | | | | 7 | | | | 5 | | | | 2 | |
| Professional Fees | | | 3 | | | | 12 | | | | 8 | | | | 3 | |
| Trustee Fees | | | 1 | | | | 4 | | | | 3 | | | | 1 | |
| Printing Fees | | | 1 | | | | 4 | | | | 3 | | | | 1 | |
| Custody Fees | | | 1 | | | | 4 | | | | 2 | | | | 1 | |
| Registration Fees | | | 1 | | | | 2 | | | | 2 | | | | 1 | |
Insurance and Other Expenses | | | 3 | | | | 8 | | | | 6 | | | | 3 | |
| | | 178 | | | | 639 | | | | 424 | | | | 144 | |
Recovery of Investment Advisory Fees Previously Waived (2) | | | — | | | | — | | | | 1 | | | | — | |
| Less, Waivers of: | | | | | | | | | | | | | | | | |
| Shareholder Servicing Fees — Class N | | | (13 | ) | | | — | | | | — | | | | — | |
| Investment Advisory Fees | | | — | | | | (59 | ) | | | — | | | | (25 | ) |
| | | (2 | ) | | | (7 | ) | | | (5 | ) | | | (2 | ) |
| | | 163 | | | | 573 | | | | 420 | | | | 117 | |
| | | | | | | | | | | | | | | | | |
| | | 315 | | | | 1,143 | | | | 1,682 | | | | 635 | |
| Net Realized Gain From Securities Transactions | | | 179 | | | | 140 | | | | 365 | | | | 69 | |
Net Change in Unrealized Depreciation on Investments | | | (646 | ) | | | (2,763 | ) | | | (2,794 | ) | | | (1,185 | ) |
Net Decrease in Net Assets Resulting From Operations | | $ | (152 | ) | | $ | (1,480 | ) | | $ | (747 | ) | | $ | (481 | ) |
| (1) | Includes class specific distribution expenses. |
| (2) | See Note 4 for Advisory Fees recovered. |
| Amounts designated as “—” are either $0 or have been rounded to $0. |
See accompanying notes to financial statements.
CNI CHARTER FUNDS | PAGE 61
| statements of operations |
For the six months ended March 31, 2011 (Unaudited) |
| | | Full Maturity Fixed Income Fund (000) | | | High Yield Bond Fund (000) | | | | | | Diversified Equity Fund (000) | |
| INCOME: | | | | | | | | | | | | |
| Interest Income | | $ | 813 | | | $ | 3,107 | | | $ | 3 | | | $ | — | |
| Dividend Income | | | — | | | | — | | | | 506 | | | | 435 | |
| Income from Affiliated Investments | | | — | | | | — | | | | 103 | | | | — | |
Less: Foreign Taxes Withheld | | | — | | | | — | | | | — | | | | (1 | ) |
| | | 813 | | | | 3,107 | | | | 612 | | | | 434 | |
| | | | | | | | | | | | | | | | | |
| EXPENSES: | | | | | | | | | | | | | | | | |
| Investment Advisory Fee | | | 120 | | | | 247 | | | | 93 | | | | 256 | |
| Shareholder Servicing Fees — Institutional Class | | | — | | | | 50 | | | | 16 | | | | — | |
Shareholder Servicing Fees — Class N (1) | | | 12 | | | | 71 | | | | 60 | | | | 18 | |
| Transfer Agent Fees | | | 24 | | | | 3 | | | | 2 | | | | 29 | |
| Administration Fee | | | 12 | | | | 16 | | | | 9 | | | | 17 | |
| Trustee Fees | | | 1 | | | | 2 | | | | 1 | | | | 2 | |
| Printing Fees | | | 1 | | | | 2 | | | | 1 | | | | 2 | |
| Professional Fees | | | 4 | | | | 5 | | | | 3 | | | | 5 | |
| Custody Fees | | | 1 | | | | 1 | | | | 1 | | | | 1 | |
| Registration Fees | | | 1 | | | | 1 | | | | — | | | | 1 | |
Insurance and Other Expenses | | | 2 | | | | 3 | | | | 2 | | | | 3 | |
| | | 178 | | | | 401 | | | | 188 | | | | 334 | |
| Less, Waiver of: | | | | | | | | | | | | | | | | |
| Shareholder Servicing Fees — Class N | | | (6 | ) | | | — | | | | — | | | | (3 | ) |
| Distribution Expenses — Class N | | | — | | | | — | | | | — | | | | (5 | ) |
| Investment Advisory Fees | | | — | | | | (30 | ) | | | — | | | | — | |
| | | (2 | ) | | | (3 | ) | | | (2 | ) | | | (3 | ) |
| | | 170 | | | | 368 | | | | 186 | | | | 323 | |
| | | | | | | | | | | | | | | | | |
| | | 643 | | | | 2,739 | | | | 426 | | | | 111 | |
| Net Realized Gain From Securities Transactions | | | 337 | | | | 833 | | | | 1,179 | | | | 4,545 | |
Net Change in Unrealized Appreciation
(Depreciation) on Investments | | | (1,566 | ) | | | 1,749 | | | | 1,175 | | | | 6,881 | |
Net Change in Unrealized Appreciation on Affiliated Investments | | | — | | | | — | | | | 22 | | | | — | |
Net Increase (Decrease) in Net Assets Resulting from Operations | | $ | (586 | ) | | $ | 5,321 | | | $ | 2,802 | | | $ | 11,537 | |
| (1) | Includes class specific distribution expenses. |
| Amounts designated as “—” are either $0 or have been rounded to $0. |
See accompanying notes to financial statements.
CNI CHARTER FUNDS | PAGE 62
| statements of operations |
For the six months ended March 31, 2011 (Unaudited) |
| | | Large Cap Value Equity Fund (000) | | | Large Cap Growth Equity Fund (000) | | | Socially Responsible Equity Fund (000) | | | RCB Small Cap Value Fund (000) | |
| INCOME: | | | | | | | | | | | | |
| Dividend Income | | $ | 1,262 | | | $ | 320 | | | $ | 749 | | | $ | 132 | |
| Interest Income | | | — | | | | — | | | | — | | | | 1 | |
Less: Foreign Taxes Withheld | | | — | | | | — | | | | (12 | ) | | | — | |
| | | 1,262 | | | | 320 | | | | 737 | | | | 133 | |
| | | | | | | | | | | | | | | | | |
| EXPENSES: | | | | | | | | | | | | | | | | |
| Investment Advisory Fee | | | 346 | | | | 162 | | | | 259 | | | | 107 | |
| Shareholder Servicing Fees — Institutional Class | | | 127 | | | | 49 | | | | — | | | | 4 | |
Shareholder Servicing Fees — Class N (1) | | | 26 | | | | 26 | | | | 8 | | | | 12 | |
Shareholder Servicing Fees — Class R (1) | | | — | | | | — | | | | — | | | | 42 | |
| Administration Fee | | | 28 | | | | 12 | | | | 17 | | | | 6 | |
| Transfer Agent Fees | | | 5 | | | | 2 | | | | 28 | | | | 17 | |
| Trustee Fees | | | 3 | | | | 1 | | | | 2 | | | | 1 | |
| Professional Fees | | | 8 | | | | 4 | | | | 5 | | | | 2 | |
| Printing Fees | | | 3 | | | | 1 | | | | 2 | | | | 1 | |
| Custody Fees | | | 2 | | | | 1 | | | | 1 | | | | 1 | |
| Registration Fees | | | 2 | | | | — | | | | 1 | | | | — | |
Insurance and Other Expenses | | | 5 | | | | 2 | | | | 3 | | | | 1 | |
| | | 555 | | | | 260 | | | | 326 | | | | 194 | |
| Less, Waiver/Reimbursement of: | | | | | | | | | | | | | | | | |
| Shareholder Servicing Fees — Class N | | | — | | | | — | | | | (4 | ) | | | — | |
Shareholder Servicing Fees — Class R (1) | | | — | | | | — | | | | — | | | | (34 | ) |
| | | (5 | ) | | | (2 | ) | | | (3 | ) | | | (1 | ) |
| | | 550 | | | | 258 | | | | 319 | | | | 159 | |
| | | | | | | | | | | | | | | | | |
Net Investment Income (Loss) | | | 712 | | | | 62 | | | | 418 | | | | (26 | ) |
| Net Realized Gain (Loss) From Securities Transactions | | | 3,906 | | | | 4,086 | | | | (555 | ) | | | (258 | ) |
Net Change in Unrealized Appreciation on Investments | | | 11,598 | | | | 3,398 | | | | 9,820 | | | | 3,239 | |
Net Increase in Net Assets Resulting From Operations | | $ | 16,216 | | | $ | 7,546 | | | $ | 9,683 | | | $ | 2,955 | |
| (1) | Includes class specific distribution expenses. |
| Amounts designated as “—” are either $0 or have been rounded to $0. |
See accompanying notes to financial statements.
CNI CHARTER FUNDS | PAGE 63
| statements of changes in net assets |
For the six months ended March 31, 2011 (Unaudited) and the year ended September 30, 2010 |
| | | Government Money Market Fund (000) | | | Prime Money Market Fund (000) | |
| | | | | | | | | | | | |
| OPERATIONS: | | | | | | | | | | | | |
| Net Investment Income | | $ | 264 | | | $ | 679 | | | $ | 266 | | | $ | 755 | |
| Net Realized Gain (Loss) from Security Transactions | | | — | | | | (5 | ) | | | 2 | | | | — | |
Net Change in Unrealized Appreciation (Depreciation) on Investments | | | — | | | | — | | | | — | | | | — | |
Net Increase (Decrease) in Net Assets Resulting from Operations | | | 264 | | | | 674 | | | | 268 | | | | 755 | |
| | | | | | | | | | | | | | | | | |
| DIVIDENDS AND DISTRIBUTIONS FROM: | | | | | | | | | | | | | | | | |
| Net Investment Income: | | | | | | | | | | | | | | | | |
| Institutional Class | | | (12 | ) | | | (38 | ) | | | (181 | ) | | | (430 | ) |
| Class N | | | (255 | ) | | | (613 | ) | | | (91 | ) | | | (240 | ) |
| Class S | | | (17 | ) | | | (29 | ) | | | (32 | ) | | | (85 | ) |
| Realized Capital Gains: | | | | | | | | | | | | | | | | |
| Institutional Class | | | — | | | | — | | | | — | | | | (58 | ) |
| Class N | | | — | | | | — | | | | — | | | | (68 | ) |
| | | — | | | | — | | | | — | | | | (40 | ) |
Total Dividends and Distributions | | | (284 | ) | | | (680 | ) | | | (304 | ) | | | (921 | ) |
| | | | | | | | | | | | | | | | | |
CAPITAL SHARE TRANSACTIONS: (1) | | | | | | | | | | | | | | | | |
| Institutional Class: | | | | | | | | | | | | | | | | |
| Shares Issued | | | 218,589 | | | | 618,772 | | | | 706,492 | | | | 1,322,472 | |
| Shares Issued in Lieu of Dividends and Distributions | | | — | | | | 1 | | | | 30 | | | | 83 | |
| | | (214,834 | ) | | | (661,586 | ) | | | (671,247 | ) | | | (1,375,843 | ) |
Increase (Decrease) in Net Assets from Institutional Class Share Transactions | | | 3,755 | | | | (42,813 | ) | | | 35,275 | | | | (53,288 | ) |
| | | | | | | | | | | | | | | | | |
| Class N: | | | | | | | | | | | | | | | | |
| Shares Issued | | | 3,234,150 | | | | 4,589,006 | | | | 625,032 | | | | 1,396,173 | |
| Shares Issued in Lieu of Dividends and Distributions | | | 210 | | | | 504 | | | | 59 | | | | 195 | |
| | | (3,275,205 | ) | | | (4,540,616 | ) | | | (633,362 | ) | | | (1,620,744 | ) |
Increase (Decrease) in Net Assets from Class N Share Transactions | | | (40,845 | ) | | | 48,894 | | | | (8,271 | ) | | | (224,376 | ) |
| | | | | | | | | | | | | | | | | |
| Class S: | | | | | | | | | | | | | | | | |
| Shares Issued | | | 400,947 | | | | 990,276 | | | | 882,620 | | | | 1,102,036 | |
| Shares Issued in Lieu of Dividends and Distributions | | | — | | | | — | | | | — | | | | — | |
| | | (431,580 | ) | | | (940,420 | ) | | | (885,776 | ) | | | (1,122,183 | ) |
Increase (Decrease) in Net Assets from Class S Share Transactions | | | (30,633 | ) | | | 49,856 | | | | (3,156 | ) | | | (20,147 | ) |
| | | | | | | | | | | | | | | | | |
Net Increase (Decrease) in Net Assets from Share Transactions | | | (67,723 | ) | | | 55,937 | | | | 23,848 | | | | (297,811 | ) |
Total Increase (Decrease) in Net Assets | | | (67,743 | ) | | | 55,931 | | | | 23,812 | | | | (297,977 | ) |
| | | | | | | | | | | | | | | | | |
| NET ASSETS: | | | | | | | | | | | | | | | | |
| | | 3,027,783 | | | | 2,971,852 | | | | 1,274,880 | | | | 1,572,857 | |
| | $ | 2,960,040 | | | $ | 3,027,783 | | | $ | 1,298,692 | | | $ | 1,274,880 | |
Undistributed (Distribution in Excess of) Net Investment Income | | $ | — | | | $ | 20 | | | $ | — | | | $ | 38 | |
| (1) | See Note 8 for shares issued and redeemed. |
| Amounts designated as “—” are either $0 or have been rounded to $0. |
See accompanying notes to financial statements.
CNI CHARTER FUNDS | PAGE 64
California Tax Exempt Money Market Fund (000) | | | Limited Maturity Fixed Income Fund (000) | | | Government Bond Fund (000) | | | Corporate Bond Fund (000) | |
| | | | | | | | | | | | | | | | | | | | | | |
| | | | | | | | | | | | | | | | | | | | | | | |
| $ | 93 | | | $ | 246 | | | $ | 315 | | | $ | 806 | | | $ | 1,143 | | | $ | 2,534 | | | $ | 1,682 | | | $ | 3,304 | |
| | — | | | | 10 | | | | 179 | | | | 216 | | | | 140 | | | | 654 | | | | 365 | | | | 699 | |
| | — | | | | — | | | | (646 | ) | | | 317 | | | | (2,763 | ) | | | 1,657 | | | | (2,794 | ) | | | 2,293 | |
| | 93 | | | | 256 | | | | (152 | ) | | | 1,339 | | | | (1,480 | ) | | | 4,845 | | | | (747 | ) | | | 6,296 | |
| | | | | | | | | | | | | | | | | | | | | | | | | | | | | | | |
| | | | | | | | | | | | | | | | | | | | | | | | | | | | | | | |
| | | | | | | | | | | | | | | | | | | | | | | | | | | | | | | |
| | (21 | ) | | | (62 | ) | | | (249 | ) | | | (751 | ) | | | (1,750 | ) | | | (3,484 | ) | | | (1,652 | ) | | | (3,259 | ) |
| | (69 | ) | | | (179 | ) | | | (66 | ) | | | (97 | ) | | | (31 | ) | | | (80 | ) | | | (32 | ) | | | (48 | ) |
| | (3 | ) | | | (5 | ) | | | — | | | | — | | | | — | | | | — | | | | — | | | | — | |
| | | | | | | | | | | | | | | | | | | | | | | | | | | | | | | |
| | — | | | | (1 | ) | | | — | | | | — | | | | — | | | | — | | | | — | | | | — | |
| | — | | | | (7 | ) | | | — | | | | — | | | | — | | | | — | | | | — | | | | — | |
| | — | | | | (1 | ) | | | — | | | | — | | | | — | | | | — | | | | — | | | | — | |
| | (93 | ) | | | (255 | ) | | | (315 | ) | | | (848 | ) | | | (1,781 | ) | | | (3,564 | ) | | | (1,684 | ) | | | (3,307 | ) |
| | | | | | | | | | | | | | | | | | | | | | | | | | | | | | | |
| | | | | | | | | | | | | | | | | | | | | | | | | | | | | | | |
| | | | | | | | | | | | | | | | | | | | | | | | | | | | | | | |
| | 565,946 | | | | 1,024,504 | | | | 1,260 | | | | 26,702 | | | | 31,230 | | | | 118,193 | | | | 22,928 | | | | 35,743 | |
| | — | | | | — | | | | 163 | | | | 535 | | | | 1,279 | | | | 2,306 | | | | 525 | | | | 892 | |
| | (584,726 | ) | | | (1,025,845 | ) | | | (3,379 | ) | | | (31,618 | ) | | | (14,983 | ) | | | (38,343 | ) | | | (9,502 | ) | | | (22,899 | ) |
| | (18,780 | ) | | | (1,341 | ) | | | (1,956 | ) | | | (4,381 | ) | | | 17,526 | | | | 82,156 | | | | 13,951 | | | | 13,736 | |
| | | | | | | | | | | | | | | | | | | | | | | | | | | | | | | |
| | | | | | | | | | | | | | | | | | | | | | | | | | | | | | | |
| | 610,257 | | | | 1,197,782 | | | | 3,627 | | | | 10,788 | | | | 192 | | | | 1,787 | | | | 439 | | | | 2,426 | |
| | 66 | | | | 178 | | | | 46 | | | | 97 | | | | 17 | | | | 33 | | | | 15 | | | | 19 | |
| | (643,037 | ) | | | (1,263,962 | ) | | | (1,897 | ) | | | (3,180 | ) | | | (463 | ) | | | (1,705 | ) | | | (522 | ) | | | (1,107 | ) |
| | (32,714 | ) | | | (66,002 | ) | | | 1,776 | | | | 7,705 | | | | (254 | ) | | | 115 | | | | (68 | ) | | | 1,338 | |
| | | | | | | | | | | | | | | | | | | | | | | | | | | | | | | |
| | | | | | | | | | | | | | | | | | | | | | | | | | | | | | | |
| | 122,416 | | | | 145,553 | | | | — | | | | — | | | | — | | | | — | | | | — | | | | — | |
| | — | | | | — | | | | — | | | | — | | | | — | | | | — | | | | — | | | | — | |
| | (111,482 | ) | | | (171,684 | ) | | | — | | | | — | | | | — | | | | — | | | | — | | | | — | |
| | 10,934 | | | | (26,131 | ) | | | — | | | | — | | | | — | | | | — | | | | — | | | | — | |
| | | | | | | | | | | | | | | | | | | | | | | | | | | | | | | |
| | (40,560 | ) | | | (93,474 | ) | | | (180 | ) | | | 3,324 | | | | 17,272 | | | | 82,271 | | | | 13,883 | | | | 15,074 | |
| | (40,560 | ) | | | (93,473 | ) | | | (647 | ) | | | 3,815 | | | | 14,011 | | | | 83,552 | | | | 11,452 | | | | 18,063 | |
| | | | | | | | | | | | | | | | | | | | | | | | | | | | | | | |
| | | | | | | | | | | | | | | | | | | | | | | | | | | | | | | |
| | 827,342 | | | | 920,815 | | | | 42,541 | | | | 38,726 | | | | 158,627 | | | | 75,075 | | | | 107,955 | | | | 89,892 | |
| $ | 786,782 | | | $ | 827,342 | | | $ | 41,894 | | | $ | 42,541 | | | $ | 172,638 | | | $ | 158,627 | | | $ | 119,407 | | | $ | 107,955 | |
| $ | — | | | $ | — | | | $ | (1 | ) | | $ | (1 | ) | | $ | (638 | ) | | $ | — | | | $ | (2 | ) | | $ | — | |
See accompanying notes to financial statements.
CNI CHARTER FUNDS | PAGE 65
| statements of changes in net assets |
For the six months ended March 31, 2011 (Unaudited) and the year ended September 30, 2010 |
| | | California Tax Exempt Bond Fund (000) | | | Full Maturity Fixed Income Fund (000) | |
| | | | | | | | | | | | |
| OPERATIONS: | | | | | | | | | | | | |
| Net Investment Income | | $ | 635 | | | $ | 1,235 | | | $ | 643 | | | $ | 1,511 | |
| Net Realized Gain from Security Transactions | | | 69 | | | | 373 | | | | 337 | | | | 189 | |
Net Change in Unrealized Appreciation (Depreciation) on Investments and Affiliated Investments | | | (1,185 | ) | | | 173 | | | | (1,566 | ) | | | 2,017 | |
Increase (Decrease) in Net Assets Resulting from Operations | | | (481 | ) | | | 1,781 | | | | (586 | ) | | | 3,717 | |
| | | | | | | | | | | | | | | | | |
| DIVIDENDS AND DISTRIBUTIONS FROM: | | | | | | | | | | | | | | | | |
| Net Investment Income: | | | | | | | | | | | | | | | | |
| Institutional Class | | | (592 | ) | | | (1,175 | ) | | | (609 | ) | | | (1,464 | ) |
| Class N | | | (42 | ) | | | (60 | ) | | | (58 | ) | | | (71 | ) |
| Realized Capital Gains: | | | | | | | | | | | | | | | | |
| Institutional Class | | | (174 | ) | | | — | | | | (225 | ) | | | (195 | ) |
| Class N | | | (14 | ) | | | — | | | | (22 | ) | | | (9 | ) |
| Return of Capital: | | | | | | | | | | | | | | | | |
| Institutional Class | | | — | | | | — | | | | — | | | | — | |
| | | — | | | | — | | | | — | | | | — | |
Total Dividends and Distributions | | | (822 | ) | | | (1,235 | ) | | | (914 | ) | | | (1,739 | ) |
| | | | | | | | | | | | | | | | | |
CAPITAL SHARE TRANSACTIONS: (1) | | | | | | | | | | | | | | | | |
| Institutional Class: | | | | | | | | | | | | | | | | |
| Shares Issued | | | 15,077 | | | | 12,067 | | | | 90 | | | | 4,362 | (2) |
| Shares Issued in Lieu of Dividends and Distributions | | | 387 | | | | 500 | | | | 706 | | | | 1,366 | |
| | | (8,026 | ) | | | (11,199 | ) | | | (2,886 | ) | | | (1,339 | ) |
Increase (Decrease) in Net Assets from Institutional Class Share Transactions | | | 7,438 | | | | 1,368 | | | | (2,090 | ) | | | 4,389 | |
| | | | | | | | | | | | | | | | | |
| Class N: | | | | | | | | | | | | | | | | |
| Shares Issued | | | 108 | | | | 2,974 | | | | 1,917 | | | | 3,308 | |
| Shares Issued in Lieu of Dividends and Distributions | | | 32 | | | | 29 | | | | 55 | | | | 89 | |
| | | (116 | ) | | | (1,634 | ) | | | (345 | ) | | | (771 | ) |
Increase (Decrease) in Net Assets from Class N Share Transactions | | | 24 | | | | 1,369 | | | | 1,627 | | | | 2,626 | |
| | | | | | | | | | | | | | | | | |
Net Increase (Decrease) in Net Assets from Share Transactions | | | 7,462 | | | | 2,737 | | | | (463 | ) | | | 7,015 | |
Total Increase (Decrease) in Net Assets | | | 6,159 | | | | 3,283 | | | | (1,963 | ) | | | 8,993 | |
| | | | | | | | | | | | | | | | | |
| NET ASSETS: | | | | | | | | | | | | | | | | |
| | | 43,766 | | | | 40,483 | | | | 49,574 | | | | 40,581 | |
| | $ | 49,925 | | | $ | 43,766 | | | $ | 47,611 | | | $ | 49,574 | |
Undistributed (Distribution in Excess of) Net Investment Income | | $ | 1 | | | $ | — | | | $ | (23 | ) | | $ | 1 | |
| (1) | See Note 8 for shares issued and redeemed. |
| (2) | Includes subscriptions as a result of an in-kind transfer of securities (see Note 9). |
| Amounts designated as “—” are either $0 or have been rounded to $0. |
See accompanying notes to financial statements.
CNI CHARTER FUNDS | PAGE 66
High Yield Bond Fund (000) | | | | | | Diversified Equity Fund (000) | |
| | | | | | | | | | | | | | | | |
| | | | | | | | | | | | | | | | | |
| $ | 2,739 | | | $ | 4,049 | | | $ | 426 | | | $ | 512 | | | $ | 111 | | | $ | 301 | |
| | 833 | | | | 989 | | | | 1,179 | | | | 290 | | | | 4,545 | | | | 1,377 | |
| | 1,749 | | | | 2,994 | | | | 1,197 | | | | 1,230 | | | | 6,881 | | | | 1,658 | |
| | 5,321 | | | | 8,032 | | | | 2,802 | | | | 2,032 | | | | 11,537 | | | | 3,336 | |
| | | | | | | | | | | | | | | | | | | | | | | |
| | | | | | | | | | | | | | | | | | | | | | | |
| | | | | | | | | | | | | | | | | | | | | | | |
| | (1,695 | ) | | | (2,138 | ) | | | (161 | ) | | | (187 | ) | | | (107 | ) | | | (287 | ) |
| | (1,045 | ) | | | (1,911 | ) | | | (265 | ) | | | (334 | ) | | | (3 | ) | | | (17 | ) |
| | | | | | | | | | | | | | | | | | | | | | | |
| | — | | | | — | | | | — | | | | — | | | | — | | | | — | |
| | — | | | | — | | | | — | | | | — | | | | — | | | | — | |
| | | | | | | | | | | | | | | | | | | | | | | |
| | — | | | | — | | | | — | | | | — | | | | — | | | | (2 | ) |
| | — | | | | — | | | | — | | | | — | | | | — | | | | — | |
| | (2,740 | ) | | | (4,049 | ) | | | (426 | ) | | | (521 | ) | | | (110 | ) | | | (306 | ) |
| | | | | | | | | | | | | | | | | | | | | | | |
| | | | | | | | | | | | | | | | | | | | | | | |
| | | | | | | | | | | | | | | | | | | | | | | |
| | 13,116 | | | | 23,442 | | | | 4,895 | | | | 5,018 | | | | 2,796 | | | | 8,841 | (2) |
| | 591 | | | | 1,010 | | | | 132 | | | | 152 | | | | 92 | | | | 250 | |
| | (3,468 | ) | | | (8,902 | ) | | | (639 | ) | | | (2,817 | ) | | | (4,967 | ) | | | (5,387 | ) |
| | 10,239 | | | | 15,550 | | | | 4,388 | | | | 2,353 | | | | (2,079 | ) | | | 3,704 | |
| | | | | | | | | | | | | | | | | | | | | | | |
| | | | | | | | | | | | | | | | | | | | | | | |
| | 3,744 | | | | 4,077 | | | | 5,830 | | | | 7,196 | | | | 291 | | | | 1,605 | |
| | 651 | | | | 1,233 | | | | 151 | | | | 180 | | | | — | | | | 17 | |
| | (1,683 | ) | | | (2,980 | ) | | | (2,170 | ) | | | (3,223 | ) | | | (881 | ) | | | (922 | ) |
| | 2,712 | | | | 2,330 | | | | 3,811 | | | | 4,153 | | | | (590 | ) | | | 700 | |
| | | | | | | | | | | | | | | | | | | | | | | |
| | 12,951 | | | | 17,880 | | | | 8,199 | | | | 6,506 | | | | (2,669 | ) | | | 4,404 | |
| | 15,532 | | | | 21,863 | | | | 10,575 | | | | 8,017 | | | | 8,758 | | | | 7,434 | |
| | | | | | | | | | | | | | | | | | | | | | | |
| | | | | | | | | | | | | | | | | | | | | | | |
| | 57,855 | | | | 35,992 | | | | 33,277 | | | | 25,260 | | | | 63,419 | | | | 55,985 | |
| $ | 73,387 | | | $ | 57,855 | | | $ | 43,852 | | | $ | 33,277 | | | $ | 72,177 | | | $ | 63,419 | |
| $ | (1 | ) | | $ | — | | | $ | 2 | | | $ | 2 | | | $ | — | | | $ | (1 | ) |
See accompanying notes to financial statements.
CNI CHARTER FUNDS | PAGE 67
| statements of changes in net assets |
For the six months ended March 31, 2011 (Unaudited) and the year ended September 30, 2010 |
| | | Large Cap Value Equity Fund (000) | | | Large Cap Growth Equity Fund (000) | |
| | | | | | | | | | | | |
| OPERATIONS: | | | | | | | | | | | | |
| Net Investment Income (Loss) | | $ | 712 | | | $ | 1,233 | | | $ | 62 | | | $ | 164 | |
| Net Realized Gain (Loss) from Security Transactions | | | 3,906 | | | | 2,188 | | | | 4,086 | | | | (1,035 | ) |
Net Change in Unrealized Appreciation (Depreciation) on Investments and Affiliated Investments | | | 11,598 | | | | 2,901 | | | | 3,398 | | | | 4,167 | |
Net Increase in Net Assets Resulting from Operations | | | 16,216 | | | | 6,322 | | | | 7,546 | | | | 3,296 | |
| | | | | | | | | | | | | | | | | |
| DIVIDENDS AND DISTRIBUTIONS FROM: | | | | | | | | | | | | | | | | |
| Net Investment Income: | | | | | | | | | | | | | | | | |
| Institutional Class | | | (655 | ) | | | (1,133 | ) | | | (56 | ) | | | (139 | ) |
| Class N | | | (57 | ) | | | (101 | ) | | | (6 | ) | | | (25 | ) |
| | | — | | | | — | | | | — | | | | — | |
Total Dividends and Distributions | | | (712 | ) | | | (1,234 | ) | | | (62 | ) | | | (164 | ) |
| | | | | | | | | | | | | | | | | |
CAPITAL SHARE TRANSACTIONS: (1) | | | | | | | | | | | | | | | | |
| Institutional Class: | | | | | | | | | | | | | | | | |
| Shares Issued | | | 11,969 | | | | 22,677 | | | | 11,983 | | | | 8,758 | |
| Shares Issued in Lieu of Dividends and Distributions | | | 490 | | | | 812 | | | | 22 | | | | 48 | |
| | | (13,892 | ) | | | (14,669 | ) | | | (4,122 | ) | | | (7,928 | ) |
Increase (Decrease) in Net Assets from Institutional Class Share Transactions | | | (1,433 | ) | | | 8,820 | | | | 7,883 | | | | 878 | |
| | | | | | | | | | | | | | | | | |
| Class N: | | | | | | | | | | | | | | | | |
| Shares Issued | | | 210 | | | | 1,648 | | | | 746 | | | | 710 | |
| Shares Issued in Lieu of Dividends and Distributions | | | 37 | | | | 67 | | | | 4 | | | | 15 | |
| | | (595 | ) | | | (1,077 | ) | | | (494 | ) | | | (1,317 | ) |
Increase (Decrease) in Net Assets from Class N Share Transactions | | | (348 | ) | | | 638 | | | | 256 | | | | (592 | ) |
| | | | | | | | | | | | | | | | | |
| Class R: | | | | | | | | | | | | | | | | |
| Shares Issued | | | — | | | | — | | | | — | | | | — | |
| Shares Issued in Lieu of Dividends and Distributions | | | — | | | | — | | | | — | | | | — | |
| | | — | | | | — | | | | — | | | | — | |
Decrease in Net Assets from Class R Share Transactions | | | — | | | | — | | | | — | | | | — | |
| | | | | | | | | | | | | | | | | |
Net Increase (Decrease) in Net Assets from Share Transactions | | | (1,781 | ) | | | 9,458 | | | | 8,139 | | | | 286 | |
Total Increase in Net Assets | | | 13,723 | | | | 14,546 | | | | 15,623 | | | | 3,418 | |
| | | | | | | | | | | | | | | | | |
| NET ASSETS: | | | | | | | | | | | | | | | | |
| | | 104,814 | | | | 90,268 | | | | 40,588 | | | | 37,170 | |
| | $ | 118,537 | | | $ | 104,814 | | | $ | 56,211 | | | $ | 40,588 | |
Undistributed (Distribution in Excess of) Net Investment Income (Loss) | | $ | (2 | ) | | $ | (2 | ) | | $ | — | | | $ | — | |
| (1) | See Note 8 for shares issued and redeemed. |
| Amounts designated as “—” are either $0 or have been rounded to $0. |
See accompanying notes to financial statements.
CNI CHARTER FUNDS | PAGE 68
Socially Responsible Equity Fund (000) | | | RCB Small Cap Value Fund (000) | |
| | | | | | | | | | |
| | | | | | | | | | | |
| $ | 418 | | | $ | 587 | | | $ | (26 | ) | | $ | 53 | |
| | (555 | ) | | | (1,862 | ) | | | (258 | ) | | | 3,169 | |
| | 9,820 | | | | 5,910 | | | | 3,239 | | | | (503 | ) |
| | 9,683 | | | | 4,635 | | | | 2,955 | | | | 2,719 | |
| | | | | | | | | | | | | | | |
| | | | | | | | | | | | | | | |
| | | | | | | | | | | | | | | |
| | (402 | ) | | | (575 | ) | | | (10 | ) | | | — | |
| | (15 | ) | | | (14 | ) | | | (4 | ) | | | — | |
| | — | | | | — | | | | (77 | ) | | | (14 | ) |
| | (417 | ) | | | (589 | ) | | | (91 | ) | | | (14 | ) |
| | | | | | | | | | | | | | | |
| | | | | | | | | | | | | | | |
| | | | | | | | | | | | | | | |
| | 8,502 | | | | 11,228 | | | | 288 | | | | 1,236 | |
| | 402 | | | | 575 | | | | 10 | | | | — | |
| | (5,379 | ) | | | (8,409 | ) | | | (819 | ) | | | (491 | ) |
| | 3,525 | | | | 3,394 | | | | (521 | ) | | | 745 | |
| | | | | | | | | | | | | | | |
| | | | | | | | | | | | | | | |
| | 863 | | | | 1,491 | | | | 31 | | | | 369 | |
| | 15 | | | | 14 | | | | 3 | | | | — | |
| | (123 | ) | | | (282 | ) | | | (253 | ) | | | (346 | ) |
| | 755 | | | | 1,223 | | | | (219 | ) | | | 23 | |
| | | | | | | | | | | | | | | |
| | | | | | | | | | | | | | | |
| | — | | | | — | | | | 269 | | | | 704 | |
| | — | | | | — | | | | 74 | | | | 14 | |
| | — | | | | — | | | | (2,085 | ) | | | (2,890 | ) |
| | — | | | | — | | | | (1,742 | ) | | | (2,172 | ) |
| | | | | | | | | | | | | | | |
| | 4,280 | | | | 4,617 | | | | (2,482 | ) | | | (1,404 | ) |
| | 13,546 | | | | 8,663 | | | | 382 | | | | 1,301 | |
| | | | | | | | | | | | | | | |
| | | | | | | | | | | | | | | |
| | 62,170 | | | | 53,507 | | | | 24,599 | | | | 23,298 | |
| $ | 75,716 | | | $ | 62,170 | | | $ | 24,981 | | | $ | 24,599 | |
| $ | 2 | | | $ | 1 | | | $ | (29 | ) | | $ | 88 | |
See accompanying notes to financial statements.
CNI CHARTER FUNDS | PAGE 69
| financial highlights |
For a Share Outstanding Throughout Each Period For the six months ended March 31, 2011 (Unaudited) and the year or period ended September 30, |
| | | Net Asset Value Beginning of Period | | | | | | Dividends from Net Investment Income | | | Net Asset Value End of Period | | | | | | Net Assets End of Period (000) | | | Ratio of Expenses to Average Net Assets(1)(2) | | | Ratio of Net Investment Income to Average Net Assets(1) | | | Ratio of Expenses to Average Net Assets (Excluding Waivers & Recovered Fees)(1) | |
| Government Money Market Fund | |
| Institutional Class (commenced operations on April 3, 2000) | |
| | 2011 | † | | $ | 1.00 | | | $ | 0.000 | ^ | | $ | (0.000 | )^ | | $ | 1.00 | | | | 0.01 | % | | $ | 84,804 | | | | 0.18 | % | | | 0.03 | % | | | 0.61 | % |
| | 2010 | | | | 1.00 | | | | 0.000 | ^ | | | (0.000 | )^ | | | 1.00 | | | | 0.04 | | | | 81,050 | | | | 0.17 | | | | 0.04 | | | | 0.62 | |
| | 2009 | | | | 1.00 | | | | 0.003 | | | | (0.003 | ) | | | 1.00 | | | | 0.27 | | | | 123,863 | | | | 0.36 | | | | 0.26 | | | | 0.65 | |
| | 2008 | | | | 1.00 | | | | 0.027 | | | | (0.027 | ) | | | 1.00 | | | | 2.72 | | | | 100,674 | | | | 0.59 | | | | 2.62 | | | | 0.59 | |
| | 2007 | | | | 1.00 | | | | 0.047 | | | | (0.047 | ) | | | 1.00 | | | | 4.77 | | | | 47,858 | | | | 0.60 | | | | 4.67 | | | | 0.61 | |
| | 2006 | | | | 1.00 | | | | 0.040 | | | | (0.040 | ) | | | 1.00 | | | | 4.08 | | | | 52,782 | | | | 0.60 | | | | 4.11 | | | | 0.61 | |
| Class N (commenced operations on June 21, 1999) | |
| | 2011 | † | | $ | 1.00 | | | $ | 0.000 | ^ | | $ | (0.000 | )^ | | $ | 1.00 | | | | 0.00 | % | | $ | 2,557,174 | | | | 0.19 | % | | | 0.02 | % | | | 1.11 | % |
| | 2010 | | | | 1.00 | | | | 0.000 | ^ | | | (0.000 | )^ | | | 1.00 | | | | 0.02 | | | | 2,598,035 | | | | 0.19 | | | | 0.02 | | | | 1.12 | |
| | 2009 | | | | 1.00 | | | | 0.002 | | | | (0.002 | ) | | | 1.00 | | | | 0.19 | | | | 2,549,147 | | | | 0.47 | | | | 0.21 | | | | 1.13 | |
| | 2008 | | | | 1.00 | | | | 0.025 | | | | (0.025 | ) | | | 1.00 | | | | 2.49 | | | | 3,006,935 | | | | 0.81 | | | | 2.40 | | | | 1.09 | |
| | 2007 | | | | 1.00 | | | | 0.044 | | | | (0.044 | ) | | | 1.00 | | | | 4.54 | | | | 2,291,138 | | | | 0.82 | | | | 4.45 | | | | 1.11 | |
| | 2006 | | | | 1.00 | | | | 0.038 | | | | (0.038 | ) | | | 1.00 | | | | 3.86 | | | | 1,940,602 | | | | 0.82 | | | | 3.78 | | | | 1.11 | |
| Class S (commenced operations on October 6, 1999) | |
| | 2011 | † | | $ | 1.00 | | | $ | 0.000 | ^ | | $ | (0.000 | )^ | | $ | 1.00 | | | | 0.01 | % | | $ | 318,062 | | | | 0.20 | % | | | 0.01 | % | | | 1.11 | % |
| | 2010 | | | | 1.00 | | | | 0.000 | ^ | | | (0.000 | )^ | | | 1.00 | | | | 0.01 | | | | 348,698 | | | | 0.20 | | | | 0.01 | | | | 1.12 | |
| | 2009 | | | | 1.00 | | | | 0.001 | | | | (0.001 | ) | | | 1.00 | | | | 0.12 | | | | 298,842 | | | | 0.54 | | | | 0.13 | | | | 1.13 | |
| | 2008 | | | | 1.00 | | | | 0.023 | | | | (0.023 | ) | | | 1.00 | | | | 2.29 | | | | 408,747 | | | | 1.02 | | | | 2.23 | | | | 1.09 | |
| | 2007 | | | | 1.00 | | | | 0.042 | | | | (0.042 | ) | | | 1.00 | | | | 4.33 | | | | 321,061 | | | | 1.02 | | | | 4.24 | | | | 1.11 | |
| | 2006 | | | | 1.00 | | | | 0.036 | | | | (0.036 | ) | | | 1.00 | | | | 3.65 | | | | 232,083 | | | | 1.02 | | | | 3.60 | | | | 1.11 | |
| |
| Institutional Class (commenced operations on March 23, 1998) | |
| | 2011 | † | | $ | 1.00 | | | $ | 0.000 | ^ | | $ | (0.000 | )^ | | $ | 1.00 | | | | 0.03 | % | | $ | 525,241 | | | | 0.28 | % | | | 0.06 | % | | | 0.61 | % |
| | 2010 | | | | 1.00 | | | | 0.001 | | | | (0.001 | )* | | | 1.00 | | | | 0.09 | | | | 489,980 | | | | 0.24 | | | | 0.08 | | | | 0.60 | |
| | 2009 | | | | 1.00 | | | | 0.005 | | | | (0.005 | ) | | | 1.00 | | | | 0.46 | | | | 543,326 | | | | 0.44 | | | | 0.46 | | | | 0.65 | |
| | 2008 | | | | 1.00 | | | | 0.030 | | | | (0.030 | ) | | | 1.00 | | | | 3.01 | | | | 532,931 | | | | 0.58 | | | | 2.90 | | | | 0.58 | |
| | 2007 | | | | 1.00 | | | | 0.047 | | | | (0.047 | ) | | | 1.00 | | | | 4.85 | | | | 438,639 | | | | 0.59 | | | | 4.74 | | | | 0.60 | |
| | 2006 | | | | 1.00 | | | | 0.041 | | | | (0.041 | ) | | | 1.00 | | | | 4.17 | | | | 388,171 | | | | 0.59 | | | | 4.12 | | | | 0.60 | |
| Class N (commenced operations on October 18, 1999) | |
| | 2011 | † | | $ | 1.00 | | | $ | 0.000 | ^ | | $ | (0.000 | )^ | | $ | 1.00 | | | | 0.02 | % | | $ | 424,040 | | | | 0.31 | % | | | 0.03 | % | | | 1.11 | % |
| | 2010 | | | | 1.00 | | | | 0.000 | ^ | | | (0.000 | )*^ | | | 1.00 | | | | 0.06 | | | | 432,235 | | | | 0.28 | | | | 0.04 | | | | 1.10 | |
| | 2009 | | | | 1.00 | | | | 0.003 | | | | (0.003 | ) | | | 1.00 | | | | 0.33 | | | | 656,769 | | | | 0.61 | | | | 0.39 | | | | 1.15 | |
| | 2008 | | | | 1.00 | | | | 0.027 | | | | (0.027 | ) | | | 1.00 | | | | 2.78 | | | | 1,123,900 | | | | 0.80 | | | | 2.65 | | | | 1.08 | |
| | 2007 | | | | 1.00 | | | | 0.045 | | | | (0.045 | ) | | | 1.00 | | | | 4.62 | | | | 870,537 | | | | 0.81 | | | | 4.52 | | | | 1.10 | |
| | 2006 | | | | 1.00 | | | | 0.039 | | | | (0.039 | ) | | | 1.00 | | | | 3.94 | | | | 640,366 | | | | 0.81 | | | | 3.95 | | | | 1.10 | |
| Class S (commenced operations on October 26, 1999) | |
| | 2011 | † | | $ | 1.00 | | | $ | 0.000 | ^ | | $ | (0.000 | )^ | | $ | 1.00 | | | | 0.01 | % | | $ | 349,411 | | | | 0.33 | % | | | 0.01 | % | | | 1.11 | % |
| | 2010 | | | | 1.00 | | | | 0.000 | ^ | | | (0.000 | )*^ | | | 1.00 | | | | 0.04 | | | | 352,575 | | | | 0.30 | | | | 0.02 | | | | 1.10 | |
| | 2009 | | | | 1.00 | | | | 0.002 | | | | (0.002 | ) | | | 1.00 | | | | 0.23 | | | | 372,762 | | | | 0.73 | | | | 0.28 | | | | 1.15 | |
| | 2008 | | | | 1.00 | | | | 0.025 | | | | (0.025 | ) | | | 1.00 | | | | 2.57 | | | | 633,815 | | | | 1.00 | | | | 2.54 | | | | 1.08 | |
| | 2007 | | | | 1.00 | | | | 0.043 | | | | (0.043 | ) | | | 1.00 | | | | 4.41 | | | | 620,195 | | | | 1.01 | | | | 4.32 | | | | 1.10 | |
| | 2006 | | | | 1.00 | | | | 0.037 | | | | (0.037 | ) | | | 1.00 | | | | 3.73 | | | | 324,353 | | | | 1.01 | | | | 3.74 | | | | 1.10 | |
California Tax Exempt Money Market Fund | |
| Institutional Class (commenced operations on April 3, 2000) | |
| | 2011 | † | | $ | 1.00 | | | $ | 0.000 | ^ | | $ | (0.000 | )^ | | $ | 1.00 | | | | 0.01 | % | | $ | 121,458 | | | | 0.22 | % | | | 0.03 | % | | | 0.63 | % |
| | 2010 | | | | 1.00 | | | | 0.000 | ^ | | | (0.000 | )*^ | | | 1.00 | | | | 0.04 | | | | 140,238 | | | | 0.19 | | | | 0.04 | | | | 0.63 | |
| | 2009 | | | | 1.00 | | | | 0.003 | | | | (0.003 | ) | | | 1.00 | | | | 0.33 | | | | 141,579 | | | | 0.30 | | | | 0.31 | | | | 0.65 | |
| | 2008 | | | | 1.00 | | | | 0.018 | | | | (0.018 | ) | | | 1.00 | | | | 1.80 | | | | 157,427 | | | | 0.55 | | | | 1.69 | | | | 0.61 | |
| | 2007 | | | | 1.00 | | | | 0.030 | | | | (0.030 | ) | | | 1.00 | | | | 3.01 | | | | 89,237 | | | | 0.55 | | | | 2.97 | | | | 0.62 | |
| | 2006 | | | | 1.00 | | | | 0.026 | | | | (0.026 | ) | | | 1.00 | | | | 2.62 | | | | 85,014 | | | | 0.55 | | | | 2.60 | | | | 0.62 | |
| Class N (commenced operations on June 21, 1999) | |
| | 2011 | † | | $ | 1.00 | | | $ | 0.000 | ^ | | $ | (0.000 | )^ | | $ | 1.00 | | | | 0.01 | % | | $ | 606,125 | | | | 0.23 | % | | | 0.02 | % | | | 1.13 | % |
| | 2010 | | | | 1.00 | | | | 0.000 | ^ | | | (0.000 | )*^ | | | 1.00 | | | | 0.03 | | | | 638,839 | | | | 0.20 | | | | 0.02 | | | | 1.12 | |
| | 2009 | | | | 1.00 | | | | 0.002 | | | | (0.002 | ) | | | 1.00 | | | | 0.23 | | | | 704,840 | | | | 0.41 | | | | 0.25 | | | | 1.16 | |
| | 2008 | | | | 1.00 | | | | 0.016 | | | | (0.016 | ) | | | 1.00 | | | | 1.57 | | | | 880,794 | | | | 0.78 | | | | 1.47 | | | | 1.11 | |
| | 2007 | | | | 1.00 | | | | 0.027 | | | | (0.027 | ) | | | 1.00 | | | | 2.78 | | | | 695,318 | | | | 0.78 | | | | 2.73 | | | | 1.12 | |
| | 2006 | | | | 1.00 | | | | 0.024 | | | | (0.024 | ) | | | 1.00 | | | | 2.39 | | | | 631,478 | | | | 0.78 | | | | 2.36 | | | | 1.12 | |
| Class S (commenced operations on November 12, 1999) | |
| | 2011 | † | | $ | 1.00 | | | $ | 0.000 | ^ | | $ | (0.000 | )^ | | $ | 1.00 | | | | 0.00 | % | | $ | 59,199 | | | | 0.24 | % | | | 0.01 | % | | | 1.13 | % |
| | 2010 | | | | 1.00 | | | | 0.000 | ^ | | | (0.000 | )*^ | | | 1.00 | | | | 0.01 | | | | 48,265 | | | | 0.22 | | | | 0.01 | | | | 1.12 | |
| | 2009 | | | | 1.00 | | | | 0.002 | | | | (0.002 | ) | | | 1.00 | | | | 0.17 | | | | 74,396 | | | | 0.54 | | | | 0.26 | | | | 1.16 | |
| | 2008 | | | | 1.00 | | | | 0.014 | | | | (0.014 | ) | | | 1.00 | | | | 1.37 | | | | 141,757 | | | | 0.98 | | | | 1.40 | | | | 1.11 | |
| | 2007 | | | | 1.00 | | | | 0.025 | | | | (0.025 | ) | | | 1.00 | | | | 2.57 | | | | 178,918 | | | | 0.98 | | | | 2.55 | | | | 1.12 | |
| | 2006 | | | | 1.00 | | | | 0.022 | | | | (0.022 | ) | | | 1.00 | | | | 2.18 | | | | 107,131 | | | | 0.98 | | | | 2.17 | | | | 1.12 | |
| † | For the six months ended March 31, 2011. |
| ‡ | Returns are for the period indicated and have not been annualized. Fee waivers are in effect; if they had not been in effect, performance would have been lower. Returns shown do not reflect the deduction of taxes that a shareholder would pay on fund distributions or the redemption of fund shares. |
| ^ | Amount represents less than $0.001. |
| * | Includes a realized capital gain distribution of less than $0.001. |
| (1) | Annualized for periods less than one year. |
| (2) | Ratio includes waivers and previously waived investment advisory fees recovered. The impact of the recovered fees may cause a higher net expense ratio. |
See accompanying notes to financial statements.
CNI CHARTER FUNDS | PAGE 70
| | | Net Asset Value Beginning of Period | | | | | | Net Realized and Unrealized Gains (Losses) on Securities† | | | Dividends from Net Investment Income | | | Distri- butions from Realized Capital Gains | | | Net Asset Value End of Period | | | | | | Net Assets End of Period (000) | | | Ratio of Expenses to Average Net Assets(1)(2) | | | Ratio of Net Investment Income to Average Net Assets(1) | | | Ratio of Expenses to Average Net Assets (Excluding Waivers & Recovered Fees)(1) | | | | |
| Limited Maturity Fixed Income Fund | |
| Institutional Class (commenced operations on October 22,1988) | |
| | 2011 | * | | $ | 11.21 | | | $ | 0.08 | | | $ | (0.12 | ) | | $ | (0.08 | ) | | $ | — | | | $ | 11.09 | | | | (0.32 | )% | | $ | 30,966 | | | | 0.69 | % | | | 1.52 | % | | | 0.70 | % | | | 26 | % |
| | 2010 | | | | 11.06 | | | | 0.20 | | | | 0.16 | | | | (0.21 | ) | | | — | | | | 11.21 | | | | 3.28 | | | | 33,279 | | | | 0.73 | | | | 1.82 | | | | 0.71 | | | | 118 | |
| | 2009 | | | | 10.49 | | | | 0.30 | | | | 0.57 | | | | (0.30 | ) | | | — | | | | 11.06 | | | | 8.44 | | | | 37,255 | | | | 0.75 | | | | 2.66 | | | | 0.76 | | | | 98 | |
| | 2008 | | | | 10.59 | | | | 0.37 | | | | (0.10 | ) | | | (0.37 | ) | | | — | | | | 10.49 | | | | 2.54 | | | | 92,681 | | | | 0.76 | | | | 3.44 | | | | 0.67 | | | | 79 | |
| | 2007 | | | | 10.56 | | | | 0.45 | | | | 0.03 | | | | (0.45 | ) | | | — | | | | 10.59 | | | | 4.63 | | | | 44,365 | | | | 0.76 | | | | 4.25 | | | | 0.77 | | | | 76 | |
| | 2006 | (3) | | | 10.57 | | | | 0.34 | | | | 0.02 | | | | (0.37 | ) | | | — | | | | 10.56 | | | | 3.49 | | | | 45,340 | | | | 0.75 | | | | 3.24 | | | | 0.94 | | | | 86 | |
| Class N (commenced operations on October 22, 2004) | |
| | 2011 | * | | $ | 11.22 | | | $ | 0.07 | | | $ | (0.12 | ) | | $ | (0.07 | ) | | $ | — | | | $ | 11.10 | | | | (0.44 | )% | | $ | 10,929 | | | | 0.94 | % | | | 1.27 | % | | | 1.20 | % | | | 26 | % |
| | 2010 | | | | 11.07 | | | | 0.16 | | | | 0.17 | | | | (0.18 | ) | | | — | | | | 11.22 | | | | 3.04 | | | | 9,262 | | | | 0.98 | | | | 1.48 | | | | 1.22 | | | | 118 | |
| | 2009 | | | | 10.51 | | | | 0.27 | | | | 0.57 | | | | (0.28 | ) | | | — | | | | 11.07 | | | | 8.07 | | | | 1,471 | | | | 1.00 | | | | 2.29 | | | | 1.24 | | | | 98 | |
| | 2008 | | | | 10.61 | | | | 0.35 | | | | (0.10 | ) | | | (0.35 | ) | | | — | | | | 10.51 | | | | 2.29 | | | | 432 | | | | 1.00 | | | | 3.24 | | | | 0.92 | | | | 79 | |
| | 2007 | | | | 10.57 | | | | 0.42 | | | | 0.04 | | | | (0.42 | ) | | | — | | | | 10.61 | | | | 4.47 | | | | 310 | | | | 1.00 | | | | 3.99 | | | | 1.02 | | | | 76 | |
| | 2006 | (3) | | | 10.58 | | | | 0.30 | | | | 0.03 | | | | (0.34 | ) | | | — | | | | 10.57 | | | | 3.17 | | | | 358 | | | | 1.00 | | | | 2.88 | | | | 1.18 | | | | 86 | |
| |
| Institutional Class (commenced operations on January 14, 2000) | |
| | 2011 | * | | $ | 10.66 | | | $ | 0.07 | | | $ | (0.17 | ) | | $ | (0.12 | ) | | $ | — | | | $ | 10.44 | | | | (0.99 | )% | | $ | 169,709 | | | | 0.70 | % | | | 1.41 | % | | | 0.78 | % | | | 25 | % |
| | 2010 | | | | 10.58 | | | | 0.19 | | | | 0.16 | | | | (0.27 | ) | | | — | | | | 10.66 | | | | 3.37 | | | | 155,376 | | | | 0.70 | | | | 1.81 | | | | 0.78 | | | | 93 | |
| | 2009 | | | | 10.40 | | | | 0.35 | | | | 0.18 | | | | (0.35 | ) | | | — | | | | 10.58 | | | | 5.18 | | | | 71,966 | | | | 0.70 | | | | 3.29 | | | | 0.77 | | | | 85 | |
| | 2008 | | | | 10.33 | | | | 0.42 | | | | 0.08 | | | | (0.43 | ) | | | — | | | | 10.40 | | | | 4.87 | | | | 66,097 | | | | 0.70 | | | | 4.05 | | | | 0.77 | | | | 36 | |
| | 2007 | | | | 10.28 | | | | 0.46 | | | | 0.05 | | | | (0.46 | ) | | | — | | | | 10.33 | | | | 5.04 | | | | 52,606 | | | | 0.70 | | | | 4.50 | | | | 0.77 | | | | 83 | |
| | 2006 | | | | 10.40 | | | | 0.41 | | | | (0.12 | ) | | | (0.41 | ) | | | — | | | | 10.28 | | | | 2.89 | | | | 35,671 | | | | 0.70 | | | | 4.04 | | | | 0.78 | | | | 62 | |
| Class N (commenced operations on April 13, 2000) | |
| | 2011 | * | | $ | 10.68 | | | $ | 0.06 | | | $ | (0.18 | ) | | $ | (0.10 | ) | | $ | — | | | $ | 10.46 | | | | (1.11 | )% | | $ | 2,929 | | | | 0.95 | % | | | 1.15 | % | | | 1.03 | % | | | 25 | % |
| | 2010 | | | | 10.60 | | | | 0.16 | | | | 0.16 | | | | (0.24 | ) | | | — | | | | 10.68 | | | | 3.10 | | | | 3,251 | | | | 0.95 | | | | 1.57 | | | | 1.03 | | | | 93 | |
| | 2009 | | | | 10.42 | | | | 0.32 | | | | 0.18 | | | | (0.32 | ) | | | — | | | | 10.60 | | | | 4.91 | | | | 3,109 | | | | 0.95 | | | | 3.04 | | | | 1.02 | | | | 85 | |
| | 2008 | | | | 10.35 | | | | 0.40 | | | | 0.07 | | | | (0.40 | ) | | | — | | | | 10.42 | | | | 4.59 | | | | 2,761 | | | | 0.95 | | | | 3.80 | | | | 1.02 | | | | 36 | |
| | 2007 | | | | 10.30 | | | | 0.44 | | | | 0.04 | | | | (0.43 | ) | | | — | | | | 10.35 | | | | 4.77 | | | | 2,632 | | | | 0.95 | | | | 4.25 | | | | 1.02 | | | | 83 | |
| | 2006 | | | | 10.42 | | | | 0.39 | | | | (0.12 | ) | | | (0.39 | ) | | | — | | | | 10.30 | | | | 2.63 | | | | 1,782 | | | | 0.95 | | | | 3.81 | | | | 1.03 | | | | 62 | |
| |
| Institutional Class (commenced operations on January 14, 2000) | |
| | 2011 | * | | $ | 10.88 | | | $ | 0.16 | | | $ | (0.24 | ) | | $ | (0.16 | ) | | $ | — | | | $ | 10.64 | | | | (0.73 | )% | | $ | 117,146 | | | | 0.74 | % | | | 3.00 | % | | | 0.75 | % | | | 9 | % |
| | 2010 | | | | 10.56 | | | | 0.35 | | | | 0.32 | | | | (0.35 | ) | | | — | | | | 10.88 | | | | 6.50 | | | | 105,571 | | | | 0.74 | | | | 3.32 | | | | 0.75 | | | | 28 | |
| | 2009 | | | | 9.76 | | | | 0.39 | | | | 0.80 | | | | (0.39 | ) | | | — | | | | 10.56 | | | | 12.48 | | | | 88,897 | | | | 0.74 | | | | 3.88 | | | | 0.75 | | | | 30 | |
| | 2008 | | | | 10.18 | | | | 0.43 | | | | (0.41 | ) | | | (0.44 | ) | | | — | | | | 9.76 | | | | 0.04 | | | | 69,709 | | | | 0.73 | | | | 4.25 | | | | 0.74 | | | | 12 | |
| | 2007 | | | | 10.17 | | | | 0.45 | | | | — | | | | (0.44 | ) | | | — | | | | 10.18 | | | | 4.57 | | | | 62,210 | | | | 0.74 | | | | 4.39 | | | | 0.75 | | | | 30 | |
| | 2006 | | | | 10.27 | | | | 0.42 | | | | (0.10 | ) | | | (0.42 | ) | | | — | | | | 10.17 | | | | 3.19 | | | | 55,290 | | | | 0.75 | | | | 4.14 | | | | 0.75 | | | | 25 | |
| Class N (commenced operations on April 13, 2000) | |
| | 2011 | * | | $ | 10.89 | | | $ | 0.15 | | | $ | (0.24 | ) | | $ | (0.15 | ) | | $ | — | | | $ | 10.65 | | | | (0.85 | )% | | $ | 2,261 | | | | 0.99 | % | | | 2.75 | % | | | 1.00 | % | | | 9 | % |
| | 2010 | | | | 10.57 | | | | 0.33 | | | | 0.32 | | | | (0.33 | ) | | | — | | | | 10.89 | | | | 6.23 | | | | 2,384 | | | | 0.99 | | | | 3.05 | | | | 1.00 | | | | 28 | |
| | 2009 | | | | 9.77 | | | | 0.36 | | | | 0.81 | | | | (0.37 | ) | | | — | | | | 10.57 | | | | 12.19 | | | | 995 | | | | 0.99 | | | | 3.59 | | | | 1.00 | | | | 30 | |
| | 2008 | | | | 10.18 | | | | 0.41 | | | | (0.41 | ) | | | (0.41 | ) | | | — | | | | 9.77 | | | | (0.11 | ) | | | 608 | | | | 0.98 | | | | 4.02 | | | | 0.99 | | | | 12 | |
| | 2007 | | | | 10.17 | | | | 0.42 | | | | 0.01 | | | | (0.42 | ) | | | — | | | | 10.18 | | | | 4.30 | | | | 1,043 | | | | 0.99 | | | | 4.13 | | | | 1.00 | | | | 30 | |
| | 2006 | | | | 10.27 | | | | 0.39 | | | | (0.10 | ) | | | (0.39 | ) | | | — | | | | 10.17 | | | | 2.93 | | | | 1,332 | | | | 1.00 | | | | 3.88 | | | | 1.00 | | | | 25 | |
California Tax Exempt Bond Fund | |
| Institutional Class (commenced operations on January 14, 2000) | |
| | 2011 | * | | $ | 10.70 | | | $ | 0.15 | | | $ | (0.26 | ) | | $ | (0.15 | ) | | $ | (0.04 | ) | | $ | 10.40 | | | | (1.01 | )% | | $ | 46,687 | | | | 0.50 | % | | | 2.83 | % | | | 0.62 | % | | | 7 | % |
| | 2010 | | | | 10.57 | | | | 0.32 | | | | 0.13 | | | | (0.32 | ) | | | — | | | | 10.70 | | | | 4.34 | | | | 40,457 | | | | 0.50 | | | | 3.03 | | | | 0.62 | | | | 28 | |
| | 2009 | | | | 10.06 | | | | 0.33 | | | | 0.51 | | | | (0.33 | ) | | | — | | | | 10.57 | | | | 8.45 | | | | 38,581 | | | | 0.50 | | | | 3.18 | | | | 0.61 | | | | 50 | |
| | 2008 | | | | 10.24 | | | | 0.32 | | | | (0.18 | ) | | | (0.32 | ) | | | — | | | | 10.06 | | | | 1.38 | | | | 34,262 | | | | 0.50 | | | | 3.13 | | | | 0.61 | | | | 55 | |
| | 2007 | | | | 10.25 | | | | 0.31 | | | | (0.01 | ) | | | (0.31 | ) | | | — | | | | 10.24 | | | | 2.98 | | | | 33,802 | | | | 0.50 | | | | 3.04 | | | | 0.62 | | | | 43 | |
| | 2006 | | | | 10.26 | | | | 0.29 | | | | 0.03 | | | | (0.29 | ) | | | (0.04 | ) | | | 10.25 | | | | 3.18 | | | | 26,074 | | | | 0.50 | | | | 2.85 | | | | 0.62 | | | | 43 | |
| Class N (commenced operations on April 13, 2000) | |
| | 2011 | * | | $ | 10.73 | | | $ | 0.14 | | | $ | (0.27 | ) | | $ | (0.13 | ) | | $ | (0.04 | ) | | $ | 10.43 | | | | (1.13 | )% | | $ | 3,238 | | | | 0.75 | % | | | 2.70 | % | | | 0.87 | % | | | 7 | % |
| | 2010 | | | | 10.60 | | | | 0.29 | | | | 0.13 | | | | (0.29 | ) | | | — | | | | 10.73 | | | | 4.06 | | | | 3,309 | | | | 0.75 | | | | 2.75 | | | | 0.87 | | | | 28 | |
| | 2009 | | | | 10.09 | | | | 0.30 | | | | 0.51 | | | | (0.30 | ) | | | — | | | | 10.60 | | | | 8.15 | | | | 1,902 | | | | 0.75 | | | | 2.92 | | | | 0.87 | | | | 50 | |
| | 2008 | | | | 10.27 | | | | 0.30 | | | | (0.18 | ) | | | (0.30 | ) | | | — | | | | 10.09 | | | | 1.12 | | | | 1,049 | | | | 0.75 | | | | 2.87 | | | | 0.86 | | | | 55 | |
| | 2007 | | | | 10.27 | | | | 0.28 | | | | — | | | | (0.28 | ) | | | — | | | | 10.27 | | | | 2.82 | | | | 922 | | | | 0.75 | | | | 2.78 | | | | 0.87 | | | | 43 | |
| | 2006 | | | | 10.29 | | | | 0.26 | | | | 0.02 | | | | (0.26 | ) | | | (0.04 | ) | | | 10.27 | | | | 2.81 | | | | 1,134 | | | | 0.75 | | | | 2.59 | | | | 0.87 | | | | 43 | |
| * | For the six months ended March 31, 2011. |
| † | Per share calculations are based on Average Shares outstanding throughout the period. |
| ‡ | Returns are for the period indicated and have not been annualized. Fee waivers are in effect; if they had not been in effect, performance would have been lower. Returns shown do not reflect the deduction of taxes that a shareholder would pay on fund distributions or the redemption of fund shares. |
| (1) | Annualized for periods less than one year. |
| (2) | Ratio includes waivers and previously waived investment advisory fees recovered. The impact of the recovered fees may cause a higher net expense ratio. |
| (3) | On October 3, 2005, the predecessor Limited Maturity Fixed Income Fund was reorganized into the CNI Charter Limited Maturity Fixed Income Fund. See Note 1 in Notes to Financial Statements for more information. |
| Amounts designated as “—” are either $0 or have been rounded to $0. |
See accompanying notes to financial statements.
CNI CHARTER FUNDS | PAGE 71
| financial highlights |
For a Share Outstanding Throughout Each Period For the six months ended March 31, 2011 (Unaudited) and the year or period ended September 30, |
| | | Net Asset Value Beginning of Period | | | | | | Net Realized and Unrealized Gains (Losses) on Securities† | | | Dividends from Net Investment Income | | | Distri-butions from Realized Capital Gains | | | Net Asset Value End of Period | | | | | | Net Assets End of Period (000) | | | Ratio of Expenses to Average Net Assets(1)(2) | | | Ratio of Net Investment Income to Average Net Assets(1) | | | Ratio of Expenses to Average Net Assets (Excluding Waivers & Recovered Fees)(1) | | | | |
| Full Maturity Fixed Income Fund | |
| Institutional Class (commenced operations on October 20, 1988) | |
| | 2011 | ^ | | $ | 10.91 | | | $ | 0.14 | | | $ | (0.26 | ) | | $ | (0.15 | ) | | $ | (0.06 | ) | | $ | 10.58 | | | | (1.14 | )% | | $ | 42,301 | | | | 0.68 | % | | | 2.71 | % | | | 0.69 | % | | | 23 | % |
| | 2010 | | | | 10.46 | | | | 0.36 | | | | 0.50 | | | | (0.36 | ) | | | (0.05 | ) | | | 10.91 | | | | 8.48 | | | | 45,756 | | | | 0.70 | | | | 3.40 | | | | 0.71 | | | | 63 | |
| | 2009 | | | | 9.90 | | | | 0.40 | | | | 0.56 | | | | (0.40 | ) | | | — | | | | 10.46 | | | | 9.95 | | | | 39,495 | | | | 0.75 | | | | 3.97 | | | | 0.75 | | | | 56 | |
| | 2008 | | | | 10.16 | | | | 0.44 | | | | (0.26 | ) | | | (0.44 | ) | | | — | | | | 9.90 | | | | 1.76 | | | | 42,579 | | | | 0.64 | | | | 4.32 | | | | 0.64 | | | | 34 | |
| | 2007 | | | | 10.16 | | | | 0.45 | | | | — | | | | (0.45 | ) | | | — | | | | 10.16 | | | | 4.48 | | | | 42,096 | | | | 0.79 | | | | 4.48 | | | | 0.73 | | | | 55 | |
| | 2006 | (3) | | | 10.35 | | | | 0.43 | | | | (0.13 | ) | | | (0.43 | ) | | | (0.06 | ) | | | 10.16 | | | | 3.03 | | | | 30,398 | | | | 0.80 | | | | 4.20 | | | | 0.87 | | | | 91 | |
| Class N (commenced operations on May 11, 2004) | |
| | 2011 | ^ | | $ | 10.90 | | | $ | 0.13 | | | $ | (0.26 | ) | | $ | (0.14 | ) | | $ | (0.06 | ) | | $ | 10.57 | | | | (1.26 | )% | | $ | 5,310 | | | | 0.94 | % | | | 2.47 | % | | | 1.20 | % | | | 23 | % |
| | 2010 | | | | 10.46 | | | | 0.33 | | | | 0.50 | | | | (0.34 | ) | | | (0.05 | ) | | | 10.90 | | | | 8.12 | | | | 3,818 | | | | 0.95 | | | | 3.08 | | | | 1.21 | | | | 63 | |
| | 2009 | | | | 9.89 | | | | 0.39 | | | | 0.56 | | | | (0.38 | ) | | | — | | | | 10.46 | | | | 9.79 | | | | 1,086 | | | | 1.00 | | | | 3.70 | | | | 1.26 | | | | 56 | |
| | 2008 | | | | 10.16 | | | | 0.42 | | | | (0.27 | ) | | | (0.42 | ) | | | — | | | | 9.89 | | | | 1.42 | | | | 687 | | | | 0.89 | | | | 4.02 | | | | 0.89 | | | | 34 | |
| | 2007 | | | | 10.16 | | | | 0.42 | | | | — | | | | (0.42 | ) | | | — | | | | 10.16 | | | | 4.23 | | | | 235 | | | | 1.04 | | | | 4.23 | | | | 0.99 | | | | 55 | |
| | 2006 | (3) | | | 10.36 | | | | 0.40 | | | | (0.13 | ) | | | (0.41 | ) | | | (0.06 | ) | | | 10.16 | | | | 2.67 | | | | 145 | | | | 1.05 | | | | 3.95 | | | | 1.12 | | | | 91 | |
| |
| Institutional Class (commenced operations on January 14, 2000) | |
| | 2011 | ^ | | $ | 8.31 | | | $ | 0.36 | | | $ | 0.34 | | | $ | (0.36 | ) | | $ | — | | | $ | 8.65 | | | | 8.54 | % | | $ | 45,648 | | | | 1.00 | % | | | 8.44 | % | | | 1.10 | % | | | 38 | % |
| | 2010 | | | | 7.56 | | | | 0.72 | | | | 0.75 | | | | (0.72 | ) | | | — | | | | 8.31 | | | | 20.17 | | | | 33,845 | | | | 1.00 | | | | 8.89 | | | | 1.10 | | | | 87 | |
| | 2009 | | | | 7.40 | | | | 0.62 | | | | 0.18 | | | | (0.64 | ) | | | — | | | | 7.56 | | | | 12.94 | | | | 16,355 | | | | 1.00 | | | | 9.75 | | | | 1.10 | | | | 59 | |
| | 2008 | | | | 8.91 | | | | 0.64 | | | | (1.47 | ) | | | (0.68 | ) | | | — | | | | 7.40 | | | | (9.83 | ) | | | 13,926 | | | | 1.00 | | | | 7.72 | | | | 1.09 | | | | 20 | |
| | 2007 | | | | 8.96 | | | | 0.70 | | | | (0.06 | ) | | | (0.69 | ) | | | — | | | | 8.91 | | | | 7.27 | | | | 17,137 | | | | 1.00 | | | | 7.73 | | | | 1.10 | | | | 26 | |
| | 2006 | | | | 9.04 | | | | 0.68 | | | | (0.08 | ) | | | (0.68 | ) | | | — | | | | 8.96 | | | | 6.90 | | | | 20,887 | | | | 1.00 | | | | 7.58 | | | | 1.10 | | | | 23 | |
| Class N (commenced operations on January 14, 2000) | |
| | 2011 | ^ | | $ | 8.31 | | | $ | 0.35 | | | $ | 0.34 | | | $ | (0.35 | ) | | $ | — | | | $ | 8.65 | | | | 8.38 | % | | $ | 27,739 | | | | 1.30 | % | | | 8.14 | % | | | 1.40 | % | | | 38 | % |
| | 2010 | | | | 7.56 | | | | 0.70 | | | | 0.74 | | | | (0.69 | ) | | | — | | | | 8.31 | | | | 19.81 | | | | 24,010 | | | | 1.30 | | | | 8.68 | | | | 1.40 | | | | 87 | |
| | 2009 | | | | 7.40 | | | | 0.60 | | | | 0.18 | | | | (0.62 | ) | | | — | | | | 7.56 | | | | 12.61 | | | | 19,637 | | | | 1.30 | | | | 9.43 | | | | 1.40 | | | | 59 | |
| | 2008 | | | | 8.91 | | | | 0.62 | | | | (1.47 | ) | | | (0.66 | ) | | | — | | | | 7.40 | | | | (10.10 | ) | | | 17,521 | | | | 1.30 | | | | 7.43 | | | | 1.39 | | | | 20 | |
| | 2007 | | | | 8.96 | | | | 0.68 | | | | (0.07 | ) | | | (0.66 | ) | | | — | | | | 8.91 | | | | 6.95 | | | | 20,121 | | | | 1.30 | | | | 7.44 | | | | 1.40 | | | | 26 | |
| | 2006 | | | | 9.04 | | | | 0.65 | | | | (0.08 | ) | | | (0.65 | ) | | | — | | | | 8.96 | | | | 6.58 | | | | 20,045 | | | | 1.30 | | | | 7.28 | | | | 1.40 | | | | 23 | |
| |
| Institutional Class (commenced operations on October 1, 2007) | |
| | 2011 | ^ | | $ | 10.37 | | | $ | 0.13 | | | $ | 0.69 | | | $ | (0.13 | ) | | $ | — | | | $ | 11.06 | | | | 7.98 | % | | $ | 16,487 | | | | 0.84 | % | | | 2.42 | % | | | 0.86 | % | | | 23 | % |
| | 2010 | | | | 9.87 | | | | 0.20 | | | | 0.50 | | | | (0.20 | ) | | | — | | | | 10.37 | | | | 7.15 | | | | 11,258 | | | | 0.84 | | | | 1.96 | | | | 0.85 | | | | 76 | |
| | 2009 | | | | 9.70 | | | | 0.15 | | | | 0.18 | | | | (0.16 | ) | | | — | | | | 9.87 | | | | 3.54 | | | | 8,423 | | | | 0.83 | | | | 1.71 | | | | 0.84 | | | | 94 | |
| | 2008 | | | | 11.00 | | | | 0.25 | | | | (1.32 | ) | | | (0.23 | ) | | | — | | | | 9.70 | | | | (9.84 | ) | | | 10,741 | | | | 1.29 | | | | 2.37 | | | | 1.30 | | | | 141 | |
| Class N (commenced operations on October 1, 2007) | |
| | 2011 | ^ | | $ | 10.36 | | | $ | 0.12 | | | $ | 0.70 | | | $ | (0.12 | ) | | $ | — | | | $ | 11.06 | | | | 7.96 | % | | $ | 27,365 | | | | 1.09 | % | | | 2.24 | % | | | 1.09 | % | | | 23 | % |
| | 2010 | | | | 9.86 | | | | 0.17 | | | | 0.50 | | | | (0.17 | ) | | | — | | | | 10.36 | | | | 6.89 | | | | 22,019 | | | | 1.09 | | | | 1.69 | | | | 1.10 | | | | 76 | |
| | 2009 | | | | 9.69 | | | | 0.13 | | | | 0.18 | | | | (0.14 | ) | | | — | | | | 9.86 | | | | 3.29 | | | | 16,837 | | | | 1.09 | | | | 1.46 | | | | 1.10 | | | | 94 | |
| | 2008 | | | | 11.00 | | | | 0.23 | | | | (1.33 | ) | | | (0.21 | ) | | | — | | | | 9.69 | | | | (10.12 | ) | | | 16,708 | | | | 1.53 | | | | 2.22 | | | | 1.54 | | | | 141 | |
| |
| Institutional Class (commenced operations on October 20, 1988) | |
| | 2011 | ^ | | $ | 11.88 | | | $ | 0.02 | | | $ | 2.19 | | | $ | (0.02 | ) | | $ | — | | | $ | 14.07 | | | | 18.63 | % | | $ | 65,026 | | | | 0.92 | % | | | 0.35 | % | | | 0.95 | % | | | 44 | % |
| | 2010 | | | | 11.19 | | | | 0.06 | | | | 0.69 | | | | (0.06 | )* | | | — | | | | 11.88 | | | | 6.69 | | | | 56,809 | | | | 0.94 | | | | 0.51 | | | | 0.95 | | | | 105 | |
| | 2009 | | | | 12.19 | | | | 0.11 | | | | (1.00 | ) | | | (0.11 | )** | | | — | | | | 11.19 | | | | (7.08 | ) | | | 50,425 | | | | 0.98 | | | | 1.15 | | | | 0.99 | | | | 93 | |
| | 2008 | | | | 18.48 | | | | 0.14 | | | | (3.84 | ) | | | (0.14 | ) | | | (2.45 | ) | | | 12.19 | | | | (22.73 | ) | | | 74,997 | | | | 0.97 | | | | 0.98 | | | | 0.94 | | | | 143 | |
| | 2007 | | | | 18.17 | | | | 0.18 | | | | 1.89 | | | | (0.18 | ) | | | (1.58 | ) | | | 18.48 | | | | 11.93 | | | | 102,232 | | | | 0.99 | | | | 0.98 | | | | 1.02 | | | | 116 | |
| | 2006 | (4) | | | 17.42 | | | | 0.15 | | | | 1.55 | | | | (0.15 | ) | | | (0.80 | ) | | | 18.17 | | | | 10.16 | | | | 94,653 | | | | 1.01 | | | | 0.87 | | | | 1.09 | | | | 99 | |
| Class N (commenced operations on December 30, 2002) | |
| | 2011 | ^ | | $ | 11.92 | | | $ | 0.01 | | | $ | 2.19 | | | $ | (0.01 | ) | | $ | — | | | $ | 14.11 | | | | 18.43 | % | | $ | 7,151 | | | | 1.17 | % | | | 0.10 | % | | | 1.18 | % | | | 44 | % |
| | 2010 | | | | 11.22 | | | | 0.03 | | | | 0.70 | | | | (0.03 | ) | | | — | | | | 11.92 | | | | 6.50 | | | | 6,610 | | | | 1.19 | | | | 0.26 | | | | 1.45 | | | | 105 | |
| | 2009 | | | | 12.22 | | | | 0.09 | | | | (1.00 | ) | | | (0.09 | ) | | | — | | | | 11.22 | | | | (7.30 | ) | | | 5,560 | | | | 1.23 | | | | 0.91 | | | | 1.49 | | | | 93 | |
| | 2008 | | | | 18.52 | | | | 0.11 | | | | (3.85 | ) | | | (0.11 | ) | | | (2.45 | ) | | | 12.22 | | | | (22.93 | ) | | | 7,102 | | | | 1.22 | | | | 0.74 | | | | 1.19 | | | | 143 | |
| | 2007 | | | | 18.21 | | | | 0.13 | | | | 1.89 | | | | (0.13 | ) | | | (1.58 | ) | | | 18.52 | | | | 11.62 | | | | 10,400 | | | | 1.27 | | | | 0.73 | | | | 1.24 | | | | 116 | |
| | 2006 | (4) | | | 17.46 | | | | 0.11 | | | | 1.55 | | | | (0.11 | ) | | | (0.80 | ) | | | 18.21 | | | | 9.87 | | | | 11,122 | | | | 1.26 | | | | 0.62 | | | | 1.34 | | | | 99 | |
| ^ | For the six months ended March 31, 2011. |
| † | Per share calculations are based on Average Shares outstanding throughout the period. |
| ‡ | Returns are for the period indicated and have not been annualized. Fee waivers are in effect; if they had not been in effect, performance would have been lower. Total return figures do not include applicable sales loads. Returns shown do not reflect the deduction of taxes that a shareholder would pay on fund distributions or the redemption of fund shares. |
| * | Includes return of capital less than $0.01 per share. |
| ** | Includes return of capital of $0.01 per share. |
| (1) | Annualized for periods less than one year. |
| (2) | Ratio includes waivers and previously waived investment advisory fees recovered. The impact of the recovered fees may cause a higher net expense ratio. |
| (3) | On October 3, 2005, the predecessor Full Maturity Fixed Income Fund was reorganized into the CNI Charter Full Maturity Fixed Income Fund. See Note 1 in Notes to Financial Statements for more information. |
| (4) | On October 3, 2005, the predecessor Diversified Equity Fund was reorganized into the CNI Charter Diversified Equity Fund. See Note 1 in Notes to Financial Statements for more information. |
| Amounts designated as “—” are either $0 or have been rounded to $0. |
See accompanying notes to financial statements.
CNI CHARTER FUNDS | PAGE 72
| | | Net Asset Value Beginning of Period | | | Net Investment Income (Loss)† | | | Net Realized and Unrealized Gains (Losses) on Securities† | | | Dividends from Net Investment Income | | | Distri-butions from Realized Capital Gains | | | Net Asset Value End of Period | | | | | | Net Assets End of Period (000) | | | Ratio of Expenses to Average Net Assets (1)(2) | | | Ratio of Net Investment Income (Loss) to Average Net Assets(1) | | | Ratio of Expenses to Average Net Assets (Excluding Waivers & Recovered Fees)(1) | | | | |
| Large Cap Value Equity Fund | |
| Institutional Class (commenced operations on January 14, 2000) | |
| | 2011 | * | | $ | 7.68 | | | $ | 0.05 | | | $ | 1.17 | | | $ | (0.05 | ) | | $ | — | | | $ | 8.85 | | | | 15.97 | % | | $ | 107,289 | | | | 0.96 | % | | | 1.30 | % | | | 0.97 | % | | | 31 | % |
| | 2010 | | | | 7.28 | | | | 0.10 | | | | 0.40 | | | | (0.10 | ) | | | — | | | | 7.68 | | | | 6.85 | | | | 94,725 | | | | 0.96 | | | | 1.29 | | | | 0.97 | | | | 26 | |
| | 2009 | | | | 8.25 | | | | 0.13 | | | | (0.98 | ) | | | (0.12 | ) | | | — | | | | 7.28 | | | | (10.03 | ) | | | 81,308 | | | | 0.96 | | | | 2.11 | | | | 0.97 | | | | 18 | |
| | 2008 | | | | 11.21 | | | | 0.16 | | | | (2.48 | ) | | | (0.15 | ) | | | (0.49 | ) | | �� | 8.25 | | | | (21.57 | ) | | | 88,361 | | | | 0.95 | | | | 1.64 | | | | 0.96 | | | | 36 | |
| | 2007 | | | | 10.36 | | | | 0.19 | | | | 1.38 | | | | (0.19 | ) | | | (0.53 | ) | | | 11.21 | | | | 15.60 | | | | 110,024 | | | | 0.96 | | | | 1.73 | | | | 0.97 | | | | 24 | |
| | 2006 | | | | 9.54 | | | | 0.13 | | | | 1.21 | | | | (0.13 | ) | | | (0.39 | ) | | | 10.36 | | | | 14.50 | | | | 92,946 | | | | 0.96 | | | | 1.36 | | | | 0.97 | | | | 31 | |
| Class N (commenced operations on April 13, 2000) | |
| | 2011 | * | | $ | 7.67 | | | $ | 0.04 | | | $ | 1.16 | | | $ | (0.04 | ) | | $ | — | | | $ | 8.83 | | | | 15.71 | % | | $ | 11,248 | | | | 1.21 | % | | | 1.05 | % | | | 1.22 | % | | | 31 | % |
| | 2010 | | | | 7.27 | | | | 0.08 | | | | 0.40 | | | | (0.08 | ) | | | — | | | | 7.67 | | | | 6.59 | | | | 10,089 | | | | 1.21 | | | | 1.03 | | | | 1.22 | | | | 26 | |
| | 2009 | | | | 8.24 | | | | 0.12 | | | | (0.98 | ) | | | (0.11 | ) | | | — | | | | 7.27 | | | | (10.27 | ) | | | 8,960 | | | | 1.21 | | | | 1.89 | | | | 1.22 | | | | 18 | |
| | 2008 | | | | 11.19 | | | | 0.13 | | | | (2.46 | ) | | | (0.13 | ) | | | (0.49 | ) | | | 8.24 | | | | (21.72 | ) | | | 11,712 | | | | 1.20 | | | | 1.38 | | | | 1.21 | | | | 36 | |
| | 2007 | | | | 10.35 | | | | 0.16 | | | | 1.37 | | | | (0.16 | ) | | | (0.53 | ) | | | 11.19 | | | | 15.24 | | | | 17,190 | | | | 1.21 | | | | 1.47 | | | | 1.22 | | | | 24 | |
| | 2006 | | | | 9.53 | | | | 0.11 | | | | 1.20 | | | | (0.10 | ) | | | (0.39 | ) | | | 10.35 | | | | 14.24 | | | | 13,104 | | | | 1.21 | | | | 1.13 | | | | 1.22 | | | | 31 | |
Large Cap Growth Equity Fund | |
| Institutional Class (commenced operations on January 14, 2000) | |
| | 2011 | * | | $ | 7.67 | | | $ | 0.01 | | | $ | 1.31 | | | $ | (0.01 | ) | | $ | — | | | $ | 8.98 | | | | 17.24 | % | | $ | 45,085 | | | | 0.99 | % | | | 0.30 | % | | | 1.00 | % | | | 47 | % |
| | 2010 | | | | 7.08 | | | | 0.04 | | | | 0.59 | | | | (0.04 | ) | | | — | | | | 7.67 | | | | 8.89 | | | | 31,317 | | | | 0.99 | | | | 0.52 | | | | 1.00 | | | | 61 | |
| | 2009 | | | | 7.38 | | | | 0.04 | | | | (0.30 | ) | | | (0.04 | ) | | | — | | | | 7.08 | | | | (3.36 | ) | | | 28,050 | | | | 0.99 | | | | 0.70 | | | | 1.00 | | | | 12 | |
| | 2008 | | | | 8.86 | | | | 0.03 | | | | (1.48 | ) | | | (0.03 | ) | | | — | | | | 7.38 | | | | (16.40 | ) | | | 31,074 | | | | 0.98 | | | | 0.35 | | | | 0.99 | | | | 26 | |
| | 2007 | | | | 7.75 | | | | 0.05 | | | | 1.10 | | | | (0.04 | ) | | | — | | | | 8.86 | | | | 14.91 | | | | 45,784 | | | | 0.99 | | | | 0.52 | | | | 1.00 | | | | 30 | |
| | 2006 | | | | 7.43 | | | | 0.02 | | | | 0.32 | | | | (0.02 | ) | | | — | | | | 7.75 | | | | 4.59 | | | | 35,842 | | | | 0.99 | | | | 0.27 | | | | 1.00 | | | | 34 | |
| Class N (commenced operations on March 28, 2000) | |
| | 2011 | * | | $ | 7.59 | | | $ | — | | | $ | 1.29 | | | $ | (0.00 | )^ | | $ | — | | | $ | 8.88 | | | | 17.06 | % | | $ | 11,126 | | | | 1.24 | % | | | 0.06 | % | | | 1.24 | % | | | 47 | % |
| | 2010 | | | | 7.00 | | | | 0.02 | | | | 0.59 | | | | (0.02 | ) | | | — | | | | 7.59 | | | | 8.72 | | | | 9,271 | | | | 1.24 | | | | 0.27 | | | | 1.25 | | | | 61 | |
| | 2009 | | | | 7.31 | | | | 0.03 | | | | (0.31 | ) | | | (0.03 | ) | | | — | | | | 7.00 | | | | (3.77 | ) | | | 9,120 | | | | 1.24 | | | | 0.45 | | | | 1.25 | | | | 12 | |
| | 2008 | | | | 8.77 | | | | 0.01 | | | | (1.46 | ) | | | (0.01 | ) | | | — | | | | 7.31 | | | | (16.55 | ) | | | 11,341 | | | | 1.23 | | | | 0.11 | | | | 1.24 | | | | 26 | |
| | 2007 | | | | 7.68 | | | | 0.01 | | | | 1.10 | | | | (0.02 | ) | | | — | | | | 8.77 | | | | 14.51 | | | | 15,063 | | | | 1.24 | | | | 0.28 | | | | 1.25 | | | | 30 | |
| | 2006 | | | | 7.35 | | | | — | | | | 0.33 | | | | (— | )^ | | | — | | | | 7.68 | | | | 4.55 | | | | 10,363 | | | | 1.24 | | | | 0.03 | | | | 1.25 | | | | 34 | |
Socially Responsible Equity Fund | |
| Institutional Class (commenced operations on January 3, 2005) | |
| | 2011 | * | | $ | 8.81 | | | $ | 0.06 | | | $ | 1.28 | | | $ | (0.06 | ) | | $ | — | | | $ | 10.09 | | | | 15.19 | % | | $ | 72,150 | | | | 0.91 | % | | | 1.22 | % | | | 0.92 | % | | | 10 | % |
| | 2010 | | | | 8.20 | | | | 0.09 | | | | 0.61 | | | | (0.09 | )* | | | — | | | | 8.81 | | | | 8.51 | | | | 59,746 | | | | 0.95 | | | | 1.01 | | | | 0.96 | | | | 36 | |
| | 2009 | | | | 9.51 | | | | 0.12 | | | | (1.30 | ) | | | (0.13 | ) | | | — | | | | 8.20 | | | | (12.11 | ) | | | 52,406 | | | | 0.97 | | | | 1.74 | | | | 0.98 | | | | 48 | |
| | 2008 | | | | 12.12 | | | | 0.16 | | | | (2.04 | ) | | | (0.15 | ) | | | (0.58 | ) | | | 9.51 | | | | (16.24 | ) | | | 53,256 | | | | 0.99 | | | | 1.51 | | | | 0.90 | | | | 41 | |
| | 2007 | | | | 10.91 | | | | 0.14 | | | | 1.36 | | | | (0.14 | ) | | | (0.15 | ) | | | 12.12 | | | | 13.89 | | | | 56,490 | | | | 0.94 | | | | 1.19 | | | | 1.00 | | | | 29 | |
| | 2006 | (3) | | | 10.28 | | | | 0.12 | | | | 0.67 | | | | (0.11 | ) | | | (0.05 | ) | | | 10.91 | | | | 7.69 | | | | 45,003 | | | | 1.04 | | | | 1.10 | | | | 1.12 | | | | 29 | |
| Class N (commenced operations on August 12, 2005) | |
| | 2011 | * | | $ | 8.79 | | | $ | 0.05 | | | $ | 1.29 | | | $ | (0.05 | ) | | $ | — | | | $ | 10.08 | | | | 15.21 | % | | $ | 3,566 | | | | 1.16 | % | | | 1.01 | % | | | 1.42 | % | | | 10 | % |
| | 2010 | | | | 8.19 | | | | 0.07 | | | | 0.60 | | | | (0.07 | ) | | | — | | | | 8.79 | | | | 8.15 | | | | 2,424 | | | | 1.20 | | | | 0.81 | | | | 1.46 | | | | 36 | |
| | 2009 | | | | 9.50 | | | | 0.11 | | | | (1.31 | ) | | | (0.11 | ) | | | — | | | | 8.19 | | | | (12.34 | ) | | | 1,101 | | | | 1.22 | | | | 1.49 | | | | 1.48 | | | | 48 | |
| | 2008 | | | | 12.11 | | | | 0.14 | | | | (2.05 | ) | | | (0.12 | ) | | | (0.58 | ) | | | 9.50 | | | | (16.46 | ) | | | 885 | | | | 1.24 | | | | 1.26 | | | | 1.15 | | | | 41 | |
| | 2007 | | | | 10.90 | | | | 0.12 | | | | 1.36 | | | | (0.11 | ) | | | (0.16 | ) | | | 12.11 | | | | 13.64 | | | | 741 | | | | 1.19 | | | | 0.94 | | | | 1.25 | | | | 29 | |
| | 2006 | (3) | | | 10.28 | | | | 0.09 | | | | 0.67 | | | | (0.09 | ) | | | (0.05 | ) | | | 10.90 | | | | 7.40 | | | | 281 | | | | 1.29 | | | | 0.80 | | | | 1.37 | | | | 29 | |
| |
| Institutional Class (commenced operations on October 3, 2001) | |
| | 2011 | * | | $ | 20.77 | | | $ | (0.05 | ) | | $ | 2.62 | | | $ | (0.07 | ) | | $ | — | | | $ | 23.27 | | | | 12.38 | % | | $ | 3,187 | | | | 1.19 | % | | | (0.47 | )% | | | 1.20 | % | | | 26 | % |
| | 2010 | | | | 18.46 | | | | 0.08 | | | | 2.23 | | | | — | | | | — | | | | 20.77 | | | | 12.51 | | | | 3,331 | | | | 1.20 | | | | 0.40 | | | | 1.21 | | | | 48 | |
| | 2009 | | | | 16.42 | | | | (0.02 | ) | | | 2.35 | | | | (0.29 | ) | | | — | | | | 18.46 | | | | 15.20 | | | | 2,317 | | | | 1.19 | | | | (0.13 | ) | | | 1.20 | | | | 62 | |
| | 2008 | | | | 30.79 | | | | 0.19 | | | | (9.57 | ) | | | — | | | | (4.99 | ) | | | 16.42 | | | | (35.01 | ) | | | 1,742 | | | | 1.19 | | | | 0.85 | | | | 1.20 | | | | 78 | |
| | 2007 | | | | 28.25 | | | | 0.02 | | | | 3.00 | | | | (0.01 | ) | | | (0.47 | ) | | | 30.79 | | | | 10.65 | | | | 9,062 | | | | 1.19 | | | | 0.08 | | | | 1.20 | | | | 57 | |
| | 2006 | | | | 28.58 | | | | 0.06 | | | | 0.05 | | | | (0.07 | ) | | | (0.37 | ) | | | 28.25 | | | | 0.40 | | | | 13,435 | | | | 1.20 | | | | 0.20 | | | | 1.21 | | | | 66 | |
| Class N (commenced operations on October 3, 2001) | |
| | 2011 | * | | $ | 20.33 | | | $ | (0.04 | ) | | $ | 2.53 | | | $ | (0.02 | ) | | $ | — | | | $ | 22.80 | | | | 12.23 | % | | $ | 5,111 | | | | 1.44 | % | | | (0.39 | )% | | | 1.45 | % | | | 26 | % |
| | 2010 | | | | 18.12 | | | | 0.02 | | | | 2.19 | | | | — | | | | — | | | | 20.33 | | | | 12.20 | | | | 4,760 | | | | 1.45 | | | | 0.12 | | | | 1.46 | | | | 48 | |
| | 2009 | | | | 16.14 | | | | (0.05 | ) | | | 2.30 | | | | (0.27 | ) | | | — | | | | 18.12 | | | | 14.91 | | | | 4,226 | | | | 1.44 | | | | (0.37 | ) | | | 1.45 | | | | 62 | |
| | 2008 | | | | 30.42 | | | | 0.15 | | | | (9.44 | ) | | | — | | | | (4.99 | ) | | | 16.14 | | | | (35.16 | ) | | | 4,262 | | | | 1.44 | | | | 0.70 | | | | 1.45 | | | | 78 | |
| | 2007 | | | | 27.98 | | | | (0.05 | ) | | | 2.96 | | | | — | | | | (0.47 | ) | | | 30.42 | | | | 10.37 | | | | 9,753 | | | | 1.44 | | | | (0.16 | ) | | | 1.45 | | | | 57 | |
| | 2006 | | | | 28.31 | | | | (0.01 | ) | | | 0.05 | | | | (— | )^ | | | (0.37 | ) | | | 27.98 | | | | 0.17 | | | | 10,470 | | | | 1.45 | | | | (0.04 | ) | | | 1.46 | | | | 66 | |
| Class R (commenced operations on September 30, 1998) | |
| | 2011 | * | | $ | 20.37 | | | $ | (0.01 | ) | | $ | 2.53 | | | $ | (0.10 | ) | | $ | — | | | $ | 22.79 | | | | 12.37 | % | | $ | 16,683 | | | | 1.23 | % | | | (0.12 | )% | | | 1.63 | % | | | 26 | % |
| | 2010 | | | | 18.15 | | | | 0.04 | | | | 2.20 | | | | (0.02 | ) | | | — | | | | 20.37 | | | | 12.33 | | | | 16,508 | | | | 1.33 | | | | 0.23 | | | | 1.73 | | | | 48 | |
| | 2009 | | | | 16.15 | | | | 0.01 | | | | 2.31 | | | | (0.32 | ) | | | — | | | | 18.15 | | | | 15.50 | | | | 16,755 | | | | 0.97 | | | | 0.08 | | | | 1.55 | | | | 62 | |
| | 2008 | | | | 30.38 | | | | 0.20 | | | | (9.44 | ) | | | — | | | | (4.99 | ) | | | 16.15 | | | | (35.02 | ) | | | 19,183 | | | | 1.23 | | | | 0.92 | | | | 1.55 | | | | 78 | |
| | 2007 | | | | 27.93 | | | | (0.05 | ) | | | 2.97 | | | | — | | | | (0.47 | ) | | | 30.38 | | | | 10.43 | | | | 40,944 | | | | 1.44 | | | | (0.17 | ) | | | 1.45 | | | | 57 | |
| | 2006 | | | | 28.27 | | | | (0.01 | ) | | | 0.04 | | | | (— | )^ | | | (0.37 | ) | | | 27.93 | | | | 0.14 | | | | 45,836 | | | | 1.45 | | | | (0.04 | ) | | | 1.46 | | | | 66 | |
| * | For the six months ended March 31, 2011. |
| † | Per share calculations are based on Average Shares outstanding throughout the period. |
| ‡ | Returns are for the period indicated and have not been annualized. Fee waivers are in effect; if they had not been in effect, performance would have been lower. Total return figures do not include applicable sales loads. Returns shown do not reflect the deduction of taxes that a shareholder would pay on fund distributions or the redemption of fund shares. |
| ^ | Amount represents less than $0.01 per share. |
| (1) | Annualized for periods less than one year. |
| (2) | Ratio includes waivers and previously waived investment advisory fees recovered. The impact of the recovered fees may cause a higher net expense ratio. |
| (3) | On October 3, 2005, the predecessor Socially Responsible Equity Fund was reorganized into the CNI Charter Socially Responsible Equity Fund. See Note 1 in Notes to Financial Statements for more information. |
| Amounts designated as “—” are either $0 or have been rounded to $0. |
See accompanying notes to financial statements.
CNI CHARTER FUNDS | PAGE 73
| notes to financial statements |
March 31, 2011 (Unaudited) |
CNI Charter Funds, a Delaware statutory trust (the “Trust”), is registered under the Investment Company Act of 1940, as amended, as an open-end management investment company currently offering the following 15 series (each a “Fund” and collectively, the “Funds”): Government Money Market Fund, Prime Money Market Fund, California Tax Exempt Money Market Fund (collectively, the “Money Market Funds”); Limited Maturity Fixed Income Fund, Government Bond Fund, Corporate Bond Fund, California Tax Exempt Bond Fund, Full Maturity Fixed Income Fund, High Yield Bond Fund (collectively, the “Fixed Income Funds”); the Multi-Asset Fund (the “Multi-Asset Fund”); Diversified Equity Fund, Large Cap Value Equity Fund, Large Cap Growth Equity Fund, Socially Responsible Equity Fund and RCB Small Cap Value Fund (collectively, the “Equity Funds”); The Money Market Funds are registered to offer Institutional, Class N and Class S Shares. The Fixed Income Funds, Equity Funds and Multi-Asset Fund offer Institutional and Class N Shares; in addition, the RCB Small Cap Value Fund offers Class R Shares.
City National Asset Management, Inc. (“CNAM”) serves as the investment manager of the Funds. Prior to January 1, 2011, CCM Advisors, LLC (“CCMA”), an affiliate of CNAM, served as the investment manager to the Limited Maturity Fixed Income Fund (“Limited Maturity Fund”), Full Maturity Fixed Income Fund (“Full Maturity Fund”), Diversified Equity Fund (“Diversified Fund”) and Socially Responsible Equity Fund (“Socially Responsible Fund”). Effective January 1, 2011, CCMA combined its business with CNAM and CNAM became the investment manager to these Funds.
The assets of each Fund are segregated, and a shareholder’s interest is limited to the Fund in which shares are held. Each Fund is diversified with the exception of the California Tax Exempt Bond Fund, which is non-diversified. The Funds’ prospectus provides descriptions of each Fund’s investment objectives, policies and strategies.
| 2. | SIGNIFICANT ACCOUNTING POLICIES: |
The following is a summary of significant accounting policies followed by the Funds.
Use of Estimates – The preparation of financial statements in conformity with U.S. generally accepted accounting principles requires management to make estimates and assumptions that affect the reported amounts of assets and liabilities and disclosure of contingent assets and liabilities at the date of the financial statements and the reported amounts of increases and decreases in net assets from operations during the reporting period. Actual results could differ from those estimates.
Security Valuation – Securities listed on a securities exchange, market or automated quotation system for which quotations are readily available (except for securities traded on NASDAQ) are valued at the last quoted sale price on the primary exchange or market (foreign or domestic) on which they are traded, or, if there is no such reported sale, at the most recent quoted bid price. For securities traded on NASDAQ, the NASDAQ Official Closing Price is used. If available, debt securities are priced based upon valuations provided by independent, third-party pricing agents. Such values generally reflect the last reported sales price if the security is actively traded. The third-party pricing agents may also value debt securities at an evaluated bid price by employing methodologies that utilize actual market transactions, broker-supplied valuations, or other methodologies designed to identify the market value for such securities. Debt obligations, including money market funds, with remaining maturities of 60 days or less may be valued at their amortized cost, which approximates market value. The prices for foreign securities are reported in local currency and converted to U.S. dollars using currency exchange rates. Investments in registered investment companies are priced at the underlying funds’ daily net asset value. Prices for most securities held in the Funds are provided daily by recognized independent pricing agents. If a security price cannot be obtained from an independent, third-party pricing agent, the Funds seek to obtain a bid price from at least one independent broker.
Securities for which market prices are not “readily available” are valued in accordance with Fair Value Procedures established by the Funds’ Board of Trustees. The Funds’ Fair Value Procedures are implemented through a Fair Value Committee (the “Committee”) designated by the Funds’ Board of Trustees. Some of the more common reasons that may necessitate that a security be valued using Fair Value Procedures include: the security’s trading has been halted or suspended; the security has been de-listed from a national exchange; the security’s primary trading market is temporarily closed at a time when under normal conditions it would be open; for international securities, market events occur after the close of the foreign markets that make closing prices not representative of fair value; or the security’s primary pricing source is not able or willing to provide a price. When a security is valued in accordance with the Fair Value Procedures, the Committee will determine the value after taking into consideration relevant information reasonably available to the Committee.
CNI CHARTER FUNDS | PAGE 74
In accordance with U.S. generally accepted accounting principles, the objective of a fair value measurement is to determine the price that would be received to sell an asset or paid to transfer a liability in an orderly transaction between market participants at the measurement date (an exit price). Accordingly, the fair value hierarchy gives the highest priority to quoted prices (unadjusted) in active markets for identical assets or liabilities (Level 1) and the lowest priority to unobservable inputs (Level 3). The three levels of the fair value hierarchy are described below:
| | • | Level 1 — Unadjusted quoted prices in active markets for identical, unrestricted assets or liabilities that the Funds have the ability to access at the measurement date; |
| | • | Level 2 — Quoted prices which are not active, or inputs that are observable (either directly or indirectly) for substantially the full term of the asset or liability; and |
| | • | Level 3 — Prices, inputs or exotic modeling techniques which are both significant to the fair value measurement and unobservable (supported by little or no market activity). |
Investments are classified within the level of the lowest significant input considered in determining fair value. Investments classified within Level 3 whose fair value measurement considers several inputs may include Level 1 or Level 2 inputs as components of the overall fair value measurement.
For the six months ended March 31, 2011, there have been no significant changes to the Funds’ fair valuation methodologies.
Security Transactions and Related Income – Security transactions are accounted for on the trade date of the security purchase or sale. Costs used in determining net realized capital gains and losses on the sale of securities are those of the specific securities sold. Interest income is recognized on an accrual basis and dividend income is recognized on the ex-dividend date. Purchase discounts and premiums on securities held by the Funds are accreted and amortized to maturity using the scientific method, which approximates the effective interest method over the holding period of a security, except for the Money Market Funds which use a straight line basis.
Repurchase Agreements – Securities pledged as collateral for repurchase agreements are held by each Fund’s custodian bank, U.S. Bank, N.A., until maturity of the repurchase agreements. Provisions of the agreements and procedures adopted by the investment adviser require that the market value of the collateral, including accrued interest thereon, is sufficient in the event of default by the counterparty. The Funds also invest in tri-party repurchase agreements. Securities held as collateral for tri-party repurchase agreements are maintained by the broker’s custodian bank in a segregated account until maturity of the repurchase agreement. Provisions of the agreements require that the market value of the collateral, including accrued interest thereon, is sufficient in the event of default. If the counterparty defaults and the value of the collateral declines or if the counterparty enters into an insolvency proceeding, realization of the collateral by the Fund may be delayed or limited.
TBA Transactions – The Funds may engage in “to be announced” (“TBA”) security transactions. Such transactions involve a commitment by the Funds to purchase or sell securities for a predetermined price or yield, with payment and delivery taking place beyond the customary settlement period. The Funds record TBA securities on the trade date and maintain security positions such that sufficient liquid assets will be available to make payments for the securities purchased.
Expense Allocation – Common expenses incurred by the Funds are allocated among the Funds (i) based upon relative average daily net assets, (ii) as incurred on a specific identification basis, or (iii) equally among the Funds, depending on the nature of the expenditure.
Classes – Class-specific expenses are borne by that class. Income, non class-specific expenses, and realized and unrealized gains/losses are allocated to the respective class on the basis of relative net asset value each day.
Dividends and Distributions to Shareholders – Dividends from net investment income are declared daily and paid to shareholders monthly for the Money Market Funds and Fixed Income Funds. Dividends from net investment income are declared and paid quarterly for the Multi-Asset Fund and Equity Funds, except that dividends from net investment income are declared and paid annually for the RCB Small Cap Value Fund. Distributions from net realized capital gains are distributed to shareholders at least annually.
3. | ADMINISTRATION, TRANSFER AGENT, DISTRIBUTION AND SHAREHOLDER SERVICES AGREEMENTS: |
Pursuant to an administration agreement dated April 1, 1999, as amended April 1, 2008, January 1, 2009, January 1, 2010 and January 1, 2011 (the “Agreement”), SEI Investments Global Funds Services (the “Administrator”), a wholly owned subsidiary of SEI Investments Company, acts as the Trust’s administrator. Under the terms of the Agreement, the Administrator is entitled to receive an annual fee of 0.065% of aggregate average daily
CNI CHARTER FUNDS | PAGE 75
| notes to financial statements |
March 31, 2011 (Unaudited) |
net assets of the Trust not exceeding $2.5 billion, 0.045% of aggregate average daily net assets of the Trust exceeding $2.5 billion but not exceeding $5 billion, 0.025% of aggregate average daily net assets of the Trust exceeding $5 billion but not exceeding $7.5 billion, and 0.02% of aggregate average daily net assets of the Trust exceeding $7.5 billion. Each Fund is subject to a minimum annual fee of $90,000, which may be reduced at the sole discretion of the Administrator.
The Trust has adopted a Rule 12b-1 Distribution Plan (“the Plan”) with respect to Class N, Class S and Class R Shares that allows each Fund to pay distribution and servicing fees. Pursuant to the Plan, SEI Investments Distribution Co. (the “Distributor”) receives a distribution fee, computed daily and paid monthly, at the annual rate of 0.50% of the average daily net assets of the Class N Shares and Class S Shares of the Money Market Funds and 0.25% of the Class N Shares of the Fixed Income Funds, Multi-Asset Fund and Equity Funds and the Class R Shares of the RCB Small Cap Value Fund, with the exception of 0.30% charged to the Class N Shares of the High Yield Bond Fund, which may be used by the Distributor to provide compensation for sales support and distribution-related activities.
Effective October 1, 2009, the RCB Small Cap Value Fund Class R shares voluntarily began waiving 0.14% in 12b-1 fees.
SEI Institutional Transfer Agency, a division of SEI Investments Fund Management Corporation (the “Transfer Agent”), serves as transfer agent for the Trust and provides services at an annual rate of $15,000 per share class. The Transfer Agent has agreed to waive these fees.
As of May 24, 2010, UMB Fund Services serves as sub-transfer agent for Class R shares of the RCB Small Cap Value Fund and all share classes of the Limited Maturity Fund, Full Maturity Fund, Diversified Fund and Socially Responsible Fund and provides services at an annual rate of $14,000 per share class plus other transaction based fees and out of pocket expenses. Prior to May 24, 2010, Citigroup Fund Services, LLC served as the sub-transfer agent for those Funds, subject to the same fee arrangements.
The Trust has entered into Shareholder Servicing Agreements that permit payment of compensation to City National Bank (“CNB”) and its affiliates (including CNAM) which provide certain shareholder support for their customers who own Institutional Class, Class N, Class S or Class R Shares. In consideration for such services, a shareholder servicing fee is charged at the annual rate of up to 0.25% of each Fund’s average daily net assets. CNB and CNAM have both agreed to voluntarily waive portions of their shareholder servicing fees with respect to certain Funds. For the six months ended March 31, 2011, CNB and CNAM received Shareholder Servicing fees from the Trust in the amounts of $6,563,706 and $5,105, respectively.
Certain officers of the Trust are also officers of CNAM or the Administrator. Such officers are paid no fees by the Trust for serving as officers of the Trust.
| 4. | INVESTMENT ADVISORY FEES AND OTHER AGREEMENTS: |
Under the terms of the current investment management agreements, CNAM receives an annual fee equal to a percentage of the average daily net assets of the Funds, as follows:
| |
| Government Money Market Fund | 0.26% |
| Prime Money Market Fund | 0.25 |
| California Tax Exempt Money Market Fund | 0.27 |
| Limited Maturity Fund | 0.50 |
| Government Bond Fund | 0.43 |
| Corporate Bond Fund | 0.40 |
| California Tax Exempt Bond Fund | 0.27 |
| Full Maturity Fund | 0.50 |
| High Yield Bond Fund | 0.75 |
| Multi-Asset Fund | 0.50 |
| Diversified Fund | 0.75 |
| Large Cap Value Equity Fund | 0.62 |
| Large Cap Growth Equity Fund | 0.65 |
| Socially Responsible Fund | 0.75 |
| |
Robert W. Baird & Co., Incorporated and Boyd Watterson Asset Management, LLC act as the investment sub-advisers with respect to the Full Maturity Fund.
Guggenheim Investment Management, LLC acts as the investment sub-adviser with respect to the High Yield Bond Fund.
AMBS Investment Counsel, LLC, SKBA Capital Management, LLC, and Turner Investment Partners, Inc. act as the investment sub-advisers with respect to the Diversified Fund.
SKBA Capital Management, LLC acts as the investment sub-adviser with respect to the Socially Responsible Fund.
Reed, Conner & Birdwell, LLC acts as the investment sub-adviser with respect to the RCB Small Cap Value Fund.
Sub-adviser fees are paid by CNAM.
CNI CHARTER FUNDS | PAGE 76
CNAM has voluntarily agreed to limit its fees or reimburse expenses to the extent necessary to keep operating expenses at or below certain percentages of certain of the Funds’ respective average daily net assets. In the case of the RCB Small Cap Value Fund, the Fund’s sub-adviser has contractually agreed to limit its fees or reimburse expenses to meet the expense limitations. The expense limitations (expressed as percentages of average daily net assets) are as follows:
| Government Money Market Fund | | California Tax Exempt Money Market Fund | |
| Institutional Class | 0.63% | 0.63% | 0.55% | |
| Class N | 0.85% | 0.85% | 0.78% | |
| | | | |
| Limited Maturity Fixed Income Fund | | | California Tax Exempt Bond Fund |
| Institutional Class | 1.00% | 0.70% | 0.75% | 0.50% |
| | | | |
| Full Maturity Fixed Income Fund | | | |
| Institutional Class | 1.00% | 1.00% | 1.75% | 1.25% |
| | | | |
| Large Cap Value Equity Fund | Large Cap Growth Equity Fund | Socially Responsible Equity Fund | |
| Institutional Class | 1.00% | 1.05% | 1.25% | 1.24% |
| Class N | 1.25% | 1.30% | 1.50% | 1.49% |
| | | | |
Any fee reductions or expense reimbursements may be repaid by a Fund to CNAM or the RCB Small Cap Value Fund’s sub-adviser, as applicable, within three years after occurrence, subject to certain restrictions and only if such repayments do not cause the Fund’s expense ratios, at the time of repayment, to exceed the applicable amount shown in the preceding table.
During the six months ended March 31, 2011, the Board of Trustees approved the reimbursement to CNAM of fees previously waived by CNAM in the amount of $925 with respect to the Corporate Bond Fund.
As of March 31, 2011, fees which were previously waived by CNAM which may be subject to possible future reimbursement were as follows:
| | Potential Amount of Recovery (000) | | | | |
| Government Money Market | | $ | 2,210 | | | | 2012 | |
| | | | 5,102 | | | | 2013 | |
| | | | 2,508 | | | | 2014 | |
| Prime Money Market | | | 880 | | | | 2012 | |
| | | | 1,372 | | | | 2013 | |
| | | | 410 | | | | 2014 | |
| California Tax Exempt Money Market | | | 583 | | | | 2011 | |
| | | | 1,568 | | | | 2012 | |
| | | | 1,560 | | | | 2013 | |
| | | | 624 | | | | 2014 | |
| Government Bond | | | 39 | | | | 2011 | |
| | | | 49 | | | | 2012 | |
| | | | 101 | | | | 2013 | |
| | | | 59 | | | | 2014 | |
| California Tax Exempt Bond | | | 34 | | | | 2011 | |
| | | | 39 | | | | 2012 | |
| | | | 46 | | | | 2013 | |
| | | | 25 | | | | 2014 | |
| High Yield Bond | | | 29 | | | | 2011 | |
| | | | 25 | | | | 2012 | |
| | | | 43 | | | | 2013 | |
| | | | 30 | | | | 2014 | |
CNI CHARTER FUNDS | PAGE 77
| notes to financial statements |
March 31, 2011 (Unaudited) |
CNAM, CNB and the Administrator have voluntarily agreed to further waive and reduce their fees and/or reimburse certain expenses of the Money Market Funds in order to maintain a one-day net income yield (yield floor) of each Fund of not less than 0.01% of the Fund’s average daily net assets. The following table shows waivers, with respect to such yield floor, by class for the six months ended March 31, 2011:
| | | Shareholder Servicing Fee Waiver (000) | | | Investment Advisory Fee Waiver (000) | | | Administration Fee Waiver (000) | |
| Government Money Market | | | | | | | |
| Institutional | | $ | 98 | | | $ | 66 | | | $ | 3 | |
| Class N | | | 6,124 | | | | 2,154 | | | | 96 | |
| | | 1,129 | | | | 287 | | | | 13 | |
| | | | | | | | | | | | | |
| Prime Money Market | | | | | | | | | | | | |
| Institutional | | | 645 | | | | 168 | | | | 19 | |
| Class N | | | 1,042 | | | | 143 | | | | 17 | |
| | | 1,037 | | | | 99 | | | | 12 | |
| | | | | | | | | | | | | |
| California Tax Exempt Money Market | | | | | | | | | |
| Institutional | | | 178 | | | | 54 | | | | 5 | |
| Class N | | | 1,620 | | | | 255 | | | | 26 | |
| | | 171 | | | | 19 | | | | 2 | |
| 5. | INVESTMENT TRANSACTIONS: |
The cost of security purchases and proceeds from the sale and maturities of securities, other than temporary investments in short-term securities for the six months ended March 31, 2011, were as follows for the Fixed Income Funds, Multi-Asset Fund and Equity Funds:
| | | | | | | |
| | | | | | | | | | | | |
| Limited Maturity Fixed Income | | $ | 6,489 | | | $ | 5,159 | | | $ | 4,121 | | | $ | 5,785 | |
| Government Bond | | | 59,577 | | | | — | | | | 34,065 | | | | — | |
| Corporate Bond | | | — | | | | 21,926 | | | | 377 | | | | 8,661 | |
| California Tax Exempt Bond | | | — | | | | 8,597 | | | | — | | | | 3,153 | |
| Full Maturity Fixed Income | | | 6,015 | | | | 4,738 | | | | 5,057 | | | | 5,550 | |
| High Yield Bond | | | — | | | | 36,795 | | | | — | | | | 23,591 | |
| Multi-Asset | | | — | | | | 11,747 | * | | | — | | | | 6,943 | |
| Diversified Equity | | | — | | | | 29,437 | | | | — | | | | 35,468 | |
| Large Cap Value Equity | | | — | | | | 33,070 | | | | — | | | | 33,545 | |
| Large Cap Growth Equity | | | — | | | | 31,637 | | | | — | | | | 22,842 | |
| Socially Responsible Equity | | | — | | | | 8,705 | | | | — | | | | 6,170 | |
| | | — | | | | 6,164 | | | | — | | | | 8,855 | |
| * | Includes $829(000) of purchases of affiliated registered investment companies. |
| 6. | FEDERAL TAX INFORMATION: |
It is each Fund’s intention to continue to qualify as a regulated investment company for Federal income tax purposes and distribute all of its taxable income and net capital gains. Accordingly, no provisions for Federal income taxes are required.
Management has analyzed the Funds’ tax position taken on federal income tax returns for all open tax years and has concluded that as of March 31, 2011, no provision for income tax would be required in the Funds’ financial statements. The Funds’ federal and state income and federal excise tax returns for tax years for which the applicable statutes of limitations have not expired are subject to examination by the Internal Revenue Service and state departments of revenue.
The Funds may be subject to taxes imposed by countries in which they invest, with respect to their investments in issuers existing or operating in such countries. Such taxes are generally based on income earned. The Funds accrue such taxes when the related income is earned.
CNI CHARTER FUNDS | PAGE 78
The timing and characterization of certain income and capital gains distributions are determined annually in accordance with Federal tax regulations, which may differ from accounting principles generally accepted in the United States of America. As a result, net investment income (loss) and net realized gain (loss) on investment transactions for a reporting period may differ significantly from distributions during such period. These book/tax differences may be temporary or permanent. To the extent these differences are permanent in nature, they are charged or credited to undistributed net investment income (loss), accumulated net realized gain (loss), or paid-in capital, as appropriate, in the period that the differences arise.
Accordingly, the following permanent differences, primarily attributable to REIT adjustments, corporate action adjustments, realized gains (losses) on paydowns and timing of distributions and investments in partnerships, were reclassified to/from the following accounts as of September 30, 2010:
| | Increase (Decrease) Undistributed Net Investment Income (Loss) (000) | | | Increase (Decrease) Accumulated Net Realized Gain (Loss) (000) | | | Decrease Paid in Capital (000) | |
| Government Money Market | | $ | 4 | | | $ | (4 | ) | | $ | — | |
| Prime Money Market | | | (49 | ) | | | 49 | | | | — | |
| Limited Maturity Fixed Income | | | 42 | | | | (42 | ) | | | — | |
| Government Bond | | | 1,030 | | | | (1,030 | ) | | | — | |
| Corporate Bond | | | 3 | | | | (3 | ) | | | — | |
| Full Maturity Fixed Income | | | 26 | | | | (26 | ) | | | — | |
| Diversified Equity | | | 4 | | | | (2 | ) | | | (2 | ) |
| Large Cap Growth Equity | | | — | | | | 82 | | | | (82 | ) |
| | | 34 | | | | (34 | ) | | | — | |
These reclassifications had no effect on net assets or net asset value per share.
The tax character of dividends and distributions paid during the years ended September 30, 2010 and September 30, 2009 were as follows:
| | | | | | | | Long-Term Capital Gain (000) | | | | | | | |
| Government Money Market | |
| 2010 | | $ | — | | | $ | 680 | | | $ | — | | | $ | — | | | $ | 680 | |
| 2009 | | | — | | | | 6,635 | | | | — | | | | — | | | | 6,635 | |
| Prime Money Market | |
| 2010 | | | — | | | | 921 | | | | — | | | | — | | | | 921 | |
| 2009 | | | — | | | | 7,503 | | | | — | | | | — | | | | 7,503 | |
| California Tax Exempt Money Market | |
| 2010 | | | 246 | | | | 9 | | | | — | | | | — | | | | 255 | |
| 2009 | | | 2,953 | | | | — | | | | — | | | | — | | | | 2,953 | |
| Limited Maturity Fixed Income | |
| 2010 | | | — | | | | 848 | | | | — | | | | — | | | | 848 | |
| 2009 | | | — | | | | 1,045 | | | | — | | | | — | | | | 1,045 | |
| Government Bond | |
| 2010 | | | — | | | | 3,564 | | | | — | | | | — | | | | 3,564 | |
| 2009 | | | — | | | | 2,435 | | | | — | | | | — | | | | 2,435 | |
| Corporate Bond | |
| 2010 | | | — | | | | 3,307 | | | | — | | | | — | | | | 3,307 | |
| 2009 | | | — | | | | 2,952 | | | | — | | | | — | | | | 2,952 | |
| California Tax Exempt Bond | |
| 2010 | | | 1,234 | | | | 1 | | | | — | | | | — | | | | 1,235 | |
| 2009 | | | 1,151 | | | | — | | | | — | | | | — | | | | 1,151 | |
| Full Maturity Fixed Income | |
| 2010 | | | — | | | | 1,544 | | | | 195 | | | | — | | | | 1,739 | |
| 2009 | | | — | | | | 1,657 | | | | — | | | | — | | | | 1,657 | |
| High Yield Bond | |
| 2010 | | | — | | | | 4,049 | | | | — | | | | — | | | | 4,049 | |
| 2009 | | | — | | | | 2,755 | | | | — | | | | — | | | | 2,755 | |
| Multi-Asset | |
| 2010 | | | — | | | | 521 | | | | — | | | | — | | | | 521 | |
| 2009 | | | — | | | | 375 | | | | — | | | | — | | | | 375 | |
| Diversified Equity | |
| 2010 | | | — | | | | 304 | | | | — | | | | 2 | | | | 306 | |
| 2009 | | | — | | | | 764 | | | | — | | | | 5 | | | | 769 | |
| Large Cap Value Equity | |
| 2010 | | | — | | | | 1,234 | | | | — | | | | — | | | | 1,234 | |
| 2009 | | | — | | | | 1,495 | | | | — | | | | — | | | | 1,495 | |
| Large Cap Growth Equity | |
| 2010 | | | — | | | | 164 | | | | — | | | | — | | | | 164 | |
| 2009 | | | — | | | | 222 | | | | — | | | | — | | | | 222 | |
| Socially Responsible Equity | |
| 2010 | | | — | | | | 589 | | | | — | | | | — | | | | 589 | |
| 2009 | | | — | | | | 796 | | | | — | | | | — | | | | 796 | |
| RCB Small Cap Value | |
| 2010 | | | — | | | | 14 | | | | — | | | | — | | | | 14 | |
| 2009 | | | — | | | | 439 | | | | — | | | | — | | | | 439 | |
CNI CHARTER FUNDS | PAGE 79
| notes to financial statements |
March 31, 2011 (Unaudited) |
As of September 30, 2010, the components of Distributable Earnings/(Accumulated Losses) on a tax basis were as follows:
| | Undistributed Tax-Exempt Income (000) | | | Undistributed Ordinary Income (000) | | | Undistributed Long-Term Capital Gain (000) | | | Capital Loss Carryforwards (000) | | | | | | Unrealized Appreciation (Depreciation) (000) | | | Other Temporary Differences (000) | | | Total Distributable Earnings (Accumulated Losses) (000) | |
| Government Money Market | | $ | — | | | $ | 68 | | | $ | — | | | $ | — | | | $ | (5 | ) | | $ | — | | | $ | (48 | ) | | $ | 15 | |
| Prime Money Market | | | — | | | | 88 | | | | — | | | | — | | | | — | | | | — | | | | (50 | ) | | | 38 | |
| California Tax Exempt Money Market | | | 16 | | | | 1 | | | | — | | | | — | | | | — | | | | — | | | | (15 | ) | | | 2 | |
| Limited Maturity Fixed Income | | | — | | | | 55 | | | | — | | | | (2,815 | ) | | | — | | | | 1,110 | | | | (55 | ) | | | (1,705 | ) |
| Government Bond | | | — | | | | 314 | | | | — | | | | (26 | ) | | | (451 | ) | | | 2,881 | | | | (314 | ) | | | 2,404 | |
| Corporate Bond | | | — | | | | 278 | | | | — | | | | (519 | ) | | | — | | | | 5,946 | | | | (278 | ) | | | 5,427 | |
| California Tax Exempt Bond | | | 98 | | | | — | | | | 186 | | | | — | | | | — | | | | 1,605 | | | | (98 | ) | | | 1,791 | |
| Full Maturity Fixed Income | | | — | | | | 223 | | | | 47 | | | | — | | | | — | | | | 2,528 | | | | (116 | ) | | | 2,682 | |
| High Yield Bond | | | — | | | | 406 | | | | — | | | | (3,362 | ) | | | (206 | ) | | | 937 | | | | (406 | ) | | | (2,631 | ) |
| Multi-Asset | | | — | | | | 129 | | | | — | | | | (3,636 | ) | | | — | | | | 2,080 | | | | (129 | ) | | | (1,556 | ) |
| Diversified Equity | | | — | | | | — | | | | — | | | | (23,918 | ) | | | — | | | | 3,373 | | | | — | | | | (20,545 | ) |
| Large Cap Value Equity | | | — | | | | 314 | | | | — | | | | (8,465 | ) | | | — | | | | (818 | ) | | | (315 | ) | | | (9,284 | ) |
| Large Cap Growth Equity | | | — | | | | 40 | | | | — | | | | (4,008 | ) | | | (1,007 | ) | | | 4,839 | | | | (38 | ) | | | (174 | ) |
| Socially Responsible Equity | | | — | | | | — | | | | — | | | | (9,434 | ) | | | (1,208 | ) | | | 2,815 | | | | — | | | | (7,827 | ) |
| RCB Small Cap Value | | | — | | | | 88 | | | | — | | | | (6,160 | ) | | | — | | | | 3,340 | | | | — | | | | (2,732 | ) |
For tax purposes, the losses in the Funds can be carried forward for a maximum of eight years to offset any future net realized capital gains. As of September 30, 2010, the breakdown of capital loss carryforwards was as follows:
| | | | |
| | | 2011 (000) | | | | 2012 (000) | | | | 2013 (000) | | | | 2014 (000) | | | | 2015 (000) | | | | 2016 (000) | | | | 2017 (000) | | | | 2018 (000) | |
| Limited Maturity Fixed Income | | $ | — | | | $ | 22 | | | $ | 838 | | | $ | 132 | | | $ | 1,415 | | | $ | — | | | $ | 81 | | | $ | 327 | |
| Government Bond | | | — | | | | — | | | | — | | | | — | | | | — | | | | 26 | | | | — | | | | — | |
| Corporate Bond | | | — | | | | — | | | | — | | | | 42 | | | | 271 | | | | 116 | | | | 90 | | | | — | |
| High Yield Bond | | | 521 | | | | — | | | | — | | | | 268 | | | | — | | | | — | | | | 832 | | | | 1,741 | |
| Multi-Asset | | | — | | | | — | | | | — | | | | — | | | | — | | | | — | | | | 2,309 | | | | 1,327 | |
| Diversified Equity | | | — | | | | — | | | | — | | | | — | | | | — | | | | — | | | | 10,584 | | | | 13,334 | |
| Large Cap Value Equity | | | — | | | | — | | | | — | | | | — | | | | — | | | | — | | | | 2,809 | | | | 5,656 | |
| Large Cap Growth Equity | | | 1,844 | | | | 227 | | | | — | | | | — | | | | — | | | | — | | | | 454 | | | | 1,483 | |
| Socially Responsible Equity | | | — | | | | — | | | | — | | | | — | | | | — | | | | 81 | | | | 2,161 | | | | 7,192 | |
| RCB Small Cap Value | | | — | | | | — | | | | — | | | | — | | | | — | | | | — | | | | 589 | | | | 5,571 | |
During the year ended September 30, 2010, the following Funds had utilized capital loss carryforwards to offset capital gains amounting to:
| | | |
| Government Bond | | $ | 88 | |
| Corporate Bond | | | 22 | |
California Tax Exempt Bond | | | 186 | |
Under the recently enacted Regulated Investment Company Modernization Act of 2010, Funds will be permitted to carry forward capital losses incurred in taxable years beginning after December 22, 2010 for an unlimited period. However, any losses incurred during those future taxable years will be required to be utilized prior to the losses incurred in pre-enactment taxable years. As a result of this ordering rule, pre-enactment capital loss carryforwards may be more likely to expire unused. Additionally, post-enactment capital losses that are carried forward will retain their character as either short-term or long-term capital losses rather than being considered all short-term as under previous law.
CNI CHARTER FUNDS | PAGE 80
Post-October losses represent losses realized on investments and foreign currency transactions from November 1, 2009, through September 30, 2010, that, in accordance with Federal income tax regulations, the Funds have elected to defer and treat as having arisen in the following fiscal year.
The aggregate gross unrealized appreciation on securities, the aggregate gross unrealized depreciation on securities and the net unrealized appreciation/ (depreciation) for tax purposes at March 31, 2011, for each of the Fixed Income Funds, Equity Funds and Multi-Asset Fund were as follows:
| | | | | Aggregate Gross Unrealized Appreciation (000) | | | Aggregate Gross Unrealized Depreciation (000) | | | Net Unrealized Appreciation (Deprecation) (000) | |
| Limited Maturity Fixed Income | | $ | 41,184 | | | $ | 597 | | | $ | (133 | ) | | $ | 464 | |
| Government Bond | | | 171,712 | | | | 1,085 | | | | (955 | ) | | | 130 | |
| Corporate Bond | | | 115,645 | | | | 3,953 | | | | (801 | ) | | | 3,152 | |
| California Tax Exempt Bond | | | 48,499 | | | | 813 | | | | (393 | ) | | | 420 | |
| Full Maturity Fixed Income | | | 46,798 | | | | 1,294 | | | | (328 | ) | | | 966 | |
| High Yield Bond | | | 70,021 | | | | 3,934 | | | | (1,248 | ) | | | 2,686 | |
| Multi Asset | | | 40,056 | | | | 3,643 | | | | (59 | ) | | | 3,584 | |
| Diversified Equity | | | 61,306 | | | | 12,300 | | | | (1,261 | ) | | | 11,039 | |
| Large Cap Value Equity | | | 108,605 | | | | 16,280 | | | | (5,500 | ) | | | 10,780 | |
| Large Cap Growth Equity | | | 48,012 | | | | 9,337 | | | | (1,099 | ) | | | 8,238 | |
| Socially Responsible Equity | | | 63,055 | | | | 13,693 | | | | (1,058 | ) | | | 12,635 | |
| RCB Small Cap Value | | | 17,996 | | | | 7,388 | | | | (809 | ) | | | 6,579 | |
At March 31, 2011, the Money Market Funds’ cost of securities for Federal income tax purposes approximates the cost disclosed in the Schedule of Investments.
| 7. | CONCENTRATION OF CREDIT RISK |
In the normal course of business, the Funds enter into contracts that provide general indemnifications. The Funds’ maximum exposure under these arrangements is dependent on future claims that may be made against the Funds and, therefore, cannot be established; however, based on experience, the risk of loss from such claims is considered remote.
The Multi-Asset Fund may invest in exchange-traded notes (“ETNs”) as a non-principal investment strategy. ETNs are unsecured debt obligations of investment banks which are traded on exchanges and the returns of which are linked to the performance of market indexes. In addition to trading ETNs on exchanges, investors may redeem ETNs directly with the issuer on a weekly basis, typically in a minimum amount of 50,000 units, or hold the ETNs until maturity. ETNs are riskier than ordinary unsecured debt securities and have no principal protection. The Fund will generally invest in ETNs which are linked to commodities indexes. The Fund’s investment in an ETN may be influenced by many unpredictable factors, including highly volatile commodities prices, changes in supply and demand relationships, weather, agriculture, trade, changes in interest rates, and monetary and other governmental policies, action and inaction. Investing in ETNs is not equivalent to investing directly in index components or the relevant index itself. Because ETNs are debt securities, they possess credit risk; if the issuer has financial difficulties or goes bankrupt, the investor may not receive the return it was promised.
California Tax Exempt Funds – Specific Risks
The ability of issuers to pay interest on, and repay principal of, California municipal securities may be affected by economic and political developments in the State of California.
Certain securities are backed by letters of credit from various financial institutions and financial guaranty assurance agencies. These letters of credit enhance the credit quality of the individual securities; however, if any of the financial institutions or financial guaranty assurance agencies’ credit quality should deteriorate, it could cause the individual security’s credit quality to change. Additionally, if any of the Funds concentrate their letters of credit in any one financial institution, the risk of credit quality deterioration increases.
CNI CHARTER FUNDS | PAGE 81
| notes to financial statements |
March 31, 2011 (Unaudited) |
| 8. | CAPITAL SHARES ISSUED AND REDEEMED: |
Capital share activity for the six months ended March 31, 2011 (Unaudited) and the year ended September 30, 2010, were as follows:
| | | Government Money Market Fund (000) | | | Prime Money Market Fund (000) | | | California Tax Exempt Money Market Fund (000) | |
| | | | | | | | | | | | | | | | | | |
| CAPITAL SHARES ISSUED AND REDEEMED: | | | | | | | | | | | | | | | | | | |
| Institutional Class: | | | | | | | | | | | | | | | | | | |
| Shares issued | | | 218,589 | | | | 618,772 | | | | 706,492 | | | | 1,322,472 | | | | 565,946 | | | | 1,024,504 | |
| Shares issued in Lieu of Dividends and Distributions | | | — | | | | 1 | | | | 30 | | | | 83 | | | | — | | | | — | |
| | | (214,834 | ) | | | (661,586 | ) | | | (671,247 | ) | | | (1,375,843 | ) | | | (584,726 | ) | | | (1,025,845 | ) |
Net Institutional Class transactions | | | 3,755 | | | | (42,813 | ) | | | 35,275 | | | | (53,288 | ) | | | (18,780 | ) | | | (1,341 | ) |
| Class N: | | | | | | | | | | | | | | | | | | | | | | | | |
| Shares issued | | | 3,234,150 | | | | 4,589,006 | | | | 625,032 | | | | 1,396,173 | | | | 610,257 | | | | 1,197,782 | |
| Shares issued in Lieu of Dividends and Distributions | | | 210 | | | | 504 | | | | 59 | | | | 195 | | | | 66 | | | | 178 | |
| | | (3,275,205 | ) | | | (4,540,616 | ) | | | (633,362 | ) | | | (1,620,744 | ) | | | (643,037 | ) | | | (1,263,962 | ) |
| | | (40,845 | ) | | | 48,894 | | | | (8,271 | ) | | | (224,376 | ) | | | (32,714 | ) | | | (66,002 | ) |
| Class S: | | | | | | | | | | | | | | | | | | | | | | | | |
| Shares issued | | | 400,947 | | | | 990,276 | | | | 882,620 | | | | 1,102,036 | | | | 122,416 | | | | 145,553 | |
| Shares issued in Lieu of Dividends and Distributions | | | — | | | | — | | | | — | | | | — | | | | — | | | | — | |
| | | (431,580 | ) | | | (940,420 | ) | | | (885,776 | ) | | | (1,122,183 | ) | | | (111,482 | ) | | | (171,685 | ) |
| | | (30,633 | ) | | | 49,856 | | | | (3,156 | ) | | | (20,147 | ) | | | 10,934 | | | | (26,132 | ) |
| | | Limited Maturity Fixed Income Fund (000) | | | Government Bond Fund (000) | | | | | | California Tax Exempt Bond Fund (000) | |
| | | | | | | | | | | | | | | | | | | | | | | | |
| CAPITAL SHARES ISSUED AND REDEEMED: | | | | | | | | | | | | | | | | | | | | | | | | |
| Institutional Class: | | | | | | | | | | | | | | | | | | | | | | | | |
| Shares issued | | | 114 | | | | 2,399 | | | | 2,975 | | | | 11,176 | | | | 2,142 | | | | 3,350 | | | | 1,438 | | | | 1,204 | |
| Shares issued in Lieu of Dividends and Distributions | | | 15 | | | | 48 | | | | 122 | | | | 217 | | | | 49 | | | | 84 | | | | 37 | | | | 39 | |
| | | (305 | ) | | | (2,846 | ) | | | (1,424 | ) | | | (3,622 | ) | | | (886 | ) | | | (2,143 | ) | | | (764 | ) | | | (998 | ) |
Net Institutional Class transactions | | | (176 | ) | | | (399 | ) | | | 1,673 | | | | 7,771 | | | | 1,305 | | | | 1,291 | | | | 711 | | | | 245 | |
| Class N: | | | | | | | | | | | | | | | | | | | | | | | | | | | | | | | | |
| Shares issued | | | 325 | | | | 970 | | | | 18 | | | | 168 | | | | 41 | | | | 227 | | | | 11 | | | | 132 | |
| Shares issued in Lieu of Dividends and Distributions | | | 4 | | | | 9 | | | | 2 | | | | 3 | | | | 1 | | | | 2 | | | | 2 | | | | 1 | |
| | | (170 | ) | | | (286 | ) | | | (45 | ) | | | (160 | ) | | | (49 | ) | | | (104 | ) | | | (11 | ) | | | (58 | ) |
| | | 159 | | | | 693 | | | | (25 | ) | | | 11 | | | | (7 | ) | | | 125 | | | | 2 | | | | 75 | |
CNI CHARTER FUNDS | PAGE 82
| 8. | CAPITAL SHARES ISSUED AND REDEEMED (CONTINUED): |
| | | Full Maturity Fixed Income Fund (000) | | | High Yield Bond Fund (000) | | | | | | Diversified Equity Fund (000) | |
| | | | | | | | | | | | | | | | | | | | | | | | | |
| CAPITAL SHARES ISSUED AND REDEEMED: | | | | | | | | | | | | | | | | | | | | | | | | |
| Institutional Class: | | | | | | | | | | | | | | | | | | | | | | | | |
| Shares issued | | | 9 | | | | 415 | (1) | | | 1,540 | | | | 2,887 | | | | 451 | | | | 499 | | | | 211 | | | | 725 | (1) |
| Shares issued in Lieu of Dividends and Distributions | | | 66 | | | | 129 | | | | 69 | | | | 126 | | | | 12 | | | | 15 | | | | — | | | | 21 | |
| | | (268 | ) | | | (126 | ) | | | (407 | ) | | | (1,103 | ) | | | (59 | ) | | | (282 | ) | | | (370 | ) | | | (471 | ) |
Net Institutional Class transactions | | | (193 | ) | | | 418 | | | | 1,202 | | | | 1,910 | | | | 404 | | | | 232 | | | | (159 | ) | | | 275 | |
| Class N: | | | | | | | | | | | | | | | | | | | | | | | | | | | | | | | | |
| Shares issued | | | 179 | | | | 311 | | | | 437 | | | | 511 | | | | 537 | | | | 720 | | | | 22 | | | | 136 | |
| Shares issued in Lieu of Dividends and Distributions | | | 5 | | | | 8 | | | | 76 | | | | 153 | | | | 14 | | | | 18 | | | | — | | | | 1 | |
| | | (32 | ) | | | (73 | ) | | | (197 | ) | | | (372 | ) | | | (201 | ) | | | (320 | ) | | | (70 | ) | | | (78 | ) |
| | | 152 | | | | 246 | | | | 316 | | | | 292 | | | | 350 | | | | 418 | | | | (48 | ) | | | 59 | |
| | | Large Cap Value Equity Fund (000) | | | Large Cap Growth Equity Fund (000) | | | Socially Responsible Equity Fund (000) | | | RCB Small Cap Value Fund (000) | |
| | | | | | | | | | | | | | | | | | | | | | | | |
| CAPITAL SHARES ISSUED AND REDEEMED: | | | | | | | | | | | | | | | | | | | | | | | | |
| Institutional Class: | | | | | | | | | | | | | | | | | | | | | | | | |
| Shares issued | | | 1,419 | | | | 3,000 | | | | 1,421 | | | | 1,180 | | | | 884 | | | | 1,303 | | | | 13 | | | | 60 | |
| Shares issued in Lieu of Dividends and Distributions | | | 57 | | | | 108 | | | | 3 | | | | 6 | | | | 41 | | | | 66 | | | | — | | | | — | |
| | | (1,674 | ) | | | (1,944 | ) | | | (487 | ) | | | (1,066 | ) | | | (560 | ) | | | (974 | ) | | | (36 | ) | | | (25 | ) |
Net Institutional Class transactions | | | (198 | ) | | | 1,164 | | | | 937 | | | | 120 | | | | 365 | | | | 395 | | | | (23 | ) | | | 35 | |
| Class N: | | | | | | | | | | | | | | | | | | | | | | | | | | | | | | | | |
| Shares issued | | | 26 | | | | 214 | | | | 88 | | | | 96 | | | | 90 | | | | 172 | | | | 1 | | | | 18 | |
| Shares issued in Lieu of Dividends and Distributions | | | 4 | | | | 9 | | | | — | | | | 2 | | | | 2 | | | | 2 | | | | — | | | | — | |
| | | (71 | ) | | | (140 | ) | | | (57 | ) | | | (178 | ) | | | (14 | ) | | | (33 | ) | | | (11 | ) | | | (17 | ) |
| | | (41 | ) | | | 83 | | | | 31 | | | | (80 | ) | | | 78 | | | | 141 | | | | (10 | ) | | | 1 | |
| Class R: | | | | | | | | | | | | | | | | | | | | | | | | | | | | | | | | |
| Shares issued | | | — | | | | — | | | | — | | | | — | | | | — | | | | — | | | | 13 | | | | 36 | |
| Shares issued in Lieu of Dividends and Distributions | | | — | | | | — | | | | — | | | | — | | | | — | | | | — | | | | 3 | | | | 1 | |
| | | — | | | | — | | | | — | | | | — | | | | — | | | | — | | | | (94 | ) | | | (150 | ) |
| | | — | | | | — | | | | — | | | | — | | | | — | | | | — | | | | (78 | ) | | | (113 | ) |
| (1) | Includes subscriptions as a result of an in-kind transfer of securities (see Note 9). |
During the year ended September 30, 2010, the Full Maturity Fund and Diversified Fund issued shares of beneficial interest in exchange for securities. The securities were transferred at their current value on March 19, 2010, as follows:
| | | | | | |
| Full Maturity Fixed Income Fund | | | 411,798 | | | $ | 4,332 | |
| Diversified Equity Fund | | | 584,035 | | | $ | 7,189 | |
The Trust has evaluated the need for additional disclosures and/or adjustments resulting from subsequent events. Based on this evaluation, no adjustments were required to the financial statements as of March 31, 2011.
CNI CHARTER FUNDS | PAGE 83
disclosure of fund expenses (Unaudited) |
|
All mutual funds have operating expenses. As a shareholder of a Fund, your investment is affected by these ongoing costs, which include (among others) costs for portfolio management, administrative services, class-specific distribution fees and shareholder reports like this one. It is important for you to understand the impact of these costs on your investment returns.
Operating expenses such as these are deducted from the Fund’s gross income and directly reduce your final investment return. These expenses are expressed as a percentage of the Fund’s average net assets; this percentage is known as the Fund’s expense ratio.
The following examples use the expense ratio and are intended to help you understand the ongoing costs (in dollars) of investing in your Fund and to compare these costs with those of other mutual funds. The examples are based on an investment of $1,000 made at the beginning of the period shown and held for the entire period.
The table below illustrates your Fund’s costs in two ways:
Actual Fund Return. This section helps you to estimate the actual expenses that your Fund incurred over the period. The “Expenses Paid During Period” column shows the actual dollar expense cost incurred by a $1,000 investment in the Fund, and the “Ending Account Value” number is derived from deducting that expense cost from the Fund’s gross investment return.
You can use this information, together with the actual amount you invested in the Fund, to estimate the expenses you paid over that period. Simply divide your actual account value by $1,000 to arrive at a ratio (for example, an $8,600 account value divided by $1,000 = 8.6), then multiply that ratio by the number shown for your Fund under “Expenses Paid During Period.”
Hypothetical 5% Return. This section helps you compare your Fund’s costs with those of other mutual funds. It assumes that the Fund had an annual 5% return before expenses during the year, but that the expense ratio (Column 3) for the period is unchanged. This example is useful in making comparisons because the Securities and Exchange Commission requires all mutual funds to make this 5% calculation. You can assess your Fund’s comparative cost by comparing the hypothetical result for your Fund in the “Expenses Paid During Period” column with those that appear in the same charts in the shareholder reports for other funds.
NOTE: Because the return is set at 5% for comparison purposes – NOT your Fund’s actual return – the account values shown do not apply to your specific investment.
| | | Beginning Account Value 10/1/2010 | | | Ending Account Value 3/31/2011 | | | Annualized Expense Ratios | | | Expense Paid During Period* | |
Government Money Market Fund | |
| Actual Fund Return | |
| Institutional Class | | $ | 1,000.00 | | | $ | 1,000.10 | | | | 0.18 | % | | $ | 0.90 | |
| Class N | | | 1,000.00 | | | | 1,000.10 | | | | 0.19 | | | | 0.95 | |
| Class S | | | 1,000.00 | | | | 1,000.00 | | | | 0.20 | | | | 1.00 | |
| | | | | | | | | | | | | | | | | |
| Hypothetical 5% Return | |
| Institutional Class | | $ | 1,000.00 | | | $ | 1,024.03 | | | | 0.18 | % | | $ | 0.91 | |
| Class N | | | 1,000.00 | | | | 1,023.98 | | | | 0.19 | | | | 0.96 | |
| Class S | | | 1,000.00 | | | | 1,023.93 | | | | 0.20 | | | | 1.01 | |
| | |
| |
| Actual Fund Return | |
| Institutional Class | | $ | 1,000.00 | | | $ | 1,000.30 | | | | 0.28 | % | | $ | 1.40 | |
| Class N | | | 1,000.00 | | | | 1,000.20 | | | | 0.31 | | | | 1.55 | |
| Class S | | | 1,000.00 | | | | 1,000.10 | | | | 0.33 | | | | 1.65 | |
| | | | | | | | | | | | | | | | | |
| Hypothetical 5% Return | |
| Institutional Class | | $ | 1,000.00 | | | $ | 1,023.54 | | | | 0.28 | % | | $ | 1.41 | |
| Class N | | | 1,000.00 | | | | 1,023.39 | | | | 0.31 | | | | 1.56 | |
| Class S | | | 1,000.00 | | | | 1,023.29 | | | | 0.33 | | | | 1.66 | |
| | | Beginning Account Value 10/1/2010 | | | Ending Account Value 3/31/2011 | | | Annualized Expense Ratios | | | Expense Paid During Period* | |
California Tax Exempt Money Market Fund | |
| Actual Fund Return | |
| Institutional Class | | $ | 1,000.00 | | | $ | 1,000.10 | | | | 0.22 | % | | $ | 1.10 | |
| Class N | | | 1,000.00 | | | | 1,000.10 | | | | 0.23 | | | | 1.15 | |
| Class S | | | 1,000.00 | | | | 1,000.00 | | | | 0.24 | | | | 1.20 | |
| | | | | | | | | | | | | | | | | |
| Hypothetical 5% Return | |
| Institutional Class | | $ | 1,000.00 | | | $ | 1,023.83 | | | | 0.22 | % | | $ | 1.11 | |
| Class N | | | 1,000.00 | | | | 1,023.78 | | | | 0.23 | | | | 1.16 | |
| Class S | | | 1,000.00 | | | | 1,023.73 | | | | 0.24 | | | | 1.21 | |
| | |
Limited Maturity Fixed Income Fund | |
| Actual Fund Return | |
| Institutional Class | | $ | 1,000.00 | | | $ | 996.80 | | | | 0.69 | % | | $ | 3.44 | |
| Class N | | | 1,000.00 | | | | 995.60 | | | | 0.94 | | | | 4.68 | |
| | | | | | | | | | | | | | | | | |
| Hypothetical 5% Return | |
| Institutional Class | | $ | 1,000.00 | | | $ | 1,021.49 | | | | 0.69 | % | | $ | 3.48 | |
| Class N | | | 1,000.00 | | | | 1,020.24 | | | | 0.94 | | | | 4.73 | |
| * | Expenses are equal to the Fund’s annualized expense ratio multiplied by the average account value over the period, multiplied by 182/365 (to reflect the one-half year period). |
CNI CHARTER FUNDS | PAGE 84
| | | Beginning Account Value 10/1/2010 | | | Ending Account Value 3/31/2011 | | | Annualized Expense Ratios | | | Expense Paid During Period* | |
| |
| Actual Fund Return | |
| Institutional Class | | $ | 1,000.00 | | | $ | 990.10 | | | | 0.70 | % | | $ | 3.47 | |
| Class N | | | 1,000.00 | | | | 988.90 | | | | 0.95 | | | | 4.71 | |
| | | | | | | | | | | | | | | | | |
| Hypothetical 5% Return | |
| Institutional Class | | $ | 1,000.00 | | | $ | 1,021.44 | | | | 0.70 | % | | $ | 3.53 | |
| Class N | | | 1,000.00 | | | | 1,020.19 | | | | 0.95 | | | | 4.78 | |
| | | | | | | | | | | | | | | | | |
| |
| Actual Fund Return | |
| Institutional Class | | $ | 1,000.00 | | | $ | 992.70 | | | | 0.74 | % | | $ | 3.68 | |
| Class N | | | 1,000.00 | | | | 991.50 | | | | 0.99 | | | | 4.92 | |
| | | | | | | | | | | | | | | | | |
| Hypothetical 5% Return | |
| Institutional Class | | $ | 1,000.00 | | | $ | 1,021.24 | | | | 0.74 | % | | $ | 3.73 | |
| Class N | | | 1,000.00 | | | | 1,020.00 | | | | 0.99 | | | | 4.99 | |
| | |
California Tax-Exempt Bond Fund | |
| Actual Fund Return | |
| Institutional Class | | $ | 1,000.00 | | | $ | 989.90 | | | | 0.50 | % | | $ | 2.48 | |
| Class N | | | 1,000.00 | | | | 988.70 | | | | 0.75 | | | | 3.72 | |
| | | | | | | | | | | | | | | | | |
| Hypothetical 5% Return | |
| Institutional Class | | $ | 1,000.00 | | | $ | 1,022.44 | | | | 0.50 | % | | $ | 2.52 | |
| Class N | | | 1,000.00 | | | | 1,021.19 | | | | 0.75 | | | | 3.78 | |
| | | | | | | | | | | | | | | | | |
Full Maturity Fixed Income Fund | |
| Actual Fund Return | |
| Institutional Class | | $ | 1,000.00 | | | $ | 988.60 | | | | 0.68 | % | | $ | 3.37 | |
| Class N | | | 1,000.00 | | | | 987.40 | | | | 0.94 | | | | 4.66 | |
| | | | | | | | | | | | | | | | | |
| Hypothetical 5% Return | |
| Institutional Class | | $ | 1,000.00 | | | $ | 1,021.54 | | | | 0.68 | % | | $ | 3.43 | |
| Class N | | | 1,000.00 | | | | 1,020.24 | | | | 0.94 | | | | 4.73 | |
| | |
| |
| Actual Fund Return | |
| Institutional Class | | $ | 1,000.00 | | | $ | 1,085.40 | | | | 1.00 | % | | $ | 5.20 | |
| Class N | | | 1,000.00 | | | | 1,083.80 | | | | 1.30 | | | | 6.75 | |
| | | | | | | | | | | | | | | | | |
| Hypothetical 5% Return | |
| Institutional Class | | $ | 1,000.00 | | | $ | 1,019.95 | | | | 1.00 | % | | $ | 5.04 | |
| Class N | | | 1,000.00 | | | | 1,018.45 | | | | 1.30 | | | | 6.54 | |
| | | | | | | | | | | | | | | | | |
| |
| Actual Fund Return | |
| Institutional Class | | $ | 1,000.00 | | | $ | 1,079.80 | | | | 0.84 | % | | $ | 4.36 | |
| Class N | | | 1,000.00 | | | | 1,079.60 | | | | 1.09 | | | | 5.65 | |
| | | | | | | | | | | | | | | | | |
| Hypothetical 5% Return | |
| Institutional Class | | $ | 1,000.00 | | | $ | 1,022.24 | | | | 0.84 | % | | $ | 4.23 | |
| Class N | | | 1,000.00 | | | | 1,020.84 | | | | 1.09 | | | | 5.49 | |
| | |
| | | Beginning Account Value 10/1/2010 | | | Ending Account Value 3/31/2011 | | | | | | Expense Paid During Period* | |
| |
| Actual Fund Return | |
| Institutional Class | | $ | 1,000.00 | | | $ | 1,186.30 | | | | 0.92 | % | | $ | 5.01 | |
| Class N | | | 1,000.00 | | | | 1,184.30 | | | | 1.17 | | | | 6.37 | |
| | | | | | | | | | | | | | | | | |
| Hypothetical 5% Return | |
| Institutional Class | | $ | 1,000.00 | | | $ | 1,020.49 | | | | 0.92 | % | | $ | 4.63 | |
| Class N | | | 1,000.00 | | | | 1,019.10 | | | | 1.17 | | | | 5.89 | |
| | |
| |
| Actual Fund Return | |
| Institutional Class | | $ | 1,000.00 | | | $ | 1,159.70 | | | | 0.96 | % | | $ | 5.67 | |
| Class N | | | 1,000.00 | | | | 1,157.10 | | | | 1.21 | | | | 6.51 | |
| | | | | | | | | | | | | | | | | |
| Hypothetical 5% Return | |
| Institutional Class | | $ | 1,000.00 | | | $ | 1,020.14 | | | | 0.96 | % | | $ | 4.84 | |
| Class N | | | 1,000.00 | | | | 1,018.90 | | | | 1.21 | | | | 6.09 | |
| | | | | | | | | | | | | | | | | |
| |
| Actual Fund Return | |
| Institutional Class | | $ | 1,000.00 | | | $ | 1,172.40 | | | | 0.99 | % | | $ | 5.36 | |
| Class N | | | 1,000.00 | | | | 1,170.60 | | | | 1.24 | | | | 6.71 | |
| | | | | | | | | | | | | | | | | |
| Hypothetical 5% Return | |
| Institutional Class | | $ | 1,000.00 | | | $ | 1,020.00 | | | | 0.99 | % | | $ | 4.99 | |
| Class N | | | 1,000.00 | | | | 1,018.75 | | | | 1.24 | | | | 6.24 | |
| | |
Socially Responsible Equity Fund | |
| Actual Fund Return | |
| Institutional Class | | $ | 1,000.00 | | | $ | 1,151.90 | | | | 0.91 | % | | $ | 4.88 | |
| Class N | | | 1,000.00 | | | | 1,152.10 | | | | 1.16 | | | | 6.22 | |
| | | | | | | | | | | | | | | | | |
| Hypothetical 5% Return | |
| Institutional Class | | $ | 1,000.00 | | | $ | 1,020.39 | | | | 0.91 | % | | $ | 4.58 | |
| Class N | | | 1,000.00 | | | | 1,019.15 | | | | 1.16 | | | | 5.84 | |
| | |
| |
| Actual Fund Return | |
| Institutional Class | | $ | 1,000.00 | | | $ | 1,123.80 | | | | 1.19 | % | | $ | 6.30 | |
| Class N | | | 1,000.00 | | | | 1,122.30 | | | | 1.44 | | | | 7.62 | |
| Class R | | | 1,000.00 | | | | 1,123.70 | | | | 1.23 | | | | 6.51 | |
| | | | | | | | | | | | | | | | | |
| Hypothetical 5% Return | |
| Institutional Class | | $ | 1,000.00 | | | $ | 1,019.00 | | | | 1.19 | % | | $ | 5.99 | |
| Class N | | | 1,000.00 | | | | 1,017.75 | | | | 1.44 | | | | 7.24 | |
| Class R | | | 1,000.00 | | | | 1,018.75 | | | | 1.23 | | | | 6.19 | |
| * | Expenses are equal to the Fund’s annualized expense ratio multiplied by the average account value over the period, multiplied by 182/365 (to reflect the one-half year period). |
CNI CHARTER FUNDS | PAGE 85
| approval of sub-advisory agreements |
|
The Board of Trustees (the “Board”) of CNI Charter Funds (the “Trust”) is comprised of five Trustees, each of whom is independent of the Trust’s investment adviser and sub-advisers (collectively the “Independent Trustees”). During the six months ended March 31, 2010, the Board and the Independent Trustees approved new sub-advisory agreements (the “Agreements”) between City National Asset Management, Inc. (“CNAM”), as investment adviser, and SKBA Capital Management, Inc. (“SKBA”), as sub-adviser, with respect to the Socially Responsible Equity Fund and the Diversified Equity Fund series of the Trust (collectively the “Funds”).
SKBA has served as sub-adviser to the Socially Responsible Equity Fund and its predecessor since January 3, 2005, and to the Diversified Equity Fund since October 1, 2006. At a meeting held on February 25, 2011, the Board of Trustees considered information provided by SKBA regarding a pending transaction in which Convergent Capital Management, a wholly owned subsidiary of City National Corporation, would significantly reduce its ownership interest in SKBA. Under the Investment Company Act of 1940, as amended, the proposed transaction would result in a change of control of SKBA which would automatically terminate its current sub-advisory agreements with respect to the Funds. At its February 2011 meeting, upon the recommendation of CNAM and after careful consideration, the Board of Trustees approved the re-appointment of SKBA as the sub-adviser to each of the Funds, effective as of the closing of the transaction. On May 16, 2011, the transaction closed, and the Agreements became effective for initial two-year terms.
The following information summarizes the Board’s considerations associated with its review of the Agreements. In connection with their deliberations, the Board considered such information and factors as they believed, in light of the legal advice furnished to them and their own business judgment, to be relevant. The Agreements were considered separately for each Fund, although the Board took into account the common interests of the Funds in its review.
The Board reviewed extensive materials regarding the investment results of the Funds and the portion of the Diversified Equity Fund managed by SKBA over various periods, advisory fee comparisons, financial and profitability information with respect to SKBA, descriptions of various functions such as compliance monitoring and portfolio trading practices, and information about the personnel providing investment management services to the Funds. They also took into account information they received at past meetings of the Board and its committees with respect to these matters.
In deciding to approve the Agreements, the Board and the Independent Trustees did not identify a single factor as controlling and this summary does not describe all of the matters considered. However, the Board and the Independent Trustees concluded that each of the various factors referred to below favored such approval.
| Nature, Extent and Quality of Services |
The Board considered the nature, quality and extent of the various services performed by SKBA. In reviewing the services provided by SKBA, the Board considered a variety of matters, including the background, education and experience of SKBA’s key portfolio management and operational personnel; its overall financial strength and stability; its resources and related efforts to retain, attract and motivate capable personnel to serve the Funds; and the overall general quality and depth of its organization. The Board also reviewed SKBA’s investment philosophy and processes as well as its brokerage and trading practices.
The Board reviewed information setting forth the performance of the portion of the Diversified Equity Fund managed by SKBA compared with the performance of its benchmark for the one- and three-year periods ended December 31, 2010, and the performance of the Socially Responsible Equity Fund for the one-, three- and five-year and since-inception periods ending on that date compared with the performance of its benchmark. The Board observed that SKBA’s portion of the Diversified Equity Fund outperformed the S&P 500 Index and performed close to the average of the funds included in the Lipper Multi-Cap Core Funds
CNI CHARTER FUNDS | PAGE 86
classification for both periods. The Board also observed that the Socially Responsible Equity Fund outperformed the KLD 400 Social Index returns for the one-year period and the average of the funds included in the Lipper Multi-Cap Value Funds classification for the three- and five-year periods.
The Board and the Independent Trustees concluded that SKBA would continue to provide satisfactory management and oversight services to the Funds. They noted that the investment results of the Funds were generally competitive; that each of the Funds had met its objectives as demonstrated by various factors; and that consideration of returns of market indexes needed to take into account that indexes do not reflect the expenses of operating mutual funds.
| Advisory Fees and Other Considerations |
The Board reviewed information regarding the advisory fees charged by SKBA with respect to each Fund and observed that those fees were significantly lower than the fees SKBA charges to its other institutional clients. They noted that CNAM pays all sub-advisory fees out of CNAM’s advisory fee.
The Board also considered information prepared by SKBA relating to the profitability of its relationship with the Funds. The Board also considered the benefits received by SKBA and its affiliates as a result of its relationship with the Funds, including the sub-advisory fees paid to SKBA, the intangible benefits of SKBA’s association with the Funds generally and any favorable publicity arising in connection with the Funds’ performance.
Based on their review, including their consideration of each of the factors referred to above, the Board and the Independent Trustees concluded that the terms of each Agreement are fair and reasonable in light of the nature and quality of the services being provided by SKBA to each Fund and its shareholders, and that approval of each Agreement was in the best interest of the Funds and their shareholders.
CNI CHARTER FUNDS | PAGE 87
This page intentionally left blank.
CNI CHARTER FUNDS | PAGE 88
For more information on CNI Charter Funds, including charges
and expenses, please call 1-888-889-0799 or go to cnicharterfunds.com
for a free prospectus. Read it carefully before you invest or send money.
CNI-SA-004-0300
Not applicable for semi-annual report.
| Item 3. | Audit Committee Financial Expert. |
Not applicable for semi-annual report.
| Item 4. | Principal Accountant Fees and Services. |
Not applicable for semi-annual report.
| Item 5. | Audit Committee of Listed Registrants. |
Not applicable to open-end management investment companies.
| Item 6. | Schedule of Investments |
Not applicable.
| Item 7. | Disclosure of Proxy Voting Policies and Procedures for Closed-End Management Investment Companies. |
Not applicable to open-end management investment companies.
| Item 8. | Portfolio Managers of Closed-End Management Investment Companies |
Not applicable to open-end management investment companies.
| Item 9. | Purchases of Equity Securities by Closed-End Management Company and Affiliated Purchasers. |
Not applicable to open-end management investment companies.
| Item 10. | Submission of Matters to a Vote of Security Holders. |
CNI Charter Funds (the "Fund") has adopted the following procedures by which shareholders may recommend nominees to the Fund's Board of Trustees. The Fund has a Nominating Committee comprised solely of persons who are not considered "interested persons" of the Fund within the meaning of the Investment Company Act of 1940. The Committee periodically reviews such issues as the Board's composition, responsibilities, committees, compensation and other relevant issues, and recommends any appropriate changes to the full Board of Trustees. While the Committee normally is able to identify from its own resources an ample number of qualified candidates, it will consider shareholder suggestions of persons to be considered as nominees to fill future vacancies on the Board, so long as the shareholder or shareholder group submitting a proposed nominee: (a) beneficially owns more than 5% of the Fund's voting shares and has held such shares continuously for two years, and (b) is not an adverse holder. No eligible shareholder or shareholder group may submit more than one independent Board member nominee each year. Such suggestions must be sent in writing to the Fund 's Secretary, and must be accompanied by the shareholder's contact information, the nominee's contact information and number of Fund shares owned by the nominee, all information regarding the nominee that would be required to be disclosed in solicitations of proxies for elections of directors required under the Securities Exchange Act of 1934, and a notarized letter from the nominee stating his or her intention to serve as a nominee and be named in the Fund's proxy statement, if so designated by the Committee and the Board of Trustees.
| Item 11. | Controls and Procedures. |
(a) The certifying officers, whose certifications are included herewith, have evaluated the registrant’s disclosure controls and procedures within 90 days of the filing date of this report. In their opinion, based on their evaluation, the registrant’s disclosure controls and procedures are adequately designed, and are operating effectively to ensure, that information required to be disclosed by the registrant in the reports it files or submits under the Securities Exchange Act of 1934 is recorded, processed, summarized and reported within the time periods specified in the Securities and Exchange Commission’s rules and forms.
(b) There were no significant changes in the registrant’s internal control over financial reporting that occurred during the second fiscal quarter of the period covered by this report that has materially affected, or is reasonably likely to materially affect, the registrant’s internal control over financial reporting.
(a)(1) Not applicable for semi-annual report.
(a)(2) A separate certification for the principal executive officer and the principal financial officer of the registrant as required by Rule 30a-2(a) under the Investment Company Act of 1940, as amended (17 CFR 270.30a-2(a)), are filed herewith.
(b) Officer certifications as required by Rule 30a-2(b) under the Investment Company Act of 1940, as amended (17 CFR 270.30a-2(b)) also accompany this filing as an Exhibit.
SIGNATURES
Pursuant to the requirements of the securities Exchange Act of 1934 and the Investment Company Act of 1940, the registrant has duly caused this report to be signed on its behalf by the undersigned, thereunto duly authorized.
| (Registrant) | CNI Charter Funds |
| | |
| | |
| By (Signature and Title)* | /s/:Rich Gershen |
| | Rich Gershen, President & CEO |
| Date: June 8, 2011 | |
Pursuant to the requirements of the Securities Exchange Act of 1934 and the Investment Company Act of 1940, this report has been signed below by the following persons on behalf of the registrant and in the capacities and on the dates indicated.
| By (Signature and Title)* | /s/:Rich Gershen |
| | Rich Gershen, President & CEO |
| Date: June 8, 2011 | |
| | |
| | |
| By (Signature and Title)* | /s/:Eric Kleinschmidt |
| | Eric Kleinschmidt, Controller and COO |
| Date: June 8, 2011 | |
* Print the name and title of each signing officer under his or her signature.