| | City National Rochdale Funds Semi-Annual Report |
| | |
| 2 | Letter to Our Shareholders |
| 4 | Schedule of Investments/Consolidated Schedule of Investments |
| 96 | Statements of Assets and Liabilities/Consolidated Statement of Assets and Liabilities |
| 100 | Statements of Operations/Consolidated Statement of Operations |
| 104 | Statements of Changes in Net Assets/Consolidated Statement of Changes in Net Assets |
| 110 | Financial Highlights/Consolidated Financial Highlights |
| 115 | Notes to Financial Statements/Consolidated Notes to Financial Statements |
| 129 | Disclosure of Fund Expenses |
| 132 | Shareholder Voting Results |
| 133 | Board Approval of Advisory and Sub-Advisory Agreements |
The Funds file their complete schedules of portfolio holdings with the Securities and Exchange Commission (the “Commission”) for the first and third quarters of each fiscal year on Form N-Q within 60 days after the end of the period. The Funds’ Form N-Q filings are available on the Commission’s website at http://www.sec.gov, and may be reviewed and copied at the Commission’s Public Reference Room in Washington, DC. Information on the operation of the Public Reference Room may be obtained by calling 1-800-SEC-0330. The most current Form N-Q filing is also available on the Funds’ website at www. citynationalrochdalefunds.com and without charge, upon request, by calling 1-888-889-0799.
A description of the policies and procedures that the Funds use to determine how to vote proxies relating to the Funds’ portfolio securities, and information on how the Funds voted proxies relating to portfolio securities during the most recent 12-month period ending June 30 is available (1) without charge, upon request, by calling 1-888-889-0799, (2) on the Funds’ website at www.citynationalrochdalefunds.com, and (3) on the Securities and Exchange Commission’s website at www.sec.gov.
CITY NATIONAL ROCHDALE FUNDS | PAGE 1
letter to our shareholders
March 31, 2014 (Unaudited)
Dear Shareholders,
This semi-annual report covers the six-month period ended March 31, 2014. Calendar year 2013 ended on a high note for most risk assets, with the S&P 500 Index delivering almost an 11% return during the final quarter of the year. From an investment standpoint, there was little competition for domestic stocks from other asset classes. Growth stocks generally outpaced their value-oriented counterparts, as investor optimism and improving economic fundamentals helped support expectations of continued expansion in corporate earnings. Within fixed income markets, investors willing to assume higher levels of credit risk were rewarded, whereas securities more sensitive to interest rate movement struggled.
Through the first quarter of the year, equity markets generally treaded water, finishing either slightly ahead or slightly behind where they started, depending on their respective geographies. Volatility in emerging markets led to a sharp sell-off in risk assets during the month of January, as investor concerns surrounding China’s slowing growth and tension in Ukraine heavily influenced market sentiment around the world. Bond investors benefited from a modest decline in interest rates, with the 10-year Treasury note rallying from a 3.03% to 2.72% yield during the quarter. Severe winter weather experienced by most of the country pressured a number of economic indicators, though market participants seem willing to look beyond some of the short-term softness in hopes of fundamental resurgence as we move into the second quarter.
Our bullish positioning over the last six months has generally been well rewarded by the market, and though valuations have expanded we are still finding opportunities for continued upside. Below is a summary of the asset classes in which the City National Rochdale Funds are invested for the six months ended March 31, 2014. Please note the inclusion of our newly added City National Rochdale Municipal High Income Fund to the family as a result of our investment team’s identification of what we believe to be a compelling opportunity within the municipal bond space.
MONEY MARKET FUNDS
With short term interest rates steadily hovering near zero, we remain committed to helping our clients preserve positive returns by waiving a substantial portion of our fees. The three City National Rochdale money market funds all delivered either flat or positive absolute performance for the six-month period ending with the close of the first quarter. The Federal Reserve’s stated policy of continuing to maintain extremely low interest rates will likely keep a lid on yields for the foreseeable future, although the much-anticipated tapering agenda has recently become a reality. Though tapering is not tightening, if the economy continues to show improvement it is not unreasonable to expect an eventual rise in interest rates sometime in the late 2015 or early 2016 time frame.
BOND FUNDS
Our newest addition to the City National Rochdale fixed income offerings started off 2014 on solid footing. The City National Rochdale Municipal High Income Fund was launched on December 30, 2013, and thus far has demonstrated respectable performance and commendable asset growth. We continue to optimize investment strategies housed within our City National Rochdale Fixed Income Opportunities Fund, with recent enhancements designed to broaden credit exposure while insulating against impending interest rate risk.
U.S. core fixed income markets delivered positive performance for the six-month period ended March 31, 2014, with corporate credit leading the way in terms of return attribution. Given the low yield environment, investors have increasingly gravitated towards high yield bonds and other spread products in order to capture reasonable levels of income, relatively speaking. The Barclays U.S. Corporate High Yield Index posted a 6.7% return over the six-month period, outpacing nearly all segments of the domestic fixed income market. Domestic bank loans also generated an attractive six month print, with a return of 3.2% as measured by the Credit Suisse Leveraged Loan Index. The Barclays U.S. Aggregate Bond Index, which contains securities more susceptible to interest rate movements, delivered a 1.7% return.
CITY NATIONAL ROCHDALE FUNDS | PAGE 2
Fixed income strategies remain an important component within broadly diversified investment portfolios. By offering our clients access to unique and differentiated sources of risk premia within the space, we believe that we can preserve expectations for future positive absolute returns without incurring undue levels of interest rate risk.
ABSOLUTE RETURN FUND
Our City National Rochdale Multi-Asset Fund, designed to deliver positive absolute performance in excess of inflation irrespective of the market environment, generated an attractive return pattern during the trailing six-month period, with only two months finishing in the red. The strategy held up particularly well during the month of January, when risk assets traded off significantly. We believe this flexible, “go-anywhere” type of strategy should continue to serve investors well going forward, as our ability to invest across a wide range of asset classes within a well-defined, conservative risk framework offers valuable diversification benefits.
EQUITY FUNDS
As mentioned in the introduction, equity markets were the place to be over the trailing six-month period. Domestic stocks generated returns in the low teens, with international developed and emerging markets equities posting returns in the mid and low single digit ranges, respectively. Investment teams for our equity strategies continue to scour the globe for attractive opportunities, while maintaining a strong focus on quality and valuation. Given the run up we’ve experienced in equity markets over the last five years, it is not unreasonable to expect a correction of some sort in the coming quarters. Sticking to our knitting and not falling victim to attitudes of complacency that often surface in the latter stages of a bull market are as important as ever at this point in time.
We thank you for your trust and confidence in our abilities to continue to serve you well through your investment in the City National Rochdale Funds. We will continue to work hard to ensure that we maintain your confidence and respect as stewards of your capital.
Sincerely,
Bruce Simon
Chief Investment Officer
City National Rochdale Funds
Index returns are for illustrative purposes only and do not represent actual Fund performance. Index performance returns do not reflect any management fees, transaction costs or expenses. Indexes are unmanaged and one cannot invest directly in an index.
Past performance is no guarantee of future results. Certain shareholders may be subject to the Alternative Minimum Tax (AMT). Federal income tax rules apply to any capital gain distributions.
Investing involves risk, including the loss of principal.
Fund expenses have been waived during the period on which the performance is based. Without waivers, performance would be lower.
This information must be preceded or accompanied by a current prospectus. Please read the prospectus carefully before investing.
City National Rochdale Funds do not generally accept investments by non-U.S. persons and may not be available in all states.
The Barclays U.S. Corporate High Yield Index covers the U.S.-dollar denominated, non-investment grade, fixed rate, taxable corporate bond market and includes securities with ratings by Moody’s, Fitch, and S&P of Bal/BB+/BB+ or below.
The Credit Suisse Leveraged Loan Index is designed to mirror the investible universe of the U.S.-dollar denominated leveraged loan market.
The Barclays U.S. Aggregate Bond Index measures the performance of the U.S. investment grade bond market.
CITY NATIONAL ROCHDALE FUNDS | PAGE 3
schedule of investments
March 31, 2014 (Unaudited)
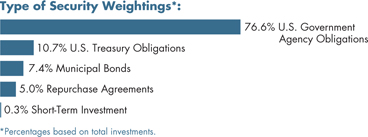
City National Rochdale Government Money Market Fund
| | | | | |
| U.S. Government Agency Obligations [76.5%] | |
| FAMC, MTN | | | | | | |
| 3.250%, 06/25/14 | | $ | 3,500 | | | $ | 3,524 | |
| FAMC DN (A) | | | | | | | | |
| 0.109%, 04/01/13 | | | 55,000 | | | | 55,000 | |
| 0.025%, 04/02/14 | | | 60,000 | | | | 60,000 | |
| 0.050%, 04/24/14 | | | 8,000 | | | | 8,000 | |
| 0.070%, 05/01/14 | | | 25,000 | | | | 24,999 | |
| 0.070%, 05/02/14 | | | 25,000 | | | | 24,998 | |
| 0.100%, 05/06/14 | | | 16,839 | | | | 16,837 | |
| 0.065%, 05/15/14 | | | 50,000 | | | | 49,996 | |
| 0.100%, 07/25/14 | | | 25,000 | | | | 24,992 | |
| FFCB | | | | | | | | |
| 0.221%, 04/01/14(B) | | | 31,690 | | | | 31,690 | |
| 0.186%, 04/13/14(B) | | | 12,300 | | | | 12,308 | |
| 0.175%, 04/23/14(B) | | | 26,500 | | | | 26,517 | |
| 0.200%, 05/13/14 | | | 20,000 | | | | 20,001 | |
| 0.250%, 05/21/14(B) | | | 21,000 | | | | 21,003 | |
| FFCB DN | | | | | | | | |
| 0.160%, 04/15/14(A) | | | 19,095 | | | | 19,094 | |
| 0.140%, 08/08/14(A) | | | 10,000 | | | | 9,995 | |
| 0.090%, 09/03/14(A) | | | 25,000 | | | | 24,991 | |
| FHLB | | | | | | | | |
| 0.104%, 04/08/14(B) | | | 40,000 | | | | 40,000 | |
| 0.109%, 04/09/14(B) | | | 40,000 | | | | 40,000 | |
| 0.119%, 04/10/14(B) | | | 50,000 | | | | 50,004 | |
| 0.125%, 04/11/14 | | | 8,800 | | | | 8,800 | |
| 0.106%, 04/14/14(B) | | | 15,000 | | | | 15,001 | |
| 0.135%, 04/15/14(B) | | | 50,000 | | | | 50,009 | |
| 0.115%, 04/16/14(B) | | | 50,000 | | | | 50,004 | |
| 0.125%, 04/17/14 | | | 51,765 | | | | 51,764 | |
| 0.106%, 04/19/14(B) | | | 50,000 | | | | 50,002 | |
| 0.094%, 04/25/14(B) | | | 50,000 | | | | 49,997 | |
| 0.125%, 05/02/14 | | | 9,350 | | | | 9,350 | |
| 0.054%, 06/12/14(B) | | | 20,000 | | | | 20,000 | |
| 5.250%, 06/18/14 | | | 10,000 | | | | 10,110 | |
| 0.125%, 06/18/14 | | | 31,040 | | | | 31,038 | |
| 0.110%, 06/23/14 | | | 40,000 | | | | 39,998 | |
| 0.120%, 07/14/14 | | | 50,000 | | | | 50,001 | |
| 0.100%, 07/15/14 | | | 50,000 | | | | 49,999 | |
| 0.125%, 09/03/14 | | | 25,000 | | | | 24,994 | |
| Face Amount (000) | | | | |
| 0.130%, 10/30/14 | | $ | 50,000 | | | $ | 49,997 | |
| 0.250%, 01/16/15 | | | 25,000 | | | | 25,021 | |
| 0.250%, 02/20/15 | | | 14,435 | | | | 14,447 | |
| FHLB DN (A) | | | | | | | | |
| 0.040%, 04/01/14 | | | 50,000 | | | | 50,000 | |
| 0.100%, 04/02/14 | | | 25,000 | | | | 25,000 | |
| 0.077%, 04/04/14 | | | 150,000 | | | | 149,999 | |
| 0.061%, 04/09/14 | | | 97,350 | | | | 97,349 | |
| 0.050%, 04/14/14 | | | 40,000 | | | | 39,999 | |
| 0.062%, 04/16/14 | | | 100,000 | | | | 99,997 | |
| 0.056%, 04/21/14 | | | 55,725 | | | | 55,723 | |
| 0.061%, 04/23/14 | | | 45,550 | | | | 45,548 | |
| 0.078%, 04/25/14 | | | 66,500 | | | | 66,497 | |
| 0.075%, 04/30/14(C) | | | 5,095 | | | | 5,095 | |
| 0.053%, 05/02/14 | | | 62,365 | | | | 62,362 | |
| 0.070%, 05/07/14 | | | 35,000 | | | | 34,998 | |
| 0.070%, 05/16/14 | | | 26,000 | | | | 25,998 | |
| 0.071%, 05/21/14 | | | 50,000 | | | | 49,995 | |
| 0.060%, 05/28/14 | | | 51,686 | | | | 51,681 | |
| 0.085%, 06/06/14 | | | 24,500 | | | | 24,496 | |
| 0.091%, 07/09/14 | | | 96,550 | | | | 96,526 | |
| 0.135%, 08/15/14 | | | 25,000 | | | | 24,987 | |
| 0.095%, 09/05/14 | | | 44,799 | | | | 44,780 | |
| 0.095%, 09/12/14 | | | 97,294 | | | | 97,252 | |
| FHLMC | | | | | | | | |
| 0.135%, 04/16/14(B) | | | 50,000 | | | | 50,010 | |
| 1.000%, 08/20/14 | | | 13,903 | | | | 13,949 | |
| 0.320%, 12/03/14 | | | 47,004 | | | | 47,056 | |
| FHLMC DN | | | | | | | | |
| 0.110%, 07/07/14(A) (C) | | | 50,000 | | | | 49,985 | |
| FNMA | | | | | | | | |
| 0.137%, 04/11/14(B) | | | 9,000 | | | | 9,002 | |
| 4.125%, 04/15/14 | | | 5,540 | | | | 5,549 | |
| 2.500%, 05/15/14 | | | 21,026 | | | | 21,086 | |
| 0.360%, 06/23/14(B) | | | 29,000 | | | | 29,013 | |
| 1.150%, 11/18/14 | | | 10,000 | | | | 10,065 | |
| FNMA DN (A) | | | | | | | | |
| 1.125%, 06/27/14 | | | 50,368 | | | | 50,491 | |
| Tennessee Valley Authority DN | | | | | | | | |
| 0.010%, 04/02/14(A) | | | 65,000 | | | | 65,000 | |
| | | | | | | | | |
| Total U.S. Government Agency Obligations | | | | | |
| (Cost $2,663,969) | | | | 2,663,969 | |
| | | | | | | | | |
| U.S. Treasury Obligations [10.7%] | |
| U.S. Treasury Bill | | | | | | | | |
| 0.001%, 04/03/14(A) | | | 40,000 | | | | 40,000 | |
| U.S. Treasury Notes | | | | | | | | |
| 0.090%, 04/01/14(B) | | | 30,000 | | | | 29,993 | |
| 1.250%, 04/15/14 | | | 50,000 | | | | 50,022 | |
See accompanying notes to financial statements.
CITY NATIONAL ROCHDALE FUNDS | PAGE 4
schedule of investments
March 31, 2014 (Unaudited)
City National Rochdale Government Money Market Fund (continued)
| Face Amount (000) | | | | |
| 1.875%, 04/30/14 | | $ | 50,000 | | | $ | 50,072 | |
| 0.250%, 04/30/14 | | | 50,000 | | | | 50,006 | |
| 2.250%, 05/31/14 | | | 50,000 | | | | 50,177 | |
| 2.625%, 06/30/14 | | | 50,000 | | | | 50,313 | |
| 0.625%, 07/15/14 | | | 50,000 | | | | 50,080 | |
| | | | | | | | | |
| Total U.S. Treasury Obligations | |
| (Cost $370,663) | | | | 370,663 | |
| | | | | | | | | |
| Municipal Bonds [7.4%] | |
| California [1.9%] | |
| ABAG Finance Authority for Nonprofit, Miramar Apartments Project, Ser A, RB, FNMA, AMT | | | | | | | | |
| 0.070%, 04/03/14(B) (D) | | | 15,000 | | | | 15,000 | |
| Anaheim, Housing Authority, Sea Wind Apartments Project, Ser C, RB, FNMA, AMT | | | | | | | | |
| 0.070%, 04/03/14(B) (D) | | | 6,300 | | | | 6,300 | |
| California Statewide, Communities Development Authority, Fairway Family Apartments Project, Ser PP, RB, FNMA, AMT | | | | | | | | |
| 0.070%, 04/03/14(B) (D) | | | 8,000 | | | | 8,000 | |
| Los Angeles, Community Redevelopment Agency, Hollywood and Vine Apartments Project, Ser A, RB, FNMA, AMT | | | | | | | | |
| 0.070%, 04/03/14(B) (D) | | | 28,450 | | | | 28,450 | |
| Sacramento County Housing Authority, Ashford Heights Apartments Project, Ser H, RB, FNMA, AMT | | | | | | | | |
| 0.070%, 04/03/14(B) (D) | | | 9,000 | | | | 9,000 | |
| | | | | | | | | |
| Total California | | | | 66,750 | |
| | | | | | | | | |
| New York [4.2%] | |
| New York State, Housing Finance Agency, 11th Avenue Project, Ser A, RB, FNMA, AMT | | | | | | | | |
| 0.050%, 04/02/14(B) (D) | | | 19,000 | | | | 19,000 | |
| New York State, Housing Finance Agency, 345 East 94th Street Project, Ser A, RB, FHLMC, AMT | | | | | | | | |
| 0.070%, 04/02/14(B) (D) | | | 13,200 | | | | 13,200 | |
| Face Amount (000) | | | | |
| New York State, Housing Finance Agency, 360 West 43rd Street Project, Ser A, RB, FNMA, AMT | | | | | | |
| 0.050%, 04/02/14(B) (D) | | $ | 14,100 | | | $ | 14,100 | |
| New York State, Housing Finance Agency, 360 West 43rd Street Project, Ser A, RB, FNMA, AMT | | | | | | | | |
| 0.050%, 04/02/14(B) (D) | | | 23,800 | | | | 23,800 | |
| New York State, Housing Finance Agency, 750 6th Avenue Project, Ser A, RB, FNMA, AMT | | | | | | | | |
| 0.050%, 04/02/14(B) (D) | | | 7,500 | | | | 7,500 | |
| New York State, Housing Finance Agency, RB | | | | | | | | |
| 0.050%, 04/02/14(B) (D) (E) | | | 25,200 | | | | 25,200 | |
| New York State, Housing Finance Agency, Victory Housing Project, Ser 2004-A, RB, FHLMC, AMT | | | | | | | | |
| 0.050%, 04/02/14(B) (D) | | | 25,500 | | | | 25,500 | |
| New York State, Housing Finance Agency, West 38th Street Project, Ser A, RB, FNMA, AMT | | | | | | | | |
| 0.070%, 04/02/14(B) (D) | | | 20,000 | | | | 20,000 | |
| | | | | | | | | |
| Total New York | | | | 148,300 | |
| | | | | | | | | |
| Texas [0.8%] | |
| Houston, Housing Finance, Regency Park Apartments Project, RB, FNMA, AMT | | | | | | | | |
| 0.090%, 04/02/14(B) (D) | | | 13,595 | | | | 13,595 | |
| Texas Department of Housing & Community Affairs, Idlewilde Apartments Project, RB, FNMA, AMT | | | | | | | | |
| 0.090%, 04/03/14(B) (D) | | | 13,610 | | | | 13,610 | |
| | | | | | | | | |
| Total Texas | | | | 27,205 | |
| | | | | | | | | |
| Washington [0.5%] | |
| Washington State, Housing Finance Commission, Vintage Spokane Project, Ser A, RB, FNMA, AMT | | | | | | | | |
| 0.090%, 04/03/14(B) (D) | | | 16,295 | | | | 16,295 | |
| | | | | | | | | |
| Total Municipal Bonds | |
| (Cost $258,550) | | | | 258,550 | |
See accompanying notes to financial statements.
CITY NATIONAL ROCHDALE FUNDS | PAGE 5
schedule of investments
March 31, 2014 (Unaudited)
City National Rochdale Government Money Market Fund (concluded)
| Face Amount (000) | | | | |
| Repurchase Agreements (F) [5.0%] | |
| Bank of America | | | | | | |
| 0.050%, dated 03/31/14, repurchased on 04/01/14, repurchase price $37,000,051 (collateralized by various U.S. Government obligations, par values ranging from $11,900,000 to $30,900,000, 0.000%, 07/01/14 to 01/15/21; with a total market value $37,700,000) | | $ | 37,000 | | | $ | 37,000 | |
| Barclays | | | | | | | | |
| 0.060%, dated 03/31/14, repurchased on 04/01/14, repurchase price $28,000,047 (collateralized by a U.S. Treasury Note, par value $28,800,000, 2.000%, 11/30/20; with a total market value $28,600,000) | | | 28,000 | | | | 28,000 | |
| Deutsche Bank | | | | | | | | |
| 0.050%, dated 03/31/14, repurchased on 04/01/14, repurchase price $25,000,035 (collateralized by various U.S. Treasury Notes, par values ranging from $1,400 to $22,500,000, 0.000% - 8.750%, 05/15/14 to 05/15/23; with a total market value $25,539,088) | | | 25,000 | | | | 25,000 | |
| Deutsche Bank | | | | | | | | |
| 0.080%, dated 03/31/14, repurchased on 04/01/14, repurchase price $25,000,056 (collateralized by various U.S. Government obligations, par values ranging from $1,000 to $4,602,000, 0.000% - 6.625%, 07/15/14 to 07/15/37; with a total market value $25,502,997) | | | 25,000 | | | | 25,000 | |
| Goldman Sachs | | | | | | | | |
| 0.070%, dated 03/31/14, repurchased on 04/01/14, repurchase price $60,000,117 (collateralized by various U.S. Government obligations, par values ranging from $4.859.000 to $55,900,000, 0.500% - 4.375%, 10/15/15 to 05/13/16; with a total market value $61,151,600) | | | 60,000 | | | | 60,000 | |
| | | | | | | | | |
| Total Repurchase Agreements | |
| (Cost $175,000) | | | | 175,000 | |
| | | | | | |
| Short-Term Investment [0.3%] | |
| Morgan Stanley Institutional Liquidity Funds - Government Portfolio, 0.050%* | | | 10,219,370 | | | $ | 10,219 | |
| | | | | | | | | |
| Total Short-Term Investment | |
| (Cost $10,219) | | | | 10,219 | |
| | | | | | | | | |
| Total Investments [99.9%] | |
| (Cost $3,478,401) | | | $ | 3,478,401 | |
Percentages are based on Net Assets of $3,480,431 (000).
| * | The rate reported is the 7-day effective yield as of March 31, 2014. |
| (A) | Zero coupon security. The rate reported is the effective yield at time of purchase. |
| (B) | Floating Rate Security — The rate reported is the rate in effect on March 31, 2014. |
| (C) | The rate reported is the effective yield at time of purchase. |
| (D) | Put and Demand Feature — The date reported is the next reset or put date. |
| (E) | Securities are held in conjunction with a letter of credit from a major bank or financial institution. |
| (F) | Tri-Party Repurchase Agreement. |
ABAG — Association of Bay Area Governments
AMT — Alternative Minimum Tax (subject to)
DN — Discount Note
FAMC — Federal Agriculture Mortgage Corporation
FFCB — Federal Farm Credit Bank
FHLB — Federal Home Loan Bank
FHLMC — Federal Home Loan Mortgage Corporation
FNMA — Federal National Mortgage Association
MTN — Medium Term Note
RB — Revenue Bond
Ser — Series
The following is a list of the inputs used as of March 31, 2014 in valuing the Fund’s investments carried at value (000):
| Investments in Securities | | | | | | | | | | | | |
| U.S. Government Agency Obligations | | $ | — | | | $ | 2,663,969 | | | $ | — | | | $ | 2,663,969 | |
| U.S. Treasury Obligations | | | — | | | | 370,663 | | | | — | | | | 370,663 | |
| Municipal Bonds | | | — | | | | 258,550 | | | | — | | | | 258,550 | |
| Repurchase Agreements | | | — | | | | 175,000 | | | | — | | | | 175,000 | |
| Short-Term Investment | | | 10,219 | | | | — | | | | — | | | | 10,219 | |
| Total Investments in Securities | | $ | 10,219 | | | $ | 3,468,182 | | | $ | — | | | $ | 3,478,401 | |
For the period ended March 31, 2014, there have been no transfers between Level 1 and Level 2 assets and liabilities. Transfers between Levels are recognized at period end.
For more information on valuation inputs, see Note 2 — Significant Accounting Policies in the Notes to Financial Statements.
See accompanying notes to financial statements.
CITY NATIONAL ROCHDALE FUNDS | PAGE 6
schedule of investments
March 31, 2014 (Unaudited)
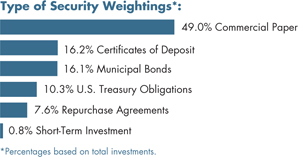
City National Rochdale Prime Money Market Fund
| | | | | |
| Commercial Paper [49.1%] | |
| Banks [28.7%] | |
| Australia and New Zealand Banking Group (A) | | | | | | |
| 0.200%, 07/08/14 | | $ | 20,000 | | | $ | 19,989 | |
| Bank of Tokyo- Mitsubishi UFJ NY | | | | | | | | |
| 0.220%, 04/23/14 | | | 15,000 | | | | 14,998 | |
| 0.190%, 04/21/14 | | | 10,000 | | | | 9,999 | |
| BNP Paribas Finance | | | | | | | | |
| 0.310%, 04/24/14 | | | 10,000 | | | | 9,998 | |
| Commonwealth Bank of Australia (A) | | | | | | | | |
| 0.165%, 06/30/14 | | | 35,000 | | | | 34,986 | |
| Credit Suisse NY | | | | | | | | |
| 0.260%, 09/09/14 | | | 10,000 | | | | 9,988 | |
| Deutsche Bank Financial | | | | | | | | |
| 0.300%, 08/25/14 | | | 10,000 | | | | 9,988 | |
| HSBC USA | | | | | | | | |
| 0.230%, 08/25/14 | | | 5,000 | | | | 4,995 | |
| 0.230%, 08/13/14 | | | 5,305 | | | | 5,300 | |
| Korea Development Bank NY | | | | | | | | |
| 0.190%, 04/14/14 | | | 25,000 | | | | 24,998 | |
| Macquarie Bank (A) | | | | | | | | |
| 0.200%, 05/08/14 | | | 35,000 | | | | 34,993 | |
| National Australia Funding Delaware (A) | | | | | | | | |
| 0.250%, 05/23/14 | | | 20,000 | | | | 19,993 | |
| 0.163%, 05/05/14 | | | 22,400 | | | | 22,397 | |
| Natixis US Finance | | | | | | | | |
| 0.330%, 07/01/14 | | | 15,000 | | | | 14,988 | |
| 0.150%, 05/05/14 | | | 10,000 | | | | 9,999 | |
| Skandinaviska Enskilda Banken (A) | | | | | | | | |
| 0.235%, 04/21/14 | | | 15,000 | | | | 14,998 | |
| Societe Generale North America | | | | | | | | |
| 0.300%, 05/02/14 | | | 15,000 | | | | 14,996 | |
| Standard Chartered Bank (A) | | | | | | | | |
| 0.250%, 09/04/14 | | | 10,000 | | | | 9,989 | |
| Sumitomo Mitsui Banking (A) | | | | | | | | |
| 0.200%, 04/21/14 | | | 5,000 | | | | 4,999 | |
| | | | | |
| Sumitomo Mitsui Trust Bank Limited (A) | | | | | | |
| 0.200%, 04/01/14 | | $ | 20,000 | | | $ | 20,000 | |
| Westpac Securities NZ (A) | | | | | | | | |
| 0.200%, 09/26/14 | | | 25,000 | | | | 24,975 | |
| | | | | | | | | |
| Total Banks | | | | 337,566 | |
| | | | | | | | | |
| Financial Services [16.0%] | |
| AllianceBernstein (A) | | | | | | | | |
| 0.190%, 04/09/14 | | | 10,000 | | | | 10,000 | |
| 0.150%, 04/11/14 | | | 10,000 | | | | 10,000 | |
| 0.120%, 04/01/14 | | | 15,000 | | | | 15,000 | |
| Allianz Finance (A) | | | | | | | | |
| 0.270%, 04/28/14 | | | 10,000 | | | | 9,998 | |
| Caisse Centrale Desjardins (A) | | | | | | | | |
| 0.170%, 04/28/14 | | | 15,000 | | | | 14,998 | |
| 0.110%, 04/03/14 | | | 10,000 | | | | 10,000 | |
| Collateralized Commercial Paper | | | | | | | | |
| 0.150%, 04/25/14 | | | 10,000 | | | | 9,999 | |
| Liberty Street Funding (A) | | | | | | | | |
| 0.180%, 05/29/14 | | | 7,700 | | | | 7,698 | |
| 0.130%, 04/01/14 | | | 30,000 | | | | 30,000 | |
| Mizuho Funding (A) | | | | | | | | |
| 0.195%, 06/02/14 | | | 20,000 | | | | 19,993 | |
| 0.175%, 05/21/14 | | | 15,000 | | | | 14,996 | |
| Toyota Financial Services de Puerto Rico | | | | | | | | |
| 0.200%, 04/04/14 | | | 10,000 | | | | 10,000 | |
| Toyota Motor Credit | | | | | | | | |
| 0.110%, 04/08/14 | | | 25,000 | | | | 24,999 | |
| | | | | | | | | |
| Total Financial Services | | | | 187,681 | |
| | | | | | | | | |
| Food, Beverage & Tobacco [1.0%] | |
| Coca-Cola (A) | | | | | | | | |
| 0.070%, 04/11/14 | | | 12,200 | | | | 12,200 | |
| | | | | | | | | |
| Import/Export [2.1%] | |
| Sumitomo Corp of America | | | | | | | | |
| 0.210%, 05/07/14 | | | 25,000 | | | | 24,995 | |
| | | | | | | | | |
| Schools [1.3%] | |
| University of California | | | | | | | | |
| 0.150%, 07/07/14 | | | 15,000 | | | | 14,994 | |
| | | | | | | | | |
| Total Commercial Paper | |
| (Cost $577,436) | | | | 577,436 | |
See accompanying notes to financial statements.
CITY NATIONAL ROCHDALE FUNDS | PAGE 7
schedule of investments
March 31, 2014 (Unaudited)
City National Rochdale Prime Money Market Fund (continued)
| | | | | |
| Certificates of Deposit [16.1%] | |
| Banco Del Estado De Chile | | | | | | |
| 0.230%, 04/08/14 | | $ | 10,000 | | | $ | 10,000 | |
| 0.210%, 04/11/14 | | | 15,000 | | | | 15,000 | |
| 0.260%, 07/08/14 | | | 15,000 | | | | 15,000 | |
| Bank of America | | | | | | | | |
| 0.230%, 07/07/14 | | | 25,000 | | | | 25,000 | |
| 0.250%, 09/08/14 | | | 10,000 | | | | 10,000 | |
| Bank of Montreal IL | | | | | | | | |
| 0.210%, 09/08/14 | | | 25,000 | | | | 25,000 | |
| Bank of Tokyo-Mitsubishi UFJ NY | | | | | | | | |
| 0.220%, 08/22/14 | | | 15,000 | | | | 15,000 | |
| Korea Development Bank NY | | | | | | | | |
| 0.210%, 04/16/14 | | | 15,000 | | | | 15,000 | |
| Norinchukin Bank | | | | | | | | |
| 0.210%, 05/13/14 | | | 15,000 | | | | 15,000 | |
| 0.210%, 06/16/14 | | | 20,000 | | | | 20,000 | |
| Skandinaviska Enskilda Banken NY | | | | | | | | |
| 0.250%, 08/25/14 | | | 15,000 | | | | 15,000 | |
| Sumitomo Mitsui Banking | | | | | | | | |
| 0.210%, 04/16/14 | | | 10,000 | | | | 10,000 | |
| | | | | | | | | |
| Total Certificates of Deposit | |
| (Cost $190,000) | | | | 190,000 | |
| | | | | | | | | |
| Municipal Bonds [16.0%] | |
| California [8.7%] | |
| California State, Health Facilities Financing Authority, St. Joseph Health System Project, Ser B, RB | | | | | | | | |
| 0.060%, 04/01/14(B) (C) (D) | | | 29,000 | | | | 29,000 | |
| California State, Pollution Control Financing Authority, Pacific Gas & Electric Project, Ser C, RB | | | | | | | | |
| 0.030%, 04/01/14(B) (C) (D) | | | 5,000 | | | | 5,000 | |
| California State, Ser A-2, RAN | | | | | | | | |
| 2.000%, 06/23/14 | | | 15,000 | | | | 15,060 | |
| Los Angeles, Department of Water & Power, Ser B-3, RB | | | | | | | | |
| 0.040%, 04/01/14(C) (D) | | | 13,000 | | | | 13,000 | |
| Los Angeles, Department of Water & Power, Sub-Ser B-1, RB | | | | | | | | |
| 0.050%, 04/03/14(C) (D) | | | 25,000 | | | | 25,000 | |
| | | | | |
| Southern California, Metropolitan Water District, Ser B-3, RB | | | | | | |
| 0.020%, 04/01/14(C) (D) | | $ | 15,000 | | | $ | 15,000 | |
| | | | | | | | | |
| Total California | | | | 102,060 | |
| | | | | | | | | |
| Illinois [1.1%] | |
| Chicago, Midway Airport Authority, Ser B, RB, AMT | | | | | | | | |
| 0.060%, 04/01/14(B) (C) (D) | | | 12,600 | | | | 12,600 | |
| | | | | | | | | |
| North Carolina [1.3%] | |
| Charlotte, Water and Sewer System, Ser B, RB | | | | | | | | |
| 0.060%, 04/03/14(C) (D) | | | 15,900 | | | | 15,900 | |
| | | | | | | | | |
| Ohio [1.5%] | |
| Ohio State, Higher Educational Facility Commission, Cleveland Clinic Project, Ser B-4, RB | | | | | | | | |
| 0.040%, 04/01/14(C) (D) | | | 17,485 | | | | 17,485 | |
| | | | | | | | | |
| Texas [3.4%] | |
| Lower Neches Valley Authority Industrial Development, Exxon-Mobil Project, RB | | | | | | | | |
| 0.040%, 04/01/14(C) (D) | | | 24,102 | | | | 24,102 | |
| Lower Neches Valley, Industrial Development Authority, Exxon Mobil Project, RB | | | | | | | | |
| 0.040%, 04/01/14(C) (D) | | | 16,700 | | | | 16,700 | |
| | | | | | | | | |
| Total Texas | | | | 40,802 | |
| | | | | | | | | |
| Total Municipal Bonds | |
| (Cost $188,847) | | | | 188,847 | |
| | | | | | | | | |
| U.S. Treasury Obligations [10.3%] | |
| U.S. Treasury Bill | | | | | | | | |
| 0.001%, 04/03/14(E) | | | 60,000 | | | | 60,000 | |
| U.S. Treasury Note | | | | | | | | |
| 4.250%, 08/15/14 | | | 30,000 | | | | 30,464 | |
| 4.250%, 11/15/14 | | | 30,000 | | | | 30,771 | |
| | | | | | | | | |
| Total U.S. Treasury Obligations | |
| (Cost $121,235) | | | | 121,235 | |
See accompanying notes to financial statements.
CITY NATIONAL ROCHDALE FUNDS | PAGE 8
schedule of investments
March 31, 2014 (Unaudited)
City National Rochdale Prime Money Market Fund (concluded)
| | | | | |
| Repurchase Agreements (F) [7.6%] | |
| Bank of America | | | | | | |
| 0.050%, dated 03/31/14, repurchased on 04/01/14, repurchase price $21,000,029 (collateralized by various U.S. Government obligations, par values ranging from $5,294,000 to $20,000,000, 0.000% - 3.000%, 01/15/21 to 03/01/28; with a total market value $21,414,254) | | $ | 21,000 | | | $ | 21,000 | |
| Barclays | | | | | | | | |
| 0.060%, dated 03/31/14, repurchased on 04/01/14, repurchase price $18,000,030 (collateralized by a U.S. Treasury Note, par value $18,500,000, 1.375%, 09/30/18; with a total market value $18,400,000) | | | 18,000 | | | | 18,000 | |
| Deutsche Bank | | | | | | | | |
| 0.050%, dated 03/31/14, repurchased on 04/01/14, repurchase price $25,000,035 (collateralized by various U.S. Treasury Notes, par values ranging from $5,162,500 to $11,000,000 0.000% - 1.750%, 07/10/14 to 05/15/23; with a total market value $25,545,532) | | | 25,000 | | | | 25,000 | |
| Deutsche Bank | | | | | | | | |
| 0.080%, dated 03/31/14, repurchased on 04/01/14, repurchase price $25,000,056 (collateralized by various U.S. Government obligations, par values ranging from $1,000 to $11,300,000, 0.000% - 1.625%, 11/06/14 to 10/15/20; with a total market value $25,504,867) | | | 25,000 | | | | 25,000 | |
| | | | | | | | | |
| Total Repurchase Agreements | |
| (Cost $89,000) | | | | 89,000 | |
| | | | | | |
| Short-Term Investment [0.8%] | |
| SEI Daily Income Trust, Prime Obligation Fund, Cl A, 0.010%* | | | 9,662,678 | | | $ | 9,663 | |
| | | | | | | | | |
| Total Short-Term Investment | |
| (Cost $9,663) | | | | 9,663 | |
| | | | | | | | | |
| Total Investments [99.9%] | |
| (Cost $1,176,181) | | | $ | 1,176,181 | |
Percentages are based on Net Assets of $1,176,835 (000).
| * | The rate reported is the 7-day effective yield as of March 31, 2014. |
| (A) | Security exempt from registration under Rule 144A of the Securities Act of 1933. These securities may be resold in transactions exempt from registration normally to qualified institutions. On March 31, 2014, the value of these securities amounted to $362,202 (000), representing 30.8% of the net assets of the Fund. |
| (B) | Securities are held in conjunction with a letter of credit from a major bank or financial institution. |
| (C) | Floating Rate Security — The rate reported is the rate in effect on March 31, 2014. |
| (D) | Put and Demand Feature — The date reported is the next reset date or put date. |
| (E) | Zero coupon security. The rate reported is the effective yield at time of purchase. |
| (F) | Tri-Party Repurchase Agreement. |
AMT — Alternative Minimum Tax (subject to)
Cl — Class
NY — New York
NZ — New Zealand
RAN — Revenue Anticipation Note
RB — Revenue Bond
Ser — Series
The following is a summary of the inputs used as of March 31, 2014 in valuing the Fund’s investments carried at value (000).
| Investments in Securities | | | | | | | | | | | | |
| Commercial Paper | | $ | — | | | $ | 577,436 | | | $ | — | | | $ | 577,436 | |
| Certificates of Deposit | | | — | | | | 190,000 | | | | — | | | | 190,000 | |
| Municipal Bonds | | | — | | | | 188,847 | | | | — | | | | 188,847 | |
| U.S. Treasury Obligations | | | — | | | | 121,235 | | | | — | | | | 121,235 | |
| Repurchase Agreements | | | — | | | | 89,000 | | | | — | | | | 89,000 | |
| Short-Term Investment | | | 9,663 | | | | — | | | | — | | | | 9,663 | |
| Total Investments in Securities | | $ | 9,663 | | | $ | 1,166,518 | | | $ | — | | | $ | 1,176,181 | |
For the period ended March 31, 2014, there have been no transfers between Level 1 and Level 2 assets and liabilities. Transfers between Levels are recognized at period end.
For more information on valuation inputs, see Note 2 — Significant Accounting Policies in the Notes to Financial Statements.
See accompanying notes to financial statements.
CITY NATIONAL ROCHDALE FUNDS | PAGE 9
schedule of investments
March 31, 2014 (Unaudited)
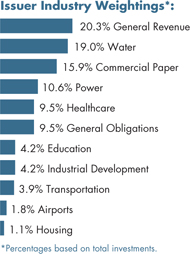
City National Rochdale California Tax Exempt Money Market Fund
| | | | | |
| Municipal Bonds [81.9%] | |
| California [75.7%] | |
| Bay Area Toll Authority, Ser A-2, RB | | | | | | |
| 0.050%, 04/03/14(A) (B) (C) | | $ | 16,700 | | | $ | 16,700 | |
| Bay Area Toll Authority, Ser C-1, RB | | | | | | | | |
| 0.050%, 04/03/14(A) (B) (C) | | | 14,445 | | | | 14,445 | |
| Bay Area Toll Authority, Ser C-2, RB | | | | | | | | |
| 0.050%, 04/03/14(A) (B) (C) | | | 4,190 | | | | 4,190 | |
| California State University, Ser A, RB, AGM | | | | | | | | |
| Pre-Refunded @ 100 | | | | | | | | |
| 5.000%, 05/01/14(D) | | | 3,800 | | | | 3,815 | |
| California State, GO | | | | | | | | |
| 5.250%, 04/01/14 | | | 1,000 | | | | 1,000 | |
| California State, Health Facilities Financing Authority, Adventis Health System Project, Ser A, RB | | | | | | | | |
| 0.050%, 04/03/14(A) (B) (C) | | | 2,600 | | | | 2,600 | |
| California State, Health Facilities Financing Authority, Adventis Health System Project, Ser B, RB | | | | | | | | |
| 0.030%, 04/01/14(A) (B) (C) | | | 8,380 | | | | 8,380 | |
| California State, Health Facilities Financing Authority, Health Facility Catholic Project, Ser B, RB | | | | | | | | |
| 0.050%, 04/02/14(A) (B) (C) | | | 2,450 | | | | 2,450 | |
| California State, Health Facilities Financing Authority, Health Facility Catholic Project, Ser I, RB | | | | | | | | |
| 0.050%, 04/02/14(A) (B) (C) | | | 3,900 | | | | 3,900 | |
| | | | | |
| California State, Health Facilities Financing Authority, Scripps Health Project, Ser A, RB | | | | | | |
| 0.050%, 04/02/14(A) (B) (C) | | $ | 2,085 | | | $ | 2,085 | |
| California State, Health Facilities Financing Authority, Scripps Health Project, Ser C, RB | | | | | | | | |
| 0.060%, 04/02/14(A) (B) (C) | | | 8,650 | | | | 8,650 | |
| California State, Kindergarten Project, Ser A-1, GO | | | | | | | | |
| 0.030%, 04/01/14(A) (B) (C) | | | 1,540 | | | | 1,540 | |
| California State, Kindergarten Project, Ser A-2, GO | | | | | | | | |
| 0.040%, 04/01/14(A) (B) (C) | | | 19,085 | | | | 19,085 | |
| California State, Kindergarten Project, Ser A-3, GO | | | | | | | | |
| 0.050%, 04/01/14(A) (B) (C) | | | 16,360 | | | | 16,360 | |
| California State, Kindergarten Project, Ser A-8, GO | | | | | | | | |
| 0.050%, 04/03/14(A) (B) (C) | | | 15,400 | | | | 15,400 | |
| California State, Kindergarten Project, Ser B-1, GO | | | | | | | | |
| 0.030%, 04/01/14(A) (B) (C) | | | 3,100 | | | | 3,100 | |
| California State, Kindergarten Project, Ser B-2, GO | | | | | | | | |
| 0.070%, 04/01/14(A) (B) (C) | | | 5,800 | | | | 5,800 | |
| California State, Municipal Finance Authority, Chevron USA Recovery Zone Project, RB | | | | | | | | |
| 0.050%, 04/01/14(A) (C) | | | 10,100 | | | | 10,100 | |
| California State, Public Works Board, Department of Mental Health Project, Ser A, RB | | | | | | | | |
| Pre-Refunded @ 100 | | | | | | | | |
| 5.500%, 06/01/14(D) | | | 2,600 | | | | 2,624 | |
| California State, Public Works Board, University of California Research Project, Ser L, RB, NATL-RE, ETM | | | | | | | | |
| 5.250%, 11/01/14 | | | 1,000 | | | | 1,030 | |
| California State, Ser A-1, RAN | | | | | | | | |
| 2.000%, 05/28/14 | | | 5,500 | | | | 5,516 | |
| California State, Ser A-2, RAN | | | | | | | | |
| 2.000%, 06/23/14 | | | 23,500 | | | | 23,594 | |
| California State, Ser B-4, GO | | | | | | | | |
| 0.060%, 04/02/14(A) (B) (C) | | | 1,900 | | | | 1,900 | |
| California State, Sub-Ser A-1, GO | | | | | | | | |
| 0.050%, 04/02/14(A) (B) (C) | | | 7,500 | | | | 7,500 | |
See accompanying notes to financial statements.
CITY NATIONAL ROCHDALE FUNDS | PAGE 10
schedule of investments
March 31, 2014 (Unaudited)
City National Rochdale California Tax Exempt Money Market Fund (continued)
| | | | | |
| California State, Sub-Ser A-2, GO | | | | | | |
| 0.060%, 04/02/14(A) (B) (C) | | $ | 1,500 | | | $ | 1,500 | |
| California Statewide, Communities Development Authority, Kaiser Permanente Project, Ser D, RB | | | | | | | | |
| 0.040%, 04/02/14(A) (C) | | | 25,000 | | | | 25,000 | |
| California Statewide, Communities Development Authority, Masters College Project, Ser A, RB | | | | | | | | |
| 0.080%, 04/03/14(A) (B) (C) | | | 3,000 | | | | 3,000 | |
| East Bay, Municipal Utility District, Ser A-3, RB | | | | | | | | |
| 0.050%, 04/02/14(A) (C) | | | 10,000 | | | | 10,000 | |
| East Bay, Municipal Utility District, Sub-Ser C, RB | | | | | | | | |
| 0.060%, 04/02/14(A) (C) | | | 7,000 | | | | 7,000 | |
| Eastern Municipal Water District, Ser C, COP | | | | | | | | |
| 0.060%, 04/02/14(A) (C) | | | 26,475 | | | | 26,475 | |
| Eastern Municipal Water District, Ser D, COP | | | | | | | | |
| 0.060%, 04/02/14(A) (C) | | | 13,200 | | | | 13,200 | |
| Elsinore Valley, Municipal Water District, Ser A, COP | | | | | | | | |
| 0.070%, 04/02/14(A) (B) (C) | | | 3,240 | | | | 3,240 | |
| Elsinore Valley, Municipal Water District, Ser B, COP | | | | | | | | |
| 0.070%, 04/02/14(A) (B) (C) | | | 2,500 | | | | 2,500 | |
| Fresno County, TRAN | | | | | | | | |
| 1.250%, 06/30/14 | | | 5,000 | | | | 5,013 | |
| Irvine Ranch, Water District, SAB | | | | | | | | |
| 0.060%, 04/03/14(A) (B) (C) | | | 4,600 | | | | 4,600 | |
| Irvine Ranch, Water District, Ser B, SAB | | | | | | | | |
| 0.070%, 04/01/14(A) (B) (C) | | | 4,725 | | | | 4,725 | |
| Irvine, California, Ser A, SAB | | | | | | | | |
| 0.060%, 04/02/14(A) (B) (C) | | | 5,000 | | | | 5,000 | |
| Los Angeles County, Metropolitan Transportation Authority, Ser A1, RB | | | | | | | | |
| 0.060%, 04/03/14(A) (C) | | | 36,180 | | | | 36,180 | |
| Los Angeles, Department of Water & Power, Ser A-5, RB | | | | | | | | |
| 0.040%, 04/03/14(A) (C) | | | 5,000 | | | | 5,000 | |
| Los Angeles, Department of Water & Power, Sub-Ser A-3, RB | | | | | | | | |
| 0.050%, 04/03/14(A) (C) | | | 2,500 | | | | 2,500 | |
| | | | | |
| Los Angeles, Department of Water & Power, Sub-Ser A-8, RB | | | | | | |
| 0.060%, 04/03/14(A) (C) | | $ | 3,000 | | | $ | 3,000 | |
| Los Angeles, Department of Water & Power, Sub-Ser B-1, RB | | | | | | | | |
| 0.050%, 04/03/14(A) (C) | | | 7,250 | | | | 7,250 | |
| Los Angeles, Department of Water & Power, Sub-Ser B-2, RB | | | | | | | | |
| 0.070%, 04/01/14(A) (C) | | | 34,900 | | | | 34,900 | |
| Los Angeles, Department of Water & Power, Sub-Ser B-4, RB | | | | | | | | |
| 0.050%, 04/03/14(A) (C) | | | 4,075 | | | | 4,075 | |
| Los Angeles, Department of Water & Power, Sub-Ser B-6, RB | | | | | | | | |
| 0.070%, 04/01/14(A) (C) | | | 23,200 | | | | 23,200 | |
| Metropolitan Water District of Southern California, Ser A-1, RB | | | | | | | | |
| 0.080%, 04/03/14(A) (C) | | | 10,000 | | | | 10,000 | |
| Metropolitan Water District of Southern California, Ser A-1, RB | | | | | | | | |
| 0.040%, 04/03/14(A) (C) | | | 1,520 | | | | 1,520 | |
| Metropolitan Water District of Southern California, Ser A-2, RB | | | | | | | | |
| 0.070%, 04/03/14(A) (C) | | | 11,000 | | | | 11,000 | |
| Metropolitan Water District of Southern California, Ser A-3, RB | | | | | | | | |
| 0.080%, 04/03/14(A) (C) | | | 11,000 | | | | 11,000 | |
| Metropolitan Water District of Southern California, Ser D, RB | | | | | | | | |
| 0.040%, 04/03/14(A) (C) | | | 3,800 | | | | 3,800 | |
| Orange County, Apartment Development Authority, Riverbend Apartments Project, Ser B, RB | | | | | | | | |
| 0.060%, 04/03/14(A) (C) | | | 10,000 | | | | 10,000 | |
| Orange County, Water District Authority, Ser A, COP | | | | | | | | |
| 0.060%, 04/02/14(A) (B) (C) | | | 25,350 | | | | 25,350 | |
| Riverside County, Public Facilities Authority, Ser C, COP | | | | | | | | |
| 0.050%, 04/02/14(A) (B) (C) | | | 3,200 | | | | 3,200 | |
See accompanying notes to financial statements.
CITY NATIONAL ROCHDALE FUNDS | PAGE 11
schedule of investments
March 31, 2014 (Unaudited)
City National Rochdale California Tax Exempt Money Market Fund (continued)
| | | | | |
| Riverside County, Water Authority, Ser A, RB | | | | | | |
| 0.080%, 04/03/14(A) (C) | | $ | 33,140 | | | $ | 33,140 | |
| San Diego County, Regional Transportation Commission, Ser B, RB | | | | | | | | |
| 0.070%, 04/03/14(A) (C) | | | 9,180 | | | | 9,180 | |
| San Diego County, Regional Transportation Commission, Ser D, RB | | | | | | | | |
| 0.050%, 04/03/14(A) (C) | | | 12,390 | | | | 12,390 | |
| San Diego County, School District, Ser A, TRAN | | | | | | | | |
| 2.000%, 06/30/14 | | | 2,500 | | | | 2,511 | |
| San Francisco City & County, Airports Commission, Ser 37C, RB | | | | | | | | |
| 0.060%, 04/02/14(A) (B) (C) | | | 15,900 | | | | 15,900 | |
| San Francisco City & County, Finance Authority, Moscone Center Project, Ser 2008-1, RB | | | | | | | | |
| 0.050%, 04/03/14(A) (B) (C) | | | 2,810 | | | | 2,810 | |
| San Francisco, Bay Area Rapid Transit District, Election 2004, Ser C, GO | | | | | | | | |
| 2.000%, 08/01/14 | | | 4,455 | | | | 4,483 | |
| Santa Barbara County, Ser A, TRAN | | | | | | | | |
| 2.000%, 06/30/14 | | | 5,000 | | | | 5,022 | |
| Santa Clara County, Financing Authority, VMC Facility Replacement Project, Ser B, RB | | | | | | | | |
| 0.060%, 04/02/14(A) (C) | | | 13,820 | | | | 13,820 | |
| Santa Clara Valley, Transportation Authority, Ser C, RB | | | | | | | | |
| 0.050%, 04/03/14(A) (C) | | | 24,300 | | | | 24,300 | |
| Santa Clara Valley, Transportation Authority, Ser C, RB | | | | | | | | |
| 0.050%, 04/03/14(A) (C) | | | 995 | | | | 995 | |
| Santa Clara Valley, Transportation Authority, Ser D, RB | | | | | | | | |
| 0.050%, 04/03/14(A) (C) | | | 14,000 | | | | 14,000 | |
| Southern California, Public Power Authority, Magnolia Power Project, Ser A-1, RB | | | | | | | | |
| 0.070%, 04/02/14(A) (B) (C) | | | 19,300 | | | | 19,300 | |
| | | | | |
| Southern California, Public Power Authority, Southern Transmission Project, Ser A, RB, AGM | | | | | | |
| 0.060%, 04/02/14(A) (C) | | $ | 35,000 | | | $ | 35,000 | |
| University of California, Ser AL-2, RB | | | | | | | | |
| 0.050%, 04/03/14(A) (C) | | | 5,000 | | | | 5,000 | |
| | | | | | | | | |
| Total California | | | | 682,843 | |
| | | | | | | | | |
| New York [3.4%] | |
| New York City, Municipal Water Finance Authority, RB | | | | | | | | |
| 0.040%, 04/01/14(A) (C) | | | 10,000 | | | | 10,000 | |
| New York City, Municipal Water Finance Authority, Ser DD-1, RB | | | | | | | | |
| 0.040%, 04/01/14(A) (C) | | | 5,010 | | | | 5,010 | |
| New York, New York, Ser A-5, GO | | | | | | | | |
| 0.060%, 04/01/14(A) (C) | | | 16,160 | | | | 16,160 | |
| | | | | | | | | |
| Total New York | | | | 31,170 | |
| | | | | | | | | |
| Texas [2.8%] | |
| Lower Neches Valley, Industrial Development Authority, Exxon Mobil Project, RB | | | | | | | | |
| 0.050%, 04/01/14(A) (C) | | | 13,385 | | | | 13,385 | |
| Lower Neches Valley, Industrial Development Authority, Exxon Mobil Project, RB | | | | | | | | |
| 0.040%, 04/01/14(A) (C) | | | 11,600 | | | | 11,600 | |
| | | | | | | | | |
| Total Texas | | | | 24,985 | |
| | | | | | | | | |
| Total Municipal Bonds | |
| (Cost $738,998) | | | | 738,998 | |
| | | | | | | | | |
| Commercial Paper [18.0%] | |
| California [18.0%] | |
| California State | | | | | | | | |
| 0.080%, 06/03/14 | | | 10,000 | | | | 10,000 | |
| 0.070%, 05/20/14 | | | 5,000 | | | | 5,000 | |
| California State University | | | | | | | | |
| 0.060%, 06/03/14 | | | 5,000 | | | | 5,000 | |
| California State, Department of Water | | | | | | | | |
| 0.080%, 07/03/14 | | | 2,838 | | | | 2,838 | |
See accompanying notes to financial statements.
CITY NATIONAL ROCHDALE FUNDS | PAGE 12
schedule of investments
March 31, 2014 (Unaudited)
City National Rochdale California Tax Exempt Money Market Fund (concluded)
| | | | | |
| California State, Educational Facilities Authority | | | | | | |
| 0.130%, 10/16/14 | | $ | 25,000 | | | $ | 25,000 | |
| 0.080%, 05/16/14 | | | 8,121 | | | | 8,121 | |
| California State, Health Facilities Financing Authority, Stanford Hospital Project, Ser B-2, RB | | | | | | | | |
| 0.130%, 06/04/14 | | | 18,550 | | | | 18,550 | |
| Sacramento, Municipal Utility District | | | | | | | | |
| 0.090%, 05/08/14 | | | 10,500 | | | | 10,500 | |
| 0.070%, 07/03/14 | | | 20,000 | | | | 20,000 | |
| San Diego, Water Authority | | | | | | | | |
| 0.090%, 04/03/14 | | | 13,100 | | | | 13,100 | |
| 0.090%, 06/04/14 | | | 10,000 | | | | 10,000 | |
| San Francisco City & County | | | | | | | | |
| 0.080%, 07/02/14 | | | 15,245 | | | | 15,245 | |
| San Francisco City & County, Airport Commission | | | | | | | | |
| 0.070%, 07/09/14 | | | 5,000 | | | | 5,000 | |
| Santa Clara Valley Water District | | | | | | | | |
| 0.070%, 06/02/14 | | | 13,865 | | | | 13,865 | |
| | | | | | | | | |
| Total California | | | | 162,219 | |
| | | | | | | | | |
| Total Commercial Paper | |
| (Cost $162,219) | | | | 162,219 | |
| | | | | | | | | |
| Total Investments [99.9%] | |
| (Cost $901,217) | | | $ | 901,217 | |
Percentages are based on Net Assets of $902,004 (000).
| (A) | Put and Demand Feature — The date reported is the next reset or put date. |
| (B) | Securities are held in conjunction with a letter of credit from a major bank or financial institution. |
| (C) | Floating Rate Security — The rate reported is the rate in effect on March 31, 2014. |
| (D) | Pre-Refunded Security — The maturity date shown is the pre-refunded date. |
AGM — Assured Guarantee Municipal
COP — Certificate of Participation
ETM — Escrowed to Maturity
GO — General Obligation
NATL-RE — National Public Finance Guarantee Corporation
RAN — Revenue Anticipation Note
RB — Revenue Bond
SAB — Special Assessment Board
Ser — Series
TRAN — Tax and Revenue Anticipation Note
As of March 31, 2014, all of the Fund’s investments are Level 2, in accordance with the authoritative guidance on the fair value measurements and disclosure under U.S. GAAP.
For the period ended March 31, 2014, there have been no transfers between Level 1 and Level 2 assets and liabilities. Transfers between Levels are recognized at period end.
For more information on valuation inputs, see Note 2 — Significant Accounting Policies in the Notes to Financial Statements.
See accompanying notes to financial statements.
CITY NATIONAL ROCHDALE FUNDS | PAGE 13
schedule of investments
March 31, 2014 (Unaudited)
City National Rochdale Limited Maturity Fixed Income Fund
| | | | | |
| Corporate Bonds [45.9%] | |
| Banks [20.8%] | |
| Barclays Bank, MTN | | | | | | |
| 2.638%, 01/10/14(A) | | $ | 545 | | | $ | 545 | |
| Citigroup | | | | | | | | |
| 5.850%, 08/02/16 | | | 975 | | | | 1,076 | |
| Deutsche Bank | | | | | | | | |
| 3.250%, 01/11/16 | | | 900 | | | | 937 | |
| Goldman Sachs Group | | | | | | | | |
| 5.125%, 01/15/15 | | | 900 | | | | 932 | |
| Korea Development Bank | | | | | | | | |
| 3.250%, 03/09/16 | | | 575 | | | | 599 | |
| Morgan Stanley | | | | | | | | |
| 5.375%, 10/15/15 | | | 900 | | | | 959 | |
| Wachovia | | | | | | | | |
| 5.750%, 06/15/17 | | | 900 | | | | 1,023 | |
| | | | | | | | | |
| Total Banks | | | | 6,071 | |
| | | | | | | | | |
| Diversified Operations [3.4%] | |
| Glencore Funding | | | | | | | | |
| 1.700%, 05/27/16(B) | | | 1,000 | | | | 1,003 | |
| | | | | | | | | |
| Financial Services [3.4%] | |
| General Electric Capital, MTN | | | | | | | | |
| 2.950%, 05/09/16 | | | 950 | | | | 990 | |
| | | | | | | | | |
| Investment Banker/Broker Dealer [3.7%] | |
| Merrill Lynch, MTN | | | | | | | | |
| 6.400%, 08/28/17 | | | 940 | | | | 1,079 | |
| | | | | | | | | |
| Oil, Gas & Consumable Fuels [3.4%] | |
| ConocoPhillips Canada Funding I | | | | | | | | |
| 5.625%, 10/15/16 | | | 900 | | | | 1,005 | |
| | | | | |
| Petroleum & Fuel Products [3.3%] | |
| Occidental Petroleum | | | | | | |
| 1.750%, 02/15/17 | | $ | 940 | | | $ | 953 | |
| | | | | | | | | |
| Telephones & Telecommunications [7.9%] | |
| America Movil | | | | | | | | |
| 1.234%, 03/12/14(A) | | | 1,000 | | | | 1,011 | |
| AT&T | | | | | | | | |
| 2.400%, 08/15/16 | | | 1,000 | | | | 1,030 | |
| Verizon Communications | | | | | | | | |
| 1.763%, 03/17/14(A) | | | 250 | | | | 257 | |
| | | | | | | | | |
| Total Telephones & Telecommunications | | | | 2,298 | |
| | | | | | | | | |
| Total Corporate Bonds | |
| (Cost $13,254) | | | | 13,399 | |
| | | | | | | | | |
| U.S. Government Agency Obligations [25.4%] | |
| FHLB | | | | | | | | |
| 0.500%, 11/20/15 | | | 580 | | | | 581 | |
| FHLMC | | | | | | | | |
| 4.375%, 07/17/15 | | | 1,800 | | | | 1,896 | |
| FNMA | | | | | | | | |
| 5.000%, 03/15/16 | | | 1,175 | | | | 1,279 | |
| 0.500%, 07/02/15 | | | 1,500 | | | | 1,506 | |
| 0.500%, 03/30/16 | | | 1,200 | | | | 1,201 | |
| 0.175%, 01/16/14(A) | | | 940 | | | | 940 | |
| | | | | | | | | |
| Total U.S. Government Agency Obligations | | | | | |
| (Cost $7,375) | | | | 7,403 | |
| | | | | | | | | |
| U.S. Treasury Obligations [10.1%] | |
| U.S. Treasury Note | | | | | | | | |
| 4.250%, 08/15/15 | | | 560 | | | | 591 | |
| 3.125%, 10/31/16 | | | 625 | | | | 664 | |
| 2.000%, 01/31/16 | | | 750 | | | | 772 | |
| 1.000%, 08/31/16 | | | 900 | | | | 908 | |
| | | | | | | | | |
| Total U.S. Treasury Obligations | |
| (Cost $2,919) | | | | 2,935 | |
| | | | | | | | | |
| U.S. Government Mortgage-Backed Obligations [4.7%] | |
| FHLMC, Pool G12806 | | | | | | | | |
| 5.500%, 09/01/22 | | | 59 | | | | 64 | |
| FHLMC, Pool G18247 | | | | | | | | |
| 5.000%, 04/01/23 | | | 36 | | | | 39 | |
| FHLMC, Pool G18251 | | | | | | | | |
| 5.000%, 05/01/23 | | | 55 | | | | 60 | |
See accompanying notes to financial statements.
CITY NATIONAL ROCHDALE FUNDS | PAGE 14
schedule of investments
March 31, 2014 (Unaudited)
City National Rochdale Limited Maturity Fixed Income Fund (continued)
| | | | | |
| FHLMC, Pool G18321 | | | | | | |
| 4.500%, 08/01/24 | | $ | 28 | | | $ | 30 | |
| FHLMC, Pool J04241 | | | | | | | | |
| 5.500%, 01/01/22 | | | 27 | | | | 29 | |
| FHLMC, Pool J04459 | | | | | | | | |
| 5.000%, 03/01/22 | | | 29 | | | | 31 | |
| FHLMC, Pool J04508 | | | | | | | | |
| 5.000%, 03/01/22 | | | 31 | | | | 33 | |
| FHLMC, Pool J07575 | | | | | | | | |
| 5.000%, 04/01/23 | | | 27 | | | | 29 | |
| FHLMC REMIC, Ser 2011-3877, Cl ND, | | | | | | | | |
| 3.000%, 02/15/25 | | | 479 | | | | 499 | |
| FNMA, Pool 837196 | | | | | | | | |
| 5.500%, 02/01/21 | | | 59 | | | | 64 | |
| FNMA, Pool 933915 | | | | | | | | |
| 4.500%, 06/01/23 | | | 39 | | | | 42 | |
| FNMA, Pool 961783 | | | | | | | | |
| 4.500%, 02/01/23 | | | 58 | | | | 61 | |
| FNMA REMIC, Ser 2010-39, Cl PD, | | | | | | | | |
| 3.000%, 06/25/38 | | | 371 | | | | 380 | |
| | | | | | | | | |
| Total U.S. Government Mortgage-Backed Obligations | | | | | |
| (Cost $1,299) | | | | 1,361 | |
| | | | | | | | | |
| Municipal Bonds [5.6%] | |
| California [2.4%] | |
| Southern California, Public Power Authority, Sub-Ser B, RB, AGM, ETM | | | | | | | | |
| 6.930%, 05/15/17 | | | 595 | | | | 688 | |
| | | | | | | | | |
| Florida [3.2%] | |
| Florida State, Hurricane Catastrophe Fund Finance, Ser A, RB | | | | | | | | |
| 2.107%, 07/01/18 | | | 930 | | | | 935 | |
| | | | | | | | | |
| Total Municipal Bonds | |
| (Cost $1,607) | | | | 1,623 | |
| | | | | | | | | |
| Sovereign Debt [3.3%] | |
| Province of Ontario, Canada | | | | | | | | |
| 1.600%, 09/21/16 | | | 950 | | | | 967 | |
| | | | | | | | | |
| Total Sovereign Debt | |
| (Cost $962) | | | | 967 | |
| | | | | |
| Asset-Backed Security [3.1%] | |
| Hyundai Auto Receivables Trust, Ser 2013-B, Cl A2 | | | | | | |
| 0.530%, 03/15/16 | | $ | 896 | | | $ | 897 | |
| | | | | | | | | |
| Total Asset-Backed Security | |
| (Cost $896) | | | | 897 | |
| | | | | | | | | |
| Short-Term Investments [1.5%] | |
| City National Rochdale Government Money Market Fund, 0.010%*† | | | 219,880 | | | | 220 | |
| SEI Daily Income Trust Government Fund, Cl A, 0.010%* | | | 219,880 | | | | 220 | |
| | | | | | | | | |
| Total Short-Term Investments | |
| (Cost $440) | | | | 440 | |
| | | | | | | | | |
| Total Investments [99.6%] | |
| (Cost $28,752) | | | $ | 29,025 | |
Percentages are based on Net Assets of $29,156 (000).
| * | The rate reported is the 7-day effective yield as of March 31, 2014. |
| † | Investment in Affiliate. |
| (A) | Floating Rate Security — The rate reported is the rate in effect on March 31, 2014. |
| (B) | Security exempt from registration under Rule 144A of the Securities Act of 1933. These securities may be resold in transactions exempt from registration normally to qualified institutions. On March 31, 2014, the value of these securities amounted to $1,003 (000), representing 3.4% of the net assets of the Fund. |
AGM — Assured Guarantee Municipal
Cl — Class
ETM — Escrowed to Maturity
FHLB — Federal Home Loan Bank
FHLMC — Federal Home Loan Mortgage Corporation
FNMA — Federal National Mortgage Association
MTN — Medium Term Note
RB — Revenue Bond
REMIC — Real Estate Mortgage Investment Conduit
Ser — Series
See accompanying notes to financial statements.
CITY NATIONAL ROCHDALE FUNDS | PAGE 15
schedule of investments
March 31, 2014 (Unaudited)
City National Rochdale Limited Maturity Fixed Income Fund (concluded)
The following is a list of the inputs used as of March 31, 2014 in valuing the Fund’s investments carried at value (000):
| Investments in Securities | | | | | | | | | | | | |
| Corporate Bonds | | $ | — | | | $ | 13,399 | | | $ | — | | | $ | 13,399 | |
| U.S. Government Agency Obligations | | | — | | | | 7,403 | | | | — | | | | 7,403 | |
| U.S. Treasury Obligations | | | — | | | | 2,935 | | | | — | | | | 2,935 | |
| U.S. Government Mortgage-Backed Obligations | | | — | | | | 1,361 | | | | — | | | | 1,361 | |
| Municipal Bonds | | | — | | | | 1,623 | | | | — | | | | 1,623 | |
| Sovereign Debt | | | — | | | | 967 | | | | — | | | | 967 | |
| Asset-Backed Security | | | — | | | | 897 | | | | — | | | | 897 | |
| Short-Term Investments | | | 440 | | | | — | | | | — | | | | 440 | |
| Total Investments in Securities | | $ | 440 | | | $ | 28,585 | | | $ | — | | | $ | 29,025 | |
For the period ended March 31, 2014, there have been no transfers between any of the fair value hierarchy levels. Transfers between Levels are recognized at period end.
For information on valuation inputs, see Note 2 — Significant Accounting Policies in the Notes to Financial Statements.
See accompanying notes to financial statements.
CITY NATIONAL ROCHDALE FUNDS | PAGE 16
schedule of investments
March 31, 2014 (Unaudited)
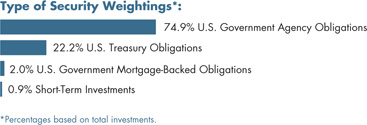
City National Rochdale Government Bond Fund
| | | | | |
| U.S. Government Agency Obligations [74.5%] | |
| Egypt Government AID Bond | | | | | | |
| 4.450%, 09/15/15 | | $ | 8,000 | | | $ | 8,472 | |
| FFCB | | | | | | | | |
| 0.239%, 01/26/14(A) | | | 10,000 | | | | 9,983 | |
| FHLB | | | | | | | | |
| 3.250%, 09/12/14 | | | 3,000 | | | | 3,043 | |
| 1.150%, 07/25/18 | | | 1,520 | | | | 1,475 | |
| 1.000%, 06/09/17 | | | 6,675 | | | | 6,654 | |
| 0.683%, 01/08/14(A) | | | 8,000 | | | | 8,001 | |
| 0.500%, 11/20/15 | | | 4,930 | | | | 4,939 | |
| FHLMC | | | | | | | | |
| 1.250%, 05/12/17 | | | 2,350 | | | | 2,368 | |
| 1.000%, 06/29/17 | | | 4,000 | | | | 3,986 | |
| 1.000%, 09/29/17 | | | 4,325 | | | | 4,290 | |
| FNMA | | | | | | | | |
| 5.000%, 03/15/16 | | | 5,475 | | | | 5,961 | |
| 5.000%, 02/13/17 | | | 5,395 | | | | 6,021 | |
| 4.875%, 12/15/16 | | | 5,000 | | | | 5,544 | |
| 2.375%, 04/11/16 | | | 5,000 | | | | 5,189 | |
| 1.875%, 02/19/19 | | | 445 | | | | 447 | |
| 1.625%, 11/27/18 | | | 5,000 | | | | 4,980 | |
| 1.000%, 10/16/17 | | | 7,000 | | | | 6,911 | |
| 0.875%, 05/21/18 | | | 4,500 | | | | 4,378 | |
| 0.625%, 08/26/16 | | | 5,000 | | | | 4,997 | |
| 0.175%, 01/15/14(A) | | | 10,000 | | | | 10,000 | |
| Israel Government AID Bond | | | | | | | | |
| 3.815%, 05/15/20(B) | | | 15,528 | | | | 13,326 | |
| Tennessee Valley Authority, Ser E | | | | | | | | |
| 6.250%, 12/15/17 | | | 8,000 | | | | 9,388 | |
| | | | | | | | | |
| Total U.S. Government Agency Obligations | | | | | |
| (Cost $129,180) | | | | 130,353 | |
| | | | | | | | | |
| U.S. Treasury Obligations [22.1%] | |
| U.S. Treasury Bond | | | | | | | | |
| 2.625%, 02/29/16 | | | 5,000 | | | | 5,212 | |
| U.S. Treasury Notes | | | | | | | | |
| 3.250%, 05/31/16 | | | 5,000 | | | | 5,298 | |
| 3.000%, 02/28/17 | | | 2,415 | | | | 2,563 | |
| 2.875%, 03/31/18 | | | 5,000 | | | | 5,295 | |
| | | | | |
| 2.750%, 02/28/18 | | $ | 5,000 | | | $ | 5,271 | |
| 1.375%, 11/30/15 to 09/30/18 | | | 10,500 | | | | 10,553 | |
| 0.875%, 02/28/17 | | | 4,500 | | | | 4,500 | |
| | | | | | | | | |
| Total U.S. Treasury Obligations | |
| (Cost $38,800) | | | | 38,692 | |
| | | | | | | | | |
| U.S. Government Mortgage-Backed Obligations [2.0%] | |
| FHLMC REMIC, Ser 2011-3877, Cl ND, | | | | | | | | |
| 3.000%, 02/15/25 | | | 1,902 | | | | 1,980 | |
| FNMA ARM, Pool 766620 | | | | | | | | |
| 2.419%, 01/01/14(A) | | | 214 | | | | 229 | |
| FNMA REMIC, Ser 2011-144, Cl CE, | | | | | | | | |
| 1.250%, 06/25/35 | | | 780 | | | | 782 | |
| GNMA, Pool 329656 | | | | | | | | |
| 8.000%, 08/15/22 | | | 5 | | | | 5 | |
| GNMA, Pool 376533 | | | | | | | | |
| 7.500%, 06/15/24 | | | 2 | | | | 2 | |
| GNMA, Pool 398660 | | | | | | | | |
| 7.500%, 05/15/26 | | | 2 | | | | 2 | |
| GNMA, Pool 497411 | | | | | | | | |
| 6.000%, 01/15/29 | | | 5 | | | | 5 | |
| GNMA, Pool 571376 | | | | | | | | |
| 7.000%, 12/15/16 | | | 4 | | | | 4 | |
| GNMA, Pool 584992 | | | | | | | | |
| 7.500%, 04/15/32 | | | 28 | | | | 31 | |
| GNMA ARM, Pool G2 81318 | | | | | | | | |
| 1.625%, 01/01/14(A) | | | 291 | | | | 303 | |
| GNMA ARM, Pool G2 81447 | | | | | | | | |
| 1.625%, 01/01/14(A) | | | 60 | | | | 63 | |
| | | | | | | | | |
| Total U.S. Government Mortgage-Backed Obligations | | | | | |
| (Cost $3,291) | | | | 3,406 | |
| | | | | | | | | |
| Short-Term Investments [0.9%] | |
| City National Rochdale Government Money Market Fund, 0.010%*† | | | 800,857 | | | | 801 | |
| SEI Daily Income Trust Government Fund, Cl A, 0.010%* | | | 800,857 | | | | 801 | |
| | | | | | | | | |
| Total Short-Term Investments | |
| (Cost $1,602) | | | | 1,602 | |
| | | | | | | | | |
| Total Investments [99.5%] | |
| (Cost $172,873) | | | $ | 174,053 | |
See accompanying notes to financial statements.
CITY NATIONAL ROCHDALE FUNDS | PAGE 17
schedule of investments
March 31, 2014 (Unaudited)
City National Rochdale Government Bond Fund (concluded)
Percentages are based on Net Assets of $174,937 (000).
| * | The rate reported is the 7-day effective yield as of March 31, 2014. |
| † | Investment in Affiliate. |
| (A) | Floating Rate Security — The rate reported is the rate in effect on March 31, 2014. |
| (B) | Zero coupon security. The rate reported is the effective yield at time of purchase. |
AID — Agency for International Development
ARM — Adjustable Rate Mortgage
Cl — Class
FFCB — Federal Farm Credit Bank
FHLB — Federal Home Loan Bank
FHLMC — Federal Home Loan Mortgage Corporation
FNMA — Federal National Mortgage Association
GNMA — Government National Mortgage Association
REMIC — Real Estate Mortgage Investment Conduit
Ser — Series
The following is a list of the inputs used as of March 31, 2014 in valuing the Fund’s investments carried at value (000):
| Investments in Securities | | | | | | | | | | | | |
| U.S. Government Agency Obligations | | $ | — | | | $ | 130,353 | | | $ | — | | | $ | 130,353 | |
| U.S. Treasury Obligations | | | — | | | | 38,692 | | | | — | | | | 38,692 | |
| U.S. Government Mortgage-Backed Obligations | | | — | | | | 3,406 | | | | — | | | | 3,406 | |
| Short-Term Investments | | | 1,602 | | | | — | | | | — | | | | 1,602 | |
| Total Investments in Securities | | $ | 1,602 | | | $ | 172,451 | | | $ | — | | | $ | 174,053 | |
For the period ended March 31, 2014, there have been no transfers between any of the fair value hierarchy levels. Transfers between Levels are recognized at period end.
For information on valuation inputs, see Note 2 — Significant Accounting Policies in the Notes to Financial Statements.
See accompanying notes to financial statements.
CITY NATIONAL ROCHDALE FUNDS | PAGE 18
schedule of investments
March 31, 2014 (Unaudited)
City National Rochdale Corporate Bond Fund
| | | | | |
| Corporate Bonds [89.8%] | |
| Banks [10.9%] | |
| Bank of America, MTN | | | | | | |
| 6.400%, 08/28/17 | | $ | 400 | | | $ | 459 | |
| Barclays Bank, MTN | | | | | | | | |
| 2.638%, 01/10/14(A) | | | 1,950 | | | | 1,950 | |
| Citigroup | | | | | | | | |
| 5.850%, 08/02/16 | | | 980 | | | | 1,082 | |
| 5.500%, 02/15/17 | | | 250 | | | | 276 | |
| Countrywide Financial | | | | | | | | |
| 6.250%, 05/15/16 | | | 1,200 | | | | 1,316 | |
| HSBC Finance | | | | | | | | |
| 5.250%, 04/15/15 | | | 1,250 | | | | 1,306 | |
| JPMorgan Chase | | | | | | | | |
| 6.300%, 04/23/19 | | | 2,000 | | | | 2,351 | |
| 6.000%, 01/15/18 | | | 405 | | | | 465 | |
| National Australia Bank, MTN | | | | | | | | |
| 2.750%, 03/09/17 | | | 480 | | | | 500 | |
| Nordea Bank | | | | | | | | |
| 2.250%, 03/20/15(B) | | | 500 | | | | 509 | |
| UBS, MTN | | | | | | | | |
| 5.875%, 12/20/17 | | | 2,000 | | | | 2,291 | |
| Wells Fargo Bank | | | | | | | | |
| 5.750%, 05/16/16 | | | 2,400 | | | | 2,639 | |
| | | | | | | | | |
| Total Banks | | | | 15,144 | |
| | | | | |
| Broadcasting & Cable [1.6%] | |
| Time Warner Cable | | | | | | |
| 5.000%, 02/01/20 | | $ | 2,000 | | | $ | 2,184 | |
| | | | | | | | | |
| Coatings/Paint [1.1%] | |
| Sherwin-Williams | | | | | | | | |
| 3.125%, 12/15/14 | | | 1,450 | | | | 1,476 | |
| | | | | | | | | |
| Computers-Memory Devices [0.8%] | |
| NetApp | | | | | | | | |
| 2.000%, 12/15/17 | | | 1,000 | | | | 1,011 | |
| | | | | | | | | |
| Diversified Metals & Mining [1.8%] | |
| Rio Tinto | | | | | | | | |
| 2.250%, 09/20/16 | | | 2,500 | | | | 2,570 | |
| | | | | | | | | |
| Diversified Minerals [3.5%] | |
| BHP Billiton | | | | | | | | |
| 5.250%, 12/15/15 | | | 2,377 | | | | 2,567 | |
| Teck Resources | | | | | | | | |
| 3.150%, 01/15/17 | | | 1,250 | | | | 1,296 | |
| 2.500%, 02/01/18 | | | 1,000 | | | | 1,004 | |
| | | | | | | | | |
| Total Diversified Minerals | | | | 4,867 | |
| | | | | | | | | |
| Diversified Operations [2.7%] | |
| Glencore Funding | | | | | | | | |
| 1.700%, 05/27/16(B) | | | 1,500 | | | | 1,505 | |
| Siemens Finc | | | | | | | | |
| 5.750%, 10/17/16(B) | | | 2,000 | | | | 2,235 | |
| | | | | | | | | |
| Total Diversified Operations | | | | 3,740 | |
| | | | | | | | | |
| Drugs [2.9%] | |
| AbbVie | | | | | | | | |
| 1.200%, 11/06/15 | | | 1,000 | | | | 1,009 | |
| GlaxoSmithKline Capital | | | | | | | | |
| 5.650%, 05/15/18 | | | 405 | | | | 465 | |
| Wyeth | | | | | | | | |
| 5.500%, 02/15/16 | | | 2,000 | | | | 2,180 | |
| 5.450%, 04/01/17 | | | 330 | | | | 370 | |
| | | | | | | | | |
| Total Drugs | | | | 4,024 | |
| | | | | | | | | |
| Electric Utilities [3.4%] | |
| American Electric Power | | | | | | | | |
| 1.650%, 12/15/17 | | | 1,000 | | | | 994 | |
| Commonwealth Edison | | | | | | | | |
| 6.950%, 07/15/18 | | | 1,000 | | | | 1,171 | |
See accompanying notes to financial statements.
CITY NATIONAL ROCHDALE FUNDS | PAGE 19
schedule of investments
March 31, 2014 (Unaudited)
City National Rochdale Corporate Bond Fund (continued)
| | | | | |
| Exelon | | | | | | |
| 4.900%, 06/15/15 | | $ | 1,138 | | | $ | 1,190 | |
| Exelon Generation | | | | | | | | |
| 6.200%, 10/01/17 | | | 1,200 | | | | 1,356 | |
| | | | | | | | | |
| Total Electric Utilities | | | | 4,711 | |
| | | | | | | | | |
| Financial Services [16.1%] | |
| American Honda Finance | | | | | | | | |
| 1.600%, 02/16/18(B) | | | 1,000 | | | | 990 | |
| Caisse Centrale Desjardins du Quebec | | | | | | | | |
| 2.650%, 09/16/15(B) | | | 3,000 | | | | 3,085 | |
| Daimler Finance North America | | | | | | | | |
| 2.300%, 01/09/15(B) | | | 1,350 | | | | 1,367 | |
| 1.875%, 09/15/14(B) | | | 1,000 | | | | 1,006 | |
| Ford Motor Credit | | | | | | | | |
| 8.000%, 12/15/16 | | | 1,000 | | | | 1,170 | |
| 2.375%, 01/16/18 | | | 1,000 | | | | 1,008 | |
| General Electric Capital | | | | | | | | |
| 5.300%, 02/11/21 | | | 2,500 | | | | 2,812 | |
| General Electric Capital, MTN | | | | | | | | |
| 2.950%, 05/09/16 | | | 50 | | | | 52 | |
| Harley-Davidson Financial Services, MTN | | | | | | | | |
| 3.875%, 03/15/16(B) | | | 1,000 | | | | 1,053 | |
| Nissan Motor Acceptance, MTN | | | | | | | | |
| 1.950%, 09/12/17(B) | | | 2,000 | | | | 2,009 | |
| PACCAR Financial, MTN | | | | | | | | |
| 0.800%, 02/08/16 | | | 1,500 | | | | 1,501 | |
| Toyota Motor Credit, MTN | | | | | | | | |
| 2.050%, 01/12/17 | | | 2,000 | | | | 2,053 | |
| VW Credit, MTN | | | | | | | | |
| 1.875%, 10/13/16 | | | 3,000 | | | | 3,057 | |
| Western Union | | | | | | | | |
| 5.930%, 10/01/16 | | | 1,000 | | | | 1,107 | |
| | | | | | | | | |
| Total Financial Services | | | | 22,270 | |
| | | | | | | | | |
| Food, Beverage & Tobacco [1.6%] | |
| Anheuser-Busch InBev Worldwide | | | | | | | | |
| 5.375%, 11/15/14 | | | 1,195 | | | | 1,231 | |
| Dr Pepper Snapple Group | | | | | | | | |
| 2.900%, 01/15/16 | | | 1,000 | | | | 1,037 | |
| | | | | | | | | |
| Total Food, Beverage & Tobacco | | | | 2,268 | |
| | | | | |
| Home Decoration Products [0.3%] | |
| Newell Rubbermaid | | | | | | |
| 2.000%, 06/15/15 | | $ | 500 | | | $ | 506 | |
| | | | | | | | | |
| Insurance [4.2%] | |
| Aflac | | | | | | | | |
| 8.500%, 05/15/19 | | | 1,100 | | | | 1,414 | |
| Genworth Financial | | | | | | | | |
| 7.700%, 06/15/20 | | | 1,400 | | | | 1,706 | |
| Metropolitan Life Global Funding I, MTN | | | | | | | | |
| 1.875%, 06/22/18(B) | | | 2,700 | | | | 2,689 | |
| | | | | | | | | |
| Total Insurance | | | | 5,809 | |
| | | | | | | | | |
| Investment Banker/Broker Dealer [8.4%] | |
| Deutsche Bank | | | | | | | | |
| 1.400%, 02/13/17 | | | 2,500 | | | | 2,500 | |
| Goldman Sachs Group | | | | | | | | |
| 5.625%, 01/15/17 | | | 1,700 | | | | 1,877 | |
| 2.625%, 01/31/19 | | | 500 | | | | 499 | |
| Jefferies Group | | | | | | | | |
| 8.500%, 07/15/19 | | | 1,370 | | | | 1,684 | |
| Macquarie Group | | | | | | | | |
| 6.000%, 01/14/20(B) | | | 2,000 | | | | 2,218 | |
| Morgan Stanley, MTN | | | | | | | | |
| 6.250%, 08/28/17 | | | 2,000 | | | | 2,289 | |
| 5.950%, 12/28/17 | | | 465 | | | | 531 | |
| | | | | | | | | |
| Total Investment Banker/Broker Dealer | | | | 11,598 | |
| | | | | | | | | |
| Machinery [0.1%] | |
| Caterpillar Financial Services, MTN | | | | | | | | |
| 1.625%, 06/01/17 | | | 215 | | | | 217 | |
| | | | | | | | | |
| Medical Products & Services [1.9%] | |
| Genentech | | | | | | | | |
| 4.750%, 07/15/15 | | | 2,500 | | | | 2,633 | |
| | | | | | | | | |
| Medical-HMO [0.9%] | |
| UnitedHealth Group | | | | | | | | |
| 4.875%, 03/15/15 | | | 1,205 | | | | 1,256 | |
| | | | | | | | | |
| Metal-Copper [0.7%] | |
| Freeport-McMoRan Copper & Gold | | | | | | | | |
| 1.400%, 02/13/15 | | | 1,000 | | | | 1,006 | |
See accompanying notes to financial statements.
CITY NATIONAL ROCHDALE FUNDS | PAGE 20
schedule of investments
March 31, 2014 (Unaudited)
City National Rochdale Corporate Bond Fund (continued)
| | | | | |
| Petroleum & Fuel Products [8.2%] | |
| BP Capital Markets | | | | | | |
| 1.375%, 05/10/18 | | $ | 2,800 | | | $ | 2,741 | |
| Kinder Morgan Energy Partners | | | | | | | | |
| 6.000%, 02/01/17 | | | 1,000 | | | | 1,114 | |
| Shell International Finance | | | | | | | | |
| 3.250%, 09/22/15 | | | 2,500 | | | | 2,611 | |
| Sunoco Logistics Partners Operations | | | | | | | | |
| 4.650%, 02/15/22 | | | 1,300 | | | | 1,359 | |
| Total Capital International | | | | | | | | |
| 1.550%, 06/28/17 | | | 425 | | | | 429 | |
| 1.500%, 02/17/17 | | | 2,980 | | | | 3,025 | |
| | | | | | | | | |
| Total Petroleum & Fuel Products | | | | 11,279 | |
| | | | | | | | | |
| Real Estate Investment Trusts [5.1%] | |
| American Tower | | | | | | | | |
| 7.250%, 05/15/19 | | | 1,200 | | | | 1,427 | |
| HCP | | | | | | | | |
| 5.625%, 05/01/17 | | | 1,000 | | | | 1,120 | |
| Health Care REIT | | | | | | | | |
| 4.700%, 09/15/17 | | | 1,000 | | | | 1,093 | |
| Kimco Realty | | | | | | | | |
| 6.875%, 10/01/19 | | | 1,080 | | | | 1,286 | |
| Simon Property Group | | | | | | | | |
| 6.100%, 05/01/16 | | | 2,000 | | | | 2,189 | |
| | | | | | | | | |
| Total Real Estate Investment Trusts | | | | 7,115 | |
| | | | | | | | | |
| Regional Authority [1.0%] | |
| Province of Ontario Canada | | | | | | | | |
| 1.600%, 09/21/16 | | | 1,360 | | | | 1,385 | |
| | | | | | | | | |
| Retail [4.0%] | |
| Lowe’s | | | | | | | | |
| 6.100%, 09/15/17 | | | 3,000 | | | | 3,451 | |
| Wal-Mart Stores | | | | | | | | |
| 2.875%, 04/01/15 | | | 2,000 | | | | 2,050 | |
| | | | | | | | | |
| Total Retail | | | | 5,501 | |
| | | | | | | | | |
| Telephones & Telecommunications [7.7%] | |
| America Movil | | | | | | | | |
| 1.234%, 03/12/14(A) | | | 2,750 | | | | 2,781 | |
| AT&T | | | | | | | | |
| 5.100%, 09/15/14 | | | 2,000 | | | | 2,042 | |
| 2.950%, 05/15/16 | | | 2,600 | | | | 2,707 | |
| | | | | |
| Motorola Solutions | | | | | | |
| 6.000%, 11/15/17 | | $ | 1,000 | | | $ | 1,143 | |
| Telefonica Emisiones SAU | | | | | | | | |
| 6.421%, 06/20/16 | | | 1,000 | | | | 1,107 | |
| Verizon Communications | | | | | | | | |
| 2.550%, 06/17/19 | | | 1,000 | | | | 1,006 | |
| | | | | | | | | |
| Total Telephones & Telecommunications | | | | 10,786 | |
| | | | | | | | | |
| Trucking & Leasing [0.9%] | |
| Penske Truck Leasing | | | | | | | | |
| 3.750%, 05/11/17(B) | | | 750 | | | | 796 | |
| 3.125%, 05/11/15(B) | | | 500 | | | | 512 | |
| | | | | | | | | |
| Total Trucking & Leasing | | | | 1,308 | |
| | | | | | | | | |
| Total Corporate Bonds | |
| (Cost $122,323) | | | | 124,664 | |
| | | | | | | | | |
| Municipal Bonds [3.1%] | |
| California [0.1%] | |
| California State, GO | | | | | | | | |
| 5.700%, 11/01/21 | | | 185 | | | | 216 | |
| | | | | | | | | |
| Florida [3.0%] | |
| Florida State, Hurricane Catastrophe Fund Finance, Ser A, RB | | | | | | | | |
| 2.107%, 07/01/18 | | | 4,130 | | | | 4,150 | |
| | | | | | | | | |
| Total Municipal Bonds | |
| (Cost $4,317) | | | | 4,366 | |
| | | | | | | | | |
| Unaffiliated Registered Investment Company [1.9%] | |
| Vanguard High-Yield Corporate Fund | | | 427,350 | | | | 2,611 | |
| | | | | | | | | |
| Total Unaffiliated Registered Investment Company | | | | | |
| (Cost $2,500) | | | | 2,611 | |
| | | | | | | | | |
| Asset-Backed Security [1.0%] | |
| Hyundai Auto Receivables Trust, Ser 2013-B, Cl A2 | | | | | | | | |
| 0.530%, 03/15/16 | | | 1,345 | | | | 1,346 | |
| | | | | | | | | |
| Total Asset-Backed Security | |
| (Cost $1,345) | | | | 1,346 | |
See accompanying notes to financial statements.
CITY NATIONAL ROCHDALE FUNDS | PAGE 21
schedule of investments
March 31, 2014 (Unaudited)
City National Rochdale Corporate Bond Fund (concluded)
| | | | | |
| Sovereign Debt [0.7%] | |
| Petroleum & Fuel Products [0.7%] | |
| Korea National Oil | | | | | | |
| 2.875%, 11/09/15(B) | | $ | 1,000 | | | $ | 1,028 | |
| | | | | | | | | |
| Total Sovereign Debt | |
| (Cost $999) | | | | 1,028 | |
| | | | | | | | | |
| U.S. Government Mortgage-Backed Obligation [0.1%] | |
| FNMA REMIC, Ser 2002-56, Cl MC | | | | | | | | |
| 5.500%, 09/25/17 | | | 93 | | | | 98 | |
| | | | | | | | | |
| Total U.S. Government Mortgage-Backed Obligation | | | | | |
| (Cost $93) | | | | 98 | |
| | | | | | | | | |
| Short-Term Investments [2.5%] | |
| City National Rochdale Prime Money Market Fund, Institutional Class, 0.010%*† | | | 1,754,959 | | | | 1,755 | |
| SEI Daily Income Trust, Prime Obligation Fund, Cl A, 0.010%* | | | 1,754,959 | | | | 1,755 | |
| | | | | | | | | |
| Total Short-Term Investments | |
| (Cost $3,510) | | | | 3,510 | |
| | | | | | | | | |
| Total Investments [99.1%] | |
| (Cost $135,087) | | | $ | 137,623 | |
Percentages are based on Net Assets of $138,864 (000).
| * | The rate reported is the 7-day effective yield as of March 31, 2014. |
| † | Investment in Affiliate. |
| (A) | Floating Rate Security — The rate reported is the rate in effect on March 31, 2014. |
| (B) | Security exempt from registration under Rule 144A of the Securities Act of 1933. These securities may be resold in transactions exempt from registration normally to qualified institutions. On March 31, 2014, the value of these securities amounted to $21,002 (000), representing 15.1% of the net assets of the Fund. |
Cl — Class
FNMA — Federal National Mortgage Association
GO — General Obligation
HMO — Health Maintenance Organization
MTN — Medium Term Note
RB — Revenue Bond
REIT — Real Estate Investment Trust
REMIC — Real Estate Mortgage Investment Conduit
Ser — Series
The following is a list of the inputs used as of March 31, 2014 in valuing the Fund’s investments carried at value (000):
| Investments in Securities | | | | | | | | | | | | |
| Corporate Bonds | | $ | — | | | $ | 124,664 | | | $ | — | | | $ | 124,664 | |
| Municipal Bonds | | | — | | | | 4,366 | | | | — | | | | 4,366 | |
| Unaffiliated Registered Investment Company | | | 2,611 | | | | — | | | | — | | | | 2,611 | |
| Asset-Backed Security | | | — | | | | 1,346 | | | | — | | | | 1,346 | |
| Sovereign Debt | | | — | | | | 1,028 | | | | — | | | | 1,028 | |
| U.S. Government Mortgage-Backed Obligation | | | — | | | | 98 | | | | — | | | | 98 | |
| Short-Term Investments | | | 3,510 | | | | — | | | | — | | | | 3,510 | |
| Total Investments in Securities | | $ | 6,121 | | | $ | 131,502 | | | $ | — | | | $ | 137,623 | |
For the period ended March 31, 2014, there have been no transfers between any of the fair value hierarchy levels. Transfers between Levels are recognized at period end.
For information on valuation inputs, see Note 2 — Significant Accounting Policies in the Notes to Financial Statements.
See accompanying notes to financial statements.
CITY NATIONAL ROCHDALE FUNDS | PAGE 22
schedule of investments
March 31, 2014 (Unaudited)
City National Rochdale California Tax Exempt Bond Fund
| | | | | |
| Municipal Bonds [97.6%] | |
| California [93.3%] | |
| ABAG Finance Authority for Nonprofit, Odd Fellows Home Project, Ser A, RB | | | | | | |
| Callable 04/01/23 @ 100 | | | | | | |
| 5.000%, 04/01/24 | | $ | 1,000 | | | $ | 1,134 | |
| Bay Area, Infrastructure Financing Authority, State Payment Acceleration Project, RB, NATL-RE FGIC | | | | | | | | |
| Pre-Refunded @ 100 | | | | | | | | |
| 5.000%, 08/01/14(A) | | | 860 | | | | 874 | |
| Beverly Hills, Community Facilities District, Ser 2002-A | | | | | | | | |
| 4.000%, 09/01/22 | | | 250 | | | | 266 | |
| Brea, Redevelopment Agency, Redevelopment Project AB, TA | | | | | | | | |
| 5.000%, 08/01/20 | | | 500 | | | | 580 | |
| California State, Department of Water Resources, Ser F-3, RB | | | | | | | | |
| Callable 05/01/18 @ 100 | | | | | | | | |
| 4.375%, 05/01/20 | | | 200 | | | | 226 | |
| California State, Economic Recovery Authority, Ser A, GO | | | | | | | | |
| Callable 07/01/19 @ 100 | | | | | | | | |
| 5.000%, 07/01/20 | | | 1,000 | | | | 1,182 | |
| California State, Economic Recovery Authority, Ser A, GO, NATL-RE | | | | | | | | |
| Callable 07/01/14 @ 100 | | | | | | | | |
| 5.000%, 07/01/15 | | | 965 | | | | 976 | |
| | | | | |
| California State, GO | | | | | | |
| Callable 03/01/15 @ 100 | | | | | | |
| 5.000%, 03/01/16 | | $ | 1,500 | | | $ | 1,563 | |
| California State, GO | | | | | | | | |
| Callable 11/01/20 @ 100 | | | | | | | | |
| 5.000%, 11/01/22 | | | 1,025 | | | | 1,178 | |
| California State, GO | | | | | | | | |
| 4.000%, 02/01/18 | | | 1,000 | | | | 1,108 | |
| 4.000%, 02/01/19 | | | 1,000 | | | | 1,121 | |
| 5.000%, 11/01/19 | | | 1,000 | | | | 1,182 | |
| 5.000%, 09/01/20 | | | 1,000 | | | | 1,180 | |
| 5.000%, 09/01/21 | | | 1,200 | | | | 1,413 | |
| 5.000%, 12/01/21 | | | 1,000 | | | | 1,179 | |
| California State, Ser E, GO | | | | | | | | |
| Callable 06/01/18 @ 100 | | | | | | | | |
| 0.939%, 12/01/29(B) | | | 1,000 | | | | 1,007 | |
| California State, Health Facilities Financing Authority, Catholic Healthcare, Ser A, RB | | | | | | | | |
| 5.000%, 07/01/18 | | | 500 | | | | 563 | |
| California State, Health Facilities Financing Authority, Catholic Healthcare, Ser A, RB | | | | | | | | |
| Callable 03/01/21 @ 100 | | | | | | | | |
| 5.250%, 03/01/22 | | | 265 | | | | 302 | |
| California State, Health Facilities Financing Authority, Cedars-Sinai Medical Center, RB | | | | | | | | |
| 5.000%, 08/15/17 | | | 750 | | | | 850 | |
| California State, Health Facilities Financing Authority, City of Hope, Ser A, RB | | | | | | | | |
| 5.000%, 11/15/17 | | | 375 | | | | 423 | |
| California State, Health Facilities Financing Authority, Memorial Health Services Corp, Ser A, RB | | | | | | | | |
| 5.000%, 10/01/15 | | | 450 | | | | 482 | |
| California State, Health Facilities Financing Authority, St. Joseph Health System, Ser D, RB | | | | | | | | |
| 5.000%, 07/01/43(B) | | | 500 | | | | 580 | |
| California State, Health Facilities Financing Authority, Sutter Health, Ser A, RB | | | | | | | | |
| 5.500%, 08/15/17 | | | 500 | | | | 571 | |
| California State, Health Facilities Financing Authority, Sutter Health, Ser A, RB | | | | | | | | |
| 5.500%, 08/15/18 | | | 125 | | | | 147 | |
See accompanying notes to financial statements.
CITY NATIONAL ROCHDALE FUNDS | PAGE 23
schedule of investments
March 31, 2014 (Unaudited)
City National Rochdale California Tax Exempt Bond Fund (continued)
| | | | | |
| California State, Public Works Board, Department of Corrections and Rehab Project, Ser A, RB | | | | | | |
| 4.000%, 09/01/17 | | $ | 500 | | | $ | 550 | |
| 5.000%, 09/01/22 | | | 1,000 | | | | 1,160 | |
| California State, Public Works Board, Department of Corrections-Administration Project, Ser A, RB, AMBAC | | | | | | | | |
| Callable 05/02/14 @ 100 | | | | | | | | |
| 5.250%, 03/01/18 | | | 155 | | | | 156 | |
| California State, Public Works Board, Department of Corrections-State Prisons, Ser A, RB, AMBAC | | | | | | | | |
| 5.000%, 12/01/19 | | | 850 | | | | 940 | |
| California State, Public Works Board, State Prisons, Ser C, RB | | | | | | | | |
| 5.000%, 10/01/16 | | | 1,000 | | | | 1,108 | |
| California State, Public Works Board, University of California Research Project, Ser L, RB, NATL-RE | | | | | | | | |
| Pre-Refunded @ 100 | | | | | | | | |
| 5.250%, 11/01/15(A) | | | 1,000 | | | | 1,081 | |
| California State, Public Works Board, Various Capital Projects, Ser A, RB | | | | | | | | |
| 4.000%, 04/01/17 | | | 500 | | | | 545 | |
| California State, Public Works Board, Various Capital Projects, Ser G-1, RB | | | | | | | | |
| Callable 10/01/19 @ 100 | | | | | | | | |
| 5.250%, 10/01/23 | | | 250 | | | | 289 | |
| California Statewide, Communities Development Authority, Kaiser Permanente, Ser A, RB | | | | | | | | |
| 5.000%, 04/01/19 | | | 850 | | | | 994 | |
| California Statewide, Communities Development Authority, Kaiser Permanente, Ser B, RB | | | | | | | | |
| Callable 02/01/17 @ 100 | | | | | | | | |
| 1.010%, 04/01/52(B) | | | 2,000 | | | | 2,007 | |
| California Statewide, Communities Development Authority, Kaiser Permanente, Ser B, RB | | | | | | | | |
| 3.900%, 08/01/31(B) | | | 625 | | | | 631 | |
| | | | | |
| California Statewide, Communities Development Authority, Sutter Health, Ser A, RB | | | | | | |
| 5.000%, 08/15/18 | | $ | 200 | | | $ | 230 | |
| Carlsbad, Public Financing Authority, Municipal Golf Course Project, Ser A, RB, AMBAC | | | | | | | | |
| 4.500%, 09/01/16 | | | 350 | | | | 376 | |
| Chula Vista, Elementary School District, School Building Project, Ser A, COP, AGM | | | | | | | | |
| 5.000%, 09/01/22 | | | 1,000 | | | | 1,128 | |
| Chula Vista, Police Facility Project, COP | | | | | | | | |
| 5.000%, 10/01/21 | | | 360 | | | | 412 | |
| El Dorado, Irrigation District, Ser A, RB, AGM | | | | | | | | |
| 4.500%, 03/01/19 | | | 500 | | | | 568 | |
| Gilroy, Public Facilities Financing Authority, RB | | | | | | | | |
| 5.000%, 11/01/21 | | | 940 | | | | 1,053 | |
| Irvine Ranch, Water District, Ser B, SAB | | | | | | | | |
| Callable 04/01/14 @ 100 | | | | | | | | |
| 0.070%, 10/01/41 (B) (C) | | | 2,500 | | | | 2,500 | |
| Jefferson, Unified High School District, Ser A, GO, NATL-RE FGIC | | | | | | | | |
| 5.000%, 08/01/14 | | | 200 | | | | 203 | |
| Jurupa, Unified School District, GO, AGM | | | | | | | | |
| 5.000%, 08/01/22 | | | 1,000 | | | | 1,150 | |
| Los Angeles County, Metropolitan Transportation Authority, Proposition C, Ser A, RB, NATL-RE | | | | | | | | |
| Pre-Refunded @ 100 | | | | | | | | |
| 5.000%, 07/01/14(A) | | | 200 | | | | 202 | |
| Los Angeles, Department of Airports, Ser C, RB | | | | | | | | |
| 4.000%, 05/15/17 | | | 545 | | | | 598 | |
| Los Angeles, Department of Water & Power, Power Systems Revenue, Ser A, RB | | | | | | | | |
| 5.000%, 07/01/19 | | | 500 | | | | 591 | |
| Los Angeles, Municipal Improvement Authority, Capital Equipment, Ser A, RB | | | | | | | | |
| 4.000%, 11/01/19 | | | 575 | | | | 634 | |
See accompanying notes to financial statements.
CITY NATIONAL ROCHDALE FUNDS | PAGE 24
schedule of investments
March 31, 2014 (Unaudited)
City National Rochdale California Tax Exempt Bond Fund (continued)
| | | | | |
| Los Angeles, Municipal Improvement Authority, Real Property, Ser E, RB | | | | | | |
| 5.000%, 09/01/15 | | $ | 275 | | | $ | 293 | |
| Los Angeles, Municipal Improvement Authority, Ser C, RB | | | | | | | | |
| 4.000%, 09/01/16 | | | 500 | | | | 538 | |
| Los Angeles, Ser A, GO | | | | | | | | |
| 5.000%, 09/01/21 | | | 240 | | | | 289 | |
| Los Angeles, Unified School District, Election of 2005, Ser E, GO, AGM | | | | | | | | |
| Callable 07/01/17 @ 100 | | | | | | | | |
| 5.000%, 07/01/19 | | | 500 | | | | 565 | |
| Los Angeles, Unified School District, Headquarters Building Project, Ser A, COP | | | | | | | | |
| 5.000%, 10/01/20 | | | 1,000 | | | | 1,155 | |
| Los Angeles, Unified School District, Headquarters Building Project, Ser B, COP | | | | | | | | |
| Callable 10/01/22 @ 100 | | | | | | | | |
| 5.000%, 10/01/25 | | | 1,000 | | | | 1,126 | |
| Los Angeles, Unified School District, Ser A-1, GO, NATL-RE | | | | | | | | |
| Callable 07/01/14 @ 100 | | | | | | | | |
| 5.000%, 07/01/17 | | | 165 | | | | 167 | |
| Modesto, Irrigation District, Ser A, RB | | | | | | | | |
| 5.000%, 07/01/17 | | | 1,000 | | | | 1,129 | |
| Mount San Antonio, Community College District, GO, ETM | | | | | | | | |
| 3.456%, 05/01/15(D) | | | 635 | | | | 633 | |
| Northern California, Power Agency, Hydroelectric Project Number 1, Ser C, RB | | | | | | | | |
| Callable 07/01/18 @ 100 | | | | | | | | |
| 5.000%, 07/01/20 | | | 500 | | | | 575 | |
| Oakland-Alameda County, Coliseum Authority, Ser A, RB | | | | | | | | |
| 5.000%, 02/01/20 | | | 795 | | | | 905 | |
| Orange County, Public Financing Authority, RB, NATL-RE | | | | | | | | |
| 5.000%, 07/01/17 | | | 1,050 | | | | 1,187 | |
| Orange County, Sanitation District, Ser A, COP | | | | | | | | |
| 3.000%, 02/01/17 | | | 500 | | | | 533 | |
| | | | | |
| Port of Oakland, Ser B, RB, NATL-RE | | | | | | |
| Callable 11/01/17 @ 100 | | | | | | |
| 5.000%, 11/01/23 | | $ | 500 | | | $ | 543 | |
| Port of Oakland, Ser C, RB, NATL-RE | | | | | | | | |
| 5.000%, 11/01/15 | | | 450 | | | | 481 | |
| Riverside County, Public Safety Communication, Ser A, COP, AMBAC | | | | | | | | |
| 5.000%, 11/01/17 | | | 1,600 | | | | 1,787 | |
| Riverside Public Financing Authority, Ser A, RB | | | | | | | | |
| 5.000%, 11/01/21 | | | 1,000 | | | | 1,143 | |
| Roseville, Finance Authority, RB | | | | | | | | |
| 4.000%, 02/01/18 | | | 500 | | | | 553 | |
| Sacramento, Area Flood Control Agency, Ser A, SAB, NATL-RE FGIC | | | | | | | | |
| Callable 10/01/17 @ 100 | | | | | | | | |
| 5.000%, 10/01/21 | | | 400 | | | | 440 | |
| Sacramento, Financing Authority, EPA Building Project, Ser A, RB | | | | | | | | |
| 4.000%, 05/01/18 | | | 850 | | | | 930 | |
| Sacramento, Unified School District, Election of 2002, GO, NATL-RE | | | | | | | | |
| Pre-Refunded @ 100 | | | | | | | | |
| 5.000%, 07/01/15(A) | | | 300 | | | | 318 | |
| San Francisco City & County, Airports Commission, Ser B, RB | | | | | | | | |
| 5.000%, 05/01/17 | | | 495 | | | | 558 | |
| San Francisco City & County, Finance, RB, NATL-RE | | | | | | | | |
| Callable 07/01/14 @ 100 | | | | | | | | |
| 3.750%, 07/01/18 | | | 500 | | | | 503 | |
| San Francisco City & County, Multiple Capital Improvement Projects, Ser B, COP | | | | | | | | |
| Callable 04/01/19 @ 100 | | | | | | | | |
| 5.000%, 04/01/22 | | | 735 | | | | 832 | |
| San Francisco City & County, Public Utilities Commission Water Revenue, Sub-Ser A, RB | | | | | | | | |
| 5.000%, 11/01/20 | | | 250 | | | | 297 | |
| San Francisco City & County, Redevelopment Agency, Redevelopment Projects, Ser B, TA | | | | | | | | |
| 5.000%, 08/01/17 | | | 540 | | | | 573 | |
See accompanying notes to financial statements.
CITY NATIONAL ROCHDALE FUNDS | PAGE 25
schedule of investments
March 31, 2014 (Unaudited)
City National Rochdale California Tax Exempt Bond Fund (continued)
| | | | | |
| San Francisco City & County, Redevelopment Agency, Redevelopment Projects, Ser B, TA, NATL-RE FGIC | | | | | | |
| Callable 05/02/14 @ 100 | | | | | | |
| 5.250%, 08/01/18 | | $ | 600 | | | $ | 601 | |
| San Mateo County, Transportation Authority, Ser A, RB, NATL-RE | | | | | | | | |
| 5.250%, 06/01/19 | | | 755 | | | | 884 | |
| San Mateo, Unified High School District, GO, ETM | | | | | | | | |
| 1.071%, 02/15/15(D) | | | 1,000 | | | | 998 | |
| Santa Clara County, Financing Authority, Lease Revenue Capital Project, RB | | | | | | | | |
| 5.000%, 02/01/20 | | | 500 | | | | 577 | |
| Santa Cruz County, Redevelopment Agency, TA | | | | | | | | |
| 5.000%, 09/01/19 | �� | | 640 | | | | 730 | |
| Santa Margarita, Dana Point Authority, Improvement Districts 3-3A-4-4A, Ser A, RB, AMBAC | | | | | | | | |
| Callable 08/01/14 @ 100 | | | | | | | | |
| 5.000%, 08/01/15 | | | 290 | | | | 295 | |
| Southern California, Public Power Authority, Subordinated Southern Transmission Project, Ser A, RB | | | | | | | | |
| 5.000%, 07/01/17 | | | 1,200 | | | | 1,364 | |
| Turlock, Irrigation District, Ser A, RB | | | | | | | | |
| 5.000%, 01/01/17 | | | 575 | | | | 634 | |
| University of California, Revenues Limited Project, Ser E, RB | | | | | | | | |
| Callable 05/15/20 @ 100 | | | | | | | | |
| 5.000%, 05/15/22 | | | 500 | | | | 575 | |
| University of California, Ser AK, RB | | | | | | | | |
| 5.000%, 05/15/14(B) | | | 1,000 | | | | 1,189 | |
| Ventura County, Public Financing Authority, Ser A, RB | | | | | | | | |
| 4.000%, 11/01/18 | | | 500 | | | | 558 | |
| Ventura County, Public Financing Authority, Ser B, RB | | | | | | | | |
| 5.000%, 11/01/18 | | | 500 | | | | 580 | |
| | | | | | | | | |
| Total California | | | | 66,231 | |
| | | | | |
| Connecticut [2.9%] | |
| Connecticut State, Ser A, GO | | | | | | |
| Callable 03/01/15 @ 100 | | | | | | |
| 1.410%, 03/01/19(B) | | $ | 1,000 | | | $ | 1,011 | |
| Connecticut State, Ser D, GO | | | | | | | | |
| 0.940%, 08/15/19 (B) | | | 1,000 | | | | 1,014 | |
| | | | | | | | | |
| Total Connecticut | | | | 2,025 | |
| | | | | | | | | |
| Illinois [0.9%] | |
| Illinois State, GO | | | | | | | | |
| 4.000%, 07/01/18 | | | 600 | | | | 656 | |
| | | | | | | | | |
| New York [0.3%] | |
| New York State, Local Assistance Correction Authority, Ser E, RB | | | | | | | | |
| 6.000%, 04/01/14 | | | 190 | | | | 190 | |
| | | | | | | | | |
| Puerto Rico [0.2%] | |
| Puerto Rico, Sales Tax Financing, Sub-Ser A, RB, ETM | | | | | | | | |
| 4.000%, 08/01/16 | | | 130 | | | | 141 | |
| | | | | | | | | |
| Total Municipal Bonds | |
| (Cost $68,130) | | | | 69,243 | |
| | | | | | | | | |
| Short-Term Investment [4.2%] | |
| City National Rochdale Tax Exempt Money Market Fund, Institutional Class, 0.010%*† | | | 2,986,997 | | | | 2,987 | |
| | | | | | | | | |
| Total Short-Term Investment | |
| (Cost $2,987) | | | | 2,987 | |
| | | | | | | | | |
| Total Investments [101.8%] | |
| (Cost $71,117) | | | $ | 72,230 | |
Percentages are based on Net Assets of $70,979 (000).
| * | The rate reported is the 7-day effective yield as of March 31, 2014. |
| † | Investment in Affiliate. |
| (A) | Pre-Refunded Security — The maturity date shown is the pre-refunded date. |
| (B) | Floating Rate Security — The rate reported is the rate in effect on March 31, 2014. |
| (C) | Securities are held in conjunction with a letter of credit from a major bank or financial institution. |
| (D) | Zero coupon security. The rate reported is the effective yield at time of purchase. |
See accompanying notes to financial statements.
CITY NATIONAL ROCHDALE FUNDS | PAGE 26
schedule of investments
March 31, 2014 (Unaudited)
City National Rochdale California Tax Exempt Bond Fund (concluded)
ABAG — Association of Bay Area Governments
AGM — Assured Guarantee Municipal
AMBAC — American Municipal Bond Assurance Company
COP — Certificate of Participation
EPA — Environmental Protection Agency
ETM — Escrowed to Maturity
FGIC — Financial Guaranty Insurance Company
GO — General Obligation
NATL-RE — National Public Finance Guarantee Corporation
RB — Revenue Bond
SAB — Special Assessment Board
Ser — Series
TA — Tax Allocation
The following is a list of the inputs used as of March 31, 2014 in valuing the Fund’s investments carried at value (000):
| Investments in Securities | | | | | | | | | | | | |
| Municipal Bonds | | $ | — | | | $ | 69,243 | | | $ | — | | | $ | 69,243 | |
| Short-Term Investment | | | 2,987 | | | | — | | | | — | | | | 2,987 | |
| Total Investments in Securities | | $ | 2,987 | | | $ | 69,243 | | | $ | — | | | $ | 72,230 | |
For the period ended March 31, 2014, there have been no transfers between Level 1 and Level 2 assets and liabilities. Transfers between Levels are recognized at period end.
For more information on valuation inputs, see Note 2 — Significant Accounting Policies in the Notes to Financial Statements.
See accompanying notes to financial statements.
CITY NATIONAL ROCHDALE FUNDS | PAGE 27
schedule of investments
March 31, 2014 (Unaudited)
City National Rochdale Municipal High Income Fund
| | | | | |
| Municipal Bonds [89.3%] | |
| Alabama [2.6%] | |
| Cullman County, Health Care Authority, Cullman Regional Medical Center Project, Ser A, RB | | | | | | |
| Callable 02/01/19 @ 100 | | | | | | |
| 7.000%, 02/01/36 | | $ | 4,315 | | | $ | 4,612 | |
| | | | | | | | | |
| Alaska [0.8%] | |
| Northern Tobacco Securitization, Ser A, RB | | | | | | | | |
| Callable 06/01/14 @ 100 | | | | | | | | |
| 5.000%, 06/01/46 | | | 2,000 | | | | 1,397 | |
| | | | | | | | | |
| Arizona [2.2%] | |
| La Paz County, Industrial Development Authority, RB | | | | | | | | |
| Callable 10/01/21 @ 102 | | | | | | | | |
| 7.800%, 10/01/39 | | | 2,250 | | | | 2,334 | |
| Pima County, Industrial Development Authority, Noah Webster School Project, RB | | | | | | | | |
| Callable 12/15/23 @ 100 | | | | | | | | |
| 7.000%, 12/15/43 | | | 1,500 | | | | 1,510 | |
| | | | | | | | | |
| Total Arizona | | | | 3,844 | |
| | | | | |
| California [10.2%] | |
| California State, GO | | | | | | |
| Callable 12/01/23 @ 100 | | | | | | |
| 5.000%, 12/01/31 | | $ | 1,500 | | | $ | 1,658 | |
| California State, Pollution Control Financing Authority, San Diego Water Project, RB | | | | | | | | |
| Callable 07/01/17 @ 100 | | | | | | | | |
| 5.000%, 11/21/45 (A) | | | 2,000 | | | | 1,972 | |
| California State, Public Works Board, Department of Corrections and Rehab Project, Ser A, RB | | | | | | | | |
| Callable 09/01/24 @ 100 | | | | | | | | |
| 5.000%, 09/01/31 | | | 5,000 | | | | 5,431 | |
| California State, Public Works Board, Various Capital Projects, Ser A, RB | | | | | | | | |
| Callable 04/01/22 @ 100 | | | | | | | | |
| 5.000%, 04/01/37 | | | 1,000 | | | | 1,047 | |
| Golden State Tobacco Securitization, Golden State Tobacco Settlement, Ser A, RB | | | | | | | | |
| Callable 06/01/15 @ 100 | | | | | | | | |
| 5.000%, 06/01/45 | | | 1,000 | | | | 1,001 | |
| Golden State Tobacco Securitization, Golden State Tobacco Settlement, Ser A-1, RB | | | | | | | | |
| Callable 06/01/17 @ 100 | | | | | | | | |
| 5.125%, 06/01/47 | | | 2,000 | | | | 1,475 | |
| San Buenaventura, Community Memorial Health System Project, RB | | | | | | | | |
| Callable 12/01/21 @ 100 | | | | | | | | |
| 7.500%, 12/01/41 | | | 1,000 | | | | 1,128 | |
| 7.000%, 12/01/26 | | | 1,000 | | | | 1,136 | |
| San Mateo, Community Facilities District, SAB | | | | | | | | |
| Callable 09/01/22 @ 100 | | | | | | | | |
| 5.500%, 09/01/44 | | | 1,000 | | | | 1,005 | |
| Southern California, Tobacco Securitization Authority, Ser A-1, RB | | | | | | | | |
| Callable 06/01/14 @ 100 | | | | | | | | |
| 5.000%, 06/01/37 | | | 3,000 | | | | 2,286 | |
| | | | | | | | | |
| Total California | | | | 18,139 | |
See accompanying notes to financial statements.
CITY NATIONAL ROCHDALE FUNDS | PAGE 28
schedule of investments
March 31, 2014 (Unaudited)
City National Rochdale Municipal High Income Fund (continued)
| | | | | |
| Colorado [7.2%] | |
| Arkansas State, River Power Authority, Colorado Improvement Project, RB | | | | | | |
| Callable 10/01/20 @ 100 | | | | | | |
| 6.125%, 10/01/40 | | $ | 2,500 | | | $ | 2,636 | |
| Colorado State, High Performance Transportation Enterprise, US 36 & I-25 Managed Lanes Project, RB, AMT | | | | | | | | |
| Callable 01/01/23 @ 100 | | | | | | | | |
| 5.750%, 01/01/44 | | | 2,000 | | | | 2,004 | |
| Colorado State, Public Energy Authority, RB | | | | | | | | |
| 6.500%, 11/15/38 | | | 4,000 | | | | 5,050 | |
| Denver City & County, United Airlines Project, Ser A, RB, AMT | | | | | | | | |
| Callable 10/01/17 @ 100 | | | | | | | | |
| 5.250%, 10/01/32 | | | 1,000 | | | | 956 | |
| Regional Transportation District, Denver Transportation Partners Project, RB | | | | | | | | |
| Callable 07/15/20 @ 100 | | | | | | | | |
| 6.000%, 01/15/41 | | | 1,000 | | | | 1,052 | |
| Wildgrass County, Metropolitan District, GO | | | | | | | | |
| Callable 12/01/16 @ 100 | | | | | | | | |
| 6.200%, 12/01/34 | | | 1,000 | | | | 979 | |
| | | | | | | | | |
| Total Colorado | | | | 12,677 | |
| | | | | | | | | |
| Delaware [1.1%] | |
| Delaware State, Economic Development Authority, Indian River Power Project, RB | | | | | | | | |
| Callable 10/01/20 @ 100 | | | | | | | | |
| 5.375%, 10/01/45 | | | 2,000 | | | | 2,016 | |
| | | | | |
| Florida [4.7%] | |
| Alachua County, Health Facilities Authority, East Ridge Retirement Village Project, RB | | | | | | |
| Callable 11/15/24 @ 100 | | | | | | |
| 6.000%, 11/15/34 | | $ | 1,500 | | | $ | 1,488 | |
| Florida State, Development Finance Corp., Renaissance Charter School Project, Ser A, RB | | | | | | | | |
| Callable 06/15/22 @ 100 | | | | | | | | |
| 6.125%, 06/15/43 | | | 1,000 | | | | 910 | |
| Florida State, Village Community Development District No. 10, SAB | | | | | | | | |
| Callable 05/01/23 @ 100 | | | | | | | | |
| 6.000%, 05/01/44 | | | 1,000 | | | | 1,008 | |
| Mid-Bay Bridge Authority, Ser A, RB | | | | | | | | |
| Callable 10/01/21 @ 100 | | | | | | | | |
| 7.250%, 10/01/34 | | | 1,000 | | | | 1,139 | |
| Osceola County, Poinciana Parkway Project, Ser A, RB | | | | | | | | |
| Callable 10/01/24 @ 100 | | | | | | | | |
| 5.375%, 10/01/47 | | | 4,000 | | | | 3,948 | |
| | | | | | | | | |
| Total Florida | | | | 8,493 | |
| | | | | | | | | |
| Georgia [2.7%] | |
| Atlanta, Department of Aviation, RB | | | | | | | | |
| Callable 01/01/24 @ 100 | | | | | | | | |
| 5.000%, 01/01/31 | | | 2,500 | | | | 2,751 | |
| DeKalb County, Hospital Authority, Dekalb Medical Center Project, RB | | | | | | | | |
| Callable 09/01/20 @ 100 | | | | | | | | |
| 6.125%, 09/01/40 | | | 1,000 | | | | 1,013 | |
| Savannah, Economic Development Authority, Marshes Skidaway Island Project, RB | | | | | | | | |
| Callable 01/01/24 @ 100 | | | | | | | | |
| 7.250%, 01/01/49 | | | 810 | | | | 818 | |
| | | | | | | | | |
| Total Georgia | | | | 4,582 | |
See accompanying notes to financial statements.
CITY NATIONAL ROCHDALE FUNDS | PAGE 29
schedule of investments
March 31, 2014 (Unaudited)
City National Rochdale Municipal High Income Fund (continued)
| | | | | |
| Guam [1.8%] | |
| Territory of Guam, Government Waterworks Authority, RB | | | | | | |
| Callable 07/01/20 @ 100 | | | | | | |
| 5.625%, 07/01/40 | | $ | 2,000 | | | $ | 2,072 | |
| Territory of Guam, Ser A, GO | | | | | | | | |
| Callable 11/15/19 @ 100 | | | | | | | | |
| 7.000%, 11/15/39 | | | 1,000 | | | | 1,059 | |
| | | | | | | | | |
| Total Guam | | | | 3,131 | |
| | | | | | | | | |
| Hawaii [0.6%] | |
| Hawaii State, Department of Budget & Finance, 15 Craigside Project, Ser A, RB | | | | | | | | |
| Callable 11/15/19 @ 100 | | | | | | | | |
| 8.750%, 11/15/29 | | | 1,000 | | | | 1,123 | |
| | | | | | | | | |
| Illinois [7.8%] | |
| Chicago, Midway International Airport, Ser B, RB | | | | | | | | |
| Callable 01/01/23 @ 100 | | | | | | | | |
| 5.000%, 01/01/35 | | | 2,000 | | | | 2,063 | |
| Chicago, Refunding Project, Ser A, GO, AGM | | | | | | | | |
| Callable 01/01/24 @ 100 | | | | | | | | |
| 5.250%, 01/01/31 | | | 1,000 | | | | 1,047 | |
| Illinois State, Finance Authority, Admiral at Lake Project, Ser A, RB | | | | | | | | |
| Callable 05/15/20 @ 100 | | | | | | | | |
| 8.000%, 05/15/40 | | | 4,000 | | | | 4,206 | |
| Illinois State, Finance Authority, Roosevelt University Project, RB | | | | | | | | |
| Callable 10/01/19 @ 100 | | | | | | | | |
| 6.500%, 04/01/39 | | | 3,445 | | | | 3,547 | |
| 6.250%, 04/01/29 | | | 1,000 | | | | 1,031 | |
| Illinois State, Finance Authority, Three Crowns Park Plaza Project, Ser A, RB | | | | | | | | |
| Callable 02/15/16 @ 100 | | | | | | | | |
| 5.875%, 02/15/38 | | | 1,000 | | | | 965 | |
| Southwestern Illinois, Development Authority, Collinsville Project, RB | | | | | | | | |
| Callable 03/01/16 @ 100 | | | | | | | | |
| 5.350%, 03/01/31 | | | 1,000 | | | | 742 | |
| | | | | | | | | |
| Total Illinois | | | | 13,601 | |
| | | | | |
| Indiana [4.0%] | |
| Carmel, Barrington Carmel Project, Ser A, RB | | | | | | |
| Callable 11/15/22 @ 100 | | | | | | |
| 7.125%, 11/15/47 | | $ | 2,000 | | | $ | 2,063 | |
| 7.000%, 11/15/32 | | | 1,650 | | | | 1,707 | |
| Indiana State, Finance Authority, Ohio Valley Electric Corporation Project, Ser A, RB | | | | | | | | |
| Callable 06/01/22 @ 100 | | | | | | | | |
| 5.000%, 06/01/39 | | | 1,000 | | | | 983 | |
| Terre Haute, Westminster Village Project, RB | | | | | | | | |
| Callable 08/01/22 @ 100 | | | | | | | | |
| 6.000%, 08/01/39 | | | 2,355 | | | | 2,131 | |
| | | | | | | | | |
| Total Indiana | | | | 6,884 | |
| | | | | | | | | |
| Kentucky [4.8%] | |
| Kentucky State, Economic Development Finance Authority, Owensboro Medical Health System Project, Ser A, RB | | | | | | | | |
| Callable 06/01/20 @ 100 | | | | | | | | |
| 6.500%, 03/01/45 | | | 2,960 | | | | 3,180 | |
| 6.375%, 06/01/40 | | | 1,000 | | | | 1,070 | |
| Kentucky State, Public Transportation Infrastructure Authority, Downtown Crossing Project, RB | | | | | | | | |
| Callable 07/01/23 @ 100 | | | | | | | | |
| 5.750%, 07/01/49 | | | 4,000 | | | | 4,207 | |
| | | | | | | | | |
| Total Kentucky | | | | 8,457 | |
| | | | | | | | | |
| Louisiana [0.6%] | |
| Louisiana State, Public Facilities Authority, Pellets Project, RB, AMT | | | | | | | | |
| Callable 07/01/23 @ 100 | | | | | | | | |
| 10.500%, 07/01/39 | | | 1,000 | | | | 1,021 | |
See accompanying notes to financial statements.
CITY NATIONAL ROCHDALE FUNDS | PAGE 30
schedule of investments
March 31, 2014 (Unaudited)
City National Rochdale Municipal High Income Fund (continued)
| | | | | |
| Maryland [1.2%] | |
| Howard County, Annapolis Junction Town Center Project, TA | | | | | | |
| Callable 02/15/24 @ 100 | | | | | | |
| 5.800%, 02/15/34 | | $ | 725 | | | $ | 727 | |
| Howard County, Annapolis Junction Town Center Project, TA | | | | | | | | |
| Callable 02/15/24 @ 100 | | | | | | | | |
| 6.100%, 02/15/44 | | | 1,425 | | | | 1,429 | |
| | | | | | | | | |
| Total Maryland | | | | 2,156 | |
| | | | | | | | | |
| Michigan [4.4%] | |
| Kent, Hospital Finance Authority, Metropolitan Hospital Project, Ser A, RB | | | | | | | | |
| Callable 07/01/15 @ 100 | | | | | | | | |
| 6.000%, 07/01/35 | | | 3,805 | | | | 3,968 | |
| Michigan State, Public Educational Facilities Authority, Old Redford Project, Ser A, RB | | | | | | | | |
| Callable 12/01/15 @ 100 | | | | | | | | |
| 5.875%, 12/01/30 | | | 2,000 | | | | 1,826 | |
| Michigan State, Tobacco Settlement Finance Authority, Turbo Project, Ser A, RB | | | | | | | | |
| Callable 06/01/18 @ 100 | | | | | | | | |
| 6.875%, 06/01/42 | | | 2,000 | | | | 1,865 | |
| | | | | | | | | |
| Total Michigan | | | | 7,659 | |
| | | | | | | | | |
| Missouri [3.1%] | |
| Kirkwood, Industrial Development Authority, Aberdeen Heights Project, Ser A, RB | | | | | | | | |
| Callable 05/15/20 @ 100 | | | | | | | | |
| 8.250%, 05/15/45 | | | 3,000 | | | | 3,382 | |
| Saint Joseph, Industrial Development Authority, Living Community Saint Joseph Project, RB | | | | | | | | |
| Callable 05/19/14 @ 101 | | | | | | | | |
| 7.000%, 08/15/32 | | | 1,000 | | | | 1,000 | |
| Saint Louis County, Lambert Airport Project, SAB | | | | | | | | |
| Callable 11/01/16 @ 105 | | | | | | | | |
| 9.000%, 11/01/31 | | | 1,000 | | | | 1,016 | |
| | | | | | | | | |
| Total Missouri | | | | 5,398 | |
| | | | | |
| Nebraska [2.3%] | |
| Central Plains Energy Project, Project #3, RB | | | | | | |
| Callable 09/01/22 @ 100 | | | | | | |
| 5.250%, 09/01/37 | | $ | 1,000 | | | $ | 1,047 | |
| 5.000%, 09/01/42 | | | 3,000 | | | | 3,049 | |
| | | | | | | | | |
| Total Nebraska | | | | 4,096 | |
| | | | | | | | | |
| Nevada [1.8%] | |
| Clark County, Department of Aviation, Sub-Ser A-2, RB | | | | | | | | |
| Callable 07/01/24 @ 100 | | | | | | | | |
| 5.000%, 07/01/35 | | | 3,000 | | | | 3,211 | |
| | | | | | | | | |
| New Jersey [1.9%] | |
| New Jersey State, Economic Development Authority, Continental Airlines Project, RB, AMT | | | | | | | | |
| Callable 08/20/22 @ 101 | | | | | | | | |
| 5.250%, 09/15/29 | | | 1,000 | | | | 997 | |
| Tobacco Settlement Financing, Ser 1A, RB | | | | | | | | |
| Callable 06/01/17 @ 100 | | | | | | | | |
| 5.000%, 06/01/41 | | | 3,000 | | | | 2,257 | |
| | | | | | | | | |
| Total New Jersey | | | | 3,254 | |
| | | | | | | | | |
| New York [0.6%] | |
| New York City, Industrial Development Agency, American Airlines JFK International Airport Project, RB, AMT | | | | | | | | |
| Callable 08/01/16 @ 101 | | | | | | | | |
| 7.750%, 08/01/31 | | | 1,000 | | | | 1,094 | |
| | | | | | | | | |
| Ohio [0.5%] | |
| Muskingum County, Genesis Healthcare System Project, RB | | | | | | | | |
| Callable 02/15/23 @ 100 | | | | | | | | |
| 5.000%, 02/15/33 | | | 1,000 | | | | 845 | |
| | | | | | | | | |
| Pennsylvania [0.9%] | |
| Pennsylvania Turnpike Commission, Ser A, RB | | | | | | | | |
| Callable 12/01/24 @ 100 | | | | | | | | |
| 5.000%, 12/01/33 | | | 1,500 | | | | 1,613 | |
See accompanying notes to financial statements.
CITY NATIONAL ROCHDALE FUNDS | PAGE 31
schedule of investments
March 31, 2014 (Unaudited)
City National Rochdale Municipal High Income Fund (continued)
| | | | | |
| Tennessee [1.2%] | |
| Johnson City, Health & Educational Facilities Board, Mountain States Health Alliance Project, RB | | | | | | |
| Callable 07/01/20 @ 100 | | | | | | |
| 6.000%, 07/01/38 | | $ | 2,000 | | | $ | 2,176 | |
| | | | | | | | | |
| Texas [9.7%] | |
| Arlington, Higher Education Finance Corp., Universal Academy Project, Ser A, RB | | | | | | | | |
| Callable 03/01/24 @ 100 | | | | | | | | |
| 7.125%, 03/01/44 | | | 2,300 | | | | 2,273 | |
| 7.000%, 03/01/34 | | | 400 | | | | 396 | |
| Central Texas, Regional Mobility Authority, RB | | | | | | | | |
| Callable 01/01/23 @ 100 | | | | | | | | |
| 5.000%, 01/01/33 | | | 1,000 | | | | 977 | |
| 5.000%, 01/01/42 | | | 1,000 | | | | 939 | |
| Grand Parkway Transportation, Toll Revenue, Sub-Ser B, RB | | | | | | | | |
| Callable 10/01/23 @ 100 | | | | | | | | |
| 5.000%, 04/01/53 | | | 2,000 | | | | 2,080 | |
| Red River, Health Facilities Development, MRC Crossings Project, Ser B, RB | | | | | | | | |
| Callable 05/15/15 @ 100 | | | | | | | | |
| 5.000%, 11/15/19 | | | 1,075 | | | | 1,074 | |
| Sanger, Industrial Development Authority, Pellets Project, Ser B, RB, AMT | | | | | | | | |
| Callable 07/01/22 @ 100 | | | | | | | | |
| 8.000%, 07/01/38 | | | 3,000 | | | | 3,100 | |
| Tarrant County, Cultural Education Facilities Finance Corp., Buckingham Senior Living Community Project, RB | | | | | | | | |
| Callable 11/15/17 @ 100 | | | | | | | | |
| 5.750%, 11/15/37 | | | 1,000 | | | | 990 | |
| Texas State, Municipal Gas Acquisition & Supply I, Ser Senior D, RB | | | | | | | | |
| 6.250%, 12/15/26 | | | 2,000 | | | | 2,383 | |
| Texas State, Private Activity Bond Surface Transportation Corp., LBJ Infrastructure Project, RB | | | | | | | | |
| Callable 06/30/20 @ 100 | | | | | | | | |
| 7.000%, 06/30/40 | | | 1,000 | | | | 1,131 | |
| | | | | |
| Texas State, Private Activity Bond Surface Transportation Corp., NTE Mobility Project, RB | | | | | | |
| Callable 12/31/19 @ 100 | | | | | | |
| 6.875%, 12/31/39 | | $ | 1,350 | | | $ | 1,506 | |
| | | | | | | | | |
| Total Texas | | | | 16,849 | |
| | | | | | | | | |
| Virginia [0.6%] | |
| Virginia State, Small Business Financing Authority, Elizabeth River Project, RB, AMT | | | | | | | | |
| Callable 07/01/22 @ 100 | | | | | | | | |
| 6.000%, 01/01/37 | | | 1,000 | | | | 1,064 | |
| | | | | | | | | |
| Washington [2.2%] | |
| Washington State, Housing Finance Commission, Rockwood Retirement Community Project, RB | | | | | | | | |
| Callable 01/01/15 @ 100 | | | | | | | | |
| 5.375%, 01/01/20 (A) | | | 2,000 | | | | 1,993 | |
| Washington State, Housing Finance Commission, Rockwood Retirement Community Project, RB | | | | | | | | |
| Callable 01/01/24 @ 100 | | | | | | | | |
| 7.500%, 01/01/49 (A) | | | 2,000 | | | | 2,016 | |
| | | | | | | | | |
| Total Washington | | | | 4,009 | |
| | | | | | | | | |
| Wisconsin [0.5%] | |
| Public Finance Authority, Airport Facilities, Senior Trips Obligation Group Project, RB, AMT | | | | | | | | |
| Callable 07/01/22 @ 100 | | | | | | | | |
| 5.000%, 07/01/42 | | | 1,000 | | | | 910 | |
| | | | | | | | | |
| Puerto Rico [7.3%] | |
| Puerto Rico Commonwealth, Aqueduct & Sewer Authority, Ser A, RB | | | | | | | | |
| Callable 07/01/22 @ 100 | | | | | | | | |
| 5.250%, 07/01/24 | | | 2,590 | | | | 1,932 | |
| 5.250%, 07/01/42 | | | 840 | | | | 562 | |
| Puerto Rico Commonwealth, Ser A, GO | | | | | | | | |
| Callable 07/01/20 @ 100 | | | | | | | | |
| 8.000%, 07/01/35 | | | 4,000 | | | | 3,733 | |
See accompanying notes to financial statements.
CITY NATIONAL ROCHDALE FUNDS | PAGE 32
schedule of investments
March 31, 2014 (Unaudited)
City National Rochdale Municipal High Income Fund (concluded)
| | | | | |
| Puerto Rico, Electric Power Authority, Ser A, RB | | | | | | |
| Callable 07/01/23 @ 100 | | | | | | |
| 7.000%, 07/01/33 | | $ | 1,440 | | | $ | 1,019 | |
| 7.000%, 07/01/40 | | | 1,000 | | | | 703 | |
| Puerto Rico, Electric Power Authority, Ser A, RB | | | | | | | | |
| Callable 07/01/22 @ 100 | | | | | | | | |
| 5.000%, 07/01/42 | | | 1,310 | | | | 772 | |
| Puerto Rico, Electric Power Authority, Ser WW, RB | | | | | | | | |
| Callable 07/01/18 @ 100 | | | | | | | | |
| 5.500%, 07/01/38 | | | 1,060 | | | | 637 | |
| Puerto Rico, Electric Power Authority, Ser XX, RB | | | | | | | | |
| Callable 07/01/20 @ 100 | | | | | | | | |
| 5.750%, 07/01/36 | | | 940 | | | | 585 | |
| Puerto Rico, Sales Tax Financing, Sub-Ser A, RB | | | | | | | | |
| Callable 08/01/19 @ 100 | | | | | | | | |
| 6.500%, 08/01/44 | | | 1,250 | | | | 1,070 | |
| 6.000%, 08/01/42 | | | 1,500 | | | | 1,206 | |
| Puerto Rico, Sales Tax Financing, Sub-Ser C, RB | | | | | | | | |
| Callable 08/01/20 @ 100 | | | | | | | | |
| 5.250%, 08/01/41 | | | 1,000 | | | $ | 740 | |
| | | | | | | | | |
| Total Puerto Rico | | | | 12,959 | |
| | | | | | | | | |
| Total Municipal Bonds | |
| (Cost $155,281) | | | | 157,270 | |
| | | | | | | | | |
| Short-Term Investments [15.9%] | |
| City National Rochdale Government Money Market Fund, 0.010%*† | | | 14,056,430 | | | | 14,056 | |
| SEI Daily Income Trust Government Fund, Cl A, 0.010%* | | | 14,056,430 | | | | 14,056 | |
| | | | | | | | | |
| Total Short-Term Investments | | | | | |
| (Cost $28,112) | | | | 28,112 | |
| | | | | | | | | |
| Total Investments [105.2%] | | | | | |
| (Cost $183,393) | | | $ | 185,382 | |
Percentages are based on Net Assets of $176,162 (000).
| * | The rate reported is the 7-day effective yield as of March 31, 2014. |
| † | Investment in Affiliate. |
| (A) | Security exempt from registration under Rule 144A of the Securities Act of 1933. These securities may be resold in transactions exempt from registration normally to qualified institutions. On March 31, 2014, the value of these securities amounted to $5,981 (000), representing 3.4% of the net assets of the Fund. |
AGM — Assured Guarantee Municipal
AMT — Alternative Minimum Tax (subject to)
Cl — Class
GO — General Obligation
RB — Revenue Bond
SAB — Special Assessment Board
Ser — Series
TA — Tax Allocation
The following is a list of the inputs used as of March 31, 2014 in valuing the Fund’s investments carried at value (000):
| Investments in Securities | | | | | | | | | | | | |
| Municipal Bonds | | $ | — | | | $ | 157,270 | | | $ | — | | | $ | 157,270 | |
| Short-Term Investments | | | 28,112 | | | | — | | | | — | | | | 28,112 | |
| Total Investments in Securities | | $ | 28,112 | | | $ | 157,270 | | | $ | — | | | $ | 185,382 | |
For the period ended March 31, 2014, there have been no transfers between Level 1 and Level 2 assets and liabilities. Transfers between Levels are recognized at period end.
For more information on valuation inputs, see Note 2 — Significant Accounting Policies in the Notes to Financial Statements.
See accompanying notes to financial statements.
CITY NATIONAL ROCHDALE FUNDS | PAGE 33
schedule of investments
March 31, 2014 (Unaudited)
City National Rochdale High Yield Bond Fund
| | | | | |
| Corporate Bonds [94.5%] | |
| Advertising Agencies [2.0%] | |
| MDC Partners | | | | | | |
| 6.750%, 04/01/20(A) | | $ | 2,300 | | | $ | 2,421 | |
| | | | | | | | | |
| Air Transportation [0.5%] | |
| CEVA Group | | | | | | | | |
| 9.000%, 09/01/21(A) | | | 300 | | | | 307 | |
| 7.000%, 03/01/21(A) | | | 300 | | | | 305 | |
| | | | | | | | | |
| Total Air Transportation | | | | 612 | |
| | | | | | | | | |
| Airlines [0.2%] | |
| Continental Airlines, Ser 2007-1, Cl C | | | | | | | | |
| 7.339%, 04/19/14 | | | 65 | | | | 65 | |
| Continental Airlines, Ser 2009-2, Cl B | | | | | | | | |
| 9.250%, 05/10/17 | | | 122 | | | | 137 | |
| | | | | | | | | |
| Total Airlines | | | | 202 | |
| | | | | | | | | |
| Autoparts [0.9%] | |
| Stanadyne | | | | | | | | |
| 10.000%, 08/15/14 | | | 900 | | | | 897 | |
| Stanadyne Holdings | | | | | | | | |
| 12.000%, 02/15/15(C) | | | 225 | | | | 170 | |
| | | | | | | | | |
| Total Autoparts | | | | 1,067 | |
| | | | | |
| Broadcasting & Cable [1.5%] | |
| CSC Holdings | | | | | | |
| 6.750%, 11/15/21 | | $ | 300 | | | $ | 335 | |
| DCP | | | | | | | | |
| 10.750%, 08/15/15(A) | | | 500 | | | | 513 | |
| DISH DBS | | | | | | | | |
| 6.750%, 06/01/21 | | | 300 | | | | 336 | |
| Unitymedia Hessen GmbH & KG | | | | | | | | |
| 5.500%, 01/15/23(A) | | | 725 | | | | 740 | |
| | | | | | | | | |
| Total Broadcasting & Cable | | | | 1,924 | |
| | | | | | | | | |
| Building & Construction [1.5%] | |
| Building Materials Corp of America | | | | | | | | |
| 6.750%, 05/01/21(A) | | | 950 | | | | 1,031 | |
| CPG Merger Sub | | | | | | | | |
| 8.000%, 10/01/21(A) | | | 500 | | | | 532 | |
| Dycom Investments | | | | | | | | |
| 7.125%, 01/15/21 | | | 300 | | | | 324 | |
| | | | | | | | | |
| Total Building & Construction | | | | 1,887 | |
| | | | | | | | | |
| Business Services [0.9%] | |
| FTI Consulting | | | | | | | | |
| 6.750%, 10/01/20 | | | 400 | | | | 431 | |
| 6.000%, 11/15/22 | | | 680 | | | | 693 | |
| | | | | | | | | |
| Total Business Services | | | | 1,124 | |
| | | | | | | | | |
| Chemicals [0.2%] | |
| Nexeo Solutions | | | | | | | | |
| 8.375%, 03/01/18 | | | 250 | | | | 252 | |
| | | | | | | | | |
| Communications Software [1.6%] | |
| Aspect Software | | | | | | | | |
| 10.625%, 05/15/17 | | | 1,910 | | | | 2,020 | |
| | | | | | | | | |
| Computer Graphics [0.4%] | |
| Epicor Software | | | | | | | | |
| 8.625%, 05/01/19 | | | 400 | | | | 437 | |
| | | | | | | | | |
| Computer System Design & Services [3.4%] | |
| Brocade Communications Systems | | | | | | | | |
| 4.625%, 01/15/23(A) | | | 1,000 | | | | 955 | |
| iGate | | | | | | | | |
| 9.000%, 05/01/16 | | | 1,250 | | | | 1,312 | |
See accompanying notes to financial statements.
CITY NATIONAL ROCHDALE FUNDS | PAGE 34
schedule of investments
March 31, 2014 (Unaudited)
City National Rochdale High Yield Bond Fund (continued)
| | | | | |
| NCR | | | | | | |
| 5.875%, 12/15/21(A) | | $ | 600 | | | $ | 632 | |
| Stratus Technologies Bermuda | | | | | | | | |
| 12.000%, 03/29/15 | | | 747 | | | | 829 | |
| Stream Global Services | | | | | | | | |
| 11.250%, 10/01/14 | | | 525 | | | | 525 | |
| | | | | | | | | |
| Total Computer System Design & Services | | | | 4,253 | |
| | | | | | | | | |
| Consumer Products & Services [3.3%] | |
| Central Garden and Pet | | | | | | | | |
| 8.250%, 03/01/18 | | | 2,200 | | | | 2,269 | |
| Gibson Brands | | | | | | | | |
| 8.875%, 08/01/18(A) | | | 175 | | | | 186 | |
| Spectrum Brands | | | | | | | | |
| 6.625%, 11/15/22 | | | 65 | | | | 71 | |
| 6.375%, 11/15/20 | | | 130 | | | | 141 | |
| WMG Acquisition | | | | | | | | |
| 6.750%, 04/15/22(A) | | | 500 | | | | 503 | |
| 6.000%, 01/15/21(A) | | | 893 | | | | 931 | |
| | | | | | | | | |
| Total Consumer Products & Services | | | | 4,101 | |
| | | | | | | | | |
| Containers & Packaging [0.8%] | |
| Pretium Packaging | | | | | | | | |
| 11.500%, 04/01/16 | | | 900 | | | | 963 | |
| | | | | | | | | |
| Data Processing/Mgmt [3.5%] | |
| Audatex North America | | | | | | | | |
| 6.000%, 06/15/21(A) | | | 1,700 | | | | 1,815 | |
| First Data | | | | | | | | |
| 8.750%, 01/15/22(A) (D) | | | 2,310 | | | | 2,524 | |
| | | | | | | | | |
| Total Data Processing/Mgmt | | | | 4,339 | |
| | | | | | | | | |
| Diversified Operations [0.5%] | |
| Amsted Industries | | | | | | | | |
| 5.000%, 03/15/22(A) | | | 650 | | | | 653 | |
| | | | | | | | | |
| Drugs [0.2%] | |
| Grifols Worldwide Operations | | | | | | | | |
| 5.250%, 04/01/22(A) | | | 200 | | | | 204 | |
| | | | | | | | | |
| E-Commerce/Services [0.7%] | |
| IAC | | | | | | | | |
| 4.750%, 12/15/22 | | | 900 | | | | 881 | |
| | | | | | | | | |
| Educational Services [1.4%] | |
| Laureate Education | | | | | | | | |
| 9.250%, 09/01/19(A) | | | 1,680 | | | | 1,789 | |
| Description | Face Amount (000) | | |
| Electric Utilities [0.8%] | |
| AES | | | | | |
| 7.375%, 07/01/21 | | $ | 850 | | | $ | 969 | |
| | | | | | | | | |
| Engines-Internal Combust [0.4%] | |
| Briggs & Stratton | | | | | | | | |
| 6.875%, 12/15/20 | | | 500 | | | | 555 | |
| | | | | | | | | |
| Enterprise Software/Serv [0.8%] | |
| Eagle Midco | | | | | | | | |
| 9.000%, 06/15/18(A) | | | 950 | | | | 997 | |
| | | | | | | | | |
| Entertainment & Gaming [1.7%] | |
| Buffalo Thunder Development Authority | | | | | | | | |
| 9.375%, 12/15/14(A) (B) (E) | | | 75 | | | | 30 | |
| Carmike Cinemas | | | | | | | | |
| 7.375%, 05/15/19 | | | 310 | | | | 338 | |
| Choctaw Resort Development Enterprise | | | | | | | | |
| 7.250%, 11/15/19(A) | | | 175 | | | | 173 | |
| Diamond Resorts | | | | | | | | |
| 12.000%, 08/15/18 | | | 750 | | | | 820 | |
| Greektown Holdings | | | | | | | | |
| 8.875%, 03/15/19(A) | | | 500 | | | | 516 | |
| Inn of the Mountain Gods Resort & Casino | | | | | | | | |
| 9.250%, 11/30/20(A) (C) | | | 99 | | | | 97 | |
| Mashantucket Western Pequot Tribe | | | | | | | | |
| 6.500%, 07/01/36 | | | 77 | | | | 12 | |
| Seminole Hard Rock Entertainment | | | | | | | | |
| 5.875%, 05/15/21(A) | | | 100 | | | | 101 | |
| Tunica-Biloxi Gaming Authority | | | | | | | | |
| 9.000%, 11/15/15(A) | | | 125 | | | | 108 | |
| | | | | | | | | |
| Total Entertainment & Gaming | | | | 2,195 | |
| | | | | | | | | |
| Financial Services [4.7%] | |
| Credit Acceptance | | | | | | | | |
| 6.125%, 02/15/21(A) | | | 1,400 | | | | 1,456 | |
| Icahn Enterprises | | | | | | | | |
| 6.000%, 08/01/20(A) | | | 1,250 | | | | 1,325 | |
| 5.875%, 02/01/22(A) | | | 800 | | | | 812 | |
| 4.875%, 03/15/19(A) | | | 200 | | | | 203 | |
| Jefferies Finance | | | | | | | | |
| 7.375%, 04/01/20(A) | | | 395 | | | | 415 | |
| Jefferies LoanCore | | | | | | | | |
| 6.875%, 06/01/20(A) | | | 450 | | | | 457 | |
See accompanying notes to financial statements.
CITY NATIONAL ROCHDALE FUNDS | PAGE 35
schedule of investments
March 31, 2014 (Unaudited)
City National Rochdale High Yield Bond Fund (continued)
| | | | | |
| Nationstar Mortgage | | | | | | |
| 6.500%, 08/01/18 | | $ | 100 | | | $ | 100 | |
| 6.500%, 07/01/21 | | | 400 | | | | 377 | |
| Oxford Finance | | | | | | | | |
| 7.250%, 01/15/18(A) | | | 650 | | | | 689 | |
| | | | | | | | | |
| Total Financial Services | | | | 5,834 | |
| | | | | | | | | |
| Food, Beverage & Tobacco [2.8%] | |
| ARAMARK | | | | | | | | |
| 5.750%, 03/15/20 | | | 375 | | | | 396 | |
| B&G Foods | | | | | | | | |
| 4.625%, 06/01/21 | | | 600 | | | | 593 | |
| Darling International | | | | | | | | |
| 5.375%, 01/15/22(A) | | | 300 | | | | 308 | |
| Diamond Foods | | | | | | | | |
| 7.000%, 03/15/19(A) | | | 300 | | | | 311 | |
| Le-Nature’s | | | | | | | | |
| 9.000%, 06/15/13(A) (B) (E) (I) | | | 150 | | | | — | |
| Vector Group | | | | | | | | |
| 7.750%, 02/15/21 | | | 1,750 | | | | 1,881 | |
| | | | | | | | | |
| Total Food, Beverage & Tobacco | | | | 3,489 | |
| | | | | | | | | |
| Food-Wholesale/Distrib [1.0%] | |
| KeHE Distributors | | | | | | | | |
| 7.625%, 08/15/21(A) | | | 1,100 | | | | 1,183 | |
| | | | | | | | | |
| Gas-Distribution [1.7%] | |
| LBC Tank Terminals Holding Netherlands | | | | | | | | |
| 6.875%, 05/15/23(A) | | | 1,200 | | | | 1,281 | |
| NGL Energy Partners | | | | | | | | |
| 6.875%, 10/15/21(A) | | | 900 | | | | 936 | |
| | | | | | | | | |
| Total Gas-Distribution | | | | 2,217 | |
| | | | | | | | | |
| Gold Mining [0.6%] | |
| Eldorado | | | | | | | | |
| 6.125%, 12/15/20(A) | | | 750 | | | | 750 | |
| | | | | | | | | |
| Insurance [2.2%] | |
| American Equity Investment Life Holding | | | | | | | | |
| 6.625%, 07/15/21 | | | 1,100 | | | | 1,173 | |
| Fidelity & Guaranty Life Holdings | | | | | | | | |
| 6.375%, 04/01/21(A) | | | 425 | | | | 453 | |
| | | | | |
| Ironshore Holdings US | | | | | | |
| 8.500%, 05/15/20(A) | | $ | 950 | | | $ | 1,107 | |
| | | | | | | | | |
| Total Insurance | | | | 2,733 | |
| | | | | | | | | |
| Internet Connectiv Svcs [1.1%] | |
| Zayo Group | | | | | | | | |
| 10.125%, 07/01/20 | | | 1,135 | | | | 1,317 | |
| | | | | | | | | |
| Internet Infrastr Equip [0.6%] | |
| CyrusOne | | | | | | | | |
| 6.375%, 11/15/22 | | | 725 | | | | 765 | |
| | | | | | | | | |
| Investment Banker/Broker Dealer [1.3%] | |
| Nuveen Investments | | | | | | | | |
| 9.125%, 10/15/17(A) | | | 1,560 | | | | 1,650 | |
| | | | | | | | | |
| Machinery [0.4%] | |
| Tempel Steel | | | | | | | | |
| 12.000%, 08/15/16(A) | | | 500 | | | | 470 | |
| | | | | | | | | |
| Medical Products & Services [0.6%] | |
| HCA | | | | | | | | |
| 5.000%, 03/15/24 | | | 250 | | | | 251 | |
| Physio-Control International | | | | | | | | |
| 9.875%, 01/15/19(A) | | | 419 | | | | 470 | |
| | | | | | | | | |
| Total Medical Products & Services | | | | 721 | |
| | | | | | | | | |
| Metal-Copper [1.4%] | |
| KGHM International | | | | | | | | |
| 7.750%, 06/15/19(A) | | | 1,590 | | | | 1,677 | |
| | | | | | | | | |
| Metals & Mining [0.7%] | |
| Kaiser Aluminum | | | | | | | | |
| 8.250%, 06/01/20 | | | 500 | | | | 564 | |
| Mirabela Nickel | | | | | | | | |
| 8.750%, 04/15/18(A) (B) (E) | | | 1,020 | | | | 245 | |
| 3.500%, 06/30/14(A) (B) | | | 161 | | | | 161 | |
| | | | | | | | | |
| Total Metals & Mining | | | | 970 | |
| | | | | | | | | |
| Miscellaneous Business Services [1.9%] | |
| ADT | | | | | | | | |
| 6.250%, 10/15/21(A) | | | 400 | | | | 411 | |
| 4.125%, 04/15/19 | | | 400 | | | | 397 | |
| MCBC Holdings | | | | | | | | |
| 6.817%, 04/15/14(A) (B) (E) | | | 50 | | | | 5 | |
See accompanying notes to financial statements.
CITY NATIONAL ROCHDALE FUNDS | PAGE 36
schedule of investments
March 31, 2014 (Unaudited)
City National Rochdale High Yield Bond Fund (continued)
| | | | | |
| Sitel | | | | | | |
| 11.000%, 08/01/17(A) | | $ | 1,425 | | | $ | 1,530 | |
| | | | | | | | | |
| Total Miscellaneous Business Services | | | | 2,343 | |
| | | | | | | | | |
| Miscellaneous Manufacturing [0.4%] | |
| AGY Holding | | | | | | | | |
| 11.000%, 11/15/14(B) | | | 100 | | | | 98 | |
| Atkore International | | | | | | | | |
| 9.875%, 01/01/18 | | | 392 | | | | 421 | |
| | | | | | | | | |
| Total Miscellaneous Manufacturing | | | | 519 | |
| | | | | | | | | |
| Motion Pictures and Services [0.5%] | |
| DreamWorks Animation SKG | | | | | | | | |
| 6.875%, 08/15/20(A) | | | 600 | | | | 649 | |
| | | | | | | | | |
| Multi-line Insurance [0.6%] | |
| ING US | | | | | | | | |
| 5.650%, 05/15/14(F) | | | 750 | | | | 745 | |
| | | | | | | | | |
| Oil-Field Services [0.8%] | |
| Exterran Partners | | | | | | | | |
| 6.000%, 04/01/21 | | | 225 | | | | 224 | |
| Hiland Partners | | | | | | | | |
| 7.250%, 10/01/20(A) | | | 725 | | | | 788 | |
| | | | | | | | | |
| Total Oil-Field Services | | | | 1,012 | |
| | | | | | | | | |
| Oil-US Royalty Trusts [0.2%] | |
| IronGate Energy Services | | | | | | | | |
| 11.000%, 07/01/18(A) | | | 225 | | | | 224 | |
| | | | | | | | | |
| Paper & Related Products [2.4%] | |
| Opal Acquisition | | | | | | | | |
| 8.875%, 12/15/21(A) | | | 1,800 | | | | 1,809 | |
| Unifrax I | | | | | | | | |
| 7.500%, 02/15/19(A) | | | 1,025 | | | | 1,087 | |
| | | | | | | | | |
| Total Paper & Related Products | | | | 2,896 | |
| | | | | | | | | |
| Petrochemicals [1.8%] | |
| TPC Group | | | | | | | | |
| 8.750%, 12/15/20(A) | | | 2,000 | | | | 2,192 | |
| | | | | | | | | |
| Petroleum & Fuel Products [20.5%] | |
| Access Midstream Partners | | | | | | | | |
| 4.875%, 03/15/24 | | | 350 | | | | 349 | |
| | | | | |
| Atlas Energy Holdings Operating | | | | | | |
| 9.250%, 08/15/21(A) | | $ | 650 | | | $ | 715 | |
| 7.750%, 01/15/21 | | | 550 | | | | 577 | |
| Atlas Pipeline Partners | | | | | | | | |
| 5.875%, 08/01/23 | | | 876 | | | | 865 | |
| 4.750%, 11/15/21 | | | 400 | | | | 380 | |
| Bill Barrett | | | | | | | | |
| 7.625%, 10/01/19 | | | 1,600 | | | | 1,734 | |
| BreitBurn Energy Partners | | | | | | | | |
| 7.875%, 04/15/22 | | | 2,300 | | | | 2,490 | |
| Carrizo Oil & Gas | | | | | | | | |
| 7.500%, 09/15/20 | | | 300 | | | | 330 | |
| Crestwood Midstream Partners | | | | | | | | |
| 6.125%, 03/01/22(A) | | | 200 | | | | 209 | |
| Eagle Rock Energy Partners | | | | | | | | |
| 8.375%, 06/01/19 | | | 1,675 | | | | 1,817 | |
| Endeavor Energy Resources | | | | | | | | |
| 7.000%, 08/15/21(A) | | | 2,100 | | | | 2,205 | |
| Gibson Energy | | | | | | | | |
| 6.750%, 07/15/21(A) | | | 1,575 | | | | 1,689 | |
| Jones Energy Holdings | | | | | | | | |
| 6.750%, 04/01/22(A) | | | 250 | | | | 255 | |
| Legacy Reserves | | | | | | | | |
| 8.000%, 12/01/20 | | | 760 | | | | 813 | |
| 6.625%, 12/01/21 | | | 600 | | | | 598 | |
| Memorial Production Partners | | | | | | | | |
| 7.625%, 05/01/21(A) | | | 1,000 | | | | 1,055 | |
| Midstates Petroleum | | | | | | | | |
| 10.750%, 10/01/20 | | | 700 | | | | 774 | |
| 9.250%, 06/01/21 | | | 400 | | | | 418 | |
| Milagro Oil & Gas | | | | | | | | |
| 10.500%, 05/15/16(B) (E) | | | 400 | | | | 312 | |
| Pacific Drilling | | | | | | | | |
| 5.375%, 06/01/20(A) | | | 750 | | | | 744 | |
| Penn Virginia Resource Partners | | | | | | | | |
| 8.375%, 06/01/20 | | | 1,245 | | | | 1,398 | |
| Precision Drilling | | | | | | | | |
| 6.625%, 11/15/20 | | | 575 | | | | 615 | |
| 6.500%, 12/15/21 | | | 400 | | | | 428 | |
| Rosetta Resources | | | | | | | | |
| 5.875%, 06/01/22 | | | 500 | | | | 511 | |
| SandRidge Energy | | | | | | | | |
| 8.125%, 10/15/22 | | | 1,000 | | | | 1,090 | |
| 7.500%, 03/15/21 | | | 650 | | | | 694 | |
| Summit Midstream Holdings | | | | | | | | |
| 7.500%, 07/01/21(A) | | | 550 | | | | 589 | |
| Ultra Petroleum | | | | | | | | |
| 5.750%, 12/15/18(A) | | | 700 | | | | 735 | |
See accompanying notes to financial statements.
CITY NATIONAL ROCHDALE FUNDS | PAGE 37
schedule of investments
March 31, 2014 (Unaudited)
City National Rochdale High Yield Bond Fund (continued)
| | | | | |
| Unit | | | | | | |
| 6.625%, 05/15/21 | | $ | 1,000 | | | $ | 1,060 | |
| | | | | | | | | |
| Total Petroleum & Fuel Products | | | | 25,449 | |
| | | | | | | | | |
| Printing & Publishing [0.0%] | |
| Expo Event Transco | | | | | | | | |
| 9.000%, 06/15/21(A) | | | 55 | | | | 56 | |
| | | | | | | | | |
| Property/Casualty Ins [0.6%] | |
| Lancashire Holdings | | | | | | | | |
| 5.700%, 10/01/22(A) | | | 480 | | | | 512 | |
| QBE Capital Funding III | | | | | | | | |
| 7.250%, 05/24/41(A) (F) | | | 250 | | | | 268 | |
| | | | | | | | | |
| Total Property/Casualty Ins | | | | 780 | |
| | | | | | | | | |
| Publishing-Books [0.3%] | |
| Baker & Taylor Acquisitions | | | | | | | | |
| 15.000%, 04/01/17(A) (B) | | | 383 | | | | 306 | |
| | | | | | | | | |
| Real Estate [1.2%] | |
| Kennedy-Wilson | | | | | | | | |
| 8.750%, 04/01/19 | | | 1,100 | | | | 1,202 | |
| 5.875%, 04/01/24 | | | 200 | | | | 200 | |
| | | | | | | | | |
| Total Real Estate | | | | 1,402 | |
| | | | | | | | | |
| Retail [6.1%] | |
| AmeriGas Finance | | | | | | | | |
| 7.000%, 05/20/22 | | | 1,510 | | | | 1,650 | |
| Brunswick | | | | | | | | |
| 4.625%, 05/15/21(A) | | | 550 | | | | 538 | |
| Checkers Drive-In Restaurants | | | | | | | | |
| 11.000%, 12/01/17(A) | | | 650 | | | | 725 | |
| CST Brands | | | | | | | | |
| 5.000%, 05/01/23 | | | 150 | | | | 147 | |
| GRD Holdings III | | | | | | | | |
| 10.750%, 06/01/19(A) | | | 2,170 | | | | 2,387 | |
| Guitar Center | | | | | | | | |
| 6.500%, 04/15/19(A) | | | 1,400 | | | | 1,391 | |
| PF Chang’s China Bistro | | | | | | | | |
| 10.250%, 06/30/20(A) | | | 285 | | | | 300 | |
| Sally Holdings | | | | | | | | |
| 5.500%, 11/01/23 | | | 400 | | | | 407 | |
| | | | | | | | | |
| Total Retail | | | | 7,545 | |
| | | | | |
| Schools-Day Care [0.3%] | |
| Knowledge Universe Education | | | | | | |
| 7.750%, 02/01/15(A) | | $ | 400 | | | $ | 401 | |
| | | | | | | | | |
| Security Brokers & Dealers [1.5%] | |
| Bank of America | | | | | | | | |
| 5.200%, 06/01/14(F) | | | 1,000 | | | | 940 | |
| Royal Bank of Scotland Group | | | | | | | | |
| 1.173%, 06/30/14(F) | | | 800 | | | | 801 | |
| | | | | | | | | |
| Total Security Brokers & Dealers | | | | 1,741 | |
| | | | | | | | | |
| Telecommunication Equip [1.7%] | |
| Alcatel-Lucent USA | | | | | | | | |
| 8.875%, 01/01/20(A) | | | 900 | | | | 1,022 | |
| 6.750%, 11/15/20(A) | | | 300 | | | | 317 | |
| Avaya | | | | | | | | |
| 7.000%, 04/01/19(A) | | | 850 | | | | 844 | |
| | | | | | | | | |
| Total Telecommunication Equip | | | | 2,183 | |
| | | | | | | | | |
| Telephones & Telecommunications [1.9%] | |
| Level 3 Financing | | | | | | | | |
| 6.125%, 01/15/21(A) | | | 400 | | | | 422 | |
| SBA Telecommunications | | | | | | | | |
| 5.750%, 07/15/20 | | | 300 | | | | 314 | |
| UPCB Finance V | | | | | | | | |
| 7.250%, 11/15/21(A) | | | 500 | | | | 551 | |
| Virgin Media Finance | | | | | | | | |
| 6.375%, 04/15/23(A) | | | 700 | | | | 742 | |
| Virgin Media Secured Finance | | | | | | | | |
| 5.375%, 04/15/21(A) | | | 355 | | | | 367 | |
| | | | | | | | | |
| Total Telephones & Telecommunications | | | | 2,396 | |
| | | | | | | | | |
| Textile-Home Furnishings [0.5%] | |
| Empire Today | | | | | | | | |
| 11.375%, 02/01/17(A) | | | 665 | | | | 676 | |
| | | | | | | | | |
| Transportation Services [5.0%] | |
| Harbinger Group | | | | | | | | |
| 7.875%, 07/15/19 | | | 1,900 | | | | 2,085 | |
| Marquette Transportation | | | | | | | | |
| 10.875%, 01/15/17 | | | 1,110 | | | | 1,168 | |
| Pegasus Solutions | | | | | | | | |
| 10.500%, 04/15/15(A) (B) | | | 100 | | | | 93 | |
| Sabre | | | | | | | | |
| 8.500%, 05/15/19(A) | | | 1,095 | | | | 1,210 | |
See accompanying notes to financial statements.
CITY NATIONAL ROCHDALE FUNDS | PAGE 38
schedule of investments
March 31, 2014 (Unaudited)
City National Rochdale High Yield Bond Fund (continued)
| | | | | |
| Travelport | | | | | | |
| 13.875%, 03/01/16(A) (D) | | $ | 174 | | | $ | 184 | |
| 11.875%, 09/01/16 | | | 90 | | | | 92 | |
| 8.861%, 06/03/14(A) (F) | | | 1,316 | | | | 1,326 | |
| | | | | | | | | |
| Total Transportation Services | | | | 6,158 | |
| | | | | | | | | |
| Total Corporate Bonds | |
| (Cost $113,441) | | | | 117,294 | |
| | | | | | | | | |
| Loan Participations [5.8%] | |
| Acosta, Term Loan | | | | | | | | |
| 0.000%, 03/03/18(H) | | | 500 | | | | 502 | |
| AlliedBarton, Delayed Term Loan | | | | | | | | |
| 4.250%, 02/12/21(G) | | | 63 | | | | — | |
| AlliedBarton, First Lien Term Loan | | | | | | | | |
| 0.000%, 02/12/21(H) | | | 177 | | | | 176 | |
| American Tire Distributors, First Lien Term Loan | | | | | | | | |
| 0.000%, 06/19/18(H) | | | 300 | | | | 301 | |
| Asurion, Incremental Tranche B-1 | | | | | | | | |
| 5.000%, 05/24/19 | | | 500 | | | | 501 | |
| Atkore International, First Lien Term Loan | | | | | | | | |
| 0.000%, 03/26/21(H) | | | 650 | | | | 649 | |
| CEVA Group, First Lien Term Loan | | | | | | | | |
| 0.000%, 03/12/21(H) | | | 200 | | | | 199 | |
| Entergis, First Lien Term Loan | | | | | | | | |
| 0.000%, 03/25/21(H) | | | 100 | | | | 100 | |
| Flexera Software, Term Loan | | | | | | | | |
| 0.000%, 04/02/20(H) | | | 500 | | | | 498 | |
| Fortescue Metals Group (FMG), Cov-Lite Term Loan | | | | | | | | |
| 0.000%, 06/30/19(H) | | | 500 | | | | 504 | |
| Global Aviation, Term Loan (B) (E) (I) | | | | | | | | |
| 10.000%, 07/13/17 | | | 22 | | | | — | |
| 3.000%, 02/13/17 | | | 216 | | | | — | |
| Interline Brands, Term Loan | | | | | | | | |
| 0.000%, 03/12/21(H) | | | 400 | | | | 399 | |
| International Lease Finance, Term Loan | | | | | | | | |
| 3.500%, 02/26/21 | | | 500 | | | | 500 | |
| J. Crew Group, Term Loan B | | | | | | | | |
| 0.000%, 03/05/21(H) | | | 1,000 | | | | 997 | |
| Neiman Marcus Group, First Lien Term Loan | | | | | | | | |
| 4.250%, 10/25/20 | | | 350 | | | | 351 | |
| | | | | |
| Tectum Holdings, Term Loan | | | | | | |
| 4.250%, 03/04/19 | | $ | 1,250 | | | $ | 1,247 | |
| Travelport, Secon Lien Term Loan | | | | | | | | |
| 0.000%, 01/31/16(H) | | | 300 | | | | 310 | |
| | | | | | | | | |
| Total Loan Participations | |
| (Cost $7,400) | | | | 7,234 | |
| | | | | | | | | |
| Preferred Stock [0.9%] | |
| Insurance [0.8%] | |
| Aspen Insurance Holdings (F) | | | 40,000 | | | | 992 | |
| | | | | | | | | |
| Miscellaneous Manufacturing [0.1%] | |
| CEVA Group * | | | 49 | | | | 62 | |
| | | | | | | | | |
| Total Preferred Stock | |
| (Cost $1,044) | | | | 1,054 | |
| | | | | | | | | |
| Common Stock [0.3%] | |
| Miscellaneous Manufacturing [0.0%] | |
| CEVA Group * | | | 22 | | | | 28 | |
| | | | | | | | | |
| Printing & Publishing [0.3%] | |
| Houghton Mifflin Harcourt * | | | 16,866 | | | | 343 | |
| | | | | | | | | |
| Total Common Stock | |
| (Cost $379) | | | | 371 | |
| | | | | | | | | |
| Mortgage-Backed Security [0.3%] | |
| SRERS Funding, Ser 2011-RS, Cl A1B1 | | | | | | | | |
| 0.407%, 04/09/14(A) (F) | | | 363 | | | | 336 | |
| | | | | | | | | |
| Total Mortgage-Backed Security | |
| (Cost $319) | | | | 336 | |
| | | | | | | | | |
| Asset-Backed Security [0.3%] | |
| United Airlines, Pass-Through Trust, Ser 2013-1, Cl B | | | | | | | | |
| 5.375%, 08/15/21 | | | 400 | | | | 416 | |
| | | | | | | | | |
| Total Asset-Backed Security | |
| (Cost $400) | | | | 416 | |
See accompanying notes to financial statements.
CITY NATIONAL ROCHDALE FUNDS | PAGE 39
schedule of investments
March 31, 2014 (Unaudited)
City National Rochdale High Yield Bond Fund (continued)
| Number of Warrants/Shares | | | | |
| Warrants* [0.0%] | |
| Alion Science and Technology, | | | | | | |
| Expires 03/15/17 (B) | | | 380 | | | $ | — | |
| CUI Acquisition, | | | | | | | | |
| Expires 09/20/20 (B) (I) (J) | | | 2,756 | | | | 28 | |
| Global Aviation (B) | | | 35,583 | | | | — | |
| | | | | | | | | |
| Total Warrants | |
| (Cost $250) | | | | 28 | |
| | | | | | | | | |
| Special Stock [0.0%] | |
| Broadcasting & Cable [0.0%] | |
| Adelphia Recovery Trust * (B) (I) | | | 8,500 | | | | — | |
| | | | | | | | | |
| Total Special Stock | |
| (Cost $9) | | | | — | |
| | | | | | | | | |
| Short-Term Investments [1.4%] | |
| City National Rochdale Prime Money Market Fund, Institutional Class, 0.010%**† | | | 847,858 | | | | 848 | |
| SEI Daily Income Trust, Prime Obligation Fund, Cl A, 0.010%** | | | 847,858 | | | | 848 | |
| | | | | | | | | |
| Total Short-Term Investments | |
| (Cost $1,696) | | | | 1,696 | |
| | | | | | | | | |
| Total Investments [103.5%] | |
| (Cost $124,938) | | | $ | 128,429 | |
Percentages are based on Net Assets of $124,114 (000).
| * | Non-income producing security. |
| ** | The rate reported is the 7-day effective yield as of March 31, 2014. |
| † | Investment in Affiliate. |
| (A) | Security exempt from registration under Rule 144A of the Securities Act of 1933. These securities may be resold in transactions exempt from registration normally to qualified institutions. On March 31, 2014, the value of these securities amounted to $66,287 (000), representing 53.4% of the net assets of the Fund. |
| (B) | Security is considered illiquid. The total market value of such securities as of March 31, 2014 was $1,278 (000) and represented 1.0% of the net assets of the Fund. |
| (C) | Step Bond — The rate reported is the rate in effect on March 31, 2014. The coupon on a step bond changes on a specific date. |
| (E) | In default on interest payments. Rate shown represents the last coupon rate prior to default. |
| (F) | Floating Rate Security — The rate reported is the rate in effect on March 31, 2014. |
| (I) | Security is fair valued using methods determined in good faith by the Fair Value Committee designated by the Board of Trustees. The total market value of such securities as of March 31, 2014 was $28 (000) and represented 0.0% of net assets of the Fund. |
| (J) | This warrant is a result of the restructuring of Cleveland Unlimited, has an exercise price of $0.0001 per share of common stock and does not have an expiration date. |
Cl — Class
Ser — Series
Amounts designated as “—” are either $0 or have been rounded to $0.
The following is a list of the inputs used as of March 31, 2014 in valuing the Fund’s investments carried at value (000):
| Investments in Securities | | | | | | | | | | | | |
| Corporate Bonds | | $ | — | | | $ | 117,294 | | | $ | — | | | $ | 117,294 | |
| Loan Participations | | | — | | | | 7,234 | | | | — | | | | 7,234 | |
| Preferred Stock | | | — | | | | 1,054 | | | | — | | | | 1,054 | |
| Common Stock | | | — | | | | 371 | | | | — | | | | 371 | |
| Mortgage-Backed Security | | | — | | | | 336 | | | | — | | | | 336 | |
| Asset-Backed Security | | | — | | | | 416 | | | | — | | | | 416 | |
| Warrants | | | — | | | | — | | | | 28 | | | | 28 | |
| Special Stock | | | — | | | | — | | | | — | | | | — | |
| Short-Term Investments | | | 1,696 | | | | — | | | | — | | | | 1,696 | |
| Total Investments in Securities | | $ | 1,696 | | | $ | 126,705 | | | $ | 28 | | | $ | 128,429 | |
| (1) | Of the $28 (000) in Level 3 securities as of March 31, 2014, $28 (000) or 0.00% are not valued via third party pricing vendors and broker quotes. If significant, the disclosure of the unobservable inputs and the interrelationships and sensitivity between these inputs is required for those Level 3 securities that are not valued by third party vendors or broker quotes. |
See accompanying notes to financial statements.
CITY NATIONAL ROCHDALE FUNDS | PAGE 40
schedule of investments
March 31, 2014 (Unaudited)
City National Rochdale High Yield Bond Fund (concluded)
The following is a reconciliation of investments in which significant unobservable inputs (Level 3) were used in determining value (000) as of March 31, 2014:
| | | Investments in Mortgage-Backed Securities | | | Investments in Preferred Stock | | | Investments in Common Stock | |
| Beginning balance as of October 1, 2013 | | $ | 334 | | | $ | 40 | | | $ | 19 | |
| Accrued discounts/ premiums | | | 1 | | | | — | | | | — | |
| Realized gain/(loss) | | | 3 | | | | — | | | | — | |
| Change in unrealized appreciation/(depreciation) | | | 17 | | | | 22 | | | | 10 | |
| Purchases | | | 5 | | | | — | | | | — | |
| Sales/paydowns | | | (24 | ) | | | — | | | | — | |
| Transfers into Level 3 | | | — | | | | — | | | | — | |
| Transfers out of Level 3 | | | (336 | ) | | | (62 | ) | | | (29 | ) |
| Ending balance as of March 31, 2014 | | $ | — | | | $ | — | | | $ | — | |
| Changes in unrealized gains/(losses) included in earnings related to securities still held at reporting date | | $ | 17 | | | $ | 22 | | | $ | 10 | |
| | | | | | | |
| Beginning balance as of October 1, 2013 | | $ | 28 | | | $ | 421 | |
| Accrued discounts/ premiums | | | — | | | | 1 | |
| Realized gain/(loss) | | | — | | | | 3 | |
| Change in unrealized appreciation/(depreciation) | | | — | | | | 49 | |
| Purchases | | | — | | | | 5 | |
| Sales/paydowns | | | — | | | | (24 | ) |
| Transfers into Level 3 | | | — | | | | — | |
| Transfers out of Level 3 | | | — | | | | (427 | ) |
| Ending balance as of March 31, 2014 | | $ | 28 | | | $ | 28 | |
| Changes in unrealized gains/(losses) included in earnings related to securities still held at reporting date | | $ | — | | | $ | 49 | |
For the period ended March 31, 2014, there have been no transfers between Level 1 and Level 2 assets and liabilities. For the period ended March 31, 2014, the transfers out of Level 3 were due to changes in the availability of observable inputs to determine fair value. Transfers between Levels are recognized at period end.
For more information on valuation inputs, see Note 2 — Significant Accounting Policies in the Notes to Financial Statements.
See accompanying notes to financial statements.
CITY NATIONAL ROCHDALE FUNDS | PAGE 41
schedule of investments
March 31, 2014 (Unaudited)
City National Rochdale Intermediate Fixed Income Fund
| | | | | |
| Corporate Bonds [71.6%] | |
| Consumer Discretionary [2.6%] | |
| AutoZone | | | | | | |
| 3.700%, 04/15/22 | | $ | 250 | | | $ | 251 | |
| Best Buy | | | | | | | | |
| 3.750%, 03/15/16 | | | 300 | | | | 309 | |
| CBS | | | | | | | | |
| 3.375%, 03/01/22 | | | 175 | | | | 171 | |
| Comcast | | | | | | | | |
| 3.125%, 07/15/22 | | | 200 | | | | 198 | |
| Expedia | | | | | | | | |
| 5.950%, 08/15/20 | | | 250 | | | | 277 | |
| Gap | | | | | | | | |
| 5.950%, 04/12/21 | | | 495 | | | | 557 | |
| Hasbro | | | | | | | | |
| 6.125%, 05/15/14 | | | 250 | | | | 251 | |
| Scripps Networks Interactive | | | | | | | | |
| 2.700%, 12/15/16 | | | 1,000 | | | | 1,038 | |
| Time Warner Cable | | | | | | | | |
| 4.125%, 02/15/21 | | | 165 | | | | 173 | |
| Toys R Us | | | | | | | | |
| 7.375%, 10/15/18 | | | 500 | | | | 400 | |
| Toys R Us Property II | | | | | | | | |
| 8.500%, 12/01/17 | | | 21 | | | | 22 | |
| Tupperware Brands | | | | | | | | |
| 4.750%, 06/01/21 | | | 500 | | | | 524 | |
| Viacom | | | | | | | | |
| 6.250%, 04/30/16 | | | 125 | | | | 138 | |
| | | | | |
| WPP Finance UK | | | | | | |
| 8.000%, 09/15/14 | | $ | 749 | | | $ | 774 | |
| 5.875%, 06/15/14 | | | 400 | | | | 404 | |
| Yum! Brands | | | | | | | | |
| 6.250%, 03/15/18 | | | 30 | | | | 34 | |
| | | | | | | | | |
| Total Consumer Discretionary | | | | 5,521 | |
| | | | | | | | | |
| Consumer Staples [2.1%] | |
| Avon Products | | | | | | | | |
| 6.500%, 03/01/19 | | | 250 | | | | 279 | |
| Bunge Finance | | | | | | | | |
| 8.500%, 06/15/19 | | | 105 | | | | 130 | |
| 5.900%, 04/01/17 | | | 100 | | | | 110 | |
| 5.100%, 07/15/15 | | | 500 | | | | 525 | |
| Campbell Soup | | | | | | | | |
| 8.875%, 05/01/21 | | | 350 | | | | 453 | |
| ConAgra Foods | | | | | | | | |
| 4.950%, 08/15/20 | | | 410 | | | | 448 | |
| 1.900%, 01/25/18 | | | 200 | | | | 198 | |
| CVS Caremark | | | | | | | | |
| 2.750%, 12/01/22 | | | 500 | | | | 472 | |
| Lorillard Tobacco | | | | | | | | |
| 8.125%, 06/23/19 | | | 500 | | | | 618 | |
| PepsiAmericas | | | | | | | | |
| 4.875%, 01/15/15 | | | 250 | | | | 259 | |
| PepsiCo | | | | | | | | |
| 3.125%, 11/01/20 | | | 260 | | | | 265 | |
| Reynolds American | | | | | | | | |
| 6.750%, 06/15/17 | | | 100 | | | | 115 | |
| WM Wrigley Jr | | | | | | | | |
| 4.650%, 07/15/15 | | | 750 | | | | 784 | |
| | | | | | | | | |
| Total Consumer Staples | | | | 4,656 | |
| | | | | | | | | |
| Energy [6.3%] | |
| Boardwalk Pipelines | | | | | | | | |
| 5.875%, 11/15/16 | | | 146 | | | | 159 | |
| 5.750%, 09/15/19 | | | 175 | | | | 190 | |
| 5.500%, 02/01/17 | | | 221 | | | | 239 | |
| 5.200%, 06/01/18 | | | 84 | | | | 88 | |
| BP Capital Markets | | | | | | | | |
| 3.200%, 03/11/16 | | | 100 | | | | 105 | |
| 3.125%, 10/01/15 | | | 145 | | | | 150 | |
| Buckeye Partners | | | | | | | | |
| 6.050%, 01/15/18 | | | 155 | | | | 173 | |
| Chesapeake Energy | | | | | | | | |
| 9.500%, 02/15/15 | | | 385 | | | | 411 | |
| ConocoPhillips | | | | | | | | |
| 5.750%, 02/01/19 | | | 290 | | | | 339 | |
See accompanying notes to financial statements.
CITY NATIONAL ROCHDALE FUNDS | PAGE 42
schedule of investments
March 31, 2014 (Unaudited)
City National Rochdale Intermediate Fixed Income Fund (continued)
| | | | | |
| DCP Midstream | | | | | | |
| 9.750%, 03/15/19(A) | | $ | 114 | | | $ | 145 | |
| DCP Midstream Operating | | | | | | | | |
| 3.250%, 10/01/15 | | | 120 | | | | 124 | |
| Ecopetrol | | | | | | | | |
| 7.625%, 07/23/19 | | | 250 | | | | 300 | |
| Enbridge Energy Partners | | | | | | | | |
| 5.875%, 12/15/16 | | | 191 | | | | 212 | |
| 5.350%, 12/15/14 | | | 20 | | | | 21 | |
| Energy Transfer Partners | | | | | | | | |
| 9.700%, 03/15/19 | | | 330 | | | | 426 | |
| 9.000%, 04/15/19 | | | 189 | | | | 237 | |
| 6.125%, 02/15/17 | | | 426 | | | | 477 | |
| 3.600%, 02/01/23 | | | 200 | | | | 191 | |
| Enterprise Products Operating | | | | | | | | |
| 6.500%, 01/31/19 | | | 140 | | | | 166 | |
| 3.700%, 06/01/15 | | | 125 | | | | 129 | |
| EOG Resources | | | | | | | | |
| 5.625%, 06/01/19 | | | 290 | | | | 335 | |
| FMC Technologies | | | | | | | | |
| 3.450%, 10/01/22 | | | 200 | | | | 191 | |
| Husky Energy | | | | | | | | |
| 3.950%, 04/15/22 | | | 150 | | | | 154 | |
| Kinder Morgan Energy Partners | | | | | | | | |
| 5.950%, 02/15/18 | | | 75 | | | | 85 | |
| 5.625%, 02/15/15 | | | 284 | | | | 296 | |
| 5.300%, 09/15/20 | | | 125 | | | | 137 | |
| Marathon Oil | | | | | | | | |
| 6.000%, 10/01/17 | | | 150 | | | | 171 | |
| National Oilwell Varco | | | | | | | | |
| 6.125%, 08/15/15 | | | 100 | | | | 100 | |
| ONEOK Partners | | | | | | | | |
| 2.000%, 10/01/17 | | | 155 | | | | 156 | |
| Panhandle Eastern Pipe Line | | | | | | | | |
| 7.000%, 06/15/18 | | | 396 | | | | 458 | |
| Petrobras International Finance | | | | | | | | |
| 5.875%, 03/01/18 | | | 160 | | | | 171 | |
| 5.750%, 01/20/20 | | | 250 | | | | 261 | |
| 3.875%, 01/27/16 | | | 100 | | | | 103 | |
| 2.875%, 02/06/15 | | | 500 | | | | 506 | |
| Petrofac | | | | | | | | |
| 3.400%, 10/10/18(A) | | | 125 | | | | 127 | |
| Plains All American Pipeline | | | | | | | | |
| 5.875%, 08/15/16 | | | 205 | | | | 223 | |
| Plains Exploration & Production | | | | | | | | |
| 6.125%, 06/15/19 | | | 2,000 | | | | 2,207 | |
| PPL Energy Supply | | | | | | | | |
| 6.200%, 05/15/16 | | | 105 | | | | 116 | |
| Puget Energy | | | | | | | | |
| 6.000%, 09/01/21 | | | 500 | | | | 576 | |
| | | | | |
| Rowan | | | | | | |
| 4.875%, 06/01/22 | | $ | 200 | | | $ | 207 | |
| Sabine Pass LNG | | | | | | | | |
| 7.500%, 11/30/16 | | | 100 | | | | 111 | |
| Spectra Energy Capital | | | | | | | | |
| 6.750%, 07/15/18 | | | 745 | | | | 849 | |
| 6.200%, 04/15/18 | | | 135 | | | | 154 | |
| Spectra Energy Partners | | | | | | | | |
| 4.750%, 03/15/24 | | | 125 | | | | 132 | |
| Total Capital International | | | | | | | | |
| 1.500%, 02/17/17 | | | 100 | | | | 101 | |
| Transocean | | | | | | | | |
| 7.375%, 04/15/18 | | | 494 | | | | 568 | |
| 6.000%, 03/15/18 | | | 500 | | | | 556 | |
| Williams Partners | | | | | | | | |
| 3.350%, 08/15/22 | | | 200 | | | | 192 | |
| | | | | | | | | |
| Total Energy | | | | 13,525 | |
| | | | | | | | | |
| Financials [23.9%] | |
| ACE INA Holdings | | | | | | | | |
| 5.800%, 03/15/18 | | | 300 | | | | 340 | |
| 2.700%, 03/13/23 | | | 850 | | | | 804 | |
| Alleghany | | | | | | | | |
| 5.625%, 09/15/20 | | | 270 | | | | 302 | |
| American Express | | | | | | | | |
| 0.826%, 05/22/14(B) | | | 3,000 | | | | 3,008 | |
| American Express Credit, MTN | | | | | | | | |
| 2.800%, 09/19/16 | | | 175 | | | | 183 | |
| American International Group | | | | | | | | |
| 6.400%, 12/15/20 | | | 125 | | | | 149 | |
| Aon | | | | | | | | |
| 3.500%, 09/30/15 | | | 200 | | | | 208 | |
| Associates Corp of North America | | | | | | | | |
| 6.950%, 11/01/18 | | | 150 | | | | 179 | |
| Axis Specialty Finance | | | | | | | | |
| 5.875%, 06/01/20 | | | 250 | | | | 283 | |
| Bank of America | | | | | | | | |
| 10.200%, 07/15/15 | | | 350 | | | | 387 | |
| 5.700%, 05/02/17 | | | 950 | | | | 1,057 | |
| 5.420%, 03/15/17 | | | 42 | | | | 46 | |
| Bank of America, MTN | | | | | | | | |
| 5.650%, 05/01/18 | | | 145 | | | | 164 | |
| Bank of Montreal, MTN | | | | | | | | |
| 1.450%, 04/09/18 | | | 340 | | | | 335 | |
| Bank of New York Mellon, MTN | | | | | | | | |
| 3.100%, 01/15/15 | | | 175 | | | | 179 | |
| Barclays Bank | | | | | | | | |
| 5.125%, 01/08/20 | | | 100 | | | | 112 | |
See accompanying notes to financial statements.
CITY NATIONAL ROCHDALE FUNDS | PAGE 43
schedule of investments
March 31, 2014 (Unaudited)
City National Rochdale Intermediate Fixed Income Fund (continued)
| | | | | |
| BB&T, MTN | | | | | | |
| 1.600%, 08/15/17 | | $ | 355 | | | $ | 356 | |
| Bear Stearns | | | | | | | | |
| 7.250%, 02/01/18 | | | 275 | | | | 327 | |
| 5.550%, 01/22/17 | | | 468 | | | | 519 | |
| Berkshire Hathaway | | | | | | | | |
| 3.000%, 02/11/23 | | | 250 | | | | 246 | |
| 1.550%, 02/09/18 | | | 300 | | | | 299 | |
| Berkshire Hathaway Finance | | | | | | | | |
| 1.600%, 05/15/17 | | | 440 | | | | 445 | |
| BlackRock | | | | | | | | |
| 3.500%, 12/10/14 | | | 170 | | | | 174 | |
| Capital One Financial | | | | | | | | |
| 7.375%, 05/23/14 | | | 100 | | | | 101 | |
| 1.500%, 03/22/18 | | | 475 | | | | 465 | |
| Citigroup | | | | | | | | |
| 6.125%, 05/15/18 | | | 140 | | | | 161 | |
| 5.000%, 09/15/14 | | | 503 | | | | 513 | |
| 4.500%, 01/14/22 | | | 2,000 | | | | 2,119 | |
| CNA Financial | | | | | | | | |
| 6.950%, 01/15/18 | | | 1,076 | | | | 1,228 | |
| Commonwealth Bank of Australia, MTN | | | | | | | | |
| 5.000%, 10/15/19(A) | | | 150 | | | | 167 | |
| Countrywide Financial, MTN | | | | | | | | |
| 6.000%, 08/26/20(C) | | | 313 | | | | 311 | |
| Credit Suisse NY, MTN | | | | | | | | |
| 5.300%, 08/13/19 | | | 150 | | | | 170 | |
| Dresdner Bank NY | | | | | | | | |
| 7.250%, 09/15/15 | | | 1,150 | | | | 1,231 | |
| ERAC USA Finance | | | | | | | | |
| 3.300%, 10/15/22(A) | | | 250 | | | | 240 | |
| Ford Motor Credit | | | | | | | | |
| 4.250%, 02/03/17 | | | 2,000 | | | | 2,147 | |
| 1.700%, 05/09/16 | | | 1,000 | | | | 1,011 | |
| Goldman Sachs Group | | | | | | | | |
| 6.250%, 09/01/17 | | | 550 | | | | 629 | |
| 6.150%, 04/01/18 | | | 150 | | | | 171 | |
| 5.625%, 01/15/17 | | | 700 | | | | 773 | |
| 5.350%, 01/15/16 | | | 250 | | | | 269 | |
| 5.125%, 01/15/15 | | | 355 | | | | 367 | |
| Goldman Sachs Group, MTN | | | | | | | | |
| 6.000%, 06/15/20 | | | 500 | | | | 574 | |
| HSBC Finance | | | | | | | | |
| 6.676%, 01/15/21 | | | 83 | | | | 97 | |
| ING Bank | | | | | | | | |
| 3.750%, 03/07/17(A) | | | 200 | | | | 213 | |
| International Lease Finance, MTN | | | | | | | | |
| 6.100%, 04/15/14 | | | 250 | | | | 250 | |
| 5.650%, 06/01/14 | | | 197 | | | | 198 | |
| | | | | |
| Janus Capital Group | | | | | | |
| 6.700%, 06/15/17 | | $ | 600 | | | $ | 677 | |
| Jefferies Group | | | | | | | | |
| 8.500%, 07/15/19 | | | 1,000 | | | | 1,229 | |
| 6.450%, 06/08/27 | | | 100 | | | | 107 | |
| 5.875%, 06/08/14 | | | 733 | | | | 740 | |
| 5.500%, 03/15/16 | | | 1,000 | | | | 1,073 | |
| JPMorgan Chase | | | | | | | | |
| 4.250%, 10/15/20 | | | 150 | | | | 160 | |
| 3.375%, 05/01/23 | | | 2,500 | | | | 2,366 | |
| JPMorgan Chase, MTN | | | | | | | | |
| 5.300%, 05/15/18 | | | 150 | | | | 149 | |
| Kookmin Bank | | | | | | | | |
| 7.250%, 05/14/14(A) | | | 100 | | | | 101 | |
| Lehman Brothers Holdings, MTN | | | | | | | | |
| 7.000%, 09/28/37(D) | | | 400 | | | | 95 | |
| Manulife Financial | | | | | | | | |
| 3.400%, 09/17/15 | | | 198 | | | | 205 | |
| Marsh & McLennan, MTN | | | | | | | | |
| 2.550%, 10/15/18 | | | 100 | | | | 101 | |
| MetLife | | | | | | | | |
| 6.817%, 08/15/18 | | | 3,500 | | | | 4,177 | |
| 5.000%, 06/15/15 | | | 175 | | | | 184 | |
| Metropolitan Life Global Funding I | | | | | | | | |
| 3.875%, 04/11/22(A) | | | 125 | | | | 129 | |
| Moody’s | | | | | | | | |
| 5.500%, 09/01/20 | | | 800 | | | | 885 | |
| Morgan Stanley | | | | | | | | |
| 5.375%, 10/15/15 | | | 210 | | | | 224 | |
| 4.750%, 04/01/14 | | | 3,398 | | | | 3,398 | |
| 4.750%, 03/22/17 | | | 155 | | | | 169 | |
| 4.200%, 11/20/14 | | | 250 | | | | 256 | |
| Morgan Stanley, MTN | | | | | | | | |
| 6.625%, 04/01/18 | | | 100 | | | | 117 | |
| 6.000%, 05/13/14 | | | 1,050 | | | | 1,056 | |
| 6.000%, 04/28/15 | | | 600 | | | | 633 | |
| 5.450%, 01/09/17 | | | 100 | | | | 111 | |
| NASDAQ OMX Group | | | | | | | | |
| 5.550%, 01/15/20 | | | 1,249 | | | | 1,371 | |
| National Bank of Canada, MTN | | | | | | | | |
| 1.450%, 11/07/17 | | | 750 | | | | 740 | |
| National Rural Utilities Cooperative Finance | | | | | | | | |
| 10.375%, 11/01/18 | | | 125 | | | | 169 | |
| 6.550%, 11/01/18 | | | 300 | | | | 357 | |
| PNC Funding | | | | | | | | |
| 4.250%, 09/21/15 | | | 325 | | | | 341 | |
See accompanying notes to financial statements.
CITY NATIONAL ROCHDALE FUNDS | PAGE 44
schedule of investments
March 31, 2014 (Unaudited)
City National Rochdale Intermediate Fixed Income Fund (continued)
| | | | | |
| Principal Financial Group | | | | | | |
| 8.875%, 05/15/19 | | $ | 130 | | | $ | 166 | |
| 3.300%, 09/15/22 | | | 200 | | | | 195 | |
| Protective Life | | | | | | | | |
| 6.400%, 01/15/18 | | | 250 | | | | 276 | |
| Prudential Financial, MTN | | | | | | | | |
| 6.200%, 01/15/15 | | | 160 | | | | 167 | |
| 5.375%, 06/21/20 | | | 145 | | | | 164 | |
| Royal Bank of Canada, MTN | | | | | | | | |
| 0.695%, 06/11/14(B) | | | 125 | | | | 126 | |
| Silicon Valley Bank | | | | | | | | |
| 6.050%, 06/01/17 | | | 355 | | | | 381 | |
| SLM, MTN | | | | | | | | |
| 5.050%, 11/14/14 | | | 500 | | | | 511 | |
| 5.000%, 06/15/18 | | | 802 | | | | 794 | |
| Sumitomo Mitsui Banking | | | | | | | | |
| 3.150%, 07/22/15(A) | | | 200 | | | | 206 | |
| SunTrust Banks | | | | | | | | |
| 6.000%, 09/11/17 | | | 254 | | | | 289 | |
| TD Ameritrade Holding | | | | | | | | |
| 5.600%, 12/01/19 | | | 290 | | | | 332 | |
| Toyota Motor Credit, MTN | | | | | | | | |
| 2.000%, 09/15/16 | | | 100 | | | | 103 | |
| UBS, MTN | | | | | | | | |
| 7.375%, 06/15/17 | | | 388 | | | | 437 | |
| US Bancorp, MTN | | | | | | | | |
| 1.650%, 05/15/17 | | | 345 | | | | 349 | |
| Volkswagen International Finance | | | | | | | | |
| 2.375%, 03/22/17(A) | | | 125 | | | | 128 | |
| Wells Fargo | | | | | | | | |
| 1.500%, 01/16/18 | | | 150 | | | | 149 | |
| Wells Fargo, MTN | | | | | | | | |
| 3.625%, 04/15/15 | | | 125 | | | | 129 | |
| 3.450%, 02/13/23 | | | 250 | | | | 243 | |
| 2.625%, 12/15/16 | | | 235 | | | | 245 | |
| 2.100%, 05/08/17 | | | 575 | | | | 589 | |
| Wells Fargo Bank | | | | | | | | |
| 5.750%, 05/16/16 | | | 100 | | | | 110 | |
| Westpac Banking, MTN | | | | | | | | |
| 1.600%, 01/12/18 | | | 250 | | | | 248 | |
| Wilmington Trust | | | | | | | | |
| 8.500%, 04/02/18 | | | 315 | | | | 375 | |
| | | | | | | | | |
| Total Financials | | | | 51,539 | |
| | | | | | | | | |
| Healthcare [0.6%] | |
| Actavis | | | | | | | | |
| 3.250%, 10/01/22 | | | 500 | | | | 479 | |
| Boston Scientific | | | | | | | | |
| 6.400%, 06/15/16 | | | 145 | | | | 161 | |
| | | | | |
| Express Scripts Holding | | | | | | |
| 3.500%, 11/15/16 | | $ | 150 | | | $ | 159 | |
| UnitedHealth Group | | | | | | | | |
| 4.700%, 02/15/21 | | | 200 | | | | 221 | |
| 1.625%, 03/15/19 | | | 250 | | | | 243 | |
| | | | | | | | | |
| Total Healthcare | | | | 1,263 | |
| | | | | | | | | |
| Industrials [6.9%] | |
| Canadian National Railway | | | | | | | | |
| 2.250%, 11/15/22 | | | 650 | | | | 598 | |
| Carlisle | | | | | | | | |
| 3.750%, 11/15/22 | | | 250 | | | | 243 | |
| CNH America | | | | | | | | |
| 7.250%, 01/15/16 | | | 388 | | | | 424 | |
| Eaton | | | | | | | | |
| 8.875%, 06/15/19 | | | 125 | | | | 155 | |
| Embraer Overseas | | | | | | | | |
| 5.696%, 09/16/23 | | | 520 | | | | 539 | |
| GATX | | | | | | | | |
| 8.750%, 05/15/14 | | | 200 | | | | 202 | |
| 6.000%, 02/15/18 | | | 170 | | | | 192 | |
| General Electric Capital | | | | | | | | |
| 5.300%, 02/11/21 | | | 3,500 | | | | 3,936 | |
| General Electric Capital, MTN | | | | | | | | |
| 6.000%, 08/07/19 | | | 410 | | | | 481 | |
| 5.625%, 09/15/17 | | | 300 | | | | 341 | |
| 4.375%, 09/16/20 | | | 150 | | | | 163 | |
| IDEX | | | | | | | | |
| 4.200%, 12/15/21 | | | 250 | | | | 256 | |
| Johnson Controls | | | | | | | | |
| 5.500%, 01/15/16 | | | 100 | | | | 108 | |
| Joy Global | | | | | | | | |
| 6.000%, 11/15/16 | | | 500 | | | | 556 | |
| Lennox International | | | | | | | | |
| 4.900%, 05/15/17 | | | 250 | | | | 265 | |
| NuStar Logistics | | | | | | | | |
| 8.150%, 04/15/18 | | | 250 | | | | 285 | |
| 4.800%, 09/01/20 | | | 200 | | | | 197 | |
| Owens Corning | | | | | | | | |
| 6.500%, 12/01/16 | | | 620 | | | | 685 | |
| Penske Truck Leasing | | | | | | | | |
| 4.875%, 07/11/22(A) | | | 200 | | | | 212 | |
| 4.250%, 01/17/23(A) | | | 300 | | | | 303 | |
| 3.750%, 05/11/17(A) | | | 3,000 | | | | 3,184 | |
| 3.375%, 03/15/18(A) | | | 250 | | | | 260 | |
| 2.500%, 03/15/16(A) | | | 500 | | | | 512 | |
| Republic Services | | | | | | | | |
| 3.550%, 06/01/22 | | | 250 | | | | 250 | |
See accompanying notes to financial statements.
CITY NATIONAL ROCHDALE FUNDS | PAGE 45
schedule of investments
March 31, 2014 (Unaudited)
City National Rochdale Intermediate Fixed Income Fund (continued)
| | | | | |
| Roper Industries | | | | | | |
| 3.125%, 11/15/22 | | $ | 200 | | | $ | 189 | |
| 1.850%, 11/15/17 | | | 250 | | | | 251 | |
| Xylem | | | | | | | | |
| 3.550%, 09/20/16 | | | 200 | | | | 211 | |
| | | | | | | | | |
| Total Industrials | | | | 14,998 | |
| | | | | | | | | |
| Information Technology [4.4%] | |
| Arrow Electronics | | | | | | | | |
| 6.875%, 06/01/18 | | | 400 | | | | 455 | |
| Avnet | | | | | | | | |
| 6.625%, 09/15/16 | | | 128 | | | | 143 | |
| Fidelity National Information Services | | | | | | | | |
| 7.875%, 07/15/20 | | | 140 | | | | 151 | |
| Fiserv | | | | | | | | |
| 3.500%, 10/01/22 | | | 250 | | | | 244 | |
| Hewlett-Packard | | | | | | | | |
| 4.750%, 06/02/14 | | | 850 | | | | 856 | |
| 4.650%, 12/09/21 | | | 150 | | | | 159 | |
| 1.550%, 05/30/14 | | | 920 | | | | 921 | |
| KLA-Tencor | | | | | | | | |
| 6.900%, 05/01/18 | | | 200 | | | | 234 | |
| Lexmark International | | | | | | | | |
| 5.125%, 03/15/20 | | | 2,250 | | | | 2,351 | |
| Nokia | | | | | | | | |
| 5.375%, 05/15/19 | | | 950 | | | | 1,000 | |
| Texas Instruments | | | | | | | | |
| 1.650%, 08/03/19 | | | 295 | | | | 285 | |
| Western Union | | | | | | | | |
| 5.253%, 04/01/20 | | | 2,000 | | | | 2,170 | |
| Xerox | | | | | | | | |
| 8.250%, 05/15/14 | | | 473 | | | | 477 | |
| | | | | | | | | |
| Total Information Technology | | | | 9,446 | |
| | | | | | | | | |
| Materials [8.2%] | |
| Airgas | | | | | | | | |
| 2.900%, 11/15/22 | | | 250 | | | | 233 | |
| Alcoa | | | | | | | | |
| 6.750%, 07/15/18 | | | 700 | | | | 798 | |
| 6.150%, 08/15/20 | | | 200 | | | | 218 | |
| 5.720%, 02/23/19 | | | 385 | | | | 418 | |
| AngloGold Ashanti Holdings | | | | | | | | |
| 5.375%, 04/15/20 | | | 1,317 | | | | 1,313 | |
| ArcelorMittal | | | | | | | | |
| 10.350%, 06/01/19 | | | 200 | | | | 253 | |
| 9.500%, 02/15/15 | | | 400 | | | | 427 | |
| 6.125%, 06/01/18 | | | 800 | | | | 877 | |
| | | | | |
| Avery Dennison | | | | | | |
| 5.375%, 04/15/20 | | $ | 405 | | | $ | 418 | |
| Cabot | | | | | | | | |
| 5.000%, 10/01/16 | | | 300 | | | | 327 | |
| Glencore Canada | | | | | | | | |
| 6.000%, 10/15/15 | | | 1,192 | | | | 1,278 | |
| 5.500%, 06/15/17 | | | 1,010 | | | | 1,107 | |
| Glencore Funding | | | | | | | | |
| 4.125%, 05/30/23(A) | | | 150 | | | | 143 | |
| 1.700%, 05/27/16(A) | | | 1,500 | | | | 1,505 | |
| 1.604%, 04/15/14 | | | 2,000 | | | | 1,994 | |
| International Paper | | | | | | | | |
| 7.950%, 06/15/18 | | | 130 | | | | 159 | |
| Kinross | | | | | | | | |
| 5.125%, 09/01/21 | | | 303 | | | | 300 | |
| Rio Tinto Finance USA | | | | | | | | |
| 8.950%, 05/01/14 | | | 100 | | | | 101 | |
| 6.500%, 07/15/18 | | | 100 | | | | 118 | |
| 3.500%, 03/22/22 | | | 4,000 | | | | 4,001 | |
| RPM International | | | | | | | | |
| 6.125%, 10/15/19 | | | 150 | | | | 170 | |
| 3.450%, 11/15/22 | | | 250 | | | | 235 | |
| Southern Copper | | | | | | | | |
| 6.375%, 07/27/15 | | | 380 | | | | 403 | |
| Vale Canada | | | | | | | | |
| 5.700%, 10/15/15 | | | 100 | | | | 107 | |
| Vale Overseas | | | | | | | | |
| 5.625%, 09/15/19 | | | 505 | | | | 558 | |
| Worthington Industries | | | | | | | | |
| 6.500%, 04/15/20 | | | 250 | | | | 267 | |
| | | | | | | | | |
| Total Materials | | | | 17,728 | |
| | | | | | | | | |
| REITs [7.1%] | |
| American Tower | | | | | | | | |
| 3.400%, 02/15/19 | | | 2,100 | | | | 2,152 | |
| BioMed Realty | | | | | | | | |
| 3.850%, 04/15/16 | | | 500 | | | | 526 | |
| Boston Properties | | | | | | | | |
| 5.875%, 10/15/19 | | | 140 | | | | 162 | |
| CommonWealth REIT | | | | | | | | |
| 6.650%, 01/15/18 | | | 300 | | | | 327 | |
| 5.875%, 09/15/20 | | | 105 | | | | 111 | |
| DDR | | | | | | | | |
| 4.625%, 07/15/22 | | | 250 | | | | 262 | |
| Equity One | | | | | | | | |
| 3.750%, 11/15/22 | | | 250 | | | | 241 | |
| HCP | | | | | | | | |
| 6.000%, 03/01/15 | | | 215 | | | | 225 | |
| 6.000%, 01/30/17 | | | 350 | | | | 394 | |
| 2.625%, 02/01/20 | | | 175 | | | | 171 | |
See accompanying notes to financial statements.
CITY NATIONAL ROCHDALE FUNDS | PAGE 46
schedule of investments
March 31, 2014 (Unaudited)
City National Rochdale Intermediate Fixed Income Fund (continued)
| | | | | |
| HCP, MTN | | | | | | |
| 6.300%, 09/15/16 | | $ | 462 | | | $ | 519 | |
| Health Care REIT | | | | | | | | |
| 5.875%, 05/15/15 | | | 268 | | | | 283 | |
| 4.950%, 01/15/21 | | | 155 | | | | 168 | |
| Healthcare Realty Trust | | | | | | | | |
| 6.500%, 01/17/17 | | | 250 | | | | 282 | |
| Highwoods Realty | | | | | | | | |
| 3.625%, 01/15/23 | | | 200 | | | | 189 | |
| Liberty Property, MTN | | | | | | | | |
| 7.500%, 01/15/18 | | | 177 | | | | 208 | |
| National Retail Properties | | | | | | | | |
| 6.875%, 10/15/17 | | | 300 | | | | 348 | |
| 3.800%, 10/15/22 | | | 350 | | | | 345 | |
| Post Apartment Homes | | | | | | | | |
| 3.375%, 12/01/22 | | | 200 | | | | 190 | |
| Prologis | | | | | | | | |
| 6.875%, 03/15/20 | | | 101 | | | | 120 | |
| 3.350%, 02/01/21 | | | 2,200 | | | | 2,176 | |
| Realty Income | | | | | | | | |
| 5.950%, 09/15/16 | | | 129 | | | | 143 | |
| 3.250%, 10/15/22 | | | 200 | | | | 191 | |
| Senior Housing Properties Trust | | | | | | | | |
| 6.750%, 12/15/21 | | | 500 | | | | 564 | |
| 4.300%, 01/15/16 | | | 500 | | | | 520 | |
| Simon Property Group | | | | | | | | |
| 6.100%, 05/01/16 | | | 600 | | | | 657 | |
| 5.750%, 12/01/15 | | | 408 | | | | 437 | |
| 2.200%, 02/01/19 | | | 2,800 | | | | 2,792 | |
| 2.150%, 09/15/17 | | | 350 | | | | 358 | |
| Tanger Properties | | | | | | | | |
| 6.150%, 11/15/15 | | | 115 | | | | 125 | |
| Washington Real Estate Investment Trust | | | | | | | | |
| 3.950%, 10/15/22 | | | 250 | | | | 244 | |
| | | | | | | | | |
| Total REITs | | | | 15,430 | |
| | | | | | | | | |
| Shipping & Transportation [0.5%] | |
| Burlington Northern Santa Fe | | | | | | | | |
| 3.000%, 03/15/23 | | | 250 | | | | 236 | |
| Federal Express 1998 Pass-Through Trust | | | | | | | | |
| 7.020%, 01/15/16 | | | 382 | | | | 402 | |
| Union Pacific | | | | | | | | |
| 4.875%, 01/15/15 | | | 400 | | | | 414 | |
| | | | | | | | | |
| Total Shipping & Transportation | | | | 1,052 | |
| | | | | |
| Telecommunication Services [4.8%] | |
| America Movil | | | | | | |
| 5.750%, 01/15/15 | | $ | 186 | | | $ | 193 | |
| 1.234%, 06/12/14(B) | | | 3,000 | | | | 3,033 | |
| AT&T | | | | | | | | |
| 5.600%, 05/15/18 | | | 310 | | | | 352 | |
| CenturyLink | | | | | | | | |
| 6.450%, 06/15/21 | | | 355 | | | | 382 | |
| 5.800%, 03/15/22 | | | 250 | | | | 256 | |
| COX Communications | | | | | | | | |
| 7.250%, 11/15/15 | | | 231 | | | | 254 | |
| COX Communications, MTN | | | | | | | | |
| 6.850%, 01/15/18 | | | 224 | | | | 255 | |
| Deutsche Telekom International Finance BV | | | | | | | | |
| 8.750%, 06/15/30 | | | 75 | | | | 108 | |
| 6.000%, 07/08/19 | | | 50 | | | | 59 | |
| New Cingular Wireless Services | | | | | | | | |
| 8.750%, 03/01/31 | | | 75 | | | | 109 | |
| Qwest | | | | | | | | |
| 6.500%, 06/01/17 | | | 100 | | | | 113 | |
| Telecom Italia Capital | | | | | | | | |
| 6.175%, 06/18/14 | | | 1,375 | | | | 1,389 | |
| Telefonica Emisiones SAU | | | | | | | | |
| 6.421%, 06/20/16 | | | 275 | | | | 304 | |
| 6.221%, 07/03/17 | | | 286 | | | | 324 | |
| 5.462%, 02/16/21 | | | 115 | | | | 126 | |
| 5.134%, 04/27/20 | | | 300 | | | | 324 | |
| 4.949%, 01/15/15 | | | 764 | | | | 788 | |
| 3.992%, 02/16/16 | | | 500 | | | | 524 | |
| 3.729%, 04/27/15 | | | 400 | | | | 412 | |
| Verizon Communications | | | | | | | | |
| 2.500%, 09/15/16 | | | 1,000 | | | | 1,035 | |
| | | | | | | | | |
| Total Telecommunication Services | | | | 10,340 | |
| | | | | | | | | |
| Utilities [4.2%] | |
| AmeriGas Partners | | | | | | | | |
| 6.500%, 05/20/21 | | | 477 | | | | 509 | |
| Arizona Public Service | | | | | | | | |
| 6.250%, 08/01/16 | | | 44 | | | | 49 | |
| British Transco Finance | | | | | | | | |
| 6.625%, 06/01/18 | | | 128 | | | | 150 | |
| Cleveland Electric Illuminating | | | | | | | | |
| 7.880%, 11/01/17 | | | 10 | | | | 12 | |
| 5.700%, 04/01/17 | | | 6 | | | | 6 | |
| Commonwealth Edison | | | | | | | | |
| 4.700%, 04/15/15 | | | 250 | | | | 260 | |
| Duke Energy Progress | | | | | | | | |
| 5.150%, 04/01/15 | | | 80 | | | | 84 | |
See accompanying notes to financial statements.
CITY NATIONAL ROCHDALE FUNDS | PAGE 47
schedule of investments
March 31, 2014 (Unaudited)
City National Rochdale Intermediate Fixed Income Fund (continued)
| | | | | |
| Entergy Mississippi | | | | | | |
| 6.640%, 07/01/19 | | $ | 540 | | | $ | 623 | |
| 4.950%, 06/01/18 | | | 39 | | | | 39 | |
| Entergy Texas | | | | | | | | |
| 7.125%, 02/01/19 | | | 190 | | | | 224 | |
| Exelon Generation | | | | | | | | |
| 6.200%, 10/01/17 | | | 2,125 | | | | 2,401 | |
| 5.200%, 10/01/19 | | | 150 | | | | 164 | |
| 4.250%, 06/15/22 | | | 100 | | | | 101 | |
| Jersey Central Power & Light | | | | | | | | |
| 5.625%, 05/01/16 | | | 265 | | | | 287 | |
| KeySpan | | | | | | | | |
| 8.000%, 11/15/30 | | | 50 | | | | 67 | |
| Korea Electric Power | | | | | | | | |
| 6.750%, 08/01/27 | | | 75 | | | | 91 | |
| National Fuel Gas | | | | | | | | |
| 4.900%, 12/01/21 | | | 500 | | | | 534 | |
| National Grid | | | | | | | | |
| 6.300%, 08/01/16 | | | 270 | | | | 302 | |
| Nisource Capital Markets, MTN | | | | | | | | |
| 7.860%, 03/27/17 | | | 163 | | | | 186 | |
| Nisource Finance | | | | | | | | |
| 5.400%, 07/15/14 | | | 266 | | | | 270 | |
| Northern Indiana Public Service, MTN | | | | | | | | |
| 7.590%, 06/12/17 | | | 440 | | | | 503 | |
| ONEOK | | | | | | | | |
| 4.250%, 02/01/22 | | | 294 | | | | 282 | |
| Pennsylvania Electric | | | | | | | | |
| 6.625%, 04/01/19 | | | 15 | | | | 17 | |
| PPL Energy Supply | | | | | | | | |
| 5.700%, 10/15/15 | | | 75 | | | | 80 | |
| Puget Energy | | | | | | | | |
| 5.625%, 07/15/22 | | | 250 | | | | 285 | |
| Puget Sound Energy, MTN | | | | | | | | |
| 6.740%, 06/15/18 | | | 57 | | | | 67 | |
| Southwestern Electric Power | | | | | | | | |
| 5.875%, 03/01/18 | | | 581 | | | | 653 | |
| 3.550%, 02/15/22 | | | 500 | | | | 503 | |
| Southwestern Public Service | | | | | | | | |
| 8.750%, 12/01/18 | | | 250 | | | | 320 | |
| Trans-Allegheny Interstate Line | | | | | | | | |
| 4.000%, 01/15/15(A) | | | 100 | | | | 102 | |
| Xcel Energy | | | | | | | | |
| 5.613%, 04/01/17 | | | 10 | | | | 11 | |
| | | | | | | | | |
| Total Utilities | | | | 9,182 | |
| | | | | | | | | |
| Total Corporate Bonds | |
| (Cost $150,953) | | | | 154,680 | |
| | | | | |
| U.S. Government Agency Obligations [9.5%] | |
| FFCB | | | | | | |
| 3.600%, 05/14/32 | | $ | 200 | | | $ | 182 | |
| FHLB | | | | | | | | |
| 3.480%, 03/25/33 | | | 990 | | | | 886 | |
| 3.400%, 10/04/32 | | | 279 | | | | 250 | |
| 3.100%, 07/09/26 | | | 538 | | | | 492 | |
| 3.070%, 10/15/27 | | | 110 | | | | 99 | |
| FHLMC | | | | | | | | |
| 1.750%, 05/30/19 | | | 3,000 | | | | 2,973 | |
| 1.000%, 09/29/17 | | | 660 | | | | 655 | |
| FNMA | | | | | | | | |
| 5.000%, 03/15/16 | | | 5,700 | | | | 6,206 | |
| 2.375%, 07/28/15 | | | 820 | | | | 843 | |
| 1.875%, 09/18/18 | | | 150 | | | | 152 | |
| 1.625%, 11/27/18 | | | 6,000 | | | | 5,976 | |
| 1.375%, 11/15/16 | | | 460 | | | | 467 | |
| 1.125%, 04/27/17 | | | 470 | | | | 472 | |
| 0.875%, 05/21/18 | | | 350 | | | | 340 | |
| 0.625%, 10/30/14 | | | 570 | | | | 572 | |
| | | | | | | | | |
| Total U.S. Government Agency Obligations | | | | | |
| (Cost $20,806) | | | | 20,565 | |
| | | | | | | | | |
| Municipal Bonds [3.7%] | |
| California [1.9%] | |
| California State, Department of Water Resources, Ser L, RB | | | | | | | | |
| Callable 05/01/20 @ 100 | | | | | | | | |
| 5.000%, 05/01/21 | | | 3,460 | | | | 4,042 | |
| | | | | | | | | |
| Florida [1.8%] | |
| Florida State, Hurricane Catastrophe Fund Finance, Ser A, RB | | | | | | | | |
| 2.107%, 07/01/18 | | | 3,870 | | | | 3,889 | |
| | | | | | | | | |
| Total Municipal Bonds | |
| (Cost $7,947) | | | | 7,931 | |
| | | | | | | | | |
| Preferred Stock [3.4%] | |
| Financials [1.2%] | |
| BB&T | | | 10,000 | | | | 224 | |
| Citigroup | | | 10,000 | | | | 229 | |
| Goldman Sachs Group | | | 25,000 | | | | 576 | |
| HSBC Holdings | | | 30,000 | | | | 809 | |
| JPMorgan Chase | | | 20,000 | | | | 437 | |
| Prudential Financial | | | 10,000 | | | | 236 | |
| | | | | | | | | |
| Total Financials | | | | 2,511 | |
See accompanying notes to financial statements.
CITY NATIONAL ROCHDALE FUNDS | PAGE 48
schedule of investments
March 31, 2014 (Unaudited)
City National Rochdale Intermediate Fixed Income Fund (continued)
| | | | | |
| Industrials [0.3%] | |
| Pitney Bowes | | | 10,000 | | | $ | 254 | |
| Stanley Black & Decker | | | 20,000 | | | | 479 | |
| | | | | | | | | |
| Total Industrials | | | | 733 | |
| | | | | | | | | |
| REITs [1.4%] | |
| Digital Realty Trust | | | 10,000 | | | | 229 | |
| Kimco Realty | | | 10,000 | | | | 208 | |
| National Retail Properties | | | 20,000 | | | | 485 | |
| Realty Income | | | 20,000 | | | | 504 | |
| Senior Housing Properties Trust | | | 52,500 | | | | 1,147 | |
| Vornado Realty Trust | | | 20,000 | | | | 434 | |
| | | | | | | | | |
| Total REITs | | | | 3,007 | |
| | | | | | | | | |
| Telecommunication Services [0.3%] | |
| Telephone & Data Systems | | | 30,000 | | | | 660 | |
| | | | | | | | | |
| Utilities [0.2%] | |
| SCE Trust I | | | 20,000 | | | | 455 | |
| | | | | | | | | |
| Total Preferred Stock | |
| (Cost $7,904) | | | | 7,366 | |
| | | | | | | | | |
| U.S. Government Mortgage-Backed Obligations [3.4%] | |
| FHLMC, Pool 1B2677 | | | | | | | | |
| 2.525%, 04/01/14(B) | | $ | 8 | | | | 8 | |
| FHLMC, Pool 1B2683 | | | | | | | | |
| 2.522%, 04/01/14(B) | | | 5 | | | | 6 | |
| FHLMC, Pool 1B2692 | | | | | | | | |
| 2.375%, 04/01/14(B) | | | 13 | | | | 14 | |
| FHLMC, Pool A93505 | | | | | | | | |
| 4.500%, 08/01/40 | | | 57 | | | | 61 | |
| FHLMC, Pool A93996 | | | | | | | | |
| 4.500%, 09/01/40 | | | 83 | | | | 88 | |
| FHLMC, Pool C03490 | | | | | | | | |
| 4.500%, 08/01/40 | | | 432 | | | | 461 | |
| FHLMC, Pool C09015 | | | | | | | | |
| 3.000%, 10/01/42 | | | 251 | | | | 242 | |
| FHLMC, Pool C20300 | | | | | | | | |
| 6.500%, 01/01/29 | | | 4 | | | | 5 | |
| FHLMC, Pool E01280 | | | | | | | | |
| 5.000%, 12/01/17 | | | 6 | | | | 6 | |
| FHLMC, Pool G02940 | | | | | | | | |
| 5.500%, 05/01/37 | | | 20 | | | | 22 | |
| FHLMC, Pool G04222 | | | | | | | | |
| 5.500%, 04/01/38 | | | 30 | | | | 33 | |
| FHLMC, Pool G04913 | | | | | | | | |
| 5.000%, 03/01/38 | | | 105 | | | | 114 | |
| | | | | |
| FHLMC, Pool G08003 | | | | | | |
| 6.000%, 07/01/34 | | $ | 25 | | | $ | 28 | |
| FHLMC, Pool G11431 | | | | | | | | |
| 6.000%, 04/01/14 | | | 4 | | | | 4 | |
| FHLMC, Pool G11880 | | | | | | | | |
| 5.000%, 12/01/20 | | | 20 | | | | 21 | |
| FHLMC, Pool G18124 | | | | | | | | |
| 6.000%, 04/01/14 | | | 15 | | | | 16 | |
| FHLMC, Pool J19197 | | | | | | | | |
| 3.000%, 05/01/27 | | | 193 | | | | 198 | |
| FHLMC, Pool Q08998 | | | | | | | | |
| 3.500%, 06/01/42 | | | 219 | | | | 220 | |
| FHLMC, Pool Q10378 | | | | | | | | |
| 3.000%, 08/01/42 | | | 241 | | | | 233 | |
| FHLMC, Ser 2004-2804, Cl VC | | | | | | | | |
| 5.000%, 07/15/21 | | | 106 | | | | 114 | |
| FHLMC Multifamily Structured Pass Through Certificates, Ser K003, Cl A4 | | | | | | | | |
| 5.053%, 01/25/19 | | | 150 | | | | 168 | |
| FHLMC Multifamily Structured Pass Through Certificates, Ser K704, Cl A2 | | | | | | | | |
| 2.412%, 08/25/18 | | | 400 | | | | 410 | |
| FHLMC Multifamily Structured Pass Through Certificates, Ser K705, Cl A2 | | | | | | | | |
| 2.303%, 09/25/18 | | | 200 | | | | 203 | |
| FHLMC Multifamily Structured Pass Through Certificates, Ser K708, Cl A2 | | | | | | | | |
| 2.130%, 01/25/19 | | | 300 | | | | 302 | |
| FNMA, Pool 252570 | | | | | | | | |
| 6.500%, 07/01/29 | | | 7 | | | | 8 | |
| FNMA, Pool 253183 | | | | | | | | |
| 7.500%, 04/01/30 | | | 1 | | | | 1 | |
| FNMA, Pool 253398 | | | | | | | | |
| 8.000%, 08/01/30 | | | 2 | | | | 3 | |
| FNMA, Pool 254545 | | | | | | | | |
| 5.000%, 12/01/17 | | | 16 | | | | 17 | |
| FNMA, Pool 254685 | | | | | | | | |
| 5.000%, 04/01/18 | | | 14 | | | | 15 | |
| FNMA, Pool 254949 | | | | | | | | |
| 5.000%, 11/01/33 | | | 19 | | | | 20 | |
| FNMA, Pool 255814 | | | | | | | | |
| 5.500%, 08/01/35 | | | 36 | | | | 40 | |
| FNMA, Pool 303168 | | | | | | | | |
| 9.500%, 02/01/25 | | | 3 | | | | 3 | |
| FNMA, Pool 725424 | | | | | | | | |
| 5.500%, 04/01/34 | | | 29 | | | | 33 | |
See accompanying notes to financial statements.
CITY NATIONAL ROCHDALE FUNDS | PAGE 49
schedule of investments
March 31, 2014 (Unaudited)
City National Rochdale Intermediate Fixed Income Fund (continued)
| | | | | |
| FNMA, Pool 735060 | | | | | | |
| 6.000%, 11/01/34 | | $ | 19 | | | $ | 21 | |
| FNMA, Pool 735228 | | | | | | | | |
| 5.500%, 02/01/35 | | | 16 | | | | 18 | |
| FNMA, Pool 735230 | | | | | | | | |
| 5.500%, 02/01/35 | | | 39 | | | | 43 | |
| FNMA, Pool 745275 | | | | | | | | |
| 5.000%, 02/01/36 | | | 159 | | | | 173 | |
| FNMA, Pool 745418 | | | | | | | | |
| 5.500%, 04/01/36 | | | 188 | | | | 209 | |
| FNMA, Pool 827223 | | | | | | | | |
| 2.215%, 04/01/14(B) | | | 75 | | | | 78 | |
| FNMA, Pool 844809 | | | | | | | | |
| 5.000%, 11/01/35 | | | 80 | | | | 87 | |
| FNMA, Pool AD0454 | | | | | | | | |
| 5.000%, 11/01/21 | | | 45 | | | | 48 | |
| FNMA, Pool AD8522 | | | | | | | | |
| 4.000%, 08/01/40 | | | 58 | | | | 60 | |
| FNMA, Pool AE0828 | | | | | | | | |
| 3.500%, 02/01/41 | | | 410 | | | | 413 | |
| FNMA, Pool AE0949 | | | | | | | | |
| 4.000%, 02/01/41 | | | 419 | | | | 435 | |
| FNMA, Pool AH0621 | | | | | | | | |
| 3.500%, 01/01/41 | | | 100 | | | | 101 | |
| FNMA, Pool AJ1407 | | | | | | | | |
| 4.000%, 09/01/41 | | | 93 | | | | 97 | |
| FNMA, Pool AJ7689 | | | | | | | | |
| 4.000%, 12/01/41 | | | 296 | | | | 308 | |
| FNMA, Pool AK0971 | | | | | | | | |
| 3.000%, 02/01/27 | | | 181 | | | | 186 | |
| FNMA, Pool AO2970 | | | | | | | | |
| 3.000%, 05/01/42 | | | 228 | | | | 220 | |
| FNMA, Pool AO4137 | | | | | | | | |
| 3.500%, 06/01/42 | | | 238 | | | | 240 | |
| FNMA, Pool MA1277 | | | | | | | | |
| 2.500%, 12/01/27 | | | 168 | | | | 168 | |
| FNMA REMIC Trust, Ser 2004-W6, Cl 1A6 | | | | | | | | |
| 5.500%, 07/25/34 | | | 106 | | | | 111 | |
| GNMA, Pool 780315 | | | | | | | | |
| 9.500%, 12/15/17 | | | 3 | | | | 3 | |
| GNMA, Pool G2 4696 | | | | | | | | |
| 4.500%, 05/20/40 | | | 207 | | | | 224 | |
| GNMA, Pool G2 4747 | | | | | | | | |
| 5.000%, 07/20/40 | | | 79 | | | | 87 | |
| GNMA, Pool G2 4923 | | | | | | | | |
| 4.500%, 01/20/41 | | | 112 | | | | 121 | |
| GNMA, Pool G2 MA0155 | | | | | | | | |
| 4.000%, 06/20/42 | | | 274 | | | | 288 | |
| | | | | |
| GNMA, Pool G2 MA0392 | | | | | | |
| 3.500%, 09/20/42 | | $ | 279 | | | $ | 285 | |
| NCUA Guaranteed Notes Trust, Ser 2010-C1, Cl A2 | | | | | | | | |
| 2.900%, 10/29/20 | | | 225 | | | | 233 | |
| NCUA Guaranteed Notes Trust, Ser 2010-R1, Cl 2A | | | | | | | | |
| 1.840%, 10/07/20 | | | 44 | | | | 44 | |
| | | | | | | | | |
| Total U.S. Government Mortgage-Backed Obligations | | | | | |
| (Cost $7,349) | | | | 7,418 | |
| | | | | | | | | |
| U.S. Treasury Obligations [3.1%] | |
| U.S. Treasury Bond | | | | | | | | |
| 6.250%, 08/15/23 | | | 550 | | | | 718 | |
| U.S. Treasury Note | | | | | | | | |
| 2.750%, 02/15/19 | | | 845 | | | | 887 | |
| 2.625%, 11/15/20 | | | 425 | | | | 436 | |
| 2.375%, 07/31/17 | | | 1,010 | | | | 1,052 | |
| 1.750%, 10/31/18 | | | 610 | | | | 614 | |
| 1.250%, 04/30/19 | | | 2,375 | | | | 2,315 | |
| 0.875%, 07/31/19 | | | 815 | | | | 774 | |
| | | | | | | | | |
| Total U.S. Treasury Obligations | |
| (Cost $6,913) | | | | 6,796 | |
| | | | | | | | | |
| Asset-Backed Securities [1.9%] | |
| American Express Credit Account Master Trust, Ser 2009-2, Cl A | | | | | | | | |
| 1.405%, 04/15/14(B) | | | 575 | | | | 578 | |
| Bayview Financial Acquisition Trust, Ser 2007-A, Cl 1A2 | | | | | | | | |
| 6.205%, 05/28/37 | | | 121 | | | | 129 | |
| BT SPE (Acquired 07/06/11, Acquisition Cost $1,102,589) | | | | | | | | |
| 9.250%, 06/06/16(E) (F) (G) | | | 1,011 | | | | 953 | |
| Cityscape Home Equity Loan Trust Series, Ser 1997-C, Cl A4 | | | | | | | | |
| 7.000%, 07/25/28(D) (F) | | | 5 | | | | — | |
| Conseco Financial, Ser 1997-7, Cl A6 | | | | | | | | |
| 6.760%, 07/15/28 | | | 32 | | | | 33 | |
| Contimortgage Home Equity Loan Trust, Ser 1997-2, Cl A9 | | | | | | | | |
| 7.090%, 04/15/28 | | | — | | | | — | |
| GMACM Mortgage Loan Trust, Ser 2004-GH1, Cl A6 | | | | | | | | |
| 4.810%, 07/25/35 | | | 33 | | | | 33 | |
See accompanying notes to financial statements.
CITY NATIONAL ROCHDALE FUNDS | PAGE 50
schedule of investments
March 31, 2014 (Unaudited)
City National Rochdale Intermediate Fixed Income Fund (continued)
| | | | | |
| Hyundai Auto Receivables Trust, Ser 2013-B, Cl A2 | | | | | | |
| 0.530%, 03/15/16 | | $ | 2,241 | | | $ | 2,243 | |
| RAAC, Ser 2004-SP1, Cl AI4 | | | | | | | | |
| 5.285%, 04/01/14(B) | | | 9 | | | | 9 | |
| Residential Asset Mortgage Products, Ser 2002-RS3, Cl AI5 | | | | | | | | |
| 5.572%, 06/25/32(B) | | | 34 | | | | 34 | |
| | | | | | | | | |
| Total Asset-Backed Securities | |
| (Cost $4,072) | | | | 4,012 | |
| | | | | | | | | |
| Commercial Mortgage-Backed Obligations [1.1%] | |
| Bear Stearns Commercial Mortgage Securities Trust, Ser PWR9, Cl A4A | | | | | | | | |
| 4.871%, 09/11/42 | | | 200 | | | | 209 | |
| CD 2005-CD1 Commercial Mortgage Trust, Ser CD1, Cl A4 | | | | | | | | |
| 5.219%, 04/01/14(B) | | | 199 | | | | 209 | |
| Commercial Mortgage Trust, Ser 2005-C6, Cl A5A | | | | | | | | |
| 5.116%, 06/10/44(B) | | | 274 | | | | 286 | |
| Commercial Mortgage Trust, Ser 2012-CR2, Cl A4 | | | | | | | | |
| 3.147%, 04/01/14 | | | 125 | | | | 123 | |
| Credit Suisse First Boston Mortgage Securities, Ser C5, Cl A4 | | | | | | | | |
| 5.100%, 08/15/38(B) | | | 274 | | | | 284 | |
| GS Mortgage Securities II, Ser GCJ9, Cl A3 | | | | | | | | |
| 2.773%, 11/10/45 | | | 275 | | | | 262 | |
| JP Morgan Chase Commercial Mortgage Securities Trust, Ser 2005-CB12, Cl A4 | | | | | | | | |
| 4.895%, 09/12/37 | | | 275 | | | | 286 | |
| JP Morgan Chase Commercial Mortgage Securities Trust, Ser 2013-LC11, Cl A5 | | | | | | | | |
| 2.960%, 04/01/14 | | | 150 | | | | 144 | |
| Morgan Stanley Bank of America Merrill Lynch Trust, Ser C6, Cl A4 | | | | | | | | |
| 2.858%, 11/15/45 | | | 275 | | | | 264 | |
| | | | | |
| Wachovia Bank Commercial Mortgage Trust Series, Ser C22, Cl A4 | | | | | | |
| 5.291%, 04/01/14(B) | | $ | 250 | | | $ | 265 | |
| | | | | | | | | |
| Total Commercial Mortgage-Backed Obligations | | | | | |
| (Cost $2,388) | | | | 2,332 | |
| | | | | | | | | |
| Foreign Government Bonds [0.2%] | |
| Mexico Government International Bond, MTN | | | | | | | | |
| 5.125%, 01/15/20 | | | 100 | | | | 111 | |
| Province of Newfoundland and Labrador Canada | | | | | | | | |
| 7.320%, 10/13/23 | | | 100 | | | | 129 | |
| Province of Quebec Canada, MTN | | | | | | | | |
| 7.380%, 04/09/26(C) | | | 100 | | | | 131 | |
| | | | | | | | | |
| Total Foreign Government Bonds | |
| (Cost $363) | | | | 371 | |
| | | | | | | | | |
| Certificate of Deposit [0.1%] | |
| Swiss Bank | | | | | | | | |
| 7.375%, 07/15/15 | | | 175 | | | | 189 | |
| | | | | | | | | |
| Total Certificate of Deposit | |
| (Cost $180) | | | | 189 | |
| | | | | | | | | |
| Residential Mortgage-Backed Securities [0.1%] | |
| Banc of America Alternative Loan Trust, Ser 2004-2, Cl 5A1 | | | | | | | | |
| 5.500%, 03/25/19 | | | 35 | | | | 36 | |
| Residential Accredit Loans, Ser 2004-QS5, Cl A5 | | | | | | | | |
| 4.750%, 04/25/34 | | | 10 | | | | 11 | |
| Residential Accredit Loans, Ser 2004-QS6, Cl A1 | | | | | | | | |
| 5.000%, 05/25/19 | | | 17 | | | | 17 | |
| WaMu Mortgage Pass-Through Certificates Series Trust, Ser 2004-CB2, Cl 5A | | | | | | | | |
| 5.000%, 07/25/19 | | | 53 | | | | 54 | |
| | | | | | | | | |
| Total Residential Mortgage-Backed Securities | | | | | |
| (Cost $114) | | | | 118 | |
See accompanying notes to financial statements.
CITY NATIONAL ROCHDALE FUNDS | PAGE 51
schedule of investments
March 31, 2014 (Unaudited)
City National Rochdale Intermediate Fixed Income Fund (continued)
| | | | | |
| Convertible Bond [0.0%] | |
| Information Technology [0.0%] | |
| Advanced Micro Devices | | | | | | |
| 8.125%, 12/15/17 | | $ | 61 | | | $ | 64 | |
| | | | | | | | | |
| Total Convertible Bond | |
| (Cost $62) | | | | 64 | |
| | | | | | | | | |
| Short-Term Investments [0.8%] | |
| City National Rochdale Government Money Market Fund, 0.010%*† | | | 129,763 | | | | 130 | |
| SEI Daily Income Trust Government Fund, Cl A, 0.010%* | | | 1,698,015 | | | | 1,698 | |
| | | | | | | | | |
| Total Short-Term Investments | |
| (Cost $1,828) | | | | 1,828 | |
| | | | | | | | | |
| Total Investments [98.9%] | |
| (Cost $210,879) | | | $ | 213,670 | |
Percentages are based on Net Assets of $216,066 (000).
| * | The rate reported is the 7-day effective yield as of March 31, 2014. |
| † | Investment in Affiliate. |
| (A) | Security exempt from registration under Rule 144A of the Securities Act of 1933. These securities may be resold in transactions exempt from registration normally to qualified institutions. On March 31, 2014, the value of these securities amounted to $7,677 (000), representing 3.6% of the net assets of the Fund. |
| (B) | Floating Rate Security — The rate reported is the rate in effect on March 31, 2014. |
| (C) | Step Bond — The rate reported is the rate in effect on March 31, 2014. The coupon on a step bond changes on a specific date. |
| (D) | In default on interest payments. Rate shown represents the last coupon rate prior to default. |
| (E) | Security is fair valued using methods determined in good faith by the Fair Value Committee designated by the Board of Trustees. The total market value of such securities as of March 31, 2014 was $953 (000) and represented 0.4% of the net assets of the Fund. |
| (F) | Security is considered illiquid. The total market value of such securities as of March 31, 2014 was $953 (000) and represented 0.4% of the net assets of the Fund. |
| (G) | Security is considered restricted. The total market value of such securities as of March 31, 2014 was $953 (000) and represented 0.4% of the net assets of the Fund. |
Cl — Class
FFCB — Federal Farm Credit Bank
FHLB — Federal Home Loan Bank
FHLMC — Federal Home Loan Mortgage Corporation
FNMA — Federal National Mortgage Association
GNMA — Government National Mortgage Association
MTN — Medium Term Note
NCUA — National Credit Union Administration
RB — Revenue Bond
REIT — Real Estate Investment Trust
REMIC — Real Estate Mortgage Investment Conduit
Ser — Series
SPE — Special Purpose Entity
Amounts designated as “—” are either $0 or have been rounded to $0.
The following is a list of the inputs used as of March 31, 2014 in valuing the Fund’s investments carried at value (000):
| Investments in Securities | | | | | | | | | | | | |
| Corporate Bonds | | $ | — | | | $ | 154,680 | | | $ | — | | | $ | 154,680 | |
| U.S. Government Agency Obligations | | | — | | | | 20,565 | | | | — | | | | 20,565 | |
| Municipal Bonds | | | — | | | | 7,931 | | | | — | | | | 7,931 | |
| Preferred Stock | | | 4,551 | | | | 2,815 | | | | — | | | | 7,366 | |
| U.S. Government Mortgage-Backed Obligations | | | — | | | | 7,418 | | | | — | | | | 7,418 | |
| U.S. Treasury Obligations | | | — | | | | 6,796 | | | | — | | | | 6,796 | |
| Asset-Backed Securities | | | — | | | | 3,059 | | | | 953 | | | | 4,012 | |
| Commercial Mortgage-Backed Obligations | | | — | | | | 2,332 | | | | — | | | | 2,332 | |
| Foreign Government Bonds | | | — | | | | 371 | | | | — | | | | 371 | |
| Certificate of Deposit | | | — | | | | 189 | | | | — | | | | 189 | |
| Residential Mortgage-Backed Securities | | | — | | | | 118 | | | | — | | | | 118 | |
| Convertible Bond | | | — | | | | 64 | | | | — | | | | 64 | |
| Short-Term Investments | | | 1,828 | | | | — | | | | — | | | | 1,828 | |
| Total Investments in Securities | | $ | 6,379 | | | $ | 206,338 | | | $ | 953 | | | $ | 213,670 | |
See accompanying notes to financial statements.
CITY NATIONAL ROCHDALE FUNDS | PAGE 52
schedule of investments
March 31, 2014 (Unaudited)
City National Rochdale Intermediate Fixed Income Fund (concluded)
The following is a reconciliation of investments in which significant unobservable inputs (Level 3) were used in determining value (000) as of March 31, 2014:
| | | Investments in Asset-Backed Securities | |
| Beginning balance as of October 1, 2013 | | $ | 1,158 | |
| Accrued discounts/premiums | | | — | |
| Realized gain/(loss) | | | — | |
| Change in unrealized appreciation/(depreciation) | | | 13 | |
| Purchases | | | — | |
| Sales/paydowns | | | (218 | ) |
| Transfers into Level 3 | | | — | |
| Transfers out of Level 3 | | | — | |
| Ending balance as of March 31, 2014 | | $ | 953 | |
| Changes in unrealized gains/(losses) included in earnings related to securities still held at reporting date | | $ | 13 | |
The following table summarizes the quantitative inputs and assumptions used for items categorized as material Level 3 investments as of March 31, 2014. The disclosures below also include qualitative information on the sensitivity of the fair value measurements to changes in the significant unobservable inputs.
| | Fair Value at March 31, 2014 (000) | | | | |
| BT SPE | $953 | | Discounted Cash Flow Model | | |
| | | | | | |
| | | | | | |
| | | | Cumulated Collections | | |
| | | | Cumulated Defaults | | |
| | | | Annualized Default Rate | | |
| | | | Cumulated Default Rate | | |
| | | | Pace of Collection Pace of Defaults | | |
| | | | Interest Rates | | |
| | | | | | |
| | | | | | |
| | | | Projected Default Rates | | 5%-12% |
| | | | Projected Collection Rates | | 90%-100% |
| | | | Expected Discount Rates | | 7%-9.25% |
The unobservable inputs used to determine fair value of recurring Level 3 assets may have similar or diverging impacts on valuation. Significant increased and decreased in these inputs in isolation and interrelationships between those inputs could result in significantly higher or lower fair value measurement.
For the period ended March 31, 2014, there have been no transfers between Level 1 and Level 2 assets and liabilities. For the period ended March 31, 2014, there have been no transfers between Level 2 and Level 3 assets and liabilities. Transfers between Levels are recognized at period end.
For more information on valuation inputs, see Note 2 — Significant Accounting Policies in the Notes to Financial Statements. financial statements.
See accompanying notes to financial statements.
CITY NATIONAL ROCHDALE FUNDS | PAGE 53
consolidated schedule of investments
March 31, 2014 (Unaudited)
City National Rochdale Fixed Income Opportunities Fund
| | | | | |
| Corporate Bonds [50.5%] | |
| Advertising Sales [0.1%] | |
| CBS Outdoor Americas Capital | | | | | | |
| 5.625%, 02/15/24(A) | | $ | 100 | | | $ | 103 | |
| 5.250%, 02/15/22(A) | | | 125 | | | | 128 | |
| Lamar Media | | | | | | | | |
| 5.875%, 02/01/22 | | | 525 | | | | 556 | |
| 5.375%, 01/15/24(A) | | | 475 | | | | 487 | |
| 5.000%, 05/01/23 | | | 450 | | | | 450 | |
| | | | | | | | | |
| Total Advertising Sales | | | | 1,724 | |
| | | | | | | | | |
| Aerospace & Defense [0.5%] | |
| Accudyne Industries Borrower | | | | | | | | |
| 7.750%, 12/15/20(A) | | | 1,425 | | | | 1,535 | |
| BE Aerospace | | | | | | | | |
| 5.250%, 04/01/22 | | | 1,050 | | | | 1,080 | |
| Guanay Finance | | | | | | | | |
| 6.000%, 12/15/20 | | | 1,450 | | | | 1,530 | |
| TransDigm | | | | | | | | |
| 7.750%, 12/15/18 | | | 1,875 | | | | 2,011 | |
| 7.500%, 07/15/21 | | | 100 | | | | 111 | |
| | | | | | | | | |
| Total Aerospace & Defense | | | | 6,267 | |
| | | | | | | | | |
| Applications Software [0.2%] | |
| Emdeon | | | | | | | | |
| 11.000%, 12/31/19 | | | 1,075 | | | | 1,246 | |
| Nuance Communications | | | | | | | | |
| 5.375%, 08/15/20(A) | | | 800 | | | | 796 | |
| | | | | | | | | |
| Total Applications Software | | | | 2,042 | |
| | | | | |
| Auto Rent & Lease [0.4%] | |
| Hertz | | | | | | |
| 6.750%, 04/15/19 | | $ | 825 | | | $ | 884 | |
| 6.250%, 10/15/22 | | | 1,025 | | | | 1,097 | |
| United Rentals North America | | | | | | | | |
| 8.375%, 09/15/20 | | | 675 | | | | 748 | |
| 7.625%, 04/15/22 | | | 300 | | | | 336 | |
| 6.125%, 06/15/23 | | | 575 | | | | 610 | |
| 5.750%, 11/15/24 | | | 175 | | | | 176 | |
| | | | | | | | | |
| Total Auto Rent & Lease | | | | 3,851 | |
| | | | | | | | | |
| Auto/Trk Prts and Equip-Repl [0.2%] | |
| Allison Transmission | | | | | | | | |
| 7.125%, 05/15/19(A) | | | 650 | | | | 700 | |
| Exide Technologies | | | | | | | | |
| 8.625%, 02/01/18(B) | | | 375 | | | | 285 | |
| IDQ Holdings | | | | | | | | |
| 11.500%, 04/01/17(A) | | | 450 | | | | 489 | |
| JB Poindexter | | | | | | | | |
| 9.000%, 04/01/22(A) | | | 550 | | | | 588 | |
| UCI International | | | | | | | | |
| 8.625%, 02/15/19 | | | 1,575 | | | | 1,528 | |
| | | | | | | | | |
| Total Auto/Trk Prts and Equip-Repl | | | | 3,590 | |
| | | | | | | | | |
| Automotive [0.1%] | |
| Chrysler Group | | | | | | | | |
| 8.250%, 06/15/21 | | | 675 | | | | 764 | |
| Jaguar Land Rover Automotive | | | | | | | | |
| 8.125%, 05/15/21(A) | | | 625 | | | | 709 | |
| 5.625%, 02/01/23(A) | | | 325 | | | | 339 | |
| | | | | | | | | |
| Total Automotive | | | | 1,812 | |
| | | | | | | | | |
| Autoparts [0.8%] | |
| Affinia Group | | | | | | | | |
| 7.750%, 05/01/21 | | | 1,025 | | | | 1,107 | |
| American Axle & Manufacturing | | | | | | | | |
| 7.750%, 11/15/19 | | | 1,225 | | | | 1,415 | |
| 6.625%, 10/15/22 | | | 300 | | | | 325 | |
| 6.250%, 03/15/21 | | | 275 | | | | 293 | |
| 5.125%, 02/15/19 | | | 500 | | | | 521 | |
| International Automotive Components Group | | | | | | | | |
| 9.125%, 06/01/18(A) | | | 625 | | | | 659 | |
| Lear | | | | | | | | |
| 4.750%, 01/15/23(A) | | | 1,075 | | | | 1,048 | |
See accompanying notes to financial statements.
CITY NATIONAL ROCHDALE FUNDS | PAGE 54
consolidated schedule of investments
March 31, 2014 (Unaudited)
City National Rochdale Fixed Income Opportunities Fund (continued)
| | | | | |
| Schaeffler Finance BV | | | | | | |
| 8.500%, 02/15/19(A) | | $ | 1,150 | | | $ | 1,284 | |
| 4.750%, 05/15/21(A) | | | 625 | | | | 639 | |
| Schaeffler Holding Finance BV | | | | | | | | |
| 6.875%, 08/15/18(A) | | | 850 | | | | 904 | |
| Stackpole International Intermediate | | | | | | | | |
| 7.750%, 10/15/21(A) | | | 1,150 | | | | 1,232 | |
| Tenneco | | | | | | | | |
| 6.875%, 12/15/20 | | | 275 | | | | 302 | |
| Titan International | | | | | | | | |
| 6.875%, 10/01/20(A) | | | 325 | | | | 345 | |
| Tomkins | | | | | | | | |
| 9.000%, 10/01/18 | | | 461 | | | | 495 | |
| | | | | | | | | |
| Total Autoparts | | | | 10,569 | |
| | | | | | | | | |
| Banks [4.8%] | |
| Alfa Bank Via Alfa Bond Issuance | | | | | | | | |
| 7.500%, 09/26/19 | | | 1,800 | | | | 1,791 | |
| Alliance Bank JSC | | | | | | | | |
| 22.844%, 03/25/20(I) (J) | | | 7,034 | | | | 1,126 | |
| 10.500%, 03/25/17(I) | | | 137 | | | | 60 | |
| 10.014%, 03/25/20(A)(I) (J) | | | 1,838 | | | | 294 | |
| Banco BMG | | | | | | | | |
| 8.000%, 04/15/18 | | | 1,000 | | | | 1,009 | |
| Banco de Reservas de la Republica Dominicana | | | | | | | | |
| 7.000%, 02/01/23(I) | | | 133 | | | | 125 | |
| Banco do Brasil, MTN | | | | | | | | |
| 3.750%, 07/25/18 | | | 1,000 | | | | 1,412 | |
| Bank of Georgia JSC, MTN | | | | | | | | |
| 7.750%, 07/05/17 | | | 4,100 | | | | 4,371 | |
| Bank of Moscow Via Kuznetski Capital | | | | | | | | |
| 6.020%, 05/10/17(C) (D) | | | 4,033 | | | | 3,952 | |
| CIT Group | | | | | | | | |
| 6.625%, 04/01/18(A) | | | 325 | | | | 364 | |
| 5.375%, 05/15/20 | | | 225 | | | | 241 | |
| 5.250%, 03/15/18 | | | 1,050 | | | | 1,129 | |
| 5.000%, 08/01/23 | | | 1,175 | | | | 1,202 | |
| 4.750%, 02/15/15(A) | | | 225 | | | | 231 | |
| 4.250%, 08/15/17 | | | 175 | | | | 183 | |
| CorpGroup Banking | | | | | | | | |
| 6.750%, 03/15/23 | | | 2,000 | | | | 1,955 | |
| Credit Bank of Moscow Via CBOM Finance | | | | | | | | |
| 8.700%, 11/13/18 | | | 500 | | | | 460 | |
| Credit Europe Bank | | | | | | | | |
| 8.000%, 01/24/23(C) | | | 2,400 | | | | 2,376 | |
| | | | | |
| East and South African Development Bank | | | | | | |
| 6.375%, 12/06/18 | | $ | 3,000 | | | $ | 3,154 | |
| Eastern and Southern African Trade and Development Bank | | | | | | | | |
| 6.375%, 12/06/18 | | | 1,500 | | | | 1,581 | |
| Halyk Savings Bank of Kazakhstan JSC | | | | | | | | |
| 7.250%, 05/03/17 | | | 6,000 | | | | 6,381 | |
| Home Credit & Finance Bank OOO Via Eurasia Capital | | | | | | | | |
| 9.375%, 04/24/20(C) | | | 3,000 | | | | 2,745 | |
| Kaspi Bank JSC | | | | | | | | |
| 9.875%, 10/28/16 | | | 3,000 | | | | 3,053 | |
| Kazkommertsbank JSC | | | | | | | | |
| 6.765%, 07/27/16(C) (D) | | | 4,000 | | | | 3,520 | |
| NDR Finance | | | | | | | | |
| 8.000%, 06/22/17(C)(I) | | | 721 | | | | 505 | |
| Nomos Bank Via Nomos Capital | | | | | | | | |
| 10.000%, 04/26/19 | | | 1,800 | | | | 1,777 | |
| Renaissance Capital Via Renaissance Consumer Funding | | | | | | | | |
| 13.500%, 06/21/18 | | | 2,124 | | | | 2,060 | |
| Russian Agricultural Bank Via RSHB Capital | | | | | | | | |
| 6.000%, 06/03/21(C) | | | 4,000 | | | | 3,910 | |
| Russian Standard Bank Via Russian Standard Finance, MTN | | | | | | | | |
| 10.750%, 04/10/18 | | | 1,500 | | | | 1,410 | |
| Sberbank of Russia Via SB Capital | | | | | | | | |
| 5.500%, 02/26/24(C) | | | 2,000 | | | | 1,872 | |
| Tinkoff Credit Systems Via TCS Finance, MTN | | | | | | | | |
| 14.000%, 06/06/18 | | | 3,550 | | | | 3,612 | |
| Turkiye Vakiflar Bankasi Tao | | | | | | | | |
| 5.750%, 04/24/17 | | | 500 | | | | 515 | |
| Yapi ve Kredi Bankasi | | | | | | | | |
| 5.500%, 12/06/22 | | | 500 | | | | 440 | |
| | | | | | | | | |
| Total Banks | | | | 58,816 | |
| | | | | | | | | |
| Beauty Products [0.1%] | |
| First Quality Finance | | | | | | | | |
| 4.625%, 05/15/21(A) | | | 950 | | | | 924 | |
See accompanying notes to financial statements.
CITY NATIONAL ROCHDALE FUNDS | PAGE 55
consolidated schedule of investments
March 31, 2014 (Unaudited)
City National Rochdale Fixed Income Opportunities Fund (continued)
| | | | | |
| Broadcasting & Cable [1.3%] | |
| AMC Networks | | | | | | |
| 7.750%, 07/15/21 | | $ | 600 | | | $ | 676 | |
| 4.750%, 12/15/22 | | | 200 | | | | 199 | |
| Anixter | | | | | | | | |
| 5.625%, 05/01/19 | | | 600 | | | | 639 | |
| CCO Holdings | | | | | | | | |
| 8.125%, 04/30/20 | | | 50 | | | | 55 | |
| 7.375%, 06/01/20 | | | 300 | | | | 328 | |
| 6.625%, 01/31/22 | | | 650 | | | | 695 | |
| 5.750%, 09/01/23 | | | 525 | | | | 521 | |
| 5.750%, 01/15/24 | | | 250 | | | | 248 | |
| 5.250%, 03/15/21 | | | 675 | | | | 680 | |
| 5.125%, 02/15/23 | | | 825 | | | | 794 | |
| Cequel Communications Holdings I | | | | | | | | |
| 6.375%, 09/15/20(A) | | | 850 | | | | 888 | |
| 5.125%, 12/15/21(A) | | | 400 | | | | 396 | |
| Clear Channel Communications | | | | | | | | |
| 9.000%, 03/01/21 | | | 2,650 | | | | 2,766 | |
| Clear Channel Worldwide Holdings | | | | | | | | |
| 7.625%, 03/15/20 | | | 750 | | | | 809 | |
| 6.500%, 11/15/22 | | | 1,850 | | | | 1,977 | |
| Crown Media Holdings | | | | | | | | |
| 10.500%, 07/15/19 | | | 1,100 | | | | 1,246 | |
| DISH DBS | | | | | | | | |
| 5.875%, 07/15/22 | | | 2,425 | | | | 2,589 | |
| 5.000%, 03/15/23 | | | 100 | | | | 101 | |
| Gray Television | | | | | | | | |
| 7.500%, 10/01/20 | | | 1,000 | | | | 1,085 | |
| Unitymedia Hessen GmbH & KG | | | | | | | | |
| 5.500%, 01/15/23(A) | | | 525 | | | | 535 | |
| | | | | | | | | |
| Total Broadcasting & Cable | | | | 17,227 | |
| | | | | | | | | |
| Building & Construction [0.9%] | |
| Allegion US Holding | | | | | | | | |
| 5.750%, 10/01/21(A) | | | 550 | | | | 579 | |
| Building Materials Corp of America | | | | | | | | |
| 7.500%, 03/15/20(A) | | | 100 | | | | 108 | |
| 6.750%, 05/01/21(A) | | | 575 | | | | 624 | |
| CPG Merger Sub | | | | | | | | |
| 8.000%, 10/01/21(A) | | | 825 | | | | 879 | |
| Dynacast International | | | | | | | | |
| 9.250%, 07/15/19 | | | 775 | | | | 862 | |
| Grupo Cementos de Chihuahua | | | | | | | | |
| 8.125%, 02/08/20 | | | 700 | | | | 756 | |
| | | | | |
| Interline Brands | | | | | | |
| 10.000%, 11/15/18(E) | | $ | 1,350 | | | $ | 1,468 | |
| Masonite International | | | | | | | | |
| 8.250%, 04/15/21(A) | | | 925 | | | | 1,021 | |
| MasTec | | | | | | | | |
| 4.875%, 03/15/23 | | | 250 | | | | 245 | |
| Nortek | | | | | | | | |
| 8.500%, 04/15/21 | | | 1,700 | | | | 1,900 | |
| Ply Gem Industries | | | | | | | | |
| 6.500%, 02/01/22(A) | | | 900 | | | | 909 | |
| Reliance Intermediate Holdings | | | | | | | | |
| 9.500%, 12/15/19(A) | | | 300 | | | | 327 | |
| Roofing Supply Group | | | | | | | | |
| 10.000%, 06/01/20(A) | | | 775 | | | | 866 | |
| USG | | | | | | | | |
| 7.875%, 03/30/20(A) | | | 250 | | | | 279 | |
| 5.875%, 11/01/21(A) | | | 650 | | | | 692 | |
| | | | | | | | | |
| Total Building & Construction | | | | 11,515 | |
| | | | | | | | | |
| Building-Heavy Construct [0.2%] | |
| Odebrecht Offshore Drilling Finance | | | | | | | | |
| 6.750%, 10/01/22 | | | 1,946 | | | | 2,019 | |
| | | | | | | | | |
| Business Services [0.1%] | |
| CoreLogic | | | | | | | | |
| 7.250%, 06/01/21 | | | 775 | | | | 839 | |
| | | | | | | | | |
| Chemicals [0.9%] | |
| Ashland | | | | | | | | |
| 4.750%, 08/15/22 | | | 950 | | | | 932 | |
| Axiall | | | | | | | | |
| 4.875%, 05/15/23(A) | | | 100 | | | | 98 | |
| Celanese US Holdings | | | | | | | | |
| 4.625%, 11/15/22 | | | 375 | | | | 369 | |
| Eagle Spinco | | | | | | | | |
| 4.625%, 02/15/21(A) | | | 175 | | | | 173 | |
| EuroChem Mineral & Chemical via EuroChem GI | | | | | | | | |
| 5.125%, 12/12/17(A) | | | 1,000 | | | | 975 | |
| Fufeng Group | | | | | | | | |
| 7.625%, 04/13/16 | | | 4,000 | | | | 4,105 | |
| Hexion US Finance | | | | | | | | |
| 9.000%, 11/15/20 | | | 650 | | | | 644 | |
| 8.875%, 02/01/18 | | | 1,625 | | | | 1,690 | |
| Huntsman International | | | | | | | | |
| 8.625%, 03/15/20 | | | 150 | | | | 165 | |
| 8.625%, 03/15/21 | | | 425 | | | | 476 | |
| 4.875%, 11/15/20 | | | 650 | | | | 654 | |
See accompanying notes to financial statements.
CITY NATIONAL ROCHDALE FUNDS | PAGE 56
consolidated schedule of investments
March 31, 2014 (Unaudited)
City National Rochdale Fixed Income Opportunities Fund (continued)
| | | | | |
| OMNOVA Solutions | | | | | | |
| 7.875%, 11/01/18 | | $ | 900 | | | $ | 961 | |
| | | | | | | | | |
| Total Chemicals | | | | 11,242 | |
| | | | | | | | | |
| Circuit Boards [0.0%] | |
| Viasystems | | | | | | | | |
| 7.875%, 05/01/19(A) | | | 425 | | | | 458 | |
| | | | | | | | | |
| Coatings/Paint [0.1%] | |
| US Coatings Acquisition | | | | | | | | |
| 7.375%, 05/01/21(A) | | | 1,300 | | | | 1,414 | |
| | | | | | | | | |
| Commercial Serv-Finance [0.5%] | |
| Igloo Holdings | | | | | | | | |
| 8.250%, 12/15/17(A) (E) | | | 1,575 | | | | 1,586 | |
| Interactive Data | | | | | | | | |
| 10.250%, 08/01/18 | | | 625 | | | | 673 | |
| Lender Processing Services | | | | | | | | |
| 5.750%, 04/15/23 | | | 850 | | | | 906 | |
| TransUnion Holding | | | | | | | | |
| 9.625%, 06/15/18 | | | 1,200 | | | | 1,275 | |
| 8.125%, 06/15/18 | | | 475 | | | | 499 | |
| | | | | | | | | |
| Total Commercial Serv-Finance | | | | 4,939 | |
| | | | | | | | | |
| Commercial Services [0.4%] | |
| BC Luxco 1 | | | | | | | | |
| 7.375%, 01/29/20 | | | 5,000 | | | | 5,044 | |
| | | | | | | | | |
| Computer Graphics [0.2%] | |
| Epicor Software | | | | | | | | |
| 8.625%, 05/01/19 | | | 1,675 | | | | 1,832 | |
| Southern Graphics | | | | | | | | |
| 8.375%, 10/15/20(A) | | | 1,050 | | | | 1,116 | |
| | | | | | | | | |
| Total Computer Graphics | | | | 2,948 | |
| | | | | | | | | |
| Computer System Design & Services [0.4%] | |
| Compiler Finance Sub | | | | | | | | |
| 7.000%, 05/01/21(A) | | | 900 | | | | 907 | |
| NCR | | | | | | | | |
| 5.875%, 12/15/21(A) | | | 400 | | | | 421 | |
| 5.000%, 07/15/22 | | | 800 | | | | 801 | |
| 4.625%, 02/15/21 | | | 250 | | | | 251 | |
| NCR Escrow | | | | | | | | |
| 6.375%, 12/15/23(A) | | | 525 | | | | 558 | |
| | | | | |
| SunGard Data Systems | | | | | | |
| 7.625%, 11/15/20 | | $ | 575 | | | $ | 630 | |
| 7.375%, 11/15/18 | | | 25 | | | | 27 | |
| 6.625%, 11/01/19 | | | 650 | | | | 687 | |
| | | | | | | | | |
| Total Computer System Design & Services | | | | 4,282 | |
| | | | | | | | | |
| Computers-Memory Devices [0.1%] | |
| Seagate HDD Cayman | | | | | | | | |
| 7.000%, 11/01/21 | | | 300 | | | | 335 | |
| 6.875%, 05/01/20 | | | 150 | | | | 163 | |
| 4.750%, 06/01/23(A) | | | 1,225 | | | | 1,210 | |
| | | | | | | | | |
| Total Computers-Memory Devices | | | | 1,708 | |
| | | | | | | | | |
| Consumer Products & Services [0.8%] | |
| Libbey Glass | | | | | | | | |
| 6.875%, 05/15/20 | | | 1,080 | | | | 1,180 | |
| Prestige Brands | | | | | | | | |
| 8.125%, 02/01/20 | | | 475 | | | | 533 | |
| 5.375%, 12/15/21(A) | | | 525 | | | | 537 | |
| Serta Simmons Holdings | | | | | | | | |
| 8.125%, 10/01/20(A) | | | 1,825 | | | | 2,005 | |
| ServiceMaster | | | | | | | | |
| 7.450%, 08/15/27 | | | 225 | | | | 215 | |
| 7.100%, 03/01/18 | | | 475 | | | | 475 | |
| 7.000%, 08/15/20 | | | 2,250 | | | | 2,382 | |
| Spectrum Brands | | | | | | | | |
| 6.750%, 03/15/20 | | | 1,000 | | | | 1,084 | |
| | | | | | | | | |
| Total Consumer Products & Services | | | | 8,411 | |
| | | | | | | | | |
| Containers & Packaging [1.4%] | |
| Ardagh Packaging Finance | | | | | | | | |
| 9.125%, 10/15/20(A) | | | 2,200 | | | | 2,452 | |
| 6.750%, 01/31/21(A) | | | 200 | | | | 209 | |
| Ball | | | | | | | | |
| 5.000%, 03/15/22 | | | 450 | | | | 461 | |
| 4.000%, 11/15/23 | | | 825 | | | | 771 | |
| Berry Plastics | | | | | | | | |
| 9.500%, 05/15/18 | | | 1,025 | | | | 1,084 | |
| Beverage Packaging Holdings Luxembourg II | | | | | | | | |
| 6.000%, 06/15/17(A) | | | 325 | | | | 336 | |
| 5.625%, 12/15/16(A) | | | 300 | | | | 308 | |
| BOE Merger | | | | | | | | |
| 9.500%, 11/01/17(A) (E) | | | 825 | | | | 875 | |
| BWAY Holding | | | | | | | | |
| 10.000%, 06/15/18 | | | 425 | | | | 453 | |
See accompanying notes to financial statements.
CITY NATIONAL ROCHDALE FUNDS | PAGE 57
consolidated schedule of investments
March 31, 2014 (Unaudited)
City National Rochdale Fixed Income Opportunities Fund (continued)
| | | | | |
| Crown Americas | | | | | | |
| 4.500%, 01/15/23 | | $ | 650 | | | $ | 621 | |
| Greif | | | | | | | | |
| 7.750%, 08/01/19 | | | 725 | | | | 830 | |
| Pactiv | | | | | | | | |
| 7.950%, 12/15/25 | | | 200 | | | | 206 | |
| Reynolds Group Issuer | | | | | | | | |
| 9.875%, 08/15/19 | | | 1,950 | | | | 2,179 | |
| 8.250%, 02/15/21 | | | 2,575 | | | | 2,810 | |
| 5.750%, 10/15/20 | | | 1,350 | | | | 1,414 | |
| Sealed Air | | | | | | | | |
| 8.375%, 09/15/21(A) | | | 875 | | | | 1,007 | |
| 6.500%, 12/01/20(A) | | | 725 | | | | 799 | |
| | | | | | | | | |
| Total Containers & Packaging | | | | 16,815 | |
| | | | | | | | | |
| Data Processing/Mgmt [0.5%] | |
| Audatex North America | | | | | | | | |
| 6.125%, 11/01/23(A) | | | 175 | | | | 186 | |
| 6.000%, 06/15/21(A) | | | 1,100 | | | | 1,174 | |
| First Data | | | | | | | | |
| 11.250%, 01/15/21 | | | 375 | | | | 428 | |
| 8.750%, 01/15/22(A) (E) | | | 4,225 | | | | 4,616 | |
| | | | | | | | | |
| Total Data Processing/Mgmt | | | | 6,404 | |
| | | | | | | | | |
| Dialysis Centers [0.1%] | |
| DaVita HealthCare Partners | | | | | | | | |
| 5.750%, 08/15/22 | | | 875 | | | | 931 | |
| | | | | | | | | |
| Distribution/Wholesale [0.4%] | |
| American Builders & Contractors Supply | | | | | | | | |
| 5.625%, 04/15/21(A) | | | 675 | | | | 699 | |
| DH Services Luxembourg Sarl | | | | | | | | |
| 7.750%, 12/15/20(A) | | | 1,350 | | | | 1,441 | |
| VWR Funding | | | | | | | | |
| 7.250%, 09/15/17 | | | 1,875 | | | | 2,016 | |
| | | | | | | | | |
| Total Distribution/Wholesale | | | | 4,156 | |
| | | | | | | | | |
| Drugs [0.3%] | |
| Grifols Worldwide Operations | | | | | | | | |
| 5.250%, 04/01/22(A) | | | 425 | | | | 434 | |
| Valeant Pharmaceuticals International | | | | | | | | |
| 5.625%, 12/01/21(A) | | | 425 | | | | 447 | |
| | | | | |
| VPII Escrow | | | | | | |
| 7.500%, 07/15/21(A) | | $ | 2,375 | | | $ | 2,672 | |
| | | | | | | | | |
| Total Drugs | | | | 3,553 | |
| | | | | | | | | |
| E-Commerce/Services [0.2%] | |
| IAC | | | | | | | | |
| 4.875%, 11/30/18 | | | 925 | | | | 966 | |
| 4.750%, 12/15/22 | | | 1,250 | | | | 1,223 | |
| | | | | | | | | |
| Total E-Commerce/Services | | | | 2,189 | |
| | | | | | | | | |
| Educational Software [0.2%] | |
| Blackboard | | | | | | | | |
| 7.750%, 11/15/19(A) | | | 675 | | | | 707 | |
| SSI Investments II | | | | | | | | |
| 11.125%, 06/01/18 | | | 1,450 | | | | 1,546 | |
| | | | | | | | | |
| Total Educational Software | | | | 2,253 | |
| | | | | | | | | |
| Electric Utilities [0.3%] | |
| Calpine | | | | | | | | |
| 6.000%, 01/15/22(A) | | | 150 | | | | 158 | |
| Energy Future Intermediate Holding | | | | | | | | |
| 10.000%, 12/01/20 | | | 900 | | | | 947 | |
| 6.875%, 08/15/17(A) | | | 525 | | | | 537 | |
| NRG Energy | | | | | | | | |
| 8.250%, 09/01/20 | | | 575 | | | | 631 | |
| 7.875%, 05/15/21 | | | 875 | | | | 963 | |
| 7.625%, 01/15/18 | | | 150 | | | | 168 | |
| 6.625%, 03/15/23 | | | 400 | | | | 415 | |
| | | | | | | | | |
| Total Electric Utilities | | | | 3,819 | |
| | | | | | | | | |
| Electronic Parts Distrib [0.1%] | |
| Rexel | | | | | | | | |
| 6.125%, 12/15/19(A) | | | 1,275 | | | | 1,342 | |
| | | | | | | | | |
| Energy [0.1%] | |
| CGG | | | | | | | | |
| 9.500%, 05/15/16 | | | 47 | | | | 48 | |
| 6.500%, 06/01/21 | | | 1,150 | | | | 1,167 | |
| | | | | | | | | |
| Total Energy | | | | 1,215 | |
| | | | | | | | | |
| Enterprise Software/Serv [0.5%] | |
| BMC Software Finance | | | | | | | | |
| 8.125%, 07/15/21(A) | | | 1,700 | | | | 1,789 | |
See accompanying notes to financial statements.
CITY NATIONAL ROCHDALE FUNDS | PAGE 58
consolidated schedule of investments
March 31, 2014 (Unaudited)
City National Rochdale Fixed Income Opportunities Fund (continued)
| | | | | |
| Eagle Midco | | | | | | |
| 9.000%, 06/15/18(A) | | $ | 750 | | | $ | 787 | |
| Infor US | | | | | | | | |
| 11.500%, 07/15/18 | | | 550 | | | | 637 | |
| 9.375%, 04/01/19 | | | 1,225 | | | | 1,380 | |
| Sophia | | | | | | | | |
| 9.750%, 01/15/19(A) | | | 1,275 | | | | 1,415 | |
| | | | | | | | | |
| Total Enterprise Software/Serv | | | | 6,008 | |
| | | | | | | | | |
| Entertainment & Gaming [1.2%] | |
| Affinity Gaming | | | | | | | | |
| 9.000%, 05/15/18 | | | 775 | | | | 829 | |
| Ameristar Casinos | | | | | | | | |
| 7.500%, 04/15/21 | | | 725 | | | | 785 | |
| Chester Downs & Marina | | | | | | | | |
| 9.250%, 02/01/20(A) | | | 775 | | | | 771 | |
| Churchill Downs | | | | | | | | |
| 5.375%, 12/15/21(A) | | | 300 | | | | 306 | |
| Cinemark USA | | | | | | | | |
| 7.375%, 06/15/21 | | | 375 | | | | 416 | |
| 5.125%, 12/15/22 | | | 300 | | | | 300 | |
| GLP Capital | | | | | | | | |
| 5.375%, 11/01/23(A) | | | 350 | | | | 359 | |
| 4.875%, 11/01/20(A) | | | 600 | | | | 616 | |
| MGM Resorts International | | | | | | | | |
| 8.625%, 02/01/19 | | | 400 | | | | 479 | |
| 7.750%, 03/15/22 | | | 1,625 | | | | 1,885 | |
| 6.750%, 10/01/20 | | | 250 | | | | 277 | |
| 5.250%, 03/31/20 | | | 350 | | | | 360 | |
| Mohegan Tribal Gaming Authority | | | | | | | | |
| 9.750%, 09/01/21 | | | 1,150 | | | | 1,282 | |
| Penn National Gaming | | | | | | | | |
| 5.875%, 11/01/21(A) | | | 1,275 | | | | 1,253 | |
| Pinnacle Entertainment | | | | | | | | |
| 7.750%, 04/01/22 | | | 600 | | | | 647 | |
| PNK Finance | | | | | | | | |
| 6.375%, 08/01/21(A) | | | 400 | | | | 416 | |
| Regal Entertainment Group | | | | | | | | |
| 5.750%, 03/15/22 | | | 500 | | | | 515 | |
| Seminole Hard Rock Entertainment | | | | | | | | |
| 5.875%, 05/15/21(A) | | | 1,450 | | | | 1,461 | |
| Seminole Indian Tribe of Florida | | | | | | | | |
| 7.804%, 10/01/20(A) | | | 640 | | | | 707 | |
| Station Casinos | | | | | | | | |
| 7.500%, 03/01/21 | | | 1,075 | | | | 1,162 | |
| | | | | | | | | |
| Total Entertainment & Gaming | | | | 14,826 | |
| | | | | |
| Entertainment Software [0.1%] | |
| Activision Blizzard | | | | | | |
| 6.125%, 09/15/23(A) | | $ | 625 | | | $ | 680 | |
| 5.625%, 09/15/21(A) | | | 150 | | | | 161 | |
| | | | | | | | | |
| Total Entertainment Software | | | | 841 | |
| | | | | | | | | |
| Financial Services [0.8%] | |
| Ally Financial | | | | | | | | |
| 8.300%, 02/12/15 | | | 275 | | | | 291 | |
| 7.500%, 09/15/20 | | | 275 | | | | 327 | |
| 6.250%, 12/01/17 | | | 1,400 | | | | 1,563 | |
| 5.500%, 02/15/17 | | | 1,075 | | | | 1,166 | |
| 4.750%, 09/10/18 | | | 1,150 | | | | 1,216 | |
| 2.750%, 01/30/17 | | | 600 | | | | 606 | |
| Astana Finance BV | | | | | | | | |
| 9.000%, 11/16/11(B)(I) | | | 3,000 | | | | 382 | |
| Astana Finance BV, MTN | | | | | | | | |
| 7.875%, 06/08/10(B)(I) | | | 250 | | | | 44 | |
| Credito Real | | | | | | | | |
| 7.500%, 03/13/19 | | | 500 | | | | 508 | |
| General Motors Financial | | | | | | | | |
| 4.250%, 05/15/23 | | | 300 | | | | 296 | |
| International Lease Finance | | | | | | | | |
| 8.750%, 03/15/17 | | | 625 | | | | 734 | |
| 5.875%, 08/15/22 | | | 1,025 | | | | 1,084 | |
| 4.625%, 04/15/21 | | | 1,775 | | | | 1,775 | |
| SLM, MTN | | | | | | | | |
| 4.875%, 06/17/19 | | | 350 | | | | 355 | |
| | | | | | | | | |
| Total Financial Services | | | | 10,347 | |
| | | | | | | | | |
| Firearms and Ammunition [0.1%] | |
| FGI Operating Company | | | | | | | | |
| 7.875%, 05/01/20 | | | 925 | | | | 984 | |
| | | | | | | | | |
| Food, Beverage & Tobacco [2.4%] | |
| ARAMARK | | | | | | | | |
| 5.750%, 03/15/20 | | | 1,350 | | | | 1,426 | |
| B&G Foods | | | | | | | | |
| 4.625%, 06/01/21 | | | 425 | | | | 420 | |
| Bertin | | | | | | | | |
| 10.250%, 10/05/16 | | | 3,365 | | | | 3,786 | |
| Constellation Brands | | | | | | | | |
| 6.000%, 05/01/22 | | | 975 | | | | 1,078 | |
| Darling International | | | | | | | | |
| 5.375%, 01/15/22(A) | | | 550 | | | | 565 | |
| Del Monte | | | | | | | | |
| 7.625%, 02/15/19 | | | 1,106 | | | | 1,152 | |
See accompanying notes to financial statements.
CITY NATIONAL ROCHDALE FUNDS | PAGE 59
consolidated schedule of investments
March 31, 2014 (Unaudited)
City National Rochdale Fixed Income Opportunities Fund (continued)
| | | | | |
| Hawk Acquisition Sub | | | | | | |
| 4.250%, 10/15/20(A) | | $ | 1,775 | | | $ | 1,746 | |
| JBS | | | | | | | | |
| 10.500%, 08/04/16 | | | 500 | | | | 561 | |
| Marfrig Holding Europe BV | | | | | | | | |
| 9.875%, 07/24/17 | | | 3,000 | | | | 3,131 | |
| Marfrig Overseas | | | | | | | | |
| 9.500%, 05/04/20 | | | 500 | | | | 502 | |
| MHP | | | | | | | | |
| 8.250%, 04/02/20 | | | 2,600 | | | | 2,236 | |
| Michael Foods Group | | | | | | | | |
| 9.750%, 07/15/18 | | | 850 | | | | 907 | |
| Michael Foods Holding | | | | | | | | |
| 8.500%, 07/15/18(A) (E) | | | 1,800 | | | | 1,881 | |
| Minerva Luxembourg | | | | | | | | |
| 7.750%, 01/31/23 | | | 4,300 | | | | 4,403 | |
| Pinnacle Foods Finance | | | | | | | | |
| 4.875%, 05/01/21 | | | 1,675 | | | | 1,637 | |
| Shearer’s Foods | | | | | | | | |
| 9.000%, 11/01/19(A) | | | 650 | | | | 710 | |
| Smithfield Foods | | | | | | | | |
| 7.750%, 07/01/17 | | | 425 | | | | 493 | |
| 6.625%, 08/15/22 | | | 1,275 | | | | 1,377 | |
| Sun Merger Sub | | | | | | | | |
| 5.875%, 08/01/21(A) | | | 600 | | | | 623 | |
| 5.250%, 08/01/18(A) | | | 75 | | | | 78 | |
| | | | | | | | | |
| Total Food, Beverage & Tobacco | | | | 28,712 | |
| | | | | | | | | |
| Food-Canned [0.0%] | |
| TreeHouse Foods | | | | | | | | |
| 4.875%, 03/15/22 | | | 100 | | | | 101 | |
| | | | | | | | | |
| Food-Wholesale/Distrib [0.2%] | |
| US Foods | | | | | | | | |
| 8.500%, 06/30/19 | | | 2,700 | | | | 2,921 | |
| | | | | | | | | |
| Footwear and Related Apparel [0.0%] | |
| Wolverine World Wide | | | | | | | | |
| 6.125%, 10/15/20 | | | 275 | | | | 297 | |
| | | | | | | | | |
| Gaming [0.1%] | |
| Rivers Pittsburgh Borrower | | | | | | | | |
| 9.500%, 06/15/19(A) | | | 1,033 | | | | 1,132 | |
| | | | | | | | | |
| Gold Mining [0.2%] | |
| Banro | | | | | | | | |
| 10.000%, 03/01/17(I) | | | 2,500 | | | | 2,112 | |
| 10.000%, 03/01/17(A)(I) | | | 500 | | | | 423 | |
| | | | | | | | | |
| Total Gold Mining | | | | 2,535 | |
| | | | | |
| Health Care [0.1%] | | | | | | |
| Envision Healthcare | | | | | | |
| 8.125%, 06/01/19 | | $ | 626 | | | $ | 669 | |
| | | | | | | | | |
| Home Decoration Products [0.1%] | |
| RSI Home Products | | | | | | | | |
| 6.875%, 03/01/18(A) | | | 1,050 | | | | 1,126 | |
| | | | | | | | | |
| Hotels and Motels [0.1%] | |
| Choice Hotels International | | | | | | | | |
| 5.750%, 07/01/22 | | | 525 | | | | 556 | |
| Hilton Worldwide Finance | | | | | | | | |
| 5.625%, 10/15/21(A) | | | 700 | | | | 732 | |
| | | | | | | | | |
| Total Hotels and Motels | | | | 1,288 | |
| | | | | | | | | |
| Industrial [0.4%] | |
| Belden | | | | | | | | |
| 5.500%, 09/01/22(A) | | | 1,050 | | | | 1,063 | |
| General Cable | | | | | | | | |
| 5.750%, 10/01/22(A) | | | 700 | | | | 710 | |
| Hillman Group | | | | | | | | |
| 10.875%, 06/01/18 | | | 1,050 | | | | 1,118 | |
| Unifrax I | | | | | | | | |
| 7.500%, 02/15/19(A) | | | 900 | | | | 954 | |
| WESCO Distribution | | | | | | | | |
| 5.375%, 12/15/21(A) | | | 875 | | | | 895 | |
| | | | | | | | | |
| Total Industrial | | | | 4,740 | |
| | | | | | | | | |
| Internet Connectiv Svcs [0.3%] | |
| Adria Bidco BV | | | | | | | | |
| 7.875%, 11/15/20 | | | 3,000 | | | | 4,267 | |
| | | | | | | | | |
| Internet Security [0.0%] | |
| VeriSign | | | | | | | | |
| 4.625%, 05/01/23 | | | 575 | | | | 552 | |
| | | | | | | | | |
| Investment Banker/Broker Dealer [0.3%] | |
| Neuberger Berman Group | | | | | | | | |
| 5.875%, 03/15/22(A) | | | 400 | | | | 426 | |
| 5.625%, 03/15/20(A) | | | 500 | | | | 525 | |
| Nuveen Investments | | | | | | | | |
| 9.500%, 10/15/20(A) | | | 1,975 | | | | 2,103 | |
| | | | | | | | | |
| Total Investment Banker/Broker Dealer | | | | 3,054 | |
| | | | | | | | | |
| Mach Tools and Rel Products [0.1%] | |
| Mcron Finance Sub | | | | | | | | |
| 8.375%, 05/15/19(A) | | | 575 | | | | 635 | |
See accompanying notes to financial statements.
CITY NATIONAL ROCHDALE FUNDS | PAGE 60
consolidated schedule of investments
March 31, 2014 (Unaudited)
City National Rochdale Fixed Income Opportunities Fund (continued)
| | | | | |
| Milacron | | | | | | |
| 7.750%, 02/15/21(A) | | $ | 350 | | | $ | 378 | |
| | | | | | | | | |
| Total Mach Tools and Rel Products | | | | 1,013 | |
| | | | | | | | | |
| Machinery [0.3%] | |
| Lonking Holdings | | | | | | | | |
| 8.500%, 06/03/16 | | | 4,000 | | | | 4,140 | |
| | | | | | | | | |
| Machinery-General Indust [0.1%] | |
| Gardner Denver | | | | | | | | |
| 6.875%, 08/15/21(A) | | | 1,125 | | | | 1,159 | |
| Waterjet Holdings | | | | | | | | |
| 7.625%, 02/01/20(A) | | | 300 | | | | 318 | |
| | | | | | | | | |
| Total Machinery-General Indust | | | | 1,477 | |
| | | | | | | | | |
| Manufacturing [0.1%] | |
| Cleaver-Brooks | | | | | | | | |
| 8.750%, 12/15/19(A) | | | 675 | | | | 746 | |
| | | | | | | | | |
| Media - Non-Cable [0.4%] | |
| Intelsat Jackson Holdings | | | | | | | | |
| 8.500%, 11/01/19 | | | 475 | | | | 509 | |
| 7.250%, 04/01/19 | | | 350 | | | | 376 | |
| 7.250%, 10/15/20 | | | 900 | | | | 977 | |
| 6.625%, 12/15/22 | | | 1,275 | | | | 1,326 | |
| 5.500%, 08/01/23(A) | | | 350 | | | | 343 | |
| Intelsat Luxembourg | | | | | | | | |
| 8.125%, 06/01/23(A) | | | 600 | | | | 636 | |
| 7.750%, 06/01/21(A) | | | 925 | | | | 974 | |
| | | | | | | | | |
| Total Media - Non-Cable | | | | 5,141 | |
| | | | | | | | | |
| Medical Information Sys [0.1%] | |
| Healthcare Technology Intermediate | | | | | | | | |
| 7.375%, 09/01/18(A) | | | 1,850 | | | | 1,887 | |
| | | | | | | | | |
| Medical Products & Services [1.9%] | |
| Biomet | | | | | | | | |
| 6.500%, 08/01/20 | | | 1,300 | | | | 1,400 | |
| 6.500%, 10/01/20 | | | 925 | | | | 983 | |
| CHS | | | | | | | | |
| 6.875%, 02/01/22(A) | | | 1,050 | | | | 1,097 | |
| 5.125%, 08/01/21(A) | | | 350 | | | | 359 | |
| DJO Finance | | | | | | | | |
| 9.875%, 04/15/18 | | | 400 | | | | 436 | |
| 7.750%, 04/15/18 | | | 1,225 | | | | 1,289 | |
| | | | | |
| HCA | | | | | | |
| 7.500%, 02/15/22 | | $ | 1,925 | | | $ | 2,199 | |
| 6.500%, 02/15/20 | | | 450 | | | | 504 | |
| 5.875%, 03/15/22 | | | 800 | | | | 862 | |
| 5.875%, 05/01/23 | | | 825 | | | | 849 | |
| 5.000%, 03/15/24 | | | 1,150 | | | | 1,152 | |
| HCA Holdings | | | | | | | | |
| 7.750%, 05/15/21 | | | 3,125 | | | | 3,445 | |
| IASIS Healthcare | | | | | | | | |
| 8.375%, 05/15/19 | | | 1,775 | | | | 1,895 | |
| LifePoint Hospitals | | | | | | | | |
| 5.500%, 12/01/21(A) | | | 925 | | | | 960 | |
| Omnicare | | | | | | | | |
| 7.750%, 06/01/20 | | | 450 | | | | 495 | |
| Tenet Healthcare | | | | | | | | |
| 8.125%, 04/01/22 | | | 1,525 | | | | 1,704 | |
| 4.500%, 04/01/21 | | | 850 | | | | 831 | |
| 4.375%, 10/01/21 | | | 925 | | | | 893 | |
| United Surgical Partners International | | | | | | | | |
| 9.000%, 04/01/20 | | | 1,050 | | | | 1,165 | |
| Universal Hospital Services | | | | | | | | |
| 7.625%, 08/15/20 | | | 950 | | | | 1,017 | |
| | | | | | | | | |
| Total Medical Products & Services | | | | 23,535 | |
| | | | | | | | | |
| Medical-HMO [0.3%] | |
| MPH Acquisition Holdings | | | | | | | | |
| 6.625%, 04/01/22(A) | | | 1,525 | | | | 1,565 | |
| MultiPlan | | | | | | | | |
| 9.875%, 09/01/18(A) | | | 1,850 | | | | 2,007 | |
| | | | | | | | | |
| Total Medical-HMO | | | | 3,572 | |
| | | | | | | | | |
| Metal-Copper [1.0%] | |
| Carmen Copper | | | | | | | | |
| 6.500%, 03/21/17 | | | 1,000 | | | | 966 | |
| First Quantum Minerals | | | | | | | | |
| 7.250%, 10/15/19 | | | 4,000 | | | | 4,105 | |
| 7.000%, 02/15/21(A) | | | 1,725 | | | | 1,755 | |
| 6.750%, 02/15/20(A) | | | 1,725 | | | | 1,747 | |
| Sterlite Industries India | | | | | | | | |
| 4.000%, 10/30/14 | | | 4,000 | | | | 4,005 | |
| | | | | | | | | |
| Total Metal-Copper | | | | 12,578 | |
| | | | | | | | | |
| Metal-Iron [0.4%] | |
| Ferrexpo Finance | | | | | | | | |
| 7.875%, 04/07/16 | | | 2,000 | | | | 1,920 | |
See accompanying notes to financial statements.
CITY NATIONAL ROCHDALE FUNDS | PAGE 61
consolidated schedule of investments
March 31, 2014 (Unaudited)
City National Rochdale Fixed Income Opportunities Fund (continued)
| | | | | |
| Metalloinvest Finance | | | | | | |
| 6.500%, 07/21/16 | | $ | 1,000 | | | $ | 1,024 | |
| 5.625%, 04/17/20 | | | 2,120 | | | | 1,993 | |
| | | | | | | | | |
| Total Metal-Iron | | | | 4,937 | |
| | | | | | | | | |
| Metals & Mining [0.8%] | |
| Consolidated Minerals | | | �� | | | | | |
| 8.875%, 05/01/16 | | | 1,000 | | | | 1,045 | |
| 8.875%, 05/01/16(A) | | | 3,000 | | | | 3,135 | |
| TiZir | | | | | | | | |
| 9.000%, 09/28/17 | | | 4,400 | | | | 4,653 | |
| Wise Metals Group | | | | | | | | |
| 8.750%, 12/15/18(A) | | | 875 | | | | 939 | |
| | | | | | | | | |
| Total Metals & Mining | | | | 9,772 | |
| | | | | | | | | |
| Mining Other [0.6%] | |
| Uranium One Investments | | | | | | | | |
| 6.250%, 12/13/18 | | | 7,350 | | | | 7,093 | |
| | | | | | | | | |
| Miscellaneous Business Services [0.1%] | |
| Garda World Security | | | | | | | | |
| 7.250%, 11/15/21(A) | | | 775 | | | | 827 | |
| | | | | | | | | |
| Miscellaneous Manufacturing [0.9%] | |
| China Liansu Group | | | | | | | | |
| 7.875%, 05/13/16 | | | 4,000 | | | | 4,140 | |
| Jasper Explorer | | | | | | | | |
| 13.500%, 05/27/16 | | | 2,000 | | | | 1,840 | |
| MAF Global Securities | | | | | | | | |
| 7.125%, 10/29/49(C) | | | 3,200 | | | | 3,416 | |
| Mueller Water Products | | | | | | | | |
| 8.750%, 09/01/20 | | | 259 | | | | 290 | |
| 7.375%, 06/01/17 | | | 950 | | | | 971 | |
| | | | | | | | | |
| Total Miscellaneous Manufacturing | | | | 10,657 | |
| | | | | | | | | |
| Office Automation and Equip [0.1%] | |
| CDW | | | | | | | | |
| 12.535%, 10/12/17 | | | 35 | | | | 37 | |
| 8.500%, 04/01/19 | | | 900 | | | | 985 | |
| | | | | | | | | |
| Total Office Automation and Equip | | | | 1,022 | |
| | | | | | | | | |
| Oil-Field Services [1.5%] | |
| Anton Oilfield Services Group | | | | | | | | |
| 7.500%, 11/06/18 | | | 3,000 | | | | 3,135 | |
| Basic Energy Services | | | | | | | | |
| 7.750%, 02/15/19 | | | 400 | | | | 429 | |
| 7.750%, 10/15/22 | | | 100 | | | | 108 | |
| | | | | |
| Norshore Atlantic BV | | | | | | |
| 12.000%, 12/21/18(A) | | $ | 3,000 | | | $ | 3,030 | |
| Oro Negro Drilling Pte | | | | | | | | |
| 7.500%, 01/24/19(A) | | | 4,000 | | | | 4,020 | |
| Polarcus | | | | | | | | |
| 8.000%, 06/07/18(A) | | | 1,000 | | | | 968 | |
| Sea Trucks Group | | | | | | | | |
| 9.000%, 03/26/18(A) | | | 6,800 | | | | 6,613 | |
| SESI | | | | | | | | |
| 7.125%, 12/15/21 | | | 700 | | | | 781 | |
| 6.375%, 05/01/19 | | | 150 | | | | 160 | |
| | | | | | | | | |
| Total Oil-Field Services | | | | 19,244 | |
| | | | | | | | | |
| Paper & Related Products [0.2%] | |
| Bio Pappel | | | | | | | | |
| 10.000%, 08/27/13(D) | | | 2,325 | | | | 2,334 | |
| | | | | | | | | |
| Petroleum & Fuel Products [9.0%] | |
| Access Midstream Partners | | | | | | | | |
| 4.875%, 05/15/23 | | | 1,025 | | | | 1,033 | |
| 4.875%, 03/15/24 | | | 825 | | | | 823 | |
| Afren | | | | | | | | |
| 6.625%, 12/09/20 | | | 4,000 | | | | 4,080 | |
| Antero Resources Finance | | | | | | | | |
| 6.000%, 12/01/20 | | | 1,025 | | | | 1,090 | |
| 5.375%, 11/01/21(A) | | | 475 | | | | 482 | |
| Approach Resources | | | | | | | | |
| 7.000%, 06/15/21 | | | 1,200 | | | | 1,236 | |
| Athlon Holdings | | | | | | | | |
| 7.375%, 04/15/21(A) | | | 1,100 | | | | 1,171 | |
| BassDrill Alpha | | | | | | | | |
| 7.500%, 07/05/18(A) | | | 967 | | | | 952 | |
| BassDrill Beta | | | | | | | | |
| 8.500%, 04/24/18(A) | | | 3,000 | | | | 3,075 | |
| BreitBurn Energy Partners | | | | | | | | |
| 7.875%, 04/15/22 | | | 1,025 | | | | 1,110 | |
| Carrizo Oil & Gas | | | | | | | | |
| 7.500%, 09/15/20 | | | 275 | | | | 302 | |
| Chaparral Energy | | | | | | | | |
| 9.875%, 10/01/20 | | | 500 | | | | 569 | |
| 7.625%, 11/15/22 | | | 900 | | | | 974 | |
| Chesapeake Energy | | | | | | | | |
| 6.875%, 11/15/20 | | | 850 | | | | 965 | |
| 5.750%, 03/15/23 | | | 700 | | | | 741 | |
| 5.375%, 06/15/21 | | | 500 | | | | 526 | |
| Chesapeake Oilfield Operating | | | | | | | | |
| 6.625%, 11/15/19 | | | 775 | | | | 804 | |
See accompanying notes to financial statements.
CITY NATIONAL ROCHDALE FUNDS | PAGE 62
consolidated schedule of investments
March 31, 2014 (Unaudited)
City National Rochdale Fixed Income Opportunities Fund (continued)
| | | | | |
| China Oil & Gas Group | | | | | | |
| 5.250%, 04/25/18 | | $ | 1,500 | | | $ | 1,508 | |
| Crestwood Midstream Partners | | | | | | | | |
| 6.125%, 03/01/22(A) | | | 250 | | | | 261 | |
| 6.000%, 12/15/20 | | | 425 | | | | 445 | |
| CVR Refining | | | | | | | | |
| 6.500%, 11/01/22 | | | 200 | | | | 210 | |
| DNO International | | | | | | | | |
| 7.742%, 04/11/16(C) | | | 4,800 | | | | 4,974 | |
| Drill Rigs Holdings | | | | | | | | |
| 6.500%, 10/01/17(A) | | | 575 | | | | 599 | |
| El Paso | | | | | | | | |
| 7.250%, 06/01/18 | | | 400 | | | | 455 | |
| 6.500%, 09/15/20 | | | 675 | | | | 741 | |
| Energy Transfer Equity | | | | | | | | |
| 7.500%, 10/15/20 | | | 825 | | | | 944 | |
| 5.875%, 01/15/24 | | | 875 | | | | 895 | |
| Energy XXI Gulf Coast | | | | | | | | |
| 7.500%, 12/15/21(A) | | | 1,725 | | | | 1,807 | |
| EP Energy | | | | | | | | |
| 9.375%, 05/01/20 | | | 350 | | | | 405 | |
| Forest Oil | | | | | | | | |
| 7.250%, 06/15/19 | | | 192 | | | | 168 | |
| GeoPark Latin America Agencia en Chile | | | | | | | | |
| 7.500%, 02/11/20 | | | 3,000 | | | | 3,098 | |
| 7.500%, 02/11/20(A) | | | 1,000 | | | | 1,033 | |
| Georgian Oil and Gas | | | | | | | | |
| 6.875%, 05/16/17 | | | 4,000 | | | | 4,155 | |
| Holly Energy Partners | | | | | | | | |
| 6.500%, 03/01/20 | | | 900 | | | | 956 | |
| InterOil Exploration and Production | | | | | | | | |
| 15.000%, 03/14/16 | | | 24,000 | | | | 4,148 | |
| Kinder Morgan | | | | | | | | |
| 5.625%, 11/15/23(A) | | | 1,025 | | | | 1,014 | |
| Kodiak Oil & Gas | | | | | | | | |
| 5.500%, 01/15/21 | | | 375 | | | | 385 | |
| 5.500%, 02/01/22 | | | 350 | | | | 358 | |
| Linn Energy | | | | | | | | |
| 8.625%, 04/15/20 | | | 900 | | | | 978 | |
| 7.750%, 02/01/21 | | | 550 | | | | 591 | |
| 7.250%, 11/01/19(A) | | | 425 | | | | 443 | |
| Lone Pine Resources Canada | | | | | | | | |
| 0.000%, 02/15/17(I) | | | 75 | | | | — | |
| MarkWest Energy Partners | | | | | | | | |
| 6.250%, 06/15/22 | | | 601 | | | | 649 | |
| Metro Exploration Holding | | | | | | | | |
| 8.000%, 02/14/16(D) | | | 4,050 | | | | 3,999 | |
| MIE Holdings | | | | | | | | |
| 9.750%, 05/12/16 | | | 1,000 | | | | 1,053 | |
| | | | | |
| MIE Holdings, MTN | | | | | | |
| 6.875%, 02/06/18 | | $ | 3,700 | | | $ | 3,589 | |
| Newfield Exploration | | | | | | | | |
| 5.625%, 07/01/24 | | | 875 | | | | 908 | |
| Northern Oil and Gas | | | | | | | | |
| 8.000%, 06/01/20 | | | 1,275 | | | | 1,355 | |
| Nostrum Oil & Gas Finance BV | | | | | | | | |
| 6.375%, 02/14/19 | | | 2,500 | | | | 2,547 | |
| Oasis Petroleum | | | | | | | | |
| 6.875%, 03/15/22(A) | | | 150 | | | | 162 | |
| 6.500%, 11/01/21 | | | 850 | | | | 914 | |
| Panoro Energy | | | | | | | | |
| 12.000%, 11/15/18(A) | | | 4,431 | | | | 4,675 | |
| Petrobras Global Finance BV | | | | | | | | |
| 3.113%, 03/17/20(C) | | | 2,000 | | | | 1,998 | |
| 2.593%, 03/17/17(C) | | | 250 | | | | 251 | |
| Petroleos de Venezuela | | | | | | | | |
| 5.250%, 04/12/17 | | | 3,000 | | | | 2,243 | |
| 4.900%, 10/28/14 | | | 1,000 | | | | 955 | |
| Plains Exploration & Production | | | | | | | | |
| 6.750%, 02/01/22 | | | 350 | | | | 387 | |
| Puma International Financing | | | | | | | | |
| 6.750%, 02/01/21 | | | 4,000 | | | | 4,050 | |
| QGOG Constellation | | | | | | | | |
| 6.250%, 11/09/19 | | | 4,000 | | | | 3,995 | |
| Range Resources | | | | | | | | |
| 5.000%, 08/15/22 | | | 175 | | | | 178 | |
| 5.000%, 03/15/23 | | | 700 | | | | 709 | |
| Regency Energy Partners | | | | | | | | |
| 5.875%, 03/01/22 | | | 400 | | | | 415 | |
| 5.500%, 04/15/23 | | | 200 | | | | 201 | |
| 4.500%, 11/01/23 | | | 350 | | | | 325 | |
| Sabine Pass Liquefaction | | | | | | | | |
| 6.250%, 03/15/22(A) | | | 525 | | | | 547 | |
| 5.625%, 02/01/21 | | | 1,075 | | | | 1,109 | |
| 5.625%, 04/15/23 | | | 175 | | | | 174 | |
| SandRidge Energy | | | | | | | | |
| 8.125%, 10/15/22 | | | 1,000 | | | | 1,090 | |
| 7.500%, 03/15/21 | | | 325 | | | | 347 | |
| 7.500%, 02/15/23 | | | 350 | | | | 371 | |
| Santa Maria Offshore | | | | | | | | |
| 8.875%, 07/03/18(A) | | | 3,800 | | | | 4,028 | |
| Sibur Securities | | | | | | | | |
| 3.914%, 01/31/18 | | | 3,000 | | | | 2,753 | |
| SM Energy | | | | | | | | |
| 5.000%, 01/15/24(A) | | | 200 | | | | 194 | |
| Tesoro | | | | | | | | |
| 5.125%, 04/01/24 | | | 325 | | | | 323 | |
See accompanying notes to financial statements.
CITY NATIONAL ROCHDALE FUNDS | PAGE 63
consolidated schedule of investments
March 31, 2014 (Unaudited)
City National Rochdale Fixed Income Opportunities Fund (continued)
| | | | | |
| Tesoro Logistics | | | | | | |
| 6.125%, 10/15/21 | | $ | 225 | | | $ | 239 | |
| 5.875%, 10/01/20 | | | 700 | | | | 732 | |
| 5.875%, 10/01/20(A) | | | 475 | | | | 496 | |
| Tethys Oil | | | | | | | | |
| 9.500%, 09/07/15 | | | 20,000 | | | | 3,223 | |
| W&T Offshore | | | | | | | | |
| 8.500%, 06/15/19 | | | 725 | | | | 783 | |
| Yingde Gases Investment | | | | | | | | |
| 8.125%, 04/22/18 | | | 4,000 | | | | 4,000 | |
| Zhaikmunai LLP | | | | | | | | |
| 10.500%, 10/19/15 | | | 4,000 | | | | 4,181 | |
| | | | | | | | | |
| Total Petroleum & Fuel Products | | | | 110,652 | |
| | | | | | | | | |
| Pharmacy Services [0.0%] | |
| Catamaran | | | | | | | | |
| 4.750%, 03/15/21 | | | 175 | | | | 178 | |
| | | | | | | | | |
| Printing & Publishing [0.3%] | |
| Expo Event Transco | | | | | | | | |
| 9.000%, 06/15/21(A) | | | 1,150 | | | | 1,170 | |
| Mustang Merger | | | | | | | | |
| 8.500%, 08/15/21(A) | | | 800 | | | | 876 | |
| Nielsen Finance | | | | | | | | |
| 5.000%, 04/15/22(A) | | | 275 | | | | 276 | |
| 4.500%, 10/01/20 | | | 1,475 | | | | 1,486 | |
| Visant | | | | | | | | |
| 10.000%, 10/01/17 | | | 375 | | | | 374 | |
| | | | | | | | | |
| Total Printing & Publishing | | | | 4,182 | |
| | | | | | | | | |
| Publishing-Newspapers [0.1%] | |
| Gannett | | | | | | | | |
| 6.375%, 10/15/23(A) | | | 925 | | | | 982 | |
| 5.125%, 10/15/19(A) | | | 175 | | | | 183 | |
| | | | | | | | | |
| Total Publishing-Newspapers | | | | 1,165 | |
| | | | | | | | | |
| Quarrying [0.0%] | |
| Compass Minerals International | | | | | | | | |
| 8.000%, 06/01/19 | | | 250 | | | | 262 | |
| | | | | | | | | |
| Radio [0.5%] | |
| Cumulus Media Holdings | | | | | | | | |
| 7.750%, 05/01/19 | | | 1,050 | | | | 1,118 | |
| Entercom Radio | | | | | | | | |
| 10.500%, 12/01/19 | | | 600 | | | | 690 | |
| Radio One | | | | | | | | |
| 9.250%, 02/15/20(A) | | | 900 | | | | 954 | |
| | | | | |
| Sirius XM Holdings | | | | | | |
| 5.250%, 08/15/22(A) | | $ | 700 | | | $ | 721 | |
| 4.625%, 05/15/23(A) | | | 1,100 | | | | 1,037 | |
| 4.250%, 05/15/20(A) | | | 350 | | | | 342 | |
| Townsquare Radio | | | | | | | | |
| 9.000%, 04/01/19(A) | | | 1,100 | | | | 1,210 | |
| | | | | | | | | |
| Total Radio | | | | 6,072 | |
| | | | | | | | | |
| Real Estate [0.1%] | |
| DIP Sukuk | | | | | | | | |
| 4.291%, 02/20/19 | | | 1,250 | | | | 1,254 | |
| | | | | | | | | |
| Real Estate Oper/Develop [0.0%] | |
| Renhe Commercial Holdings | | | | | | | | |
| 13.000%, 03/10/16 | | | 500 | | | | 340 | |
| | | | | | | | | |
| Research and Development [0.2%] | |
| Jaguar Holding I | | | | | | | | |
| 9.375%, 10/15/17(A) (E) | | | 1,750 | | | | 1,840 | |
| Jaguar Holding II | | | | | | | | |
| 9.500%, 12/01/19(A) | | | 650 | | | | 723 | |
| | | | | | | | | |
| Total Research and Development | | | | 2,563 | |
| | | | | | | | | |
| Resorts/Theme Parks [0.2%] | |
| Cedar Fair | | | | | | | | |
| 5.250%, 03/15/21 | | | 1,300 | | | | 1,316 | |
| Six Flags Entertainment | | | | | | | | |
| 5.250%, 01/15/21(A) | | | 1,325 | | | | 1,335 | |
| | | | | | | | | |
| Total Resorts/Theme Parks | | | | 2,651 | |
| | | | | | | | | |
| Retail [2.2%] | |
| Academy | | | | | | | | |
| 9.250%, 08/01/19(A) | | | 1,050 | | | | 1,146 | |
| Claire’s Stores | | | | | | | | |
| 6.125%, 03/15/20(A) | | | 750 | | | | 703 | |
| DineEquity | | | | | | | | |
| 9.500%, 10/30/18 | | | 1,400 | | | | 1,526 | |
| Grupo Famsa | | | | | | | | |
| 7.250%, 06/01/20(A) | | | 700 | | | | 709 | |
| 7.250%, 06/01/20 | | | 2,500 | | | | 2,531 | |
| 6.125%, 01/28/15 | | | 2,000 | | | | 2,019 | |
| Gymboree | | | | | | | | |
| 9.125%, 12/01/18 | | | 375 | | | | 317 | |
| Jo-Ann Stores | | | | | | | | |
| 8.125%, 03/15/19(A) | | | 1,200 | | | | 1,245 | |
| Jo-Ann Stores Holdings | | | | | | | | |
| 9.750%, 10/15/19(A) (E) | | | 1,425 | | | | 1,486 | |
See accompanying notes to financial statements.
CITY NATIONAL ROCHDALE FUNDS | PAGE 64
consolidated schedule of investments
March 31, 2014 (Unaudited)
City National Rochdale Fixed Income Opportunities Fund (continued)
| | | | | |
| L Brands | | | | | | |
| 5.625%, 10/15/23 | | $ | 700 | | | $ | 726 | |
| Limited Brands | | | | | | | | |
| 5.625%, 02/15/22 | | | 350 | | | | 370 | |
| Michaels FinCo Holdings | | | | | | | | |
| 7.500%, 08/01/18(A) | | | 1,350 | | | | 1,391 | |
| Michaels Stores | | | | | | | | |
| 7.750%, 11/01/18 | | | 800 | | | | 855 | |
| 5.875%, 12/15/20(A) | | | 600 | | | | 607 | |
| Neiman Marcus Group | | | | | | | | |
| 8.750%, 10/15/21(A) | | | 900 | | | | 994 | |
| 8.000%, 10/15/21(A) | | | 275 | | | | 302 | |
| New Academy Finance | | | | | | | | |
| 8.000%, 06/15/18(A) (E) | | | 1,525 | | | | 1,561 | |
| NPC International | | | | | | | | |
| 10.500%, 01/15/20 | | | 1,175 | | | | 1,343 | |
| Party City Holdings | | | | | | | | |
| 8.875%, 08/01/20 | | | 900 | | | | 1,002 | |
| PC Nextco Holdings | | | | | | | | |
| 8.750%, 08/15/19(A) | | | 1,275 | | | | 1,318 | |
| Petco Animal Supplies | | | | | | | | |
| 9.250%, 12/01/18(A) | | | 1,200 | | | | 1,290 | |
| Petco Holdings | | | | | | | | |
| 8.500%, 10/15/17(A) (E) | | | 1,300 | | | | 1,324 | |
| PVH | | | | | | | | |
| 4.500%, 12/15/22 | | | 925 | | | | 913 | |
| Sally Holdings | | | | | | | | |
| 6.875%, 11/15/19 | | | 1,075 | | | | 1,177 | |
| 5.750%, 06/01/22 | | | 175 | | | | 185 | |
| | | | | | | | | |
| Total Retail | | | | 27,040 | |
| | | | | | | | | |
| Rubber & Plastic [0.3%] | |
| Gajah Tunggal | | | | | | | | |
| 7.750%, 02/06/18 | | | 3,000 | | | | 3,056 | |
| | | | | | | | | |
| Security Services [0.0%] | |
| Monitronics International | | | | | | | | |
| 9.125%, 04/01/20 | | | 500 | | | | 535 | |
| | | | | | | | | |
| Semicon Compo-Intg Circu [0.1%] | |
| NXP BV | | | | | | | | |
| 5.750%, 02/15/21(A) | | | 200 | | | | 213 | |
| 5.750%, 03/15/23(A) | | | 200 | | | | 210 | |
| 3.750%, 06/01/18(A) | | | 300 | | | | 302 | |
| | | | | | | | | |
| Total Semicon Compo-Intg Circu | | | | 725 | |
| | | | | | | | | |
| Semi-Conductors [0.3%] | |
| Advanced Micro Devices | | | | | | | | |
| 7.500%, 08/15/22 | | | 225 | | | | 223 | |
| | | | | |
| Entegris | | | | | | |
| 6.000%, 04/01/22(A) | | $ | 475 | | | $ | 486 | |
| Flextronics International | | | | | | | | |
| 5.000%, 02/15/23 | | | 300 | | | | 302 | |
| 4.625%, 02/15/20 | | | 250 | | | | 252 | |
| Freescale Semiconductor | | | | | | | | |
| 6.000%, 01/15/22(A) | | | 1,550 | | | | 1,645 | |
| Magnachip Semiconductor | | | | | | | | |
| 6.625%, 07/15/21 | | | 675 | | | | 671 | |
| | | | | | | | | |
| Total Semi-Conductors | | | | 3,579 | |
| | | | | | | | | |
| Steel & Steel Works [0.1%] | |
| Evraz Group | | | | | | | | |
| 7.400%, 04/24/17 | | | 500 | | | | 490 | |
| Steel Dynamics | | | | | | | | |
| 5.250%, 04/15/23 | | | 125 | | | | 127 | |
| | | | | | | | | |
| Total Steel & Steel Works | | | | 617 | |
| | | | | | | | | |
| Technology [0.2%] | |
| Sophia Holding Finance | | | | | | | | |
| 9.625%, 12/01/18(A) | | | 700 | | | | 733 | |
| Truven Health Analytics | | | | | | | | |
| 10.625%, 06/01/20 | | | 775 | | | | 880 | |
| | | | | | | | | |
| Total Technology | | | | 1,613 | |
| | | | | | | | | |
| Telecommunication Equip [0.2%] | |
| CommScope | | | | | | | | |
| 8.250%, 01/15/19(A) | | | 831 | | | | 899 | |
| CommScope Holding | | | | | | | | |
| 6.625%, 06/01/20(A) (E) | | | 1,350 | | | | 1,428 | |
| | | | | | | | | |
| Total Telecommunication Equip | | | | 2,327 | |
| | | | | | | | | |
| Telephones & Telecommunications [2.1%] | |
| Digicel | | | | | | | | |
| 8.250%, 09/01/17 | | | 575 | | | | 598 | |
| 8.250%, 09/01/17(A) | | | 550 | | | | 572 | |
| 7.000%, 02/15/20(A) | | | 450 | | | | 468 | |
| 6.000%, 04/15/21(A) | | | 400 | | | | 409 | |
| Digicel Group | | | | | | | | |
| 10.500%, 04/15/18(A) | | | 600 | | | | 636 | |
| 8.250%, 09/30/20(A) | | | 1,575 | | | | 1,681 | |
| Level 3 Communications | | | | | | | | |
| 8.875%, 06/01/19 | | | 400 | | | | 439 | |
| Level 3 Financing | | | | | | | | |
| 8.125%, 07/01/19 | | | 1,050 | | | | 1,152 | |
| 7.000%, 06/01/20 | | | 650 | | | | 713 | |
| 6.125%, 01/15/21(A) | | | 250 | | | | 264 | |
See accompanying notes to financial statements.
CITY NATIONAL ROCHDALE FUNDS | PAGE 65
consolidated schedule of investments
March 31, 2014 (Unaudited)
City National Rochdale Fixed Income Opportunities Fund (continued)
| | | | | |
| MetroPCS Wireless | | | | | | |
| 6.625%, 11/15/20 | | $ | 600 | | | $ | 640 | |
| Sprint | | | | | | | | |
| 7.875%, 09/15/23(A) | | | 2,475 | | | | 2,723 | |
| Sprint Capital | | | | | | | | |
| 6.875%, 11/15/28 | | | 1,850 | | | | 1,795 | |
| Sprint Nextel | | | | | | | | |
| 7.000%, 03/01/20(A) | | | 600 | | | | 692 | |
| 6.000%, 11/15/22 | | | 1,825 | | | | 1,859 | |
| Syniverse Holdings | | | | | | | | |
| 9.125%, 01/15/19 | | | 1,600 | | | | 1,740 | |
| T-Mobile USA | | | | | | | | |
| 6.836%, 04/28/23 | | | 925 | | | | 992 | |
| 6.731%, 04/28/22 | | | 125 | | | | 134 | |
| 6.633%, 04/28/21 | | | 125 | | | | 134 | |
| 6.625%, 04/01/23 | | | 675 | | | | 716 | |
| 6.500%, 01/15/24 | | | 575 | | | | 602 | |
| 6.125%, 01/15/22 | | | 1,050 | | | | 1,100 | |
| VimpelCom Holdings BV | | | | | | | | |
| 7.504%, 03/01/22 | | | 1,000 | | | | 1,014 | |
| 6.255%, 03/01/17 | | | 1,100 | | | | 1,111 | |
| 5.200%, 02/13/19 | | | 200 | | | | 189 | |
| Virgin Media Finance | | | | | | | | |
| 6.375%, 04/15/23(A) | | | 675 | | | | 715 | |
| Vivacom, MTN | | | | | | | | |
| 6.625%, 11/15/18 | | | 2,500 | | | | 3,616 | |
| | | | | | | | | |
| Total Telephones & Telecommunications | | | | 26,704 | |
| | | | | | | | | |
| Textile-Apparel [0.1%] | |
| Texhong Textile Group | | | | | | | | |
| 7.625%, 01/19/16 | | | 500 | | | | 517 | |
| 6.500%, 01/18/19 | | | 1,000 | | | | 983 | |
| | | | | | | | | |
| Total Textile-Apparel | | | | 1,500 | |
| | | | | | | | | |
| Textile-Home Furnishings [0.1%] | |
| SIWF Merger Sub | | | | | | | | |
| 6.250%, 06/01/21(A) | | | 625 | | | | 650 | |
| | | | | | | | | |
| Tools-Hand Held [0.0%] | |
| BC Mountain | | | | | | | | |
| 7.000%, 02/01/21(A) | | | 550 | | | | 544 | |
| | | | | | | | | |
| Transactional Software [0.0%] | |
| ACI Worldwide | | | | | | | | |
| 6.375%, 08/15/20(A) | | | 125 | | | | 132 | |
| | | | | | | | | |
| Transportation Services [1.5%] | |
| Azerbaijan Railways Via Aquarius Investments | | | | | | | | |
| 8.250%, 02/18/16 | | | 550 | | | | 571 | |
| | | | | |
| DME Airport | | | | | | |
| 6.000%, 11/26/18 | | $ | 4,000 | | | $ | 3,860 | |
| DTEK Finance | | | | | | | | |
| 7.875%, 04/04/18 | | | 3,000 | | | | 2,550 | |
| Dubai Holding Commercial Operations, MTN | | | | | | | | |
| 6.000%, 02/01/17 | | | 3,200 | | | | 5,615 | |
| Far East Capital | | | | | | | | |
| 8.000%, 05/02/18 | | | 3,000 | | | | 2,445 | |
| Nielsen Luxembourg SaRL | | | | | | | | |
| 5.500%, 10/01/21(A) | | | 250 | | | | 261 | |
| Royal Caribbean Cruises | | | | | | | | |
| 5.250%, 11/15/22 | | | 300 | | | | 308 | |
| Ukraine Railways via Shortline | | | | | | | | |
| 9.500%, 05/21/18 | | | 4,000 | | | | 3,280 | |
| | | | | | | | | |
| Total Transportation Services | | | | 18,890 | |
| | | | | | | | | |
| Transport-Equip and Leasng [0.0%] | |
| Jurassic Holdings III | | | | | | | | |
| 6.875%, 02/15/21(A) | | | 200 | | | | 206 | |
| | | | | | | | | |
| Utility [0.0%] | |
| Suburban Propane Partners | | | | | | | | |
| 7.500%, 10/01/18 | | | 464 | | | | 493 | |
| 7.375%, 08/01/21 | | | 275 | | | | 303 | |
| | | | | | | | | |
| Total Utility | | | | 796 | |
| | | | | | | | | |
| Web Portals/ISP [0.4%] | |
| Pacnet | | | | | | | | |
| 9.000%, 12/12/18 | | | 4,000 | | | | 4,270 | |
| | | | | | | | | |
| X-Ray Equipment [0.0%] | |
| Hologic | | | | | | | | |
| 6.250%, 08/01/20 | | | 600 | | | | 634 | |
| | | | | | | | | |
| Total Corporate Bonds | |
| (Cost $607,664) | | | | 621,830 | |
| | | | | | | | | |
| Loan Participations (C) [29.5%] | |
| Aerospace [0.6%] | |
| Air Canada, Term Loan B | | | | | | | | |
| 5.500%, 09/20/19 | | | 1,450 | | | | 1,475 | |
| Alliant Techsystems, Term Loan B | | | | | | | | |
| 3.500%, 10/22/20 | | | 110 | | | | 110 | |
| AM General Corporation, Term Loan B - 2013 | | | | | | | | |
| 10.250%, 03/20/18 | | | 486 | | | | 430 | |
See accompanying notes to financial statements.
CITY NATIONAL ROCHDALE FUNDS | PAGE 66
consolidated schedule of investments
March 31, 2014 (Unaudited)
City National Rochdale Fixed Income Opportunities Fund (continued)
| | | | | |
| American Airlines, Exit Term Loan | | | | | | |
| 3.750%, 06/21/19 | | $ | 2,010 | | | $ | 2,015 | |
| Atlantic Aviation FBO, Term Loan B | | | | | | | | |
| 3.250%, 05/16/20 | | | 154 | | | | 153 | |
| Dae Aviation Holdings, Second Lien Term Loan | | | | | | | | |
| 7.750%, 07/30/19 | | | 100 | | | | 102 | |
| Dae Aviation Holdings, Term Loan B1 - 2014 | | | | | | | | |
| 5.000%, 11/02/18 | | | 364 | | | | 369 | |
| Dae Aviation Holdings, Term Loan B2 - 2014 | | | | | | | | |
| 6.250%, 11/02/18 | | | 165 | | | | 167 | |
| Delta Air Lines, Term Loan B1 - 2014 | | | | | | | | |
| 3.500%, 10/18/18 | | | 554 | | | | 553 | |
| TransDigm Group, Term Loan C | | | | | | | | |
| 3.750%, 02/28/20 | | | 743 | | | | 743 | |
| US Airways Group Inc, Term Loan B-1 | | | | | | | | |
| 3.500%, 05/23/19 | | | 650 | | | | 649 | |
| WP CPP Holdings, Second Lien | | | | | | | | |
| 8.750%, 04/23/21 | | | 45 | | | | 46 | |
| WP CPP Holdings, Term Loan | | | | | | | | |
| 4.750%, 12/21/19 | | | 172 | | | | 171 | |
| | | | | | | | | |
| Total Aerospace | | | | 6,983 | |
| | | | | | | | | |
| Automotive [0.2%] | |
| Oasis Holdings | | | | | | | | |
| 3.500%, 11/19/20 | | | 4,580 | | | | 3,023 | |
| | | | | | | | | |
| Broadcasting [1.5%] | |
| CBS Outdoor Americas Capital LLC, Term Loan B | | | | | | | | |
| 3.000%, 01/15/21 | | | 500 | | | | 498 | |
| Clear Channel Communication, Term Loan B | | | | | | | | |
| 3.803%, 01/29/16 | | | 3,129 | | | | 3,090 | |
| Clear Channel Communication, Term Loan C | | | | | | | | |
| 3.803%, 01/29/16 | | | 173 | | | | 169 | |
| Clear Channel Communication, Term Loan D Extended | | | | | | | | |
| 6.903%, 01/30/19 | | | 4,938 | | | | 4,833 | |
| Clear Channel Communication, Term Loan E | | | | | | | | |
| 7.660%, 07/30/19 | | | 2,000 | | | | 1,996 | |
| | | | | |
| Cumulus Media, Term Loan B | | | | | | |
| 4.250%, 12/23/20 | | $ | 1,994 | | | $ | 2,002 | |
| Encompass Digital Media, Term Loan | | | | | | | | |
| 6.750%, 08/10/17 | | | 168 | | | | 169 | |
| Granite Broadcasting, Term Loan B | | | | | | | | |
| 6.750%, 05/23/18 | | | 177 | | | | 178 | |
| Gray Television, Term Loan B - 2012 | | | | | | | | |
| 4.500%, 10/11/19 | | | 153 | | | | 154 | |
| Hubbard Broadcasting, Term Loan B | | | | | | | | |
| 4.500%, 04/28/17 | | | 257 | | | | 257 | |
| Lin Television, Term Loan B | | | | | | | | |
| 4.000%, 12/15/18 | | | 148 | | | | 148 | |
| Media General, Delayed Draw Term Loa B | | | | | | | | |
| 4.250%, 07/30/20 | | | 235 | | | | 237 | |
| Nine Entertainment, Term Loan B | | | | | | | | |
| 3.500%, 01/31/20 | | | 292 | | | | 290 | |
| Radio One, Term Loan | | | | | | | | |
| 7.500%, 03/23/16 | | | 433 | | | | 443 | |
| Sinclair Broadcasting Group, Term Loan B - 2011 | | | | | | | | |
| 3.000%, 10/28/16 | | | 153 | | | | 151 | |
| Univision Comm (fka Umbrella), Term Loan C-4 | | | | | | | | |
| 4.000%, 03/01/20 | | | 1,662 | | | | 1,664 | |
| Univision Communications, TL C-3 (2013 Inc. Term Loans) | | | | | | | | |
| 4.000%, 03/01/20 | | | 1,343 | | | | 1,341 | |
| Van Wagner, Term Loan B | | | | | | | | |
| 8.250%, 08/03/18 | | | 244 | | | | 246 | |
| | | | | | | | | |
| Total Broadcasting | | | | 17,866 | |
| | | | | | | | | |
| Building Materials [0.3%] | |
| Cemex | | | | | | | | |
| 0.000%, 02/14/17(H) | | | 3,040 | | | | 3,024 | |
| | | | | | | | | |
| Cable/Wireless Video [1.9%] | |
| Altice Financing, Term Loan B | | | | | | | | |
| 5.500%, 07/03/19 | | | 2,544 | | | | 2,594 | |
| Atlantic Broadband, Term Loan B - 2013 | | | | | | | | |
| 3.250%, 09/20/19 | | | 368 | | | | 366 | |
| Cablevision Systems, Term Loan A | | | | | | | | |
| 2.153%, 04/16/18 | | | 455 | | | | 453 | |
See accompanying notes to financial statements.
CITY NATIONAL ROCHDALE FUNDS | PAGE 67
consolidated schedule of investments
March 31, 2014 (Unaudited)
City National Rochdale Fixed Income Opportunities Fund (continued)
| | | | | |
| Cablevision Systems, Term Loan B - 2013 | | | | | | |
| 2.653%, 04/17/20 | | $ | 2,184 | | | $ | 2,154 | |
| Cequel Communications, Term Loan B 2012 | | | | | | | | |
| 3.500%, 02/10/19 | | | 1,202 | | | | 1,201 | |
| Charter Comm Operating, Term Loan A1 | | | | | | | | |
| 2.160%, 04/22/18 | | | 470 | | | | 468 | |
| Charter Comm Operating, Term Loan E | | | | | | | | |
| 3.000%, 04/10/20 | | | 2,953 | | | | 2,925 | |
| Liberty Cablevision of Puerto Rico, Second Lien TL | | | | | | | | |
| 10.000%, 06/19/18 | | | 525 | | | | 527 | |
| Liberty Cablevision of Puerto Rico, Term Loan B | | | | | | | | |
| 6.000%, 06/19/17 | | | 321 | | | | 322 | |
| MCC Iowa (Broadband), Delay Draw D-1 | | | | | | | | |
| 1.880%, 01/31/15 | | | 364 | | | | 363 | |
| MCC Iowa (Broadband), Term Loan G | | | | | | | | |
| 4.000%, 01/20/20 | | | 256 | | | | 256 | |
| MCC Iowa (Broadband), Term Loan H | | | | | | | | |
| 3.250%, 01/22/21 | | | 1,296 | | | | 1,287 | |
| Quebecor Media, Term Loan B | | | | | | | | |
| 3.250%, 07/31/20 | | | 1,599 | | | | 1,589 | |
| TWCC Hld Corp-Weather Channel, Term Loan - 2013 | | | | | | | | |
| 3.500%, 02/13/17 | | | 207 | | | | 203 | |
| UPC Financing, Term Loan AH | | | | | | | | |
| 3.250%, 06/10/21 | | | 860 | | | | 857 | |
| Virgin Media Invst Holdings, Term Loan B | | | | | | | | |
| 3.500%, 02/15/20 | | | 2,475 | | | | 2,469 | |
| WideOpenWest Finance, Term Loan B - 2019 | | | | | | | | |
| 4.750%, 03/26/19 | | | 233 | | | | 233 | |
| Ziggo B.V., Term Loan B1 | | | | | | | | |
| 0.000%, 01/15/22(H) | | | 1,849 | | | | 1,828 | |
| Ziggo B.V., Term Loan B2 | | | | | | | | |
| 0.000%, 01/15/22(H) | | | 1,191 | | | | 1,178 | |
| Ziggo B.V., Term Loan B3 | | | | | | | | |
| 0.000%, 01/15/22(H) | | | 1,960 | | | | 1,937 | |
| | | | | | | | | |
| Total Cable/Wireless Video | | | | 23,210 | |
| | | | | |
| Chemicals [0.5%] | |
| Axalta Coating Systems US Holdings Inc., Term Loan B - 2014 | | | | | | |
| 4.000%, 02/01/20 | | $ | 337 | | | $ | 337 | |
| Eagle Spinco, Term Loan | | | | | | | | |
| 3.500%, 01/27/17 | | | 108 | | | | 108 | |
| Huntsman International, 2013-2 Add TL (7yr) | | | | | | | | |
| 0.000%, 01/31/21(H) | | | 480 | | | | 480 | |
| Huntsman International, Term Loan C | | | | | | | | |
| 2.445%, 06/30/16 | | | 14 | | | | 14 | |
| Huntsman International, TLB Extended | | | | | | | | |
| 2.705%, 04/19/17 | | | – | | | | 5 | |
| Ineos Group Holdings, Dollar Term Loans - 2018 | | | | | | | | |
| 3.750%, 04/27/18 | | | 2,175 | | | | 2,161 | |
| Kronos Worldwide, Inc., Term Loan B | | | | | | | | |
| 4.750%, 02/12/20 | | | 160 | | | | 161 | |
| MacDermid Holdings, Term Loan | | | | | | | | |
| 4.000%, 06/05/20 | | | 348 | | | | 348 | |
| Nexeo Solutions, Term Loan B | | | | | | | | |
| 5.000%, 09/08/17 | | | 373 | | | | 373 | |
| Oxbow Carbon & Minerals, Term Loan B | | | | | | | | |
| 4.250%, 07/18/19 | | | 135 | | | | 135 | |
| OXEA, Term Loan | | | | | | | | |
| 4.250%, 12/06/19 | | | 150 | | | | 151 | |
| Polymer Group, Term Loan B | | | | | | | | |
| 5.250%, 12/13/19 | | | 269 | | | | 271 | |
| PQ Corporation, Term Loans | | | | | | | | |
| 4.500%, 08/07/17 | | | 156 | | | | 156 | |
| PQ, New 2013 Term Loan | | | | | | | | |
| 4.500%, 02/09/19 | | | 7 | | | | 7 | |
| Ravago Holdings America, Term Loan B | | | | | | | | |
| 5.500%, 12/19/20 | | | 205 | | | | 207 | |
| Royal Adhesives and Sealants, Term Loan B | | | | | | | | |
| 5.500%, 07/31/18 | | | 199 | | | | 201 | |
| Taminco Global, Term B-3 Loan | | | | | | | | |
| 3.250%, 02/15/19 | | | 162 | | | | 161 | |
| Tata Chemicals North America, Term Loan B | | | | | | | | |
| 3.750%, 08/07/20 | | | 114 | | | | 114 | |
| Tronox, Term Loan B | | | | | | | | |
| 4.500%, 02/03/18 | | | 447 | | | | 449 | |
See accompanying notes to financial statements.
CITY NATIONAL ROCHDALE FUNDS | PAGE 68
consolidated schedule of investments
March 31, 2014 (Unaudited)
City National Rochdale Fixed Income Opportunities Fund (continued)
| | | | | |
| Univar, Term Loan B - 2011 | | | | | | |
| 5.000%, 06/30/17 | | $ | 101 | | | $ | 101 | |
| | | | | | | | | |
| Total Chemicals | | | | 5,940 | |
| | | | | | | | | |
| Consumer Durables [0.1%] | |
| Serta Simmons Holdings, Term Loan B | | | | | | | | |
| 4.250%, 09/19/19 | | | 558 | | | | 560 | |
| Total Safety US, Term Loan B | | | | | | | | |
| 5.750%, 03/11/20 | | | 109 | | | | 109 | |
| WNA Holdings, Term Loan - CAD Borrower | | | | | | | | |
| 4.500%, 05/21/20 | | | 142 | | | | 142 | |
| WNA Holdings, Term Loan - USD Borrower | | | | | | | | |
| 4.500%, 05/21/20 | | | 77 | | | | 77 | |
| | | | | | | | | |
| Total Consumer Durables | | | | 888 | |
| | | | | | | | | |
| Consumer Non-Durables [0.1%] | |
| Eastman Kodak Company, Exit Term Loan | | | | | | | | |
| 7.250%, 07/31/19 | | | 337 | | | | 342 | |
| Revlon Consumer Products, Term Loan | | | | | | | | |
| 4.000%, 08/19/19 | | | 788 | | | | 789 | |
| Revlon Consumer Products, Term Loan | | | | | | | | |
| 0.000%, 11/19/17(H) | | | 250 | | | | 250 | |
| Spectrum Brands, Term Loan C - 6 year | | | | | | | | |
| 3.500%, 08/13/19 | | | 104 | | | | 104 | |
| Sun Products, Term Loan B | | | | | | | | |
| 5.500%, 03/21/20 | | | 248 | | | | 234 | |
| | | | | | | | | |
| Total Consumer Non-Durables | | | | | | | 1,719 | |
| | | | | | | | | |
| Diversified Media [1.7%] | |
| Affinion Group, Term Loan | | | | | | | | |
| 6.750%, 10/08/16 | | | 566 | | | | 558 | |
| Alliance Data Systems, Term Loan | | | | | | | | |
| 1.910%, 07/10/18 | | | 787 | | | | 785 | |
| Catalina Marketing, Term Loan B | | | | | | | | |
| 5.250%, 10/07/20 | | | 393 | | | | 392 | |
| Emerald Expositions Holding, Term Loan B | | | | | | | | |
| 5.500%, 06/12/20 | | | 208 | | | | 210 | |
| | | | | |
| EMI Music Publishing Limited, Term B Loan | | | | | | |
| 3.750%, 03/05/18 | | $ | 321 | | | $ | 321 | |
| Getty Images, Term Loan | | | | | | | | |
| 4.750%, 10/03/19 | | | 442 | | | | 423 | |
| Harland Clarke Holdings, Cov-Lite Term Loan B-4 | | | | | | | | |
| 6.000%, 08/04/19 | | | 1,988 | | | | 1,997 | |
| Harland Clarke Holdings, Term Loan B3 | | | | | | | | |
| 7.000%, 04/26/18 | | | 5,022 | | | | 5,088 | |
| Harland Clarke Holdings, Tranche B-2 TL | | | | | | | | |
| 5.484%, 06/30/17 | | | 189 | | | | 189 | |
| IMG World Wide, Term Loan B - 2011 | | | | | | | | |
| 5.500%, 06/16/16 | | | 980 | | | | 974 | |
| Learfield Communications, Term Loan | | | | | | | | |
| 5.000%, 10/08/20 | | | 170 | | | | 170 | |
| Nielsen Finance, Class E Dollar Term Loan | | | | | | | | |
| 2.904%, 05/02/16 | | | 524 | | | | 524 | |
| PrePaid Legal Services, Term Loan B | | | | | | | | |
| 6.250%, 06/07/19 | | | 277 | | | | 279 | |
| Southern Graphics, Term Loan - 2013 | | | | | | | | |
| 4.250%, 10/17/19 | | | 212 | | | | 211 | |
| Tribune Company, Term Loan B - 2013 | | | | | | | | |
| 4.000%, 12/27/20 | | | 4,065 | | | | 4,061 | |
| Village Roadshow, Ultimates Facility Tranche A-2 | | | | | | | | |
| 4.750%, 11/16/17 | | | 1,436 | | | | 1,450 | |
| Warner Music Group, Term Loan - 2013 | | | | | | | | |
| 3.750%, 07/01/20 | | | 1,035 | | | | 1,029 | |
| WME IMG Holdings LLC, Second Lien | | | | | | | | |
| 0.000%, 03/21/22(H) | | | 360 | | | | 363 | |
| WME IMG Holdings LLC, Term Loan B | | | | | | | | |
| 0.000%, 03/19/21(H) | | | 2,320 | | | | 2,304 | |
| | | | | | | | | |
| Total Diversified Media | | | | 21,328 | |
| | | | | | | | | |
| Energy [2.7%] | |
| Alon USA, MLP Term Loan | | | | | | | | |
| 9.250%, 11/13/18 | | | 502 | | | | 518 | |
| Atlas Energy , Term Loan B | | | | | | | | |
| 6.500%, 07/31/19 | | | 567 | | | | 582 | |
See accompanying notes to financial statements.
CITY NATIONAL ROCHDALE FUNDS | PAGE 69
consolidated schedule of investments
March 31, 2014 (Unaudited)
City National Rochdale Fixed Income Opportunities Fund (continued)
| | | | | |
| Azure Midstream Holdings, Term Loan B | | | | | | |
| 6.500%, 11/12/18 | | $ | 331 | | | $ | 333 | |
| Bashneft | | | | | | | | |
| 1.706%, 08/16/14 | | | 1,042 | | | | 1,034 | |
| Bronco Midstream Funding, Term Loan B | | | | | | | | |
| 5.000%, 08/15/20 | | | 763 | | | | 769 | |
| Chesapeake Energy, Term Loan B | | | | | | | | |
| 5.750%, 12/01/17 | | | 5,735 | | | | 5,859 | |
| CITGO Petroleum, Term Loan B | | | | | | | | |
| 8.000%, 06/24/15 | | | 309 | | | | 310 | |
| Drillships Financing Holding, Term Loan B1 | | | | | | | | |
| 6.000%, 02/02/21 | | | 1,727 | | | | 1,758 | |
| EMG Utica, Term Loan | | | | | | | | |
| 4.750%, 03/26/20 | | | 890 | | | | 892 | |
| Energy Transfer Equity, Term Loan B | | | | | | | | |
| 3.250%, 11/15/19 | | | 5,060 | | | | 5,047 | |
| EP Energy (aka Everest Acquisition), Term Loan B-2 | | | | | | | | |
| 4.500%, 04/26/19 | | | 203 | | | | 203 | |
| EP Energy (aka Everest Acquisition), Term Loan B-3 | | | | | | | | |
| 3.500%, 05/24/18 | | | 734 | | | | 733 | |
| Fieldwood Energy LLC, Second Lien | | | | | | | | |
| 8.125%, 09/30/20 | | | 85 | | | | 88 | |
| Fieldwood Energy, Term Loan | | | | | | | | |
| 3.875%, 09/28/18 | | | 498 | | | | 498 | |
| Frac Tech International, Term Loan B | | | | | | | | |
| 8.500%, 05/06/16 | | | 2,549 | | | | 2,591 | |
| Glenn Pool Oil, Term Loan | | | | | | | | |
| 4.500%, 05/02/16 | | | 816 | | | | 824 | |
| Harvey Gulf International Marine, Term Loan B | | | | | | | | |
| 5.500%, 06/12/20 | | | 1,335 | | | | 1,336 | |
| MEG Energy, Term Loan B - 2013 | | | | | | | | |
| 3.750%, 03/31/20 | | | 1,419 | | | | 1,423 | |
| Obsidian Natural Gas Trust | | | | | | | | |
| 7.000%, 11/02/15 | | | 845 | | | | 856 | |
| Pacific Drilling, Term Loan B | | | | | | | | |
| 4.500%, 05/18/18 | | | 352 | | | | 353 | |
| Petroleum Geo-Services, Term Loan B | | | | | | | | |
| 3.250%, 03/14/21 | | | 805 | | | | 799 | |
| | | | | |
| Philadelphia Energy Solutions, Term Loan | | | | | | |
| 6.250%, 04/03/18 | | $ | 362 | | | $ | 320 | |
| Ruby Western Pipeline Holdings, Term Loan | | | | | | | | |
| 3.500%, 03/27/20 | | | 313 | | | | 312 | |
| Samson Investment Company, Cov-Lite Term Loan | | | | | | | | |
| 5.000%, 09/25/18 | | | 315 | | | | 318 | |
| Seadrill Operating LP, Term Loan B | | | | | | | | |
| 4.000%, 02/22/21 | | | 319 | | | | 318 | |
| Sheridan Production Partners, Term Loan I-A | | | | | | | | |
| 4.250%, 10/01/19 | | | 20 | | | | 20 | |
| Sheridan Production Partners, Term Loan II-A | | | | | | | | |
| 4.250%, 12/16/20 | | | 59 | | | | 60 | |
| Sheridan Production Partners, Term Loan II-M | | | | | | | | |
| 4.250%, 12/16/20 | | | 22 | | | | 22 | |
| Sheridan Production Partners, Term Loan II-SIP | | | | | | | | |
| 4.250%, 12/16/20 | | | 427 | | | | 430 | |
| Sheridan Production Partners, Term Loan I-M | | | | | | | | |
| 4.250%, 10/01/19 | | | 12 | | | | 12 | |
| Sheridan Production Partners, Term Loan I-SIP | | | | | | | | |
| 4.250%, 10/01/19 | | | 151 | | | | 152 | |
| Sonangol Finance | | | | | | | | |
| 1.155%, 10/15/14 | | | 645 | | | | 635 | |
| Templar Energy, Second Lien | | | | | | | | |
| 8.000%, 11/25/20 | | | 2,205 | | | | 2,226 | |
| Vantage Drilling Co (Offshore), Term Loan | | | | | | | | |
| 5.000%, 10/25/17 | | | 602 | | | | 602 | |
| Vantage Drilling Co (Offshore), Term Loan B (2013) | | | | | | | | |
| 5.750%, 03/22/19 | | | 614 | | | | 619 | |
| Western Refining, Term Loan B | | | | | | | | |
| 4.250%, 12/20/20 | | | 723 | | | | 729 | |
| | | | | | | | | |
| Total Energy | | | | 33,581 | |
| | | | | | | | | |
| Financial [1.6%] | |
| Alliant Holdings, Term Loan | | | | | | | | |
| 4.250%, 12/07/19 | | | 293 | | | | 294 | |
| American Capital Holdings, Inc., Term Loan B - 2017 | | | | | | | | |
| 3.500%, 08/22/17 | | | 385 | | | | 384 | |
See accompanying notes to financial statements.
CITY NATIONAL ROCHDALE FUNDS | PAGE 70
consolidated schedule of investments
March 31, 2014 (Unaudited)
City National Rochdale Fixed Income Opportunities Fund (continued)
| | | | | |
| AWAS Aviation, Term Loan B | | | | | | |
| 3.500%, 06/26/18 | | $ | 147 | | | $ | 147 | |
| Clipper Acquisitions (aka TCW), Term Loan | | | | | | | | |
| 3.000%, 12/20/19 | | | 222 | | | | 220 | |
| Compass Investors Inc. (USI), Term Loan | | | | | | | | |
| 4.250%, 12/27/19 | | | 351 | | | | 352 | |
| Crown Acquisitons | | | | | | | | |
| 0.000%, 03/26/21(H) | | | 3,000 | | | | 5,039 | |
| Duff & Phelps, Term Loan | | | | | | | | |
| 4.500%, 03/14/20 | | | 114 | | | | 115 | |
| Flying Fortress, Term Loan | | | | | | | | |
| 3.500%, 06/30/17 | | | 300 | | | | 299 | |
| Grosvenor Capital Management Holdings, Cov-Lite Term Loan | | | | | | | | |
| 3.750%, 11/25/20 | | | 249 | | | | 248 | |
| Guggenheim Partners Investment, Term Loan B | | | | | | | | |
| 4.250%, 07/22/22 | | | — | | | | — | |
| Hub International Holdings, Term Loan B | | | | | | | | |
| 4.750%, 09/17/20 | | | 353 | | | | 353 | |
| International Lease Finance, Term Loan | | | | | | | | |
| 3.500%, 02/26/21 | | | 370 | | | | 370 | |
| iStar Financial, Term Loan | | | | | | | | |
| 4.500%, 10/11/17 | | | 2,307 | | | | 2,312 | |
| iStar Financial, Term Loan A-2 - 2012 | | | | | | | | |
| 7.000%, 03/19/17 | | | 156 | | | | 160 | |
| JSC BTA Bank | | | | | | | | |
| 4.728%, 09/30/13 | | | 5,967 | | | | 5,355 | |
| LPL Holdings, Term Loan B - 2013 | | | | | | | | |
| 3.250%, 03/29/19 | | | 129 | | | | 128 | |
| Mondrian Investment Partners, Term Loan B | | | | | | | | |
| 4.000%, 07/12/18 | | | 98 | | | | 98 | |
| Nuveen Investments Inc., Second Lien | | | | | | | | |
| 6.500%, 02/28/19 | | | 430 | | | | 431 | |
| Nuveen Investments, Term Loan | | | | | | | | |
| 4.153%, 05/13/17 | | | 710 | | | | 712 | |
| RCS Capital Corporation, Term Loan | | | | | | | | |
| 0.000%, 03/29/19(H) | | | 530 | | | | 533 | |
| SAM Finance (Santander), Cov-Lite Term Loan | | | | | | | | |
| 4.250%, 11/26/20 | | | 584 | | | | 585 | |
| | | | | |
| Sedgwick, Inc. , First Lien Term Loan | | | | | | |
| 3.750%, 02/11/21 | | $ | 685 | | | $ | 677 | |
| Sedgwick, Inc. , Second Lien | | | | | | | | |
| 6.750%, 02/11/22 | | | 260 | | | | 258 | |
| Starwood Property Trust, Term Loan | | | | | | | | |
| 3.500%, 04/17/20 | | | 452 | | | | 450 | |
| Virtu Financial, Term Loan | | | | | | | | |
| 5.750%, 11/05/19 | | | 145 | | | | 146 | |
| | | | | | | | | |
| Total Financial | | | | 19,666 | |
| | | | | | | | | |
| Food and Drug [0.4%] | |
| Albertsons, Term Loan B-1 | | | | | | | | |
| 4.250%, 03/21/16 | | | 217 | | | | 218 | |
| Albertsons, Term Loan B-2 | | | | | | | | |
| 4.750%, 05/21/19 | | | 877 | | | | 882 | |
| Dunkin’ Brands, Term B3 | | | | | | | | |
| 3.750%, 02/14/20 | | | 906 | | | | 899 | |
| Rite Aid Corporation, Tranche 7 Term Loan | | | | | | | | |
| 4.000%, 02/21/20 | | | 471 | | | | 471 | |
| Rite Aid, Second Lien - Tranche 1 Term Loans | | | | | | | | |
| 5.750%, 07/07/20 | | | 1,085 | | | | 1,107 | |
| Rite Aid, Second Lien - Tranche 2 Term Loans | | | | | | | | |
| 4.875%, 06/11/21 | | | 440 | | | | 446 | |
| Supervalu, Term Loan B - 2013 | | | | | | | | |
| 4.500%, 03/21/19 | | | 275 | | | | 276 | |
| Weight Watchers International, Term Loan B-2 | | | | | | | | |
| 3.750%, 04/02/20 | | | — | | | | — | |
| | | | | | | | | |
| Total Food and Drug | | | | 4,299 | |
| | | | | | | | | |
| Food/Tobacco [0.9%] | |
| Aramark Corp, Term Loan F | | | | | | | | |
| 3.250%, 02/24/21 | | | 480 | | | | 475 | |
| Arby’s Restaurant (ARG IH), Term Loan | | | | | | | | |
| 5.000%, 11/15/20 | | | 299 | | | | 301 | |
| Blue Buffalo, Term Loan B3 | | | | | | | | |
| 4.000%, 08/08/19 | | | 281 | | | | 283 | |
| CEC Entertainment, Inc., Term Loan B | | | | | | | | |
| 4.250%, 02/12/21 | | | 320 | | | | 317 | |
| CTI Foods Holding, Term Loan B | | | | | | | | |
| 4.500%, 06/12/20 | | | 234 | | | | 234 | |
See accompanying notes to financial statements.
CITY NATIONAL ROCHDALE FUNDS | PAGE 71
consolidated schedule of investments
March 31, 2014 (Unaudited)
City National Rochdale Fixed Income Opportunities Fund (continued)
| | | | | |
| Darling International, Term Loan B | | | | | | |
| 3.250%, 01/01/21 | | $ | 425 | | | $ | 424 | |
| Del Monte Foods Consumer Products, Cov-Lite Term Loan | | | | | | | | |
| 4.250%, 01/26/21 | | | 315 | | | | 315 | |
| HJ Heinz, Term Loan B1 | | | | | | | | |
| 3.250%, 03/27/19 | | | 3,126 | | | | 3,132 | |
| HJ Heinz, Term Loan B2 | | | | | | | | |
| 3.500%, 06/07/20 | | | 2,907 | | | | 2,918 | |
| JBS USA, Term Loan B-2 | | | | | | | | |
| 3.750%, 09/18/20 | | | 294 | | | | 293 | |
| Landry’s, Term Loan B | | | | | | | | |
| 4.000%, 04/19/18 | | | 257 | | | | 258 | |
| OSI Restaurant Partners, Term Loan | | | | | | | | |
| 3.500%, 10/23/19 | | | 97 | | | | 97 | |
| Pacific Industrial US Finco (Spotless), Term Loan B | | | | | | | | |
| 5.000%, 09/24/18 | | | 204 | | | | 206 | |
| Pinnacle Foods Group, Incremental Term Loan H | | | | | | | | |
| 3.250%, 04/29/20 | | | 209 | | | | 208 | |
| Pinnacle Foods Group, Term Loan G | | | | | | | | |
| 3.250%, 04/29/20 | | | 1,079 | | | | 1,073 | |
| Wendy’s International, Term Loan B - 2013 | | | | | | | | |
| 3.250%, 05/15/19 | | | 176 | | | | 176 | |
| | | | | | | | | |
| Total Food/Tobacco | | | | 10,710 | |
| | | | | | | | | |
| Forest Prod/Containers [0.5%] | |
| Ardagh Holdings USA Inc., Incremental Term Loan B | | | | | | | | |
| 0.000%, 12/17/19(H) | | | 500 | | | | 500 | |
| Ardagh Holdings USA, Term Loan B | | | | | | | | |
| 4.250%, 12/12/19 | | | 339 | | | | 340 | |
| Berry Plastics, Cov-Lite Term Loan E | | | | | | | | |
| 3.750%, 12/18/20 | | | 1,560 | | | | 1,556 | |
| Berry Plastics, Term Loan D | | | | | | | | |
| 3.500%, 02/08/20 | | | 3,158 | | | | 3,142 | |
| BWAY Holding Company, Term Loan B - 2012 | | | | | | | | |
| 4.500%, 08/07/17 | | | 158 | | | | 158 | |
| Caraustar Industries, Term Loan | | | | | | | | |
| 7.500%, 04/26/19 | | | 142 | | | | 145 | |
| NewPage Corporation, Term Loan B | | | | | | | | |
| 0.000%, 02/05/21(H) | | | 500 | | | | 504 | |
| | | | | |
| Reynolds Group Holdings, Term Loan B - 2013 | | | | | | |
| 4.000%, 12/26/18 | | $ | 360 | | | $ | 361 | |
| | | | | | | | | |
| Total Forest Prod/Containers | | | | 6,706 | |
| | | | | | | | | |
| Gaming/Leisure [2.2%] | |
| Activision Blizzard Inc., Term Loan B | | | | | | | | |
| 3.250%, 07/26/20 | | | 1,761 | | | | 1,759 | |
| Bally Technologies, Term Loan B | | | | | | | | |
| 4.250%, 11/25/20 | | | 189 | | | | 189 | |
| Belmond Interfin Ltd., Term Loan | | | | | | | | |
| 4.000%, 03/19/21 | | | 180 | | | | 180 | |
| Boyd Gaming, Term Loan B | | | | | | | | |
| 4.000%, 08/12/20 | | | 204 | | | | 204 | |
| Caesars Entertainment Op Co, Prop Co Term Loan | | | | | | | | |
| 7.000%, 10/09/20 | | | 1,536 | | | | 1,555 | |
| Caesars Entertainment Op Co, Term Loan B-4 | | | | | | | | |
| 9.500%, 01/28/15 | | | 189 | | | | 188 | |
| Caesars Entertainment Op Co, Term Loan B-6 Extended | | | | | | | | |
| 5.489%, 01/28/18 | | | 5,617 | | | | 5,292 | |
| CCM Merger (Motor City), Term Loan B | | | | | | | | |
| 5.000%, 03/01/17 | | | 298 | | | | 299 | |
| Cedar Fair, US Term Loan | | | | | | | | |
| 3.250%, 03/06/20 | | | 226 | | | | 225 | |
| Cinemark USA, Term Loan | | | | | | | | |
| 3.160%, 12/18/19 | | | 157 | | | | 157 | |
| Formula One (Alpha Topco), New Facility B | | | | | | | | |
| 4.500%, 04/30/19 | | | 67 | | | | 68 | |
| Four Seasons Holdings Inc., Term Loan (12/13) | | | | | | | | |
| 3.500%, 06/27/20 | | | 443 | | | | 443 | |
| Four Seasons Holdings, Second Lien | | | | | | | | |
| 6.250%, 12/24/20 | | | 150 | | | | 152 | |
| Golden Nugget, Delay Draw | | | | | | | | |
| 5.500%, 11/21/19 | | | 67 | | | | 69 | |
| Golden Nugget, Term Loan B | | | | | | | | |
| 5.500%, 11/21/19 | | | 157 | | | | 160 | |
| Great Wolf Resorts, Term Loan | | | | | | | | |
| 4.500%, 07/31/20 | | | 243 | | | | 244 | |
| Hilton Worldwide Finance, Term Loan B-1 | | | | | | | | |
| 3.750%, 09/23/20 | | | 4,965 | | | | 4,971 | |
See accompanying notes to financial statements.
CITY NATIONAL ROCHDALE FUNDS | PAGE 72
consolidated schedule of investments
March 31, 2014 (Unaudited)
City National Rochdale Fixed Income Opportunities Fund (continued)
| | | | | |
| Hoyts Group Holdings, Term Loan | | | | | | |
| 4.000%, 05/22/20 | | $ | 124 | | | $ | 124 | |
| Kasima, Term Loan B | | | | | | | | |
| 3.250%, 05/17/21 | | | 915 | | | | 908 | |
| La Quinta Intermediate Holdings, Term Loan B | | | | | | | | |
| 0.000%, 02/19/21(H) | | | 660 | | | | 659 | |
| Las Vegas Sands, Term Loan B | | | | | | | | |
| 3.250%, 12/17/20 | | | 1,985 | | | | 1,982 | |
| Lions Gate Entertainment, Second Lien | | | | | | | | |
| 5.000%, 07/19/20 | | | 300 | | | | 305 | |
| Marina District Finance (Borgata), Cov-Lite Term Loan B | | | | | | | | |
| 6.750%, 08/15/18 | | | 574 | | | | 581 | |
| MGM Resorts, Term Loan B | | | | | | | | |
| 3.500%, 12/20/19 | | | 747 | | | | 745 | |
| Mohegan Tribal Gaming, Term Loan B | | | | | | | | |
| 5.500%, 11/19/19 | | | 224 | | | | 229 | |
| Penn National Gaming, Term Loan B | | | | | | | | |
| 3.250%, 10/23/20 | | | 85 | | | | 84 | |
| Pinnacle Entertainment, Term Loan B-2 | | | | | | | | |
| 3.750%, 08/05/20 | | | 342 | | | | 343 | |
| Playa Resorts Holding, Term Loan B | | | | | | | | |
| 4.750%, 08/06/19 | | | 189 | | | | 190 | |
| Scientific Games, Term Loan B | | | | | | | | |
| 4.250%, 05/22/20 | | | 3,751 | | | | 3,751 | |
| SeaWorld Parks & Entertainmnt, Term Loan B-2 | | | | | | | | |
| 3.000%, 05/30/20 | | | 637 | | | | 627 | |
| Seminole Indian Tribe of Florida, Term Loan B - 2013 | | | | | | | | |
| 3.000%, 04/11/20 | | | 386 | | | | 384 | |
| Shingle Springs Tribal, Term Loan B | | | | | | | | |
| 6.250%, 08/02/19 | | | 158 | | | | 161 | |
| | | | | | | | | |
| Total Gaming/Leisure | | | | 27,228 | |
| | | | | | | | | |
| Healthcare [1.7%] | |
| Accellent Inc., First Lien Term Loan | | | | | | | | |
| 0.000%, 02/19/21(H) | | | 320 | | | | 319 | |
| Allscripts Healthcare Solutions, Term Loan A1 | | | | | | | | |
| 2.910%, 06/28/18 | | | 481 | | | | 480 | |
| | | | | |
| Ardent Health Services, Term Loan B | | | | | | |
| 6.750%, 07/02/18 | | $ | 236 | | | $ | 237 | |
| Biomet, Term Loan B-2 | | | | | | | | |
| 3.665%, 07/25/17 | | | — | | | | — | |
| Bright Horizons Family Solutions, Term Loan B | | | | | | | | |
| 5.250%, 01/24/20 | | | 104 | | | | 104 | |
| Carestream Health Holdings, Term Loan | | | | | | | | |
| 5.000%, 06/05/19 | | | 491 | | | | 495 | |
| Community Health Systems, Extended Term Loan | | | | | | | | |
| 3.447%, 01/25/17 | | | 160 | | | | 161 | |
| Community Health Systems, Inc., 2021 Term D Loan | | | | | | | | |
| 4.250%, 01/27/21 | | | 426 | | | | 429 | |
| Community Health Systems, Inc., Term Loan A - 2019 | | | | | | | | |
| 2.983%, 01/25/19 | | | 4,000 | | | | 3,976 | |
| ConvaTec Healthcare, Term Loan B | | | | | | | | |
| 4.000%, 12/30/16 | | | 494 | | | | 495 | |
| DaVita, Term Loan B-2 | | | | | | | | |
| 4.000%, 08/21/19 | | | 296 | | | | 297 | |
| Drumm Investors (Golden Living), Term Loan | | | | | | | | |
| 5.000%, 05/04/18 | | | 618 | | | | 610 | |
| Endo Pharmaceutical, Term Loan B - 2013 | | | | | | | | |
| 3.250%, 12/11/20 | | | 205 | | | | 204 | |
| Envision Acquisition Company, First Lien Term Loan | | | | | | | | |
| 5.750%, 09/23/20 | | | 169 | | | | 169 | |
| Gentiva Health Services, Term Loan C | | | | | | | | |
| 5.750%, 10/16/18 | | | 232 | | | | 229 | |
| Grifols, Inc, Term Loan B | | | | | | | | |
| 3.155%, 03/05/21 | | | 2,525 | | | | 2,522 | |
| HCA, Term Loan B-5 | | | | | | | | |
| 2.903%, 03/31/17 | | | 498 | | | | 497 | |
| HCA, Tranche B-4 Term Loan | | | | | | | | |
| 2.984%, 05/01/18 | | | 950 | | | | 949 | |
| Hologic, Term Loan B - Refi | | | | | | | | |
| 3.250%, 08/01/19 | | | 325 | | | | 324 | |
| Iasis Healthcare, Term Loan B - 2013 | | | | | | | | |
| 4.500%, 05/03/18 | | | 379 | | | | 380 | |
| IMS Healthcare, Term Loan B - 2021 | | | | | | | | |
| 3.750%, 03/17/21 | | | 173 | | | | 173 | |
See accompanying notes to financial statements.
CITY NATIONAL ROCHDALE FUNDS | PAGE 73
consolidated schedule of investments
March 31, 2014 (Unaudited)
City National Rochdale Fixed Income Opportunities Fund (continued)
| | | | | |
| INC Research, Term Loan | | | | | | |
| 6.000%, 07/12/18 | | $ | 553 | | | $ | 554 | |
| LifePoint Hospitals, Term Loan B | | | | | | | | |
| 2.660%, 07/31/17 | | | 116 | | | | 117 | |
| Mallinckrodt PLC, Term Loan B | | | | | | | | |
| 3.500%, 03/05/21 | | | 255 | | | | 255 | |
| MultiPlan Inc, Term Loan | | | | | | | | |
| 4.000%, 03/19/21 | | | 640 | | | | 638 | |
| P2 Lower Acq. (Progressive), Term Loan | | | | | | | | |
| 5.500%, 10/16/20 | | | 1,622 | | | | 1,631 | |
| Par Pharmaceuticals, Term B-2 Loan | | | | | | | | |
| 4.000%, 09/30/19 | | | 981 | | | | 982 | |
| Patheon Inc, Term Loan B | | | | | | | | |
| 0.000%, 01/22/21(H) | | | 550 | | | | 547 | |
| Regional Care (aka RCHP), Term Loan | | | | | | | | |
| 7.000%, 11/04/18 | | | 750 | | | | 743 | |
| Royalty Pharma (aka RPI), Term Loan B-2 | | | | | | | | |
| 3.250%, 05/09/18 | | | 898 | | | | 901 | |
| Salix Pharmaceuticals, Term Loan | | | | | | | | |
| 4.250%, 12/17/19 | | | 469 | | | | 473 | |
| US Renal Care, Tranche B2 Term Loan | | | | | | | | |
| 4.250%, 07/03/19 | | | 159 | | | | 159 | |
| Valeant Pharmaceuticals International, Series C-2 TLB | | | | | | | | |
| 3.750%, 12/11/19 | | | 128 | | | | 128 | |
| Valeant Pharmaceuticals International, Series D-2 TLB | | | | | | | | |
| 3.750%, 02/13/19 | | | 357 | | | | 357 | |
| Valeant Pharmaceuticals International, Series E Tranche B Term Loan | | | | | | | | |
| 3.750%, 06/26/20 | | | 952 | | | | 954 | |
| | | | | | | | | |
| Total Healthcare | | | | 21,489 | |
| | | | | | | | | |
| Housing [0.5%] | |
| ABC Supply Company, Term Loan B | | | | | | | | |
| 3.500%, 04/16/20 | | | 1,104 | | | | 1,100 | |
| Capital Automotive, Second Lien | | | | | | | | |
| 6.000%, 04/30/20 | | | 825 | | | | 842 | |
| Capital Automotive, Term Loan - 2013 | | | | | | | | |
| 4.000%, 04/05/19 | | | 1,722 | | | | 1,726 | |
| | | | | |
| CB Richard Ellis , Term Loan B | | | | | | |
| 2.905%, 03/26/21 | | $ | 712 | | | $ | 709 | |
| Continental Building Products, First Lien Term Loan | | | | | | | | |
| 4.750%, 08/14/20 | | | 527 | | | | 528 | |
| CPG International, Term Loan B | | | | | | | | |
| 4.750%, 09/30/20 | | | 224 | | | | 224 | |
| Norcraft Companies, Term Loan | | | | | | | | |
| 5.250%, 10/24/20 | | | 90 | | | | 90 | |
| QUIKRETE Holdings, First Lien Term Loan | | | | | | | | |
| 4.000%, 09/18/20 | | | 284 | | | | 284 | |
| Realogy Corporation, New Term Loan B | | | | | | | | |
| 3.750%, 03/05/20 | | | 317 | | | | 318 | |
| Realogy, Synthetic LC - extended | | | | | | | | |
| 0.018%, 10/10/16 | | | 13 | | | | 13 | |
| | | | | | | | | |
| Total Housing | | | | 5,834 | |
| | | | | | | | | |
| Industrials [0.2%] | |
| Interpipe Ukraine | | | | | | | | |
| 4.273%, 03/06/15(I) | | | 3,624 | | | | 2,646 | |
| | | | | | | | | |
| Information Technology [2.4%] | |
| Alcatel Lucent USA, US Term Loan (TLC) | | | | | | | | |
| 4.500%, 01/29/19 | | | 3,227 | | | | 3,241 | |
| Allflex Holdings III, Term Loan B | | | | | | | | |
| 4.250%, 06/05/20 | | | 194 | | | | 194 | |
| Arris Group, Term Loan B | | | | | | | | |
| 3.500%, 04/17/20 | | | 733 | | | | 729 | |
| Avaya Inc., Term B-6 Loans | | | | | | | | |
| 6.500%, 03/31/18 | | | 1,390 | | | | 1,391 | |
| Avaya, Term B3 Extended | | | | | | | | |
| 4.734%, 10/26/17 | | | 1,175 | | | | 1,146 | |
| Blackboard, Term Loan B3 | | | | | | | | |
| 4.750%, 10/04/18 | | | 219 | | | | 221 | |
| BMC Software Finance, Term Loan | | | | | | | | |
| 5.000%, 08/07/20 | | | 813 | | | | 814 | |
| CDW, Term Loan | | | | | | | | |
| 3.250%, 04/29/20 | | | 1,578 | | | | 1,562 | |
| CompuCom Systems, Term Loan B | | | | | | | | |
| 4.250%, 05/07/20 | | | 144 | | | | 144 | |
| Datapipe, Term Loan B | | | | | | | | |
| 5.750%, 03/07/19 | | | 109 | | | | 109 | |
See accompanying notes to financial statements.
CITY NATIONAL ROCHDALE FUNDS | PAGE 74
consolidated schedule of investments
March 31, 2014 (Unaudited)
City National Rochdale Fixed Income Opportunities Fund (continued)
| | | | | |
| Dealertrack Technologies, Inc., Term Loan B | | | | | | |
| 3.500%, 02/26/21 | | $ | 160 | | | $ | 160 | |
| Dell, Term Loan B | | | | | | | | |
| 4.500%, 09/23/20 | | | 2,975 | | | | 2,953 | |
| Deluxe Entertainment Services Group, Term Loan | | | | | | | | |
| 6.500%, 02/25/20 | | | 610 | | | | 611 | |
| Fidji Luxembourg (BC3) S.à r.l., Term Loan | | | | | | | | |
| 6.250%, 12/18/20 | | | 285 | | | | 286 | |
| First Advantage, Term Loan B | | | | | | | | |
| 6.250%, 02/28/19 | | | 287 | | | | 288 | |
| Freescale Semiconductor, Term B-5 | | | | | | | | |
| 5.000%, 01/15/21 | | | 234 | | | | 236 | |
| Freescale Semiconductor, Tranche B4 Term Loan | | | | | | | | |
| 4.250%, 03/01/20 | | | 4,080 | | | | 4,094 | |
| Genesys Telecom, Term Loan B 2013 | | | | | | | | |
| 4.000%, 01/31/20 | | | 191 | | | | 191 | |
| Infor (US), Term Loan B-3 | | | | | | | | |
| 3.750%, 05/22/20 | | | 192 | | | | 191 | |
| Infor (US), Term Loan B-5 | | | | | | | | |
| 3.750%, 06/03/20 | | | 912 | | | | 909 | |
| Interactive Data, Term B Loan | | | | | | | | |
| 3.750%, 02/11/18 | | | 598 | | | | 597 | |
| Internap Network Services, Term Loan | | | | | | | | |
| 6.000%, 11/22/19 | | | 314 | | | | 316 | |
| ION Trading Technologies, Term Loan | | | | | | | | |
| 4.500%, 05/22/20 | | | 136 | | | | 136 | |
| iQor US Inc., Term Loan B | | | | | | | | |
| 0.000%, 02/19/21(H) | | | 1,090 | | | | 1,057 | |
| Merrill, Term Loan | | | | | | | | |
| 5.750%, 03/08/18 | | | 416 | | | | 420 | |
| Microsemi Corporation, Term Loan B-1 | | | | | | | | |
| 3.250%, 02/19/20 | | | 295 | | | | 295 | |
| Nuance Communications, Term Loan | | | | | | | | |
| 2.910%, 08/02/19 | | | 189 | | | | 187 | |
| Oberthur Technologies, Term Loan B | | | | | | | | |
| 5.750%, 10/09/19 | | | 289 | | | | 291 | |
| Omnitracs, Term Loan | | | | | | | | |
| 4.750%, 11/25/20 | | | 299 | | | | 302 | |
| On Semiconductor, Term Loan | | | | | | | | |
| 1.997%, 01/02/18 | | | 548 | | | | 535 | |
| | | | | |
| Open Text, Term Loan | | | | | | |
| 3.250%, 12/18/20 | | $ | 544 | | | $ | 543 | |
| Peak 10, Term Loan B | | | | | | | | |
| 7.250%, 10/25/18 | | | 267 | | | | 269 | |
| Presidio, Inc., Term Loan - 2014 | | | | | | | | |
| 5.000%, 03/31/17 | | | 306 | | | | 307 | |
| Redtop Acquisitions, First Lien Term Loan | | | | | | | | |
| 4.500%, 12/22/20 | | | 315 | | | | 318 | |
| Redtop Acquisitions, Second Lien | | | | | | | | |
| 8.250%, 06/22/21 | | | 190 | | | | 195 | |
| Rovi Solutions Corporation, Tranche B-3 Loan | | | | | | | | |
| 3.500%, 03/28/19 | | | 362 | | | | 361 | |
| Sophia LP, Term Loan B-1 | | | | | | | | |
| 0.000%, 07/19/18 | | | 499 | | | | 499 | |
| Spansion, Term Loan B | | | | | | | | |
| 3.750%, 12/13/18 | | | 269 | | | | 269 | |
| SS&C Technologies, Replacement TL B1 | | | | | | | | |
| 3.250%, 06/07/19 | | | 121 | | | | 121 | |
| SS&C Technologies, Replacement TL B2 | | | | | | | | |
| 3.250%, 06/07/19 | | | 13 | | | | 13 | |
| SunGard Data Systems, Term Loan E | | | | | | | | |
| 4.000%, 03/08/20 | | | 873 | | | | 875 | |
| Telx Group, Term Loan B | | | | | | | | |
| 5.250%, 09/22/17 | | | 713 | | | | 717 | |
| The Active Network, First Lien Term Loan | | | | | | | | |
| 5.500%, 11/06/20 | | | 110 | | | | 111 | |
| Triple Point Group Holdings, Term Loan B | | | | | | | | |
| 5.250%, 07/10/20 | | | 214 | | | | 201 | |
| Verint Systems, Inc, Cov-Lite Term Loan | | | | | | | | |
| 3.500%, 09/06/19 | | | 250 | | | | 249 | |
| Vertafore, Term Loan - 2013 | | | | | | | | |
| 4.250%, 11/30/19 | | | 276 | | | | 277 | |
| WestCorp, Term Loan B-10 | | | | | | | | |
| 3.250%, 06/30/18 | | | 500 | | | | 497 | |
| | | | | | | | | |
| Total Information Technology | | | | 29,428 | |
| | | | | | | | | |
| Manufacturing [0.2%] | |
| Accudyne Industries (Hamilton), 2013 Specified Refinancing Term Loan | | | | | | | | |
| 4.000%, 12/13/19 | | | 242 | | | | 241 | |
See accompanying notes to financial statements.
CITY NATIONAL ROCHDALE FUNDS | PAGE 75
consolidated schedule of investments
March 31, 2014 (Unaudited)
City National Rochdale Fixed Income Opportunities Fund (continued)
| | | | | |
| Alliance Laundry, Term Loan - 2013 | | | | | | |
| 4.250%, 12/07/18 | | $ | 684 | | | $ | 687 | |
| Bombardier Recreational Products, Term Loan B | | | | | | | | |
| 4.000%, 01/23/19 | | | 136 | | | | 136 | |
| Generac Power Systems, Term Loan B | | | | | | | | |
| 3.500%, 06/22/18 | | | 214 | | | | 213 | |
| Minimax GmbH & Co. KG, Term Loan B | | | | | | | | |
| 4.500%, 08/07/20 | | | 134 | | | | 135 | |
| Mirror Bidco Corp. (Dematic), Cov-Lite Term Loan | | | | | | | | |
| 4.250%, 12/28/19 | | | 296 | | | | 297 | |
| WTG Holdings III, Cov-Lite Term Loan | | | | | | | | |
| 4.750%, 12/11/20 | | | 170 | | | | 170 | |
| | | | | | | | | |
| Total Manufacturing | | | | 1,879 | |
| | | | | | | | | |
| Metals/Minerals [1.0%] | |
| Arch Coal, Term Loan B | | | | | | | | |
| 6.250%, 05/16/18 | | | 812 | | | | 800 | |
| Atkore International, First Lien Term Loan | | | | | | | | |
| 0.000%, 03/26/21(H) | | | 360 | | | | 359 | |
| Atlas Iron Limited, Term Loan | | | | | | | | |
| 8.750%, 12/07/17 | | | 153 | | | | 153 | |
| Boomerang Tube, Term Loan B | | | | | | | | |
| 11.000%, 10/02/17 | | | 222 | | | | 215 | |
| Fairmount Minerals, Term Loan B-2 | | | | | | | | |
| 5.000%, 09/03/19 | | | 95 | | | | 95 | |
| Foresight Energy, Term Loan B | | | | | | | | |
| 5.500%, 08/21/20 | | | 264 | | | | 265 | |
| Fortescue Metals Group (FMG), Cov-Lite Term Loan | | | | | | | | |
| 4.250%, 06/30/19 | | | 6,030 | | | | 6,073 | |
| Freeport-McMoran C & G, Term Loan A | | | | | | | | |
| 1.660%, 02/12/18 | | | 1,825 | | | | 1,811 | |
| Murray Energy, Term Loan | | | | | | | | |
| 5.250%, 11/21/19 | | | 495 | | | | 499 | |
| Novelis, Term Loan - 2013 | | | | | | | | |
| 3.750%, 03/10/17 | | | 1,269 | | | | 1,266 | |
| Peabody Energy, Term Loan B | | | | | | | | |
| 4.250%, 09/24/20 | | | 522 | | | | 523 | |
| TMS International, Term Loan B | | | | | | | | |
| 4.500%, 10/02/20 | | | 110 | | | | 110 | |
| | | | | |
| Walter Energy, Term Loan B | | | | | | |
| 6.750%, 04/02/18 | | $ | 420 | | | $ | 405 | |
| | | | | | | | | |
| Total Metals/Minerals | | | | 12,574 | |
| | | | | | | | | |
| Retail [1.5%] | |
| Academy Sports, Term Loan - 2012 | | | | | | | | |
| 4.500%, 08/03/18 | | | 182 | | | | 182 | |
| BJ’s Wholesale Club, First Lien Term Loan | | | | | | | | |
| 4.500%, 09/26/19 | | | 100 | | | | 100 | |
| BJ’s Wholesale Club, Second Lien Term Loan | | | | | | | | |
| 8.500%, 03/31/20 | | | 105 | | | | 107 | |
| CWGS Group, Term Loan | | | | | | | | |
| 5.750%, 02/14/20 | | | 273 | | | | 275 | |
| Harbor Freight, Term Loan | | | | | | | | |
| 4.750%, 07/25/19 | | | 84 | | | | 85 | |
| HMK Intermediate Holdings (Sleepys), Term Loan | | | | | | | | |
| 5.000%, 04/01/19 | | | 343 | | | | 345 | |
| Hudson’s Bay Company, Term Loan B | | | | | | | | |
| 4.750%, 10/07/20 | | | 486 | | | | 492 | |
| J. Crew Group, Term Loan B | | | | | | | | |
| 4.000%, 03/05/21 | | | 1,155 | | | | 1,152 | |
| JC Penney, Term Loan B | | | | | | | | |
| 6.000%, 05/21/18 | | | 3,316 | | | | 3,296 | |
| Jo-Ann Stores, Initial Loans | | | | | | | | |
| 4.000%, 03/16/18 | | | 628 | | | | 627 | |
| Lands’ End, Inc., Term Loan B | | | | | | | | |
| 0.000%, 03/12/21(H) | | | 895 | | | | 893 | |
| Michaels Stores, Term Loan B | | | | | | | | |
| 3.750%, 01/28/20 | | | 357 | | | | 358 | |
| Moneygram International, Term Loan B - 2013 | | | | | | | | |
| 4.250%, 03/26/20 | | | 139 | | | | 139 | |
| Neiman Marcus Group, First Lien Term Loan | | | | | | | | |
| 4.250%, 10/25/20 | | | 3,602 | | | | 3,612 | |
| Ollie’s Bargain Outlet, Term Loan B | | | | | | | | |
| 6.250%, 09/27/19 | | | 139 | | | | 138 | |
| Party City Holdings Inc., 2014 Replacement Term Loans | | | | | | | | |
| 4.250%, 07/27/19 | | | 46 | | | | 46 | |
| Party City Holdings, 2013 Replacement Term Loans | | | | | | | | |
| 4.000%, 07/23/19 | | | 477 | | | | 477 | |
See accompanying notes to financial statements.
CITY NATIONAL ROCHDALE FUNDS | PAGE 76
consolidated schedule of investments
March 31, 2014 (Unaudited)
City National Rochdale Fixed Income Opportunities Fund (continued)
| | | | | |
| Payless, Inc., Term Loan B | | | | | | |
| 5.000%, 03/05/21 | | $ | 225 | | | $ | 225 | |
| Petco Animal Supplies, Term Loan B - 2013 | | | | | | | | |
| 4.000%, 11/24/17 | | | 375 | | | | 376 | |
| PVH, Term Loan B - 2012 | | | | | | | | |
| 3.250%, 02/13/20 | | | 292 | | | | 292 | |
| Savers, New Term Loan | | | | | | | | |
| 5.000%, 07/09/19 | | | 198 | | | | 199 | |
| Sears Roebuck Acceptance, Term Loan B | | | | | | | | |
| 5.500%, 06/30/18 | | | 3,392 | | | | 3,406 | |
| Toys R Us Property Company, Initial Term Loan | | | | | | | | |
| 6.000%, 08/21/19 | | | 903 | | | | 872 | |
| Toys R Us-Delaware, Term Loan | | | | | | | | |
| 6.000%, 09/01/16 | | | 898 | | | | 811 | |
| Toys R Us-Delaware, Term Loan B-3 | | | | | | | | |
| 5.250%, 05/25/18 | | | 140 | | | | 117 | |
| | | | | | | | | |
| Total Retail | | | | 18,622 | |
| | | | | | | | | |
| Service [2.3%] | |
| A’Ayan Leasing | | | | | | | | |
| 3.750%, 04/13/20(I) | | | 3,525 | | | | 1,516 | |
| Advanced Disposal Services, Term Loan B-2 | | | | | | | | |
| 3.750%, 10/05/19 | | | 1,229 | | | | 1,226 | |
| Asurion Corporation, Second Lien | | | | | | | | |
| 8.500%, 03/03/21 | | | 1,540 | | | | 1,588 | |
| Asurion Corporation, Term Loan B3 | | | | | | | | |
| 3.750%, 02/27/17 | | | 150 | | | | 150 | |
| Asurion, Incremental Term Loan B-1 | | | | | | | | |
| 5.000%, 05/24/19 | | | 3,735 | | | | 3,741 | |
| Asurion, Incremental Term Loan B-2 | | | | | | | | |
| 4.250%, 06/19/20 | | | 1,270 | | | | 1,265 | |
| Avis Budget Car Rental, New Tranche B Term Loan | | | | | | | | |
| 3.000%, 03/15/19 | | | 335 | | | | 332 | |
| Brand Energy & Infrastructure, Term Loan B | | | | | | | | |
| 4.750%, 11/20/20 | | | 2,288 | | | | 2,294 | |
| Ceridian Corporation, Term B Loan | | | | | | | | |
| 4.404%, 05/09/17 | | | 208 | | | | 208 | |
| | | | | |
| DigitalGlobe, Term Loan B | | | | | | |
| 3.750%, 01/31/20 | | $ | 540 | | | $ | 540 | |
| Evertec Group, Term Loan A | | | | | | | | |
| 2.742%, 04/17/18 | | | 578 | | | | 569 | |
| Evertec Group, Term Loan B | | | | | | | | |
| 3.500%, 04/11/20 | | | 193 | | | | 191 | |
| First Data Corporation, 2021 Extended Dollar Term Loan | | | | | | | | |
| 4.155%, 03/24/21 | | | 1,745 | | | | 1,748 | |
| First Data, 2018 Dollar TL (Extended) | | | | | | | | |
| 4.155%, 03/24/18 | | | 4,095 | | | | 4,102 | |
| First Data, 2018B New Term Loan | | | | | | | | |
| 4.155%, 09/30/18 | | | 805 | | | | 806 | |
| Hertz, Term Loan B1 | | | | | | | | |
| 3.750%, 03/12/18 | | | 697 | | | | 697 | |
| Live Nation, Term Loan B | | | | | | | | |
| 3.500%, 08/14/20 | | | 527 | | | | 526 | |
| McGraw-Hill, Cov-Lite Term Loan | | | | | | | | |
| 5.750%, 03/22/19 | | | 264 | | | | 266 | |
| Power Buyer, Delay Draw | | | | | | | | |
| 4.250%, 05/06/20 | | | 66 | | | | 66 | |
| Power Buyer, Second Lien | | | | | | | | |
| 8.250%, 11/06/20 | | | 180 | | | | 178 | |
| Power Buyer, Term Loan | | | | | | | | |
| 4.250%, 05/06/20 | | | 527 | | | | 524 | |
| Sabre, Term Loan B-2 | | | | | | | | |
| 4.500%, 02/19/19 | | | 100 | | | | 99 | |
| Sabre, Term Loan C | | | | | | | | |
| 4.000%, 02/15/18 | | | 236 | | | | 236 | |
| Securitas Direct | | | | | | | | |
| 0.000%, 08/30/19(H) | | | 3,000 | | | | 4,360 | |
| Spin Holdco (Coinmach), Term Loan B | | | | | | | | |
| 4.250%, 11/14/19 | | | 110 | | | | 109 | |
| Springer Science Business Media, Term Loan B2 | | | | | | | | |
| 5.000%, 07/24/20 | | | 274 | | | | 274 | |
| Tervita Corp, Term Loan | | | | | | | | |
| 6.250%, 05/14/18 | | | 200 | | | | 198 | |
| USIC Holdings, Term Loan | | | | | | | | |
| 4.000%, 07/24/20 | | | 189 | | | | 188 | |
| | | | | | | | | |
| Total Service | | | | 27,997 | |
| | | | | | | | | |
| Sovereign [0.3%] | |
| Tanzania Term Loan | | | | | | | | |
| 6.130%, 03/03/20 | | | 4,000 | | | | 3,980 | |
See accompanying notes to financial statements.
CITY NATIONAL ROCHDALE FUNDS | PAGE 77
consolidated schedule of investments
March 31, 2014 (Unaudited)
City National Rochdale Fixed Income Opportunities Fund (continued)
| | | | | |
| Telecommunications [2.3%] | |
| Cincinnati Bell, Term Loan B - 2013 | | | | | | |
| 4.000%, 08/20/20 | | $ | 1,926 | | | $ | 1,924 | |
| Consolidated Communications, Term Loan | | | | | | | | |
| 4.250%, 12/20/20 | | | 374 | | | | 376 | |
| Eircom Finco | | | | | | | | |
| 0.000%, 09/30/19(H) | | | 3,000 | | | | 3,981 | |
| Frontier Communications, Term Loan A | | | | | | | | |
| 3.035%, 10/15/16 | | | 4,429 | | | | 4,418 | |
| Integra Telecom, Second Lien | | | | | | | | |
| 9.750%, 02/21/20 | | | 165 | | | | 169 | |
| Integra Telecom, Term B Loan | | | | | | | | |
| 5.250%, 02/22/19 | | | 465 | | | | 467 | |
| Intelsat Jackson Holdings, Term Loan B2 | | | | | | | | |
| 3.750%, 06/30/19 | | | 2,488 | | | | 2,492 | |
| Level 3 Communications, Term Loan B - 2020 | | | | | | | | |
| 4.000%, 01/15/20 | | | 4,020 | | | | 4,025 | |
| Level 3 Communications, Term Loan B-3 -2019 | | | | | | | | |
| 4.000%, 08/01/19 | | | 1,145 | | | | 1,148 | |
| LTS Buyer (Light Tower), Second Lien | | | | | | | | |
| 8.000%, 04/12/21 | | | 51 | | | | 51 | |
| LTS Buyer (Light Tower), Term Loan | | | | | | | | |
| 4.000%, 04/13/20 | | | 1,014 | | | | 1,007 | |
| TASC | | | | | | | | |
| 4.500%, 12/18/15 | | | 541 | | | | 508 | |
| Telenet Communications | | | | | | | | |
| 0.000%, 06/30/23(H) | | | 3,000 | | | | 4,123 | |
| Windstream, Term Loan B4 | | | | | | | | |
| 3.500%, 01/10/20 | | | 316 | | | | 315 | |
| Zayo Group, Term Loan B - 2012 | | | | | | | | |
| 4.000%, 07/02/19 | | | 3,420 | | | | 3,421 | |
| | | | | | | | | |
| Total Telecommunications | | | | 28,425 | |
| | | | | | | | | |
| Transportation [0.6%] | |
| Affinia Group, Term Loan B-2 | | | | | | | | |
| 4.750%, 04/25/20 | | | 114 | | | | 114 | |
| Allison Transmission, New Term B2 | | | | | | | | |
| 3.160%, 08/07/17 | | | 39 | | | | 39 | |
| Allison Transmission, Term Loan B3 (2013) | | | | | | | | |
| 3.750%, 08/23/19 | | | 1,308 | | | | 1,308 | |
| | | | | |
| Chrysler Automotive, 2014 Term Loan B | | | | | | |
| 3.250%, 12/05/18 | | $ | 1,500 | | | $ | 1,493 | |
| Chrysler Group | | | | | | | | |
| 4.250%, 05/24/17 | | | 1,266 | | | | 1,265 | |
| Commercial Barge Line Company, Term Loan B | | | | | | | | |
| 7.500%, 09/20/19 | | | 297 | | | | 297 | |
| CS Intermedia Holdco 2 LLC, Term Loan | | | | | | | | |
| 0.000%, 03/26/21(H) | | | 285 | | | | 285 | |
| FleetPride, Term Loan B | | | | | | | | |
| 5.250%, 11/15/19 | | | 212 | | | | 209 | |
| Key Safety Systems, Term Loan B | | | | | | | | |
| 4.750%, 05/18/18 | | | 149 | | | | 149 | |
| Navios Maritime Partners, Term Loan B | | | | | | | | |
| 5.250%, 06/19/18 | | | 352 | | | | 358 | |
| Navistar, Tranche B Term Loan | | | | | | | | |
| 5.750%, 08/17/17 | | | 300 | | | | 305 | |
| Remy International, Term Loan - 2013 | | | | | | | | |
| 4.250%, 02/28/20 | | | 435 | | | | 436 | |
| Schaeffler Finance BV, Term Loan C | | | | | | | | |
| 4.250%, 01/20/17 | | | 600 | | | | 602 | |
| Tomkins (Pinafore), Term B-2 Loan | | | | | | | | |
| 3.750%, 09/29/16 | | | 417 | | | | 417 | |
| Tower Auto Holdings, Term Loan B - 2020 | | | | | | | | |
| 4.750%, 04/23/20 | | | 223 | | | | 223 | |
| Wabash National, Term Loan | | | | | | | | |
| 4.500%, 05/08/19 | | | 173 | | | | 174 | |
| | | | | | | | | |
| Total Transportation | | | | 7,674 | |
| | | | | | | | | |
| Utility [0.8%] | |
| Astoria Generating Co Acquisitions, Term Loan | | | | | | | | |
| 8.500%, 10/26/17 | | | 280 | | | | 289 | |
| Calpine, Construction TL B1 (2020) | | | | | | | | |
| 3.000%, 04/24/20 | | | 149 | | | | 146 | |
| Calpine, Construction TL B2 (2022) | | | | | | | | |
| 3.250%, 01/02/22 | | | 1,095 | | | | 1,075 | |
| Calpine, Term Loan | | | | | | | | |
| 4.000%, 04/01/18 | | | 805 | | | | 807 | |
| Calpine, Term Loan B2 | | | | | | | | |
| 4.000%, 04/02/18 | | | 83 | | | | 83 | |
See accompanying notes to financial statements.
CITY NATIONAL ROCHDALE FUNDS | PAGE 78
consolidated schedule of investments
March 31, 2014 (Unaudited)
City National Rochdale Fixed Income Opportunities Fund (continued)
| | | | | |
| Calpine, Term Loan B3 | | | | | | |
| 4.000%, 09/27/19 | | $ | 1,573 | | | $ | 1,576 | |
| Calpine, Term Loan B4 | | | | | | | | |
| 4.000%, 10/30/20 | | | 1,152 | | | | 1,155 | |
| Dynegy, Term Loan B-2 | | | | | | | | |
| 4.000%, 04/23/20 | | | 328 | | | | 329 | |
| EFS Cogen Holdings I, Term Loan | | | | | | | | |
| 3.750%, 11/20/20 | | | 514 | | | | 516 | |
| Empire Generating Co, LLC, Term Loan B | | | | | | | | |
| 5.250%, 03/12/21 | | | 435 | | | | 434 | |
| Empire Generating Co, LLC, Term Loan C | | | | | | | | |
| 5.250%, 03/12/21 | | | 30 | | | | 30 | |
| ExGen Renewables I, LLC, Term Loan | | | | | | | | |
| 0.000%, 02/06/21(H) | | | 400 | | | | 405 | |
| La Frontera Generation, Term Loan B | | | | | | | | |
| 4.500%, 09/30/20 | | | 1,006 | | | | 1,006 | |
| NGPL Pipeco, Term Loan | | | | | | | | |
| 6.750%, 09/15/17 | | | 54 | | | | 53 | |
| NRG Energy, Term Loan | | | | | | | | |
| 2.750%, 07/01/18 | | | 952 | | | | 943 | |
| TPF Generation Holdings, Term Loan B - 2013 | | | | | | | | |
| 4.750%, 11/06/17 | | | 924 | | | | 888 | |
| TPF II, First Lien Term Loan | | | | | | | | |
| 6.500%, 08/16/19 | | | 184 | | | | 186 | |
| Viva Alamo LLC, Term Loan B | | | | | | | | |
| 4.750%, 02/17/21 | | | 240 | | | | 240 | |
| | | | | | | | | |
| Total Utility | | | | 10,161 | |
| | | | | | | | | |
| Wireless Communications [0.5%] | |
| Cellular South, Term Loan B | | | | | | | | |
| 3.250%, 05/22/20 | | | 84 | | | | 84 | |
| Crown Castle International, Incremental Term Loan B | | | | | | | | |
| 3.250%, 01/29/21 | | | 2,962 | | | | 2,951 | |
| nTelos, Term Loan B | | | | | | | | |
| 5.750%, 11/08/19 | | | 997 | | | | 988 | |
| SBA Senior Finance, Tranche B-1 Term Loan | | | | | | | | |
| 3.250%, 03/24/21 | | | 650 | | | | 647 | |
| Syniverse Technologies, Old Term Loan B | | | | | | | | |
| 4.000%, 04/23/19 | | | 775 | | | | 774 | |
| | | | | |
| Syniverse Technologies, Tranche B Term Loan | | | | | | |
| 4.000%, 04/23/19 | | $ | 887 | | | $ | 887 | |
| | | | | | | | | |
| Total Wireless Communications | | | | 6,331 | |
| | | | | | | | | |
| Total Loan Participations | |
| (Cost $361,828) | | | | 363,211 | |
| | | | | | | | | |
| Life Settlement Contracts [4.2%] (F)(G)(I) | |
| AXA Equitable Life #0474, Acquired 11/04/2013* | | | 7,290 | | | | 8,815 | |
| AXA Equitable Life #0932, Acquired 11/04/2013* | | | 1,014 | | | | 2,776 | |
| AXA Equitable Life #1898, Acquired 11/04/2013* | | | 441 | | | | 129 | |
| AXA Equitable Life #4496, Acquired 11/04/2013* | | | 115 | | | | 519 | |
| AXA Equitable Life #7233, Acquired 11/04/2013* | | | 395 | | | | 828 | |
| AXA Equitable Life #7578, Acquired 11/04/2013* | | | 2,104 | | | | 1,043 | |
| AXA Equitable Life #7857, Acquired 11/04/2013* | | | 2,297 | | | | 2,232 | |
| AXA Equitable Life #8538, Acquired 11/04/2013* | | | 1,333 | | | | 1,499 | |
| AXA Equitable Life #9345, Acquired 11/04/2013* | | | 143 | | | | — | |
| Guardian Insurance #0346, Acquired 11/04/2013* | | | 646 | | | | 1,772 | |
| ING Reliastar #1234, Acquired 12/05/2013* | | | 1,067 | | | | 1,935 | |
| ING Reliastar #1649, Acquired 12/05/2013* | | | 61 | | | | 852 | |
| ING Reliastar #4842, Acquired 11/20/2013* | | | 921 | | | | 1,749 | |
| John Hancock #2223, Acquired 11/19/2013* | | | 1,280 | | | | 2,616 | |
| John Hancock #5080, Acquired 11/19/2013* | | | 313 | | | | 1,362 | |
| Mass Mutual #1849, Acquired 11/05/2013* | | | 2,926 | | | | 3,003 | |
| Mass Mutual #5681, Acquired 11/05/2013* | | | 288 | | | | 1,361 | |
| Mass Mutual #6620, Acquired 11/05/2013* | | | 222 | | | | 1,053 | |
| Principal Financial #6653, Acquired 10/30/2013* | | | 306 | | | | 971 | |
| Security Mutual Life #5380, Acquired 10/30/2013* | | | 410 | | | | 554 | |
| Transamerica #0152, Acquired 10/28/2013* | | | 2,916 | | | | 3,713 | |
See accompanying notes to financial statements.
CITY NATIONAL ROCHDALE FUNDS | PAGE 79
consolidated schedule of investments
March 31, 2014 (Unaudited)
City National Rochdale Fixed Income Opportunities Fund (continued)
| | | | | |
| Transamerica #1708, Acquired 10/28/2013* | | $ | 957 | | | $ | 2,461 | |
| Transamerica #2275, Acquired 10/28/2013* | | | 6,252 | | | | 5,874 | |
| Transamerica #3426, Acquired 11/12/2013* | | | 274 | | | | 495 | |
| Transamerica #8205, Acquired 10/28/2013* | | | 714 | | | | 1,230 | |
| Union Central Life #4500, Acquired 10/30/2013* | | | 790 | | | | 3,022 | |
| | | | | | | | | |
| Total Life Settlement Contracts | |
| (Cost $35,475) | | | | 51,864 | |
| | | | | | | | | |
| Sovereign Debt [2.2%] | |
| Arab Republic of Egypt | | | | | | | | |
| 4.717%, 01/04/21(I) (J) | | | 3,403 | | | | 2,802 | |
| Bosnia & Herzegovina Government International Bond | | | | | | | | |
| 1.154%, 12/11/21(C) | | | 1,193 | | | | 1,331 | |
| 1.063%, 12/11/17(C) | | | 1,963 | | | | 2,285 | |
| Deutsche Bank, MTN | | | | | | | | |
| 5.319%, 06/21/16(C) | | | 1,083 | | | | 1,485 | |
| Egyptian Paris Club | | | | | | | | |
| 2.390%, 01/01/21(I) (J) | | | 253 | | | | 209 | |
| Ghana Government Bond | | | | | | | | |
| 14.250%, 07/25/16(I) | | | 1,489 | | | | 453 | |
| Mozambique EMATUM Finance 2020 BV | | | | | | | | |
| 6.305%, 09/11/20 | | | 4,000 | | | | 3,820 | |
| Republic of Angola | | | | | | | | |
| 6.597%, 12/06/20 | | | 7,000 | | | | 6,965 | |
| United Republic of Tanzania | | | | | | | | |
| 6.332%, 03/09/20(C) | | | 1,000 | | | | 1,059 | |
| Republic of Serbia | | | | | | | | |
| 6.750%, 11/01/24(D) | | | 3,210 | | | | 3,222 | |
| Sri Lanka Government International Bond | | | | | | | | |
| 6.000%, 01/14/19 | | | 4,000 | | | | 4,185 | |
| | | | | | | | | |
| Total Sovereign Debt | |
| (Cost $27,527) | | | | 27,816 | |
| Face Amount (000)/Number of Warrants | | | | |
| Asset-Backed Securities [1.2%] | |
| BT SPE (Acquired 07/06/11, Acquisition Cost $10,781,378) | | | | | | |
| 9.250%, 06/06/16(F)(I) | | $ | 9,890 | | | $ | 9,315 | |
| Start CLO, Ser 2011-7A, Cl A | | | | | | | | |
| 15.235%, 06/09/16(A) (C) | | | 3,500 | | | | 3,695 | |
| Yapi Kredi Diversified Payment Rights Finance, Ser 2010-1, Cl A | | | | | | | | |
| 0.869%, 11/21/14(C)(I) | | | 1,412 | | | | 1,399 | |
| | | | | | | | | |
| Total Asset-Backed Securities | |
| (Cost $14,815) | | | | 14,409 | |
| | | | | | | | | |
| Convertible Bonds [0.8%] | |
| Diversified Minerals [0.2%] | |
| African Minerals | | | | | | | | |
| 8.500%, 02/10/17 | | | 2,600 | | | | 2,470 | |
| | | | | | | | | |
| Medical Products & Services [0.1%] | |
| Bio City Development B.V | | | | | | | | |
| 8.000%, 07/06/18(I) | | | 1,000 | | | | 850 | |
| | | | | | | | | |
| Metal-Iron [0.1%] | |
| London Mining Jersey | | | | | | | | |
| 12.000%, 02/15/16 | | | 1,500 | | | | 1,410 | |
| | | | | | | | | |
| Miscellaneous Manufacturing [0.4%] | |
| Dana Gas Sukuk | | | | | | | | |
| 7.000%, 10/31/17 | | | 2,522 | | | | 2,706 | |
| TMK Bonds | | | | | | | | |
| 5.250%, 02/11/15 | | | 2,000 | | | | 1,970 | |
| | | | | | | | | |
| Total Miscellaneous Manufacturing | | | | 4,676 | |
| | | | | | | | | |
| Total Convertible Bonds | |
| (Cost $9,526) | | | | 9,406 | |
| | | | | | | | | |
| Warrants* [0.4%] | |
| Central Bank of Nigeria, | | | | | | | | |
| Expires 11/15/20 | | | 34,250 | | | | 5,617 | |
| | | | | | | | | |
| Total Warrants | |
| (Cost $6,166) | | | | 5,617 | |
See accompanying notes to financial statements.
CITY NATIONAL ROCHDALE FUNDS | PAGE 80
consolidated schedule of investments
March 31, 2014 (Unaudited)
City National Rochdale Fixed Income Opportunities Fund (continued)
| | | | | | |
| Mortgage-Backed Securities [0.2%] | |
| Russian Mortgage Backed Security | | | | | | |
| 1.140%, 05/15/34(I) | | $ | 1,250 | | | $ | 1,203 | |
| Sealane Trade Finance, Ser 2011-1X, Cl A | | | | | | | | |
| 14.234%, 02/12/16(C) | | | 1,000 | | | | 1,056 | |
| | | | | | | | | |
| Total Mortgage-Backed Securities | |
| (Cost $2,193) | | | | 2,259 | |
| | | | | | | | | |
| Sovereign Loan [0.2%] | |
| Kenya Ministry of Finance | | | | | | | | |
| 5.143%, 05/15/14 | | | 2,000 | | | | 1,990 | |
| | | | | | | | | |
| Total Sovereign Loan | |
| (Cost $1,997) | | | | 1,990 | |
| | | | | | | | | |
| Common Stock [0.0%] | |
| Energy [0.0%] | |
| Aventine Renewable Energy Holdings *(I) | | | 3,836 | | | | 38 | |
| Lone Pine Resource *(I) | | | 9,355 | | | | — | |
| Lone Pine Resource A *(I) | | | 9,355 | | | | 23 | |
| | | | | | | | | |
| Total Energy | | | | 61 | |
| | | | | | | | | |
| Services [0.0%] | |
| A’Ayan Leasing *(F) | | | 1,113,750 | | | | 221 | |
| | | | | | | | | |
| Total Common Stock | |
| (Cost $477) | | | | 282 | |
| | | | | | | | | |
| Short-Term Investment [11.8%] | |
| SEI Daily Income Trust Government Fund, Cl A, 0.020%** | | | 145,284,142 | | | | 145,284 | |
| | | | | | | | | |
| Total Short-Term Investment | |
| (Cost $145,284) | | | | 145,284 | |
| | | | | | | | | |
| Total Investments [101.0%] | |
| (Cost $1,212,952) | | | $ | 1,243,968 | |
Percentages are based on Net Assets of $1,231,611 (000).
| * | Non-income producing security. |
| ** | The rate reported is the 7-day effective yield as of March 31, 2014. |
| (A) | Security exempt from registration under Rule 144A of the Securities Act of 1933. These securities may be resold in transactions exempt from registration normally to qualified institutions. On March 31, 2014, the value of these securities amounted to $182,497 (000), representing 14.8% of the net assets of the Fund. |
| (B) | In default on interest payments. Rate shown represents the last coupon rate prior to default. |
| (C) | Floating Rate Security — The rate reported is the rate in effect on March 31, 2014. |
| (D) | Step Bond — The rate reported is the rate in effect on March 31, 2014. The coupon on a step bond changes on a specific date. |
| (F) | Security fair valued using methods determined in good faith by the Fair Value Committee designated by the Board of Trustees. The total market value of such securities as of March 31, 2014 was $61,400 (000) and represented 5.0% of Net Assets of the Fund. |
| (G) | Security is considered restricted. The total market value of such securities as of March 31, 2014 was $51,864 (000) and represented 4.2% of Net Assets of the Fund. |
| (I) | Security is considered illiquid. The total market value of such securities as of March 31, 2014 was $77,389 (000) and represented 6.3% of the Net Assets of the Fund. |
| (J) | Rate shown is the effective yield at time of purchase. |
CHF — Swiss Franc
Cl — Class
CLO — Collateralized Loan Obligation
EUR — Euro
GBP — British Pound Sterling
HMO — Health Maintenance Organization
LLC — Limited Liability Corporation
LLP — Limited Liability Partnership
MLP — Master Limited Partnership
MTN — Medium Term Note
NOK — Norwegian Krone
PLC — Public Limited Company
SEK — Swedish Krone
Ser — Series
SPE — Special Purpose Entity
USD — United States Dollar
Amounts designated as “—” are $0 or have been rounded to $0.
See accompanying notes to financial statements.
CITY NATIONAL ROCHDALE FUNDS | PAGE 81
consolidated schedule of investments
March 31, 2014 (Unaudited)
City National Rochdale Fixed Income Opportunities Fund (continued)
A list of the open forward foreign currency contracts held by the Fund at March 31, 2014, is as follows:
| Settlement Date | | Currency to Deliver (000) | | Currency to Receive (000) | | | Unrealized Appreciation (Depreciation) (000) | |
| 4/30/2014 | | EUR | | | 10,107 | | USD | | | 13,900 | | | $ | (23 | ) |
| 4/30/2014 | | GBP | | | 3,735 | | USD | | | 6,206 | | | | (20 | ) |
| 4/30/2014 | | NOK | | | 26,296 | | USD | | | 4,429 | | | | 42 | |
| 5/2/2014 | | SEK | | | 22,000 | | USD | | | 3,318 | | | | (79 | ) |
| 5/2/2014 | | USD | | | 147 | | SEK | | | 936 | | | | (2 | ) |
| 7/15/2014 | | CHF | | | 2,360 | | USD | | | 2,615 | | | | (57 | ) |
| | | | | | | | | | | | | | $ | (139 | ) |
A list of the counterparties for the outstanding forward foreign currency contracts held by the Fund at March 31, 2014, is as follows:
| Counterparty | | Currency to Deliver (000) | | | Currency to Receive (000) | | | Unrealized Depreciation (000) | |
| US Bank | | $ | (30,751 | ) | | $ | 30,612 | | | $ | (139 | ) |
For the period ended March 31, 2014, the total amount of all open forward foreign currency contracts, as presented in the table above, are representative of the volume of activity for this derivative type during the period.
The following is a list of the inputs used as of March 31, 2014 in valuing the Fund’s investments carried at value (000):
| Investments in Securities | | | | | | | | | | | | |
| Corporate Bonds | | $ | — | | | $ | 621,830 | | | $ | — | | | $ | 621,830 | |
| Loan Participations | | | — | | | | 360,409 | | | | 2,802 | | | | 363,211 | |
| Life Settlement Contracts | | | — | | | | — | | | | 51,864 | | | | 51,864 | |
| Sovereign Debt | | | — | | | | 27,607 | | | | 209 | | | | 27,816 | |
| Asset-Backed Securities | | | — | | | | — | | | | 14,409 | | | | 14,409 | |
| Convertible Bonds | | | — | | | | 9,406 | | | | — | | | | 9,406 | |
| Warrants | | | 5,617 | | | | — | | | | — | | | | 5,617 | |
| Mortgage-Backed Securities | | | — | | | | 1,203 | | | | 1,056 | | | | 2,259 | |
| Sovereign Loan | | | — | | | | 1,990 | | | | — | | | | 1,990 | |
| Common Stock | | | — | | | | 282 | | | | — | | | | 282 | |
| Short-Term Investment | | | 145,284 | | | | — | | | | — | | | | 145,284 | |
| Total Investments in Securities | | $ | 150,901 | | | $ | 1,022,727 | | | $ | 70,340 | | | $ | 1,243,968 | |
| Other Financial Instruments | | | | | | | | | | | | |
| Forwards Contracts* | | | | | | | | | | | | |
| Unrealized Appreciation | | $ | — | | | $ | 42 | | | $ | — | | | $ | 42 | |
| Unrealized Depreciation | | | — | | | | (181 | ) | | | — | | | | (181 | ) |
| Total Other Financial Instruments | | $ | — | | | $ | (139 | ) | | $ | — | | | $ | (139 | ) |
| * | Forwards contracts are valued at the unrealized appreciation (depreciation) on the instrument. |
| (1) | Of the $70,340 (000) in Level 3 securities as of March 31, 2014, $221 (000) or 0.02% are not valued via third party pricing vendors and broker quotes. If significant, the disclosure of the unobservable inputs and the interrelationships and sensitivity between these inputs is required for those Level 3 securities that are not valued by third party vendors or broker quotes. |
The following is a reconciliation of investments in which significant unobservable inputs (Level 3) were used in determining value (000) as of March 31, 2014:
| | | Investments in Loan Participations | | | Investments in Life Settlement Contracts | | | Investments in Sovereign Debt | |
| Beginning balance as of October 1, 2013 | | $ | 995 | | | $ | — | | | $ | 234 | |
| Accrued discounts/ premiums | | | (4 | ) | | | — | | | | 5 | |
| Realized gain/(loss) | | | 2 | | | | — | | | | 9 | |
| Change in unrealized appreciation/(depreciation) | | | (1 | ) | | | 16,388 | | | | 5 | |
| Purchases | | | — | | | | 35,476 | | | | — | |
| Sales/paydowns | | | (992 | ) | | | — | | | | (44 | ) |
| Transfers into Level 3 | | | 2,802 | | | | — | | | | — | |
| Transfers out of Level 3 | | | — | | | | — | | | | — | |
| Ending balance as of March 31, 2014 | | $ | 2,802 | | | $ | 51,864 | | | $ | 209 | |
| Changes in unrealized gains/(losses) included in earnings related to securities still held at reporting date | | $ | — | | | $ | 16,388 | | | $ | 5 | |
| | | Investments in Asset-Backed Securities | | | Investments in Mortgage-Backed Securities | | | | |
| Beginning balance as of October 1, 2013 | | $ | 18,301 | | | $ | 1,038 | | | $ | 20,568 | |
| Accrued discounts/ premiums | | | (34 | ) | | | — | | | | (33 | ) |
| Realized gain/(loss) | | | (1 | ) | | | — | | | | 10 | |
| Change in unrealized appreciation/(depreciation) | | | 195 | | | | 18 | | | | 16,605 | |
| Purchases | | | — | | | | — | | | | 35,476 | |
| Sales/paydowns | | | (4,052 | ) | | | — | | | | (5,088 | ) |
| Transfers into Level 3 | | | — | | | | — | | | | 2,802 | |
| Transfers out of Level 3 | | | — | | | | — | | | | — | |
| Ending balance as of March 31, 2014 | | $ | 14,409 | | | $ | 1,056 | | | $ | 70,340 | |
| Changes in unrealized gains/(losses) included in earnings related to securities still held at reporting date | | $ | 195 | | | $ | 18 | | | $ | 16,606 | |
See accompanying notes to financial statements.
CITY NATIONAL ROCHDALE FUNDS | PAGE 82
consolidated schedule of investments
March 31, 2014 (Unaudited)
City National Rochdale Fixed Income Opportunities Fund (concluded)
The following table summarizes the quantitative inputs and assumptions used for items categorized as material Level 3 investments as of March 31, 2014. The disclosures below also include qualitative information on the sensitivity of the fair value measurements to changes in the significant unobservable inputs.
| | Fair Value at March 31, 2014 (000) | | | | |
| BT SPE | $9,315 | | Discounted Cash Flow Model | | |
| | | | | | |
| | | | | | |
| | | | Cumulated Collections | | |
| | | | Cumulated Defaults | | |
| | | | Annualized Default Rate | | |
| | | | Cumulated Default Rate | | |
| | | | Pace of Collection Pace of Defaults | | |
| | | | Interest Rates | | |
| | | | | | |
| | | | | | |
| | | | Projected Default Rates | | 5%-12% |
| | | | Projected Collection Rates | | 90%-100% |
| | | | Expected Discount Rates | | 7%-9.25% |
| | | | | | |
| Life Settlement Contracts | 51,864 | | Discounted Cash Flow Model | | |
| | | | | | |
| | | | | | |
| | | | N/A | | |
| | | | | | |
| | | | | | |
| | | | Discount Rate | | 14% |
| | | | Expected Maturity (months) | | 33-128 |
The unobservable inputs used to determine fair value of recurring Level 3 assets may have similar or diverging impacts on valuation. Significant increases and decreases in these inputs in isolation and interrelationships between those inputs could result in significantly higher or lower fair value measurement.
For the period ended March 31, 2014, there have been no transfers between Level 1 and Level 2 assets and liabilities. For the period ended March 31, 2014, there were no transfers between Level 2 and Level 3 assets and liabilities. Transfers between Levels are recognized at period end.
For information on valuation inputs, see Note 2 — Significant Accounting Policies in the Notes to Financial Statements.
See accompanying notes to financial statements.
CITY NATIONAL ROCHDALE FUNDS | PAGE 83
schedule of investments
March 31, 2014 (Unaudited)
City National Rochdale Multi-Asset Fund
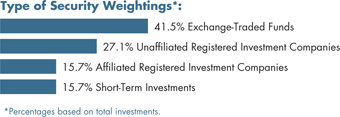
| | | | | |
| Exchange Traded Funds [41.5%] | |
| Financial Select Sector SPDR | | | 25,248 | | | $ | 564 | |
| Industrial Select Sector SPDR | | | 11,351 | | | | 594 | |
| iShares 7-10 Year Treasury Bond ETF | | | 24,965 | | | | 2,540 | |
| iShares Russell 3000 Index Fund | | | 11,970 | | | | 1,344 | |
| iShares S&P MidCap 400 Index Fund | | | 8,135 | | | | 1,118 | |
| SPDR S&P 500 | | | 9,498 | | | | 1,776 | |
| SPDR S&P Dividend | | | 15,412 | | | | 1,134 | |
| Vanguard REIT | | | 5,235 | | | | 370 | |
| Vanguard Small Cap Value | | | 10,845 | | | | 1,225 | |
| | | | | | | | | |
| Total Exchange Traded Funds | |
| (Cost $9,573) | | | | 10,665 | |
| | | | | | | | | |
| Unaffiliated Registered Investment Companies [27.1%] | |
| Eaton Vance Floating Rate Advantage Fund | | | 136,530 | | | | 1,523 | |
| ING Global Real Estate Fund | | | 46,443 | | | | 876 | |
| Ivy High Income Fund | | | 169,075 | | | | 1,480 | |
| Oppenheimer Senior Floating Rate Fund | | | 91,150 | | | | 766 | |
| Vanguard Short-Term Bond Index Fund | | | 222,143 | | | | 2,333 | |
| | | | | | | | | |
| Total Registered Investment Companies | |
| (Cost $6,905) | | | | 6,978 | |
| | | | | | | | | |
| Affiliated Registered Investment Companies † [15.7%] | |
| City National Rochdale Corporate Bond Fund, Servicing Class | | | 151,889 | | | | 1,622 | |
| City National Rochdale Government Bond Fund, Institutional Class | | | 111,358 | | | | 1,167 | |
| City National Rochdale Limited Maturity Fixed Income Fund, Institutional Class | | | 110,714 | | | | 1,238 | |
| | | | | | | | | |
| Total Affiliated Registered Investment Companies | | | | | |
| (Cost $4,082) | | | | 4,027 | |
| | | | | |
| Short-Term Investments [15.7%] | |
| City National Rochdale Prime Money Market Fund, Institutional Class, 0.010%*† | | | 2,013,284 | | | $ | 2,013 | |
| SEI Daily Income Trust, Prime Obligation Fund, Cl A, 0.010%* | | | 2,012,977 | | | | 2,013 | |
| | | | | | | | | |
| Total Short-Term Investments | |
| (Cost $4,026) | | | | 4,026 | |
| | | | | | | | | |
| Total Investments [100.0%] | |
| (Cost $24,586) | | | $ | 25,696 | |
Percentages are based on Net Assets of $25,688 (000).
| * | The rate reported is the 7-day effective yield as of March 31, 2014. |
| † | Investment in Affiliate (See Note 5). |
Cl — Class
ETF — Exchange Traded Fund
REIT — Real Estate Investment Trust
S&P — Standard & Poor’s
SPDR — Standard & Poor’s Depositary Receipts
As of March 31, 2014, all of the Fund’s investments are Level 1, in accordance with the authoritative guidance on fair value measurements and disclosure under U.S. GAAP.
For the period ended March 31, 2014, there have been no transfers between any of the fair value hierarchy levels. Transfers between Levels are recognized at period end.
For more information on valuation inputs, see Note 2 — Significant Accounting Policies in the Notes to Financial Statements.
See accompanying notes to financial statements.
CITY NATIONAL ROCHDALE FUNDS | PAGE 84
schedule of investments
March 31, 2014 (Unaudited)
City National Rochdale Dividend & Income Fund
| | | | | | |
Common Stock [93.8%] ‡ | |
| Consumer Discretionary [4.9%] | |
| Mattel | | | 95,500 | | | $ | 3,831 | |
| McDonald’s | | | 33,800 | | | | 3,313 | |
| Regal Entertainment Group, Cl A | | | 82,300 | | | | 1,537 | |
| | | | | | | | | |
| Total Consumer Discretionary | | | | 8,681 | |
| | | | | | | | | |
| Consumer Staples [25.2%] | |
| Altria Group | | | 14,250 | | | | 533 | |
| B&G Foods | | | 70,900 | | | | 2,135 | |
| Campbell Soup | | | 15,000 | | | | 673 | |
| Clorox | | | 32,100 | | | | 2,825 | |
| Coca-Cola | | | 18,000 | | | | 696 | |
| ConAgra Foods | | | 27,800 | | | | 863 | |
| Dr Pepper Snapple Group | | | 52,900 | | | | 2,881 | |
| General Mills | | | 66,680 | | | | 3,455 | |
| Hershey | | | 14,400 | | | | 1,503 | |
| Imperial Tobacco Group ADR | | | 23,152 | | | | 1,880 | |
| Kellogg | | | 40,500 | | | | 2,540 | |
| Kimberly-Clark | | | 18,200 | | | | 2,007 | |
| Kraft Foods Group | | | 13,194 | | | | 740 | |
| Lorillard | | | 83,590 | | | | 4,521 | |
| PepsiCo | | | 8,000 | | | | 668 | |
| Philip Morris International | | | 52,600 | | | | 4,306 | |
| Procter & Gamble | | | 39,149 | | | | 3,155 | |
| Reynolds American | | | 10,692 | | | | 571 | |
| | | | | | |
| Sysco | | | 61,600 | | | $ | 2,226 | |
| Unilever ADR | | | 22,200 | | | | 950 | |
| Vector Group | | | 132,647 | | | | 2,857 | |
| Wal-Mart Stores | | | 35,200 | | | | 2,690 | |
| | | | | | | | | |
| Total Consumer Staples | | | | 44,675 | |
| | | | | | | | | |
| Energy [12.3%] | |
| Buckeye Partners | | | 4,400 | | | | 330 | |
| Chevron | | | 30,683 | | | | 3,649 | |
| ConocoPhillips | | | 27,500 | | | | 1,935 | |
| Crestwood Midstream Partners | | | 60,071 | | | | 1,354 | |
| Enbridge Energy Partners | | | 15,000 | | | | 411 | |
| Energy Transfer Partners | | | 3,700 | | | | 199 | |
| Enterprise Products Partners | | | 36,292 | | | | 2,517 | |
| Exxon Mobil | | | 25,838 | | | | 2,524 | |
| Kinder Morgan Energy Partners | | | 5,700 | | | | 421 | |
| NuStar Energy | | | 11,250 | | | | 618 | |
| Occidental Petroleum | | | 25,500 | | | | 2,430 | |
| ONEOK | | | 18,500 | | | | 1,096 | |
| ONEOK Partners | | | 2,400 | | | | 129 | |
| Plains All American Pipeline | | | 60,725 | | | | 3,347 | |
| Spectra Energy | | | 4,753 | | | | 176 | |
| TransCanada | | | 13,928 | | | | 634 | |
| | | | | | | | | |
| Total Energy | | | | 21,770 | |
| | | | | | | | | |
| Financials [5.9%] | |
| Arthur J Gallagher | | | 13,200 | | | | 628 | |
| BB&T | | | 33,000 | | | | 1,326 | |
| Cincinnati Financial | | | 51,700 | | | | 2,516 | |
| Compass Diversified Holdings | | | 32,000 | | | | 605 | |
| FirstMerit | | | 28,571 | | | | 595 | |
| JPMorgan Chase | | | 12,000 | | | | 729 | |
| Mercury General | | | 15,000 | | | | 676 | |
| NBT Bancorp | | | 25,935 | | | | 634 | |
| People’s United Financial | | | 30,000 | | | | 446 | |
| Prospect Capital | | | 120,000 | | | | 1,296 | |
| Travelers | | | 6,067 | | | | 516 | |
| US Bancorp | | | 10,000 | | | | 429 | |
| | | | | | | | | |
| Total Financials | | | | 10,396 | |
| | | | | | | | | |
| Health Care [8.2%] | |
| Bristol-Myers Squibb | | | 62,000 | | | | 3,221 | |
| Eli Lilly | | | 48,400 | | | | 2,849 | |
| GlaxoSmithKline ADR | | | 32,000 | | | | 1,710 | |
| Johnson & Johnson | | | 38,200 | | | | 3,752 | |
| Merck | | | 28,150 | | | | 1,598 | |
See accompanying notes to financial statements.
CITY NATIONAL ROCHDALE FUNDS | PAGE 85
schedule of investments
March 31, 2014 (Unaudited)
City National Rochdale Dividend & Income Fund (continued)
| | | | | | |
| Pfizer | | | 41,944 | | | $ | 1,347 | |
| | | | | | | | | |
| Total Health Care | | | | 14,477 | |
| | | | | | | | | |
| Industrials [4.5%] | |
| 3M | | | 5,400 | | | | 733 | |
| Eaton(A) | | | 39,700 | | | | 2,982 | |
| General Dynamics | | | 14,500 | | | | 1,579 | |
| General Electric | | | 57,400 | | | | 1,486 | |
| Honeywell International | | | 1,872 | | | | 174 | |
| Lockheed Martin | | | 6,000 | | | | 979 | |
| | | | | | | | | |
| Total Industrials | | | | 7,933 | |
| | | | | | | | | |
| Information Technology [2.1%] | |
| IBM | | | 2,000 | | | | 385 | |
| Intel | | | 83,000 | | | | 2,142 | |
| Paychex | | | 10,000 | | | | 426 | |
| Seagate Technology | | | 15,000 | | | | 843 | |
| | | | | | | | | |
| Total Information Technology | | | | 3,796 | |
| | | | | | | | | |
| Materials [4.6%] | |
| Dow Chemical | | | 19,000 | | | | 923 | |
| EI du Pont de Nemours | | | 52,700 | | | | 3,536 | |
| Nucor | | | 15,000 | | | | 758 | |
| Olin | | | 57,000 | | | | 1,574 | |
| Sonoco Products | | | 24,000 | | | | 985 | |
| Southern Copper | | | 12,128 | | | | 353 | |
| | | | | | | | | |
| Total Materials | | | | 8,129 | |
| | | | | | | | | |
| REITs [9.5%] | |
| Apartment Investment & Management, Cl A | | | 17,229 | | | | 521 | |
| Camden Property Trust | | | 8,914 | | | | 600 | |
| EPR Properties | | | 18,200 | | | | 972 | |
| Government Properties Income Trust | | | 35,000 | | | | 882 | |
| Health Care Property Investors | | | 33,546 | | | | 1,301 | |
| Health Care REIT | | | 11,612 | | | | 692 | |
| Healthcare Realty Trust | | | 17,000 | | | | 411 | |
| Liberty Property Trust | | | 17,385 | | | | 642 | |
| Mack-Cali Realty | | | 35,000 | | | | 728 | |
| National Health Investors | | | 20,000 | | | | 1,209 | |
| National Retail Properties | | | 36,500 | | | | 1,253 | |
| Plum Creek Timber | | | 24,000 | | | | 1,009 | |
| Public Storage | | | 10,000 | | | | 257 | |
| QTS Realty Trust, Cl A | | | 8,000 | | | | 201 | |
| Ramco-Gershenson Properties Trust | | | 4,000 | | | | 65 | |
| | | | | | |
| Select Income REIT | | | 50,000 | | | $ | 1,513 | |
| Senior Housing Properties Trust | | | 13,000 | | | | 292 | |
| Sovran Self Storage | | | 10,036 | | | | 737 | |
| Tanger Factory Outlet Centers | | | 27,984 | | | | 979 | |
| Ventas | | | 38,632 | | | | 2,340 | |
| Weyerhaeuser | | | 9,170 | | | | 269 | |
| | | | | | | | | |
| Total REITs | | | | 16,873 | |
| | | | | | | | | |
| Shipping & Transportation [0.7%] | |
| Fly Leasing ADR | | | 87,370 | | | | 1,311 | |
| | | | | | | | | |
| Telecommunication Services [5.0%] | |
| AT&T | | | 84,500 | | | | 2,963 | |
| Consolidated Communications Holdings | | | 110,400 | | | | 2,209 | |
| Verizon Communications | | | 54,067 | | | | 2,572 | |
| Windstream Holdings | | | 136,128 | | | | 1,122 | |
| | | | | | | | | |
| Total Telecommunication Services | | | | 8,866 | |
| | | | | | | | | |
| Utilities [10.9%] | |
| AmeriGas Partners | | | 28,200 | | | | 1,191 | |
| Atmos Energy | | | 15,000 | | | | 707 | |
| Brookfield Infrastructure Partners | | | 20,000 | | | | 789 | |
| Cleco | | | 4,536 | | | | 230 | |
| DTE Energy | | | 10,000 | | | | 743 | |
| Duke Energy | | | 31,006 | | | | 2,208 | |
| Entergy | | | 13,700 | | | | 916 | |
| Ferrellgas Partners | | | 7,300 | | | | 169 | |
| FirstEnergy | | | 38,000 | | | | 1,293 | |
| Hawaiian Electric Industries | | | 24,010 | | | | 610 | |
| National Fuel Gas | | | 13,286 | | | | 931 | |
| NiSource | | | 20,000 | | | | 711 | |
| Northeast Utilities | | | 37,492 | | | | 1,706 | |
| Northwest Natural Gas | | | 8,396 | | | | 369 | |
| OGE Energy | | | 33,600 | | | | 1,235 | |
| ONE Gas * | | | 4,625 | | | | 166 | |
| Pinnacle West Capital | | | 28,885 | | | | 1,579 | |
| Portland General Electric | | | 12,000 | | | | 388 | |
| PPL | | | 20,000 | | | | 663 | |
| Suburban Propane Partners | | | 11,200 | | | | 465 | |
| UIL Holdings | | | 11,000 | | | | 405 | |
| United Utilities Group ADR | | | 19,318 | | | | 506 | |
| Wisconsin Energy | | | 27,500 | | | | 1,280 | |
| | | | | | | | | |
| Total Utilities | | | | 19,260 | |
| | | | | | | | | |
| Total Common Stock | |
| (Cost $124,900) | | | | 166,167 | |
See accompanying notes to financial statements.
CITY NATIONAL ROCHDALE FUNDS | PAGE 86
schedule of investments
March 31, 2014 (Unaudited)
City National Rochdale Dividend & Income Fund (continued)
| | | | | |
| Preferred Stock [0.8%] | |
| REITs [0.5%] | |
| CommonWealth | | | 10,000 | | | $ | 252 | |
| First Potomac Realty Trust | | | 10,000 | | | | 253 | |
| National Retail Properties | | | 10,000 | | | | 243 | |
| Public Storage | | | 10,000 | | | | 236 | |
| | | | | | | | | |
| Total REITs | | | | 984 | |
| | | | | | | | | |
| Telecommunication Services [0.3%] | |
| Qwest | | | 10,000 | | | | 261 | |
| Verizon Communications | | | 10,000 | | | | 250 | |
| | | | | | | | | |
| Total Telecommunication Services | | | | 511 | |
| | | | | | | | | |
| Total Preferred Stock | |
| (Cost $1,500) | | | | 1,495 | |
| | | | | | | | | |
| Asset-Backed Security [0.3%] | |
| BT SPE (Acquired 07/06/11, Acquisition Cost $551,294) | | | | | | | | |
| 9.250%, 06/06/16(B) (C) (D) | | $ | 506 | | | | 476 | |
| | | | | | | | | |
| Total Asset-Backed Security | |
| (Cost $506) | | | | 476 | |
| | | | | | | | | |
| Short-Term Investments [4.8%] | |
| City National Rochdale Government Money Market Fund, 0.010%**† | | | 4,248,195 | | | | 4,248 | |
| SEI Daily Income Trust Government Fund, Cl A, 0.010%** | | | 4,248,195 | | | | 4,248 | |
| | | | | | | | | |
| Total Short-Term Investments | |
| (Cost $8,496) | | | | 8,496 | |
| | | | | | | | | |
| Total Investments [99.7%] | |
| (Cost $135,402) | | | $ | 176,634 | |
Percentages are based on Net Assets of $177,192 (000).
| ‡ | The Fund uses more specific categories in following its investment limitations on investment concentrations. Broad industry sectors are used for financial reporting purposes. |
| * | Non-income producing security. |
| ** | The rate reported is the 7-day effective yield as of March 31, 2014. |
| † | Investment in Affiliate. |
| (B) | Security is considered illiquid. The total market value of such security as of March 31, 2014 was $476 (000) and represented 0.3% of net assets of the Fund. |
| (C) | Security fair valued using methods determined in good faith by the Fair Value Committee designated by the Board of Trustees. The total market value of such security as of March 31, 2014 was $476 (000) and represented 0.3% of net assets of the Fund . |
| (D) | Security is considered restricted. The total market value of such security as of March 31, 2014 was $476 (000) and represented 0.3% of net assets of the Fund . |
ADR — American Depositary Receipt
Cl — Class
REIT — Real Estate Investment Trust
SPE — Special Purpose Entity
The following is a list of the inputs used as of March 31, 2014 in valuing the Fund’s investments carried at value (000):
| Investments in Securities | | | | | | | | | | | | |
| Common Stock | | $ | 166,167 | | | $ | — | | | $ | — | | | $ | 166,167 | |
| Preferred Stock | | | 1,495 | | | | — | | | | — | | | | 1,495 | |
| Asset-Backed Security | | | — | | | | — | | | | 476 | | | | 476 | |
| Short-Term Investments | | | 8,496 | | | | — | | | | — | | | | 8,496 | |
| Total Investments in Securities | | $ | 176,158 | | | $ | — | | | $ | 476 | | | $ | 176,634 | |
The following is a reconciliation of investments in which significant unobservable inputs (Level 3) were used in determining value (000) as of March 31, 2014:
| | | Investments in Asset-Backed Security (000) | |
| Beginning balance as of October 1, 2013 | | $ | 579 | |
| Accrued discounts/premiums | | | — | |
| Realized gain/(loss) | | | — | |
| Change in unrealized appreciation/(depreciation) | | | 6 | |
| Purchases | | | — | |
| Sales/paydowns | | | (109 | ) |
| Transfers into Level 3 | | | — | |
| Transfers out of Level 3 | | | — | |
| Ending balance as of March 31, 2014 | | $ | 476 | |
| Changes in unrealized gains/(losses) included in earnings related to securities still held at reporting date | | $ | 6 | |
See accompanying notes to financial statements.
CITY NATIONAL ROCHDALE FUNDS | PAGE 87
schedule of investments
March 31, 2014 (Unaudited)
City National Rochdale Dividend & Income Fund (concluded)
The following table summarizes the quantitative inputs and assumptions used for items categorized as material Level 3 investments as of March 31, 2014. The disclosures below also include qualitative information on the sensitivity of the fair value measurements to changes in the significant unobservable inputs.
| | Fair Value at March 31, 2014 (000) | | | | |
| BT SPE | $476 | | Discounted Cash Flow Model | | |
| | | | | | |
| | | | | | |
| | | | Cumulated Collections | | |
| | | | Cumulated Defaults | | |
| | | | Annualized Default Rate | | |
| | | | Cumulated Default Rate | | |
| | | | Pace of Collection Pace of Defaults | | |
| | | | Interest Rates | | |
| | | | | | |
| | | | | | |
| | | | Projected Default Rates | | 5%-12% |
| | | | Projected Collection Rates | | 90%-100% |
| | | | Expected Discount Rates | | 7%-9.25% |
The unobservable inputs used to determine fair value of recurring Level 3 assets may have similar or diverging impacts on valuation. Significant increased and decreased in these inputs in isolation and interrelationships between those inputs could result in significantly higher or lower fair value measurement.
For the period ended March 31, 2014, the transfers into Level 1 were due to changes in the availability of observable inputs to determine fair value. Transfers between Levels are recognized at period end.
For information on valuation inputs, see Note 2 — Significant Accounting Policies in the Notes to Financial Statements.
See accompanying notes to financial statements.
CITY NATIONAL ROCHDALE FUNDS | PAGE 88
schedule of investments
March 31, 2014 (Unaudited)
City National Rochdale U.S. Core Equity Fund
| | | | | | |
| Common Stock [98.5%] | |
| Aerospace & Defense [3.8%] | |
| Hexcel * | | | 53,520 | | | $ | 2,330 | |
| Textron | | | 72,020 | | | | 2,830 | |
| United Technologies | | | 29,020 | | | | 3,391 | |
| | | | | | | | | |
| Total Aerospace & Defense | | | | 8,551 | |
| | | | | | | | | |
| Auto Components [1.5%] | |
| Magna International | | | 33,530 | | | | 3,229 | |
| | | | | | | | | |
| Biotechnology [6.5%] | |
| Biogen Idec * | | | 12,670 | | | | 3,875 | |
| Celgene * | | | 39,310 | | | | 5,488 | |
| Gilead Sciences * | | | 73,080 | | | | 5,179 | |
| | | | | | | | | |
| Total Biotechnology | | | | 14,542 | |
| | | | | | | | | |
| Capital Markets [3.4%] | |
| Affiliated Managers Group * | | | 17,450 | | | | 3,491 | |
| State Street | | | 57,370 | | | | 3,990 | |
| | | | | | | | | |
| Total Capital Markets | | | | 7,481 | |
| | | | | | | | | |
| Commercial Banks [3.4%] | |
| CIT Group | | | 60,050 | | | | 2,944 | |
| Wells Fargo | | | 93,640 | | | | 4,658 | |
| | | | | | | | | |
| Total Commercial Banks | | | | 7,602 | |
| | | | | | |
| Communications Equipment [3.1%] | |
| Ciena * | | | 140,120 | | | $ | 3,187 | |
| Qualcomm | | | 46,490 | | | | 3,666 | |
| | | | | | | | | |
| Total Communications Equipment | | | | 6,853 | |
| | | | | | | | | |
| Computers & Peripherals [3.8%] | |
| Apple | | | 15,830 | | | | 8,497 | |
| | | | | | | | | |
| Construction & Engineering [3.5%] | |
| Chicago Bridge & Iron | | | 49,710 | | | | 4,332 | |
| Quanta Services * | | | 91,490 | | | | 3,376 | |
| | | | | | | | | |
| Total Construction & Engineering | | | | 7,708 | |
| | | | | | | | | |
| Consumer Finance [2.5%] | |
| American Express | | | 61,660 | | | | 5,551 | |
| | | | | | | | | |
| Diversified Financial Services [5.2%] | |
| Citigroup | | | 124,120 | | | | 5,908 | |
| JPMorgan Chase | | | 93,640 | | | | 5,685 | |
| | | | | | | | | |
| Total Diversified Financial Services | | | | 11,593 | |
| | | | | | | | | |
| Diversified Telecommunication Services [1.1%] | |
| Verizon Communications | | | 54,110 | | | | 2,574 | |
| | | | | | | | | |
| Energy Equipment & Services [4.0%] | |
| National Oilwell Varco | | | 54,170 | | | | 4,218 | |
| Schlumberger | | | 48,970 | | | | 4,775 | |
| | | | | | | | | |
| Total Energy Equipment & Services | | | | 8,993 | |
| | | | | | | | | |
| Food & Staples Retailing [4.2%] | |
| Costco Wholesale | | | 28,730 | | | | 3,209 | |
| CVS | | | 80,490 | | | | 6,025 | |
| | | | | | | | | |
| Total Food & Staples Retailing | | | | 9,234 | |
| | | | | | | | | |
| Food Products [2.5%] | |
| ConAgra Foods | | | 52,600 | | | | 1,632 | |
| WhiteWave Foods, Cl A * | | | 140,908 | | | | 4,022 | |
| | | | | | | | | |
| Total Food Products | | | | 5,654 | |
| | | | | | | | | |
| Health Care Equipment & Supplies [2.6%] | |
| Edwards Lifesciences * | | | 38,270 | | | | 2,838 | |
| Intuitive Surgical * | | | 6,680 | | | | 2,926 | |
| | | | | | | | | |
| Total Health Care Equipment & Supplies | | | | 5,764 | |
See accompanying notes to financial statements.
CITY NATIONAL ROCHDALE FUNDS | PAGE 89
schedule of investments
March 31, 2014 (Unaudited)
City National Rochdale U.S. Core Equity Fund (continued)
| | | | | | |
| Hotels, Restaurants & Leisure [1.3%] | |
| Starbucks | | | 39,430 | | | $ | 2,893 | |
| | | | | | | | | |
| Household Durables [1.9%] | |
| PulteGroup | | | 216,940 | | | | 4,163 | |
| | | | | | | | | |
| Insurance [3.4%] | |
| ACE | | | 24,110 | | | | 2,388 | |
| Prudential Financial | | | 60,280 | | | | 5,103 | |
| | | | | | | | | |
| Total Insurance | | | | 7,491 | |
| | | | | | | | | |
| Internet Software & Services [5.2%] | |
| Facebook, Cl A * | | | 61,140 | | | | 3,683 | |
| Google, Cl A * | | | 7,020 | | | | 7,824 | |
| | | | | | | | | |
| Total Internet Software & Services | | | | 11,507 | |
| | | | | | | | | |
| IT Services [4.1%] | |
| MasterCard, Cl A | | | 76,640 | | | | 5,725 | |
| Visa, Cl A | | | 15,920 | | | | 3,436 | |
| | | | | | | | | |
| Total IT Services | | | | 9,161 | |
| | | | | | | | | |
| Leisure Equipment & Products [1.7%] | |
| Polaris Industries | | | 27,520 | | | | 3,845 | |
| | | | | | | | | |
| Life Sciences Tools & Services [2.0%] | |
| Thermo Fisher Scientific | | | 36,550 | | | | 4,395 | |
| | | | | | | | | |
| Machinery [3.6%] | |
| Cummins | | | 25,460 | | | | 3,793 | |
| Wabtec | | | 55,160 | | | | 4,275 | |
| | | | | | | | | |
| Total Machinery | | | | 8,068 | |
| | | | | | | | | |
| Media [3.5%] | |
| Comcast, Cl A | | | 75,710 | | | | 3,787 | |
| DIRECTV * | | | 53,060 | | | | 4,055 | |
| | | | | | | | | |
| Total Media | | | | 7,842 | |
| | | | | | | | | |
| Oil, Gas & Consumable Fuels [6.1%] | |
| Cabot Oil & Gas | | | 94,510 | | | | 3,202 | |
| Continental Resources * | | | 32,240 | | | | 4,005 | |
| Exxon Mobil | | | 33,390 | | | | 3,262 | |
| Occidental Petroleum | | | 31,350 | | | | 2,987 | |
| | | | | | | | | |
| Total Oil, Gas & Consumable Fuels | | | | 13,456 | |
| | | | | | |
| Paper & Forest Products [1.1%] | |
| International Paper | | | 51,690 | | | $ | 2,372 | |
| | | | | | | | | |
| Pharmaceuticals [3.3%] | |
| Allergan | | | 30,890 | | | | 3,833 | |
| Mylan * | | | 72,640 | | | | 3,547 | |
| | | | | | | | | |
| Total Pharmaceuticals | | | | 7,380 | |
| | | | | | | | | |
| Professional Services [0.8%] | |
| Verisk Analytics, Cl A * | | | 30,440 | | | | 1,825 | |
| | | | | | | | | |
| Road & Rail [3.9%] | |
| Hertz Global Holdings * | | | 159,760 | | | | 4,256 | |
| Union Pacific | | | 23,160 | | | | 4,346 | |
| | | | | | | | | |
| Total Road & Rail | | | | 8,602 | |
| | | | | | | | | |
| Software [1.0%] | |
| Adobe Systems * | | | 32,910 | | | | 2,163 | |
| | | | | | | | | |
| Specialty Retail [3.2%] | |
| Home Depot | | | 51,750 | | | | 4,095 | |
| Lowe’s | | | 61,770 | | | | 3,021 | |
| | | | | | | | | |
| Total Specialty Retail | | | | 7,116 | |
| | | | | | | | | |
| Water Utilities [1.3%] | |
| American Water Works | | | 61,790 | | | | 2,805 | |
| | | | | | | | | |
| Total Common Stock | |
| (Cost $187,315) | | | | 218,910 | |
| | | | | | | | | |
| Short-Term Investments [2.4%] | |
| City National Rochdale Prime Money Market Fund, Institutional Class, 0.010%**† | | | 2,672,568 | | | | 2,673 | |
| SEI Daily Income Trust, Prime Obligation Fund, Cl A, 0.010%** | | | 2,672,568 | | | | 2,673 | |
| | | | | | | | | |
| Total Short-Term Investments | |
| (Cost $5,346) | | | | 5,346 | |
| | | | | | | | | |
| Total Investments [100.9%] | |
| (Cost $192,661) | | | $ | 224,256 | |
See accompanying notes to financial statements.
CITY NATIONAL ROCHDALE FUNDS | PAGE 90
schedule of investments
March 31, 2014 (Unaudited)
City National Rochdale U.S. Core Equity Fund (concluded)
Percentages are based on Net Assets of $222,292 (000).
| * | Non-income producing security. |
| ** | The rate reported is the 7-day effective yield as of March 31, 2014. |
| † | Investment in Affiliate. |
Cl — Class
As of March 31, 2014, all of the Fund’s investments are Level 1, in accordance with the authoritative guidance on fair value measurements and disclosure under U.S. GAAP.
For the period ended March 31, 2014, there have been no transfers between any of the fair value hierarchy levels. Transfers between Levels are recognized at period end.
For information on valuation inputs, see Note 2 — Significant Accounting Policies in the Notes to Financial Statements.
See accompanying notes to financial statements.
CITY NATIONAL ROCHDALE FUNDS | PAGE 91
schedule of investments
March 31, 2014 (Unaudited)
City National Rochdale Socially Responsible Equity Fund
| | | | | | |
| Common Stock [97.2%] | |
| Apparel/Textiles [1.2%] | |
| Coach | | | 20,000 | | | $ | 993 | |
| | | | | | | | | |
| Automotive [5.3%] | |
| Ford Motor | | | 100,200 | | | | 1,563 | |
| Johnson Controls | | | 24,400 | | | | 1,155 | |
| Paccar | | | 26,000 | | | | 1,753 | |
| | | | | | | | | |
| Total Automotive | | | | 4,471 | |
| | | | | | | | | |
| Banks [5.0%] | |
| Bank of America | | | 124,400 | | | | 2,140 | |
| CIT Group | | | 41,500 | | | | 2,034 | |
| | | | | | | | | |
| Total Banks | | | | 4,174 | |
| | | | | | | | | |
| Broadcasting & Cable [1.9%] | |
| Cisco Systems | | | 71,900 | | | | 1,611 | |
| | | | | | | | | |
| Building & Construction [2.0%] | |
| Owens Corning | | | 37,900 | | | | 1,636 | |
| | | | | | | | | |
| Business Services [2.0%] | |
| Xerox | | | 145,300 | | | | 1,642 | |
| | | | | | | | | |
| Chemicals [1.9%] | |
| EI du Pont de Nemours | | | 24,100 | | | | 1,617 | |
| | | | | | | | | |
| Commercial Banks [2.5%] | |
| BB&T | | | 52,400 | | | | 2,105 | |
| | | | | | |
| Communication & Media [2.6%] | |
| Starz * | | | 67,600 | | | $ | 2,182 | |
| | | | | | | | | |
| Computer Software [2.5%] | |
| Microsoft | | | 51,400 | | | | 2,107 | |
| | | | | | | | | |
| Drugs [2.5%] | |
| AbbVie | | | 39,900 | | | | 2,051 | |
| | | | | | | | | |
| Electrical Services [4.3%] | |
| Eaton | | | 25,900 | | | | 1,946 | |
| Northeast Utilities | | | 36,700 | | | | 1,670 | |
| | | | | | | | | |
| Total Electrical Services | | | | 3,616 | |
| | | | | | | | | |
| Electronic Equipment & Instruments [1.5%] | |
| Arrow Electronics * | | | 21,700 | | | | 1,288 | |
| | | | | | | | | |
| Financial Services [2.7%] | |
| American Express | | | 13,400 | | | | 1,206 | |
| CME Group, Cl A | | | 13,700 | | | | 1,014 | |
| | | | | | | | | |
| Total Financial Services | | | | 2,220 | |
| | | | | | | | | |
| Food, Beverage & Tobacco [2.8%] | |
| PepsiCo | | | 27,600 | | | | 2,305 | |
| | | | | | | | | |
| Healthcare Products & Services [0.9%] | |
| Cardinal Health | | | 11,300 | | | | 791 | |
| | | | | | | | | |
| Household Furniture & Fixtures [1.9%] | |
| Stanley Black & Decker | | | 19,200 | | | | 1,560 | |
| | | | | | | | | |
| Insurance [15.1%] | |
| American International Group | | | 47,000 | | | | 2,350 | |
| Berkshire Hathaway, Cl B * | | | 13,400 | | | | 1,675 | |
| Chubb | | | 8,900 | | | | 795 | |
| DaVita HealthCare Partners * | | | 23,000 | | | | 1,583 | |
| Genworth Financial, Cl A * | | | 151,900 | | | | 2,693 | |
| HCC Insurance Holdings | | | 32,300 | | | | 1,469 | |
| Symetra Financial | | | 102,000 | | | | 2,022 | |
| | | | | | | | | |
| Total Insurance | | | | 12,587 | |
| | | | | | | | | |
| Machinery [1.0%] | |
| Titan International | | | 45,200 | | | | 858 | |
| | | | | | | | | |
| Medical Products & Services [10.2%] | |
| Baxter International | | | 26,800 | | | | 1,972 | |
| Becton Dickinson | | | 14,000 | | | | 1,639 | |
| Covidien | | | 22,900 | | | | 1,687 | |
See accompanying notes to financial statements.
CITY NATIONAL ROCHDALE FUNDS | PAGE 92
schedule of investments
March 31, 2014 (Unaudited)
City National Rochdale Socially Responsible Equity Fund (concluded)
| | | | | | |
| Laboratory Corp of America Holdings * | | | 18,000 | | | $ | 1,768 | |
| Patterson | | | 35,300 | | | | 1,474 | |
| | | | | | | | | |
| Total Medical Products & Services | | | | 8,540 | |
| | | | | | | | | |
| Personal Products [1.5%] | |
| Elizabeth Arden * | | | 42,100 | | | | 1,242 | |
| | | | | | | | | |
| Petroleum & Fuel Products [11.3%] | |
| ConocoPhillips | | | 30,000 | | | | 2,111 | |
| Denbury Resources | | | 104,500 | | | | 1,714 | |
| Phillips 66 | | | 9,900 | | | | 763 | |
| Southwestern Energy * | | | 55,700 | | | | 2,563 | |
| Spectra Energy | | | 41,700 | | | | 1,540 | |
| Whiting Petroleum * | | | 11,300 | | | | 784 | |
| | | | | | | | | |
| Total Petroleum & Fuel Products | | | | 9,475 | |
| | | | | | | | | |
| Printing & Publishing [1.5%] | |
| Tyco International | | | 29,875 | | | | 1,267 | |
| | | | | | | | | |
| Property & Casualty Insurance [1.4%] | |
| Fidelity National Financial, Cl A | | | 37,700 | | | | 1,185 | |
| | | | | | | | | |
| Real Estate Investment Trust [3.2%] | |
| Redwood Trust | | | 60,400 | | | | 1,225 | |
| Weyerhaeuser | | | 50,500 | | | | 1,482 | |
| | | | | | | | | |
| Total Real Estate Investment Trust | | | | 2,707 | |
| | | | | | | | | |
| Real Estate Management & Development [2.5%] | |
| Brookfield Asset Management, Cl A | | | 50,000 | | | | 2,043 | |
| | | | | | | | | |
| Semi-Conductors [1.5%] | |
| Broadcom, Cl A | | | 40,200 | | | | 1,265 | |
| | | | | | | | | |
| Telephones & Telecommunications [3.6%] | |
| Corning | | | 78,900 | | | | 1,643 | |
| Verizon Communications | | | 10,704 | | | | 509 | |
| Vodafone Group ADR | | | 22,200 | | | | 817 | |
| | | | | | | | | |
| Total Telephones & Telecommunications | | | | 2,969 | |
| | | | | | | | | |
| Transportation Services [0.9%] | |
| United Parcel Service, Cl B | | | 7,400 | | | | 721 | |
| | | | | | | | | |
| Total Common Stock | |
| (Cost $63,476) | | | | 81,228 | |
| | | | | | |
| Short-Term Investment [1.7%] | |
| AIM STIT-Government TaxAdvantage Portfolio, 0.020%** | | | 1,436,354 | | | $ | 1,436 | |
| | | | | | | | | |
| Total Short-Term Investment | |
| (Cost $1,436) | | | | 1,436 | |
| | | | | | | | | |
| Total Investments [98.9%] | |
| (Cost $64,912) | | | | 82,664 | |
Percentages are based on Net Assets of $83,561 (000).
| * | Non-income producing security. |
| ** | The rate reported is the 7-day effective yield as of March 31, 2014. |
ADR — American Depositary Receipt
Cl — Class
As of March 31, 2014, all of the Fund’s investments are Level 1, in accordance with the authoritative guidance on fair value measurements and disclosure under U.S. GAAP.
For the period ended March 31, 2014, there have been no transfers between Level 1 and Level 2 assets and liabilities. Transfers between Levels are recognized at period end.
For more information on valuation inputs, see Note 2 — Significant Accounting Policies in the Notes to Financial Statements.
See accompanying notes to financial statements.
CITY NATIONAL ROCHDALE FUNDS | PAGE 93
schedule of investments
March 31, 2014 (Unaudited)
City National Rochdale Emerging Markets Fund
| | | | | | |
| Common Stock [90.3%] | |
| China [26.5%] | |
| AAC Technologies Holdings | | | 1,299,200 | | | $ | 6,725 | |
| ANTA Sports Products | | | 2,606,000 | | | | 4,348 | |
| China Medical System Holdings | | | 1,580,300 | | | | 1,789 | |
| China Pioneer Pharma Holdings | | | 13,223,000 | | | | 6,972 | |
| China State Construction International Holdings | | | 4,034,000 | | | | 6,834 | |
| CIMC Enric Holdings | | | 3,664,000 | | | | 5,168 | |
| Fufeng Group | | | 12,079,000 | | | | 4,594 | |
| Goodbaby International Holdings | | | 11,561,705 | | | | 6,171 | |
| Great Wall Motor, Cl H | | | 3,278,000 | | | | 16,440 | |
| Li Ning * | | | 3,425,000 | | | | 2,314 | |
| Man Wah Holdings | | | 1,938,000 | | | | 3,273 | |
| Ping An Insurance Group of China, Cl H | | | 758,500 | | | | 6,288 | |
| Shanghai Fosun Pharmaceutical Group, Cl H | | | 551,000 | | | | 1,918 | |
| Shanghai Pharmaceuticals Holding, Cl H | | | 1,404,900 | | | | 3,195 | |
| Sunac China Holdings | | | 10,571,000 | | | | 6,133 | |
| Sunny Optical Technology Group | | | 6,404,000 | | | | 6,233 | |
| Tencent Holdings | | | 220,900 | | | | 15,364 | |
| Tingyi Cayman Islands Holding | | | 1,326,000 | | | | 3,804 | |
| XTEP International Holdings | | | 12,005,000 | | | | 5,138 | |
| Zhejiang Expressway, Cl H | | | 5,250,000 | | | | 4,785 | |
| ZTE, Cl H | | | 1,818,100 | | | | 3,530 | |
| | | | | | | | | |
| Total China | | | | 121,016 | |
| | | | | | |
| Hong Kong [16.0%] | |
| Chaowei Power Holdings | | | 8,015,000 | | | $ | 3,265 | |
| China Gas Holdings | | | 4,132,000 | | | | 6,457 | |
| Chow Sang Sang Holdings International | | | 1,643,000 | | | | 3,889 | |
| CPMC Holdings | | | 4,619,000 | | | | 3,668 | |
| Freetech Road Recycling Technology Holdings | | | 12,142,000 | | | | 3,914 | |
| Galaxy Entertainment Group * | | | 1,804,000 | | | | 15,687 | |
| Geely Automobile Holdings | | | 7,235,000 | | | | 2,845 | |
| Magic Holdings International | | | 7,764,000 | | | | 6,296 | |
| NagaCorp | | | 14,314,600 | | | | 14,912 | |
| REXLot Holdings | | | 26,625,000 | | | | 3,089 | |
| SJM Holdings | | | 1,771,000 | | | | 4,978 | |
| Skyworth Digital Holdings | | | 7,691,088 | | | | 4,224 | |
| | | | | | | | | |
| Total Hong Kong | | | | 73,224 | |
| | | | | | | | | |
| India [25.0%] | |
| Amtek Auto (A) | | | 1,847,730 | | | | 4,922 | |
| Bajaj Auto (A) | | | 145,682 | | | | 5,083 | |
| Bharti Airtel (A) | | | 1,038,943 | | | | 5,528 | |
| CESC (A) | | | 540,329 | | | | 4,535 | |
| Crompton Greaves (A) | | | 1,313,394 | | | | 3,527 | |
| Dr. Reddy’s Laboratories ADR | | | 152,200 | | | | 6,682 | |
| Emami (A) | | | 534,681 | | | | 3,897 | |
| HDFC Bank (A) | | | 323,793 | | | | 4,060 | |
| HDFC Bank ADR | | | 78,500 | | | | 3,221 | |
| ICICI Bank (A) | | | 63,161 | | | | 1,317 | |
| ICICI Bank ADR | | | 291,767 | | | | 12,779 | |
| ITC (A) | | | 826,492 | | | | 4,883 | |
| Kotak Mahindra Bank (A) | | | 404,648 | | | | 5,292 | |
| KPIT Technologies (A) | | | 928,933 | | | | 2,502 | |
| McLeod Russel India (A) | | | 828,708 | | | | 4,244 | |
| Mindtree (A) | | | 162,484 | | | | 3,594 | |
| Persistent Systems (A) | | | 171,540 | | | | 3,014 | |
| Shree Cement (A) | | | 27,260 | | | | 2,588 | |
| Sobha Developers (A) | | | 593,022 | | | | 3,719 | |
| Sun Pharmaceutical Industries (A) | | | 337,004 | | | | 3,243 | |
| Tata Global Beverages (A) | | | 1,875,017 | | | | 4,711 | |
| Tata Motors, Cl A (A) | | | 915,068 | | | | 3,101 | |
| Tata Motors ADR | | | 111,800 | | | | 3,959 | |
| Tech Mahindra (A) | | | 175,827 | | | | 5,286 | |
| United Spirits (A) | | | 107,352 | | | | 4,759 | |
| Vardhman Textiles (A) | | | 620,334 | | | | 3,669 | |
| | | | | | | | | |
| Total India | | | | 114,115 | |
See accompanying notes to financial statements.
CITY NATIONAL ROCHDALE FUNDS | PAGE 94
schedule of investments
March 31, 2014 (Unaudited)
City National Rochdale Emerging Markets Fund (concluded)
| | | | | | |
| Indonesia [7.3%] | |
| Bank Mandiri Persero | | | 3,094,700 | | | $ | 2,575 | |
| Bank Pembangunan Daerah Jawa Barat Dan Banten | | | 10,415,700 | | | | 958 | |
| Ciputra Development | | | 36,147,600 | | | | 3,691 | |
| Global Mediacom | | | 12,833,100 | | | | 2,655 | |
| Lippo Karawaci | | | 34,428,600 | | | | 3,288 | |
| Media Nusantara Citra | | | 11,803,200 | | | | 2,732 | |
| Ramayana Lestari Sentosa | | | 42,357,500 | | | | 5,183 | |
| Surya Citra Media | | | 29,078,300 | | | | 8,191 | |
| United Tractors | | | 2,181,500 | | | | 3,985 | |
| | | | | | | | | |
| Total Indonesia | | | | 33,258 | |
| | | | | | | | | |
| Malaysia [3.7%] | |
| Berjaya Sports Toto | | | 949,000 | | | | 1,154 | |
| Genting Malaysia | | | 2,015,200 | | | | 2,592 | |
| Magnum | | | 4,164,600 | | | | 3,813 | |
| Malayan Banking | | | 1,834,577 | | | | 5,438 | |
| My EG Services | | | 2,870,100 | | | | 2,488 | |
| Sime Darby | | | 523,355 | | | | 1,492 | |
| | | | | | | | | |
| Total Malaysia | | | | 16,977 | |
| | | | | | | | | |
| Philippines [5.1%] | |
| GT Capital Holdings | | | 377,320 | | | | 6,609 | |
| Megaworld | | | 74,942,426 | | | | 7,002 | |
| Metropolitan Bank & Trust | | | 1,823,002 | | | | 3,142 | |
| SM Prime Holdings | | | 20,256,375 | | | | 6,595 | |
| | | | | | | | | |
| Total Philippines | | | | 23,348 | |
| | | | | | | | | |
| Thailand [6.0%] | |
| Charoen Pokphand Foods - Foreign | | | 5,299,629 | | | | 4,574 | |
| Krung Thai Bank - Foreign | | | 8,441,450 | | | | 4,866 | |
| LPN Development NVDR | | | 6,174,501 | | | | 3,046 | |
| LPN Development | | | 2,200,000 | | | | 1,085 | |
| Minor International - Foreign | | | 8,835,150 | | | | 6,754 | |
| PTT Exploration & Production - Foreign | | | 700,412 | | | | 3,390 | |
| Siam Cement - Foreign | | | 295,500 | | | | 3,790 | |
| | | | | | | | | |
| Total Thailand | | | | 27,505 | |
| | | | | | | | | |
| United States [0.7%] | | | | | | | | |
| Cognizant Technology Solutions, Cl A * | | | 68,600 | | | | 3,472 | |
| | | | | | | | | |
| Total Common Stock | |
| (Cost $355,232) | | | | 412,915 | |
| | | | | | |
| Short-Term Investments [7.9%] | |
| City National Rochdale Government Money Market Fund, 0.010%**† | | | 24,687,246 | | | $ | 24,687 | |
| SEI Daily Income Trust Government Fund, Cl A, 0.010%** | | | 11,481,371 | | | | 11,481 | |
| | | | | | | | | |
| Total Short-Term Investments | |
| (Cost $36,168) | | | | 36,168 | |
| | | | | | | | | |
| Total Investments [98.2%] | |
| (Cost $391,400) | | | $ | 449,083 | |
Percentages are based on Net Assets of $457,125 (000).
| * | Non-income producing security. |
| ** | The rate reported is the 7-day effective yield as of March 31, 2014. |
| † | Investment in Affiliate. |
| (A) | Securities held through a Mauritius Subsidiary. |
ADR — American Depositary Receipt
Cl — Class
NVDR — Non-Voting Depositary Receipt
As of March 31, 2014, all of the Fund’s investments are Level 1, in accordance with the authoritative guidance on fair value measurements and disclosure under U.S. GAAP.
For the period ended March 31, 2014, there have been no transfers between Level 1 and Level 2 assets and liabilities. Transfers between Levels are recognized at period end.
For more information on valuation inputs, see Note 2 — Significant Accounting Policies in the Notes to Financial Statements.
See accompanying notes to financial statements.
CITY NATIONAL ROCHDALE FUNDS | PAGE 95
statements of assets and liabilities (000)
March 31, 2014 (Unaudited)
| | | City National Rochdale Government Money Market Fund | | | City National Rochdale Prime Money Market Fund | | | City National Rochdale California Tax Exempt Money Market Fund | | | City National Rochdale Limited Maturity Fixed Income Fund | |
| ASSETS: | | | | | | | | | | | | |
Cost of securities (including repurchase agreements) | | $ | 3,478,401 | | | $ | 1,176,181 | | | $ | 901,217 | | | $ | 28,752 | |
| Investments in securities, at value | | $ | 3,303,401 | | | $ | 1,087,181 | | | $ | 901,217 | | | $ | 28,805 | |
| Affiliated investments, at value | | | — | | | | — | | | | — | | | | 220 | |
| Repurchase agreements, at value | | | 175,000 | | | | 89,000 | | | | — | | | | — | |
| Cash | | | — | | | | — | | | | 17,126 | | | | — | |
| Dividend and interest receivable | | | 2,439 | | | | 897 | | | | 750 | | | | 178 | |
| Investment advisory fees receivable | | | — | | | | — | | | | 21 | | | | — | |
| | | 219 | | | | 74 | | | | 52 | | | | 2 | |
| | | 3,481,059 | | | | 1,177,152 | | | | 919,166 | | | | 29,205 | |
| | | | | | | | | | | | | | | | | |
| LIABILITIES: | | | | | | | | | | | | | | | | |
| Payable for income distributions | | | 10 | | | | 7 | | | | 2 | | | | 8 | |
| Payable for investment securities purchased | | | — | | | | — | | | | 17,000 | | | | — | |
| Investment advisory fees payable | | | 48 | | | | 71 | | | | — | | | | 4 | |
| Shareholder servicing and distribution fees payable | | | 30 | | | | 10 | | | | 3 | | | | 5 | |
| Administrative fees payable | | | 47 | | | | 20 | | | | 17 | | | | 9 | |
| | | 493 | | | | 209 | | | | 140 | | | | 23 | |
| | | 628 | | | | 317 | | | | 17,162 | | | | 49 | |
| | $ | 3,480,431 | | | $ | 1,176,835 | | | $ | 902,004 | | | $ | 29,156 | |
| | | | | | | | | | | | | | | | | |
| NET ASSETS: | | | | | | | | | | | | | | | | |
| Paid-in Capital (unlimited authorization — $0.01 par value) | | $ | 3,480,432 | | | $ | 1,176,850 | | | $ | 902,004 | | | $ | 30,852 | |
| Distributions in excess of net investment income | | | — | | | | — | | | | — | | | | (4 | ) |
| Accumulated net realized loss on investments | | | (1 | ) | | | (15 | ) | | | — | | | | (1,965 | ) |
Net unrealized appreciation on investments | | | — | | | | — | | | | — | | | | 273 | |
| | $ | 3,480,431 | | | $ | 1,176,835 | | | $ | 902,004 | | | $ | 29,156 | |
| | | | | | | | | | | | | | | | | |
| Institutional Class Shares: | | | | | | | | | | | | | | | | |
| Net Assets ($Dollars) | | $ | — | | | $ | 53,785,027 | | | $ | — | | | $ | 24,092,827 | |
| Total shares outstanding at end of period | | | — | | | | 53,785,031 | | | | — | | | | 2,154,080 | |
| Net asset value, offering and redemption price per share | | | | | | | | | | | | | | | | |
| (net assets ÷ shares outstanding) | | $ | — | | | $ | 1.00 | | | $ | — | | | $ | 11.18 | |
| | | | | | | | | | | | | | | | | |
| Class N Shares: | | | | | | | | | | | | | | | | |
| Net Assets ($Dollars) | | $ | 2,723,914,294 | | | $ | 328,600,108 | | | $ | 653,099,756 | | | $ | 5,063,492 | |
| Total shares outstanding at end of period | | | 2,723,912,528 | | | | 328,662,623 | | | | 653,102,675 | | | | 452,450 | |
| Net asset value, offering and redemption price per share | | | | | | | | | | | | | | | | |
| (net assets ÷ shares outstanding) | | $ | 1.00 | | | $ | 1.00 | | | $ | 1.00 | | | $ | 11.19 | |
| | | | | | | | | | | | | | | | | |
| Class S Shares: | | | | | | | | | | | | | | | | |
| Net Assets ($Dollars) | | $ | 596,757,182 | | | $ | 187,939,368 | | | $ | 61,351,086 | | | $ | — | |
| Total shares outstanding at end of period | | | 596,758,236 | | | | 187,905,022 | | | | 61,347,582 | | | | — | |
| Net asset value, offering and redemption price per share | | | | | | | | | | | | | | | | |
| (net assets ÷ shares outstanding) | | $ | 1.00 | | | $ | 1.00 | | | $ | 1.00 | | | $ | — | |
| | | | | | | | | | | | | | | | | |
| Servicing Class Shares: | | | | | | | | | | | | | | | | |
| Net Assets ($Dollars) | | $ | 159,759,726 | | | $ | 606,510,953 | | | $ | 187,553,439 | | | $ | — | |
| Total shares outstanding at end of period | | | 159,761,016 | | | | 606,590,874 | | | | 187,555,525 | | | | — | |
| Net asset value, offering and redemption price per share | | | | | | | | | | | | | | | | |
| (net assets ÷ shares outstanding) | | $ | 1.00 | | | $ | 1.00 | | | $ | 1.00 | | | $ | — | |
Amounts designated as “—” are either $0 or have been rounded to $0.
See accompanying notes to financial statements.
CITY NATIONAL ROCHDALE FUNDS | PAGE 96
statements of assets and liabilities (000)
March 31, 2014 (Unaudited)
| | | City National Rochdale Government Bond Fund | | | City National Rochdale Corporate Bond Fund | | | City National Rochdale California Tax Exempt Bond Fund | | | City National Rochdale Municipal High Income Fund | |
| ASSETS: | | | | | | | | | | | | |
Cost of securities (including affiliated investments) | | $ | 172,873 | | | $ | 135,087 | | | $ | 71,117 | | | $ | 183,393 | |
| Investments in securities, at value | | $ | 173,252 | | | $ | 135,868 | | | $ | 69,243 | | | $ | 171,326 | |
| Affiliated investments, at value | | | 801 | | | | 1,755 | | | | 2,987 | | | | 14,056 | |
| Dividend and income receivable | | | 615 | | | | 1,220 | | | | 719 | | | | 2,463 | |
| Receivable for capital shares sold | | | 693 | | | | 418 | | | | 138 | | | | 5,723 | |
| Deferred offering costs | | | — | | | | — | | | | — | | | | 22 | |
| | | 8 | | | | 7 | | | | 3 | | | | — | |
| | | 175,369 | | | | 139,268 | | | | 73,090 | | | | 193,590 | |
| | | | | | | | | | | | | | | | | |
| LIABILITIES: | | | | | | | | | | | | | | | | |
| Payable for income distributions | | | 17 | | | | 156 | | | | 75 | | | | 355 | |
| Payable for capital shares redeemed | | | 281 | | | | 126 | | | | 263 | | | | 60 | |
| Payable for investment securities purchased | | | — | | | | — | | | | 1,712 | | | | 16,888 | |
| Investment advisory fees payable | | | 57 | | | | 40 | | | | 8 | | | | 51 | |
| Shareholder servicing and distribution fees payable | | | 25 | | | | 30 | | | | 15 | | | | 42 | |
| Administrative fees payable | | | 11 | | | | 10 | | | | 9 | | | | 10 | |
| | | 41 | | | | 42 | | | | 29 | | | | 22 | |
| | | 432 | | | | 404 | | | | 2,111 | | | | 17,428 | |
| | $ | 174,937 | | | $ | 138,864 | | | $ | 70,979 | | | $ | 176,162 | |
| | | | | | | | | | | | | | | | | |
| NET ASSETS: | | | | | | | | | | | | | | | | |
| Paid-in Capital (unlimited authorization — $0.01 par value) | | $ | 175,304 | | | $ | 135,528 | | | $ | 69,633 | | | $ | 174,173 | |
| Undistributed (Distributions in excess of) net investment income | | | (14 | ) | | | 6 | | | | — | | | | — | |
| Accumulated net realized gain (loss) on investments | | | (1,533 | ) | | | 794 | | | | 233 | | | | — | |
Net unrealized appreciation on investments | | | 1,180 | | | | 2,536 | | | | 1,113 | | | | 1,989 | |
| | $ | 174,937 | | | $ | 138,864 | | | $ | 70,979 | | | $ | 176,162 | |
| | | | | | | | | | | | | | | | | |
| Institutional Class Shares: | | | | | | | | | | | | | | | | |
| Net Assets ($Dollars) | | $ | 58,613,257 | | | $ | — | | | $ | — | | | $ | — | |
| Total shares outstanding at end of period | | | 5,594,517 | | | | — | | | | — | | | | — | |
| Net asset value, offering and redemption price per share | | | | | | | | | | | | | | | | |
| (net assets ÷ shares outstanding) | | $ | 10.48 | | | $ | — | | | $ | — | | | $ | — | |
| | | | | | | | | | | | | | | | | |
| Class N Shares: | | | | | | | | | | | | | | | | |
| Net Assets ($Dollars) | | $ | 2,351,889 | | | $ | 3,354,120 | | | $ | 10,036,799 | | | $ | 76,820,539 | |
| Total shares outstanding at end of period | | | 224,116 | | | | 313,646 | | | | 945,893 | | | | 7,450,133 | |
| Net asset value, offering and redemption price per share | | | | | | | | | | | | | | | | |
| (net assets ÷ shares outstanding) | | $ | 10.49 | | | $ | 10.69 | | | $ | 10.61 | | | $ | 10.31 | |
| | | | | | | | | | | | | | | | | |
| Servicing Class Shares: | | | | | | | | | | | | | | | | |
| Net Assets ($Dollars) | | $ | 113,972,112 | | | $ | 135,510,233 | | | $ | 60,941,713 | | | $ | 99,341,379 | |
| Total shares outstanding at end of period | | | 10,882,254 | | | | 12,687,223 | | | | 5,759,312 | | | | 9,629,629 | |
| Net asset value, offering and redemption price per share | | | | | | | | | | | | | | | | |
| (net assets ÷ shares outstanding) | | $ | 10.47 | | | $ | 10.68 | | | $ | 10.58 | | | $ | 10.32 | |
Amounts designated as “—” are either $0 or have been rounded to $0.
See accompanying notes to financial statements.
CITY NATIONAL ROCHDALE FUNDS | PAGE 97
statements of assets and liabilities/
consolidated statement of assets and liabilities (000)
March 31, 2014 (Unaudited)
| | | City National Rochdale High Yield Bond Fund | | | City National Rochdale Intermediate Fixed Income Fund | | | City National Rochdale Fixed Income Opportunities Fund | | | City National Rochdale Multi-Asset Fund | |
| ASSETS: | | | | | | | | | | | | |
Cost of securities (including affiliated investments) | | $ | 124,938 | | | $ | 210,879 | | | $ | 1,212,952 | | | $ | 24,586 | |
| Investments in securities, at value | | $ | 127,581 | | | $ | 213,540 | | | $ | 1,243,968 | | | $ | 19,656 | |
| Affiliated investments, at value | | | 848 | | | | 130 | | | | — | | | | 6,040 | |
| Cash | | | 6 | | | | — | | | | 15,868 | | | | 37 | |
Foreign Currency(1) | | | — | | | | — | | | | 1,139 | | | | — | |
| Dividend and income receivable | | | 2,583 | | | | 2,048 | | | | 14,947 | | | | 16 | |
| Receivable for capital shares sold | | | 105 | | | | 662 | | | | 6,250 | | | | 1 | |
| Receivable for investment securities sold | | | 795 | | | | — | | | | 15,584 | | | | — | |
| Unrealized gain on forward foreign currency contracts | | | — | | | | — | | | | 42 | | | | — | |
| | | 8 | | | | 5 | | | | 43 | | | | 1 | |
| | | 131,926 | | | | 216,385 | | | | 1,297,841 | | | | 25,751 | |
| | | | | | | | | | | | | | | | | |
| LIABILITIES: | | | | | | | | | | | | | | | | |
| Payable for income distributions | | | 280 | | | | — | | | | — | | | | — | |
| Payable for capital shares redeemed | | | 118 | | | | 121 | | | | 641 | | | | 18 | |
| Payable for investment securities purchased | | | 7,270 | | | | — | | | | 64,111 | | | | — | |
| Unrealized loss on forward foreign currency contracts | | | — | | | | — | | | | 181 | | | | — | |
| Investment advisory fees payable | | | 54 | | | | 71 | | | | 519 | | | | 7 | |
| Shareholder servicing and distribution fees payable | | | 38 | | | | 74 | | | | 260 | | | | 10 | |
| Administrative fees payable | | | 10 | | | | 11 | | | | 26 | | | | 8 | |
| | | 42 | | | | 42 | | | | 492 | | | | 20 | |
| | | 7,812 | | | | 319 | | | | 66,230 | | | | 63 | |
| | $ | 124,114 | | | $ | 216,066 | | | $ | 1,231,611 | | | $ | 25,688 | |
| | | | | | | | | | | | | | | | | |
| NET ASSETS: | | | | | | | | | | | | | | | | |
| Paid-in Capital (unlimited authorization — $0.01 par value) | | $ | 117,347 | | | $ | 216,360 | | | $ | 1,205,786 | | | $ | 25,408 | |
| Undistributed (Distributions in excess of) net investment income | | | 13 | | | | 24 | | | | (632 | ) | | | (34 | ) |
| Accumulated net realized gain (loss) on investments and foreign currency | | | 3,263 | | | | (3,109 | ) | | | (4,578 | ) | | | (796 | ) |
| Net unrealized appreciation on: | | | | | | | | | | | | | | | | |
| Investments | | | 3,491 | | | | 2,791 | | | | 31,016 | | | | 1,110 | |
Translation of other assets and liabilities denominated in foreign currencies | | | — | | | | — | | | | 19 | | | | — | |
| | $ | 124,114 | | | $ | 216,066 | | | $ | 1,231,611 | | | $ | 25,688 | |
| | | | | | | | | | | | | | | | | |
| Institutional Class Shares: | | | | | | | | | | | | | | | | |
| Net Assets ($Dollars) | | $ | 40,951,291 | | | $ | 40,507,085 | | | $ | — | | | $ | — | |
| Total shares outstanding at end of period | | | 4,595,647 | | | | 1,550,682 | | | | — | | | | — | |
| Net asset value, offering and redemption price per share | | | | | | | | | | | | | | | | |
| (net assets ÷ shares outstanding) | | $ | 8.91 | | | $ | 26.12 | | | $ | — | | | $ | — | |
| | | | | | | | | | | | | | | | | |
| Class N Shares: | | | | | | | | | | | | | | | | |
| Net Assets ($Dollars) | | $ | 36,614,014 | | | $ | 175,559,385 | | | $ | 1,231,610,588 | | | $ | 19,729,554 | |
| Total shares outstanding at end of period | | | 4,110,049 | | | | 6,720,764 | | | | 44,772,629 | | | | 1,779,178 | |
| Net asset value, offering and redemption price per share | | | | | | | | | | | | | | | | |
| (net assets ÷ shares outstanding) | | $ | 8.91 | | | $ | 26.12 | | | $ | 27.51 | | | $ | 11.09 | |
| | | | | | | | | | | | | | | | | |
| Servicing Class Shares: | | | | | | | | | | | | | | | | |
| Net Assets ($Dollars) | | $ | 46,548,576 | | | $ | — | | | $ | — | | | $ | 5,958,007 | |
| Total shares outstanding at end of period | | | 5,225,495 | | | | — | | | | — | | | | 536,790 | |
| Net asset value, offering and redemption price per share | | | | | | | | | | | | | | | | |
| (net assets ÷ shares outstanding) | | $ | 8.91 | | | $ | — | | | $ | — | | | $ | 11.10 | |
Amounts designated as “—” are either $0 or have been rounded to $0.
| (1) | Cost of foreign currency $1,138 (000). |
See accompanying notes to financial statements.
CITY NATIONAL ROCHDALE FUNDS | PAGE 98
statements of assets and liabilities (000)
March 31, 2014 (Unaudited)
| | | City National Rochdale Dividend & Income Fund | | | City National Rochdale U.S. Core Equity Fund | | | City National Rochdale Socially Responsible Fund | | | City National Rochdale Emerging Markets Fund | |
| ASSETS: | | | | | | | | | | | | |
Cost of securities (including affiliated investments) | | $ | 135,402 | | | $ | 192,661 | | | $ | 64,912 | | | $ | 391,400 | |
| Investments in securities, at value | | $ | 172,386 | | | $ | 221,583 | | | $ | 82,664 | | | $ | 424,396 | |
| Affiliated investments, at value | | | 4,248 | | | | 2,673 | | | | — | | | | 24,687 | |
| Cash | | | 10 | | | | — | | | | — | | | | — | |
Foreign Currency(1) | | | — | | | | — | | | | — | | | | 11,207 | |
| Dividend and income receivable | | | 374 | | | | 133 | | | | 54 | | | | 170 | |
| Receivable for investment securities sold | | | — | | | | — | | | | 1,000 | | | | 1,406 | |
| Receivable for capital shares sold | | | 469 | | | | 274 | | | | 149 | | | | 1,799 | |
| | | 6 | | | | 8 | | | | 3 | | | | 12 | |
| | | 177,493 | | | | 224,671 | | | | 83,870 | | | | 463,677 | |
| | | | | | | | | | | | | | | | | |
| LIABILITIES: | | | | | | | | | | | | | | | | |
| Payable for capital shares redeemed | | | 111 | | | | 107 | | | | 214 | | | | 301 | |
| Payable for investment securities purchased | | | — | | | | 2,062 | | | | — | | | | 5,630 | |
| Investment advisory fees payable | | | 67 | | | | 86 | | | | 48 | | | | 373 | |
| Shareholder servicing and distribution fees payable | | | 73 | | | | 63 | | | | 9 | | | | 186 | |
| Administrative fees payable | | | 11 | | | | 12 | | | | 9 | | | | 15 | |
| | | 39 | | | | 49 | | | | 29 | | | | 47 | |
| | | 301 | | | | 2,379 | | | | 309 | | | | 6,552 | |
| | $ | 177,192 | | | $ | 222,292 | | | $ | 83,561 | | | $ | 457,125 | |
| | | | | | | | | | | | | | | | | |
| NET ASSETS: | | | | | | | | | | | | | | | | |
| Paid-in Capital (unlimited authorization — $0.01 par value) | | $ | 143,359 | | | $ | 189,336 | | | $ | 62,599 | | | $ | 404,524 | |
| Undistributed (Distributions in excess of) net investment income | | | (222 | ) | | | (3 | ) | | | 5 | | | | (1,808 | ) |
| Accumulated net realized gain (loss) on investments and foreign currencies | | | (7,177 | ) | | | 1,364 | | | | 3,205 | | | | (3,538 | ) |
| Net unrealized appreciation on: | | | | | | | | | | | | | | | | |
| Investments | | | 41,232 | | | | 31,595 | | | | 17,752 | | | | 57,683 | |
Foreign currencies and translation of other assets and liabilities denominated in foreign currencies | | | — | | | | — | | | | — | | | | 264 | |
| | $ | 177,192 | | | $ | 222,292 | | | $ | 83,561 | | | $ | 457,125 | |
| | | | | | | | | | | | | | | | | |
| Institutional Class Shares: | | | | | | | | | | | | | | | | |
| Net Assets ($Dollars) | | $ | — | | | $ | 50,395,213 | | | $ | 50,338,036 | | | $ | — | |
| Total shares outstanding at end of period | | | — | | | | 3,794,825 | | | | 4,405,792 | | | | — | |
| Net asset value, offering and redemption price per share | | | | | | | | | | | | | | | | |
| (net assets ÷ shares outstanding) | | $ | — | | | $ | 13.28 | | | $ | 11.43 | | | $ | — | |
| | | | | | | | | | | | | | | | | |
| Class N Shares: | | | | | | | | | | | | | | | | |
| Net Assets ($Dollars) | | $ | 177,191,813 | | | $ | 85,805,658 | | | $ | 33,222,470 | | | $ | 457,124,929 | |
| Total shares outstanding at end of period | | | 5,138,632 | | | | 6,515,275 | | | | 2,914,262 | | | | 12,458,682 | |
| Net asset value, offering and redemption price per share | | | | | | | | | | | | | | | | |
| (net assets ÷ shares outstanding) | | $ | 34.48 | | | $ | 13.17 | | | $ | 11.40 | | | $ | 36.69 | |
| | | | | | | | | | | | | | | | | |
| Servicing Class Shares: | | | | | | | | | | | | | | | | |
| Net Assets ($Dollars) | | $ | — | | | $ | 86,091,495 | | | $ | — | | | $ | — | |
| Total shares outstanding at end of period | | | — | | | | 6,530,157 | | | | — | | | | — | |
| Net asset value, offering and redemption price per share | | | | | | | | | | | | | | | | |
| (net assets ÷ shares outstanding) | | $ | — | | | $ | 13.18 | | | $ | — | | | $ | — | |
Amounts designated as “—” are either $0 or have been rounded to $0.
| (1) | Cost of foreign currency $10,933 (000). |
See accompanying notes to financial statements.
CITY NATIONAL ROCHDALE FUNDS | PAGE 99
statements of operations (000)
For the six months ended March 31, 2014 (Unaudited)
| | | City National Rochdale Government Money Market Fund | | | City National Rochdale Prime Money Market Fund | | | City National Rochdale California Tax Exempt Money Market Fund | | | City National Rochdale Limited Maturity Fixed Income Fund | |
| INCOME: | | | | | | | | | | | | |
| | $ | 1,694 | | | $ | 1,000 | | | $ | 309 | | | $ | 243 | |
| | | 1,694 | | | | 1,000 | | | | 309 | | | | 243 | |
| | | | | | | | | | | | | | | | | |
| EXPENSES: | | | | | | | | | | | | | | | | |
| Investment Advisory Fees | | | 4,775 | | | | 1,582 | | | | 1,293 | | | | 94 | |
Shareholder Servicing Fees — Class N(1) | | | 8,219 | | | | 1,050 | | | | 1,947 | | | | 12 | |
Shareholder Servicing Fees — Class S(1) | | | 1,984 | | | | 864 | | | | 264 | | | | — | |
| Shareholder Servicing Fees — Servicing Class | | | 194 | | | | 774 | | | | 225 | | | | — | |
| Administration Fees | | | 366 | | | | 156 | | | | 129 | | | | 49 | |
| Transfer Agent Fees | | | 251 | | | | 91 | | | | 65 | | | | 3 | |
| Trustee Fees | | | 50 | | | | 23 | | | | 18 | | | | 8 | |
| Professional Fees | | | 187 | | | | 74 | | | | 55 | | | | 10 | |
| Printing Fees | | | 77 | | | | 28 | | | | 20 | | | | 1 | |
| Custody Fees | | | 134 | | | | 50 | | | | 29 | | | | 2 | |
| Registration Fees | | | 89 | | | | 33 | | | | 26 | | | | 1 | |
Insurance and Other Expenses | | | 147 | | | | 59 | | | | 43 | | | | 2 | |
| | | 16,473 | | | | 4,784 | | | | 4,114 | | | | 182 | |
| Less, Waivers of: | | | | | | | | | | | | | | | | |
| Investment Advisory Fees | | | (4,483 | ) | | | (1,124 | ) | | | (1,293 | ) | | | (44 | ) |
| Reimbursement of Other Operating Expenses | | | — | | | | — | | | | (98 | ) | | | — | |
Shareholder Servicing Fees — Class N(1) | | | (8,219 | ) | | | (1,050 | ) | | | (1,947 | ) | | | (6 | ) |
Shareholder Servicing Fees — Class S(1) | | | (1,984 | ) | | | (864 | ) | | | (264 | ) | | | — | |
| Shareholder Servicing Fees — Servicing Class | | | (194 | ) | | | (774 | ) | | | (225 | ) | | | — | |
| | | (82 | ) | | | (35 | ) | | | (26 | ) | | | — | |
| | | 1,511 | | | | 937 | | | | 261 | | | | 132 | |
| | | | | | | | | | | | | | | | | |
| | | 183 | | | | 63 | | | | 48 | | | | 111 | |
| Net Realized Gain (Loss) from Securities Transactions | | | — | | | | — | | | | (2 | ) | | | 28 | |
Net Change in Unrealized Appreciation on Investments | | | — | | | | — | | | | — | | | | 75 | |
Net Increase in Net Assets Resulting from Operations | | $ | 183 | | | $ | 63 | | | $ | 46 | | | $ | 214 | |
| (1) | Includes class specific distribution expenses. |
Amounts designated as “—” are either $0 or have been rounded to $0.
See accompanying notes to financial statements.
CITY NATIONAL ROCHDALE FUNDS | PAGE 100
statements of operations (000)
For the six months ended March 31, 2014 (Unaudited)
| | | City National Rochdale Government Bond Fund | | | City National Rochdale Corporate Bond Fund | | | City National Rochdale California Tax Exempt Bond Fund | | | City National Rochdale Municipal High Income Fund (2) | |
| INCOME: | | | | | | | | | | | | |
| | $ | 999 | | | $ | 1,614 | | | $ | 754 | | | $ | 1,104 | |
| | | 999 | | | | 1,614 | | | | 754 | | | | 1,104 | |
| | | | | | | | | | | | | | | | | |
| EXPENSES: | | | | | | | | | | | | | | | | |
| Investment Advisory Fees | | | 371 | | | | 276 | | | | 92 | | | | 95 | |
Shareholder Servicing Fees — Class N(1) | | | 6 | | | | 8 | | | | 23 | | | | 40 | |
| Shareholder Servicing Fees — Servicing Class | | | 142 | | | | 168 | | | | 74 | | | | 33 | |
| Administration Fees | | | 60 | | | | 58 | | | | 51 | | | | 26 | |
| Transfer Agent Fees | | | 11 | | | | 9 | | | | 5 | | | | 3 | |
| Trustee Fees | | | 9 | | | | 9 | | | | 8 | | | | 4 | |
| Professional Fees | | | 16 | | | | 14 | | | | 11 | | | | 9 | |
| Custody Fees | | | 7 | | | | 6 | | | | 3 | | | | 1 | |
| Registration Fees | | | 5 | | | | 4 | | | | 2 | | | | 1 | |
| Printing Fees | | | 4 | | | | 3 | | | | 1 | | | | 1 | |
| Offering Costs | | | — | | | | — | | | | — | | | | 3 | |
Insurance and Other Expenses | | | 8 | | | | 11 | | | | 3 | | | | 4 | |
| | | 639 | | | | 566 | | | | 273 | | | | 220 | |
| Less, Waivers of: | | | | | | | | | | | | | | | | |
| | | (35 | ) | | | (38 | ) | | | (47 | ) | | | (13 | ) |
| | | 604 | | | | 528 | | | | 226 | | | | 207 | |
| | | | | | | | | | | | | | | | | |
| | | 395 | | | | 1,086 | | | | 528 | | | | 897 | |
| Net Realized Gain from Securities Transactions | | | 192 | | | | 839 | | | | 380 | | | | — | |
Net Change in Unrealized Appreciation (Depreciation) on Investments | | | (100 | ) | | | (123 | ) | | | 207 | | | | 1,989 | |
Net Increase in Net Assets Resulting from Operations | | $ | 487 | | | $ | 1,802 | | | $ | 1,115 | | | $ | 2,886 | |
| (1) | Includes class specific distribution expenses. |
| (2) | Fund commenced operations December 30, 2013. |
Amounts designated as “—” are either $0 or have been rounded to $0.
See accompanying notes to financial statements.
CITY NATIONAL ROCHDALE FUNDS | PAGE 101
statements of operations/
consolidated statement of operations (000)
For the six months ended March 31, 2014 (Unaudited)
| | | City National Rochdale High Yield Bond Fund | | | City National Rochdale Intermediate Fixed Income Fund | | | City National Rochdale Fixed Income Opportunities Fund | | | City National Rochdale Multi-Asset Fund | |
| INCOME: | | | | | | | | | | | | |
| Dividend Income | | $ | 30 | | | $ | 291 | | | $ | 6 | | | $ | 246 | |
| Dividend Income from Affiliated Investments | | | — | | | | — | | | | — | | | | 40 | |
| Interest Income | | | 5,272 | | | | 2,867 | | | | 32,705 | | | | — | |
Less: Foreign Taxes Withheld | | | — | | | | — | | | | (4,014 | ) | | | — | |
| | | 5,302 | | | | 3,158 | | | | 28,697 | | | | 286 | |
| | | | | | | | | | | | | | | | | |
| EXPENSES: | | | | | | | | | | | | | | | | |
| Investment Advisory Fees | | | 449 | | | | 375 | | | | 2,763 | | | | 73 | |
Shareholder Servicing Fees — Class N(1) | | | 89 | | | | 413 | | | | 2,763 | | | | 52 | |
| Shareholder Servicing Fees — Servicing Class | | | 93 | | | | — | | | | — | | | | 7 | |
| Administration Fees | | | 59 | | | | 63 | | | | 174 | | | | 48 | |
| Transfer Agent Fees | | | 11 | | | | 11 | | | | 66 | | | | 2 | |
| Trustee Fees | | | 9 | | | | 9 | | | | 28 | | | | 7 | |
| Professional Fees | | | 16 | | | | 15 | | | | 101 | | | | 9 | |
| Custody Fees | | | 9 | | | | 5 | | | | 32 | | | | 1 | |
| Registration Fees | | | 4 | | | | 12 | | | | 29 | | | | 1 | |
| Printing Fees | | | 4 | | | | 3 | | | | 20 | | | | 1 | |
Insurance and Other Expenses | | | 8 | | | | 6 | | | | 45 | | | | 2 | |
| | | 751 | | | | 912 | | | | 6,021 | | | | 203 | |
Recovery of Investment Advisory Fees Previously Waived(2) | | | — | | | | — | | | | 97 | | | | — | |
| Less, Waiver of: | | | | | | | | | | | | | | | | |
| | | (46 | ) | | | (21 | ) | | | — | | | | (4 | ) |
| | | 705 | | | | 891 | | | | 6,118 | | | | 199 | |
| | | | | | | | | | | | | | | | | |
| | | 4,597 | | | | 2,267 | | | | 22,579 | | | | 87 | |
| Net Realized Gain (Loss) from: | | | | | | | | | | | | | | | | |
| Securities Transactions | | | 3,317 | | | | (272 | ) | | | (3,398 | ) | | | 830 | |
| Affiliated Investments | | | — | | | | — | | | | — | | | | 35 | |
| Distributions of Realized Gains from Investment Company Shares | | | — | | | | — | | | | — | | | | 38 | |
| Forward Foreign Currency Contracts | | | — | | | | — | | | | (703 | ) | | | — | |
| Foreign Currency Transactions | | | — | | | | — | | | | (408 | ) | | | — | |
| Net Change in Unrealized Appreciation (Depreciation) on: | | | | | | | | | | | | | | | | |
| Investments | | | 2,397 | | | | 2,032 | | | | 35,425 | | | | 269 | |
| Affiliated Investments | | | — | | | | — | | | | — | | | | (20 | ) |
| Forward Foreign Currency Contracts | | | — | | | | — | | | | 325 | | | | — | |
Foreign Currency Transactions | | | — | | | | — | | | | 147 | | | | — | |
Net Increase in Net Assets Resulting from Operations | | $ | 10,311 | | | $ | 4,027 | | | $ | 53,967 | | | $ | 1,239 | |
| (1) | Includes class specific distribution expenses. |
| (2) | See Note 4 for Advisory Fees recovered. |
Amounts designated as “—” are either $0 or have been rounded to $0.
See accompanying notes to financial statements.
CITY NATIONAL ROCHDALE FUNDS | PAGE 102
statements of operations (000)
For the six months ended March 31, 2014 (Unaudited)
| | | City National Rochdale Dividend & Income Fund | | | City National Rochdale U.S. Core Equity Fund | | | City National Rochdale Socially Responsible Fund | | | City National Rochdale Emerging Markets Fund | |
| INCOME: | | | | | | | | | | | | |
| Dividend Income | | $ | 3,036 | | | $ | 908 | | | $ | 1,472 | | | $ | 1,153 | |
| Interest Income | | | 399 | | | | — | | | | — | | | | — | |
Less: Foreign Taxes Withheld | | | (8 | ) | | | (5 | ) | | | (3 | ) | | | (55 | ) |
| | | 3,427 | | | | 903 | | | | 1,469 | | | | 1,098 | |
| | | | | | | | | | | | | | | | | |
| EXPENSES: | | | | | | | | | | | | | | | | |
| Investment Advisory Fees | | | 420 | | | | 317 | | | | 301 | | | | 1,807 | |
Shareholder Servicing Fees — Class N(1) | | | 420 | | | | 190 | | | | 82 | | | | 903 | |
| Shareholder Servicing Fees — Servicing Class | | | — | | | | 100 | | | | — | | | | — | |
| Administration Fees | | | 60 | | | | 54 | | | | 53 | | | | 77 | |
| Transfer Agent Fees | | | 12 | | | | 10 | | | | 5 | | | | 21 | |
| Trustee Fees | | | 9 | | | | 9 | | | | 8 | | | | 11 | |
| Professional Fees | | | 16 | | | | 15 | | | | 12 | | | | 24 | |
| Custody Fees | | | 5 | | | | 5 | | | | 3 | | | | 20 | |
| Printing Fees | | | 3 | | | | 3 | | | | 2 | | | | 7 | |
| Registration Fees | | | 15 | | | | 2 | | | | 3 | | | | 15 | |
Insurance and Other Expenses | | | 9 | | | | 10 | | | | 5 | | | | 32 | |
| | | 969 | | | | 715 | | | | 474 | | | | 2,917 | |
| Less, Waiver of: | | | | | | | | | | | | | | | | |
| Investment Advisory Fees | | | (37 | ) | | | — | | | | (35 | ) | | | (12 | ) |
Shareholder Servicing Fees — Class N | | | — | | | | — | | | | (41 | ) | | | — | |
| | | 932 | | | | 715 | | | | 398 | | | | 2,905 | |
| | | | | | | | | | | | | | | | | |
Net Investment Income (Loss) | | | 2,495 | | | | 188 | | | | 1,071 | | | | (1,807 | ) |
| Net Realized Gain (Loss) from: | | | | | | | | | | | | | | | | |
| Securities Transactions | | | 2,179 | | | | 1,957 | | | | 3,917 | | | | (2,111 | ) |
| Foreign Currency Transactions | | | — | | | | — | | | | — | | | | (321 | ) |
| Net Change in Unrealized Appreciation on: | | | | | | | | | | | | | | | | |
| Investments | | | 9,167 | | | | 12,773 | | | | 3,936 | | | | 29,854 | |
Foreign Currency Transactions | | | — | | | | — | | | | — | | | | 261 | |
Net Increase in Net Assets Resulting from Operations | | $ | 13,841 | | | $ | 14,918 | | | $ | 8,924 | | | $ | 25,876 | |
| (1) | Includes class specific distribution expenses. |
Amounts designated as “—” are either $0 or have been rounded to $0.
See accompanying notes to financial statements.
CITY NATIONAL ROCHDALE FUNDS | PAGE 103
statements of changes in net assets (000)
For the six months ended March 31, 2014 (Unaudited) and the year ended September 30, 2013
| | | City National Rochdale Government Money Market Fund | | | City National Rochdale Prime Money Market Fund | |
| | | | | | | | | | | | |
| OPERATIONS: | | | | | | | | | | | | |
| Net Investment Income | | $ | 183 | | | $ | 330 | | | $ | 63 | | | $ | 228 | |
| Net Realized Gain (Loss) from Security Transactions | | | — | | | | 6 | | | | — | | | | (1 | ) |
Net Change in Unrealized Appreciation (Depreciation) on Investments | | | — | | | | — | | | | — | | | | — | |
Net Increase (Decrease) in Net Assets Resulting from Operations | | | 183 | | | | 336 | | | | 63 | | | | 227 | |
| | | | | | | | | | | | | | | | | |
| DIVIDENDS AND DISTRIBUTIONS FROM: | | | | | | | | | | | | | | | | |
| Net Investment Income: | | | | | | | | | | | | | | | | |
| Institutional Class | | | — | | | | — | | | | (2 | ) | | | (1 | ) |
| Class N | | | (149 | ) | | | (281 | ) | | | (19 | ) | | | (65 | ) |
| Class S | | | (26 | ) | | | (38 | ) | | | (11 | ) | | | (26 | ) |
| Servicing Class | | | (8 | ) | | | (11 | ) | | | (31 | ) | | | (136 | ) |
| Realized Capital Gains: | | | | | | | | | | | | | | | | |
| Institutional Class | | | — | | | | — | | | | — | | | | — | |
| Class N | | | — | | | | — | | | | — | | | | — | |
| | | — | | | | — | | | | — | | | | — | |
Total Dividends and Distributions | | | (183 | ) | | | (330 | ) | | | (63 | ) | | | (228 | ) |
| | | | | | | | | | | | | | | | | |
CAPITAL SHARE TRANSACTIONS:(1) | | | | | | | | | | | | | | | | |
| Institutional Class: | | | | | | | | | | | | | | | | |
| Shares Issued | | | — | | | | — | | | | 130,467 | | | | 64,765 | |
| Shares Issued in Lieu of Dividends and Distributions | | | — | | | | — | | | | — | | | | — | |
| | | — | | | | — | | | | (87,889 | ) | | | (53,558 | ) |
Increase (Decrease) in Net Assets from Institutional Class Share Transactions | | | — | | | | — | | | | 42,578 | | | | 11,207 | |
| | | | | | | | | | | | | | | | | |
| Class N: | | | | | | | | | | | | | | | | |
| Shares Issued | | | 1,918,722 | | | | 4,569,767 | | | | 343,074 | | | | 958,377 | |
| Shares Issued in Lieu of Dividends and Distributions | | | 123 | | | | 232 | | | | 12 | | | | 43 | |
| | | (2,235,328 | ) | | | (4,337,676 | ) | | | (439,458 | ) | | | (927,483 | ) |
Increase (Decrease) in Net Assets from Class N Share Transactions | | | (316,483 | ) | | | 232,323 | | | | (96,372 | ) | | | 30,937 | |
| | | | | | | | | | | | | | | | | |
| Class S: | | | | | | | | | | | | | | | | |
| Shares Issued | | | 611,574 | | | | 1,126,727 | | | | 437,190 | | | | 820,945 | |
| Shares Issued in Lieu of Dividends and Distributions | | | — | | | | — | | | | — | | | | — | |
| | | (489,967 | ) | | | (940,498 | ) | | | (456,503 | ) | | | (869,753 | ) |
Increase (Decrease) in Net Assets from Class S Share Transactions | | | 121,607 | | | | 186,229 | | | | (19,313 | ) | | | (48,808 | ) |
| | | | | | | | | | | | | | | | | |
| Servicing Class: | | | | | | | | | | | | | | | | |
| Shares Issued | | | 395,977 | | | | 778,145 | | | | 565,318 | | | | 2,068,692 | |
| Shares Issued in Lieu of Dividends and Distributions | | | — | | | | — | | | | 5 | | | | 22 | |
| | | (364,640 | ) | | | (746,175 | ) | | | (572,258 | ) | | | (1,961,996 | ) |
Increase (Decrease) in Net Assets from Servicing Class Share Transactions | | | 31,337 | | | | 31,970 | | | | (6,935 | ) | | | 106,718 | |
| | | | | | | | | | | | | | | | | |
Net Increase (Decrease) in Net Assets from Share Transactions | | | (163,539 | ) | | | 450,522 | | | | (80,042 | ) | | | 100,054 | |
Total Increase (Decrease) in Net Assets | | | (163,539 | ) | | | 450,528 | | | | (80,042 | ) | | | 100,053 | |
| | | | | | | | | | | | | | | | | |
| NET ASSETS: | | | | | | | | | | | | | | | | |
| | | 3,643,970 | | | | 3,193,442 | | | | 1,256,877 | | | | 1,156,824 | |
| | $ | 3,480,431 | | | $ | 3,643,970 | | | $ | 1,176,835 | | | $ | 1,256,877 | |
Undistributed (Distributions in excess of) net investment income | | $ | — | | | $ | — | | | $ | — | | | $ | — | |
| (1) | See Note 9 for shares issued and redeemed. |
Amounts designated as “—” are either $0 or have been rounded to $0.
See accompanying notes to financial statements.
CITY NATIONAL ROCHDALE FUNDS | PAGE 104
City National Rochdale California Tax Exempt Money Market Fund | | | City National Rochdale Limited Maturity Fixed Income Fund | | | City National Rochdale Government Bond Fund | | | City National Rochdale Corporate Bond Fund | |
| | | | | | | | | | | | | | | | | | | | | | |
| | | | | | | | | | | | | | | | | | | | | | | |
| $ | 48 | | | $ | 94 | | | $ | 111 | | | $ | 239 | | | $ | 395 | | | $ | 1,317 | | | $ | 1,086 | | | $ | 2,431 | |
| | (2 | ) | | | — | | | | 28 | | | | 89 | | | | 192 | | | | (81 | ) | | | 839 | | | | 926 | |
| | — | | | | — | | | | 75 | | | | (425 | ) | | | (100 | ) | | | (3,438 | ) | | | (123 | ) | | | (2,436 | ) |
| | 46 | | | | 94 | | | | 214 | | | | (97 | ) | | | 487 | | | | (2,202 | ) | | | 1,802 | | | | 921 | |
| | | | | | | | | | | | | | | | | | | | | | | | | | | | | | | |
| | | | | | | | | | | | | | | | | | | | | | | | | | | | | | | |
| | | | | | | | | | | | | | | | | | | | | | | | | | | | | | | |
| | — | | | | — | | | | (105 | ) | | | (288 | ) | | | (183 | ) | | | (746 | ) | | | — | | | | — | |
| | (35 | ) | | | (71 | ) | | | (10 | ) | | | (19 | ) | | | (2 | ) | | | (23 | ) | | | (20 | ) | | | (46 | ) |
| | (4 | ) | | | (7 | ) | | | — | | | | — | | | | — | | | | — | | | | — | | | | — | |
| | (9 | ) | | | (16 | ) | | | — | | | | — | | | | (224 | ) | | | (1,285 | ) | | | (1,060 | ) | | | (2,423 | ) |
| | | | | | | | | | | | | | | | | | | | | | | | | | | | | | | |
| | — | | | | — | | | | — | | | | — | | | | — | | | | — | | | | — | | | | — | |
| | — | | | | — | | | | — | | | | — | | | | — | | | | — | | | | (20 | ) | | | (20 | ) |
| | — | | | | — | | | | — | | | | — | | | | — | | | | — | | | | (914 | ) | | | (1,056 | ) |
| | (48 | ) | | | (94 | ) | | | (115 | ) | | | (307 | ) | | | (409 | ) | | | (2,054 | ) | | | (2,014 | ) | | | (3,545 | ) |
| | | | | | | | | | | | | | | | | | | | | | | | | | | | | | | |
| | | | | | | | | | | | | | | | | | | | | | | | | | | | | | | |
| | | | | | | | | | | | | | | | | | | | | | | | | | | | | | | |
| | — | | | | — | | | | 370 | | | | 1,086 | | | | 6,482 | | | | 10,986 | | | | — | | | | — | |
| | — | | | | — | | | | 40 | | | | 87 | | | | 179 | | | | 720 | | | | — | | | | — | |
| | — | | | | — | | | | (16,610 | ) | | | (8,747 | ) | | | (4,420 | ) | | | (9,510 | ) | | | — | | | | — | |
| | — | | | | — | | | | (16,200 | ) | | | (7,574 | ) | | | 2,241 | | | | 2,196 | | | | — | | | | — | |
| | | | | | | | | | | | | | | | | | | | | | | | | | | | | | | |
| | | | | | | | | | | | | | | | | | | | | | | | | | | | | | | |
| | 398,827 | | | | 1,060,390 | | | | 921 | | | | 2,071 | | | | 224 | | | | 306 | | | | 566 | | | | 1,782 | |
| | 34 | | | | 70 | | | | 10 | | | | 19 | | | | 1 | | | | 13 | | | | 30 | | | | 43 | |
| | (418,968 | ) | | | (1,053,783 | ) | | | (409 | ) | | | (1,865 | ) | | | (380 | ) | | | (720 | ) | | | (338 | ) | | | (1,196 | ) |
| | (20,107 | ) | | | 6,677 | | | | 522 | | | | 225 | | | | (155 | ) | | | (401 | ) | | | 258 | | | | 629 | |
| | | | | | | | | | | | | | | | | | | | | | | | | | | | | | | |
| | | | | | | | | | | | | | | | | | | | | | | | | | | | | | | |
| | 171,410 | | | | 320,188 | | | | — | | | | — | | | | — | | | | — | | | | — | | | | — | |
| | — | | | | — | | | | — | | | | — | | | | — | | | | — | | | | — | | | | — | |
| | (189,371 | ) | | | (340,847 | ) | | | — | | | | — | | | | — | | | | — | | | | — | | | | — | |
| | (17,961 | ) | | | (20,659 | ) | | | — | | | | — | | | | — | | | | — | | | | — | | | | — | |
| | | | | | | | | | | | | | | | | | | | | | | | | | | | | | | |
| | | | | | | | | | | | | | | | | | | | | | | | | | | | | | | |
| | 274,446 | | | | 808,580 | | | | — | | | | — | | | | 13,919 | | | | 36,855 | | | | 19,372 | | | | 44,640 | |
| | — | | | | — | | | | — | | | | — | | | | 107 | | | | 604 | | | | 180 | | | | 309 | |
| | (252,631 | ) | | | (780,506 | ) | | | — | | | | — | | | | (15,061 | ) | | | (43,783 | ) | | | (19,018 | ) | | | (40,992 | ) |
| | 21,815 | | | | 28,074 | | | | — | | | | — | | | | (1,035 | ) | | | (6,324 | ) | | | 534 | | | | 3,957 | |
| | | | | | | | | | | | | | | | | | | | | | | | | | | | | | | |
| | (16,253 | ) | | | 14,092 | | | | (15,678 | ) | | | (7,349 | ) | | | 1,051 | | | | (4,529 | ) | | | 792 | | | | 4,586 | |
| | (16,255 | ) | | | 14,092 | | | | (15,579 | ) | | | (7,753 | ) | | | 1,129 | | | | (8,785 | ) | | | 580 | | | | 1,962 | |
| | | | | | | | | | | | | | | | | | | | | | | | | | | | | | | |
| | | | | | | | | | | | | | | | | | | | | | | | | | | | | | | |
| | 918,259 | | | | 904,167 | | | | 44,735 | | | | 52,488 | | | | 173,808 | | | | 182,593 | | | | 138,284 | | | | 136,322 | |
| $ | 902,004 | | | $ | 918,259 | | | $ | 29,156 | | | $ | 44,735 | | | $ | 174,937 | | | $ | 173,808 | | | $ | 138,864 | | | $ | 138,284 | |
| $ | — | | | $ | — | | | $ | (4 | ) | | $ | — | | | $ | (14 | ) | | $ | — | | | $ | 6 | | | $ | — | |
See accompanying notes to financial statements.
CITY NATIONAL ROCHDALE FUNDS | PAGE 105
statements of changes in net assets/
consolidated statement of changes in net assets (000)
For the six months ended March 31, 2014 (Unaudited) and the year ended September 30, 2013
| | | City National Rochdale California Tax Exempt Bond Fund | | | City National Rochdale Municipal High Income Fund (2) | |
| | | | | | | | | |
| OPERATIONS: | | | | | | | | | |
| Net Investment Income | | $ | 528 | | | $ | 1,190 | | | $ | 897 | |
| Net Realized Gain (Loss) from: | | | | | | | | | | | | |
| Security Transactions and Affiliated Investments | | | 380 | | | | 81 | | | | — | |
| Distributions of Realized Gains from Investment Company Shares | | | — | | | | — | | | | — | |
| Foreign Currency Transactions | | | — | | | | — | | | | — | |
| Net Change in Unrealized Appreciation (Depreciation) on: | | | | | | | | | | | | |
| Investments | | | 207 | | | | (1,430 | ) | | | 1,989 | |
| Affiliated Investments | | | — | | | | — | | | | — | |
Foreign Currency Transactions | | | — | | | | — | | | | — | |
Net Increase (Decrease) in Net Assets Resulting from Operations | | | 1,115 | | | | (159 | ) | | | 2,886 | |
| DIVIDENDS AND DISTRIBUTIONS FROM: | | | | | | | | | | | | |
| Net Investment Income: | | | | | | | | | | | | |
| Institutional Class | | | — | | | | — | | | | — | |
| Class N | | | (61 | ) | | | (112 | ) | | | (332 | ) |
| Servicing Class | | | (467 | ) | | | (1,078 | ) | | | (565 | ) |
| Realized Capital Gains: | | | | | | | | | | | | |
| Institutional Class | | | — | | | | — | | | | — | |
| Class N | | | (17 | ) | | | (55 | ) | | | — | |
| | | (110 | ) | | | (474 | ) | | | — | |
Total Dividends and Distributions | | | (655 | ) | | | (1,719 | ) | | | (897 | ) |
CAPITAL SHARE TRANSACTIONS:(1) | | | | | | | | | | | | |
| Institutional Class: | | | | | | | | | | | | |
| Shares Issued | | | — | | | | — | | | | — | |
Shares Issued from Merger(5) | | | — | | | | — | | | | — | |
| Shares Issued in Lieu of Dividends and Distributions | | | — | | | | — | | | | — | |
| | | — | | | | — | | | | — | |
Increase (Decrease) in Net Assets from Institutional Class Share Transactions | | | — | | | | — | | | | — | |
| Class N: | | | | | | | | | | | | |
| Shares Issued | | | 2,719 | | | | 5,757 | | | | 76,550 | |
| Shares Issued in Lieu of Dividends and Distributions | | | 43 | | | | 106 | | | | 194 | |
| Shares Redeemed | | | (985 | ) | | | (3,552 | ) | | | (569 | ) |
| | | — | | | | — | | | | — | |
Increase (Decrease) in Net Assets from Class N Share Transactions | | | 1,777 | | | | 2,311 | | | | 76,175 | |
| Servicing Class: | | | | | | | | | | | | |
| Shares Issued | | | 11,300 | | | | 26,421 | | | | 100,427 | |
| Shares Issued in Lieu of Dividends and Distributions | | | 62 | | | | 211 | | | | 2 | |
| | | (9,966 | ) | | | (17,652 | ) | | | (2,431 | ) |
Increase (Decrease) in Net Assets from Servicing Class Share Transactions | | | 1,396 | | | | 8,980 | | | | 97,998 | |
Net Increase (Decrease) in Net Assets from Share Transactions | | | 3,173 | | | | 11,291 | | | | 174,173 | |
Total Increase (Decrease) in Net Assets | | | 3,633 | | | | 9,413 | | | | 176,162 | |
| NET ASSETS: | | | | | | | | | | | | |
| | | 67,346 | | | | 57,933 | | | | — | |
| | $ | 70,979 | | | $ | 67,346 | | | $ | 176,162 | |
Undistributed (Distributions in excess of) net investment income | | $ | — | | | $ | — | | | $ | — | |
| † | For the nine months ended September 30, 2013 and the year ended December 31, 2012. Effective March 29, 2013, Rochdale Investment Trust’s Rochdale Intermediate Fixed Income Portfolio and Rochdale Fixed Income Opportunities Portfolio (each a “Predecessor Fund”) were merged into City National Rochdale Fund’s Intermediate Fixed Income Fund and Fixed Income Opportunities Fund, respectively. Information presented for the period prior to March 29, 2013, is that of the respective Predecessor Fund, which had a December 31 fiscal year end. See Note 1 in Notes to Financial Statements for additional information. |
| (1) | See Note 9 for shares issued and redeemed. |
| (2) | Fund commenced operations December 30, 2013. |
| (3) | Institutional Class commenced operations on December 20, 2013. |
| (4) | Institutional Class ceased operations on January 31, 2014. |
| (5) | See Note 10 in Notes to Financial Statements. |
| * | On March 29, 2013, the Rochdale Intermediate Fixed Income Portfolio and Rochdale Fixed Income Opportunities Portfolio were reorganized into the City National Rochdale Intermediate Fixed Income Fund and City National Rochdale Fixed Income Opportunities Fund, respectively. See Note 1 in Notes to Financial Statements for additional information. |
Amounts designated as “—” are either $0 or have been rounded to $0.
See accompanying notes to financial statements.
CITY NATIONAL ROCHDALE FUNDS | PAGE 106
City National Rochdale High Yield Bond Fund | | | City National Rochdale Intermediate Fixed Income Fund* (3) | | | City National Rochdale Fixed Income Opportunities Fund * | | | City National Rochdale Multi-Asset Fund (4) | |
| | | | | | | | | | 2013† | | | | 2012† | | | | 2014 | | | | 2013† | | | | 2012† | | | | 2014 | | | | 2013 | |
| | | | | | | | | | | | | | | | | | | | | | | | | | | | | | | | | | | | |
| $ | 4,597 | | | $ | 10,977 | | | $ | 2,267 | | | $ | 3,312 | | | $ | 4,083 | | | $ | 22,579 | | | $ | 34,256 | | | $ | 36,480 | | | $ | 87 | | | $ | 591 | |
| | | | | | | | | | | | | | | | | | | | | | | | | | | | | | | | | | | | | | | |
| | 3,317 | | | | 857 | | | | (272 | ) | | | (354 | ) | | | 473 | | | | (3,398 | ) | | | 5,542 | | | | 1,021 | | | | 865 | | | | 1,977 | |
| | — | | | | — | | | | — | | | | — | | | | — | | | | — | | | | — | | | | — | | | | 38 | | | | 55 | |
| | — | | | | — | | | | — | | | | — | | | | — | | | | (1,111 | ) | | | (61 | ) | | | (345 | ) | | | — | | | | — | |
| | | | | | | | | | | | | | | | | | | | | | | | | | | | | | | | | | | | | | | |
| | 2,397 | | | | (2,333 | ) | | | 2,032 | | | | (4,677 | ) | | | 4,019 | | | | 35,425 | | | | (18,357 | ) | | | 21,698 | | | | 269 | | | | (1,236 | ) |
| | — | | | | — | | | | — | | | | — | | | | — | | | | — | | | | — | | | | — | | | | (20 | ) | | | 197 | |
| | — | | | | — | | | | — | | | | — | | | | — | | | | 472 | | | | (184 | ) | | | (312 | ) | | | — | | | | — | |
| | 10,311 | | | | 9,501 | | | | 4,027 | | | | (1,719 | ) | | | 8,575 | | | | 53,967 | | | | 21,196 | | | | 58,542 | | | | 1,239 | | | | 1,584 | |
| | | | | | | | | | | | | | | | | | | | | | | | | | | | | | | | | | | | | | | |
| | | | | | | | | | | | | | | | | | | | | | | | | | | | | | | | | | | | | | | |
| | (1,271 | ) | | | (2,806 | ) | | | (294 | ) | | | — | | | | — | | | | — | | | | — | | | | — | | | | (28 | ) | | | (150 | ) |
| | (1,042 | ) | | | (2,840 | ) | | | (1,921 | ) | | | (3,505 | ) | | | (4,065 | ) | | | (23,407 | ) | | | (34,355 | ) | | | (35,978 | ) | | | (69 | ) | | | (404 | ) |
| | (2,271 | ) | | | (5,350 | ) | | | — | | | | — | | | | — | | | | — | | | | — | | | | — | | | | (24 | ) | | | (113 | ) |
| | | | | | | | | | | | | | | | | | | | | | | | | | | | | | | | | | | | | | | |
| | (90 | ) | | | — | | | | — | | | | — | | | | — | | | | — | | | | — | | | | — | | | | — | | | | — | |
| | (83 | ) | | | — | | | | — | | | | — | | | | — | | | | (5,256 | ) | | | (52 | ) | | | (1,348 | ) | | | — | | | | — | |
| | (208 | ) | | | — | | | | — | | | | — | | | | — | | | | — | | | | — | | | | — | | | | — | | | | — | |
| | (4,965 | ) | | | (10,996 | ) | | | (2,215 | ) | | | (3,505 | ) | | | (4,065 | ) | | | (28,663 | ) | | | (34,407 | ) | | | (37,326 | ) | | | (121 | ) | | | (667 | ) |
| | | | | | | | | | | | | | | | | | | | | | | | | | | | | | | | | | | | | | | |
| | | | | | | | | | | | | | | | | | | | | | | | | | | | | | | | | | | | | | | |
| | 4,658 | | | | 6,781 | | | | — | | | | — | | | | — | | | | — | | | | — | | | | — | | | | 783 | | | | 1,941 | |
| | — | | | | — | | | | 44,899 | | | | — | | | | — | | | | — | | | | — | | | | — | | | | — | | | | — | |
| | 1,277 | | | | 2,324 | | | | 331 | | | | — | | | | — | | | | — | | | | — | | | | — | | | | 28 | | | | 150 | |
| | (5,656 | ) | | | (10,577 | ) | | | (5,074 | ) | | | — | | | | — | | | | — | | | | — | | | | — | | | | (7,291 | ) | | | (8,488 | ) |
| | 279 | | | | (1,472 | ) | | | 40,156 | | | | — | | | | — | | | | — | | | | — | | | | — | | | | (6,480 | ) | | | (6,397 | ) |
| | | | | | | | | | | | | | | | | | | | | | | | | | | | | | | | | | | | | | | |
| | 2,033 | | | | 15,763 | | | | 45,656 | | | | 56,237 | | | | 52,862 | | | | 362,749 | | | | 337,721 | | | | 204,737 | | | | 369 | | | | 2,100 | |
| | 698 | | | | 1,427 | | | | 873 | | | | 1,718 | | | | 3,348 | | | | 15,134 | | | | 19,896 | | | | 34,855 | | | | 49 | | | | 267 | |
| | (1,766 | ) | | | (21,520 | ) | | | (28,171 | ) | | | (27,350 | ) | | | (38,323 | ) | | | (96,020 | ) | | | (74,057 | ) | | | (104,410 | ) | | | (3,403 | ) | | | (6,000 | ) |
| | — | | | | — | | | | — | | | | — | | | | 5 | | | | — | | | | — | | | | 13 | | | | — | | | | — | |
| | 965 | | | | (4,330 | ) | | | 18,358 | | | | 30,605 | | | | 17,892 | | | | 281,863 | | | | 283,560 | | | | 135,195 | | | | (2,985 | ) | | | (3,633 | ) |
| | | | | | | | | | | | | | | | | | | | | | | | | | | | | | | | | | | | | | | |
| | 17,376 | | | | 62,803 | | | | — | | | | — | | | | — | | | | — | | | | — | | | | — | | | | 1,024 | | | | 194 | |
| | 350 | | | | 674 | | | | — | | | | — | | | | — | | | | — | | | | — | | | | — | | | | 13 | | | | 55 | |
| | (62,741 | ) | | | (47,406 | ) | | | — | | | | — | | | | — | | | | — | | | | — | | | | — | | | | (213 | ) | | | (2,692 | ) |
| | (45,015 | ) | | | 16,071 | | | | — | | | | — | | | | — | | | | — | | | | — | | | | — | | | | 824 | | | | (2,443 | ) |
| | (43,771 | ) | | | 10,269 | | | | 58,514 | | | | 30,605 | | | | 17,892 | | | | 281,863 | | | | 283,560 | | | | 135,195 | | | | (8,641 | ) | | | (12,473 | ) |
| | (38,425 | ) | | | 8,774 | | | | 60,326 | | | | 25,381 | | | | 22,402 | | | | 307,167 | | | | 270,349 | | | | 156,411 | | | | (7,523 | ) | | | (11,556 | ) |
| | | | | | | | | | | | | | | | | | | | | | | | | | | | | | | | | | | | | | | |
| | 162,539 | | | | 153,765 | | | | 155,740 | | | | 130,359 | | | | 107,957 | | | | 924,444 | | | | 654,095 | | | | 497,684 | | | | 33,211 | | | | 44,767 | |
| $ | 124,114 | | | $ | 162,539 | | | $ | 216,066 | | | $ | 155,740 | | | $ | 130,359 | | | $ | 1,231,611 | | | $ | 924,444 | | | $ | 654,095 | | | $ | 25,688 | | | $ | 33,211 | |
| $ | 13 | | | $ | — | | | $ | 24 | | | $ | 18 | | | $ | 173 | | | $ | (632 | ) | | $ | 196 | | | $ | 699 | | | $ | (34 | ) | | $ | — | |
See accompanying notes to financial statements.
CITY NATIONAL ROCHDALE FUNDS | PAGE 107
statements of changes in net assets (000)
For the six months ended March 31, 2014 (Unaudited) and the year ended September 30, 2013
| | | City National Rochdale Dividend & Income Fund * | |
| | | | | | 2013† | | | | 2012† | |
| OPERATIONS: | | | | | | | | | | | |
| Net Investment Income (Loss) | | $ | 2,495 | | | $ | 2,602 | | | $ | 4,050 | |
| Net Realized Gain (Loss) from: | | | | | | | | | | | | |
| Security Transactions | | | 2,179 | | | | 4,278 | | | | (2,661 | ) |
| Distributions of Realized Gains from Investment Company Shares | | | — | | | | — | | | | 116 | |
| Foreign Currency Transactions | | | — | | | | 8 | | | | (6 | ) |
| Net Change in Unrealized Appreciation on: | | | | | | | | | | | | |
| Investments | | | 9,167 | | | | 8,298 | | | | 7,411 | |
Foreign Currency Transactions | | | — | | | | — | | | | — | |
Net Increase in Net Assets Resulting from Operations | | | 13,841 | | | | 15,186 | | | | 8,910 | |
| DIVIDENDS AND DISTRIBUTIONS FROM: | | | | | | | | | | | | |
| Net Investment Income: | | | | | | | | | | | | |
| Institutional Class | | | — | | | | — | | | | — | |
| Class N | | | (2,711 | ) | | | (2,296 | ) | | | (4,044 | ) |
| Servicing Class | | | — | | | | — | | | | — | |
| Realized Capital Gains: | | | | | | | | | | | | |
| Institutional Class | | | — | | | | — | | | | — | |
| Class N | | | — | | | | — | | | | — | |
| Servicing Class | | | — | | | | — | | | | — | |
| Return of Capital: | | | | | | | | | | | | |
| | | — | | | | (1,135 | ) | | | (727 | ) |
Total Dividends and Distributions | | | (2,711 | ) | | | (3,431 | ) | | | (4,771 | ) |
CAPITAL SHARE TRANSACTIONS:(1) | | | | | | | | | | | | |
| Institutional Class: | | | | | | | | | | | | |
| Shares Issued | | | — | | | | — | | | | — | |
Shares Issued from Merger(3) | | | — | | | | — | | | | — | |
| Shares Issued in Lieu of Dividends and Distributions | | | — | | | | — | | | | — | |
| | | — | | | | — | | | | — | |
Increase (Decrease) in Net Assets from Institutional Class Share Transactions | | | — | | | | — | | | | — | |
| Class N: | | | | | | | | | | | | |
| Shares Issued | | | 41,598 | | | | 65,148 | | | | 49,255 | |
Shares Issued from Merger(3) | | | — | | | | — | | | | — | |
| Shares Issued in Lieu of Dividends and Distributions | | | 1,766 | | | | 2,657 | | | | 4,440 | |
| Shares Redeemed | | | (33,109 | ) | | | (39,891 | ) | | | (48,715 | ) |
| | | — | | | | — | | | | 7 | |
Increase (Decrease) in Net Assets from Class N Share Transactions | | | 10,255 | | | | 27,914 | | | | 4,987 | |
| Servicing Class: | | | | | | | | | | | | |
| Shares Issued | | | — | | | | — | | | | — | |
| Shares Issued in Lieu of Dividends and Distributions | | | — | | | | — | | | | — | |
| | | — | | | | — | | | | — | |
Increase in Net Assets from Servicing Class Share Transactions | | | — | | | | — | | | | — | |
Net Increase (Decrease) in Net Assets from Share Transactions | | | 10,255 | | | | 27,914 | | | | 4,987 | |
Total Increase (Decrease) in Net Assets | | | 21,385 | | | | 39,669 | | | | 9,126 | |
| NET ASSETS: | | | | | | | | | | | | |
| | | 155,807 | | | | 116,138 | | | | 107,012 | |
| | $ | 177,192 | | | $ | 155,807 | | | $ | 116,138 | |
Undistributed (Distributions in excess of) net investment income | | $ | (222 | ) | | $ | (6 | ) | | $ | 502 | |
| † | For the nine months ended September 30, 2013 and the year ended December 31, 2012. Effective March 29, 2013, Rochdale Investment Trust’s Rochdale Dividend & Income Portfolio and Rochdale Emerging Markets Portfolio (each a “Predecessor Fund”) were merged into City National Rochdale Fund’s Dividend & Income Fund and Emerging Markets Fund, respectively. Information presented for the period prior to March 29, 2013, is that of the respective Predecessor Fund, which had a December 31 fiscal year end. See Note 1 in Notes to Financial Statements for additional information. |
| (1) | See Note 9 for shares issued and redeemed. |
| (2) | Commenced operations on December 3, 2012. |
| (3) | See Note 10 in Notes to Financial Statements. |
| * | On March 29, 2013, the Rochdale Dividend & Income Portfolio and Rochdale Emerging Markets Portfolio were reorganized into the City National Rochdale Dividend & Income Fund and City National Rochdale Emerging Markets Fund, respectively. See Note 1 in Notes to Financial Statements for additional information. |
Amounts designated as “—” are either $0 or have been rounded to $0.
See accompanying notes to financial statements.
CITY NATIONAL ROCHDALE FUNDS | PAGE 108
City National Rochdale U.S. Core Equity Fund (2) | | | City National Rochdale Socially Responsible Equity Fund | | | City National Rochdale Emerging Markets Fund * | |
| | | | | | | | | | | | | | | | 2013† | | | | 2012† | |
| | | | | | | | | | | | | | | | | | | | | | |
| $ | 188 | | | $ | 572 | | | $ | 1,071 | | | $ | 1,120 | | | $ | (1,807 | ) | | $ | 2,076 | | | $ | 127 | |
| | | | | | | | | | | | | | | | | | | | | | | | | | | |
| | 1,957 | | | | 2,022 | | | | 3,917 | | | | 22,369 | | | | (2,111 | ) | | | 1,280 | | | | (2,280 | ) |
| | — | | | | — | | | | — | | | | — | | | | — | | | | — | | | | — | |
| | — | | | | — | | | | — | | | | — | | | | (321 | ) | | | (985 | ) | | | (359 | ) |
| | | | | | | | | | | | | | | | | | | | | | | | | | | |
| | 12,773 | | | | 18,822 | | | | 3,936 | | | | 1,198 | | | | 29,854 | | | | 7,095 | | | | 20,671 | |
| | — | | | | — | | | | — | | | | — | | | | 261 | | | | 14 | | | | (11 | ) |
| | 14,918 | | | | 21,416 | | | | 8,924 | | | | 24,687 | | | | 25,876 | | | | 9,480 | | | | 18,148 | |
| | | | | | | | | | | | | | | | | | | | | | | | | | | |
| | | | | | | | | | | | | | | | | | | | | | | | | | | |
| | — | | | | — | | | | (653 | ) | | | (887 | ) | | | — | | | | — | | | | — | |
| | (50 | ) | | | (245 | ) | | | (413 | ) | | | (247 | ) | | | (1,072 | ) | | | — | | | | — | |
| | (142 | ) | | | (326 | ) | | | — | | | | — | | | | — | | | | — | | | | — | |
| | | | | | | | | | | | | | | | | | | | | | | | | | | |
| | — | | | | — | | | | (7,405 | ) | | | — | | | | — | | | | — | | | | — | |
| | (1,261 | ) | | | — | | | | (5,241 | ) | | | — | | | | — | | | | — | | | | — | |
| | (1,354 | ) | | | — | | | | — | | | | — | | | | — | | | | — | | | | — | |
| | | | | | | | | | | | | | | | | | | | | | | | | | | |
| | — | | | | — | | | | — | | | | — | | | | — | | | | — | | | | (67 | ) |
| | (2,807 | ) | | | (571 | ) | | | (13,712 | ) | | | (1,134 | ) | | | (1,072 | ) | | | — | | | | (67 | ) |
| | | | | | | | | | | | | | | | | | | | | | | | | | | |
| | | | | | | | | | | | | | | | | | | | | | | | | | | |
| | 2,968 | | | | — | | | | 2,828 | | | | 14,934 | | | | — | | | | — | | | | — | |
| | 50,816 | | | | — | | | | — | | | | — | | | | — | | | | — | | | | — | |
| | — | | | | — | | | | 8,054 | | | | 887 | | | | — | | | | — | | | | — | |
| | — | | | | — | | | | (3,191 | ) | | | (68,200 | ) | | | — | | | | — | | | | — | |
| | 53,784 | | | | — | | | | 7,691 | | | | (52,379 | ) | | | — | | | | — | | | | — | |
| | | | | | | | | | | | | | | | | | | | | | | | | | | |
| | 12,287 | | | | 61,997 | | | | 8,240 | | | | 7,776 | | | | 159,357 | | | | 168,575 | | | | 125,949 | |
| | 2,752 | | | | — | | | | — | | | | — | | | | — | | | | — | | | | — | |
| | 1,172 | | | | 211 | | | | 5,517 | | | | 246 | | | | 530 | | | | — | | | | 63 | |
| | (5,317 | ) | | | (6,431 | ) | | | (9,843 | ) | | | (8,192 | ) | | | (21,606 | ) | | | (20,853 | ) | | | (13,211 | ) |
| | — | | | | — | | | | — | | | | — | | | | — | | | | — | | | | 22 | |
| | 10,894 | | | | 55,777 | | | | 3,914 | | | | (170 | ) | | | 138,281 | | | | 147,722 | | | | 112,823 | |
| | | | | | | | | | | | | | | | | | | | | | | | | | | |
| | 17,839 | | | | 70,761 | | | | — | | | | — | | | | — | | | | — | | | | — | |
| | 10 | | | | 3 | | | | — | | | | — | | | | — | | | | — | | | | — | |
| | (7,410 | ) | | | (12,322 | ) | | | — | | | | — | | | | — | | | | — | | | | — | |
| | 10,439 | | | | 58,442 | | | | — | | | | — | | | | — | | | | — | | | | — | |
| | 75,117 | | | | 114,219 | | | | 11,605 | | | | (52,549 | ) | | | 138,281 | | | | 147,722 | | | | 112,823 | |
| | 87,228 | | | | 135,064 | | | | 6,817 | | | | (28,996 | ) | | | 163,085 | | | | 157,202 | | | | 130,904 | |
| | | | | | | | | | | | | | | | | | | | | | | | | | | |
| | 135,064 | | | | — | | | | 76,744 | | | | 105,740 | | | | 294,040 | | | | 136,838 | | | | 5,934 | |
| $ | 222,292 | | | $ | 135,064 | | | $ | 83,561 | | | $ | 76,744 | | | $ | 457,125 | | | $ | 294,040 | | | $ | 136,838 | |
| $ | (3 | ) | | $ | 1 | | | $ | 5 | | | $ | — | | | $ | (1,808 | ) | | $ | 1,071 | | | $ | (125 | ) |
See accompanying notes to financial statements.
CITY NATIONAL ROCHDALE FUNDS | PAGE 109
financial highlights
For a Share Outstanding Throughout Each Period
For the six months ended March 31, 2014 (Unaudited) and the year or period ended September 30,
| | | Net Asset Value Beginning of Period | | | | | | Dividends from Net Investment Income | | | Net Asset Value End of Period | | | | | | Net Assets End of Period (000) | | Ratio of Expenses to Average Net Assets(1)(2) | | Ratio of Net Investment Income to Average Net Assets(1) | | | Ratio of Expenses to Average Net Assets (Excluding Waivers & Recovered Fees)(1) | |
| City National Rochdale Government Money Market Fund | |
| Class N (commenced operations on June 21, 1999) | |
| | 2014 | ** | | $ | 1.00 | | | $ | 0.000 | ^ | | $ | (0.000 | )^ | | $ | 1.00 | | | | 0.00 | % | | $ | 2,723,914 | | | | 0.08 | % | | | 0.01 | % | | | 0.88 | % |
| | 2013 | | | | 1.00 | | | | 0.000 | ^ | | | (0.000 | )^ | | | 1.00 | | | | 0.01 | | | | 3,040,396 | | | | 0.13 | | | | 0.01 | | | | 0.97 | |
| | 2012 | | | | 1.00 | | | | 0.000 | ^ | | | (0.000 | )^ | | | 1.00 | | | | 0.00 | | | | 2,808,068 | | | | 0.14 | | | | 0.01 | | | | 1.11 | |
| | 2011 | | | | 1.00 | | | | 0.000 | ^ | | | (0.000 | )^ | | | 1.00 | | | | 0.02 | | | | 2,926,120 | | | | 0.14 | | | | 0.02 | | | | 1.11 | |
| | 2010 | | | | 1.00 | | | | 0.000 | ^ | | | (0.000 | )^ | | | 1.00 | | | | 0.02 | | | | 2,598,035 | | | | 0.19 | | | | 0.02 | | | | 1.12 | |
| | 2009 | | | | 1.00 | | | | 0.002 | | | | (0.002 | ) | | | 1.00 | | | | 0.19 | | | | 2,549,147 | | | | 0.47 | | | | 0.21 | | | | 1.13 | |
| Class S (commenced operations on October 6, 1999) | |
| | 2014 | ** | | $ | 1.00 | | | $ | 0.000 | ^ | | $ | (0.000 | )^ | | $ | 1.00 | | | | 0.00 | % | | $ | 596,757 | | | | 0.08 | % | | | 0.01 | % | | | 1.08 | % |
| | 2013 | | | | 1.00 | | | | 0.000 | ^ | | | (0.000 | )^ | | | 1.00 | | | | 0.01 | | | | 475,151 | | | | 0.12 | | | | 0.01 | | | | 1.11 | |
| | 2012 | | | | 1.00 | | | | 0.000 | ^ | | | (0.000 | )^ | | | 1.00 | | | | 0.00 | | | | 288,922 | | | | 0.14 | | | | 0.01 | | | | 1.11 | |
| | 2011 | | | | 1.00 | | | | 0.000 | ^ | | | (0.000 | )^ | | | 1.00 | | | | 0.01 | | | | 291,194 | | | | 0.15 | | | | 0.01 | | | | 1.11 | |
| | 2010 | | | | 1.00 | | | | 0.000 | ^ | | | (0.000 | )^ | | | 1.00 | | | | 0.01 | | | | 348,698 | | | | 0.20 | | | | 0.01 | | | | 1.12 | |
| | 2009 | | | | 1.00 | | | | 0.001 | | | | (0.001 | ) | | | 1.00 | | | | 0.12 | | | | 298,842 | | | | 0.54 | | | | 0.13 | | | | 1.13 | |
| Servicing Class (commenced operations on April 3, 2000)^^ | |
| | 2014 | ** | | $ | 1.00 | | | $ | 0.000 | ^ | | $ | (0.000 | )^ | | $ | 1.00 | | | | 0.00 | % | | $ | 159,760 | | | | 0.08 | % | | | 0.01 | % | | | 0.58 | % |
| | 2013 | | | | 1.00 | | | | 0.000 | ^ | | | (0.000 | )^ | | | 1.00 | | | | 0.01 | | | | 128,423 | | | | 0.12 | | | | 0.01 | | | | 0.61 | |
| | 2012 | | | | 1.00 | | | | 0.000 | ^ | | | (0.000 | )^ | | | 1.00 | | | | 0.00 | | | | 96,452 | | | | 0.14 | | | | 0.01 | | | | 0.61 | |
| | 2011 | | | | 1.00 | | | | 0.000 | ^ | | | (0.000 | )^ | | | 1.00 | | | | 0.02 | | | | 51,705 | | | | 0.14 | | | | 0.03 | | | | 0.61 | |
| | 2010 | | | | 1.00 | | | | 0.000 | ^ | | | (0.000 | )^ | | | 1.00 | | | | 0.04 | | | | 81,050 | | | | 0.17 | | | | 0.04 | | | | 0.62 | |
| | 2009 | | | | 1.00 | | | | 0.003 | | | | (0.003 | ) | | | 1.00 | | | | 0.27 | | | | 123,863 | | | | 0.36 | | | | 0.26 | | | | 0.65 | |
City National Rochdale Prime Money Market Fund | |
| Institutional Class (commenced operations on December 19, 2012) | |
| | 2014 | ** | | $ | 1.00 | | | $ | 0.000 | ^ | | $ | (0.000 | )^ | | $ | 1.00 | | | | 0.00 | % | | $ | 53,785 | | | | 0.15 | % | | | 0.01 | % | | | 0.33 | % |
| | 2013 | | | | 1.00 | | | | 0.000 | ^ | | | (0.000 | )^ | | | 1.00 | | | | 0.02 | | | | 11,207 | | | | 0.18 | | | | 0.02 | | | | 0.35 | |
| Class N (commenced operations on October 18, 1999) | |
| | 2014 | ** | | $ | 1.00 | | | $ | 0.000 | ^ | | $ | (0.000 | )^ | | $ | 1.00 | | | | 0.00 | % | | $ | 328,600 | | | | 0.15 | % | | | 0.01 | % | | | 0.88 | % |
| | 2013 | | | | 1.00 | | | | 0.000 | ^ | | | (0.000 | )^ | | | 1.00 | | | | 0.02 | | | | 424,972 | | | | 0.20 | | | | 0.02 | | | | 0.96 | |
| | 2012 | | | | 1.00 | | | | 0.000 | ^ | | | (0.000 | )^ | | | 1.00 | | | | 0.00 | | | | 394,036 | | | | 0.24 | | | | 0.01 | | | | 1.10 | |
| | 2011 | | | | 1.00 | | | | 0.000 | ^ | | | (0.000 | )^ | | | 1.00 | | | | 0.03 | | | | 450,282 | | | | 0.25 | | | | 0.03 | | | | 1.10 | |
| | 2010 | | | | 1.00 | | | | 0.000 | ^ | | | (0.000 | )*^ | | | 1.00 | | | | 0.06 | | | | 432,235 | | | | 0.28 | | | | 0.04 | | | | 1.10 | |
| | 2009 | | | | 1.00 | | | | 0.003 | | | | (0.003 | ) | | | 1.00 | | | | 0.33 | | | | 656,769 | | | | 0.61 | | | | 0.39 | | | | 1.15 | |
| Class S (commenced operations on October 26, 1999) | |
| | 2014 | ** | | $ | 1.00 | | | $ | 0.000 | ^ | | $ | (0.000 | )^ | | $ | 1.00 | | | | 0.00 | % | | $ | 187,939 | | | | 0.15 | % | | | 0.01 | % | | | 1.08 | % |
| | 2013 | | | | 1.00 | | | | 0.000 | ^ | | | (0.000 | )^ | | | 1.00 | | | | 0.01 | | | | 207,252 | | | | 0.21 | | | | 0.01 | | | | 1.09 | |
| | 2012 | | | | 1.00 | | | | 0.000 | ^ | | | (0.000 | )^ | | | 1.00 | | | | 0.00 | | | | 256,060 | | | | 0.24 | | | | 0.01 | | | | 1.10 | |
| | 2011 | | | | 1.00 | | | | 0.000 | ^ | | | 0.000 | ^ | | | 1.00 | | | | 0.02 | | | | 265,116 | | | | 0.27 | | | | 0.01 | | | | 1.10 | |
| | 2010 | | | | 1.00 | | | | 0.000 | ^ | | | (0.000 | )*^ | | | 1.00 | | | | 0.04 | | | | 352,575 | | | | 0.30 | | | | 0.02 | | | | 1.10 | |
| | 2009 | | | | 1.00 | | | | 0.002 | | | | (0.002 | ) | | | 1.00 | | | | 0.23 | | | | 372,762 | | | | 0.73 | | | | 0.28 | | | | 1.15 | |
| Servicing Class (commenced operations on March 23, 1998)^^ | |
| | 2014 | ** | | $ | 1.00 | | | $ | 0.000 | ^ | | $ | (0.000 | )^ | | $ | 1.00 | | | | 0.00 | % | | $ | 606,511 | | | | 0.15 | % | | | 0.01 | % | | | 0.58 | % |
| | 2013 | | | | 1.00 | | | | 0.000 | ^ | | | (0.000 | )^ | | | 1.00 | | | | 0.02 | | | | 613,445 | | | | 0.19 | | | | 0.02 | | | | 0.59 | |
| | 2012 | | | | 1.00 | | | | 0.000 | ^ | | | (0.000 | )^ | | | 1.00 | | | | 0.00 | | | | 506,728 | | | | 0.23 | | | | 0.02 | | | | 0.60 | |
| | 2011 | | | | 1.00 | | | | 0.001 | | | | (0.001 | ) | | | 1.00 | | | | 0.06 | | | | 630,250 | | | | 0.22 | | | | 0.05 | | | | 0.60 | |
| | 2010 | | | | 1.00 | | | | 0.001 | | | | (0.001 | )* | | | 1.00 | | | | 0.09 | | | | 489,980 | | | | 0.24 | | | | 0.08 | | | | 0.60 | |
| | 2009 | | | | 1.00 | | | | 0.005 | | | | (0.005 | ) | | | 1.00 | | | | 0.46 | | | | 543,326 | | | | 0.44 | | | | 0.46 | | | | 0.65 | |
City National Rochdale California Tax Exempt Money Market Fund | |
| Class N (commenced operations on June 21, 1999) | |
| | 2014 | ** | | $ | 1.00 | | | $ | 0.000 | ^ | | $ | (0.000 | )^ | | $ | 1.00 | | | | 0.00 | % | | $ | 653,100 | | | | 0.05 | % | | | 0.01 | % | | | 0.90 | % |
| | 2013 | | | | 1.00 | | | | 0.000 | ^ | | | (0.000 | )^ | | | 1.00 | | | | 0.01 | | | | 673,208 | | | | 0.11 | | | | 0.01 | | | | 0.97 | |
| | 2012 | | | | 1.00 | | | | 0.000 | ^ | | | (0.000 | )^ | | | 1.00 | | | | 0.00 | | | | 666,532 | | | | 0.12 | | | | 0.01 | | | | 1.11 | |
| | 2011 | | | | 1.00 | | | | 0.000 | ^ | | | (0.000 | )^ | | | 1.00 | | | | 0.02 | | | | 628,163 | | | | 0.17 | | | | 0.02 | | | | 1.12 | |
| | 2010 | | | | 1.00 | | | | 0.000 | ^ | | | (0.000 | )*^ | | | 1.00 | | | | 0.03 | | | | 638,839 | | | | 0.20 | | | | 0.02 | | | | 1.12 | |
| | 2009 | | | | 1.00 | | | | 0.002 | | | | (0.002 | ) | | | 1.00 | | | | 0.23 | | | | 704,840 | | | | 0.41 | | | | 0.25 | | | | 1.16 | |
| Class S (commenced operations on November 12, 1999) | |
| | 2014 | ** | | $ | 1.00 | | | $ | 0.000 | ^ | | $ | (0.000 | )^ | | $ | 1.00 | | | | 0.00 | % | | $ | 61,351 | | | | 0.06 | % | | | 0.01 | % | | | 1.10 | % |
| | 2013 | | | | 1.00 | | | | 0.000 | ^ | | | (0.000 | )^ | | | 1.00 | | | | 0.01 | | | | 79,312 | | | | 0.11 | | | | 0.01 | | | | 1.11 | |
| | 2012 | | | | 1.00 | | | | 0.000 | ^ | | | (0.000 | )^ | | | 1.00 | | | | 0.00 | | | | 99,970 | | | | 0.12 | | | | 0.01 | | | | 1.11 | |
| | 2011 | | | | 1.00 | | | | 0.000 | ^ | | | (0.000 | )^ | | | 1.00 | | | | 0.01 | | | | 78,221 | | | | 0.17 | | | | 0.01 | | | | 1.12 | |
| | 2010 | | | | 1.00 | | | | 0.000 | ^ | | | (0.000 | )*^ | | | 1.00 | | | | 0.01 | | | | 48,265 | | | | 0.22 | | | | 0.01 | | | | 1.12 | |
| | 2009 | | | | 1.00 | | | | 0.002 | | | | (0.002 | ) | | | 1.00 | | | | 0.17 | | | | 74,396 | | | | 0.54 | | | | 0.26 | | | | 1.16 | |
| Servicing Class (commenced operations on April 3, 2000)^^ | |
| | 2014 | ** | | $ | 1.00 | | | $ | 0.000 | ^ | | $ | (0.000 | )^ | | $ | 1.00 | | | | 0.00 | % | | $ | 187,553 | | | | 0.05 | % | | | 0.01 | % | | | 0.60 | % |
| | 2013 | | | | 1.00 | | | | 0.000 | ^ | | | (0.000 | )^ | | | 1.00 | | | | 0.01 | | | | 165,740 | | | | 0.10 | | | | 0.01 | | | | 0.61 | |
| | 2012 | | | | 1.00 | | | | 0.000 | ^ | | | (0.000 | )^ | | | 1.00 | | | | 0.00 | | | | 137,665 | | | | 0.12 | | | | 0.01 | | | | 0.61 | |
| | 2011 | | | | 1.00 | | | | 0.000 | ^ | | | (0.000 | )^ | | | 1.00 | | | | 0.02 | | | | 169,932 | | | | 0.16 | | | | 0.02 | | | | 0.62 | |
| | 2010 | | | | 1.00 | | | | 0.000 | ^ | | | (0.000 | )*^ | | | 1.00 | | | | 0.04 | | | | 140,238 | | | | 0.19 | | | | 0.04 | | | | 0.63 | |
| | 2009 | | | | 1.00 | | | | 0.003 | | | | (0.003 | ) | | | 1.00 | | | | 0.33 | | | | 141,579 | | | | 0.30 | | | | 0.31 | | | | 0.65 | |
| ** | For the six months ended March 31, 2014. |
| † | Per share calculations are based on Average Shares outstanding throughout the period. |
| ‡ | Returns are for the period indicated and have not been annualized. Fee waivers are in effect; if they had not been in effect, performance would have been lower. Returns shown do not reflect the deduction of taxes that a shareholder would pay on fund distributions or the redemption of fund shares. |
| ^ | Amount represents less than $0.001. |
| ^^ | Effective November 28, 2012, Institutional Class Shares were redesignated as Servicing Class Shares. This share class name change had no impact on the Fund’s operations or investment policy. |
| * | Includes a realized capital gain distribution of less than $0.001. |
| (1) | Annualized for periods less than one year. |
| (2) | Ratio includes waivers and previously waived investment advisory fees recovered. The impact of the recovered fees may cause a higher net expense ratio. |
See accompanying notes to financial statements.
CITY NATIONAL ROCHDALE FUNDS | PAGE 110
| | | Net Asset Value Beginning of Period | | | | | | Net Realized and Unrealized Gains (Losses) on Securities† | | | Dividends from Net Investment Income | | | Distri-butions from Realized Capital Gains | | | Net Asset Value End of Period | | | | | | Net Assets End of Period (000) | | | Ratio of Expenses to Average Net Assets(1)(2) | | | Ratio of Net Investment Income to Average Net Assets(1) | | | Ratio of Expenses to Average Net Assets (Excluding Waivers & Recovered Fees)(1) | | | | |
| City National Rochdale Limited Maturity Fixed Income Fund | |
| Institutional Class (commenced operations on October 22,1988) | |
| | 2014 | ** | | $ | 11.16 | | | $ | 0.03 | | | $ | 0.03 | | | $ | (0.04 | ) | | $ | — | | | $ | 11.18 | | | | 0.51 | % | | $ | 24,093 | | | | 0.67 | % | | | 0.62 | % | | | 0.90 | % | | | 18 | % |
| | 2013 | | | | 11.25 | | | | 0.06 | | | | (0.08 | ) | | | (0.07 | ) | | | — | | | | 11.16 | | | | (0.15 | ) | | | 40,205 | | | | 0.64 | | | | 0.51 | | | | 0.64 | | | | 32 | |
| | 2012 | | | | 11.15 | | | | 0.09 | | | | 0.12 | | | | (0.11 | ) | | | — | | | | 11.25 | | | | 1.88 | | | | 48,141 | | | | 0.68 | | | | 0.85 | | | | 0.68 | | | | 87 | |
| | 2011 | | | | 11.21 | | | | 0.16 | | | | (0.06 | ) | | | (0.16 | ) | | | — | | | | 11.15 | | | | 0.92 | | | | 31,743 | | | | 0.66 | | | | 1.46 | | | | 0.67 | | | | 50 | |
| | 2010 | | | | 11.06 | | | | 0.20 | | | | 0.16 | | | | (0.21 | ) | | | — | | | | 11.21 | | | | 3.28 | | | | 33,279 | | | | 0.73 | | | | 1.82 | | | | 0.71 | | | | 118 | |
| | 2009 | | | | 10.49 | | | | 0.30 | | | | 0.57 | | | | (0.30 | ) | | | — | | | | 11.06 | | | | 8.44 | | | | 37,255 | | | | 0.75 | | | | 2.66 | | | | 0.76 | | | | 98 | |
| Class N (commenced operations on October 22, 2004) | |
| | 2014 | ** | | $ | 11.16 | | | $ | 0.02 | | | $ | 0.03 | | | $ | (0.02 | ) | | $ | — | | | $ | 11.19 | | | | 0.47 | % | | $ | 5,063 | | | | 0.92 | % | | | 0.39 | % | | | 1.42 | % | | | 18 | % |
| | 2013 | | | | 11.26 | | | | 0.03 | | | | (0.08 | ) | | | (0.05 | ) | | | — | | | | 11.16 | | | | (0.49 | ) | | | 4,530 | | | | 0.89 | | | | 0.26 | | | | 1.14 | | | | 32 | |
| | 2012 | | | | 11.15 | | | | 0.08 | | | | 0.11 | | | | (0.08 | ) | | | — | | | | 11.26 | | | | 1.71 | | | | 4,347 | | | | 0.94 | | | | 0.69 | | | | 1.19 | | | | 87 | |
| | 2011 | | | | 11.22 | | | | 0.14 | | | | (0.08 | ) | | | (0.13 | ) | | | — | | | | 11.15 | | | | 0.58 | | | | 6,402 | | | | 0.91 | | | | 1.21 | | | | 1.17 | | | | 50 | |
| | 2010 | | | | 11.07 | | | | 0.16 | | | | 0.17 | | | | (0.18 | ) | | | — | | | | 11.22 | | | | 3.04 | | | | 9,262 | | | | 0.98 | | | | 1.48 | | | | 1.22 | | | | 118 | |
| | 2009 | | | | 10.51 | | | | 0.27 | | | | 0.57 | | | | (0.28 | ) | | | — | | | | 11.07 | | | | 8.07 | | | | 1,471 | | | | 1.00 | | | | 2.29 | | | | 1.24 | | | | 98 | |
City National Rochdale Government Bond Fund | |
| Institutional Class (commenced operations on February 1, 2012) | |
| | 2014 | ** | | $ | 10.47 | | | $ | 0.03 | | | $ | 0.01 | | | $ | (0.03 | ) | | $ | — | | | $ | 10.48 | | | | 0.42 | % | | $ | 58,613 | | | | 0.53 | % | | | 0.63 | % | | | 0.57 | % | | | 34 | % |
| | 2013 | | | | 10.73 | | | | 0.11 | | | | (0.23 | ) | | | (0.14 | ) | | | — | | | | 10.47 | | | | (1.11 | ) | | | 56,351 | | | | 0.54 | | | | 1.03 | | | | 0.52 | | | | 28 | |
| | 2012 | | | | 10.75 | | | | 0.05 | | | | 0.04 | | | | (0.11 | ) | | | — | | | | 10.73 | | | | 0.01 | | | | 55,502 | | | | 0.55 | | | | 0.96 | | | | 0.53 | | | | 55 | |
| Class N (commenced operations on April 13, 2000) | |
| | 2014 | ** | | $ | 10.49 | | | $ | 0.01 | | | $ | — | | | $ | (0.01 | ) | | $ | — | | | $ | 10.49 | | | | 0.07 | % | | $ | 2,352 | | | | 1.03 | % | | | 0.13 | % | | | 1.07 | % | | | 34 | % |
| | 2013 | | | | 10.75 | | | | 0.04 | | | | (0.21 | ) | | | (0.09 | ) | | | — | | | | 10.49 | | | | (1.60 | ) | | | 2,505 | | | | 1.03 | | | | 0.38 | | | | 1.02 | | | | 28 | |
| | 2012 | | | | 10.77 | | | | 0.06 | | | | 0.05 | | | | (0.12 | ) | | | (0.01 | ) | | | 10.75 | | | | 0.01 | | | | 2,970 | | | | 1.03 | | | | 0.56 | | | | 1.03 | | | | 55 | |
| | 2011 | | | | 10.68 | | | | 0.12 | | | | 0.15 | | | | (0.18 | ) | | | — | | | | 10.77 | | | | 2.60 | | | | 2,940 | | | | 0.95 | | | | 1.17 | | | | 1.03 | | | | 86 | |
| | 2010 | | | | 10.60 | | | | 0.16 | | | | 0.16 | | | | (0.24 | ) | | | — | | | | 10.68 | | | | 3.10 | | | | 3,251 | | | | 0.95 | | | | 1.57 | | | | 1.03 | | | | 93 | |
| | 2009 | | | | 10.42 | | | | 0.32 | | | | 0.18 | | | | (0.32 | ) | | | — | | | | 10.60 | | | | 4.91 | | | | 3,109 | | | | 0.95 | | | | 3.04 | | | | 1.02 | | | | 85 | |
| Servicing Class (commenced operations on January 14, 2000)^ | |
| | 2014 | ** | | $ | 10.47 | | | $ | 0.02 | | | $ | — | | | $ | (0.02 | ) | | $ | — | | | $ | 10.47 | | | | 0.20 | % | | $ | 113,972 | | | | 0.78 | % | | | 0.38 | % | | | 0.82 | % | | | 34 | % |
| | 2013 | | | | 10.72 | | | | 0.07 | | | | (0.20 | ) | | | (0.12 | ) | | | — | | | | 10.47 | | | | (1.26 | ) | | | 114,953 | | | | 0.79 | | | | 0.62 | | | | 0.77 | | | | 28 | |
| | 2012 | | | | 10.75 | | | | 0.09 | | | | 0.03 | | | | (0.14 | ) | | | (0.01 | ) | | | 10.72 | | | | 0.01 | | | | 124,121 | | | | 0.77 | | | | 0.83 | | | | 0.78 | | | | 55 | |
| | 2011 | | | | 10.66 | | | | 0.15 | | | | 0.15 | | | | (0.21 | ) | | | — | | | | 10.75 | | | | 2.86 | | | | 175,866 | | | | 0.70 | | | | 1.40 | | | | 0.78 | | | | 86 | |
| | 2010 | | | | 10.58 | | | | 0.19 | | | | 0.16 | | | | (0.27 | ) | | | — | | | | 10.66 | | | | 3.37 | | | | 155,376 | | | | 0.70 | | | | 1.81 | | | | 0.78 | | | | 93 | |
| | 2009 | | | | 10.40 | | | | 0.35 | | | | 0.18 | | | | (0.35 | ) | | | — | | | | 10.58 | | | | 5.18 | | | | 71,966 | | | | 0.70 | | | | 3.29 | | | | 0.77 | | | | 85 | |
City National Rochdale Corporate Bond Fund | |
| Class N (commenced operations on April 13, 2000) | |
| | 2014 | ** | | $ | 10.71 | | | $ | 0.07 | | | $ | 0.05 | | | $ | (0.07 | ) | | $ | (0.07 | ) | | $ | 10.69 | | | | 1.16 | % | | $ | 3,354 | | | | 1.01 | % | | | 1.33 | % | | | 1.06 | % | | | 22 | % |
| | 2013 | | | | 10.91 | | | | 0.16 | | | | (0.10 | ) | | | (0.17 | ) | | | (0.09 | ) | | | 10.71 | | | | 0.49 | | | | 3,100 | | | | 1.00 | | | | 1.51 | | | | 1.00 | | | | 29 | |
| | 2012 | | | | 10.59 | | | | 0.22 | | | | 0.37 | | | | (0.22 | ) | | | (0.05 | ) | | | 10.91 | | | | 0.06 | | | | 2,535 | | | | 1.00 | | | | 2.05 | | | | 1.00 | | | | 31 | |
| | 2011 | | | | 10.89 | | | | 0.29 | | | | (0.30 | ) | | | (0.29 | ) | | | — | | | | 10.59 | | | | (0.10 | ) | | | 2,481 | | | | 1.00 | | | | 2.69 | | | | 1.00 | | | | 40 | |
| | 2010 | | | | 10.57 | | | | 0.33 | | | | 0.32 | | | | (0.33 | ) | | | — | | | | 10.89 | | | | 6.23 | | | | 2,384 | | | | 0.99 | | | | 3.05 | | | | 1.00 | | | | 28 | |
| | 2009 | | | | 9.77 | | | | 0.36 | | | | 0.81 | | | | (0.37 | ) | | | — | | | | 10.57 | | | | 12.19 | | | | 995 | | | | 0.99 | | | | 3.59 | | | | 1.00 | | | | 30 | |
| Servicing Class (commenced operations on January 14, 2000)^ | |
| | 2014 | ** | | $ | 10.70 | | | $ | 0.08 | | | $ | 0.05 | | | $ | (0.08 | ) | | $ | (0.07 | ) | | $ | 10.68 | | | | 1.28 | % | | $ | 135,510 | | | | 0.76 | % | | | 1.58 | % | | | 0.82 | % | | | 22 | % |
| | 2013 | | | | 10.90 | | | | 0.19 | | | | (0.11 | ) | | | (0.19 | ) | | | (0.09 | ) | | | 10.70 | | | | 0.75 | | | | 135,184 | | | | 0.75 | | | | 1.77 | | | | 0.75 | | | | 29 | |
| | 2012 | | | | 10.58 | | | | 0.25 | | | | 0.37 | | | | (0.25 | ) | | | (0.05 | ) | | | 10.90 | | | | 0.06 | | | | 133,787 | | | | 0.75 | | | | 2.30 | | | | 0.75 | | | | 31 | |
| | 2011 | | | | 10.88 | | | | 0.32 | | | | (0.30 | ) | | | (0.32 | ) | | | — | | | | 10.58 | | | | 0.15 | | | | 111,563 | | | | 0.75 | | | | 2.94 | | | | 0.75 | | | | 40 | |
| | 2010 | | | | 10.56 | | | | 0.35 | | | | 0.32 | | | | (0.35 | ) | | | — | | | | 10.88 | | | | 6.50 | | | | 105,571 | | | | 0.74 | | | | 3.32 | | | | 0.75 | | | | 28 | |
| | 2009 | | | | 9.76 | | | | 0.39 | | | | 0.80 | | | | (0.39 | ) | | | — | | | | 10.56 | | | | 12.48 | | | | 88,897 | | | | 0.74 | | | | 3.88 | | | | 0.75 | | | | 30 | |
City National Rochdale California Tax Exempt Bond Fund | |
| Class N (commenced operations on April 13, 2000) | |
| | 2014 | ** | | $ | 10.54 | | | $ | 0.07 | | | $ | 0.09 | | | $ | (0.07 | ) | | $ | (0.02 | ) | | $ | 10.61 | | | | 1.52 | % | | $ | 10,037 | | | | 0.88 | % | | | 1.32 | % | | | 1.02 | % | | | 22 | % |
| | 2013 | | | | 10.86 | | | | 0.18 | | | | (0.22 | ) | | | (0.18 | ) | | | (0.10 | ) | | | 10.54 | | | | (0.95 | ) | | | 8,197 | | | | 0.87 | | | | 1.64 | | | | 0.86 | | | | 34 | |
| | 2012 | | | | 10.70 | | | | 0.22 | | | | 0.23 | | | | (0.22 | ) | | | (0.07 | ) | | | 10.86 | | | | 4.32 | | | | 6,093 | | | | 0.83 | | | | 2.07 | | | | 0.86 | | | | 27 | |
| | 2011 | | | | 10.73 | | | | 0.26 | | | | 0.01 | | | | (0.26 | ) | | | (0.04 | ) | | | 10.70 | | | | 2.65 | | | | 4,563 | | | | 0.75 | | | | 2.46 | | | | 0.87 | | | | 26 | |
| | 2010 | | | | 10.60 | | | | 0.29 | | | | 0.13 | | | | (0.29 | ) | | | — | | | | 10.73 | | | | 4.06 | | | | 3,309 | | | | 0.75 | | | | 2.75 | | | | 0.87 | | | | 28 | |
| | 2009 | | | | 10.09 | | | | 0.30 | | | | 0.51 | | | | (0.30 | ) | | | — | | | | 10.60 | | | | 8.15 | | | | 1,902 | | | | 0.75 | | | | 2.92 | | | | 0.87 | | | | 50 | |
| Servicing Class (commenced operations on January 14, 2000)^ | |
| | 2014 | ** | | $ | 10.51 | | | $ | 0.08 | | | $ | 0.09 | | | $ | (0.08 | ) | | $ | (0.02 | ) | | $ | 10.58 | | | | 1.65 | % | | $ | 60,942 | | | | 0.63 | % | | | 1.58 | % | | | 0.77 | % | | | 22 | % |
| | 2013 | | | | 10.83 | | | | 0.20 | | | | (0.22 | ) | | | (0.20 | ) | | | (0.10 | ) | | | 10.51 | | | | (0.20 | ) | | | 59,149 | | | | 0.62 | | | | 1.91 | | | | 0.62 | �� | | | 34 | |
| | 2012 | | | | 10.67 | | | | 0.25 | | | | 0.23 | | | | (0.25 | ) | | | (0.07 | ) | | | 10.83 | | | | 4.59 | | | | 51,840 | | | | 0.58 | | | | 2.34 | | | | 0.61 | | | | 27 | |
| | 2011 | | | | 10.70 | | | | 0.29 | | | | 0.01 | | | | (0.29 | ) | | | (0.04 | ) | | | 10.67 | | | | 2.92 | | | | 53,464 | | | | 0.50 | | | | 2.73 | | | | 0.62 | | | | 26 | |
| | 2010 | | | | 10.57 | | | | 0.32 | | | | 0.13 | | | | (0.32 | ) | | | — | | | | 10.70 | | | | 4.34 | | | | 40,457 | | | | 0.50 | | | | 3.03 | | | | 0.62 | | | | 28 | |
| | 2009 | | | | 10.06 | | | | 0.33 | | | | 0.51 | | | | (0.33 | ) | | | — | | | | 10.57 | | | | 8.45 | | | | 38,581 | | | | 0.50 | | | | 3.18 | | | | 0.61 | | | | 50 | |
| ** | For the six months ended or period ended March 31, 2014. |
| † | Per share calculations are based on Average Shares outstanding throughout the period. |
| ‡ | Returns are for the period indicated and have not been annualized. Fee waivers are in effect; if they had not been in effect, performance would have been lower. Returns shown do not reflect the deduction of taxes that a shareholder would pay on fund distributions or the redemption of fund shares. |
| ^ | Effective December 19, 2011, Institutional Class Shares were redesignated as Servicing Class Shares. This share class name change had no impact on the Fund’s operations or investment policy. |
| (1) | Annualized for periods less than one year. |
| (2) | Ratio includes waivers and previously waived investment advisory fees recovered. The impact of the recovered fees may cause a higher net expense ratio. |
Amounts designated as “—” are either $0 or have been rounded to $0.
See accompanying notes to financial statements.
CITY NATIONAL ROCHDALE FUNDS | PAGE 111
financial highlights/consolidated financial highlights
For a Share Outstanding Throughout Each Period
For the six months ended March 31, 2014 (Unaudited) and the year or period ended September 30,
| | | Net Asset Value Beginning of Period | | | | | | Net Realized and Unrealized Gains (Losses) on Securities† | | | Dividends from Net Investment Income | | | Distri-butions from Realized Capital Gains | | | Net Asset Value End of Period | | | | | | Net Assets End of Period (000) | | | Ratio of Expenses to Average Net Assets(1)(2) | | | Ratio of Net Investment Income to Average Net Assets(1) | | | Ratio of Expenses to Average Net Assets (Excluding Waivers & Recovered Fees)(1) | | | | |
| City National Rochdale Municipal High Income Fund | |
| Class N (commenced operations on December 30, 2013) | |
| | 2014 | ** | | $ | 10.00 | | | $ | 0.11 | | | $ | 0.30 | | | $ | (0.10 | ) | | $ | — | | | $ | 10.31 | | | | 4.14 | % | | $ | 76,821 | | | | 1.12 | % | | | 4.08 | % | | | 1.15 | % | | | 0 | % |
| Servicing Class (commenced operations on December 30, 2013) | |
| | 2014 | ** | | $ | 10.00 | | | $ | 0.11 | | | $ | 0.32 | | | $ | (0.11 | ) | | $ | — | | | $ | 10.32 | | | | 4.29 | % | | $ | 99,341 | | | | 0.88 | % | | | 4.27 | % | | | 0.95 | % | | | 0 | % |
City National Rochdale High Yield Bond Fund | |
| Institutional Class (commenced operations on February 2, 2012) | |
| | 2014 | ** | | $ | 8.59 | | | $ | 0.28 | | | $ | 0.34 | | | $ | (0.28 | ) | | $ | (0.02 | ) | | $ | 8.91 | | | | 7.31 | % | | $ | 40,951 | | | | 0.70 | % | | | 6.40 | % | | | 0.77 | % | | | 30 | % |
| | 2013 | | | | 8.64 | | | | 0.60 | | | | (0.05 | ) | | | (0.60 | ) | | | — | | | | 8.59 | | | | 6.49 | | | | 39,219 | | | | 0.75 | | | | 6.87 | | | | 0.75 | | | | 56 | |
| | 2012 | | | | 8.39 | | | | 0.43 | | | | 0.26 | | | | (0.44 | ) | | | — | | | | 8.64 | | | | 8.39 | | | | 40,891 | | | | 0.85 | | | | 7.66 | | | | 0.85 | | | | 41 | |
| Class N (commenced operations on January 14, 2000) | |
| | 2014 | ** | | $ | 8.59 | | | $ | 0.26 | | | $ | 0.34 | | | $ | (0.26 | ) | | $ | (0.02 | ) | | $ | 8.91 | | | | 7.04 | % | | $ | 36,614 | | | | 1.20 | % | | | 5.91 | % | | | 1.27 | % | | | 30 | % |
| | 2013 | | | | 8.64 | | | | 0.56 | | | | (0.05 | ) | | | (0.56 | ) | | | — | | | | 8.59 | | | | 5.95 | | | | 34,371 | | | | 1.27 | | | | 6.37 | | | | 1.26 | | | | 56 | |
| | 2012 | | | | 7.98 | | | | 0.62 | | | | 0.66 | | | | (0.62 | ) | | | — | | | | 8.64 | | | | 16.56 | | | | 38,629 | | | | 1.38 | | | | 7.43 | | | | 1.39 | | | | 41 | |
| | 2011 | | | | 8.31 | | | | 0.69 | | | | (0.33 | ) | | | (0.69 | ) | | | — | | | | 7.98 | | | | 4.14 | | | | 28,672 | | | | 1.30 | | | | 8.12 | | | | 1.40 | | | | 56 | |
| | 2010 | | | | 7.56 | | | | 0.70 | | | | 0.74 | | | | (0.69 | ) | | | — | | | | 8.31 | | | | 19.81 | | | | 24,010 | | | | 1.30 | | | | 8.68 | | | | 1.40 | | | | 87 | |
| | 2009 | | | | 7.40 | | | | 0.60 | | | | 0.18 | | | | (0.62 | ) | | | — | | | | 7.56 | | | | 12.61 | | | | 19,637 | | | | 1.30 | | | | 9.43 | | | | 1.40 | | | | 59 | |
| Servicing Class (commenced operations on January 14, 2000)^ | |
| | 2014 | ** | | $ | 8.59 | | | $ | 0.27 | | | $ | 0.34 | | | $ | (0.27 | ) | | $ | (0.02 | ) | | $ | 8.91 | | | | 7.18 | % | | $ | 46,549 | | | | 0.95 | % | | | 6.12 | % | | | 1.01 | % | | | 30 | % |
| | 2013 | | | | 8.63 | | | | 0.58 | | | | (0.04 | ) | | | (0.58 | ) | | | — | | | | 8.59 | | | | 6.35 | | | | 88,949 | | | | 0.99 | | | | 6.58 | | | | 0.99 | | | | 56 | |
| | 2012 | | | | 7.98 | | | | 0.65 | | | | 0.65 | | | | (0.65 | ) | | | — | | | | 8.63 | | | | 16.77 | | | | 74,245 | | | | 1.08 | | | | 7.76 | | | | 1.09 | | | | 41 | |
| | 2011 | | | | 8.31 | | | | 0.72 | | | | (0.33 | ) | | | (0.72 | ) | | | — | | | | 7.98 | | | | 4.45 | | | | 65,829 | | | | 1.00 | | | | 8.43 | | | | 1.10 | | | | 56 | |
| | 2010 | | | | 7.56 | | | | 0.72 | | | | 0.75 | | | | (0.72 | ) | | | — | | | | 8.31 | | | | 20.17 | | | | 33,845 | | | | 1.00 | | | | 8.89 | | | | 1.10 | | | | 87 | |
| | 2009 | | | | 7.40 | | | | 0.62 | | | | 0.18 | | | | (0.64 | ) | | | — | | | | 7.56 | | | | 12.94 | | | | 16,355 | | | | 1.00 | | | | 9.75 | | | | 1.10 | | | | 59 | |
City National Rochdale Intermediate Fixed Income Fund | |
| Institutional Class (commenced operations on December 20, 2013) | |
| | 2014 | ** | | $ | 25.89 | | | $ | 0.20 | | | $ | 0.22 | | | $ | (0.19 | ) | | $ | — | | | $ | 26.12 | | | | 1.61 | % | | $ | 40,507 | | | | 0.51 | % | | | 2.70 | % | | | 0.52 | % | | | 10 | % |
| Class N (commenced operations on December 31, 1999) | |
| | 2014 | ** | | $ | 25.89 | | | $ | 0.31 | | | $ | 0.22 | | | $ | (0.30 | ) | | $ | — | | | $ | 26.12 | | | | 2.05 | % | | $ | 175,559 | | | | 1.01 | % | | | 2.38 | % | | | 1.03 | % | | | 10 | % |
| | 2013 | * | | | 26.76 | | | | 0.60 | | | | (0.85 | ) | | | (0.62 | ) | | | — | | | | 25.89 | | | | (0.96 | ) | | | 155,740 | | | | 1.02 | | | | 3.04 | | | | 1.04 | | | | 21 | |
| | 2012 | | | | 25.68 | | | | 0.95 | | | | 1.08 | | | | (0.95 | ) | | | — | | | | 26.76 | | | | 7.99 | | | | 130,359 | | | | 1.13 | | | | 3.59 | | | | 1.12 | | | | 26 | |
| | 2011 | | | | 25.89 | | | | 0.97 | | | | (0.23 | ) | | | (0.95 | ) | | | — | | | | 25.68 | | | | 2.88 | | | | 107,957 | | | | 1.15 | | | | 3.74 | | | | 1.15 | | | | 58 | |
| | 2010 | | | | 25.11 | | | | 0.95 | | | | 0.79 | | | | (0.96 | ) | | | — | | | | 25.89 | | | | 7.01 | | | | 75,900 | | | | 1.15 | | | | 3.79 | | | | 1.12 | | | | 52 | |
| | 2009 | | | | 24.68 | | | | 0.95 | | | | 0.44 | | | | (0.96 | ) | | | — | | | | 25.11 | | | | 5.77 | | | | 61,600 | | | | 1.12 | | | | 3.99 | | | | 1.22 | | | | 70 | |
City National Rochdale Fixed Income Opportunities Fund | |
| Class N (commenced operations on July 1, 2009) | |
| | 2014 | ** | | $ | 26.83 | | | $ | 0.56 | | | $ | 0.80 | | | $ | (0.55 | ) | | $ | (0.13 | ) | | $ | 27.51 | | | | 5.12 | % | | $ | 1,231,611 | | | | 1.11 | %(3) | | | 4.09 | % | | | 1.09 | %(3) | | | 26 | % |
| | 2013 | * | | | 27.20 | | | | 1.28 | | | | (0.43 | ) | | | (1.22 | ) | | | — | ^^ | | | 26.83 | | | | 3.16 | | | | 924,444 | | | | 1.08 | | | | 6.24 | | | | 1.11 | | | | 52 | |
| | 2012 | | | | 26.16 | | | | 1.70 | | | | 1.04 | | | | (1.64 | ) | | | (0.06 | ) | | | 27.20 | | | | 10.70 | | | | 654,095 | | | | 1.12 | | | | 6.29 | | | | 1.12 | | | | 41 | |
| | 2011 | | | | 27.34 | | | | 1.58 | | | | (1.02 | ) | | | (1.45 | ) | | | (0.29 | ) | | | 26.16 | | | | 2.04 | | | | 497,684 | | | | 1.16 | | | | 5.80 | | | | 1.16 | | | | 60 | |
| | 2010 | | | | 26.56 | | | | 1.79 | | | | 1.07 | | | | (1.79 | ) | | | (0.29 | ) | | | 27.34 | | | | 11.10 | | | | 257,900 | | | | 1.18 | | | | 6.60 | | | | 1.18 | | | | 62 | |
| | 2009 | | | | 25.00 | | | | 0.76 | | | | 1.38 | | | | (0.52 | ) | | | (0.06 | ) | | | 26.56 | | | | 8.60 | | | | 166,200 | | | | 1.21 | | | | 5.82 | | | | 1.21 | | | | 22 | |
| ** | For the six months ended or period ended March 31, 2014. |
| * | For the nine months ended September 30, 2013 and the year or period ended December 31. Effective March 29, 2013, Rochdale Investment Trust’s Rochdale Intermediate Fixed Income Portfolio and Rochdale Fixed Income Opportunities Portfolio (each a “Predecessor Fund”) were merged into City National Rochdale Fund’s Intermediate Fixed Income Fund and Fixed Income Opportunities Fund, respectively. Information presented for the period prior to March 29, 2013, is that of the respective Predecessor Fund, which had a December 31 fiscal year end. See Note 1 in Notes to Financial Statements for additional information. |
| † | Per share calculations are based on Average Shares outstanding throughout the period. |
| ‡ | Returns are for the period indicated and have not been annualized. Fee waivers are in effect; if they had not been in effect, performance would have been lower. Returns shown do not reflect the deduction of taxes that a shareholder would pay on fund distributions or the redemption of fund shares. |
| ^ | Effective December 19, 2011, Institutional Class Shares were redesignated as Servicing Class Shares. This share class name change had no impact on the Fund’s operations or investment policy. |
| ^^ | Amount represents less than $0.01 per share. |
| (1) | Annualized for periods less than one year. |
| (2) | Ratio includes waivers and previously waived investment advisory fees recovered. The impact of the recovered fees may cause a higher net expense ratio. |
| (3) | The expense ratio includes acquired fund fee expenses from the investment in Subsidiary. Had this expense been excluded, the ratios would have been 1.09% and 1.07%, respectively. |
Amounts designated as “—” are either $0 or have been rounded to $0.
See accompanying notes to financial statements.
CITY NATIONAL ROCHDALE FUNDS | PAGE 112
| | Net Asset Value Beginning of Period | | Net Investment Income† | | Net Realized and Unrealized Gains (Losses) on Securities† | | Redem-ption Fees | | Dividends from Net Investment Income | | Distri-butions from Realized Capital Gains | | Distri-butions from Return of Capital | | Net Asset Value End of Period | | Total Return‡ | | Net Assets End of Period (000) | | Ratio of Expenses to Average Net Assets (1)(2) | | Ratio of Net Investment Income to Average Net Assets(1) | | Ratio of Expenses to Average Net Assets (Excluding Waivers & Recovered Fees)(1) | | Portfolio Turnover Rate | |
| City National Rochdale Multi-Asset Fund | |
| Class N (commenced operations on October 1, 2007) | |
| | 2014 | ** | | $ | 10.70 | | | $ | 0.02 | | | $ | 0.41 | | | $ | — | | | $ | (0.04 | ) | | $ | — | | | $ | — | | | $ | 11.09 | | | | 3.99 | % | | $ | 19,730 | | | | 1.47 | % | | | 0.40 | % | | | 1.50 | % | | | 29 | % |
| | 2013 | | | | 10.44 | | | | 0.15 | | | | 0.29 | | | | — | | | | (0.18 | ) | | | — | | | | — | | | | 10.70 | | | | 4.25 | | | | 21,966 | | | | 1.09 | | | | 1.45 | | | | 1.10 | | | | 56 | |
| | 2012 | | | | 9.88 | | | | 0.18 | | | | 0.57 | | | | — | | | | (0.19 | ) | | | — | | | | — | | | | 10.44 | | | | 7.61 | | | | 25,001 | | | | 1.09 | | | | 1.72 | | | | 1.10 | | | | 89 | |
| | 2011 | | | | 10.36 | | | | 0.17 | | | | (0.48 | ) | | | — | | | | (0.17 | ) | | | — | | | | — | | | | 9.88 | | | | (3.11 | ) | | | 26,377 | | | | 1.09 | | | | 1.57 | | | | 1.10 | | | | 67 | |
| | 2010 | | | | 9.86 | | | | 0.17 | | | | 0.50 | | | | — | | | | (0.17 | ) | | | — | | | | — | | | | 10.36 | | | | 6.89 | | | | 22,019 | | | | 1.09 | | | | 1.69 | | | | 1.10 | | | | 76 | |
| | 2009 | | | | 9.69 | | | | 0.13 | | | | 0.18 | | | | — | | | | (0.14 | ) | | | — | | | | — | | | | 9.86 | | | | 3.29 | | | | 16,837 | | | | 1.09 | | | | 1.46 | | | | 1.10 | | | | 94 | |
| Servicing Class (commenced operations on October 1, 2007)^^ | |
| | 2014 | ** | | $ | 10.71 | | | $ | 0.03 | | | $ | 0.41 | | | $ | — | | | $ | (0.05 | ) | | $ | — | | | $ | — | | | $ | 11.10 | | | | 4.12 | % | | $ | 5,958 | | | | 1.22 | % | | | 0.61 | % | | | 1.25 | % | | | 29 | % |
| | 2013 | | | | 10.45 | | | | 0.18 | | | | 0.29 | | | | — | | | | (0.21 | ) | | | — | | | | — | | | | 10.71 | | | | 4.51 | | | | 4,938 | | | | 0.84 | | | | 1.70 | | | | 0.84 | | | | 56 | |
| | 2012 | | | | 9.88 | | | | 0.20 | | | | 0.57 | | | | — | | | | (0.20 | ) | | | — | | | | — | | | | 10.45 | | | | 7.89 | | | | 7,230 | | | | 0.84 | | | | 1.99 | | | | 0.84 | | | | 89 | |
| | 2011 | | | | 10.37 | | | | 0.19 | | | | (0.48 | ) | | | — | | | | (0.20 | ) | | | — | | | | — | | | | 9.88 | | | | (2.97 | ) | | | 19,084 | | | | 0.84 | | | | 1.76 | | | | 0.85 | | | | 67 | |
| | 2010 | | | | 9.87 | | | | 0.20 | | | | 0.50 | | | | — | | | | (0.20 | ) | | | — | | | | — | | | | 10.37 | | | | 7.15 | | | | 11,258 | | | | 0.84 | | | | 1.96 | | | | 0.85 | | | | 76 | |
| | 2009 | | | | 9.70 | | | | 0.15 | | | | 0.18 | | | | — | | | | (0.16 | ) | | | — | | | | — | | | | 9.87 | | | | 3.54 | | | | 8,423 | | | | 0.83 | | | | 1.71 | | | | 0.84 | | | | 94 | |
City National Rochdale Dividend & Income Fund | |
| Class N (commenced operations on June 1, 1999) | |
| | 2014 | ** | | $ | 32.25 | | | $ | 0.50 | | | $ | 2.27 | | | $ | — | | | $ | (0.54 | ) | | $ | — | | | $ | — | | | $ | 34.48 | | | | 8.62 | % | | $ | 177,192 | | | | 1.11 | % | | | 2.97 | % | | | 1.15 | % | | | 9 | % |
| | 2013 | * | | | 29.07 | | | | 0.62 | | | | 3.37 | | | | — | | | | (0.54 | ) | | | — | | | | (0.27 | ) | | | 32.25 | | | | 13.74 | | | | 155,807 | | | | 1.16 | | | | 2.55 | | | | 1.19 | | | | 17 | |
| | 2012 | | | | 28.06 | | | | 0.92 | | | | 1.17 | | | | — | | | | (0.92 | ) | | | — | | | | (0.16 | ) | | | 29.07 | | | | 7.49 | | | | 116,138 | | | | 1.38 | | | | 3.18 | | | | 1.37 | | | | 13 | |
| | 2011 | | | | 26.73 | | | | 0.90 | | | | 1.46 | | | | 0.01 | | | | (0.88 | ) | | | — | | | | (0.16 | ) | | | 28.06 | | | | 9.02 | | | | 107,012 | | | | 1.40 | | | | 3.27 | | | | 1.40 | | | | 21 | |
| | 2010 | | | | 23.71 | | | | 0.82 | | | | 3.24 | | | | — | | | | (0.81 | ) | | | — | | | | (0.23 | ) | | | 26.73 | | | | 17.48 | | | | 70,800 | | | | 1.35 | | | | 3.29 | | | | 1.35 | | | | 16 | |
| | 2009 | | | | 20.87 | | | | 0.90 | | | | 2.94 | | | | — | | | | (0.87 | ) | | | — | | | | (0.13 | ) | | | 23.71 | | | | 19.21 | | | | 59,100 | | | | 1.47 | | | | 4.25 | | | | 1.48 | | | | 16 | |
City National Rochdale U.S. Core Equity Fund | |
| Institutional Class (commenced operations on December 3, 2012) | |
| | 2014 | ** | | $ | 12.13 | | | $ | 0.02 | | | $ | 1.39 | | | $ | — | | | $ | (0.04 | ) | | $ | (0.22 | ) | | $ | — | | | $ | 13.28 | | | | 11.70 | % | | $ | 50,395 | | | | 0.51 | % | | | 0.25 | % | | | 0.51 | % | | | 14 | % |
| | 2013 | | | | 10.00 | | | | 0.14 | | | | 2.08 | | | | — | | | | (0.09 | ) | | | — | | | | — | | | | 12.13 | | | | 22.23 | | | | — | | | | 0.00 | (3) | | | 1.57 | | | | 0.00 | (3) | | | 32 | |
| Class N (commenced operations on December 3, 2012) | |
| | 2014 | ** | | $ | 12.08 | | | $ | 0.01 | | | $ | 1.31 | | | $ | — | | | $ | (0.01 | ) | | $ | (0.22 | ) | | $ | — | | | $ | 13.17 | | | | 11.00 | % | | $ | 85,806 | | | | 1.04 | % | | | 0.11 | % | | | 1.04 | % | | | 14 | % |
| | 2013 | | | | 10.00 | | | | 0.05 | | | | 2.08 | | | | — | | | | (0.05 | ) | | | — | | | | — | | | | 12.08 | | | | 21.33 | | | | 66,145 | | | | 0.99 | | | | 0.52 | | | | 0.99 | | | | 32 | |
| Servicing Class (commenced operations on December 3, 2012) | |
| | 2014 | ** | | $ | 12.09 | | | $ | 0.02 | | | $ | 1.31 | | | $ | — | | | $ | (0.02 | ) | | $ | (0.22 | ) | | $ | — | | | $ | 13.18 | | | | 11.11 | % | | $ | 86,091 | | | | 0.78 | % | | | 0.36 | % | | | 0.78 | % | | | 14 | % |
| | 2013 | | | | 10.00 | | | | 0.07 | | | | 2.08 | | | | — | | | | (0.06 | ) | | | — | | | | — | | | | 12.09 | | | | 21.60 | | | | 68,919 | | | | 0.74 | | | | 0.73 | | | | 0.74 | | | | 32 | |
| ** | For the six months ended March 31, 2014. |
| * | For the nine months ended September 30, 2013 and the year or period ended December 31. Effective March 29, 2013, the Rochdale Investment Trust’s Rochdale Dividend & Income Portfolio (the “Predecessor Fund”) was merged into City National Rochdale Funds’ Dividend & Income Fund. Information presented for the period prior to March 29, 2013, is that of the Predecessor Fund, which had a December 31 fiscal year end. See Note 1 in Notes to Financial Statements for additional information. |
| † | Per share calculations are based on Average Shares outstanding throughout the period. |
| ‡ | Returns are for the period indicated and have not been annualized. Fee waivers are in effect; if they had not been in effect, performance would have been lower. Returns shown do not reflect the deduction of taxes that a shareholder would pay on fund distributions or the redemption of fund shares. |
| ^ | Amount represents less than $0.01 per share. |
| ^^ | Effective December 19, 2011, Institutional Class Shares were redesignated as Servicing Class Shares. This share class name change had no impact on the Fund’s operations or investment policy. |
| (1) | Annualized for periods less than one year. |
| (2) | Ratio includes waivers and previously waived investment advisory fees recovered. The impact of the recovered fees may cause a higher net expense ratio. |
| (3) | Amount represents less than 0.01%. |
Amounts designated as “—” are either $0 or have been rounded to $0.
See accompanying notes to financial statements.
CITY NATIONAL ROCHDALE FUNDS | PAGE 113
financial highlights
For a Share Outstanding Throughout Each Period
For the six months ended March 31, 2014 (Unaudited) and the year or period ended September 30,
| | Net Asset Value Beginning of Period | | Net Investment Income (Loss)† | | Net Realized and Unrealized Gains (Losses) on Securities† | | Redem-ption Fees | | Dividends from Net Investment Income | | Distri-butions from Realized Capital Gains | | Distri-butions from Return of Capital | | Net Asset Value End of Period | | Total Return‡ | | Net Assets End of Period (000) | | Ratio of Expenses to Average Net Assets (1)(2) | | Ratio of Net Investment Income (Loss) to Average Net Assets(1) | | Ratio of Expenses to Average Net Assets (Excluding Waivers & Recovered Fees)(1) | | Portfolio Turnover Rate | |
| City National Rochdale Socially Responsible Equity Fund | |
| Institutional Class (commenced operations on January 3, 2005) | |
| | 2014 | ** | | $ | 12.28 | | | $ | 0.16 | | | $ | 1.16 | | | $ | — | | | $ | (0.15 | ) | | $ | (2.02 | ) | | $ | — | | | $ | 11.43 | | | | 11.95 | % | | $ | 50,338 | | | | 0.89 | % | | | 2.76 | % | | | 0.98 | % | | | 14 | % |
| | 2013 | | | | 10.06 | | | | 0.12 | | | | 2.22 | | | | — | | | | (0.12 | ) | | | — | | | | — | | | | 12.28 | | | | 23.38 | | | | 45,357 | | | | 0.87 | | | | 1.10 | | | | 0.87 | | | | 42 | |
| | 2012 | | | | 8.38 | | | | 0.13 | | | | 1.68 | | | | — | | | | (0.13 | ) | | | — | | | | — | | | | 10.06 | | | | 21.63 | | | | 80,109 | | | | 0.90 | | | | 1.37 | | | | 0.90 | | | | 38 | |
| | 2011 | | | | 8.81 | | | | 0.12 | | | | (0.43 | ) | | | — | | | | (0.12 | ) | | | — | | | | — | | | | 8.38 | | | | (3.67 | ) | | | 62,193 | | | | 0.88 | | | | 1.27 | | | | 0.89 | | | | 22 | |
| | 2010 | | | | 8.20 | | | | 0.09 | | | | 0.61 | | | | — | | | | (0.09 | ) | | | — | | | | — | ^ | | | 8.81 | | | | 8.51 | | | | 59,746 | | | | 0.95 | | | | 1.01 | | | | 0.96 | | | | 36 | |
| | 2009 | | | | 9.51 | | | | 0.12 | | | | (1.30 | ) | | | — | | | | (0.13 | ) | | | — | | | | — | | | | 8.20 | | | | (12.11 | ) | | | 52,406 | | | | 0.97 | | | | 1.74 | | | | 0.98 | | | | 48 | |
| Class N (commenced operations on August 12, 2005) | |
| | 2014 | ** | | $ | 12.26 | | | $ | 0.15 | | | $ | 1.15 | | | $ | — | | | $ | (0.14 | ) | | $ | (2.02 | ) | | $ | — | | | $ | 11.40 | | | | 11.75 | % | | $ | 33,223 | | | | 1.14 | % | | | 2.54 | % | | | 1.48 | % | | | 14 | % |
| | 2013 | | | | 10.04 | | | | 0.09 | | | | 2.22 | | | | — | | | | (0.09 | ) | | | — | | | | — | | | | 12.26 | | | | 23.12 | | | | 31,387 | | | | 1.13 | | | | 0.81 | | | | 1.38 | | | | 42 | |
| | 2012 | | | | 8.37 | | | | 0.11 | | | | 1.67 | | | | — | | | | (0.11 | ) | | | — | | | | — | | | | 10.04 | | | | 21.28 | | | | 25,631 | | | | 1.15 | | | | 1.13 | | | | 1.40 | | | | 38 | |
| | 2011 | | | | 8.79 | | | | 0.10 | | | | (0.42 | ) | | | — | | | | (0.10 | ) | | | — | | | | — | | | | 8.37 | | | | (3.80 | ) | | | 3,132 | | | | 1.13 | | | | 1.05 | | | | 1.39 | | | | 22 | |
| | 2010 | | | | 8.19 | | | | 0.07 | | | | 0.60 | | | | — | | | | (0.07 | ) | | | — | | | | — | | | | 8.79 | | | | 8.15 | | | | 2,424 | | | | 1.20 | | | | 0.81 | | | | 1.46 | | | | 36 | |
| | 2009 | | | | 9.50 | | | | 0.11 | | | | (1.31 | ) | | | — | | | | (0.11 | ) | | | — | | | | — | | | | 8.19 | | | | (12.34 | ) | | | 1,101 | | | | 1.22 | | | | 1.49 | | | | 1.48 | | | | 48 | |
City National Rochdale Emerging Markets Fund | |
| Class N (commenced operations on December 14, 2011) | |
| | 2014 | ** | | $ | 34.24 | | | $ | (0.18 | ) | | $ | 2.74 | | | $ | — | | | $ | (0.11 | ) | | $ | — | | | $ | — | | | $ | 36.69 | | | | 7.48 | % | | $ | 457,125 | | | | 1.61 | % | | | (1.00 | )% | | | 1.62 | % | | | 17 | % |
| | 2013 | * | | | 32.31 | | | | 0.33 | | | | 1.60 | | | | — | | | | — | | | | — | | | | — | | | | 34.24 | | | | 5.97 | | | | 294,040 | | | | 1.62 | | | | 1.31 | | | | 1.69 | | | | 25 | |
| | 2012 | | | | 25.28 | | | | 0.04 | | | | 7.00 | | | | 0.01 | | | | — | | | | — | | | | (0.02 | ) | | | 32.31 | | | | 27.87 | | | | 136,838 | | | | 1.97 | | | | 0.15 | | | | 1.94 | | | | 69 | |
| | 2011 | | | | 25.00 | | | | (0.02 | )(3) | | | 0.30 | | | | — | ^ | | | — | | | | — | | | | — | | | | 25.28 | | | | 1.12 | | | | 5,934 | | | | 2.25 | | | | (2.15 | ) | | | 9.74 | | | | 6 | |
| ** | For the six months ended March 31, 2014. |
| * | For the nine months ended September 30, 2013 and the year or period ended December 31. Effective March 29, 2013, the Rochdale Investment Trust’s Rochdale Emerging Markets Portfolio (the “Predecessor Fund”) was merged into City National Rochdale Fund’s Emerging Markets Fund. Information presented for the period prior to March 29, 2013, is that of the Predecessor Fund, which had a December 31 fiscal year end. See Note 1 in Notes to Financial Statements for additional information. |
| † | Per share calculations are based on Average Shares outstanding throughout the period. |
| ‡ | Returns are for the period indicated and have not been annualized. Fee waivers are in effect; if they had not been in effect, performance would have been lower. Returns shown do not reflect the deduction of taxes that a shareholder would pay on fund distributions or the redemption of fund shares. |
| ^ | Amount represents less than $0.01 per share. |
| (1) | Annualized for periods less than one year. |
| (2) | Ratio includes waivers and previously waived investment advisory fees recovered. The impact of the recovered fees may cause a higher net expense ratio. |
| (3) | Net investment loss per share is calculated using ending balances prior to consideration of adjustments for permanent book and tax differences. |
Amounts designated as “—” are either $0 or have been rounded to $0.
See accompanying notes to financial statements.
CITY NATIONAL ROCHDALE FUNDS | PAGE 114
notes to financial statements/
consolidated notes to financial statements
March 31, 2014 (Unaudited)
City National Rochdale Funds, a Delaware statutory trust (the “Trust”), is registered under the Investment Company Act of 1940, as amended (the “1940 Act”), as an open-end management investment company currently offering the following 16 series (each a “Fund” and collectively, the “Funds”): City National Rochdale Government Money Market Fund (“Government Money Market Fund”), City National Rochdale Prime Money Market Fund (“Prime Money Market Fund”), City National Rochdale California Tax Exempt Money Market Fund (“California Money Market Fund”) (collectively, the “Money Market Funds”); City National Rochdale Limited Maturity Fixed Income Fund (“Limited Maturity Fixed Income Fund”), City National Rochdale Government Bond Fund (“Government Bond Fund”), City National Rochdale Corporate Bond Fund (“Corporate Bond Fund”), City National Rochdale California Tax Exempt Bond Fund (“California Tax Exempt Bond Fund”), City National Rochdale Municipal High Income Fund (“Municipal High Income Fund”), City National Rochdale High Yield Bond Fund (“High Yield Bond Fund”), City National Rochdale Intermediate Fixed Income Fund (“Intermediate Fixed Income Fund”), City National Rochdale Fixed Income Opportunities Fund (“Fixed Income Opportunities Fund”) (collectively, the “Fixed Income Funds”); City National Rochdale Multi-Asset Fund (“Multi-Asset Fund”); City National Rochdale Dividend & Income Fund (“Dividend & Income Fund”), City National Rochdale U.S. Core Equity Fund (“U.S. Core Equity Fund”), City National Rochdale Socially Responsible Equity Fund (“Socially Responsible Equity Fund”) City National Rochdale Emerging Markets Fund (“Emerging Markets Fund”) (collectively, the “Equity Funds”).
On December 11, 2012, the Board of Trustees of the Rochdale Investment Trust, an open-end management investment company registered under the 1940 Act, approved the reorganization of each Portfolio of the Rochdale Investment Trust into a corresponding Fund of the Trust. This included the Rochdale Dividend & Income Portfolio, the Rochdale Intermediate Fixed Income Portfolio, the Rochdale Fixed Income Opportunities Portfolio and the Rochdale Emerging Markets Portfolio. The effective date of the reorganization of each Portfolio (each a “Predecessor Fund” and collectively the “Predecessor Funds”) into a corresponding Fund of the Trust was March 29, 2013. Each Predecessor Fund was the accounting survivor in the reorganization and, therefore, the statements of changes in net assets and financial highlights of each corresponding fund reflect the financial information of the corresponding Predecessor Funds through March 28, 2013.
Prior to September 10, 2013, the name of the Trust was CNI Charter Funds.
On September 17, 2013, the Board of Trustees of the Trust approved the reorganizations of the City National Rochdale Full Maturity Fixed Income Fund into the Intermediate Fixed Income Fund and the City National Rochdale Diversified Equity Fund into the U.S. Core Equity Fund. The reorganizations were effective as of the close of business on December 20, 2013 and March 21, 2014, respectively.
The Municipal High Income Fund commenced operations on December 30, 2013.
Effective November 28, 2012, Institutional Class was redesignated Servicing Class for the Government Money Market Fund, Prime Money Market Fund and California Tax Exempt Money Market Fund. Also effective November 28, 2012, the Prime Money Market Fund opened a new Institutional Class.
On December 20, 2013, a new Institutional Class of the Intermediate Fixed Income Fund opened.
On January 31, 2014, the Institutional Class of the Multi-Asset Fund closed.
Effective September 10, 2013, Rochdale Investment Management, LLC, investment manager of the Intermediate Fixed Income Fund, Fixed Income Opportunities Fund, Dividend & Income Fund and Emerging Markets Fund, changed its name to City National Rochdale, LLC (“City National Rochdale”). Also effective September 10, 2013, City National Asset Management, Inc. (“CNAM”), a wholly-owned subsidiary of City National Bank and investment manager of all the Funds except the Intermediate Fixed Income Fund, Fixed Income Opportunities Fund, Dividend & Income Fund and Emerging Markets Fund, reorganized into City National Rochdale. City National Rochdale acts as the investment adviser to the Funds.
The assets of each Fund are segregated, and a shareholder’s interest is limited to the Fund in which shares are held. Each Fund is diversified with the exception of the California Tax Exempt Bond Fund and the Emerging Markets Fund, which are non-diversified. The Funds’ prospectus provides descriptions of each Fund’s investment objectives, policies and strategies.
| 2. | SIGNIFICANT ACCOUNTING POLICIES: |
The following is a summary of significant accounting policies followed by the Funds.
CITY NATIONAL ROCHDALE FUNDS | PAGE 115
notes to financial statements/
consolidated notes to financial statements
March 31, 2014 (Unaudited)
Use of Estimates – The preparation of financial statements in conformity with U.S. generally accepted accounting principles (“GAAP”) requires management to make estimates and assumptions that affect the reported amounts of assets and liabilities and disclosure of contingent assets and liabilities at the date of the financial statements and the reported amounts of increases and decreases in net assets from operations during the reporting period. Actual results could differ from those estimates.
Security Valuation – Securities listed on a securities exchange, market or automated quotation system for which quotations are readily available (except for securities traded on NASDAQ) are valued at the last quoted sale price on the primary exchange or market (foreign or domestic) on which they are traded, or, if there is no such reported sale, at the most recent quoted bid price. For securities traded on NASDAQ, the NASDAQ Official Closing Price is used. If available, debt securities are priced based upon valuations provided by independent, third-party pricing agents. Such values generally reflect the last reported sales price if the security is actively traded. The third-party pricing agents may also value debt securities at an evaluated bid price by employing methodologies that utilize actual market transactions, broker-supplied valuations, or other methodologies designed to identify the market value for such securities. Debt obligations with remaining maturities of 60 days or less may be valued at their amortized cost, which approximates market value. Investments in underlying registered investment companies are valued at their respective daily net assets in accordance with pricing procedures approved by their respective boards. The prices for foreign securities are reported in local currency and converted to U.S. dollars using currency exchange rates. Prices for most securities held in the Funds are provided daily by recognized independent pricing agents. If a security price cannot be obtained from an independent, third-party pricing agent, the Funds seek to obtain a bid price from one or more independent brokers.
Securities for which market prices are not “readily available” are valued in accordance with Fair Value Procedures established by the Trust’s Board of Trustees. The Funds’ Fair Value Procedures are implemented through a Fair Value Committee (the “Committee”) designated by the Trust’s Board of Trustees. Some of the more common reasons that may necessitate that a security be valued using Fair Value Procedures include: the security’s trading has been halted or suspended; the security has been de-listed from a national exchange; the security’s primary trading market is temporarily closed at a time when under normal conditions it would be open; for international securities, market events occur after the close of the foreign markets that make closing prices not representative of fair value; or the security’s primary pricing source is not able or willing to provide a price. When a security is valued in accordance with the Fair Value Procedures, the Committee will determine the value after taking into consideration relevant information reasonably available to the Committee.
In accordance with GAAP, the objective of a fair value measurement is to determine the price that would be received to sell an asset or paid to transfer a liability in an orderly transaction between market participants at the measurement date (an exit price). The fair value hierarchy gives the highest priority to quoted prices (unadjusted) in active markets for identical assets or liabilities (Level 1) and the lowest priority to unobservable inputs (Level 3). The three levels of the fair value hierarchy are described below:
| | • | Level 1 — Unadjusted quoted prices in active markets for identical, unrestricted assets or liabilities that the Funds have the ability to access at the measurement date; |
| | • | Level 2 — Quoted prices in inactive markets, or inputs that are observable (either directly or indirectly) for substantially the full term of the asset or liability; and |
| | • | Level 3 — Prices, inputs or exotic modeling techniques which are both significant to the fair value measurement and unobservable (supported by little or no market activity). |
Investments are classified within the level of the lowest significant input considered in determining fair value. Investments classified within Level 3, the fair value measurement of which considers several inputs, may include Level 1 or Level 2 inputs as components of the overall fair value measurement.
For the six months ended March 31, 2014, there have been no changes to the Funds’ fair valuation methodologies. For more details of the investment classification, refer to the Schedules of Investments.
Security Transactions and Related Income – Security transactions are accounted for on the trade date of the security purchase or sale. Costs used in determining net realized capital gains and losses on the sale of securities are those of the specific securities sold. Interest income is recognized on an accrual basis and dividend income is recognized on the ex-dividend date. Purchase discounts and premiums on securities held by the Funds are accreted and amortized to maturity using the scientific method, which approximates the effective interest method over
CITY NATIONAL ROCHDALE FUNDS | PAGE 116
the holding period of a security, except for the Money Market Funds, which use a straight line basis which is not materially different from the scientific method.
Repurchase Agreements – Securities pledged as collateral for repurchase agreements are held by each Fund’s custodian bank, U.S. Bank, N.A., until maturity of the repurchase agreements. Provisions of the agreements and procedures adopted by the investment adviser require that the market value of the collateral, including accrued interest thereon, is sufficient in the event of default by the counterparty. The Funds also invest in tri-party repurchase agreements. Securities held as collateral for tri-party repurchase agreements are maintained by the broker’s custodian bank in a segregated account until maturity of the repurchase agreement. Provisions of the agreements require that the market value of the collateral, including accrued interest thereon, is sufficient in the event of default. If the counterparty defaults and the value of the collateral declines or if the counterparty enters into an insolvency proceeding, realization of the collateral by the Fund may be delayed or limited.
TBA Transactions – The Funds may engage in “to be announced” (“TBA”) security transactions. Such transactions involve a commitment by a Fund to purchase or sell securities for a predetermined price or yield, with payment and delivery taking place beyond the customary settlement period. The Funds record TBA securities on the trade date and maintain security positions such that sufficient liquid assets will be available to make payments for the securities purchased.
Expense Allocation – Common expenses incurred by the Funds are allocated among the Funds (i) based upon relative average daily net assets, (ii) as incurred on a specific identification basis, (iii) equally among the Funds, or (iv) a combination of the above, depending on the nature of the expenditure.
Classes – Class-specific expenses are borne by that class. Income, non class-specific expenses, and realized and unrealized gains/losses are allocated to the respective class on the basis of relative net asset value each day.
Dividends and Distributions to Shareholders – Dividends from net investment income are declared daily and paid to shareholders monthly for the Money Market Funds and Fixed Income Funds except for the Intermediate Fixed Income Fund, Fixed Income Opportunities Fund and Dividend & Income Fund. Dividends from net investment income are declared and paid quarterly for the Intermediate Fixed Income Fund, Fixed Income Opportunities Fund, Dividend & Income Fund, Multi-Asset Fund and Equity Funds except for the Emerging Markets Fund. Dividends from net investment income are declared and paid annually for the Emerging Markets Fund. Distributions from net realized capital gains are distributed to shareholders at least annually.
Foreign Currency – Values of investments denominated in foreign currencies are converted into U.S. dollars using the spot market rate of exchange at the time of valuation. Purchases and sales of investments and dividend and interest income are translated into U.S. dollars using the spot market rate of exchange prevailing on the respective dates of such translations. The gain or loss upon the sale of a security resulting from changes in foreign exchange rates is included with net realized and unrealized gain or loss from investments, as appropriate. Foreign securities and currency transactions may involve certain considerations and risks not typically associated with those of domestic origin.
Forward Foreign Currency Contracts – A forward foreign currency contract is an agreement between two parties to buy or sell a currency at a set price on a future date. Forward contracts are marked to market daily and the change in market value is recorded as an unrealized gain (loss) on forward foreign currency contracts in the Consolidated Statements of Assets and Liabilities. When a contract is closed, the Fund records a realized gain or loss equal to the difference between the value of the contract at the time it was opened and the value at the time it was closed, which is included within realized gain (loss) on foreign currency transactions in the Consolidated Statement of Operations. The Fund could be at risk if the counterparties are unable to meet the terms of the contracts or if the value of the currency changes unfavorably.
Restricted Securities – Restricted securities include securities that have not been registered under the Securities Act of 1933, as amended, and securities that are subject to restrictions on resale. A Fund may invest in restricted securities that are consistent with a Fund’s investment objective and investment strategies. A Fund will not invest in a restricted security if, immediately after and as a result of the investment in such security, more than 15% (5% in the case of the Money Market Funds) of the Fund’s net assets would be invested in illiquid securities. In some cases, the issuer of restricted securities has agreed to register such securities for resale, at the issuer’s expense either upon demand by the Fund or in connection with another registered offering of the securities. Investments in restricted securities are valued at fair value as determined in good faith in accordance with procedures adopted by the Board of Trustees. It is possible that the estimated value may differ significantly from the amount that might ultimately be realized in the near term, and the difference could be material.
CITY NATIONAL ROCHDALE FUNDS | PAGE 117
notes to financial statements/
consolidated notes to financial statements
March 31, 2014 (Unaudited)
Master Limited Partnerships – Entities commonly referred to as “MLPs” are generally organized under state law as limited partnerships or limited liability companies. The City National Rochdale Dividend & Income Fund may, as a non-principal investment strategy, invest in MLPs receiving partnership taxation treatment under the Internal Revenue Code of 1986, interests or “units” of which are traded on securities exchanges like shares of corporate stock. To qualify as an MLP for U.S. federal income tax purposes, an entity must receive at least 90% of its income from qualifying sources such as interest, dividends, real estate rents, gain from the sale or disposition of real property, income and gain from certain mineral or natural resources activities, income and gain from the transportation or storage of certain fuels, and, in certain circumstances, income and gain from commodities or futures, forwards and options with respect to commodities, and gain from the sale or other disposition of a capital asset held for the production of such income. Mineral or natural resources activities include exploration, development, production, mining, processing, refining, marketing and transportation (including pipelines), of oil and gas, minerals, geothermal energy, fertilizer, timber or industrial source carbon dioxide. An MLP consists of a general partner and limited partners (or in the case of MLPs organized as limited liability companies, a managing member and members). The general partner or managing member typically controls the operations and management of the MLP and has an ownership stake in the partnership. The limited partners or members, through their ownership of limited partner or member interests, provide capital to the entity, are intended to have no role in the operation and management of the entity and receive cash distributions. The MLPs themselves generally do not pay U.S. federal income taxes. Thus, unlike investors in corporate securities, direct MLP investors are generally not subject to double taxation (i.e., corporate level tax and tax on corporate dividends). Currently, most MLPs operate in the energy, natural resources or real estate sector.
Investments in Irish Subsidiary – The Fixed Income Opportunities Fund may invest up to 15% of its net assets in life insurance policies and interests related thereto purchased through life settlement transactions. The Fund may invest in life insurance policies and related interests directly or through a wholly-owned subsidiary of the Fund under the laws of Ireland (the “Subsidiary”).
The principal purpose of investment in the Subsidiary is to allow the Fixed Income Opportunities Fund to gain exposure to life insurance policies within the limitations of the federal tax law requirements applicable to regulated investment companies. The Subsidiary is a company organized under the laws of Ireland and is overseen by its own board of directors. Although the Subsidiary has its own board of directors, the Subsidiary is wholly-owned and controlled by the Fund. The Subsidiary is not an investment company registered under the 1940 Act and is not subject to all of the investor protections of the 1940 Act.
Information regarding the Fixed Income Opportunities Fund and its subsidiary has been consolidated in the Consolidated Schedule of Investments, Consolidated Statement of Assets & Liabilities, Consolidated Statement of Operations and Consolidated Statement of Changes in Net Assets.
The subsidiary commenced operations on October 3, 2013. The net assets of the subsidiary at March 31, 2014 were $62,622,872, which represented 5.1% of the net assets of the Fixed Income Opportunities Fund.
Redemption Fees – Prior to January 9, 2013, the Predecessor Funds charged a 2% redemption fee on shares redeemed or exchanged within 45 days of purchase. These fees were deducted from the redemption proceeds otherwise payable out of a Predecessor Fund to the shareholder. Each Predecessor Fund retained the fee charged as paid-in capital and such fees became part of the Predecessor Fund’s daily net asset value per share (“NAV”) calculations. Effective January 9, 2013, the Board of Trustees of the Rochdale Investment Trust approved the elimination of the redemption fee charged by the Predecessor Funds.
Investment in Affiliated Security – The Funds may invest excess cash in the Money Market Funds. The Multi-Asset Fund also invests in other series of the Trust.
Deferred Offering Costs — Offering costs, including costs of printing initial prospectuses and legal and registration fees, are amortized over twelve months from inception of a fund. As of March 31, 2014, the remaining amount still to be amortized for the Municipal High Income Fund was $22,191.
| 3. | ADMINISTRATION, TRANSFER AGENT, DISTRIBUTION AND SHAREHOLDER SERVICES AGREEMENTS: |
Pursuant to an Amended and Restated Administration Agreement dated January 1, 2013, as amended (the “Agreement”), SEI Investments Global Funds Services (the “Administrator”), a wholly owned subsidiary of SEI Investments Company, acts as the Trust’s administrator. Under the terms of the Agreement, the Administrator is entitled to receive an annual fee of 0.050% of aggregate average daily net assets of the Trust not exceeding $2.0 billion, 0.040% of aggregate average daily
CITY NATIONAL ROCHDALE FUNDS | PAGE 118
net assets of the Trust exceeding $2.0 billion but not exceeding $4 billion, 0.030% of aggregate average daily net assets of the Trust exceeding $4 billion but not exceeding $6 billion, 0.025% of aggregate average daily net assets of the Trust exceeding $6 billion but not exceeding $8 billion, and 0.020% of aggregate average net assets of the Trust exceeding $8 billion. Each Fund is subject to a minimum annual fee of $1,800,000 for the first 20 portfolios of the Trust and $90,000 for each portfolio thereafter which may be reduced at the sole discretion of the Administrator.
The Trust has adopted a Rule 12b-1 Distribution Plan (“the Plan”) with respect to Class N and Class S Shares that allows each Fund to pay distribution and servicing fees. Pursuant to the Plan, SEI Investments Distribution Co. (the “Distributor”) receives a distribution fee, computed daily and paid monthly, at the annual rate of 0.50% of the average daily net assets of the Class S Shares and 0.30% of the average daily net assets of the Class N Shares of the Money Market Funds and 0.25% of the Class N Shares of the Fixed Income Funds, Multi-Asset Fund and Equity Funds, which may be used by the Distributor to provide compensation for sales support and distribution-related activities.
US Bancorp Fund Services, LLC (the “Transfer Agent”) serves as transfer agent for the Trust and provides services at an annual rate of $20,000 per share class for all Funds plus other transaction based fees and out-of-pocket expenses.
The Trust has entered into Shareholder Servicing Agreements that permit payment of compensation to City National Bank (“CNB”) and its affiliates (including City National Rochdale), which provide certain shareholder support for their customers who own Class N, Class S or Servicing Class Shares (in the case of the Money Market Funds Servicing Class only). In consideration for such services, a shareholder servicing fee is charged at the annual rate of up to 0.25% of average daily net assets of the relevant class of each Fund. CNB and City National Rochdale have agreed to voluntarily waive portions of their shareholder servicing fees with respect to certain Funds. For the six months ended March 31, 2014, CNB and City National Rochdale received $2,784,690 in Shareholder Servicing fees from the Trust.
Certain officers of the Trust are also officers or employees of City National Rochdale or the Administrator. Such officers are paid no fees by the Trust for serving as officers of the Trust.
| 4. | INVESTMENT ADVISORY FEES AND OTHER AGREEMENTS: |
Under the terms of the current investment management agreements, City National Rochdale receives an annual fee equal to a percentage of the average daily net assets of each Fund, as follows:
| |
| Government Money Market Fund | 0.26% |
| Prime Money Market Fund | 0.25 |
| California Tax Exempt Money Market Fund | 0.27 |
| Limited Maturity Fixed Income Fund | 0.50 |
| Government Bond Fund | 0.43 |
| Corporate Bond Fund | 0.40 |
| California Tax Exempt Bond Fund | 0.27 |
| Municipal High Income Fund | 0.45 |
| High Yield Bond Fund | 0.60 |
| Intermediate Fixed Income Fund | 0.40 |
| Fixed Income Opportunities Fund | 0.50 |
| Multi-Asset Fund | 0.50 |
| Dividend & Income Fund | 0.50 |
| U.S. Core Equity Fund | 0.40 |
| Socially Responsible Equity Fund | 0.75 |
| Emerging Markets Fund | 1.00 |
Guggenheim Partners Investment Management, LLC (“Guggenheim”) acts as the investment sub-adviser with respect to the High Yield Bond Fund.
Federated Global Investment Management Corp., Seix Investment Advisors LLC, Alcentra LTD and GML Capital LLP act as the investment sub-advisers with respect to the Fixed Income Opportunities Fund.
SKBA Capital Management, LLC acts as the investment sub-adviser with respect to the Socially Responsible Equity Fund.
Waddell & Reed Investment Management Company acts as the investment sub-adviser with respect to the Municipal High Income Fund.
Sub-adviser fees are paid by City National Rochdale.
City National Rochdale has agreed to limit its fees or reimburse expenses to the extent necessary to keep operating expenses at or below certain percentages of certain of the Funds’ respective average daily net assets. With respect to the Limited Maturity Fixed Income Fund and Socially Responsible Equity Fund, voluntary limits are in addition to the contractual expense limitations described in the fee table in each Fund’s prospectus. The voluntary expense limitations (expressed as percentages of average daily net assets) are as follows:
CITY NATIONAL ROCHDALE FUNDS | PAGE 119
notes to financial statements/
consolidated notes to financial statements
March 31, 2014 (Unaudited)
| Government Money Market Fund | | California Tax Exempt Money Market Fund | |
| Institutional Class | n/a | 0.38% | n/a | |
| Class N | 0.93% | 0.93% | 0.85% | |
| Class S | 1.13% | 1.13% | 1.05% | |
| | | | |
| Limited Maturity Fixed Income Fund | | | California Tax Exempt Bond Fund |
| Institutional Class | 0.67% | 0.53% | n/a | n/a |
| Class N | 0.92% | 1.03% | 1.01% | 0.88% |
| | | | |
| Municipal High Income Fund | | Intermediate Fixed Income Fund | Fixed Income Opportunities Fund |
| Institutional Class | n/a | 0.70% | 0.51% | n/a |
| Class N | 1.15% | 1.20% | 1.01% | 1.09% |
| | | | |
| | | | Socially Responsible Equity Fund |
| Institutional Class | n/a | n/a | 0.55% | 0.89% |
| Class N | 1.49% | 1.11% | 1.05% | 1.14% |
| | | | |
| | | |
| Institutional Class | n/a | | |
| Class N | 1.61% | | |
| | | |
The contractual limitations for the Limited Maturity Fixed Income Fund and Socially Responsible Equity Fund are as follows:
| Limited Maturity Fixed Income Fund | Socially Responsible Equity Fund | |
| Institutional Class | 1.00% | 1.25% | |
| | | |
Any fee reductions or expense reimbursements may be repaid by a Fund to City National Rochdale, within three years after occurrence if such repayments can be achieved within a Fund’s expense limit in effect at the time such expenses were incurred and if certain other conditions are satisfied.
As of March 31, 2014, fees which were previously waived by City National Rochdale (or CNAM, prior to September 10, 2013) which may be subject to possible future reimbursement were as follows:
| | Potential Amount of Recovery (000) | | | | | |
| Government Money Market Fund | | $ | 6,470 | | | | 2014 | |
| | | | 6,662 | | | | 2015 | |
| | | | 7,131 | | | | 2016 | |
| | | | 4,483 | | | | 2017 | |
| Prime Money Market Fund | | | 1,533 | | | | 2014 | |
| | | | 1,222 | | | | 2015 | |
| | | | 1,741 | | | | 2016 | |
| | | | 1,124 | | | | 2017 | |
| California Tax Exempt Money Market Fund | | | 1,498 | | | | 2014 | |
| | | | 2,066 | | | | 2015 | |
| | | | 2,275 | | | | 2016 | |
| | | | 1,391 | | | | 2017 | |
| Limited Maturity Fixed Income Fund | | | 44 | | | | 2017 | |
| Government Bond Fund | | | 122 | | | | 2014 | |
| | | | 25 | | | | 2015 | |
| | | | 5 | | | | 2016 | |
| | | | 35 | | | | 2017 | |
| Corporate Bond Fund | | | 38 | | | | 2017 | |
| California Tax Exempt Bond Fund | | | 56 | | | | 2014 | |
| | | | 17 | | | | 2015 | |
| | | | 3 | | | | 2016 | |
| | | | 47 | | | | 2017 | |
| Municipal High Income Fund | | | 13 | | | | 2017 | |
| High Yield Bond Fund | | | 67 | | | | 2014 | |
| | | | 17 | | | | 2015 | |
| | | | 6 | | | | 2016 | |
| | | | 46 | | | | 2017 | |
| Intermediate Fixed Income Fund | | | 16 | | | | 2016 | |
| | | | 21 | | | | 2017 | |
| Fixed Income Opportunities Fund | | | 45 | | | | 2016 | |
| Multi-Asset Fund | | | 4 | | | | 2017 | |
| Dividend & Income Fund | | | 23 | | | | 2016 | |
| | | | 37 | | | | 2017 | |
| Socially Responsible Fund | | | 35 | | | | 2017 | |
| Emerging Markets Fund | | | 115 | | | | 2016 | |
| | | | 12 | | | | 2017 | |
City National Rochdale, CNB and the Administrator have voluntarily agreed to further waive and reduce their fees and/or reimburse certain expenses of the Money Market Funds in order to maintain a one-day net income yield (yield floor) of each Fund of not less than 0.01% of the Fund’s average daily net assets. The following table shows waivers, with respect to such yield floor, by class for the six months ended March 31, 2014:
CITY NATIONAL ROCHDALE FUNDS | PAGE 120
| | Shareholder Servicing Fee Waiver (000) | | | Investment Advisory Fee Waiver (000) | | | Administration Fee Waiver (000) | |
| Government Money Market Fund | | | | | | | |
| Class N | | $ | 7,323 | (1) | | $ | 3,649 | | | $ | 67 | |
| Class S | | | 1,826 | (1) | | | 645 | | | | 12 | |
| | | 194 | | | | 189 | | | | 3 | |
| | | | | | | | | | | | | |
| Prime Money Market Fund | | | | | | | | | | | | |
| Institutional Class | | $ | — | | | $ | 31 | | | $ | 1 | |
| Class N | | | 936 | (1) | | | 339 | | | | 11 | |
| Class S | | | 794 | (1) | | | 204 | | | | 6 | |
| | | 774 | | | | 550 | | | | 17 | |
| | | | | | | | | | | | | |
| California Tax Exempt Money Market Fund | | | | | | | | | |
| Class N | | $ | 1,699 | (1) | | $ | 851 | | | $ | 19 | |
| Class S | | | 239 | (1) | | | 84 | | | | 2 | |
| | | 225 | | | | 217 | | | | 5 | |
| (1) | Includes class specific distribution expenses. |
| 5. | INVESTMENT TRANSACTIONS: |
The cost of security purchases and proceeds from the sale and maturities of securities, other than temporary investments in short-term securities for the six months/period ended March 31, 2014, were as follows for the Fixed Income Funds, Multi-Asset Fund and Equity Funds:
| | | | | | | |
| | | | | | | | | | | | |
| Limited Maturity Fixed Income Fund | | $ | 4,247 | | | $ | 1,618 | | | $ | 9,077 | | | $ | 9,026 | |
| Government Bond Fund | | | 57,625 | | | | 2,807 | | | | 46,942 | | | | — | |
| Corporate Bond Fund | | | — | | | | 28,627 | | | | 31 | | | | 27,842 | |
| California Tax Exempt Bond Fund | | | — | | | | 13,150 | | | | — | | | | 13,189 | |
| Municipal High Income Fund** | | | — | | | | 153,048 | | | | — | | | | — | |
| High Yield Bond Fund | | | — | | | | 41,077 | | | | — | | | | 78,737 | |
| Intermediate Fixed Income Fund | | | 15,262 | | | | 78,654 | | | | 3,176 | | | | 14,172 | |
| Fixed Income Opportunities Fund | | | — | | | | 406,373 | | | | — | | | | 181,769 | |
| Multi-Asset Fund | | | — | | | | 7,315 | * | | | — | | | | 13,384 | * |
| Dividend & Income Fund | | | — | | | | 23,668 | | | | — | | | | 14,129 | |
| U.S. Core Equity | | | — | | | | 96,700 | | | | — | | | | 22,776 | |
| Socially Responsible Equity Fund | | | — | | | | 11,144 | | | | — | | | | 12,278 | |
| | | — | | | | 188,553 | | | | — | | | | 55,889 | |
| * | Includes $562 (000) and $2,615 (000) of purchases and sales, respectively, of affiliated registered investment companies. |
| ** | For the period December 30, 2013 through March 31, 2014. |
The Funds may purchase or sell investment securities in transactions with affiliated entities under procedures adopted by the Board, pursuant to the 1940 Act. These transactions are effected at market rates without incurring broker commissions.
The following is a summary of the transactions with affiliates for the period ended March 31, 2014:
| | Corporate Bond Fund, Servicing Class (000) | | | Government Bond Fund, Institutional Class (000) | | | High Yield Bond Fund, Institutional Class (000) | | | Limited Maturity Fixed Income Fund, Institutional Class (000) | |
| Beginning balance as of October 1, 2013 | | $ | 2,219 | | | $ | 1,590 | | | $ | 570 | | | $ | 1,686 | |
| Purchases at Cost | | | 51 | | | | 36 | | | | 436 | | | | 39 | |
| Proceeds from Sales | | | (642 | ) | | | (461 | ) | | | (1,022 | ) | | | (490 | ) |
| Realized Gain (Loss) | | | (1 | ) | | | (2 | ) | | | 40 | | | | (2 | ) |
| Unrealized Gain (Loss) | | | (5 | ) | | | 4 | | | | (24 | ) | | | 5 | |
| Ending balance as of March 31, 2014 | | $ | 1,622 | | | $ | 1,167 | | | $ | — | | | $ | 1,238 | |
| 6. | FEDERAL TAX INFORMATION: |
Each Fund intends to qualify or continue to qualify as a regulated investment company for Federal income tax purposes and distribute all of its taxable income and net capital gains. Accordingly, no provisions for Federal income taxes are required.
Effective September 30, 2013, the Intermediate Fixed Income Fund, Fixed Income Opportunities Fund, Dividend & Income Fund and the Emerging Markets Fund changed their tax year-ends from December 31 to September 30.
Management has analyzed the Funds’ tax position taken on Federal income tax returns for all open tax years and has concluded that as of September 30, 2013, no provision for income tax would be required in the Funds’ financial statements. The Funds’ Federal and state income and Federal excise tax returns for tax years for which the applicable statutes of limitations have not expired are subject to examination by the Internal Revenue Service and state departments of revenue.
The Funds may be subject to taxes imposed by countries in which they invest, with respect to their investments in issuers existing or operating in such countries. Such taxes are generally based on income earned. The Funds accrue such taxes when the related income is earned.
The timing and characterization of certain income and capital gains distributions are determined annually in accordance with Federal tax regulations, which may differ from accounting principles generally accepted in the United States of America.
CITY NATIONAL ROCHDALE FUNDS | PAGE 121
notes to financial statements/
consolidated notes to financial statements
March 31, 2014 (Unaudited)
As a result, net investment income (loss) and net realized gain (loss) on investment transactions for a reporting period may differ significantly from distributions during such period. These book/tax differences may be temporary or permanent. To the extent these differences are permanent in nature, they are charged or credited to undistributed net investment income (loss), accumulated net realized gain (loss), or paid-in capital, as appropriate, in the period that the differences arise.
Accordingly, the following permanent differences, primarily attributable to REIT adjustments, MLP dividend income reclasses, realized gains (losses) on paydowns, expiration of capital loss carryovers, net operating losses, return of capital distributions, investments in defaulted bonds, investments in Passive Foreign Investment Companies and timing of distributions, were reclassified to/from the following accounts as of September 30, 2013:
| | Increase (Decrease) Undistributed Net Investments Income (Loss) (000) | | | Increase (Decrease) Accumulated Net Realized Gain (Loss) (000) | | | Increase (Decrease) Paid-in Capital (000) | |
| Limited Maturity Fixed Income Fund | | $ | 68 | | | $ | 68 | | | $ | (136 | ) |
| California Tax Exempt Bond Fund | | | — | | | | — | | | | — | |
| Government Bond Fund | | | 737 | | | | (737 | ) | | | — | |
| Corporate Bond Fund | | | 38 | | | | (38 | ) | | | — | |
| High Yield Bond Fund | | | (4 | ) | | | 4 | | | | — | |
| Intermediate Fixed Income Fund | | | 38 | | | | (38 | ) | | | — | |
| Fixed Income Opportunities Fund | | | (404 | ) | | | 404 | | | | — | |
| Multi-Asset Fund | | | 57 | | | | (54 | ) | | | (3 | ) |
| Dividend & Income Fund | | | 321 | | | | 760 | | | | (1,081 | ) |
| Socially Responsible Equity Fund | | | 14 | | | | (14 | ) | | | — | |
| Emerging Markets Fund | | | (880 | ) | | | 880 | | | | — | |
| Amounts designated as “—” are either $0 or have been rounded to $0. |
The tax character of dividends and distributions declared during the years ended September 30, 2013 and September 30, 2012 unless otherwise indicated were as follows:
| | | | | | | | Long-Term Capital Gain (000) | | | | | | | |
| Government Money Market Fund | |
| 2013 | | $ | — | | | $ | 330 | | | $ | — | | | $ | — | | | $ | 330 | |
| 2012 | | | — | | | | 333 | | | | — | | | | — | | | | 333 | |
| Fund | | | | | | | | | | | Long-Term Capital Gain (000) | | | | | | | | | |
| Prime Money Market Fund | | | | | | | | | | | | | | | | | | | | |
| 2013 | | $ | — | | | $ | 228 | | | $ | — | | | $ | — | | | $ | 228 | |
| 2012 | | | — | | | | 209 | | | | — | | | | — | | | | 209 | |
| California Tax Exempt Money Market Fund | |
| 2013 | | $ | 94 | | | $ | — | | | $ | — | | | $ | — | | | $ | 94 | |
| 2012 | | | 90 | | | | 1 | | | | — | | | | — | | | | 91 | |
| Limited Maturity Fixed Income Fund | |
| 2013 | | $ | — | | | $ | 307 | | | $ | — | | | $ | — | | | $ | 307 | |
| 2012 | | | — | | | | 389 | | | | — | | | | — | | | | 389 | |
| Government Bond Fund | |
| 2013 | | $ | — | | | $ | 2,054 | | | $ | — | | | $ | — | | | $ | 2,054 | |
| 2012 | | | — | | | | 2,432 | | | | 143 | | | | — | | | | 2,575 | |
| Corporate Bond Fund | |
| 2013 | | $ | — | | | $ | 2,507 | | | $ | 1,038 | | | $ | — | | | $ | 3,545 | |
| 2012 | | | — | | | | 2,795 | | | | 538 | | | | — | | | | 3,333 | |
| California Tax Exempt Bond Fund | |
| 2013 | | $ | 1,190 | | | $ | 150 | | | $ | 379 | | | $ | — | | | $ | 1,719 | |
| 2012 | | | 1,360 | | | | 63 | | | | 332 | | | | — | | | | 1,755 | |
| High Yield Bond Fund | |
| 2013 | | $ | — | | | $ | 10,996 | | | $ | — | | | $ | — | | | $ | 10,996 | |
| 2012 | | | — | | | | 9,684 | | | | — | | | | — | | | | 9,684 | |
| Intermediate Fixed Income Fund† | |
| 2013 | | $ | — | | | $ | 3,505 | | | $ | — | | | $ | — | | | $ | 3,505 | |
| 2012 | | | — | | | | 4,065 | | | | — | | | | — | | | | 4,065 | |
| 2011 | | | — | | | | 3,317 | | | | — | | | | — | | | | 3,317 | |
| Fixed Income Opportunities Fund† | |
| 2013 | | $ | — | | | $ | 34,355 | | | $ | 52 | | | $ | — | | | $ | 34,407 | |
| 2012 | | | — | | | | 35,978 | | | | 1,348 | | | | — | | | | 37,326 | |
| 2011 | | | — | | | | 20,952 | | | | 4,794 | | | | — | | | | 25,746 | |
| Multi-Asset Fund | |
| 2013 | | $ | — | | | $ | 667 | | | $ | — | | | $ | — | | | | 667 | |
| 2012 | | | — | | | | 899 | | | | — | | | | — | | | | 899 | |
| Dividend & Income Fund† | |
| 2013 | | $ | — | | | $ | 2,296 | | | $ | — | | | $ | 1,135 | | | $ | 3,431 | |
| 2012 | | | — | | | | 4,044 | | | | — | | | | 727 | | | | 4,771 | |
| 2011 | | | — | | | | 2,681 | | | | — | | | | 502 | | | | 3,183 | |
| U.S. Core Equity Fund^ | |
| 2013 | | $ | — | | | $ | 571 | | | $ | — | | | $ | — | | | $ | 571 | |
| Socially Responsible Equity Fund | | | | | | | | | | | | | | | | | |
| 2013 | | $ | — | | | $ | 1,134 | | | $ | — | | | $ | — | | | $ | 1,134 | |
| 2012 | | | — | | | | 1,199 | | | | — | | | | — | | | | 1,199 | |
| Emerging Markets Fund† | | | | | | | | | | | | | | | | | |
| 2013 | | $ | — | | | $ | — | | | $ | — | | | $ | — | | | $ | — | |
| 2012 | | | — | | | | — | | | | — | | | | 67 | | | | 67 | |
| † | For the years ended December 31, 2012 and December 31, 2011. |
| ^ | For the period December 3, 2012 (commencement of operations) through September 30, 2013. |
CITY NATIONAL ROCHDALE FUNDS | PAGE 122
As of September 30, 2013, the components of Distributable Earnings/(Accumulated Losses) on a tax basis were as follows:
| | Undistributed Tax-Exempt Income (000) | | | Undistributed Ordinary Income (000) | | | Undistributed Long-Term Capital Gain (000) | | | Capital Loss Carryforwards (000) | | | | | | Unrealized Appreciation (000) | | | Other Temporary Differences (000) | | | Total Distributable Earnings (Accumulated Losses) (000) | |
| Government Money Market Fund | | $ | — | | | $ | 30 | | | $ | — | | | $ | (1 | ) | | $ | — | | | $ | — | | | $ | (30 | ) | | $ | (1 | ) |
| Prime Money Market Fund | | | — | | | | 10 | | | | — | | | | (14 | ) | | | (1 | ) | | | — | | | | (10 | ) | | | (15 | ) |
| California Tax Exempt Money Market Fund | | | 8 | | | | — | | | | — | | | | — | | | | — | | | | — | | | | (6 | ) | | | 2 | |
| Limited Maturity Fixed Income Fund | | | — | | | | 22 | | | | — | | | | (1,955 | ) | | | (38 | ) | | | 198 | | | | (22 | ) | | | (1,795 | ) |
| Government Bond Fund | | | — | | | | 100 | | | | — | | | | (972 | ) | | | (753 | ) | | | 1,280 | | | | (100 | ) | | | (445 | ) |
| Corporate Bond Fund | | | — | | | | 184 | | | | 916 | | | | — | | | | (28 | ) | | | 2,659 | | | | (183 | ) | | | 3,548 | |
| California Tax Exempt Bond Fund | | | 96 | | | | — | | | | 127 | | | | — | | | | (147 | ) | | | 906 | | | | (96 | ) | | | 886 | |
| High Yield Bond Fund | | | — | | | | 880 | | | | 355 | | | | — | | | | — | | | | 1,037 | | | | (851 | ) | | | 1,421 | |
| Intermediate Fixed Income Fund | | | — | | | | 32 | | | | — | | | | (2,835 | ) | | | — | | | | 505 | | | | — | | | | (2,298 | ) |
| Fixed Income Opportunities Fund | | | — | | | | — | | | | 5,195 | | | | — | | | | — | | | | (4,871 | ) | | | 197 | | | | 521 | |
| Multi-Asset Fund | | | — | | | | — | | | | — | | | | (1,698 | ) | | | — | | | | 860 | | | | — | | | | (838 | ) |
| Dividend & Income Fund | | | — | | | | — | | | | — | | | | (10,202 | ) | | | — | | | | 32,905 | | | | — | | | | 22,703 | |
| U.S. Core Equity Fund | | | — | | | | 2,037 | | | | — | | | | — | | | | — | | | | 18,808 | | | | — | | | | 20,845 | |
| Socially Responsible Equity Fund | | | — | | | | — | | | | 12,244 | | | | — | | | | — | | | | 13,506 | | | | — | | | | 25,750 | |
| Emerging Markets Fund | | | — | | | | 1,072 | | | | — | | | | (838 | ) | | | — | | | | 27,563 | | | | — | | | | 27,797 | |
For tax purposes, the losses in the Funds generated prior to the Regulated Investment Company Modernization Act of 2010 can be carried forward for a maximum of eight years to offset any future net realized capital gains. As of September 30, 2013, the breakdown of capital loss carryforwards was as follows:
| | | | |
| | | | | | | | | | | | | | | | | | |
| Government Money Market Fund | | $ | — | | | $ | — | | | $ | — | | | $ | — | | | $ | 1 | | | $ | 1 | |
| Limited Maturity Fixed Income Fund | | | 132 | | | | 1,415 | | | | 81 | | | | 327 | | | | — | | | | 1,955 | |
| Multi-Asset Fund | | | — | | | | — | | | | 370 | | | | 1,328 | | | | — | | | | 1,698 | |
| | | | |
| | | | | | | | | | | | |
| Intermediate Fixed Income Fund | | $ | 192 | | | $ | 2,240 | | | $ | — | | | $ | 2,432 | |
| Dividend & Income Fund | | | 1,513 | | | | 6,397 | | | | 1,455 | | | | 9,365 | |
Post-October losses represent losses realized on investments and foreign currency transactions from November 1, 2012, through September 30, 2013, that, in accordance with Federal income tax regulations, the Funds have elected to defer and treat as having arisen in the following fiscal year.
Under the Regulated Investment Company Modernization Act of 2010, the Funds will be permitted to carry forward capital losses incurred in taxable years beginning after December 22, 2010 for an unlimited period. However, any losses incurred during those future taxable years will be required to be utilized prior to the losses incurred in pre-enactment taxable years. As a result of this ordering rule, pre-enactment capital loss carryforwards may be more likely to expire unused. Additionally, post-enactment capital losses that are carried forward will retain their character as either short-term or long-term capital losses rather than being considered all short-term as under previous law. Losses carried forward under these new provisions are as follows:
CITY NATIONAL ROCHDALE FUNDS | PAGE 123
notes to financial statements/
consolidated notes to financial statements
March 31, 2014 (Unaudited)
| | | | | | | | | |
| Prime Money Market Fund | | $ | 14 | | | $ | — | | | $ | 14 | |
| Government Bond Fund | | | 555 | | | | 417 | | | | 972 | |
| Intermediate Fixed Income Fund | | | 403 | | | | — | | | | 403 | |
| Dividend & Income Fund | | | 837 | | | | — | | | | 837 | |
| Emerging Markets Fund | | | 838 | | | | — | | | | 838 | |
| * | This table should be used in conjunction with the capital loss carryforwards table. |
During the year ended September 30, 2013, the following Funds utilized capital loss carryforwards to offset capital gains amounting to:
| | | |
| Government Money Market Fund | | $ | 5 | |
| Limited Maturity Fixed Income Fund | | | 48 | |
| High Yield Bond Fund | | | 504 | |
| Multi-Asset Fund | | | 661 | |
| Dividend & Income Fund | | | 3,568 | |
| Socially Responsible Equity Fund | | | 10,257 | |
| | | 1,063 | |
The aggregate gross unrealized appreciation on securities, the aggregate gross unrealized depreciation on securities and the net unrealized appreciation/ (depreciation) for tax purposes at March 31, 2014, for each of the Fixed Income Funds, Multi-Asset Fund and Equity Funds were as follows:
| | | | | Aggregate Gross Unrealized Appreciation (000) | | | Aggregate Gross Unrealized Depreciation (000) | | | Net Unrealized Appreciation (000) | |
| Limited Maturity Fixed Income Fund | | $ | 28,752 | | | $ | 277 | | | $ | (4 | ) | | $ | 273 | |
| Government Bond Fund | | | 172,873 | | | | 1,736 | | | | (556 | ) | | | 1,180 | |
| Corporate Bond Fund | | | 135,087 | | | | 2,690 | | | | (154 | ) | | | 2,536 | |
| California Tax Exempt Bond Fund | | | 71,117 | | | | 1,310 | | | | (197 | ) | | | 1,113 | |
| Municipal High Income Fund | | | 183,393 | | | | 2,424 | | | | (435 | ) | | | 1,989 | |
| High Yield Bond Fund | | | 124,938 | | | | 5,422 | | | | (1,931 | ) | | | 3,491 | |
| Intermediate Fixed Income Fund | | | 210,879 | | | | 5,011 | | | | (2,220 | ) | | | 2,791 | |
| Fixed Income Opportunities Fund | | | 1,212,952 | | | | 43,674 | | | | (12,658 | ) | | | 31,016 | |
| Multi-Asset Fund | | | 24,586 | | | | 1,219 | | | | (109 | ) | | | 1,110 | |
| Dividend & Income Fund | | | 135,402 | | | | 42,942 | | | | (1,710 | ) | | | 41,232 | |
| U.S. Core Equity Fund | | | 192,661 | | | | 32,229 | | | | (634 | ) | | | 31,595 | |
| Socially Responsible Equity Fund | | | 64,912 | | | | 18,917 | | | | (1,165 | ) | | | 17,752 | |
| Emerging Markets Fund | | | 391,400 | | | | 65,613 | | | | (7,930 | ) | | | 57,683 | |
At March 31, 2014, the Money Market Funds’ cost of securities for Federal income tax purposes approximates the cost disclosed in the Schedule of Investments.
In the normal course of business, the Funds enter into contracts that provide general indemnifications. The Funds’ maximum exposure under these arrangements is dependent on future claims that may be made against the Funds and, therefore, cannot be established; however, based on experience, the risk of loss from such claims is considered remote.
The Multi-Asset Fund may invest in exchange-traded notes (“ETNs”) as a non-principal investment strategy. ETNs are unsecured debt obligations of investment banks which are traded on exchanges and the returns of which are linked to the performance of market indexes. In addition to trading ETNs on exchanges, investors may redeem ETNs directly with the issuer on a weekly basis, typically in a minimum amount of 50,000 units, or hold the ETNs until maturity. ETNs are riskier than ordinary unsecured debt securities and have no principal protection. The Fund will generally invest in ETNs which are linked to commodities indexes. The Fund’s investment in an ETN may be influenced by many unpredictable factors, including highly volatile commodities prices, changes in supply and demand relationships, weather, agriculture, trade, changes in interest rates, and monetary and other governmental policies, action and inaction. Investing in ETNs is not equivalent to investing directly in index components or the relevant index itself. Because ETNs are debt securities, they possess credit risk; if the issuer has financial difficulties or goes bankrupt, the investor may not receive the return it was promised.
The Municipal High Income Fund, High Yield Bond Fund, Intermediate Fixed Income Fund, Fixed Income Opportunities Fund and Multi-Asset Fund may invest in lower-rated corporate bonds, known as high yield bonds. High yield bonds involve greater risks of default, downgrade, or price declines and are more volatile than investment grade securities. Issuers of high yield bonds may be more susceptible than other issuers to economic downturns and are subject to a greater risk that the issuer may not be able to pay interest or dividends and ultimately to repay principal upon maturity. Discontinuation of these payments could have a substantial adverse effect on the market value of the security.
The Intermediate Fixed Income Fund and Fixed Income Opportunities Fund may invest in asset-backed and mortgage-backed securities. As a general rule, prepayments of the principal of the loans underlying mortgage-backed or other pass-through securities increase during a period of falling interest rates and
CITY NATIONAL ROCHDALE FUNDS | PAGE 124
decrease during a period of rising interest rates. In periods of declining interest rates, as a result of prepayments a Fund may be required to reinvest its assets in securities with lower interest rates. In periods of increasing interest rates, the securities subject to prepayment risk held by a Fund may exhibit price characteristics of longer-term debt securities.
The Intermediate Fixed Income Fund and Fixed Income Opportunities Fund may invest in bank loans. Bank loans are not traded on an exchange and purchasers and sellers of bank loans generally rely on market makers, typically the administrative agent under a bank loan, to effect private sales transactions. As a result, bank loans may have relatively less liquidity than other types of fixed income assets, and a Fund may be more likely to incur losses on the sale of bank loans than on other, more liquid, investments.
The Fixed Income Opportunities Fund may invest in beneficial interests in individual life insurance policies (“Policies”). The Policy owner transfers his or her Policy at a discount to its face value (the amount that is payable upon the death of the insured) in return for an immediate cash settlement. The ultimate purchaser of the Policy (in this case, the Fund) is responsible for premiums payable on the Policy and is entitled to receive the full face value from the insurance company upon the death of the insured. If the Fund is unable to make premium payments on a Policy, the Policy will lapse and the Fund will lose its ownership interest in the Policy. There is currently no established secondary market for Policies, and the Policies are not considered liquid investments by the Fund. If the Fund must sell Policies to meet redemption requests or other cash needs, the Fund may be forced to sell at a loss. The longer the insured lives, the lower the Fund’s rate of return on the Policy. The underwriter’s estimate of the insured’s life expectancy may be incorrect. An insurance company may be unable or refuse to pay benefits on a Policy. In addition, market quotations will not be readily available for the Policies and the Policies will be priced using a fair value methodology adopted by the Trust’s Board. The sales price the Fund could receive for a Policy may differ from the Trust’s valuation of the Policy. A Policy is a liability of the issuing life insurance company, and if the life insurance company goes out of business, sufficient funds may not be available to pay that liability.
California Tax Exempt Funds – Specific Risks
The ability of issuers to pay interest on, and repay principal of, California municipal securities may be affected by economic and political developments in the State of California.
Certain securities are backed by letters of credit from various financial institutions and financial guaranty assurance agencies. These letters of credit enhance the credit quality of the individual securities; however, if any of the financial institutions’ or financial guaranty assurance agencies’ credit quality should deteriorate, it could cause the individual security’s credit quality to change. Additionally, if any of the Funds concentrate their letters of credit in any one financial institution, the risk of credit quality deterioration increases.
Emerging Markets Fund – Specific Risks
Foreign investments tend to be more volatile than domestic securities, and are subject to risks that are not typically associated with domestic securities (e.g., changes in currency rates and exchange control regulations, future political and economic developments and the possibility of seizure or nationalization of companies, or the imposition of withholding taxes on income). There may be less government supervision of foreign markets. As a result, foreign issuers may not be subject to the uniform accounting, auditing, and financial reporting standards and practices applicable to domestic issuers, and there may be less publicly available information about foreign issuers.
As long as the Emerging Markets Fund holds a foreign security, its value will be affected by the value of the local currency relative to the U.S. dollar. The value of a foreign currency may decline in relation to the U.S. dollar while the Fund holds securities denominated in such currency. Currency exchange rates can be volatile and can be affected by, among other factors, the general economics of a country or the actions of the U.S. or foreign governments or central banks. U.S. dollar-denominated securities of foreign issuers may also be affected by currency risk, as the value of these securities may also be affected by changes in the issuer’s local currency.
Risks associated with foreign investments may be intensified in the case of investments in emerging market countries, the political, legal and economic systems of which are less developed and less stable than those of more developed nations. Emerging markets may have relatively unstable governments, immature economic structures, national policies restricting investments by foreigners, social instability, and different and/or developing legal systems. In some countries, there is the risk that the government may take over the assets or operations of a company or that the government may impose withholding and other taxes or limits on the removal of the Emerging Market Fund’s assets from that country. In addition, the economies of emerging markets may be predominantly based on only a few industries, may be highly vulnerable to changes in local or global trade conditions, and may suffer from extreme and volatile debt burdens or inflation rates. Such investments are often less liquid and/or more volatile than securities issued by companies located in developed nations. Emerging market securities are also subject to the risk that the securities may not be sold at the quoted market price within a reasonable period of time.
CITY NATIONAL ROCHDALE FUNDS | PAGE 125
notes to financial statements/
consolidated notes to financial statements
March 31, 2014 (Unaudited)
| 8. | CAPITAL SHARES ISSUED AND REDEEMED: |
Capital share activity for the six months ended March 31, 2014 and the year ended September 30, 2013 were as follows (000):
| | | Government Money Market Fund | | | Prime Money Market Fund (1) | | | California Tax Exempt Money Market Fund | |
| | | | | | | | | | | | | | | | | | | |
| CAPITAL SHARES ISSUED AND REDEEMED: | | | | | | | | | | | | | | | | |
| Institutional Class: | | | | | | | | | | | | | | | | | | |
| Shares issued | | | — | | | | — | | | | 130,467 | | | | 64,765 | | | | — | | | | — | |
| Shares issued in Lieu of Dividends and Distributions | | | — | | | | — | | | | — | | | | — | | | | — | | | | — | |
| | | — | | | | — | | | | (87,889 | ) | | | (53,558 | ) | | | — | | | | — | |
Net Institutional Class transactions | | | — | | | | — | | | | 42,578 | | | | 11,207 | | | | — | | | | — | |
| Class N: | | | | | | | | | | | | | | | | | | | | | | | | |
| Shares issued | | | 1,918,722 | | | | 4,569,767 | | | | 343,074 | | | | 958,377 | | | | 398,827 | | | | 1,060,390 | |
| Shares issued in Lieu of Dividends and Distributions | | | 123 | | | | 232 | | | | 12 | | | | 43 | | | | 34 | | | | 69 | |
| | | (2,235,328 | ) | | | (4,337,676 | ) | | | (439,458 | ) | | | (927,483 | ) | | | (418,968 | ) | | | (1,053,782 | ) |
| | | (316,483 | ) | | | 232,323 | | | | (96,372 | ) | | | 30,937 | | | | (20,107 | ) | | | 6,677 | |
| Class S: | | | | | | | | | | | | | | | | | | | | | | | | |
| Shares issued | | | 611,574 | | | | 1,126,727 | | | | 437,190 | | | | 820,945 | | | | 171,410 | | | | 320,188 | |
| Shares issued in Lieu of Dividends and Distributions | | | — | | | | — | | | | — | | | | — | | | | — | | | | — | |
| | | (489,967 | ) | | | (940,498 | ) | | | (456,503 | ) | | | (869,753 | ) | | | (189,371 | ) | | | (340,847 | ) |
| | | 121,607 | | | | 186,229 | | | | (19,313 | ) | | | (48,808 | ) | | | (17,961 | ) | | | (20,659 | ) |
| Servicing Class^: | | | | | | | | | | | | | | | | | | | | | | | | |
| Shares issued | | | 395,977 | | | | 778,145 | | | | 565,318 | | | | 2,068,692 | | | | 274,446 | | | | 808,580 | |
| Shares issued in Lieu of Dividends and Distributions | | | — | | | | — | | | | 5 | | | | 22 | | | | — | | | | — | |
| | | (364,640 | ) | | | (746,175 | ) | | | (572,258 | ) | | | (1,961,996 | ) | | | (252,631 | ) | | | (780,506 | ) |
Net Servicing Class transactions | | | 31,337 | | | | 31,970 | | | | (6,935 | ) | | | 106,718 | | | | 21,815 | | | | 28,074 | |
| | | Limited Maturity Fixed Income Fund | | | | | | | | | California Tax Exempt Bond Fund | |
| | | | | | | | | | | | | | | | | | | | | | | | | |
| CAPITAL SHARES ISSUED AND REDEEMED: | | | | | | | | | | | | | | | | | |
| Institutional Class: | | | | | | | | | | | | | | | | | | | | | | | | |
| Shares issued | | | 33 | | | | 97 | | | | 618 | | | | 1,036 | | | | — | | | | — | | | | — | | | | — | |
| Shares issued in Lieu of Dividends and Distributions | | | 4 | | | | 8 | | | | 17 | | | | 68 | | | | — | | | | — | | | | — | | | | — | |
| | | (1,486 | ) | | | (780 | ) | | | (421 | ) | | | (896 | ) | | | — | | | | — | | | | — | | | | — | |
Net Institutional Class transactions | | | (1,449 | ) | | | (675 | ) | | | 214 | | | | 208 | | | | — | | | | — | | | | — | | | | — | |
| Class N: | | | | | | | | | | | | | | | | | | | | | | | | | | | | | | | | |
| Shares issued | | | 82 | | | | 184 | | | | 21 | | | | 29 | | | | 53 | | | | 164 | | | | 257 | | | | 540 | |
| Shares issued in Lieu of Dividends and Distributions | | | 1 | | | | 2 | | | | — | | | | 1 | | | | 3 | | | | 4 | | | | 4 | | | | 10 | |
| | | (37 | ) | | | (166 | ) | | | (36 | ) | | | (67 | ) | | | (31 | ) | | | (111 | ) | | | (93 | ) | | | (333 | ) |
| | | 46 | | | | 20 | | | | (15 | ) | | | (37 | ) | | | 25 | | | | 57 | | | | 168 | | | | 217 | |
| Servicing Class^: | | | | | | | | | | | | | | | | | | | | | | | | | | | | | | | | |
| Shares issued | | | — | | | | — | | | | 1,327 | | | | 3,473 | | | | 1,811 | | | | 4,137 | | | | 1,069 | | | | 2,479 | |
| Shares issued in Lieu of Dividends and Distributions | | | — | | | | — | | | | 10 | | | | 57 | | | | 17 | | | | 28 | | | | 6 | | | | 20 | |
| | | — | | | | — | | | | (1,435 | ) | | | (4,124 | ) | | | (1,778 | ) | | | (3,802 | ) | | | (945 | ) | | | (1,658 | ) |
Net Servicing Class transactions | | | — | | | | — | | | | (98 | ) | | | (594 | ) | | | 50 | | | | 363 | | | | 130 | | | | 841 | |
| (1) | Institutional Class commenced operations December 19, 2012. |
| ^ | Effective November 28, 2012, Institutional Class Shares were redesignated as Servicing Class Shares. This share class name change had no impact on the Fund’s operations or investment policy. |
CITY NATIONAL ROCHDALE FUNDS | PAGE 126
| | | Municipal High Income Fund (1) | | | | | | Intermediate Fixed Income Fund (2)^ | | | Fixed Income Opportunities Fund ^ | |
| | | | | | | | | | | | | | | | 2013 | | | | 2012† | | | | 2014 | | | | 2013† | | | | 2012† | |
| CAPITAL SHARES ISSUED AND REDEEMED: | | | | | | | | | | | | | | | | | | | | | | | | | | | |
| Institutional Class: | | | | | | | | | | | | | | | | | | | | | | | | | | | | | | | | |
| Shares issued | | | — | | | | 532 | | | | 775 | | | | — | | | | — | | | | — | | | | — | | | | — | | | | — | |
| Shares issued from Merger | | | — | | | | — | | | | — | | | | 1,734 | | | | — | | | | — | | | | — | | | | — | | | | — | |
| Shares issued in Lieu of Dividends and Distributions | | | — | | | | 145 | | | | 266 | | | | 13 | | | | — | | | | — | | | | — | | | | — | | | | — | |
| | | — | | | | (645 | ) | | | (1,212 | ) | | | (196 | ) | | | — | | | | — | | | | — | | | | — | | | | — | |
Net Institutional Class transactions | | | — | | | | 32 | | | | (171 | ) | | | 1,551 | | | | — | | | | — | | | | — | | | | — | | | | — | |
| Class N: | | | | | | | | | | | | | | | | | | | | | | | | | | | | | | | | | | | | |
| Shares issued | | | 7,487 | | | | 232 | | | | 1,804 | | | | 1,752 | | | | 2,111 | | | | 1,995 | | | | 13,257 | | | | 12,348 | | | | 7,602 | |
| Shares issued in Lieu of Dividends and Distributions | | | 19 | | | | 79 | | | | 163 | | | | 34 | | | | 66 | | | | 127 | | | | 553 | | | | 736 | | | | 1,297 | |
| | | (56 | ) | | | (202 | ) | | | (2,440 | ) | | | (1,081 | ) | | | (1,032 | ) | | | (1,454 | ) | | | (3,494 | ) | | | (2,675 | ) | | | (3,875 | ) |
| | | 7,450 | | | | 109 | | | | (473 | ) | | | 705 | | | | 1,145 | | | | 668 | | | | 10,316 | | | | 10,409 | | | | 5,024 | |
| Servicing Class: | | | | | | | | | | | | | | | | | | | | | | | | | | | | | | | | | | | | |
| Shares issued | | | 9,866 | | | | 1,996 | | | | 7,140 | | | | — | | | | — | | | | — | | | | — | | | | — | | | | — | |
| Shares issued in Lieu of Dividends and Distributions | | | — | | | | 40 | | | | 77 | | | | — | | | | — | | | | — | | | | — | | | | — | | | | — | |
| | | (236 | ) | | | (7,163 | ) | | | (5,463 | ) | | | — | | | | — | | | | — | | | | — | | | | — | | | | — | |
Net Servicing Class transactions | | | 9,630 | | | | (5,127 | ) | | | 1,754 | | | | — | | | | — | | | | — | | | | — | | | | — | | | | — | |
| | | | | | | | | U.S. Core Equity Fund (4) | |
| | | | | | | | | | | | | 2013† | | | | 2012† | | | | 2014 | | | | 2013 | |
| CAPITAL SHARES ISSUED AND REDEEMED: | | | | | | | | | | | | | | | | | | | | | | | |
| Institutional Class: | | | | | | | | | | | | | | | | | | | | | | | | | |
| Shares issued | | | 71 | | | | 184 | | | | — | | | | — | | | | — | | | | — | | | | — | |
Shares issued from Merger(5) | | | — | | | | — | | | | — | | | | — | | | | — | | | | 207 | | | | — | |
| Shares issued in Lieu of Dividends and Distributions | | | 3 | | | | 14 | | | | — | | | | — | | | | — | | | | — | | | | — | |
| | | (664 | ) | | | (809 | ) | | | — | | | | — | | | | — | | | | — | | | | — | |
Net Institutional Class transactions | | | (590 | ) | | | (611 | ) | | | — | | | | — | | | | — | | | | 207 | | | | — | |
| Class N: | | | | | | | | | | | | | | | | | | | | | | | | | | | | |
| Shares issued | | | 34 | | | | 198 | | | | 1,246 | | | | 357 | | | | 1,706 | | | | 1,148 | | | | 6,045 | |
Shares issued from Merger(5) | | | — | | | | — | | | | — | | | | — | | | | — | | | | 3,795 | | | | — | |
| Shares issued in Lieu of Dividends and Distributions | | | 4 | | | | 25 | | | | 52 | | | | 26 | | | | 152 | | | | 94 | | | | 19 | |
| | | (312 | ) | | | (565 | ) | | | (991 | ) | | | (535 | ) | | | (1,677 | ) | | | (411 | ) | | | (586 | ) |
| | | (274 | ) | | | (342 | ) | | | 307 | | | | (152 | ) | | | 181 | | | | 4,626 | | | | 5,478 | |
| Servicing Class: | | | | | | | | | | | | | | | | | | | | | | | | | | | | |
| Shares issued | | | 94 | | | | 18 | | | | — | | | | — | | | | — | | | | 1,397 | | | | 6,805 | |
| Shares issued in Lieu of Dividends and Distributions | | | 1 | | | | 5 | | | | — | | | | — | | | | — | | | | 1 | | | | — | |
| | | (19 | ) | | | (254 | ) | | | — | | | | — | | | | — | | | | (570 | ) | | | (1,103 | ) |
Net Servicing Class transactions | | | 76 | | | | (231 | ) | | | — | | | | — | | | | — | | | | 828 | | | | 5,702 | |
| (1) | Fund commenced operations on December 30, 2013. |
| (2) | Institutional Class commenced operations on December 20, 2013. |
| (3) | Institutional Class commenced operations on January 10, 2014. |
| (4) | Fund commenced operations on December 3, 2012. |
| (5) | See Note 10 in Notes to Financial Statements. |
| ^ | On March 29, 2013, the Intermediate Fixed Income Fund, the Fixed Income Opportunities Fund and the Dividend & Income Fund were reorganized into series of the City National Rochdale Funds. See Note 1 in Notes to Financial Statements for additional information. |
| † | For the nine months ended September 30, 2013 and the year ended December 31, 2012. |
CITY NATIONAL ROCHDALE FUNDS | PAGE 127
notes to financial statements/
consolidated notes to financial statements
March 31, 2014 (Unaudited)
| | | Socially Responsible Equity Fund | | | | |
| | | | | | | | | | | | | 2013† | | | | 2012† | |
| CAPITAL SHARES ISSUED AND REDEEMED: | | | | | | | | | | | | | | | |
| Institutional Class: | | | | | | | | | | | | | | | | | |
| Shares issued | | | 243 | | | | 1,334 | | | | — | | | | — | | | | — | |
| Shares issued in Lieu of Dividends and Distributions | | | 743 | | | | 79 | | | | — | | | | — | | | | — | |
| | | (274 | ) | | | (5,685 | ) | | | — | | | | — | | | | — | |
Net Institutional Class transactions | | | 712 | | | | (4,272 | ) | | | — | | | | — | | | | — | |
| Class N: | | | | | | | | | | | | | | | | | | | | |
| Shares issued | | | 719 | | | | 702 | | | | 4,458 | | | | 4,972 | | | | 4,464 | |
| Shares issued in Lieu of Dividends and Distributions | | | 510 | | | | 22 | | | | 15 | | | | — | | | | 2 | |
| | | (875 | ) | | | (717 | ) | | | (603 | ) | | | (618 | ) | | | (466 | ) |
| | | 354 | | | | 7 | | | | 3,870 | | | | 4,354 | | | | 4,000 | |
| † | For the nine months ended September 30, 2013, year ended December 31, 2012. |
| ^ | On March 29, 2013, the Emerging Markets Fund was reorganized into series of the City National Rochdale Funds. See Note 1 in Notes to Financial Statements for additional information. |
On December 20, 2013, the assets of the Full Maturity Fixed Income Fund were reorganized into the Intermediate Fixed Income Fund. In this reorganization, 4,352,128 shares of the Full Maturity Fixed Income Fund were exchanged for 1,734,179 shares of the Intermediate Fixed Income Fund in a tax-free exchange.
The value of the Full Maturity Fixed Income Fund was $44,899,004. Upon the business combination of such Funds on December 20, 2013, the value of the Full Maturity Fixed Income Fund, which included accumulated realized losses of $124,817 and unrealized gains of $238,492, combined with the Intermediate Fixed Income Fund was $209,405,691.
On March 21, 2014, the assets of the Diversified Equity Fund were reorganized into the U.S. Core Equity Fund. In this reorganization, 3,019,691 shares of the Diversified Equity Fund were exchanged for 207,167 Class N shares and 3,794,815 Institutional Class shares of the U.S. Core Equity Fund in a tax-free exchange.
The value of the Diversified Equity Fund on March 21, 2014 was $53,568,331. Upon the business combination of such Funds on March 21, 2014, the value of the Diversified Equity Fund, which included accumulated realized losses of $451,745 and distributions in excess of net investment income of $210, combined with the U.S. Core Equity Fund was $223,593,114.
The Trust has evaluated the need for additional disclosures and/or adjustments resulting from subsequent events. Based on this evaluation, no adjustments were required to the financial statements as of March 31, 2014 and no issues were noted to disclose, except as follows:
A Special Meeting of Shareholders of the City National Rochdale Alternative Total Return Fund LLC (the “Target Fund”) will be held on May 30, 2014, for the shareholders of the Target Fund to consider and vote on a proposed reorganization of the Target Fund into the City National Rochdale Fixed Income Opportunities Fund and the subsequent dissolution of the Target Fund, expected to take place as of May 30, 2014.
CITY NATIONAL ROCHDALE FUNDS | PAGE 128
disclosure of fund expenses (Unaudited)
All mutual funds have operating expenses. As a shareholder of a Fund, your investment is affected by these ongoing costs, which include (among others) costs for portfolio management, administrative services, class-specific distribution fees, acquired fund fees and shareholder reports like this one. It is important for you to understand the impact of these costs on your investment returns.
Operating expenses such as these are deducted from the Fund’s gross income and directly reduce your final investment return. These expenses are expressed as a percentage of the Fund’s average net assets; this percentage is known as the Fund’s expense ratio.
The following examples use the expense ratio and are intended to help you understand the ongoing costs (in dollars) of investing in your Fund and to compare these costs with those of other mutual funds. The examples are based on an investment of $1,000 made at the beginning of the period shown and held for the entire period.
The table below illustrates your Fund’s costs in two ways:
Actual Fund Return. This section helps you to estimate the actual expenses that your Fund incurred over the period. The “Expenses Paid During Period” column shows the actual dollar expense cost incurred by a $1,000 investment in the Fund, and the “Ending Account Value” number is derived from deducting that expense cost from the Fund’s gross investment return.
You can use this information, together with the actual amount you invested in the Fund, to estimate the expenses you paid over that period. Simply divide your actual account value by $1,000 to arrive at a ratio (for example, an $8,600 account value divided by $1,000 = 8.6), then multiply that ratio by the number shown for your Fund under “Expenses Paid During Period.”
Hypothetical 5% Return. This section helps you compare your Fund’s costs with those of other mutual funds. It assumes that the Fund had an annual 5% return before expenses during the year, but that the expense ratio (Column 3) for the period is unchanged. This example is useful in making comparisons because the Securities and Exchange Commission requires all mutual funds to make this 5% calculation. You can assess your Fund’s comparative cost by comparing the hypothetical result for your Fund in the “Expenses Paid During Period” column with those that appear in the same charts in the shareholder reports for other funds.
NOTE: Because the return is set at 5% for comparison purposes – NOT your Fund’s actual return – the account values shown do not apply to your specific investment.
CITY NATIONAL ROCHDALE FUNDS | PAGE 129
disclosure of fund expenses (Unaudited) (Continued)
| | | Beginning Account Value 10/01/2013 | | | Ending Account Value 03/31/2014 | | | Annualized Expense Ratios | | Expense Paid During Period* | |
City National Rochdale Government Money Market Fund | |
| Actual Fund Return | | | | | | | | | | | | |
| Class N | | $ | 1,000.00 | | | $ | 1,000.00 | | | | 0.08 | % | | $ | 0.40 | |
| Class S | | | 1,000.00 | | | | 1,000.00 | | | | 0.08 | % | | | 0.40 | |
| Servicing Class | | | 1,000.00 | | | | 1,000.00 | | | | 0.08 | % | | | 0.40 | |
| | | | | | | | | | | | | | | | | |
| Hypothetical 5% Return | | | | | | | | | | | | | | | | |
| Class N | | $ | 1,000.00 | | | $ | 1,024.53 | | | | 0.08 | % | | $ | 0.40 | |
| Class S | | | 1,000.00 | | | | 1,024.53 | | | | 0.08 | % | | | 0.40 | |
| Servicing Class | | | 1,000.00 | | | | 1,024.53 | | | | 0.08 | % | | | 0.40 | |
| | | | | | | | | | | | | | | | | |
City National Rochdale Prime Money Market Fund | |
| Actual Fund Return | | | | | | | | | | | | | | | | |
| Institutional Class | | $ | 1,000.00 | | | $ | 1,000.00 | | | | 0.15 | % | | $ | 0.75 | |
| Class N | | | 1,000.00 | | | | 1,000.00 | | | | 0.15 | % | | | 0.75 | |
| Class S | | | 1,000.00 | | | | 1,000.00 | | | | 0.15 | % | | | 0.75 | |
| Servicing Class | | | 1,000.00 | | | | 1,000.00 | | | | 0.15 | % | | | 0.75 | |
| | | | | | | | | | | | | | | | | |
| Hypothetical 5% Return | | | | | | | | | | | | | | | | |
| Institutional Class | | $ | 1,000.00 | | | $ | 1,024.18 | | | | 0.15 | % | | $ | 0.76 | |
| Class N | | | 1,000.00 | | | | 1,024.18 | | | | 0.15 | % | | | 0.76 | |
| Class S | | | 1,000.00 | | | | 1,024.18 | | | | 0.15 | % | | | 0.76 | |
| Servicing Class | | | 1,000.00 | | | | 1,024.18 | | | | 0.15 | % | | | 0.76 | |
| | | | | | | | | | | | | | | | | |
City National Rochdale California Tax Exempt Money Market Fund | |
| Actual Fund Return | | | | | | | | | | | | | | | | |
| Class N | | $ | 1,000.00 | | | $ | 1,000.00 | | | | 0.05 | % | | $ | 0.25 | |
| Class S | | | 1,000.00 | | | | 1,000.00 | | | | 0.06 | % | | | 0.30 | |
| Servicing Class | | | 1,000.00 | | | | 1,000.00 | | | | 0.05 | % | | | 0.25 | |
| | | | | | | | | | | | | | | | | |
| Hypothetical 5% Return | | | | | | | | | | | | | | | | |
| Class N | | $ | 1,000.00 | | | $ | 1,024.68 | | | | 0.05 | % | | $ | 0.25 | |
| Class S | | | 1,000.00 | | | | 1,024.63 | | | | 0.06 | % | | | 0.30 | |
| Servicing Class | | | 1,000.00 | | | | 1,024.68 | | | | 0.05 | % | | | 0.25 | |
City National Rochdale Limited Maturity Fixed Income Fund | |
| Actual Fund Return | | | | | | | | | | | | | | | | |
| Institutional Class | | $ | 1,000.00 | | | $ | 1,005.10 | | | | 0.67 | % | | $ | 3.35 | |
| Class N | | | 1,000.00 | | | | 1,004.70 | | | | 0.92 | % | | | 4.60 | |
| | | | | | | | | | | | | | | | | |
| Hypothetical 5% Return | | | | | | | | | | | | | | | | |
| Institutional Class | | $ | 1,000.00 | | | $ | 1,021.59 | | | | 0.67 | % | | $ | 3.38 | |
| Class N | | | 1,000.00 | | | | 1,020.34 | | | | 0.92 | % | | | 4.63 | |
| | | | Beginning Account Value 10/01/2013 | | | | Ending Account Value 03/31/2014 | | | | Annualized Expense Ratios | | | Expense Paid During Period* | |
City National Rochdale Government Bond Fund | |
| Actual Fund Return | | | | | | | | | | | | | | | | |
| Institutional Class | | $ | 1,000.00 | | | $ | 1,004.20 | | | | 0.53 | % | | $ | 0.87 | |
| Class N | | | 1,000.00 | | | | 1,000.70 | | | | 1.03 | % | | | 5.14 | |
| Servicing Class | | | 1,000.00 | | | | 1,002.00 | | | | 0.78 | % | | | 3.89 | |
| | | | | | | | | | | | | | | | | |
| Hypothetical 5% Return | | | | | | | | | | | | | | | | |
| Institutional Class | | $ | 1,000.00 | | | $ | 1,022.29 | | | | 0.53 | % | | $ | 2.67 | |
| Class N | | | 1,000.00 | | | | 1,019.80 | | | | 1.03 | % | | | 5.19 | |
| Servicing Class | | | 1,000.00 | | | | 1,021.04 | | | | 0.78 | % | | | 3.93 | |
| | | | | | | | | | | | | | | | | |
City National Rochdale Corporate Bond Fund | |
| Actual Fund Return | | | | | | | | | | | | | | | | |
| Class N | | $ | 1,000.00 | | | $ | 1,011.60 | | | | 1.01 | % | | $ | 5.07 | |
| Servicing Class | | | 1,000.00 | | | | 1,012.80 | | | | 0.76 | % | | | 3.81 | |
| | | | | | | | | | | | | | | | | |
| Hypothetical 5% Return | | | | | | | | | | | | | | | | |
| Class N | | $ | 1,000.00 | | | $ | 1,019.90 | | | | 1.01 | % | | $ | 5.09 | |
| Servicing Class | | | 1,000.00 | | | | 1,021.14 | | | | 0.76 | % | | | 3.83 | |
| | |
City National Rochdale California Tax Exempt Bond Fund | |
| Actual Fund Return | | | | | | | | | | | | | | | | |
| Class N | | $ | 1,000.00 | | | $ | 1,015.20 | | | | 0.88 | % | | $ | 4.42 | |
| Servicing Class | | | 1,000.00 | | | | 1,016.50 | | | | 0.63 | % | | | 3.17 | |
| | | | | | | | | | | | | | | | | |
| Hypothetical 5% Return | | | | | | | | | | | | | | | | |
| Class N | | $ | 1,000.00 | | | $ | 1,020.54 | | | | 0.88 | % | | $ | 4.43 | |
| Servicing Class | | | 1,000.00 | | | | 1,021.79 | | | | 0.63 | % | | | 3.18 | |
| | | | | | | | | | | | | | | | | |
City National Rochdale Municipal High Income Fund | |
| Actual Fund Return | | | | | | | | | | | | | | | | |
| Class N** | | $ | 1,000.00 | | | $ | 1,041.40 | | | | 1.12 | % | | $ | 2.88 | |
| Servicing Class** | | | 1,000.00 | | | | 1,042.90 | | | | 0.88 | % | | | 2.27 | |
| | | | | | | | | | | | | | | | | |
| Hypothetical 5% Return | | | | | | | | | | | | | | | | |
| Class N | | $ | 1,000.00 | | | $ | 1,019.35 | | | | 1.12 | % | | $ | 5.64 | |
| Servicing Class | | | 1,000.00 | | | | 1,020.54 | | | | 0.88 | % | | | 4.43 | |
| | |
City National Rochdale High Yield Bond Fund | |
| Actual Fund Return | | | | | | | | | | | | | | | | |
| Institutional Class | | $ | 1,000.00 | | | $ | 1,073.10 | | | | 0.70 | % | | $ | 1.17 | |
| Class N | | | 1,000.00 | | | | 1,070.40 | | | | 1.20 | % | | | 6.19 | |
| Servicing Class | | | 1,000.00 | | | | 1,071.80 | | | | 0.95 | % | | | 4.91 | |
| | | | | | | | | | | | | | | | | |
| Hypothetical 5% Return | | | | | | | | | | | | | | | | |
| Institutional Class | | $ | 1,000.00 | | | $ | 1,021.44 | | | | 0.70 | % | | $ | 3.53 | |
| Class N | | | 1,000.00 | | | | 1,018.95 | | | | 1.20 | % | | | 6.04 | |
| Servicing Class | | | 1,000.00 | | | | 1,020.19 | | | | 0.95 | % | | | 4.78 | |
| * | Expenses are equal to the Fund’s annualized expense ratio multiplied by the average account value over the period, multiplied by 182/365 (to reflect the one-half year period). |
| ** | Expenses are equal to the Fund’s annualized expense ratio multiplied by the average account value over the period, multiplied by 92/365 (to reflect the period since inception (December 30, 2013) to period end). |
CITY NATIONAL ROCHDALE FUNDS | PAGE 130
| | | Beginning Account Value 10/01/2013 | | | Ending Account Value 03/31/2014 | | | Annualized Expense Ratios | | Expense Paid During Period* | |
City National Rochdale Intermediate Fixed Income Fund | |
| Actual Fund Return | | | | | | | | | | | | | | | | |
| Institutional Class** | | $ | 1,000.00 | | | $ | 1,016.10 | | | | 0.51 | % | | $ | 1.42 | |
| Class N | | | 1,000.00 | | | | 1,020.50 | | | | 1.01 | % | | | 5.09 | |
| | | | | | | | | | | | | | | | | |
| Hypothetical 5% Return | | | | | | | | | | | | | | | | |
| Institutional Class | | $ | 1,000.00 | | | $ | 1,022.39 | | | | 0.51 | % | | $ | 2.57 | |
| Class N | | | 1,000.00 | | | | 1,019.90 | | | | 1.01 | % | | | 5.09 | |
| | | | | | | | | | | | | | | | | |
City National Rochdale Fixed Income Opportunities Fund | |
| Actual Fund Return | | | | | | | | | | | | | | | | |
| Class N | | $ | 1,000.00 | | | $ | 1,051.20 | | | | 1.11 | % | | $ | 5.68 | |
| | | | | | | | | | | | | | | | | |
| Hypothetical 5% Return | | | | | | | | | | | | | | | | |
| Class N | | $ | 1,000.00 | | | $ | 1,019.40 | | | | 1.11 | % | | $ | 5.59 | |
| | | | | | | | | | | | | | | | | |
City National Rochdale Multi-Asset Fund | |
| Actual Fund Return | | | | | | | | | | | | | | | | |
| Class N | | $ | 1,000.00 | | | $ | 1,039.90 | | | | 1.47 | % | | $ | 7.48 | |
| Servicing Class | | | 1,000.00 | | | | 1,041.20 | | | | 1.22 | % | | | 6.21 | |
| | | | | | | | | | | | | | | | | |
| Hypothetical 5% Return | | | | | | | | | | | | | | | | |
| Class N | | $ | 1,000.00 | | | $ | 1,017.60 | | | | 1.47 | % | | $ | 7.39 | |
| Servicing Class | | | 1,000.00 | | | | 1,018.85 | | | | 1.22 | % | | | 6.14 | |
| | | | | | | | | | | | | | | | | |
City National Rochdale Dividend & Income Fund | |
| Actual Fund Return | | | | | | | | | | | | | | | | |
| Class N | | $ | 1,000.00 | | | $ | 1,137.40 | | | | 1.11 | % | | $ | 5.92 | |
| | | | | | | | | | | | | | | | | |
| Hypothetical 5% Return | | | | | | | | | | | | | | | | |
| Class N | | $ | 1,000.00 | | | $ | 1,019.40 | | | | 1.11 | % | | $ | 5.59 | |
| | | | Beginning Account Value 10/01/2013 | | | | Ending Account Value 03/31/2014 | | | | Annualized Expense Ratios | | | Expense Paid During Period* | |
City National Rochdale U.S. Core Equity Fund | |
| Actual Fund Return | | | | | | | | | | | | | | | | |
| Institutional Class | | $ | 1,000.00 | | | $ | 1,117.00 | | | | 0.51 | % | | $ | 0.89 | |
| Class N | | | 1,000.00 | | | | 1,110.00 | | | | 1.04 | % | | | 5.47 | |
| Servicing Class | | | 1,000.00 | | | | 1,111.10 | | | | 0.78 | % | | | 4.11 | |
| | | | | | | | | | | | | | | | | |
| Hypothetical 5% Return | | | | | | | | | | | | | | | | |
| Institutional Class | | $ | 1,000.00 | | | $ | 1,022.39 | | | | 0.51 | % | | $ | 2.57 | |
| Class N | | | 1,000.00 | | | | 1,019.75 | | | | 1.04 | % | | | 5.24 | |
| Servicing Class | | | 1,000.00 | | | | 1,021.04 | | | | 0.78 | % | | | 3.93 | |
| | | | | | | | | | | | | | | | | |
City National Rochdale Socially Responsible Equity Fund | |
| Actual Fund Return | | | | | | | | | | | | | | | | |
| Institutional Class | | $ | 1,000.00 | | | $ | 1,119.50 | | | | 0.89 | % | | $ | 4.70 | |
| Class N | | | 1,000.00 | | | | 1,117.50 | | | | 1.14 | % | | | 6.02 | |
| | | | | | | | | | | | | | | | | |
| Hypothetical 5% Return | | | | | | | | | | | | | | | | |
| Institutional Class | | $ | 1,000.00 | | | $ | 1,020.49 | | | | 0.89 | % | | $ | 4.48 | |
| Class N | | | 1,000.00 | | | | 1,019.25 | | | | 1.14 | % | | | 5.74 | |
| | | | | | | | | | | | | | | | | |
City National Rochdale Emerging Markets Fund | |
| Actual Fund Return | | | | | | | | | | | | | | | | |
| Class N | | $ | 1,000.00 | | | $ | 1,074.80 | | | | 1.61 | % | | $ | 8.33 | |
| | | | | | | | | | | | | | | | | |
| Hypothetical 5% Return | | | | | | | | | | | | | | | | |
| Class N | | $ | 1,000.00 | | | $ | 1,016.90 | | | | 1.61 | % | | $ | 8.10 | |
| * | Expenses are equal to the Fund’s annualized expense ratio multiplied by the average account value over the period, multiplied by 182/365 (to reflect the one-half year period). |
| ** | Expenses are equal to the Fund’s annualized expense ratio multiplied by the average account value over the period, multiplied by 101/365 (to reflect the period since inception (December 20, 2013) to period end). |
CITY NATIONAL ROCHDALE FUNDS | PAGE 131
shareholder voting results (Unaudited)
On December 20, 2013, a Special Meeting of Shareholders of the City National Rochdale Full Maturity Fixed Income Fund was held to consider and act upon a proposal to reorganize the City National Rochdale Full Maturity Fixed Income Fund into the City National Rochdale Intermediate Fixed Income Fund and dissolve the City National Rochdale Full Maturity Fixed Income Fund. Shares were voted as follows:
| | Number of Shares Voted | % of Shares Voted | % of Total Outstanding Shares |
| For | 3,541,895.943 | 100.000% | 81.488% |
| Against | 0.000 | 0.000% | 0.000% |
| Abstain | 0.000 | 0.000% | 0.000% |
On March 20, 2014, a Special Meeting of Shareholders of the City National Diversified Equity Fund was held to consider and act upon a proposal to reorganize the City National Diversified Equity Fund into the City National Rochdale U.S. Core Equity Fund and dissolve the City National Diversified Equity Fund. Shares were voted as follows:
| | Number of Shares Voted | % of Shares Voted | % of Total Outstanding Shares |
| For | 2,529,004.847 | 99.970% | 83.217% |
| Against | 764.000 | 0.030% | 0.025% |
| Abstain | 0.000 | 0.000% | 0.000% |
CITY NATIONAL ROCHDALE FUNDS | PAGE 132
board approval of advisory and sub-advisory agreements
The Board of Trustees of City National Rochdale Funds (the “Trust”) is comprised of eight Trustees, six of whom are independent of the Trust’s investment adviser and sub-advisers (the “Independent Trustees”). During the six months ended March 30, 2014, the Board and the Independent Trustees approved the following advisory agreement and sub-advisory agreements:
| | • | An advisory agreement between the Trust and City National Rochdale, LLC (the “Adviser”) with respect to the new City National Rochdale Municipal High Income Fund series of the Trust (the “Muni High Income Fund”); |
| | • | A sub-advisory agreement between the Adviser and Waddell & Reed Investment Management Company (“Waddell”) with respect to the Muni High Income Fund; |
| | • | A sub-advisory agreement between the Adviser and Alcentra Limited (“Alcentra”) with respect to the City National Rochdale Fixed Income Opportunities Fund (the “Fixed Income Opportunities Fund”); and |
| | • | A sub-advisory agreement between the Adviser and Seix Investment Advisors LLC (“Seix”) with respect to the Fixed Income Opportunities Fund. |
The advisory and sub-advisory agreements listed above are collectively referred to below as the “Agreements” and Waddell, Alcentra and Seix are collectively referred to below as the “Sub-Advisers.”
GENERAL INFORMATION
The following information summarizes the Board’s considerations associated with its review of the Agreements. In connection with their deliberations, the Board considered such information and factors as they believed, in light of the legal advice furnished to them and their own business judgment, to be relevant. As described below, the Board considered the nature, quality and extent of the various investment advisory and administrative services performed by the Adviser and each Sub-Adviser.
The Board was familiar with the organizations and operations of the Adviser and Seix as a result of their past services to the Trust and the Fixed Income Opportunities Fund, respectively. The Board reviewed materials regarding the investment results of each Sub-Adviser, advisory fee and expense comparisons, financial information with respect to each entity, descriptions of various functions such as compliance monitoring and portfolio trading practices, and information about the personnel providing or proposed to provide investment management and administrative services to the Funds. They also took into account information they received at past meetings of the Board and its committees with respect to these matters.
In deciding to approve the Agreements, the Board and the Independent Trustees did not identify a single factor as controlling and this summary does not describe all of the matters considered. In addition, each Board member did not necessarily attribute the same weight to each matter. However, the Board and the Independent Trustees concluded that each of the various factors referred to below favored such approval.
CITY NATIONAL ROCHDALE MUNICIPAL HIGH INCOME FUND
Nature, Extent and Quality of Services
In reviewing the services to be provided by each of the Adviser and Waddell to the Muni High Income Fund, the Board considered a variety of matters, including the background, education and experience of its key portfolio management and operational personnel; its overall financial strength and stability; its resources and efforts to retain, attract and motivate capable personnel to serve the Fund; and the overall general quality and depth of its organization. With respect to each entity, the Board also took into account the experience, capability and integrity of its senior management; its investment philosophy and processes; its brokerage, trading and soft dollar practices; its disaster recovery and contingency planning; and its commitment and systems in place with regard to compliance with applicable laws and regulations.
The Board considered the nature and quality of the services provided by the Adviser in overseeing the activities of sub-advisers to other series of the Trust. The Board also considered the investment performance for periods ended September 30, 2013, of two mutual funds managed by Waddell using the same investment strategies and styles as it would use to manage the Muni High Income Fund. The materials provided to the Board indicated that the investment results of one of those two mutual funds had exceeded the returns of the Barclays High Yield Municipal Index for the five-year period (while the other fund underperformed relative to the Index by 28 basis points over the period), and that both mutual funds underperformed relative to the Index for the one-year period (by 268 basis points or less), three-year period (by 183 basis points or less) and ten-year period (by 69 basis points or less). The Board considered Waddell’s explanation of the periods of underperformance, and concluded that the services proposed to be provided to the Fund by the Adviser and Waddell would benefit the shareholders of the Fund.
CITY NATIONAL ROCHDALE FUNDS | PAGE 133
board approval of advisory and sub-advisory agreements
Advisory Fees, Fund Expenses, Profitability, Benefits to Adviser and Economies of Scale
The Board reviewed information regarding the advisory fees (before and after waivers) and sub-advisory fees proposed to be charged by the Adviser and Waddell with respect to the Muni High Income Fund, respectively, and the total expenses (net of fee waivers) of the Fund as a percentage of its average annual net assets compared to those of the funds included in the Fund’s Lipper universe and a peer group of funds selected by the Adviser.
The Board observed, among other things, that the proposed advisory fee and total expenses for the Muni High Income Fund were within the middle 60% of comparable funds in the Lipper High Yield Municipal Debt Funds Universe, and the anticipated costs and profits of the Adviser with respect to the Fund were reasonable. The Board also considered the potential benefits to be received by the Adviser, Waddell and their respective affiliates as a result of their relationships with the Fund generally, including investment advisory fees paid to the Adviser and Waddell, fees paid to affiliates such as City National Bank (“CNB”), City National Securities, Inc. and RIM Securities, LLC for providing certain shareholder servicing and sub-distribution services to the Trust, benefits to CNB’s brokerage and wealth management business as a result of the availability of the Muni High Income Fund to its customers, and the intangible benefits of any favorable publicity arising in connection with the Fund’s performance. They also noted that although the sub-advisory agreement provided for breakpoints while the advisory agreement did not, the portion of the proposed advisory fee retained by the Adviser would be low and significant economies of scale were not likely to be realized by the Adviser at the asset levels anticipated during the first several years of the Fund’s operations.
Conclusions
Based on their review, including their consideration of each of the factors referred to above, the Board and the Independent Trustees concluded that the proposed compensation payable to each of the Adviser and Waddell with respect to the Muni High Income Fund is fair and reasonable in relation to the services to be provided by it to the Fund, and approved the proposed advisory agreement and sub-advisory agreement.
CITY NATIONAL ROCHDALE FIXED INCOME OPPORTUNITIES FUND
Alcentra Limited
Nature, Extent and Quality of Services
In reviewing the services to be provided by Alcentra to the Fixed Income Opportunities Fund, the Board considered a variety of matters, including the background, education and experience of Alcentra’s key portfolio management and operational personnel; its overall financial strength and stability; its resources and related efforts to retain, attract and motivate capable personnel to serve the Fund; and the overall general quality and depth of its organization. The Board also reviewed Alcentra’s investment philosophy and processes as well as its brokerage and trading practices, its disaster recovery and contingency planning, and its commitment and systems in place with regard to compliance with applicable laws and regulations.
The Board considered the composite performance of accounts managed by Alcentra using the same investment strategies it would use to manage its portion of the Fixed Income Opportunities Fund. The Board observed that the composite returns were higher than the returns of the Standard & Poor’s European Leveraged Loan Index in 2003, 2004, 2006, 2007, 2008 and 2012, and on a compound basis from 2003 through 2012. The Board also noted that the Fund had underperformed relative to the Index by 1,390 basis points in 2009, and by 135 basis points or less in 2005, 2010 and 2011. The Board concluded that the services proposed to be provided to the Fund by Alcentra would benefit the shareholders of the Fund.
Sub-Advisory Fees, Benefits to Sub-Adviser and Economies of Scale
The Board reviewed the fees charged by Alcentra to a commingled fund that it managed using the same investment strategies it would use to manage its portion of the Fixed Income Opportunities Fund, and noted that the asset-based fees charged by Alcentra to the commingled fund were the same as the management fees it was charging with respect to the Fund, and that the commingled fund also paid a significant performance-based fee. The Board also considered the potential benefits to be received by Alcentra as a result of its relationship with the Fixed Income Opportunities Fund, including investment advisory fees paid to Alcentra and the intangible benefits of its association with the Fund generally and any favorable publicity arising in connection with the Fund’s performance. The Board considered that although neither the Fund’s advisory agreement nor the sub-advisory agreement included fee breakpoints, the portion of the proposed advisory fee retained by the Adviser after payment of
CITY NATIONAL ROCHDALE FUNDS | PAGE 134
sub-advisory fees was low and significant economies of scale were not likely to be realized by the Adviser or Alcentra at the Fund asset levels anticipated during the next several years of the Fund’s operations.
Conclusions
Based on their review, including their consideration of each of the factors referred to above, the Board and the Independent Trustees concluded that the terms of the proposed sub-advisory agreement, including the fees to be received by Alcentra, were fair and reasonable in light of the nature and quality of the services proposed to be provided by Alcentra to the Fixed Income Opportunities Fund and its shareholders, and approved the sub-advisory agreement.
Seix Investment Advisors LLC
Seix has been a sub-adviser with respect to a portion of the Fixed Income Opportunities Fund since the Fund’s predecessor reorganized into the Fund on March 29, 2013, and served as a sub-adviser to the Fund’s predecessor from July 2009. In December 2013, Seix informed the Fund that employees of the parent company of Seix, RidgeWorth Capital Management Inc., and Lightyear Capital LLC, a private equity firm, had entered into an agreement to acquire ownership of RidgeWorth Capital Management from SunTrust Bank, Inc. This transaction is scheduled to close on May 31, 2014, and will result in a change of control of Seix and the automatic termination of the existing sub-advisory agreement between the Adviser and Seix with respect to the Fund. At a meeting in February 2014 the Board approved a new sub-advisory agreement between the Adviser and Seix with respect to the Fund to take effect upon the closing of the transaction. The terms of the new sub-advisory agreement are substantially the same as the terms of the current sub-advisory agreement between the Adviser and Seix with respect to the Fund.
Nature, Extent and Quality of Services
In reviewing the services provided by Seix to the Fixed Income Opportunities Fund, the Board considered a variety of matters, including information about Seix’s organization, personnel who provide services to the Fund, and compensation structure; its investment philosophy and investment process; performance results of the Fund and the portion of the Fund managed by Seix over various periods; and Seix’s sub-advisory fees with respect to the Fund. The Board also reviewed certain information regarding Seix’s compliance policies and procedures, disaster recovery and contingency planning, and policies with respect to portfolio trade execution. Some of the information the Board considered had been provided in August 2013, when the Board last renewed Seix’s prior sub-advisory agreement with respect to the Fund, and the Board considered information from Seix regarding any material changes to the August 2013 information.
The Board assessed the investment results of the Fixed Income Opportunities Fund for various periods during the previous three years ended December 31, 2013, compared with the returns of the Credit Suisse Leveraged Loan Index (the “Benchmark Index”), the Barclays U.S. Corporate High Yield Bond Index (the “Barclays Index”), the Fund’s Lipper peer group average and the Fund’s Morningstar category average. The Board observed that the Fund’s annualized returns were higher than the returns of the Benchmark Index for the one-, two- and three-year periods and for each period were below the returns of the Barclays Index (by 299 basis points or less), below the returns of the Lipper peer group average (by 207 basis points or less), and below the returns of the Morningstar category average (by 218 basis points or less). The Board also assessed the investment results of the portion of the Fund managed by Seix for various periods since June 2011 through December 31, 2013, compared with the results of the Benchmark Index, and noted that the returns of that portion of the Fund trailed the returns of the Benchmark Index for the one- and two-year periods by 121 basis points or less. The Board considered Seix’s explanation of the periods of underperformance, and concluded that the services proposed to be provided to the Fund by Seix would continue to benefit the shareholders of the Fund.
Sub-Advisory Fees and Benefits to Sub-Adviser
The Board reviewed information regarding the sub-advisory fees charged by Seix with respect to the Fixed Income Opportunities Fund and observed that Seix’s sub-advisory fee was higher than the fee it charged to another mutual fund for which it served as sub-adviser using a similar strategy. The Board noted, however, that the other fund was significantly larger than the Fund and was a part of a larger mutual fund complex for which Seix serves as sub-adviser, and considered Seix’s indication that the lower sub-advisory fee for the other mutual reflected the economies of scale of the other fund and the group of funds to which it belongs.
The Board also considered the benefits received by Seix as a result of its relationship with the Fixed Income Opportunities Fund, including the sub-advisory fees paid to Seix, research provided to it by broker-dealers providing execution services to the Fund, and the intangible benefits of its association with the Fund
CITY NATIONAL ROCHDALE FUNDS | PAGE 135
board approval of advisory and sub-advisory agreements
generally and any favorable publicity arising in connection with the Fund’s performance. The Board considered that although neither the Fund’s advisory agreement nor the Seix sub-advisory agreement included fee breakpoints, the portion of the advisory fee retained by the Adviser after payment of sub-advisory fees was low and significant economies of scale were not likely to be realized by the Adviser or Seix at the Fund asset levels anticipated during the next several years of the Fund’s operations.
Conclusions
Based on their review, including their consideration of each of the factors referred to above, the Board and the Independent Trustees concluded that the terms of the proposed sub-advisory agreement, including the fees to be received by Seix, were fair and reasonable in light of the nature and quality of the services proposed to be provided by Seix to the Fixed Income Opportunities Fund and its shareholders, and approved the sub-advisory agreement.
CITY NATIONAL ROCHDALE FUNDS | PAGE 136
For more information on City National Rochdale Funds, including charges and expenses, please call 1-888-889-0799 or go to citynationalrochdalefunds.com for a free prospectus. Read it carefully before you invest or send money.
CNR-SA-004-0600
Not applicable for semi-annual report.
| Item 3. | Audit Committee Financial Expert. |
Not applicable for semi-annual report.
| Item 4. | Principal Accountant Fees and Services. |
Not applicable for semi-annual report.
| Item 5. | Audit Committee of Listed Registrants. |
Not applicable to open-end management investment companies.
| Item 6. | Schedule of Investments |
Not applicable.
| Item 7. | Disclosure of Proxy Voting Policies and Procedures for Closed-End Management Investment Companies. |
Not applicable to open-end management investment companies.
| Item 8. | Portfolio Managers of Closed-End Management Investment Companies |
Not applicable to open-end management investment companies.
| Item 9. | Purchases of Equity Securities by Closed-End Management Company and Affiliated Purchasers. |
Not applicable to open-end management investment companies.
| Item 10. | Submission of Matters to a Vote of Security Holders. |
None.
| Item 11. | Controls and Procedures. |
(a) The certifying officers, whose certifications are included herewith, have evaluated the registrant’s disclosure controls and procedures within 90 days of the filing date of this report. In their opinion, based on their evaluation, the registrant’s disclosure controls and procedures are adequately designed, and are operating effectively to ensure, that information required to be disclosed by the registrant in the reports it files or submits under the Securities Exchange Act of 1934 is recorded, processed, summarized and reported within the time periods specified in the Securities and Exchange Commission’s rules and forms.
(b) There were no significant changes in the registrant’s internal control over financial reporting that occurred during the second fiscal quarter of the period covered by this report that has materially affected, or is reasonably likely to materially affect, the registrant’s internal control over financial reporting.
(a)(1) Not applicable for semi-annual report.
(a)(2) A separate certification for the principal executive officer and the principal financial officer of the registrant as required by Rule 30a-2(a) under the Investment Company Act of 1940, as amended (17 CFR 270.30a-2(a)), are filed herewith.
(b) Officer certifications as required by Rule 30a-2(b) under the Investment Company Act of 1940, as amended (17 CFR 270.30a-2(b)) also accompany this filing as an Exhibit.
SIGNATURES
Pursuant to the requirements of the securities Exchange Act of 1934 and the Investment Company Act of 1940, the registrant has duly caused this report to be signed on its behalf by the undersigned, thereunto duly authorized.
| (Registrant) | City National Rochdale Funds | |
| | | |
| By (Signature and Title)* | /s/ Garrett R. D’Alessandro | |
| | Garrett R. D’Alessandro, | |
| | President and Chief Executive Officer | |
| | | |
| Date: June 6, 2014 | | |
| | | |
| Pursuant to the requirements of the Securities Exchange Act of 1934 and the Investment Company Act of 1940, this report has been signed below by the following persons on behalf of the registrant and in the capacities and on the dates indicated. |
| | | |
| By (Signature and Title)* | /s/ Garrett R. D’Alessandro | |
| | Garrett R. D’Alessandro, | |
| | President and Chief Executive Officer | |
| Date: June 6, 2014 | | |
| | | |
| By (Signature and Title)* | /s/ Eric Kleinschmidt | |
| | Eric Kleinschmidt, Controller and COO | |
Date: June 6, 2014
| * | Print the name and title of each signing officer under his or her signature. |